Breve análisis del Dell XPS 13 9360 QHD+ i7-7500U


| SD Card Reader | |
| average JPG Copy Test (av. of 3 runs) | |
| MSI GT73VR 6RF | |
| Dell XPS 13 9360 QHD+ i7 | |
| Asus Zenbook UX360UA-C4159T | |
| maximum AS SSD Seq Read Test (1GB) | |
| Dell XPS 13 9360 QHD+ i7 | |
| MSI GT73VR 6RF | |
| Asus Zenbook UX360UA-C4159T | |
| Networking | |
| Wi-Fi Client 1m 512KB | |
| Wi-Fi Server 1m 512KB |
| |||||||||||||||||||||||||
iluminación: 84 %
Brillo con batería: 396.2 cd/m²
Contraste: 1489:1 (Negro: 0.266 cd/m²)
ΔE ColorChecker Calman: 3.9 | ∀{0.5-29.43 Ø4.72}
ΔE Greyscale Calman: 4.16 | ∀{0.09-98 Ø4.97}
88.7% sRGB (Argyll 1.6.3 3D)
57.5% AdobeRGB 1998 (Argyll 1.6.3 3D)
64.6% AdobeRGB 1998 (Argyll 3D)
89.4% sRGB (Argyll 3D)
62.8% Display P3 (Argyll 3D)
Gamma: 2.31
CCT: 6514 K
| Dell XPS 13 9360 QHD+ i7 Sharp SHP144A, IPS, 13.3", 3200x1800 | HP Spectre x360 13-w023dx Chi Mei CMN1367, IPS, 13.3", 1920x1080 | HP EliteBook 1030 G1-X2F03EA Sharp SHP1465, IPS, 13.3", 3200x1800 | Asus Zenbook UX360UA-C4159T AU Optronics AOU272D / B133HAN02.7, IPS, 13.3", 1920x1080 | Apple MacBook Air 13 inch 2015-03 Apple APP9CF0, TN LED, 13.3", 1440x900 | |
|---|---|---|---|---|---|
| Display | 2% | 7% | 3% | -35% | |
| Display P3 Coverage (%) | 62.8 | 65.4 4% | 67.6 8% | 64.8 3% | 40.1 -36% |
| sRGB Coverage (%) | 89.4 | 90.4 1% | 94.7 6% | 93.1 4% | 59.8 -33% |
| AdobeRGB 1998 Coverage (%) | 64.6 | 65.8 2% | 69 7% | 66 2% | 41.51 -36% |
| Response Times | 14% | 8% | 34% | ||
| Response Time Grey 50% / Grey 80% * (ms) | 43.6 ? | 33.2 ? 24% | 42.4 ? 3% | 29 ? 33% | |
| Response Time Black / White * (ms) | 29.2 ? | 28 ? 4% | 25.6 ? 12% | 19 ? 35% | |
| PWM Frequency (Hz) | 50 ? | ||||
| Screen | -28% | -1% | -16% | -18% | |
| Brightness middle (cd/m²) | 396.2 | 334.6 -16% | 401 1% | 344 -13% | 329 -17% |
| Brightness (cd/m²) | 357 | 319 -11% | 369 3% | 326 -9% | 310 -13% |
| Brightness Distribution (%) | 84 | 90 7% | 85 1% | 86 2% | 82 -2% |
| Black Level * (cd/m²) | 0.266 | 0.336 -26% | 0.35 -32% | 0.27 -2% | 0.405 -52% |
| Contrast (:1) | 1489 | 996 -33% | 1146 -23% | 1274 -14% | 812 -45% |
| Colorchecker dE 2000 * | 3.9 | 6.21 -59% | 3.5 10% | 5.53 -42% | 3.96 -2% |
| Colorchecker dE 2000 max. * | 7.58 | 12 -58% | 6.33 16% | 10.01 -32% | 7.51 1% |
| Greyscale dE 2000 * | 4.16 | 7.71 -85% | 4.13 1% | 6.67 -60% | 3.51 16% |
| Gamma | 2.31 95% | 2.36 93% | 2.28 96% | 2.43 91% | 3.83 57% |
| CCT | 6514 100% | 6458 101% | 6508 100% | 7012 93% | 6711 97% |
| Color Space (Percent of AdobeRGB 1998) (%) | 57.5 | 58.6 2% | 61.56 7% | 60 4% | 38.4 -33% |
| Color Space (Percent of sRGB) (%) | 88.7 | 90 1% | 94.64 7% | 93 5% | 59.8 -33% |
| Media total (Programa/Opciones) | -4% /
-16% | 5% /
2% | 7% /
-6% | -27% /
-22% |
* ... más pequeño es mejor
Tiempos de respuesta del display
| ↔ Tiempo de respuesta de Negro a Blanco | ||
|---|---|---|
| 29.2 ms ... subida ↗ y bajada ↘ combinada | ↗ 9.2 ms subida | 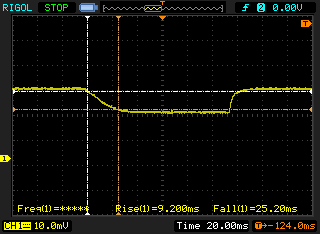 |
| ↘ 20 ms bajada | ||
| La pantalla mostró tiempos de respuesta relativamente lentos en nuestros tests pero podría ser demasiado lenta para los jugones. En comparación, todos los dispositivos de prueba van de ##min### (mínimo) a 240 (máximo) ms. » 78 % de todos los dispositivos son mejores. Eso quiere decir que el tiempo de respuesta es peor que la media (19.8 ms) de todos los dispositivos testados. | ||
| ↔ Tiempo de respuesta 50% Gris a 80% Gris | ||
| 43.6 ms ... subida ↗ y bajada ↘ combinada | ↗ 13.6 ms subida | 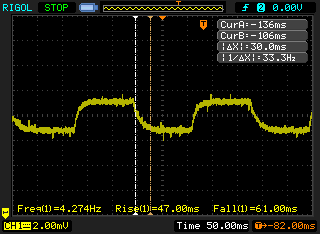 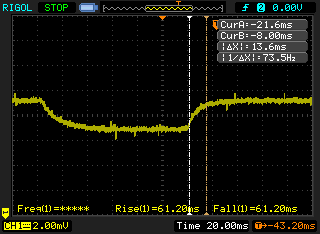 |
| ↘ 30 ms bajada | ||
| La pantalla mostró tiempos de respuesta lentos en nuestros tests y podría ser demasiado lenta para los jugones. En comparación, todos los dispositivos de prueba van de ##min### (mínimo) a 636 (máximo) ms. » 73 % de todos los dispositivos son mejores. Eso quiere decir que el tiempo de respuesta es peor que la media (31 ms) de todos los dispositivos testados. | ||
Parpadeo de Pantalla / PWM (Pulse-Width Modulation)
| Parpadeo de Pantalla / PWM no detectado | 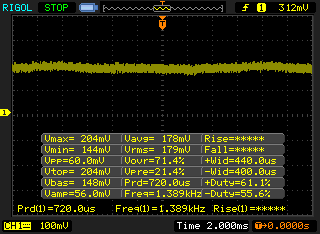 | ||
Comparación: 52 % de todos los dispositivos testados no usaron PWM para atenuar el display. Si se usó, medimos una media de 7772 (mínimo: 5 - máxmo: 343500) Hz. | |||
| Cinebench R15 | |
| CPU Single 64Bit | |
| MSI CX72-7QL | |
| Intel Skull Canyon NUC6i7KYK | |
| Dell XPS 13 9360 QHD+ i7 | |
| Acer Aspire E5-774G-78NA | |
| Lenovo U31-70 80M5003EGE | |
| Dell XPS 13 9360 QHD+ i5 | |
| Lenovo Y40-59423035 | |
| HP EliteBook 1030 G1-X2F03EA | |
| CPU Multi 64Bit | |
| Intel Skull Canyon NUC6i7KYK | |
| MSI CX72-7QL | |
| Dell XPS 13 9360 QHD+ i7 | |
| Acer Aspire E5-774G-78NA | |
| Dell XPS 13 9360 QHD+ i5 | |
| HP EliteBook 1030 G1-X2F03EA | |
| Lenovo U31-70 80M5003EGE | |
| Lenovo Y40-59423035 | |
| Cinebench R11.5 | |
| CPU Single 64Bit | |
| MSI CX72-7QL | |
| Dell XPS 13 9360 QHD+ i7 | |
| Intel Skull Canyon NUC6i7KYK | |
| Acer Aspire E5-774G-78NA | |
| Lenovo U31-70 80M5003EGE | |
| Dell XPS 13 9360 QHD+ i5 | |
| HP EliteBook 1030 G1-X2F03EA | |
| Lenovo Y40-59423035 | |
| CPU Multi 64Bit | |
| Intel Skull Canyon NUC6i7KYK | |
| MSI CX72-7QL | |
| Dell XPS 13 9360 QHD+ i7 | |
| Acer Aspire E5-774G-78NA | |
| Dell XPS 13 9360 QHD+ i5 | |
| HP EliteBook 1030 G1-X2F03EA | |
| Lenovo U31-70 80M5003EGE | |
| Lenovo Y40-59423035 | |
| Cinebench R10 | |
| Rendering Multiple CPUs 32Bit | |
| Intel Skull Canyon NUC6i7KYK | |
| MSI CX72-7QL | |
| Dell XPS 13 9360 QHD+ i7 | |
| Acer Aspire E5-774G-78NA | |
| Lenovo U31-70 80M5003EGE | |
| Rendering Single 32Bit | |
| MSI CX72-7QL | |
| Dell XPS 13 9360 QHD+ i7 | |
| Intel Skull Canyon NUC6i7KYK | |
| Acer Aspire E5-774G-78NA | |
| Lenovo U31-70 80M5003EGE | |
| wPrime 2.10 - 1024m | |
| Lenovo Y40-59423035 | |
| Dell XPS 13 9360 QHD+ i5 | |
| Dell XPS 13 9360 QHD+ i7 | |
| MSI CX72-7QL | |
| Intel Skull Canyon NUC6i7KYK | |
| Super Pi Mod 1.5 XS 32M - 32M | |
| Lenovo Y40-59423035 | |
| Dell XPS 13 9360 QHD+ i7 | |
| MSI CX72-7QL | |
| Intel Skull Canyon NUC6i7KYK | |
* ... más pequeño es mejor
| PCMark 8 | |
| Home Score Accelerated v2 | |
| Intel Skull Canyon NUC6i7KYK | |
| HP Spectre x360 13-w023dx | |
| HP Spectre 13 | |
| Asus Zenbook UX360UA-C4159T | |
| Dell XPS 13 9360 QHD+ i7 | |
| Dell XPS 13 9360 QHD+ i5 | |
| Work Score Accelerated v2 | |
| Intel Skull Canyon NUC6i7KYK | |
| HP Spectre x360 13-w023dx | |
| HP Spectre 13 | |
| Asus Zenbook UX360UA-C4159T | |
| Dell XPS 13 9360 QHD+ i7 | |
| Creative Score Accelerated v2 | |
| Intel Skull Canyon NUC6i7KYK | |
| HP Spectre x360 13-w023dx | |
| HP Spectre 13 | |
| Dell XPS 13 9360 QHD+ i7 | |
| PCMark 8 Home Score Accelerated v2 | 2855 puntos | |
| PCMark 8 Creative Score Accelerated v2 | 4172 puntos | |
| PCMark 8 Work Score Accelerated v2 | 4176 puntos | |
ayuda | ||
| Dell XPS 13 9360 QHD+ i7 Toshiba NVMe THNSN5256GPUK | HP Spectre x360 13-w023dx Samsung PM951 NVMe MZVLV512 | HP EliteBook 1030 G1-X2F03EA Sandisk X300 SD7SN6S-512G-1006 | Apple MacBook Air 13 inch 2015-03 Apple SSD SD0256F | Dell XPS 13 9360 QHD+ i5 Toshiba NVMe THNSN5256GPUK | |
|---|---|---|---|---|---|
| CrystalDiskMark 3.0 | 16% | -38% | 18% | -1% | |
| Read Seq (MB/s) | 1214 | 1376 13% | 387.5 -68% | 1352 11% | 1168 -4% |
| Write Seq (MB/s) | 655 | 571 -13% | 348.7 -47% | 1111 70% | 329 -50% |
| Read 512 (MB/s) | 1019 | 679 -33% | 239.9 -76% | 880 -14% | 1015 0% |
| Write 512 (MB/s) | 445.7 | 571 28% | 335.3 -25% | 1023 130% | 307 -31% |
| Read 4k (MB/s) | 35.55 | 42.66 20% | 30.34 -15% | 21.93 -38% | 33 -7% |
| Write 4k (MB/s) | 130 | 137.9 6% | 75.9 -42% | 30.94 -76% | 132 2% |
| Read 4k QD32 (MB/s) | 537 | 535 0% | 311.3 -42% | 339.5 -37% | 525 -2% |
| Write 4k QD32 (MB/s) | 173.8 | 361.2 108% | 192.8 11% | 342.9 97% | 325 87% |

| 3DMark | |
| 1280x720 Cloud Gate Standard Graphics | |
| Intel Skull Canyon NUC6i7KYK | |
| MSI CX72-7QL | |
| Dell XPS 13 9360 QHD+ i7 | |
| Asus X302UV-FN016T | |
| Dell XPS 13 9360 QHD+ i5 | |
| Lenovo Ideapad 510S-13ISK | |
| HP Pavilion x2 12-b000ng | |
| Dell Vostro 3546 JAN15HSW1601_1K9_Win | |
| Lenovo B50-50 80S2000QGE | |
| 1920x1080 Fire Strike Graphics | |
| Intel Skull Canyon NUC6i7KYK | |
| Asus X302UV-FN016T | |
| MSI CX72-7QL | |
| Dell XPS 13 9360 QHD+ i7 | |
| Dell XPS 13 9360 QHD+ i5 | |
| Lenovo Ideapad 510S-13ISK | |
| HP Pavilion x2 12-b000ng | |
| Lenovo B50-50 80S2000QGE | |
| Dell Vostro 3546 JAN15HSW1601_1K9_Win | |
| 3DMark 11 | |
| 1280x720 Performance GPU | |
| Intel Skull Canyon NUC6i7KYK | |
| Asus X302UV-FN016T | |
| MSI CX72-7QL | |
| Dell XPS 13 9360 QHD+ i7 | |
| Dell XPS 13 9360 QHD+ i5 | |
| Lenovo Ideapad 510S-13ISK | |
| HP Pavilion x2 12-b000ng | |
| Lenovo B50-50 80S2000QGE | |
| Dell Vostro 3546 JAN15HSW1601_1K9_Win | |
| 1280x720 Performance Combined | |
| Intel Skull Canyon NUC6i7KYK | |
| MSI CX72-7QL | |
| Asus X302UV-FN016T | |
| Dell XPS 13 9360 QHD+ i7 | |
| Dell XPS 13 9360 QHD+ i5 | |
| Lenovo Ideapad 510S-13ISK | |
| HP Pavilion x2 12-b000ng | |
| Lenovo B50-50 80S2000QGE | |
| Dell Vostro 3546 JAN15HSW1601_1K9_Win | |
| 3DMark 06 Standard Score | 9655 puntos | |
| 3DMark 11 Performance | 1771 puntos | |
| 3DMark Ice Storm Standard Score | 55532 puntos | |
| 3DMark Cloud Gate Standard Score | 6460 puntos | |
| 3DMark Fire Strike Score | 876 puntos | |
| 3DMark Fire Strike Extreme Score | 401 puntos | |
ayuda | ||
| BioShock Infinite | |
| 1280x720 Very Low Preset | |
| Acer TravelMate P278-MG-76L2 | |
| Acer Aspire E5-574-53YZ | |
| MSI CX72-7QL | |
| Dell XPS 13 9360 QHD+ i7 | |
| Lenovo ThinkPad Yoga 12 20DK002EPB | |
| HP ProBook 650 G2 V1A44ET | |
| 1366x768 Medium Preset | |
| Acer TravelMate P278-MG-76L2 | |
| Acer Aspire E5-574-53YZ | |
| MSI CX72-7QL | |
| Dell XPS 13 9360 QHD+ i7 | |
| Lenovo ThinkPad Yoga 12 20DK002EPB | |
| HP ProBook 650 G2 V1A44ET | |
| 1366x768 High Preset | |
| Acer TravelMate P278-MG-76L2 | |
| Acer Aspire E5-574-53YZ | |
| MSI CX72-7QL | |
| Dell XPS 13 9360 QHD+ i7 | |
| Lenovo ThinkPad Yoga 12 20DK002EPB | |
| HP ProBook 650 G2 V1A44ET | |
| bajo | medio | alto | ultra | |
|---|---|---|---|---|
| BioShock Infinite (2013) | 55 | 28.2 | 26.1 | 8.3 |
| The Witcher 3 (2015) | 15.7 | |||
| Dota 2 Reborn (2015) | 59.6 | 50.7 | 27 | 24.2 |
| Rise of the Tomb Raider (2016) | 21.8 | 12.5 | 6.2 | |
| Overwatch (2016) | 49.7 | 34.8 | 16.4 | |
| FIFA 17 (2016) | 56 graves problemas gráficos (flickering and slowdowns) | |||
| Battlefield 1 (2016) | 30.3 | |||
| Titanfall 2 (2016) | 36.6 | 24.9 |
Ruido
| Ocioso |
| 28.8 / 28.8 / 30.8 dB(A) |
| Carga |
| 34.8 / 34.8 dB(A) |
 | ||
30 dB silencioso 40 dB(A) audible 50 dB(A) ruidosamente alto |
||
min: | ||
| Dell XPS 13 9360 QHD+ i7 HD Graphics 620, i7-7500U, Toshiba NVMe THNSN5256GPUK | HP Spectre x360 13-w023dx HD Graphics 620, i7-7500U, Samsung PM951 NVMe MZVLV512 | HP Spectre 13 HD Graphics 520, 6500U, Samsung PM951 NVMe MZVLV256 | Apple MacBook Air 13 inch 2015-03 HD Graphics 6000, 5650U, Apple SSD SD0256F | Dell XPS 13 9360 QHD+ i5 HD Graphics 620, i5-7200U, Toshiba NVMe THNSN5256GPUK | |
|---|---|---|---|---|---|
| Noise | -4% | -6% | -9% | -4% | |
| apagado / medio ambiente * (dB) | 28.8 | 29.1 -1% | 28.5 1% | 30.3 -5% | |
| Idle Minimum * (dB) | 28.8 | 29.1 -1% | 28.5 1% | 29.2 -1% | 30.6 -6% |
| Idle Average * (dB) | 28.8 | 29.1 -1% | 30.9 -7% | 29.2 -1% | 30.6 -6% |
| Idle Maximum * (dB) | 30.8 | 31.2 -1% | 31.6 -3% | 29.2 5% | 32.2 -5% |
| Load Average * (dB) | 34.8 | 37.3 -7% | 38.8 -11% | 40.2 -16% | 32.2 7% |
| Load Maximum * (dB) | 34.8 | 39.6 -14% | 41.4 -19% | 46.3 -33% | 38.5 -11% |
* ... más pequeño es mejor
(-) La temperatura máxima en la parte superior es de 50.8 °C / 123 F, frente a la media de 35.9 °C / 97 F, que oscila entre 21.4 y 59 °C para la clase Subnotebook.
(-) El fondo se calienta hasta un máximo de 50.8 °C / 123 F, frente a la media de 39.2 °C / 103 F
(+) En reposo, la temperatura media de la parte superior es de 25.7 °C / 78# F, frente a la media del dispositivo de 30.8 °C / 87 F.
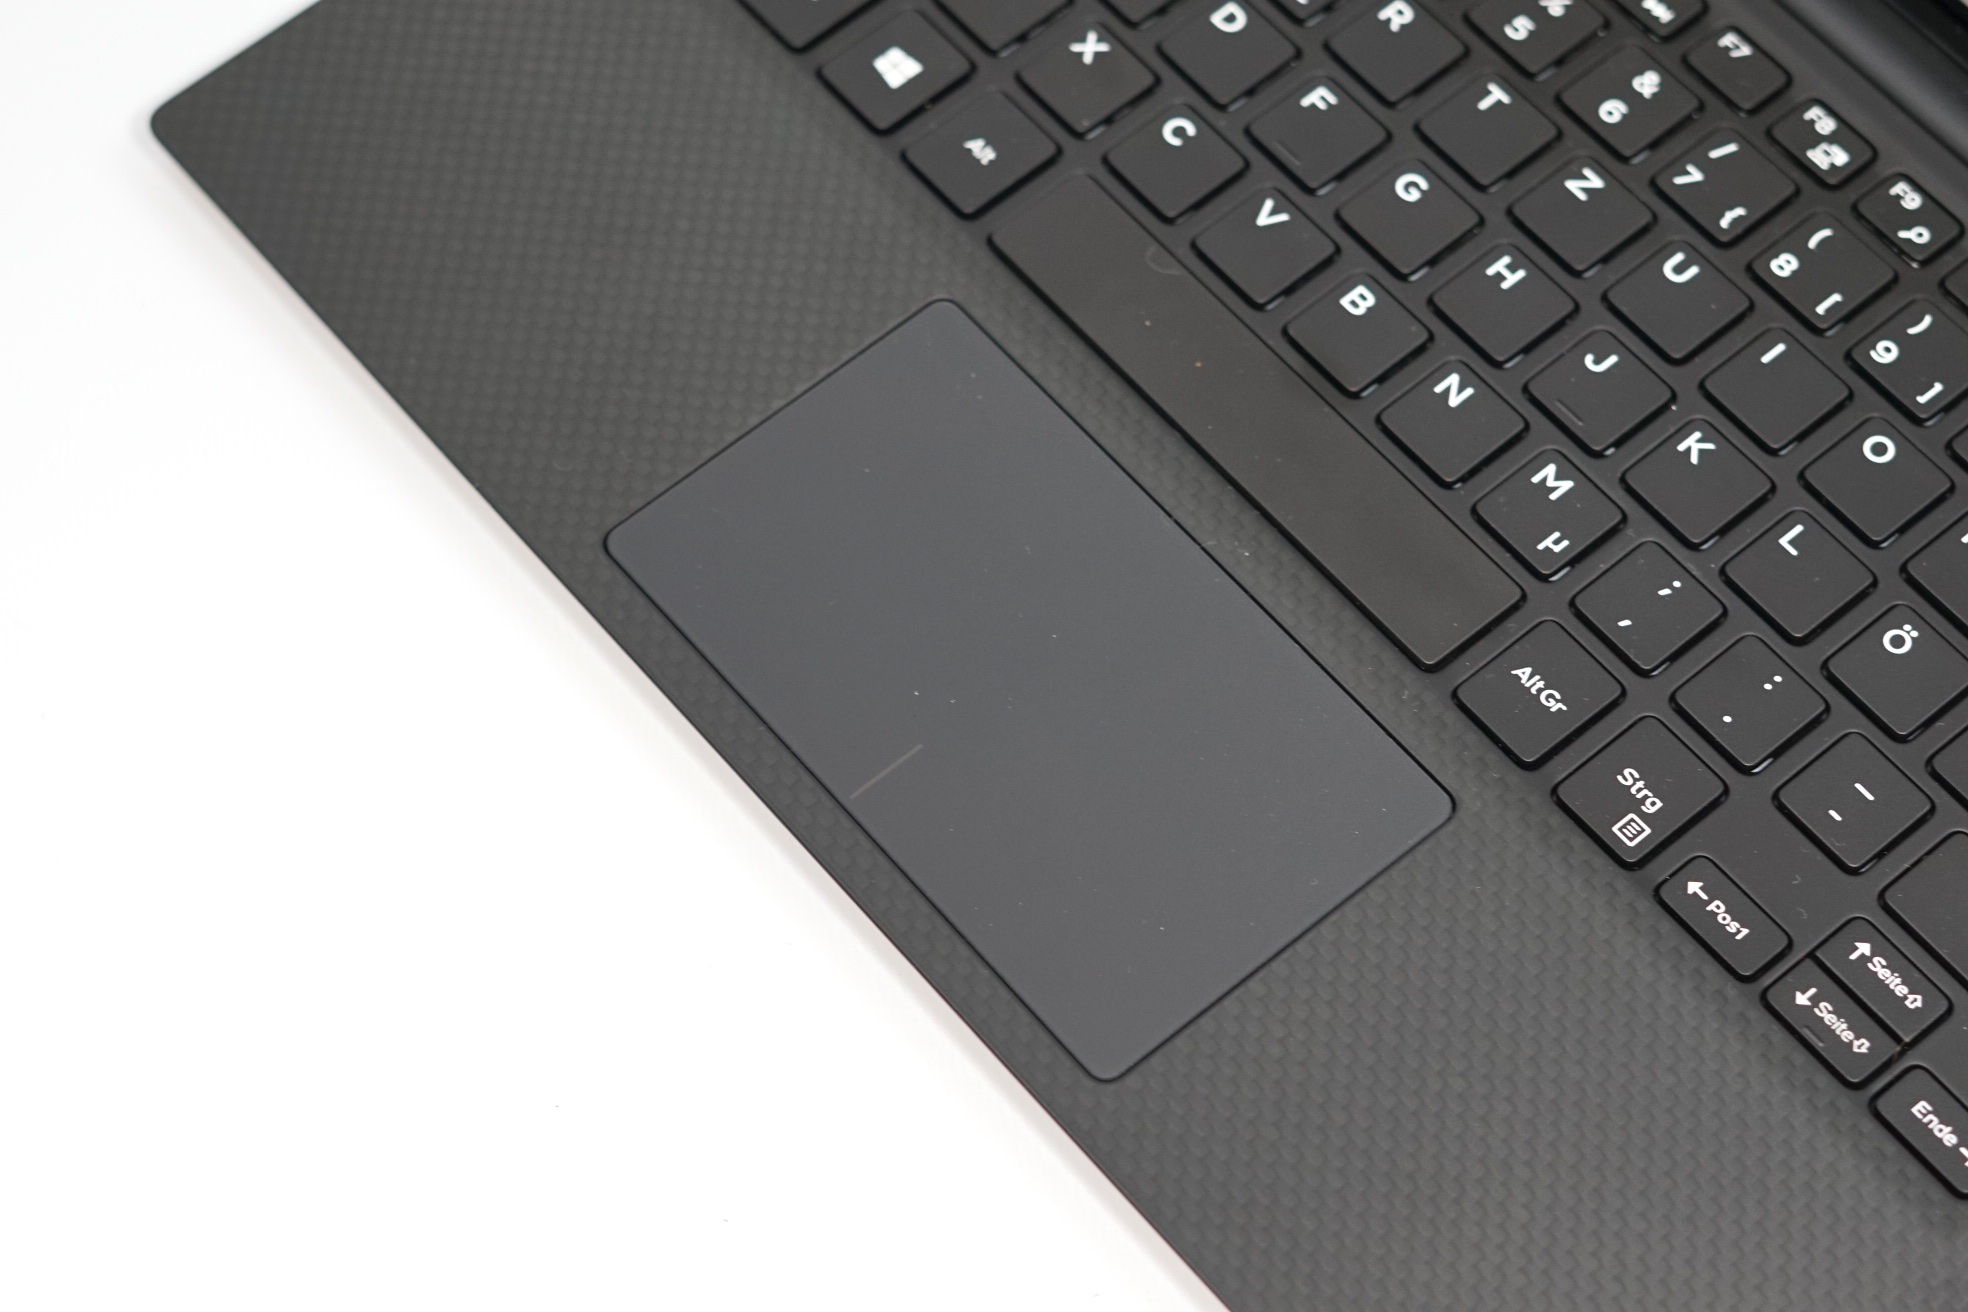
(+) El reposamanos y el panel táctil están a una temperatura inferior a la de la piel, con un máximo de 31 °C / 87.8 F y, por tanto, son fríos al tacto.
(-) La temperatura media de la zona del reposamanos de dispositivos similares fue de 28.2 °C / 82.8 F (-2.8 °C / -5 F).
Dell XPS 13 9360 QHD+ i7 análisis de audio
(±) | la sonoridad del altavoz es media pero buena (72.4 dB)
Graves 100 - 315 Hz
(±) | lubina reducida - en promedio 6.5% inferior a la mediana
(±) | la linealidad de los graves es media (12.6% delta a frecuencia anterior)
Medios 400 - 2000 Hz
(+) | medios equilibrados - a sólo 4.6% de la mediana
(+) | los medios son lineales (6.9% delta a la frecuencia anterior)
Altos 2 - 16 kHz
(+) | máximos equilibrados - a sólo 3.4% de la mediana
(-) | los máximos no son lineales (18.9% delta a la frecuencia anterior)
Total 100 - 16.000 Hz
(±) | la linealidad del sonido global es media (20.8% de diferencia con la mediana)
En comparación con la misma clase
» 68% de todos los dispositivos probados de esta clase eran mejores, 7% similares, 25% peores
» El mejor tuvo un delta de 5%, la media fue 18%, el peor fue ###max##%
En comparación con todos los dispositivos probados
» 56% de todos los dispositivos probados eran mejores, 8% similares, 36% peores
» El mejor tuvo un delta de 4%, la media fue 24%, el peor fue ###max##%
Apple MacBook 12 (Early 2016) 1.1 GHz análisis de audio
(+) | los altavoces pueden reproducir a un volumen relativamente alto (#83.6 dB)
Graves 100 - 315 Hz
(±) | lubina reducida - en promedio 11.3% inferior a la mediana
(±) | la linealidad de los graves es media (14.2% delta a frecuencia anterior)
Medios 400 - 2000 Hz
(+) | medios equilibrados - a sólo 2.4% de la mediana
(+) | los medios son lineales (5.5% delta a la frecuencia anterior)
Altos 2 - 16 kHz
(+) | máximos equilibrados - a sólo 2% de la mediana
(+) | los máximos son lineales (4.5% delta a la frecuencia anterior)
Total 100 - 16.000 Hz
(+) | el sonido global es lineal (10.2% de diferencia con la mediana)
En comparación con la misma clase
» 7% de todos los dispositivos probados de esta clase eran mejores, 2% similares, 91% peores
» El mejor tuvo un delta de 5%, la media fue 18%, el peor fue ###max##%
En comparación con todos los dispositivos probados
» 5% de todos los dispositivos probados eran mejores, 1% similares, 94% peores
» El mejor tuvo un delta de 4%, la media fue 24%, el peor fue ###max##%
| Off / Standby | |
| Ocioso | |
| Carga |
|
Clave:
min: | |
| Dell XPS 13 9360 QHD+ i7 i7-7500U, HD Graphics 620, Toshiba NVMe THNSN5256GPUK, IPS, 3200x1800, 13.3" | HP Spectre x360 13-w023dx i7-7500U, HD Graphics 620, Samsung PM951 NVMe MZVLV512, IPS, 1920x1080, 13.3" | HP EliteBook 1030 G1-X2F03EA 6Y75, HD Graphics 515, Sandisk X300 SD7SN6S-512G-1006, IPS, 3200x1800, 13.3" | Apple MacBook Air 13 inch 2015-03 5650U, HD Graphics 6000, Apple SSD SD0256F, TN LED, 1440x900, 13.3" | Dell XPS 13 9360 QHD+ i5 i5-7200U, HD Graphics 620, Toshiba NVMe THNSN5256GPUK, , 3200x1800, 13.3" | |
|---|---|---|---|---|---|
| Power Consumption | -4% | -3% | 11% | 9% | |
| Idle Minimum * (Watt) | 6.4 | 5.5 14% | 4 37% | 2.7 58% | 3.7 42% |
| Idle Average * (Watt) | 6.6 | 6.7 -2% | 8 -21% | 5.7 14% | 6.1 8% |
| Idle Maximum * (Watt) | 6.8 | 7.1 -4% | 8.6 -26% | 6 12% | 6.5 4% |
| Load Average * (Watt) | 27.5 | 33.1 -20% | 26.5 4% | 32.1 -17% | 29.5 -7% |
| Load Maximum * (Watt) | 32.4 | 35.2 -9% | 34.8 -7% | 36.2 -12% | 33 -2% |
* ... más pequeño es mejor
| Dell XPS 13 9360 QHD+ i7 i7-7500U, HD Graphics 620, 60 Wh | HP Spectre x360 13-w023dx i7-7500U, HD Graphics 620, 57.8 Wh | HP EliteBook 1030 G1-X2F03EA 6Y75, HD Graphics 515, 40 Wh | Apple MacBook Air 13 inch 2015-03 5650U, HD Graphics 6000, 54 Wh | Dell XPS 13 9360 QHD+ i5 i5-7200U, HD Graphics 620, 60 Wh | |
|---|---|---|---|---|---|
| Duración de Batería | 5% | -24% | 14% | 4% | |
| Reader / Idle (h) | 17.6 | 20.6 17% | 10.3 -41% | 26.2 49% | |
| WiFi v1.3 (h) | 8.6 | 9.3 8% | 5.1 -41% | 10.3 20% | 8.8 2% |
| Load (h) | 2.2 | 2 -9% | 2.4 9% | 1.6 -27% | 2.3 5% |
Pro
Contra
Para la mayoría de usuarios, la parte más importante de la actualización a Kaby Lake XPS 13 9360 es el hecho de que el XPS 13 9350 Skylake ahora será más barato. Las deltas de rendimiento entre estos portátiles casi idénticos son tan mínimas que los ocmpradores que quieran usar el portátil para clase, navegar, o multimedia, encontrarán poquísimos beneficios tangibles a Kaby Lake. De hecho, ciertas configuraciones del XPS 13 9350 con Iris Graphics pueden dejar atrás a las configuraciones Kaby Lake si los usuarios piden más potencia gráfica.
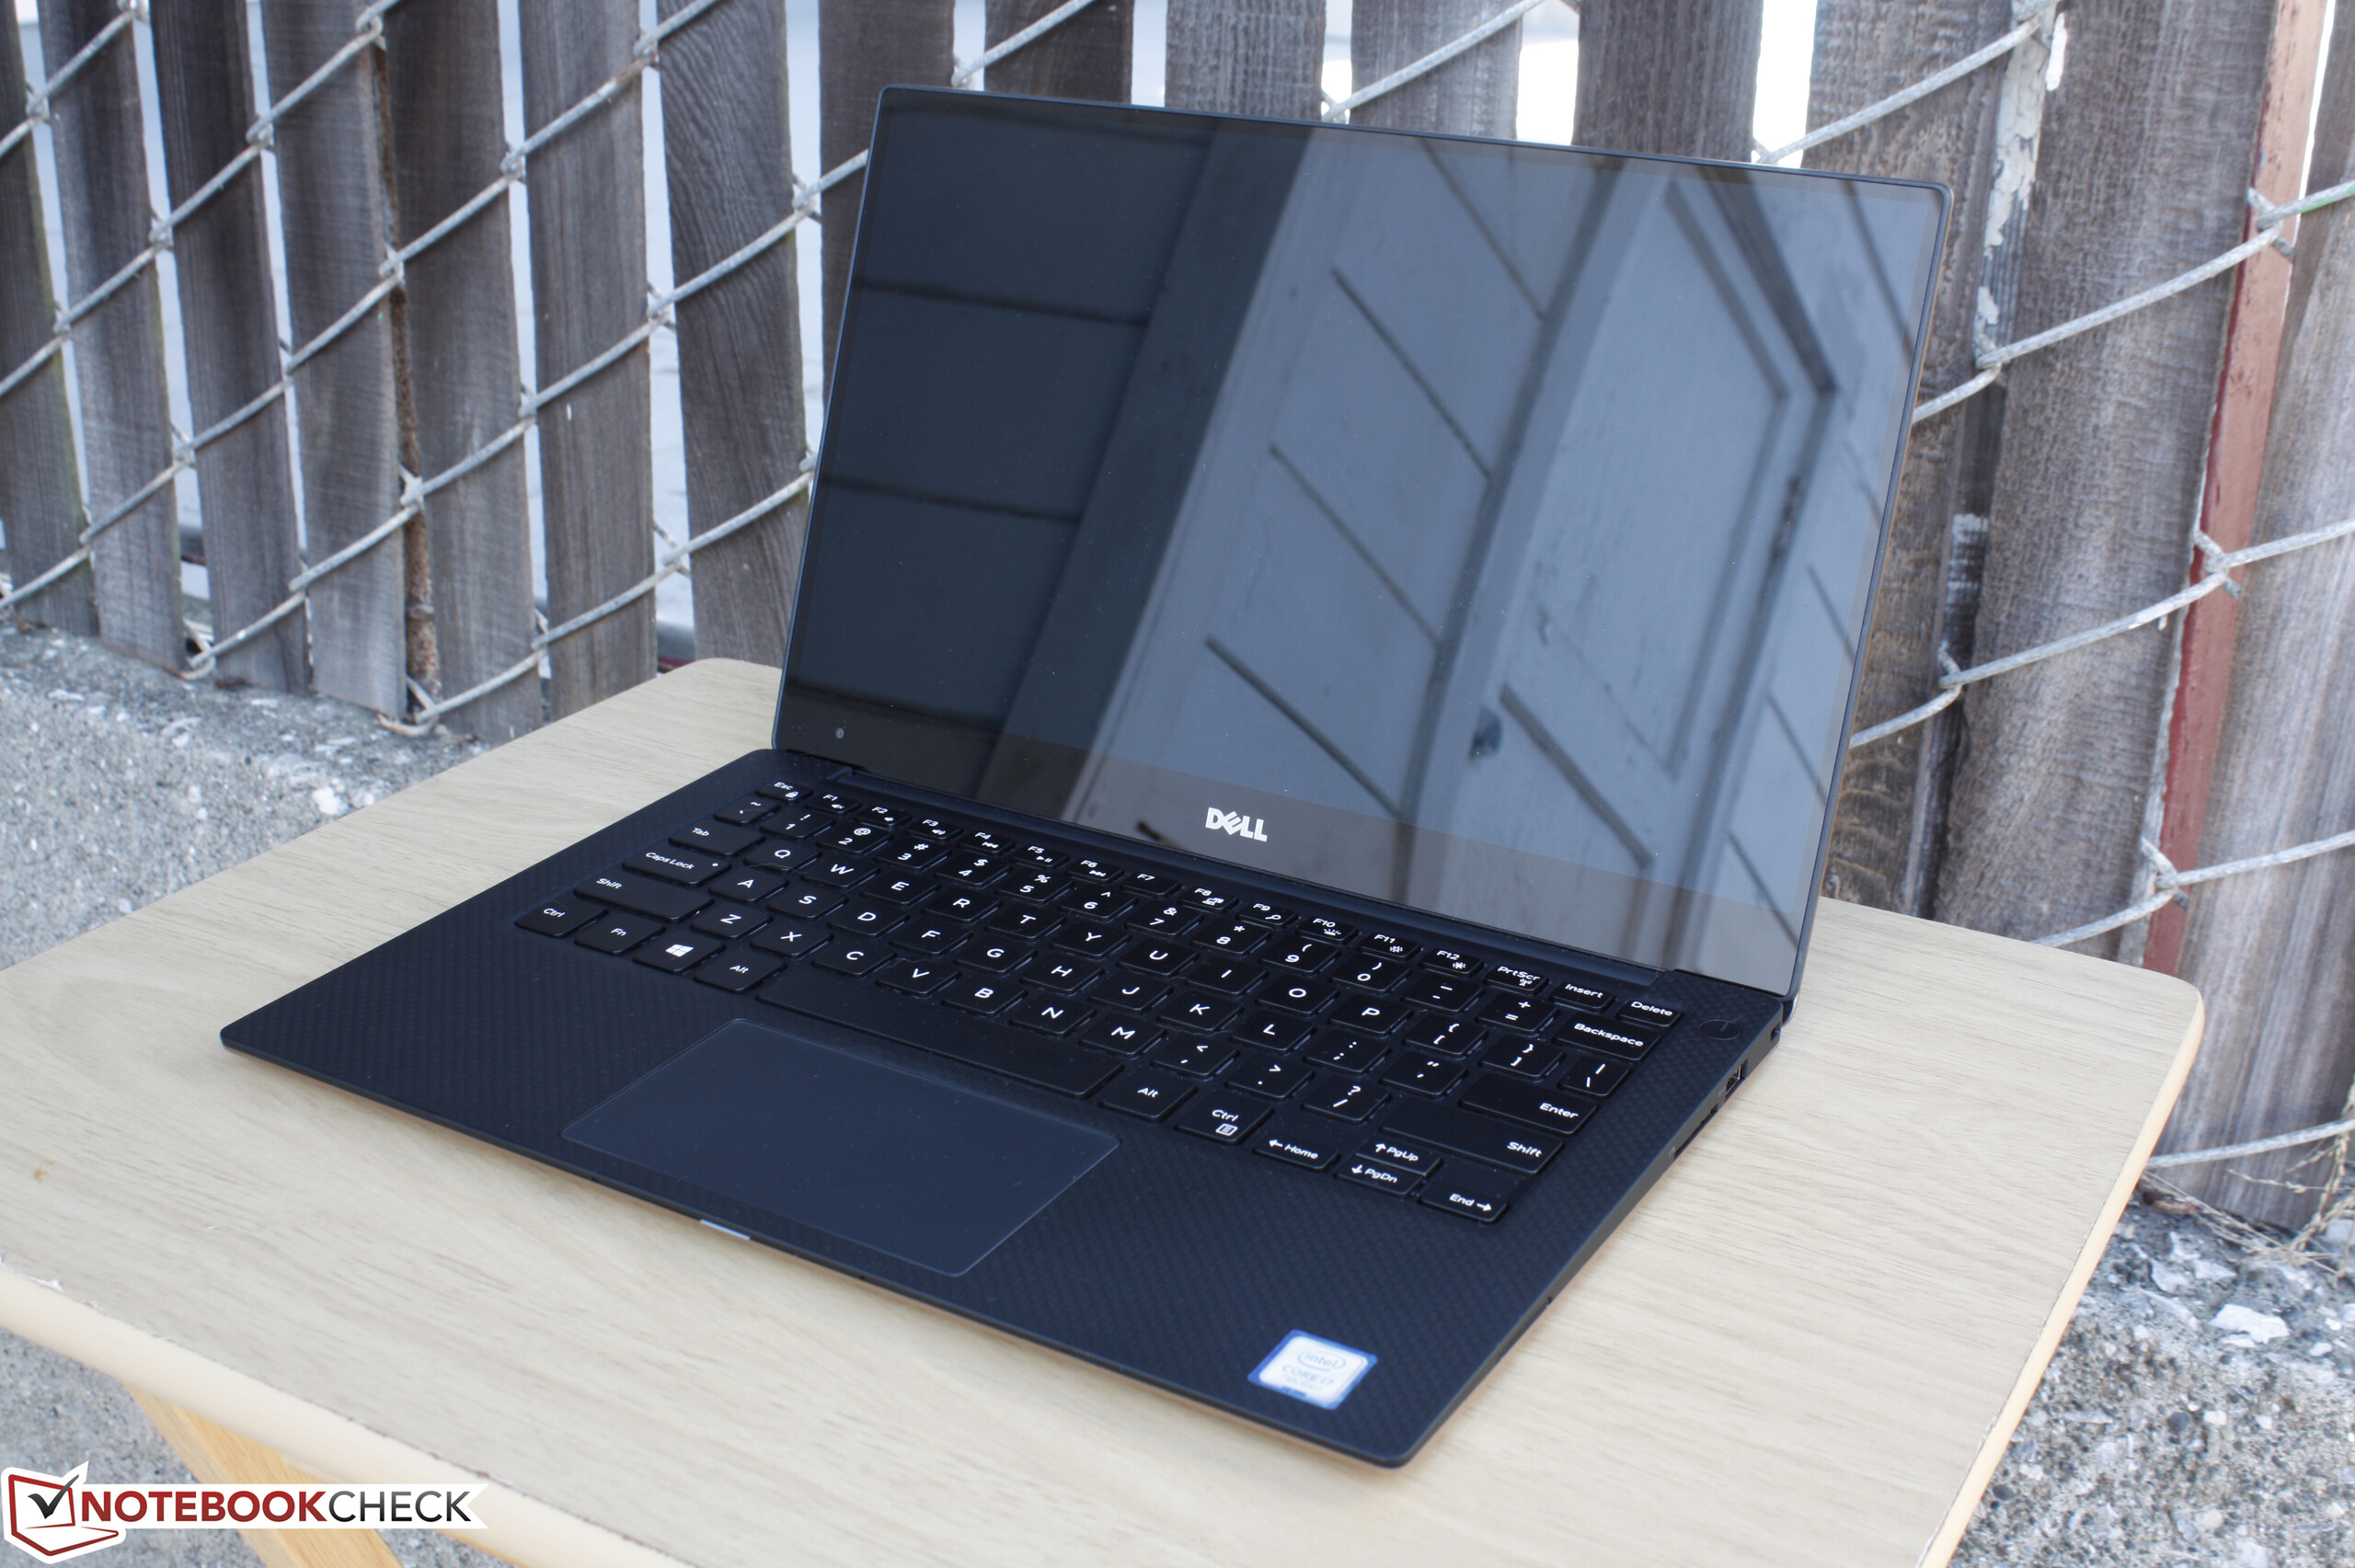
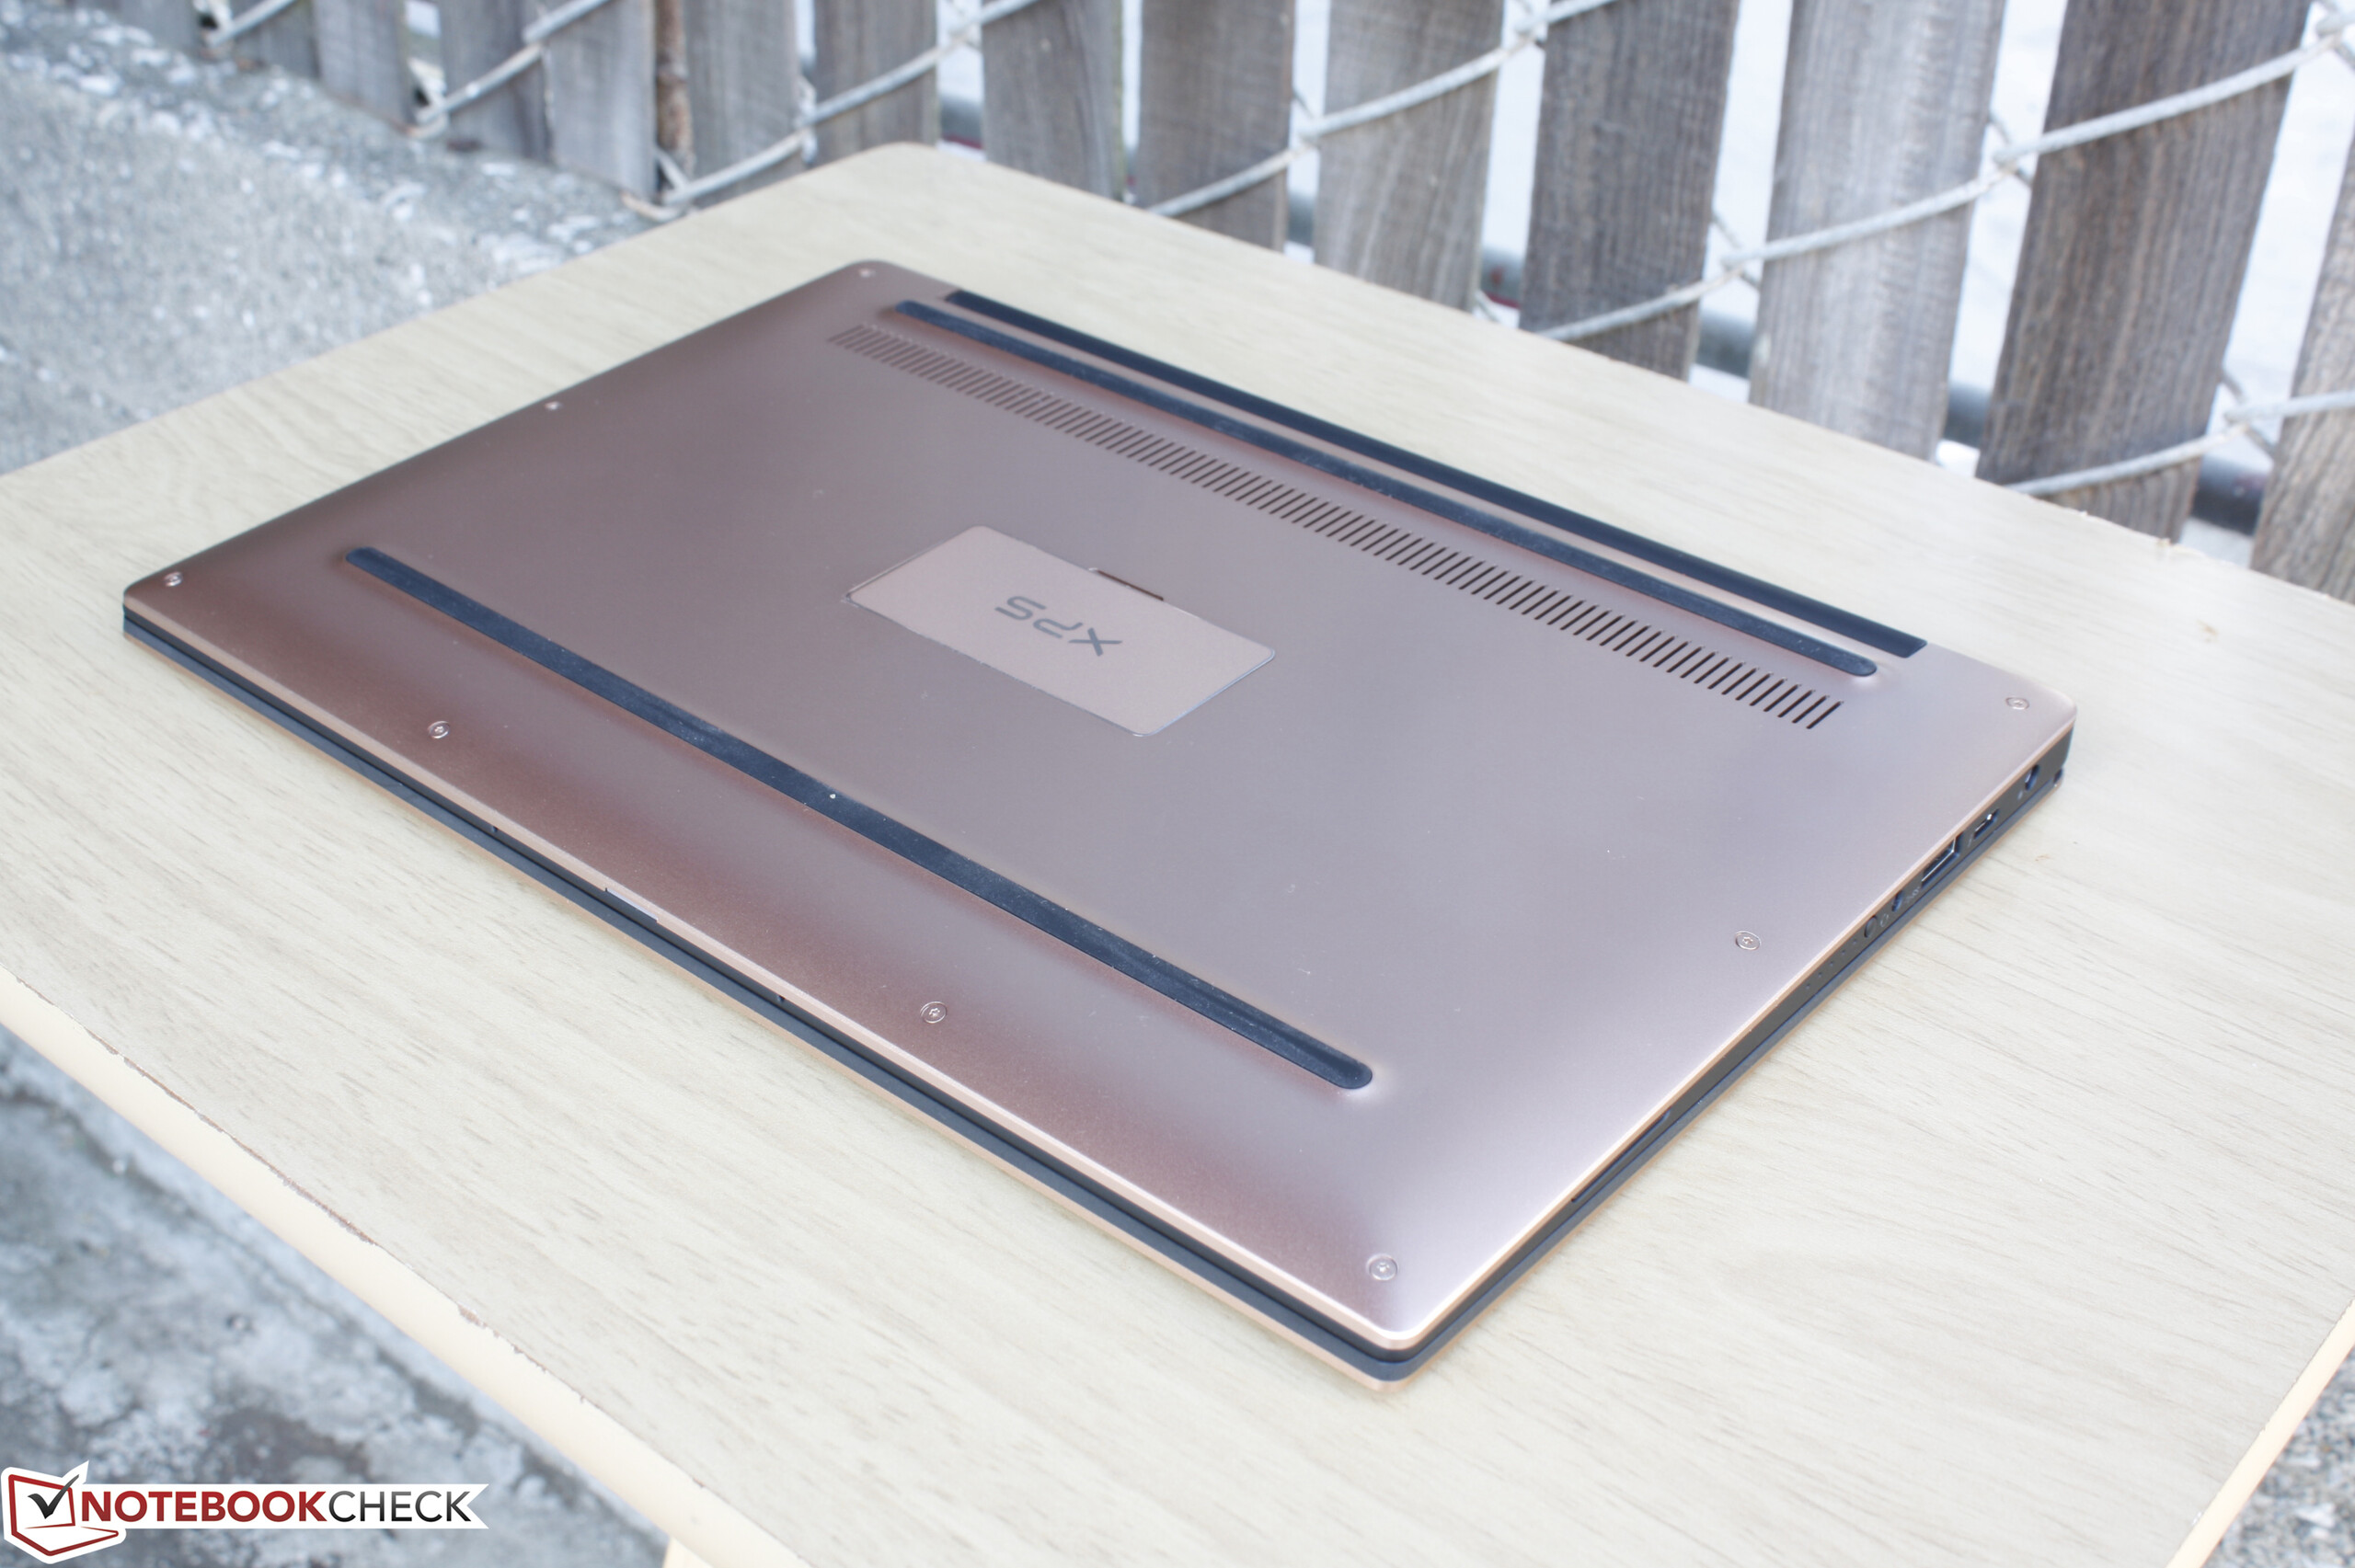
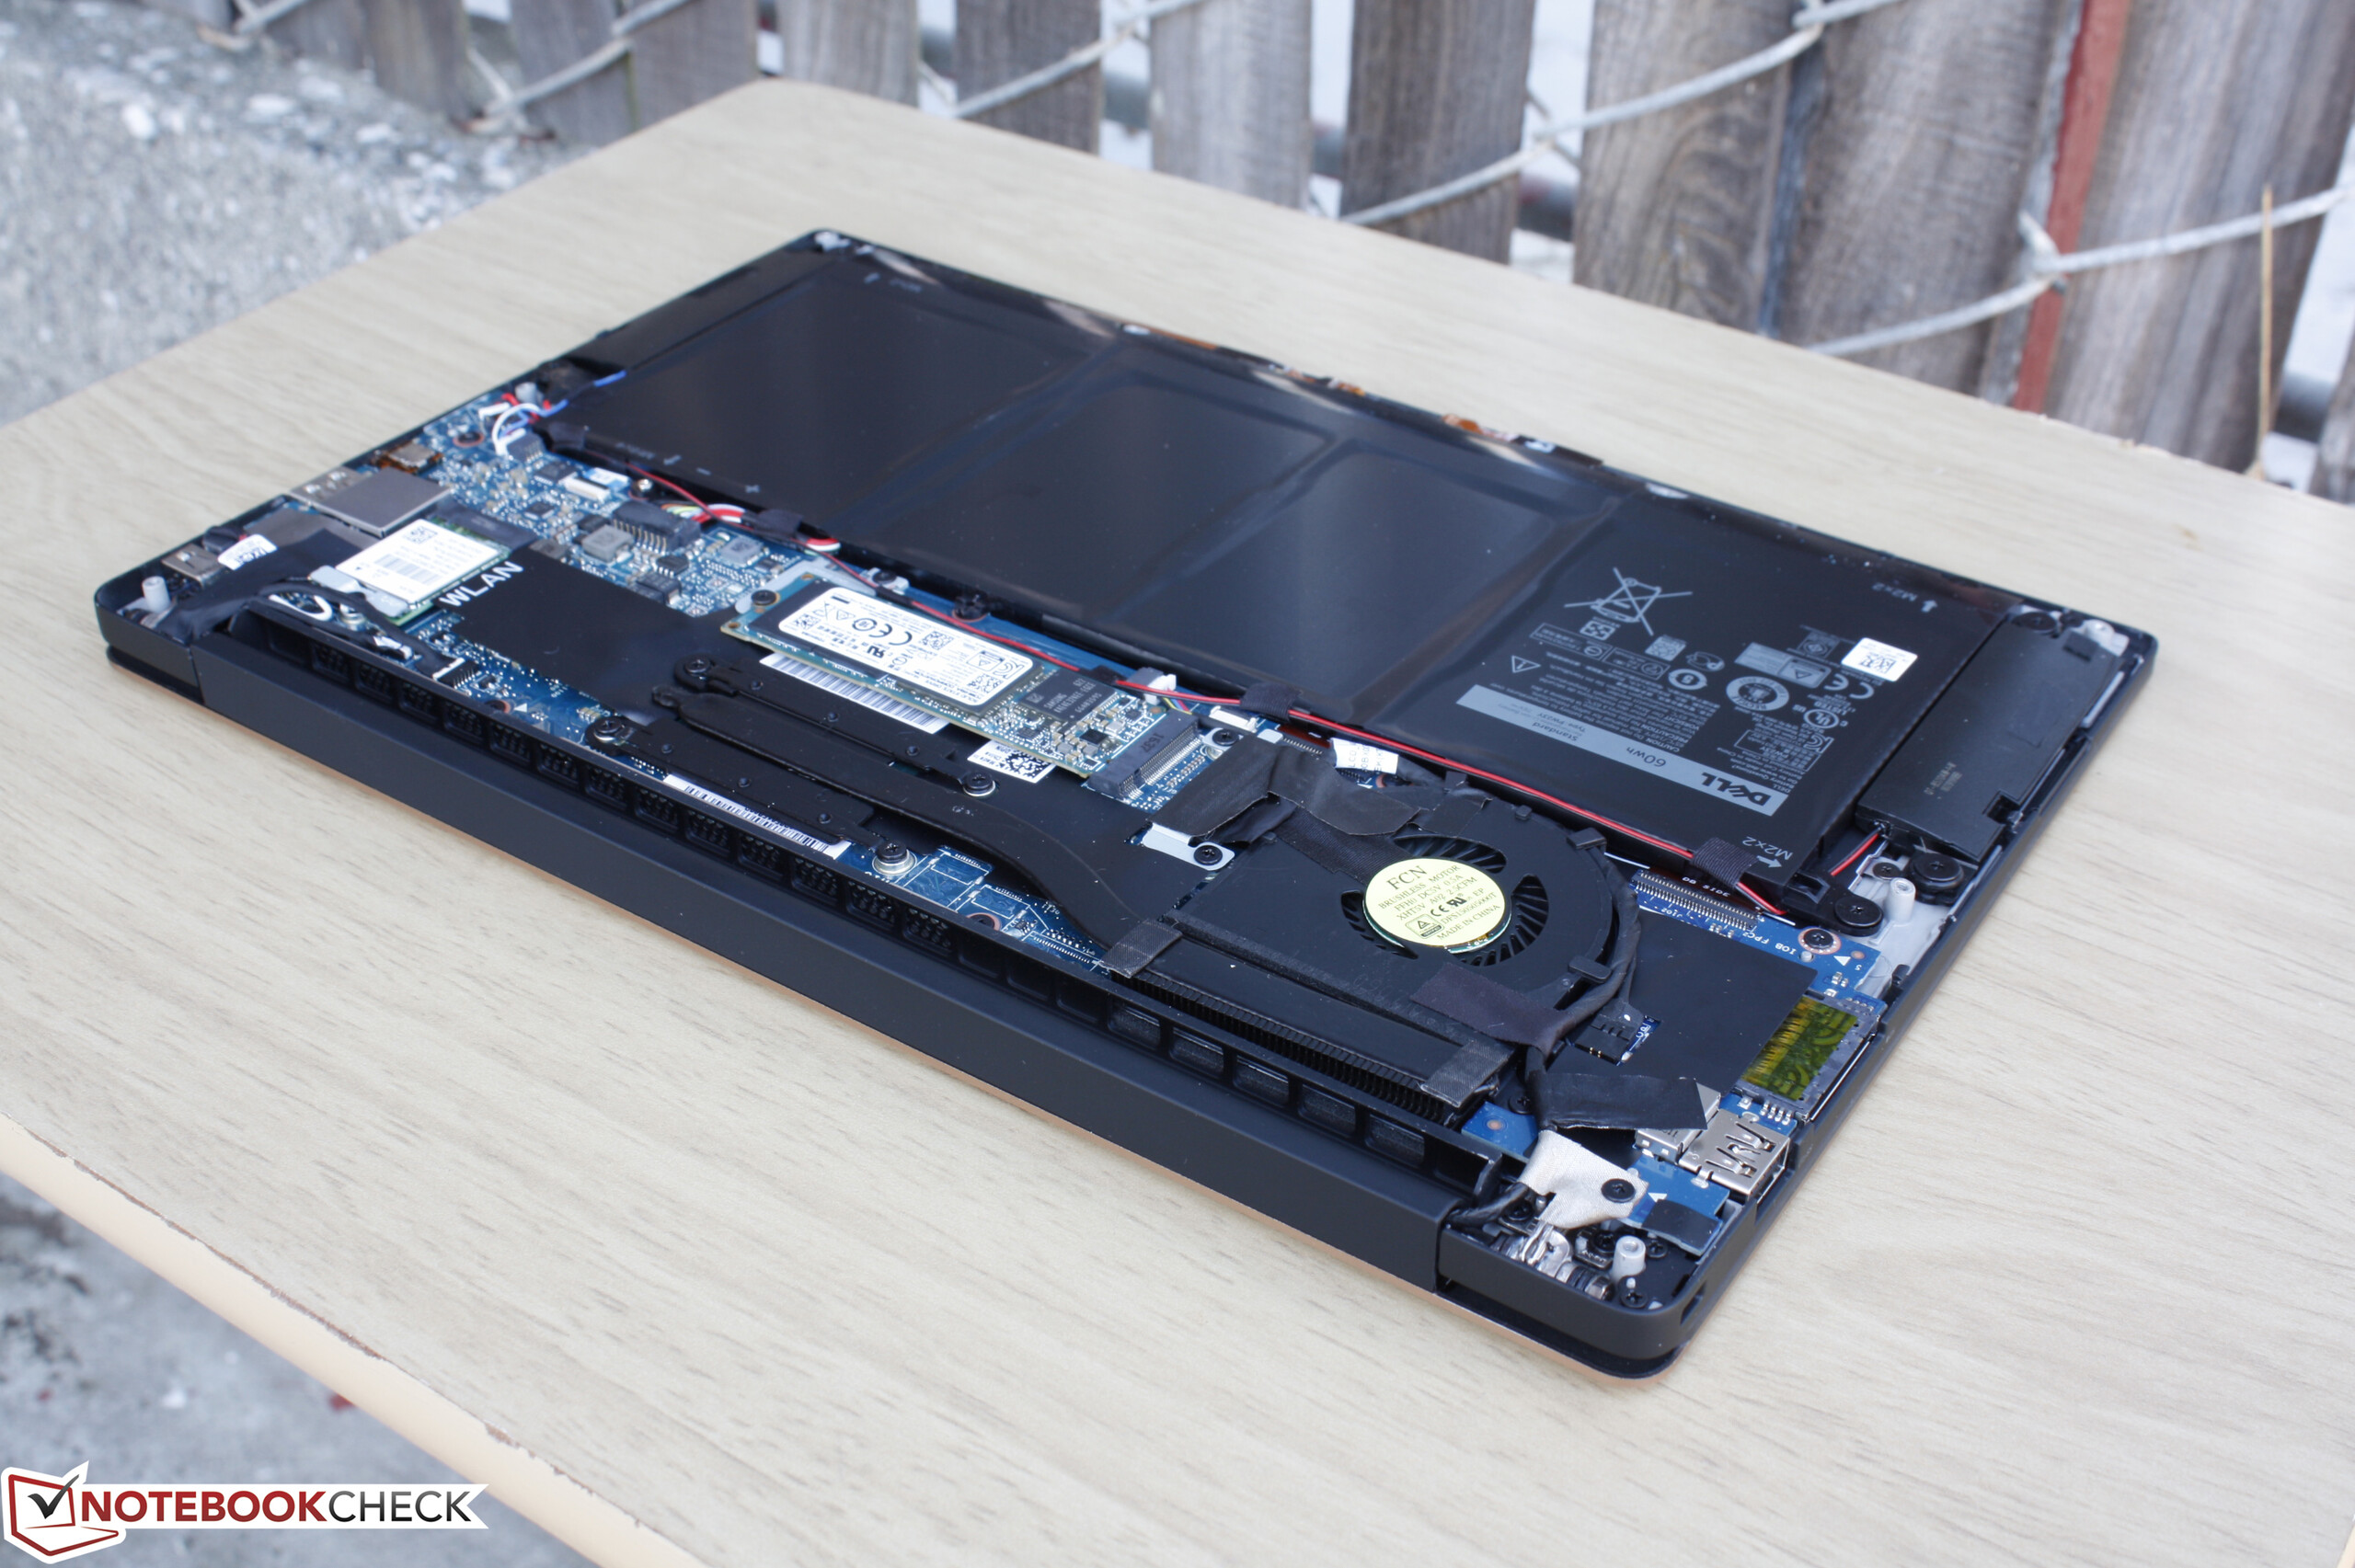
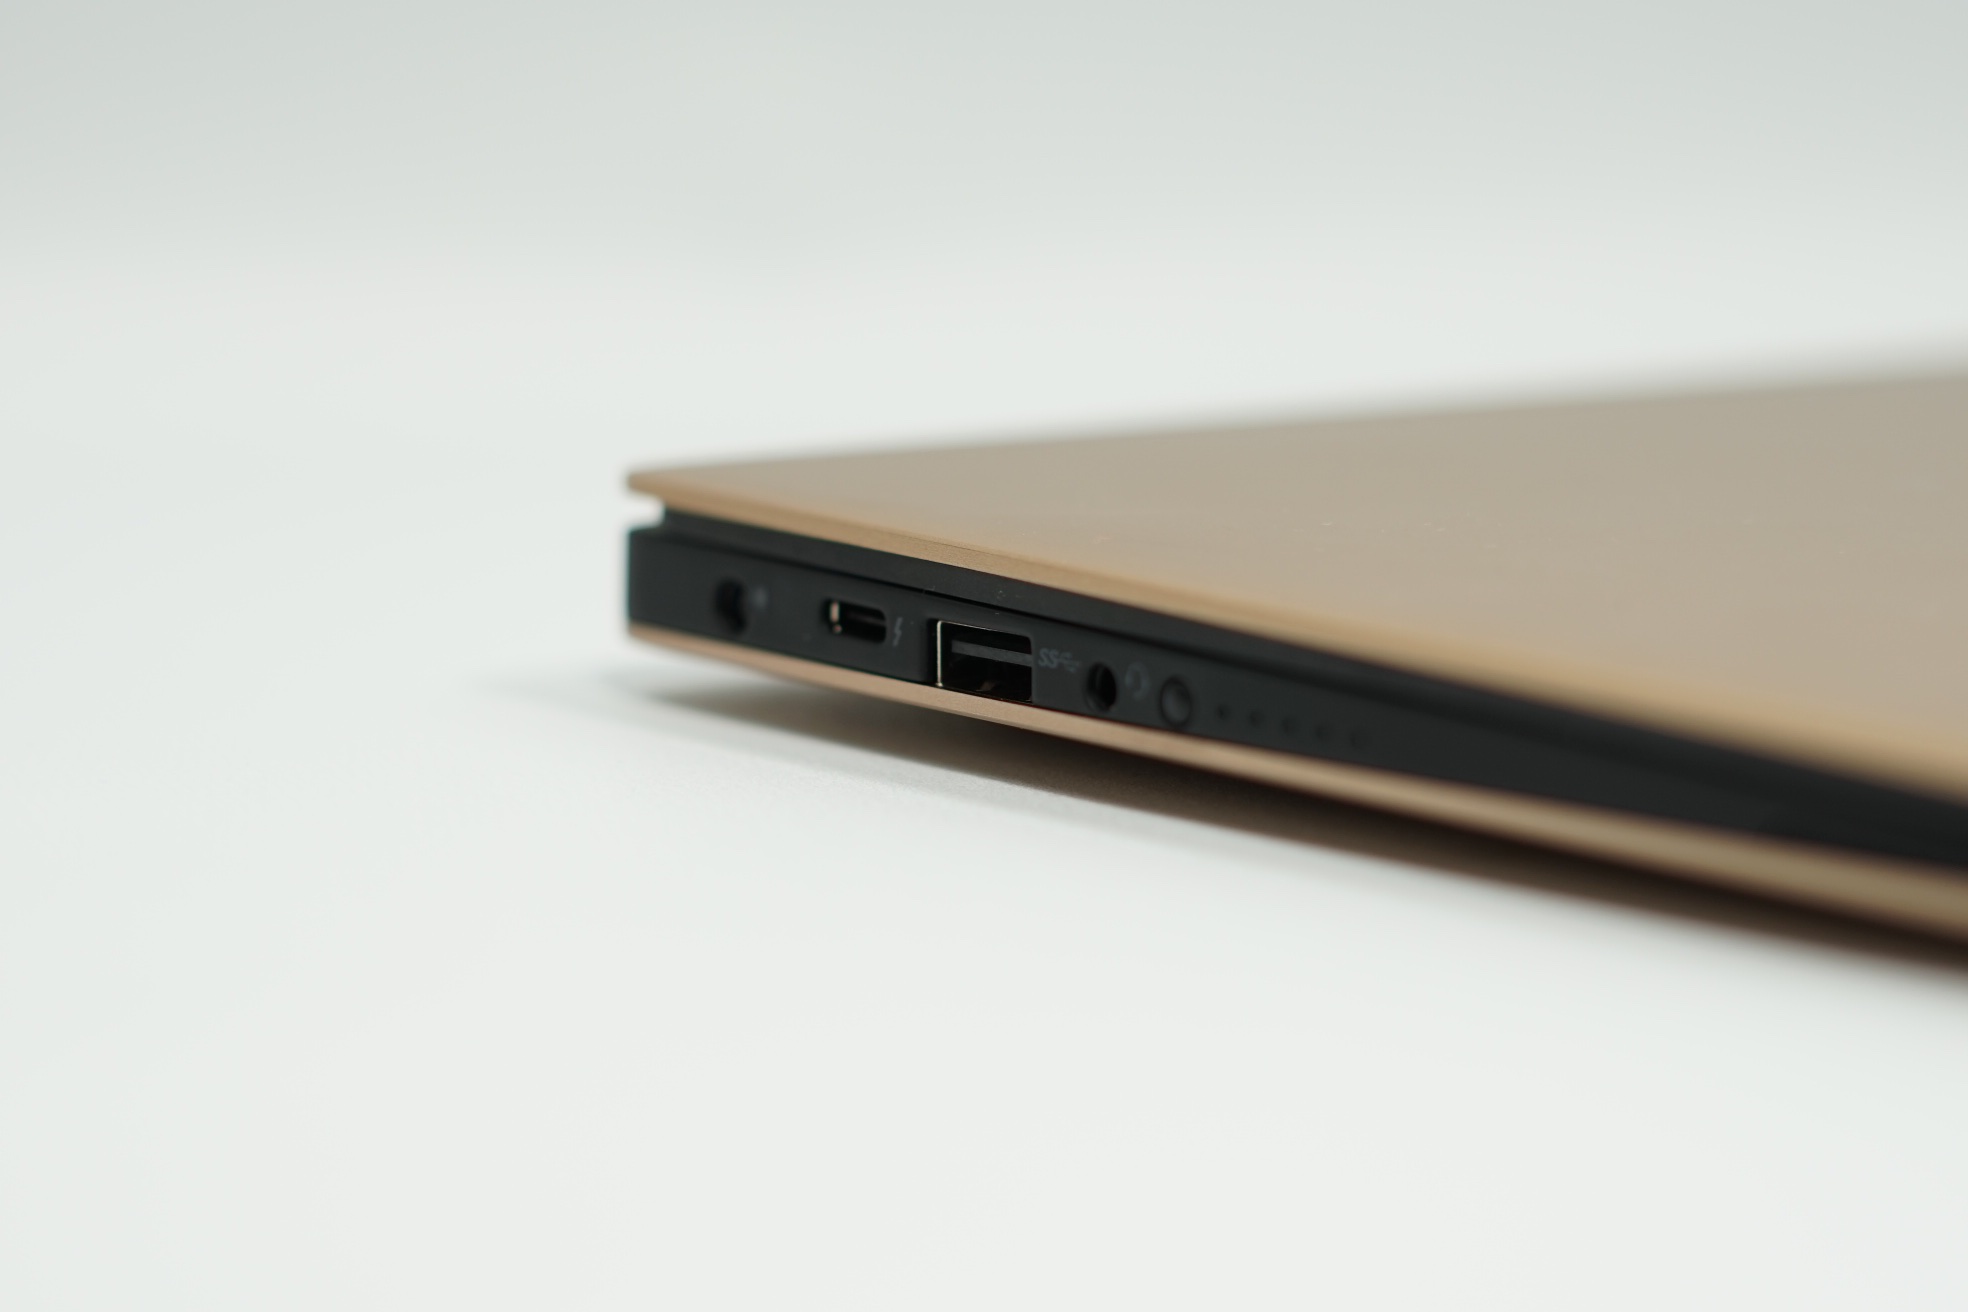
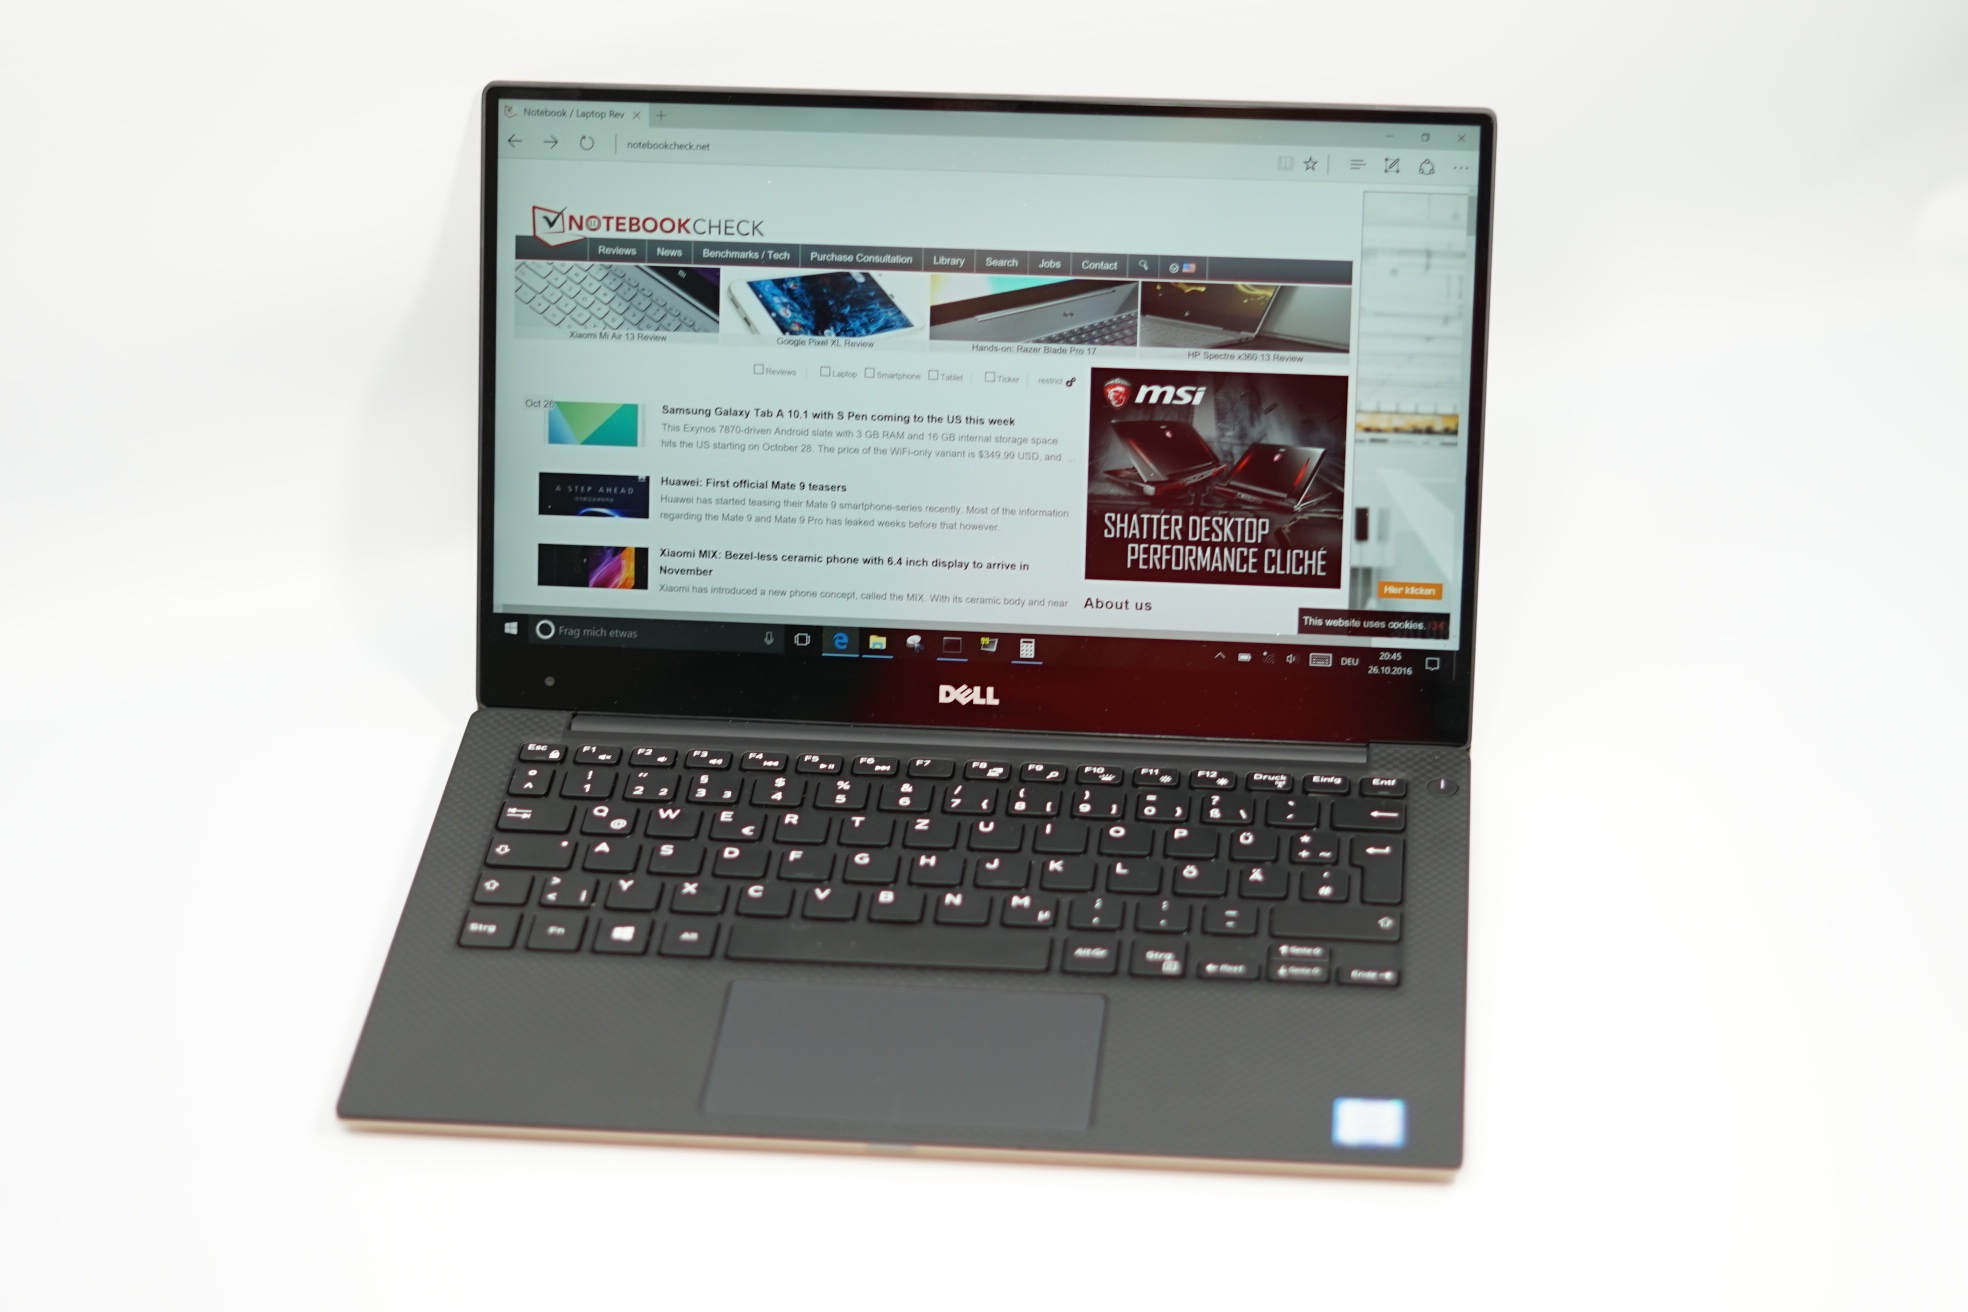
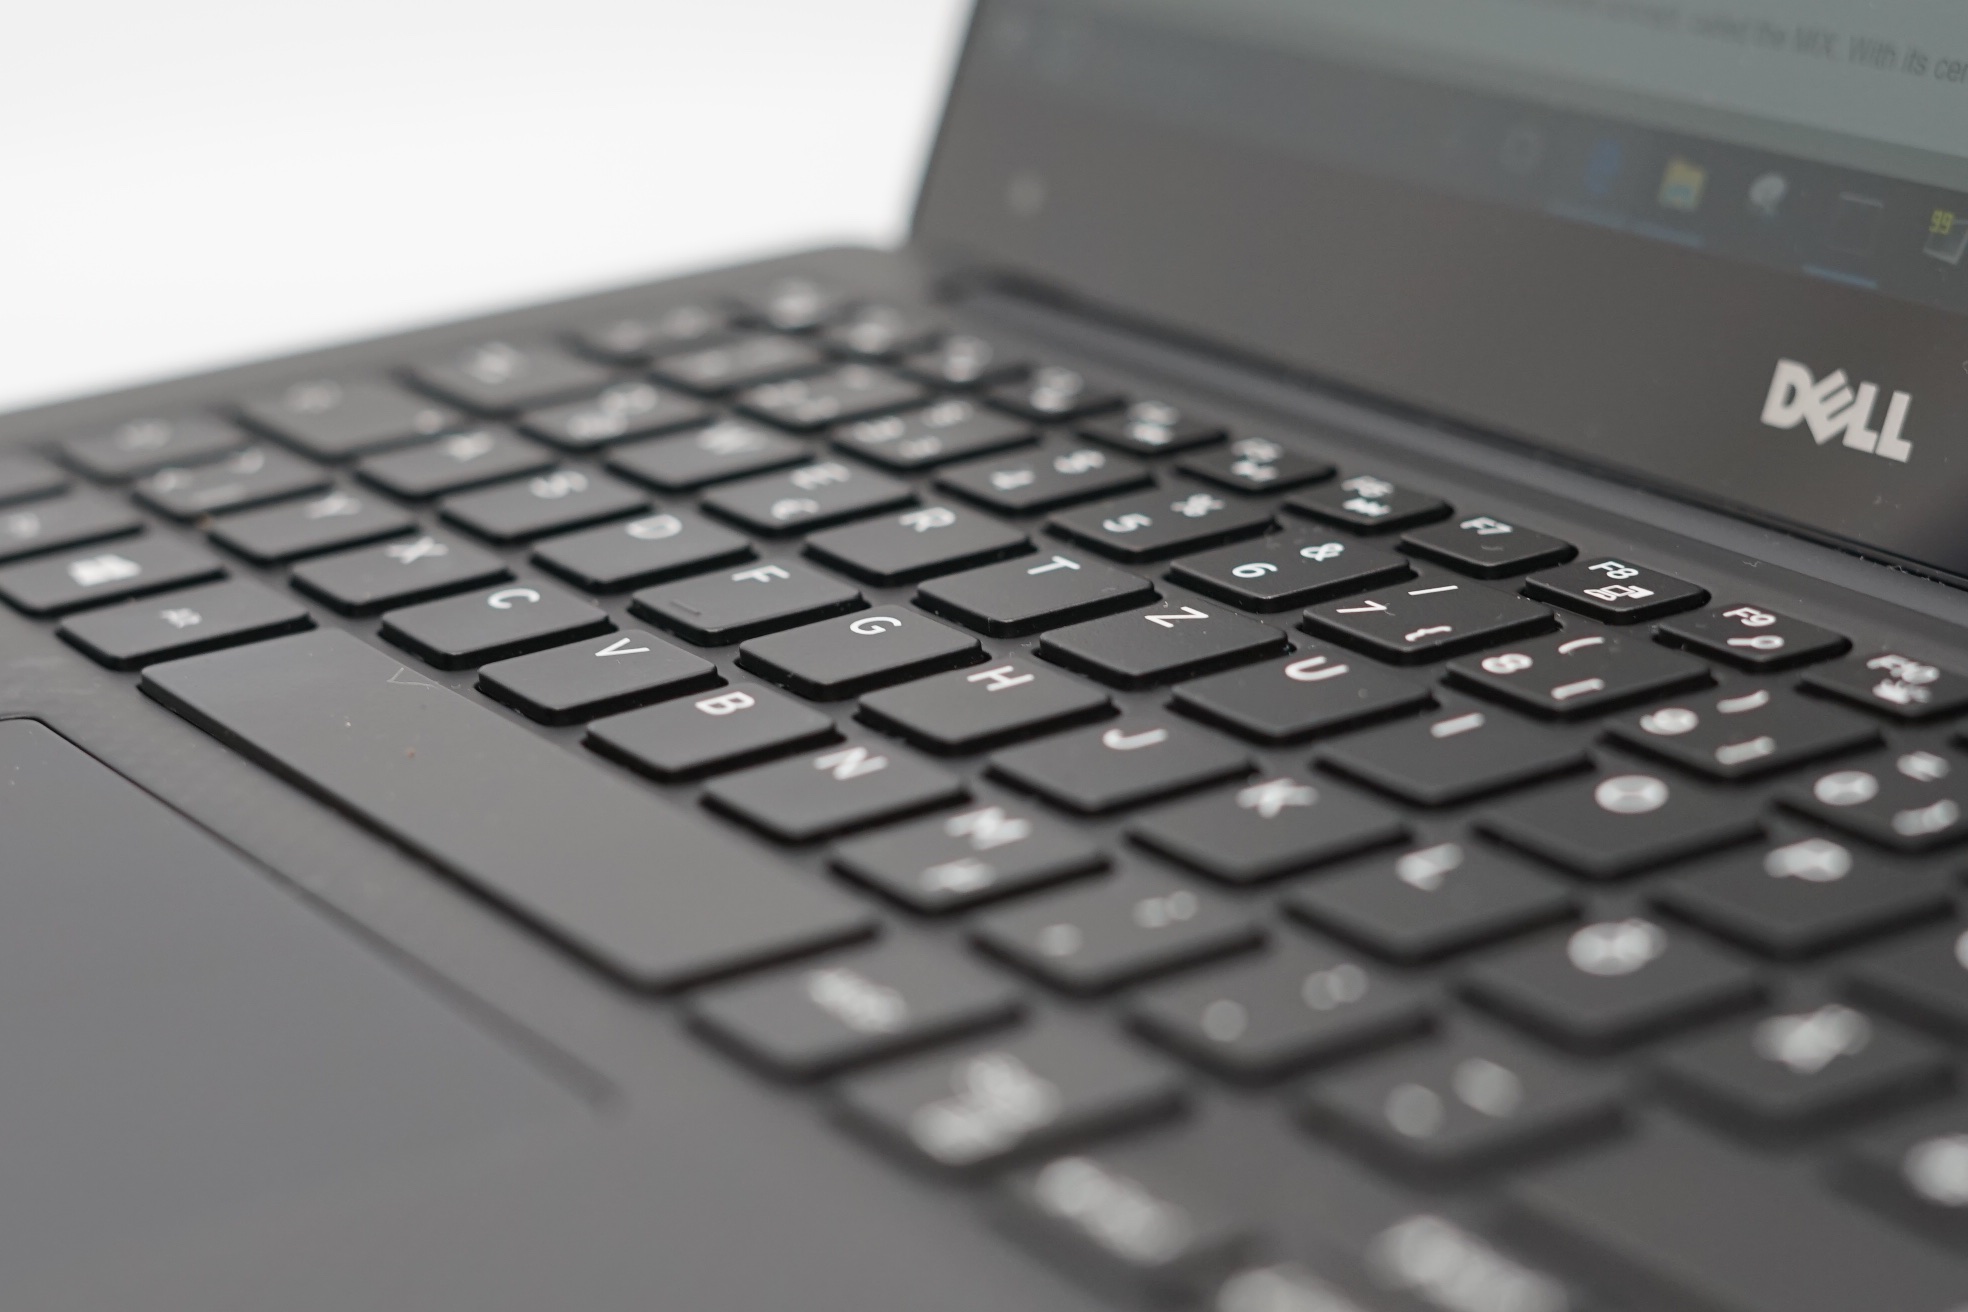
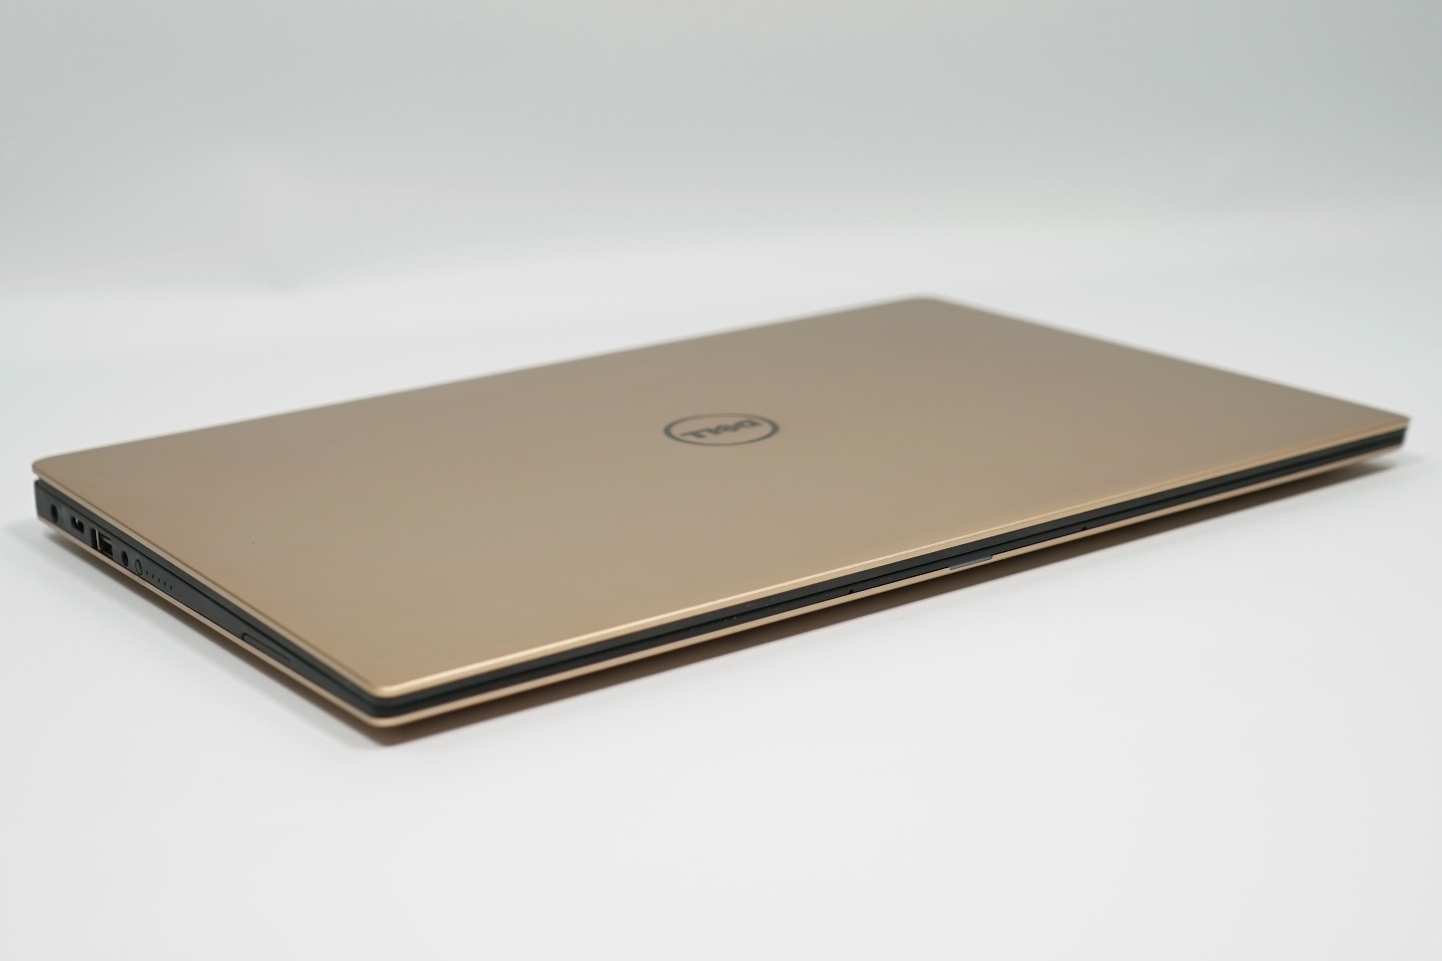
El XPS 13 sigue siendo uno de los mejores Ultrabooks tradicionales de 13" que hay si las bisagras de 360º o los displays desmontables no son importantes. Su peuqeño tamaño y su diseño de calidad no pueden subestimarse y sus biseles superestrechos ya los están incorporando portátiles de la competencia incluyendo el Yoga 910. No ha cambiado mucho para el XPS 13, pero la serie seguirá siendo muy competitiva conforme lleguen las vacaciones.
Los compradores dispuestos a pagar un poco más por el Kaby Lake XPS 13 encontrarán un rendimiento y aguante de batería superiores. Por lo demás, el Skylake XPS 13 saliente ofrecerá una experiencia casi idéntica por menos dinero.
Ésta es una versión acortada del análisis original. Puedes leer el análisis completo en inglés aquí.
Dell XPS 13 9360 QHD+ i7
- 11/22/2016 v5.1 (old)
Allen Ngo, Klaus Hinum
Price comparison
