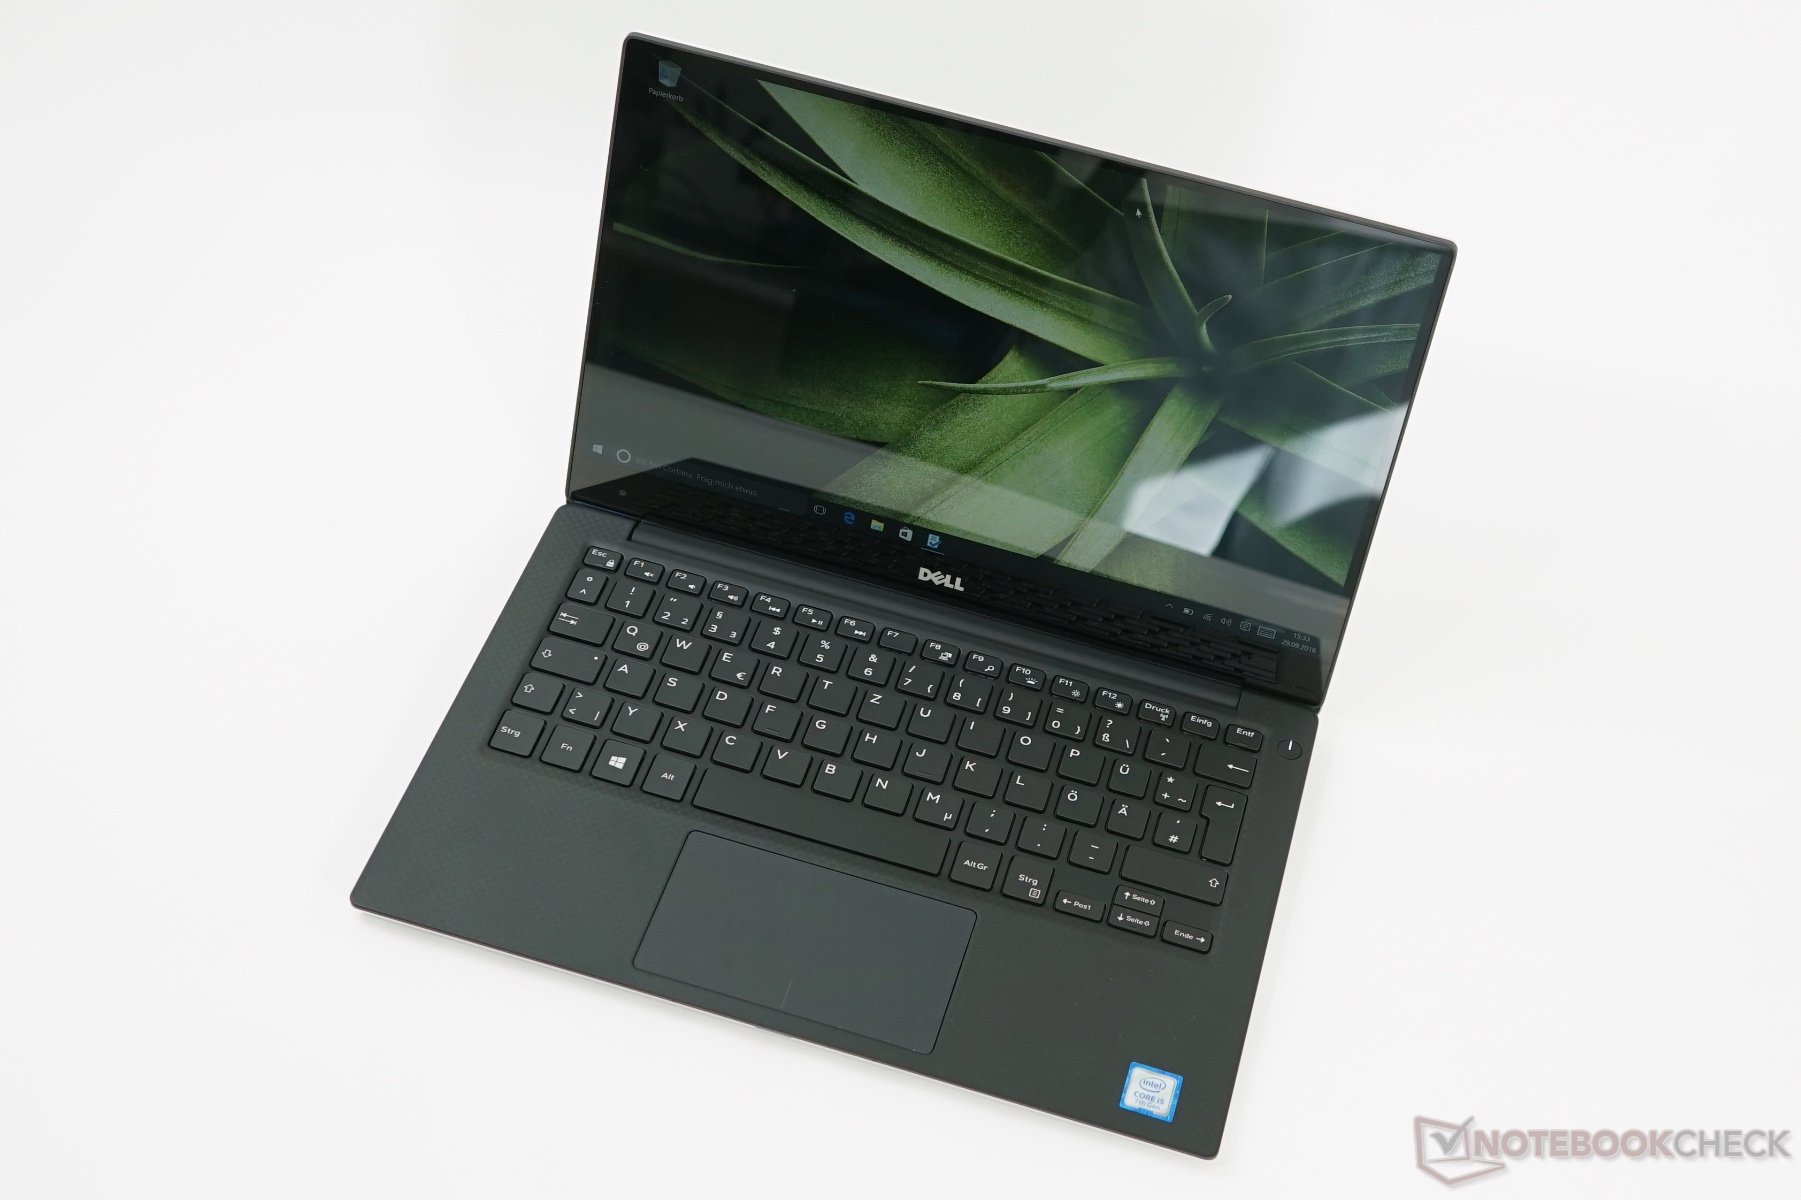
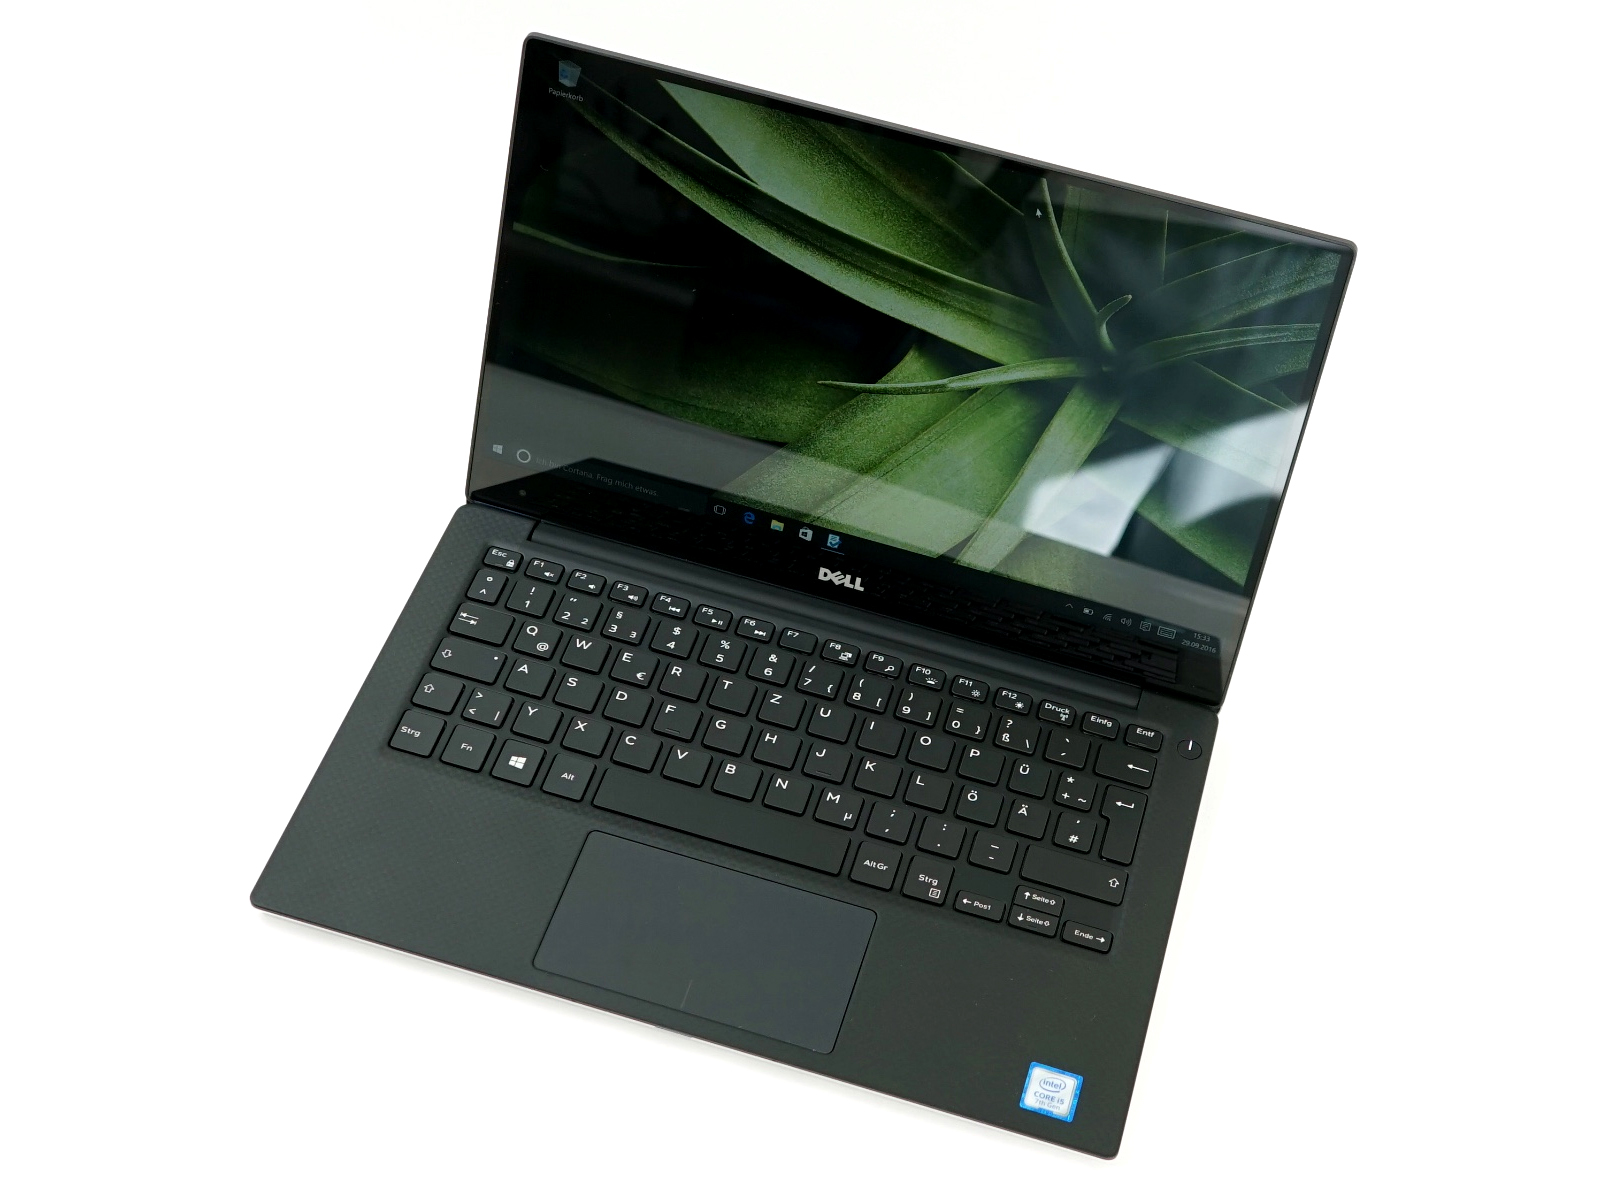
Breve análisis del portátil Dell XPS 13 9360 (FHD, i7, Iris)
| SD Card Reader | |
| average JPG Copy Test (av. of 3 runs) | |
| Dell XPS 13 9360 FHD i7 Iris | |
| Dell XPS 15 9560 (i7-7700HQ, UHD) | |
| HP Envy 13-ad065nr | |
| maximum AS SSD Seq Read Test (1GB) | |
| Dell XPS 15 9560 (i7-7700HQ, UHD) | |
| Dell XPS 13 9360 FHD i7 Iris | |
| HP Envy 13-ad065nr | |
| Networking | |
| iperf3 transmit AX12 | |
| Huawei MateBook X | |
| Dell XPS 13 9360 FHD i7 Iris | |
| Apple MacBook Pro 13 2017 | |
| HP Envy 13-ad065nr | |
| iperf3 receive AX12 | |
| Apple MacBook Pro 13 2017 | |
| HP Envy 13-ad065nr | |
| Dell XPS 13 9360 FHD i7 Iris | |
| Huawei MateBook X | |
Parpadeo de Pantalla / PWM (Pulse-Width Modulation)
| Parpadeo de Pantalla / PWM detectado | 19530 Hz | ≤ 80 % de brillo | 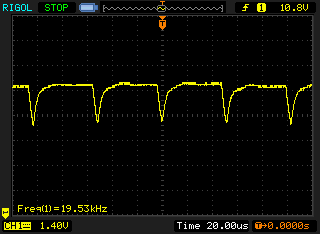 |
La retroiluminación del display parpadea a 19530 Hz (seguramente usa PWM - Pulse-Width Modulation) a un brillo del 80 % e inferior. Sobre este nivel de brillo no debería darse parpadeo / PWM. La frecuencia de 19530 Hz es bastante alta, por lo que la mayoría de gente sensible al parpadeo no debería ver parpadeo o tener fatiga visual. Comparación: 52 % de todos los dispositivos testados no usaron PWM para atenuar el display. Si se usó, medimos una media de 7744 (mínimo: 5 - máxmo: 343500) Hz. | |||
| |||||||||||||||||||||||||
iluminación: 85 %
Brillo con batería: 461 cd/m²
Contraste: 2305:1 (Negro: 0.2 cd/m²)
ΔE ColorChecker Calman: 5.4 | ∀{0.5-29.43 Ø4.71}
ΔE Greyscale Calman: 5.4 | ∀{0.09-98 Ø4.96}
76.9% sRGB (Argyll 1.6.3 3D)
48.6% AdobeRGB 1998 (Argyll 1.6.3 3D)
53.3% AdobeRGB 1998 (Argyll 3D)
77.4% sRGB (Argyll 3D)
51.6% Display P3 (Argyll 3D)
Gamma: 2.15
CCT: 7258 K
| Dell XPS 13 9360 FHD i7 Iris SHP1449, , 1920x1080, 13.3" | Dell XPS 13 i7-8550U ID: Sharp SHP144A, Name: LQ133Z1, , 3200x1800, 13.3" | Apple MacBook Pro 13 2017 APPA033, , 2560x1600, 13.3" | Razer Blade Stealth QHD i7-7500U Sharp SHP1493 (LQ133Z1JW26), , 3200x1800, 13.3" | Huawei MateBook X Chi Mei CMN8201 / P130ZDZ-EF1, , 2160x1440, 13.3" | HP Envy 13-ad065nr LG Philips LGD0576, , 1920x1080, 13.3" | |
|---|---|---|---|---|---|---|
| Display | 22% | 61% | 26% | 26% | 17% | |
| Display P3 Coverage (%) | 51.6 | 63.6 23% | 99.2 92% | 65.6 27% | 65.8 28% | 65.5 27% |
| sRGB Coverage (%) | 77.4 | 93 20% | 99.9 29% | 95.5 23% | 96.2 24% | 83.8 8% |
| AdobeRGB 1998 Coverage (%) | 53.3 | 65.4 23% | 87.1 63% | 67.6 27% | 66.8 25% | 61.3 15% |
| Response Times | 12% | 0% | -8% | 20% | 29% | |
| Response Time Grey 50% / Grey 80% * (ms) | 41.2 ? | 35.6 ? 14% | 42.8 ? -4% | 46 ? -12% | 33 ? 20% | 28 ? 32% |
| Response Time Black / White * (ms) | 30 ? | 27.2 ? 9% | 28.8 ? 4% | 31.2 ? -4% | 24 ? 20% | 22.4 ? 25% |
| PWM Frequency (Hz) | 19530 ? | 19690 ? | 19380 ? | 10200 ? | ||
| Screen | -5% | 20% | 3% | 7% | -11% | |
| Brightness middle (cd/m²) | 461 | 386.1 -16% | 588 28% | 406 -12% | 408 -11% | 290 -37% |
| Brightness (cd/m²) | 418 | 357 -15% | 561 34% | 373 -11% | 395 -6% | 270 -35% |
| Brightness Distribution (%) | 85 | 83 -2% | 92 8% | 84 -1% | 88 4% | 78 -8% |
| Black Level * (cd/m²) | 0.2 | 0.33 -65% | 0.45 -125% | 0.25 -25% | 0.45 -125% | 0.32 -60% |
| Contrast (:1) | 2305 | 1170 -49% | 1307 -43% | 1624 -30% | 907 -61% | 906 -61% |
| Colorchecker dE 2000 * | 5.4 | 4.2 22% | 1.7 69% | 4.5 17% | 1.55 71% | 4.8 11% |
| Colorchecker dE 2000 max. * | 12.2 | 7.6 38% | 3.5 71% | 8.2 33% | 2.19 82% | 11.2 8% |
| Greyscale dE 2000 * | 5.4 | 5.7 -6% | 1.9 65% | 5.2 4% | 1.91 65% | 2.8 48% |
| Gamma | 2.15 102% | 2.28 96% | 2.33 94% | 2.11 104% | 2.34 94% | 2.19 100% |
| CCT | 7258 90% | 7336 89% | 6738 96% | 7709 84% | 6491 100% | 6382 102% |
| Color Space (Percent of AdobeRGB 1998) (%) | 48.6 | 59 21% | 77.92 60% | 61.3 26% | 61 26% | 54.9 13% |
| Color Space (Percent of sRGB) (%) | 76.9 | 92.2 20% | 99.94 30% | 95.4 24% | 96 25% | 83.5 9% |
| Media total (Programa/Opciones) | 10% /
2% | 27% /
25% | 7% /
6% | 18% /
12% | 12% /
-0% |
* ... más pequeño es mejor
Tiempos de respuesta del display
| ↔ Tiempo de respuesta de Negro a Blanco | ||
|---|---|---|
| 30 ms ... subida ↗ y bajada ↘ combinada | ↗ 17.6 ms subida | 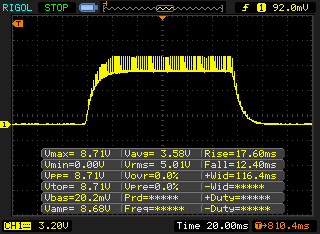 |
| ↘ 12.4 ms bajada | ||
| La pantalla mostró tiempos de respuesta lentos en nuestros tests y podría ser demasiado lenta para los jugones. En comparación, todos los dispositivos de prueba van de ##min### (mínimo) a 240 (máximo) ms. » 80 % de todos los dispositivos son mejores. Eso quiere decir que el tiempo de respuesta es peor que la media (19.8 ms) de todos los dispositivos testados. | ||
| ↔ Tiempo de respuesta 50% Gris a 80% Gris | ||
| 41.2 ms ... subida ↗ y bajada ↘ combinada | ↗ 22.8 ms subida | 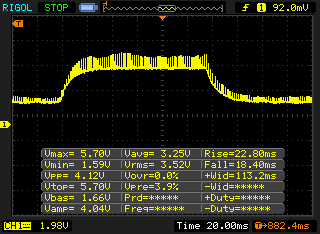 |
| ↘ 18.4 ms bajada | ||
| La pantalla mostró tiempos de respuesta lentos en nuestros tests y podría ser demasiado lenta para los jugones. En comparación, todos los dispositivos de prueba van de ##min### (mínimo) a 636 (máximo) ms. » 66 % de todos los dispositivos son mejores. Eso quiere decir que el tiempo de respuesta es peor que la media (30.9 ms) de todos los dispositivos testados. | ||
| PCMark 8 | |
| Home Score Accelerated v2 | |
| Apple MacBook Pro 13 2017 | |
| Dell XPS 13 9360 FHD i7 Iris | |
| HP Envy 13-ad065nr | |
| Dell XPS 15 9560 (i7-7700HQ, UHD) | |
| Dell XPS 13 9360 FHD i5 | |
| Huawei MateBook X | |
| Dell XPS 13 i7-8550U | |
| Dell XPS 13 9360 QHD+ i7 | |
| Work Score Accelerated v2 | |
| Dell XPS 13 9360 FHD i7 Iris | |
| HP Envy 13-ad065nr | |
| Dell XPS 13 9360 FHD i5 | |
| Apple MacBook Pro 13 2017 | |
| Dell XPS 13 i7-8550U | |
| Dell XPS 15 9560 (i7-7700HQ, UHD) | |
| Huawei MateBook X | |
| Dell XPS 13 9360 QHD+ i7 | |
| PCMark 8 Home Score Accelerated v2 | 3902 puntos | |
| PCMark 8 Creative Score Accelerated v2 | 5083 puntos | |
| PCMark 8 Work Score Accelerated v2 | 4890 puntos | |
ayuda | ||
| Dell XPS 13 9360 FHD i7 Iris Toshiba XG4 NVMe (THNSN5512GPUK) | Dell XPS 13 i7-8550U Toshiba XG5 KXG50ZNV256G | Huawei MateBook X LITEON CB1-SD256 | Lenovo Yoga 920-13IKB-80Y7 Samsung PM961 MZVLW256HEHP | |
|---|---|---|---|---|
| CrystalDiskMark 5.2 / 6 | -28% | -35% | 28% | |
| Write 4K (MB/s) | 131.9 | 121.5 -8% | 68.1 -48% | 142.1 8% |
| Read 4K (MB/s) | 46.72 | 24.92 -47% | 28.95 -38% | 44.19 -5% |
| Write Seq (MB/s) | 1036 | 345 -67% | 529 -49% | 1112 7% |
| Read Seq (MB/s) | 1352 | 1313 -3% | 711 -47% | 1884 39% |
| Write 4K Q32T1 (MB/s) | 487.7 | 346.1 -29% | 306.4 -37% | 747 53% |
| Read 4K Q32T1 (MB/s) | 443.9 | 389.4 -12% | 501 13% | 446.8 1% |
| Write Seq Q32T1 (MB/s) | 1048 | 334.7 -68% | 496.9 -53% | 1255 20% |
| Read Seq Q32T1 (MB/s) | 1699 | 1840 8% | 1297 -24% | 3400 100% |

| 3DMark 11 - 1280x720 Performance GPU | |
| Apple MacBook Pro 13 2017 | |
| Dell XPS 13 9360 FHD i7 Iris | |
| Dell XPS 13 i7-8550U | |
| Acer Spin 5 SP513-52N-566U | |
| Dell XPS 13 9360 QHD+ i7 | |
| Dell XPS 13 9360 FHD i5 | |
| Huawei MateBook X | |
| HP Envy 13-ad065nr | |
| 3DMark | |
| 1280x720 Cloud Gate Standard Graphics | |
| Apple MacBook Pro 13 2017 | |
| Dell XPS 13 9360 FHD i7 Iris | |
| Dell XPS 13 i7-8550U | |
| Acer Spin 5 SP513-52N-566U | |
| Dell XPS 13 9360 FHD i5 | |
| Dell XPS 13 9360 QHD+ i7 | |
| HP Envy 13-ad065nr | |
| Huawei MateBook X | |
| 1920x1080 Fire Strike Graphics | |
| Apple MacBook Pro 13 2017 | |
| Dell XPS 13 9360 FHD i7 Iris | |
| Dell XPS 13 i7-8550U | |
| Acer Spin 5 SP513-52N-566U | |
| Dell XPS 13 9360 FHD i5 | |
| Dell XPS 13 9360 QHD+ i7 | |
| HP Envy 13-ad065nr | |
| Huawei MateBook X | |
| 3DMark 11 Performance | 2275 puntos | |
| 3DMark Cloud Gate Standard Score | 7685 puntos | |
| 3DMark Fire Strike Score | 1265 puntos | |
| 3DMark Fire Strike Extreme Score | 577 puntos | |
| 3DMark Time Spy Score | 467 puntos | |
ayuda | ||
| BioShock Infinite | |
| 1920x1080 Ultra Preset, DX11 (DDOF) | |
| Apple MacBook Pro 13 2017 | |
| Dell XPS 13 9360 FHD i7 Iris | |
| Dell XPS 13 i7-8550U | |
| Dell XPS 13 9360 QHD+ i7 | |
| HP Envy 13-ad065nr | |
| 1366x768 High Preset | |
| Apple MacBook Pro 13 2017 | |
| Dell XPS 13 9360 FHD i7 Iris | |
| Dell XPS 13 i7-8550U | |
| Acer Spin 5 SP513-52N-566U | |
| HP Envy 13-ad065nr | |
| Dell XPS 13 9360 QHD+ i7 | |
| 1366x768 Medium Preset | |
| Apple MacBook Pro 13 2017 | |
| Dell XPS 13 9360 FHD i7 Iris | |
| Dell XPS 13 i7-8550U | |
| Acer Spin 5 SP513-52N-566U | |
| HP Envy 13-ad065nr | |
| Dell XPS 13 9360 QHD+ i7 | |
| 1280x720 Very Low Preset | |
| Dell XPS 13 i7-8550U | |
| Apple MacBook Pro 13 2017 | |
| Dell XPS 13 9360 FHD i7 Iris | |
| Dell XPS 13 9360 QHD+ i7 | |
| HP Envy 13-ad065nr | |
| Acer Spin 5 SP513-52N-566U | |
| Tomb Raider | |
| 1920x1080 Ultra Preset AA:FX AF:16x | |
| Apple MacBook Pro 13 2017 | |
| Dell XPS 13 9360 FHD i7 Iris | |
| Dell XPS 13 9360 FHD i5 | |
| 1366x768 High Preset AA:FX AF:8x | |
| Apple MacBook Pro 13 2017 | |
| Dell XPS 13 9360 FHD i7 Iris | |
| Dell XPS 13 9360 FHD i5 | |
| 1366x768 Normal Preset AA:FX AF:4x | |
| Apple MacBook Pro 13 2017 | |
| Dell XPS 13 9360 FHD i7 Iris | |
| Dell XPS 13 9360 FHD i5 | |
| 1024x768 Low Preset | |
| Apple MacBook Pro 13 2017 | |
| Dell XPS 13 9360 FHD i7 Iris | |
| Dell XPS 13 9360 FHD i5 | |
| Overwatch | |
| 1920x1080 Epic (Render Scale 100 %) AA:SM AF:16x | |
| Apple MacBook Pro 13 2017 | |
| 1920x1080 High (Render Scale 100 %) AA:SM AF:4x | |
| Apple MacBook Pro 13 2017 | |
| Dell XPS 13 9360 FHD i7 Iris | |
| Dell XPS 13 9360 QHD+ i7 | |
| Dell XPS 13 i7-8550U | |
| Acer Spin 5 SP513-52N-566U | |
| 1366x768 Medium (Render Scale 100 %) AA:FX AF:2x | |
| Apple MacBook Pro 13 2017 | |
| Dell XPS 13 9360 FHD i7 Iris | |
| Dell XPS 13 9360 QHD+ i7 | |
| Dell XPS 13 i7-8550U | |
| Acer Spin 5 SP513-52N-566U | |
| HP Envy 13-ad065nr | |
| 1280x720 Low (Render Scale 100 %) AA:FX AF:1x | |
| Apple MacBook Pro 13 2017 | |
| Dell XPS 13 9360 FHD i7 Iris | |
| Dell XPS 13 9360 QHD+ i7 | |
| Dell XPS 13 i7-8550U | |
| Acer Spin 5 SP513-52N-566U | |
| HP Envy 13-ad065nr | |
| Rocket League | |
| 1920x1080 High Quality AA:High FX | |
| Apple MacBook Pro 13 2017 | |
| Dell XPS 13 9360 FHD i7 Iris | |
| 1920x1080 Quality AA:Medium FX | |
| Apple MacBook Pro 13 2017 | |
| Dell XPS 13 9360 FHD i7 Iris | |
| Acer Spin 5 SP513-52N-566U | |
| 1280x720 Performance | |
| Apple MacBook Pro 13 2017 | |
| Acer Spin 5 SP513-52N-566U | |
| Dell XPS 13 9360 FHD i7 Iris | |
| bajo | medio | alto | ultra | |
|---|---|---|---|---|
| Tomb Raider (2013) | 103 | 54.1 | 37 | 17.2 |
| BioShock Infinite (2013) | 61 | 40.2 | 33.5 | 10.7 |
| Battlefield 4 (2013) | 43.1 | 29.7 | 23.2 | 8.2 |
| The Witcher 3 (2015) | 17.5 | |||
| Rainbow Six Siege (2015) | 50.5 | 29 | 16.4 | |
| Overwatch (2016) | 56.1 | 36.5 | 29.9 | |
| Rocket League (2017) | 69.3 | 35.8 | 25.3 | |
| F1 2017 (2017) | 33 | 15 |
Ruido
| Ocioso |
| 29.9 / 29.9 / 30.3 dB(A) |
| Carga |
| 33.9 / 34.9 dB(A) |
 | ||
30 dB silencioso 40 dB(A) audible 50 dB(A) ruidosamente alto |
||
min: | ||
(-) La temperatura máxima en la parte superior es de 46.2 °C / 115 F, frente a la media de 35.9 °C / 97 F, que oscila entre 21.4 y 59 °C para la clase Subnotebook.
(-) El fondo se calienta hasta un máximo de 48.8 °C / 120 F, frente a la media de 39.2 °C / 103 F
(+) En reposo, la temperatura media de la parte superior es de 26.7 °C / 80# F, frente a la media del dispositivo de 30.8 °C / 87 F.
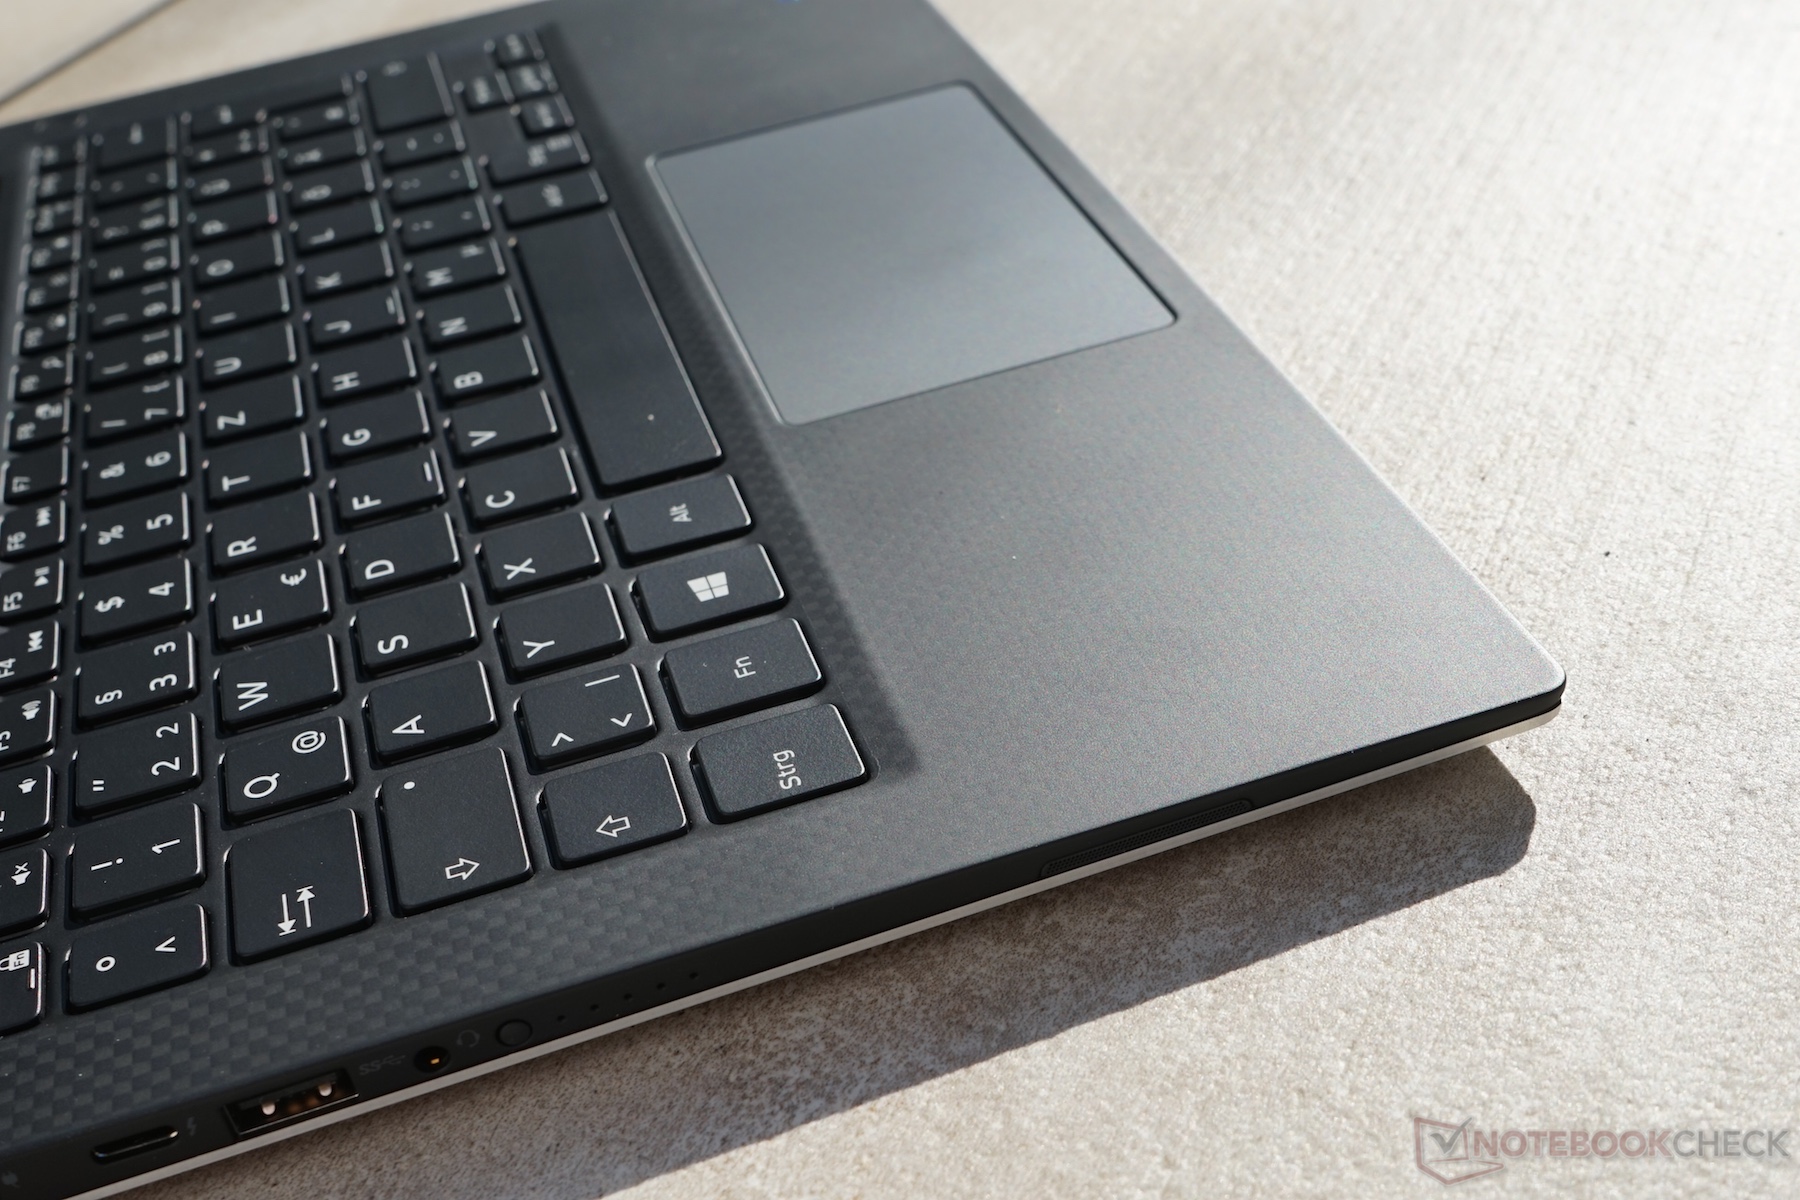
(+) Los reposamanos y el panel táctil alcanzan como máximo la temperatura de la piel (33.6 °C / 92.5 F) y, por tanto, no están calientes.
(-) La temperatura media de la zona del reposamanos de dispositivos similares fue de 28.2 °C / 82.8 F (-5.4 °C / -9.7 F).
| Off / Standby | |
| Ocioso | |
| Carga |
|
Clave:
min: | |
| Dell XPS 13 9360 FHD i7 Iris i7-7560U, Iris Plus Graphics 640, IPS, 1920x1080, 13.3" | Dell XPS 13 i7-8550U i5-8550U, UHD Graphics 620, IGZO IPS, 3200x1800, 13.3" | Dell XPS 13 9360 FHD i5 i5-7200U, HD Graphics 620, IPS, 1920x1080, 13.3" | Dell XPS 13 9360 QHD+ i7 i7-7500U, HD Graphics 620, IPS, 3200x1800, 13.3" | Huawei MateBook X i5-7200U, HD Graphics 620, , 2160x1440, 13.3" | HP Envy 13-ad065nr i5-7200U, HD Graphics 620, IPS, 1920x1080, 13.3" | Apple MacBook Pro 13 2017 i5-7360U, Iris Plus Graphics 640, IPS, 2560x1600, 13.3" | |
|---|---|---|---|---|---|---|---|
| Power Consumption | -10% | 17% | -17% | -47% | 8% | -14% | |
| Idle Minimum * (Watt) | 3.32 | 4.1 -23% | 4.1 -23% | 6.4 -93% | 4.6 -39% | 2.8 16% | 3.7 -11% |
| Idle Average * (Watt) | 5.27 | 5.8 -10% | 4.2 20% | 6.6 -25% | 11 -109% | 5.8 -10% | 5.2 1% |
| Idle Maximum * (Watt) | 6.32 | 6 5% | 5.1 19% | 6.8 -8% | 12 -90% | 6.4 -1% | 7.6 -20% |
| Load Average * (Watt) | 32 | 42.5 -33% | 22.1 31% | 27.5 14% | 39.5 -23% | 31.3 2% | 41.6 -30% |
| Load Maximum * (Watt) | 45.9 | 41.4 10% | 29.4 36% | 32.4 29% | 34.6 25% | 31.7 31% | 50.5 -10% |
* ... más pequeño es mejor
| Dell XPS 13 9360 FHD i7 Iris i7-7560U, Iris Plus Graphics 640, 60 Wh | Dell XPS 13 i7-8550U i5-8550U, UHD Graphics 620, 60 Wh | Razer Blade Stealth QHD i7-7500U i7-7500U, HD Graphics 620, 53.6 Wh | Huawei MateBook X i5-7200U, HD Graphics 620, 40 Wh | HP Envy 13-ad065nr i5-7200U, HD Graphics 620, 53.6 Wh | Dell XPS 13 9360 FHD i5 i5-7200U, HD Graphics 620, 60 Wh | Dell XPS 13 9360 QHD+ i7 i7-7500U, HD Graphics 620, 60 Wh | Apple MacBook Pro 13 2017 i5-7360U, Iris Plus Graphics 640, 54.5 Wh | |
|---|---|---|---|---|---|---|---|---|
| Duración de Batería | -15% | -41% | -37% | -11% | -4% | -22% | -23% | |
| Reader / Idle (h) | 25.4 | 18.5 -27% | 8.5 -67% | 24.8 -2% | 21.6 -15% | 17.6 -31% | ||
| H.264 (h) | 15 | 11.4 -24% | ||||||
| WiFi v1.3 (h) | 10.9 | 9.8 -10% | 6.4 -41% | 5.6 -49% | 9.5 -13% | 11.3 4% | 8.6 -21% | 11.4 5% |
| Load (h) | 2.6 | 2.4 -8% | 2.7 4% | 2.1 -19% | 2.6 0% | 2.2 -15% | 1.3 -50% |
Pro
Contra
Los compradores potenciales de Dell XPS 13 se enfrentan a una decisión interesante en este momento. Los nuevos procesadores Kaby Lake-R proporcionan mucho más rendimiento de CPU, mientras que la GPU Iris en combinación con las "antiguas" CPU Kaby Lake promete más rendimiento de la GPU. Al menos en teoría, porque la decisión es bastante fácil después del análisis.
El nuevo quad-core ULV es superior a los antiguos núcleos duales si puedes usar núcleos/hilos adicionales. El rendimiento de la GPU también es un poco más alto. Otro aspecto decisivo es el limitado uso del rendimiento del i7-7560U en el XPS 13. No queda mucho de las ventajas de rendimiento debido a la limitación habitual de 15 W. Nuestra recomendación es, por lo tanto, fácil: si planeas comprar el XPS 13, que sea con uno de los nuevos chips Kaby Lake-R.
El Kaby Lake en combinación con la GPU Iris más potente no tiene mucho sentido para el XPS 13, porque no puede utilizar todo su potencial. Los nuevos procesadores de octava generación (Kaby Lake-Refresh) son superiores en términos de rendimiento de la CPU, y la GPU tampoco es significativamente más lenta.
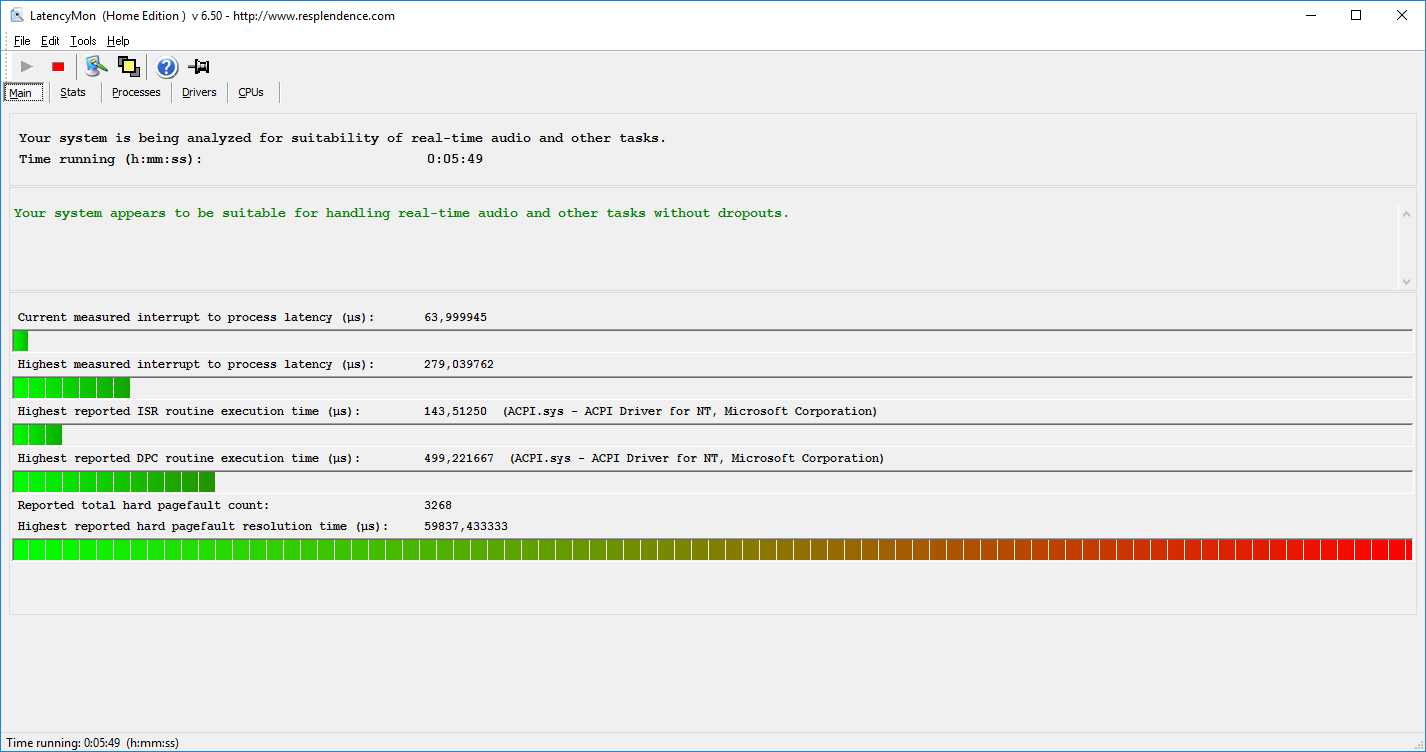
De lo contrario, ya no hay mucho que decir sobre el XPS 13. Desafortunadamente, Dell todavía no se ha librado de los problemas de ruido, y esto distrae más en esta unidad en particular.
Ésta es una versión acortada del análisis original. Puedes leer el análisis completo en inglés aquí.
Dell XPS 13 9360 FHD i7 Iris
- 11/06/2017 v6 (old)
Andreas Osthoff
Price comparison
