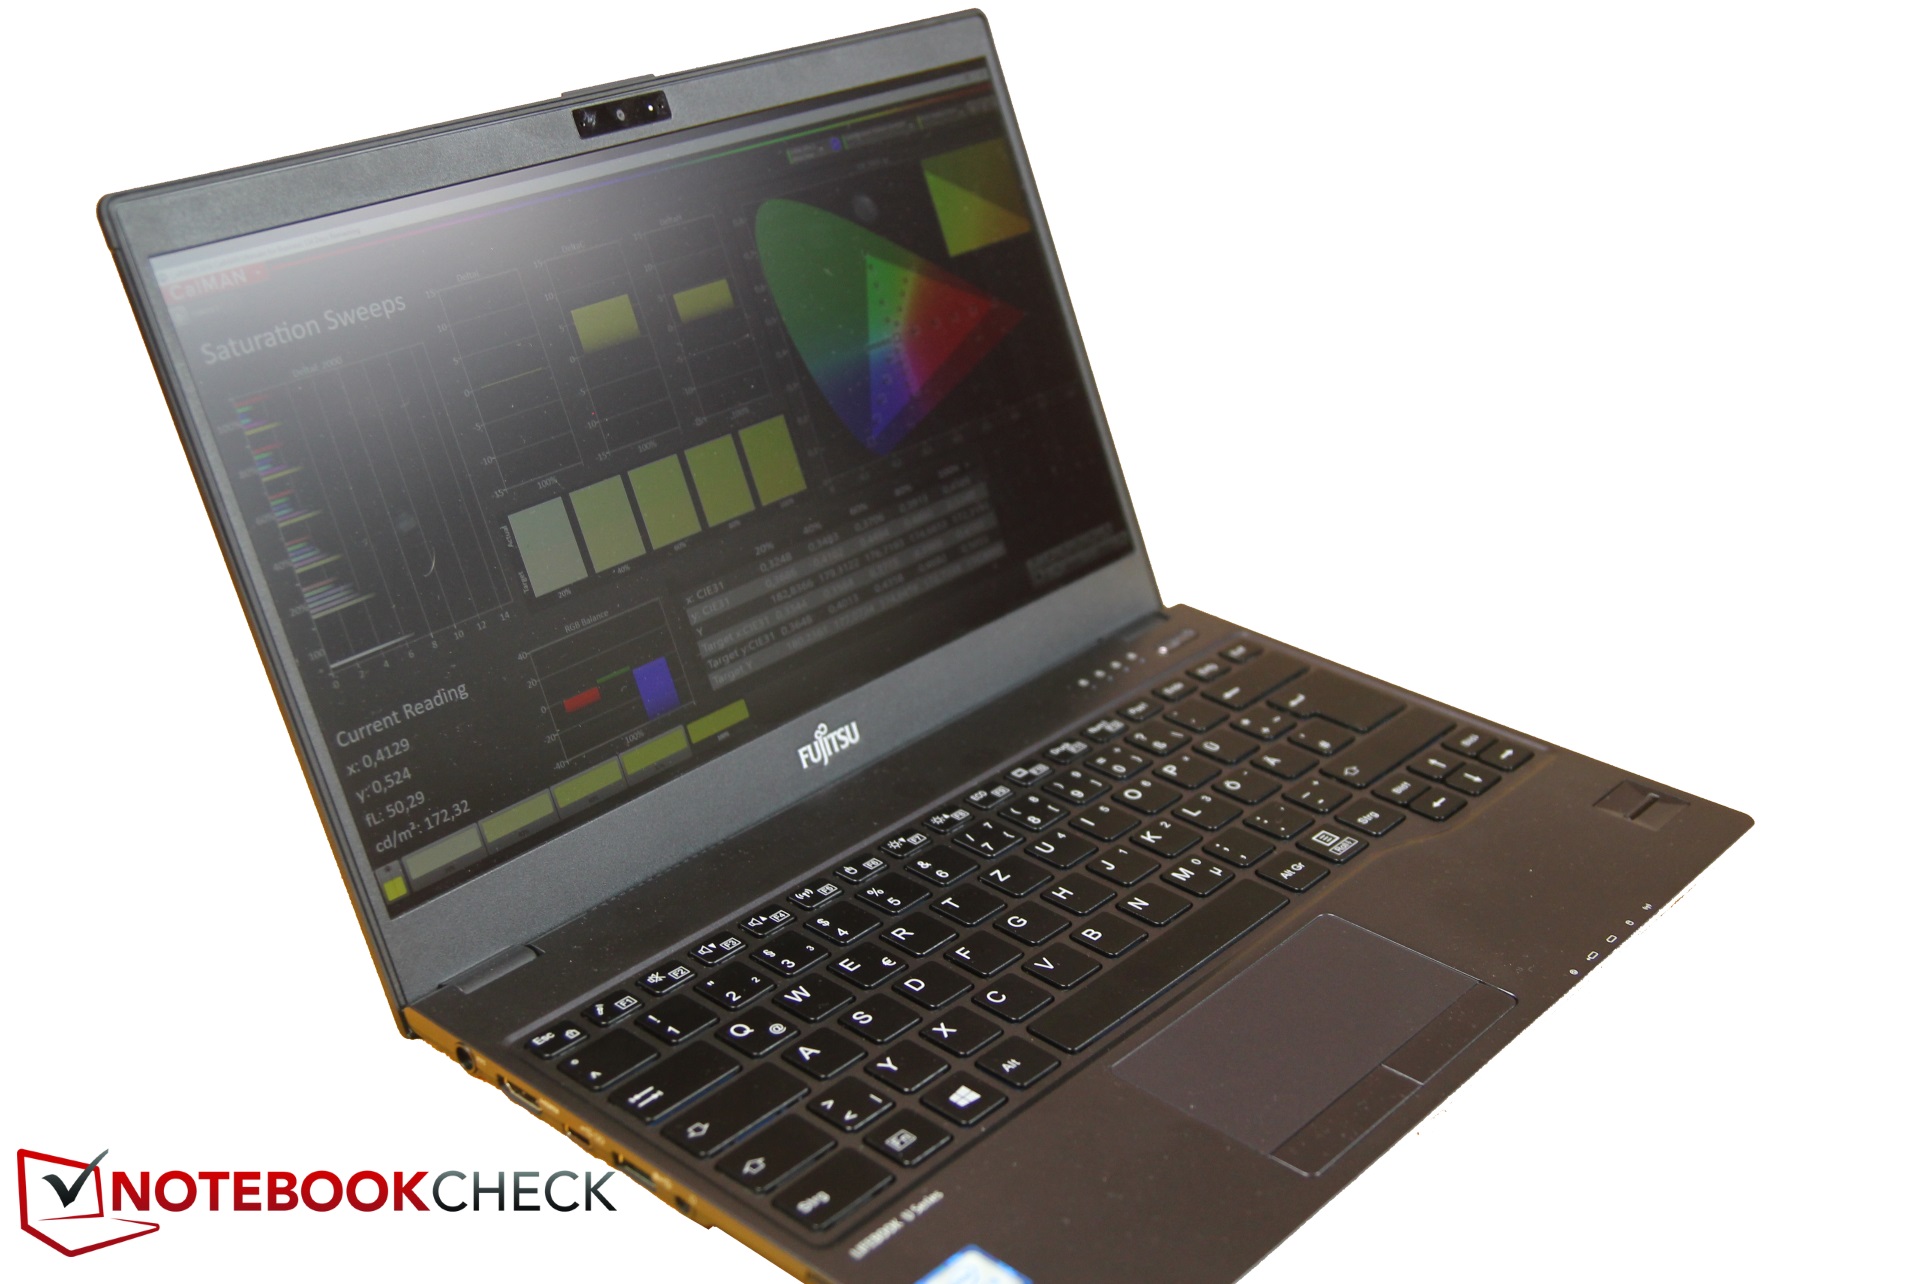
Breve análisis del portátil Fujitsu LifeBook U937 (Core i5, Full-HD)
| SD Card Reader | |
| average JPG Copy Test (av. of 3 runs) | |
| Fujitsu LifeBook U937 (Toshiba Exceria Pro SDXC 64 GB UHS-II) | |
| Dell XPS 13 9360 FHD i5 (Toshiba Exceria Pro SDXC 64 GB UHS-II) | |
| Lenovo ThinkPad X1 Carbon 2017-20HR0021GE (Toshiba Exceria Pro M401) | |
| Toshiba Portege X30-D (PT274U-01N001) (Toshiba Exceria Pro M401) | |
| maximum AS SSD Seq Read Test (1GB) | |
| Dell XPS 13 9360 FHD i5 (Toshiba Exceria Pro SDXC 64 GB UHS-II) | |
| Fujitsu LifeBook U937 (Toshiba Exceria Pro SDXC 64 GB UHS-II) | |
| Toshiba Portege X30-D (PT274U-01N001) (Toshiba Exceria Pro M401) | |
| Lenovo ThinkPad X1 Carbon 2017-20HR0021GE (Toshiba Exceria Pro M401) | |
| |||||||||||||||||||||||||
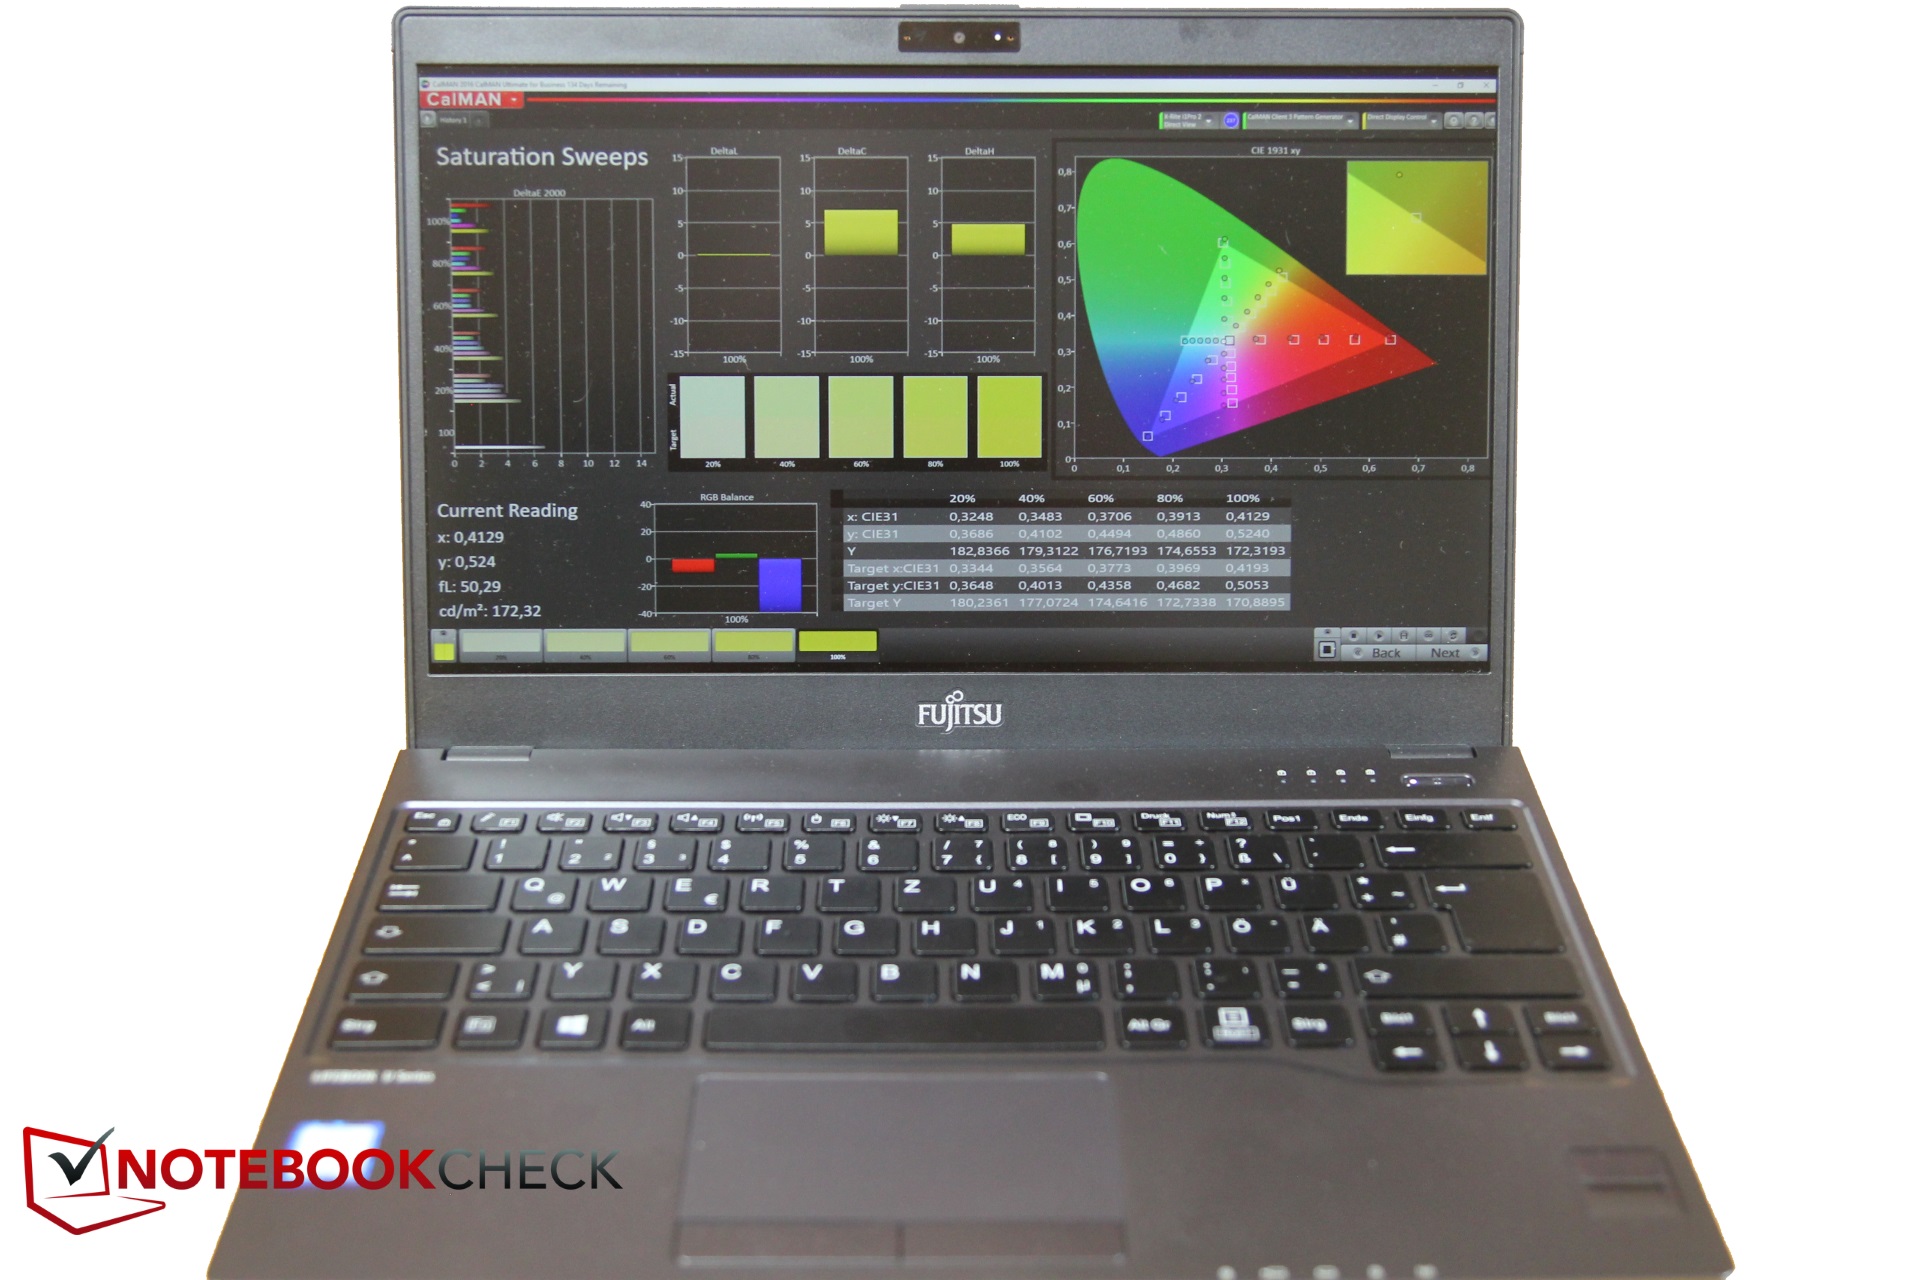
iluminación: 81 %
Brillo con batería: 350 cd/m²
Contraste: 1070:1 (Negro: 0.33 cd/m²)
ΔE ColorChecker Calman: 3.5 | ∀{0.5-29.43 Ø4.72}
ΔE Greyscale Calman: 4.9 | ∀{0.09-98 Ø4.97}
98.1% sRGB (Argyll 1.6.3 3D)
63.5% AdobeRGB 1998 (Argyll 1.6.3 3D)
70.4% AdobeRGB 1998 (Argyll 3D)
98% sRGB (Argyll 3D)
68.6% Display P3 (Argyll 3D)
Gamma: 2.21
CCT: 7136 K
| Fujitsu LifeBook U937 Sharp SHP1483, LQ133M1JW28, , 1920x1080, 13.3" | Asus ASUSPRO B9440UA-GV0100T AU Optronics AUO353D / B140HAN03.5, , 1920x1080, 14" | Lenovo ThinkPad X1 Carbon 2017-20HR0021GE B140HAN03_1, , 1920x1080, 14" | HP Spectre 13-v131ng CMN1374, , 1920x1080, 13.3" | Dell XPS 13 9360 FHD i5 Sharp SHP1449 LQ133M1, , 1920x1080, 13.3" | Toshiba Portege X30-D (PT274U-01N001) Toshiba TOS508F, , 1920x1080, 13.3" | |
|---|---|---|---|---|---|---|
| Display | -8% | -11% | -8% | -27% | -4% | |
| Display P3 Coverage (%) | 68.6 | 64 -7% | 61.6 -10% | 64.6 -6% | 48.94 -29% | 66.4 -3% |
| sRGB Coverage (%) | 98 | 89.1 -9% | 87.6 -11% | 88.8 -9% | 73.3 -25% | 93.5 -5% |
| AdobeRGB 1998 Coverage (%) | 70.4 | 65.2 -7% | 62.6 -11% | 64.8 -8% | 50.5 -28% | 66.6 -5% |
| Response Times | -39% | -37% | -41% | -25% | -21% | |
| Response Time Grey 50% / Grey 80% * (ms) | 39.2 ? | 48.8 ? -24% | 48 ? -22% | 46 ? -17% | 32.8 ? 16% | 36.8 ? 6% |
| Response Time Black / White * (ms) | 20 ? | 30.8 ? -54% | 30.4 ? -52% | 33 ? -65% | 33.2 ? -66% | 29.6 ? -48% |
| PWM Frequency (Hz) | 211.9 ? | |||||
| Screen | -31% | 5% | -10% | -11% | 9% | |
| Brightness middle (cd/m²) | 353 | 319 -10% | 278 -21% | 404 14% | 351.2 -1% | 332.6 -6% |
| Brightness (cd/m²) | 347 | 294 -15% | 271 -22% | 382 10% | 325 -6% | 323 -7% |
| Brightness Distribution (%) | 81 | 87 7% | 91 12% | 91 12% | 89 10% | 86 6% |
| Black Level * (cd/m²) | 0.33 | 0.26 21% | 0.16 52% | 0.35 -6% | 0.195 41% | 0.28 15% |
| Contrast (:1) | 1070 | 1227 15% | 1738 62% | 1154 8% | 1801 68% | 1188 11% |
| Colorchecker dE 2000 * | 3.5 | 7.1 -103% | 4.5 -29% | 5.37 -53% | 7.4 -111% | 2.6 26% |
| Colorchecker dE 2000 max. * | 6.9 | 13.7 -99% | 8.4 -22% | 9.46 -37% | 9.08 -32% | 6.7 3% |
| Greyscale dE 2000 * | 4.9 | 9.61 -96% | 3.2 35% | 6.44 -31% | 6.71 -37% | 2.5 49% |
| Gamma | 2.21 100% | 2.33 94% | 2.02 109% | 2.52 87% | 2.74 80% | 2.12 104% |
| CCT | 7136 91% | 6021 108% | 7042 92% | 6738 96% | 7222 90% | 6720 97% |
| Color Space (Percent of AdobeRGB 1998) (%) | 63.5 | 54.01 -15% | 57 -10% | 58 -9% | 50.48 -21% | 62 -2% |
| Color Space (Percent of sRGB) (%) | 98.1 | 83.02 -15% | 87.5 -11% | 89 -9% | 73.31 -25% | 94 -4% |
| Media total (Programa/Opciones) | -26% /
-27% | -14% /
-4% | -20% /
-14% | -21% /
-16% | -5% /
2% |
* ... más pequeño es mejor
Tiempos de respuesta del display
| ↔ Tiempo de respuesta de Negro a Blanco | ||
|---|---|---|
| 20 ms ... subida ↗ y bajada ↘ combinada | ↗ 9.2 ms subida | 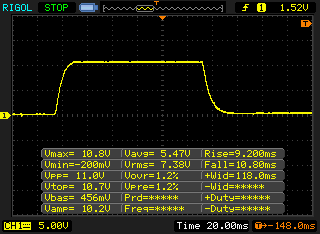 |
| ↘ 10.8 ms bajada | ||
| La pantalla mostró buenos tiempos de respuesta en nuestros tests pero podría ser demasiado lenta para los jugones competitivos. En comparación, todos los dispositivos de prueba van de ##min### (mínimo) a 240 (máximo) ms. » 44 % de todos los dispositivos son mejores. Eso quiere decir que el tiempo de respuesta es similar al dispositivo testado medio (19.9 ms). | ||
| ↔ Tiempo de respuesta 50% Gris a 80% Gris | ||
| 39.2 ms ... subida ↗ y bajada ↘ combinada | ↗ 20.4 ms subida | 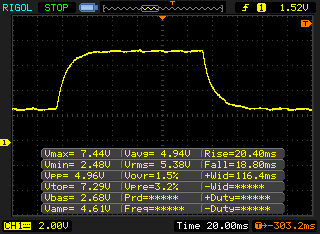 |
| ↘ 18.8 ms bajada | ||
| La pantalla mostró tiempos de respuesta lentos en nuestros tests y podría ser demasiado lenta para los jugones. En comparación, todos los dispositivos de prueba van de ##min### (mínimo) a 636 (máximo) ms. » 60 % de todos los dispositivos son mejores. Eso quiere decir que el tiempo de respuesta es peor que la media (31.1 ms) de todos los dispositivos testados. | ||
Parpadeo de Pantalla / PWM (Pulse-Width Modulation)
| Parpadeo de Pantalla / PWM detectado | 211.9 Hz | ≤ 20 % de brillo | 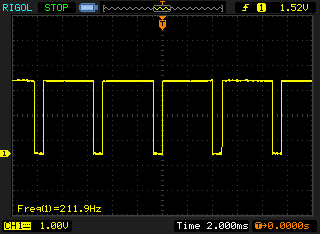 |
La retroiluminación del display parpadea a 211.9 Hz (seguramente usa PWM - Pulse-Width Modulation) a un brillo del 20 % e inferior. Sobre este nivel de brillo no debería darse parpadeo / PWM. La frecuencia de 211.9 Hz es relativamente baja, por lo que la gente sensible debería ver parpadeos y padecer fatiga visual por la pantalla (usado al brillo indicado a continuación). Comparación: 52 % de todos los dispositivos testados no usaron PWM para atenuar el display. Si se usó, medimos una media de 7784 (mínimo: 5 - máxmo: 343500) Hz. | |||
| Cinebench R10 | |
| Rendering Single CPUs 64Bit | |
| HP Spectre 13-v131ng | |
| Lenovo ThinkPad X1 Carbon 2017-20HR0021GE | |
| Fujitsu LifeBook U937 | |
| Rendering Multiple CPUs 64Bit | |
| HP Spectre 13-v131ng | |
| Lenovo ThinkPad X1 Carbon 2017-20HR0021GE | |
| Fujitsu LifeBook U937 | |
| PCMark 10 - Score | |
| Lenovo ThinkPad X1 Carbon 2017-20HR0021GE | |
| Fujitsu LifeBook U937 | |
| PCMark 8 Home Score Accelerated v2 | 3601 puntos | |
| PCMark 8 Work Score Accelerated v2 | 4538 puntos | |
| PCMark 10 Score | 2198 puntos | |
ayuda | ||
| Fujitsu LifeBook U937 Samsung CM871a MZNTY256HDHP | Asus ASUSPRO B9440UA-GV0100T Micron SSD 1100 (MTFDDAV256TBN) | Lenovo ThinkPad X1 Carbon 2017-20HR0021GE Toshiba THNSF5256GPUK | HP Spectre 13-v131ng Samsung PM961 NVMe MZVLW512HMJP | Dell XPS 13 9360 FHD i5 Toshiba NVMe THNSN5256GPUK | Toshiba Portege X30-D (PT274U-01N001) Samsung PM961 MZVLW256HEHP | |
|---|---|---|---|---|---|---|
| CrystalDiskMark 3.0 | -3% | 55% | 107% | 61% | 114% | |
| Read Seq (MB/s) | 509 | 462 -9% | 1277 151% | 1090 114% | 1233 142% | 1270 150% |
| Write Seq (MB/s) | 462.3 | 441.4 -5% | 648 40% | 1088 135% | 733 59% | 1213 162% |
| Read 512 (MB/s) | 385.1 | 323.2 -16% | 972 152% | 753 96% | 1036 169% | 858 123% |
| Write 512 (MB/s) | 228.5 | 398.8 75% | 311 36% | 911 299% | 439.9 93% | 763 234% |
| Read 4k (MB/s) | 34.85 | 26.81 -23% | 34.63 -1% | 57.5 65% | 29.31 -16% | 40.9 17% |
| Write 4k (MB/s) | 90.5 | 87.8 -3% | 128.5 42% | 140.2 55% | 116.9 29% | 143.6 59% |
| Read 4k QD32 (MB/s) | 392.8 | 247.3 -37% | 477.3 22% | 497.1 27% | 479.2 22% | 626 59% |
| Write 4k QD32 (MB/s) | 253.6 | 232.1 -8% | 241.2 -5% | 416 64% | 218.3 -14% | 536 111% |

| 3DMark 11 Performance | 1628 puntos | |
| 3DMark Cloud Gate Standard Score | 6277 puntos | |
| 3DMark Fire Strike Score | 865 puntos | |
ayuda | ||
| bajo | medio | alto | ultra | |
|---|---|---|---|---|
| The Witcher 3 (2015) | 13.85 | 8.84 | 4.77 | |
| Rise of the Tomb Raider (2016) | 17.88 | 11.33 | 6.14 | |
| Rocket League (2017) | 54.3 | 24.39 | 15.18 |
Ruido
| Ocioso |
| 30.8 / 30.8 / 31.1 dB(A) |
| Carga |
| 32.3 / 35.7 dB(A) |
 | ||
30 dB silencioso 40 dB(A) audible 50 dB(A) ruidosamente alto |
||
min: | ||
| Fujitsu LifeBook U937 HD Graphics 620, i5-7200U, Samsung CM871a MZNTY256HDHP | Asus ASUSPRO B9440UA-GV0100T HD Graphics 620, i5-7200U, Micron SSD 1100 (MTFDDAV256TBN) | Lenovo ThinkPad X1 Carbon 2017-20HR0021GE HD Graphics 620, i5-7200U, Toshiba THNSF5256GPUK | HP Spectre 13-v131ng HD Graphics 620, i7-7500U, Samsung PM961 NVMe MZVLW512HMJP | Dell XPS 13 9360 FHD i5 HD Graphics 620, i5-7200U, Toshiba NVMe THNSN5256GPUK | Toshiba Portege X30-D (PT274U-01N001) HD Graphics 620, i7-7600U, Samsung PM961 MZVLW256HEHP | |
|---|---|---|---|---|---|---|
| Noise | -0% | 0% | -5% | 6% | 4% | |
| apagado / medio ambiente * (dB) | 30.8 | 29 6% | 29.6 4% | 30.4 1% | 28.4 8% | |
| Idle Minimum * (dB) | 30.8 | 29 6% | 29.6 4% | 30.4 1% | 28.9 6% | 28.4 8% |
| Idle Average * (dB) | 30.8 | 29 6% | 29.6 4% | 30.4 1% | 28.9 6% | 28.4 8% |
| Idle Maximum * (dB) | 31.1 | 29 7% | 32.2 -4% | 30.4 2% | 28.9 7% | 28.4 9% |
| Load Average * (dB) | 32.3 | 36.7 -14% | 34.2 -6% | 40 -24% | 30.9 4% | 33.2 -3% |
| Load Maximum * (dB) | 35.7 | 40.2 -13% | 36.1 -1% | 40 -12% | 33.5 6% | 37.9 -6% |
* ... más pequeño es mejor
(±) La temperatura máxima en la parte superior es de 43.4 °C / 110 F, frente a la media de 35.9 °C / 97 F, que oscila entre 21.4 y 59 °C para la clase Subnotebook.
(±) El fondo se calienta hasta un máximo de 41.6 °C / 107 F, frente a la media de 39.2 °C / 103 F
(+) En reposo, la temperatura media de la parte superior es de 25.3 °C / 78# F, frente a la media del dispositivo de 30.8 °C / 87 F.
(+) El reposamanos y el panel táctil están a una temperatura inferior a la de la piel, con un máximo de 26.4 °C / 79.5 F y, por tanto, son fríos al tacto.
(±) La temperatura media de la zona del reposamanos de dispositivos similares fue de 28.2 °C / 82.8 F (+1.8 °C / 3.3 F).
| Fujitsu LifeBook U937 HD Graphics 620, i5-7200U, Samsung CM871a MZNTY256HDHP | Asus ASUSPRO B9440UA-GV0100T HD Graphics 620, i5-7200U, Micron SSD 1100 (MTFDDAV256TBN) | Lenovo ThinkPad X1 Carbon 2017-20HR0021GE HD Graphics 620, i5-7200U, Toshiba THNSF5256GPUK | HP Spectre 13-v131ng HD Graphics 620, i7-7500U, Samsung PM961 NVMe MZVLW512HMJP | Dell XPS 13 9360 FHD i5 HD Graphics 620, i5-7200U, Toshiba NVMe THNSN5256GPUK | Toshiba Portege X30-D (PT274U-01N001) HD Graphics 620, i7-7600U, Samsung PM961 MZVLW256HEHP | |
|---|---|---|---|---|---|---|
| Heat | -0% | -10% | -8% | -5% | -4% | |
| Maximum Upper Side * (°C) | 43.4 | 36.6 16% | 48.5 -12% | 54.2 -25% | 43.4 -0% | 40.6 6% |
| Maximum Bottom * (°C) | 41.6 | 41 1% | 46.1 -11% | 37.7 9% | 49.2 -18% | 40 4% |
| Idle Upper Side * (°C) | 26.5 | 28 -6% | 28.5 -8% | 29 -9% | 26.4 -0% | 30 -13% |
| Idle Bottom * (°C) | 26 | 29 -12% | 27.8 -7% | 27.6 -6% | 26.4 -2% | 29.2 -12% |
* ... más pequeño es mejor
Fujitsu LifeBook U937 análisis de audio
(+) | los altavoces pueden reproducir a un volumen relativamente alto (#82 dB)
Graves 100 - 315 Hz
(-) | casi sin bajos - de media 31.6% inferior a la mediana
(+) | el bajo es lineal (3.5% delta a la frecuencia anterior)
Medios 400 - 2000 Hz
(±) | medios reducidos - de media 7.3% inferior a la mediana
(±) | la linealidad de los medios es media (8.4% delta respecto a la frecuencia anterior)
Altos 2 - 16 kHz
(±) | máximos más altos - de media 9.2% más altos que la mediana
(±) | la linealidad de los máximos es media (7% delta a frecuencia anterior)
Total 100 - 16.000 Hz
(-) | el sonido global no es lineal (33.4% de diferencia con la mediana)
En comparación con la misma clase
» 95% de todos los dispositivos probados de esta clase eran mejores, 1% similares, 3% peores
» El mejor tuvo un delta de 5%, la media fue 18%, el peor fue ###max##%
En comparación con todos los dispositivos probados
» 92% de todos los dispositivos probados eran mejores, 1% similares, 6% peores
» El mejor tuvo un delta de 4%, la media fue 24%, el peor fue ###max##%
Asus ASUSPRO B9440UA-GV0100T análisis de audio
(±) | la sonoridad del altavoz es media pero buena (78 dB)
Graves 100 - 315 Hz
(±) | lubina reducida - en promedio 9.4% inferior a la mediana
(±) | la linealidad de los graves es media (9.6% delta a frecuencia anterior)
Medios 400 - 2000 Hz
(+) | medios equilibrados - a sólo 2% de la mediana
(+) | los medios son lineales (4.4% delta a la frecuencia anterior)
Altos 2 - 16 kHz
(±) | máximos más altos - de media 5.3% más altos que la mediana
(+) | los máximos son lineales (6.8% delta a la frecuencia anterior)
Total 100 - 16.000 Hz
(±) | la linealidad del sonido global es media (16.1% de diferencia con la mediana)
En comparación con la misma clase
» 18% de todos los dispositivos probados de esta clase eran mejores, 6% similares, 76% peores
» El mejor tuvo un delta de 7%, la media fue 21%, el peor fue ###max##%
En comparación con todos los dispositivos probados
» 26% de todos los dispositivos probados eran mejores, 5% similares, 69% peores
» El mejor tuvo un delta de 4%, la media fue 24%, el peor fue ###max##%
| Off / Standby | |
| Ocioso | |
| Carga |
|
Clave:
min: | |
| Fujitsu LifeBook U937 i5-7200U, HD Graphics 620, Samsung CM871a MZNTY256HDHP, IPS, 1920x1080, 13.3" | Asus ASUSPRO B9440UA-GV0100T i5-7200U, HD Graphics 620, Micron SSD 1100 (MTFDDAV256TBN), IPS, 1920x1080, 14" | Lenovo ThinkPad X1 Carbon 2017-20HR0021GE i5-7200U, HD Graphics 620, Toshiba THNSF5256GPUK, IPS, 1920x1080, 14" | HP Spectre 13-v131ng i7-7500U, HD Graphics 620, Samsung PM961 NVMe MZVLW512HMJP, IPS UWVA, 1920x1080, 13.3" | Dell XPS 13 9360 FHD i5 i5-7200U, HD Graphics 620, Toshiba NVMe THNSN5256GPUK, IPS, 1920x1080, 13.3" | Toshiba Portege X30-D (PT274U-01N001) i7-7600U, HD Graphics 620, Samsung PM961 MZVLW256HEHP, IPS, 1920x1080, 13.3" | |
|---|---|---|---|---|---|---|
| Power Consumption | -5% | -22% | -16% | 12% | -12% | |
| Idle Minimum * (Watt) | 3.11 | 3.1 -0% | 3.8 -22% | 3.6 -16% | 4.1 -32% | 4.6 -48% |
| Idle Average * (Watt) | 6.1 | 6.1 -0% | 7.1 -16% | 6.4 -5% | 4.2 31% | 7.6 -25% |
| Idle Maximum * (Watt) | 6.75 | 6.8 -1% | 8.3 -23% | 9.2 -36% | 5.1 24% | 8.2 -21% |
| Load Average * (Watt) | 28.9 | 27.4 5% | 34.2 -18% | 34 -18% | 22.1 24% | 23.8 18% |
| Load Maximum * (Watt) | 33.3 | 43.7 -31% | 43.3 -30% | 34.4 -3% | 29.4 12% | 28 16% |
* ... más pequeño es mejor
| Fujitsu LifeBook U937 i5-7200U, HD Graphics 620, 50 Wh | Asus ASUSPRO B9440UA-GV0100T i5-7200U, HD Graphics 620, 48 Wh | Lenovo ThinkPad X1 Carbon 2017-20HR0021GE i5-7200U, HD Graphics 620, 57 Wh | HP Spectre 13-v131ng i7-7500U, HD Graphics 620, 38 Wh | Dell XPS 13 9360 FHD i5 i5-7200U, HD Graphics 620, 60 Wh | Toshiba Portege X30-D (PT274U-01N001) i7-7600U, HD Graphics 620, 48 Wh | |
|---|---|---|---|---|---|---|
| Duración de Batería | -14% | -23% | -44% | 4% | -27% | |
| Reader / Idle (h) | 19.2 | 19 -1% | 13.7 -29% | 12 -37% | 21.6 13% | 15 -22% |
| H.264 (h) | 11.9 | 9.6 -19% | 6.1 -49% | |||
| WiFi v1.3 (h) | 10.9 | 8.9 -18% | 9.1 -17% | 6.6 -39% | 11.3 4% | 7.2 -34% |
| Load (h) | 2.7 | 2.1 -22% | 2 -26% | 1.3 -52% | 2.6 -4% | 2 -26% |
Pro
Contra
Nos gustó el Fujitsu LifeBook U937. Aparte del touchpad malo y la falta de retroiluminación del teclado, los pocos puntos de crítica que tenemos son sólo cosas menores que no tienen un gran impacto en el rendimiento general; el pequeño compañero business no tiene debilidades reales.
Sí, la pantalla podría tener una mejor distribución del brillo y el ruido del ventilador podría molestar a los usuarios sensibles. Pero el SSD SATA III también se puede cambiar para una versión PCIe y los ventiladores de enfriamiento pequeños suenan igual en la mayoría de los dispositivos de comparación.
Por otro lado, hay muchos aspectos positivos de este dispositivo: en primer lugar, el peso increíblemente ligero de 950 g y su tamaño compacto. También tiene un montón de características de seguridad y muy buen tiempo de duración de la batería. Otra ventaja es que es fácil de reparar y ampliar. El dispositivo es especialmente adecuado como un portátil business (tarjeta inteligente), pero también podría satisfacer a los usuarios domésticos.
Por poco menos $1500, puedes comprar un portátil business muy pequeño y probablemente el más ligero con un montón de características de seguridad, un buen tiempo de duración de la batería y un display brillante. Sin duda recomendamos el U937. Sólo tiene algunas debilidades menores y rinde espectacularmente en muchos aspectos.
Ésta es una versión acortada del análisis original. Puedes leer el análisis completo en inglés aquí.
Fujitsu LifeBook U937
- 08/02/2017 v6 (old)
Christian Hintze