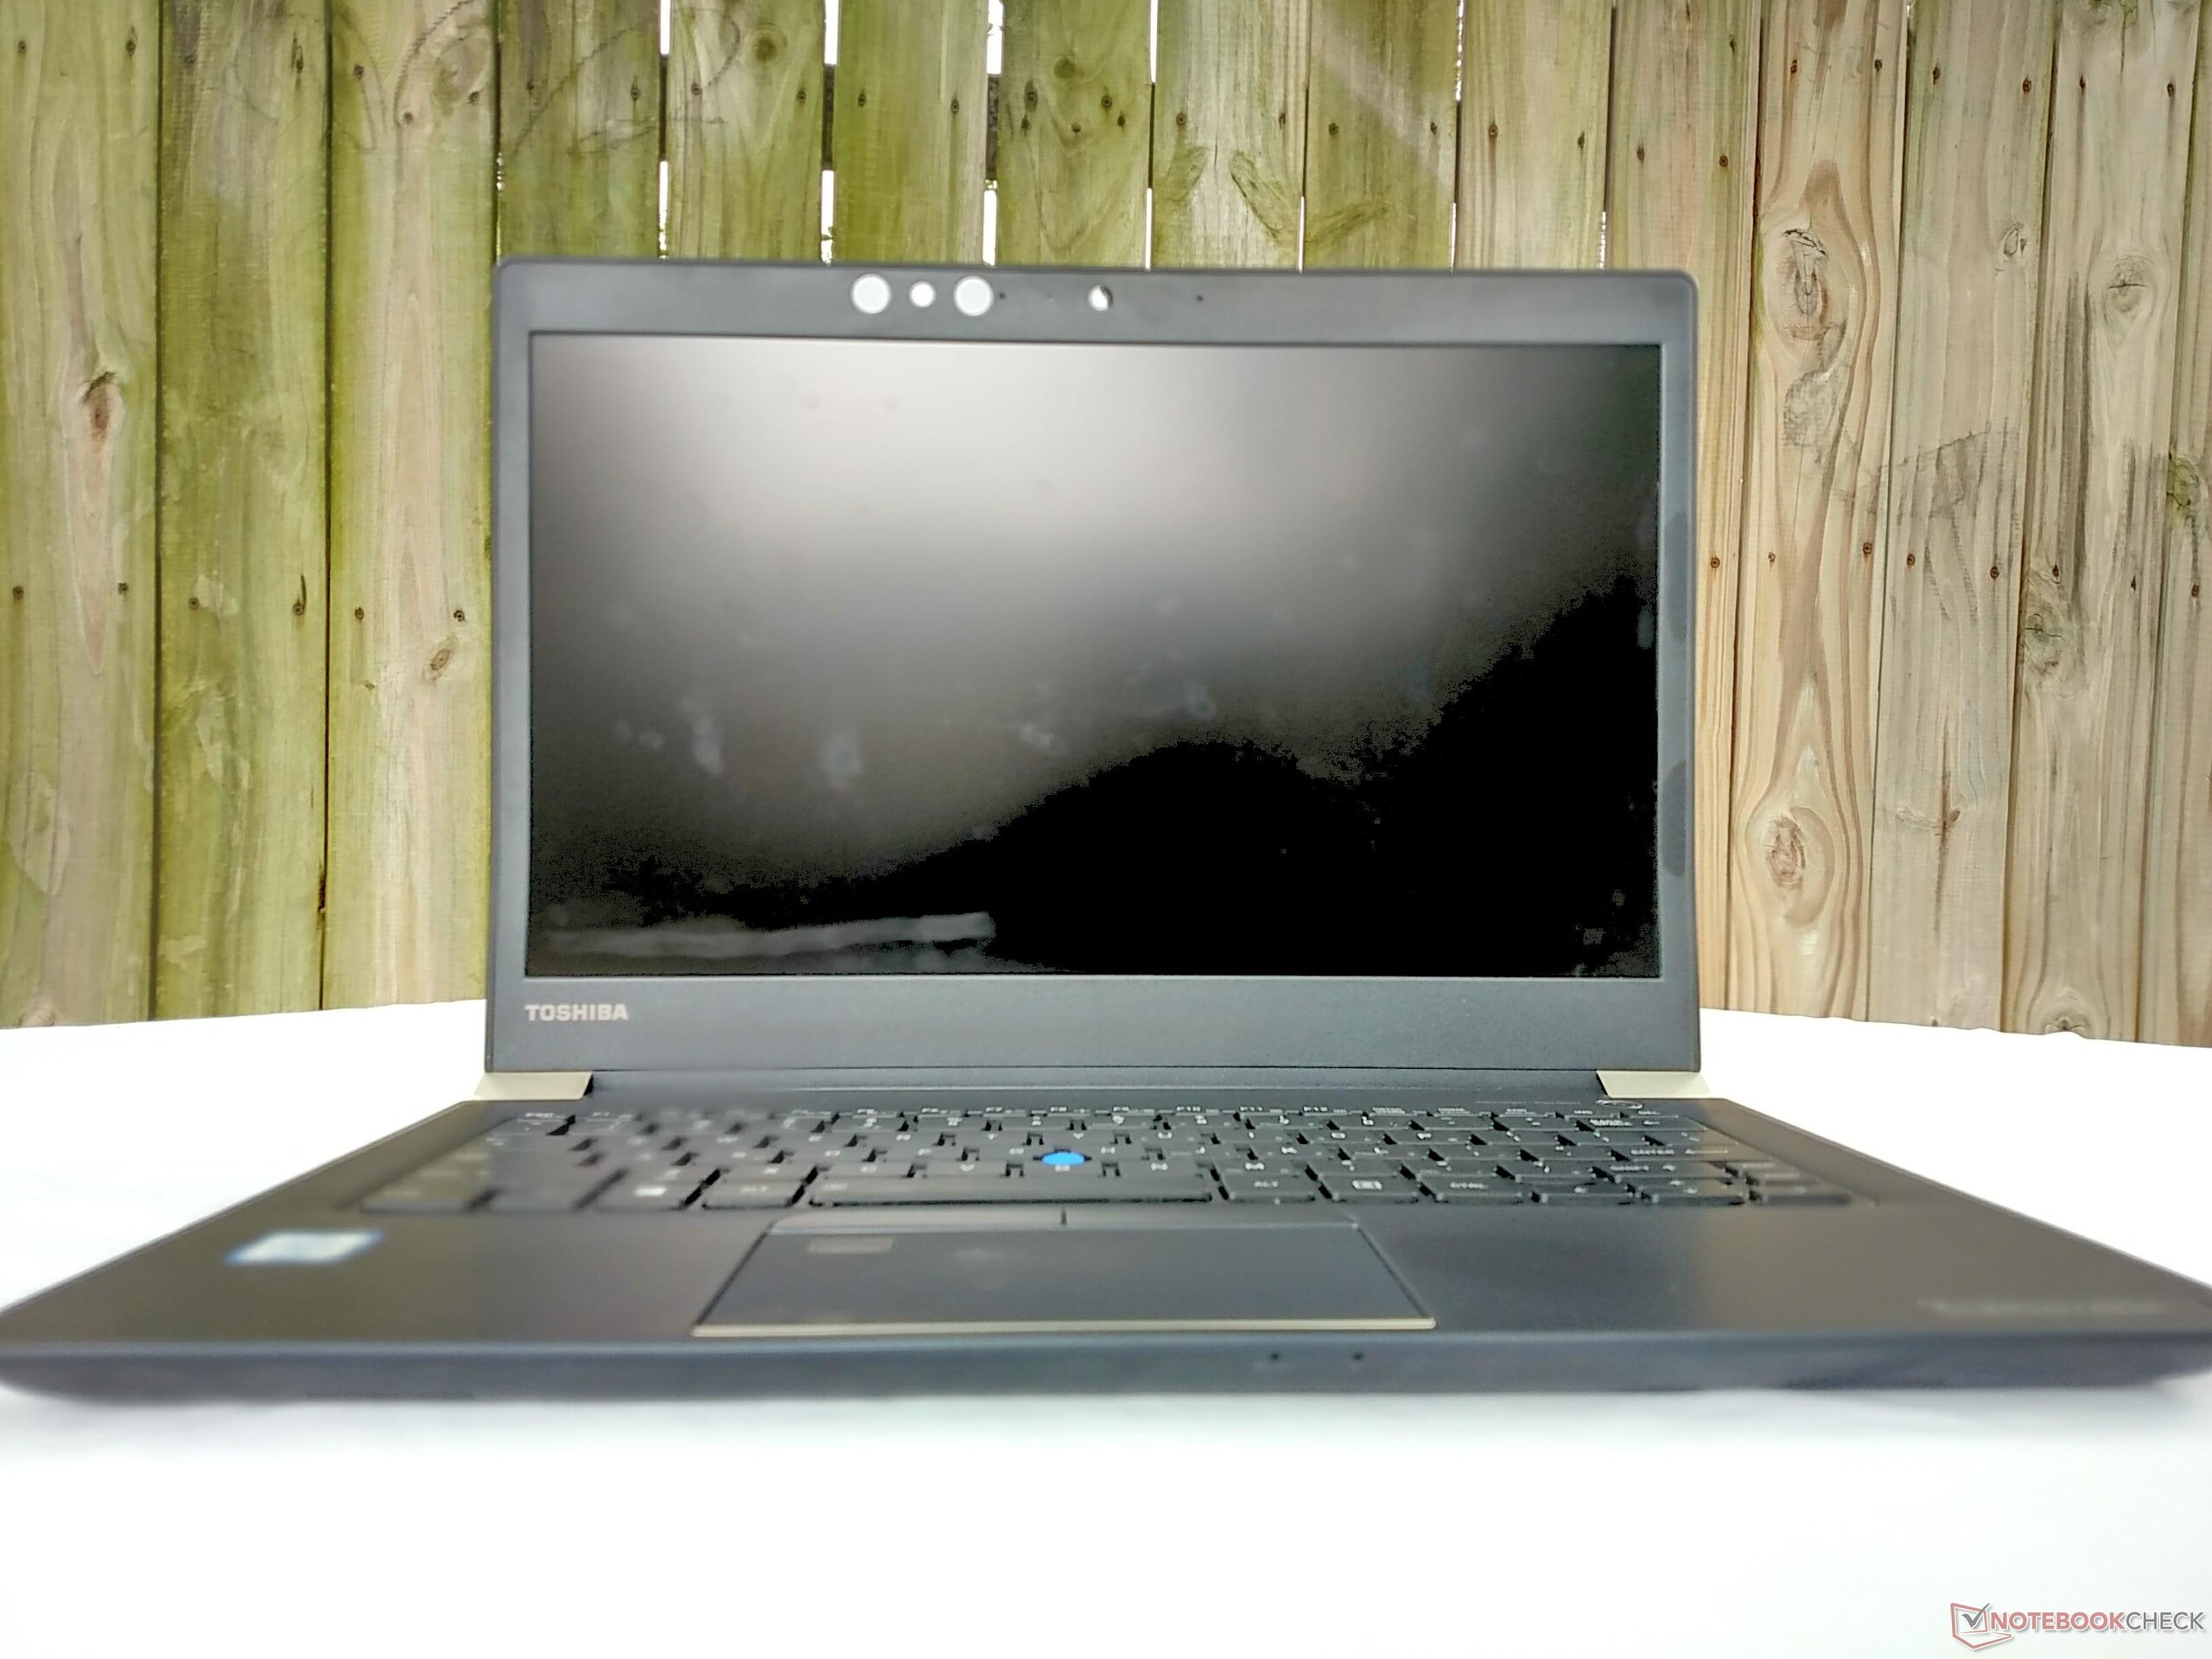
Breve análisis del portátil Toshiba Portégé X30 (i7-7600U, 256 GB)

| SD Card Reader | |
| average JPG Copy Test (av. of 3 runs) | |
| Dell XPS 13 9360 FHD i7 Iris | |
| Lenovo ThinkPad T470s-20HF0012US | |
| Toshiba Portege X30-D (PT274U-01N001) | |
| Lenovo ThinkPad X1 Carbon 2017-20HQS03P00 | |
| maximum AS SSD Seq Read Test (1GB) | |
| Dell XPS 13 9360 FHD i7 Iris | |
| Lenovo ThinkPad T470s-20HF0012US | |
| Toshiba Portege X30-D (PT274U-01N001) | |
| Lenovo ThinkPad X1 Carbon 2017-20HQS03P00 | |
| |||||||||||||||||||||||||
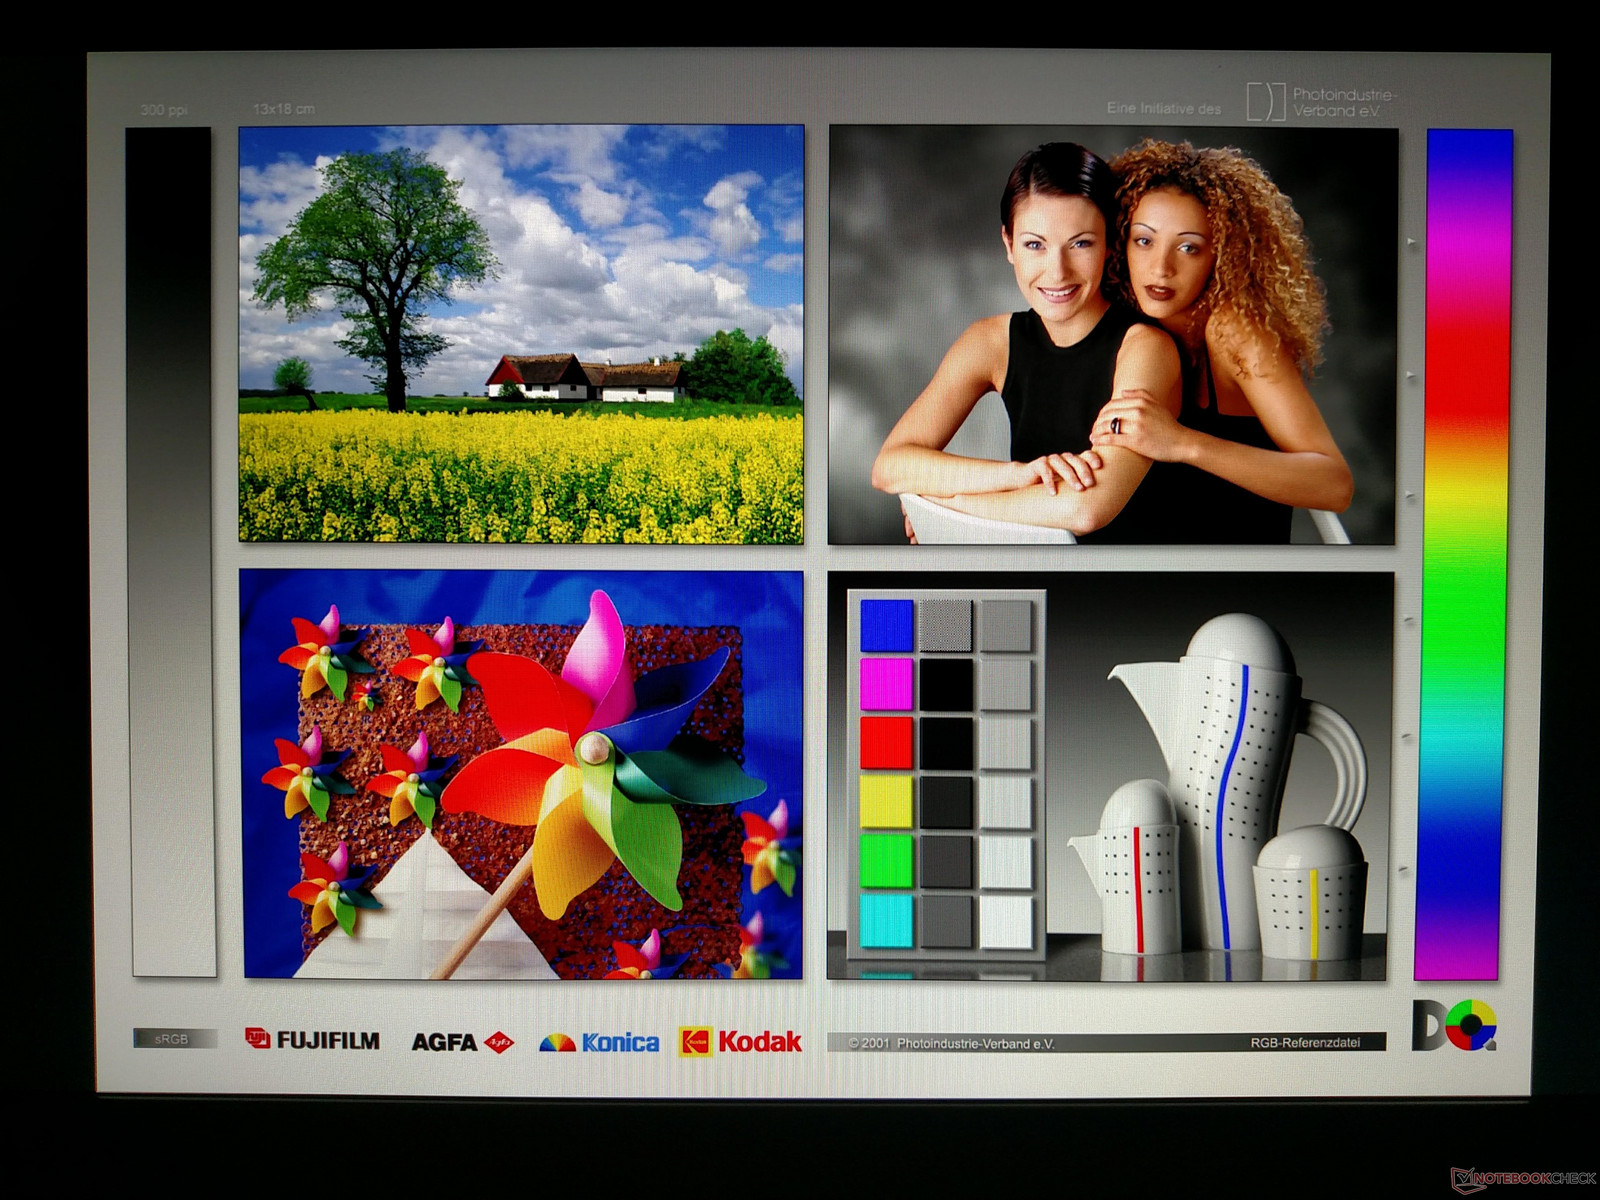
iluminación: 86 %
Brillo con batería: 332.6 cd/m²
Contraste: 1188:1 (Negro: 0.28 cd/m²)
ΔE ColorChecker Calman: 2.6 | ∀{0.5-29.43 Ø4.73}
ΔE Greyscale Calman: 2.5 | ∀{0.09-98 Ø4.97}
94% sRGB (Argyll 1.6.3 3D)
62% AdobeRGB 1998 (Argyll 1.6.3 3D)
66.6% AdobeRGB 1998 (Argyll 3D)
93.5% sRGB (Argyll 3D)
66.4% Display P3 (Argyll 3D)
Gamma: 2.12
CCT: 6720 K
| Toshiba Portege X30-D (PT274U-01N001) Toshiba TOS508F, IPS, 13.3", 1920x1080 | Lenovo ThinkPad X1 Carbon 2017-20HQS03P00 B140HAN03_1, IPS, 14", 1920x1080 | Lenovo ThinkPad T470s-20HF0012US LEN40A9 (R140NWF5 R1), IPS, 14", 1920x1080 | Apple MacBook 12 2017 APPA027, LED IPS, 12", 2304x1440 | HP Spectre 13-v131ng CMN1374, IPS UWVA, 13.3", 1920x1080 | |
|---|---|---|---|---|---|
| Display | -7% | -37% | -4% | ||
| Display P3 Coverage (%) | 66.4 | 61.4 -8% | 40.35 -39% | 64.6 -3% | |
| sRGB Coverage (%) | 93.5 | 85.9 -8% | 60.3 -36% | 88.8 -5% | |
| AdobeRGB 1998 Coverage (%) | 66.6 | 62.4 -6% | 41.72 -37% | 64.8 -3% | |
| Response Times | -10% | -4% | -5% | -18% | |
| Response Time Grey 50% / Grey 80% * (ms) | 36.8 ? | 41.6 ? -13% | 40.8 ? -11% | 40.8 ? -11% | 46 ? -25% |
| Response Time Black / White * (ms) | 29.6 ? | 31.6 ? -7% | 28.8 ? 3% | 29.2 ? 1% | 33 ? -11% |
| PWM Frequency (Hz) | 219.3 ? | 116000 | |||
| Screen | -31% | -60% | -30% | ||
| Brightness middle (cd/m²) | 332.6 | 311 -6% | 271.6 -18% | 404 21% | |
| Brightness (cd/m²) | 323 | 288 -11% | 264 -18% | 382 18% | |
| Brightness Distribution (%) | 86 | 85 -1% | 88 2% | 91 6% | |
| Black Level * (cd/m²) | 0.28 | 0.24 14% | 0.24 14% | 0.35 -25% | |
| Contrast (:1) | 1188 | 1296 9% | 1132 -5% | 1154 -3% | |
| Colorchecker dE 2000 * | 2.6 | 5.5 -112% | 6.1 -135% | 5.37 -107% | |
| Colorchecker dE 2000 max. * | 6.7 | 9 -34% | 28.6 -327% | 9.46 -41% | |
| Greyscale dE 2000 * | 2.5 | 6.2 -148% | 3.4 -36% | 6.44 -158% | |
| Gamma | 2.12 104% | 2.02 109% | 2.12 104% | 2.52 87% | |
| CCT | 6720 97% | 5950 109% | 6077 107% | 6738 96% | |
| Color Space (Percent of AdobeRGB 1998) (%) | 62 | 55.96 -10% | 38 -39% | 58 -6% | |
| Color Space (Percent of sRGB) (%) | 94 | 85.77 -9% | 60 -36% | 89 -5% | |
| Media total (Programa/Opciones) | -16% /
-23% | -34% /
-48% | -5% /
-5% | -17% /
-23% |
* ... más pequeño es mejor
Tiempos de respuesta del display
| ↔ Tiempo de respuesta de Negro a Blanco | ||
|---|---|---|
| 29.6 ms ... subida ↗ y bajada ↘ combinada | ↗ 17.2 ms subida | 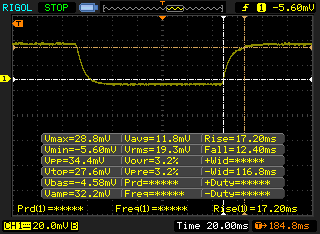 |
| ↘ 12.4 ms bajada | ||
| La pantalla mostró tiempos de respuesta relativamente lentos en nuestros tests pero podría ser demasiado lenta para los jugones. En comparación, todos los dispositivos de prueba van de ##min### (mínimo) a 240 (máximo) ms. » 79 % de todos los dispositivos son mejores. Eso quiere decir que el tiempo de respuesta es peor que la media (19.9 ms) de todos los dispositivos testados. | ||
| ↔ Tiempo de respuesta 50% Gris a 80% Gris | ||
| 36.8 ms ... subida ↗ y bajada ↘ combinada | ↗ 18.8 ms subida | 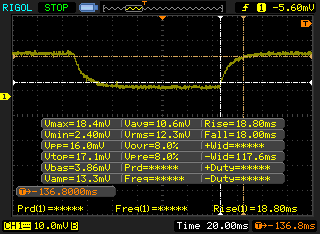 |
| ↘ 18 ms bajada | ||
| La pantalla mostró tiempos de respuesta lentos en nuestros tests y podría ser demasiado lenta para los jugones. En comparación, todos los dispositivos de prueba van de ##min### (mínimo) a 636 (máximo) ms. » 53 % de todos los dispositivos son mejores. Eso quiere decir que el tiempo de respuesta es peor que la media (31.1 ms) de todos los dispositivos testados. | ||
Parpadeo de Pantalla / PWM (Pulse-Width Modulation)
| Parpadeo de Pantalla / PWM no detectado | 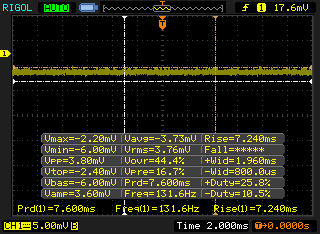 | ||
Comparación: 52 % de todos los dispositivos testados no usaron PWM para atenuar el display. Si se usó, medimos una media de 7798 (mínimo: 5 - máxmo: 343500) Hz. | |||
| Cinebench R11.5 | |
| CPU Single 64Bit | |
| Toshiba Portege X30-D (PT274U-01N001) | |
| Lenovo ThinkPad T470s-20HF0012US | |
| HP Spectre 13-v131ng | |
| CPU Multi 64Bit | |
| Lenovo ThinkPad T470s-20HF0012US | |
| Toshiba Portege X30-D (PT274U-01N001) | |
| HP Spectre 13-v131ng | |
| Cinebench R10 | |
| Rendering Multiple CPUs 32Bit | |
| Toshiba Portege X30-D (PT274U-01N001) | |
| HP Spectre 13-v131ng | |
| Rendering Single 32Bit | |
| Toshiba Portege X30-D (PT274U-01N001) | |
| HP Spectre 13-v131ng | |
| wPrime 2.10 - 1024m | |
| Toshiba Portege X30-D (PT274U-01N001) | |
| Lenovo ThinkPad T470s-20HF0012US | |
* ... más pequeño es mejor
| PCMark 7 Score | 5667 puntos | |
| PCMark 8 Home Score Accelerated v2 | 3543 puntos | |
| PCMark 8 Creative Score Accelerated v2 | 4561 puntos | |
| PCMark 8 Work Score Accelerated v2 | 4910 puntos | |
ayuda | ||
| Toshiba Portege X30-D (PT274U-01N001) Samsung PM961 MZVLW256HEHP | Lenovo ThinkPad X1 Carbon 2017-20HQS03P00 Samsung PM961 NVMe MZVLW512HMJP | Lenovo ThinkPad T470s-20HF0012US Samsung PM961 MZVLW256HEHP | Apple MacBook 12 2017 Apple SSD AP0256 | HP Spectre 13-v131ng Samsung PM961 NVMe MZVLW512HMJP | |
|---|---|---|---|---|---|
| CrystalDiskMark 3.0 | 19% | 8% | -39% | -3% | |
| Read Seq (MB/s) | 1270 | 1827 44% | 1399 10% | 955 -25% | 1090 -14% |
| Write Seq (MB/s) | 1213 | 1383 14% | 1213 0% | 899 -26% | 1088 -10% |
| Read 512 (MB/s) | 858 | 814 -5% | 831 -3% | 658 -23% | 753 -12% |
| Write 512 (MB/s) | 763 | 1098 44% | 856 12% | 579 -24% | 911 19% |
| Read 4k (MB/s) | 40.9 | 61 49% | 60.7 48% | 9.721 -76% | 57.5 41% |
| Write 4k (MB/s) | 143.6 | 172.2 20% | 159.2 11% | 12.78 -91% | 140.2 -2% |
| Read 4k QD32 (MB/s) | 626 | 601 -4% | 580 -7% | 521 -17% | 497.1 -21% |
| Write 4k QD32 (MB/s) | 536 | 495.6 -8% | 499.4 -7% | 370.1 -31% | 416 -22% |

| 3DMark | |
| 1280x720 Cloud Gate Standard Graphics | |
| Dell XPS 13 9360 FHD i7 Iris | |
| Lenovo ThinkPad X1 Carbon 2017-20HQS03P00 | |
| Lenovo ThinkPad T470s-20HF0012US | |
| HP Spectre 13-v131ng | |
| Toshiba Portege X30-D (PT274U-01N001) | |
| Apple MacBook 12 2017 | |
| 1920x1080 Fire Strike Graphics | |
| Dell XPS 13 9360 FHD i7 Iris | |
| Lenovo ThinkPad X1 Carbon 2017-20HQS03P00 | |
| Lenovo ThinkPad T470s-20HF0012US | |
| HP Spectre 13-v131ng | |
| Toshiba Portege X30-D (PT274U-01N001) | |
| 1920x1080 Ice Storm Extreme Graphics | |
| HP Spectre 13-v131ng | |
| Toshiba Portege X30-D (PT274U-01N001) | |
| 3DMark 11 Performance | 1577 puntos | |
| 3DMark Ice Storm Standard Score | 52149 puntos | |
| 3DMark Cloud Gate Standard Score | 5812 puntos | |
| 3DMark Fire Strike Score | 780 puntos | |
ayuda | ||
Ruido
| Ocioso |
| 28.4 / 28.4 / 28.4 dB(A) |
| Carga |
| 33.2 / 37.9 dB(A) |
 | ||
30 dB silencioso 40 dB(A) audible 50 dB(A) ruidosamente alto |
||
min: | ||
| Toshiba Portege X30-D (PT274U-01N001) HD Graphics 620, i7-7600U, Samsung PM961 MZVLW256HEHP | Lenovo ThinkPad X1 Carbon 2017-20HQS03P00 HD Graphics 620, i7-7500U, Samsung PM961 NVMe MZVLW512HMJP | Lenovo ThinkPad T470s-20HF0012US HD Graphics 620, i5-7300U, Samsung PM961 MZVLW256HEHP | Apple MacBook 12 2017 HD Graphics 615, m3-7Y32, Apple SSD AP0256 | HP Spectre 13-v131ng HD Graphics 620, i7-7500U, Samsung PM961 NVMe MZVLW512HMJP | Dell XPS 13 9360 FHD i7 Iris Iris Plus Graphics 640, i7-7560U, Toshiba XG4 NVMe (THNSN5512GPUK) | |
|---|---|---|---|---|---|---|
| Noise | -5% | -1% | -9% | -3% | ||
| apagado / medio ambiente * (dB) | 28.4 | 29.3 -3% | 27.8 2% | 30.4 -7% | 29.9 -5% | |
| Idle Minimum * (dB) | 28.4 | 29.3 -3% | 27.8 2% | 30.4 -7% | 29.9 -5% | |
| Idle Average * (dB) | 28.4 | 29.3 -3% | 27.8 2% | 30.4 -7% | 29.9 -5% | |
| Idle Maximum * (dB) | 28.4 | 32.2 -13% | 27.8 2% | 30.4 -7% | 30.3 -7% | |
| Load Average * (dB) | 33.2 | 34.3 -3% | 34.8 -5% | 40 -20% | 33.9 -2% | |
| Load Maximum * (dB) | 37.9 | 39.3 -4% | 42 -11% | 40 -6% | 34.9 8% | |
| Witcher 3 ultra * (dB) | 42 |
* ... más pequeño es mejor
(±) La temperatura máxima en la parte superior es de 40.6 °C / 105 F, frente a la media de 34.3 °C / 94 F, que oscila entre 21.2 y 62.5 °C para la clase Office.
(±) El fondo se calienta hasta un máximo de 40 °C / 104 F, frente a la media de 36.8 °C / 98 F
(+) En reposo, la temperatura media de la parte superior es de 26.7 °C / 80# F, frente a la media del dispositivo de 29.5 °C / 85 F.
(+) El reposamanos y el panel táctil están a una temperatura inferior a la de la piel, con un máximo de 27.2 °C / 81 F y, por tanto, son fríos al tacto.
(±) La temperatura media de la zona del reposamanos de dispositivos similares fue de 27.5 °C / 81.5 F (+0.3 °C / 0.5 F).
Toshiba Portege X30-D (PT274U-01N001) análisis de audio
(±) | la sonoridad del altavoz es media pero buena (77 dB)
Graves 100 - 315 Hz
(-) | casi sin bajos - de media 16.7% inferior a la mediana
(±) | la linealidad de los graves es media (14.2% delta a frecuencia anterior)
Medios 400 - 2000 Hz
(+) | medios equilibrados - a sólo 2.6% de la mediana
(+) | los medios son lineales (6.8% delta a la frecuencia anterior)
Altos 2 - 16 kHz
(+) | máximos equilibrados - a sólo 3.5% de la mediana
(±) | la linealidad de los máximos es media (9.3% delta a frecuencia anterior)
Total 100 - 16.000 Hz
(±) | la linealidad del sonido global es media (19.7% de diferencia con la mediana)
En comparación con la misma clase
» 41% de todos los dispositivos probados de esta clase eran mejores, 8% similares, 52% peores
» El mejor tuvo un delta de 7%, la media fue 21%, el peor fue ###max##%
En comparación con todos los dispositivos probados
» 50% de todos los dispositivos probados eran mejores, 7% similares, 43% peores
» El mejor tuvo un delta de 4%, la media fue 24%, el peor fue ###max##%
HP Spectre 13-v131ng análisis de audio
(-) | altavoces no muy altos (#68 dB)
Graves 100 - 315 Hz
(-) | casi sin bajos - de media 23.7% inferior a la mediana
(±) | la linealidad de los graves es media (9.6% delta a frecuencia anterior)
Medios 400 - 2000 Hz
(±) | medios reducidos - de media 5.1% inferior a la mediana
(±) | la linealidad de los medios es media (7.6% delta respecto a la frecuencia anterior)
Altos 2 - 16 kHz
(±) | máximos más altos - de media 7.7% más altos que la mediana
(+) | los máximos son lineales (3.1% delta a la frecuencia anterior)
Total 100 - 16.000 Hz
(±) | la linealidad del sonido global es media (28.6% de diferencia con la mediana)
En comparación con la misma clase
» 90% de todos los dispositivos probados de esta clase eran mejores, 2% similares, 7% peores
» El mejor tuvo un delta de 5%, la media fue 18%, el peor fue ###max##%
En comparación con todos los dispositivos probados
» 86% de todos los dispositivos probados eran mejores, 3% similares, 11% peores
» El mejor tuvo un delta de 4%, la media fue 24%, el peor fue ###max##%
| Off / Standby | |
| Ocioso | |
| Carga |
|
Clave:
min: | |
| Toshiba Portege X30-D (PT274U-01N001) i7-7600U, HD Graphics 620, Samsung PM961 MZVLW256HEHP, IPS, 1920x1080, 13.3" | Lenovo ThinkPad X1 Carbon 2017-20HQS03P00 i7-7500U, HD Graphics 620, Samsung PM961 NVMe MZVLW512HMJP, IPS, 1920x1080, 14" | Lenovo ThinkPad T470s-20HF0012US i5-7300U, HD Graphics 620, Samsung PM961 MZVLW256HEHP, IPS, 1920x1080, 14" | Apple MacBook 12 2017 m3-7Y32, HD Graphics 615, Apple SSD AP0256, LED IPS, 2304x1440, 12" | HP Spectre 13-v131ng i7-7500U, HD Graphics 620, Samsung PM961 NVMe MZVLW512HMJP, IPS UWVA, 1920x1080, 13.3" | |
|---|---|---|---|---|---|
| Power Consumption | -24% | -20% | 29% | -8% | |
| Idle Minimum * (Watt) | 4.6 | 3.84 17% | 4.8 -4% | 2 57% | 3.6 22% |
| Idle Average * (Watt) | 7.6 | 6.3 17% | 6.6 13% | 5.4 29% | 6.4 16% |
| Idle Maximum * (Watt) | 8.2 | 8.6 -5% | 7 15% | 6.6 20% | 9.2 -12% |
| Load Average * (Watt) | 23.8 | 41.9 -76% | 39.2 -65% | 22 8% | 34 -43% |
| Load Maximum * (Watt) | 28 | 48.7 -74% | 44.8 -60% | 20 29% | 34.4 -23% |
* ... más pequeño es mejor
| Toshiba Portege X30-D (PT274U-01N001) i7-7600U, HD Graphics 620, 48 Wh | Lenovo ThinkPad X1 Carbon 2017-20HQS03P00 i7-7500U, HD Graphics 620, 57 Wh | Lenovo ThinkPad T470s-20HF0012US i5-7300U, HD Graphics 620, 51 Wh | Apple MacBook 12 2017 m3-7Y32, HD Graphics 615, 41.4 Wh | HP Spectre 13-v131ng i7-7500U, HD Graphics 620, 38 Wh | |
|---|---|---|---|---|---|
| Duración de Batería | 15% | 25% | 25% | -21% | |
| Reader / Idle (h) | 15 | 20.9 39% | 17.7 18% | 12 -20% | |
| WiFi v1.3 (h) | 7.2 | 8.3 15% | 8.1 13% | 9 25% | 6.6 -8% |
| Load (h) | 2 | 1.8 -10% | 2.9 45% | 1.3 -35% |
Pro
Contra
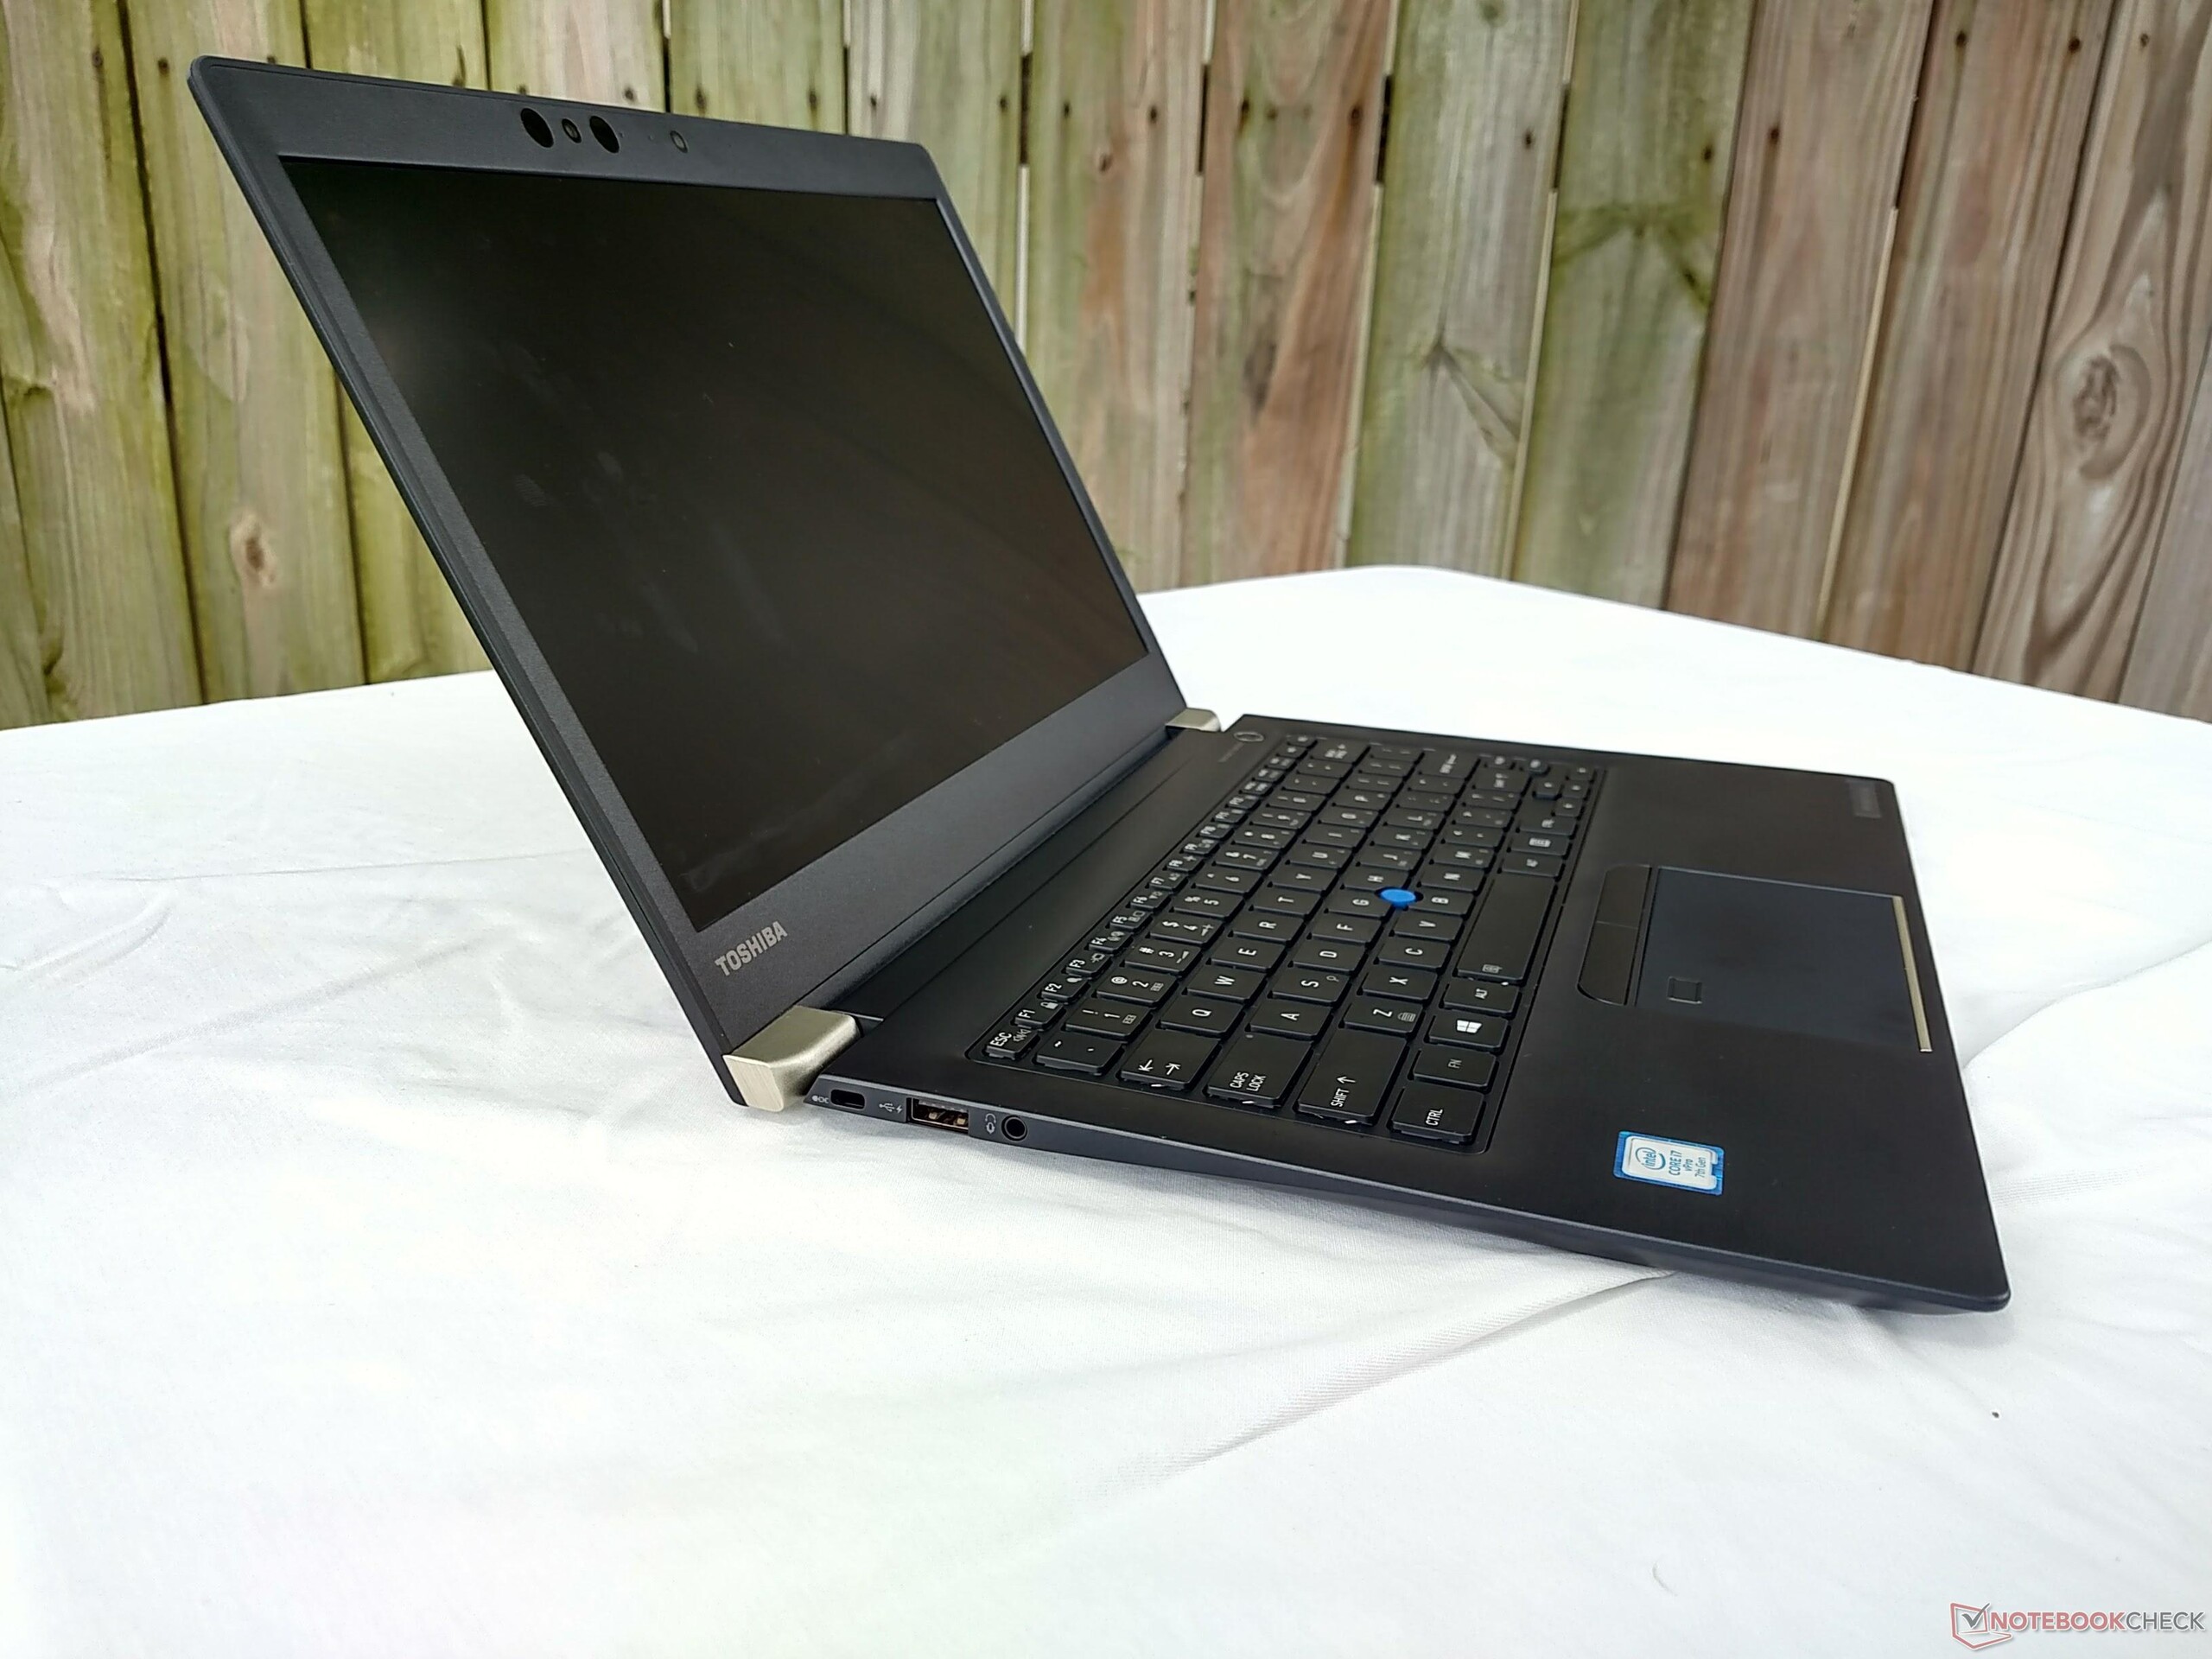
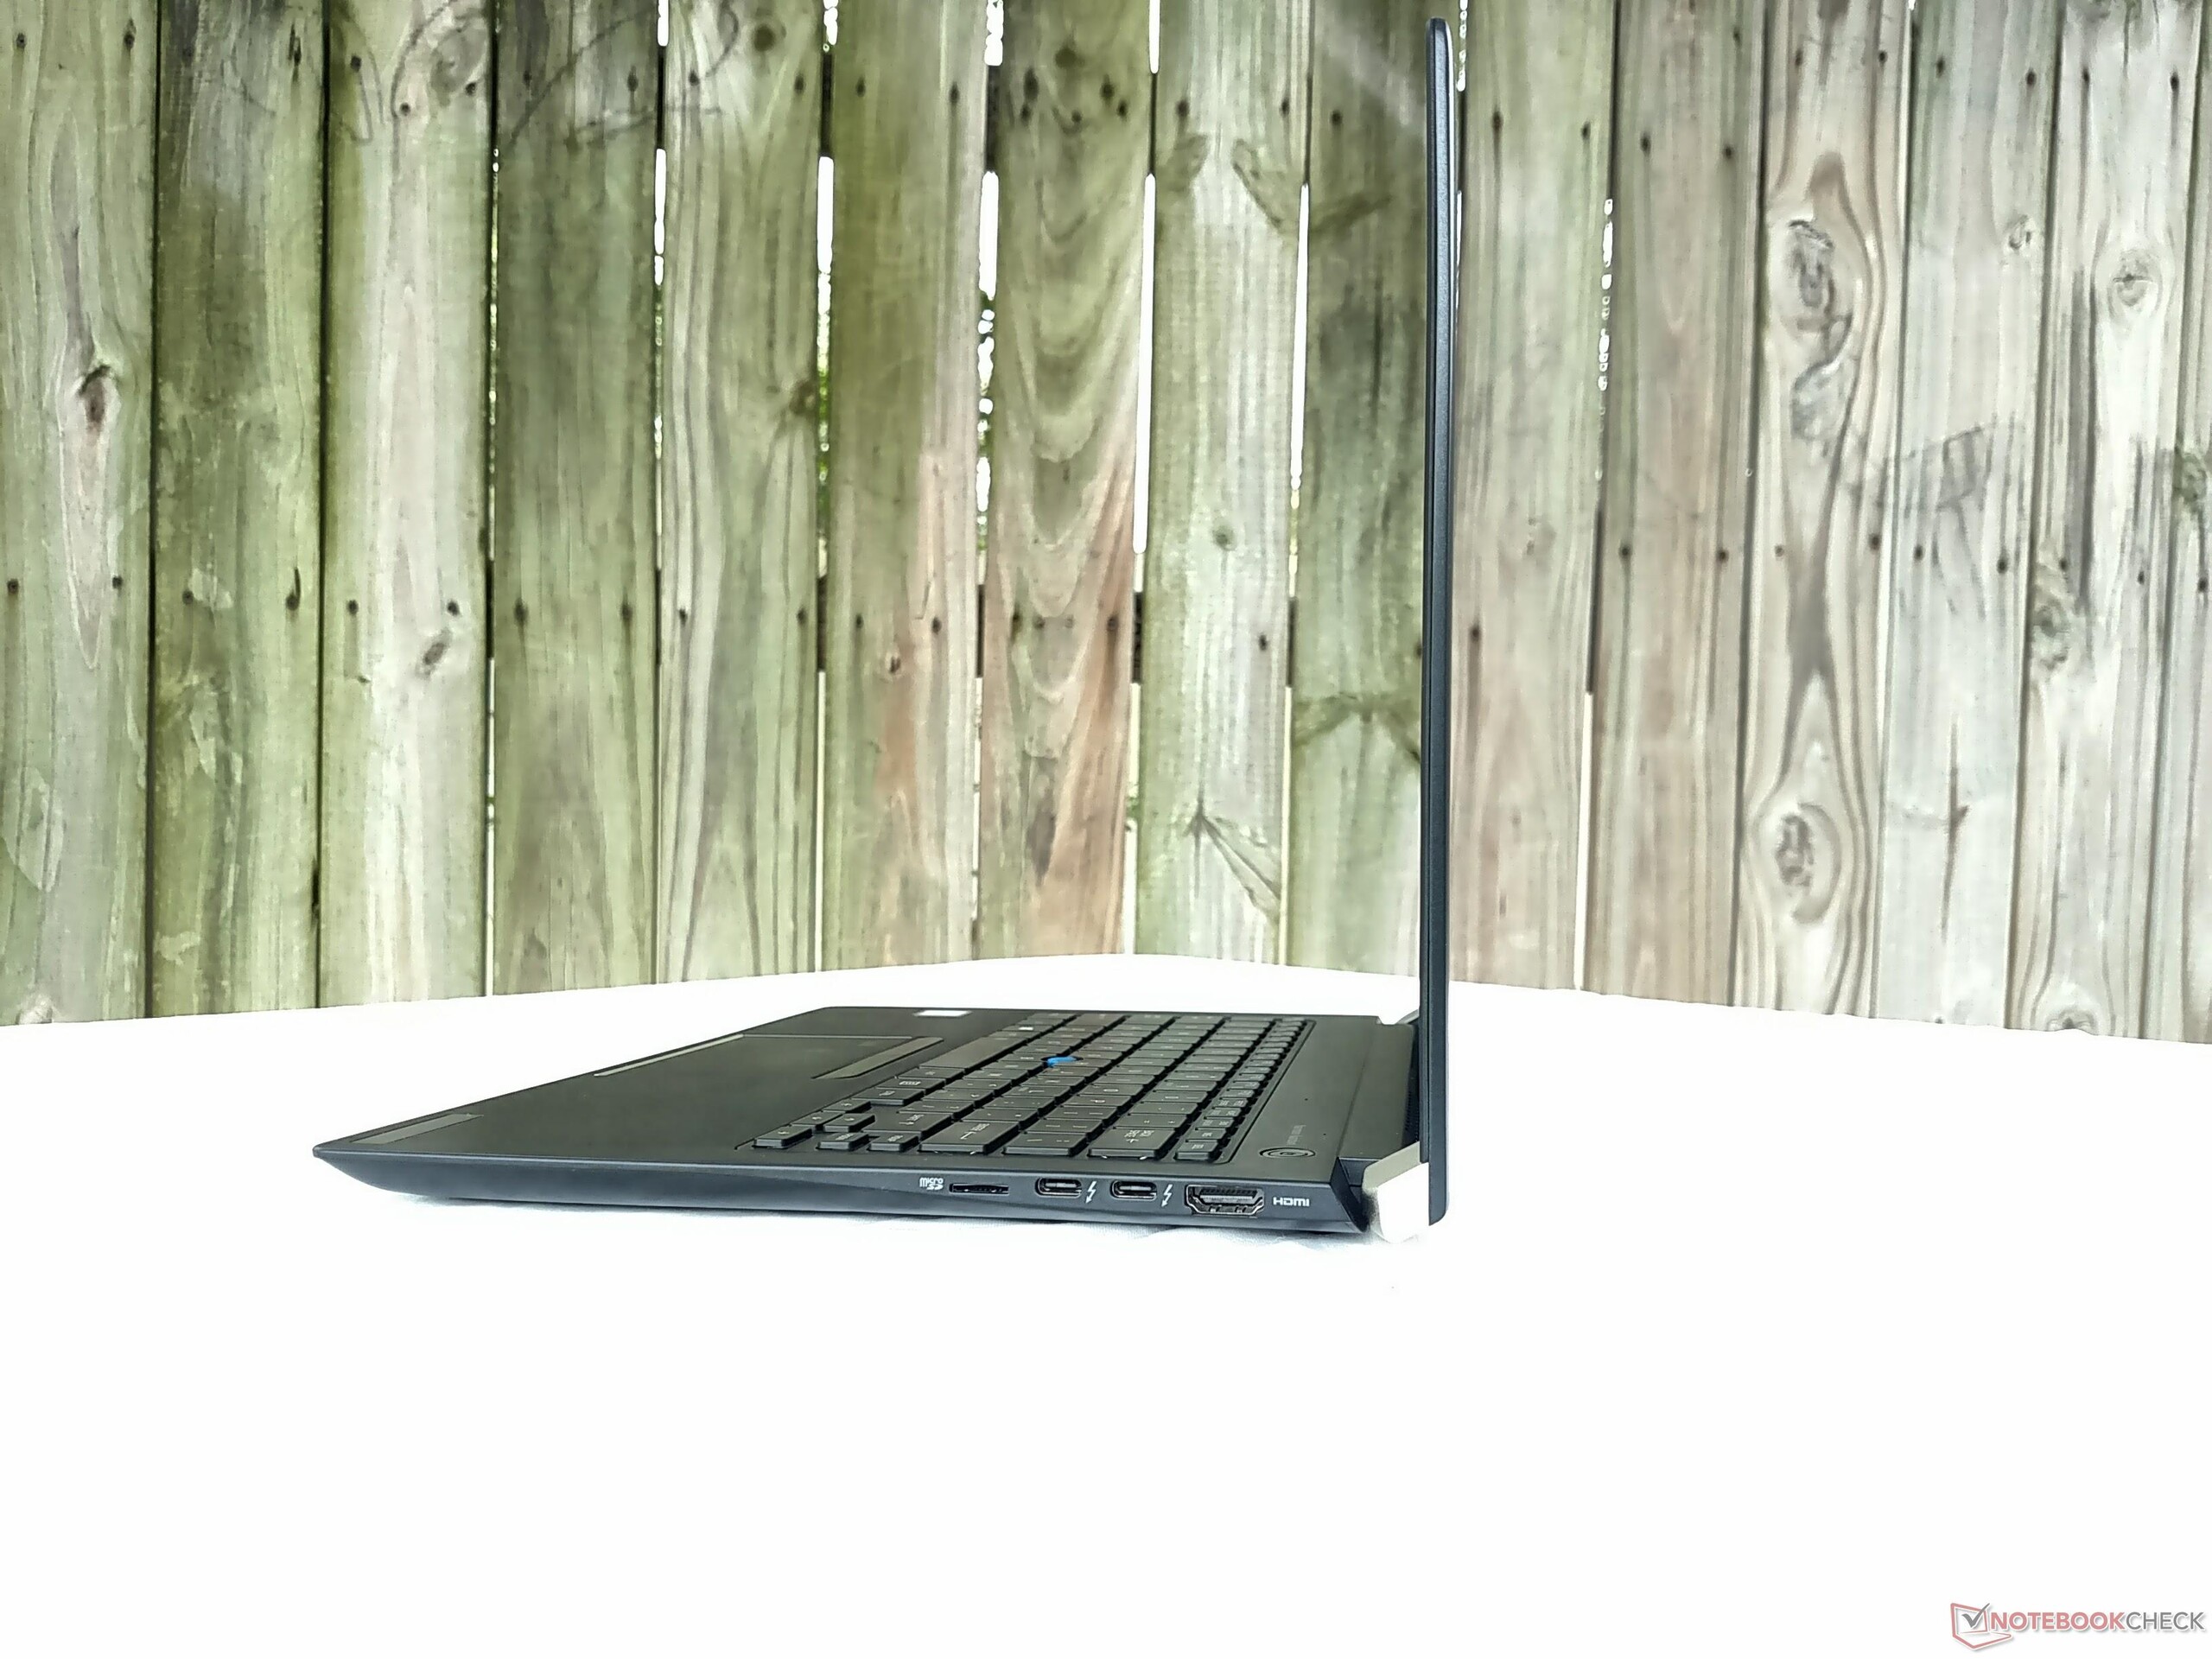
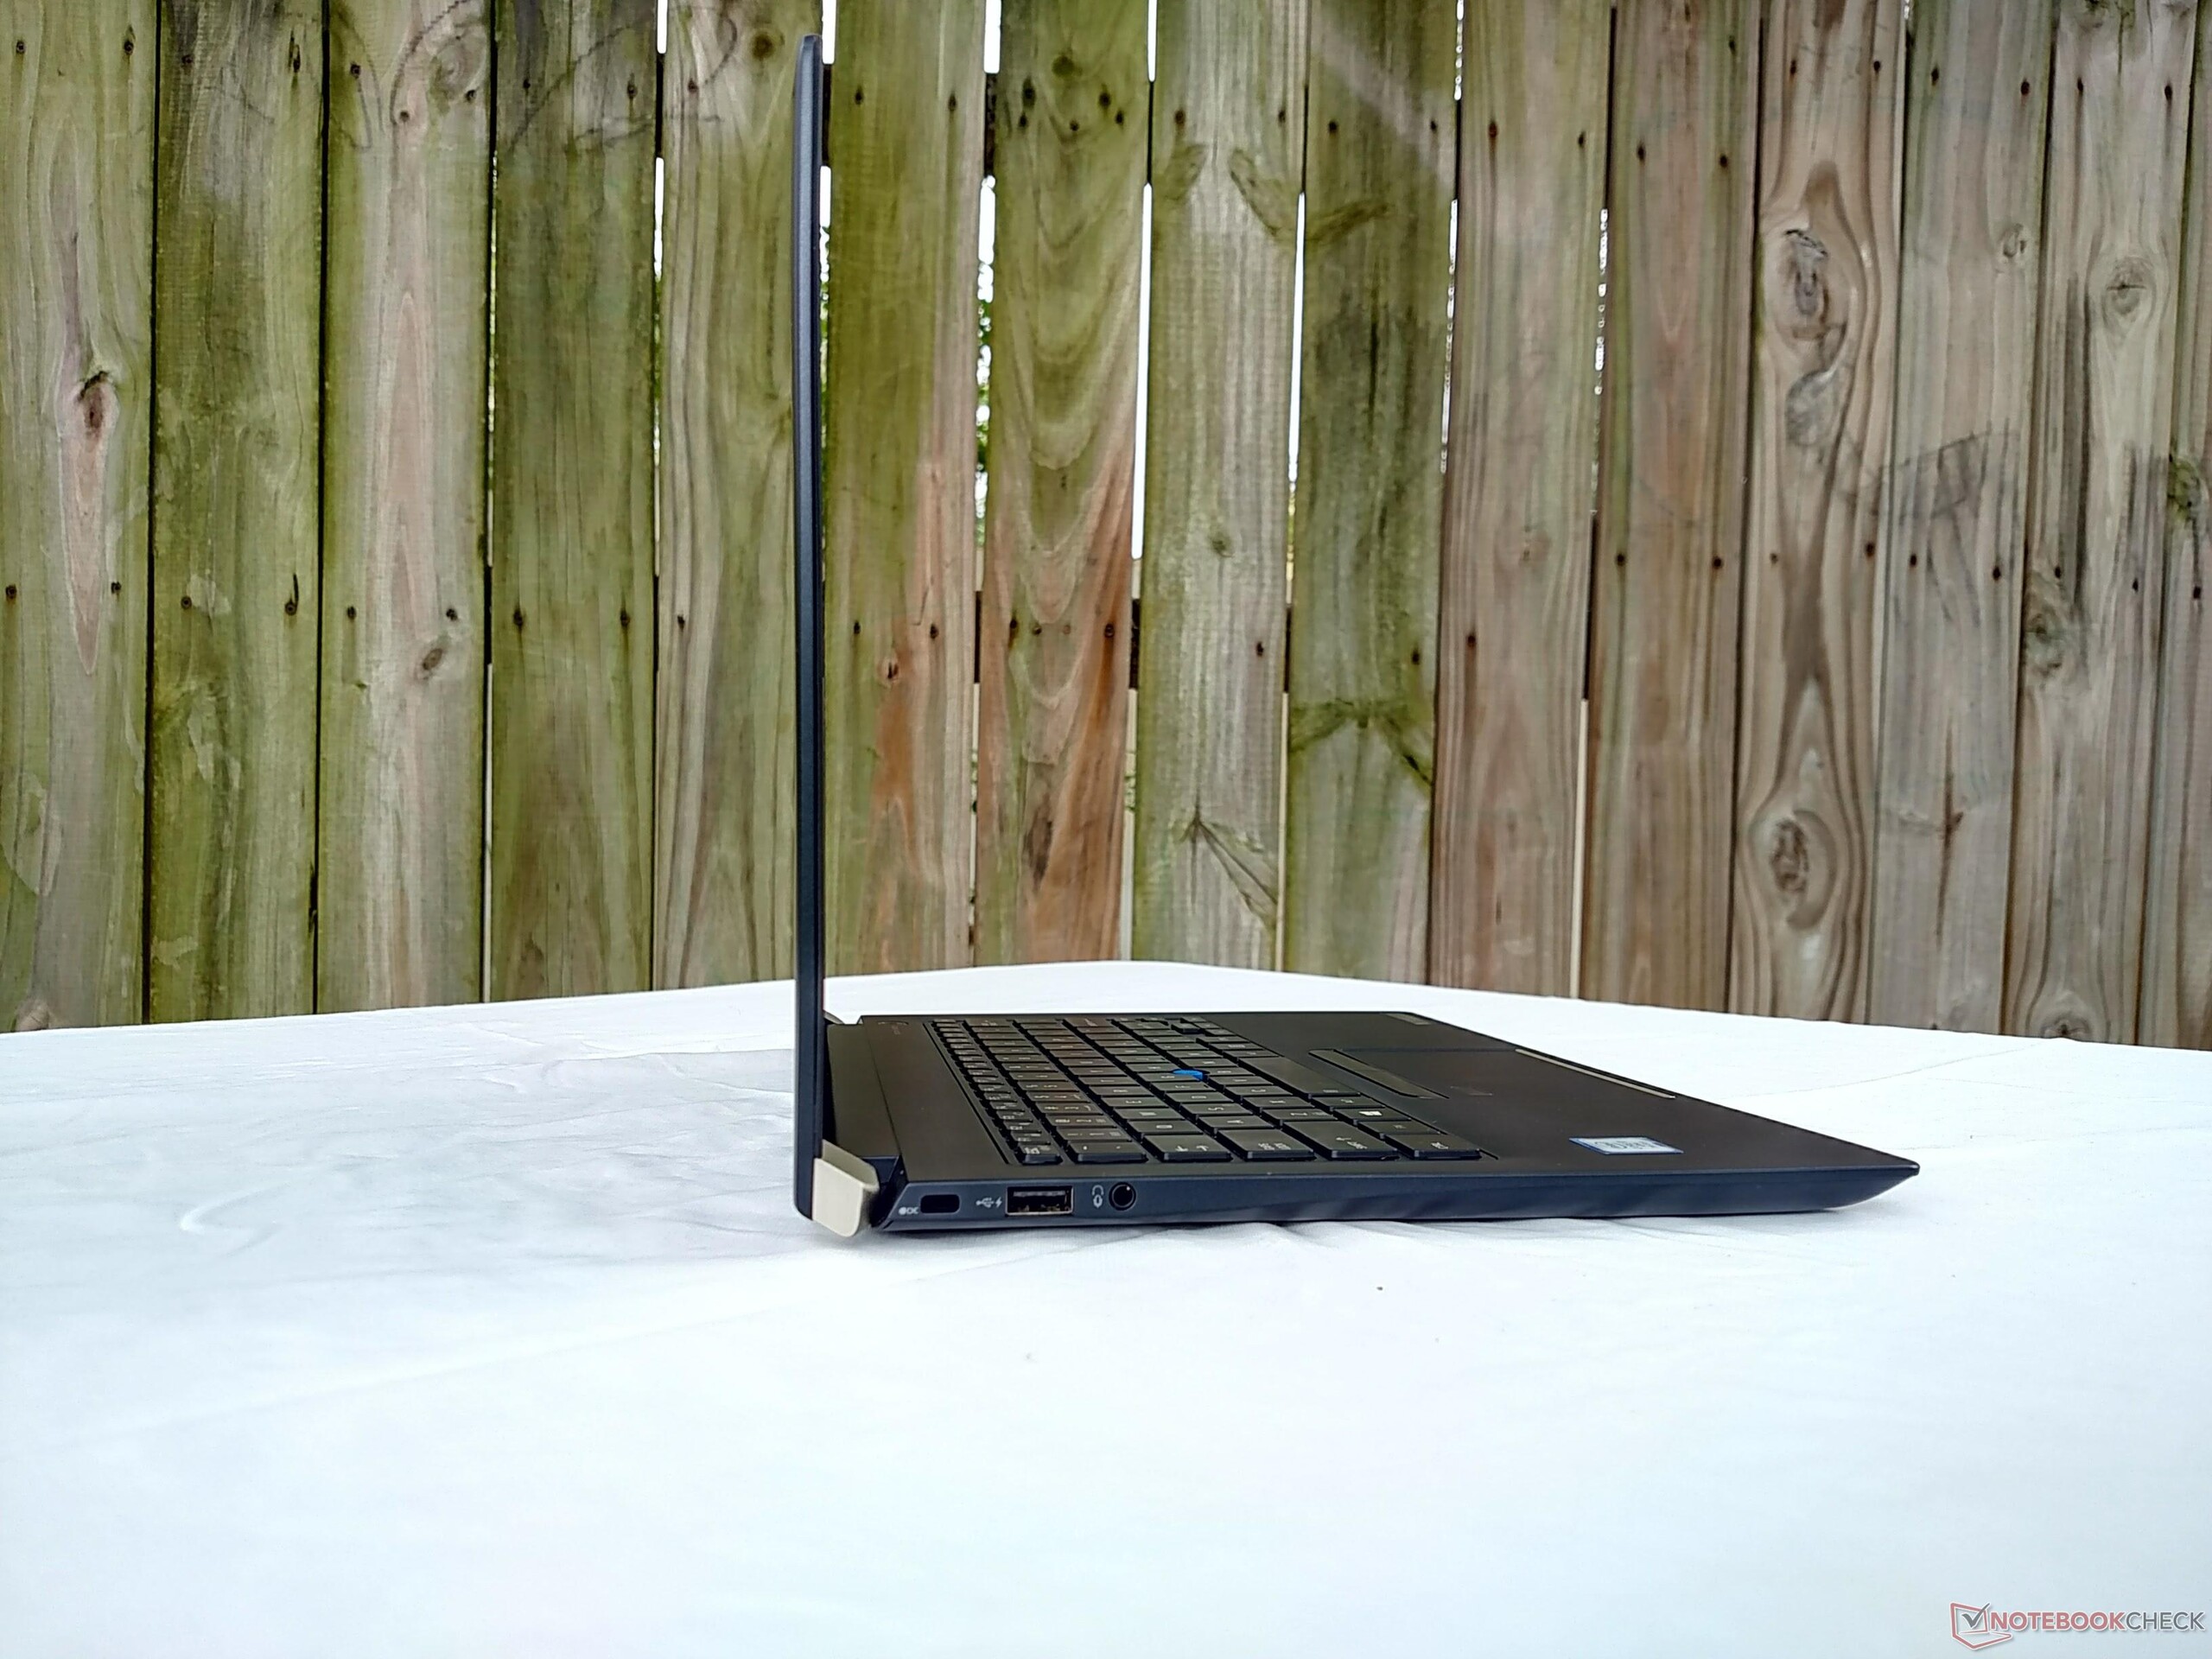
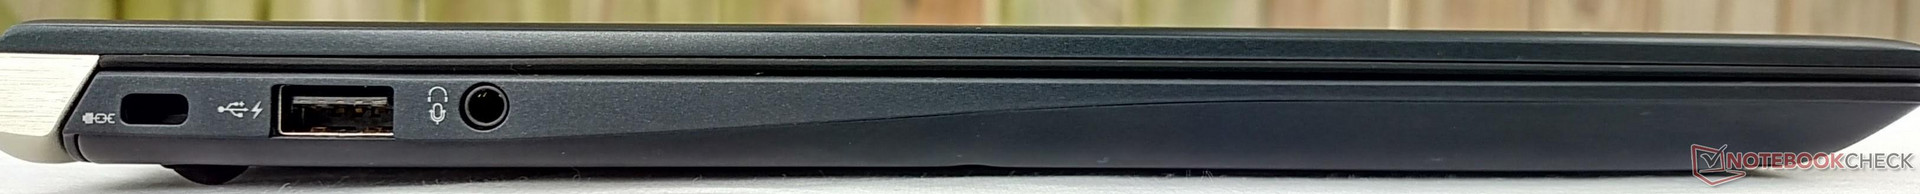
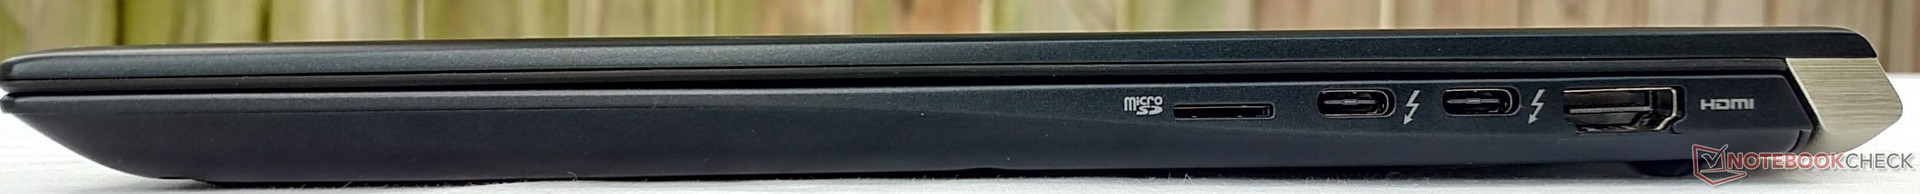
Toshiba ha creado un buen contrincante. El Portégé X30 es un logro impresionante de la ingeniería; que contenga tanto en un cuerpo tan fino y ligero se merece un aplauso. La inclusión de dos puertos Thunderbolt 3 ayuda a mitigar uno de los problemas principales de los finos-y-delgados actuales- E/S anémicá. Incluso en este sentido, el X30 aun ofrece suficientes puertos que serán útiles para muchos. Aunque seguimos prefiriendo las opciones de conectividad aportadas por el X1 Carbon, vienen a cambio de que sea más pesado y un poco mas grande. Los usuarios avanzados quizás prefieran también el superior teclado y el mantenimiento del X1, complicando la decisión de elegir entre Toshiba y Lenovo.
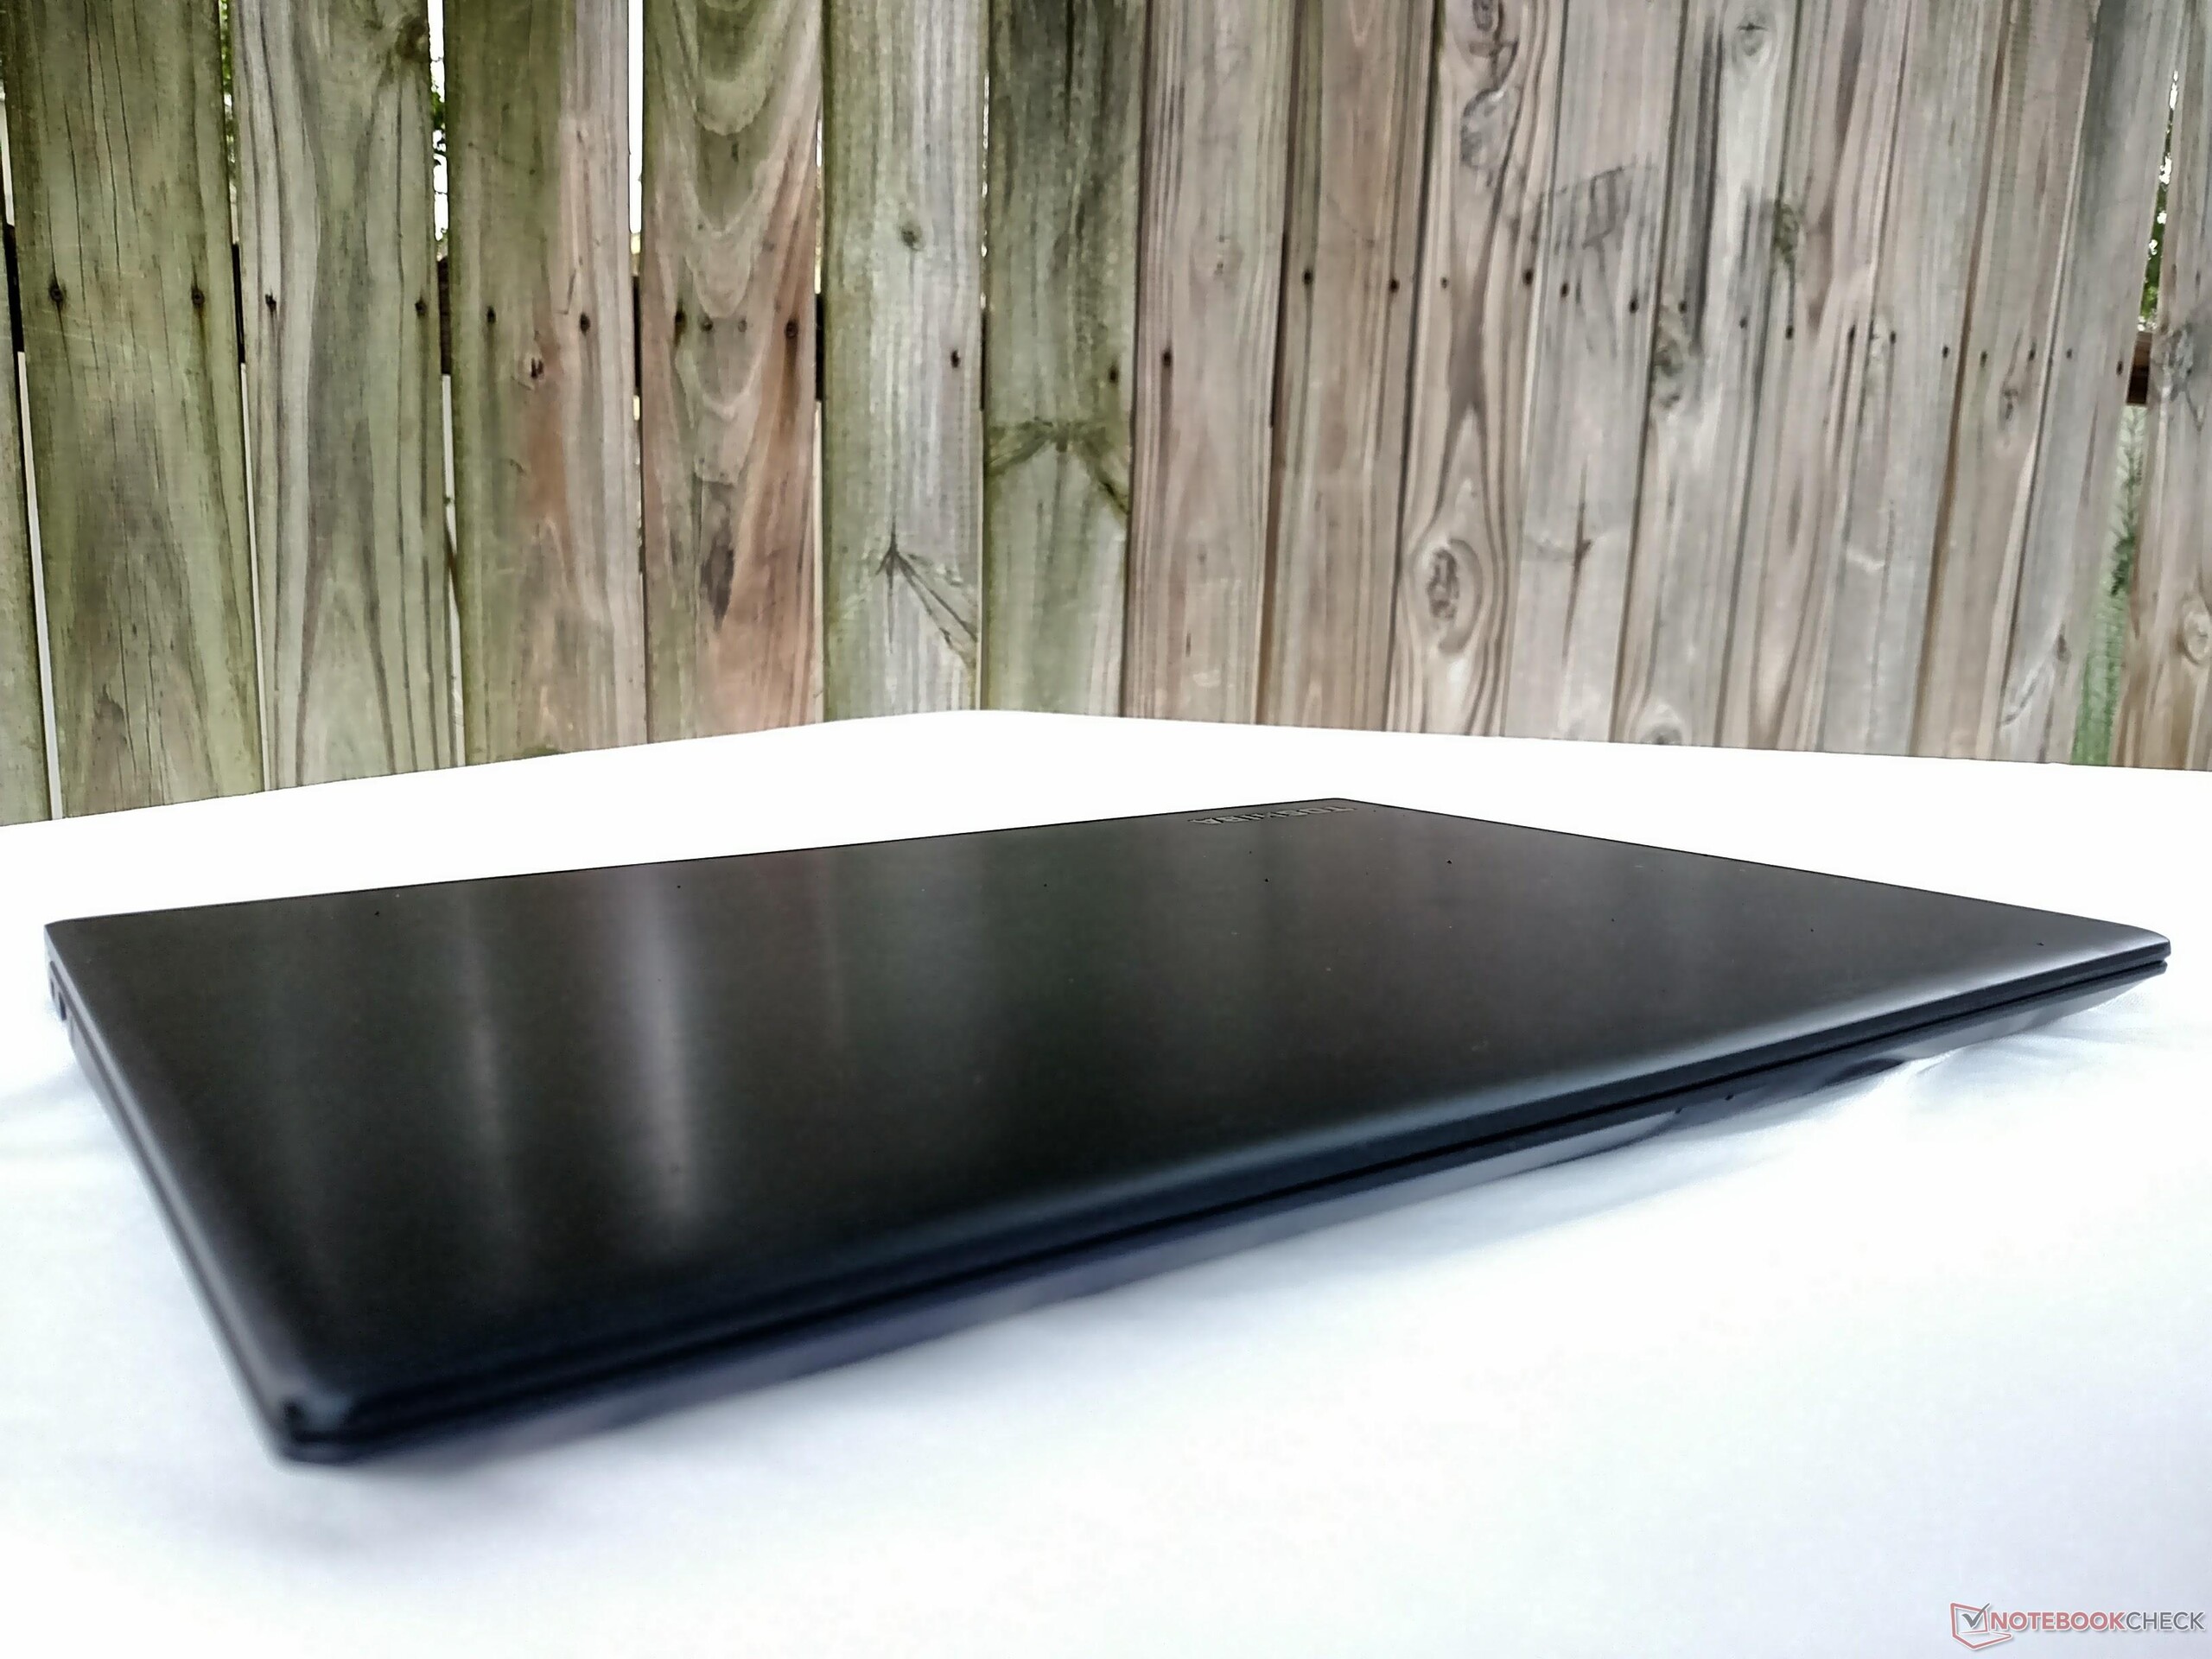
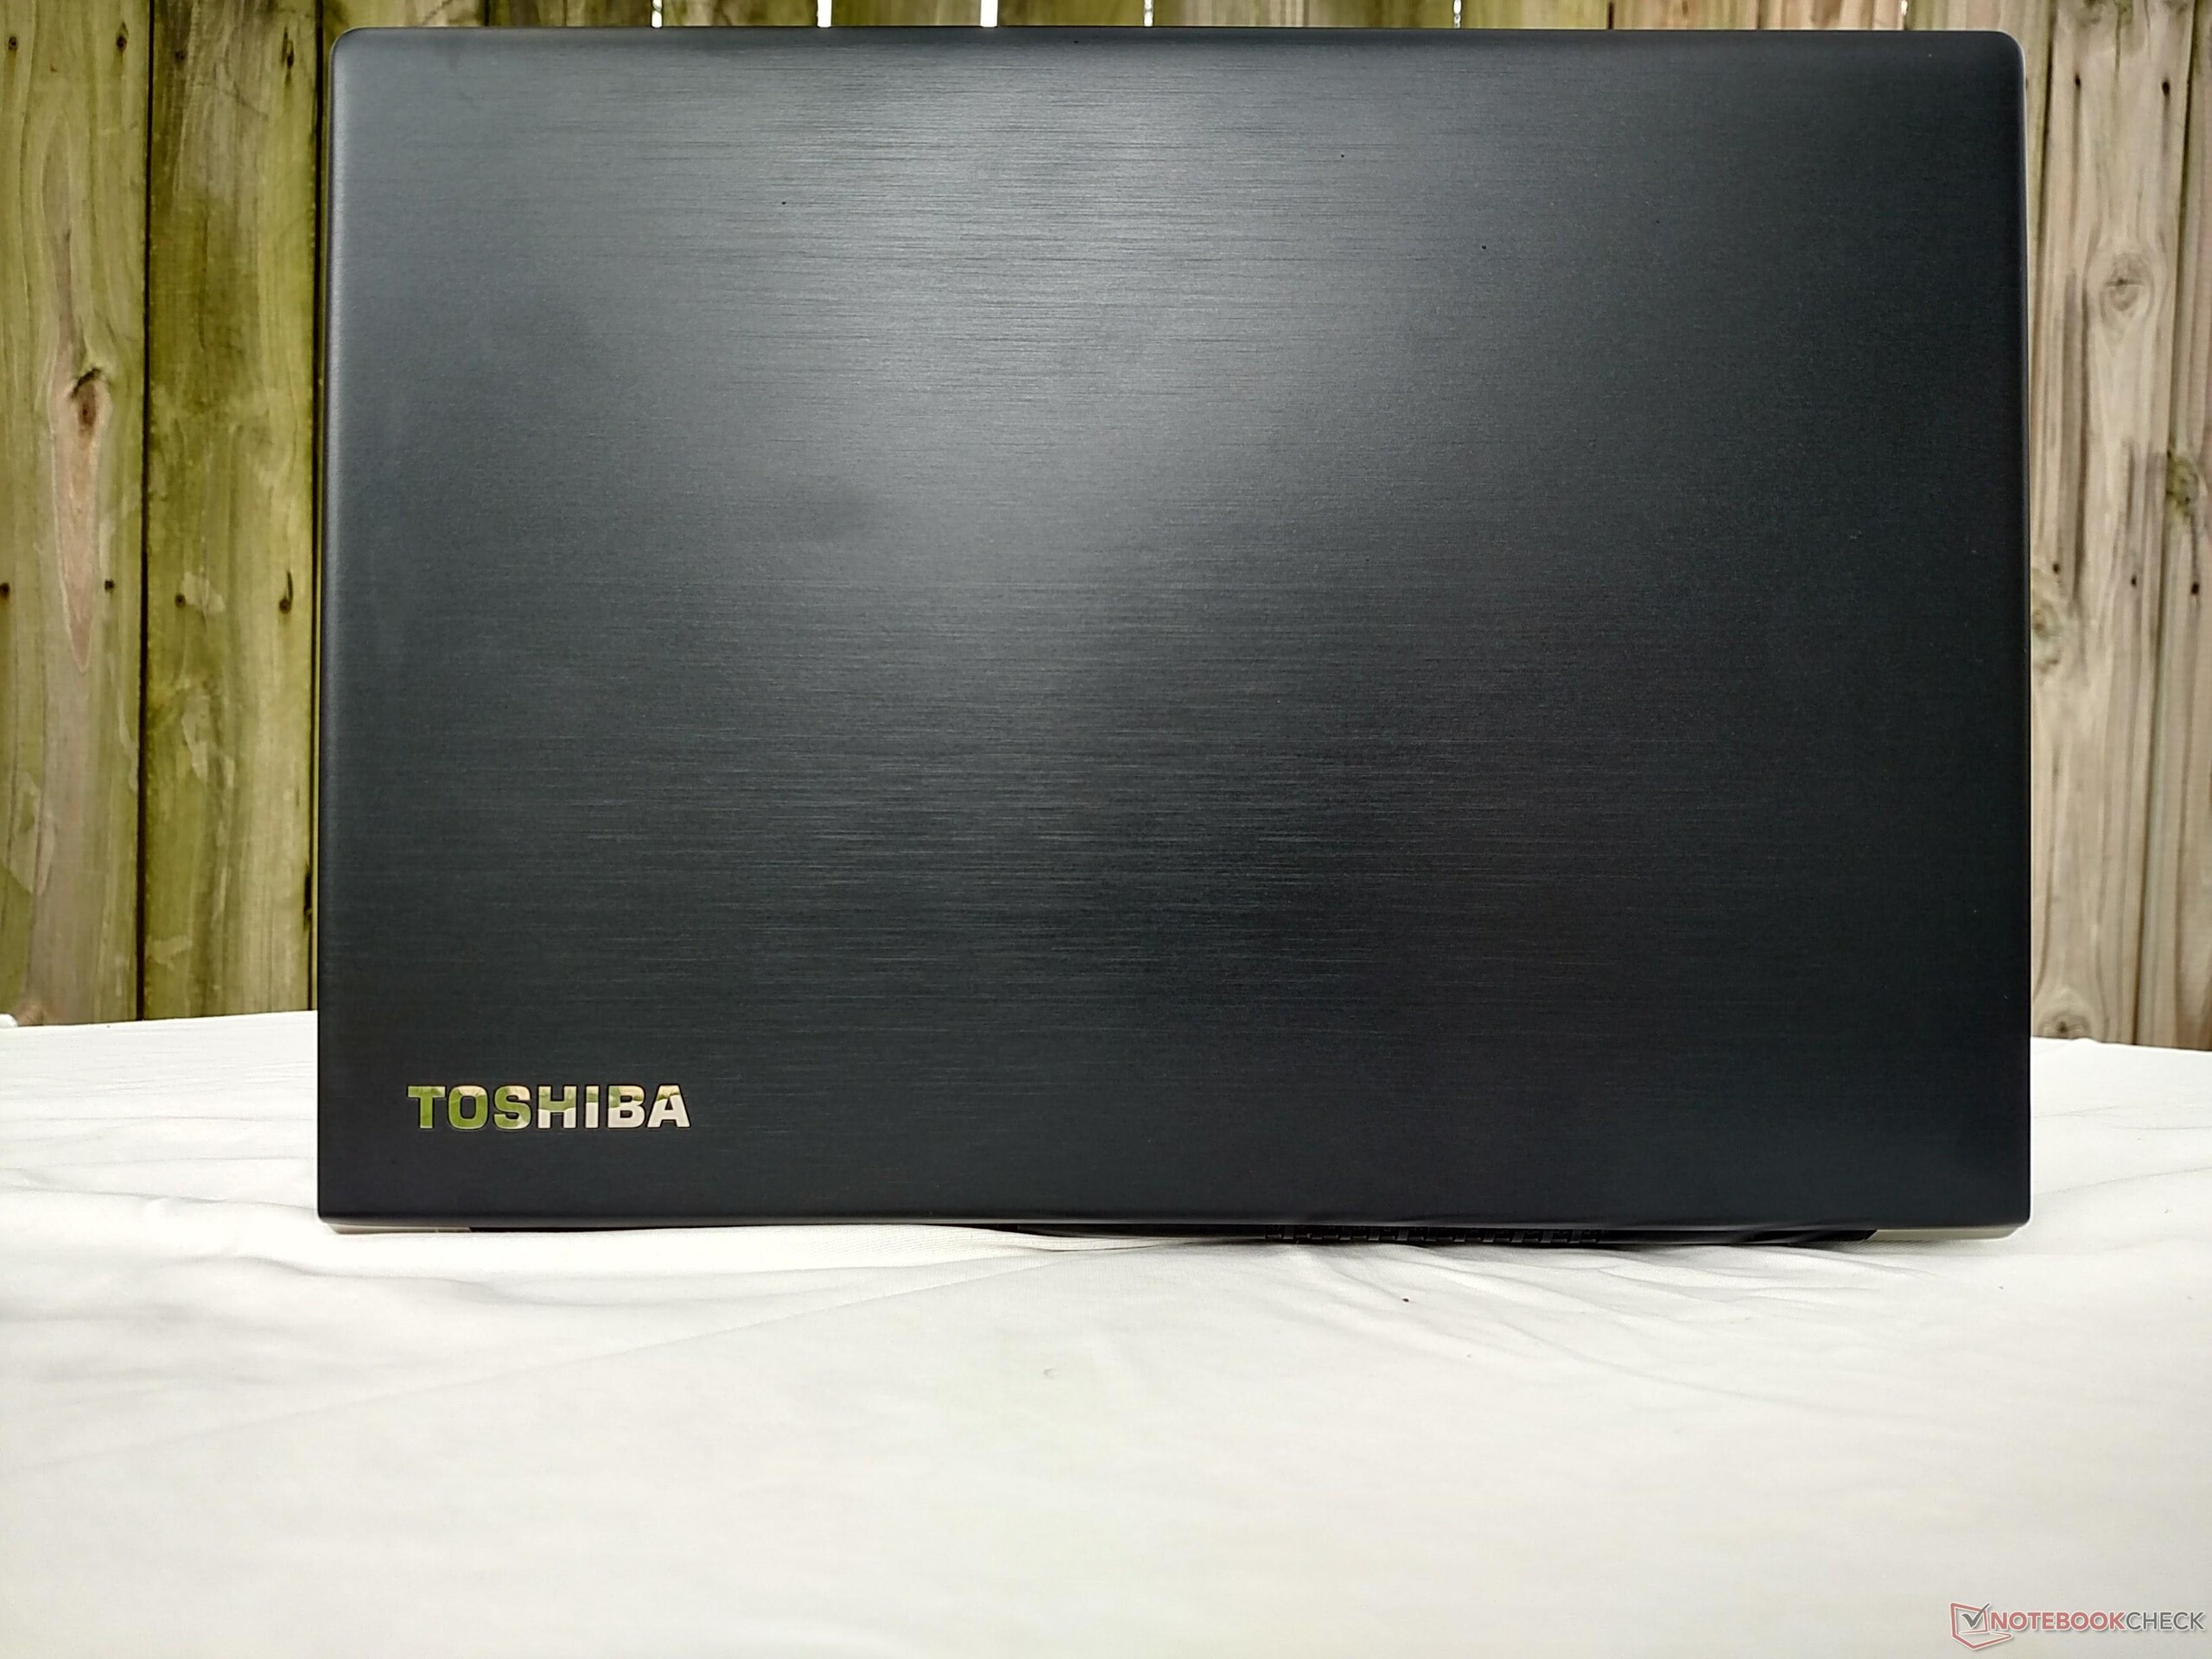
El ligero peso contradice la robustez del chásis. Apenas hay flexibilidad en la cubierta del teclado ni en el panel inferior, lo que es, de nuevo, increíble, Aun así, la tapa se dobla si se le aplica presión; esto puede convertirse en un problema después de meses o años de uso. Otras desventajas incluyen el teclado mediocre y la colocación de las teclas especiales además de el acabado del cuerpo de dispositivo, propenso a acumular huellas. Nuestra principal preocupación es el rendimiento del procesador. El Core i7-7600U parece mejor en teoría de lo que ha rendido aquí. Esto puede deberse al embotellamiento (Para mantener la temperatura controlada), indiferentemente de la CPU, o una combinación de los dos. Aunque no podemos determinar claramente la causa, es en consecuencia del rendimiento general del sistema. Sí, el X30 funciona un poco lento en las pruebas en comparación a sus rivales, pero en el uso que le dará mundo real, se sigue sintiendo rápido y veloz.
En general, el Toshiba Portégé X30 es un portátil excelente para gente que siempre esté de viaje, como gente de negocios y amantes de la carretera. Tiene una buena cantidad de E/S, pantalla preciosa y un chásis bien hecho, que son los puntos álgidos de este maravilloso dispositivo, y delicadezas como el escáner de iris rápido y la garantía por 3 años son la cereza de este pastel.
Ésta es una versión acortada del análisis original. Puedes leer el análisis completo en inglés aquí.
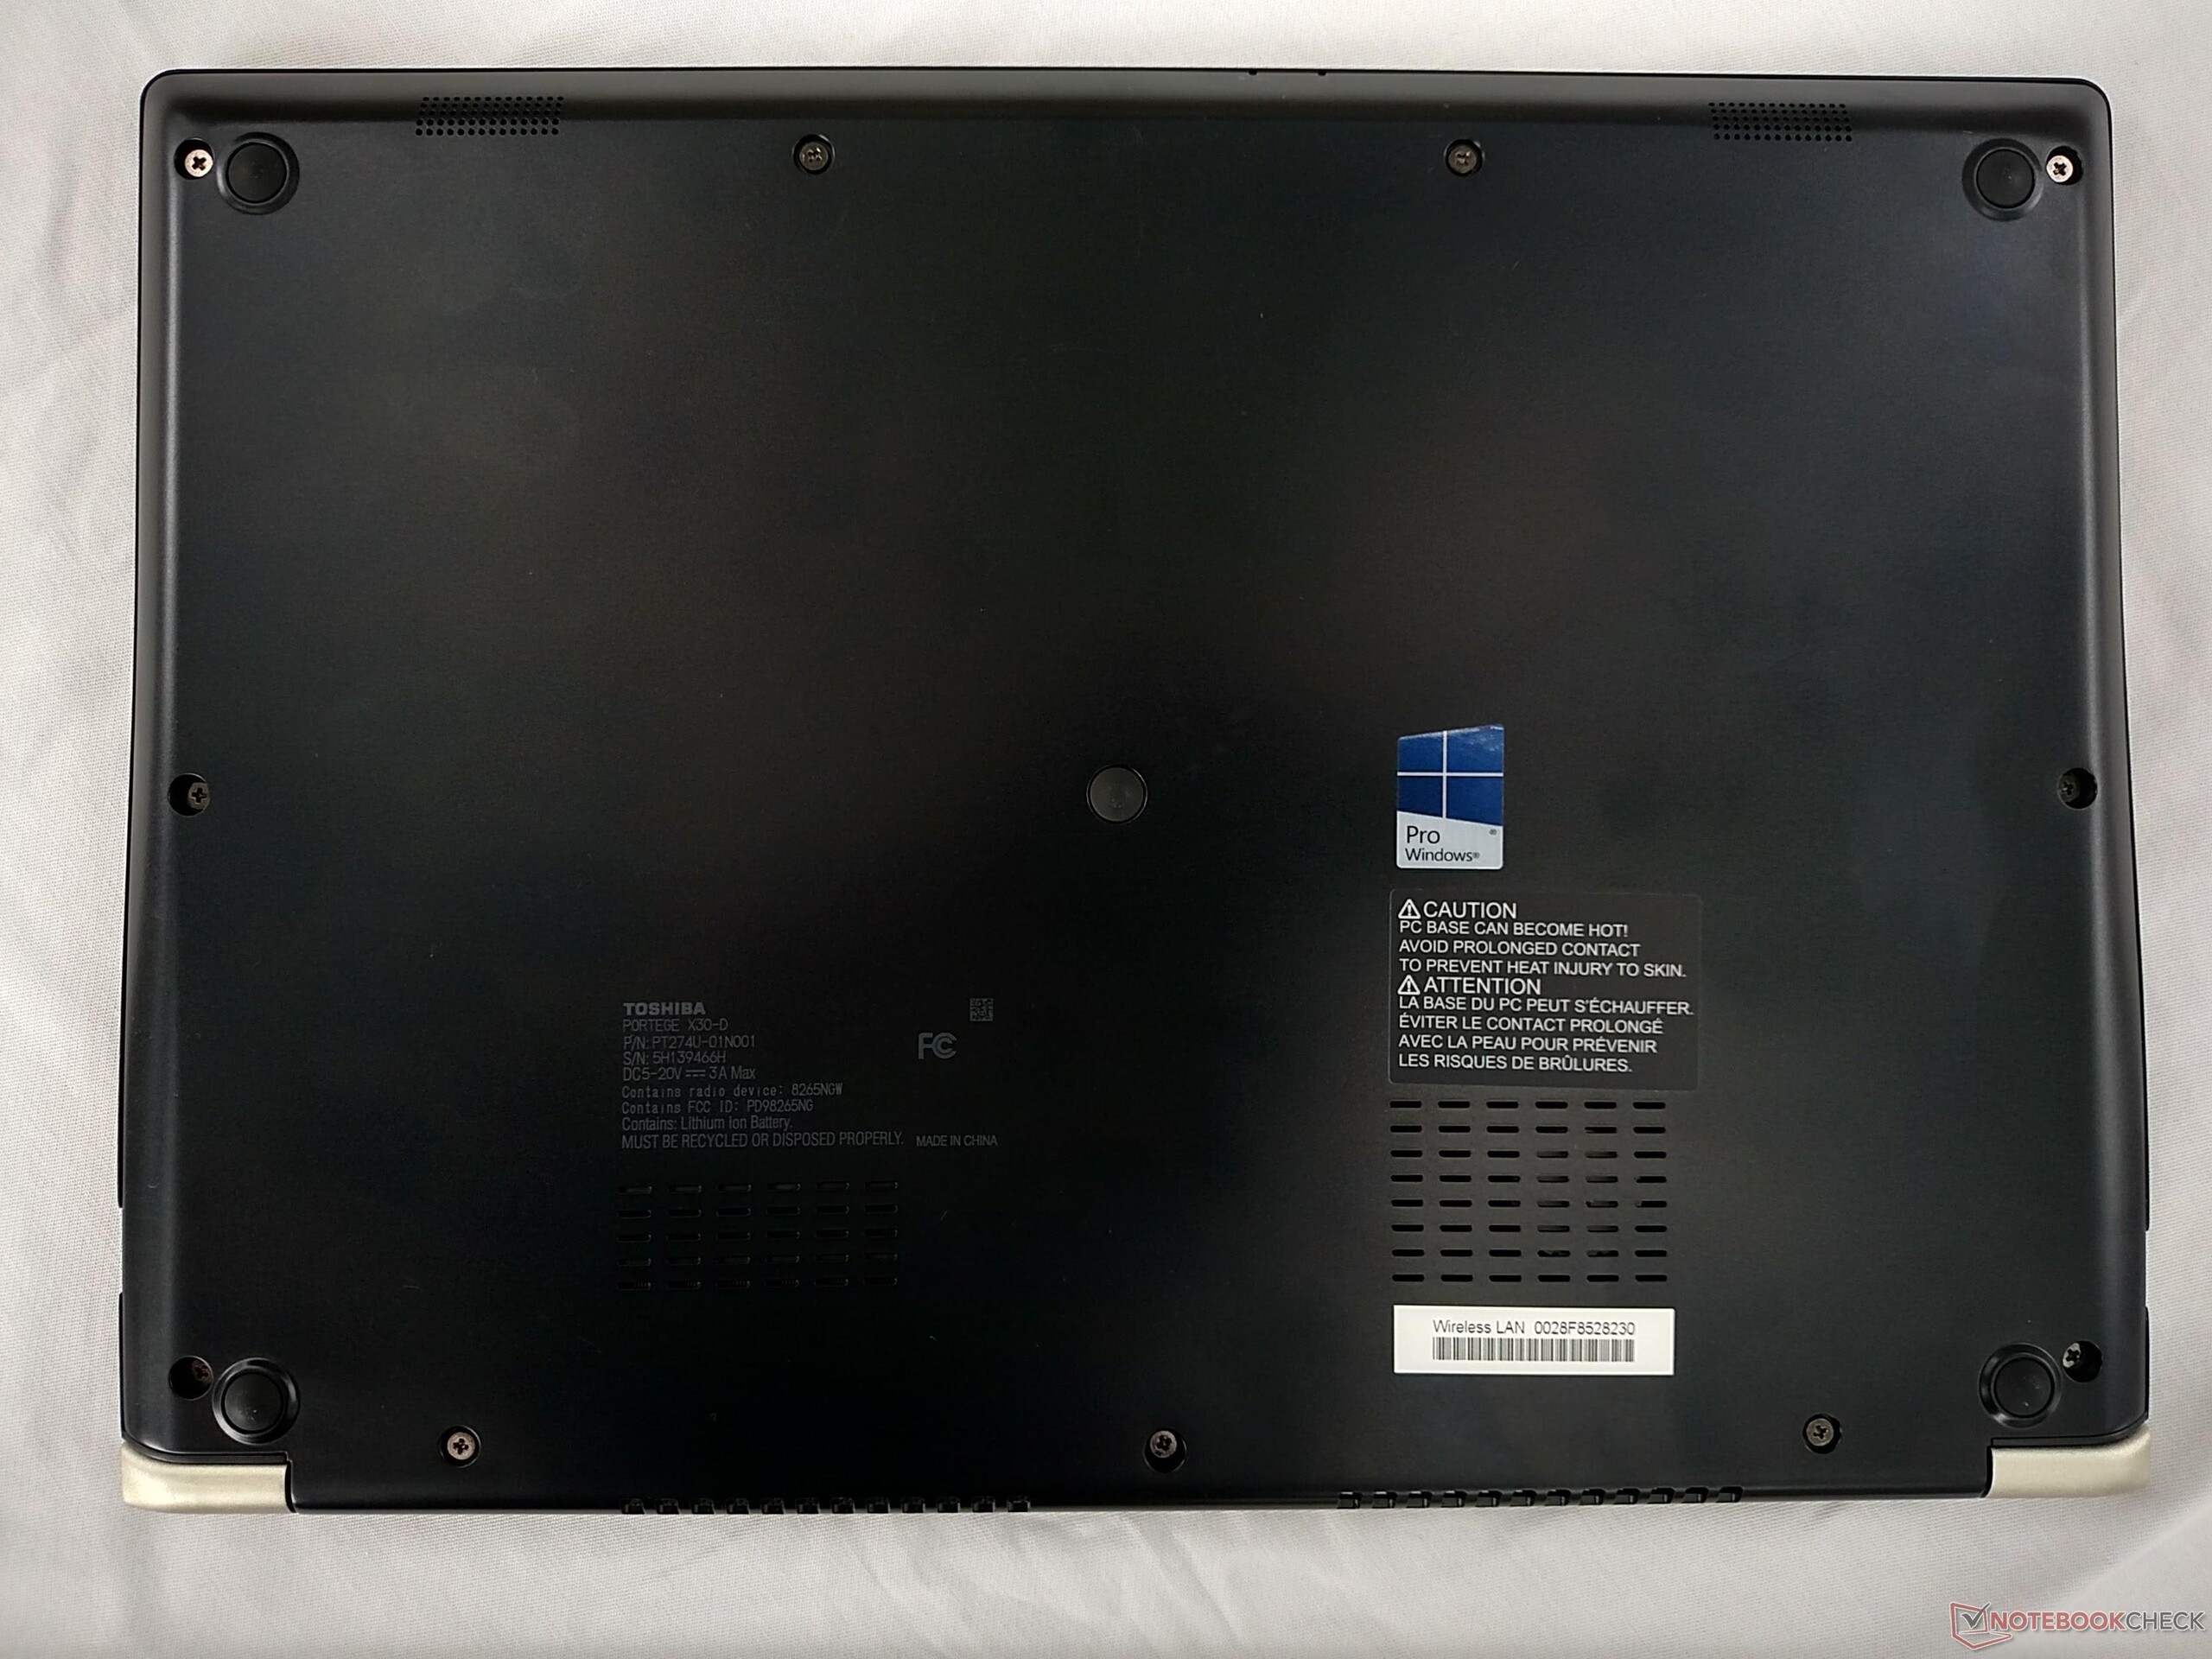
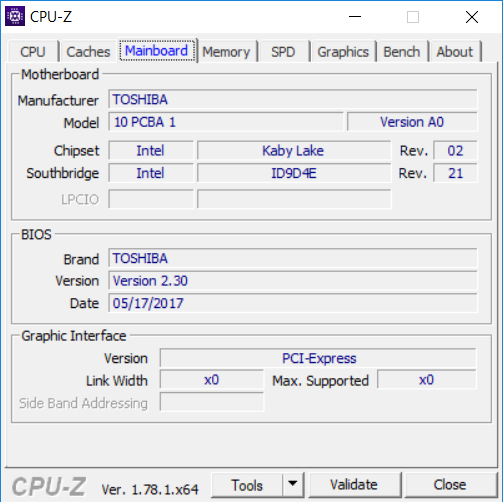
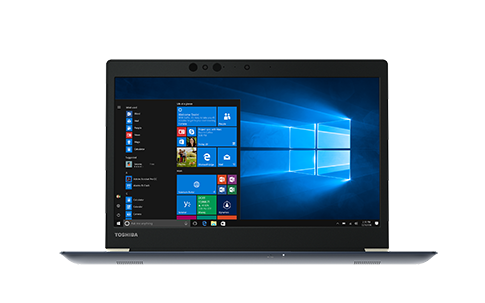
Toshiba Portege X30-D (PT274U-01N001)
- 06/27/2017 v6 (old)
Sam Medley
Price comparison
