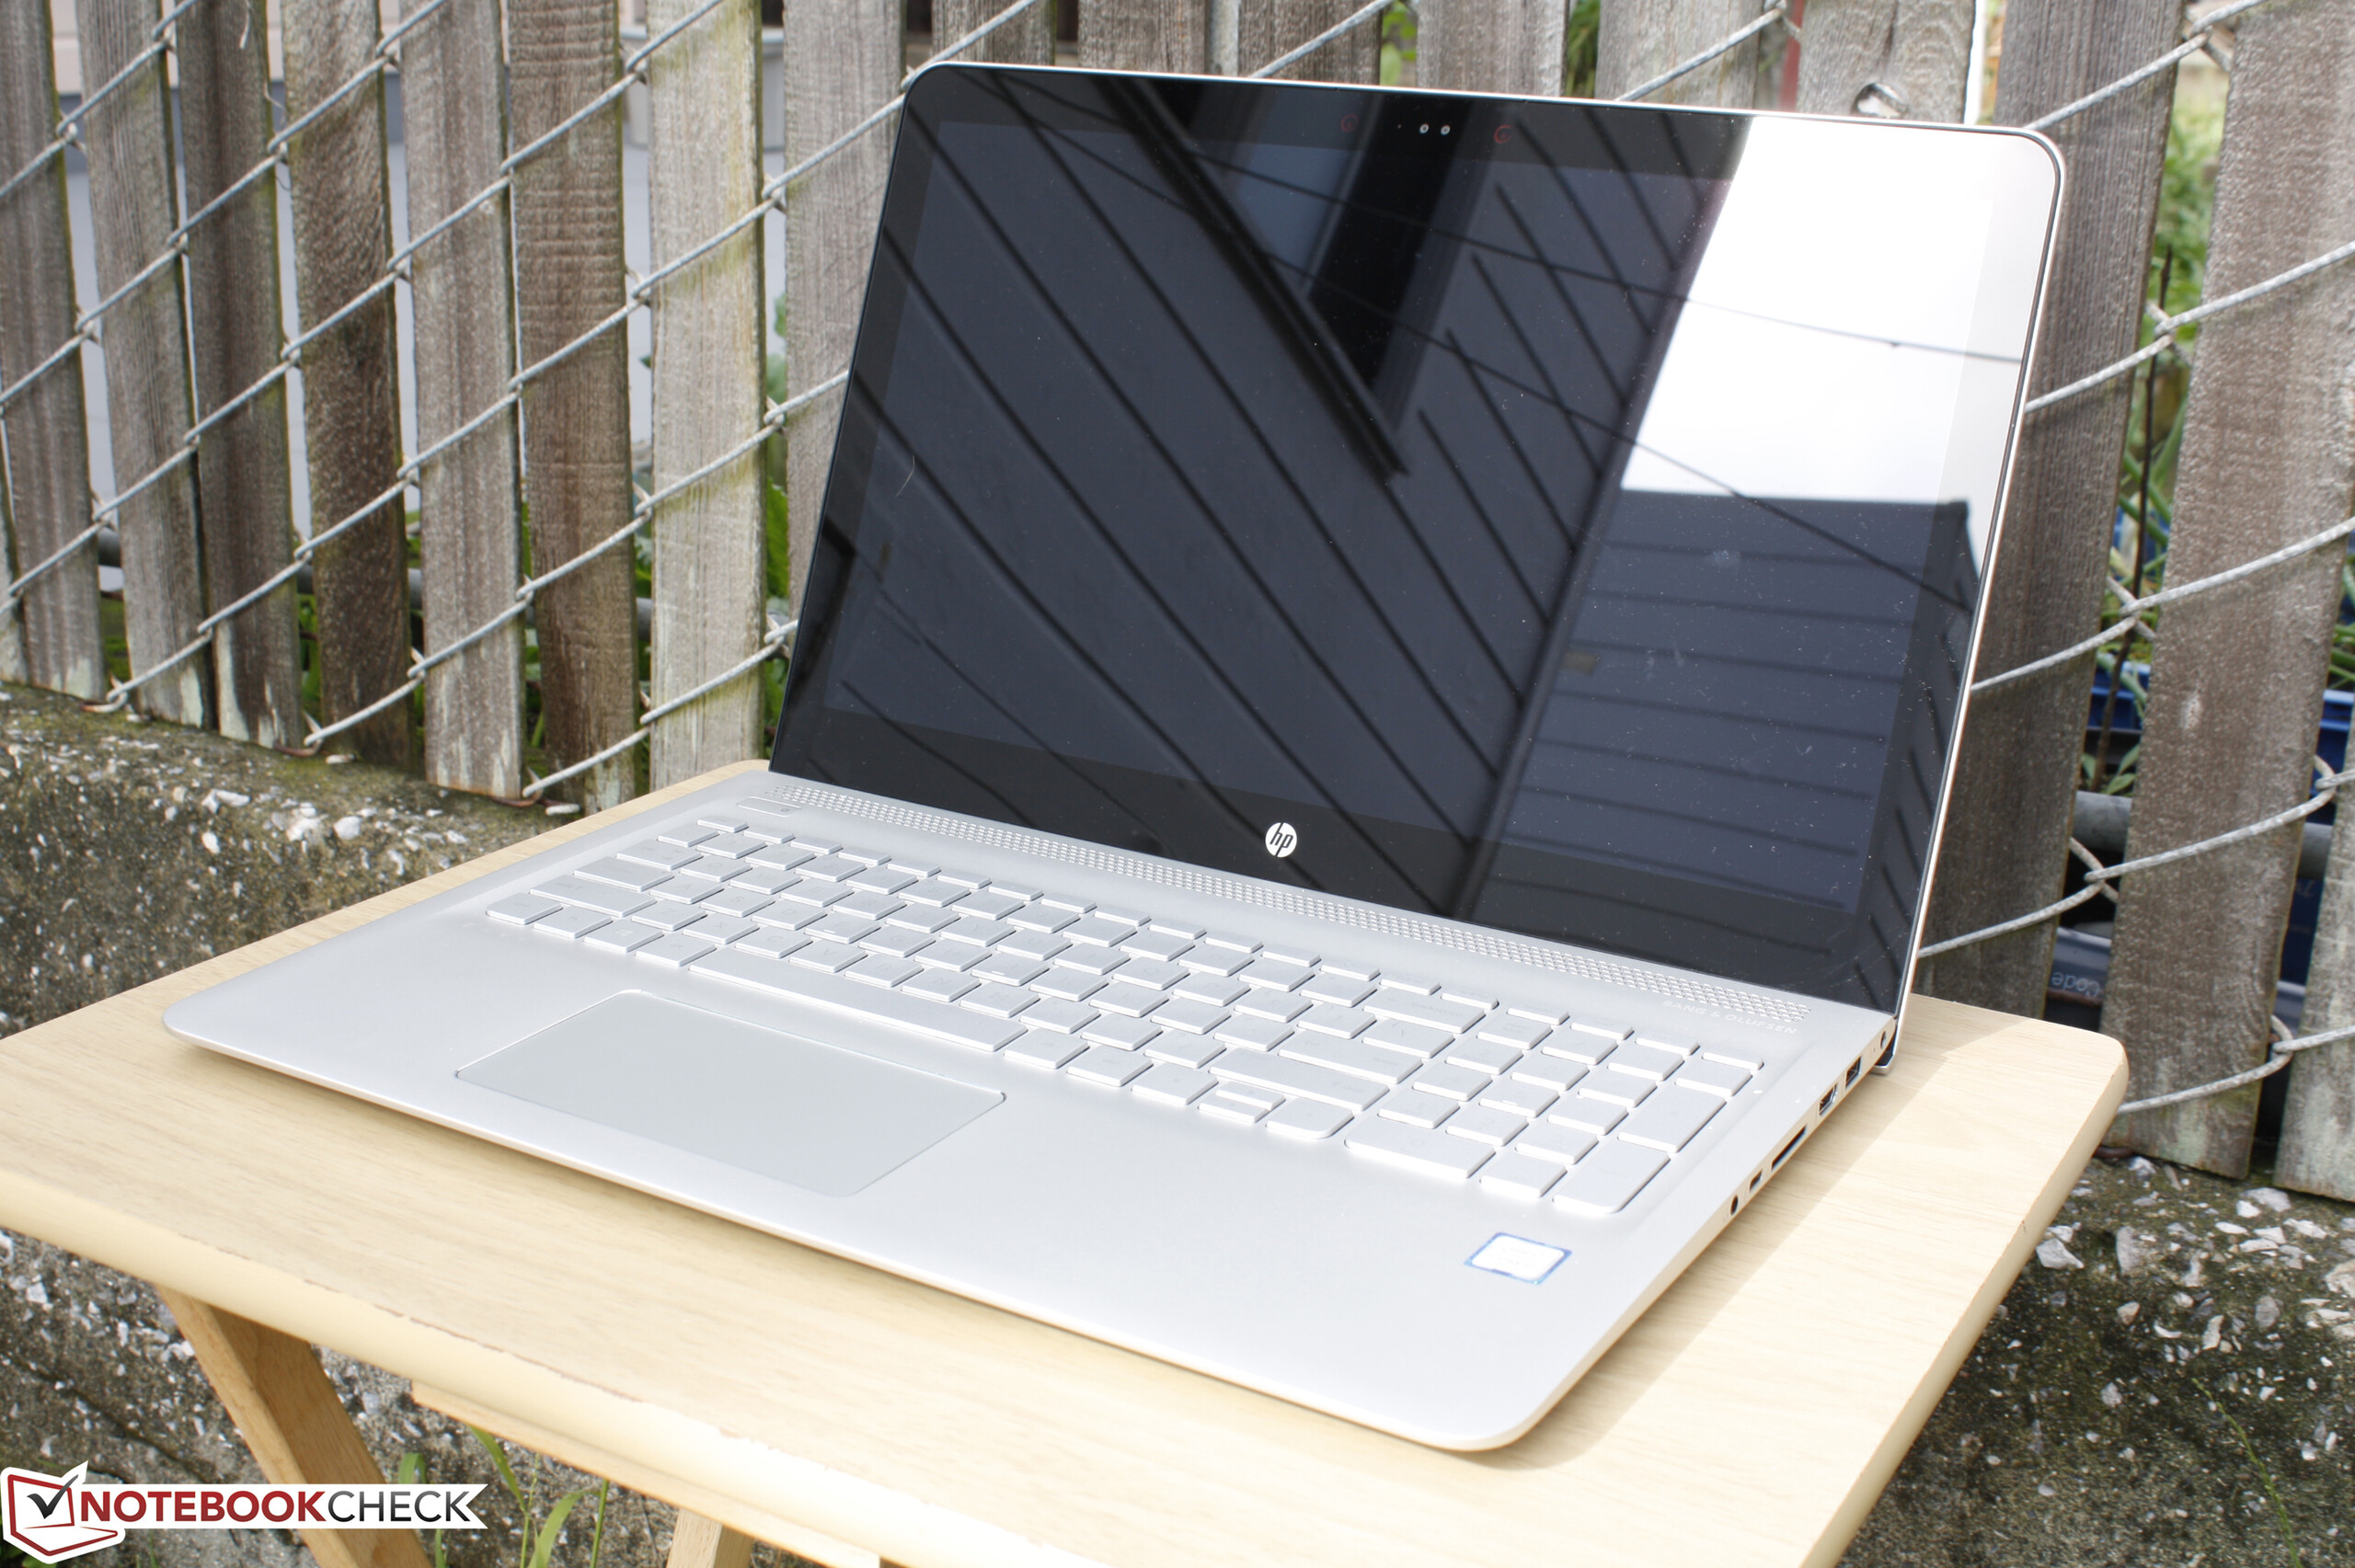
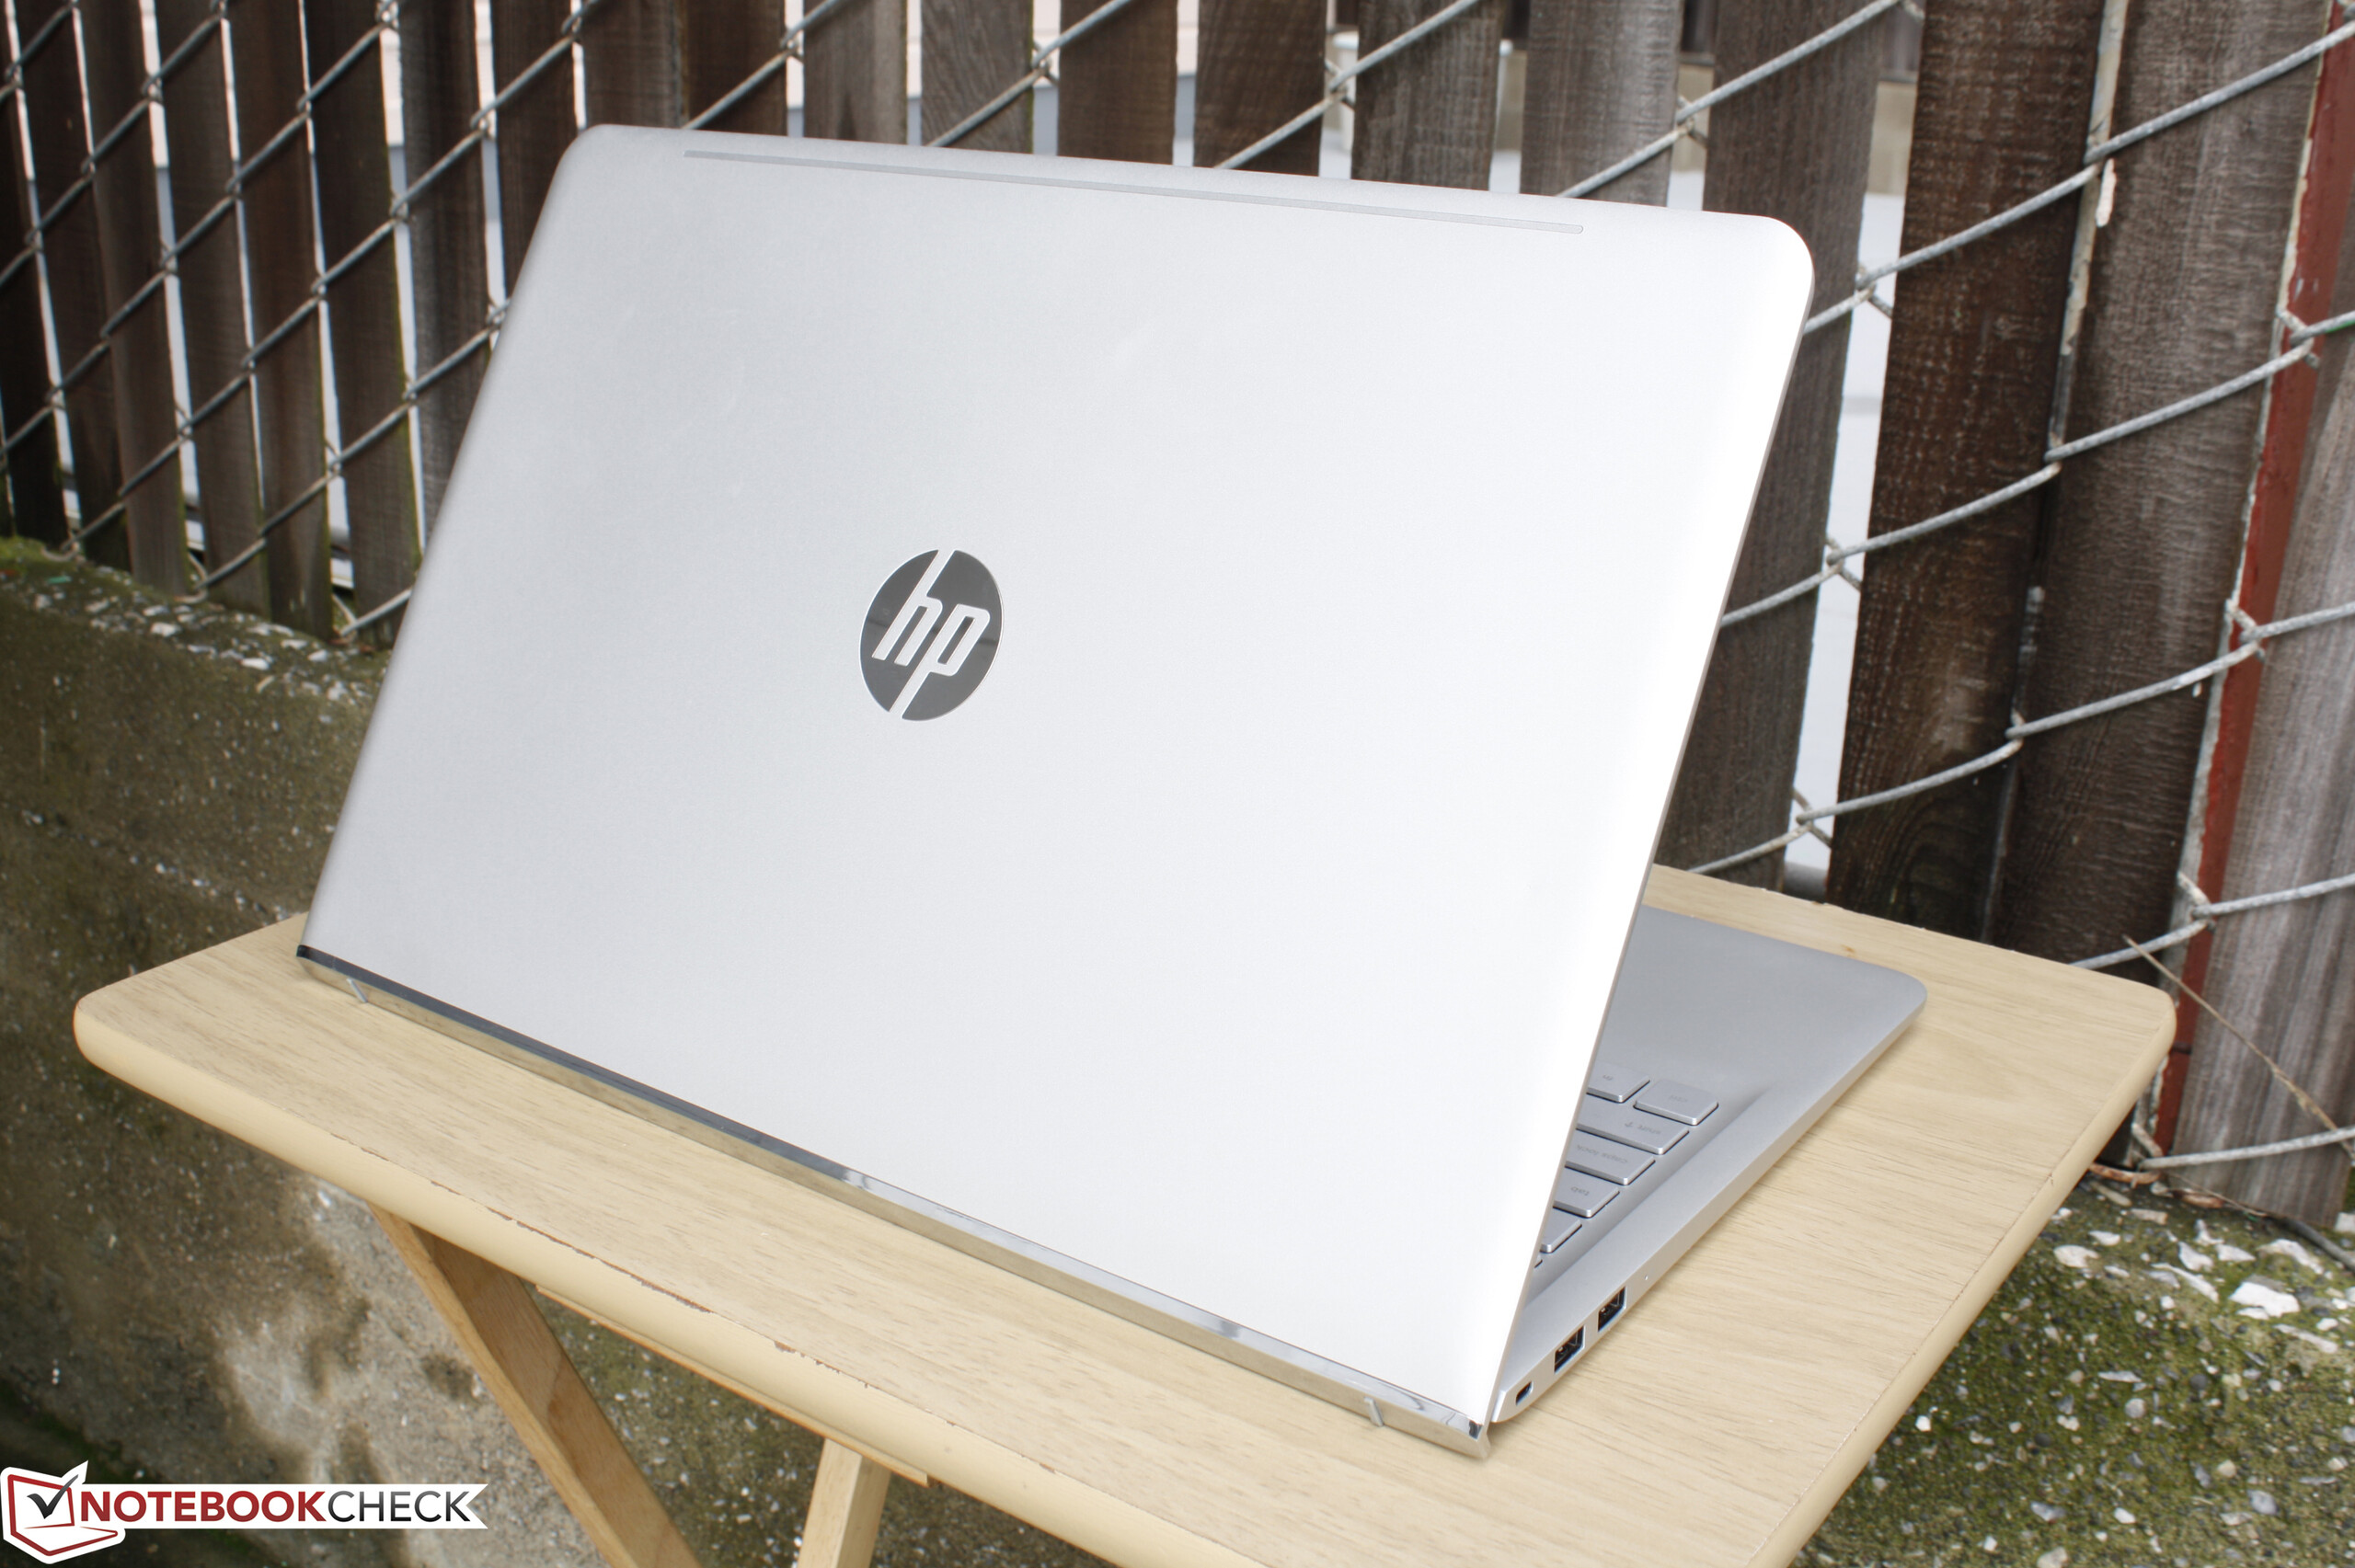
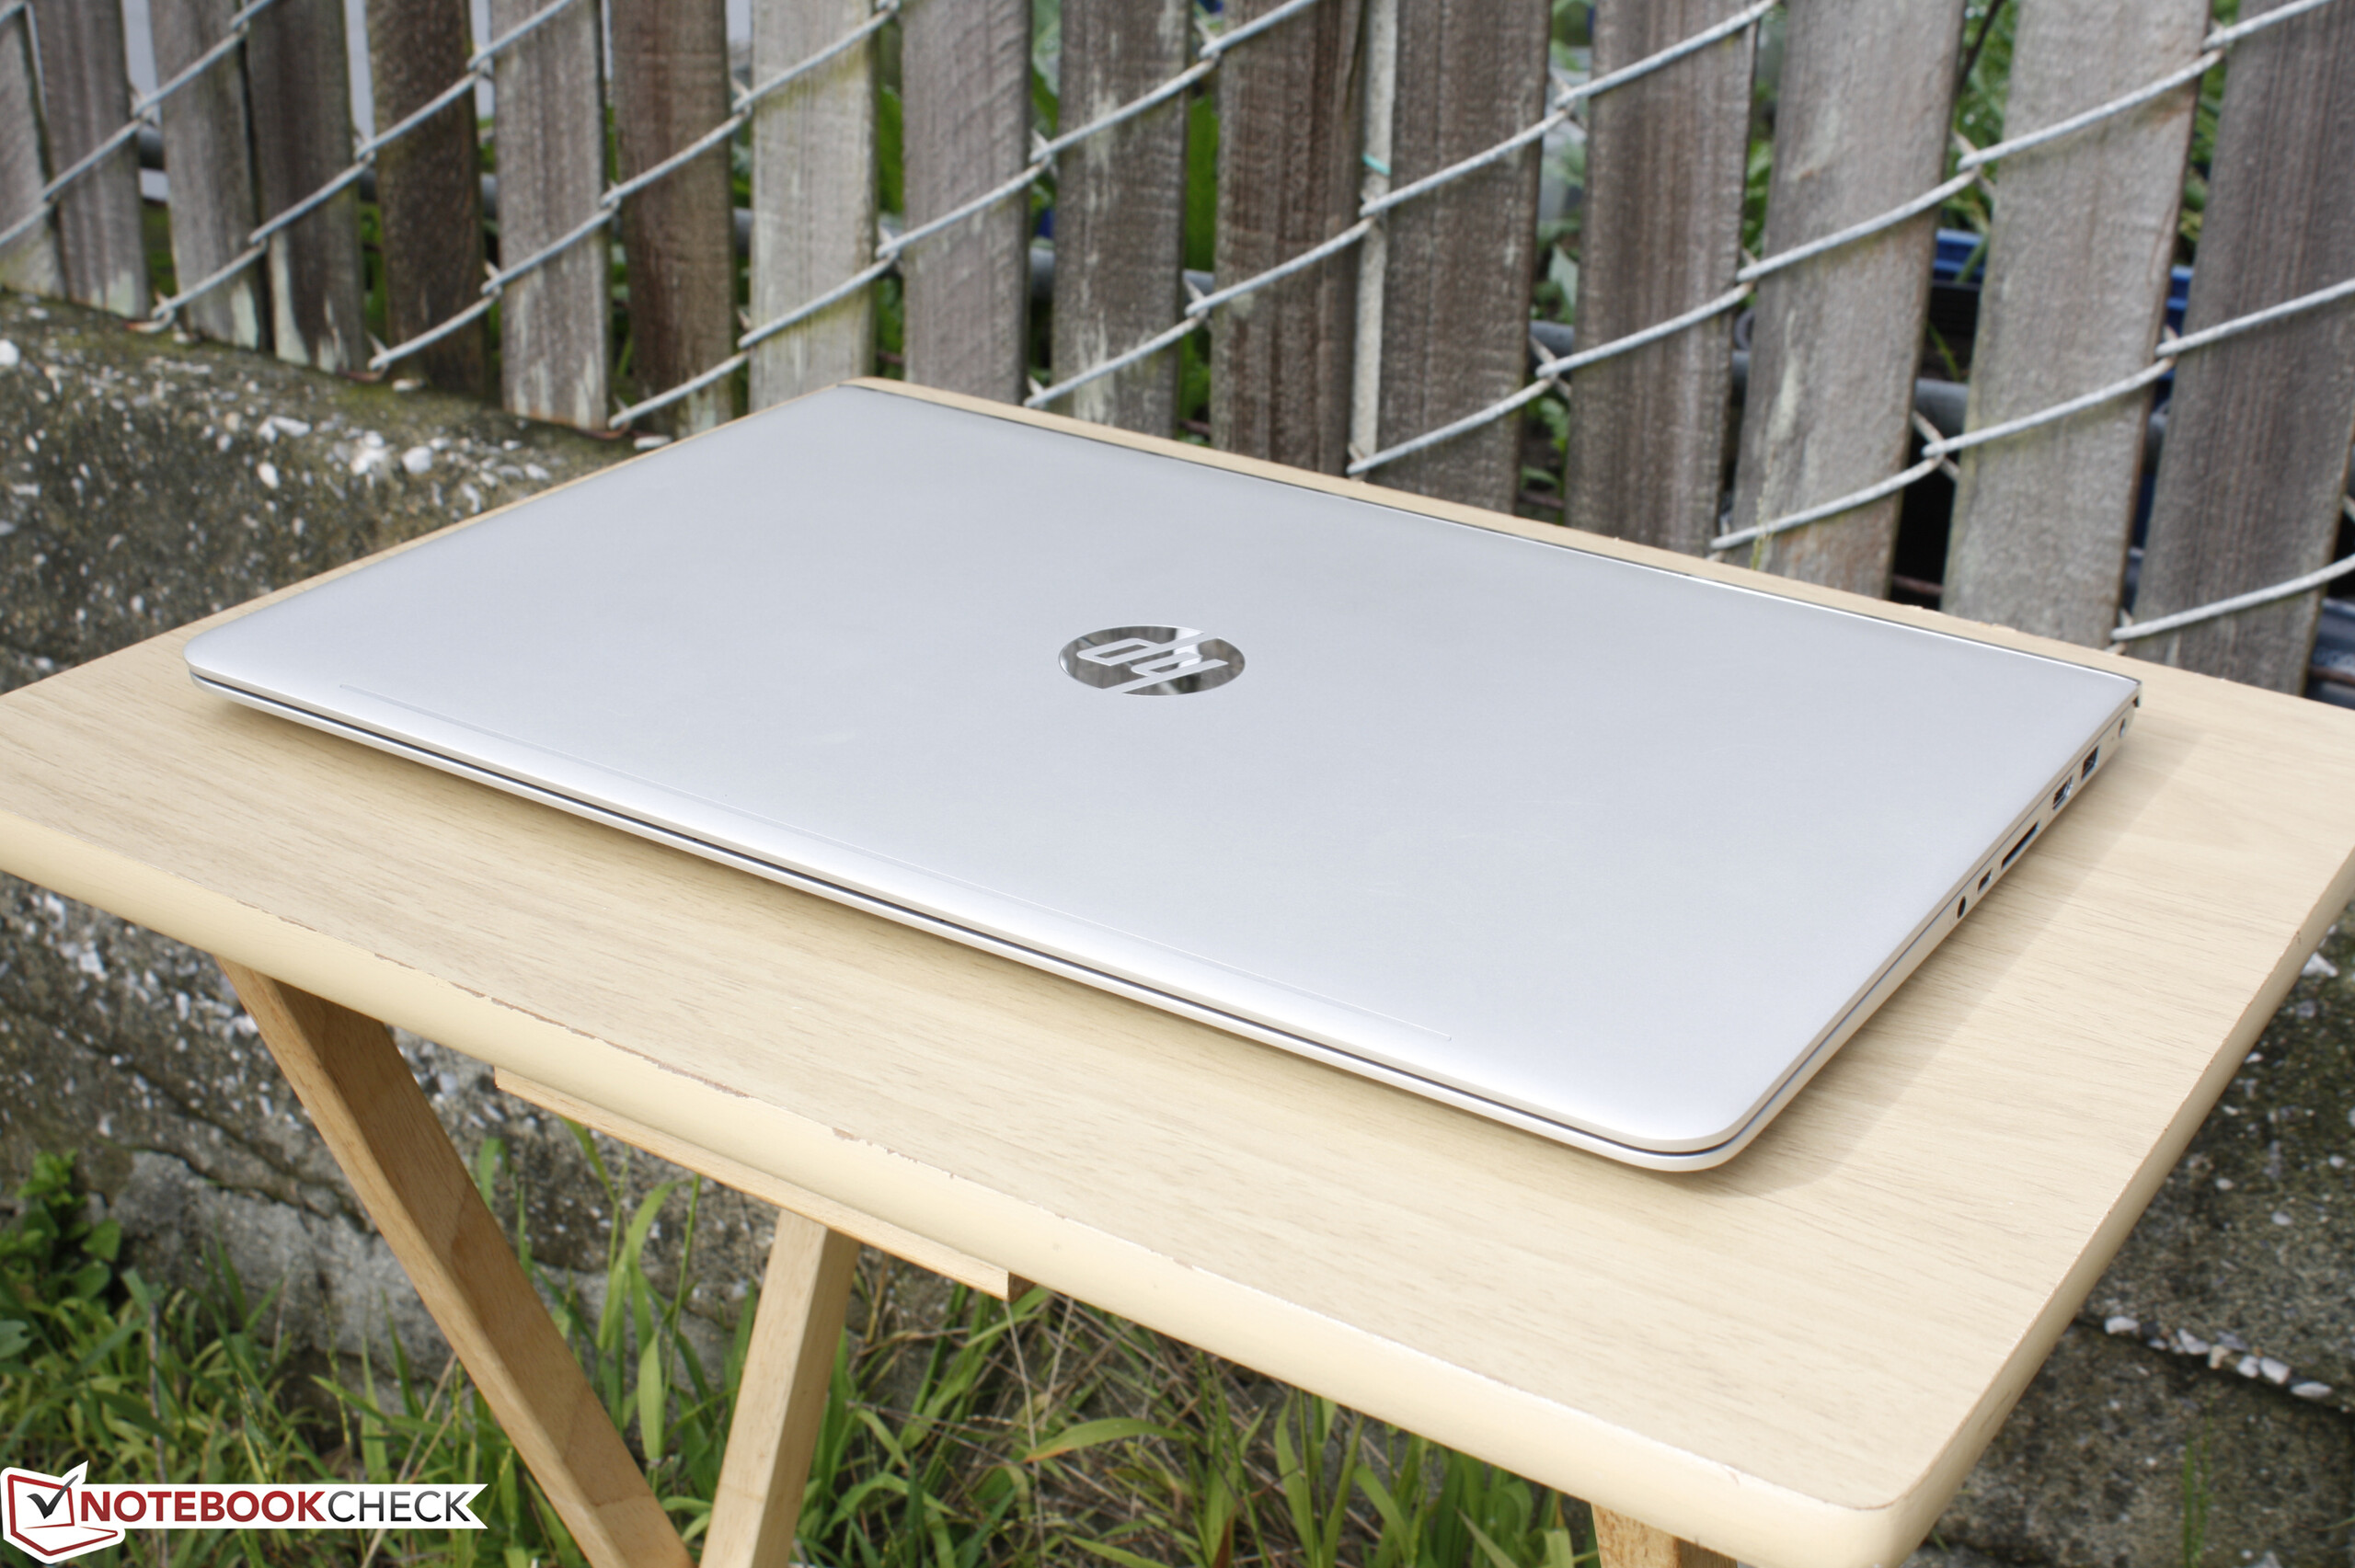
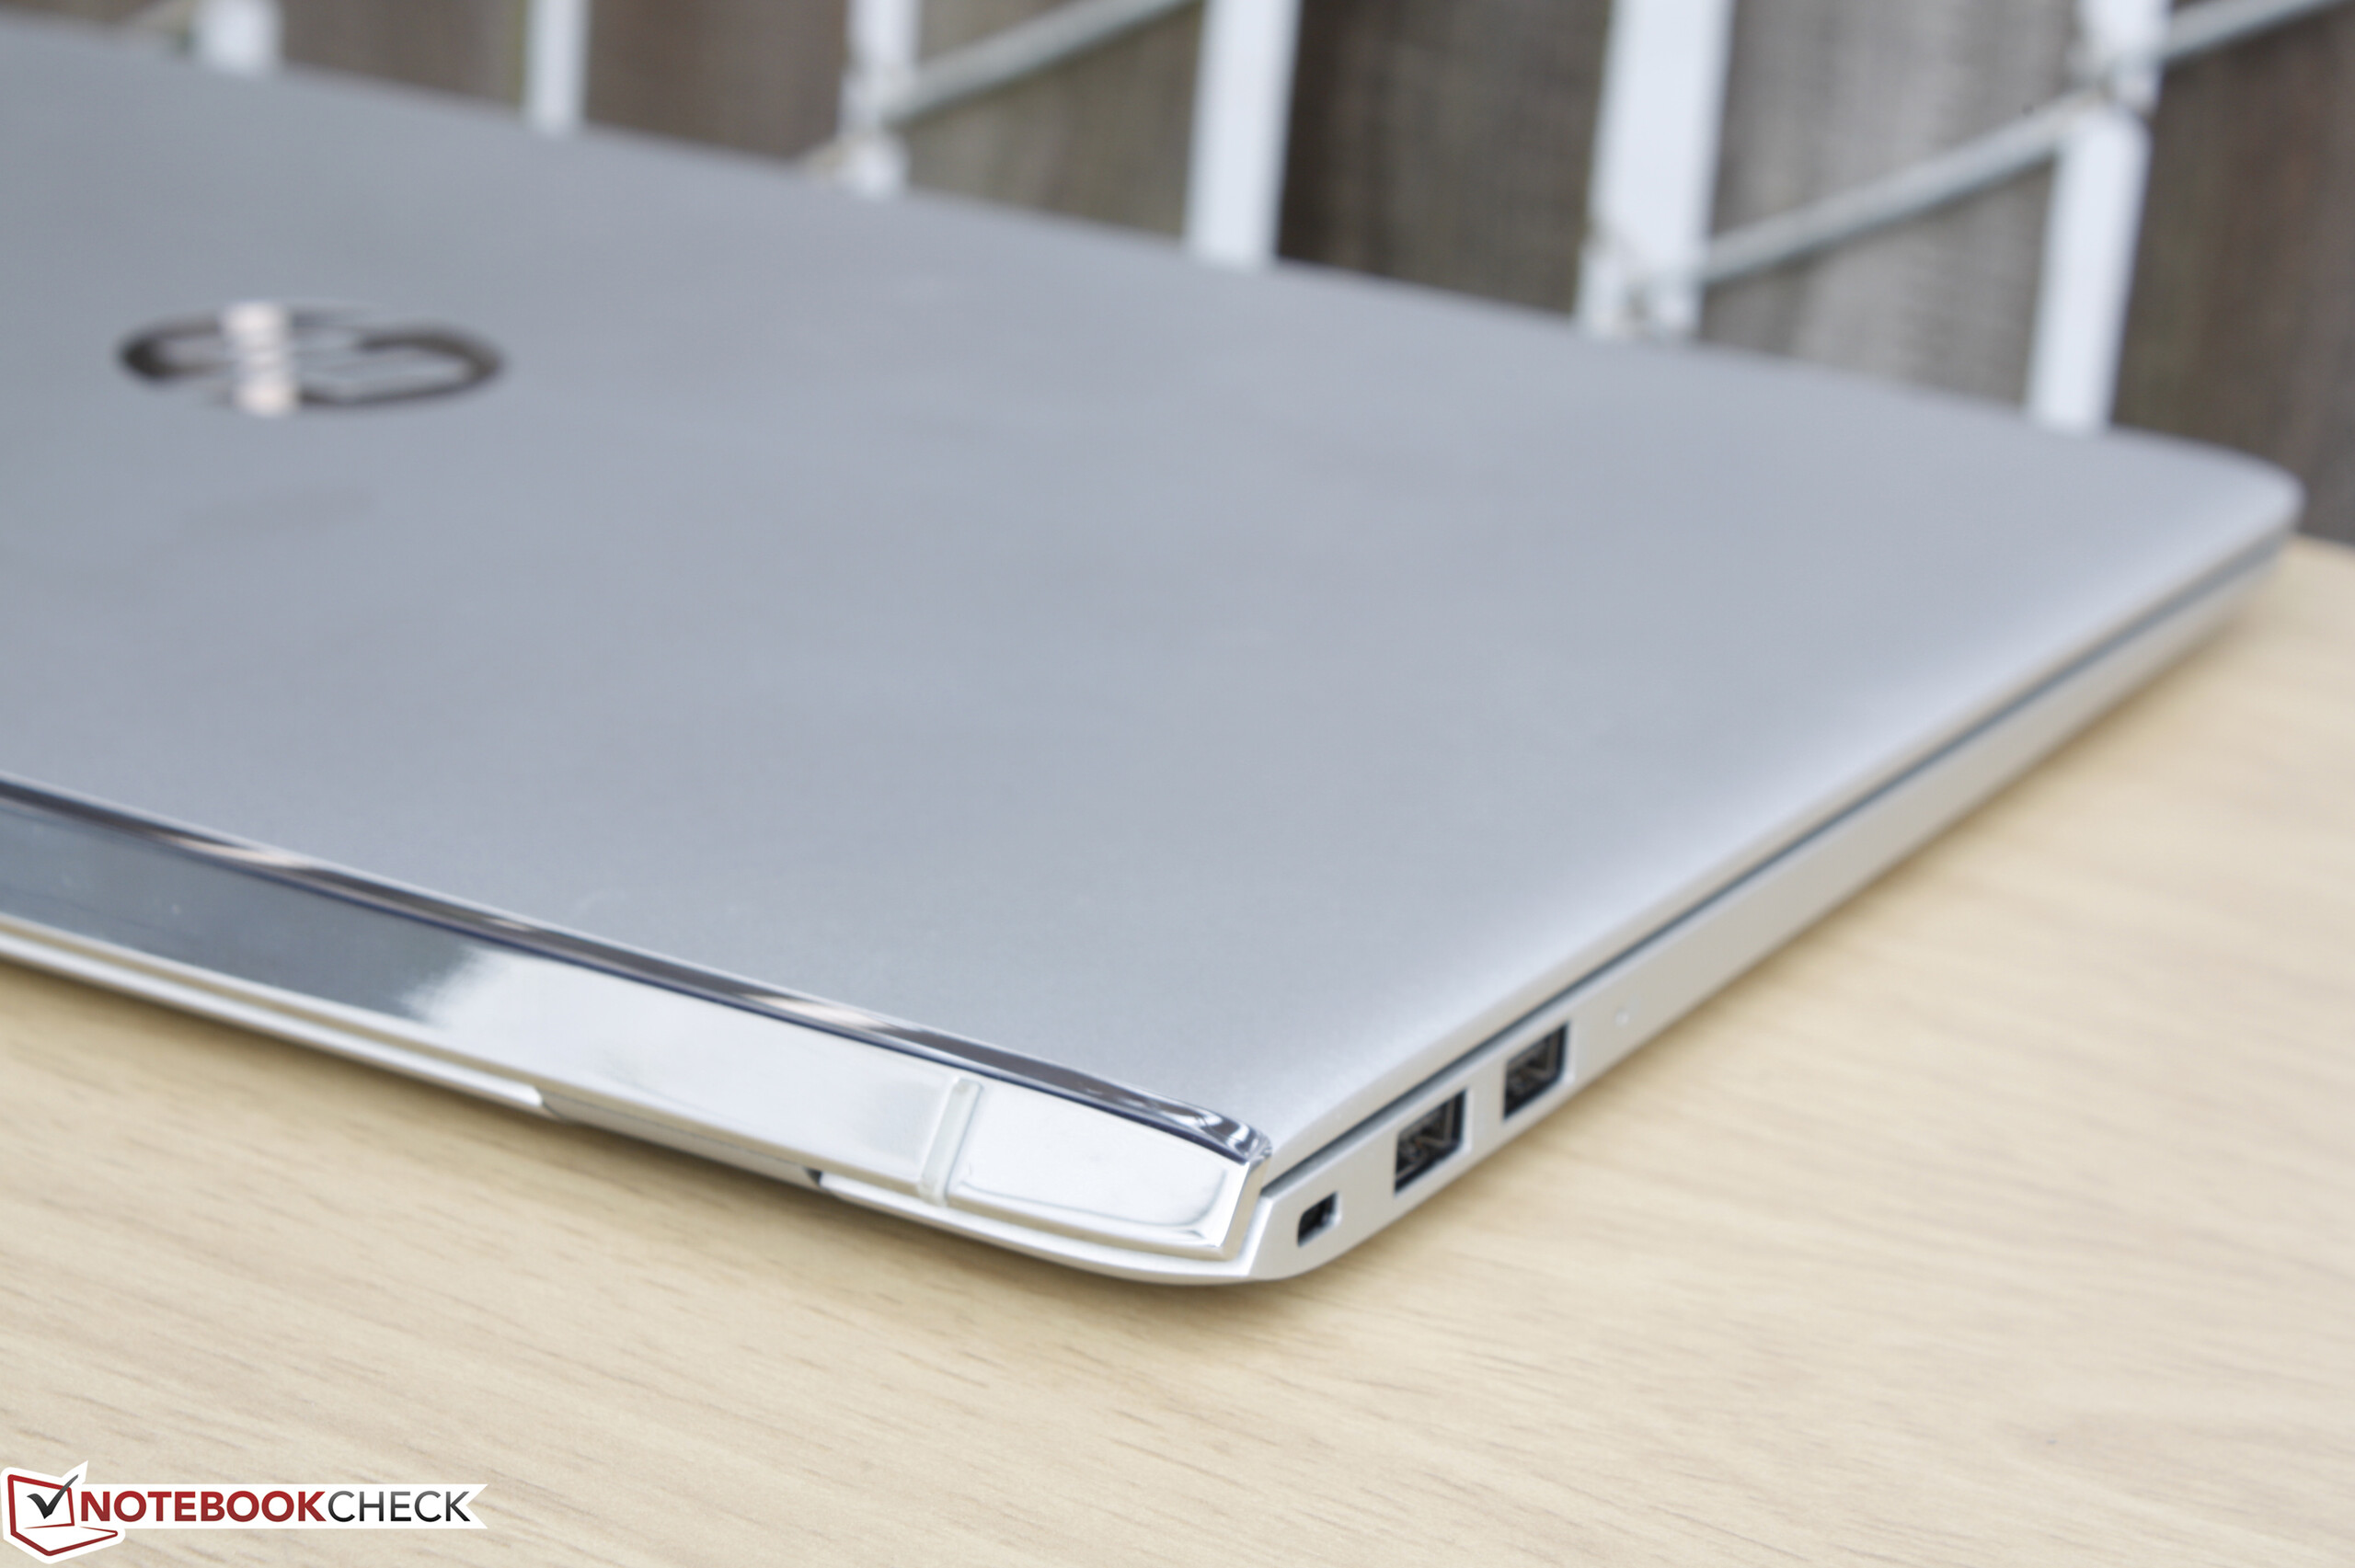
Breve análisis del portátil HP Envy 15 as133cl

| SD Card Reader | |
| average JPG Copy Test (av. of 3 runs) | |
| Dell XPS 13 9360 FHD i5 | |
| HP Envy 15-as133cl | |
| HP 17-y044ng | |
| maximum AS SSD Seq Read Test (1GB) | |
| Dell XPS 13 9360 FHD i5 | |
| HP Envy 15-as133cl | |
| HP 17-y044ng | |
| Networking | |
| iperf3 transmit AX12 | |
| Dell XPS 13 9360 FHD i5 | |
| HP Envy 15-as133cl | |
| HP 15-ba077ng | |
| iperf3 receive AX12 | |
| HP Envy 15-as133cl | |
| Dell XPS 13 9360 FHD i5 | |
| HP 15-ba077ng | |
| |||||||||||||||||||||||||
iluminación: 83 %
Brillo con batería: 262.3 cd/m²
Contraste: 1093:1 (Negro: 0.24 cd/m²)
ΔE ColorChecker Calman: 5 | ∀{0.5-29.43 Ø4.71}
ΔE Greyscale Calman: 3.2 | ∀{0.09-98 Ø4.96}
63.5% sRGB (Argyll 1.6.3 3D)
40.5% AdobeRGB 1998 (Argyll 1.6.3 3D)
44.41% AdobeRGB 1998 (Argyll 3D)
64.3% sRGB (Argyll 3D)
42.95% Display P3 (Argyll 3D)
Gamma: 2.45
CCT: 6817 K
| HP Envy 15-as133cl Chi Mei CMN15D8, IPS, 15.6", 1920x1080 | Dell XPS 15 2017 9560 (7300HQ, Full-HD) Sharp SHP1453 LQ156M1, LED IGZO IPS InfinityEdge, 15.6", 1920x1080 | HP 15-ba077ng BOE, TN LED, 15.6", 1920x1080 | Acer Aspire E15 E5-553G-109A Chi Mei CMN15C4 / N156HGE-EAB, TN LED, 15.6", 1920x1080 | HP Pavilion 15t-au100 CTO (W0P31AV) BOE0693, IPS, 15.6", 1920x1080 | Lenovo Ideapad 310-15IKB BOE NT156FHM-N31, TN LED, 15.6", 1920x1080 | |
|---|---|---|---|---|---|---|
| Display | 58% | -7% | -8% | 1% | -11% | |
| Display P3 Coverage (%) | 42.95 | 68.9 60% | 39.98 -7% | 39.72 -8% | 43.27 1% | 38.07 -11% |
| sRGB Coverage (%) | 64.3 | 98.9 54% | 60.2 -6% | 59.2 -8% | 64.9 1% | 57.3 -11% |
| AdobeRGB 1998 Coverage (%) | 44.41 | 70.9 60% | 41.31 -7% | 41.07 -8% | 44.71 1% | 39.34 -11% |
| Response Times | -49% | 16% | 28% | -4% | 17% | |
| Response Time Grey 50% / Grey 80% * (ms) | 44.4 ? | 54 ? -22% | 42 ? 5% | 42.4 ? 5% | 42 ? 5% | 43 ? 3% |
| Response Time Black / White * (ms) | 30 ? | 52.4 ? -75% | 22 ? 27% | 14.6 ? 51% | 33.6 ? -12% | 21 ? 30% |
| PWM Frequency (Hz) | 1000 ? | 50 ? | 28740 | 198.4 | ||
| Screen | 19% | -71% | -54% | -10% | -33% | |
| Brightness middle (cd/m²) | 262.3 | 400 52% | 209 -20% | 224 -15% | 186.5 -29% | 185 -29% |
| Brightness (cd/m²) | 240 | 392 63% | 200 -17% | 201 -16% | 174 -27% | 184 -23% |
| Brightness Distribution (%) | 83 | 89 7% | 88 6% | 75 -10% | 69 -17% | 95 14% |
| Black Level * (cd/m²) | 0.24 | 0.26 -8% | 0.56 -133% | 0.46 -92% | 0.18 25% | 0.28 -17% |
| Contrast (:1) | 1093 | 1538 41% | 373 -66% | 487 -55% | 1036 -5% | 661 -40% |
| Colorchecker dE 2000 * | 5 | 4.9 2% | 12.21 -144% | 10.5 -110% | 5.7 -14% | 8.07 -61% |
| Colorchecker dE 2000 max. * | 20.6 | 11 47% | 20.66 -0% | 16.8 18% | 22.5 -9% | 14.83 28% |
| Greyscale dE 2000 * | 3.2 | 7.2 -125% | 13.48 -321% | 11.23 -251% | 4.4 -38% | 8.83 -176% |
| Gamma | 2.45 90% | 2.11 104% | 2.34 94% | 2.12 104% | 2.35 94% | 2.47 89% |
| CCT | 6817 95% | 6911 94% | 15364 42% | 11096 59% | 6963 93% | 10628 61% |
| Color Space (Percent of AdobeRGB 1998) (%) | 40.5 | 64.2 59% | 38 -6% | 38 -6% | 44.71 10% | 36.2 -11% |
| Color Space (Percent of sRGB) (%) | 63.5 | 98.9 56% | 60 -6% | 59 -7% | 64.95 2% | 57 -10% |
| Media total (Programa/Opciones) | 9% /
18% | -21% /
-46% | -11% /
-34% | -4% /
-7% | -9% /
-22% |
* ... más pequeño es mejor
Tiempos de respuesta del display
| ↔ Tiempo de respuesta de Negro a Blanco | ||
|---|---|---|
| 30 ms ... subida ↗ y bajada ↘ combinada | ↗ 6.4 ms subida | 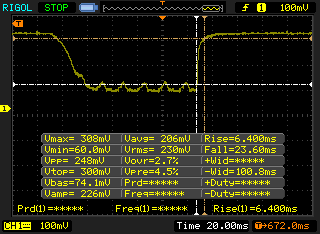 |
| ↘ 23.6 ms bajada | ||
| La pantalla mostró tiempos de respuesta lentos en nuestros tests y podría ser demasiado lenta para los jugones. En comparación, todos los dispositivos de prueba van de ##min### (mínimo) a 240 (máximo) ms. » 80 % de todos los dispositivos son mejores. Eso quiere decir que el tiempo de respuesta es peor que la media (19.8 ms) de todos los dispositivos testados. | ||
| ↔ Tiempo de respuesta 50% Gris a 80% Gris | ||
| 44.4 ms ... subida ↗ y bajada ↘ combinada | ↗ 16 ms subida | 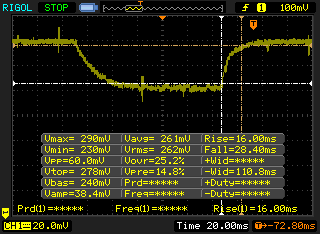 |
| ↘ 28.4 ms bajada | ||
| La pantalla mostró tiempos de respuesta lentos en nuestros tests y podría ser demasiado lenta para los jugones. En comparación, todos los dispositivos de prueba van de ##min### (mínimo) a 636 (máximo) ms. » 76 % de todos los dispositivos son mejores. Eso quiere decir que el tiempo de respuesta es peor que la media (30.9 ms) de todos los dispositivos testados. | ||
Parpadeo de Pantalla / PWM (Pulse-Width Modulation)
| Parpadeo de Pantalla / PWM detectado | 1000 Hz | ≤ 99 % de brillo | 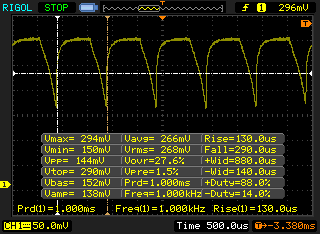 |
La retroiluminación del display parpadea a 1000 Hz (seguramente usa PWM - Pulse-Width Modulation) a un brillo del 99 % e inferior. Sobre este nivel de brillo no debería darse parpadeo / PWM. La frecuencia de 1000 Hz es bastante alta, por lo que la mayoría de gente sensible al parpadeo no debería ver parpadeo o tener fatiga visual. Comparación: 52 % de todos los dispositivos testados no usaron PWM para atenuar el display. Si se usó, medimos una media de 7741 (mínimo: 5 - máxmo: 343500) Hz. | |||
| wPrime 2.10 - 1024m | |
| Lenovo Y40-59423035 | |
| Fujitsu LifeBook A557 PL | |
| HP Envy 15-as133cl | |
| Super Pi Mod 1.5 XS 32M - 32M | |
| Lenovo Y40-59423035 | |
| Fujitsu LifeBook A557 PL | |
| HP Envy 15-as133cl | |
* ... más pequeño es mejor
| PCMark 8 | |
| Home Score Accelerated v2 | |
| Dell Inspiron 15 5000 5567-1753 | |
| HP Envy 15-as133cl | |
| Asus Zenbook UX310UQ-GL011T | |
| Acer TravelMate P249-M-5452 | |
| Work Score Accelerated v2 | |
| Dell Inspiron 15 5000 5567-1753 | |
| Asus Zenbook UX310UQ-GL011T | |
| HP Envy 15-as133cl | |
| Acer TravelMate P249-M-5452 | |
| Creative Score Accelerated v2 | |
| Dell Inspiron 15 5000 5567-1753 | |
| Asus Zenbook UX310UQ-GL011T | |
| HP Envy 15-as133cl | |
| Acer TravelMate P249-M-5452 | |
| PCMark 8 Home Score Accelerated v2 | 3809 puntos | |
| PCMark 8 Creative Score Accelerated v2 | 4361 puntos | |
| PCMark 8 Work Score Accelerated v2 | 4594 puntos | |
ayuda | ||
| HP Envy 15-as133cl HGST Travelstar 5K1000 HTS541010A7E630 | Dell XPS 15 2017 9560 (7300HQ, Full-HD) WDC WD10SPCX-75KHST0 + SanDisk Z400s M.2 2242 32 GB Cache | HP 15-ba077ng SanDisk Z400s SD8SNAT-256G | Acer Aspire E15 E5-553G-109A Liteonit CV3-8D128 | HP Pavilion 15t-au100 CTO (W0P31AV) Toshiba MQ01ABD100 | |
|---|---|---|---|---|---|
| CrystalDiskMark 3.0 | 1425% | 5547% | 5871% | 1% | |
| Read Seq (MB/s) | 103.2 | 123 19% | 447.4 334% | 348.6 238% | 109.5 6% |
| Write Seq (MB/s) | 102.6 | 74.2 -28% | 243.3 137% | 311.8 204% | 105.2 3% |
| Read 512 (MB/s) | 31.46 | 101.7 223% | 333.4 960% | 295.9 841% | 34.08 8% |
| Write 512 (MB/s) | 46.3 | 42.51 -8% | 283.1 511% | 185.8 301% | 40.02 -14% |
| Read 4k (MB/s) | 0.366 | 10.84 2862% | 20.99 5635% | 23.76 6392% | 0.429 17% |
| Write 4k (MB/s) | 1.008 | 1.021 1% | 62.7 6120% | 44.94 4358% | 1.008 0% |
| Read 4k QD32 (MB/s) | 0.828 | 69.8 8330% | 143.1 17183% | 171.6 20625% | 0.81 -2% |
| Write 4k QD32 (MB/s) | 1.015 | 1.057 4% | 138 13496% | 143.2 14008% | 0.893 -12% |

| 3DMark 11 | |
| 1280x720 Performance GPU | |
| Acer Aspire V3-572PG-604M | |
| Asus Zenbook UX310UQ-GL011T | |
| Dell Inspiron 15 5000 5567-1753 | |
| HP 250 G4 T6P08ES | |
| Lenovo U31-70 80M5003EGE | |
| HP Envy 15-as133cl | |
| Fujitsu LifeBook A557 PL | |
| Acer TravelMate P249-M-5452 | |
| 1280x720 Performance Combined | |
| Dell Inspiron 15 5000 5567-1753 | |
| Asus Zenbook UX310UQ-GL011T | |
| Acer Aspire V3-572PG-604M | |
| HP Envy 15-as133cl | |
| HP 250 G4 T6P08ES | |
| Lenovo U31-70 80M5003EGE | |
| Acer TravelMate P249-M-5452 | |
| Fujitsu LifeBook A557 PL | |
| 3DMark | |
| 1280x720 Cloud Gate Standard Graphics | |
| Dell Inspiron 15 5000 5567-1753 | |
| Acer Aspire V3-572PG-604M | |
| HP Envy 15-as133cl | |
| Asus Zenbook UX310UQ-GL011T | |
| Lenovo U31-70 80M5003EGE | |
| Fujitsu LifeBook A557 PL | |
| Acer TravelMate P249-M-5452 | |
| HP 250 G4 T6P08ES | |
| 1920x1080 Fire Strike Graphics | |
| Acer Aspire V3-572PG-604M | |
| Asus Zenbook UX310UQ-GL011T | |
| Dell Inspiron 15 5000 5567-1753 | |
| Lenovo U31-70 80M5003EGE | |
| HP 250 G4 T6P08ES | |
| HP Envy 15-as133cl | |
| Fujitsu LifeBook A557 PL | |
| Acer TravelMate P249-M-5452 | |
| 1920x1080 Ice Storm Extreme Graphics | |
| HP Envy 15-as133cl | |
| Asus Zenbook UX310UQ-GL011T | |
| Dell Inspiron 15 5000 5567-1753 | |
| Acer TravelMate P249-M-5452 | |
| 3DMark 11 Performance | 1780 puntos | |
| 3DMark Ice Storm Standard Score | 72759 puntos | |
| 3DMark Cloud Gate Standard Score | 6756 puntos | |
| 3DMark Fire Strike Score | 929 puntos | |
| 3DMark Fire Strike Extreme Score | 427 puntos | |
ayuda | ||
| bajo | medio | alto | ultra | |
|---|---|---|---|---|
| BioShock Infinite (2013) | 52.7 | 30.7 | 26.4 | 8.3 |
| Rise of the Tomb Raider (2016) | 20.2 | 12.1 | ||
| Overwatch (2016) | 49.5 | 35.1 |
Ruido
| Ocioso |
| 32.5 / 32.5 / 32.5 dB(A) |
| HDD |
| 33.8 dB(A) |
| Carga |
| 38.7 / 32.5 dB(A) |
 | ||
30 dB silencioso 40 dB(A) audible 50 dB(A) ruidosamente alto |
||
min: | ||
| HP Envy 15-as133cl HD Graphics 620, i7-7500U, HGST Travelstar 5K1000 HTS541010A7E630 | Dell XPS 15 2017 9560 (7300HQ, Full-HD) GeForce GTX 1050 Mobile, i5-7300HQ, WDC WD10SPCX-75KHST0 + SanDisk Z400s M.2 2242 32 GB Cache | HP 15-ba077ng Radeon R7 (Bristol Ridge), A12-9700P, SanDisk Z400s SD8SNAT-256G | Acer Aspire E15 E5-553G-109A Radeon R8 M445DX, A12-9700P, Liteonit CV3-8D128 | HP Pavilion 15t-au100 CTO (W0P31AV) GeForce 940MX, i7-7500U, Toshiba MQ01ABD100 | Lenovo Ideapad 310-15IKB HD Graphics 620, i5-7200U, Hynix HFS128G3MND | |
|---|---|---|---|---|---|---|
| Noise | -12% | 4% | 3% | -7% | 1% | |
| apagado / medio ambiente * (dB) | 30 | 30.3 -1% | 30.6 -2% | 30.5 -2% | 29 3% | |
| Idle Minimum * (dB) | 32.5 | 31.6 3% | 31.5 3% | 31.4 3% | 32.2 1% | 30.6 6% |
| Idle Average * (dB) | 32.5 | 31.6 3% | 31.8 2% | 31.4 3% | 32.2 1% | 30.6 6% |
| Idle Maximum * (dB) | 32.5 | 33.4 -3% | 31.8 2% | 31.9 2% | 33.7 -4% | 30.6 6% |
| Load Average * (dB) | 38.7 | 47.8 -24% | 31.4 19% | 33.7 13% | 39.4 -2% | 36.8 5% |
| Load Maximum * (dB) | 32.5 | 47.8 -47% | 33.4 -3% | 33.8 -4% | 42.2 -30% | 38.2 -18% |
| Witcher 3 ultra * (dB) | 40.6 |
* ... más pequeño es mejor
(+) La temperatura máxima en la parte superior es de 35.6 °C / 96 F, frente a la media de 36.8 °C / 98 F, que oscila entre 21 y 71 °C para la clase Multimedia.
(+) El fondo se calienta hasta un máximo de 39.4 °C / 103 F, frente a la media de 39.1 °C / 102 F
(+) En reposo, la temperatura media de la parte superior es de 23 °C / 73# F, frente a la media del dispositivo de 31.3 °C / 88 F.
(+) El reposamanos y el panel táctil están a una temperatura inferior a la de la piel, con un máximo de 24.6 °C / 76.3 F y, por tanto, son fríos al tacto.
(+) La temperatura media de la zona del reposamanos de dispositivos similares fue de 28.7 °C / 83.7 F (+4.1 °C / 7.4 F).
HP Envy 15-as133cl análisis de audio
(±) | la sonoridad del altavoz es media pero buena (77.2 dB)
Graves 100 - 315 Hz
(-) | casi sin bajos - de media 16.6% inferior a la mediana
(±) | la linealidad de los graves es media (13.8% delta a frecuencia anterior)
Medios 400 - 2000 Hz
(+) | medios equilibrados - a sólo 1.9% de la mediana
(+) | los medios son lineales (4.3% delta a la frecuencia anterior)
Altos 2 - 16 kHz
(+) | máximos equilibrados - a sólo 2.6% de la mediana
(±) | la linealidad de los máximos es media (9.8% delta a frecuencia anterior)
Total 100 - 16.000 Hz
(±) | la linealidad del sonido global es media (20% de diferencia con la mediana)
En comparación con la misma clase
» 66% de todos los dispositivos probados de esta clase eran mejores, 8% similares, 26% peores
» El mejor tuvo un delta de 5%, la media fue 17%, el peor fue ###max##%
En comparación con todos los dispositivos probados
» 51% de todos los dispositivos probados eran mejores, 8% similares, 40% peores
» El mejor tuvo un delta de 4%, la media fue 23%, el peor fue ###max##%
Apple MacBook 12 (Early 2016) 1.1 GHz análisis de audio
(+) | los altavoces pueden reproducir a un volumen relativamente alto (#83.6 dB)
Graves 100 - 315 Hz
(±) | lubina reducida - en promedio 11.3% inferior a la mediana
(±) | la linealidad de los graves es media (14.2% delta a frecuencia anterior)
Medios 400 - 2000 Hz
(+) | medios equilibrados - a sólo 2.4% de la mediana
(+) | los medios son lineales (5.5% delta a la frecuencia anterior)
Altos 2 - 16 kHz
(+) | máximos equilibrados - a sólo 2% de la mediana
(+) | los máximos son lineales (4.5% delta a la frecuencia anterior)
Total 100 - 16.000 Hz
(+) | el sonido global es lineal (10.2% de diferencia con la mediana)
En comparación con la misma clase
» 7% de todos los dispositivos probados de esta clase eran mejores, 2% similares, 90% peores
» El mejor tuvo un delta de 5%, la media fue 18%, el peor fue ###max##%
En comparación con todos los dispositivos probados
» 5% de todos los dispositivos probados eran mejores, 1% similares, 94% peores
» El mejor tuvo un delta de 4%, la media fue 23%, el peor fue ###max##%
| Off / Standby | |
| Ocioso | |
| Carga |
|
Clave:
min: | |
| HP Envy 15-as133cl | Dell XPS 15 2017 9560 (7300HQ, Full-HD) | HP 15-ba077ng | Acer Aspire E15 E5-553G-109A | HP Pavilion 15t-au100 CTO (W0P31AV) | Lenovo Ideapad 310-15IKB | |
|---|---|---|---|---|---|---|
| Power Consumption | -145% | -7% | -76% | -56% | -7% | |
| Idle Minimum * (Watt) | 4.6 | 6.6 -43% | 4.4 4% | 7.2 -57% | 6.16 -34% | 3.5 24% |
| Idle Average * (Watt) | 7.7 | 9 -17% | 6.8 12% | 10.3 -34% | 8.48 -10% | 6.1 21% |
| Idle Maximum * (Watt) | 7.8 | 10.7 -37% | 8.9 -14% | 11.9 -53% | 9.62 -23% | 7 10% |
| Load Average * (Watt) | 30.5 | 77.5 -154% | 30.9 -1% | 48.2 -58% | 41.63 -36% | 31.2 -2% |
| Load Maximum * (Watt) | 22.7 | 130 -473% | 31 -37% | 63 -178% | 63.22 -179% | 42.9 -89% |
| Witcher 3 ultra * (Watt) | 51.8 |
* ... más pequeño es mejor
| HP Envy 15-as133cl i7-7500U, HD Graphics 620, 52 Wh | Dell XPS 15 2017 9560 (7300HQ, Full-HD) i5-7300HQ, GeForce GTX 1050 Mobile, 56 Wh | HP 15-ba077ng A12-9700P, Radeon R7 (Bristol Ridge), 41 Wh | Acer Aspire E15 E5-553G-109A A12-9700P, Radeon R8 M445DX, 40 Wh | HP Pavilion 15t-au100 CTO (W0P31AV) i7-7500U, GeForce 940MX, 41 Wh | Lenovo Ideapad 310-15IKB i5-7200U, HD Graphics 620, 30 Wh | |
|---|---|---|---|---|---|---|
| Duración de Batería | -1% | 14% | -33% | -7% | -7% | |
| Reader / Idle (h) | 9.6 | 9.4 -2% | 12.4 29% | 6 -37% | 7.3 -24% | 10.2 6% |
| WiFi v1.3 (h) | 6.8 | 5.6 -18% | 4.9 -28% | 4.3 -37% | 3.7 -46% | 3.8 -44% |
| Load (h) | 1.2 | 1.4 17% | 1.7 42% | 0.9 -25% | 1.8 50% | 1.4 17% |
Pro
Contra
Nada destaca particularmente en el Envy 15. Su chasis y su diseño lo hacen más atractivo que los competidores de Acer o Lenovo en precios por debajo de los 900 euros y la batería es muy buena, pero el rendimiento general es un poco decepcionante. El ventilador del sistema está en funcionamiento constante, las teclas del teclado y el clickpad son muy blandas, la cobertura sRGB es limitada, todas las configuraciones incluyen pantalla táctil y la tapa podría ser más firme y moverse menos. Recomendamos evitar configuraciones con HDD e invertir en uno con SSD para obtener un mayor rendimiento ya que instalarlo después es complicado.
Si el usuario puede optar a otros dispositivos de la competencia, el usuario encontrará un dispositivo mejor en el Dell XPS 15 9550. La configuración del Envy 15 con 256 GB de SSD sube el precio hasta casi los cuatro dígitos donde las configuraciones más modestas del XPS 15 9550, Spectre 15 x360, o la gama Asus Zenbook son inalcanzables.
Ésta es una versión acortada del análisis original. Puedes leer el análisis completo en inglés aquí.
HP Envy 15-as133cl
- 02/13/2017 v6 (old)
Allen Ngo
Price comparison
