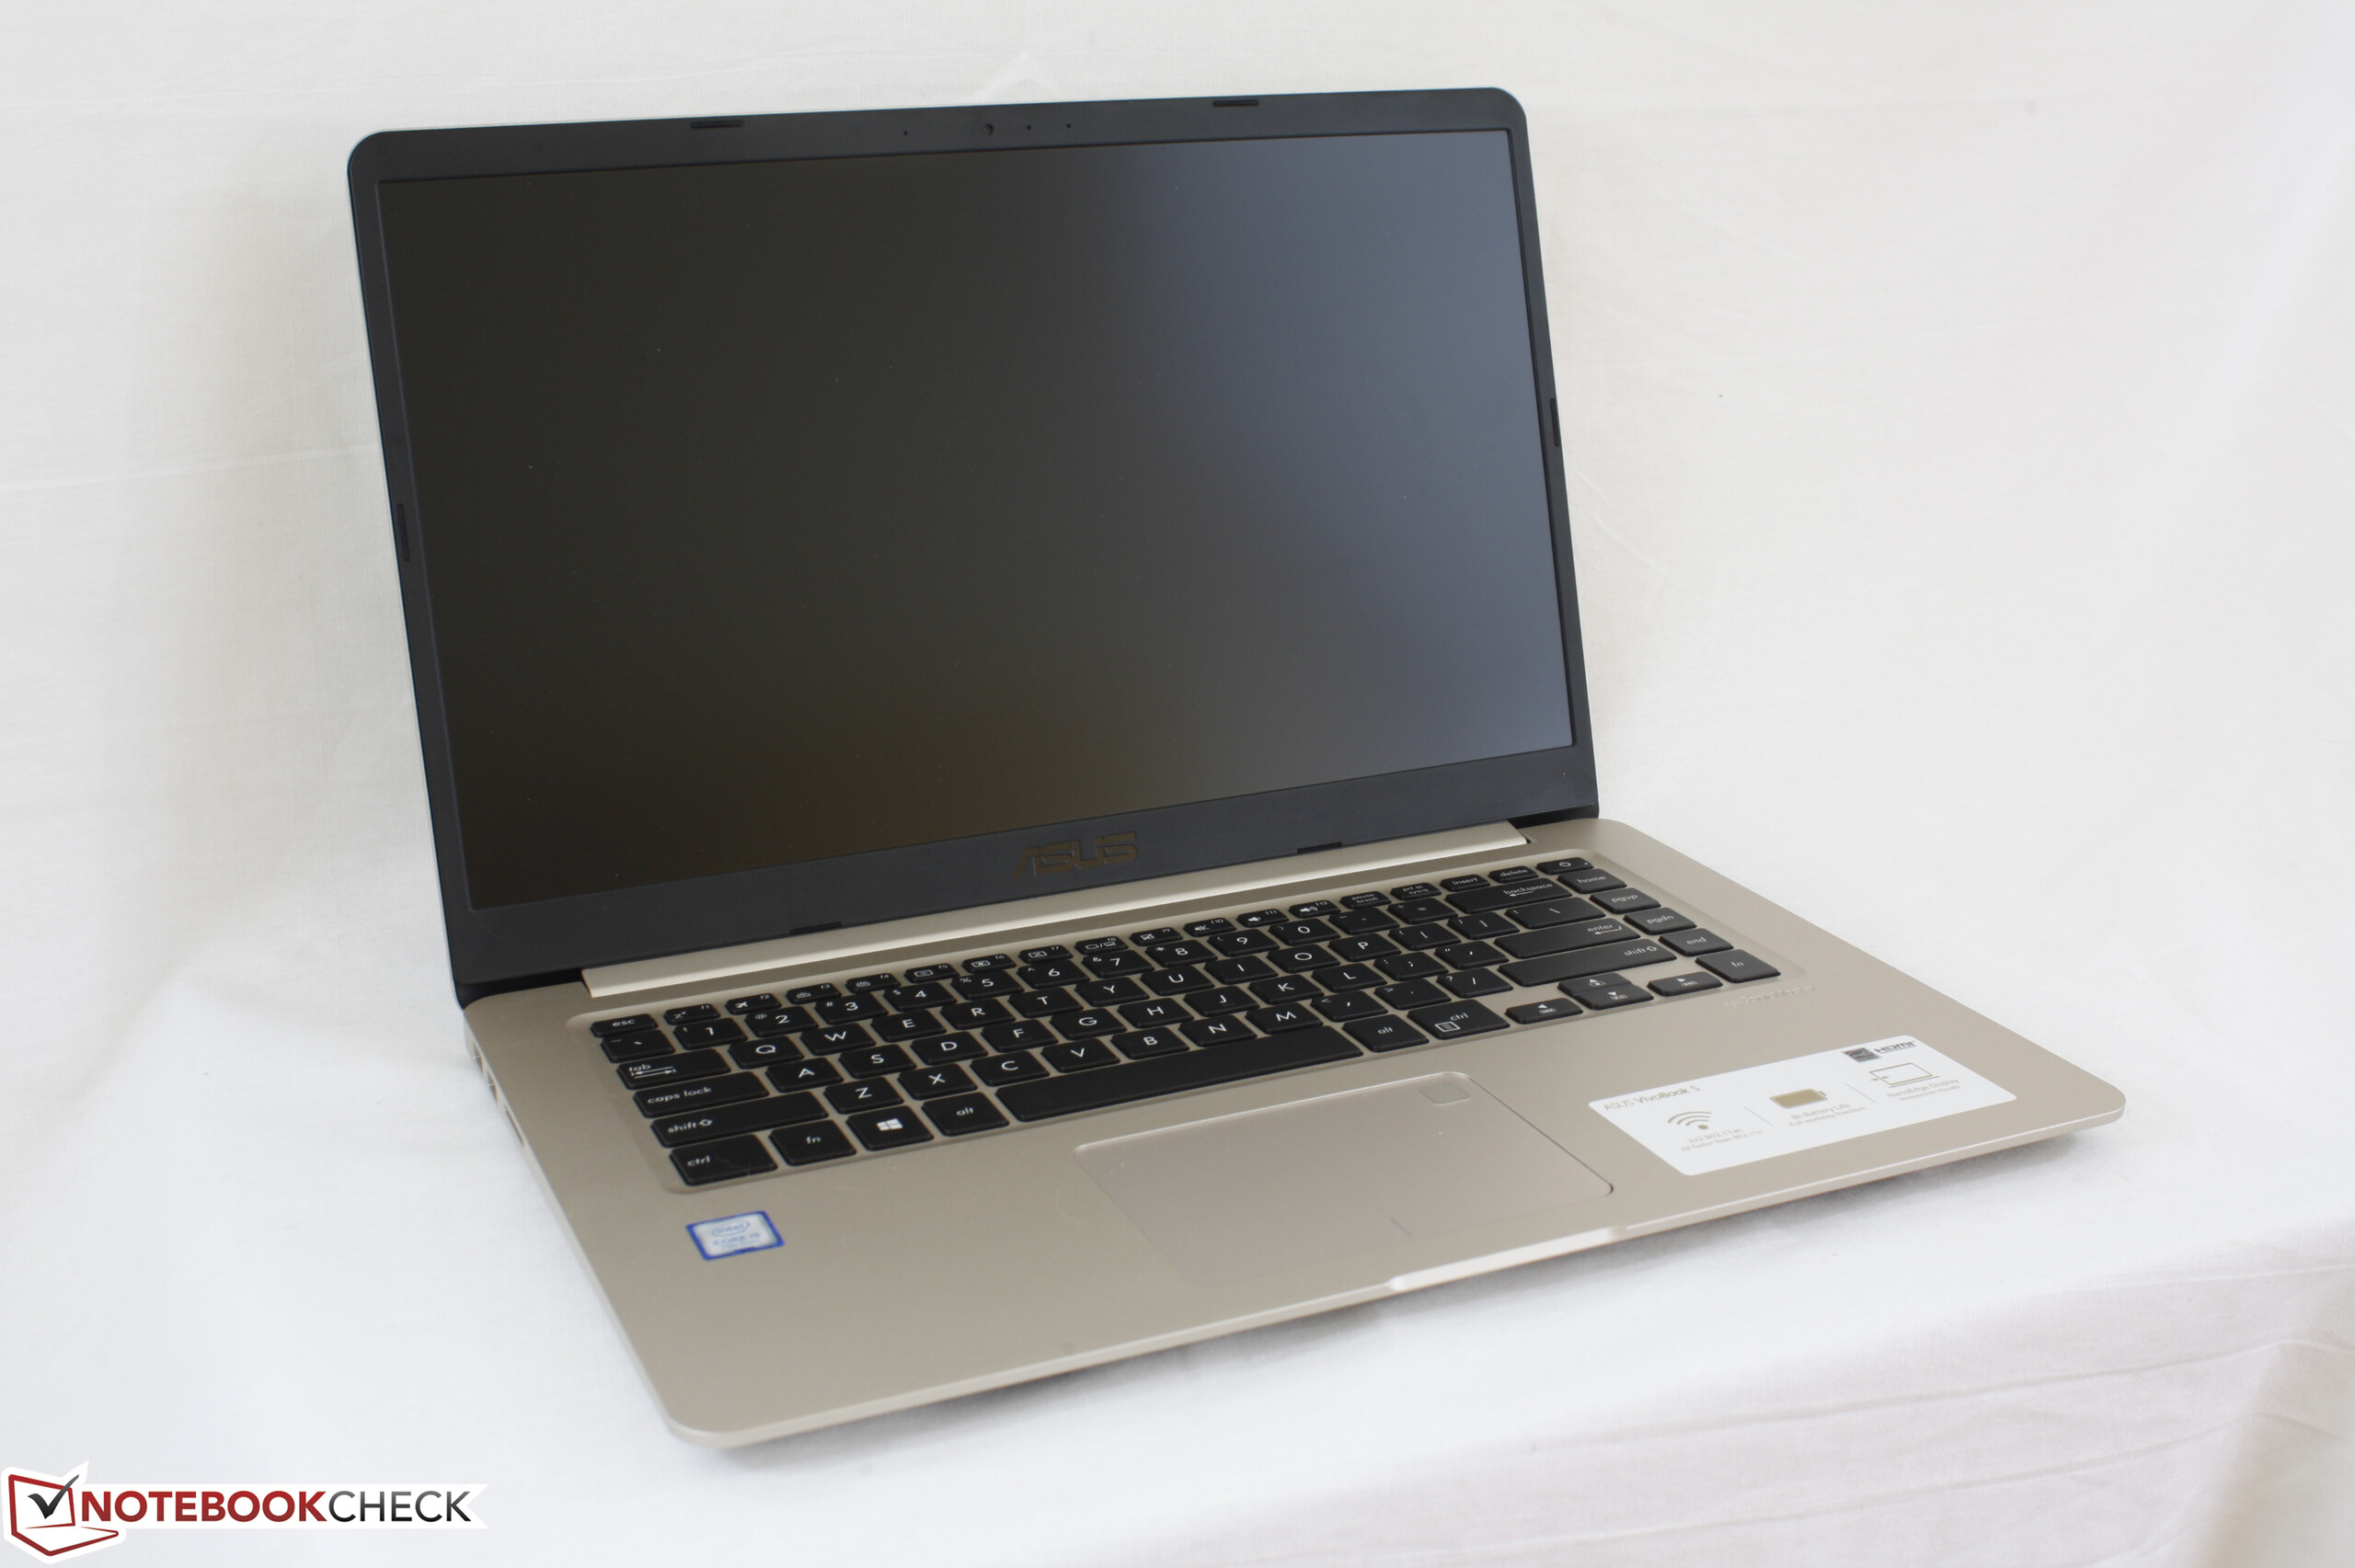
Breve análisis del portátil Asus VivoBook S15 S510UA (i5-7200U, FHD)


| SD Card Reader | |
| average JPG Copy Test (av. of 3 runs) | |
| HP Pavilion 15t-au100 CTO (W0P31AV) | |
| Asus VivoBook S15 S510UA | |
| Dell Inspiron 15 7000 7567 | |
| maximum AS SSD Seq Read Test (1GB) | |
| HP Pavilion 15t-au100 CTO (W0P31AV) | |
| Asus VivoBook S15 S510UA | |
| Dell Inspiron 15 7000 7567 | |
| Networking | |
| iperf3 transmit AX12 | |
| Asus VivoBook S15 S510UA | |
| Lenovo V510-15IKB 80WQ0002GE | |
| Dell Inspiron 15 7000 7567 (jseb) | |
| iperf3 receive AX12 | |
| Asus VivoBook S15 S510UA | |
| Lenovo V510-15IKB 80WQ0002GE | |
| Dell Inspiron 15 7000 7567 (jseb) | |
| |||||||||||||||||||||||||
iluminación: 89 %
Brillo con batería: 277.5 cd/m²
Contraste: 793:1 (Negro: 0.35 cd/m²)
ΔE ColorChecker Calman: 4.8 | ∀{0.5-29.43 Ø4.73}
ΔE Greyscale Calman: 3 | ∀{0.09-98 Ø4.97}
69.3% sRGB (Argyll 1.6.3 3D)
37.7% AdobeRGB 1998 (Argyll 1.6.3 3D)
41.11% AdobeRGB 1998 (Argyll 3D)
59.5% sRGB (Argyll 3D)
39.9% Display P3 (Argyll 3D)
Gamma: 2.39
CCT: 6854 K
| Asus VivoBook S15 S510UA ID: LGD0573, Name: LG Display LP156WF9-SPK2, IPS, 15.6", 1920x1080 | Lenovo V510-15IKB 80WQ0002GE LG Philips LP156WF6-SPK3, IPS, 15.6", 1920x1080 | HP Pavilion 15t-au100 CTO (W0P31AV) BOE0693, IPS, 15.6", 1920x1080 | Apple MacBook Pro 15 2016 (2.9 GHz, 460) Apple APPA030, IPS, 15.4", 2880x1800 | HP Envy 15-as133cl Chi Mei CMN15D8, IPS, 15.6", 1920x1080 | Dell Inspiron 15 7000 7567 AU Optronics AUO38ED B156HTN 28H80, TN, 15.6", 1920x1080 | |
|---|---|---|---|---|---|---|
| Display | -2% | 9% | 109% | 8% | -8% | |
| Display P3 Coverage (%) | 39.9 | 38.8 -3% | 43.27 8% | 99 148% | 42.95 8% | 36.42 -9% |
| sRGB Coverage (%) | 59.5 | 58.1 -2% | 64.9 9% | 100 68% | 64.3 8% | 54.9 -8% |
| AdobeRGB 1998 Coverage (%) | 41.11 | 40.12 -2% | 44.71 9% | 87.3 112% | 44.41 8% | 37.62 -8% |
| Response Times | -8% | -18% | -66% | -15% | -15% | |
| Response Time Grey 50% / Grey 80% * (ms) | 38.4 ? | 39 ? -2% | 42 ? -9% | 46 ? -20% | 44.4 ? -16% | 36 ? 6% |
| Response Time Black / White * (ms) | 26.4 ? | 30 ? -14% | 33.6 ? -27% | 56 ? -112% | 30 ? -14% | 36 ? -36% |
| PWM Frequency (Hz) | 20000 ? | 198.4 | 119000 ? | 1000 ? | ||
| Screen | -6% | -9% | 46% | 2% | -75% | |
| Brightness middle (cd/m²) | 277.5 | 256 -8% | 186.5 -33% | 420 51% | 262.3 -5% | 246 -11% |
| Brightness (cd/m²) | 265 | 252 -5% | 174 -34% | 401 51% | 240 -9% | 235 -11% |
| Brightness Distribution (%) | 89 | 87 -2% | 69 -22% | 90 1% | 83 -7% | 75 -16% |
| Black Level * (cd/m²) | 0.35 | 0.3 14% | 0.18 49% | 0.3 14% | 0.24 31% | 0.55 -57% |
| Contrast (:1) | 793 | 853 8% | 1036 31% | 1400 77% | 1093 38% | 447 -44% |
| Colorchecker dE 2000 * | 4.8 | 5.4 -13% | 5.7 -19% | 3.33 31% | 5 -4% | 10.97 -129% |
| Colorchecker dE 2000 max. * | 17.8 | 9.36 47% | 22.5 -26% | 5.11 71% | 20.6 -16% | |
| Greyscale dE 2000 * | 3 | 5.37 -79% | 4.4 -47% | 2.73 9% | 3.2 -7% | 14.25 -375% |
| Gamma | 2.39 92% | 2.58 85% | 2.35 94% | 2.48 89% | 2.45 90% | 1.83 120% |
| CCT | 6854 95% | 6795 96% | 6963 93% | 6457 101% | 6817 95% | 11200 58% |
| Color Space (Percent of AdobeRGB 1998) (%) | 37.7 | 37 -2% | 44.71 19% | 78.09 107% | 40.5 7% | 35 -7% |
| Color Space (Percent of sRGB) (%) | 69.3 | 58 -16% | 64.95 -6% | 99.97 44% | 63.5 -8% | 55 -21% |
| Media total (Programa/Opciones) | -5% /
-5% | -6% /
-7% | 30% /
43% | -2% /
1% | -33% /
-52% |
* ... más pequeño es mejor
Tiempos de respuesta del display
| ↔ Tiempo de respuesta de Negro a Blanco | ||
|---|---|---|
| 26.4 ms ... subida ↗ y bajada ↘ combinada | ↗ 15.6 ms subida | 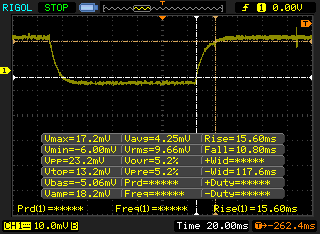 |
| ↘ 10.8 ms bajada | ||
| La pantalla mostró tiempos de respuesta relativamente lentos en nuestros tests pero podría ser demasiado lenta para los jugones. En comparación, todos los dispositivos de prueba van de ##min### (mínimo) a 240 (máximo) ms. » 66 % de todos los dispositivos son mejores. Eso quiere decir que el tiempo de respuesta es peor que la media (19.9 ms) de todos los dispositivos testados. | ||
| ↔ Tiempo de respuesta 50% Gris a 80% Gris | ||
| 38.4 ms ... subida ↗ y bajada ↘ combinada | ↗ 19.2 ms subida | 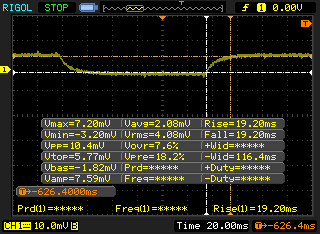 |
| ↘ 19.2 ms bajada | ||
| La pantalla mostró tiempos de respuesta lentos en nuestros tests y podría ser demasiado lenta para los jugones. En comparación, todos los dispositivos de prueba van de ##min### (mínimo) a 636 (máximo) ms. » 57 % de todos los dispositivos son mejores. Eso quiere decir que el tiempo de respuesta es peor que la media (31.1 ms) de todos los dispositivos testados. | ||
Parpadeo de Pantalla / PWM (Pulse-Width Modulation)
| Parpadeo de Pantalla / PWM no detectado | 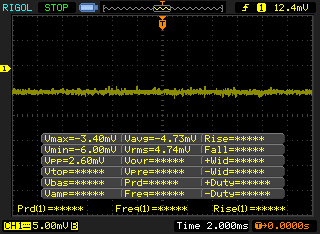 | ||
Comparación: 52 % de todos los dispositivos testados no usaron PWM para atenuar el display. Si se usó, medimos una media de 7794 (mínimo: 5 - máxmo: 343500) Hz. | |||
| Cinebench R10 | |
| Rendering Multiple CPUs 32Bit | |
| Asus VivoBook S15 S510UA | |
| Dell Latitude 5280 | |
| Lenovo ThinkPad 13-20J2S00G00 | |
| HP ProBook 640 G2-T9X60ET | |
| Lenovo Thinkpad 13-20J1001BUS | |
| HP 250 G4 T6P08ES | |
| Lenovo IdeaPad Z40-59422614 | |
| HP EliteBook 725 G4 | |
| Rendering Single 32Bit | |
| Asus VivoBook S15 S510UA | |
| Dell Latitude 5280 | |
| Lenovo ThinkPad 13-20J2S00G00 | |
| HP ProBook 640 G2-T9X60ET | |
| HP 250 G4 T6P08ES | |
| Lenovo Thinkpad 13-20J1001BUS | |
| Lenovo IdeaPad Z40-59422614 | |
| HP EliteBook 725 G4 | |
| wPrime 2.10 - 1024m | |
| Lenovo IdeaPad Z40-59422614 | |
| Lenovo Thinkpad 13-20J1001BUS | |
| HP EliteBook 725 G4 | |
| Dell Latitude 5280 | |
| Asus VivoBook S15 S510UA | |
| Lenovo ThinkPad T470s-20HF0012US | |
* ... más pequeño es mejor
| PCMark 8 | |
| Home Score Accelerated v2 | |
| Apple MacBook Pro 15 2016 (2.9 GHz, 460) | |
| Asus VivoBook S15 S510UA | |
| HP Pavilion 15t-au100 CTO (W0P31AV) | |
| Work Score Accelerated v2 | |
| Apple MacBook Pro 15 2016 (2.9 GHz, 460) | |
| Asus VivoBook S15 S510UA | |
| HP Pavilion 15t-au100 CTO (W0P31AV) | |
| Creative Score Accelerated v2 | |
| Apple MacBook Pro 15 2016 (2.9 GHz, 460) | |
| Asus VivoBook S15 S510UA | |
| HP Pavilion 15t-au100 CTO (W0P31AV) | |
| PCMark 8 Home Score Accelerated v2 | 3831 puntos | |
| PCMark 8 Creative Score Accelerated v2 | 4627 puntos | |
| PCMark 8 Work Score Accelerated v2 | 4746 puntos | |
ayuda | ||
| Asus VivoBook S15 S510UA Toshiba HG6 THNSNJ128G8NY | Lenovo V510-15IKB 80WQ0002GE Samsung CM871a MZNTY256HDHP | HP Pavilion 15t-au100 CTO (W0P31AV) Toshiba MQ01ABD100 | Apple MacBook Pro 15 2016 (2.9 GHz, 460) Apple SSD SM1024L | Dell Inspiron 15 7000 7567 Intel SSDSCKKF256H6 | |
|---|---|---|---|---|---|
| CrystalDiskMark 3.0 | 51% | -91% | 165% | 29% | |
| Read Seq (MB/s) | 503 | 532 6% | 109.5 -78% | 1458 190% | 485.8 -3% |
| Write Seq (MB/s) | 396 | 511 29% | 105.2 -73% | 1440 264% | 422.8 7% |
| Read 512 (MB/s) | 417.7 | 414.8 -1% | 34.08 -92% | 914 119% | 338.9 -19% |
| Write 512 (MB/s) | 342 | 307.7 -10% | 40.02 -88% | 1058 209% | 304 -11% |
| Read 4k (MB/s) | 19.48 | 39.51 103% | 0.429 -98% | 9.786 -50% | 27.11 39% |
| Write 4k (MB/s) | 64.6 | 108.1 67% | 1.008 -98% | 10.9 -83% | 85.4 32% |
| Read 4k QD32 (MB/s) | 250.3 | 361.6 44% | 0.81 -100% | 679 171% | 279.6 12% |
| Write 4k QD32 (MB/s) | 94.3 | 253 168% | 0.893 -99% | 562 496% | 255.1 171% |

| 3DMark 11 | |
| 1280x720 Performance GPU | |
| Apple MacBook Pro 13 2016 (2.9 GHz) | |
| HP Spectre x360 15-bl002xx | |
| HP EliteBook 725 G4 | |
| HP EliteBook 725 G4 | |
| HP 250 G4 T6P08ES | |
| Asus VivoBook S15 S510UA | |
| Lenovo ThinkPad 13-20J2S00G00 | |
| Acer TravelMate P249-M-5452 | |
| Dell Latitude 5280 | |
| 1280x720 Performance Combined | |
| HP Spectre x360 15-bl002xx | |
| Apple MacBook Pro 13 2016 (2.9 GHz) | |
| Asus VivoBook S15 S510UA | |
| HP 250 G4 T6P08ES | |
| HP EliteBook 725 G4 | |
| HP EliteBook 725 G4 | |
| Acer TravelMate P249-M-5452 | |
| Lenovo ThinkPad 13-20J2S00G00 | |
| Dell Latitude 5280 | |
| 3DMark | |
| 1280x720 Cloud Gate Standard Graphics | |
| Apple MacBook Pro 13 2016 (2.9 GHz) | |
| HP Spectre x360 15-bl002xx | |
| Asus VivoBook S15 S510UA | |
| Acer TravelMate P249-M-5452 | |
| Dell Latitude 5280 | |
| HP 250 G4 T6P08ES | |
| HP EliteBook 725 G4 | |
| 1920x1080 Fire Strike Graphics | |
| HP Spectre x360 15-bl002xx | |
| Apple MacBook Pro 13 2016 (2.9 GHz) | |
| HP EliteBook 725 G4 | |
| HP EliteBook 725 G4 | |
| Asus VivoBook S15 S510UA | |
| HP 250 G4 T6P08ES | |
| Acer TravelMate P249-M-5452 | |
| Dell Latitude 5280 | |
| 1920x1080 Ice Storm Extreme Graphics | |
| Asus VivoBook S15 S510UA | |
| Acer TravelMate P249-M-5452 | |
| Dell Latitude 5280 | |
| HP Spectre x360 15-bl002xx | |
| HP EliteBook 725 G4 | |
| 3DMark 11 Performance | 1768 puntos | |
| 3DMark Ice Storm Standard Score | 69286 puntos | |
| 3DMark Cloud Gate Standard Score | 6704 puntos | |
| 3DMark Fire Strike Score | 965 puntos | |
| 3DMark Fire Strike Extreme Score | 449 puntos | |
ayuda | ||
| bajo | medio | alto | ultra | |
|---|---|---|---|---|
| BioShock Infinite (2013) | 62.7 | 33.9 | 28.6 | 8.8 |
| Dota 2 Reborn (2015) | 82 | 56 | 20 |
Ruido
| Ocioso |
| 30.2 / 30.2 / 30.2 dB(A) |
| HDD |
| 30.2 dB(A) |
| Carga |
| 36.9 / 37 dB(A) |
 | ||
30 dB silencioso 40 dB(A) audible 50 dB(A) ruidosamente alto |
||
min: | ||
| Asus VivoBook S15 S510UA HD Graphics 620, i5-7200U, Toshiba HG6 THNSNJ128G8NY | Lenovo V510-15IKB 80WQ0002GE HD Graphics 620, i5-7200U, Samsung CM871a MZNTY256HDHP | HP Pavilion 15t-au100 CTO (W0P31AV) GeForce 940MX, i7-7500U, Toshiba MQ01ABD100 | Apple MacBook Pro 15 2016 (2.9 GHz, 460) Radeon Pro 460, 6920HQ, Apple SSD SM1024L | Dell Inspiron 15 7000 7567 GeForce GTX 1050 Ti Mobile, i7-7700HQ, Intel SSDSCKKF256H6 | |
|---|---|---|---|---|---|
| Noise | 0% | -9% | -4% | -11% | |
| apagado / medio ambiente * (dB) | 28.2 | 30.2 -7% | 29 -3% | 30.3 -7% | |
| Idle Minimum * (dB) | 30.2 | 30.2 -0% | 32.2 -7% | 30.3 -0% | 30.9 -2% |
| Idle Average * (dB) | 30.2 | 30.2 -0% | 32.2 -7% | 30.3 -0% | 30.9 -2% |
| Idle Maximum * (dB) | 30.2 | 32 -6% | 33.7 -12% | 30.3 -0% | 31 -3% |
| Load Average * (dB) | 36.9 | 34.7 6% | 39.4 -7% | 35.1 5% | 46.5 -26% |
| Load Maximum * (dB) | 37 | 33.9 8% | 42.2 -14% | 46 -24% | 46.8 -26% |
* ... más pequeño es mejor
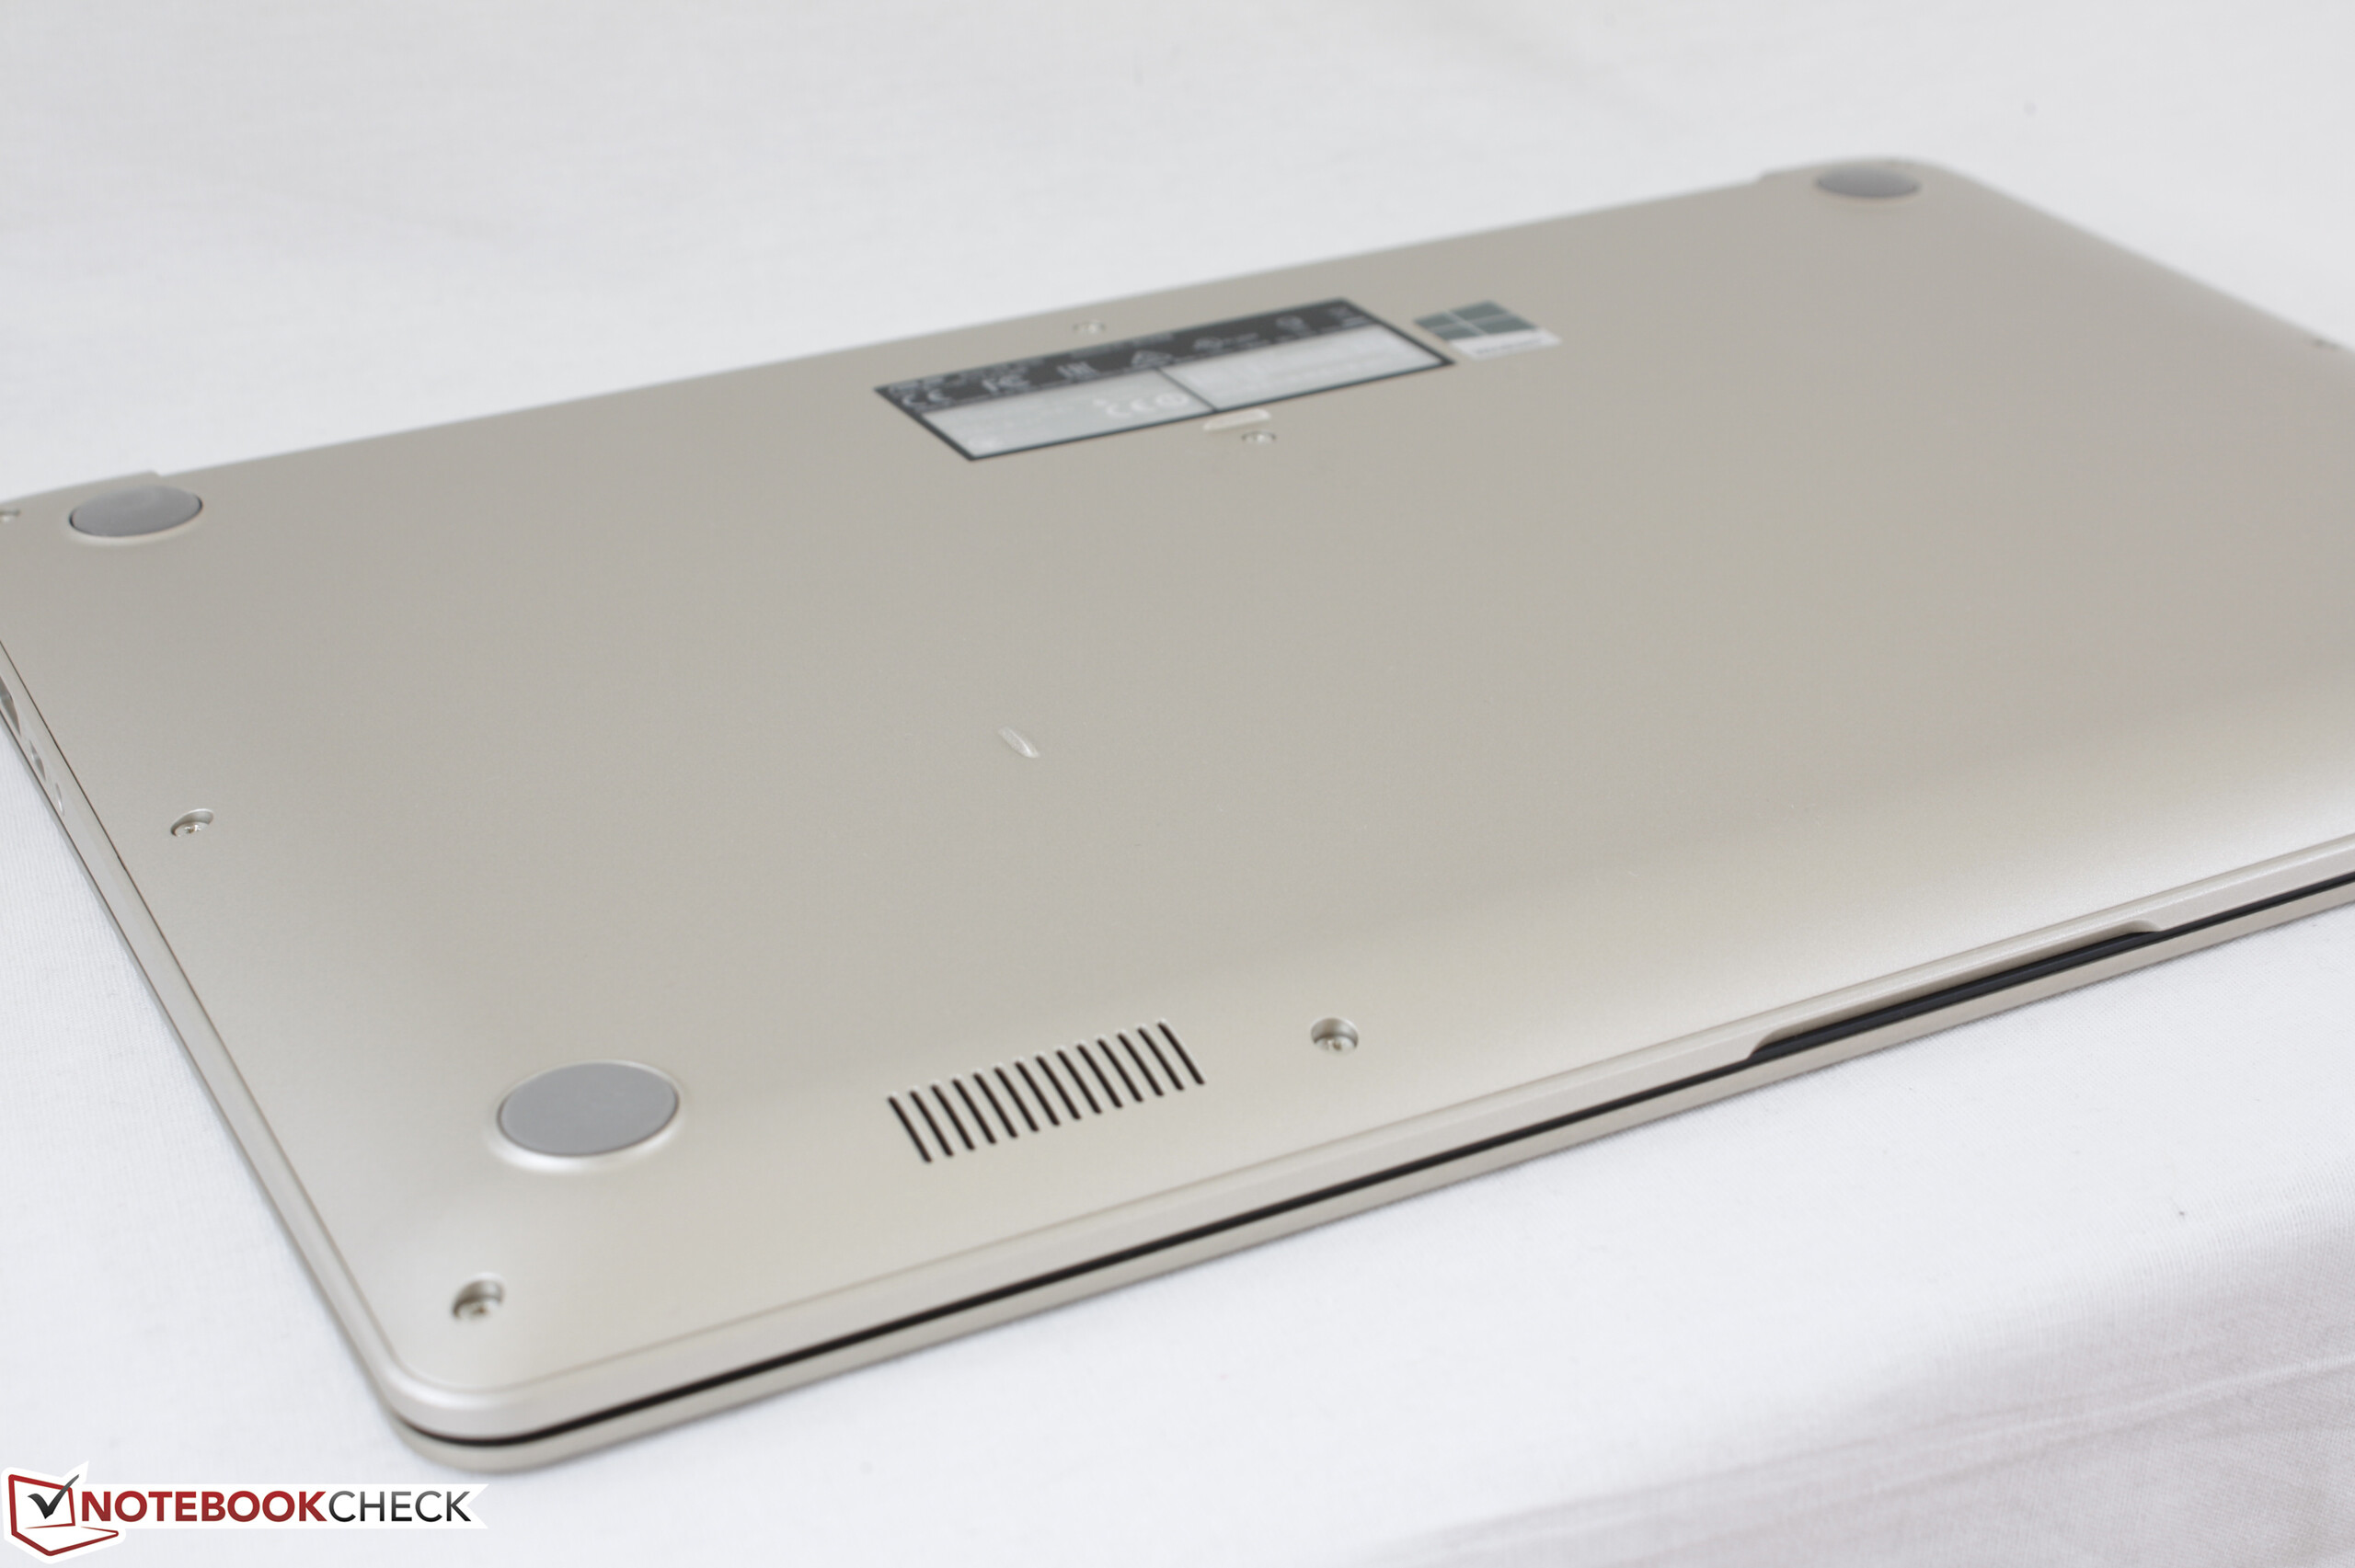
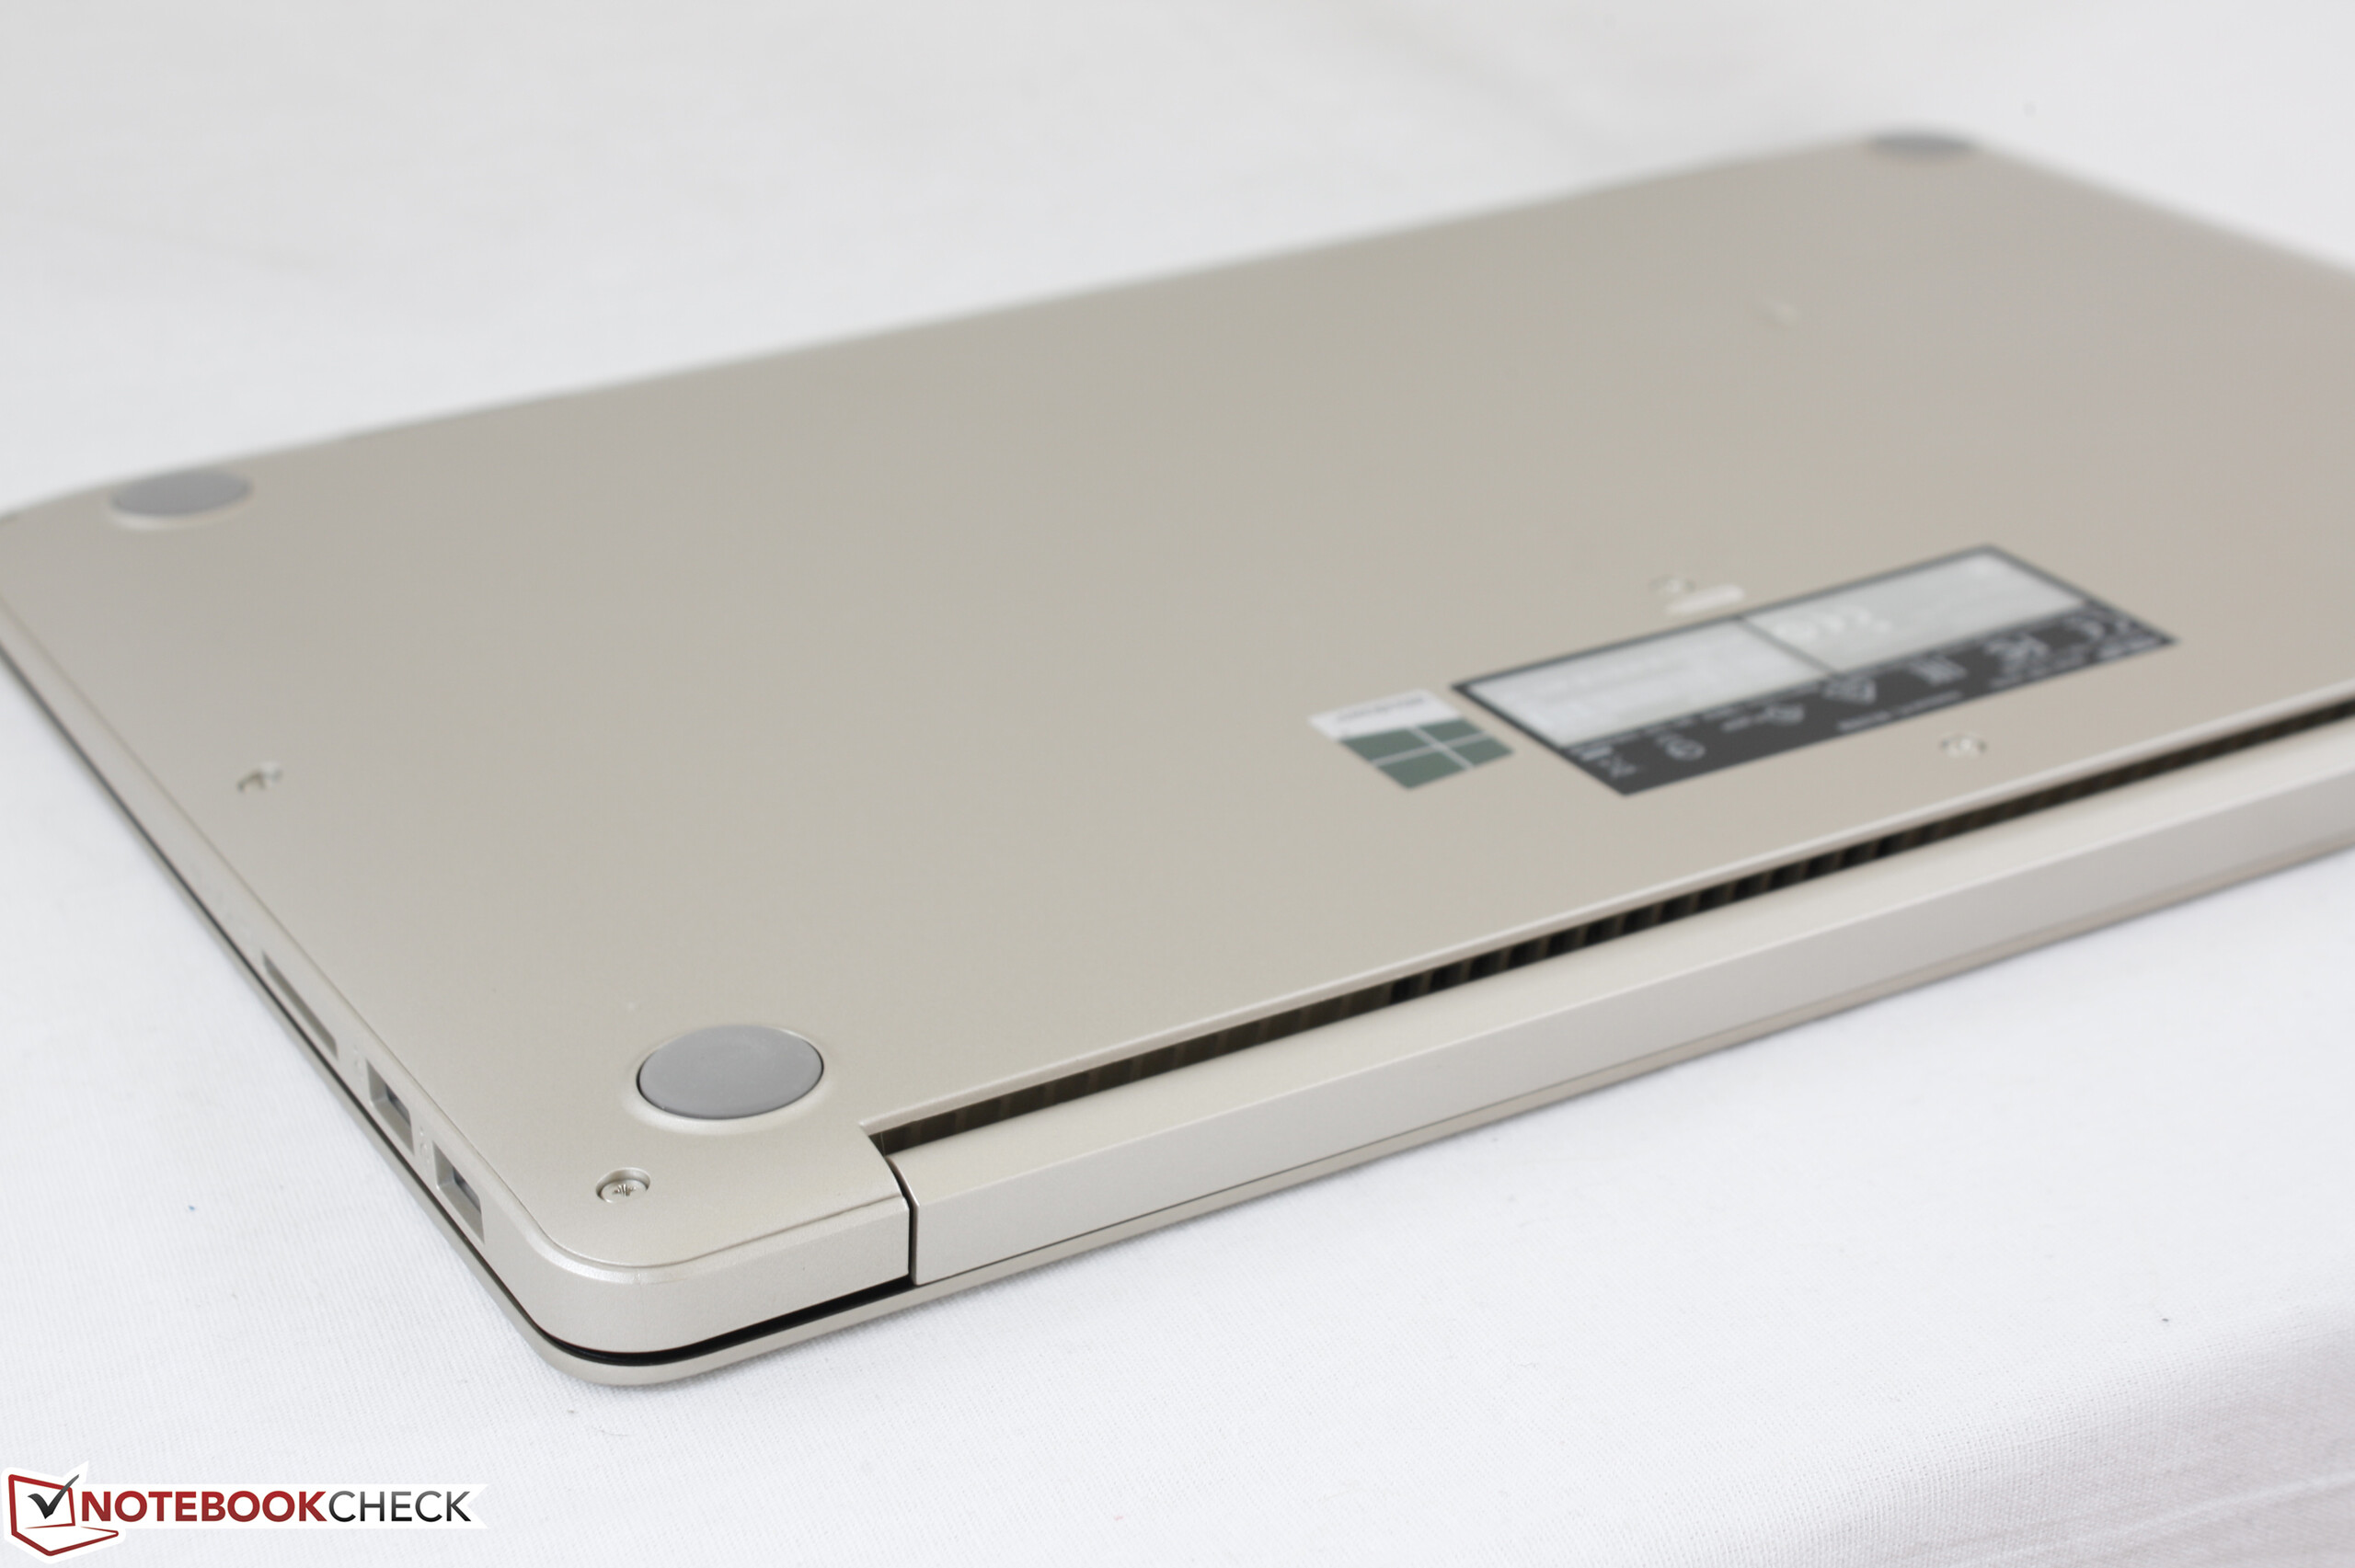
(-) La temperatura máxima en la parte superior es de 46 °C / 115 F, frente a la media de 36.8 °C / 98 F, que oscila entre 21 y 71 °C para la clase Multimedia.
(±) El fondo se calienta hasta un máximo de 45 °C / 113 F, frente a la media de 39.1 °C / 102 F
(+) En reposo, la temperatura media de la parte superior es de 23.5 °C / 74# F, frente a la media del dispositivo de 31.3 °C / 88 F.
(+) Los reposamanos y el panel táctil alcanzan como máximo la temperatura de la piel (32.4 °C / 90.3 F) y, por tanto, no están calientes.
(-) La temperatura media de la zona del reposamanos de dispositivos similares fue de 28.7 °C / 83.7 F (-3.7 °C / -6.6 F).
Asus VivoBook S15 S510UA análisis de audio
(-) | altavoces no muy altos (#66.4 dB)
Graves 100 - 315 Hz
(-) | casi sin bajos - de media 15.3% inferior a la mediana
(±) | la linealidad de los graves es media (12.2% delta a frecuencia anterior)
Medios 400 - 2000 Hz
(+) | medios equilibrados - a sólo 1.6% de la mediana
(+) | los medios son lineales (6.8% delta a la frecuencia anterior)
Altos 2 - 16 kHz
(+) | máximos equilibrados - a sólo 3.8% de la mediana
(±) | la linealidad de los máximos es media (10.6% delta a frecuencia anterior)
Total 100 - 16.000 Hz
(±) | la linealidad del sonido global es media (19.8% de diferencia con la mediana)
En comparación con la misma clase
» 65% de todos los dispositivos probados de esta clase eran mejores, 6% similares, 28% peores
» El mejor tuvo un delta de 5%, la media fue 17%, el peor fue ###max##%
En comparación con todos los dispositivos probados
» 50% de todos los dispositivos probados eran mejores, 7% similares, 43% peores
» El mejor tuvo un delta de 4%, la media fue 24%, el peor fue ###max##%
Apple MacBook 12 (Early 2016) 1.1 GHz análisis de audio
(+) | los altavoces pueden reproducir a un volumen relativamente alto (#83.6 dB)
Graves 100 - 315 Hz
(±) | lubina reducida - en promedio 11.3% inferior a la mediana
(±) | la linealidad de los graves es media (14.2% delta a frecuencia anterior)
Medios 400 - 2000 Hz
(+) | medios equilibrados - a sólo 2.4% de la mediana
(+) | los medios son lineales (5.5% delta a la frecuencia anterior)
Altos 2 - 16 kHz
(+) | máximos equilibrados - a sólo 2% de la mediana
(+) | los máximos son lineales (4.5% delta a la frecuencia anterior)
Total 100 - 16.000 Hz
(+) | el sonido global es lineal (10.2% de diferencia con la mediana)
En comparación con la misma clase
» 7% de todos los dispositivos probados de esta clase eran mejores, 2% similares, 91% peores
» El mejor tuvo un delta de 5%, la media fue 18%, el peor fue ###max##%
En comparación con todos los dispositivos probados
» 5% de todos los dispositivos probados eran mejores, 1% similares, 94% peores
» El mejor tuvo un delta de 4%, la media fue 24%, el peor fue ###max##%
| Off / Standby | |
| Ocioso | |
| Carga |
|
Clave:
min: | |
| Asus VivoBook S15 S510UA i5-7200U, HD Graphics 620, Toshiba HG6 THNSNJ128G8NY, IPS, 1920x1080, 15.6" | Lenovo V510-15IKB 80WQ0002GE i5-7200U, HD Graphics 620, Samsung CM871a MZNTY256HDHP, IPS, 1920x1080, 15.6" | HP Pavilion 15t-au100 CTO (W0P31AV) i7-7500U, GeForce 940MX, Toshiba MQ01ABD100, IPS, 1920x1080, 15.6" | Apple MacBook Pro 15 2016 (2.9 GHz, 460) 6920HQ, Radeon Pro 460, Apple SSD SM1024L, IPS, 2880x1800, 15.4" | HP Envy 15-as133cl i7-7500U, HD Graphics 620, HGST Travelstar 5K1000 HTS541010A7E630, IPS, 1920x1080, 15.6" | |
|---|---|---|---|---|---|
| Power Consumption | -5% | -33% | -62% | 10% | |
| Idle Minimum * (Watt) | 4.6 | 4 13% | 6.16 -34% | 3 35% | 4.6 -0% |
| Idle Average * (Watt) | 7.6 | 9.6 -26% | 8.48 -12% | 9.9 -30% | 7.7 -1% |
| Idle Maximum * (Watt) | 7.7 | 9.7 -26% | 9.62 -25% | 12.5 -62% | 7.8 -1% |
| Load Average * (Watt) | 35.1 | 27.7 21% | 41.63 -19% | 70.6 -101% | 30.5 13% |
| Load Maximum * (Watt) | 36.2 | 38.4 -6% | 63.22 -75% | 90.8 -151% | 22.7 37% |
* ... más pequeño es mejor
| Asus VivoBook S15 S510UA i5-7200U, HD Graphics 620, 42 Wh | Lenovo V510-15IKB 80WQ0002GE i5-7200U, HD Graphics 620, 32 Wh | HP Pavilion 15t-au100 CTO (W0P31AV) i7-7500U, GeForce 940MX, 41 Wh | Apple MacBook Pro 15 2016 (2.9 GHz, 460) 6920HQ, Radeon Pro 460, 76 Wh | HP Envy 15-as133cl i7-7500U, HD Graphics 620, 52 Wh | |
|---|---|---|---|---|---|
| Duración de Batería | -12% | 3% | 58% | 17% | |
| Reader / Idle (h) | 10.2 | 7.3 -28% | 9.6 -6% | ||
| WiFi v1.3 (h) | 4.3 | 3.8 -12% | 3.7 -14% | 10.3 140% | 6.8 58% |
| Load (h) | 1.2 | 1.8 50% | 0.9 -25% | 1.2 0% |
Pro
Contra

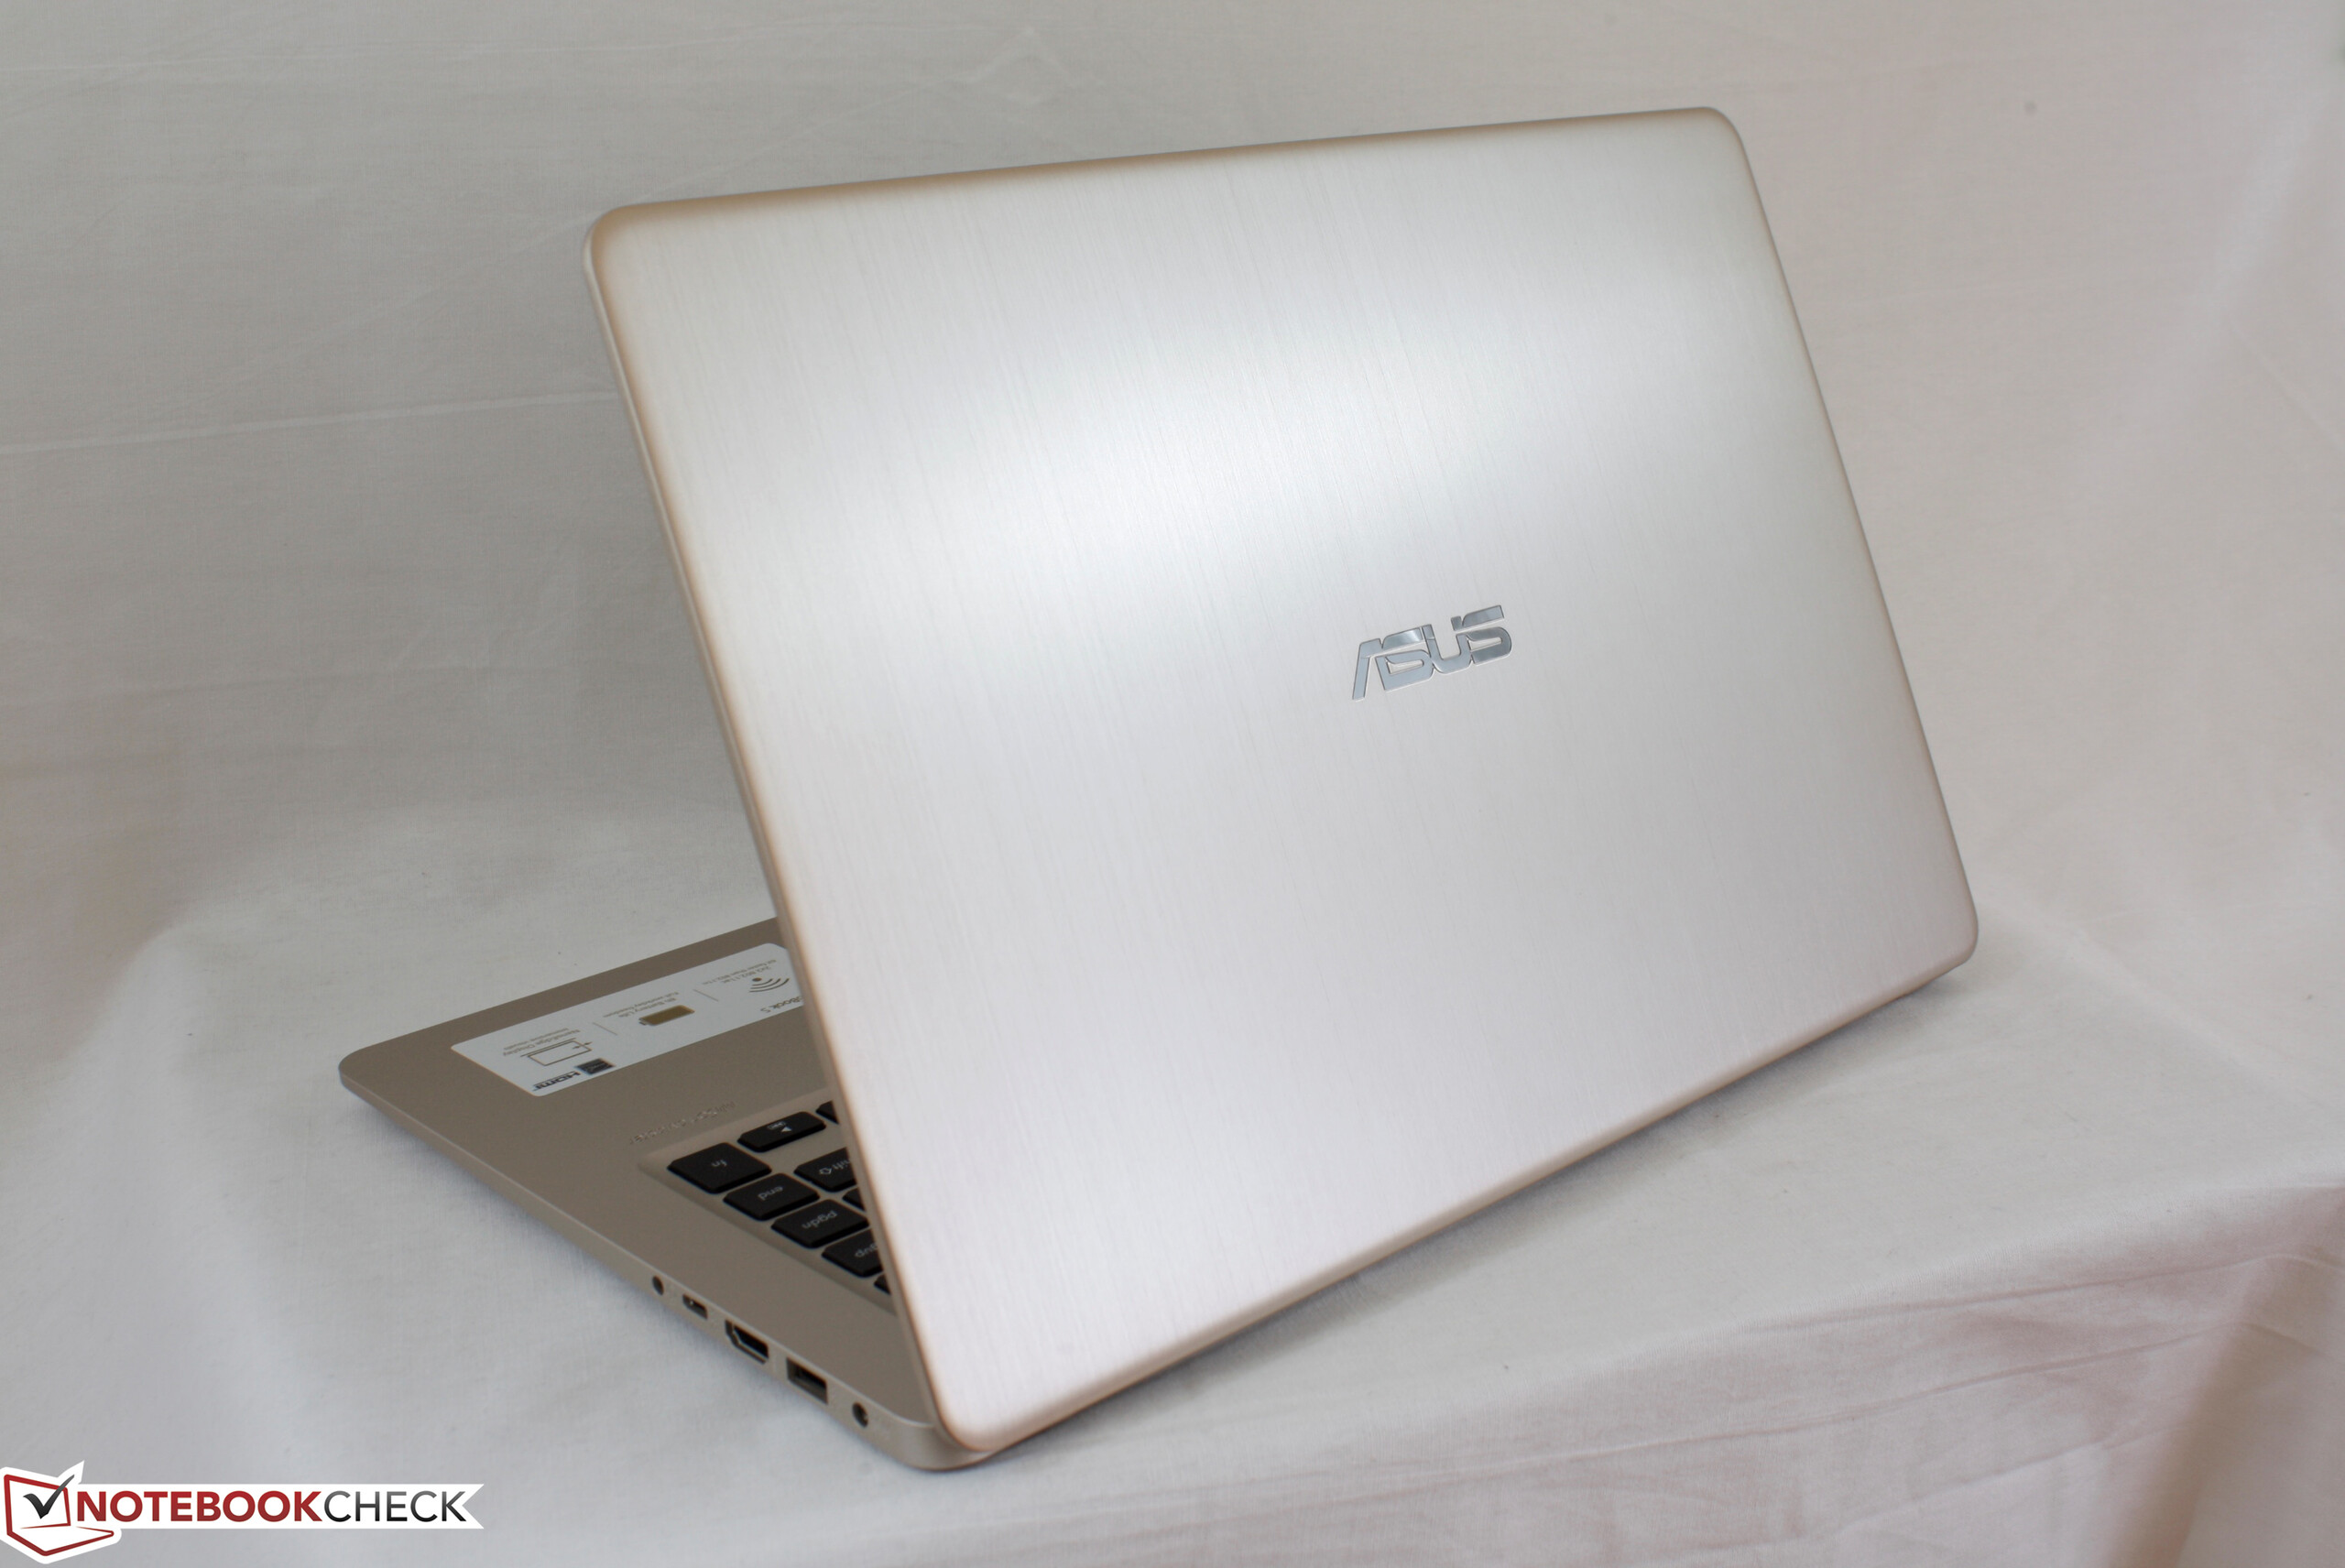
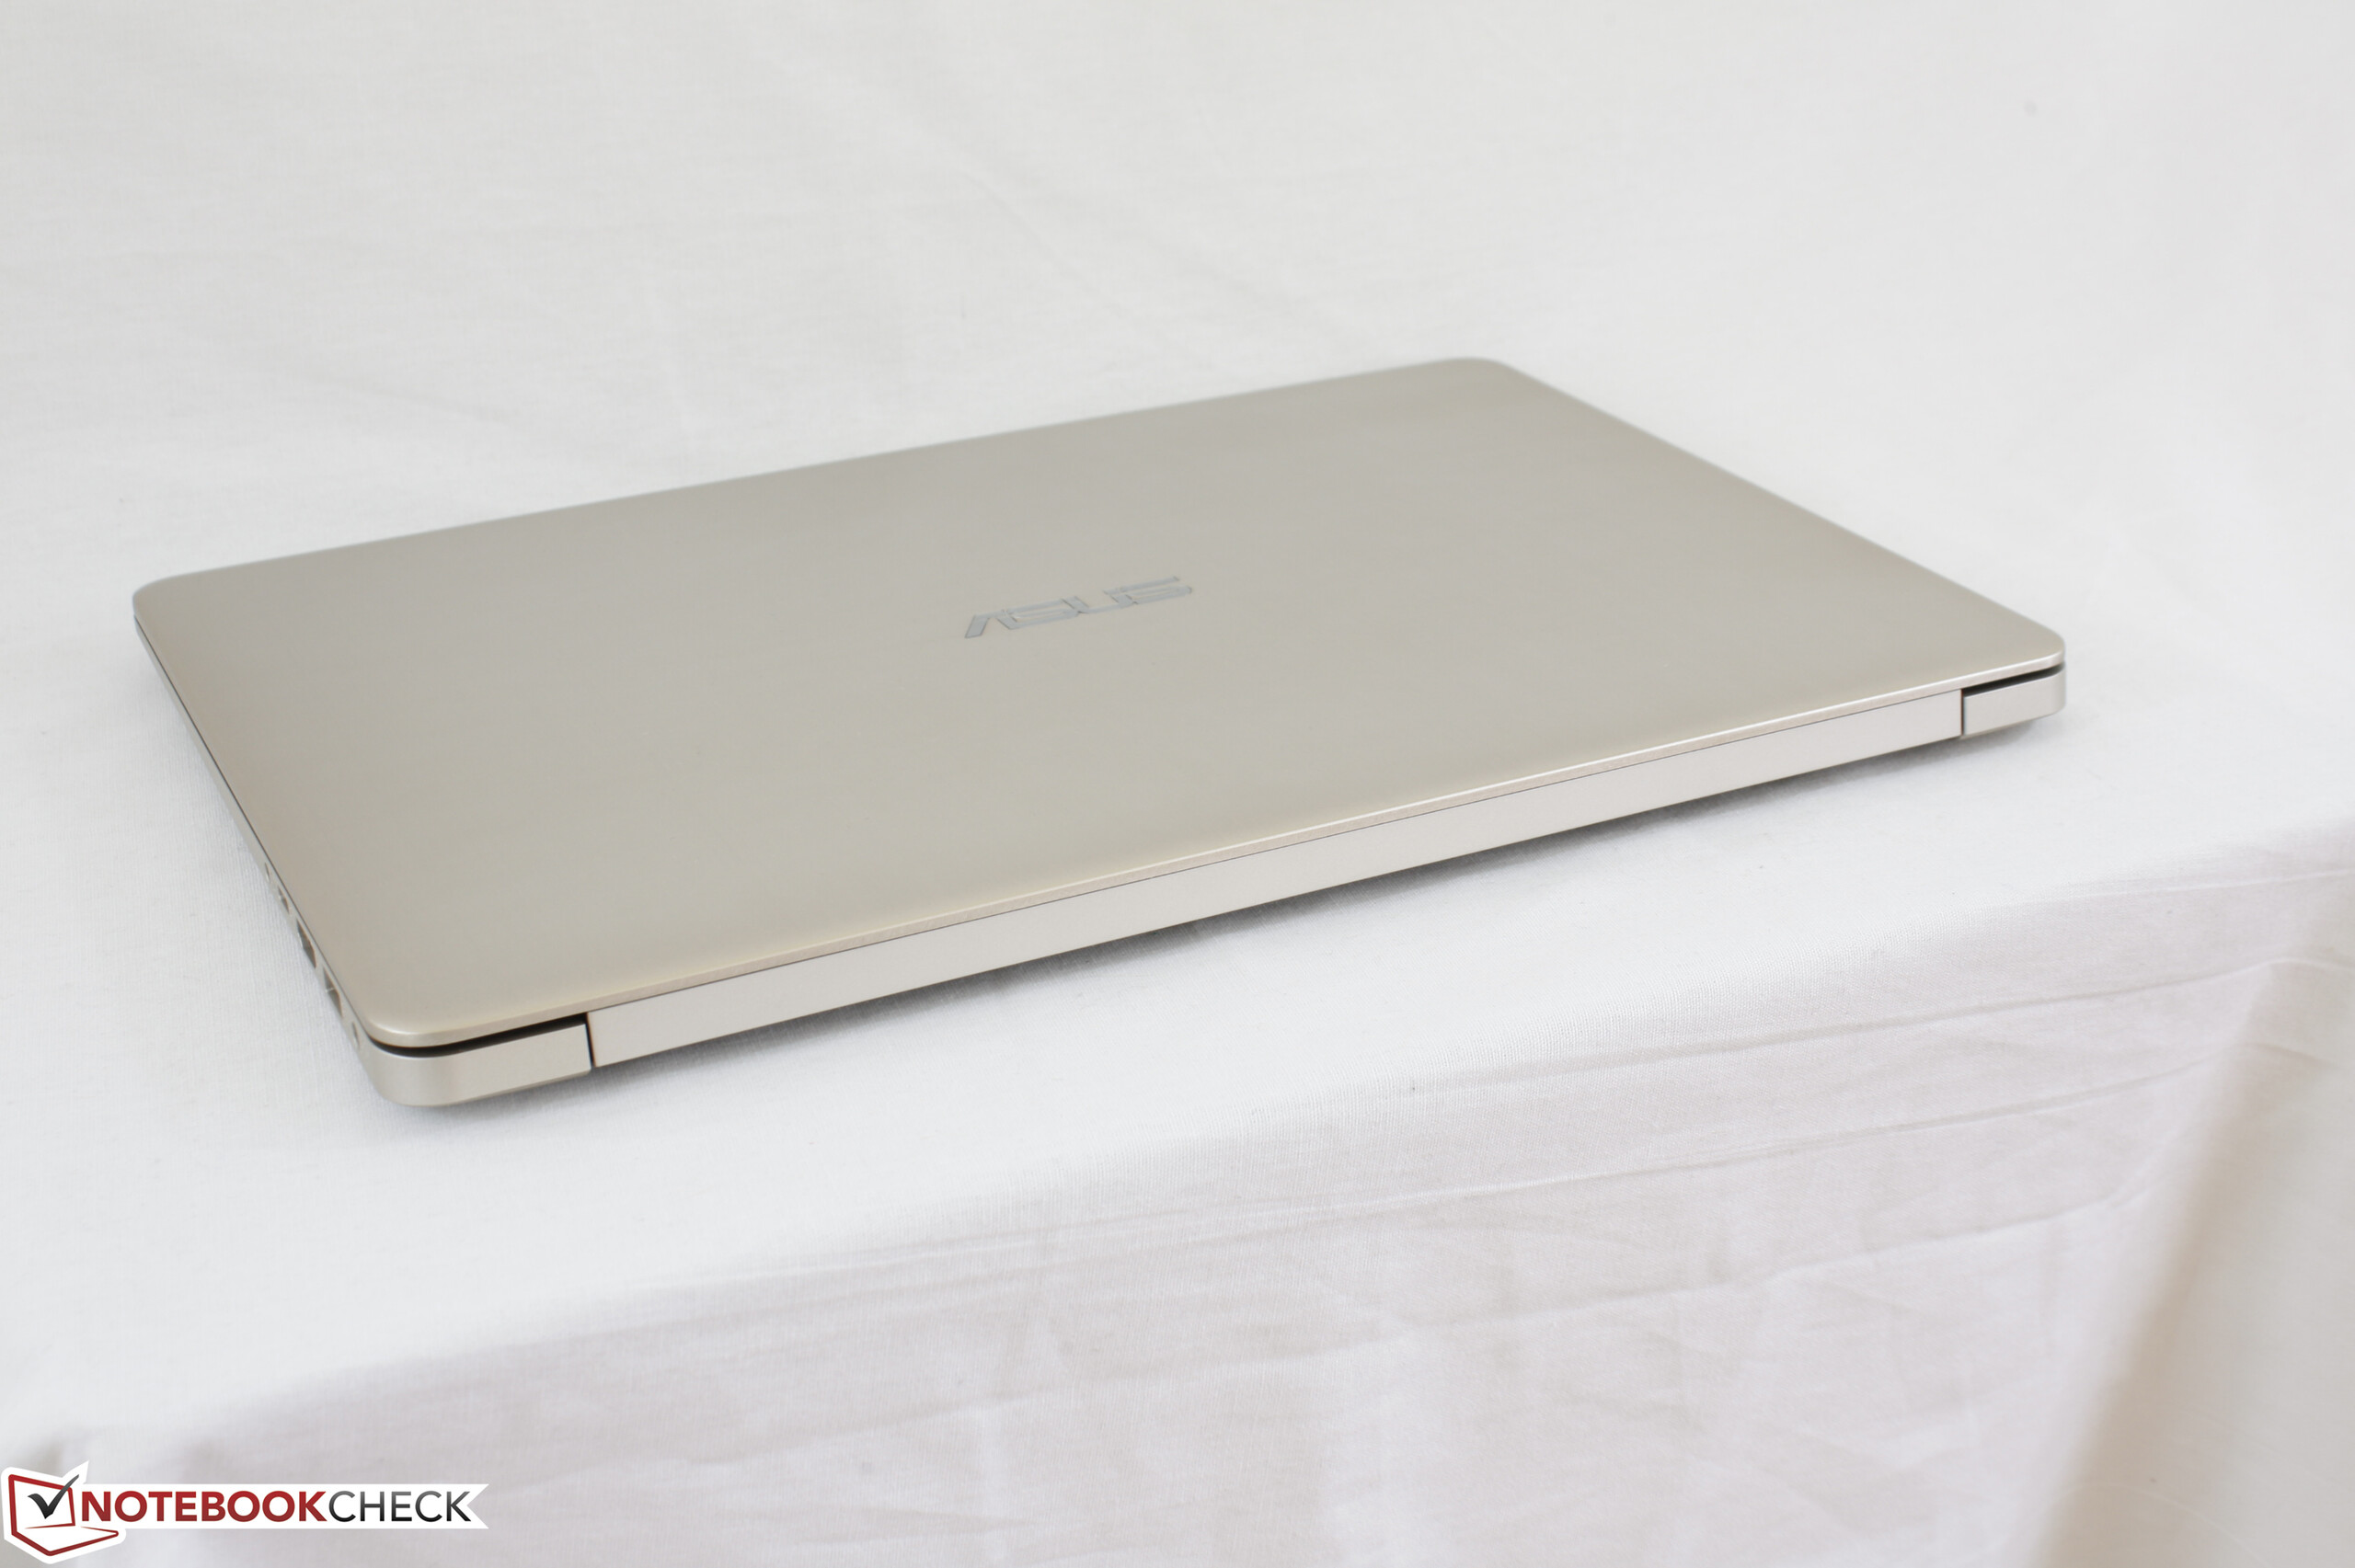
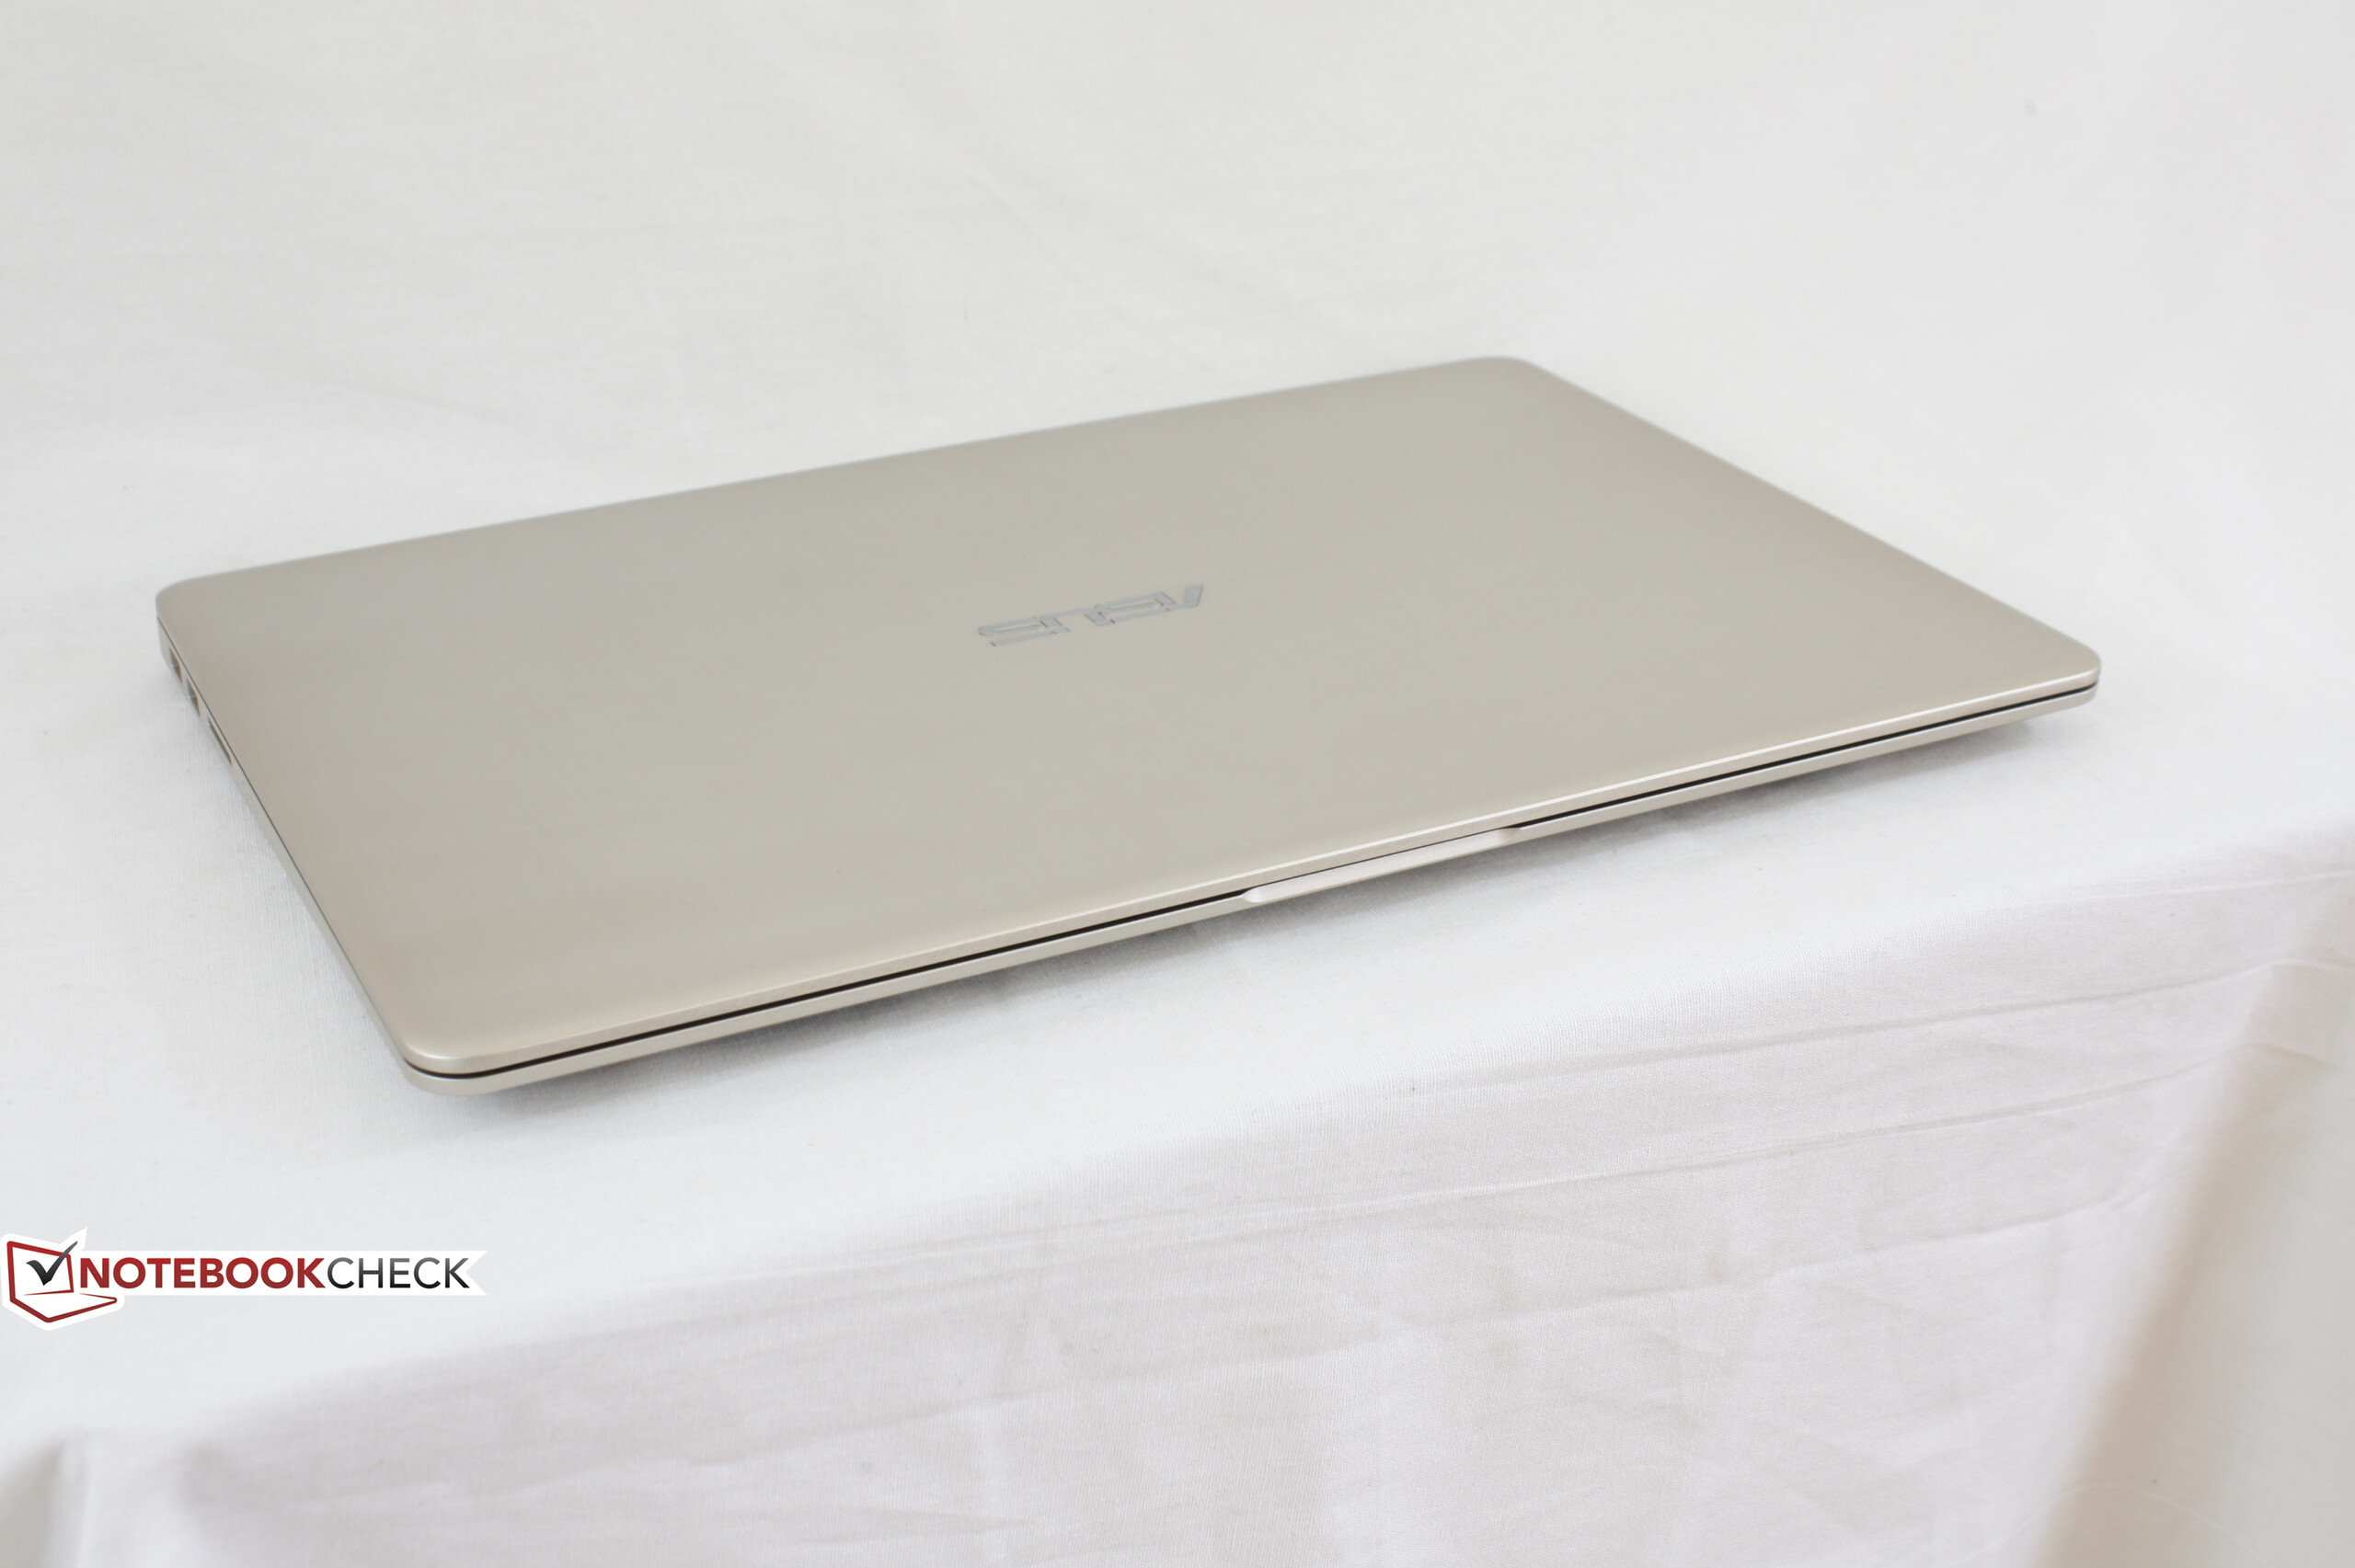
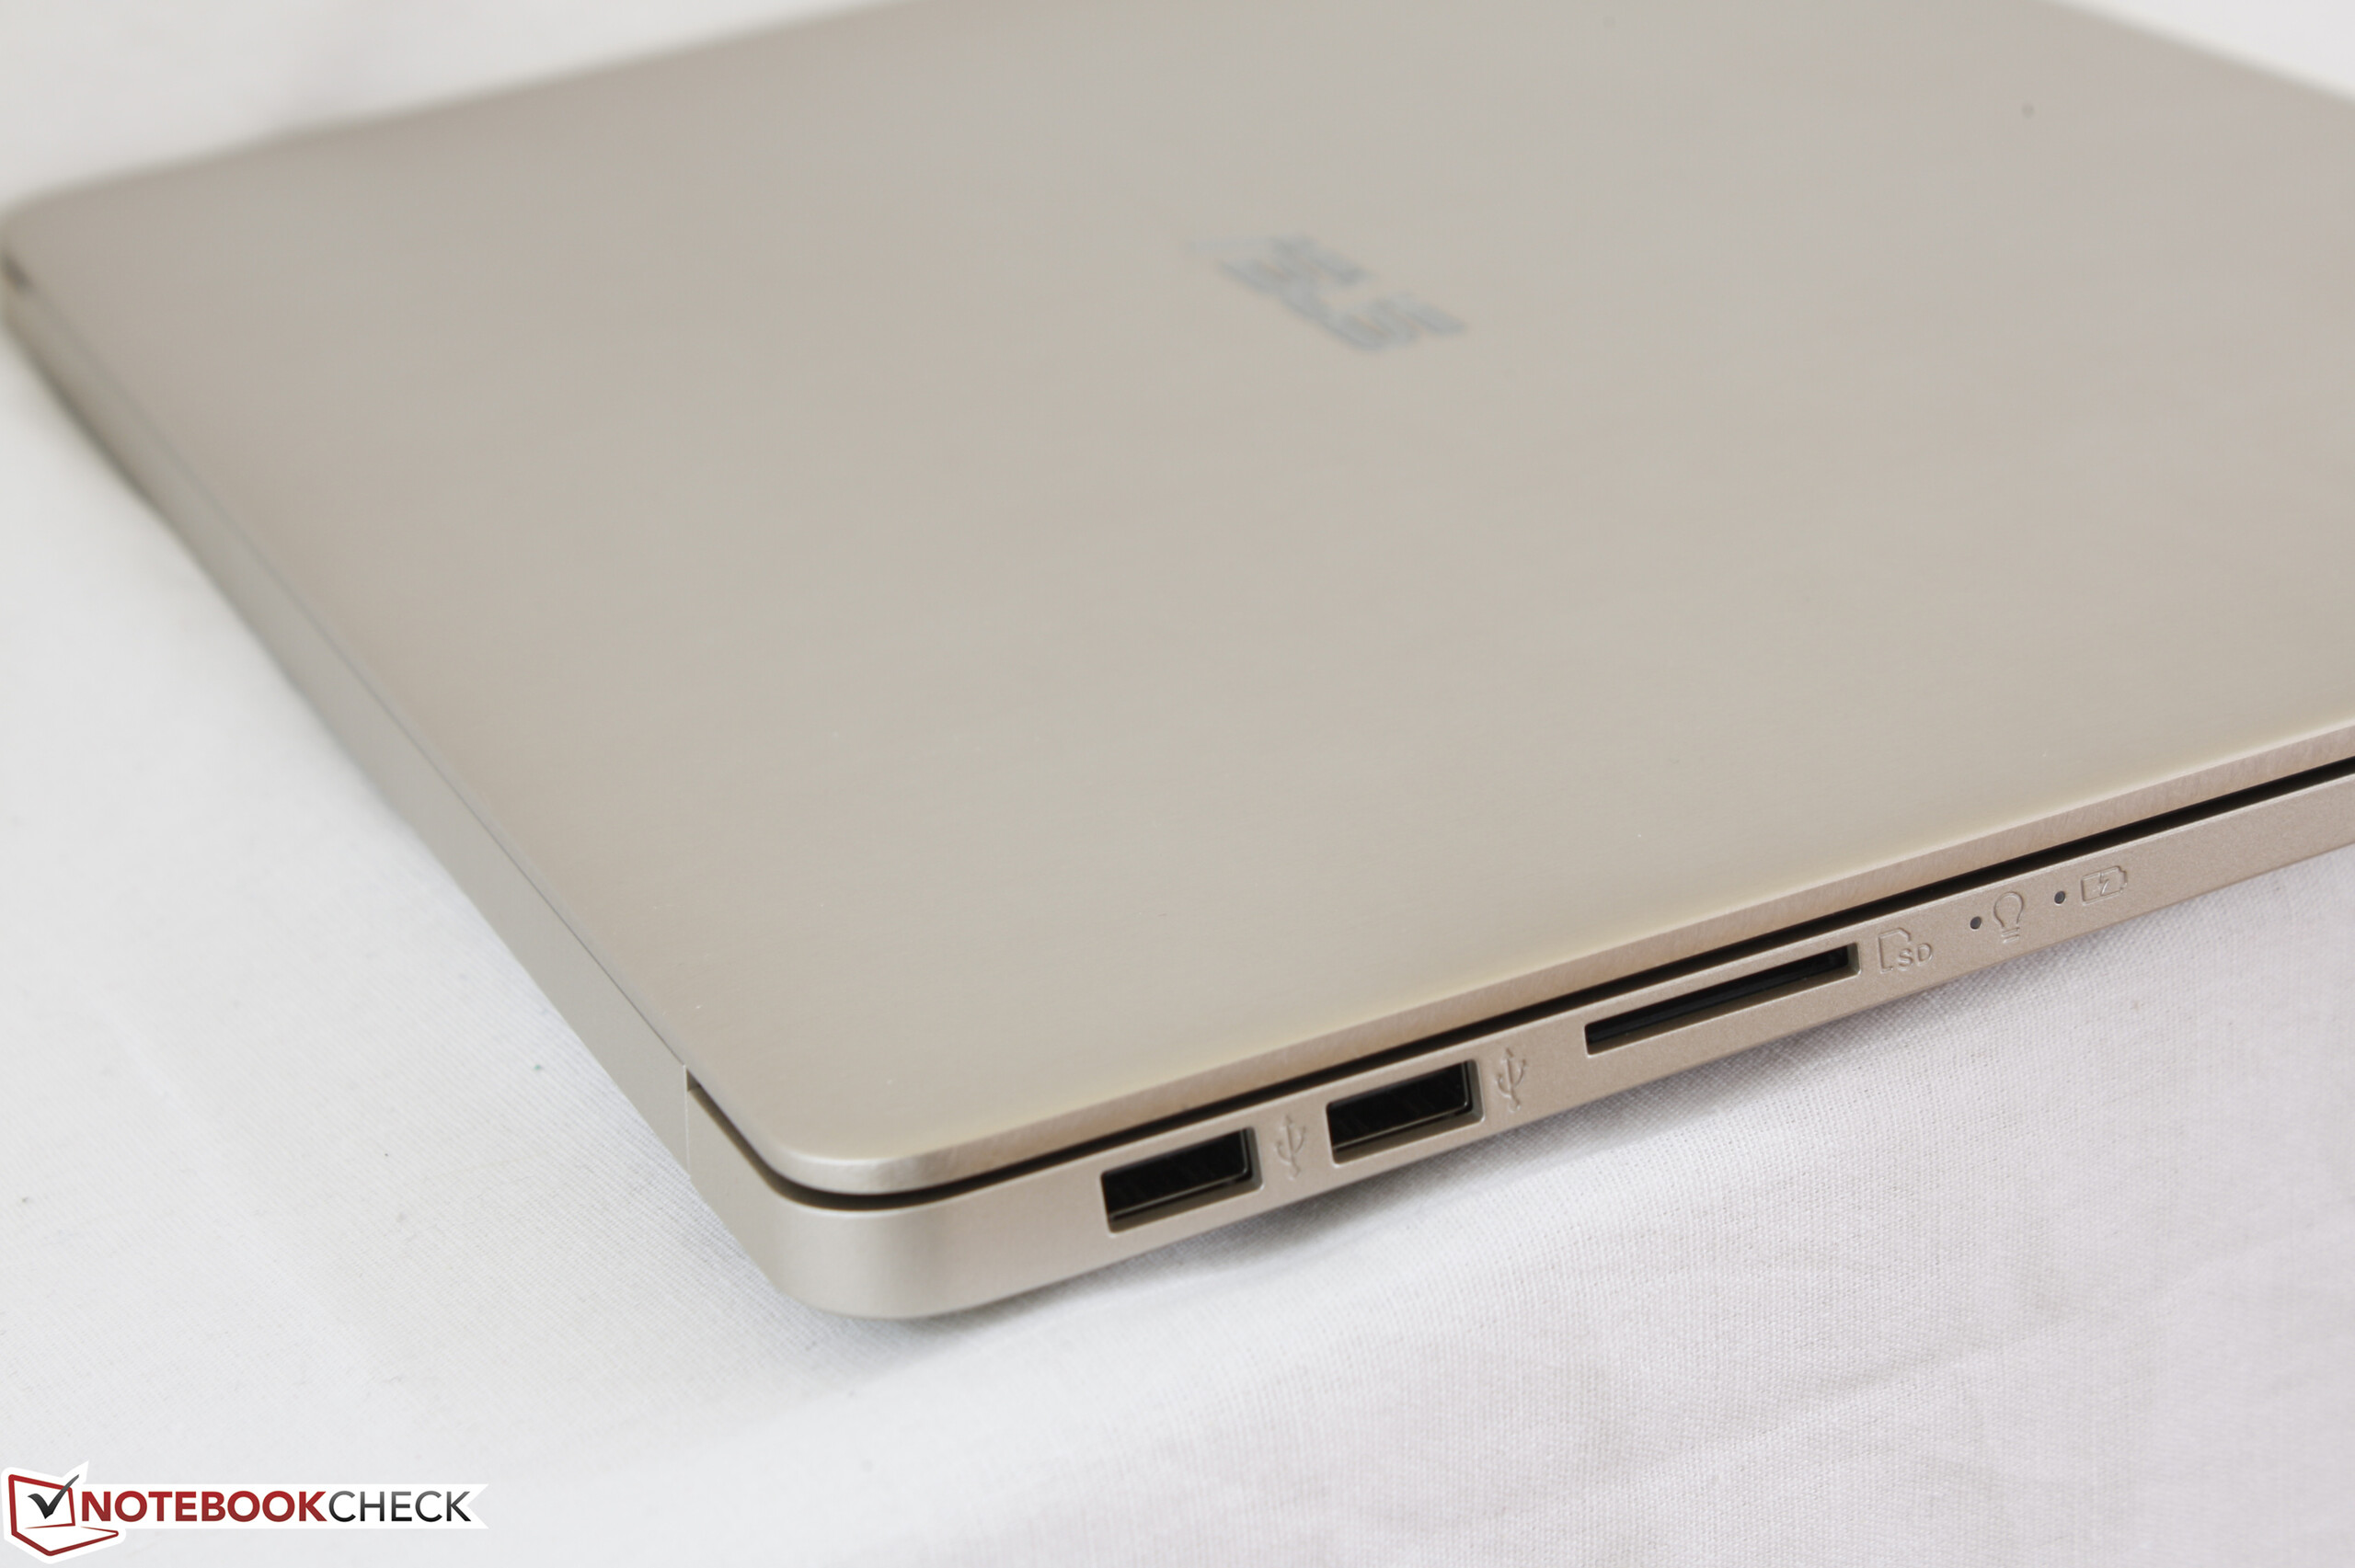
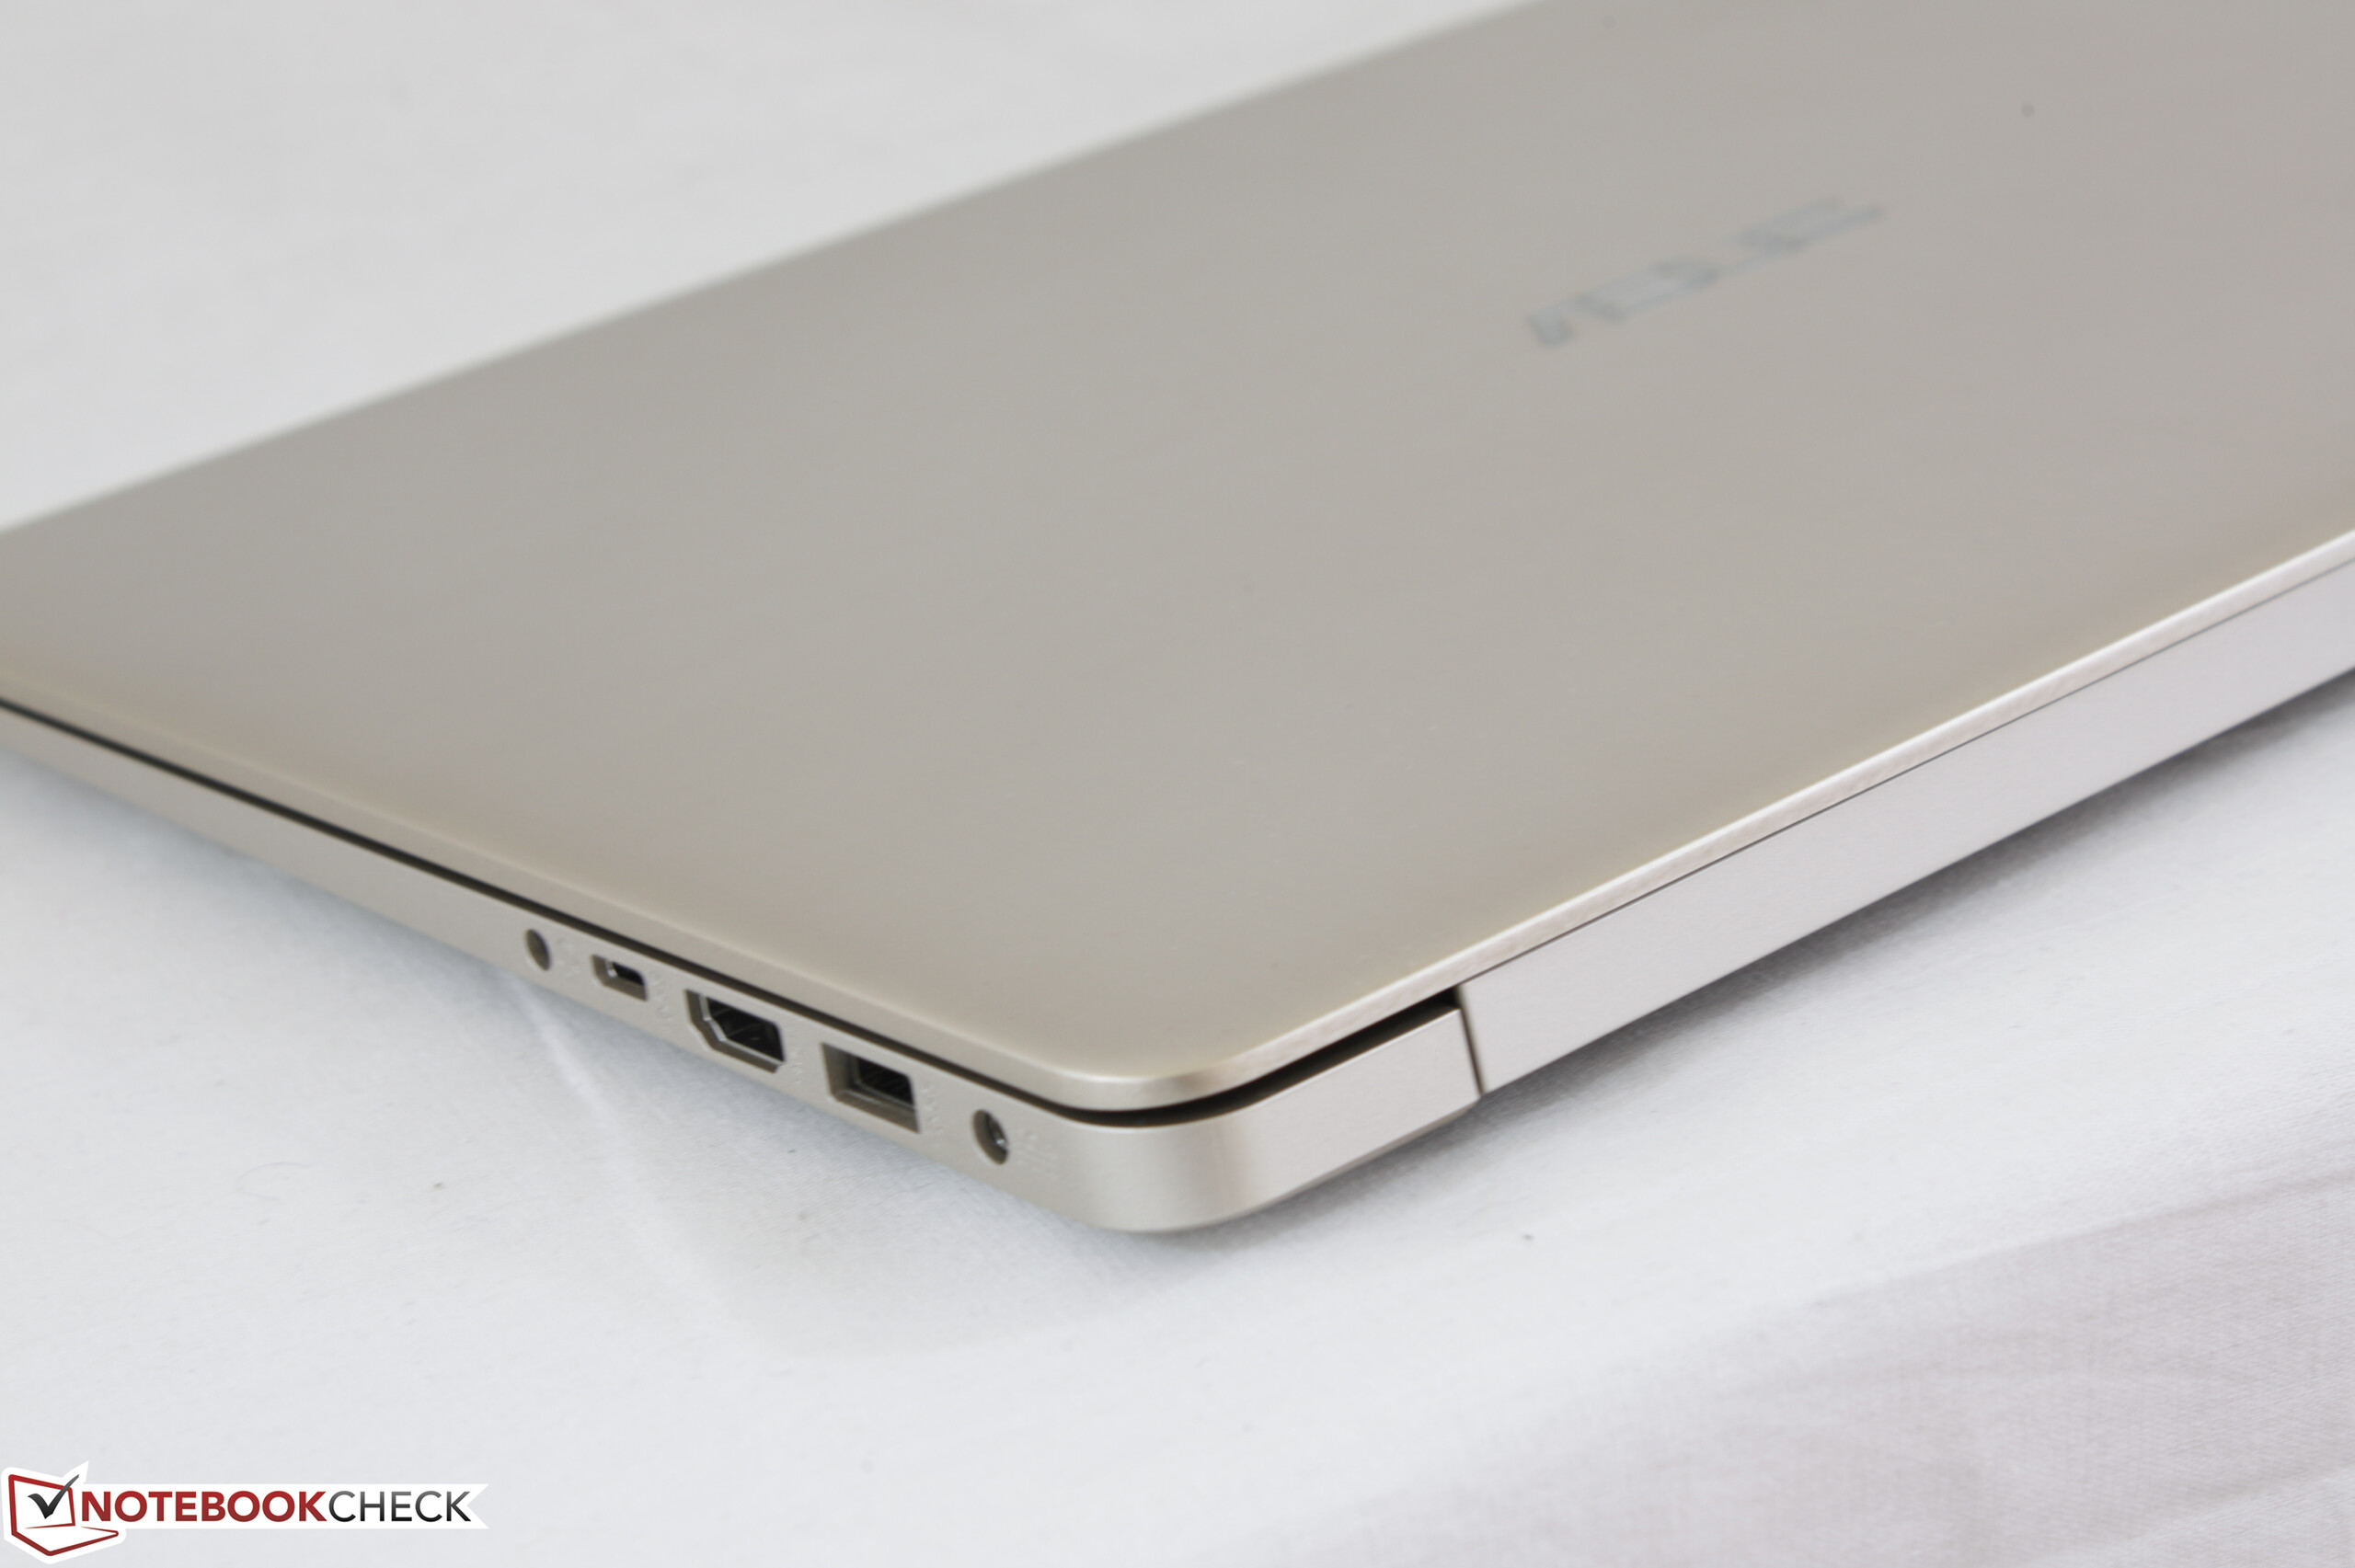
La gama VivoBook S510 fue diseñada para resultar más asequible que las gamas ZenBook, XPS, o Spectre sin resultar más pesada o menos atractiva. Es, en esencia, un portátil de precio reducido para todos los públicos con un diseño muy premium y delgado. Asus ha tenido éxito en este aspecto ya que el S510UA tiene un precio inicial de menos de 1000$ y sus delgados marcos hacen que tenga un tamaño inferior al que encontramos en portátiles de características similares en las familias Pavilion, Inspiron, o IdeaPad. Nos ha agradado ver que no se ha ahorrado en la calidad de la pantalla o en el rendimiento del procesador que que mantiene velocidades Turbo Boost sin problema. El escaso ruido del ventilador es otro punto muy positivo, especialmente si lo comparamos con los ventiladores del XPS 15.
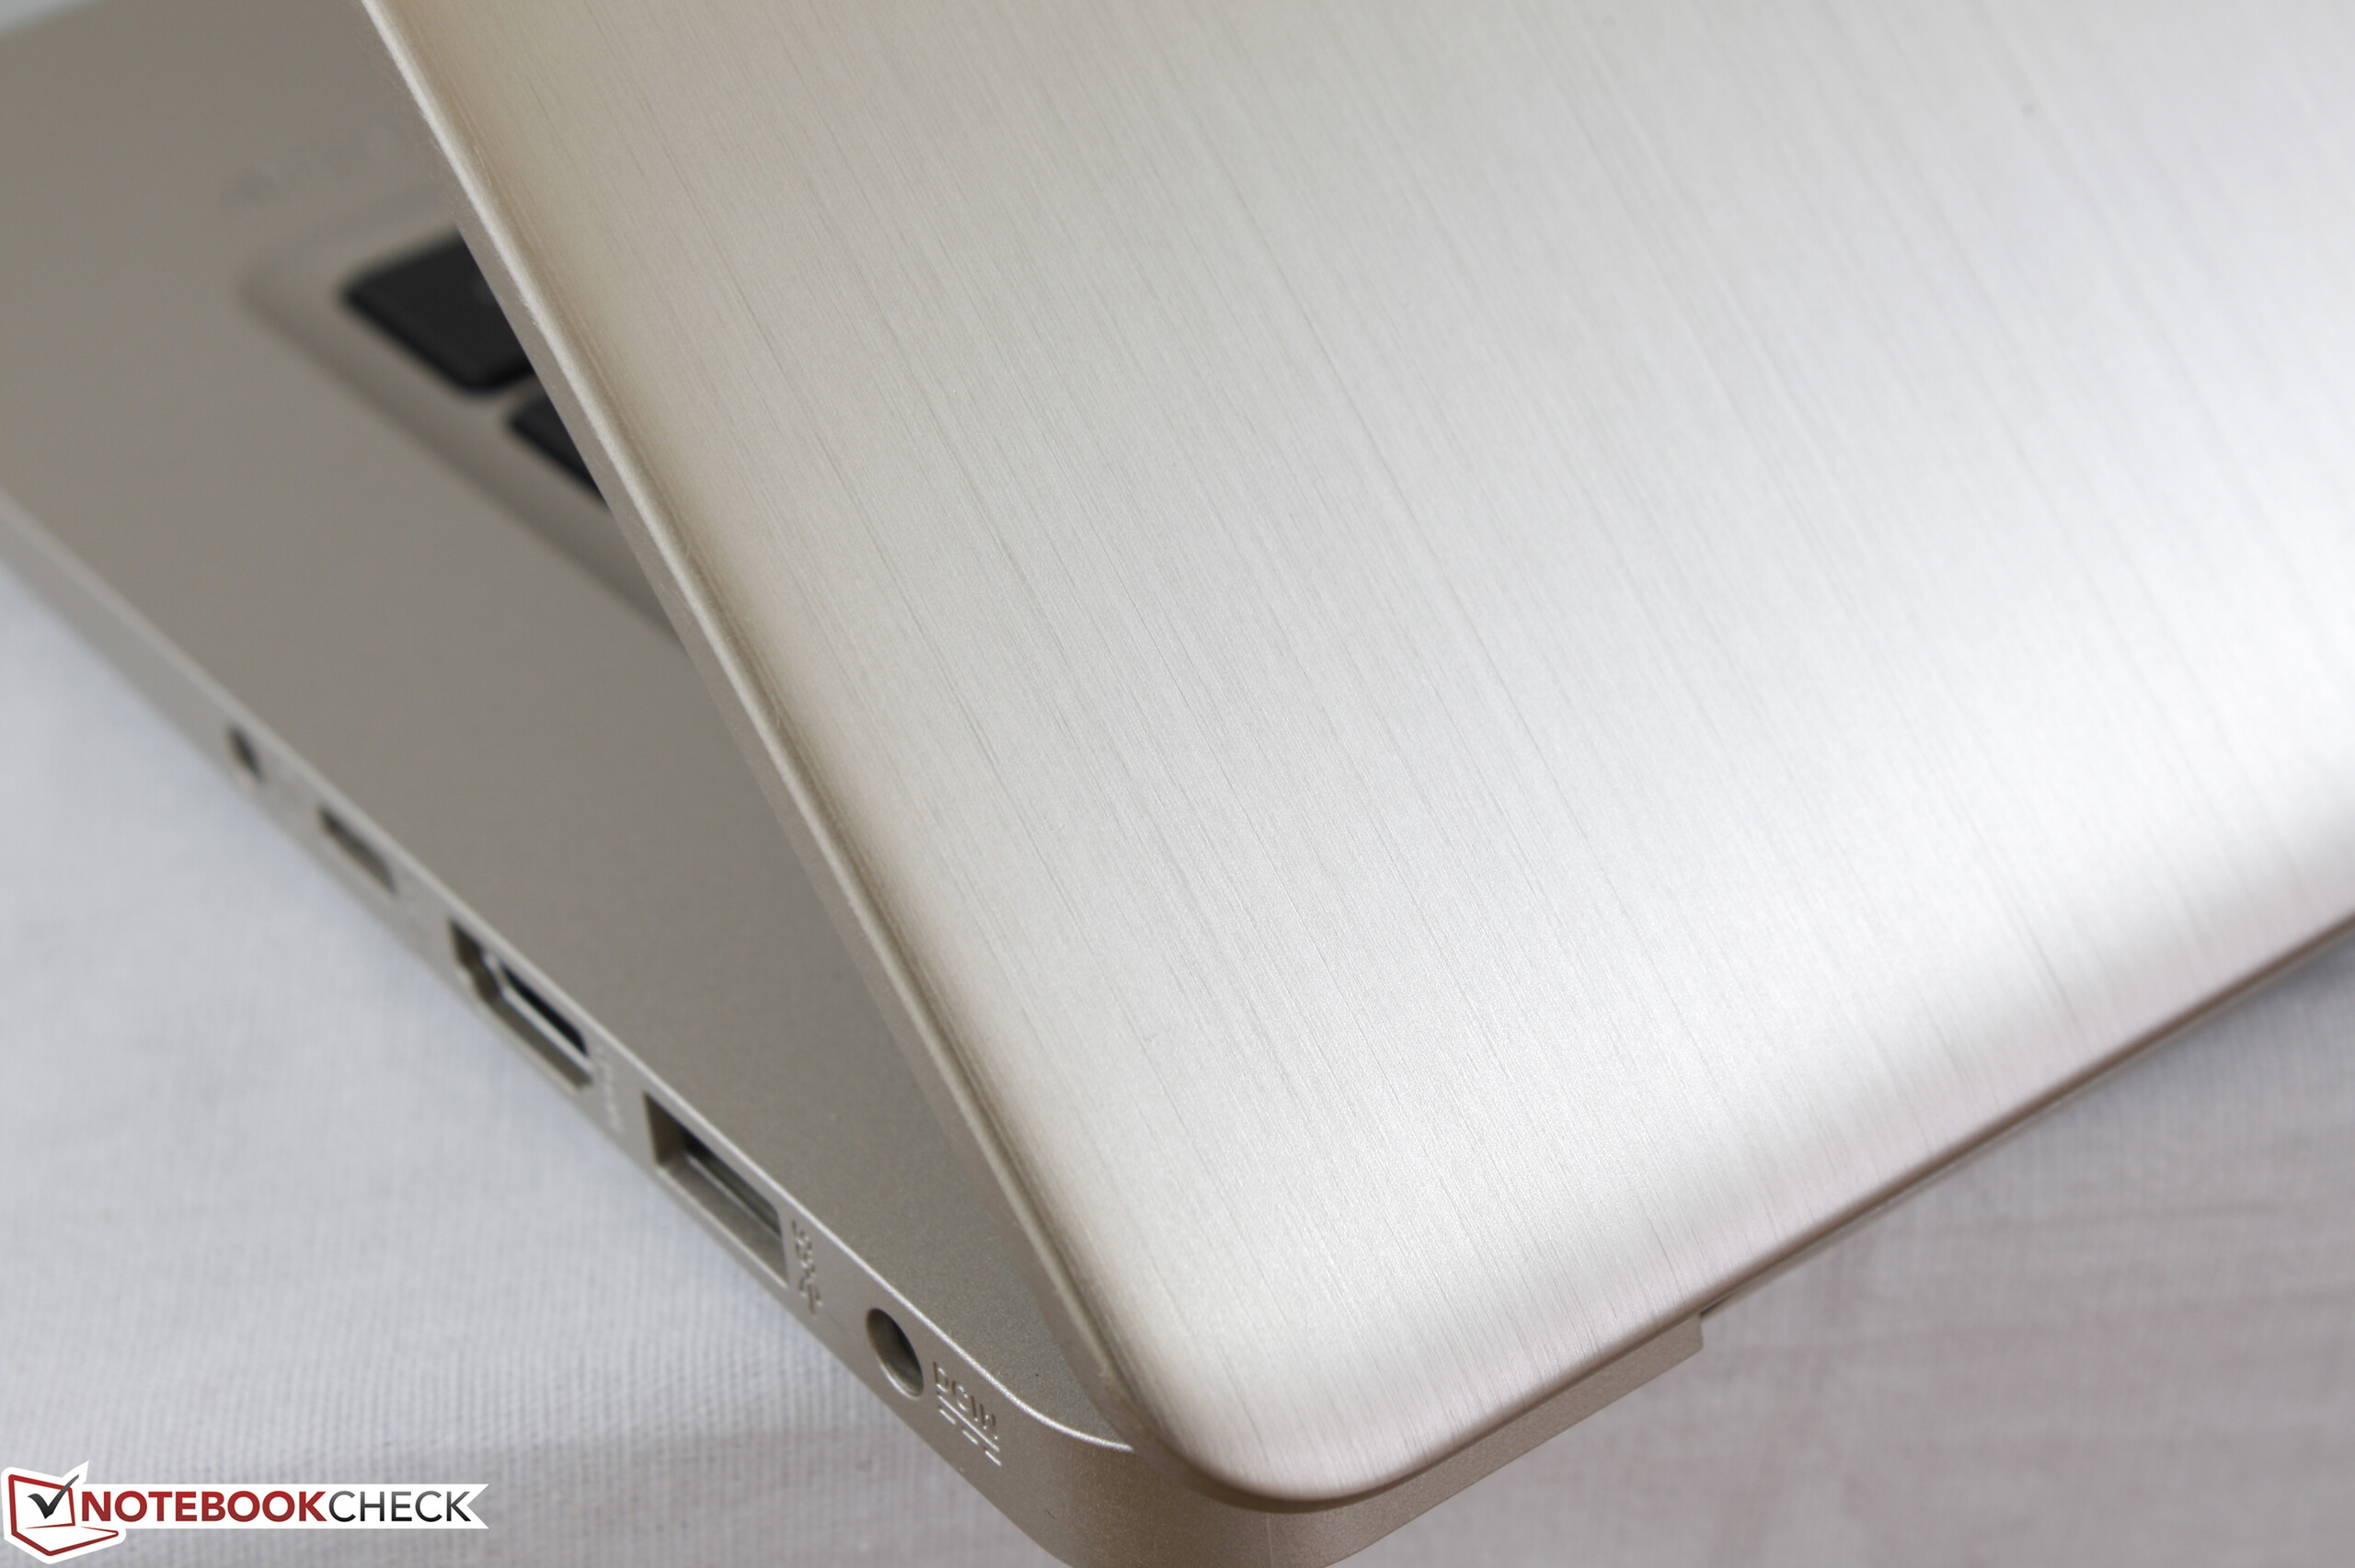
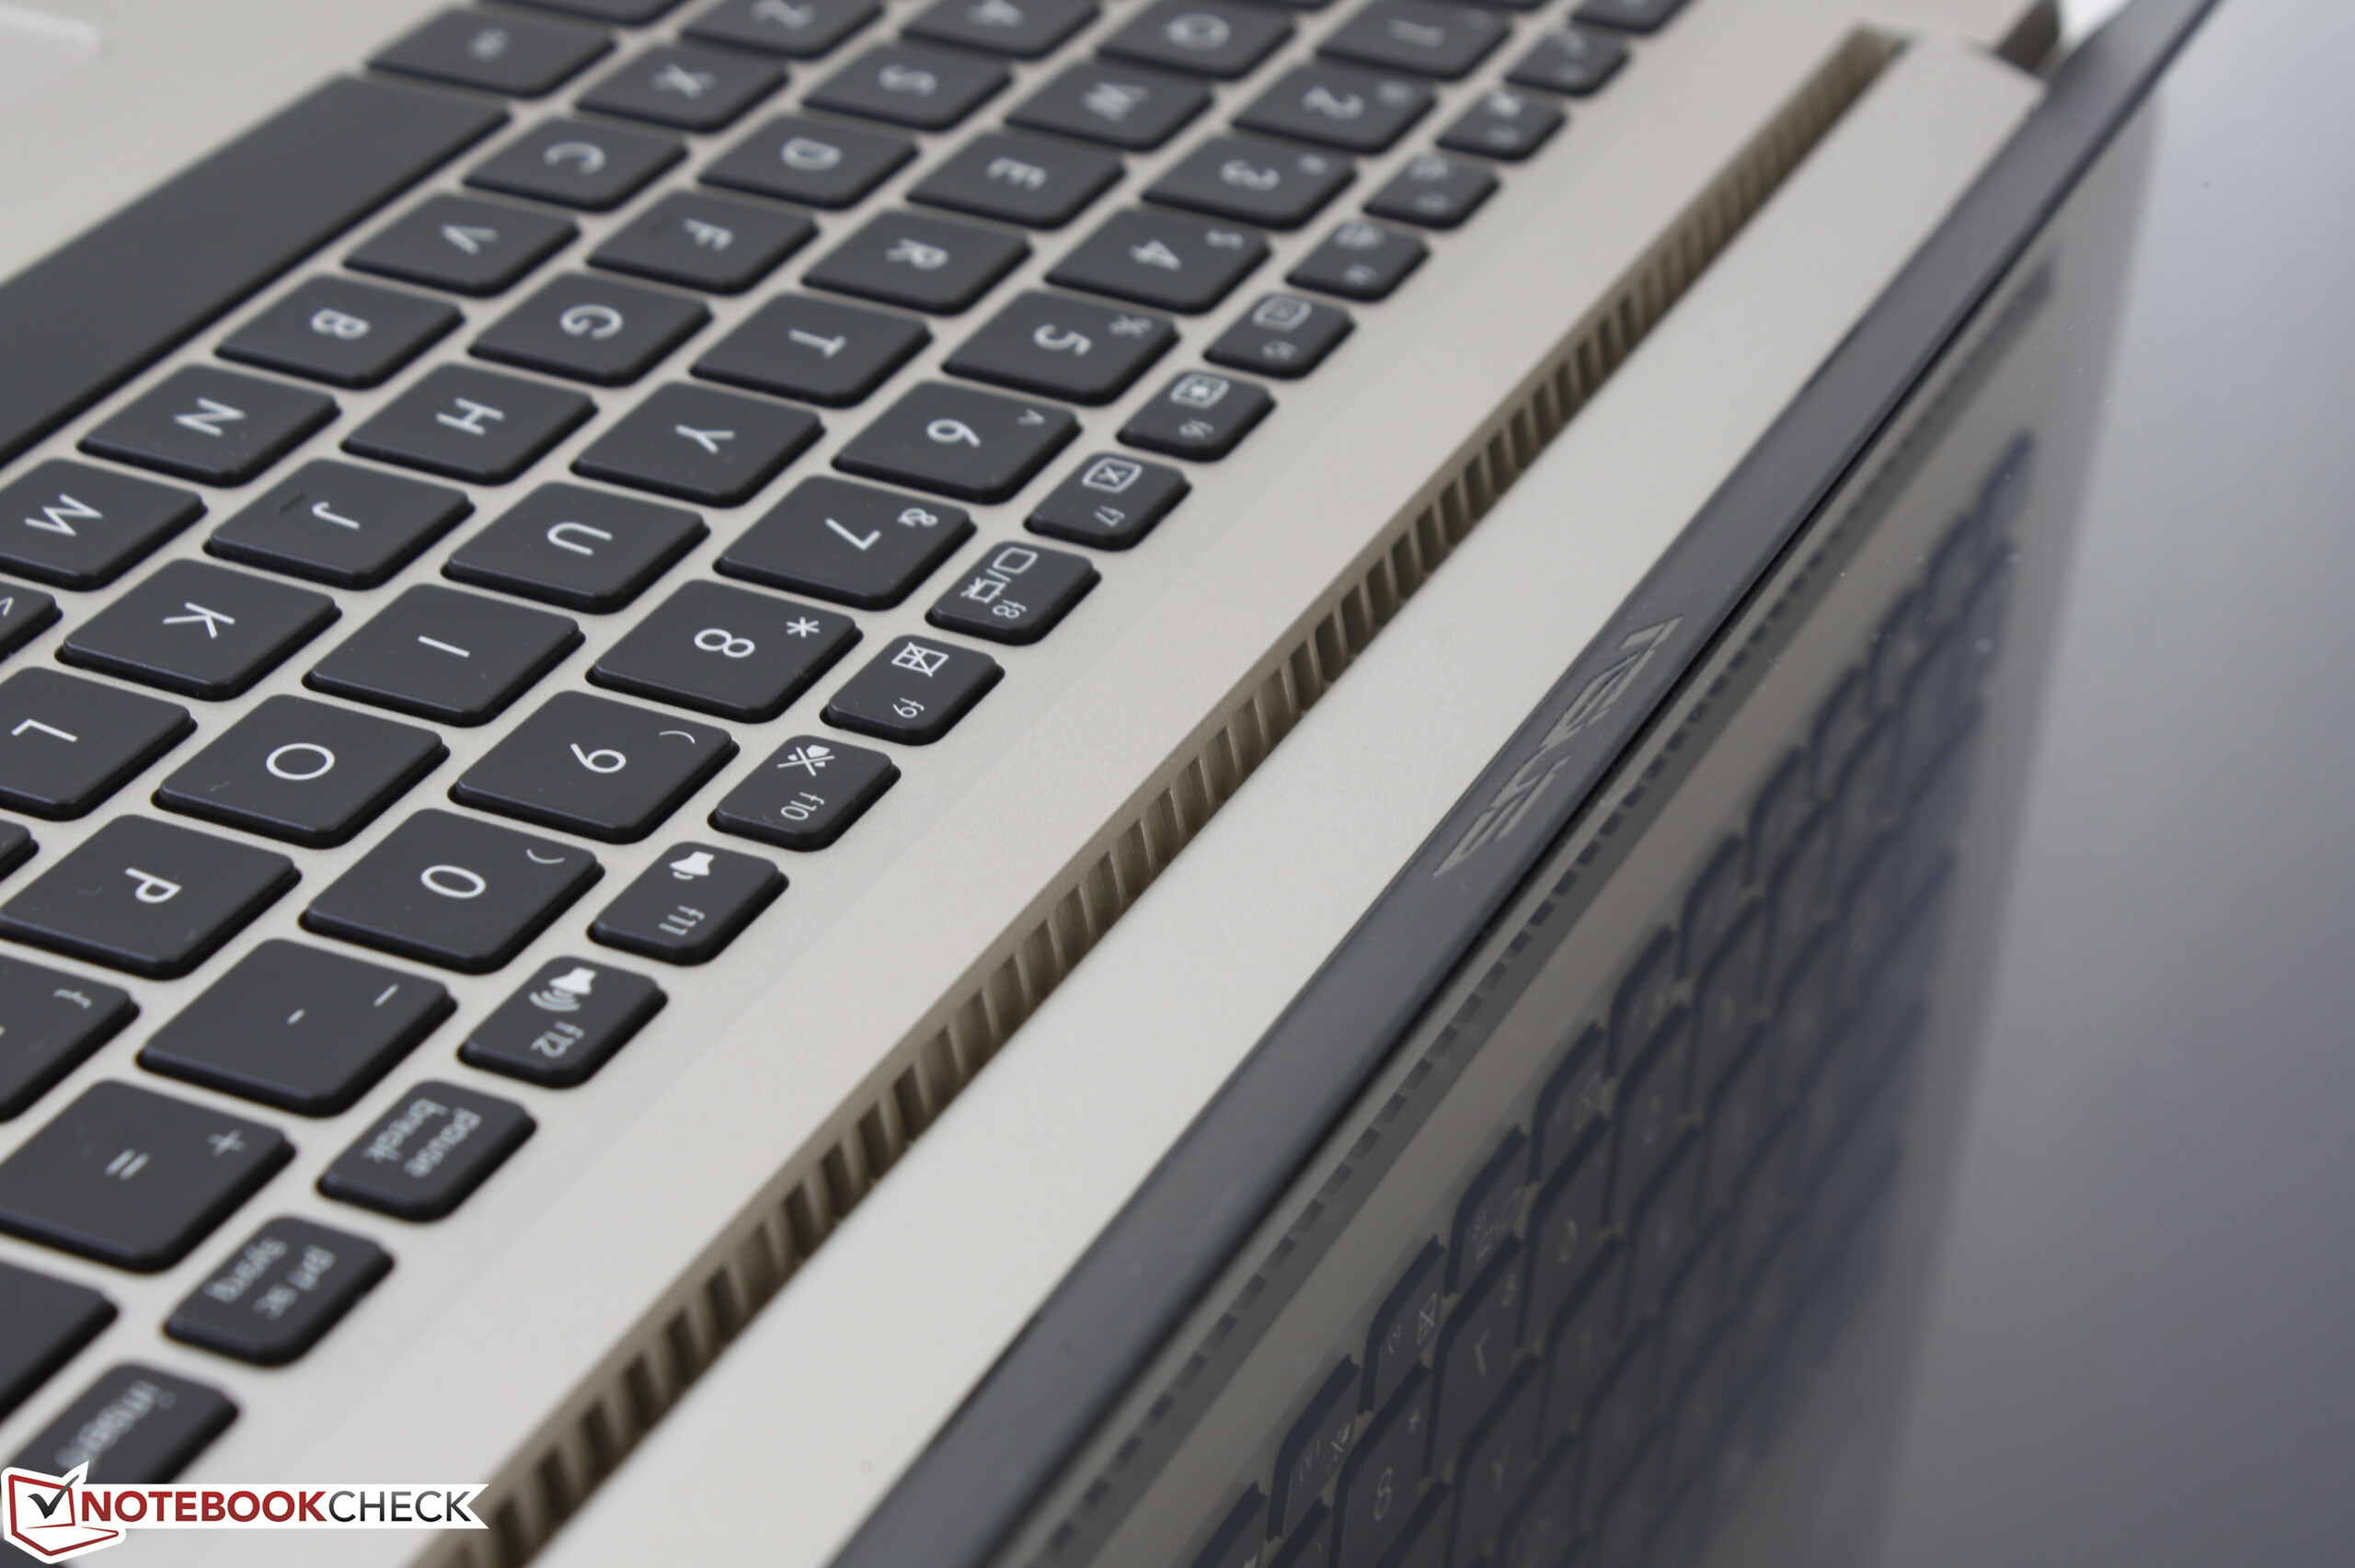
Los fallos del S510UA sin embargo son difíciles de obviar. La carcasa no es muy rígida y tanto el teclado como el trackpad no son tan firmes como debieran. Su chasis puede parecer de gama alta, pero no resulta tan sólido. La duración de batería es escasa y la marca alrededor del procesador en la parte inferior indica que se ha ahorrado en diseño. Confiamos en que esto no sea indicativo de problemas mayores del VivoBook S15, pero nos gustaría poder analizar más configuraciones para tener una mejor perspectiva.
Podemos recomendar el VivoBook S15 S510 sobre el HP Pavilion 15 o la gama Asus F si lo que buscas es un dispositivo portable y asequible. Si no, y si puedes invertir entre 200 y 300$ más, encontrarás una mejor experiencia de uso en un ZenBook, XPS, o un Spectre de gama básica.
El ligero S510UA es delgado, rinde maravillosamente y tiene una pantalla mate 1080p más que respetable. El teclado esponjoso, la duración de batería por debajo y la media y algunos pequeños defectos de fabricación en nuestra unidad de prueba, indican que el usuario tiene que andarse con ojo antes de invertir en la nueva gama VivoBook S15.
Ésta es una versión acortada del análisis original. Puedes leer el análisis completo en inglés aquí.
Asus VivoBook S15 S510UA
- 06/11/2017 v6 (old)
Allen Ngo
Price comparison
