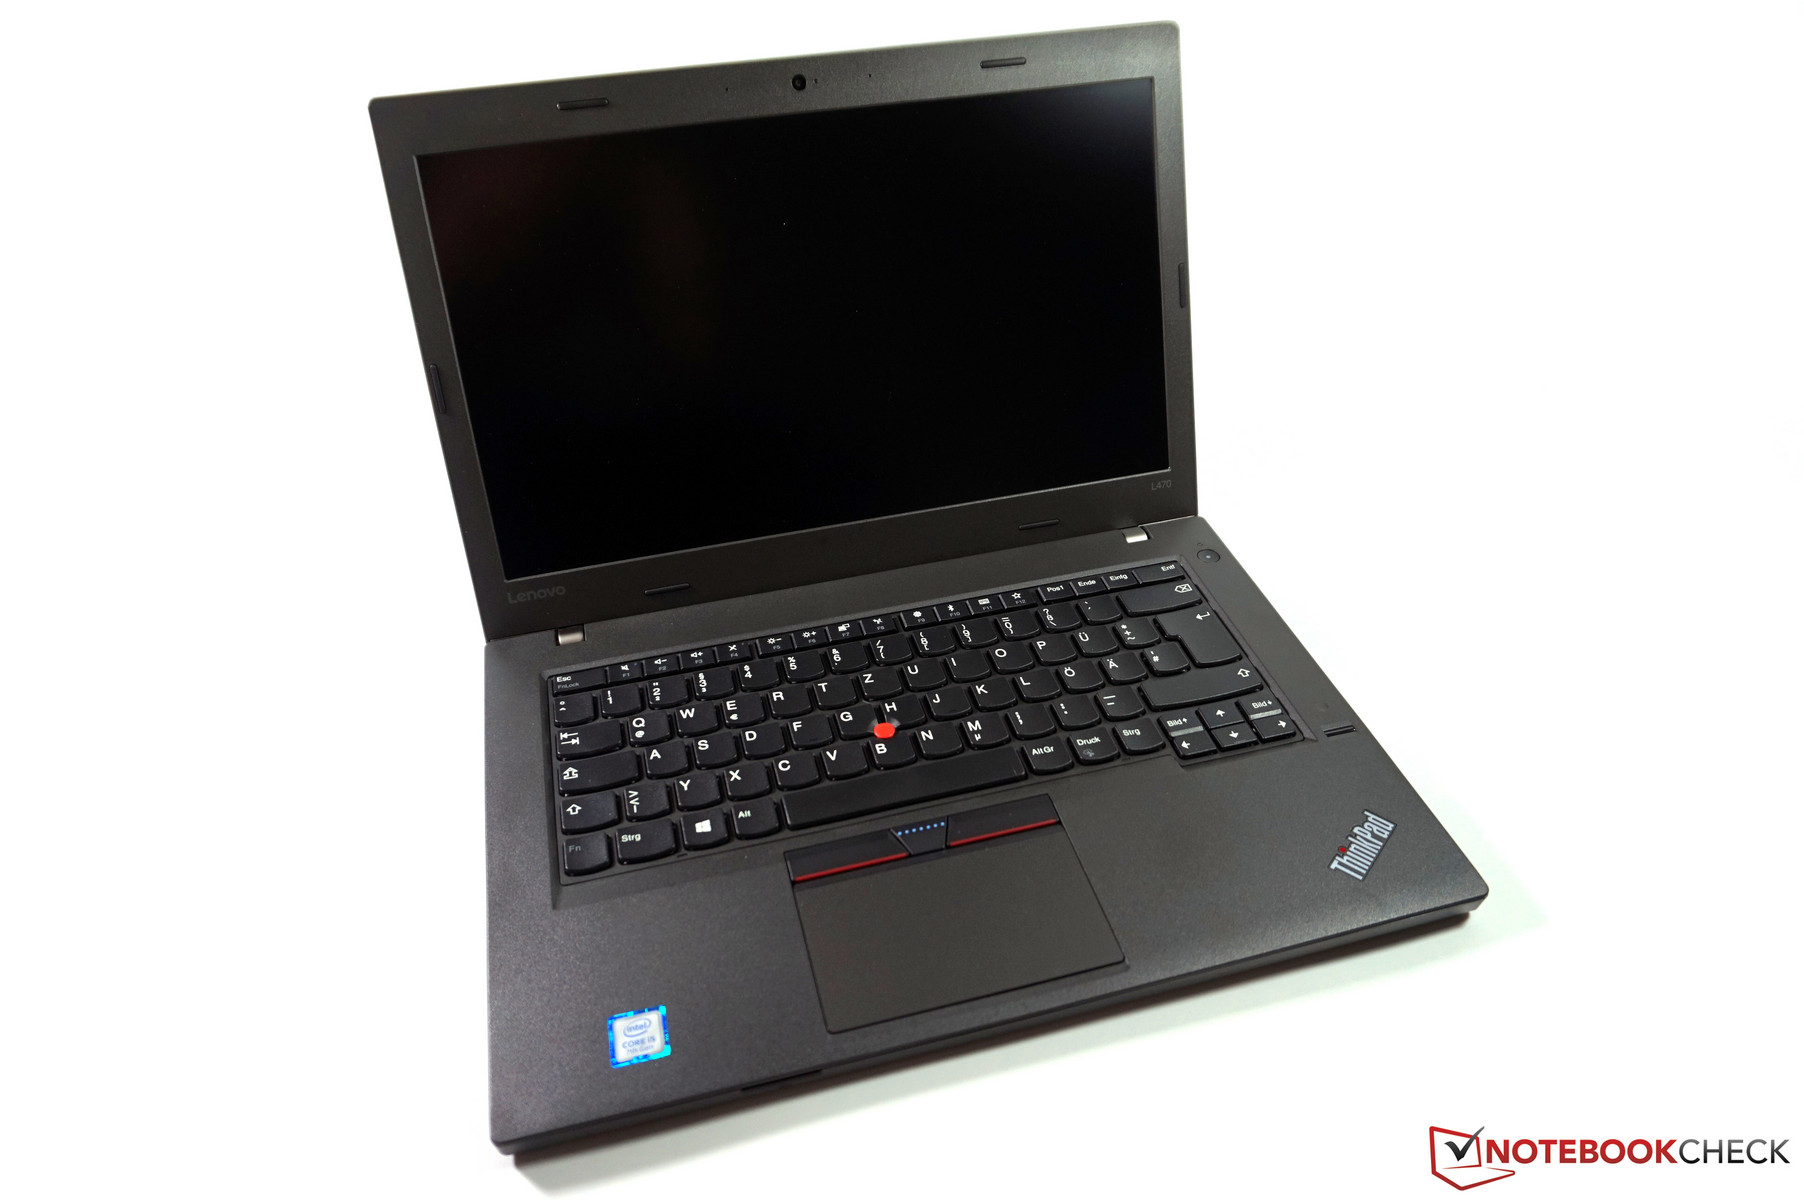
Breve análisis del portátil Lenovo ThinkPad L470 (i5-7200U, FHD-IPS)

| SD Card Reader | |
| average JPG Copy Test (av. of 3 runs) | |
| Dell Latitude 5480 | |
| Lenovo ThinkPad L470-20J5S00C00 | |
| HP ProBook 440 G4-Y8B51EA | |
| HP ProBook 640 G3 Z2W33ET | |
| Lenovo ThinkPad E470-20H2S00400 | |
| Lenovo ThinkPad L460-20FVS01400 | |
| maximum AS SSD Seq Read Test (1GB) | |
| Dell Latitude 5480 | |
| HP ProBook 440 G4-Y8B51EA | |
| Lenovo ThinkPad L470-20J5S00C00 | |
| Lenovo ThinkPad L460-20FVS01400 | |
| Lenovo ThinkPad E470-20H2S00400 | |
| HP ProBook 640 G3 Z2W33ET | |
| Networking | |
| iperf3 transmit AX12 | |
| HP ProBook 640 G3 Z2W33ET (jseb) | |
| Lenovo ThinkPad L470-20J5S00C00 | |
| Lenovo ThinkPad E470-20H2S00400 | |
| Dell Latitude 5480 | |
| iperf3 receive AX12 | |
| Lenovo ThinkPad L470-20J5S00C00 | |
| Dell Latitude 5480 | |
| Lenovo ThinkPad E470-20H2S00400 | |
| HP ProBook 640 G3 Z2W33ET (jseb) | |
| |||||||||||||||||||||||||
iluminación: 85 %
Brillo con batería: 273 cd/m²
Contraste: 783:1 (Negro: 0.35 cd/m²)
ΔE ColorChecker Calman: 6.1 | ∀{0.5-29.43 Ø4.71}
ΔE Greyscale Calman: 5.7 | ∀{0.09-98 Ø4.96}
62.4% sRGB (Argyll 1.6.3 3D)
40.2% AdobeRGB 1998 (Argyll 1.6.3 3D)
43.71% AdobeRGB 1998 (Argyll 3D)
62.7% sRGB (Argyll 3D)
42.21% Display P3 (Argyll 3D)
Gamma: 2.11
CCT: 6419 K
| Lenovo ThinkPad L470-20J5S00C00 N140HCA-EAB, , 1920x1080, 14" | Lenovo ThinkPad T470-20HD002HGE N140HCA-EAB, , 1920x1080, 14" | Lenovo ThinkPad E470-20H2S00400 N140HCA-EAB, , 1920x1080, 14" | HP ProBook 440 G4-Y8B51EA AUO1E3D, , 1920x1080, 14" | HP ProBook 640 G3 Z2W33ET Chi Mei, , 1920x1080, 14" | Dell Latitude 5480 LG Philips LGD0553, , 1920x1080, 14" | Lenovo ThinkPad L460-20FVS01400 Lenovo N140HCE-EAA, , 1920x1080, 14" | |
|---|---|---|---|---|---|---|---|
| Display | -1% | -2% | -11% | 18% | -3% | -0% | |
| Display P3 Coverage (%) | 42.21 | 41.6 -1% | 41.23 -2% | 37.6 -11% | 49.46 17% | 40.62 -4% | 42.2 0% |
| sRGB Coverage (%) | 62.7 | 61.9 -1% | 61.4 -2% | 56.6 -10% | 74.5 19% | 61.2 -2% | 62.3 -1% |
| AdobeRGB 1998 Coverage (%) | 43.71 | 43.06 -1% | 42.67 -2% | 38.85 -11% | 51.1 17% | 41.96 -4% | 43.72 0% |
| Response Times | 4% | 10% | 18% | 11% | 25% | 8% | |
| Response Time Grey 50% / Grey 80% * (ms) | 50.4 ? | 41.6 ? 17% | 40.8 ? 19% | 43.2 ? 14% | 41 ? 19% | 32.8 ? 35% | 44.4 ? 12% |
| Response Time Black / White * (ms) | 30.8 ? | 34 ? -10% | 30.4 ? 1% | 24.4 ? 21% | 30 ? 3% | 26.4 ? 14% | 29.6 ? 4% |
| PWM Frequency (Hz) | 192 ? | ||||||
| Screen | 7% | -5% | -26% | -17% | 6% | -2% | |
| Brightness middle (cd/m²) | 274 | 306 12% | 244 -11% | 216 -21% | 343 25% | 215.9 -21% | 245 -11% |
| Brightness (cd/m²) | 256 | 287 12% | 231 -10% | 203 -21% | 332 30% | 205 -20% | 225 -12% |
| Brightness Distribution (%) | 85 | 88 4% | 89 5% | 83 -2% | 88 4% | 90 6% | 83 -2% |
| Black Level * (cd/m²) | 0.35 | 0.3 14% | 0.37 -6% | 0.47 -34% | 0.69 -97% | 0.22 37% | 0.24 31% |
| Contrast (:1) | 783 | 1020 30% | 659 -16% | 460 -41% | 497 -37% | 981 25% | 1021 30% |
| Colorchecker dE 2000 * | 6.1 | 6.2 -2% | 6.41 -5% | 8.98 -47% | 9.06 -49% | 5.1 16% | 6.89 -13% |
| Colorchecker dE 2000 max. * | 13.8 | 13.6 1% | 13.4 3% | 14.07 -2% | 14.84 -8% | 15.6 -13% | 17.62 -28% |
| Greyscale dE 2000 * | 5.7 | 5.8 -2% | 5.94 -4% | 9.61 -69% | 9.87 -73% | 4 30% | 6.45 -13% |
| Gamma | 2.11 104% | 2.04 108% | 2.28 96% | 2.63 84% | 2.5 88% | 2.41 91% | 2.46 89% |
| CCT | 6419 101% | 6277 104% | 6101 107% | 11265 58% | 11115 58% | 6856 95% | 6857 95% |
| Color Space (Percent of AdobeRGB 1998) (%) | 40.2 | 39.62 -1% | 39.3 -2% | 35.9 -11% | 47 17% | 41.96 4% | 40.1 0% |
| Color Space (Percent of sRGB) (%) | 62.4 | 61.44 -2% | 61.1 -2% | 56.7 -9% | 75 20% | 61.15 -2% | 61.8 -1% |
| Media total (Programa/Opciones) | 3% /
5% | 1% /
-2% | -6% /
-17% | 4% /
-6% | 9% /
7% | 2% /
-0% |
* ... más pequeño es mejor
Tiempos de respuesta del display
| ↔ Tiempo de respuesta de Negro a Blanco | ||
|---|---|---|
| 30.8 ms ... subida ↗ y bajada ↘ combinada | ↗ 16.4 ms subida | 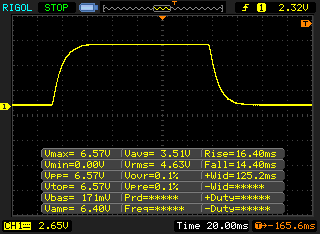 |
| ↘ 14.4 ms bajada | ||
| La pantalla mostró tiempos de respuesta lentos en nuestros tests y podría ser demasiado lenta para los jugones. En comparación, todos los dispositivos de prueba van de ##min### (mínimo) a 240 (máximo) ms. » 83 % de todos los dispositivos son mejores. Eso quiere decir que el tiempo de respuesta es peor que la media (19.8 ms) de todos los dispositivos testados. | ||
| ↔ Tiempo de respuesta 50% Gris a 80% Gris | ||
| 50.4 ms ... subida ↗ y bajada ↘ combinada | ↗ 27.6 ms subida | 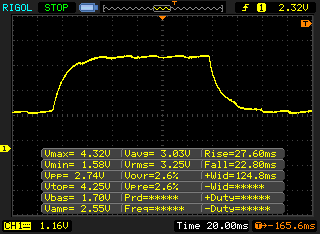 |
| ↘ 22.8 ms bajada | ||
| La pantalla mostró tiempos de respuesta lentos en nuestros tests y podría ser demasiado lenta para los jugones. En comparación, todos los dispositivos de prueba van de ##min### (mínimo) a 636 (máximo) ms. » 87 % de todos los dispositivos son mejores. Eso quiere decir que el tiempo de respuesta es peor que la media (31 ms) de todos los dispositivos testados. | ||
Parpadeo de Pantalla / PWM (Pulse-Width Modulation)
| Parpadeo de Pantalla / PWM no detectado | 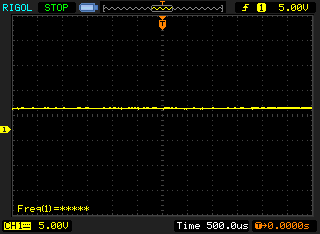 | ||
Comparación: 52 % de todos los dispositivos testados no usaron PWM para atenuar el display. Si se usó, medimos una media de 7747 (mínimo: 5 - máxmo: 343500) Hz. | |||


| PCMark 8 Home Score Accelerated v2 | 3294 puntos | |
| PCMark 8 Creative Score Accelerated v2 | 4172 puntos | |
| PCMark 8 Work Score Accelerated v2 | 4111 puntos | |
ayuda | ||
| Lenovo ThinkPad L470-20J5S00C00 SanDisk X400 256GB, SATA (SD8SB8U-256G) | Lenovo ThinkPad T470-20HD002HGE Samsung PM961 NVMe MZVLW512HMJP | Lenovo ThinkPad E470-20H2S00400 SanDisk X400 SED 256GB, SATA (SD8TB8U-256G) | HP ProBook 440 G4-Y8B51EA SanDisk SD8SNAT256G1002 | HP ProBook 640 G3 Z2W33ET Samsung PM951 NVMe MZVLV256 | Dell Latitude 5480 Toshiba SG5 256GB THNSNK256GVN8 | Lenovo ThinkPad L460-20FVS01400 Toshiba HG6 THNSFJ256GCSU | |
|---|---|---|---|---|---|---|---|
| CrystalDiskMark 3.0 | 116% | -2% | -14% | 57% | 3% | -7% | |
| Read Seq (MB/s) | 495.2 | 1155 133% | 476.5 -4% | 491.2 -1% | 1285 159% | 469.4 -5% | 480.9 -3% |
| Write Seq (MB/s) | 485.7 | 1076 122% | 458.7 -6% | 322.2 -34% | 283.6 -42% | 264.8 -45% | 426.4 -12% |
| Read 512 (MB/s) | 323.4 | 811 151% | 346.4 7% | 310.1 -4% | 679 110% | 408.1 26% | 361.8 12% |
| Write 512 (MB/s) | 291.5 | 862 196% | 291.1 0% | 276 -5% | 300.8 3% | 265.5 -9% | 220.9 -24% |
| Read 4k (MB/s) | 34.2 | 55.5 62% | 35.15 3% | 19.57 -43% | 41.79 22% | 24.66 -28% | 21.51 -37% |
| Write 4k (MB/s) | 74.3 | 134.6 81% | 78.8 6% | 77.8 5% | 138.6 87% | 114.8 55% | 71.5 -4% |
| Read 4k QD32 (MB/s) | 321.3 | 496.2 54% | 276 -14% | 146.3 -54% | 507 58% | 380.3 18% | 277.6 -14% |
| Write 4k QD32 (MB/s) | 188 | 425.4 126% | 178.3 -5% | 241.4 28% | 293.3 56% | 207.2 10% | 230.4 23% |

| 3DMark 11 Performance | 1540 puntos | |
| 3DMark Ice Storm Standard Score | 55477 puntos | |
| 3DMark Cloud Gate Standard Score | 5839 puntos | |
| 3DMark Fire Strike Score | 771 puntos | |
ayuda | ||
| bajo | medio | alto | ultra | |
|---|---|---|---|---|
| BioShock Infinite (2013) | 41.4 | 23.1 | 19.6 | 6.5 |
| Battlefield 4 (2013) | 30.4 | 24.7 | 16.1 | |
| The Witcher 3 (2015) | 13.4 |
Ruido
| Ocioso |
| 29.3 / 29.3 / 29.3 dB(A) |
| Carga |
| 33.8 / 37.5 dB(A) |
 | ||
30 dB silencioso 40 dB(A) audible 50 dB(A) ruidosamente alto |
||
min: | ||
(±) La temperatura máxima en la parte superior es de 40.1 °C / 104 F, frente a la media de 34.3 °C / 94 F, que oscila entre 21.2 y 62.5 °C para la clase Office.
(-) El fondo se calienta hasta un máximo de 51 °C / 124 F, frente a la media de 36.8 °C / 98 F
(+) En reposo, la temperatura media de la parte superior es de 21.6 °C / 71# F, frente a la media del dispositivo de 29.5 °C / 85 F.
(±) El reposamanos y el touchpad pueden calentarse mucho al tacto con un máximo de 37.2 °C / 99 F.
(-) La temperatura media de la zona del reposamanos de dispositivos similares fue de 27.5 °C / 81.5 F (-9.7 °C / -17.5 F).
Lenovo ThinkPad L470-20J5S00C00 análisis de audio
(±) | la sonoridad del altavoz es media pero buena (80 dB)
Graves 100 - 315 Hz
(-) | casi sin bajos - de media 15.9% inferior a la mediana
(±) | la linealidad de los graves es media (10% delta a frecuencia anterior)
Medios 400 - 2000 Hz
(±) | medias más altas - de media 5.6% más altas que la mediana
(±) | la linealidad de los medios es media (8.6% delta respecto a la frecuencia anterior)
Altos 2 - 16 kHz
(+) | máximos equilibrados - a sólo 1.9% de la mediana
(+) | los máximos son lineales (5% delta a la frecuencia anterior)
Total 100 - 16.000 Hz
(±) | la linealidad del sonido global es media (18.8% de diferencia con la mediana)
En comparación con la misma clase
» 35% de todos los dispositivos probados de esta clase eran mejores, 7% similares, 58% peores
» El mejor tuvo un delta de 7%, la media fue 21%, el peor fue ###max##%
En comparación con todos los dispositivos probados
» 43% de todos los dispositivos probados eran mejores, 8% similares, 49% peores
» El mejor tuvo un delta de 4%, la media fue 23%, el peor fue ###max##%
Lenovo ThinkPad T470-20HD002HGE análisis de audio
(±) | la sonoridad del altavoz es media pero buena (80.4 dB)
Graves 100 - 315 Hz
(-) | casi sin bajos - de media 16.6% inferior a la mediana
(±) | la linealidad de los graves es media (8.8% delta a frecuencia anterior)
Medios 400 - 2000 Hz
(+) | medios equilibrados - a sólo 4.3% de la mediana
(+) | los medios son lineales (6.7% delta a la frecuencia anterior)
Altos 2 - 16 kHz
(±) | máximos más altos - de media 5.4% más altos que la mediana
(±) | la linealidad de los máximos es media (13.3% delta a frecuencia anterior)
Total 100 - 16.000 Hz
(±) | la linealidad del sonido global es media (18.7% de diferencia con la mediana)
En comparación con la misma clase
» 35% de todos los dispositivos probados de esta clase eran mejores, 6% similares, 59% peores
» El mejor tuvo un delta de 7%, la media fue 21%, el peor fue ###max##%
En comparación con todos los dispositivos probados
» 43% de todos los dispositivos probados eran mejores, 8% similares, 50% peores
» El mejor tuvo un delta de 4%, la media fue 23%, el peor fue ###max##%
| Off / Standby | |
| Ocioso | |
| Carga |
|
Clave:
min: | |
| Lenovo ThinkPad L470-20J5S00C00 i5-7200U, HD Graphics 620, SanDisk X400 256GB, SATA (SD8SB8U-256G), IPS, 1920x1080, 14" | Lenovo ThinkPad L460-20FVS01400 6500U, Radeon R5 M330, Toshiba HG6 THNSFJ256GCSU, IPS, 1920x1080, 14" | Lenovo ThinkPad E470-20H2S00400 i5-7200U, GeForce 940MX, SanDisk X400 SED 256GB, SATA (SD8TB8U-256G), IPS, 1920x1080, 14" | HP ProBook 440 G4-Y8B51EA i7-7500U, GeForce 930MX, SanDisk SD8SNAT256G1002, TN, 1920x1080, 14" | HP ProBook 640 G3 Z2W33ET i5-7200U, HD Graphics 620, Samsung PM951 NVMe MZVLV256, TN LED, 1920x1080, 14" | Dell Latitude 5480 i7-7600U, HD Graphics 620, Toshiba SG5 256GB THNSNK256GVN8, IPS, 1920x1080, 14" | Lenovo ThinkPad T470-20HD002HGE i5-7200U, HD Graphics 620, Samsung PM961 NVMe MZVLW512HMJP, IPS, 1920x1080, 14" | |
|---|---|---|---|---|---|---|---|
| Power Consumption | -14% | -18% | -13% | 18% | -31% | 0% | |
| Idle Minimum * (Watt) | 2.6 | 3.1 -19% | 2.7 -4% | 3 -15% | 2.3 12% | 6.64 -155% | 3.21 -23% |
| Idle Average * (Watt) | 6.3 | 6.3 -0% | 5.5 13% | 5.4 14% | 5.2 17% | 6.67 -6% | 6.15 2% |
| Idle Maximum * (Watt) | 7 | 7.9 -13% | 6.5 7% | 6.3 10% | 5.6 20% | 7.78 -11% | 6.82 3% |
| Load Average * (Watt) | 29.1 | 29.5 -1% | 44.2 -52% | 37.5 -29% | 27.2 7% | 30.83 -6% | 28.5 2% |
| Load Maximum * (Watt) | 42.3 | 57.3 -35% | 65.2 -54% | 61.1 -44% | 28.7 32% | 31.7 25% | 34.5 18% |
* ... más pequeño es mejor

| Lenovo ThinkPad L470-20J5S00C00 i5-7200U, HD Graphics 620, 48 Wh | Lenovo ThinkPad L460-20FVS01400 6500U, Radeon R5 M330, 48 Wh | Lenovo ThinkPad T470-20HD002HGE i5-7200U, HD Graphics 620, 48 Wh | Lenovo ThinkPad E470-20H2S00400 i5-7200U, GeForce 940MX, 45 Wh | HP ProBook 440 G4-Y8B51EA i7-7500U, GeForce 930MX, 48 Wh | HP ProBook 640 G3 Z2W33ET i5-7200U, HD Graphics 620, 46 Wh | Dell Latitude 5480 i7-7600U, HD Graphics 620, 68 Wh | |
|---|---|---|---|---|---|---|---|
| Duración de Batería | -22% | -10% | -21% | -9% | 8% | 42% | |
| Reader / Idle (h) | 23.3 | 19.2 -18% | 17.4 -25% | 18.1 -22% | 24.6 6% | 24.1 3% | |
| H.264 (h) | 10.8 | 7.2 -33% | 10.4 -4% | 8.4 -22% | 9.5 -12% | 8.7 -19% | |
| WiFi v1.3 (h) | 8 | 7.1 -11% | 7.3 -9% | 5.4 -32% | 6.9 -14% | 8.7 9% | 16.1 101% |
| Load (h) | 2.2 | 1.6 -27% | 1.8 -18% | 2.1 -5% | 2.5 14% | 3 36% | 2.7 23% |
Pro
Contra
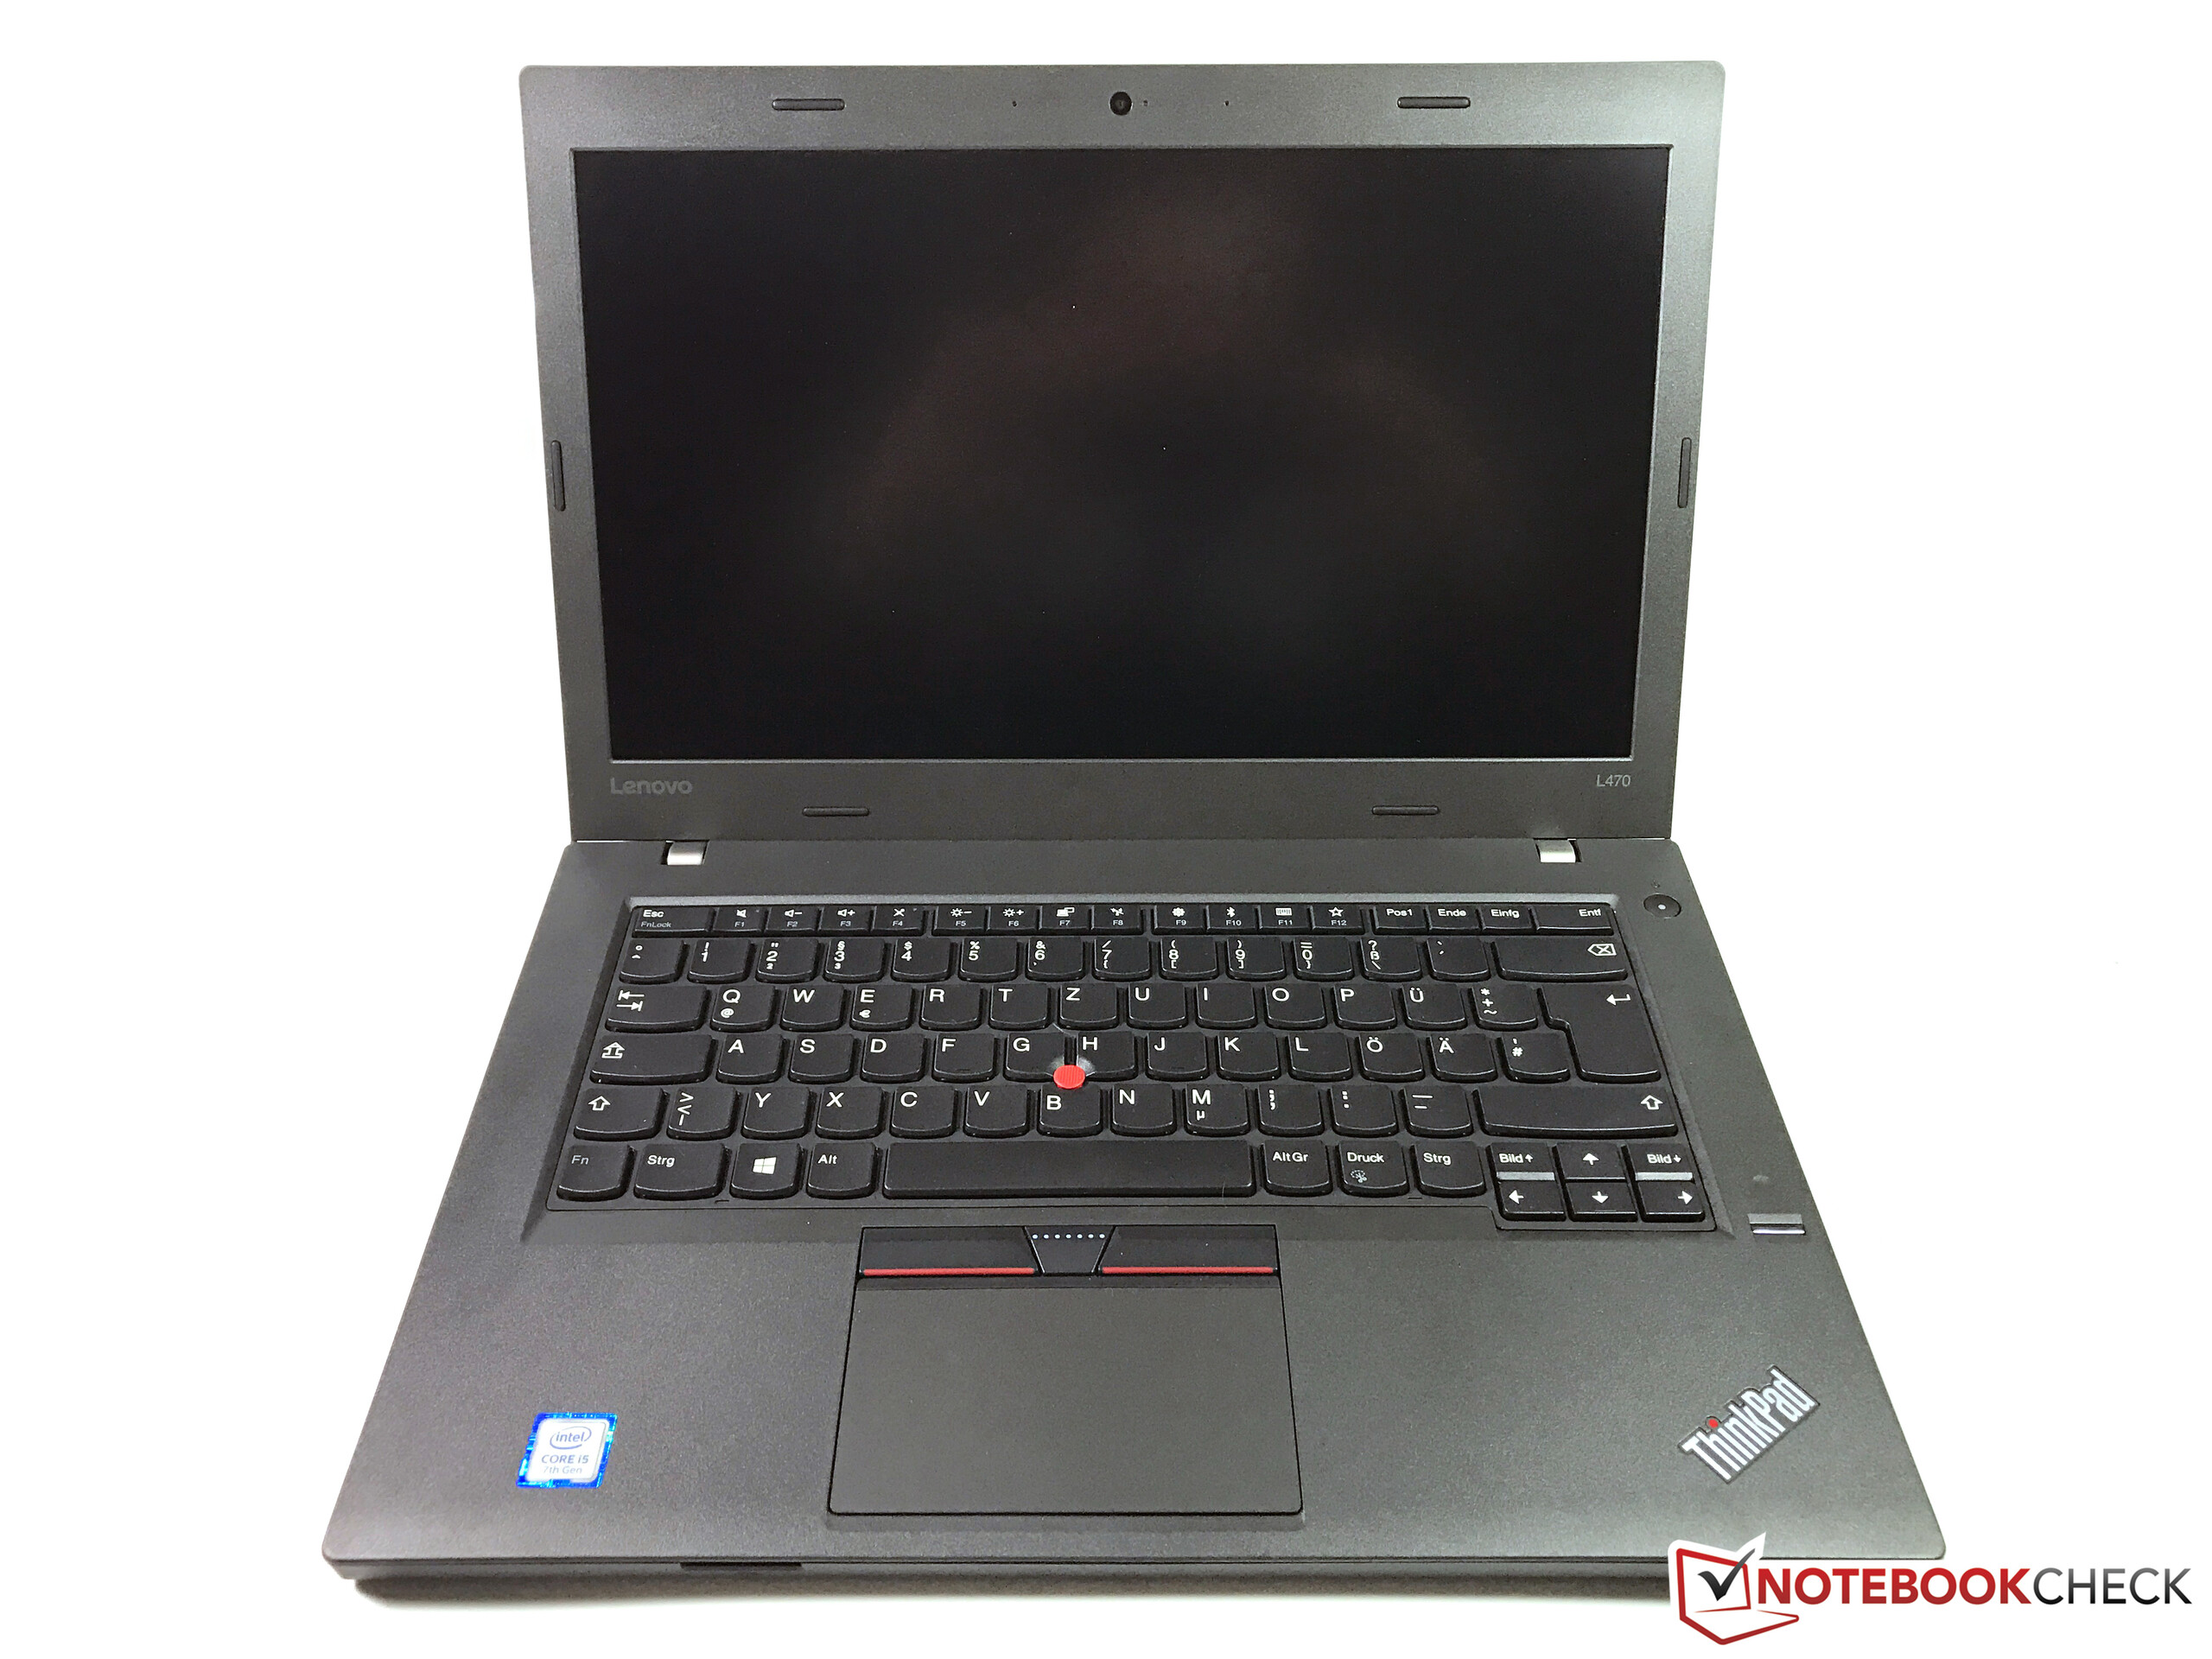
Con el L470, Lenovo ofrece un ThinkPad orientado aa compradores con bajo presupuesto, que, sobre todo, debe ser interesante para estudiantes y empresas.
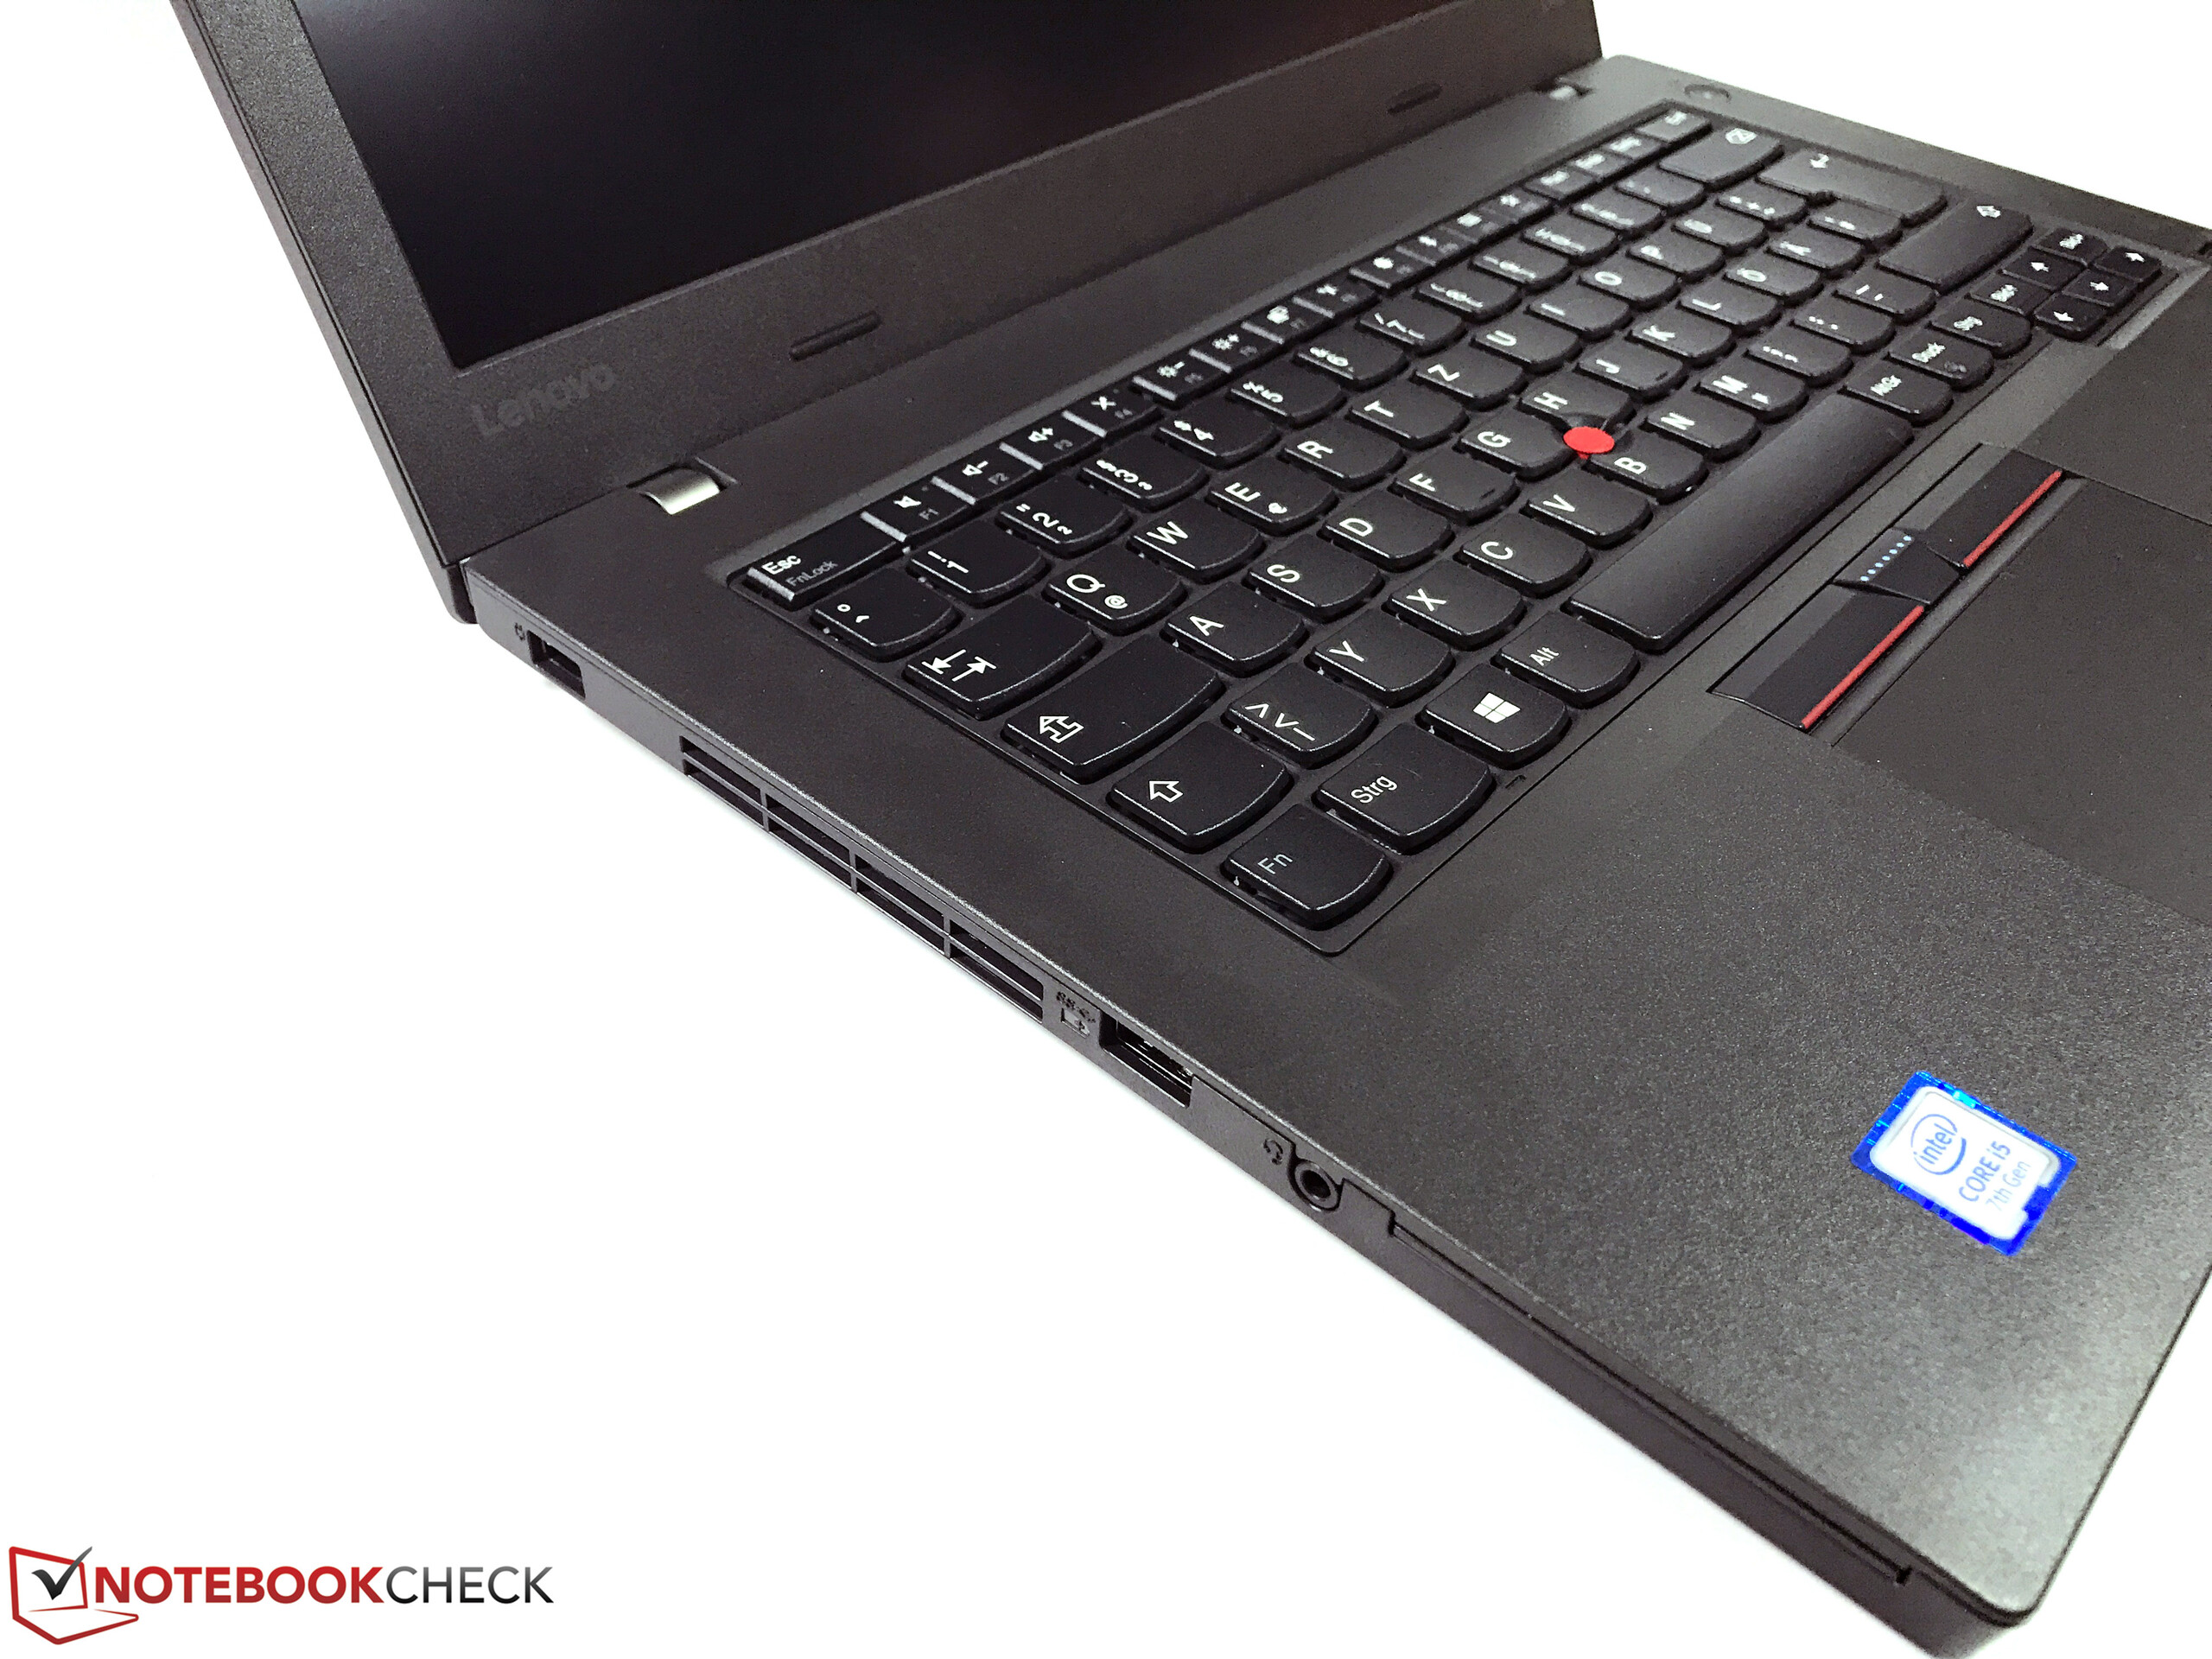
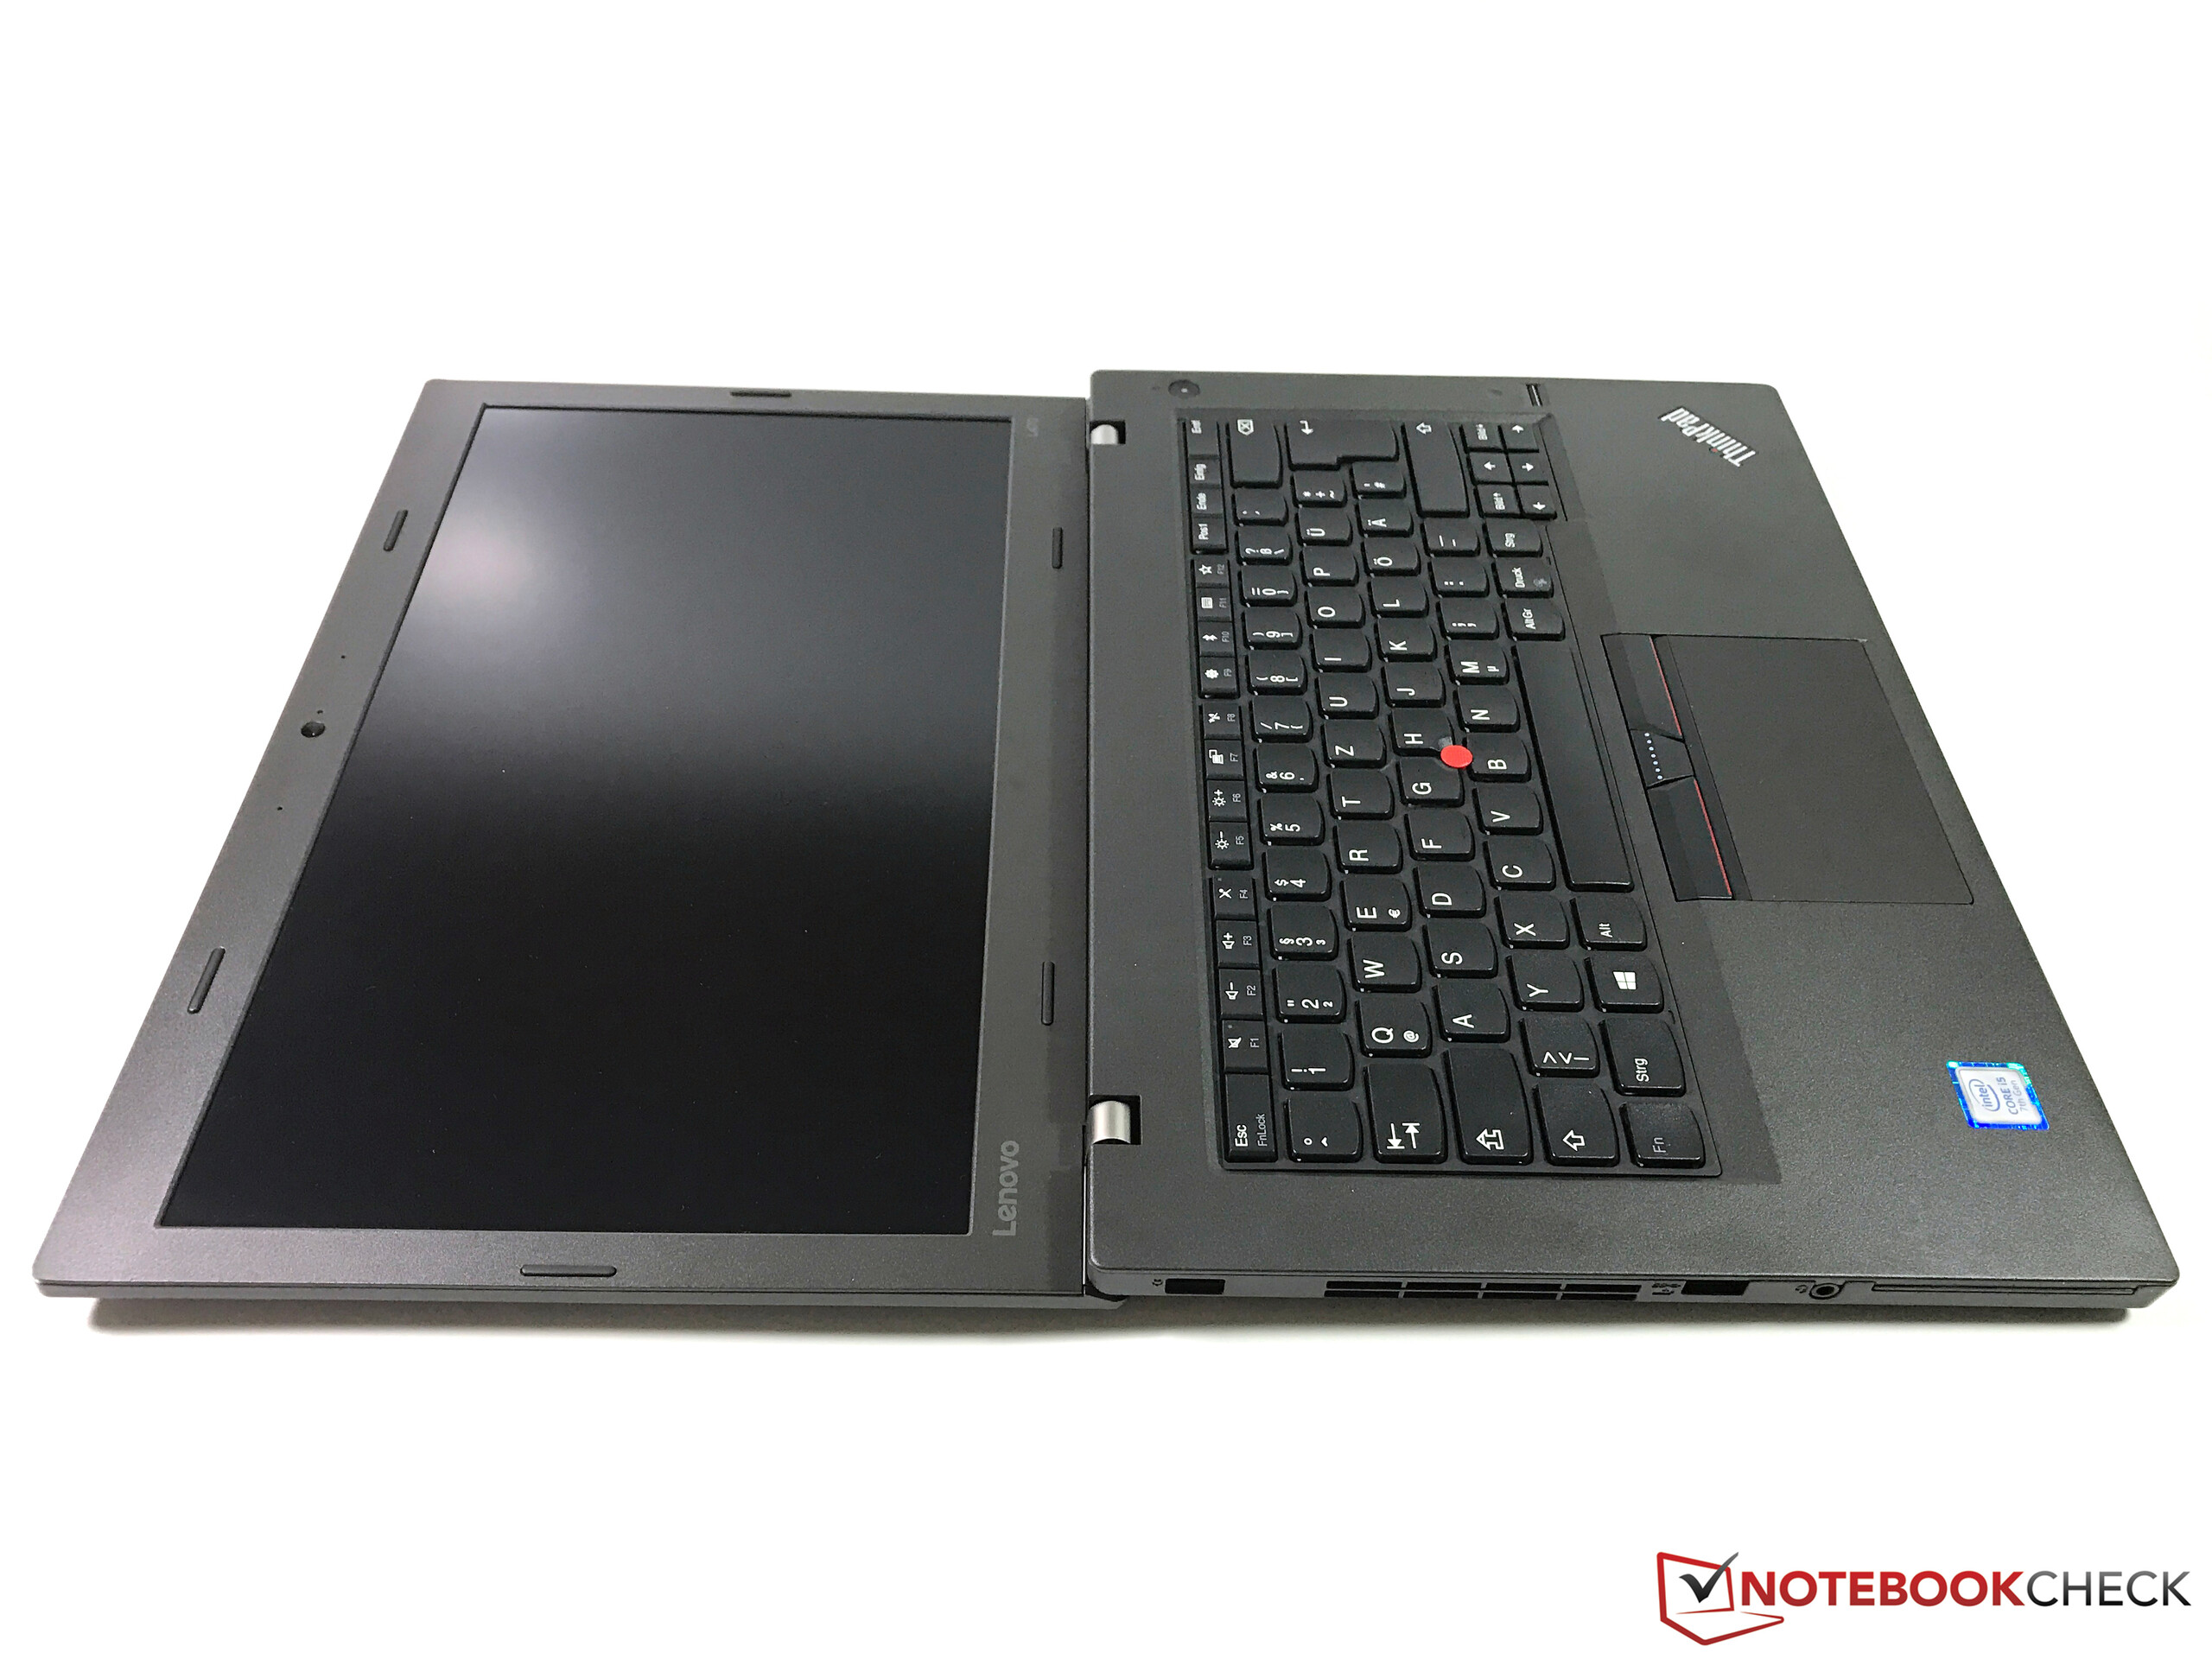
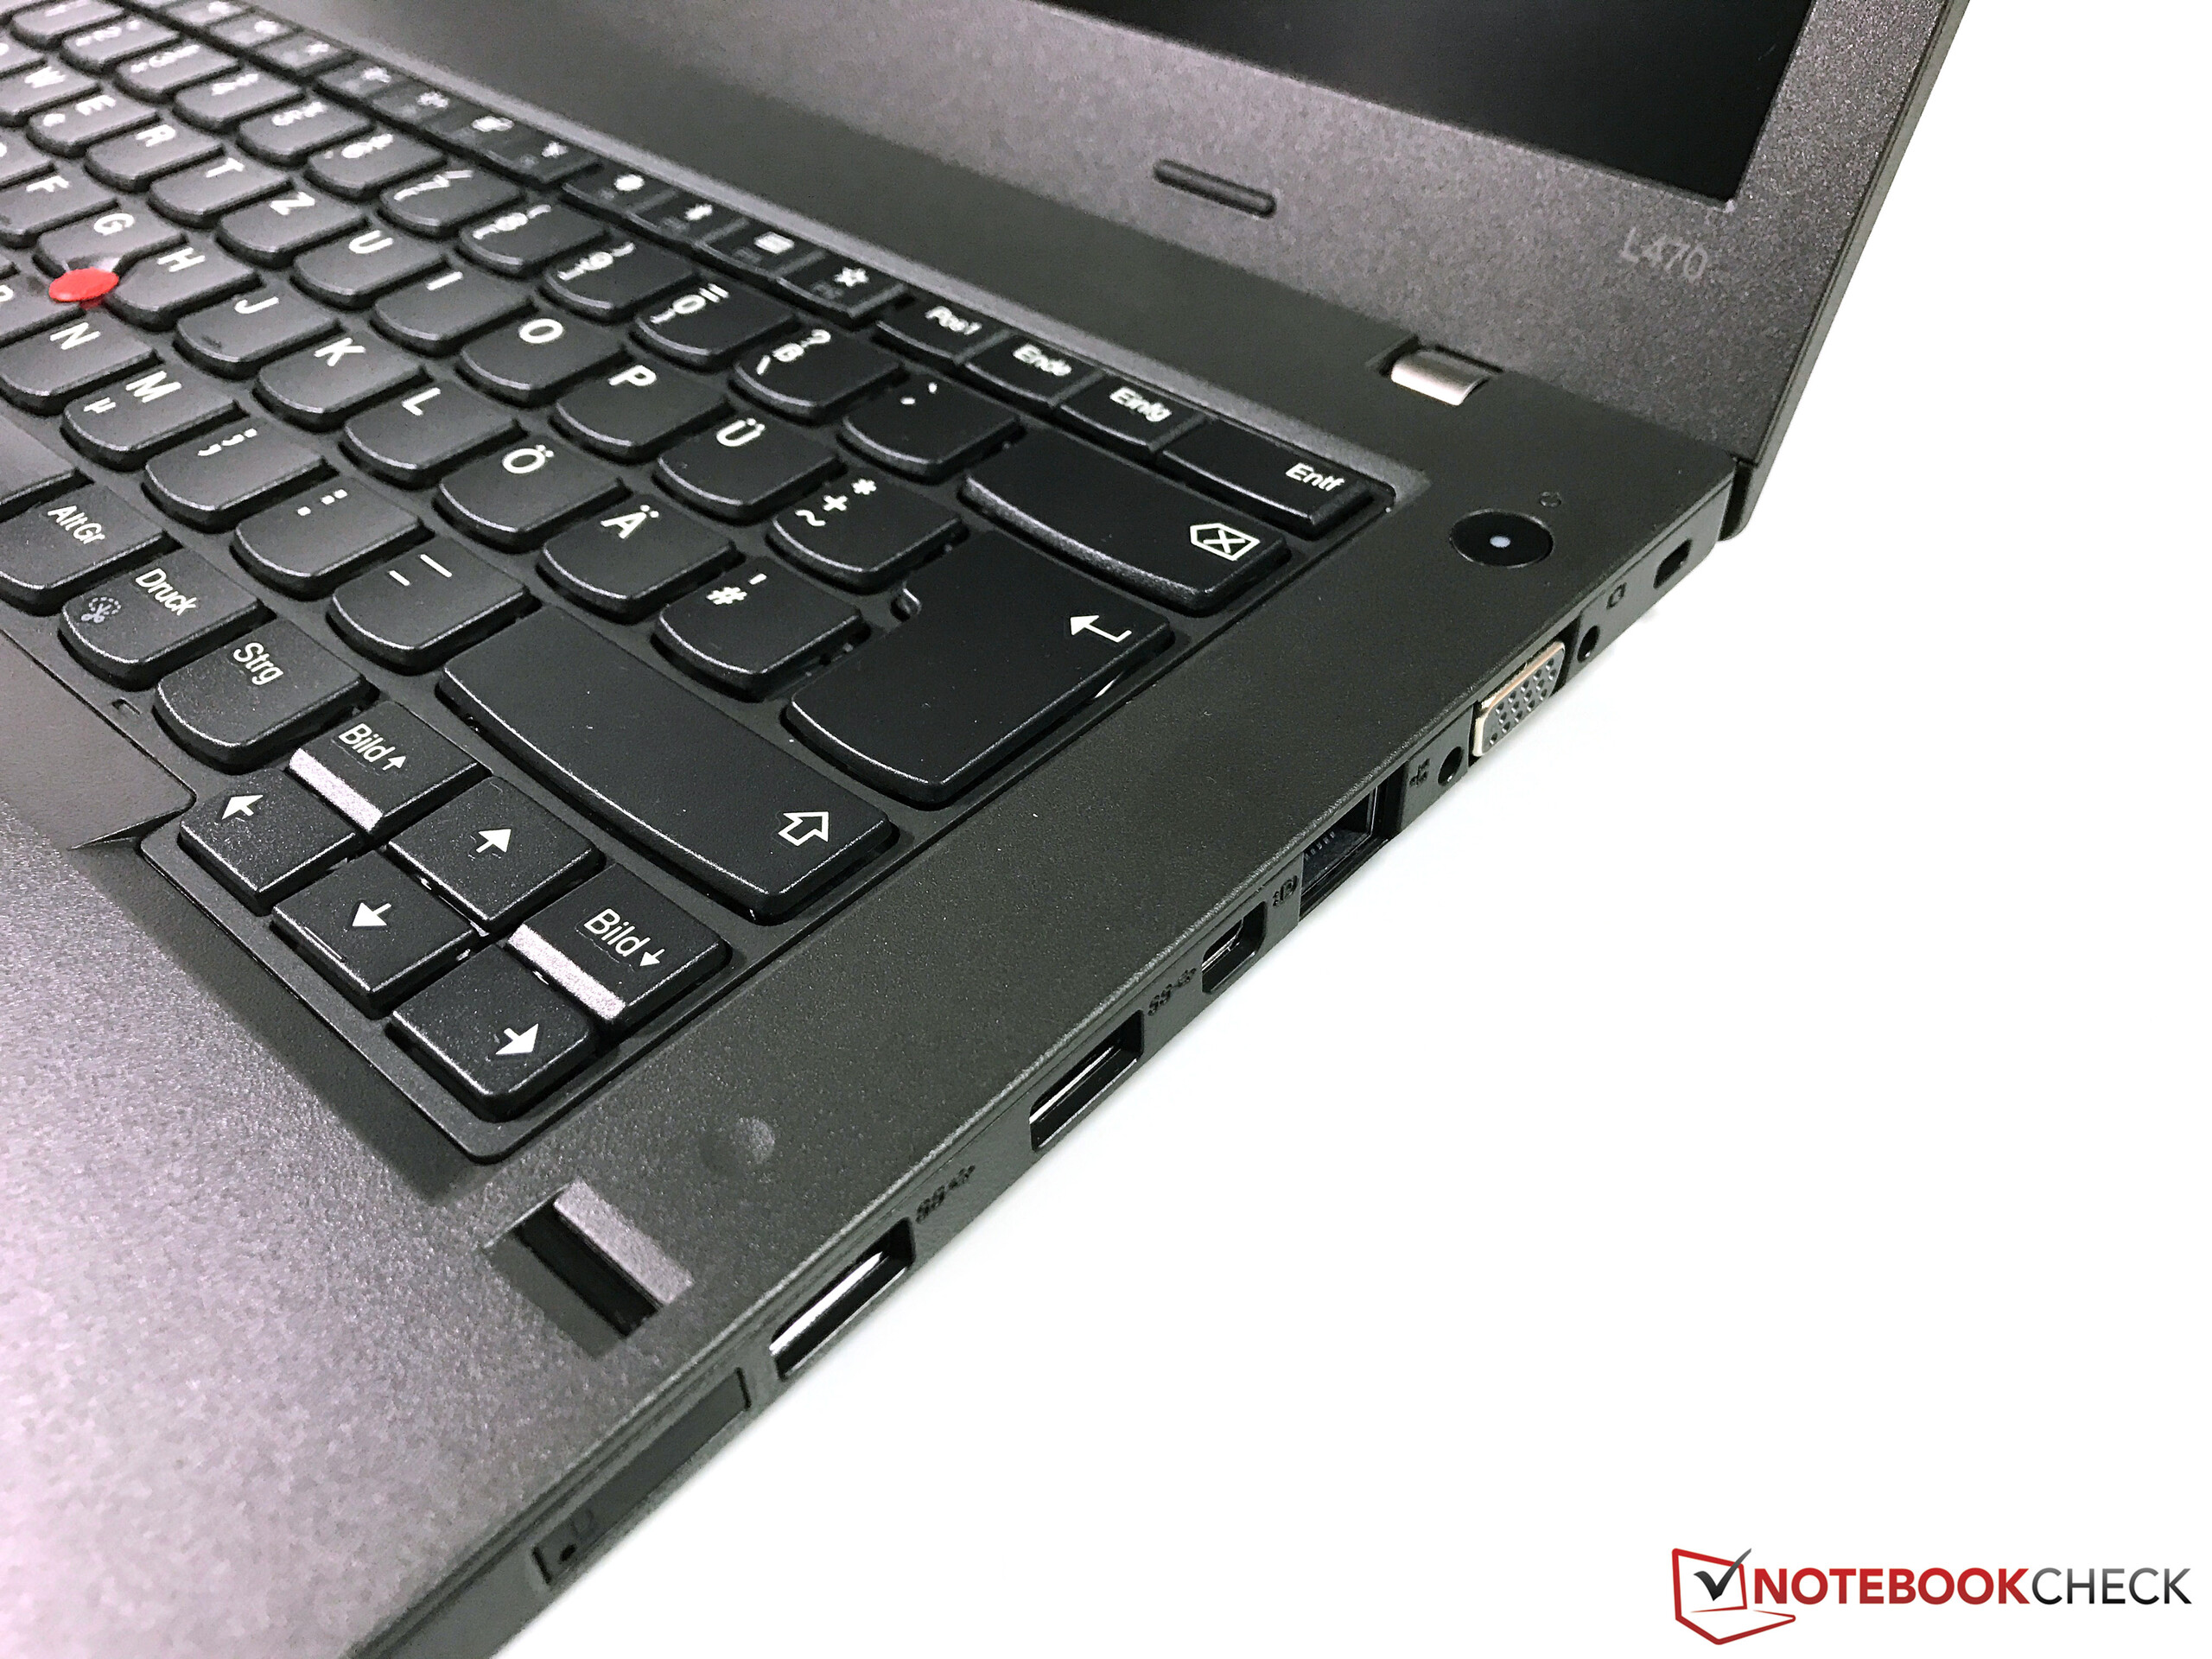
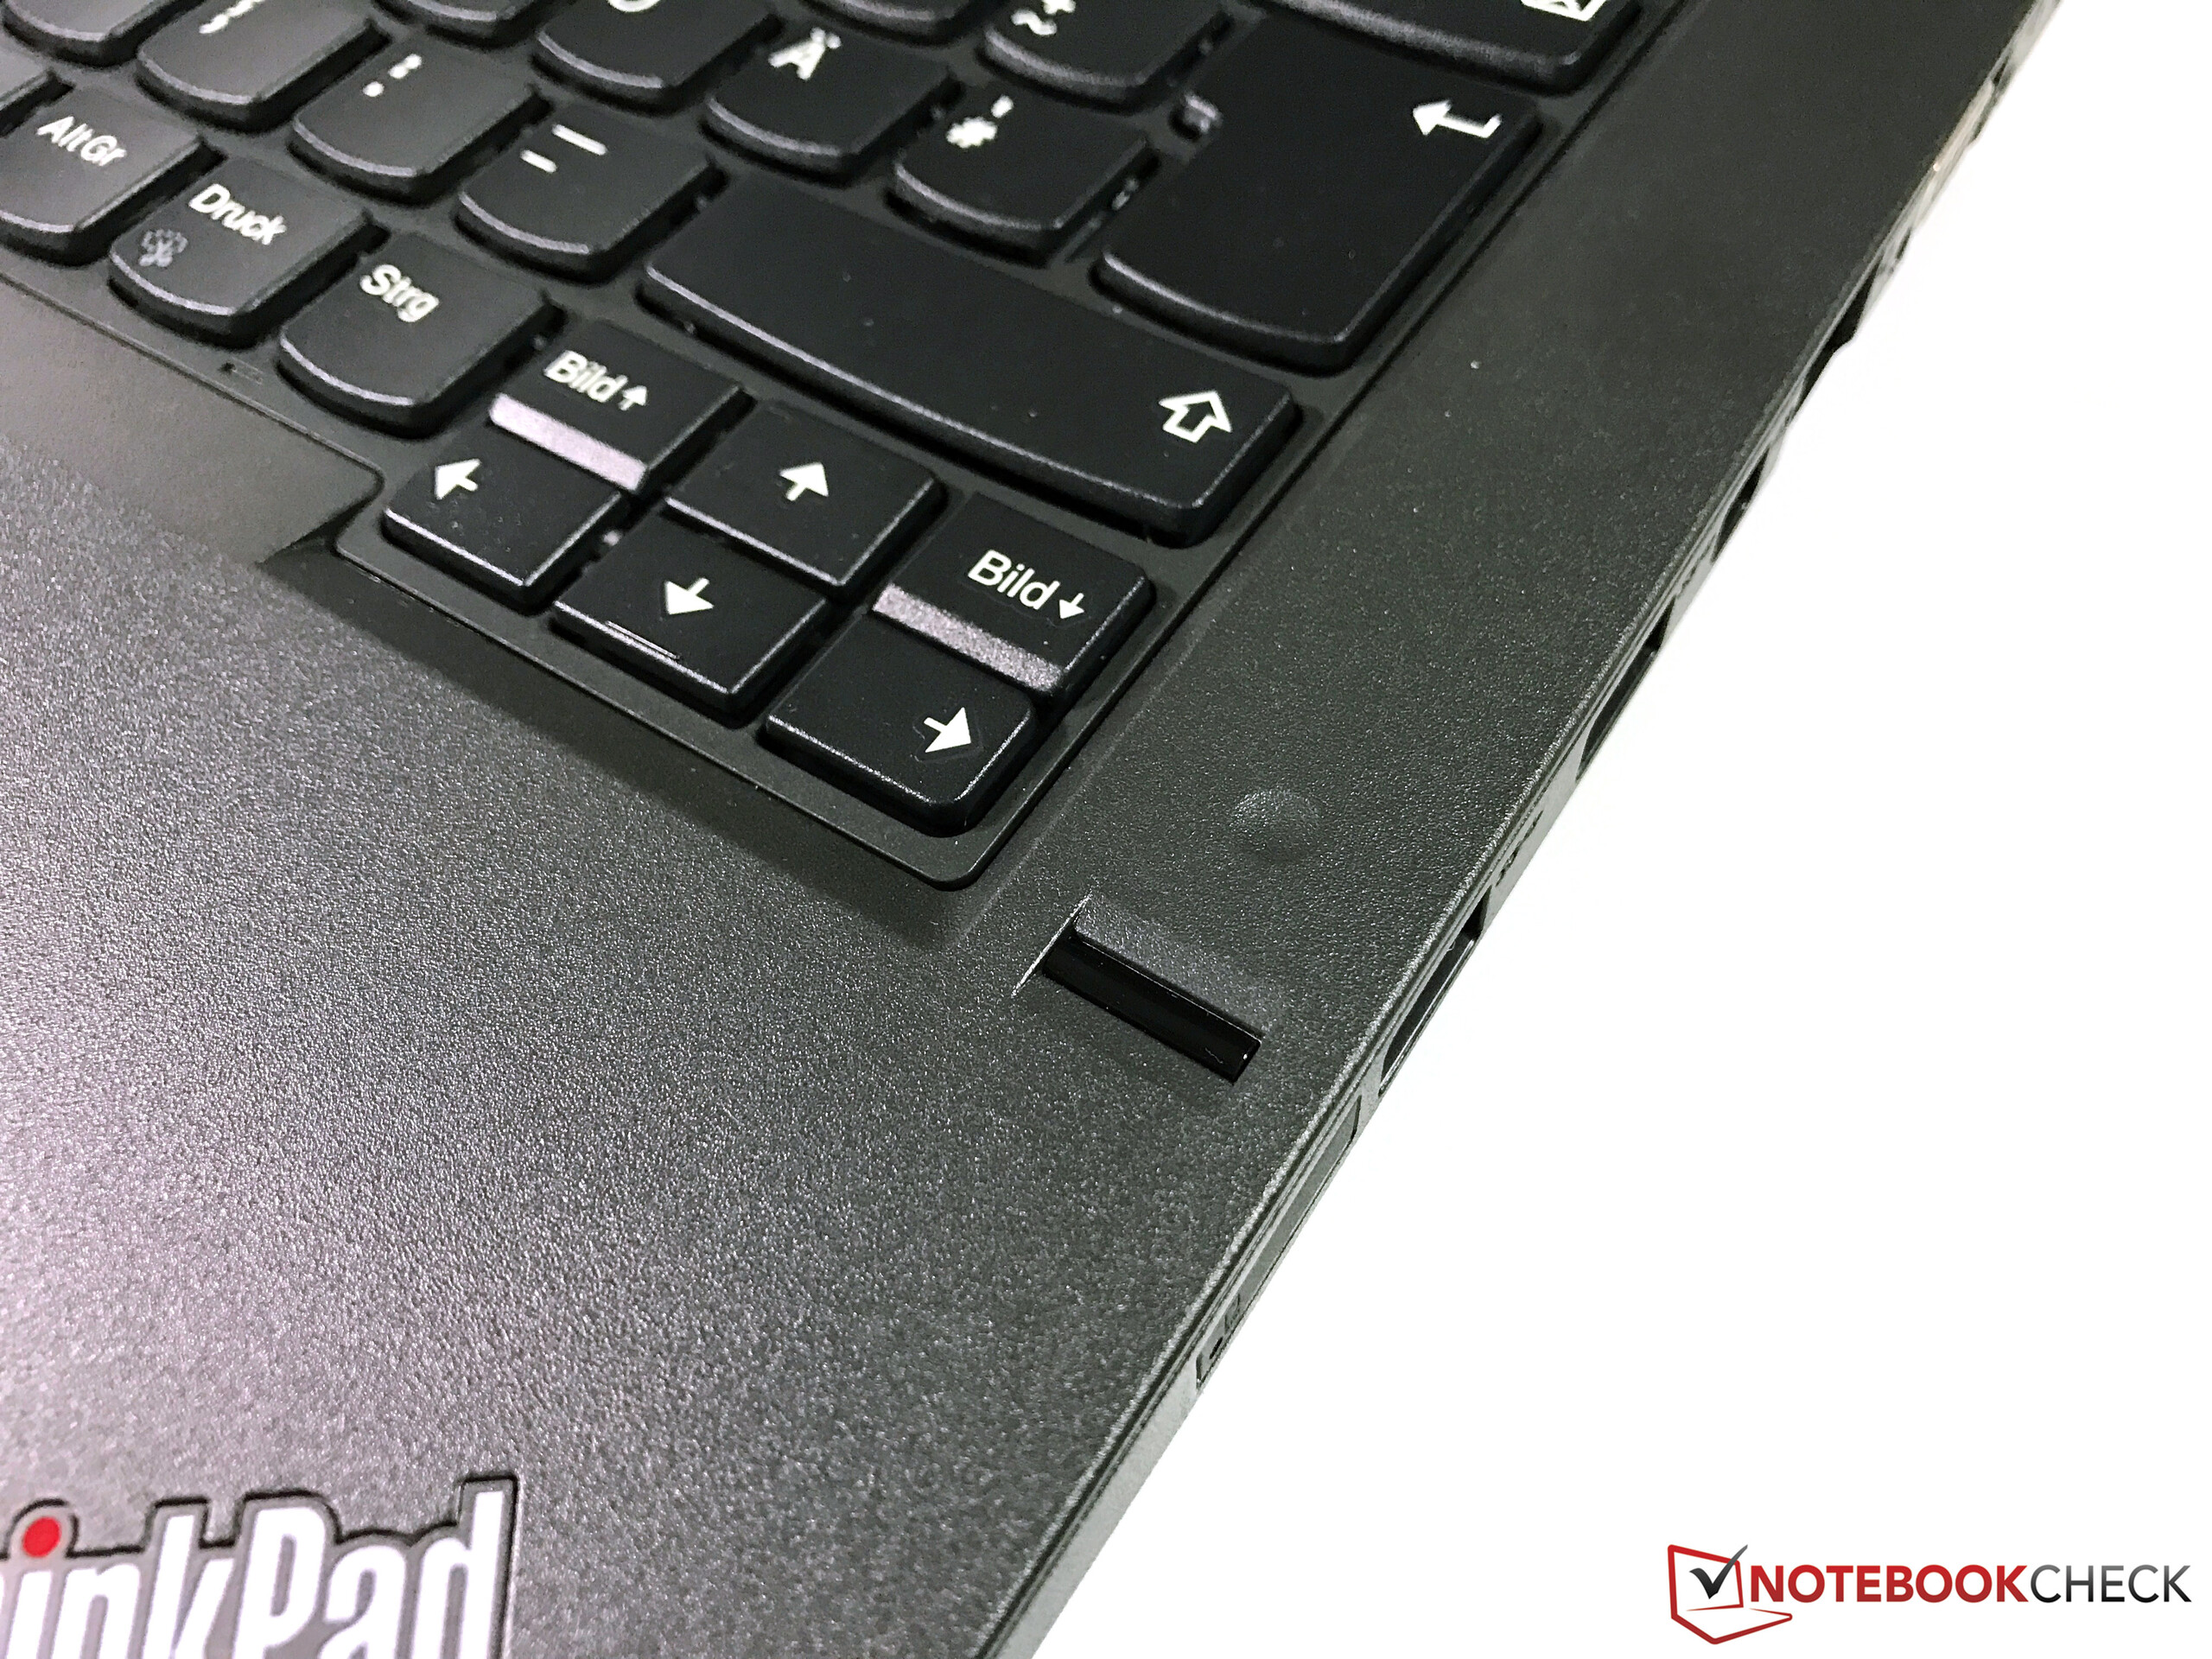
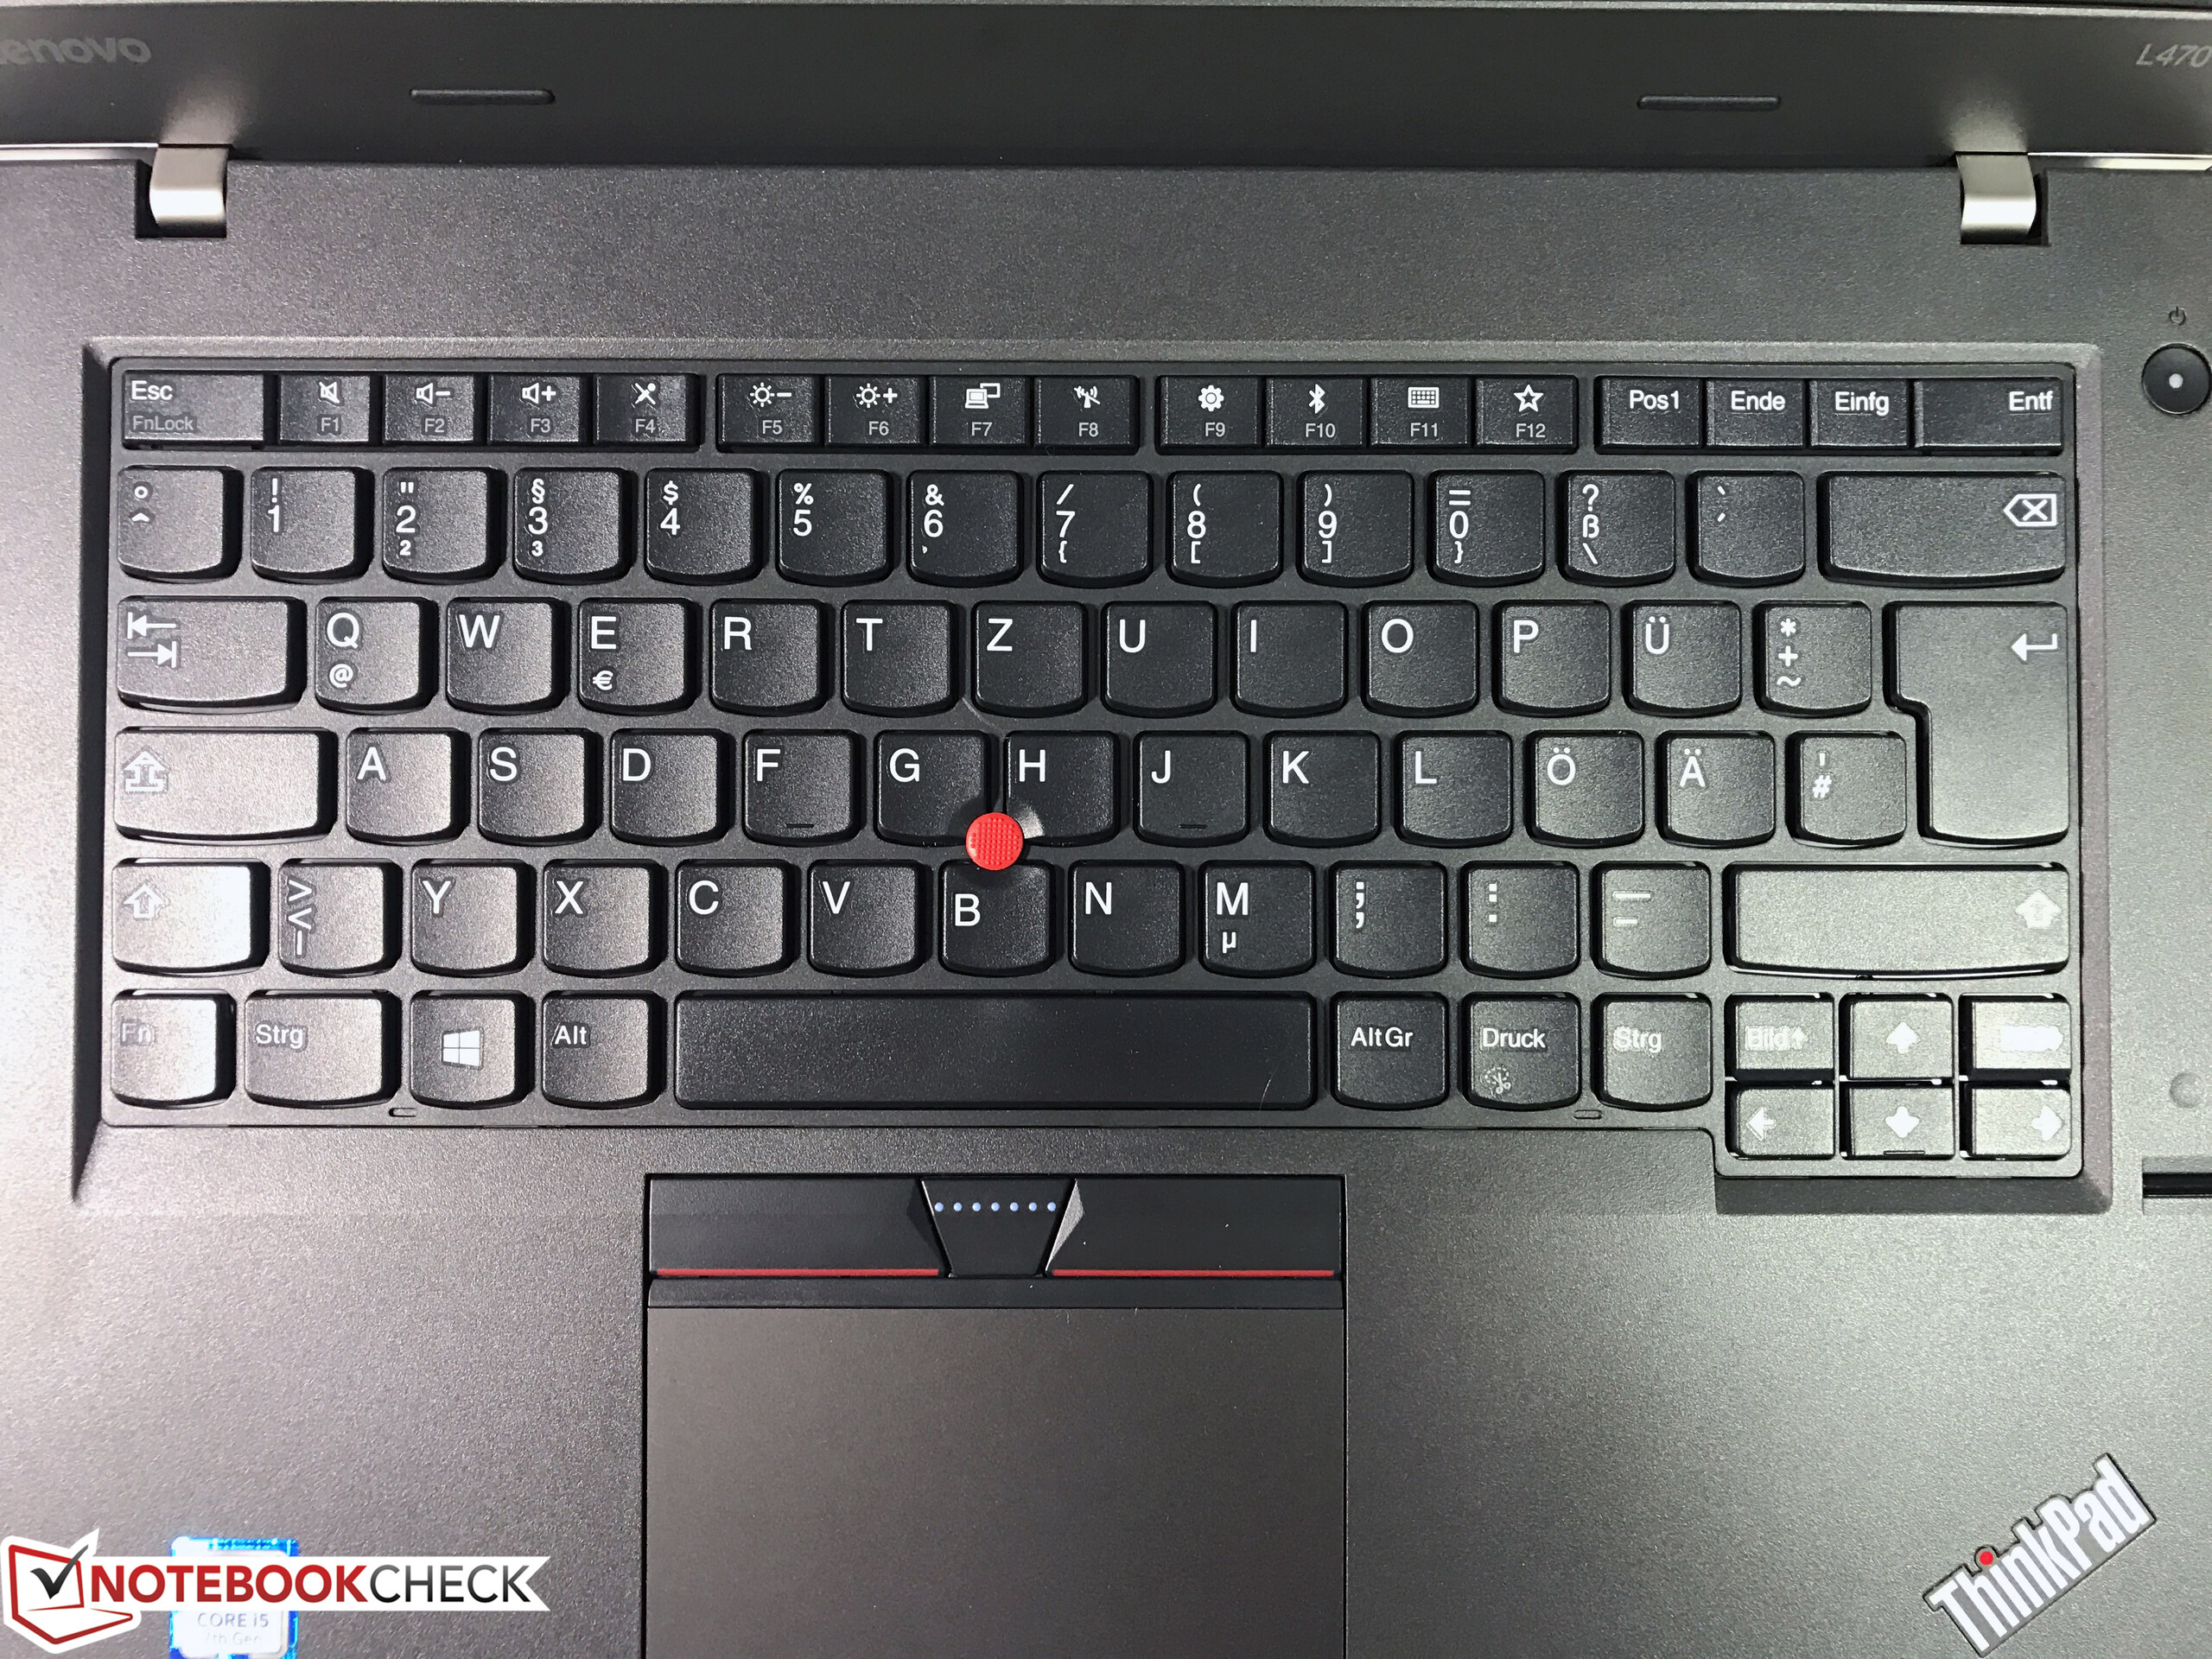
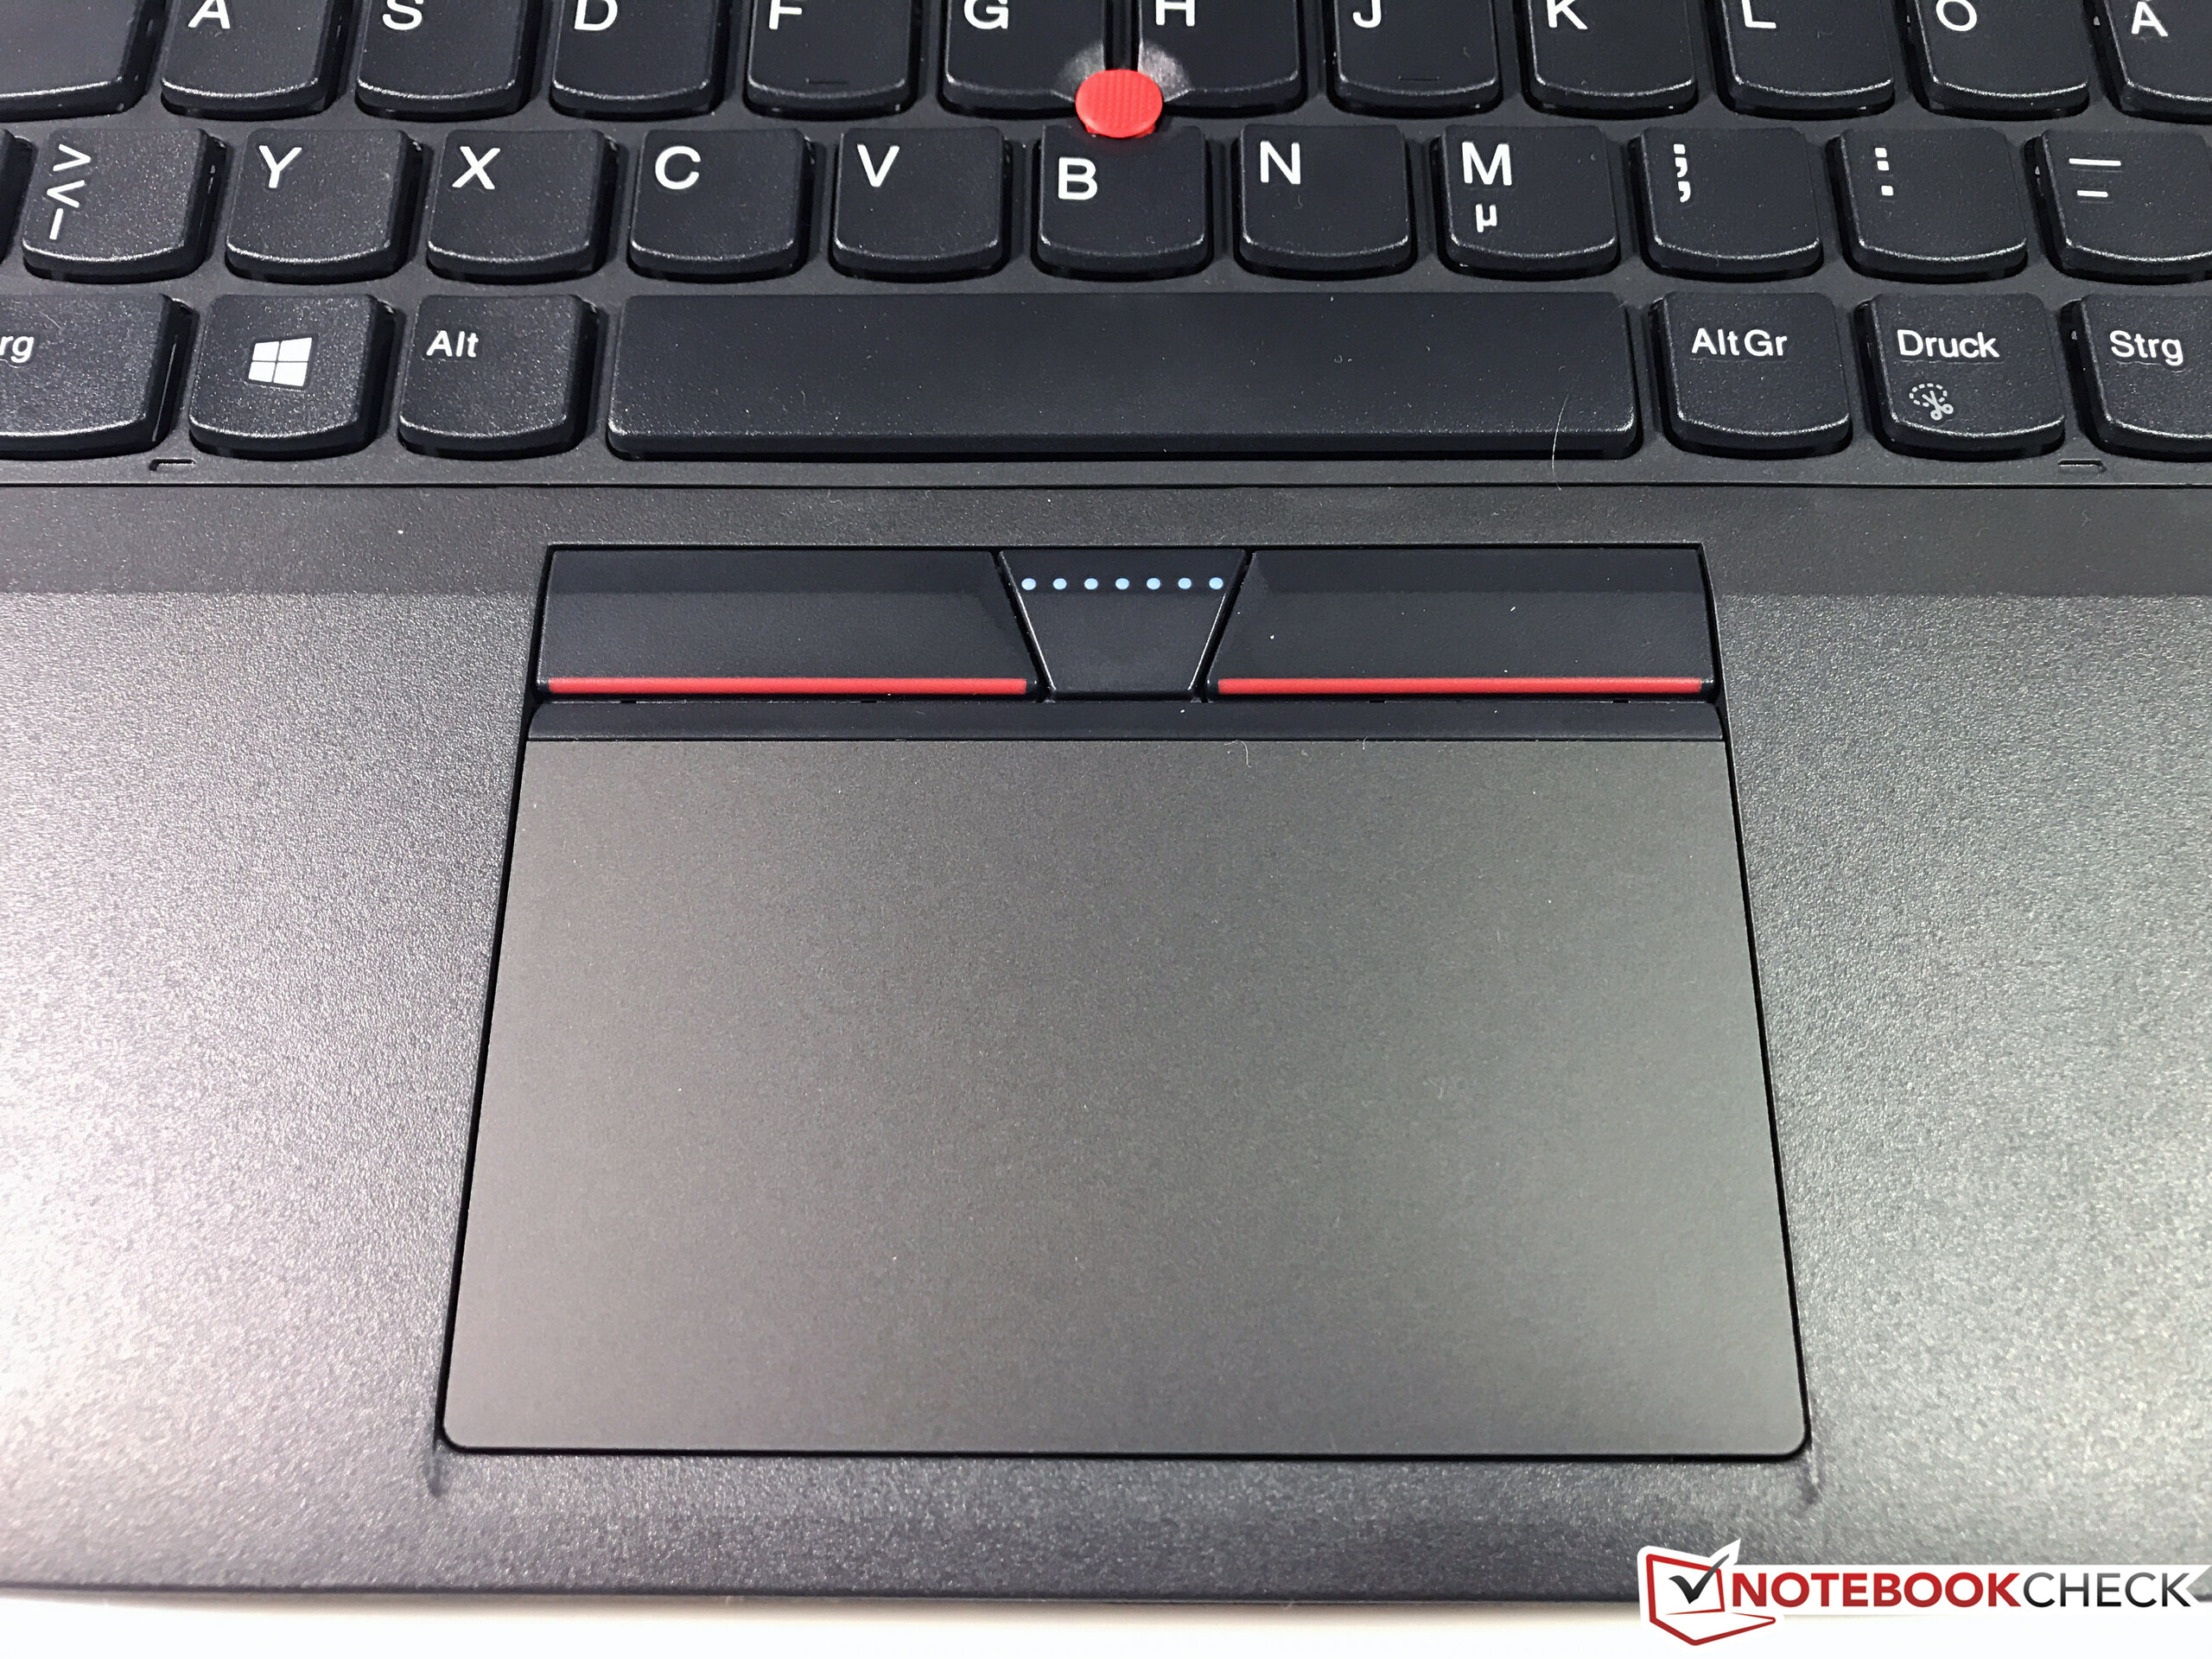
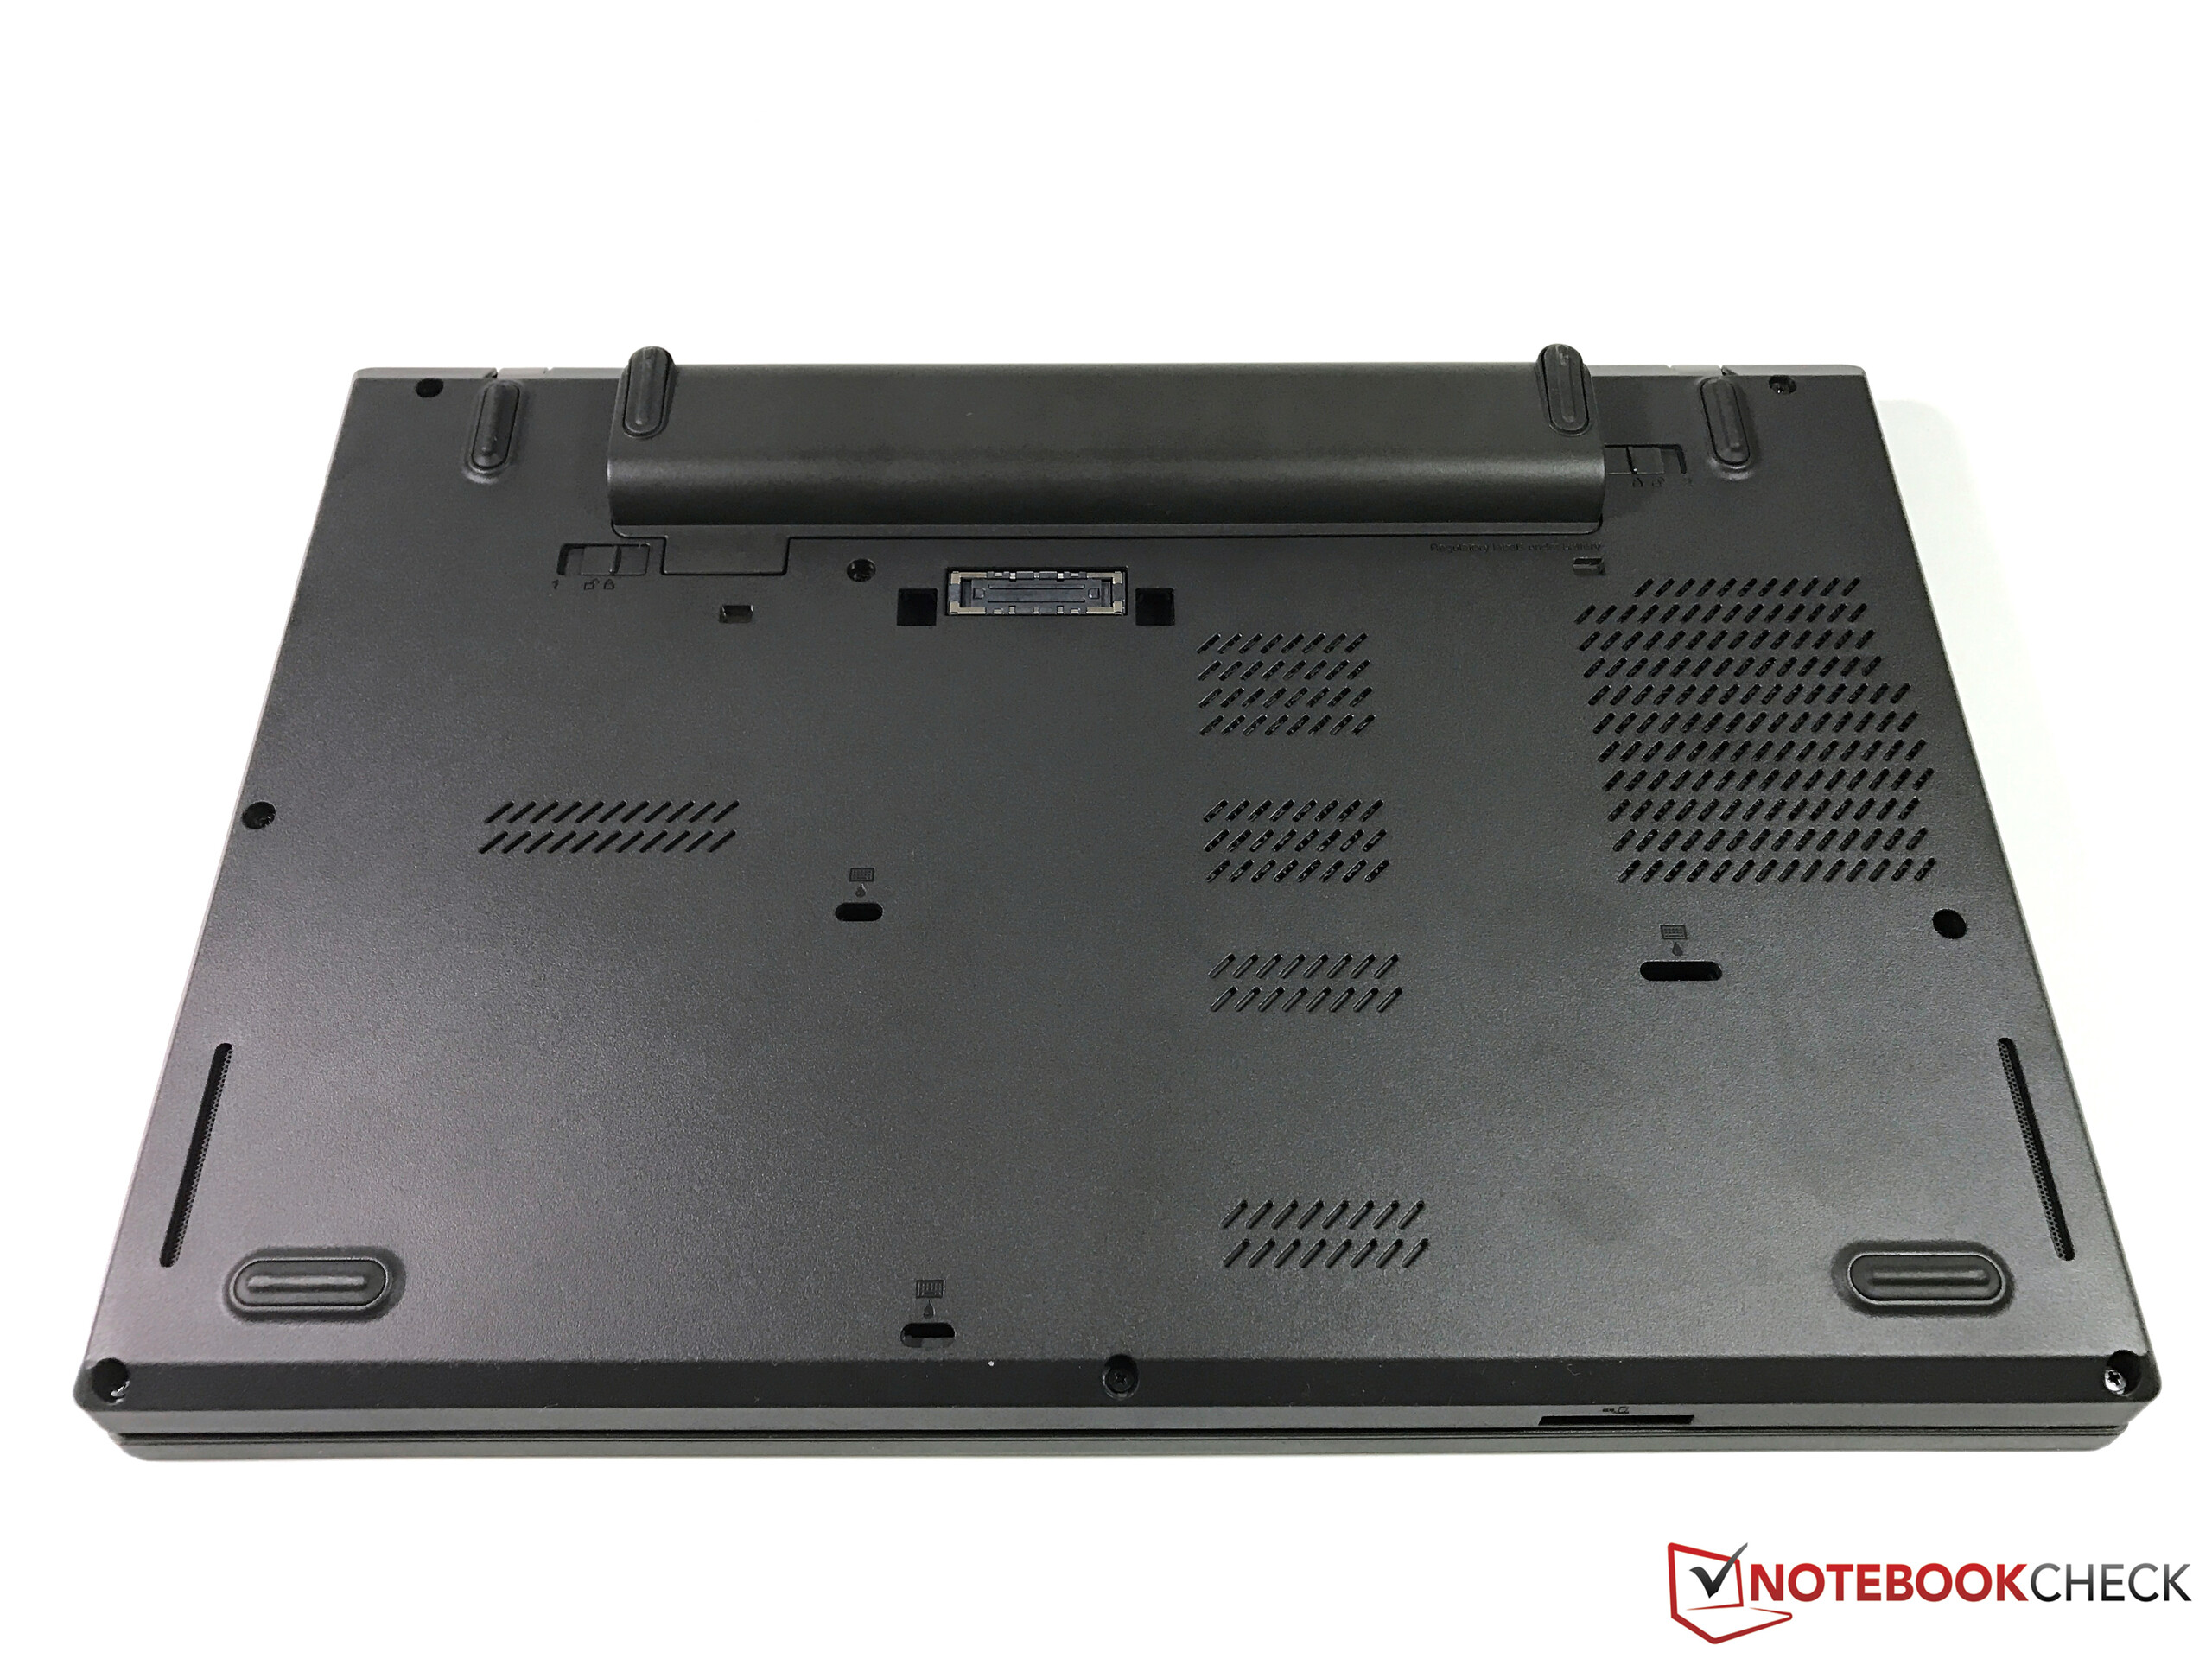
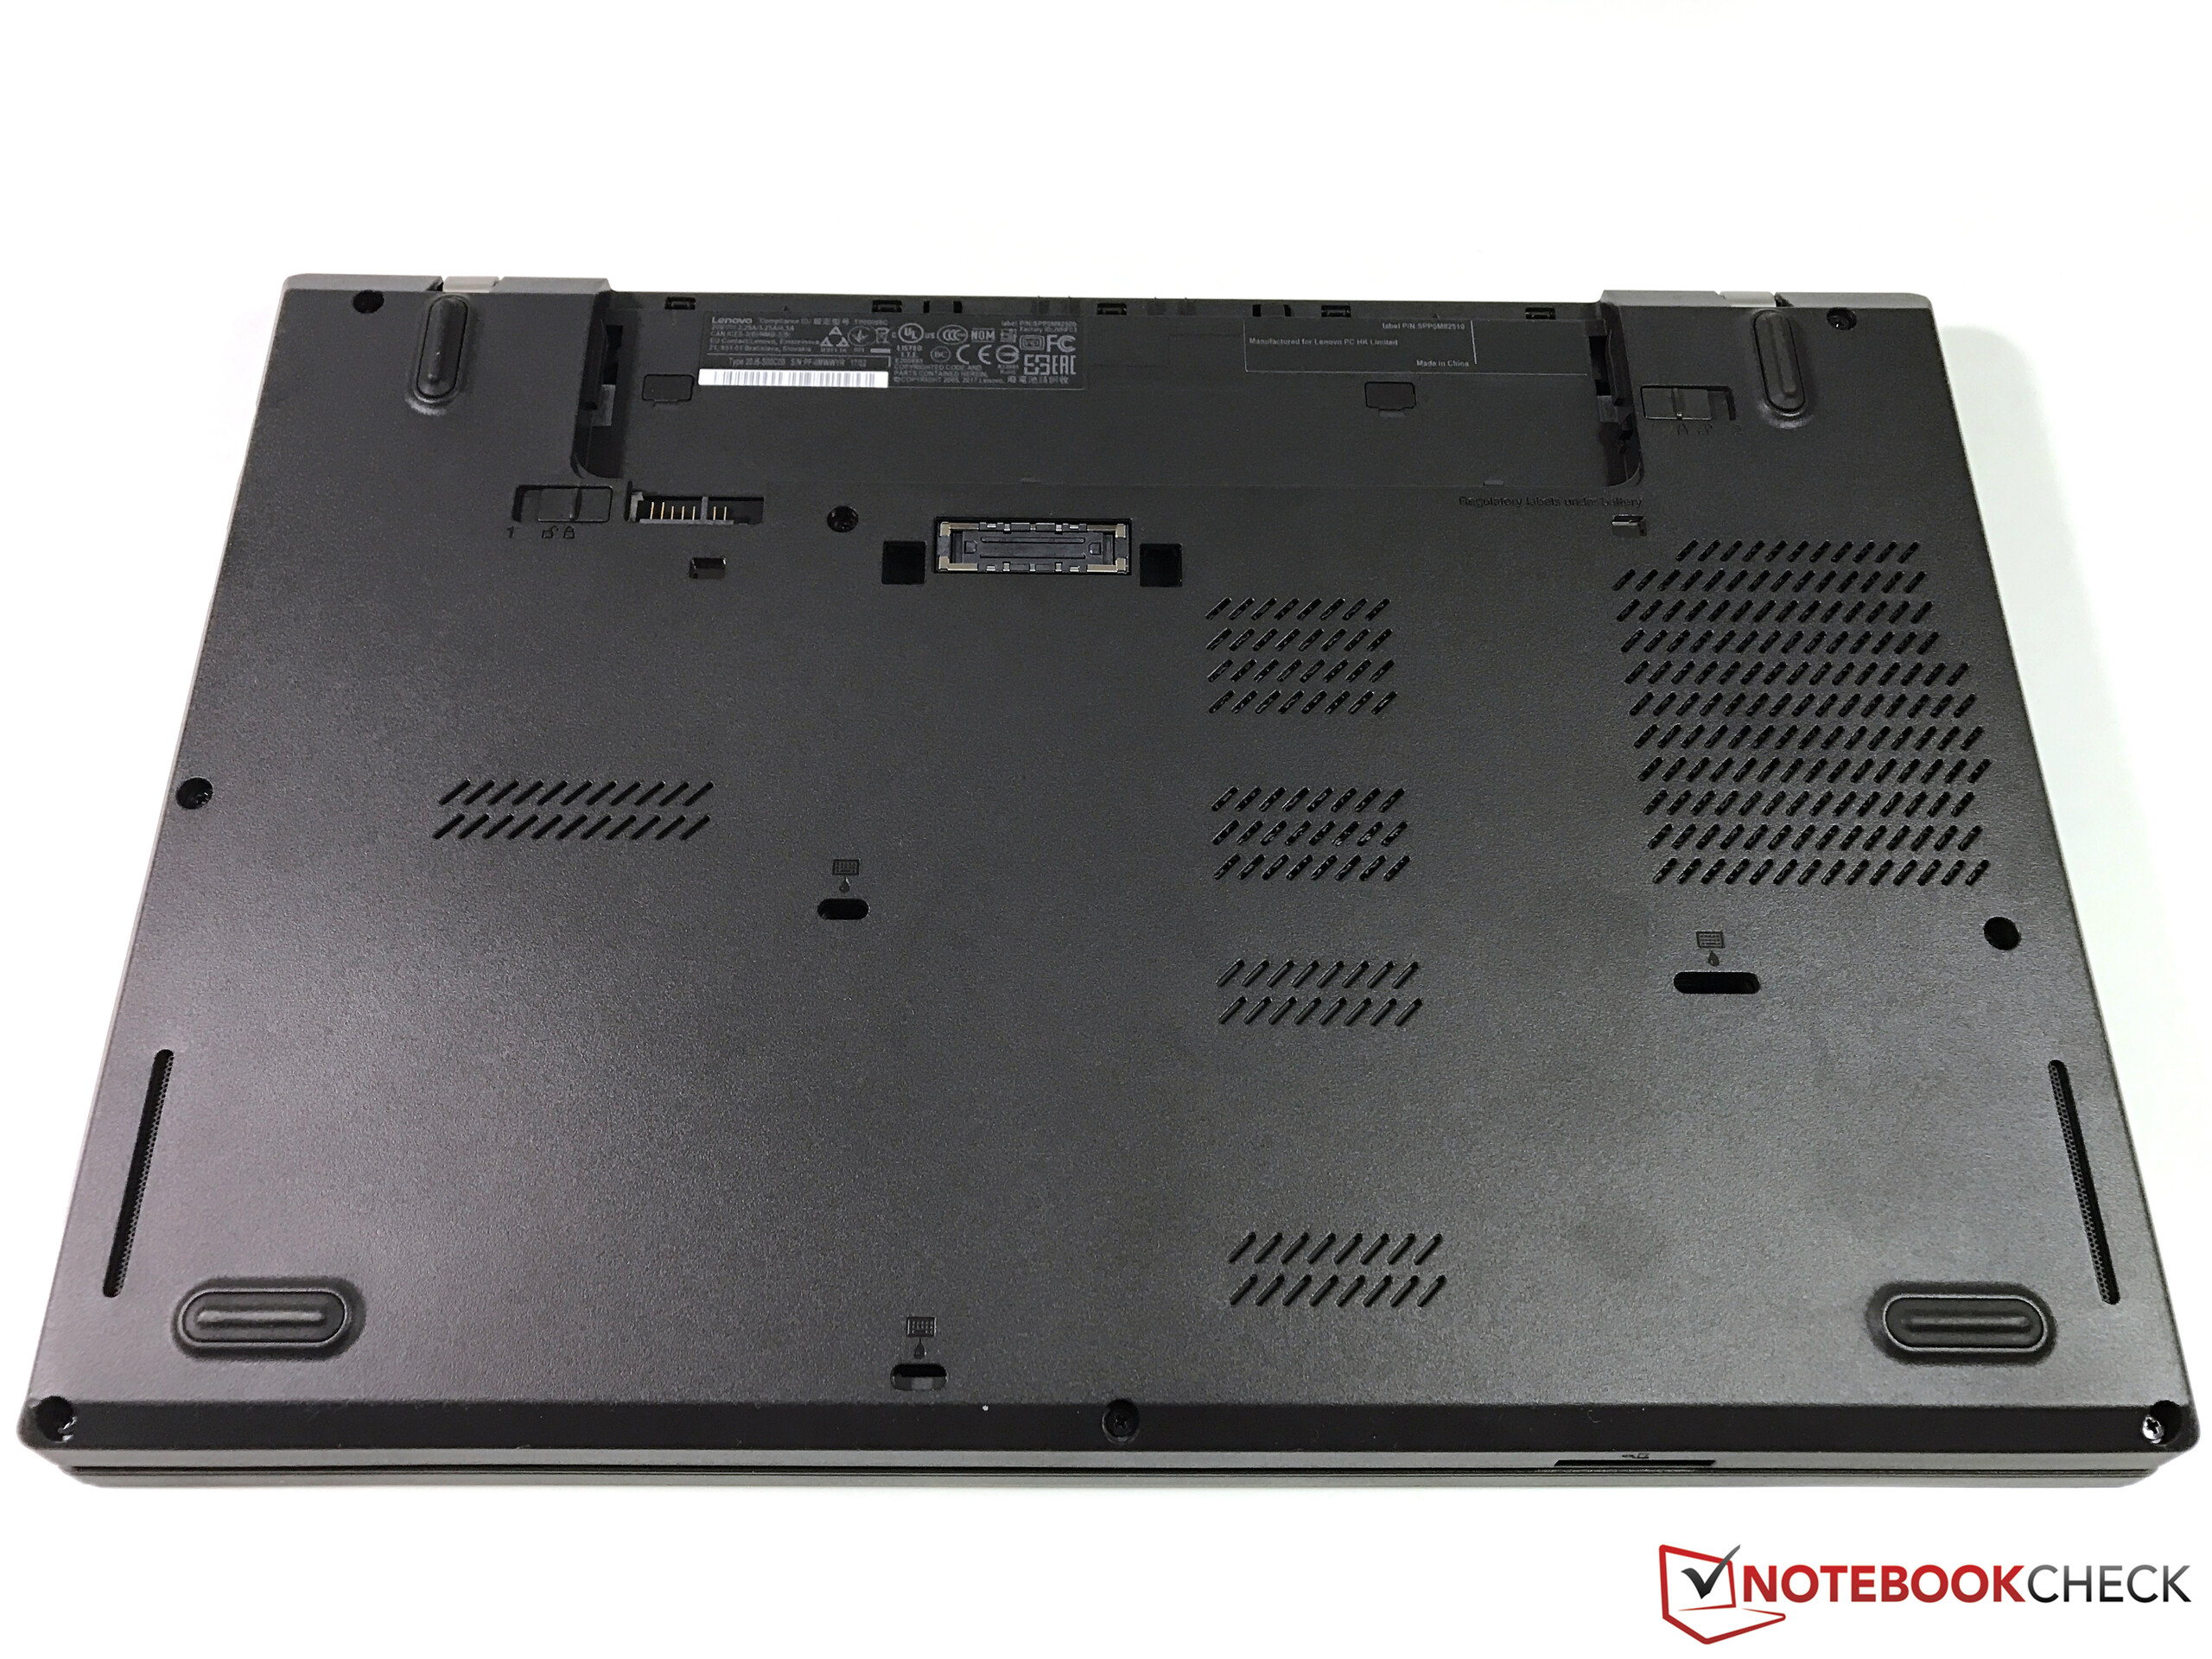
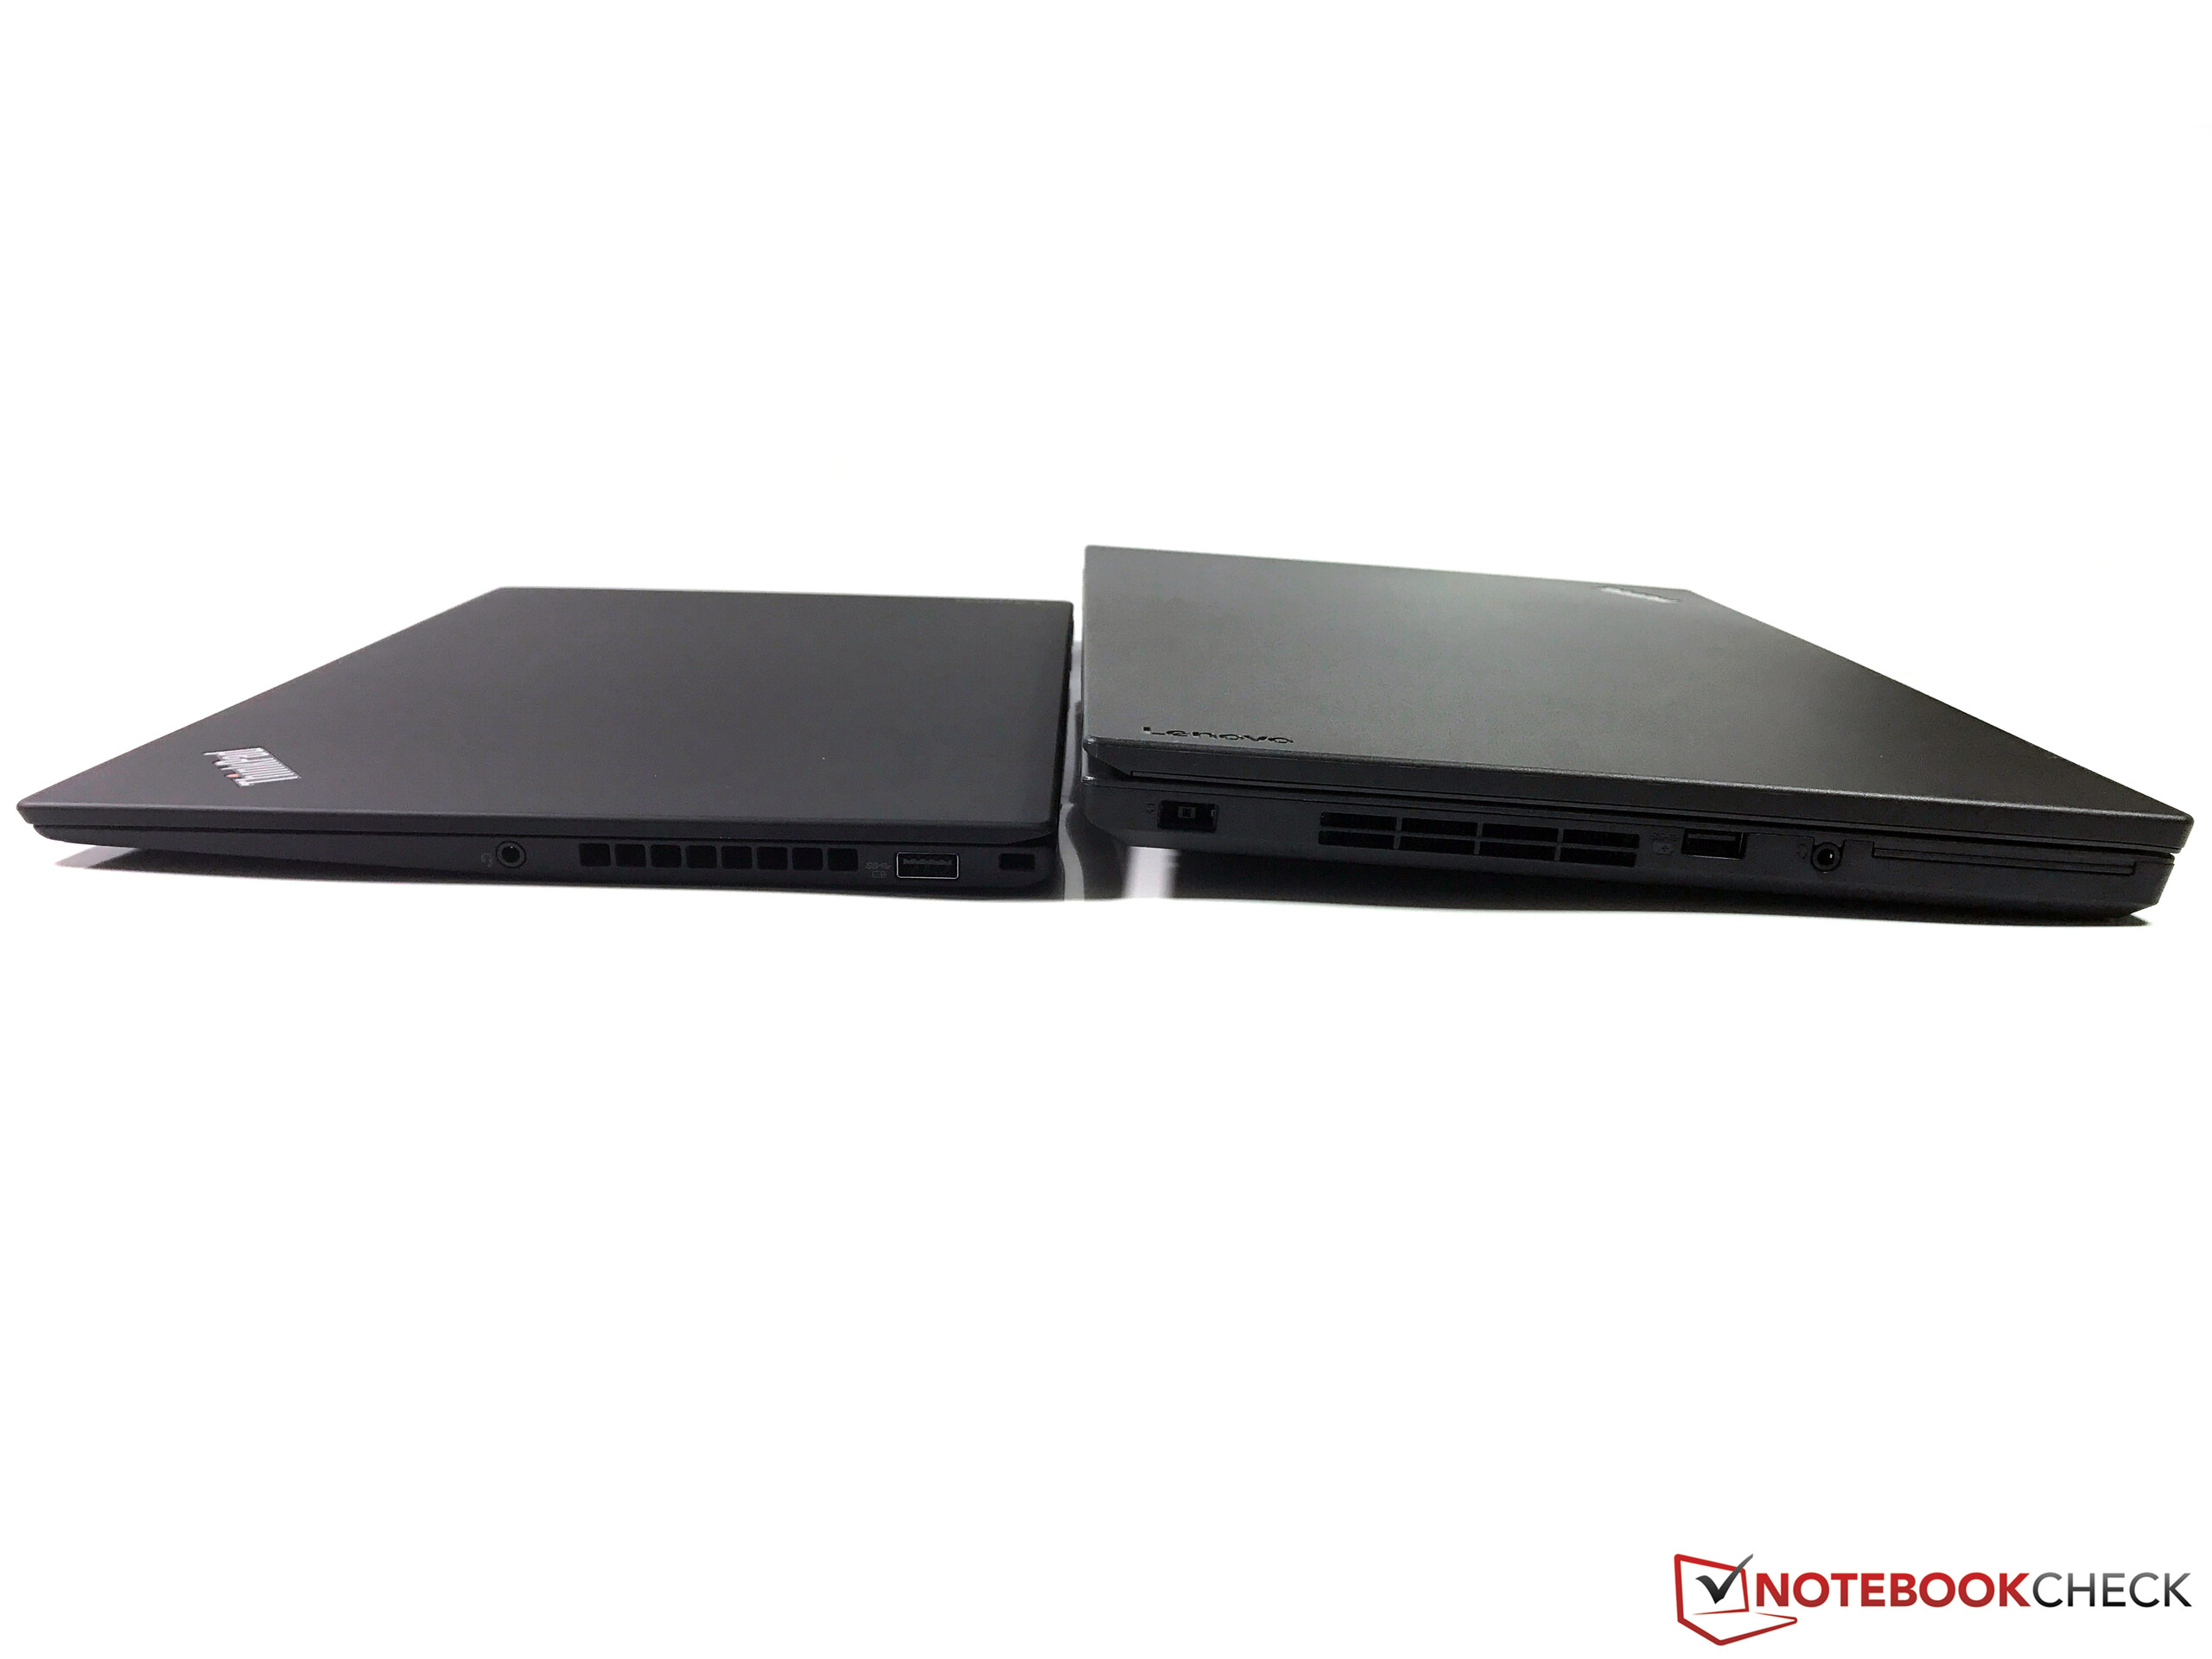
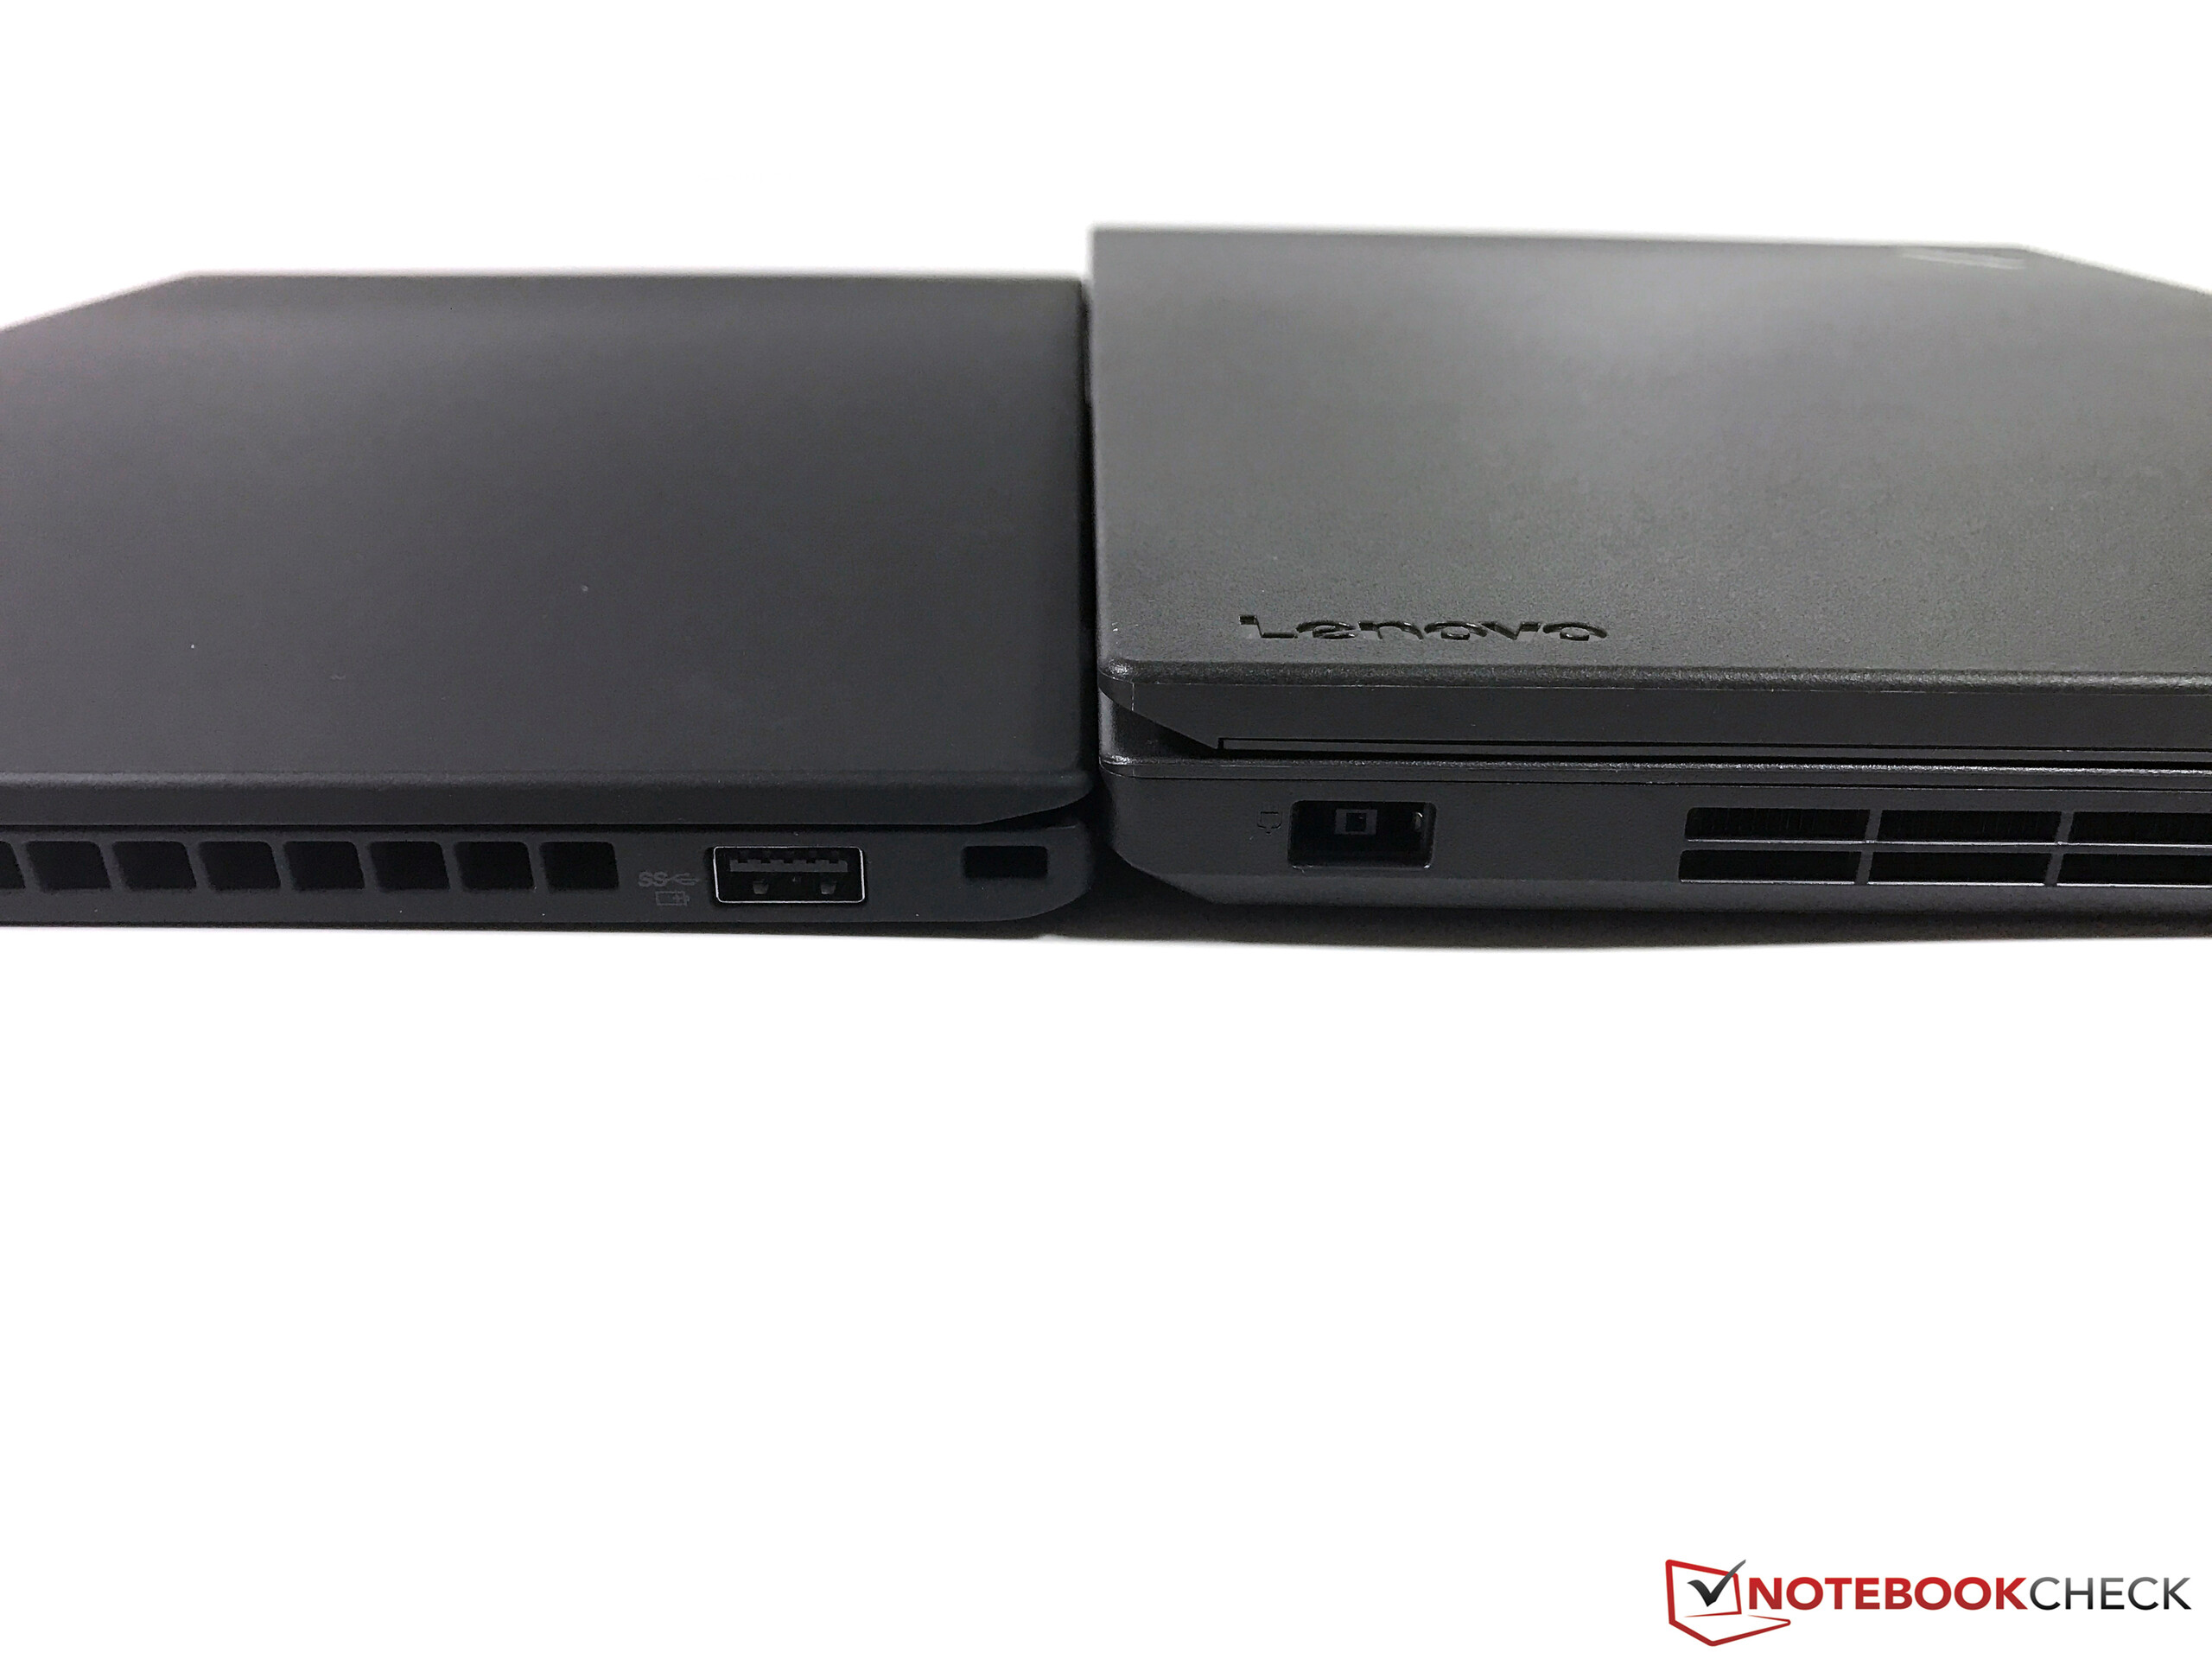
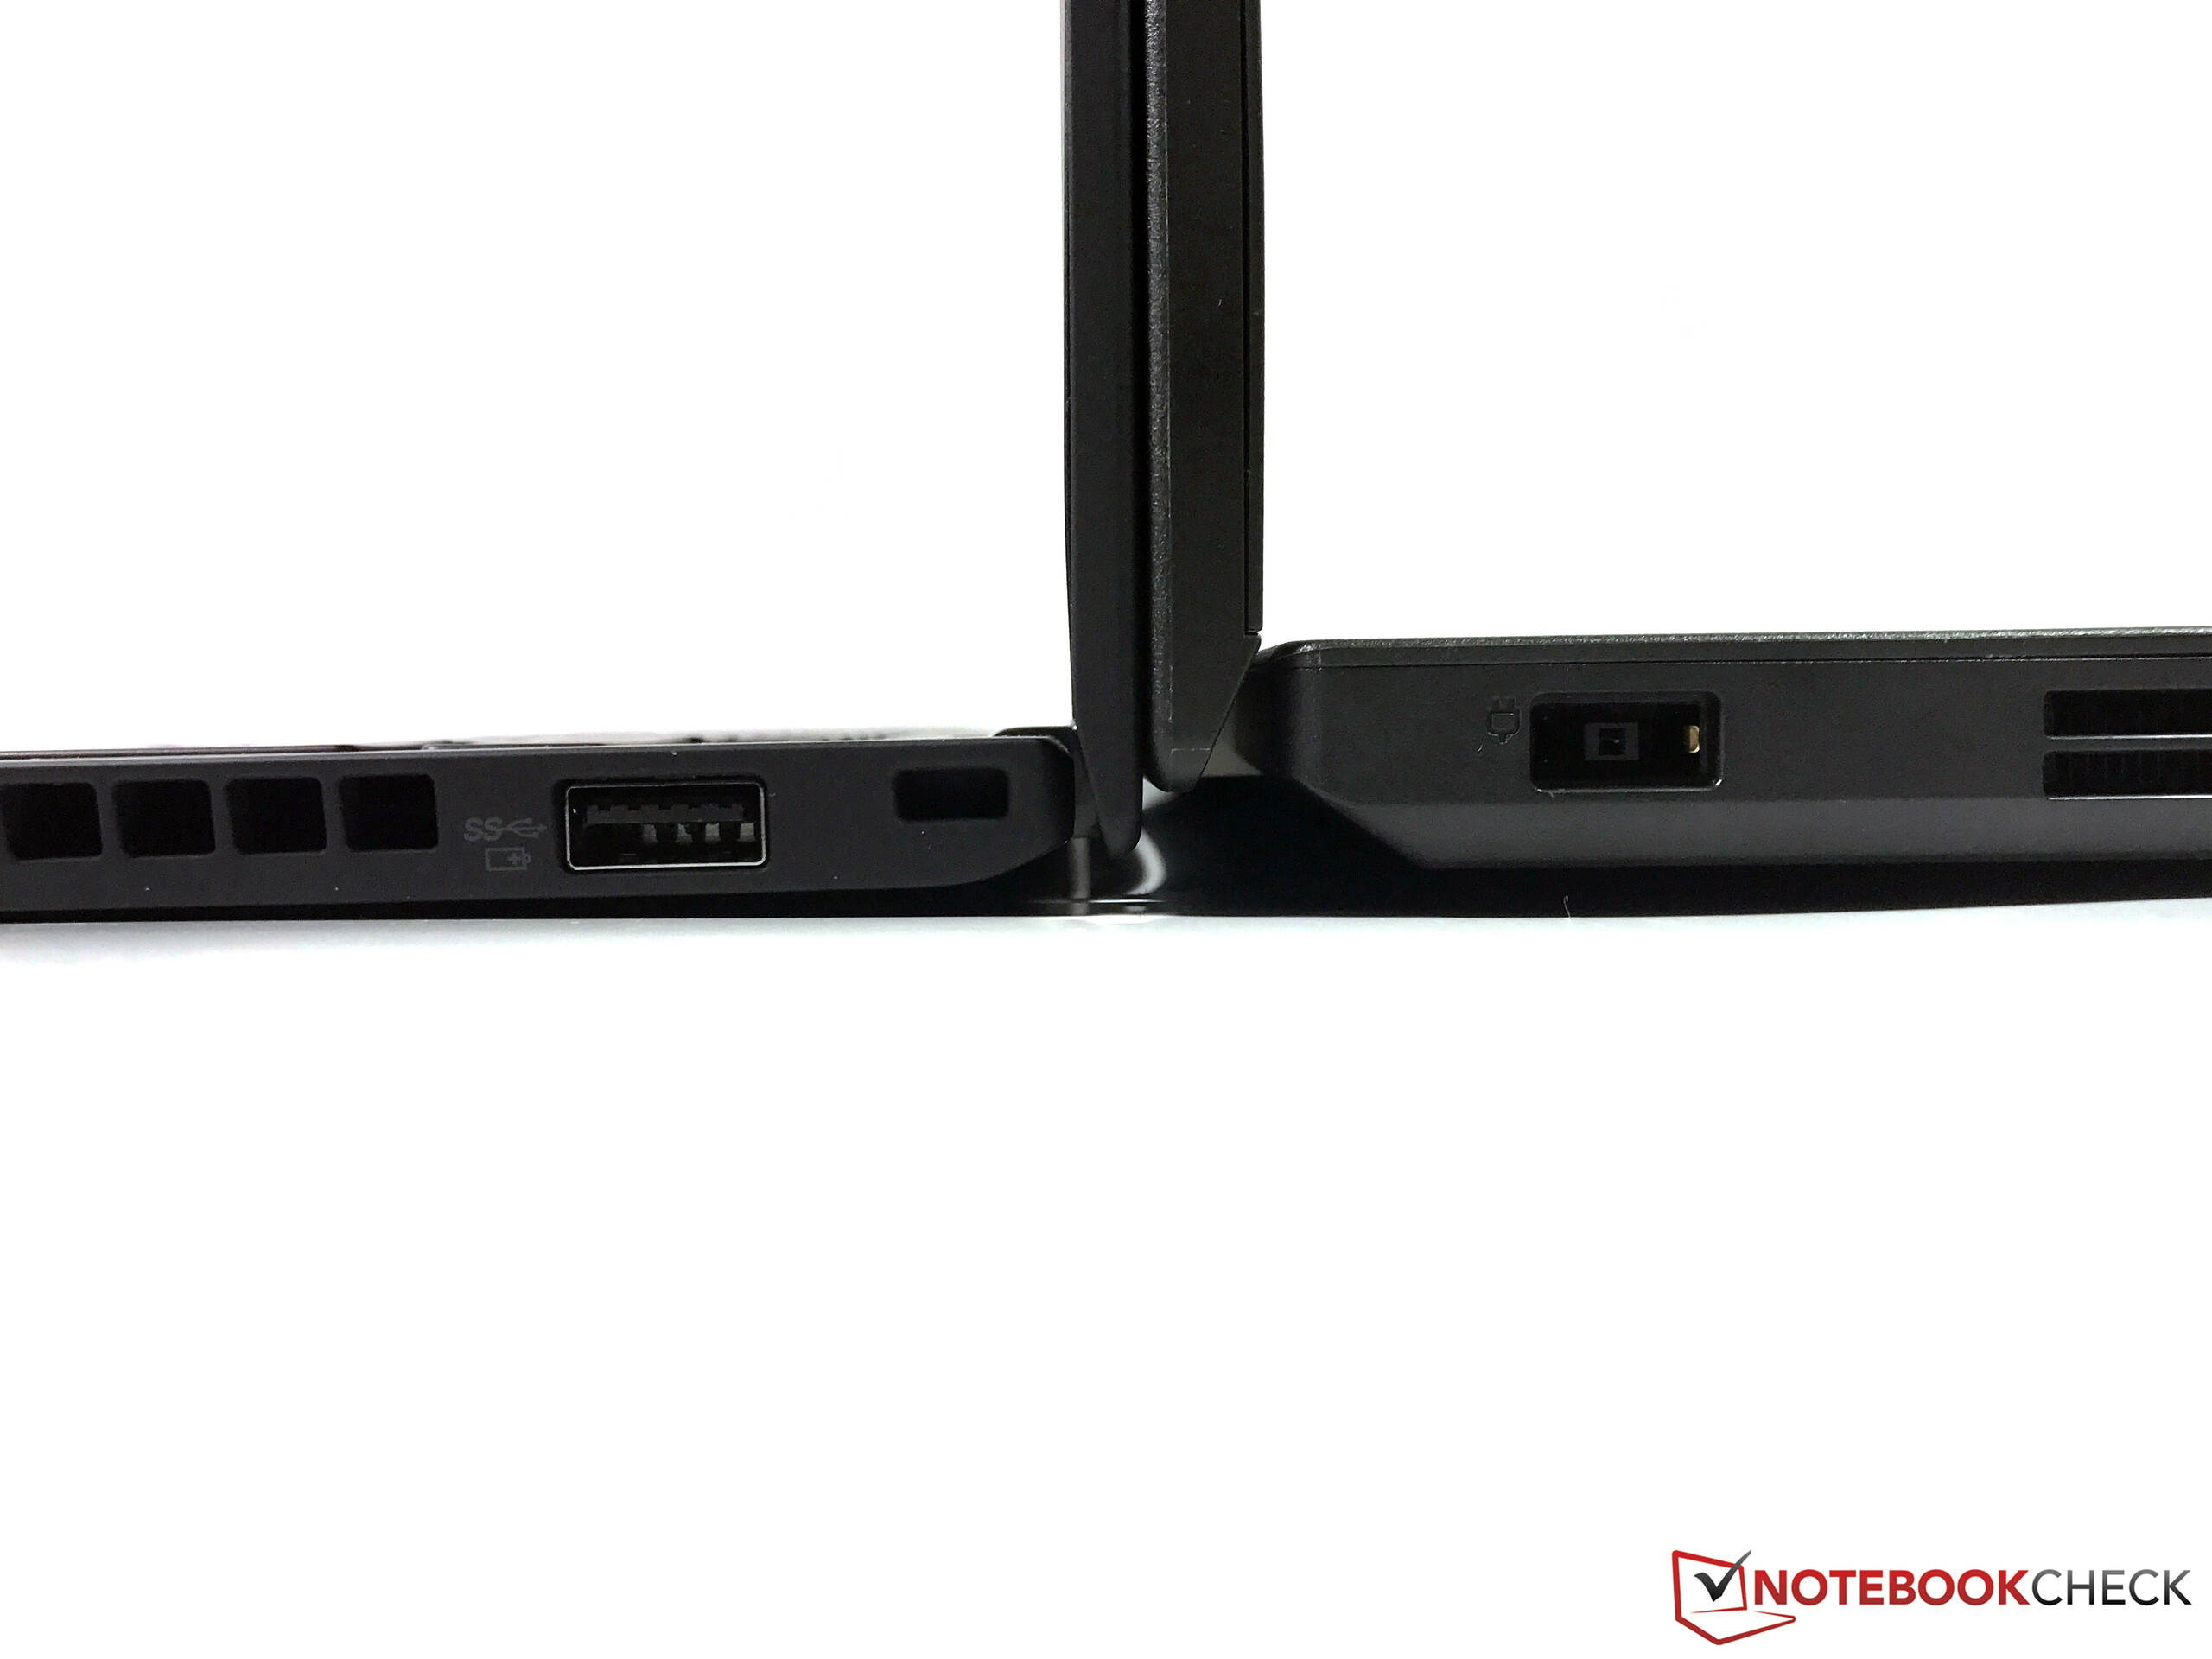
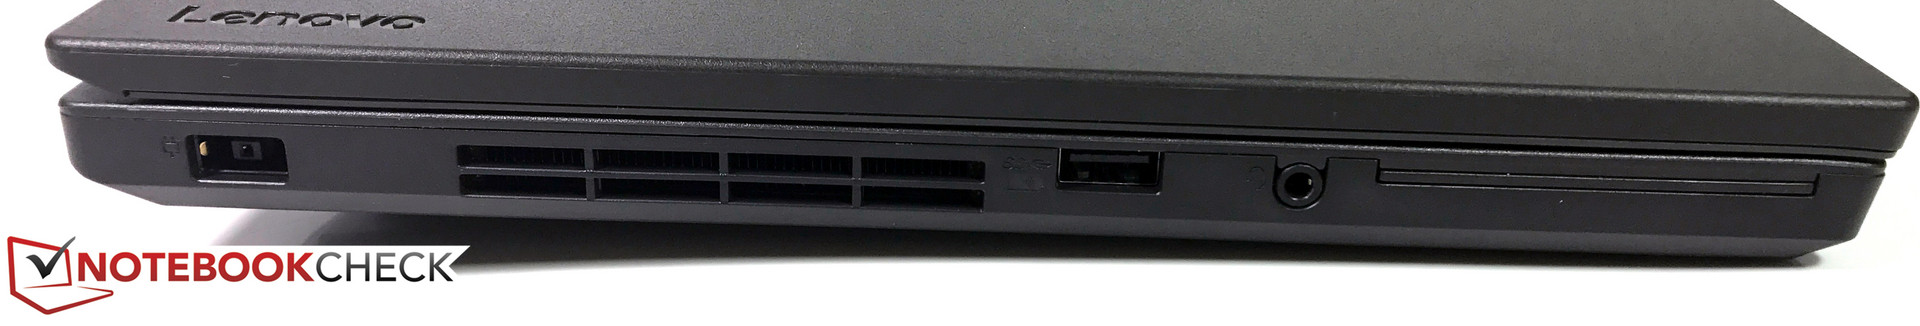
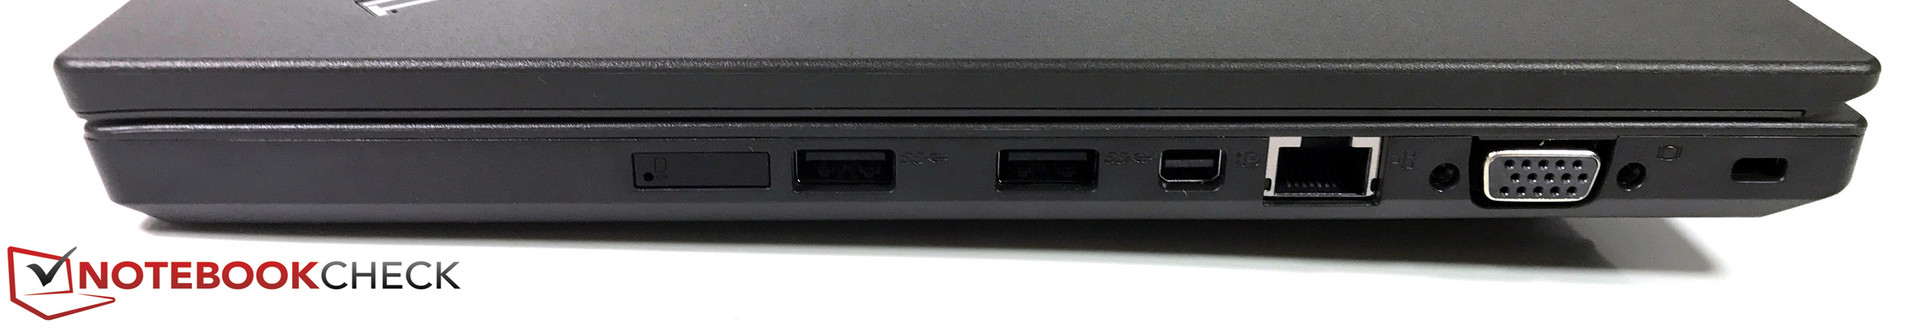
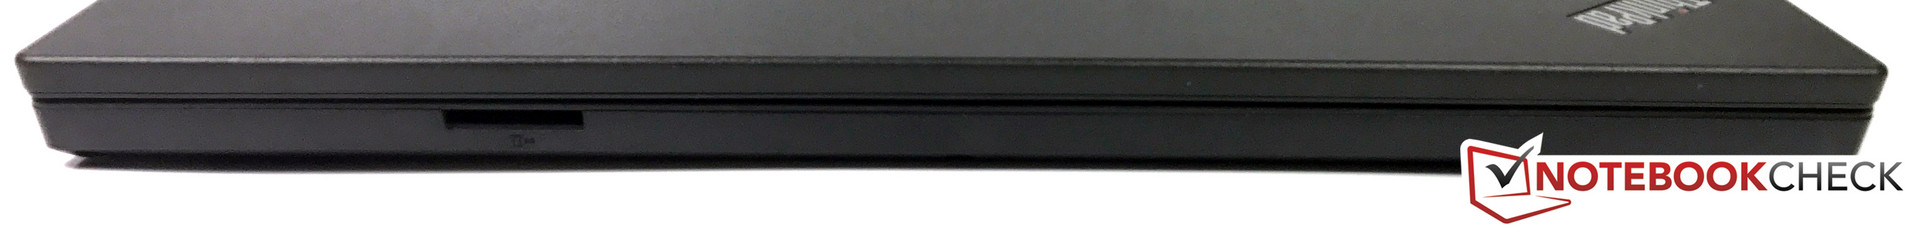
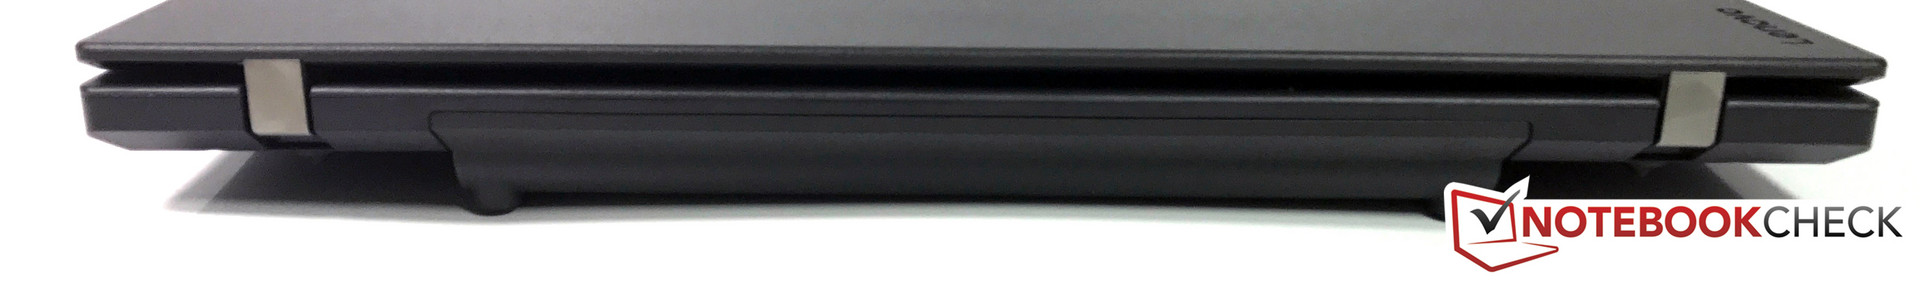
Por un precio relativamente bajo, el L470 ofrece el famoso y excelente teclado ThinkPad, TrackPoint incluido. También en la caja: una pantalla IPS Full HD, que no puede darse por sentada en esta categoría de precios. La carcasa de plástico no parece cara, sin embargo se siente bastante robusta y tiene bisagras duraderas. Como un portátil de negocios, el L470 ofrece una buena variedad de puertos. Aquí uno debe lamentar la falta de un puerto USB tipo C, sin embargo, esto se ve algo contrarrestado por el hecho de que Lenovo todavía integra un puerto de acoplamiento dedicado. Por lo tanto, uno no depende de las estaciones de acoplamiento USB tipo C. También es bueno es que Lenovo aún equipe el L470 con un puerto VGA, que es una característica única entre los ThinkPads actuales. Para las escuelas, universidades y empresas que todavía usan proyectores antiguos, este es un importante punto de venta. En este caso, se debe apreciar el buen aguante de la batería y la flexibilidad de una batería reemplazable, incluso si sube un poco el dispositivo.
Lenovo no comete grandes errores. Lo primero y más importante en esta categoría es el molesto ruido, lo cual es una gran lástima, porque de lo contrario el dispositivo habría estado completamente silencioso durante el funcionamiento en espera. El estrangulamiento de la GPU, cuando funciona por batería, también es comprensible. La baja cobertura de espacio de color de la pantalla no debe verse demasiado negativamente con un dispositivo destinado para uso comercial,sin embargo, debe mencionarse. Finalmente, uno debe criticar el período de garantía estándar, un año simplemente no es suficiente.
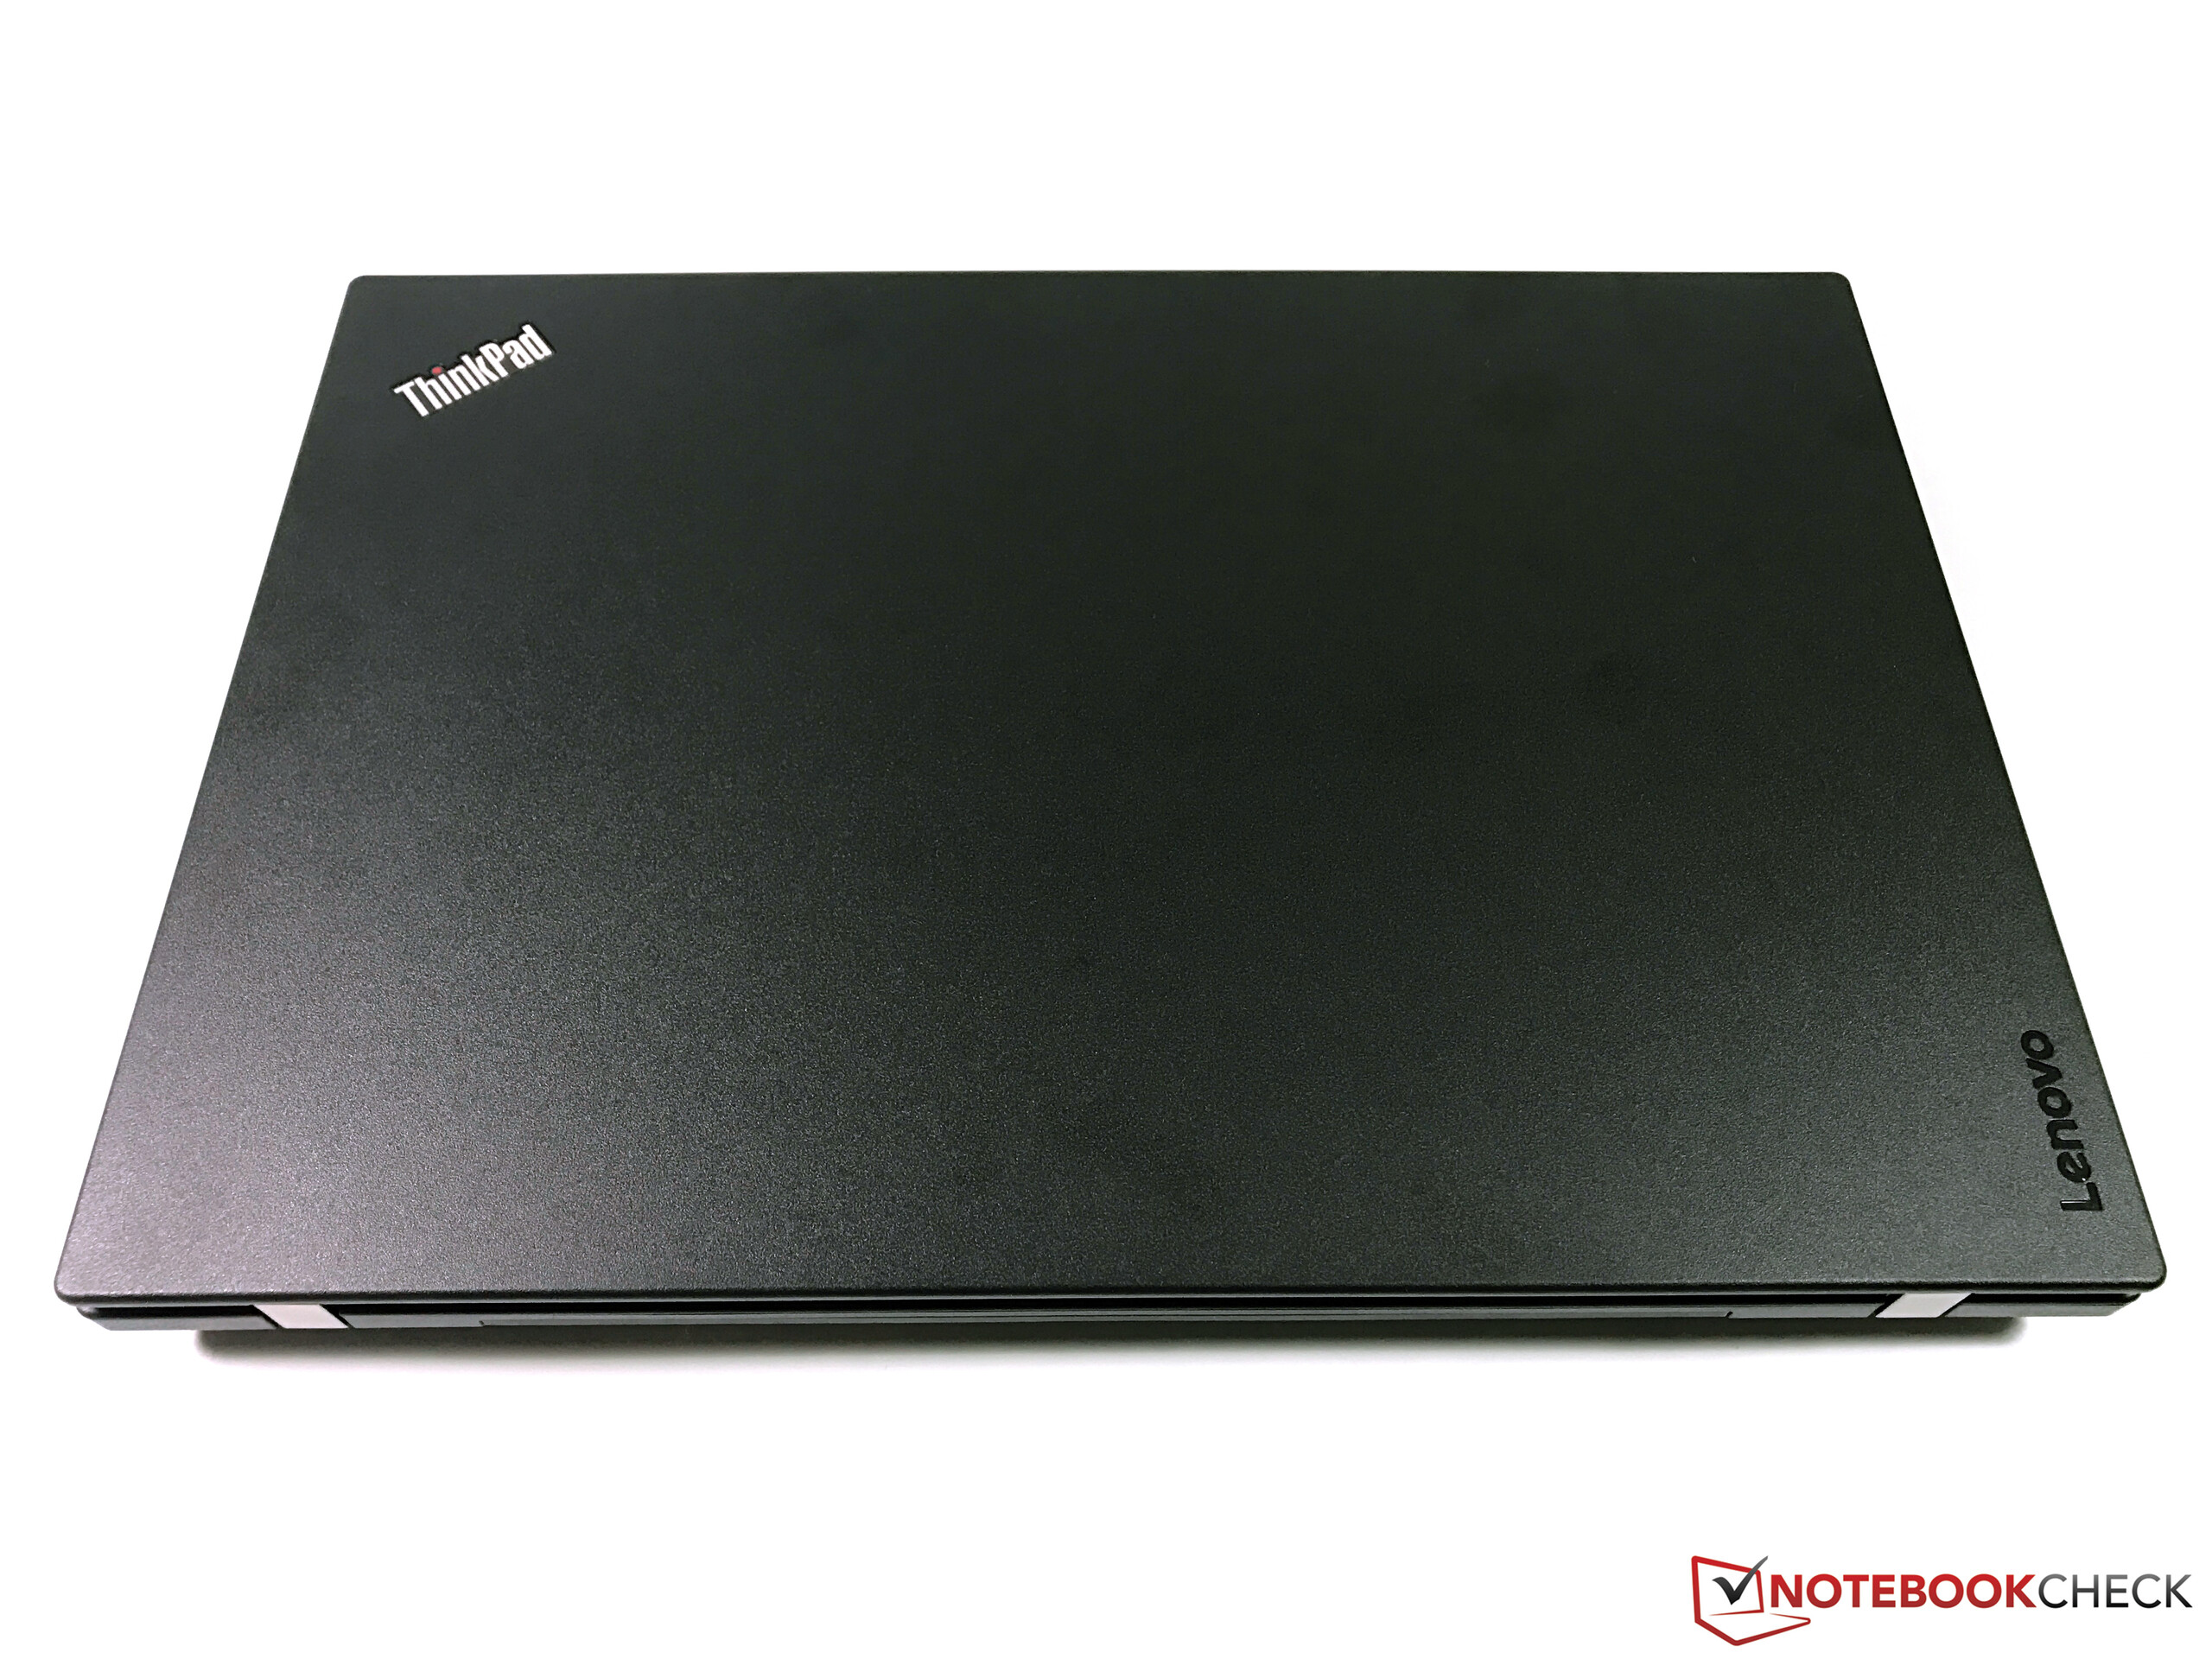
Ganador en precio/rendimiento: con un precio bajo y funciones heredadas, como un puerto VGA y una batería reemplazable, el L470 es un interesante ordenador portátil de negocios de 14".
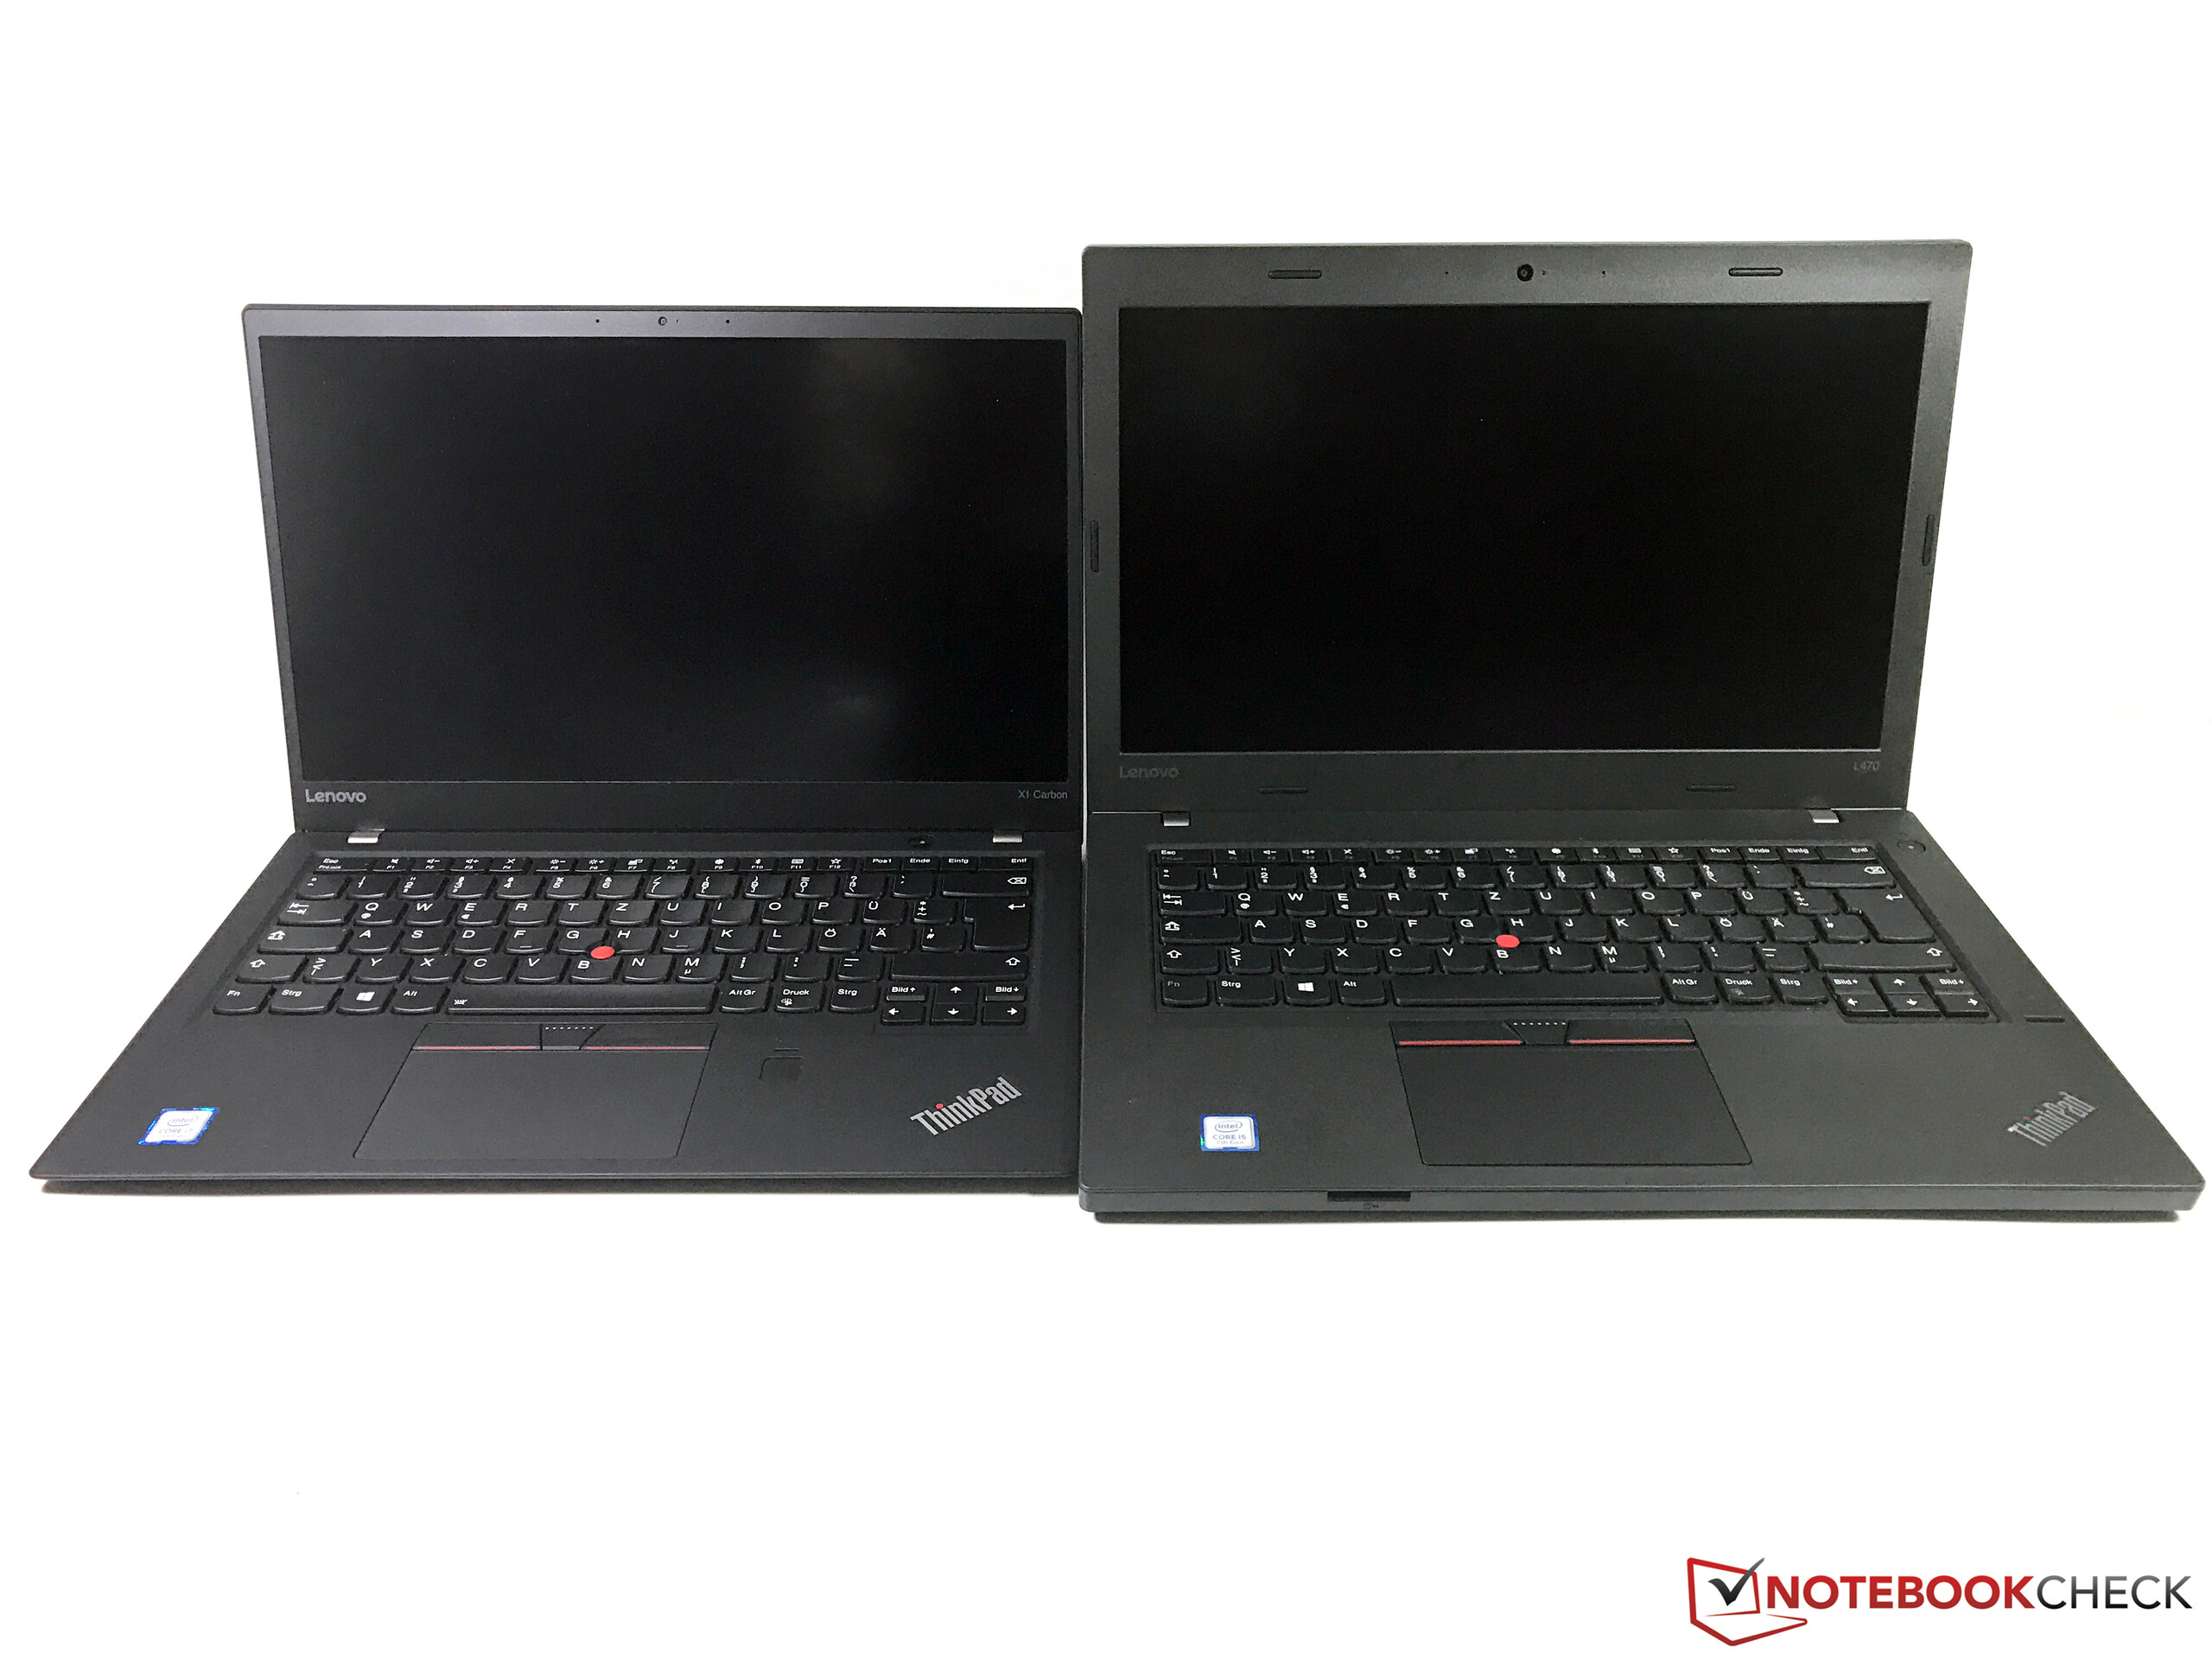
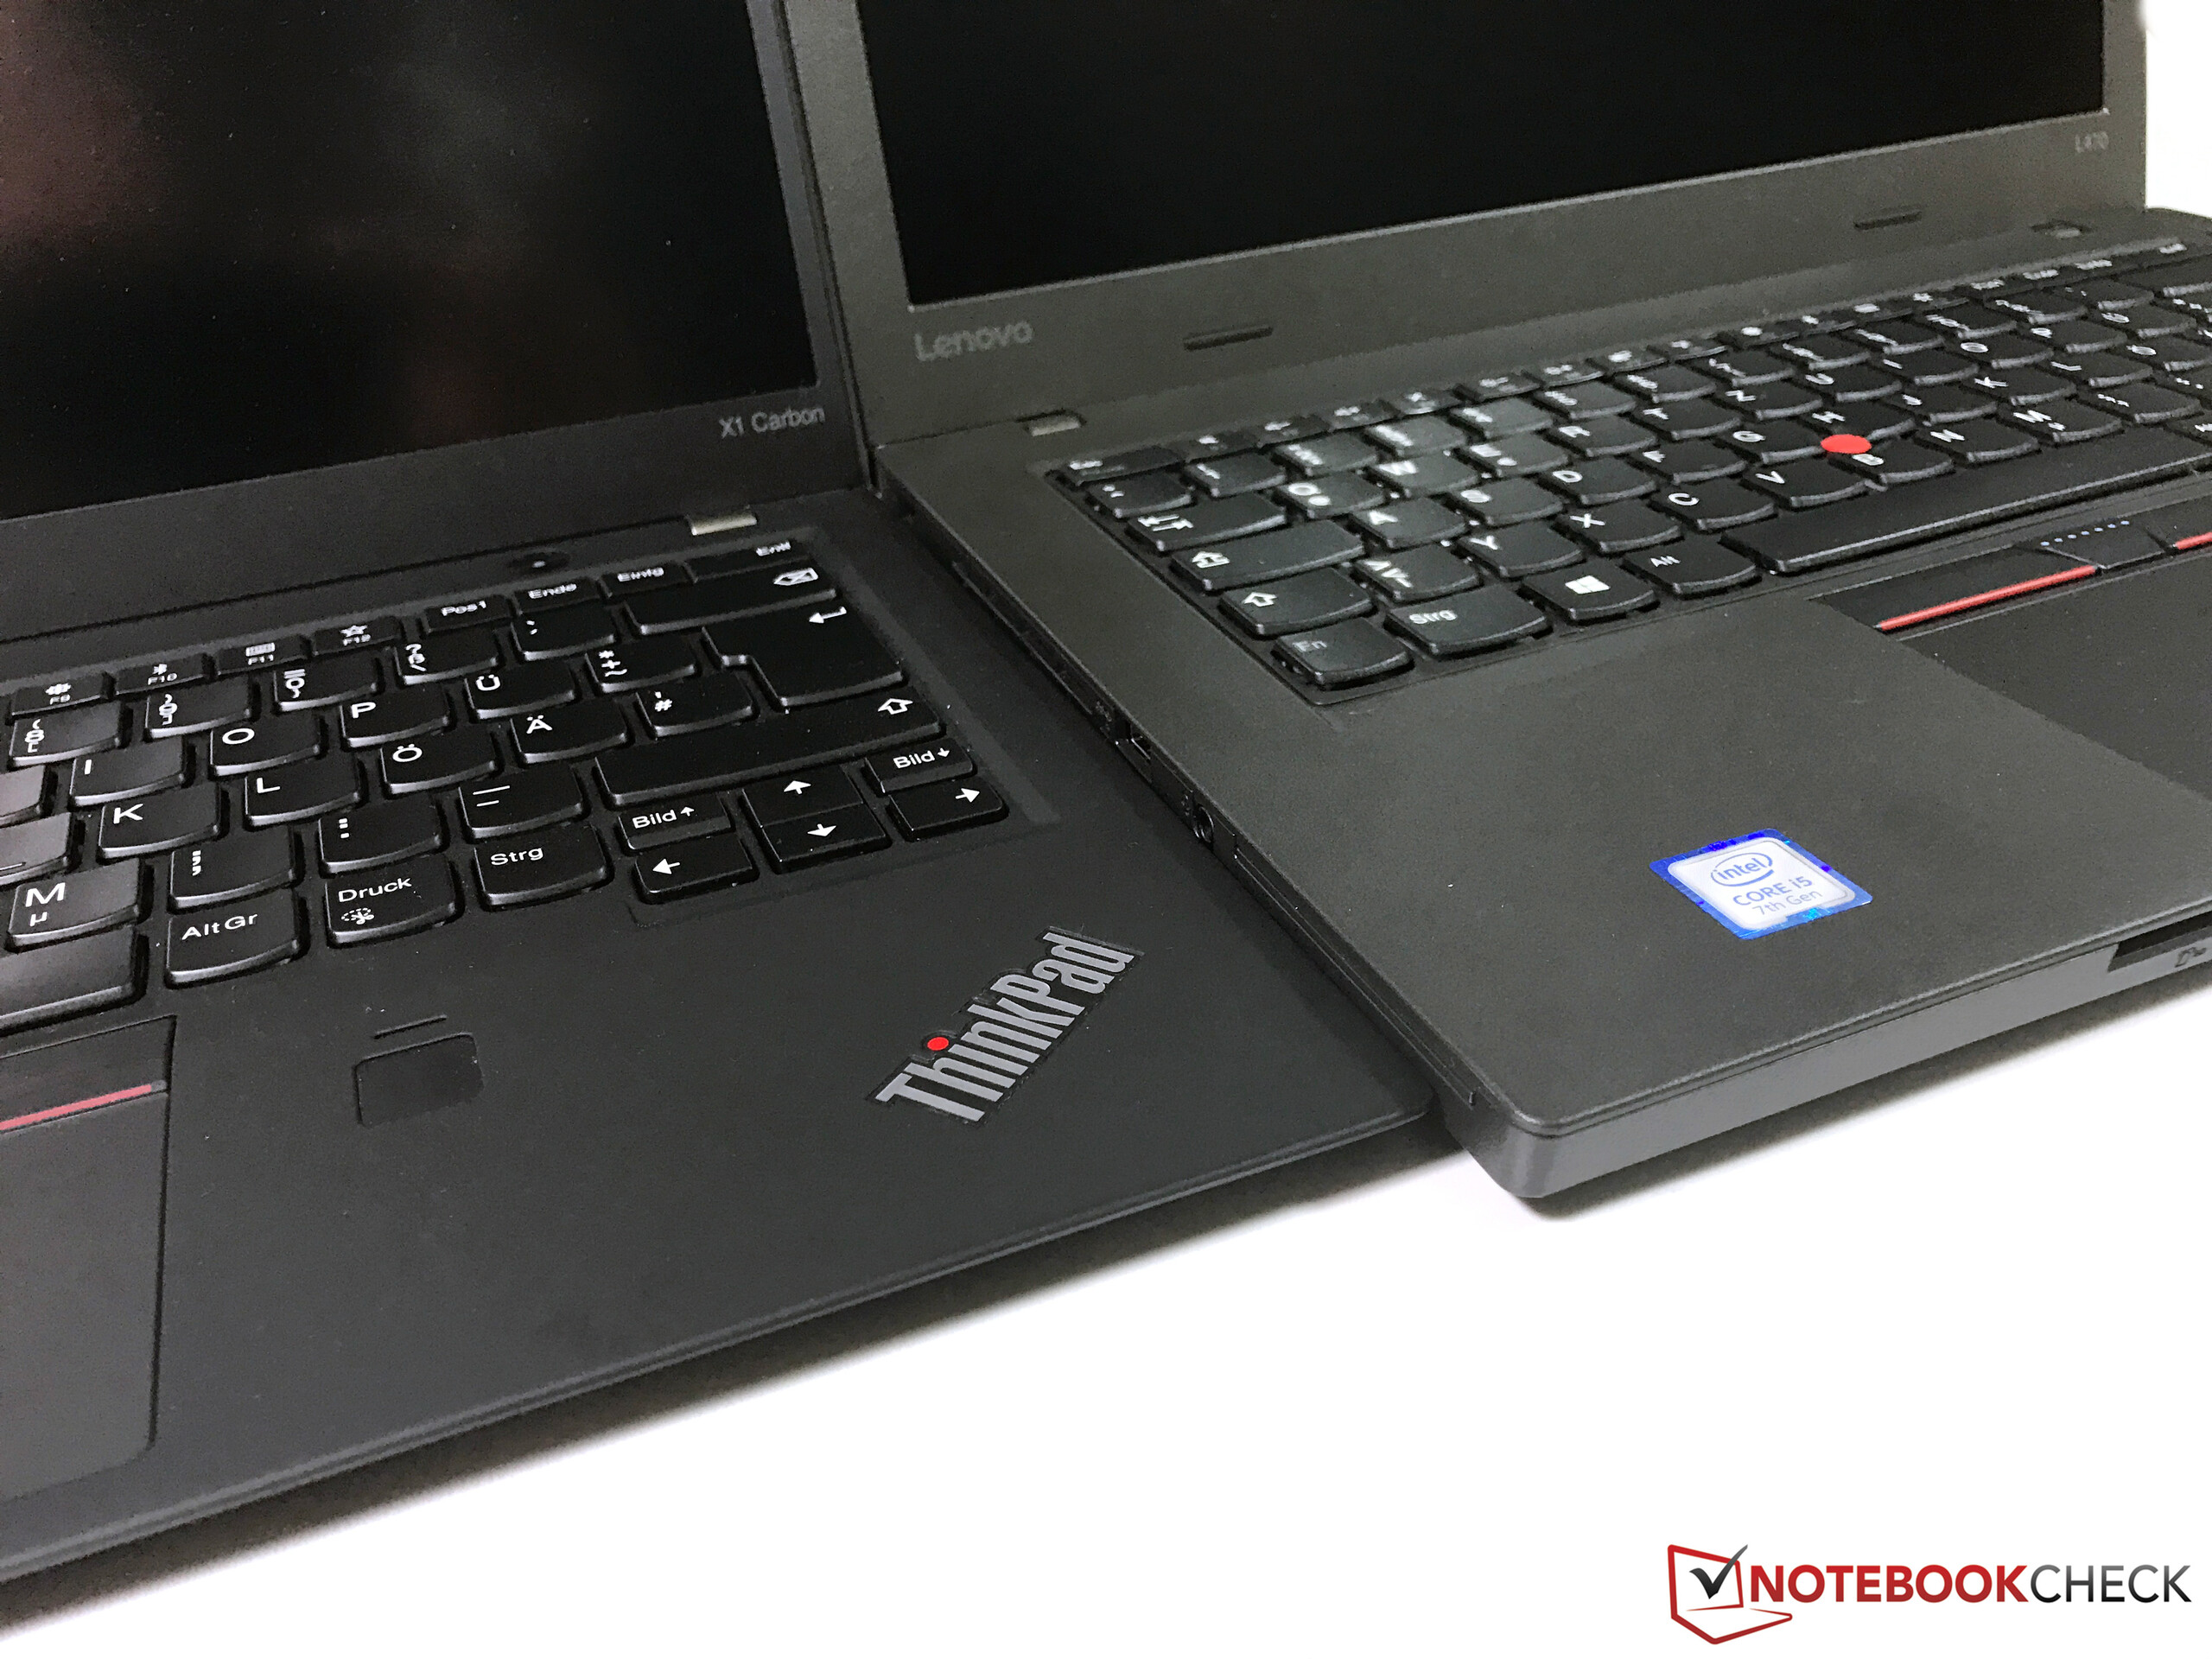
A pesar de estos inconvenientes, el L470 merece una recomendación como un paquete atractivo de precio/rendimiento. Contra su competidor interno más cercano, el E470, el L470 algo más caro puede distinguirse a través de un puerto de acoplamiento dedicado, un puerto VGA y la batería reemplazable. Sin embargo, con la Nvidia GeForce 940MX, el E470 es más interesante para los jugadores casuales. Sobre todo, el L470 supera a los HP ProBooks 440 y 640 gracias a la pantalla IPS, ya que ambos Probooks vienen con pantallas TN. El competidor más difícil es el Dell Latitude 5480, que, en términos de precio, compite más con el ThinkPad T470 que con el L470.
Ésta es una versión acortada del análisis original. Puedes leer el análisis completo en inglés aquí.
Lenovo ThinkPad L470-20J5S00C00
- 11/02/2017 v6 (old)
Benjamin Herzig