Breve análisis del Dell Latitude 5480 (7600U, FHD)
| SD Card Reader | |
| average JPG Copy Test (av. of 3 runs) | |
| Dell Latitude 5480 | |
| HP ProBook 440 G4-Y8B51EA | |
| Acer TravelMate P648-M-757N | |
| Toshiba Tecra Z40-C-106 | |
| Lenovo ThinkPad T460s-20F9003SGE | |
| maximum AS SSD Seq Read Test (1GB) | |
| Dell Latitude 5480 | |
| HP ProBook 440 G4-Y8B51EA | |
| Lenovo ThinkPad T460s-20F9003SGE | |
| Toshiba Tecra Z40-C-106 | |
| Networking | |
| iperf3 transmit AX12 | |
| HP Spectre x360 15-bl002xx | |
| Dell Latitude 5480 | |
| iperf3 receive AX12 | |
| Dell Latitude 5480 | |
| HP Spectre x360 15-bl002xx | |
| |||||||||||||||||||||||||
iluminación: 90 %
Brillo con batería: 215.9 cd/m²
Contraste: 981:1 (Negro: 0.22 cd/m²)
ΔE ColorChecker Calman: 5.1 | ∀{0.5-29.43 Ø4.72}
ΔE Greyscale Calman: 4 | ∀{0.09-98 Ø4.97}
61.15% sRGB (Argyll 1.6.3 3D)
41.96% AdobeRGB 1998 (Argyll 1.6.3 3D)
41.96% AdobeRGB 1998 (Argyll 3D)
61.2% sRGB (Argyll 3D)
40.62% Display P3 (Argyll 3D)
Gamma: 2.41
CCT: 6856 K
| Dell Latitude 5480 LG Philips LGD0553, IPS, 14", 1920x1080 | Dell Latitude 14 E5470 LP140WF3, AH-IPS, WLED, 14", 1920x1080 | Lenovo ThinkPad T460s-20F9003SGE N140HCE-EAA, LEN40A9, IPS, 14", 1920x1080 | HP ProBook 440 G4-Y8B51EA AUO1E3D, TN, 14", 1920x1080 | Lenovo ThinkPad X1 Carbon 20FB-005XUS IPS, 14", 1920x1080 | Acer TravelMate P648-M-757N AU Optronics B140HAN02.1, IPS, 14", 1920x1080 | Toshiba Tecra Z40-C-106 Toshiba TOS508F, IPS, 14", 1920x1080 | |
|---|---|---|---|---|---|---|---|
| Display | 49% | 2% | -7% | 42% | -13% | 48% | |
| Display P3 Coverage (%) | 40.62 | 64.8 60% | 41.65 3% | 37.6 -7% | 58.9 45% | 35.53 -13% | 64.8 60% |
| sRGB Coverage (%) | 61.2 | 84.8 39% | 61.6 1% | 56.6 -8% | 83.1 36% | 53.3 -13% | 84.4 38% |
| AdobeRGB 1998 Coverage (%) | 41.96 | 62 48% | 43.14 3% | 38.85 -7% | 60.3 44% | 36.72 -12% | 61.7 47% |
| Response Times | -9% | -20% | -12% | -25% | -15% | 3% | |
| Response Time Grey 50% / Grey 80% * (ms) | 32.8 ? | 39 ? -19% | 42 ? -28% | 43.2 ? -32% | 47.2 ? -44% | 44 ? -34% | 32.8 ? -0% |
| Response Time Black / White * (ms) | 26.4 ? | 26 ? 2% | 29.2 ? -11% | 24.4 ? 8% | 27.6 ? -5% | 25 ? 5% | 25.2 ? 5% |
| PWM Frequency (Hz) | |||||||
| Screen | 6% | -8% | -40% | 24% | 13% | 5% | |
| Brightness middle (cd/m²) | 215.9 | 323 50% | 226 5% | 216 0% | 321.7 49% | 254 18% | 269 25% |
| Brightness (cd/m²) | 205 | 316 54% | 211 3% | 203 -1% | 301 47% | 243 19% | 257 25% |
| Brightness Distribution (%) | 90 | 79 -12% | 89 -1% | 83 -8% | 89 -1% | 90 0% | 86 -4% |
| Black Level * (cd/m²) | 0.22 | 0.57 -159% | 0.22 -0% | 0.47 -114% | 0.294 -34% | 0.19 14% | 0.52 -136% |
| Contrast (:1) | 981 | 567 -42% | 1027 5% | 460 -53% | 1094 12% | 1337 36% | 517 -47% |
| Colorchecker dE 2000 * | 5.1 | 3.68 28% | 6.44 -26% | 8.98 -76% | 3.96 22% | 4.93 3% | 3.45 32% |
| Colorchecker dE 2000 max. * | 15.6 | 8.33 47% | 17.18 -10% | 14.07 10% | 6.69 57% | 10.14 35% | 9.34 40% |
| Greyscale dE 2000 * | 4 | 2.99 25% | 5.87 -47% | 9.61 -140% | 3.15 21% | 2.71 32% | 2.28 43% |
| Gamma | 2.41 91% | 2.49 88% | 2.37 93% | 2.63 84% | 2.34 94% | 2.36 93% | 2.38 92% |
| CCT | 6856 95% | 6572 99% | 6856 95% | 11265 58% | 7082 92% | 6914 94% | 6230 104% |
| Color Space (Percent of AdobeRGB 1998) (%) | 41.96 | 55 31% | 39.58 -6% | 35.9 -14% | 53.8 28% | 34 -19% | 55.24 32% |
| Color Space (Percent of sRGB) (%) | 61.15 | 85 39% | 61.15 0% | 56.7 -7% | 82.7 35% | 53 -13% | 84.32 38% |
| Media total (Programa/Opciones) | 15% /
13% | -9% /
-7% | -20% /
-30% | 14% /
21% | -5% /
4% | 19% /
13% |
* ... más pequeño es mejor
Tiempos de respuesta del display
| ↔ Tiempo de respuesta de Negro a Blanco | ||
|---|---|---|
| 26.4 ms ... subida ↗ y bajada ↘ combinada | ↗ 5.2 ms subida | 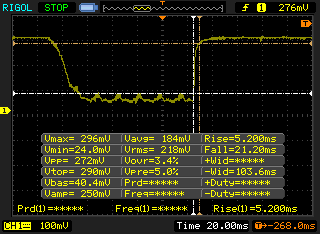 |
| ↘ 21.2 ms bajada | ||
| La pantalla mostró tiempos de respuesta relativamente lentos en nuestros tests pero podría ser demasiado lenta para los jugones. En comparación, todos los dispositivos de prueba van de ##min### (mínimo) a 240 (máximo) ms. » 66 % de todos los dispositivos son mejores. Eso quiere decir que el tiempo de respuesta es peor que la media (19.8 ms) de todos los dispositivos testados. | ||
| ↔ Tiempo de respuesta 50% Gris a 80% Gris | ||
| 32.8 ms ... subida ↗ y bajada ↘ combinada | ↗ 14 ms subida | 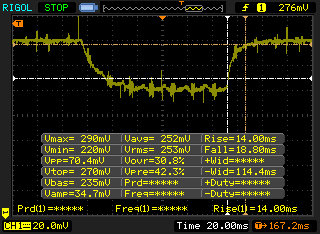 |
| ↘ 18.8 ms bajada | ||
| La pantalla mostró tiempos de respuesta lentos en nuestros tests y podría ser demasiado lenta para los jugones. En comparación, todos los dispositivos de prueba van de ##min### (mínimo) a 636 (máximo) ms. » 44 % de todos los dispositivos son mejores. Eso quiere decir que el tiempo de respuesta es similar al dispositivo testado medio (31 ms). | ||
Parpadeo de Pantalla / PWM (Pulse-Width Modulation)
| Parpadeo de Pantalla / PWM no detectado | 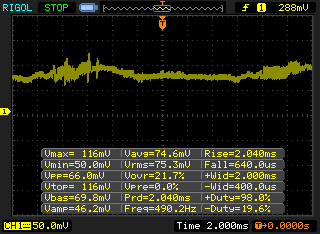 | ||
Comparación: 52 % de todos los dispositivos testados no usaron PWM para atenuar el display. Si se usó, medimos una media de 7778 (mínimo: 5 - máxmo: 343500) Hz. | |||
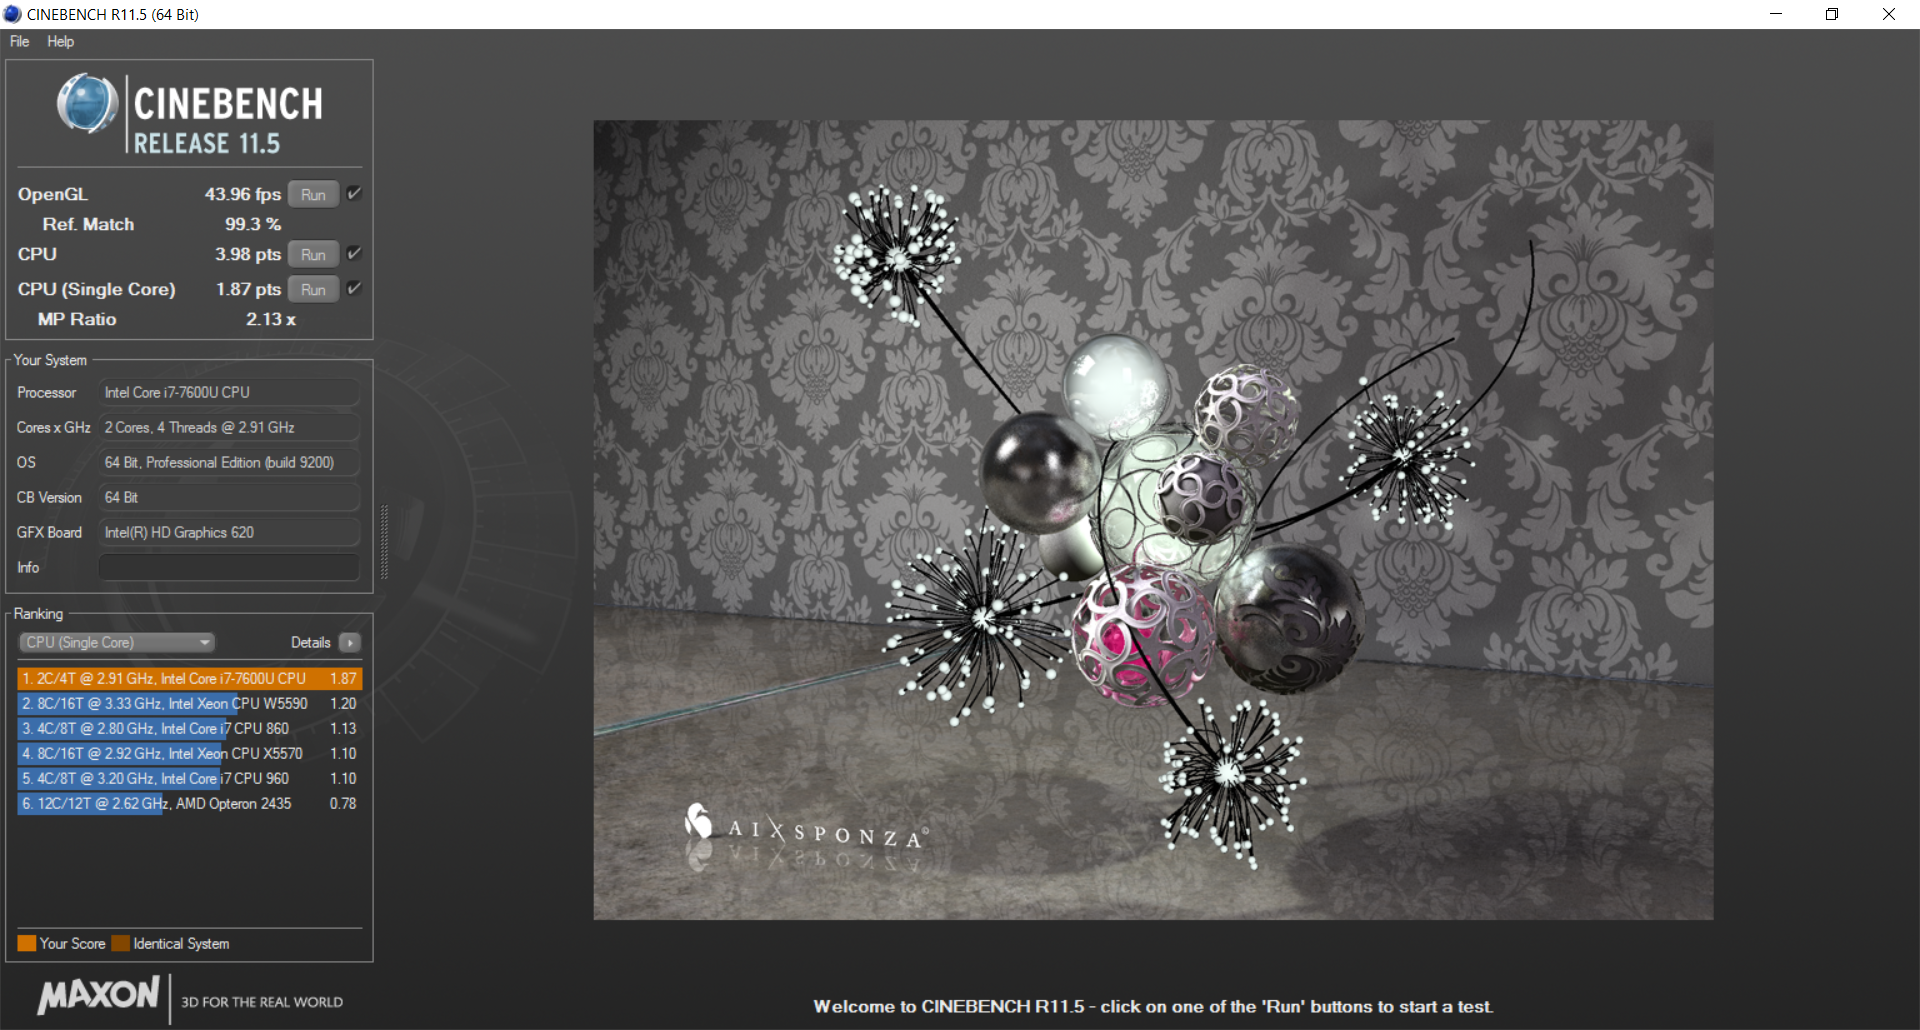
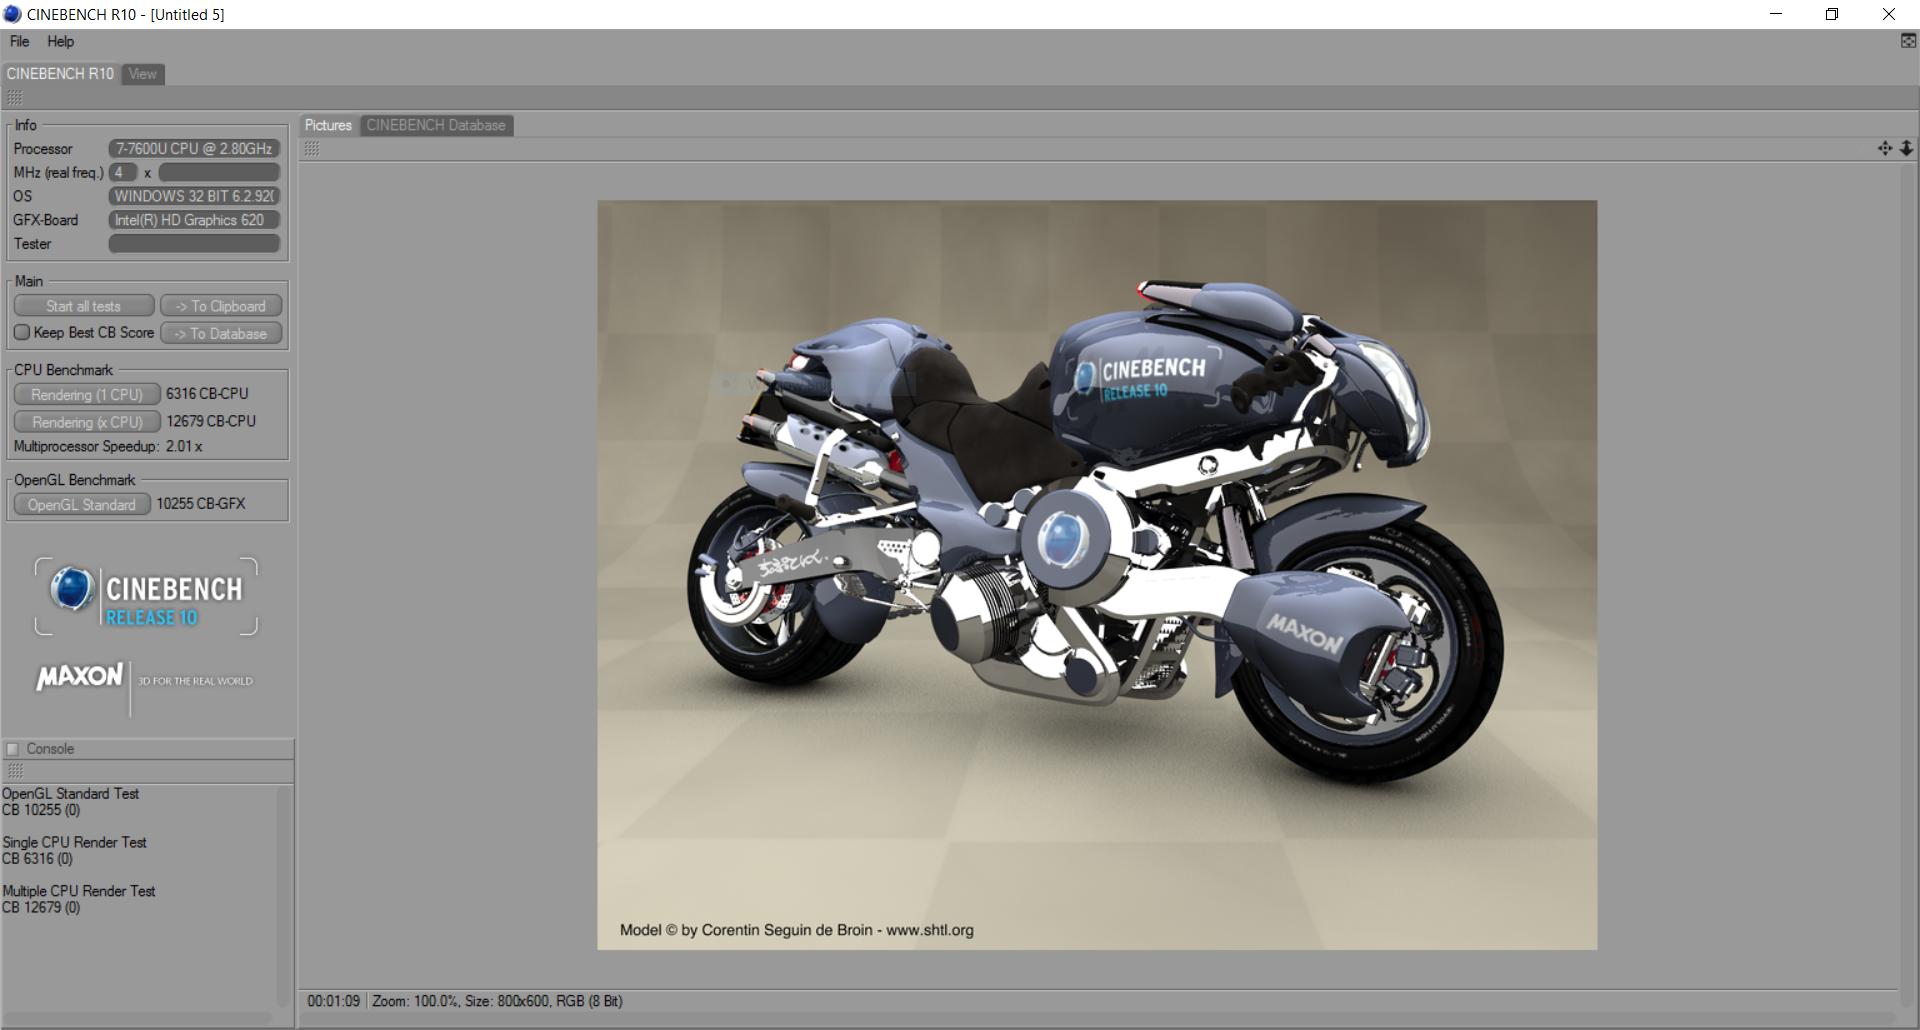
| Cinebench R10 | |
| Rendering Single 32Bit | |
| Dell Latitude 5480 | |
| HP ProBook 440 G4-Y8B51EA | |
| Dell Latitude 14 E5470 | |
| Lenovo ThinkPad X1 Carbon 20FB-005XUS | |
| Acer TravelMate P648-M-757N | |
| Rendering Multiple CPUs 32Bit | |
| Dell Latitude 14 E5470 | |
| Dell Latitude 5480 | |
| HP ProBook 440 G4-Y8B51EA | |
| Acer TravelMate P648-M-757N | |
| Lenovo ThinkPad X1 Carbon 20FB-005XUS | |
| wPrime 2.10 - 1024m | |
| Lenovo ThinkPad X1 Carbon 20FB-005XUS | |
| Dell Latitude 5480 | |
* ... más pequeño es mejor
| PCMark 8 Home Score Accelerated v2 | 3913 puntos | |
| PCMark 8 Creative Score Accelerated v2 | 4923 puntos | |
| PCMark 8 Work Score Accelerated v2 | 4992 puntos | |
ayuda | ||
| Dell Latitude 5480 Toshiba SG5 256GB THNSNK256GVN8 | Dell Latitude 14 E5470 Micron SSD 1100 (MTFDDAV256TBN) | Lenovo ThinkPad T460s-20F9003SGE Samsung CM871 MZ7LF192HCGS | HP ProBook 440 G4-Y8B51EA SanDisk SD8SNAT256G1002 | Lenovo ThinkPad X1 Carbon 20FB-005XUS Samsung SM951 MZVPV256 m.2 | Acer TravelMate P648-M-757N Lite-On CV1-8B256 | Toshiba Tecra Z40-C-106 Toshiba HG6 THNSNJ256G8NY | |
|---|---|---|---|---|---|---|---|
| CrystalDiskMark 3.0 | -7% | -52% | -11% | 177% | 6% | 3% | |
| Read Seq (MB/s) | 469.4 | 465.4 -1% | 446.5 -5% | 491.2 5% | 1720 266% | 531 13% | 521 11% |
| Write Seq (MB/s) | 264.8 | 363.1 37% | 171.1 -35% | 322.2 22% | 1263 377% | 358.8 35% | 444.5 68% |
| Read 512 (MB/s) | 408.1 | 338.4 -17% | 259.2 -36% | 310.1 -24% | 1223 200% | 384.8 -6% | 420.2 3% |
| Write 512 (MB/s) | 265.5 | 246.1 -7% | 167.2 -37% | 276 4% | 1249 370% | 363 37% | 421 59% |
| Read 4k (MB/s) | 24.66 | 25.83 5% | 5.78 -77% | 19.57 -21% | 49.65 101% | 31.3 27% | 20.32 -18% |
| Write 4k (MB/s) | 114.8 | 80.3 -30% | 35.47 -69% | 77.8 -32% | 123 7% | 80.3 -30% | 79.6 -31% |
| Read 4k QD32 (MB/s) | 380.3 | 246.1 -35% | 94.9 -75% | 146.3 -62% | 464.6 22% | 239.4 -37% | 229 -40% |
| Write 4k QD32 (MB/s) | 207.2 | 197.7 -5% | 36.43 -82% | 241.4 17% | 354.7 71% | 225.3 9% | 153.6 -26% |

| 3DMark 11 Performance | 1845 puntos | |
| 3DMark Ice Storm Standard Score | 67522 puntos | |
| 3DMark Cloud Gate Standard Score | 6916 puntos | |
| 3DMark Fire Strike Score | 952 puntos | |
| 3DMark Fire Strike Extreme Score | 444 puntos | |
ayuda | ||
| Tomb Raider | |
| 1024x768 Low Preset (ordenar por valor) | |
| Dell Latitude 5480 | |
| Lenovo ThinkPad T460s-20F9003SGE | |
| HP ProBook 440 G4-Y8B51EA | |
| Acer TravelMate P648-M-757N | |
| 1366x768 Normal Preset AA:FX AF:4x (ordenar por valor) | |
| Dell Latitude 5480 | |
| Lenovo ThinkPad T460s-20F9003SGE | |
| HP ProBook 440 G4-Y8B51EA | |
| Acer TravelMate P648-M-757N | |
| 1366x768 High Preset AA:FX AF:8x (ordenar por valor) | |
| Dell Latitude 5480 | |
| Lenovo ThinkPad T460s-20F9003SGE | |
| HP ProBook 440 G4-Y8B51EA | |
| Acer TravelMate P648-M-757N | |
| 1920x1080 Ultra Preset AA:FX AF:16x (ordenar por valor) | |
| Dell Latitude 5480 | |
| HP ProBook 440 G4-Y8B51EA | |
| Acer TravelMate P648-M-757N | |
| bajo | medio | alto | ultra | |
|---|---|---|---|---|
| Anno 2070 (2011) | 88.9 | 49.7 | 30.3 | 13.8 |
| Tomb Raider (2013) | 86.2 | 45.1 | 28.6 | 13.2 |
Ruido
| Ocioso |
| 29.6 / 29.6 / 29.6 dB(A) |
| Carga |
| 42 / 47.1 dB(A) |
 | ||
30 dB silencioso 40 dB(A) audible 50 dB(A) ruidosamente alto |
||
min: | ||
| Dell Latitude 5480 HD Graphics 620, i7-7600U, Toshiba SG5 256GB THNSNK256GVN8 | Acer TravelMate P648-M-757N HD Graphics 520, 6500U, Lite-On CV1-8B256 | Lenovo ThinkPad T460s-20F9003SGE HD Graphics 520, 6200U, Samsung CM871 MZ7LF192HCGS | HP ProBook 440 G4-Y8B51EA GeForce 930MX, i7-7500U, SanDisk SD8SNAT256G1002 | Lenovo ThinkPad X1 Carbon 20FB-005XUS HD Graphics 520, 6300U, Samsung SM951 MZVPV256 m.2 | Toshiba Tecra Z40-C-106 HD Graphics 520, 6200U, Toshiba HG6 THNSNJ256G8NY | Dell Latitude 14 E5470 HD Graphics 530, 6440HQ, Micron SSD 1100 (MTFDDAV256TBN) | |
|---|---|---|---|---|---|---|---|
| Noise | 7% | 10% | 7% | 10% | 8% | 9% | |
| Idle Minimum * (dB) | 29.6 | 31.2 -5% | 29.1 2% | 29 2% | 28.8 3% | 29.8 -1% | 30.3 -2% |
| Idle Average * (dB) | 29.6 | 31.2 -5% | 29.1 2% | 29 2% | 28.9 2% | 29.8 -1% | 30.3 -2% |
| Idle Maximum * (dB) | 29.6 | 31.6 -7% | 29.1 2% | 29 2% | 28.9 2% | 29.8 -1% | 30.3 -2% |
| Load Average * (dB) | 42 | 33.3 21% | 32.3 23% | 37.4 11% | 35 17% | 32.6 22% | 31.6 25% |
| Load Maximum * (dB) | 47.1 | 32.4 31% | 36.6 22% | 39 17% | 35.8 24% | 37.2 21% | 35 26% |
| apagado / medio ambiente * (dB) | 31.2 | 29.1 | 29 | 28.8 | 29 | 30.3 |
* ... más pequeño es mejor
(+) La temperatura máxima en la parte superior es de 36.4 °C / 98 F, frente a la media de 34.3 °C / 94 F, que oscila entre 21.2 y 62.5 °C para la clase Office.
(±) El fondo se calienta hasta un máximo de 45 °C / 113 F, frente a la media de 36.8 °C / 98 F
(+) En reposo, la temperatura media de la parte superior es de 24 °C / 75# F, frente a la media del dispositivo de 29.5 °C / 85 F.
(+) El reposamanos y el panel táctil están a una temperatura inferior a la de la piel, con un máximo de 24.8 °C / 76.6 F y, por tanto, son fríos al tacto.
(+) La temperatura media de la zona del reposamanos de dispositivos similares fue de 27.5 °C / 81.5 F (+2.7 °C / 4.9 F).
Dell Latitude 5480 análisis de audio
(±) | la sonoridad del altavoz es media pero buena (80.5 dB)
Graves 100 - 315 Hz
(±) | lubina reducida - en promedio 8.7% inferior a la mediana
(±) | la linealidad de los graves es media (10.1% delta a frecuencia anterior)
Medios 400 - 2000 Hz
(+) | medios equilibrados - a sólo 3.6% de la mediana
(±) | la linealidad de los medios es media (7.8% delta respecto a la frecuencia anterior)
Altos 2 - 16 kHz
(±) | máximos más altos - de media 5.7% más altos que la mediana
(±) | la linealidad de los máximos es media (9.2% delta a frecuencia anterior)
Total 100 - 16.000 Hz
(±) | la linealidad del sonido global es media (15.6% de diferencia con la mediana)
En comparación con la misma clase
» 16% de todos los dispositivos probados de esta clase eran mejores, 4% similares, 80% peores
» El mejor tuvo un delta de 7%, la media fue 21%, el peor fue ###max##%
En comparación con todos los dispositivos probados
» 23% de todos los dispositivos probados eran mejores, 5% similares, 72% peores
» El mejor tuvo un delta de 4%, la media fue 24%, el peor fue ###max##%
Apple MacBook 12 (Early 2016) 1.1 GHz análisis de audio
(+) | los altavoces pueden reproducir a un volumen relativamente alto (#83.6 dB)
Graves 100 - 315 Hz
(±) | lubina reducida - en promedio 11.3% inferior a la mediana
(±) | la linealidad de los graves es media (14.2% delta a frecuencia anterior)
Medios 400 - 2000 Hz
(+) | medios equilibrados - a sólo 2.4% de la mediana
(+) | los medios son lineales (5.5% delta a la frecuencia anterior)
Altos 2 - 16 kHz
(+) | máximos equilibrados - a sólo 2% de la mediana
(+) | los máximos son lineales (4.5% delta a la frecuencia anterior)
Total 100 - 16.000 Hz
(+) | el sonido global es lineal (10.2% de diferencia con la mediana)
En comparación con la misma clase
» 7% de todos los dispositivos probados de esta clase eran mejores, 2% similares, 91% peores
» El mejor tuvo un delta de 5%, la media fue 18%, el peor fue ###max##%
En comparación con todos los dispositivos probados
» 5% de todos los dispositivos probados eran mejores, 1% similares, 94% peores
» El mejor tuvo un delta de 4%, la media fue 24%, el peor fue ###max##%
| Off / Standby | |
| Ocioso | |
| Carga |
|
Clave:
min: | |
| Dell Latitude 5480 i7-7600U, HD Graphics 620, Toshiba SG5 256GB THNSNK256GVN8, IPS, 1920x1080, 14" | Acer TravelMate P648-M-757N 6500U, HD Graphics 520, Lite-On CV1-8B256, IPS, 1920x1080, 14" | Lenovo ThinkPad T460s-20F9003SGE 6200U, HD Graphics 520, Samsung CM871 MZ7LF192HCGS, IPS, 1920x1080, 14" | HP ProBook 440 G4-Y8B51EA i7-7500U, GeForce 930MX, SanDisk SD8SNAT256G1002, TN, 1920x1080, 14" | Lenovo ThinkPad X1 Carbon 20FB-005XUS 6300U, HD Graphics 520, Samsung SM951 MZVPV256 m.2, IPS, 1920x1080, 14" | Toshiba Tecra Z40-C-106 6200U, HD Graphics 520, Toshiba HG6 THNSNJ256G8NY, IPS, 1920x1080, 14" | Dell Latitude 14 E5470 6440HQ, HD Graphics 530, Micron SSD 1100 (MTFDDAV256TBN), AH-IPS, WLED, 1920x1080, 14" | |
|---|---|---|---|---|---|---|---|
| Power Consumption | -14% | 11% | -4% | -9% | 5% | -19% | |
| Idle Minimum * (Watt) | 6.64 | 5.3 20% | 3.7 44% | 3 55% | 7.6 -14% | 4.3 35% | 4.1 38% |
| Idle Average * (Watt) | 6.67 | 9.3 -39% | 6.8 -2% | 5.4 19% | 9 -35% | 7.6 -14% | 8.1 -21% |
| Idle Maximum * (Watt) | 7.78 | 11.5 -48% | 7.3 6% | 6.3 19% | 9.6 -23% | 8.3 -7% | 11.4 -47% |
| Load Average * (Watt) | 30.83 | 30.8 -0% | 26.3 15% | 37.5 -22% | 24.5 21% | 26.8 13% | 33.5 -9% |
| Load Maximum * (Watt) | 31.7 | 32 -1% | 34.6 -9% | 61.1 -93% | 30.3 4% | 32.6 -3% | 49 -55% |
* ... más pequeño es mejor
| Dell Latitude 5480 i7-7600U, HD Graphics 620, 68 Wh | Acer TravelMate P648-M-757N 6500U, HD Graphics 520, 54 Wh | Lenovo ThinkPad T460s-20F9003SGE 6200U, HD Graphics 520, 49 Wh | HP ProBook 440 G4-Y8B51EA i7-7500U, GeForce 930MX, 48 Wh | Lenovo ThinkPad X1 Carbon 20FB-005XUS 6300U, HD Graphics 520, 52 Wh | Toshiba Tecra Z40-C-106 6200U, HD Graphics 520, 64 Wh | Dell Latitude 14 E5470 6440HQ, HD Graphics 530, 62 Wh | |
|---|---|---|---|---|---|---|---|
| Duración de Batería | -34% | -42% | -30% | -42% | -24% | -47% | |
| Reader / Idle (h) | 24.1 | 18.1 -25% | 15.3 -37% | 18.1 -25% | 12.9 -46% | 17.4 -28% | 15.2 -37% |
| WiFi v1.3 (h) | 16.1 | 9.1 -43% | 6.6 -59% | 6.9 -57% | 6.9 -57% | 9 -44% | 7.2 -55% |
| Load (h) | 2.7 | 1.8 -33% | 1.9 -30% | 2.5 -7% | 2.1 -22% | 2.7 0% | 1.4 -48% |
Pro
Contra
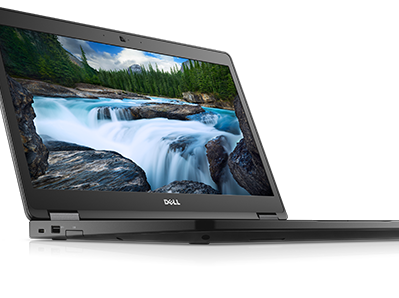
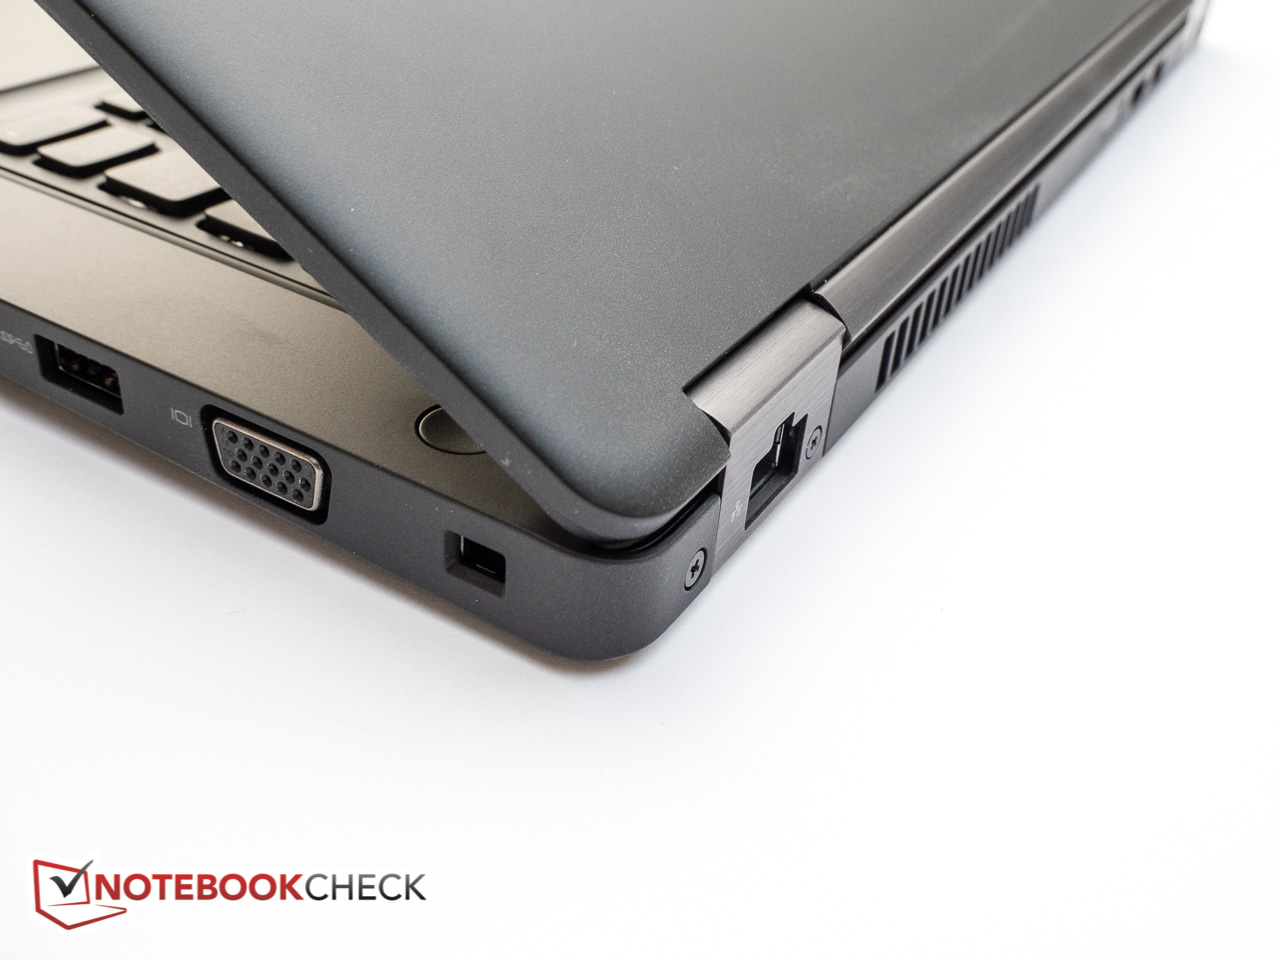
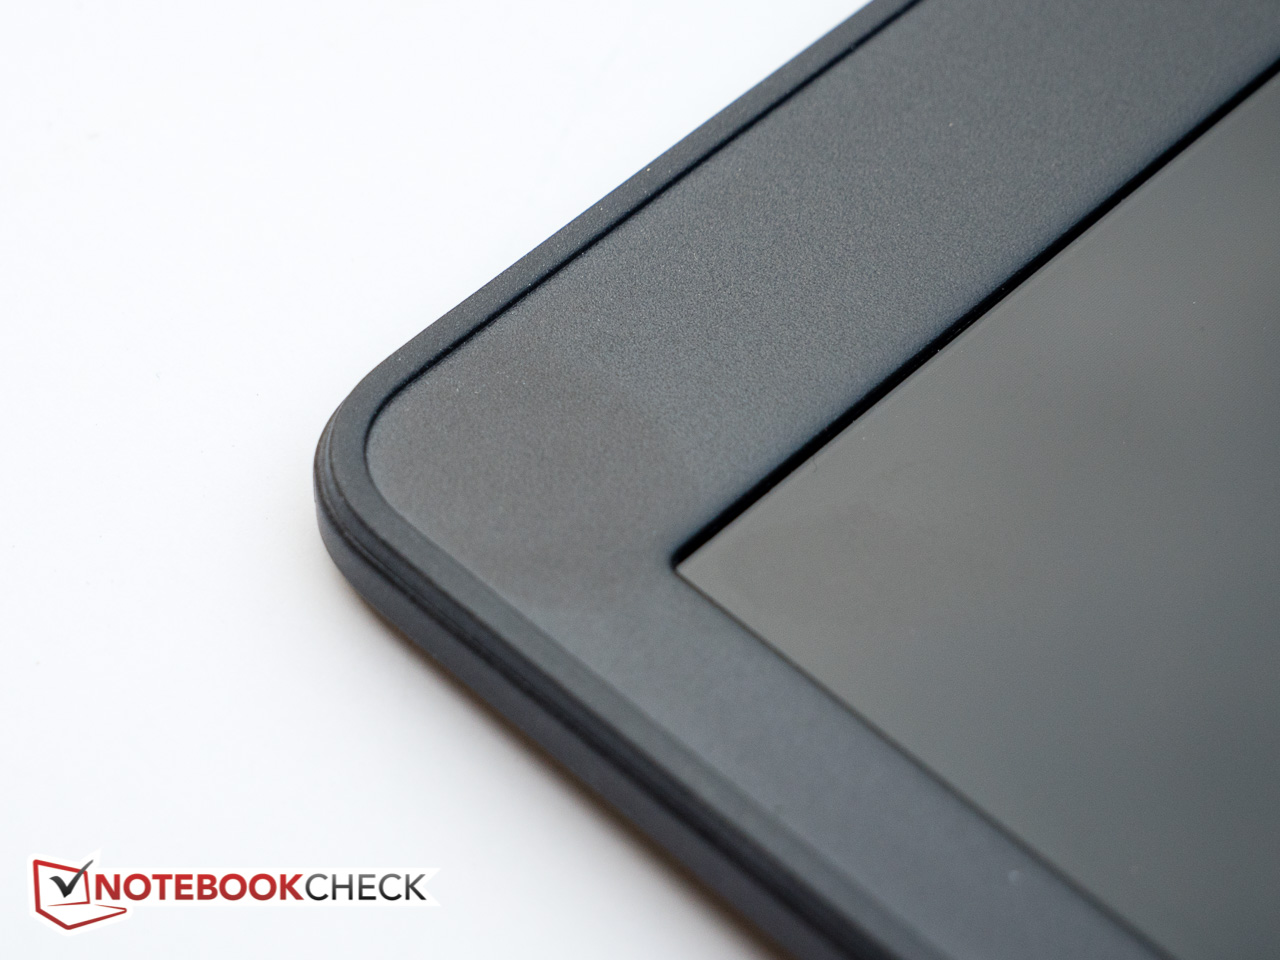
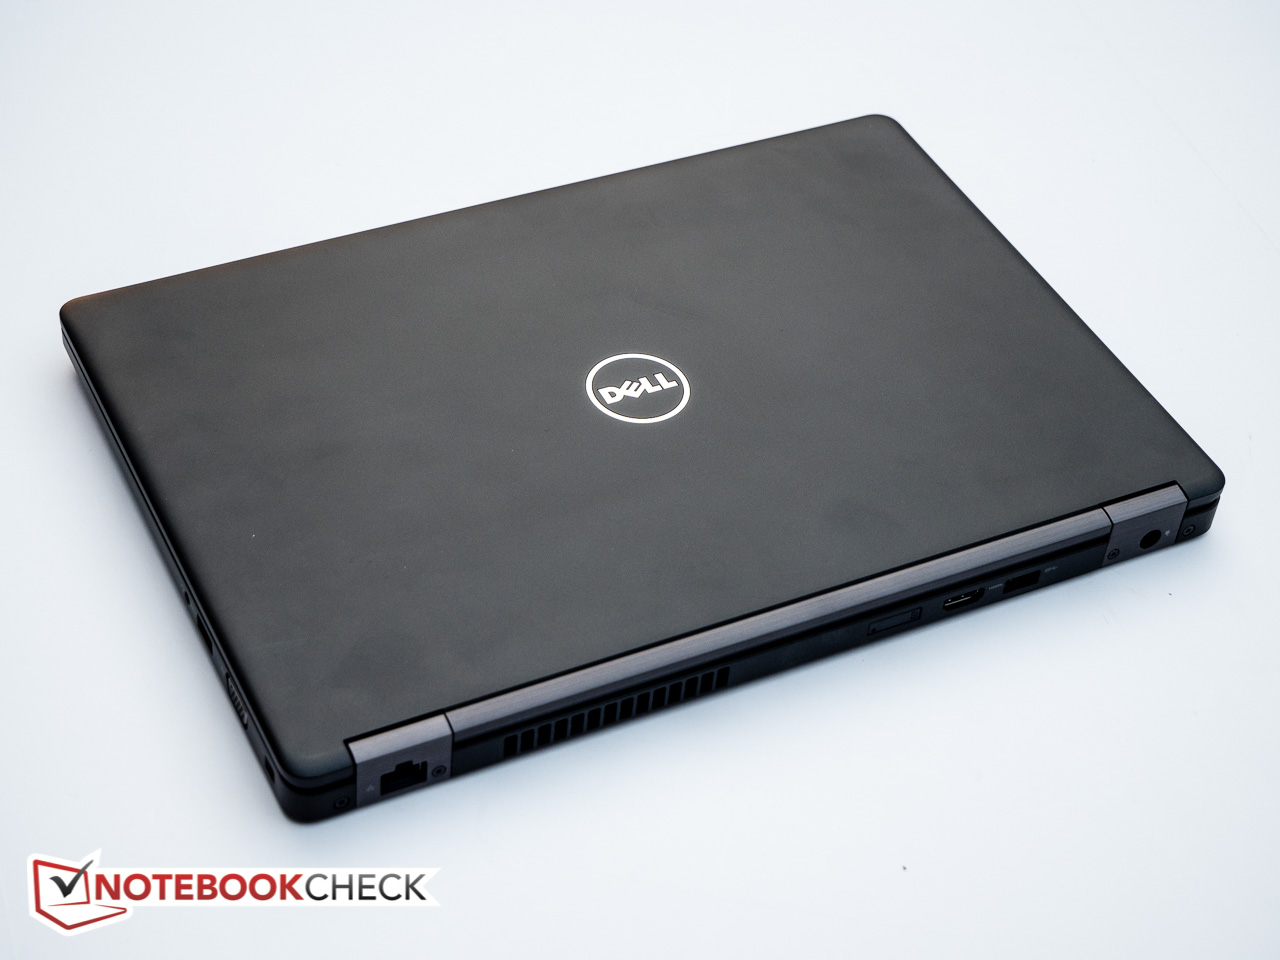
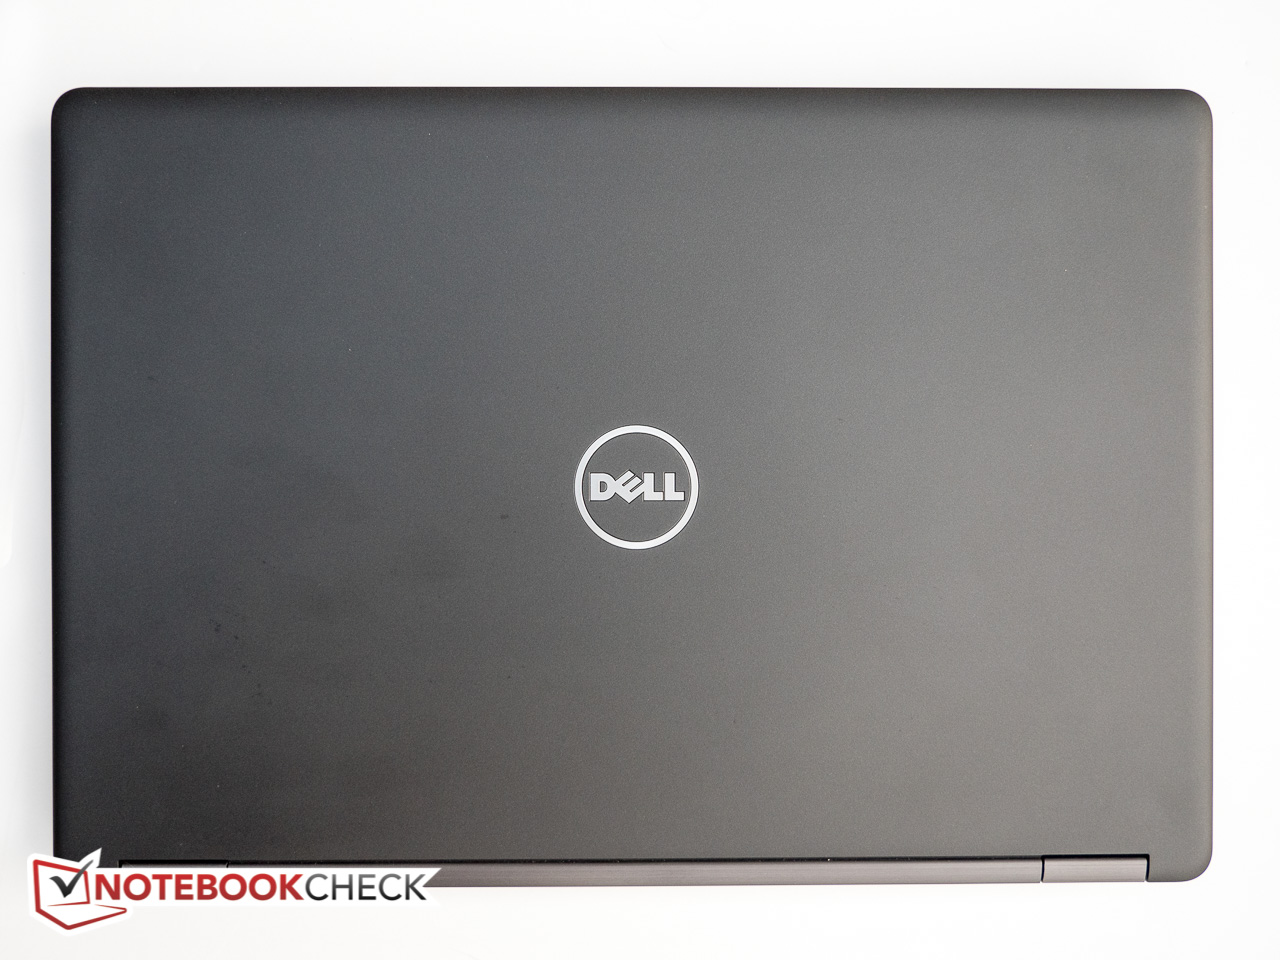
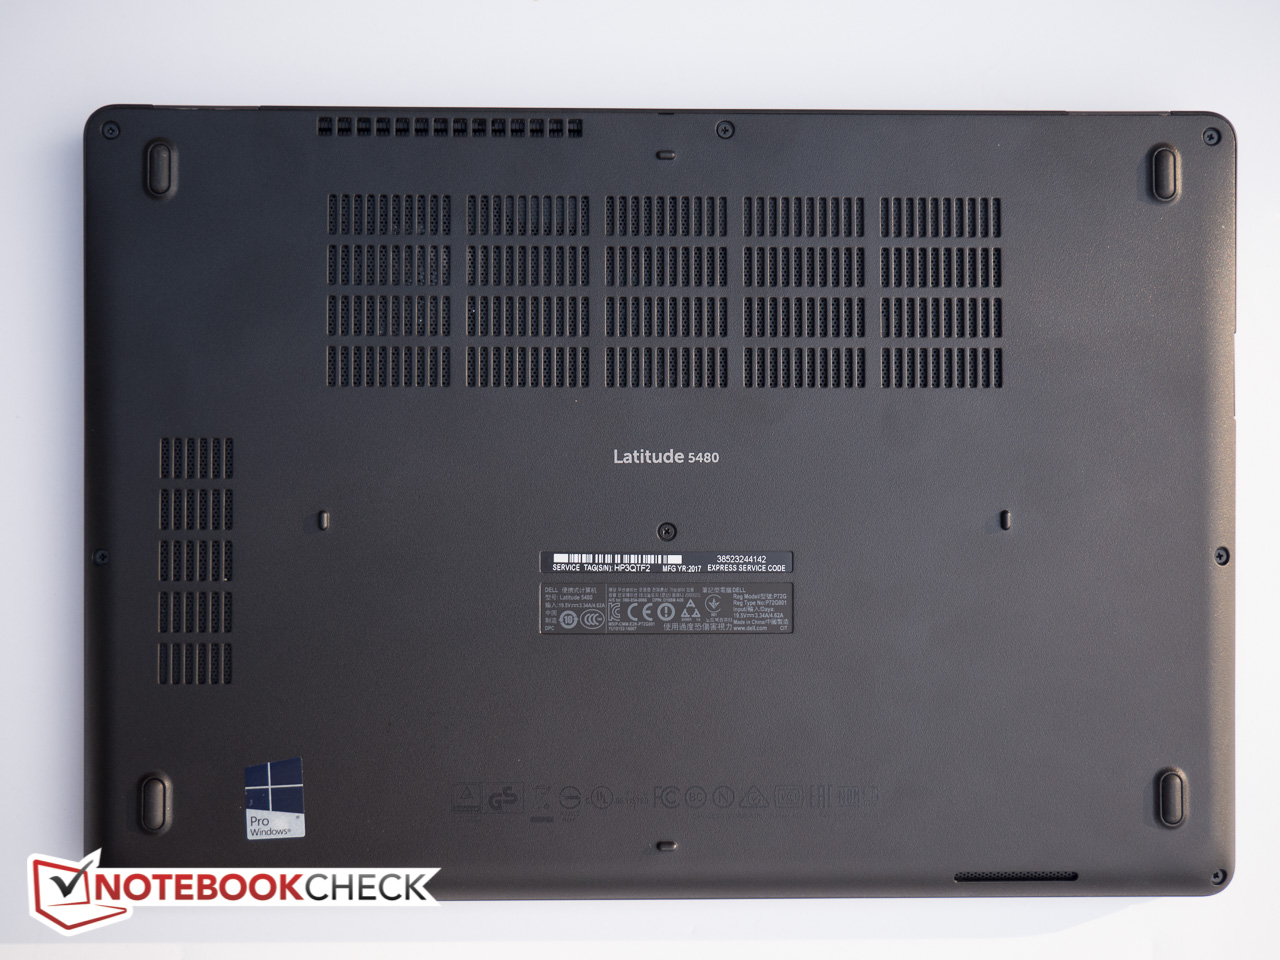
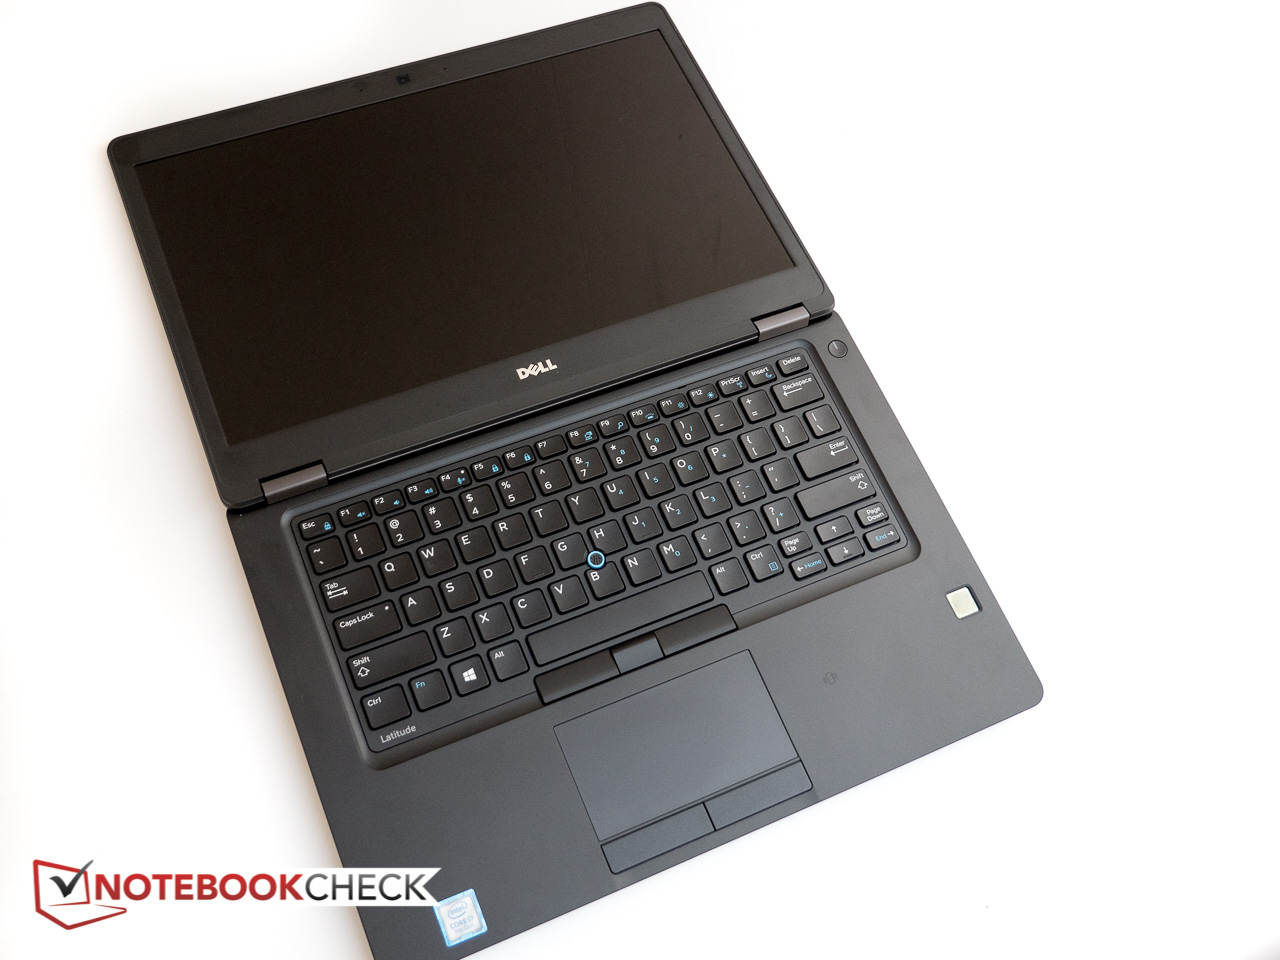
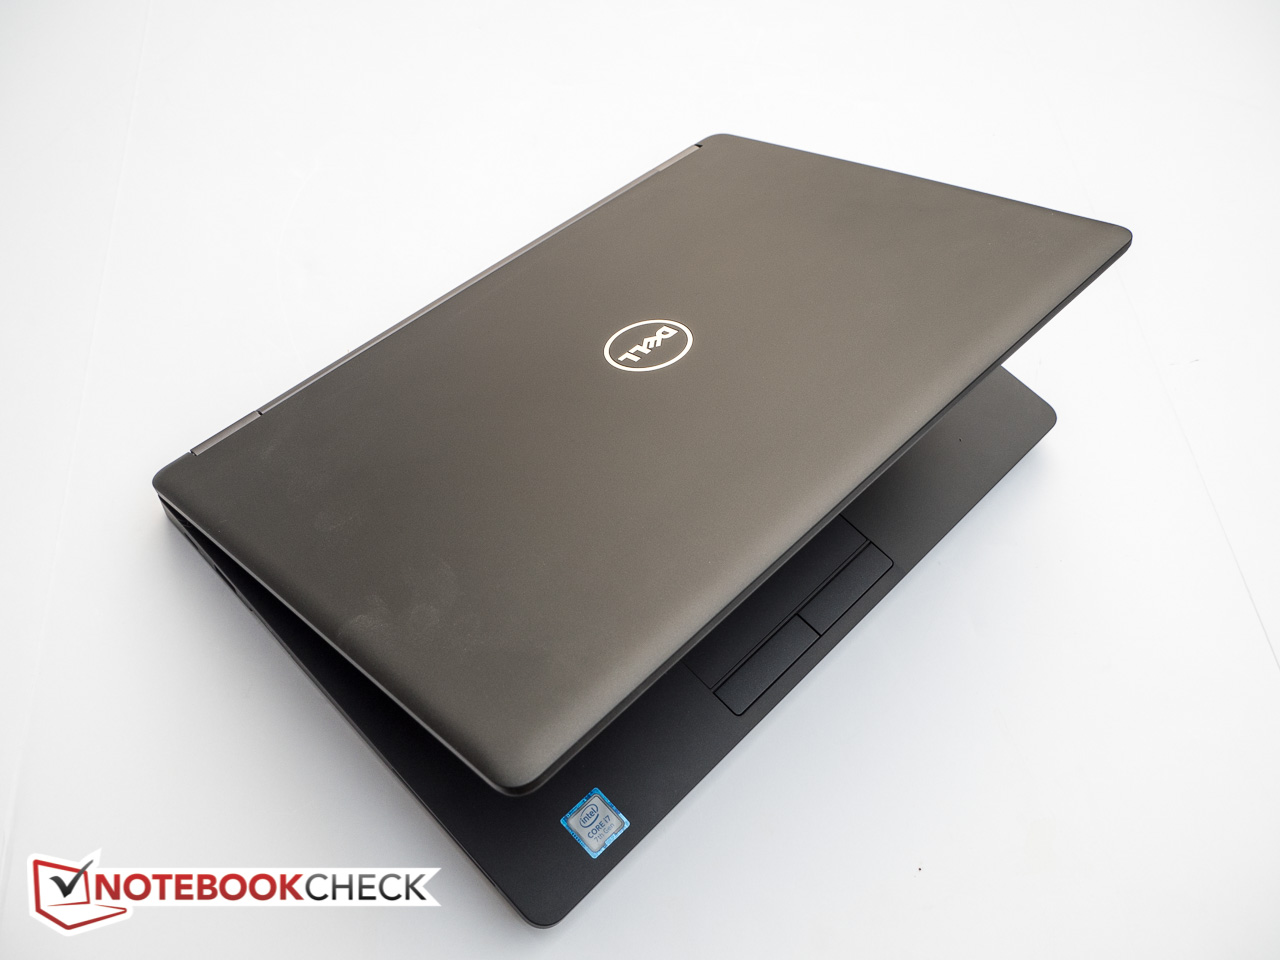
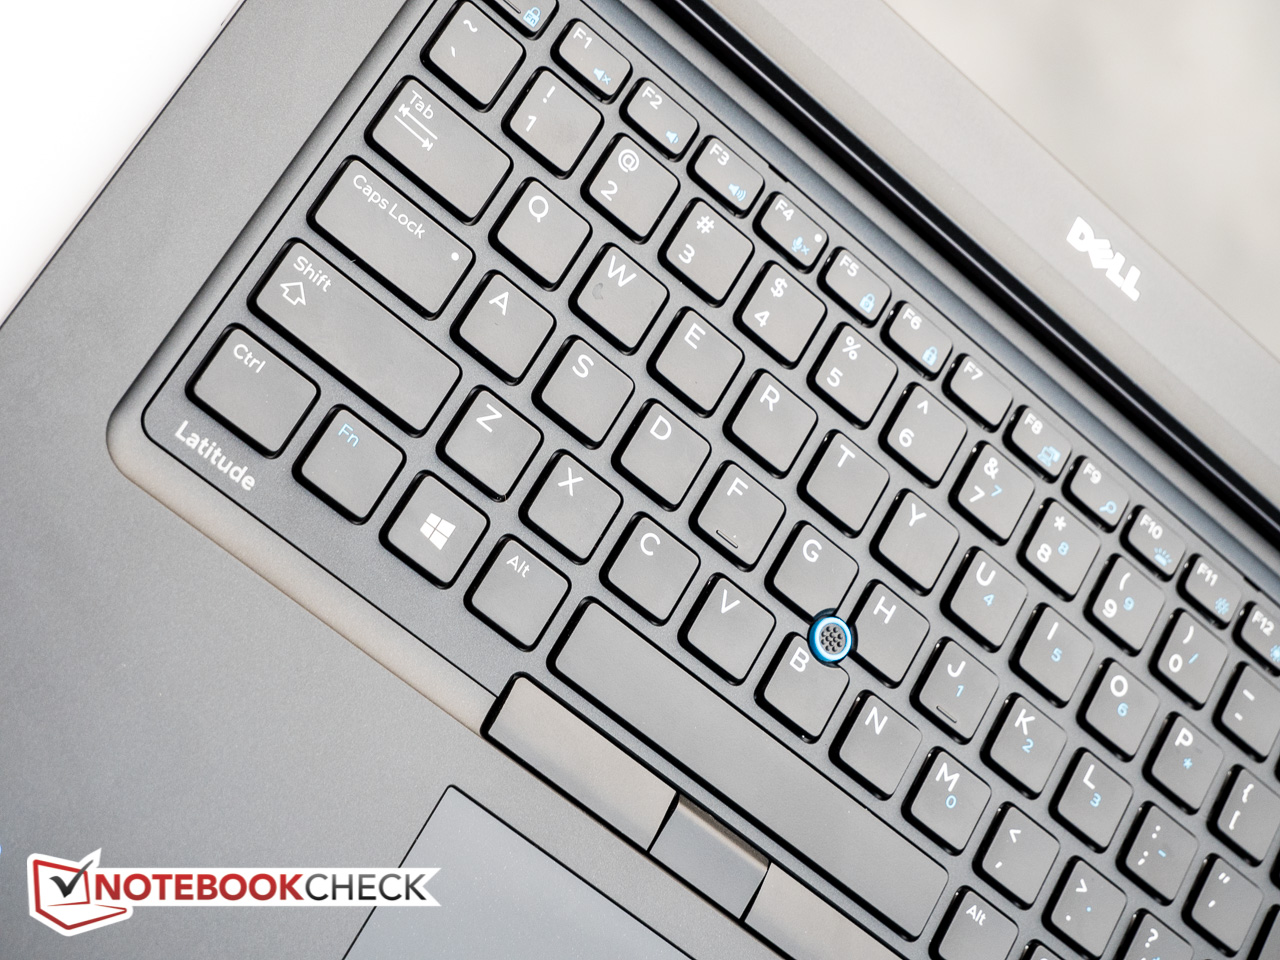
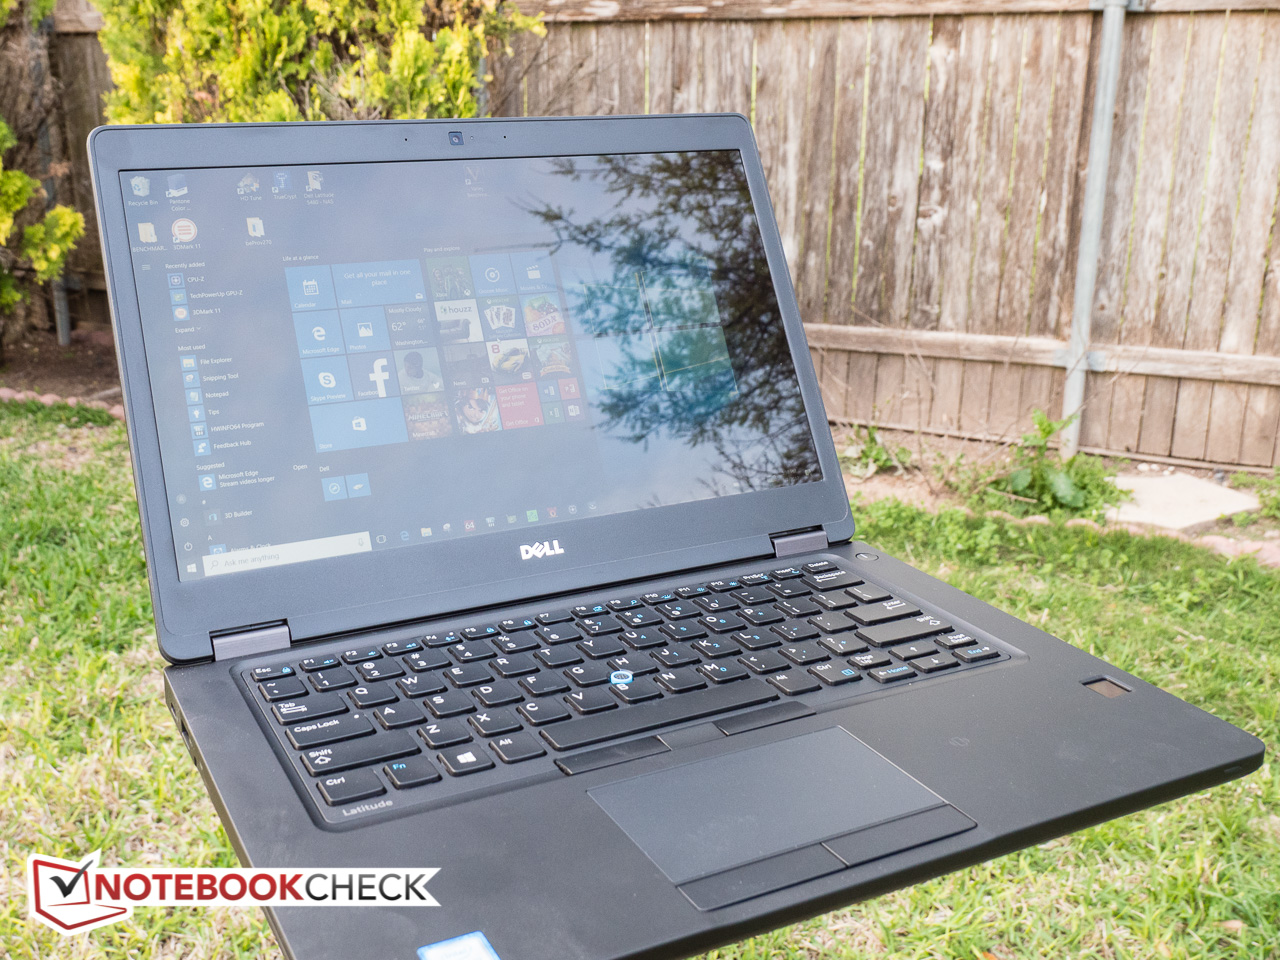
No ha cambiado mucho en la superficie: con su diseño discreto y su exterior negro liso, el Dell Latitude 5480 sigue pareciéndose mucho al predecesor Latitude 14 E5470. La CPU dual-core de gama alta Kaby Lake i7 ofrece rendimiento sobresaliente que basta para la mayoría de tareas business. La iGPU sólo ofrece una potencia 3D moderada; los usuarios que necesiten mejor procesado gráfico pueden elegir un modelo Latitude equipado con una dGPU Nvidia GeForce 930MX. La calidad de construcción es alta incluso con huecos homogéneos y pocas tolerancias, aunque el teclado se flexiona en el centro demasiado para nuestro gusto. Los dispositivos de entrada - incluyendo la pantalla táctil - funcionan muy bien y para los mecanógrafos el teclado será una gozada. Los usuarios de Pointstick que vengan de un Thinkpad igual no quedan particularmente impresionados con el diseño de los botones de ratón, empero.
Una de las diferencias principales - y un gran paso atrás a nuestro parecer - es el nuevo panel de display. Si bien ofrece mejor contraste, tanto el espacio de color como el brillo en particular - el nuevo panel es un 35 % más ténue - se han llevado un golpe importante. En el lado positivo, el aguante de batería ha dado un gran paso adelante, derrotando fácilmente a la competencia y por un margen importante.
El aguante de batería del Latitude 5480 es lo máximo - 16 horas de navegación WLAN deberían ser suficiente incluso para los power users. Sin embargo: cambiaríamos sin pensar un par de horas de aguante por un display más brillante.
Ésta es una versión acortada del análisis original. Puedes leer el análisis completo en inglés aquí.
Dell Latitude 5480
- 04/18/2017 v6 (old)
Bernhard Pechlaner
Price comparison
