Notebookcheck Logo

Análisis de la AMD Radeon RX 6900 XT: Rendimiento cercano a la RTX 3090 por 500 dólares menos, pero sólo ligeramente mejor que la RX 6800 XT

Radeon ha vuelto a entrar en el chat. La Radeon RX 6900 XT supone la reentrada de AMD en el espacio de las GPUs insignia desde la salida de la R9 Fury X en 2015. La RX 6900 XT ofrece un excelente rendimiento de rasterización que la sitúa firmemente al alcance de la NVIDIA GeForce RTX 3090 a pesar de algunas insuficiencias en el trazado de rayos y la falta de supermuestreo basado en IA. Llevamos la AMD Radeon RX 6900 XT a una prueba y vemos lo bien que ha progresado Team Red con RDNA 2 hasta ahora.

AMD tenía (y sigue teniendo) una gran marcha contra Intel en el espacio de la CPU con Ryzen, pero la unidad Radeon se ha quedado significativamente por detrás de la competencia hasta ahora. La última vez que vimos mencionar una tarjeta gráfica insignia de AMD al mismo tiempo que la de NVIDIA fue la Radeon R9 Fury X que compitió con la NVIDIA Maxwell GeForce 980 Ti allá por 2015

Durante mucho tiempo, las piezas Turing, el buque insignia de NVIDIA, no tuvieron rival. Los modelos Vega 56, Vega 64de AMD, y la Radeon VII hicieron poco para dar a NVIDIA noches de insomnio. No fue hasta julio de 2019 cuando AMD saboreó un éxito moderado con la Radeon RX 5700 XTpero, en el mejor de los casos, fue comparable a la GeForce RTX 2070 Super

Todo eso ya es historia. El pasado mes de octubre, AMD presentó oficialmente las tarjetas de la serie Radeon RX 6000, compuesta por la RX 6800 RX 6800 XTRX 6900 XT y, más recientemente, la RX 6700 XTcon la promesa de enfrentarse a las ofertas de gama alta de NVIDIA, como la RTX 3070, RTX 3080y la RTX 3090 para juegos a 1440p y 4K

La RX 6900 XT se considera un competidor de la RTX 3090, al menos en términos de rendimiento de rasterización puro (con salvedades, por supuesto). Las tarjetas NVIDIA llevan la delantera en lo que respecta a funciones como el trazado de rayos y el supermuestreo basado en IA. Sin embargo, la RX 6900 XT también tiene algunos trucos en la manga

En este análisis, ponemos a prueba la tarjeta Navi 21 XTX, la mejor del mercado, para ver si tiene las agallas necesarias para enfrentarse al Goliat Ampere de NVIDIA

Comparación de la Radeon RX 6900 XT con otras GPU de AMD

Especificaciones Radeon RX6900 XT Radeon RX6800 XT RadeonRX 6800 RadeonRX 6700 XT RadeonRX 5700 XT RadeonRX 5700 RadeonVII
GPU Navi21 XTX Navi 21 XT Navi 21 XL Navi 22 Navi 10 XT Navi 10 XL Vega 20 XT
Proceso de fabricación 7nm 7 nm 7 nm 7 nm 7 nm
ComputeUnits 80 72 60 40 40 36 60
ShadingUnits 5,120 4,608 3,840 2,560 2,560 2,304 3,840
Unidades de mapeo de texturas 320 288 240 160 160 144 240
RayAccelerators 80 72 60 40 -- -- --
Reloj base 1.825 MHz 1.825 MHz 1.700 MHz 2.321 MHz 1.605 MHz 1.465 MHz 1.400 MHz
Reloj de juego 2.015 MHz 2.015 MHz 1.815 MHz 2.424 MHz 1.755 MHz 1.625 MHz 1.750 MHz
Reloj Boost 2.250MHz 2.250 MHz 2.105 MHz 2.581 MHz 1.905 MHz 1.725 MHz 1.802 MHz
Caché infinita 128MB 128 MB 96 MB
Memory BusWidth 256-bit 256-bit 256-bit 192-bit 256-bit 256-bit 4096-bit
Ancho de banda de la memoria 512GB/s 512 GB/s 512 GB/s 384 GB/s 448 GB/s 448 GB/s 1.024 GB/s
Tamaño de la memoria 16GB GDDR6 16 GB GDDR6 12 GB GDDR6 8 GB GDDR6 8 GB GDDR6 16 GB HBM2
TBP 300W 300 W 250 W 230 W 225 W 180 W 295 W

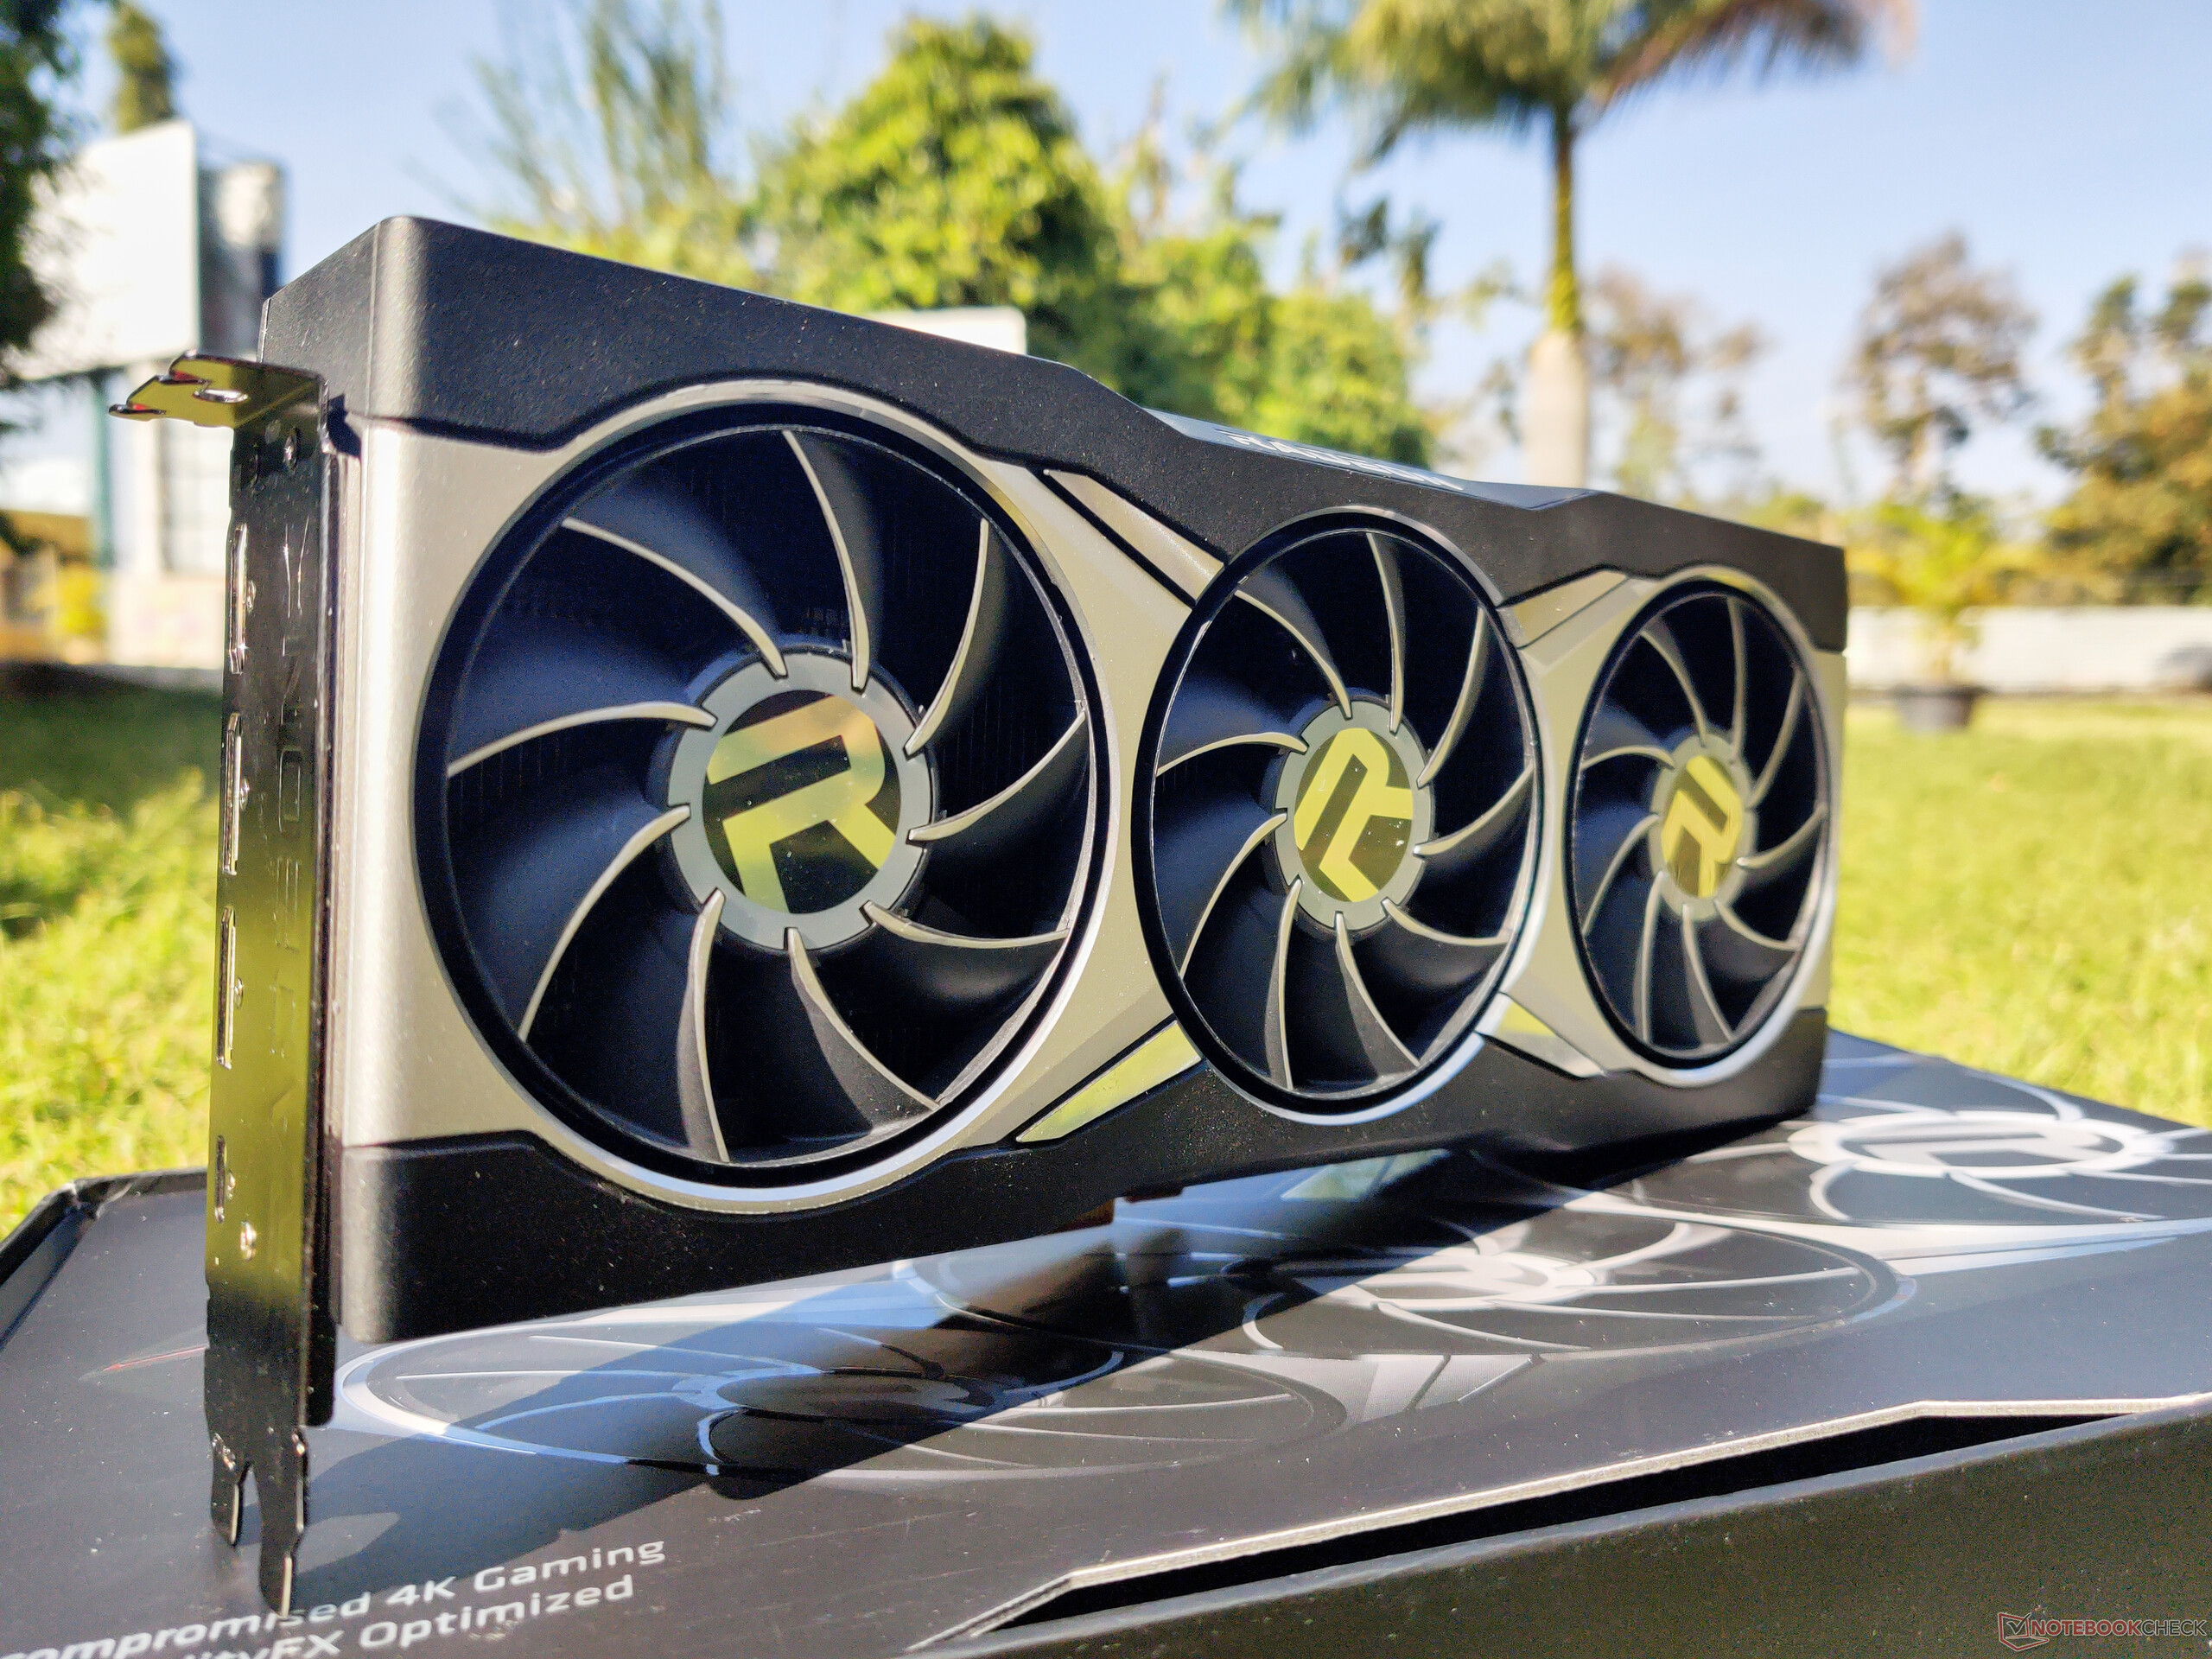
Un recorrido por la AMD Radeon RX 6900 XT

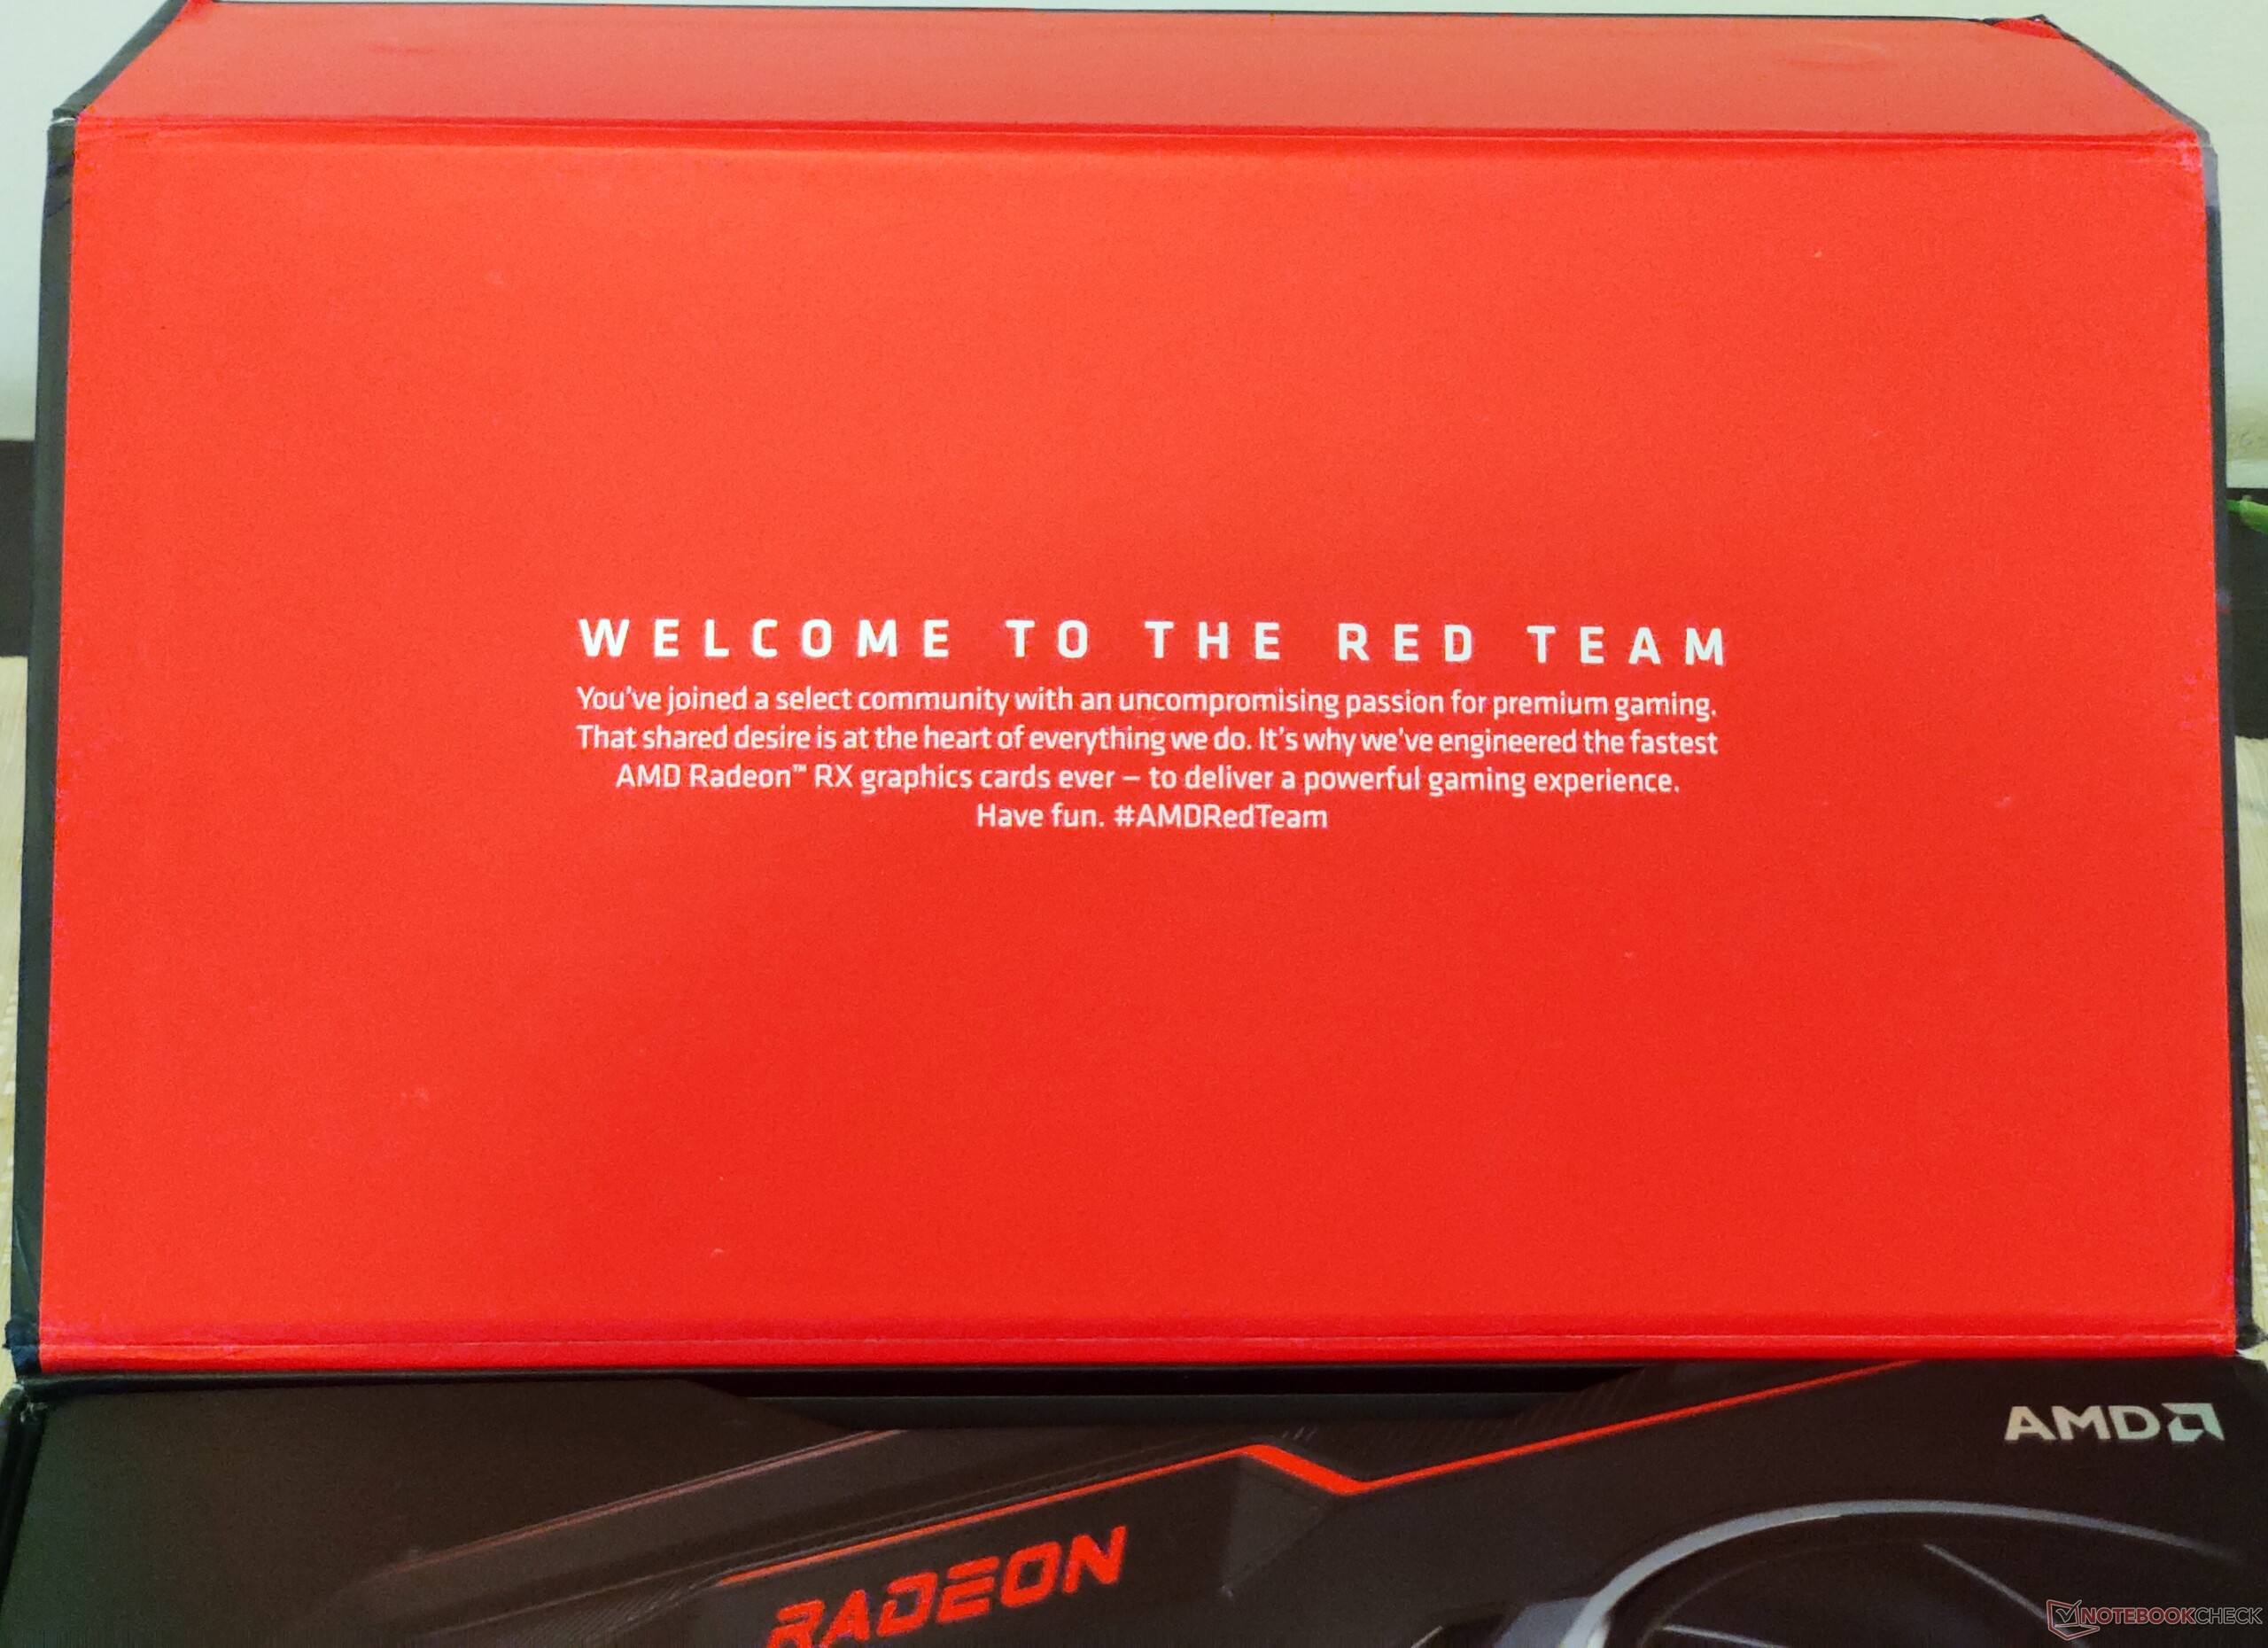
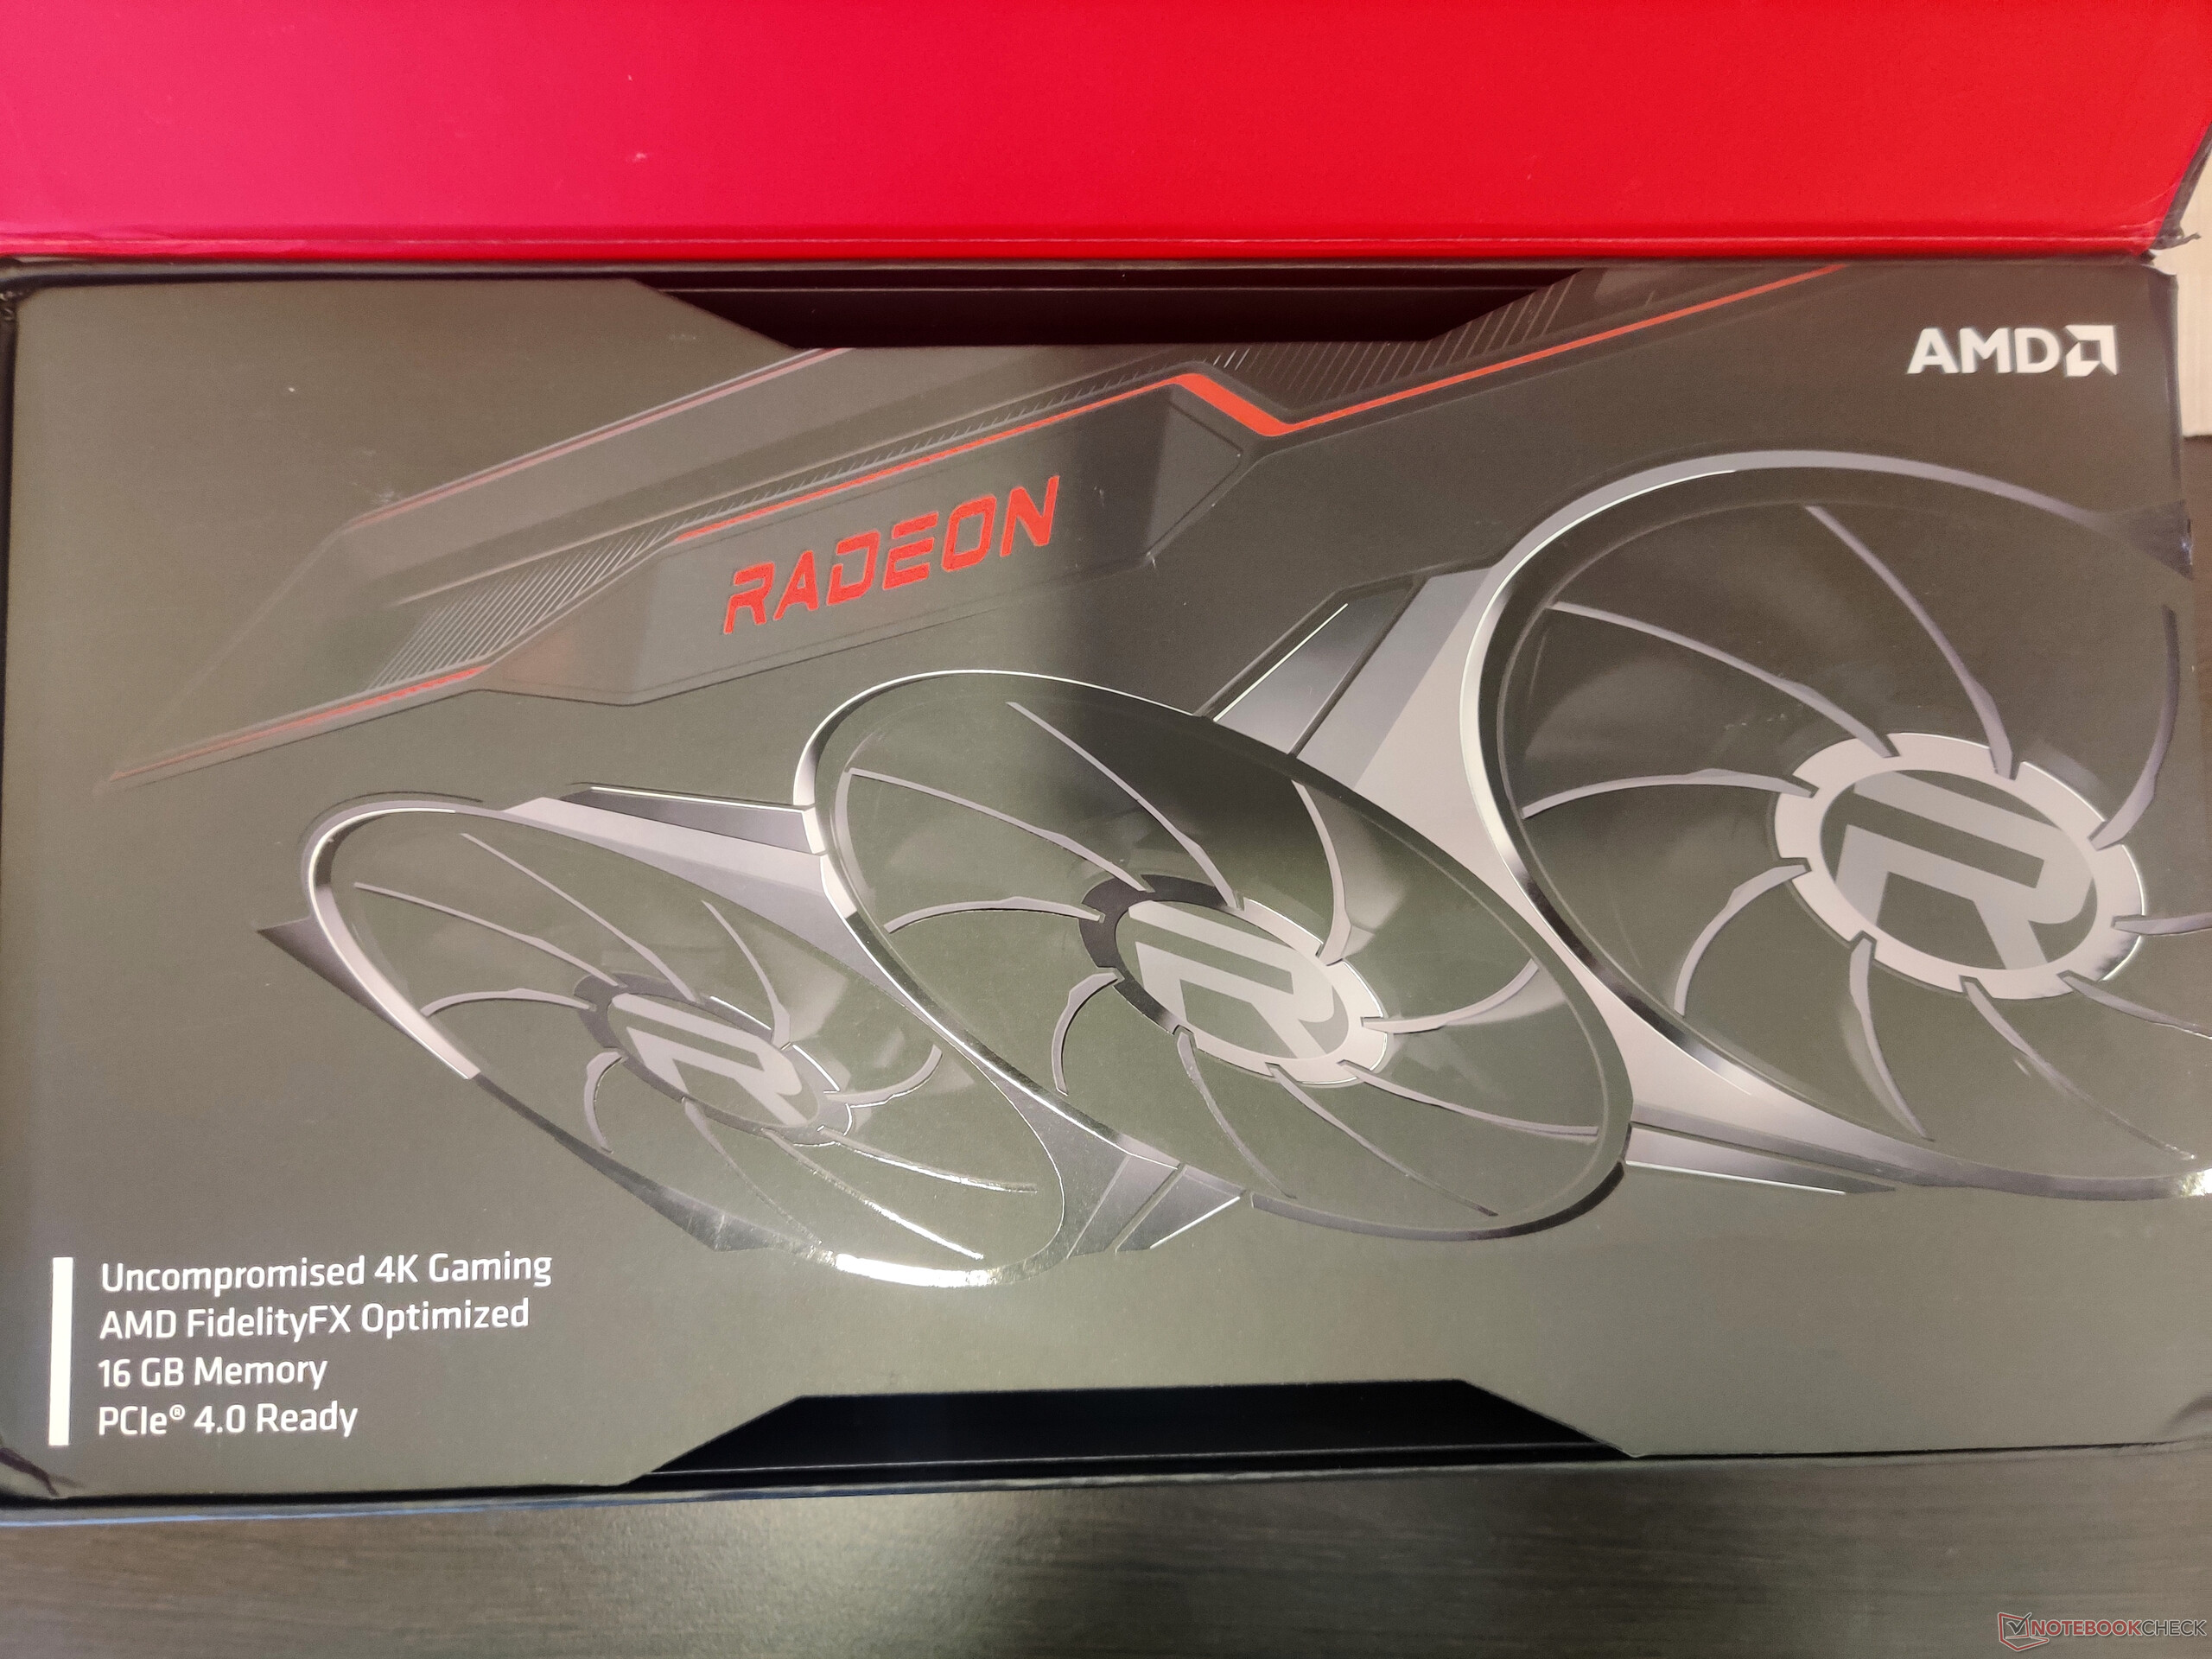
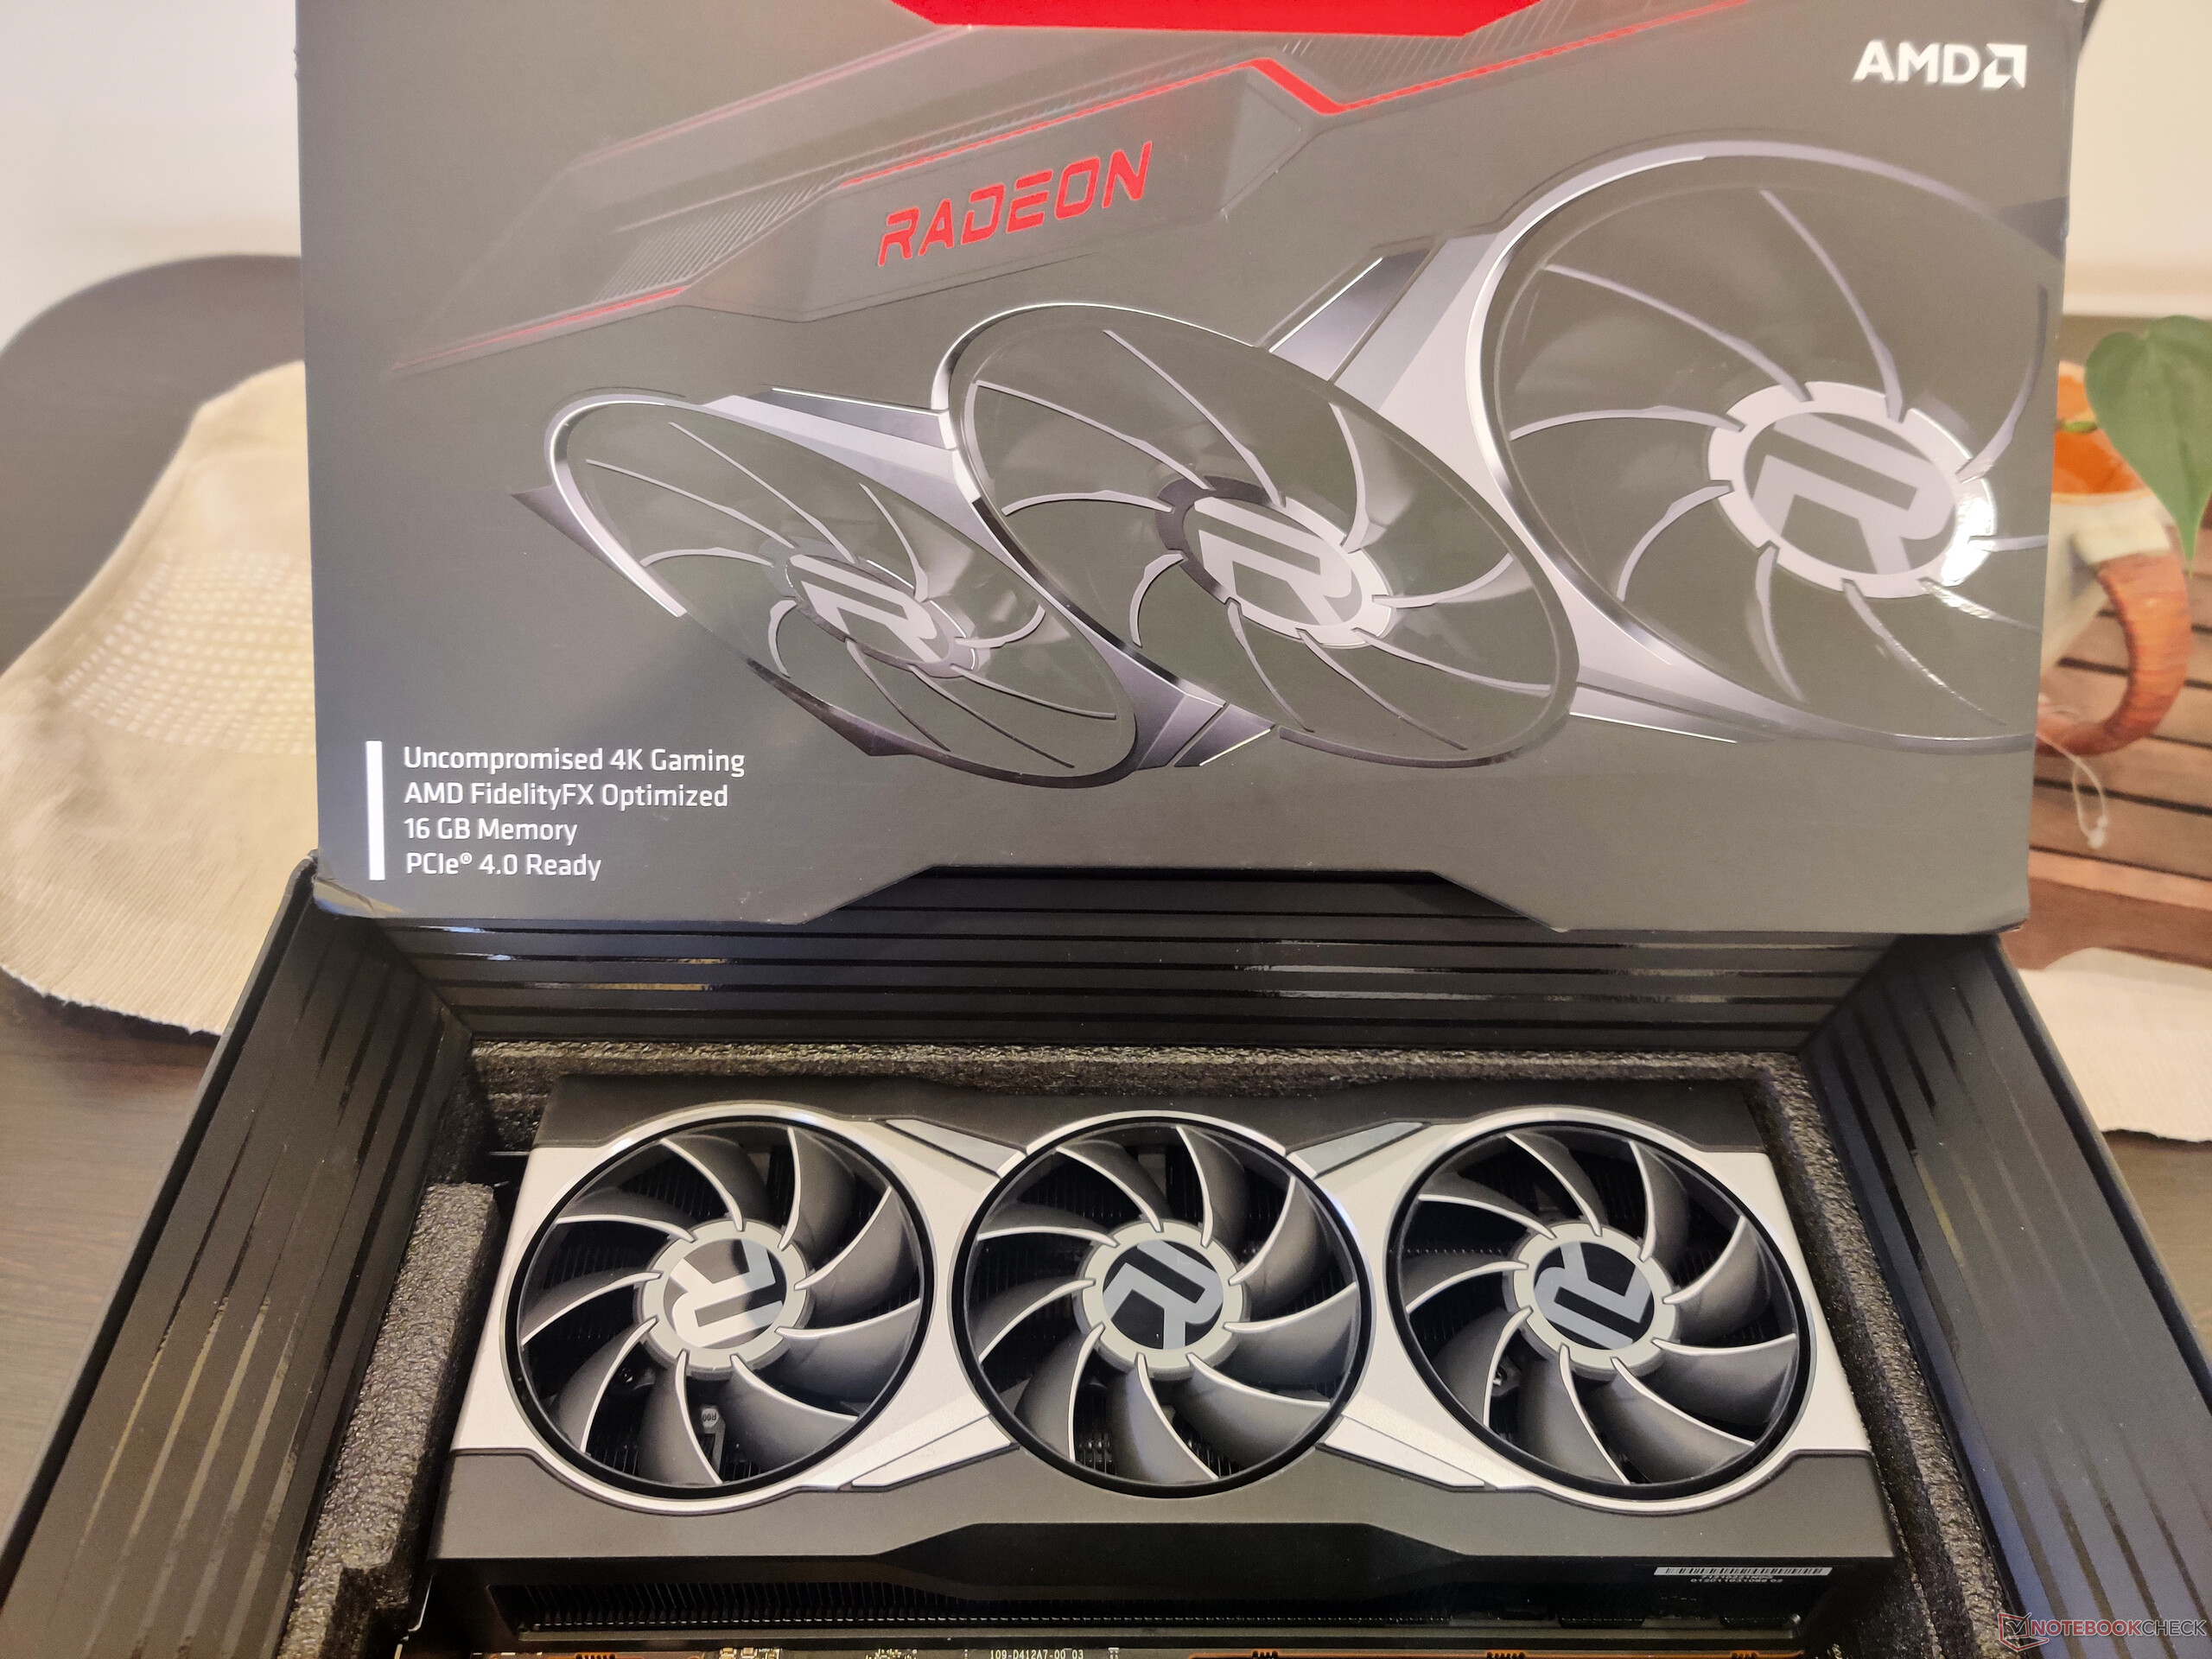
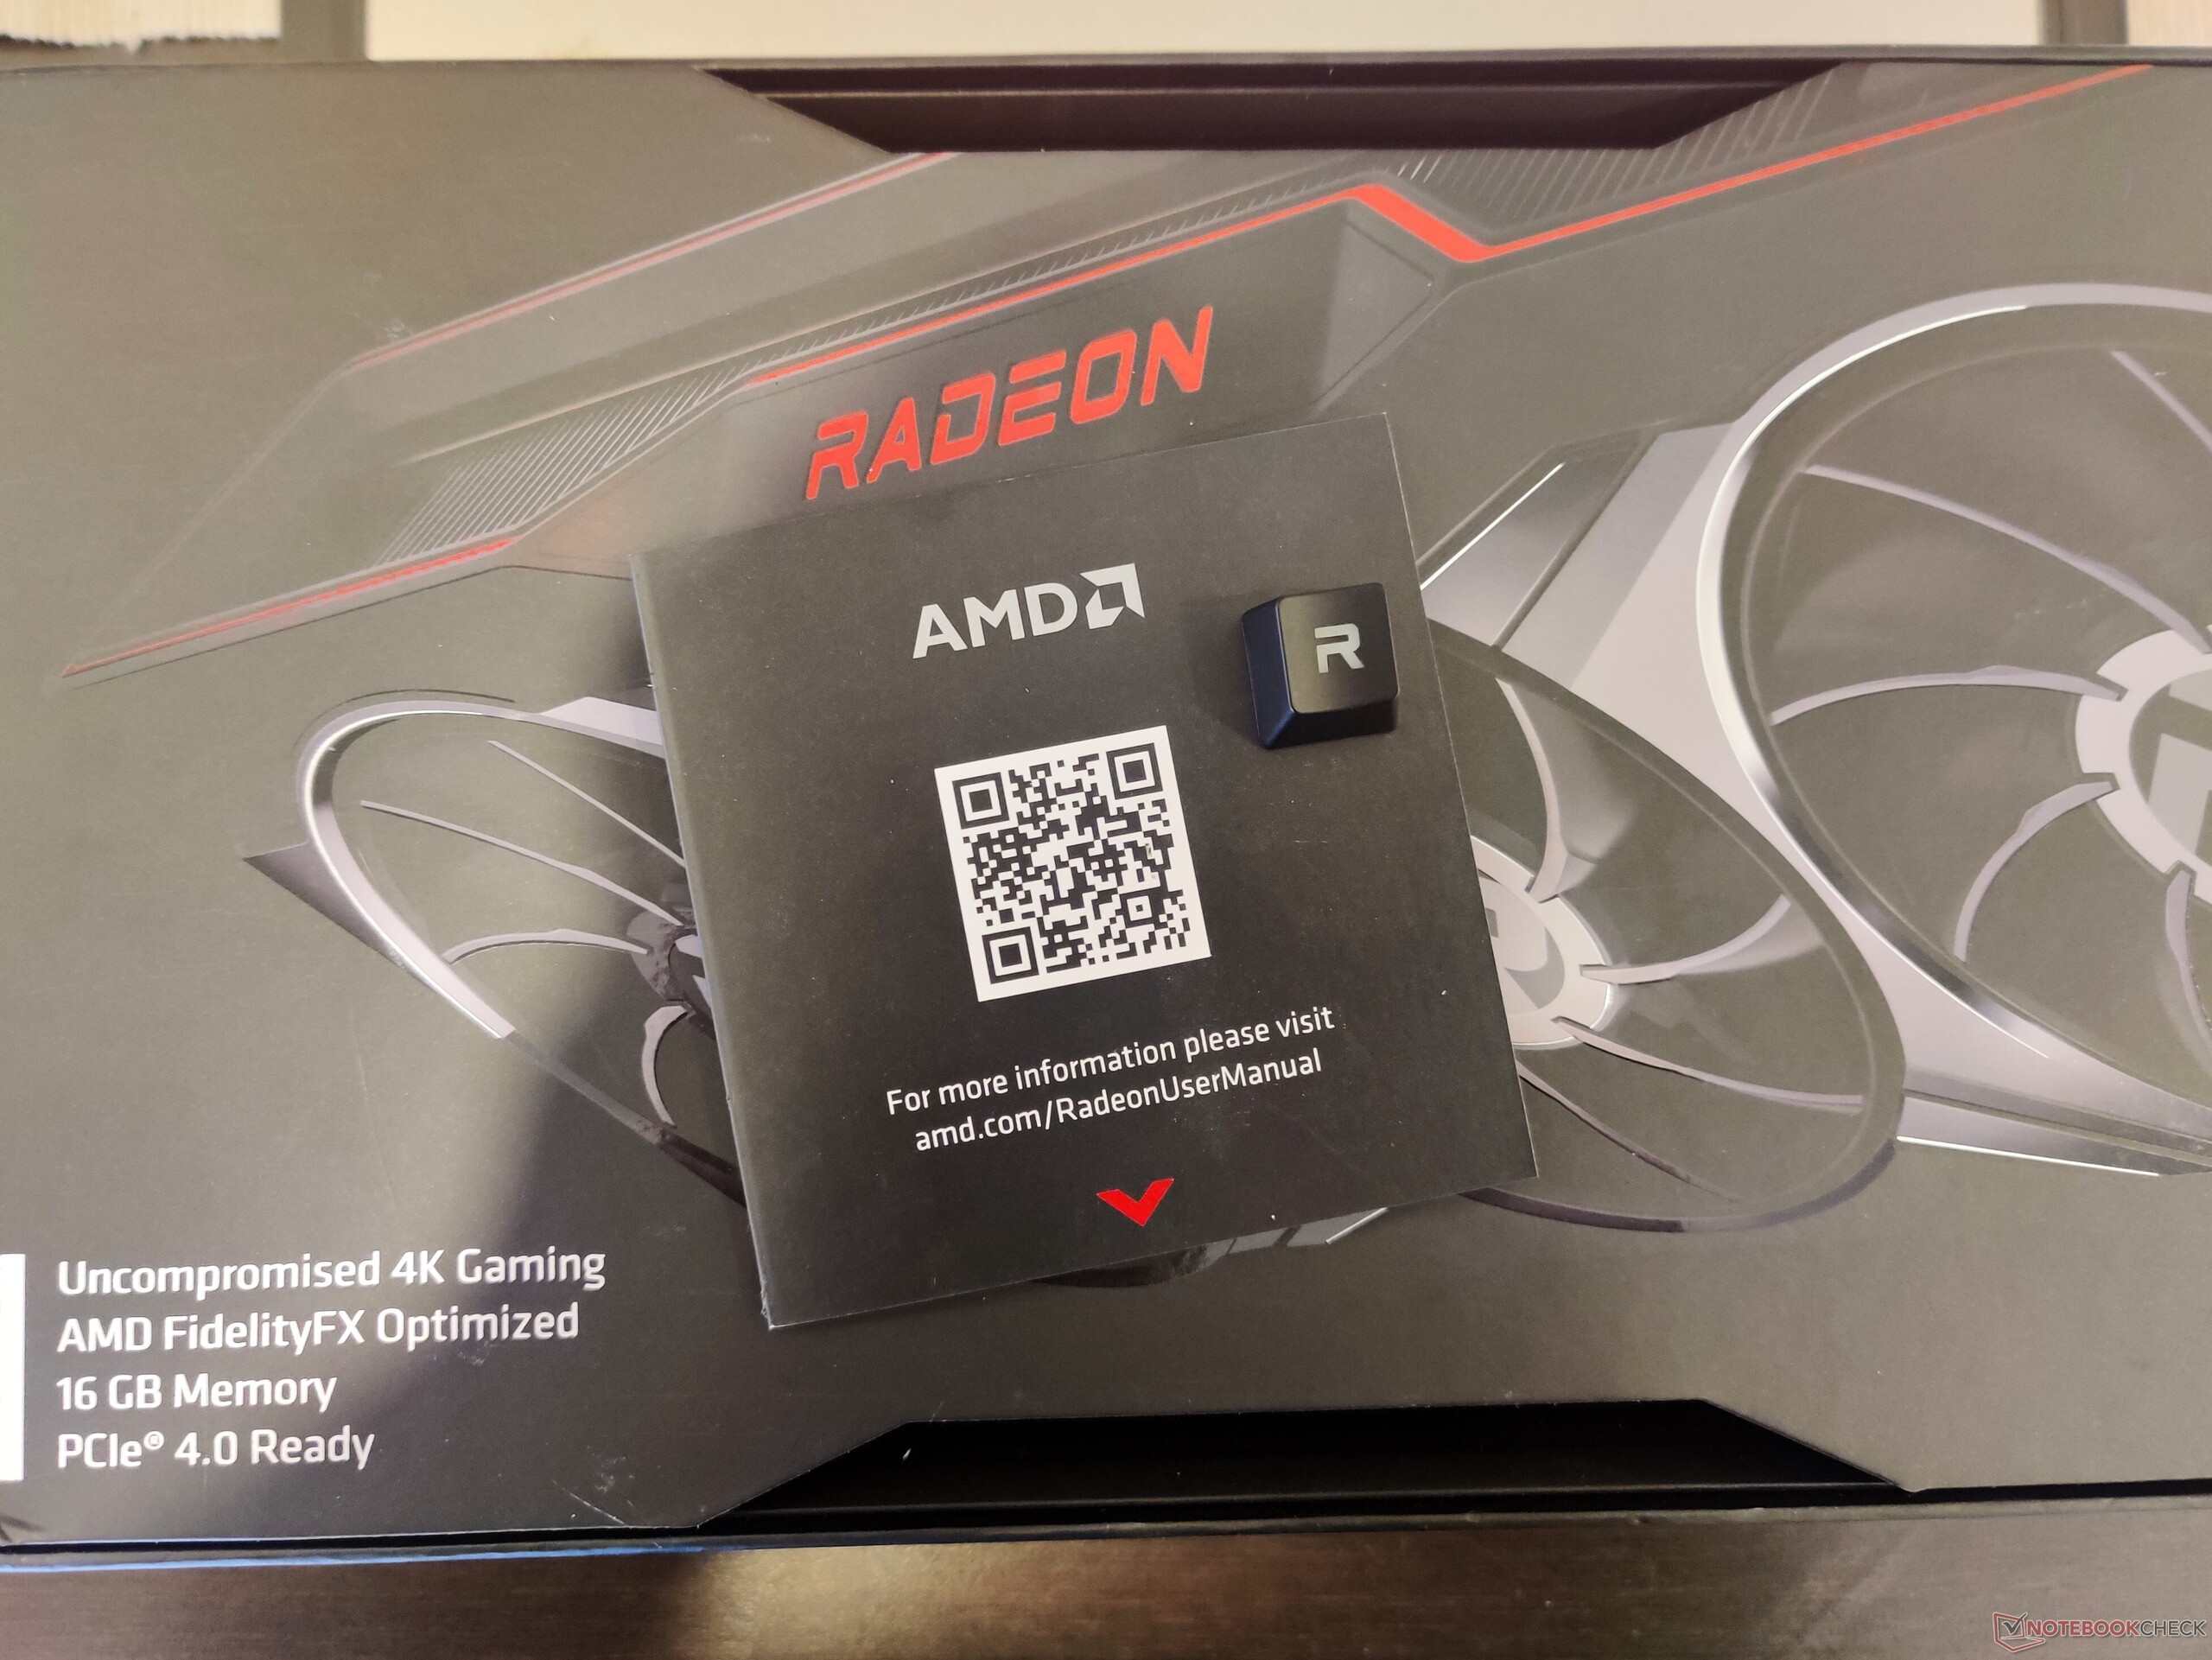
Al abrir la caja, nos recibe un mensaje de "Bienvenido al Equipo Rojo". El embalaje incluye un cartón de Radeon en el que se incluye una guía de inicio rápido y una tecla "R" para el teclado. La tecla "R" está diseñada con la típica fuente Radeon y permite el paso de la luz RGB. Por desgracia, nuestro paquete no incluía una alfombrilla de ratón de la marca AMD, que, sin embargo, debería estar presente en la caja de venta.

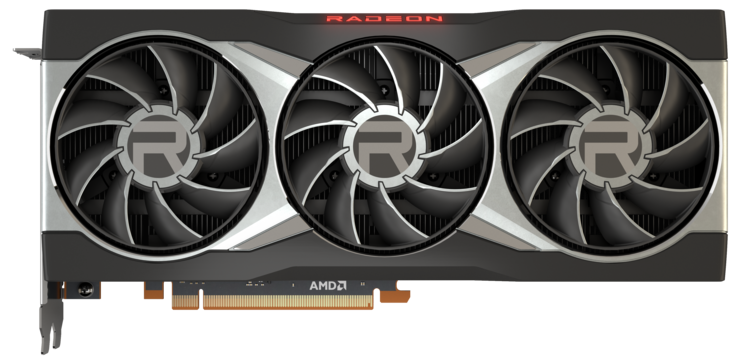
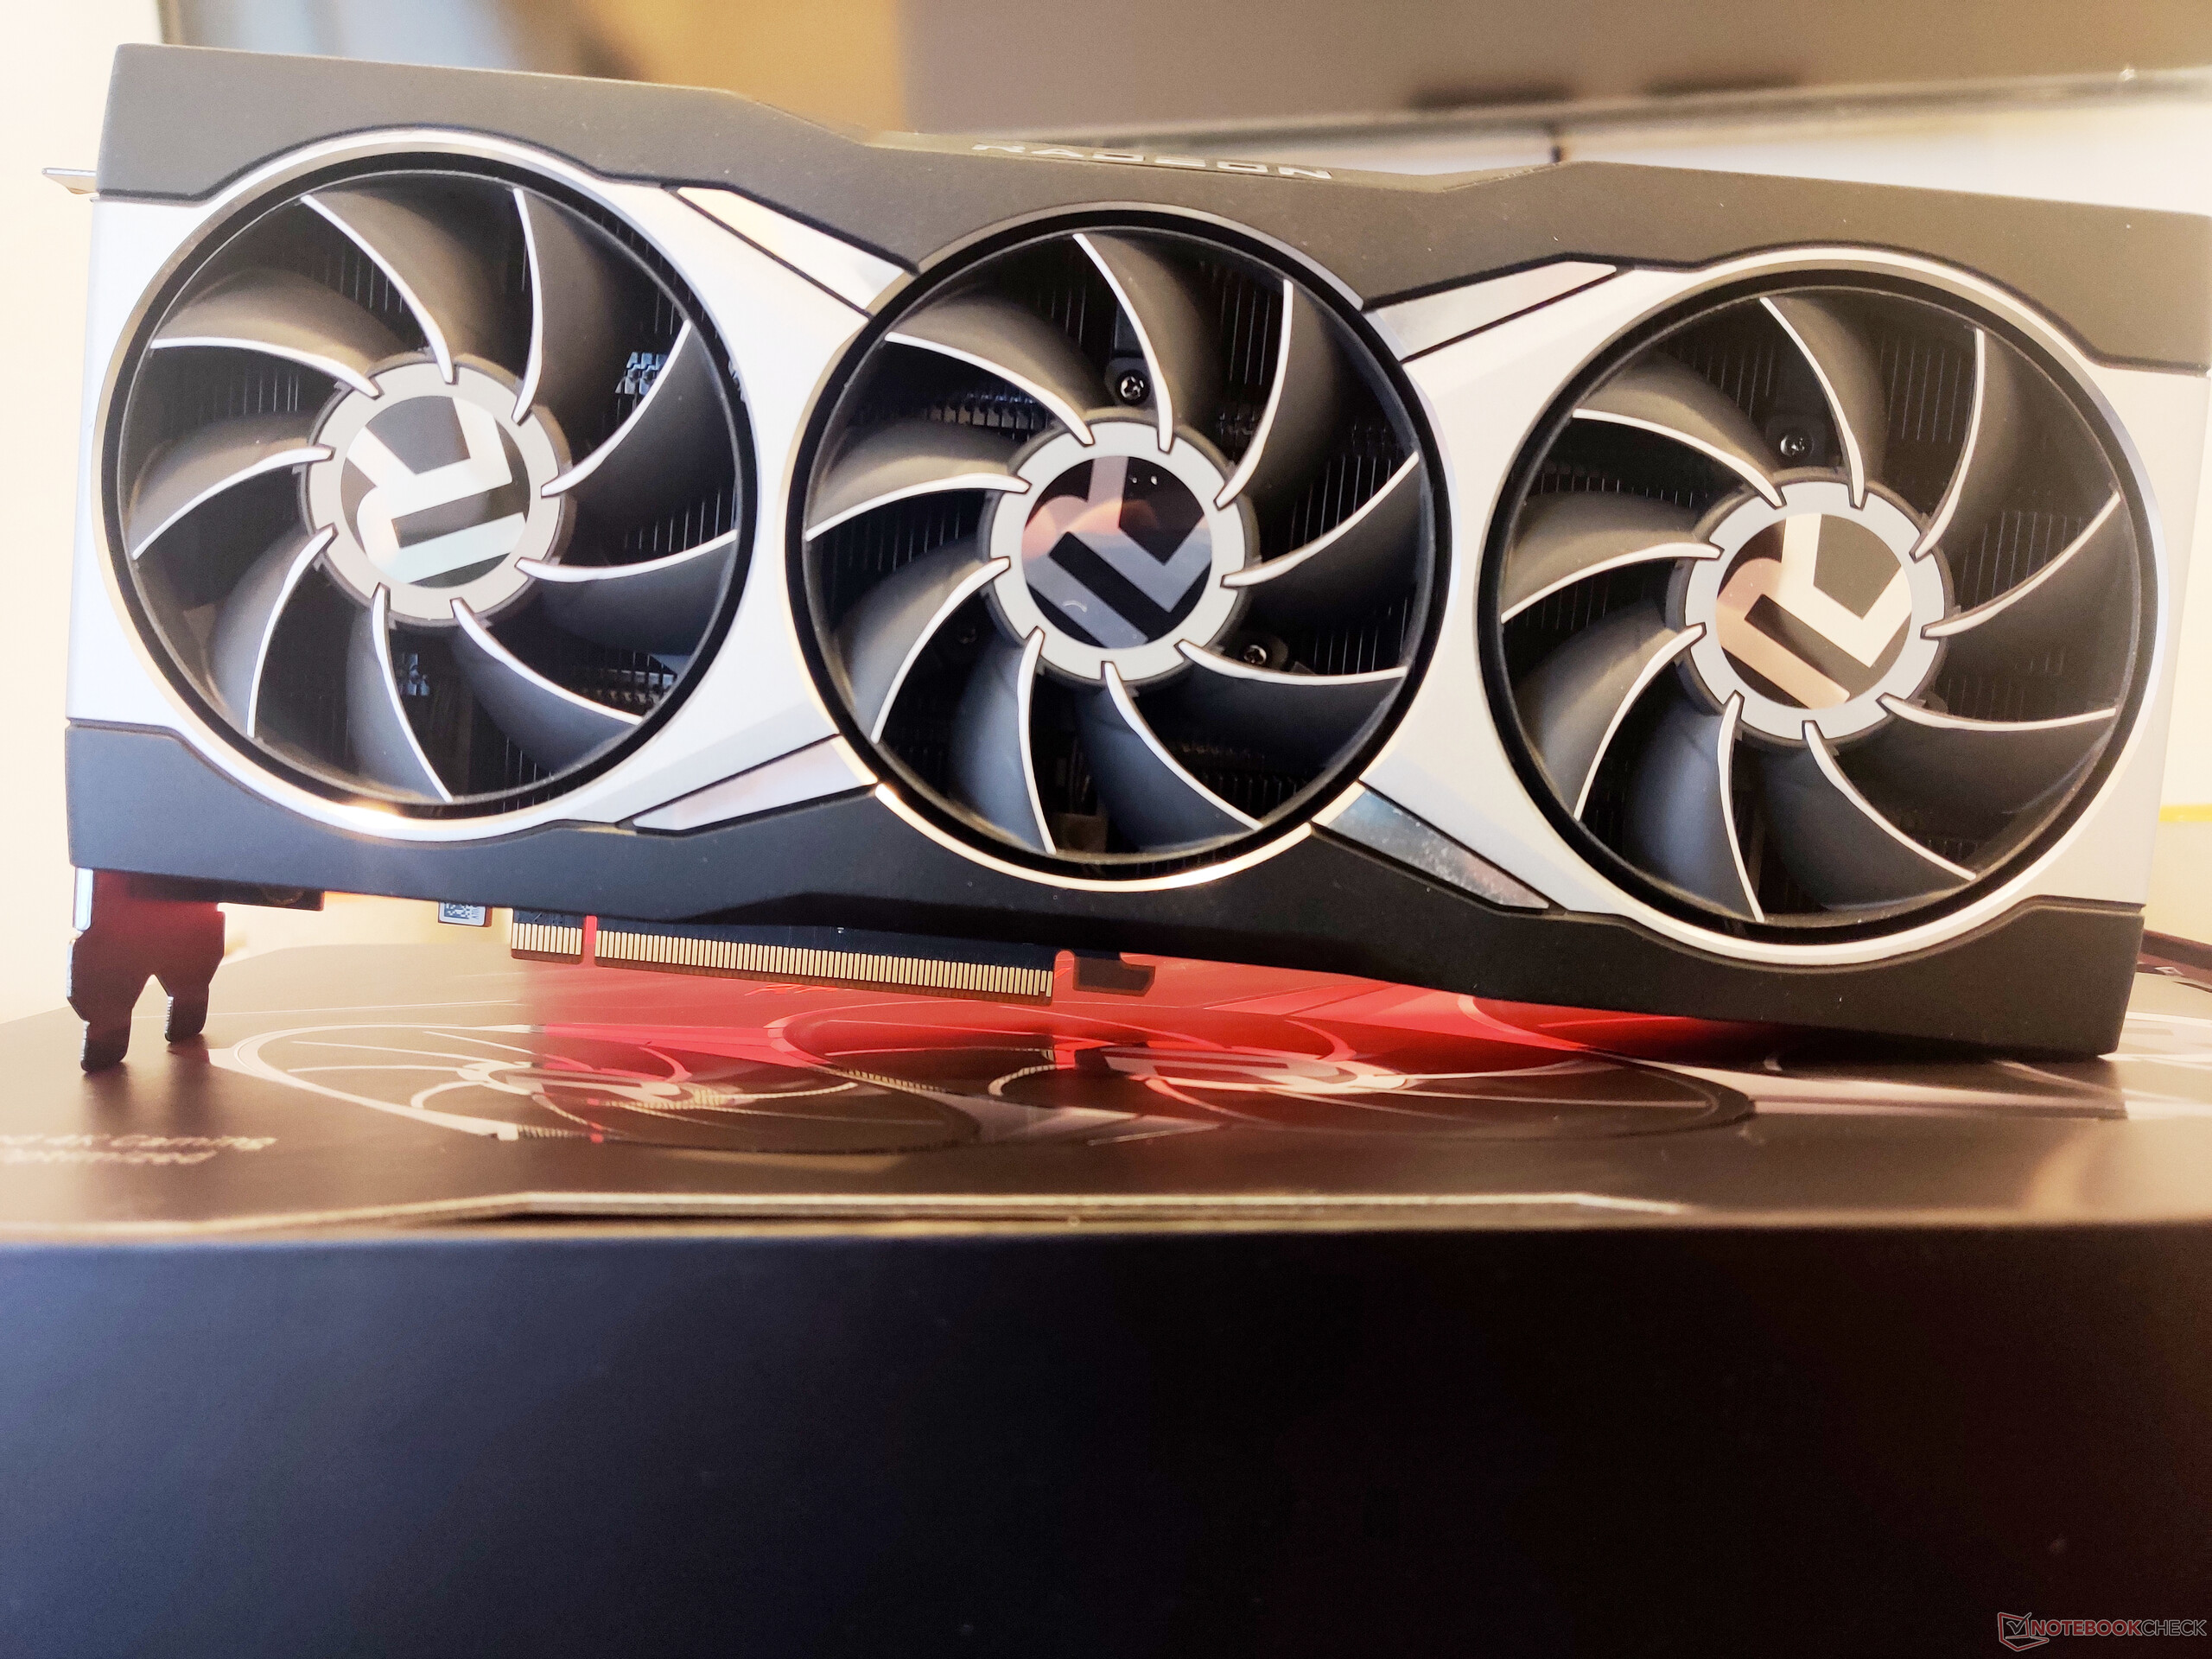
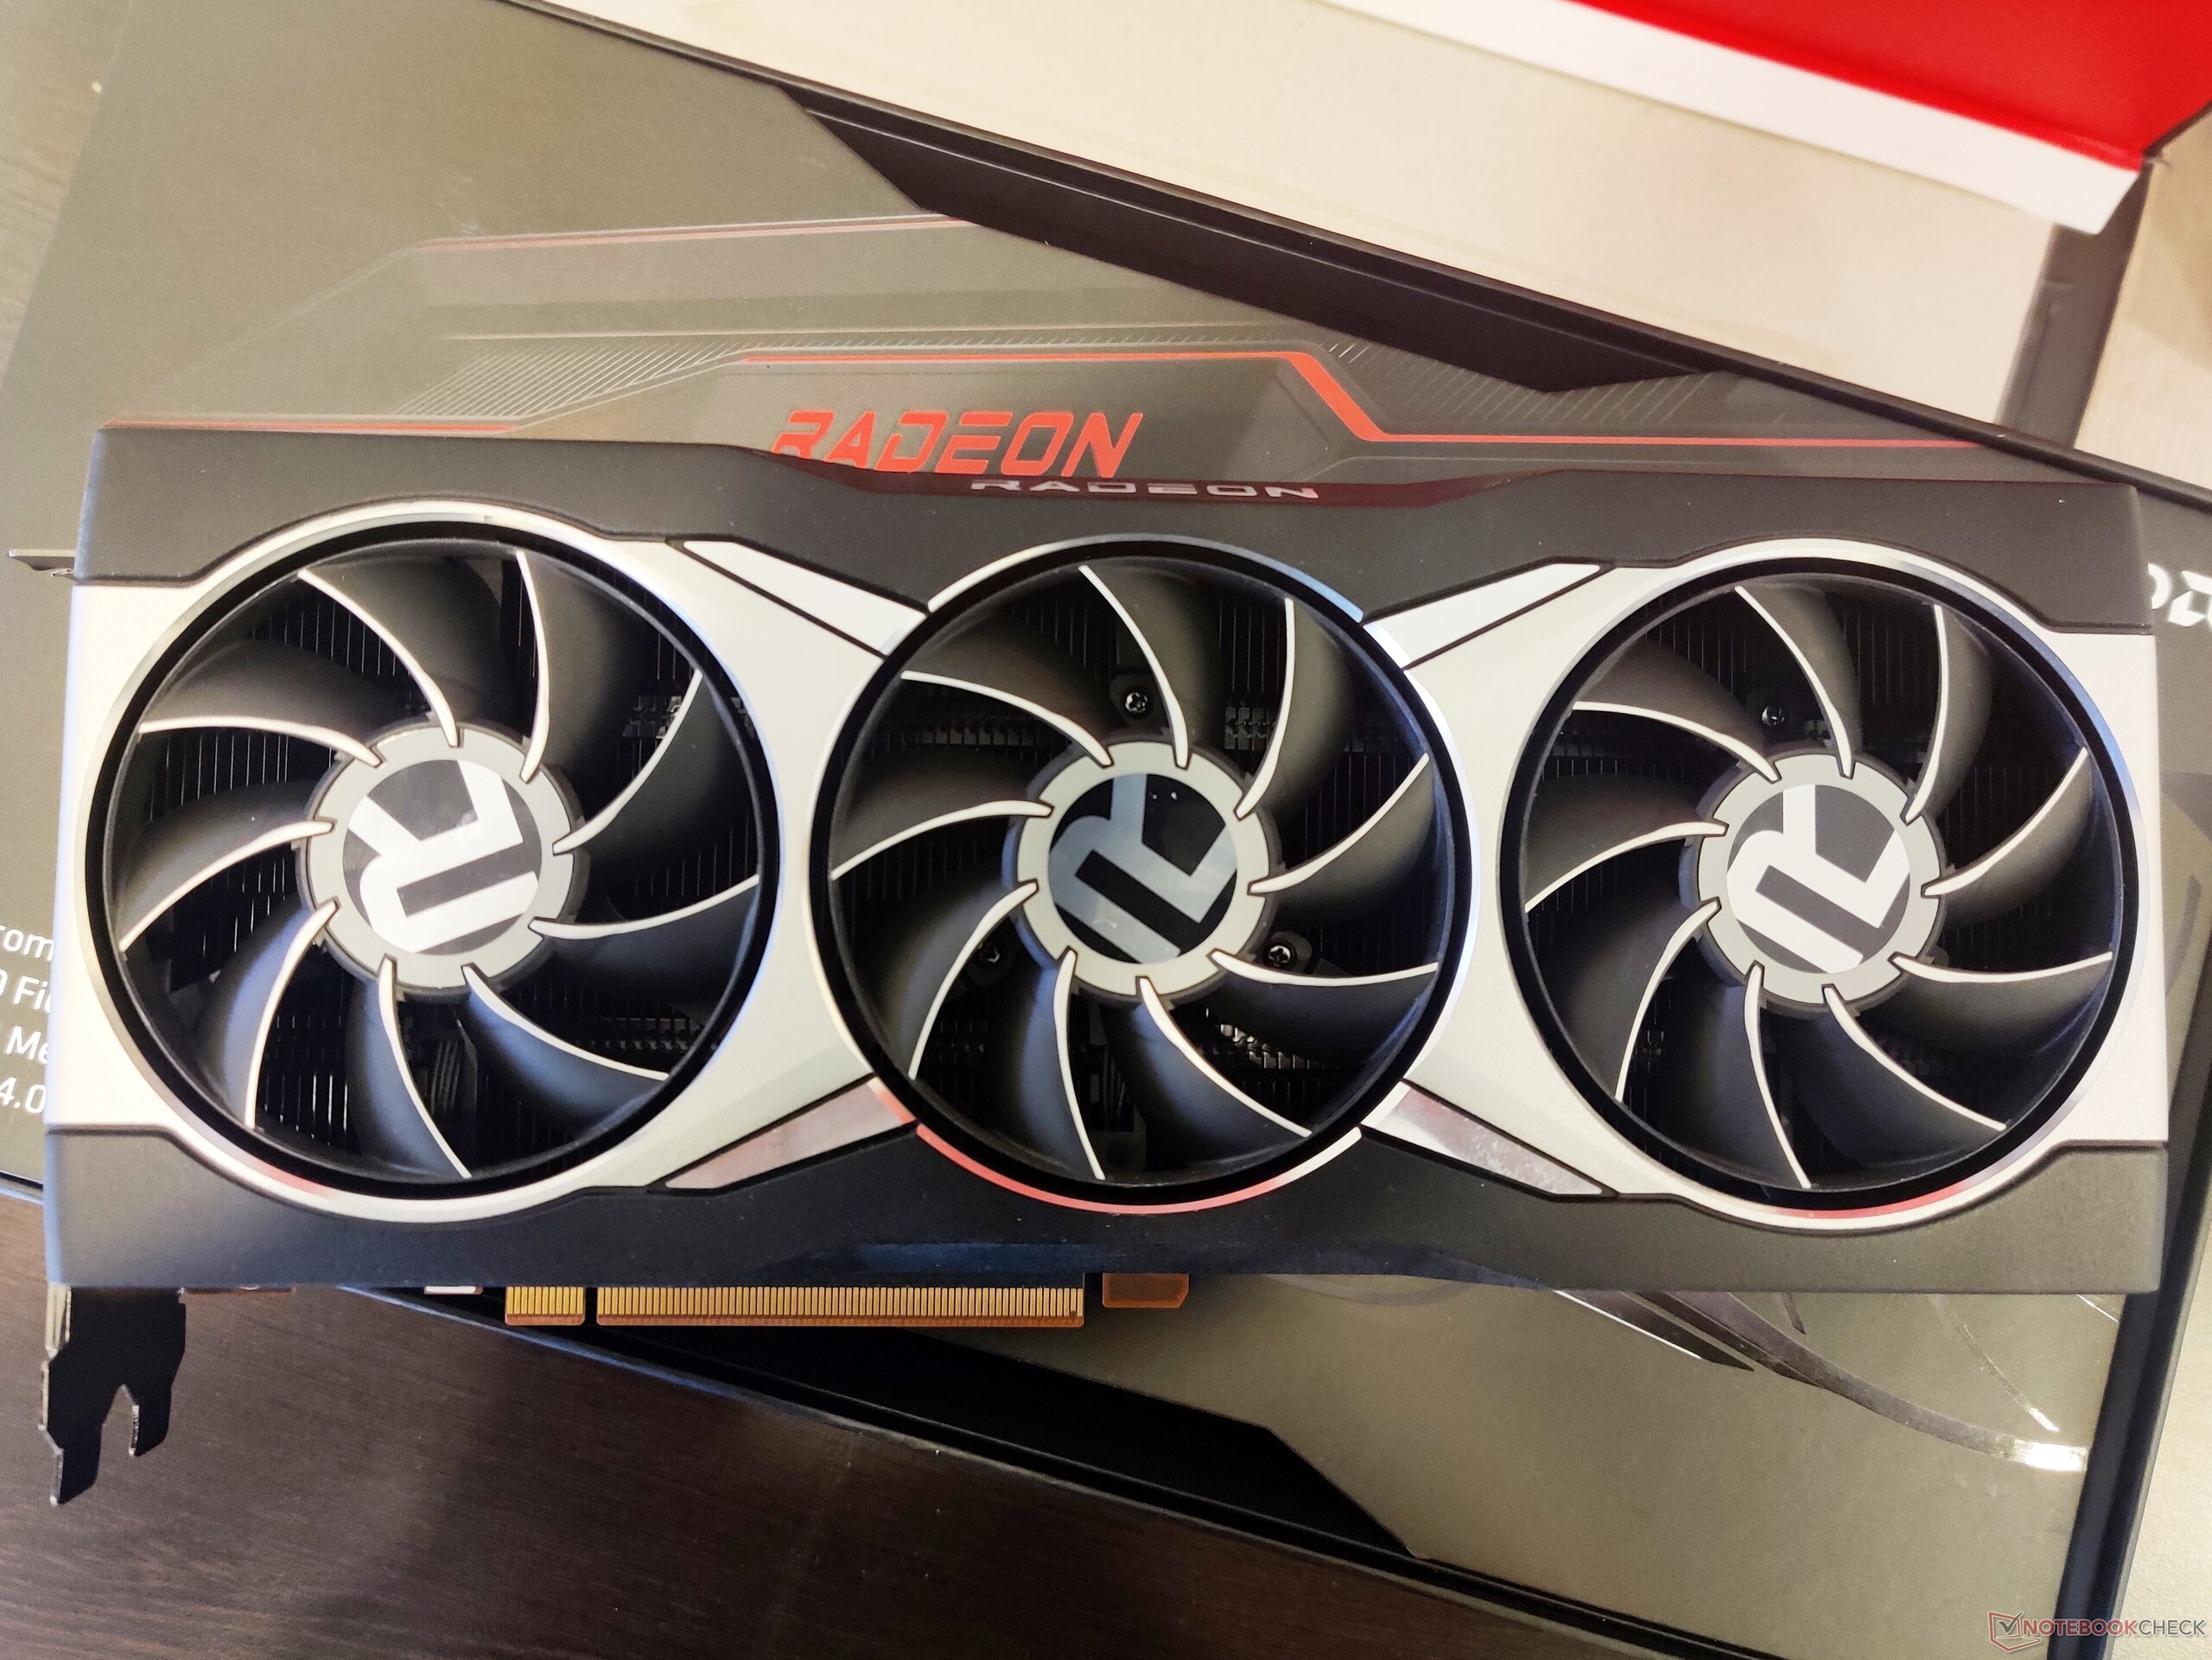
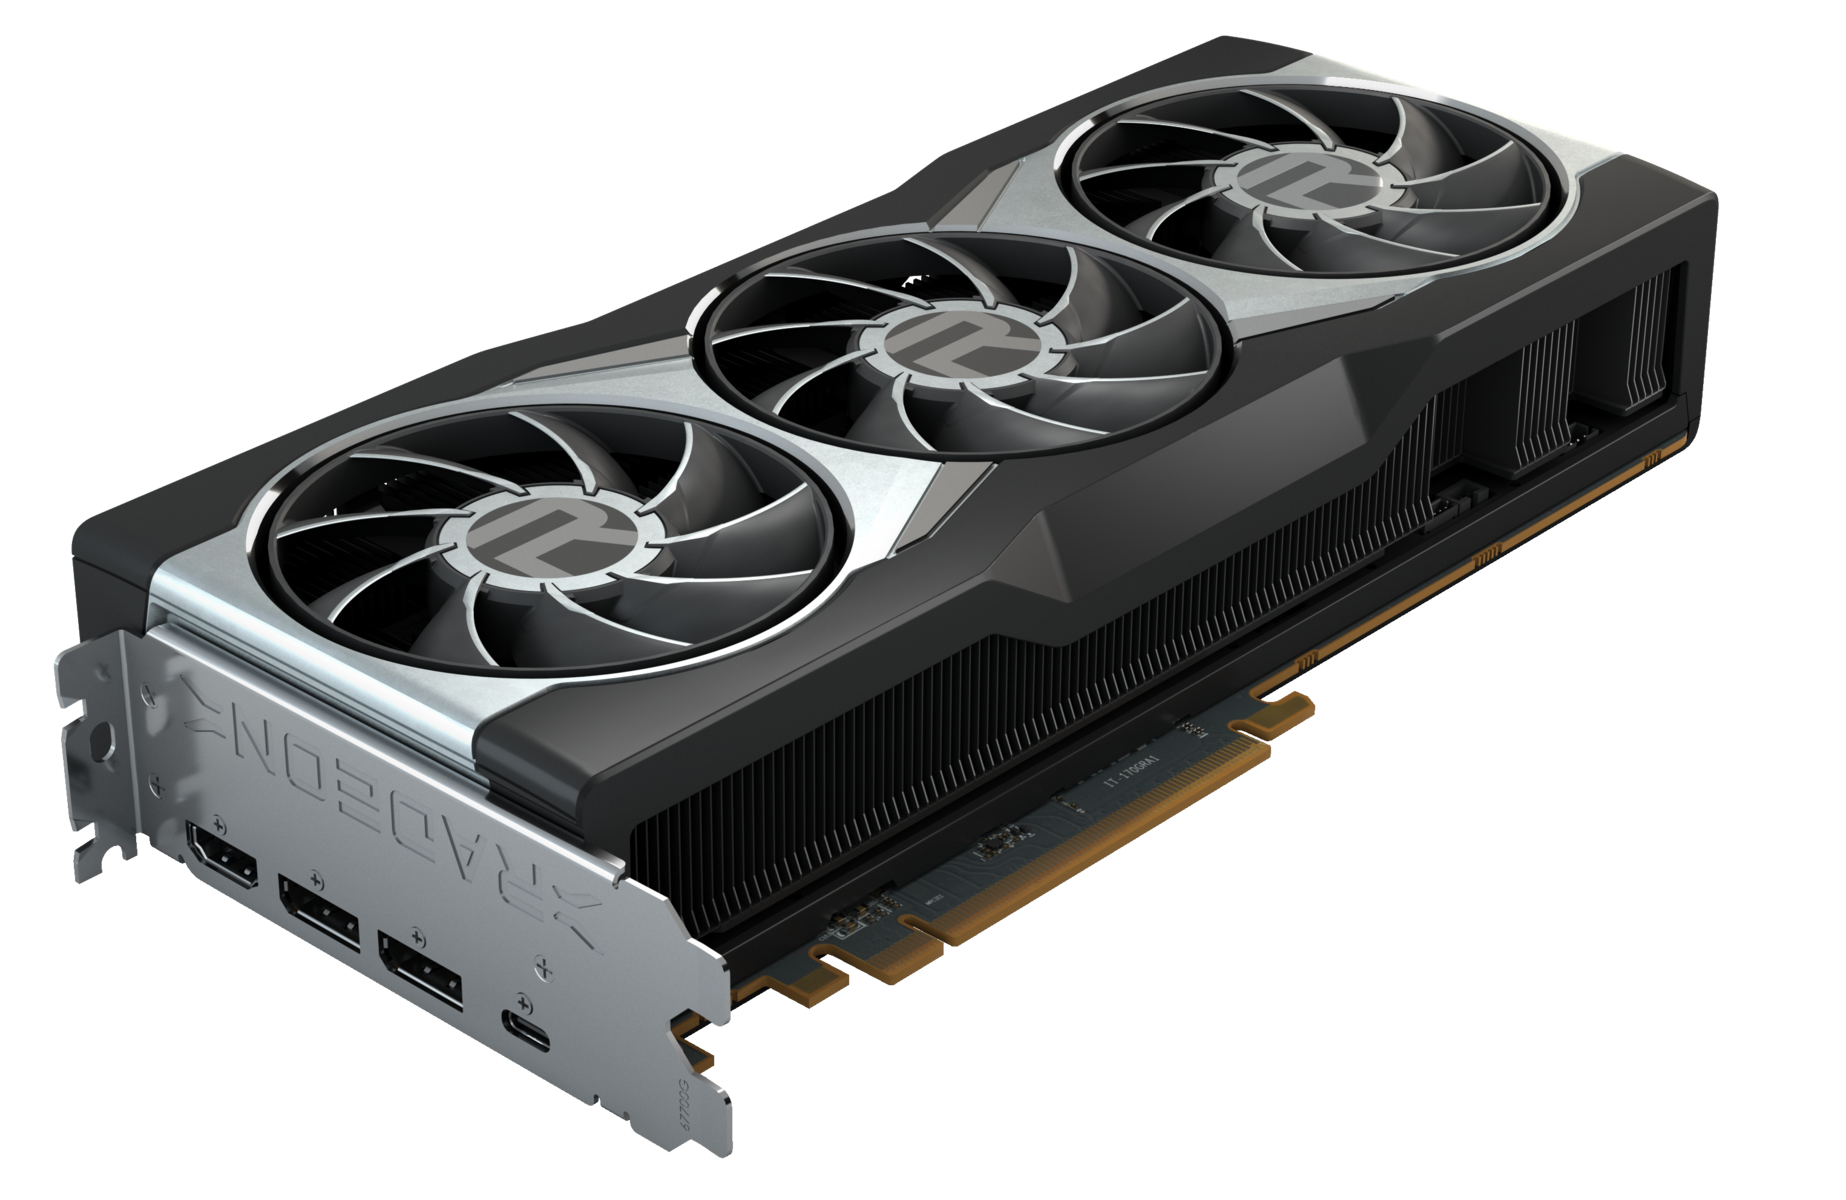
En cuanto a la tarjeta en sí, vemos que AMD ha dejado de lado el ventilador de la tarjeta de referencia RX 5700 XT y ha optado por un ventilador triple. Los ventiladores llevan el distintivo "R" y están integrados en un marco de metal plateado brillante. En la parte superior, encontramos un ribete rojo que recorre toda la tarjeta y también un logotipo RGB de Radeon.

El logotipo de Radeon brilla en rojo por defecto, pero se puede descargar una herramienta LED RGB de CoolerMaster https://www.amd.com/en/support/graphics/amd-radeon-6000-series/amd-radeon-6900-series/amd-radeon-rx-6900-xt para cambiar de color. Nos atreveríamos a adivinar que CoolerMaster tiene algo que ver con el sistema de refrigeración del diseño de referencia, a tenor de lo que hemos visto antes con el refrigerador de stock Wraith Prism de Ryzen.

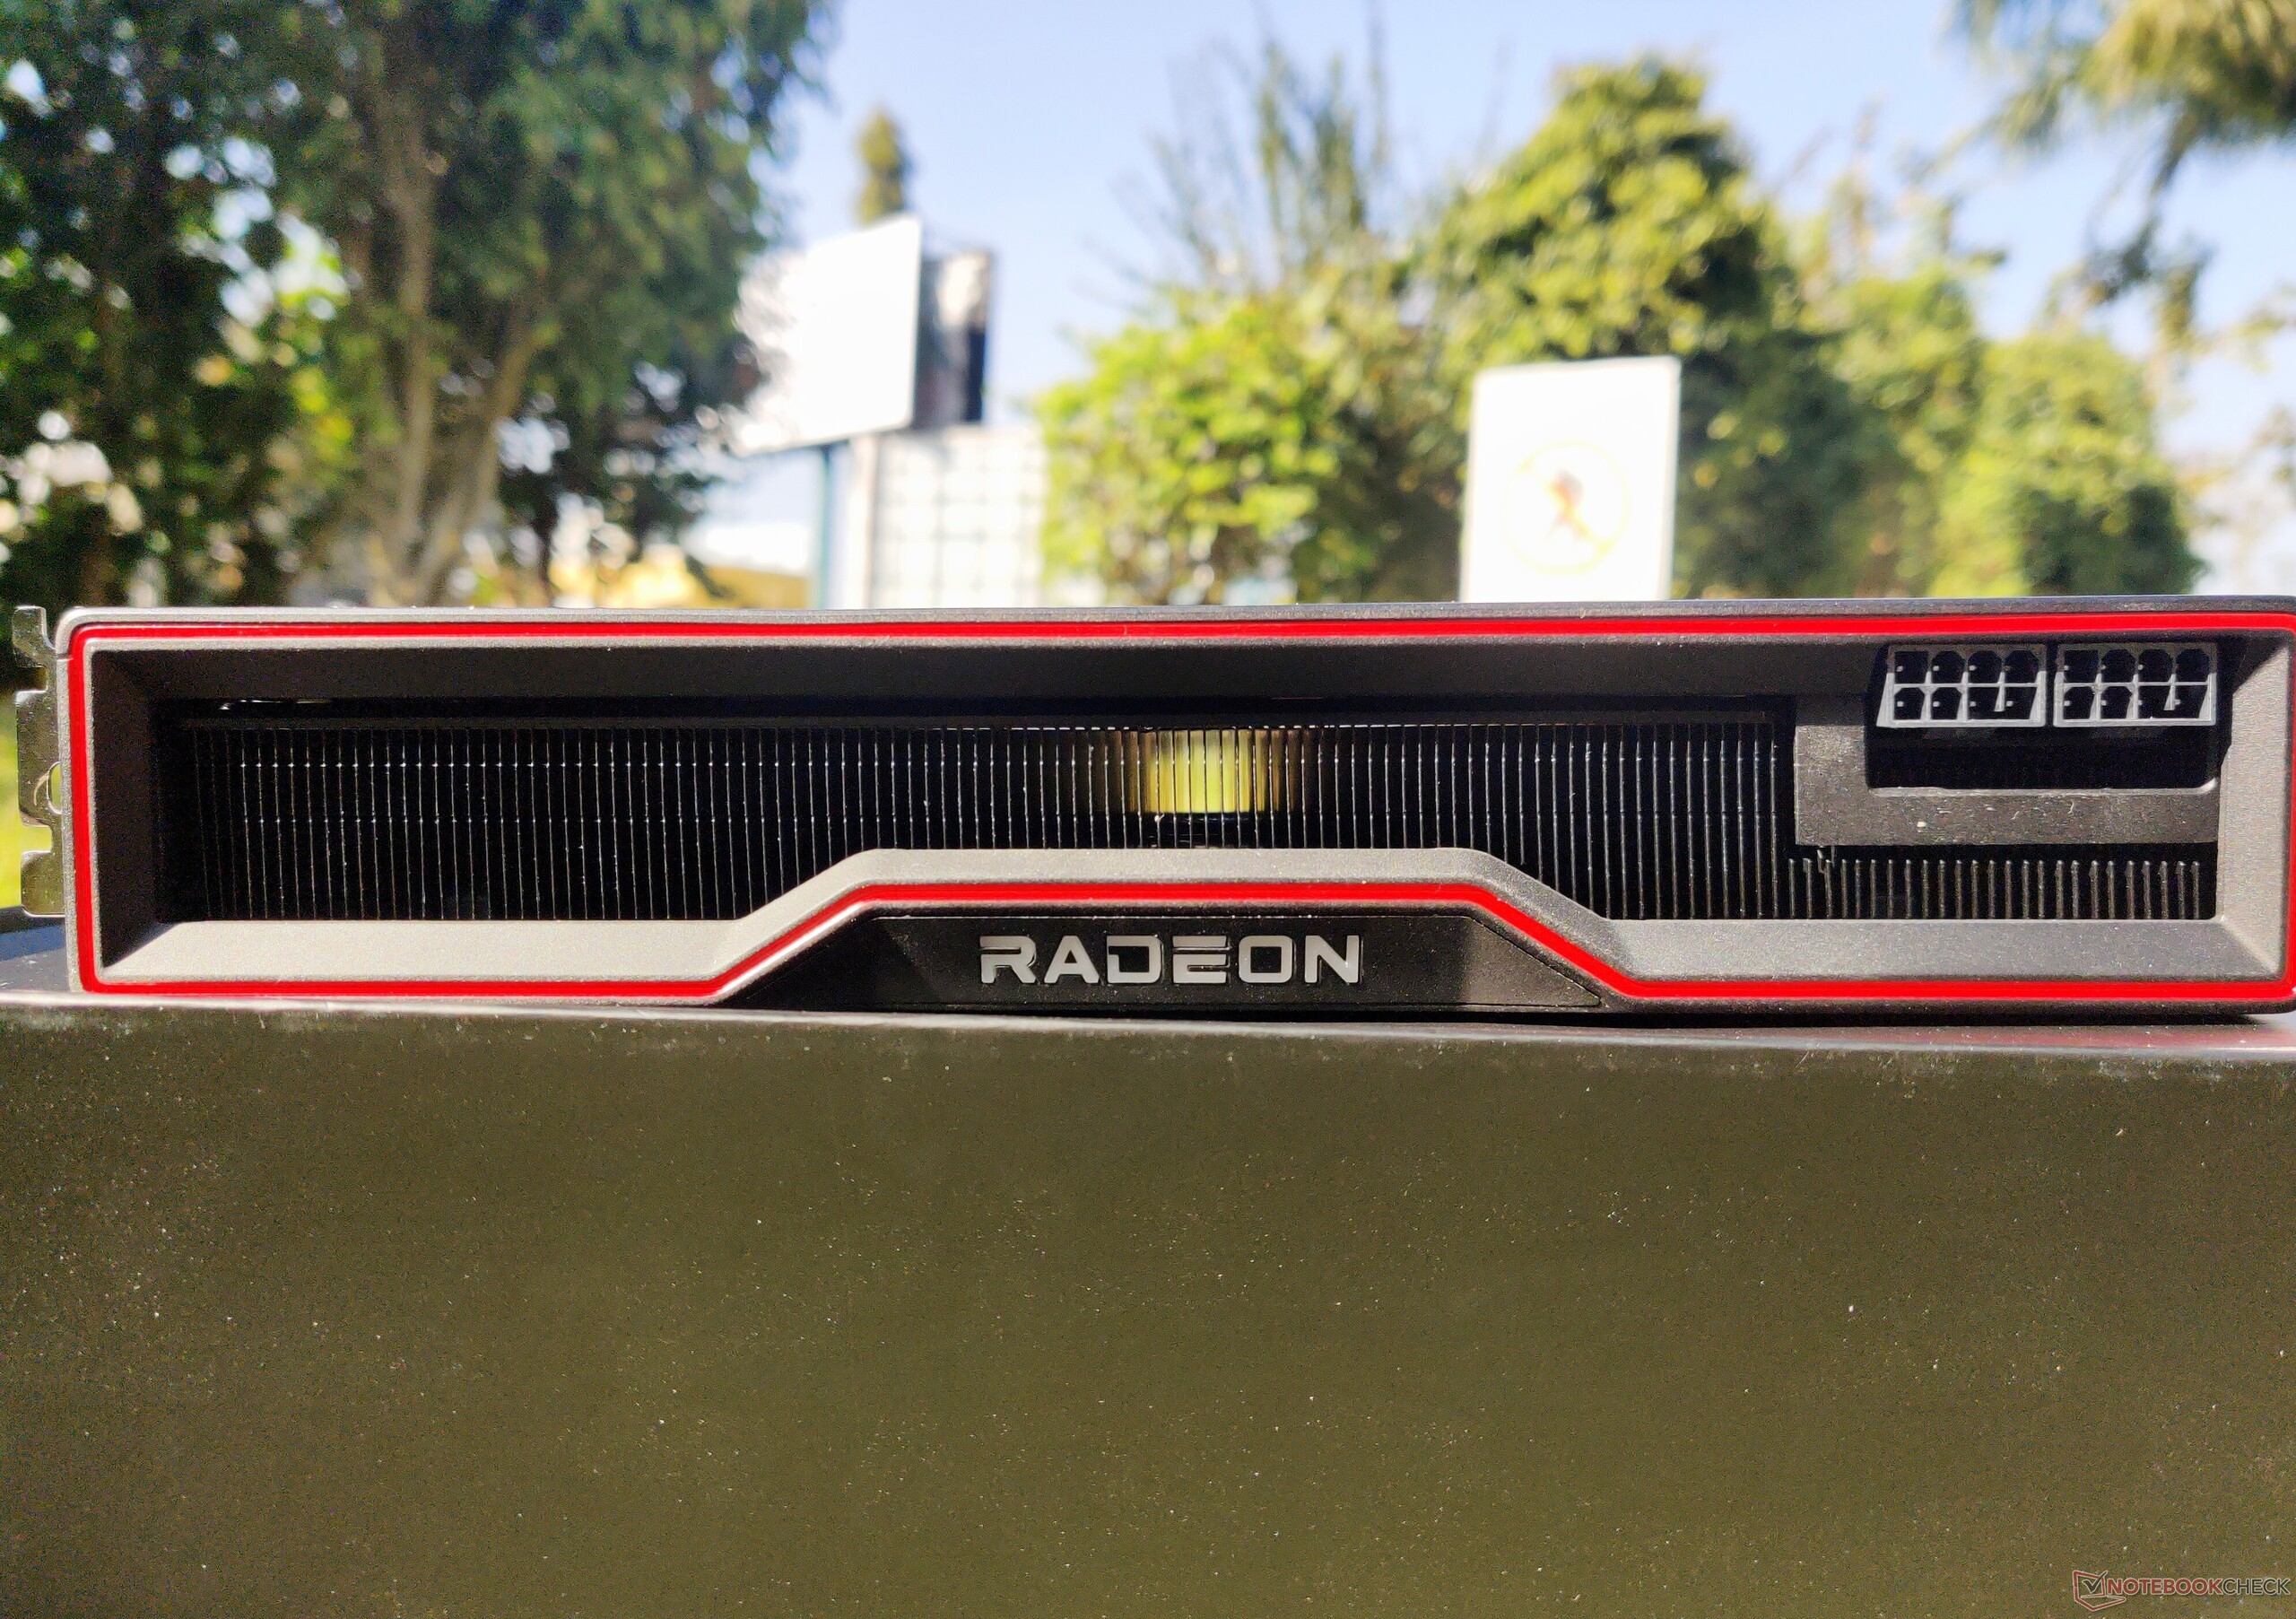
Siguiendo con la parte superior, vemos dos conectores de alimentación de 8 pines que están colocados hacia el borde derecho - no hay antenas extrañas de 12 pines como las de NVIDIA, lo que puede ser bueno o malo dependiendo de tu preferencia.

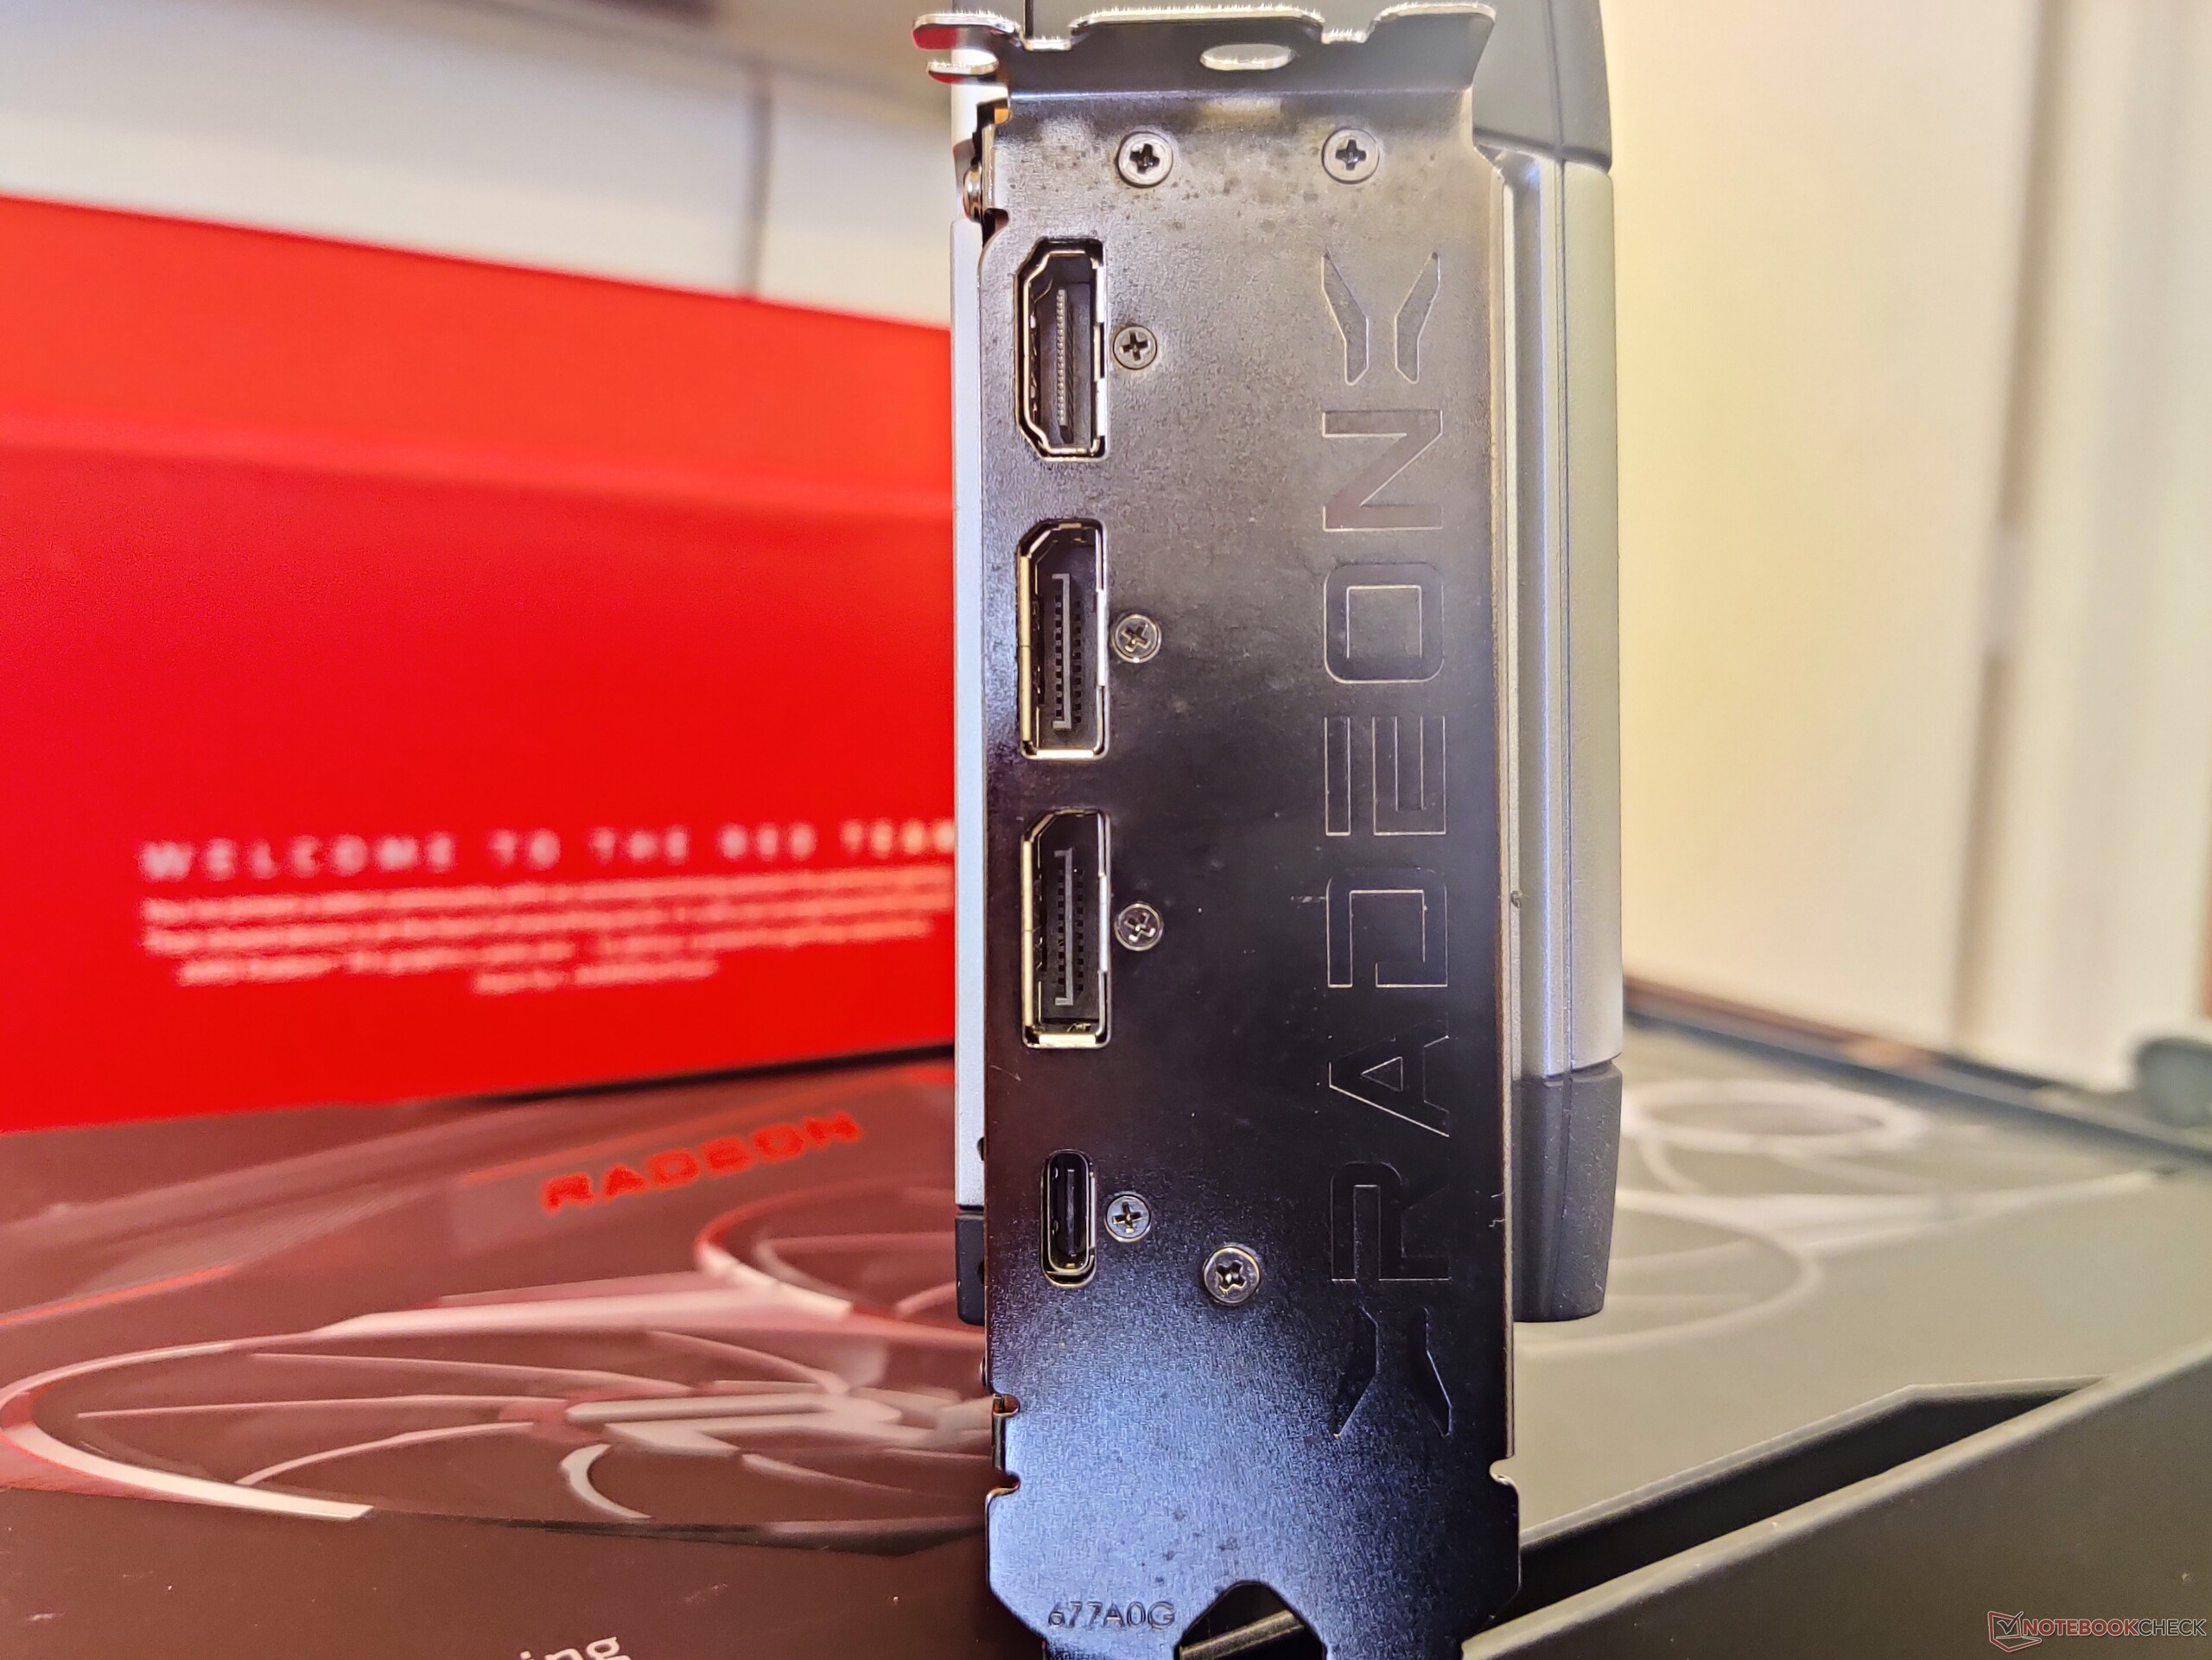
En la parte trasera, tenemos dos salidas DisplayPort 1.4, una salida HDMI 2.1 y un USB Type-C con DisplayPort. Es bueno ver que AMD ofrece un puerto USB Type-C en un momento en que NVIDIA se deshizo de él aparentemente para ahorrar algo de energía en las tarjetas Ampere.

No es exactamente una novedad, pero hace tiempo que AMD se ha se despidió a la compatibilidad con CrossFire, por lo que no hay ningún puerto CrossFire Bridge disponible. NVIDIA, por su parte, sigue ofreciendo un conector NVLink en la RTX 3090.

En general, la RX 6900 XT presenta un diseño de referencia de 2,7 ranuras que debería tener un atractivo casi universal.

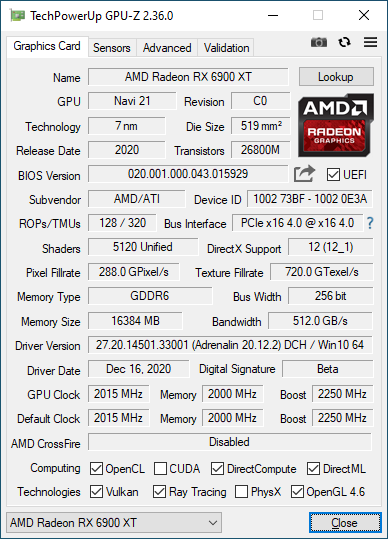
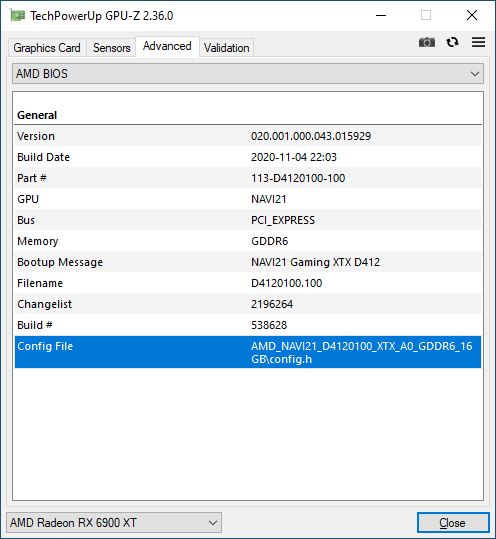
La Radeon RX 6900 XT se basa en la GPU RDNA 2 Navi 21 XTX, una pieza de 7 nm que ofrece 80 unidades de cálculo (CU), es decir, 5.120 unidades de sombreado. La tarjeta tiene un reloj base de 1.825 MHz. Para la mayoría de las aplicaciones, la GPU funciona a 2.015 MHz, lo que AMD anuncia como el reloj de juego, mientras que se potencia hasta los 2.250 MHz. Dependiendo de la carga de trabajo y del espacio térmico disponible, también es posible aumentar la velocidad.

Al igual que la RX 6800 XT, la RX 6900 XT también ofrece 16 GB de VRAM GDDR6 en un bus de 256 bits que proporciona un ancho de banda de memoria de hasta 512 GB/s. AMD ha dotado a la Radeon RX 6900 XT de un Infinity Cache de 128 MB que en cierto modo cubre la VRAM GDDR6 más lenta (pero más fácil de conseguir) y el bus de memoria más pequeño de 256 bits para conseguir niveles de rendimiento similares a los que puede conseguir NVIDIA con un bus más grande, una VRAM GDDR6X más cara y un mayor ancho de banda de memoria

La Radeon RX 6900 XT tiene una potencia total en la placa de 300 W. Durante las pruebas de estrés, observamos que el núcleo por sí solo puede consumir hasta 255 W

El banco de pruebas

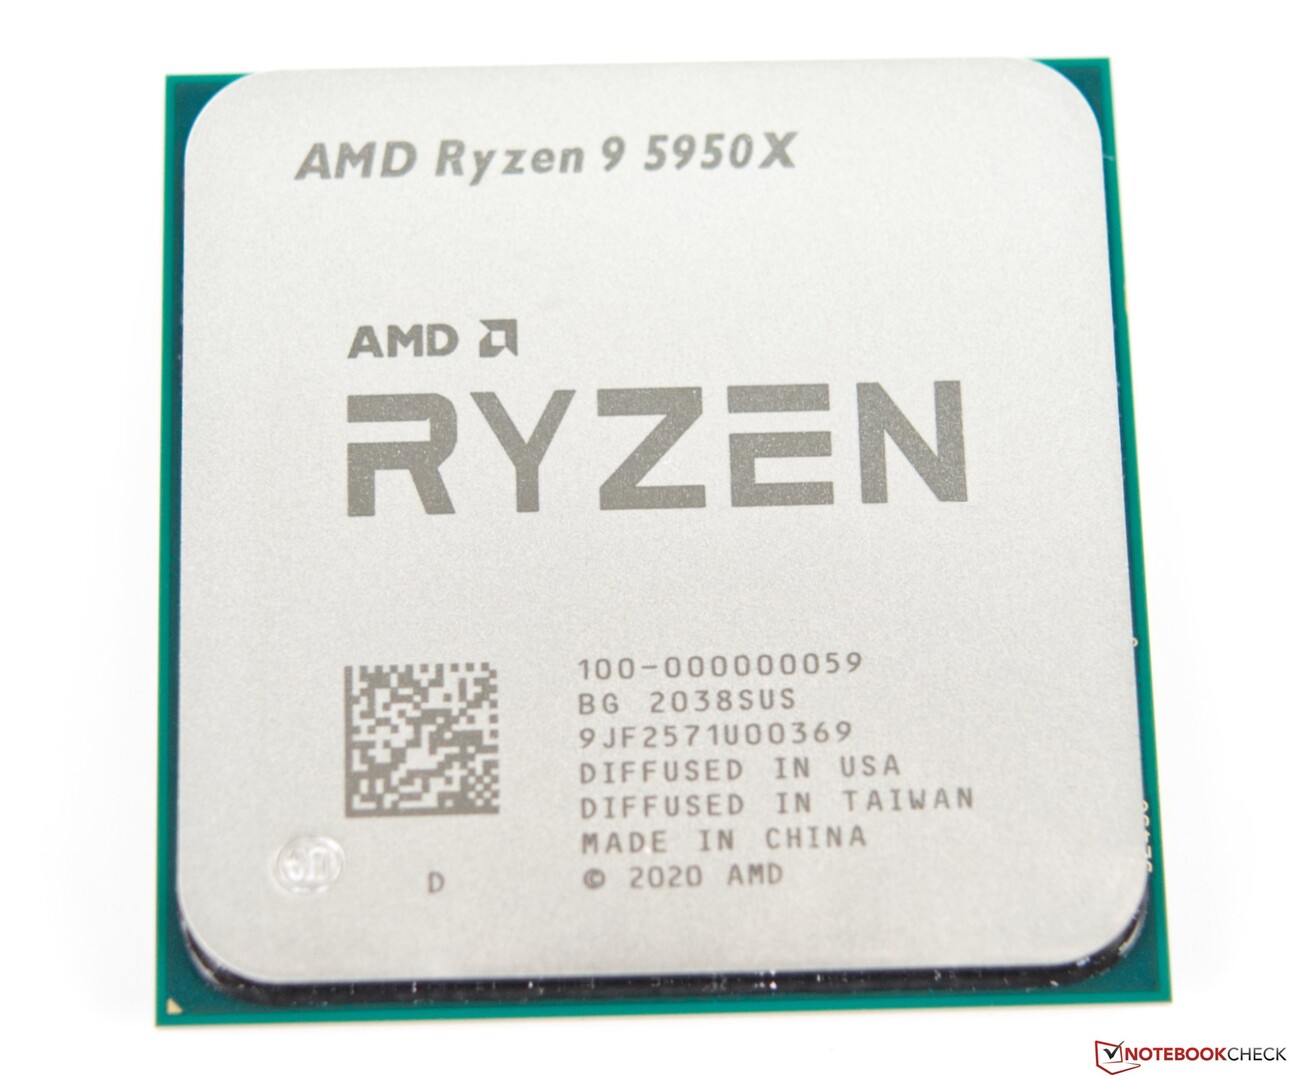
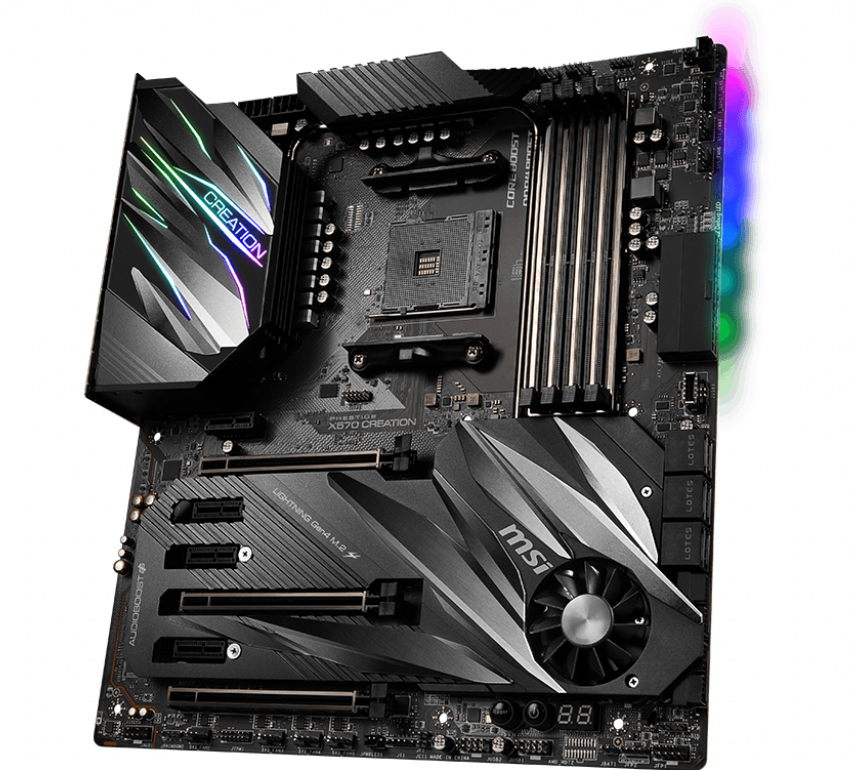
Utilizamos una plataforma AMD X570 como banco de pruebas para evaluar la RX 6900 XT. Nuestra configuración incluye un AMD Ryzen 9 5950X emparejado con 32 GB (16 GB x) de RAM G.SKILL Trident Z Neo DDR4-3200 (tiempos 16-19-19-39) en una placa base MSI Prestige X570 Creation

Se utilizó un SSD Gigabyte Aorus NVMe Gen4 de 1 TB para ejecutar Windows 10 20H2 con los últimos parches acumulativos, mientras que los puntos de referencia y los juegos se instalaron en dos SSD Crucial MX500 SATA de 1 TB.

El refrigerador Corsair iCUE H115i Capellix AIO se encargó de mantener fresco el Ryzen 9 5950X de 16C/32T. La configuración estaba alojada en una caja Corsair iCUE 4000X RGB con una fuente de alimentación Thermaltake Toughpower 850 W 80 Plus Gold.

La RX 6900 XT se emparejó con un televisor inteligente OnePlus U Series 55U1 que funcionaba a 4K 60 Hz. La salida de color se configuró en formato de píxeles Full RGB 4:4:4 en el software de Radeon y el escalado de escritorio de Windows se configuró al 100%.

Nos gustaría dar las gracias a AMD por proporcionar la RX 6900 XT y el Ryzen 9 5950X, a Corsair por el refrigerador iCUE Elite Capellix AIO y la caja iCUE 4000X, y a OnePlus por el televisor 4K de la serie U 55U1

CPU AMD Ryzen 9 5950X
Placa base MSI Prestige X570 Creation. (Fuente de la imagen: MSI)
SSD Gigabyte Aorus NVMe Gen4. (Fuente de la imagen: Gigabyte)
Memoria RAM G.SKILL Trident Z Neo DDR4-3600. (Fuente de la imagen: G.SKILL)

Parámetros sintéticos

En la mayoría de las pruebas 3DMark, la RX 6900 XT está a la par o incluso mejor que la NVIDIA RTX 3090. Las ventajas máximas se ven en 3DMark Fire Strike hasta 1440p. En el 4K Fire Strike Ultra, la ventaja se reduce a cerca de un 11% sobre la media de la RTX 3090. Time Spy , sin embargo, muestra que los buques insignia de AMD y NVIDIA están más o menos a la par

Las capacidades de la arquitectura RDNA2 en lo que respecta al trazado de rayos no son malas en sí, pero las deficiencias se hacen bastante evidentes en la prueba de Port Royal, en la que la RX 6900 XT se queda perceptiblemente por detrás de la RTX 3080 en un 15% y significativamente por detrás de la RTX 3090 en un 24%. Dicho esto, vemos que la RX 6900 XT rinde un 9% más que la media de la RTX 2080 Ti en esta prueba.

Los benchmarks de Unigine muestran mejores puntuaciones en las pruebas DirectX en comparación con las OpenGL, especialmente en los benchmarks Valley y Heaven. En Superposition, la RX 6900 XT se lleva una paliza en la prueba 8K Optimized, quedando por detrás de la RTX 3090 en un 20%. Esta diferencia se reduce significativamente en resoluciones más bajas, y vemos que la GPU sólo queda por detrás en un 8% en la prueba optimizada para 4K

3DMark
2560x1440 Time Spy Graphics
Average NVIDIA GeForce RTX 3090
  (18685 - 20433, n=17)
19266 Points +6%
Nvidia GeForce RTX 3090 Founders Edition
NVIDIA GeForce RTX 3090, R9 5900X
18685 Points +3%
AMD Radeon RX 6900 XT
AMD Radeon RX 6900 XT, R9 5950X
18210 Points
AMD Radeon RX 6800 XT
AMD Radeon RX 6800 XT, R9 5950X
17603 Points -3%
Average NVIDIA GeForce RTX 3080
  (17467 - 17604, n=2)
17536 Points -4%
ASUS GeForce RTX 3080 ROG STRIX OC GAMING
NVIDIA GeForce RTX 3080, R9 5900X
17467 Points -4%
AMD Ryzen 9 5900X
NVIDIA Titan RTX, R9 5900X
15283 Points -16%
Average NVIDIA Titan RTX
  (14216 - 15283, n=29)
14884 Points -18%
Average NVIDIA GeForce RTX 2080 Ti (Desktop)
  (13744 - 14645, n=4)
14283 Points -22%
KFA2 GeForce RTX 2080 Ti EX
NVIDIA GeForce RTX 2080 Ti (Desktop), R9 3900X
13744 Points -25%
MSI GeForce RTX 3070 Gaming X Trio
NVIDIA GeForce RTX 3070, R9 5900X
13579 Points -25%
Average NVIDIA GeForce RTX 3070
  (11043 - 13579, n=7)
12616 Points -31%
Nvidia GeForce RTX 2080 Super
NVIDIA GeForce RTX 2080 Super (Desktop), R7 2700X
11477 Points -37%
Average NVIDIA GeForce RTX 2080 Super (Desktop)
  (11313 - 11542, n=4)
11439 Points -37%
Nvidia GeForce RTX 2070 Super
NVIDIA GeForce RTX 2070 Super (Desktop), R7 2700X
10094 Points -45%
Average NVIDIA GeForce RTX 2070 Super (Desktop)
  (9564 - 10094, n=8)
9846 Points -46%
AMD Radeon RX 5700 XT
AMD Radeon RX 5700 XT (Desktop), R7 2700X
8673 Points -52%
Average AMD Radeon RX 5700 XT (Desktop)
  (6050 - 9371, n=7)
8574 Points -53%
AMD Radeon RX 5700
AMD Radeon RX 5700 (Desktop), R7 2700X
7675 Points -58%
1920x1080 Fire Strike Graphics
AMD Radeon RX 6900 XT
AMD Radeon RX 6900 XT, R9 5950X
50587 Points
AMD Radeon RX 6800 XT
AMD Radeon RX 6800 XT, R9 5950X
49735 Points -2%
Average NVIDIA GeForce RTX 3090
  (41298 - 49282, n=17)
46856 Points -7%
Nvidia GeForce RTX 3090 Founders Edition
NVIDIA GeForce RTX 3090, R9 5900X
41298 Points -18%
ASUS GeForce RTX 3080 ROG STRIX OC GAMING
NVIDIA GeForce RTX 3080, R9 5900X
40910 Points -19%
Average NVIDIA GeForce RTX 3080
  (37604 - 40910, n=2)
39257 Points -22%
Average NVIDIA Titan RTX
  (33377 - 40910, n=30)
36062 Points -29%
AMD Ryzen 9 5900X
NVIDIA Titan RTX, R9 5900X
34722 Points -31%
Average NVIDIA GeForce RTX 2080 Ti (Desktop)
  (32081 - 35851, n=4)
34141 Points -33%
KFA2 GeForce RTX 2080 Ti EX
NVIDIA GeForce RTX 2080 Ti (Desktop), R9 3900X
32081 Points -37%
MSI GeForce RTX 3070 Gaming X Trio
NVIDIA GeForce RTX 3070, R9 5900X
31096 Points -39%
Average NVIDIA GeForce RTX 3070
  (20357 - 33270, n=7)
28949 Points -43%
Average NVIDIA GeForce RTX 2080 Super (Desktop)
  (26824 - 28968, n=4)
27647 Points -45%
Nvidia GeForce RTX 2080 Super
NVIDIA GeForce RTX 2080 Super (Desktop), R7 2700X
27075 Points -46%
AMD Radeon RX 5700 XT
AMD Radeon RX 5700 XT (Desktop), R7 2700X
25383 Points -50%
Average AMD Radeon RX 5700 XT (Desktop)
  (19850 - 27164, n=7)
25322 Points -50%
Average NVIDIA GeForce RTX 2070 Super (Desktop)
  (22819 - 25799, n=8)
24645 Points -51%
Nvidia GeForce RTX 2070 Super
NVIDIA GeForce RTX 2070 Super (Desktop), R7 2700X
24151 Points -52%
AMD Radeon RX 5700
AMD Radeon RX 5700 (Desktop), R7 2700X
22457 Points -56%
3840x2160 Fire Strike Ultra Graphics
AMD Radeon RX 6900 XT
AMD Radeon RX 6900 XT, R9 5950X
13370 Points
AMD Radeon RX 6800 XT
AMD Radeon RX 6800 XT, R9 5950X
12626 Points -6%
Average NVIDIA GeForce RTX 3090
  (11613 - 12587, n=14)
12289 Points -8%
Nvidia GeForce RTX 3090 Founders Edition
NVIDIA GeForce RTX 3090, R9 5900X
11613 Points -13%
ASUS GeForce RTX 3080 ROG STRIX OC GAMING
NVIDIA GeForce RTX 3080, R9 5900X
10793 Points -19%
Average NVIDIA GeForce RTX 3080
  (10645 - 10793, n=2)
10719 Points -20%
Average NVIDIA Titan RTX
  (8461 - 10793, n=29)
8868 Points -34%
AMD Ryzen 9 5900X
NVIDIA Titan RTX, R9 5900X
8649 Points -35%
MSI GeForce RTX 3070 Gaming X Trio
NVIDIA GeForce RTX 3070, R9 5900X
8483 Points -37%
Average NVIDIA GeForce RTX 3070
  (8043 - 8483, n=5)
8250 Points -38%
Average NVIDIA GeForce RTX 2080 Ti (Desktop)
  (7925 - 8504, n=4)
8226 Points -38%
KFA2 GeForce RTX 2080 Ti EX
NVIDIA GeForce RTX 2080 Ti (Desktop), R9 3900X
7925 Points -41%
Average NVIDIA GeForce RTX 2080 Super (Desktop)
  (6500 - 6700, n=3)
6585 Points -51%
Nvidia GeForce RTX 2080 Super
NVIDIA GeForce RTX 2080 Super (Desktop), R7 2700X
6500 Points -51%
Average AMD Radeon RX 5700 XT (Desktop)
  (4989 - 6500, n=7)
6119 Points -54%
AMD Radeon RX 5700 XT
AMD Radeon RX 5700 XT (Desktop), R7 2700X
5955 Points -55%
Nvidia GeForce RTX 2070 Super
NVIDIA GeForce RTX 2070 Super (Desktop), R7 2700X
5786 Points -57%
Average NVIDIA GeForce RTX 2070 Super (Desktop)
  (2290 - 5882, n=7)
5313 Points -60%
AMD Radeon RX 5700
AMD Radeon RX 5700 (Desktop), R7 2700X
5292 Points -60%
Fire Strike Extreme Graphics
AMD Radeon RX 6900 XT
AMD Radeon RX 6900 XT, R9 5950X
26650 Points
AMD Radeon RX 6800 XT
AMD Radeon RX 6800 XT, R9 5950X
25015 Points -6%
Average NVIDIA GeForce RTX 3090
  (22075 - 24730, n=14)
23806 Points -11%
Nvidia GeForce RTX 3090 Founders Edition
NVIDIA GeForce RTX 3090, R9 5900X
22075 Points -17%
ASUS GeForce RTX 3080 ROG STRIX OC GAMING
NVIDIA GeForce RTX 3080, R9 5900X
20861 Points -22%
Average NVIDIA GeForce RTX 3080
  (20007 - 20861, n=2)
20434 Points -23%
Average NVIDIA Titan RTX
  (16484 - 20861, n=29)
17649 Points -34%
AMD Ryzen 9 5900X
NVIDIA Titan RTX, R9 5900X
17176 Points -36%
Average NVIDIA GeForce RTX 2080 Ti (Desktop)
  (15603 - 16856, n=3)
16416 Points -38%
MSI GeForce RTX 3070 Gaming X Trio
NVIDIA GeForce RTX 3070, R9 5900X
16196 Points -39%
Average NVIDIA GeForce RTX 3070
  (15503 - 16276, n=5)
15859 Points -40%
KFA2 GeForce RTX 2080 Ti EX
NVIDIA GeForce RTX 2080 Ti (Desktop), R9 3900X
15603 Points -41%
Average NVIDIA GeForce RTX 2080 Super (Desktop)
  (12968 - 13551, n=3)
13172 Points -51%
Nvidia GeForce RTX 2080 Super
NVIDIA GeForce RTX 2080 Super (Desktop), R7 2700X
12968 Points -51%
Average AMD Radeon RX 5700 XT (Desktop)
  (12178 - 12921, n=6)
12611 Points -53%
AMD Radeon RX 5700 XT
AMD Radeon RX 5700 XT (Desktop), R7 2700X
12209 Points -54%
Average NVIDIA GeForce RTX 2070 Super (Desktop)
  (11382 - 12044, n=7)
11850 Points -56%
Nvidia GeForce RTX 2070 Super
NVIDIA GeForce RTX 2070 Super (Desktop), R7 2700X
11634 Points -56%
AMD Radeon RX 5700
AMD Radeon RX 5700 (Desktop), R7 2700X
10876 Points -59%
2560x1440 Port Royal Graphics
Average NVIDIA GeForce RTX 3090
  (12255 - 13075, n=6)
12767 Points +33%
Nvidia GeForce RTX 3090 Founders Edition
NVIDIA GeForce RTX 3090, R9 5900X
12384 Points +29%
Average NVIDIA GeForce RTX 3080
  (11238 - 11433, n=2)
11336 Points +18%
ASUS GeForce RTX 3080 ROG STRIX OC GAMING
NVIDIA GeForce RTX 3080, R9 5900X
11238 Points +17%
AMD Radeon RX 6900 XT
AMD Radeon RX 6900 XT, R9 5950X
9585 Points
AMD Ryzen 9 5900X
NVIDIA Titan RTX, R9 5900X
9335 Points -3%
AMD Ryzen 9 5900X
NVIDIA Titan RTX, R9 5900X
9239 Points -4%
Average NVIDIA Titan RTX
  (8945 - 9528, n=24)
9303 Points -3%
Average NVIDIA GeForce RTX 2080 Ti (Desktop)
  (8537 - 9021, n=2)
8779 Points -8%
KFA2 GeForce RTX 2080 Ti EX
NVIDIA GeForce RTX 2080 Ti (Desktop), R9 3900X
8537 Points -11%
MSI GeForce RTX 3070 Gaming X Trio
NVIDIA GeForce RTX 3070, R9 5900X
8191 Points -15%
Average NVIDIA GeForce RTX 3070
  (7796 - 8191, n=5)
7941 Points -17%
Average NVIDIA GeForce RTX 2080 Super (Desktop)
  (6745 - 6947, n=3)
6873 Points -28%
Nvidia GeForce RTX 2080 Super
NVIDIA GeForce RTX 2080 Super (Desktop), R7 2700X
6745 Points -30%
Nvidia GeForce RTX 2070 Super
NVIDIA GeForce RTX 2070 Super (Desktop), R7 2700X
5840 Points -39%
Average NVIDIA GeForce RTX 2070 Super (Desktop)
  (5725 - 5988, n=5)
5838 Points -39%
Unigine Heaven 4.0
Extreme Preset DX11
Average NVIDIA GeForce RTX 3090
  (272 - 315, n=11)
300 fps +16%
Nvidia GeForce RTX 3090 Founders Edition
NVIDIA GeForce RTX 3090, R9 5900X
274 fps +6%
AMD Radeon RX 6900 XT
AMD Radeon RX 6900 XT, R9 5950X
259.5 (49.3min - 537.2max) fps
AMD Radeon RX 6800 XT
AMD Radeon RX 6800 XT, R9 5950X
247.9 fps -4%
Average NVIDIA GeForce RTX 3080
  (233 - 253, n=2)
243 fps -6%
AMD Ryzen 9 5900X
NVIDIA Titan RTX, R9 5900X
237.1 fps -9%
Average NVIDIA Titan RTX
  (207 - 248, n=12)
236 fps -9%
ASUS GeForce RTX 3080 ROG STRIX OC GAMING
NVIDIA GeForce RTX 3080, R9 5900X
232.6 fps -10%
Average NVIDIA GeForce RTX 2080 Ti (Desktop)
  (215 - 226, n=3)
222 fps -14%
KFA2 GeForce RTX 2080 Ti EX
NVIDIA GeForce RTX 2080 Ti (Desktop), R9 3900X
215.2 fps -17%
Average NVIDIA GeForce RTX 3070
  (196.4 - 214, n=5)
206 fps -21%
MSI GeForce RTX 3070 Gaming X Trio
NVIDIA GeForce RTX 3070, R9 5900X
202.5 fps -22%
Nvidia GeForce RTX 2080 Super
NVIDIA GeForce RTX 2080 Super (Desktop), R7 2700X
175.2 fps -32%
Average NVIDIA GeForce RTX 2080 Super (Desktop)
  ()
175.2 fps -32%
Average NVIDIA GeForce RTX 2070 Super (Desktop)
  (160.1 - 172.3, n=4)
167.1 fps -36%
Nvidia GeForce RTX 2070 Super
NVIDIA GeForce RTX 2070 Super (Desktop), R7 2700X
160.1 fps -38%
Average AMD Radeon RX 5700 XT (Desktop)
  (132.5 - 144.7, n=5)
136.8 fps -47%
AMD Radeon RX 5700 XT
AMD Radeon RX 5700 XT (Desktop), R7 2700X
132.5 fps -49%
AMD Radeon RX 5700
AMD Radeon RX 5700 (Desktop), R7 2700X
119.9 fps -54%
Extreme Preset OpenGL
Average NVIDIA GeForce RTX 3090
  (188.2 - 284, n=10)
270 fps +31%
Average NVIDIA GeForce RTX 3080
  (232 - 243, n=2)
238 fps +15%
ASUS GeForce RTX 3080 ROG STRIX OC GAMING
NVIDIA GeForce RTX 3080, R9 5900X
232.4 fps +13%
Average NVIDIA Titan RTX
  (203 - 299, n=12)
223 fps +8%
AMD Ryzen 9 5900X
NVIDIA Titan RTX, R9 5900X
215.1 fps +4%
AMD Radeon RX 6900 XT
AMD Radeon RX 6900 XT, R9 5950X
206.5 (8.2min - 453.7max) fps
Average NVIDIA GeForce RTX 2080 Ti (Desktop)
  (202 - 213, n=3)
206 fps 0%
KFA2 GeForce RTX 2080 Ti EX
NVIDIA GeForce RTX 2080 Ti (Desktop), R9 3900X
204.4 fps -1%
AMD Radeon RX 6800 XT
AMD Radeon RX 6800 XT, R9 5950X
204 fps -1%
MSI GeForce RTX 3070 Gaming X Trio
NVIDIA GeForce RTX 3070, R9 5900X
196.1 fps -5%
Average NVIDIA GeForce RTX 3070
  (187.5 - 196.1, n=4)
192.5 fps -7%
Nvidia GeForce RTX 3090 Founders Edition
NVIDIA GeForce RTX 3090, R9 5900X
188.2 fps -9%
Nvidia GeForce RTX 2080 Super
NVIDIA GeForce RTX 2080 Super (Desktop), R7 2700X
167.5 fps -19%
Average NVIDIA GeForce RTX 2080 Super (Desktop)
  ()
167.5 fps -19%
Average NVIDIA GeForce RTX 2070 Super (Desktop)
  (153.5 - 157.1, n=4)
155.4 fps -25%
Nvidia GeForce RTX 2070 Super
NVIDIA GeForce RTX 2070 Super (Desktop), R7 2700X
153.5 fps -26%
Average AMD Radeon RX 5700 XT (Desktop)
  (97.8 - 161.9, n=6)
124.7 fps -40%
AMD Radeon RX 5700 XT
AMD Radeon RX 5700 XT (Desktop), R7 2700X
110.2 fps -47%
AMD Radeon RX 5700
AMD Radeon RX 5700 (Desktop), R7 2700X
100.7 fps -51%
Unigine Valley 1.0
1920x1080 Extreme HD DirectX AA:x8
Average NVIDIA GeForce RTX 3090
  (184.2 - 247, n=11)
225 fps +12%
AMD Radeon RX 6900 XT
AMD Radeon RX 6900 XT, R9 5950X
200.8 (53.4min - 359.1max) fps
Nvidia GeForce RTX 3090 Founders Edition
NVIDIA GeForce RTX 3090, R9 5900X
192.4 fps -4%
AMD Radeon RX 6800 XT
AMD Radeon RX 6800 XT, R9 5950X
190.6 fps -5%
AMD Ryzen 9 5900X
NVIDIA Titan RTX, R9 5900X
180.1 fps -10%
Average NVIDIA GeForce RTX 3080
  (176.2 - 181.8, n=2)
179 fps -11%
ASUS GeForce RTX 3080 ROG STRIX OC GAMING
NVIDIA GeForce RTX 3080, R9 5900X
176.2 fps -12%
Average NVIDIA Titan RTX
  (135 - 191.4, n=12)
173.3 fps -14%
Average NVIDIA GeForce RTX 2080 Ti (Desktop)
  (159.4 - 164.1, n=3)
162.2 fps -19%
Average NVIDIA GeForce RTX 3070
  (155.1 - 168.5, n=5)
161.2 fps -20%
KFA2 GeForce RTX 2080 Ti EX
NVIDIA GeForce RTX 2080 Ti (Desktop), R9 3900X
159.4 fps -21%
MSI GeForce RTX 3070 Gaming X Trio
NVIDIA GeForce RTX 3070, R9 5900X
155.1 fps -23%
Average NVIDIA GeForce RTX 2070 Super (Desktop)
  (113.7 - 127.4, n=4)
122.5 fps -39%
Nvidia GeForce RTX 2080 Super
NVIDIA GeForce RTX 2080 Super (Desktop), R7 2700X
120.2 fps -40%
Average NVIDIA GeForce RTX 2080 Super (Desktop)
  ()
120.2 fps -40%
Nvidia GeForce RTX 2070 Super
NVIDIA GeForce RTX 2070 Super (Desktop), R7 2700X
113.7 fps -43%
Average AMD Radeon RX 5700 XT (Desktop)
  (106.3 - 116, n=4)
111.5 fps -44%
AMD Radeon RX 5700 XT
AMD Radeon RX 5700 XT (Desktop), R7 2700X
106.3 fps -47%
AMD Radeon RX 5700
AMD Radeon RX 5700 (Desktop), R7 2700X
99.3 fps -51%
1920x1080 Extreme HD Preset OpenGL AA:x8
Average NVIDIA GeForce RTX 3090
  (158.8 - 226, n=10)
203 fps +21%
Average NVIDIA GeForce RTX 3080
  (163.8 - 172, n=2)
167.9 fps 0%
AMD Radeon RX 6900 XT
AMD Radeon RX 6900 XT, R9 5950X
167.4 (56.7min - 375.7max) fps
ASUS GeForce RTX 3080 ROG STRIX OC GAMING
NVIDIA GeForce RTX 3080, R9 5900X
163.8 fps -2%
Nvidia GeForce RTX 3090 Founders Edition
NVIDIA GeForce RTX 3090, R9 5900X
158.8 fps -5%
AMD Ryzen 9 5900X
NVIDIA Titan RTX, R9 5900X
158.5 fps -5%
AMD Radeon RX 6800 XT
AMD Radeon RX 6800 XT, R9 5950X
158.2 fps -5%
Average NVIDIA Titan RTX
  (139.2 - 181.2, n=12)
158.1 fps -6%
Average NVIDIA GeForce RTX 2080 Ti (Desktop)
  (144.5 - 147.8, n=3)
145.8 fps -13%
KFA2 GeForce RTX 2080 Ti EX
NVIDIA GeForce RTX 2080 Ti (Desktop), R9 3900X
145.1 fps -13%
MSI GeForce RTX 3070 Gaming X Trio
NVIDIA GeForce RTX 3070, R9 5900X
142.9 fps -15%
Average NVIDIA GeForce RTX 3070
  (140.2 - 144.9, n=4)
142.7 fps -15%
Nvidia GeForce RTX 2080 Super
NVIDIA GeForce RTX 2080 Super (Desktop), R7 2700X
114.5 fps -32%
Average NVIDIA GeForce RTX 2080 Super (Desktop)
  ()
114.5 fps -32%
Average NVIDIA GeForce RTX 2070 Super (Desktop)
  (105.6 - 112, n=4)
109.5 fps -35%
Nvidia GeForce RTX 2070 Super
NVIDIA GeForce RTX 2070 Super (Desktop), R7 2700X
105.6 fps -37%
Average AMD Radeon RX 5700 XT (Desktop)
  (88.5 - 108.5, n=5)
92.8 fps -45%
AMD Radeon RX 5700 XT
AMD Radeon RX 5700 XT (Desktop), R7 2700X
89.1 fps -47%
AMD Radeon RX 5700
AMD Radeon RX 5700 (Desktop), R7 2700X
82.7 fps -51%
Unigine Superposition
1280x720 720p Low
Average NVIDIA GeForce RTX 3090
  (33329 - 54879, n=10)
46049 Points +24%
AMD Ryzen 9 5900X
NVIDIA Titan RTX, R9 5900X
40994 Points +11%
Average NVIDIA Titan RTX
  (25622 - 50876, n=9)
40891 Points +10%
Average NVIDIA GeForce RTX 2070 Super (Desktop)
  (26742 - 45424, n=3)
38495 Points +4%
Average AMD Radeon RX 5700 XT (Desktop)
  (28674 - 42884, n=3)
37187 Points 0%
AMD Radeon RX 6900 XT
AMD Radeon RX 6900 XT, R9 5950X
37023 Points
AMD Radeon RX 6800 XT
AMD Radeon RX 6800 XT, R9 5950X
36452 Points -2%
Nvidia GeForce RTX 3090 Founders Edition
NVIDIA GeForce RTX 3090, R9 5900X
34649 Points -6%
Average NVIDIA GeForce RTX 3070
  (27330 - 40007, n=5)
34576 Points -7%
MSI GeForce RTX 3070 Gaming X Trio
NVIDIA GeForce RTX 3070, R9 5900X
31666 Points -14%
Average NVIDIA GeForce RTX 3080
  (30851 - 32183, n=2)
31517 Points -15%
ASUS GeForce RTX 3080 ROG STRIX OC GAMING
NVIDIA GeForce RTX 3080, R9 5900X
30851 Points -17%
Average NVIDIA GeForce RTX 2080 Super (Desktop)
  ()
26907 Points -27%
1920x1080 1080p High
Average NVIDIA GeForce RTX 3090
  (23626 - 27207, n=11)
26018 Points +4%
AMD Radeon RX 6900 XT
AMD Radeon RX 6900 XT, R9 5950X
25029 Points
Nvidia GeForce RTX 3090 Founders Edition
NVIDIA GeForce RTX 3090, R9 5900X
23853 Points -5%
AMD Radeon RX 6800 XT
AMD Radeon RX 6800 XT, R9 5950X
22265 Points -11%
Average NVIDIA GeForce RTX 3080
  (21333 - 21912, n=2)
21623 Points -14%
ASUS GeForce RTX 3080 ROG STRIX OC GAMING
NVIDIA GeForce RTX 3080, R9 5900X
21333 Points -15%
AMD Ryzen 9 5900X
NVIDIA Titan RTX, R9 5900X
20315 Points -19%
Average NVIDIA Titan RTX
  (19460 - 20658, n=9)
20301 Points -19%
MSI GeForce RTX 3070 Gaming X Trio
NVIDIA GeForce RTX 3070, R9 5900X
17346 Points -31%
Average NVIDIA GeForce RTX 3070
  (17054 - 17491, n=5)
17312 Points -31%
Average NVIDIA GeForce RTX 2080 Super (Desktop)
  ()
15558 Points -38%
Average NVIDIA GeForce RTX 2070 Super (Desktop)
  (13655 - 13832, n=3)
13765 Points -45%
Average AMD Radeon RX 5700 XT (Desktop)
  (11874 - 11902, n=3)
11886 Points -53%
1920x1080 1080p Extreme
Average NVIDIA GeForce RTX 3090
  (11806 - 12694, n=11)
12209 Points +14%
Nvidia GeForce RTX 3090 Founders Edition
NVIDIA GeForce RTX 3090, R9 5900X
11806 Points +11%
Average NVIDIA GeForce RTX 3080
  (10572 - 10822, n=2)
10697 Points 0%
AMD Radeon RX 6900 XT
AMD Radeon RX 6900 XT, R9 5950X
10683 Points
ASUS GeForce RTX 3080 ROG STRIX OC GAMING
NVIDIA GeForce RTX 3080, R9 5900X
10572 Points -1%
AMD Radeon RX 6800 XT
AMD Radeon RX 6800 XT, R9 5950X
10046 Points -6%
AMD Ryzen 9 5900X
NVIDIA Titan RTX, R9 5900X
9056 Points -15%
Average NVIDIA Titan RTX
  (8916 - 9285, n=9)
9051 Points -15%
MSI GeForce RTX 3070 Gaming X Trio
NVIDIA GeForce RTX 3070, R9 5900X
8507 Points -20%
Average NVIDIA GeForce RTX 3070
  (8276 - 8507, n=5)
8354 Points -22%
Average NVIDIA GeForce RTX 2080 Super (Desktop)
  ()
7080 Points -34%
Average NVIDIA GeForce RTX 2070 Super (Desktop)
  (6161 - 6178, n=3)
6169 Points -42%
Average AMD Radeon RX 5700 XT (Desktop)
  (4901 - 4967, n=3)
4927 Points -54%
3840x2160 4k Optimized
Average NVIDIA GeForce RTX 3090
  (15794 - 16868, n=11)
16326 Points +9%
Nvidia GeForce RTX 3090 Founders Edition
NVIDIA GeForce RTX 3090, R9 5900X
15794 Points +6%
AMD Radeon RX 6900 XT
AMD Radeon RX 6900 XT, R9 5950X
14955 Points
Average NVIDIA GeForce RTX 3080
  (13984 - 14243, n=2)
14114 Points -6%
ASUS GeForce RTX 3080 ROG STRIX OC GAMING
NVIDIA GeForce RTX 3080, R9 5900X
13984 Points -6%
AMD Radeon RX 6800 XT
AMD Radeon RX 6800 XT, R9 5950X
13471 Points -10%
Average NVIDIA Titan RTX
  (11937 - 12644, n=9)
12203 Points -18%
AMD Ryzen 9 5900X
NVIDIA Titan RTX, R9 5900X
12186 Points -19%
MSI GeForce RTX 3070 Gaming X Trio
NVIDIA GeForce RTX 3070, R9 5900X
10755 Points -28%
Average NVIDIA GeForce RTX 3070
  (10544 - 10755, n=5)
10667 Points -29%
Average NVIDIA GeForce RTX 2080 Super (Desktop)
  ()
9338 Points -38%
Average NVIDIA GeForce RTX 2070 Super (Desktop)
  (8096 - 8111, n=3)
8101 Points -46%
Average AMD Radeon RX 5700 XT (Desktop)
  (6885 - 7034, n=3)
6973 Points -53%
7680x4320 8k Optimized
Average NVIDIA GeForce RTX 3090
  (6969 - 7521, n=11)
7144 Points +24%
Nvidia GeForce RTX 3090 Founders Edition
NVIDIA GeForce RTX 3090, R9 5900X
7002 Points +21%
Average NVIDIA GeForce RTX 3080
  (6243 - 6346, n=2)
6295 Points +9%
ASUS GeForce RTX 3080 ROG STRIX OC GAMING
NVIDIA GeForce RTX 3080, R9 5900X
6243 Points +8%
AMD Radeon RX 6900 XT
AMD Radeon RX 6900 XT, R9 5950X
5764 Points
AMD Ryzen 9 5900X
NVIDIA Titan RTX, R9 5900X
5402 Points -6%
Average NVIDIA Titan RTX
  (5255 - 5571, n=9)
5393 Points -6%
AMD Radeon RX 6800 XT
AMD Radeon RX 6800 XT, R9 5950X
5256 Points -9%
MSI GeForce RTX 3070 Gaming X Trio
NVIDIA GeForce RTX 3070, R9 5900X
4695 Points -19%
Average NVIDIA GeForce RTX 3070
  (4587 - 4695, n=5)
4624 Points -20%
Average NVIDIA GeForce RTX 2080 Super (Desktop)
  ()
3989 Points -31%
Average NVIDIA GeForce RTX 2070 Super (Desktop)
  (3419 - 3435, n=3)
3429 Points -41%
Average AMD Radeon RX 5700 XT (Desktop)
  (2867 - 2887, n=3)
2877 Points -50%
3DMark 11 Performance
42418 puntos
3DMark Fire Strike Score
39057 puntos
3DMark Fire Strike Extreme Score
25197 puntos
3DMark Time Spy Score
17549 puntos
ayuda

Puntos de referencia informáticos

La RX 6900 XT se enfrenta decentemente a la RTX 3090 en las pruebas de cálculo. En ComputeMark, vemos que la mejor oferta de AMD queda entre un 3% y un 26% por detrás de la RTX 3090, dependiendo de la prueba. Curiosamente, LuxMark parece mostrar toda la potencia de cálculo de la RDNA 2, ya que la RX 6900 XT muestra la friolera de un 114% de ventaja sobre la RTX 3090 en la prueba de sólo GPU de Sala, aunque la tarjeta se ve afectada en un 12% en la prueba de sólo GPU de Sala.

El rendimiento en la prueba de cálculo Geekbench 5.3 con OpenCL y Vulkan no parece ser impresionante, ya que incluso la RTX 3080 ofrece un rendimiento ligeramente superior al de la RX 6900 XT en OpenCL. Aunque la suerte se invierte en la parte de Vulkan de la prueba cuando se compara con la RTX 3080, la RTX 3090 Founders Edition sigue teniendo una cómoda ventaja del 67% sobre la RX 6900 XT

ComputeMark v2.1
1024x600 Normal, QJuliaRayTrace
Average NVIDIA GeForce RTX 3090
  (16403 - 18223, n=10)
17454 Points +42%
Nvidia GeForce RTX 3090 Founders Edition
NVIDIA GeForce RTX 3090, R9 5900X
16543 Points +35%
Average NVIDIA GeForce RTX 3080
  (14718 - 15508, n=2)
15113 Points +23%
ASUS GeForce RTX 3080 ROG STRIX OC GAMING
NVIDIA GeForce RTX 3080, R9 5900X
14718 Points +20%
AMD Radeon RX 6900 XT
AMD Radeon RX 6900 XT, R9 5950X
12255 Points
MSI GeForce RTX 3070 Gaming X Trio
NVIDIA GeForce RTX 3070, R9 5900X
11816 Points -4%
Average NVIDIA GeForce RTX 3070
  (11510 - 11816, n=3)
11665 Points -5%
AMD Radeon RX 6800 XT
AMD Radeon RX 6800 XT, R9 5950X
11304 Points -8%
Average NVIDIA Titan RTX
  (9418 - 10129, n=3)
9748 Points -20%
Average NVIDIA GeForce RTX 2080 Ti (Desktop)
  (9104 - 9690, n=3)
9492 Points -23%
KFA2 GeForce RTX 2080 Ti EX
NVIDIA GeForce RTX 2080 Ti (Desktop), R9 3900X
9104 Points -26%
Nvidia GeForce RTX 2080 Super
NVIDIA GeForce RTX 2080 Super (Desktop), R7 2700X
7258 Points -41%
Average NVIDIA GeForce RTX 2080 Super (Desktop)
  ()
7258 Points -41%
Average NVIDIA GeForce RTX 2070 Super (Desktop)
  (6155 - 6158, n=2)
6157 Points -50%
Nvidia GeForce RTX 2070 Super
NVIDIA GeForce RTX 2070 Super (Desktop), R7 2700X
6155 Points -50%
AMD Radeon RX 5700 XT
AMD Radeon RX 5700 XT (Desktop), R7 2700X
5761 Points -53%
Average AMD Radeon RX 5700 XT (Desktop)
  (5677 - 5761, n=2)
5719 Points -53%
AMD Radeon RX 5700
AMD Radeon RX 5700 (Desktop), R7 2700X
4703 Points -62%
1024x600 Normal, Mandel Scalar
Average NVIDIA GeForce RTX 3090
  (10650 - 11564, n=10)
11162 Points +3%
AMD Radeon RX 6900 XT
AMD Radeon RX 6900 XT, R9 5950X
10834 Points
Nvidia GeForce RTX 3090 Founders Edition
NVIDIA GeForce RTX 3090, R9 5900X
10650 Points -2%
AMD Radeon RX 6800 XT
AMD Radeon RX 6800 XT, R9 5950X
10018 Points -8%
Average NVIDIA GeForce RTX 3080
  (9554 - 9938, n=2)
9746 Points -10%
ASUS GeForce RTX 3080 ROG STRIX OC GAMING
NVIDIA GeForce RTX 3080, R9 5900X
9554 Points -12%
MSI GeForce RTX 3070 Gaming X Trio
NVIDIA GeForce RTX 3070, R9 5900X
7314 Points -32%
Average NVIDIA GeForce RTX 3070
  (7042 - 7314, n=3)
7169 Points -34%
Average NVIDIA Titan RTX
  (5977 - 6406, n=3)
6184 Points -43%
Average NVIDIA GeForce RTX 2080 Ti (Desktop)
  (5679 - 6226, n=3)
6010 Points -45%
KFA2 GeForce RTX 2080 Ti EX
NVIDIA GeForce RTX 2080 Ti (Desktop), R9 3900X
5679 Points -48%
AMD Radeon RX 5700 XT
AMD Radeon RX 5700 XT (Desktop), R7 2700X
4869 Points -55%
Average AMD Radeon RX 5700 XT (Desktop)
  (4846 - 4869, n=2)
4858 Points -55%
Nvidia GeForce RTX 2080 Super
NVIDIA GeForce RTX 2080 Super (Desktop), R7 2700X
4525 Points -58%
Average NVIDIA GeForce RTX 2080 Super (Desktop)
  ()
4525 Points -58%
AMD Radeon RX 5700
AMD Radeon RX 5700 (Desktop), R7 2700X
4043 Points -63%
Nvidia GeForce RTX 2070 Super
NVIDIA GeForce RTX 2070 Super (Desktop), R7 2700X
3782 Points -65%
Average NVIDIA GeForce RTX 2070 Super (Desktop)
  (3748 - 3782, n=2)
3765 Points -65%
1024x600 Normal, Mandel Vector
Average NVIDIA GeForce RTX 3090
  (8038 - 10097, n=10)
9467 Points +9%
Nvidia GeForce RTX 3090 Founders Edition
NVIDIA GeForce RTX 3090, R9 5900X
9236 Points +6%
AMD Radeon RX 6900 XT
AMD Radeon RX 6900 XT, R9 5950X
8690 Points
AMD Radeon RX 6800 XT
AMD Radeon RX 6800 XT, R9 5950X
8399 Points -3%
Average NVIDIA GeForce RTX 3080
  (7148 - 7540, n=2)
7344 Points -15%
ASUS GeForce RTX 3080 ROG STRIX OC GAMING
NVIDIA GeForce RTX 3080, R9 5900X
7148 Points -18%
Average NVIDIA GeForce RTX 3070
  (5364 - 6266, n=3)
5707 Points -34%
MSI GeForce RTX 3070 Gaming X Trio
NVIDIA GeForce RTX 3070, R9 5900X
5490 Points -37%
Average NVIDIA Titan RTX
  (4944 - 5440, n=3)
5158 Points -41%
Average NVIDIA GeForce RTX 2080 Ti (Desktop)
  (4695 - 5092, n=3)
4941 Points -43%
KFA2 GeForce RTX 2080 Ti EX
NVIDIA GeForce RTX 2080 Ti (Desktop), R9 3900X
4695 Points -46%
Average AMD Radeon RX 5700 XT (Desktop)
  (4246 - 4371, n=2)
4309 Points -50%
AMD Radeon RX 5700 XT
AMD Radeon RX 5700 XT (Desktop), R7 2700X
4246 Points -51%
Nvidia GeForce RTX 2080 Super
NVIDIA GeForce RTX 2080 Super (Desktop), R7 2700X
3835 Points -56%
Average NVIDIA GeForce RTX 2080 Super (Desktop)
  ()
3835 Points -56%
AMD Radeon RX 5700
AMD Radeon RX 5700 (Desktop), R7 2700X
3532 Points -59%
Nvidia GeForce RTX 2070 Super
NVIDIA GeForce RTX 2070 Super (Desktop), R7 2700X
3358 Points -61%
Average NVIDIA GeForce RTX 2070 Super (Desktop)
  (3348 - 3358, n=2)
3353 Points -61%
1024x600 Normal, Fluid 2DTexArr
Average NVIDIA GeForce RTX 3090
  (4344 - 4608, n=10)
4492 Points +14%
Nvidia GeForce RTX 3090 Founders Edition
NVIDIA GeForce RTX 3090, R9 5900X
4344 Points +11%
Average NVIDIA GeForce RTX 3080
  (4087 - 4159, n=2)
4123 Points +5%
ASUS GeForce RTX 3080 ROG STRIX OC GAMING
NVIDIA GeForce RTX 3080, R9 5900X
4087 Points +4%
AMD Radeon RX 6800 XT
AMD Radeon RX 6800 XT, R9 5950X
3947 Points +1%
AMD Radeon RX 6900 XT
AMD Radeon RX 6900 XT, R9 5950X
3924 Points
Average NVIDIA Titan RTX
  (3691 - 3828, n=3)
3757 Points -4%
Average NVIDIA GeForce RTX 2080 Ti (Desktop)
  (3444 - 3539, n=3)
3499 Points -11%
KFA2 GeForce RTX 2080 Ti EX
NVIDIA GeForce RTX 2080 Ti (Desktop), R9 3900X
3444 Points -12%
MSI GeForce RTX 3070 Gaming X Trio
NVIDIA GeForce RTX 3070, R9 5900X
2704 Points -31%
Average NVIDIA GeForce RTX 3070
  (2666 - 2706, n=3)
2692 Points -31%
Nvidia GeForce RTX 2080 Super
NVIDIA GeForce RTX 2080 Super (Desktop), R7 2700X
2655 Points -32%
Average NVIDIA GeForce RTX 2080 Super (Desktop)
  ()
2655 Points -32%
Average NVIDIA GeForce RTX 2070 Super (Desktop)
  (2331 - 2354, n=2)
2343 Points -40%
Nvidia GeForce RTX 2070 Super
NVIDIA GeForce RTX 2070 Super (Desktop), R7 2700X
2331 Points -41%
Average AMD Radeon RX 5700 XT (Desktop)
  (1960 - 2005, n=2)
1983 Points -49%
AMD Radeon RX 5700 XT
AMD Radeon RX 5700 XT (Desktop), R7 2700X
1960 Points -50%
AMD Radeon RX 5700
AMD Radeon RX 5700 (Desktop), R7 2700X
1810 Points -54%
1024x600 Normal, Fluid 3DTex
Average NVIDIA GeForce RTX 3090
  (5246 - 5520, n=10)
5448 Points +6%
Nvidia GeForce RTX 3090 Founders Edition
NVIDIA GeForce RTX 3090, R9 5900X
5246 Points +2%
AMD Radeon RX 6800 XT
AMD Radeon RX 6800 XT, R9 5950X
5154 Points 0%
AMD Radeon RX 6900 XT
AMD Radeon RX 6900 XT, R9 5950X
5154 Points
Average NVIDIA GeForce RTX 3080
  (4417 - 4450, n=2)
4434 Points -14%
ASUS GeForce RTX 3080 ROG STRIX OC GAMING
NVIDIA GeForce RTX 3080, R9 5900X
4417 Points -14%
Average NVIDIA Titan RTX
  (3877 - 4027, n=3)
3955 Points -23%
Average NVIDIA GeForce RTX 2080 Ti (Desktop)
  (3589 - 3653, n=3)
3625 Points -30%
KFA2 GeForce RTX 2080 Ti EX
NVIDIA GeForce RTX 2080 Ti (Desktop), R9 3900X
3589 Points -30%
MSI GeForce RTX 3070 Gaming X Trio
NVIDIA GeForce RTX 3070, R9 5900X
2776 Points -46%
Average NVIDIA GeForce RTX 3070
  (2749 - 2791, n=3)
2772 Points -46%
Nvidia GeForce RTX 2080 Super
NVIDIA GeForce RTX 2080 Super (Desktop), R7 2700X
2736 Points -47%
Average NVIDIA GeForce RTX 2080 Super (Desktop)
  ()
2736 Points -47%
Average NVIDIA GeForce RTX 2070 Super (Desktop)
  (2456 - 2486, n=2)
2471 Points -52%
Nvidia GeForce RTX 2070 Super
NVIDIA GeForce RTX 2070 Super (Desktop), R7 2700X
2456 Points -52%
Average AMD Radeon RX 5700 XT (Desktop)
  (2349 - 2376, n=2)
2363 Points -54%
AMD Radeon RX 5700 XT
AMD Radeon RX 5700 XT (Desktop), R7 2700X
2349 Points -54%
AMD Radeon RX 5700
AMD Radeon RX 5700 (Desktop), R7 2700X
2294 Points -55%
1024x600 Normal, Score
Average NVIDIA GeForce RTX 3090
  (44948 - 49118, n=9)
47804 Points +17%
Nvidia GeForce RTX 3090 Founders Edition
NVIDIA GeForce RTX 3090, R9 5900X
46018 Points +13%
AMD Radeon RX 6900 XT
AMD Radeon RX 6900 XT, R9 5950X
40857 Points
Average NVIDIA GeForce RTX 3080
  (39924 - 41594, n=2)
40759 Points 0%
ASUS GeForce RTX 3080 ROG STRIX OC GAMING
NVIDIA GeForce RTX 3080, R9 5900X
39924 Points -2%
AMD Radeon RX 6800 XT
AMD Radeon RX 6800 XT, R9 5950X
38823 Points -5%
MSI GeForce RTX 3070 Gaming X Trio
NVIDIA GeForce RTX 3070, R9 5900X
30100 Points -26%
Average NVIDIA GeForce RTX 3070
  (29330 - 30581, n=3)
30004 Points -27%
Average NVIDIA Titan RTX
  (27907 - 29830, n=3)
28802 Points -30%
Average NVIDIA GeForce RTX 2080 Ti (Desktop)
  (26510 - 28145, n=3)
27567 Points -33%
KFA2 GeForce RTX 2080 Ti EX
NVIDIA GeForce RTX 2080 Ti (Desktop), R9 3900X
26510 Points -35%
Nvidia GeForce RTX 2080 Super
NVIDIA GeForce RTX 2080 Super (Desktop), R7 2700X
21009 Points -49%
Average NVIDIA GeForce RTX 2080 Super (Desktop)
  ()
21009 Points -49%
Average AMD Radeon RX 5700 XT (Desktop)
  (19184 - 19274, n=2)
19229 Points -53%
AMD Radeon RX 5700 XT
AMD Radeon RX 5700 XT (Desktop), R7 2700X
19184 Points -53%
Average NVIDIA GeForce RTX 2070 Super (Desktop)
  (18083 - 18095, n=2)
18089 Points -56%
Nvidia GeForce RTX 2070 Super
NVIDIA GeForce RTX 2070 Super (Desktop), R7 2700X
18083 Points -56%
AMD Radeon RX 5700
AMD Radeon RX 5700 (Desktop), R7 2700X
16383 Points -60%
LuxMark v2.0 64Bit
Room GPUs-only
Average NVIDIA GeForce RTX 3090
  (5727 - 5985, n=9)
5893 Samples/s +16%
Nvidia GeForce RTX 3090 Founders Edition
NVIDIA GeForce RTX 3090, R9 5900X
5808 Samples/s +14%
Average NVIDIA GeForce RTX 3080
  (5112 - 5198, n=2)
5155 Samples/s +1%
ASUS GeForce RTX 3080 ROG STRIX OC GAMING
NVIDIA GeForce RTX 3080, R9 5900X
5112 Samples/s +1%
AMD Radeon RX 6900 XT
AMD Radeon RX 6900 XT, R9 5950X
5084 Samples/s
AMD Radeon RX 6800 XT
AMD Radeon RX 6800 XT, R9 5950X
5057 Samples/s -1%
Average NVIDIA Titan RTX
  (4643 - 4703, n=2)
4673 Samples/s -8%
Average NVIDIA GeForce RTX 2080 Ti (Desktop)
  (4425 - 4494, n=3)
4449 Samples/s -12%
KFA2 GeForce RTX 2080 Ti EX
NVIDIA GeForce RTX 2080 Ti (Desktop), R9 3900X
4429 Samples/s -13%
MSI GeForce RTX 3070 Gaming X Trio
NVIDIA GeForce RTX 3070, R9 5900X
4293 Samples/s -16%
Average NVIDIA GeForce RTX 3070
  (2187 - 4293, n=3)
3588 Samples/s -29%
Nvidia GeForce RTX 2080 Super
NVIDIA GeForce RTX 2080 Super (Desktop), R7 2700X
3430 Samples/s -33%
Average NVIDIA GeForce RTX 2080 Super (Desktop)
  ()
3430 Samples/s -33%
Nvidia GeForce RTX 2070 Super
NVIDIA GeForce RTX 2070 Super (Desktop), R7 2700X
3404 Samples/s -33%
Average NVIDIA GeForce RTX 2070 Super (Desktop)
  ()
3404 Samples/s -33%
AMD Radeon RX 5700 XT
AMD Radeon RX 5700 XT (Desktop), R7 2700X
2104 Samples/s -59%
Average AMD Radeon RX 5700 XT (Desktop)
  (1915 - 2104, n=2)
2010 Samples/s -60%
AMD Radeon RX 5700
AMD Radeon RX 5700 (Desktop), R7 2700X
1856 Samples/s -63%
Sala GPUs-only
AMD Radeon RX 6900 XT
AMD Radeon RX 6900 XT, R9 5950X
31400 Samples/s
AMD Radeon RX 6800 XT
AMD Radeon RX 6800 XT, R9 5950X
28023 Samples/s -11%
Average NVIDIA GeForce RTX 3090
  (14590 - 15242, n=9)
14945 Samples/s -52%
Nvidia GeForce RTX 3090 Founders Edition
NVIDIA GeForce RTX 3090, R9 5900X
14670 Samples/s -53%
Average NVIDIA GeForce RTX 3080
  (12797 - 12980, n=2)
12889 Samples/s -59%
ASUS GeForce RTX 3080 ROG STRIX OC GAMING
NVIDIA GeForce RTX 3080, R9 5900X
12797 Samples/s -59%
Average NVIDIA Titan RTX
  (10799 - 10996, n=2)
10898 Samples/s -65%
Average NVIDIA GeForce RTX 2080 Ti (Desktop)
  (9999 - 10291, n=3)
10156 Samples/s -68%
MSI GeForce RTX 3070 Gaming X Trio
NVIDIA GeForce RTX 3070, R9 5900X
10115 Samples/s -68%
Average NVIDIA GeForce RTX 3070
  (10096 - 10115, n=3)
10107 Samples/s -68%
KFA2 GeForce RTX 2080 Ti EX
NVIDIA GeForce RTX 2080 Ti (Desktop), R9 3900X
9999 Samples/s -68%
Nvidia GeForce RTX 2080 Super
NVIDIA GeForce RTX 2080 Super (Desktop), R7 2700X
7878 Samples/s -75%
Average NVIDIA GeForce RTX 2080 Super (Desktop)
  ()
7878 Samples/s -75%
Nvidia GeForce RTX 2070 Super
NVIDIA GeForce RTX 2070 Super (Desktop), R7 2700X
7594 Samples/s -76%
Average NVIDIA GeForce RTX 2070 Super (Desktop)
  ()
7594 Samples/s -76%
AMD Radeon RX 5700 XT
AMD Radeon RX 5700 XT (Desktop), R7 2700X
6188 Samples/s -80%
Average AMD Radeon RX 5700 XT (Desktop)
  (4650 - 6188, n=2)
5419 Samples/s -83%
AMD Radeon RX 5700
AMD Radeon RX 5700 (Desktop), R7 2700X
5312 Samples/s -83%
Geekbench 5.5
OpenCL Score
Average NVIDIA GeForce RTX 3090
  (199930 - 224611, n=19)
214008 Points +24%
Nvidia GeForce RTX 3090 Founders Edition
NVIDIA GeForce RTX 3090, R9 5900X
199930 Points +16%
ASUS GeForce RTX 3080 ROG STRIX OC GAMING
NVIDIA GeForce RTX 3080, R9 5900X
192091 Points +11%
Average NVIDIA GeForce RTX 3080
  (164477 - 192091, n=2)
178284 Points +3%
AMD Radeon RX 6900 XT
AMD Radeon RX 6900 XT, R9 5950X
172661 Points
AMD Radeon RX 6800 XT
AMD Radeon RX 6800 XT, R9 5950X
159072 Points -8%
AMD Ryzen 9 5900X
NVIDIA Titan RTX, R9 5900X
149070 Points -14%
Average NVIDIA Titan RTX
  (132850 - 153940, n=20)
140450 Points -19%
Average NVIDIA GeForce RTX 3070
  (134961 - 138625, n=4)
136574 Points -21%
MSI GeForce RTX 3070 Gaming X Trio
NVIDIA GeForce RTX 3070, R9 5900X
136521 Points -21%
Average NVIDIA GeForce RTX 2080 Super (Desktop)
  (118695 - 127035, n=3)
122884 Points -29%
Average NVIDIA GeForce RTX 2070 Super (Desktop)
  (102914 - 132850, n=2)
117882 Points -32%
Average AMD Radeon RX 5700 XT (Desktop)
  (56327 - 84682, n=2)
70505 Points -59%
Vulkan Score
Nvidia GeForce RTX 3090 Founders Edition
NVIDIA GeForce RTX 3090, R9 5900X
147831 Points +67%
Average NVIDIA GeForce RTX 3090
  (62516 - 168974, n=19)
128422 Points +45%
Average NVIDIA Titan RTX
  (70085 - 138172, n=20)
92754 Points +5%
AMD Radeon RX 6900 XT
AMD Radeon RX 6900 XT, R9 5950X
88587 Points
AMD Radeon RX 6800 XT
AMD Radeon RX 6800 XT, R9 5950X
81098 Points -8%
Average NVIDIA GeForce RTX 3080
  (76596 - 83486, n=2)
80041 Points -10%
Average NVIDIA GeForce RTX 2080 Super (Desktop)
  (62324 - 91321, n=3)
78667 Points -11%
Average NVIDIA GeForce RTX 2070 Super (Desktop)
  (76596 - 80530, n=2)
78563 Points -11%
AMD Ryzen 9 5900X
NVIDIA Titan RTX, R9 5900X
76596 Points -14%
ASUS GeForce RTX 3080 ROG STRIX OC GAMING
NVIDIA GeForce RTX 3080, R9 5900X
76596 Points -14%
Average NVIDIA GeForce RTX 3070
  (27460 - 107958, n=4)
71908 Points -19%
MSI GeForce RTX 3070 Gaming X Trio
NVIDIA GeForce RTX 3070, R9 5900X
62516 Points -29%
Average AMD Radeon RX 5700 XT (Desktop)
  (14776 - 57117, n=2)
35947 Points -59%

Aplicaciones profesionales

Navi 2x parece mostrar un buen rendimiento en las aplicaciones profesionales en comparación con las piezas Navi 1x, e incluso con las mejores ofertas de consumo Ampere de NVIDIA. Aunque la Titan RTX y Quadro RTX 5000 son mejores opciones en general cuando se trata de aplicaciones CAD/CAM, energía, automóvil y medicina, las puntuaciones de los componentes individuales en las pruebas SPECviewperf muestran que la RX 6900 XT no se queda atrás, al menos cuando se trata de flujos de trabajo específicos de autoría 3D y CAD

AMD Radeon RX 6900 XT
AMD Radeon RX 6900 XT, R9 5950X
AMD Radeon RX 6800 XT
AMD Radeon RX 6800 XT, R9 5950X
AMD Radeon RX 5700 XT
AMD Radeon RX 5700 XT (Desktop), R7 2700X
Nvidia GeForce RTX 3090 Founders Edition
NVIDIA GeForce RTX 3090, R9 5900X
ASUS GeForce RTX 3080 ROG STRIX OC GAMING
NVIDIA GeForce RTX 3080, R9 5900X
AMD Ryzen 9 5900X
NVIDIA Titan RTX, R9 5900X
Acer ConceptD 9 Pro
NVIDIA Quadro RTX 5000 (Laptop), i9-9980HK
SPECviewperf 12
-15%
-45%
-31%
-35%
55%
49%
1900x1060 Solidworks (sw-03)
167
150
-10%
89.6
-46%
71.4
-57%
71.1
-57%
174.9
5%
230.1
38%
1900x1060 Siemens NX (snx-02)
47.7
45.07
-6%
35.27
-26%
14.8
-69%
13.27
-72%
273.2
473%
258.1
441%
1900x1060 Showcase (showcase-01)
241
223
-7%
137.8
-43%
239
-1%
199.9
-17%
191.1
-21%
126.4
-48%
1900x1060 Medical (medical-01)
88.4
77.3
-13%
46.9
-47%
47.2
-47%
50.8
-43%
90.7
3%
109.3
24%
1900x1060 Maya (maya-04)
151
118
-22%
86.5
-43%
190
26%
184.6
22%
188.3
25%
179
19%
1900x1060 Energy (energy-01)
30.8
28.39
-8%
12.72
-59%
20.6
-33%
18.47
-40%
28.31
-8%
26
-16%
1900x1060 Creo (creo-01)
127
119
-6%
66.9
-47%
74.8
-41%
74.2
-42%
173
36%
172.1
36%
1900x1060 Catia (catia-04)
292
238
-18%
158.8
-46%
127
-57%
126.1
-57%
262.7
-10%
220
-25%
1900x1060 3ds Max (3dsmax-05)
318
167
-47%
173.8
-45%
320
1%
275.6
-13%
292.6
-8%
235.8
-26%
SPECviewperf 13
-8%
-45%
-57%
-38%
44%
35%
Solidworks (sw-04)
214
193
-10%
114.4
-47%
82.9
-61%
92.4
-57%
196.4
-8%
203.8
-5%
Siemens NX (snx-03)
85.8
81.4
-5%
61.3
-29%
15.6
-82%
23.22
-73%
493.4
475%
465.3
442%
Showcase (showcase-02)
241
232
-4%
137.6
-43%
114
-53%
190.5
-21%
127.1
-47%
Medical (medical-02)
148
130
-12%
82.8
-44%
49.3
-67%
91.8
-38%
90.8
-39%
133.4
-10%
Maya (maya-05)
395
348
-12%
220.3
-44%
253
-36%
360.2
-9%
458
16%
340.8
-14%
Energy (energy-02)
60.6
58.4
-4%
26.82
-56%
26.6
-56%
36.08
-40%
52
-14%
57.3
-5%
Creo (creo-02)
292
276
-5%
157
-46%
176
-40%
281.2
-4%
346.5
19%
319.8
10%
Catia (catia-05)
468
412
-12%
242.8
-48%
111
-76%
190.4
-59%
374.8
-20%
338.9
-28%
3ds Max (3dsmax-06)
317
284
-10%
175.6
-45%
180
-43%
238.2
-25%
291.3
-8%
232.2
-27%
SPECviewperf 2020
5%
-37%
64%
3840x2160 Solidworks (solidworks-05)
112
108
-4%
93.1
-17%
153
37%
3840x2160 Siemens NX (snx-04)
85
81.7
-4%
13.2
-84%
347
308%
3840x2160 Medical (medical-03)
30.4
27.84
-8%
9.95
-67%
16.42
-46%
3840x2160 Maya (maya-06)
266
224
-16%
181
-32%
257
-3%
3840x2160 Energy (energy-03)
32.6
60.8
87%
22.3
-32%
58.2
79%
3840x2160 Creo (creo-03)
65.4
65
-1%
68.1
4%
113
73%
3840x2160 CATIA (catia-06)
44.6
42.4
-5%
32.3
-28%
78.2
75%
3840x2160 3ds Max (3dsmax-07)
121
114
-6%
70.2
-42%
108
-11%
Media total (Programa/Opciones)
-6% / -6%
-45% / -45%
-42% / -42%
-37% / -37%
54% / 54%
42% / 42%

Puntos de referencia del juego

En la gran mayoría de los juegos probados, la RX 6900 XT rinde en las líneas esperadas con ajustes 4K Ultra. La RX 6900 XT sí parece tener ventaja sobre las tarjetas NVIDIA en títulos optimizados para hardware AMD como Assassin's Creed Odyssey y Assassin's Creed Valhalla. La tarjeta insignia de AMD lideró las tablas en Battlefield V, Hitman 3, F1 2020y Forza Horizon 4 también

Dicho esto, la RTX 3090 mostró entre un 9% y un 20% de ventaja en la mayoría de los títulos que probamos, llegando a veces al 30% en 4K Ultra en Mafia Definitive Edition. La presencia de ocho unidades de cálculo (CU) adicionales en la RX 6900 XT no parece conferir una ventaja significativa sobre la RX 6800 XT en los juegos

El trazado de rayos, aunque está disponible, palidece en comparación con la actual generación de tarjetas Ampere. Sin embargo, hay que elogiar a AMD por haber conseguido un rendimiento de trazado de rayos que, en su mayoría, está a la par o, en ocasiones, es algo mejor que el de la RTX 2080 Ti.

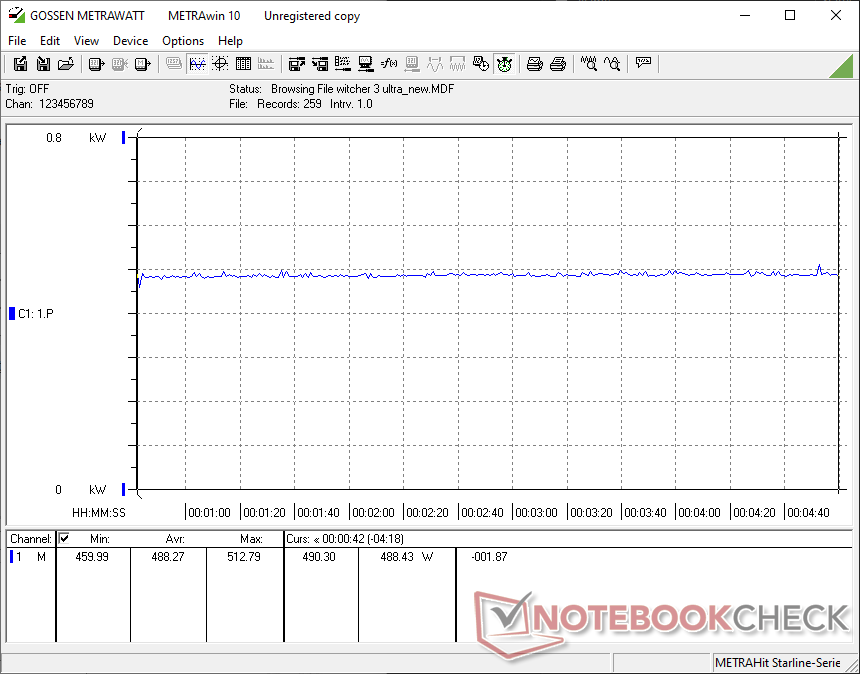
En El Witcher 3 prueba de estrés a 1080p Ultra, la RX 6900 XT ofrece un rendimiento sostenido bastante bueno, cercano a los 172 fps en su mayor parte. Sin embargo, vemos una ralentización ocasional, que hace caer los fps de forma significativa. Esto puede atribuirse probablemente a un descenso de los relojes cuando la tarjeta se acerca al punto caliente o a la temperatura de unión de 110 °C

0102030405060708090100110120130140150160170Tooltip
AMD Radeon RX 6900 XT Radeon RX 6900 XT, R9 5950X: Ø171.1 (125-176)
The Witcher 3
3840x2160 High Graphics & Postprocessing (Nvidia HairWorks Off)
Average NVIDIA GeForce RTX 3090
  (128 - 160.2, n=12)
151.5 fps +24%
Nvidia GeForce RTX 3090 Founders Edition
NVIDIA GeForce RTX 3090, R9 5900X
148 fps +21%
AMD Radeon RX 6900 XT
AMD Radeon RX 6900 XT, R9 5950X
122 (105min, 105P1 - 134max) fps
ASUS GeForce RTX 3080 ROG STRIX OC GAMING
NVIDIA GeForce RTX 3080, R9 5900X
115 (107min - 124max) fps -6%
Average NVIDIA GeForce RTX 3080
  (114 - 115, n=2)
114.5 fps -6%
AMD Radeon RX 6800 XT
AMD Radeon RX 6800 XT, R9 5950X
110 (97min - 117max) fps -10%
AMD Ryzen 9 5900X
NVIDIA Titan RTX, R9 5900X
104 (97min - 112max) fps -15%
Average NVIDIA Titan RTX
  (94 - 107.1, n=28)
102.4 fps -16%
Average NVIDIA GeForce RTX 2080 Ti (Desktop)
  (96 - 101, n=3)
98.3 fps -19%
KFA2 GeForce RTX 2080 Ti EX
NVIDIA GeForce RTX 2080 Ti (Desktop), R9 3900X
96 (87min - 109max) fps -21%
Average NVIDIA GeForce RTX 3070
  (84 - 93.9, n=5)
89.3 fps -27%
MSI GeForce RTX 3070 Gaming X Trio
NVIDIA GeForce RTX 3070, R9 5900X
88.2 (82min - 97max) fps -28%
Nvidia GeForce RTX 2080 Super
NVIDIA GeForce RTX 2080 Super (Desktop), R7 2700X
79 (71min - 87max) fps -35%
Average NVIDIA GeForce RTX 2080 Super (Desktop)
  ()
79 fps -35%
Nvidia GeForce RTX 2070 Super
NVIDIA GeForce RTX 2070 Super (Desktop), R7 2700X
68 (61min - 74max) fps -44%
Average NVIDIA GeForce RTX 2070 Super (Desktop)
  (65.5 - 71, n=5)
68 fps -44%
AMD Radeon RX 5700 XT
AMD Radeon RX 5700 XT (Desktop), R7 2700X
52.1 (47min - 57max) fps -57%
Average AMD Radeon RX 5700 XT (Desktop)
  (44 - 55.9, n=5)
52.1 fps -57%
AMD Radeon RX 5700
AMD Radeon RX 5700 (Desktop), R7 2700X
46.8 (42min - 51max) fps -62%
3840x2160 Ultra Graphics & Postprocessing (HBAO+)
Average NVIDIA GeForce RTX 3090
  (85.4 - 98.5, n=8)
93.4 fps +22%
Nvidia GeForce RTX 3090 Founders Edition
NVIDIA GeForce RTX 3090, R9 5900X
91.8 fps +20%
Average NVIDIA GeForce RTX 3080
  (78 - 85.7, n=2)
81.9 fps +7%
ASUS GeForce RTX 3080 ROG STRIX OC GAMING
NVIDIA GeForce RTX 3080, R9 5900X
78 (72min - 83max) fps +2%
AMD Radeon RX 6900 XT
AMD Radeon RX 6900 XT, R9 5950X
76.6 (70min, 70P1 - 84max) fps
Average NVIDIA Titan RTX
  ()
71.8 fps -6%
Average NVIDIA GeForce RTX 2080 Ti (Desktop)
  (65 - 67, n=3)
65.7 fps -14%
KFA2 GeForce RTX 2080 Ti EX
NVIDIA GeForce RTX 2080 Ti (Desktop), R9 3900X
65 (59min - 71max) fps -15%
Average NVIDIA GeForce RTX 3070
  (59 - 60.3, n=2)
59.7 fps -22%
Nvidia GeForce RTX 2080 Super
NVIDIA GeForce RTX 2080 Super (Desktop), R7 2700X
55.2 (49min - 61max) fps -28%
Average NVIDIA GeForce RTX 2080 Super (Desktop)
  (55.2 - 55.2, n=2)
55.2 fps -28%
Average NVIDIA GeForce RTX 2070 Super (Desktop)
  (46.3 - 49.3, n=4)
47.4 fps -38%
Nvidia GeForce RTX 2070 Super
NVIDIA GeForce RTX 2070 Super (Desktop), R7 2700X
46.3 (41min - 50max) fps -40%
AMD Radeon RX 5700 XT
AMD Radeon RX 5700 XT (Desktop), R7 2700X
39.7 (35min - 43max) fps -48%
Average AMD Radeon RX 5700 XT (Desktop)
  (38.9 - 40.4, n=3)
39.7 fps -48%
AMD Radeon RX 5700
AMD Radeon RX 5700 (Desktop), R7 2700X
35.6 (32min - 40max) fps -54%
1920x1080 Ultra Graphics & Postprocessing (HBAO+)
Average NVIDIA GeForce RTX 3090
  (160 - 192.6, n=16)
179.9 fps +10%
Nvidia GeForce RTX 3090 Founders Edition
NVIDIA GeForce RTX 3090, R9 5900X
171.5 fps +5%
AMD Radeon RX 6900 XT
AMD Radeon RX 6900 XT, R9 5950X
163.6 (139min - 179max) fps
AMD Radeon RX 6800 XT
AMD Radeon RX 6800 XT, R9 5950X
160 (138min - 179max) fps -2%
ASUS GeForce RTX 3080 ROG STRIX OC GAMING
NVIDIA GeForce RTX 3080, R9 5900X
152 (138min - 171max) fps -7%
Average NVIDIA GeForce RTX 3080
  (145 - 152, n=2)
148.5 fps -9%
AMD Ryzen 9 5900X
NVIDIA Titan RTX, R9 5900X
141 (127min - 154max) fps -14%
Average NVIDIA Titan RTX
  (124 - 150, n=28)
137.7 fps -16%
KFA2 GeForce RTX 2080 Ti EX
NVIDIA GeForce RTX 2080 Ti (Desktop), R9 3900X
135 (118min - 158max) fps -17%
Average NVIDIA GeForce RTX 2080 Ti (Desktop)
  (131 - 136, n=3)
134 fps -18%
MSI GeForce RTX 3070 Gaming X Trio
NVIDIA GeForce RTX 3070, R9 5900X
122 (110min - 138max) fps -25%
Nvidia GeForce RTX 2080 Super
NVIDIA GeForce RTX 2080 Super (Desktop), R7 2700X
109 (81min - 123max) fps -33%
Average NVIDIA GeForce RTX 2080 Super (Desktop)
  ()
109 fps -33%
Average NVIDIA GeForce RTX 3070
  (52.8 - 132.2, n=7)
106.1 fps -35%
Average NVIDIA GeForce RTX 2070 Super (Desktop)
  (95.6 - 109.6, n=6)
100.9 fps -38%
Nvidia GeForce RTX 2070 Super
NVIDIA GeForce RTX 2070 Super (Desktop), R7 2700X
97 (83min - 109max) fps -41%
AMD Radeon RX 5700 XT
AMD Radeon RX 5700 XT (Desktop), R7 2700X
92 (79min - 99max) fps -44%
Average AMD Radeon RX 5700 XT (Desktop)
  (71.6 - 102.4, n=6)
92 fps -44%
AMD Radeon RX 5700
AMD Radeon RX 5700 (Desktop), R7 2700X
80 (70min - 87max) fps -51%
Assassin´s Creed Odyssey
3840x2160 Ultra High Preset
Average NVIDIA GeForce RTX 3090
  (65 - 74, n=2)
69.5 fps +2%
AMD Radeon RX 6900 XT
AMD Radeon RX 6900 XT, R9 5950X
68 (14min - 149max) fps
Average NVIDIA Titan RTX
  ()
52 fps -24%
Average NVIDIA GeForce RTX 2080 Ti (Desktop)
  (46 - 53, n=2)
49.5 fps -27%
Average NVIDIA GeForce RTX 3070
  ()
48 fps -29%
KFA2 GeForce RTX 2080 Ti EX
NVIDIA GeForce RTX 2080 Ti (Desktop), R9 3900X
46 fps -32%
Nvidia GeForce RTX 2080 Super
NVIDIA GeForce RTX 2080 Super (Desktop), R7 2700X
41 fps -40%
Average NVIDIA GeForce RTX 2080 Super (Desktop)
  ()
41 fps -40%
Nvidia GeForce RTX 2070 Super
NVIDIA GeForce RTX 2070 Super (Desktop), R7 2700X
39 fps -43%
Average NVIDIA GeForce RTX 2070 Super (Desktop)
  (38 - 39, n=2)
38.5 fps -43%
AMD Radeon RX 5700 XT
AMD Radeon RX 5700 XT (Desktop), R7 2700X
35 fps -49%
Average AMD Radeon RX 5700 XT (Desktop)
  ()
35 fps -49%
AMD Radeon RX 5700
AMD Radeon RX 5700 (Desktop), R7 2700X
31 fps -54%
2560x1440 Ultra High Preset
AMD Radeon RX 6900 XT
AMD Radeon RX 6900 XT, R9 5950X
99 (37min - 156max) fps
Average NVIDIA GeForce RTX 3090
  (82 - 104, n=2)
93 fps -6%
Average NVIDIA GeForce RTX 2080 Ti (Desktop)
  (71 - 72, n=2)
71.5 fps -28%
KFA2 GeForce RTX 2080 Ti EX
NVIDIA GeForce RTX 2080 Ti (Desktop), R9 3900X
71 fps -28%
Average NVIDIA GeForce RTX 3070
  ()
68 fps -31%
Nvidia GeForce RTX 2080 Super
NVIDIA GeForce RTX 2080 Super (Desktop), R7 2700X
58 fps -41%
Average NVIDIA GeForce RTX 2080 Super (Desktop)
  ()
58 fps -41%
Average NVIDIA GeForce RTX 2070 Super (Desktop)
  (56 - 57, n=2)
56.5 fps -43%
Nvidia GeForce RTX 2070 Super
NVIDIA GeForce RTX 2070 Super (Desktop), R7 2700X
56 fps -43%
AMD Radeon RX 5700 XT
AMD Radeon RX 5700 XT (Desktop), R7 2700X
53 fps -46%
Average AMD Radeon RX 5700 XT (Desktop)
  ()
53 fps -46%
AMD Radeon RX 5700
AMD Radeon RX 5700 (Desktop), R7 2700X
51 fps -48%
1920x1080 Ultra High Preset
Average NVIDIA GeForce RTX 3090
  (92 - 123, n=2)
107.5 fps +10%
AMD Radeon RX 6900 XT
AMD Radeon RX 6900 XT, R9 5950X
98 (37min - 162max) fps
Average NVIDIA GeForce RTX 2080 Ti (Desktop)
  (80 - 83, n=2)
81.5 fps -17%
Average NVIDIA GeForce RTX 3070
  ()
81 fps -17%
KFA2 GeForce RTX 2080 Ti EX
NVIDIA GeForce RTX 2080 Ti (Desktop), R9 3900X
80 fps -18%
Average NVIDIA Titan RTX
  ()
79 fps -19%
Nvidia GeForce RTX 2080 Super
NVIDIA GeForce RTX 2080 Super (Desktop), R7 2700X
68 fps -31%
Average NVIDIA GeForce RTX 2080 Super (Desktop)
  ()
68 fps -31%
Average NVIDIA GeForce RTX 2070 Super (Desktop)
  (64 - 66, n=2)
65 fps -34%
Nvidia GeForce RTX 2070 Super
NVIDIA GeForce RTX 2070 Super (Desktop), R7 2700X
64 fps -35%
AMD Radeon RX 5700 XT
AMD Radeon RX 5700 XT (Desktop), R7 2700X
62 fps -37%
Average AMD Radeon RX 5700 XT (Desktop)
  ()
62 fps -37%
AMD Radeon RX 5700
AMD Radeon RX 5700 (Desktop), R7 2700X
60 fps -39%
Battlefield V
1920x1080 Ultra Preset DXR
ASUS GeForce RTX 3080 ROG STRIX OC GAMING
NVIDIA GeForce RTX 3080, R9 5900X
128 (95min - 161max) fps +27%
Average NVIDIA GeForce RTX 3080
  (122.1 - 128, n=2)
125.1 fps +24%
Nvidia GeForce RTX 3090 Founders Edition
NVIDIA GeForce RTX 3090, R9 5900X
124.8 fps +24%
Average NVIDIA GeForce RTX 3090
  (106 - 128, n=3)
119.6 fps +18%
AMD Radeon RX 6900 XT
AMD Radeon RX 6900 XT, R9 5950X
101 (18.7min, 50.6P0.1, 65.1P1 - 290max) fps
Average NVIDIA GeForce RTX 3070
  (87.7 - 104.5, n=2)
96.1 fps -5%
Average NVIDIA GeForce RTX 2080 Ti (Desktop)
  (94 - 96, n=2)
95 fps -6%
AMD Radeon RX 6800 XT
AMD Radeon RX 6800 XT, R9 5950X
94.5 fps -6%
KFA2 GeForce RTX 2080 Ti EX
NVIDIA GeForce RTX 2080 Ti (Desktop), R9 3900X
94 (74min - 129max) fps -7%
MSI GeForce RTX 3070 Gaming X Trio
NVIDIA GeForce RTX 3070, R9 5900X
87.7 fps -13%
Nvidia GeForce RTX 2070 Super
NVIDIA GeForce RTX 2070 Super (Desktop), R7 2700X
80 (57min - 103max) fps -21%
Nvidia GeForce RTX 2080 Super
NVIDIA GeForce RTX 2080 Super (Desktop), R7 2700X
80 (47min - 111max) fps -21%
Average NVIDIA GeForce RTX 2080 Super (Desktop)
  ()
80 fps -21%
Average NVIDIA GeForce RTX 2070 Super (Desktop)
  (70.8 - 80, n=3)
75.6 fps -25%
3840x2160 Ultra Preset
AMD Radeon RX 6900 XT
AMD Radeon RX 6900 XT, R9 5950X
134 (28.5min, 44.9P0.1, 89P1 - 463max) fps
Average NVIDIA GeForce RTX 3090
  (94 - 130, n=4)
112.5 fps -16%
AMD Radeon RX 6800 XT
AMD Radeon RX 6800 XT, R9 5950X
102.5 fps -24%
Average NVIDIA Titan RTX
  ()
97.3 fps -27%
Nvidia GeForce RTX 3090 Founders Edition
NVIDIA GeForce RTX 3090, R9 5900X
95.8 fps -29%
ASUS GeForce RTX 3080 ROG STRIX OC GAMING
NVIDIA GeForce RTX 3080, R9 5900X
94.2 (78min - 135max) fps -30%
Average NVIDIA GeForce RTX 3080
  (87.2 - 94.2, n=2)
90.7 fps -32%
Average NVIDIA GeForce RTX 2080 Ti (Desktop)
  (73 - 99, n=2)
86 fps -36%
KFA2 GeForce RTX 2080 Ti EX
NVIDIA GeForce RTX 2080 Ti (Desktop), R9 3900X
73 (61min - 110max) fps -46%
Average NVIDIA GeForce RTX 3070
  (69 - 70.9, n=2)
70 fps -48%
MSI GeForce RTX 3070 Gaming X Trio
NVIDIA GeForce RTX 3070, R9 5900X
69 fps -49%
Average NVIDIA GeForce RTX 2080 Super (Desktop)
  (55.7 - 80, n=2)
67.9 fps -49%
AMD Radeon RX 5700 XT
AMD Radeon RX 5700 XT (Desktop), R7 2700X
59.5 (49min - 92max) fps -56%
Average AMD Radeon RX 5700 XT (Desktop)
  ()
59.5 fps -56%
Nvidia GeForce RTX 2080 Super
NVIDIA GeForce RTX 2080 Super (Desktop), R7 2700X
55.7 (33min - 81max) fps -58%
AMD Radeon RX 5700
AMD Radeon RX 5700 (Desktop), R7 2700X
53.5 (44min - 83max) fps -60%
Average NVIDIA GeForce RTX 2070 Super (Desktop)
  (50.9 - 54.4, n=3)
52.7 fps -61%
Nvidia GeForce RTX 2070 Super
NVIDIA GeForce RTX 2070 Super (Desktop), R7 2700X
50.9 (41min - 73max) fps -62%
2560x1440 Ultra Preset
AMD Radeon RX 6900 XT
AMD Radeon RX 6900 XT, R9 5950X
196 (24.2min, 63.2P0.1, 120P1 - 512max) fps
AMD Radeon RX 6800 XT
AMD Radeon RX 6800 XT, R9 5950X
153.7 fps -22%
Average NVIDIA GeForce RTX 3090
  (124 - 178, n=3)
143.8 fps -27%
Average NVIDIA GeForce RTX 2080 Ti (Desktop)
  (108 - 159, n=2)
133.5 fps -32%
ASUS GeForce RTX 3080 ROG STRIX OC GAMING
NVIDIA GeForce RTX 3080, R9 5900X
132 (109min - 179max) fps -33%
Nvidia GeForce RTX 3090 Founders Edition
NVIDIA GeForce RTX 3090, R9 5900X
129.5 fps -34%
Average NVIDIA GeForce RTX 3080
  (116.1 - 132, n=2)
124.1 fps -37%
KFA2 GeForce RTX 2080 Ti EX
NVIDIA GeForce RTX 2080 Ti (Desktop), R9 3900X
108 (87min - 153max) fps -45%
Average NVIDIA GeForce RTX 2080 Super (Desktop)
  (85 - 131, n=2)
108 fps -45%
Average NVIDIA GeForce RTX 3070
  (98.8 - 106.8, n=2)
102.8 fps -48%
MSI GeForce RTX 3070 Gaming X Trio
NVIDIA GeForce RTX 3070, R9 5900X
98.8 fps -50%
AMD Radeon RX 5700 XT
AMD Radeon RX 5700 XT (Desktop), R7 2700X
89 (70min - 130max) fps -55%
Average AMD Radeon RX 5700 XT (Desktop)
  ()
89 fps -55%
Nvidia GeForce RTX 2080 Super
NVIDIA GeForce RTX 2080 Super (Desktop), R7 2700X
85 (43min - 122max) fps -57%
Average NVIDIA GeForce RTX 2070 Super (Desktop)
  (78 - 94, n=3)
85 fps -57%
AMD Radeon RX 5700
AMD Radeon RX 5700 (Desktop), R7 2700X
81 (64min - 122max) fps -59%
Nvidia GeForce RTX 2070 Super
NVIDIA GeForce RTX 2070 Super (Desktop), R7 2700X
78 (65min - 110max) fps -60%
1920x1080 Ultra Preset
AMD Radeon RX 6900 XT
AMD Radeon RX 6900 XT, R9 5950X
197 (46.7min, 68.3P0.1, 114P1 - 501max) fps
AMD Radeon RX 6800 XT
AMD Radeon RX 6800 XT, R9 5950X
175.4 fps -11%
Average NVIDIA Titan RTX
  ()
160.4 fps -19%
Average NVIDIA GeForce RTX 2080 Ti (Desktop)
  (127 - 190, n=2)
158.5 fps -20%
Average NVIDIA GeForce RTX 3090
  (141 - 187, n=3)
157.9 fps -20%
ASUS GeForce RTX 3080 ROG STRIX OC GAMING
NVIDIA GeForce RTX 3080, R9 5900X
152 (126min - 199max) fps -23%
Nvidia GeForce RTX 3090 Founders Edition
NVIDIA GeForce RTX 3090, R9 5900X
145.8 fps -26%
Average NVIDIA GeForce RTX 3080
  (137.9 - 152, n=2)
145 fps -26%
Average NVIDIA GeForce RTX 2080 Super (Desktop)
  (101 - 160, n=2)
130.5 fps -34%
KFA2 GeForce RTX 2080 Ti EX
NVIDIA GeForce RTX 2080 Ti (Desktop), R9 3900X
127 (102min - 175max) fps -36%
Average NVIDIA GeForce RTX 3070
  (113.6 - 125.2, n=2)
119.4 fps -39%
MSI GeForce RTX 3070 Gaming X Trio
NVIDIA GeForce RTX 3070, R9 5900X
113.6 fps -42%
AMD Radeon RX 5700 XT
AMD Radeon RX 5700 XT (Desktop), R7 2700X
105 (81min - 150max) fps -47%
Average AMD Radeon RX 5700 XT (Desktop)
  ()
105 fps -47%
Average NVIDIA GeForce RTX 2070 Super (Desktop)
  (93.2 - 123, n=3)
103.7 fps -47%
Nvidia GeForce RTX 2080 Super
NVIDIA GeForce RTX 2080 Super (Desktop), R7 2700X
101 (63min - 139max) fps -49%
AMD Radeon RX 5700
AMD Radeon RX 5700 (Desktop), R7 2700X
97 (76min - 140max) fps -51%
Nvidia GeForce RTX 2070 Super
NVIDIA GeForce RTX 2070 Super (Desktop), R7 2700X
95 (77min - 133max) fps -52%
The Division 2
3840x2160 Ultra Preset
Average NVIDIA GeForce RTX 3090
  (71.9 - 78, n=4)
74.9 fps +12%
Nvidia GeForce RTX 3090 Founders Edition
NVIDIA GeForce RTX 3090, R9 5900X
72 fps +8%
AMD Radeon RX 6900 XT
AMD Radeon RX 6900 XT, R9 5950X
66.6 (40.2min, 54.6P1) fps
ASUS GeForce RTX 3080 ROG STRIX OC GAMING
NVIDIA GeForce RTX 3080, R9 5900X
65 fps -2%
Average NVIDIA GeForce RTX 3080
  ()
65 fps -2%
AMD Radeon RX 6800 XT
AMD Radeon RX 6800 XT, R9 5950X
63.2 (34.5min, 54.1P1) fps -5%
Average NVIDIA Titan RTX
  ()
62 fps -7%
Average NVIDIA GeForce RTX 2080 Ti (Desktop)
  (53 - 57, n=3)
55.3 fps -17%
KFA2 GeForce RTX 2080 Ti EX
NVIDIA GeForce RTX 2080 Ti (Desktop), R9 3900X
53 fps -20%
MSI GeForce RTX 3070 Gaming X Trio
NVIDIA GeForce RTX 3070, R9 5900X
49 fps -26%
Average NVIDIA GeForce RTX 3070
  ()
49 fps -26%
Nvidia GeForce RTX 2080 Super
NVIDIA GeForce RTX 2080 Super (Desktop), R7 2700X
45 fps -32%
Average NVIDIA GeForce RTX 2080 Super (Desktop)
  (43 - 45, n=2)
44 fps -34%
Nvidia GeForce RTX 2070 Super
NVIDIA GeForce RTX 2070 Super (Desktop), R7 2700X
39 fps -41%
Average NVIDIA GeForce RTX 2070 Super (Desktop)
  (37 - 39, n=2)
38 fps -43%
AMD Radeon RX 5700 XT
AMD Radeon RX 5700 XT (Desktop), R7 2700X
34.1 (16.9min, 21.4P1) fps -49%
Average AMD Radeon RX 5700 XT (Desktop)
  (26 - 34.1, n=2)
30.1 fps -55%
AMD Radeon RX 5700
AMD Radeon RX 5700 (Desktop), R7 2700X
30 (2.5min, 24.3P1) fps -55%
2560x1440 Ultra Preset
Average NVIDIA GeForce RTX 3090
  (120 - 136, n=4)
126.3 fps +7%
Nvidia GeForce RTX 3090 Founders Edition
NVIDIA GeForce RTX 3090, R9 5900X
121 fps +3%
AMD Radeon RX 6900 XT
AMD Radeon RX 6900 XT, R9 5950X
118 (51.3min, 70.9P1) fps
AMD Radeon RX 6800 XT
AMD Radeon RX 6800 XT, R9 5950X
114 (52.4min, 73P1) fps -3%
ASUS GeForce RTX 3080 ROG STRIX OC GAMING
NVIDIA GeForce RTX 3080, R9 5900X
107 fps -9%
Average NVIDIA GeForce RTX 3080
  ()
107 fps -9%
Average NVIDIA Titan RTX
  ()
102 fps -14%
Average NVIDIA GeForce RTX 2080 Ti (Desktop)
  (92 - 100, n=3)
96.3 fps -18%
KFA2 GeForce RTX 2080 Ti EX
NVIDIA GeForce RTX 2080 Ti (Desktop), R9 3900X
92 fps -22%
MSI GeForce RTX 3070 Gaming X Trio
NVIDIA GeForce RTX 3070, R9 5900X
82 fps -31%
Average NVIDIA GeForce RTX 3070
  ()
82 fps -31%
Nvidia GeForce RTX 2080 Super
NVIDIA GeForce RTX 2080 Super (Desktop), R7 2700X
79 fps -33%
Average NVIDIA GeForce RTX 2080 Super (Desktop)
  ()
79 fps -33%
Nvidia GeForce RTX 2070 Super
NVIDIA GeForce RTX 2070 Super (Desktop), R7 2700X
69 fps -42%
Average NVIDIA GeForce RTX 2070 Super (Desktop)
  (67 - 69, n=2)
68 fps -42%
AMD Radeon RX 5700 XT
AMD Radeon RX 5700 XT (Desktop), R7 2700X
64 (33.2min, 45.2P1) fps -46%
AMD Radeon RX 5700
AMD Radeon RX 5700 (Desktop), R7 2700X
56.9 (22.8min, 39.8P1) fps -52%
Average AMD Radeon RX 5700 XT (Desktop)
  (49 - 64, n=2)
56.5 fps -52%
1920x1080 Ultra Preset
Average NVIDIA GeForce RTX 3090
  (140 - 180, n=4)
158 fps +14%
Nvidia GeForce RTX 3090 Founders Edition
NVIDIA GeForce RTX 3090, R9 5900X
152 fps +10%
ASUS GeForce RTX 3080 ROG STRIX OC GAMING
NVIDIA GeForce RTX 3080, R9 5900X
140 fps +1%
Average NVIDIA GeForce RTX 3080
  ()
140 fps +1%
AMD Radeon RX 6800 XT
AMD Radeon RX 6800 XT, R9 5950X
138 (45.5min, 74.1P1) fps 0%
AMD Radeon RX 6900 XT
AMD Radeon RX 6900 XT, R9 5950X
138 (54.9min, 75.2P1) fps
Average NVIDIA GeForce RTX 2080 Ti (Desktop)
  (123 - 133, n=3)
127 fps -8%
KFA2 GeForce RTX 2080 Ti EX
NVIDIA GeForce RTX 2080 Ti (Desktop), R9 3900X
123 fps -11%
Average NVIDIA Titan RTX
  ()
113 fps -18%
MSI GeForce RTX 3070 Gaming X Trio
NVIDIA GeForce RTX 3070, R9 5900X
112 fps -19%
Average NVIDIA GeForce RTX 3070
  ()
112 fps -19%
Nvidia GeForce RTX 2080 Super
NVIDIA GeForce RTX 2080 Super (Desktop), R7 2700X
106 fps -23%
Average NVIDIA GeForce RTX 2080 Super (Desktop)
  ()
106 fps -23%
Average NVIDIA GeForce RTX 2070 Super (Desktop)
  (90 - 96, n=2)
93 fps -33%
Nvidia GeForce RTX 2070 Super
NVIDIA GeForce RTX 2070 Super (Desktop), R7 2700X
90 fps -35%
AMD Radeon RX 5700 XT
AMD Radeon RX 5700 XT (Desktop), R7 2700X
88 (30.2min, 50P1) fps -36%
Average AMD Radeon RX 5700 XT (Desktop)
  (69 - 88, n=2)
78.5 fps -43%
AMD Radeon RX 5700
AMD Radeon RX 5700 (Desktop), R7 2700X
78 (14.6min, 42.2P1) fps -43%
Red Dead Redemption 2
3840x2160 Maximum Settings
Average NVIDIA GeForce RTX 3090
  (61.9 - 67, n=3)
64.1 fps +17%
Nvidia GeForce RTX 3090 Founders Edition
NVIDIA GeForce RTX 3090, R9 5900X
63.5 (29min - 85max) fps +16%
Average NVIDIA GeForce RTX 3080
  (56 - 56.4, n=2)
56.2 fps +3%
ASUS GeForce RTX 3080 ROG STRIX OC GAMING
NVIDIA GeForce RTX 3080, R9 5900X
56 fps +3%
AMD Radeon RX 6900 XT
AMD Radeon RX 6900 XT, R9 5950X
54.6 (36.2min, 47.6P1 - 67max) fps
AMD Radeon RX 6800 XT
AMD Radeon RX 6800 XT, R9 5950X
52.9 (41min, 45.5P1 - 65.3max) fps -3%
MSI GeForce RTX 3070 Gaming X Trio
NVIDIA GeForce RTX 3070, R9 5900X
44 (32min - 55max) fps -19%
Average NVIDIA GeForce RTX 3070
  (42.1 - 44, n=3)
42.9 fps -21%
Average NVIDIA GeForce RTX 2080 Ti (Desktop)
  ()
42.3 fps -23%
Average NVIDIA Titan RTX
  ()
41 fps -25%
Average NVIDIA GeForce RTX 2080 Super (Desktop)
  ()
33 fps -40%
Average NVIDIA GeForce RTX 2070 Super (Desktop)
  (28 - 28.7, n=2)
28.4 fps -48%
Average AMD Radeon RX 5700 XT (Desktop)
  ()
27 fps -51%
2560x1440 Maximum Settings
Average NVIDIA GeForce RTX 3090
  (91.9 - 96, n=3)
93.4 fps +14%
Nvidia GeForce RTX 3090 Founders Edition
NVIDIA GeForce RTX 3090, R9 5900X
92.3 (33min - 132max) fps +12%
Average NVIDIA GeForce RTX 3080
  (81 - 86.4, n=2)
83.7 fps +2%
AMD Radeon RX 6800 XT
AMD Radeon RX 6800 XT, R9 5950X
82.7 (59min, 66.7P1 - 103max) fps +1%
AMD Radeon RX 6900 XT
AMD Radeon RX 6900 XT, R9 5950X
82.1 (34min, 66.7P1 - 104max) fps
ASUS GeForce RTX 3080 ROG STRIX OC GAMING
NVIDIA GeForce RTX 3080, R9 5900X
81 fps -1%
MSI GeForce RTX 3070 Gaming X Trio
NVIDIA GeForce RTX 3070, R9 5900X
65 (33min - 100max) fps -21%
Average NVIDIA GeForce RTX 3070
  (63.2 - 65, n=3)
63.9 fps -22%
Average NVIDIA GeForce RTX 2080 Ti (Desktop)
  ()
63 fps -23%
Average NVIDIA Titan RTX
  ()
63 fps -23%
Average NVIDIA GeForce RTX 2080 Super (Desktop)
  ()
50.6 fps -38%
Average NVIDIA GeForce RTX 2070 Super (Desktop)
  (43.3 - 44, n=2)
43.7 fps -47%
Average AMD Radeon RX 5700 XT (Desktop)
  ()
41.8 fps -49%
1920x1080 Maximum Settings
Average NVIDIA GeForce RTX 3090
  (109.9 - 115, n=3)
111.6 fps +14%
Nvidia GeForce RTX 3090 Founders Edition
NVIDIA GeForce RTX 3090, R9 5900X
109.9 (37min - 148max) fps +12%
AMD Radeon RX 6800 XT
AMD Radeon RX 6800 XT, R9 5950X
102 (68.7min, 76.9P1 - 129max) fps +4%
Average NVIDIA GeForce RTX 3080
  (96 - 103, n=2)
99.5 fps +2%
AMD Radeon RX 6900 XT
AMD Radeon RX 6900 XT, R9 5950X
98 (34.2min, 76.9P1 - 125max) fps
ASUS GeForce RTX 3080 ROG STRIX OC GAMING
NVIDIA GeForce RTX 3080, R9 5900X
96 fps -2%
MSI GeForce RTX 3070 Gaming X Trio
NVIDIA GeForce RTX 3070, R9 5900X
78 (38min - 126max) fps -20%
Average NVIDIA GeForce RTX 3070
  (76.2 - 78, n=3)
77.4 fps -21%
Average NVIDIA GeForce RTX 2080 Ti (Desktop)
  ()
76 fps -22%
Average NVIDIA Titan RTX
  ()
76 fps -22%
Average NVIDIA GeForce RTX 2080 Super (Desktop)
  ()
61 fps -38%
Average NVIDIA GeForce RTX 2070 Super (Desktop)
  (53 - 54.6, n=2)
53.8 fps -45%
Average AMD Radeon RX 5700 XT (Desktop)
  ()
51.5 fps -47%
Mafia Definitive Edition
3840x2160 High Preset
Average NVIDIA GeForce RTX 3090
  (84.5 - 89.1, n=2)
86.8 fps +30%
Nvidia GeForce RTX 3090 Founders Edition
NVIDIA GeForce RTX 3090, R9 5900X
84.5 fps +26%
ASUS GeForce RTX 3080 ROG STRIX OC GAMING
NVIDIA GeForce RTX 3080, R9 5900X
78.2 (17.9min, 31P0.1, 59.3P1 - 292max) fps +17%
Average NVIDIA GeForce RTX 3080
  (78.1 - 78.2, n=2)
78.2 fps +17%
AMD Radeon RX 6900 XT
AMD Radeon RX 6900 XT, R9 5950X
67 (32.3min, 41.7P0.1, 44.7P1 - 211max) fps
Average NVIDIA Titan RTX
  ()
63.4 fps -5%
AMD Radeon RX 6800 XT
AMD Radeon RX 6800 XT, R9 5950X
62.6 (28min, 37.6P0.1, 49.2P1 - 87.3max) fps -7%
Average NVIDIA GeForce RTX 2080 Ti (Desktop)
  ()
62.4 fps -7%
MSI GeForce RTX 3070 Gaming X Trio
NVIDIA GeForce RTX 3070, R9 5900X
56.6 (34.7min, 37.9P0.1, 44.2P1 - 177max) fps -16%
Average NVIDIA GeForce RTX 3070
  (55.2 - 56.6, n=2)
55.9 fps -17%
Average NVIDIA GeForce RTX 2080 Super (Desktop)
  ()
48.5 fps -28%
Average NVIDIA GeForce RTX 2070 Super (Desktop)
  ()
41.8 fps -38%
Average AMD Radeon RX 5700 XT (Desktop)
  ()
36.4 fps -46%
2560x1440 High Preset
Average NVIDIA GeForce RTX 3090
  (142.3 - 149, n=2)
145.7 fps +21%
Nvidia GeForce RTX 3090 Founders Edition
NVIDIA GeForce RTX 3090, R9 5900X
142.3 fps +19%
ASUS GeForce RTX 3080 ROG STRIX OC GAMING
NVIDIA GeForce RTX 3080, R9 5900X
137 (26.5min, 66.2P0.1, 95.7P1 - 265max) fps +14%
Average NVIDIA GeForce RTX 3080
  (127 - 137, n=2)
132 fps +10%
AMD Radeon RX 6900 XT
AMD Radeon RX 6900 XT, R9 5950X
120 (17.6min, 61.2P0.1, 83.1P1 - 238max) fps
AMD Radeon RX 6800 XT
AMD Radeon RX 6800 XT, R9 5950X
112 (23.5min, 64P0.1, 80.8P1 - 169max) fps -7%
Average NVIDIA Titan RTX
  ()
109 fps -9%
Average NVIDIA GeForce RTX 2080 Ti (Desktop)
  ()
105 fps -12%
MSI GeForce RTX 3070 Gaming X Trio
NVIDIA GeForce RTX 3070, R9 5900X
98.7 (45.2min, 55.9P0.1, 69.4P1 - 191max) fps -18%
Average NVIDIA GeForce RTX 3070
  (98.1 - 98.7, n=2)
98.4 fps -18%
Average NVIDIA GeForce RTX 2080 Super (Desktop)
  ()
88.8 fps -26%
Average NVIDIA GeForce RTX 2070 Super (Desktop)
  ()
78.1 fps -35%
Average AMD Radeon RX 5700 XT (Desktop)
  ()
67.7 fps -44%
1920x1080 High Preset
ASUS GeForce RTX 3080 ROG STRIX OC GAMING
NVIDIA GeForce RTX 3080, R9 5900X
169 (32.7min, 75.7P0.1, 112P1 - 361max) fps +22%
Nvidia GeForce RTX 3090 Founders Edition
NVIDIA GeForce RTX 3090, R9 5900X
158.8 fps +15%
Average NVIDIA GeForce RTX 3090
  (157 - 158.8, n=2)
157.9 fps +14%
Average NVIDIA GeForce RTX 3080
  (144 - 169, n=2)
156.5 fps +13%
AMD Radeon RX 6900 XT
AMD Radeon RX 6900 XT, R9 5950X
138 (32.8min, 68.1P0.1, 90.2P1 - 334max) fps
Average NVIDIA GeForce RTX 3070
  (124 - 132, n=2)
128 fps -7%
MSI GeForce RTX 3070 Gaming X Trio
NVIDIA GeForce RTX 3070, R9 5900X
124 (57.4min, 62.8P0.1, 82P1 - 251max) fps -10%
Average NVIDIA Titan RTX
  ()
123.7 fps -10%
AMD Radeon RX 6800 XT
AMD Radeon RX 6800 XT, R9 5950X
121 (23.7min, 68P0.1, 83.3P1 - 223max) fps -12%
Average NVIDIA GeForce RTX 2080 Super (Desktop)
  ()
118.1 fps -14%
Average NVIDIA GeForce RTX 2080 Ti (Desktop)
  ()
117 fps -15%
Average NVIDIA GeForce RTX 2070 Super (Desktop)
  ()
111.6 fps -19%
Average AMD Radeon RX 5700 XT (Desktop)
  ()
92.3 fps -33%
Cyberpunk 2077 1.0
3840x2160 Ultra Preset
Average NVIDIA GeForce RTX 3090
  (41.5 - 45.3, n=2)
43.4 fps +25%
Nvidia GeForce RTX 3090 Founders Edition
NVIDIA GeForce RTX 3090, R9 5900X
41.5 fps +19%
Average NVIDIA GeForce RTX 3080
  ()
38.9 fps +12%
AMD Radeon RX 6900 XT
AMD Radeon RX 6900 XT, R9 5950X
34.8 (19.4min, 22.8P0.1, 29.7P1 - 177max) fps
Average NVIDIA GeForce RTX 2080 Ti (Desktop)
  ()
32.2 fps -7%
AMD Ryzen 9 5900X
NVIDIA Titan RTX, R9 5900X
30.9 fps -11%
Average NVIDIA Titan RTX
  ()
30.9 fps -11%
Average NVIDIA GeForce RTX 3070
  (26.6 - 27.9, n=2)
27.3 fps -22%
Average NVIDIA GeForce RTX 2080 Super (Desktop)
  ()
24.1 fps -31%
Average NVIDIA GeForce RTX 2070 Super (Desktop)
  ()
21.5 fps -38%
Average AMD Radeon RX 5700 XT (Desktop)
  ()
16.5 fps -53%
2560x1440 Ultra Preset
Average NVIDIA GeForce RTX 3090
  (78.1 - 85.3, n=2)
81.7 fps +13%
Nvidia GeForce RTX 3090 Founders Edition
NVIDIA GeForce RTX 3090, R9 5900X
78.1 fps +8%
Average NVIDIA GeForce RTX 3080
  ()
72.5 fps 0%
AMD Radeon RX 6900 XT
AMD Radeon RX 6900 XT, R9 5950X
72.3 (21min, 36.7P0.1, 58.6P1 - 231max) fps
Average NVIDIA GeForce RTX 2080 Ti (Desktop)
  ()
64 fps -11%
AMD Ryzen 9 5900X
NVIDIA Titan RTX, R9 5900X
58.4 fps -19%
Average NVIDIA Titan RTX
  ()
58.4 fps -19%
Average NVIDIA GeForce RTX 3070
  (53.7 - 54.8, n=2)
54.3 fps -25%
Average NVIDIA GeForce RTX 2080 Super (Desktop)
  ()
49.1 fps -32%
Average NVIDIA GeForce RTX 2070 Super (Desktop)
  ()
43.7 fps -40%
Average AMD Radeon RX 5700 XT (Desktop)
  ()
36.9 fps -49%
1920x1080 Ultra Preset
Nvidia GeForce RTX 3090 Founders Edition
NVIDIA GeForce RTX 3090, R9 5900X
109.7 fps +3%
Average NVIDIA GeForce RTX 3090
  (108 - 109.7, n=2)
108.9 fps +3%
AMD Radeon RX 6900 XT
AMD Radeon RX 6900 XT, R9 5950X
106 (23.2min, 48.3P0.1, 76.1P1 - 189max) fps
Average NVIDIA GeForce RTX 3080
  ()
103 fps -3%
Average NVIDIA GeForce RTX 2080 Ti (Desktop)
  ()
95.4 fps -10%
AMD Ryzen 9 5900X
NVIDIA Titan RTX, R9 5900X
82.3 fps -22%
Average NVIDIA Titan RTX
  ()
82.3 fps -22%
Average NVIDIA GeForce RTX 3070
  (80.6 - 81, n=2)
80.8 fps -24%
Average NVIDIA GeForce RTX 2080 Super (Desktop)
  ()
72.1 fps -32%
Average NVIDIA GeForce RTX 2070 Super (Desktop)
  ()
65.4 fps -38%
Average AMD Radeon RX 5700 XT (Desktop)
  ()
58.9 fps -44%
Call of Duty Black Ops Cold War
1920x1080 Highest Settings + Ultra Ray Tracing
AMD Ryzen 9 5900X
NVIDIA Titan RTX, R9 5900X
119 fps +71%
Average NVIDIA Titan RTX
  ()
119 fps +71%
Nvidia GeForce RTX 3090 Founders Edition
NVIDIA GeForce RTX 3090, R9 5900X
89 fps +28%
Average NVIDIA GeForce RTX 3090
  (88.3 - 89, n=2)
88.7 fps +28%
Average NVIDIA GeForce RTX 3080
  ()
81.9 fps +18%
Average NVIDIA GeForce RTX 2080 Ti (Desktop)
  ()
77.2 fps +11%
AMD Radeon RX 6900 XT
AMD Radeon RX 6900 XT, R9 5950X
69.5 (40.4min, 48.2P0.1, 54.5P1 - 302max) fps
MSI GeForce RTX 3070 Gaming X Trio
NVIDIA GeForce RTX 3070, R9 5900X
68.5 (19.1min, 22.3P0.1, 30.4P1 - 229max) fps -1%
Average NVIDIA GeForce RTX 3070
  (49.8 - 70.1, n=3)
62.8 fps -10%
Average NVIDIA GeForce RTX 2080 Super (Desktop)
  ()
59 fps -15%
Average NVIDIA GeForce RTX 2070 Super (Desktop)
  ()
55.6 fps -20%
AMD Radeon RX 6800 XT
AMD Radeon RX 6800 XT, R9 5950X
21.8 (8.8min, 9.61P0.1, 16.2P1 - 49.5max) fps -69%
3840x2160 Highest Settings
Average NVIDIA GeForce RTX 3090
  (74.6 - 76.1, n=2)
75.4 fps +11%
Nvidia GeForce RTX 3090 Founders Edition
NVIDIA GeForce RTX 3090, R9 5900X
74.6 fps +10%
MSI GeForce RTX 3070 Gaming X Trio
NVIDIA GeForce RTX 3070, R9 5900X
74 (32.6min, 43.5P0.1, 50.6P1 - 270max) fps +9%
AMD Radeon RX 6900 XT
AMD Radeon RX 6900 XT, R9 5950X
68.1 (42.2min, 50.7P0.1, 56.8P1 - 172max) fps
Average NVIDIA GeForce RTX 3080
  ()
65.6 fps -4%
AMD Radeon RX 6800 XT
AMD Radeon RX 6800 XT, R9 5950X
64 (10.8min, 11.6P0.1, 50.8P1 - 159max) fps -6%
Average NVIDIA GeForce RTX 3070
  (43.8 - 74, n=3)
56 fps -18%
Average NVIDIA GeForce RTX 2080 Ti (Desktop)
  ()
54.4 fps -20%
AMD Ryzen 9 5900X
NVIDIA Titan RTX, R9 5900X
52.9 fps -22%
Average NVIDIA Titan RTX
  ()
52.9 fps -22%
Average NVIDIA GeForce RTX 2080 Super (Desktop)
  (38 - 44.5, n=2)
41.3 fps -39%
Average NVIDIA GeForce RTX 2070 Super (Desktop)
  ()
37.6 fps -45%
Average AMD Radeon RX 5700 XT (Desktop)
  ()
33.3 fps -51%
2560x1440 Highest Settings
Nvidia GeForce RTX 3090 Founders Edition
NVIDIA GeForce RTX 3090, R9 5900X
124.7 fps +8%
Average NVIDIA GeForce RTX 3090
  (122 - 124.7, n=2)
123.4 fps +7%
AMD Radeon RX 6900 XT
AMD Radeon RX 6900 XT, R9 5950X
115 (54.9min, 82.8P0.1, 92.3P1 - 314max) fps
MSI GeForce RTX 3070 Gaming X Trio
NVIDIA GeForce RTX 3070, R9 5900X
107 (43.6min, 54P0.1, 62.7P1 - 272max) fps -7%
Average NVIDIA GeForce RTX 3080
  ()
104 fps -10%
Average NVIDIA GeForce RTX 3070
  (83 - 107, n=3)
93.2 fps -19%
Average NVIDIA GeForce RTX 2080 Ti (Desktop)
  ()
89.2 fps -22%
AMD Ryzen 9 5900X
NVIDIA Titan RTX, R9 5900X
87.6 fps -24%
Average NVIDIA Titan RTX
  ()
87.6 fps -24%
AMD Radeon RX 6800 XT
AMD Radeon RX 6800 XT, R9 5950X
80.4 (16.5min, 31.8P0.1, 64.3P1 - 285max) fps -30%
Average NVIDIA GeForce RTX 2070 Super (Desktop)
  ()
67.7 fps -41%
Average NVIDIA GeForce RTX 2080 Super (Desktop)
  (51 - 77.6, n=2)
64.3 fps -44%
Average AMD Radeon RX 5700 XT (Desktop)
  ()
59.6 fps -48%
1920x1080 Highest Settings
Nvidia GeForce RTX 3090 Founders Edition
NVIDIA GeForce RTX 3090, R9 5900X
161.1 fps +5%
Average NVIDIA GeForce RTX 3090
  (161 - 161.1, n=2)
161.1 fps +5%
AMD Radeon RX 6900 XT
AMD Radeon RX 6900 XT, R9 5950X
153 (60.9min, 98.1P0.1, 117P1 - 437max) fps
AMD Ryzen 9 5900X
NVIDIA Titan RTX, R9 5900X
144 fps -6%
AMD Radeon RX 6800 XT
AMD Radeon RX 6800 XT, R9 5950X
144 (58.7min, 90.7P0.1, 105P1 - 365max) fps -6%
Average NVIDIA Titan RTX
  ()
144 fps -6%
Average NVIDIA GeForce RTX 3080
  ()
127 fps -17%
MSI GeForce RTX 3070 Gaming X Trio
NVIDIA GeForce RTX 3070, R9 5900X
122 (45min, 57.3P0.1, 67.9P1 - 301max) fps -20%
Average NVIDIA GeForce RTX 2080 Ti (Desktop)
  ()
118 fps -23%
Average NVIDIA GeForce RTX 3070
  (95.7 - 122, n=3)
112.6 fps -26%
Average NVIDIA GeForce RTX 2070 Super (Desktop)
  ()
92.7 fps -39%
Average NVIDIA GeForce RTX 2080 Super (Desktop)
  (59 - 106, n=2)
82.5 fps -46%
Average AMD Radeon RX 5700 XT (Desktop)
  ()
81.3 fps -47%
Metro Exodus
1920x1080 Ultra Quality DXR AF:16x
Average NVIDIA GeForce RTX 3090
  (68.6 - 122.2, n=12)
111.4 fps +23%
Average NVIDIA GeForce RTX 3080
  (91.5 - 102, n=2)
96.8 fps +7%
ASUS GeForce RTX 3080 ROG STRIX OC GAMING
NVIDIA GeForce RTX 3080, R9 5900X
91.5 (51.03min - 134.52max) fps +1%
AMD Radeon RX 6900 XT
AMD Radeon RX 6900 XT, R9 5950X
90.5 (55.53min - 126.79max) fps
AMD Ryzen 9 5900X
NVIDIA Titan RTX, R9 5900X
87.9 (49.32min - 136.76max) fps -3%
Average NVIDIA Titan RTX
  (69 - 95.5, n=23)
86.1 fps -5%
AMD Radeon RX 6800 XT
AMD Radeon RX 6800 XT, R9 5950X
85.5 (52.71min - 120.38max) fps -6%
Average NVIDIA GeForce RTX 2080 Ti (Desktop)
  (78.6 - 84.9, n=3)
81.8 fps -10%
Average NVIDIA GeForce RTX 3070
  (80.4 - 83, n=5)
81.6 fps -10%
MSI GeForce RTX 3070 Gaming X Trio
NVIDIA GeForce RTX 3070, R9 5900X
80.4 (43.5min - 124.3max) fps -11%
KFA2 GeForce RTX 2080 Ti EX
NVIDIA GeForce RTX 2080 Ti (Desktop), R9 3900X
78.6 (43min - 115max) fps -13%
Nvidia GeForce RTX 3090 Founders Edition
NVIDIA GeForce RTX 3090, R9 5900X
68.6 (37.68min - 117.88max) fps -24%
Nvidia GeForce RTX 2080 Super
NVIDIA GeForce RTX 2080 Super (Desktop), R7 2700X
65 (37.62min - 97.62max) fps -28%
Average NVIDIA GeForce RTX 2080 Super (Desktop)
  ()
65 fps -28%
Average NVIDIA GeForce RTX 2070 Super (Desktop)
  (56.3 - 62.1, n=4)
58.5 fps -35%
Nvidia GeForce RTX 2070 Super
NVIDIA GeForce RTX 2070 Super (Desktop), R7 2700X
57.5 (34min - 85max) fps -36%
3840x2160 Ultra Quality AF:16x
Average NVIDIA GeForce RTX 3090
  (70.6 - 77.3, n=12)
75 fps +12%
Nvidia GeForce RTX 3090 Founders Edition
NVIDIA GeForce RTX 3090, R9 5900X
70.6 (41.43min - 118.98max) fps +6%
AMD Radeon RX 6900 XT
AMD Radeon RX 6900 XT, R9 5950X
66.7 (42.71min - 92.25max) fps
Average NVIDIA GeForce RTX 3080
  (64.1 - 65.9, n=2)
65 fps -3%
ASUS GeForce RTX 3080 ROG STRIX OC GAMING
NVIDIA GeForce RTX 3080, R9 5900X
64.1 (36.54min - 108.57max) fps -4%
AMD Radeon RX 6800 XT
AMD Radeon RX 6800 XT, R9 5950X
56.3 (40.14min - 64.28max) fps -16%
AMD Ryzen 9 5900X
NVIDIA Titan RTX, R9 5900X
54.9 (34.88min - 89.73max) fps -18%
Average NVIDIA Titan RTX
  (51.3 - 57.9, n=27)
54.9 fps -18%
Average NVIDIA GeForce RTX 2080 Ti (Desktop)
  (47.5 - 51, n=3)
49.7 fps -25%
MSI GeForce RTX 3070 Gaming X Trio
NVIDIA GeForce RTX 3070, R9 5900X
49.1 (30.24min - 89.89max) fps -26%
Average NVIDIA GeForce RTX 3070
  (48.3 - 49.7, n=5)
48.9 fps -27%
KFA2 GeForce RTX 2080 Ti EX
NVIDIA GeForce RTX 2080 Ti (Desktop), R9 3900X
47.5 (31min - 69max) fps -29%
Average NVIDIA GeForce RTX 2080 Super (Desktop)
  (40 - 40.4, n=2)
40.2 fps -40%
Nvidia GeForce RTX 2080 Super
NVIDIA GeForce RTX 2080 Super (Desktop), R7 2700X
40 (25.84min - 59.35max) fps -40%
Average NVIDIA GeForce RTX 2070 Super (Desktop)
  (35 - 38.1, n=5)
36.8 fps -45%
Nvidia GeForce RTX 2070 Super
NVIDIA GeForce RTX 2070 Super (Desktop), R7 2700X
35 (23min - 51max) fps -48%
Average AMD Radeon RX 5700 XT (Desktop)
  (29.6 - 35.7, n=3)
33.6 fps -50%
AMD Radeon RX 5700 XT
AMD Radeon RX 5700 XT (Desktop), R7 2700X
29.6 (20.7min - 36.64max) fps -56%
AMD Radeon RX 5700
AMD Radeon RX 5700 (Desktop), R7 2700X
28.6 (19.67min - 36.24max) fps -57%
2560x1440 Ultra Quality AF:16x
Average NVIDIA GeForce RTX 3090
  (102 - 118.2, n=12)
113.2 fps +11%
Nvidia GeForce RTX 3090 Founders Edition
NVIDIA GeForce RTX 3090, R9 5900X
106 (54.88min - 173.25max) fps +4%
AMD Radeon RX 6900 XT
AMD Radeon RX 6900 XT, R9 5950X
102 (59.52min - 156.84max) fps
Average NVIDIA GeForce RTX 3080
  (92.2 - 97.4, n=2)
94.8 fps -7%
AMD Radeon RX 6800 XT
AMD Radeon RX 6800 XT, R9 5950X
94.6 (55.44min - 143.68max) fps -7%
ASUS GeForce RTX 3080 ROG STRIX OC GAMING
NVIDIA GeForce RTX 3080, R9 5900X
92.2 (46.62min - 155.93max) fps -10%
AMD Ryzen 9 5900X
NVIDIA Titan RTX, R9 5900X
84.9 (46.03min - 152.65max) fps -17%
Average NVIDIA Titan RTX
  (69 - 92.9, n=26)
84 fps -18%
Average NVIDIA GeForce RTX 3070
  (74.4 - 78.3, n=5)
75.8 fps -26%
Average NVIDIA GeForce RTX 2080 Ti (Desktop)
  (71.9 - 77.9, n=3)
75.3 fps -26%
MSI GeForce RTX 3070 Gaming X Trio
NVIDIA GeForce RTX 3070, R9 5900X
74.4 (38.95min - 129.85max) fps -27%
KFA2 GeForce RTX 2080 Ti EX
NVIDIA GeForce RTX 2080 Ti (Desktop), R9 3900X
71.9 (40min - 108max) fps -30%
Average NVIDIA GeForce RTX 2080 Super (Desktop)
  (61 - 65, n=2)
63 fps -38%
Nvidia GeForce RTX 2080 Super
NVIDIA GeForce RTX 2080 Super (Desktop), R7 2700X
61 (35.51min - 95.82max) fps -40%
Average NVIDIA GeForce RTX 2070 Super (Desktop)
  (54.3 - 61.9, n=5)
57.6 fps -44%
Average AMD Radeon RX 5700 XT (Desktop)
  (54.5 - 57.7, n=3)
56.4 fps -45%
AMD Radeon RX 5700 XT
AMD Radeon RX 5700 XT (Desktop), R7 2700X
54.5 (31.85min - 78.06max) fps -47%
Nvidia GeForce RTX 2070 Super
NVIDIA GeForce RTX 2070 Super (Desktop), R7 2700X
54.3 (32min - 83max) fps -47%
AMD Radeon RX 5700
AMD Radeon RX 5700 (Desktop), R7 2700X
48.4 (28.7min - 68.51max) fps -53%
1920x1080 Ultra Quality AF:16x
Average NVIDIA GeForce RTX 3090
  (108 - 145, n=12)
135.3 fps +10%
Nvidia GeForce RTX 3090 Founders Edition
NVIDIA GeForce RTX 3090, R9 5900X
124 (65.58min - 188.71max) fps +1%
AMD Radeon RX 6900 XT
AMD Radeon RX 6900 XT, R9 5950X
123 (67.67min - 199.52max) fps
AMD Radeon RX 6800 XT
AMD Radeon RX 6800 XT, R9 5950X
115 (64.52min - 181.92max) fps -7%
Average NVIDIA GeForce RTX 3080
  (111 - 116, n=2)
113.5 fps -8%
ASUS GeForce RTX 3080 ROG STRIX OC GAMING
NVIDIA GeForce RTX 3080, R9 5900X
111 (57.16min - 183.25max) fps -10%
AMD Ryzen 9 5900X
NVIDIA Titan RTX, R9 5900X
106 (52.66min - 176.55max) fps -14%
Average NVIDIA Titan RTX
  (73 - 116, n=27)
102.2 fps -17%
Average NVIDIA GeForce RTX 3070
  (91.3 - 97.7, n=5)
93.9 fps -24%
Average NVIDIA GeForce RTX 2080 Ti (Desktop)
  (89.7 - 98.6, n=3)
93.8 fps -24%
MSI GeForce RTX 3070 Gaming X Trio
NVIDIA GeForce RTX 3070, R9 5900X
91.3 (46.36min - 152.74max) fps -26%
KFA2 GeForce RTX 2080 Ti EX
NVIDIA GeForce RTX 2080 Ti (Desktop), R9 3900X
89.7 (46min - 140max) fps -27%
Average NVIDIA GeForce RTX 2080 Super (Desktop)
  (76 - 82, n=2)
79 fps -36%
Nvidia GeForce RTX 2080 Super
NVIDIA GeForce RTX 2080 Super (Desktop), R7 2700X
76 (38.54min - 122.4max) fps -38%
Average NVIDIA GeForce RTX 2070 Super (Desktop)
  (67.8 - 79.1, n=5)
72.3 fps -41%
Average AMD Radeon RX 5700 XT (Desktop)
  (61 - 73.8, n=3)
69.3 fps -44%
Nvidia GeForce RTX 2070 Super
NVIDIA GeForce RTX 2070 Super (Desktop), R7 2700X
67.8 (36min - 110max) fps -45%
AMD Radeon RX 5700 XT
AMD Radeon RX 5700 XT (Desktop), R7 2700X
61 (36.09min - 86.1max) fps -50%
AMD Radeon RX 5700
AMD Radeon RX 5700 (Desktop), R7 2700X
58.6 (32.67min - 85.8max) fps -52%

Memoria de acceso inteligente de AMD

Ajustes de BAR redimensionables en la placa base MSI Prestige X570 Creation.

La memoria de acceso inteligente (SAM) es el término elegante de AMD para referirse al registro de direcciones base redimensionable (BAR), una especificación PCIe que permite a la CPU acceder a toda la VRAM de la GPU en todo momento (originalmente limitada a 256 MB de memoria de la GPU para la compatibilidad con el sistema operativo de 32 bits). Aunque todas las GPUs RDNA 2 son compatibles con SAM desde el primer momento, tienen que estar emparejadas con una CPU Ryzen de la serie 5000 y una placa base con un chipset B550 o X570 (las CPUs Ryzen 3000 en estas placas base son ahora también compatibles también). También es posible que tengas que buscar actualizaciones del BIOS (AGESA 1.1.0.0 o más reciente) de tu proveedor de placas base que habiliten esta función.

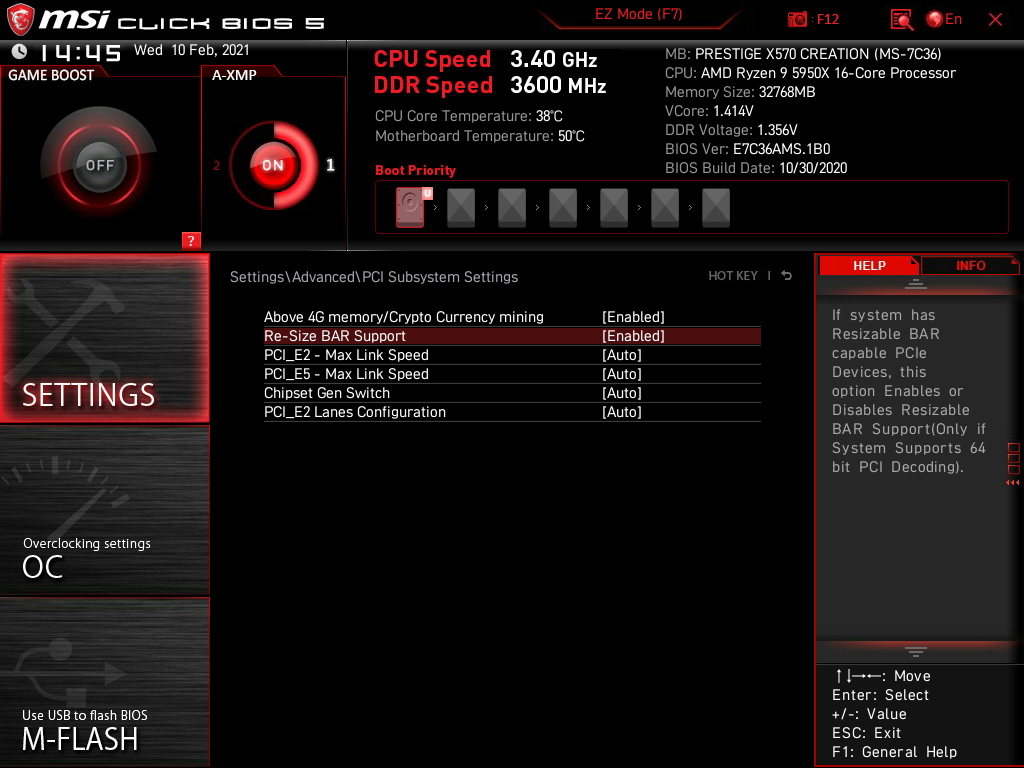
Para habilitar SAM, tienes que ir a la BIOS y habilitar tanto "Memoria superior a 4G/Minería de criptomonedas" como "Soporte de redimensionamiento de BAR" en la configuración del subsistema PCIe. Por desgracia, no hay forma de comprobar el estado de SAM a través del controlador.

Aunque AMD parecía bastante entusiasmada con SAM durante su keynote de lanzamiento de Big Navi, las ganancias de rendimiento en el mundo real, si es que las hay, sólo se ven en un puñado de juegos por el momento. En nuestras pruebas, encontramos que SAM ofrece aumentos marginales de fps en Borderlands 3 y Shadow of the Tomb Raider con ajustes QHD Ultra y 4K Ultra

Sin embargo, la activación de SAM mostró ganancias de +18% a 1080p Ultra, +13% a 1440p Ultra y +8% a 4K Ultra en Assassin's Creed Valhalla. SAM no pareció ser de ningún beneficio a 1080p Ultra en Forza Horizon 4, pero sí vemos beneficios de +11% y +13% a 1440p Ultra y 4K Ultra, respectivamente. F1 2020 solo mostró ganancias menores a 1080p Ultra. Juegos como Control, Hitman 3y Watch Dogs Legion no mostraron ninguna mejora o regresión de rendimiento con SAM activado

Ahora que todas las nuevas GPU y placas base son compatibles con la BAR redimensionable, esperamos que más juegos aprovechen esta función en los próximos días.

Borderlands 3
3840x2160 Badass Overall Quality (DX11)
Average NVIDIA GeForce RTX 3090
  (68 - 75.3, n=13)
72.8 fps +22%
Nvidia GeForce RTX 3090 Founders Edition
NVIDIA GeForce RTX 3090, R9 5900X
68 fps +14%
Average NVIDIA GeForce RTX 3080
  (61.5 - 61.9, n=2)
61.7 fps +3%
ASUS GeForce RTX 3080 ROG STRIX OC GAMING
NVIDIA GeForce RTX 3080, R9 5900X
61.5 fps +3%
AMD Radeon RX 6900 XT
AMD Radeon RX 6900 XT, R9 5950X (SAM ENABLED)
59.8 fps
AMD Radeon RX 6900 XT
AMD Radeon RX 6900 XT, R9 5950X
57.1 fps -5%
AMD Radeon RX 6800 XT
AMD Radeon RX 6800 XT, R9 5950X
53.6 fps -10%
Average NVIDIA Titan RTX
  (46 - 52.8, n=29)
47.3 fps -21%
AMD Ryzen 9 5900X
NVIDIA Titan RTX, R9 5900X
46.7 fps -22%
Average NVIDIA GeForce RTX 2080 Ti (Desktop)
  (43.6 - 47, n=2)
45.3 fps -24%
Average NVIDIA GeForce RTX 3070
  (42.7 - 46.3, n=5)
44.3 fps -26%
MSI GeForce RTX 3070 Gaming X Trio
NVIDIA GeForce RTX 3070, R9 5900X
44.2 fps -26%
KFA2 GeForce RTX 2080 Ti EX
NVIDIA GeForce RTX 2080 Ti (Desktop), R9 3900X
43.6 fps -27%
Average NVIDIA GeForce RTX 2080 Super (Desktop)
  ()
35.9 fps -40%
Average NVIDIA GeForce RTX 2070 Super (Desktop)
  (29.5 - 32.7, n=5)
31.3 fps -48%
Average AMD Radeon RX 5700 XT (Desktop)
  (28.1 - 30.5, n=3)
29.6 fps -51%
2560x1440 Badass Overall Quality (DX11)
Average NVIDIA GeForce RTX 3090
  (105 - 131.6, n=13)
123.8 fps +16%
AMD Radeon RX 6900 XT
AMD Radeon RX 6900 XT, R9 5950X (SAM ENABLED)
107 fps
AMD Radeon RX 6900 XT
AMD Radeon RX 6900 XT, R9 5950X
105 fps -2%
Nvidia GeForce RTX 3090 Founders Edition
NVIDIA GeForce RTX 3090, R9 5900X
105 fps -2%
ASUS GeForce RTX 3080 ROG STRIX OC GAMING
NVIDIA GeForce RTX 3080, R9 5900X
103 fps -4%
Average NVIDIA GeForce RTX 3080
  (95.7 - 103, n=2)
99.4 fps -7%
AMD Radeon RX 6800 XT
AMD Radeon RX 6800 XT, R9 5950X
93.6 fps -13%
AMD Ryzen 9 5900X
NVIDIA Titan RTX, R9 5900X
84.7 fps -21%
Average NVIDIA Titan RTX
  (74 - 93.1, n=29)
84.7 fps -21%
Average NVIDIA GeForce RTX 2080 Ti (Desktop)
  (78 - 83, n=2)
80.5 fps -25%
KFA2 GeForce RTX 2080 Ti EX
NVIDIA GeForce RTX 2080 Ti (Desktop), R9 3900X
78 fps -27%
Average NVIDIA GeForce RTX 3070
  (75.1 - 82.9, n=5)
77.7 fps -27%
MSI GeForce RTX 3070 Gaming X Trio
NVIDIA GeForce RTX 3070, R9 5900X
75.9 fps -29%
Average NVIDIA GeForce RTX 2080 Super (Desktop)
  ()
65.5 fps -39%
Average NVIDIA GeForce RTX 2070 Super (Desktop)
  (53.7 - 60.3, n=5)
57.3 fps -46%
Average AMD Radeon RX 5700 XT (Desktop)
  (51.1 - 56.1, n=3)
54.3 fps -49%
1920x1080 Badass Overall Quality (DX11)
Average NVIDIA GeForce RTX 3090
  (117 - 170.1, n=13)
150.7 fps +15%
AMD Radeon RX 6900 XT
AMD Radeon RX 6900 XT, R9 5950X (SAM ENABLED)
131 fps
AMD Radeon RX 6900 XT
AMD Radeon RX 6900 XT, R9 5950X
130 fps -1%
ASUS GeForce RTX 3080 ROG STRIX OC GAMING
NVIDIA GeForce RTX 3080, R9 5900X
128 fps -2%
Average NVIDIA GeForce RTX 3080
  (117 - 128, n=2)
122.5 fps -6%
AMD Radeon RX 6800 XT
AMD Radeon RX 6800 XT, R9 5950X
120 fps -8%
Nvidia GeForce RTX 3090 Founders Edition
NVIDIA GeForce RTX 3090, R9 5900X
119 fps -9%
AMD Ryzen 9 5900X
NVIDIA Titan RTX, R9 5900X
118 fps -10%
Average NVIDIA Titan RTX
  (77.2 - 128.7, n=29)
112 fps -15%
Average NVIDIA GeForce RTX 2080 Ti (Desktop)
  (101.3 - 109, n=2)
105.2 fps -20%
KFA2 GeForce RTX 2080 Ti EX
NVIDIA GeForce RTX 2080 Ti (Desktop), R9 3900X
101.3 fps -23%
Average NVIDIA GeForce RTX 3070
  (95.3 - 108.9, n=5)
100.6 fps -23%
MSI GeForce RTX 3070 Gaming X Trio
NVIDIA GeForce RTX 3070, R9 5900X
95.8 fps -27%
Average NVIDIA GeForce RTX 2080 Super (Desktop)
  ()
91 fps -31%
Average NVIDIA GeForce RTX 2070 Super (Desktop)
  (74.3 - 86, n=5)
80.9 fps -38%
Average AMD Radeon RX 5700 XT (Desktop)
  (71.7 - 79.1, n=3)
76.6 fps -42%
Control
1920x1080 High Quality Preset & High Ray Tracing Preset (DX12)
Average NVIDIA GeForce RTX 3090
  (91.4 - 122.6, n=5)
111.1 fps +46%
Nvidia GeForce RTX 3090 Founders Edition
NVIDIA GeForce RTX 3090, R9 5900X
106.9 fps +40%
ASUS GeForce RTX 3080 ROG STRIX OC GAMING
NVIDIA GeForce RTX 3080, R9 5900X
103 (94min - 116max) fps +35%
Average NVIDIA GeForce RTX 3080
  (98.1 - 103, n=2)
100.6 fps +32%
Average NVIDIA Titan RTX
  (63 - 120, n=3)
88.1 fps +16%
AMD Radeon RX 6900 XT
AMD Radeon RX 6900 XT, R9 5950X (SAM ENABLED)
76.2 (38.7min, 43.3P0.1, 62.8P1 - 142max) fps
AMD Radeon RX 6900 XT
AMD Radeon RX 6900 XT, R9 5950X
73.1 (31.6min, 40.9P0.1, 62.6P1 - 149max) fps -4%
Average NVIDIA GeForce RTX 2080 Ti (Desktop)
  (72 - 76, n=2)
74 fps -3%
KFA2 GeForce RTX 2080 Ti EX
NVIDIA GeForce RTX 2080 Ti (Desktop), R9 3900X
72 (67min - 80max) fps -6%
Average NVIDIA GeForce RTX 3070
  (57.9 - 75.1, n=3)
68.5 fps -10%
AMD Radeon RX 6800 XT
AMD Radeon RX 6800 XT, R9 5950X
66.9 (60min - 75max) fps -12%
MSI GeForce RTX 3070 Gaming X Trio
NVIDIA GeForce RTX 3070, R9 5900X
57.9 (29min - 79max) fps -24%
Average NVIDIA GeForce RTX 2080 Super (Desktop)
  ()
53.2 fps -30%
Average NVIDIA GeForce RTX 2070 Super (Desktop)
  (51.1 - 54.2, n=4)
52.7 fps -31%
3840x2160 High Quality Preset (DX11)
Average NVIDIA GeForce RTX 3090
  (61.3 - 66, n=5)
62.9 fps +15%
Nvidia GeForce RTX 3090 Founders Edition
NVIDIA GeForce RTX 3090, R9 5900X
61.3 fps +12%
Average NVIDIA GeForce RTX 3080
  (56.2 - 56.7, n=2)
56.5 fps +3%
ASUS GeForce RTX 3080 ROG STRIX OC GAMING
NVIDIA GeForce RTX 3080, R9 5900X
56.2 (49min - 64max) fps +3%
AMD Radeon RX 6900 XT
AMD Radeon RX 6900 XT, R9 5950X
54.7 (39.8min, 41.7P0.1, 44.9P1 - 65.8max) fps
AMD Radeon RX 6900 XT
AMD Radeon RX 6900 XT, R9 5950X (SAM ENABLED)
53.9 (36.6min, 41.7P0.1, 43.5P1 - 64.9max) fps -1%
AMD Radeon RX 6800 XT
AMD Radeon RX 6800 XT, R9 5950X
51.6 (46min - 58max) fps -6%
Average NVIDIA Titan RTX
  (45.2 - 47.3, n=3)
46.5 fps -15%
Average NVIDIA GeForce RTX 2080 Ti (Desktop)
  (42.6 - 45.8, n=2)
44.2 fps -19%
KFA2 GeForce RTX 2080 Ti EX
NVIDIA GeForce RTX 2080 Ti (Desktop), R9 3900X
42.6 (37min - 49max) fps -22%
MSI GeForce RTX 3070 Gaming X Trio
NVIDIA GeForce RTX 3070, R9 5900X
42.3 (37min - 49max) fps -23%
Average NVIDIA GeForce RTX 3070
  (40.6 - 42.3, n=3)
41.3 fps -24%
Average AMD Radeon RX 5700 XT (Desktop)
  (26.3 - 55.2, n=2)
40.8 fps -25%
Average NVIDIA GeForce RTX 2080 Super (Desktop)
  ()
30.4 fps -44%
Average NVIDIA GeForce RTX 2070 Super (Desktop)
  (29.2 - 30.7, n=4)
30.1 fps -45%
2560x1440 High Quality Preset (DX11)
Average NVIDIA GeForce RTX 3090
  (115.8 - 123.7, n=5)
120.4 fps +7%
Nvidia GeForce RTX 3090 Founders Edition
NVIDIA GeForce RTX 3090, R9 5900X
115.8 fps +2%
AMD Radeon RX 6900 XT
AMD Radeon RX 6900 XT, R9 5950X
113 (71.5min, 73.2P0.1, 79.6P1 - 164max) fps
AMD Radeon RX 6900 XT
AMD Radeon RX 6900 XT, R9 5950X (SAM ENABLED)
113 (68min, 71.3P0.1, 81.1P1 - 193max) fps 0%
AMD Radeon RX 6800 XT
AMD Radeon RX 6800 XT, R9 5950X
108 (93min - 123max) fps -4%
ASUS GeForce RTX 3080 ROG STRIX OC GAMING
NVIDIA GeForce RTX 3080, R9 5900X
106 (92min - 123max) fps -6%
Average NVIDIA GeForce RTX 3080
  (105 - 106, n=2)
105.5 fps -7%
Average NVIDIA Titan RTX
  (89 - 93.6, n=3)
91.5 fps -19%
Average NVIDIA GeForce RTX 2080 Ti (Desktop)
  (84 - 89, n=2)
86.5 fps -23%
KFA2 GeForce RTX 2080 Ti EX
NVIDIA GeForce RTX 2080 Ti (Desktop), R9 3900X
84 (75min - 95max) fps -26%
MSI GeForce RTX 3070 Gaming X Trio
NVIDIA GeForce RTX 3070, R9 5900X
82.5 (72min - 96max) fps -27%
Average NVIDIA GeForce RTX 3070
  (79.8 - 82.5, n=3)
81.2 fps -28%
Average AMD Radeon RX 5700 XT (Desktop)
  (53.4 - 91, n=2)
72.2 fps -36%
Average NVIDIA GeForce RTX 2080 Super (Desktop)
  ()
62 fps -45%
Average NVIDIA GeForce RTX 2070 Super (Desktop)
  (56.9 - 62.6, n=4)
60.6 fps -46%
1920x1080 High Quality Preset (DX11)
Average NVIDIA GeForce RTX 3090
  (172.2 - 189.2, n=5)
179.9 fps +3%
AMD Radeon RX 6900 XT
AMD Radeon RX 6900 XT, R9 5950X
175 (56.8min, 96P0.1, 112P1 - 314max) fps
AMD Radeon RX 6900 XT
AMD Radeon RX 6900 XT, R9 5950X (SAM ENABLED)
174 (54min, 99P0.1, 112P1 - 335max) fps -1%
Nvidia GeForce RTX 3090 Founders Edition
NVIDIA GeForce RTX 3090, R9 5900X
172.2 fps -2%
AMD Radeon RX 6800 XT
AMD Radeon RX 6800 XT, R9 5950X
168 (145min - 194max) fps -4%
ASUS GeForce RTX 3080 ROG STRIX OC GAMING
NVIDIA GeForce RTX 3080, R9 5900X
155 (133min - 178max) fps -11%
Average NVIDIA GeForce RTX 3080
  (151 - 155, n=2)
153 fps -13%
Average NVIDIA Titan RTX
  (135 - 141.9, n=3)
137.3 fps -22%
Average NVIDIA GeForce RTX 2080 Ti (Desktop)
  (126 - 132, n=2)
129 fps -26%
KFA2 GeForce RTX 2080 Ti EX
NVIDIA GeForce RTX 2080 Ti (Desktop), R9 3900X
126 (111min - 143max) fps -28%
MSI GeForce RTX 3070 Gaming X Trio
NVIDIA GeForce RTX 3070, R9 5900X
122 (103min - 138max) fps -30%
Average NVIDIA GeForce RTX 3070
  (117 - 124.9, n=3)
121.3 fps -31%
Average AMD Radeon RX 5700 XT (Desktop)
  (83 - 121.9, n=2)
102.5 fps -41%
Average NVIDIA GeForce RTX 2080 Super (Desktop)
  ()
95 fps -46%
Average NVIDIA GeForce RTX 2070 Super (Desktop)
  (88 - 97.3, n=4)
93.3 fps -47%
Assassin´s Creed Valhalla
3840x2160 Ultra High Preset
AMD Radeon RX 6900 XT
AMD Radeon RX 6900 XT, R9 5950X (SAM ENABLED)
68 (33min - 230max) fps
AMD Radeon RX 6900 XT
AMD Radeon RX 6900 XT, R9 5950X
63 (32min - 219max) fps -7%
AMD Radeon RX 6800 XT
AMD Radeon RX 6800 XT, R9 5950X
65 (33min - 179max) fps -4%
Average NVIDIA GeForce RTX 3090
  (55 - 74, n=3)
62 fps -9%
Nvidia GeForce RTX 3090 Founders Edition
NVIDIA GeForce RTX 3090, R9 5900X
57 (36min - 113max) fps -16%
Average NVIDIA GeForce RTX 3080
  ()
52 fps -24%
MSI GeForce RTX 3070 Gaming X Trio
NVIDIA GeForce RTX 3070, R9 5900X
47 (31min - 92max) fps -31%
Average NVIDIA GeForce RTX 2080 Ti (Desktop)
  ()
46 fps -32%
Average NVIDIA GeForce RTX 3070
  (42 - 47, n=3)
44 fps -35%
AMD Ryzen 9 5900X
NVIDIA Titan RTX, R9 5900X
43 fps -37%
Average NVIDIA Titan RTX
  ()
43 fps -37%
Average NVIDIA GeForce RTX 2080 Super (Desktop)
  ()
36 fps -47%
Average AMD Radeon RX 5700 XT (Desktop)
  ()
33 fps -51%
Average NVIDIA GeForce RTX 2070 Super (Desktop)
  ()
32 fps -53%
2560x1440 Ultra High Preset
AMD Radeon RX 6900 XT
AMD Radeon RX 6900 XT, R9 5950X (SAM ENABLED)
115 (41min - 242max) fps
AMD Radeon RX 6900 XT
AMD Radeon RX 6900 XT, R9 5950X
102 (40min - 239max) fps -11%
AMD Radeon RX 6800 XT
AMD Radeon RX 6800 XT, R9 5950X
98 (25min - 211max) fps -15%
Average NVIDIA GeForce RTX 3090
  (76 - 120, n=3)
91.7 fps -20%
Nvidia GeForce RTX 3090 Founders Edition
NVIDIA GeForce RTX 3090, R9 5900X
79 (44min - 135max) fps -31%
Average NVIDIA GeForce RTX 3080
  ()
76 fps -34%
MSI GeForce RTX 3070 Gaming X Trio
NVIDIA GeForce RTX 3070, R9 5900X
67 (39min - 124max) fps -42%
Average NVIDIA GeForce RTX 2080 Ti (Desktop)
  ()
67 fps -42%
AMD Ryzen 9 5900X
NVIDIA Titan RTX, R9 5900X
66 fps -43%
Average NVIDIA Titan RTX
  ()
66 fps -43%
Average NVIDIA GeForce RTX 3070
  (65 - 67, n=3)
65.7 fps -43%
Average AMD Radeon RX 5700 XT (Desktop)
  ()
59 fps -49%
Average NVIDIA GeForce RTX 2080 Super (Desktop)
  ()
57 fps -50%
Average NVIDIA GeForce RTX 2070 Super (Desktop)
  ()
53 fps -54%
1920x1080 Ultra High Preset
AMD Radeon RX 6900 XT
AMD Radeon RX 6900 XT, R9 5950X (SAM ENABLED)
148 (44min - 248max) fps
AMD Radeon RX 6900 XT
AMD Radeon RX 6900 XT, R9 5950X
125 (43min - 252max) fps -16%
AMD Radeon RX 6800 XT
AMD Radeon RX 6800 XT, R9 5950X
118 (29min - 255max) fps -20%
Average NVIDIA GeForce RTX 3090
  (88 - 152, n=3)
110.3 fps -25%
Nvidia GeForce RTX 3090 Founders Edition
NVIDIA GeForce RTX 3090, R9 5900X
91 (48min - 158max) fps -39%
Average NVIDIA GeForce RTX 3080
  ()
88 fps -41%
AMD Ryzen 9 5900X
NVIDIA Titan RTX, R9 5900X
80 fps -46%
Average NVIDIA GeForce RTX 2080 Ti (Desktop)
  ()
80 fps -46%
Average NVIDIA Titan RTX
  ()
80 fps -46%
Average NVIDIA GeForce RTX 3070
  (77 - 80, n=3)
78.3 fps -47%
MSI GeForce RTX 3070 Gaming X Trio
NVIDIA GeForce RTX 3070, R9 5900X
78 (15min - 139max) fps -47%
Average AMD Radeon RX 5700 XT (Desktop)
  ()
78 fps -47%
Average NVIDIA GeForce RTX 2080 Super (Desktop)
  ()
70 fps -53%
Average NVIDIA GeForce RTX 2070 Super (Desktop)
  ()
66 fps -55%
Shadow of the Tomb Raider
3840x2160 Highest Preset AA:T
Average NVIDIA GeForce RTX 3090
  (89.3 - 99.7, n=12)
96.4 fps +12%
Nvidia GeForce RTX 3090 Founders Edition
NVIDIA GeForce RTX 3090, R9 5900X
94 fps +9%
AMD Radeon RX 6900 XT
AMD Radeon RX 6900 XT, R9 5950X (SAM ENABLED)
86 fps
AMD Radeon RX 6900 XT
AMD Radeon RX 6900 XT, R9 5950X
84 fps -2%
Average NVIDIA GeForce RTX 3080
  (83.9 - 87.9, n=2)
85.9 fps 0%
ASUS GeForce RTX 3080 ROG STRIX OC GAMING
NVIDIA GeForce RTX 3080, R9 5900X
83.9 fps -2%
AMD Radeon RX 6800 XT
AMD Radeon RX 6800 XT, R9 5950X
79.6 fps -7%
Average NVIDIA Titan RTX
  (59 - 71.1, n=24)
66.9 fps -22%
AMD Ryzen 9 5900X
NVIDIA Titan RTX, R9 5900X
66.3 fps -23%
Average NVIDIA GeForce RTX 3070
  (61 - 63.5, n=4)
62.3 fps -28%
MSI GeForce RTX 3070 Gaming X Trio
NVIDIA GeForce RTX 3070, R9 5900X
61 fps -29%
Average NVIDIA GeForce RTX 2080 Ti (Desktop)
  (60 - 61, n=2)
60.5 fps -30%
KFA2 GeForce RTX 2080 Ti EX
NVIDIA GeForce RTX 2080 Ti (Desktop), R9 3900X
60 fps -30%
Nvidia GeForce RTX 2080 Super
NVIDIA GeForce RTX 2080 Super (Desktop), R7 2700X
49 fps -43%
Average NVIDIA GeForce RTX 2080 Super (Desktop)
  (49 - 49, n=2)
49 fps -43%
Average NVIDIA GeForce RTX 2070 Super (Desktop)
  (43 - 47.9, n=5)
45.5 fps -47%
Nvidia GeForce RTX 2070 Super
NVIDIA GeForce RTX 2070 Super (Desktop), R7 2700X
43 fps -50%
AMD Radeon RX 5700 XT
AMD Radeon RX 5700 XT (Desktop), R7 2700X
38 fps -56%
Average AMD Radeon RX 5700 XT (Desktop)
  (32 - 40.9, n=4)
37.9 fps -56%
AMD Radeon RX 5700
AMD Radeon RX 5700 (Desktop), R7 2700X
34 fps -60%
2560x1440 Highest Preset AA:T
Average NVIDIA GeForce RTX 3090
  (137 - 172.3, n=12)
165.6 fps +2%
AMD Radeon RX 6900 XT
AMD Radeon RX 6900 XT, R9 5950X (SAM ENABLED)
163 fps
AMD Radeon RX 6900 XT
AMD Radeon RX 6900 XT, R9 5950X
155 fps -5%
Nvidia GeForce RTX 3090 Founders Edition
NVIDIA GeForce RTX 3090, R9 5900X
159 fps -2%
Average NVIDIA GeForce RTX 3080
  (147 - 152, n=2)
149.5 fps -8%
AMD Radeon RX 6800 XT
AMD Radeon RX 6800 XT, R9 5950X
148 fps -9%
ASUS GeForce RTX 3080 ROG STRIX OC GAMING
NVIDIA GeForce RTX 3080, R9 5900X
147 fps -10%
AMD Ryzen 9 5900X
NVIDIA Titan RTX, R9 5900X
120 fps -26%
Average NVIDIA Titan RTX
  (98 - 128, n=23)
117.8 fps -28%
Average NVIDIA GeForce RTX 3070
  (108 - 116, n=4)
113.2 fps -31%
Average NVIDIA GeForce RTX 2080 Ti (Desktop)
  (108 - 112, n=2)
110 fps -33%
KFA2 GeForce RTX 2080 Ti EX
NVIDIA GeForce RTX 2080 Ti (Desktop), R9 3900X
108 fps -34%
MSI GeForce RTX 3070 Gaming X Trio
NVIDIA GeForce RTX 3070, R9 5900X
108 fps -34%
Average NVIDIA GeForce RTX 2080 Super (Desktop)
  (91 - 92, n=2)
91.5 fps -44%
Nvidia GeForce RTX 2080 Super
NVIDIA GeForce RTX 2080 Super (Desktop), R7 2700X
91 fps -44%
Average NVIDIA GeForce RTX 2070 Super (Desktop)
  (81 - 89.6, n=5)
85.4 fps -48%
Nvidia GeForce RTX 2070 Super
NVIDIA GeForce RTX 2070 Super (Desktop), R7 2700X
81 fps -50%
AMD Radeon RX 5700 XT
AMD Radeon RX 5700 XT (Desktop), R7 2700X
76 fps -53%
Average AMD Radeon RX 5700 XT (Desktop)
  (61 - 79.2, n=4)
73.8 fps -55%
AMD Radeon RX 5700
AMD Radeon RX 5700 (Desktop), R7 2700X
68 fps -58%
1920x1080 Highest Preset AA:T
Average NVIDIA GeForce RTX 3090
  (145 - 240, n=14)
204 fps +1%
AMD Radeon RX 6900 XT
AMD Radeon RX 6900 XT, R9 5950X
202 fps
AMD Radeon RX 6900 XT
AMD Radeon RX 6900 XT, R9 5950X (SAM ENABLED)
199 fps -1%
AMD Radeon RX 6800 XT
AMD Radeon RX 6800 XT, R9 5950X
194 fps -4%
Nvidia GeForce RTX 3090 Founders Edition
NVIDIA GeForce RTX 3090, R9 5900X
187 fps -7%
ASUS GeForce RTX 3080 ROG STRIX OC GAMING
NVIDIA GeForce RTX 3080, R9 5900X
185 fps -8%
Average NVIDIA GeForce RTX 3080
  (177 - 185, n=2)
181 fps -10%
AMD Ryzen 9 5900X
NVIDIA Titan RTX, R9 5900X
166 fps -18%
Average NVIDIA GeForce RTX 3070
  (138 - 160, n=4)
151.3 fps -25%
Average NVIDIA Titan RTX
  (106 - 178.8, n=24)
149.5 fps -26%
MSI GeForce RTX 3070 Gaming X Trio
NVIDIA GeForce RTX 3070, R9 5900X
138 fps -32%
Average NVIDIA GeForce RTX 2080 Ti (Desktop)
  (130 - 142, n=2)
136 fps -33%
KFA2 GeForce RTX 2080 Ti EX
NVIDIA GeForce RTX 2080 Ti (Desktop), R9 3900X
130 fps -36%
Average NVIDIA GeForce RTX 2070 Super (Desktop)
  (104 - 131.1, n=5)
119.7 fps -41%
Average NVIDIA GeForce RTX 2080 Super (Desktop)
  (110 - 118, n=2)
114 fps -44%
Average AMD Radeon RX 5700 XT (Desktop)
  (89 - 119, n=6)
110.8 fps -45%
Nvidia GeForce RTX 2080 Super
NVIDIA GeForce RTX 2080 Super (Desktop), R7 2700X
110 fps -46%
AMD Radeon RX 5700 XT
AMD Radeon RX 5700 XT (Desktop), R7 2700X
110 fps -46%
Nvidia GeForce RTX 2070 Super
NVIDIA GeForce RTX 2070 Super (Desktop), R7 2700X
104 fps -49%
AMD Radeon RX 5700
AMD Radeon RX 5700 (Desktop), R7 2700X
90 fps -55%
Forza Horizon 4
3840x2160 Ultra Preset AA:2xMS
AMD Radeon RX 6900 XT
AMD Radeon RX 6900 XT, R9 5950X (SAM ENABLED)
172 fps
AMD Radeon RX 6900 XT
AMD Radeon RX 6900 XT, R9 5950X
152 fps -12%
Average NVIDIA GeForce RTX 3090
  (147 - 159, n=2)
153 fps -11%
Average NVIDIA Titan RTX
  (90 - 121, n=17)
112.9 fps -34%
KFA2 GeForce RTX 2080 Ti EX
NVIDIA GeForce RTX 2080 Ti (Desktop), R9 3900X
107 fps -38%
Average NVIDIA GeForce RTX 2080 Ti (Desktop)
  (98 - 111, n=3)
105.3 fps -39%
Average NVIDIA GeForce RTX 2070 Super (Desktop)
  (76 - 85, n=3)
81.7 fps -52%
Nvidia GeForce RTX 2080 Super
NVIDIA GeForce RTX 2080 Super (Desktop), R7 2700X
81 fps -53%
Average NVIDIA GeForce RTX 2080 Super (Desktop)
  ()
81 fps -53%
AMD Radeon RX 5700 XT
AMD Radeon RX 5700 XT (Desktop), R7 2700X
79 fps -54%
Average AMD Radeon RX 5700 XT (Desktop)
  ()
79 fps -54%
Nvidia GeForce RTX 2070 Super
NVIDIA GeForce RTX 2070 Super (Desktop), R7 2700X
76 fps -56%
AMD Radeon RX 5700
AMD Radeon RX 5700 (Desktop), R7 2700X
70 fps -59%
2560x1440 Ultra Preset AA:2xMS
AMD Radeon RX 6900 XT
AMD Radeon RX 6900 XT, R9 5950X (SAM ENABLED)
243 fps
AMD Radeon RX 6900 XT
AMD Radeon RX 6900 XT, R9 5950X
218 fps -10%
Average NVIDIA GeForce RTX 3090
  (164 - 229, n=2)
196.5 fps -19%
Average NVIDIA Titan RTX
  (127 - 171, n=16)
154.8 fps -36%
KFA2 GeForce RTX 2080 Ti EX
NVIDIA GeForce RTX 2080 Ti (Desktop), R9 3900X
147 fps -40%
Average NVIDIA GeForce RTX 2080 Ti (Desktop)
  (131 - 150, n=3)
142.7 fps -41%
Average NVIDIA GeForce RTX 2070 Super (Desktop)
  (108 - 125, n=3)
119.3 fps -51%
AMD Radeon RX 5700 XT
AMD Radeon RX 5700 XT (Desktop), R7 2700X
119 fps -51%
Average AMD Radeon RX 5700 XT (Desktop)
  ()
119 fps -51%
Nvidia GeForce RTX 2080 Super
NVIDIA GeForce RTX 2080 Super (Desktop), R7 2700X
117 fps -52%
Average NVIDIA GeForce RTX 2080 Super (Desktop)
  ()
117 fps -52%
Nvidia GeForce RTX 2070 Super
NVIDIA GeForce RTX 2070 Super (Desktop), R7 2700X
108 fps -56%
AMD Radeon RX 5700
AMD Radeon RX 5700 (Desktop), R7 2700X
103 fps -58%
1920x1080 Ultra Preset AA:2xMS
AMD Radeon RX 6900 XT
AMD Radeon RX 6900 XT, R9 5950X
248 fps
AMD Radeon RX 6900 XT
AMD Radeon RX 6900 XT, R9 5950X (SAM ENABLED)
247 fps 0%
Average NVIDIA GeForce RTX 3090
  (166 - 267, n=2)
217 fps -12%
Average NVIDIA Titan RTX
  (129 - 196, n=17)
169.8 fps -32%
KFA2 GeForce RTX 2080 Ti EX
NVIDIA GeForce RTX 2080 Ti (Desktop), R9 3900X
168 fps -32%
Average NVIDIA GeForce RTX 2080 Ti (Desktop)
  (153 - 169, n=3)
163.3 fps -34%
Average AMD Radeon RX 5700 XT (Desktop)
  (138 - 149, n=3)
145 fps -42%
Average NVIDIA GeForce RTX 2070 Super (Desktop)
  (129 - 153, n=3)
145 fps -42%
AMD Radeon RX 5700 XT
AMD Radeon RX 5700 XT (Desktop), R7 2700X
138 fps -44%
Nvidia GeForce RTX 2080 Super
NVIDIA GeForce RTX 2080 Super (Desktop), R7 2700X
133 fps -46%
Average NVIDIA GeForce RTX 2080 Super (Desktop)
  ()
133 fps -46%
Nvidia GeForce RTX 2070 Super
NVIDIA GeForce RTX 2070 Super (Desktop), R7 2700X
129 fps -48%
AMD Radeon RX 5700
AMD Radeon RX 5700 (Desktop), R7 2700X
118 fps -52%
Hitman 3
3840x2160 Maximum Settings AF:16x
AMD Radeon RX 6900 XT
AMD Radeon RX 6900 XT, R9 5950X
128.4 fps
AMD Radeon RX 6900 XT
AMD Radeon RX 6900 XT, R9 5950X (SAM ENABLED)
127.8 fps 0%
Average NVIDIA GeForce RTX 3090
  (115 - 122, n=2)
118.5 fps -8%
Nvidia GeForce RTX 3090 Founders Edition
NVIDIA GeForce RTX 3090, R9 5900X
115 fps -10%
Average NVIDIA GeForce RTX 3080
  ()
109 fps -15%
Average NVIDIA GeForce RTX 2080 Ti (Desktop)
  ()
85.2 fps -34%
AMD Ryzen 9 5900X
NVIDIA Titan RTX, R9 5900X
82 fps -36%
Average NVIDIA Titan RTX
  ()
82 fps -36%
Average NVIDIA GeForce RTX 3070
  ()
77.5 fps -40%
Average NVIDIA GeForce RTX 2080 Super (Desktop)
  ()
64 fps -50%
Average NVIDIA GeForce RTX 2070 Super (Desktop)
  ()
55 fps -57%
Average AMD Radeon RX 5700 XT (Desktop)
  ()
53 fps -59%
2560x1440 Maximum Settings AF:16x
AMD Radeon RX 6900 XT
AMD Radeon RX 6900 XT, R9 5950X
213.1 fps
AMD Radeon RX 6900 XT
AMD Radeon RX 6900 XT, R9 5950X (SAM ENABLED)
213.1 fps 0%
Nvidia GeForce RTX 3090 Founders Edition
NVIDIA GeForce RTX 3090, R9 5900X
190 fps -11%
Average NVIDIA GeForce RTX 3090
  (166 - 190, n=2)
178 fps -16%
Average NVIDIA GeForce RTX 3080
  ()
164 fps -23%
Average NVIDIA GeForce RTX 2080 Ti (Desktop)
  ()
147 fps -31%
AMD Ryzen 9 5900X
NVIDIA Titan RTX, R9 5900X
145 fps -32%
Average NVIDIA Titan RTX
  ()
145 fps -32%
Average NVIDIA GeForce RTX 3070
  ()
140 fps -34%
Average NVIDIA GeForce RTX 2080 Super (Desktop)
  ()
115 fps -46%
Average NVIDIA GeForce RTX 2070 Super (Desktop)
  ()
101 fps -53%
Average AMD Radeon RX 5700 XT (Desktop)
  ()
95 fps -55%
1920x1080 Maximum Settings AF:16x
AMD Radeon RX 6900 XT
AMD Radeon RX 6900 XT, R9 5950X
276.2 fps
AMD Radeon RX 6900 XT
AMD Radeon RX 6900 XT, R9 5950X (SAM ENABLED)
269.4 fps -2%
Nvidia GeForce RTX 3090 Founders Edition
NVIDIA GeForce RTX 3090, R9 5900X
223 fps -19%
AMD Ryzen 9 5900X
NVIDIA Titan RTX, R9 5900X
202 fps -27%
Average NVIDIA Titan RTX
  ()
202 fps -27%
Average NVIDIA GeForce RTX 3090
  (167 - 223, n=2)
195 fps -29%
Average NVIDIA GeForce RTX 3080
  ()
166 fps -40%
Average NVIDIA GeForce RTX 2080 Super (Desktop)
  ()
166 fps -40%
Average NVIDIA GeForce RTX 3070
  ()
165 fps -40%
Average NVIDIA GeForce RTX 2080 Ti (Desktop)
  ()
162 fps -41%
Average NVIDIA GeForce RTX 2070 Super (Desktop)
  ()
148 fps -46%
Average AMD Radeon RX 5700 XT (Desktop)
  ()
141 fps -49%
Watch Dogs Legion
1920x1080 Ultra Preset + Ultra Ray Tracing (DX12)
Average NVIDIA GeForce RTX 3090
  (75.7 - 110, n=3)
88 fps +58%
Nvidia GeForce RTX 3090 Founders Edition
NVIDIA GeForce RTX 3090, R9 5900X
75.7 (33.41min, 58.92P1 - 126.05max) fps +36%
AMD Radeon RX 6800 XT
AMD Radeon RX 6800 XT, R9 5950X
71.4 (47.71min, 55.63P1 - 113.42max) fps +28%
Average NVIDIA GeForce RTX 3080
  (70.9 - 71.3, n=2)
71.1 fps +28%
ASUS GeForce RTX 3080 ROG STRIX OC GAMING
NVIDIA GeForce RTX 3080, R9 5900X
70.9 (37.64min, 58.05P1 - 113.63max) fps +28%
Average NVIDIA GeForce RTX 2080 Ti (Desktop)
  ()
55.8 fps 0%
AMD Radeon RX 6900 XT
AMD Radeon RX 6900 XT, R9 5950X
55.6 (35.81min, 41.86P1 - 76.28max) fps
AMD Radeon RX 6900 XT
AMD Radeon RX 6900 XT, R9 5950X (SAM ENABLED)
55.5 (36.48min, 43.27P1 - 76.42max) fps 0%
Average NVIDIA Titan RTX
  ()
55.4 fps 0%
Average NVIDIA GeForce RTX 3070
  (51.7 - 61, n=4)
55.1 fps -1%
MSI GeForce RTX 3070 Gaming X Trio
NVIDIA GeForce RTX 3070, R9 5900X
54.3 (18.74min, 40.53P1 - 81.06max) fps -2%
Average NVIDIA GeForce RTX 2080 Super (Desktop)
  ()
45.4 fps -18%
Average NVIDIA GeForce RTX 2070 Super (Desktop)
  ()
39.2 fps -29%
3840x2160 Ultra Preset (DX12)
Average NVIDIA GeForce RTX 3090
  (57.6 - 64, n=3)
60.6 fps +13%
Nvidia GeForce RTX 3090 Founders Edition
NVIDIA GeForce RTX 3090, R9 5900X
57.6 (24.58min, 45.93P1 - 114.36max) fps +7%
ASUS GeForce RTX 3080 ROG STRIX OC GAMING
NVIDIA GeForce RTX 3080, R9 5900X
54.1 (24.72min, 44.97P1 - 114.7max) fps +1%
Average NVIDIA GeForce RTX 3080
  (53.5 - 54.1, n=2)
53.8 fps 0%
AMD Radeon RX 6900 XT
AMD Radeon RX 6900 XT, R9 5950X (SAM ENABLED)
53.6 (34.78min, 44.93P1 - 72.47max) fps
AMD Radeon RX 6900 XT
AMD Radeon RX 6900 XT, R9 5950X
53.5 (33.75min, 44.2P1 - 82.3max) fps 0%
AMD Radeon RX 6800 XT
AMD Radeon RX 6800 XT, R9 5950X
49.3 (32.85min, 41.54P1 - 76.12max) fps -8%
Average NVIDIA GeForce RTX 2080 Ti (Desktop)
  ()
44 fps -18%
Average NVIDIA Titan RTX
  ()
43.4 fps -19%
Average NVIDIA GeForce RTX 3070
  (37 - 39.2, n=4)
38 fps -29%
MSI GeForce RTX 3070 Gaming X Trio
NVIDIA GeForce RTX 3070, R9 5900X
37 (17.44min, 25.32P1 - 81.3max) fps -31%
Average NVIDIA GeForce RTX 2080 Super (Desktop)
  ()
34.4 fps -36%
Average NVIDIA GeForce RTX 2070 Super (Desktop)
  ()
29.2 fps -46%
Average AMD Radeon RX 5700 XT (Desktop)
  ()
12.7 fps -76%
2560x1440 Ultra Preset (DX12)
Average NVIDIA GeForce RTX 3090
  (88.3 - 103, n=3)
93.7 fps +3%
AMD Radeon RX 6900 XT
AMD Radeon RX 6900 XT, R9 5950X (SAM ENABLED)
91.4 (38.16min, 73.25P1 - 135.95max) fps
AMD Radeon RX 6900 XT
AMD Radeon RX 6900 XT, R9 5950X
91.1 (31.59min, 72.21P1 - 151.03max) fps 0%
Nvidia GeForce RTX 3090 Founders Edition
NVIDIA GeForce RTX 3090, R9 5900X
88.3 (48.36min, 68.18P1 - 160.5max) fps -3%
AMD Radeon RX 6800 XT
AMD Radeon RX 6800 XT, R9 5950X
84.5 (58.88min, 69.45P1 - 137.16max) fps -8%
ASUS GeForce RTX 3080 ROG STRIX OC GAMING
NVIDIA GeForce RTX 3080, R9 5900X
81.6 (44.31min, 65.35P1 - 139.28max) fps -11%
Average NVIDIA GeForce RTX 3080
  (81.1 - 81.6, n=2)
81.4 fps -11%
Average NVIDIA GeForce RTX 2080 Ti (Desktop)
  ()
72.9 fps -20%
Average NVIDIA Titan RTX
  ()
69.9 fps -24%
Average NVIDIA GeForce RTX 3070
  (65.3 - 67, n=4)
66.1 fps -28%
MSI GeForce RTX 3070 Gaming X Trio
NVIDIA GeForce RTX 3070, R9 5900X
65.7 (25.01min, 51.86P1 - 96.9max) fps -28%
Average NVIDIA GeForce RTX 2080 Super (Desktop)
  ()
57.3 fps -37%
Average NVIDIA GeForce RTX 2070 Super (Desktop)
  ()
51.4 fps -44%
Average AMD Radeon RX 5700 XT (Desktop)
  ()
46.4 fps -49%
1920x1080 Ultra Preset (DX12)
AMD Radeon RX 6900 XT
AMD Radeon RX 6900 XT, R9 5950X (SAM ENABLED)
121 (67.26min, 95.56P1 - 184.97max) fps
AMD Radeon RX 6900 XT
AMD Radeon RX 6900 XT, R9 5950X
120 (81.32min, 93.02P1 - 209.32max) fps -1%
Average NVIDIA GeForce RTX 3090
  (103 - 134, n=3)
114.7 fps -5%
AMD Radeon RX 6800 XT
AMD Radeon RX 6800 XT, R9 5950X
112 (75.12min, 87.97P1 - 181.69max) fps -7%
Nvidia GeForce RTX 3090 Founders Edition
NVIDIA GeForce RTX 3090, R9 5900X
107 (24.35min, 77.46P1 - 174.03max) fps -12%
ASUS GeForce RTX 3080 ROG STRIX OC GAMING
NVIDIA GeForce RTX 3080, R9 5900X
103 (55.63min, 83.65P1 - 156.57max) fps -15%
Average NVIDIA GeForce RTX 3080
  (99.3 - 103, n=2)
101.2 fps -16%
Average NVIDIA GeForce RTX 2080 Ti (Desktop)
  ()
89.6 fps -26%
Average NVIDIA Titan RTX
  ()
85.5 fps -29%
Average NVIDIA GeForce RTX 3070
  (79 - 89, n=4)
84.7 fps -30%
MSI GeForce RTX 3070 Gaming X Trio
NVIDIA GeForce RTX 3070, R9 5900X
79 (42.91min, 56.59P1 - 121.27max) fps -35%
Average NVIDIA GeForce RTX 2080 Super (Desktop)
  ()
75.4 fps -38%
Average NVIDIA GeForce RTX 2070 Super (Desktop)
  ()
68.3 fps -44%
Average AMD Radeon RX 5700 XT (Desktop)
  ()
66.8 fps -45%
F1 2020
3840x2160 Ultra High Preset AA:T AF:16x
Average NVIDIA GeForce RTX 3090
  (133 - 149.6, n=11)
142.3 fps +4%
AMD Radeon RX 6900 XT
AMD Radeon RX 6900 XT, R9 5950X (SAM ENABLED)
137 (109min - 165max) fps
AMD Radeon RX 6900 XT
AMD Radeon RX 6900 XT, R9 5950X
136 (110min - 161max) fps -1%
Nvidia GeForce RTX 3090 Founders Edition
NVIDIA GeForce RTX 3090, R9 5900X
135 (116min - 157max) fps -1%
AMD Radeon RX 6800 XT
AMD Radeon RX 6800 XT, R9 5950X (704326)
128 (106min - 152max) fps -7%
ASUS GeForce RTX 3080 ROG STRIX OC GAMING
NVIDIA GeForce RTX 3080, R9 5900X (692646)
118 (102min - 137max) fps -14%
Average NVIDIA GeForce RTX 3080
  (114 - 118, n=2)
116 fps -15%
Average NVIDIA Titan RTX
  (97.4 - 103.4, n=6)
101.5 fps -26%
Average NVIDIA GeForce RTX 2080 Ti (Desktop)
  ()
100 fps -27%
Average NVIDIA GeForce RTX 3070
  (88.7 - 92.7, n=3)
90.2 fps -34%
MSI GeForce RTX 3070 Gaming X Trio
NVIDIA GeForce RTX 3070, R9 5900X (692646)
89.2 (73min - 104max) fps -35%
Average NVIDIA GeForce RTX 2080 Super (Desktop)
  ()
77.2 fps -44%
Average NVIDIA GeForce RTX 2070 Super (Desktop)
  (67.6 - 71.4, n=3)
69.2 fps -49%
Average AMD Radeon RX 5700 XT (Desktop)
  (47 - 65, n=4)
59.3 fps -57%
2560x1440 Ultra High Preset AA:T AF:16x
AMD Radeon RX 6900 XT
AMD Radeon RX 6900 XT, R9 5950X (SAM ENABLED)
228 (178min - 275max) fps
AMD Radeon RX 6900 XT
AMD Radeon RX 6900 XT, R9 5950X
220 (173min - 264max) fps -4%
Average NVIDIA GeForce RTX 3090
  (204 - 241, n=11)
228 fps 0%
AMD Radeon RX 6800 XT
AMD Radeon RX 6800 XT, R9 5950X (704326)
215 (166min - 264max) fps -6%
Nvidia GeForce RTX 3090 Founders Edition
NVIDIA GeForce RTX 3090, R9 5900X
207 (171min - 241max) fps -9%
Average NVIDIA Titan RTX
  (153 - 175.8, n=6)
167.4 fps -27%
Average NVIDIA GeForce RTX 2080 Ti (Desktop)
  ()
162 fps -29%
ASUS GeForce RTX 3080 ROG STRIX OC GAMING
NVIDIA GeForce RTX 3080, R9 5900X (692646)
155 (128min - 184max) fps -32%
Average NVIDIA GeForce RTX 3080
  (146 - 155, n=2)
150.5 fps -34%
Average NVIDIA GeForce RTX 3070
  (143 - 162.2, n=3)
150.4 fps -34%
MSI GeForce RTX 3070 Gaming X Trio
NVIDIA GeForce RTX 3070, R9 5900X (692646)
146 (121min - 168max) fps -36%
Average NVIDIA GeForce RTX 2080 Super (Desktop)
  ()
127 fps -44%
Average NVIDIA GeForce RTX 2070 Super (Desktop)
  (117.6 - 121.1, n=3)
118.9 fps -48%
Average AMD Radeon RX 5700 XT (Desktop)
  (80 - 109, n=4)
99.3 fps -56%
1920x1080 Ultra High Preset AA:T AF:16x
AMD Radeon RX 6900 XT
AMD Radeon RX 6900 XT, R9 5950X (SAM ENABLED)
291 (222min - 355max) fps
AMD Radeon RX 6900 XT
AMD Radeon RX 6900 XT, R9 5950X
275 (213min - 338max) fps -5%
Average NVIDIA GeForce RTX 3090
  (227 - 312, n=11)
282 fps -3%
AMD Radeon RX 6800 XT
AMD Radeon RX 6800 XT, R9 5950X (704326)
279 (211min - 345max) fps -4%
Nvidia GeForce RTX 3090 Founders Edition
NVIDIA GeForce RTX 3090, R9 5900X
250 (214min - 304max) fps -14%
Average NVIDIA Titan RTX
  (194 - 231, n=7)
216 fps -26%
Average NVIDIA GeForce RTX 2080 Ti (Desktop)
  ()
202 fps -31%
Average NVIDIA GeForce RTX 3070
  (179 - 215, n=3)
191.7 fps -34%
ASUS GeForce RTX 3080 ROG STRIX OC GAMING
NVIDIA GeForce RTX 3080, R9 5900X (692646)
185 (158min - 218max) fps -36%
Average NVIDIA GeForce RTX 3080
  (179 - 185, n=2)
182 fps -37%
MSI GeForce RTX 3070 Gaming X Trio
NVIDIA GeForce RTX 3070, R9 5900X (692646)
179 (153min - 213max) fps -38%
Average NVIDIA GeForce RTX 2080 Super (Desktop)
  ()
162 fps -44%
Average NVIDIA GeForce RTX 2070 Super (Desktop)
  (153 - 163, n=3)
157.4 fps -46%
Average AMD Radeon RX 5700 XT (Desktop)
  (108 - 149, n=4)
131.9 fps -55%
bajo medio alto ultraQHD4K
The Witcher 3 (2015) 589 375 323 163.6 122
Shadow of the Tomb Raider (2018) 248 222 213 199 163 86
Forza Horizon 4 (2018) 350 283 279 247 243 172
Assassin´s Creed Odyssey (2018) 124 117 106 98 99 68
Battlefield V (2018) 196 195 196 197 196 134
Far Cry New Dawn (2019) 141 126 123 118 117 101
Metro Exodus (2019) 274 214 154 123 102 66.7
The Division 2 (2019) 217 190 157 138 118 66.6
Anno 1800 (2019) 223 162 139 87.1 70.7 52
Total War: Three Kingdoms (2019) 429.7 263 180.3 141.3 92.9 44.9
Control (2019) 240 234 174 113 53.9
Borderlands 3 (2019) 197 169 152 131 107 59.8
Red Dead Redemption 2 (2019) 208 196 150 98 82.1 54.6
Doom Eternal (2020) 624 480 416 411 328 185
Gears Tactics (2020) 495.8 338.1 249 175.1 136.4 74.1
F1 2020 (2020) 520 442 395 291 228 137
Horizon Zero Dawn (2020) 245 205 184 164 136 76
Mafia Definitive Edition (2020) 160 142 138 120 67
Watch Dogs Legion (2020) 191 190 170 121 91.4 53.6
Assassin´s Creed Valhalla (2020) 227 169 142 148 115 68
Call of Duty Black Ops Cold War (2020) 298 198 169 153 115 68.1
Immortals Fenyx Rising (2020) 139 126 127 122 121 83
Cyberpunk 2077 1.0 (2020) 160 152 127 106 72.3 34.8
Hitman 3 (2021) 352.8 283.2 279.9 269.4 213.1 127.8

Emissions

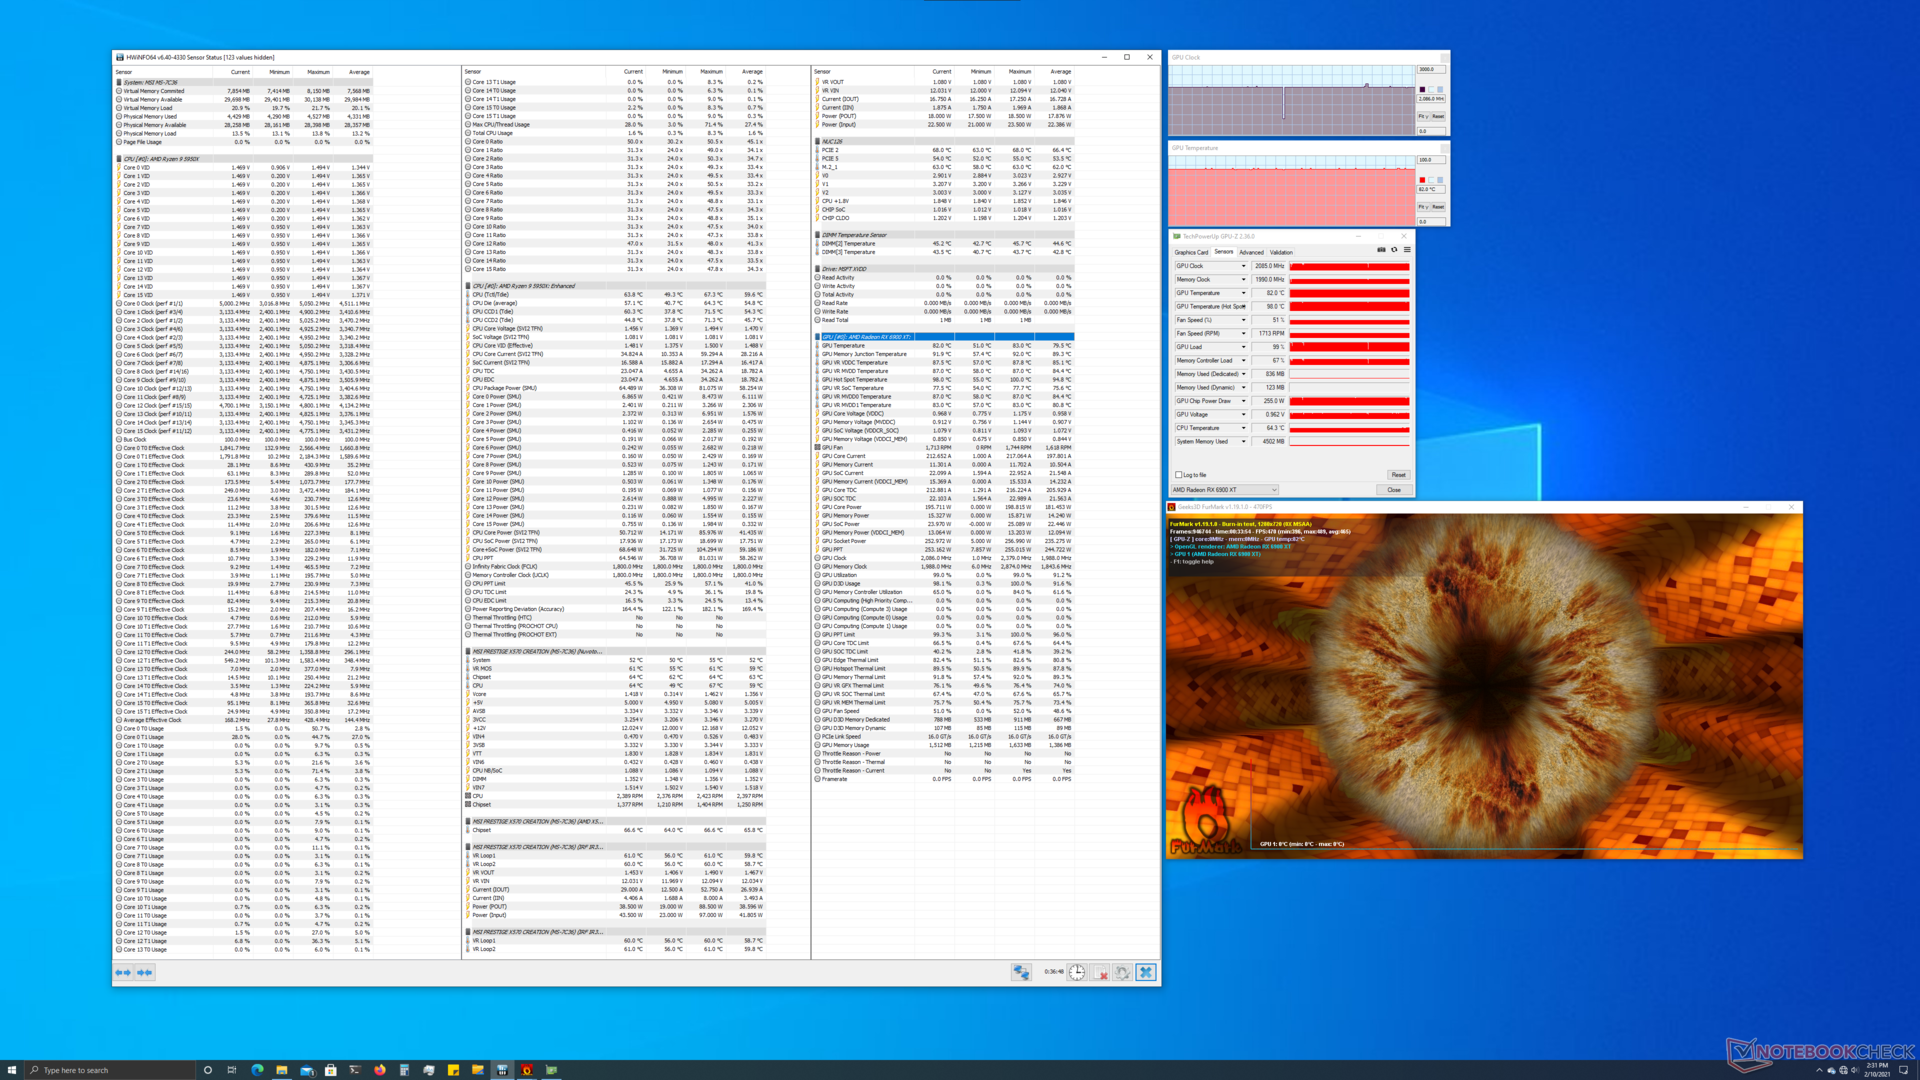
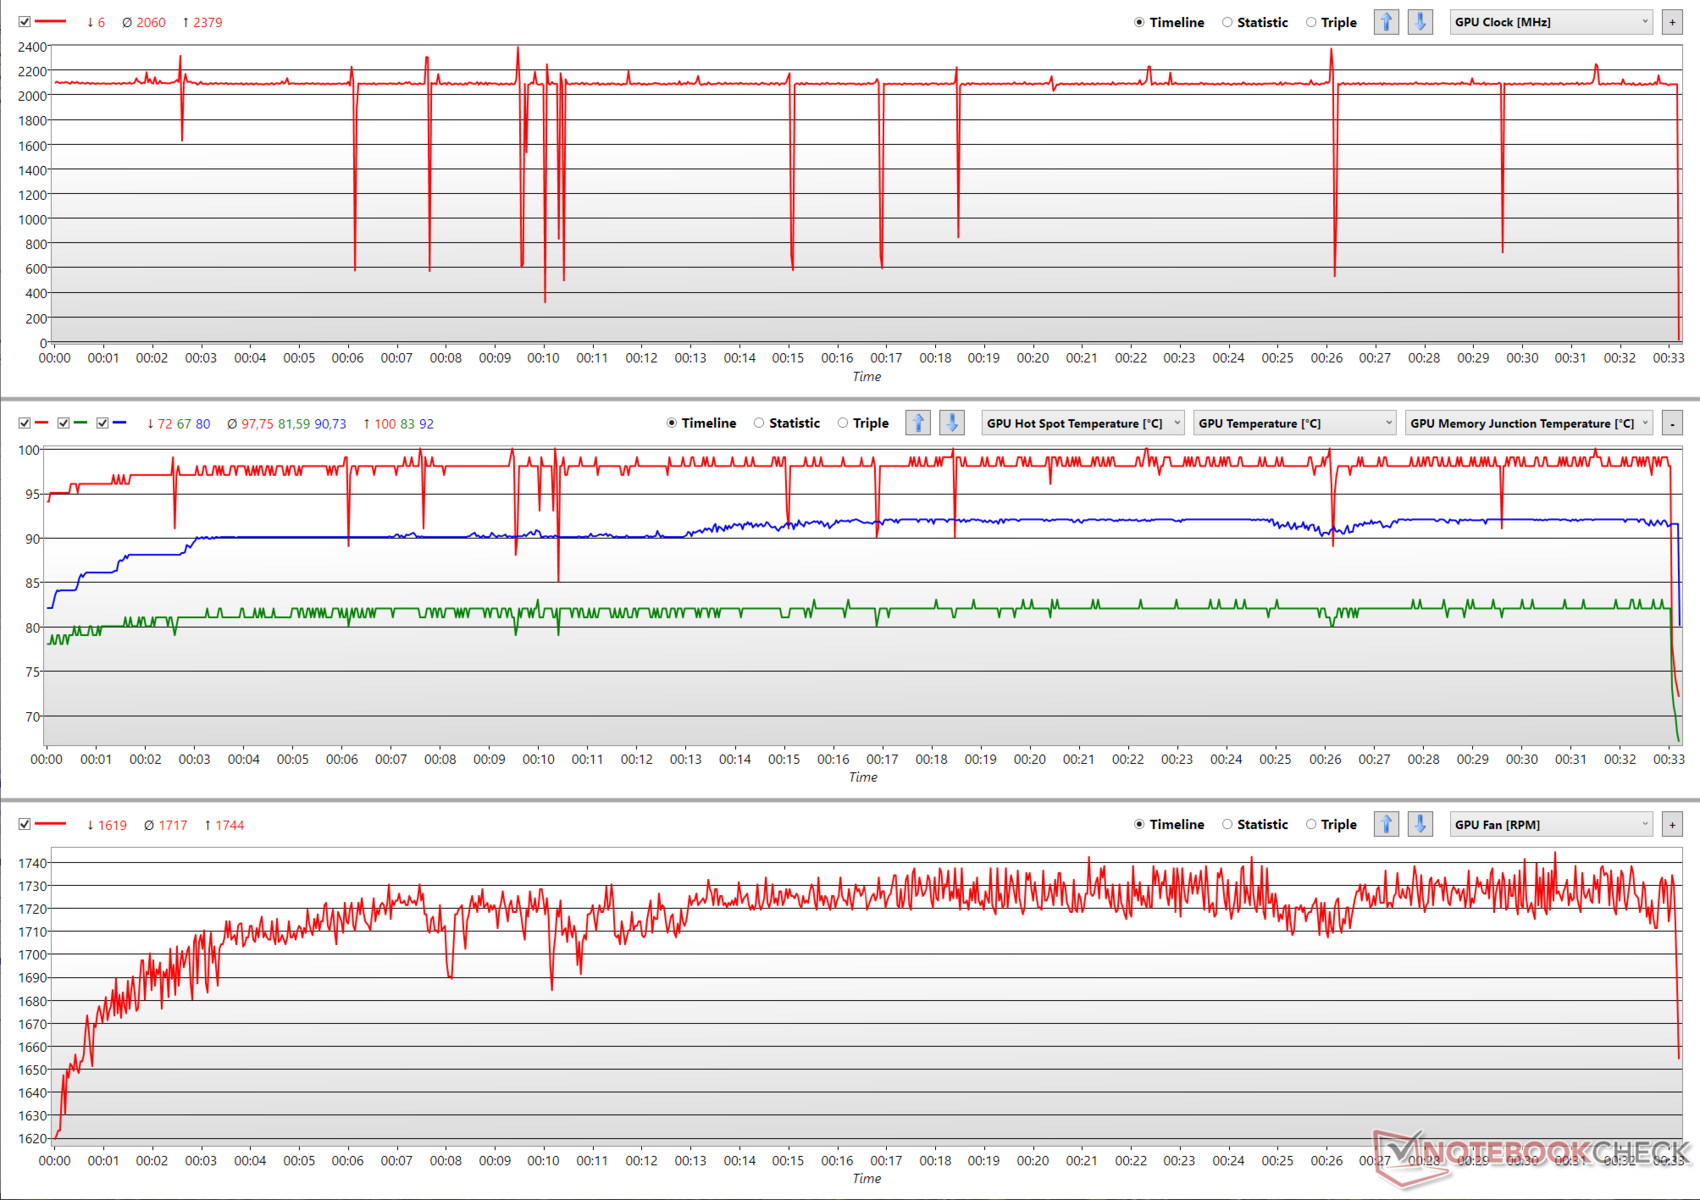
Con la serie RX 6000, AMD se ha deshecho de su tradicional ventilador por un sistema de refrigeración de tres ventiladores más potente. Aunque este nuevo refrigerador permite sin duda una mayor estabilidad de los relojes, la tarjeta se acerca a menudo a los 100 °C de temperatura en FurMark. El núcleo también se calienta bastante, a 82 °C

En su mayor parte, la RX 6900 XT puede ofrecer una aceleración bastante sostenida de 2.086 MHz y a veces incluso puede alcanzar los 2.379 MHz. Sin embargo, vemos un estrangulamiento ocasional cuando la temperatura del punto caliente alcanza los 100 °C, aunque los relojes se recuperan con bastante rapidez

Usamos FurMark stress para determinar los niveles de ruido y temperatura. Para medir el consumo de energía se utilizaron FuMark y The Witcher 3 a 1080p Ultra

Estrés de FurMark
Estrés de FurMark
Gráficos de los relojes de los núcleos, las temperaturas (temperatura del punto caliente de la GPU - rojo, temperatura de la GPU - verde, temperatura de la unión de la GDDR6 - azul) y la velocidad de los ventiladores durante el estrés de FurMark

Temperatura

Mapa de calor de la AMD Radeon RX 6900 XT.

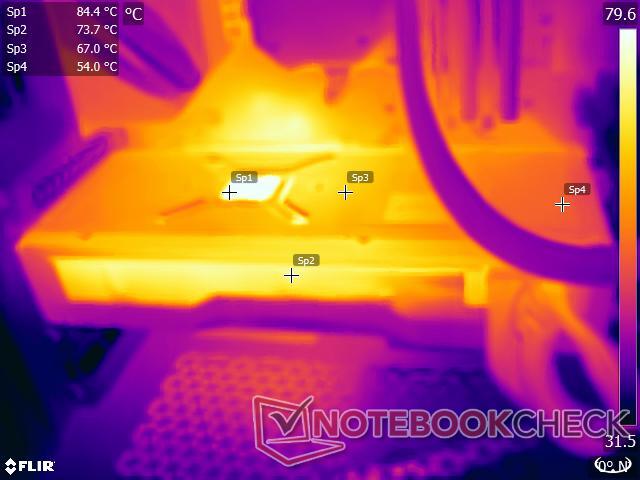
Las temperaturas superficiales también parecen estar en el lado más alto. Registramos casi 85 °C cerca de la zona de la GPU y 67 °C cerca de la sección VRM de la fuente de alimentación mientras ejecutábamos la prueba de estrés FurMark.

Las salidas de aire de la parte superior de la tarjeta pueden alcanzar hasta casi 74 °C. Por lo tanto, recomendamos utilizar un buen extractor de aire para evitar la acumulación de calor en el interior de la caja, especialmente si ésta tiene un panel lateral de vidrio templado. A los usuarios potentes les puede interesar subvoltear la tarjeta y establecer un límite de potencia más bajo. Esto puede reducir potencialmente la temperatura del punto caliente y evitar algunas de las caídas del reloj que hemos visto antes.

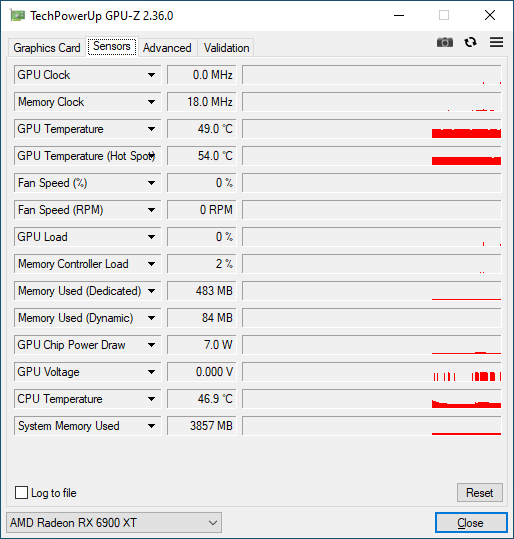
Registramos 49 °C y 54 °C como temperaturas de la GPU y del punto caliente, respectivamente, en reposo. A diferencia de la tarjeta de referencia Radeon RX 5700 XT, la RX 6900 XT incorpora ahora la función de parada de ventiladores en reposo, lo que significa que los ventiladores se apagan por completo cuando no hay carga

Consumo de energía

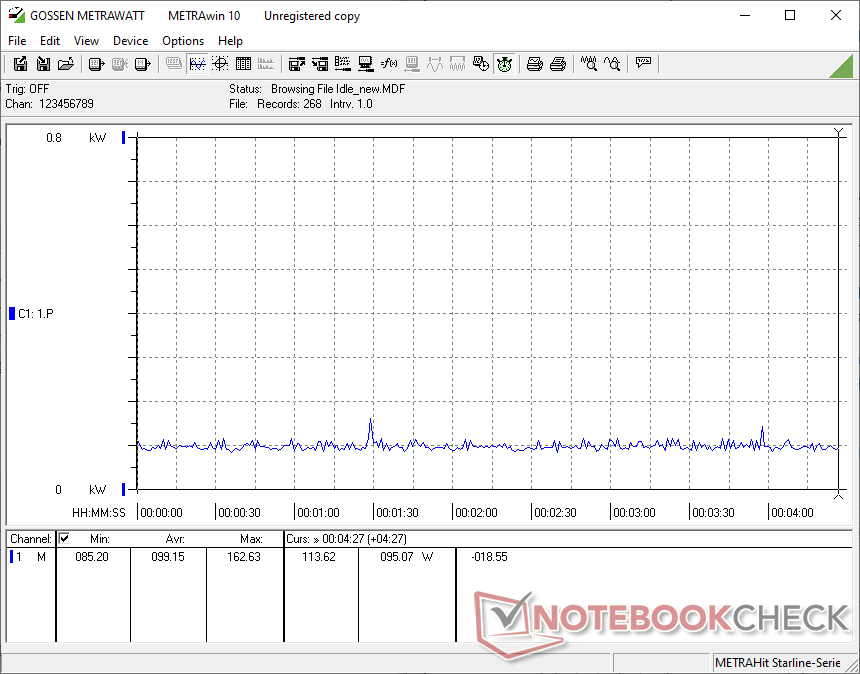
Nuestro banco de pruebas consume una media de 99 W en reposo con toda la iluminación RGB apagada y un total de cinco ventiladores (tres Corsair SP de 120 mm para la caja y dos Corsair ML de 120 mm para el radiador) y la bomba Elite Capellix AIO funcionando en un perfil equilibrado.

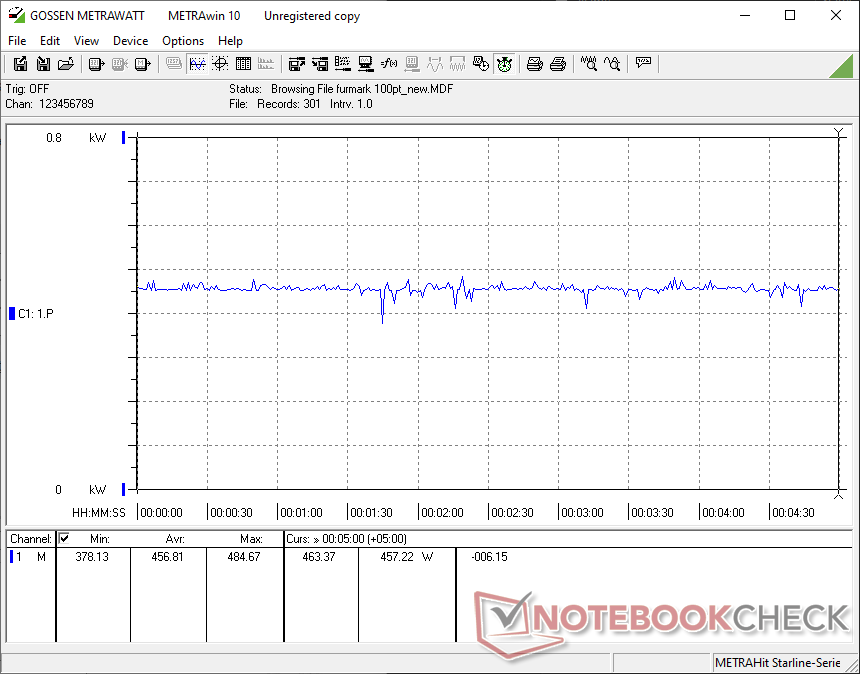
Nuestro sistema basado en la RX 6900 XT consume una media de 456,8 W y 488 W durante las pruebas de estrés de FurMark y The Witcher 3 Ultra, respectivamente. El consumo de energía durante el estrés de FurMark muestra una caída ocasional consistente con las caídas de velocidad de reloj que hemos descrito antes

Aunque las nuevas tarjetas RDNA 2 muestran definitivamente un mayor consumo de energía respecto a la RX 5700 XT, es interesante observar que no hay mucha diferencia entre la RX 6800 XT y la RX 6900 XT en este sentido. La RTX 3090 Founders Edition, por otro lado, consume un 10% más de energía que la RX 6900 XT en el estrés de FurMark también mientras que es un 5% más económica en The Witcher 3 Ultra

Consumo de energía del sistema - En reposo
Consumo de energía del sistema - FurMark stress
Consumo de energía del sistema - El preajuste Witcher 3 1080p Ultra
Power Consumption
1280x720 FurMark 1.19 GPU Stress Test (external Monitor)
ASUS GeForce RTX 3080 ROG STRIX OC GAMING
NVIDIA GeForce RTX 3080, R9 5900X (Idle: 88.3 W)
505 (493min - 541max) Watt * -11%
Nvidia GeForce RTX 3090 Founders Edition
NVIDIA GeForce RTX 3090, R9 5900X (Idle: 91.1 W)
502 (425min - 525max) Watt * -10%
Average NVIDIA GeForce RTX 3080
  (Idle: 492 - 505, n=2 W)
499 Watt * -9%
Average NVIDIA GeForce RTX 3090
  (Idle: 281 - 551, n=8 W)
469 Watt * -3%
AMD Radeon RX 6900 XT
AMD Radeon RX 6900 XT, R9 5950X (Idle: 99.15 W)
456.8 (378.13min - 484.67max) Watt *
AMD Radeon RX 6800 XT
AMD Radeon RX 6800 XT, R9 5950X (Idle: 99.5 W)
447.9 (413min - 484max) Watt * +2%
Average NVIDIA Titan RTX
  (Idle:  W)
419 Watt * +8%
KFA2 GeForce RTX 2080 Ti EX
NVIDIA GeForce RTX 2080 Ti (Desktop), R9 3900X (Idle: 100.5 W)
400.8 (354min - 432max) Watt * +12%
Average NVIDIA GeForce RTX 2080 Ti (Desktop)
  (Idle: 330 - 439, n=3 W)
390 Watt * +15%
MSI GeForce RTX 3070 Gaming X Trio
NVIDIA GeForce RTX 3070, R9 5900X (Idle: 95.1 W)
376.9 (369min - 433max) Watt * +17%
Nvidia GeForce RTX 2080 Super
NVIDIA GeForce RTX 2080 Super (Desktop), R7 2700X (Idle: 78.87 W)
376.8 (331min - 409max) Watt * +18%
Average NVIDIA GeForce RTX 2080 Super (Desktop)
  (Idle: 328 - 414, n=4 W)
362 Watt * +21%
Average NVIDIA GeForce RTX 3070
  (Idle: 281 - 393, n=6 W)
348 Watt * +24%
Average AMD Radeon RX 5700 XT (Desktop)
  (Idle: 327 - 352, n=3 W)
339 Watt * +26%
Average NVIDIA GeForce RTX 2070 Super (Desktop)
  (Idle: 280 - 358, n=6 W)
329 Watt * +28%
AMD Radeon RX 5700 XT
AMD Radeon RX 5700 XT (Desktop), R7 2700X (239 fps, Idle: 69.8 W)
326.6 (313min - 351max) Watt * +29%
Nvidia GeForce RTX 2070 Super
NVIDIA GeForce RTX 2070 Super (Desktop), R7 2700X (283 fps, Idle: 80.5 W)
326 (315min - 348max) Watt * +29%
AMD Radeon RX 5700
AMD Radeon RX 5700 (Desktop), R7 2700X (207 fps, Idle: 64.5 W)
280.5 (271min - 312max) Watt * +39%
1920x1080 The Witcher 3 ultra (external Monitor)
Average NVIDIA GeForce RTX 3090
  (Idle: 464 - 597, n=17 W)
524 Watt * -7%
ASUS GeForce RTX 3080 ROG STRIX OC GAMING
NVIDIA GeForce RTX 3080, R9 5900X (Idle: 88.3 W)
505 (389min - 543max) Watt * -3%
AMD Radeon RX 6800 XT
AMD Radeon RX 6800 XT, R9 5950X (Idle: 99.5 W)
505 (389min - 543max) Watt * -3%
Average NVIDIA GeForce RTX 3080
  (Idle: 498 - 505, n=2 W)
502 Watt * -3%
AMD Radeon RX 6900 XT
AMD Radeon RX 6900 XT, R9 5950X (Idle: 99.15 W)
488.3 (459.99min - 512.79max) Watt *
Nvidia GeForce RTX 3090 Founders Edition
NVIDIA GeForce RTX 3090, R9 5900X (Idle: 91.1 W)
463.7 (450min - 487max) Watt * +5%
AMD Ryzen 9 5900X
NVIDIA Titan RTX, R9 5900X (Idle: 78.1 W)
439.6 (419min - 497max) Watt * +10%
KFA2 GeForce RTX 2080 Ti EX
NVIDIA GeForce RTX 2080 Ti (Desktop), R9 3900X (Idle: 100.5 W)
438.8 (431min - 463max) Watt * +10%
Average NVIDIA GeForce RTX 2080 Ti (Desktop)
  (Idle: 359 - 467, n=3 W)
422 Watt * +14%
Average NVIDIA Titan RTX
  (Idle: 371 - 463, n=27 W)
408 Watt * +16%
Average NVIDIA GeForce RTX 3070
  (Idle: 317 - 550, n=5 W)
401 Watt * +18%
MSI GeForce RTX 3070 Gaming X Trio
NVIDIA GeForce RTX 3070, R9 5900X (Idle: 95.1 W)
394.5 (381min - 430max) Watt * +19%
Nvidia GeForce RTX 2080 Super
NVIDIA GeForce RTX 2080 Super (Desktop), R7 2700X (Idle: 78.87 W)
382.8 (360min - 410max) Watt * +22%
Average NVIDIA GeForce RTX 2080 Super (Desktop)
  (Idle: 336 - 416, n=5 W)
363 Watt * +26%
Average AMD Radeon RX 5700 XT (Desktop)
  (Idle: 326 - 376, n=3 W)
350 Watt * +28%
AMD Radeon RX 5700 XT
AMD Radeon RX 5700 XT (Desktop), R7 2700X (Idle: 69.8 W)
348.7 (341min - 359max) Watt * +29%
Nvidia GeForce RTX 2070 Super
NVIDIA GeForce RTX 2070 Super (Desktop), R7 2700X (96.8 fps, Idle: 80.5 W)
344.7 (335min - 370max) Watt * +29%
Average NVIDIA GeForce RTX 2070 Super (Desktop)
  (Idle: 296 - 377, n=6 W)
342 Watt * +30%
AMD Radeon RX 5700
AMD Radeon RX 5700 (Desktop), R7 2700X (84.2 fps, Idle: 64.5 W)
295.9 (284min - 304max) Watt * +39%

* ... más pequeño es mejor

Niveles de ruido

El nuevo sistema de refrigeración de triple ventilador de AMD parece funcionar con niveles de ruido decentes. Con la disponibilidad de un modo de parada completa del ventilador, el nivel de presión sonora (SPL) es casi el mismo que los niveles ambientales con 28,70 db(A) a una distancia de 20 cm de la carcasa cerrada

Durante las pruebas de estrés de FurMark, el SPL subió a 44,13 db(A), lo que es bastante tolerable cuando la caja está cerrada. Los usuarios pueden optimizar aún más las temperaturas y las curvas de los ventiladores usando Radeon Software Adrenalin Edition o mediante herramientas de terceros como MSI Afterburner

Niveles de ruido - En reposo con los ventiladores de la caja apagados
Niveles de ruido - FurMark stress con los ventiladores de la caja apagados

Pro

+ Buena calidad de construcción
+ Placa trasera de aluminio
+ Refrigerador de triple ventilador
+ Puerto USB tipo C
+ Rendimiento entre una RTX 3080 y una RTX 3090 en la mayoría de los benchmarks de juegos sintéticos y 4K
+ Buen espectáculo en aplicaciones 3D profesionales
+ Consumo de energía a la par con una RX 6800 XT y menos que la RTX 3090
+ Parada completa del ventilador en reposo
+ Niveles de ruido tolerables bajo estrés
+ 500 dólares más barata en el precio de venta al público en comparación con una RTX 3090

Contra

- El rendimiento informático puede ser mejor
- El trazado de rayos está significativamente por detrás de la RTX 3080 y la RTX 3090
- Todavía no hay soporte de supermuestreo basado en IA
- Memoria de acceso inteligente de poca importancia en la mayoría de los juegos
- Altas temperaturas del núcleo y de la superficie bajo carga
- Ralentización esporádica bajo carga
- Rendimiento general sólo ligeramente superior al de la RX 6800 XT
- Existencias muy limitadas

Veredicto

AMD Radeon RX 6900 XT. Unidad de revisión por cortesía de AMD India.

Los días en los que AMD no era la favorita en el mercado de las GPU han terminado oficialmente con la Radeon RX 6900 XT. La RX 6900 XT tiene el temple necesario para enfrentarse de verdad a los buques insignia de NVIDIA, y lo vemos reflejado en la mayoría de las pruebas. Con las últimas tarjetas Navi 2x, AMD parece haber adoptado un diseño más llamativo, con un logotipo RGB de Radeon y un refrigerador de tres ventiladores para mejorar el rendimiento térmico en comparación con los refrigeradores tipo soplador que hemos visto hasta ahora.

La RX 6900 XT se defiende bastante bien, incluso superando a la RTX 3090 en algunas pruebas sintéticas. Teniendo en cuenta el precio de venta al público de 999 dólares de la RX 6900 XT frente al precio de venta al público de 1.499 dólares de la RTX 3090, el ligero déficit de rendimiento queda bien compensado por la diferencia de precio de 500 dólares. Además, vemos cifras excelentes en aplicaciones profesionales, lo que convierte a la RX 6900 XT en una buena opción si tu carga de trabajo no depende de CUDA.

Los jugadores que desean tener una tarjeta AMD emblemática que pueda ser una alternativa viable a la de NVIDIA encontrarán que la RX 6900 XT merece la pena, especialmente si los juegos están optimizados para el hardware de AMD. Los controladores Radeon Software Adrenalin han avanzado mucho en cuanto a ofrecer una experiencia establey la inclusión de la adaptación de Ryzen y Radeon en la última versión es definitivamente un paso en la dirección correcta. La memoria de acceso inteligente, aunque es bueno tenerla, actualmente tiene poca importancia en la gran mayoría de los juegos actuales.

Sin embargo, AMD va por detrás de NVIDIA en dos tecnologías que los desarrolladores de juegos están adoptando rápidamente: el trazado de rayos y el supermuestreo basado en IA. El rendimiento del trazado de rayos de la RX 6900 XT es sin duda de la clase RTX 2080 Ti, pero no es realmente competitivo con lo que pueden ofrecer las RTX 3080 y RTX 3090. Además, AMD aún no ha presentado con una solución de supermuestreo en la línea de Deep Learning Super Sampling (DLSS) de NVIDIA.

Las ocho CU adicionales de la RX 6900 XT no parecen ofrecer una ganancia de rendimiento significativa con respecto a la RX 6800 XT de 72 CUDA. Por lo tanto, si buscas principalmente una tarjeta para jugar, la RX 6800 XT, con un precio de venta al público de 649 dólares, probablemente sea una mejor inversión

La AMD Radeon RX 6900 XT es justo lo que los fans de Team Red han estado pidiendo desde hace tiempo para mantener a raya a la competencia. Aunque la RX 6900 XT no supera del todo a la NVIDIA GeForce RTX 3090, está a una distancia considerable y, en ocasiones, puede superar a la principal de NVIDIA por un buen margen, lo que la convierte en una buena opción si las tecnologías de nueva generación, como el trazado de rayos y el supermuestreo basado en IA, no son las principales preocupaciones."

La RX 6900 XT no ayuda precisamente a ahorrar en la factura de la luz. Sin embargo, sigue siendo comparativamente más económica en el consumo de energía si se compara con la RTX 3080 y la RTX 3090. Si bien los niveles de ruido bajo carga son tolerables, las temperaturas parecen estar en el lado más alto que conduce a la aceleración esporádica en nuestras pruebas de estrés

Con la RDNA 2 convirtiéndose en el hardware gráfico básico de las consolas de nueva generación, como la Xbox Series X/S y la PlayStation 5, hay mucha ventaja potencial entre plataformas que los desarrolladores pueden aprovechar. Esperemos que AMD también mejore lo que pueda en el frente del trazado de rayos y ofrezca una alternativa viable al DLSS en los próximos meses

Precio y disponibilidad

AMD no dispone actualmente de tarjetas Radeon RX 6900 XT de referencia, pero ha prometido a que seguirá ofreciendo el diseño de referencia. Aunque se espera que las existencias de las tarjetas de referencia se espera que se repongan pronto, las tarjetas asociadas a la placa base (AiB) de empresas como MSI, Sapphire, XFX y PowerColor pueden obtenerse en línea en función de las existencias

En el momento de escribir este artículo, la Sapphire RX 6900 XT está disponible en Amazon por 2.388 dólares, mientras que la XFX Speedster MERC 319 Radeon RX 6900 XT está disponible por 2.661,99 dólares en Walmartambos tienen un precio bastante elevado. Las tarjetas AiB en Best Buy y Newegg siguen sin existencias en el momento de la publicación

Recomendamos estar atentos a la disponibilidad de las tarjetas de referencia de AMD y esperar a que los precios de las versiones AiB bajen en las próximas semanas antes de dar el paso

Pricecompare

Please share our article, every link counts!
> Análisis y pruebas de ordenadores portátiles y móviles teléfonos > Análisis > Análisis de la AMD Radeon RX 6900 XT: Rendimiento cercano a la RTX 3090 por 500 dólares menos, pero sólo ligeramente mejor que la RX 6800 XT
Vaidyanathan Subramaniam, 2021-05- 4 (Update: 2021-05- 8)