Análisis del portátil Lenovo Legion 5 Pro Gen 7: ¿Ryzen 7 6800H o Ryzen 9 6900HX?
El Legion 5 Pro Gen 7 es un portátil para juegos de gama media alta que se sitúa justo por debajo del aún más caro Legion serie 7 16. Se une a la línea cada vez más común de portátiles para juegos de 16 pulgadas como el HP Omen 16, Asus ROG Zephyrus M16, Dell G16o el Gigabyte Aero 16 todas ellas alternativas al modelo de Lenovo en cuestión.
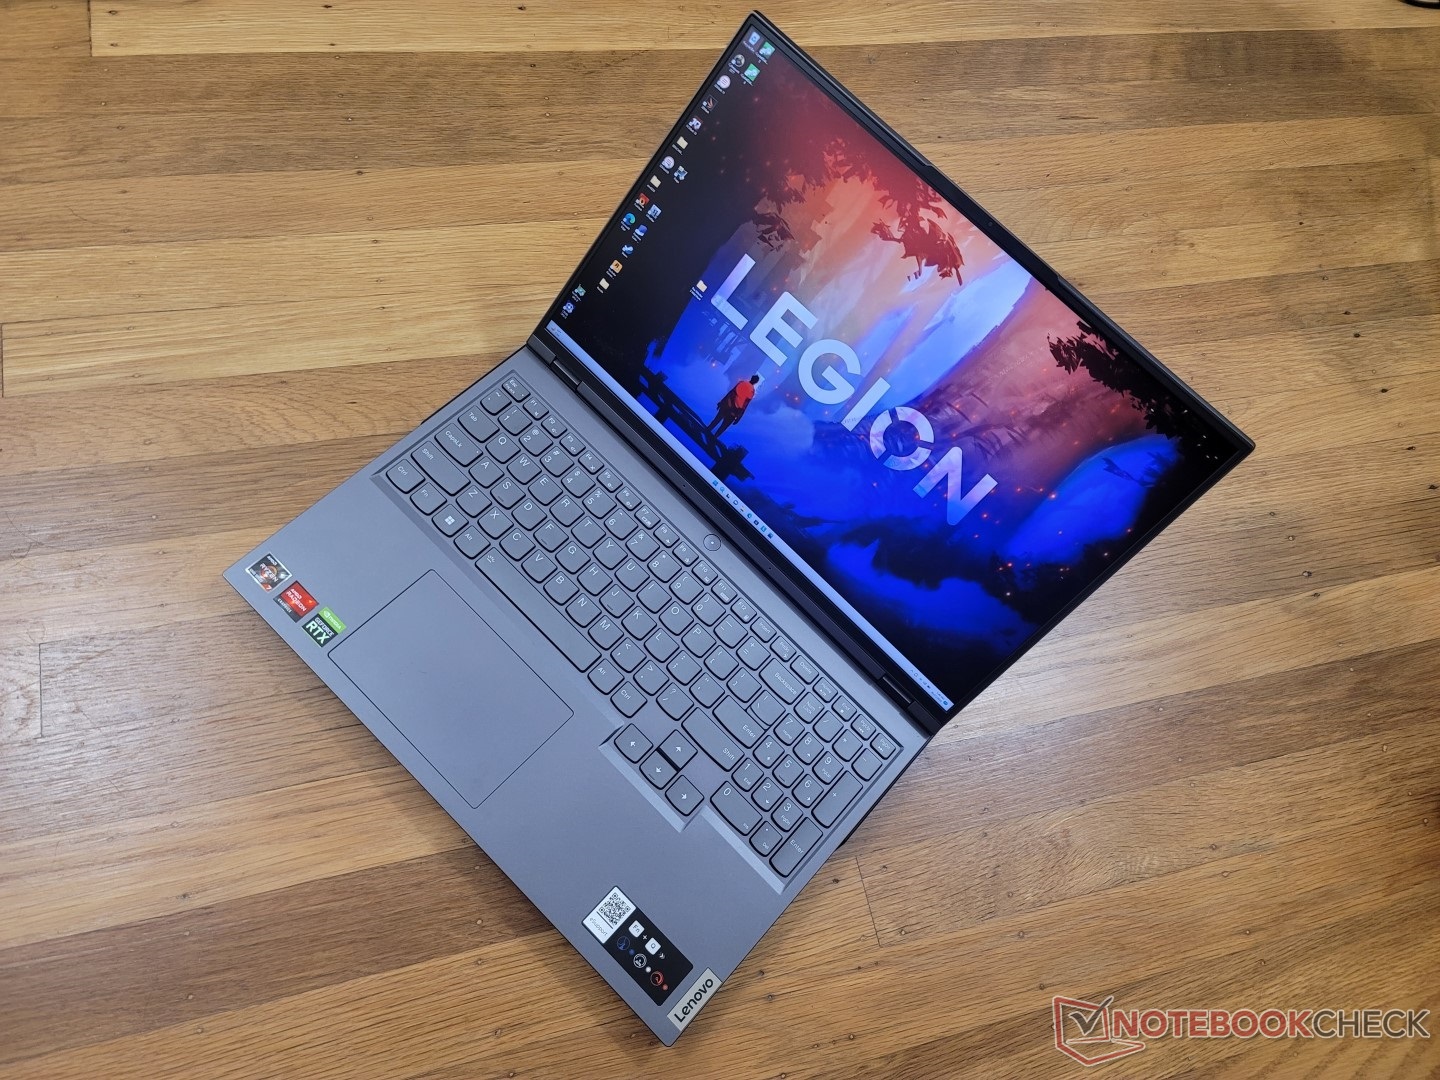
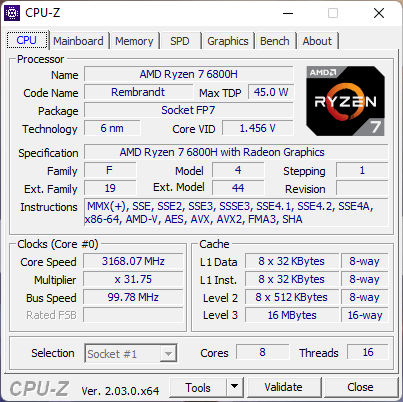
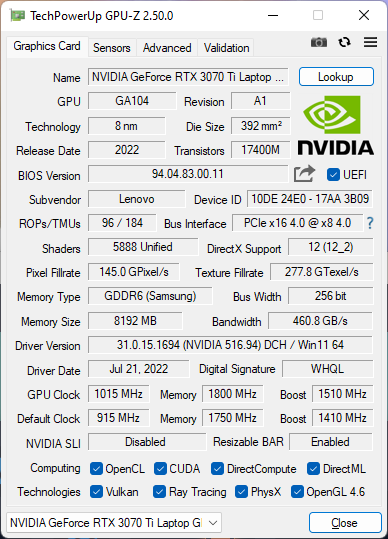
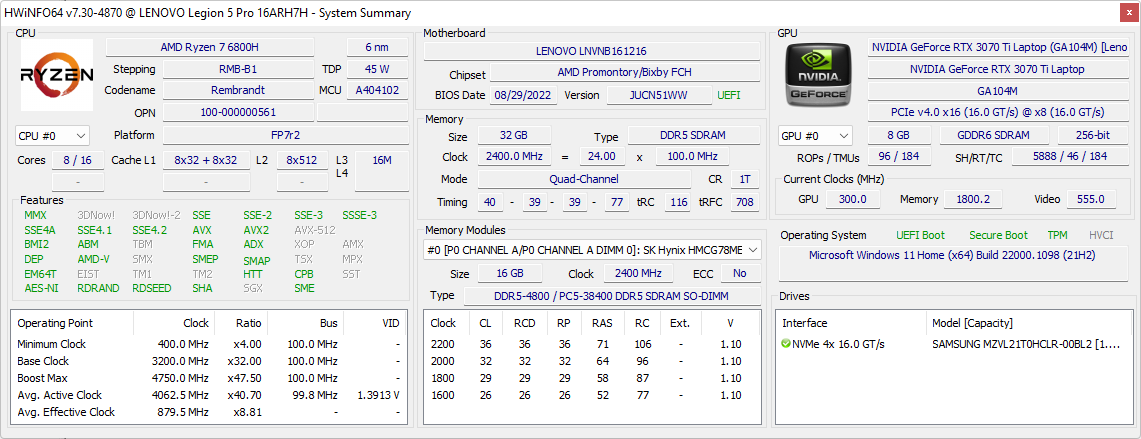
Nuestra unidad de pruebas viene con la CPU AMD Zen 3+ Ryzen 7 6800H con gráfica TGP GeForce RTX 3070 Ti de 150 W por unos 1900 dólares. Hay otras versiones disponibles con Ryzen 9 6900HX, RTX 3070, RTX 3060, o RTX 3050 Ti, pero todas las opciones vienen con la misma pantalla IPS 16:10 2560 x 1600 con soporte G-Sync.
El Legion 5 Pro Gen 7 de 2022 comparte el mismo diseño de chasis que en el modelo del año pasado, por lo que recomendamos consultar nuestro análisis existente del modelo 2021 para obtener más información sobre las características físicas del dispositivo. En comparación, la versión anterior utiliza procesadores Zen 3 Ryzen 7 5800H más lentos y TGP GeForce RTX 3070 de 140 W
Más análisis de Lenovo:
Posibles contendientes en la comparación
Valoración | Fecha | Modelo | Peso | Altura | Tamaño | Resolución | Precio |
|---|---|---|---|---|---|---|---|
| 87.7 % v7 (old) | 10/2022 | Lenovo Legion 5 Pro 16ARH7H RTX 3070 Ti R7 6800H, GeForce RTX 3070 Ti Laptop GPU | 2.6 kg | 26.6 mm | 16.00" | 2560x1600 | |
| 86.6 % v7 (old) | 07/2022 | Lenovo Legion 5 Pro 16IAH7H i7-12700H, GeForce RTX 3060 Laptop GPU | 2.6 kg | 27 mm | 16.00" | 2560x1600 | |
| 85.6 % v7 (old) | 07/2021 | Asus ROG Zephyrus M16 GU603H i9-11900H, GeForce RTX 3070 Laptop GPU | 2 kg | 20 mm | 16.00" | 2560x1600 | |
| 90.8 % v7 (old) | 09/2022 | Lenovo Legion 7 16ARHA7 R9 6900HX, Radeon RX 6850M XT | 2.6 kg | 19.4 mm | 16.00" | 2560x1600 | |
| 82.3 % v7 (old) | 05/2022 | HP Victus 16-e0145ng R5 5600H, GeForce RTX 3050 Ti Laptop GPU | 2.4 kg | 23.5 mm | 16.10" | 1920x1080 | |
| 86.1 % v7 (old) | 10/2022 | Dell G16 7620 i7-12700H, GeForce RTX 3060 Laptop GPU | 2.6 kg | 26.9 mm | 16.00" | 2560x1600 |
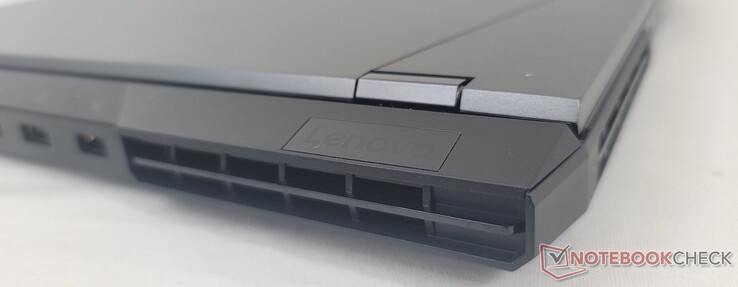
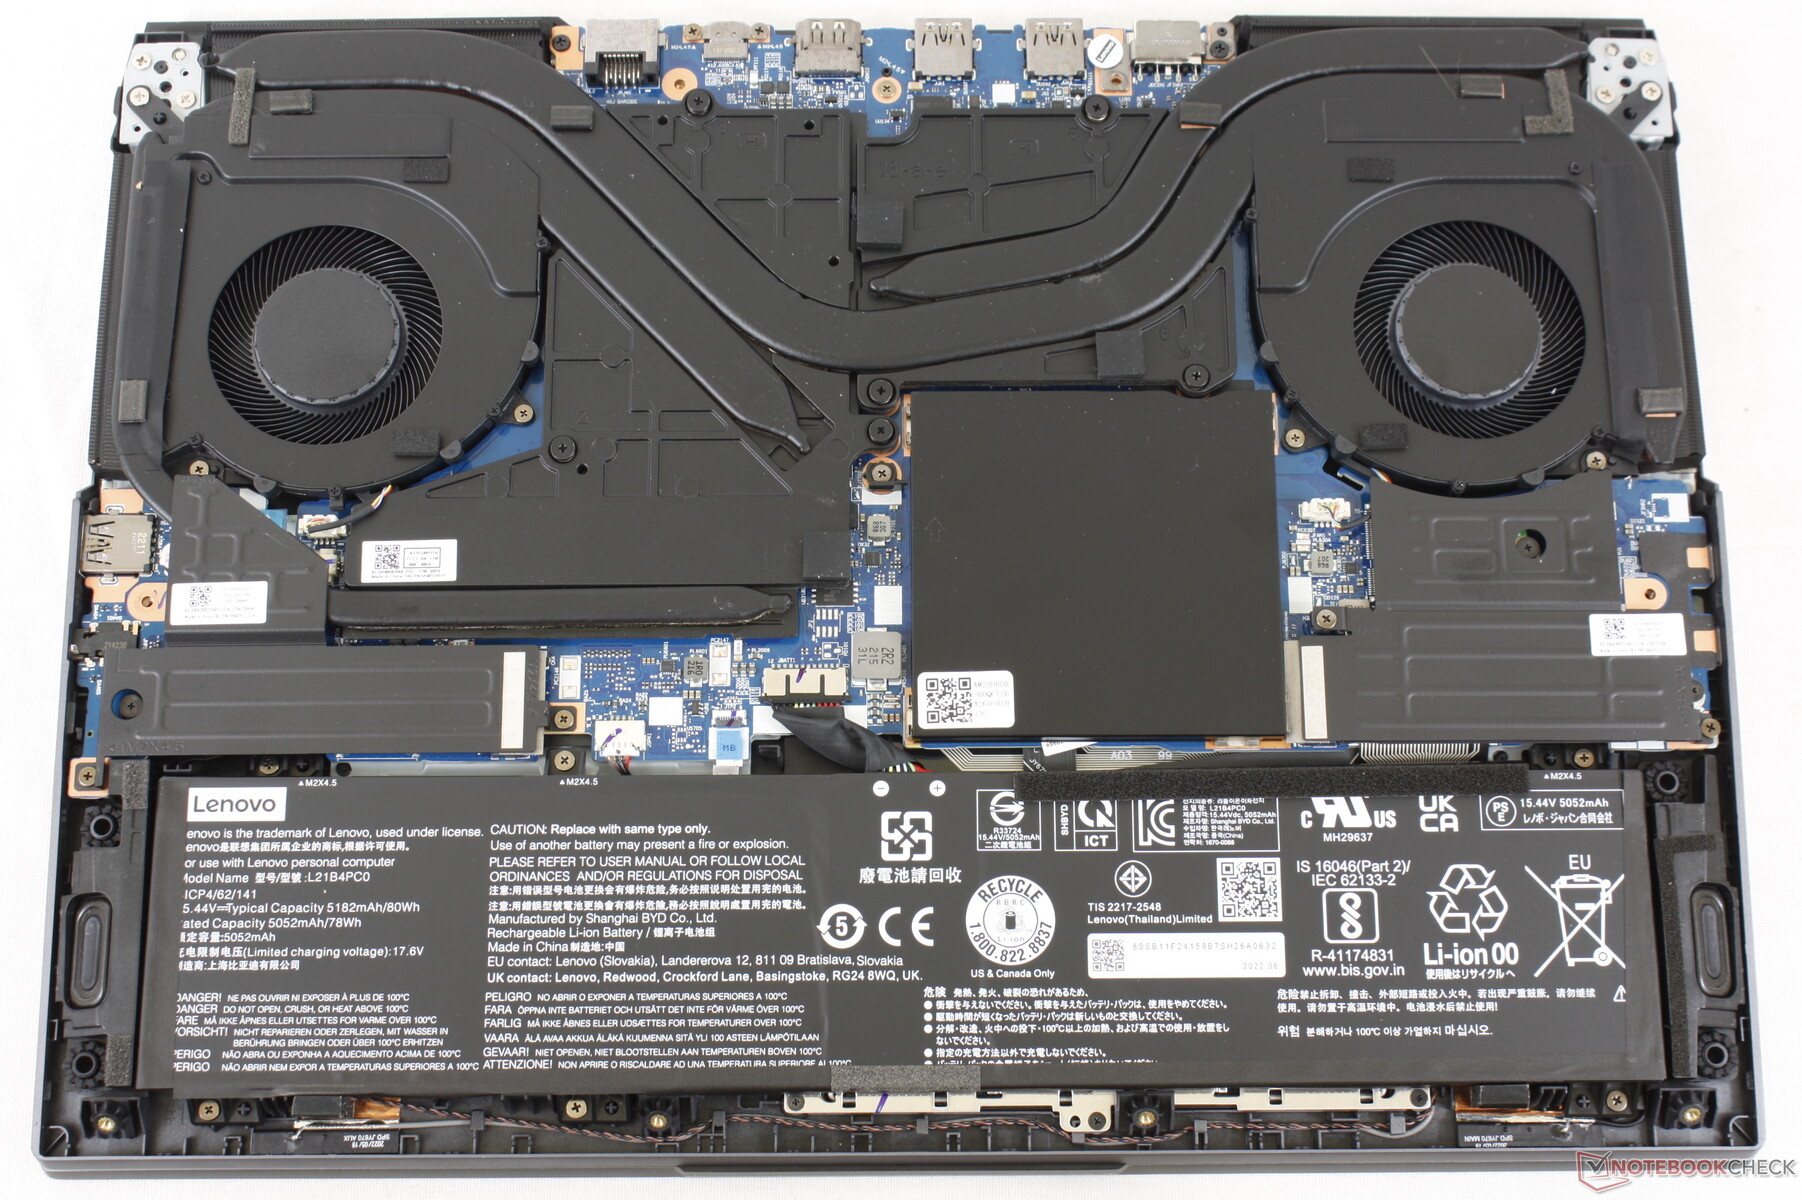
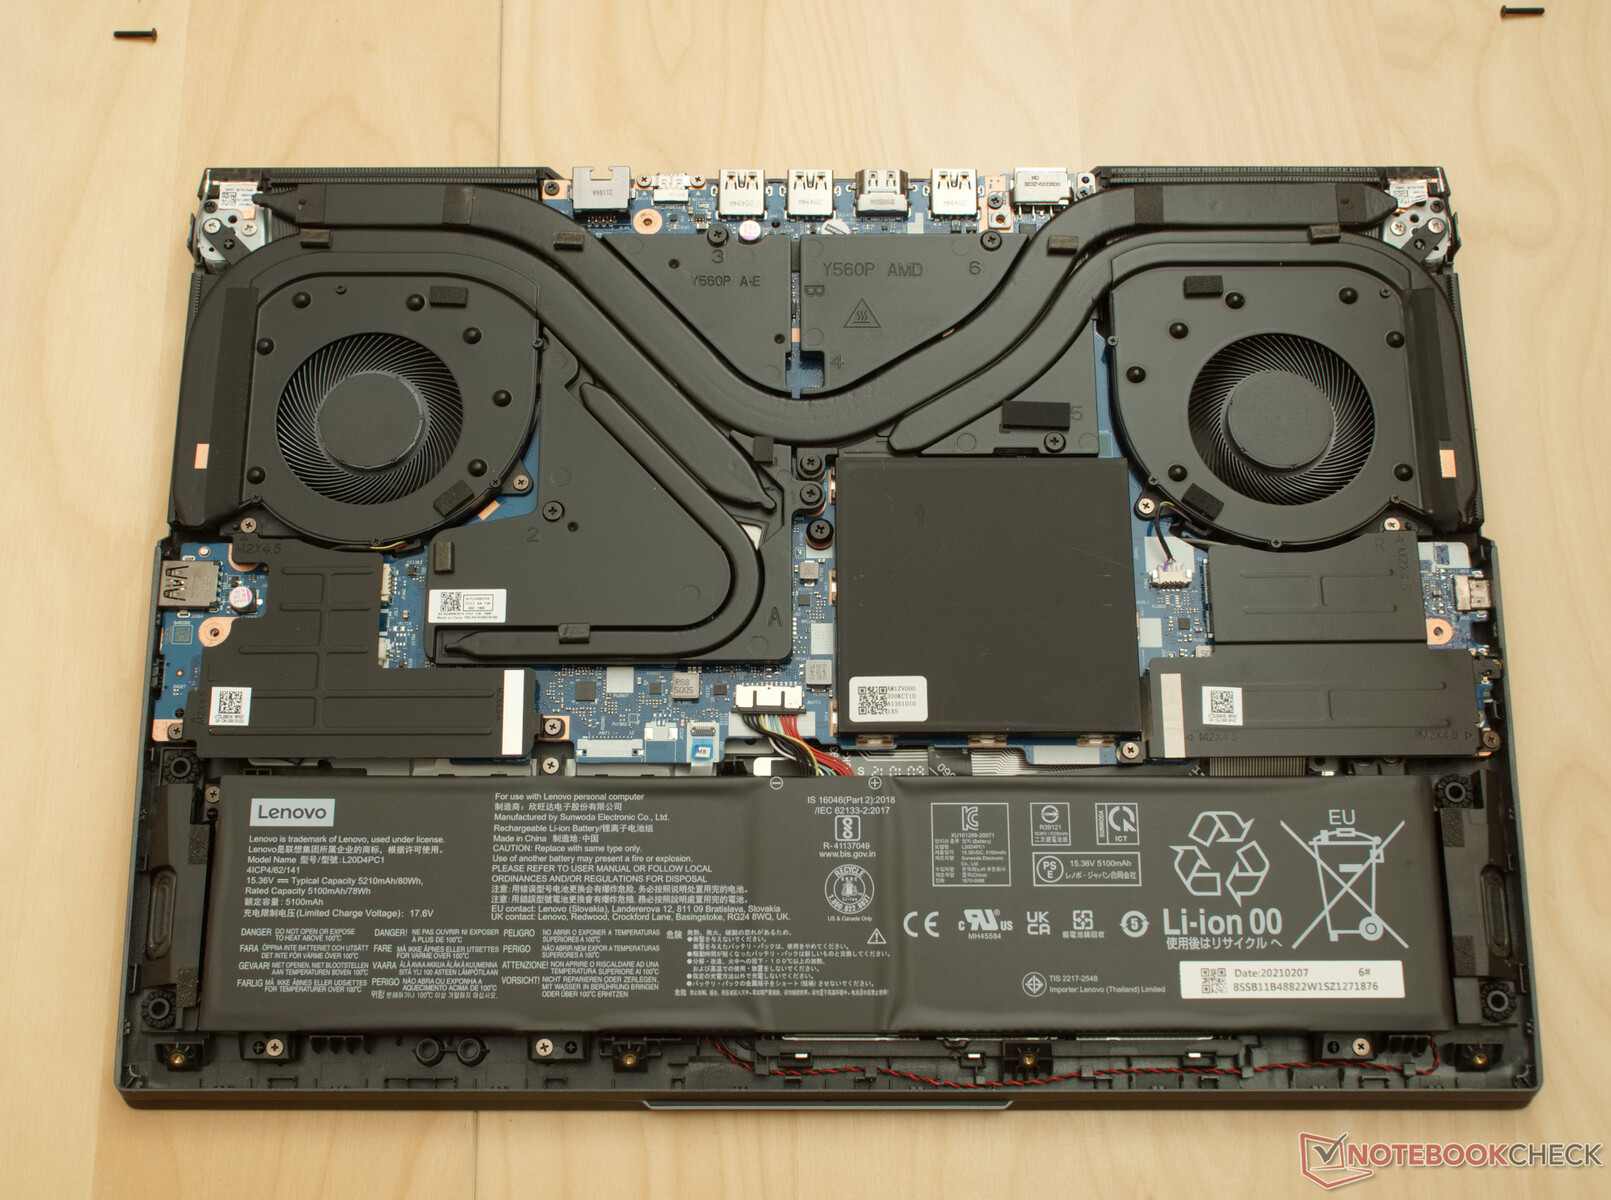
Caja - Tapa exterior de aluminio y base inferior
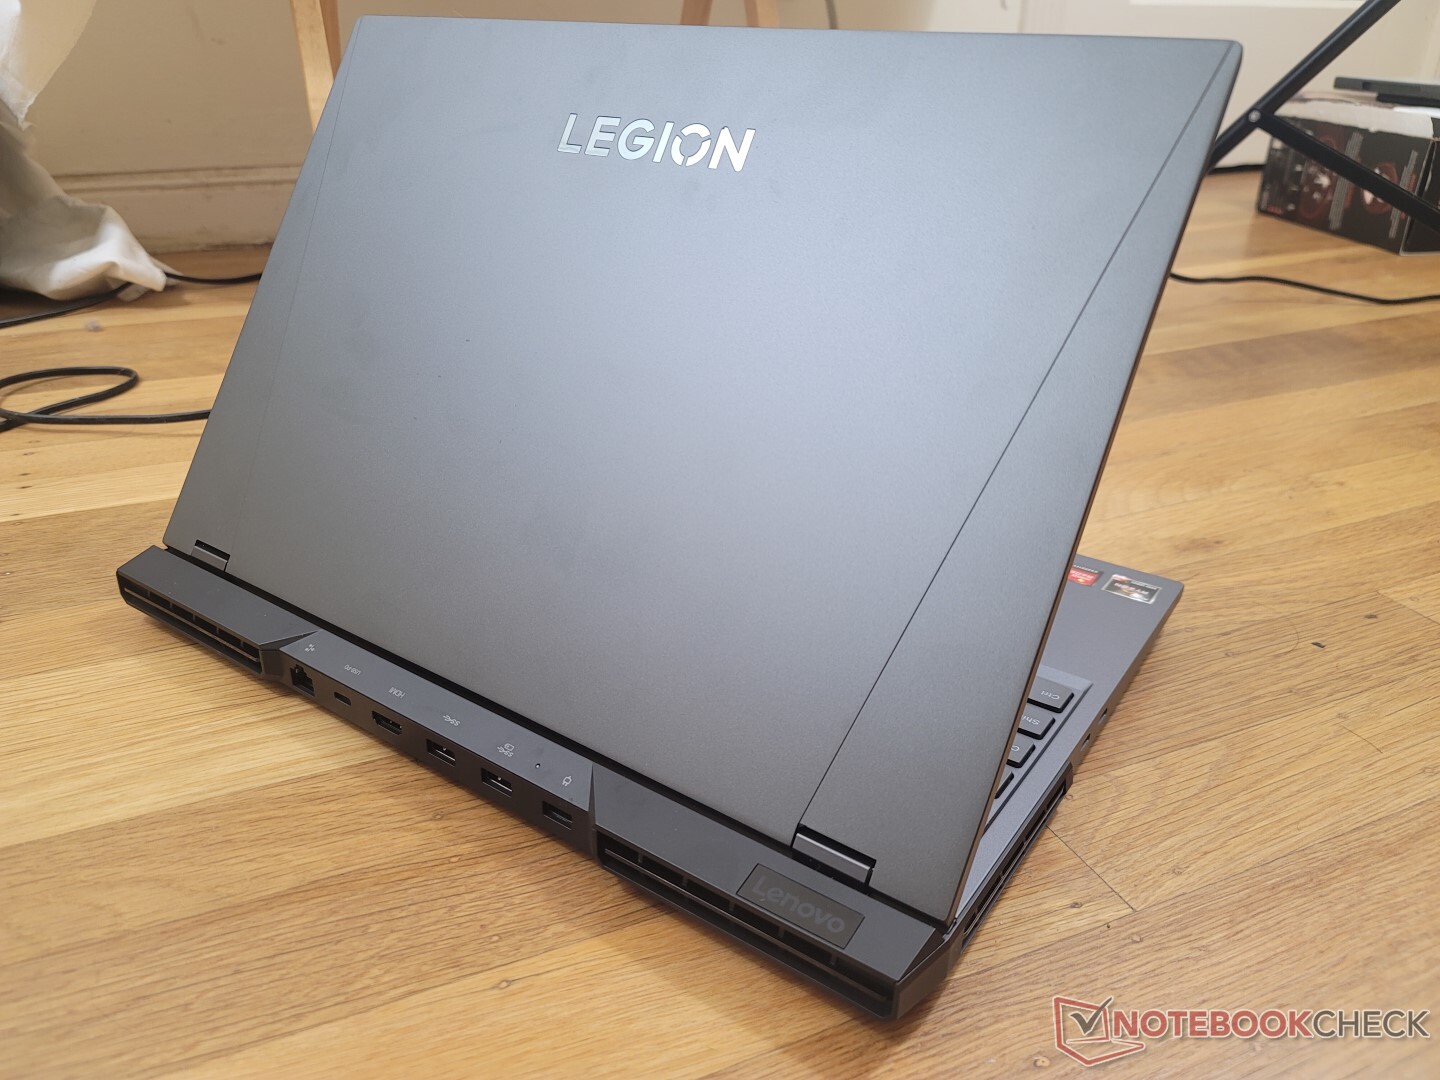
Hay una forma fácil de distinguir el Legion 5 Pro 16 del 2021 Legion 5 Pro 16. El modelo 2022 tiene un puerto USB-C más en el borde izquierdo para un total de tres, mientras que el modelo 2021 sólo tiene dos. Mientras tanto, el número de puertos USB-A se ha reducido de cuatro a tres. Por lo demás, los dos modelos son visualmente idénticos.
Comunicación
| Networking | |
| iperf3 transmit AX12 | |
| Asus ROG Zephyrus M16 GU603H | |
| iperf3 receive AX12 | |
| Asus ROG Zephyrus M16 GU603H | |
| iperf3 receive AXE11000 6GHz | |
| Lenovo Legion 5 Pro 16ARH7H RTX 3070 Ti | |
| Lenovo Legion 7 16ARHA7 | |
| iperf3 receive AXE11000 | |
| Dell G16 7620 | |
| HP Victus 16-e0145ng | |
| iperf3 transmit AXE11000 6GHz | |
| Lenovo Legion 7 16ARHA7 | |
| Lenovo Legion 5 Pro 16ARH7H RTX 3070 Ti | |
| iperf3 transmit AXE11000 | |
| Dell G16 7620 | |
| HP Victus 16-e0145ng | |
Cámara web
La webcam sigue siendo sólo de 720p y sin IR.


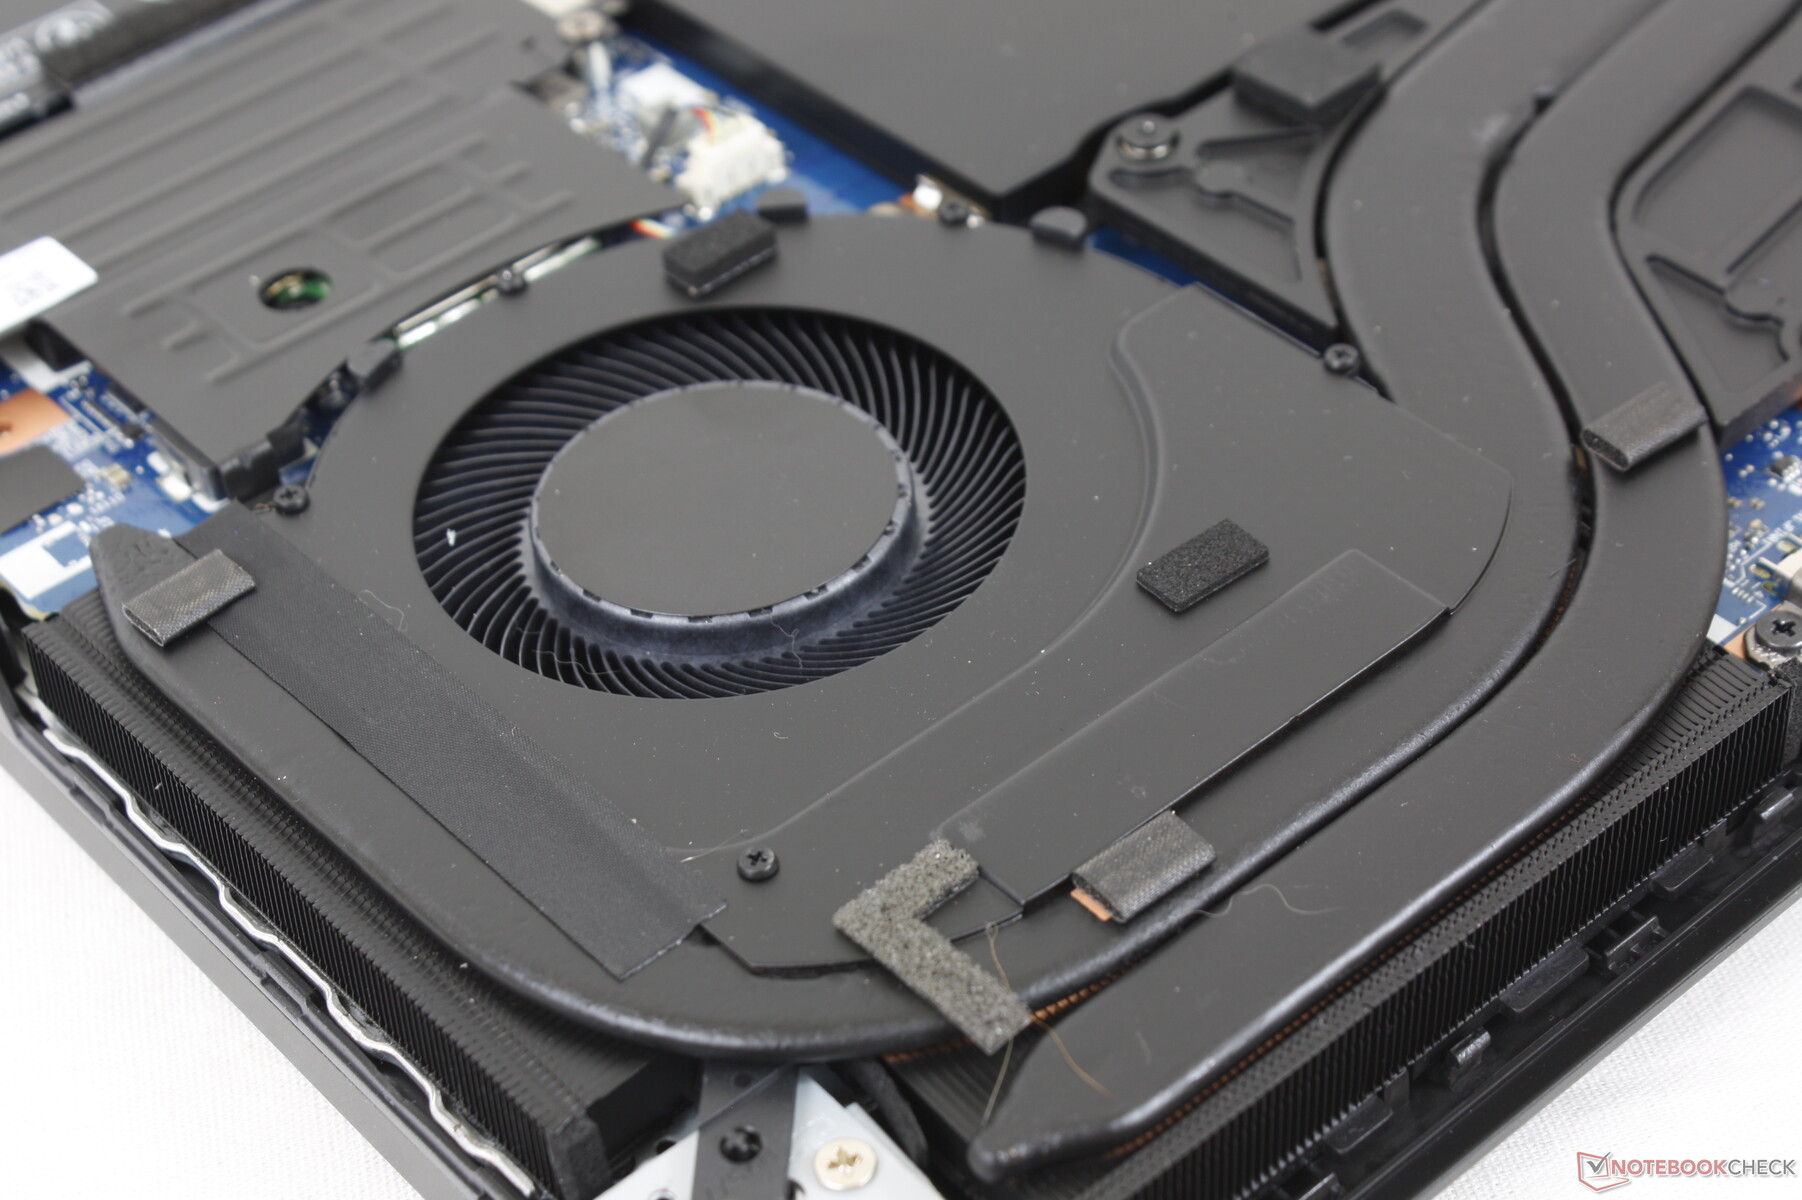
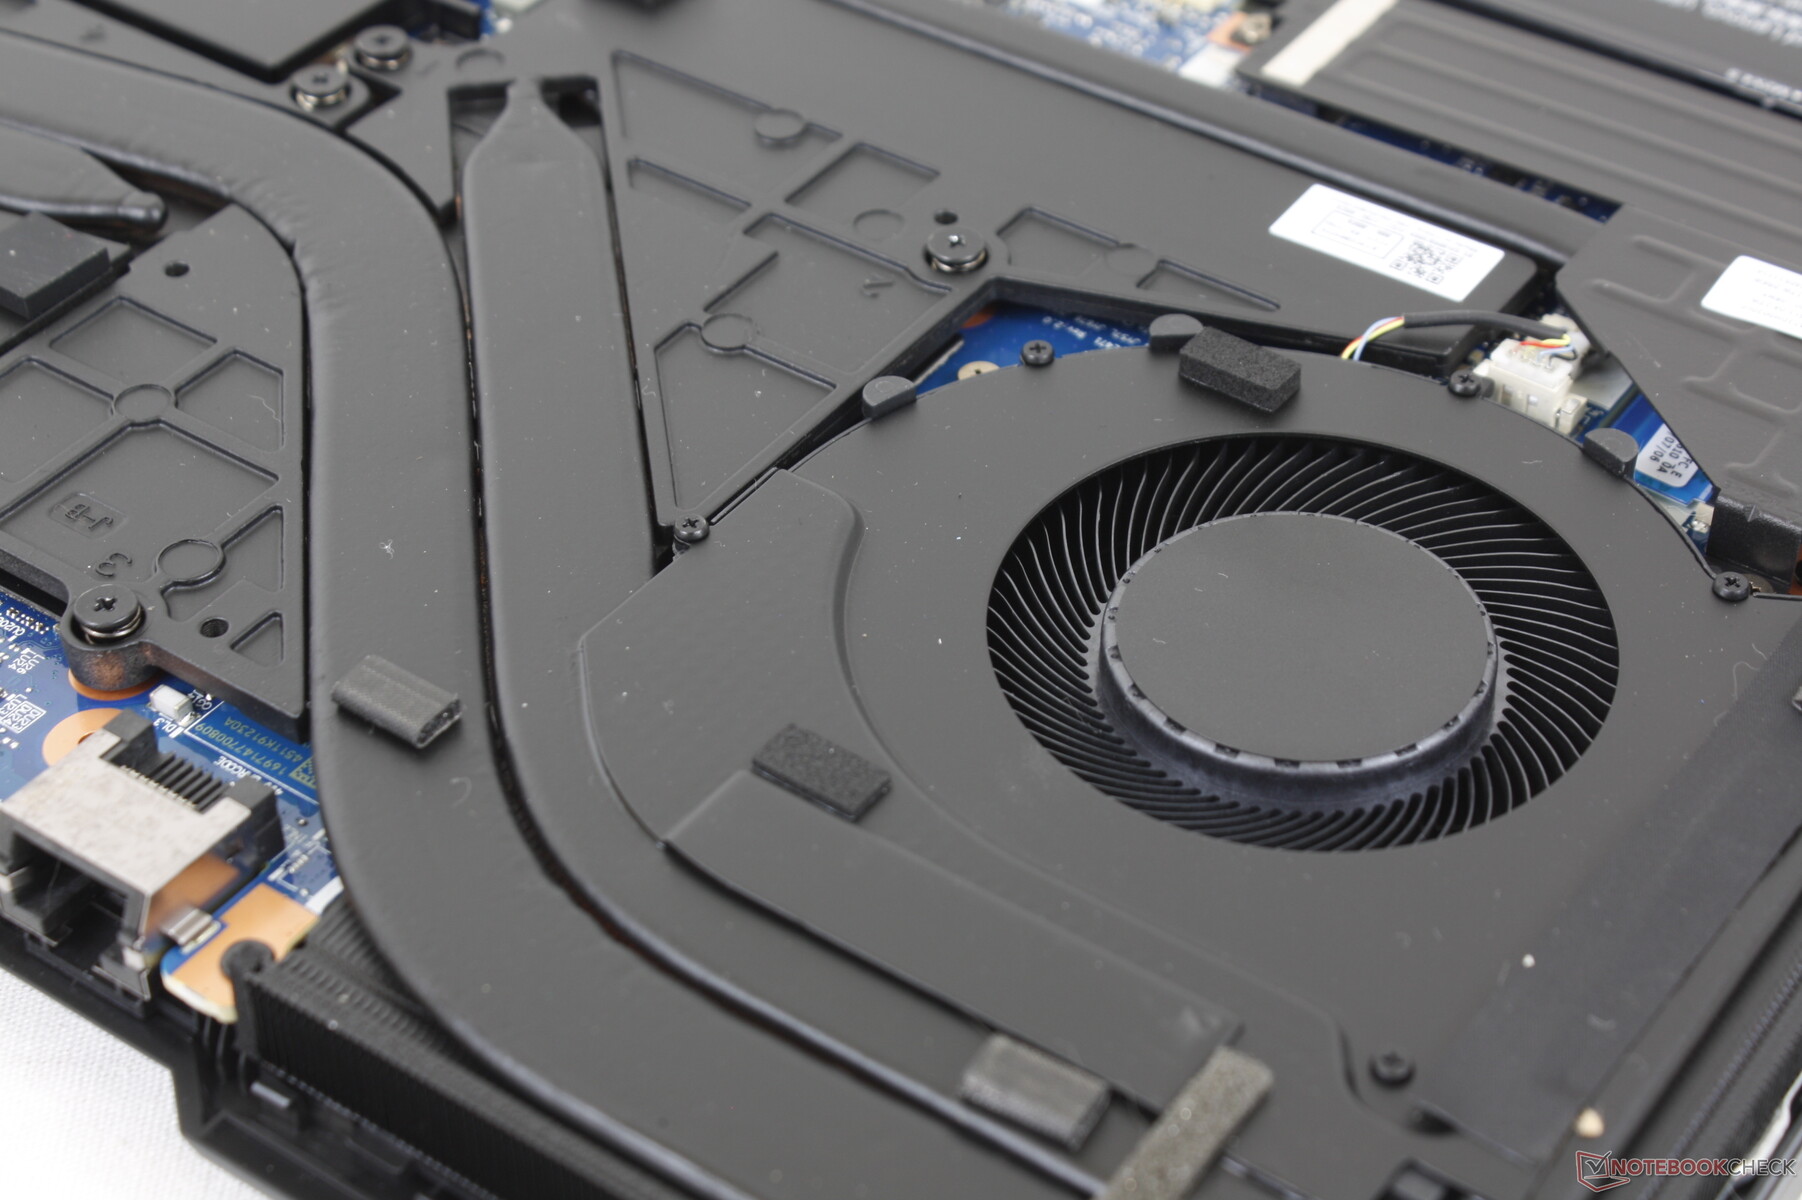
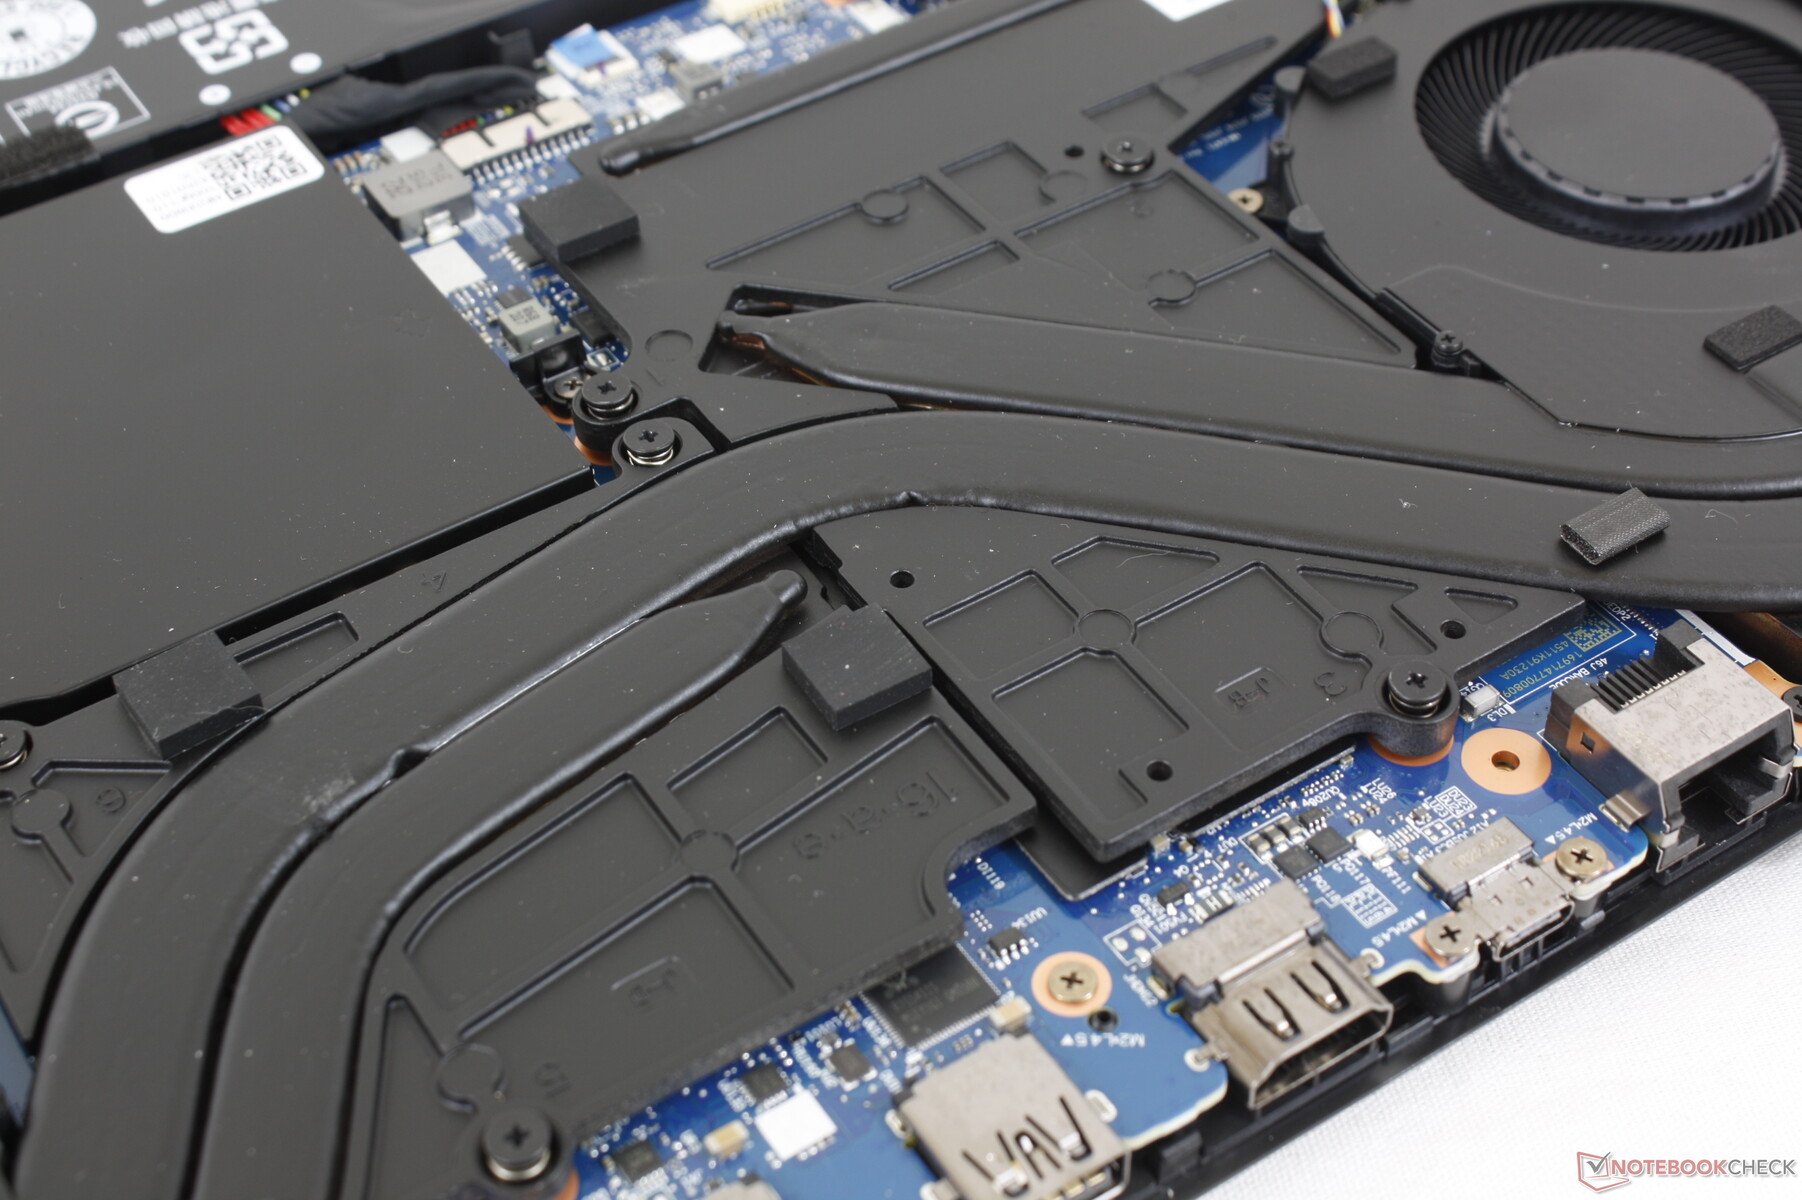
Mantenimiento
Accesorios y garantía
No hay extras en la caja más allá del adaptador de CA y la documentación. La garantía estándar de un año limitada del fabricante se aplica si se compra en los Estados Unidos.
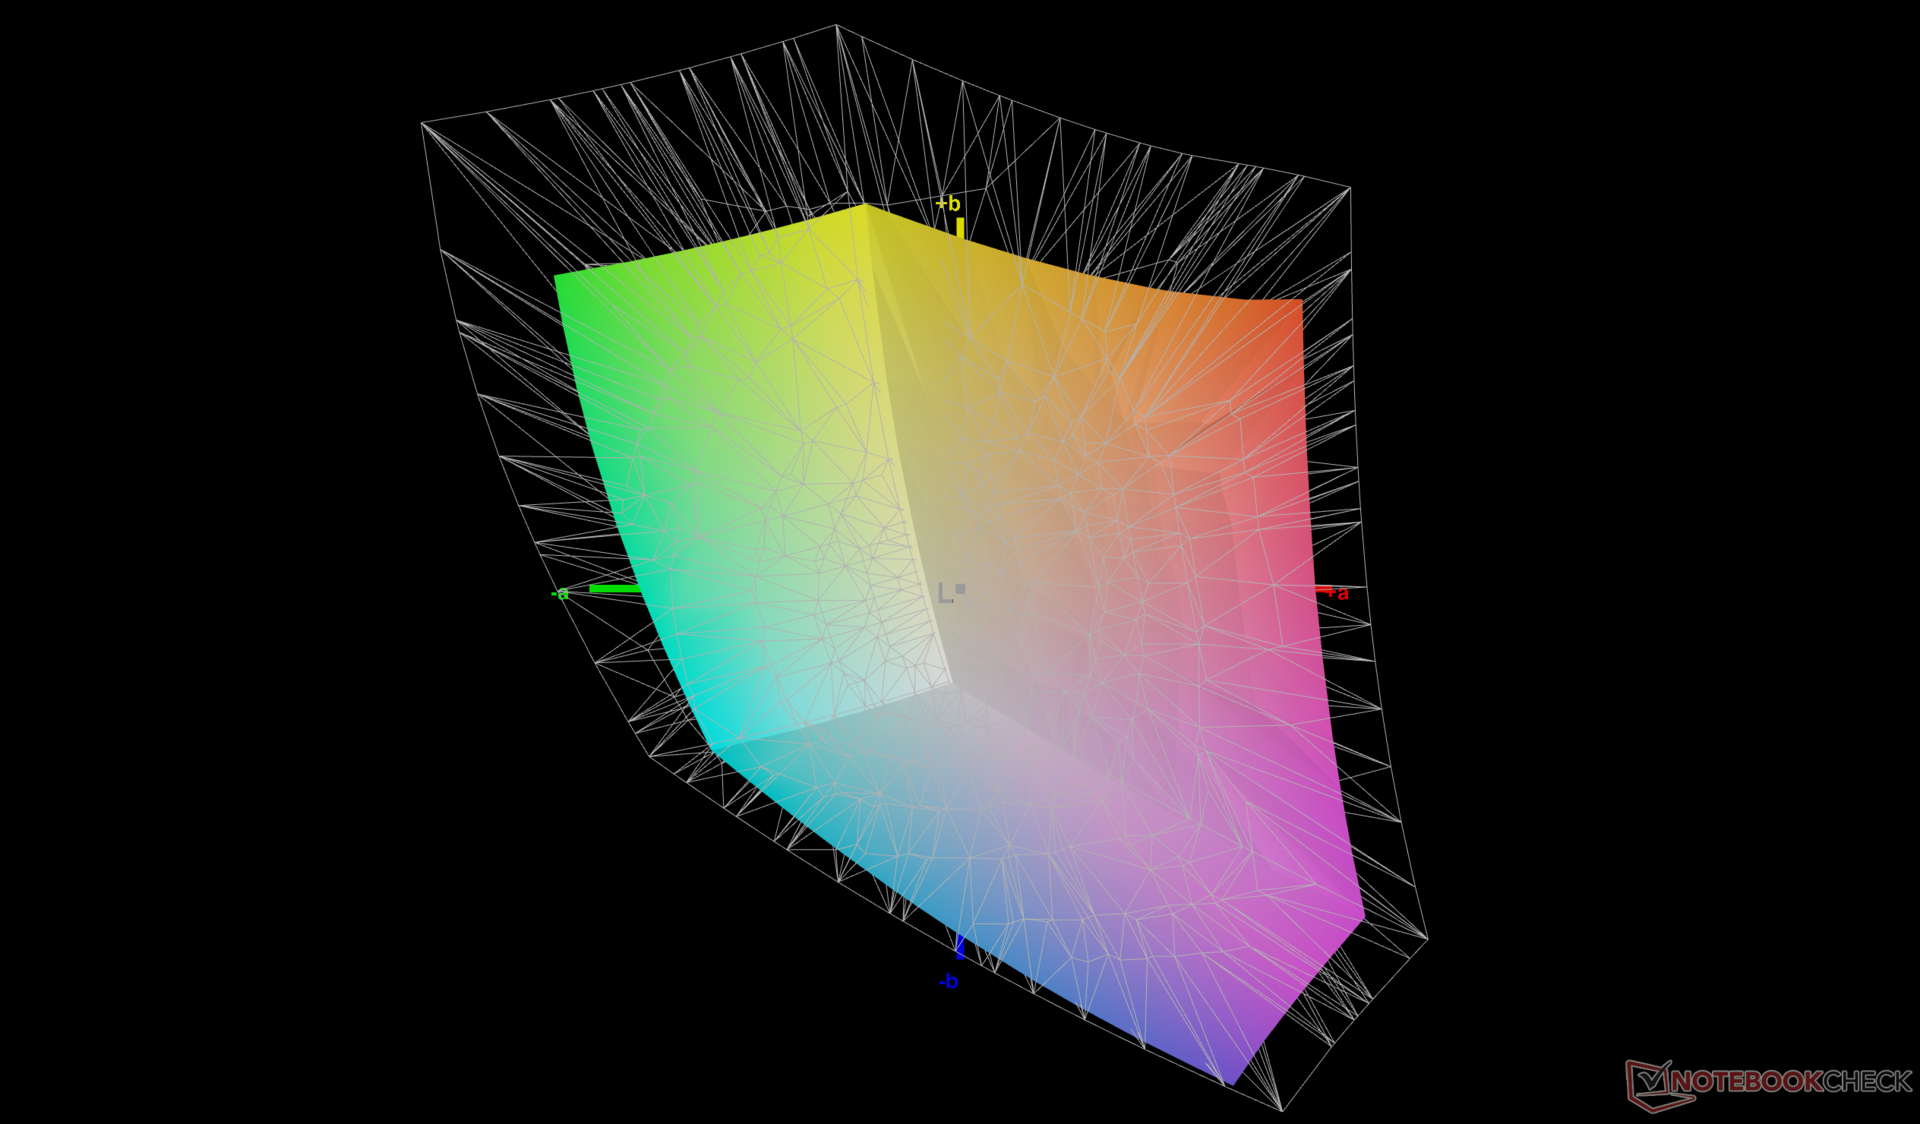
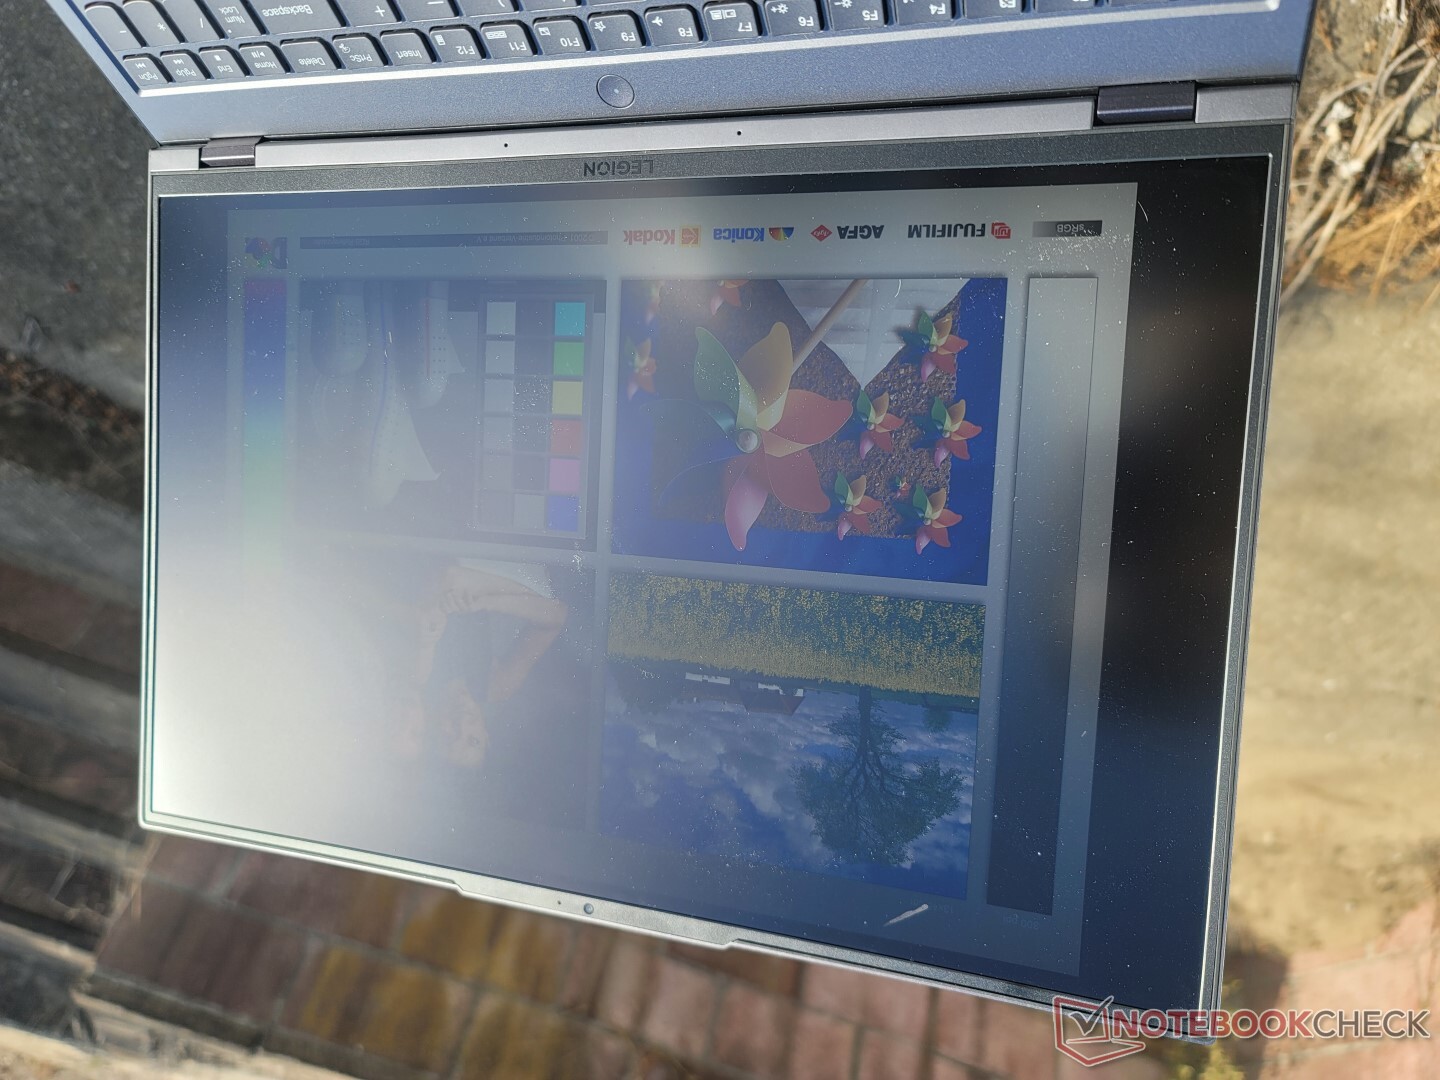
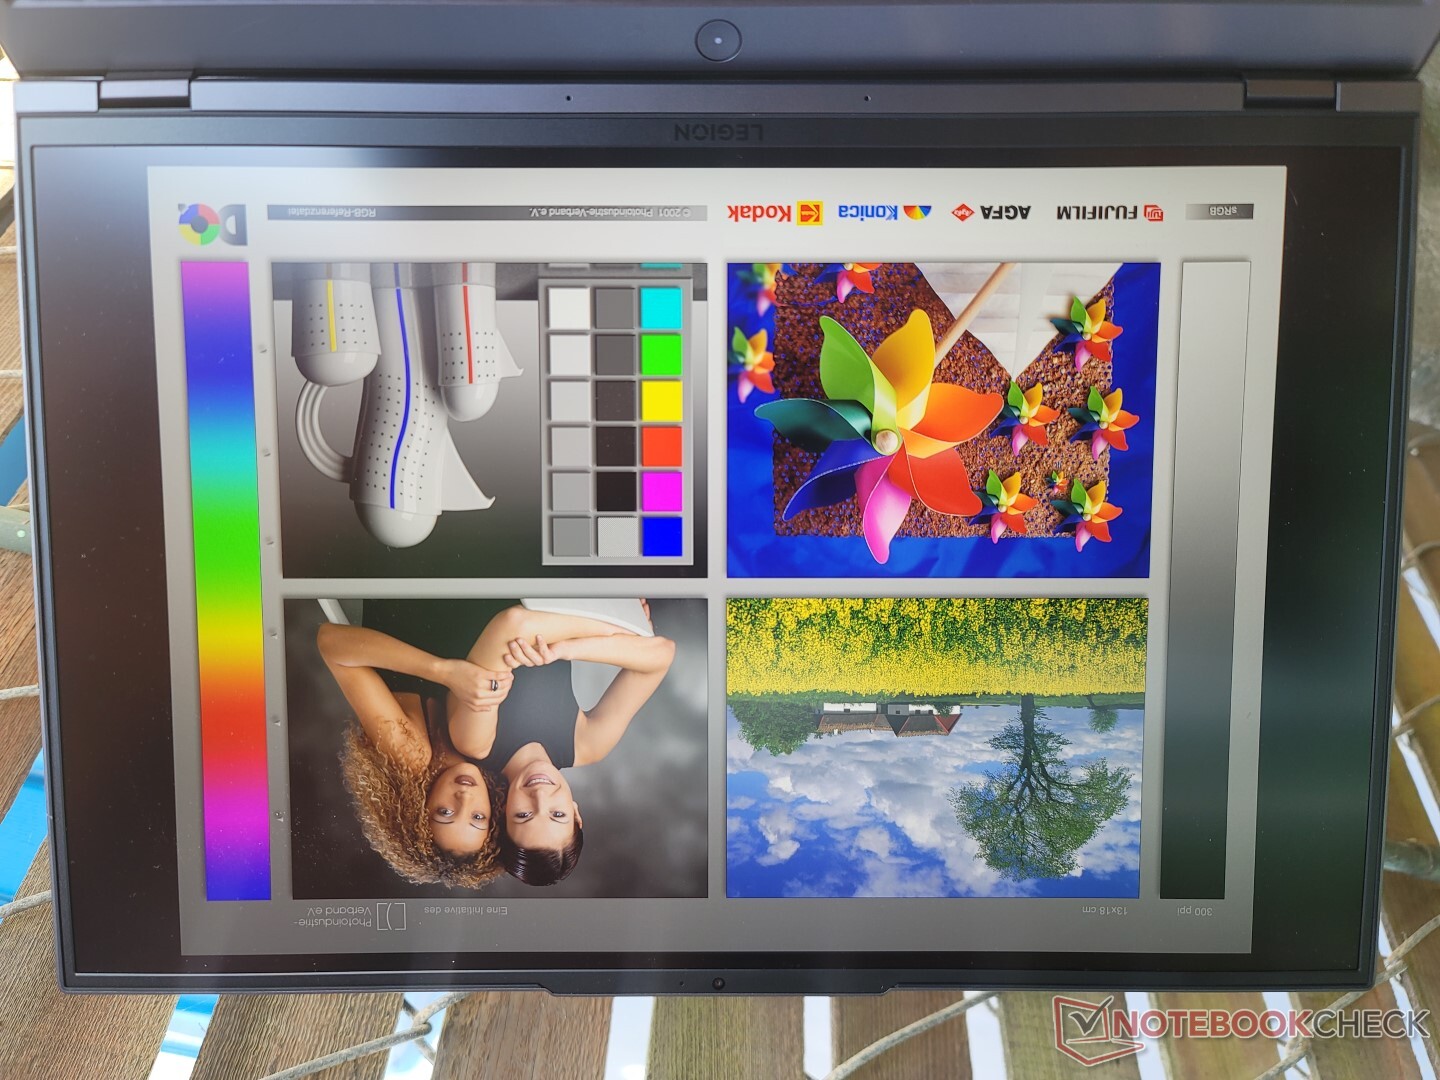
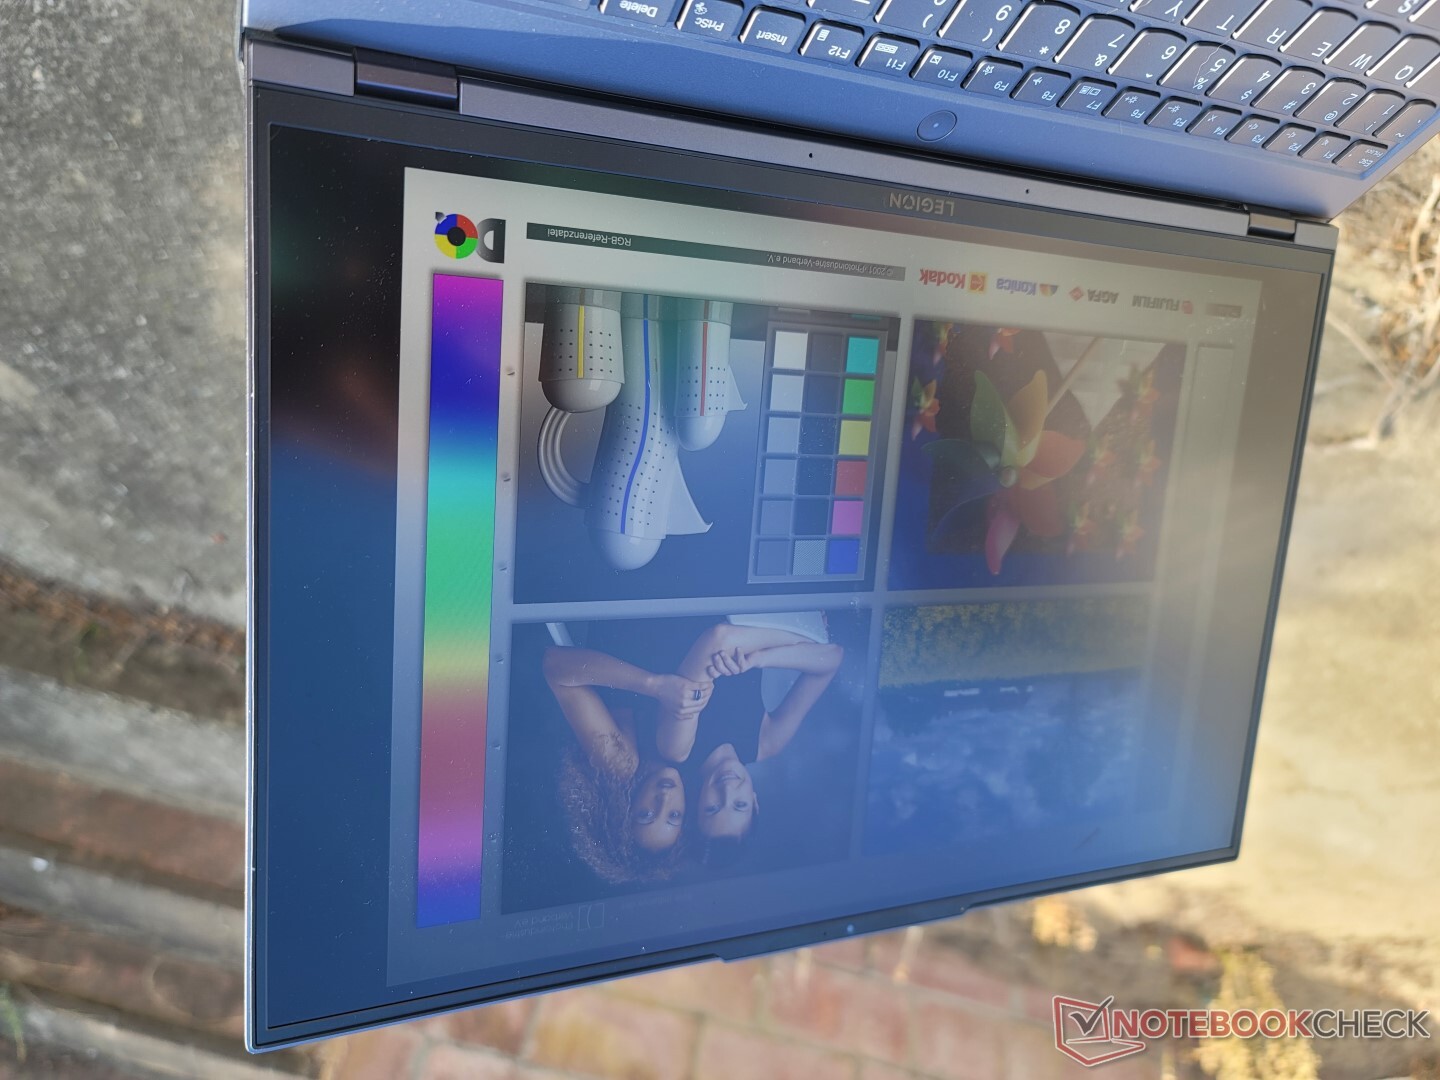
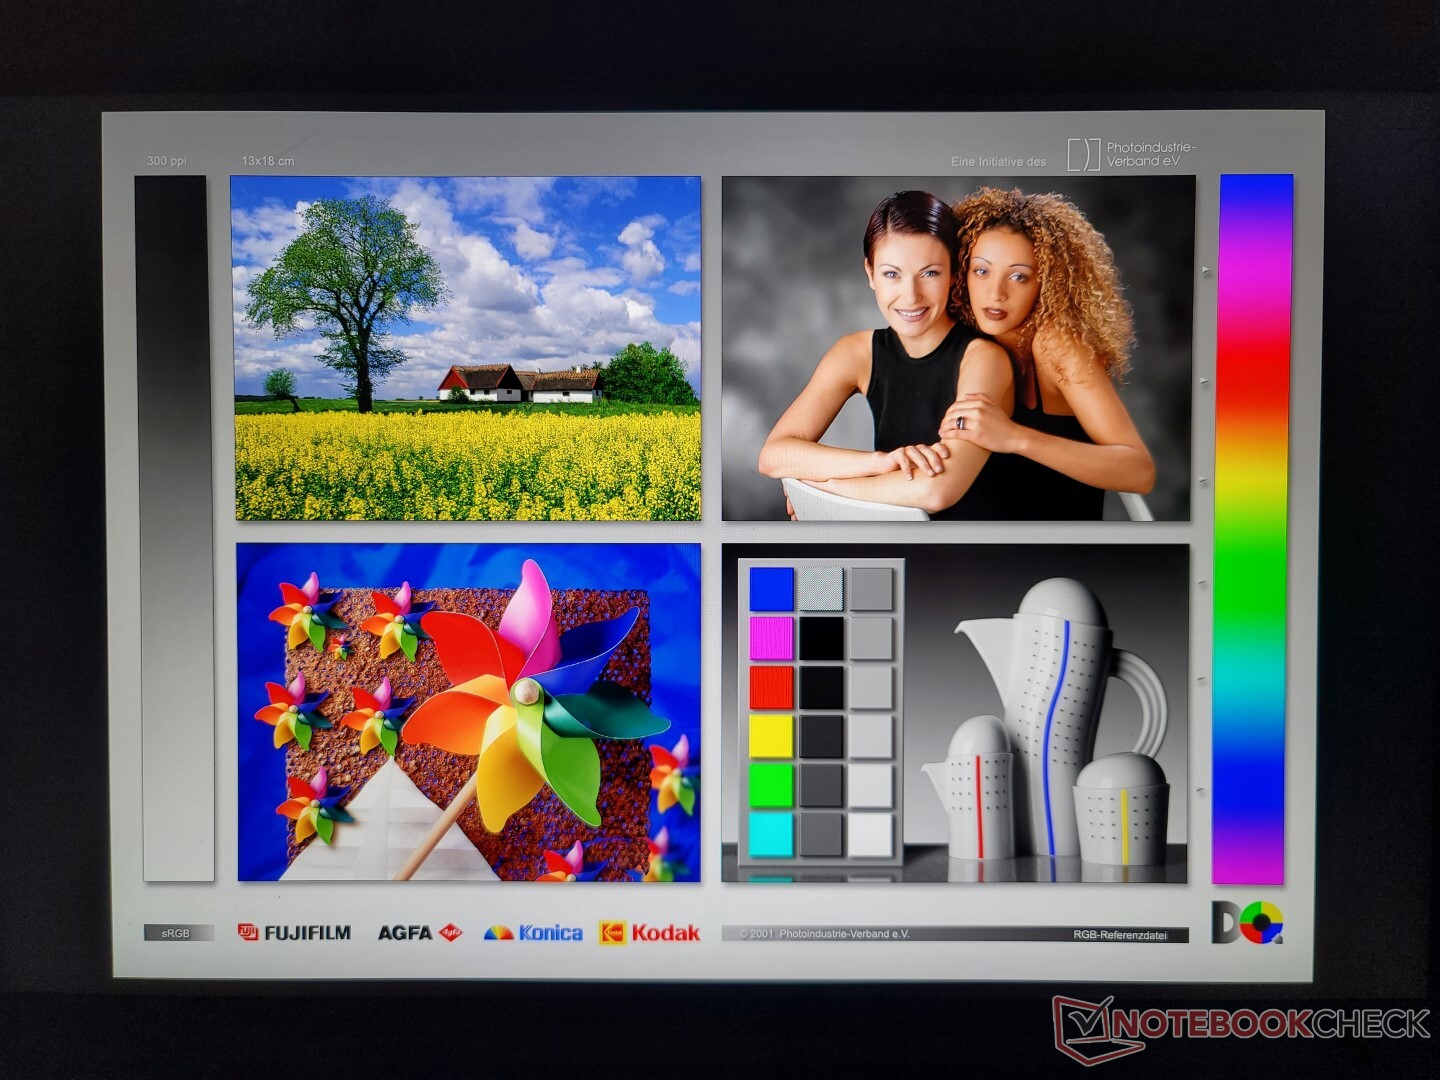
Pantalla - Una sola opción
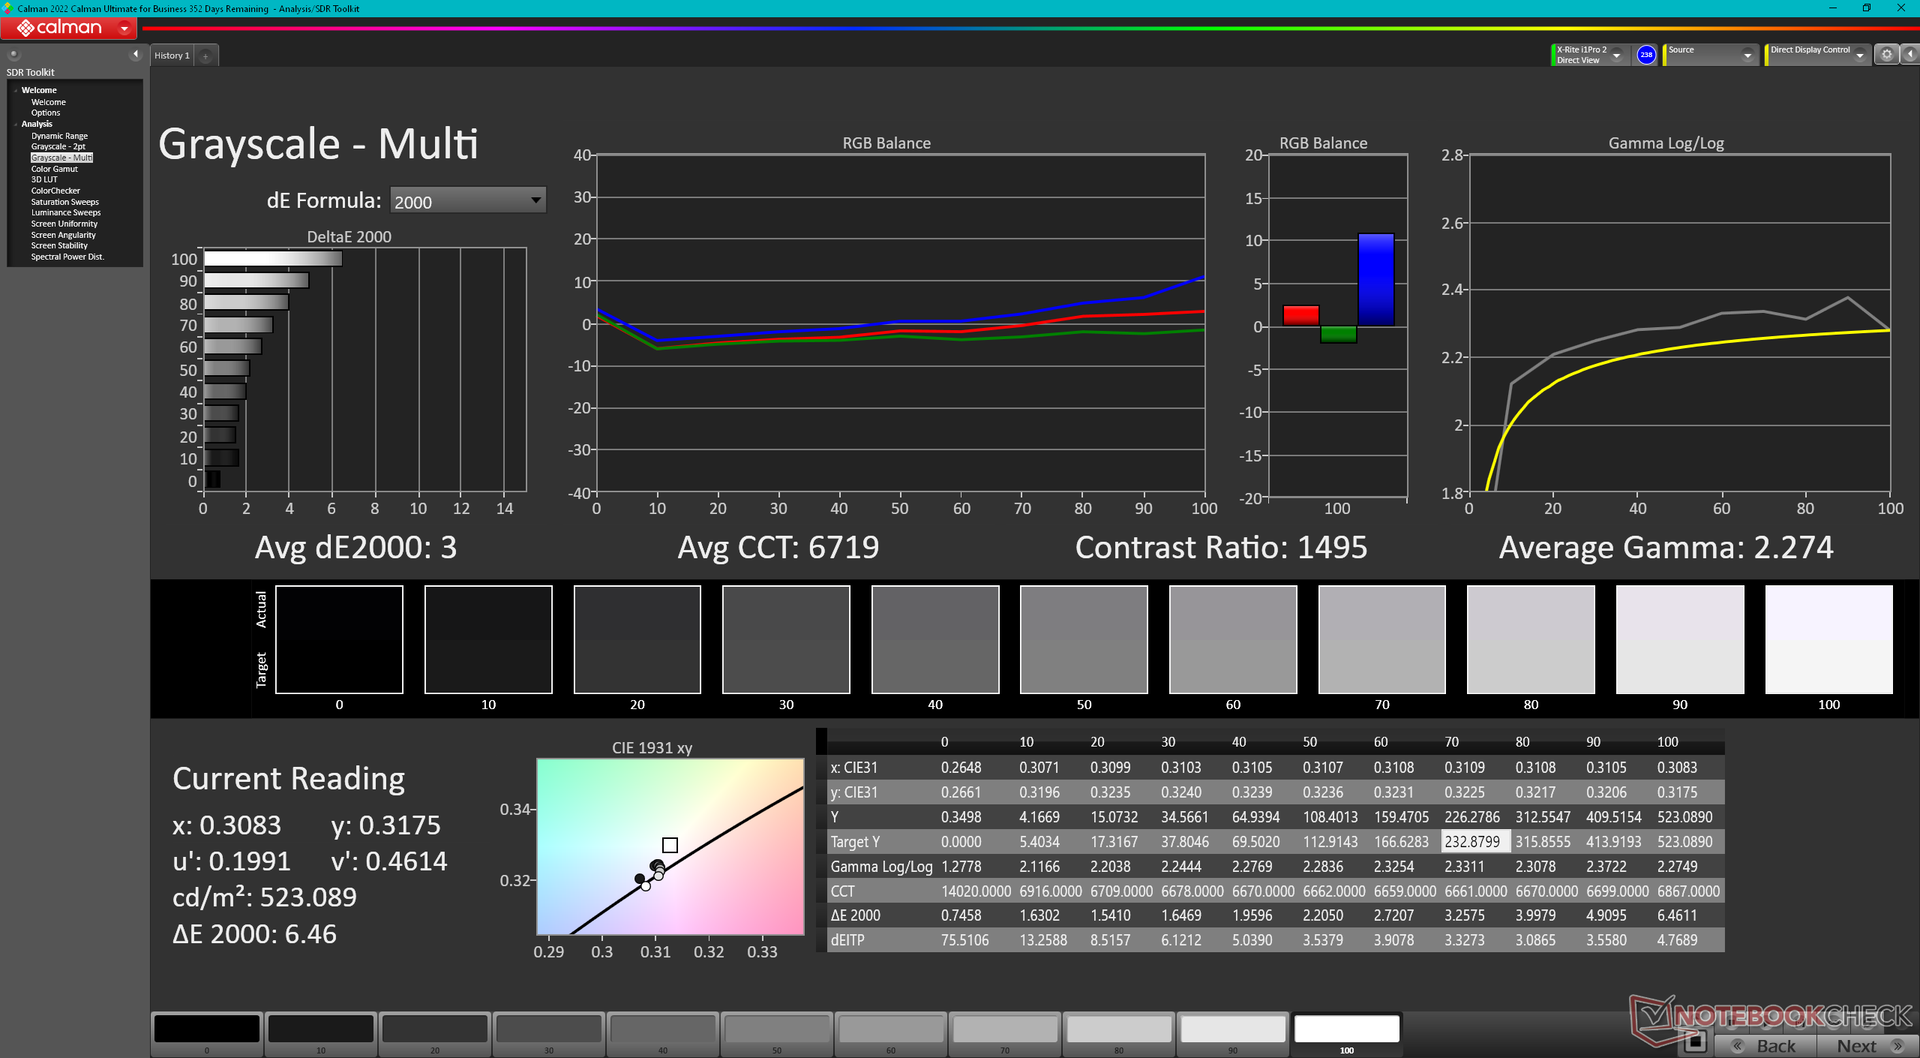
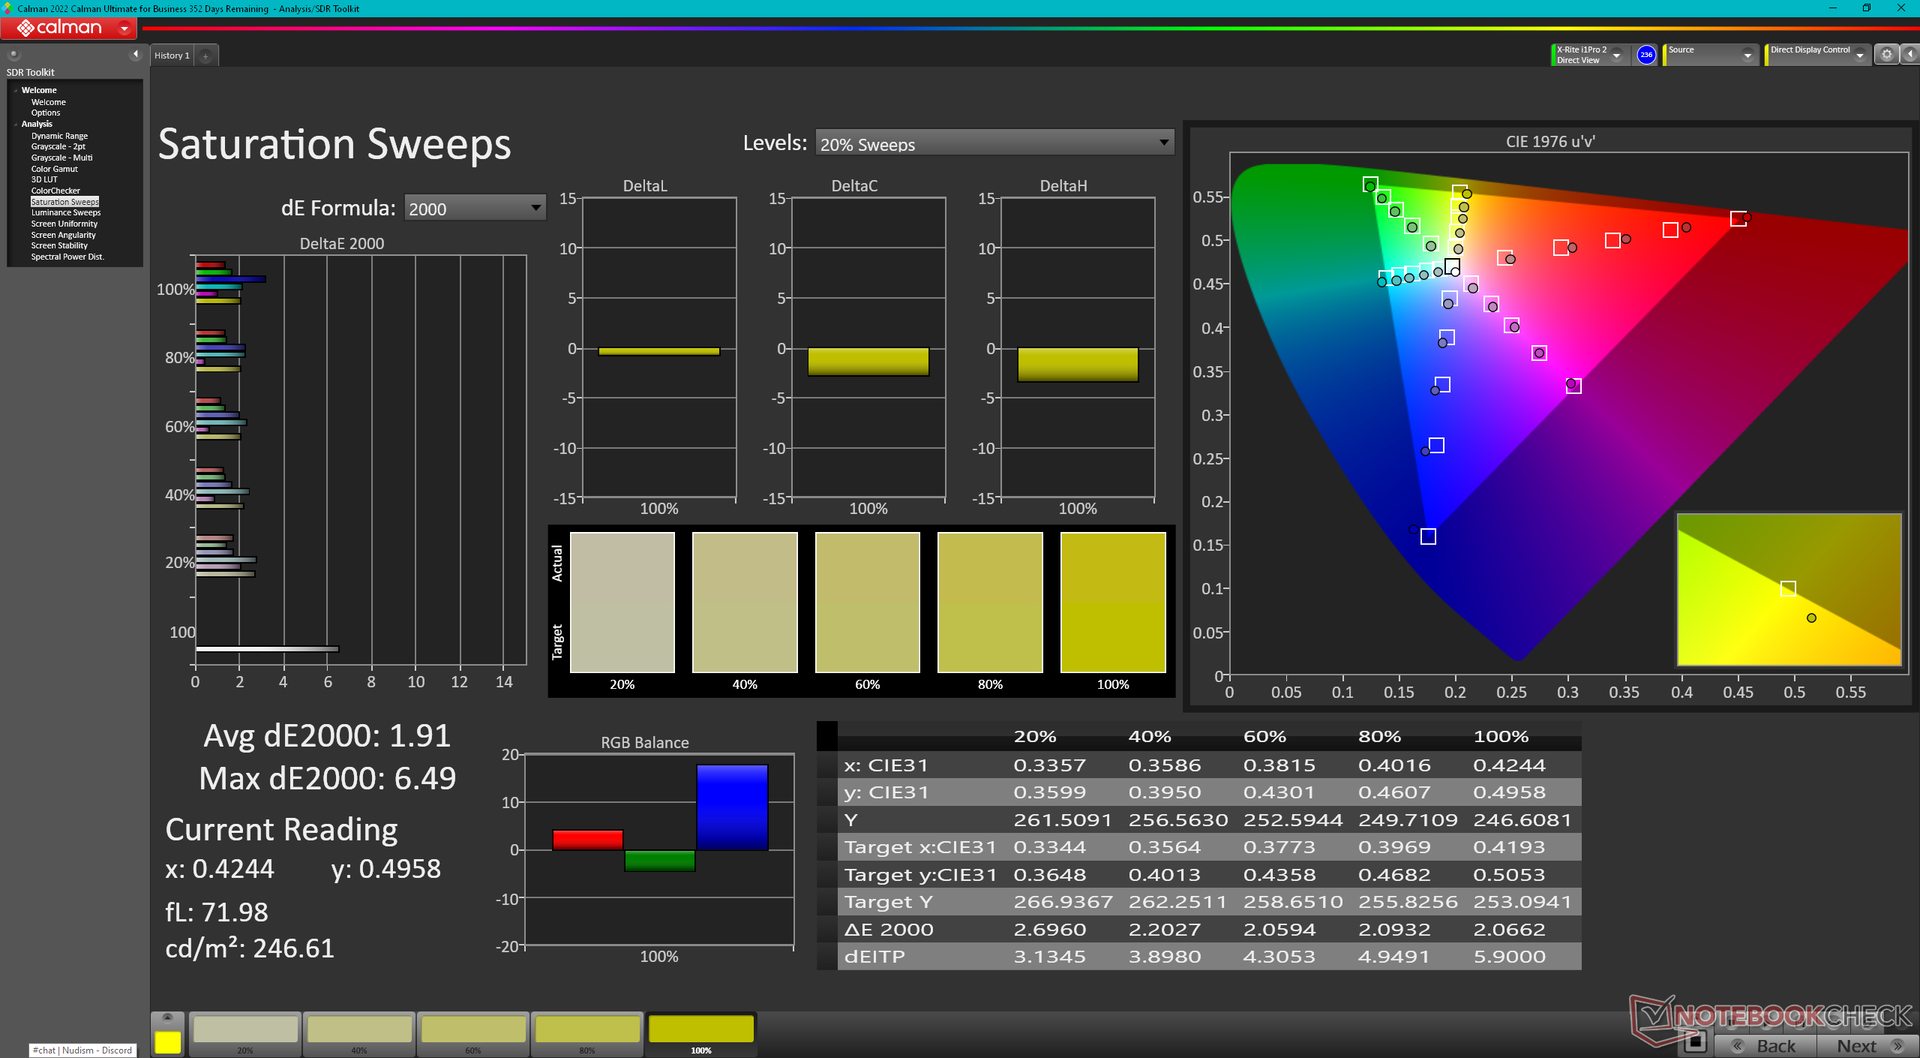
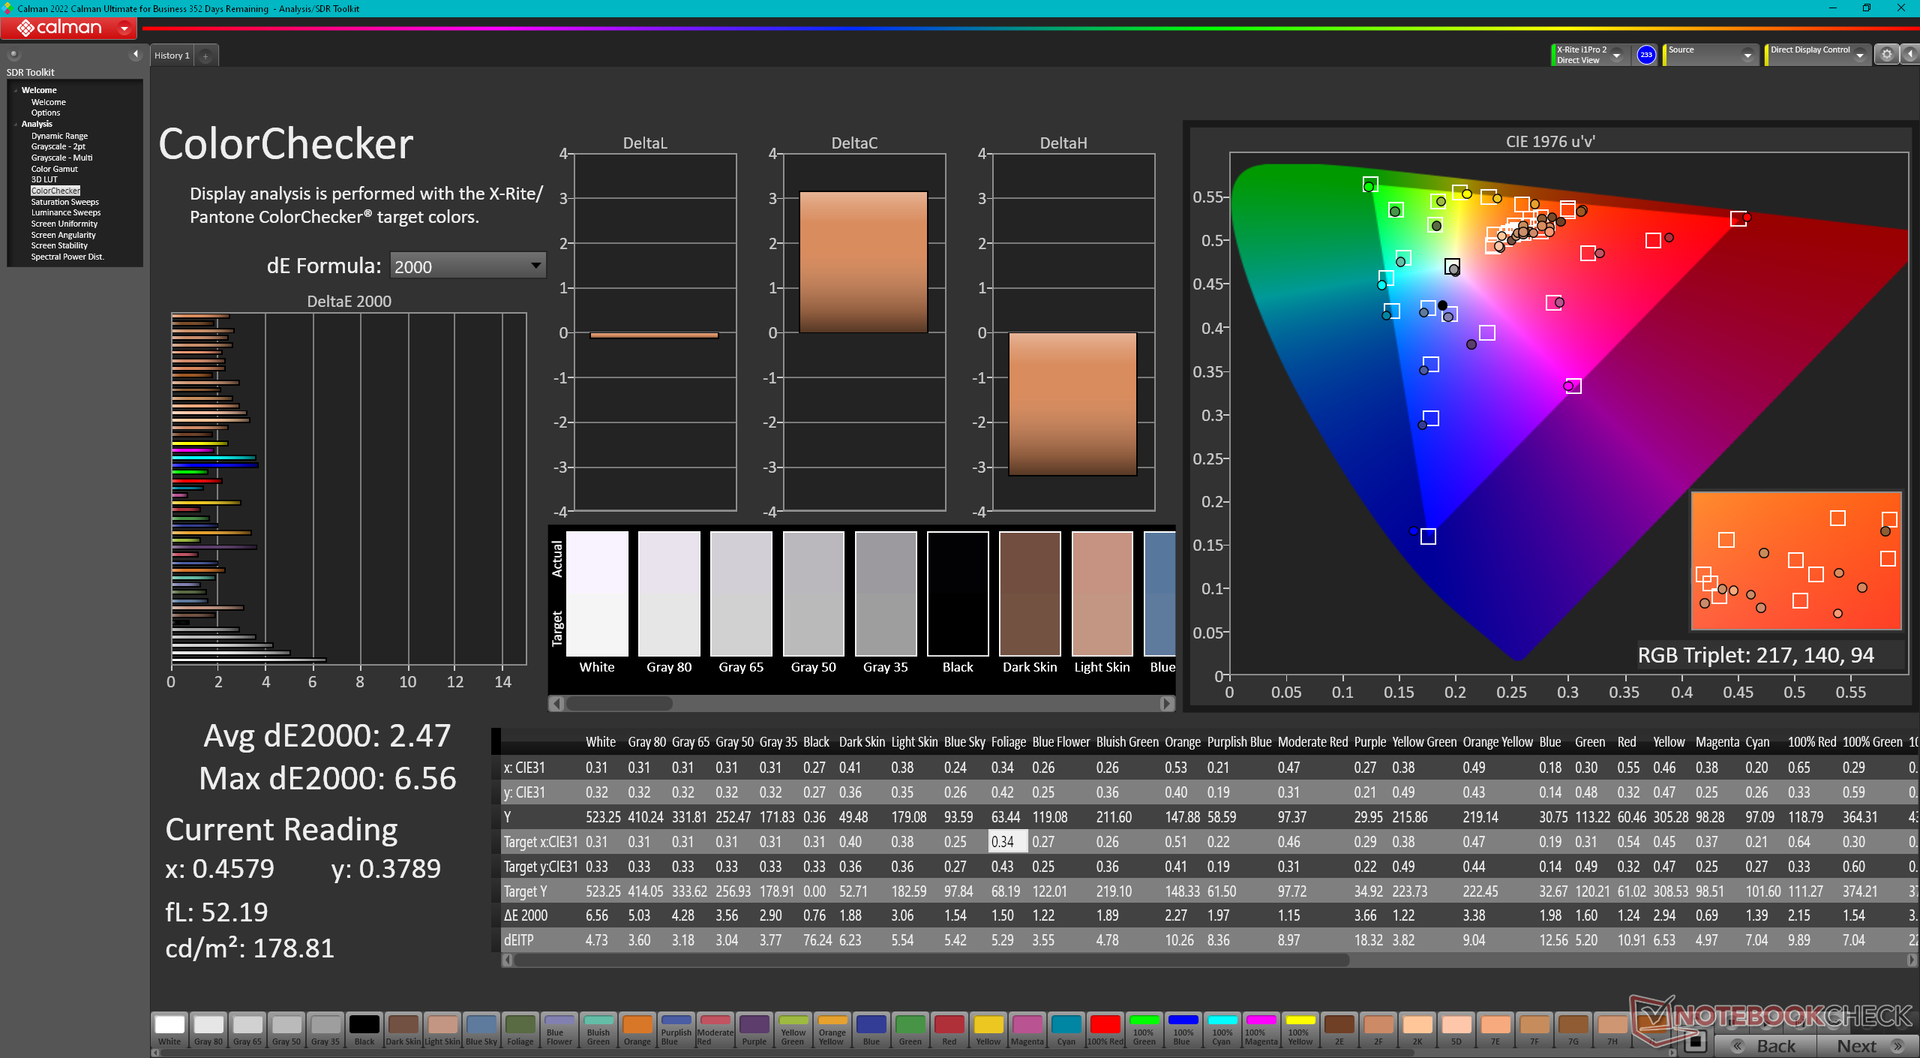
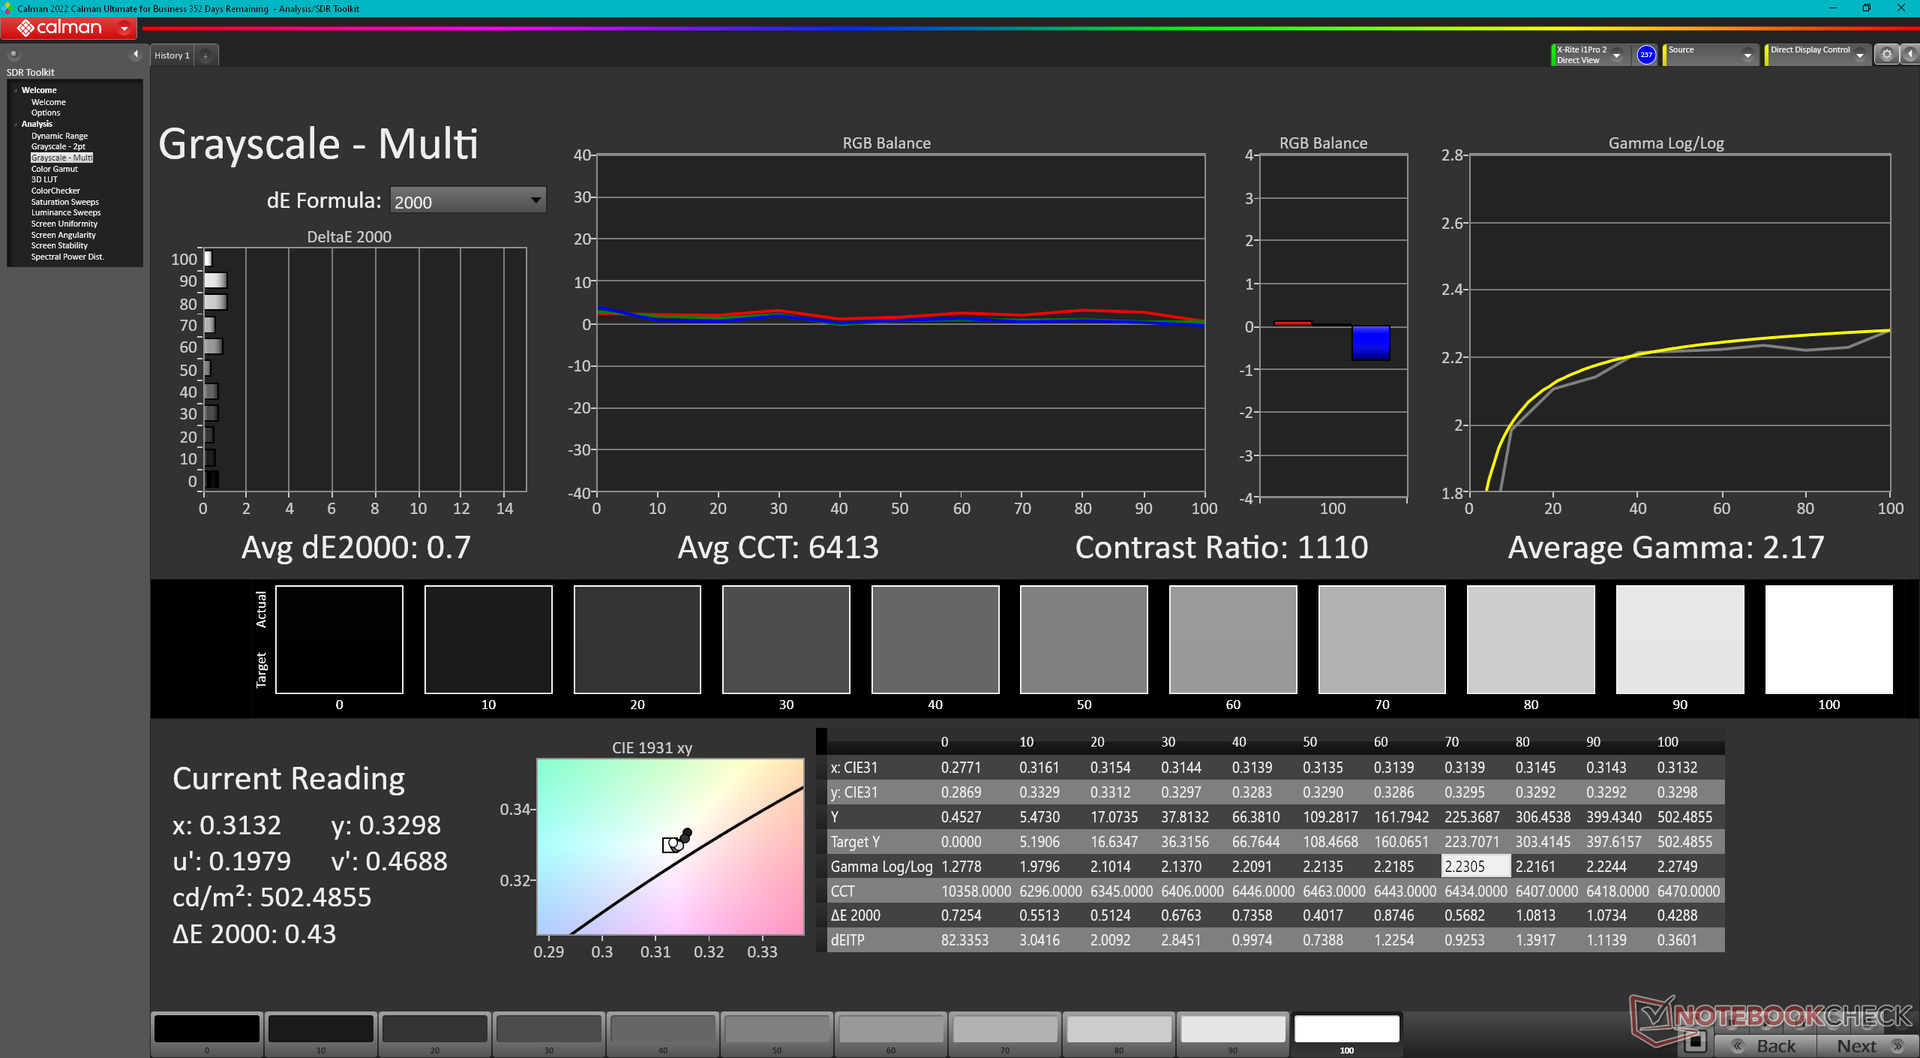
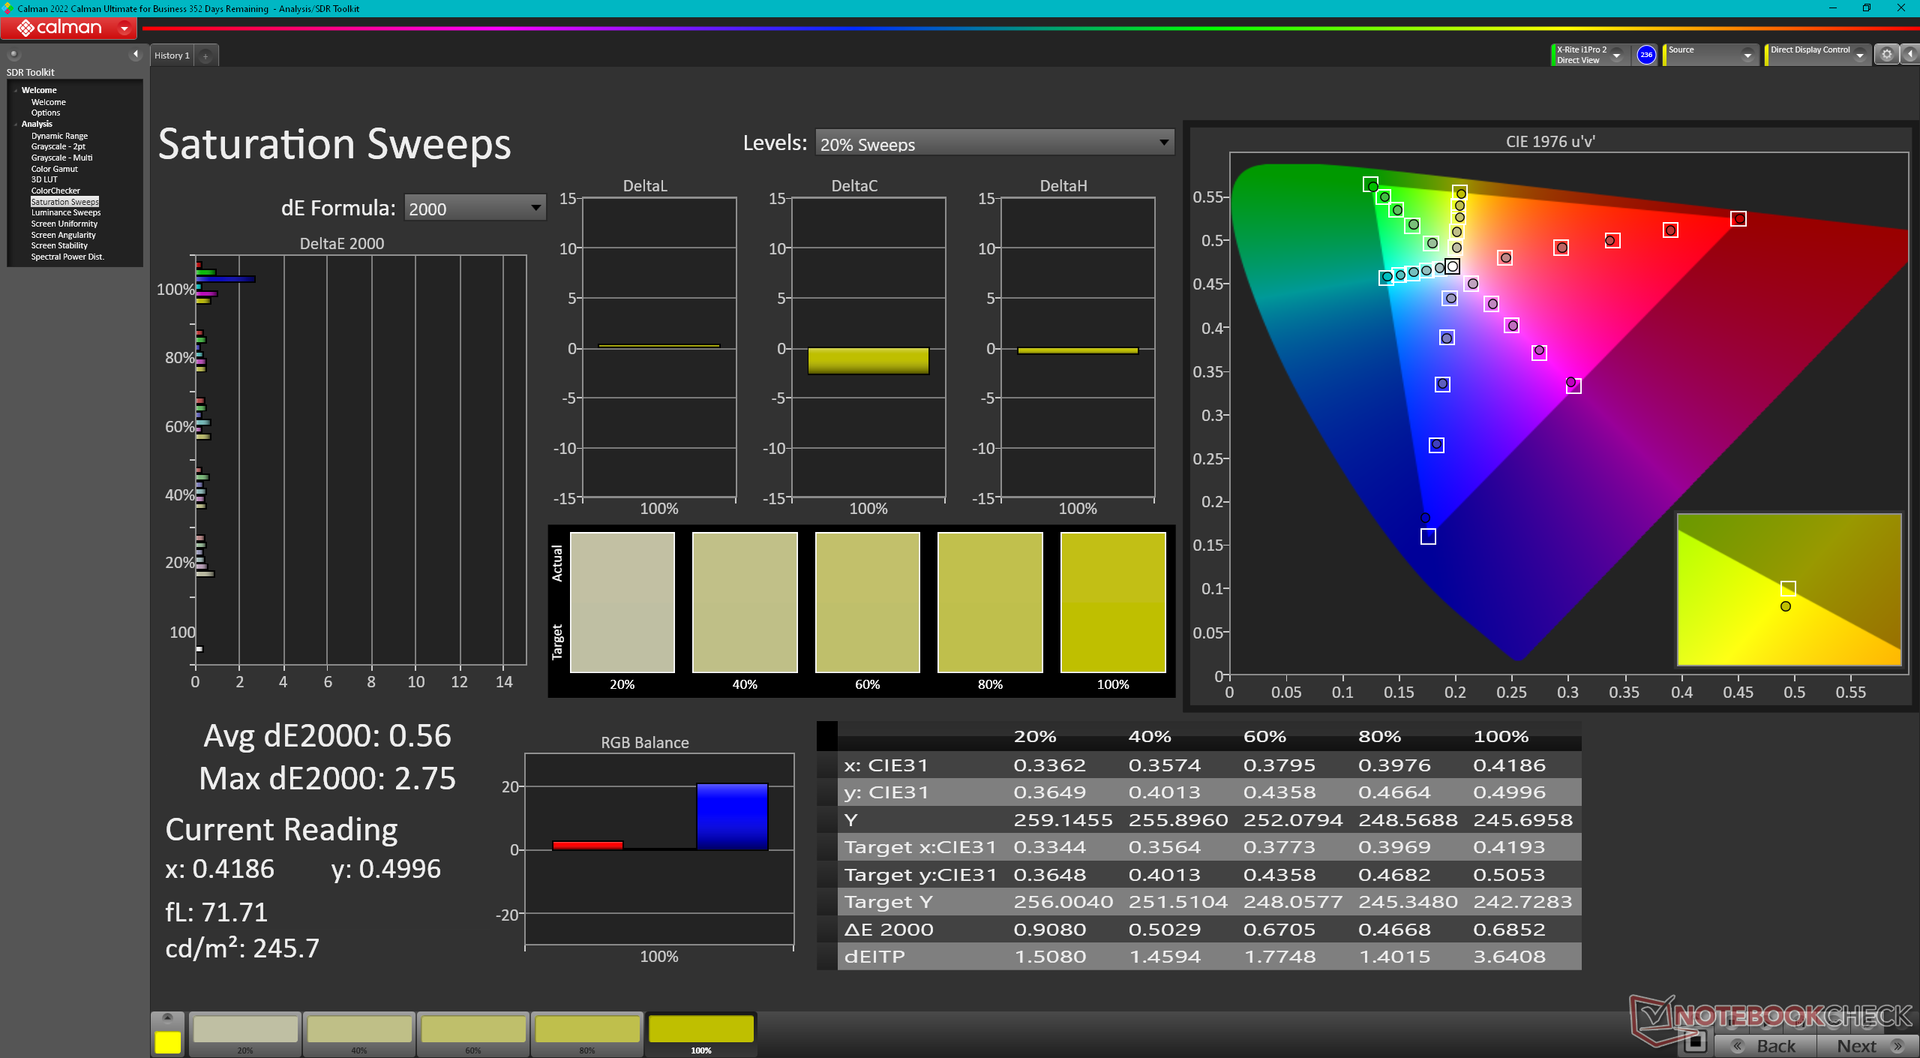
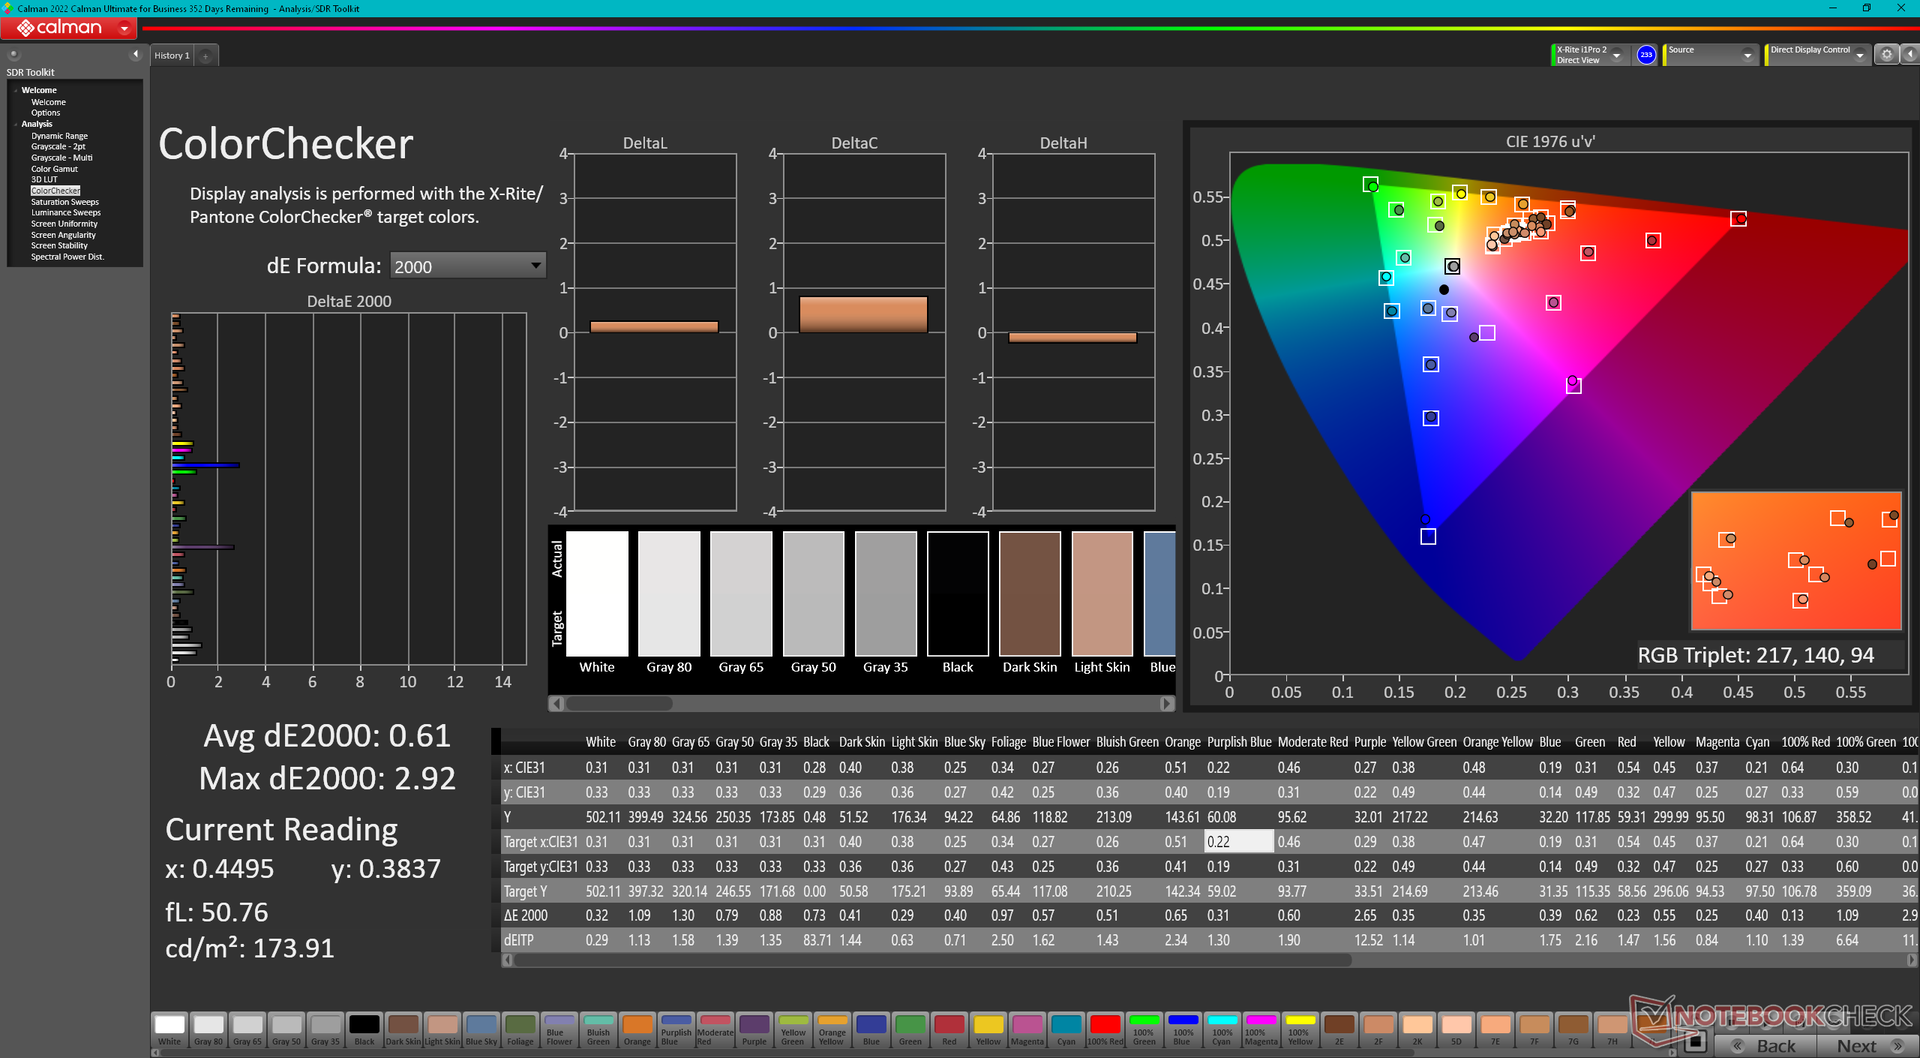
Lenovo no ha cambiado nada en el panel IPS BOE CQ NE160QDM-NY1 respecto al modelo Legion 5 Pro 16 del año pasado. Nuestras mediciones a continuación muestran atributos similares en todo el tablero, incluyendo la cobertura sRGB completa, los rápidos tiempos de respuesta en blanco y negro, la relación de contraste de ~1000:1 y la brillante retroiluminación de 500 nits.
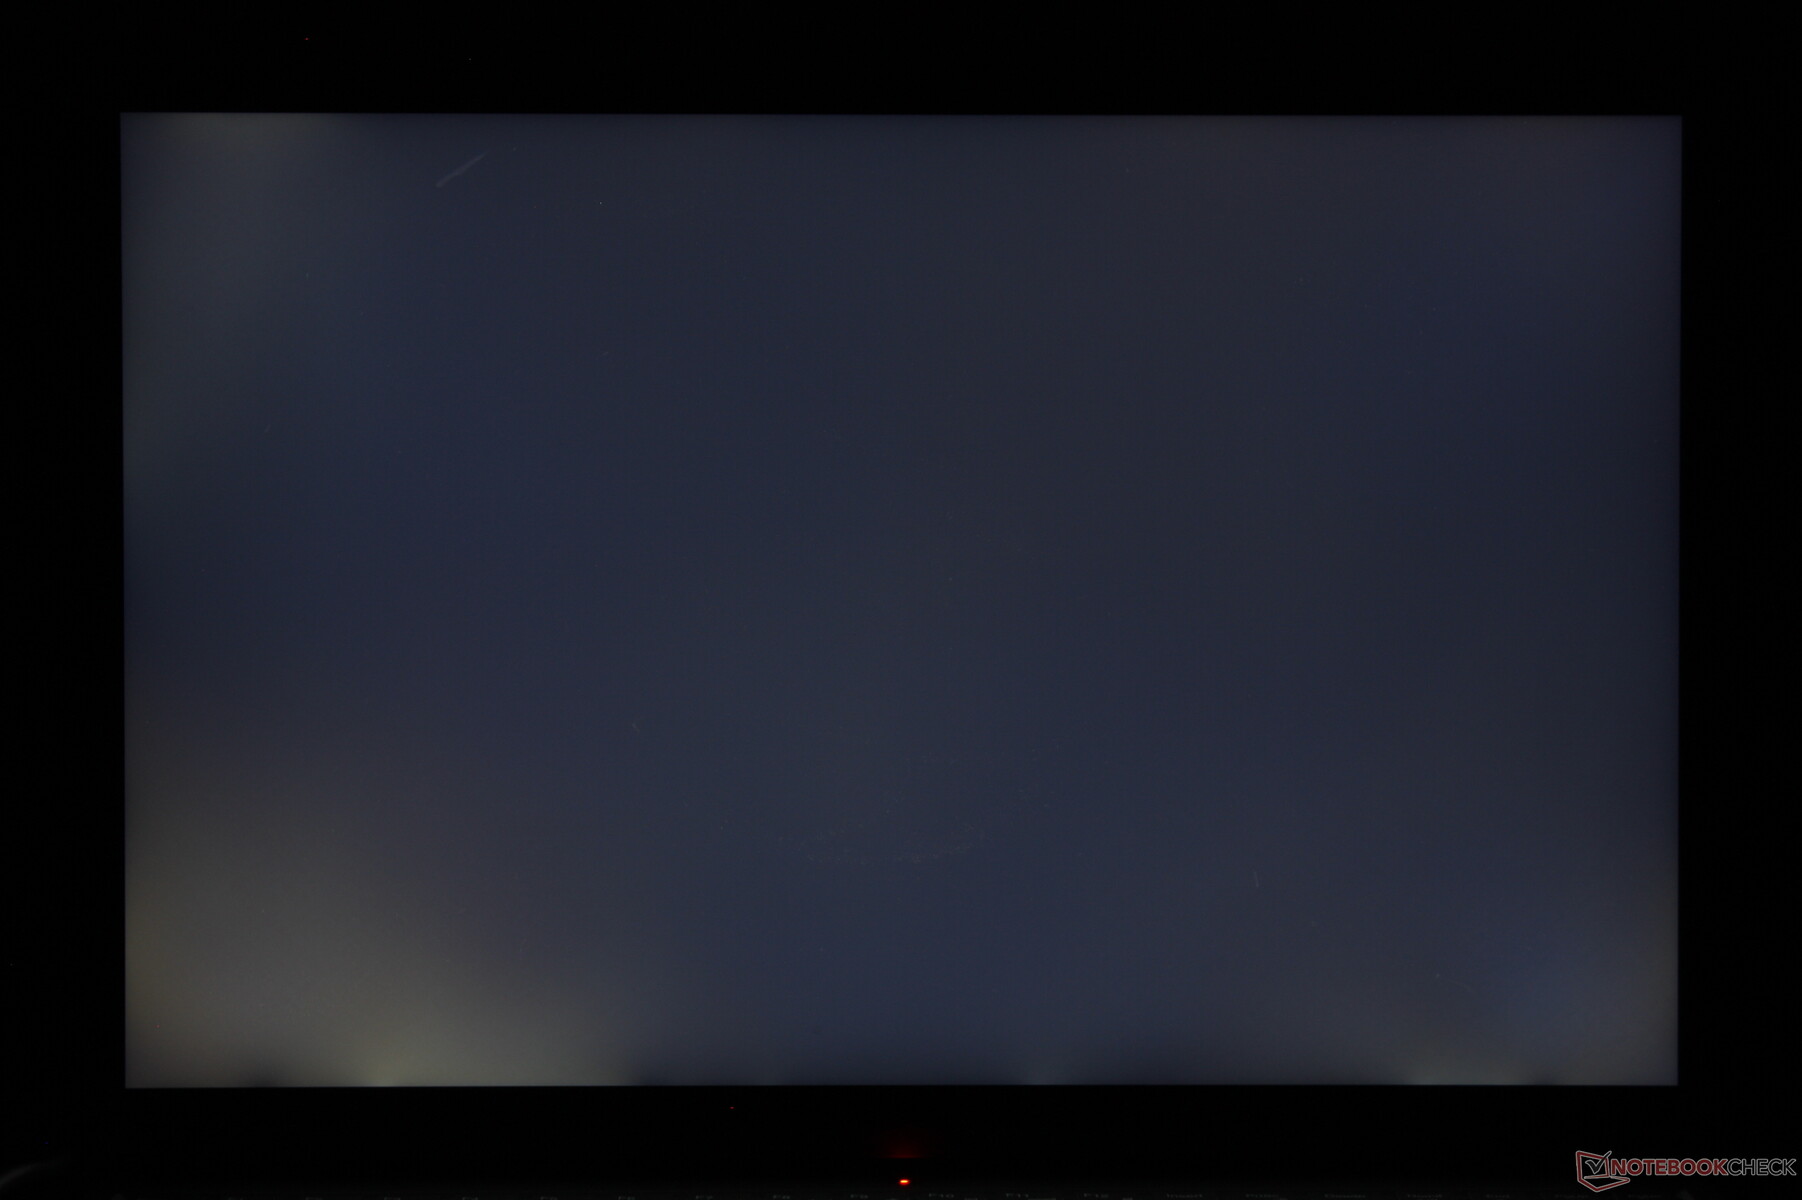
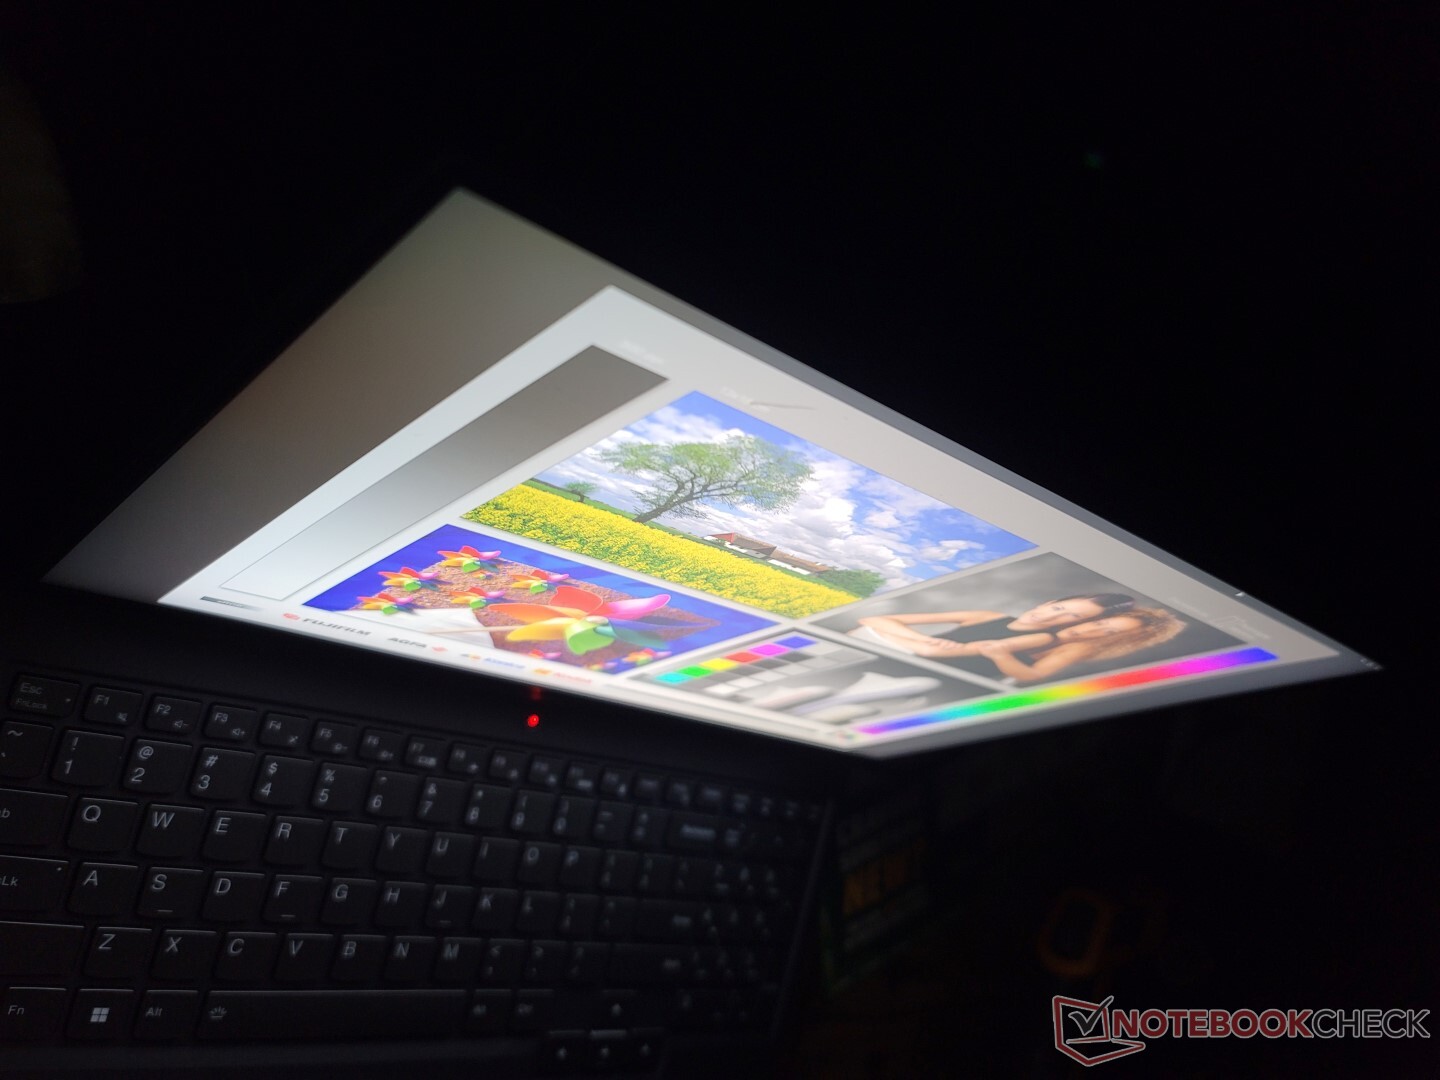
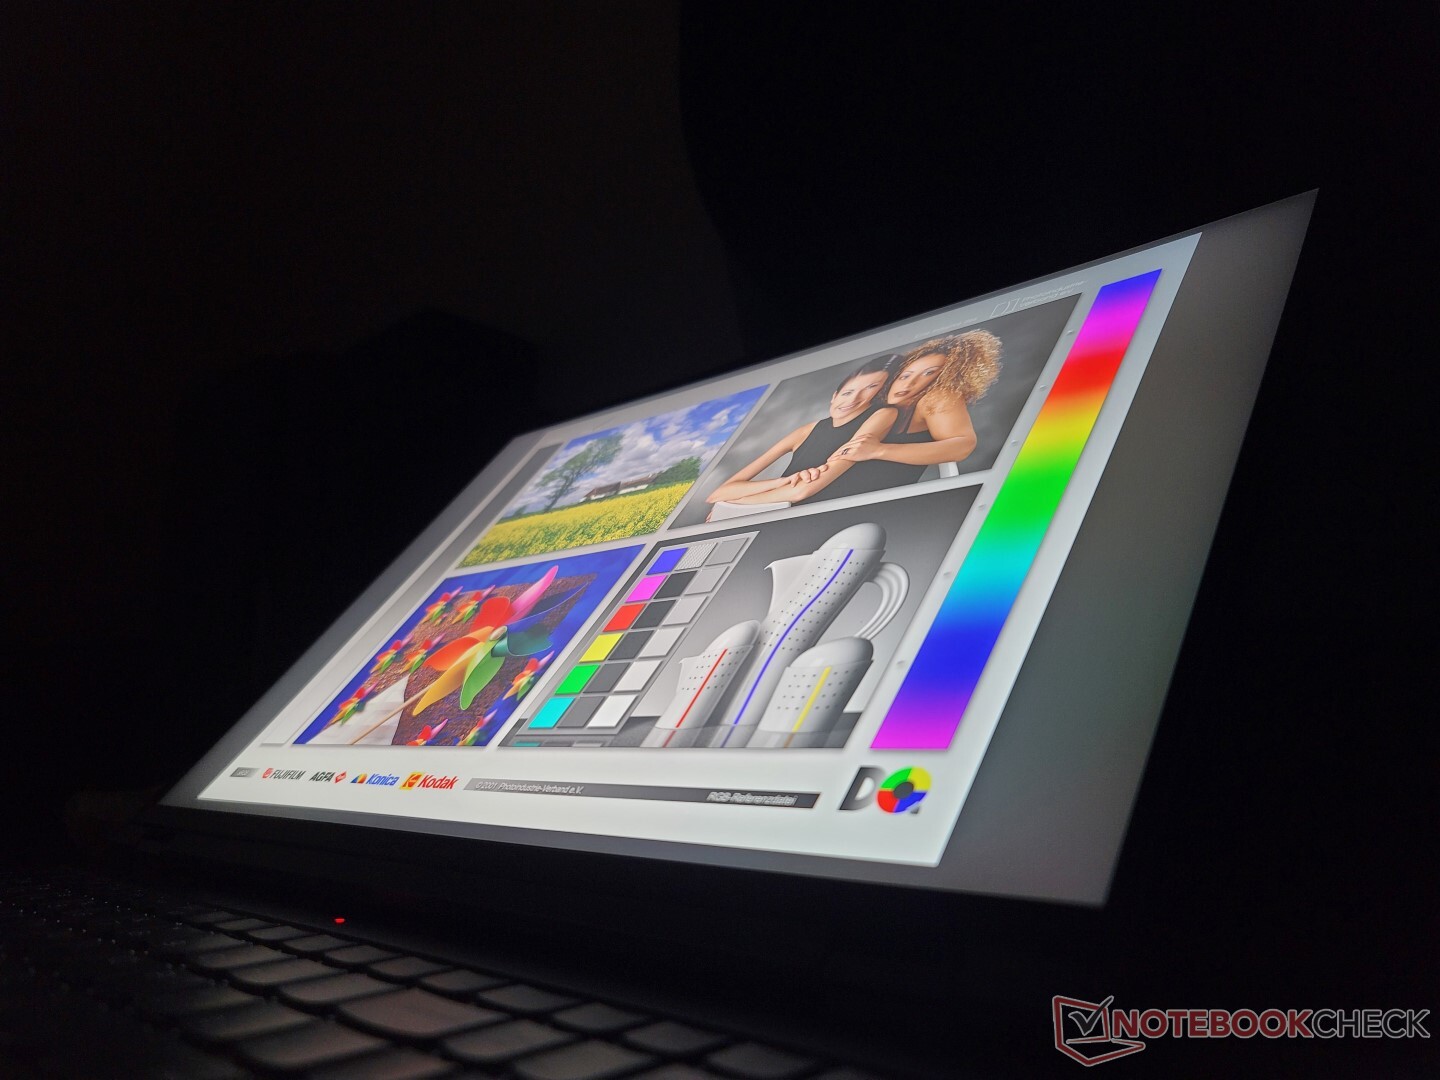
Sin embargo, nuestra unidad específica sufre de un sangrado de luz de fondo moderado-pesado como se muestra en nuestra imagen de abajo. Es de esperar que la mayoría de los paneles IPS sufran algún tipo de sangrado de luz irregular, pero esta intensidad es particularmente molesta en una máquina de juego de gama alta como el Legion 5 Pro 16.

| |||||||||||||||||||||||||
iluminación: 84 %
Brillo con batería: 522.8 cd/m²
Contraste: 1275:1 (Negro: 0.41 cd/m²)
ΔE ColorChecker Calman: 2.47 | ∀{0.5-29.43 Ø4.71}
calibrated: 0.61
ΔE Greyscale Calman: 3 | ∀{0.09-98 Ø4.96}
69.5% AdobeRGB 1998 (Argyll 3D)
96.1% sRGB (Argyll 3D)
67.3% Display P3 (Argyll 3D)
Gamma: 2.27
CCT: 6719 K
| Lenovo Legion 5 Pro 16ARH7H RTX 3070 Ti BOE CQ NE160QDM-NY1, IPS, 2560x1600, 16" | Lenovo Legion 5 Pro 16IAH7H BOE CCQ_NE160QDM_NY1, IPS, 2560x1600, 16" | Asus ROG Zephyrus M16 GU603H AU Optronics AUOC199, IPS, 2560x1600, 16" | Lenovo Legion 7 16ARHA7 BOE CQ NE160QDM-NY1, IPS, 2560x1600, 16" | HP Victus 16-e0145ng CMN1609, IPS, 1920x1080, 16.1" | Dell G16 7620 BOE NE16QDM, IPS, 2560x1600, 16" | |
|---|---|---|---|---|---|---|
| Display | 2% | -4% | -37% | 1% | ||
| Display P3 Coverage (%) | 67.3 | 68.53 2% | 63.7 -5% | 41.6 -38% | 68.3 1% | |
| sRGB Coverage (%) | 96.1 | 98.38 2% | 95.3 -1% | 61.9 -36% | 98 2% | |
| AdobeRGB 1998 Coverage (%) | 69.5 | 70.45 1% | 65.7 -5% | 43 -38% | 70.5 1% | |
| Response Times | 25% | 57% | 25% | -90% | 24% | |
| Response Time Grey 50% / Grey 80% * (ms) | 14.4 ? | 14 ? 3% | 4.8 ? 67% | 9.2 ? 36% | 29.6 ? -106% | 8.6 ? 40% |
| Response Time Black / White * (ms) | 11.2 ? | 6 ? 46% | 6 ? 46% | 9.6 ? 14% | 19.4 ? -73% | 10.4 ? 7% |
| PWM Frequency (Hz) | ||||||
| Screen | -7% | -51% | -19% | -127% | -10% | |
| Brightness middle (cd/m²) | 522.8 | 515 -1% | 448 -14% | 478.8 -8% | 257 -51% | 369.4 -29% |
| Brightness (cd/m²) | 503 | 475 -6% | 446 -11% | 477 -5% | 239 -52% | 348 -31% |
| Brightness Distribution (%) | 84 | 85 1% | 86 2% | 90 7% | 88 5% | 83 -1% |
| Black Level * (cd/m²) | 0.41 | 0.45 -10% | 0.48 -17% | 0.43 -5% | 0.25 39% | 0.32 22% |
| Contrast (:1) | 1275 | 1144 -10% | 933 -27% | 1113 -13% | 1028 -19% | 1154 -9% |
| Colorchecker dE 2000 * | 2.47 | 2.38 4% | 2.76 -12% | 2.24 9% | 6.91 -180% | 1.78 28% |
| Colorchecker dE 2000 max. * | 6.56 | 4.37 33% | 7.09 -8% | 4.49 32% | 22.27 -239% | 4.41 33% |
| Colorchecker dE 2000 calibrated * | 0.61 | 1.1 -80% | 2.86 -369% | 1.89 -210% | 3.61 -492% | 1.22 -100% |
| Greyscale dE 2000 * | 3 | 2.71 10% | 3.1 -3% | 2.3 23% | 7.5 -150% | 3.2 -7% |
| Gamma | 2.27 97% | 2.49 88% | 2.153 102% | 2.25 98% | 2.125 104% | 2.2 100% |
| CCT | 6719 97% | 6117 106% | 6826 95% | 6955 93% | 6025 108% | 6750 96% |
| Color Space (Percent of AdobeRGB 1998) (%) | 87 | |||||
| Color Space (Percent of sRGB) (%) | 100 | |||||
| Media total (Programa/Opciones) | 7% /
-0% | 3% /
-31% | 1% /
-9% | -85% /
-102% | 5% /
-3% |
* ... más pequeño es mejor
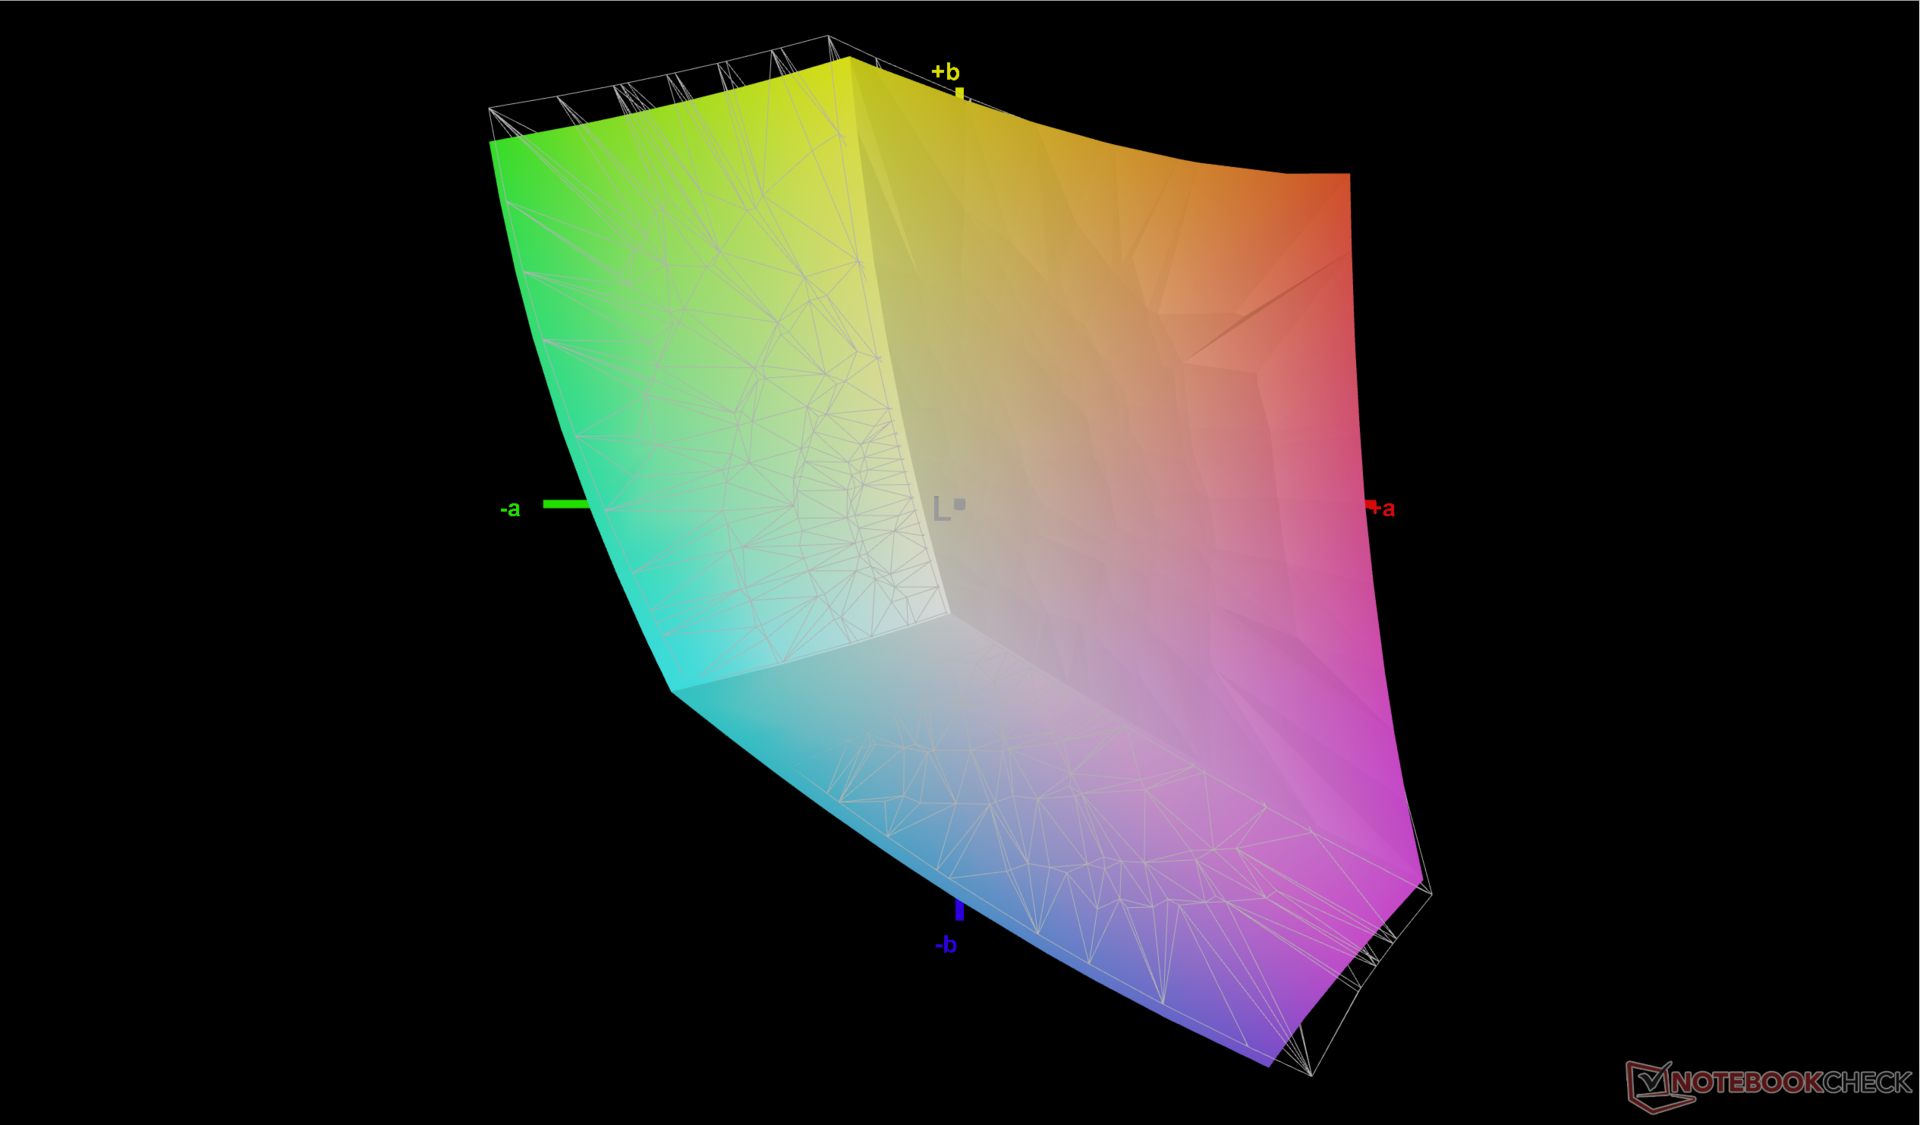
La pantalla viene precalibrada con valores medios de deltaE en escala de grises y color de sólo 3 y 2,47, respectivamente, en nuestra unidad específica. Calibrando nosotros mismos el panel con un colorímetro X-Rite, los valores deltaE mejorarían aún más, hasta llegar a sólo 0,7 y 0,6. Recomendamos aplicar nuestro perfil ICM calibrado más arriba para aprovechar mejor la cobertura sRGB completa de la pantalla.
Tiempos de respuesta del display
| ↔ Tiempo de respuesta de Negro a Blanco | ||
|---|---|---|
| 11.2 ms ... subida ↗ y bajada ↘ combinada | ↗ 6 ms subida | 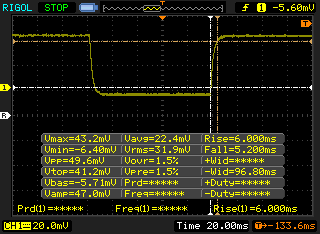 |
| ↘ 5.2 ms bajada | ||
| La pantalla mostró buenos tiempos de respuesta en nuestros tests pero podría ser demasiado lenta para los jugones competitivos. En comparación, todos los dispositivos de prueba van de ##min### (mínimo) a 240 (máximo) ms. » 30 % de todos los dispositivos son mejores. Esto quiere decir que el tiempo de respuesta medido es mejor que la media (19.8 ms) de todos los dispositivos testados. | ||
| ↔ Tiempo de respuesta 50% Gris a 80% Gris | ||
| 14.4 ms ... subida ↗ y bajada ↘ combinada | ↗ 7.6 ms subida | 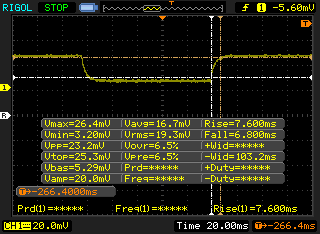 |
| ↘ 6.8 ms bajada | ||
| La pantalla mostró buenos tiempos de respuesta en nuestros tests pero podría ser demasiado lenta para los jugones competitivos. En comparación, todos los dispositivos de prueba van de ##min### (mínimo) a 636 (máximo) ms. » 28 % de todos los dispositivos son mejores. Esto quiere decir que el tiempo de respuesta medido es mejor que la media (31 ms) de todos los dispositivos testados. | ||
Parpadeo de Pantalla / PWM (Pulse-Width Modulation)
| Parpadeo de Pantalla / PWM no detectado | 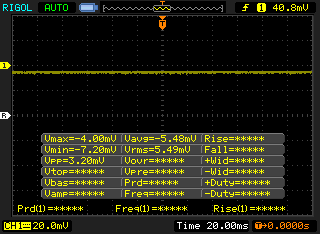 | ||
Comparación: 52 % de todos los dispositivos testados no usaron PWM para atenuar el display. Si se usó, medimos una media de 7754 (mínimo: 5 - máxmo: 343500) Hz. | |||
Rendimiento - Sólo un poco más rápido
Condiciones de la prueba
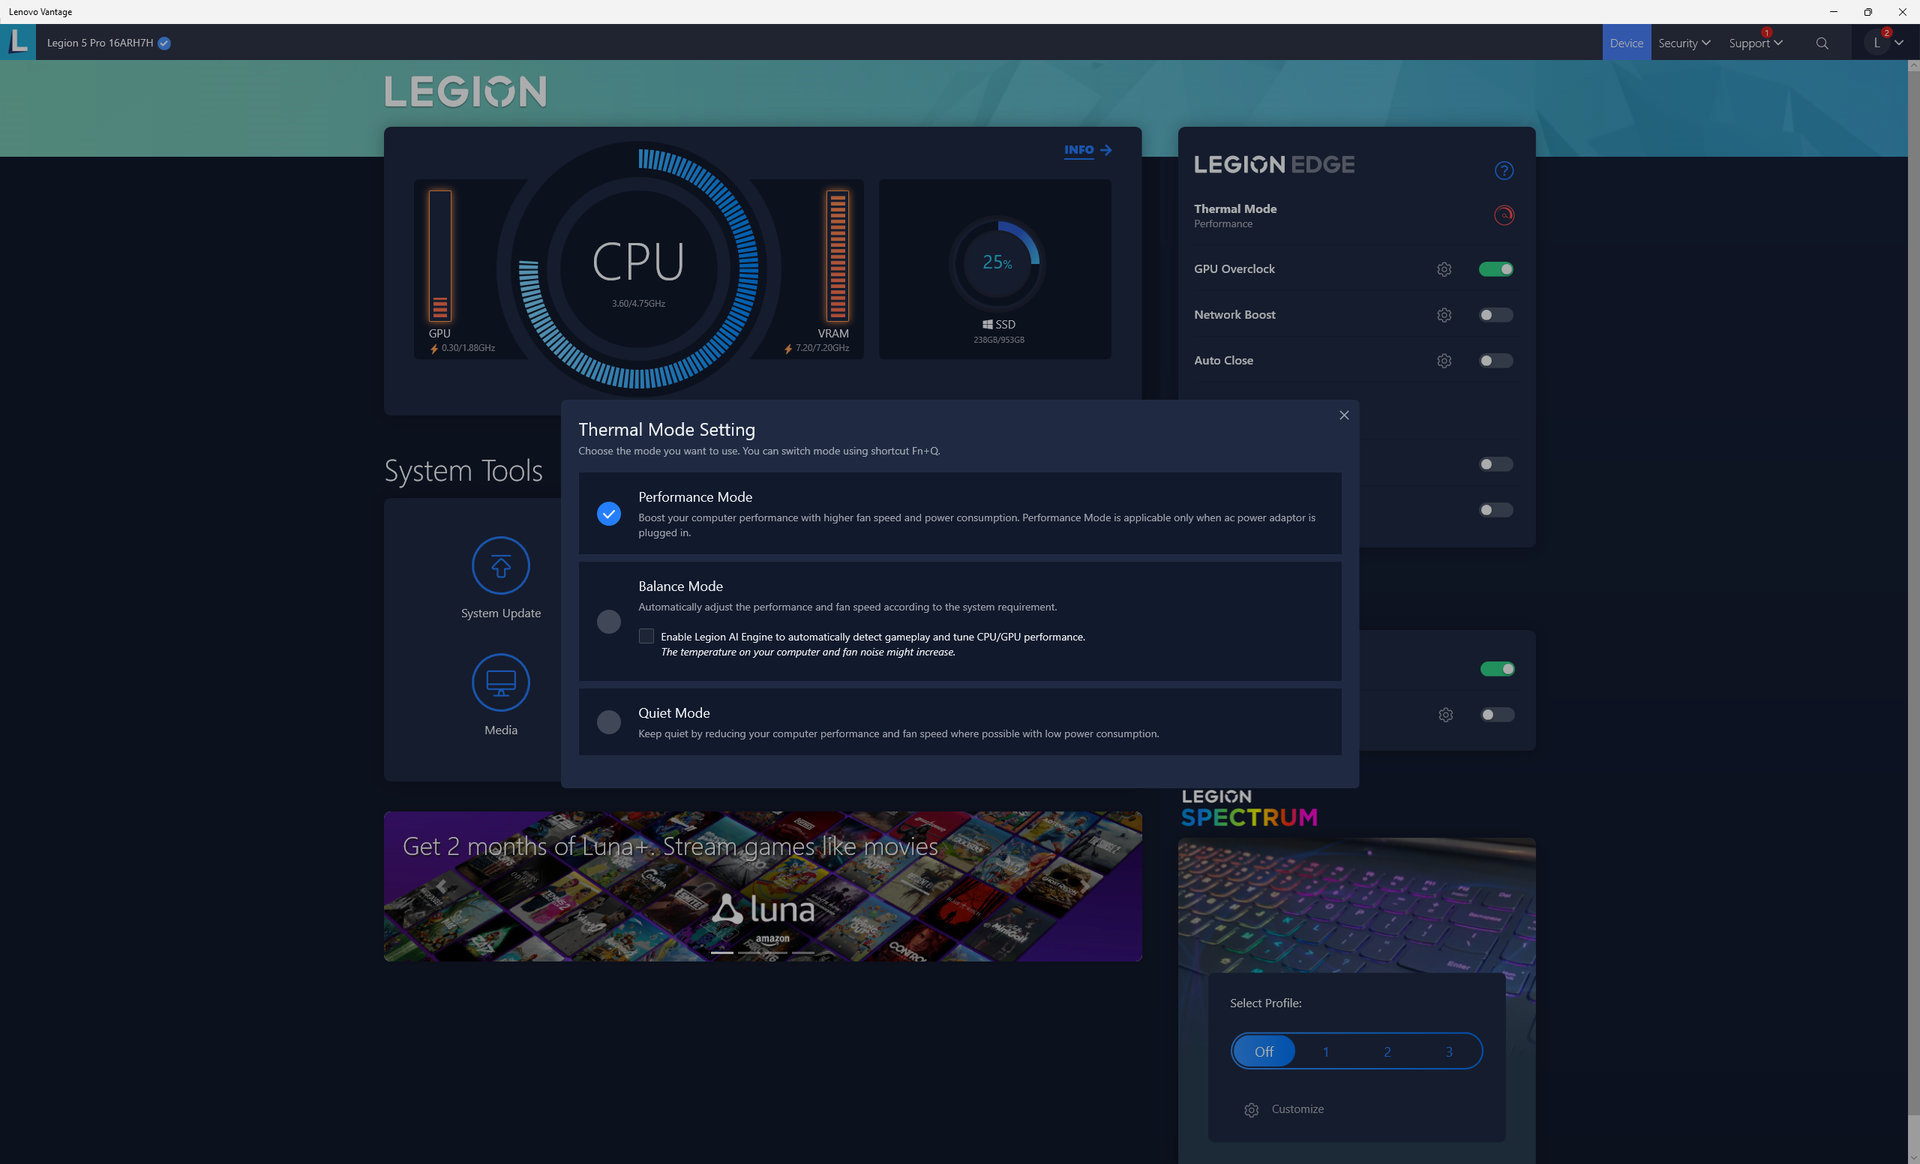
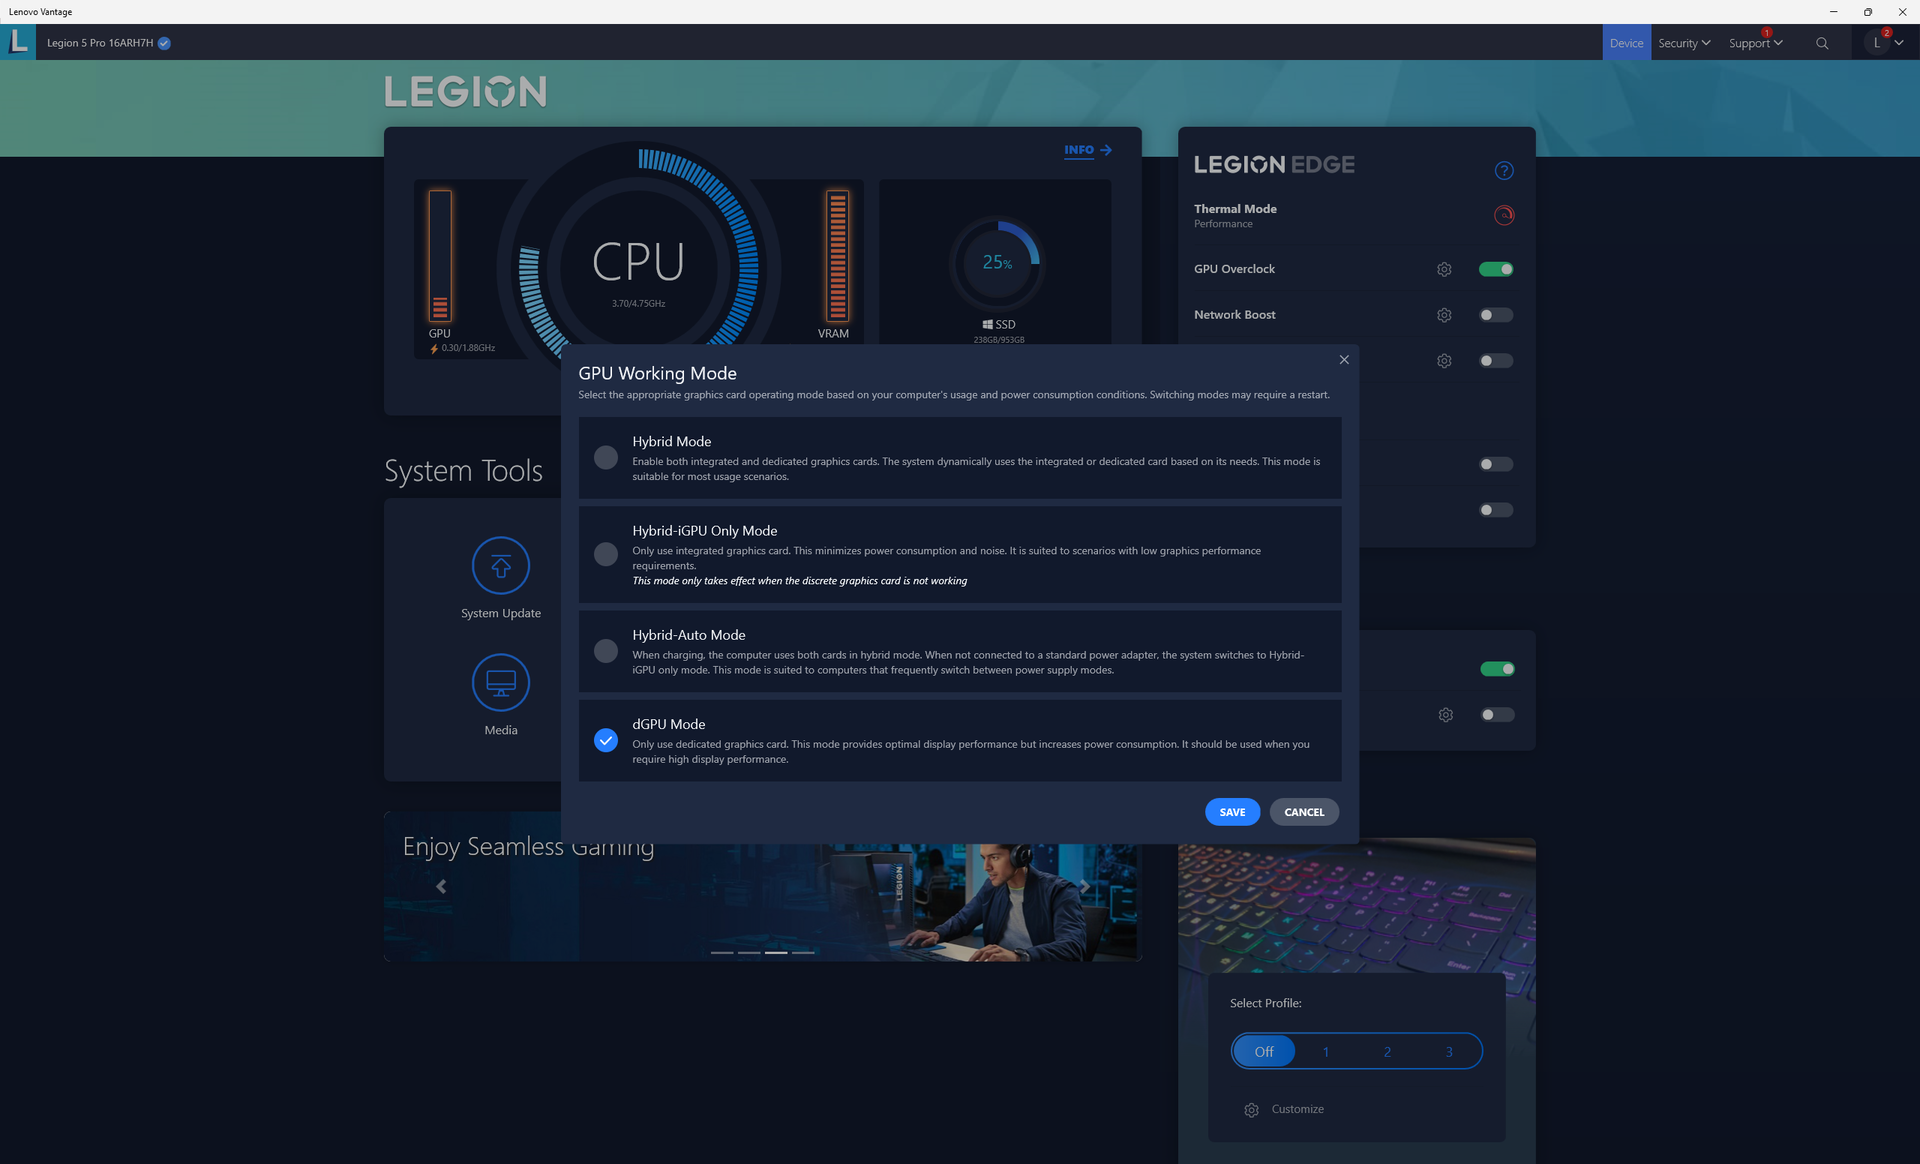
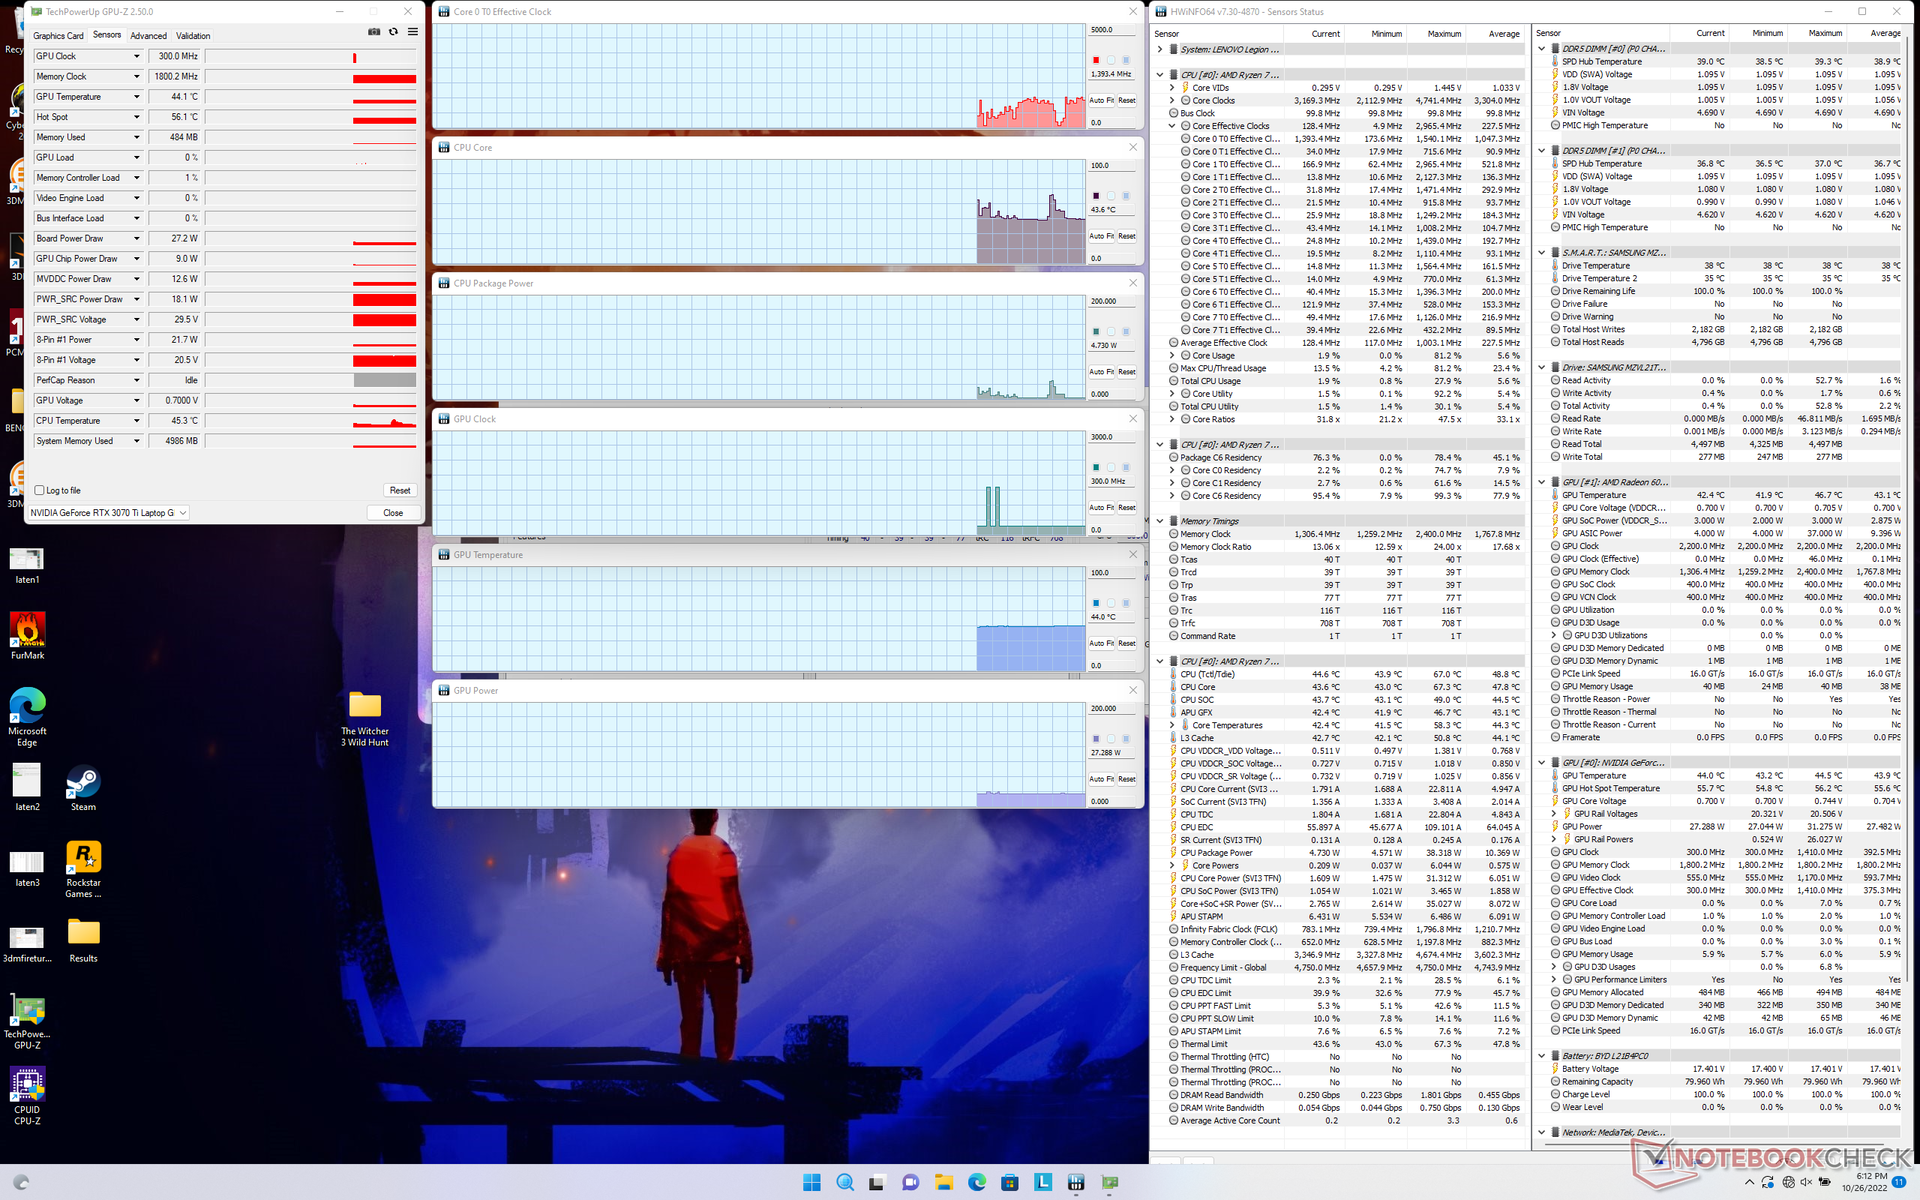
Hemos puesto nuestra unidad en modo Rendimiento tanto a través de Windows como del software Lenovo Vantage antes de ejecutar cualquier prueba de rendimiento. También nos aseguramos de activar el Overclock de la GPU y el modo de trabajo de la GPU en "sólo dGPU" para obtener el máximo rendimiento. Los propietarios deberían familiarizarse con el software Vantage y sus diferentes configuraciones, tal y como se muestra en las siguientes capturas de pantalla.

Procesador
El rendimiento de un solo hilo y de varios hilos es aproximadamente un 10 por ciento y un 20 por ciento más rápido que en la última generación Ryzen 7 5800Hrespectivamente, basándonos en nuestro tiempo con el HP Omen 16 y el Lenovo 2021 Legion 5 Pro 16. Aunque no es insignificante, el aumento de rendimiento de un año a otro no es tan grande como el salto de la 11ª a la 12ª generación de Intel. El Core i7-12700Hpor ejemplo, sigue siendo entre un 15 y un 30 por ciento más rápido que nuestro Ryzen 7 6800H
La actualización al Ryzen 9 6900HX desde nuestro Ryzen 7 6800H se espera que aporte sólo ganancias marginales en el mejor de los casos, como se muestra en nuestras tablas de comparación a continuación. Por tanto, los compradores preocupados por el presupuesto pueden considerar un Ryzen 7 6800H menos caro.
Cinebench R15 Multi Loop
Cinebench R23: Multi Core | Single Core
Cinebench R15: CPU Multi 64Bit | CPU Single 64Bit
Blender: v2.79 BMW27 CPU
7-Zip 18.03: 7z b 4 | 7z b 4 -mmt1
Geekbench 5.5: Multi-Core | Single-Core
HWBOT x265 Benchmark v2.2: 4k Preset
LibreOffice : 20 Documents To PDF
R Benchmark 2.5: Overall mean
| HWBOT x265 Benchmark v2.2 / 4k Preset | |
| Lenovo Legion 5 Pro 16IAH7H | |
| Alienware x15 R2 P111F | |
| Dell G16 7620 | |
| Lenovo Legion 5 Pro 16ARH7H RTX 3070 Ti | |
| Lenovo Legion 7 16ARHA7 | |
| Gigabyte A5 X1 | |
| Medio AMD Ryzen 7 6800H (14.9 - 18.5, n=9) | |
| HP Omen 16-c0077ng | |
| Asus ROG Zephyrus M16 GU603H | |
| HP Victus 16-e0145ng | |
| Lenovo Legion C7 15IMH05 82EH0030GE | |
* ... más pequeño es mejor
AIDA64: FP32 Ray-Trace | FPU Julia | CPU SHA3 | CPU Queen | FPU SinJulia | FPU Mandel | CPU AES | CPU ZLib | FP64 Ray-Trace | CPU PhotoWorxx
| Performance rating | |
| Lenovo Legion 7 16ARHA7 | |
| Lenovo Legion 5 Pro 16ARH7H RTX 3070 Ti | |
| Medio AMD Ryzen 7 6800H | |
| Dell G16 7620 | |
| Lenovo Legion 5 Pro 16IAH7H | |
| HP Victus 16-e0145ng | |
| Asus ROG Zephyrus M16 GU603H -9! | |
| AIDA64 / FP32 Ray-Trace | |
| Lenovo Legion 7 16ARHA7 | |
| Lenovo Legion 5 Pro 16ARH7H RTX 3070 Ti | |
| Medio AMD Ryzen 7 6800H (12876 - 17031, n=8) | |
| Dell G16 7620 | |
| Lenovo Legion 5 Pro 16IAH7H | |
| Lenovo Legion 5 Pro 16IAH7H | |
| HP Victus 16-e0145ng | |
| AIDA64 / FPU Julia | |
| Lenovo Legion 7 16ARHA7 | |
| Lenovo Legion 5 Pro 16ARH7H RTX 3070 Ti | |
| Medio AMD Ryzen 7 6800H (82673 - 105987, n=8) | |
| Dell G16 7620 | |
| Lenovo Legion 5 Pro 16IAH7H | |
| Lenovo Legion 5 Pro 16IAH7H | |
| HP Victus 16-e0145ng | |
| AIDA64 / CPU SHA3 | |
| Dell G16 7620 | |
| Lenovo Legion 7 16ARHA7 | |
| Lenovo Legion 5 Pro 16ARH7H RTX 3070 Ti | |
| Lenovo Legion 5 Pro 16IAH7H | |
| Lenovo Legion 5 Pro 16IAH7H | |
| Medio AMD Ryzen 7 6800H (2886 - 3634, n=8) | |
| HP Victus 16-e0145ng | |
| AIDA64 / CPU Queen | |
| Lenovo Legion 5 Pro 16ARH7H RTX 3070 Ti | |
| Lenovo Legion 7 16ARHA7 | |
| Dell G16 7620 | |
| Lenovo Legion 5 Pro 16IAH7H | |
| Medio AMD Ryzen 7 6800H (75117 - 106322, n=8) | |
| HP Victus 16-e0145ng | |
| AIDA64 / FPU SinJulia | |
| Lenovo Legion 7 16ARHA7 | |
| Lenovo Legion 5 Pro 16ARH7H RTX 3070 Ti | |
| Medio AMD Ryzen 7 6800H (11771 - 13120, n=8) | |
| Lenovo Legion 5 Pro 16IAH7H | |
| Lenovo Legion 5 Pro 16IAH7H | |
| Dell G16 7620 | |
| HP Victus 16-e0145ng | |
| AIDA64 / FPU Mandel | |
| Lenovo Legion 7 16ARHA7 | |
| Lenovo Legion 5 Pro 16ARH7H RTX 3070 Ti | |
| Medio AMD Ryzen 7 6800H (45287 - 58327, n=8) | |
| HP Victus 16-e0145ng | |
| Lenovo Legion 5 Pro 16IAH7H | |
| Lenovo Legion 5 Pro 16IAH7H | |
| Dell G16 7620 | |
| AIDA64 / CPU AES | |
| Lenovo Legion 7 16ARHA7 | |
| Lenovo Legion 5 Pro 16ARH7H RTX 3070 Ti | |
| Lenovo Legion 5 Pro 16IAH7H | |
| Lenovo Legion 5 Pro 16IAH7H | |
| Medio AMD Ryzen 7 6800H (67816 - 137383, n=8) | |
| Dell G16 7620 | |
| HP Victus 16-e0145ng | |
| AIDA64 / FP64 Ray-Trace | |
| Lenovo Legion 7 16ARHA7 | |
| Lenovo Legion 5 Pro 16ARH7H RTX 3070 Ti | |
| Medio AMD Ryzen 7 6800H (6917 - 8980, n=8) | |
| Dell G16 7620 | |
| Lenovo Legion 5 Pro 16IAH7H | |
| Lenovo Legion 5 Pro 16IAH7H | |
| HP Victus 16-e0145ng | |
| AIDA64 / CPU PhotoWorxx | |
| Dell G16 7620 | |
| Lenovo Legion 5 Pro 16IAH7H | |
| Lenovo Legion 5 Pro 16IAH7H | |
| Lenovo Legion 7 16ARHA7 | |
| Lenovo Legion 5 Pro 16ARH7H RTX 3070 Ti | |
| Medio AMD Ryzen 7 6800H (26496 - 30360, n=8) | |
| HP Victus 16-e0145ng | |
Rendimiento del sistema
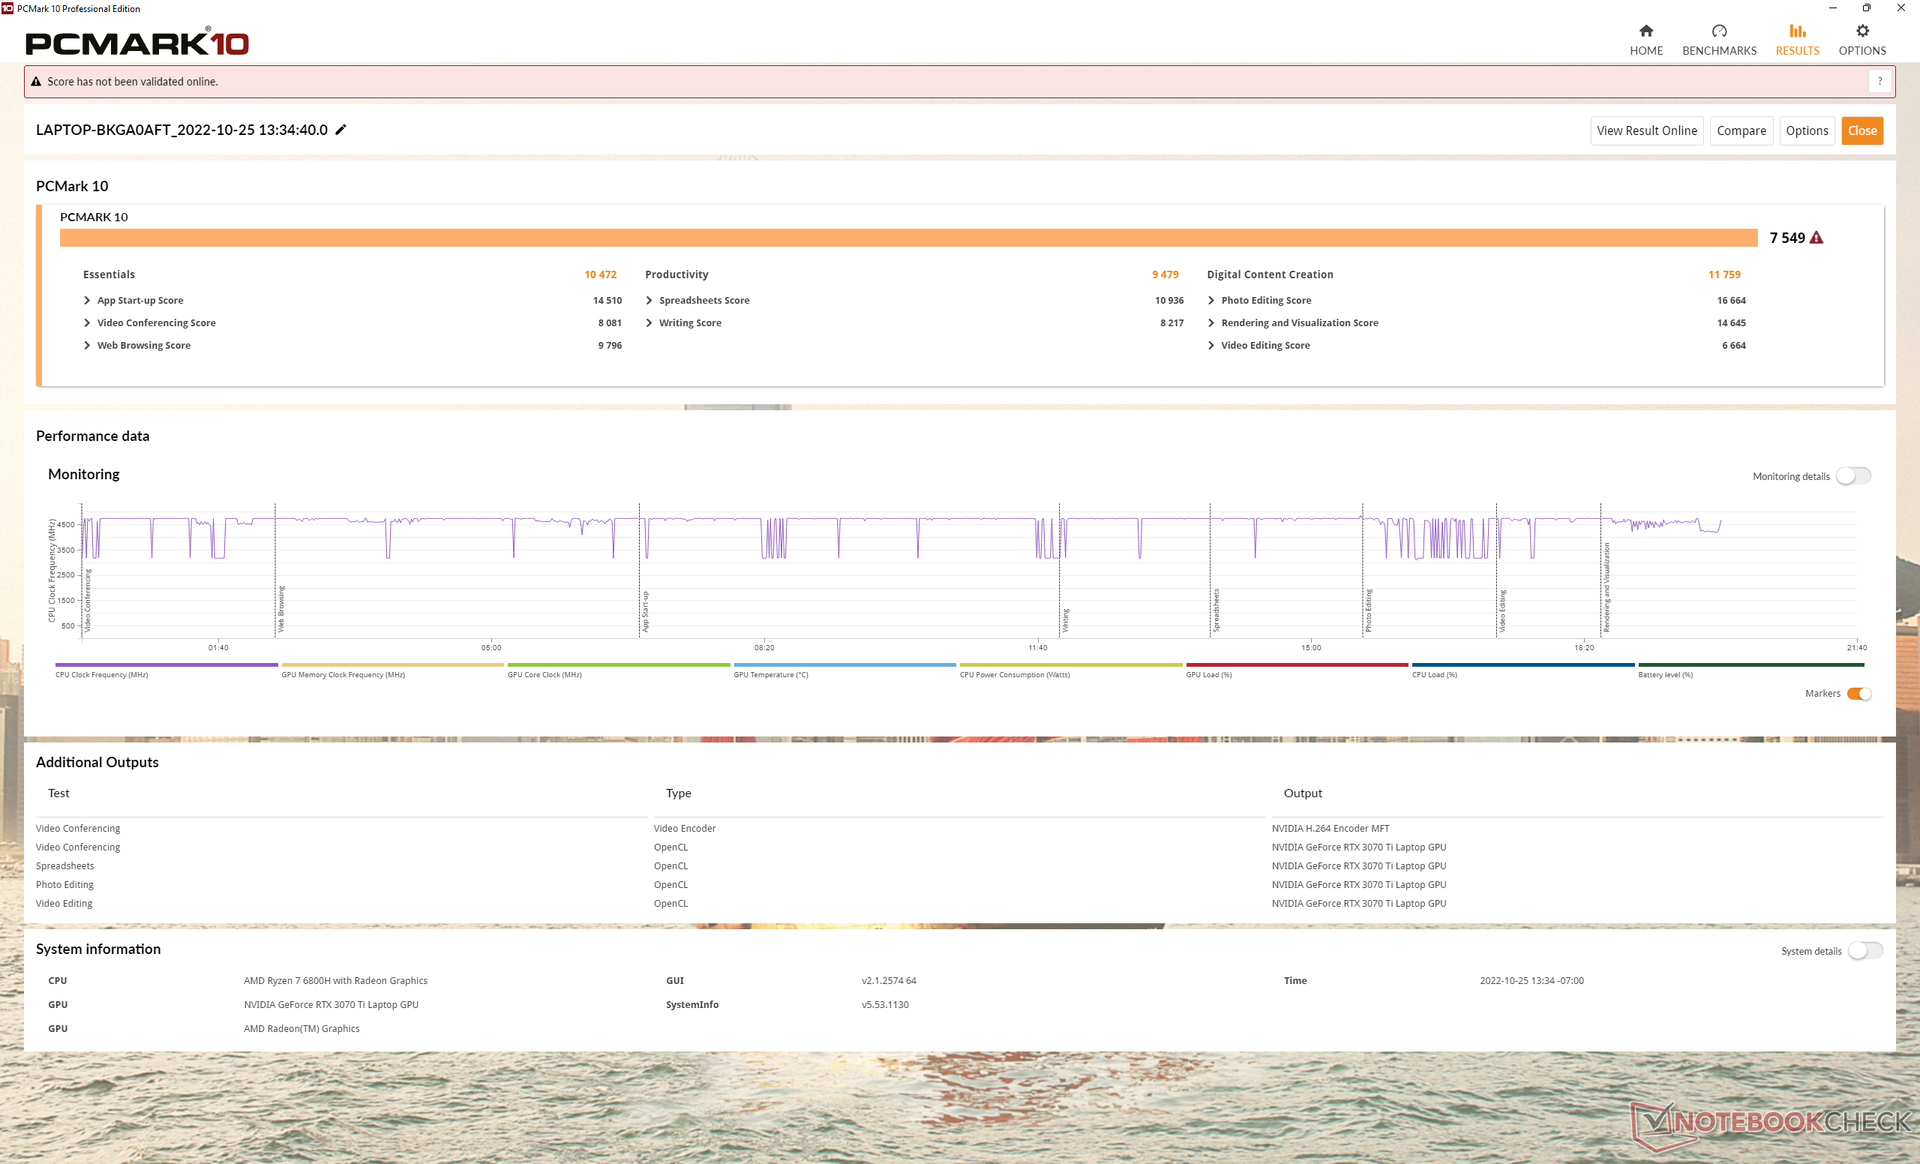
Los resultados de PCMark están a un solo dígito de puntos porcentuales de otros portátiles de gama alta basados en Intel para juegos, como elDell G16 7620 aunque el Ryzen 7 6800H no pueda seguir el ritmo de las últimas CPUs Core de 12ª generación.
CrossMark: Overall | Productivity | Creativity | Responsiveness
| PCMark 10 / Score | |
| Lenovo Legion 5 Pro 16ARH7H RTX 3070 Ti | |
| Lenovo Legion 5 Pro 16IAH7H | |
| Lenovo Legion 7 16ARHA7 | |
| Dell G16 7620 | |
| Medio AMD Ryzen 7 6800H, NVIDIA GeForce RTX 3070 Ti Laptop GPU (6783 - 7549, n=2) | |
| Asus ROG Zephyrus M16 GU603H | |
| HP Victus 16-e0145ng | |
| PCMark 10 / Essentials | |
| Lenovo Legion 5 Pro 16IAH7H | |
| Asus ROG Zephyrus M16 GU603H | |
| Lenovo Legion 7 16ARHA7 | |
| Lenovo Legion 5 Pro 16ARH7H RTX 3070 Ti | |
| Medio AMD Ryzen 7 6800H, NVIDIA GeForce RTX 3070 Ti Laptop GPU (10343 - 10472, n=2) | |
| Dell G16 7620 | |
| HP Victus 16-e0145ng | |
| PCMark 10 / Productivity | |
| Lenovo Legion 5 Pro 16ARH7H RTX 3070 Ti | |
| Lenovo Legion 5 Pro 16IAH7H | |
| Medio AMD Ryzen 7 6800H, NVIDIA GeForce RTX 3070 Ti Laptop GPU (8991 - 9479, n=2) | |
| Asus ROG Zephyrus M16 GU603H | |
| Lenovo Legion 7 16ARHA7 | |
| Dell G16 7620 | |
| HP Victus 16-e0145ng | |
| PCMark 10 / Digital Content Creation | |
| Lenovo Legion 5 Pro 16ARH7H RTX 3070 Ti | |
| Lenovo Legion 7 16ARHA7 | |
| Lenovo Legion 5 Pro 16IAH7H | |
| Dell G16 7620 | |
| Medio AMD Ryzen 7 6800H, NVIDIA GeForce RTX 3070 Ti Laptop GPU (9108 - 11759, n=2) | |
| Asus ROG Zephyrus M16 GU603H | |
| HP Victus 16-e0145ng | |
| CrossMark / Overall | |
| Dell G16 7620 | |
| Lenovo Legion 5 Pro 16IAH7H | |
| Lenovo Legion 5 Pro 16ARH7H RTX 3070 Ti | |
| Lenovo Legion 7 16ARHA7 | |
| Medio AMD Ryzen 7 6800H, NVIDIA GeForce RTX 3070 Ti Laptop GPU (1522 - 1643, n=2) | |
| CrossMark / Productivity | |
| Lenovo Legion 5 Pro 16IAH7H | |
| Dell G16 7620 | |
| Lenovo Legion 5 Pro 16ARH7H RTX 3070 Ti | |
| Medio AMD Ryzen 7 6800H, NVIDIA GeForce RTX 3070 Ti Laptop GPU (1530 - 1600, n=2) | |
| Lenovo Legion 7 16ARHA7 | |
| CrossMark / Creativity | |
| Dell G16 7620 | |
| Lenovo Legion 5 Pro 16IAH7H | |
| Lenovo Legion 7 16ARHA7 | |
| Lenovo Legion 5 Pro 16ARH7H RTX 3070 Ti | |
| Medio AMD Ryzen 7 6800H, NVIDIA GeForce RTX 3070 Ti Laptop GPU (1589 - 1746, n=2) | |
| CrossMark / Responsiveness | |
| Lenovo Legion 5 Pro 16IAH7H | |
| Dell G16 7620 | |
| Lenovo Legion 5 Pro 16ARH7H RTX 3070 Ti | |
| Medio AMD Ryzen 7 6800H, NVIDIA GeForce RTX 3070 Ti Laptop GPU (1316 - 1481, n=2) | |
| Lenovo Legion 7 16ARHA7 | |
| PCMark 10 Score | 7549 puntos | |
ayuda | ||
| AIDA64 / Memory Copy | |
| Lenovo Legion 5 Pro 16IAH7H | |
| Lenovo Legion 5 Pro 16IAH7H | |
| Dell G16 7620 | |
| Lenovo Legion 5 Pro 16ARH7H RTX 3070 Ti | |
| Lenovo Legion 7 16ARHA7 | |
| Medio AMD Ryzen 7 6800H (48209 - 51186, n=8) | |
| HP Victus 16-e0145ng | |
| AIDA64 / Memory Read | |
| Dell G16 7620 | |
| Lenovo Legion 5 Pro 16IAH7H | |
| Lenovo Legion 5 Pro 16IAH7H | |
| Lenovo Legion 7 16ARHA7 | |
| Lenovo Legion 5 Pro 16ARH7H RTX 3070 Ti | |
| Medio AMD Ryzen 7 6800H (43828 - 51778, n=8) | |
| HP Victus 16-e0145ng | |
| AIDA64 / Memory Write | |
| Lenovo Legion 5 Pro 16IAH7H | |
| Lenovo Legion 5 Pro 16IAH7H | |
| Dell G16 7620 | |
| Lenovo Legion 5 Pro 16ARH7H RTX 3070 Ti | |
| Lenovo Legion 7 16ARHA7 | |
| Medio AMD Ryzen 7 6800H (51116 - 55307, n=8) | |
| HP Victus 16-e0145ng | |
| AIDA64 / Memory Latency | |
| Lenovo Legion 5 Pro 16IAH7H | |
| Lenovo Legion 5 Pro 16IAH7H | |
| Dell G16 7620 | |
| Medio AMD Ryzen 7 6800H (83.1 - 104.1, n=8) | |
| Lenovo Legion 5 Pro 16ARH7H RTX 3070 Ti | |
| Lenovo Legion 7 16ARHA7 | |
| HP Victus 16-e0145ng | |
| Asus ROG Zephyrus M16 GU603H | |
* ... más pequeño es mejor
Latencia del CPD
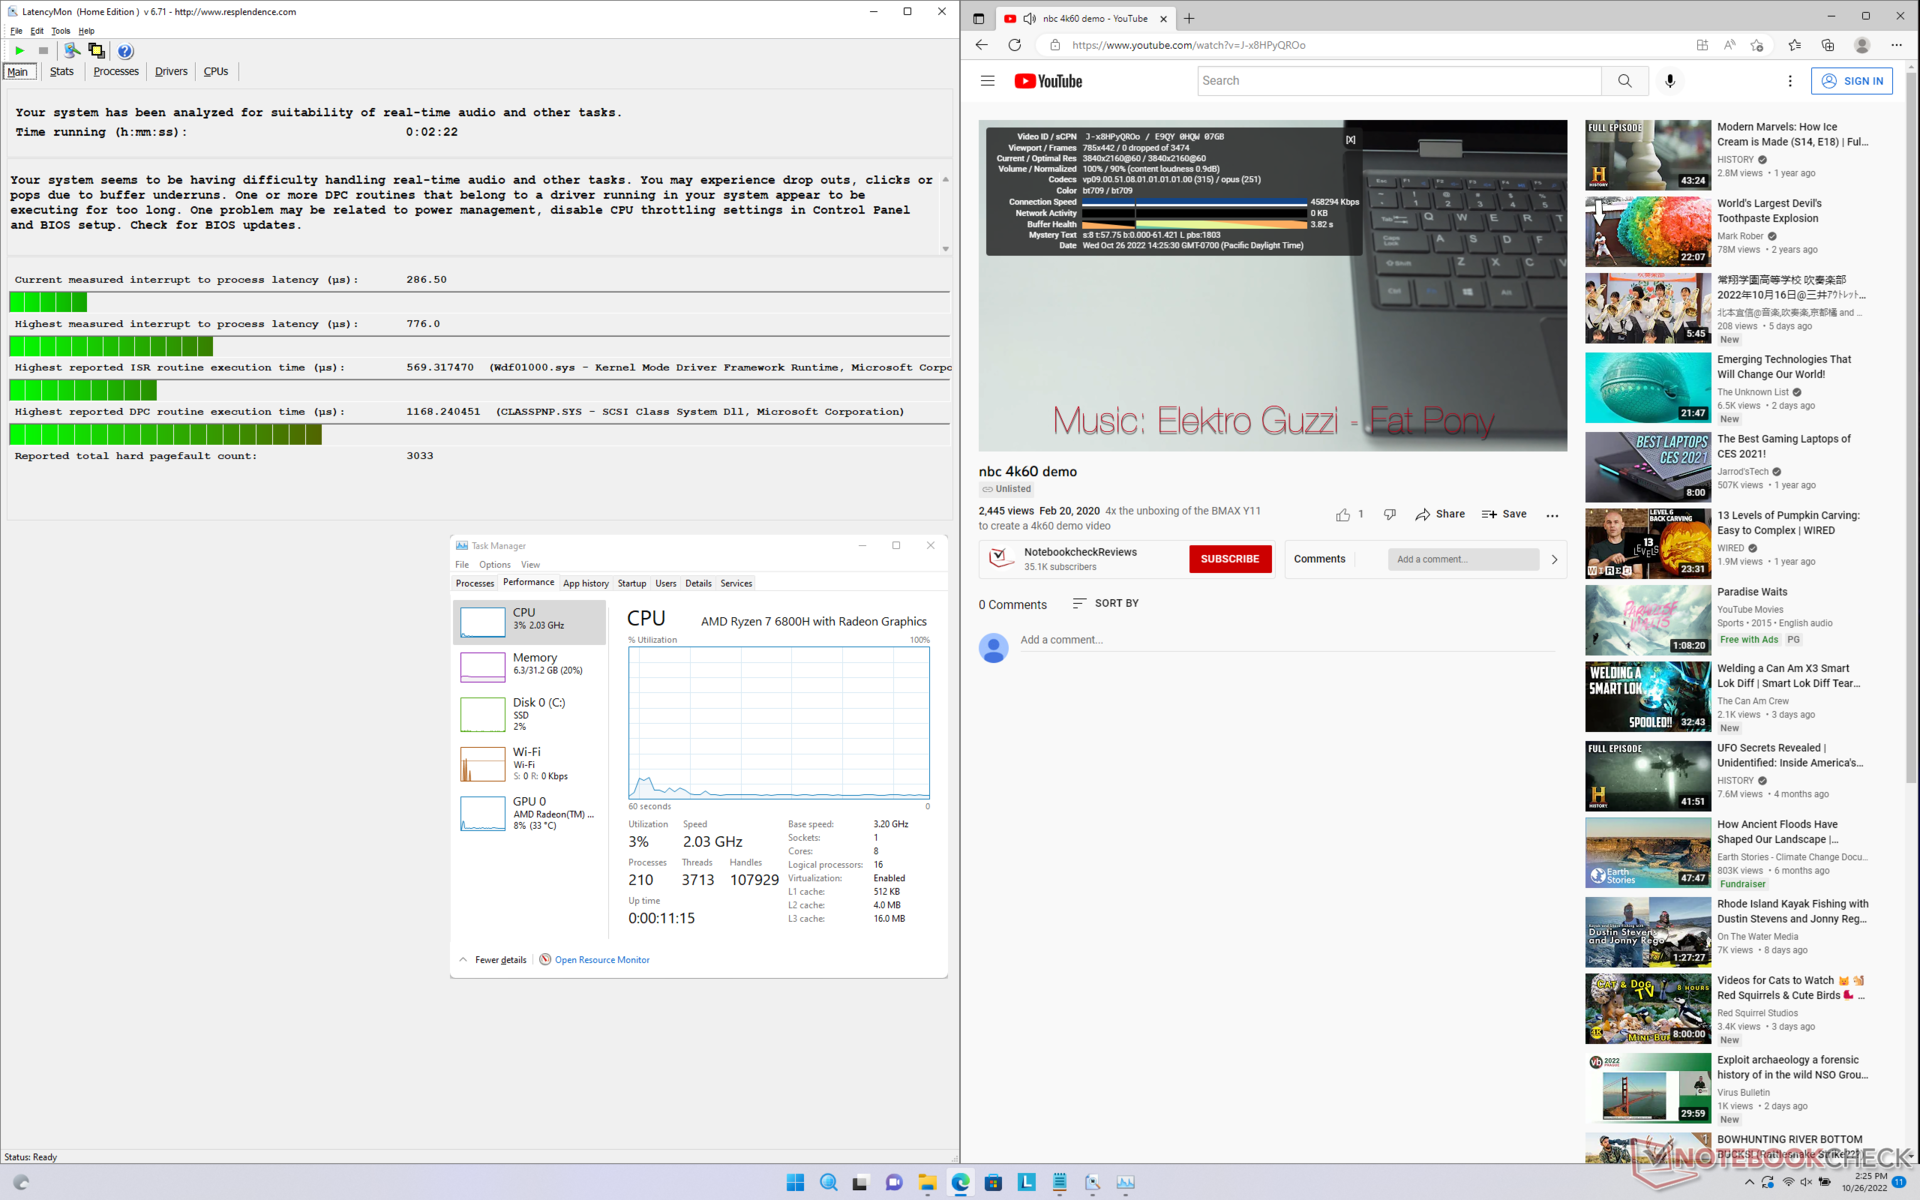
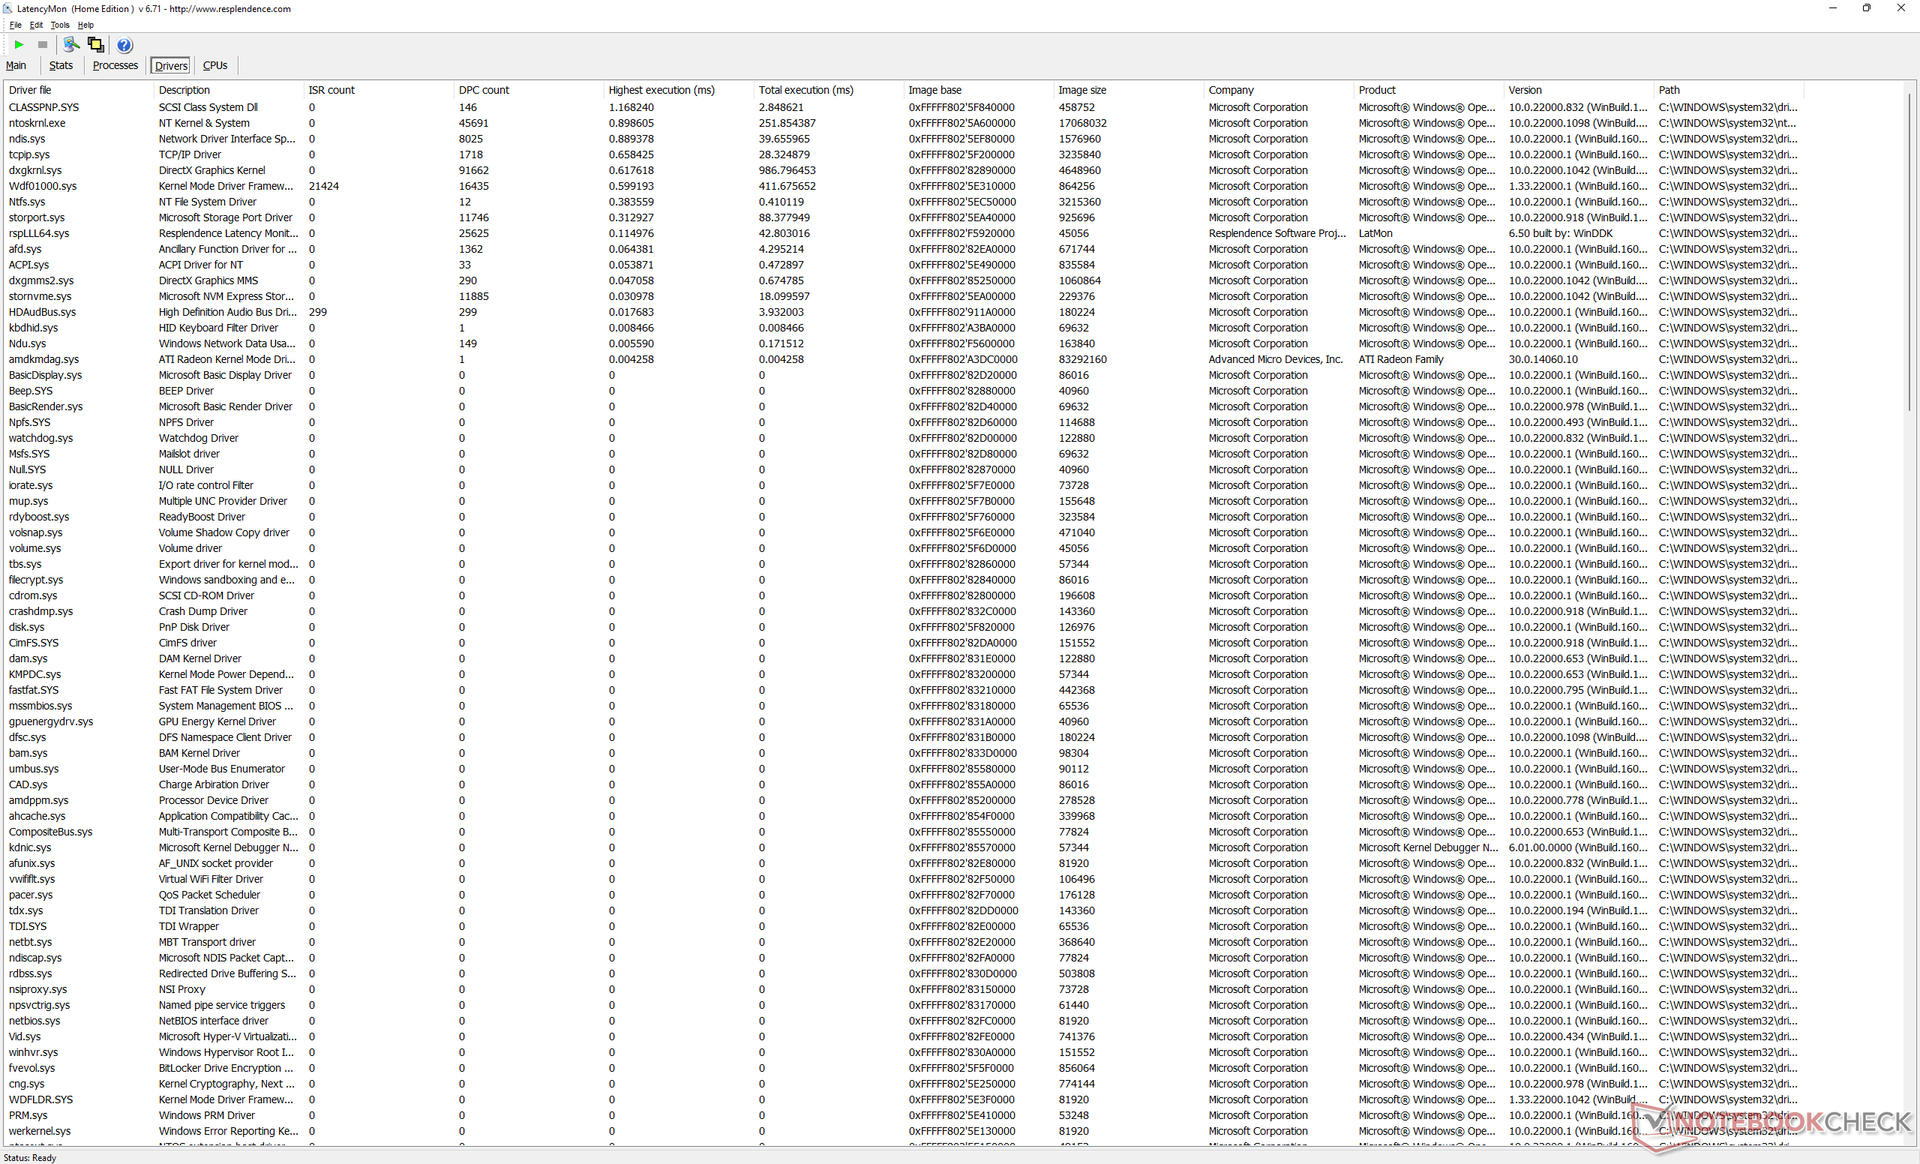
LatencyMon revela problemas menores de CPD al abrir varias pestañas del navegador de nuestra página web. por lo demás, la reproducción de vídeo 4K a 60 FPS es perfecta y sin pérdida de fotogramas.
| DPC Latencies / LatencyMon - interrupt to process latency (max), Web, Youtube, Prime95 | |
| Lenovo Legion 7 16ARHA7 | |
| Asus ROG Zephyrus M16 GU603H | |
| Dell G16 7620 | |
| HP Victus 16-e0145ng | |
| Lenovo Legion 5 Pro 16ARH7H RTX 3070 Ti | |
| Lenovo Legion 5 Pro 16IAH7H | |
* ... más pequeño es mejor
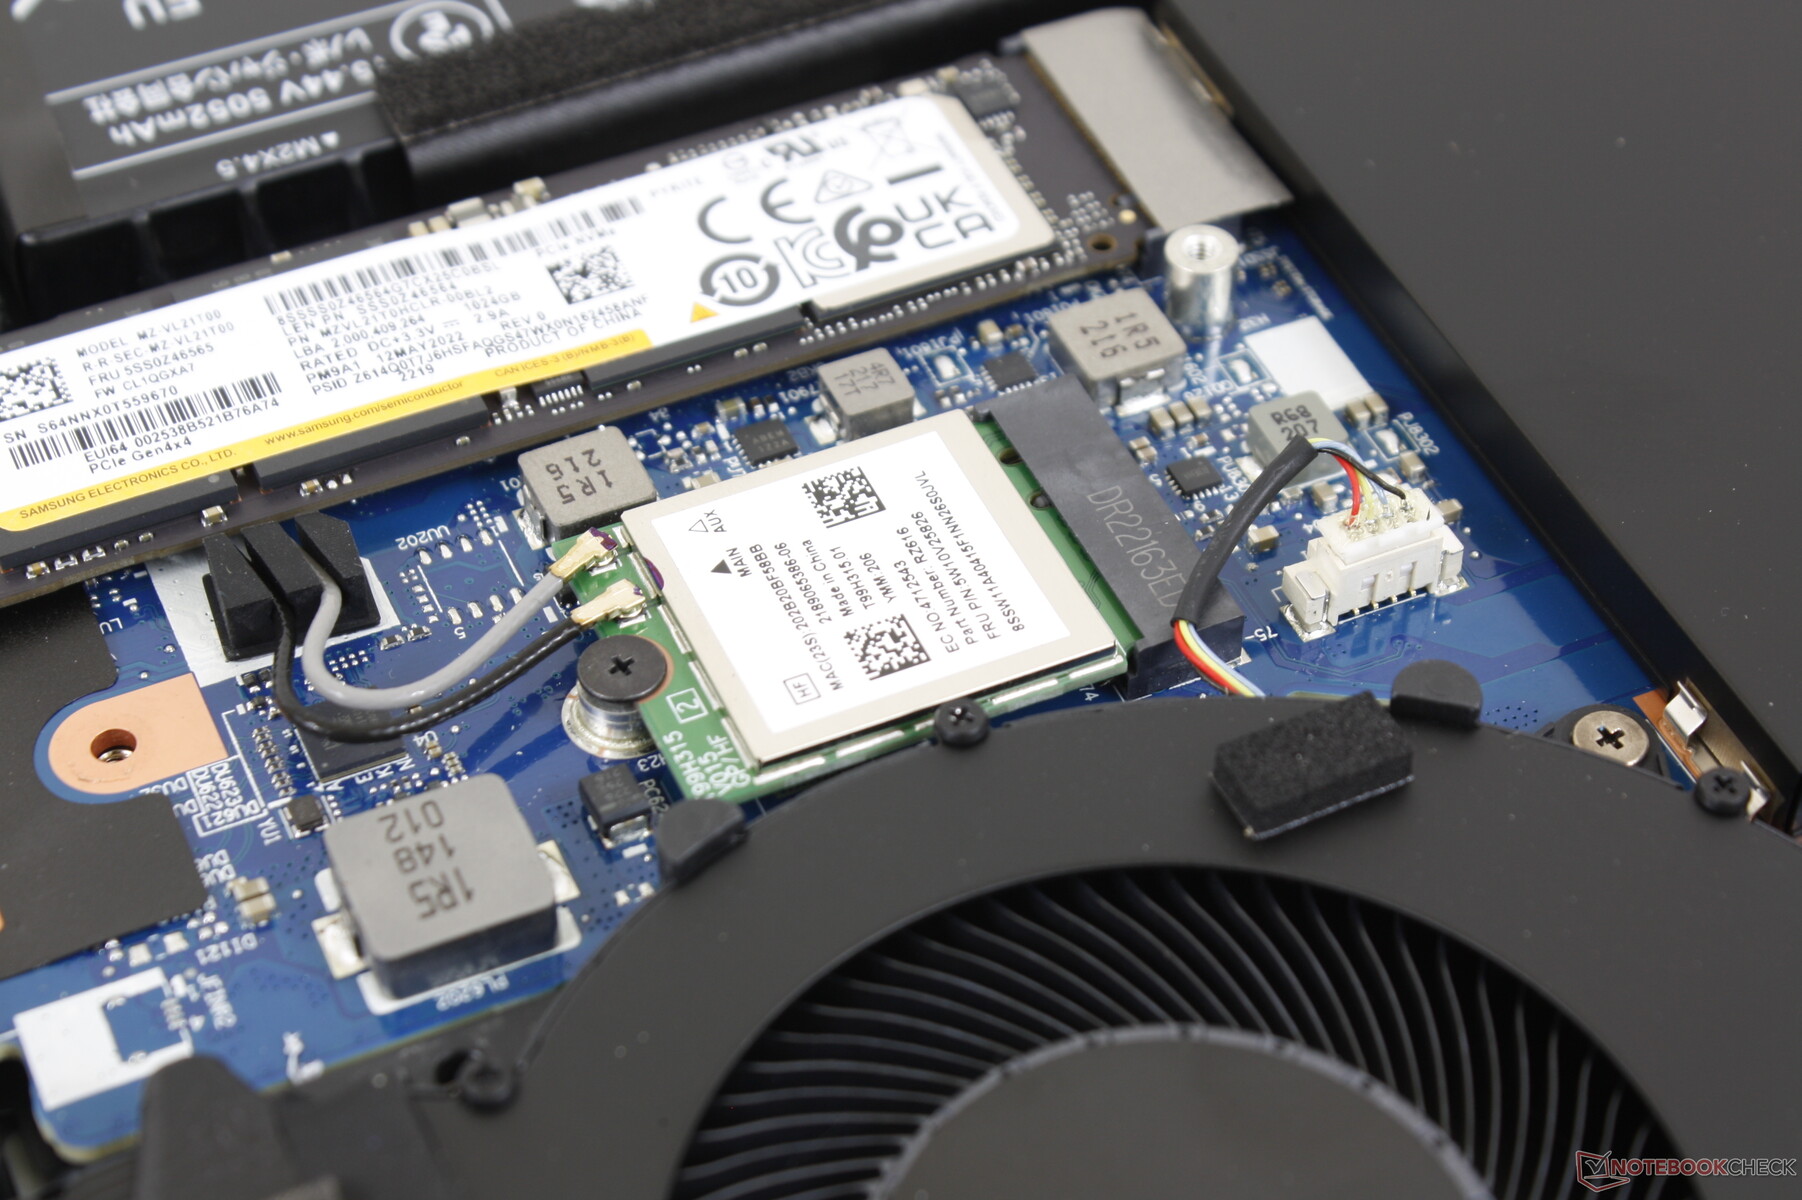
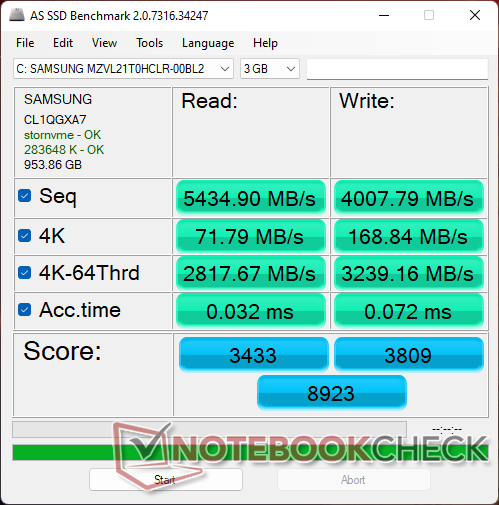
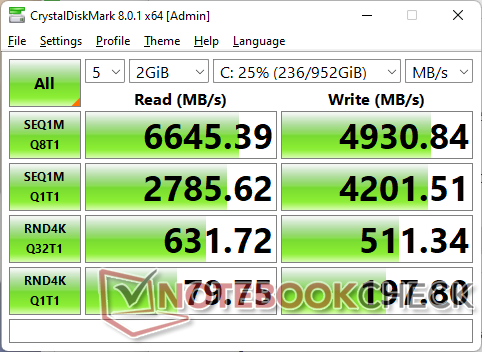
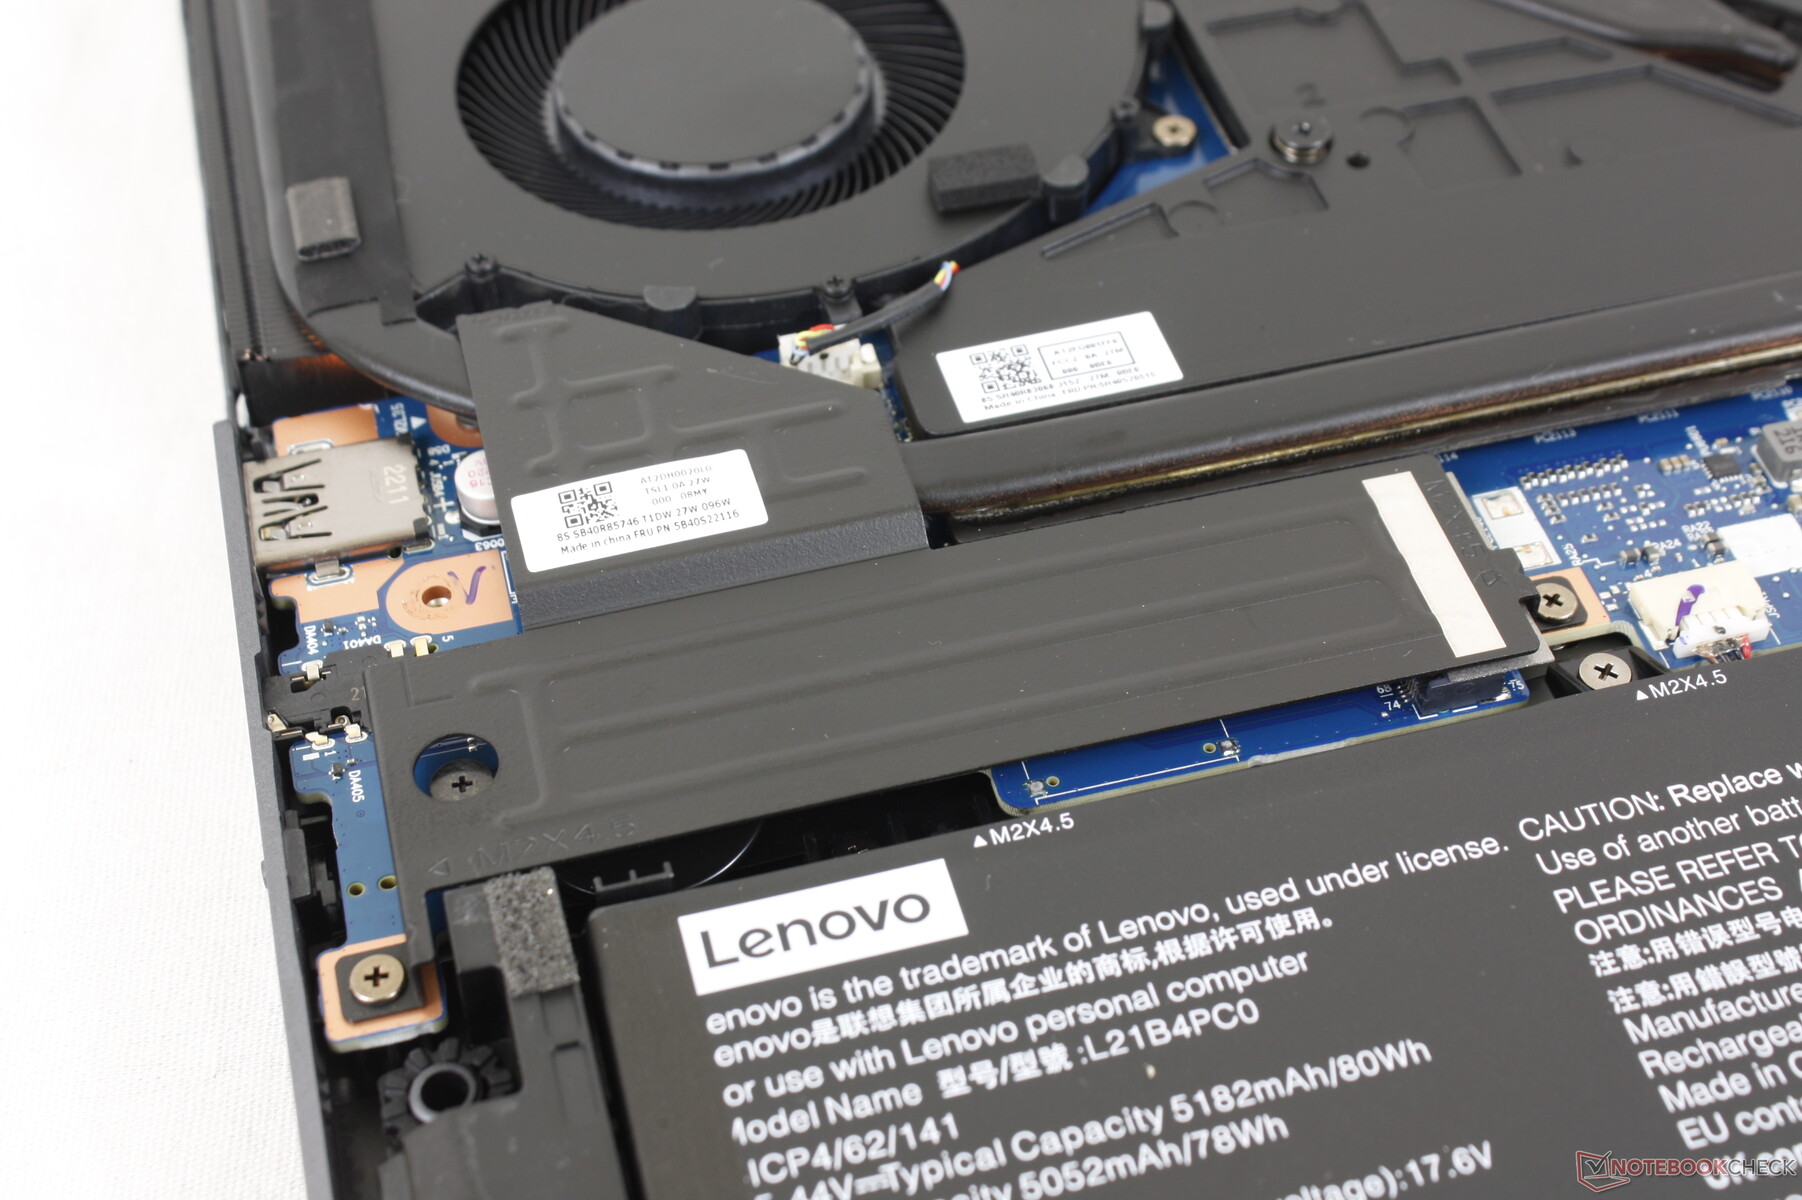
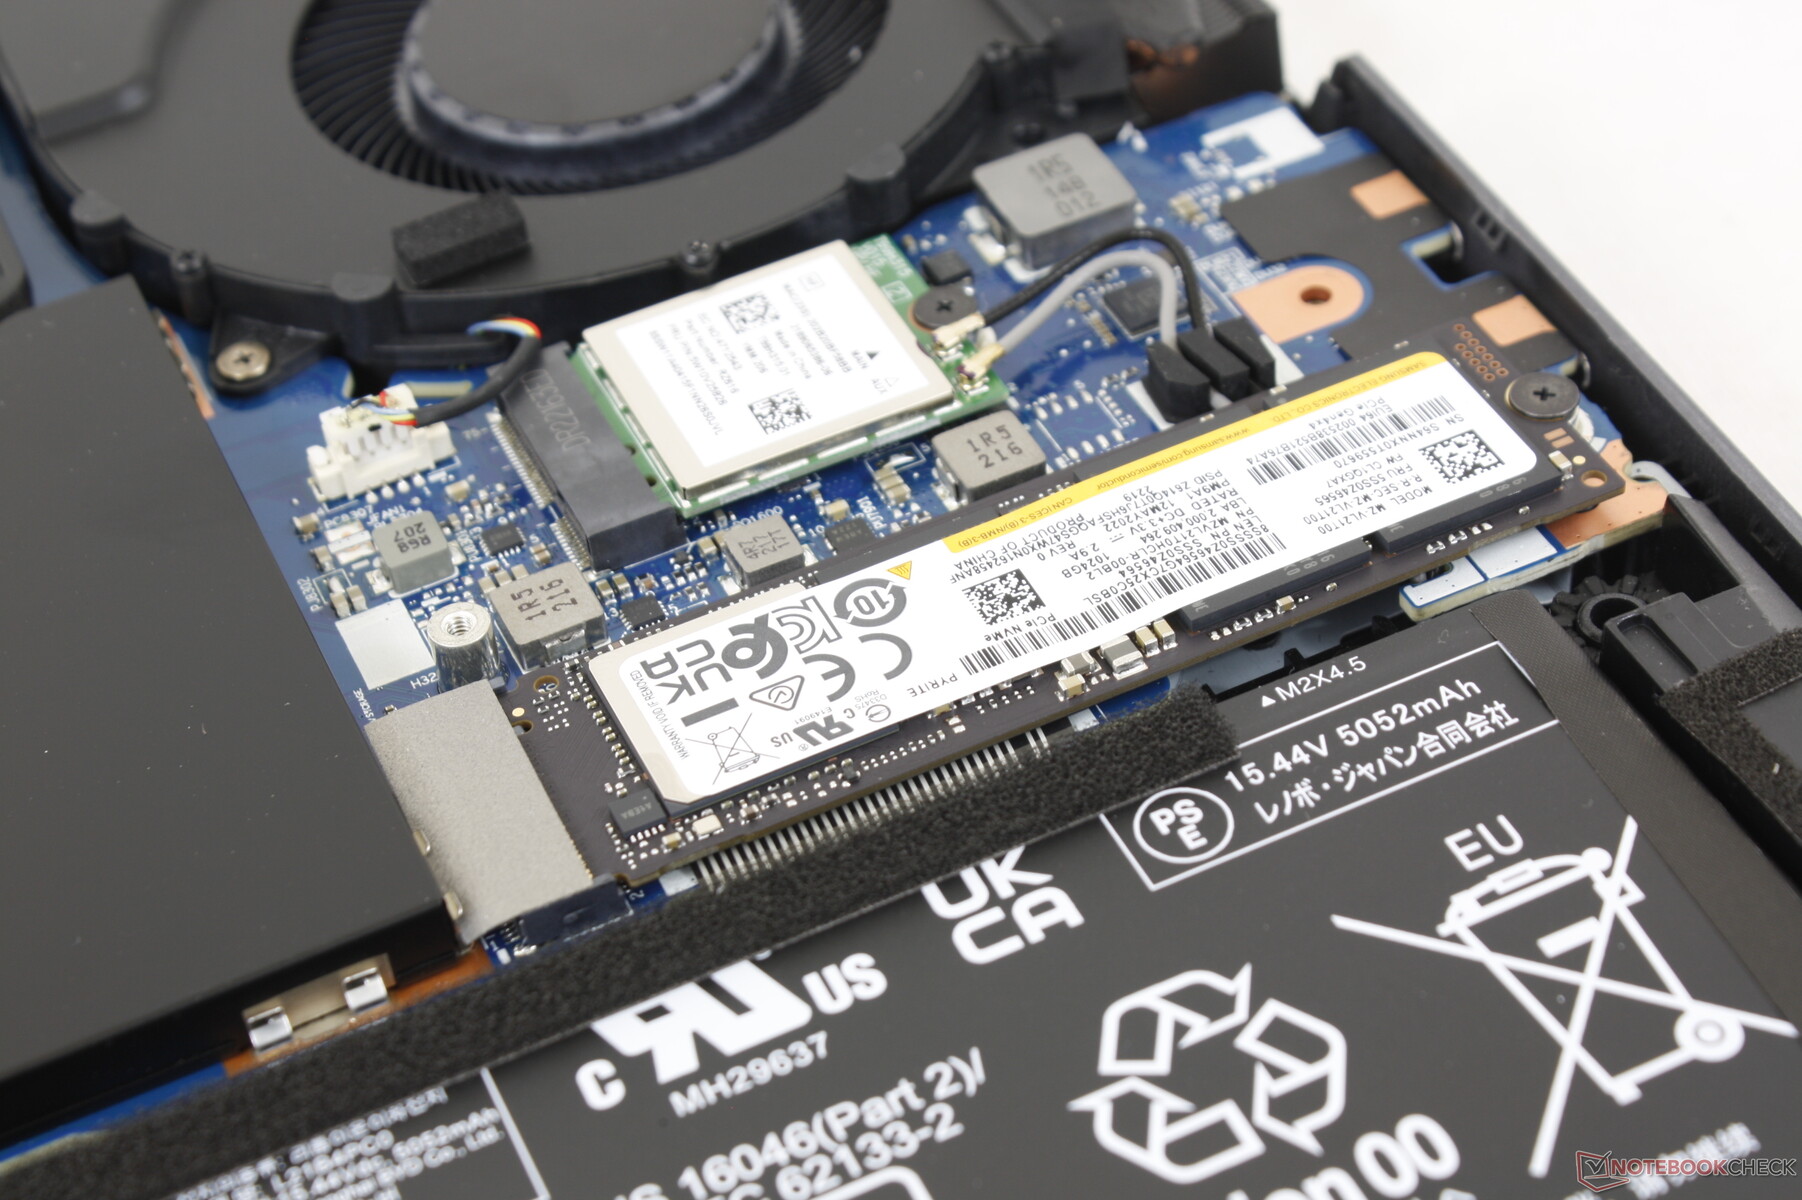
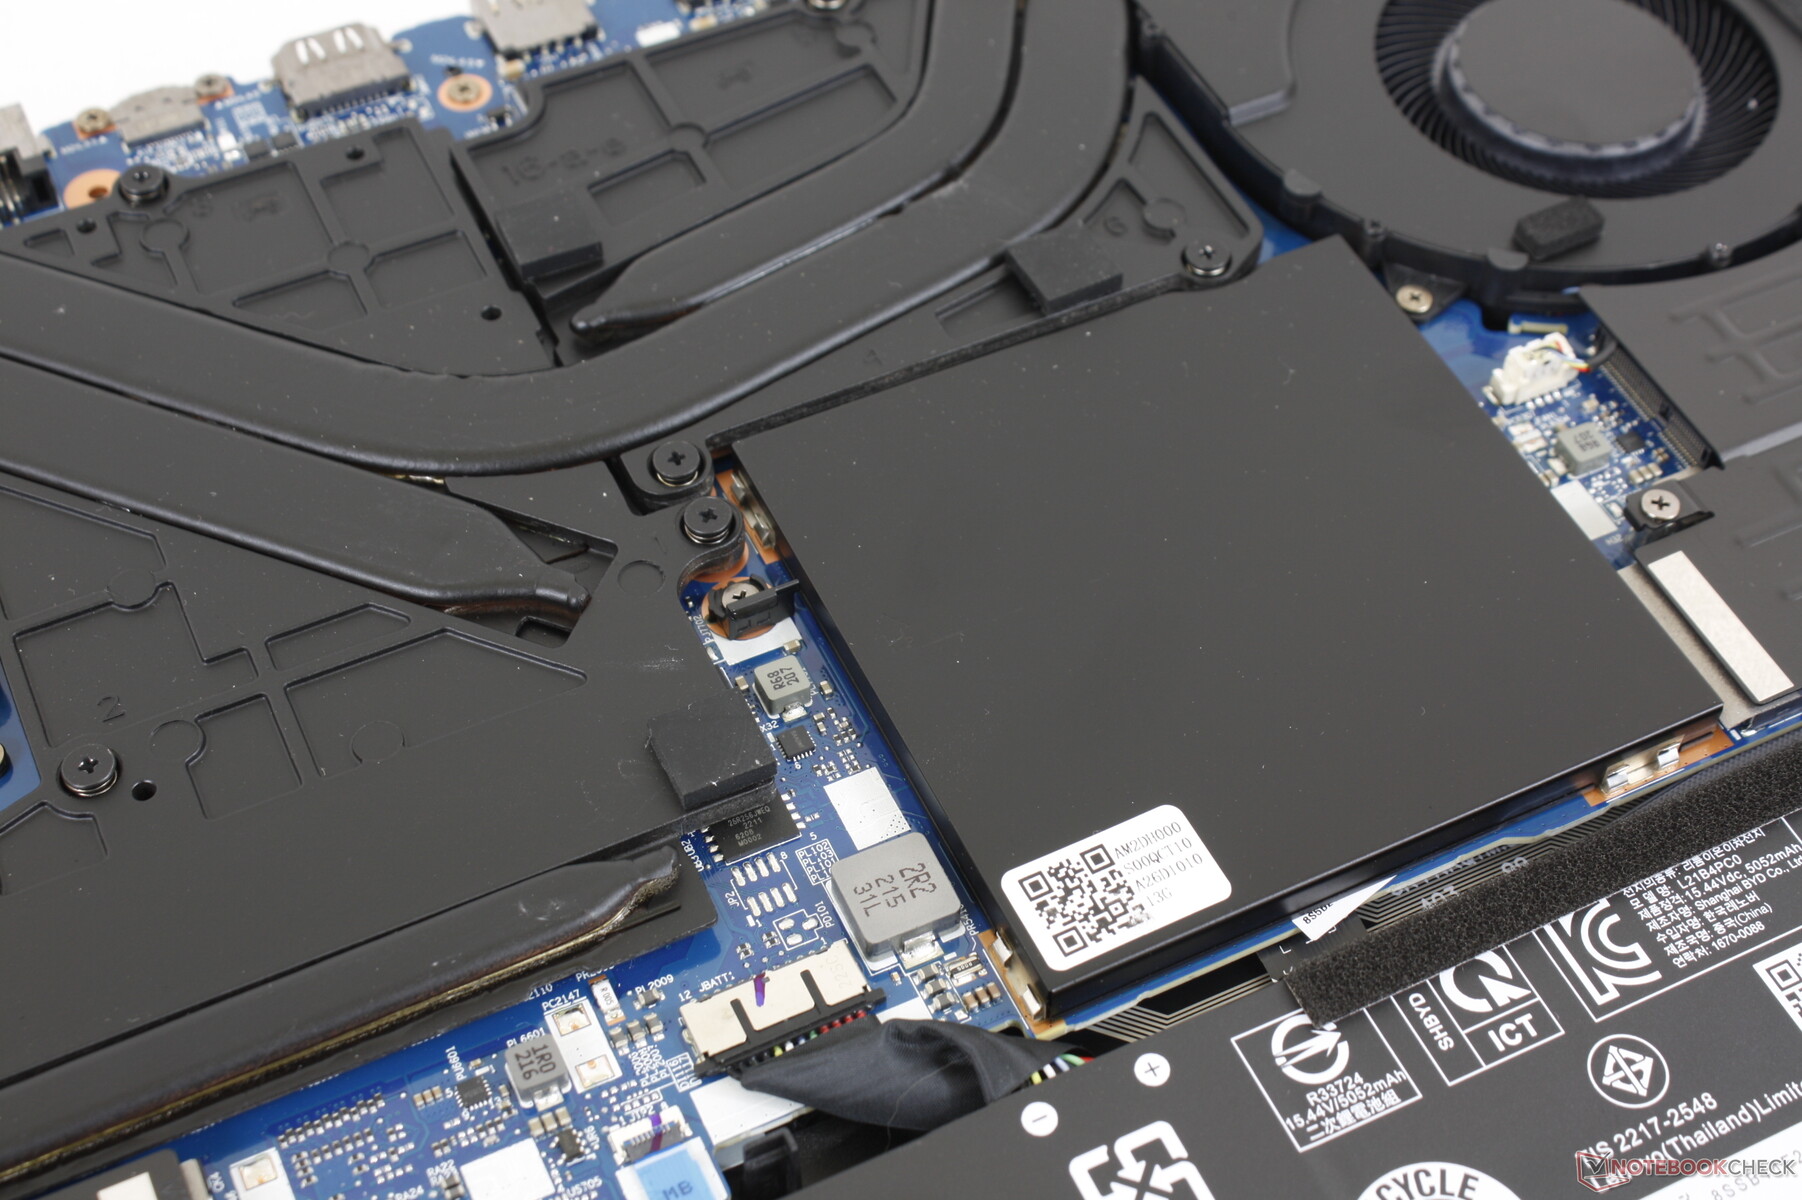
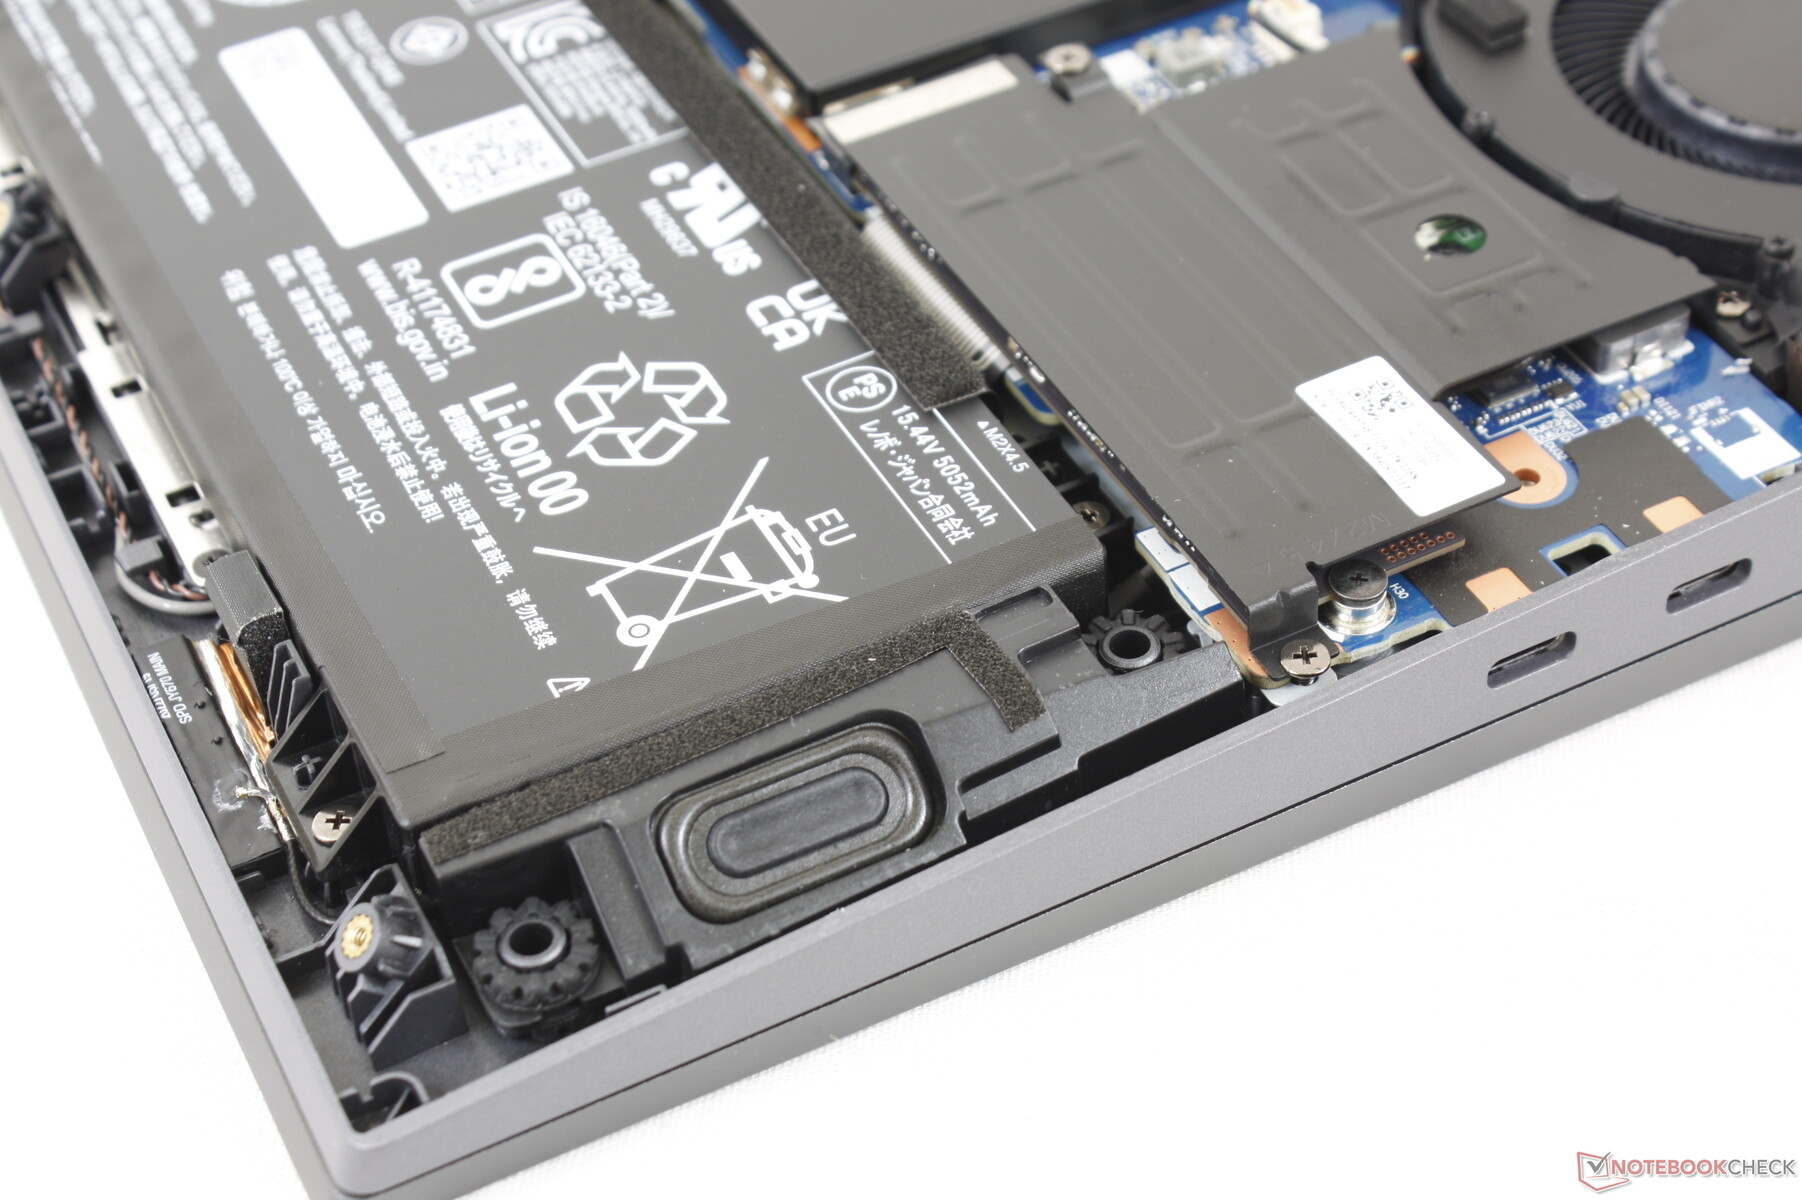
Dispositivos de almacenamiento: hasta dos SSD PCIe4 NVMe

| Drive Performance rating - Percent | |
| Lenovo Legion 5 Pro 16IAH7H | |
| Lenovo Legion 5 Pro 16ARH7H RTX 3070 Ti | |
| Asus ROG Zephyrus M16 GU603H | |
| Dell G16 7620 | |
| Lenovo Legion 7 16ARHA7 | |
| HP Victus 16-e0145ng | |
* ... más pequeño es mejor
Disk Throttling: DiskSpd Read Loop, Queue Depth 8
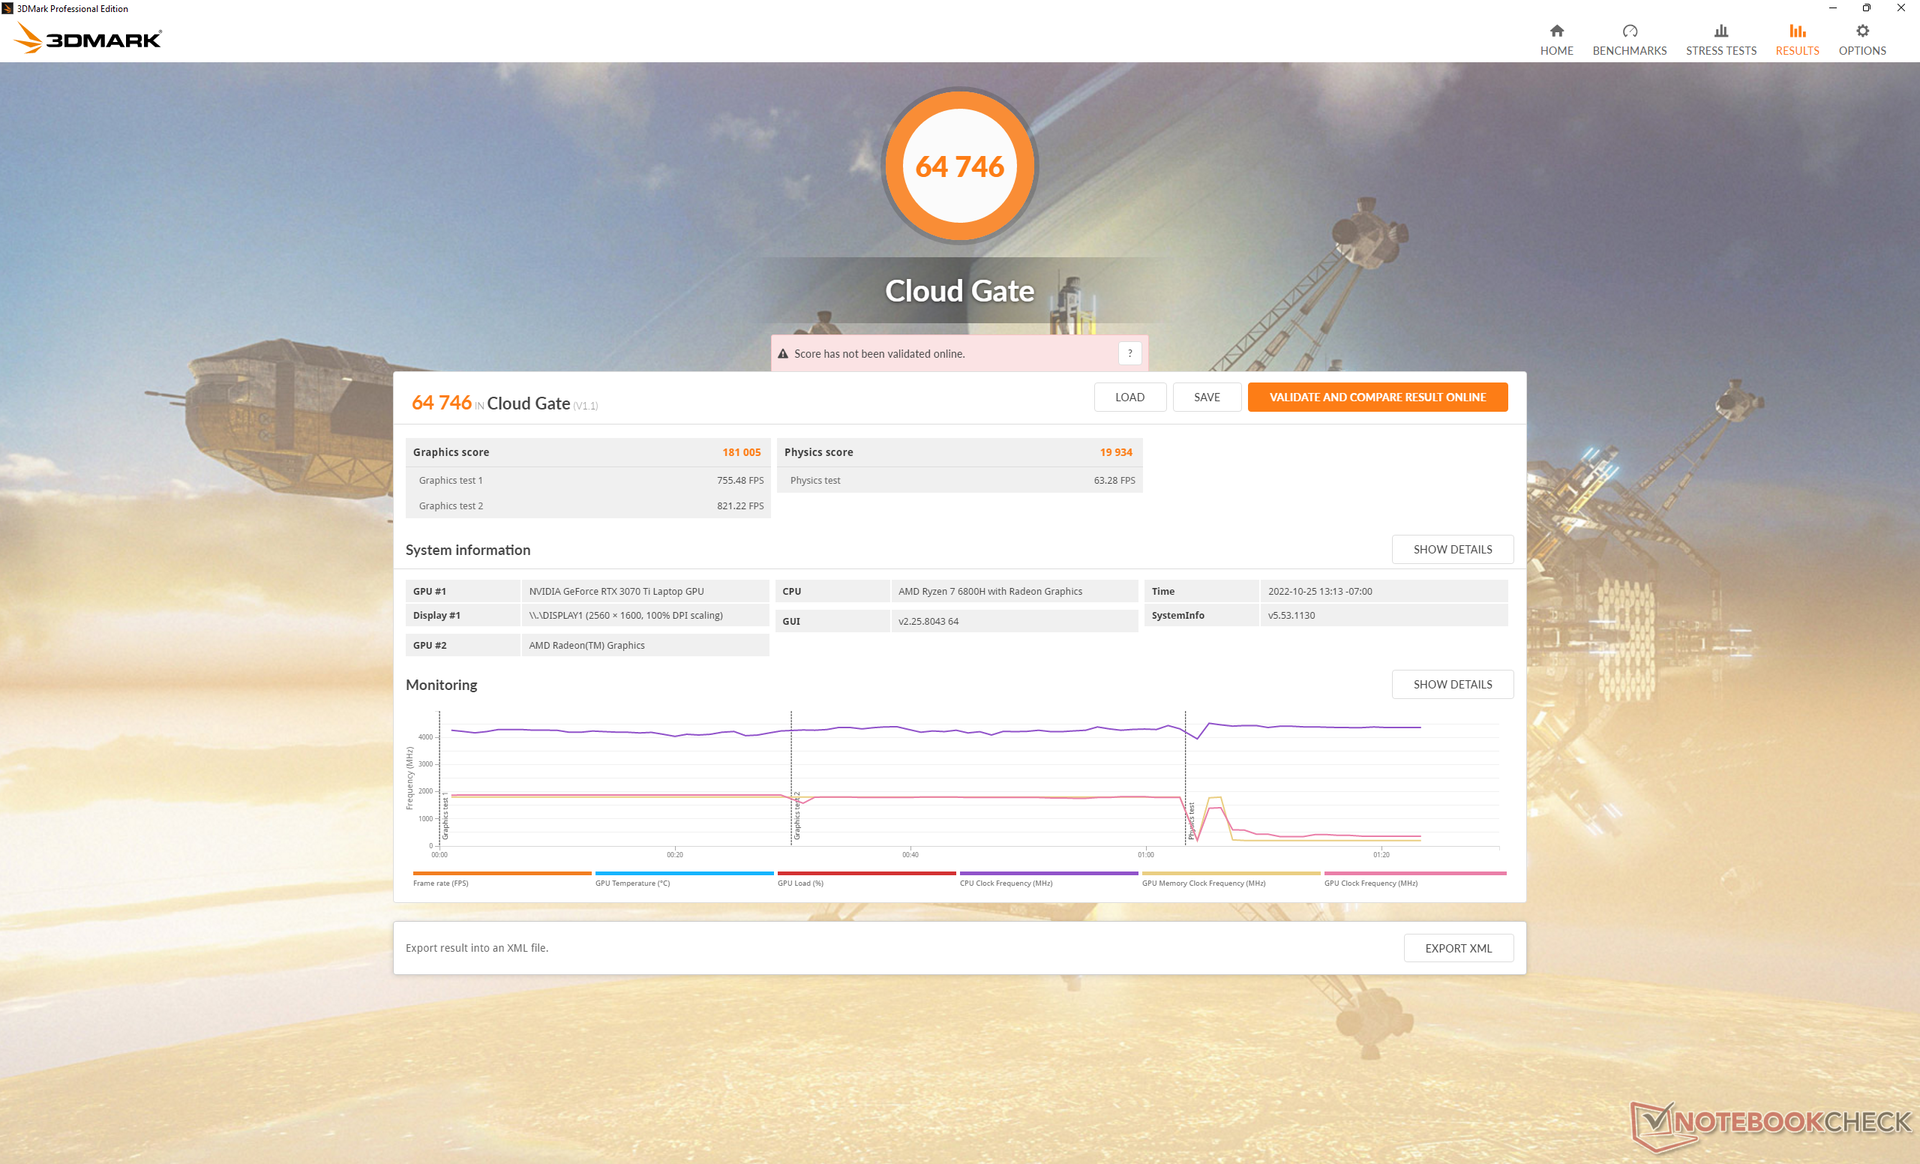
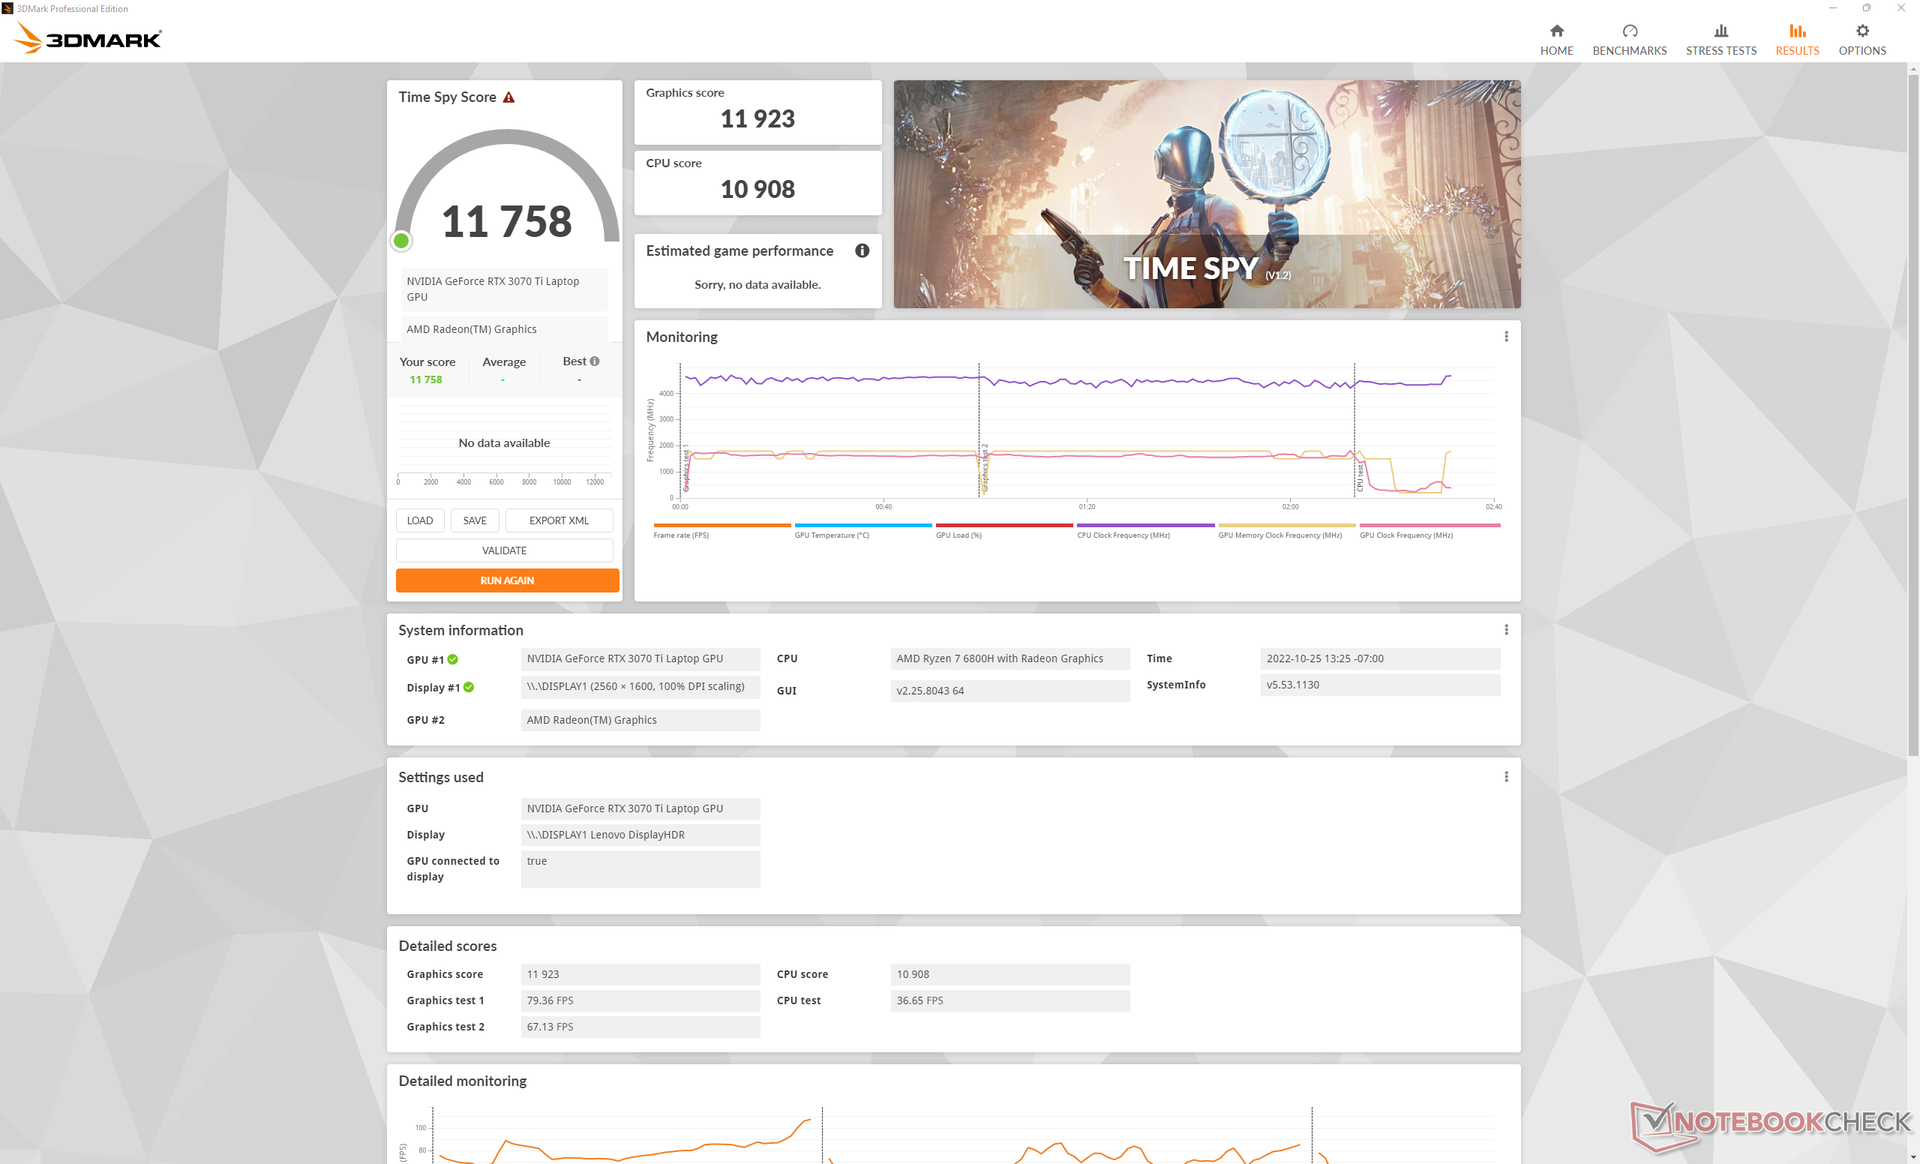
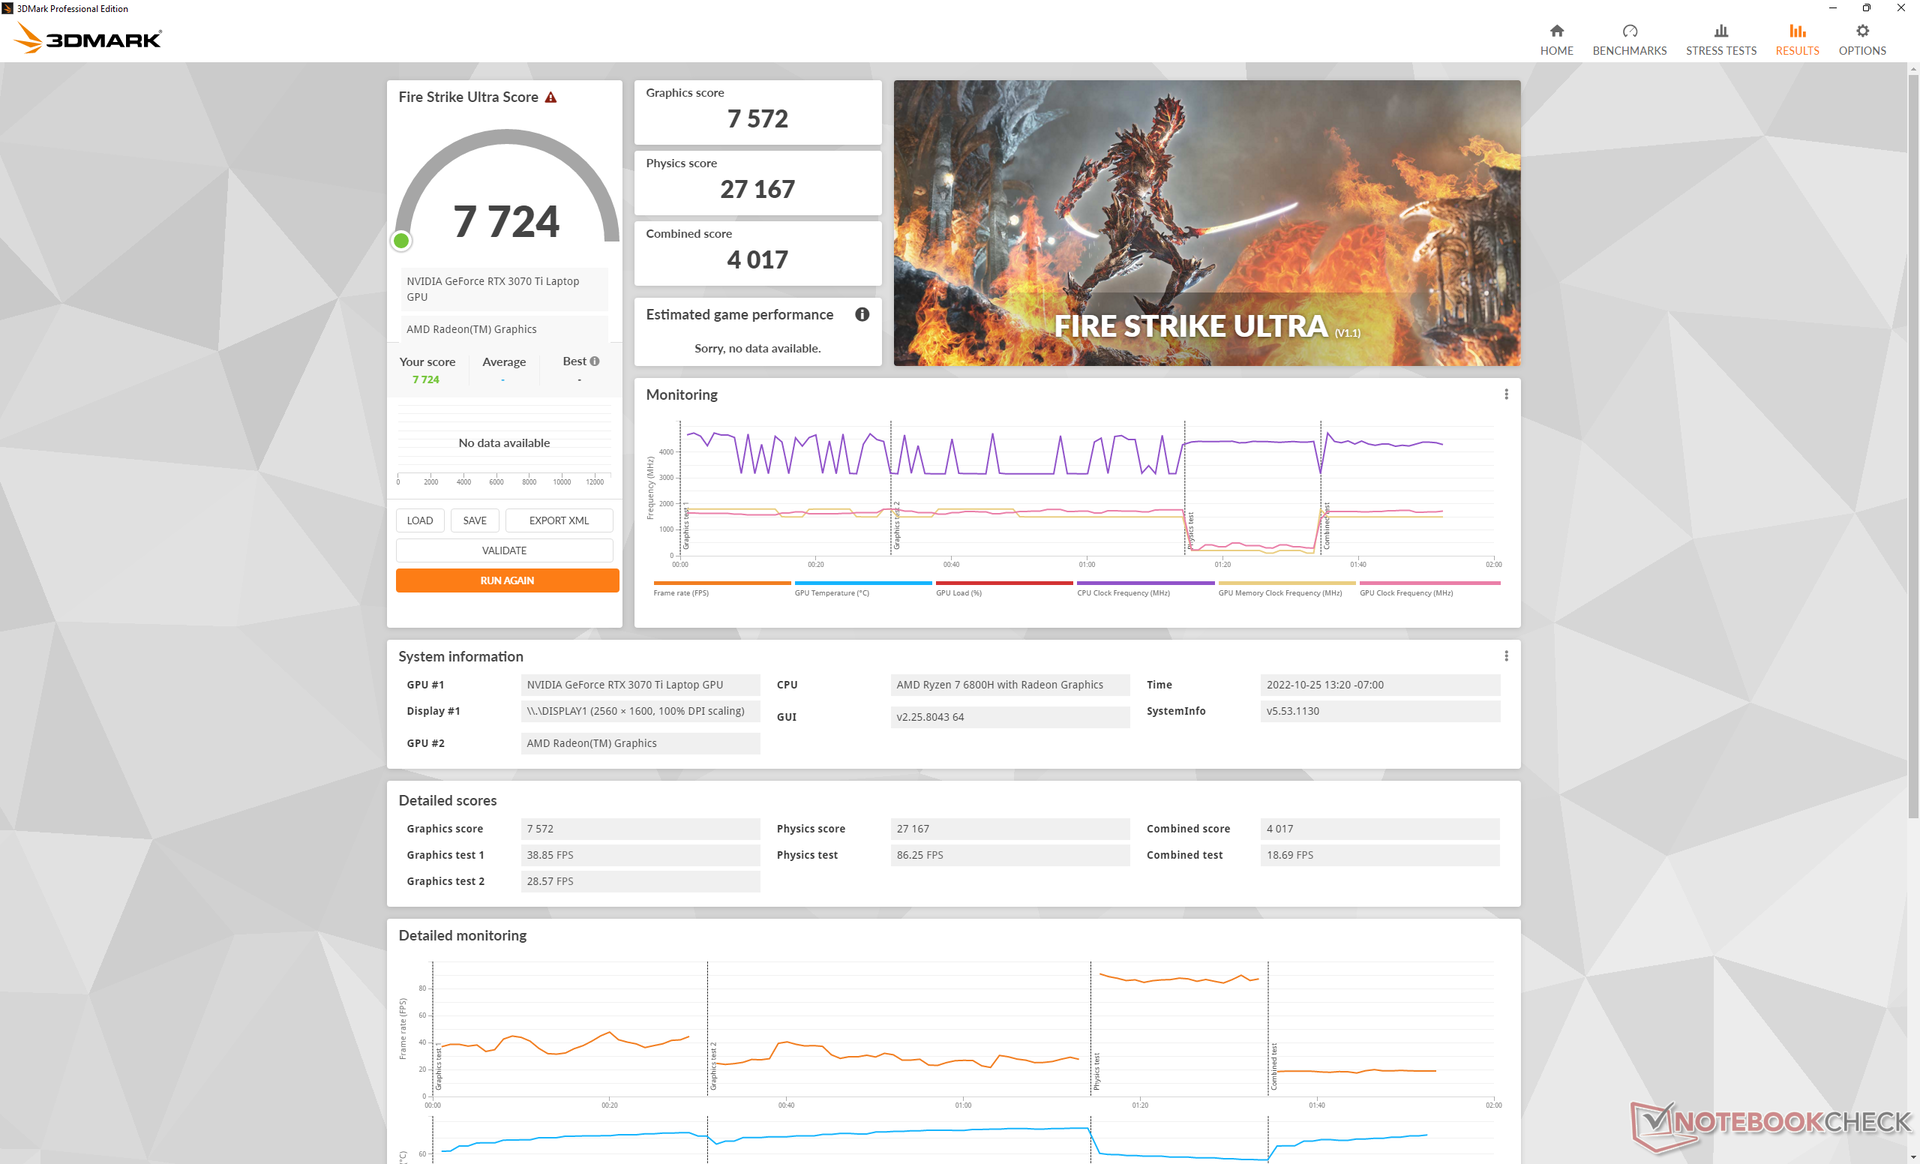
Rendimiento de la GPU - Gráficos de 150 W
El rendimiento gráfico es excelente, con unos resultados en 3DMark que son casi un 15 por ciento más rápidos que la media de los portátiles de nuestra base de datos con la misma GeForce RTX 3070 Ti GPU. De hecho, incluso supera a la RTX 3080 Ti en el Alienware x15 R2.
El rendimiento sólo cae un 5% si se desactiva el modo Turbo. Por tanto, los usuarios deben recordar activar el modo Turbo a través de Lenovo Vantage si quieren que el portátil funcione al máximo.
Si se pasa a la gama baja de la RTX 3070 o RTX 3060 Supondrá un descenso del rendimiento de un 10% y un 30%, respectivamente, según nuestra experiencia con varios portátiles RTX 3070 o 3060.
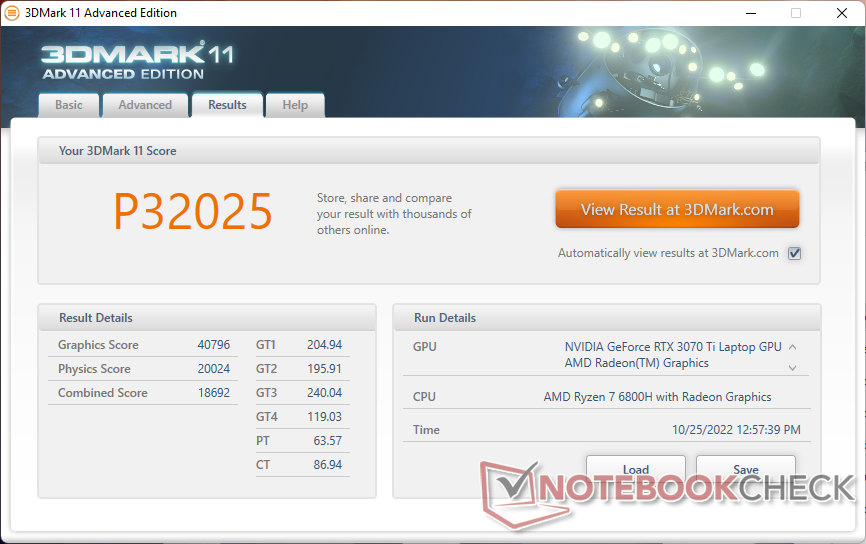
| 3DMark 11 Performance | 32025 puntos | |
| 3DMark Cloud Gate Standard Score | 64746 puntos | |
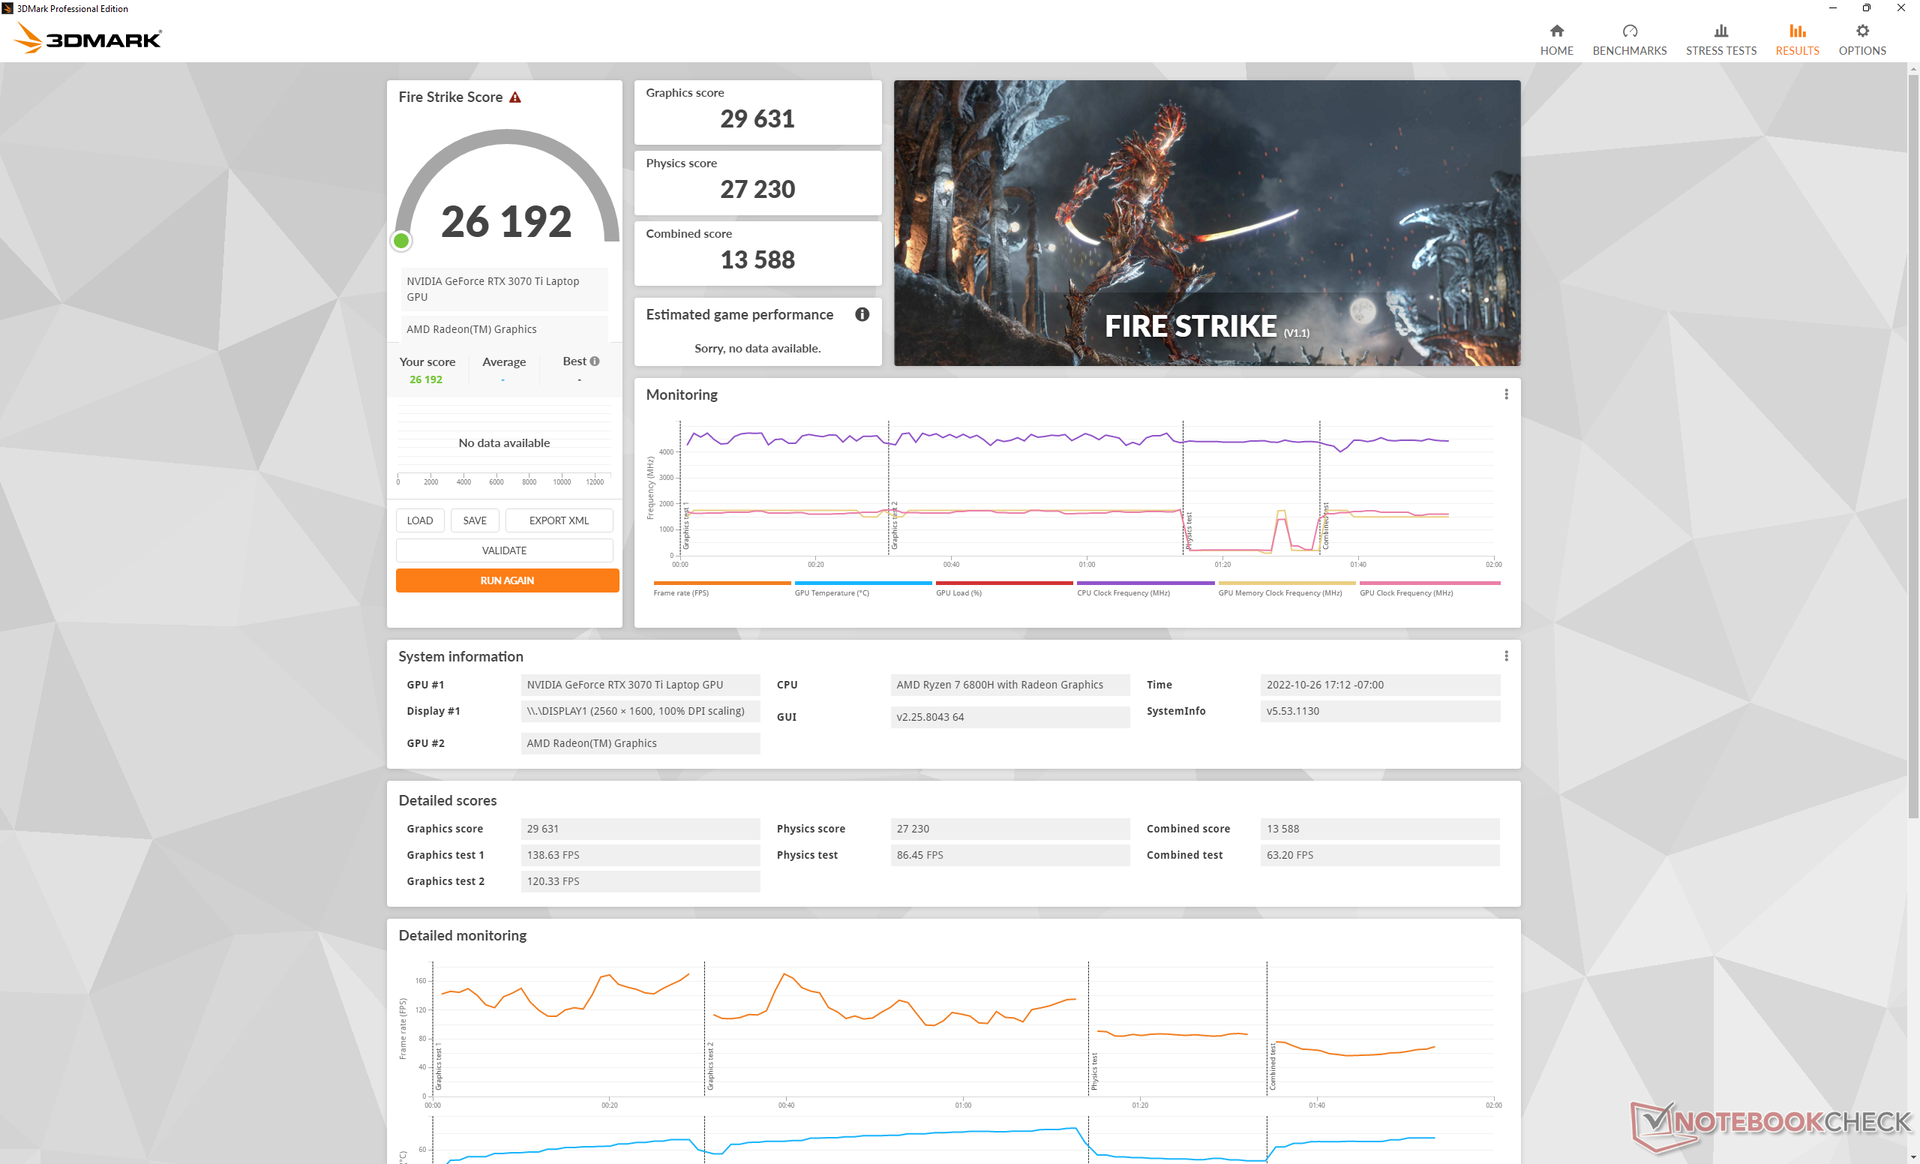
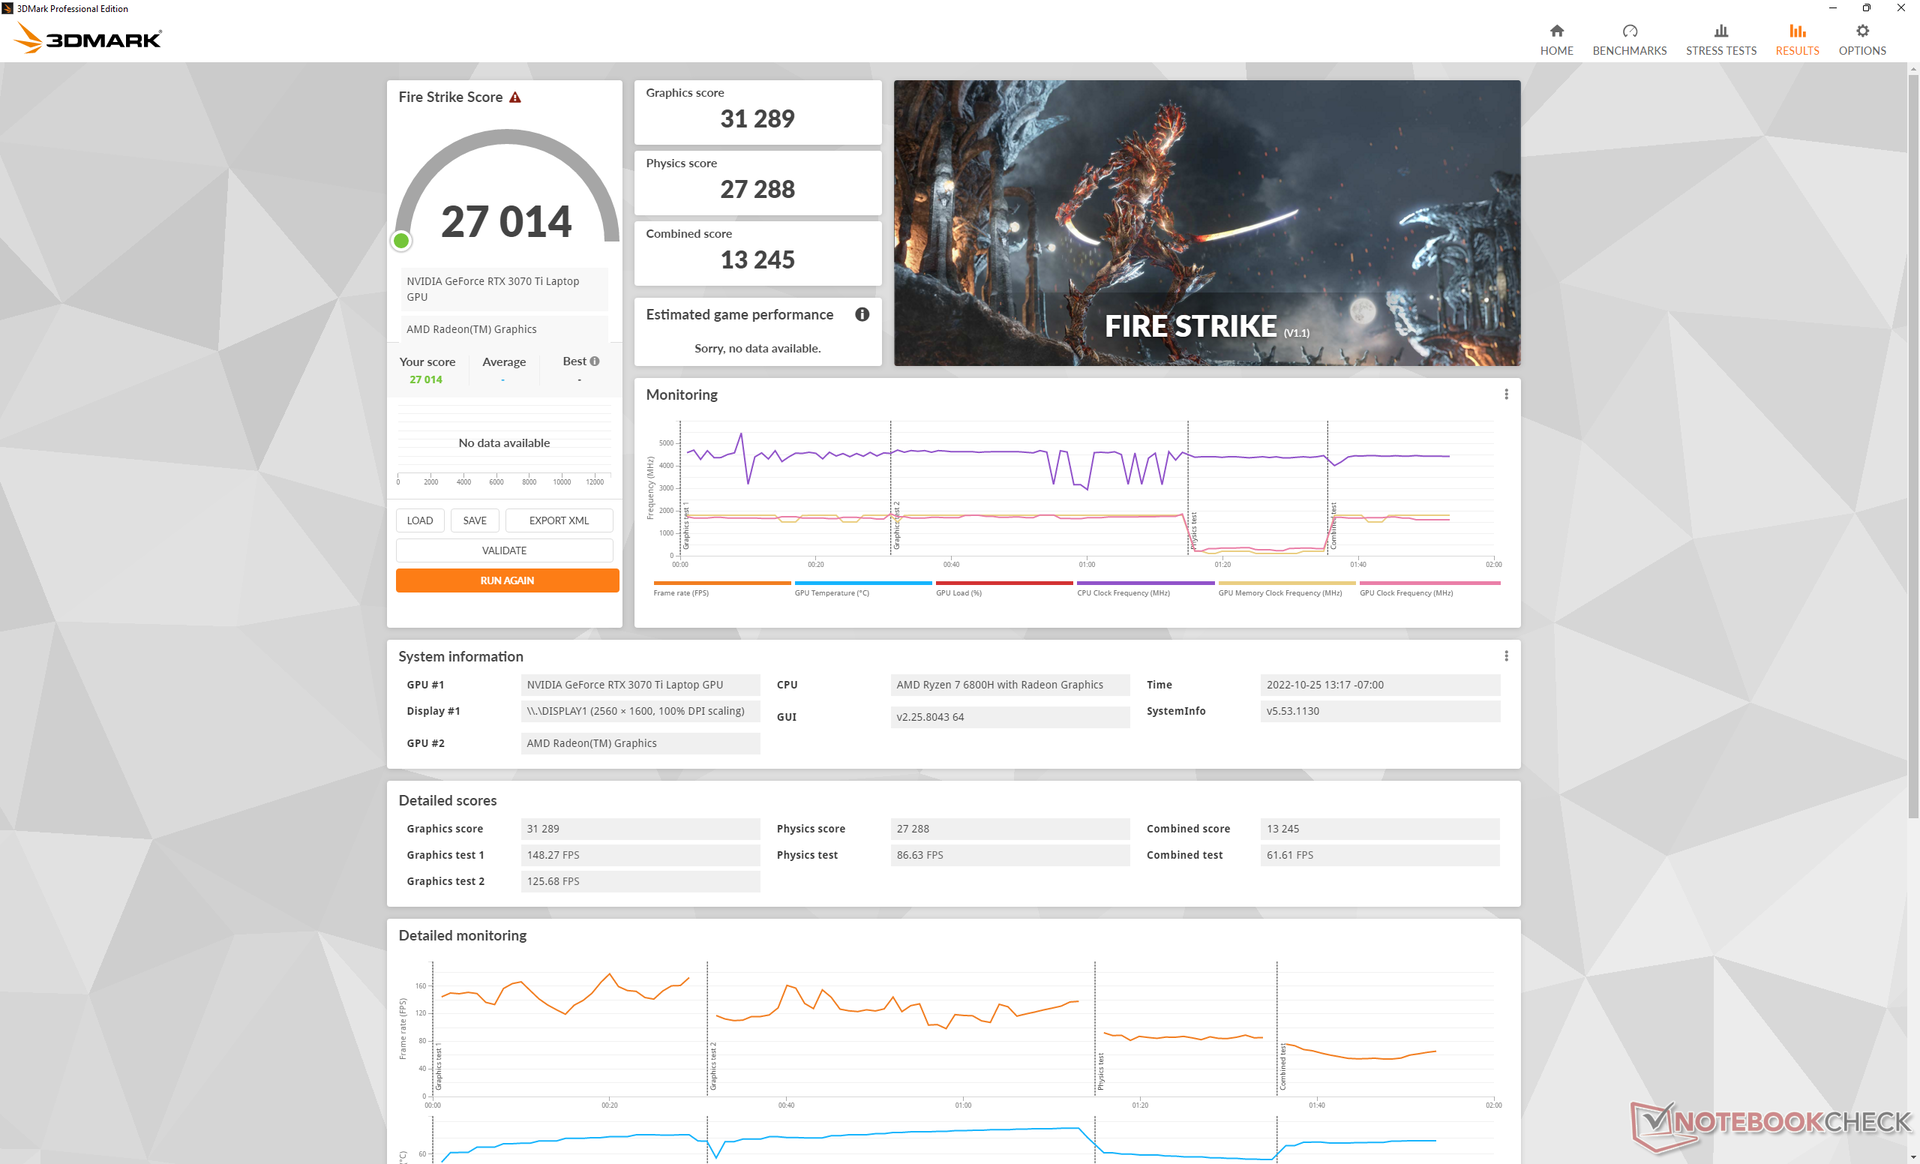
| 3DMark Fire Strike Score | 27014 puntos | |
| 3DMark Time Spy Score | 11758 puntos | |
ayuda | ||
* ... más pequeño es mejor
Witcher 3 FPS Chart
| bajo | medio | alto | ultra | QHD | |
|---|---|---|---|---|---|
| GTA V (2015) | 181.5 | 176.5 | 167.6 | 104 | 98.8 |
| The Witcher 3 (2015) | 370.5 | 308.8 | 226 | 117 | |
| Dota 2 Reborn (2015) | 150.4 | 138 | 132.2 | 126.6 | |
| Final Fantasy XV Benchmark (2018) | 187.2 | 156 | 115.6 | 90.4 | |
| X-Plane 11.11 (2018) | 119.6 | 103.6 | 83.9 | ||
| Strange Brigade (2018) | 383 | 298 | 248 | 217 | 160.5 |
| Cyberpunk 2077 1.6 (2022) | 148.9 | 130.2 | 102.1 | 86 | 54.4 |
Emisiones - Bastante ruidosas
Ruido del sistema
El comportamiento del ruido del ventilador está ligado a la configuración del perfil de energía. En el modo de ahorro de energía con la GPU discreta deshabilitada, por ejemplo, el sistema permanece silencioso con 23,7 dB(A) contra un fondo silencioso de 23,5 dB(A). Por desgracia, la multitarea ligera o el streaming de vídeo son suficientes para elevar el ruido a unos más audibles 32 dB(A), como observamos en el modelo del año pasado
Los juegos inducen un ruido de ventilador de casi 55 dB(A) incluso si el modo Turbo está desactivado. Por lo tanto, es mejor activar el modo Turbo cuando se juega, ya que no parece hacer que el sistema sea más ruidoso o más silencioso. El rango medio de 50 dB(A) es más ruidoso que lo que registramos en el HP Victus 16 o el Dell G16 en condiciones similares.
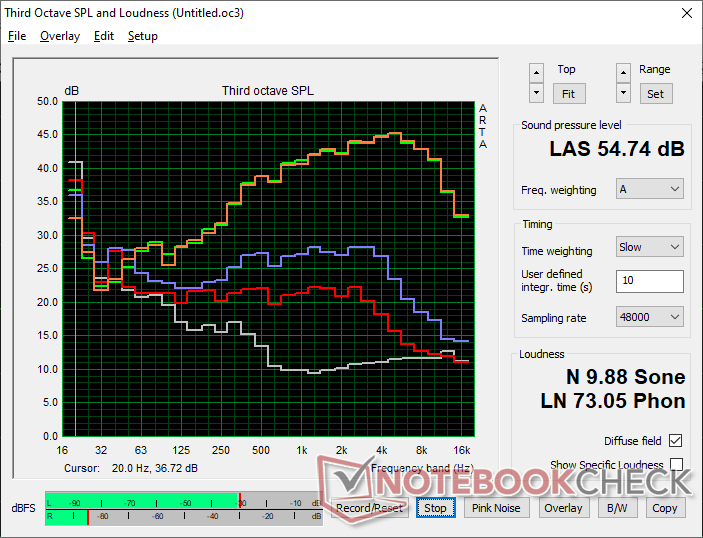
Ruido
| Ocioso |
| 23.7 / 31.1 / 32.2 dB(A) |
| Carga |
| 38.4 / 54.8 dB(A) |
 | ||
30 dB silencioso 40 dB(A) audible 50 dB(A) ruidosamente alto |
||
min: | ||
| Lenovo Legion 5 Pro 16ARH7H RTX 3070 Ti GeForce RTX 3070 Ti Laptop GPU, R7 6800H, Samsung PM9A1 MZVL21T0HCLR | Lenovo Legion 5 Pro 16IAH7H GeForce RTX 3060 Laptop GPU, i7-12700H, 2x Samsung PM9A1 MZVL21T0HCLR (RAID 0) | Asus ROG Zephyrus M16 GU603H GeForce RTX 3070 Laptop GPU, i9-11900H, Samsung PM9A1 MZVL22T0HBLB | Lenovo Legion 7 16ARHA7 Radeon RX 6850M XT, R9 6900HX, Samsung PM9A1 MZVL22T0HBLB | HP Victus 16-e0145ng GeForce RTX 3050 Ti Laptop GPU, R5 5600H, Samsung SSD PM981a MZVLB512HBJQ | Dell G16 7620 GeForce RTX 3060 Laptop GPU, i7-12700H, WDC PC SN810 512GB | |
|---|---|---|---|---|---|---|
| Noise | -8% | -9% | 13% | -2% | 6% | |
| apagado / medio ambiente * (dB) | 23.5 | 24.6 -5% | 25 -6% | 22.8 3% | 26 -11% | 23.2 1% |
| Idle Minimum * (dB) | 23.7 | 28.7 -21% | 25 -5% | 23 3% | 26 -10% | 28.3 -19% |
| Idle Average * (dB) | 31.1 | 32 -3% | 31 -0% | 23 26% | 28 10% | 28.8 7% |
| Idle Maximum * (dB) | 32.2 | 32 1% | 42 -30% | 23 29% | 34 -6% | 28.9 10% |
| Load Average * (dB) | 38.4 | 45.2 -18% | 48 -25% | 26.8 30% | 44 -15% | 32.4 16% |
| Witcher 3 ultra * (dB) | 54.8 | 52 5% | 54.3 1% | 48 12% | 48.3 12% | |
| Load Maximum * (dB) | 54.8 | 54.4 1% | 56 -2% | 54.2 1% | 53 3% | 48.1 12% |
* ... más pequeño es mejor
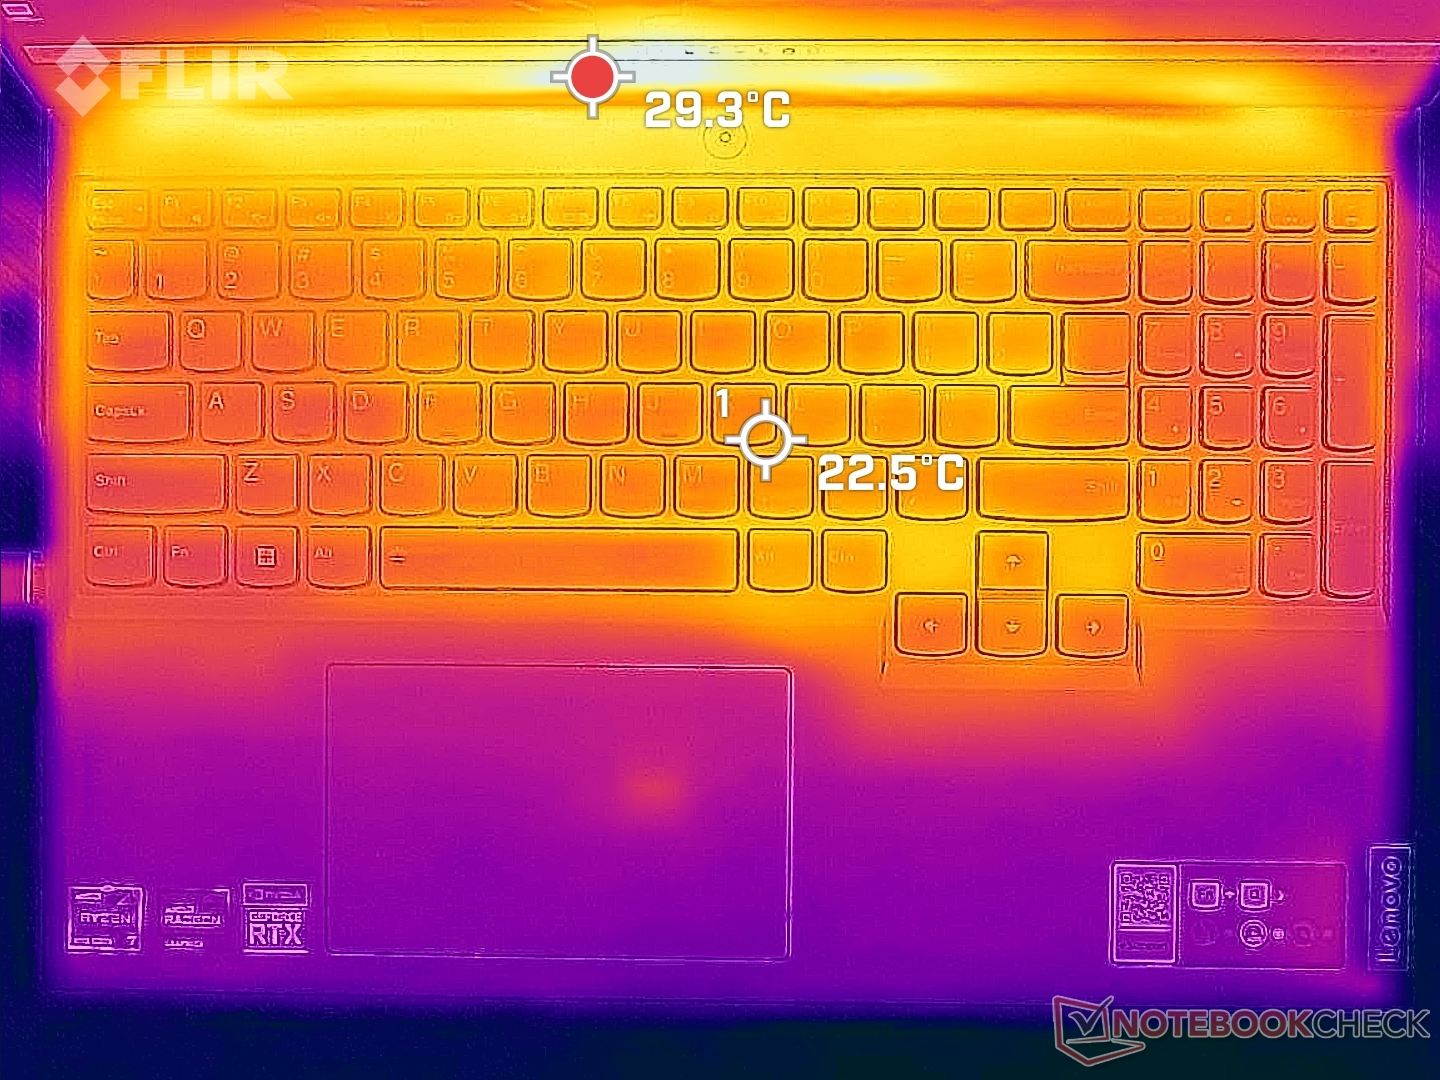
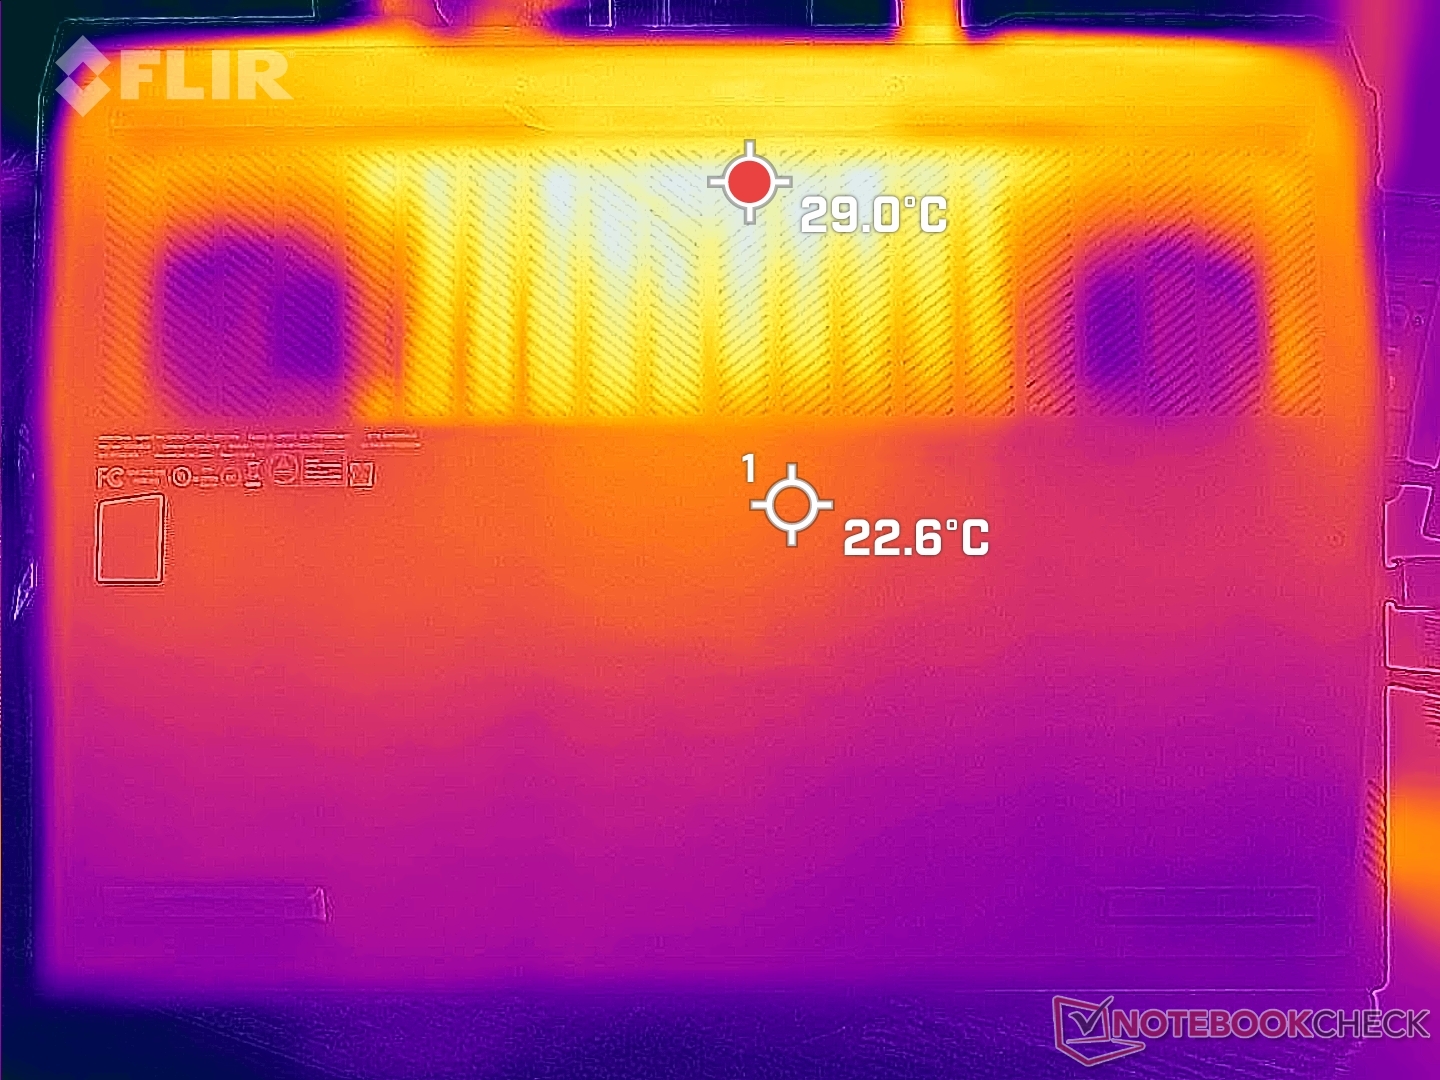
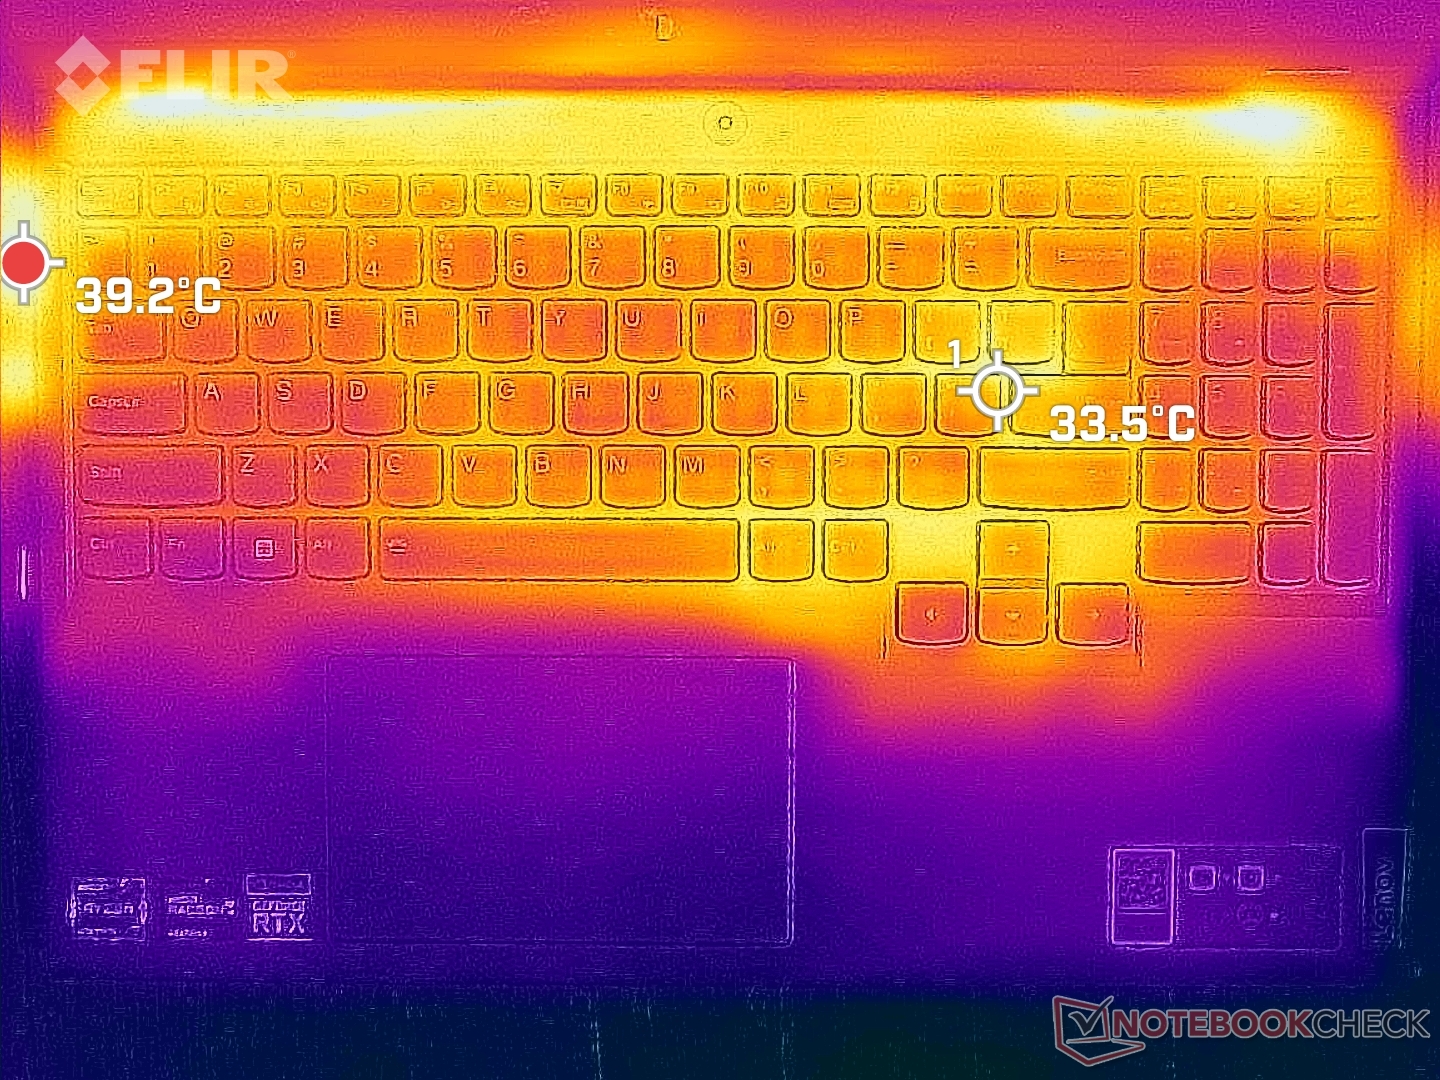
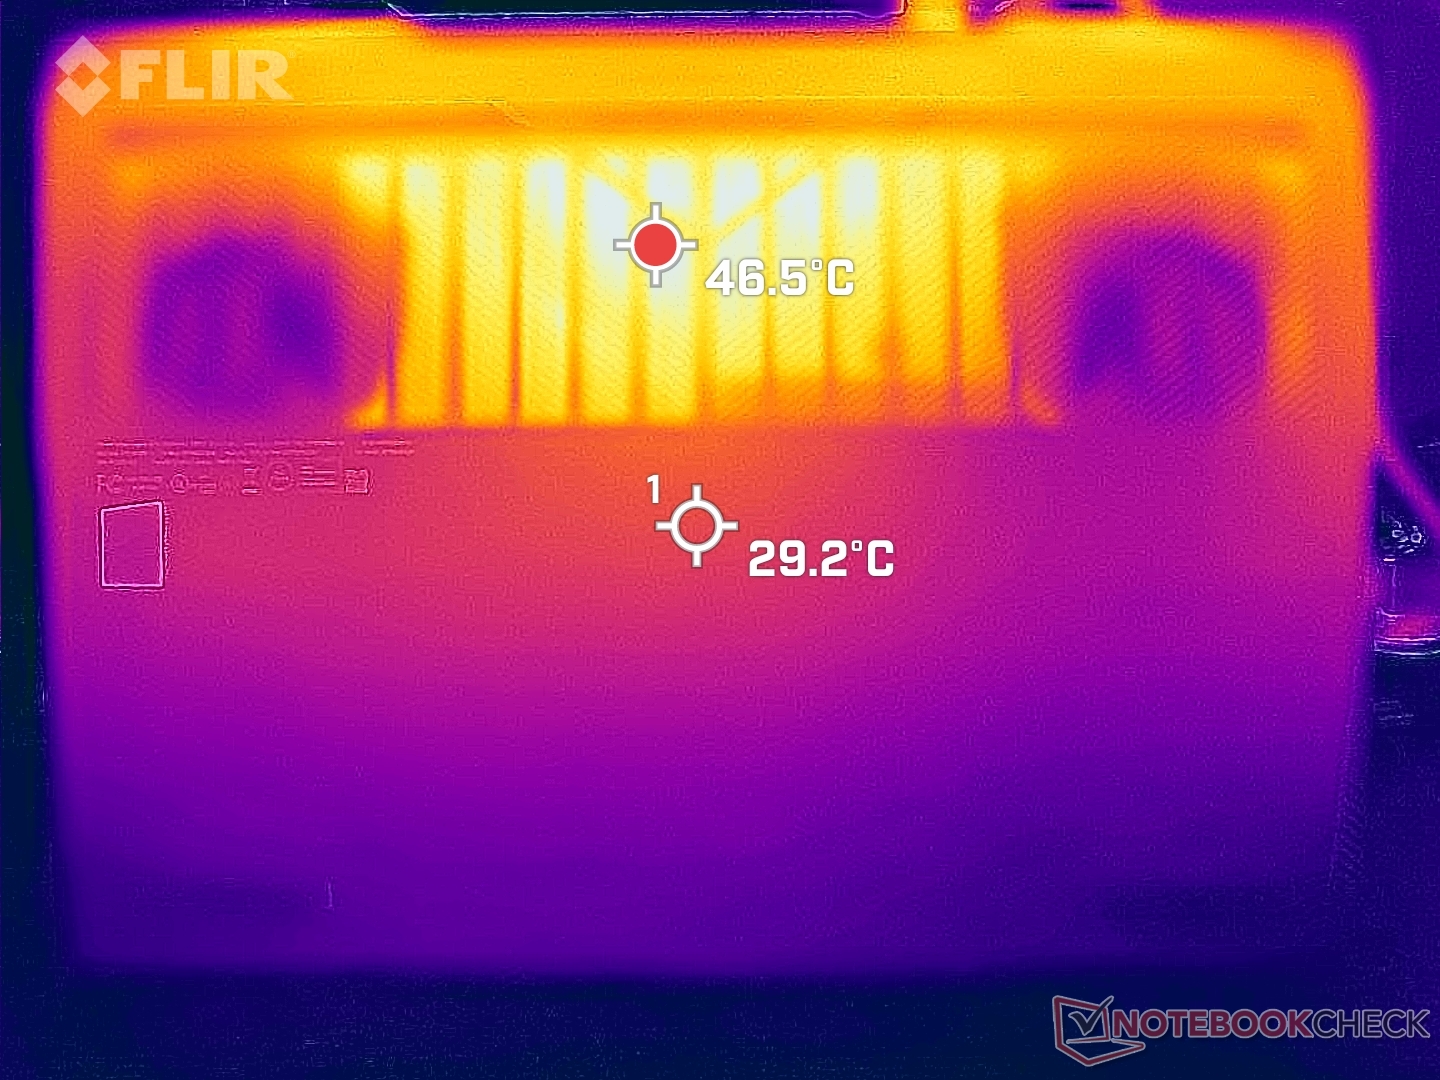
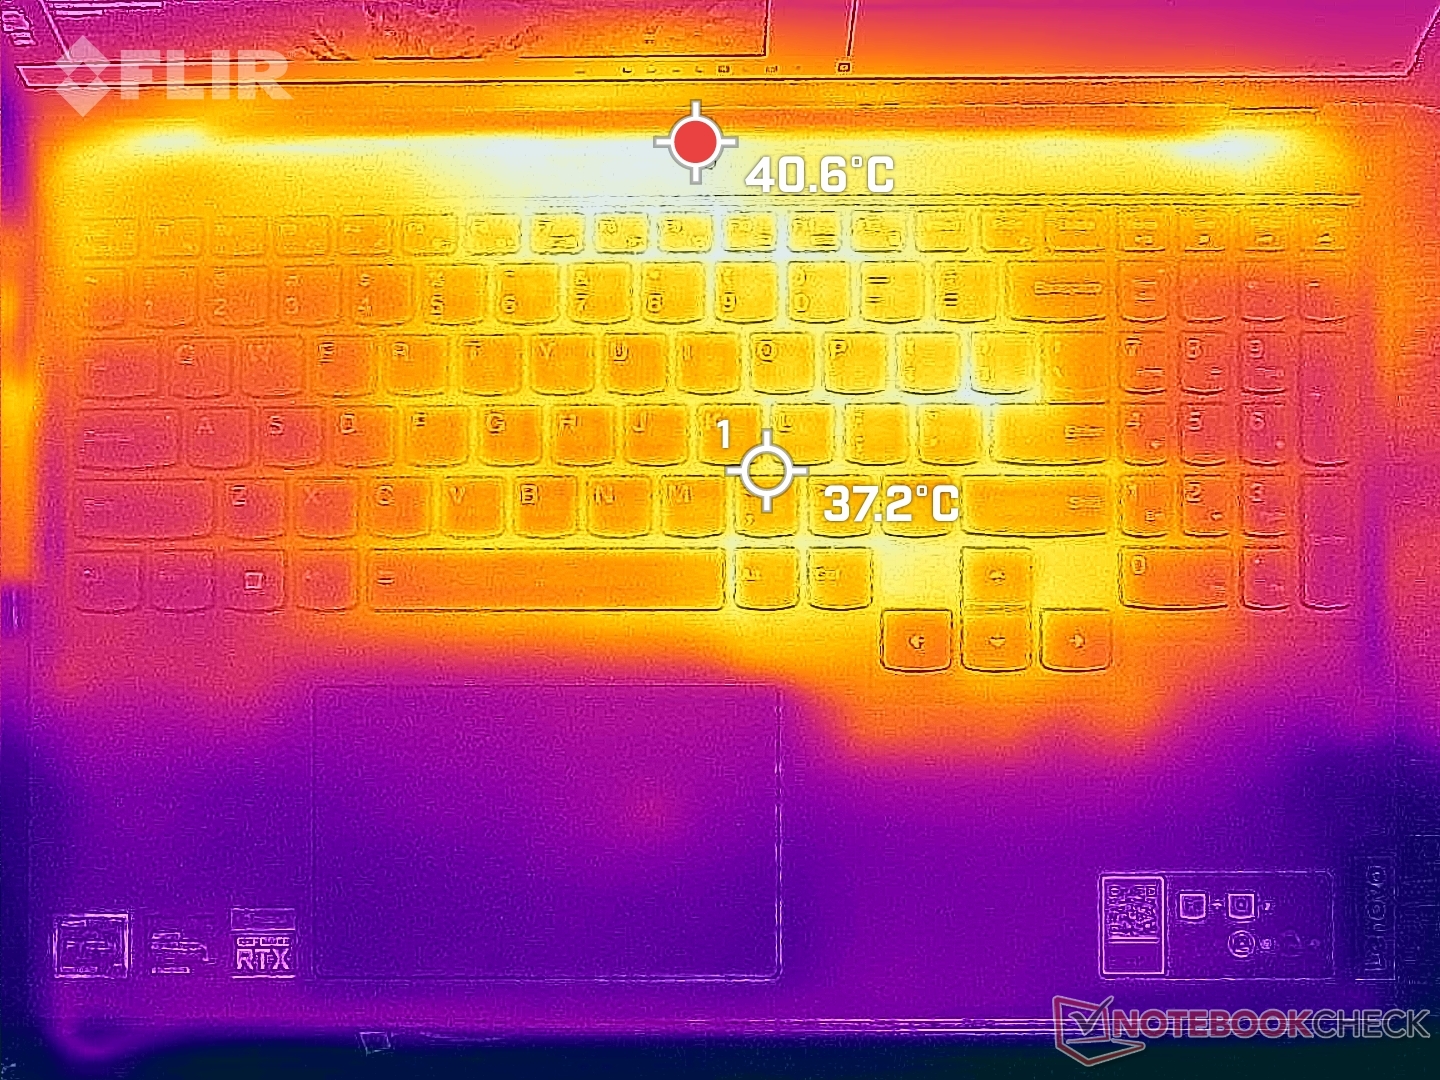
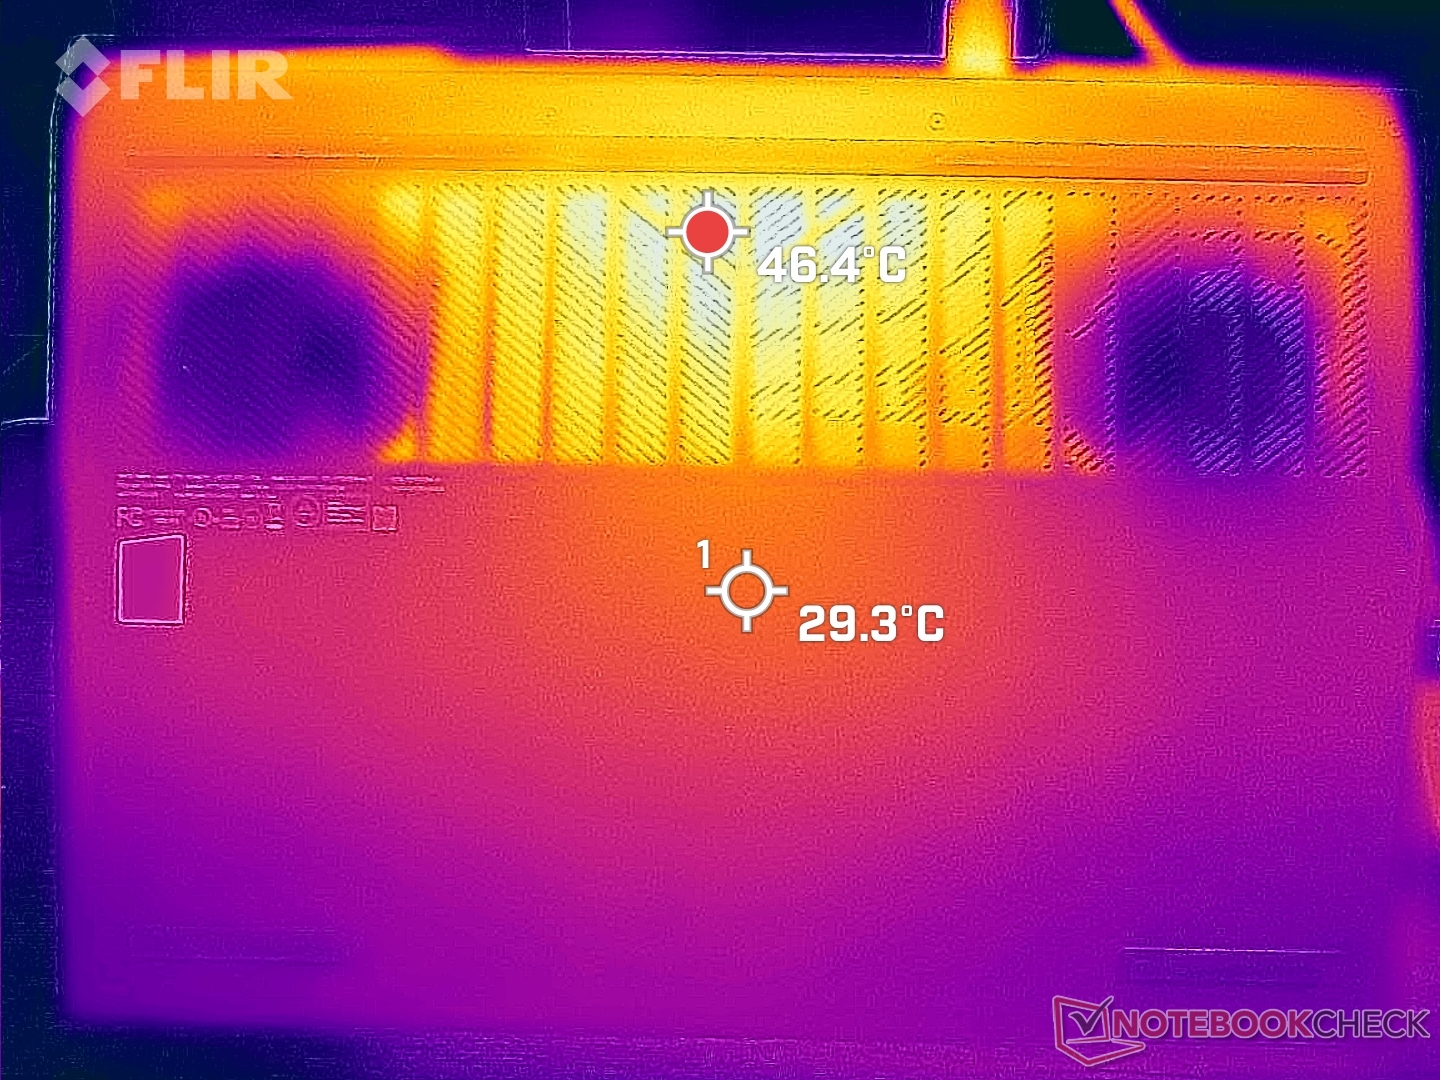
Temperatura
Las temperaturas medias de la superficie son mucho más frescas que en el Asus ROG Zephyrus M16 aunque sus puntos calientes son similares. Por ejemplo, los puntos más calientes del Lenovo y del Asus pueden alcanzar hasta 53 C cada uno, pero los reposamanos y las zonas del teclado del Lenovo siguen siendo notablemente más fríos y, por tanto, más cómodos para jugar.
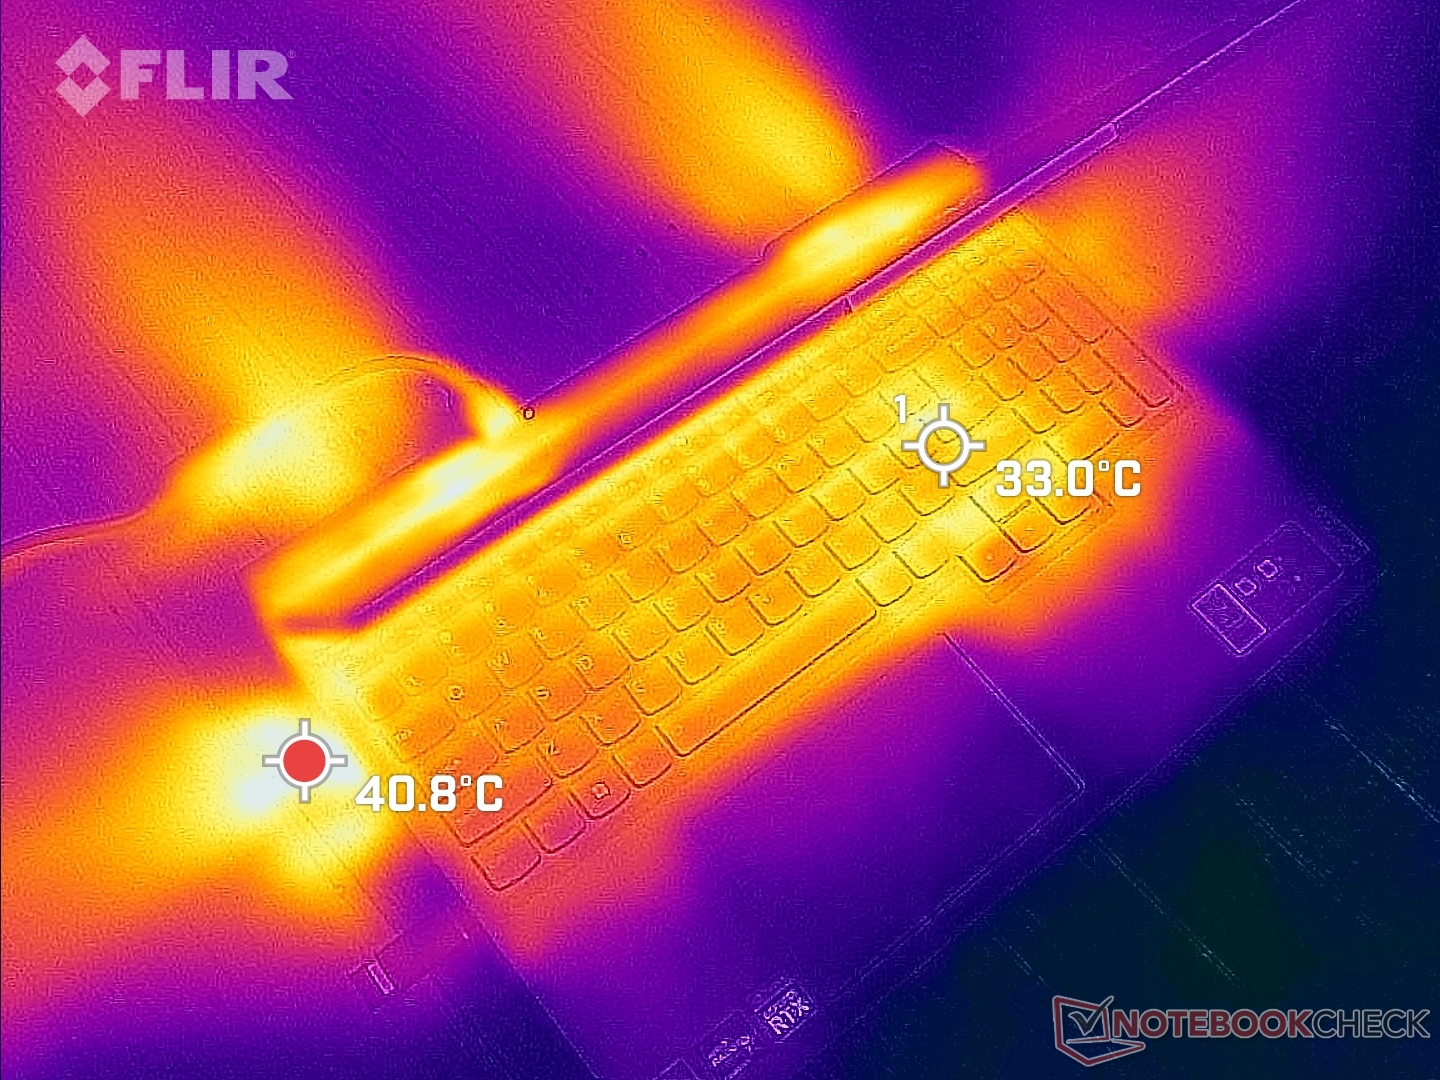
(±) La temperatura máxima en la parte superior es de 43.8 °C / 111 F, frente a la media de 40.4 °C / 105 F, que oscila entre 21.2 y 68.8 °C para la clase Gaming.
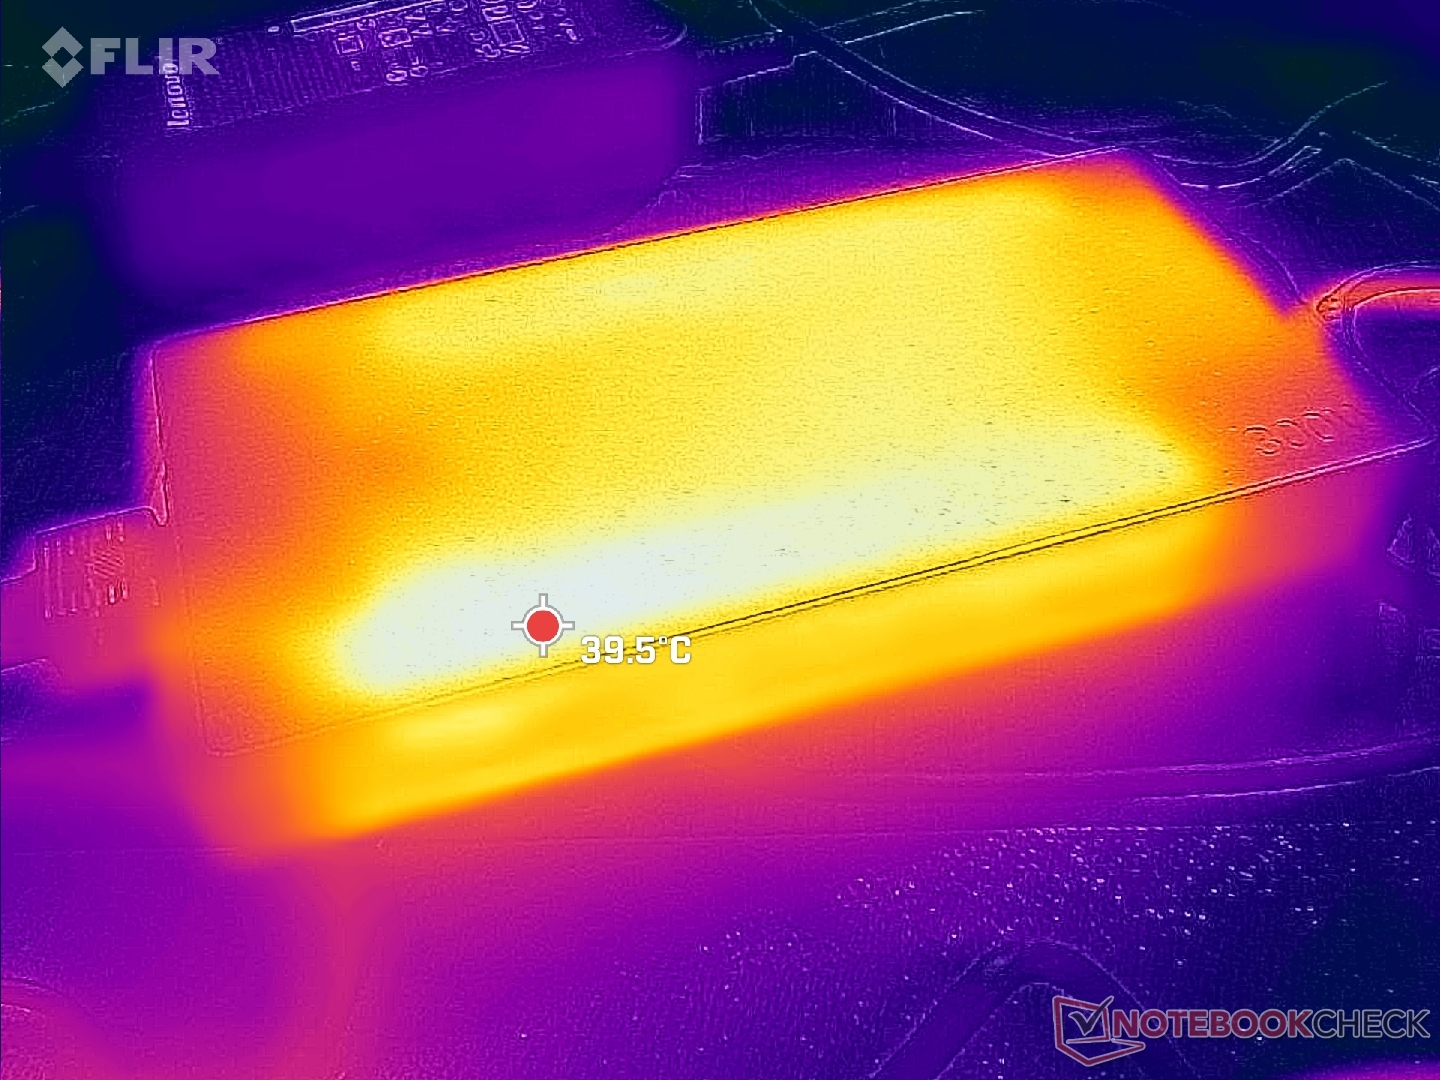
(-) El fondo se calienta hasta un máximo de 53 °C / 127 F, frente a la media de 43.2 °C / 110 F
(+) En reposo, la temperatura media de la parte superior es de 27.4 °C / 81# F, frente a la media del dispositivo de 33.9 °C / 93 F.
(±) Jugando a The Witcher 3, la temperatura media de la parte superior es de 33.5 °C / 92 F, frente a la media del dispositivo de 33.9 °C / 93 F.
(+) El reposamanos y el panel táctil están a una temperatura inferior a la de la piel, con un máximo de 29.4 °C / 84.9 F y, por tanto, son fríos al tacto.
(±) La temperatura media de la zona del reposamanos de dispositivos similares fue de 28.8 °C / 83.8 F (-0.6 °C / -1.1 F).
| Lenovo Legion 5 Pro 16ARH7H RTX 3070 Ti AMD Ryzen 7 6800H, NVIDIA GeForce RTX 3070 Ti Laptop GPU | Lenovo Legion 5 Pro 16IAH7H Intel Core i7-12700H, NVIDIA GeForce RTX 3060 Laptop GPU | Asus ROG Zephyrus M16 GU603H Intel Core i9-11900H, NVIDIA GeForce RTX 3070 Laptop GPU | Lenovo Legion 7 16ARHA7 AMD Ryzen 9 6900HX, AMD Radeon RX 6850M XT | HP Victus 16-e0145ng AMD Ryzen 5 5600H, NVIDIA GeForce RTX 3050 Ti Laptop GPU | Dell G16 7620 Intel Core i7-12700H, NVIDIA GeForce RTX 3060 Laptop GPU | |
|---|---|---|---|---|---|---|
| Heat | -7% | -19% | 5% | -12% | 9% | |
| Maximum Upper Side * (°C) | 43.8 | 45.8 -5% | 52 -19% | 37.2 15% | 54 -23% | 47.6 -9% |
| Maximum Bottom * (°C) | 53 | 66.3 -25% | 53 -0% | 43 19% | 47 11% | 54 -2% |
| Idle Upper Side * (°C) | 30 | 30.4 -1% | 38 -27% | 34 -13% | 41 -37% | 23 23% |
| Idle Bottom * (°C) | 31.8 | 30.4 4% | 41 -29% | 32.8 -3% | 31 3% | 24.6 23% |
* ... más pequeño es mejor
Prueba de esfuerzo
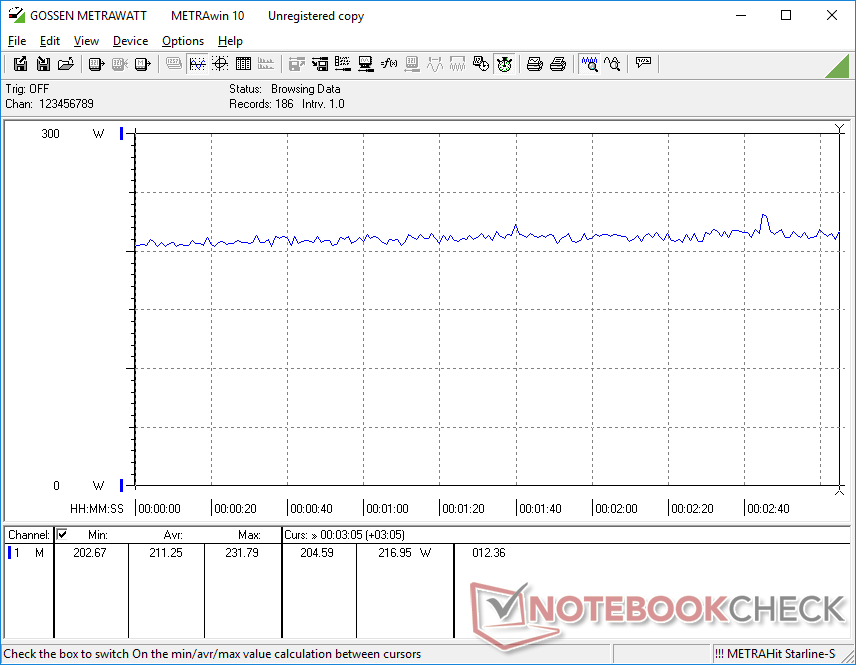
Bajo el estrés de Prime95, la CPU aumenta a 4,2 GHz y 90 W indefinidamente sin necesidad de acelerar. Desgraciadamente, las temperaturas del núcleo se calientan mucho, justo por debajo de los 95 C, lo que es más cálido que en la mayoría de los otros portátiles para juegos.
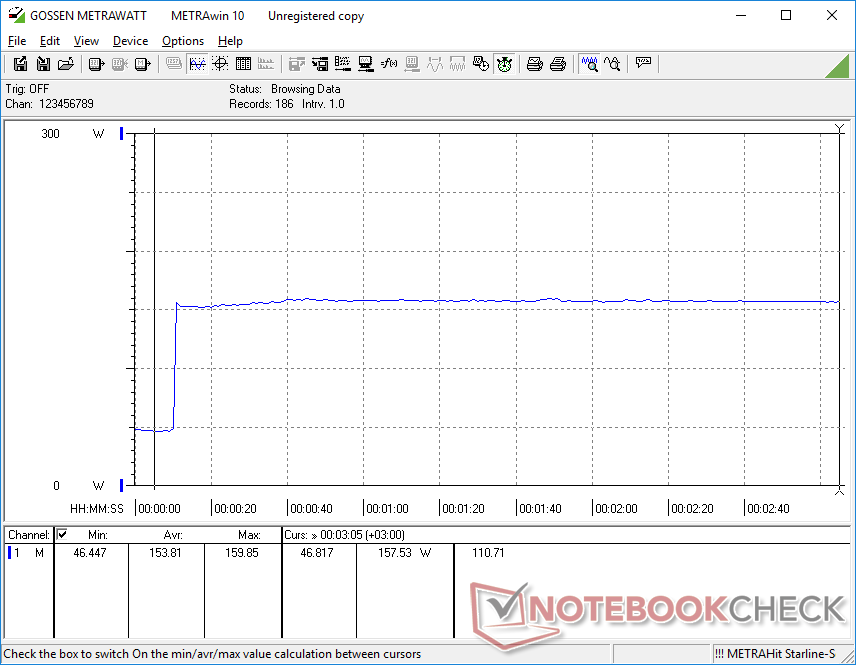
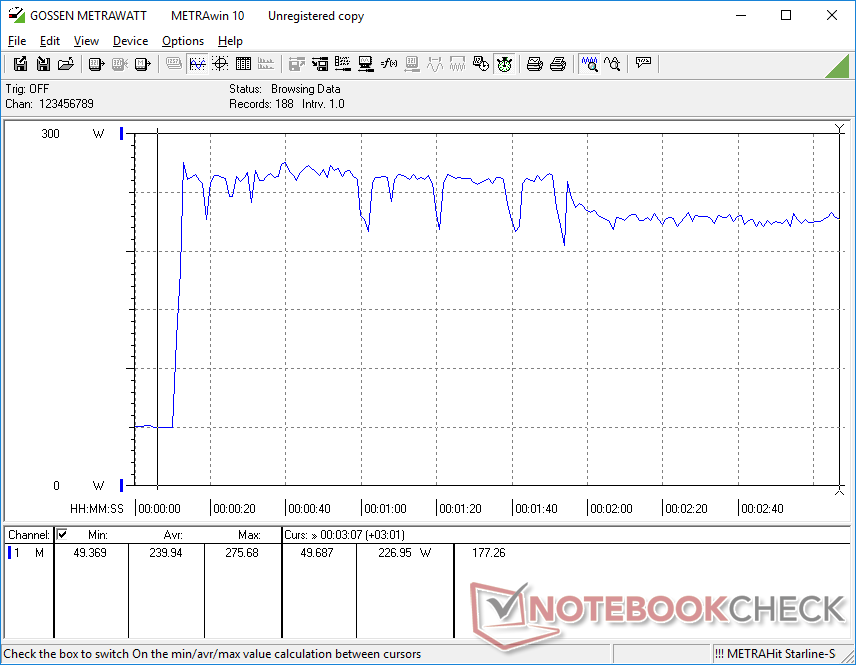
Cuando se ejecuta Witcher 3 con el modo Turbo activo, la GPU Nvidia se estabiliza en 1620 MHz de núcleo, 1800 MHz de memoria y 136 W de consumo. Curiosamente, si se repite esta prueba con el modo Turbo desactivado, el núcleo y la memoria se ralentizan a 1605 MHz y 1750 MHz, respectivamente, pero el consumo de energía de la placa es mayor, de 149 W. De todos modos, es recomendable activar el modo Turbo, ya que el rendimiento gráfico sigue siendo ligeramente más rápido que con el modo Turbo desactivado.
El funcionamiento con batería limita el rendimiento. Una prueba de Fire Strike con baterías arroja unas puntuaciones de Física y Gráficos de 20957 y 13153 puntos, respectivamente, frente a los 27288 y 31289 puntos de la red eléctrica.
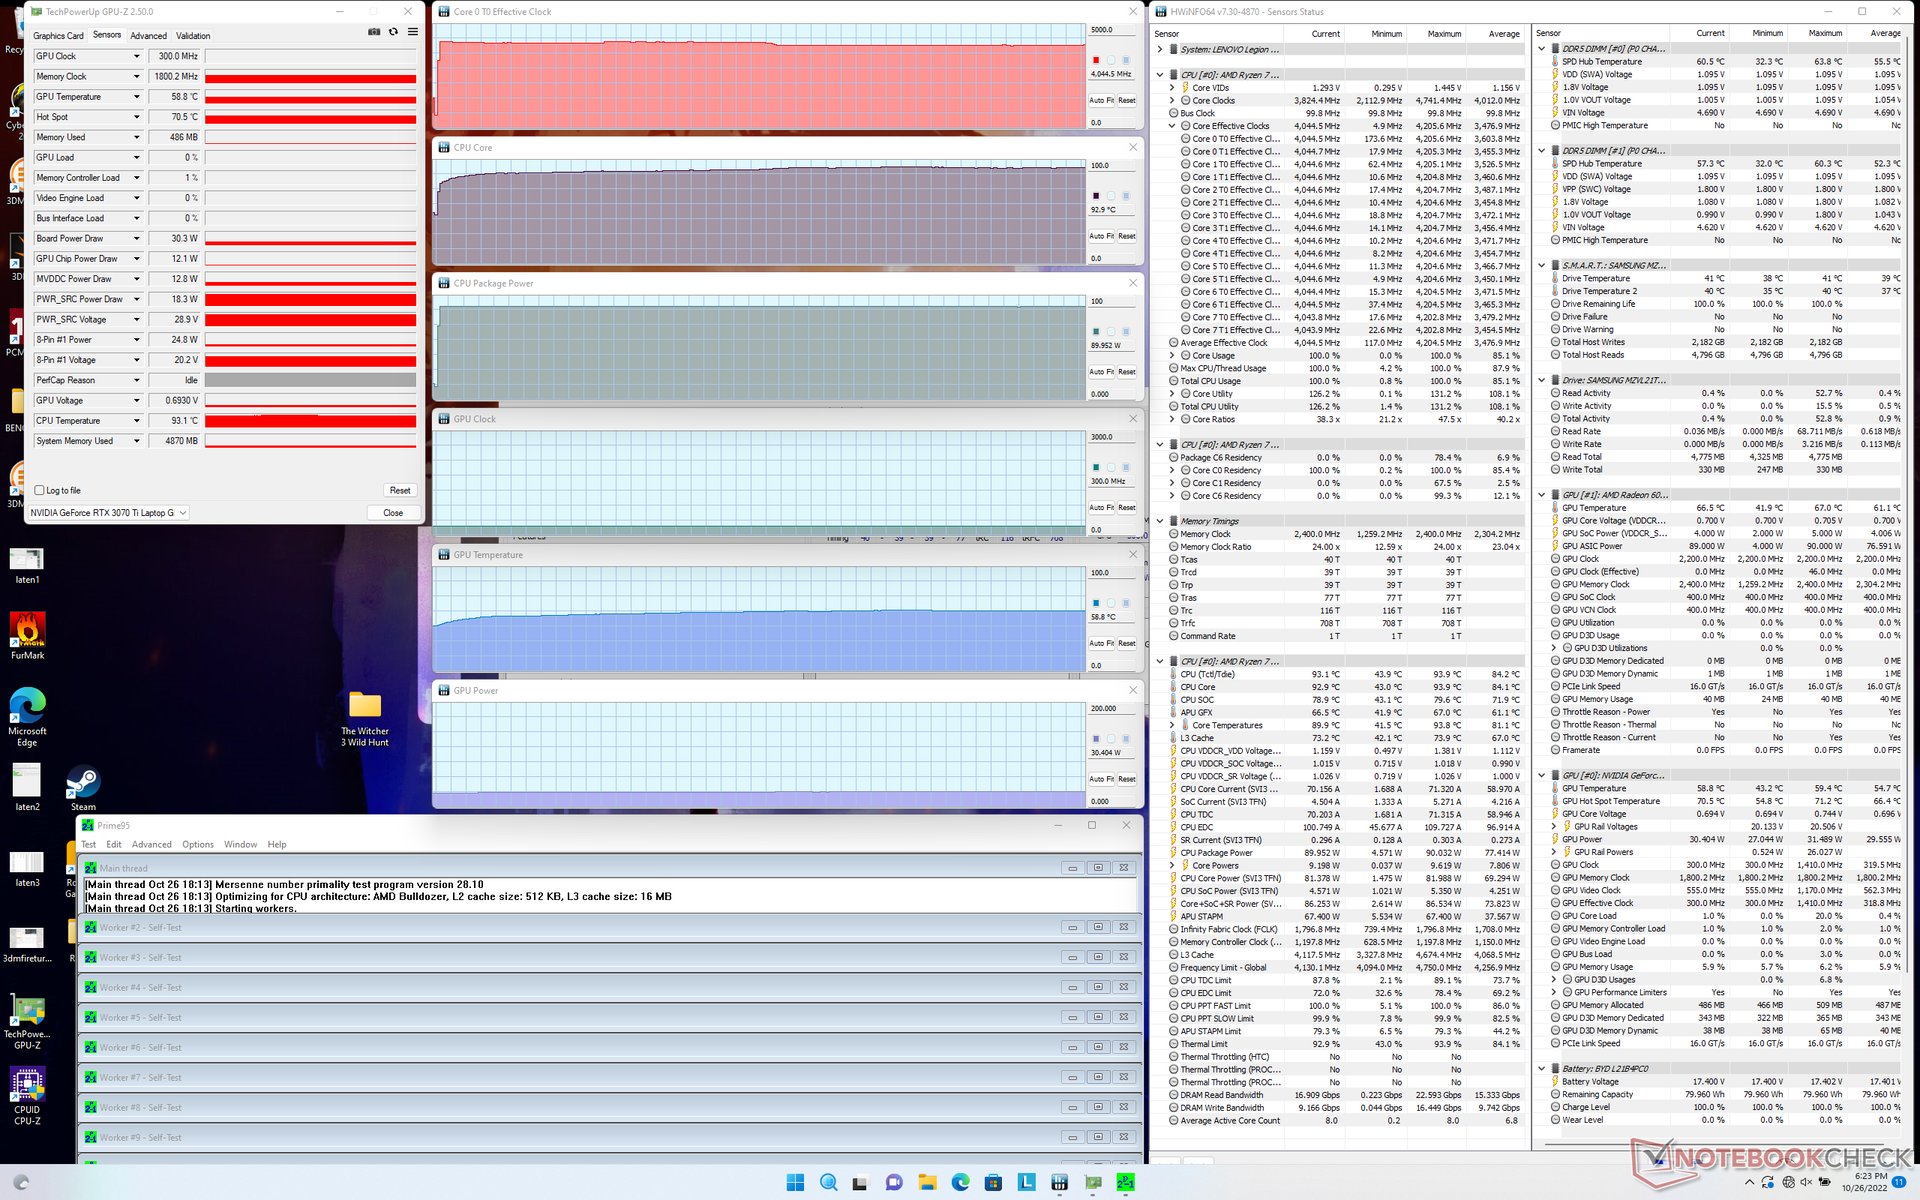
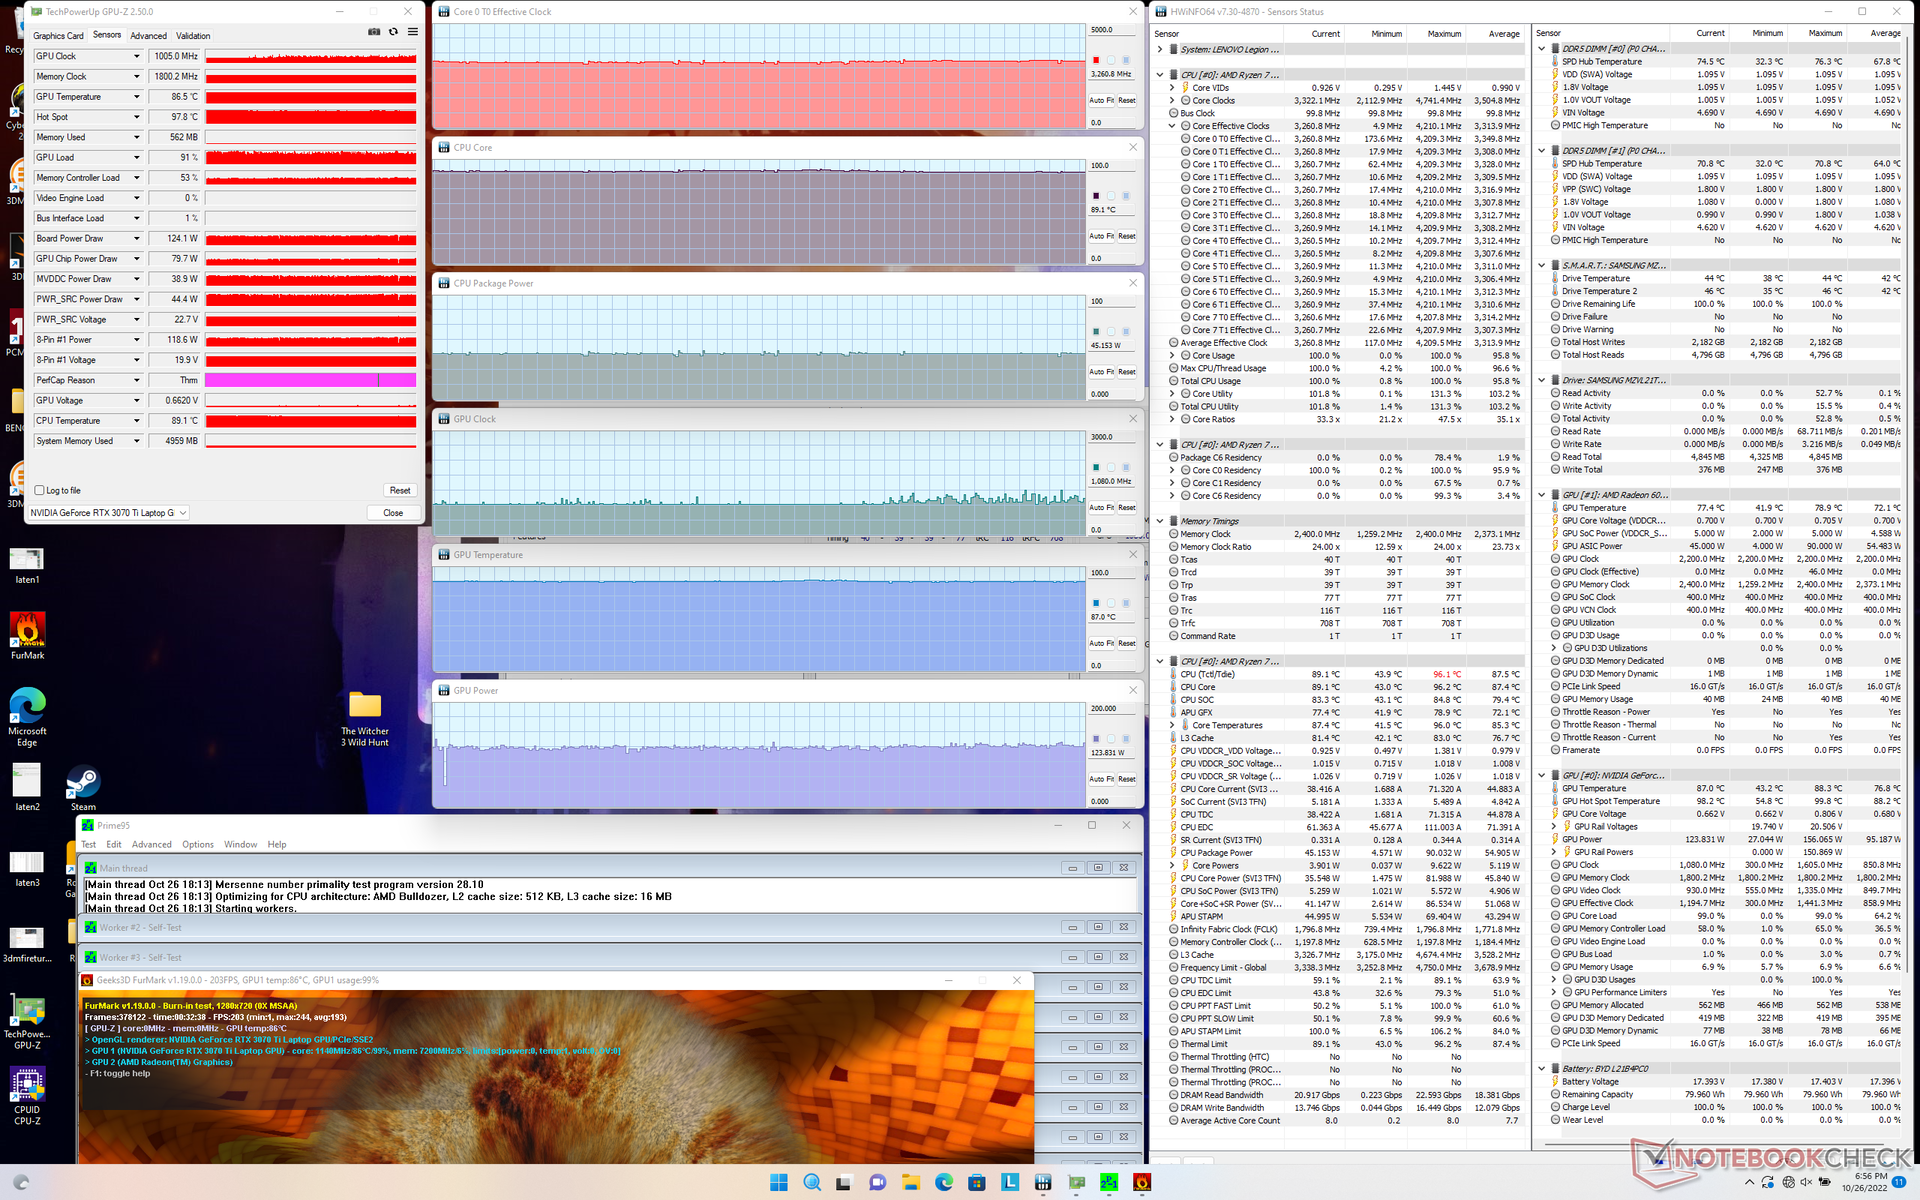
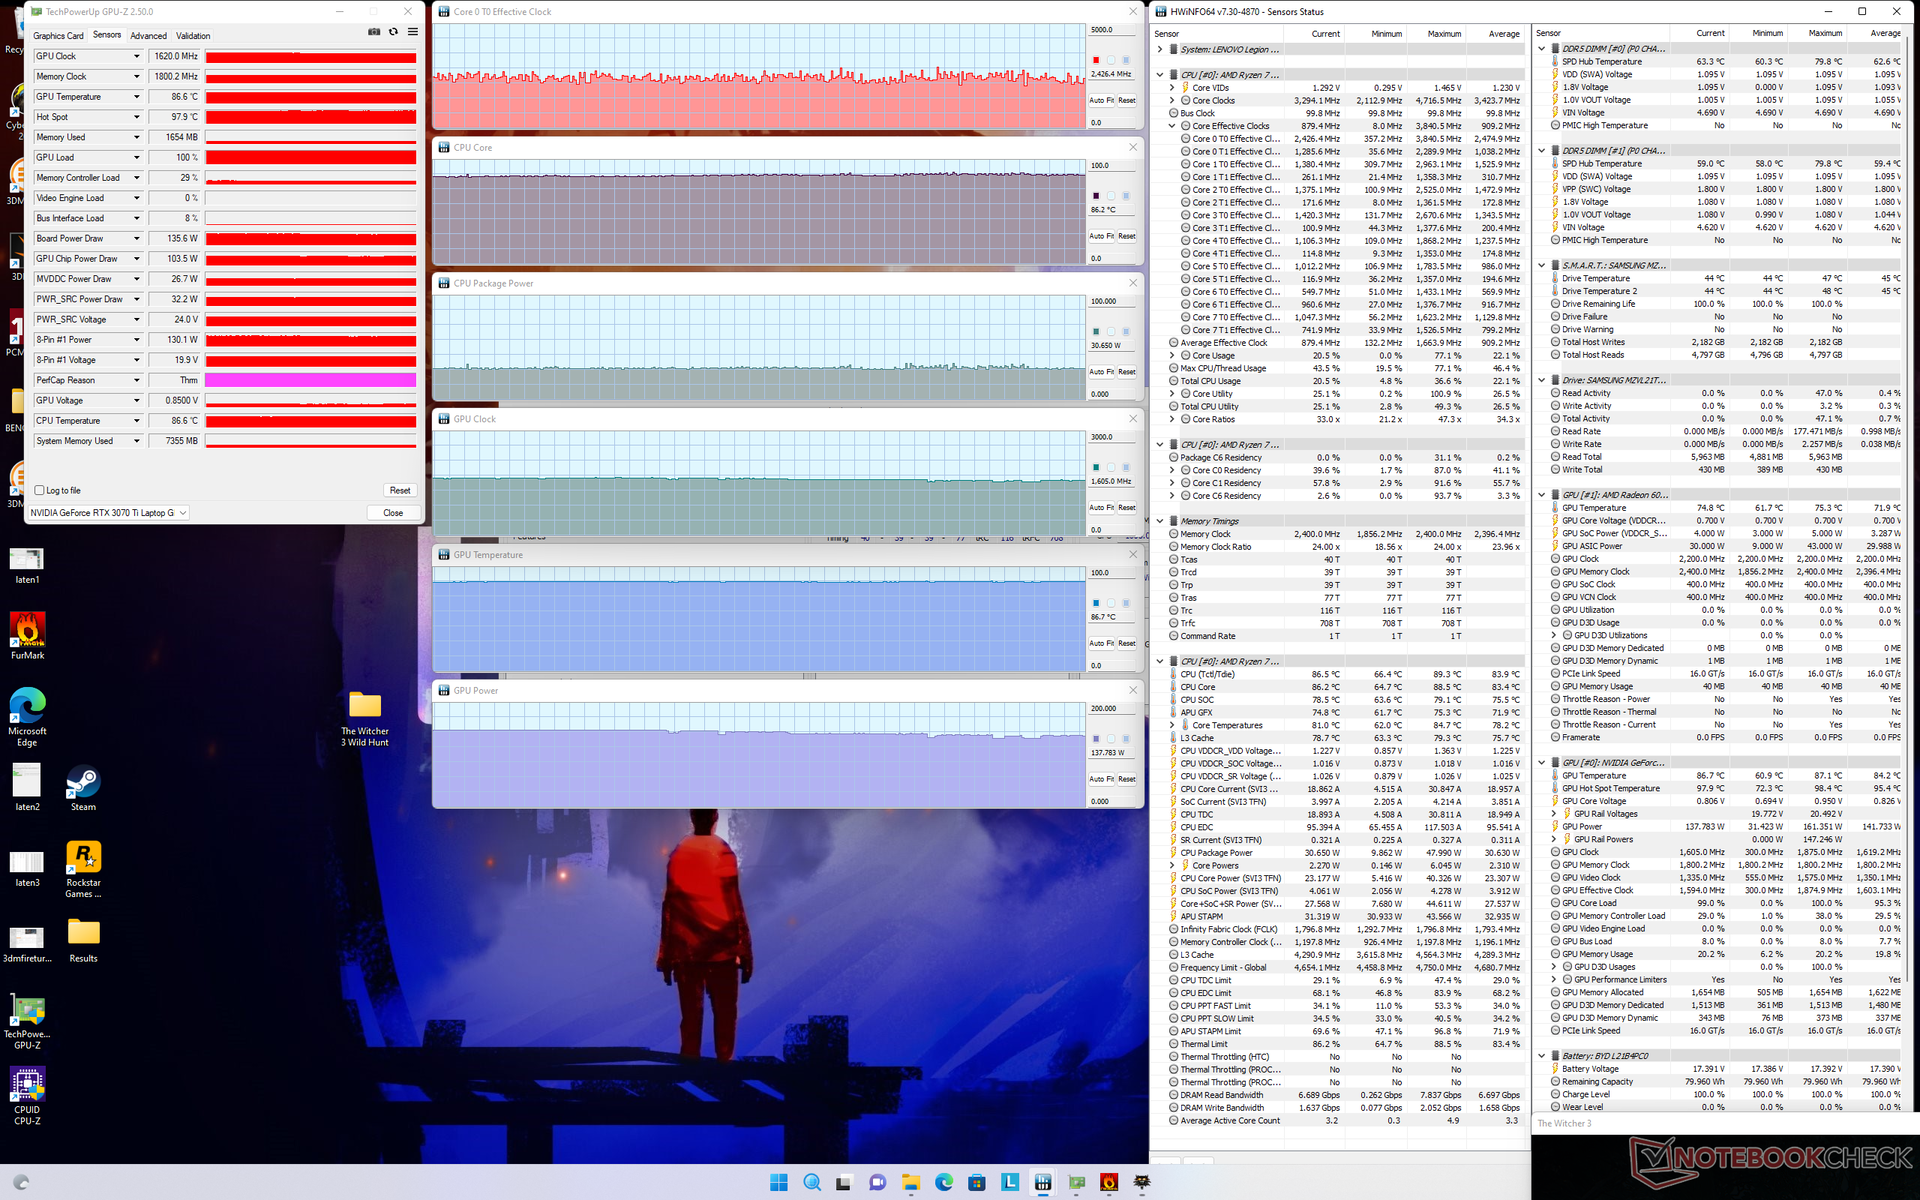
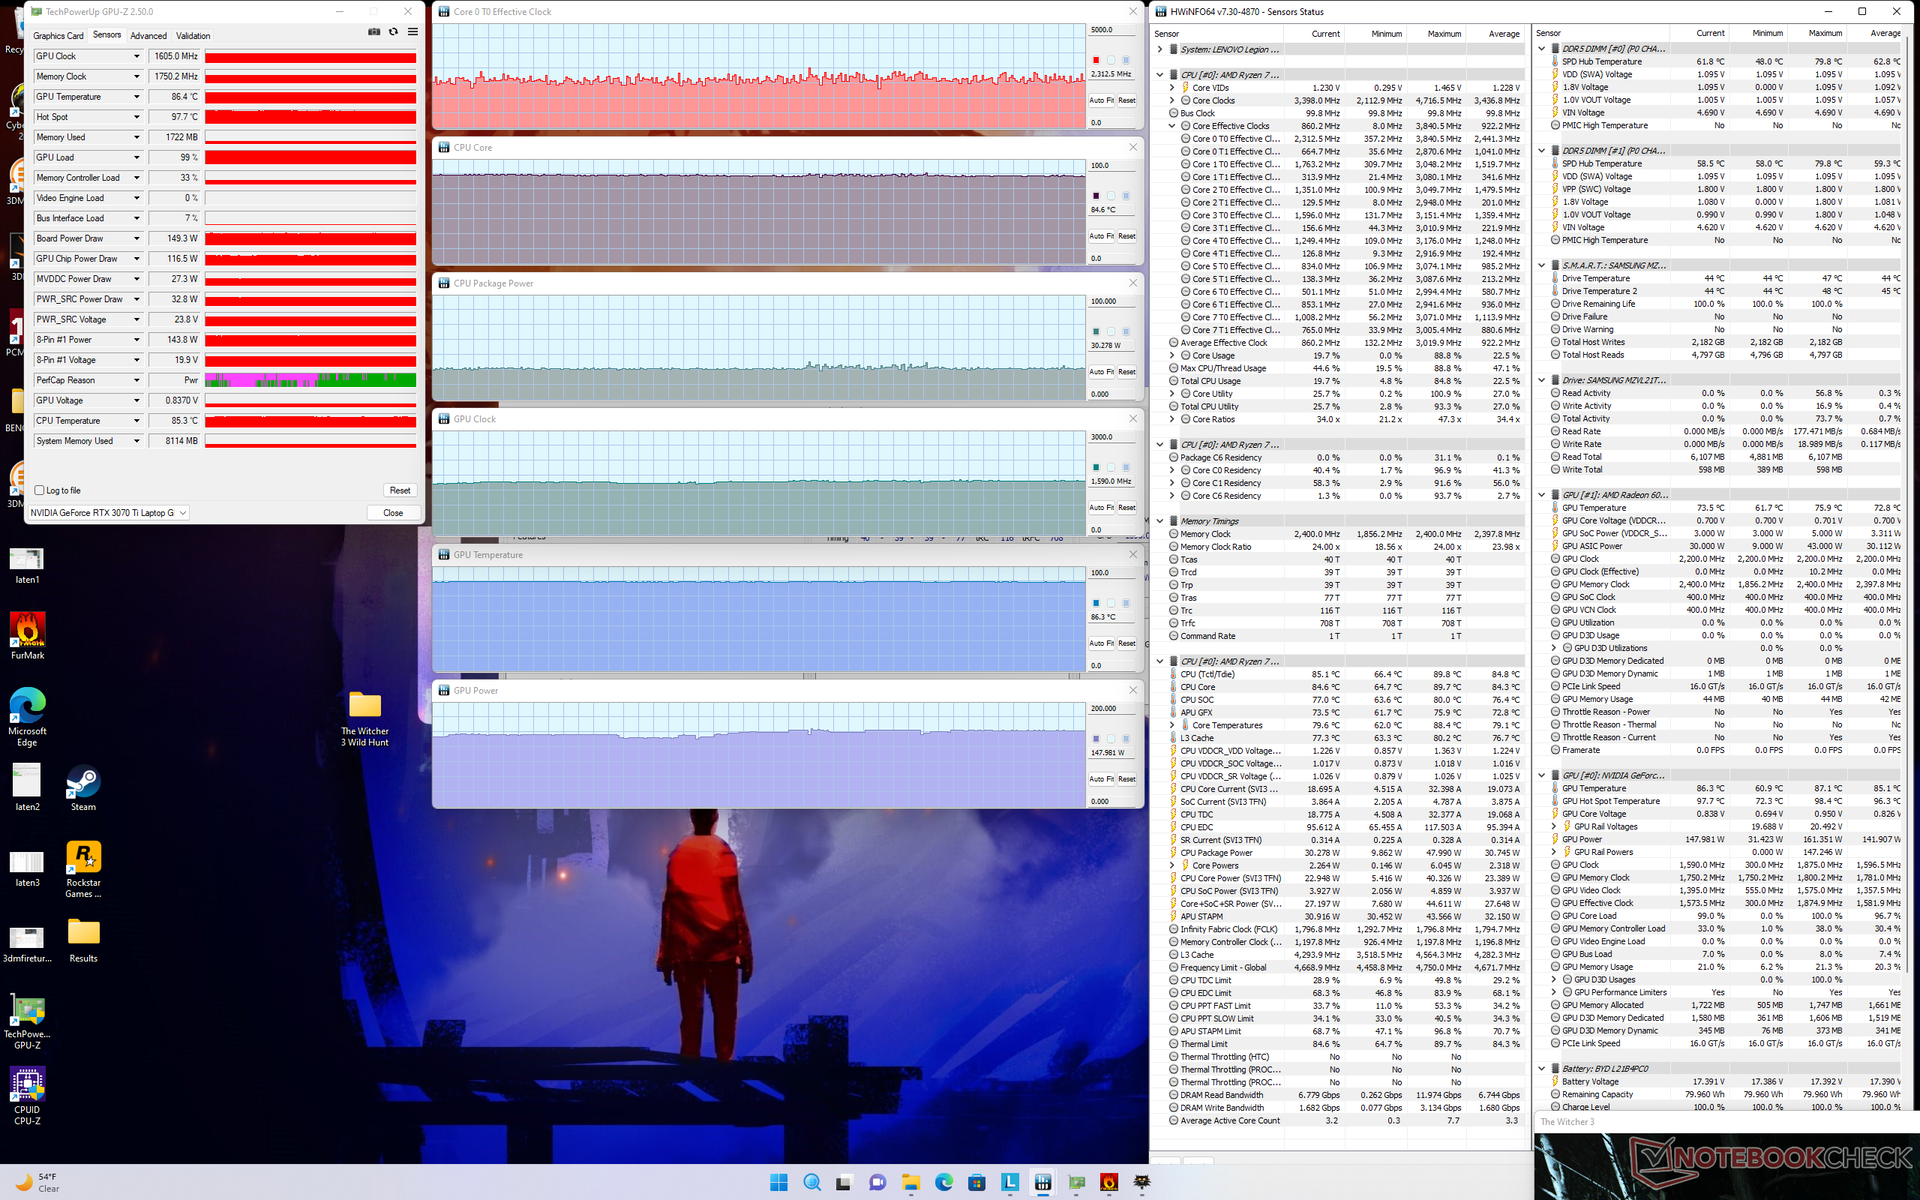
| Reloj dela CPU (GHz) | Reloj de la GPU (MHz) | Temperatura media dela CPU (°C) | Temperatura media de la GPU (°C) | |
| Sistema en reposo | -- | -- | 44 | 44 |
| Prime95Stress | 4.1 | -- | 93 | 59 |
| Estrés de Prime95+ FurMark | 3,3 | 1005 | 89 | 87 |
| Witcher 3 Estrés (Turboon) | ~2,3 | 1620 | 86 | 87 |
| Witcher 3 Estrés (Turbooff) | ~2,3 | 1605 | 85 | 86 |
Altavoces
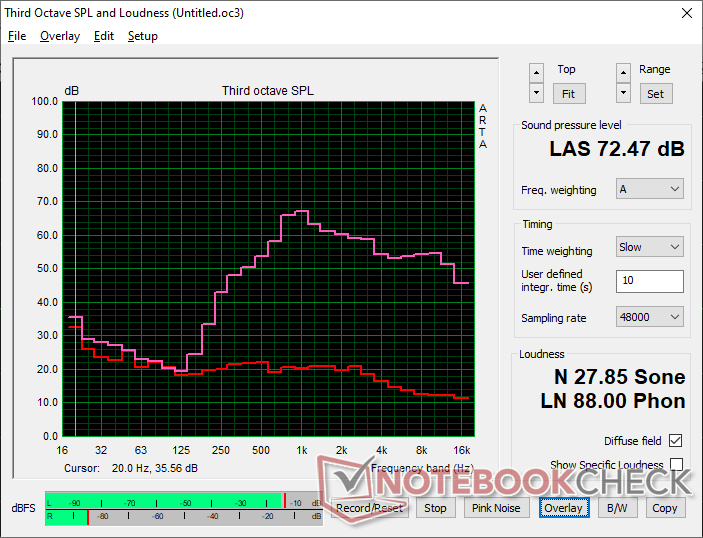
Lenovo Legion 5 Pro 16ARH7H RTX 3070 Ti análisis de audio
(±) | la sonoridad del altavoz es media pero buena (72.5 dB)
Graves 100 - 315 Hz
(-) | casi sin bajos - de media 22.3% inferior a la mediana
(-) | los graves no son lineales (15.4% delta a la frecuencia anterior)
Medios 400 - 2000 Hz
(±) | medias más altas - de media 7.1% más altas que la mediana
(±) | la linealidad de los medios es media (9.5% delta respecto a la frecuencia anterior)
Altos 2 - 16 kHz
(+) | máximos equilibrados - a sólo 1.9% de la mediana
(+) | los máximos son lineales (3.6% delta a la frecuencia anterior)
Total 100 - 16.000 Hz
(-) | el sonido global no es lineal (30.3% de diferencia con la mediana)
En comparación con la misma clase
» 96% de todos los dispositivos probados de esta clase eran mejores, 2% similares, 3% peores
» El mejor tuvo un delta de 6%, la media fue 18%, el peor fue ###max##%
En comparación con todos los dispositivos probados
» 89% de todos los dispositivos probados eran mejores, 3% similares, 9% peores
» El mejor tuvo un delta de 4%, la media fue 23%, el peor fue ###max##%
Asus ROG Zephyrus M16 GU603H análisis de audio
(±) | la sonoridad del altavoz es media pero buena (80 dB)
Graves 100 - 315 Hz
(±) | lubina reducida - en promedio 7.4% inferior a la mediana
(±) | la linealidad de los graves es media (9.2% delta a frecuencia anterior)
Medios 400 - 2000 Hz
(±) | medias más altas - de media 5.6% más altas que la mediana
(+) | los medios son lineales (4% delta a la frecuencia anterior)
Altos 2 - 16 kHz
(+) | máximos equilibrados - a sólo 2.6% de la mediana
(+) | los máximos son lineales (6.7% delta a la frecuencia anterior)
Total 100 - 16.000 Hz
(+) | el sonido global es lineal (12.1% de diferencia con la mediana)
En comparación con la misma clase
» 12% de todos los dispositivos probados de esta clase eran mejores, 4% similares, 84% peores
» El mejor tuvo un delta de 6%, la media fue 18%, el peor fue ###max##%
En comparación con todos los dispositivos probados
» 10% de todos los dispositivos probados eran mejores, 2% similares, 88% peores
» El mejor tuvo un delta de 4%, la media fue 23%, el peor fue ###max##%
Gestión de la energía - Máquina exigente
Consumo de energía
Aunque el Ryzen 7 6800H es aproximadamente un 25 por ciento más lento que el Core i7-12700H, no es necesariamente un 25 por ciento más eficiente desde el punto de vista energético. De hecho, el consumo de energía entre las versiones AMD e Intel del Legion 5 Pro 16 es de unos 160 W en cada sistema cuando se ejecuta Prime95. El consumo de energía también sigue siendo bastante similar entre ellos cuando se ejecuta Witcher 3
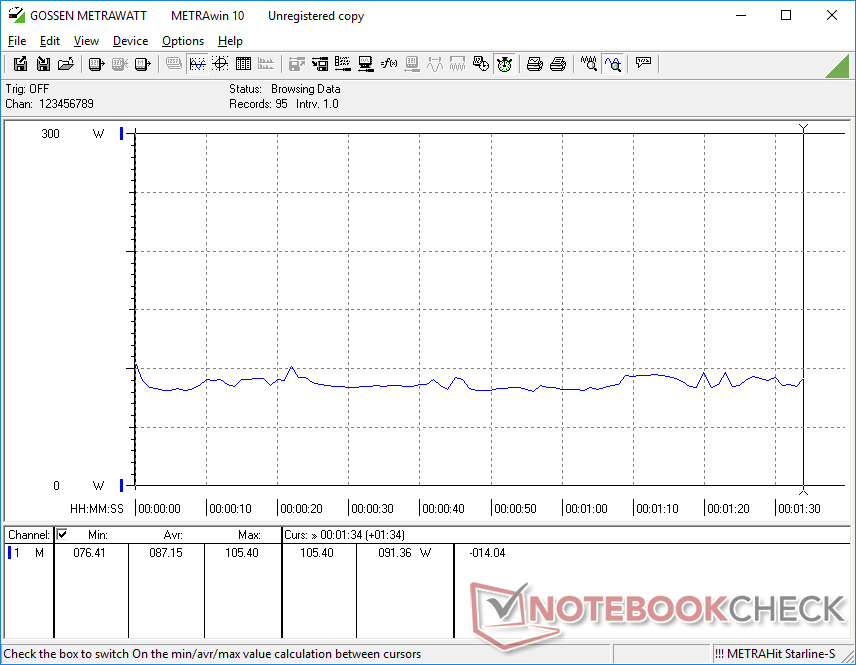
Hemos podido registrar un consumo máximo temporal de 275 W en el gran adaptador de CA de 300 W (~19,9 x 9,8 x 2,6 cm) cuando tanto la CPU como la GPU están al 100% de utilización. El sistema puede cargar a un ritmo razonable y ejecutar cargas exigentes simultáneamente.
| Off / Standby | |
| Ocioso | |
| Carga |
|
Clave:
min: | |
| Lenovo Legion 5 Pro 16ARH7H RTX 3070 Ti R7 6800H, GeForce RTX 3070 Ti Laptop GPU, Samsung PM9A1 MZVL21T0HCLR, IPS, 2560x1600, 16" | Lenovo Legion 5 Pro 16IAH7H i7-12700H, GeForce RTX 3060 Laptop GPU, 2x Samsung PM9A1 MZVL21T0HCLR (RAID 0), IPS, 2560x1600, 16" | Asus ROG Zephyrus M16 GU603H i9-11900H, GeForce RTX 3070 Laptop GPU, Samsung PM9A1 MZVL22T0HBLB, IPS, 2560x1600, 16" | Lenovo Legion 7 16ARHA7 R9 6900HX, Radeon RX 6850M XT, Samsung PM9A1 MZVL22T0HBLB, IPS, 2560x1600, 16" | HP Victus 16-e0145ng R5 5600H, GeForce RTX 3050 Ti Laptop GPU, Samsung SSD PM981a MZVLB512HBJQ, IPS, 1920x1080, 16.1" | Dell G16 7620 i7-12700H, GeForce RTX 3060 Laptop GPU, WDC PC SN810 512GB, IPS, 2560x1600, 16" | |
|---|---|---|---|---|---|---|
| Power Consumption | -50% | 2% | -5% | 33% | -4% | |
| Idle Minimum * (Watt) | 9.7 | 22.8 -135% | 11 -13% | 9.9 -2% | 7 28% | 14.4 -48% |
| Idle Average * (Watt) | 14.8 | 26.5 -79% | 20 -35% | 22 -49% | 9 39% | 17.8 -20% |
| Idle Maximum * (Watt) | 45.8 | 41 10% | 30 34% | 23.1 50% | 15 67% | 31.5 31% |
| Load Average * (Watt) | 87.2 | 191 -119% | 111 -27% | 94.4 -8% | 93 -7% | 101.2 -16% |
| Witcher 3 ultra * (Watt) | 209 | 194.7 7% | 156 25% | 249 -19% | 134.5 36% | 176.9 15% |
| Load Maximum * (Watt) | 275.3 | 238 14% | 197 28% | 276 -0% | 185 33% | 242.9 12% |
* ... más pequeño es mejor
Power Consumption Witcher 3 / Stresstest
Power Consumption external Monitor
Duración de la batería - No está mal
El tiempo de funcionamiento de la WLAN es casi una hora más largo que en la versión Intel del Legion 5 Pro 16 cuando se configura el perfil de energía equilibrado con la iGPU activa. La mejora en la duración de la batería se debe probablemente a que la CPU AMD es más eficiente cuando se ejecuta con menos cargas, como se muestra en nuestra sección de consumo de energía más arriba. No obstante, sigue siendo relativamente corta con algo menos de 4,5 horas comparado con las casi 8 horas del Asus ROG Zephyrus M16.
La carga de vacío a plena capacidad tarda poco menos de una hora cuando la función de carga rápida está activada. La mayoría de los otros portátiles tardan entre 1,5 y 2 horas.
| Lenovo Legion 5 Pro 16ARH7H RTX 3070 Ti R7 6800H, GeForce RTX 3070 Ti Laptop GPU, 80 Wh | Lenovo Legion 5 Pro 16IAH7H i7-12700H, GeForce RTX 3060 Laptop GPU, 80 Wh | Asus ROG Zephyrus M16 GU603H i9-11900H, GeForce RTX 3070 Laptop GPU, 90 Wh | Lenovo Legion 7 16ARHA7 R9 6900HX, Radeon RX 6850M XT, 99 Wh | HP Victus 16-e0145ng R5 5600H, GeForce RTX 3050 Ti Laptop GPU, 70 Wh | Dell G16 7620 i7-12700H, GeForce RTX 3060 Laptop GPU, 84 Wh | |
|---|---|---|---|---|---|---|
| Duración de Batería | -18% | 75% | 66% | 61% | 14% | |
| WiFi v1.3 (h) | 4.4 | 3.6 -18% | 7.7 75% | 7.3 66% | 7.1 61% | 5 14% |
| H.264 (h) | 4.1 | |||||
| Witcher 3 ultra (h) | 2.1 | |||||
| Load (h) | 0.6 | 1.6 | 1.8 | 0.7 | ||
| Reader / Idle (h) | 13.3 | 4.9 | 7.1 |
Pro
Contra
Veredicto - Sólo un poco más rápido
El Ryzen 7 6800H y el GeForce RTX 3070 Ti de 150 W son cada uno un 10 por ciento más rápido que el Ryzen 7 5800H y el GeForce RTX 3070 de 140 W del año pasado Legion 5 Pro. La actualización de 2022 es, por tanto, una mera actualización menor sobre el modelo de 2021 sin grandes cambios externos o internos.
Si ya tienes el Lenovo Legion 5 Pro 16 de 2021, no te pierdes mucho por saltarte la versión de 2022. Es probable que Lenovo renueve completamente la serie en los próximos uno o dos años para introducir más mejoras importantes.
Las alternativas más cercanas al Legion 5 Pro 16 en este momento son el Dell G16 y el Asus ROG Zephyrus M16 cada uno con una frecuencia de refresco similar de 165 Hz y opciones de CPU de la serie H. El modelo Asus es significativamente más pequeño y ligero, pero funciona aún más caliente y es igual de ruidoso. Mientras tanto, el modelo de Dell es más silencioso, pero su tamaño y las temperaturas del núcleo son ligeramente más cálidos y pesados que el ya cálido y pesado Lenovo.
Para futuras revisiones, nos gustaría ver temperaturas de núcleo más frías y un software más sencillo para controlar el rendimiento. En la versión actual de Vantage, los usuarios deben habilitar cuatro configuraciones separadas individualmente (MUX, GPU Overclock, Rendimiento Vantage, y modos de Rendimiento Windows) para explotar completamente la potencia del portátil, lo que puede resultar molesto al cambiar entre diferentes modos de energía.
Precio y disponibilidad
Lenovo Legion 5 Pro 16ARH7H RTX 3070 Ti
- 10/29/2022 v7 (old)
Allen Ngo
Price comparison

