Análisis del portátil HP Omen 16: Potente portátil para juegos con RTX 3070 pero con inconvenientes innecesarios
El HP Omen 16 ha sido presentado recientemente este año. El antiguo Omen 15 todavía no ha visto un sucesor directo. En su lugar, HP ha equipado un chasis de 15,6 pulgadas con una pantalla de 16,1 pulgadas. Como resultado, los biseles son ahora más pequeños y hay pequeñas diferencias en la construcción de la carcasa. Comparado con el modelo del año pasado, también hay, por supuesto, mejoras en la CPU (Tiger Lake) y la GPU (RTX 3000)
Naturalmente, compararemos nuestro dispositivo de pruebas con su predecesor, el HP Omen 15 (Ryzen 4000 y RTX 2060)y su nuevo hermano, el HP Victus 16 (Ryzen 5000 y RTX 3060). Además, seleccionamos el equipo similar Lenovo Legion 5 Pro 16y el más caro Alienware x15 R1 y el MSI Katana GF66 11UG como dispositivos para nuestra comparación
Potential competitors in comparison
Valoración | Fecha | Modelo | Peso | Altura | Tamaño | Resolución | Precio |
|---|---|---|---|---|---|---|---|
| 86.6 % v7 (old) | 10/2021 | HP Omen 16-b0085ng i7-11800H, GeForce RTX 3070 Laptop GPU | 2.4 kg | 23 mm | 16.10" | 1920x1080 | |
| 82.8 % v7 (old) | 01/2021 | HP Omen 15-en0375ng R7 4800H, GeForce RTX 2060 Mobile | 2.2 kg | 23 mm | 15.60" | 1920x1080 | |
| 84.3 % v7 (old) | 09/2021 | HP Victus 16-e0179ng R7 5800H, GeForce RTX 3060 Laptop GPU | 2.5 kg | 23.5 mm | 16.10" | 1920x1080 | |
| 87.4 % v7 (old) | 08/2021 | Lenovo Legion 5 Pro 16ACH6H (82JQ001PGE) R7 5800H, GeForce RTX 3070 Laptop GPU | 2.6 kg | 26.85 mm | 16.00" | 2560x1600 | |
| 87.2 % v7 (old) | 09/2021 | Alienware x15 RTX 3070 P111F i7-11800H, GeForce RTX 3070 Laptop GPU | 2.4 kg | 15.9 mm | 15.60" | 2560x1440 | |
| 79.2 % v7 (old) | 09/2021 | MSI Katana GF66 11UG-220 i7-11800H, GeForce RTX 3070 Laptop GPU | 2.3 kg | 25 mm | 15.60" | 1920x1080 |
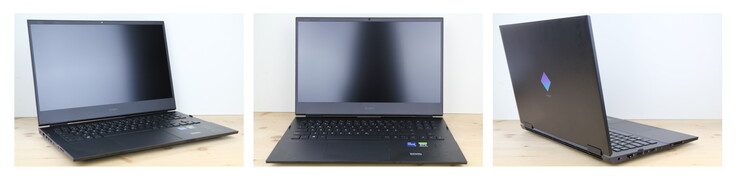
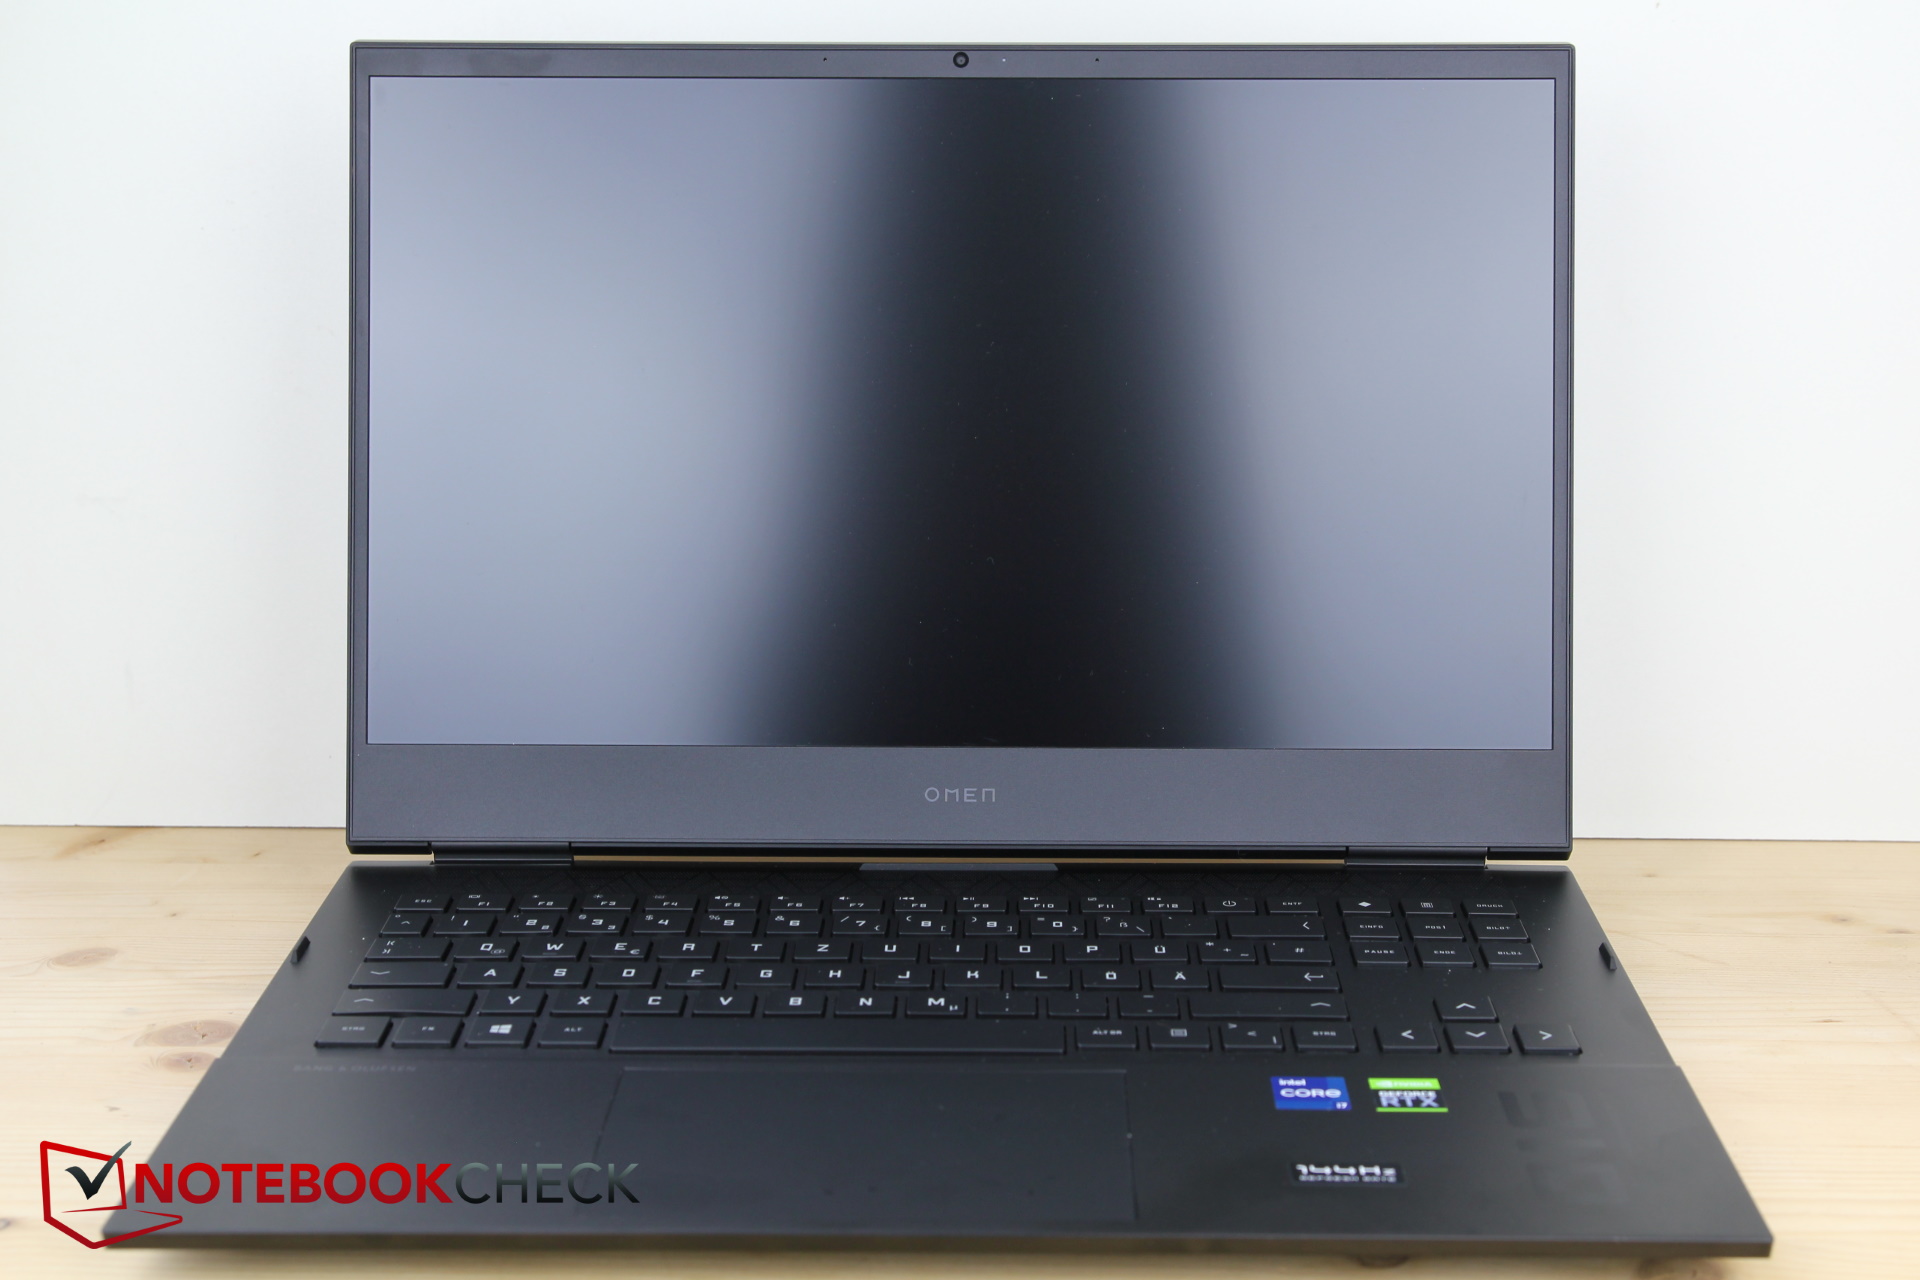
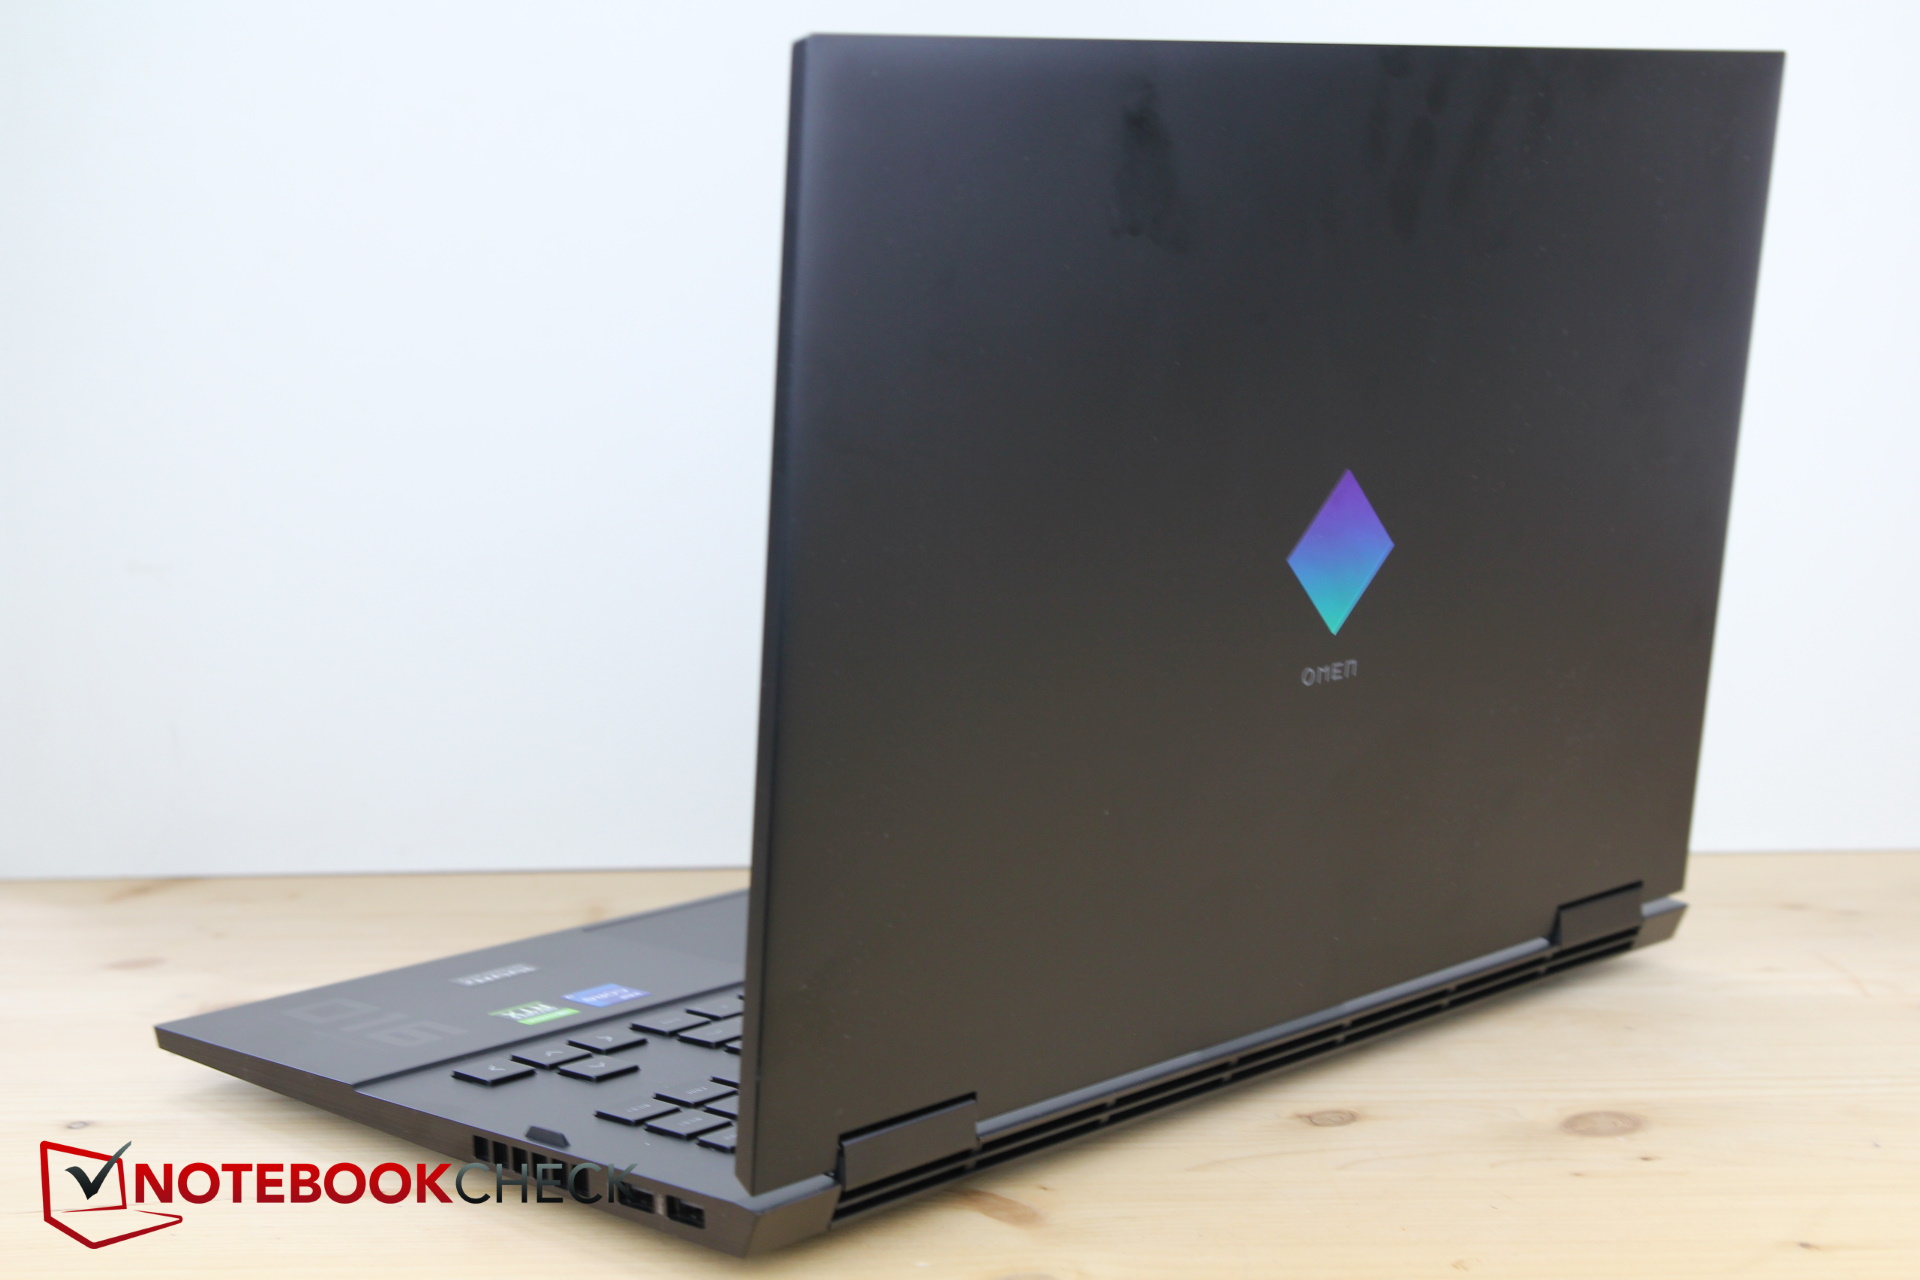
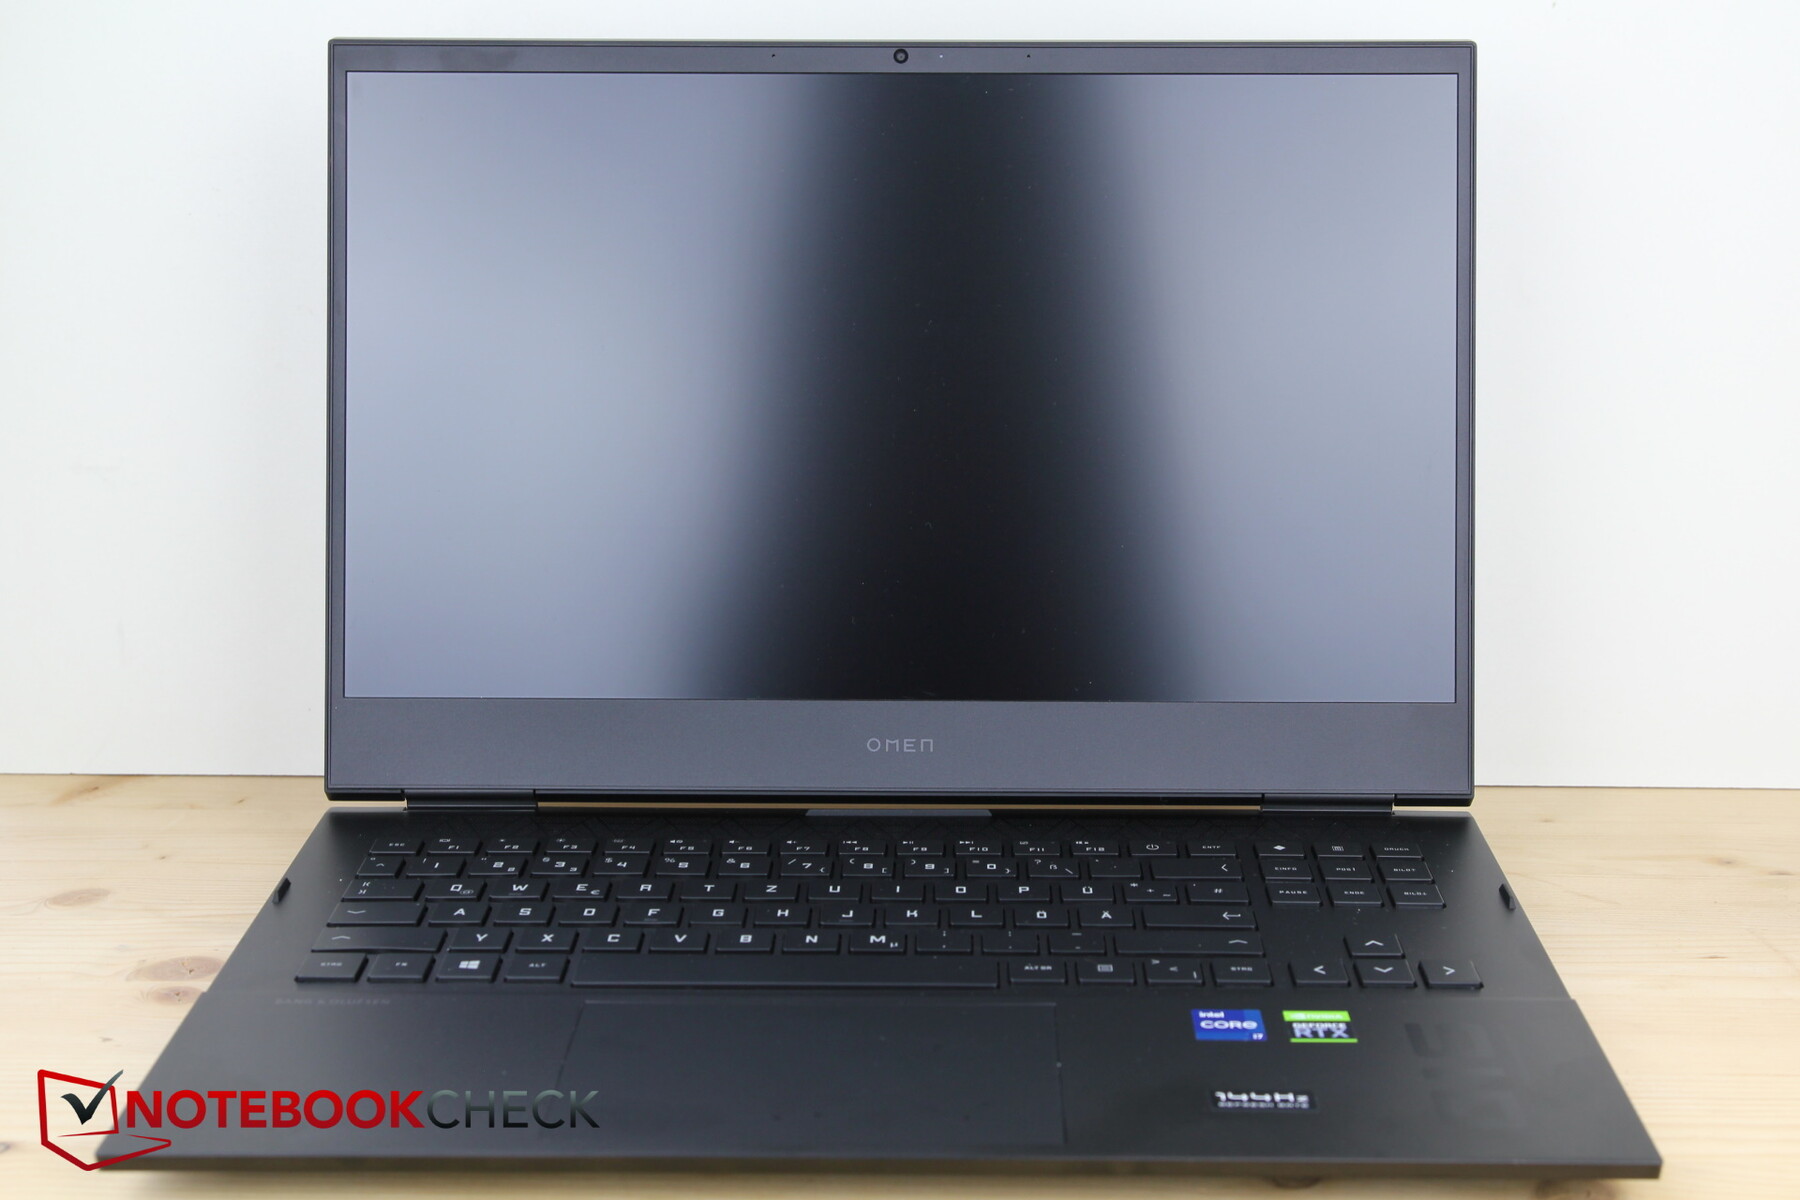
Chasis - Pequeñas actualizaciones del HP Omen
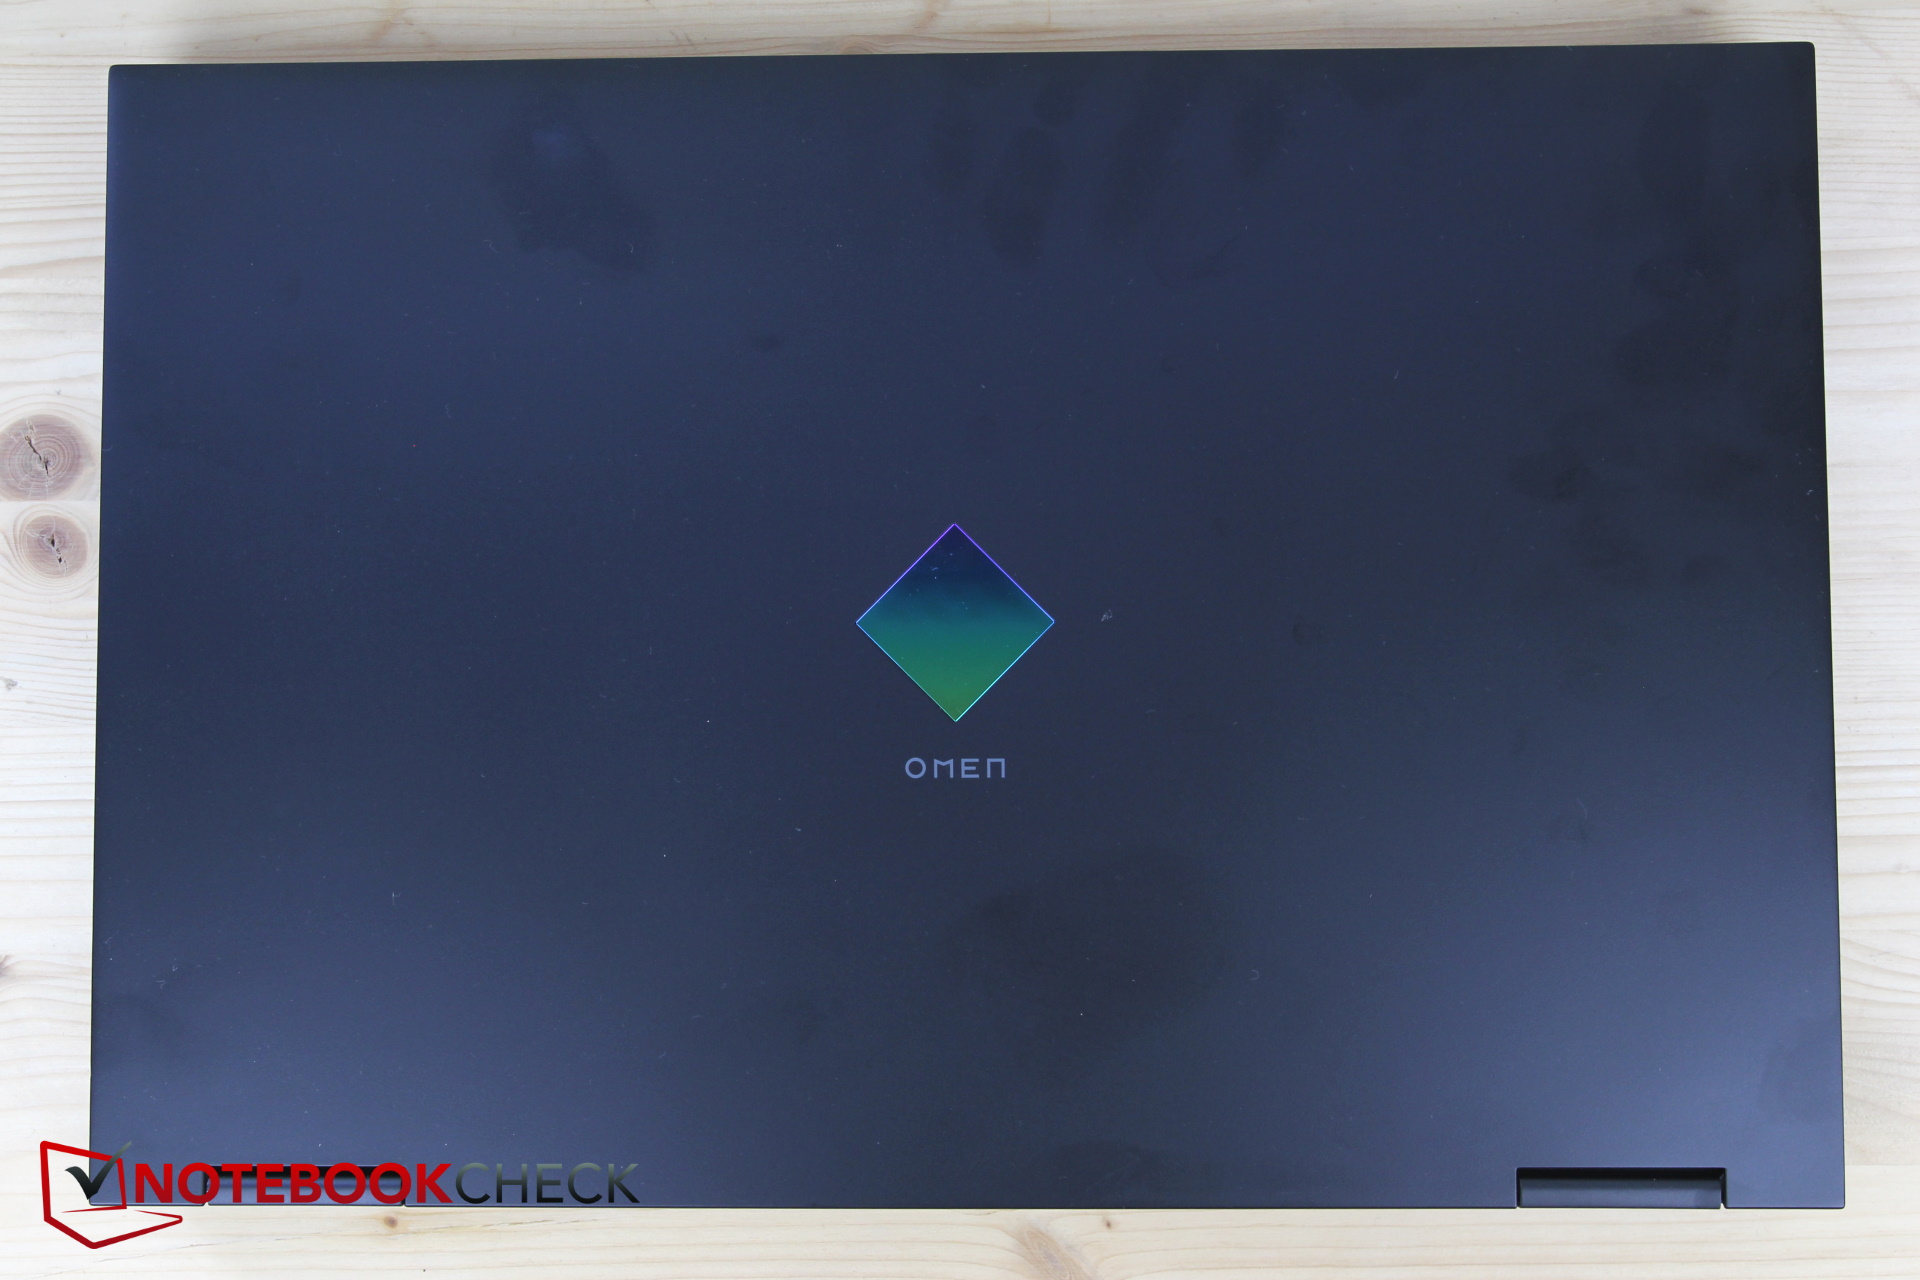
El chasis apenas difiere del modelo del año pasado. Las diferencias, por ejemplo, en los materiales, la disposición de los puertos o los cambios de diseño sólo se hacen evidentes al examinarlos más de cerca.
La base ahora consiste casi exclusivamente en metal ennegrecido y el marco de la pantalla es de plástico duro, mientras que los biseles son de plástico más blando que es un auténtico imán para las huellas dactilares. Aunque la base de metal cede ligeramente bajo pequeñas cantidades de presión y la pantalla es bastante susceptible de torcerse, lo que provoca un fuerte sangrado de luz en la pantalla IPS, en general da una impresión muy sólida.
Aunque la tapa se puede abrir con una sola mano, las dos bisagras podrían haber sido más firmes para evitar que se tambalee
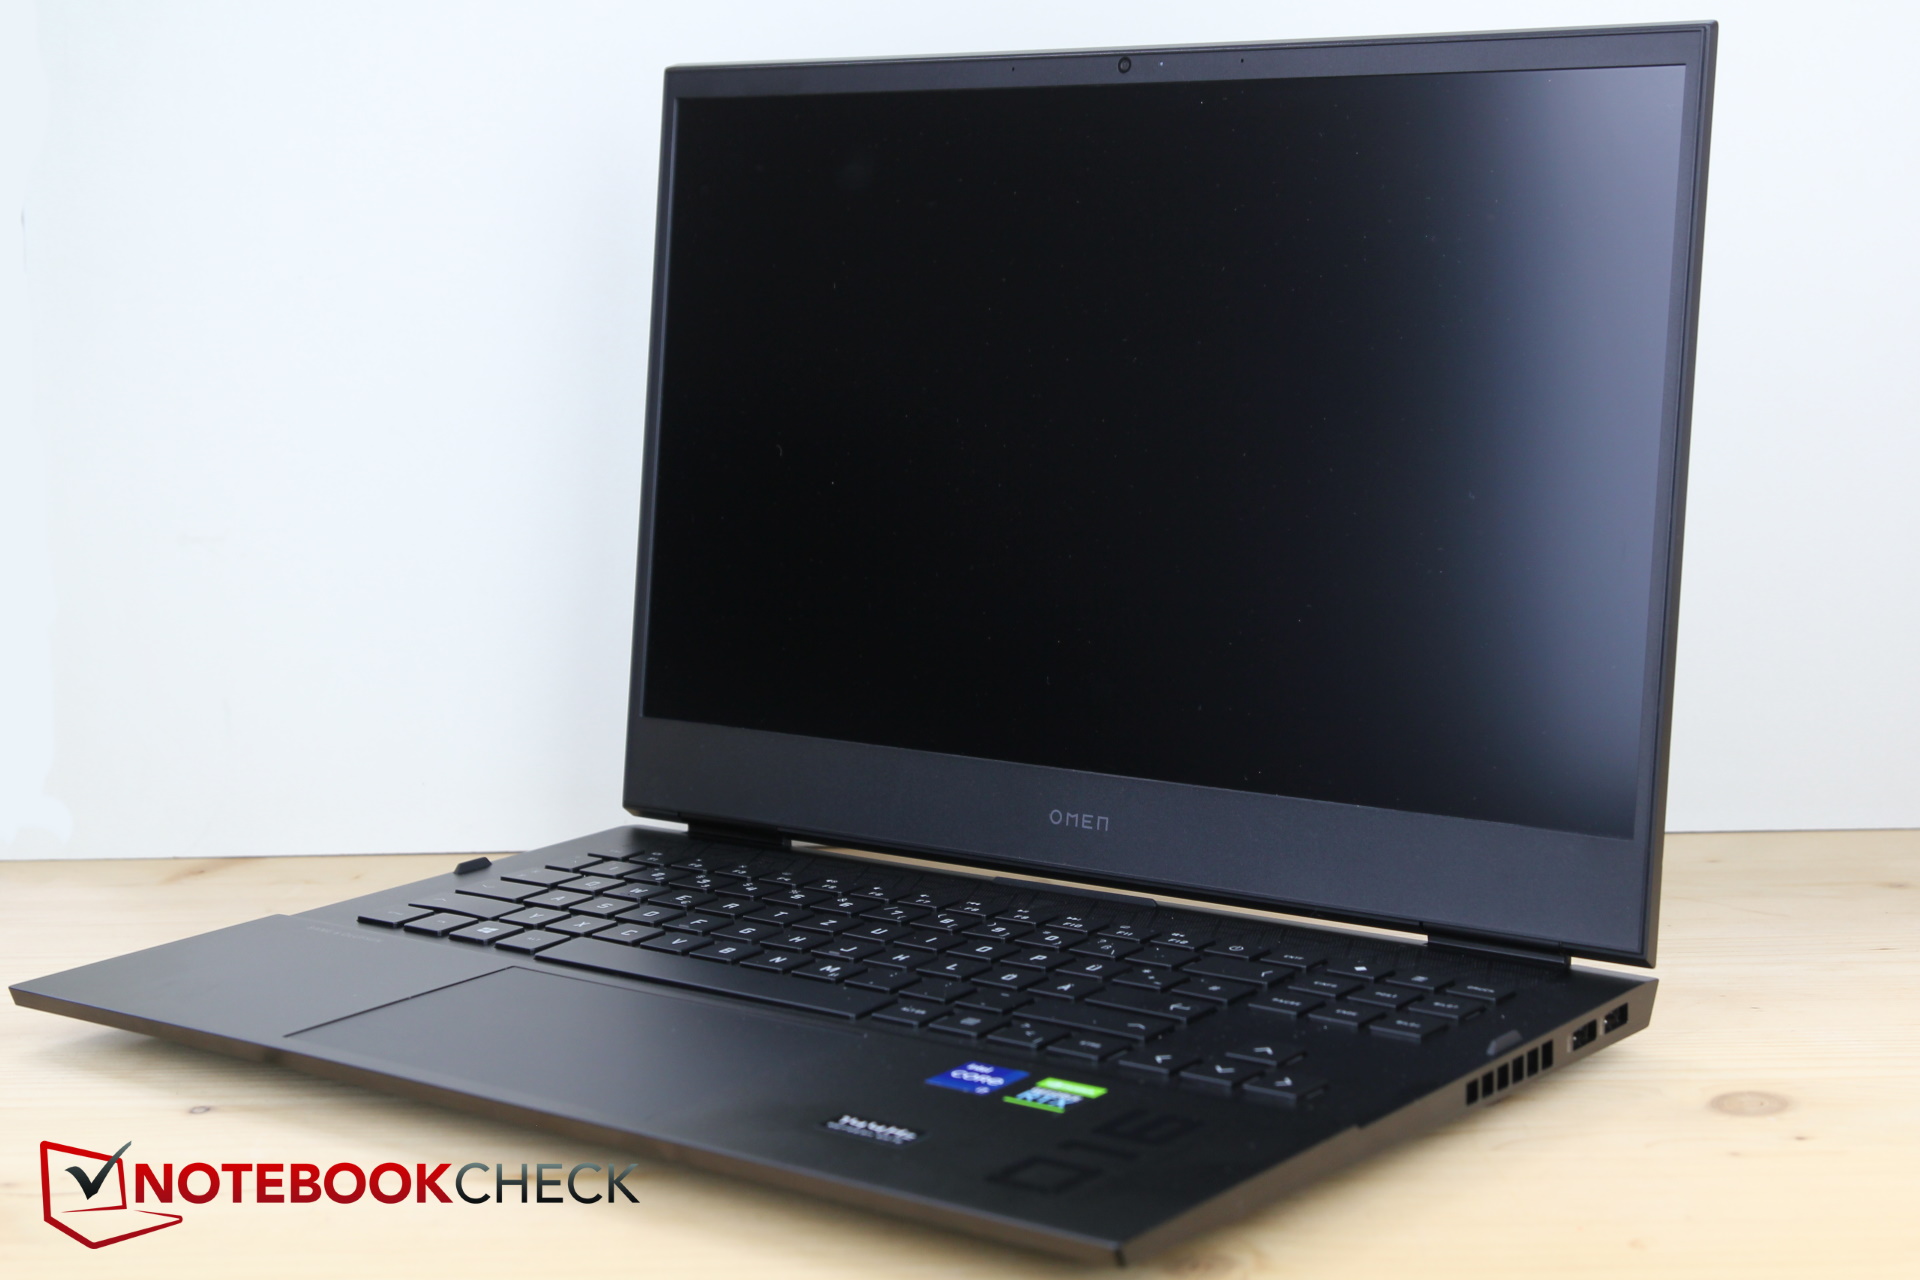
En comparación con la Omen 15, la Omen 16 es ligeramente más ancha y profunda. Aunque tiene aproximadamente la misma anchura, el HP Victus es más largo en profundidad por alrededor de 1 cm. Sin embargo, otros competidores de 15 pulgadas no son necesariamente más compactos. Mientras que el Omen 16 y el Victus 16 son más anchos que los modelos de 15 pulgadas, tanto el Legion 5 Pro como el Alienware son más largos en profundidad.
Por último, el Omen 16 ha ganado 200 g en comparación con el Omen 15, lo que sigue haciéndolo más ligero que la mayoría de los competidores
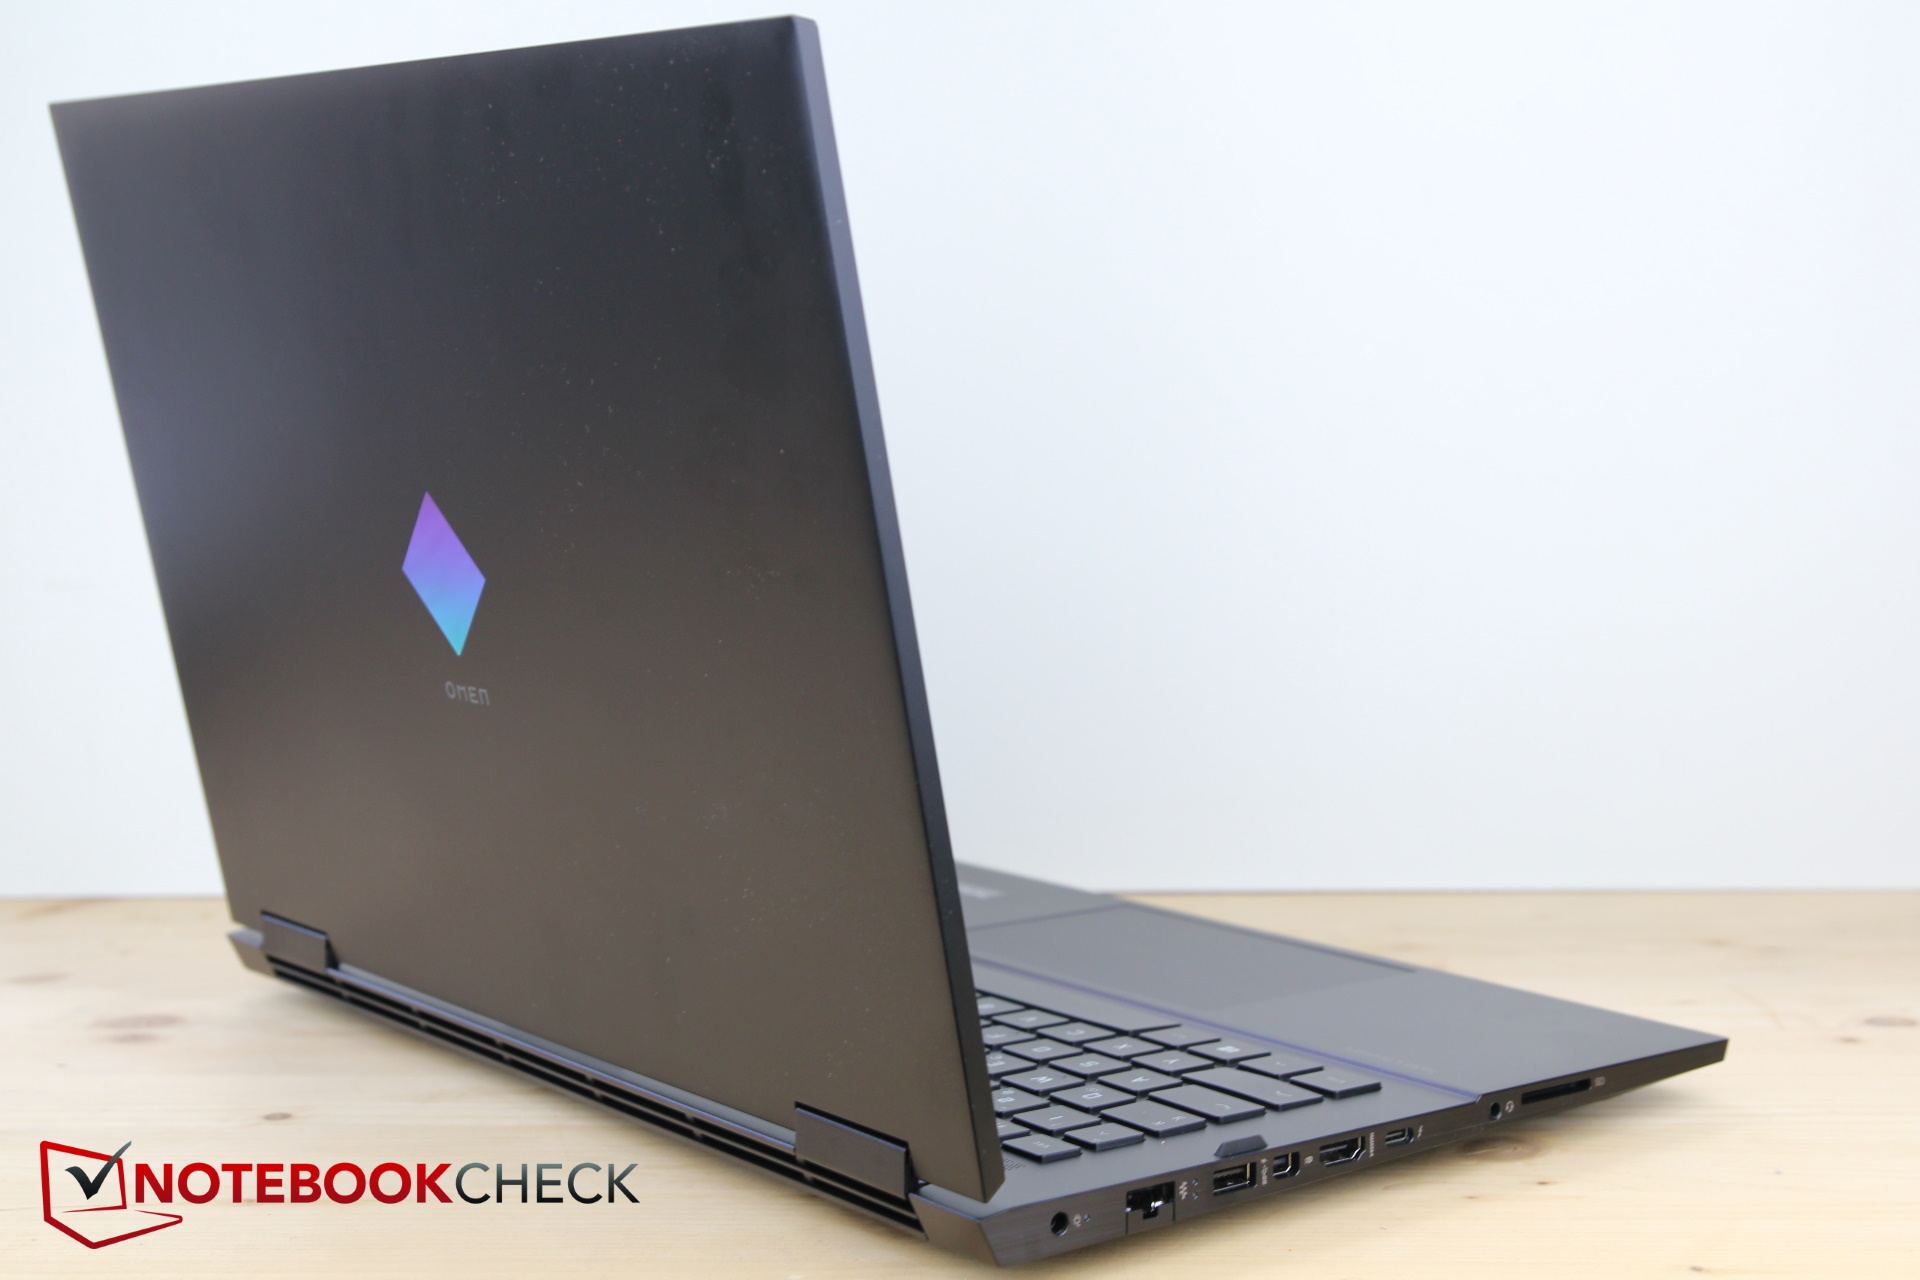
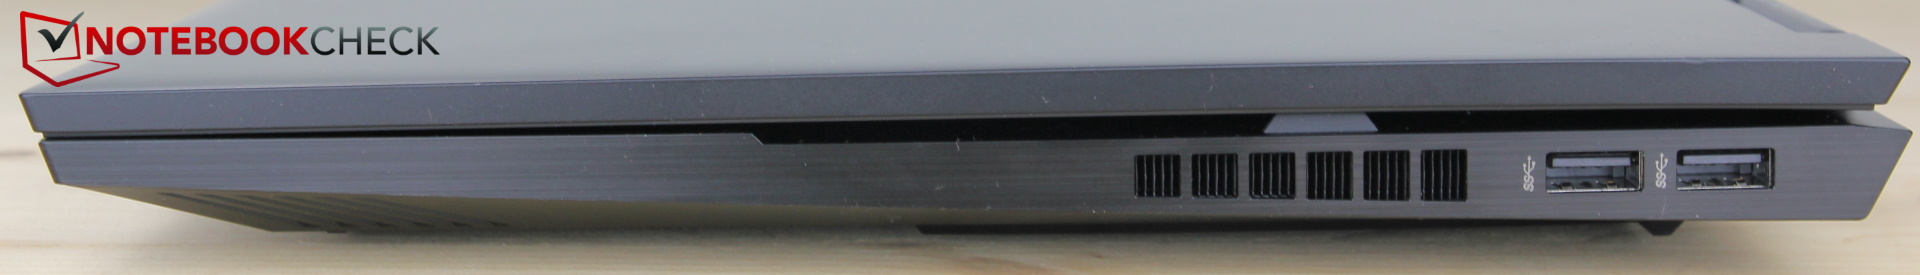
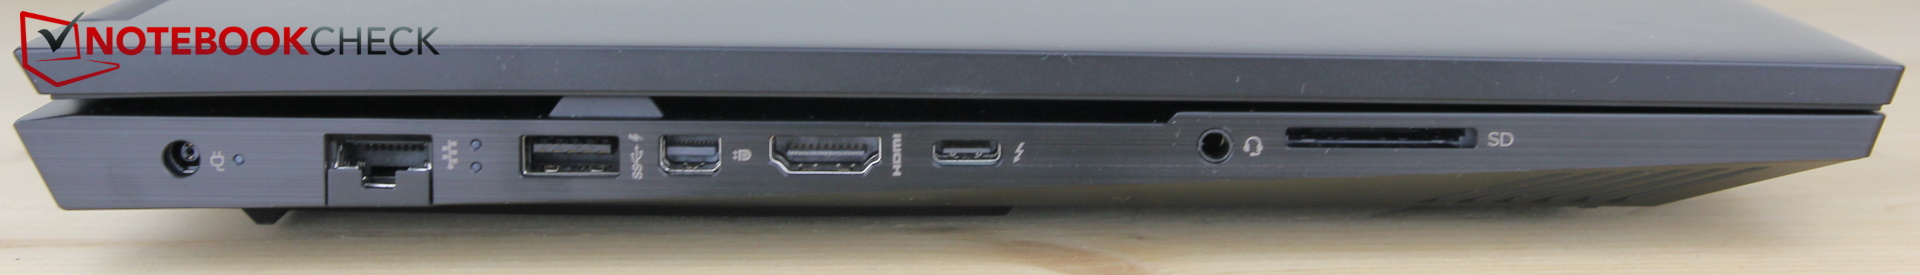
Conectividad - Thunderbolt 4, de lo contrario sólo USB 3.0
Aunque los usuarios diestros se alegrarán de saber que sólo hay dos puertos USB-A en la parte superior del lado derecho del chasis, hay tan poco espacio entre ellos que incluso una pequeña unidad flash USB deslizante no cabría junto a un cable de ratón USB aún más pequeño.
El resto de los puertos están ubicados a la izquierda y muy apretados también, lo que puede dar lugar a que los cables obstruyan las interfaces cercanas. Afortunadamente, la distribución (como miniDP junto a USB-A) debería contrarrestar en su mayor parte este problema. No hay puertos en la parte delantera o trasera.
El puerto USB 4 con Thunderbolt 4 y factor de forma tipo-C es un plus. Aunque los tres puertos USB-A restantes han sido etiquetados como "Superspeed" por HP, sólo soportan el estándar 3.0.
El lector de tarjetas con resorte acepta tarjetas SD de tamaño completo. Desaparecen casi por completo dentro de la carcasa y no sobresalen innecesariamente de ella
Lector de tarjetas SD
La transferencia del lector de tarjetas SD tiende a estar por debajo de la media. Copiar 1 GB de imágenes desde nuestra tarjeta de memoria de referencia AV PRO microSD 128 GB V60 al escritorio lleva casi 18 segundos. En promedio, los portátiles para juegos de nuestra base de datos están equipados con modelos significativamente más rápidos, con el Alienware más caro mostrando lo que es posible en términos de velocidades. En el otro extremo del espectro están el Lenovo y el MSI, que vienen sin lector de tarjetas SD
| SD Card Reader | |
| average JPG Copy Test (av. of 3 runs) | |
| Alienware x15 RTX 3070 P111F (AV Pro V60) | |
| Media de la clase Gaming (20.9 - 210, n=54, últimos 2 años) | |
| HP Victus 16-e0179ng (AV PRO microSD 128 GB V60) | |
| HP Omen 15-en0375ng (Toshiba Exceria Pro SDXC 64 GB UHS-II) | |
| HP Omen 16-b0085ng (AV PRO microSD 128 GB V60) | |
| maximum AS SSD Seq Read Test (1GB) | |
| Alienware x15 RTX 3070 P111F (AV Pro V60) | |
| Media de la clase Gaming (25.5 - 261, n=51, últimos 2 años) | |
| HP Omen 15-en0375ng (Toshiba Exceria Pro SDXC 64 GB UHS-II) | |
| HP Omen 16-b0085ng (AV PRO microSD 128 GB V60) | |
| HP Victus 16-e0179ng (AV PRO microSD 128 GB V60) | |
Comunicación
Además de la LAN de 1 Gbps, el Omen 16 también soporta Wi-Fi 6E a través de su módulo Intel AX210. Este último es capaz de alcanzar velocidades de Gigabit y sólo queda por debajo de nuestras expectativas por un pequeño margen
Cámara web
HP se ha decantado por una webcam de 720p. Con HP Wide Vision, la cámara capta un ángulo de 88 grados, lo que hace que se vea gran parte del entorno en lugar de que una persona llene la pantalla. Esto puede ser deseable o no para las videollamadas
Por lo demás, la calidad coincide con los bajos estándares del mercado, con una imagen relativamente granulada y colores desvaídos. El brillo automático actúa de forma extraña, sobreexponiendo inicialmente los rostros sólo para ajustar con dureza el perfil de brillo un momento después, lo que hace que los fondos en particular se vean demasiado oscuros

")
")
Seguridad
El Omen 16 carece de bloqueo Kensington y de sensor de huellas dactilares. Gracias a la CPU, el TPM 2.0 es por supuesto compatible
Accesorios y garantía
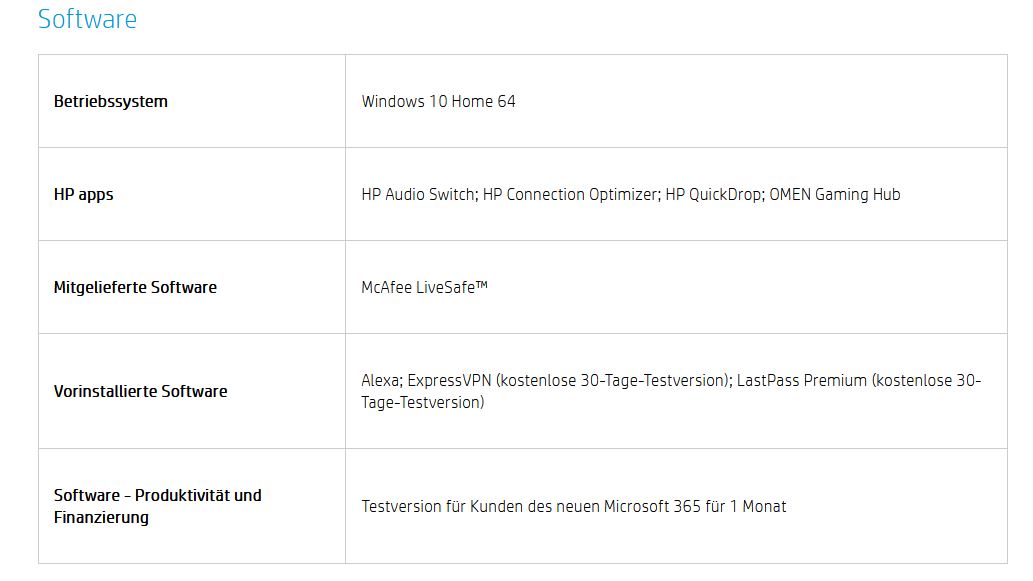
El paquete no contenía ningún accesorio adicional. El Omen 16 incluye innecesariamente versiones de prueba de software preinstaladas por defecto, como ExpressVPN (versión de prueba gratuita de 30 días), LastPass Premium (versión de prueba gratuita de 30 días) y una licencia de 1 mes para Microsoft 365. Los usuarios molestos por esto tendrán que instalar manualmente las aplicaciones
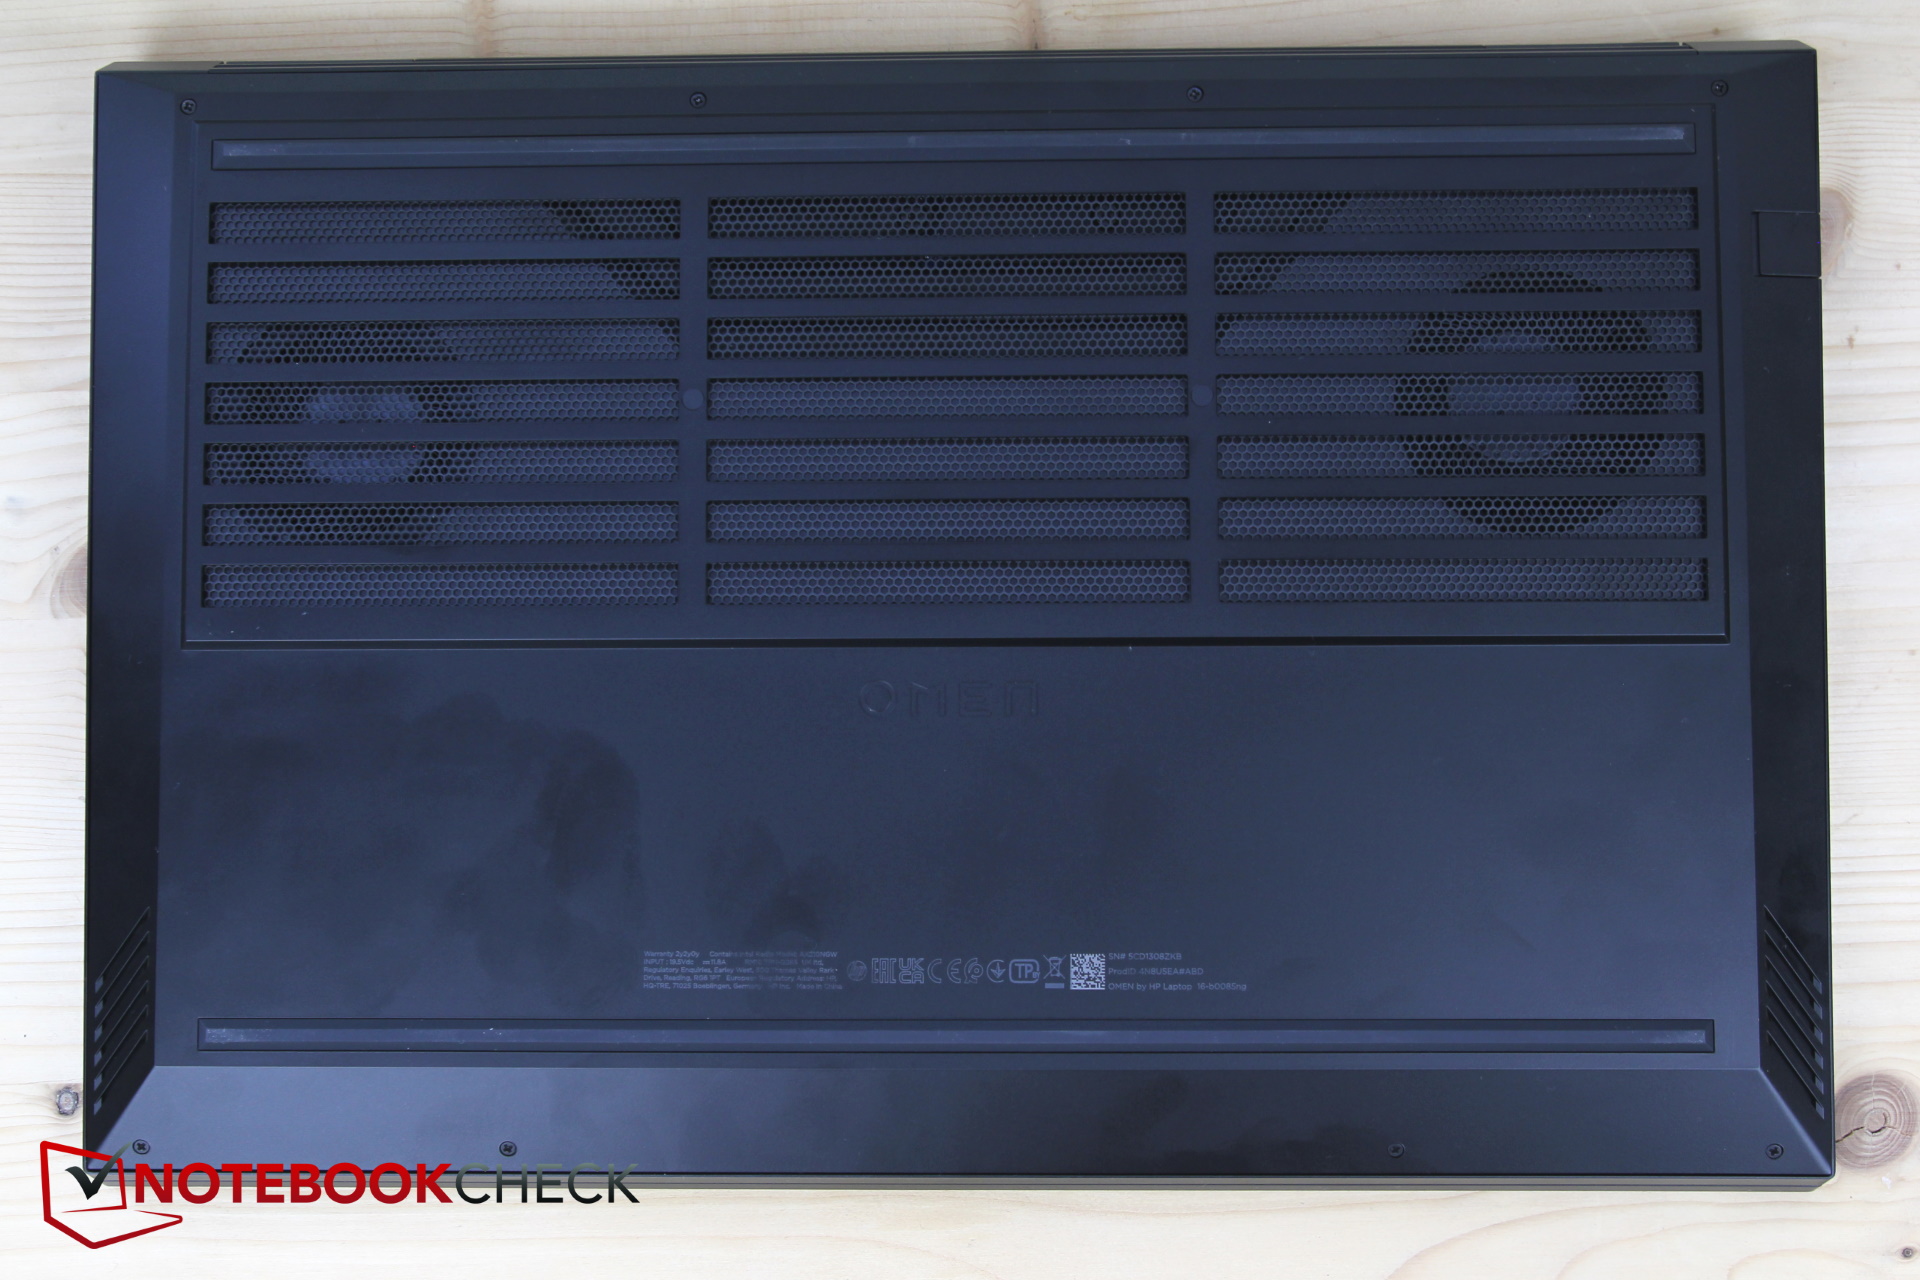
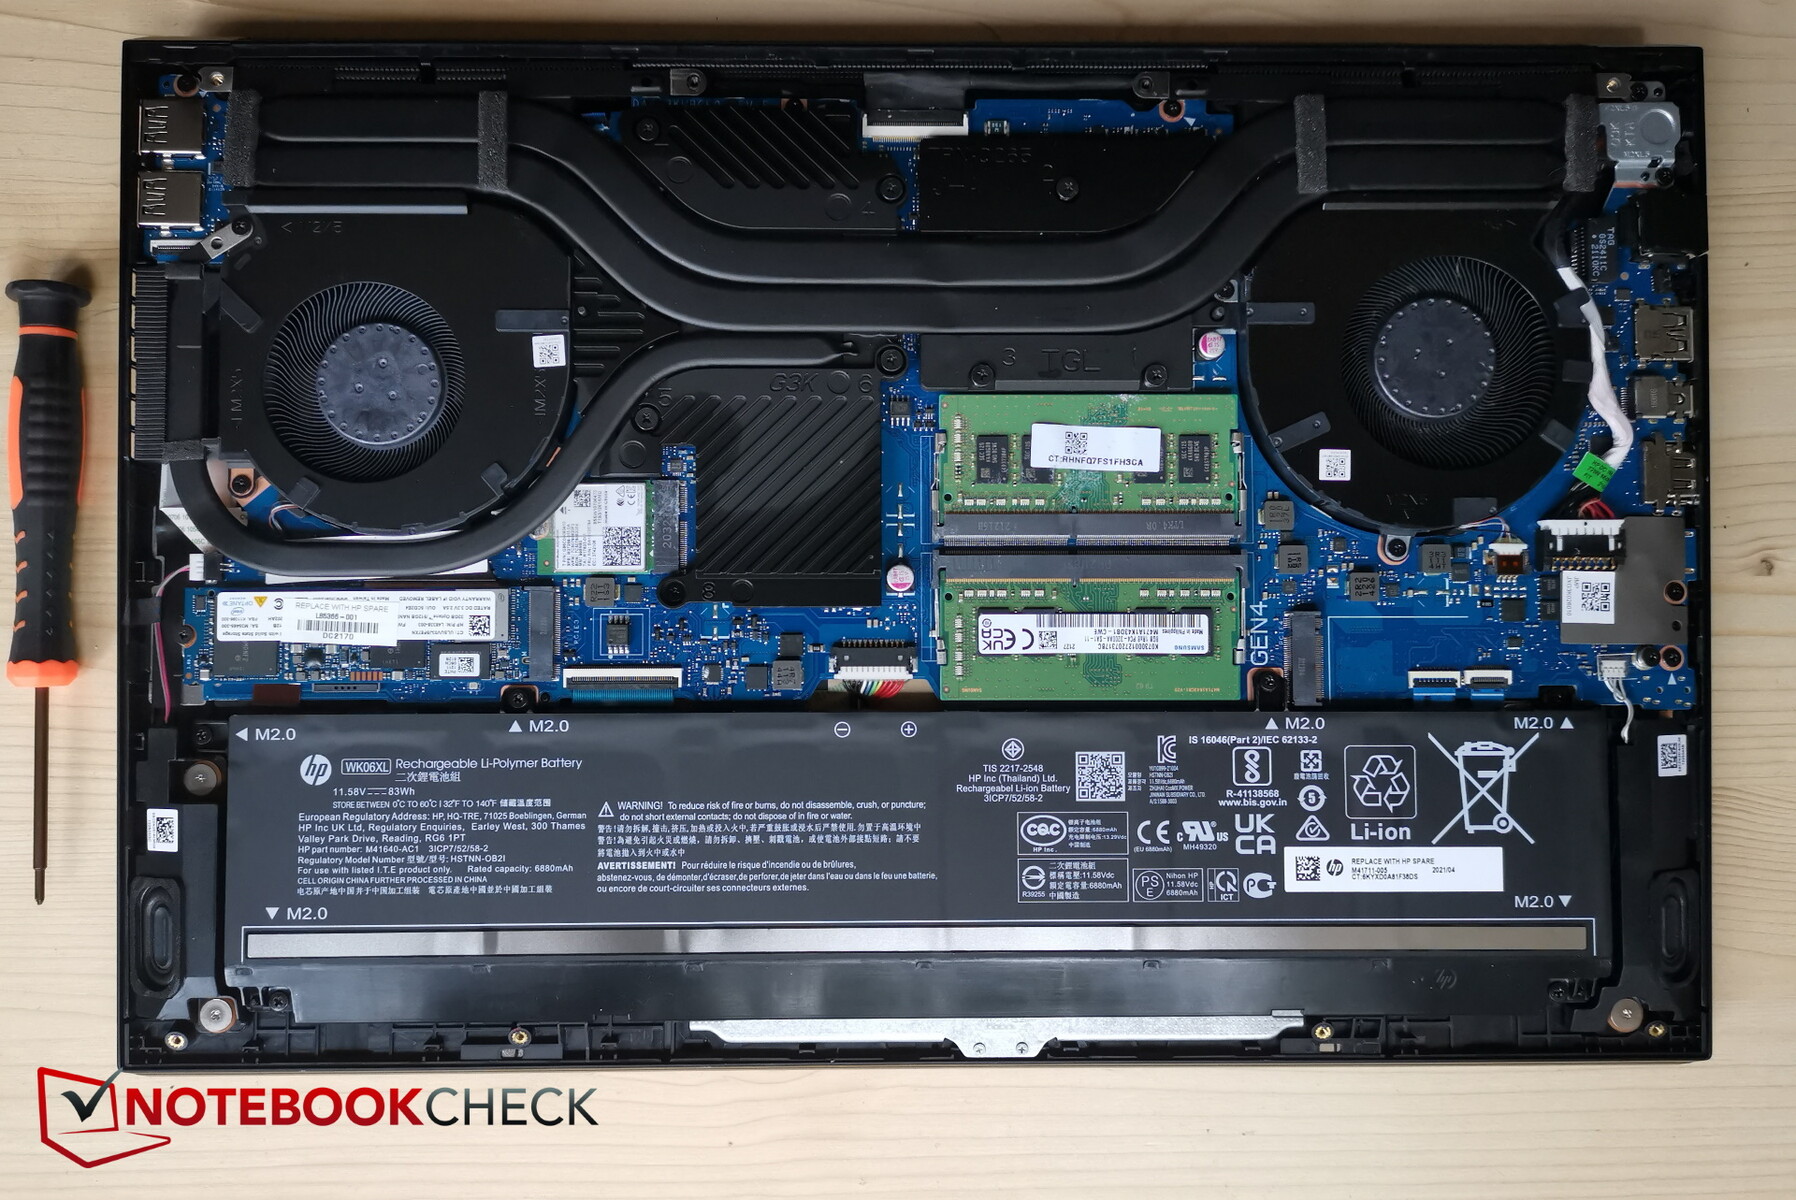
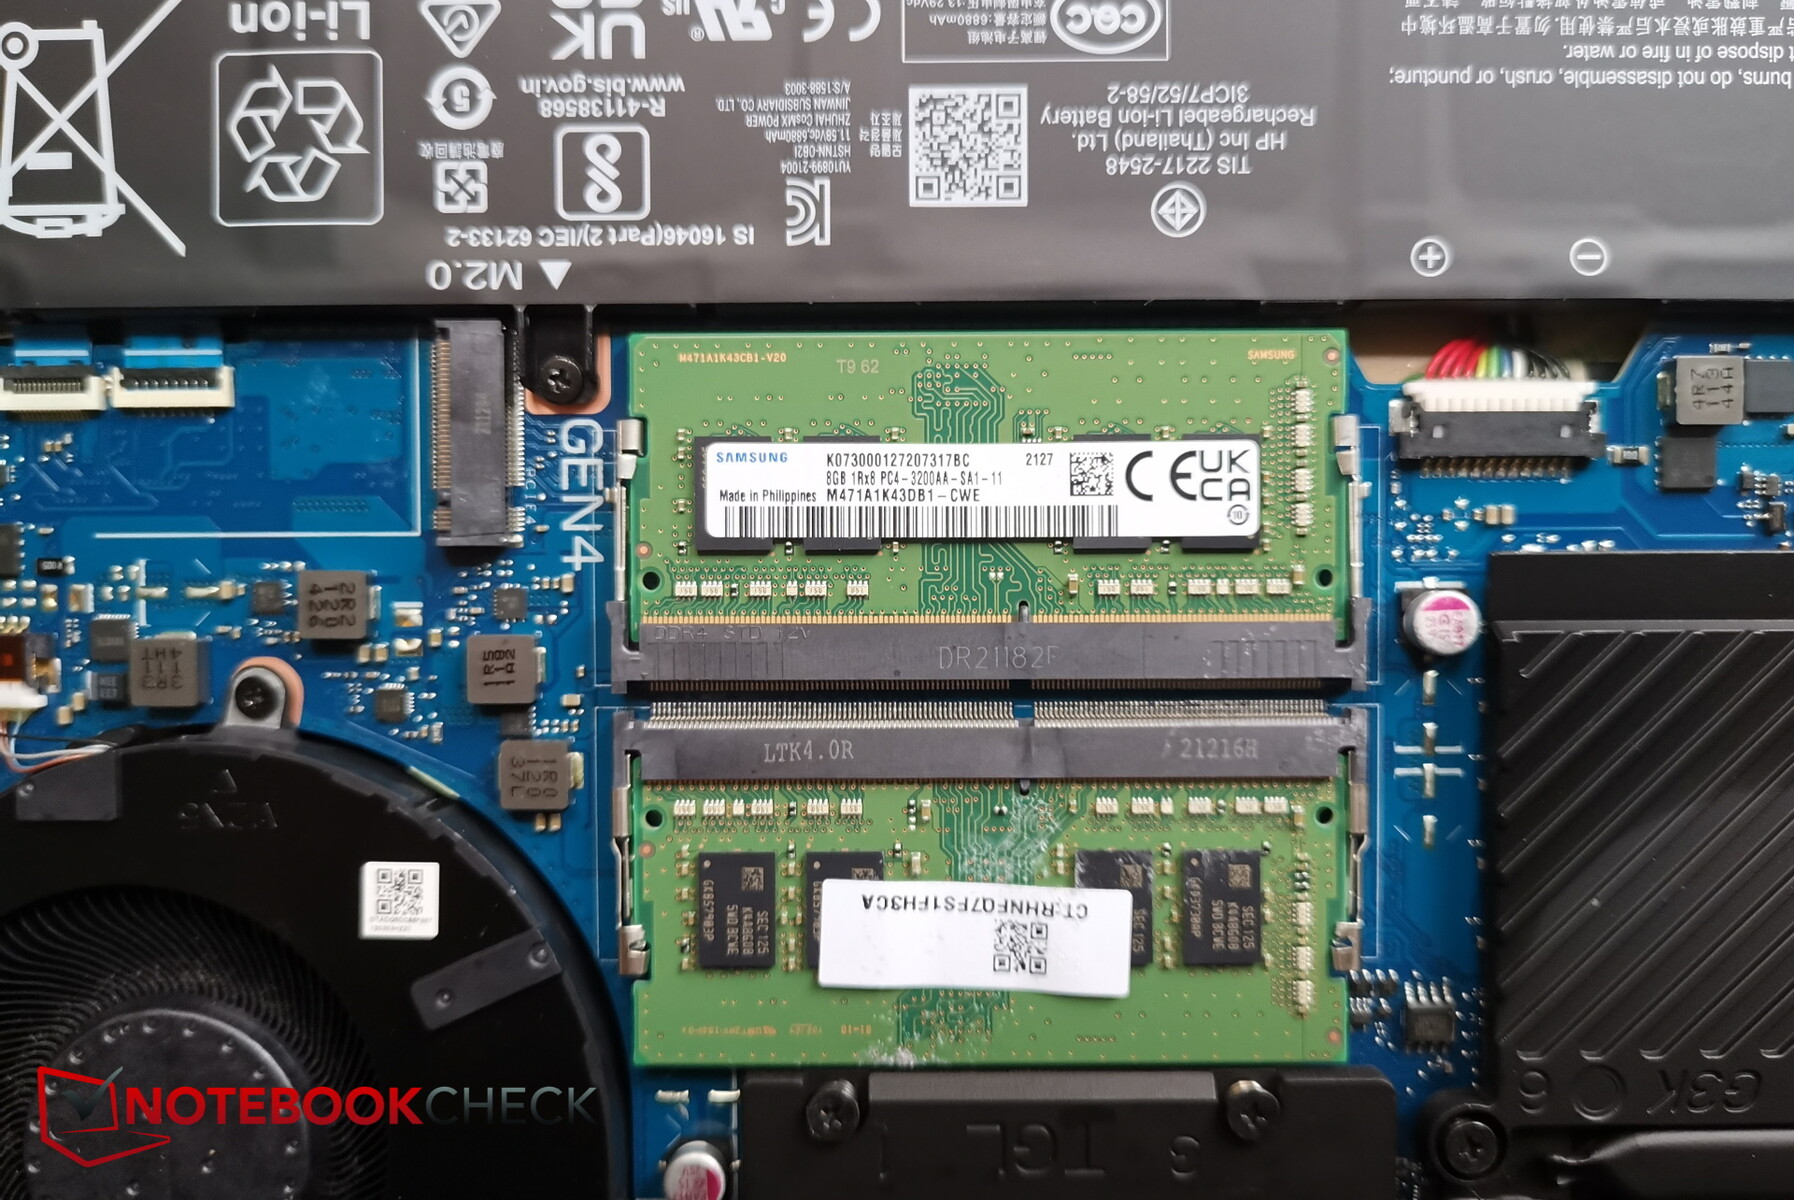
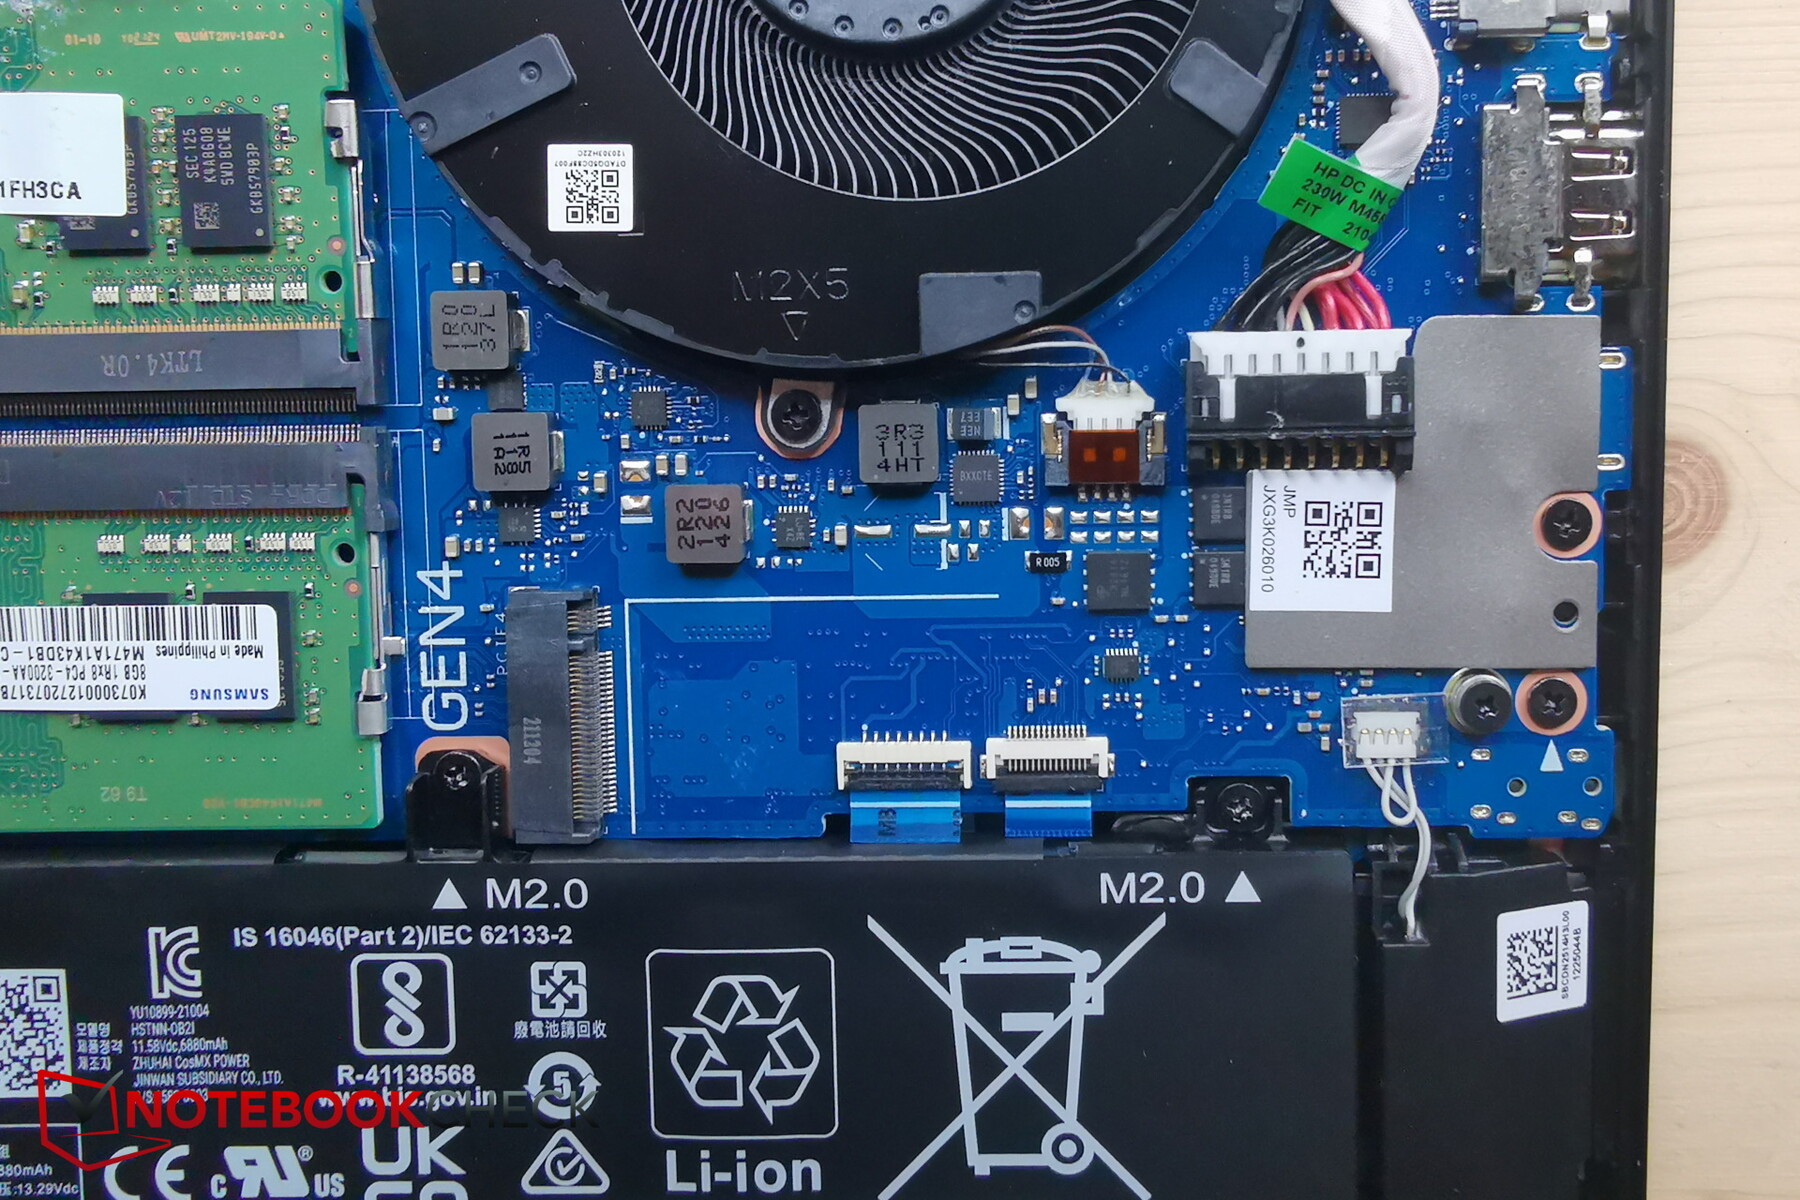
Mantenimiento
La placa inferior se fija con 8 tamaños diferentes de tornillos Phillips y varios clips. A pesar de los clips de plástico, la placa inferior puede quitarse sin herramientas - ¡genial! Posteriormente, los usuarios tienen acceso a los dos ventiladores, las ranuras de RAM, el módulo Wi-Fi (parcialmente cubierto por los heatpipes), la batería, el SSD y una ranura SSD adicional no ocupada
Garantía
HP ofrece una garantía de hardware limitada de 12 meses con 1 año de asistencia técnica limitada para el software y la configuración inicial. La garantía puede ampliarse con opciones como el soporte de hardware in situ, si se desea.
Dispositivos de entrada - Usuario a Touchpad, por favor responda!
Teclado
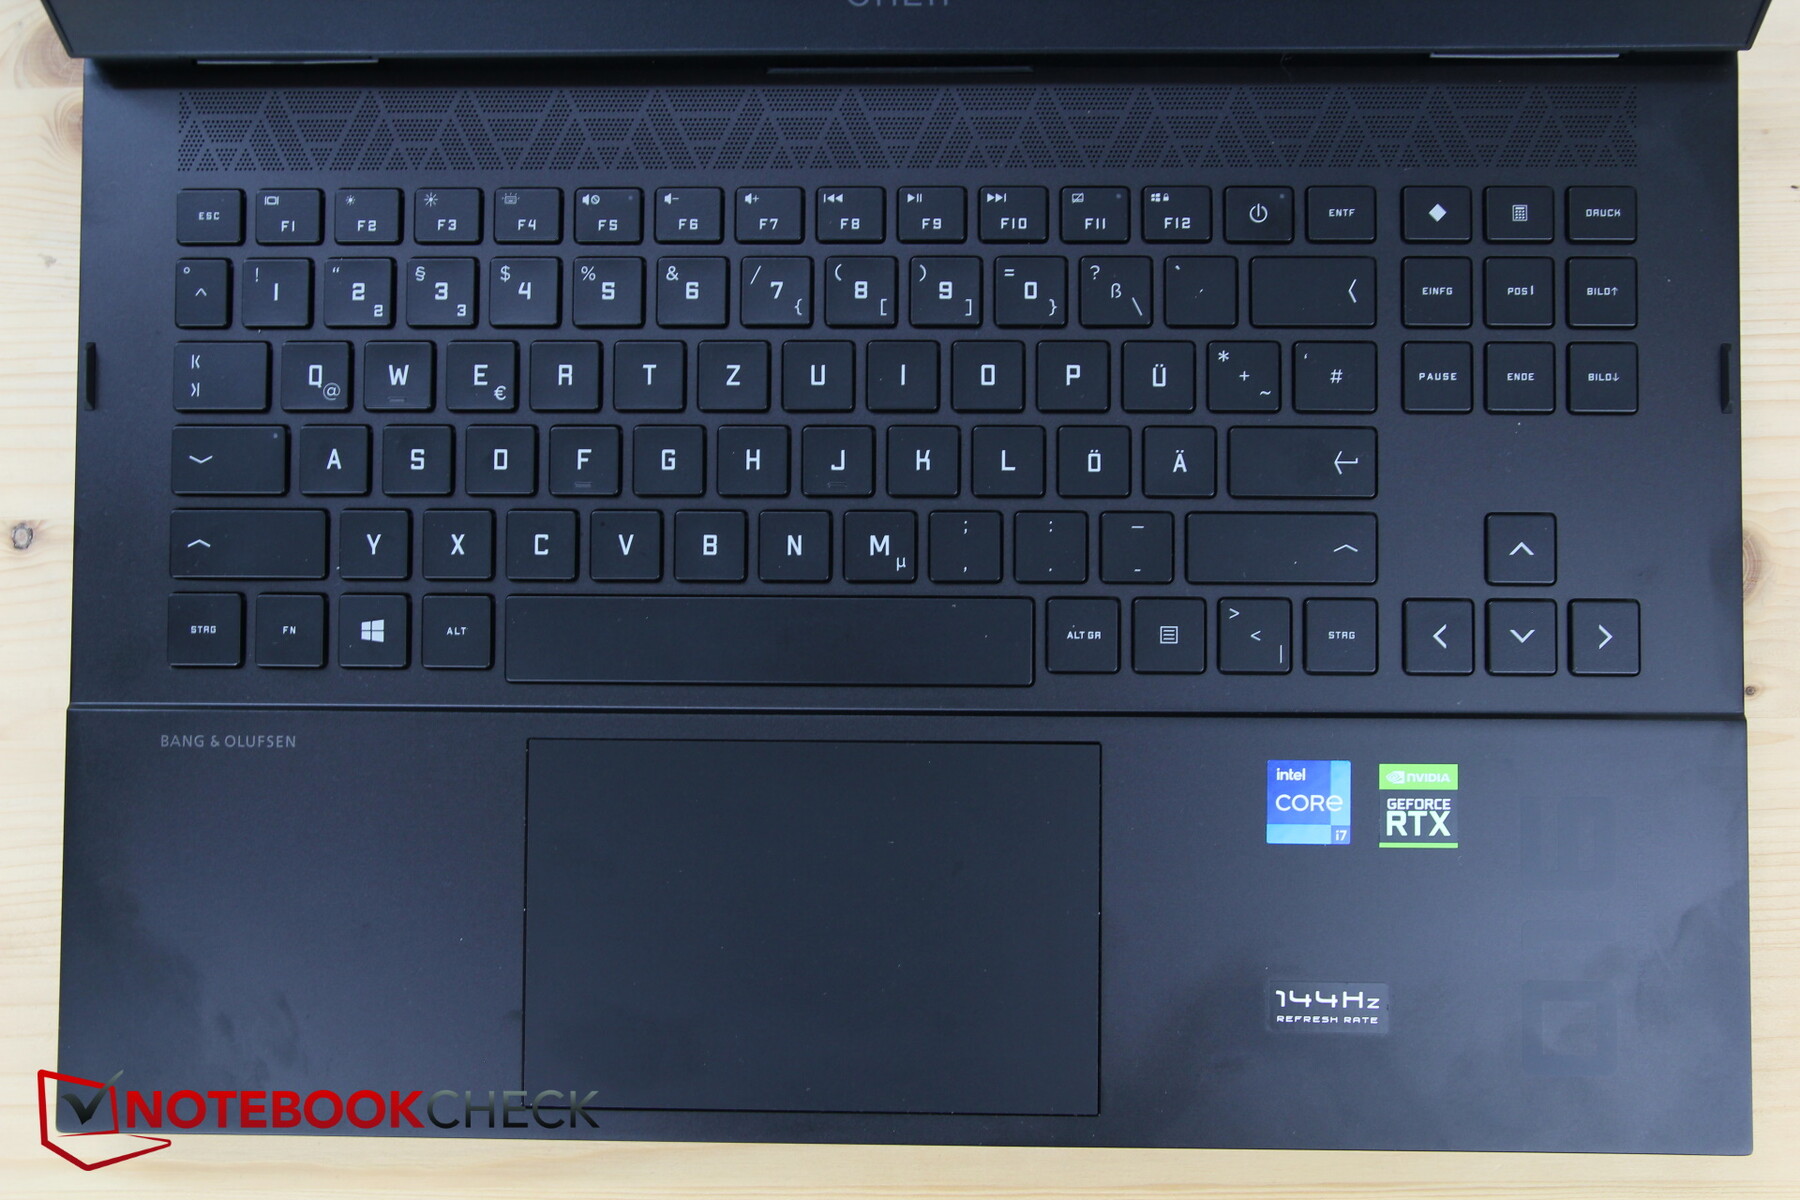
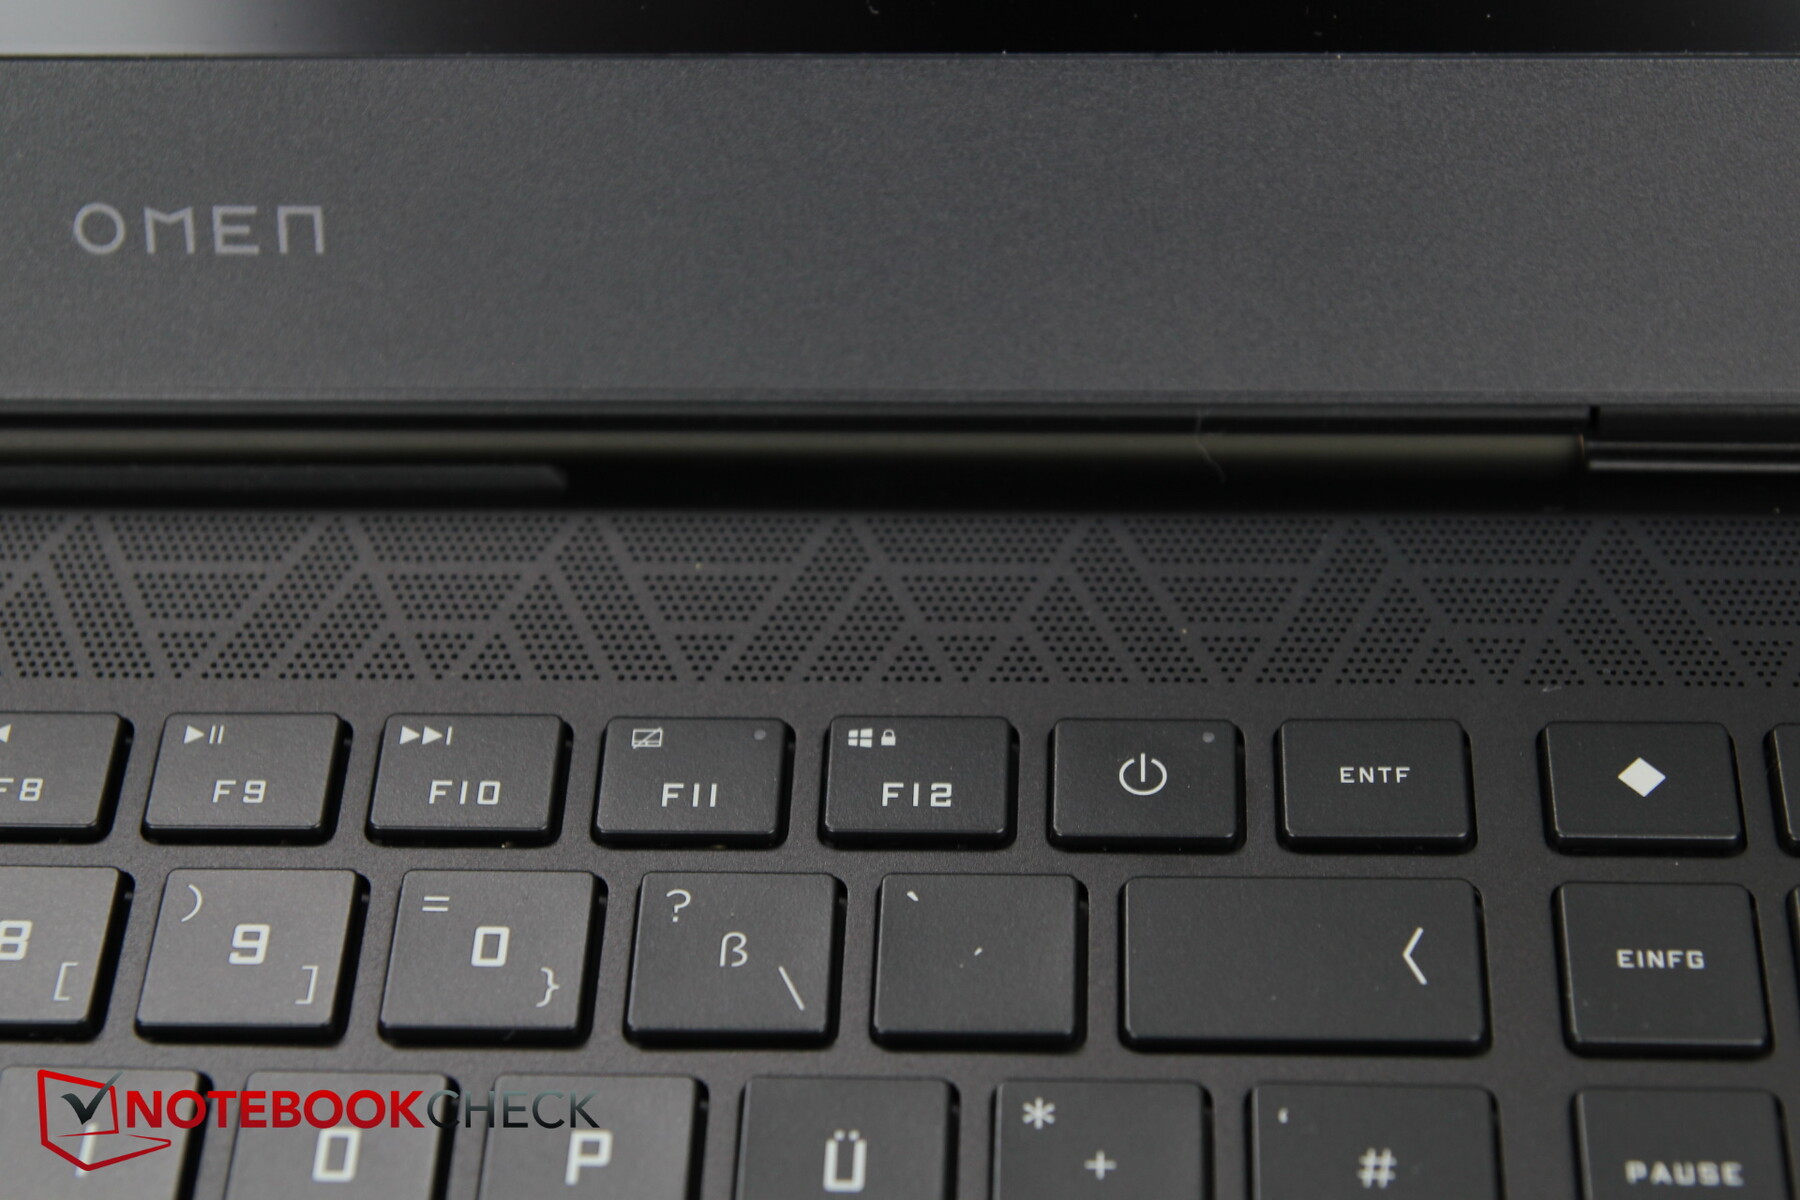
A diferencia del HP Victus 16, el Omen 16 no viene con un teclado numérico, lo que significa que hay más espacio para las flechas, pos1, fin, y otras teclas, así como la tecla dedicada a imprimir la pantalla en la parte superior derecha, que es muy conveniente para tomar capturas de pantalla. Por lo demás, la distribución del teclado parece muy organizada, lo que puede ser consecuencia del espacio disponible, y los símbolos de las teclas son fáciles de leer. Hay una tecla especial para lanzar el Omen Gaming Hub, donde se pueden ajustar los parámetros de rendimiento (ventiladores, perfil de rendimiento).
La ubicación del botón de encendido en la fila superior de teclas especiales entre las teclas F12 y Del no parece ser óptima, pero no causó ningún problema durante nuestras pruebas
Las teclas ofrecen un recorrido mediocre y una respuesta sólida. El punto de accionamiento distinto se alcanza muy rápidamente y el resto de la pulsación de las teclas se siente suave para un tecleo cómodo y rápido. El traqueteo de las teclas es moderado
HP ha instalado una retroiluminación RGB con cuatro zonas. En la práctica, hay tres zonas grandes con las teclas WASD que suelen usarse en los juegos como cuarta zona. Los colores se pueden personalizar a través del Gaming Hub.
Panel táctil
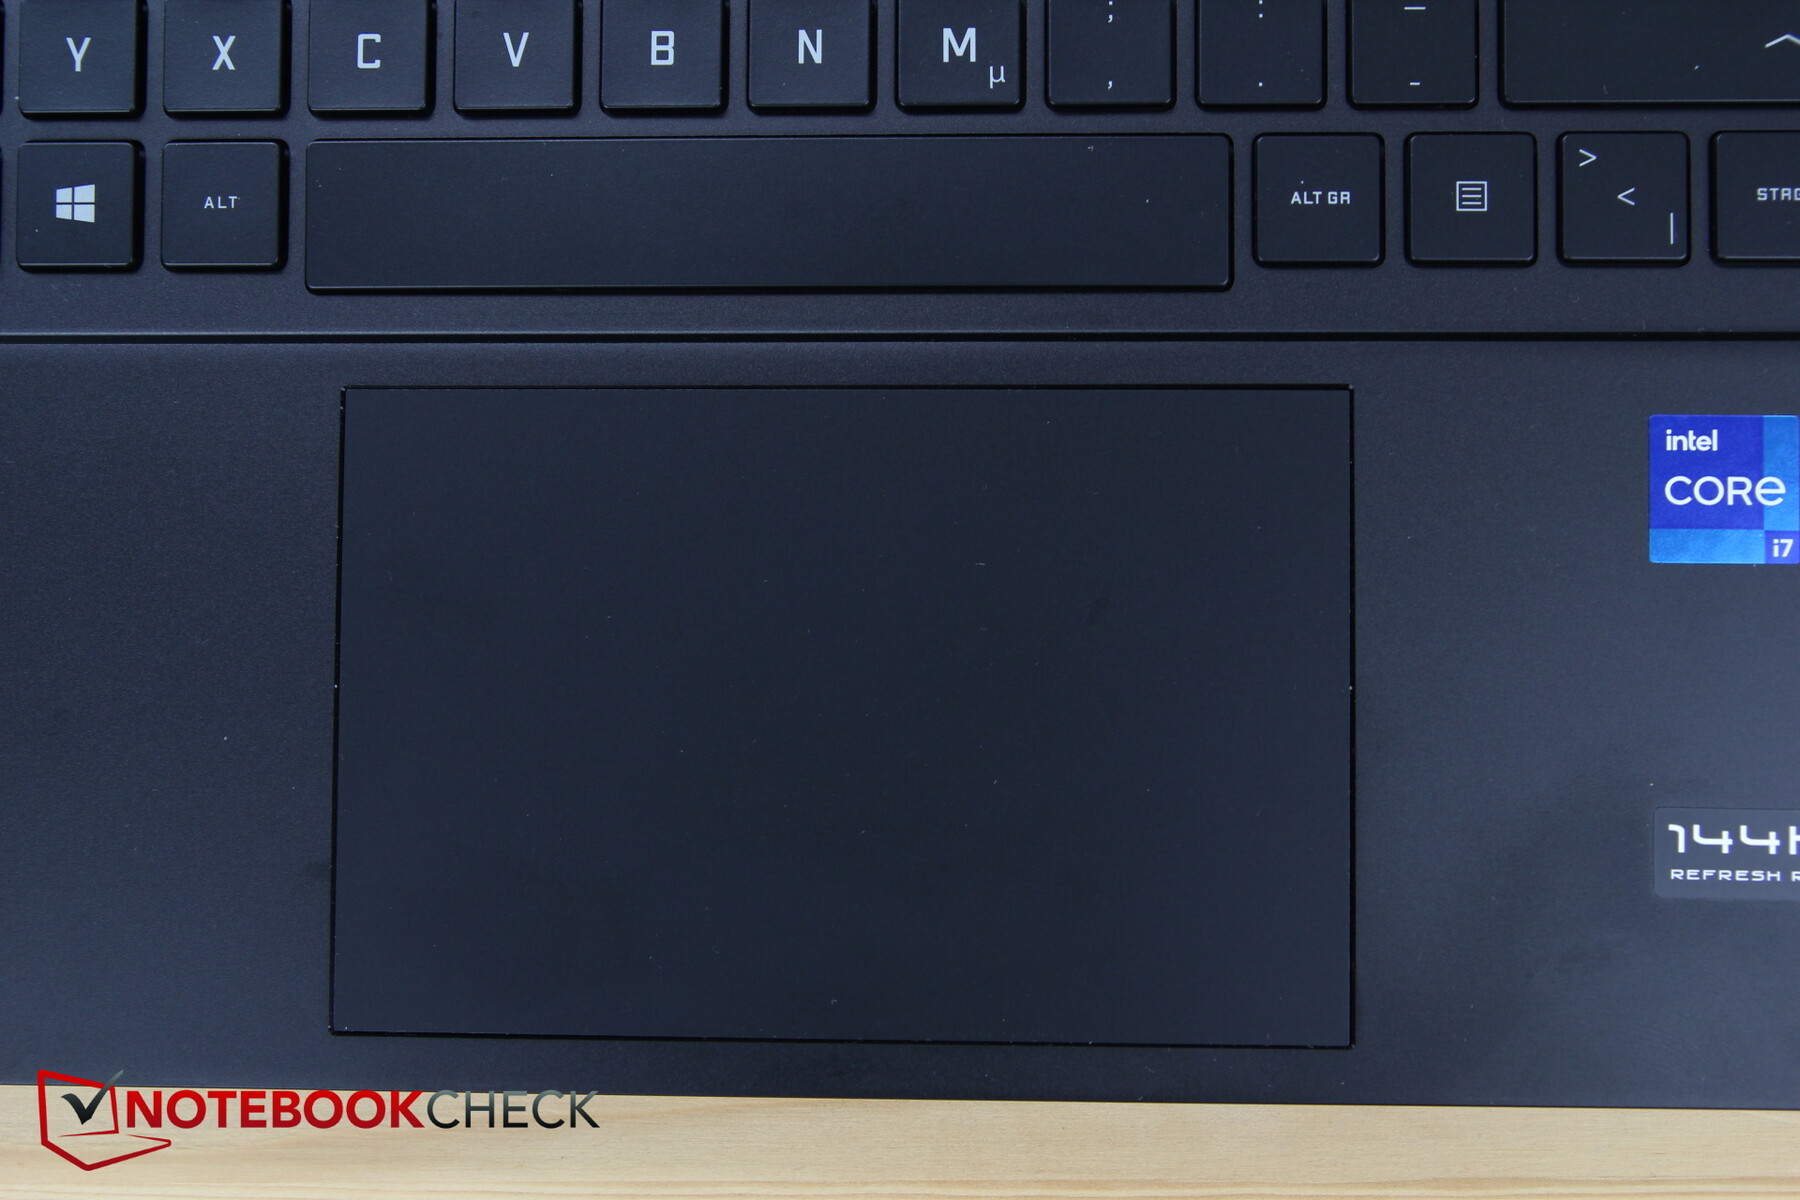
Experimentamos un par de problemas con el touchpad, que de hecho puede ser defectuoso y complicar una calificación en este punto. Incluso después de desinstalar y reinstalar los drivers, hubo varias caídas. Tanto los clics como los movimientos a veces simplemente no eran reconocidos.
Por el contrario, no tenemos ninguna crítica en cuanto al tamaño o la textura del clickpad, ya que las propiedades de deslizamiento son muy buenas incluso a velocidades lentas y los clics producen una respuesta acústica moderada
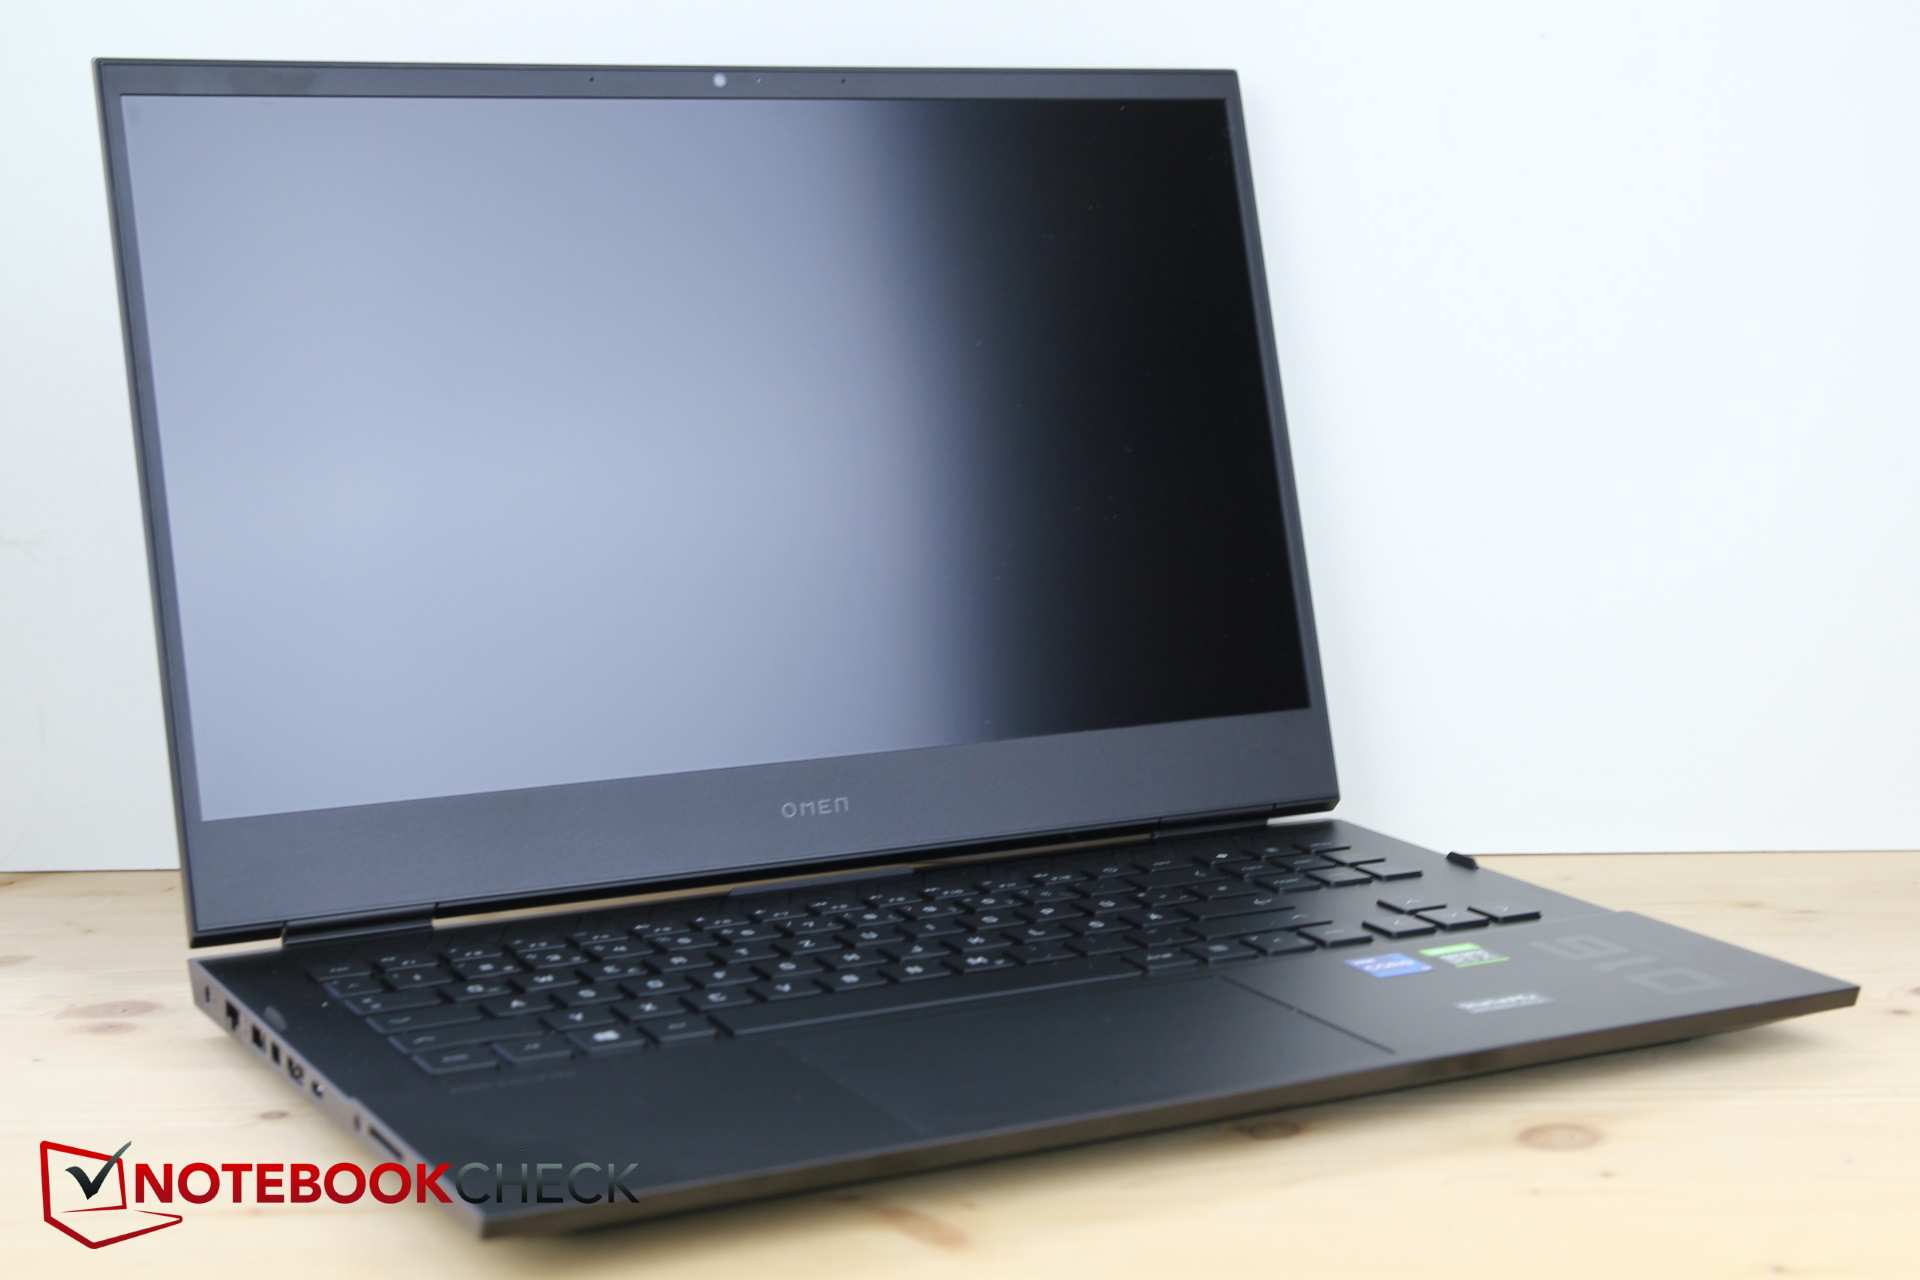
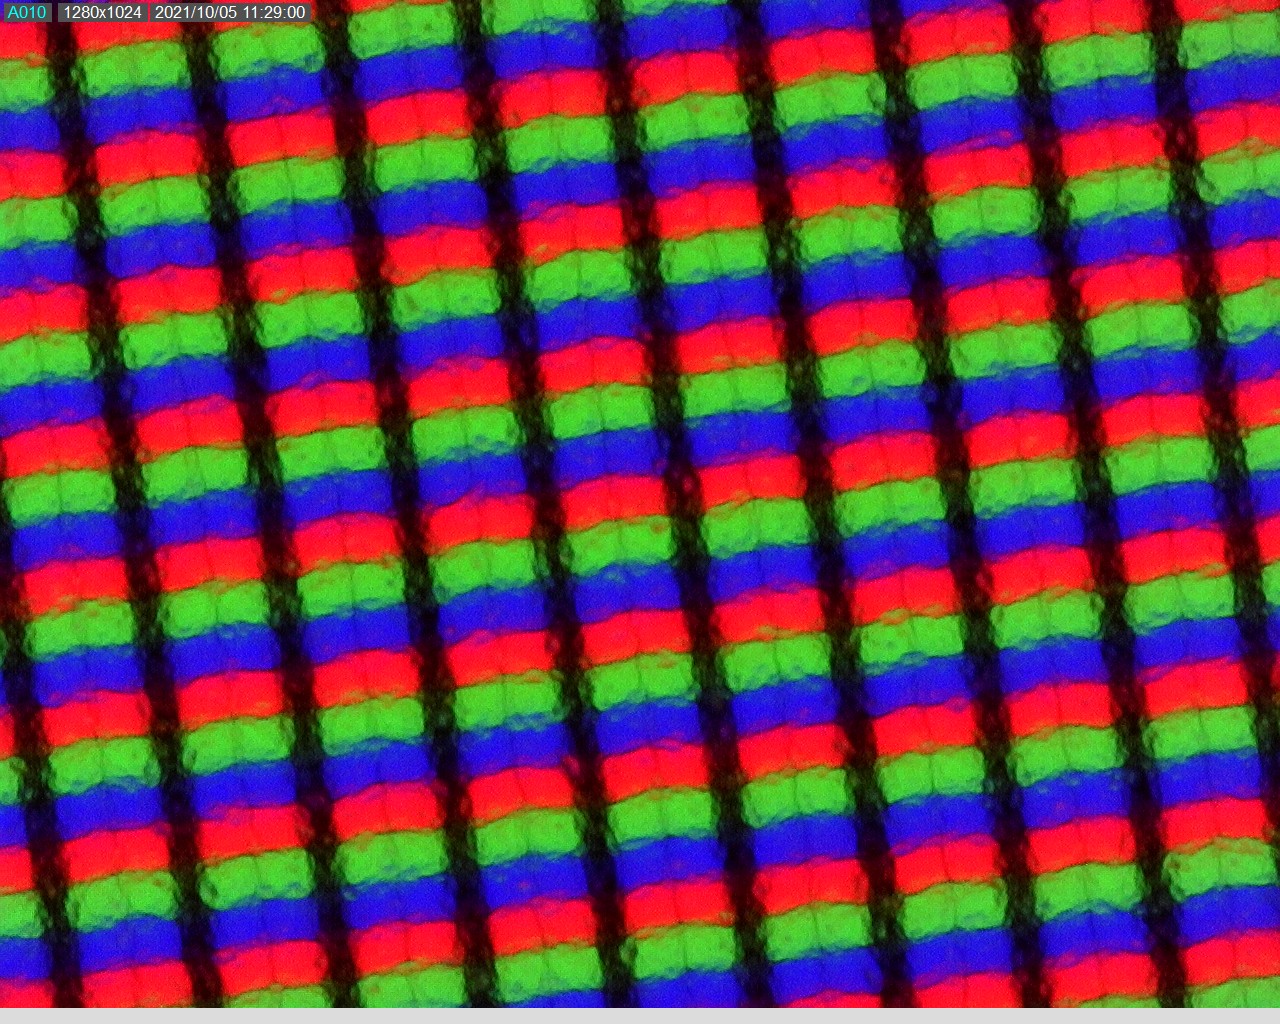
Pantalla - Buen modelo Full HD con 144 Hz
El Omen 16 utiliza el mismo panel IPS FHD 144-Hz mate de 16,1 pulgadas que el Victus 16. Por tanto, los resultados son similares. La pantalla alcanza un nivel de brillo de casi 400 nits con una iluminación del 87% - un resultado decente. Comparado con el antiguo Omen 15, es una mejora significativa.
Aunque el panel sufre algo de sangrado de luz a lo largo de los bordes, sólo se hace evidente en condiciones de luz ambiental muy oscura
Los tiempos de respuesta, muy cortos, se ajustan a las expectativas de esta clase y la pantalla no utiliza PWM para los ajustes de brillo

| |||||||||||||||||||||||||
iluminación: 87 %
Brillo con batería: 407 cd/m²
Contraste: 1191:1 (Negro: 0.34 cd/m²)
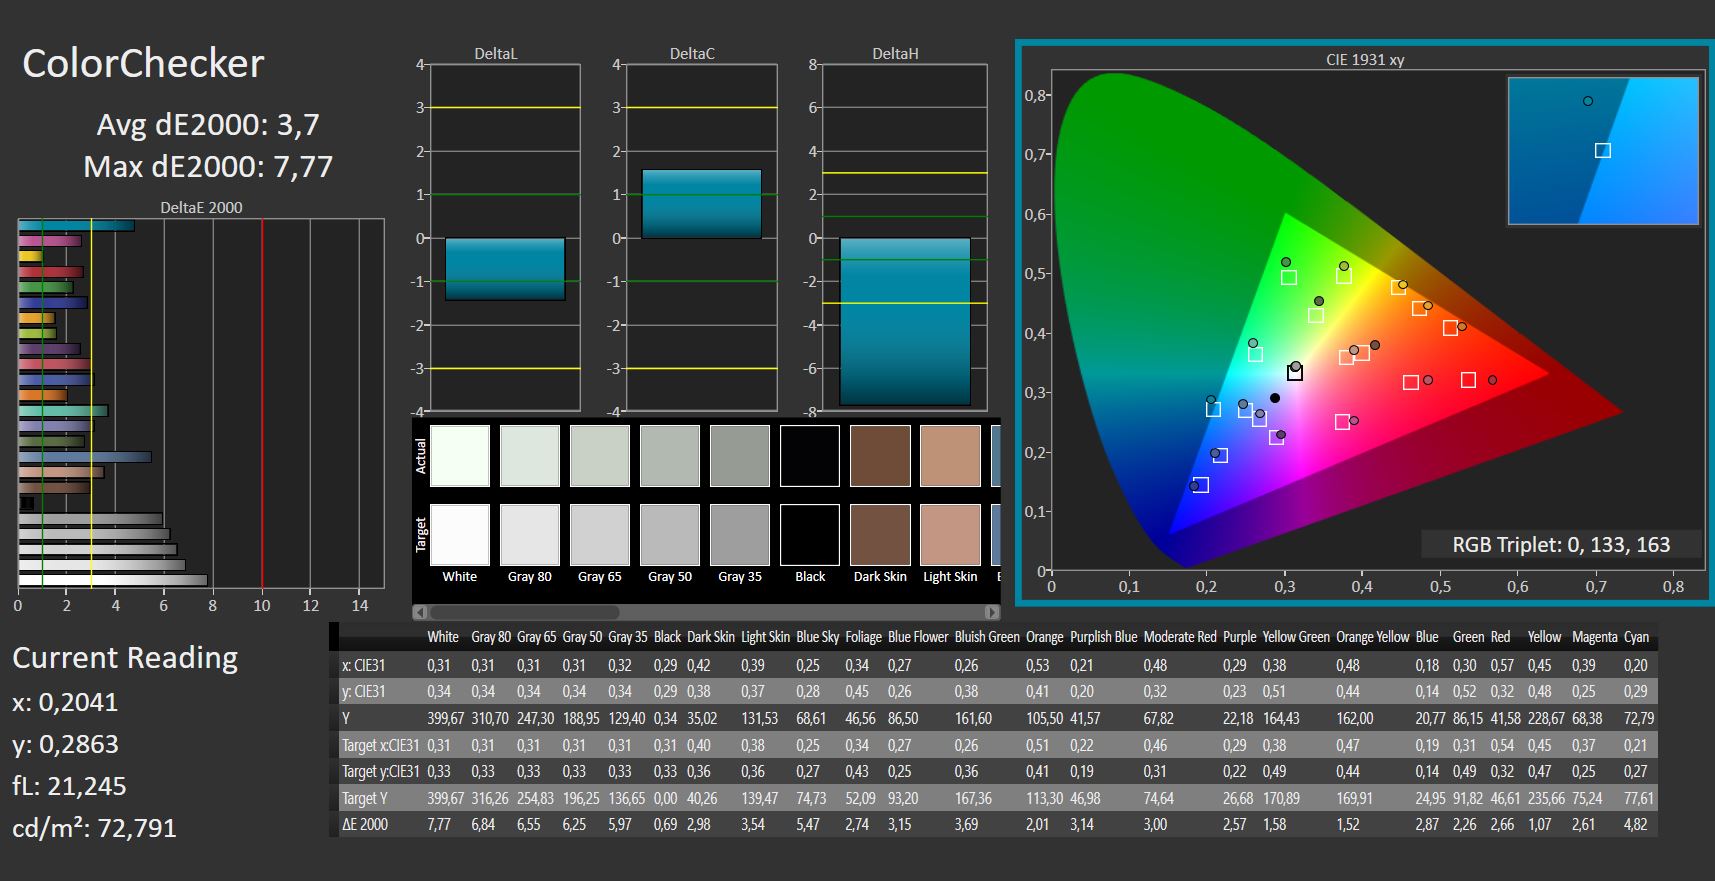
ΔE ColorChecker Calman: 3.7 | ∀{0.5-29.43 Ø4.71}
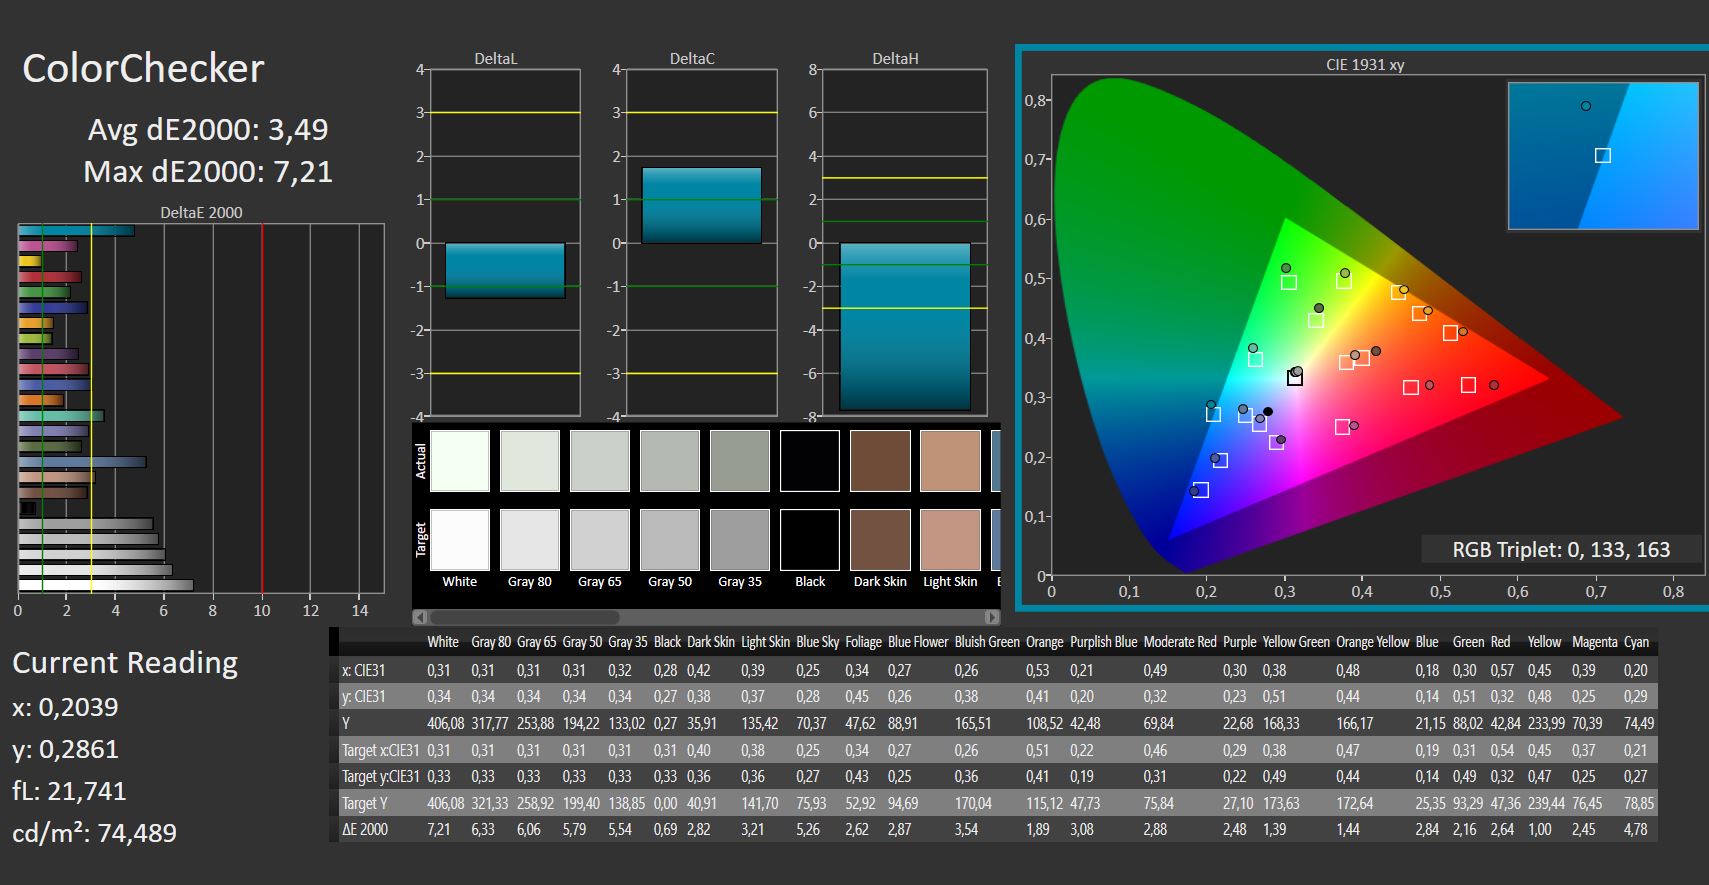
calibrated: 3.49
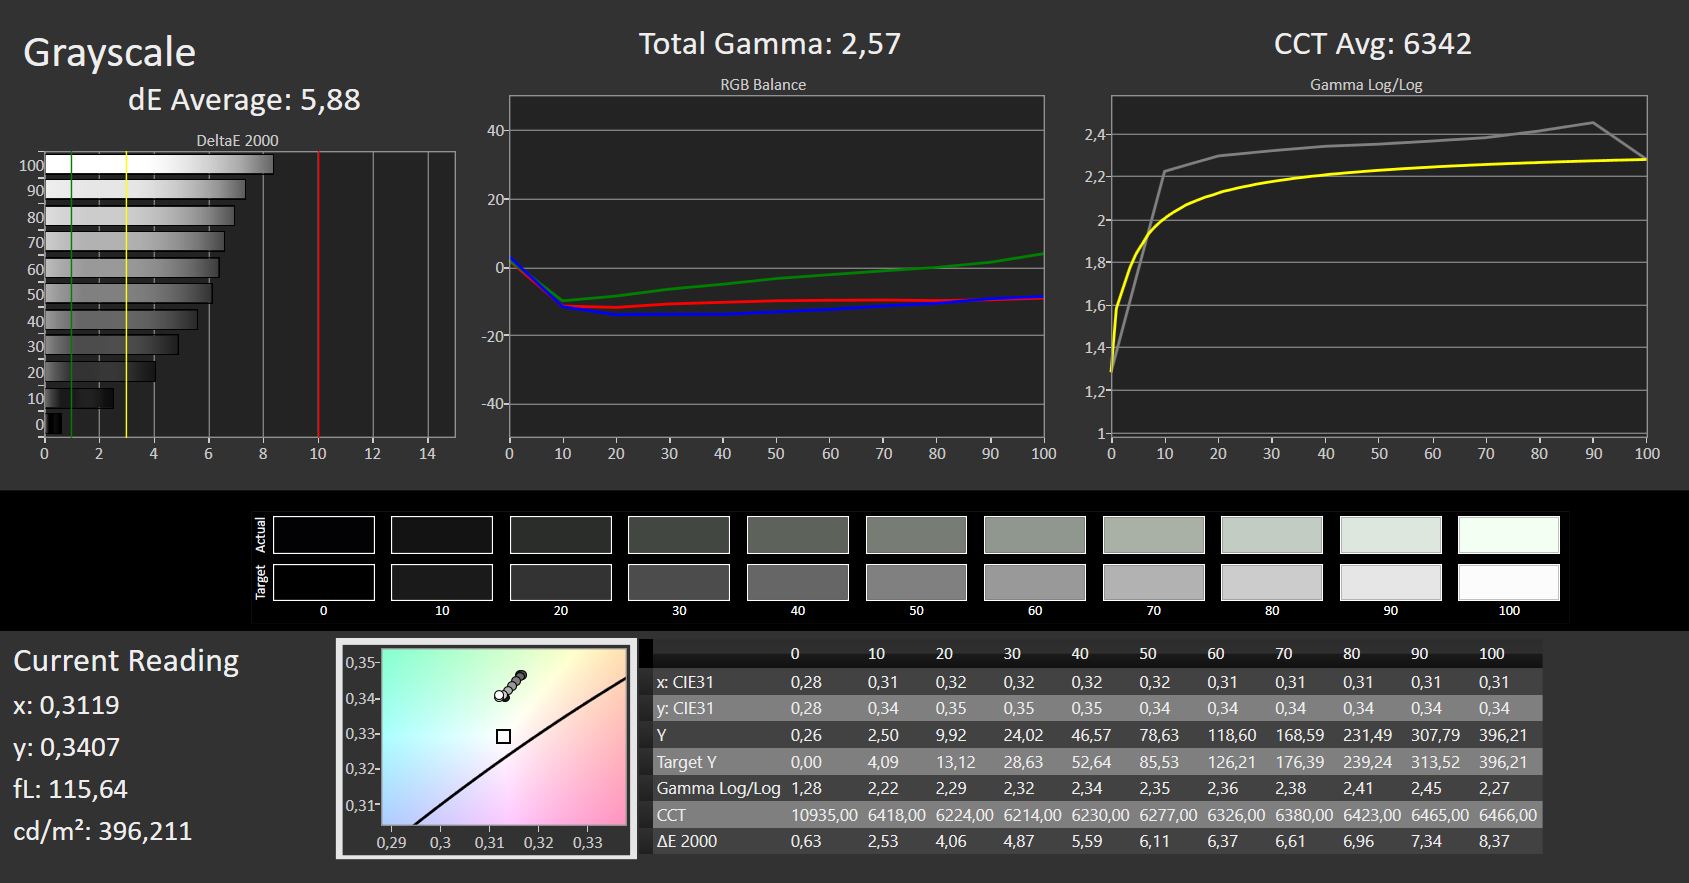
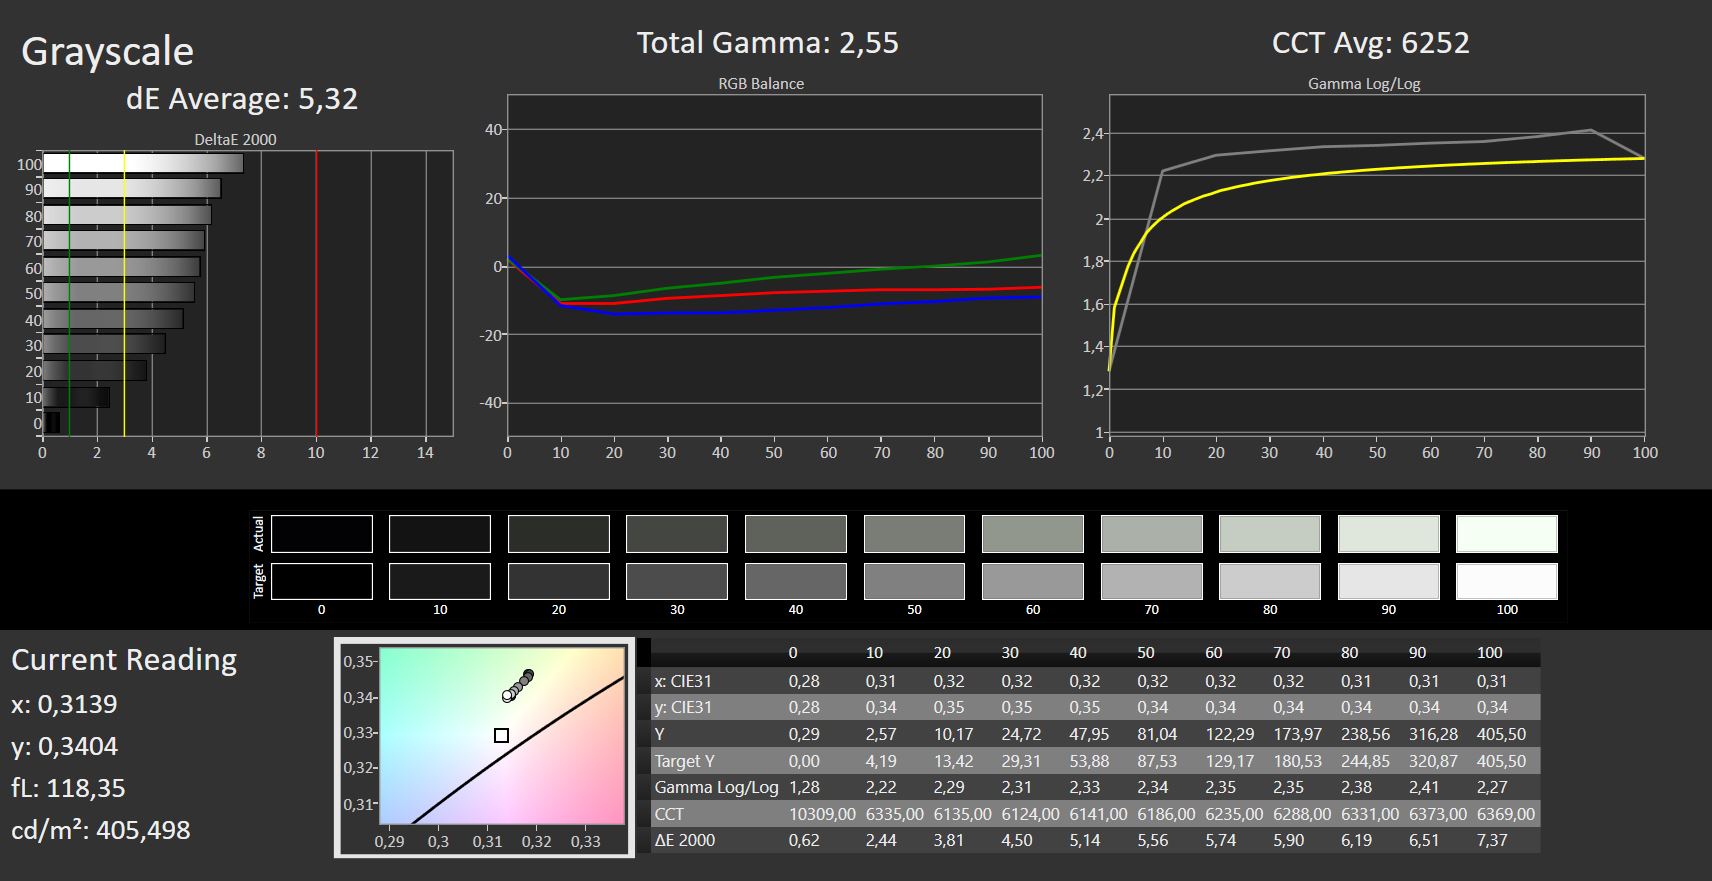
ΔE Greyscale Calman: 5.88 | ∀{0.09-98 Ø4.96}
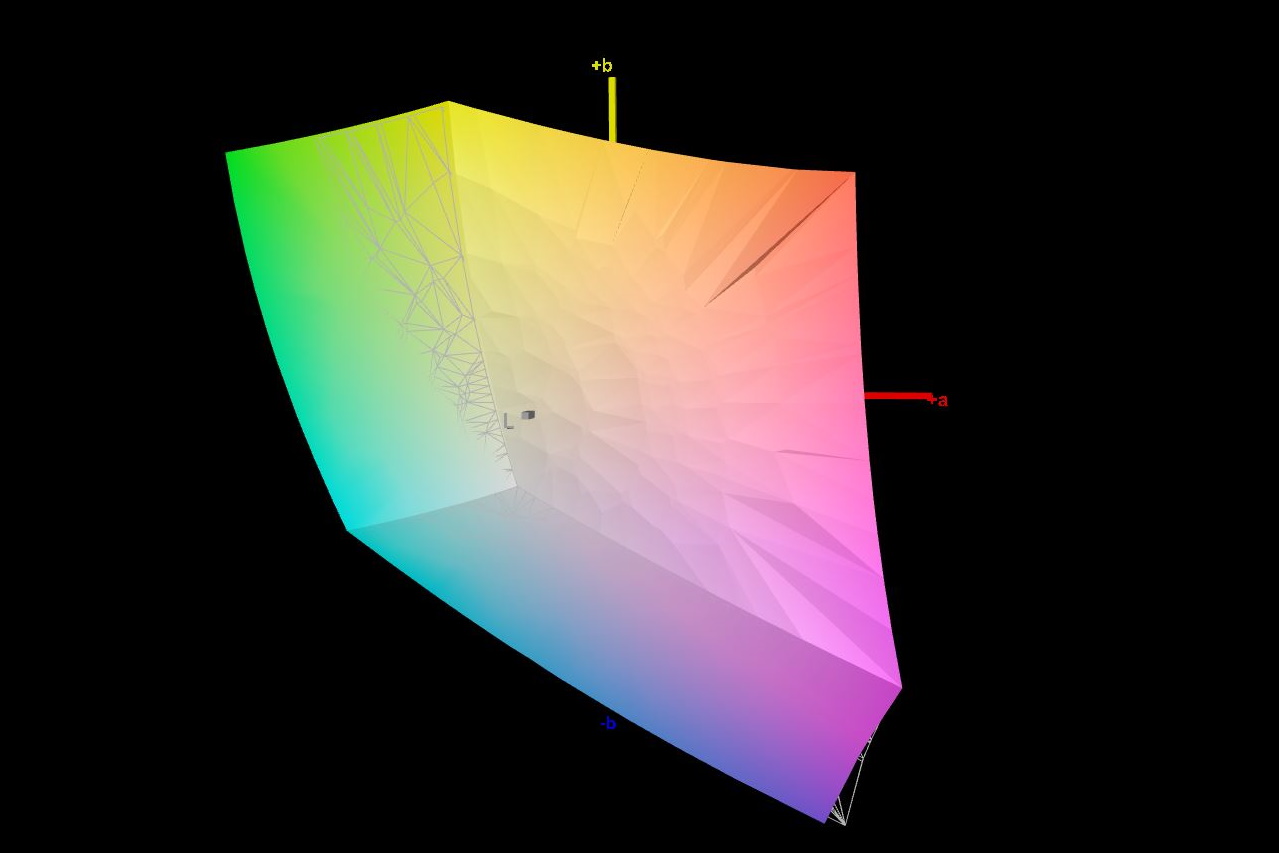
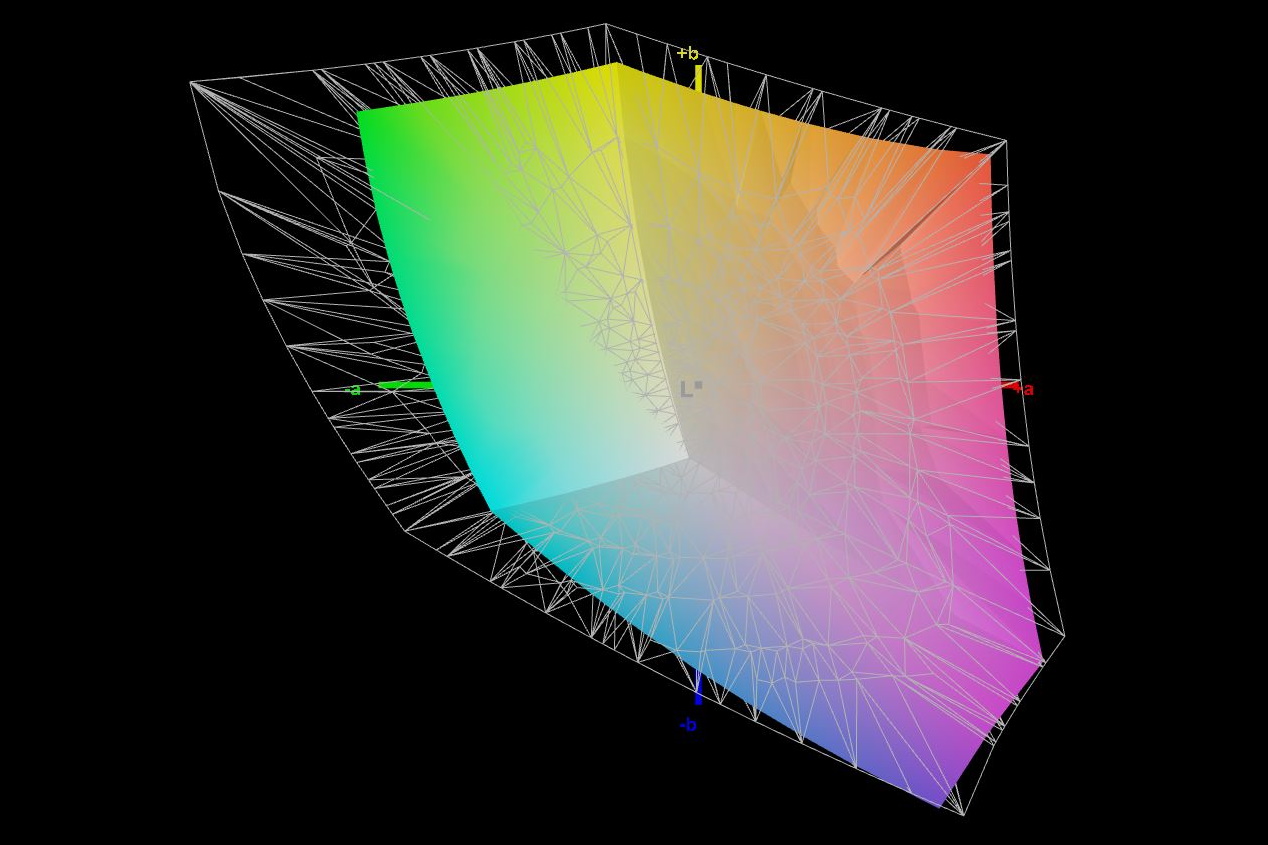
99.47% sRGB (Calman 2D)
99.47% sRGB (Argyll 1.6.3 3D)
73.76% AdobeRGB 1998 (Argyll 1.6.3 3D)
73.8% AdobeRGB 1998 (Argyll 3D)
99.5% sRGB (Argyll 3D)
72.3% Display P3 (Argyll 3D)
Gamma: 2.57
CCT: 6342 K
| HP Omen 16-b0085ng BOE09BE, IPS, 1920x1080, 16.1" | HP Omen 15-en0375ng BOE0852, IPS, 1920x1080, 15.6" | HP Victus 16-e0179ng BOE09BE, IPS, 1920x1080, 16.1" | Lenovo Legion 5 Pro 16ACH6H (82JQ001PGE) CSOT T3 MNG007DA1-1, IPS, 2560x1600, 16" | Alienware x15 RTX 3070 P111F LG Philips 156QHG, IPS, 2560x1440, 15.6" | MSI Katana GF66 11UG-220 AU Optronics B156HAN08.0, IPS, 1920x1080, 15.6" | |
|---|---|---|---|---|---|---|
| Display | -44% | 0% | -1% | 18% | -9% | |
| Display P3 Coverage (%) | 72.3 | 39.12 -46% | 72.6 0% | 97.8 35% | 65.4 -10% | |
| sRGB Coverage (%) | 99.5 | 57.6 -42% | 100 1% | 99 -1% | 99.9 0% | 91.3 -8% |
| AdobeRGB 1998 Coverage (%) | 73.8 | 40.42 -45% | 73.5 0% | 73 -1% | 66.7 -10% | |
| Response Times | -174% | -18% | 23% | -17% | 9% | |
| Response Time Grey 50% / Grey 80% * (ms) | 8 ? | 30.4 ? -280% | 9.6 ? -20% | 9.2 ? -15% | 12 ? -50% | 7.4 ? 7% |
| Response Time Black / White * (ms) | 12.4 ? | 20.8 ? -68% | 14.4 ? -16% | 4.8 61% | 10.4 ? 16% | 11.2 ? 10% |
| PWM Frequency (Hz) | 200 ? | |||||
| Screen | -27% | 15% | 22% | 6% | 0% | |
| Brightness middle (cd/m²) | 405 | 297 -27% | 361 -11% | 551 36% | 409.5 1% | 307 -24% |
| Brightness (cd/m²) | 378 | 275 -27% | 341 -10% | 523 38% | 390 3% | 321 -15% |
| Brightness Distribution (%) | 87 | 88 1% | 88 1% | 88 1% | 88 1% | 83 -5% |
| Black Level * (cd/m²) | 0.34 | 0.33 3% | 0.3 12% | 0.54 -59% | 0.47 -38% | 0.27 21% |
| Contrast (:1) | 1191 | 900 -24% | 1203 1% | 1020 -14% | 871 -27% | 1137 -5% |
| Colorchecker dE 2000 * | 3.7 | 4.54 -23% | 2.44 34% | 1.8 51% | 3.48 6% | 4.67 -26% |
| Colorchecker dE 2000 max. * | 7.77 | 18.92 -144% | 6.37 18% | 2.53 67% | 6.31 19% | 7.53 3% |
| Colorchecker dE 2000 calibrated * | 3.49 | 4.66 -34% | 1.26 64% | 1.66 52% | 0.89 74% | 2.41 31% |
| Greyscale dE 2000 * | 5.88 | 2.1 64% | 4.6 22% | 1.85 69% | 5 15% | 4.5 23% |
| Gamma | 2.57 86% | 2.066 106% | 2.268 97% | 2.3 96% | 2.16 102% | 2.276 97% |
| CCT | 6342 102% | 6291 103% | 6609 98% | 6338 103% | 6591 99% | 6824 95% |
| Color Space (Percent of AdobeRGB 1998) (%) | 73.76 | 40 -46% | 72.81 -1% | |||
| Color Space (Percent of sRGB) (%) | 99.47 | 58 -42% | 99.41 0% | |||
| Media total (Programa/Opciones) | -82% /
-49% | -1% /
7% | 15% /
19% | 2% /
4% | 0% /
-1% |
* ... más pequeño es mejor
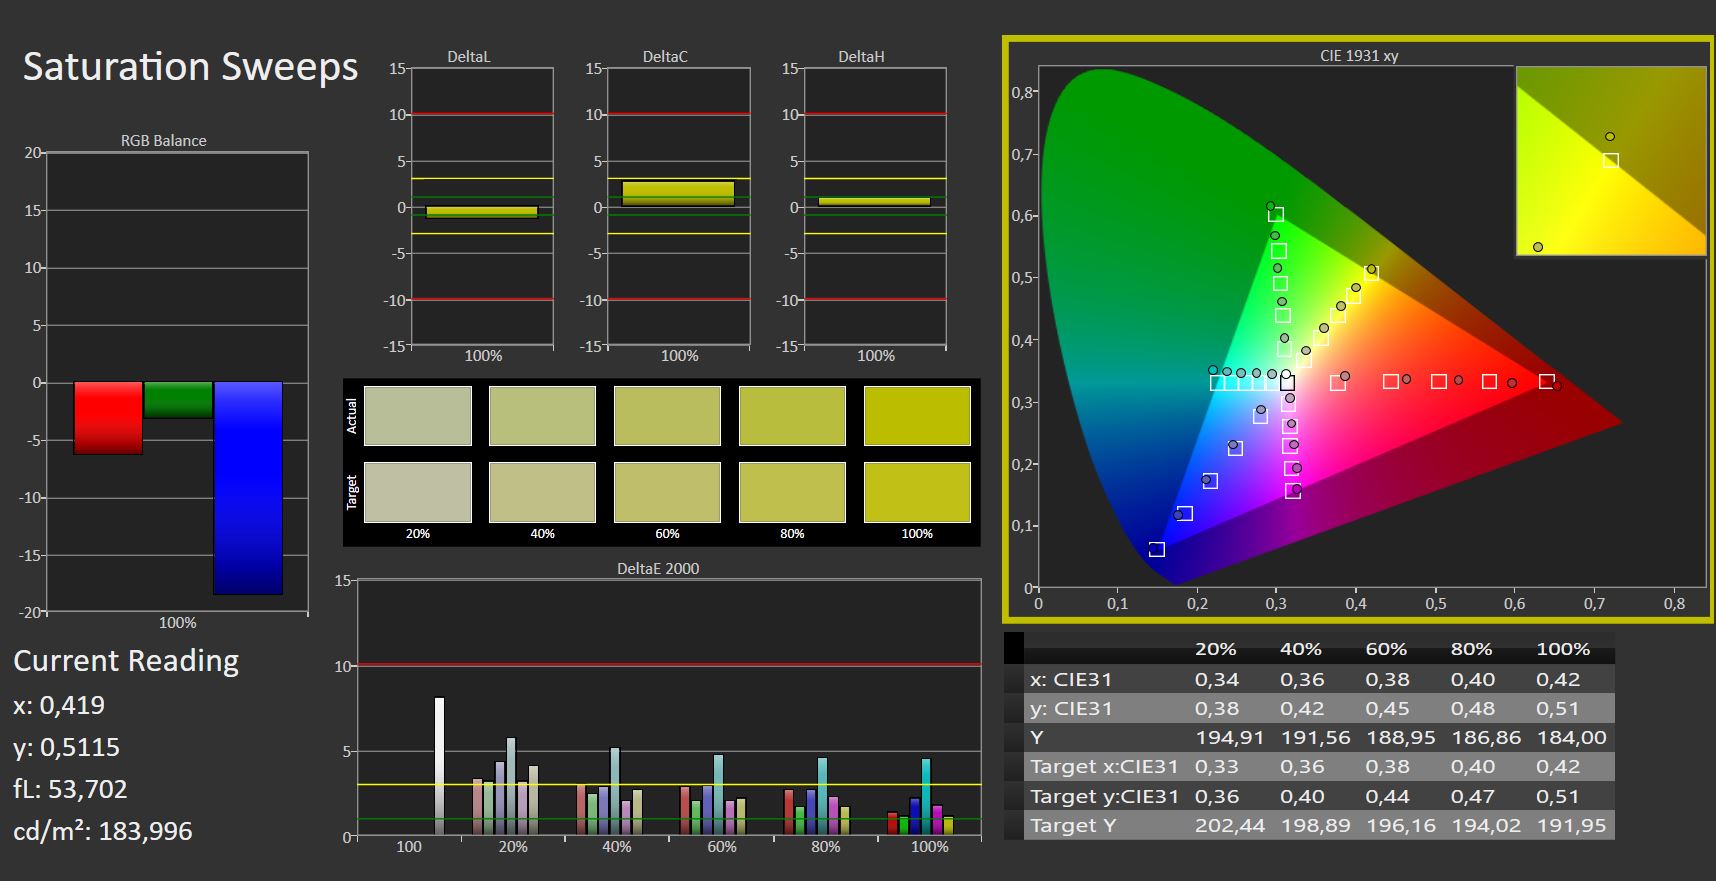
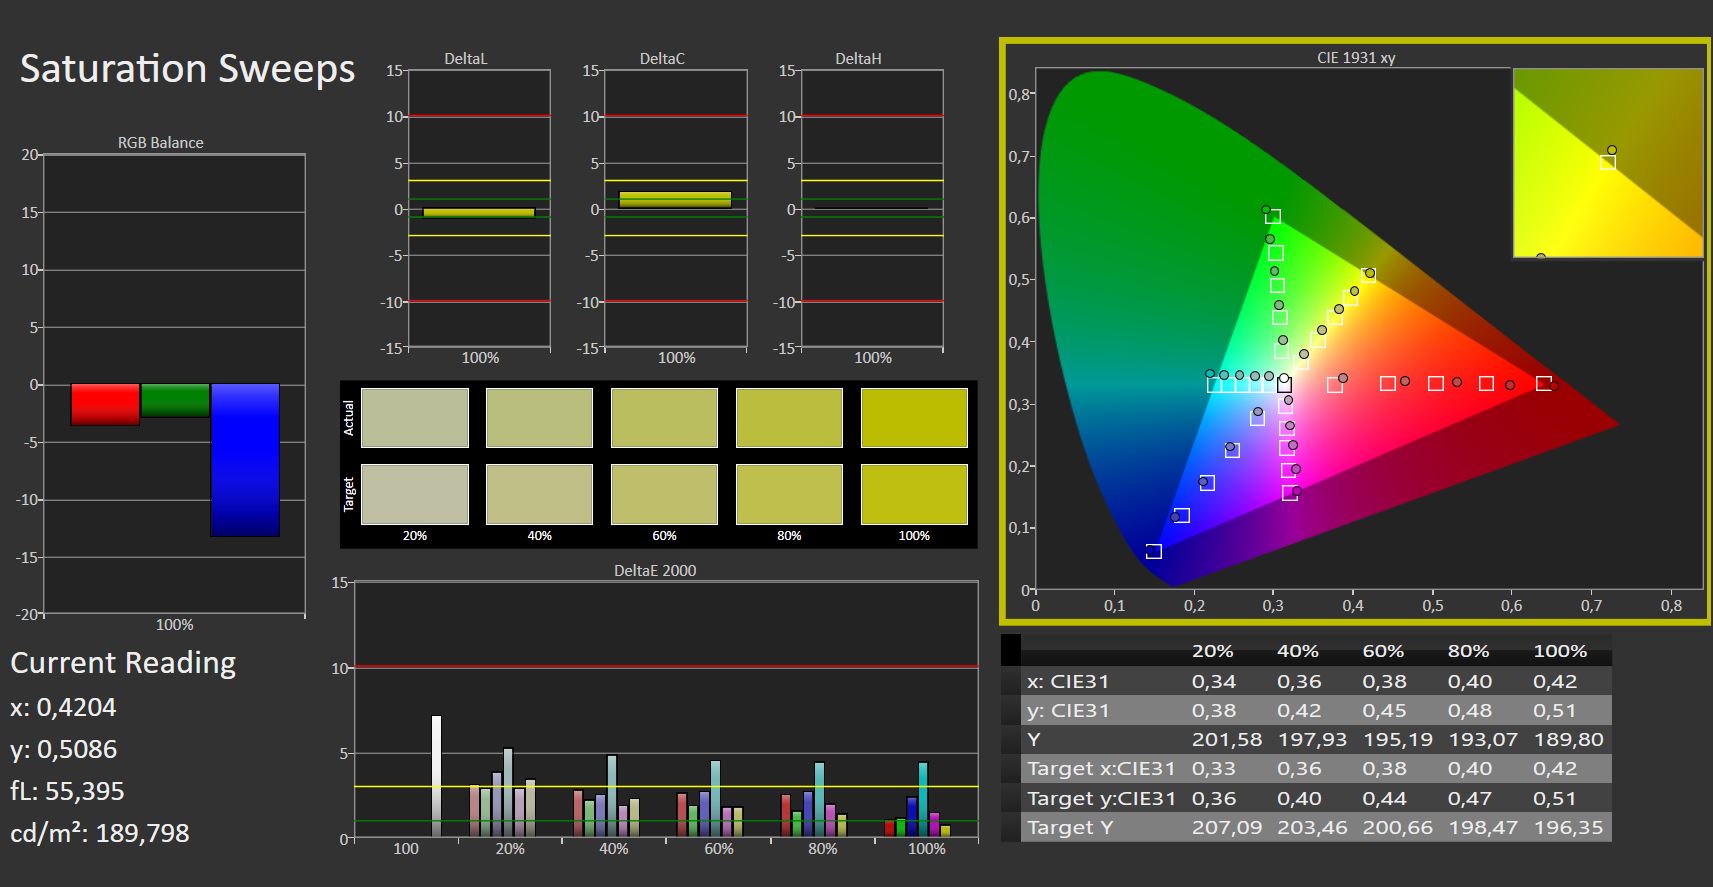
La relación de contraste y los valores de negro son competitivos en comparación con los promedios de la clase y el espacio de color sRGB se cubre esencialmente en su totalidad. Mientras tanto, la pantalla sigue cubriendo el 73% de los espacios de color AdobeRGB y DCI-P3
Aunque la pantalla está bien calibrada de fábrica, pudimos mejorar aún más los colores realizando una calibración manual de la pantalla
El revestimiento mate evita la mayoría de los reflejos y el brillo es suficiente para el uso en exteriores. Como es habitual, los reflejos se vuelven molestos cuando se mira la pantalla desde un ángulo


Tiempos de respuesta del display
| ↔ Tiempo de respuesta de Negro a Blanco | ||
|---|---|---|
| 12.4 ms ... subida ↗ y bajada ↘ combinada | ↗ 6.6 ms subida | 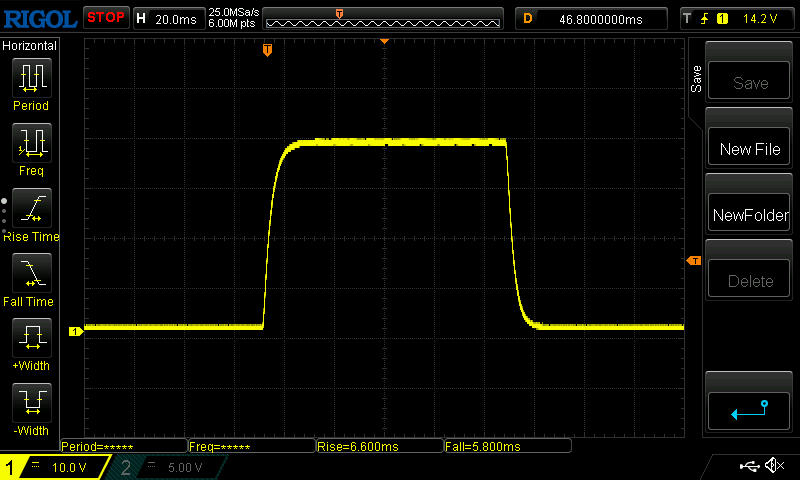 |
| ↘ 5.8 ms bajada | ||
| La pantalla mostró buenos tiempos de respuesta en nuestros tests pero podría ser demasiado lenta para los jugones competitivos. En comparación, todos los dispositivos de prueba van de ##min### (mínimo) a 240 (máximo) ms. » 33 % de todos los dispositivos son mejores. Esto quiere decir que el tiempo de respuesta medido es mejor que la media (19.8 ms) de todos los dispositivos testados. | ||
| ↔ Tiempo de respuesta 50% Gris a 80% Gris | ||
| 8 ms ... subida ↗ y bajada ↘ combinada | ↗ 4.2 ms subida | 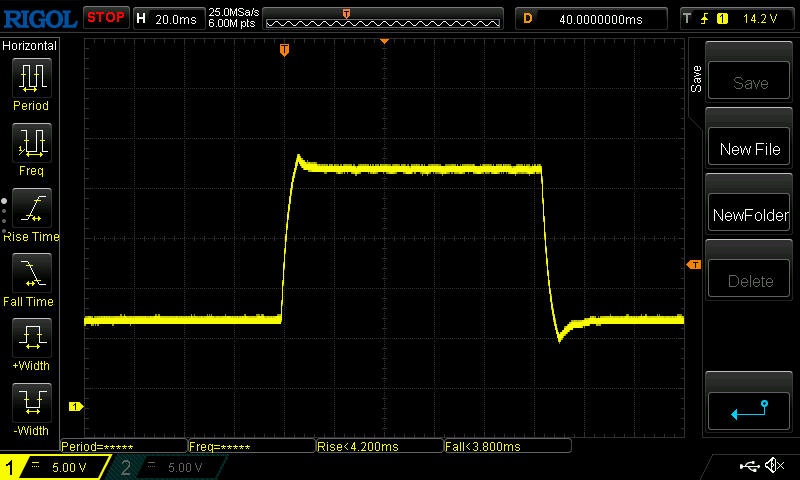 |
| ↘ 3.8 ms bajada | ||
| La pantalla mostró tiempos de respuesta rápidos en nuestros tests y debería ser adecuada para juegos. En comparación, todos los dispositivos de prueba van de ##min### (mínimo) a 636 (máximo) ms. » 21 % de todos los dispositivos son mejores. Esto quiere decir que el tiempo de respuesta medido es mejor que la media (30.9 ms) de todos los dispositivos testados. | ||
Parpadeo de Pantalla / PWM (Pulse-Width Modulation)
| Parpadeo de Pantalla / PWM no detectado | ||
Comparación: 52 % de todos los dispositivos testados no usaron PWM para atenuar el display. Si se usó, medimos una media de 7741 (mínimo: 5 - máxmo: 343500) Hz. | ||
Teniendo en cuenta que se trata de una pantalla IPS, el nivel de brillo percibido cae de forma bastante drástica cuando se ve desde ángulos extremos y quizás incluso más de lo habitual. Sin embargo, esto apenas se nota en condiciones normales

Rendimiento - ¡Rápido!
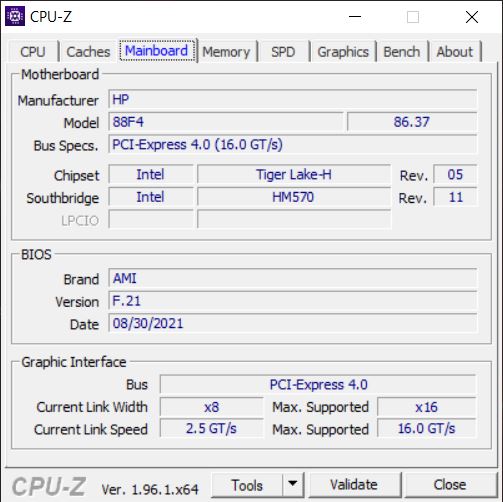
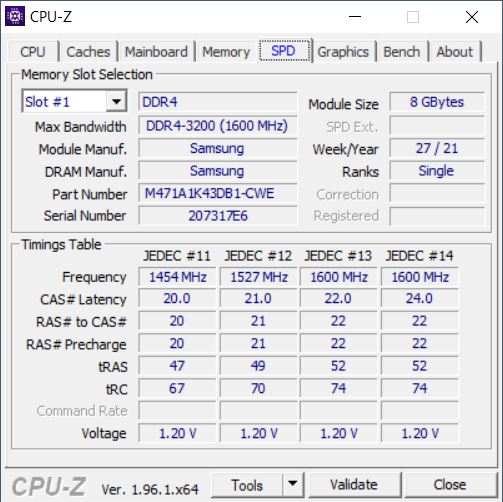
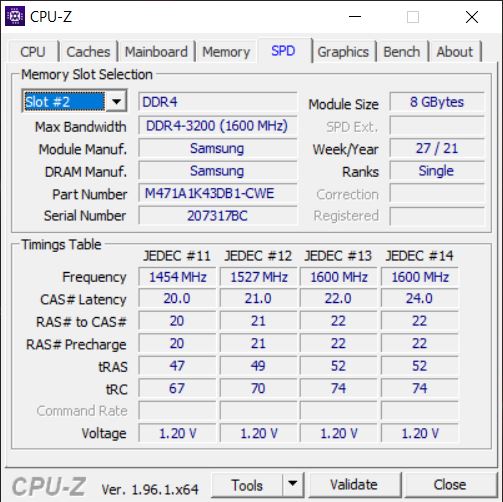
El Omen 16 es un sistema de juegos. El octa-core Intel Core i7-11800H y, lo que es más importante, la GPU NVIDIA GeForce RTX 3070 para portátiles así como la pantalla de 144 Hz son pistas bastante obvias en este sentido. Con 16 GB, la capacidad de RAM también debería ser suficiente. Con su diseño elegante, pero sutil, el Omen fue hecho principalmente para los jugadores que prefieren un diseño más relajado en lugar del exterior más común y hortera.
En el Omen Gaming Hub, los usuarios pueden elegir entre unos cuantos perfiles de rendimiento predeterminados. Para las pruebas de rendimiento bruto, seleccionamos el perfil de rendimiento "Rendimiento" y pusimos el conmutador de gráficos en dedicado, para asegurarnos de que la GPU dedicada estuviera siempre activada. A continuación, cambiamos al modo híbrido (Optimus) para las pruebas de batería
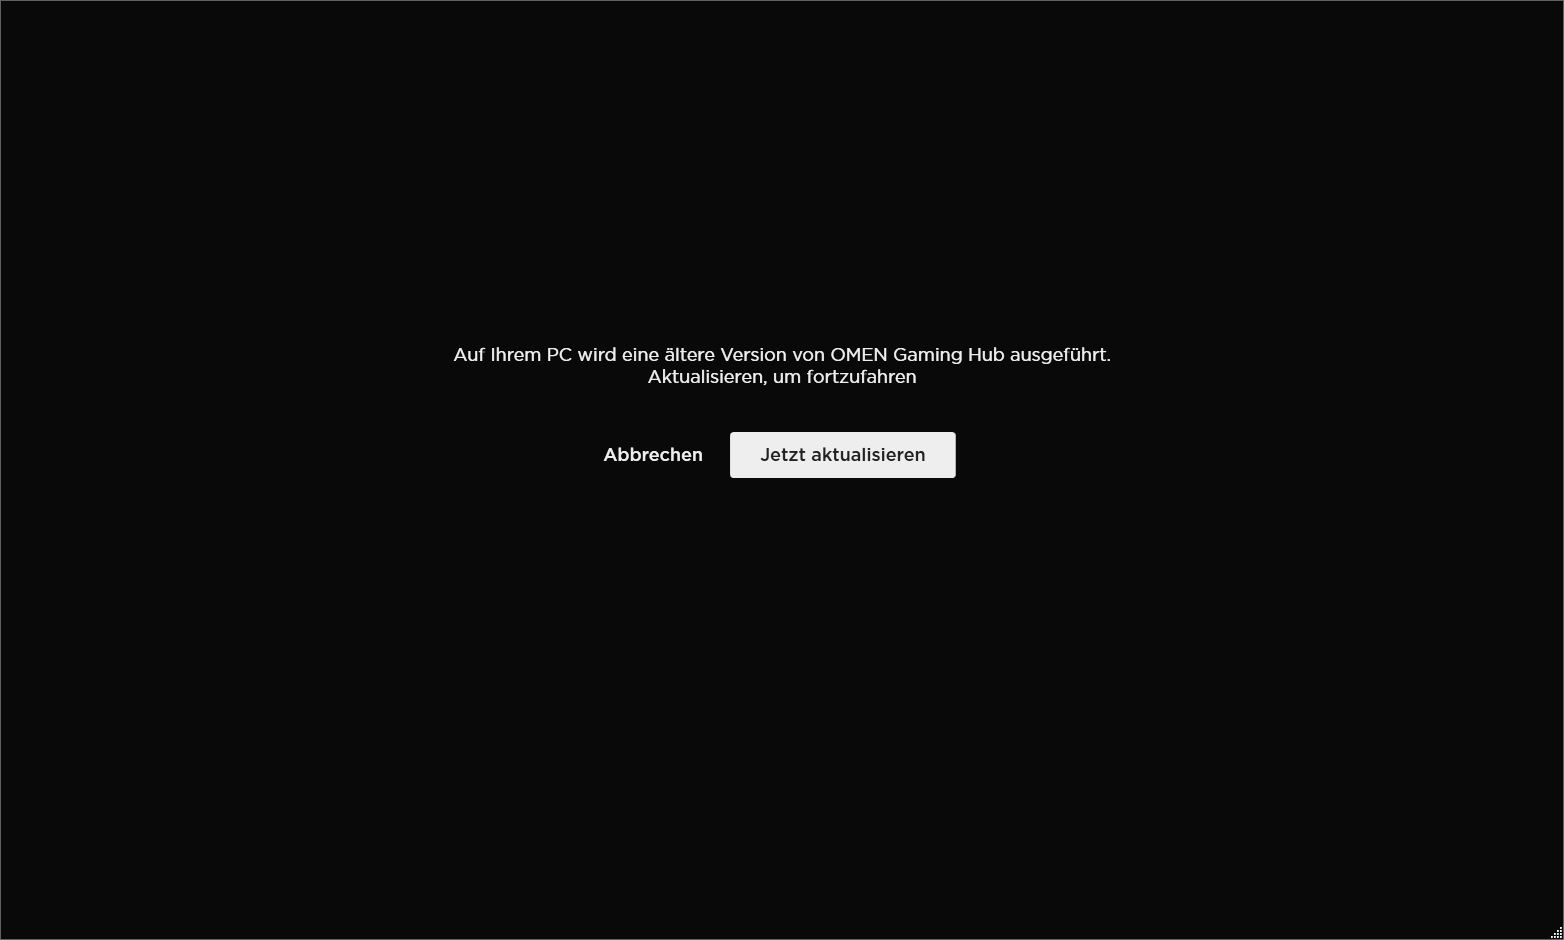
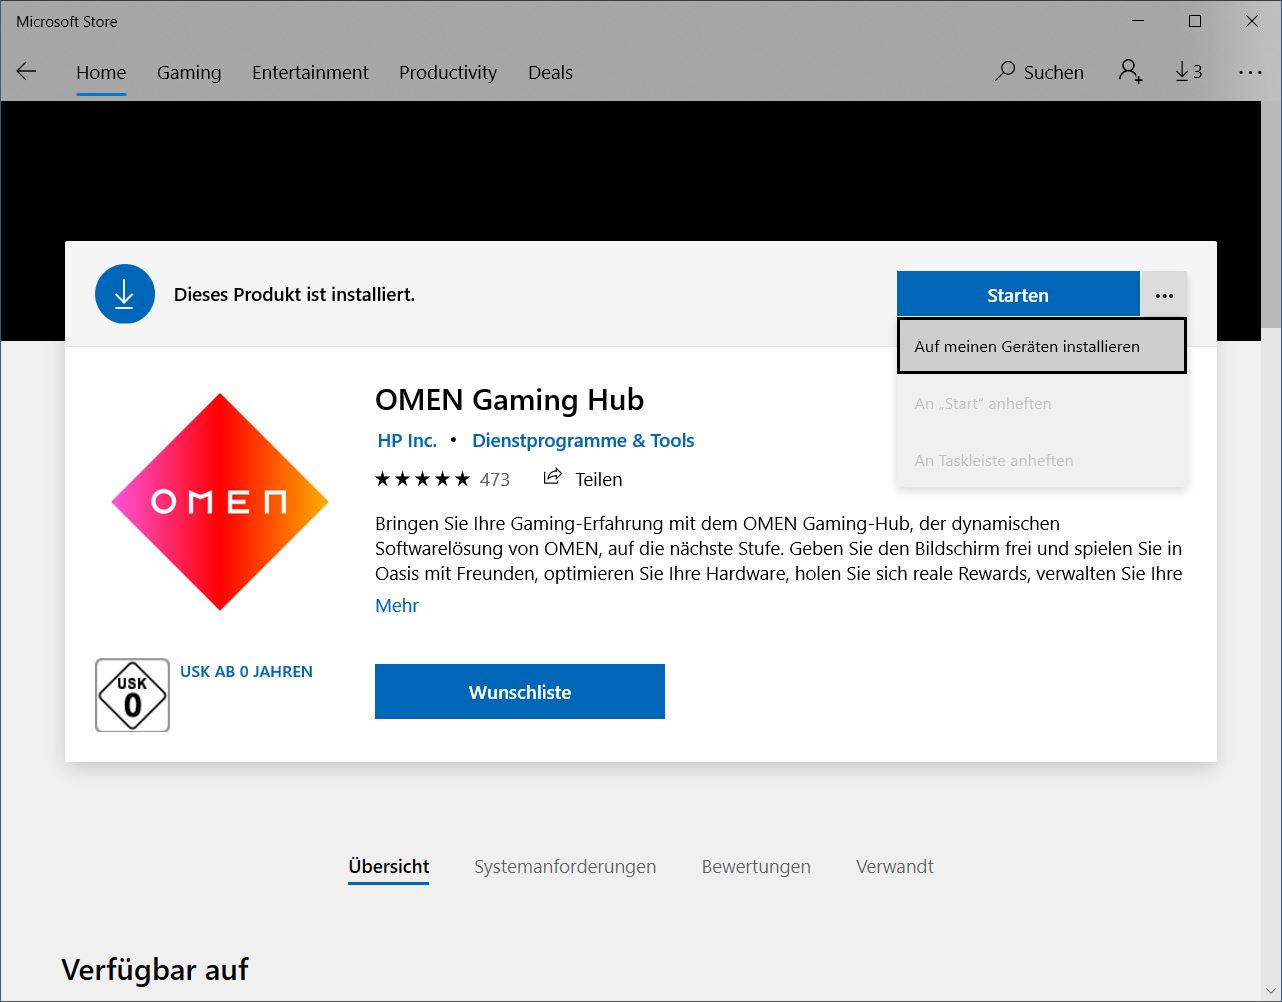
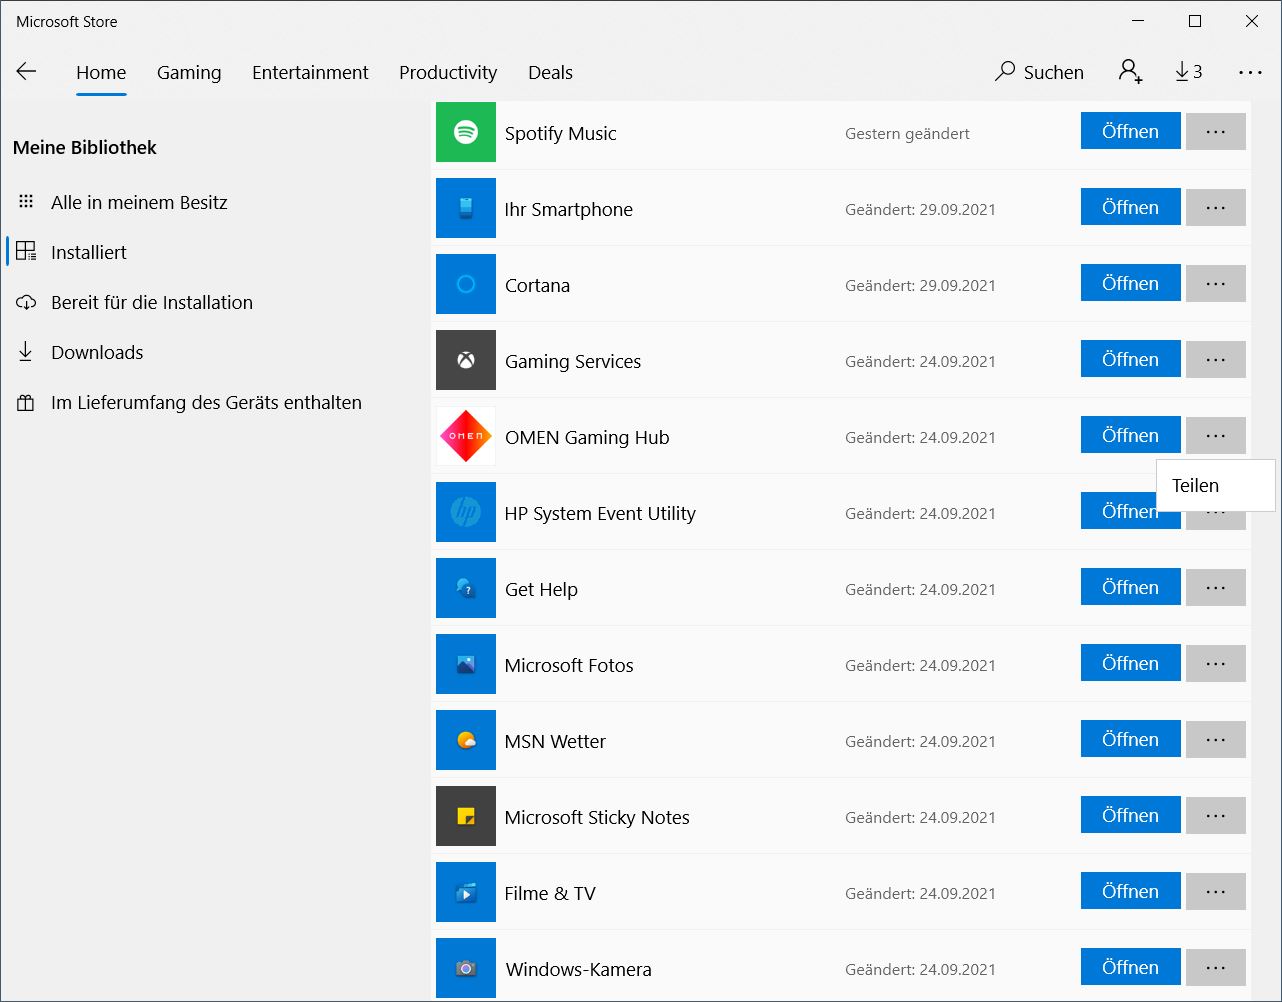
Nos encontramos con un problema frustrante con el software Gaming Hub, que nos recordaba que estábamos usando una versión antigua en cada lanzamiento. Sin embargo, al intentar actualizarlo nos redirigía a la Windows Store. Aquí, el software aparece como "ya instalado" sin opción a ninguna actualización


Procesador
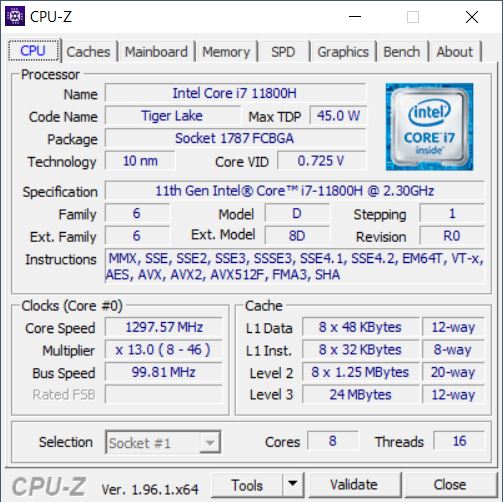
El Omen viene con un Intel Core i7-11800Hun procesador octa-core con velocidades de reloj teóricas de 2,3 a 4,6 GHz. Cuenta con Thunderbolt 4, que está notablemente ausente en las plataformas de la competencia de AMD.
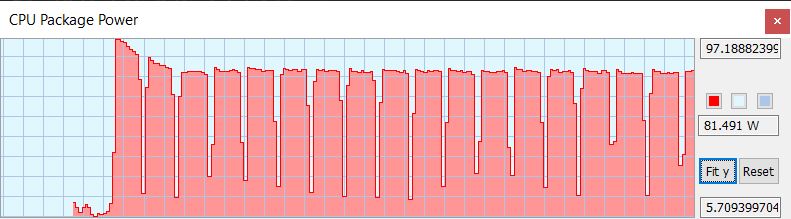
Durante nuestro bucle de Cinebench R15, el rendimiento se mantiene muy consistente sin ninguna caída inicial. Aunque el TDP empieza por encima de los 95 W, cae después del segundo bucle y se mantiene relativamente constante en torno a los 80 W. El rendimiento es similar al del Legion 5 Pro y el Alienware x15 y coincide con nuestras expectativas. El Victus, más barato, es un 15% más lento en las pruebas de Cinebench
En todas las pruebas, el rendimiento de la CPU es rápido y similar al del Legion 5 Pro, siendo el Alienware ligeramente más rápido en algunas pruebas. Por el contrario, el Omen se sitúa en primer lugar en Geekbench y algunos otros benchmarks
En el modo de batería, el rendimiento de la CPU se reduce en un 40%
Cinebench R15 Multi Dauertest
Cinebench R20: CPU (Multi Core) | CPU (Single Core)
Cinebench R15: CPU Multi 64Bit | CPU Single 64Bit
Blender: v2.79 BMW27 CPU
7-Zip 18.03: 7z b 4 | 7z b 4 -mmt1
Geekbench 5.5: Multi-Core | Single-Core
HWBOT x265 Benchmark v2.2: 4k Preset
LibreOffice : 20 Documents To PDF
R Benchmark 2.5: Overall mean
| Cinebench R23 / Multi Core | |
| Media de la clase Gaming (10488 - 42661, n=104, últimos 2 años) | |
| Alienware x15 RTX 3070 P111F | |
| Lenovo Legion 5 Pro 16ACH6H (82JQ001PGE) | |
| Lenovo Legion 5 Pro 16ACH6H (82JQ001PGE) | |
| HP Omen 16-b0085ng | |
| Medio Intel Core i7-11800H (6508 - 14088, n=48) | |
| HP Omen 15-en0375ng | |
| HP Victus 16-e0179ng | |
| MSI Katana GF66 11UG-220 | |
| Cinebench R23 / Single Core | |
| Media de la clase Gaming (1601 - 2415, n=104, últimos 2 años) | |
| MSI Katana GF66 11UG-220 | |
| HP Omen 16-b0085ng | |
| Alienware x15 RTX 3070 P111F | |
| Medio Intel Core i7-11800H (1386 - 1522, n=45) | |
| HP Victus 16-e0179ng | |
| Lenovo Legion 5 Pro 16ACH6H (82JQ001PGE) | |
| Lenovo Legion 5 Pro 16ACH6H (82JQ001PGE) | |
| HP Omen 15-en0375ng | |
| Cinebench R20 / CPU (Multi Core) | |
| Media de la clase Gaming (4029 - 16433, n=103, últimos 2 años) | |
| Alienware x15 RTX 3070 P111F | |
| Lenovo Legion 5 Pro 16ACH6H (82JQ001PGE) | |
| Lenovo Legion 5 Pro 16ACH6H (82JQ001PGE) | |
| HP Omen 16-b0085ng | |
| Medio Intel Core i7-11800H (2498 - 5408, n=50) | |
| HP Omen 15-en0375ng | |
| HP Victus 16-e0179ng | |
| MSI Katana GF66 11UG-220 | |
| Cinebench R20 / CPU (Single Core) | |
| Media de la clase Gaming (622 - 913, n=103, últimos 2 años) | |
| HP Omen 16-b0085ng | |
| MSI Katana GF66 11UG-220 | |
| Alienware x15 RTX 3070 P111F | |
| Medio Intel Core i7-11800H (520 - 586, n=47) | |
| HP Victus 16-e0179ng | |
| Lenovo Legion 5 Pro 16ACH6H (82JQ001PGE) | |
| Lenovo Legion 5 Pro 16ACH6H (82JQ001PGE) | |
| HP Omen 15-en0375ng | |
| Cinebench R15 / CPU Multi 64Bit | |
| Media de la clase Gaming (1578 - 6330, n=102, últimos 2 años) | |
| Alienware x15 RTX 3070 P111F | |
| HP Omen 16-b0085ng | |
| MSI Katana GF66 11UG-220 | |
| MSI Katana GF66 11UG-220 | |
| Lenovo Legion 5 Pro 16ACH6H (82JQ001PGE) | |
| HP Victus 16-e0179ng | |
| HP Omen 15-en0375ng | |
| Medio Intel Core i7-11800H (1342 - 2173, n=50) | |
| Cinebench R15 / CPU Single 64Bit | |
| Media de la clase Gaming (188.8 - 350, n=103, últimos 2 años) | |
| HP Victus 16-e0179ng | |
| Lenovo Legion 5 Pro 16ACH6H (82JQ001PGE) | |
| Lenovo Legion 5 Pro 16ACH6H (82JQ001PGE) | |
| MSI Katana GF66 11UG-220 | |
| MSI Katana GF66 11UG-220 | |
| HP Omen 16-b0085ng | |
| Alienware x15 RTX 3070 P111F | |
| Medio Intel Core i7-11800H (201 - 231, n=46) | |
| HP Omen 15-en0375ng | |
| Blender / v2.79 BMW27 CPU | |
| MSI Katana GF66 11UG-220 | |
| Medio Intel Core i7-11800H (217 - 454, n=46) | |
| HP Omen 15-en0375ng | |
| HP Victus 16-e0179ng | |
| Lenovo Legion 5 Pro 16ACH6H (82JQ001PGE) | |
| Lenovo Legion 5 Pro 16ACH6H (82JQ001PGE) | |
| HP Omen 16-b0085ng | |
| Alienware x15 RTX 3070 P111F | |
| Media de la clase Gaming (79 - 330, n=101, últimos 2 años) | |
| 7-Zip 18.03 / 7z b 4 | |
| Media de la clase Gaming (33491 - 148086, n=102, últimos 2 años) | |
| HP Victus 16-e0179ng | |
| Lenovo Legion 5 Pro 16ACH6H (82JQ001PGE) | |
| Lenovo Legion 5 Pro 16ACH6H (82JQ001PGE) | |
| HP Omen 16-b0085ng | |
| Alienware x15 RTX 3070 P111F | |
| HP Omen 15-en0375ng | |
| Medio Intel Core i7-11800H (33718 - 56758, n=46) | |
| MSI Katana GF66 11UG-220 | |
| 7-Zip 18.03 / 7z b 4 -mmt1 | |
| Media de la clase Gaming (4824 - 7436, n=102, últimos 2 años) | |
| HP Omen 16-b0085ng | |
| HP Victus 16-e0179ng | |
| MSI Katana GF66 11UG-220 | |
| Lenovo Legion 5 Pro 16ACH6H (82JQ001PGE) | |
| Lenovo Legion 5 Pro 16ACH6H (82JQ001PGE) | |
| Medio Intel Core i7-11800H (5138 - 5732, n=46) | |
| Alienware x15 RTX 3070 P111F | |
| HP Omen 15-en0375ng | |
| Geekbench 5.5 / Multi-Core | |
| Media de la clase Gaming (6460 - 28263, n=102, últimos 2 años) | |
| HP Omen 16-b0085ng | |
| Medio Intel Core i7-11800H (4655 - 9851, n=40) | |
| Lenovo Legion 5 Pro 16ACH6H (82JQ001PGE) | |
| Lenovo Legion 5 Pro 16ACH6H (82JQ001PGE) | |
| HP Omen 15-en0375ng | |
| HP Victus 16-e0179ng | |
| MSI Katana GF66 11UG-220 | |
| Geekbench 5.5 / Single-Core | |
| Media de la clase Gaming (1403 - 2474, n=102, últimos 2 años) | |
| HP Omen 16-b0085ng | |
| MSI Katana GF66 11UG-220 | |
| Medio Intel Core i7-11800H (1429 - 1625, n=40) | |
| HP Victus 16-e0179ng | |
| Lenovo Legion 5 Pro 16ACH6H (82JQ001PGE) | |
| Lenovo Legion 5 Pro 16ACH6H (82JQ001PGE) | |
| HP Omen 15-en0375ng | |
| HWBOT x265 Benchmark v2.2 / 4k Preset | |
| Media de la clase Gaming (11.5 - 44.4, n=102, últimos 2 años) | |
| HP Omen 16-b0085ng | |
| Alienware x15 RTX 3070 P111F | |
| Lenovo Legion 5 Pro 16ACH6H (82JQ001PGE) | |
| Lenovo Legion 5 Pro 16ACH6H (82JQ001PGE) | |
| HP Victus 16-e0179ng | |
| Medio Intel Core i7-11800H (7.38 - 17.4, n=46) | |
| HP Omen 15-en0375ng | |
| MSI Katana GF66 11UG-220 | |
| LibreOffice / 20 Documents To PDF | |
| Lenovo Legion 5 Pro 16ACH6H (82JQ001PGE) | |
| Lenovo Legion 5 Pro 16ACH6H (82JQ001PGE) | |
| HP Omen 15-en0375ng | |
| HP Victus 16-e0179ng | |
| Media de la clase Gaming (33.2 - 88.8, n=102, últimos 2 años) | |
| MSI Katana GF66 11UG-220 | |
| Alienware x15 RTX 3070 P111F | |
| Medio Intel Core i7-11800H (38.6 - 59.9, n=45) | |
| HP Omen 16-b0085ng | |
| R Benchmark 2.5 / Overall mean | |
| HP Omen 15-en0375ng | |
| Alienware x15 RTX 3070 P111F | |
| Medio Intel Core i7-11800H (0.548 - 0.615, n=46) | |
| Lenovo Legion 5 Pro 16ACH6H (82JQ001PGE) | |
| Lenovo Legion 5 Pro 16ACH6H (82JQ001PGE) | |
| HP Omen 16-b0085ng | |
| MSI Katana GF66 11UG-220 | |
| HP Victus 16-e0179ng | |
| Media de la clase Gaming (0.3439 - 0.59, n=102, últimos 2 años) | |
* ... más pequeño es mejor
Rendimiento del sistema

El Omen 16 logra buenos resultados de rendimiento del sistema (PCMark 10) y consigue situarse en primer lugar en las categorías general y Essentials.
Dicho esto, las diferencias son relativamente menores
| PCMark 10 / Score | |
| Media de la clase Gaming (5828 - 12414, n=93, últimos 2 años) | |
| HP Omen 16-b0085ng | |
| Alienware x15 RTX 3070 P111F | |
| Medio Intel Core i7-11800H, NVIDIA GeForce RTX 3070 Laptop GPU (6126 - 7311, n=11) | |
| Lenovo Legion 5 Pro 16ACH6H (82JQ001PGE) | |
| MSI Katana GF66 11UG-220 | |
| HP Victus 16-e0179ng | |
| HP Omen 15-en0375ng | |
| PCMark 10 / Essentials | |
| HP Omen 16-b0085ng | |
| Media de la clase Gaming (8810 - 11935, n=97, últimos 2 años) | |
| Alienware x15 RTX 3070 P111F | |
| Medio Intel Core i7-11800H, NVIDIA GeForce RTX 3070 Laptop GPU (9248 - 10832, n=11) | |
| HP Victus 16-e0179ng | |
| Lenovo Legion 5 Pro 16ACH6H (82JQ001PGE) | |
| MSI Katana GF66 11UG-220 | |
| HP Omen 15-en0375ng | |
| PCMark 10 / Productivity | |
| Media de la clase Gaming (6845 - 25323, n=95, últimos 2 años) | |
| MSI Katana GF66 11UG-220 | |
| Medio Intel Core i7-11800H, NVIDIA GeForce RTX 3070 Laptop GPU (8571 - 9669, n=11) | |
| Alienware x15 RTX 3070 P111F | |
| HP Omen 16-b0085ng | |
| HP Victus 16-e0179ng | |
| Lenovo Legion 5 Pro 16ACH6H (82JQ001PGE) | |
| HP Omen 15-en0375ng | |
| PCMark 10 / Digital Content Creation | |
| Media de la clase Gaming (7602 - 19954, n=95, últimos 2 años) | |
| Alienware x15 RTX 3070 P111F | |
| HP Omen 16-b0085ng | |
| Medio Intel Core i7-11800H, NVIDIA GeForce RTX 3070 Laptop GPU (7627 - 10851, n=11) | |
| Lenovo Legion 5 Pro 16ACH6H (82JQ001PGE) | |
| MSI Katana GF66 11UG-220 | |
| HP Victus 16-e0179ng | |
| HP Omen 15-en0375ng | |
| PCMark 10 Score | 7231 puntos | |
ayuda | ||
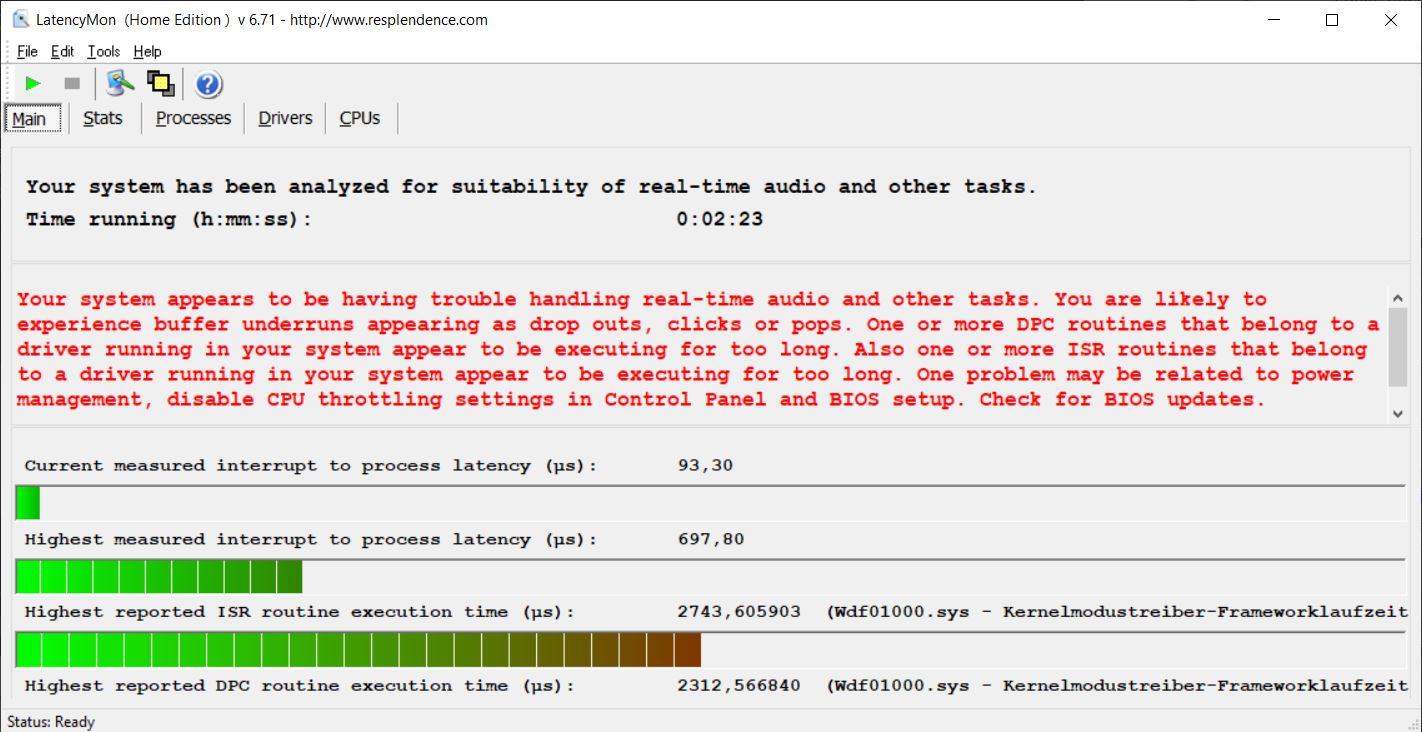
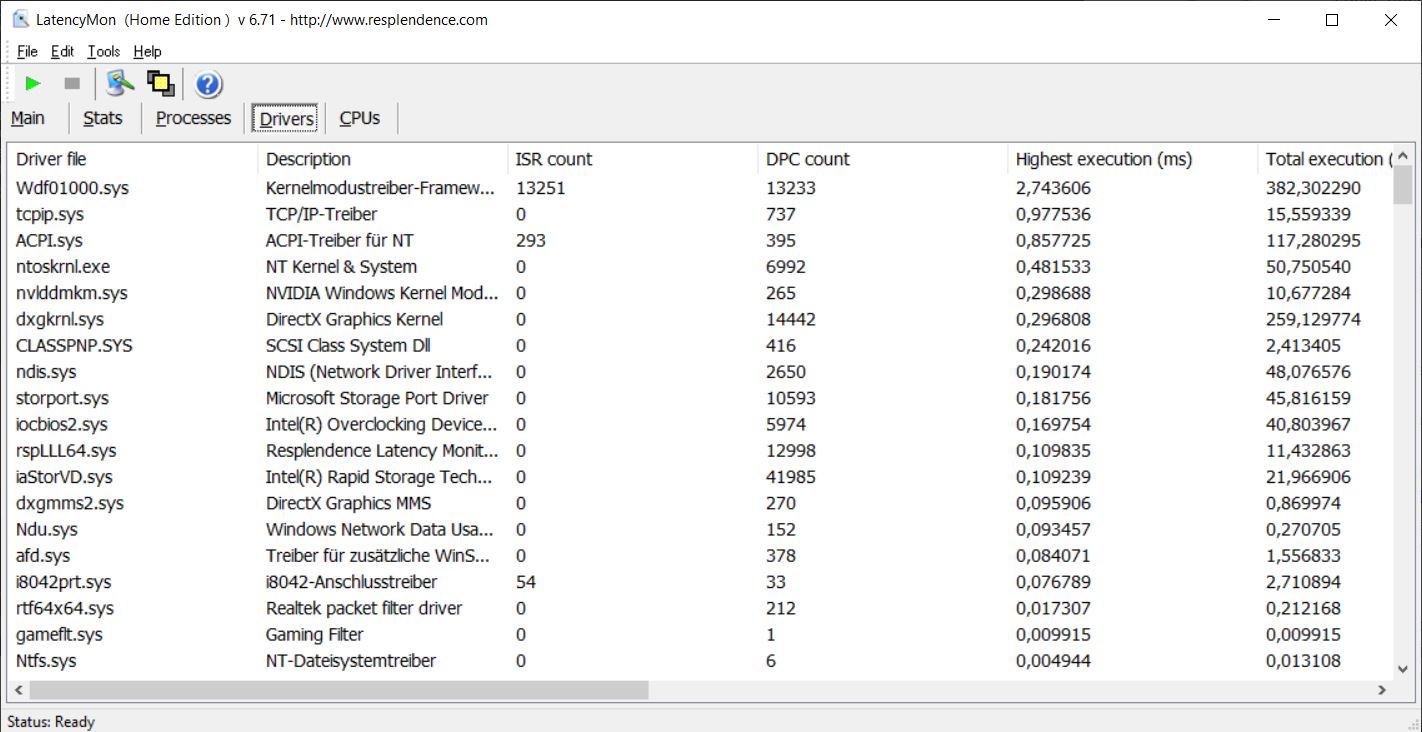
Latencias del CPD
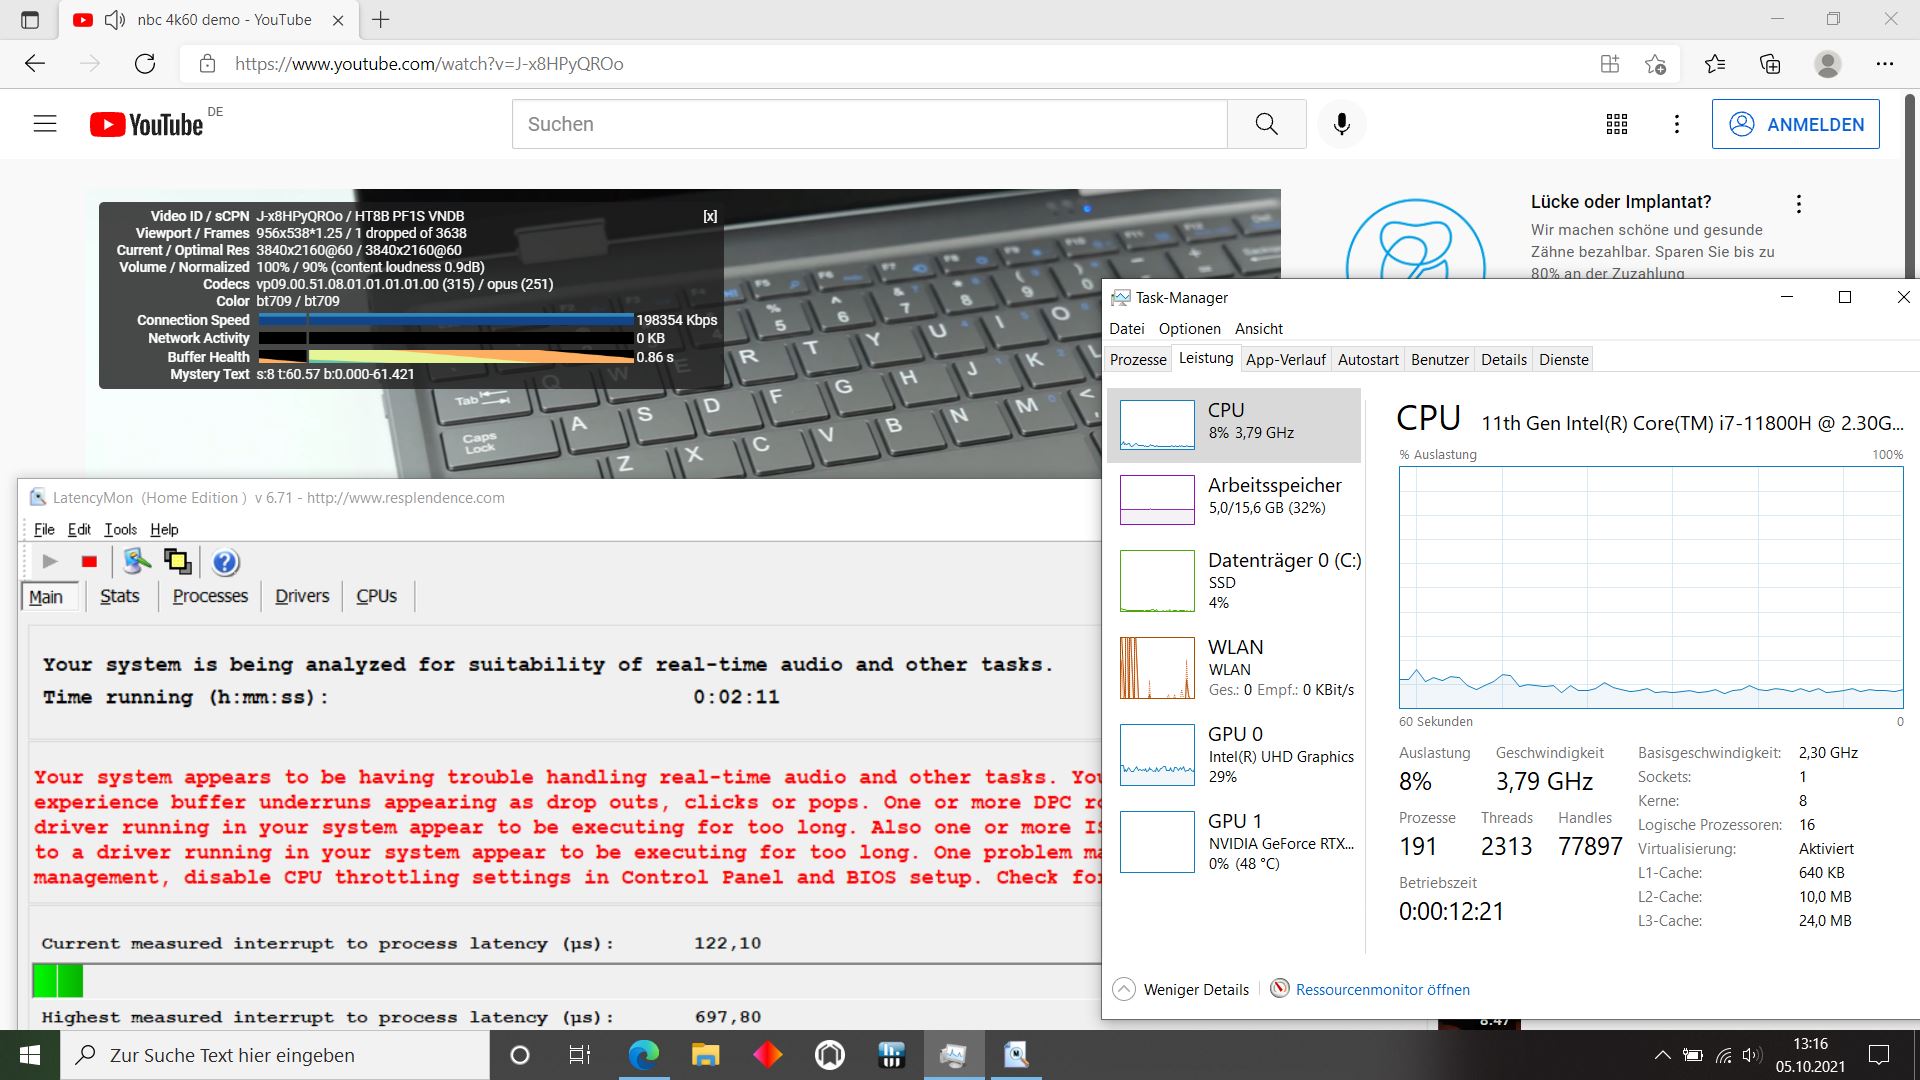
Incluso el mero hecho de abrir nuestra página de inicio en el navegador Edge provoca latencias de CPD problemáticas según LatencyMon. Al menos sólo se cayó 1 fotograma al reproducir nuestro vídeo de YouTube a 4K60FPS. Esperamos que HP revise sus controladores y lance versiones actualizadas
| DPC Latencies / LatencyMon - interrupt to process latency (max), Web, Youtube, Prime95 | |
| HP Omen 16-b0085ng | |
* ... más pequeño es mejor
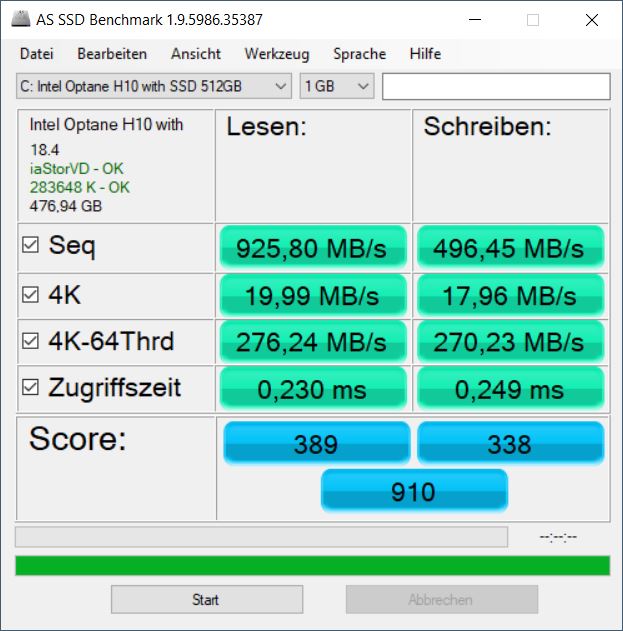
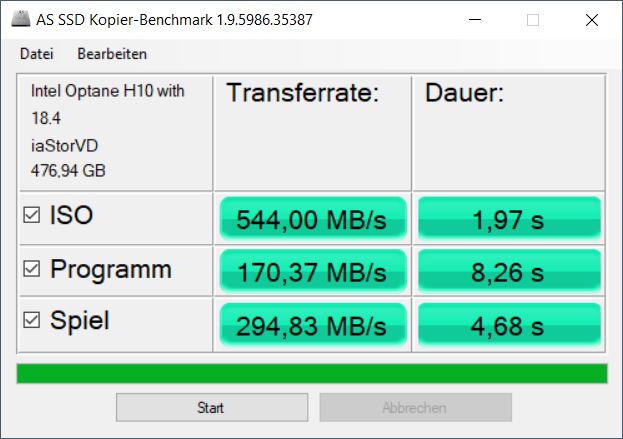
Solución de almacenamiento
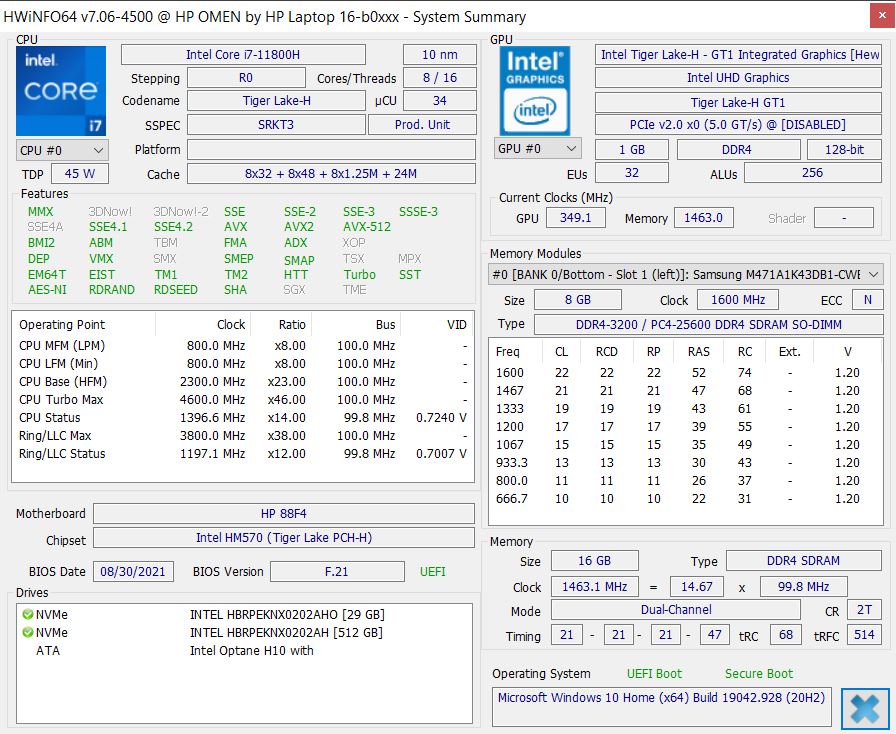
En cuanto a la solución de almacenamiento, nuestro dispositivo de pruebas usa una solución combinada que consiste en la memoria Intel Optane H10 de 32 GB + 512 GB. Los 32 GB de caché Optane sólo son ventajosos tras repetidas ejecuciones de la misma carga de trabajo y el SSD de Intel no rinde precisamente de forma espectacular por lo demás - algunos competidores son hasta el doble de rápidos
Teniendo esto en cuenta, los excelentes resultados de rendimiento del sistema son algo sorprendentes. Quizás, la memoria Optane ultrarrápida es capaz de compensar las desventajas de rendimiento del SSD primario instalado. En nuestra Tabla HDD/SSDlas pobres mediciones sintéticas del SSD lo sitúan en el puesto 262
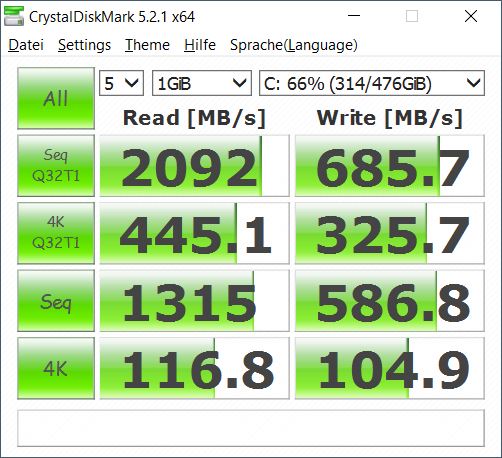
| HP Omen 16-b0085ng Intel Optane Memory H10 with Solid State Storage 32GB + 512GB HBRPEKNX0202A(L/H) | HP Omen 15-en0375ng WDC PC SN730 SDBPNTY-512G | HP Victus 16-e0179ng WDC PC SN730 SDBPNTY-1T00 | Lenovo Legion 5 Pro 16ACH6H (82JQ001PGE) WDC PC SN730 SDBPNTY-1T00 | Alienware x15 RTX 3070 P111F WDC PC SN730 SDBPNTY-512G | MSI Katana GF66 11UG-220 Kingston OM8PDP3512B-AI1 | Medio Intel Optane Memory H10 with Solid State Storage 32GB + 512GB HBRPEKNX0202A(L/H) | |
|---|---|---|---|---|---|---|---|
| CrystalDiskMark 5.2 / 6 | 96% | 113% | 57% | 89% | -14% | 13% | |
| Write 4K (MB/s) | 104.9 | 119.6 14% | 157.3 50% | 89.9 -14% | 179.6 71% | 138.2 32% | 110.3 ? 5% |
| Read 4K (MB/s) | 116.8 | 47.4 -59% | 49 -58% | 30.98 -73% | 49.21 -58% | 31.31 -73% | 131.9 ? 13% |
| Write Seq (MB/s) | 587 | 2677 356% | 2983 408% | 2062 251% | 459.3 -22% | 569 ? -3% | |
| Read Seq (MB/s) | 1316 | 2220 69% | 2247 71% | 1849 41% | 1283 -3% | 1372 ? 4% | |
| Write 4K Q32T1 (MB/s) | 325.7 | 427.4 31% | 395 21% | 371.6 14% | 462.9 42% | 321 -1% | 387 ? 19% |
| Read 4K Q32T1 (MB/s) | 445.1 | 549 23% | 557 25% | 470.6 6% | 470.2 6% | 394.5 -11% | 375 ? -16% |
| Write Seq Q32T1 (MB/s) | 686 | 2706 294% | 3094 351% | 3065 347% | 2702 294% | 436 -36% | 1141 ? 66% |
| Read Seq Q32T1 (MB/s) | 2092 | 2869 37% | 2871 37% | 3370 61% | 3371 61% | 2222 6% | 2439 ? 17% |
| Write 4K Q8T8 (MB/s) | 1619 | ||||||
| Read 4K Q8T8 (MB/s) | 1670 | ||||||
| AS SSD | 377% | 377% | 176% | 249% | 48% | 119% | |
| Seq Read (MB/s) | 925 | 2255 144% | 2383 158% | 2695 191% | 2871 210% | 1978 114% | 1056 ? 14% |
| Seq Write (MB/s) | 496 | 2129 329% | 2466 397% | 2384 381% | 1511 205% | 308.3 -38% | 429 ? -14% |
| 4K Read (MB/s) | 19.99 | 49.5 148% | 44.14 121% | 29.75 49% | 44.3 122% | 24.04 20% | 61.9 ? 210% |
| 4K Write (MB/s) | 17.96 | 175.1 875% | 117.5 554% | 52 190% | 162 802% | 113.7 533% | 105 ? 485% |
| 4K-64 Read (MB/s) | 276.2 | 1463 430% | 1734 528% | 1193 332% | 1038 276% | 256.5 -7% | 459 ? 66% |
| 4K-64 Write (MB/s) | 270.2 | 2061 663% | 2088 673% | 1107 310% | 966 258% | 242.8 -10% | 644 ? 138% |
| Access Time Read * (ms) | 0.23 | 0.138 40% | 0.049 79% | 0.136 41% | 0.077 67% | 0.15 35% | 0.1019 ? 56% |
| Access Time Write * (ms) | 0.249 | 0.022 91% | 0.032 87% | 0.36 -45% | 0.066 73% | 0.353 -42% | 0.09417 ? 62% |
| Score Read (Points) | 389 | 1738 347% | 2017 419% | 1493 284% | 1370 252% | 478 23% | 627 ? 61% |
| Score Write (Points) | 338 | 2449 625% | 2452 625% | 1397 313% | 1279 278% | 387 14% | 792 ? 134% |
| Score Total (Points) | 910 | 5075 458% | 5503 505% | 3636 300% | 3288 261% | 1033 14% | 1732 ? 90% |
| Copy ISO MB/s (MB/s) | 544 | 1007 85% | 1962 261% | 278.1 -49% | 782 ? 44% | ||
| Copy Program MB/s (MB/s) | 170.4 | 43.11 -75% | 407.9 139% | 282.3 66% | 464 ? 172% | ||
| Copy Game MB/s (MB/s) | 294.8 | 621 111% | 1105 275% | 284.2 -4% | 722 ? 145% | ||
| Media total (Programa/Opciones) | 237% /
259% | 245% /
266% | 117% /
140% | 169% /
190% | 17% /
26% | 66% /
80% |
* ... más pequeño es mejor

Dauerleistung Lesen: DiskSpd Read Loop, Queue Depth 8
Rendimiento de la GPU
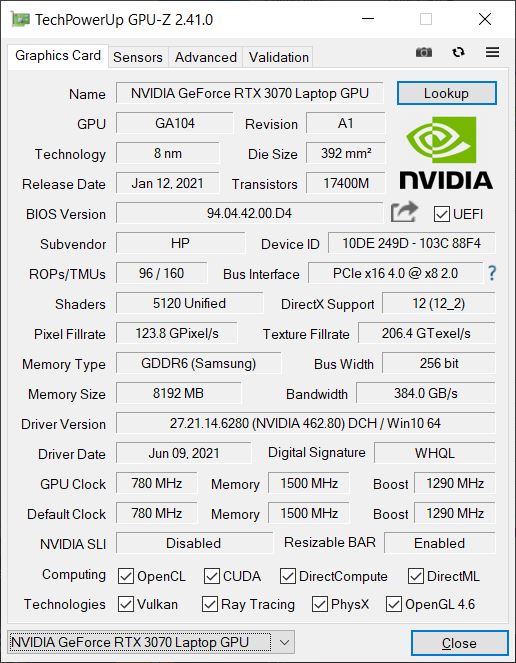
En modo híbrido, la integrada UHD Graphics y la dedicada NVIDIA GeForce RTX 3070 dedicada para portátiles con 8 GB de VRAM se turnan en función de la carga. El TGP de esta última está ajustado a 115 W. Con un espectro posible de 80 W a 125 W pertenece a la categoría de alto rendimiento. Como alternativa, también está disponible un Omen 16 con una RTX 3060
Los resultados 3DMark del Omen 16 son buenos y muy similares a los del Alienware y el Legion 5 Pro. Mientras tanto, la RTX 3060 del HP Victus es un 30% más lenta
En modo batería, el rendimiento gráfico del sistema cae un 64%
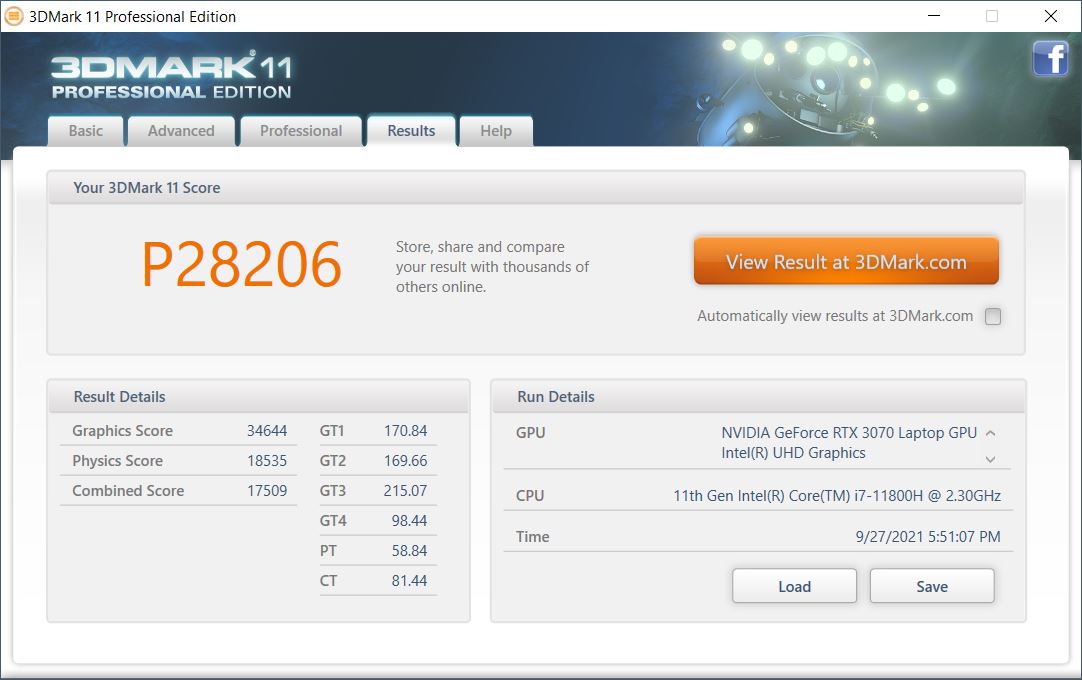
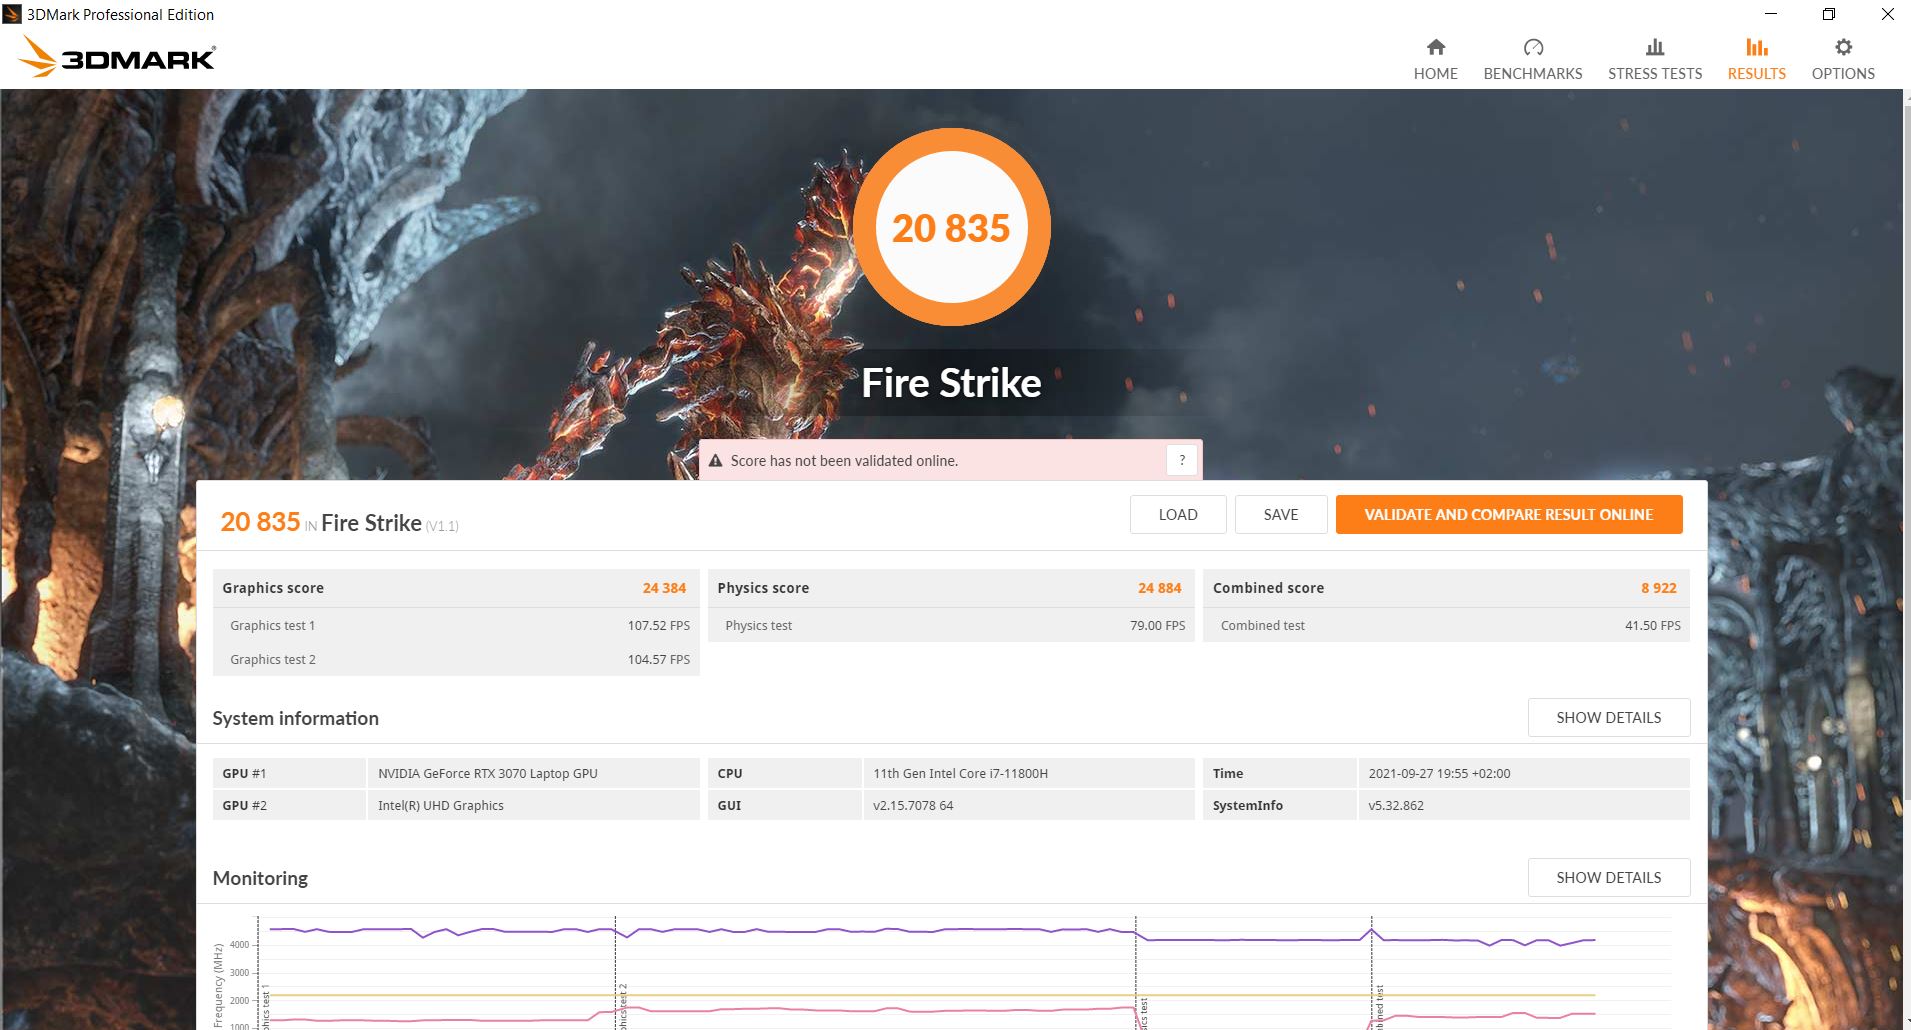
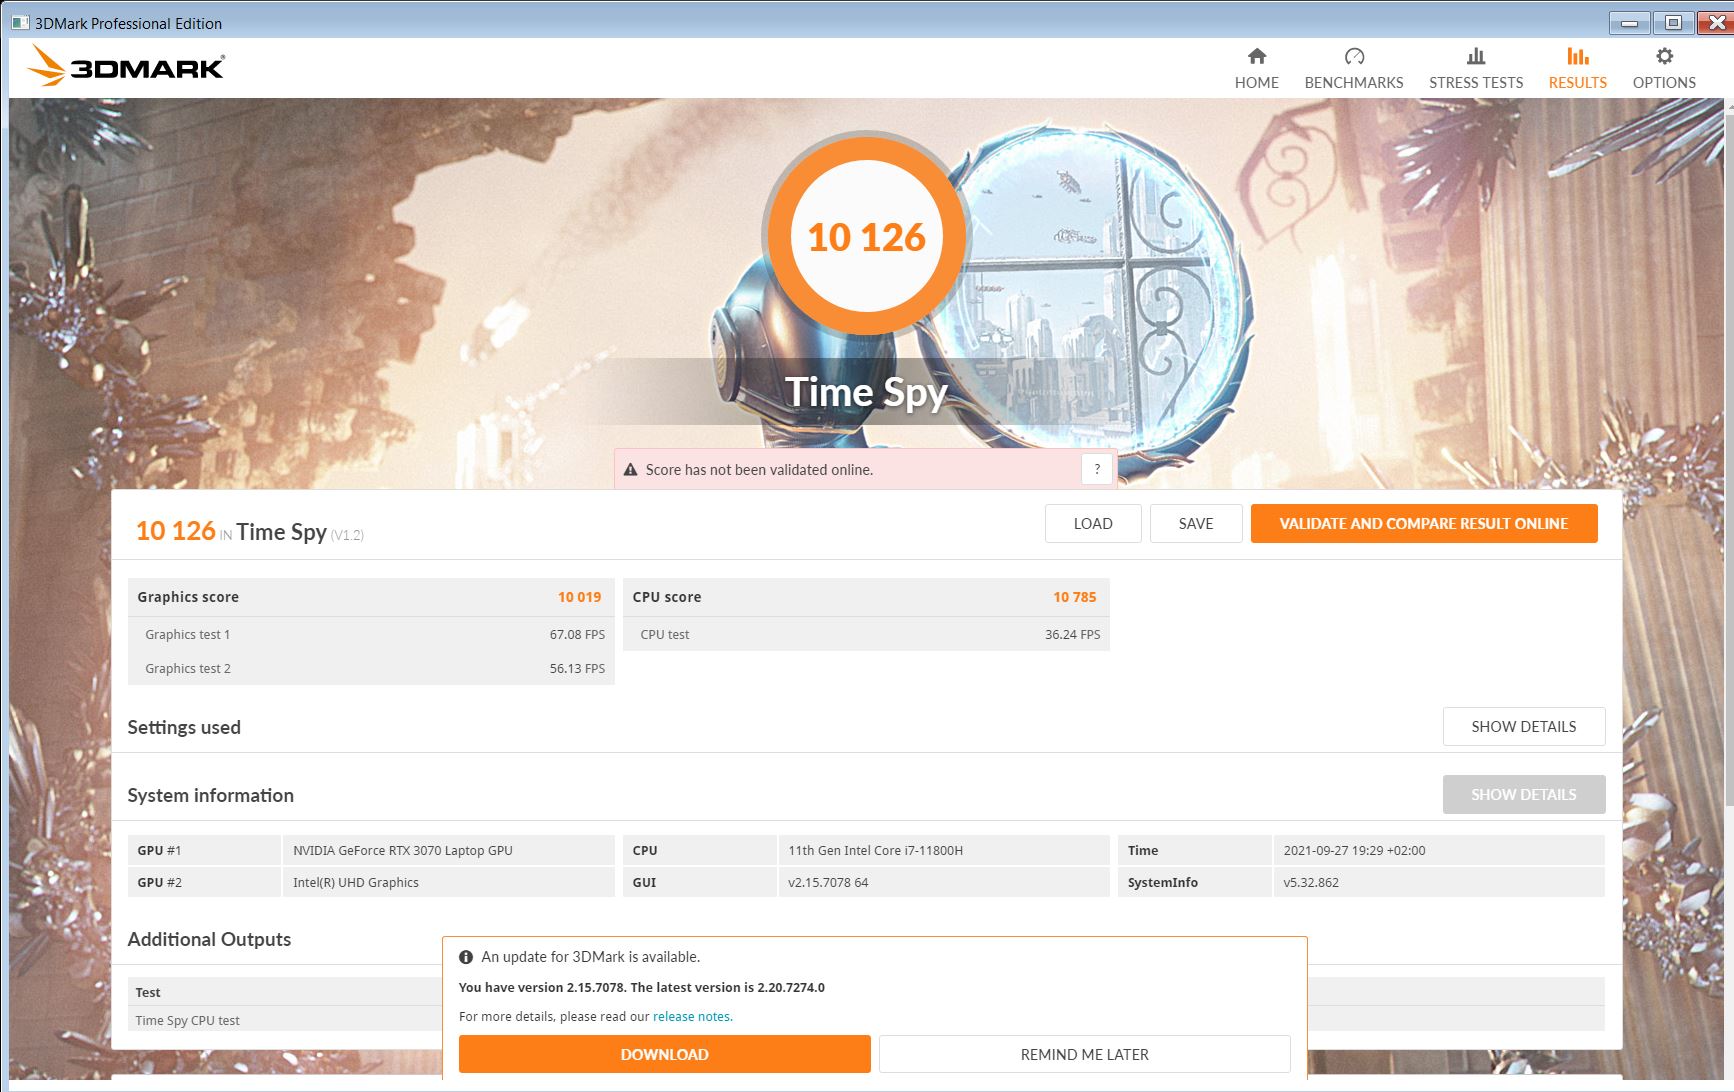
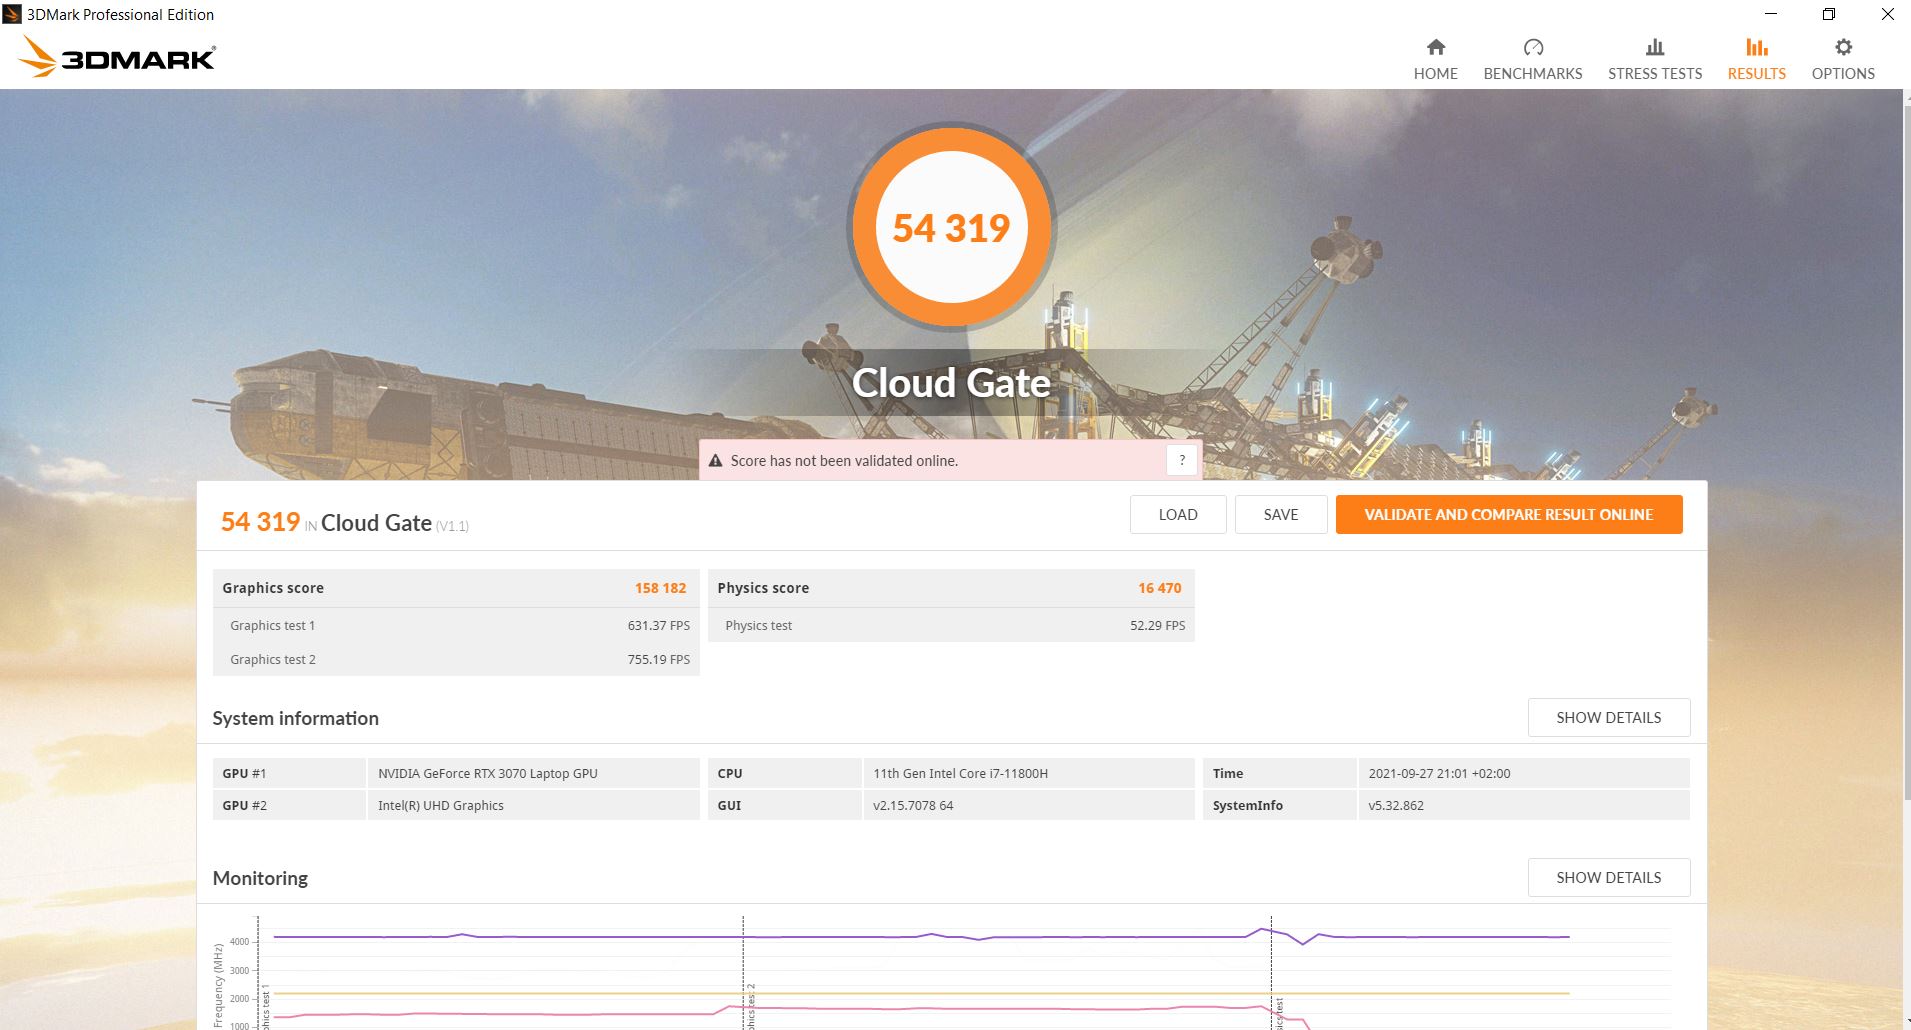
| 3DMark 11 Performance | 28206 puntos | |
| 3DMark Cloud Gate Standard Score | 54319 puntos | |
| 3DMark Fire Strike Score | 20835 puntos | |
| 3DMark Time Spy Score | 10126 puntos | |
ayuda | ||
Rendimiento de los juegos
El Omen 16 es un peso pesado cuando se trata de nuestros benchmarks de juegos y compite por el primer lugar con el Alienware. Sin embargo, este último tiende a superar a nuestro Omen 16 por un pequeño margen, sobre todo en resoluciones y ajustes de calidad más altos
| New World | |
| 1920x1080 Low Video Quality | |
| HP Omen 16-b0085ng | |
| Medio NVIDIA GeForce RTX 3070 Laptop GPU (99.8 - 120.5, n=3) | |
| 1920x1080 Medium Video Quality | |
| HP Omen 16-b0085ng | |
| Medio NVIDIA GeForce RTX 3070 Laptop GPU (84.6 - 96.8, n=4) | |
| 1920x1080 High Video Quality | |
| HP Omen 16-b0085ng | |
| Medio NVIDIA GeForce RTX 3070 Laptop GPU (81.7 - 94.8, n=4) | |
| 1920x1080 Very High Video Quality | |
| Medio NVIDIA GeForce RTX 3070 Laptop GPU (79.4 - 86.8, n=4) | |
| HP Omen 16-b0085ng | |
Durante nuestra prueba de 60 minutos Witcher 3 de prueba en reposo, las velocidades de fotogramas no son totalmente constantes. Aquí, el rendimiento fluctúa ligeramente, aunque el gráfico no muestra una disminución significativa del rendimiento a largo plazo
Witcher 3 FPS-Diagramm
| bajo | medio | alto | ultra | |
|---|---|---|---|---|
| GTA V (2015) | 185 | 181 | 172 | 103 |
| The Witcher 3 (2015) | 416 | 304.5 | 184.4 | 98.6 |
| Dota 2 Reborn (2015) | 171 | 151 | 145 | 137 |
| X-Plane 11.11 (2018) | 136 | 121 | 96.7 | |
| Far Cry 5 (2018) | 156 | 129 | 123 | 115 |
| Strange Brigade (2018) | 482 | 254 | 205 | 178 |
| Shadow of the Tomb Raider (2018) | 159 | 140 | 135 | 126 |
| New World (2021) | 128 | 96.8 | 94.8 | 81.8 |
Emisiones: no se pueden ignorar los fuertes presagios
Ruido del sistema
En el modo híbrido, los ventiladores tienden a no encenderse durante la inactividad del sistema. Después de seleccionar el modo de rendimiento desde el software Gaming Hub, los ventiladores giran casi siempre, pero no siempre, en silencio. Bajo carga, ambos ventiladores se vuelven muy ruidosos con niveles de ruido que superan los de la competencia. Sin embargo, subjetivamente, el portátil no es notablemente más ruidoso que sus competidores.
Dicho esto, hay un poco de silbido de la bobina que se produce de forma esporádica. Esto parece coincidir con los escenarios de alta carga como el lanzamiento Witcher 3 a altas resoluciones y ajustes de calidad. Afortunadamente, los ruidos electrónicos relativamente silenciosos son temporales y sólo se notan a veces
Ruido
| Ocioso |
| 23 / 23 / 34.81 dB(A) |
| Carga |
| 35.02 / 56 dB(A) |
 | ||
30 dB silencioso 40 dB(A) audible 50 dB(A) ruidosamente alto |
||
min: | ||
| HP Omen 16-b0085ng GeForce RTX 3070 Laptop GPU, i7-11800H, Intel Optane Memory H10 with Solid State Storage 32GB + 512GB HBRPEKNX0202A(L/H) | HP Omen 15-en0375ng GeForce RTX 2060 Mobile, R7 4800H, WDC PC SN730 SDBPNTY-512G | HP Victus 16-e0179ng GeForce RTX 3060 Laptop GPU, R7 5800H, WDC PC SN730 SDBPNTY-1T00 | Lenovo Legion 5 Pro 16ACH6H (82JQ001PGE) GeForce RTX 3070 Laptop GPU, R7 5800H, WDC PC SN730 SDBPNTY-1T00 | Alienware x15 RTX 3070 P111F GeForce RTX 3070 Laptop GPU, i7-11800H, WDC PC SN730 SDBPNTY-512G | MSI Katana GF66 11UG-220 GeForce RTX 3070 Laptop GPU, i7-11800H, Kingston OM8PDP3512B-AI1 | |
|---|---|---|---|---|---|---|
| Noise | -5% | -4% | 4% | 1% | -18% | |
| apagado / medio ambiente * (dB) | 23 | 24 -4% | 24 -4% | 23 -0% | 24.1 -5% | 25 -9% |
| Idle Minimum * (dB) | 23 | 24 -4% | 24 -4% | 25 -9% | 26.6 -16% | 34 -48% |
| Idle Average * (dB) | 23 | 25 -9% | 25 -9% | 25 -9% | 26.6 -16% | 35 -52% |
| Idle Maximum * (dB) | 34.81 | 37 -6% | 34 2% | 25 28% | 26.6 24% | 36 -3% |
| Load Average * (dB) | 35.02 | 45 -28% | 44 -26% | 35.5 -1% | 30.9 12% | 48 -37% |
| Witcher 3 ultra * (dB) | 52 | 48 8% | 50 4% | 46.67 10% | 49.9 4% | 46 12% |
| Load Maximum * (dB) | 56 | 51 9% | 52 7% | 50.35 10% | 53.5 4% | 49 12% |
* ... más pequeño es mejor
Temperatura
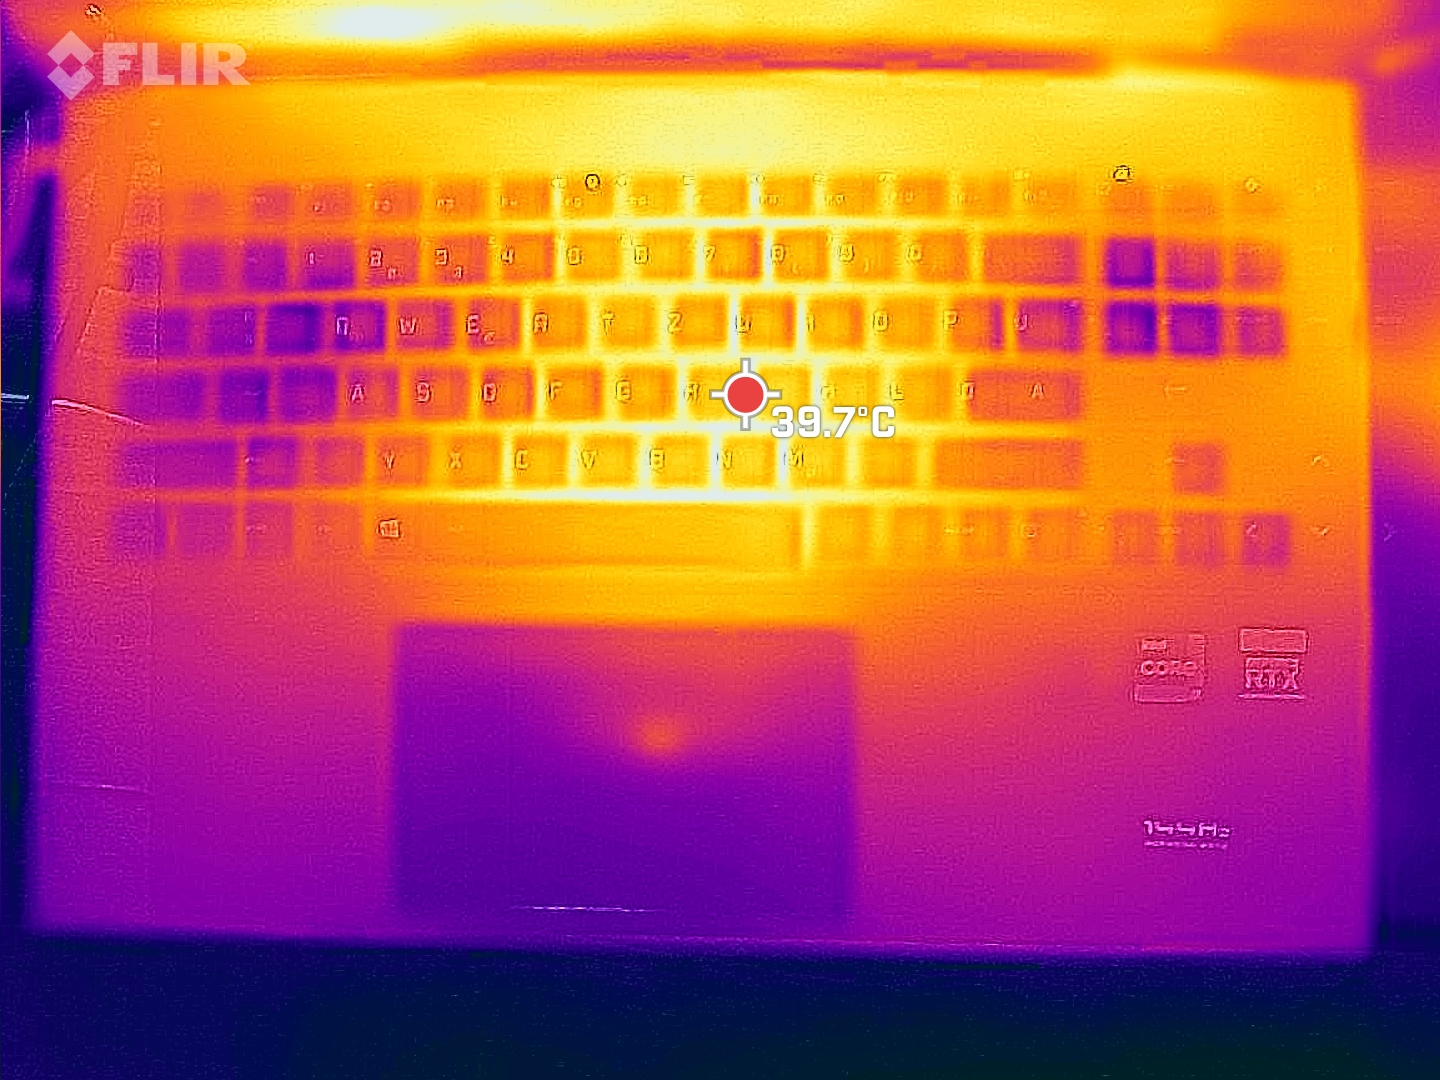
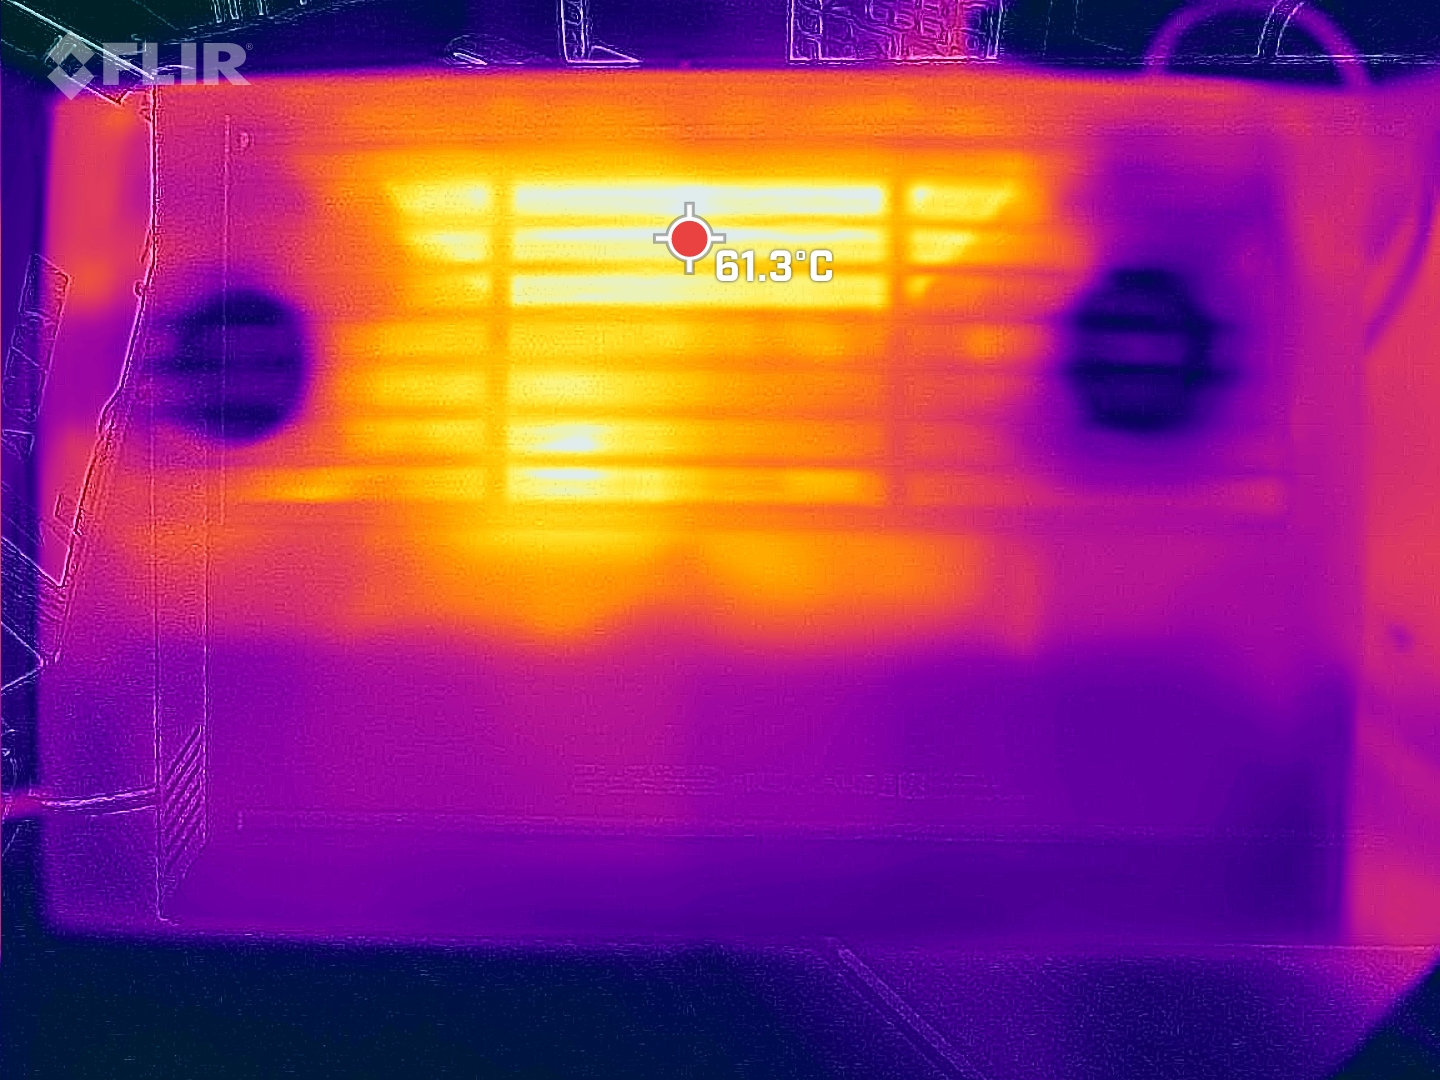
El Omen 16 se calienta principalmente en la parte inferior, donde las amplias rejillas sirven tanto de entrada como de salida de calor
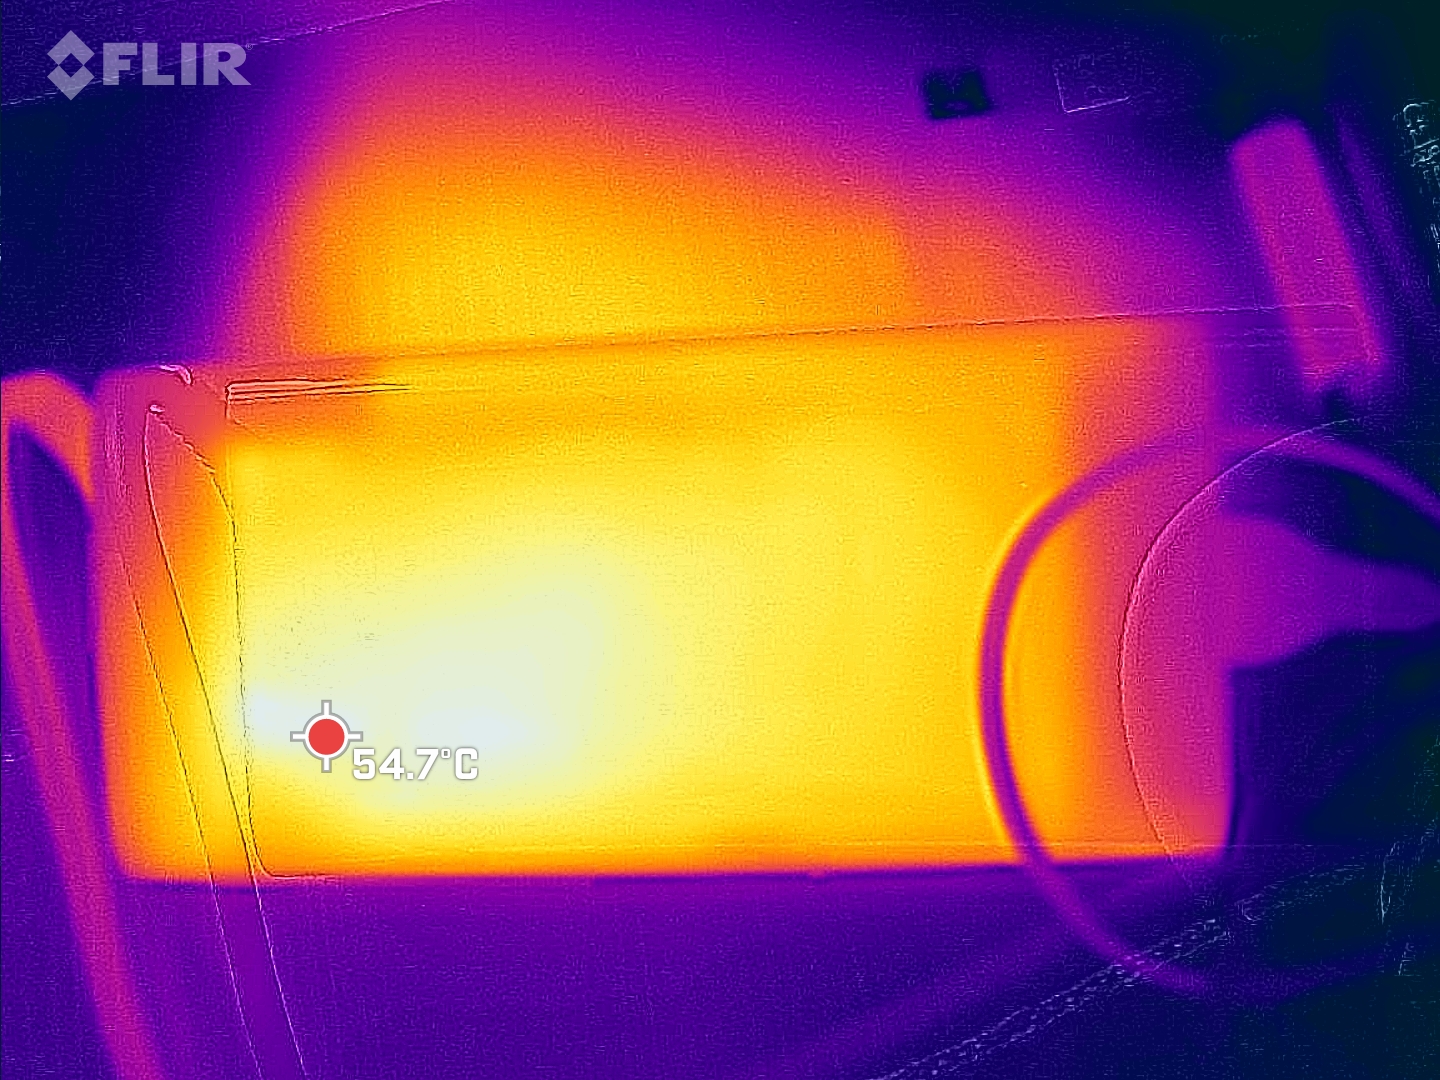
En la parte superior, el Omen se mantiene relativamente fresco. Los puntos calientes en la parte inferior alcanzan hasta los 55 C, lo que es bastante tranquilo en comparación. Aquí, la solución de refrigeración altamente dinámica con altos niveles de ruido bajo carga completa demuestra de lo que es capaz. A pesar de estar equipado con una solución de refrigeración aún más espaciosa, el Alienware alcanza temperaturas aún más altas, mientras que logra un rendimiento sólo marginalmente más rápido
Los reposamanos permanecen cómodamente frescos e incluso la temperatura de las teclas WASD es sorprendentemente baja. En este sentido, HP ha conseguido equilibrar la distribución del calor de una forma que debería hacer felices a los jugadores
(-) La temperatura máxima en la parte superior es de 48 °C / 118 F, frente a la media de 40.4 °C / 105 F, que oscila entre 21.2 y 68.8 °C para la clase Gaming.
(-) El fondo se calienta hasta un máximo de 55 °C / 131 F, frente a la media de 43.2 °C / 110 F
(+) En reposo, la temperatura media de la parte superior es de 30.9 °C / 88# F, frente a la media del dispositivo de 33.9 °C / 93 F.
(±) Jugando a The Witcher 3, la temperatura media de la parte superior es de 36.2 °C / 97 F, frente a la media del dispositivo de 33.9 °C / 93 F.
(+) Los reposamanos y el panel táctil alcanzan como máximo la temperatura de la piel (33 °C / 91.4 F) y, por tanto, no están calientes.
(-) La temperatura media de la zona del reposamanos de dispositivos similares fue de 28.8 °C / 83.8 F (-4.2 °C / -7.6 F).
| HP Omen 16-b0085ng GeForce RTX 3070 Laptop GPU, i7-11800H, Intel Optane Memory H10 with Solid State Storage 32GB + 512GB HBRPEKNX0202A(L/H) | HP Omen 15-en0375ng GeForce RTX 2060 Mobile, R7 4800H, WDC PC SN730 SDBPNTY-512G | HP Victus 16-e0179ng GeForce RTX 3060 Laptop GPU, R7 5800H, WDC PC SN730 SDBPNTY-1T00 | Lenovo Legion 5 Pro 16ACH6H (82JQ001PGE) GeForce RTX 3070 Laptop GPU, R7 5800H, WDC PC SN730 SDBPNTY-1T00 | Alienware x15 RTX 3070 P111F GeForce RTX 3070 Laptop GPU, i7-11800H, WDC PC SN730 SDBPNTY-512G | MSI Katana GF66 11UG-220 GeForce RTX 3070 Laptop GPU, i7-11800H, Kingston OM8PDP3512B-AI1 | |
|---|---|---|---|---|---|---|
| Heat | 14% | -11% | -1% | 3% | 3% | |
| Maximum Upper Side * (°C) | 48 | 42 12% | 51 -6% | 50 -4% | 59.2 -23% | 56 -17% |
| Maximum Bottom * (°C) | 55 | 54 2% | 52 5% | 55 -0% | 58 -5% | 49 11% |
| Idle Upper Side * (°C) | 33 | 28 15% | 46 -39% | 34 -3% | 28.4 14% | 36 -9% |
| Idle Bottom * (°C) | 39 | 29 26% | 41 -5% | 37 5% | 29 26% | 28 28% |
* ... más pequeño es mejor
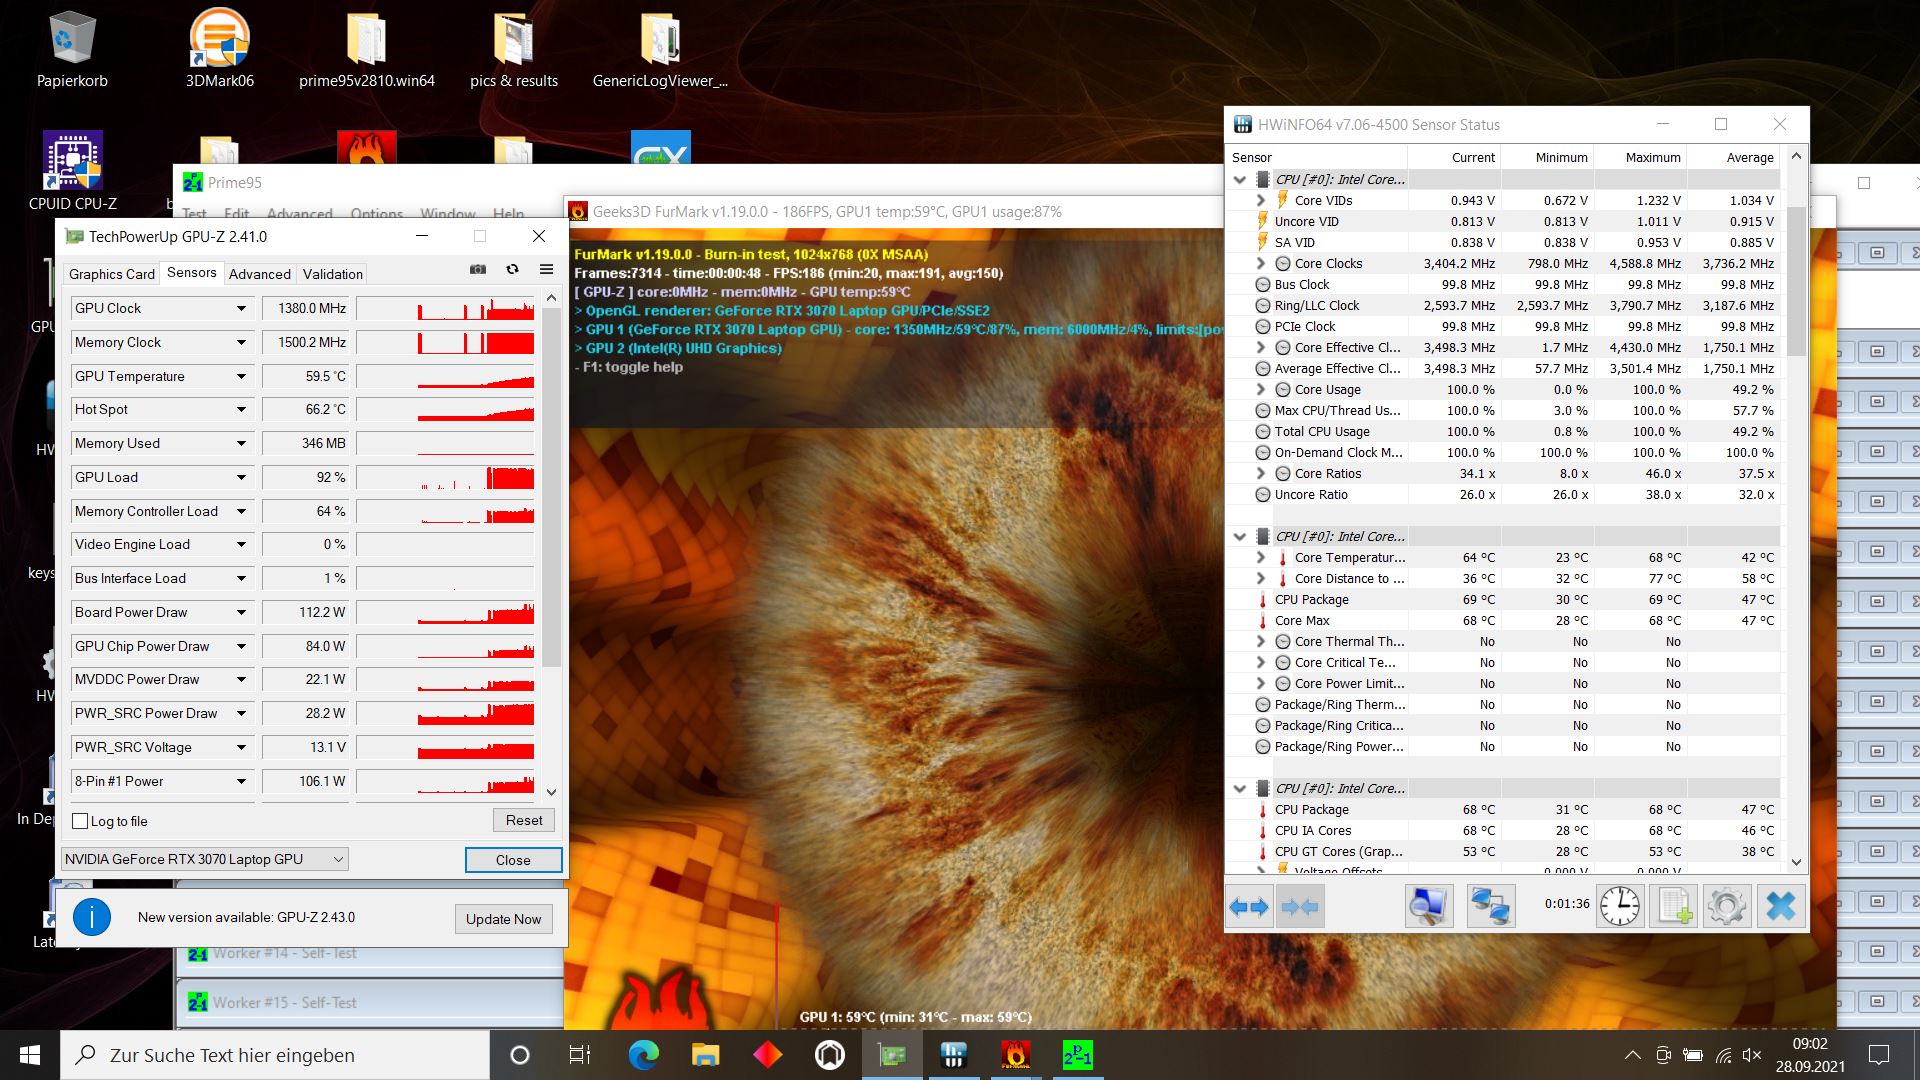
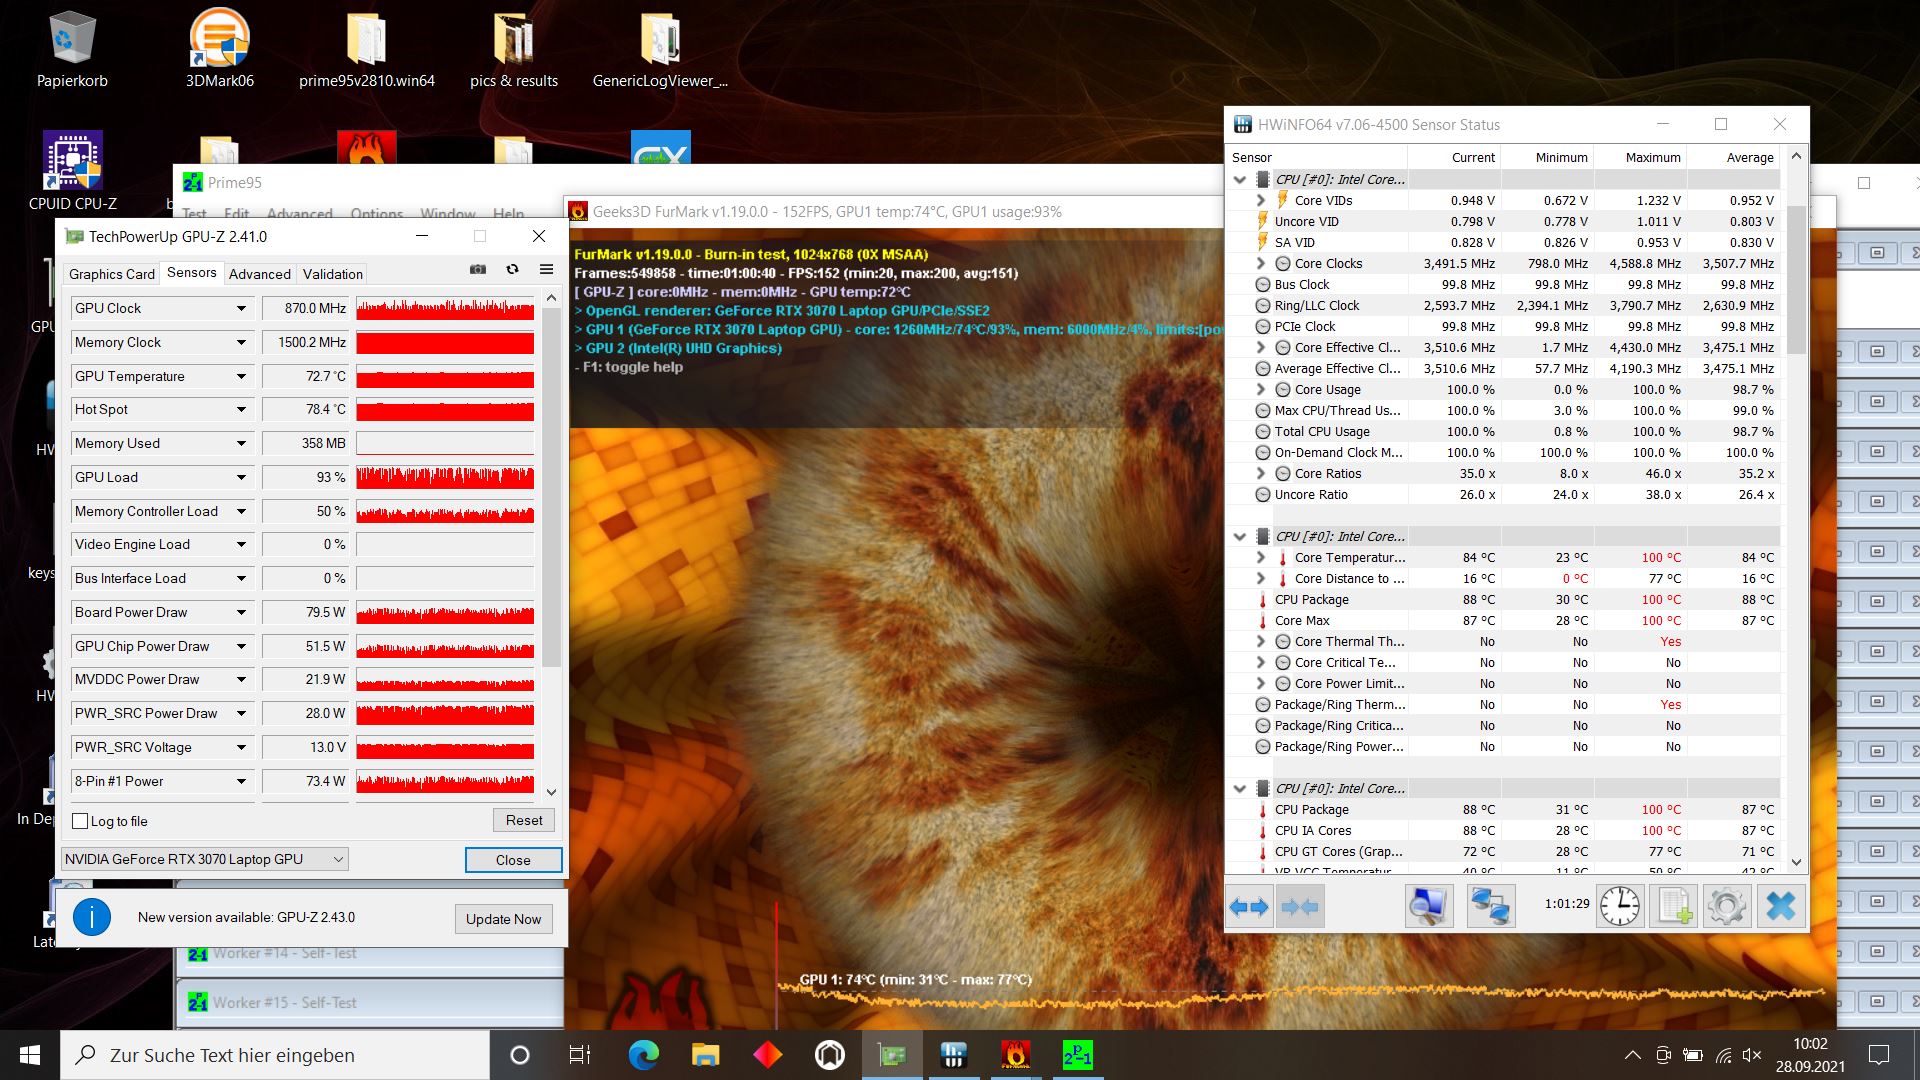
La CPU comienza nuestra prueba de estrés a aproximadamente 4,2 GHz. Después de menos de un minuto, la velocidad de reloj cae a 3,5 GHz. Este nivel de rendimiento se mantiene durante el resto de la prueba de estrés a pesar de las fluctuaciones de temperatura. La temperatura media es de 84 C, con breves picos temporales de hasta 100 C que pueden hacer que las velocidades de reloj disminuyan ligeramente y (más probablemente) que la solución de refrigeración se acelere
Por el contrario, la GPU realiza un gran número de ciclos durante toda la prueba de estrés, con velocidades de reloj registradas que oscilan entre los 690 y los 1.425 MHz, incluso después de que haya pasado una hora. Aparentemente, la GPU se ralentiza temporalmente al alcanzar los 75 C
Altavoces
Los altavoces estéreo son bastante potentes y ofrecen unos medios y agudos equilibrados. Naturalmente, les faltan los graves. La única salida analógica del portátil es una toma de auriculares combinada
HP Omen 16-b0085ng análisis de audio
(+) | los altavoces pueden reproducir a un volumen relativamente alto (#84.4 dB)
Graves 100 - 315 Hz
(-) | casi sin bajos - de media 17.4% inferior a la mediana
(±) | la linealidad de los graves es media (13.9% delta a frecuencia anterior)
Medios 400 - 2000 Hz
(+) | medios equilibrados - a sólo 3.2% de la mediana
(+) | los medios son lineales (2.9% delta a la frecuencia anterior)
Altos 2 - 16 kHz
(+) | máximos equilibrados - a sólo 1.5% de la mediana
(+) | los máximos son lineales (3.9% delta a la frecuencia anterior)
Total 100 - 16.000 Hz
(+) | el sonido global es lineal (12.1% de diferencia con la mediana)
En comparación con la misma clase
» 12% de todos los dispositivos probados de esta clase eran mejores, 4% similares, 84% peores
» El mejor tuvo un delta de 6%, la media fue 18%, el peor fue ###max##%
En comparación con todos los dispositivos probados
» 10% de todos los dispositivos probados eran mejores, 2% similares, 88% peores
» El mejor tuvo un delta de 4%, la media fue 23%, el peor fue ###max##%
Lenovo Legion 5 Pro 16ACH6H (82JQ001PGE) análisis de audio
(±) | la sonoridad del altavoz es media pero buena (76.1 dB)
Graves 100 - 315 Hz
(±) | lubina reducida - en promedio 10.8% inferior a la mediana
(±) | la linealidad de los graves es media (14.7% delta a frecuencia anterior)
Medios 400 - 2000 Hz
(±) | medias más altas - de media 6.7% más altas que la mediana
(±) | la linealidad de los medios es media (7.8% delta respecto a la frecuencia anterior)
Altos 2 - 16 kHz
(±) | máximos reducidos - de media 5.2% inferior a la mediana
(±) | la linealidad de los máximos es media (8.6% delta a frecuencia anterior)
Total 100 - 16.000 Hz
(±) | la linealidad del sonido global es media (17.4% de diferencia con la mediana)
En comparación con la misma clase
» 48% de todos los dispositivos probados de esta clase eran mejores, 12% similares, 40% peores
» El mejor tuvo un delta de 6%, la media fue 18%, el peor fue ###max##%
En comparación con todos los dispositivos probados
» 33% de todos los dispositivos probados eran mejores, 8% similares, 58% peores
» El mejor tuvo un delta de 4%, la media fue 23%, el peor fue ###max##%
Gestión de la energía - Buena duración de la batería
Consumo de energía
En reposo, los competidores equipados de forma similar muestran valores de consumo similares, con el Alienware consumiendo un poco más y el Lenovo Legion Pro consumiendo un poco menos. Al jugar a Witcher 3, el consumo de energía del Omen es menor y durante la prueba de estrés es ligeramente mayor en comparación con sus competidores. Los valores de consumo coinciden con nuestras expectativas en general.
| Ocioso | |
| Carga |
|
Clave:
min: | |
| HP Omen 16-b0085ng i7-11800H, GeForce RTX 3070 Laptop GPU, Intel Optane Memory H10 with Solid State Storage 32GB + 512GB HBRPEKNX0202A(L/H), IPS, 1920x1080, 16.1" | HP Omen 15-en0375ng R7 4800H, GeForce RTX 2060 Mobile, WDC PC SN730 SDBPNTY-512G, IPS, 1920x1080, 15.6" | HP Victus 16-e0179ng R7 5800H, GeForce RTX 3060 Laptop GPU, WDC PC SN730 SDBPNTY-1T00, IPS, 1920x1080, 16.1" | Lenovo Legion 5 Pro 16ACH6H (82JQ001PGE) R7 5800H, GeForce RTX 3070 Laptop GPU, WDC PC SN730 SDBPNTY-1T00, IPS, 2560x1600, 16" | Alienware x15 RTX 3070 P111F i7-11800H, GeForce RTX 3070 Laptop GPU, WDC PC SN730 SDBPNTY-512G, IPS, 2560x1440, 15.6" | MSI Katana GF66 11UG-220 i7-11800H, GeForce RTX 3070 Laptop GPU, Kingston OM8PDP3512B-AI1, IPS, 1920x1080, 15.6" | Medio NVIDIA GeForce RTX 3070 Laptop GPU | Media de la clase Gaming | |
|---|---|---|---|---|---|---|---|---|
| Power Consumption | 22% | 16% | 2% | -26% | 12% | -22% | -16% | |
| Idle Minimum * (Watt) | 12 | 4 67% | 5 58% | 10.45 13% | 15.7 -31% | 8 33% | 15.6 ? -30% | 13.1 ? -9% |
| Idle Average * (Watt) | 18 | 9 50% | 10 44% | 14.92 17% | 20.3 -13% | 12 33% | 20.1 ? -12% | 19 ? -6% |
| Idle Maximum * (Watt) | 21 | 22 -5% | 20 5% | 16.02 24% | 43 -105% | 22 -5% | 29.4 ? -40% | 24.6 ? -17% |
| Load Average * (Watt) | 94 | 102 -9% | 108 -15% | 119.65 -27% | 94.4 -0% | 98 -4% | 110.8 ? -18% | 111.3 ? -18% |
| Witcher 3 ultra * (Watt) | 147 | 119 19% | 145 1% | 174.9 -19% | 167 -14% | 152 -3% | ||
| Load Maximum * (Watt) | 199 | 182 9% | 189 5% | 187.26 6% | 183.4 8% | 162 19% | 214 ? -8% | 260 ? -31% |
* ... más pequeño es mejor
Energy Consumption Witcher 3 / Stress Test
Duración de la batería
HP ha instalado una batería de 83 Wh. Para las pruebas de batería, cambiamos al modo híbrido, activando Optimus. A pesar de estar equipados con baterías ligeramente más grandes en algunos casos, ni el Alienware, ni el Legion, ni el MSI Katana duran tanto como nuestro Omen. El Victus viene con una batería más pequeña de 70-Wh y una duración de batería significativamente menor a pesar de su hardware más débil.
Nuestro dispositivo de pruebas permite unas 7,5 horas de navegación por Wi-Fi con brillo reducido y con 5,5 horas, las noches de cine tampoco son un problema. Para un dispositivo de juego, la duración de la batería es decente y casi coincide con las medias de la clase, que no suelen cumplir los portátiles de esta categoría de precios, como muestra la competencia directa
| HP Omen 16-b0085ng i7-11800H, GeForce RTX 3070 Laptop GPU, 83 Wh | HP Omen 15-en0375ng R7 4800H, GeForce RTX 2060 Mobile, 70.9 Wh | HP Victus 16-e0179ng R7 5800H, GeForce RTX 3060 Laptop GPU, 70 Wh | Lenovo Legion 5 Pro 16ACH6H (82JQ001PGE) R7 5800H, GeForce RTX 3070 Laptop GPU, 80 Wh | Alienware x15 RTX 3070 P111F i7-11800H, GeForce RTX 3070 Laptop GPU, 87 Wh | MSI Katana GF66 11UG-220 i7-11800H, GeForce RTX 3070 Laptop GPU, 90 Wh | Media de la clase Gaming | |
|---|---|---|---|---|---|---|---|
| Duración de Batería | 34% | -15% | -29% | -28% | -22% | 18% | |
| H.264 (h) | 5.4 | 8.27 ? 53% | |||||
| WiFi v1.3 (h) | 7.6 | 10.5 38% | 5.9 -22% | 7 -8% | 6.1 -20% | 5.3 -30% | 7.08 ? -7% |
| Load (h) | 1.4 | 1.8 29% | 1.3 -7% | 0.7 -50% | 0.9 -36% | 1.2 -14% | 1.496 ? 7% |
| Reader / Idle (h) | 20 | 8.5 | 9.1 | 9.7 | 9.1 | 7.84 ? |
Pro
Contra
Veredicto - Un gran rendimiento con pequeños errores
El Omen 16 ha demostrado ser un portátil de juegos de gama media bastante bueno con mejoras en todos los aspectos en comparación con el Omen 15. El alto nivel de rendimiento general en todos los casos de uso, la larga duración de la batería, y la buena pantalla FHD constituyen las principales ventajas de este portátil HP. Los principales inconvenientes son el defectuoso touchpad (uno de...) y las altas latencias que pueden observarse incluso tras abrir el navegador. Además, las inútiles versiones de prueba de 30 días preinstaladas de varios programas también entran en la categoría de "innecesarios".
El Omen 16 es un buen portátil para juegos en general y alcanza un nivel de rendimiento muy alto. Sin embargo, aún queda trabajo por hacer en lo que respecta a los drivers y el touchpad.
Comparado con el Victus 16 de HP, más barato, el sobreprecio del Omen 16 puede estar justificado por su base metálica, mejor conectividad (USB 4 con Thunderbolt 4), un rendimiento de GPU alrededor de un 30% más rápido, mejor distribución del teclado (aunque sin numpad) y una construcción ligeramente más ligera a pesar del hardware más potente. Mientras tanto, ambos modelos comparten una buena pantalla y un rendimiento similar de la CPU.
Precio y disponibilidad
Una configuración de HP Omen 16 similar a la nuestra con una RTX 3070 está listada en BestBuy por unos 1800 dólares y se espera que esté disponible en las próximas semanas
HP Omen 16-b0085ng
- 10/06/2021 v7 (old)
Christian Hintze
Price comparison

