Asus TUF Gaming A15 con Ryzen 7 en revisión: Portátil para juegos de nivel básico con CPU de AMD

Con el Asus TUF Gaming F15, ya pudimos probar una versión casi idéntica de nuestro dispositivo de pruebas con una CPU Intel. Ahora tenemos la versión AMD con unRyzen 7 5800Hen la forma del Asus TUF Gaming A15, que se apoya en 16 GB de RAM. UnaNvidia GeForce RTX 3070se encarga
de mostrar el contenido de las imágenes, y también hay un SSD de 1 TB.Esta configuración se ofrece a un precio de unos 1,700 Euros (~$2,008), lo que significa que el TUF Gaming A15 tiene que enfrentarse a la comparación con la competencia listada a continuación. También puedes añadir más portátiles de nuestra base de datos para comparar en cada sección.
Possible contenders in comparison
Valoración | Fecha | Modelo | Peso | Altura | Tamaño | Resolución | Precio |
|---|---|---|---|---|---|---|---|
| 85 % v7 (old) | 07/2021 | Asus TUF Gaming A15 FA506QR-AZ061T R7 5800H, GeForce RTX 3070 Laptop GPU | 2.3 kg | 24 mm | 15.60" | 1920x1080 | |
| 85.9 % v7 (old) | 06/2021 | Asus TUF Gaming F15 FX506HM i7-11800H, GeForce RTX 3060 Laptop GPU | 2.3 kg | 24.9 mm | 15.60" | 1920x1080 | |
| 84.7 % v7 (old) | 06/2021 | Alienware m15 R5 Ryzen Edition R7 5800H, GeForce RTX 3060 Laptop GPU | 2.5 kg | 22.85 mm | 15.60" | 1920x1080 | |
| 86.1 % v7 (old) | 02/2021 | Aorus 15P XC i7-10870H, GeForce RTX 3070 Laptop GPU | 2.2 kg | 27 mm | 15.60" | 1920x1080 | |
| 80.4 % v7 (old) | 03/2021 | MSI GF65 Thin 10UE i7-10750H, GeForce RTX 3060 Laptop GPU | 1.9 kg | 21.7 mm | 15.60" | 1920x1080 |
Funda - Sólido portátil Gaming de plástico
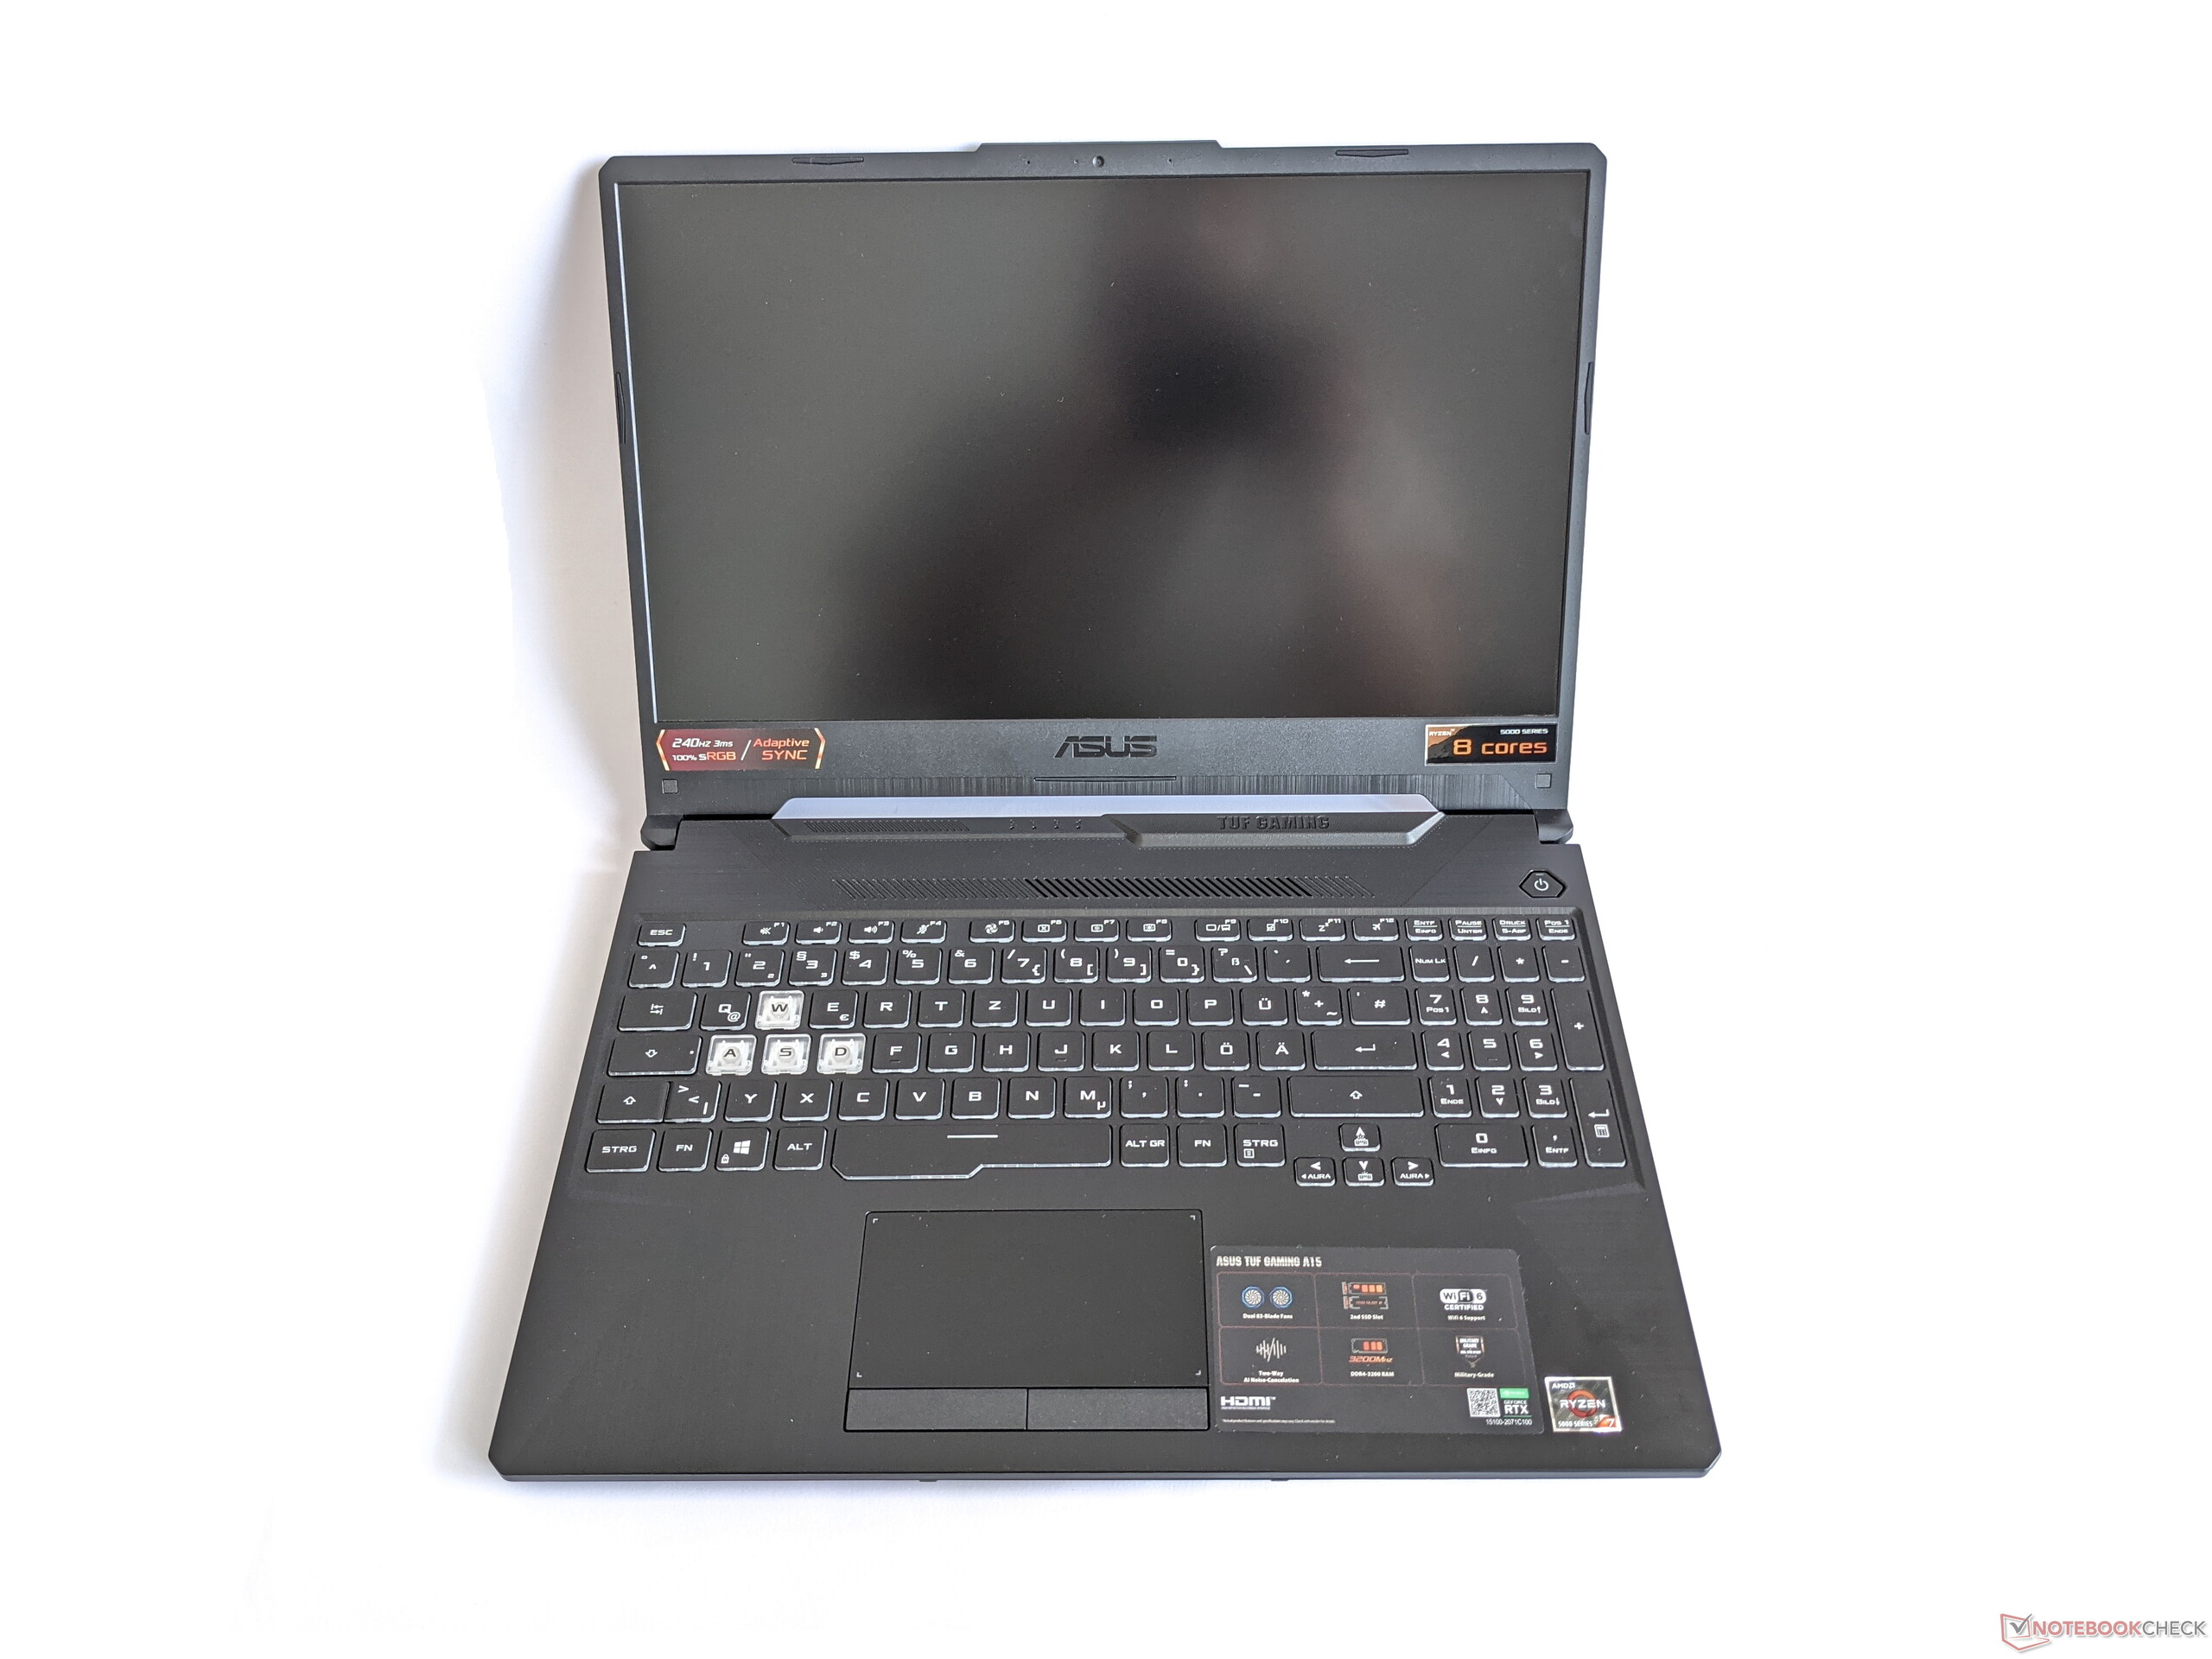
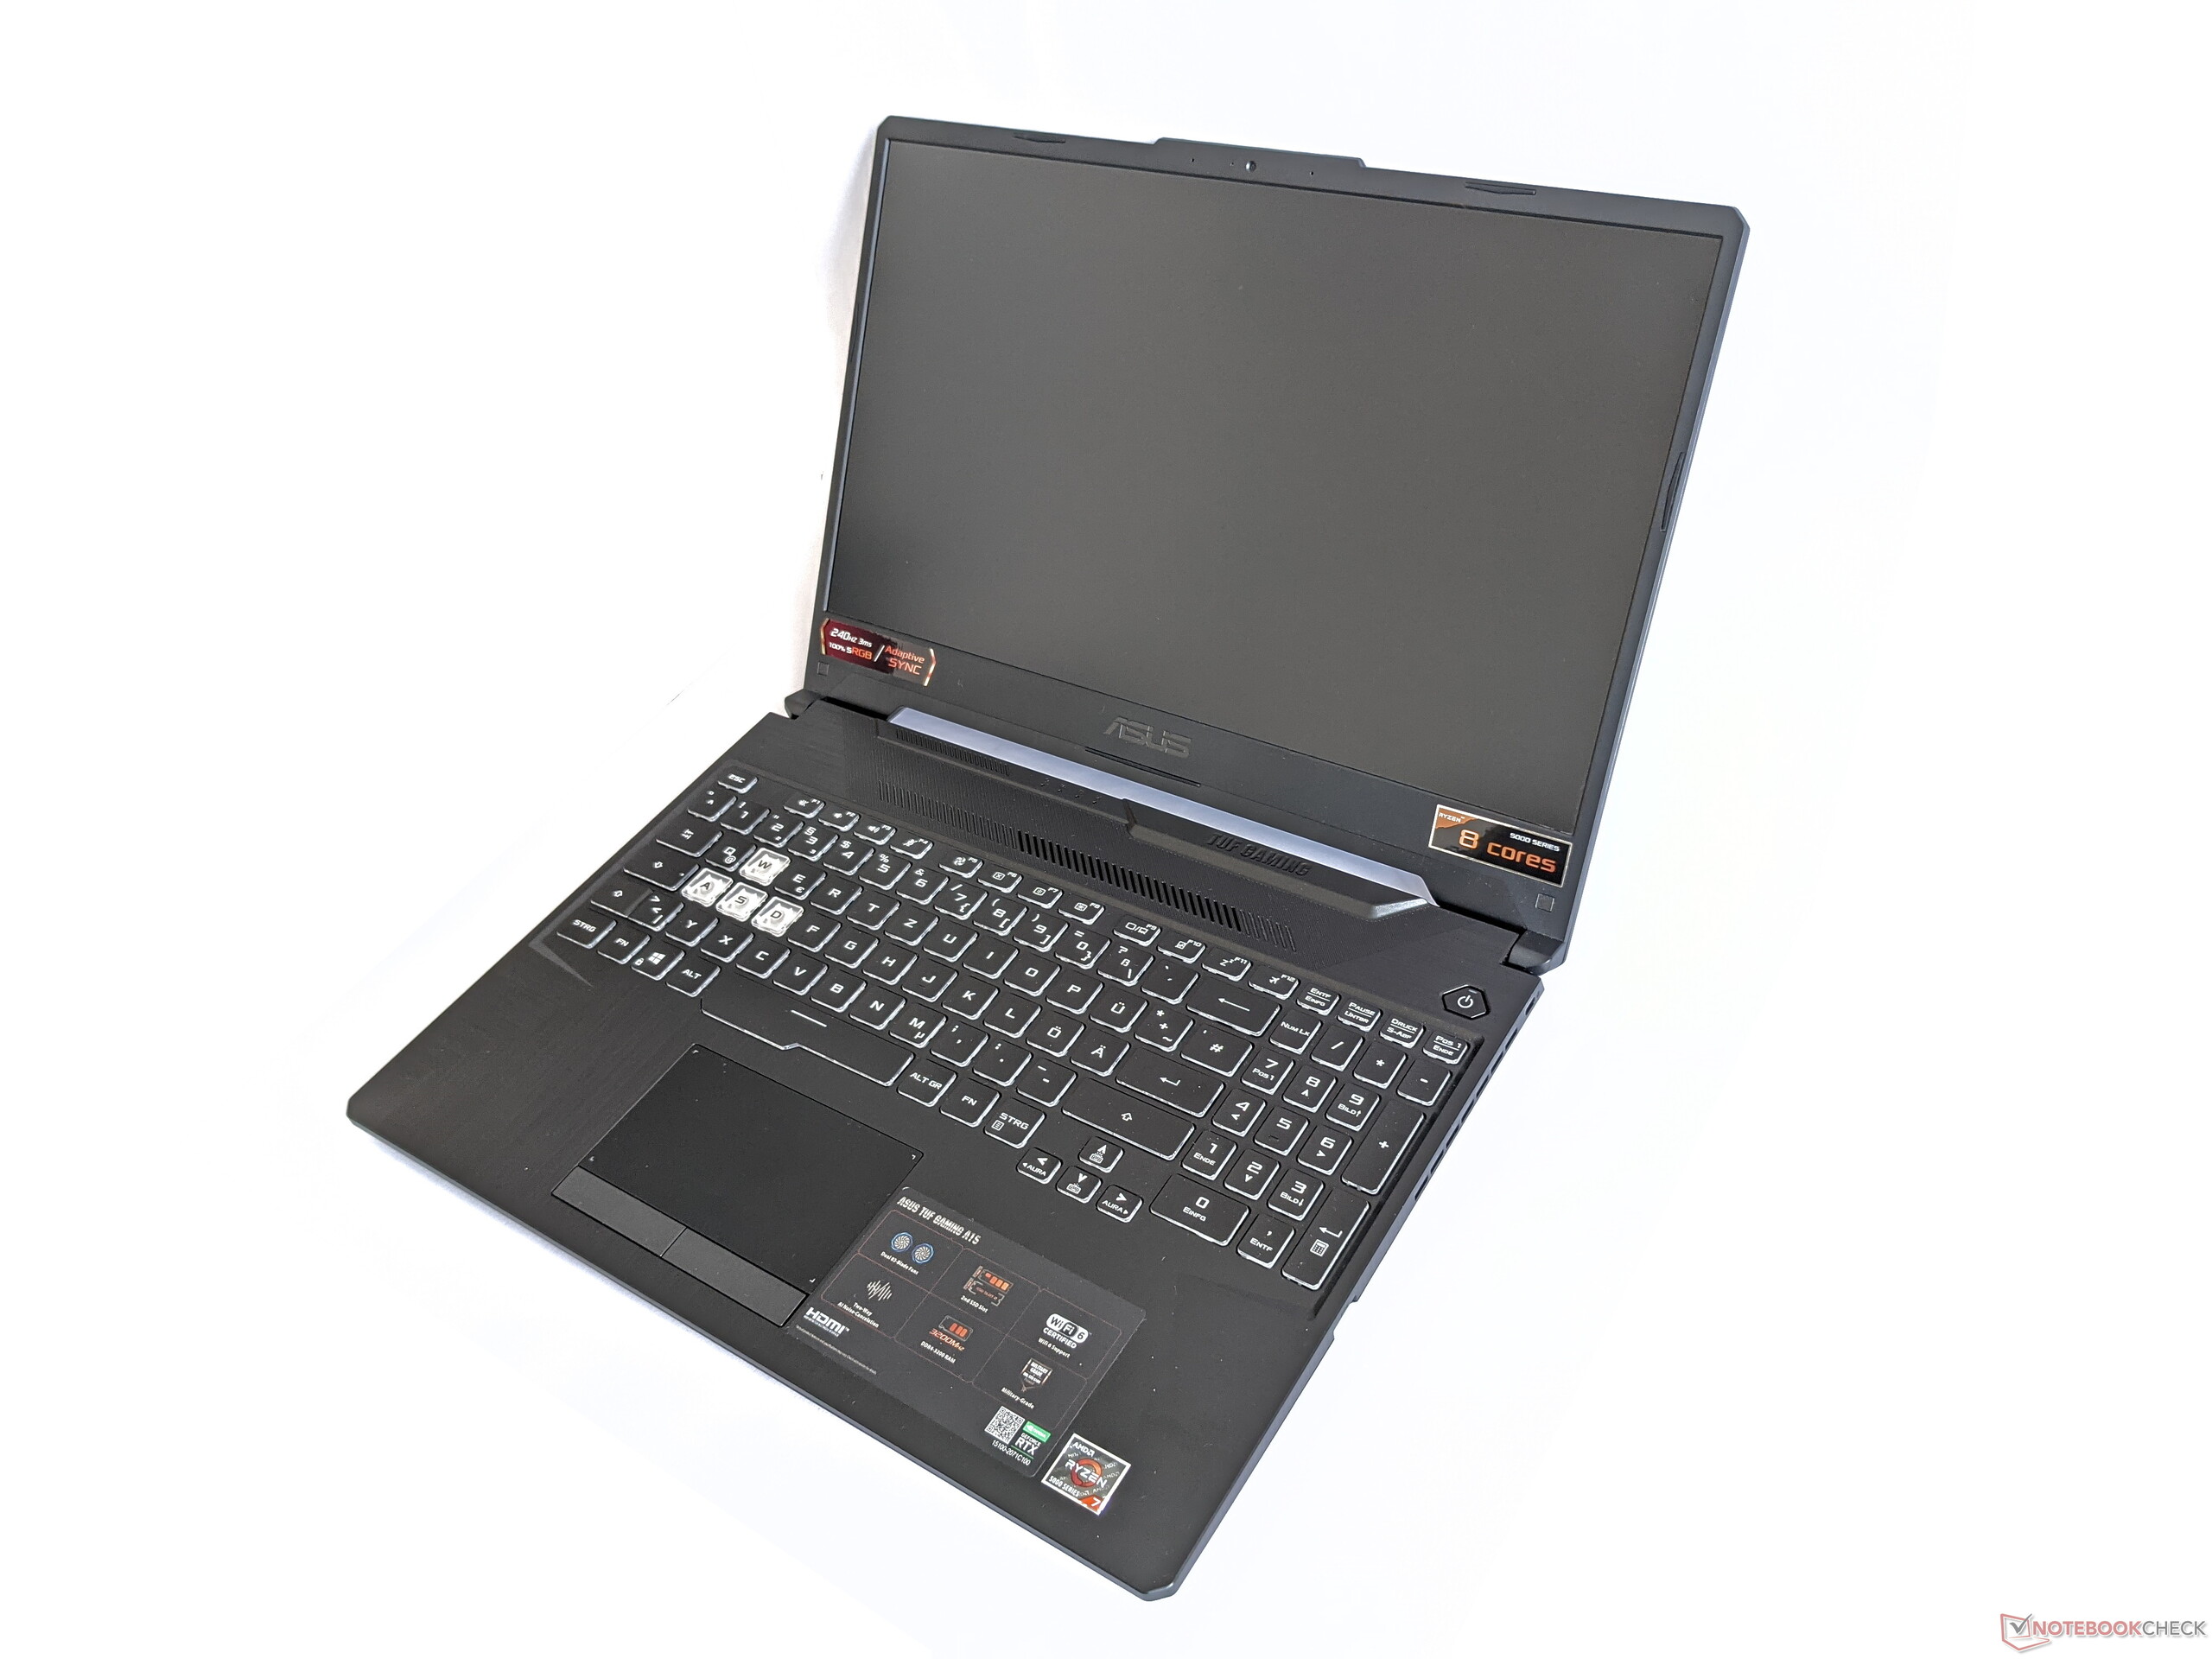
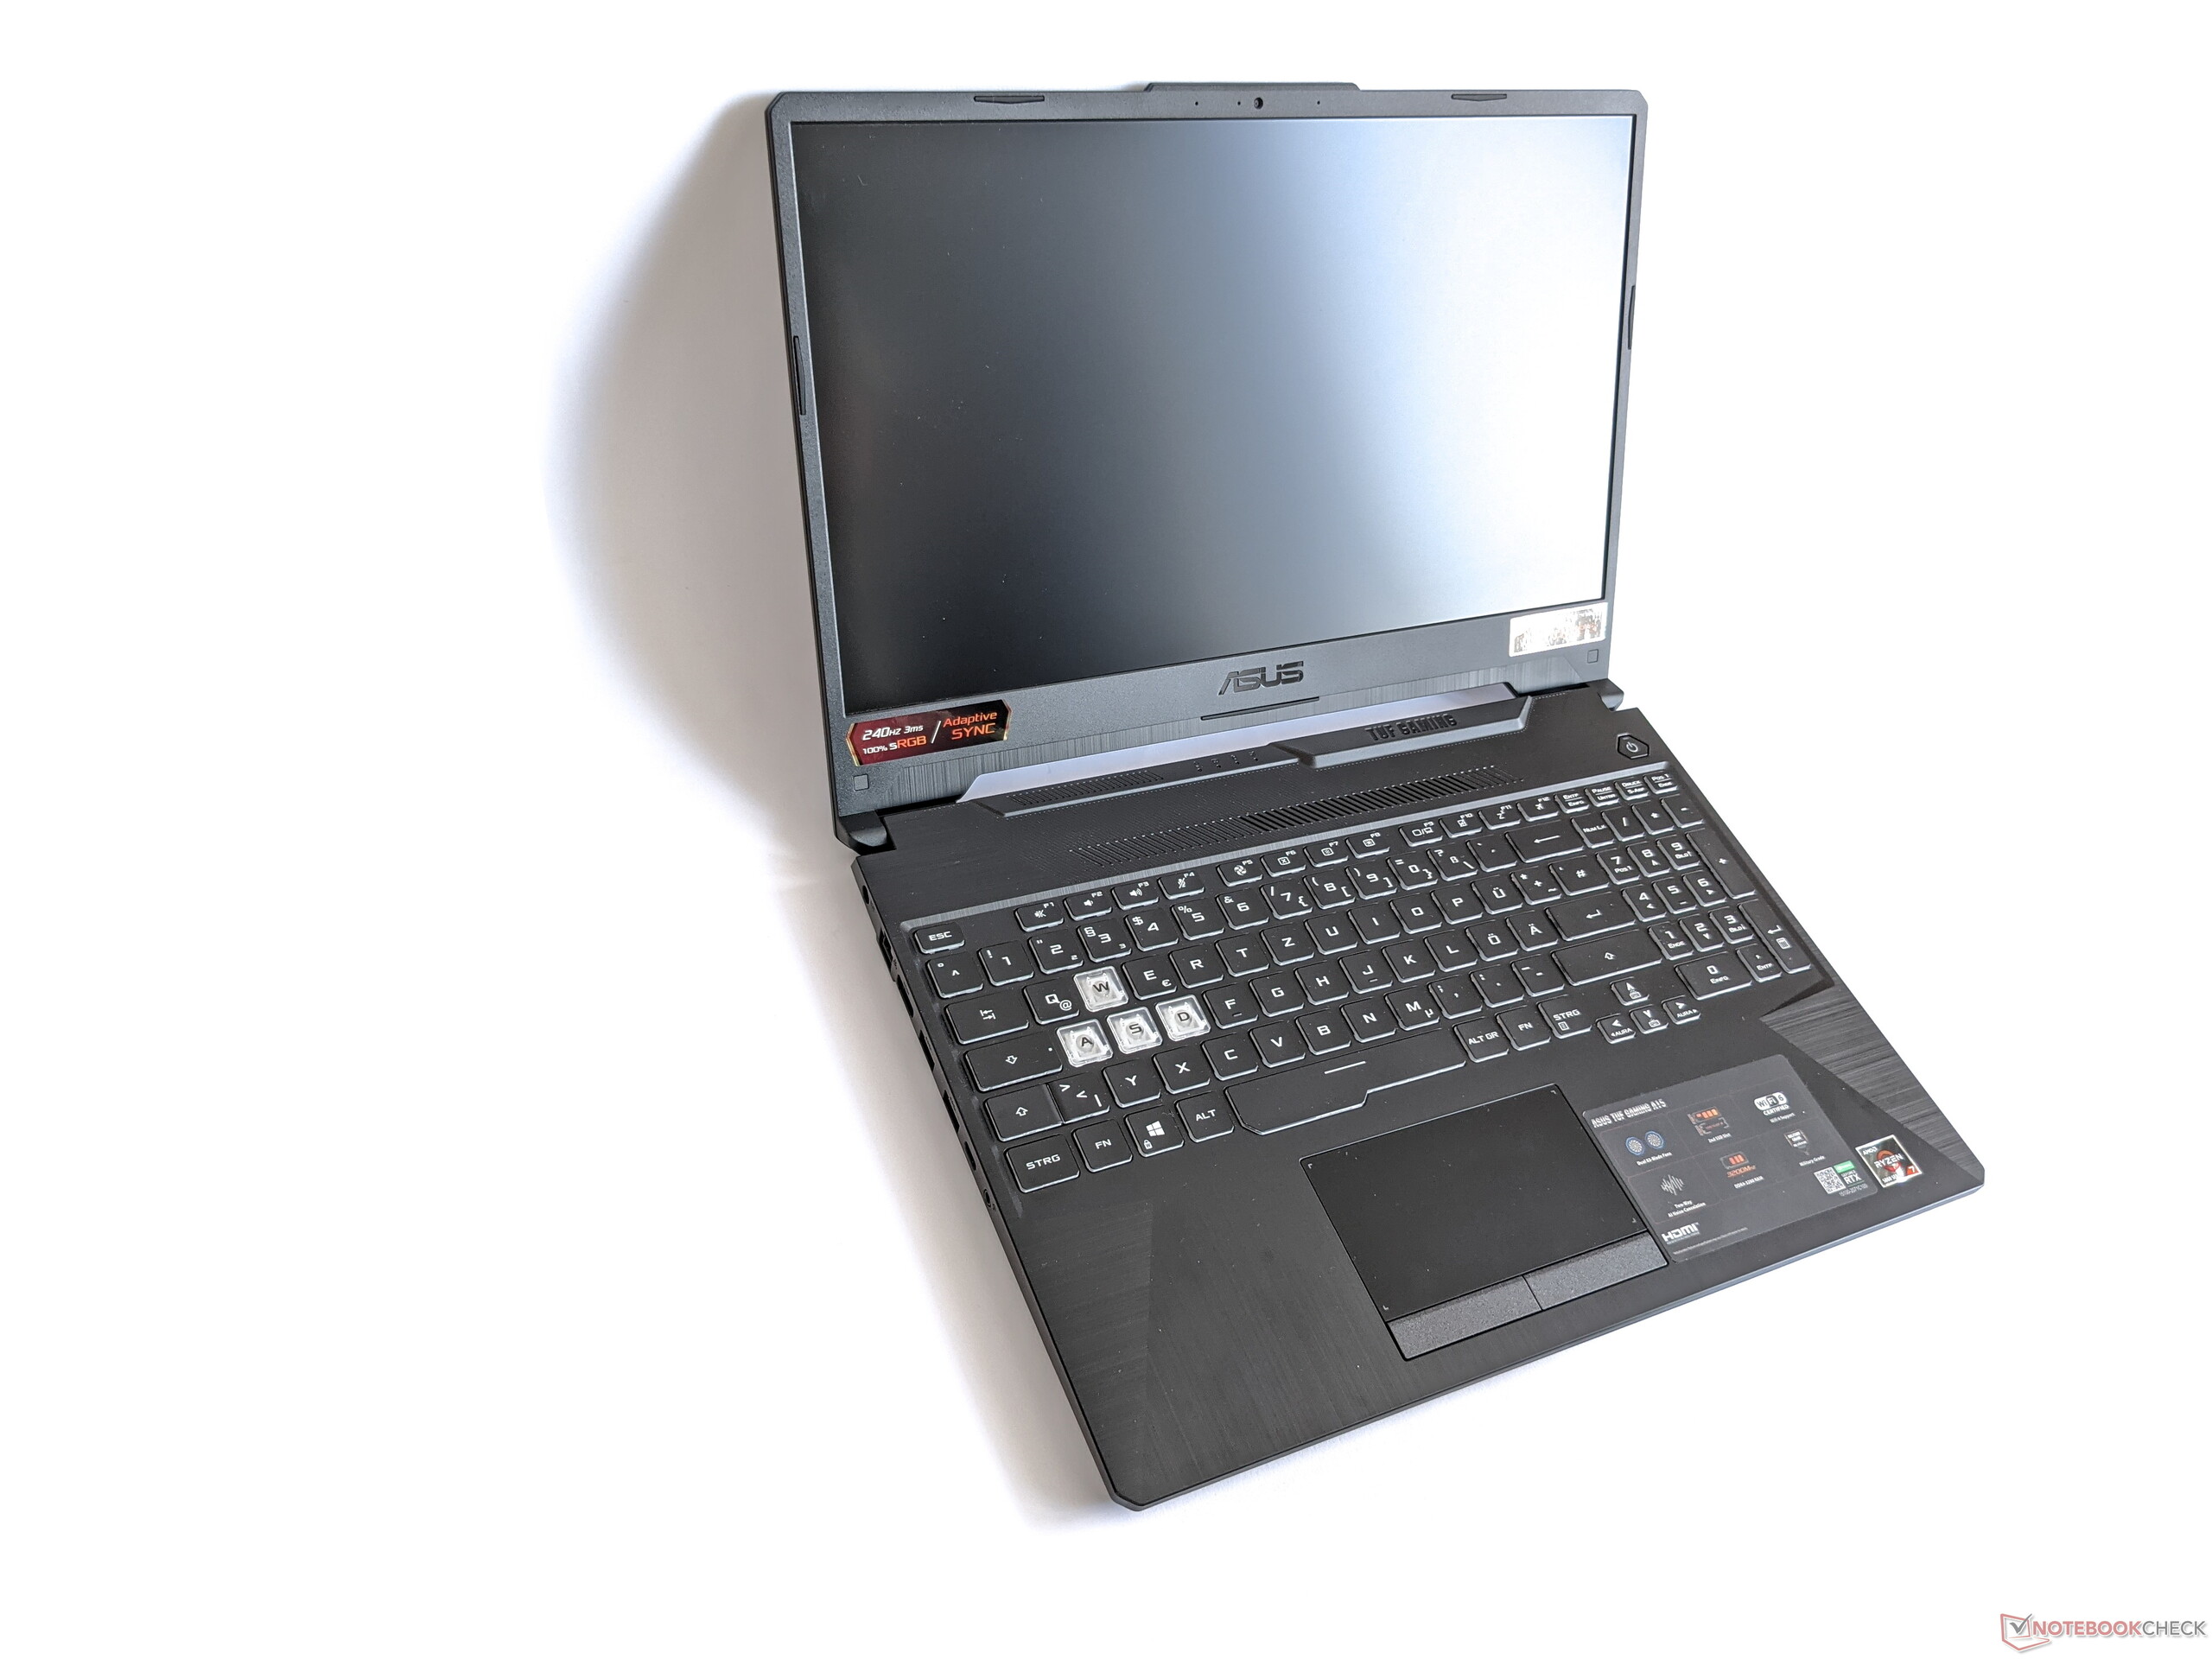
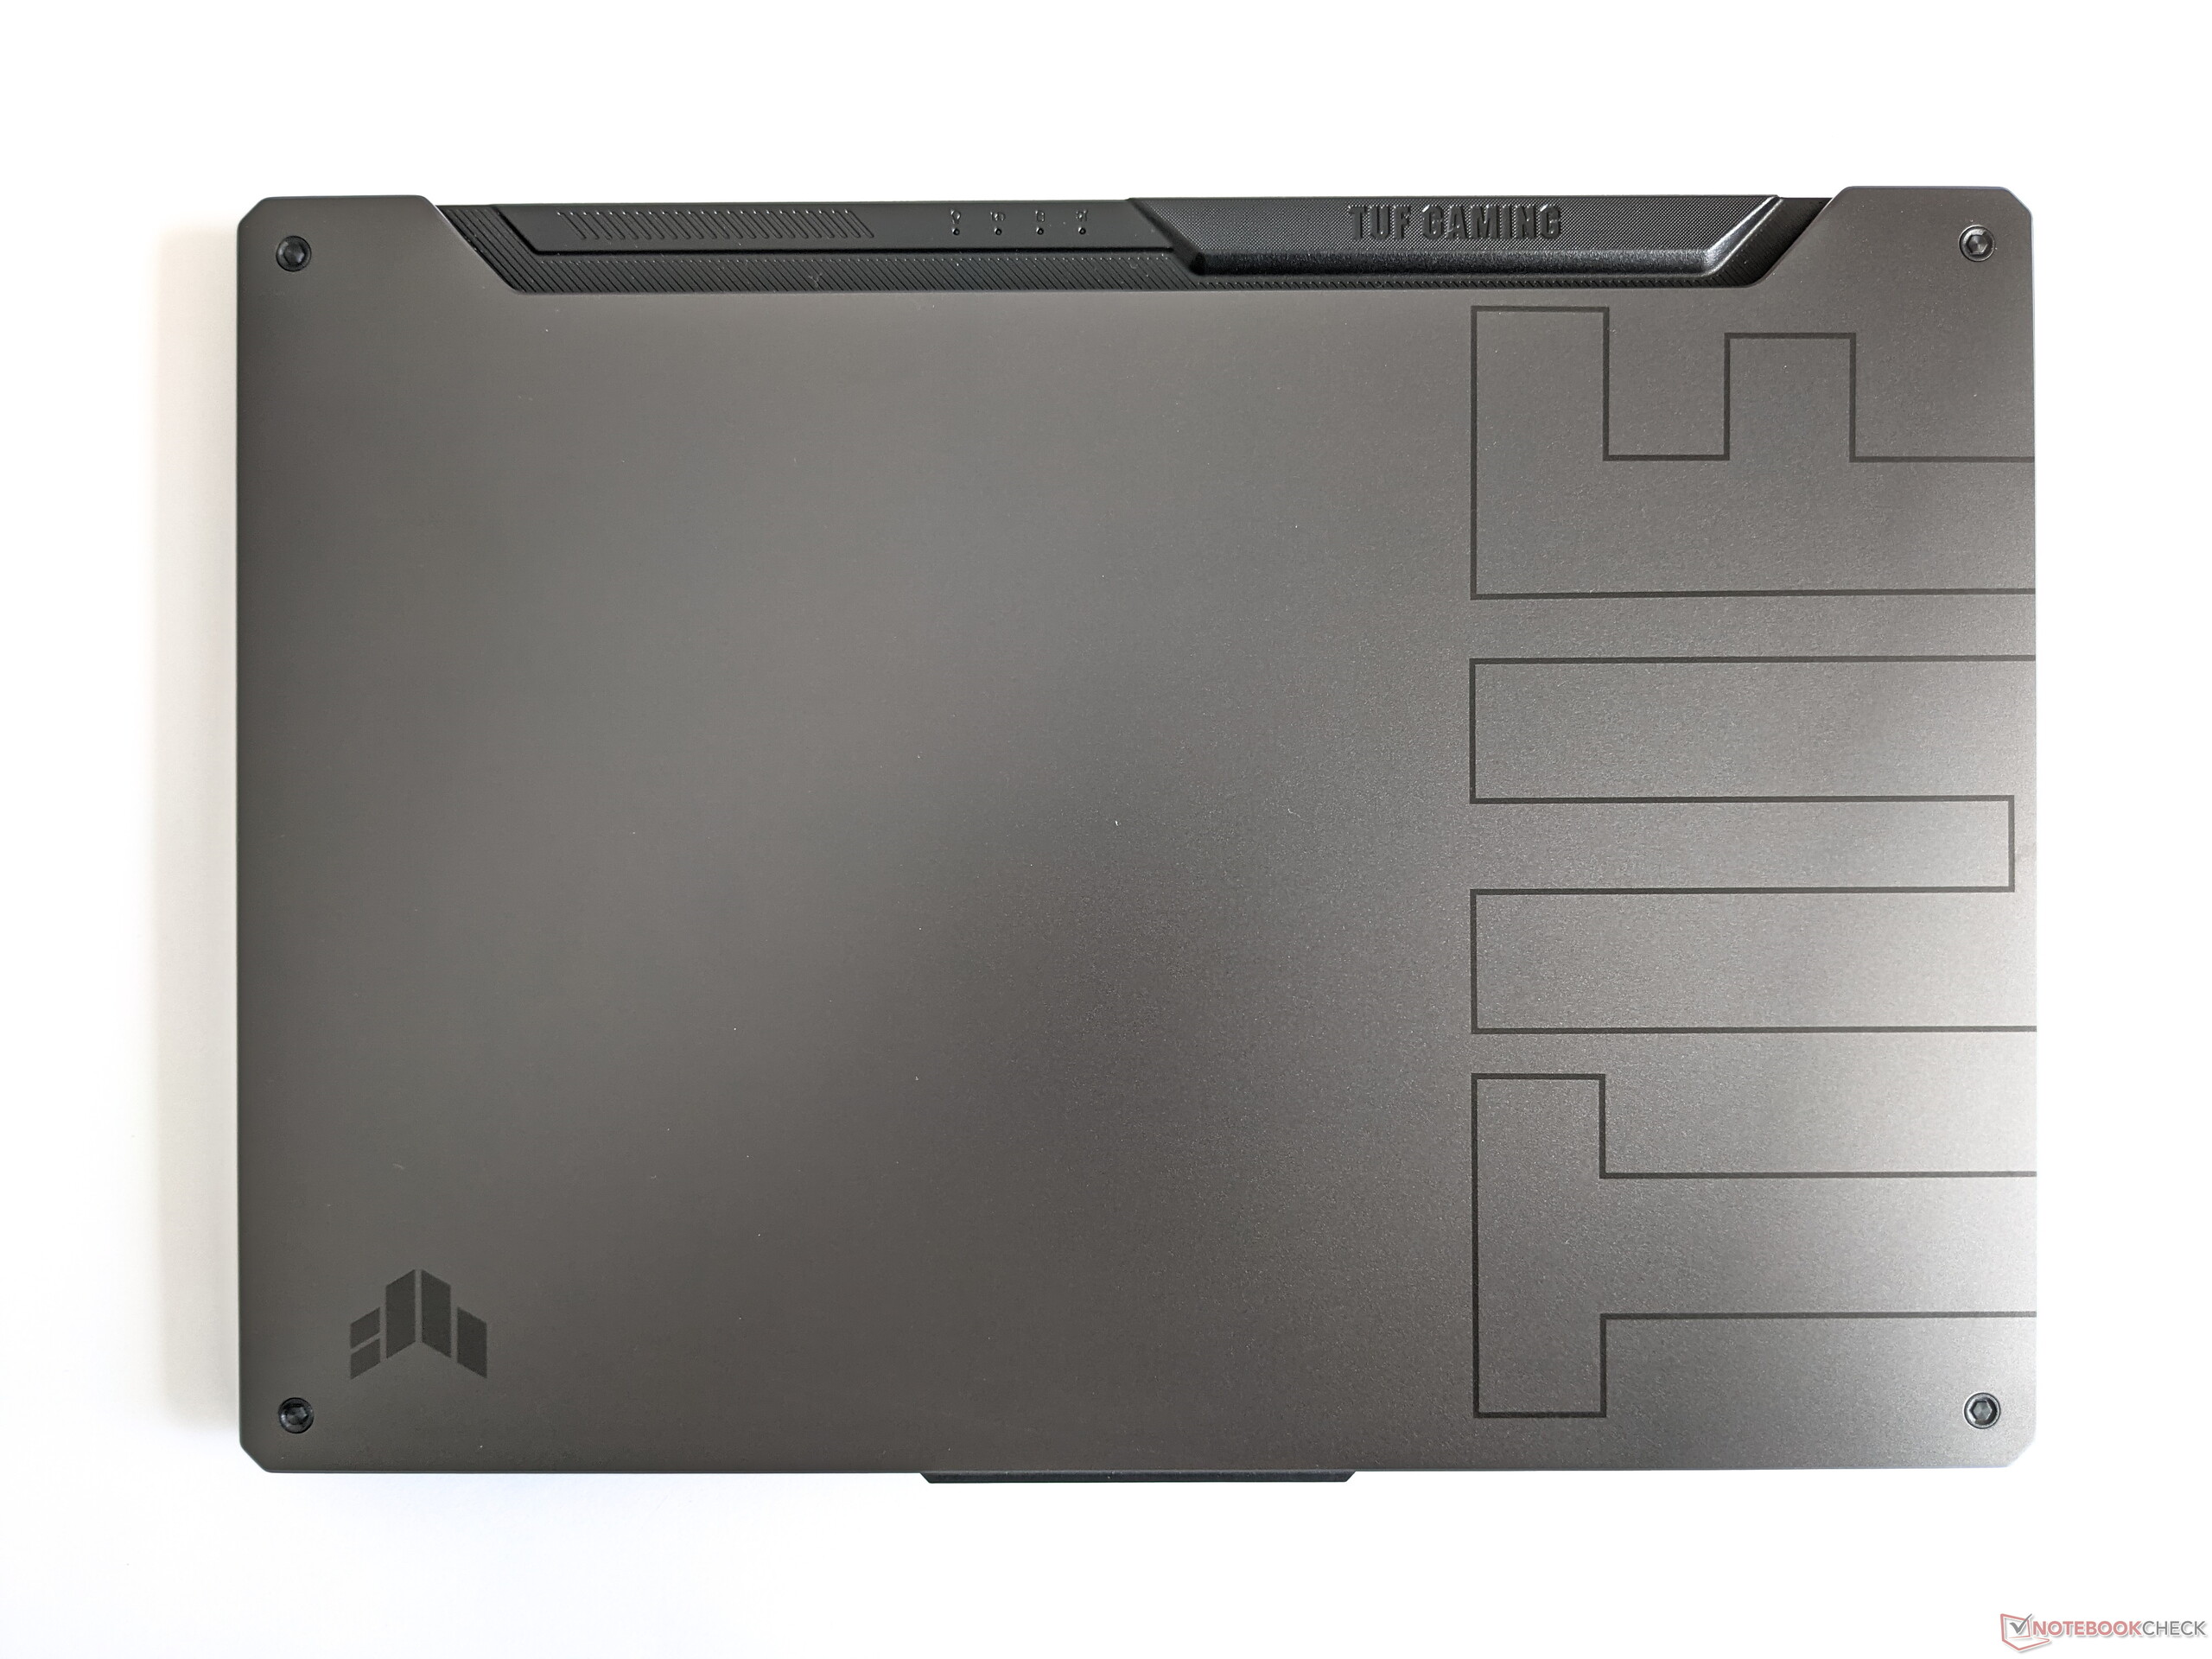
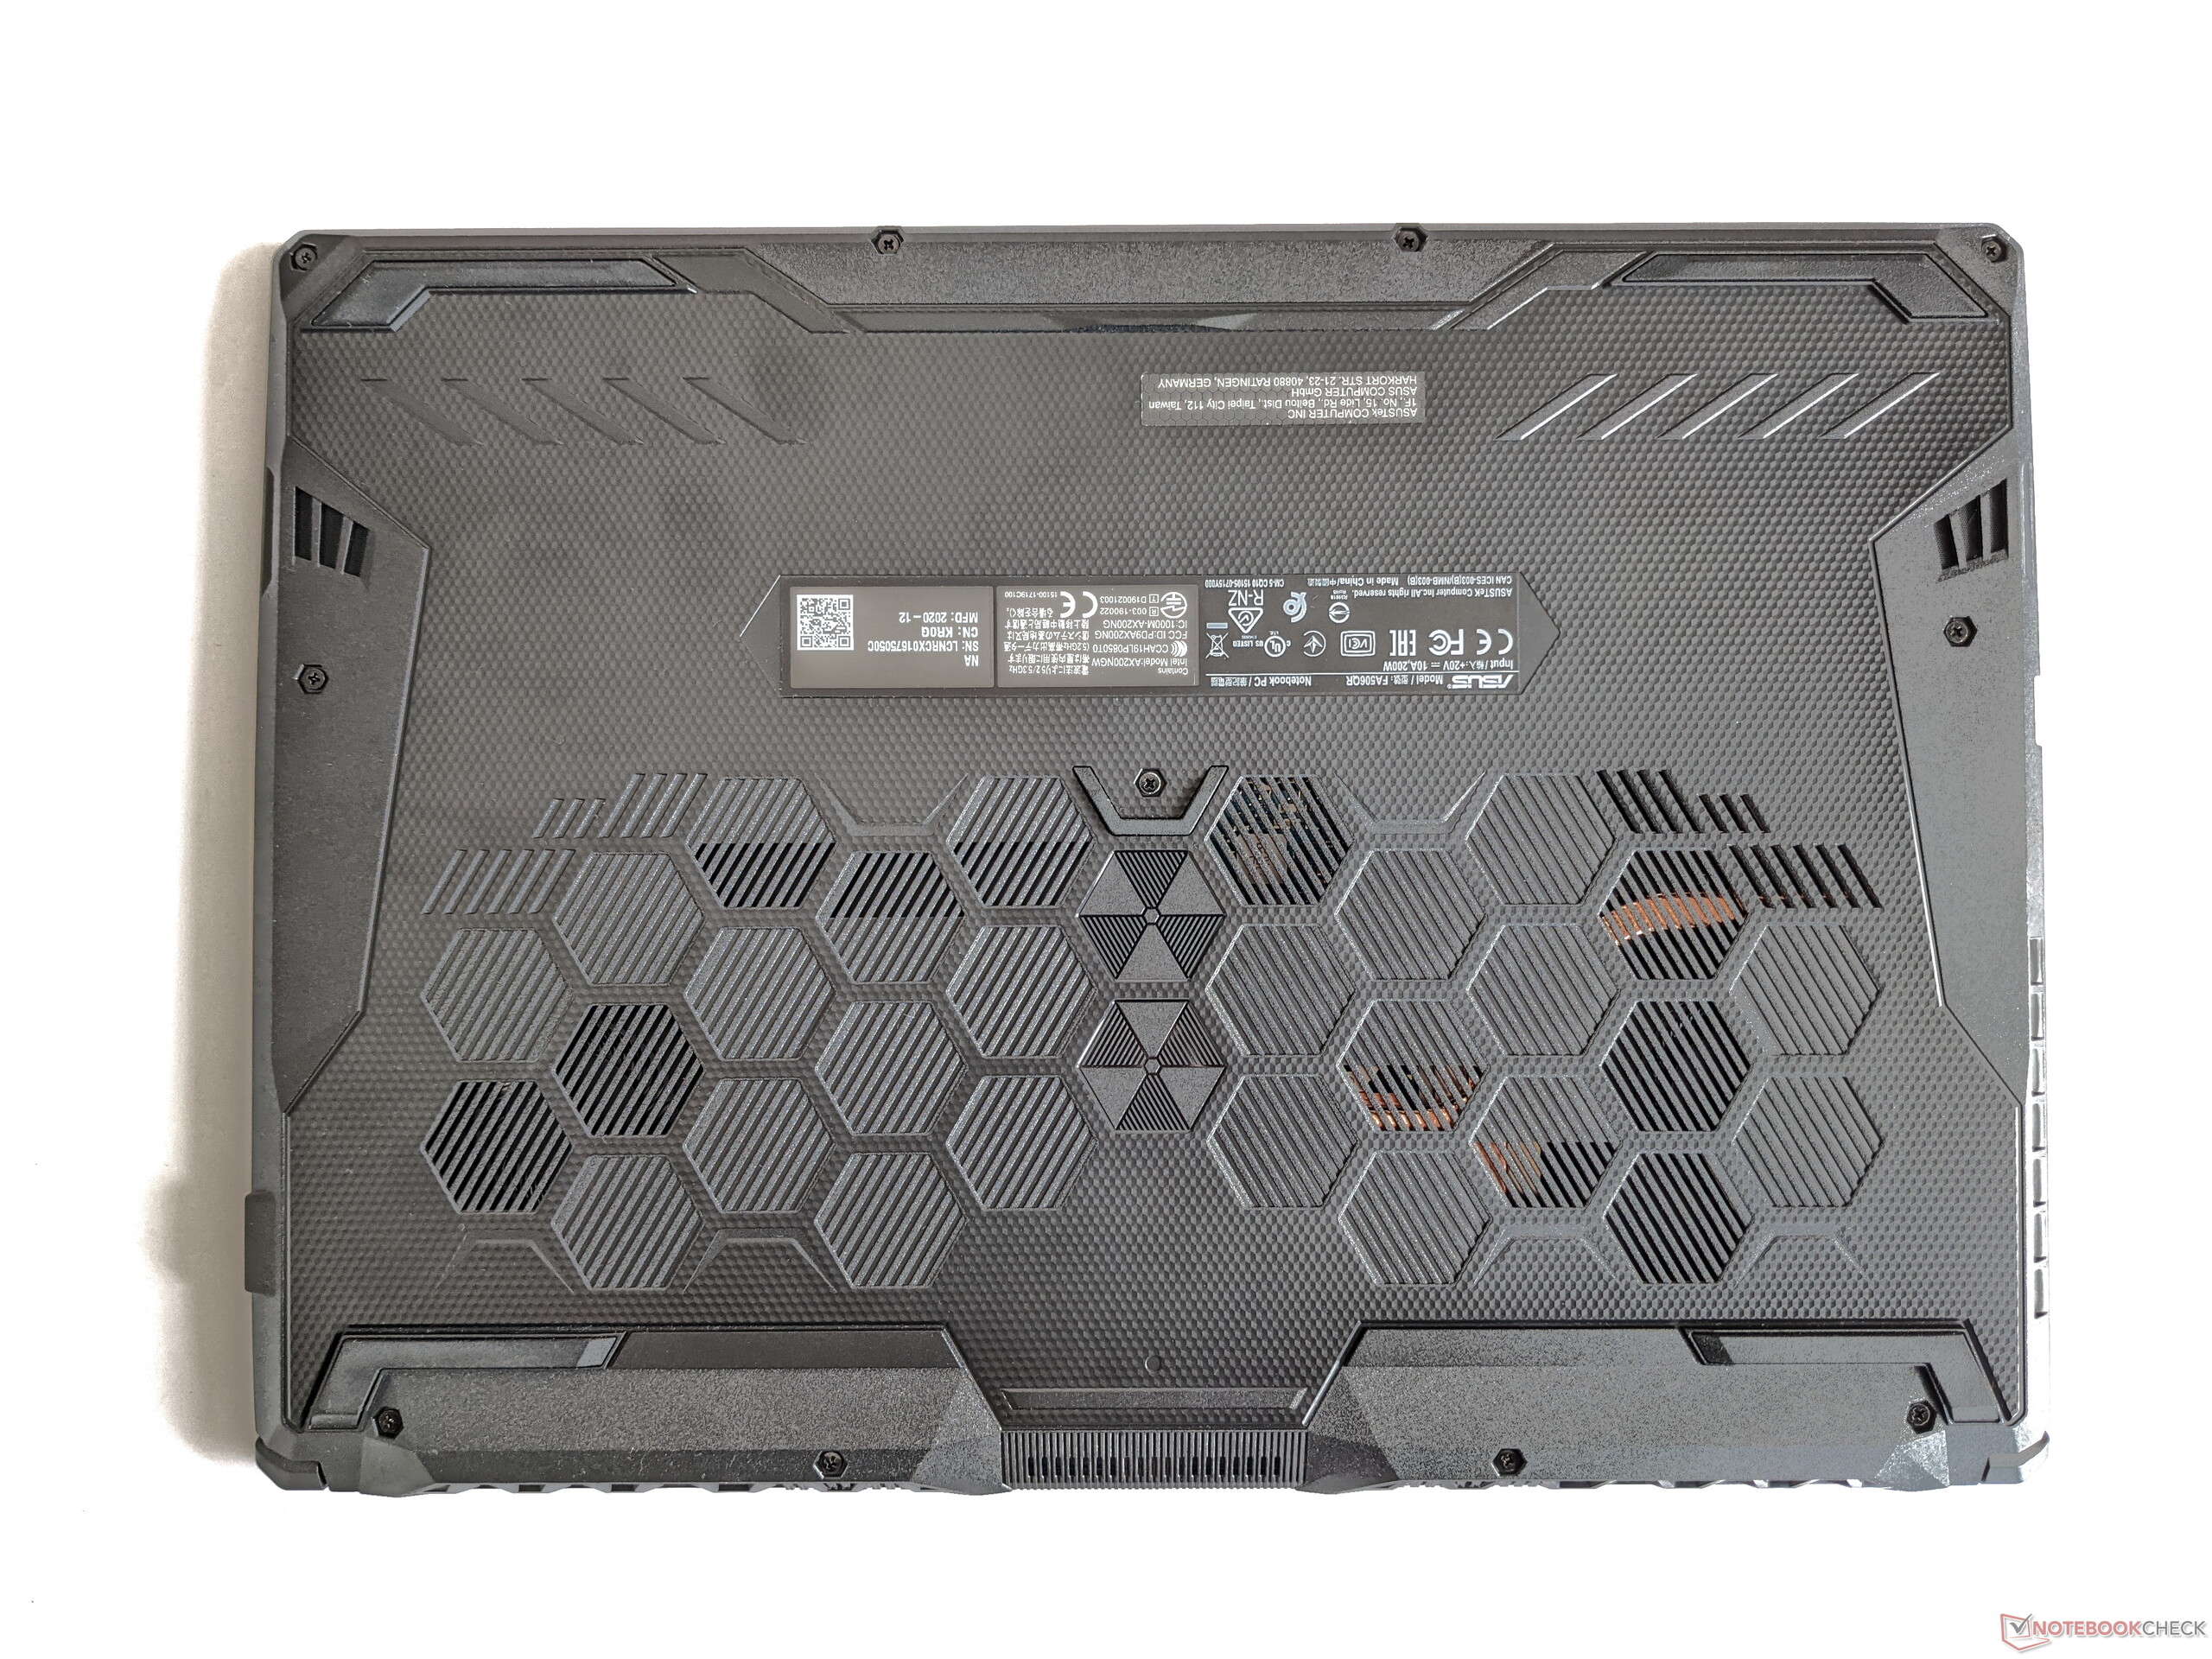
Asus construye la carcasa del TUF Gaming A15 con un plástico resistente y la decora con una serie de acentos distintivos. Por ejemplo, la tapa está adornada con tornillos simulados, y los reposamanos presentan un extenso acabado cepillado. La pantalla está rodeada de biseles estrechos y puede abrirse hasta un ángulo de aproximadamente 120 grados. Se puede encontrar una descripción detallada del diseño en el análisis del Asus TUF Gaming F15
El peso y las dimensiones del TUF A15 son similares a los de otros portátiles para juegos de 15 pulgadas. Sólo elAlienware m15es más pesado y tiene una profundidad significativamente mayor
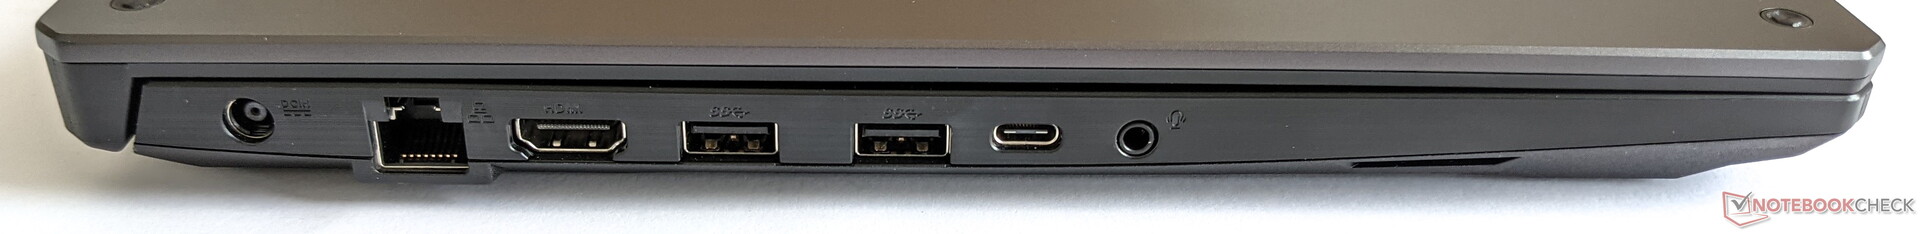
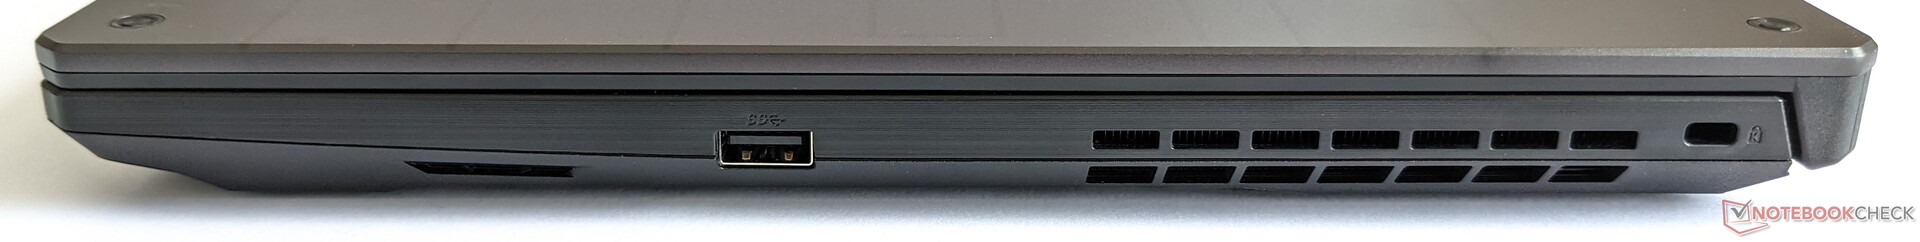
Conectividad - No hay Thunderbolt, pero sí una rápida WLAN
La configuración de puertos del Asus TUF Gaming A15 es versátil, y se proporciona todo lo necesario para la mayoría de las aplicaciones. A diferencia de la varianteTUF Gaming F15 Intel, sin embargo, aquí tienes que prescindir de Thunderbolt
Comunicación
El Asus TUF Gaming A15 puede conectarse de forma inalámbrica mediante Bluetooth 5.2 y Wi-Fi 6. En combinación con nuestro router de referencia Netgear Nighthawk AX12, se alcanzan velocidades medias de transferencia de datos de 1.480 Mb/s y velocidades de recepción de datos de 1.613 Mb/s, lo que sitúa al A15 en el primer puesto de nuestro campo de pruebas
Cámara web
La webcam del TUF Gaming A15 produce imágenes de 0,9 MP y, en consecuencia, ofrece la misma baja resolución que la mayoría de los portátiles actuales. La calidad es correspondientemente pobre, incluso en buenas condiciones de iluminación


Accesorios
Además del propio portátil, en la caja del dispositivo de juego Asus sólo se incluye el adaptador de corriente. Sin embargo, se pueden comprar otros accesorios generales en la web del fabricante
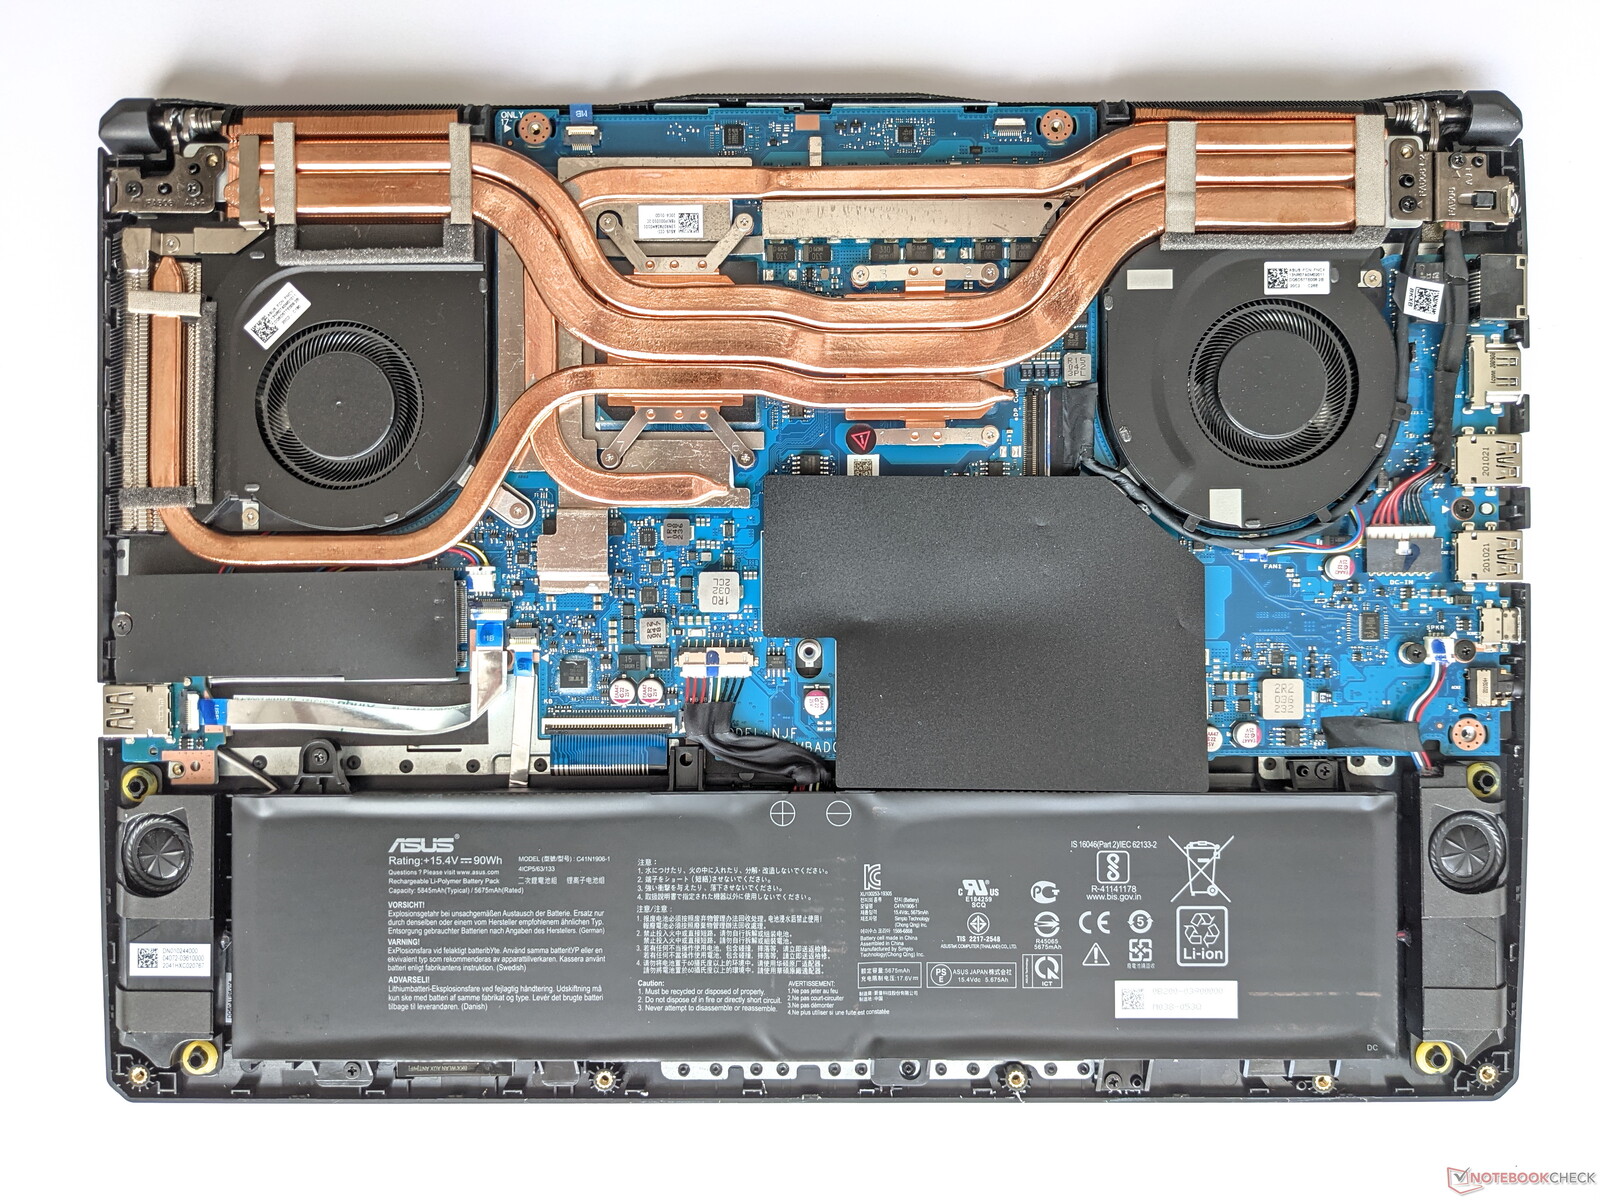
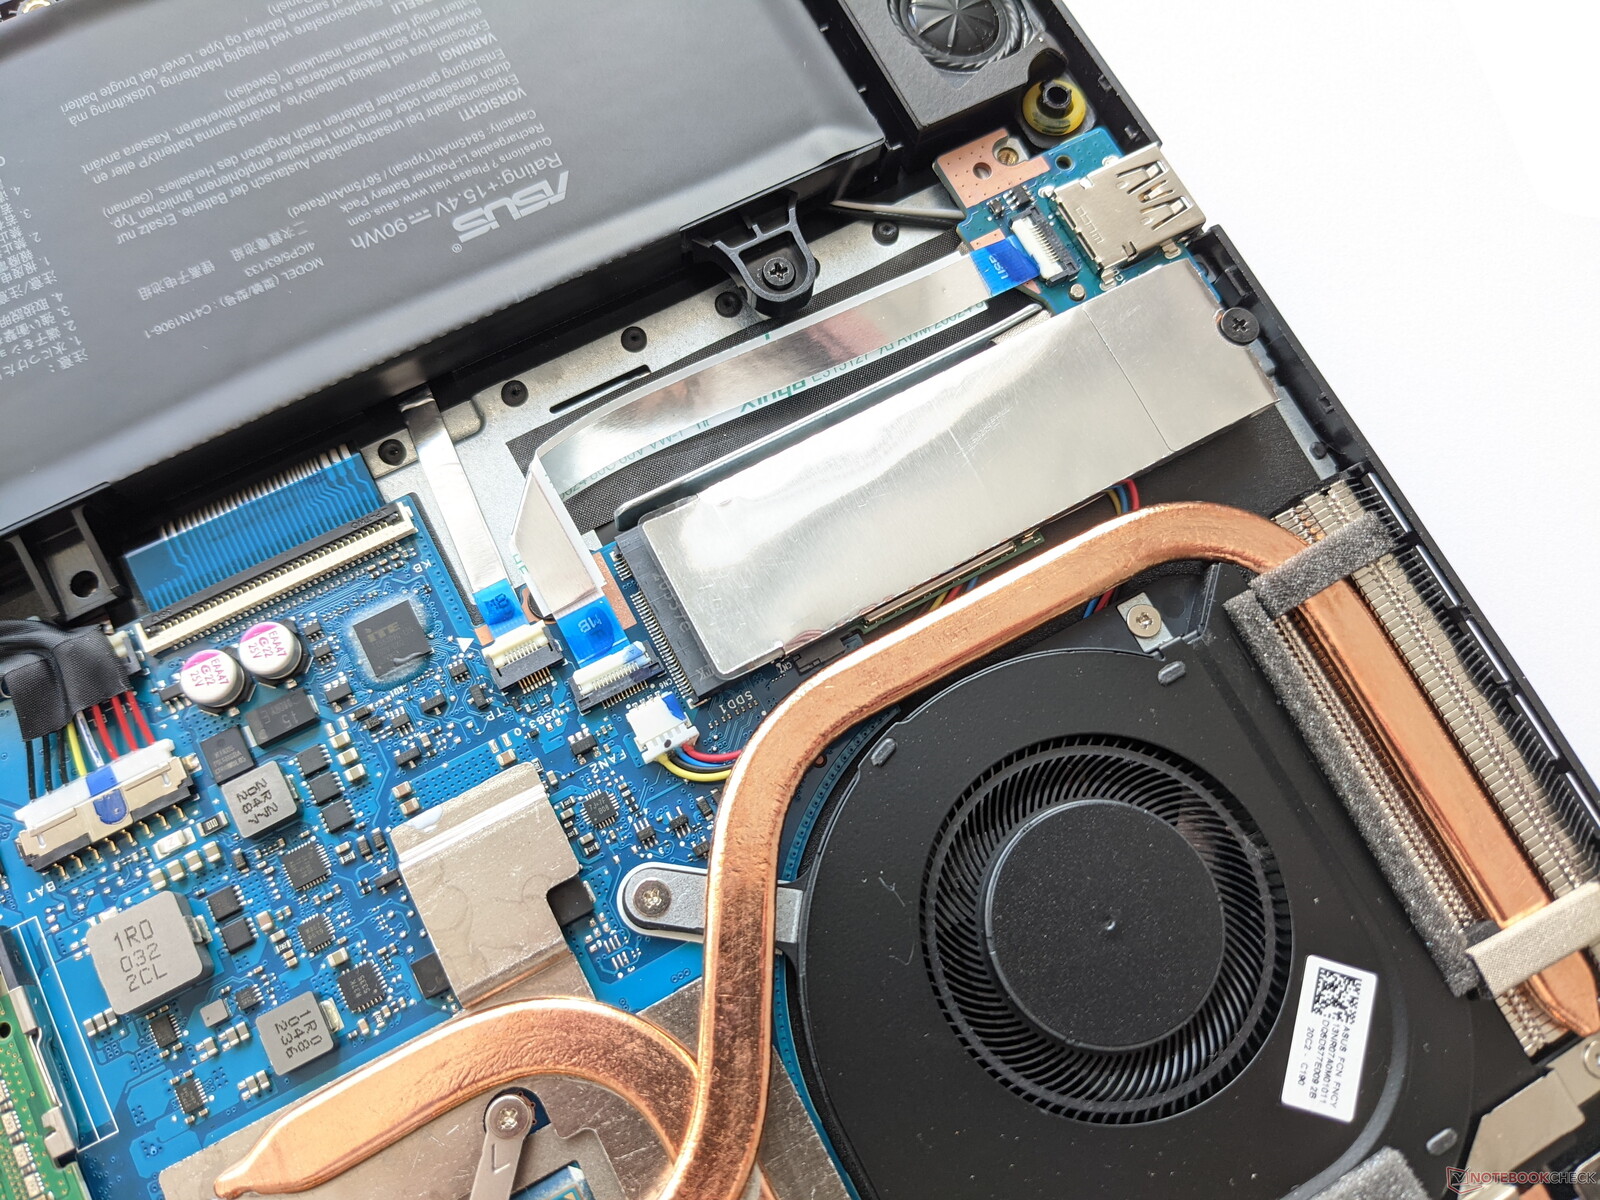
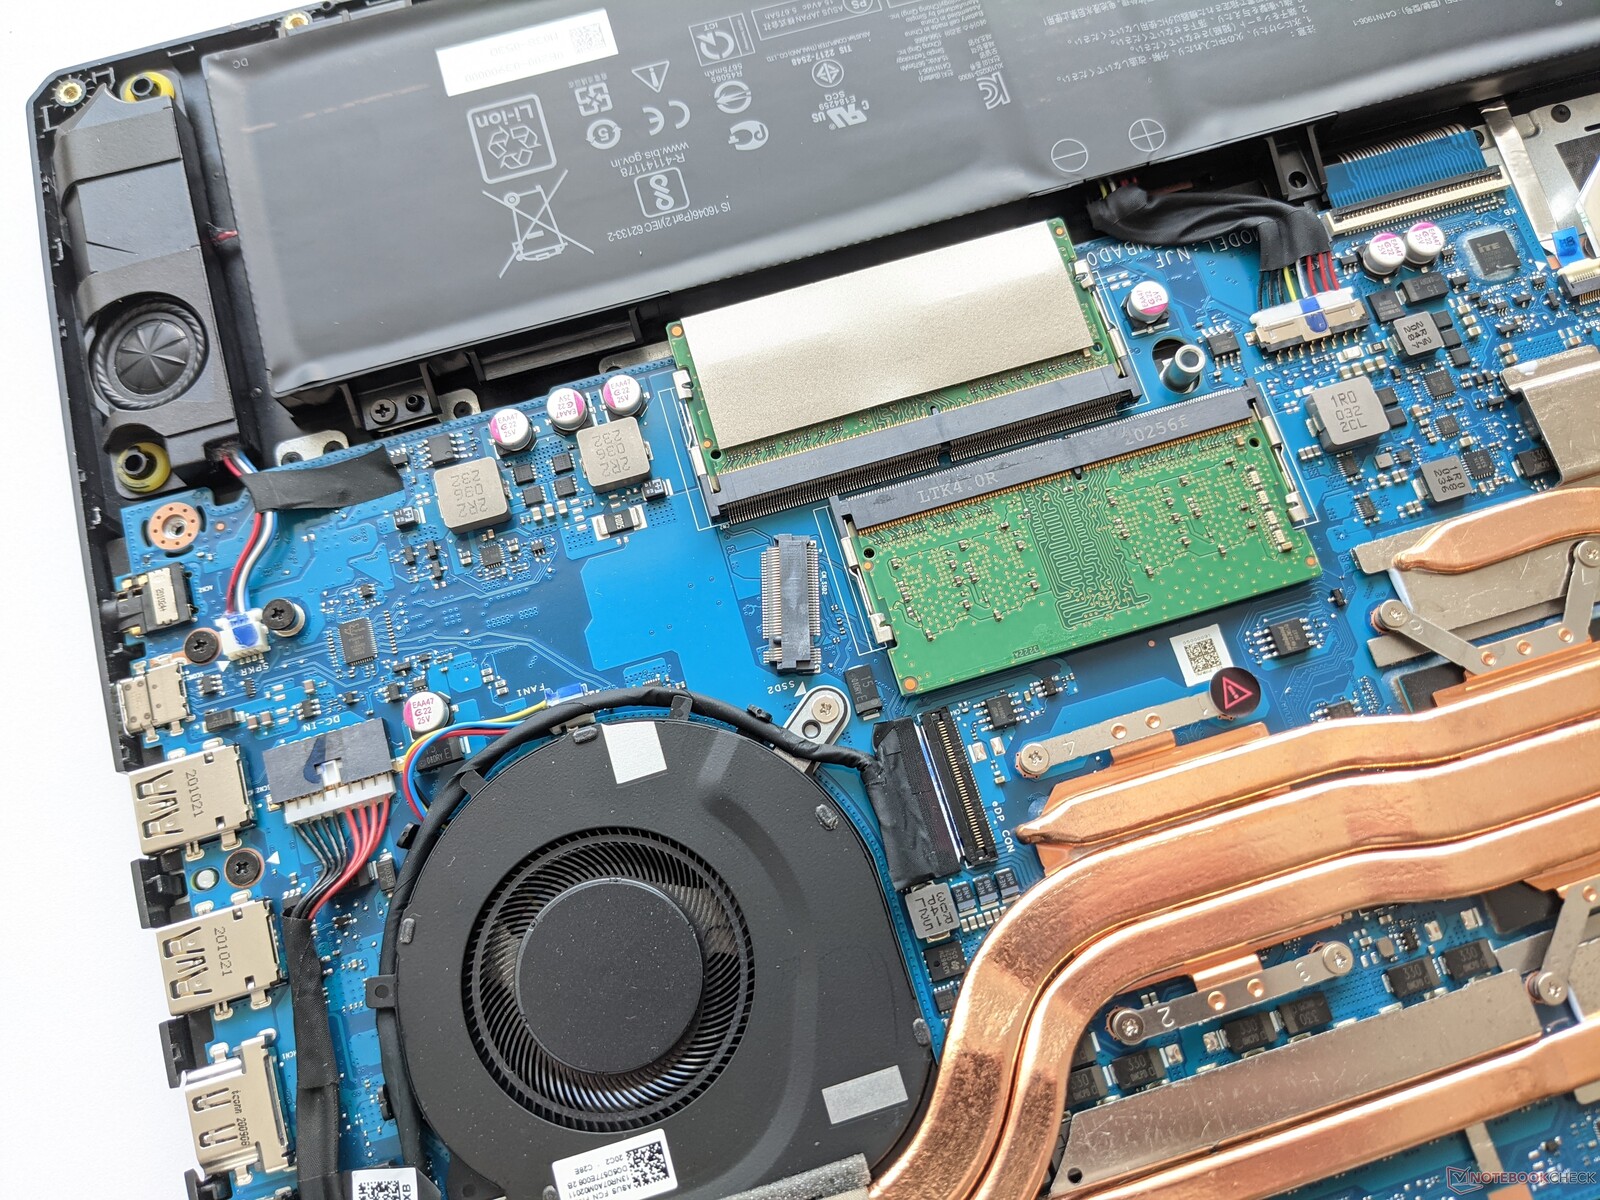
Mantenimiento
La cubierta inferior del Asus TUF Gaming A15 puede retirarse tras aflojar todos los tornillos de la parte inferior. Dos ranuras de RAM y dos de SSD se encuentran en el interior, lo que permite ampliar o sustituir la memoria o el almacenamiento masivo. El módulo WLAN debajo del SSD primario también puede ser accedido de esta manera
Garantía
Asus concede a los compradores del TUF Gaming A15 un periodo de garantía de 12 meses
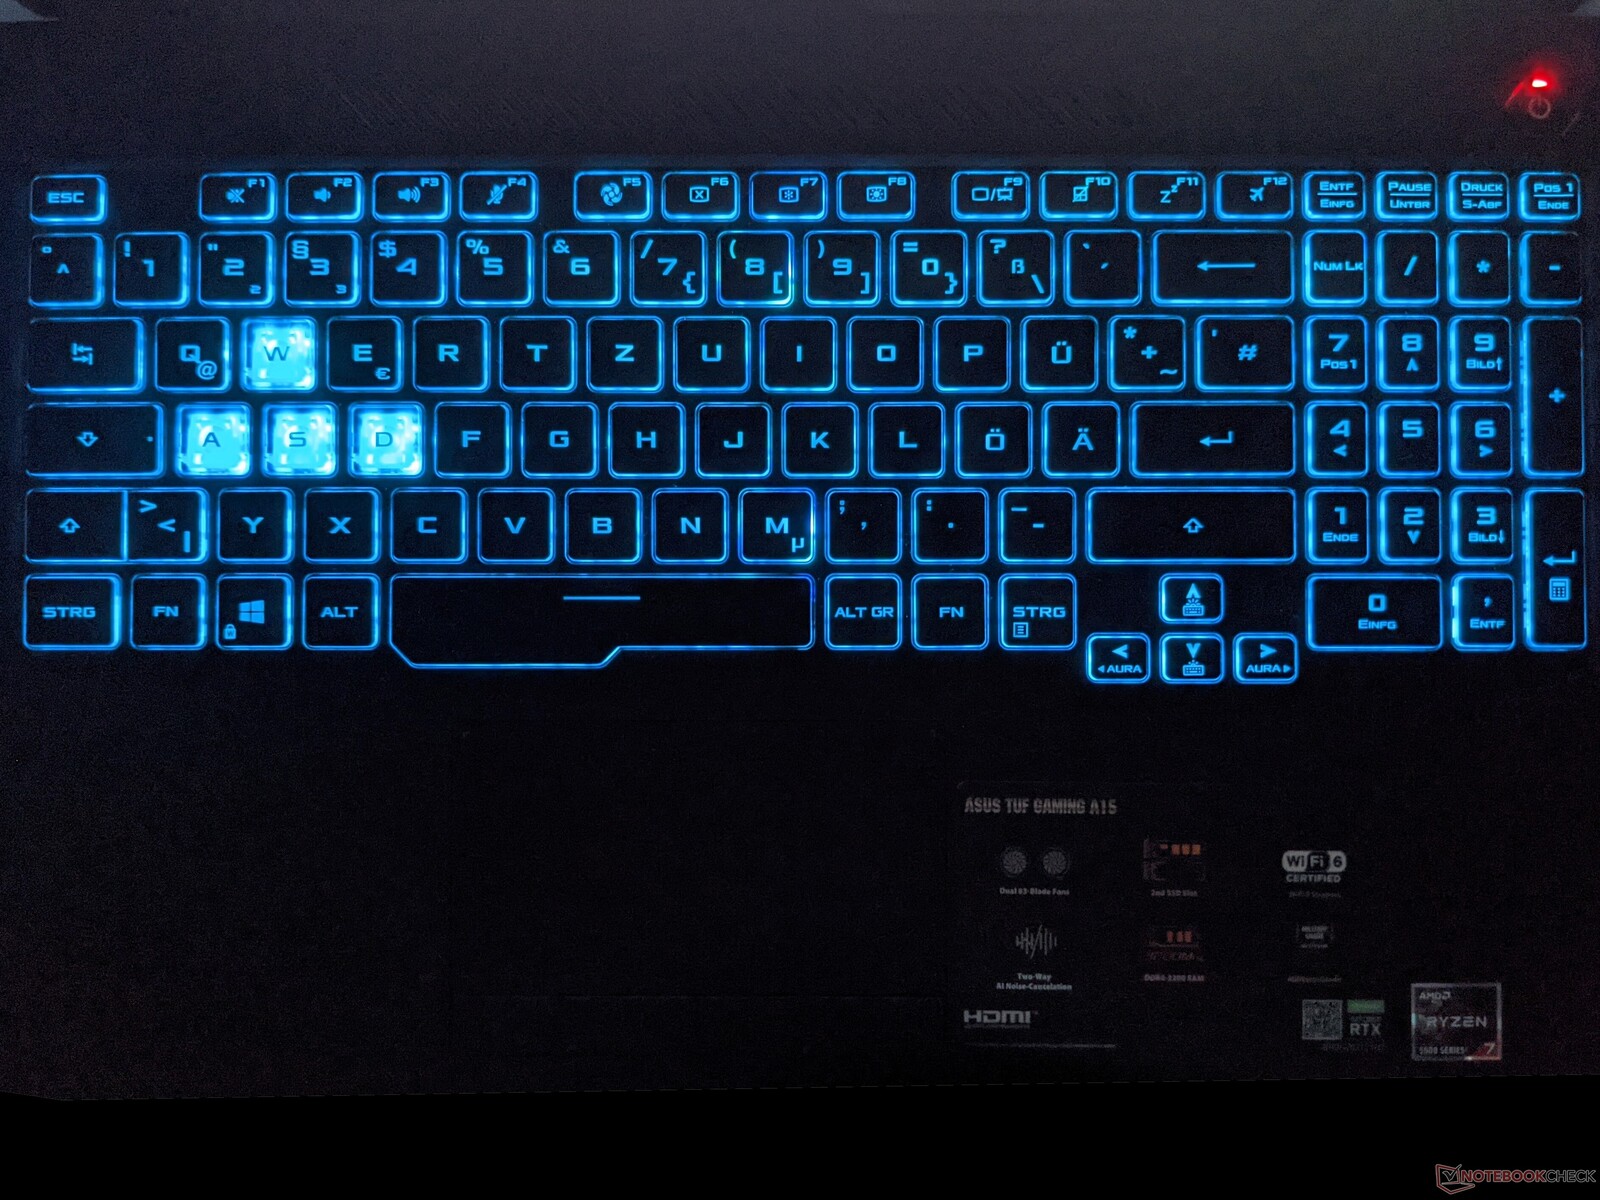
Dispositivos de entrada - No hay iluminación individual de las teclas
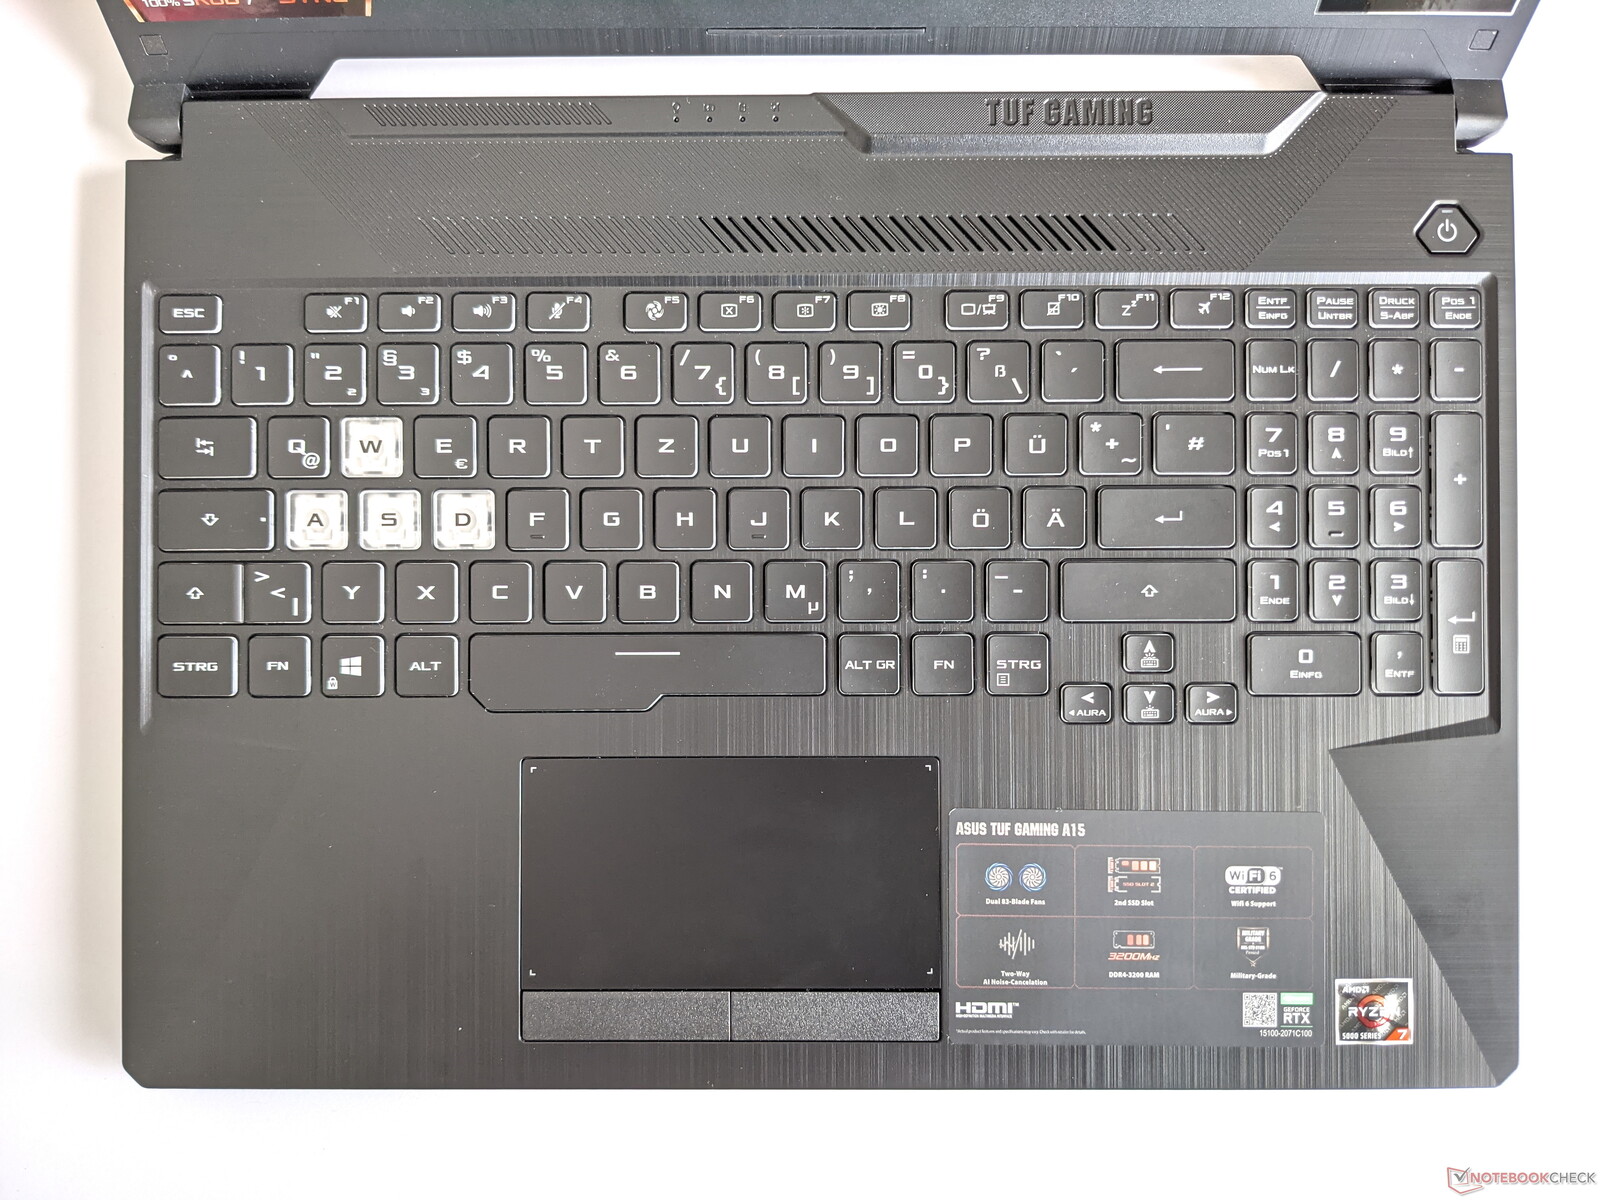
Teclado
Las teclas del Asus TUF Gaming A15 ofrecen una retroalimentación media con un punto de presión menos perceptible, pero también son adecuadas para escribir textos más largos tras un breve periodo de familiarización. Las teclas WASD destacan del resto del teclado gracias a su diseño transparente, lo que las hace más prominentes cuando se utiliza la iluminación de las teclas en tres fases. Esta última puede configurarse en diferentes colores, pero no ofrece iluminación individual de las teclas ni diferentes zonas
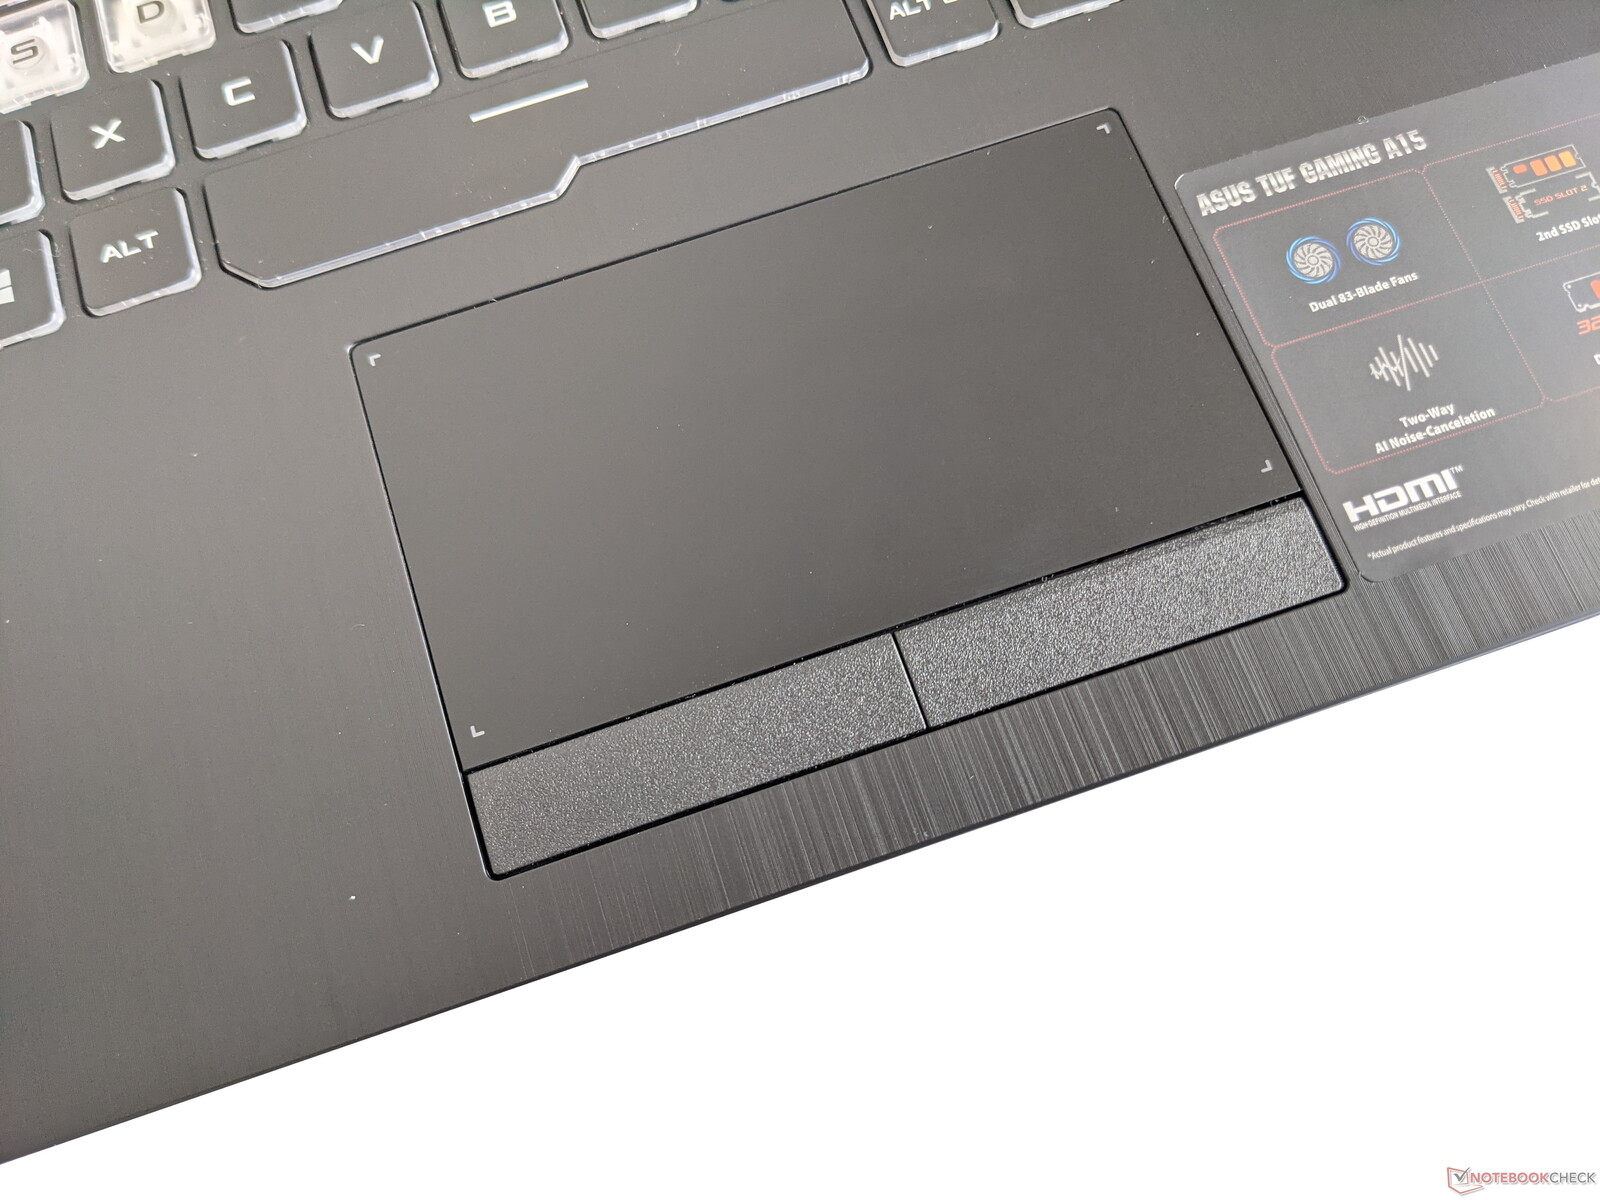
Panel táctil
Asus opta por un touchpad clásico con botones de ratón separados como reemplazo del ratón. Estos botones tienen un punto de presión suave, pero se disparan de forma fiable. El touchpad también responde con precisión al tacto y es muy adecuado para navegar con el puntero del ratón
Pantalla - 360 Hz y fuerte contraste

La pantalla del Asus TUF Gaming A15 consiste en un panel IPS de 15 pulgadas que ofrece una resolución de 1920x1080 píxeles así como una tasa de refresco de 240 Hz. También soporta Adaptive Sync. El brillo máximo de 268 cd/m² de media está en la mitad de nuestro campo de pruebas. Lo mismo ocurre con la distribución del brillo del 84%. Asus no ofrece más variantes de pantalla.
PWM a una frecuencia de 1,250 MHz es usado para el control de brillo. Pero como esto sólo tiene efecto a partir de niveles de brillo del 20%, debería ser posible usar la pantalla sin problemas incluso con ojos sensibles.
| |||||||||||||||||||||||||
iluminación: 84 %
Brillo con batería: 297 cd/m²
Contraste: 1350:1 (Negro: 0.22 cd/m²)
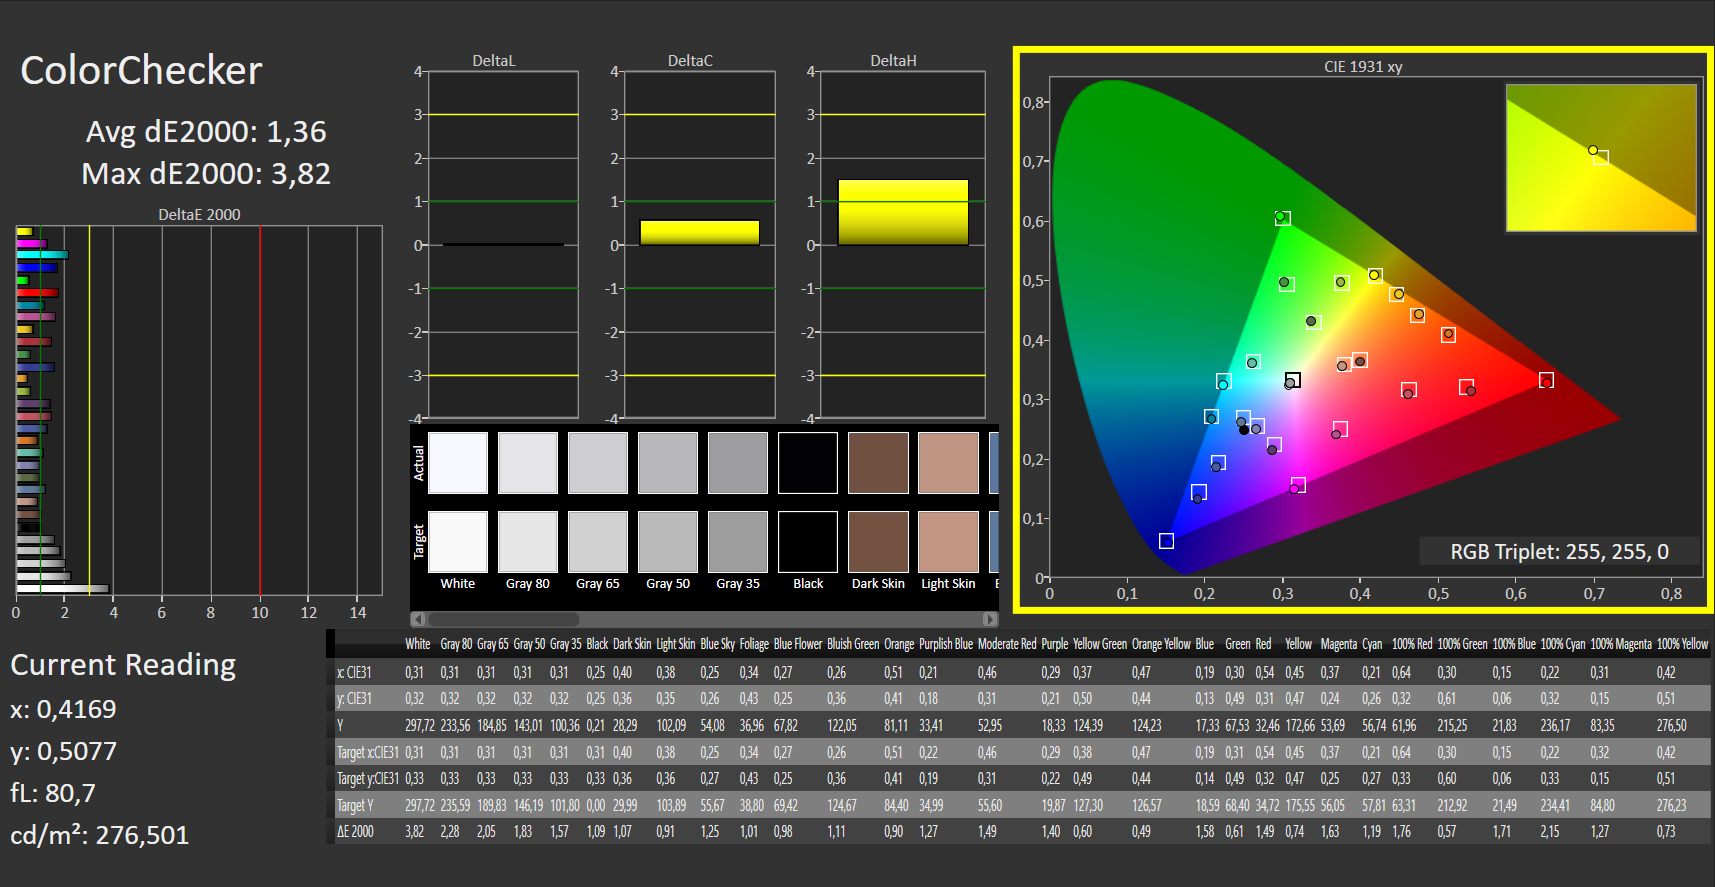
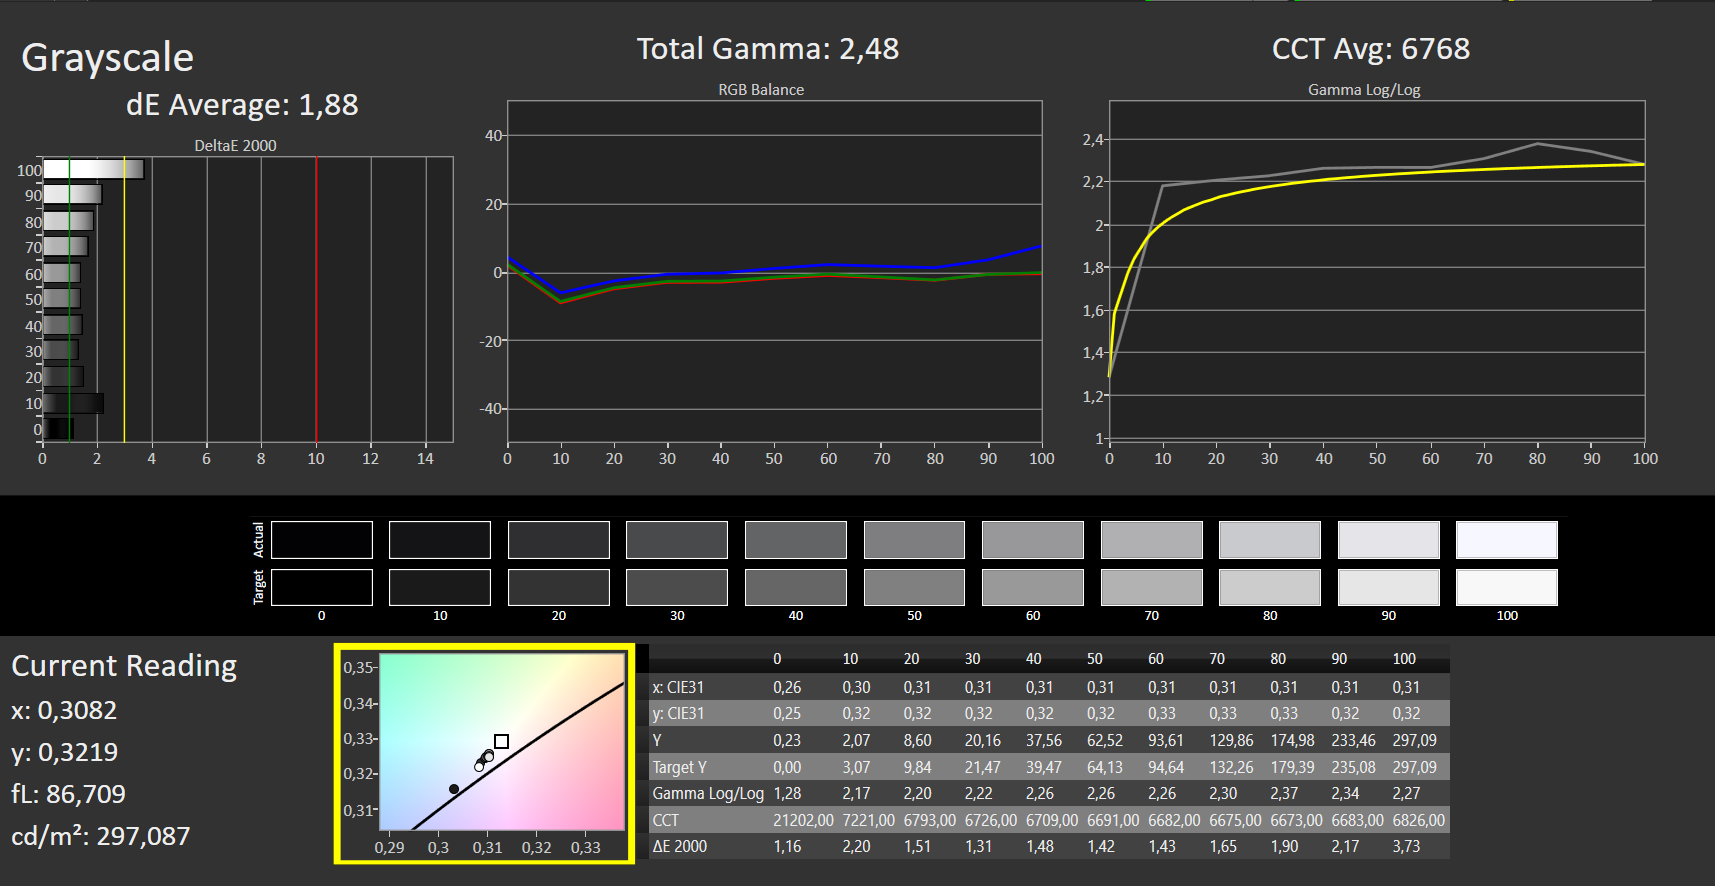
ΔE ColorChecker Calman: 1.36 | ∀{0.5-29.43 Ø4.72}
ΔE Greyscale Calman: 1.88 | ∀{0.09-98 Ø4.97}
99% sRGB (Argyll 1.6.3 3D)
63% AdobeRGB 1998 (Argyll 1.6.3 3D)
Gamma: 2.48
CCT: 6768 K
| Asus TUF Gaming A15 FA506QR-AZ061T Sharp SHP1532, IPS, 1920x1080, 15.6" | Asus TUF Gaming F15 FX506HM Chi Mei N156HRA-EA1, IPS, 1920x1080, 15.6" | Alienware m15 R5 Ryzen Edition B156HAN, IPS, 1920x1080, 15.6" | Aorus 15P XC Sharp LQ156M1JW03, IPS, 1920x1080, 15.6" | MSI GF65 Thin 10UE AU Optronics B156HAN08.4, IPS, 1920x1080, 15.6" | |
|---|---|---|---|---|---|
| Display | |||||
| Display P3 Coverage (%) | 41.9 | 67.2 | 37.65 | ||
| sRGB Coverage (%) | 62.9 | 98.7 | 56.3 | ||
| AdobeRGB 1998 Coverage (%) | 43.3 | 68.6 | 38.9 | ||
| Response Times | -154% | 31% | -7% | -251% | |
| Response Time Grey 50% / Grey 80% * (ms) | 12 ? | 28.4 ? -137% | 4 ? 67% | 11.2 ? 7% | 36.8 ? -207% |
| Response Time Black / White * (ms) | 8 ? | 21.6 ? -170% | 8.4 ? -5% | 9.6 ? -20% | 31.6 ? -295% |
| PWM Frequency (Hz) | 1250 ? | 24040 ? | |||
| Screen | -110% | -14% | 3% | -87% | |
| Brightness middle (cd/m²) | 297 | 268.3 -10% | 329 11% | 298 0% | 266.5 -10% |
| Brightness (cd/m²) | 268 | 257 -4% | 321 20% | 278 4% | 262 -2% |
| Brightness Distribution (%) | 84 | 84 0% | 92 10% | 88 5% | 91 8% |
| Black Level * (cd/m²) | 0.22 | 0.34 -55% | 0.27 -23% | 0.29 -32% | 0.18 18% |
| Contrast (:1) | 1350 | 789 -42% | 1219 -10% | 1028 -24% | 1481 10% |
| Colorchecker dE 2000 * | 1.36 | 5.05 -271% | 2.78 -104% | 0.96 29% | 5.33 -292% |
| Colorchecker dE 2000 max. * | 3.82 | 15.43 -304% | 4.88 -28% | 3.22 16% | 18.28 -379% |
| Greyscale dE 2000 * | 1.88 | 5.5 -193% | 2.5 -33% | 1.3 31% | 4.5 -139% |
| Gamma | 2.48 89% | 2.35 94% | 2.106 104% | 2.242 98% | 2.35 94% |
| CCT | 6768 96% | 7392 88% | 6201 105% | 6519 100% | 6289 103% |
| Color Space (Percent of AdobeRGB 1998) (%) | 63 | 76 21% | 69 10% | 35.6 -43% | |
| Color Space (Percent of sRGB) (%) | 99 | 99 0% | 91 -8% | 55.8 -44% | |
| Colorchecker dE 2000 calibrated * | 3.21 | 1.63 | 0.83 | 4.36 | |
| Media total (Programa/Opciones) | -132% /
-119% | 9% /
-6% | -2% /
2% | -169% /
-115% |
* ... más pequeño es mejor
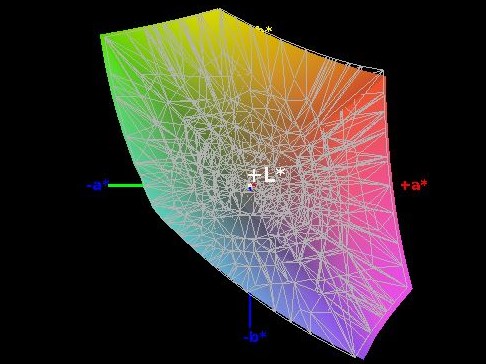
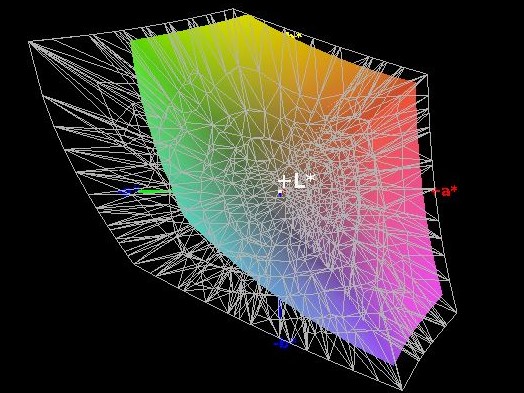
Nuestras mediciones muestran que la pantalla del Asus TUF Gaming A15 tiene un buen ratio de contraste de 1,350:1 y un nivel de negro sólo ligeramente elevado de 0.22 cd/m². La cobertura del espacio de color es muy buena con 99% (sRGB) y 63% (AdobeRGB).
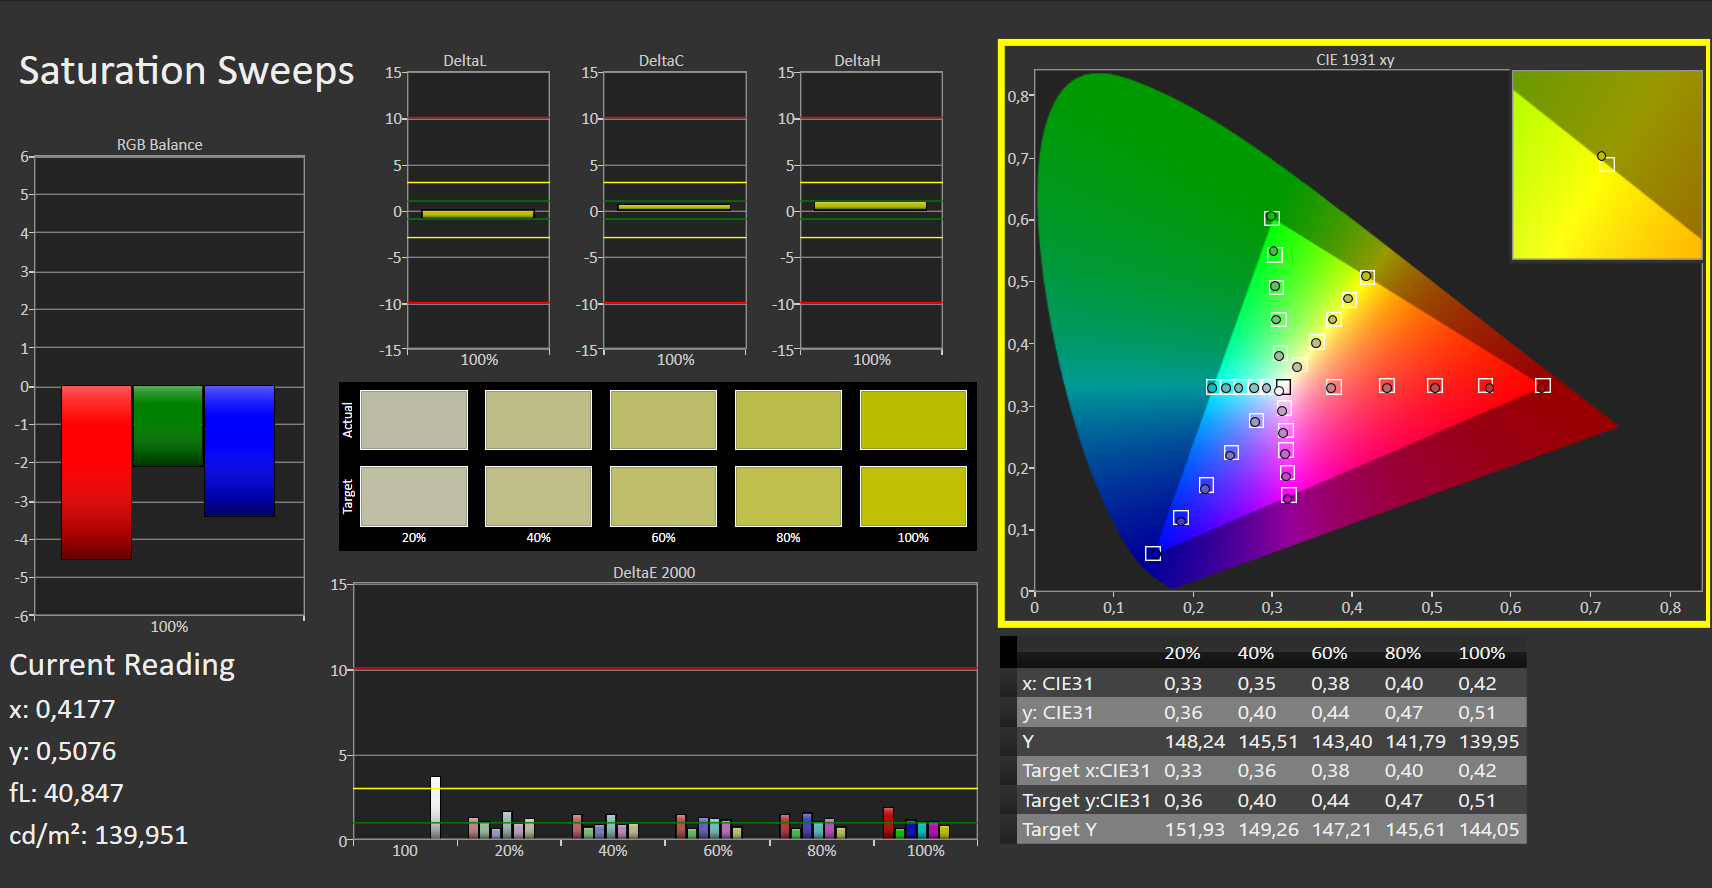
El análisis CalMAN también muestra que la pantalla ya reproduce los colores de forma muy equilibrada al sacarla de la caja. Por lo tanto, la calibración sólo supone una ligera mejora. El archivo ICC correspondiente puede descargarse en la ventana situada en la parte superior, a la derecha del gráfico de distribución del brillo de la pantalla
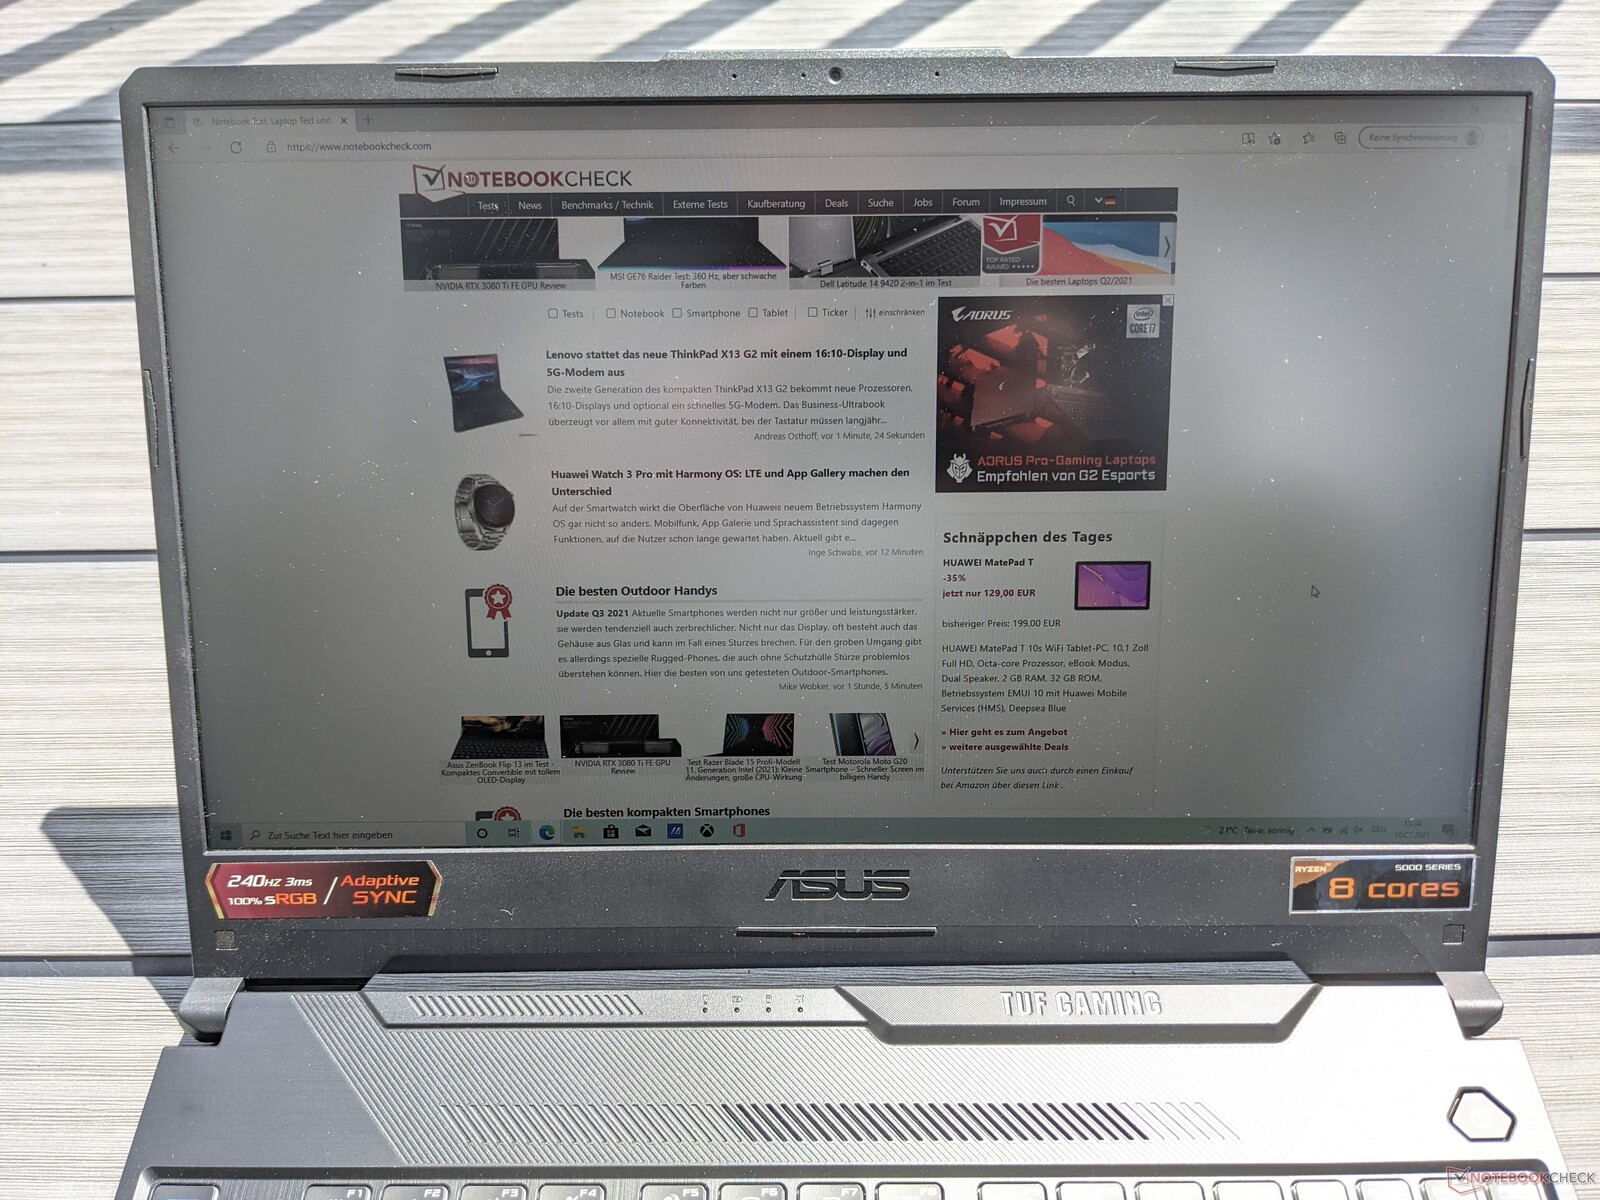
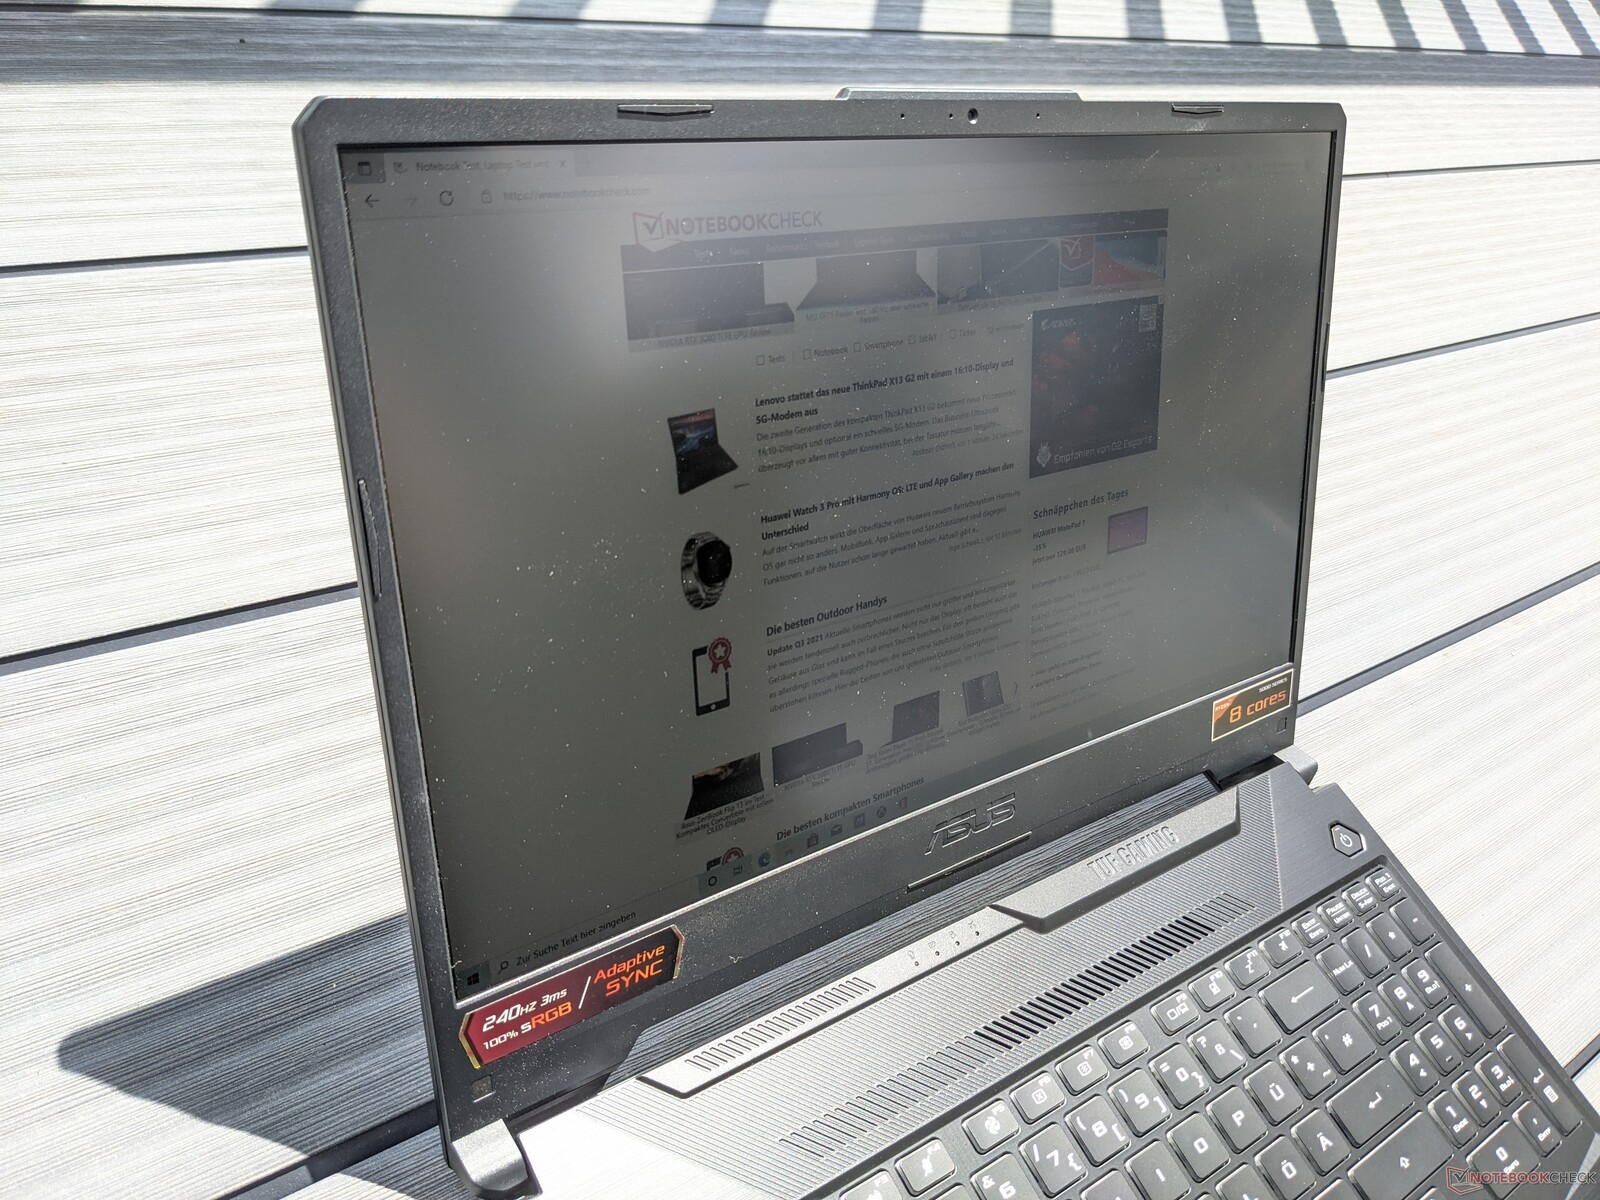
El TUF Gaming A15 puede usarse en exteriores siempre que se prioricen los lugares a la sombra. El brillo de la pantalla no es suficiente para mostrar el contenido de forma legible bajo la luz solar directa
Tiempos de respuesta del display
| ↔ Tiempo de respuesta de Negro a Blanco | ||
|---|---|---|
| 8 ms ... subida ↗ y bajada ↘ combinada | ↗ 4 ms subida |  |
| ↘ 4 ms bajada | ||
| La pantalla mostró tiempos de respuesta rápidos en nuestros tests y debería ser adecuada para juegos. En comparación, todos los dispositivos de prueba van de ##min### (mínimo) a 240 (máximo) ms. » 22 % de todos los dispositivos son mejores. Esto quiere decir que el tiempo de respuesta medido es mejor que la media (19.8 ms) de todos los dispositivos testados. | ||
| ↔ Tiempo de respuesta 50% Gris a 80% Gris | ||
| 12 ms ... subida ↗ y bajada ↘ combinada | ↗ 6 ms subida |  |
| ↘ 6 ms bajada | ||
| La pantalla mostró buenos tiempos de respuesta en nuestros tests pero podría ser demasiado lenta para los jugones competitivos. En comparación, todos los dispositivos de prueba van de ##min### (mínimo) a 636 (máximo) ms. » 25 % de todos los dispositivos son mejores. Esto quiere decir que el tiempo de respuesta medido es mejor que la media (31 ms) de todos los dispositivos testados. | ||
Parpadeo de Pantalla / PWM (Pulse-Width Modulation)
| Parpadeo de Pantalla / PWM detectado | 1250 Hz | ≤ 20 % de brillo |  |
La retroiluminación del display parpadea a 1250 Hz (seguramente usa PWM - Pulse-Width Modulation) a un brillo del 20 % e inferior. Sobre este nivel de brillo no debería darse parpadeo / PWM. La frecuencia de 1250 Hz es bastante alta, por lo que la mayoría de gente sensible al parpadeo no debería ver parpadeo o tener fatiga visual. Comparación: 52 % de todos los dispositivos testados no usaron PWM para atenuar el display. Si se usó, medimos una media de 7772 (mínimo: 5 - máxmo: 343500) Hz. | |||
El panel IPS del portátil Asus es muy estable en cuanto al ángulo de visión. El contenido de la imagen puede leerse desde casi cualquier ángulo sin que aparezca distorsionado o con colores incorrectos

Rendimiento - Potente portátil para juegos con procesador AMD
Asus posiciona el TUF Gaming A15 como un portátil para juegos de nivel básico y lo equipa con el hardware correspondiente. Aunque es muy adecuado para los juegos modernos, las opciones de configuración disponibles son más limitadas que en los portátiles más caros. Por ejemplo, además de la configuración probada aquí, sólo hay otra variante disponible en forma deAsus TUF Gaming F15 equipado con una CPU Intel
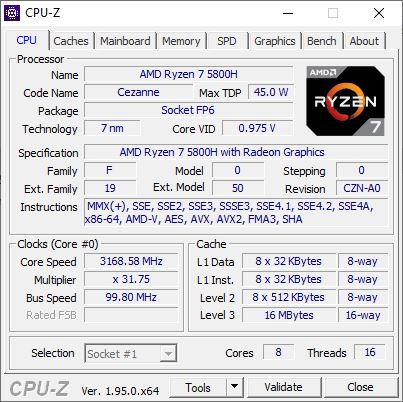
Procesador
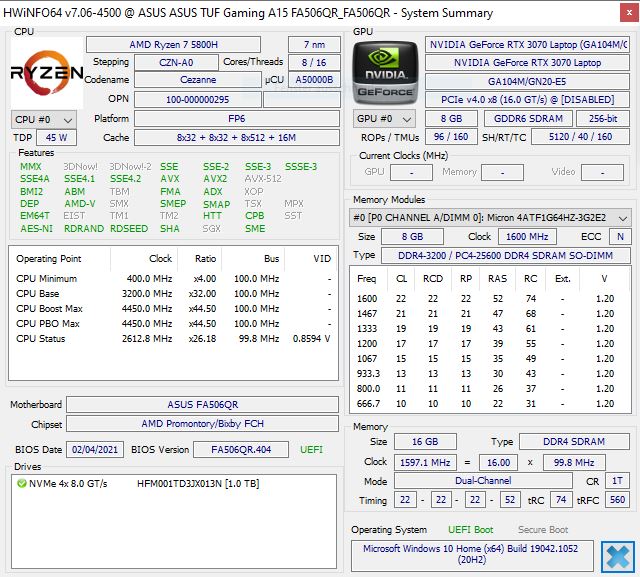
ElAMD Ryzen 7 5800Hutilizado aquí es un procesador octa-core que puede manejar hasta 16 tareas simultáneamente. Sus velocidades de reloj se sitúan entre los 3,2 y los 4,4 GHz, y la duración durante la cual se pueden mantener las velocidades de reloj máximas depende en gran medida del sistema de refrigeración. El consumo de energía a corto plazo está configurado en 65 vatios, mientras que elRyzen 7 5800Hen el
TUF Gaming A15 puede funcionar a 35 vatios a largo plazo.Como muestra nuestro test de resistencia Cinebench R15, la CPU puede mantener su rendimiento durante un periodo prolongado de tiempo antes de que el rendimiento caiga alrededor de un 8%. Este no es el caso de dispositivos como elAlienware m15y elTUF Gaming F15cuando el rendimiento inicial es el mismo. En las pruebas individuales, la CPU alcanza tasas dentro del rango superior de nuestro campo de pruebas.
Cinebench R20: CPU (Single Core) | CPU (Multi Core)
Cinebench R15: CPU Single 64Bit | CPU Multi 64Bit
Blender: v2.79 BMW27 CPU
7-Zip 18.03: 7z b 4 -mmt1 | 7z b 4
Geekbench 5.5: Single-Core | Multi-Core
HWBOT x265 Benchmark v2.2: 4k Preset
LibreOffice : 20 Documents To PDF
R Benchmark 2.5: Overall mean
| Cinebench R23 / Single Core | |
| Media de la clase Gaming (1166 - 2356, n=111, últimos 2 años) | |
| Asus TUF Gaming F15 FX506HM | |
| Alienware m15 R5 Ryzen Edition | |
| Medio AMD Ryzen 7 5800H (1294 - 1441, n=29) | |
| MSI GF65 Thin 10UE | |
| Aorus 15P XC | |
| Cinebench R23 / Multi Core | |
| Media de la clase Gaming (10488 - 40970, n=111, últimos 2 años) | |
| Asus TUF Gaming F15 FX506HM | |
| Alienware m15 R5 Ryzen Edition | |
| Medio AMD Ryzen 7 5800H (8812 - 13214, n=29) | |
| Aorus 15P XC | |
| MSI GF65 Thin 10UE | |
| Cinebench R20 / CPU (Single Core) | |
| Media de la clase Gaming (442 - 895, n=110, últimos 2 años) | |
| Asus TUF Gaming F15 FX506HM | |
| Alienware m15 R5 Ryzen Edition | |
| Asus TUF Gaming A15 FA506QR-AZ061T | |
| Medio AMD Ryzen 7 5800H (502 - 560, n=30) | |
| MSI GF65 Thin 10UE | |
| Aorus 15P XC | |
| Cinebench R20 / CPU (Multi Core) | |
| Media de la clase Gaming (4029 - 16108, n=110, últimos 2 años) | |
| Asus TUF Gaming F15 FX506HM | |
| Alienware m15 R5 Ryzen Edition | |
| Medio AMD Ryzen 7 5800H (3430 - 5020, n=31) | |
| Asus TUF Gaming A15 FA506QR-AZ061T | |
| Aorus 15P XC | |
| MSI GF65 Thin 10UE | |
| Cinebench R15 / CPU Single 64Bit | |
| Media de la clase Gaming (188.8 - 343, n=110, últimos 2 años) | |
| Asus TUF Gaming A15 FA506QR-AZ061T | |
| Alienware m15 R5 Ryzen Edition | |
| Asus TUF Gaming F15 FX506HM | |
| Medio AMD Ryzen 7 5800H (209 - 234, n=29) | |
| MSI GF65 Thin 10UE | |
| Aorus 15P XC | |
| Cinebench R15 / CPU Multi 64Bit | |
| Media de la clase Gaming (1578 - 6271, n=109, últimos 2 años) | |
| Asus TUF Gaming F15 FX506HM | |
| Asus TUF Gaming A15 FA506QR-AZ061T | |
| Alienware m15 R5 Ryzen Edition | |
| Medio AMD Ryzen 7 5800H (1487 - 2119, n=28) | |
| Aorus 15P XC | |
| MSI GF65 Thin 10UE | |
| Blender / v2.79 BMW27 CPU | |
| MSI GF65 Thin 10UE | |
| Aorus 15P XC | |
| Asus TUF Gaming A15 FA506QR-AZ061T | |
| Medio AMD Ryzen 7 5800H (237 - 340, n=29) | |
| Alienware m15 R5 Ryzen Edition | |
| Asus TUF Gaming F15 FX506HM | |
| Media de la clase Gaming (80 - 330, n=108, últimos 2 años) | |
| 7-Zip 18.03 / 7z b 4 -mmt1 | |
| Media de la clase Gaming (4199 - 7436, n=109, últimos 2 años) | |
| Asus TUF Gaming F15 FX506HM | |
| Alienware m15 R5 Ryzen Edition | |
| Asus TUF Gaming A15 FA506QR-AZ061T | |
| Medio AMD Ryzen 7 5800H (5038 - 5632, n=29) | |
| Aorus 15P XC | |
| MSI GF65 Thin 10UE | |
| 7-Zip 18.03 / 7z b 4 | |
| Media de la clase Gaming (33491 - 148086, n=109, últimos 2 años) | |
| Medio AMD Ryzen 7 5800H (45773 - 59986, n=28) | |
| Alienware m15 R5 Ryzen Edition | |
| Asus TUF Gaming A15 FA506QR-AZ061T | |
| Asus TUF Gaming F15 FX506HM | |
| Aorus 15P XC | |
| MSI GF65 Thin 10UE | |
| Geekbench 5.5 / Single-Core | |
| Media de la clase Gaming (986 - 2474, n=109, últimos 2 años) | |
| Alienware m15 R5 Ryzen Edition | |
| Medio AMD Ryzen 7 5800H (1336 - 1505, n=28) | |
| Asus TUF Gaming A15 FA506QR-AZ061T | |
| MSI GF65 Thin 10UE | |
| Aorus 15P XC | |
| Geekbench 5.5 / Multi-Core | |
| Media de la clase Gaming (6460 - 27010, n=109, últimos 2 años) | |
| Medio AMD Ryzen 7 5800H (6551 - 9062, n=28) | |
| Aorus 15P XC | |
| Asus TUF Gaming A15 FA506QR-AZ061T | |
| Alienware m15 R5 Ryzen Edition | |
| MSI GF65 Thin 10UE | |
| HWBOT x265 Benchmark v2.2 / 4k Preset | |
| Media de la clase Gaming (11.5 - 44.3, n=109, últimos 2 años) | |
| Asus TUF Gaming F15 FX506HM | |
| Alienware m15 R5 Ryzen Edition | |
| Medio AMD Ryzen 7 5800H (11.6 - 16.1, n=29) | |
| Asus TUF Gaming A15 FA506QR-AZ061T | |
| Aorus 15P XC | |
| MSI GF65 Thin 10UE | |
| LibreOffice / 20 Documents To PDF | |
| Medio AMD Ryzen 7 5800H (47.4 - 113, n=29) | |
| Alienware m15 R5 Ryzen Edition | |
| Aorus 15P XC | |
| Media de la clase Gaming (19 - 88.8, n=109, últimos 2 años) | |
| Asus TUF Gaming A15 FA506QR-AZ061T | |
| MSI GF65 Thin 10UE | |
| Asus TUF Gaming F15 FX506HM | |
| R Benchmark 2.5 / Overall mean | |
| MSI GF65 Thin 10UE | |
| Aorus 15P XC | |
| Asus TUF Gaming F15 FX506HM | |
| Medio AMD Ryzen 7 5800H (0.511 - 0.559, n=28) | |
| Alienware m15 R5 Ryzen Edition | |
| Asus TUF Gaming A15 FA506QR-AZ061T | |
| Media de la clase Gaming (0.3439 - 0.759, n=110, últimos 2 años) | |
* ... más pequeño es mejor
Rendimiento del sistema
En la prueba PCMark 10 para evaluar el rendimiento del sistema, el Asus TUF Gaming A15 ocupa el primer lugar en nuestro campo de pruebas. En las disciplinas individuales, obtiene el resultado más alto en la prueba de "Productividad", mientras que sólo es superado por elTUF Gaming F15en la
puntuación "Esencial". El portátil para juegos ofrece un funcionamiento muy fluido en el uso diario. No notamos ningún micro tartamudeo o similar durante el periodo de prueba.El rendimiento que se puede esperar de otros portátiles en comparación se puede encontrar en nuestro artículoCPU Benchmarks.
| PCMark 10 / Score | |
| Media de la clase Gaming (5828 - 11574, n=96, últimos 2 años) | |
| Asus TUF Gaming A15 FA506QR-AZ061T | |
| Asus TUF Gaming F15 FX506HM | |
| Medio AMD Ryzen 7 5800H, NVIDIA GeForce RTX 3070 Laptop GPU (6717 - 6983, n=6) | |
| Alienware m15 R5 Ryzen Edition | |
| Aorus 15P XC | |
| MSI GF65 Thin 10UE | |
| PCMark 10 / Essentials | |
| Media de la clase Gaming (8810 - 12600, n=100, últimos 2 años) | |
| Asus TUF Gaming F15 FX506HM | |
| Asus TUF Gaming A15 FA506QR-AZ061T | |
| Medio AMD Ryzen 7 5800H, NVIDIA GeForce RTX 3070 Laptop GPU (9548 - 10226, n=6) | |
| Alienware m15 R5 Ryzen Edition | |
| Aorus 15P XC | |
| MSI GF65 Thin 10UE | |
| PCMark 10 / Productivity | |
| Media de la clase Gaming (6845 - 21327, n=98, últimos 2 años) | |
| Asus TUF Gaming A15 FA506QR-AZ061T | |
| Medio AMD Ryzen 7 5800H, NVIDIA GeForce RTX 3070 Laptop GPU (8849 - 9514, n=6) | |
| Alienware m15 R5 Ryzen Edition | |
| Asus TUF Gaming F15 FX506HM | |
| Aorus 15P XC | |
| MSI GF65 Thin 10UE | |
| PCMark 10 / Digital Content Creation | |
| Media de la clase Gaming (7602 - 19657, n=98, últimos 2 años) | |
| Aorus 15P XC | |
| Medio AMD Ryzen 7 5800H, NVIDIA GeForce RTX 3070 Laptop GPU (8948 - 10389, n=6) | |
| Asus TUF Gaming F15 FX506HM | |
| Asus TUF Gaming A15 FA506QR-AZ061T | |
| Alienware m15 R5 Ryzen Edition | |
| MSI GF65 Thin 10UE | |
| PCMark 10 Score | 6917 puntos | |
ayuda | ||
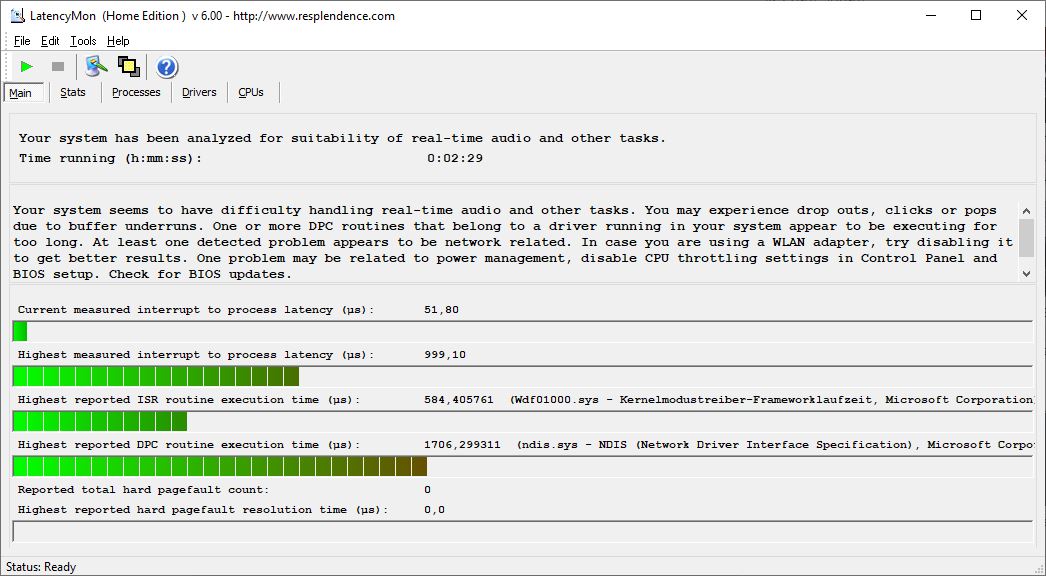
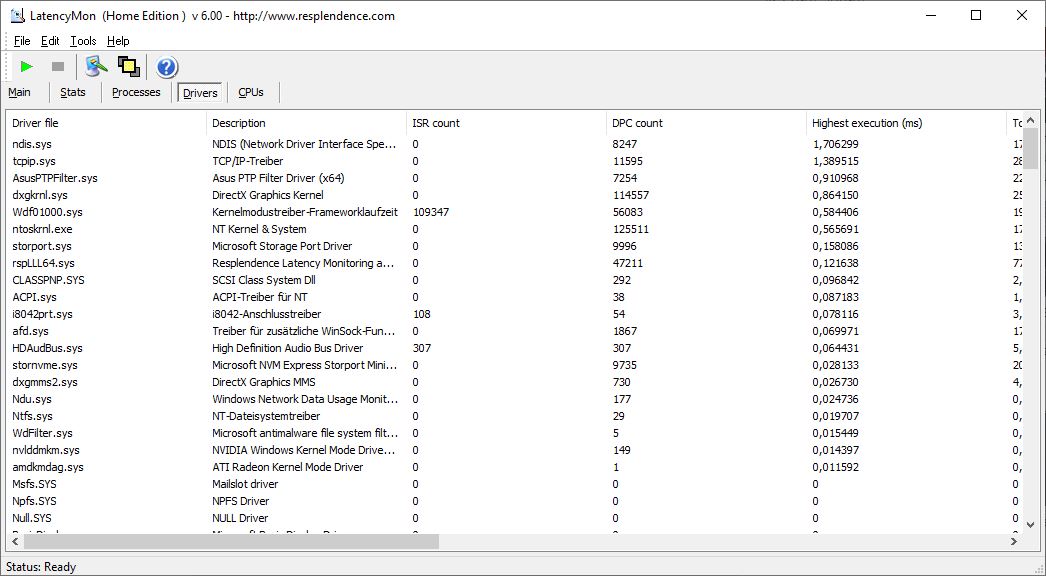
Latencias del CPD
En la prueba con LatencyMon, el portátil para juegos de Asus sólo muestra tiempos de interrupción ligeramente elevados. Esto lo hace adecuado para aplicaciones en tiempo real hasta cierto punto
| DPC Latencies / LatencyMon - interrupt to process latency (max), Web, Youtube, Prime95 | |
| Asus TUF Gaming F15 FX506HM | |
| Aorus 15P XC | |
| Asus TUF Gaming A15 FA506QR-AZ061T | |
| MSI GF65 Thin 10UE | |
| Alienware m15 R5 Ryzen Edition | |
* ... más pequeño es mejor
Almacenamiento
Asus instala un SSD de 1 TB de SK Hynix en el TUF Gaming A15. Alcanza muy buenas velocidades de lectura y escritura en las pruebas de almacenamiento, que están ligeramente por encima del nivel de la competencia.
El rendimiento de otros dispositivos de almacenamiento masivo en comparación se encuentra en nuestro artículoHDD/SSD Benchmarks.
| Asus TUF Gaming A15 FA506QR-AZ061T SK Hynix HFM001TD3JX013N | Asus TUF Gaming F15 FX506HM SK Hynix HFM001TD3JX013N | Alienware m15 R5 Ryzen Edition Toshiba KBG40ZNS512G NVMe | Aorus 15P XC ESR512GTLCG-EAC-4 | MSI GF65 Thin 10UE Samsung SSD PM981 MZVLB1T0HALR | Medio SK Hynix HFM001TD3JX013N | |
|---|---|---|---|---|---|---|
| CrystalDiskMark 5.2 / 6 | -6% | -27% | -8% | -11% | -2% | |
| Write 4K (MB/s) | 182.5 | 168.1 -8% | 116.9 -36% | 130.2 -29% | 157.3 -14% | 155.8 ? -15% |
| Read 4K (MB/s) | 73.2 | 65.1 -11% | 44.56 -39% | 45.47 -38% | 46.69 -36% | 57 ? -22% |
| Write Seq (MB/s) | 3005 | 2124 -29% | 1552 -48% | 2269 -24% | 2389 -20% | 3943 ? 31% |
| Read Seq (MB/s) | 2358 | 2204 -7% | 1682 -29% | 1643 -30% | 2196 -7% | 2180 ? -8% |
| Write 4K Q32T1 (MB/s) | 389.5 | 455.3 17% | 497.8 28% | 547 40% | 407.6 5% | 452 ? 16% |
| Read 4K Q32T1 (MB/s) | 463.8 | 465.6 0% | 436.8 -6% | 654 41% | 519 12% | 447 ? -4% |
| Write Seq Q32T1 (MB/s) | 3166 | 2911 -8% | 1461 -54% | 2512 -21% | 2401 -24% | 2859 ? -10% |
| Read Seq Q32T1 (MB/s) | 3590 | 3519 -2% | 2364 -34% | 3382 -6% | 3344 -7% | 3515 ? -2% |
| AS SSD | -22% | -91% | -12% | -27% | -17% | |
| Seq Read (MB/s) | 3133 | 2873 -8% | 2082 -34% | 2694 -14% | 3002 -4% | 2839 ? -9% |
| Seq Write (MB/s) | 2969 | 1619 -45% | 825 -72% | 2327 -22% | 2420 -18% | 1917 ? -35% |
| 4K Read (MB/s) | 55.2 | 57.5 4% | 42.41 -23% | 47.77 -13% | 48.46 -12% | 53 ? -4% |
| 4K Write (MB/s) | 129.7 | 149.6 15% | 98.3 -24% | 98.8 -24% | 114.3 -12% | 127.3 ? -2% |
| 4K-64 Read (MB/s) | 1891 | 1252 -34% | 1255 -34% | 1746 -8% | 1873 -1% | 1369 ? -28% |
| 4K-64 Write (MB/s) | 1795 | 2196 22% | 738 -59% | 2267 26% | 1882 5% | 1939 ? 8% |
| Access Time Read * (ms) | 0.052 | 0.04 23% | 0.109 -110% | 0.079 -52% | 0.045 13% | 0.0468 ? 10% |
| Access Time Write * (ms) | 0.028 | 0.082 -193% | 0.17 -507% | 0.039 -39% | 0.101 -261% | 0.0532 ? -90% |
| Score Read (Points) | 2259 | 1597 -29% | 1506 -33% | 2063 -9% | 2221 -2% | 1706 ? -24% |
| Score Write (Points) | 2221 | 2508 13% | 918 -59% | 2598 17% | 2238 1% | 2258 ? 2% |
| Score Total (Points) | 5630 | 4869 -14% | 3136 -44% | 5698 1% | 5565 -1% | 4797 ? -15% |
| Media total (Programa/Opciones) | -14% /
-15% | -59% /
-64% | -10% /
-11% | -19% /
-20% | -10% /
-11% |
* ... más pequeño es mejor

Continuous load read: DiskSpd Read Loop, Queue Depth 8
Tarjeta gráfica
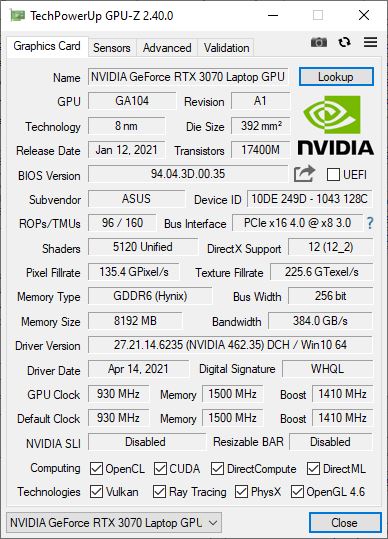
Asus utiliza unaNvidia GeForce RTX 3070en el
TUF Gaming A15. Esta tarjeta gráfica es actualmente uno de los modelos más potentes disponibles para portátiles, aunque el rendimiento real depende mucho del TGP configurado. Este puede llegar a 125 vatios, pero está limitado a 90 vatios en el A15. Esto lleva a valores en la mitad de nuestro campo de pruebas en los benchmarks 3DMark, lo que habla de un buen rendimiento en este rango de precios.El rendimiento ofrecido por otras tarjetas gráficas se puede encontrar en nuestro artículoGPU Benchmarks.
| 3DMark 11 Performance | 23459 puntos | |
| 3DMark Cloud Gate Standard Score | 46591 puntos | |
| 3DMark Fire Strike Score | 20237 puntos | |
| 3DMark Time Spy Score | 8446 puntos | |
ayuda | ||
Rendimiento de los juegos
LaNvidia GeForce RTX 3070 incorporada aquí es muy adecuada para los juegos. Los títulos más recientes se renderizan con fluidez a resolución Full HD y ajustes de alto detalle a altas velocidades de fotogramas. Solo los juegos muy exigentes, como Cyberpunk 2077, pueden experimentar tasas de fotogramas por debajo de los 60 fps en ajustes gráficos altos.
NuestroartículoGPU Games muestra el rendimiento que se puede esperar en otros títulos.
| The Witcher 3 - 1920x1080 Ultra Graphics & Postprocessing (HBAO+) | |
| Media de la clase Gaming (95 - 240, n=8, últimos 2 años) | |
| Aorus 15P XC | |
| Medio NVIDIA GeForce RTX 3070 Laptop GPU (34.9 - 109, n=52) | |
| Asus TUF Gaming A15 FA506QR-AZ061T | |
| Alienware m15 R5 Ryzen Edition | |
| Asus TUF Gaming F15 FX506HM | |
| MSI GF65 Thin 10UE | |
| Cyberpunk 2077 1.0 - 1920x1080 Ultra Preset | |
| Aorus 15P XC | |
| Medio NVIDIA GeForce RTX 3070 Laptop GPU (50 - 70.5, n=11) | |
| Asus TUF Gaming A15 FA506QR-AZ061T | |
| Alienware m15 R5 Ryzen Edition | |
| Final Fantasy XV Benchmark - 1920x1080 High Quality | |
| Media de la clase Gaming (41 - 215, n=100, últimos 2 años) | |
| Medio NVIDIA GeForce RTX 3070 Laptop GPU (27.9 - 107, n=49) | |
| Asus TUF Gaming A15 FA506QR-AZ061T | |
| Alienware m15 R5 Ryzen Edition | |
| Asus TUF Gaming F15 FX506HM | |
| MSI GF65 Thin 10UE | |
La prueba de resistencia con The Witcher 3 en configuración gráfica Ultra muestra que, aunque el rendimiento disminuye un poco con el tiempo, el sistema también es capaz de recuperarse de esta caída. Por tanto, no cabe esperar caídas de rendimiento ni siquiera durante largas sesiones de juego
The Witcher 3 FPS diagram
| bajo | medio | alto | ultra | |
|---|---|---|---|---|
| GTA V (2015) | 174 | 141 | 83.1 | |
| The Witcher 3 (2015) | 78 | |||
| Dota 2 Reborn (2015) | 140 | 131 | 115 | 110 |
| Final Fantasy XV Benchmark (2018) | 152 | 106 | 80.1 | |
| X-Plane 11.11 (2018) | 92.7 | 81.4 | 68 | |
| Far Cry 5 (2018) | 127 | 106 | 104 | 100 |
| Strange Brigade (2018) | 272 | 170 | 152 | 139 |
| Cyberpunk 2077 1.0 (2020) | 97.3 | 76.8 | 64.6 | 57 |
Emisiones - El TUF Gaming A15 tiene buenos altavoces
Emisiones acústicas
Los ventiladores del Asus TUF Gaming A15 alcanzan niveles de ruido de hasta 49 dB(A) y son, por tanto, claramente audibles bajo carga pesada. Se produce un ruido constante, que puede tolerarse bien. El zumbido de la bobina ocurrió muy raramente en nuestro dispositivo de prueba, pero desapareció rápidamente
Ruido
| Ocioso |
| 26 / 26 / 27.4 dB(A) |
| Carga |
| 46.6 / 49.3 dB(A) |
 | ||
30 dB silencioso 40 dB(A) audible 50 dB(A) ruidosamente alto |
||
min: | ||
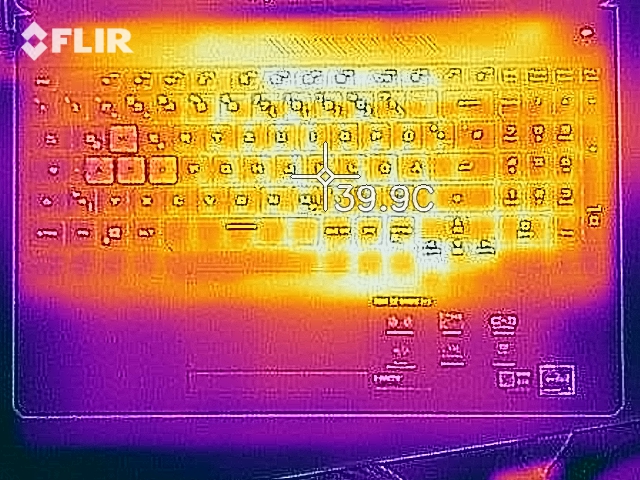
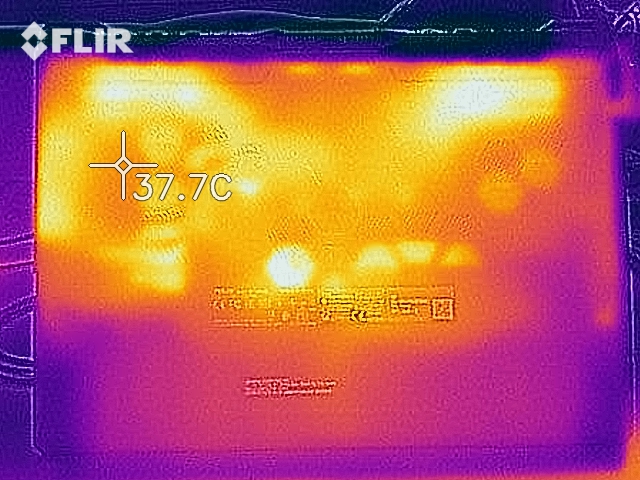
Temperatura
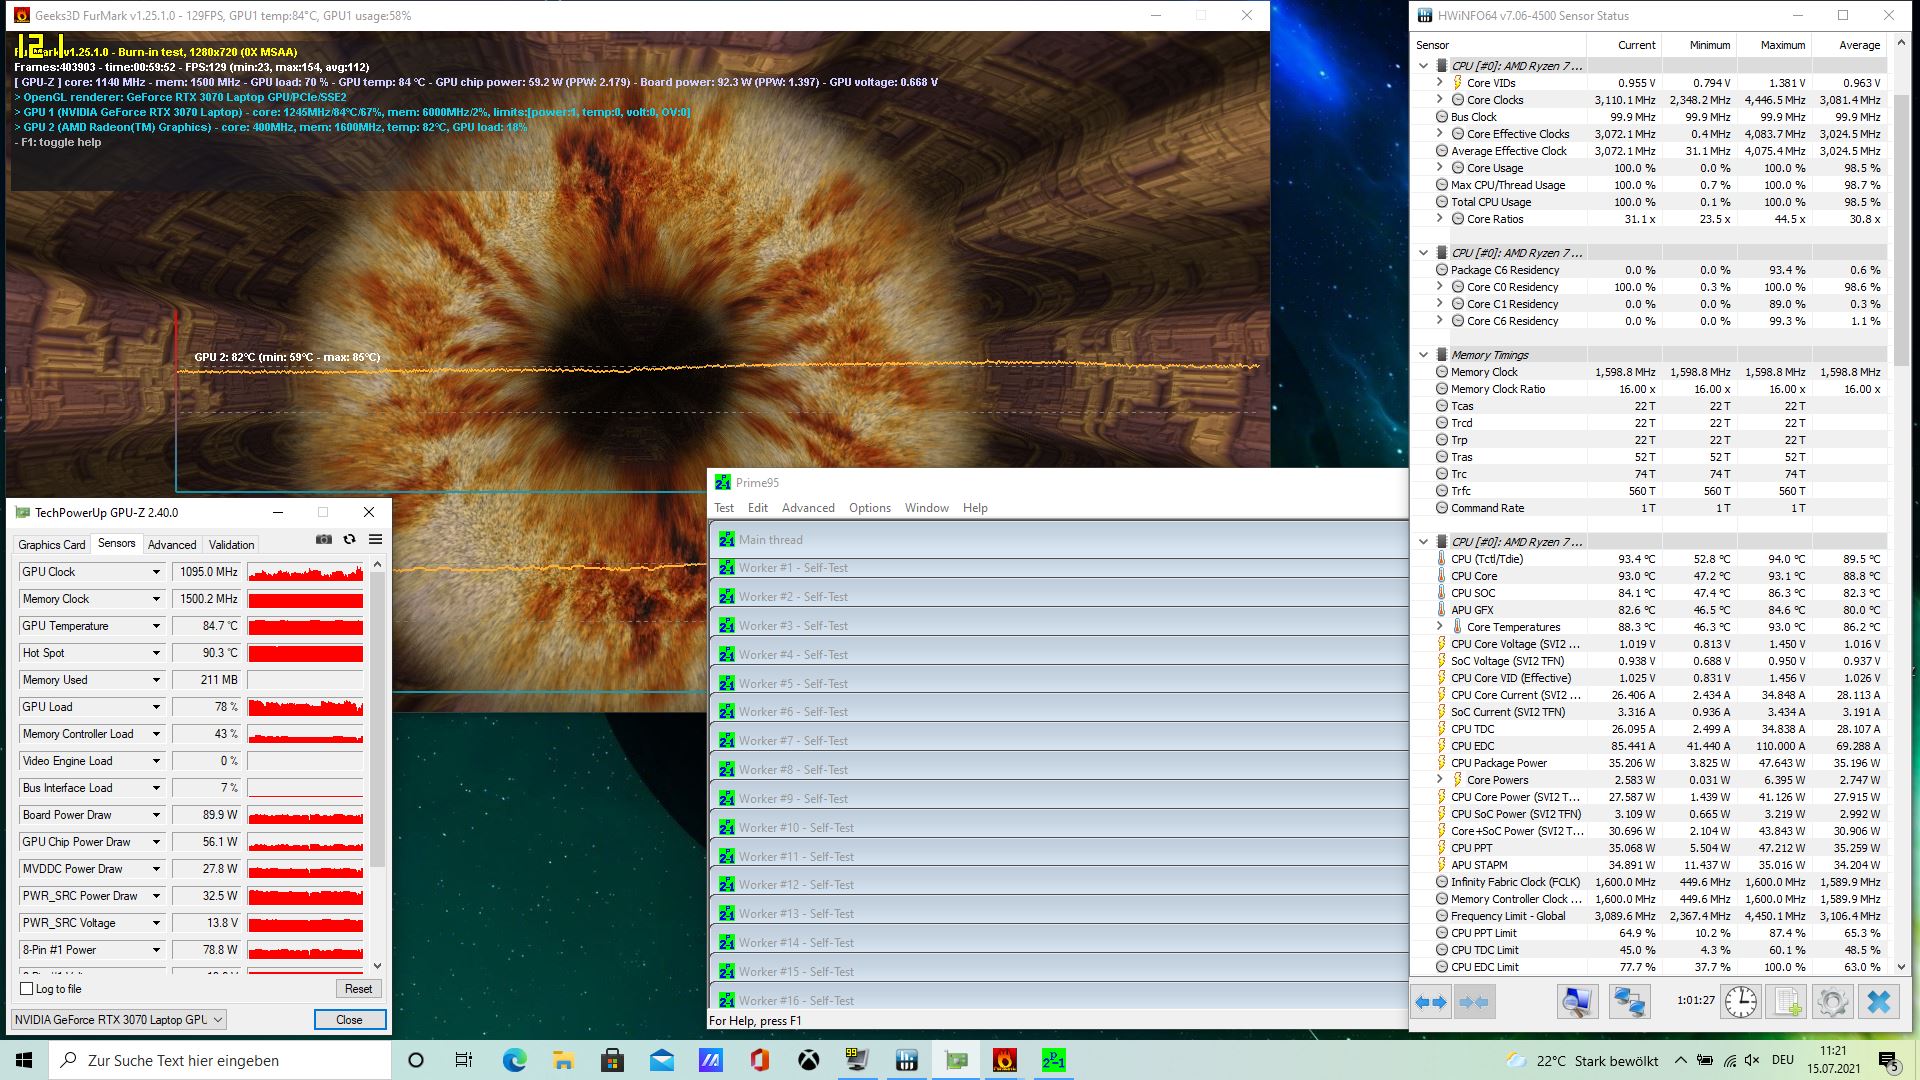
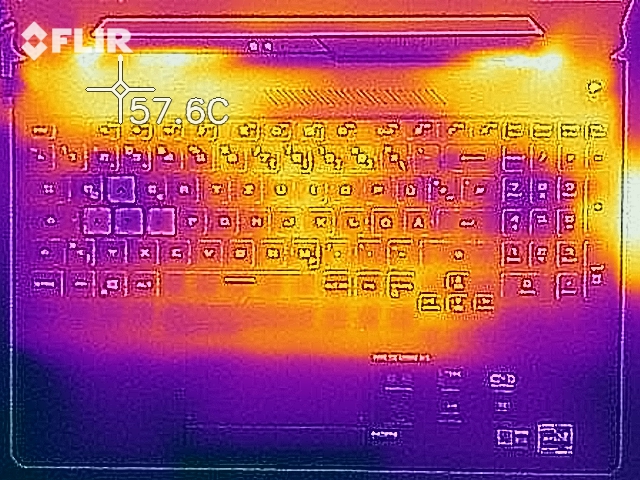
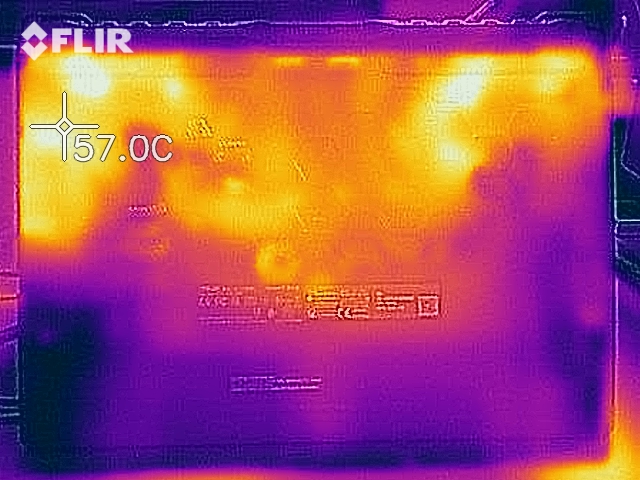
Según nuestras mediciones, las superficies del TUF Gaming A15 se calientan hasta 55.9 °C bajo carga. El punto más cálido está en la esquina trasera derecha de la parte inferior. Los reposamanos siempre se mantienen lo suficientemente frescos a temperaturas inferiores a los 30 °C, por lo que el portátil se mantiene utilizable en todo momento
Las temperaturas dentro del A15 aumentaron hasta 94 °C durante nuestra prueba de estrés de aproximadamente una hora. En el proceso, las velocidades de reloj cayeron a unos 2,4 GHz, lo que está por debajo de la velocidad de reloj base de 3,2 GHz. Sin embargo, el sistema pudo seguir funcionando sin problemas y se estabilizó rápidamente tras el final de la prueba. Por tanto, no se esperan restricciones debidas a temperaturas excesivamente altas
(-) La temperatura máxima en la parte superior es de 46.7 °C / 116 F, frente a la media de 40.4 °C / 105 F, que oscila entre 21.2 y 68.8 °C para la clase Gaming.
(-) El fondo se calienta hasta un máximo de 55.9 °C / 133 F, frente a la media de 43.2 °C / 110 F
(±) En reposo, la temperatura media de la parte superior es de 33 °C / 91# F, frente a la media del dispositivo de 33.9 °C / 93 F.
(+) El reposamanos y el panel táctil están a una temperatura inferior a la de la piel, con un máximo de 29.4 °C / 84.9 F y, por tanto, son fríos al tacto.
(±) La temperatura media de la zona del reposamanos de dispositivos similares fue de 28.8 °C / 83.8 F (-0.6 °C / -1.1 F).
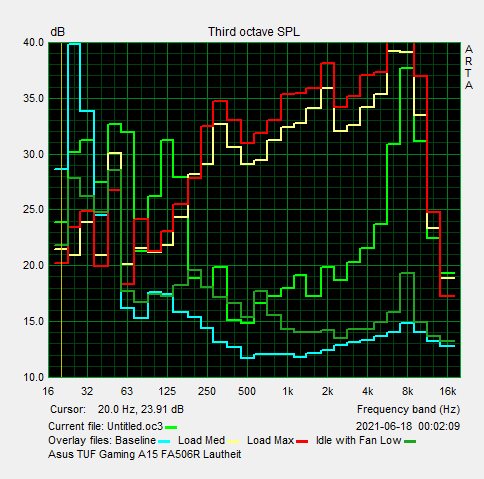
Altavoces
Los altavoces del TUF Gaming A15 ofrecen un volumen moderado y un espectro de sonido bastante amplio. Esto los hace adecuados para consumir contenido multimedia, pero se siguen recomendando altavoces externos o auriculares para escuchar música o jugar
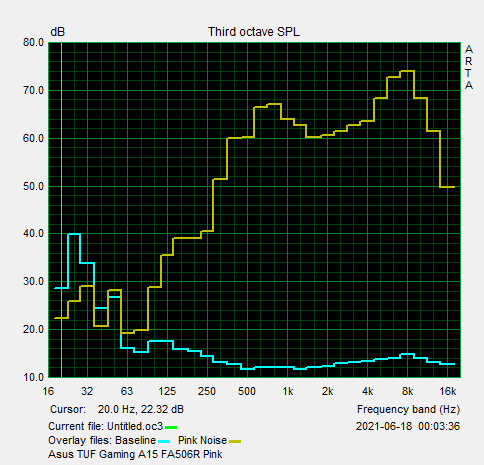
Asus TUF Gaming A15 FA506QR-AZ061T análisis de audio
(±) | la sonoridad del altavoz es media pero buena (74 dB)
Graves 100 - 315 Hz
(-) | casi sin bajos - de media 22.4% inferior a la mediana
(±) | la linealidad de los graves es media (10.8% delta a frecuencia anterior)
Medios 400 - 2000 Hz
(+) | medios equilibrados - a sólo 2.4% de la mediana
(+) | los medios son lineales (5.9% delta a la frecuencia anterior)
Altos 2 - 16 kHz
(±) | máximos más altos - de media 5.8% más altos que la mediana
(+) | los máximos son lineales (5.6% delta a la frecuencia anterior)
Total 100 - 16.000 Hz
(±) | la linealidad del sonido global es media (20.1% de diferencia con la mediana)
En comparación con la misma clase
» 71% de todos los dispositivos probados de esta clase eran mejores, 6% similares, 23% peores
» El mejor tuvo un delta de 6%, la media fue 18%, el peor fue ###max##%
En comparación con todos los dispositivos probados
» 52% de todos los dispositivos probados eran mejores, 8% similares, 40% peores
» El mejor tuvo un delta de 4%, la media fue 24%, el peor fue ###max##%
Aorus 15P XC análisis de audio
(+) | los altavoces pueden reproducir a un volumen relativamente alto (#84 dB)
Graves 100 - 315 Hz
(-) | casi sin bajos - de media 20.8% inferior a la mediana
(±) | la linealidad de los graves es media (10.8% delta a frecuencia anterior)
Medios 400 - 2000 Hz
(±) | medias más altas - de media 7.1% más altas que la mediana
(+) | los medios son lineales (4.9% delta a la frecuencia anterior)
Altos 2 - 16 kHz
(+) | máximos equilibrados - a sólo 1.9% de la mediana
(+) | los máximos son lineales (4.6% delta a la frecuencia anterior)
Total 100 - 16.000 Hz
(±) | la linealidad del sonido global es media (17% de diferencia con la mediana)
En comparación con la misma clase
» 45% de todos los dispositivos probados de esta clase eran mejores, 12% similares, 43% peores
» El mejor tuvo un delta de 6%, la media fue 18%, el peor fue ###max##%
En comparación con todos los dispositivos probados
» 30% de todos los dispositivos probados eran mejores, 8% similares, 62% peores
» El mejor tuvo un delta de 4%, la media fue 24%, el peor fue ###max##%
Gestión de la energía: portátil para juegos con buena duración de la batería
Consumo de energía
Nuestras mediciones muestran un consumo de energía de hasta 184 vatios bajo carga para el portátil de juegos Asus. Mientras que el A15 exhibe un bajo consumo de energía a la par de nuestro campo de pruebas con su promedio de 12.8 watts en nuestro escenario inactivo, el valor promedio bajo carga es comparativamente alto con 120 watts.
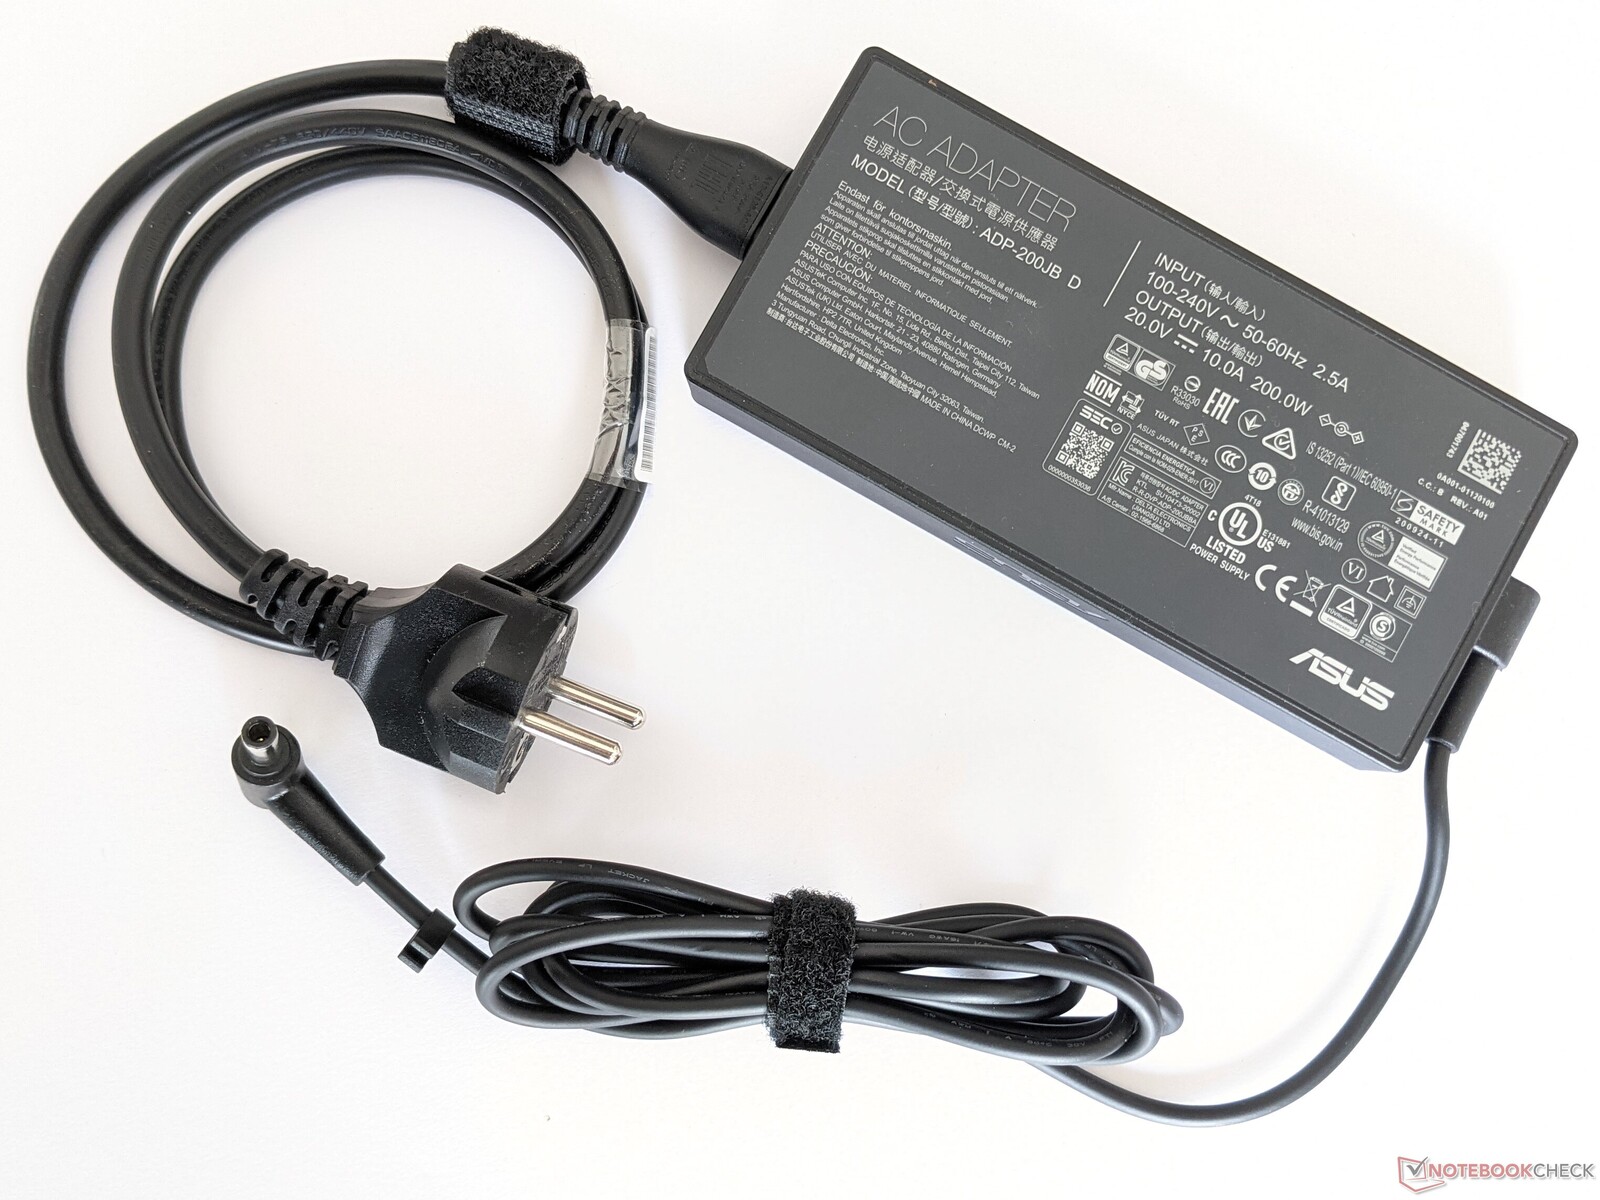
El adaptador de poder incluido tiene una salida suficientemente alta de 200 watts.
| Off / Standby | |
| Ocioso | |
| Carga |
|
Clave:
min: | |
| Asus TUF Gaming A15 FA506QR-AZ061T R7 5800H, GeForce RTX 3070 Laptop GPU, SK Hynix HFM001TD3JX013N, IPS, 1920x1080, 15.6" | Asus TUF Gaming F15 FX506HM i7-11800H, GeForce RTX 3060 Laptop GPU, SK Hynix HFM001TD3JX013N, IPS, 1920x1080, 15.6" | Alienware m15 R5 Ryzen Edition R7 5800H, GeForce RTX 3060 Laptop GPU, Toshiba KBG40ZNS512G NVMe, IPS, 1920x1080, 15.6" | Aorus 15P XC i7-10870H, GeForce RTX 3070 Laptop GPU, ESR512GTLCG-EAC-4, IPS, 1920x1080, 15.6" | MSI GF65 Thin 10UE i7-10750H, GeForce RTX 3060 Laptop GPU, Samsung SSD PM981 MZVLB1T0HALR, IPS, 1920x1080, 15.6" | Medio NVIDIA GeForce RTX 3070 Laptop GPU | Media de la clase Gaming | |
|---|---|---|---|---|---|---|---|
| Power Consumption | -4% | -22% | -39% | 12% | -41% | -32% | |
| Idle Minimum * (Watt) | 10.2 | 9.5 7% | 11 -8% | 14 -37% | 5.4 47% | 15.6 ? -53% | 13.1 ? -28% |
| Idle Average * (Watt) | 12.8 | 12.1 5% | 14 -9% | 17 -33% | 12.8 -0% | 20.1 ? -57% | 18.8 ? -47% |
| Idle Maximum * (Watt) | 15 | 22.5 -50% | 25 -67% | 33 -120% | 19.5 -30% | 29.4 ? -96% | 24.4 ? -63% |
| Load Average * (Watt) | 130 | 99.5 23% | 123 5% | 96 26% | 86.6 33% | 110.8 ? 15% | 108.5 ? 17% |
| Witcher 3 ultra * (Watt) | 137 | 157 -15% | 176 -28% | 179 -31% | 115.7 16% | ||
| Load Maximum * (Watt) | 184 | 173.5 6% | 226 -23% | 256 -39% | 175.2 5% | 214 ? -16% | 254 ? -38% |
* ... más pequeño es mejor
Energy consumption during The Witcher 3
Duración de la batería
Durante nuestra prueba de Wi-Fi en el mundo real, el TUF Gaming A15 logra una duración de 11:25 horas. Esto es un valor muy bueno y habla de una buena utilización de la batería de 90 Wh. Además, es el mejor resultado en nuestro campo de pruebas
| Asus TUF Gaming A15 FA506QR-AZ061T R7 5800H, GeForce RTX 3070 Laptop GPU, 90 Wh | Asus TUF Gaming F15 FX506HM i7-11800H, GeForce RTX 3060 Laptop GPU, 90 Wh | Alienware m15 R5 Ryzen Edition R7 5800H, GeForce RTX 3060 Laptop GPU, 86 Wh | Aorus 15P XC i7-10870H, GeForce RTX 3070 Laptop GPU, 99 Wh | MSI GF65 Thin 10UE i7-10750H, GeForce RTX 3060 Laptop GPU, 51 Wh | Media de la clase Gaming | |
|---|---|---|---|---|---|---|
| Duración de Batería | -28% | -44% | -41% | -50% | -43% | |
| Reader / Idle (h) | 17.4 | 11 -37% | 14.7 -16% | 9.5 -45% | 11.1 -36% | 8.71 ? -50% |
| WiFi v1.3 (h) | 11.4 | 7.9 -31% | 5.1 -55% | 6.7 -41% | 4.6 -60% | 6.98 ? -39% |
| Load (h) | 2.4 | 2 -17% | 0.9 -62% | 1.5 -37% | 1.1 -54% | 1.47 ? -39% |
| Witcher 3 ultra (h) | 1.6 |
Pro
Contra
Veredicto - Adecuado para juegos de nivel básico
El TUF Gaming A15 es un buen portátil para juegos por el precio establecido por Asus de aproximadamente 1,800 Euros (~$2,126). A pesar del limitado TGP, ofrece un alto rendimiento de juego, y tanto la velocidad Wi-Fi como la calidad del display son decentes. El portátil gaming no necesita esconderse cuando se compara con la competencia, y también puede convencer con un diseño original.
El Asus TUF Gaming A15 ofrece un buen rendimiento de juego dentro del alcance del hardware instalado.
En una comparación directa, el AMD Ryzen 7 5800H instalado aquí tiene un buen rendimiento, pero dispositivos como el TUF Gaming F15 y el Alienware m15 están ligeramente mejor equipados en términos de rendimiento a largo plazo. La duración de la batería del A15 es muy buena también, y es mucho mejor que el resto de nuestro campo de pruebas. Las opciones de mantenimiento también son muy buenas, con RAM ampliable y una segunda ranura para SSD.
Como resultado, el Asus TUF Gaming A15 no sólo es interesante como dispositivo de nivel de entrada, sino que también cumple con demandas más ambiciosas. Si el precio sigue siendo demasiado alto para tu presupuesto, merece la pena echar un vistazo al MSI GF65 Thin 10UEque está disponible por menos de 1.200 euros.
Precio y disponibilidad
Asus TUF Gaming A15 FA506QR-AZ061T
- 07/15/2021 v7 (old)
Mike Wobker
Price comparison

