Breve análisis del Dell XPS 15 9550 (Core i7, FHD)
| |||||||||||||||||||||||||
iluminación: 92 %
Brillo con batería: 371.5 cd/m²
Contraste: 1474:1 (Negro: 0.252 cd/m²)
ΔE ColorChecker Calman: 5.55 | ∀{0.5-29.43 Ø4.73}
ΔE Greyscale Calman: 7.1 | ∀{0.09-98 Ø4.97}
97.9% sRGB (Argyll 1.6.3 3D)
63.4% AdobeRGB 1998 (Argyll 1.6.3 3D)
70.4% AdobeRGB 1998 (Argyll 3D)
97.2% sRGB (Argyll 3D)
68.5% Display P3 (Argyll 3D)
Gamma: 2.1
| Dell XPS 15 9550 i7 FHD 15.6", 1920x1080 | Dell XPS 15-9550 i7 15.6", 3840x2160 | Dell XPS 15 2016 9550 15.6", 1920x1080 | Dell XPS 15 (9530-0538) 15.6", 3840x2160 | Dell XPS 15 (Late 2013) 15.6", 3200x1800 | Dell XPS 13 2016 i7 256GB QHD 13.3", 3200x1800 | |
|---|---|---|---|---|---|---|
| Display | 24% | 0% | -4% | 3% | -6% | |
| Display P3 Coverage (%) | 68.5 | 87.8 28% | 68.8 0% | 64.9 -5% | 72.6 6% | 63.6 -7% |
| sRGB Coverage (%) | 97.2 | 100 3% | 97.9 1% | 96.1 -1% | 96.1 -1% | 93.6 -4% |
| AdobeRGB 1998 Coverage (%) | 70.4 | 99.4 41% | 70.7 0% | 66.9 -5% | 72.9 4% | 65.5 -7% |
| Response Times | 20% | 12% | 39% | |||
| Response Time Grey 50% / Grey 80% * (ms) | 64 ? | 58 ? 9% | 62 ? 3% | 40 ? 37% | ||
| Response Time Black / White * (ms) | 50 ? | 35 ? 30% | 40 ? 20% | 30 ? 40% | ||
| PWM Frequency (Hz) | 362 ? | 4900 ? | ||||
| Screen | -2% | 1% | 6% | -6% | 2% | |
| Brightness middle (cd/m²) | 371.5 | 361 -3% | 399 7% | 349 -6% | 349 -6% | 285 -23% |
| Brightness (cd/m²) | 356 | 344 -3% | 394 11% | 365 3% | 322 -10% | 281 -21% |
| Brightness Distribution (%) | 92 | 90 -2% | 89 -3% | 87 -5% | 83 -10% | 90 -2% |
| Black Level * (cd/m²) | 0.252 | 0.38 -51% | 0.24 5% | 0.282 -12% | 0.21 17% | 0.18 29% |
| Contrast (:1) | 1474 | 950 -36% | 1663 13% | 1238 -16% | 1662 13% | 1583 7% |
| Colorchecker dE 2000 * | 5.55 | 5.34 4% | 5.95 -7% | 2.65 52% | 8.27 -49% | 4.89 12% |
| Colorchecker dE 2000 max. * | 10.95 | |||||
| Greyscale dE 2000 * | 7.1 | 4.84 32% | 8.41 -18% | 3.77 47% | 7.99 -13% | 5.16 27% |
| Gamma | 2.1 105% | 2.21 100% | 2.35 94% | 2.41 91% | 3.42 64% | 2.15 102% |
| Color Space (Percent of AdobeRGB 1998) (%) | 63.4 | 89 40% | 64 1% | 61.02 -4% | 69.08 9% | 59 -7% |
| Color Space (Percent of sRGB) (%) | 97.9 | 100 2% | 98 0% | 96.1 -2% | 93 -5% | |
| CCT | 7395 88% | 7010 93% | 6786 96% | 8117 80% | 7106 91% | |
| Media total (Programa/Opciones) | 14% /
7% | 4% /
2% | 1% /
4% | -2% /
-4% | 12% /
5% |
* ... más pequeño es mejor
Tiempos de respuesta del display
| ↔ Tiempo de respuesta de Negro a Blanco | ||
|---|---|---|
| 50 ms ... subida ↗ y bajada ↘ combinada | ↗ 12 ms subida | 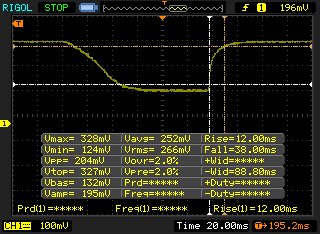 |
| ↘ 38 ms bajada | ||
| La pantalla mostró tiempos de respuesta lentos en nuestros tests y podría ser demasiado lenta para los jugones. En comparación, todos los dispositivos de prueba van de ##min### (mínimo) a 240 (máximo) ms. » 99 % de todos los dispositivos son mejores. Eso quiere decir que el tiempo de respuesta es peor que la media (19.9 ms) de todos los dispositivos testados. | ||
| ↔ Tiempo de respuesta 50% Gris a 80% Gris | ||
| 64 ms ... subida ↗ y bajada ↘ combinada | ↗ 27 ms subida | 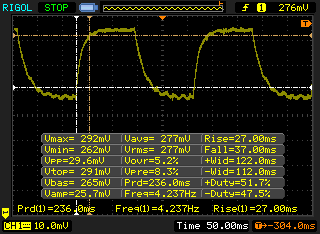 |
| ↘ 37 ms bajada | ||
| La pantalla mostró tiempos de respuesta lentos en nuestros tests y podría ser demasiado lenta para los jugones. En comparación, todos los dispositivos de prueba van de ##min### (mínimo) a 636 (máximo) ms. » 97 % de todos los dispositivos son mejores. Eso quiere decir que el tiempo de respuesta es peor que la media (31.1 ms) de todos los dispositivos testados. | ||
| Cinebench R11.5 | |
| CPU Single 64Bit (ordenar por valor) | |
| Dell XPS 15 9550 i7 FHD | |
| Dell XPS 15-9550 i7 | |
| Dell XPS 15 (9530-0538) | |
| Dell XPS 15 (L521x) PL | |
| Dell XPS 15 2016 9550 | |
| CPU Multi 64Bit (ordenar por valor) | |
| Dell XPS 15 9550 i7 FHD | |
| Dell XPS 15-9550 i7 | |
| Dell XPS 15 (9530-0538) | |
| Dell XPS 15 (L521x) PL | |
| Dell XPS 15 2016 9550 | |
| Cinebench R10 | |
| Rendering Single CPUs 64Bit (ordenar por valor) | |
| Dell XPS 15-9550 i7 | |
| Dell XPS 15 (9530-0538) | |
| Dell XPS 15 (L521x) PL | |
| Dell XPS 15 2016 9550 | |
| Rendering Multiple CPUs 64Bit (ordenar por valor) | |
| Dell XPS 15-9550 i7 | |
| Dell XPS 15 (9530-0538) | |
| Dell XPS 15 (L521x) PL | |
| Dell XPS 15 2016 9550 | |
| Super Pi Mod 1.5 XS 32M - 32M (ordenar por valor) | |
| Dell XPS 15 9550 i7 FHD | |
| Dell XPS 15 (L521x) PL | |
| wPrime 2.10 - 1024m (ordenar por valor) | |
| Dell XPS 15 9550 i7 FHD | |
* ... más pequeño es mejor
| PCMark 7 - Score (ordenar por valor) | |
| Dell XPS 15 9550 i7 FHD | |
| Dell XPS 15 (9530-0538) | |
| Dell XPS 15-9550 i7 | |
| Dell XPS 15 2016 9550 | |
| PCMark 8 | |
| Home Score Accelerated v2 (ordenar por valor) | |
| Dell XPS 15 9550 i7 FHD | |
| Dell XPS 15-9550 i7 | |
| Dell XPS 15 2016 9550 | |
| Work Score Accelerated v2 (ordenar por valor) | |
| Dell XPS 15 9550 i7 FHD | |
| Dell XPS 15-9550 i7 | |
| Creative Score Accelerated v2 (ordenar por valor) | |
| Dell XPS 15 9550 i7 FHD | |
| Dell XPS 15-9550 i7 | |
| Dell XPS 15 2016 9550 | |
| PCMark 7 Score | 5739 puntos | |
| PCMark 8 Home Score Accelerated v2 | 3753 puntos | |
| PCMark 8 Creative Score Accelerated v2 | 4659 puntos | |
| PCMark 8 Work Score Accelerated v2 | 4696 puntos | |
ayuda | ||
| Dell XPS 15 9550 i7 FHD GeForce GTX 960M, 6700HQ, Samsung PM951 NVMe 512 GB | Dell XPS 15-9550 i7 GeForce GTX 960M, 6700HQ, Samsung PM951 NVMe 512 GB | Dell XPS 15 2016 9550 GeForce GTX 960M, 6300HQ, WDC WD10SPCX-75KHST0 + LiteON CS1-SP32-11 M.2 2242 32GB | Dell XPS 15 (9530-0538) GeForce GT 750M, 4712HQ, Lite-On LMT-512L9M | Dell XPS 15 (Late 2013) GeForce GT 750M, 4702HQ, Samsung SSD SM841 512GB | Dell XPS 13 2016 i7 256GB QHD HD Graphics 520, 6500U, Samsung PM951 NVMe MZ-VLV256D | |
|---|---|---|---|---|---|---|
| AS SSD | -5% | -7397% | -51% | -67% | -32% | |
| Copy Game MB/s (MB/s) | 805 | 785 -2% | 66.4 -92% | 292.6 -64% | 148.9 -82% | |
| Copy Program MB/s (MB/s) | 325.3 | 318.4 -2% | 42.24 -87% | 238.5 -27% | 46.64 -86% | |
| Copy ISO MB/s (MB/s) | 1127 | 716 -36% | 15.75 -99% | 468.2 -58% | 397.7 -65% | |
| Score Total (Points) | 2410 | 2410 0% | 44 -98% | 1021 -58% | 1070 -56% | 1603 -33% |
| Score Write (Points) | 675 | 694 3% | 10 -99% | 352 -48% | 391 -42% | 391 -42% |
| Score Read (Points) | 1180 | 1166 -1% | 24 -98% | 440 -63% | 448 -62% | 809 -31% |
| Access Time Write * (ms) | 0.035 | 0.036 -3% | 17.31 -49357% | 0.058 -66% | 0.061 -74% | 0.034 3% |
| Access Time Read * (ms) | 0.038 | 0.053 -39% | 20.2 -53058% | 0.065 -71% | 0.114 -200% | 0.071 -87% |
| 4K-64 Write (MB/s) | 513 | 532 4% | 0.91 -100% | 253.1 -51% | 290.5 -43% | 263.7 -49% |
| 4K-64 Read (MB/s) | 990 | 975 -2% | 10.11 -99% | 361.5 -63% | 374.5 -62% | 698 -29% |
| 4K Write (MB/s) | 105.4 | 105.6 0% | 0.98 -99% | 62 -41% | 59.6 -43% | 97.6 -7% |
| 4K Read (MB/s) | 31.86 | 34.63 9% | 1.53 -95% | 29.65 -7% | 23.83 -25% | 38.21 20% |
| Seq Write (MB/s) | 570 | 562 -1% | 77.6 -86% | 373.5 -34% | 404.9 -29% | 301.2 -47% |
| Seq Read (MB/s) | 1579 | 1569 -1% | 122.2 -92% | 486.2 -69% | 498.5 -68% | 735 -53% |
* ... más pequeño es mejor
| 3DMark 11 | |
| 1280x720 Performance (ordenar por valor) | |
| Dell XPS 15-9550 i7 | |
| Dell XPS 15 2016 9550 | |
| Dell XPS 15 (9530-0538) | |
| Dell XPS 15 (Late 2013) | |
| Dell XPS 15 (L521x) PL | |
| 1280x720 Performance GPU (ordenar por valor) | |
| Dell XPS 15-9550 i7 | |
| Dell XPS 15 2016 9550 | |
| Dell XPS 15 (9530-0538) | |
| Dell XPS 15 (Late 2013) | |
| Dell XPS 15 (L521x) PL | |
| 1280x720 Performance Physics (ordenar por valor) | |
| Dell XPS 15-9550 i7 | |
| Dell XPS 15 2016 9550 | |
| Dell XPS 15 (9530-0538) | |
| Dell XPS 15 (Late 2013) | |
| Dell XPS 15 (L521x) PL | |
| 3DMark Ice Storm Standard Score | 77565 puntos | |
| 3DMark Cloud Gate Standard Score | 17140 puntos | |
| 3DMark Fire Strike Score | 3939 puntos | |
| 3DMark Fire Strike Extreme Score | 1981 puntos | |
ayuda | ||
| BioShock Infinite | |
| 1366x768 High Preset (ordenar por valor) | |
| Dell XPS 15 9550 i7 FHD | |
| Dell XPS 15 2016 9550 | |
| Dell XPS 15 (9530-0538) | |
| Dell XPS 15 (Late 2013) | |
| Dell XPS 13 2016 i7 256GB QHD | |
| 1920x1080 Ultra Preset, DX11 (DDOF) (ordenar por valor) | |
| Dell XPS 15 9550 i7 FHD | |
| Dell XPS 15-9550 i7 | |
| Dell XPS 15 2016 9550 | |
| Dell XPS 15 (9530-0538) | |
| Dell XPS 15 (Late 2013) | |
| Dell XPS 13 2016 i7 256GB QHD | |
| bajo | medio | alto | ultra | |
|---|---|---|---|---|
| Sleeping Dogs (2012) | 89.2 | 23.4 | ||
| Guild Wars 2 (2012) | 52.5 | 28.6 | ||
| Tomb Raider (2013) | 112 | 52.4 | ||
| StarCraft II: Heart of the Swarm (2013) | 140.3 | 71.1 | ||
| BioShock Infinite (2013) | 106.9 | 44.1 | ||
| Metro: Last Light (2013) | 55.7 | 30.9 | ||
| Thief (2014) | 51.2 | 26.6 | ||
| Middle-earth: Shadow of Mordor (2014) | 39.9 | 30.5 | ||
| Batman: Arkham Knight (2015) | 39 | 19 | ||
| Metal Gear Solid V (2015) | 55 | 37.5 | ||
| Fallout 4 (2015) | 31 | 24.2 | ||
| Rise of the Tomb Raider (2016) | 23.8 | 21.2 |
| Dell XPS 15 9550 i7 FHD GeForce GTX 960M, 6700HQ, Samsung PM951 NVMe 512 GB | Dell XPS 15 2016 9550 GeForce GTX 960M, 6300HQ, WDC WD10SPCX-75KHST0 + LiteON CS1-SP32-11 M.2 2242 32GB | Dell XPS 15 (9530-0538) GeForce GT 750M, 4712HQ, Lite-On LMT-512L9M | Dell XPS 13 2016 i7 256GB QHD HD Graphics 520, 6500U, Samsung PM951 NVMe MZ-VLV256D | Asus ZenBook Pro UX501VW-DS71T GeForce GTX 960M, 6700HQ, Samsung SM951 MZVPV512HDGL m.2 PCI-e | Lenovo Ideapad Y700 15ISK 80NW GeForce GTX 960M, 6700HQ, Samsung MZNLN128HCGR-000L2 | |
|---|---|---|---|---|---|---|
| Noise | -9% | -7% | -1% | -1% | -7% | |
| Idle Minimum * (dB) | 29.2 | 32.6 -12% | 29.6 -1% | 31.8 -9% | 28.9 1% | 30.4 -4% |
| Idle Average * (dB) | 29.3 | 33.6 -15% | 31.6 -8% | 31.8 -9% | 28.9 1% | 30.5 -4% |
| Idle Maximum * (dB) | 29.5 | 33.6 -14% | 31.6 -7% | 34.8 -18% | 30.2 -2% | 33.3 -13% |
| Load Average * (dB) | 36.5 | 37.1 -2% | 45.4 -24% | 34.8 5% | 41.8 -15% | 41.4 -13% |
| Load Maximum * (dB) | 47.7 | 47.5 -0% | 45.4 5% | 34.8 27% | 43.9 8% | 47 1% |
* ... más pequeño es mejor
Ruido
| Ocioso |
| 29.2 / 29.3 / 29.5 dB(A) |
| Carga |
| 36.5 / 47.7 dB(A) |
 | ||
30 dB silencioso 40 dB(A) audible 50 dB(A) ruidosamente alto |
||
min: | ||
(-) La temperatura máxima en la parte superior es de 56.6 °C / 134 F, frente a la media de 36.8 °C / 98 F, que oscila entre 21 y 71 °C para la clase Multimedia.
(-) El fondo se calienta hasta un máximo de 46.9 °C / 116 F, frente a la media de 39.1 °C / 102 F
(+) En reposo, la temperatura media de la parte superior es de 23.9 °C / 75# F, frente a la media del dispositivo de 31.3 °C / 88 F.
(+) El reposamanos y el panel táctil están a una temperatura inferior a la de la piel, con un máximo de 26.6 °C / 79.9 F y, por tanto, son fríos al tacto.
(+) La temperatura media de la zona del reposamanos de dispositivos similares fue de 28.7 °C / 83.7 F (+2.1 °C / 3.8 F).
| Dell XPS 15 9550 i7 FHD 84 Wh | Dell XPS 15-9550 i7 84 Wh | Dell XPS 15 2016 9550 56 Wh | Dell XPS 15 (9530-0538) 88 Wh | Dell XPS 13-9350 56 Wh | |
|---|---|---|---|---|---|
| Duración de Batería | -24% | -19% | -43% | 0% | |
| Reader / Idle (h) | 16.3 | 8.8 -46% | 9.1 -44% | 13 -20% | |
| WiFi v1.3 (h) | 9.1 | 5.2 -43% | 5.5 -40% | 5.2 -43% | 7.5 -18% |
| Load (h) | 1.8 | 2.1 17% | 2.3 28% | 2.5 39% |
Pro
Contra
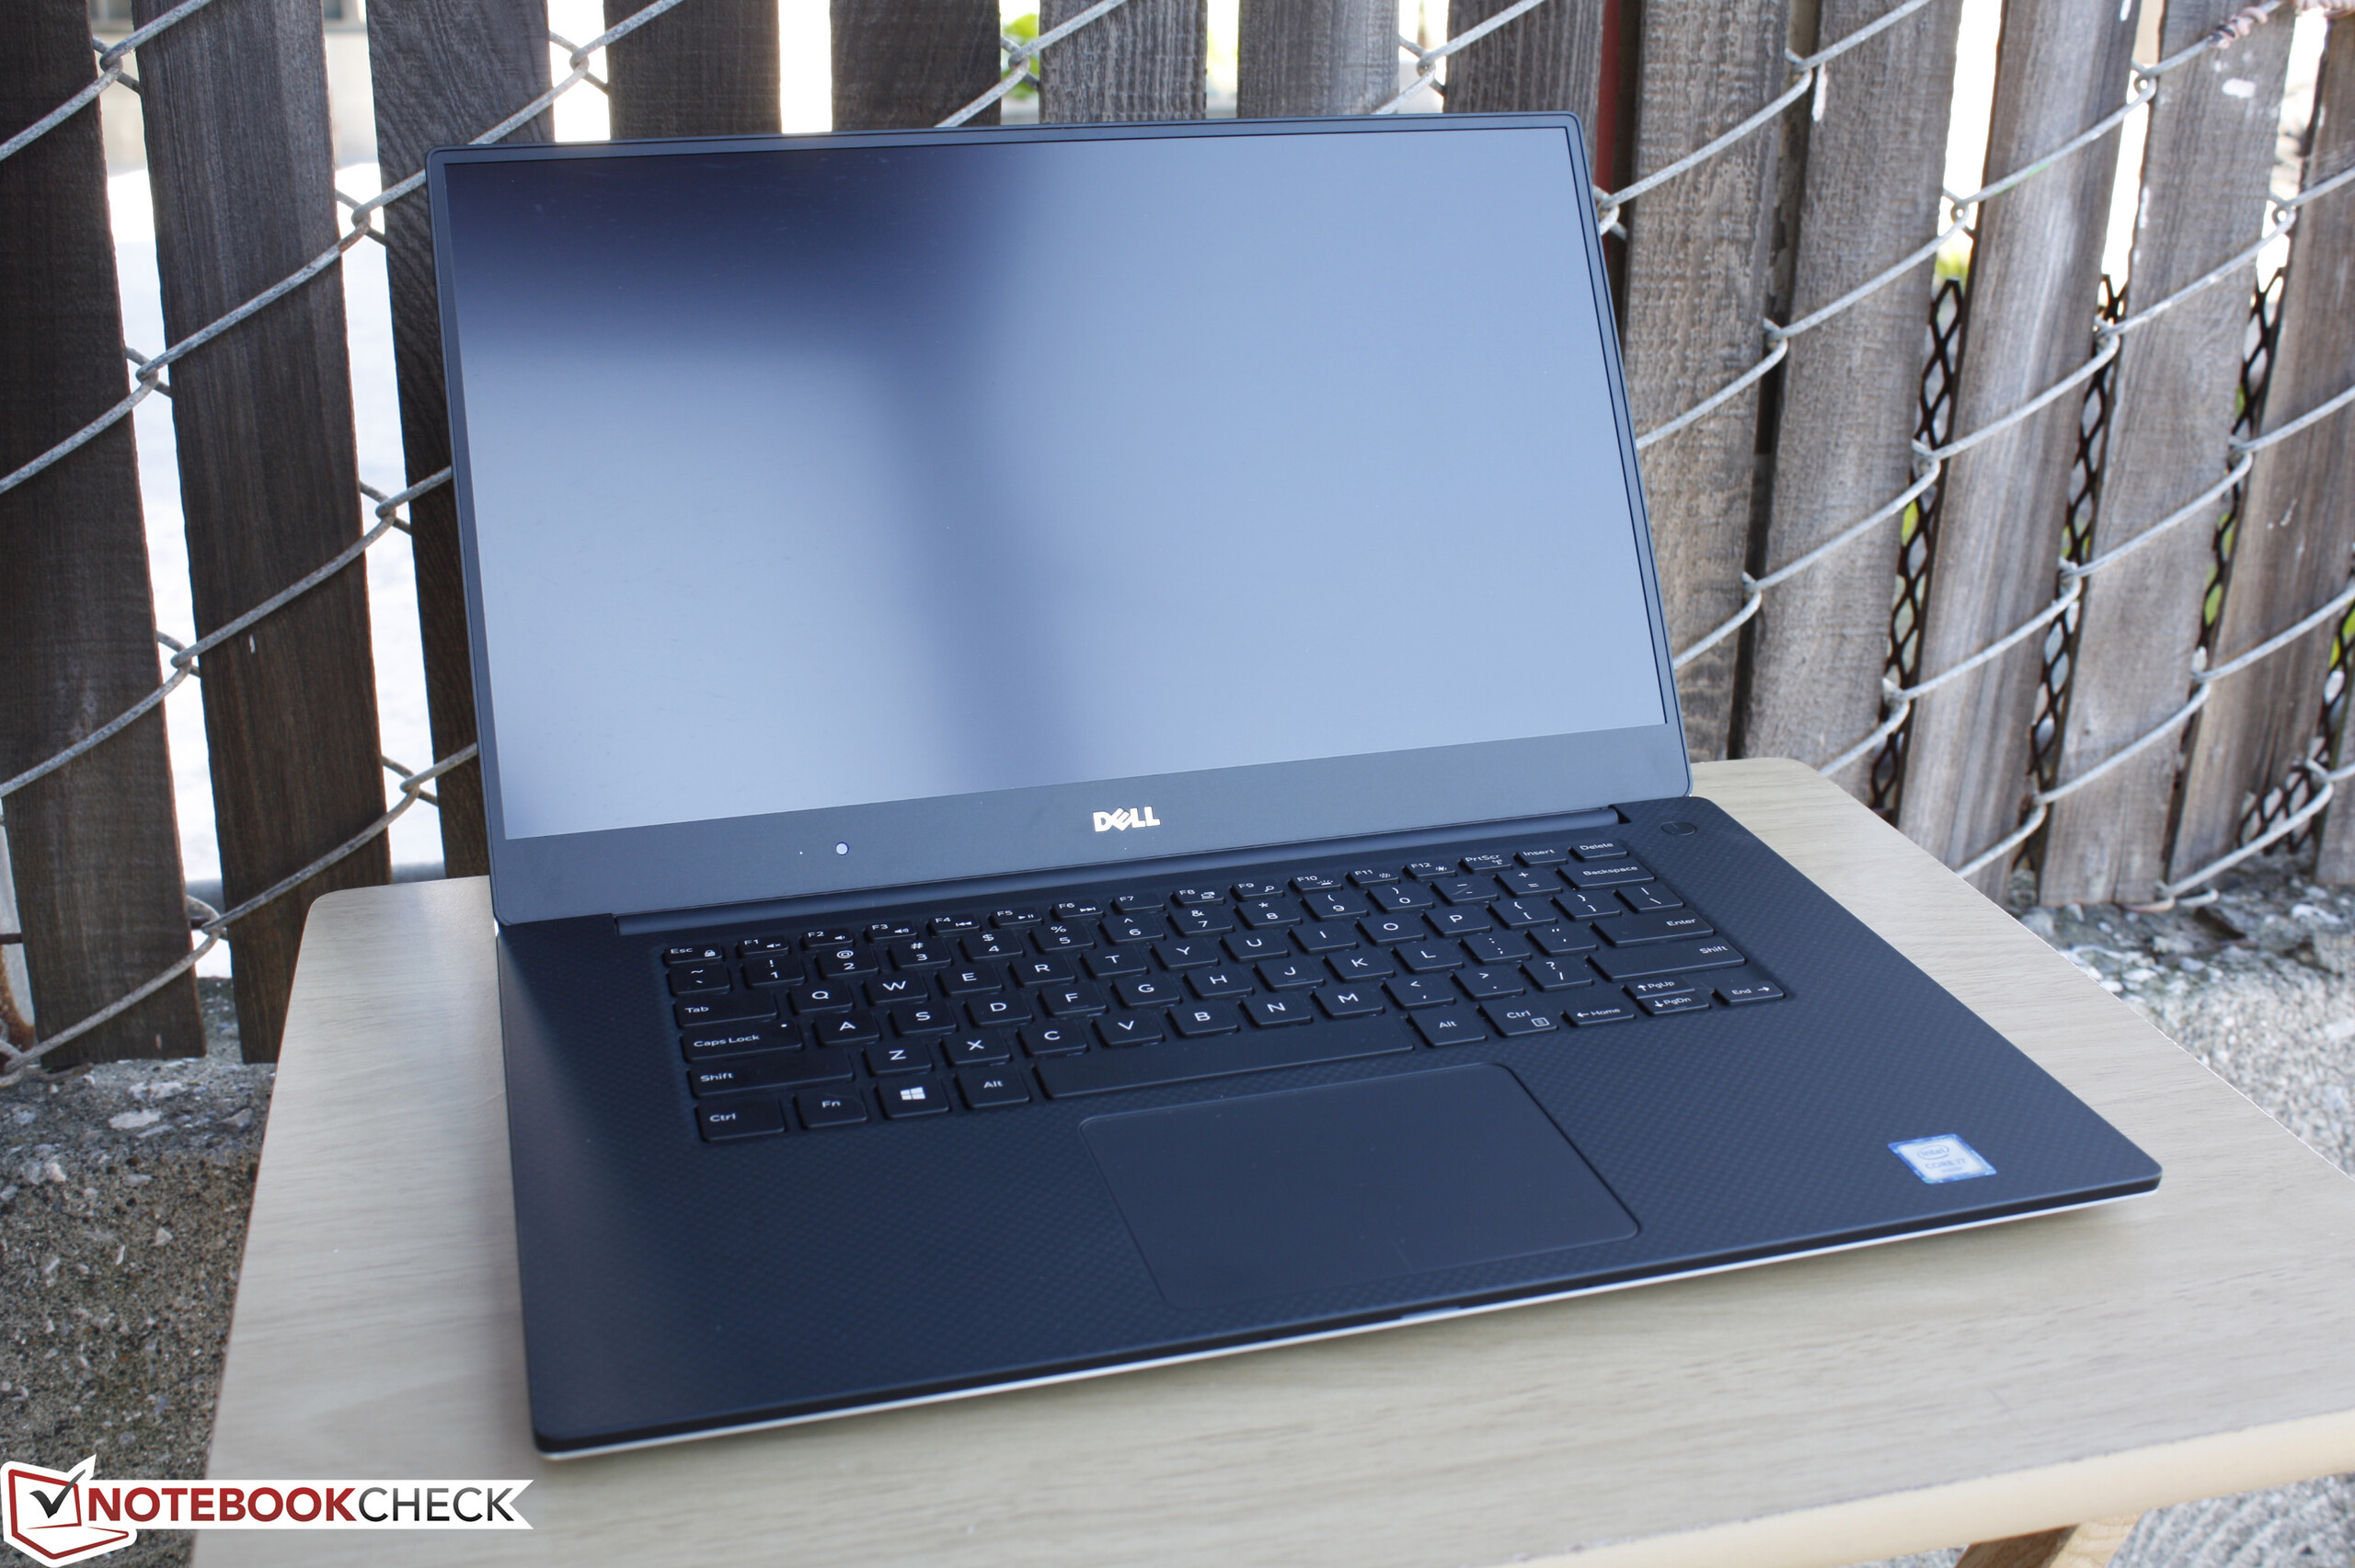
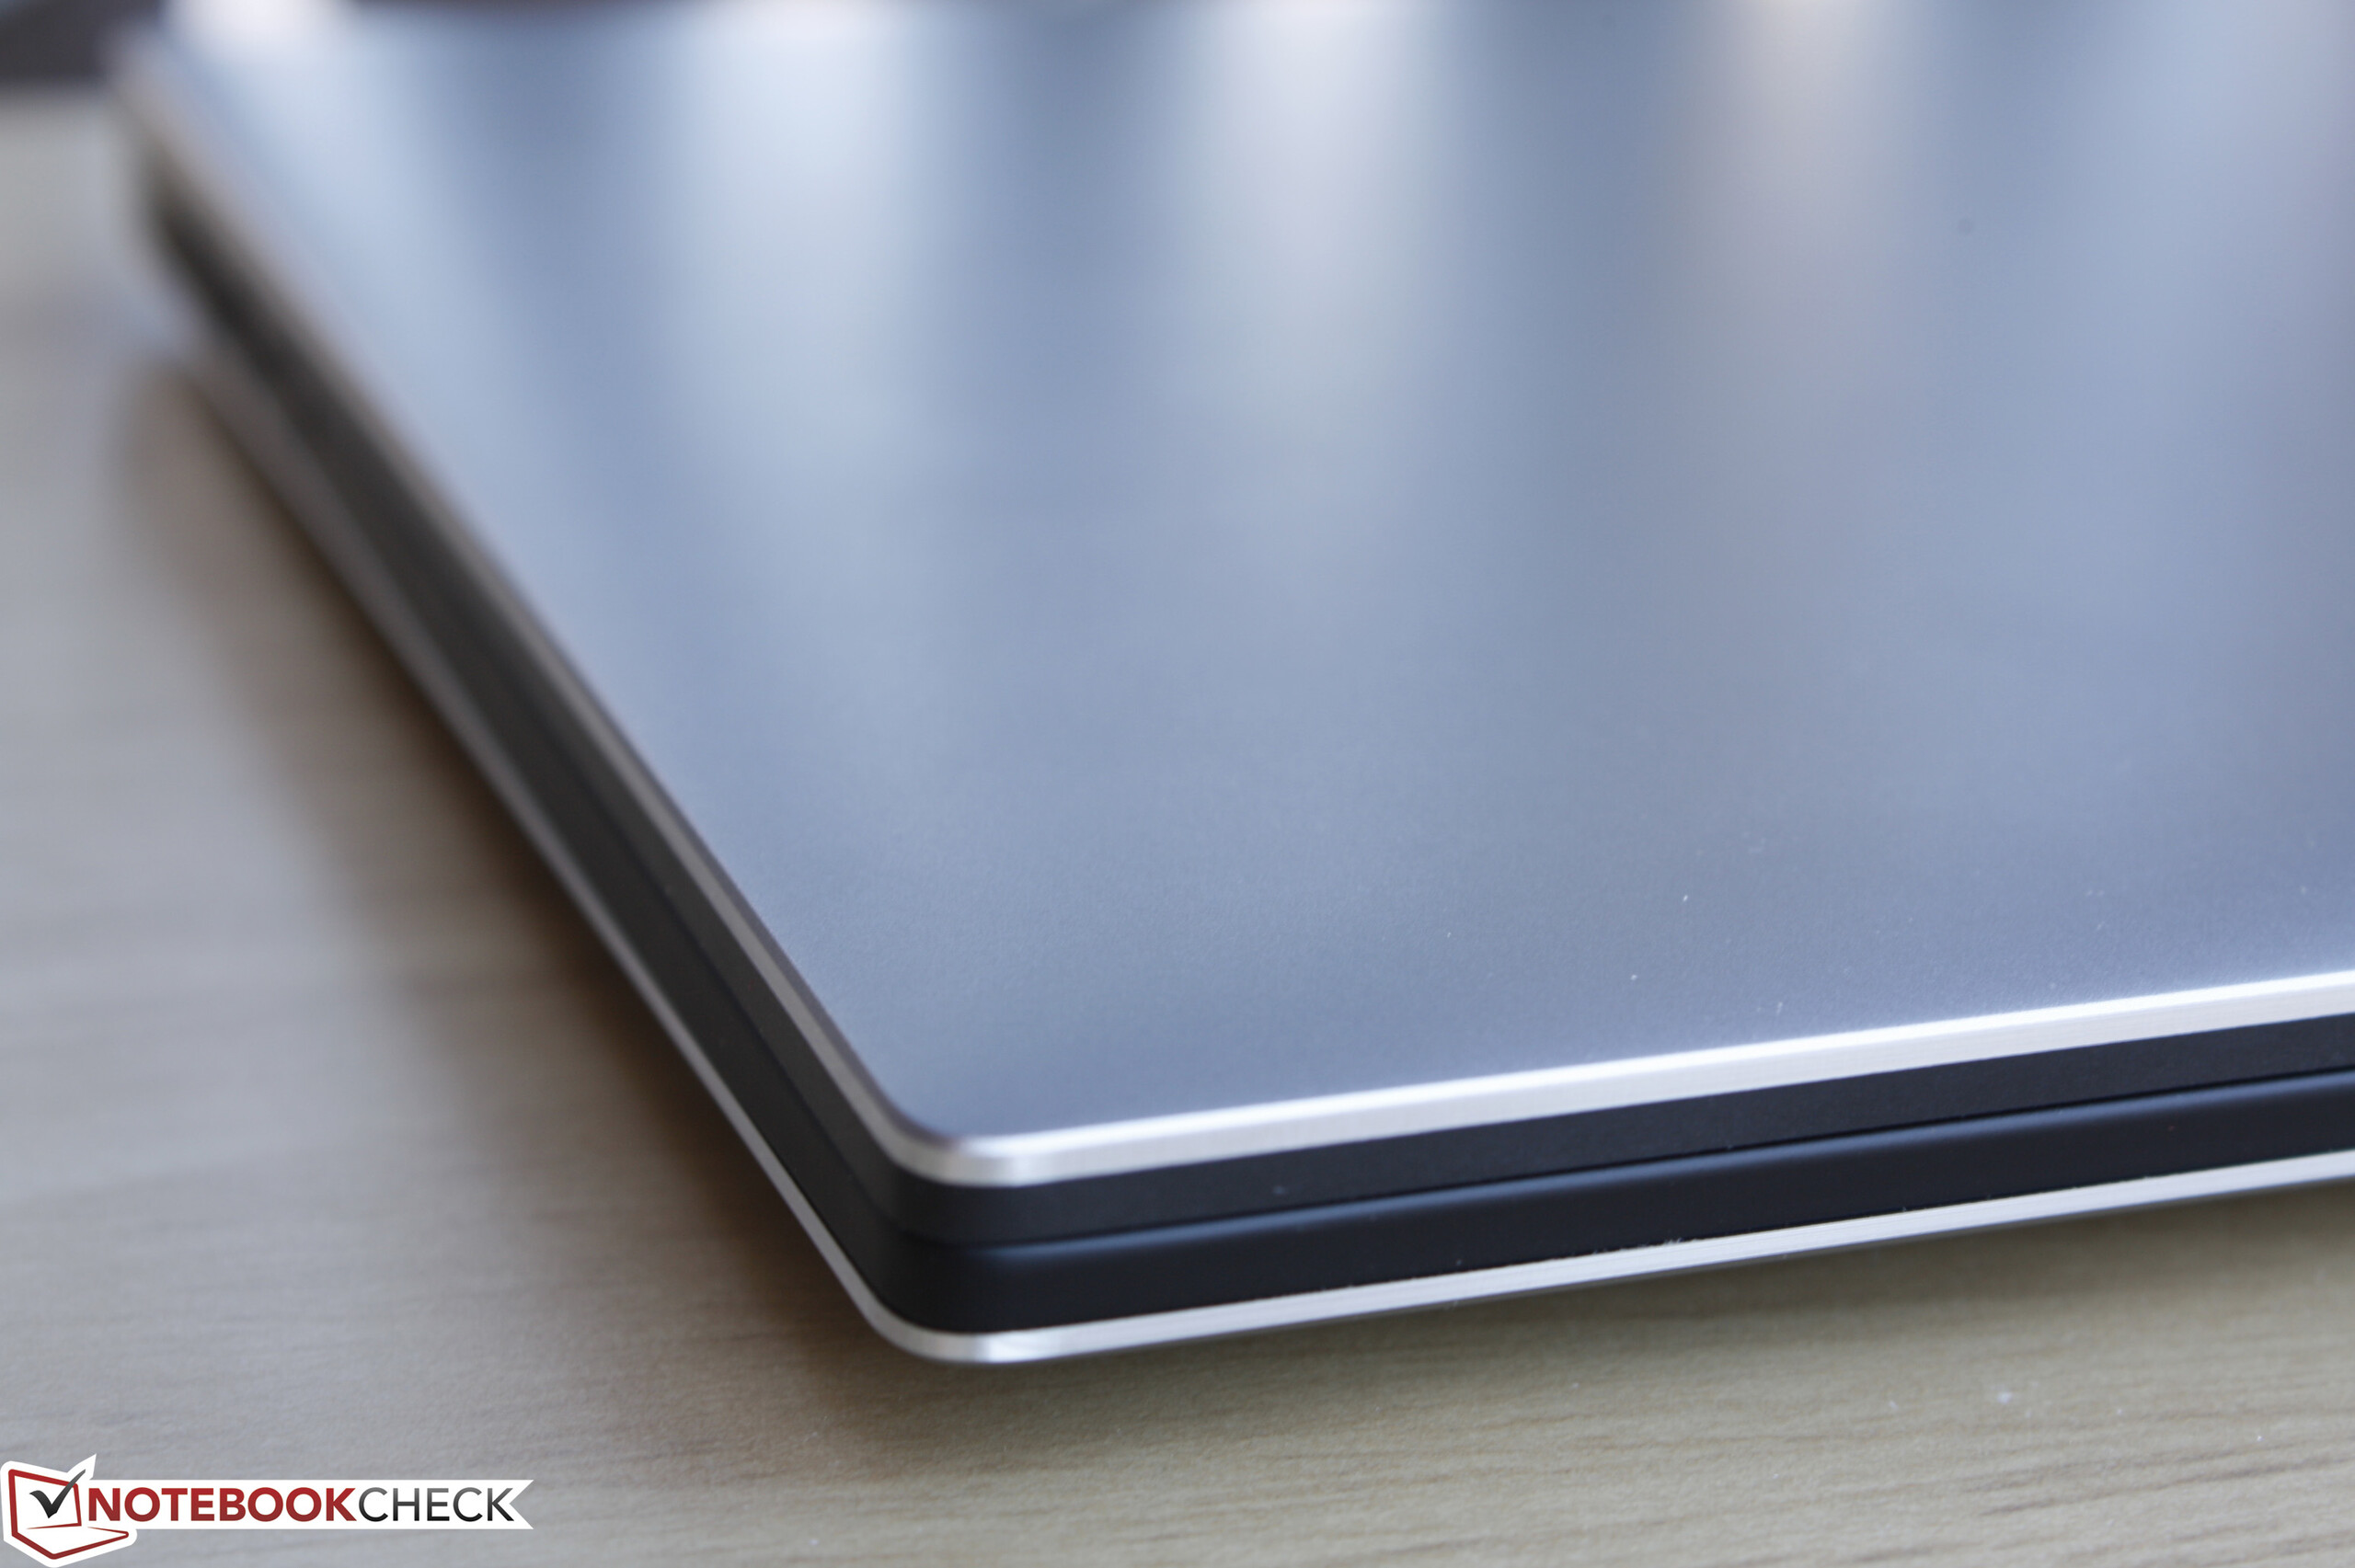
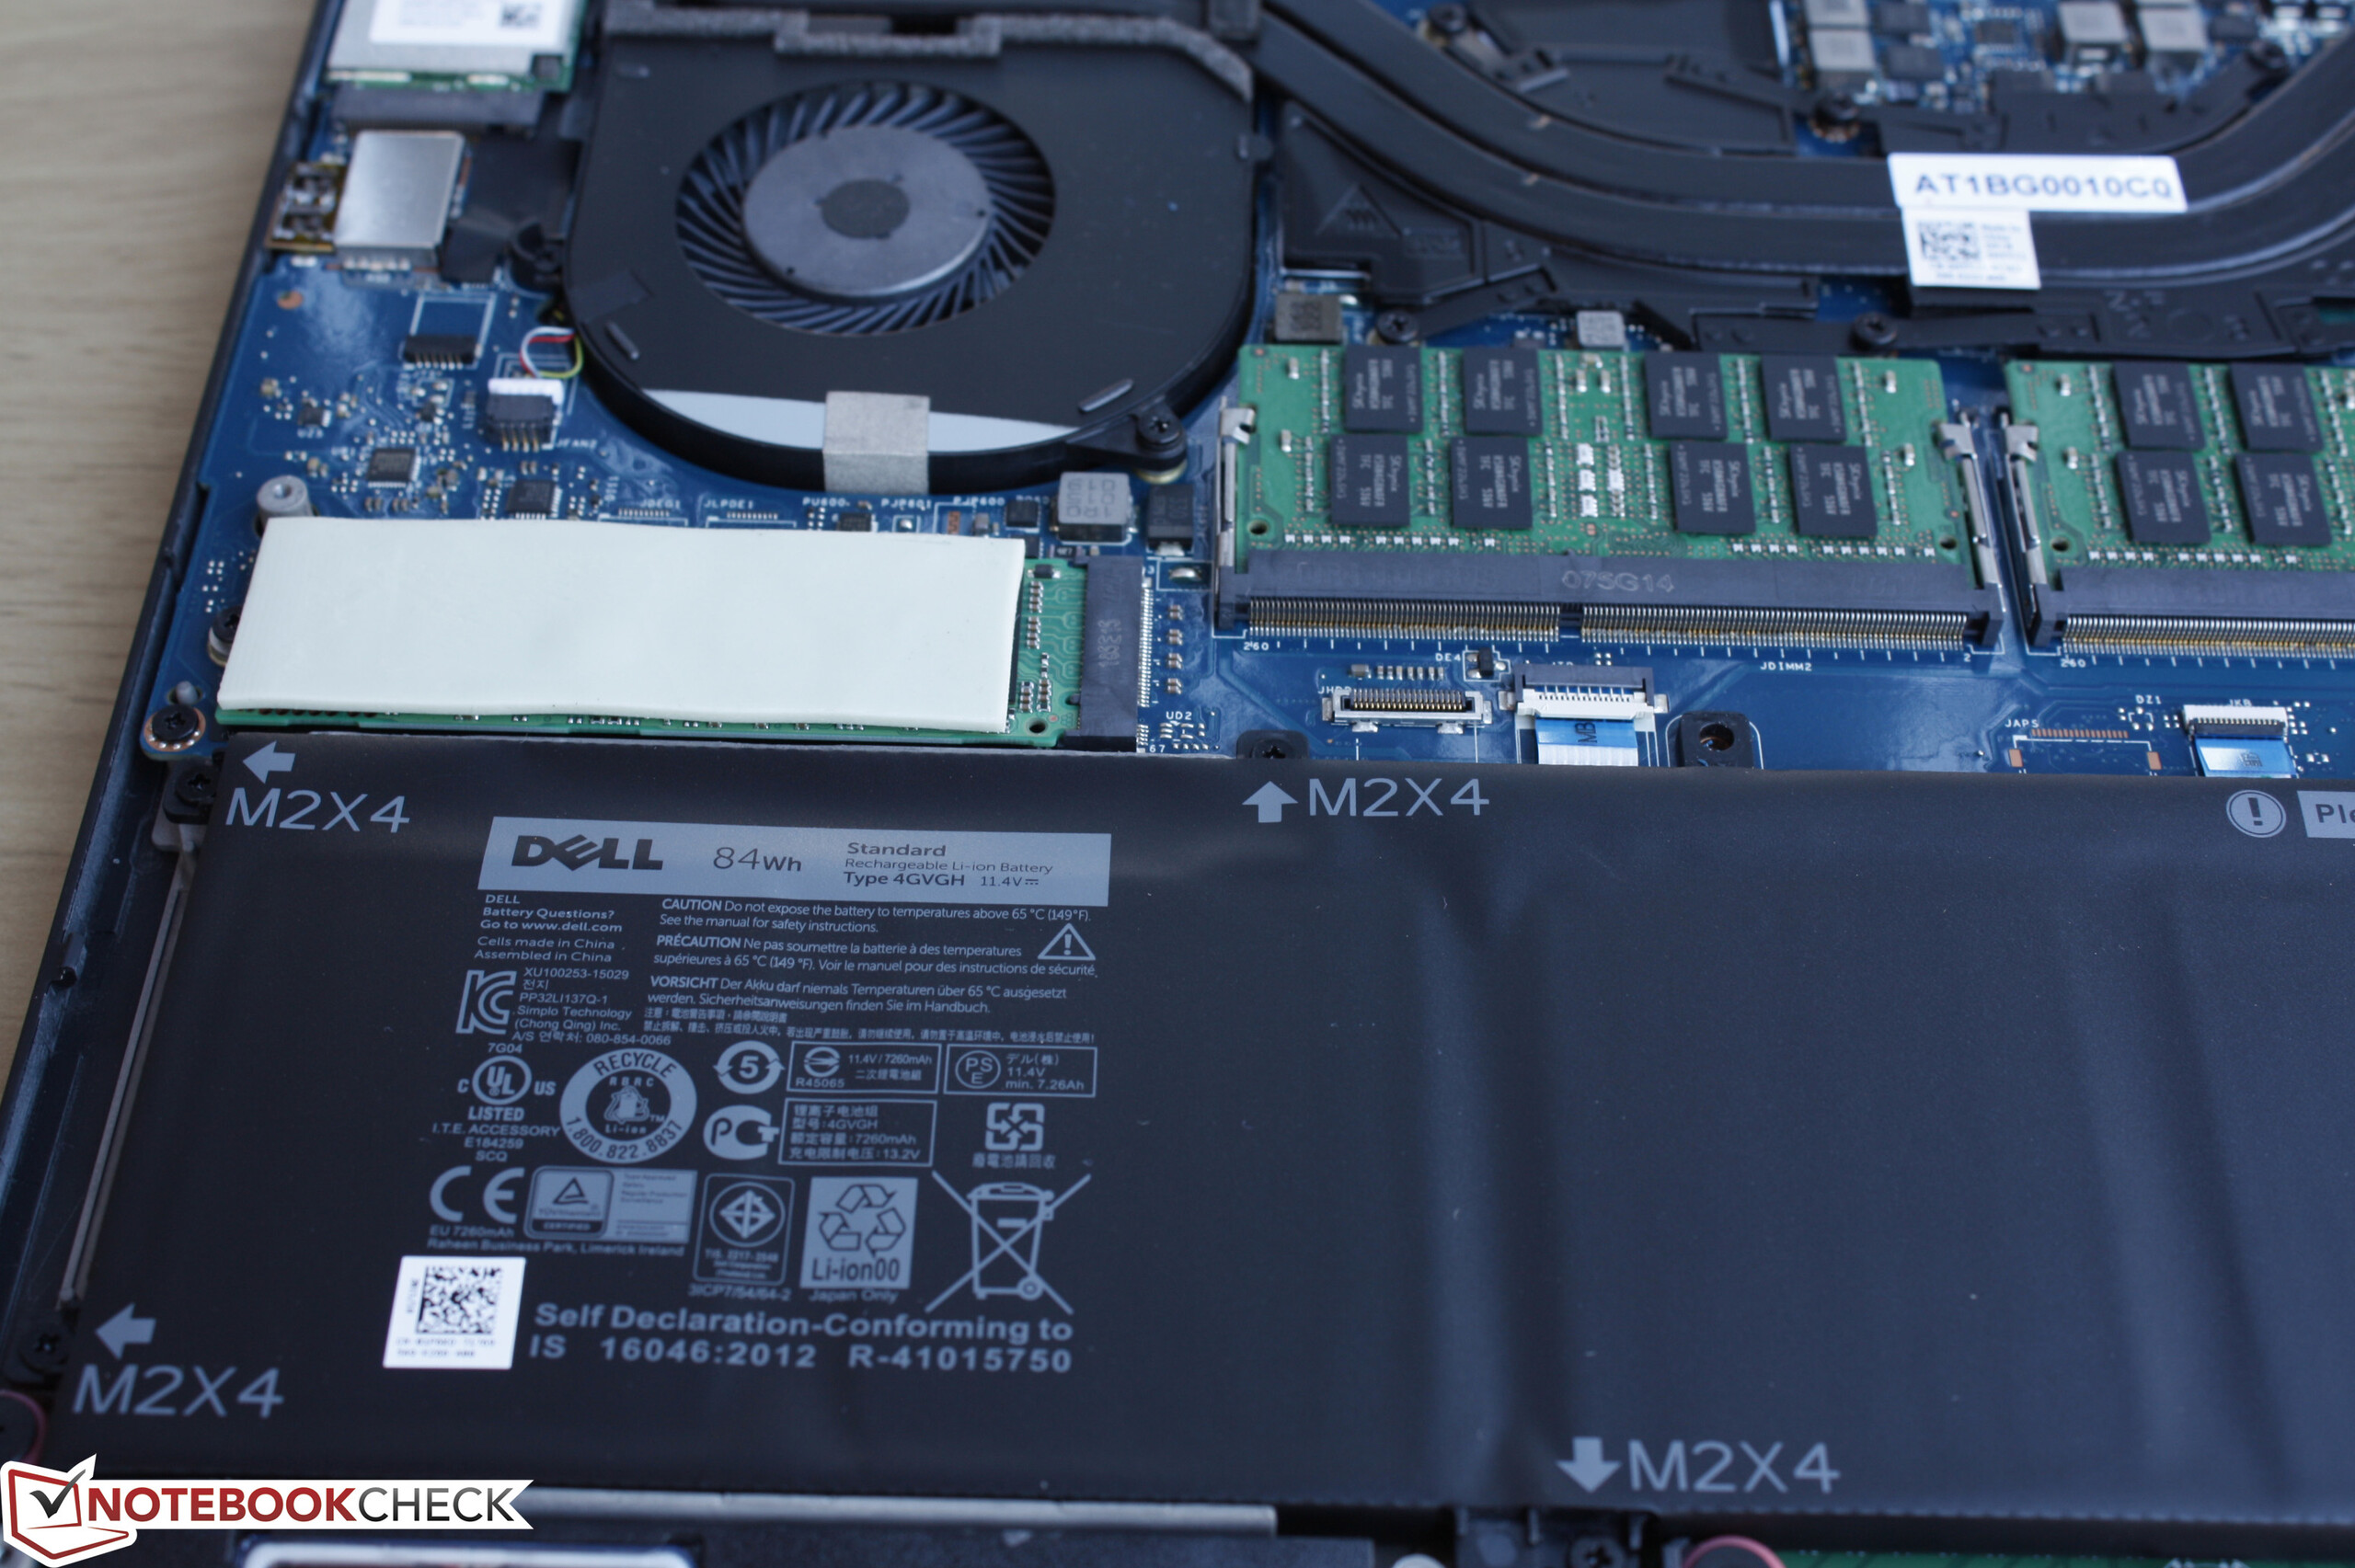
Aunque salió con algunos quebraderos de cabeza, la actualización de 2016 del XPS 15 es una mejora respecto al diseño saliente en casi todos los aspectos, especialmente en gráficos, tamaño y peso. La batería de 84Wh tiene una duración increíble y el sistema pudo mantener temperaturas estables sin ningún problema importante de ralentización.
La retroiluminación pulsante a niveles de brillo bajos sigue siendo un problema con los SKUs FHD y se puede evitar manteniendo el brillo por encima del 30 o 40%. Además, los SKUs FHD tienen una cobertura casi completa del sRGB mientras que los SKUs 4K UHD cubren un espectro aún más amplio de casi todo el estándar AdobeRGB. Estas dos razones por sí mismas pueden bastar para persuadir a los artistas digitales a comprar una configuración 4K UHD en vez de las opciones FHD aún si no les interesa la mayor resolución.
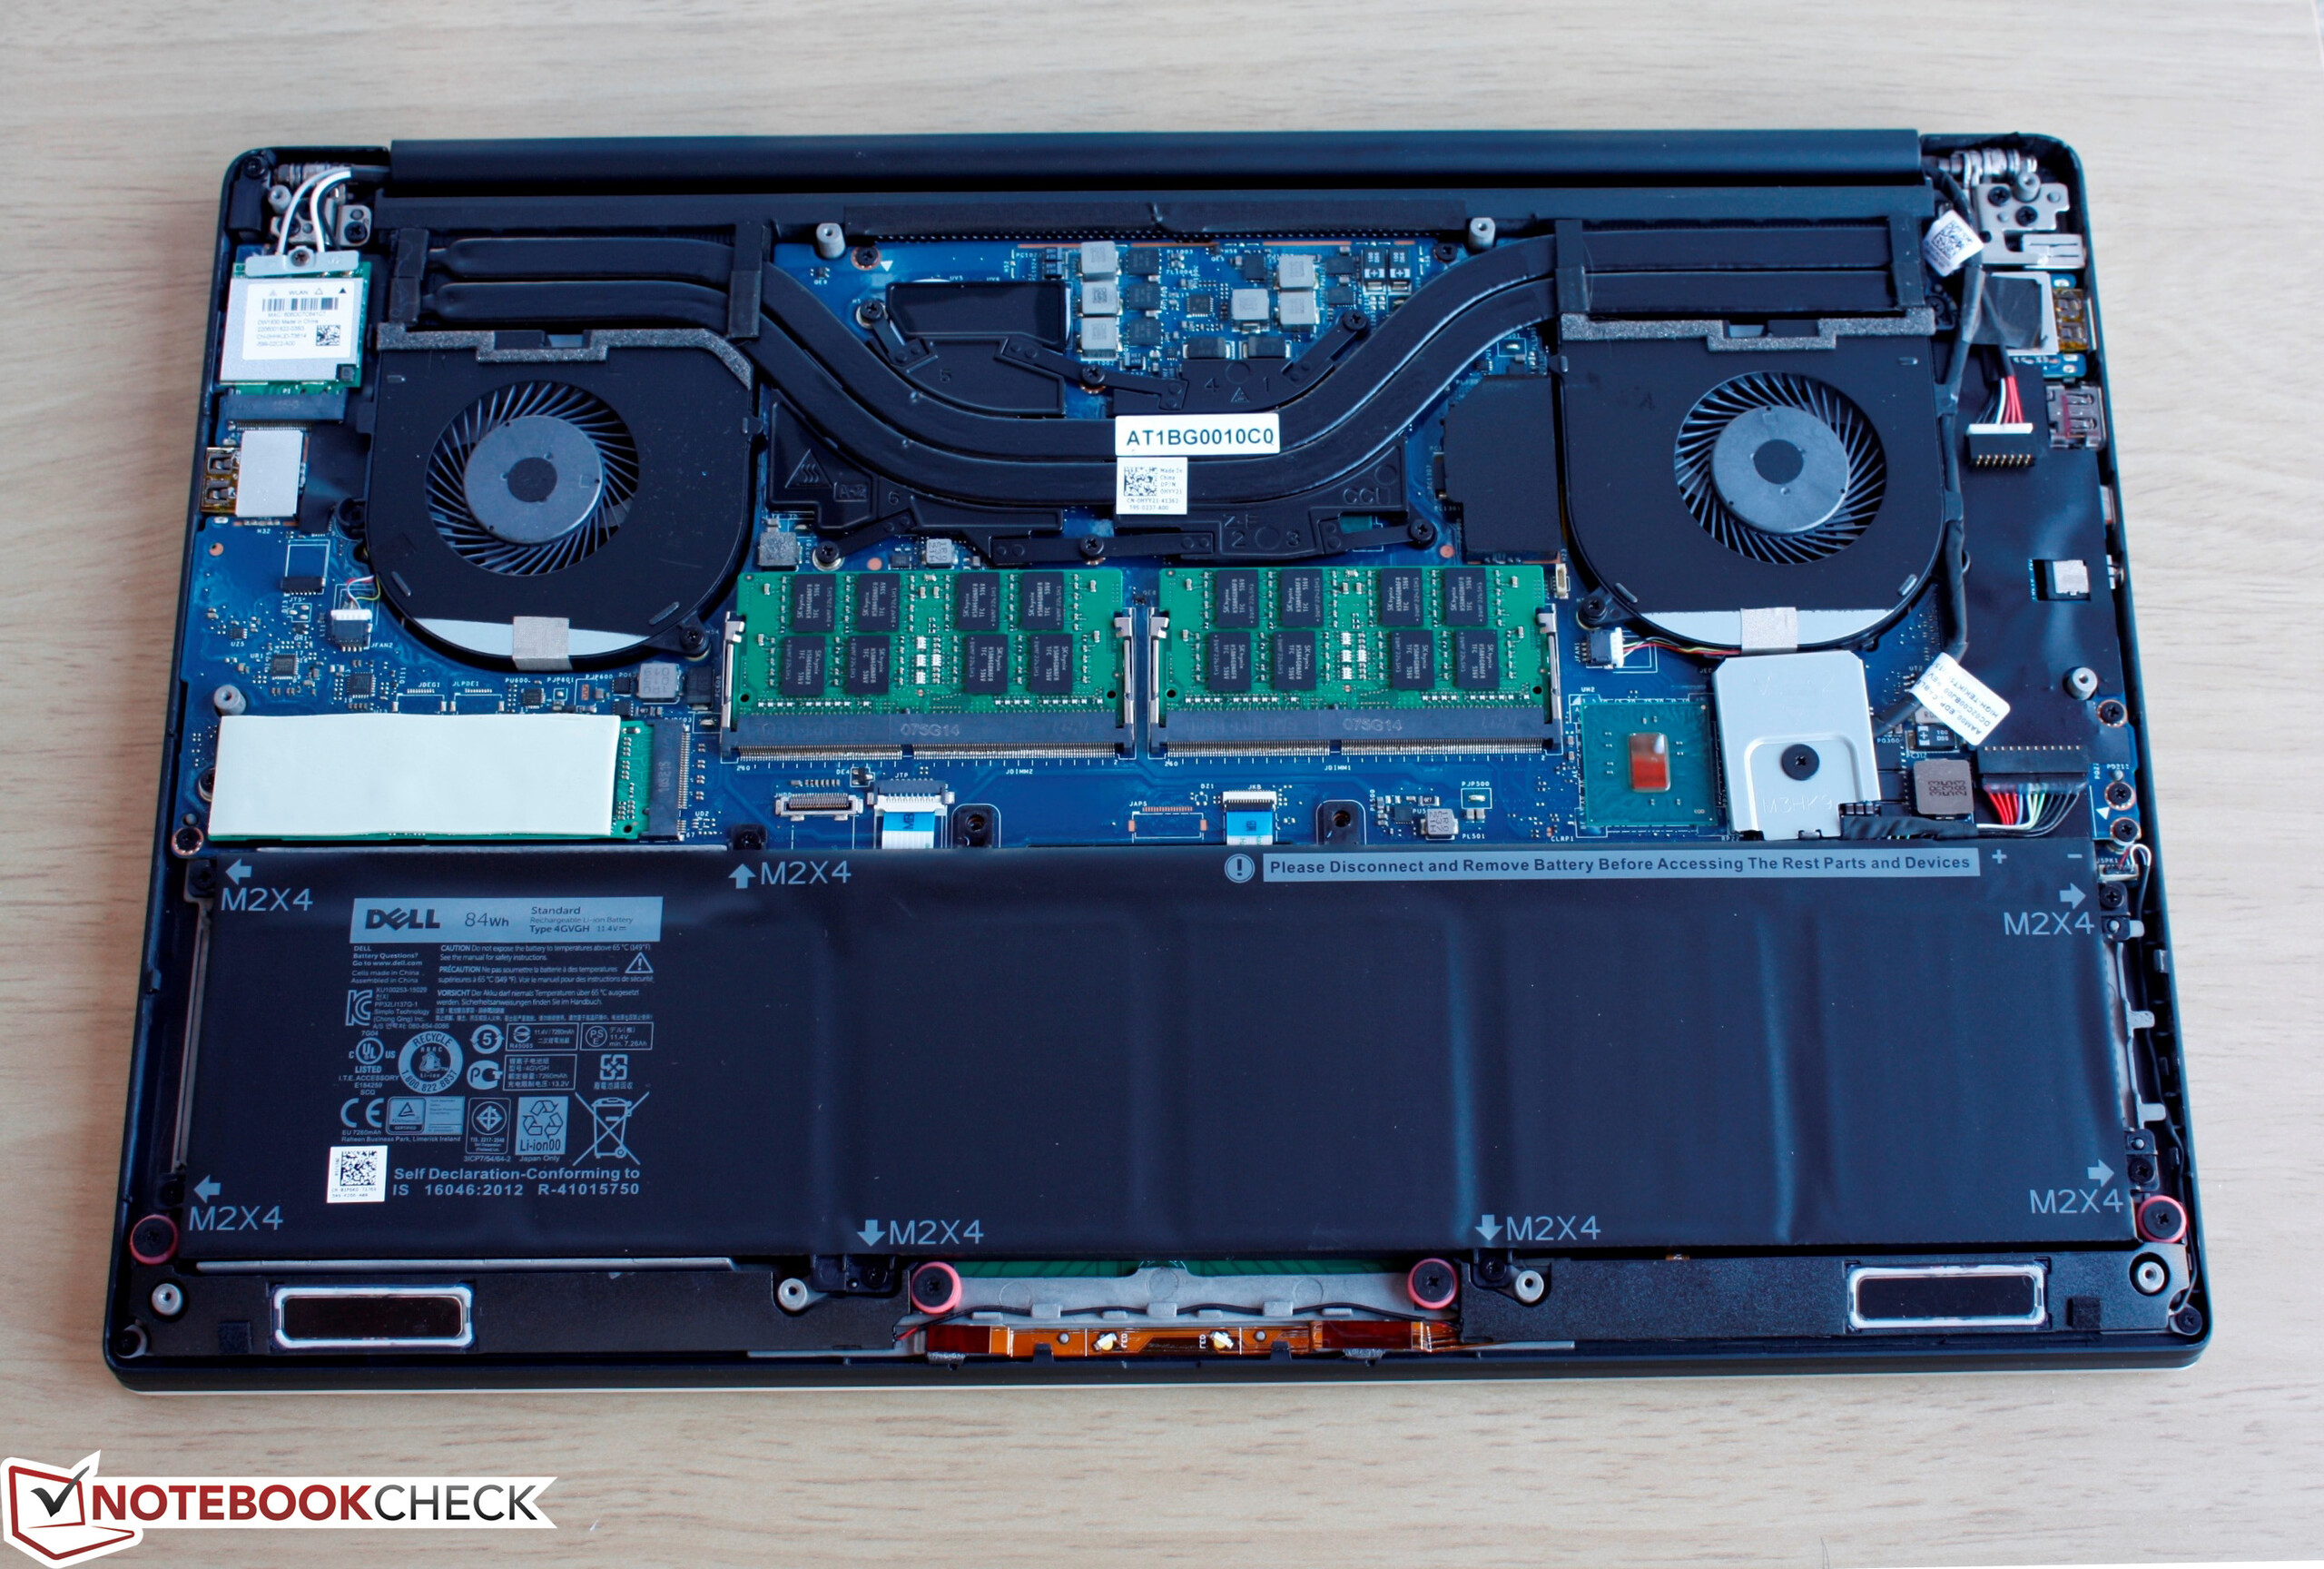
La mayor capacidad de la batería tiene el precio del almacenamiento secundario y tales configuraciones pueden no estar disponibles en todas las regiones. Modelos con una batería más pequeña pueden ser preferibles para los que quieran usar el XPS 15 principalmente como máquina multimedia y de juego.
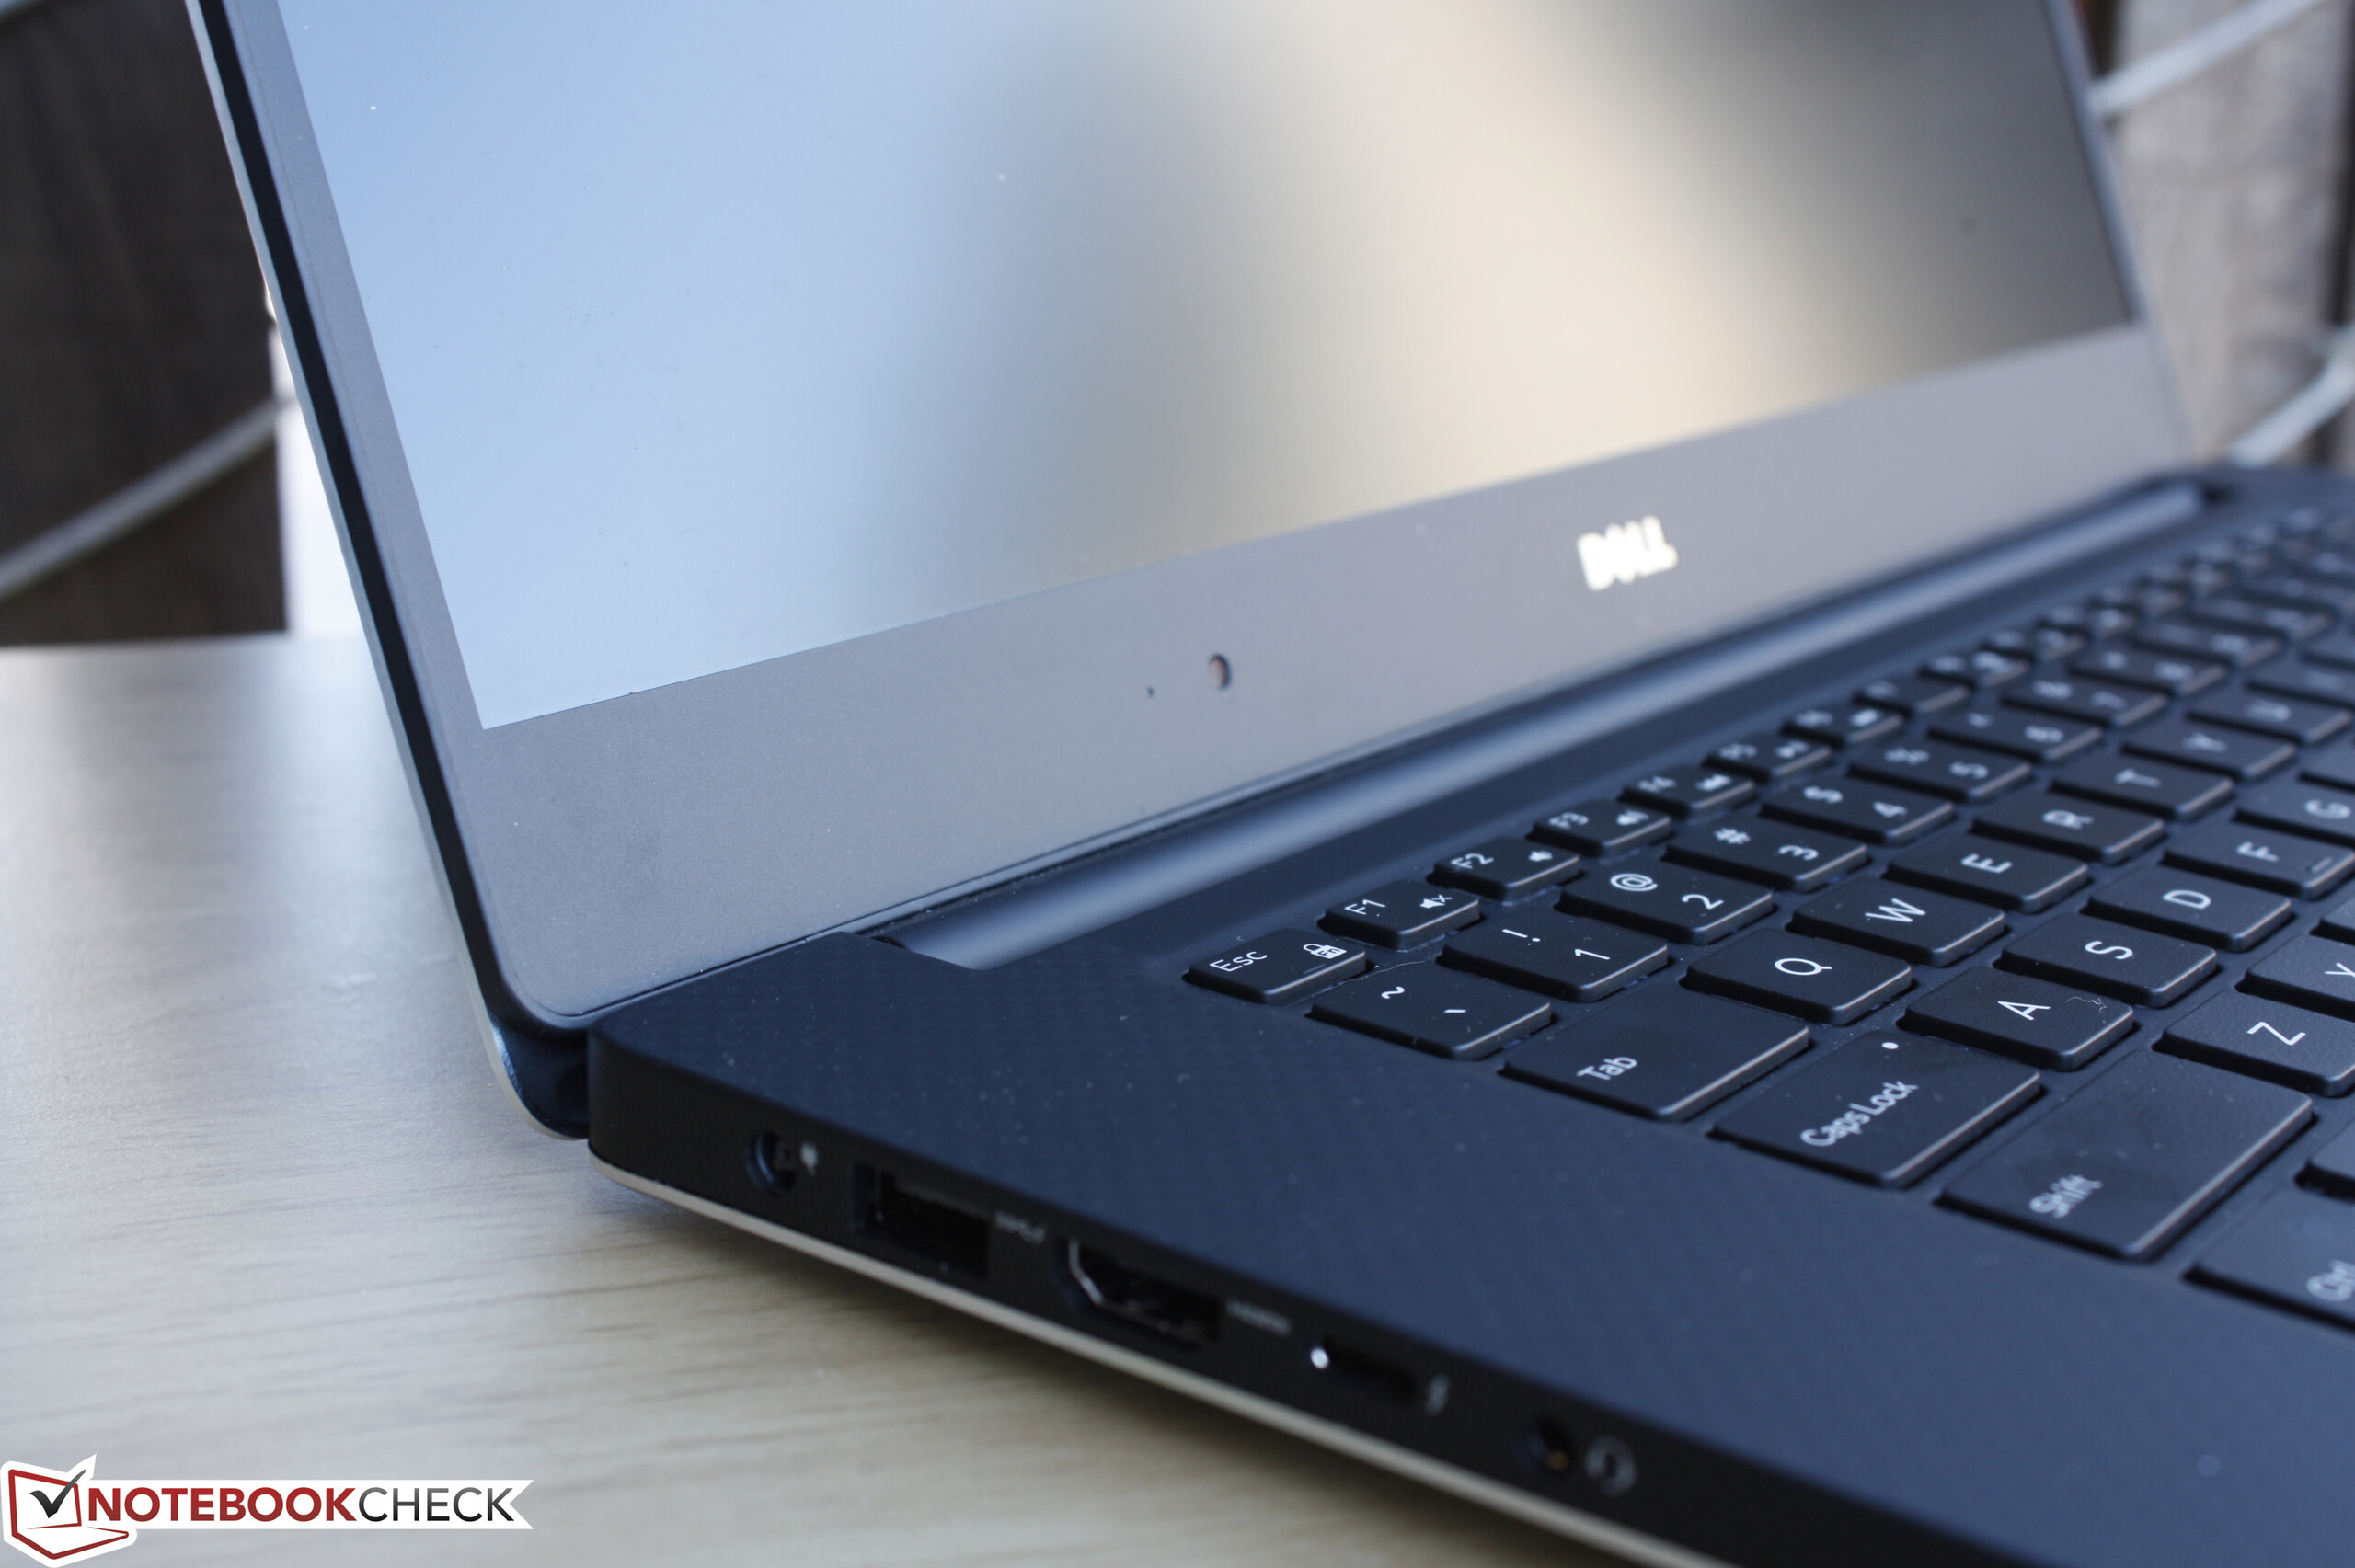
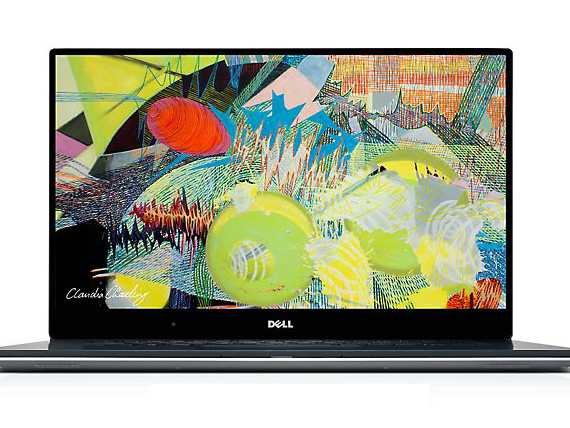
El gran display, pequeño tamaño, y potencia gráfica hacen del último XPS 15 una excelente solución para viajar, jugar y las labores escolares. Es un sistema muy centrado ya que le faltan características business y opciones de conectividad adecuadas para el uso profesional a pesar de las amplias opciones de color.
Ésta es una versión acortada del análisis original. Puedes leer el análisis completo en inglés aquí.
Dell XPS 15 9550 i7 FHD
- 02/08/2016 v4.1 (old)
Allen Ngo
Price comparison
