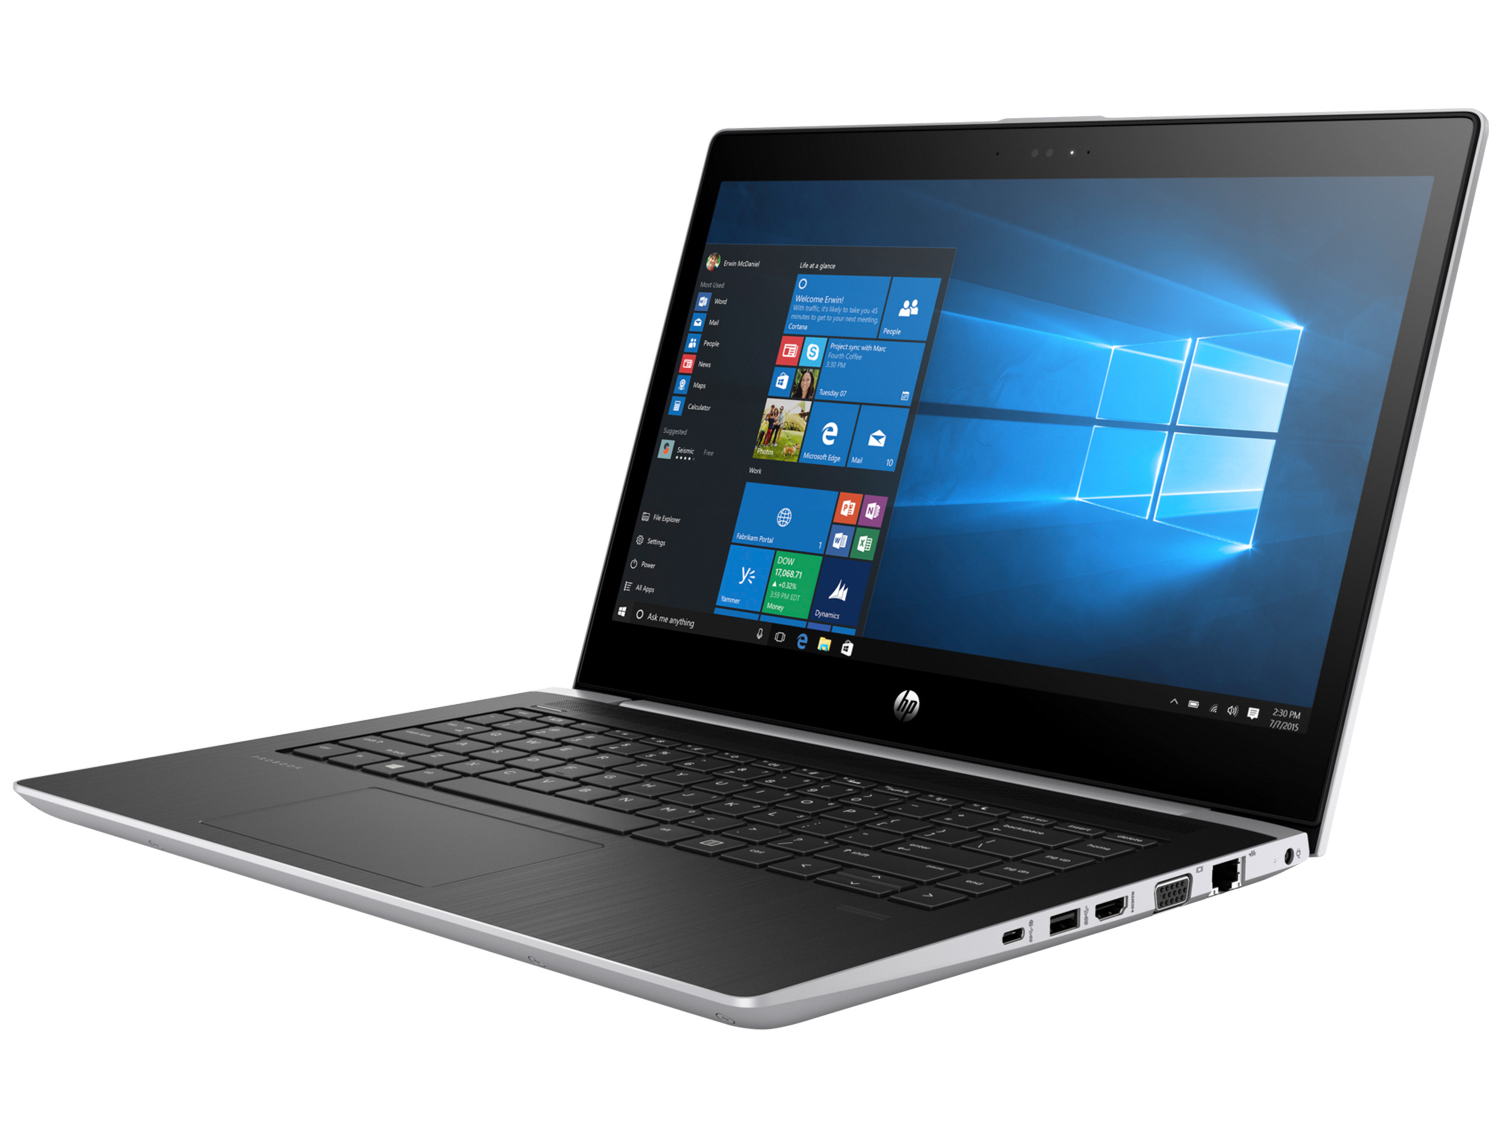
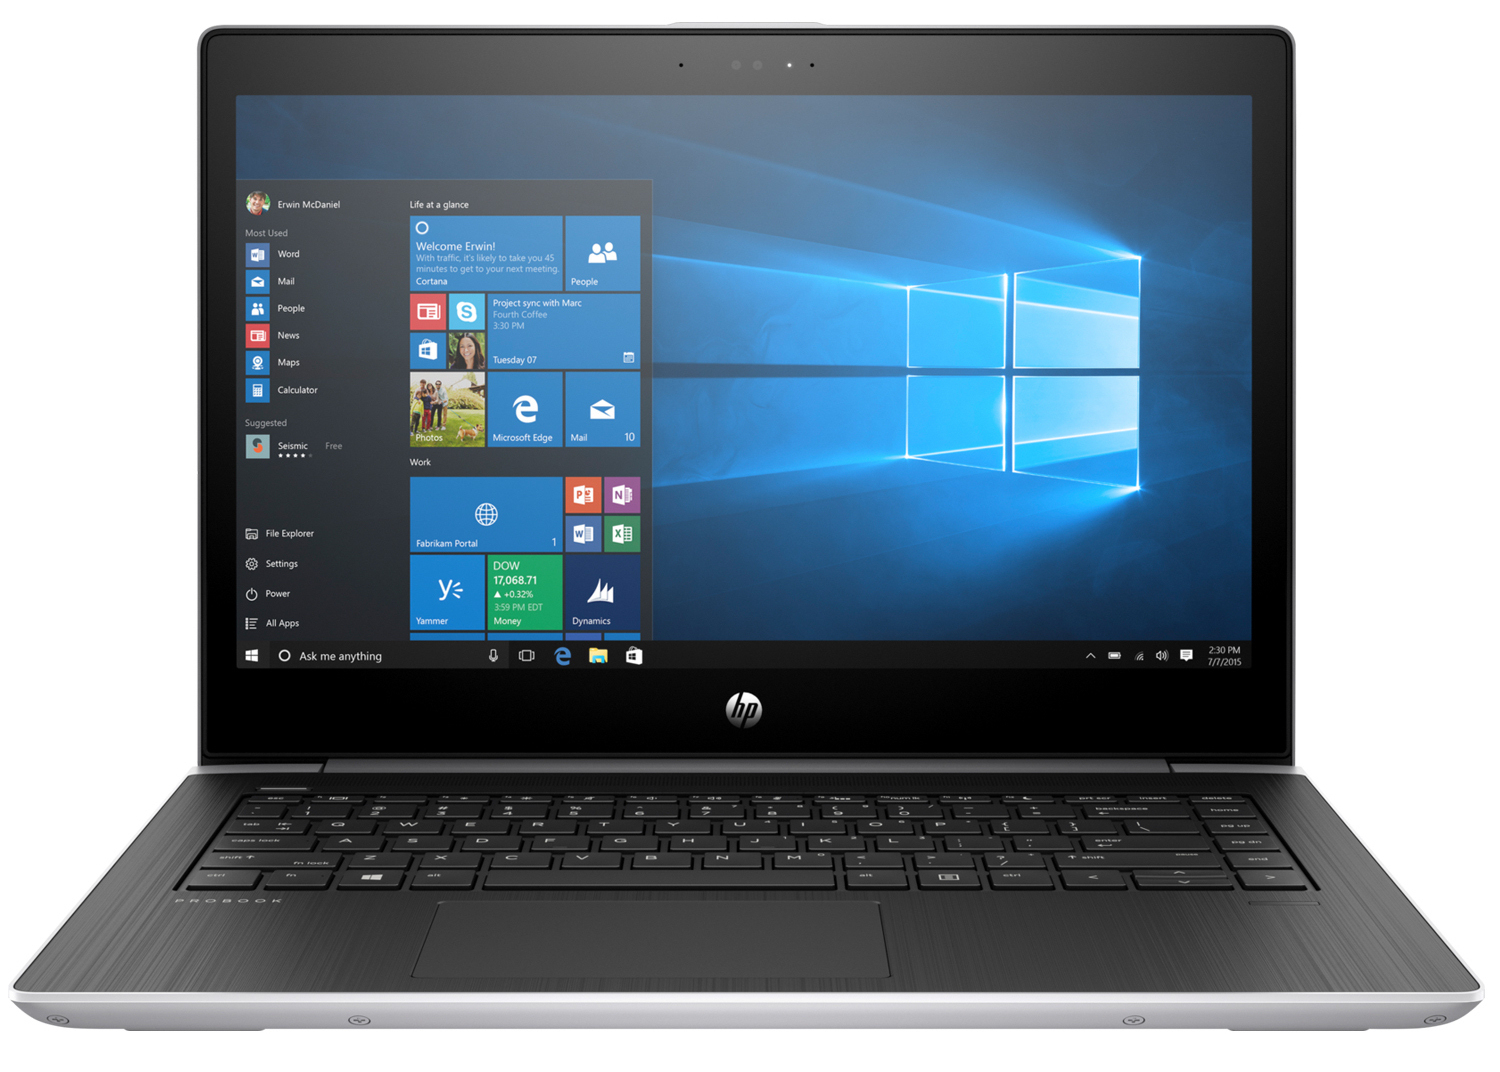
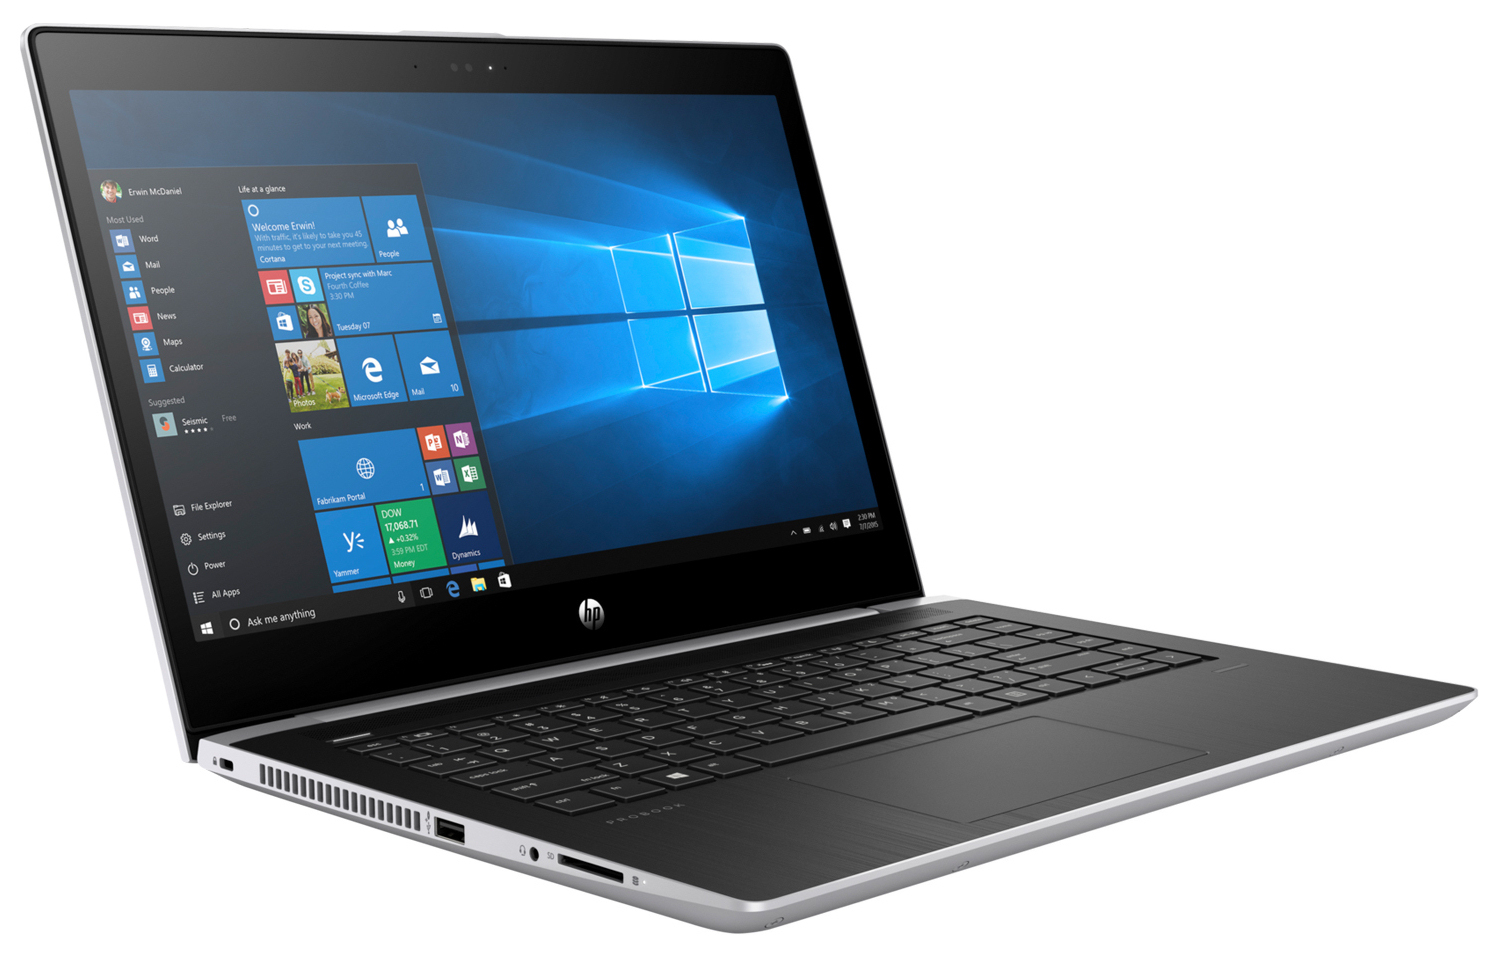
Revisión del Thin Client móvil HP mt21 (Celeron 3865U, SSD, HD)
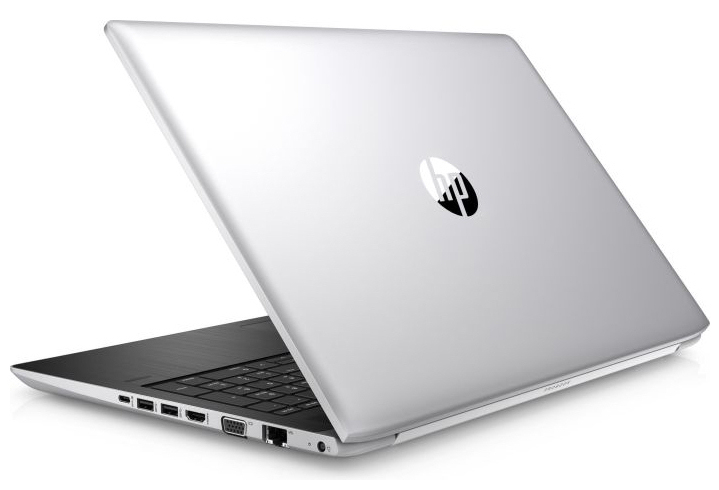
HP lanzó el mt21, un Thin Client móvil de 14 pulgadas basado en el HP ProBook 440 G5. El mt21 está impulsado por un procesador de generación Intel Celeron Kaby Lake e Intel HD Graphics 610. Utilizaremos el Lenovo ThinkPad L480, el Dell Latitude 5490 y el Acer TravelMate P449-G2-M como dispositivos contra los cuales comparamos HP mt21. No examinaremos detenidamente el caso, la conectividad, los dispositivos de entrada y los altavoces del mt21, ya que son idénticos a los que ya hemos examinado en nuestra revisión del HP ProBook 440 G5.
Debemos señalar que HP envía el mt21 con Windows 10 IoT Enterprise para Thin Clients 64. Instalamos Windows 10 Pro (64 bits) para realizar nuestras pruebas para eliminar las diferencias de rendimiento entre las dos versiones de Windows 10 al comparar el mt21 con nuestro dispositivos de comparación.
Conectividad
| SD Card Reader | |
| average JPG Copy Test (av. of 3 runs) | |
| Dell Latitude 5490-TD70X (Toshiba Exceria Pro SDXC 64 GB UHS-II) | |
| HP ProBook 440 G5-3KX87ES (Toshiba Exceria Pro SDXC 64 GB UHS-II) | |
| Lenovo ThinkPad L480-20LS001AGE (Toshiba Exceria Pro M501 microSDXC 64GB) | |
| HP mt21 (Toshiba Exceria Pro SDXC 64 GB UHS-II) | |
| HP mt43 (Toshiba Exceria Pro SDXC 64 GB UHS-II) | |
| Media de la clase Office (22.4 - 198.5, n=22, últimos 2 años) | |
| Fujitsu Lifebook E746 (Toshiba Exceria Pro SDXC 64 GB UHS-II) | |
| Acer TravelMate P449-G2-M-56CD (Toshiba Exceria Pro SDXC 64 GB UHS-II) | |
| maximum AS SSD Seq Read Test (1GB) | |
| Dell Latitude 5490-TD70X (Toshiba Exceria Pro SDXC 64 GB UHS-II) | |
| HP ProBook 440 G5-3KX87ES (Toshiba Exceria Pro SDXC 64 GB UHS-II) | |
| Lenovo ThinkPad L480-20LS001AGE (Toshiba Exceria Pro M501 microSDXC 64GB) | |
| HP mt21 (Toshiba Exceria Pro SDXC 64 GB UHS-II) | |
| HP mt43 (Toshiba Exceria Pro SDXC 64 GB UHS-II) | |
| Media de la clase Office (27.4 - 249, n=20, últimos 2 años) | |
| Acer TravelMate P449-G2-M-56CD (Toshiba Exceria Pro SDXC 64 GB UHS-II) | |
Display

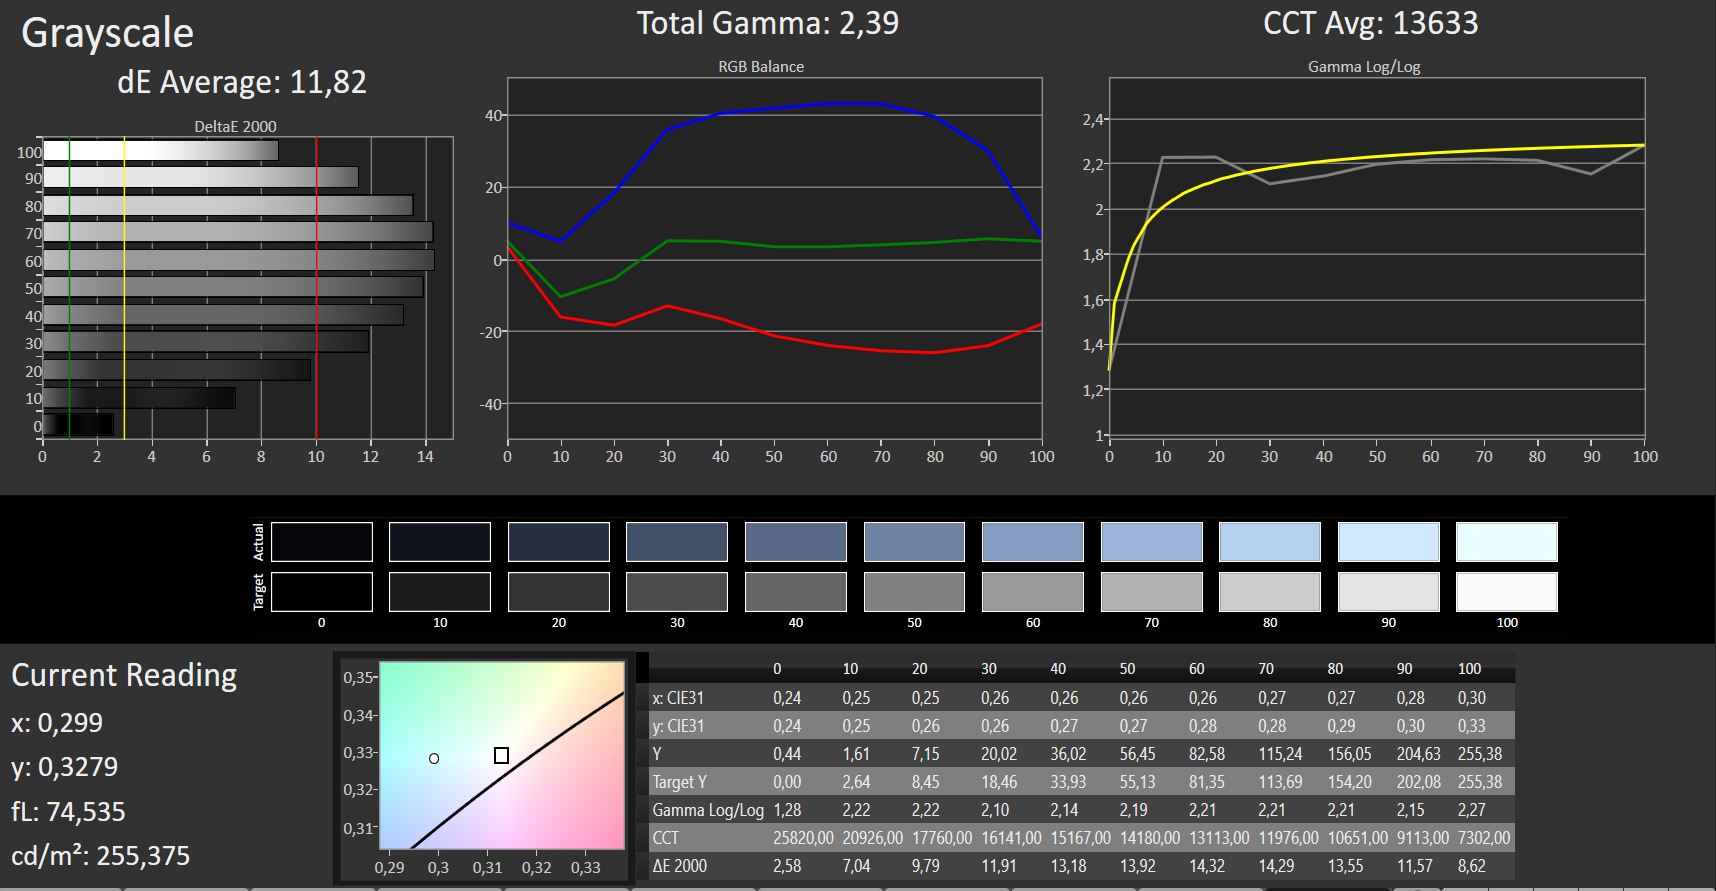
La pantalla mate de 14 pulgadas tiene una resolución nativa de 1366x768. Medimos los niveles de brillo y contraste en 228,2 cd/m² y 564:1 respectivamente. Estos valores no son impresionantes, especialmente porque se esperan valores superiores a 300 cd/m² y 1000:1.
La pantalla tiene parpadeo PWM a 1.000 Hz para niveles de brillo del 90% o inferiores. Afortunadamente, esta frecuencia es lo suficientemente alta como para que incluso aquellos sensibles a los dolores de cabeza relacionados con PWM o a la fatiga ocular puedan usar el mt21 sin problemas.
| |||||||||||||||||||||||||
iluminación: 81 %
Brillo con batería: 254 cd/m²
Contraste: 564:1 (Negro: 0.45 cd/m²)
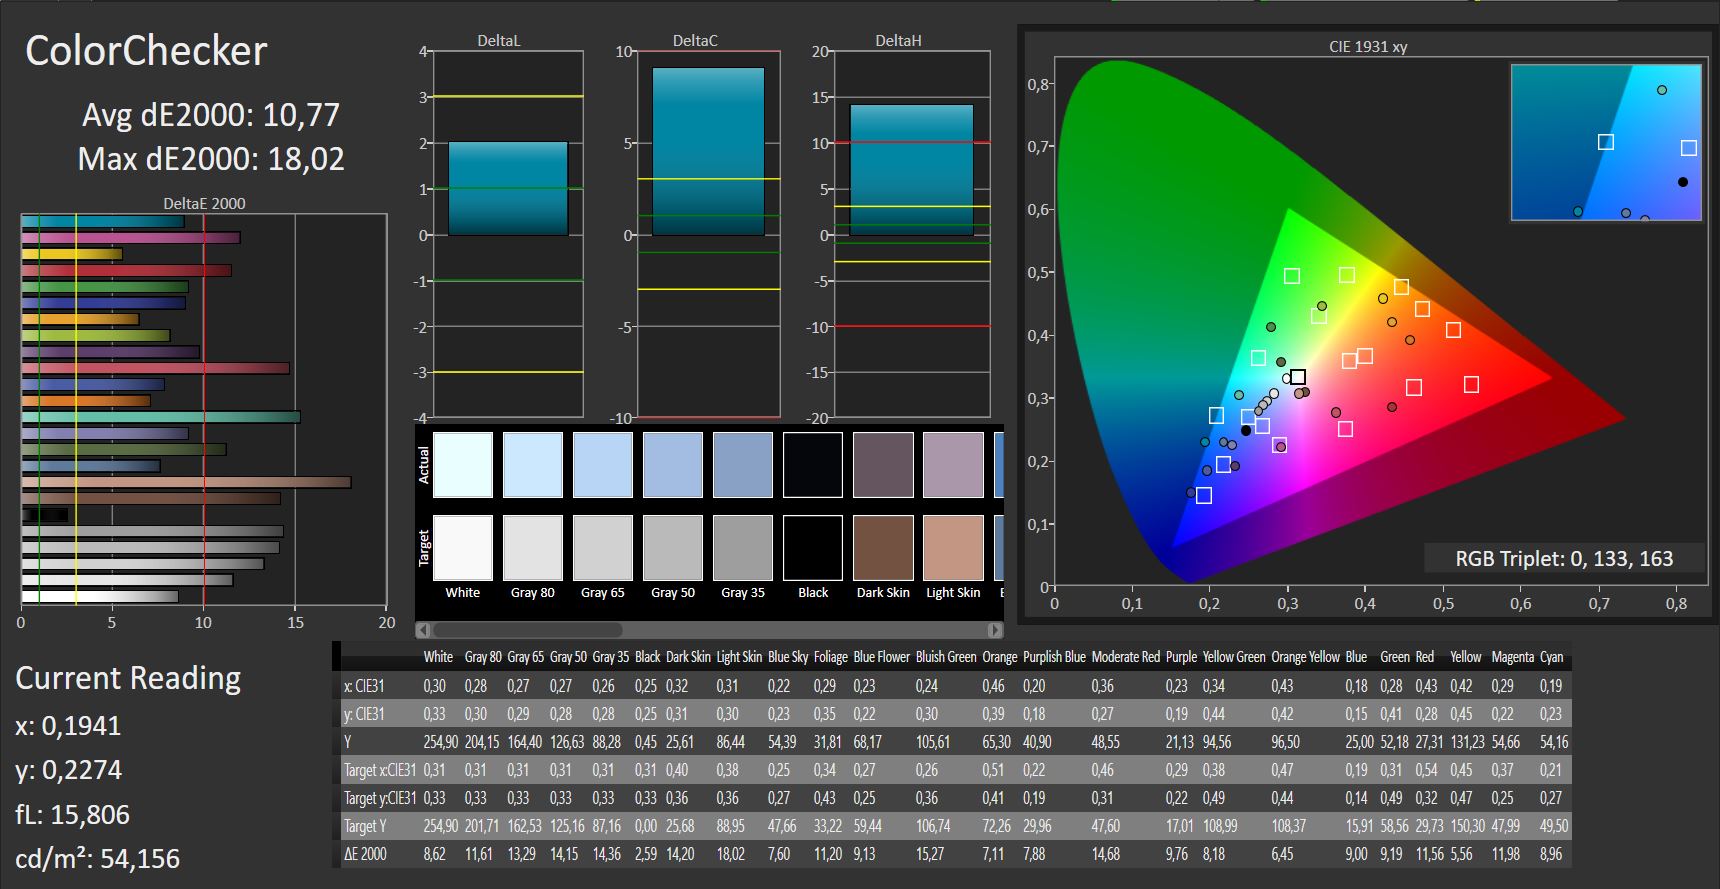
ΔE ColorChecker Calman: 10.77 | ∀{0.5-29.43 Ø4.73}
ΔE Greyscale Calman: 11.82 | ∀{0.09-98 Ø4.97}
63% sRGB (Argyll 1.6.3 3D)
40% AdobeRGB 1998 (Argyll 1.6.3 3D)
43.48% AdobeRGB 1998 (Argyll 3D)
62.8% sRGB (Argyll 3D)
42.06% Display P3 (Argyll 3D)
Gamma: 2.39
CCT: 13633 K
| HP mt21 TN LED, 1366x768, 14" | Lenovo ThinkPad L480-20LS001AGE IPS, 1920x1080, 14" | Fujitsu Lifebook E746 IPS, 1920x1080, 14" | Dell Latitude 5490-TD70X IPS, 1920x1080, 14" | HP ProBook 440 G5-3KX87ES IPS LED, 1920x1080, 14" | Acer TravelMate P449-G2-M-56CD IPS, 1920x1080, 14" | |
|---|---|---|---|---|---|---|
| Display | -14% | 42% | -14% | -6% | -2% | |
| Display P3 Coverage (%) | 42.06 | 36.37 -14% | 64.1 52% | 36.28 -14% | 39.56 -6% | 41.04 -2% |
| sRGB Coverage (%) | 62.8 | 54.7 -13% | 83.9 34% | 54.6 -13% | 59.3 -6% | 61.2 -3% |
| AdobeRGB 1998 Coverage (%) | 43.48 | 37.57 -14% | 61.3 41% | 37.48 -14% | 40.88 -6% | 42.47 -2% |
| Response Times | -95% | -20% | -59% | -43% | -39% | |
| Response Time Grey 50% / Grey 80% * (ms) | 43 ? | 73 ? -70% | 34 ? 21% | 46.9 ? -9% | 40 ? 7% | 39 ? 9% |
| Response Time Black / White * (ms) | 15 ? | 33 ? -120% | 24 ? -60% | 31.2 ? -108% | 28.8 ? -92% | 28 ? -87% |
| PWM Frequency (Hz) | 1000 ? | 21000 ? | 25000 ? | |||
| Screen | 35% | 45% | 24% | 18% | 19% | |
| Brightness middle (cd/m²) | 254 | 222 -13% | 320 26% | 227 -11% | 236 -7% | 271 7% |
| Brightness (cd/m²) | 228 | 209 -8% | 315 38% | 211 -7% | 221 -3% | 256 12% |
| Brightness Distribution (%) | 81 | 73 -10% | 86 6% | 88 9% | 88 9% | 85 5% |
| Black Level * (cd/m²) | 0.45 | 0.17 62% | 0.31 31% | 0.19 58% | 0.26 42% | 0.43 4% |
| Contrast (:1) | 564 | 1306 132% | 1032 83% | 1195 112% | 908 61% | 630 12% |
| Colorchecker dE 2000 * | 10.77 | 3.91 64% | 3.44 68% | 5.6 48% | 5.7 47% | 5.03 53% |
| Colorchecker dE 2000 max. * | 18.02 | 7.74 57% | 9.39 48% | 22.4 -24% | 22 -22% | 11.9 34% |
| Greyscale dE 2000 * | 11.82 | 1.56 87% | 2.31 80% | 2.4 80% | 3.8 68% | 4.02 66% |
| Gamma | 2.39 92% | 2.53 87% | 2.38 92% | 2.44 90% | 2.1 105% | 2.31 95% |
| CCT | 13633 48% | 6701 97% | 6496 100% | 6506 100% | 7318 89% | 6659 98% |
| Color Space (Percent of AdobeRGB 1998) (%) | 40 | 35 -12% | 55 38% | 34.5 -14% | 37.7 -6% | 39 -2% |
| Color Space (Percent of sRGB) (%) | 63 | 55 -13% | 84 33% | 54.4 -14% | 59.2 -6% | 61 -3% |
| Media total (Programa/Opciones) | -25% /
8% | 22% /
36% | -16% /
5% | -10% /
5% | -7% /
7% |
* ... más pequeño es mejor
Parpadeo de Pantalla / PWM (Pulse-Width Modulation)
| Parpadeo de Pantalla / PWM detectado | 1000 Hz | ≤ 90 % de brillo | 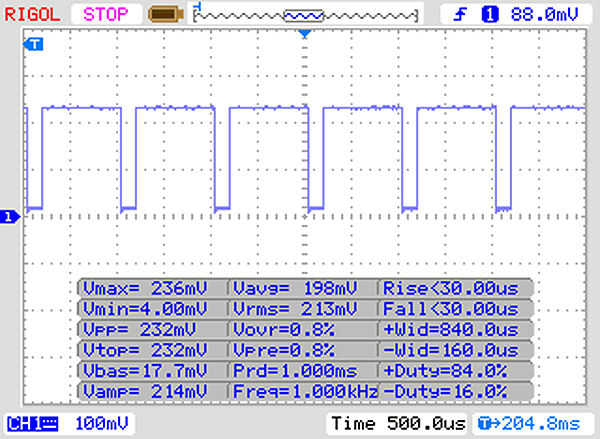 |
La retroiluminación del display parpadea a 1000 Hz (seguramente usa PWM - Pulse-Width Modulation) a un brillo del 90 % e inferior. Sobre este nivel de brillo no debería darse parpadeo / PWM. La frecuencia de 1000 Hz es bastante alta, por lo que la mayoría de gente sensible al parpadeo no debería ver parpadeo o tener fatiga visual. Comparación: 52 % de todos los dispositivos testados no usaron PWM para atenuar el display. Si se usó, medimos una media de 7801 (mínimo: 5 - máxmo: 343500) Hz. | |||
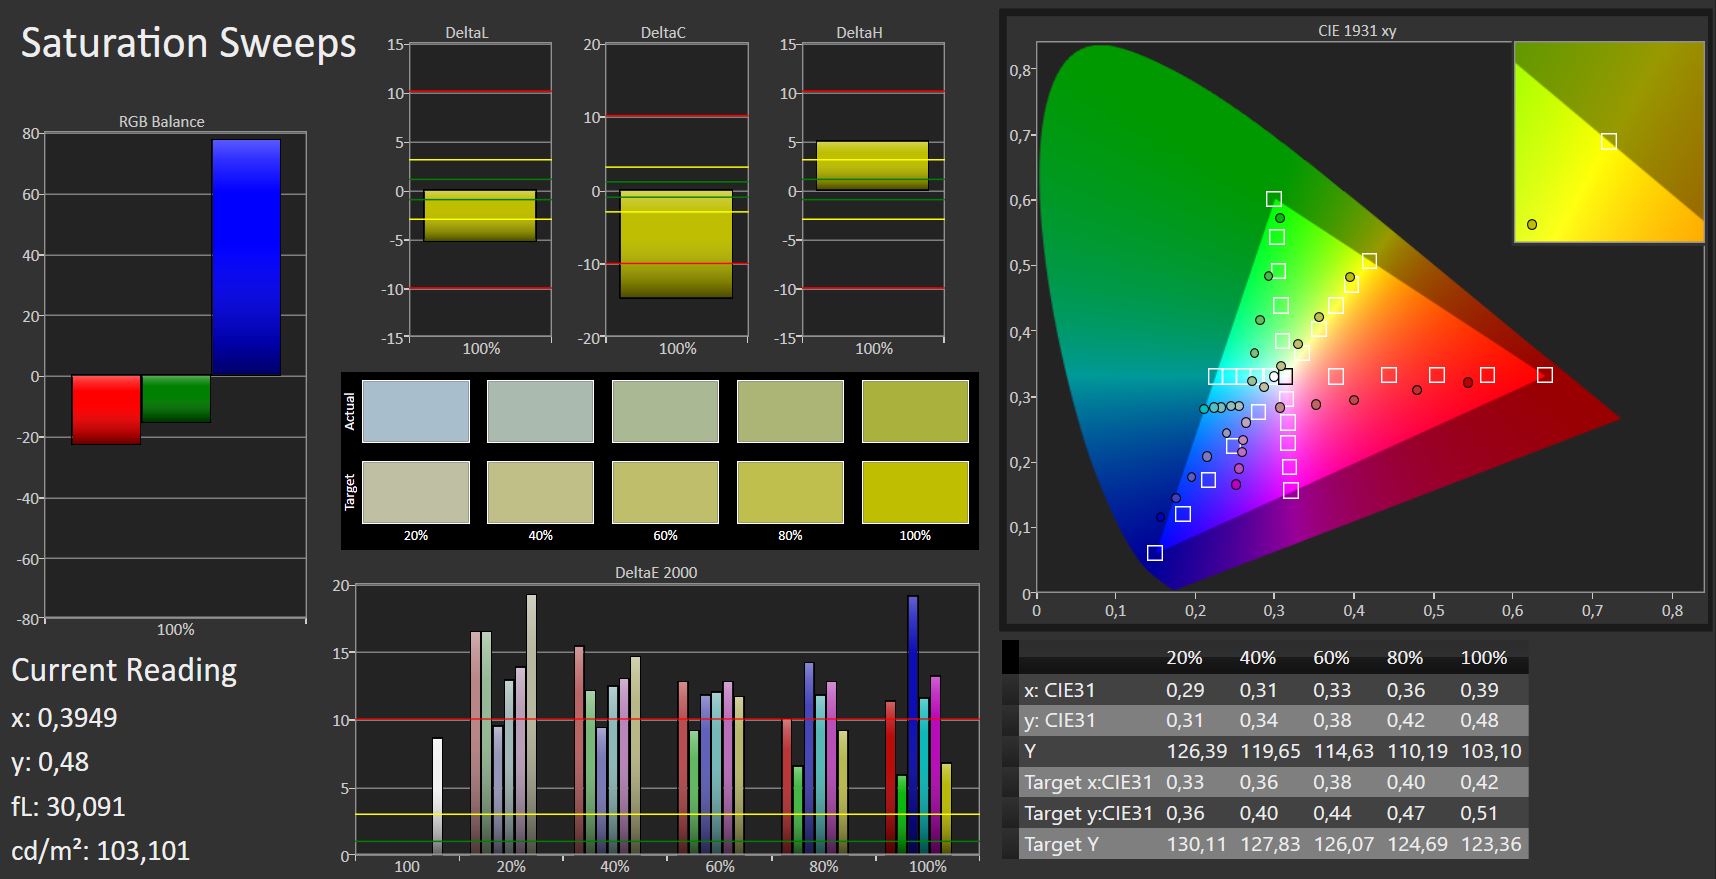
El mt21 tiene desviaciones de color Delta E 2000 de 10.77. Esto es mucho más alto que los valores ideales de menos de 3. Además, notamos un tinte azul claro en la pantalla durante la prueba.
Tiempos de respuesta del display
| ↔ Tiempo de respuesta de Negro a Blanco | ||
|---|---|---|
| 15 ms ... subida ↗ y bajada ↘ combinada | ↗ 10 ms subida | 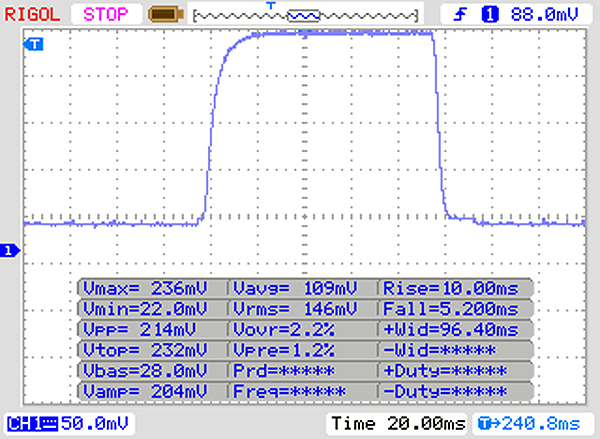 |
| ↘ 5 ms bajada | ||
| La pantalla mostró buenos tiempos de respuesta en nuestros tests pero podría ser demasiado lenta para los jugones competitivos. En comparación, todos los dispositivos de prueba van de ##min### (mínimo) a 240 (máximo) ms. » 36 % de todos los dispositivos son mejores. Esto quiere decir que el tiempo de respuesta medido es mejor que la media (19.9 ms) de todos los dispositivos testados. | ||
| ↔ Tiempo de respuesta 50% Gris a 80% Gris | ||
| 43 ms ... subida ↗ y bajada ↘ combinada | ↗ 24 ms subida | 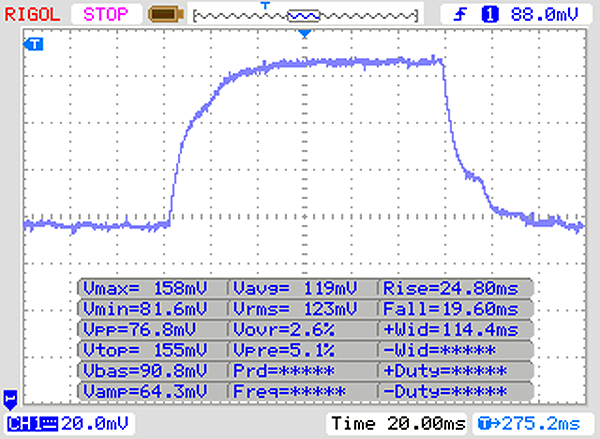 |
| ↘ 19 ms bajada | ||
| La pantalla mostró tiempos de respuesta lentos en nuestros tests y podría ser demasiado lenta para los jugones. En comparación, todos los dispositivos de prueba van de ##min### (mínimo) a 636 (máximo) ms. » 71 % de todos los dispositivos son mejores. Eso quiere decir que el tiempo de respuesta es peor que la media (31.1 ms) de todos los dispositivos testados. | ||
El mt21 tiene un panel TN con ángulos de visión pobres. El contenido no se puede leer desde cualquier ángulo, excepto cuando estás directamente frente a la pantalla. El mt21 se puede usar al aire libre, pero solo cuando el sol no es demasiado brillante.
Rendimiento
El mt21 es un dispositivo de 14 pulgadas que se encuentra dentro de la gama HP Thin Client. El mt21 está basado en el ProBook 400 G5 y tiene suficiente potencia para su uso previsto. El mt21 está disponible por entre € 1,200 a € 1,300 (~ $ 1485 a $ 1609).
Procesador
El mt21 está impulsado por un procesador de doble núcleo Intel Celeron 3865U Kaby Lake. Esta CPU funciona a una velocidad máxima de 1.8 GHz y no es compatible con Intel Turbo Boost ni Intel Hyper-Threading. Durante nuestras pruebas, la CPU tuvo un rendimiento igual de rápido con la energía de la batería que con la alimentación de la red.
Probamos el rendimiento del Celeron 3865U utilizando el banco de pruebas Cinebench R15 multihilo en un ciclo de treinta minutos. El mt21 se realizó en el mismo nivel de manera consistente sin caída de rendimiento incluso hacia el final de la prueba.
| Geekbench 3 | |
| 32 Bit Multi-Core Score | |
| Lenovo IdeaPad V110-15IKB 80TH001SGE | |
| Asus X510UA-BR305T | |
| HP mt43 | |
| HP 250 G6 2UB93ES | |
| HP mt21 | |
| Medio Intel Celeron 3865U (n=1) | |
| 32 Bit Single-Core Score | |
| Lenovo IdeaPad V110-15IKB 80TH001SGE | |
| Asus X510UA-BR305T | |
| HP 250 G6 2UB93ES | |
| HP mt43 | |
| HP mt21 | |
| Medio Intel Celeron 3865U (n=1) | |
| Octane V2 - Total Score | |
| Media de la clase Office (49011 - 122119, n=19, últimos 2 años) | |
| HP ProBook 440 G5-3KX87ES (Edge) | |
| Acer TravelMate P449-G2-M-56CD (Edge) | |
| Lenovo ThinkPad L480-20LS001AGE (Edge 41.16299.248.0) | |
| Lenovo IdeaPad V110-15IKB 80TH001SGE (Edge 40) | |
| HP mt43 (Edge 41) | |
| HP mt21 (Edge 41) | |
| Medio Intel Celeron 3865U (n=1) | |
| Mozilla Kraken 1.1 - Total | |
| HP mt43 (Edge 41) | |
| HP mt21 (Edge 41) | |
| Medio Intel Celeron 3865U (n=1) | |
| Lenovo IdeaPad V110-15IKB 80TH001SGE (Edge 40) | |
| Lenovo ThinkPad L480-20LS001AGE (Edge 41.16299.248.0) | |
| Acer TravelMate P449-G2-M-56CD (Edge) | |
| HP ProBook 440 G5-3KX87ES (Edge) | |
| Media de la clase Office (391 - 1297, n=76, últimos 2 años) | |
| JetStream 1.1 - 1.1 Total | |
| HP ProBook 440 G5-3KX87ES (Edge) | |
| Lenovo ThinkPad L480-20LS001AGE (Edge 41.16299.248.0) | |
| Acer TravelMate P449-G2-M-56CD (Edge) | |
| Asus X510UA-BR305T (Edge 40) | |
| Lenovo IdeaPad V110-15IKB 80TH001SGE (Edge 40) | |
| Fujitsu Lifebook E746 | |
| HP 250 G6 2UB93ES (Edge 41) | |
| HP mt21 (Edge 41) | |
| Medio Intel Celeron 3865U (n=1) | |
| HP mt43 (Edge 41) | |
* ... más pequeño es mejor
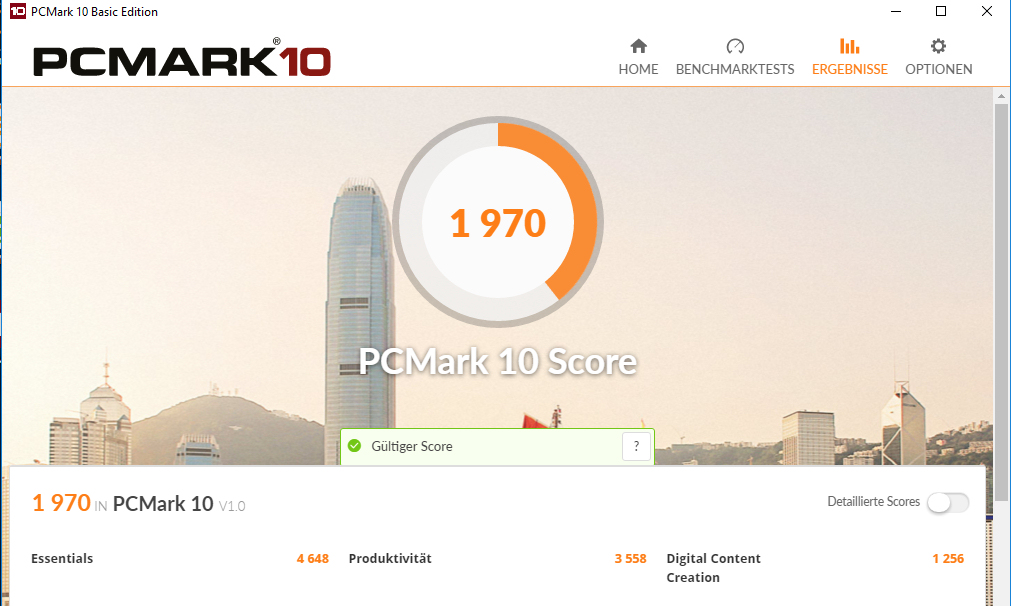
Rendimiento de sistema
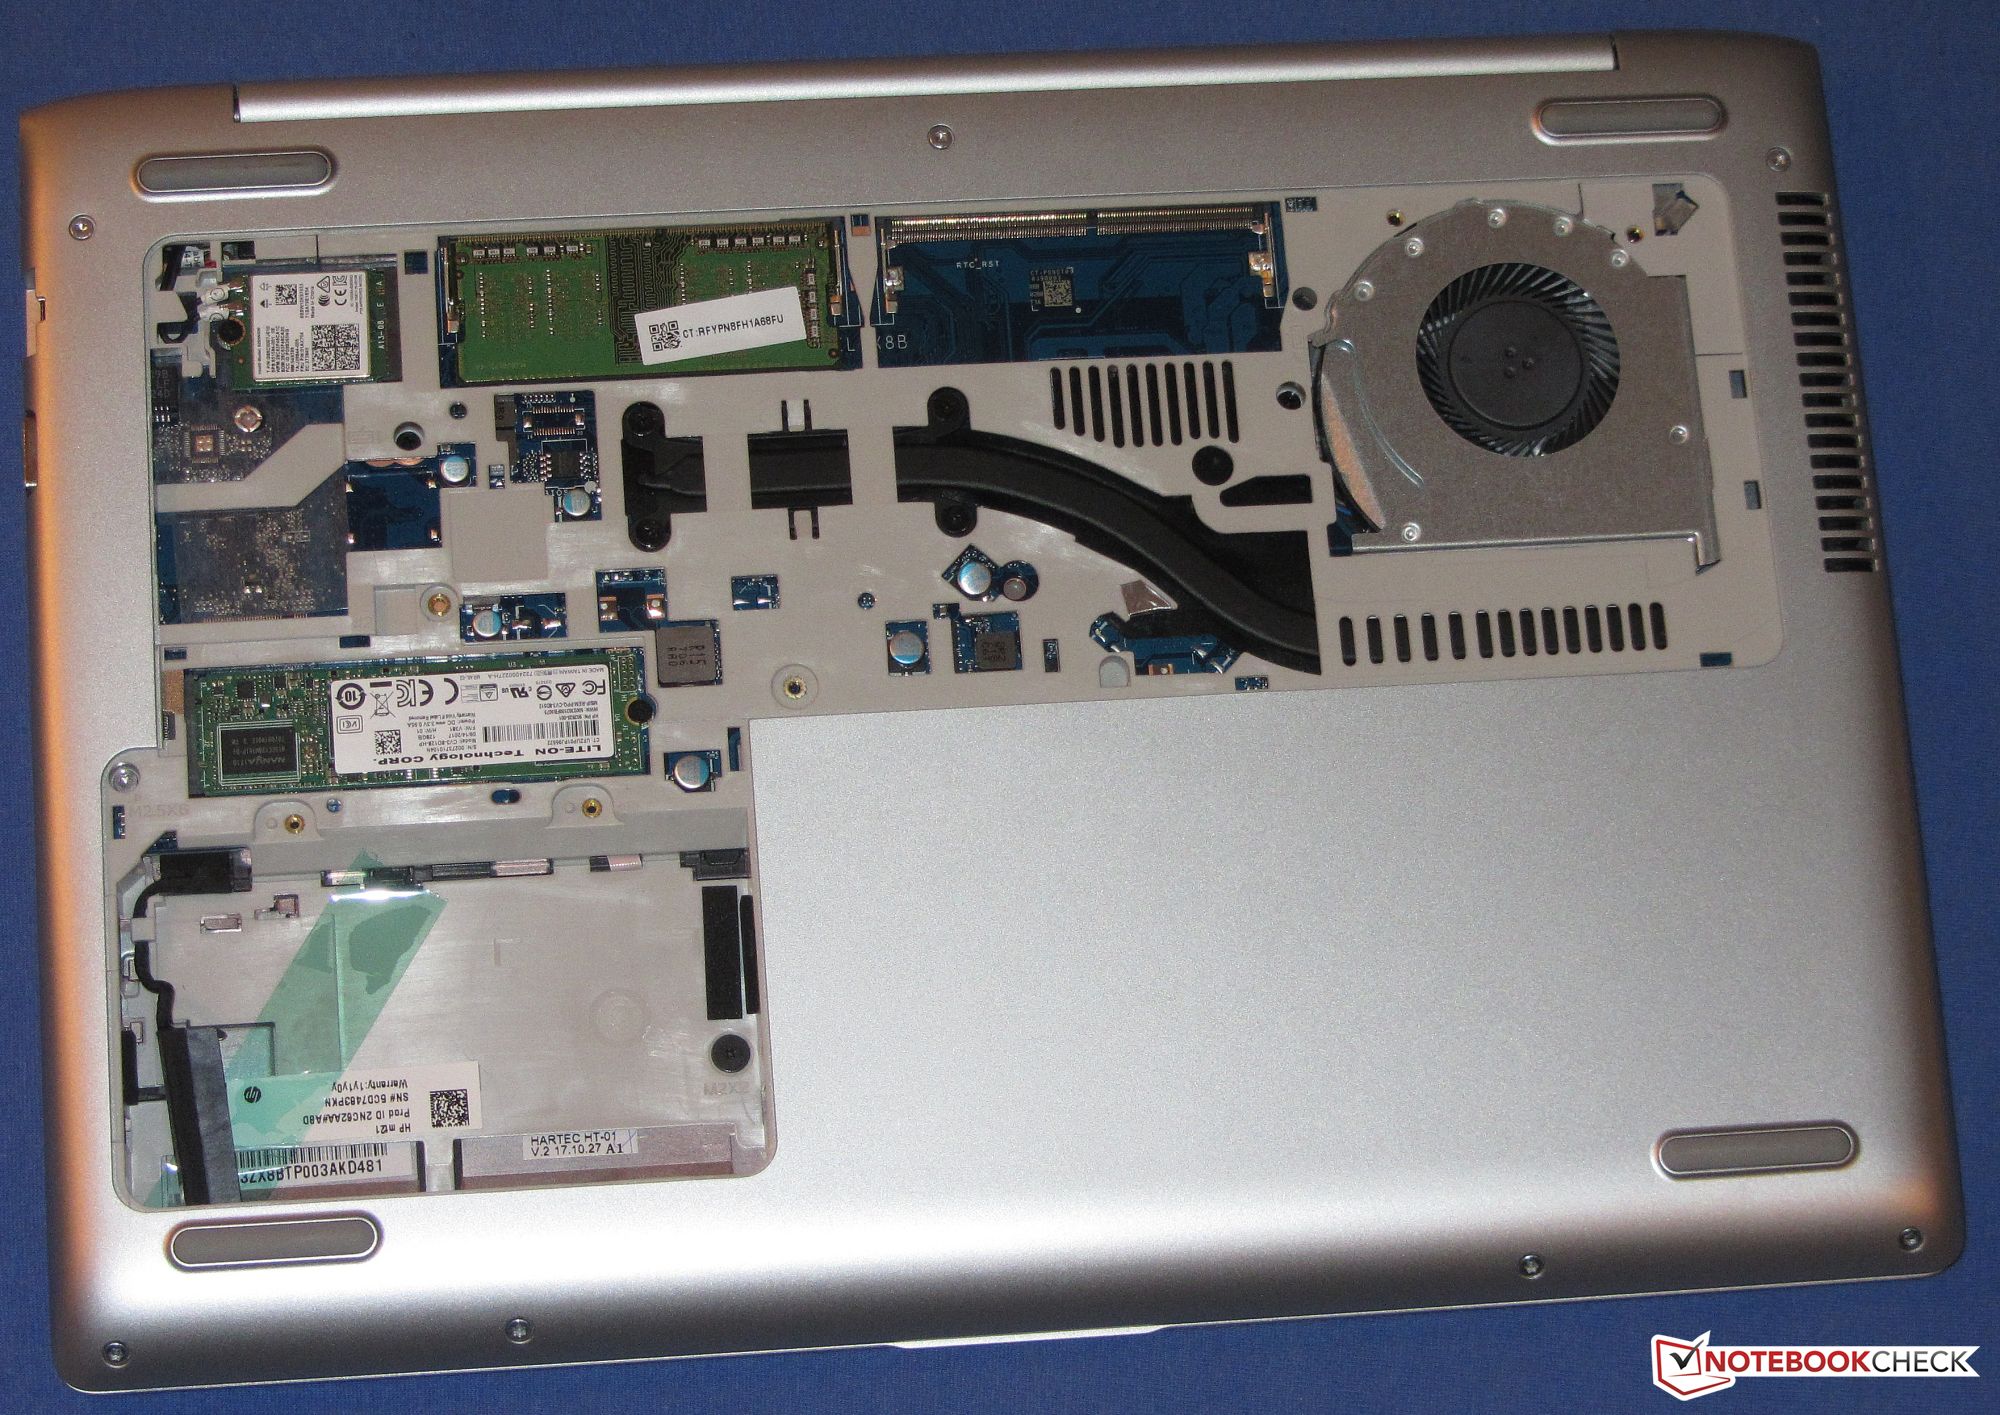
El rendimiento del sistema es suave y receptivo. No encontramos problemas durante nuestras pruebas. El mt21 es lo suficientemente potente para aplicaciones de oficina e Internet, lo que confirma los resultados de las pruebas PCMark. El mt21 tiene dos ranuras de RAM, de las cuales solo una está ocupada en nuestro dispositivo de prueba. El sistema se ejecuta en modo de un solo canal, lo que significa que todavía hay espacio para un ligero aumento en el rendimiento. Agregar un segundo módulo de RAM daría al mt21 ese aumento de rendimiento activando el modo de doble canal.
| PCMark 7 Score | 3910 puntos | |
| PCMark 8 Home Score Accelerated v2 | 2629 puntos | |
| PCMark 8 Creative Score Accelerated v2 | 2775 puntos | |
| PCMark 8 Work Score Accelerated v2 | 3714 puntos | |
| PCMark 10 Score | 1970 puntos | |
ayuda | ||
Dispositivos de almacenamiento
El mt21 tiene un M.2-2280 SATA III de 128 GB de LiteOn. Medimos velocidades de transferencia decentes. También sería posible equipar el mt21 con un disco duro secundario de 2,5 pulgadas, ya que hay una ranura SATA III disponible. Sin embargo, el marco de montaje debería comprarse por separado, ya que HP no lo incluyó con nuestro dispositivo de prueba.

| HP mt21 Liteonit CV3-8D128 | Lenovo ThinkPad L480-20LS001AGE Toshiba KXG5AZNV256G | Fujitsu Lifebook E746 Toshiba THNSNK256GCS8 | Dell Latitude 5490-TD70X Toshiba KSG60ZMV512G | HP ProBook 440 G5-3KX87ES Intel SSD 600p SSDPEKKW256G7 | HP mt43 SanDisk SD8SN8U256G1006 | Acer TravelMate P449-G2-M-56CD Intel SSD 600p SSDPEKKW512G7 | Medio Liteonit CV3-8D128 | Media de la clase Office | |
|---|---|---|---|---|---|---|---|---|---|
| CrystalDiskMark 3.0 | 121% | 41% | 55% | 151% | -1% | 146% | -3% | 451% | |
| Read Seq (MB/s) | 488.1 | 1463 200% | 490.6 1% | 465.1 -5% | 1181 142% | 464.3 -5% | 1086 122% | 450 ? -8% | 3104 ? 536% |
| Write Seq (MB/s) | 277.4 | 556 100% | 264.8 -5% | 425 53% | 602 117% | 309.3 11% | 581 109% | 238 ? -14% | 2916 ? 951% |
| Read 512 (MB/s) | 252.9 | 765 202% | 411.6 63% | 410.1 62% | 923 265% | 370.9 47% | 869 244% | 267 ? 6% | 899 ? 255% |
| Write 512 (MB/s) | 154.2 | 351.9 128% | 262.3 70% | 360.7 134% | 600 289% | 181.9 18% | 584 279% | 167 ? 8% | 2309 ? 1397% |
| Read 4k (MB/s) | 26.35 | 33.56 27% | 24.86 -6% | 27.34 4% | 35.48 35% | 28.79 9% | 35.89 36% | 23.3 ? -12% | 54.1 ? 105% |
| Write 4k (MB/s) | 57.5 | 111.7 94% | 110.1 91% | 89 55% | 139.8 143% | 49.6 -14% | 122.4 113% | 55.9 ? -3% | 114.1 ? 98% |
| Read 4k QD32 (MB/s) | 213.8 | 384.6 80% | 383.4 79% | 295.6 38% | 287.8 35% | 115.4 -46% | 462.9 117% | 227 ? 6% | 463 ? 117% |
| Write 4k QD32 (MB/s) | 150 | 351.3 134% | 198.7 32% | 300.2 100% | 417.1 178% | 106.6 -29% | 370.9 147% | 145.9 ? -3% | 370 ? 147% |
Tarjeta grafica
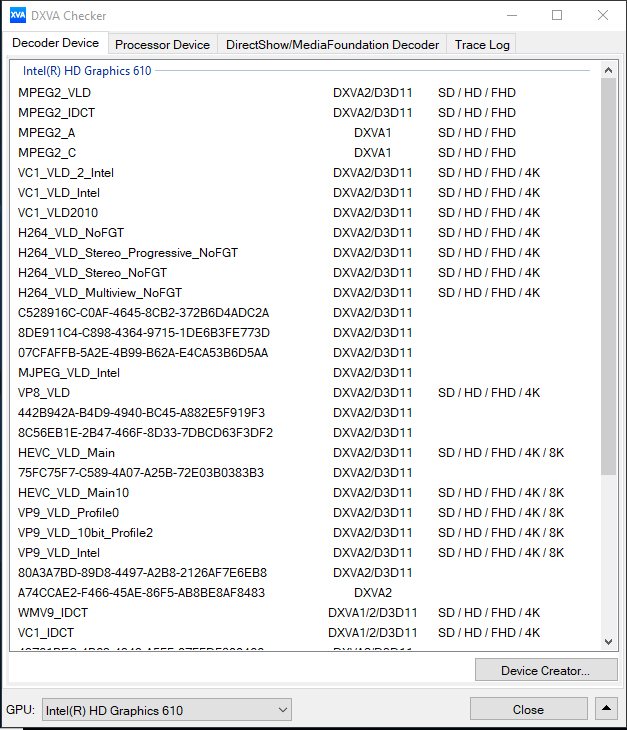
Los gráficos son manejados por el núcleo gráfico integrado Intel HD Graphics 610, que admite DirectX12 y puede sincronizar hasta 900 MHz. Los resultados del benchmark 3DMark son típicos para un dispositivo con alimentación Intel HD Graphics 610. El modo de memoria de doble canal haría un mejor uso de la GPU y aumentaría el rendimiento de los gráficos.
| 3DMark 11 Performance | 885 puntos | |
| 3DMark Ice Storm Standard Score | 31465 puntos | |
| 3DMark Cloud Gate Standard Score | 3061 puntos | |
| 3DMark Fire Strike Score | 496 puntos | |
ayuda | ||
Rendimiento de juego
El mt21 puede jugar algunos juegos, pero esto se limita a aquellos con requisitos moderados de hardware. Incluso entonces, estos solo pueden reproducirse realmente a bajas resoluciones y configuraciones de baja calidad. Si bien activar el modo de doble canal aumentaría las velocidades de fotogramas, no haría jugables juegos hambrientos de rendimiento como Kingdom Come: Deliverance .
| bajo | medio | alto | ultra | |
|---|---|---|---|---|
| BioShock Infinite (2013) | 30.6 | 16.9 | 14.5 |
Emisiones y Energía
Ruido del ventilador
El mt21 permanece silencioso incluso a plena carga. Durante nuestras pruebas de resistencia, medimos el ruido del ventilador a solo 31 dB (A). En consecuencia, el ventilador es muy silencioso o está apagado cuando el mt21 está al ralentí.
Ruido
| Ocioso |
| 30.4 / 30.4 / 30.4 dB(A) |
| Carga |
| 31.4 / 31.4 dB(A) |
 | ||
30 dB silencioso 40 dB(A) audible 50 dB(A) ruidosamente alto |
||
min: | ||
Temperatura
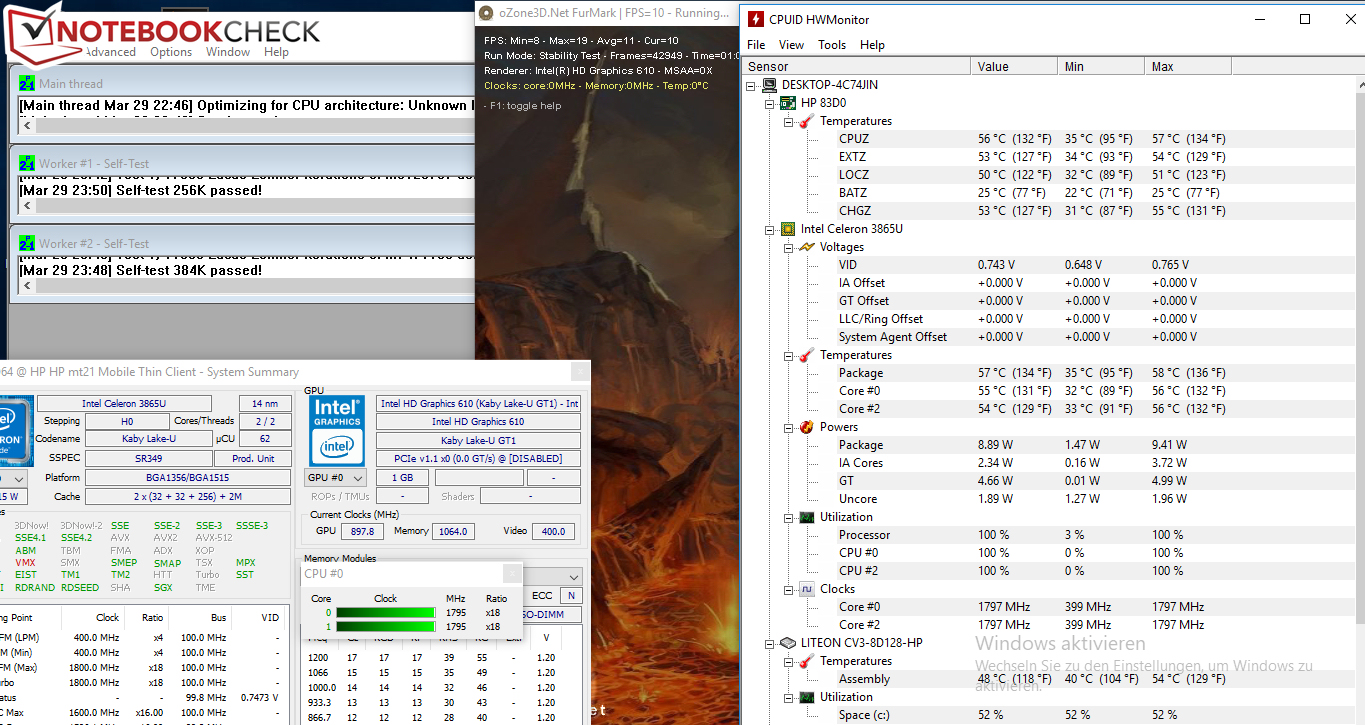
El mt21 se desempeñó igualmente bien con la energía de la batería que con la alimentación de red durante nuestras pruebas de estrés Prime95 y FurMark de una hora. La CPU y la GPU funcionaron consistentemente a sus velocidades respectivas máximas de 1.8 GHz y 900 MHz.
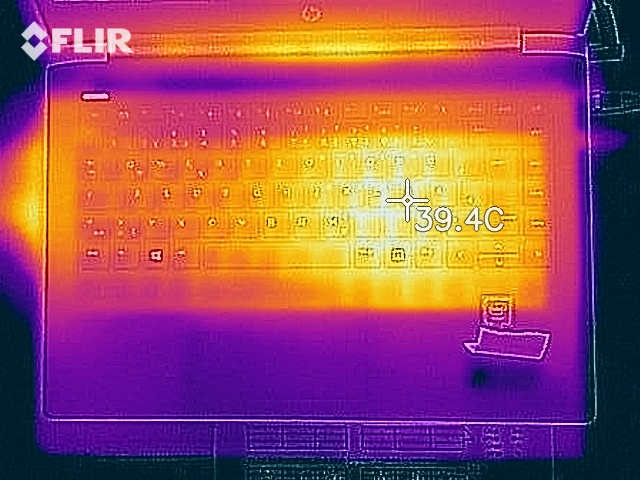
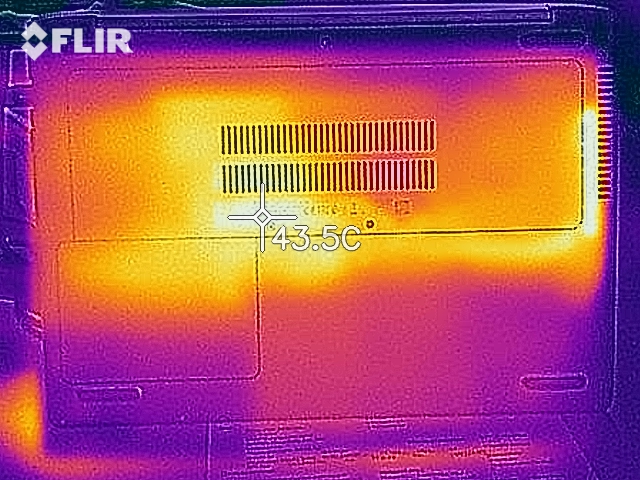
Nuestro dispositivo de prueba tampoco se calentó demasiado. Durante las pruebas de resistencia, medimos las temperaturas de la superficie a una temperatura muy inferior a los 40 ° C (104 ° F) en todos los puntos del dispositivo.
(+) La temperatura máxima en la parte superior es de 34 °C / 93 F, frente a la media de 34.3 °C / 94 F, que oscila entre 21.2 y 62.5 °C para la clase Office.
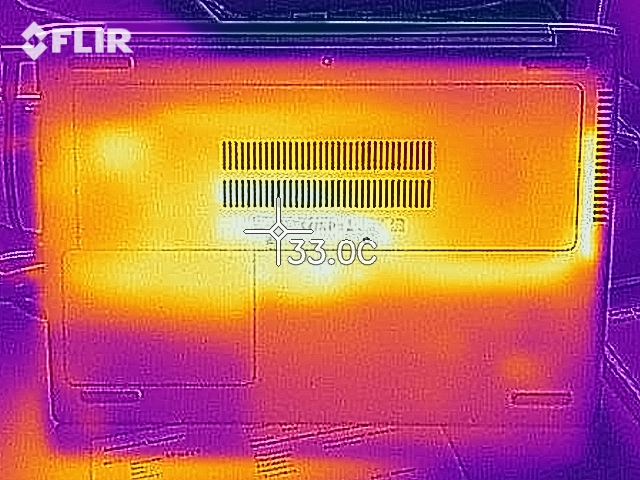
(+) El fondo se calienta hasta un máximo de 34.6 °C / 94 F, frente a la media de 36.8 °C / 98 F
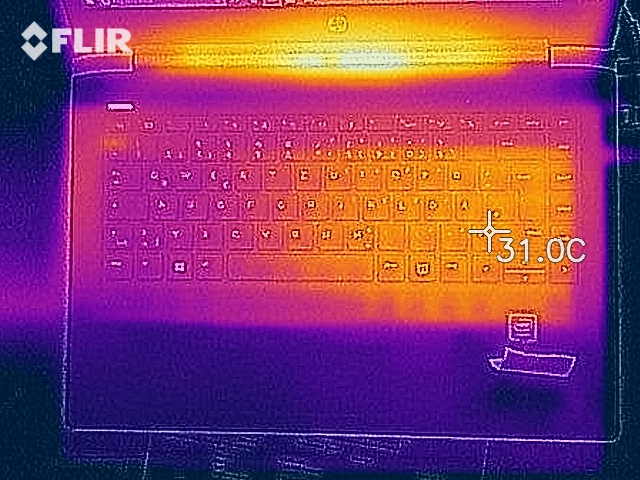
(+) En reposo, la temperatura media de la parte superior es de 26.5 °C / 80# F, frente a la media del dispositivo de 29.5 °C / 85 F.
(+) El reposamanos y el panel táctil están a una temperatura inferior a la de la piel, con un máximo de 25.2 °C / 77.4 F y, por tanto, son fríos al tacto.
(+) La temperatura media de la zona del reposamanos de dispositivos similares fue de 27.5 °C / 81.5 F (+2.3 °C / 4.1 F).
Altavoces
HP mt21 análisis de audio
(±) | la sonoridad del altavoz es media pero buena (72.9 dB)
Graves 100 - 315 Hz
(-) | casi sin bajos - de media 25.3% inferior a la mediana
(±) | la linealidad de los graves es media (9.9% delta a frecuencia anterior)
Medios 400 - 2000 Hz
(±) | medias más altas - de media 6.6% más altas que la mediana
(±) | la linealidad de los medios es media (11.7% delta respecto a la frecuencia anterior)
Altos 2 - 16 kHz
(+) | máximos equilibrados - a sólo 2.3% de la mediana
(+) | los máximos son lineales (6.6% delta a la frecuencia anterior)
Total 100 - 16.000 Hz
(±) | la linealidad del sonido global es media (26.4% de diferencia con la mediana)
En comparación con la misma clase
» 81% de todos los dispositivos probados de esta clase eran mejores, 7% similares, 13% peores
» El mejor tuvo un delta de 7%, la media fue 21%, el peor fue ###max##%
En comparación con todos los dispositivos probados
» 81% de todos los dispositivos probados eran mejores, 4% similares, 15% peores
» El mejor tuvo un delta de 4%, la media fue 24%, el peor fue ###max##%
Apple MacBook 12 (Early 2016) 1.1 GHz análisis de audio
(+) | los altavoces pueden reproducir a un volumen relativamente alto (#83.6 dB)
Graves 100 - 315 Hz
(±) | lubina reducida - en promedio 11.3% inferior a la mediana
(±) | la linealidad de los graves es media (14.2% delta a frecuencia anterior)
Medios 400 - 2000 Hz
(+) | medios equilibrados - a sólo 2.4% de la mediana
(+) | los medios son lineales (5.5% delta a la frecuencia anterior)
Altos 2 - 16 kHz
(+) | máximos equilibrados - a sólo 2% de la mediana
(+) | los máximos son lineales (4.5% delta a la frecuencia anterior)
Total 100 - 16.000 Hz
(+) | el sonido global es lineal (10.2% de diferencia con la mediana)
En comparación con la misma clase
» 7% de todos los dispositivos probados de esta clase eran mejores, 2% similares, 91% peores
» El mejor tuvo un delta de 5%, la media fue 18%, el peor fue ###max##%
En comparación con todos los dispositivos probados
» 5% de todos los dispositivos probados eran mejores, 1% similares, 94% peores
» El mejor tuvo un delta de 4%, la media fue 24%, el peor fue ###max##%
Diagrama de frecuencia en comparación (las casillas de verificación son de / seleccionables)
El consumo de energía
El mt21 tiene un buen consumo de energía independientemente de la carga. Medimos un consumo máximo de 7 W a ralentí, que aumentó a 19.2 W a carga máxima. La fuente de alimentación tiene una potencia nominal de 45 W, que será más que suficiente para cargar el dispositivo incluso cuando está funcionando con carga máxima.
| Off / Standby | |
| Ocioso | |
| Carga |
|
Clave:
min: | |
Duración de la batería
Probamos el mt21 en nuestra práctica prueba de Wi-Fi, que usa un script para simular la carga requerida para cargar y renderizar sitios web. Durante esta prueba, configuramos el modo de energía de Windows 10 en Balanceado, el brillo de la pantalla en 150 cd / m² y desactivamos las funciones de ahorro de energía. El mt21 duró 8:45 horas bajo estas condiciones.
Pro
Contra
Veredicto
Un Thin Client móvil no necesita el máximo rendimiento, por lo que no importa que el procesador que alimenta HP mt21 sea uno de los procesadores Kaby Lake menos potentes que Intel ofrece.
Sin embargo, esta falta de poder es una virtud, ya que permite que el mt21 se ejecute cerca silenciosamente. Además, el procesador es energéticamente eficiente, lo que le da al mt21 una buena duración de la batería y temperaturas superficiales relativamente frías incluso bajo una carga simulada extrema.
Con el mt21, HP ha creado un Mobile Thin Client silencioso y consistente.
Un SSD garantiza un rendimiento del sistema sin problemas. El SSD podría intercambiarse, e incluso hay espacio para una unidad de 2,5 pulgadas si es necesario. Mejor aún, ambas bahías de unidades son accesibles por una cubierta de mantenimiento, en lugar de tener que quitar la carcasa inferior como es el caso con otros dispositivos. El mt21 tiene un buen teclado adecuado para el papeleo regular, aunque no hay luz de fondo del teclado.
La pantalla mate de 14 pulgadas no inspirará a nadie. HP ha usado un panel TN oscuro y de bajo contraste con ángulos de visión deficientes. En este punto de precio, hubiéramos esperado un panel IPS más brillante y de mayor contraste en su lugar.
HP mt21
- 04/04/2018 v6 (old)
Sascha Mölck
Price comparison
