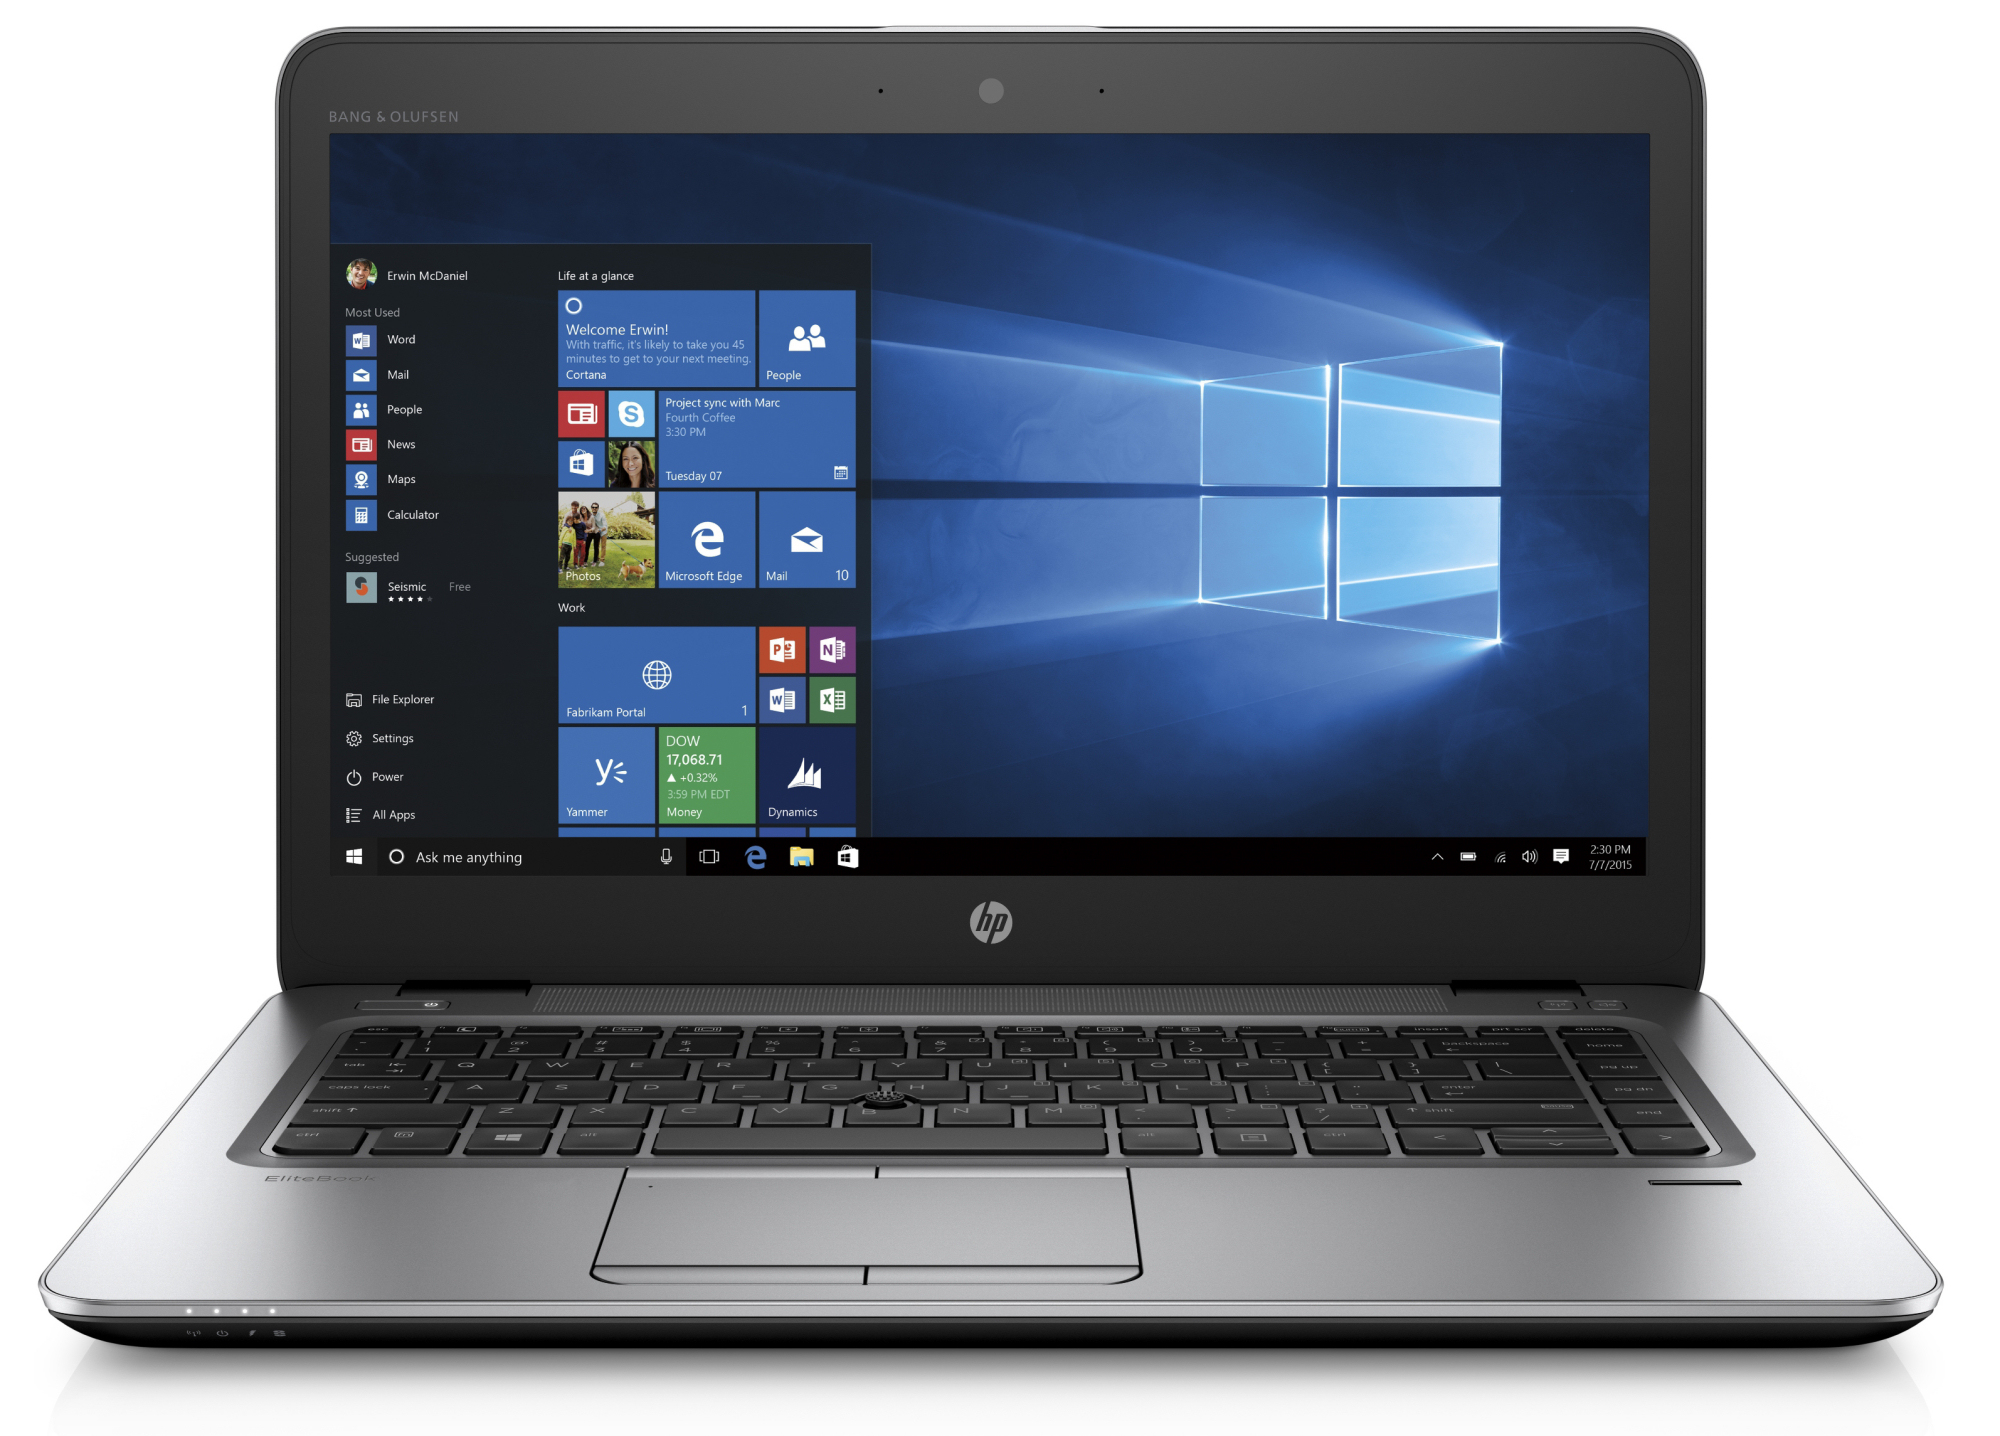
Análisis del HP mt43 (A8-9600B, SSD, FHD) Thin Client
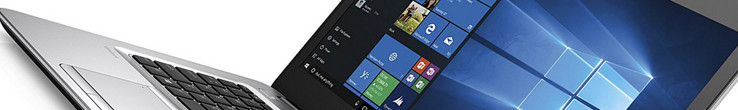
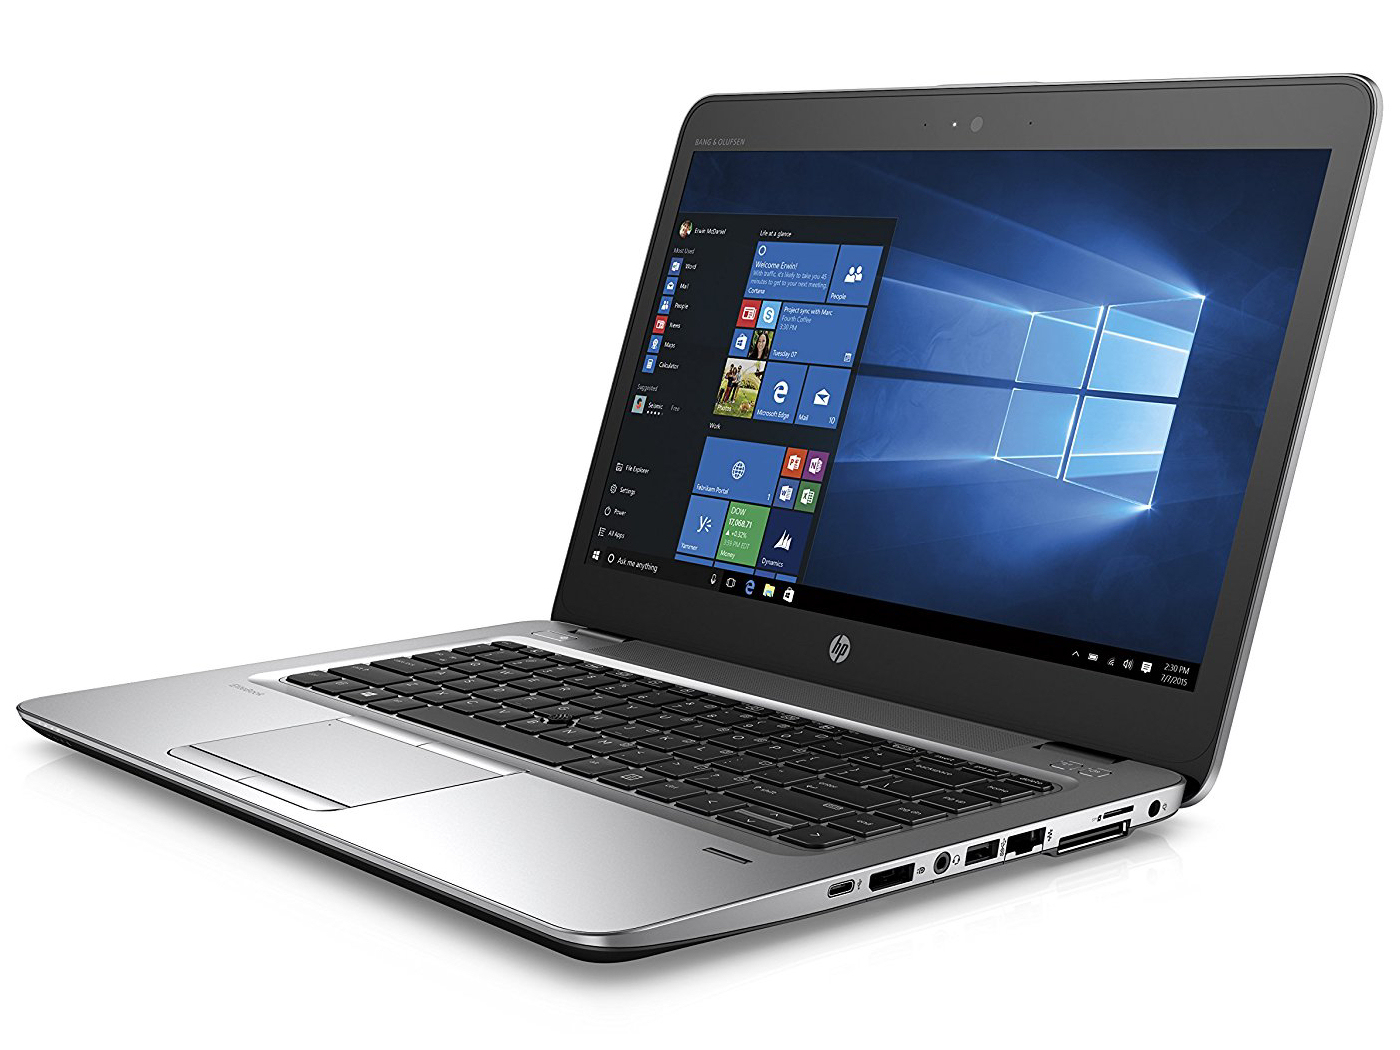
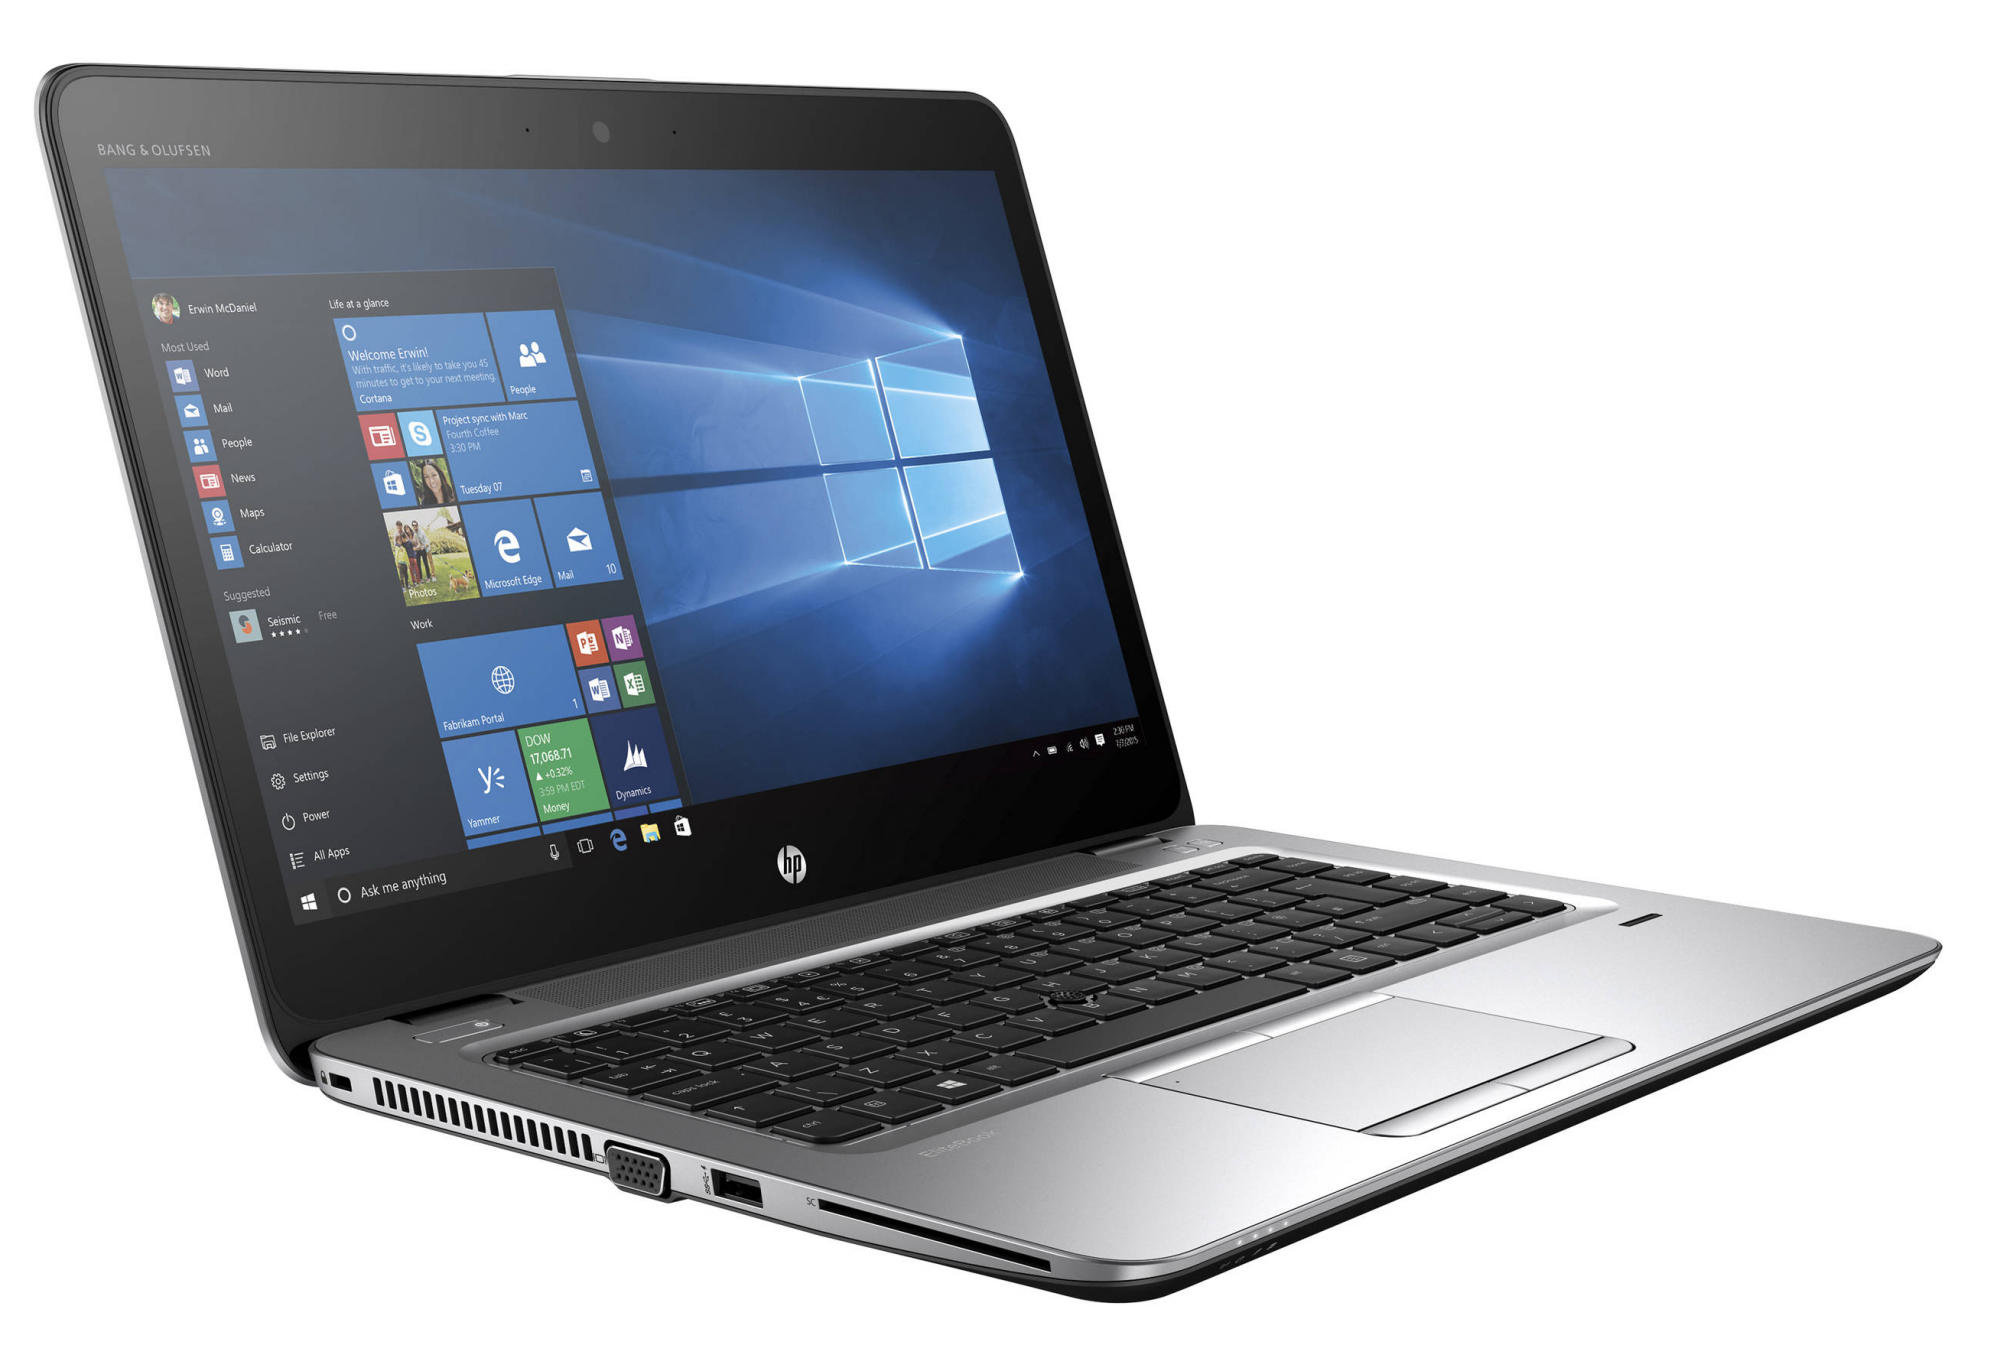
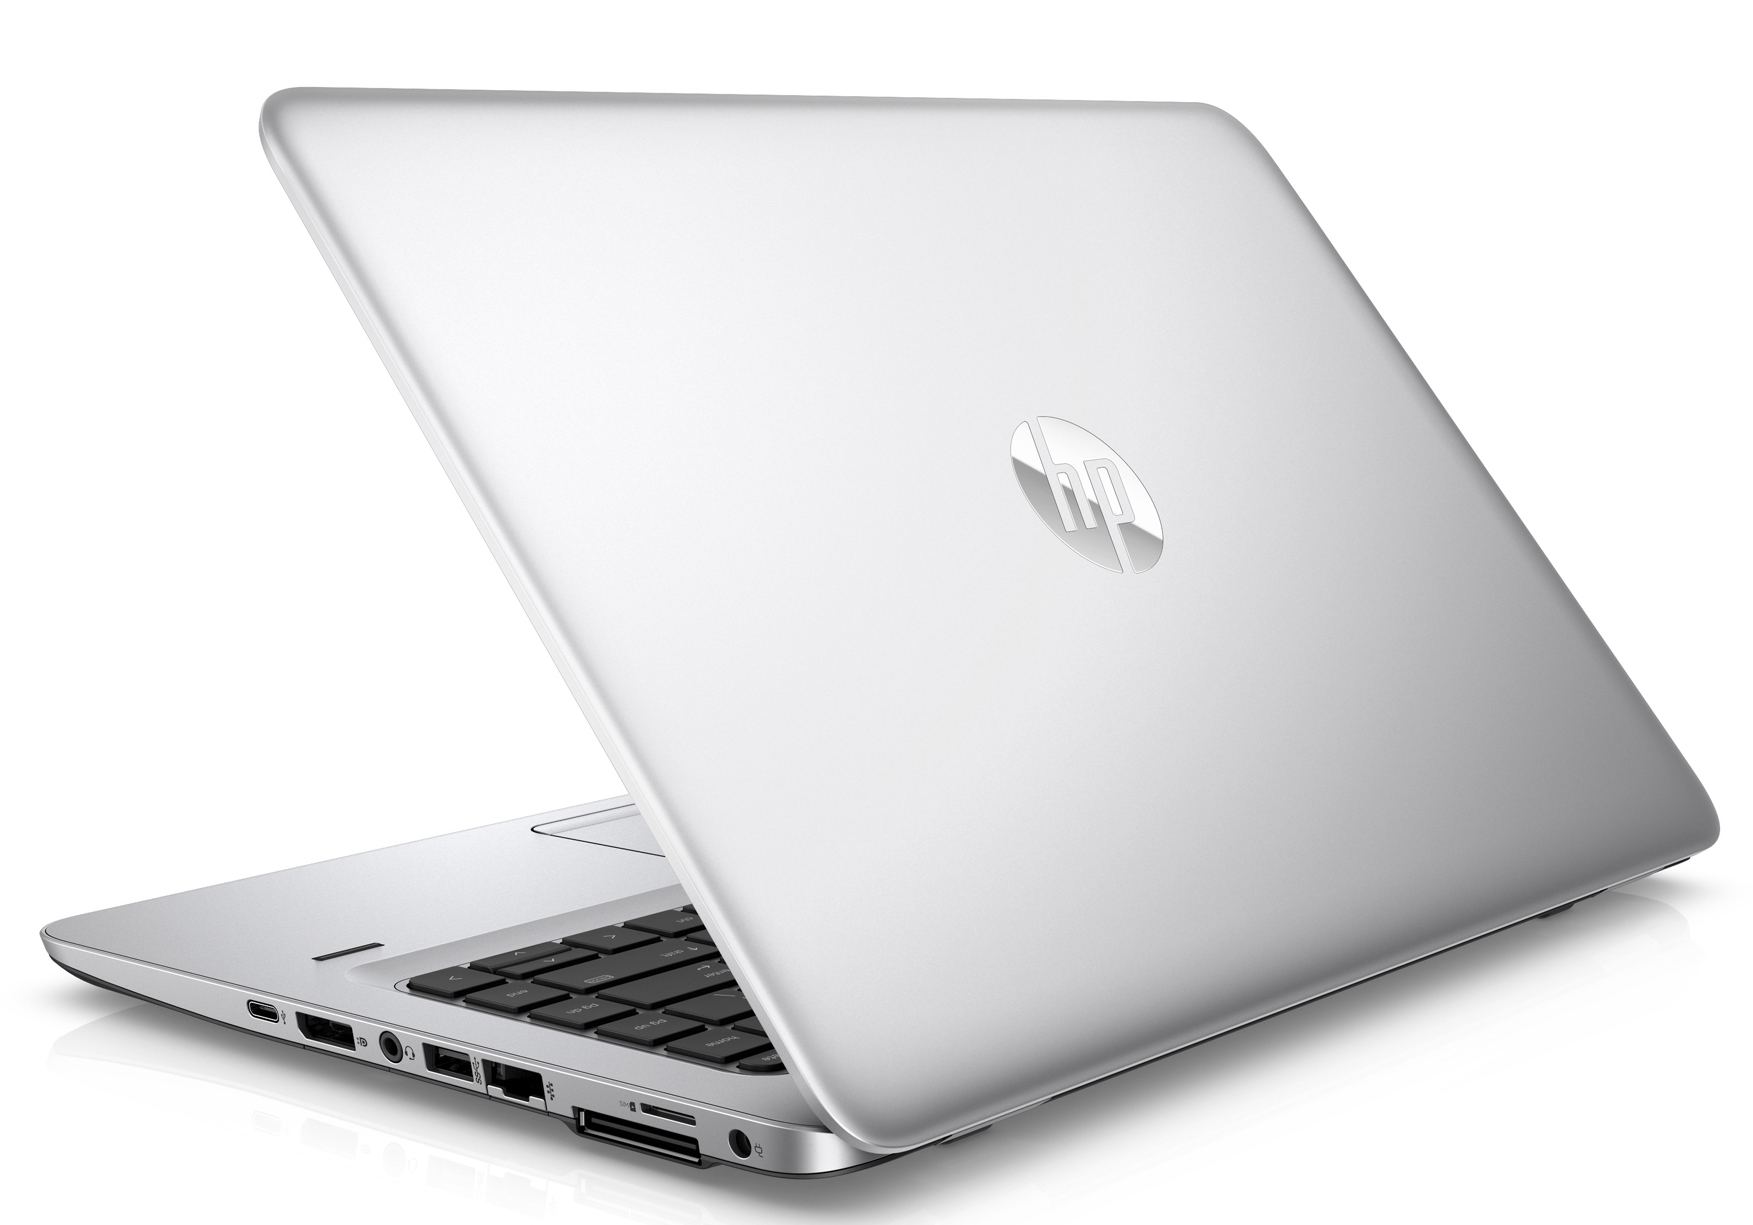
El HP mt43 Mobile Thin Client parecerá familiar a muchos lectores, ya que es un EliteBook 745 G4 renombrado, que también es idéntico en construcción al EliteBook 840 G4. El 14" es conducido por una APU de AMD de la generación de Bristol-Ridge. Los competidores incluyen dispositivos como el Lenovo ThinkPad T480s, el Dell Latitude 5490-TD70X, el Toshiba Tecra X40-D y el Acer TravelMate P449-G2-M.
Como el mt43 tiene una construcción idéntica a la del EliteBook 840 G4, no discutiremos la carcasa, las características, los dispositivos de entrada o los altavoces aquí, y puede encontrar esta información en el análisis del EliteBook 840 G4.
Nota: Para ejecutar nuestras pruebas, instalamos Windows 10 Pro (64 Bit) en la computadora. HP vende el Thin Client con Windows 10 IoT Enterprise para Thin Clients 64.
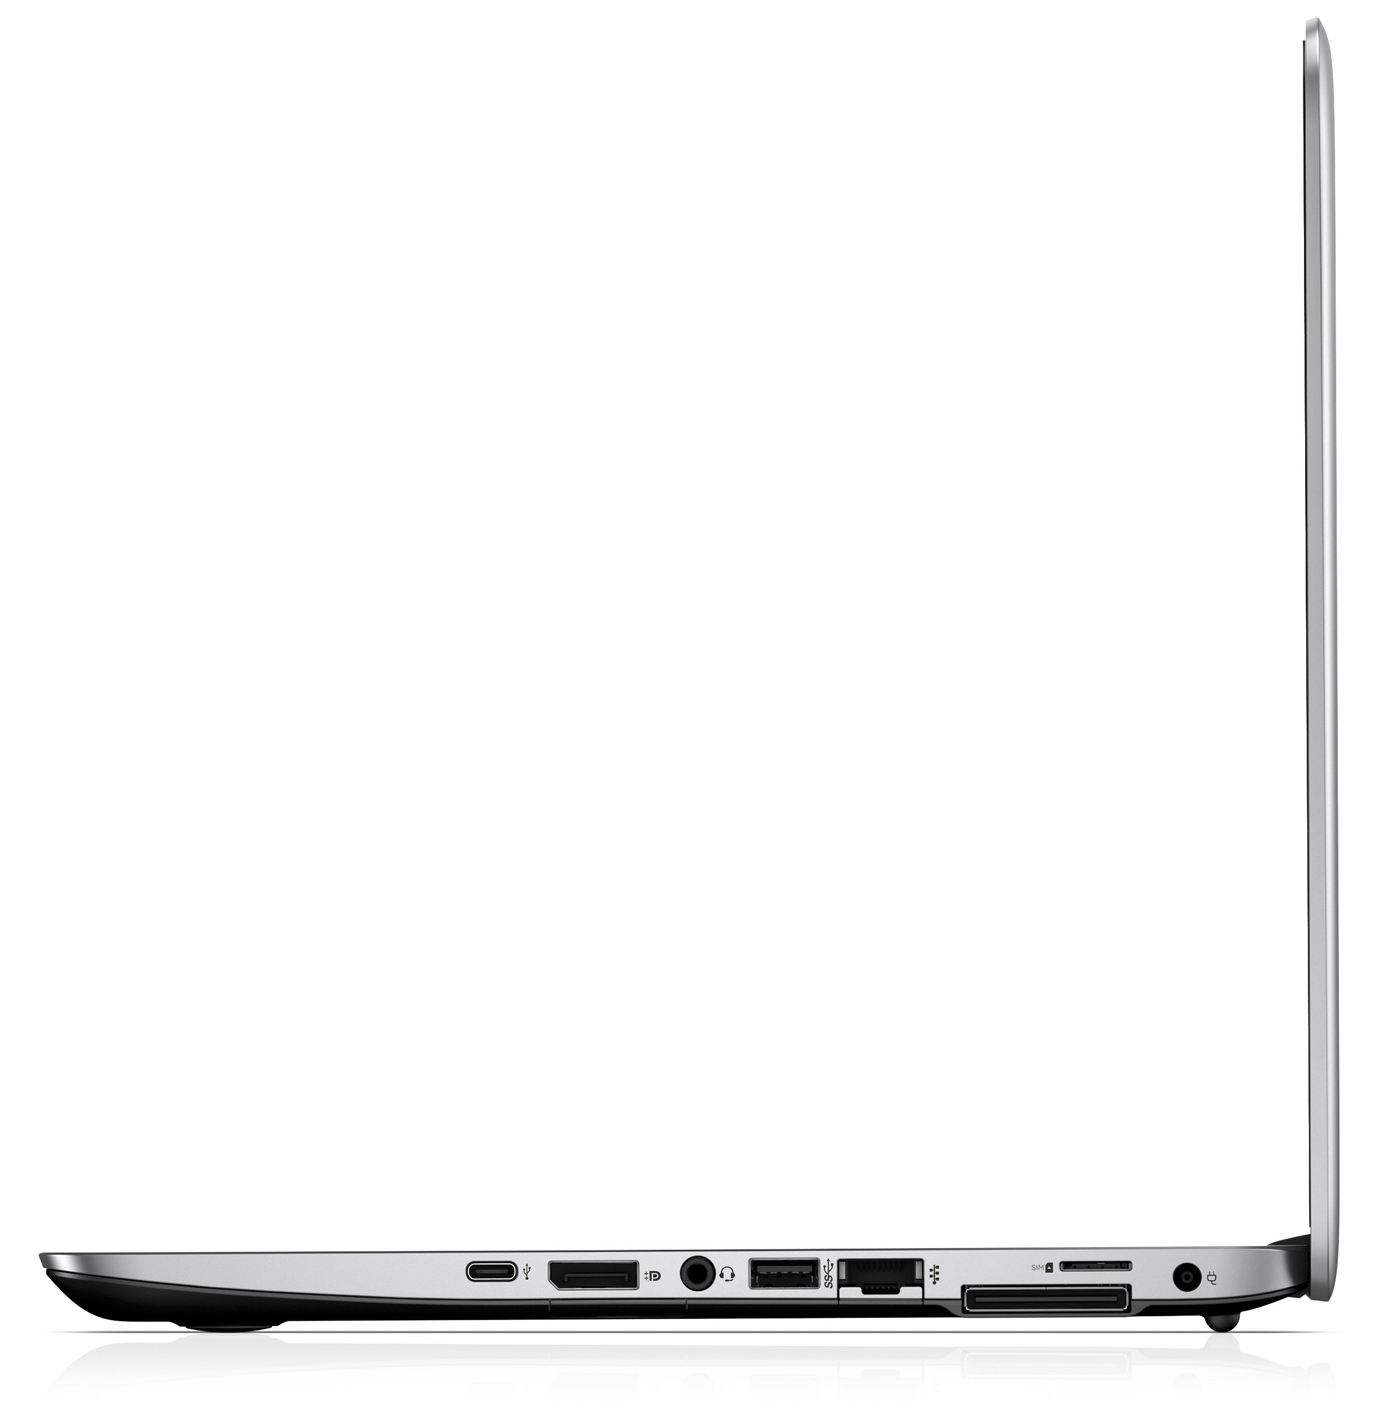
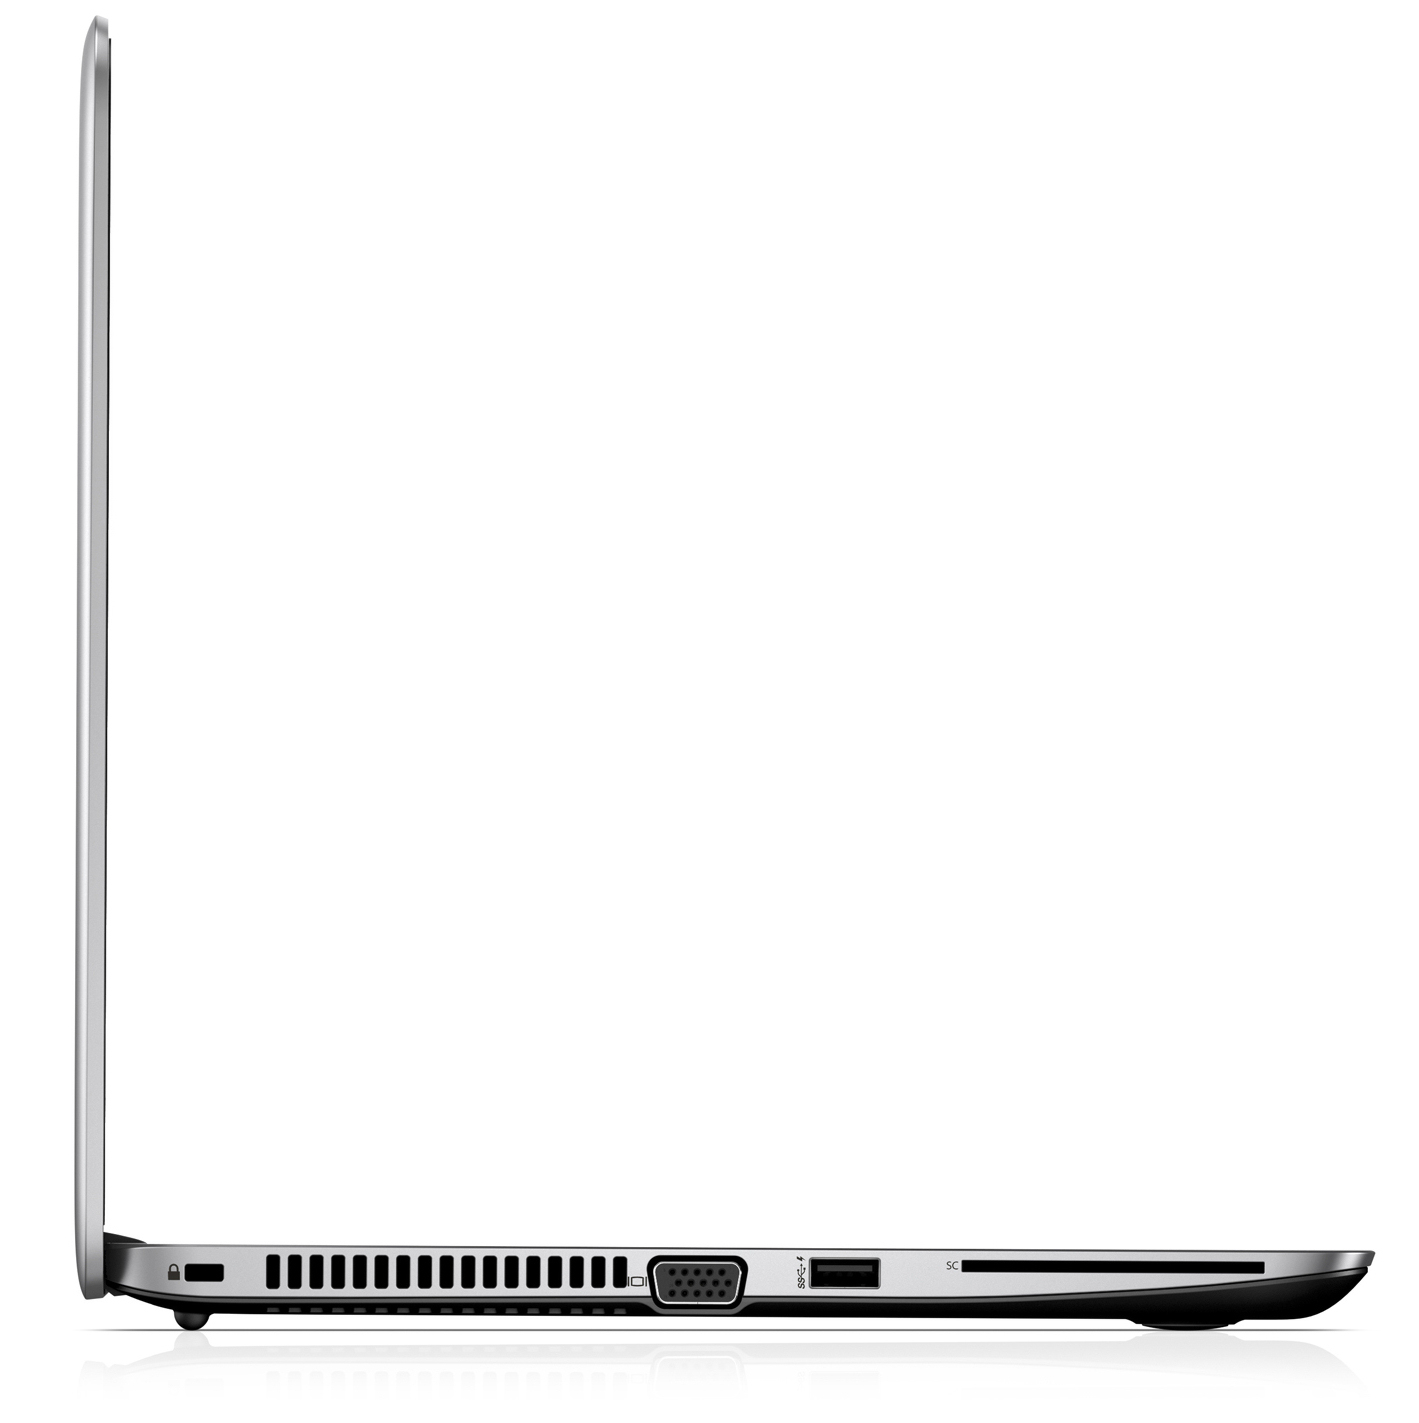
Conexiones
| SD Card Reader | |
| average JPG Copy Test (av. of 3 runs) | |
| Dell Latitude 5490-TD70X (Toshiba Exceria Pro SDXC 64 GB UHS-II) | |
| Lenovo ThinkPad T480s-20L8S02D00 (Toshiba Exceria Pro SDXC 64 GB UHS-II) | |
| Toshiba Tecra X40-D | |
| HP EliteBook 840 G4-Z2V49ET ABD (Toshiba Exceria Pro SDXC 64 GB UHS-II) | |
| HP mt21 (Toshiba Exceria Pro SDXC 64 GB UHS-II) | |
| HP EliteBook 745 G3 | |
| HP mt43 (Toshiba Exceria Pro SDXC 64 GB UHS-II) | |
| Media de la clase Office (22.4 - 198.5, n=22, últimos 2 años) | |
| Acer TravelMate P449-G2-M-56CD (Toshiba Exceria Pro SDXC 64 GB UHS-II) | |
| maximum AS SSD Seq Read Test (1GB) | |
| Dell Latitude 5490-TD70X (Toshiba Exceria Pro SDXC 64 GB UHS-II) | |
| Lenovo ThinkPad T480s-20L8S02D00 (Toshiba Exceria Pro SDXC 64 GB UHS-II) | |
| Toshiba Tecra X40-D | |
| HP mt21 (Toshiba Exceria Pro SDXC 64 GB UHS-II) | |
| HP EliteBook 840 G4-Z2V49ET ABD (Toshiba Exceria Pro SDXC 64 GB UHS-II) | |
| HP EliteBook 745 G3 | |
| HP mt43 (Toshiba Exceria Pro SDXC 64 GB UHS-II) | |
| Media de la clase Office (27.4 - 249, n=20, últimos 2 años) | |
| Acer TravelMate P449-G2-M-56CD (Toshiba Exceria Pro SDXC 64 GB UHS-II) | |
Pantalla: HP Thin Client tiene una pantalla brillante cuyos ángulos de visión no son estables
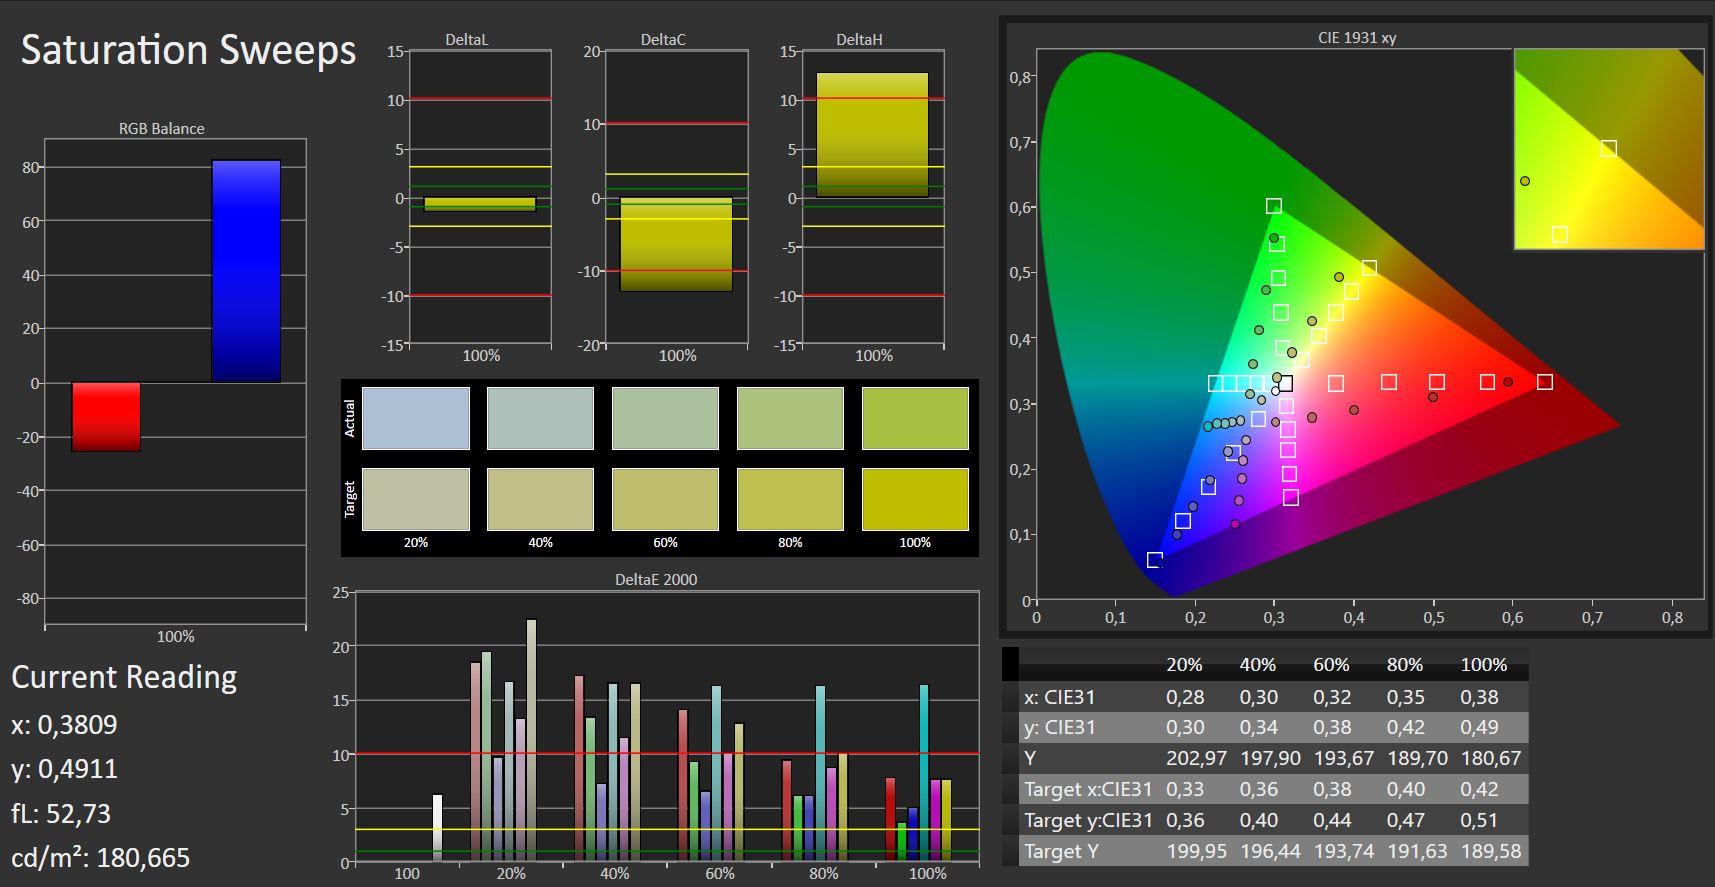
La pantalla mate de 14 pulgadas del mt43 tiene una resolución nativa de 1920x1080 píxeles. El brillo (357,7 cd/m²) sabe agradar. Mientras que el contraste (798:1) puede considerarse bastante decente, teniendo en cuenta el nivel de precios del Thin Client, habríamos esperado un valor superior a 1000:1.
Desafortunadamente, a niveles de brillo del 90% o inferiores, la pantalla muestra PWM parpadeando a una frecuencia de 1000 Hz. Sin embargo, a esta frecuencia, incluso las personas sensibles deben evitar los dolores de cabeza o las molestias oculares.
| |||||||||||||||||||||||||
iluminación: 84 %
Brillo con batería: 282 cd/m²
Contraste: 798:1 (Negro: 0.49 cd/m²)
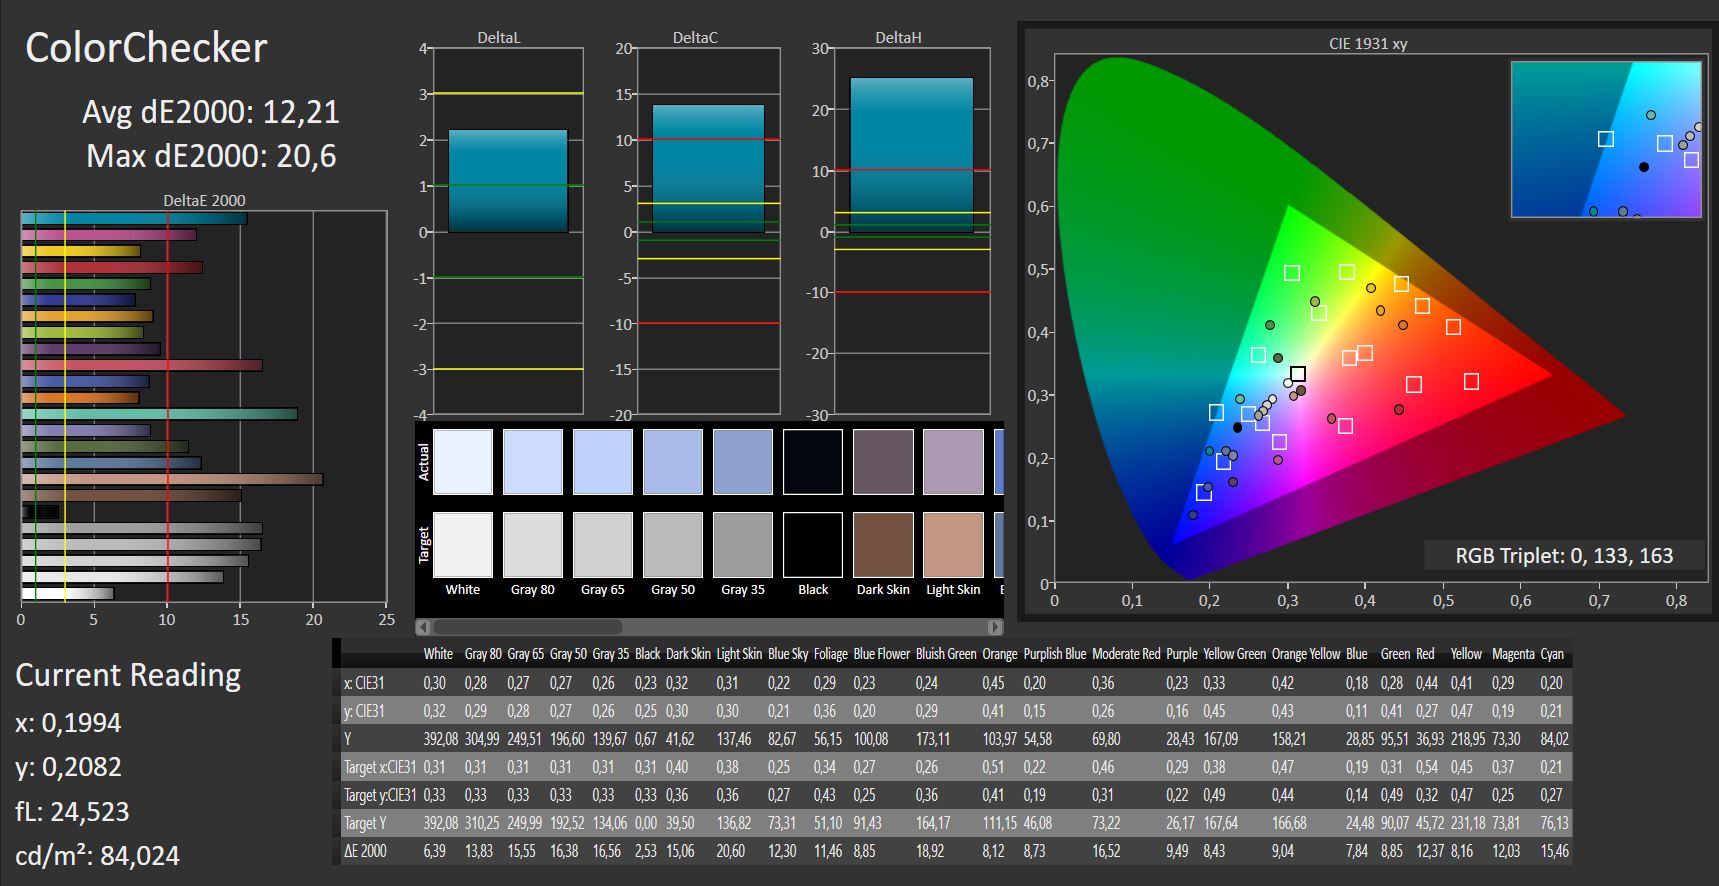
ΔE ColorChecker Calman: 12.21 | ∀{0.5-29.43 Ø4.73}
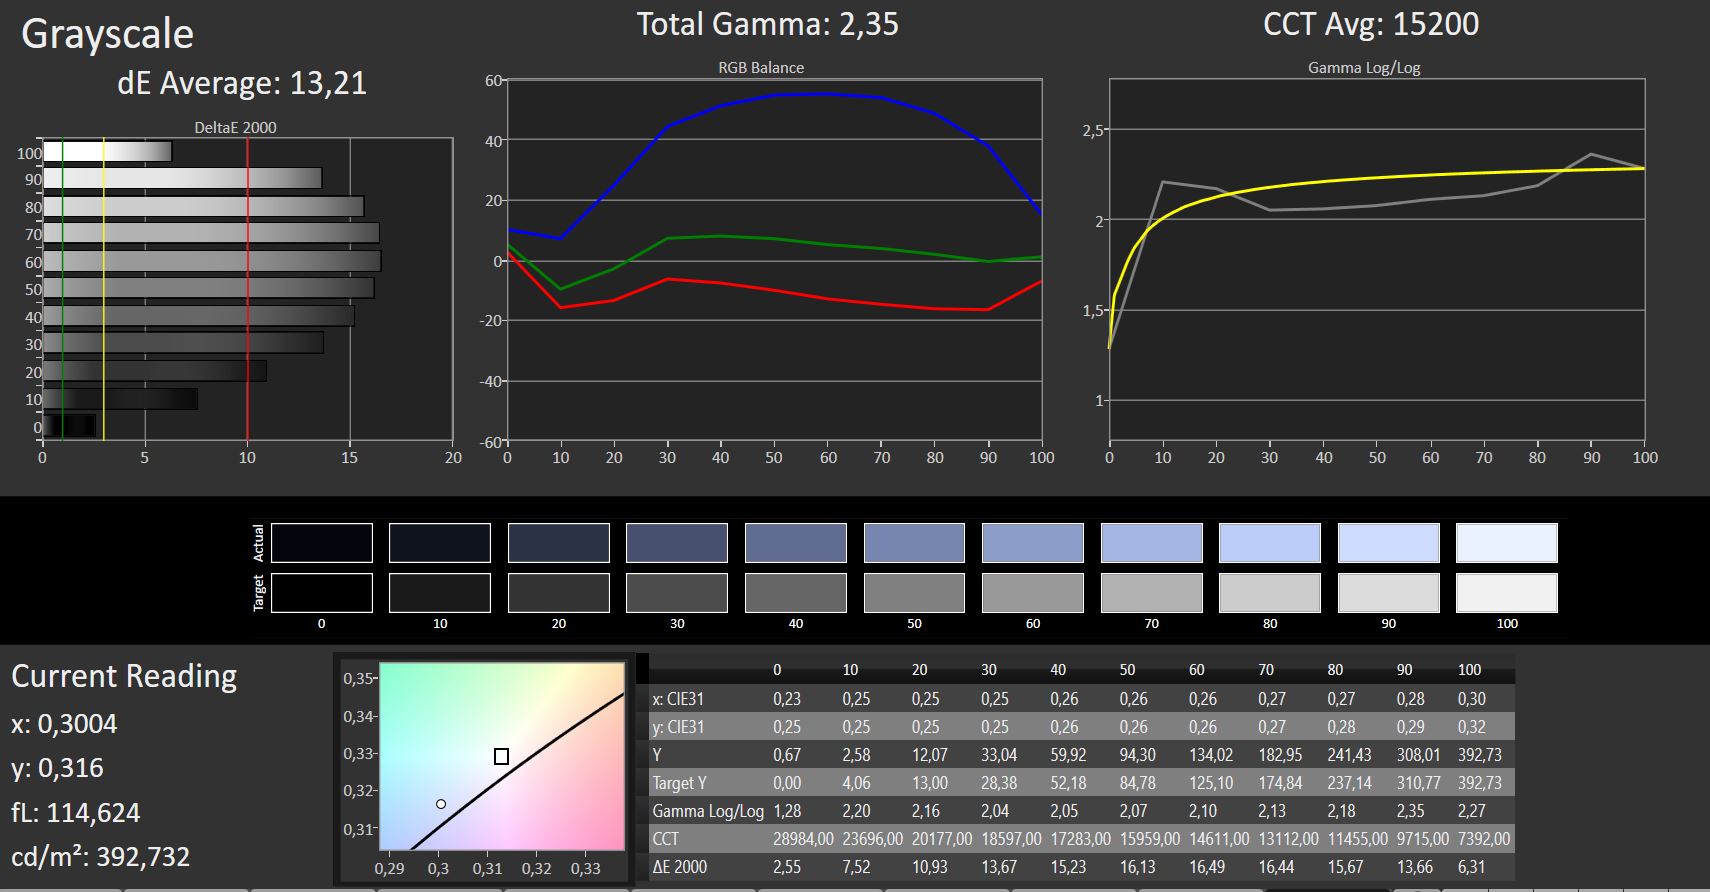
ΔE Greyscale Calman: 13.21 | ∀{0.09-98 Ø4.97}
75% sRGB (Argyll 1.6.3 3D)
48% AdobeRGB 1998 (Argyll 1.6.3 3D)
51.3% AdobeRGB 1998 (Argyll 3D)
74.8% sRGB (Argyll 3D)
49.86% Display P3 (Argyll 3D)
Gamma: 2.35
CCT: 15200 K
| HP mt43 TN LED, 1920x1080, 14" | HP EliteBook 840 G4-Z2V49ET ABD TN, 1920x1080, 14" | HP EliteBook 745 G3 IPS-Panel, 2560x1440, 14" | Lenovo ThinkPad T480s-20L8S02D00 IPS, 2560x1440, 14" | Dell Latitude 5490-TD70X IPS, 1920x1080, 14" | Toshiba Tecra X40-D IPS, 1920x1080, 14" | Acer TravelMate P449-G2-M-56CD IPS, 1920x1080, 14" | |
|---|---|---|---|---|---|---|---|
| Display | 11% | 42% | 40% | -27% | -18% | -18% | |
| Display P3 Coverage (%) | 49.86 | 55.8 12% | 75.7 52% | 72.8 46% | 36.28 -27% | 40.55 -19% | 41.04 -18% |
| sRGB Coverage (%) | 74.8 | 80.7 8% | 95.8 28% | 97.9 31% | 54.6 -27% | 61 -18% | 61.2 -18% |
| AdobeRGB 1998 Coverage (%) | 51.3 | 57.7 12% | 74.5 45% | 74.1 44% | 37.48 -27% | 41.89 -18% | 42.47 -17% |
| Response Times | 15% | 2% | 5% | -10% | 8% | 5% | |
| Response Time Grey 50% / Grey 80% * (ms) | 47 ? | 39 ? 17% | 46.8 ? -0% | 38.4 ? 18% | 46.9 ? -0% | 38 ? 19% | 39 ? 17% |
| Response Time Black / White * (ms) | 26 ? | 23 ? 12% | 25.2 ? 3% | 28.4 ? -9% | 31.2 ? -20% | 26.8 ? -3% | 28 ? -8% |
| PWM Frequency (Hz) | 1000 ? | 20410 ? | 25000 ? | ||||
| Screen | -5% | 21% | 27% | 11% | 11% | 7% | |
| Brightness middle (cd/m²) | 391 | 346 -12% | 319 -18% | 352 -10% | 227 -42% | 283.9 -27% | 271 -31% |
| Brightness (cd/m²) | 358 | 317 -11% | 301 -16% | 343 -4% | 211 -41% | 261 -27% | 256 -28% |
| Brightness Distribution (%) | 84 | 86 2% | 74 -12% | 91 8% | 88 5% | 85 1% | 85 1% |
| Black Level * (cd/m²) | 0.49 | 0.86 -76% | 0.29 41% | 0.46 6% | 0.19 61% | 0.25 49% | 0.43 12% |
| Contrast (:1) | 798 | 402 -50% | 1100 38% | 765 -4% | 1195 50% | 1136 42% | 630 -21% |
| Colorchecker dE 2000 * | 12.21 | 8.64 29% | 7.23 41% | 3.3 73% | 5.6 54% | 6.4 48% | 5.03 59% |
| Colorchecker dE 2000 max. * | 20.6 | 13.58 34% | 7.3 65% | 22.4 -9% | 18.7 9% | 11.9 42% | |
| Greyscale dE 2000 * | 13.21 | 11.24 15% | 6 55% | 5.3 60% | 2.4 82% | 6.3 52% | 4.02 70% |
| Gamma | 2.35 94% | 2.62 84% | 2.14 103% | 2.22 99% | 2.44 90% | 2.39 92% | 2.31 95% |
| CCT | 15200 43% | 12530 52% | 6904 94% | 6452 101% | 6506 100% | 6511 100% | 6659 98% |
| Color Space (Percent of AdobeRGB 1998) (%) | 48 | 52 8% | 65.8 37% | 68.4 43% | 34.5 -28% | 38 -21% | 39 -19% |
| Color Space (Percent of sRGB) (%) | 75 | 80 7% | 95.3 27% | 98 31% | 54.4 -27% | 60 -20% | 61 -19% |
| Media total (Programa/Opciones) | 7% /
0% | 22% /
23% | 24% /
27% | -9% /
0% | 0% /
4% | -2% /
1% |
* ... más pequeño es mejor
Parpadeo de Pantalla / PWM (Pulse-Width Modulation)
| Parpadeo de Pantalla / PWM detectado | 1000 Hz | ≤ 90 % de brillo | 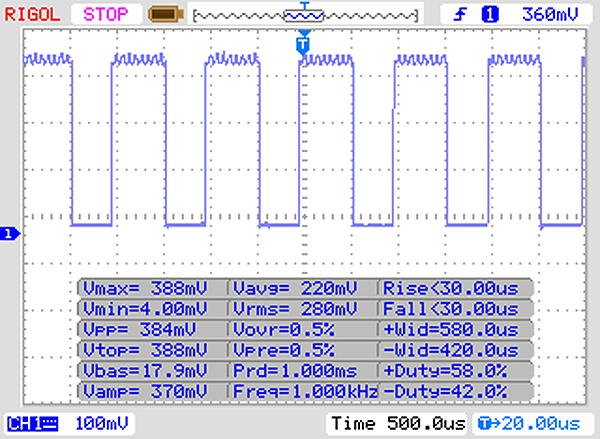 |
La retroiluminación del display parpadea a 1000 Hz (seguramente usa PWM - Pulse-Width Modulation) a un brillo del 90 % e inferior. Sobre este nivel de brillo no debería darse parpadeo / PWM. La frecuencia de 1000 Hz es bastante alta, por lo que la mayoría de gente sensible al parpadeo no debería ver parpadeo o tener fatiga visual. Comparación: 52 % de todos los dispositivos testados no usaron PWM para atenuar el display. Si se usó, medimos una media de 7801 (mínimo: 5 - máxmo: 343500) Hz. | |||
De fábrica, la pantalla muestra una desviación de color DeltaE-2000 de 12.21, que está lejos del rango objetivo de DeltaE menor que 3. Además, la pantalla presenta un tono azul claro.
Tiempos de respuesta del display
| ↔ Tiempo de respuesta de Negro a Blanco | ||
|---|---|---|
| 26 ms ... subida ↗ y bajada ↘ combinada | ↗ 22 ms subida | 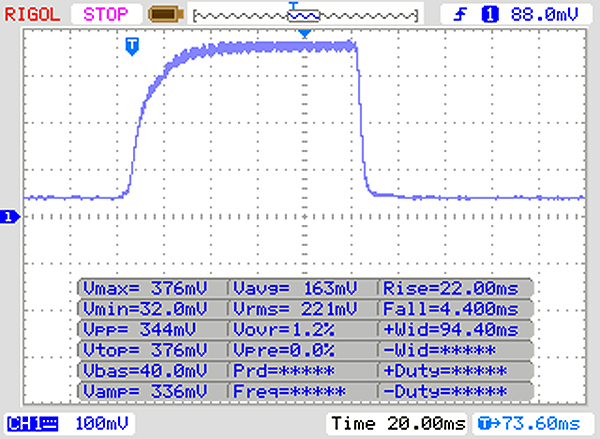 |
| ↘ 4 ms bajada | ||
| La pantalla mostró tiempos de respuesta relativamente lentos en nuestros tests pero podría ser demasiado lenta para los jugones. En comparación, todos los dispositivos de prueba van de ##min### (mínimo) a 240 (máximo) ms. » 62 % de todos los dispositivos son mejores. Eso quiere decir que el tiempo de respuesta es peor que la media (19.9 ms) de todos los dispositivos testados. | ||
| ↔ Tiempo de respuesta 50% Gris a 80% Gris | ||
| 47 ms ... subida ↗ y bajada ↘ combinada | ↗ 29 ms subida | 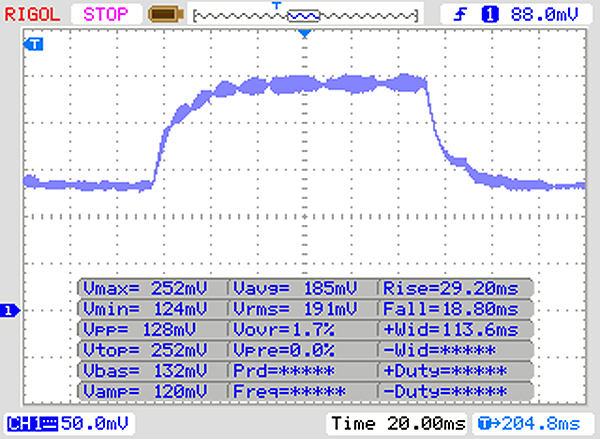 |
| ↘ 18 ms bajada | ||
| La pantalla mostró tiempos de respuesta lentos en nuestros tests y podría ser demasiado lenta para los jugones. En comparación, todos los dispositivos de prueba van de ##min### (mínimo) a 636 (máximo) ms. » 81 % de todos los dispositivos son mejores. Eso quiere decir que el tiempo de respuesta es peor que la media (31.1 ms) de todos los dispositivos testados. | ||
HP ha equipado la pantalla de 14 pulgadas con un panel TN que no tiene ángulos de visión estables, por lo que no se puede leer lo que aparece en la pantalla desde todas las posiciones. Gracias al alto brillo de la pantalla, puede utilizar el portátil también al aire libre.
La función Vari-Bright de AMD está activada de forma predeterminada. Esto garantiza que el brillo máximo de la pantalla se reduzca a 282 cd/m² en funcionamiento con batería. Si no le gusta este ajuste, debe apagar Vari-Bright, lo cual puede hacer en la pestaña "Display" del software "Radeon Settings".
Rendimiento: la PC HP no ofrece ningún rendimiento excesivo
Con el mt43, Hewlett Packard ofrece un Thin Client móvil en el formato de 14 pulgadas. El dispositivo se basa en el EliteBook 745 G4 y ofrece un rendimiento suficiente para el escenario de uso previsto. Debe pagar entre 1100 y 1200 euros ($ 1350-1475, $ 799 en los EE. UU.) Por el portátil.
Procesador
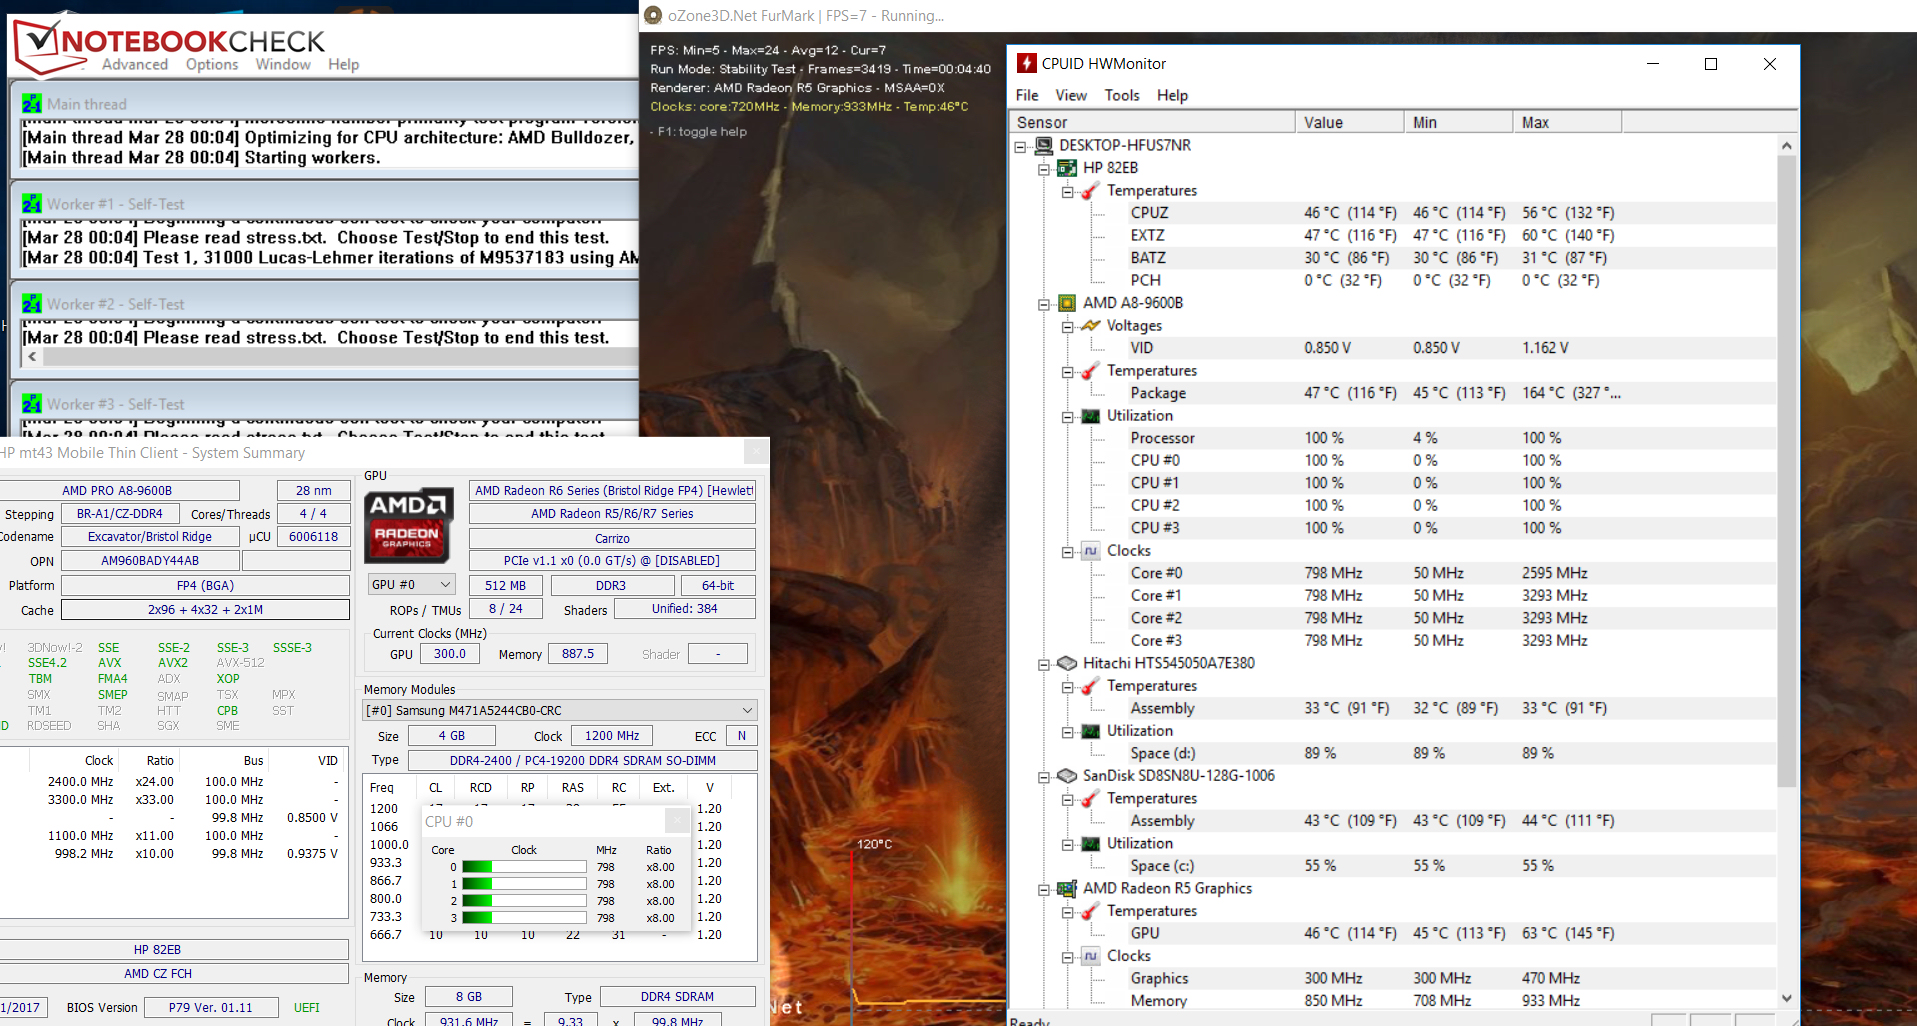
El mt43 usa una APU AMD Pro A8-9600B (Bristol Ridge). Esta es una APU para el segmento de negocios. AMD garantiza una alta estabilidad y larga disponibilidad de la APU. Tiene las mismas especificaciones técnicas que la APU A10-9600P. Con un TDP de 15 vatios, la APU se encuentra al mismo nivel que los procesadores ULV de Intel. La sección de la CPU de la APU consiste en un procesador de cuatro núcleos que se ejecuta a una velocidad de reloj básica de 2,4 GHz. A través de Turbo, esto se puede aumentar hasta 3.3 GHz.
Las pruebas de CPU de un solo subproceso que realizamos corrieron a 2.6 GHz con un núcleo ocasionalmente ralentizado a 2.4 GHz. Las pruebas multihilo corrieron a 2.4 a 2.6 GHz al principio, pero fueron ralentizadas bastante rápido a 2 - 2.4 GHz. Entonces el Turbo apenas se está utilizando. Esto se ve mejor en la operación diaria, donde a menudo se puede alcanzar brevemente la velocidad máxima de 3,3 GHz.
Estamos probando si el Turbo se puede usar constantemente ejecutando la prueba de múltiples hilos de los benchmarks Cinebench-R15 durante aproximadamente 30 minutos en un bucle constante. Los resultados caen entre la primera y la tercera ejecución y luego permanecen en ese nivel. El Turbo no se usa.
Como la APU A8-9600B y la APU A10-9600P están construidas de forma idéntica, esta última se puede usar para evaluar el rendimiento de la APU A8-9600B. Los resultados de las pruebas de CPU que ejecutamos permanecen ligeramente por detrás de los resultados que se logran con los portátiles A10-9600P. La distancia se vuelve un poco más grande en las pruebas de múltiples hilos que en las pruebas de un solo hilo. En otras palabras, la APU integrada en el mt43 se ejecuta a velocidades ligeramente más bajas en promedio.
| Geekbench 3 | |
| 32 Bit Multi-Core Score | |
| HP Pavilion 15-aw004ng | |
| HP 17-y044ng | |
| HP mt43 | |
| Medio AMD PRO A8-9600B (n=1) | |
| HP EliteBook 745 G3 | |
| HP mt21 | |
| 32 Bit Single-Core Score | |
| HP Pavilion 15-aw004ng | |
| HP 17-y044ng | |
| HP EliteBook 745 G3 | |
| HP mt43 | |
| Medio AMD PRO A8-9600B (n=1) | |
| HP mt21 | |
| Geekbench 4.0 | |
| 64 Bit Multi-Core Score | |
| Media de la clase Office (15873 - 41046, n=4, últimos 2 años) | |
| HP 17-y044ng | |
| HP mt43 | |
| Medio AMD PRO A8-9600B (n=1) | |
| HP mt21 | |
| 64 Bit Single-Core Score | |
| Media de la clase Office (4598 - 7721, n=4, últimos 2 años) | |
| HP mt21 | |
| HP 17-y044ng | |
| HP mt43 | |
| Medio AMD PRO A8-9600B (n=1) | |
| Geekbench 4.4 | |
| 64 Bit Multi-Core Score | |
| Media de la clase Office (23754 - 41544, n=9, últimos 2 años) | |
| Dell Latitude 5490-TD70X | |
| HP mt43 | |
| Medio AMD PRO A8-9600B (n=1) | |
| HP mt21 | |
| 64 Bit Single-Core Score | |
| Media de la clase Office (4564 - 8042, n=9, últimos 2 años) | |
| Dell Latitude 5490-TD70X | |
| HP mt21 | |
| HP mt43 | |
| Medio AMD PRO A8-9600B (n=1) | |
| Octane V2 - Total Score | |
| Media de la clase Office (49011 - 122119, n=19, últimos 2 años) | |
| Lenovo ThinkPad T480s-20L8S02D00 (Edge 41.16299.248.0) | |
| Acer TravelMate P449-G2-M-56CD (Edge) | |
| HP Pavilion 15-aw004ng (Edge 25) | |
| HP mt43 (Edge 41) | |
| Medio AMD PRO A8-9600B (n=1) | |
| HP mt21 (Edge 41) | |
| HP EliteBook 745 G3 (IE 11) | |
| Mozilla Kraken 1.1 - Total | |
| HP EliteBook 745 G3 (IE 11) | |
| HP mt43 (Edge 41) | |
| Medio AMD PRO A8-9600B (n=1) | |
| HP mt21 (Edge 41) | |
| HP Pavilion 15-aw004ng (Edge 25) | |
| Lenovo ThinkPad T480s-20L8S02D00 (Edge 41.16299.248.0) | |
| Acer TravelMate P449-G2-M-56CD (Edge) | |
| Media de la clase Office (391 - 1297, n=76, últimos 2 años) | |
| JetStream 1.1 - 1.1 Total | |
| Lenovo ThinkPad T480s-20L8S02D00 (Edge 41.16299.248.0) | |
| Acer TravelMate P449-G2-M-56CD (Edge) | |
| HP Pavilion 15-aw004ng (Edge 25) | |
| HP 17-y044ng (Edge 38) | |
| HP mt21 (Edge 41) | |
| HP mt43 (Edge 41) | |
| Medio AMD PRO A8-9600B (n=1) | |
| HP EliteBook 745 G3 (IE 11) | |
* ... más pequeño es mejor
Rendimiento de sistema
El sistema funciona sin problemas y no encontramos ningún problema. La APU ofrece potencia informática suficiente para aplicaciones en la oficina y áreas de Internet. Esto también lo confirman los resultados en el benchmark PC-Mark. El rendimiento general no se puede aumentar, pero HP ya ha agotado todas las opciones.
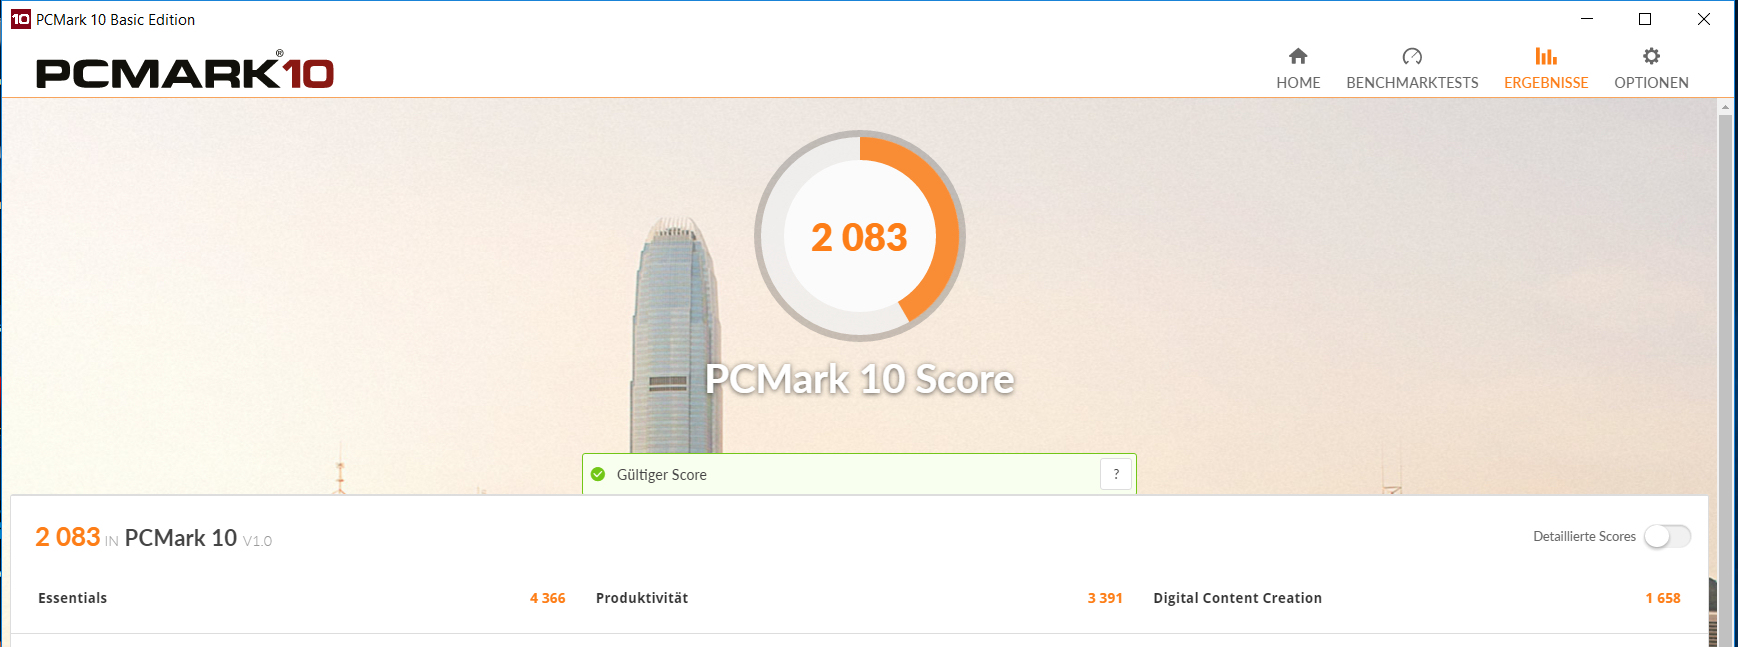
| PCMark 7 Score | 3945 puntos | |
| PCMark 8 Home Score Accelerated v2 | 2579 puntos | |
| PCMark 8 Creative Score Accelerated v2 | 3083 puntos | |
| PCMark 8 Work Score Accelerated v2 | 3466 puntos | |
| PCMark 10 Score | 2083 puntos | |
ayuda | ||
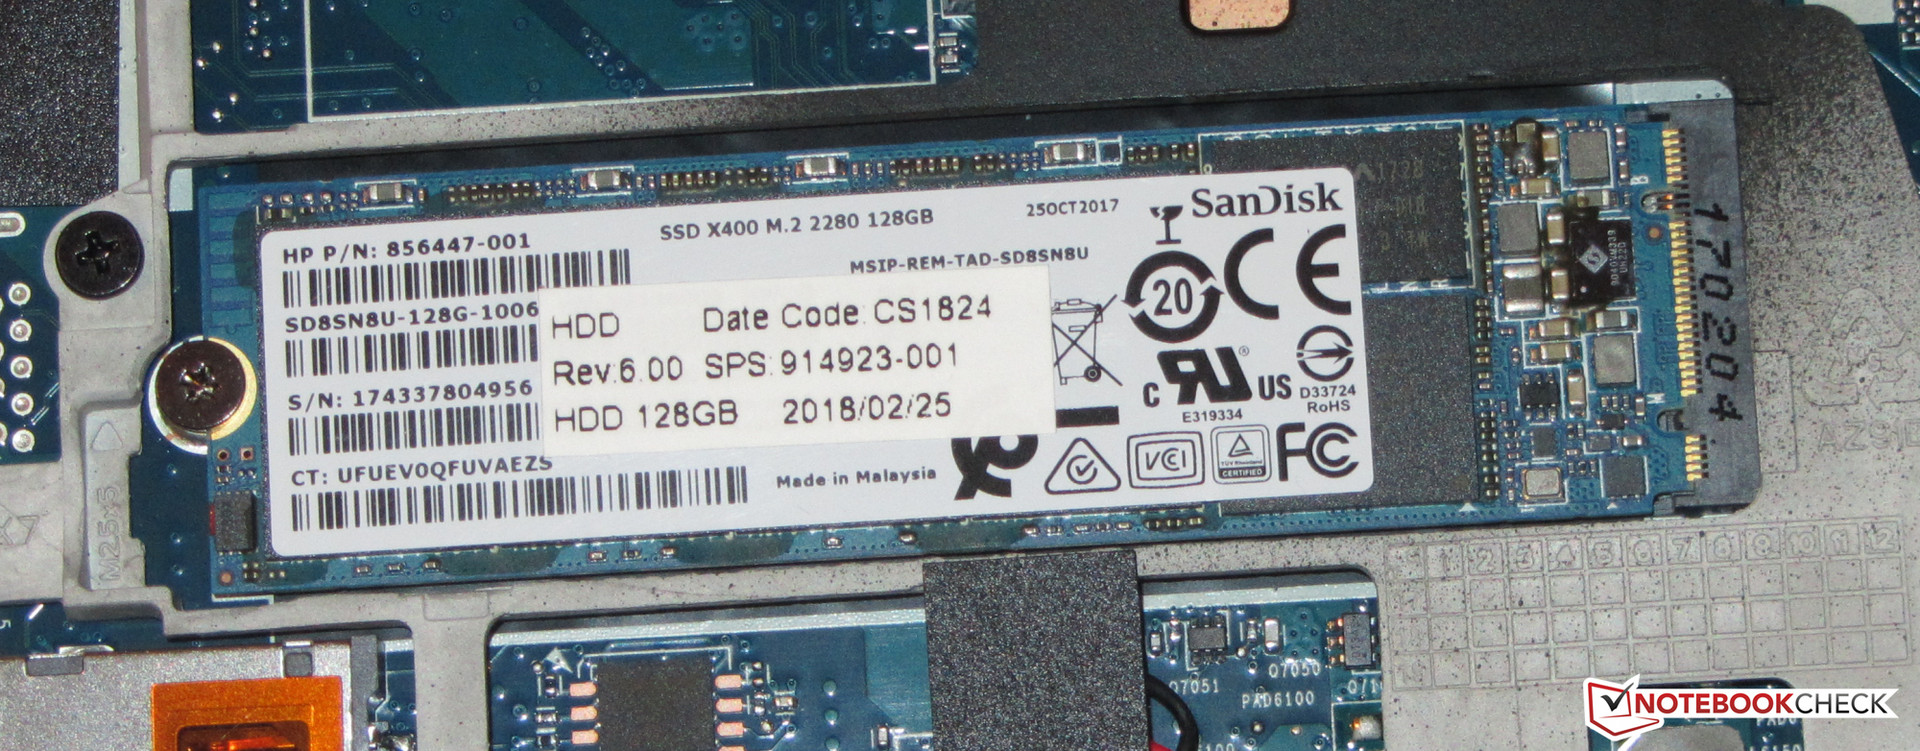
Solución de almacenamiento
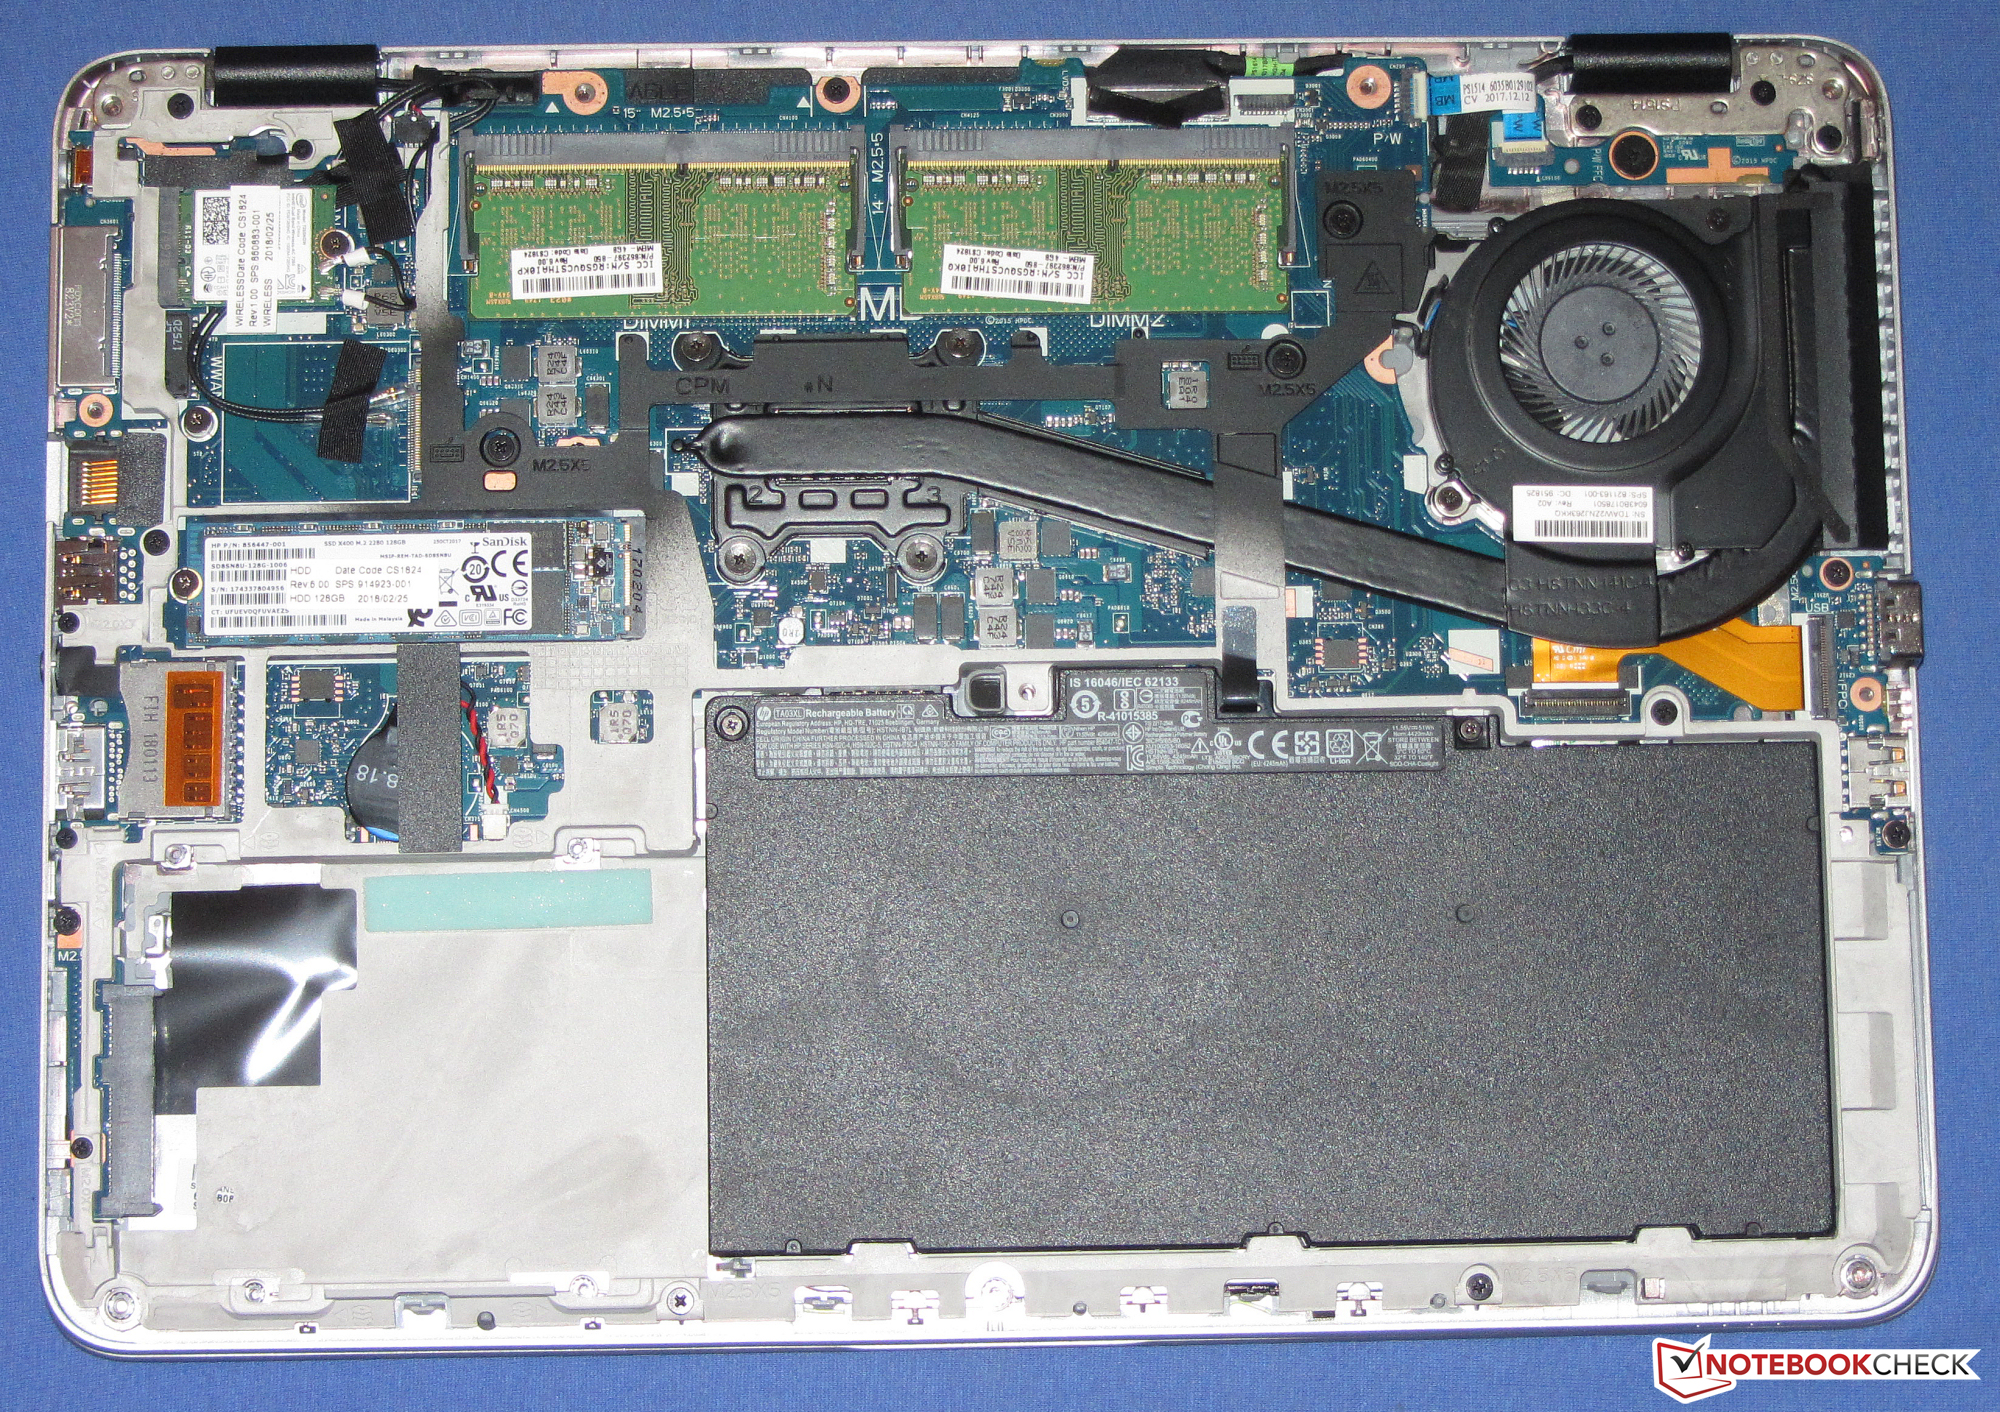
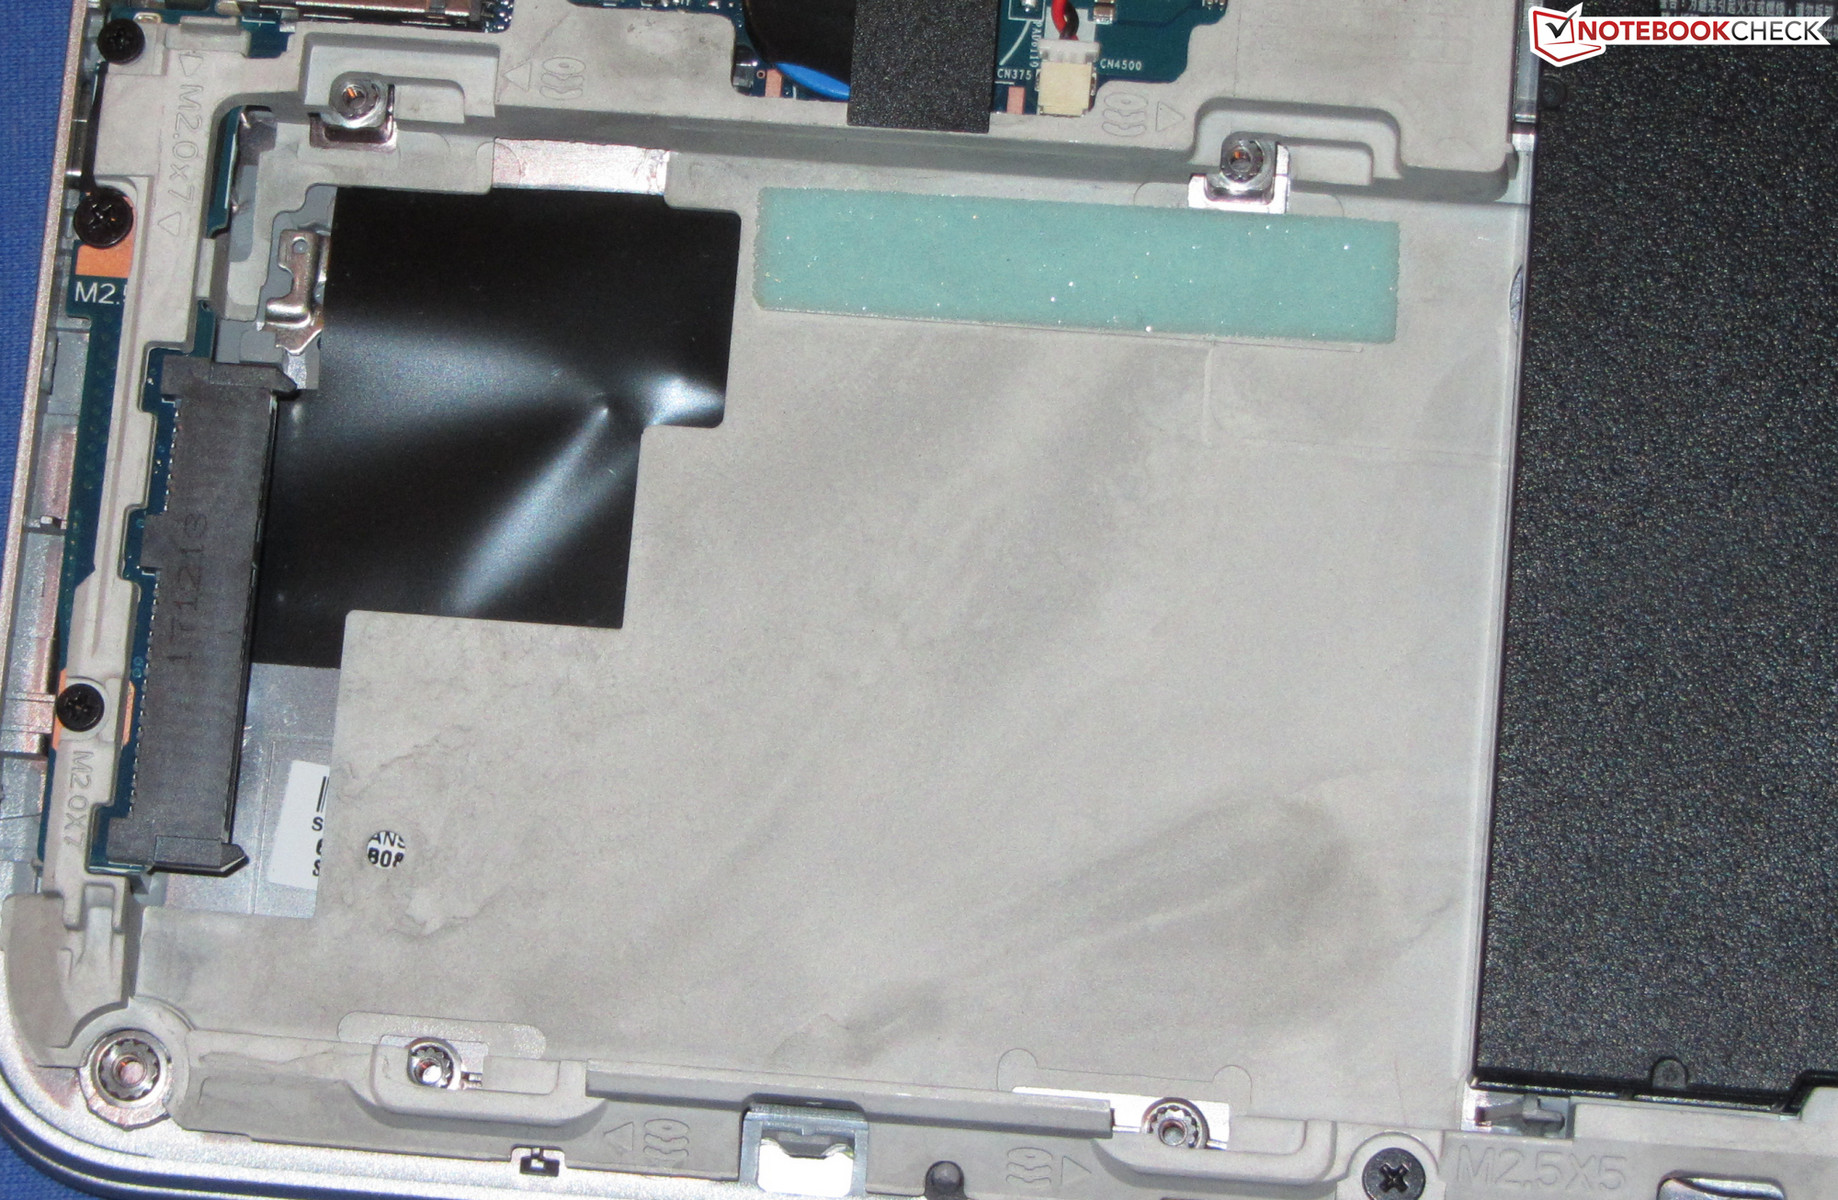
HP ha equipado el mt43 con un SSD SATA-III de SanDisk. Este es un modelo en el formato M.2-2280 con una capacidad total de 128 GB. Las tasas de transferencia resultan buenas. El mt43 ofrece una ranura SATA-III vacía adicional que puede ocupar con un disco duro de 2,5 pulgadas. Sin embargo, necesitaría comprar el marco de instalación para esto por separado.

| HP mt43 SanDisk SD8SN8U256G1006 | HP EliteBook 840 G4-Z2V49ET ABD Samsung PM961 MZVLW256HEHP | HP EliteBook 745 G3 Samsung SSD PM851 256 GB MZNTE256HMHP | Lenovo ThinkPad T480s-20L8S02D00 Samsung SSD PM981 MZVLB512HAJQ | Dell Latitude 5490-TD70X Toshiba KSG60ZMV512G | Toshiba Tecra X40-D Samsung PM961 MZVLW256HEHP | Acer TravelMate P449-G2-M-56CD Intel SSD 600p SSDPEKKW512G7 | Medio SanDisk SD8SN8U256G1006 | Media de la clase Office | |
|---|---|---|---|---|---|---|---|---|---|
| CrystalDiskMark 3.0 | 256% | 35% | 311% | 70% | 162% | 26% | 436% | ||
| Read Seq (MB/s) | 464.3 | 1819 292% | 446.1 -4% | 1540 232% | 465.1 0% | 1086 134% | 471 ? 1% | 3104 ? 569% | |
| Write Seq (MB/s) | 309.3 | 1263 308% | 268.9 -13% | 1613 422% | 425 37% | 581 88% | 425 ? 37% | 2916 ? 843% | |
| Read 512 (MB/s) | 370.9 | 922 149% | 361.6 -3% | 835 125% | 410.1 11% | 869 134% | 351 ? -5% | 899 ? 142% | |
| Write 512 (MB/s) | 181.9 | 804 342% | 268.8 48% | 1716 843% | 360.7 98% | 584 221% | 280 ? 54% | 2309 ? 1169% | |
| Read 4k (MB/s) | 28.79 | 61.4 113% | 27.12 -6% | 66.9 132% | 27.34 -5% | 35.89 25% | 25 ? -13% | 54.1 ? 88% | |
| Write 4k (MB/s) | 49.6 | 157.1 217% | 84.4 70% | 160.6 224% | 89 79% | 122.4 147% | 53.9 ? 9% | 114.1 ? 130% | |
| Read 4k QD32 (MB/s) | 115.4 | 513 345% | 239.8 108% | 444.9 286% | 295.6 156% | 462.9 301% | 211 ? 83% | 463 ? 301% | |
| Write 4k QD32 (MB/s) | 106.6 | 410.2 285% | 188.9 77% | 343 222% | 300.2 182% | 370.9 248% | 147.3 ? 38% | 370 ? 247% |
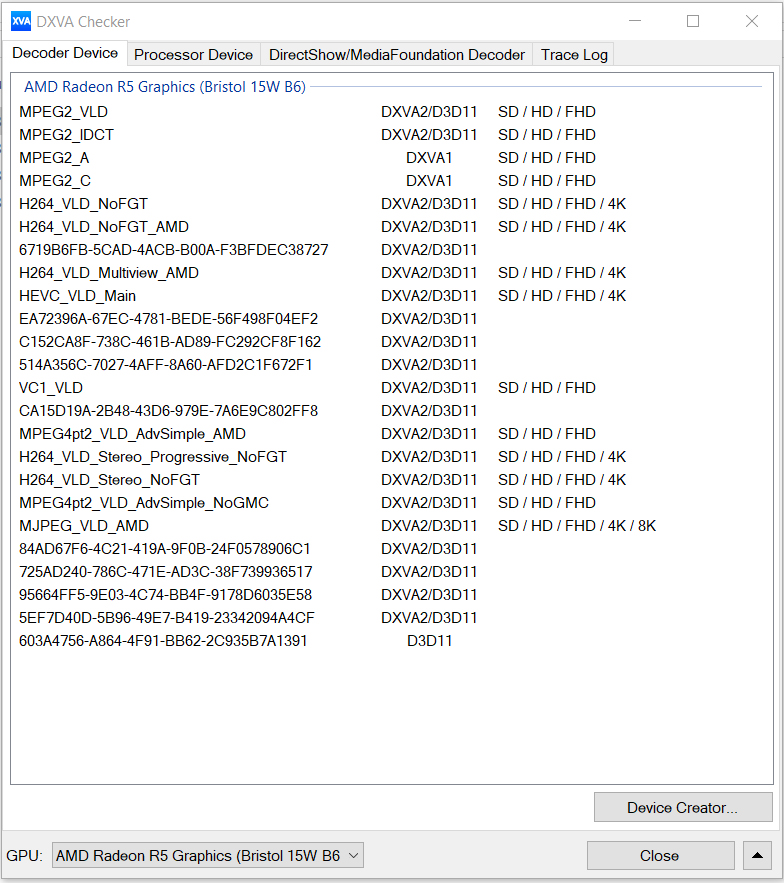
Tarjeta grafica
La GPU integrada Radeon R5 (Bristol Ridge) es compatible con DirectX 12 y alcanza velocidades de hasta 720 MHz. Los resultados en las pruebas 3DMark se mantienen en un nivel normal para esta GPU. Se beneficia de la memoria de trabajo que se ejecuta en modo de doble canal, lo que permite que el núcleo de gráficos alcance todo su potencial y dé como resultado un mejor rendimiento.
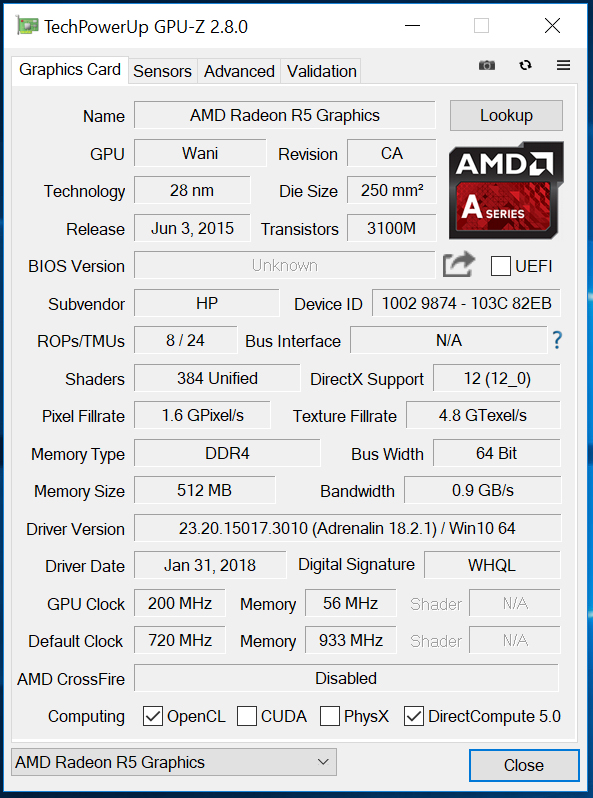
| 3DMark 06 Standard Score | 6431 puntos | |
| 3DMark 11 Performance | 1672 puntos | |
| 3DMark Ice Storm Standard Score | 38641 puntos | |
| 3DMark Cloud Gate Standard Score | 4797 puntos | |
| 3DMark Fire Strike Score | 994 puntos | |
ayuda | ||
Rendimiento de juego
La APU ciertamente puede traer algunos juegos sin problemas a la pantalla. Sin embargo, esto se aplica principalmente a los juegos que no plantean grandes demandas en el hardware o los juegos que tienen algunos años en su haber. Los juegos hambrientos de poder como "Final Fantasy XV" no se pueden jugar bajo ninguna circunstancia. Gracias a la memoria de trabajo que se ejecuta en modo de doble canal, las velocidades de cuadro resultan más altas que en dispositivos comparables cuya memoria de trabajo se ejecuta en modo de un solo canal.
| bajo | medio | alto | ultra | |
|---|---|---|---|---|
| StarCraft 2 (2010) | 105.8 | 32.1 | 26.2 | 17.2 |
| Deus Ex Human Revolution (2011) | 64.1 | 41.4 | 16.2 | |
| Anno 2070 (2011) | 62.9 | 33.5 | 21.5 | 9.4 |
| Dead Space 3 (2013) | 50.9 | 29.3 | 24.6 | 16.9 |
| Tomb Raider (2013) | 67.4 | 37.4 | 21.1 | 9.9 |
| BioShock Infinite (2013) | 61.1 | 36.3 | 31.2 | 11 |
| GRID: Autosport (2014) | 70.1 | 27.3 | 15.5 | 12.5 |
| Alien: Isolation (2014) | 42.9 | 22.9 | 11.7 | 11.5 |
| Dota 2 Reborn (2015) | 37.9 | 24.1 | 17.7 | 16.7 |
| Hitman 2016 (2016) | 9.4 | 6.1 | ||
| Ashes of the Singularity (2016) | 8 | 5 | ||
| Overwatch (2016) | 32.5 | 29 | 16 | 11.6 |
| For Honor (2017) | 20.8 | 6.8 | ||
| Ghost Recon Wildlands (2017) | 12.7 | 5.6 | ||
| Warhammer 40.000: Dawn of War III (2017) | 13 | 6 | ||
| Prey (2017) | 21 | 10.8 | 8.8 | 5.3 |
| Rocket League (2017) | 61.3 | 22.8 | 14.3 | |
| Dirt 4 (2017) | 39.2 | 12.1 | ||
| Team Fortress 2 (2017) | 38.5 | 38.3 | 31.1 | 21.9 |
| F1 2017 (2017) | 18 | 14 | ||
| Middle-earth: Shadow of War (2017) | 16 | 7 | ||
| ELEX (2017) | 10.7 | 5.8 | ||
| Destiny 2 (2017) | 15.3 | |||
| Assassin´s Creed Origins (2017) | 10 | 6 | ||
| Call of Duty WWII (2017) | 20.7 | 14.2 | ||
| Need for Speed Payback (2017) | 11.2 | 7.9 | ||
| Star Wars Battlefront 2 (2017) | 9 | 6.3 | ||
| Fortnite (2018) | 29.4 | 9 | ||
| Final Fantasy XV Benchmark (2018) | 8 | 4 | ||
| Kingdom Come: Deliverance (2018) | 9.4 | 4.4 | ||
| X-Plane 11.11 (2018) | 12.7 | 8.6 |
Emisiones y potencia: la computadora portátil Hewlett-Packard carece de resistencia
Emisiones de ruido
Durante el funcionamiento en vacío, el ventilador puede estar quieto a veces. Pero, por lo general, funciona a velocidades muy bajas y apenas puede oírse. Sin embargo, incluso una pequeña carga es suficiente para hacer que el ventilador acelere. El ventilador produce la mayor cantidad de ruido durante el funcionamiento con cargas medianas. No necesita acelerar demasiado a plena carga (prueba de esfuerzo: Prime95 y Furmark funcionan durante al menos una hora), ya que la CPU y la GPU solo funcionan a sus velocidades mínimas.
Ruido
| Ocioso |
| 30.4 / 30.6 / dB(A) |
| Carga |
| 34.1 / 32.3 dB(A) |
 | ||
30 dB silencioso 40 dB(A) audible 50 dB(A) ruidosamente alto |
||
min: | ||
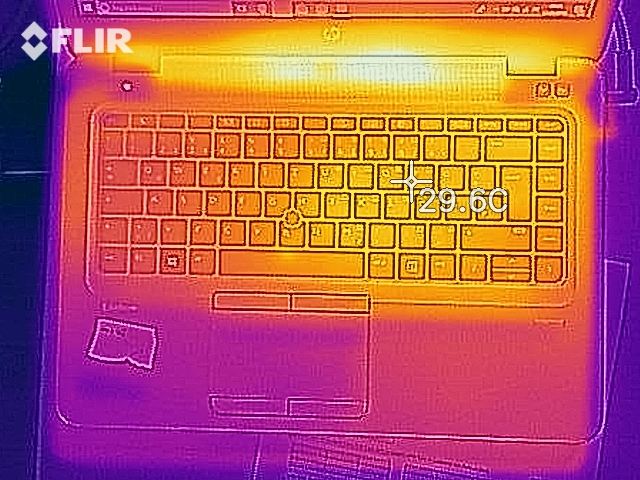
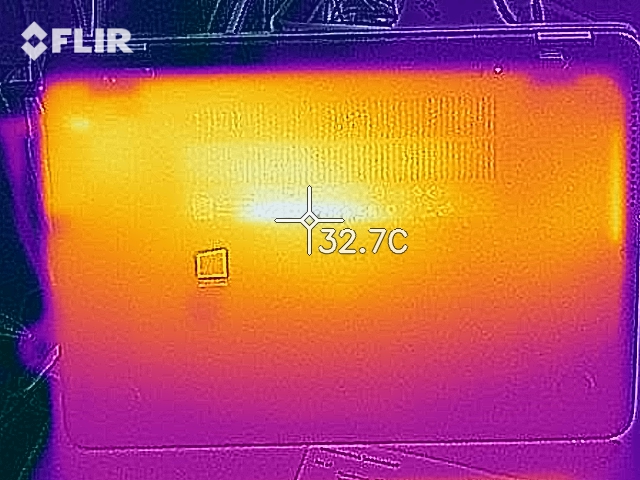
Temperatura
El mt43 se somete a nuestra prueba de esfuerzo (Prime95 y Furmark funcionan durante al menos una hora) de la misma manera en funcionamiento con batería y red, con el procesador (800 MHz) y el núcleo gráfico (300 MHz) funcionando a velocidades muy bajas.
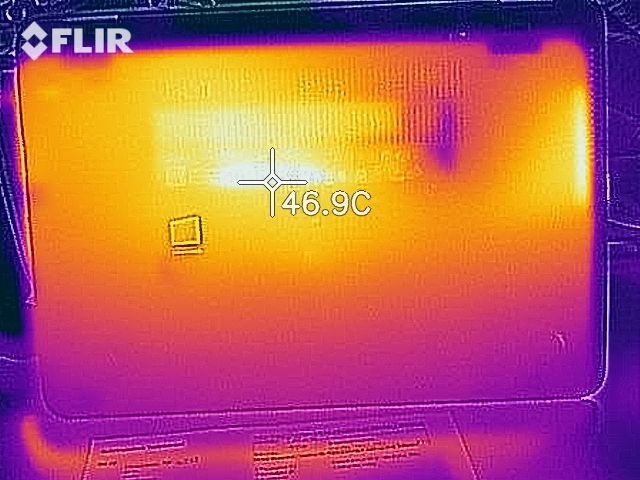
El Thin Client no se calienta especialmente. Durante la prueba de esfuerzo, las temperaturas permanecen claramente por debajo de 40 °C (104 °F) en todos los puntos de medición.
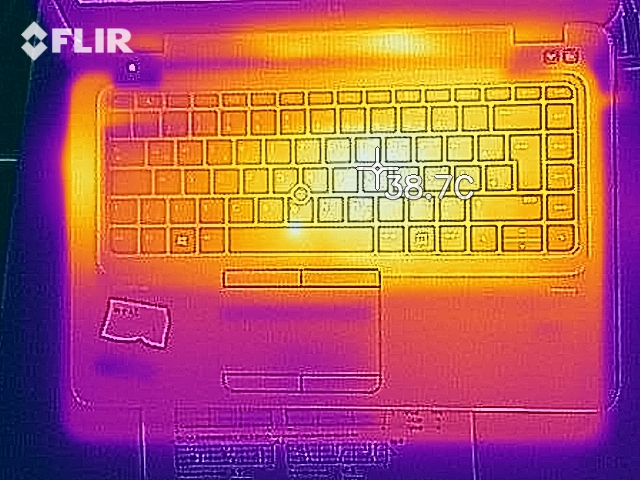
(+) La temperatura máxima en la parte superior es de 33.4 °C / 92 F, frente a la media de 34.3 °C / 94 F, que oscila entre 21.2 y 62.5 °C para la clase Office.
(+) El fondo se calienta hasta un máximo de 36 °C / 97 F, frente a la media de 36.8 °C / 98 F
(+) En reposo, la temperatura media de la parte superior es de 27 °C / 81# F, frente a la media del dispositivo de 29.5 °C / 85 F.
(+) El reposamanos y el panel táctil están a una temperatura inferior a la de la piel, con un máximo de 27.9 °C / 82.2 F y, por tanto, son fríos al tacto.
(±) La temperatura media de la zona del reposamanos de dispositivos similares fue de 27.5 °C / 81.5 F (-0.4 °C / -0.7 F).
Altavoces
HP mt43 análisis de audio
(±) | la sonoridad del altavoz es media pero buena (74.1 dB)
Graves 100 - 315 Hz
(-) | casi sin bajos - de media 23.3% inferior a la mediana
(±) | la linealidad de los graves es media (10.9% delta a frecuencia anterior)
Medios 400 - 2000 Hz
(±) | medias más altas - de media 5.4% más altas que la mediana
(±) | la linealidad de los medios es media (13.4% delta respecto a la frecuencia anterior)
Altos 2 - 16 kHz
(+) | máximos equilibrados - a sólo 1.8% de la mediana
(+) | los máximos son lineales (4.3% delta a la frecuencia anterior)
Total 100 - 16.000 Hz
(±) | la linealidad del sonido global es media (22% de diferencia con la mediana)
En comparación con la misma clase
» 57% de todos los dispositivos probados de esta clase eran mejores, 8% similares, 35% peores
» El mejor tuvo un delta de 7%, la media fue 21%, el peor fue ###max##%
En comparación con todos los dispositivos probados
» 63% de todos los dispositivos probados eran mejores, 6% similares, 30% peores
» El mejor tuvo un delta de 4%, la media fue 24%, el peor fue ###max##%
Apple MacBook 12 (Early 2016) 1.1 GHz análisis de audio
(+) | los altavoces pueden reproducir a un volumen relativamente alto (#83.6 dB)
Graves 100 - 315 Hz
(±) | lubina reducida - en promedio 11.3% inferior a la mediana
(±) | la linealidad de los graves es media (14.2% delta a frecuencia anterior)
Medios 400 - 2000 Hz
(+) | medios equilibrados - a sólo 2.4% de la mediana
(+) | los medios son lineales (5.5% delta a la frecuencia anterior)
Altos 2 - 16 kHz
(+) | máximos equilibrados - a sólo 2% de la mediana
(+) | los máximos son lineales (4.5% delta a la frecuencia anterior)
Total 100 - 16.000 Hz
(+) | el sonido global es lineal (10.2% de diferencia con la mediana)
En comparación con la misma clase
» 7% de todos los dispositivos probados de esta clase eran mejores, 2% similares, 91% peores
» El mejor tuvo un delta de 5%, la media fue 18%, el peor fue ###max##%
En comparación con todos los dispositivos probados
» 5% de todos los dispositivos probados eran mejores, 1% similares, 94% peores
» El mejor tuvo un delta de 4%, la media fue 24%, el peor fue ###max##%
El consumo de energía
En toda la gama de cargas, el consumo de energía se mantiene en un nivel normal para el hardware incorporado. Durante el funcionamiento en vacío, medimos un consumo de potencia máximo de 9.2 vatios. Durante la prueba de estrés, este valor aumenta hasta 33 vatios. La fuente de alimentación tiene una potencia de 65 vatios.
| Off / Standby | |
| Ocioso | |
| Carga |
|
Clave:
min: | |
Duración de la batería
Simulamos la carga al cargar sitios web con nuestro test WLAN prácticamente relevante. El perfil "Equilibrado" está activo y el brillo se ajusta a unos 150 cd/m². El mt43 alcanza un aguante de 4:59 h, que no es un valor sobresaliente.
Pro
Contra
Veredicto: un HP EliteBook como un Thin Client móvil
Como Thin Client móvil, el mt43 no necesita ofrecer un exceso de potencia informática. En consecuencia, la APU AMD incorporada cumple con las demandas. Sin embargo, a pesar del rendimiento bastante moderado, la computadora no puede funcionar silenciosamente, y puedes escuchar claramente el ventilador incluso con poca carga.
Teniendo en cuenta el precio, el nivel de características del HP m43 resulta demasiado ahorrativo.
Un disco de estado sólido asegura un sistema que se ejecuta rápidamente. Sería posible reemplazar el SSD. Pero para hacer eso, tendrías que quitar la parte inferior de la carcasa. Hay un espacio adicional para un disco duro de 2.5 pulgadas adentro.
La pantalla mate de 14 pulgadas ofrece un alto brillo y un contraste muy decente. Sin embargo, considerando el nivel de precios, esto debería ser más grande. No entendemos por qué HP usa aquí un modelo TN cuyos ángulos de visión no son estables. El nivel de precios exige un modelo IPS.
El teclado es muy bueno y también es adecuado para escritores prolíficos. Sin embargo, HP renuncia a la iluminación del teclado aquí. Hay un espacio vacío para un módem LTE dentro del mt43. Las antenas necesarias y una ranura para tarjeta SIM también están allí. Mientras que HP llama al mt43 un "Mobile Thin Client", la movilidad dista de ser ideal. La computadora apenas dura 5 horas en nuestra prueba WLAN prácticamente relevante. El modelo hermano HP Elitebook 840 G4, que está construido de forma idéntica, dura casi el doble de tiempo con la misma batería.
HP mt43
- 04/04/2018 v6 (old)
Sascha Mölck