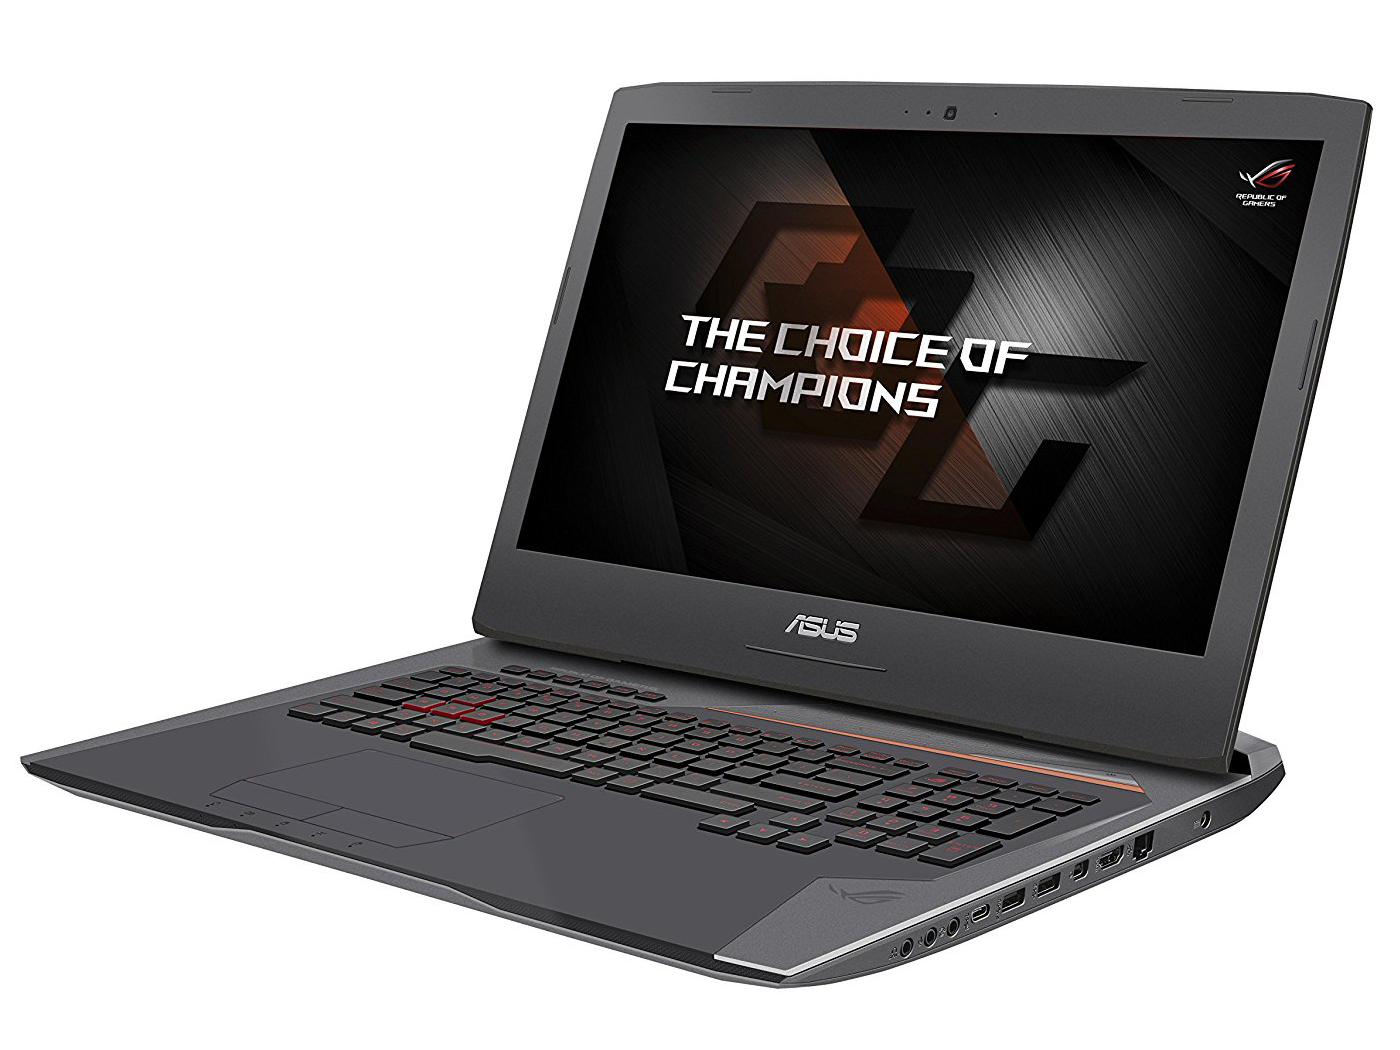
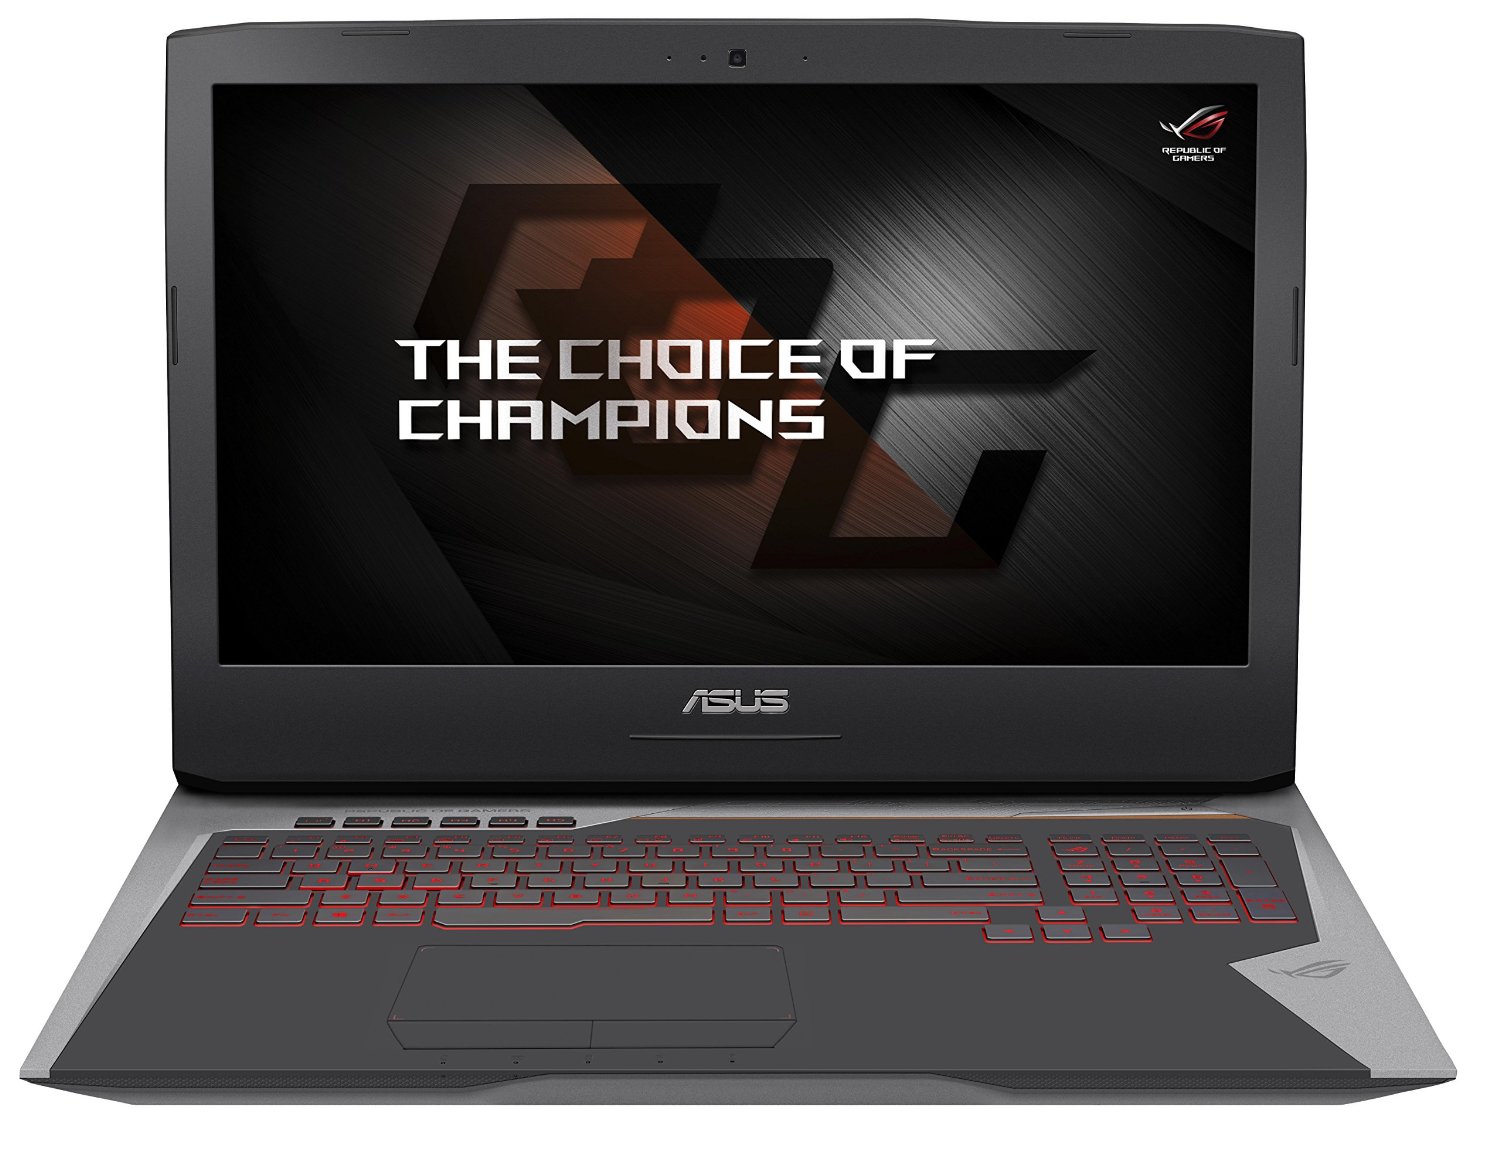
Análisis completo del Asus ROG G752VS (7700HQ, GTX 1070, FHD)
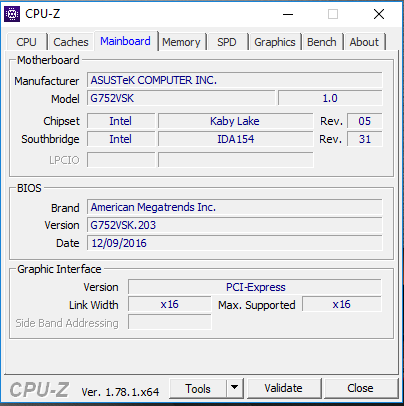
No es la primera vez que analizamos el Asus G752VS; el G752VS-XB78K aún tenía un procesador Skylake. El nuevo modelo usa un moderno chip Kaby Lake, pero la gráfica es idéntica. El nuevo portátil vuelve a traer la GPU GeForce GTX 1070. Rivales del Asus son otros portátiles como Acer Predator 17, Nexoc G734IV, MSI GT72VR 7RE-433 y Alienware 17 R4.
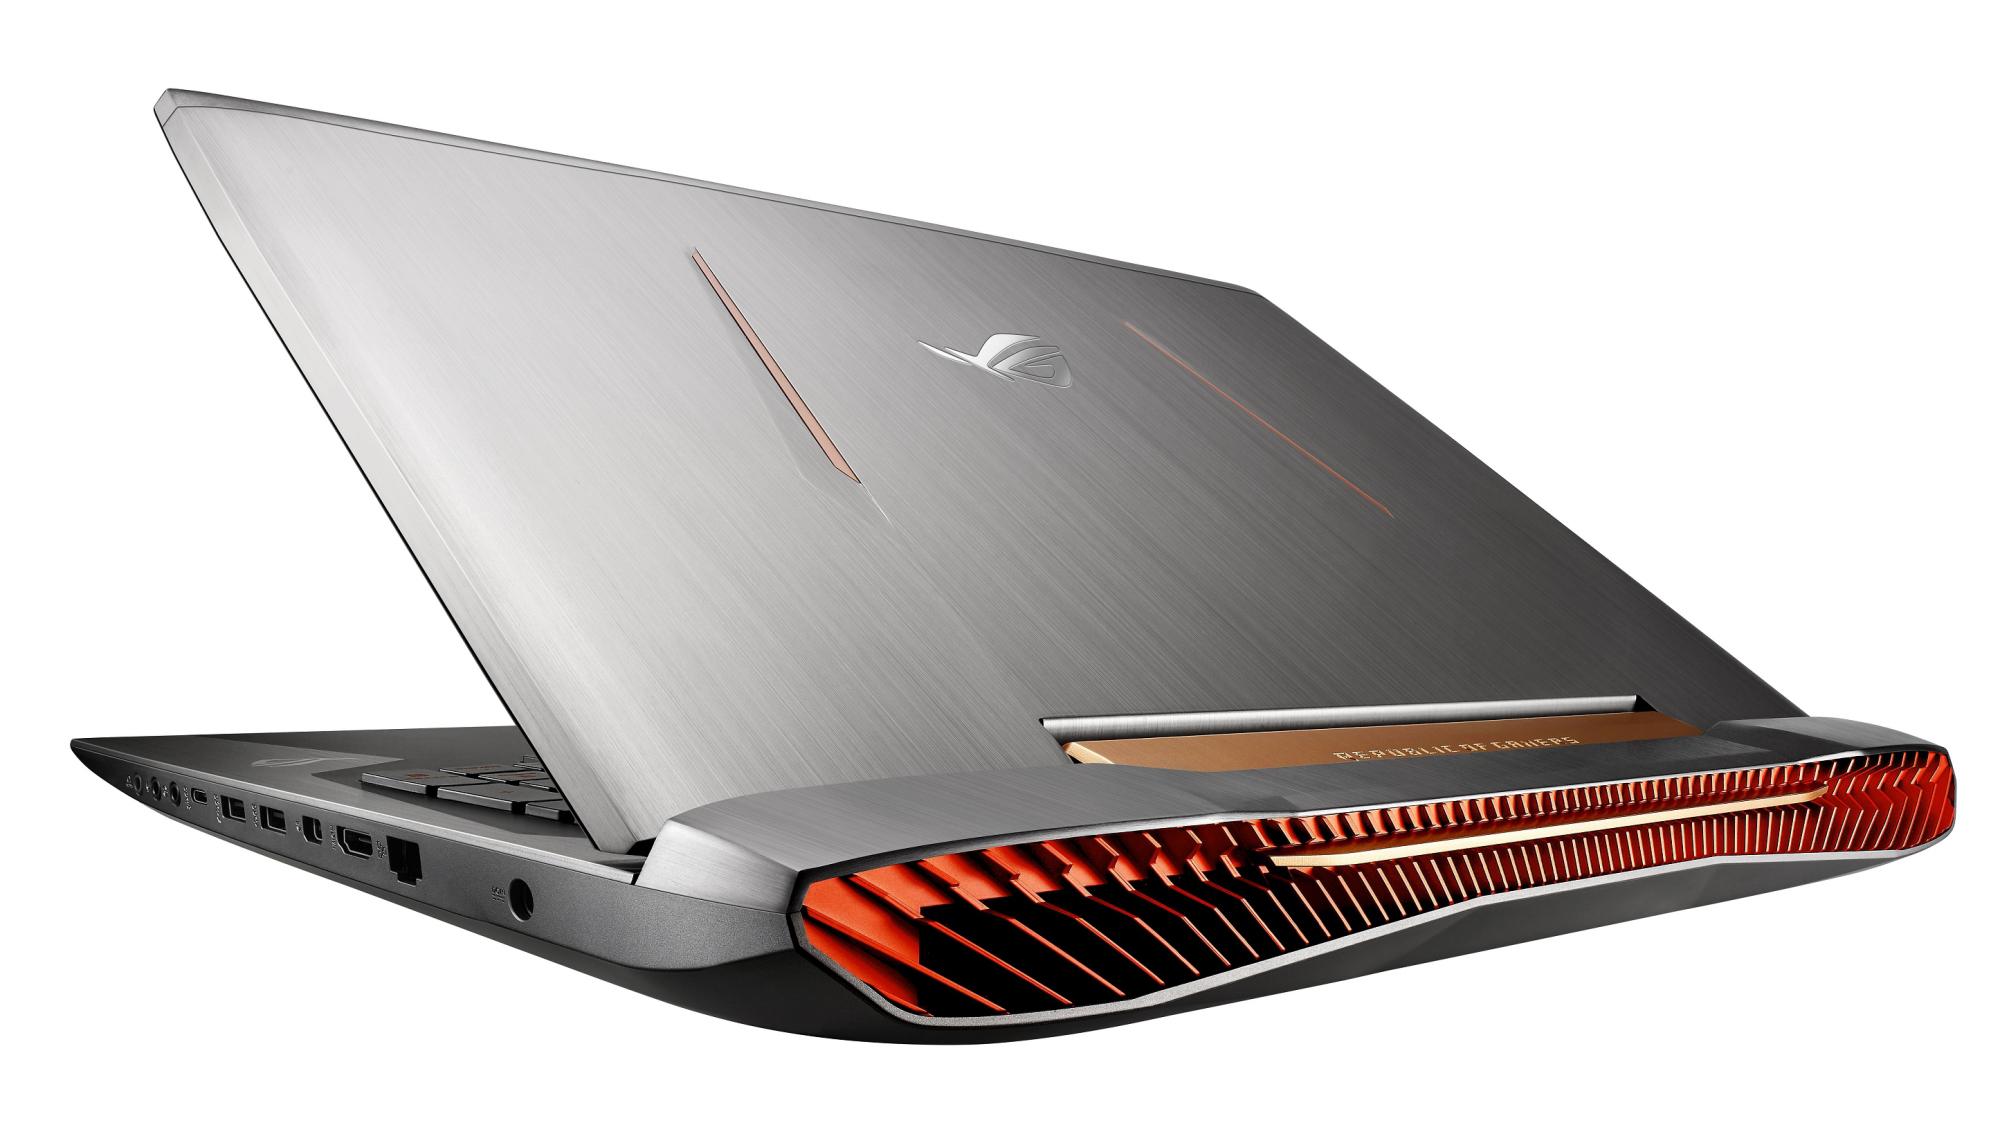
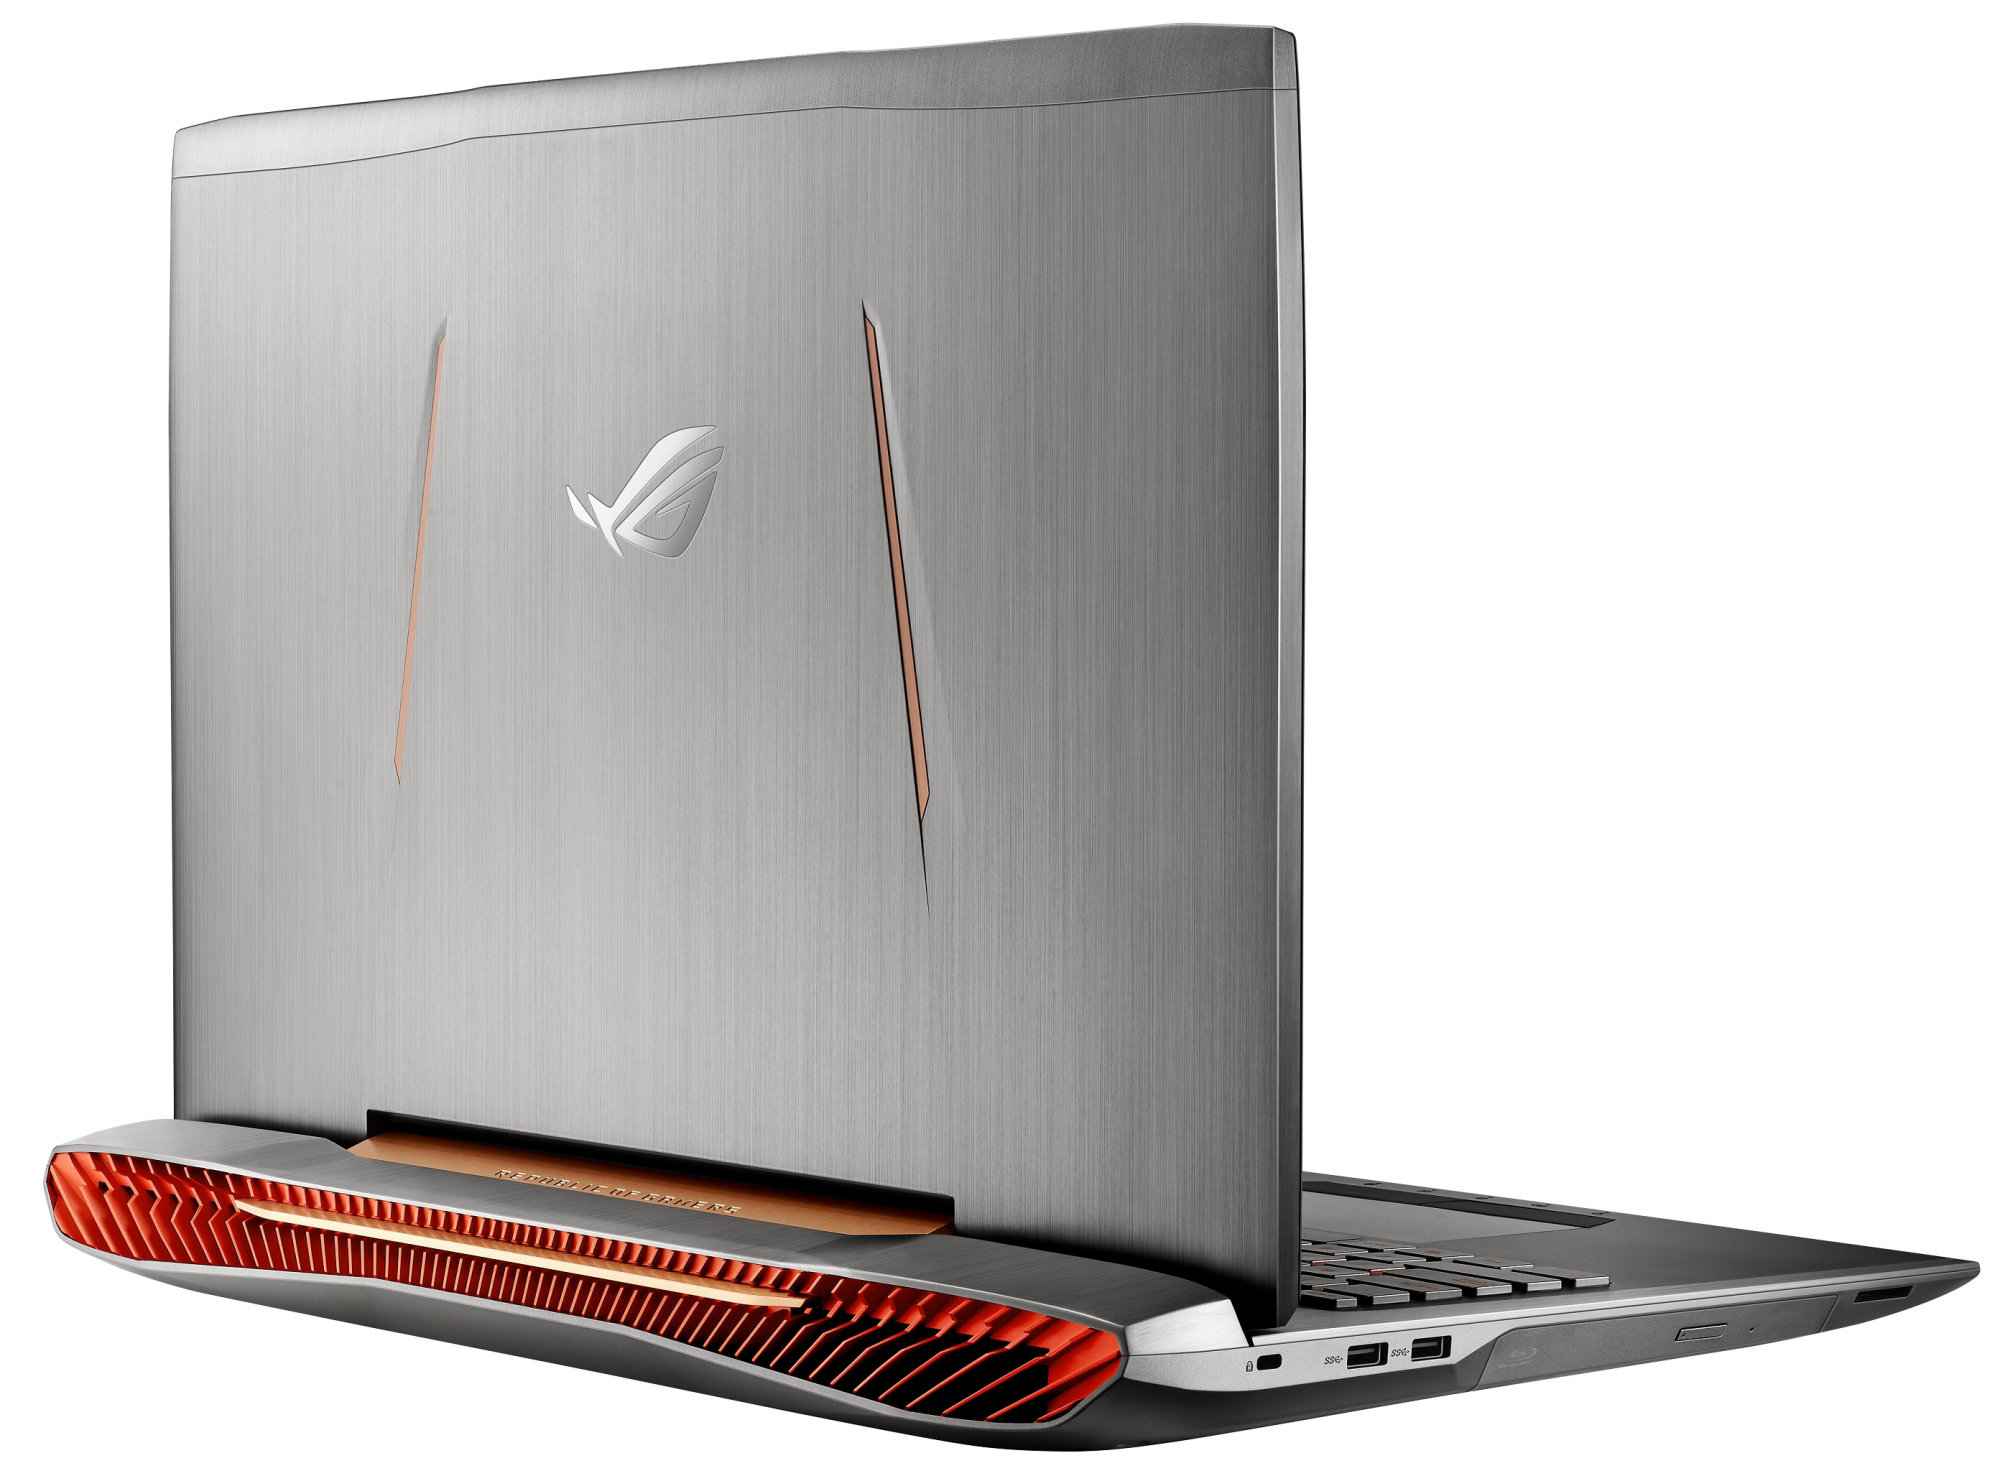
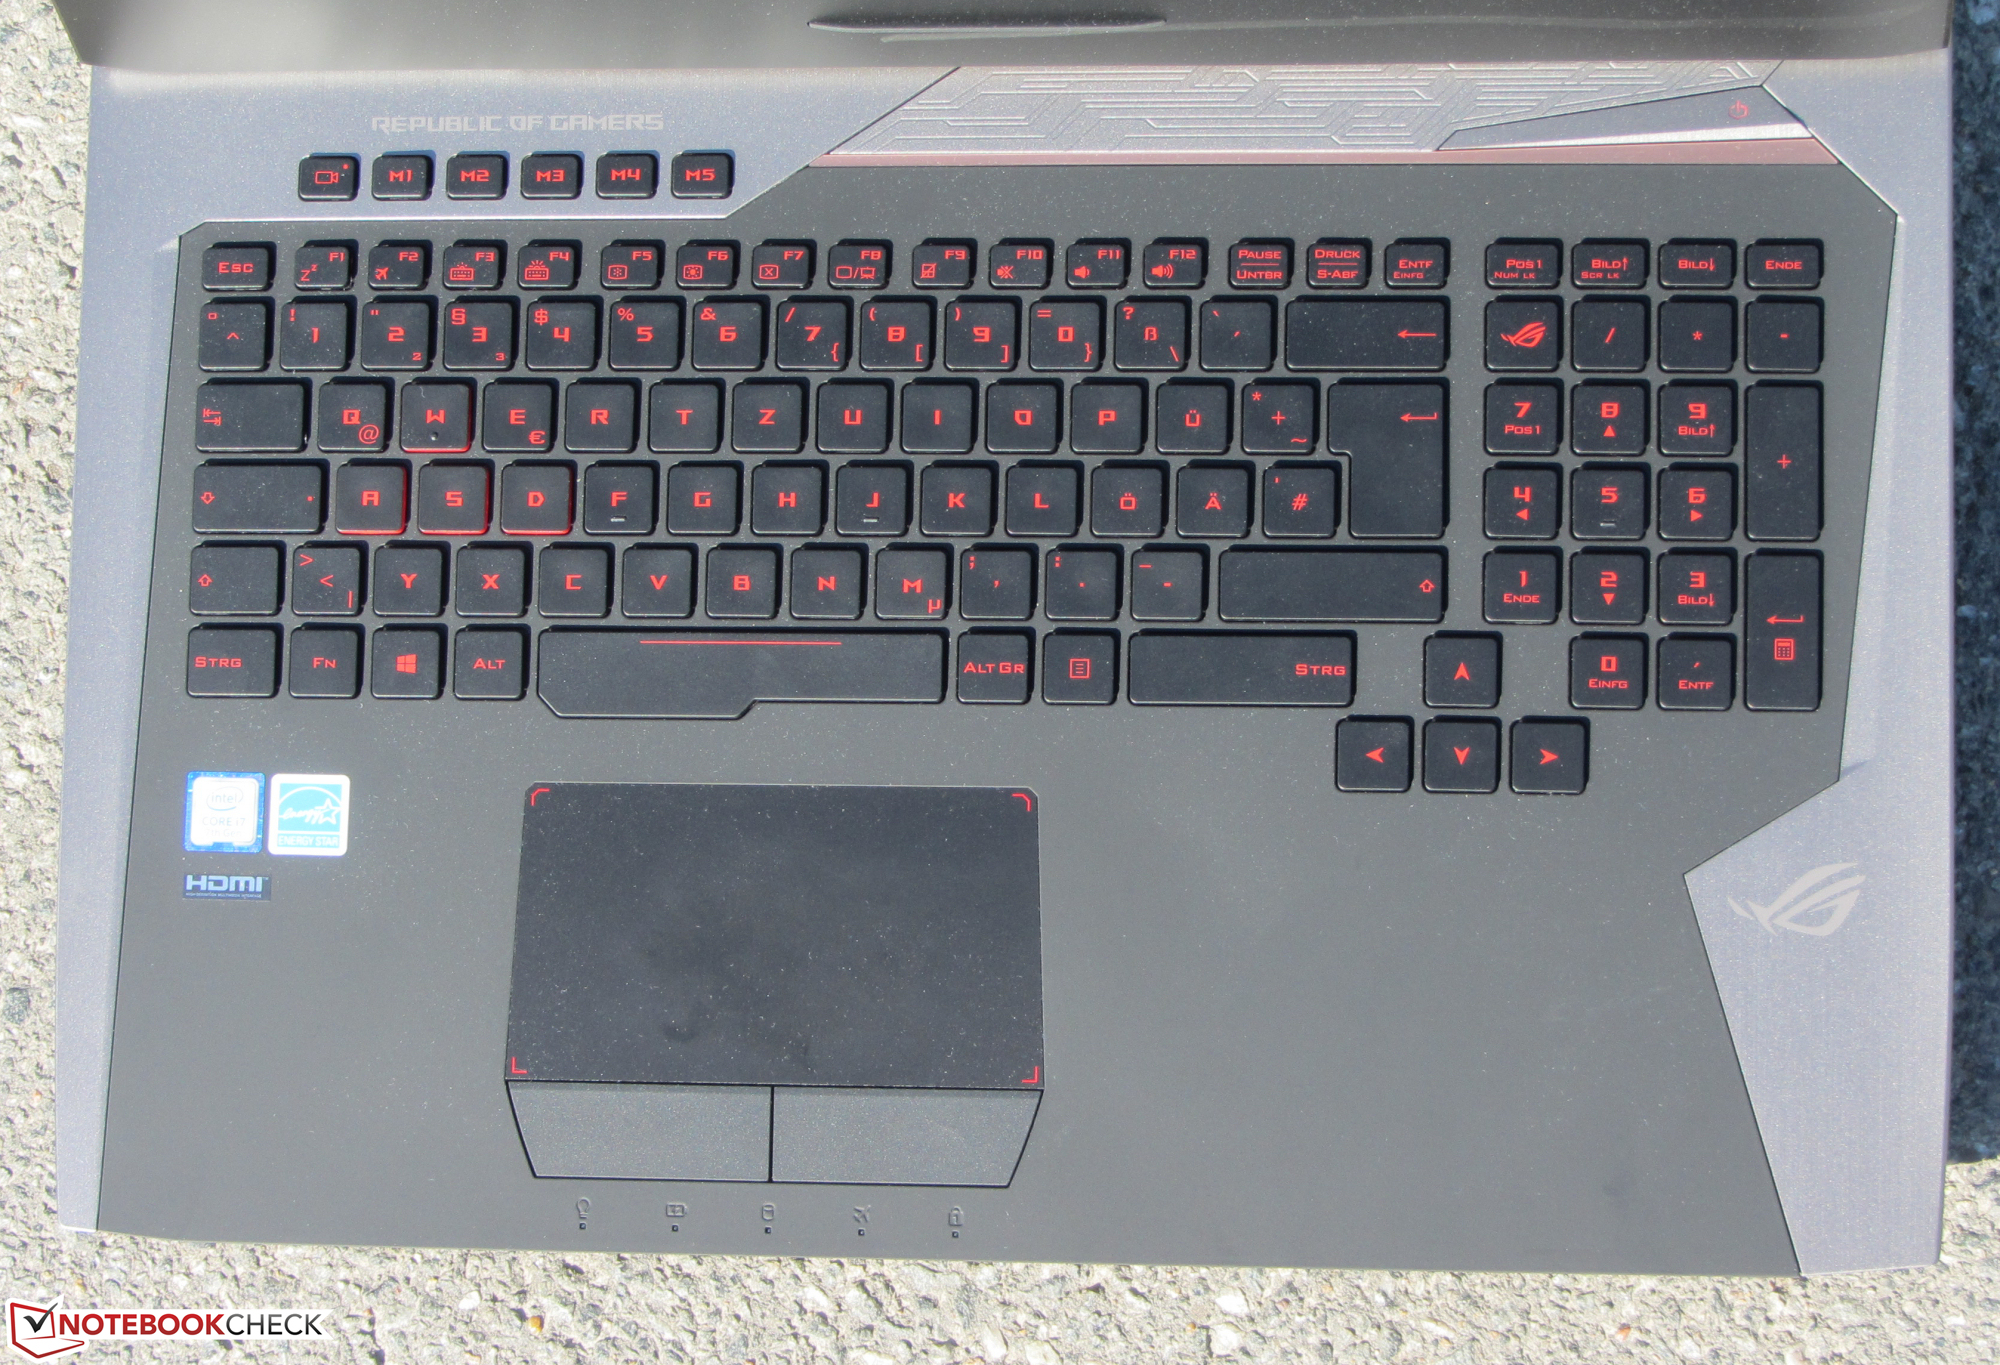
Los dos modelos G752VS tienen construcciones idénticas, por lo que no cubriremos las secciones de Carcasa, Conectividad, Dispositivos de Entrada, y Altavoces. Toda la información correspondiente está en el análisis del Asus G752VS-XB78K.
| SD Card Reader | |
| average JPG Copy Test (av. of 3 runs) | |
| MSI GT72VR 7RE-433 | |
| Acer Predator 17 G9-793-70PJ | |
| Gigabyte P57X v7 | |
| Asus G752VS-BA338T | |
| Asus G752VS-XB78K | |
| Nexoc G734IV | |
| maximum AS SSD Seq Read Test (1GB) | |
| MSI GT72VR 7RE-433 | |
| Gigabyte P57X v7 | |
| Acer Predator 17 G9-793-70PJ | |
| Nexoc G734IV | |
| Asus G752VS-BA338T | |
| Asus G752VS-XB78K | |
| Networking | |
| iperf3 transmit AX12 | |
| Acer Predator 17 G9-793-70PJ | |
| MSI GT72VR 7RE-433 | |
| Alienware 17 R4 | |
| Nexoc G734IV | |
| Asus G752VS-BA338T | |
| iperf3 receive AX12 | |
| Acer Predator 17 G9-793-70PJ | |
| Asus G752VS-BA338T | |
| Nexoc G734IV | |
| MSI GT72VR 7RE-433 | |
| Alienware 17 R4 | |
Display
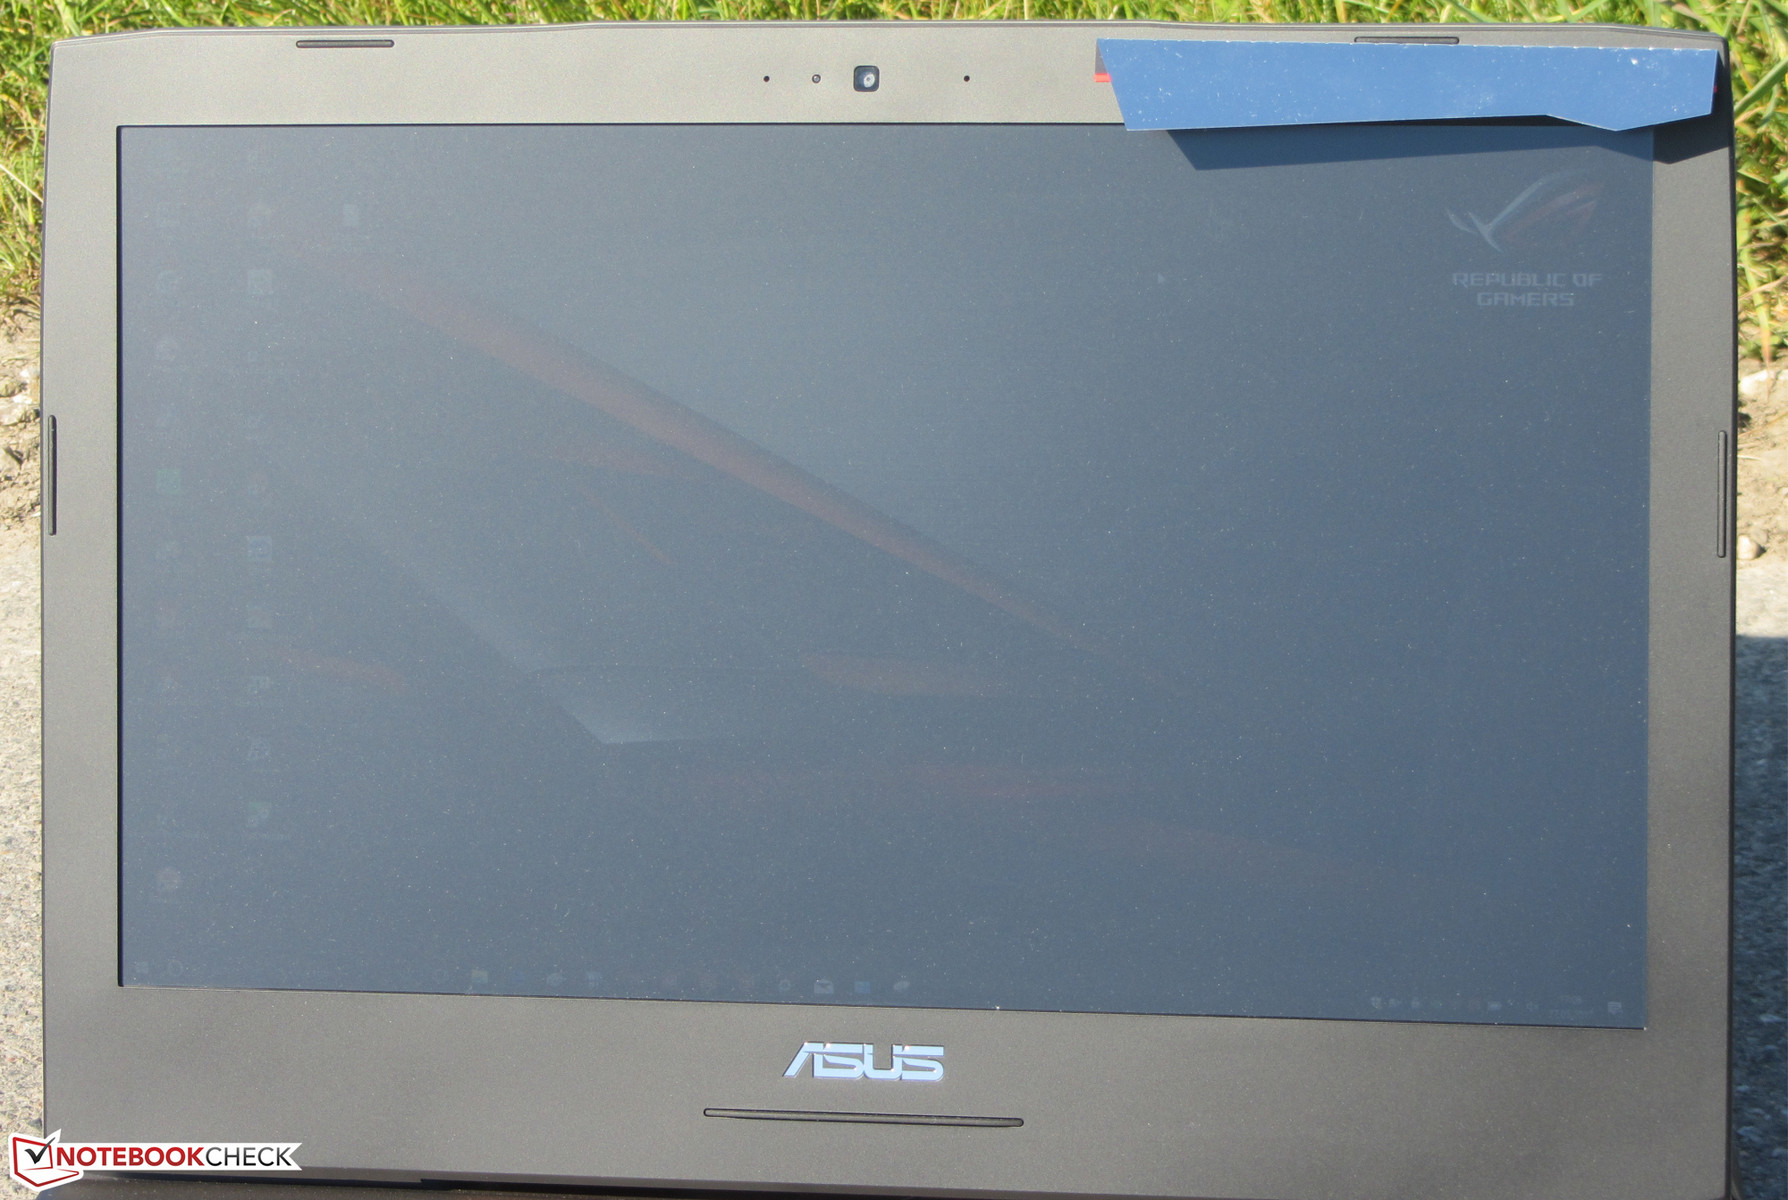
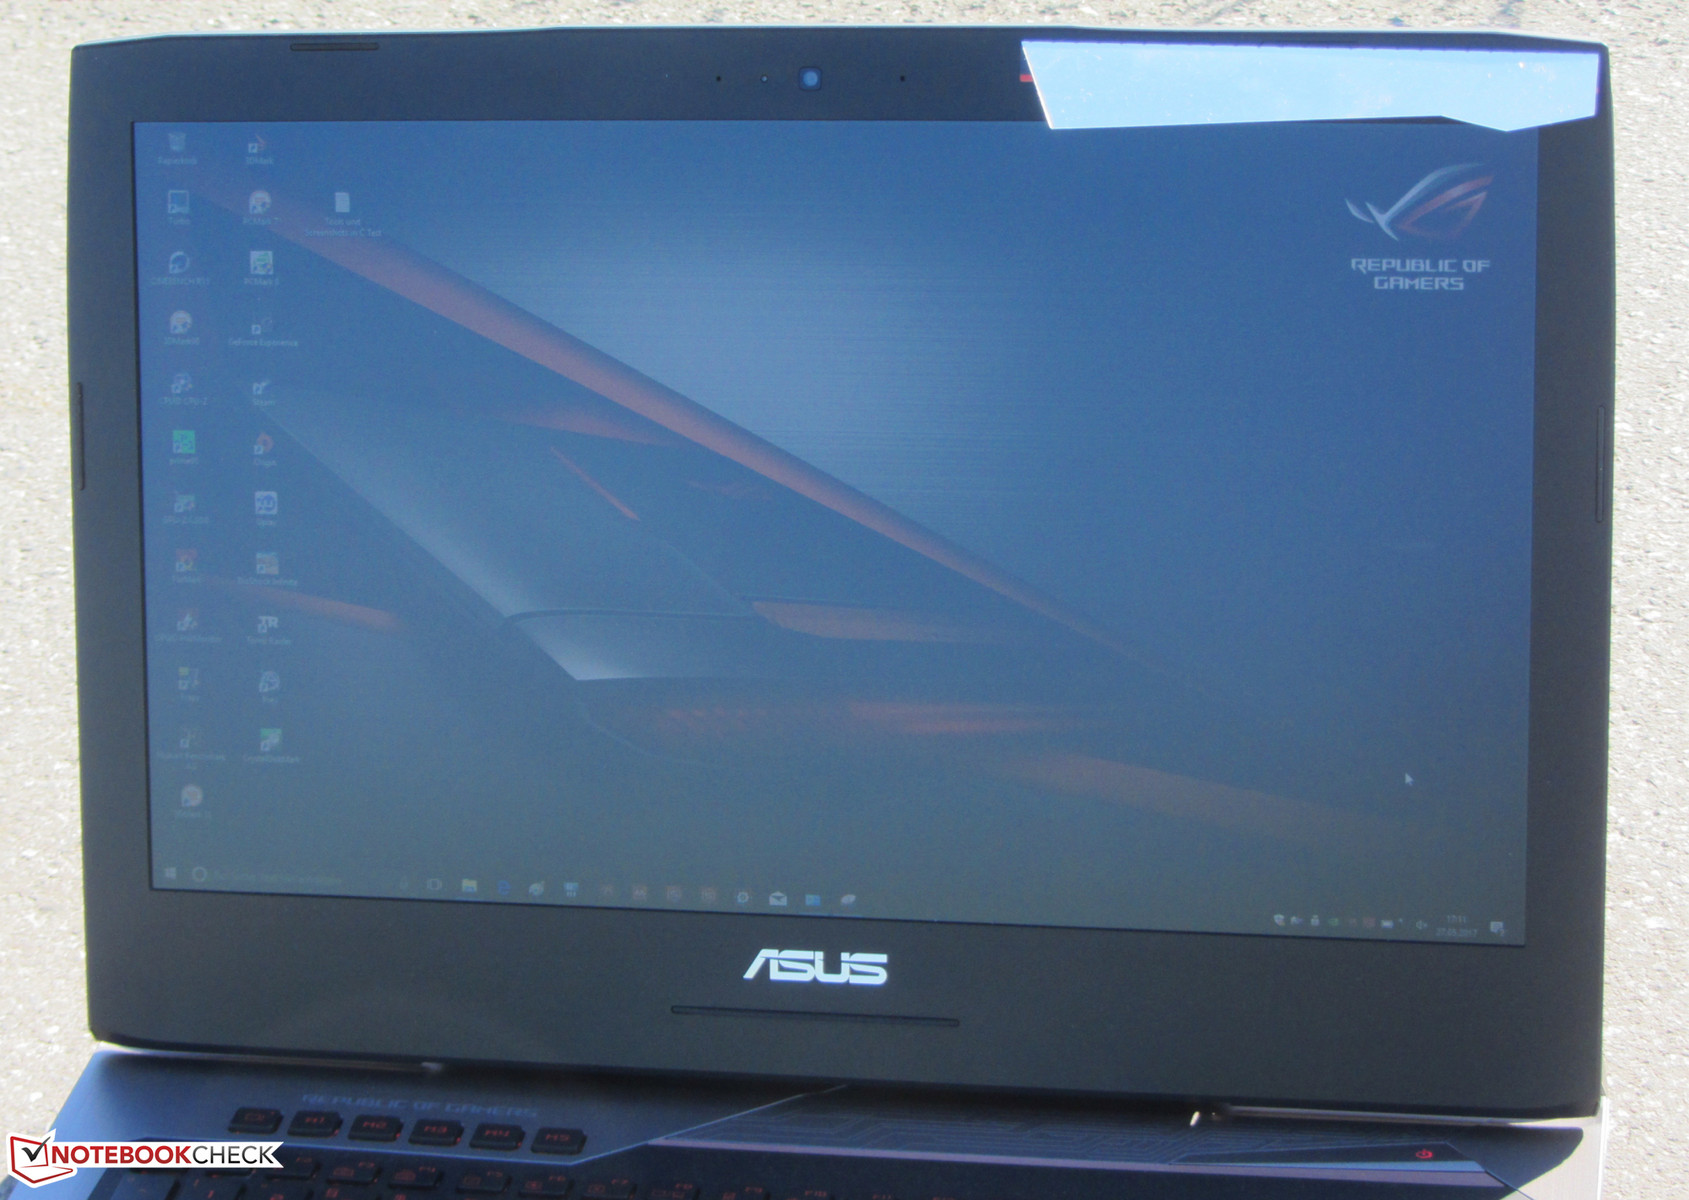
El display mate de 17.3" del G752VS tiene una resolución de 1920x1080 pixels. Brillo (300.3 nits) y contraste (959:1) son buenos. Podemos ver un claro sangrado de pantalla en las esquinas inferiores en una pantalla oscura. La falta de parpadeo PWM es un aspecto positivo.
El panel de 120 Hz soporta Nvidia G-Sync. Permite el ajuste dinámico de la tasa de refresco de display y gráfica. Debería crear una imagen más fluida – especialmente durante los juegos.
| |||||||||||||||||||||||||
iluminación: 88 %
Brillo con batería: 307 cd/m²
Contraste: 959:1 (Negro: 0.32 cd/m²)
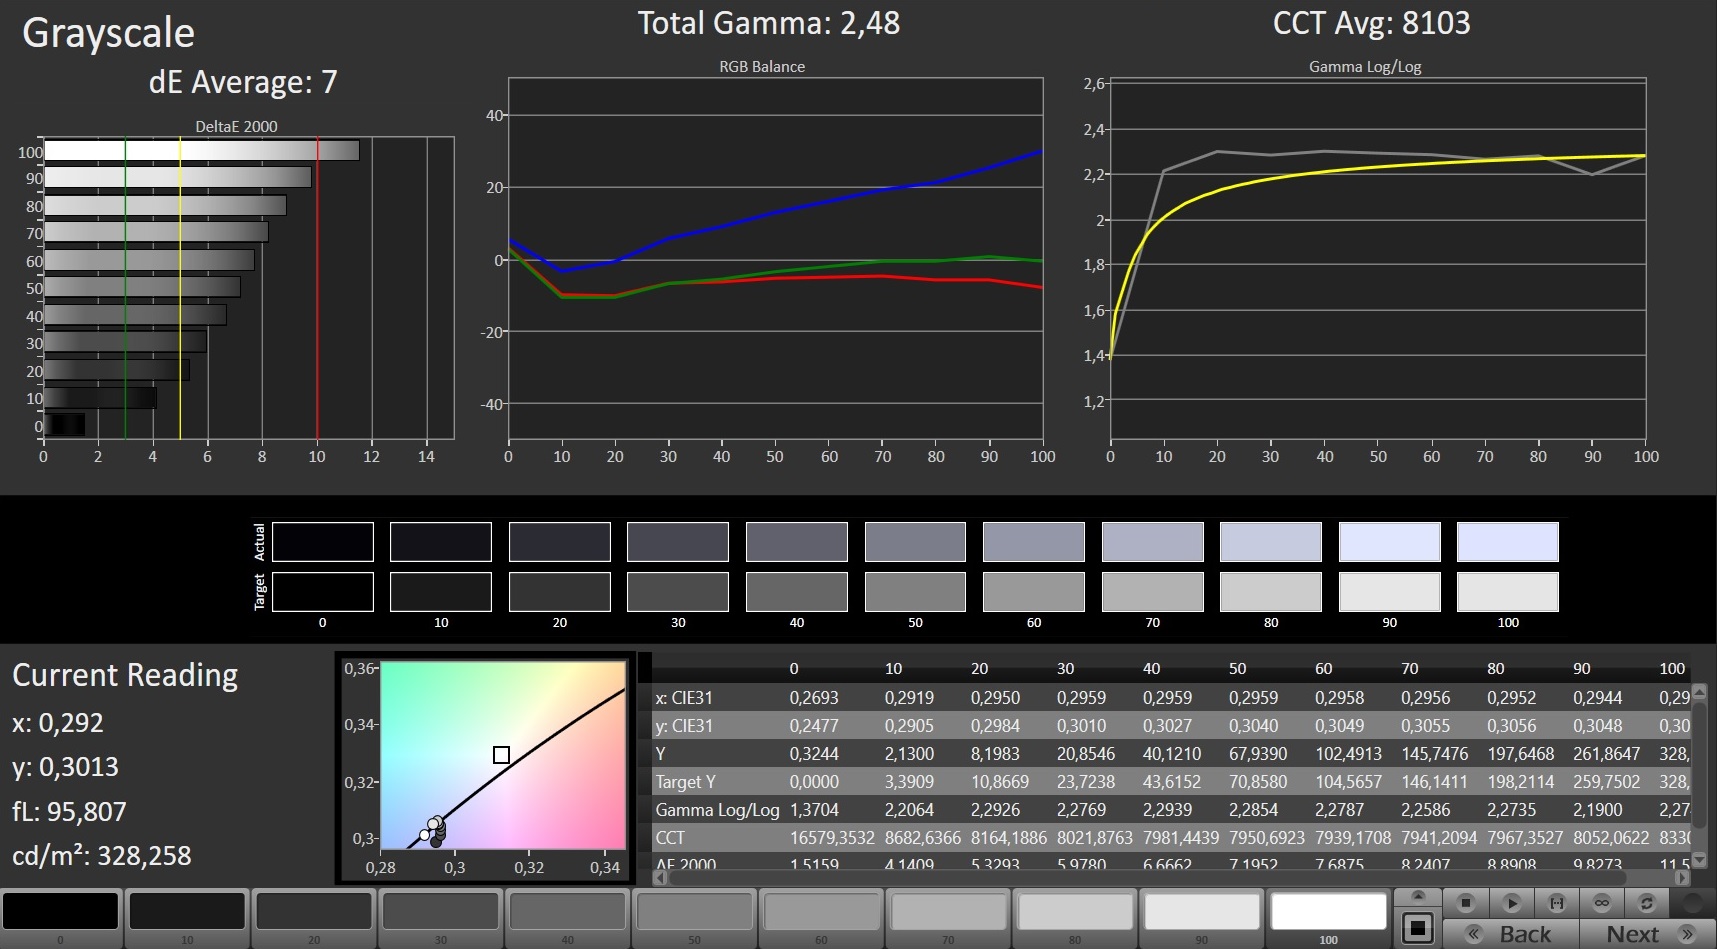
ΔE ColorChecker Calman: 5.53 | ∀{0.5-29.43 Ø4.71}
ΔE Greyscale Calman: 7 | ∀{0.09-98 Ø4.96}
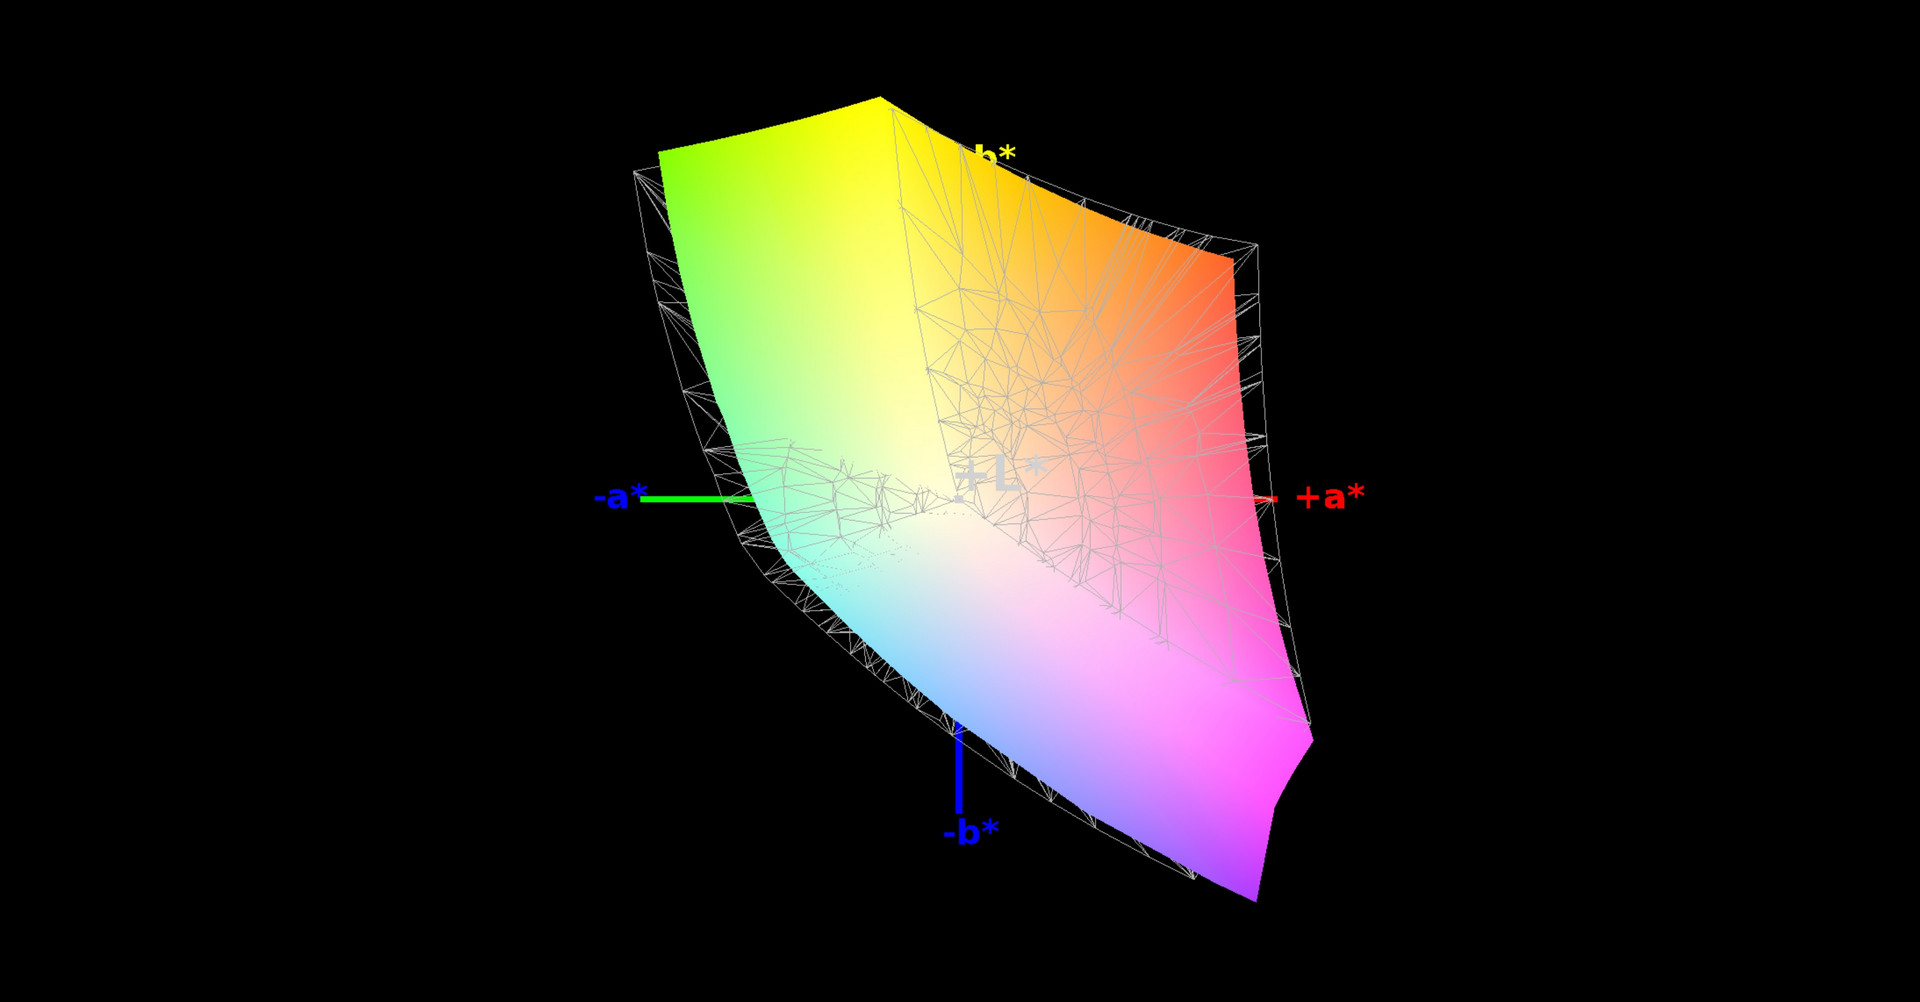
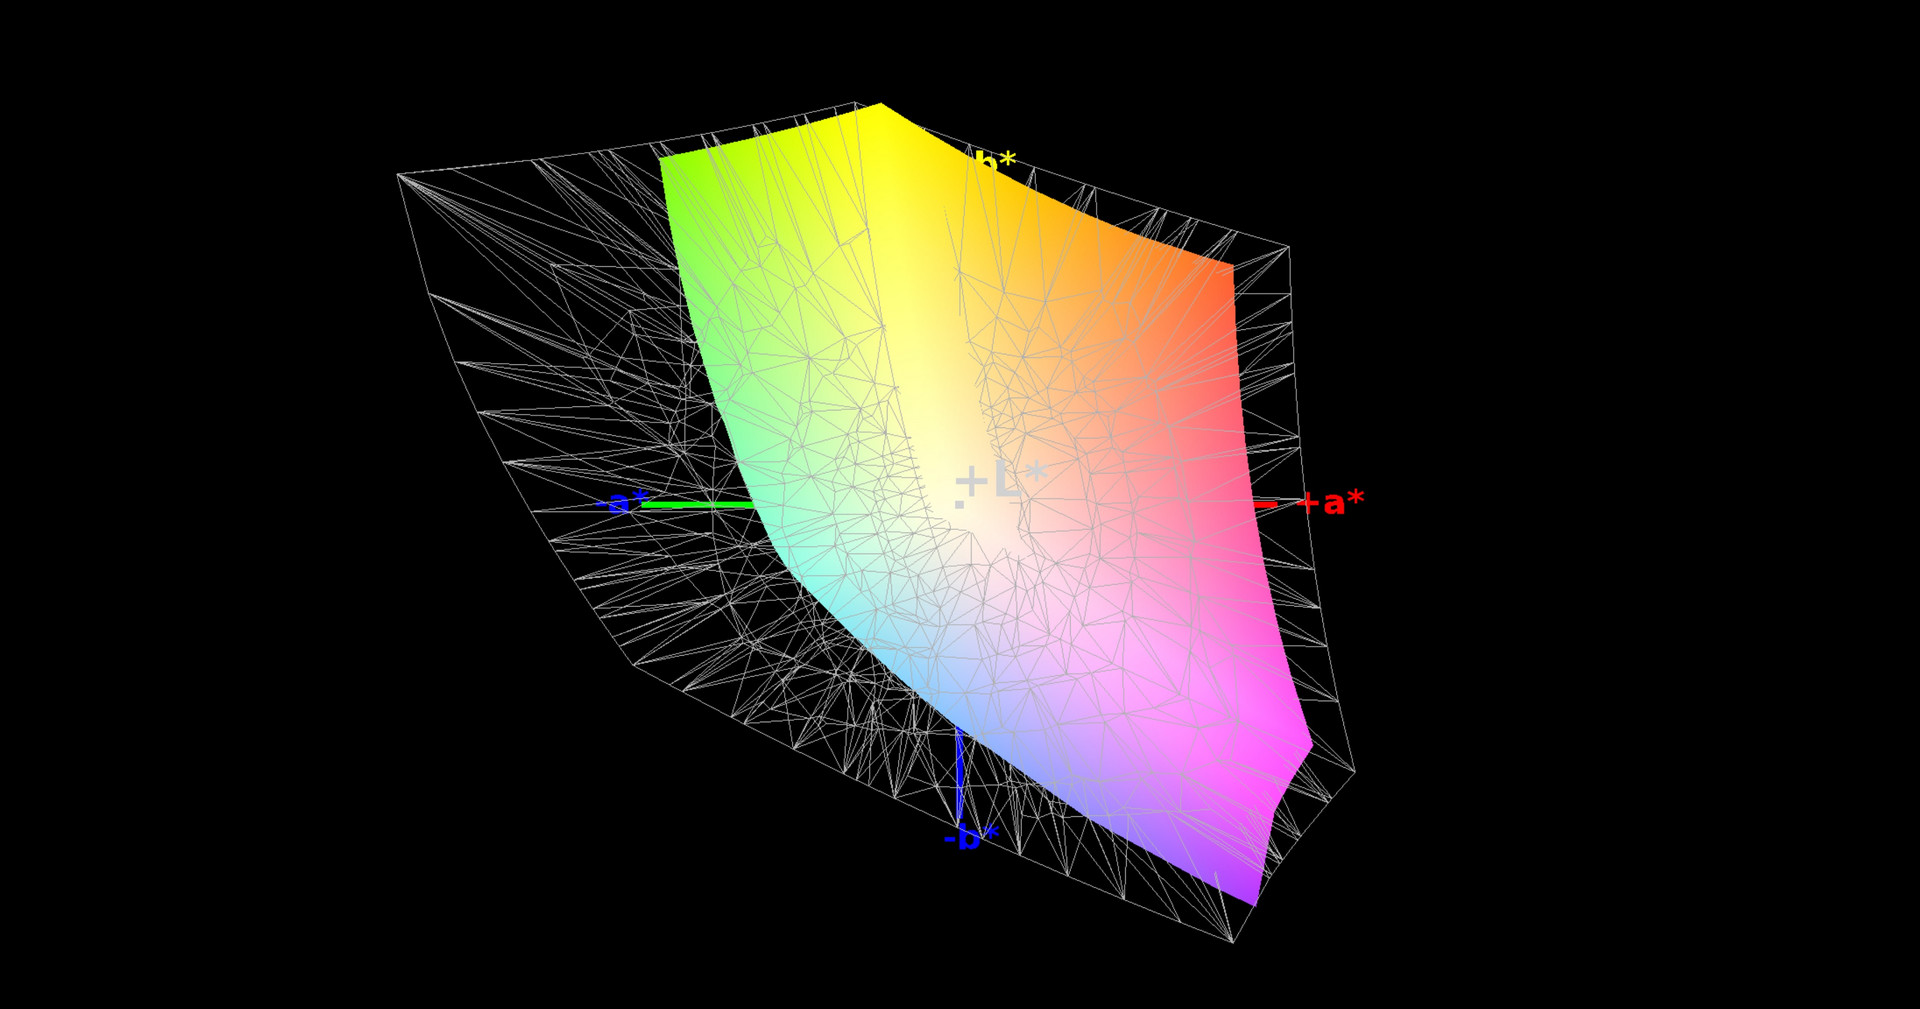
90% sRGB (Argyll 1.6.3 3D)
58% AdobeRGB 1998 (Argyll 1.6.3 3D)
62.8% AdobeRGB 1998 (Argyll 3D)
90.3% sRGB (Argyll 3D)
61.6% Display P3 (Argyll 3D)
Gamma: 2.48
CCT: 8103 K
| Asus G752VS-BA338T AU Optronics B173HAN01.1 (AUO119D), IPS, 1920x1080 | Asus G752VS-XB78K LG Philips LP173WF4-SPF3 (LGD04E8), IPS, 1920x1080 | MSI GT72VR 7RE-433 Chi Mei N173HHE-G32 (CMN1747), TN LED, 1920x1080 | Gigabyte P57X v7 SHP145E, IPS, 3840x2160 | Nexoc G734IV LG Philips LP173WF4-SPD1 (LGD046C), IPS, 1920x1080 | Acer Predator 17 G9-793-70PJ AU Optronics B173ZAN01.0 (AUO109B), IPS, 3840x2160 | Alienware 17 R4 TN LED, 2560x1440 | |
|---|---|---|---|---|---|---|---|
| Display | 1% | 3% | 37% | -1% | 36% | -4% | |
| Display P3 Coverage (%) | 61.6 | 66.9 9% | 68.3 11% | 87.8 43% | 66.2 7% | 86.4 40% | 61.2 -1% |
| sRGB Coverage (%) | 90.3 | 85.2 -6% | 86.7 -4% | 100 11% | 83.7 -7% | 99.9 11% | 82.9 -8% |
| AdobeRGB 1998 Coverage (%) | 62.8 | 62.3 -1% | 63.4 1% | 98.9 57% | 61.2 -3% | 99.1 58% | 60.5 -4% |
| Response Times | 5% | 46% | -67% | -13% | -19% | 34% | |
| Response Time Grey 50% / Grey 80% * (ms) | 36 ? | 38 ? -6% | 29 ? 19% | 55.6 ? -54% | 42 ? -17% | 50 ? -39% | 30 ? 17% |
| Response Time Black / White * (ms) | 26 ? | 22 ? 15% | 7 ? 73% | 46.8 ? -80% | 28 ? -8% | 25.6 ? 2% | 12.8 ? 51% |
| PWM Frequency (Hz) | 1000 ? | ||||||
| Screen | 14% | -9% | 17% | 12% | 22% | -4% | |
| Brightness middle (cd/m²) | 307 | 328 7% | 299 -3% | 441.3 44% | 348 13% | 343 12% | 402.3 31% |
| Brightness (cd/m²) | 300 | 317 6% | 277 -8% | 408 36% | 336 12% | 328 9% | 372 24% |
| Brightness Distribution (%) | 88 | 88 0% | 87 -1% | 86 -2% | 91 3% | 84 -5% | 86 -2% |
| Black Level * (cd/m²) | 0.32 | 0.3 6% | 0.27 16% | 0.44 -38% | 0.32 -0% | 0.29 9% | 0.62 -94% |
| Contrast (:1) | 959 | 1093 14% | 1107 15% | 1003 5% | 1088 13% | 1183 23% | 649 -32% |
| Colorchecker dE 2000 * | 5.53 | 3.74 32% | 9.65 -75% | 5.1 8% | 4.13 25% | 4.01 27% | 5.6 -1% |
| Colorchecker dE 2000 max. * | 11.54 | 8.97 22% | 15.43 -34% | 9.8 15% | 9.21 20% | 6.03 48% | 9.8 15% |
| Greyscale dE 2000 * | 7 | 2.67 62% | 9.68 -38% | 4.3 39% | 3.52 50% | 4.7 33% | 4.7 33% |
| Gamma | 2.48 89% | 2.41 91% | 1.89 116% | 2.08 106% | 2.32 95% | 2.4 92% | 2.14 103% |
| CCT | 8103 80% | 6861 95% | 11652 56% | 7345 88% | 6228 104% | 6451 101% | 7519 86% |
| Color Space (Percent of AdobeRGB 1998) (%) | 58 | 56 -3% | 75 29% | 87 50% | 55 -5% | 88 52% | 53.7 -7% |
| Color Space (Percent of sRGB) (%) | 90 | 85 -6% | 100 11% | 100 11% | 84 -7% | 100 11% | 82.2 -9% |
| Media total (Programa/Opciones) | 7% /
10% | 13% /
1% | -4% /
10% | -1% /
6% | 13% /
19% | 9% /
1% |
* ... más pequeño es mejor
Parpadeo de Pantalla / PWM (Pulse-Width Modulation)
| Parpadeo de Pantalla / PWM no detectado | 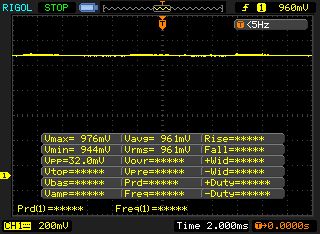 | ||
Comparación: 52 % de todos los dispositivos testados no usaron PWM para atenuar el display. Si se usó, medimos una media de 7754 (mínimo: 5 - máxmo: 343500) Hz. | |||
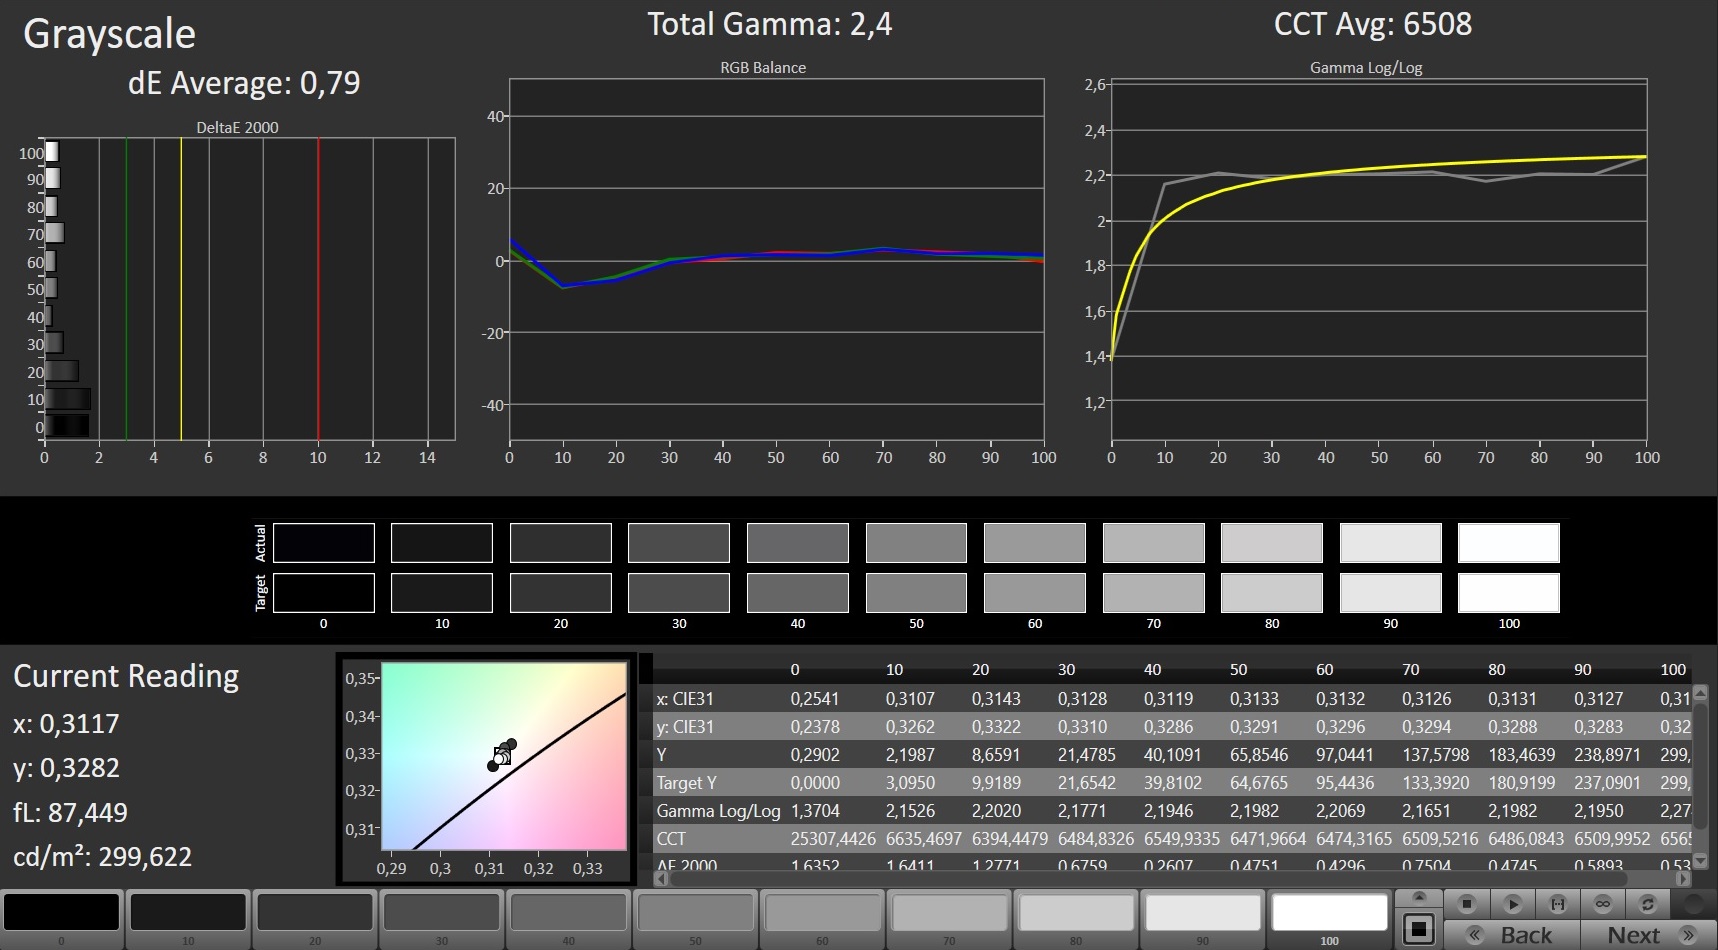
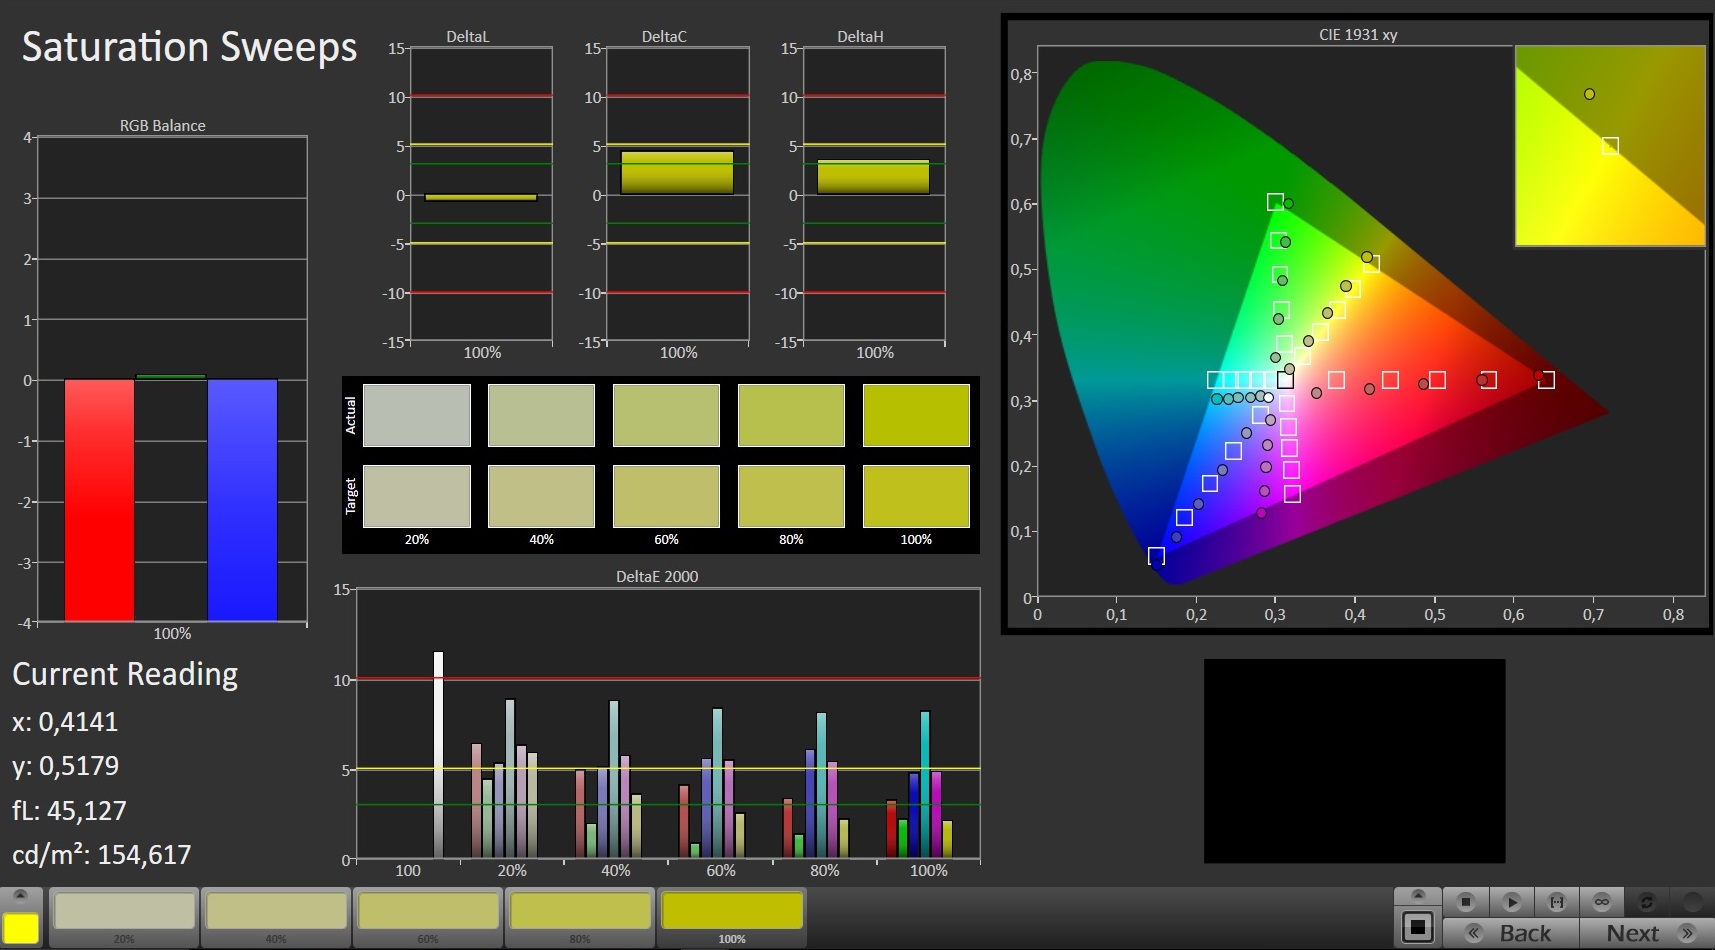
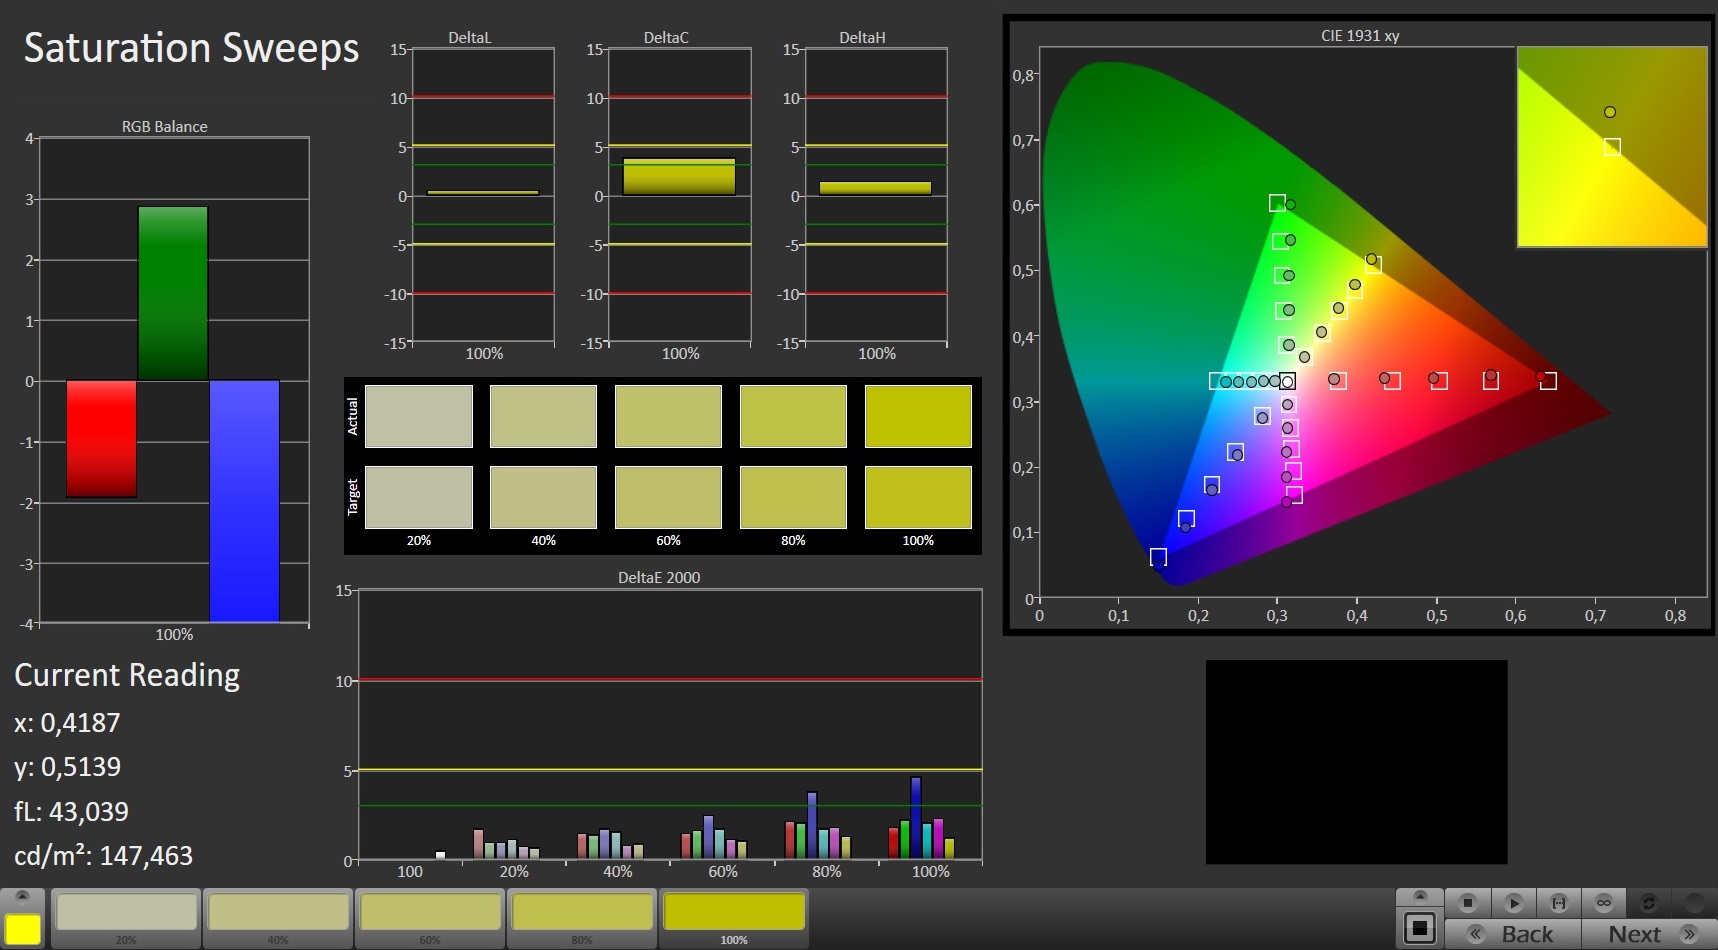
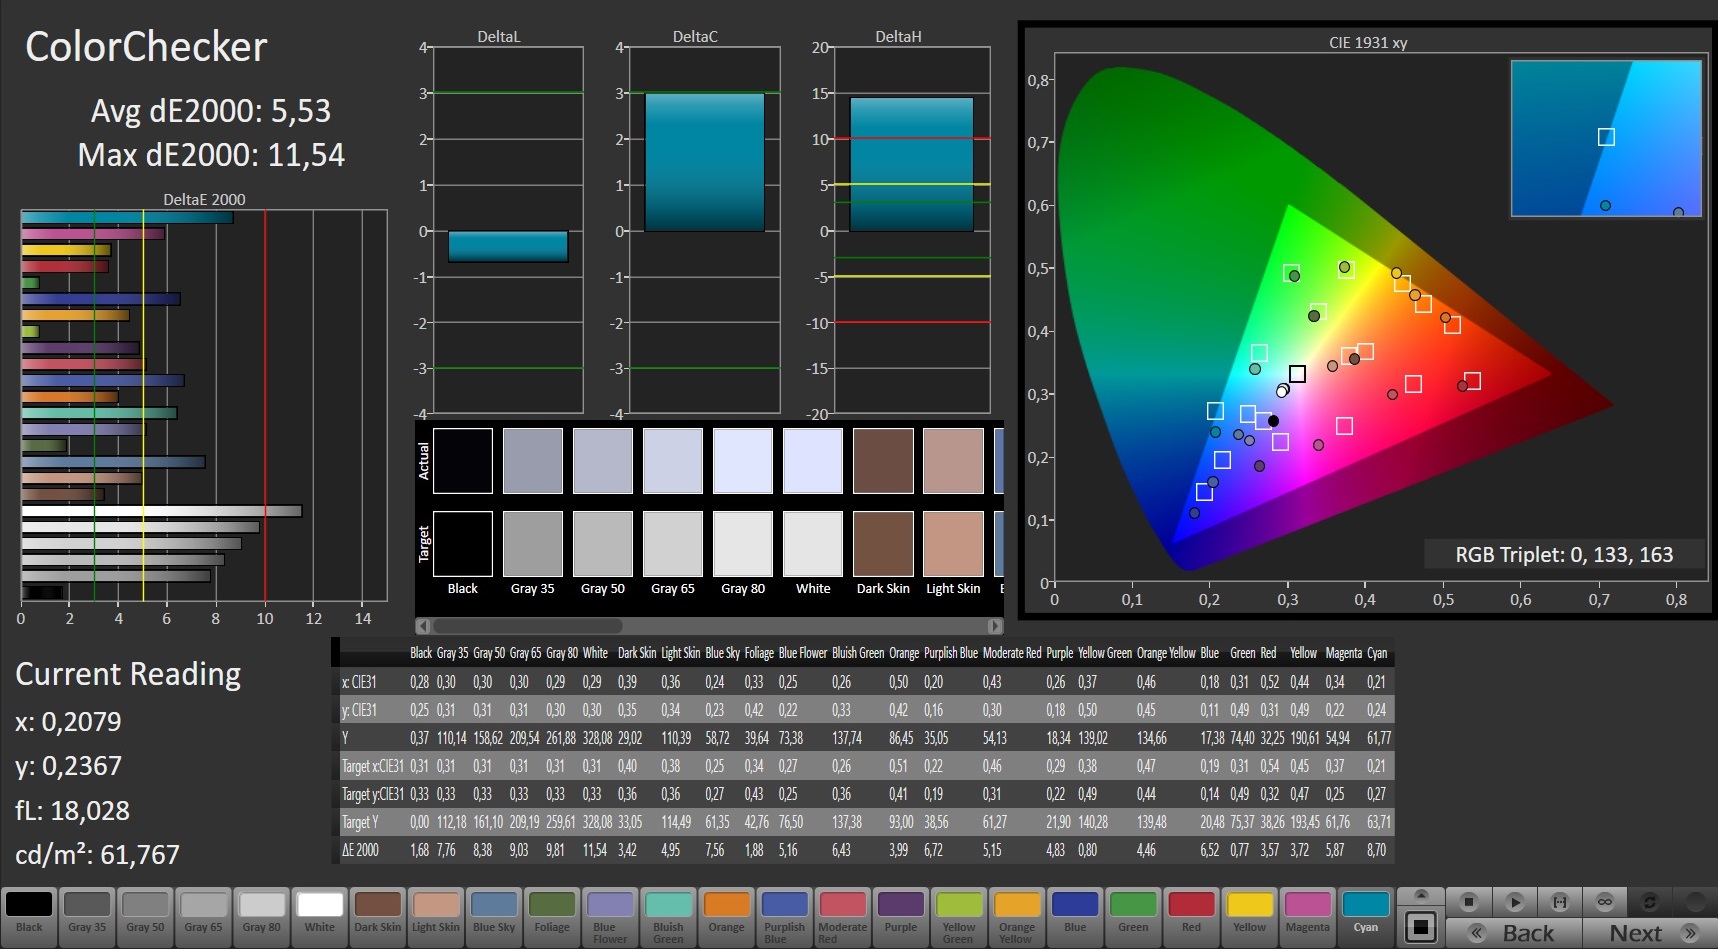
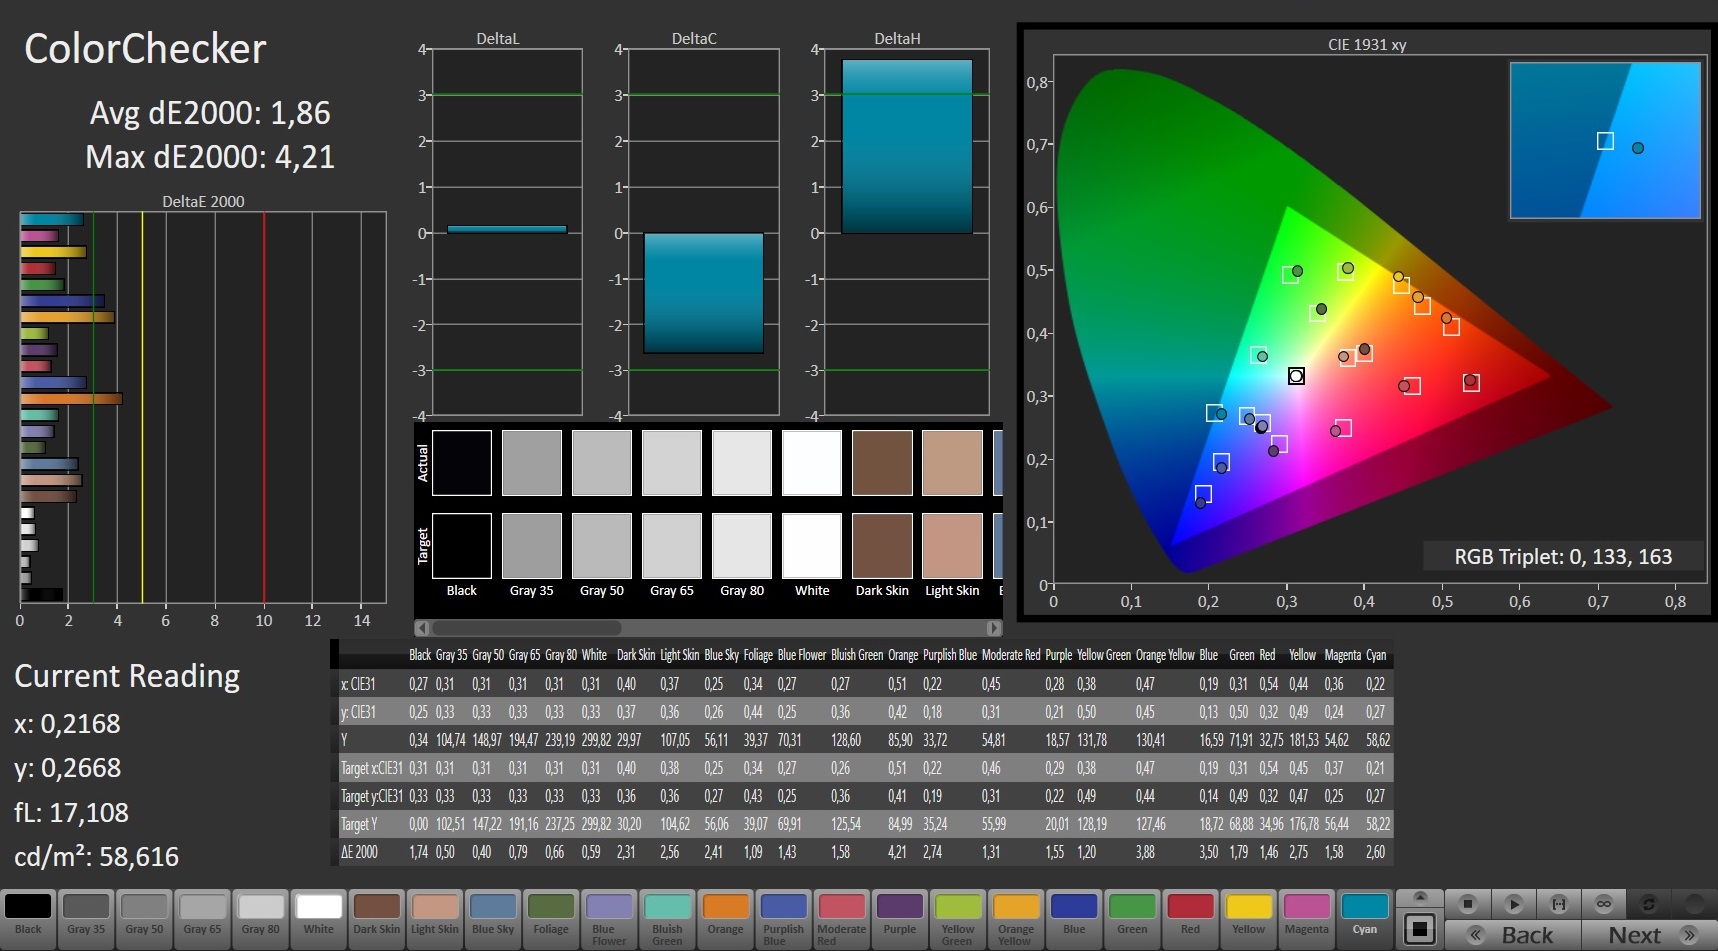
Podemos medir un DeltaE-2000 medio de 5.53 de fábrica; el valor objetivo es menos de 3. El display también tiene un ligero tinte azulado. Un calibrado mejora la situación: La desviación de color cae a 1.86, quedando así dentro del rango objetivo. El tinte azulado desaparece y el rendimiento de la escala de grises es más equilibrado. El display no cubre los espectros AdobeRGB o sRGB; sólo medimos un 58% (AdobeRGB) y 90% (sRGB), respectivamente.
Puedes usar nuestro perfil de color para mejorar el rendimiento de tu panel. Sin embargo, tienes que asegurarte de que tu portátil usa el mismo modelo de display (fabricante + número de modelo). Por lo demás, el rendimiento de color podría ser peor. Los fabricantes de portátiles a menudo usan displays de múltiples proveedores.
Tiempos de respuesta del display
| ↔ Tiempo de respuesta de Negro a Blanco | ||
|---|---|---|
| 26 ms ... subida ↗ y bajada ↘ combinada | ↗ 14.4 ms subida | 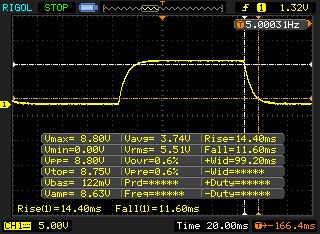 |
| ↘ 11.6 ms bajada | ||
| La pantalla mostró tiempos de respuesta relativamente lentos en nuestros tests pero podría ser demasiado lenta para los jugones. En comparación, todos los dispositivos de prueba van de ##min### (mínimo) a 240 (máximo) ms. » 63 % de todos los dispositivos son mejores. Eso quiere decir que el tiempo de respuesta es peor que la media (19.8 ms) de todos los dispositivos testados. | ||
| ↔ Tiempo de respuesta 50% Gris a 80% Gris | ||
| 36 ms ... subida ↗ y bajada ↘ combinada | ↗ 18 ms subida | 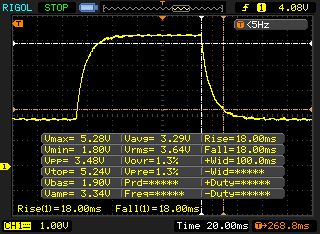 |
| ↘ 18 ms bajada | ||
| La pantalla mostró tiempos de respuesta lentos en nuestros tests y podría ser demasiado lenta para los jugones. En comparación, todos los dispositivos de prueba van de ##min### (mínimo) a 636 (máximo) ms. » 51 % de todos los dispositivos son mejores. Eso quiere decir que el tiempo de respuesta es peor que la media (31 ms) de todos los dispositivos testados. | ||
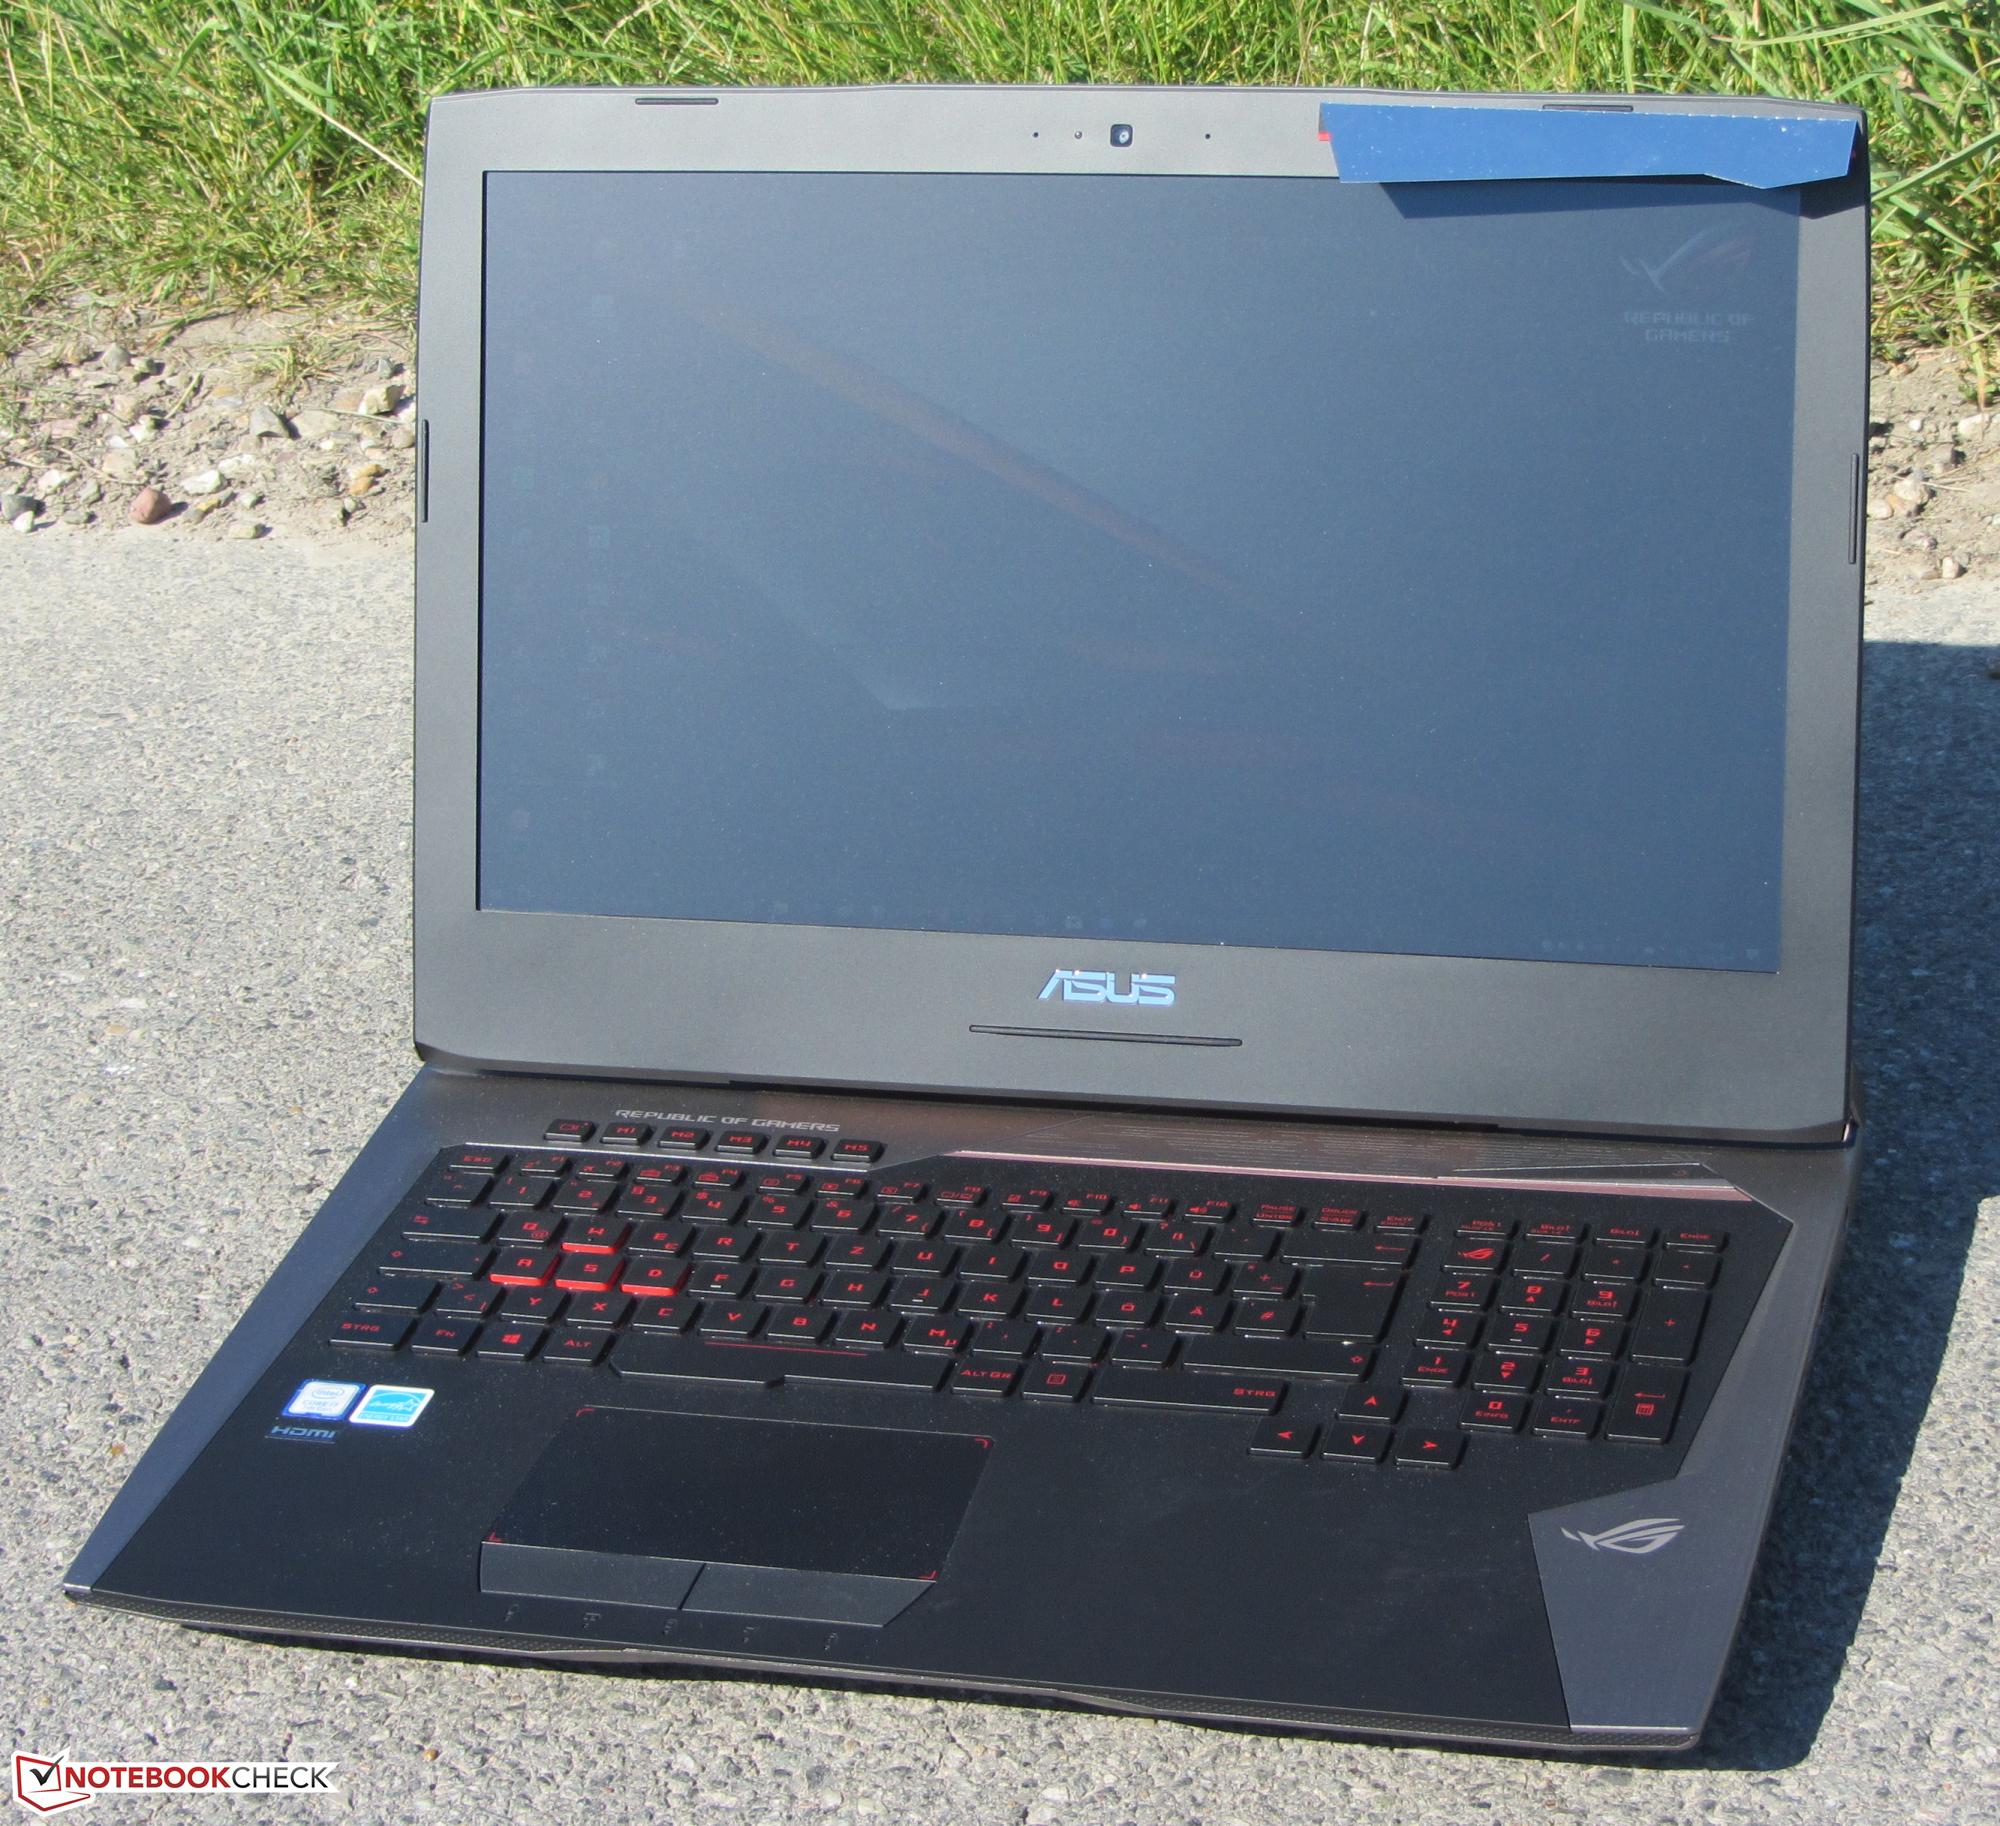
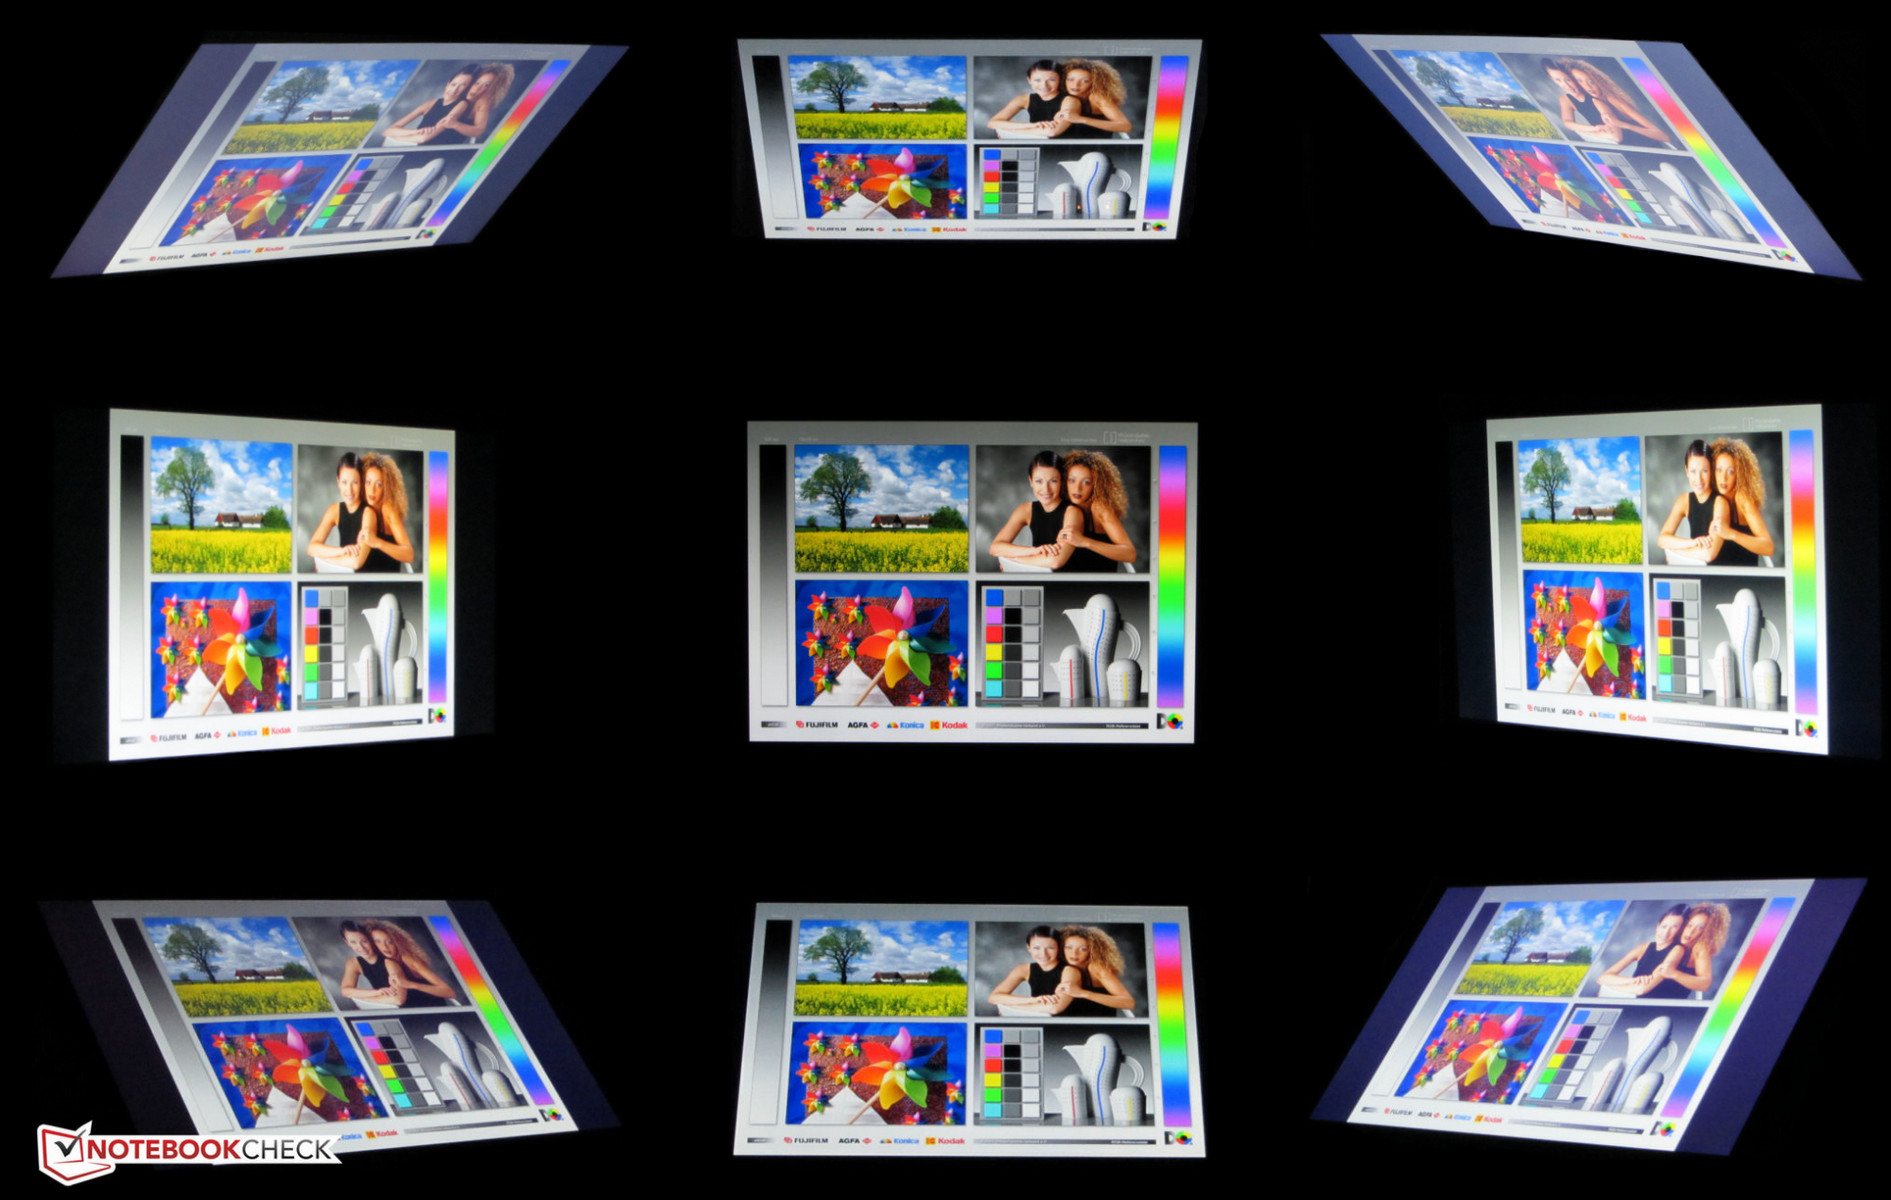
Asus equipa al G752VS con un panel IPS de buenos ángulos de visión. Esto quiere decir que puedes ver el contenido del display desde cualquier posición. Se puede usar fuera siempre que el sol no esté muy fuerte.
Rendimiento
El Asus G752VS es un portátil gaming de 17.3" y nuestro modelo de pruebas cuesta unos 2500 Euros. Asus ofrece otras configuraciones con precios a partir de unos 1700 Euros.
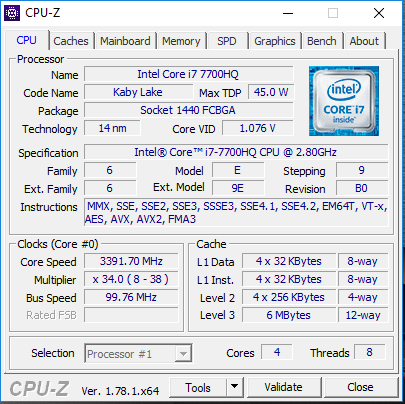
Procesador
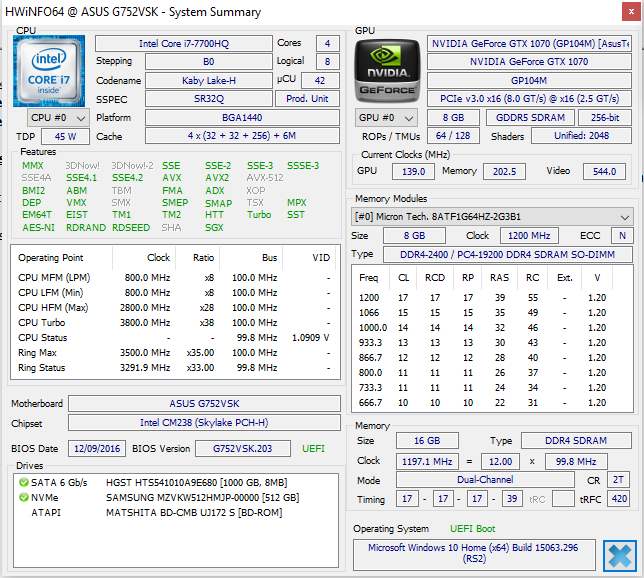
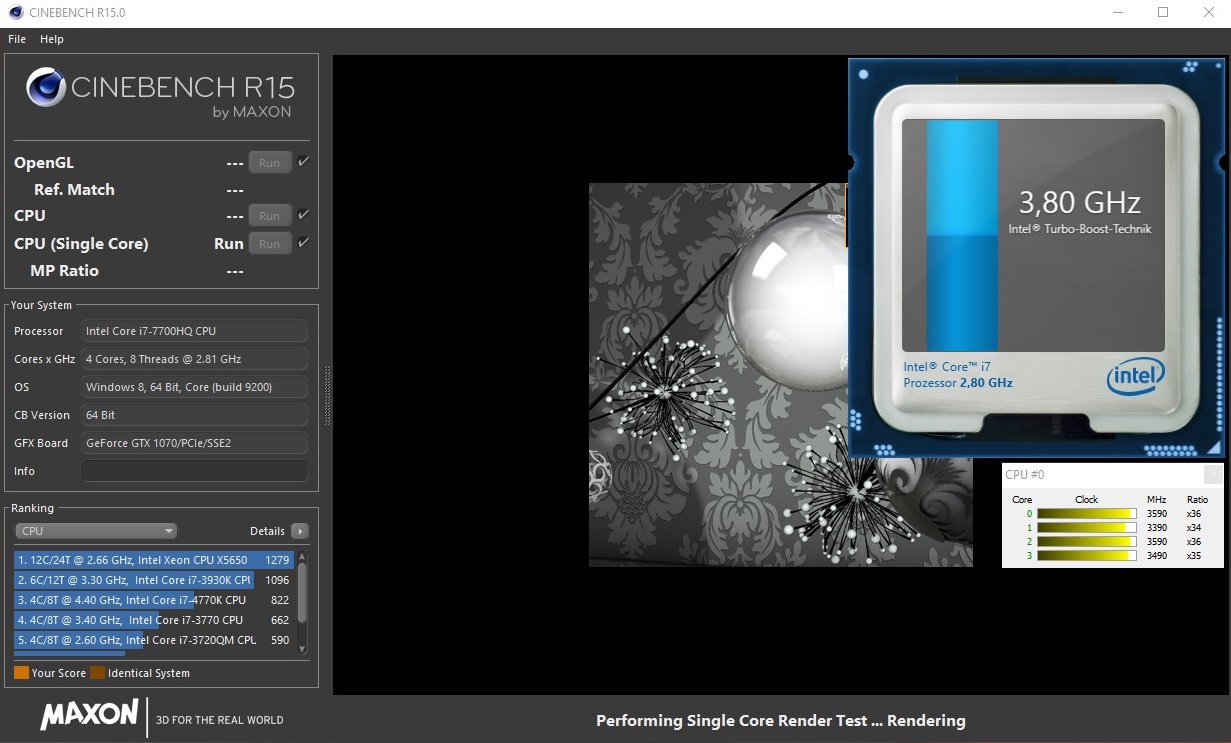
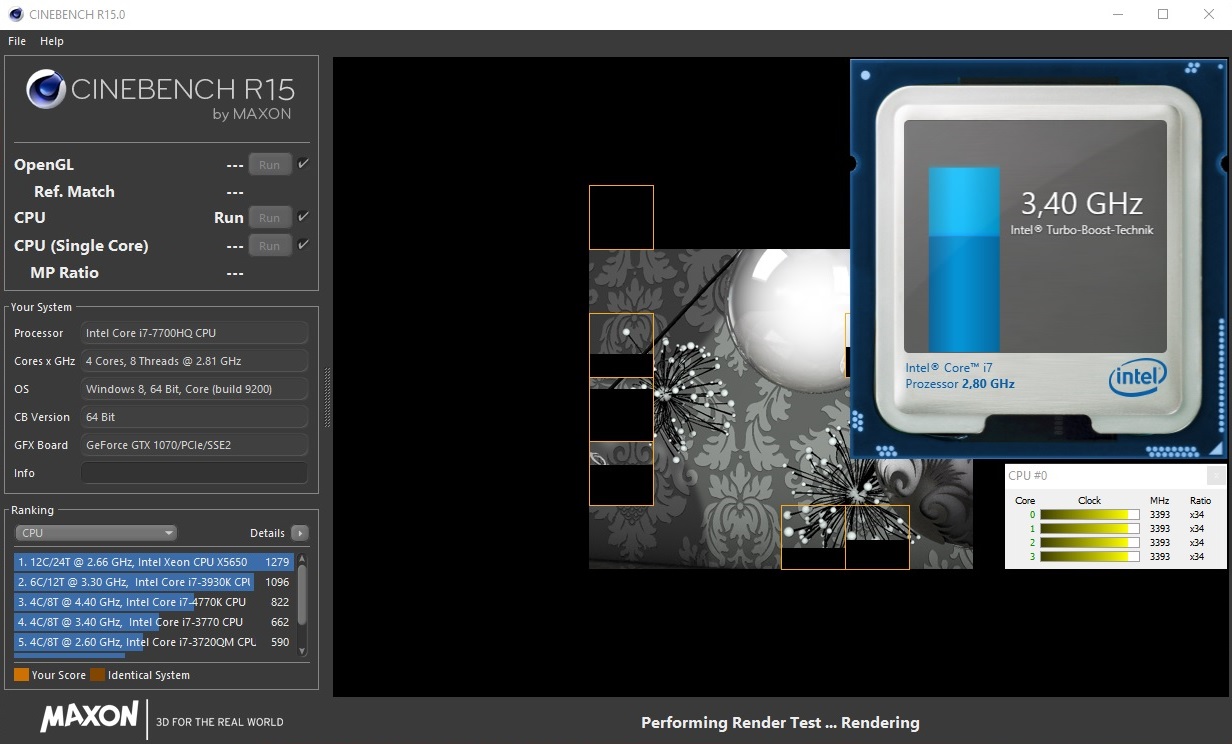
El corazón del G752VS es un procesador quad-core Core i7-7700HQ Kaby Lake. No hay grandes diferencias respecto al anterior Core i7-6700HQ; Kaby Lake es básicamente una versión optimizada de Skylake. La frecuencia base del procesador es de 2.8 GHz, que pueden subir a 3.4 GHz (cuatro núcleos), 3.6 GHz (dos núcleos) o 3.8 GHz (un núcleo), respectivamente.
El procesador siempre puede mantener su rendimiento máximo durante las pruebas, tanto enchufado como en batería. Usamos un bucle del Cinebench R15 Multi Test (30 minutos) para comprobar el rendimiento durante periodos más largos. Los resultados generalmente están al mismo nivel y no hay caída de rendimiento.
| Cinebench R10 | |
| Rendering Multiple CPUs 32Bit | |
| Alienware 17 R4 | |
| Asus G752VS-XB78K | |
| Asus G752VS-BA338T | |
| MSI GT72VR 7RE-433 | |
| Nexoc G734IV | |
| Rendering Single 32Bit | |
| Alienware 17 R4 | |
| Asus G752VS-XB78K | |
| Asus G752VS-BA338T | |
| MSI GT72VR 7RE-433 | |
| Nexoc G734IV | |
| Geekbench 3 | |
| 32 Bit Multi-Core Score | |
| Nexoc G734IV | |
| Asus G752VS-BA338T | |
| MSI GT72VR 7RE-433 | |
| 32 Bit Single-Core Score | |
| Asus G752VS-BA338T | |
| Nexoc G734IV | |
| MSI GT72VR 7RE-433 | |
| Geekbench 4.0 | |
| 64 Bit Multi-Core Score | |
| Nexoc G734IV | |
| Asus G752VS-BA338T | |
| MSI GT72VR 7RE-433 | |
| 64 Bit Single-Core Score | |
| Asus G752VS-BA338T | |
| Nexoc G734IV | |
| MSI GT72VR 7RE-433 | |
| Geekbench 4.4 | |
| 64 Bit Multi-Core Score | |
| Asus G752VS-BA338T | |
| 64 Bit Single-Core Score | |
| Asus G752VS-BA338T | |
| JetStream 1.1 - 1.1 Total | |
| Asus G752VS-BA338T | |
| Nexoc G734IV | |
| MSI GT72VR 7RE-433 | |
| Asus G752VS-XB78K | |
| Alienware 17 R4 | |
Rendimiento de sistema
Un vistazo a la hoja de especificaciones del Asus ya muestra los potentes componentes, algo que apoyan las excelentes puntuaciones en PCMark. El portátil es adecuado para todo tipo de usos que requieran mucha potencia de cálculo, incluyendo la edición de imagen y vídeo además de los juegos. Puedes mejorar más el rendimiento añadiendo un segundo SSD NVMe. Los dos SSDs se pueden usar en configuración RAID 0, lo que reduciría los tiempos de carga. La adición de dos módulos de memoria más también tendría un impacto positivo en el rendimiento general.
| PCMark 7 Score | 6805 puntos | |
| PCMark 8 Home Score Accelerated v2 | 5103 puntos | |
| PCMark 8 Creative Score Accelerated v2 | 8191 puntos | |
| PCMark 8 Work Score Accelerated v2 | 5410 puntos | |
ayuda | ||
Almacenamiento
El disco es un velocísimo SSD NVMe de Samsung. Es un modelo M.2 (2280) con una capacidad total de 512 GB. Las tasas de transferencia del SSD son excelentes. El portátil ofrece una segunda ranura M.2-2280, que también soporta un veloz SSD NVMe. Sendos discos se pueden configurar en RAID-0 o RAID-1. También tienes un HDD de 2.5" (1 TB, 5400 rpm).

| Asus G752VS-BA338T Samsung SM961 MZVKW512HMJP m.2 PCI-e | MSI GT72VR 7RE-433 Kingston RBU-SNS8152S3256GG5 | Gigabyte P57X v7 Transcend MTS800 256GB M.2 (TS256GMTS800) | Nexoc G734IV Samsung SM961 MZVKW512HMJP m.2 PCI-e | Alienware 17 R4 SK Hynix PC300 NVMe 512 GB | Asus G752VS-XB78K Toshiba NVMe THNSN5512GPU7 | |
|---|---|---|---|---|---|---|
| CrystalDiskMark 3.0 | -49% | -58% | -6% | -11% | 19% | |
| Read Seq (MB/s) | 2791 | 521 -81% | 517 -81% | 2268 -19% | 1277 -54% | 1718 -38% |
| Write Seq (MB/s) | 1596 | 311.8 -80% | 305.7 -81% | 1559 -2% | 786 -51% | 1305 -18% |
| Read 512 (MB/s) | 400.8 | 403.1 1% | 315 -21% | 413.8 3% | 894 123% | 1250 212% |
| Write 512 (MB/s) | 1606 | 332.3 -79% | 306.1 -81% | 1167 -27% | 659 -59% | 1438 -10% |
| Read 4k (MB/s) | 55.1 | 33.35 -39% | 26.04 -53% | 54 -2% | 38.11 -31% | 44.42 -19% |
| Write 4k (MB/s) | 163.8 | 111.1 -32% | 82.3 -50% | 154.9 -5% | 128.5 -22% | 154.4 -6% |
| Read 4k QD32 (MB/s) | 607 | 331.1 -45% | 281.3 -54% | 634 4% | 628 3% | 744 23% |
| Write 4k QD32 (MB/s) | 527 | 318.3 -40% | 296 -44% | 509 -3% | 531 1% | 578 10% |
Rendimiento GPU
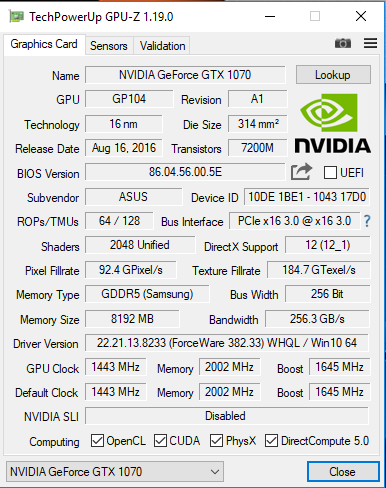
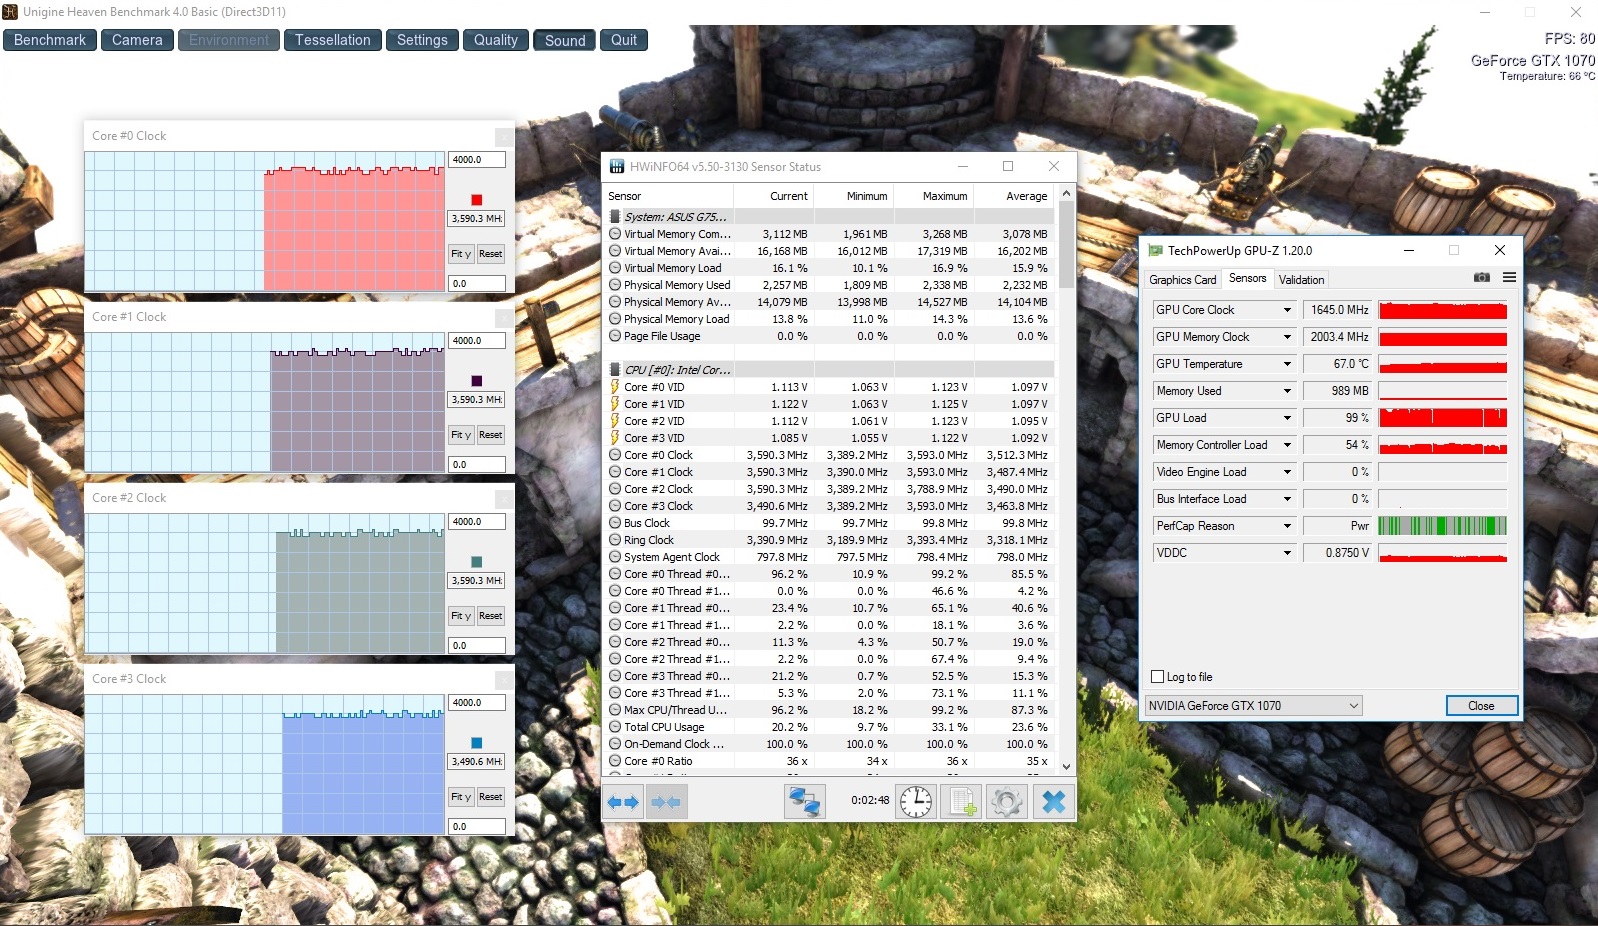
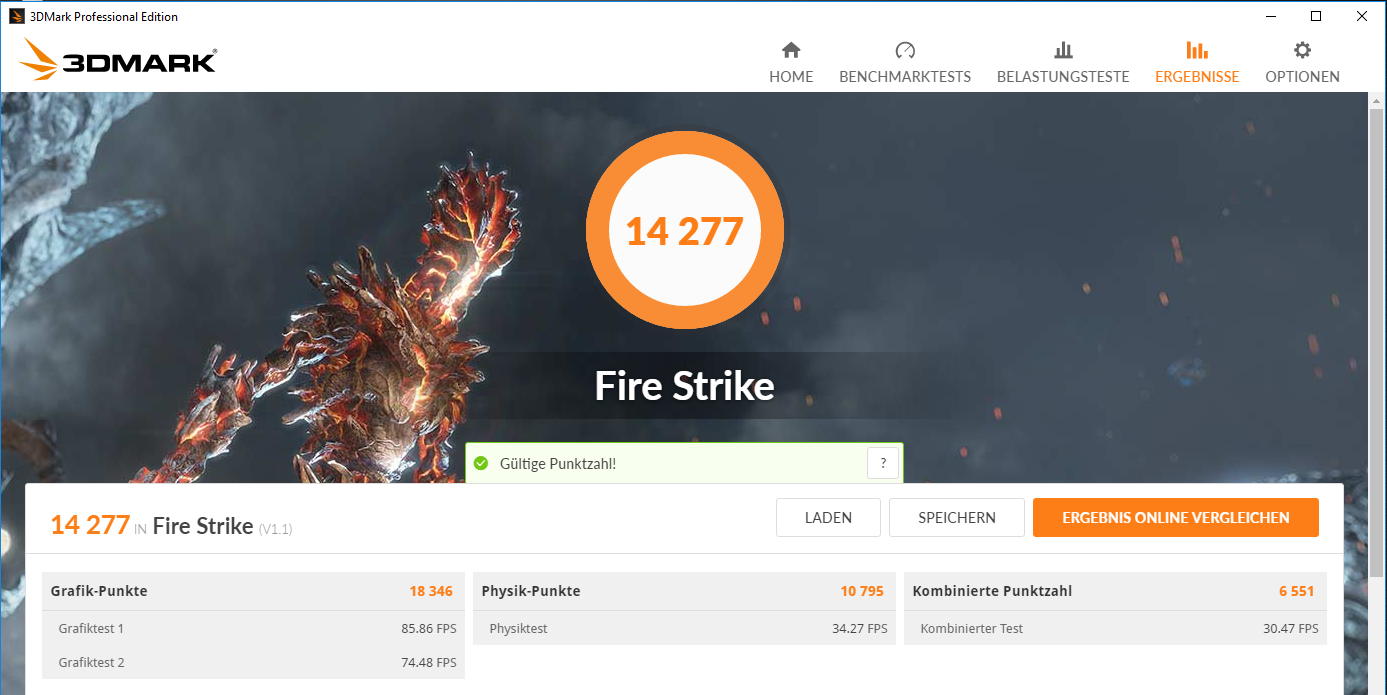
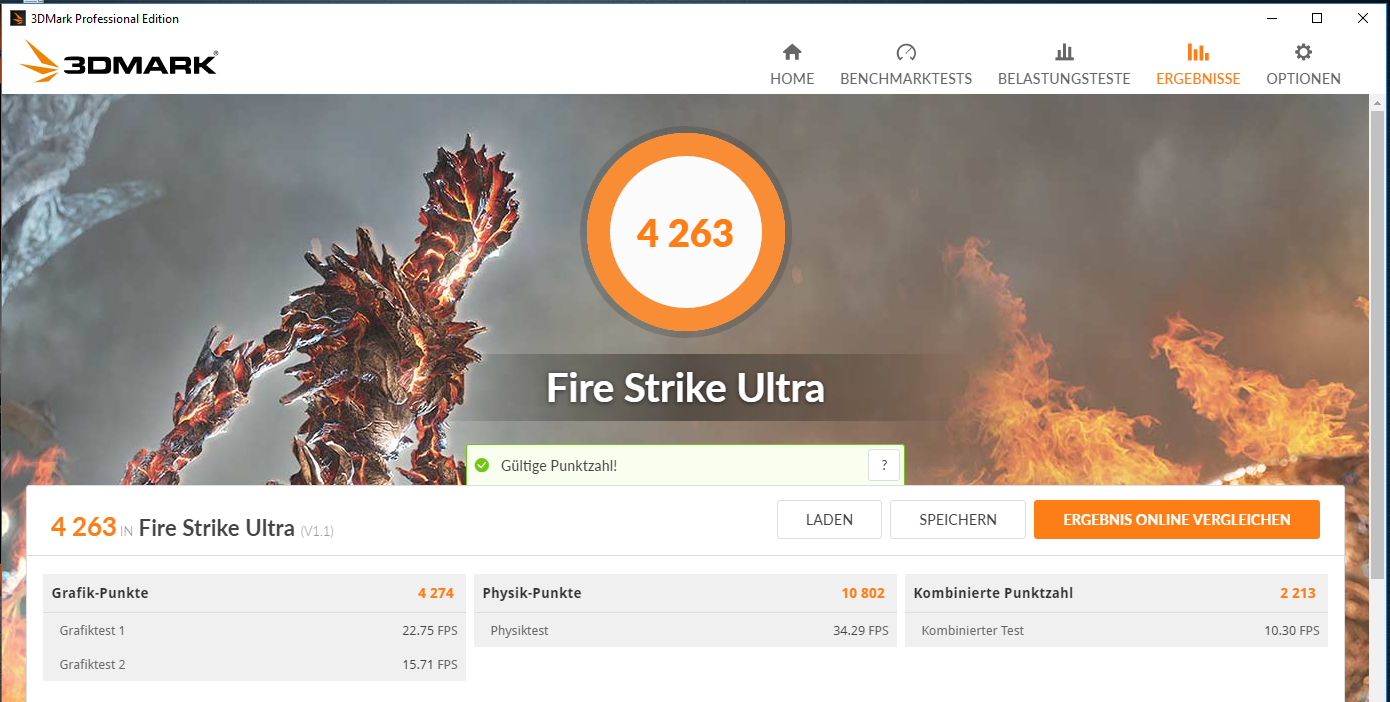
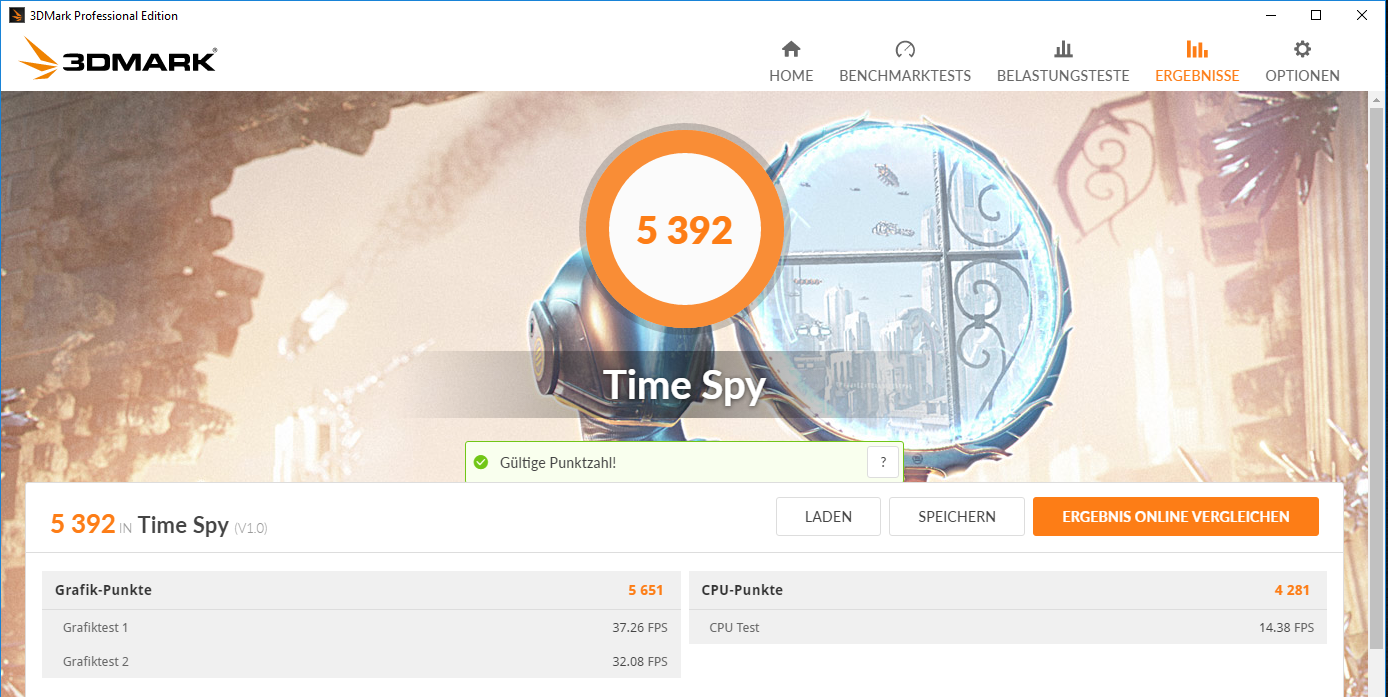
La Nvidia GeForce GTX 1070 es una gráfica de gama alta con soporte DirectX-12 y una frecuencia máxima de hasta 1898 MHz. Sin embargo, este valor no se puede mantener durante periodos prolongados. Medimos una frecuencia media de unos 1600 MHz durante nuestros tests. Es posible acelerar la GPU automáticamente por Turbo Gear Mode "Extreme" en el Gaming Center. Estos resulta en una frecuencia máxima de 2 GHz, pero de nuevo sólo por un breve periodo de tiempo. La GPU está equipada con 8192 MB de VRAM GDDR5. Los resultados en las pruebas 3DMark están al nivel esperado para esta GPU.
La iGPU HD Graphics 630 está desactivada y no se puede activar. El G752VS no soporta intercambio de gráfica.
| 3DMark 06 Standard Score | 30279 puntos | |
| 3DMark 11 Performance | 17222 puntos | |
| 3DMark Ice Storm Standard Score | 122763 puntos | |
| 3DMark Cloud Gate Standard Score | 26609 puntos | |
| 3DMark Fire Strike Score | 14277 puntos | |
| 3DMark Fire Strike Extreme Score | 7961 puntos | |
| 3DMark Time Spy Score | 5392 puntos | |
ayuda | ||
| 3DMark - 1920x1080 Fire Strike Graphics | |
| Alienware 17 R4 | |
| Asus G752VS-BA338T | |
| MSI GT72VR 7RE-433 | |
| Nexoc G734IV | |
| Gigabyte P57X v7 | |
| Acer Predator 17 G9-793-70PJ | |
| Asus G752VS-XB78K | |
| 3DMark 11 - 1280x720 Performance GPU | |
| Alienware 17 R4 | |
| Asus G752VS-BA338T | |
| Gigabyte P57X v7 | |
| MSI GT72VR 7RE-433 | |
| Acer Predator 17 G9-793-70PJ | |
| Asus G752VS-XB78K | |
| Nexoc G734IV | |
Rendimiento Gaming
No sorprende que el portátil pueda manejar una experiencia de juego fluida con todos los títulos modernos vista la potente equipación hardware. Siempre puedes jugar en resolución FHD y tampoco tienes que reducir los detalles gráficos. Puedes usar detalles altos o incluso máximos.
Usamos el juego The Witcher 3 para comprobar el rendimiento bajo cargas sostenidas. El juego está en marcha unos 60 minutos en FHD con detalles máximos. El personaje está quieto durante este tiempo. El frame rate cae de 61-63 fps a 57-61 tras un par de minutos y se queda en este nivel. No es para nada una gran caída.
| BioShock Infinite - 1920x1080 Ultra Preset, DX11 (DDOF) | |
| Alienware 17 R4 | |
| Asus G752VS-BA338T | |
| Asus G752VS-XB78K | |
| MSI GT72VR 7RE-433 | |
| Gigabyte P57X v7 | |
| Nexoc G734IV | |
| The Witcher 3 - 1920x1080 Ultra Graphics & Postprocessing (HBAO+) | |
| Alienware 17 R4 | |
| Asus G752VS-BA338T | |
| Acer Predator 17 G9-793-70PJ | |
| Asus G752VS-XB78K | |
| Far Cry Primal - 1920x1080 Ultra Preset AA:SM | |
| Asus G752VS-XB78K | |
| Asus G752VS-BA338T | |
| Rise of the Tomb Raider - 1920x1080 Very High Preset AA:FX AF:16x | |
| Alienware 17 R4 | |
| Asus G752VS-BA338T | |
| Asus G752VS-XB78K | |
| Nexoc G734IV | |
| For Honor - 1920x1080 Extreme Preset AA:T AF:16x | |
| Asus G752VS-BA338T | |
| Acer Predator 17 G9-793-70PJ | |
| bajo | medio | alto | ultra | |
|---|---|---|---|---|
| Tomb Raider (2013) | 431.5 | 407.8 | 339 | 192 |
| BioShock Infinite (2013) | 260.3 | 220.8 | 207.5 | 139.4 |
| The Witcher 3 (2015) | 228.1 | 184.4 | 117 | 59.6 |
| Rise of the Tomb Raider (2016) | 219.7 | 180.1 | 117.7 | 99 |
| Far Cry Primal (2016) | 118 | 103 | 93 | 86 |
| For Honor (2017) | 242.6 | 160 | 154 | 113.4 |
| Ghost Recon Wildlands (2017) | 127 | 96.3 | 91 | 54.4 |
| Prey (2017) | 142 | 140.2 | 135.2 | 132.5 |
Emisiones
Ruido de sistema
El G752VS no hace mucho ruido en inactivo y los ventiladores a veces se quedan quietos. Van a poca velocidad la mayor parte del tiempo, pero apenas se les oye ya que el HDD de 2.5" es más ruidoso. La cosa cambia cuando estresas el sistema. Podemos medir 49 dB(A) durante el test de estrés y 42-45 dB(A) en el test Witcher 3.
Ruido
| Ocioso |
| 30 / 32 / 36 dB(A) |
| HDD |
| 34 dB(A) |
| DVD |
| 40 / dB(A) |
| Carga |
| 43 / 49 dB(A) |
 | ||
30 dB silencioso 40 dB(A) audible 50 dB(A) ruidosamente alto |
||
min: | ||
| Asus G752VS-BA338T i7-7700HQ, GeForce GTX 1070 Mobile | MSI GT72VR 7RE-433 i7-7700HQ, GeForce GTX 1070 Mobile | Gigabyte P57X v7 i7-7700HQ, GeForce GTX 1070 Mobile | Nexoc G734IV i7-7700HQ, GeForce GTX 1070 Mobile | Acer Predator 17 G9-793-70PJ i7-7700HQ, GeForce GTX 1070 Mobile | Alienware 17 R4 i7-7820HK, GeForce GTX 1080 Mobile | Asus G752VS-XB78K 6820HK, GeForce GTX 1070 Mobile | |
|---|---|---|---|---|---|---|---|
| Noise | -1% | 0% | -13% | -4% | -8% | 3% | |
| apagado / medio ambiente * (dB) | 30 | 31 -3% | 29 3% | 30 -0% | 31 -3% | 28.2 6% | 30 -0% |
| Idle Minimum * (dB) | 30 | 34 -13% | 30.4 -1% | 34 -13% | 32 -7% | 35.6 -19% | 31 -3% |
| Idle Average * (dB) | 32 | 35 -9% | 32.1 -0% | 35 -9% | 35 -9% | 35.6 -11% | 32 -0% |
| Idle Maximum * (dB) | 36 | 37 -3% | 32.1 11% | 46 -28% | 38 -6% | 35.7 1% | 33 8% |
| Load Average * (dB) | 43 | 37 14% | 45.6 -6% | 49 -14% | 42 2% | 50.2 -17% | 40 7% |
| Witcher 3 ultra * (dB) | 43 | 44 -2% | 50.2 -17% | ||||
| Load Maximum * (dB) | 49 | 44 10% | 51.5 -5% | 56 -14% | 50 -2% | 50.2 -2% | 47 4% |
* ... más pequeño es mejor
Temperatura
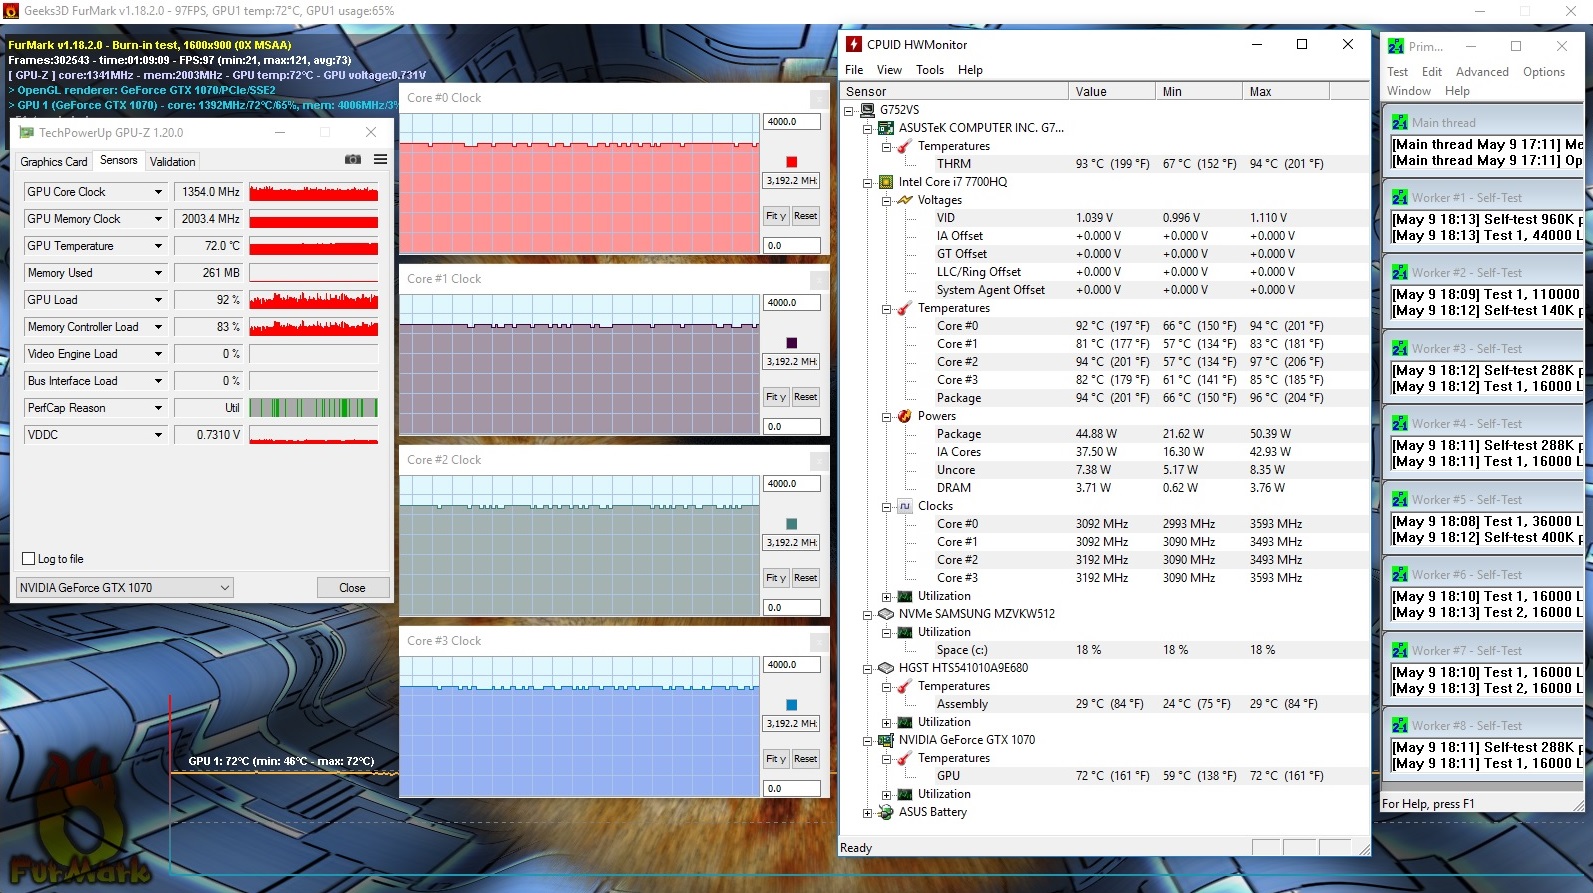
Nuestro test de estrés con Prime95 y FurMark durante al menos una hora da resultados diferentes enchufado y en batería. Con el adaptador enchufado, procesador (3.1-3.2 GHz) y gráfica (~1400 MHz) logran altas frecuencias, pero fluctúan entre valores bajos y altos en batería.
El portátil no se calienta demasiado. Sólo medimos más de 40 °C en dos puntos durante nuestro test de estrés. Las temperaturas son incluso más bajas durante el test Witcher 3 (el juego durante 1 hora con detalles máximos/FHD).
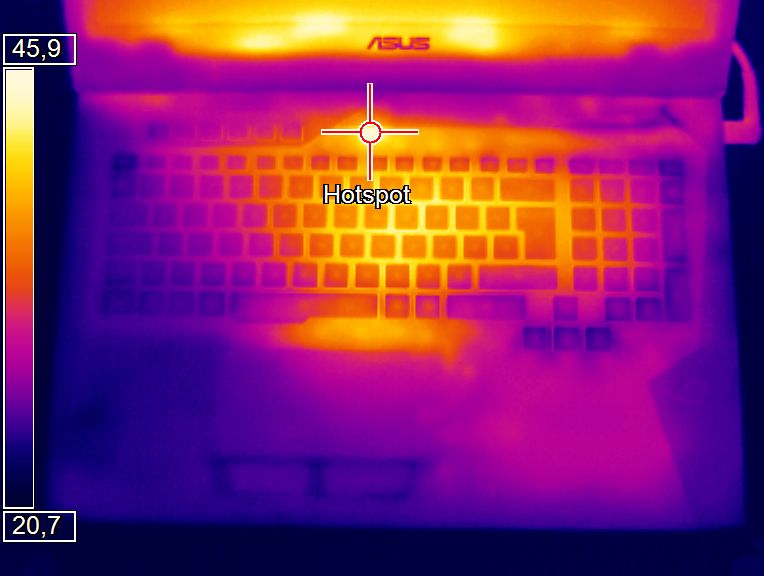
(±) La temperatura máxima en la parte superior es de 41 °C / 106 F, frente a la media de 40.4 °C / 105 F, que oscila entre 21.2 y 68.8 °C para la clase Gaming.
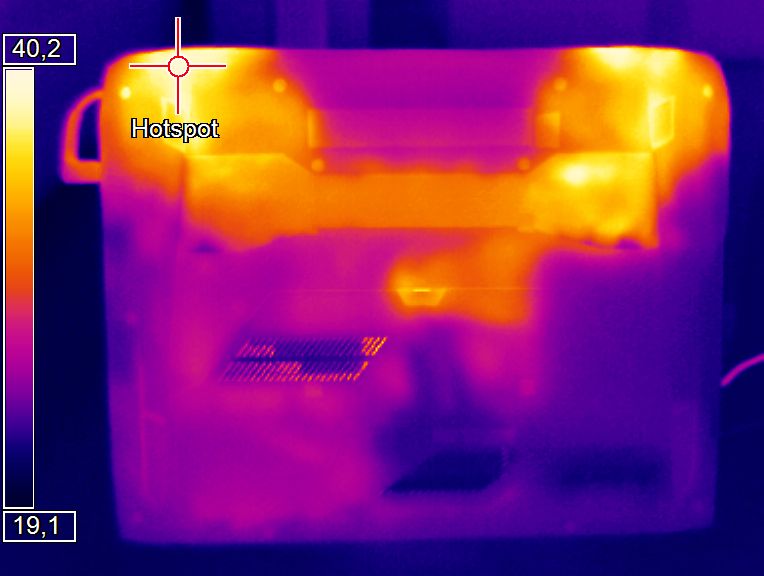
(+) El fondo se calienta hasta un máximo de 39.3 °C / 103 F, frente a la media de 43.2 °C / 110 F
(+) En reposo, la temperatura media de la parte superior es de 26.8 °C / 80# F, frente a la media del dispositivo de 33.9 °C / 93 F.
(+) Jugando a The Witcher 3, la temperatura media de la parte superior es de 31.3 °C / 88 F, frente a la media del dispositivo de 33.9 °C / 93 F.
(+) El reposamanos y el panel táctil están a una temperatura inferior a la de la piel, con un máximo de 27.6 °C / 81.7 F y, por tanto, son fríos al tacto.
(±) La temperatura media de la zona del reposamanos de dispositivos similares fue de 28.8 °C / 83.8 F (+1.2 °C / 2.1 F).
| Asus G752VS-BA338T i7-7700HQ, GeForce GTX 1070 Mobile | MSI GT72VR 7RE-433 i7-7700HQ, GeForce GTX 1070 Mobile | Gigabyte P57X v7 i7-7700HQ, GeForce GTX 1070 Mobile | Nexoc G734IV i7-7700HQ, GeForce GTX 1070 Mobile | Acer Predator 17 G9-793-70PJ i7-7700HQ, GeForce GTX 1070 Mobile | Alienware 17 R4 i7-7820HK, GeForce GTX 1080 Mobile | Asus G752VS-XB78K 6820HK, GeForce GTX 1070 Mobile | |
|---|---|---|---|---|---|---|---|
| Heat | -4% | -20% | -15% | 1% | -18% | -7% | |
| Maximum Upper Side * (°C) | 41 | 41.5 -1% | 51.2 -25% | 48.1 -17% | 39.1 5% | 49.6 -21% | 42.9 -5% |
| Maximum Bottom * (°C) | 39.3 | 50.6 -29% | 56.8 -45% | 59.3 -51% | 42.1 -7% | 56 -42% | 41.5 -6% |
| Idle Upper Side * (°C) | 28.8 | 26.4 8% | 29.2 -1% | 28.2 2% | 27.9 3% | 29.6 -3% | 31.6 -10% |
| Idle Bottom * (°C) | 27.3 | 25.4 7% | 29.2 -7% | 26 5% | 26.1 4% | 29.2 -7% | 29.5 -8% |
* ... más pequeño es mejor
Altavoces
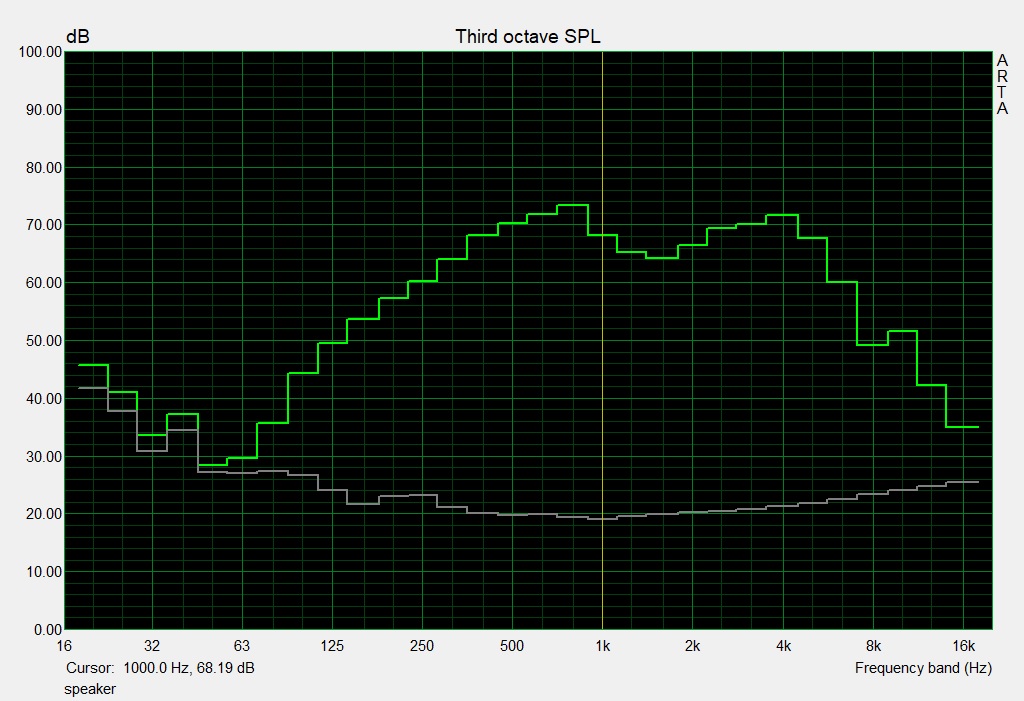
Asus G752VS-BA338T análisis de audio
(±) | la sonoridad del altavoz es media pero buena (80 dB)
Graves 100 - 315 Hz
(±) | lubina reducida - en promedio 9.4% inferior a la mediana
(±) | la linealidad de los graves es media (11.1% delta a frecuencia anterior)
Medios 400 - 2000 Hz
(+) | medios equilibrados - a sólo 4.2% de la mediana
(+) | los medios son lineales (6% delta a la frecuencia anterior)
Altos 2 - 16 kHz
(±) | máximos reducidos - de media 7.7% inferior a la mediana
(±) | la linealidad de los máximos es media (10% delta a frecuencia anterior)
Total 100 - 16.000 Hz
(±) | la linealidad del sonido global es media (21.2% de diferencia con la mediana)
En comparación con la misma clase
» 76% de todos los dispositivos probados de esta clase eran mejores, 4% similares, 19% peores
» El mejor tuvo un delta de 6%, la media fue 18%, el peor fue ###max##%
En comparación con todos los dispositivos probados
» 59% de todos los dispositivos probados eran mejores, 7% similares, 34% peores
» El mejor tuvo un delta de 4%, la media fue 23%, el peor fue ###max##%
Acer Predator 17 G9-793-70PJ análisis de audio
(+) | los altavoces pueden reproducir a un volumen relativamente alto (#87 dB)
Graves 100 - 315 Hz
(±) | lubina reducida - en promedio 5.5% inferior a la mediana
(±) | la linealidad de los graves es media (8% delta a frecuencia anterior)
Medios 400 - 2000 Hz
(+) | medios equilibrados - a sólo 2.9% de la mediana
(+) | los medios son lineales (3.5% delta a la frecuencia anterior)
Altos 2 - 16 kHz
(±) | máximos reducidos - de media 5.2% inferior a la mediana
(+) | los máximos son lineales (6.2% delta a la frecuencia anterior)
Total 100 - 16.000 Hz
(+) | el sonido global es lineal (10.3% de diferencia con la mediana)
En comparación con la misma clase
» 6% de todos los dispositivos probados de esta clase eran mejores, 2% similares, 93% peores
» El mejor tuvo un delta de 6%, la media fue 18%, el peor fue ###max##%
En comparación con todos los dispositivos probados
» 5% de todos los dispositivos probados eran mejores, 1% similares, 94% peores
» El mejor tuvo un delta de 4%, la media fue 23%, el peor fue ###max##%
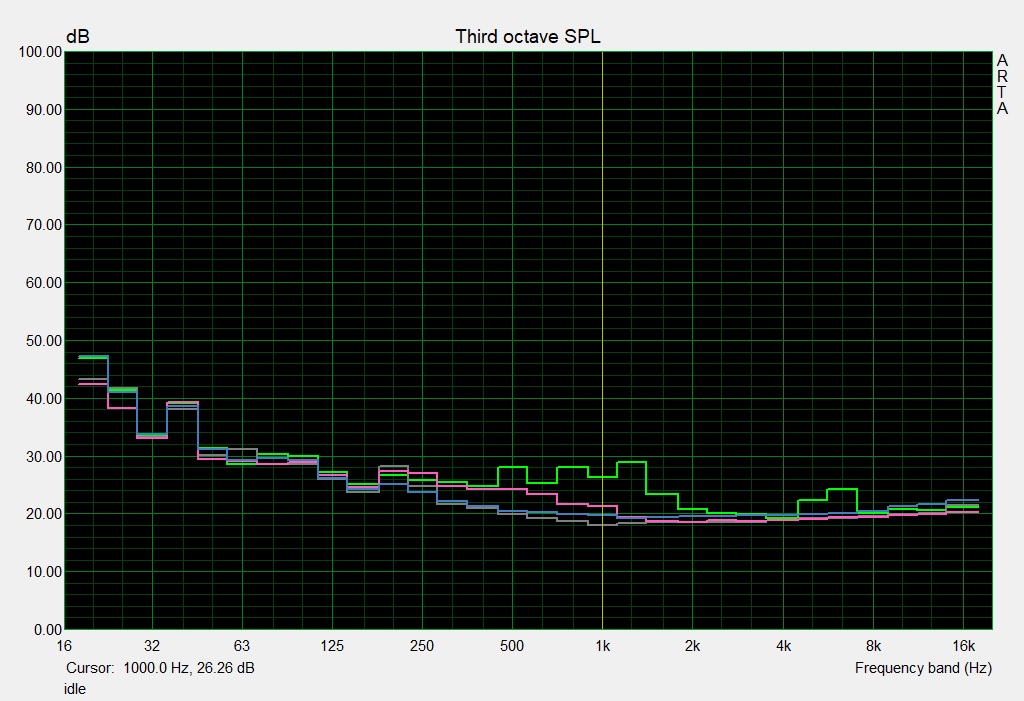
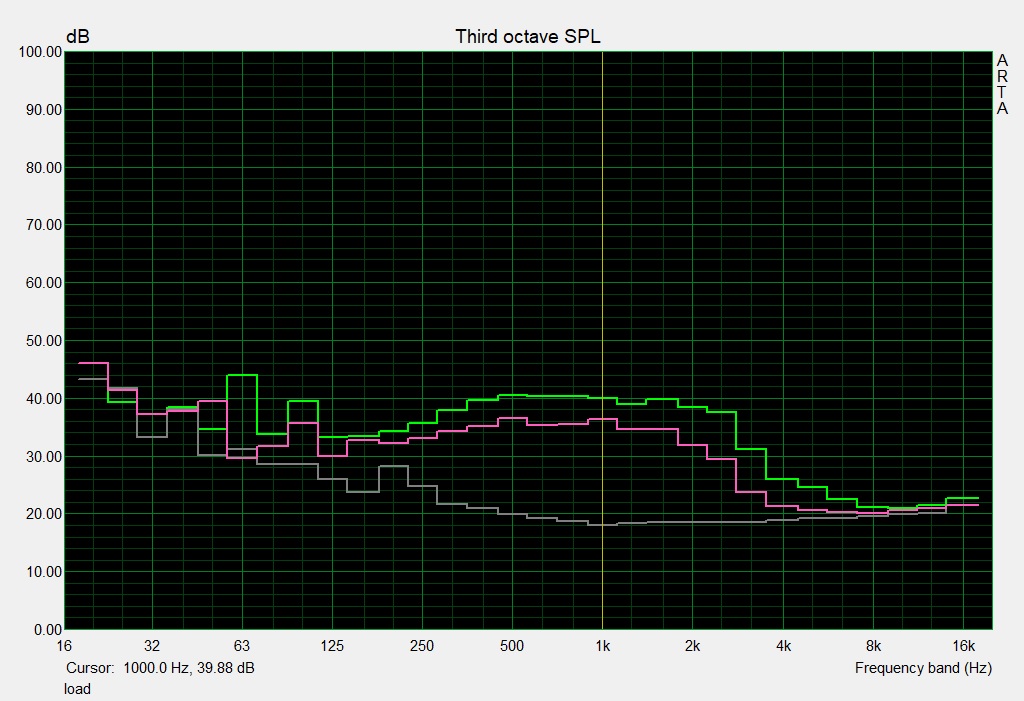
Frequency Comparison (Checkboxes select/deselectable!)
Gestión de energía
Consumo de energía
Nuestras mediciones de consumo no revelan sorpresas. Medimos 27 W de media en inactivo – un resultado normal para un portátil gaming con iGPU desactivada. Este valor aumenta a 206 W durante el test de estrés. El adaptador de corriente de 230-W es suficiente para el GL752VS. el test Witcher 3 consume unos 165 W.
| Off / Standby | |
| Ocioso | |
| Carga |
|
Clave:
min: | |
| Asus G752VS-BA338T i7-7700HQ, GeForce GTX 1070 Mobile | MSI GT72VR 7RE-433 i7-7700HQ, GeForce GTX 1070 Mobile | Gigabyte P57X v7 i7-7700HQ, GeForce GTX 1070 Mobile | Nexoc G734IV i7-7700HQ, GeForce GTX 1070 Mobile | Acer Predator 17 G9-793-70PJ i7-7700HQ, GeForce GTX 1070 Mobile | Alienware 17 R4 i7-7820HK, GeForce GTX 1080 Mobile | Asus G752VS-XB78K 6820HK, GeForce GTX 1070 Mobile | |
|---|---|---|---|---|---|---|---|
| Power Consumption | 4% | -13% | 20% | -14% | -37% | -10% | |
| Idle Minimum * (Watt) | 21 | 20 5% | 15.7 25% | 12 43% | 23 -10% | 37.5 -79% | 24 -14% |
| Idle Average * (Watt) | 27 | 27 -0% | 23.4 13% | 17 37% | 33 -22% | 37.6 -39% | 31 -15% |
| Idle Maximum * (Watt) | 32 | 31 3% | 23.5 27% | 22 31% | 40 -25% | 37.6 -18% | 36 -13% |
| Load Average * (Watt) | 86 | 86 -0% | 184.6 -115% | 86 -0% | 94 -9% | 122.4 -42% | 94 -9% |
| Witcher 3 ultra * (Watt) | 165 | 177 -7% | 180.3 -9% | ||||
| Load Maximum * (Watt) | 206 | 184 11% | 233.1 -13% | 224 -9% | 228 -11% | 277.4 -35% | 204 1% |
* ... más pequeño es mejor
Aguante de batería
El portátil Asus logra un aguante de 4:53 horas en nuestro test WLAN realista dónde simulamos la navegación con un script. Tenemos activo el perfil de energía "Balanced" y el brillo a ~150 nits. El test de vídeo con un bucle del corto Big Buck Bunny (H.264, 1920x1080 pixels) da un aguante de 4:17 horas para el G752VS (inalámbricos apagados, ahorro de energía, brillo de display 150 nits).
| Asus G752VS-BA338T i7-7700HQ, GeForce GTX 1070 Mobile, 90 Wh | MSI GT72VR 7RE-433 i7-7700HQ, GeForce GTX 1070 Mobile, 83 Wh | Gigabyte P57X v7 i7-7700HQ, GeForce GTX 1070 Mobile, 75.81 Wh | Nexoc G734IV i7-7700HQ, GeForce GTX 1070 Mobile, 60 Wh | Acer Predator 17 G9-793-70PJ i7-7700HQ, GeForce GTX 1070 Mobile, 88 Wh | Alienware 17 R4 i7-7820HK, GeForce GTX 1080 Mobile, 99 Wh | Asus G752VS-XB78K 6820HK, GeForce GTX 1070 Mobile, 90 Wh | |
|---|---|---|---|---|---|---|---|
| Duración de Batería | -17% | -30% | -19% | -20% | -34% | -25% | |
| Reader / Idle (h) | 7.4 | 5.3 -28% | 4.3 -42% | 7.7 4% | 5.4 -27% | 4.6 -38% | 5.2 -30% |
| H.264 (h) | 4.3 | 3.8 -12% | 3.3 -23% | 3.1 -28% | |||
| WiFi v1.3 (h) | 4.9 | 3.8 -22% | 2.6 -47% | 3.4 -31% | 3.6 -27% | 3 -39% | 3.5 -29% |
| Load (h) | 1.6 | 1.5 -6% | 1.6 0% | 1.2 -25% | 1.5 -6% | 1.2 -25% | 1.4 -13% |
Veredicto
Pro
Contra
El G752VS-BA338T es el modelo Kaby Lake de la serie de portátiles gaming Asus de 17". El nuevo procesador Core i7-7700HQ no es mucho más rápido que los modelos Skylake.
El procesador Kaby Lake resulta en más aguante de batería gracias a la mejor eficiencia.
La combinación CPU/GPU puede con todos los juegos modernos en Full HD con hasta detalles máximos. La tecnología Nvidia G-Sync asegura imágenes fluidas en el display de 120 Hz y la gráfica sigue teniendo holgura para resoluciones más altas. Sin embargo, esto requiere un monitor externo.
Las emisiones de ruido no son demasiado malas a pesar del potente hardware. Es también el caso del desarrollo de la temperatura. Asus equipa al portátil con un veloz SSD NVMe y hasta tiene una ranura libre para un segundo SSD NVMe. También trae un HDD de 2.5". Sustituir los discos es fácil gracias a la escotilla de mantenimiento.
Asus G752VS-BA338T
- 05/30/2017 v6 (old)
Sascha Mölck
Price comparison
