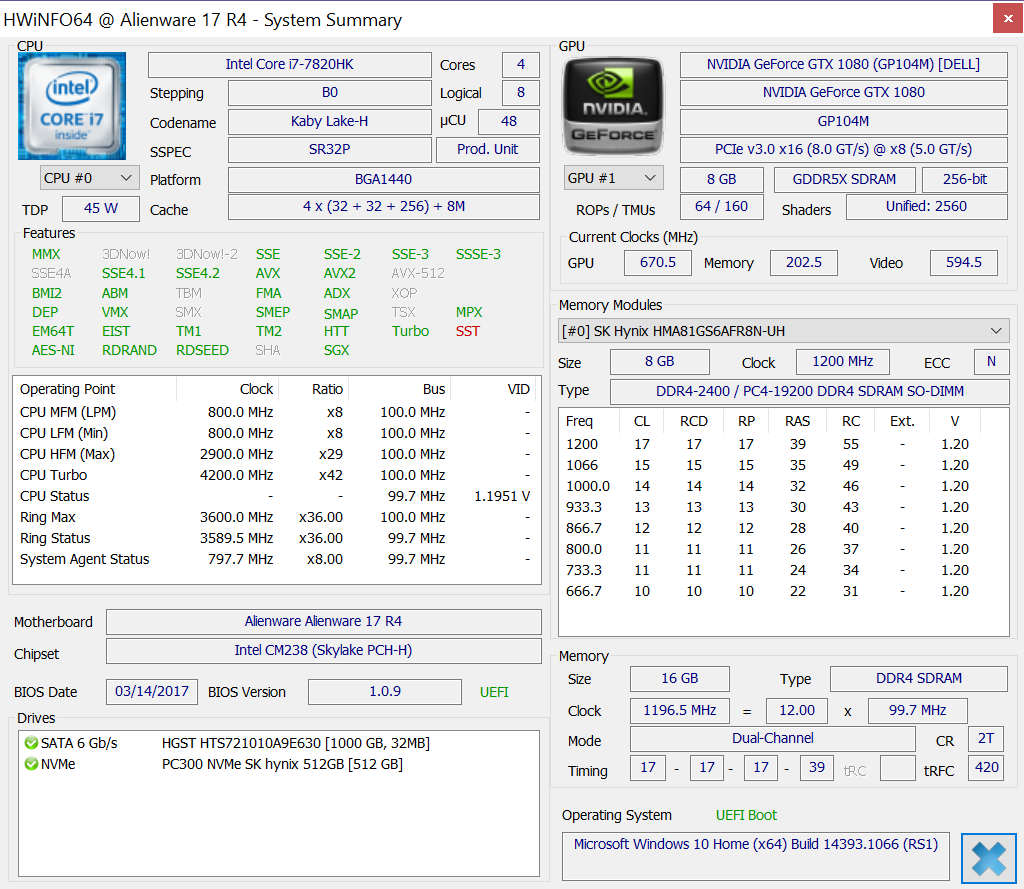
Breve del portátil Alienware 17 R4 (7820HK, QHD, GTX 1080)
| Networking | |
| iperf3 transmit AX12 | |
| Alienware 17 R4 | |
| MSI GT62VR 7RE-223 | |
| Dell XPS 15 9560 (i7-7700HQ, UHD) | |
| iperf3 receive AX12 | |
| MSI GT62VR 7RE-223 | |
| Dell XPS 15 9560 (i7-7700HQ, UHD) | |
| Alienware 17 R4 | |
| |||||||||||||||||||||||||
iluminación: 86 %
Brillo con batería: 402.3 cd/m²
Contraste: 649:1 (Negro: 0.62 cd/m²)
ΔE ColorChecker Calman: 5.6 | ∀{0.5-29.43 Ø4.71}
ΔE Greyscale Calman: 4.7 | ∀{0.09-98 Ø4.96}
82.2% sRGB (Argyll 1.6.3 3D)
53.7% AdobeRGB 1998 (Argyll 1.6.3 3D)
60.5% AdobeRGB 1998 (Argyll 3D)
82.9% sRGB (Argyll 3D)
61.2% Display P3 (Argyll 3D)
Gamma: 2.14
CCT: 7519 K
| Alienware 17 R4 TN LED, 17.3", 2560x1440 | Alienware 17 R3 (A17-9935) CV69H_173WF4 (LGD0459), IPS, 17.3", 1920x1080 | MSI GT73VR 7RF-296 N173HHE-G32 (CMN1747), TN LED, 17.3", 1920x1080 | Acer Predator 17 X GX-792-76DL LP173WF4-SPF5 (LGD056D), IPS, 17.3", 1920x1080 | Aorus X7 DT v6 AUO1096, TN LED, 17.3", 2560x1440 | |
|---|---|---|---|---|---|
| Display | 4% | 36% | 3% | -1% | |
| Display P3 Coverage (%) | 61.2 | 66.9 9% | 90.6 48% | 66 8% | 59.6 -3% |
| sRGB Coverage (%) | 82.9 | 83.9 1% | 99.9 21% | 83.7 1% | 82.8 0% |
| AdobeRGB 1998 Coverage (%) | 60.5 | 61.4 1% | 84.7 40% | 61.2 1% | 60.1 -1% |
| Response Times | -45% | 29% | -85% | 13% | |
| Response Time Grey 50% / Grey 80% * (ms) | 30 ? | 33 ? -10% | 26 ? 13% | 45 ? -50% | 21.6 ? 28% |
| Response Time Black / White * (ms) | 12.8 ? | 23 ? -80% | 7 ? 45% | 28 ? -119% | 13.2 ? -3% |
| PWM Frequency (Hz) | 59.5 | ||||
| Screen | 7% | -9% | 16% | -6% | |
| Brightness middle (cd/m²) | 402.3 | 360 -11% | 307 -24% | 380 -6% | 339.5 -16% |
| Brightness (cd/m²) | 372 | 336 -10% | 284 -24% | 362 -3% | 309 -17% |
| Brightness Distribution (%) | 86 | 90 5% | 85 -1% | 91 6% | 80 -7% |
| Black Level * (cd/m²) | 0.62 | 0.44 29% | 0.25 60% | 0.37 40% | 0.45 27% |
| Contrast (:1) | 649 | 818 26% | 1228 89% | 1027 58% | 754 16% |
| Colorchecker dE 2000 * | 5.6 | 4.76 15% | 9.65 -72% | 4.12 26% | 6.88 -23% |
| Colorchecker dE 2000 max. * | 9.8 | 10.8 -10% | 16.36 -67% | 8.19 16% | 9.99 -2% |
| Greyscale dE 2000 * | 4.7 | 3.69 21% | 10.07 -114% | 3.95 16% | 6.57 -40% |
| Gamma | 2.14 103% | 2.24 98% | 2.12 104% | 2.47 89% | 2.04 108% |
| CCT | 7519 86% | 6091 107% | 12145 54% | 6539 99% | 8608 76% |
| Color Space (Percent of AdobeRGB 1998) (%) | 53.7 | 55 2% | 75 40% | 55 2% | 54 1% |
| Color Space (Percent of sRGB) (%) | 82.2 | 84 2% | 100 22% | 84 2% | 82 0% |
| Media total (Programa/Opciones) | -11% /
-1% | 19% /
5% | -22% /
-0% | 2% /
-3% |
* ... más pequeño es mejor
Tiempos de respuesta del display
| ↔ Tiempo de respuesta de Negro a Blanco | ||
|---|---|---|
| 12.8 ms ... subida ↗ y bajada ↘ combinada | ↗ 10.8 ms subida | 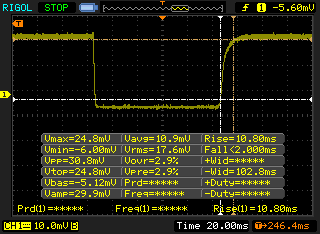 |
| ↘ 2 ms bajada | ||
| La pantalla mostró buenos tiempos de respuesta en nuestros tests pero podría ser demasiado lenta para los jugones competitivos. En comparación, todos los dispositivos de prueba van de ##min### (mínimo) a 240 (máximo) ms. » 33 % de todos los dispositivos son mejores. Esto quiere decir que el tiempo de respuesta medido es mejor que la media (19.8 ms) de todos los dispositivos testados. | ||
| ↔ Tiempo de respuesta 50% Gris a 80% Gris | ||
| 30 ms ... subida ↗ y bajada ↘ combinada | ↗ 18.8 ms subida | 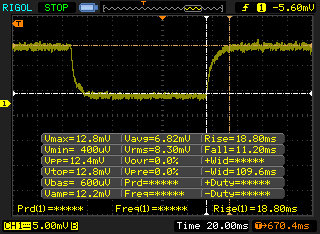 |
| ↘ 11.2 ms bajada | ||
| La pantalla mostró tiempos de respuesta lentos en nuestros tests y podría ser demasiado lenta para los jugones. En comparación, todos los dispositivos de prueba van de ##min### (mínimo) a 636 (máximo) ms. » 40 % de todos los dispositivos son mejores. Eso quiere decir que el tiempo de respuesta es similar al dispositivo testado medio (31 ms). | ||
Parpadeo de Pantalla / PWM (Pulse-Width Modulation)
| Parpadeo de Pantalla / PWM no detectado |  | ||
Comparación: 52 % de todos los dispositivos testados no usaron PWM para atenuar el display. Si se usó, medimos una media de 7747 (mínimo: 5 - máxmo: 343500) Hz. | |||
| wPrime 2.10 - 1024m | |
| Apple MacBook Pro 15 2016 (2.7 GHz, 455) | |
| EVGA SC17 GTX 1070 | |
| Samsung Odyssey NP800G5M-X01US | |
| Eurocom Sky X7E2 | |
| Alienware 17 R4 | |
| Eurocom Tornado F5 | |
* ... más pequeño es mejor
| PCMark 8 | |
| Home Score Accelerated v2 | |
| Aorus X7 DT v6 | |
| Alienware 17 R4 | |
| Eurocom Tornado F5 Killer Edition | |
| Work Score Accelerated v2 | |
| Aorus X7 DT v6 | |
| Alienware 17 R4 | |
| Eurocom Tornado F5 Killer Edition | |
| Creative Score Accelerated v2 | |
| Aorus X7 DT v6 | |
| Eurocom Tornado F5 Killer Edition | |
| Alienware 17 R4 | |
| PCMark 8 Home Score Accelerated v2 | 5064 puntos | |
| PCMark 8 Creative Score Accelerated v2 | 8272 puntos | |
| PCMark 8 Work Score Accelerated v2 | 5088 puntos | |
ayuda | ||
| Alienware 17 R4 SK Hynix PC300 NVMe 512 GB | Alienware 17 R3 (A17-9935) Samsung PM951 NVMe 512 GB | MSI GT73VR 7RF-296 2x Samsung SM951 MZVPV256HDGL (RAID 0) | Acer Predator 17 X GX-792-76DL Toshiba NVMe THNSN5512GPU7 | Aorus X7 DT v6 Samsung SM951 MZVPV512HDGL m.2 PCI-e | |
|---|---|---|---|---|---|
| CrystalDiskMark 3.0 | -20% | 100% | 30% | 43% | |
| Read Seq (MB/s) | 1277 | 1263 -1% | 3219 152% | 1494 17% | 1829 43% |
| Write Seq (MB/s) | 786 | 587 -25% | 2572 227% | 1371 74% | 1588 102% |
| Read 512 (MB/s) | 894 | 569 -36% | 1776 99% | 898 0% | 1064 19% |
| Write 512 (MB/s) | 659 | 265.2 -60% | 2445 271% | 1273 93% | 1507 129% |
| Read 4k (MB/s) | 38.11 | 42.59 12% | 51.1 34% | 43.82 15% | 52.9 39% |
| Write 4k (MB/s) | 128.5 | 140.6 9% | 141.3 10% | 161.6 26% | 161.1 25% |
| Read 4k QD32 (MB/s) | 628 | 610 -3% | 658 5% | 669 7% | 676 8% |
| Write 4k QD32 (MB/s) | 531 | 232.8 -56% | 554 4% | 552 4% | 419.1 -21% |

| 3DMark | |
| 1920x1080 Fire Strike Graphics | |
| Nvidia GeForce GTX 1080 Ti Founders Edition | |
| MSI Gaming X GeForce GTX 1080 Desktop PC | |
| Alienware 17 R4 | |
| Eurocom Tornado F5 Killer Edition | |
| Asus Strix GL702VSK | |
| Asus Strix GTX 980 Ti Desktop PC | |
| Asus G701VO-CS74K | |
| MSI GS63VR 7RF-228US | |
| Fire Strike Extreme Graphics | |
| Alienware 17 R4 | |
| Eurocom Tornado F5 Killer Edition | |
| Asus Strix GL702VSK | |
| Asus Strix GTX 980 Ti Desktop PC | |
| Asus G701VO-CS74K | |
| MSI GS63VR 7RF-228US | |
| 3840x2160 Fire Strike Ultra Graphics | |
| Nvidia GeForce GTX 1080 Ti Founders Edition | |
| Alienware 17 R4 | |
| Eurocom Tornado F5 Killer Edition | |
| Asus Strix GTX 980 Ti Desktop PC | |
| Asus G701VO-CS74K | |
| MSI GS63VR 7RF-228US | |
| 3DMark 11 | |
| 1280x720 Performance GPU | |
| Nvidia GeForce GTX 1080 Ti Founders Edition | |
| MSI Gaming X GeForce GTX 1080 Desktop PC | |
| Eurocom Tornado F5 Killer Edition | |
| Alienware 17 R4 | |
| Asus Strix GTX 980 Ti Desktop PC | |
| Asus Strix GL702VSK | |
| Asus G701VO-CS74K | |
| MSI GS63VR 7RF-228US | |
| 1280x720 Performance Combined | |
| Nvidia GeForce GTX 1080 Ti Founders Edition | |
| Asus Strix GTX 980 Ti Desktop PC | |
| MSI Gaming X GeForce GTX 1080 Desktop PC | |
| Alienware 17 R4 | |
| Asus G701VO-CS74K | |
| MSI GS63VR 7RF-228US | |
| Eurocom Tornado F5 Killer Edition | |
| Asus Strix GL702VSK | |
| Rise of the Tomb Raider - 1920x1080 Very High Preset AA:FX AF:16x | |
| Nvidia GeForce GTX 1080 Ti Founders Edition | |
| Alienware 17 R4 | |
| Eurocom Tornado F5 Killer Edition | |
| Nvidia GeForce GTX 1080 Founders Edition | |
| Nvidia GeForce GTX 1080 Founders Edition | |
| Nvidia GeForce GTX 1080 Founders Edition | |
| Asus Strix GL702VSK | |
| Asus Strix GTX 980 Ti Desktop PC | |
| MSI GS63VR 7RF-228US | |
| Asus G701VO-CS74K | |
| BioShock Infinite - 1920x1080 Ultra Preset, DX11 (DDOF) | |
| Nvidia GeForce GTX 1080 Ti Founders Edition | |
| Nvidia GeForce GTX 1080 Founders Edition | |
| Alienware 17 R4 | |
| Asus Strix GTX 980 Ti Desktop PC | |
| Eurocom Tornado F5 Killer Edition | |
| Asus Strix GL702VSK | |
| Asus G701VO-CS74K | |
| MSI GS63VR 7RF-228US | |
| Metro: Last Light - 1920x1080 Very High (DX11) AF:16x | |
| Nvidia GeForce GTX 1080 Ti Founders Edition | |
| Nvidia GeForce GTX 1080 Founders Edition | |
| Alienware 17 R4 | |
| Asus Strix GTX 980 Ti Desktop PC | |
| Eurocom Tornado F5 Killer Edition | |
| Asus Strix GL702VSK | |
| Asus G701VO-CS74K | |
| MSI GS63VR 7RF-228US | |
| Thief - 1920x1080 Very High Preset AA:FXAA & High SS AF:8x | |
| Eurocom Tornado F5 Killer Edition | |
| Alienware 17 R4 | |
| Asus Strix GL702VSK | |
| MSI GS63VR 7RF-228US | |
| Asus G701VO-CS74K | |
| The Witcher 3 - 1920x1080 Ultra Graphics & Postprocessing (HBAO+) | |
| Nvidia GeForce GTX 1080 Ti Founders Edition | |
| Alienware 17 R4 | |
| Nvidia GeForce GTX 1080 Founders Edition | |
| Eurocom Tornado F5 Killer Edition | |
| Asus Strix GTX 980 Ti Desktop PC | |
| Asus Strix GL702VSK | |
| MSI GS63VR 7RF-228US | |
| Batman: Arkham Knight - 1920x1080 High / On AA:SM AF:16x | |
| Alienware 17 R4 | |
| Eurocom Tornado F5 Killer Edition | |
| Asus G701VO-CS74K | |
| MSI GS63VR 7RF-228US | |
| Fallout 4 - 1920x1080 Ultra Preset AA:T AF:16x | |
| Nvidia GeForce GTX 1080 Ti Founders Edition | |
| Nvidia GeForce GTX 1080 Founders Edition | |
| Alienware 17 R4 | |
| Asus Strix GTX 980 Ti Desktop PC | |
| Asus Strix GL702VSK | |
| Asus G701VO-CS74K | |
| MSI GS63VR 7RF-228US | |
| Ashes of the Singularity - 1920x1080 high | |
| Nvidia GeForce GTX 1080 Ti Founders Edition | |
| Asus Strix GTX 980 Ti Desktop PC | |
| Alienware 17 R4 | |
| Eurocom Tornado F5 Killer Edition | |
| Asus Strix GL702VSK | |
| Doom - 1920x1080 Ultra Preset AA:SM | |
| Nvidia GeForce GTX 1080 Ti Founders Edition | |
| Nvidia GeForce GTX 1080 Ti Founders Edition | |
| Alienware 17 R4 | |
| Nvidia GeForce GTX 1080 Founders Edition | |
| Asus Strix GTX 980 Ti Desktop PC | |
| Asus Strix GL702VSK | |
| MSI GS63VR 7RF-228US | |
| Asus G701VO-CS74K | |
| Overwatch - 1920x1080 Epic (Render Scale 100 %) AA:SM AF:16x | |
| Nvidia GeForce GTX 1080 Ti Founders Edition | |
| Nvidia GeForce GTX 1080 Founders Edition | |
| Alienware 17 R4 | |
| Asus Strix GTX 980 Ti Desktop PC | |
| Asus G701VO-CS74K | |
| MSI GS63VR 7RF-228US | |
| Mafia 3 - 1920x1080 High Preset | |
| Eurocom Tornado F5 Killer Edition | |
| Nvidia GeForce GTX 1080 Ti Founders Edition | |
| Alienware 17 R4 | |
| Nvidia GeForce GTX 1080 Founders Edition | |
| Asus Strix GL702VSK | |
| Asus Strix GTX 980 Ti Desktop PC | |
| MSI GS63VR 7RF-228US | |
| 3DMark 11 Performance | 19125 puntos | |
| 3DMark Ice Storm Standard Score | 171837 puntos | |
| 3DMark Cloud Gate Standard Score | 32871 puntos | |
| 3DMark Fire Strike Score | 16931 puntos | |
| 3DMark Fire Strike Extreme Score | 9422 puntos | |
ayuda | ||
| bajo | medio | alto | ultra | |
|---|---|---|---|---|
| BioShock Infinite (2013) | 162.9 | |||
| Metro: Last Light (2013) | 132.2 | |||
| Thief (2014) | 107.2 | |||
| The Witcher 3 (2015) | 78.1 | |||
| Batman: Arkham Knight (2015) | 93 | |||
| Metal Gear Solid V (2015) | 60 | |||
| Dota 2 Reborn (2015) | 119.9 | |||
| Fallout 4 (2015) | 120.7 | |||
| Rise of the Tomb Raider (2016) | 118.3 | |||
| Ashes of the Singularity (2016) | 66.5 | |||
| Doom (2016) | 140.1 | |||
| Overwatch (2016) | 188 | |||
| Mafia 3 (2016) | 72.5 |
Ruido
| Ocioso |
| 35.6 / 35.6 / 35.7 dB(A) |
| HDD |
| 35.7 dB(A) |
| Carga |
| 50.2 / 50.2 dB(A) |
 | ||
30 dB silencioso 40 dB(A) audible 50 dB(A) ruidosamente alto |
||
min: | ||
| Alienware 17 R4 GeForce GTX 1080 Mobile, i7-7820HK, SK Hynix PC300 NVMe 512 GB | Alienware 17 R3 (A17-9935) GeForce GTX 980M, 6700HQ, Samsung PM951 NVMe 512 GB | MSI GT72VR 7RE-433 GeForce GTX 1070 Mobile, i7-7700HQ, Kingston RBU-SNS8152S3256GG5 | MSI GT73VR 7RF-296 GeForce GTX 1080 Mobile, i7-7820HK, 2x Samsung SM951 MZVPV256HDGL (RAID 0) | Acer Predator 17 X GX-792-76DL GeForce GTX 1080 Mobile, i7-7820HK, Toshiba NVMe THNSN5512GPU7 | Aorus X7 DT v6 GeForce GTX 1080 Mobile, 6820HK, Samsung SM951 MZVPV512HDGL m.2 PCI-e | |
|---|---|---|---|---|---|---|
| Noise | 8% | 5% | 1% | 3% | -1% | |
| apagado / medio ambiente * (dB) | 28.2 | 30 -6% | 31 -10% | 30 -6% | 30 -6% | 28.6 -1% |
| Idle Minimum * (dB) | 35.6 | 31 13% | 34 4% | 34 4% | 33 7% | 32.2 10% |
| Idle Average * (dB) | 35.6 | 32 10% | 35 2% | 35 2% | 35 2% | 35.2 1% |
| Idle Maximum * (dB) | 35.7 | 33 8% | 37 -4% | 37 -4% | 37 -4% | 35.2 1% |
| Load Average * (dB) | 50.2 | 38 24% | 37 26% | 39 22% | 40 20% | 51.7 -3% |
| Witcher 3 ultra * (dB) | 50.2 | |||||
| Load Maximum * (dB) | 50.2 | 50 -0% | 44 12% | 56 -12% | 50 -0% | 55.7 -11% |
* ... más pequeño es mejor
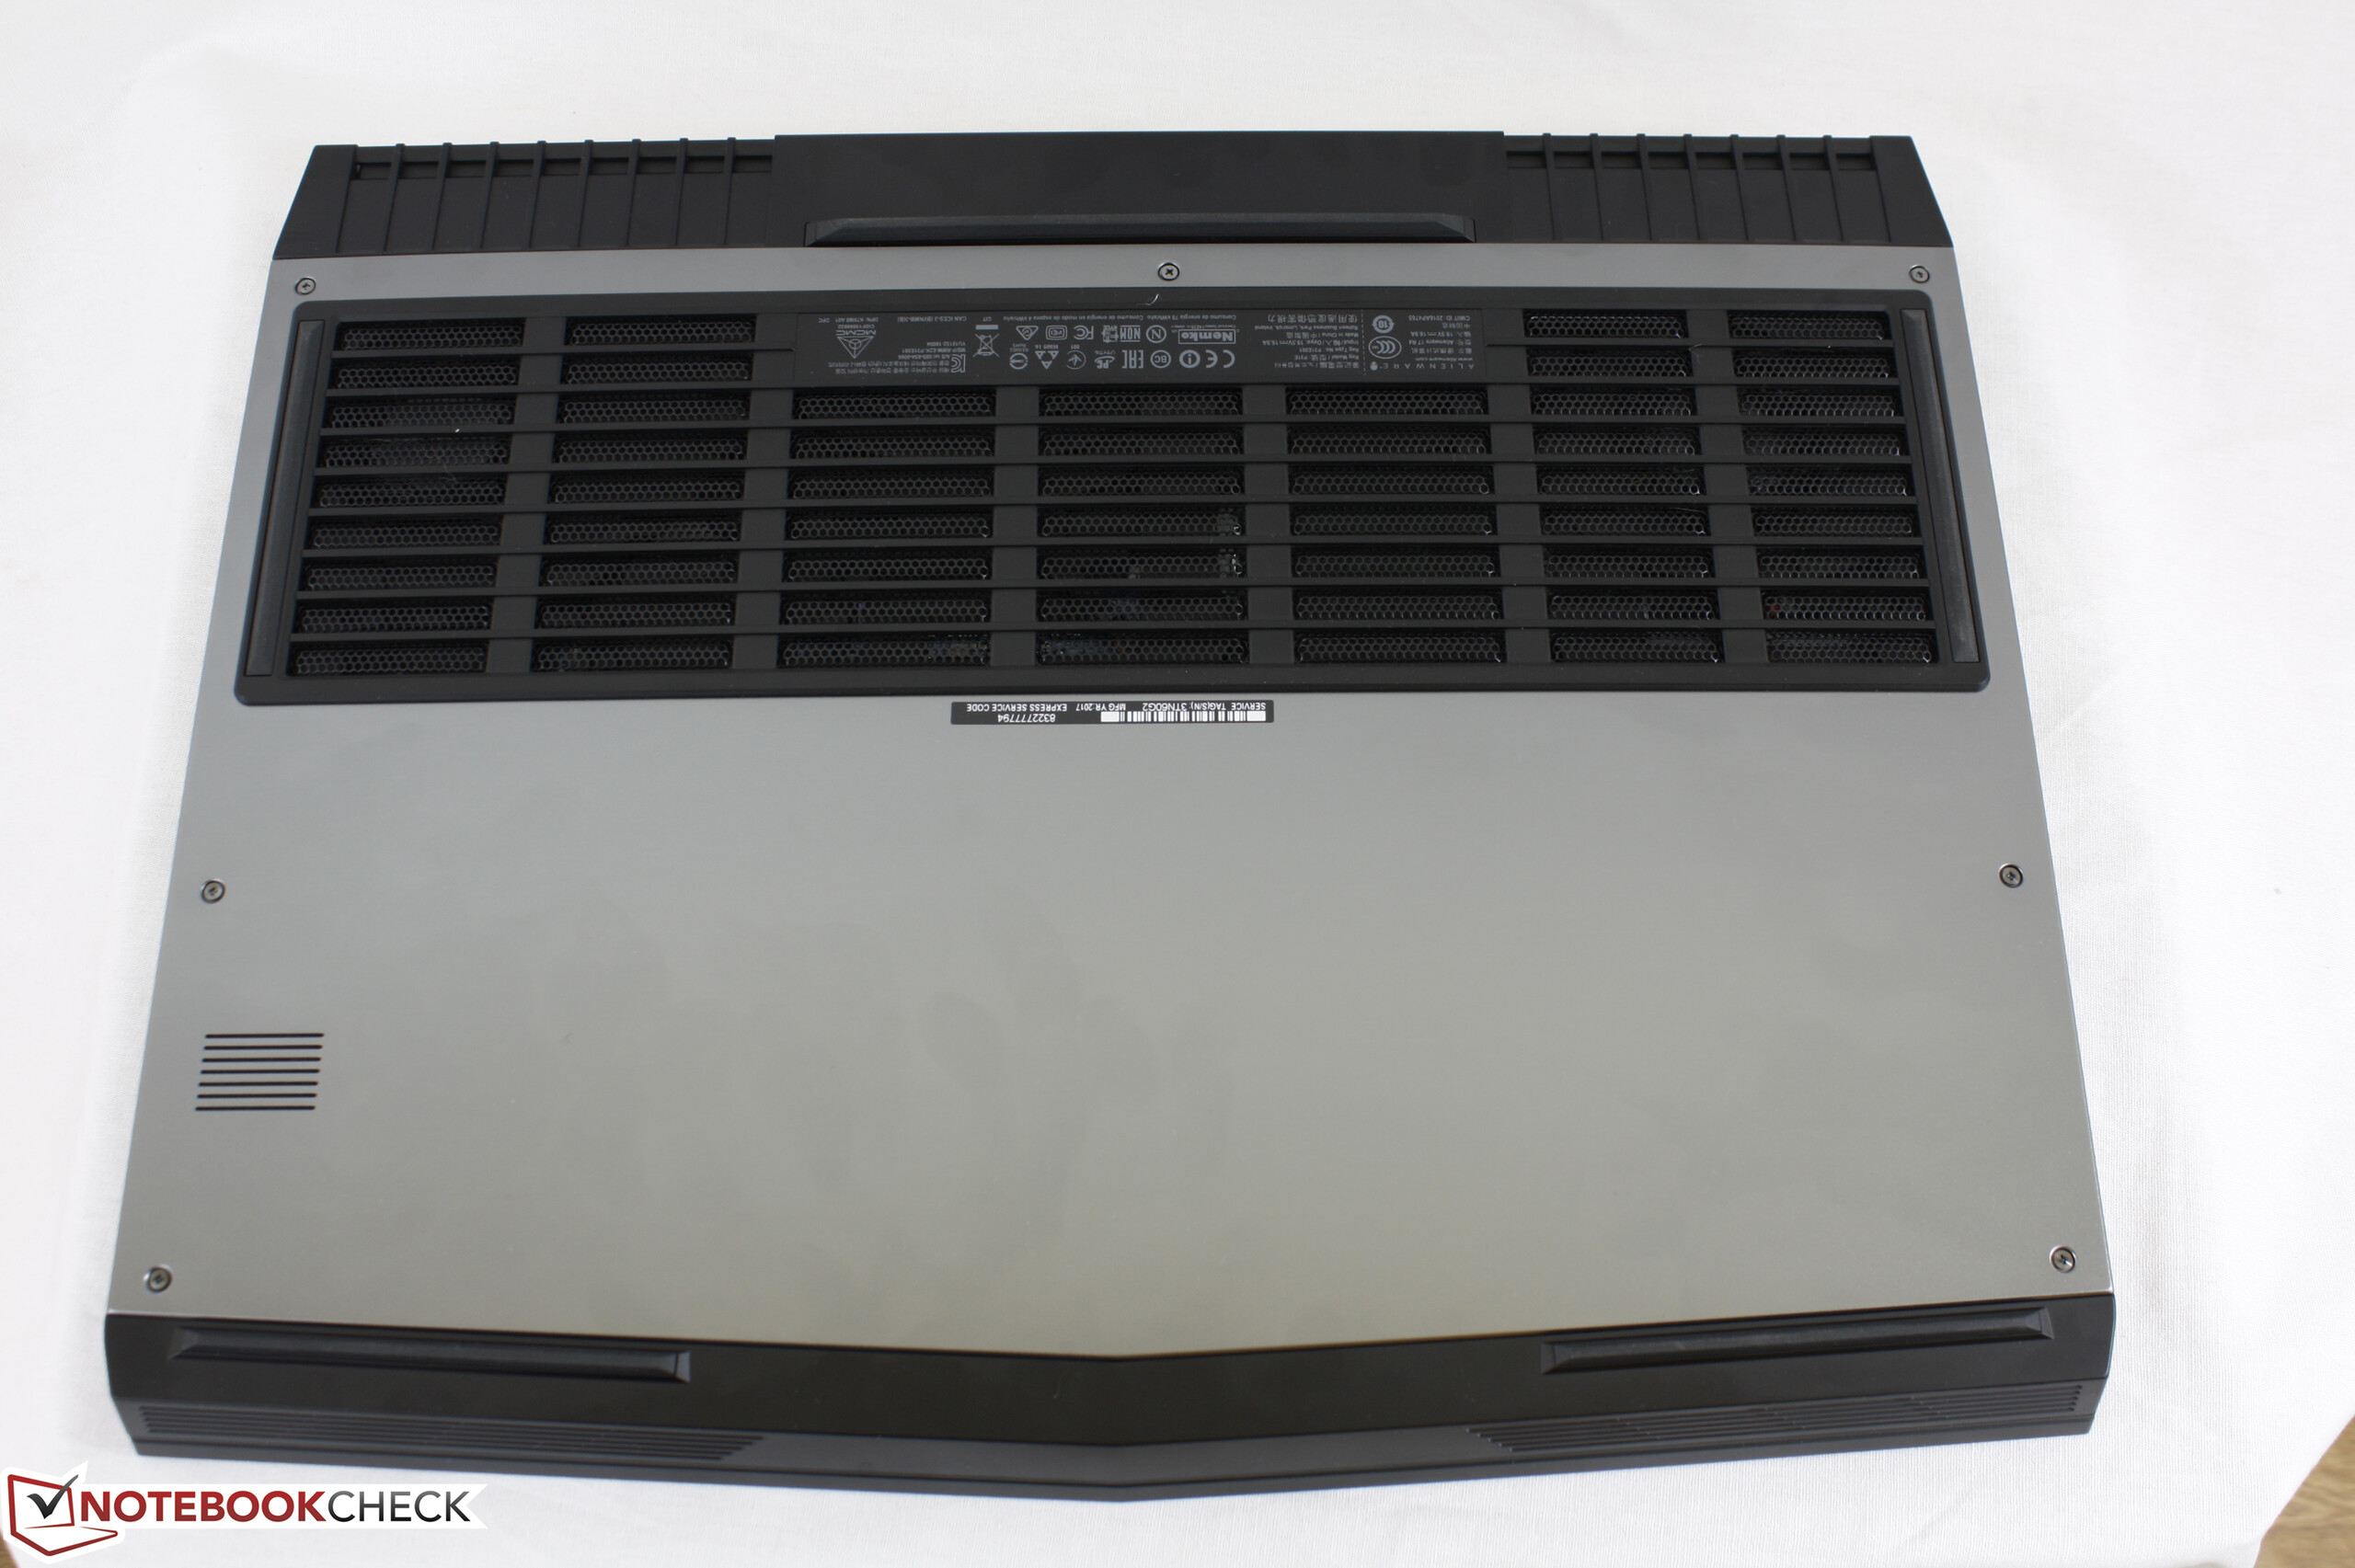
(-) La temperatura máxima en la parte superior es de 49.6 °C / 121 F, frente a la media de 40.4 °C / 105 F, que oscila entre 21.2 y 68.8 °C para la clase Gaming.
(-) El fondo se calienta hasta un máximo de 56 °C / 133 F, frente a la media de 43.2 °C / 110 F
(+) En reposo, la temperatura media de la parte superior es de 27.5 °C / 82# F, frente a la media del dispositivo de 33.9 °C / 93 F.
(±) Jugando a The Witcher 3, la temperatura media de la parte superior es de 37.2 °C / 99 F, frente a la media del dispositivo de 33.9 °C / 93 F.
(+) El reposamanos y el panel táctil están a una temperatura inferior a la de la piel, con un máximo de 27.4 °C / 81.3 F y, por tanto, son fríos al tacto.
(±) La temperatura media de la zona del reposamanos de dispositivos similares fue de 28.8 °C / 83.8 F (+1.4 °C / 2.5 F).
Alienware 17 R4 análisis de audio
(±) | la sonoridad del altavoz es media pero buena (75 dB)
Graves 100 - 315 Hz
(-) | casi sin bajos - de media 15.3% inferior a la mediana
(±) | la linealidad de los graves es media (9.6% delta a frecuencia anterior)
Medios 400 - 2000 Hz
(±) | medias más altas - de media 5.5% más altas que la mediana
(±) | la linealidad de los medios es media (8.9% delta respecto a la frecuencia anterior)
Altos 2 - 16 kHz
(±) | máximos más altos - de media 5.1% más altos que la mediana
(±) | la linealidad de los máximos es media (9.7% delta a frecuencia anterior)
Total 100 - 16.000 Hz
(±) | la linealidad del sonido global es media (22.4% de diferencia con la mediana)
En comparación con la misma clase
» 80% de todos los dispositivos probados de esta clase eran mejores, 6% similares, 14% peores
» El mejor tuvo un delta de 6%, la media fue 18%, el peor fue ###max##%
En comparación con todos los dispositivos probados
» 66% de todos los dispositivos probados eran mejores, 6% similares, 29% peores
» El mejor tuvo un delta de 4%, la media fue 23%, el peor fue ###max##%
Apple MacBook 12 (Early 2016) 1.1 GHz análisis de audio
(+) | los altavoces pueden reproducir a un volumen relativamente alto (#83.6 dB)
Graves 100 - 315 Hz
(±) | lubina reducida - en promedio 11.3% inferior a la mediana
(±) | la linealidad de los graves es media (14.2% delta a frecuencia anterior)
Medios 400 - 2000 Hz
(+) | medios equilibrados - a sólo 2.4% de la mediana
(+) | los medios son lineales (5.5% delta a la frecuencia anterior)
Altos 2 - 16 kHz
(+) | máximos equilibrados - a sólo 2% de la mediana
(+) | los máximos son lineales (4.5% delta a la frecuencia anterior)
Total 100 - 16.000 Hz
(+) | el sonido global es lineal (10.2% de diferencia con la mediana)
En comparación con la misma clase
» 7% de todos los dispositivos probados de esta clase eran mejores, 2% similares, 90% peores
» El mejor tuvo un delta de 5%, la media fue 18%, el peor fue ###max##%
En comparación con todos los dispositivos probados
» 5% de todos los dispositivos probados eran mejores, 1% similares, 94% peores
» El mejor tuvo un delta de 4%, la media fue 23%, el peor fue ###max##%
| Off / Standby | |
| Ocioso | |
| Carga |
|
Clave:
min: | |
| Alienware 17 R4 i7-7820HK, GeForce GTX 1080 Mobile, SK Hynix PC300 NVMe 512 GB, TN LED, 2560x1440, 17.3" | Alienware 17 R3 (A17-9935) 6700HQ, GeForce GTX 980M, Samsung PM951 NVMe 512 GB, IPS, 1920x1080, 17.3" | MSI GT73VR 7RF-296 i7-7820HK, GeForce GTX 1080 Mobile, 2x Samsung SM951 MZVPV256HDGL (RAID 0), TN LED, 1920x1080, 17.3" | Acer Predator 17 X GX-792-76DL i7-7820HK, GeForce GTX 1080 Mobile, Toshiba NVMe THNSN5512GPU7, IPS, 1920x1080, 17.3" | Aorus X7 DT v6 6820HK, GeForce GTX 1080 Mobile, Samsung SM951 MZVPV512HDGL m.2 PCI-e, TN LED, 2560x1440, 17.3" | |
|---|---|---|---|---|---|
| Power Consumption | 41% | 7% | 12% | -5% | |
| Idle Minimum * (Watt) | 37.5 | 12 68% | 29 23% | 27 28% | 31.5 16% |
| Idle Average * (Watt) | 37.6 | 18 52% | 35 7% | 32 15% | 33.9 10% |
| Idle Maximum * (Watt) | 37.6 | 26 31% | 40 -6% | 41 -9% | 34.6 8% |
| Load Average * (Watt) | 122.4 | 95 22% | 94 23% | 102 17% | 205.6 -68% |
| Witcher 3 ultra * (Watt) | 180.3 | ||||
| Load Maximum * (Watt) | 277.4 | 188 32% | 315 -14% | 248 11% | 250.8 10% |
* ... más pequeño es mejor
| Alienware 17 R4 i7-7820HK, GeForce GTX 1080 Mobile, 99 Wh | Alienware 17 R3 (A17-9935) 6700HQ, GeForce GTX 980M, 92 Wh | MSI GT73VR 7RF-296 i7-7820HK, GeForce GTX 1080 Mobile, 75.2 Wh | Acer Predator 17 X GX-792-76DL i7-7820HK, GeForce GTX 1080 Mobile, 88.8 Wh | Aorus X7 DT v6 6820HK, GeForce GTX 1080 Mobile, 94 Wh | |
|---|---|---|---|---|---|
| Duración de Batería | 124% | -10% | 26% | -7% | |
| Reader / Idle (h) | 4.6 | 12.6 174% | 5.2 13% | 3 -35% | |
| WiFi v1.3 (h) | 3 | 7.4 147% | 2.7 -10% | 4.2 40% | 2.4 -20% |
| Load (h) | 1.2 | 1.8 50% | 1.5 25% | 1.6 33% |
Pro
Contra
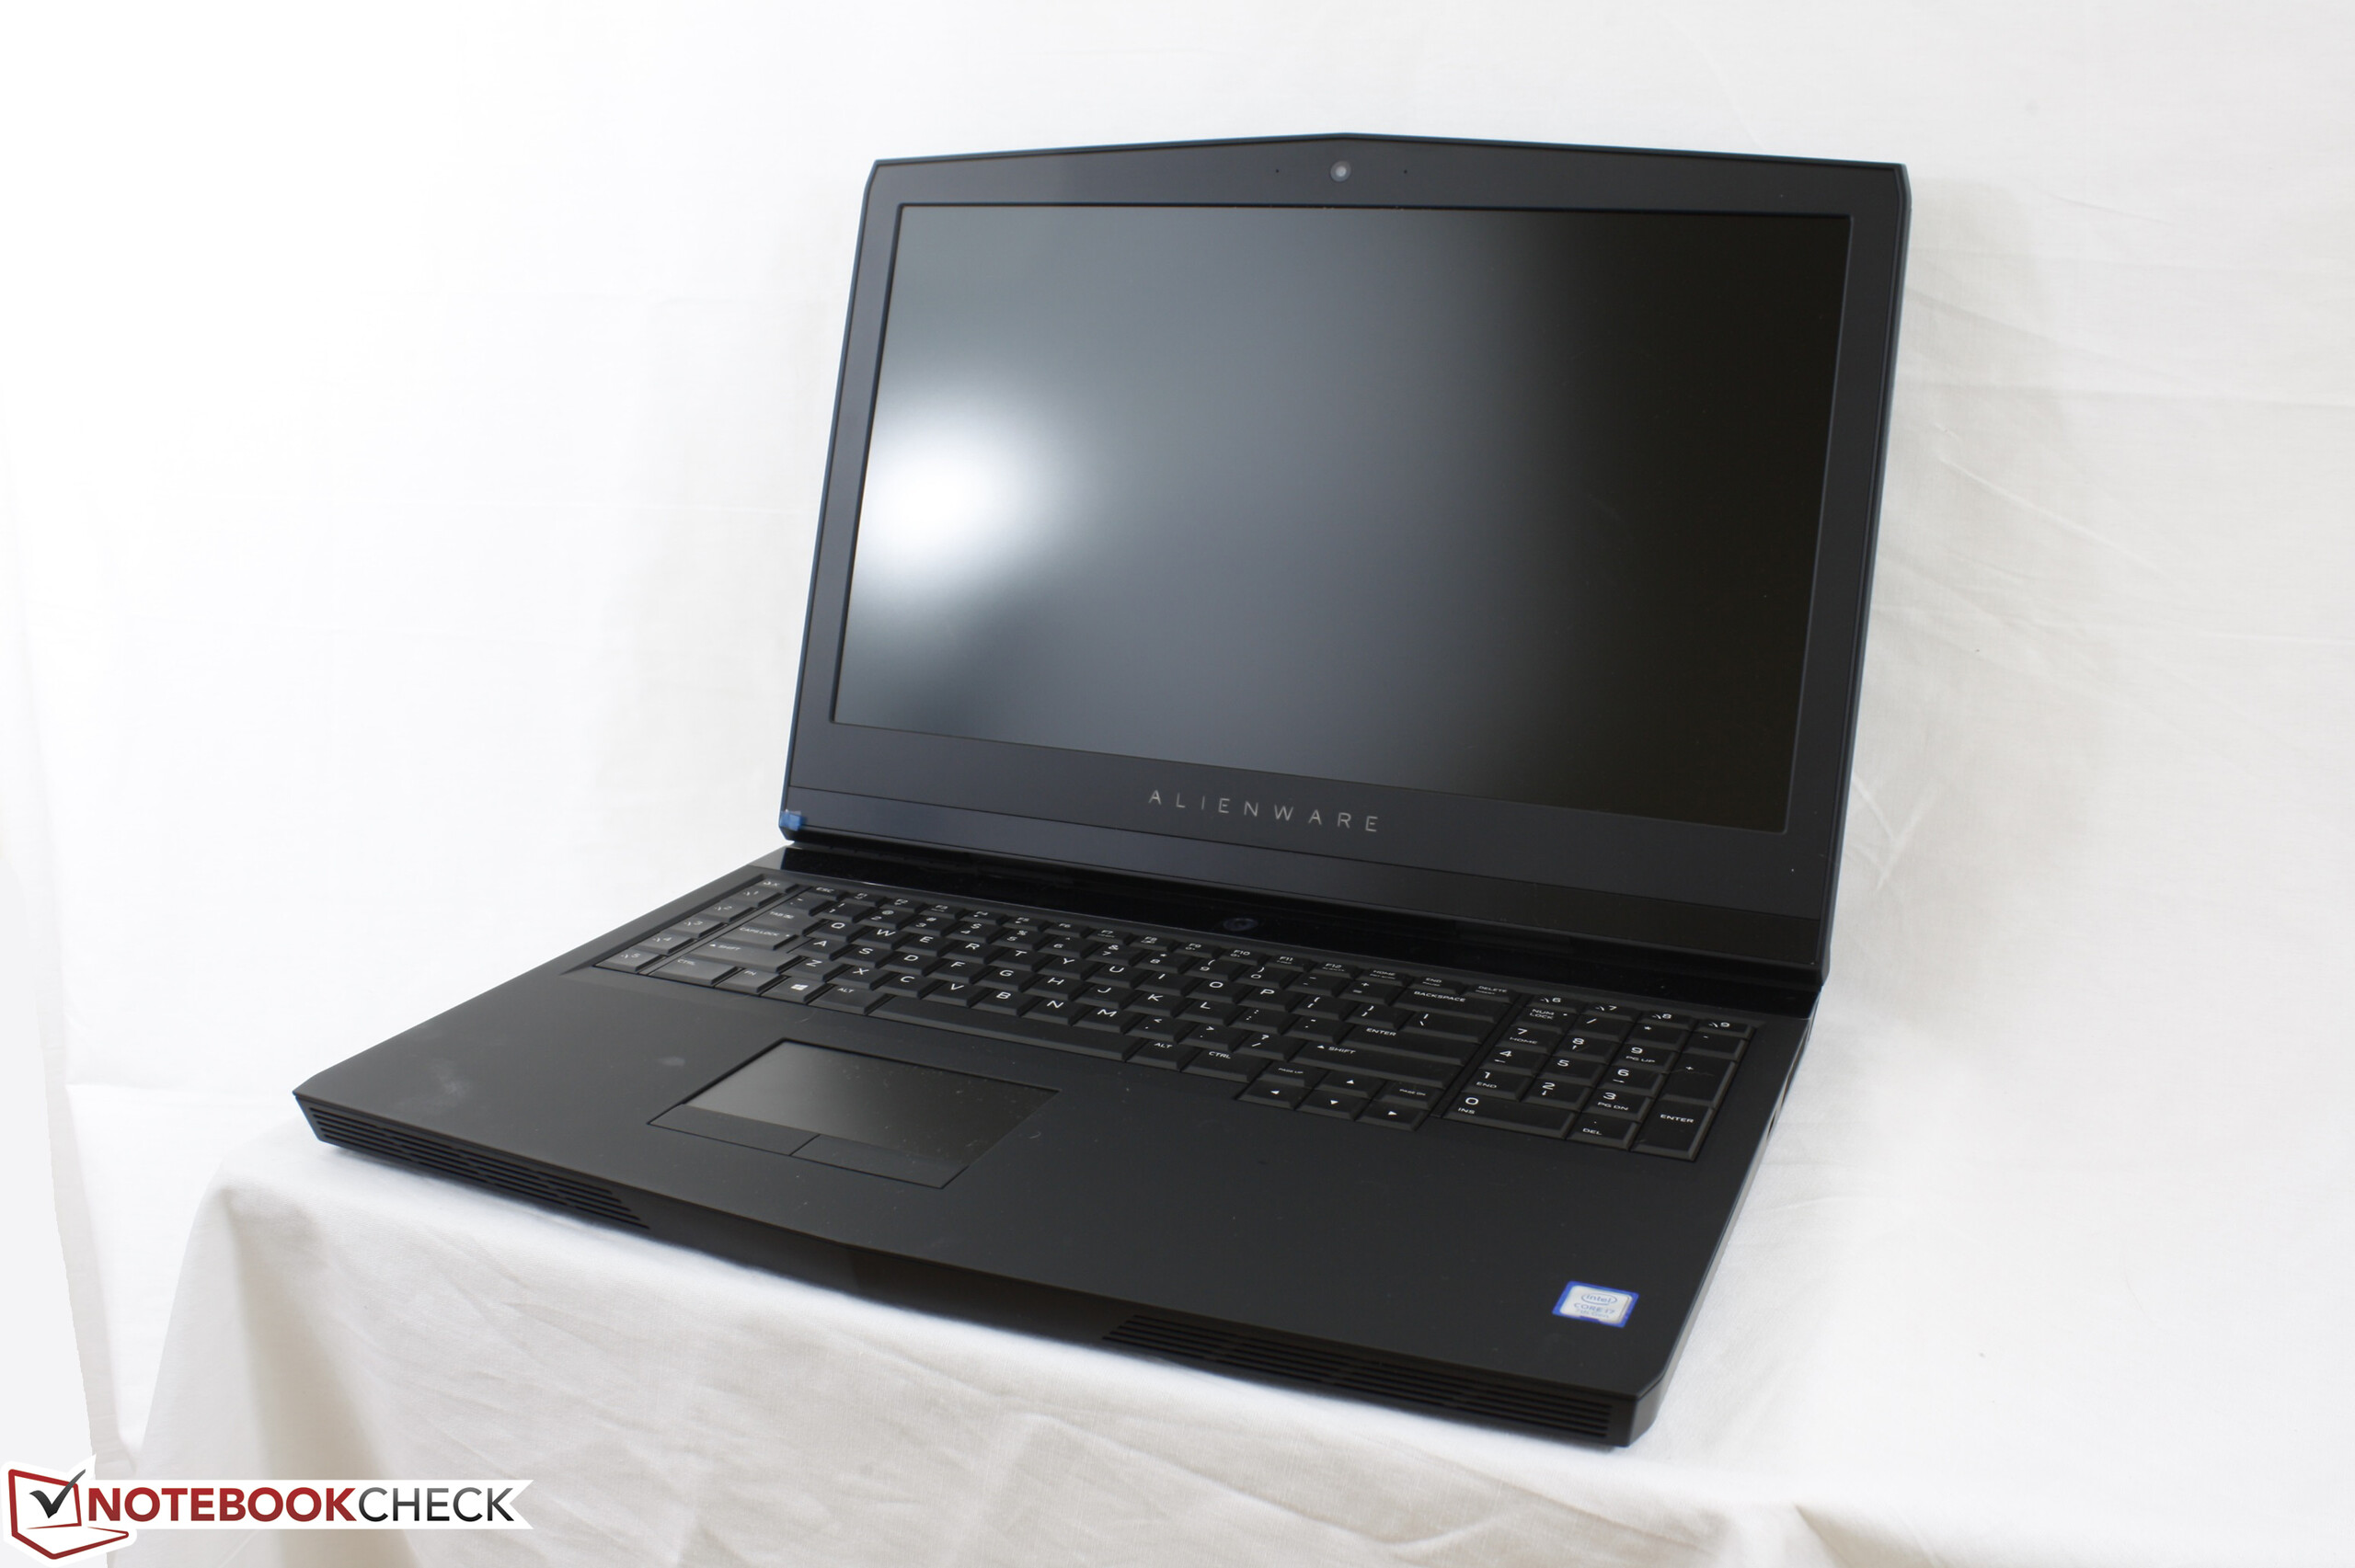
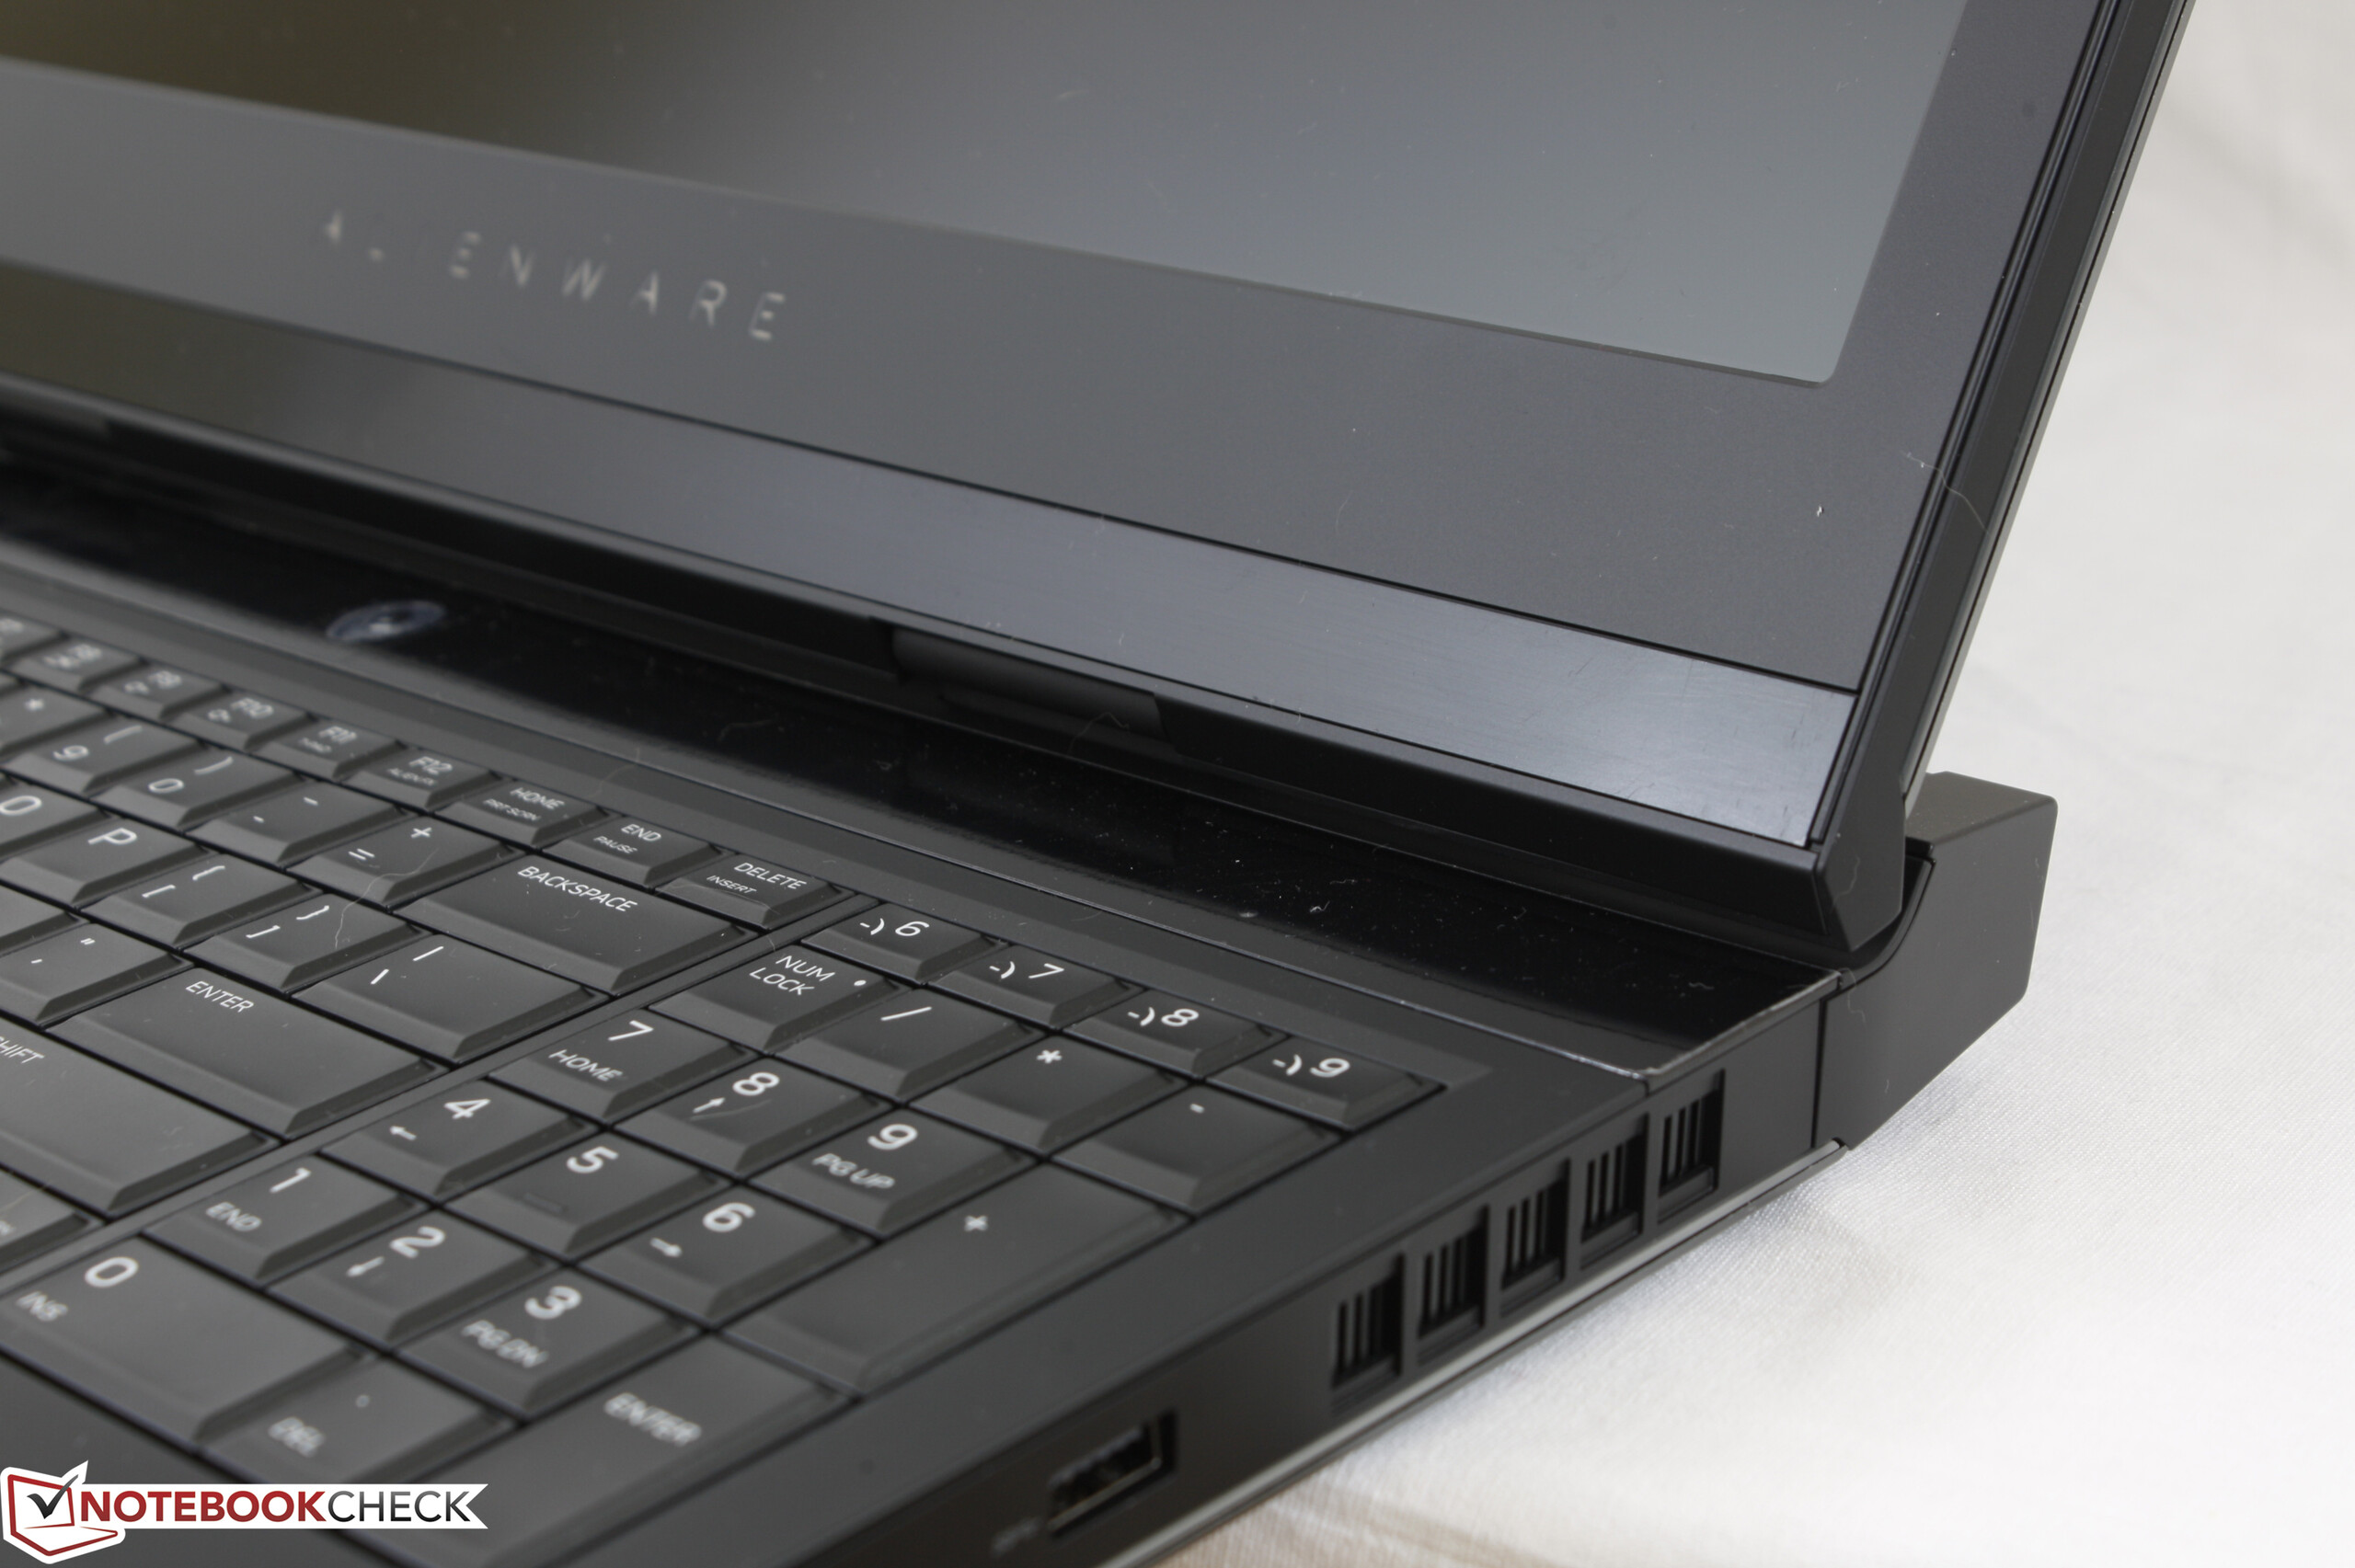
Alabamos la gama Alienware 17 por sus alto estándar de calidad que afortunadamente se mantienen iteración tras iteración. Un portátil no solo es GPU y CPU si no también el esqueleto y el diseño que rodean al software interno. En este nivel, es más sencillo recomendar el Alienware por encima de las opciones de 17 pulgadas de Aorus o el más antiguo MSI GT72.
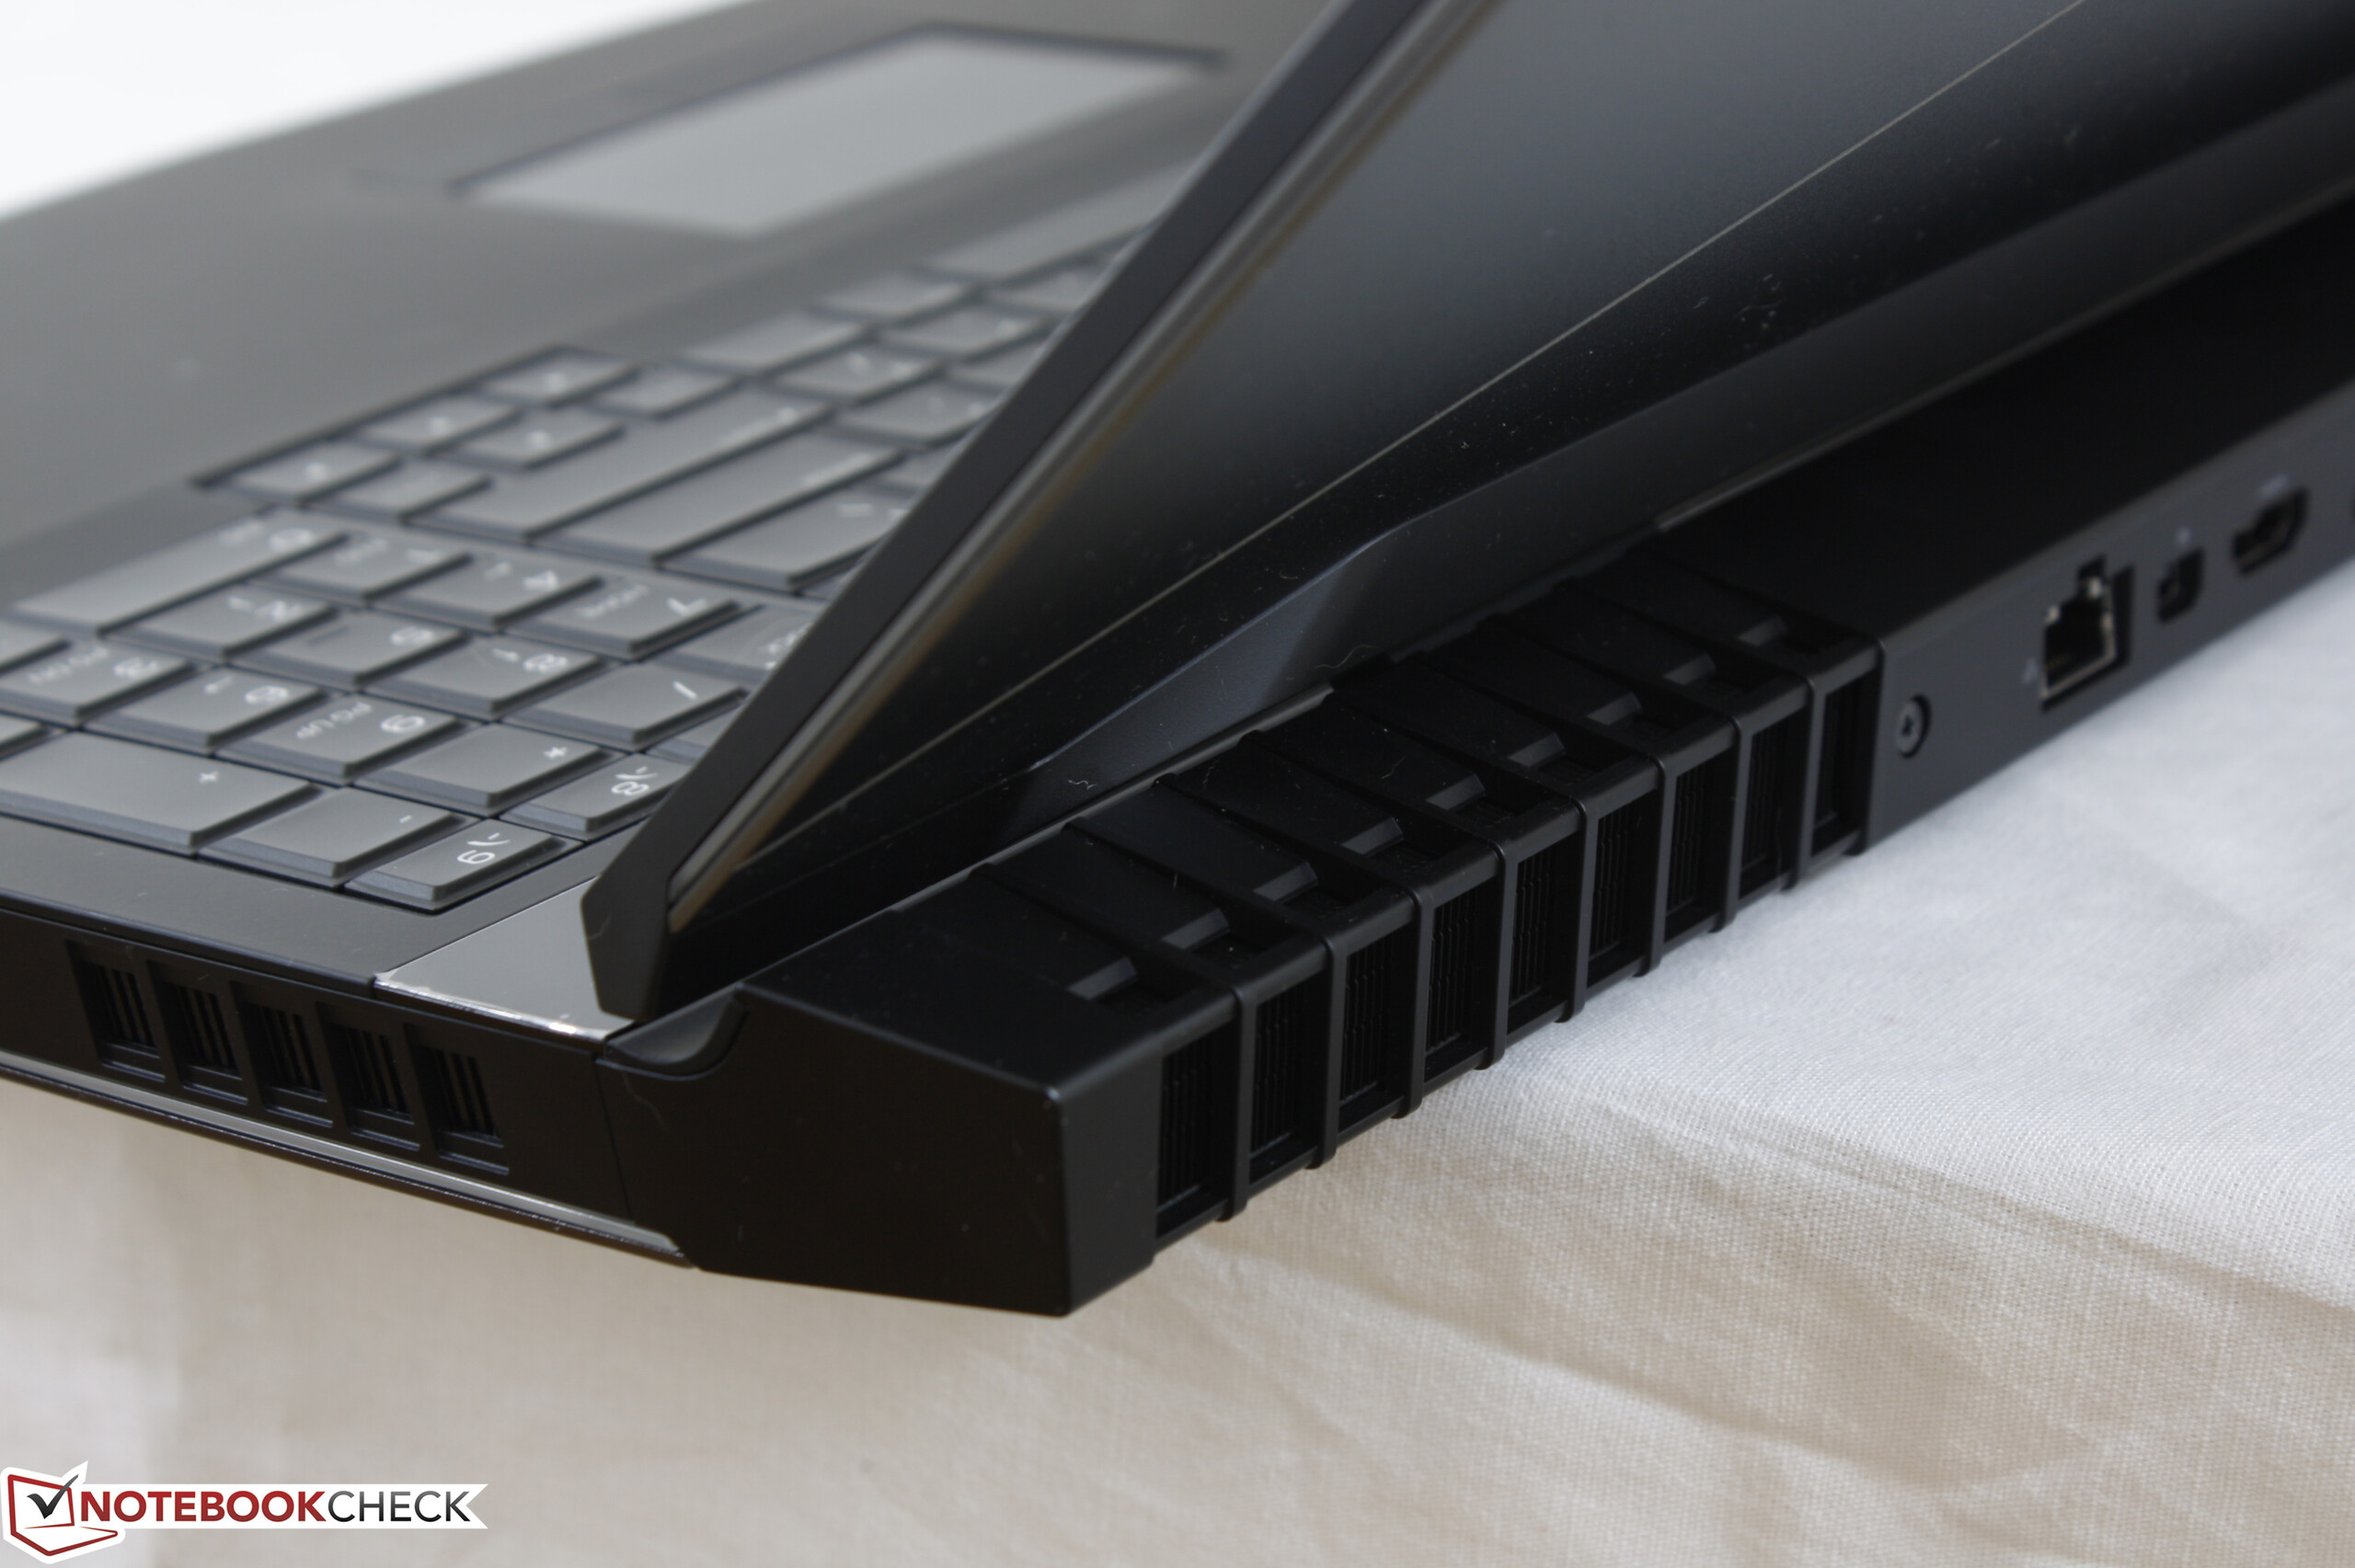
Empezamos a ver algunos problemas con el modelo con equipamento más potente. Nuestro modelo está equipado con la CPU y la GPU más rápida disponibles para el 17 R4 y el chasis apenas puede funcionar con este procesador a altas velocidades. La CPU y la GPU no reducirán su velocidad, pero la temperatura puede llegar a 90 grados o más al jugar a pesar de los ventiladores que funcionan todo el rato generando ruido de hasta 50 dB(A). En este aspecto es superado por dispositivos como el MSI GT73VR o el Acer Predator 17 X.
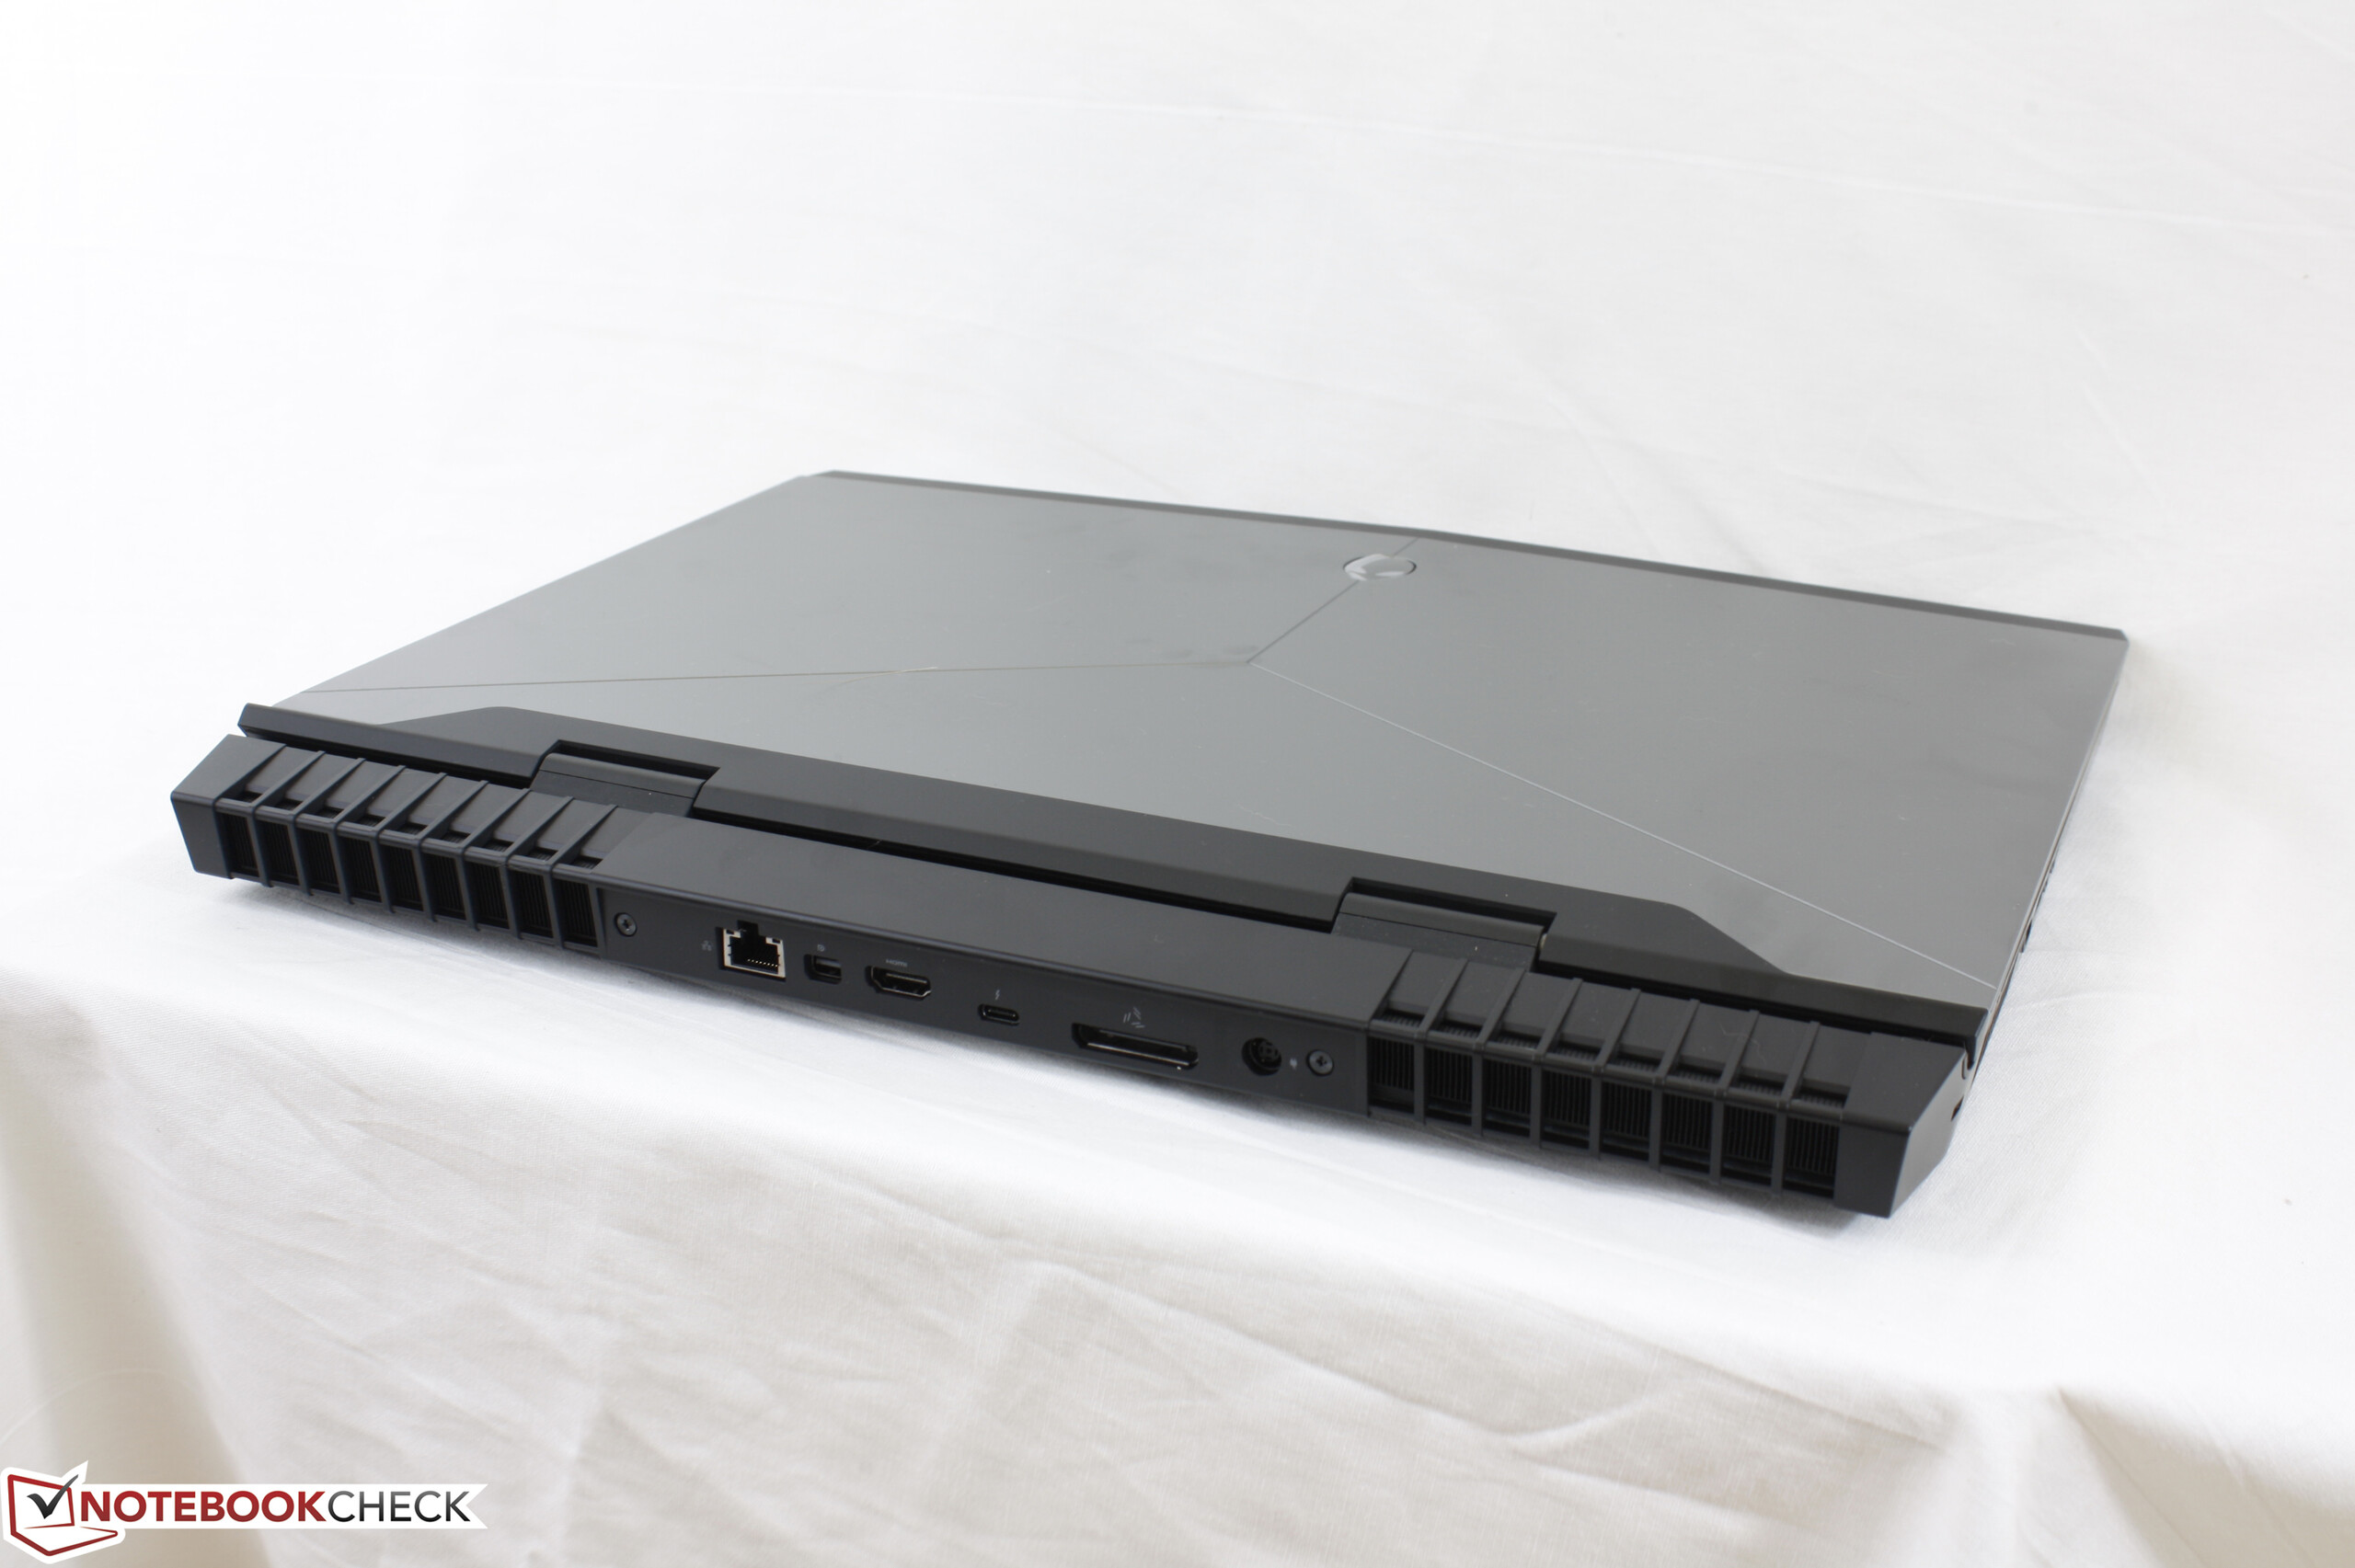
El hecho de incluir un puerto Amplificador Gráfico es una buena razón para optar por una configuración más básica con GPU GTX 1050 Ti o GTX 1060. Es bastante posible que el TDP de estas GPUs supongan un funcionamiento más silencioso, mayor duración de batería, temperaturas más bajas o, seguramente, las tres cosas a la vez. Y los usuarios que requieran más potencia gráfica pueden usar el Amplificador Gráfico. Este es un truco que la gama Alienware se saca de la manga y le da ventaja sobre las configuraciones básicas de otros fabricantes.
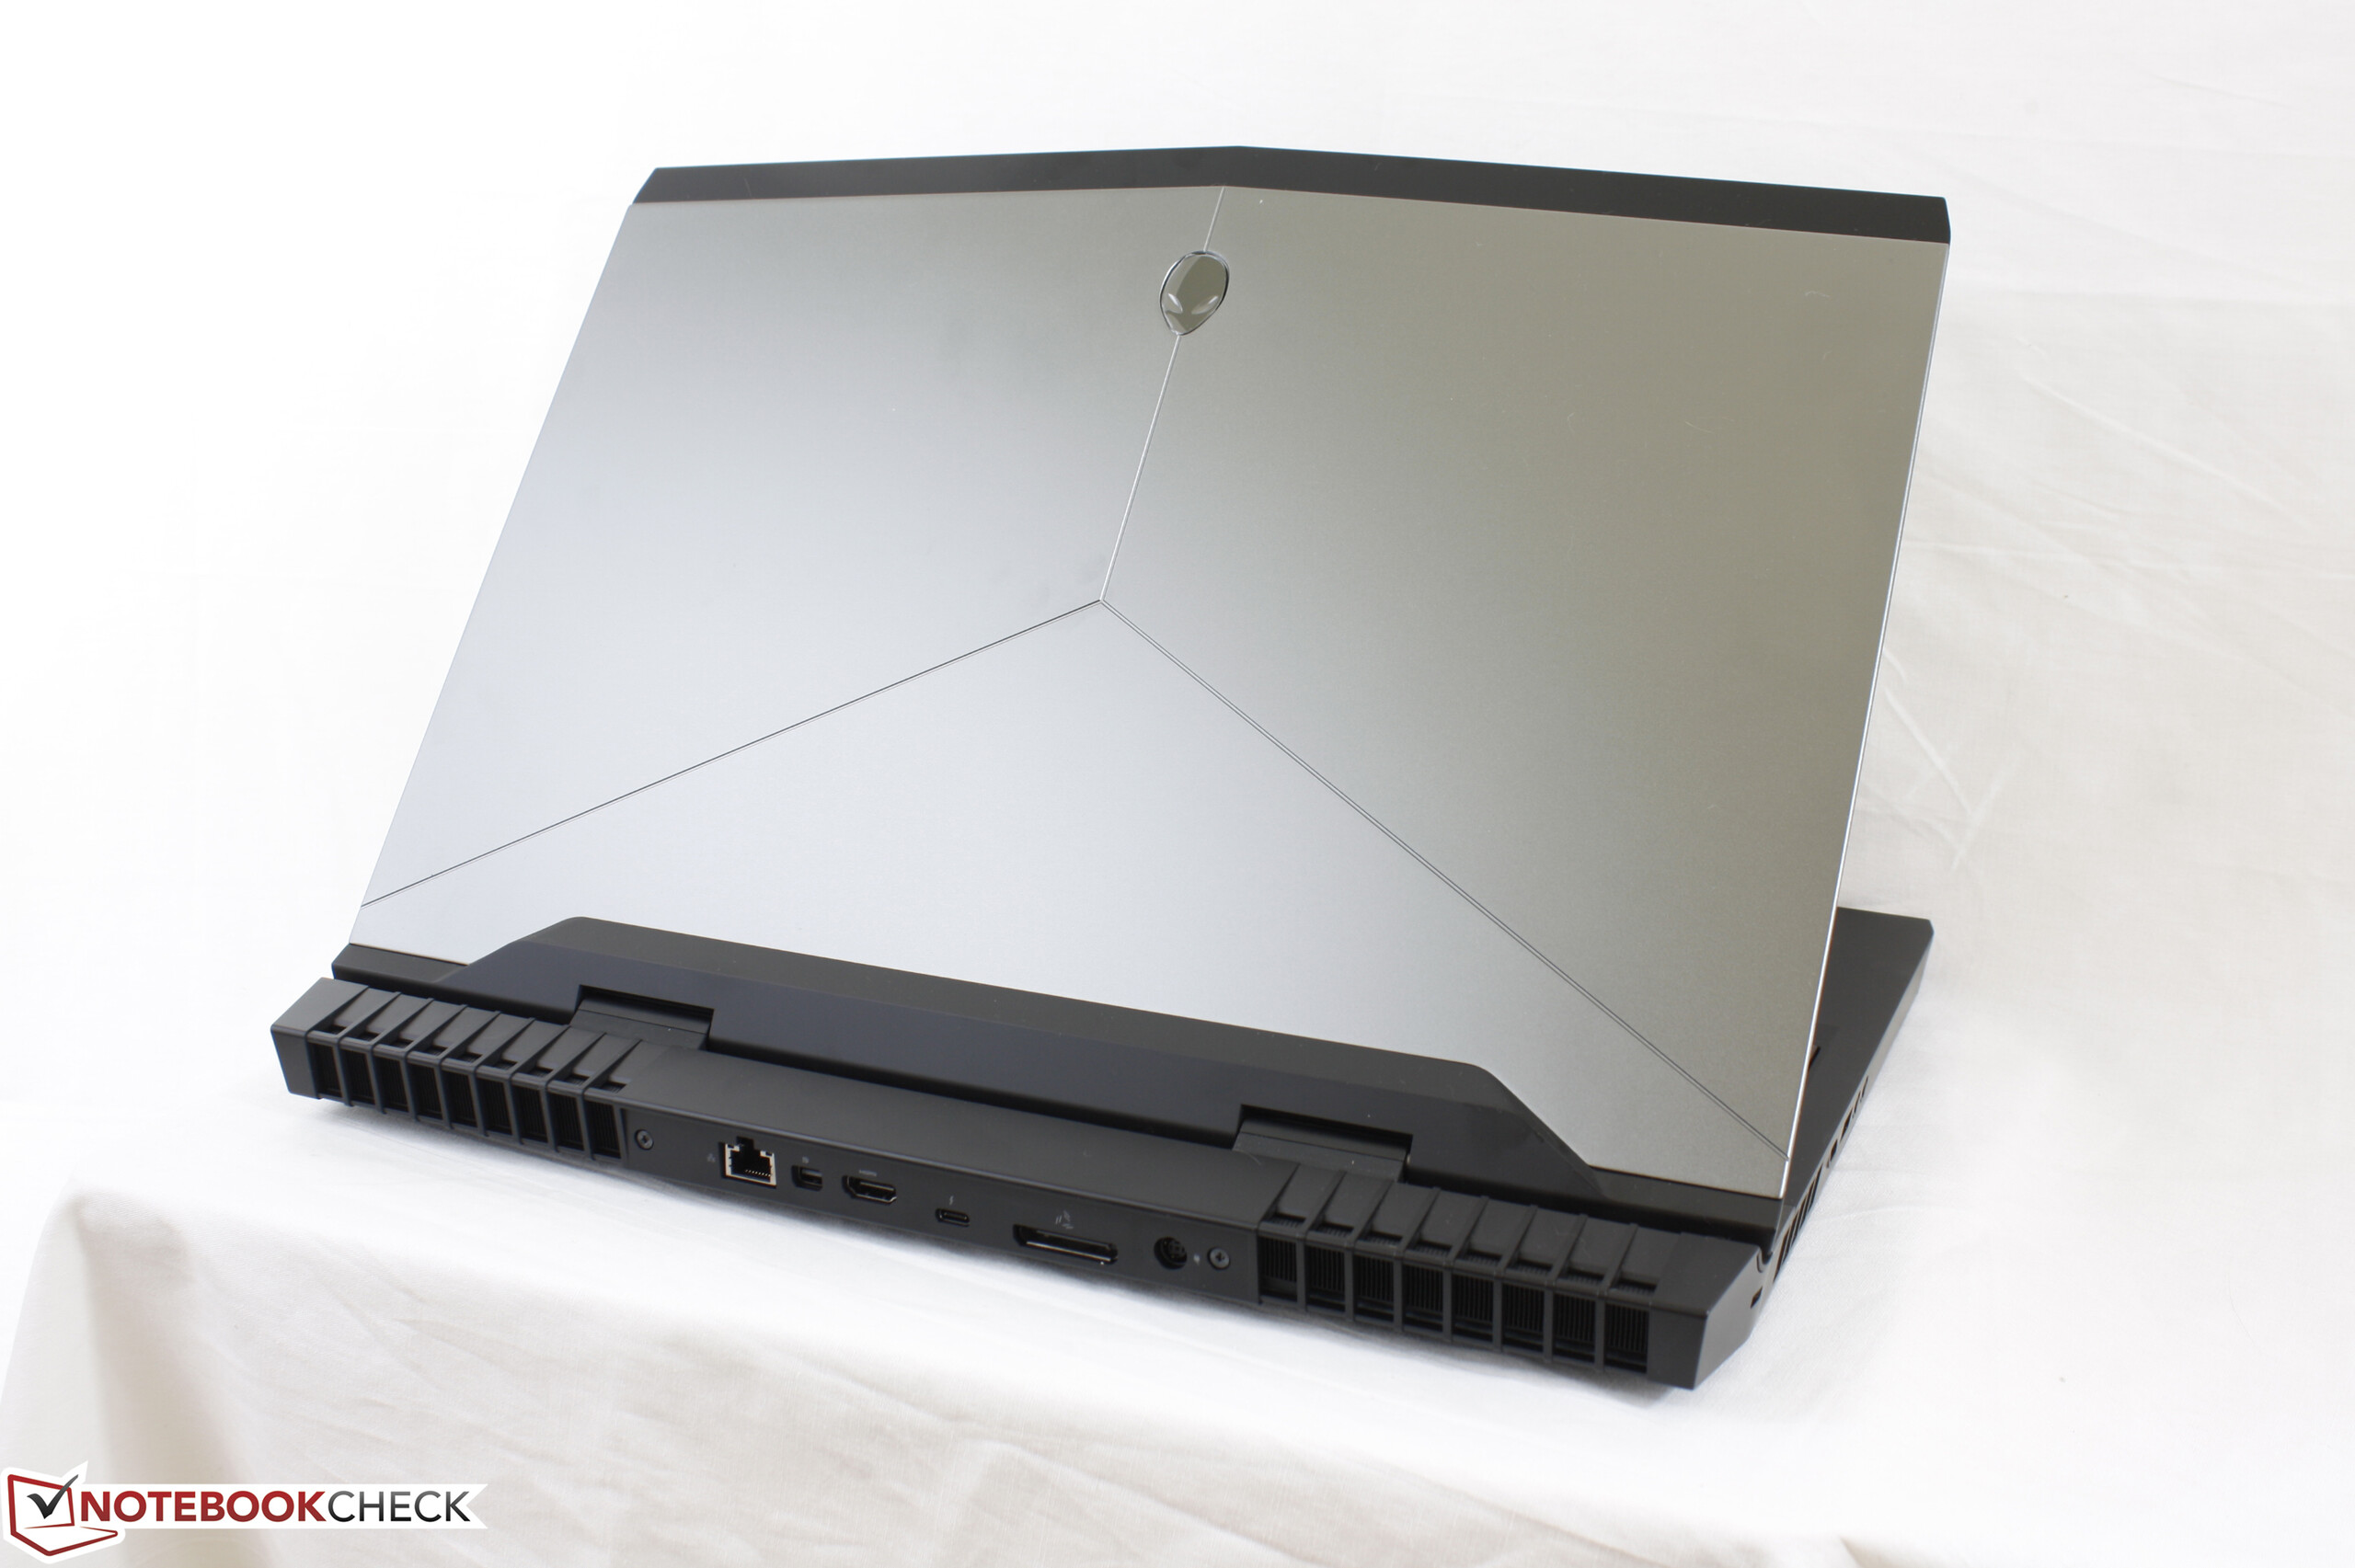
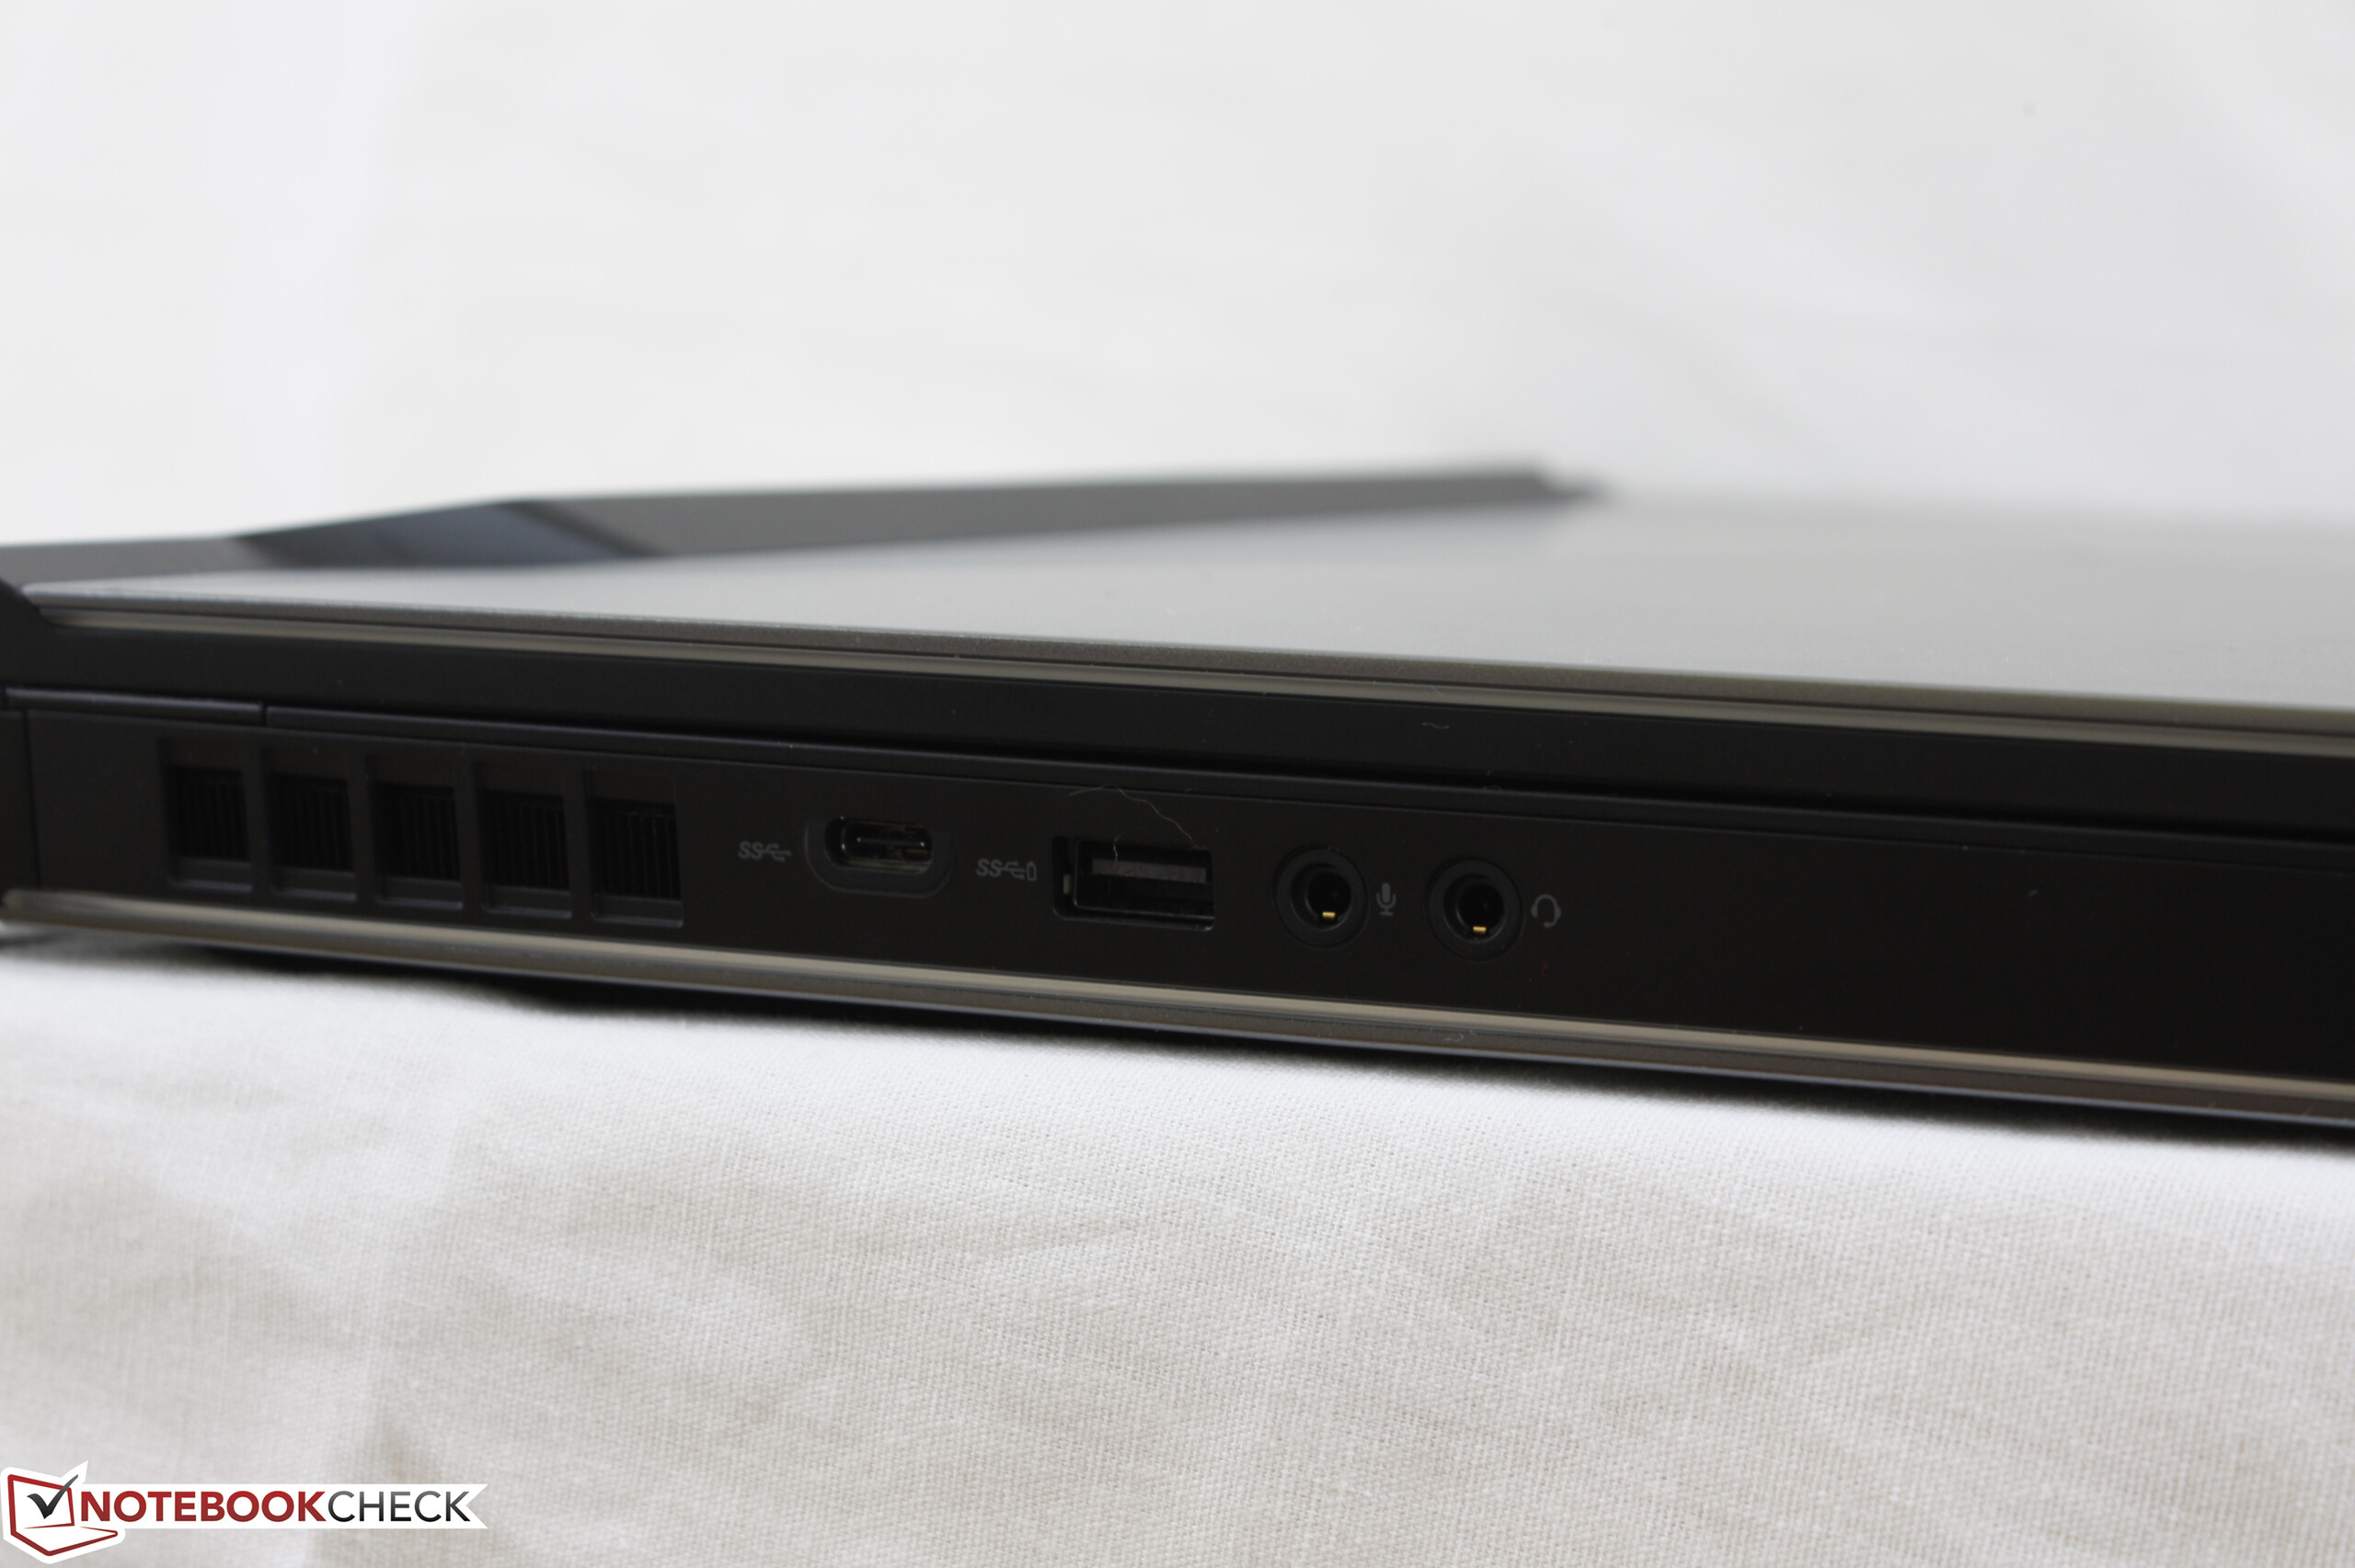
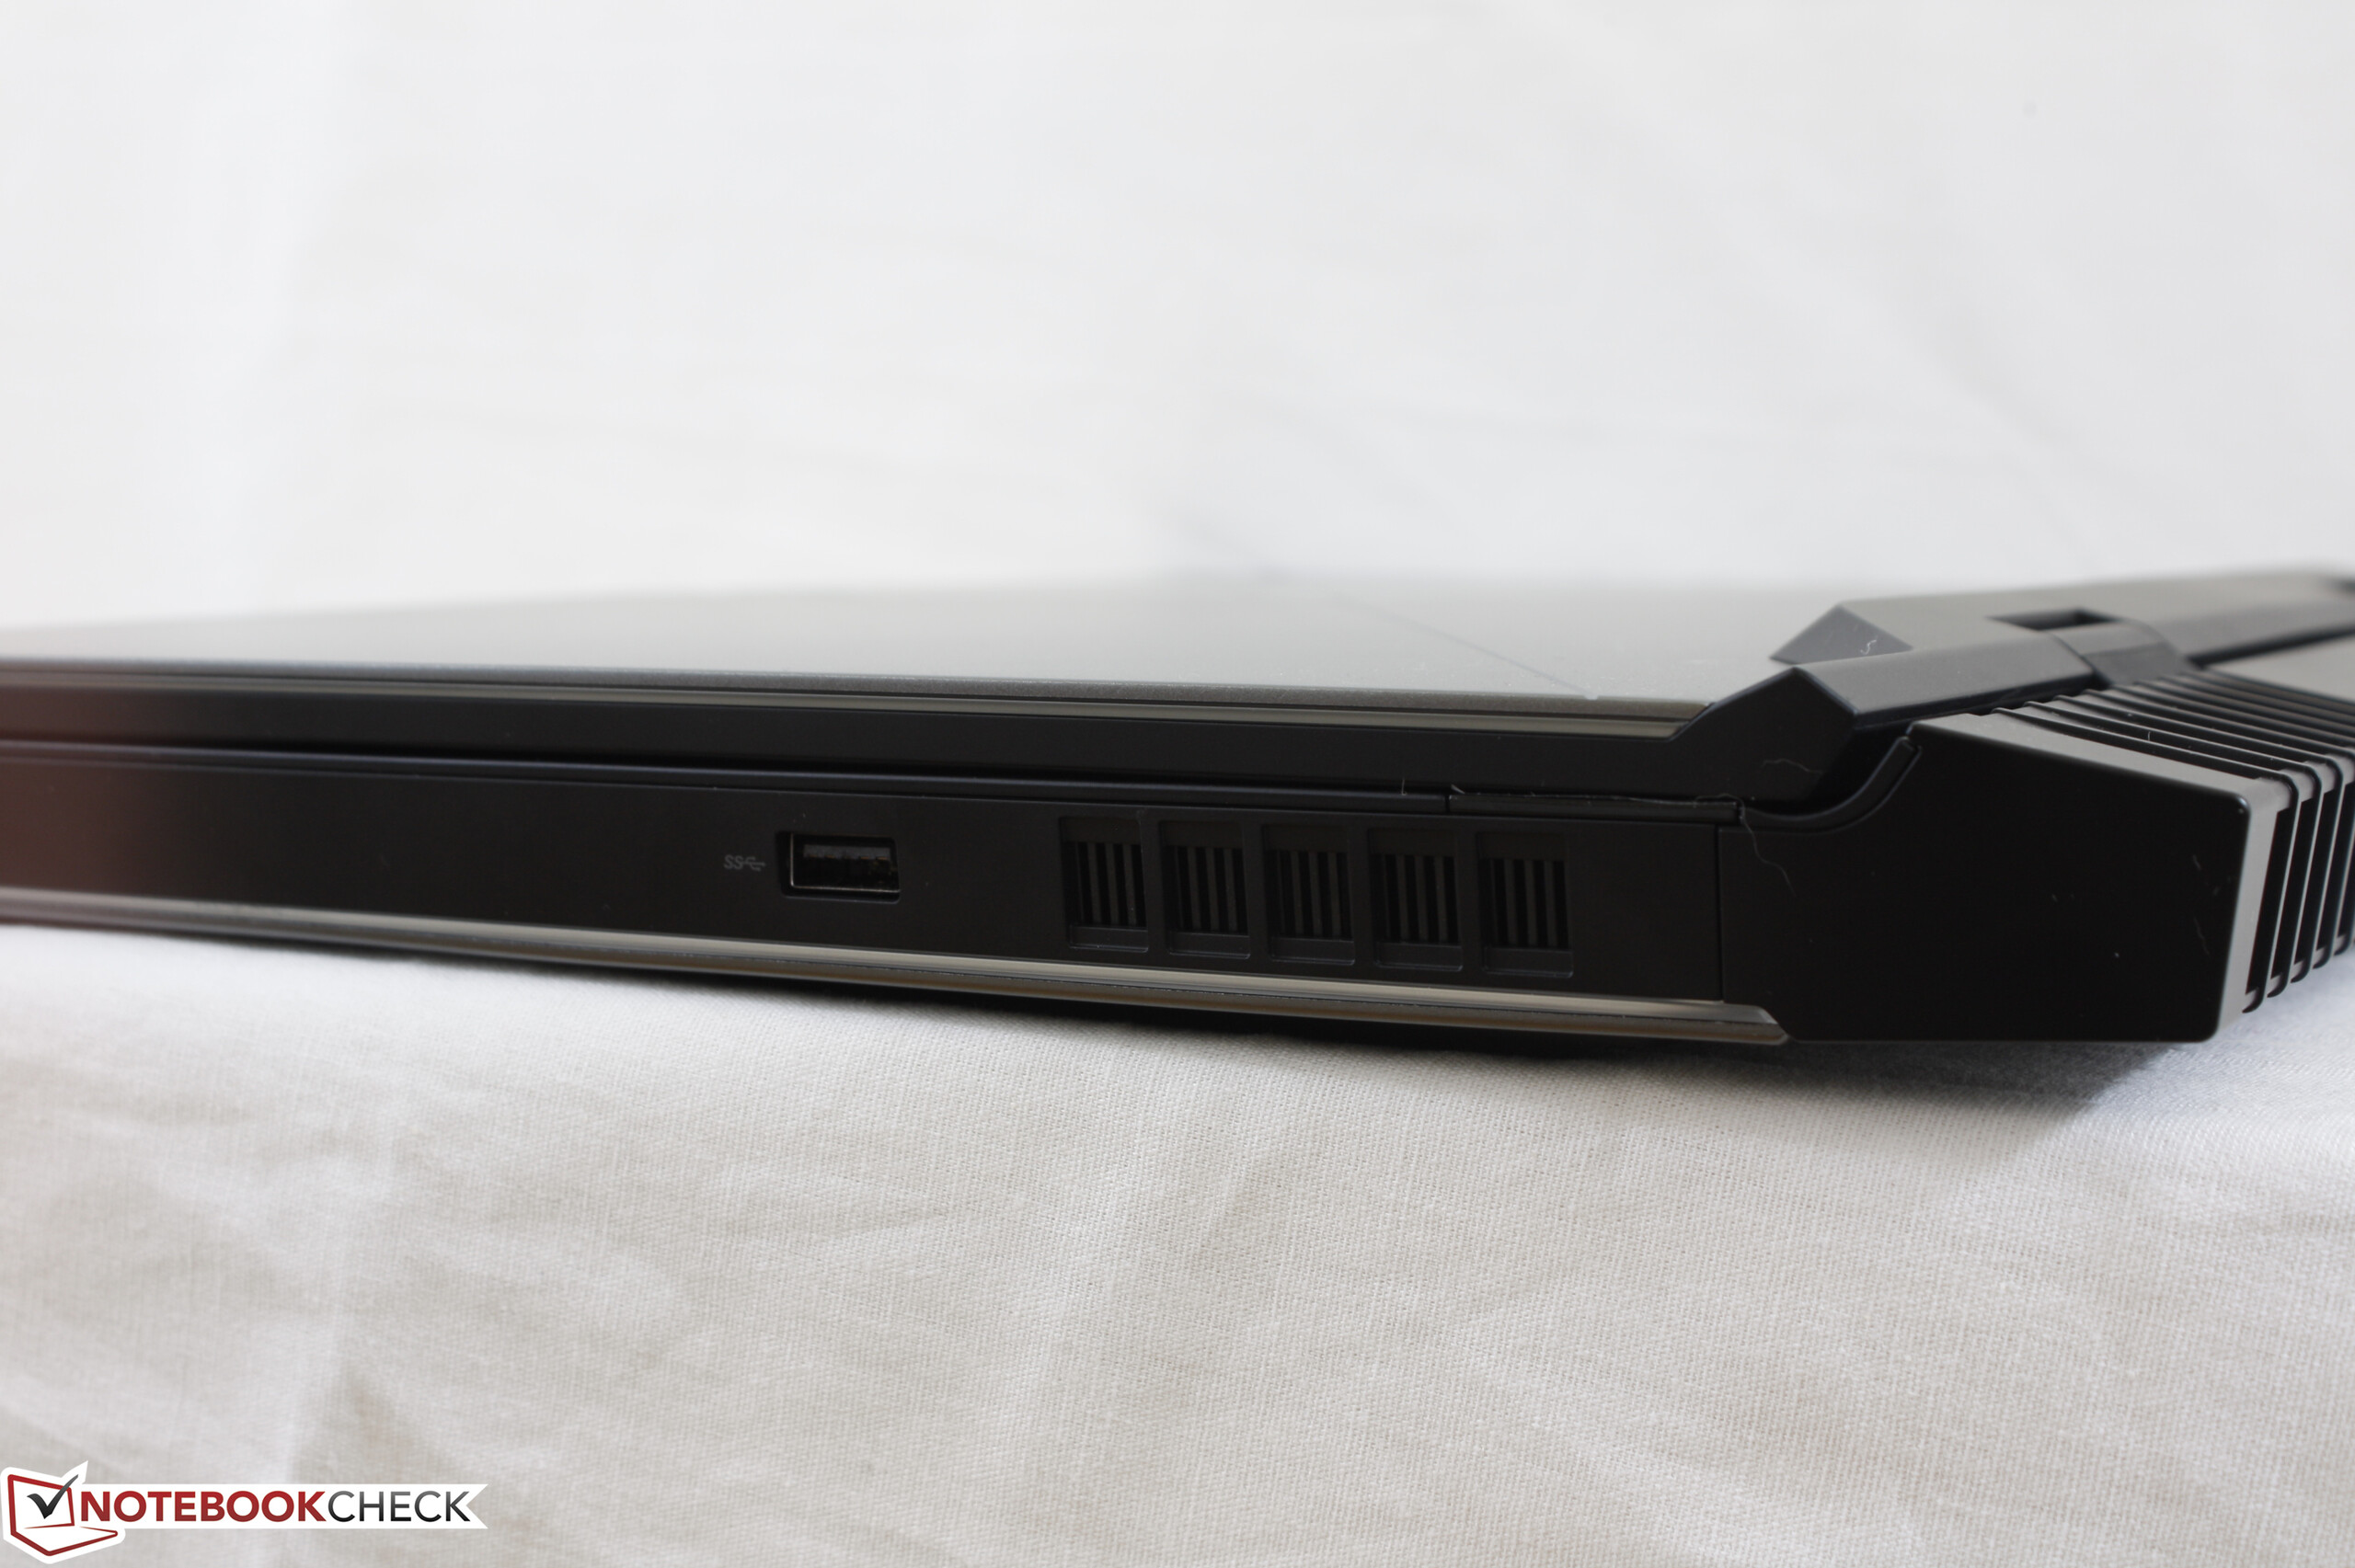
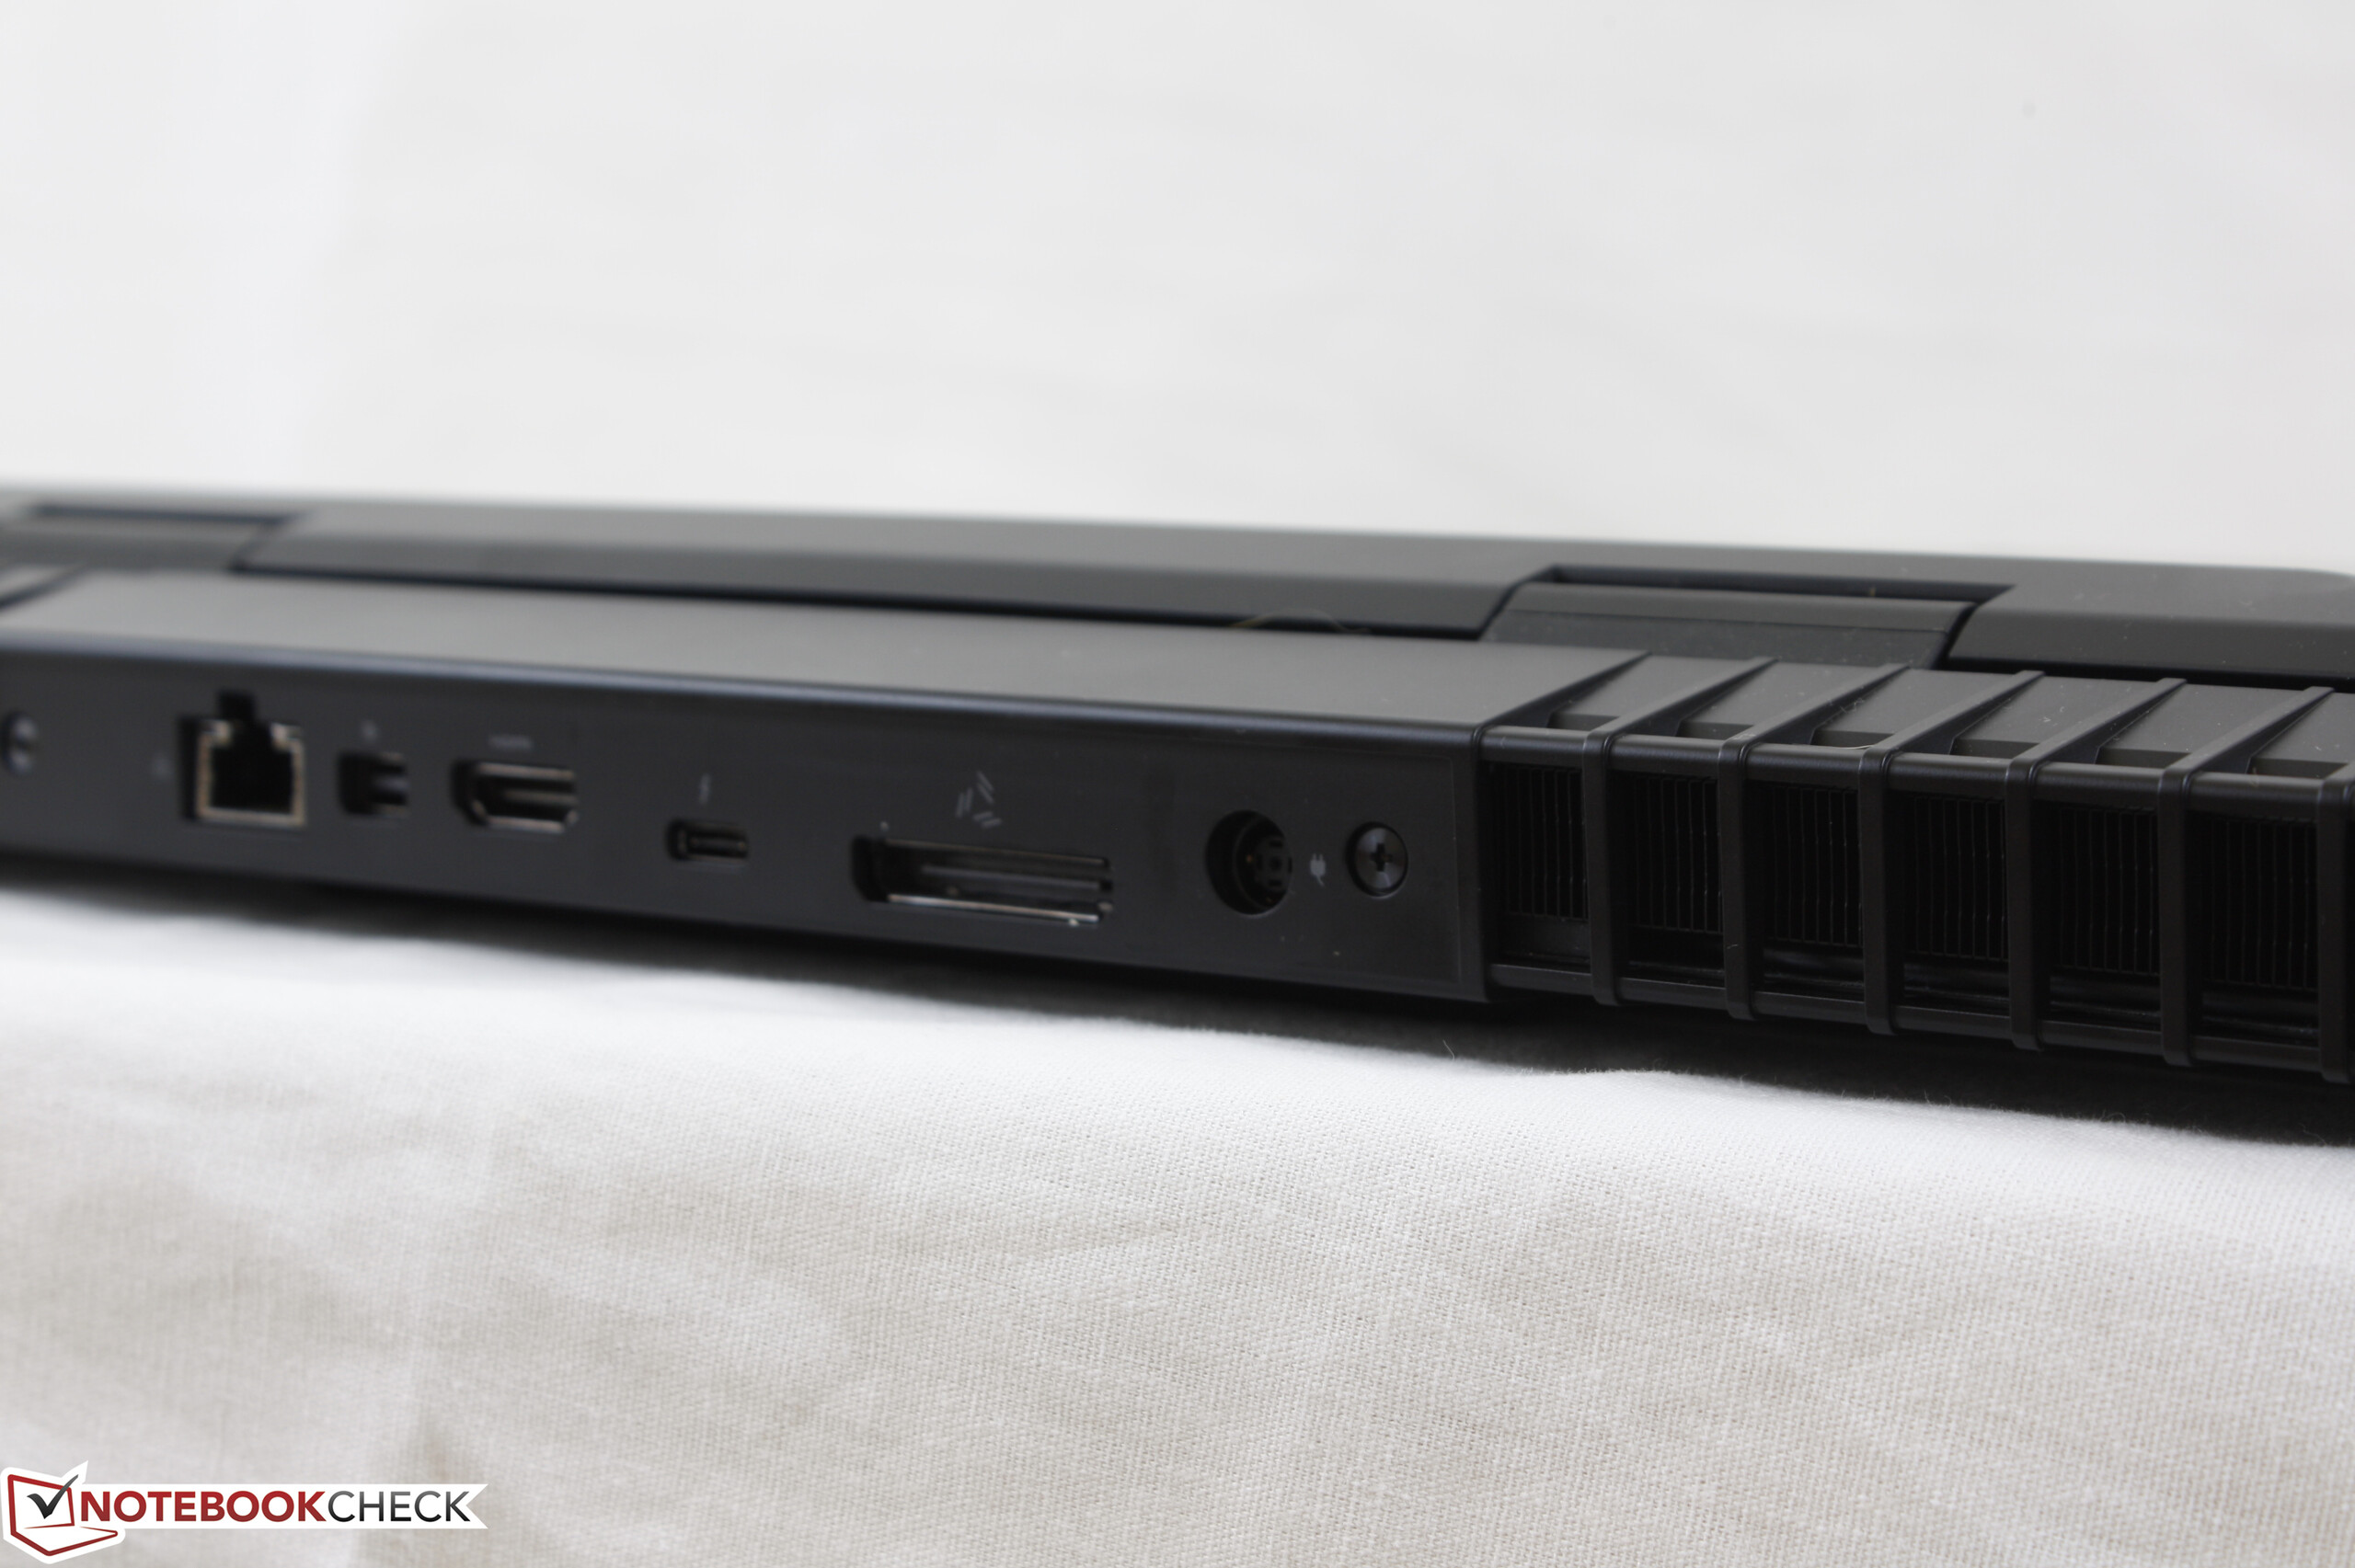
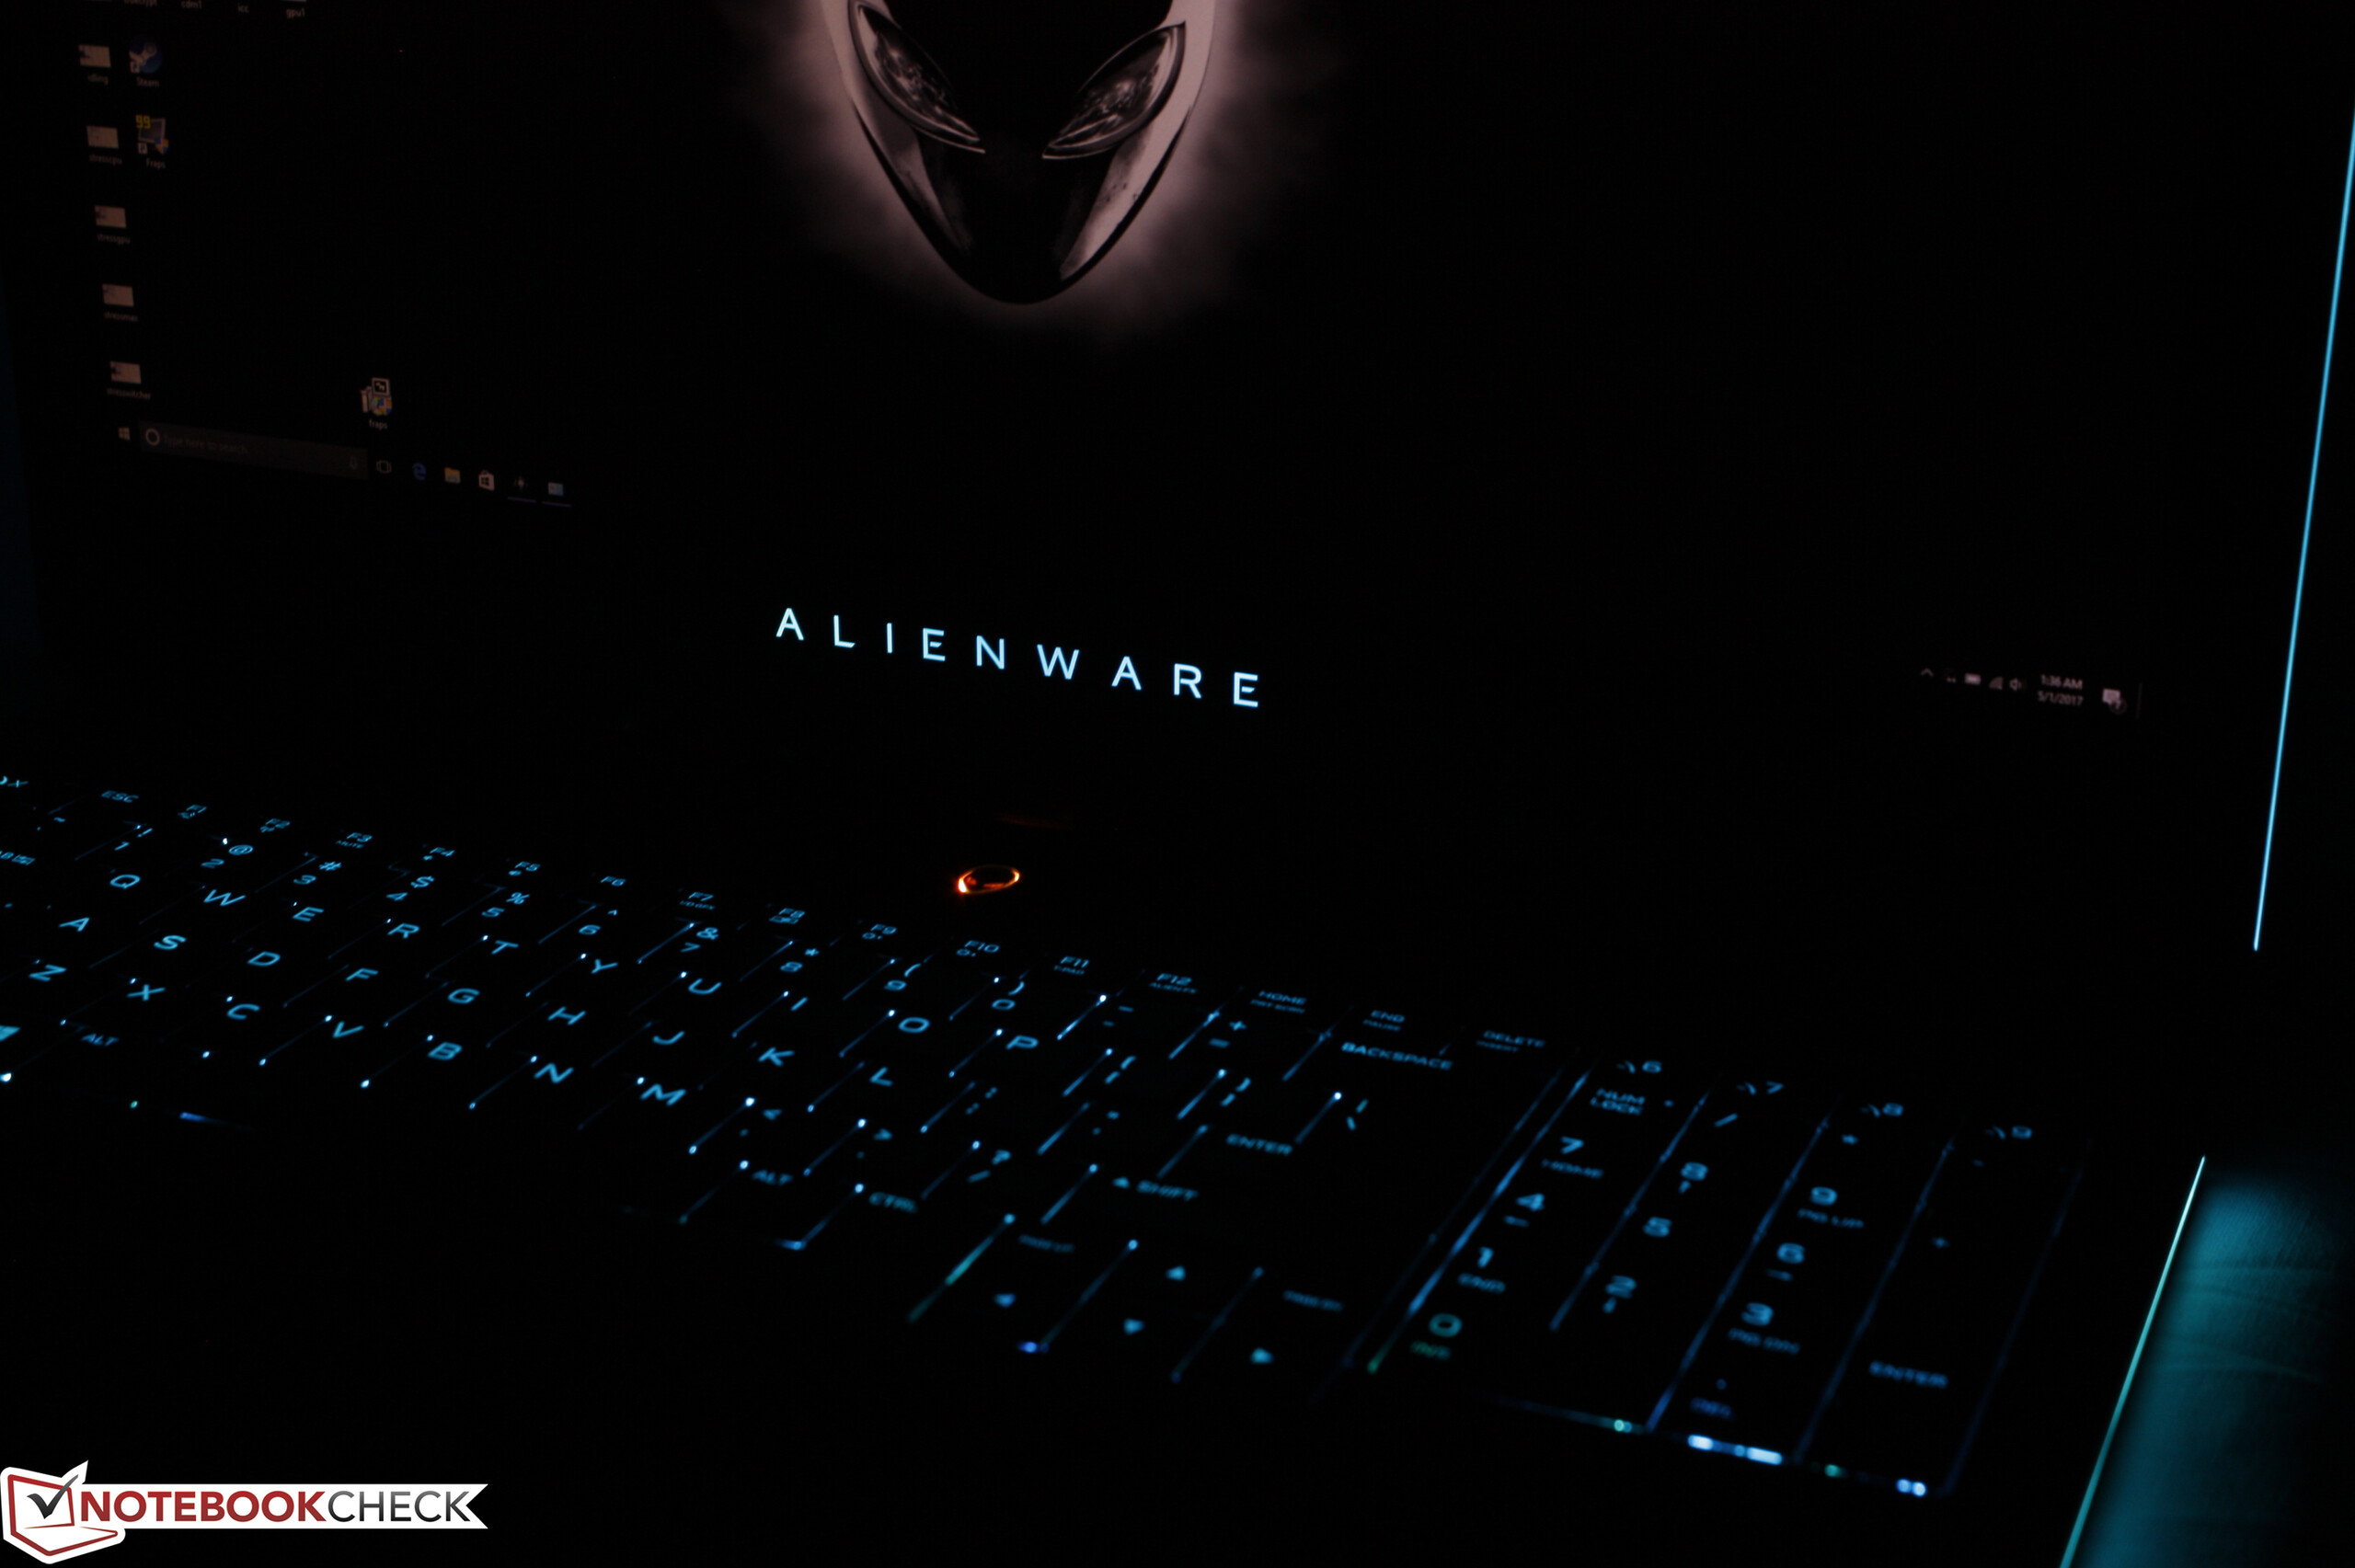
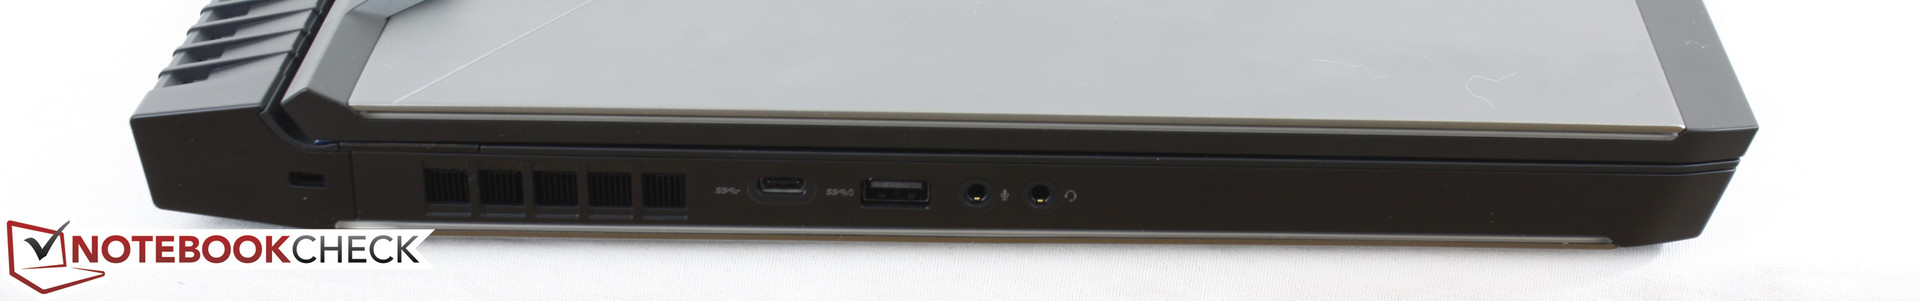
Además de estos problemas respecto al rendimiento, no hay apenas pegas que poner al portátil. Algunas características adicionales no habrían estado mal, como por ejemplo teclas iluminadas individualmente, más puertos USB-Type A o un lector de tarjetas SD. Los jugones interesados en el amplificador gráfico y en un chasis robusto encontrarán atractivas las configuraciones básicas. Otros usuarios encontraran opciones con GPU GTX 1080 más silenciosas (y menos voluminosas) entre los dispositivos de la competencia.
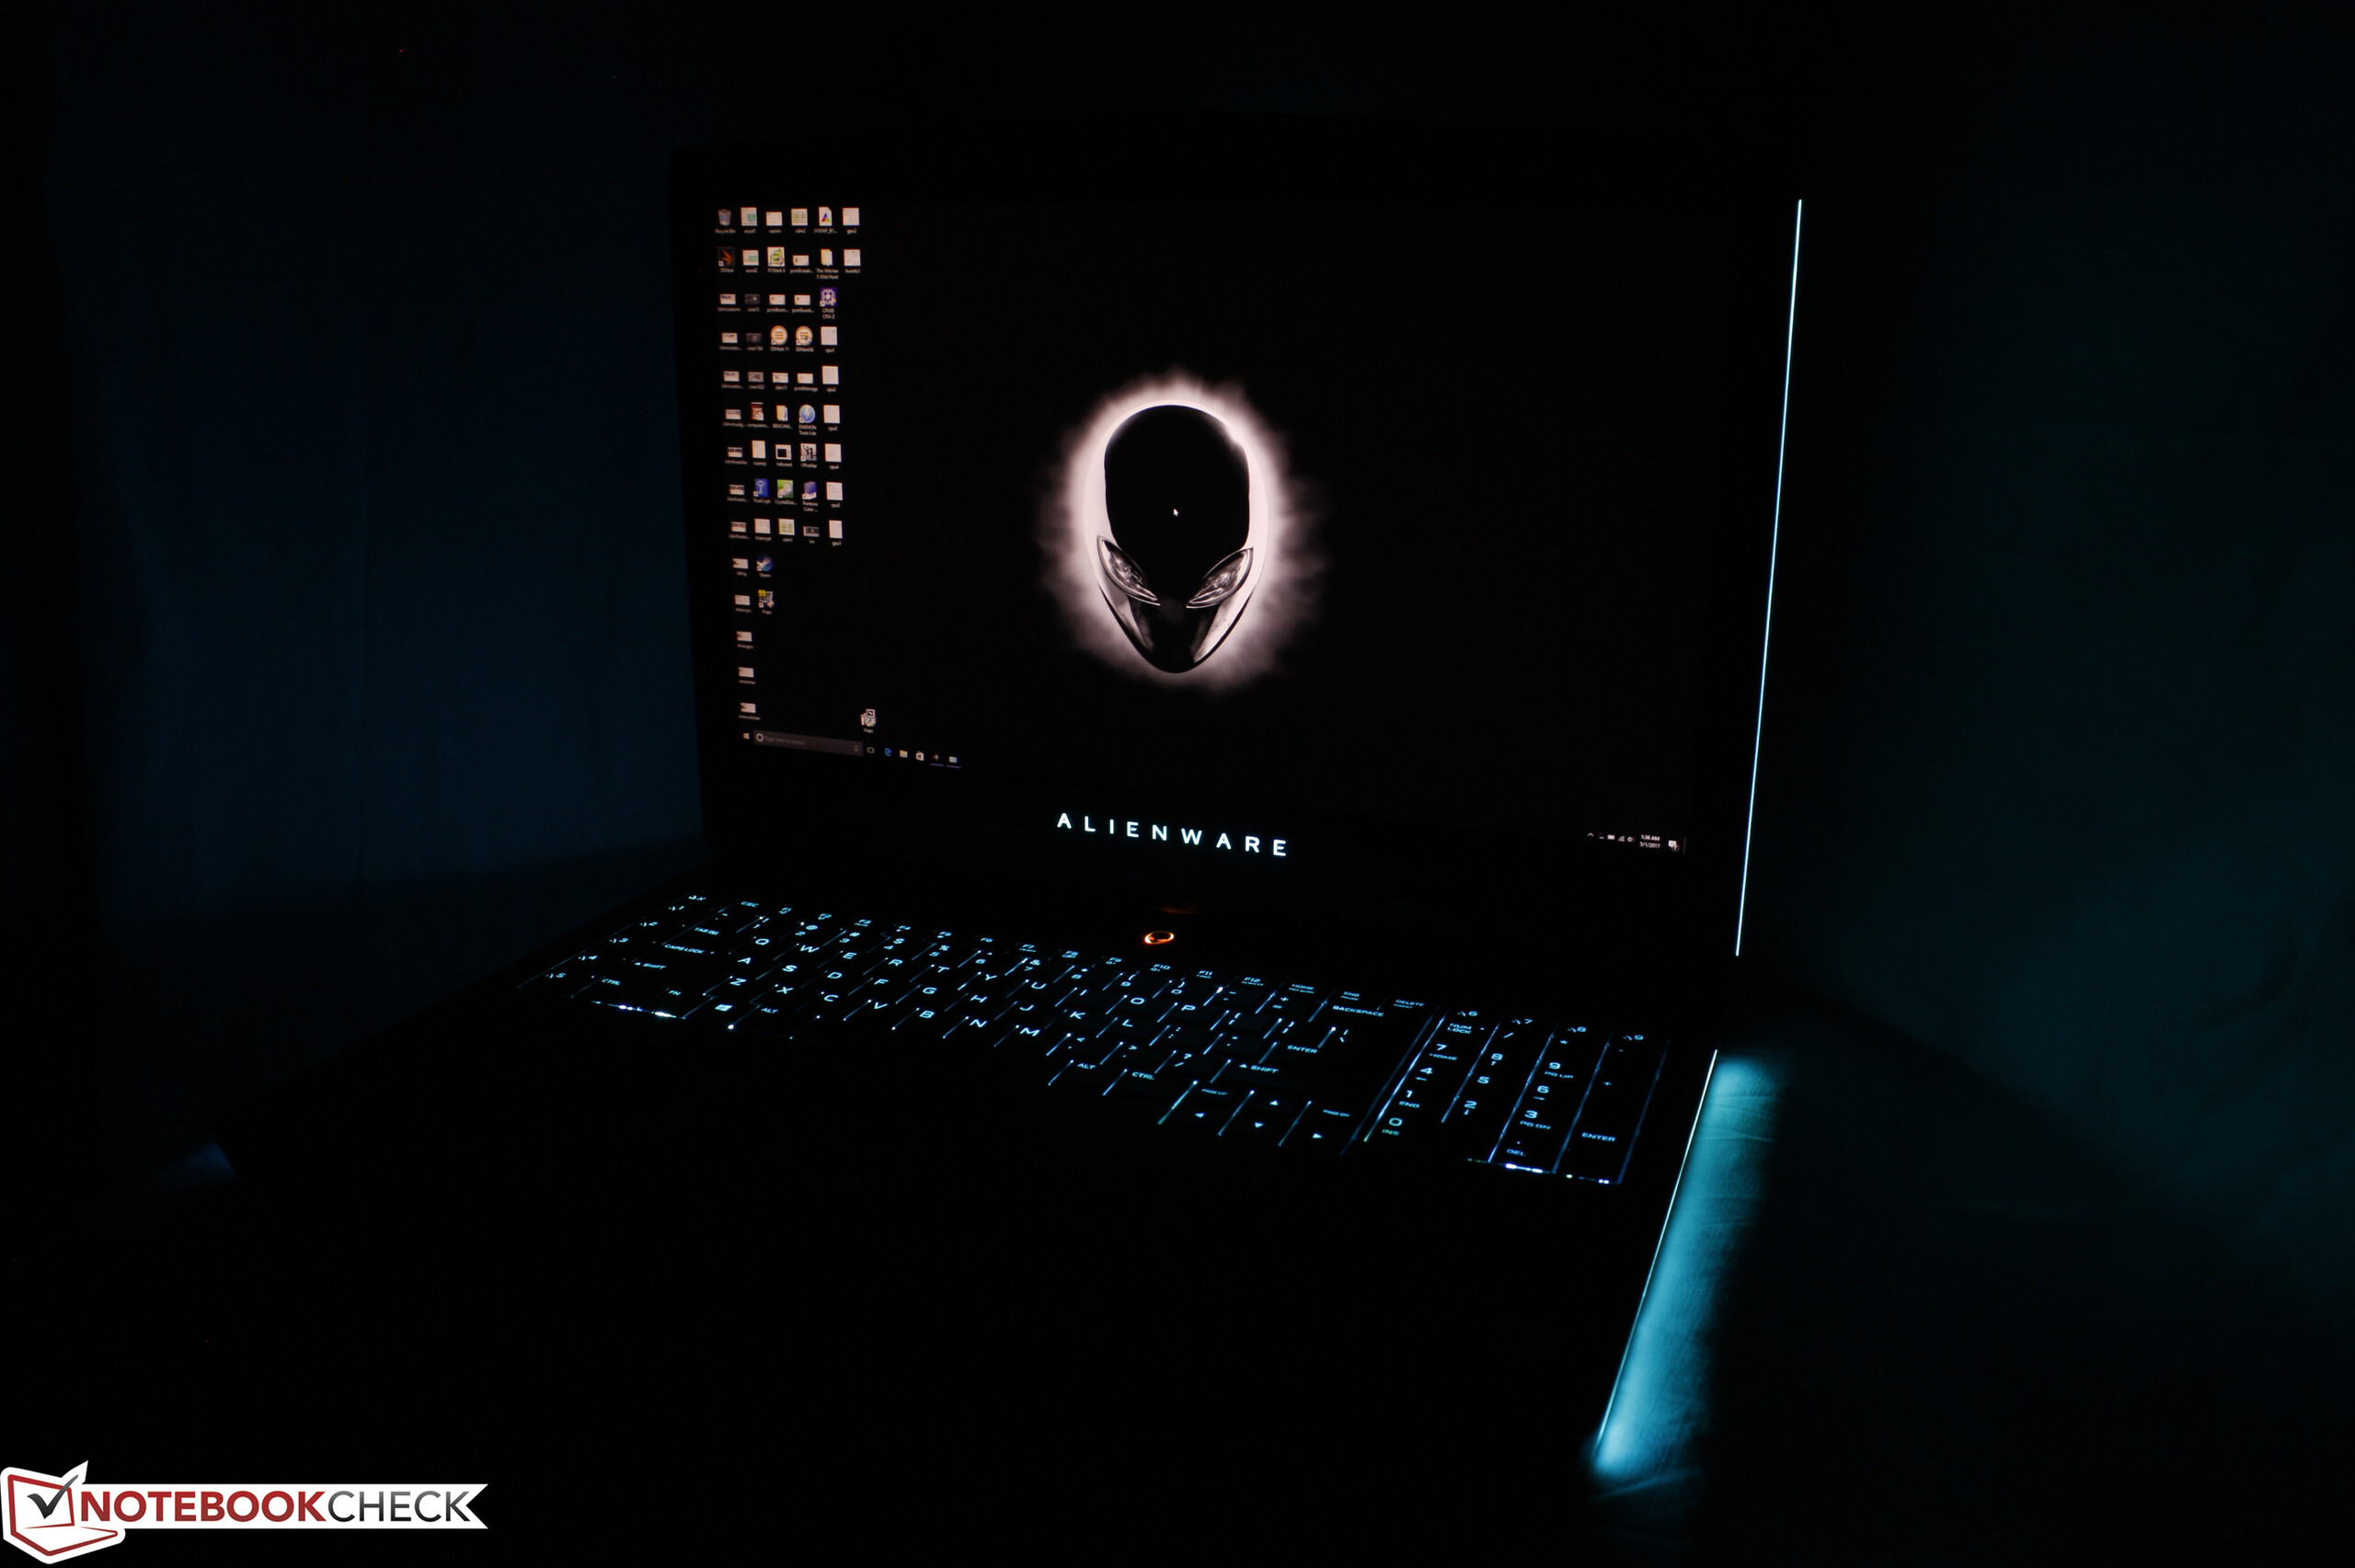
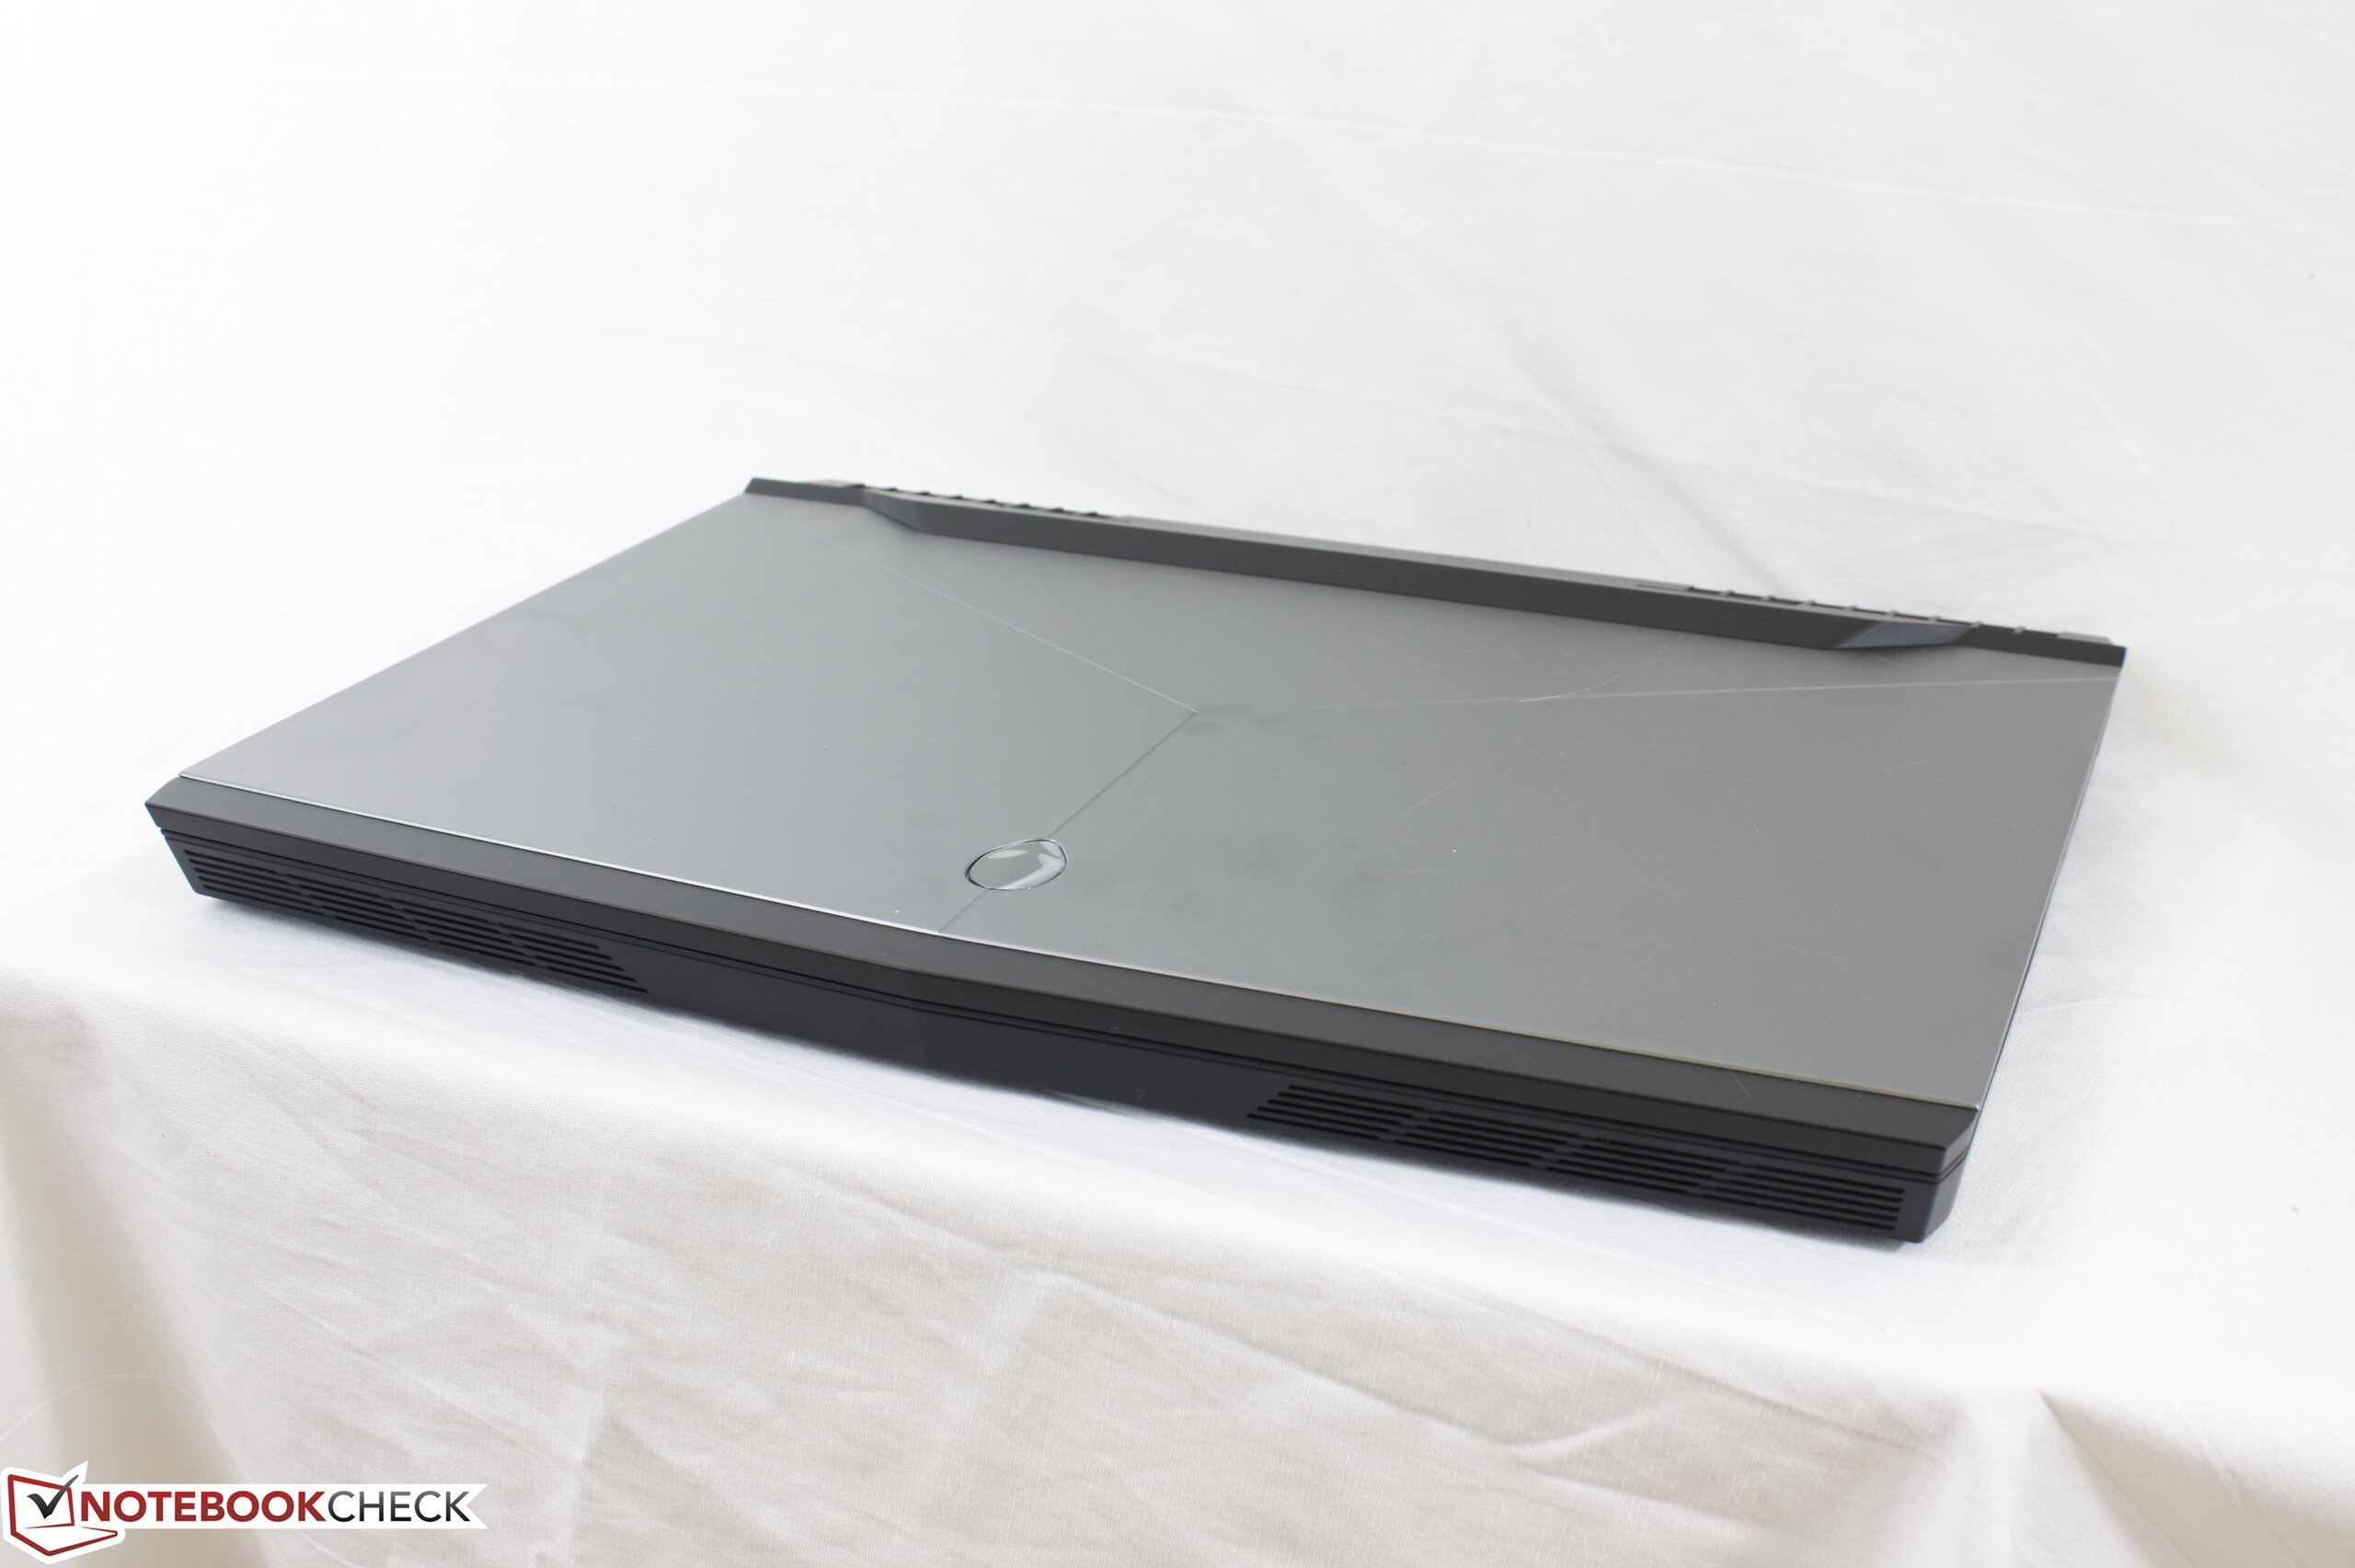
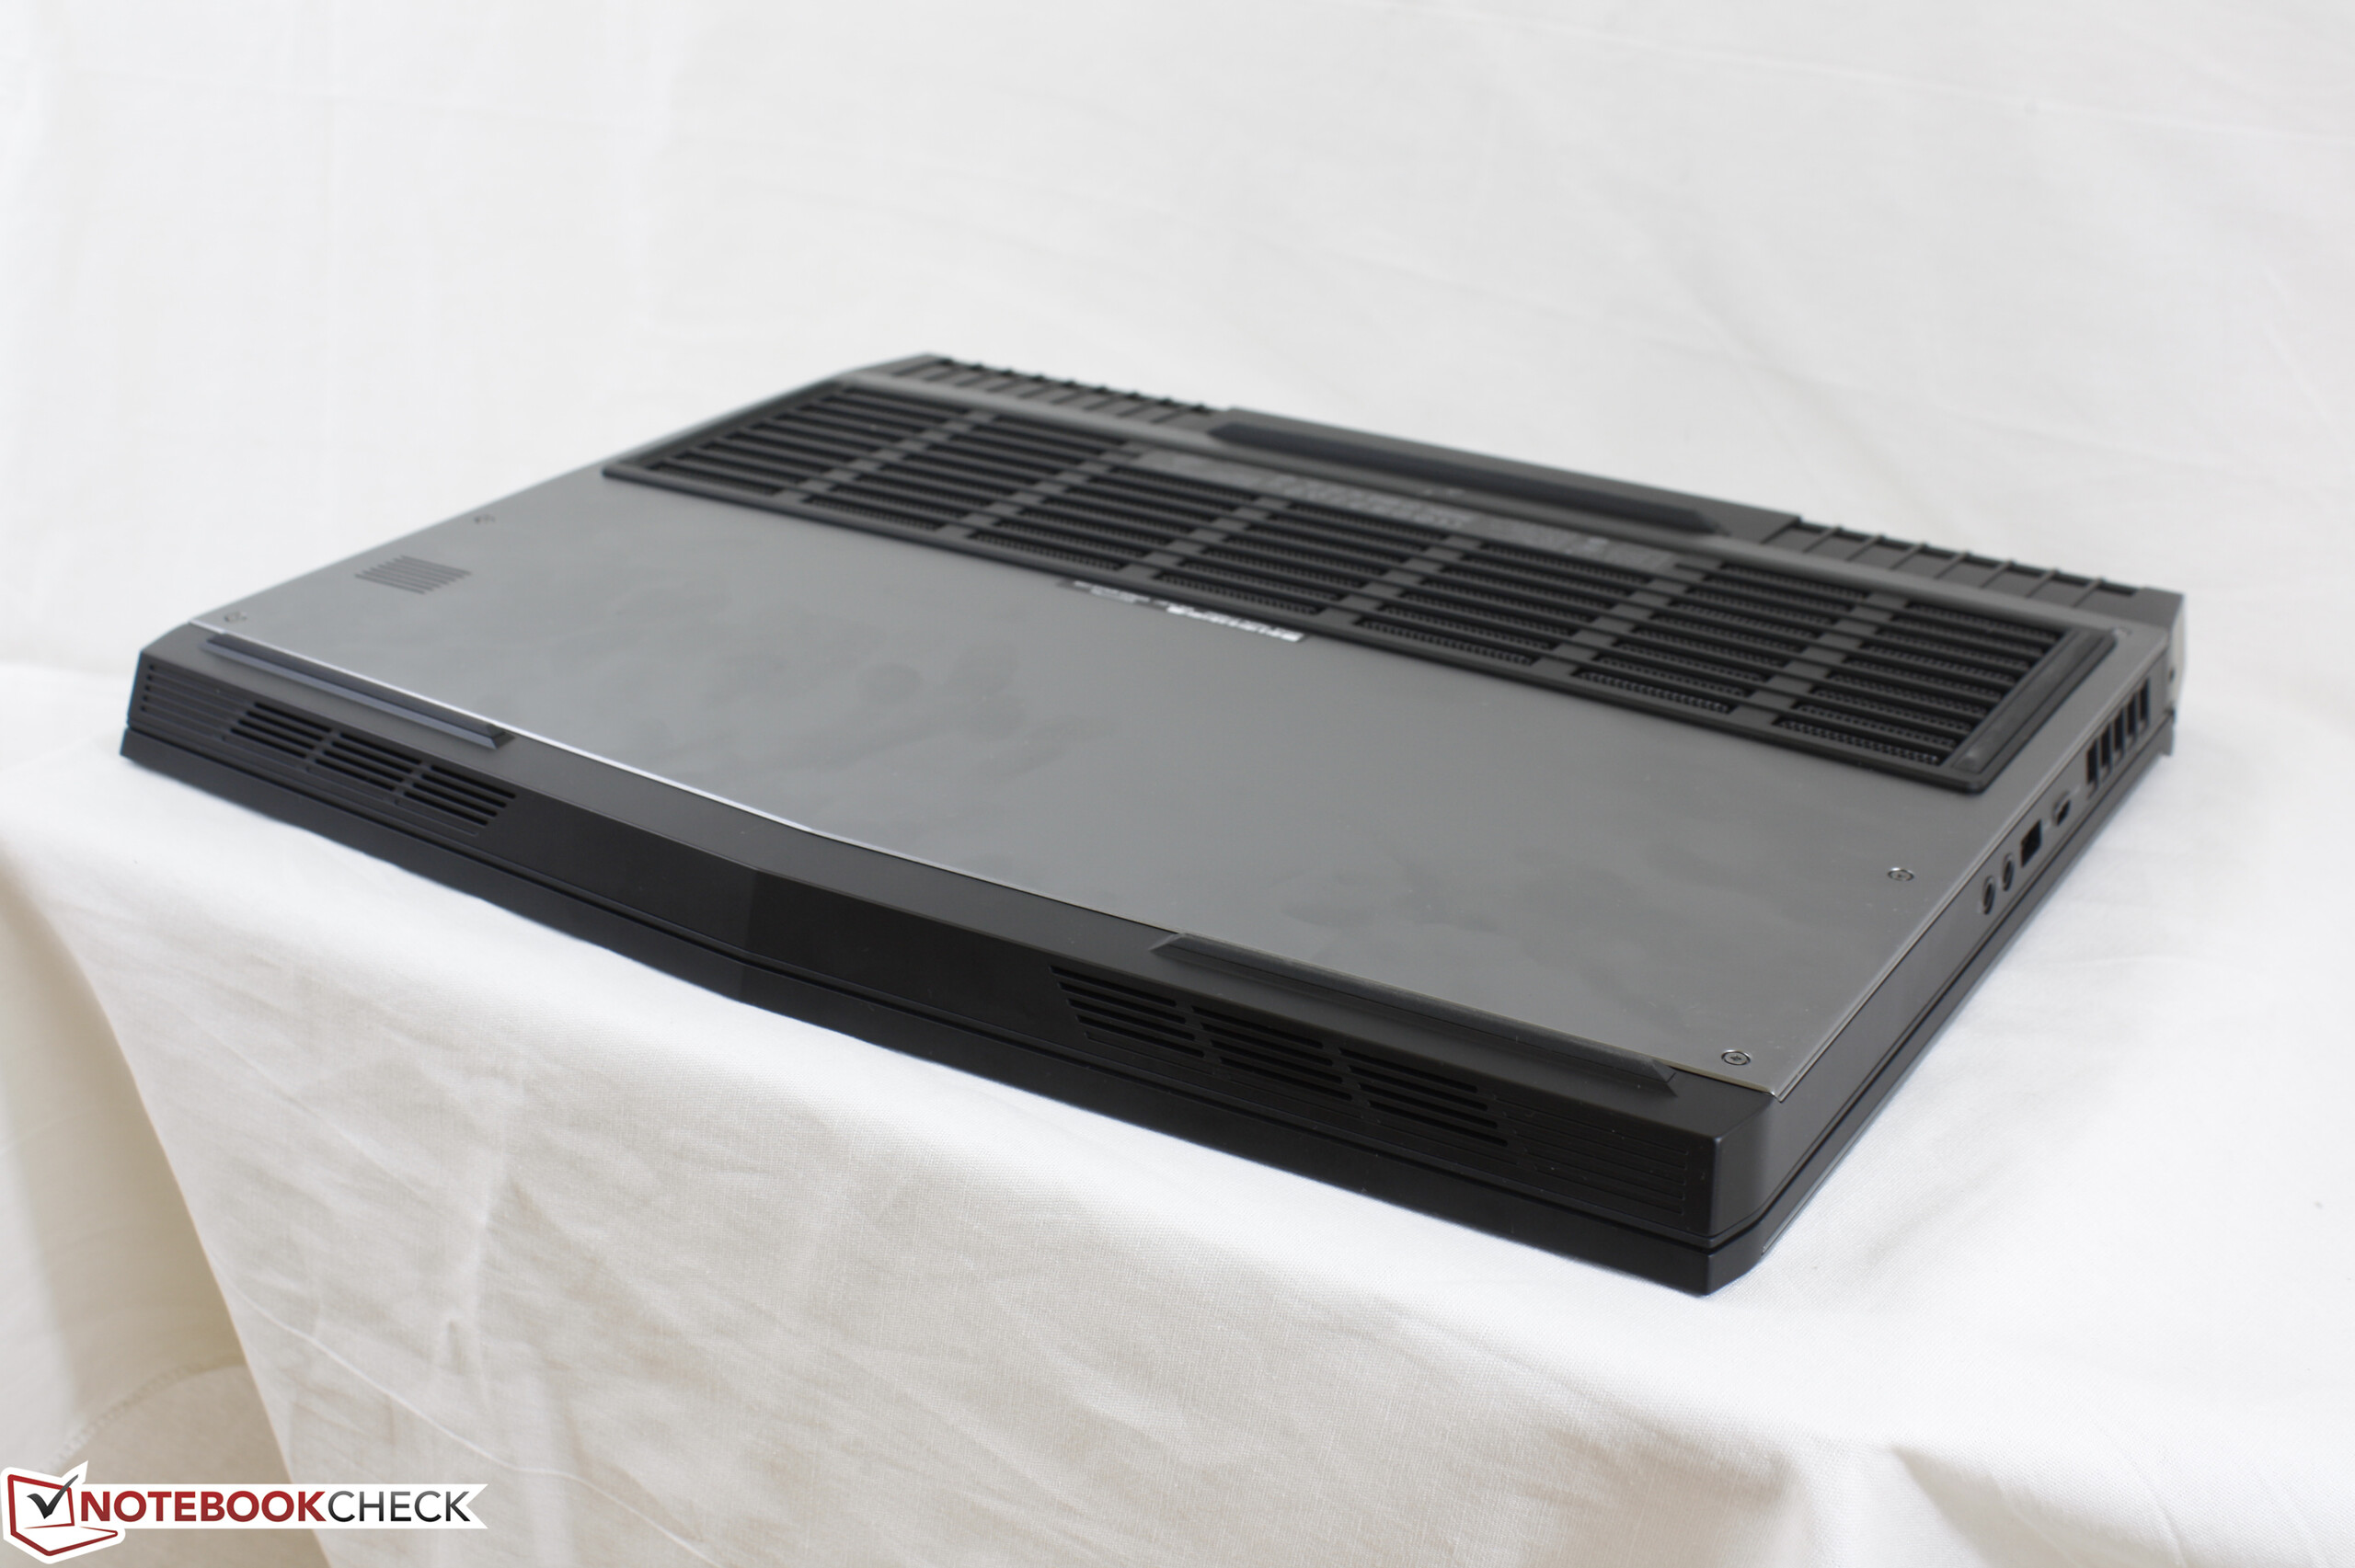
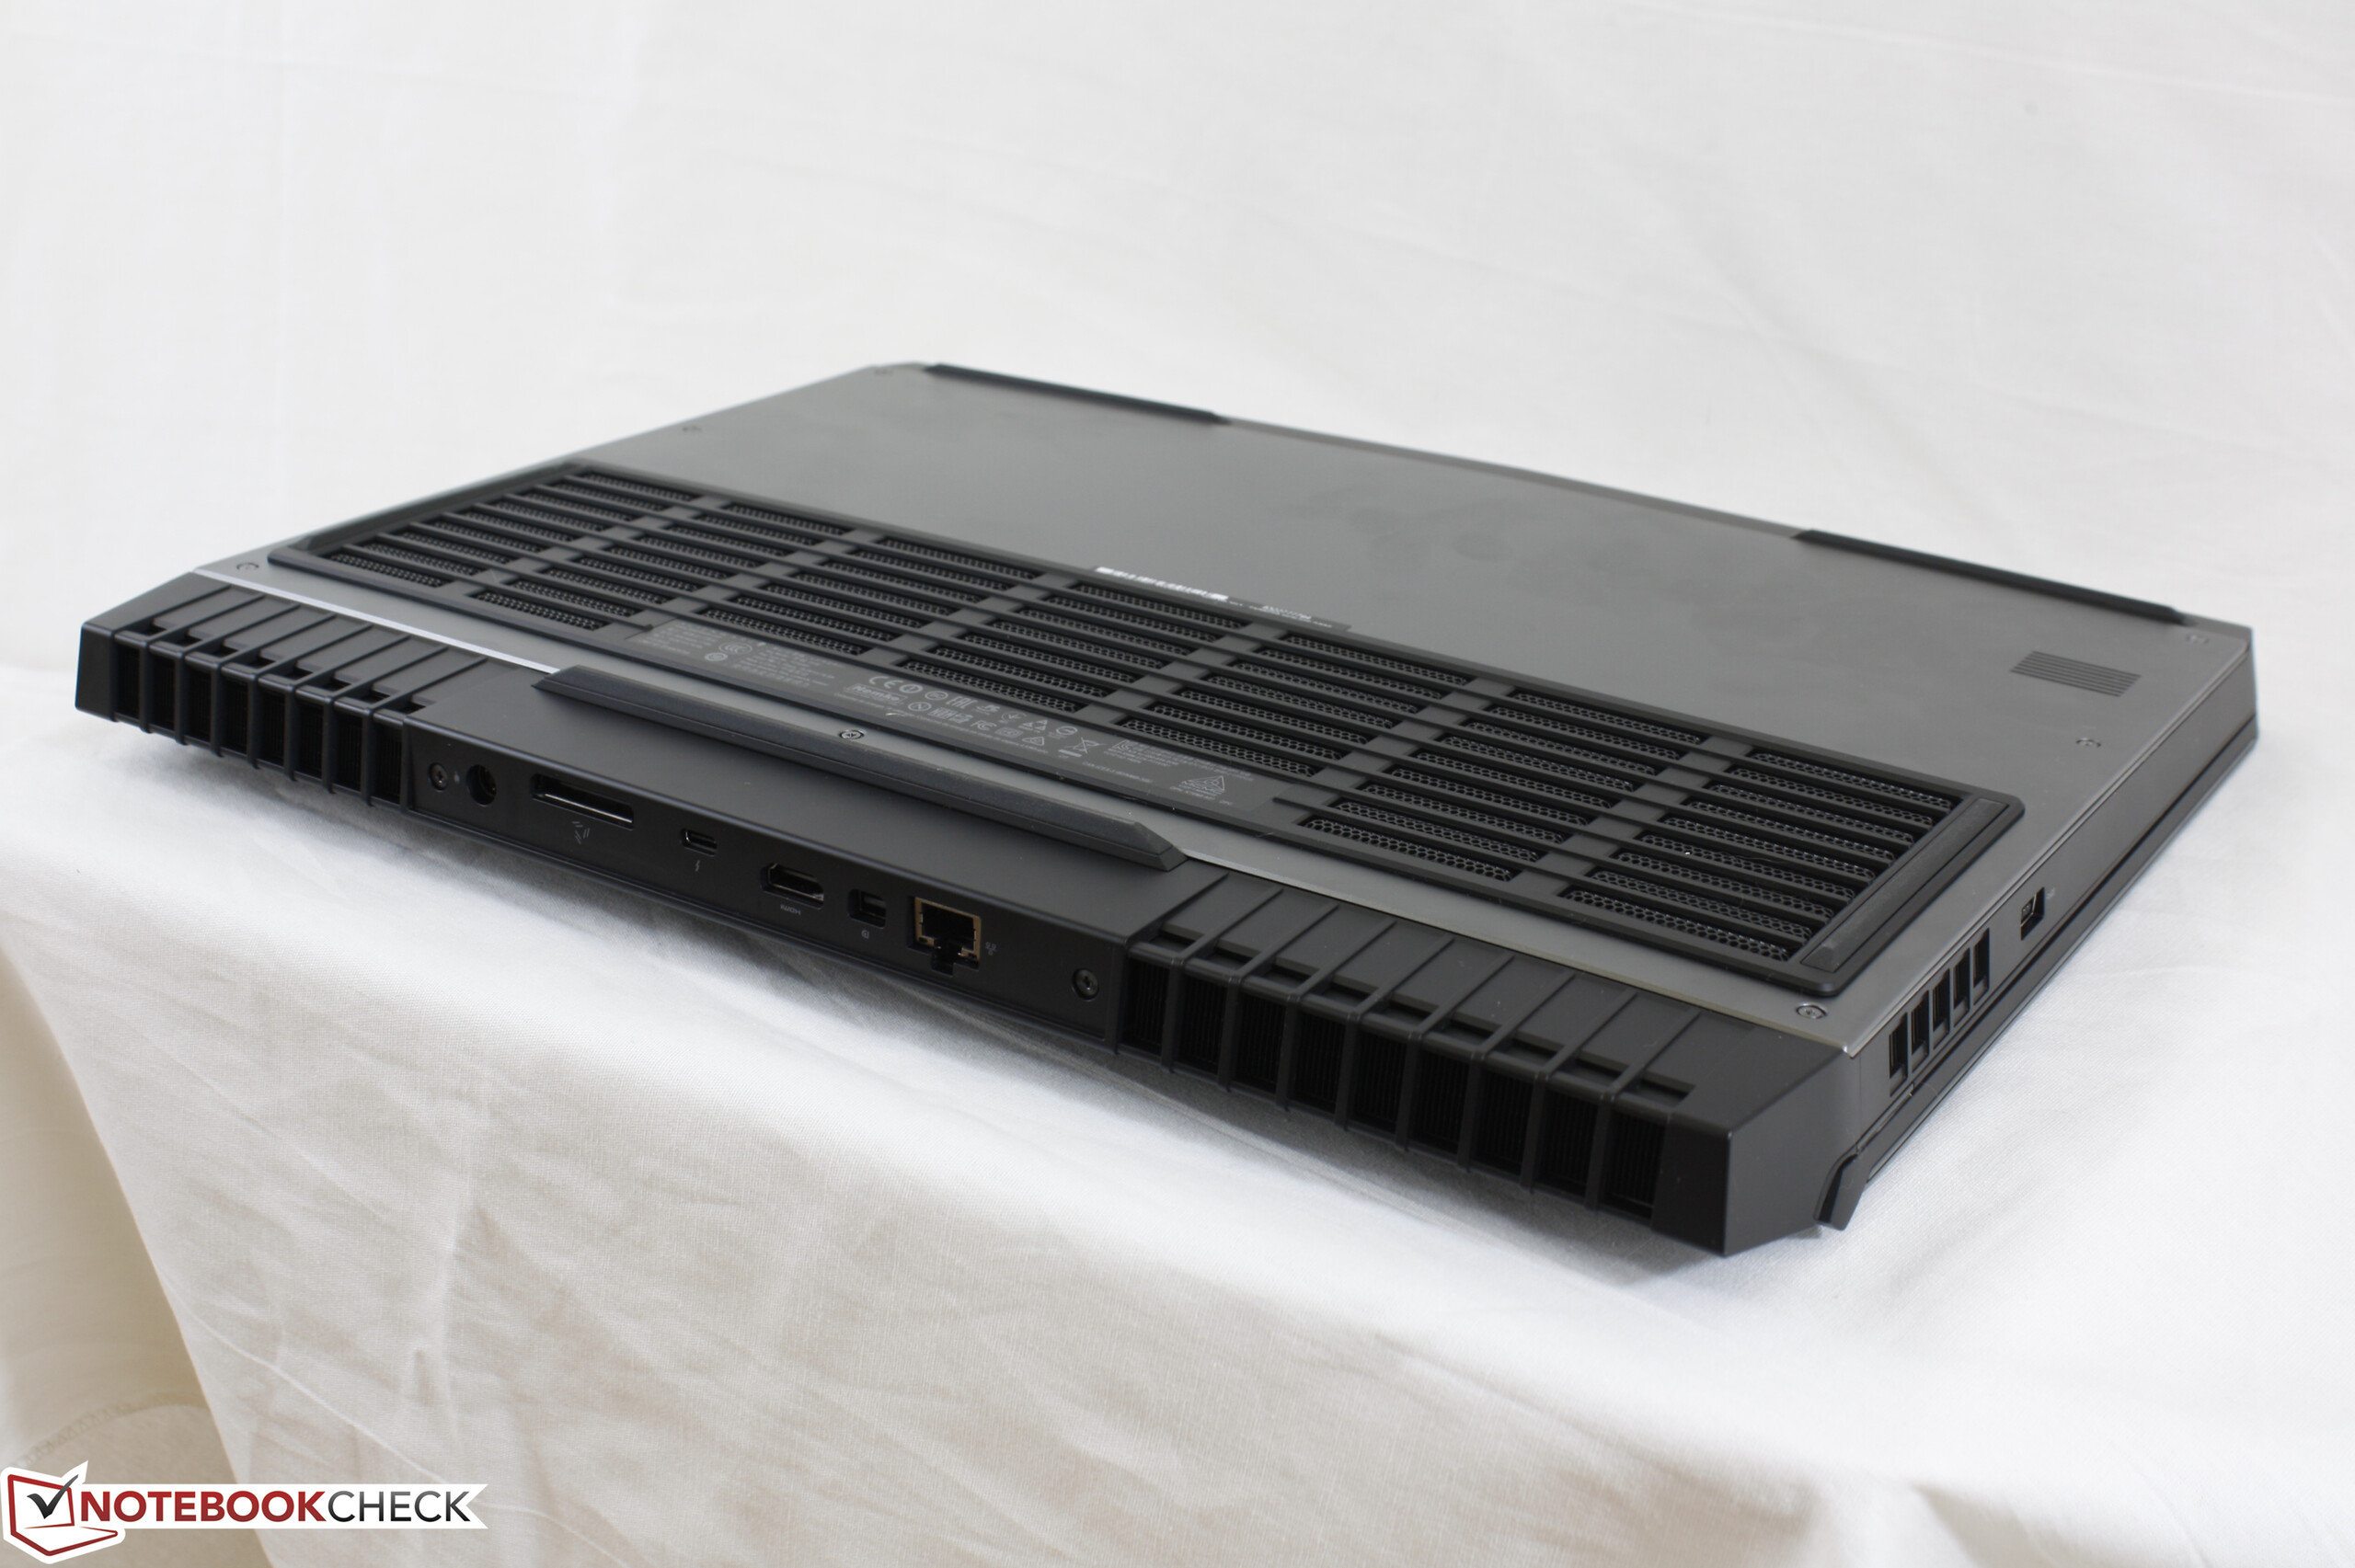
El nuevo chasis está increíblemente bien pensado y transmite sensaciones premium. Hay que tener en cuenta que la GTX 1080 lleva al límite al sistema de refrigeración del portátil.
Ésta es una versión acortada del análisis original. Puedes leer el análisis completo en inglés aquí.
Alienware 17 R4
- 05/03/2017 v6 (old)
Allen Ngo
Price comparison
