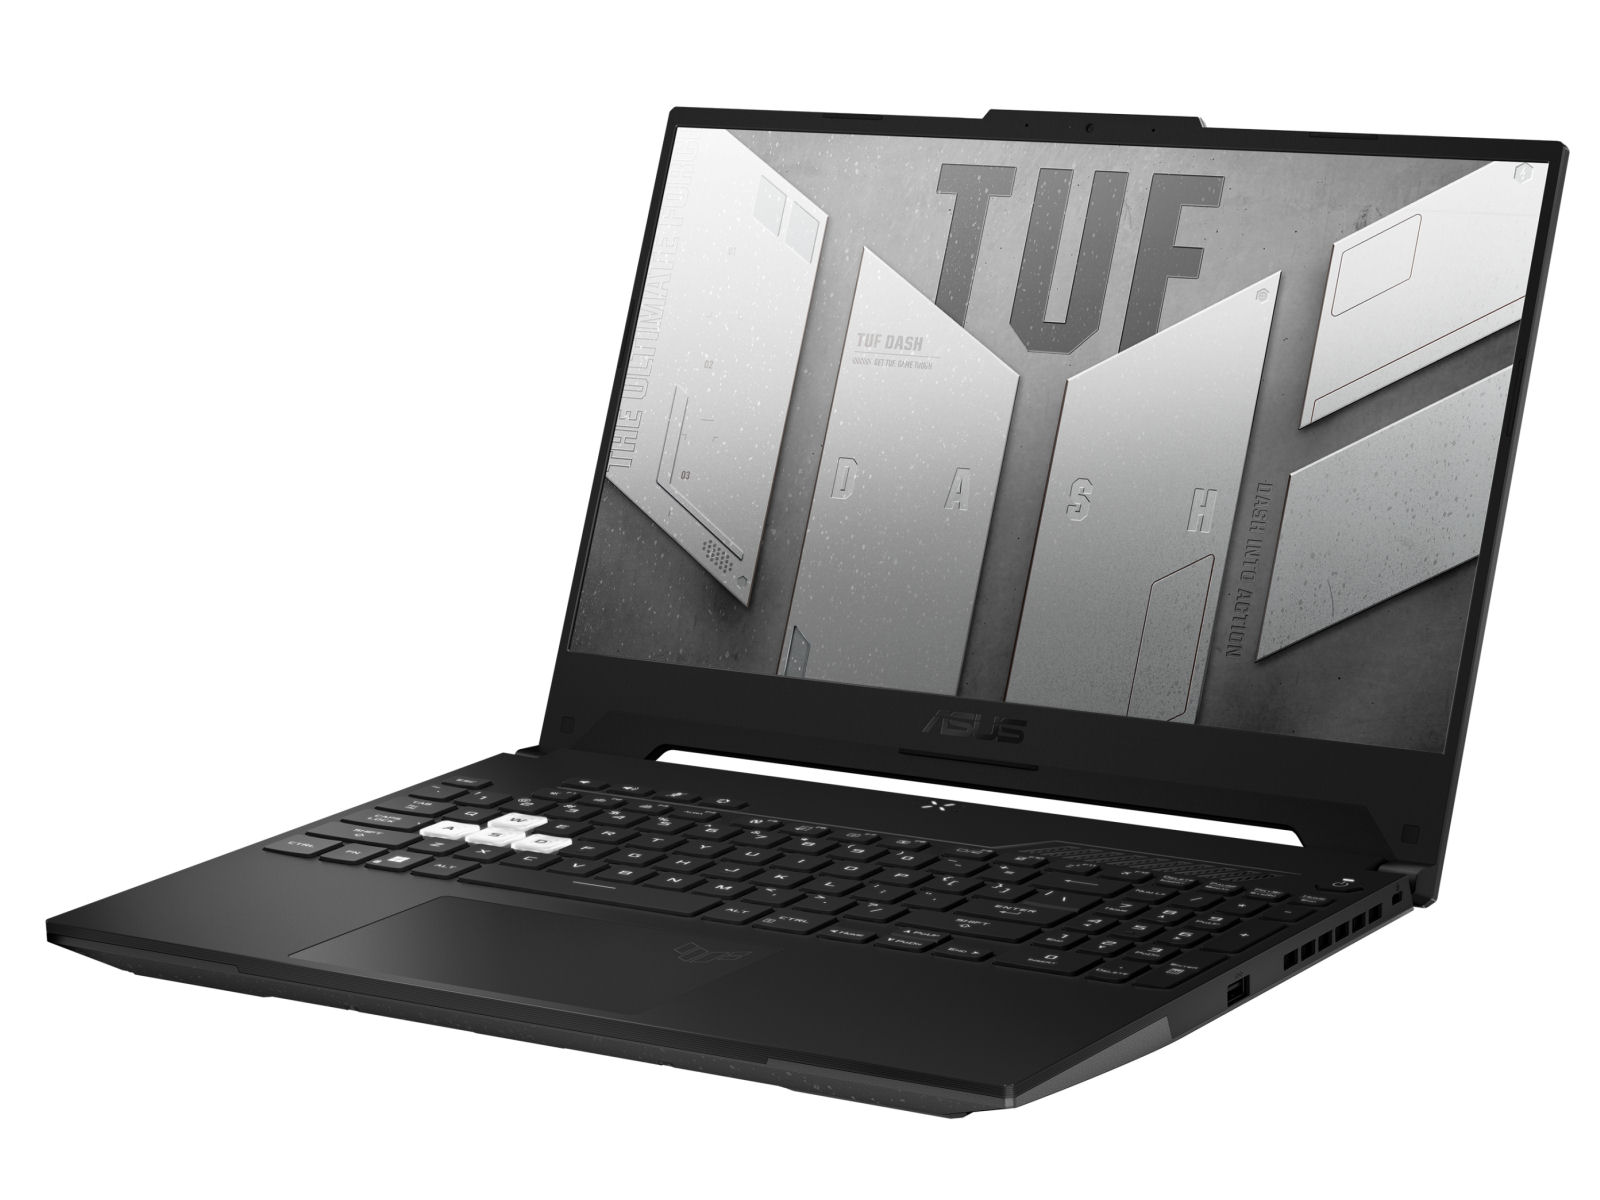
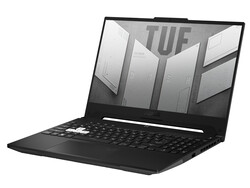
Asus TUF Dash F15 FX517ZR en revisión: Portátil con Mobile RTX 3070 y una duración de batería aceptable

Asus no busca el máximo rendimiento en el FX517ZR, sino que se centra en las dimensiones compactas y el bajo peso. Esto requiere una configuración adecuada: ElCore-i7-12650H y el procesadorGeForce RTX 3070 para portátiles GPU (TGP: 105 vatios) son hardware sólido perteneciente a la gama media alta, pero no están entre los mejores. El portátil de 2 kg compite con portátiles conceptualmente comparables como el Razer Blade 15 Modelo Basey el MSI Delta 15. El grupo más amplio de competidores incluye portátiles como el Acer Nitro 5 AN515-58y el HP Omen 16
Posibles contendientes en la comparación
Valoración | Fecha | Modelo | Peso | Altura | Tamaño | Resolución | Precio |
|---|---|---|---|---|---|---|---|
| 85.8 % v7 (old) | 07/2022 | Asus TUF Dash F15 FX517ZR i7-12650H, GeForce RTX 3070 Laptop GPU | 2 kg | 20.7 mm | 15.60" | 2560x1440 | |
| 84 % v7 (old) | 06/2022 | Acer Nitro 5 AN515-58-72QR i7-12700H, GeForce RTX 3070 Ti Laptop GPU | 2.5 kg | 26.8 mm | 15.60" | 2560x1440 | |
| 85.5 % v7 (old) | 05/2022 | HP Omen 16-b1090ng i7-12700H, GeForce RTX 3070 Ti Laptop GPU | 2.3 kg | 23 mm | 16.10" | 2560x1440 | |
| 82.9 % v7 (old) | 10/2021 | MSI Delta 15 A5EFK R9 5900HX, Radeon RX 6700M | 2 kg | 19 mm | 15.60" | 1920x1080 | |
| 85.5 % v7 (old) | 03/2021 | Razer Blade 15 Base Edition 2021, i7-10750H RTX 3060 i7-10750H, GeForce RTX 3060 Laptop GPU | 2.1 kg | 19.9 mm | 15.60" | 1920x1080 |
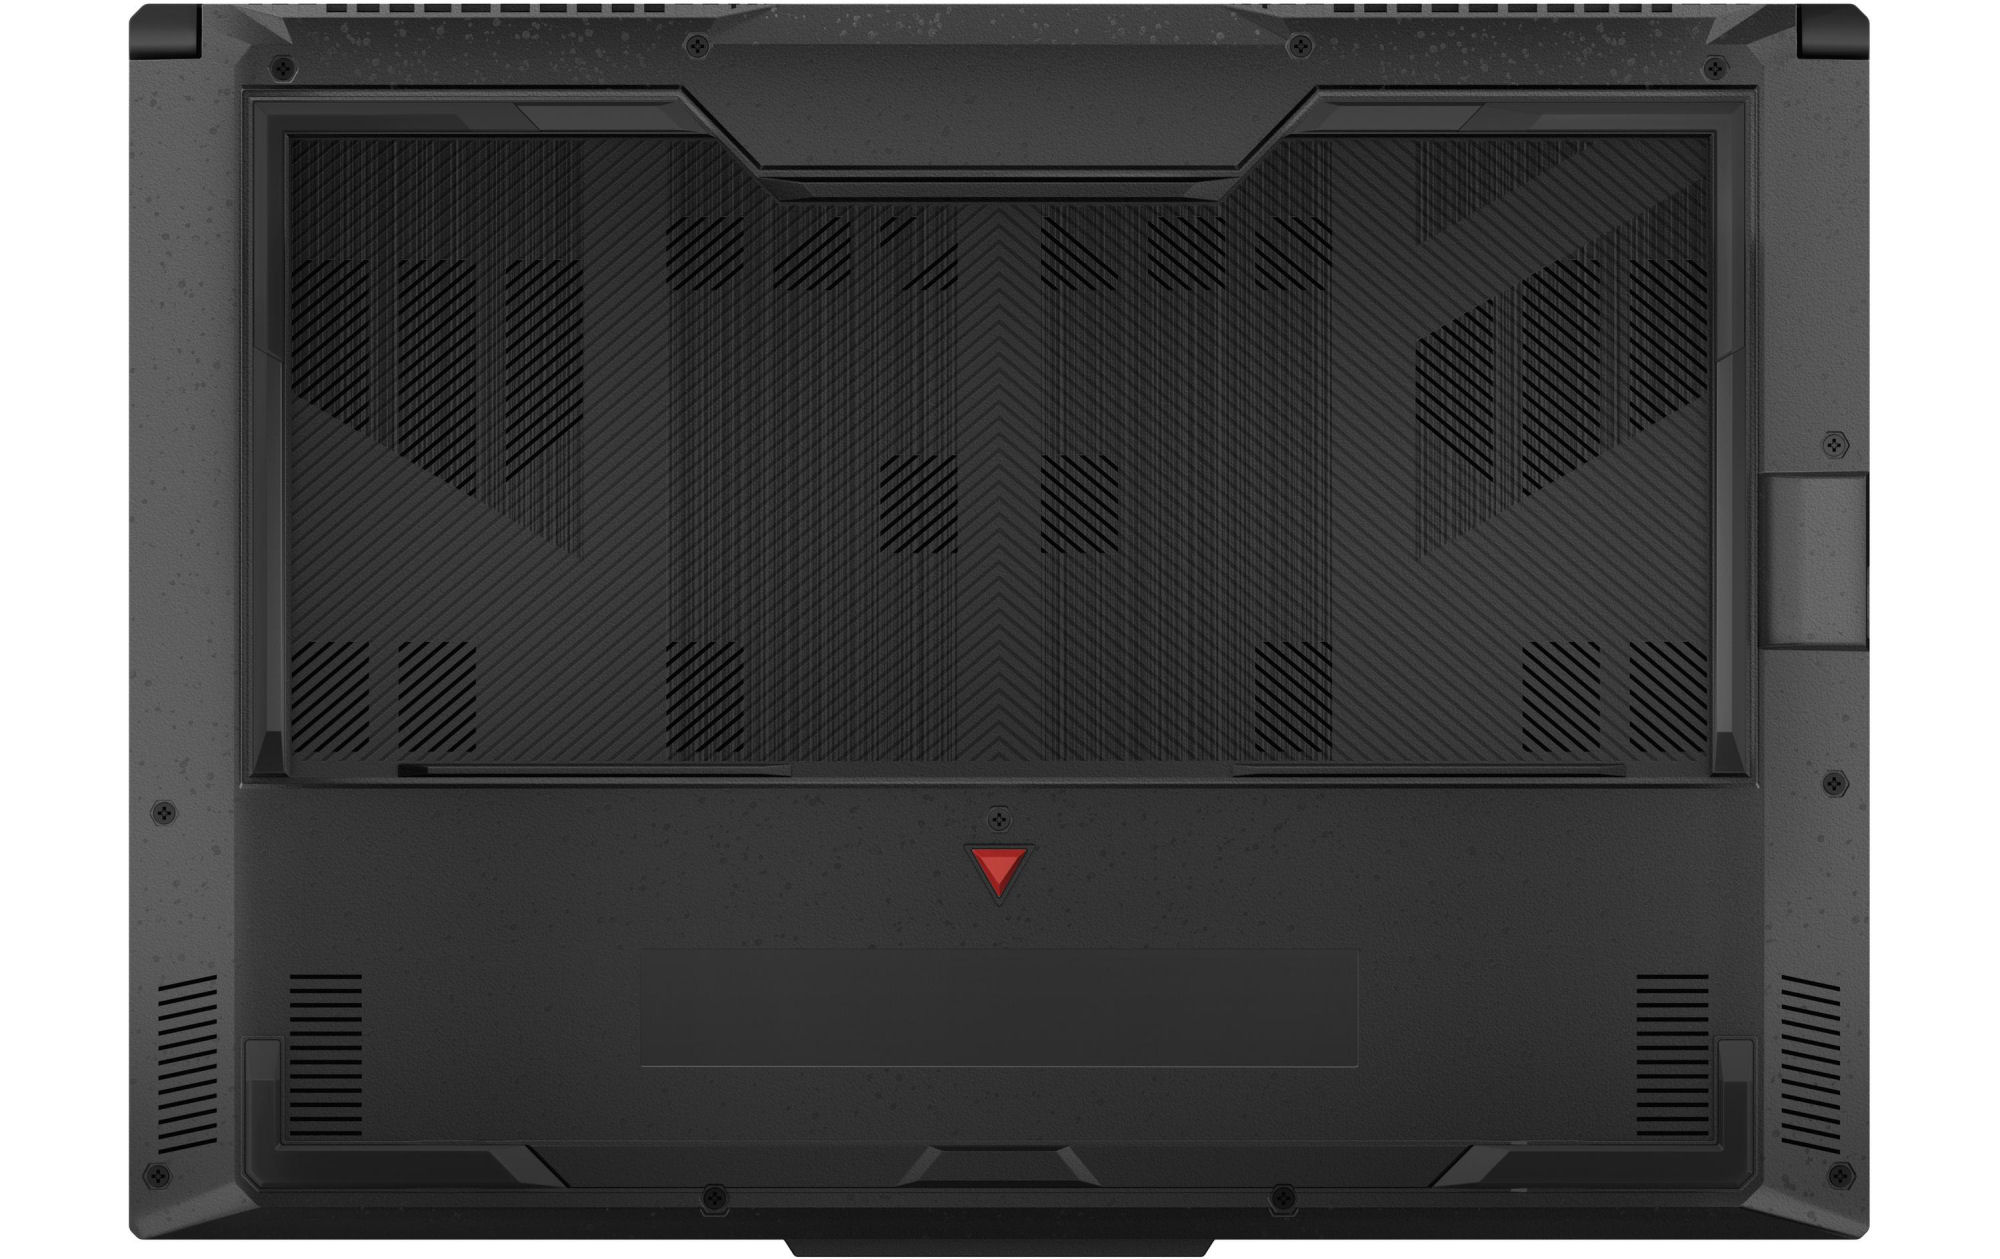
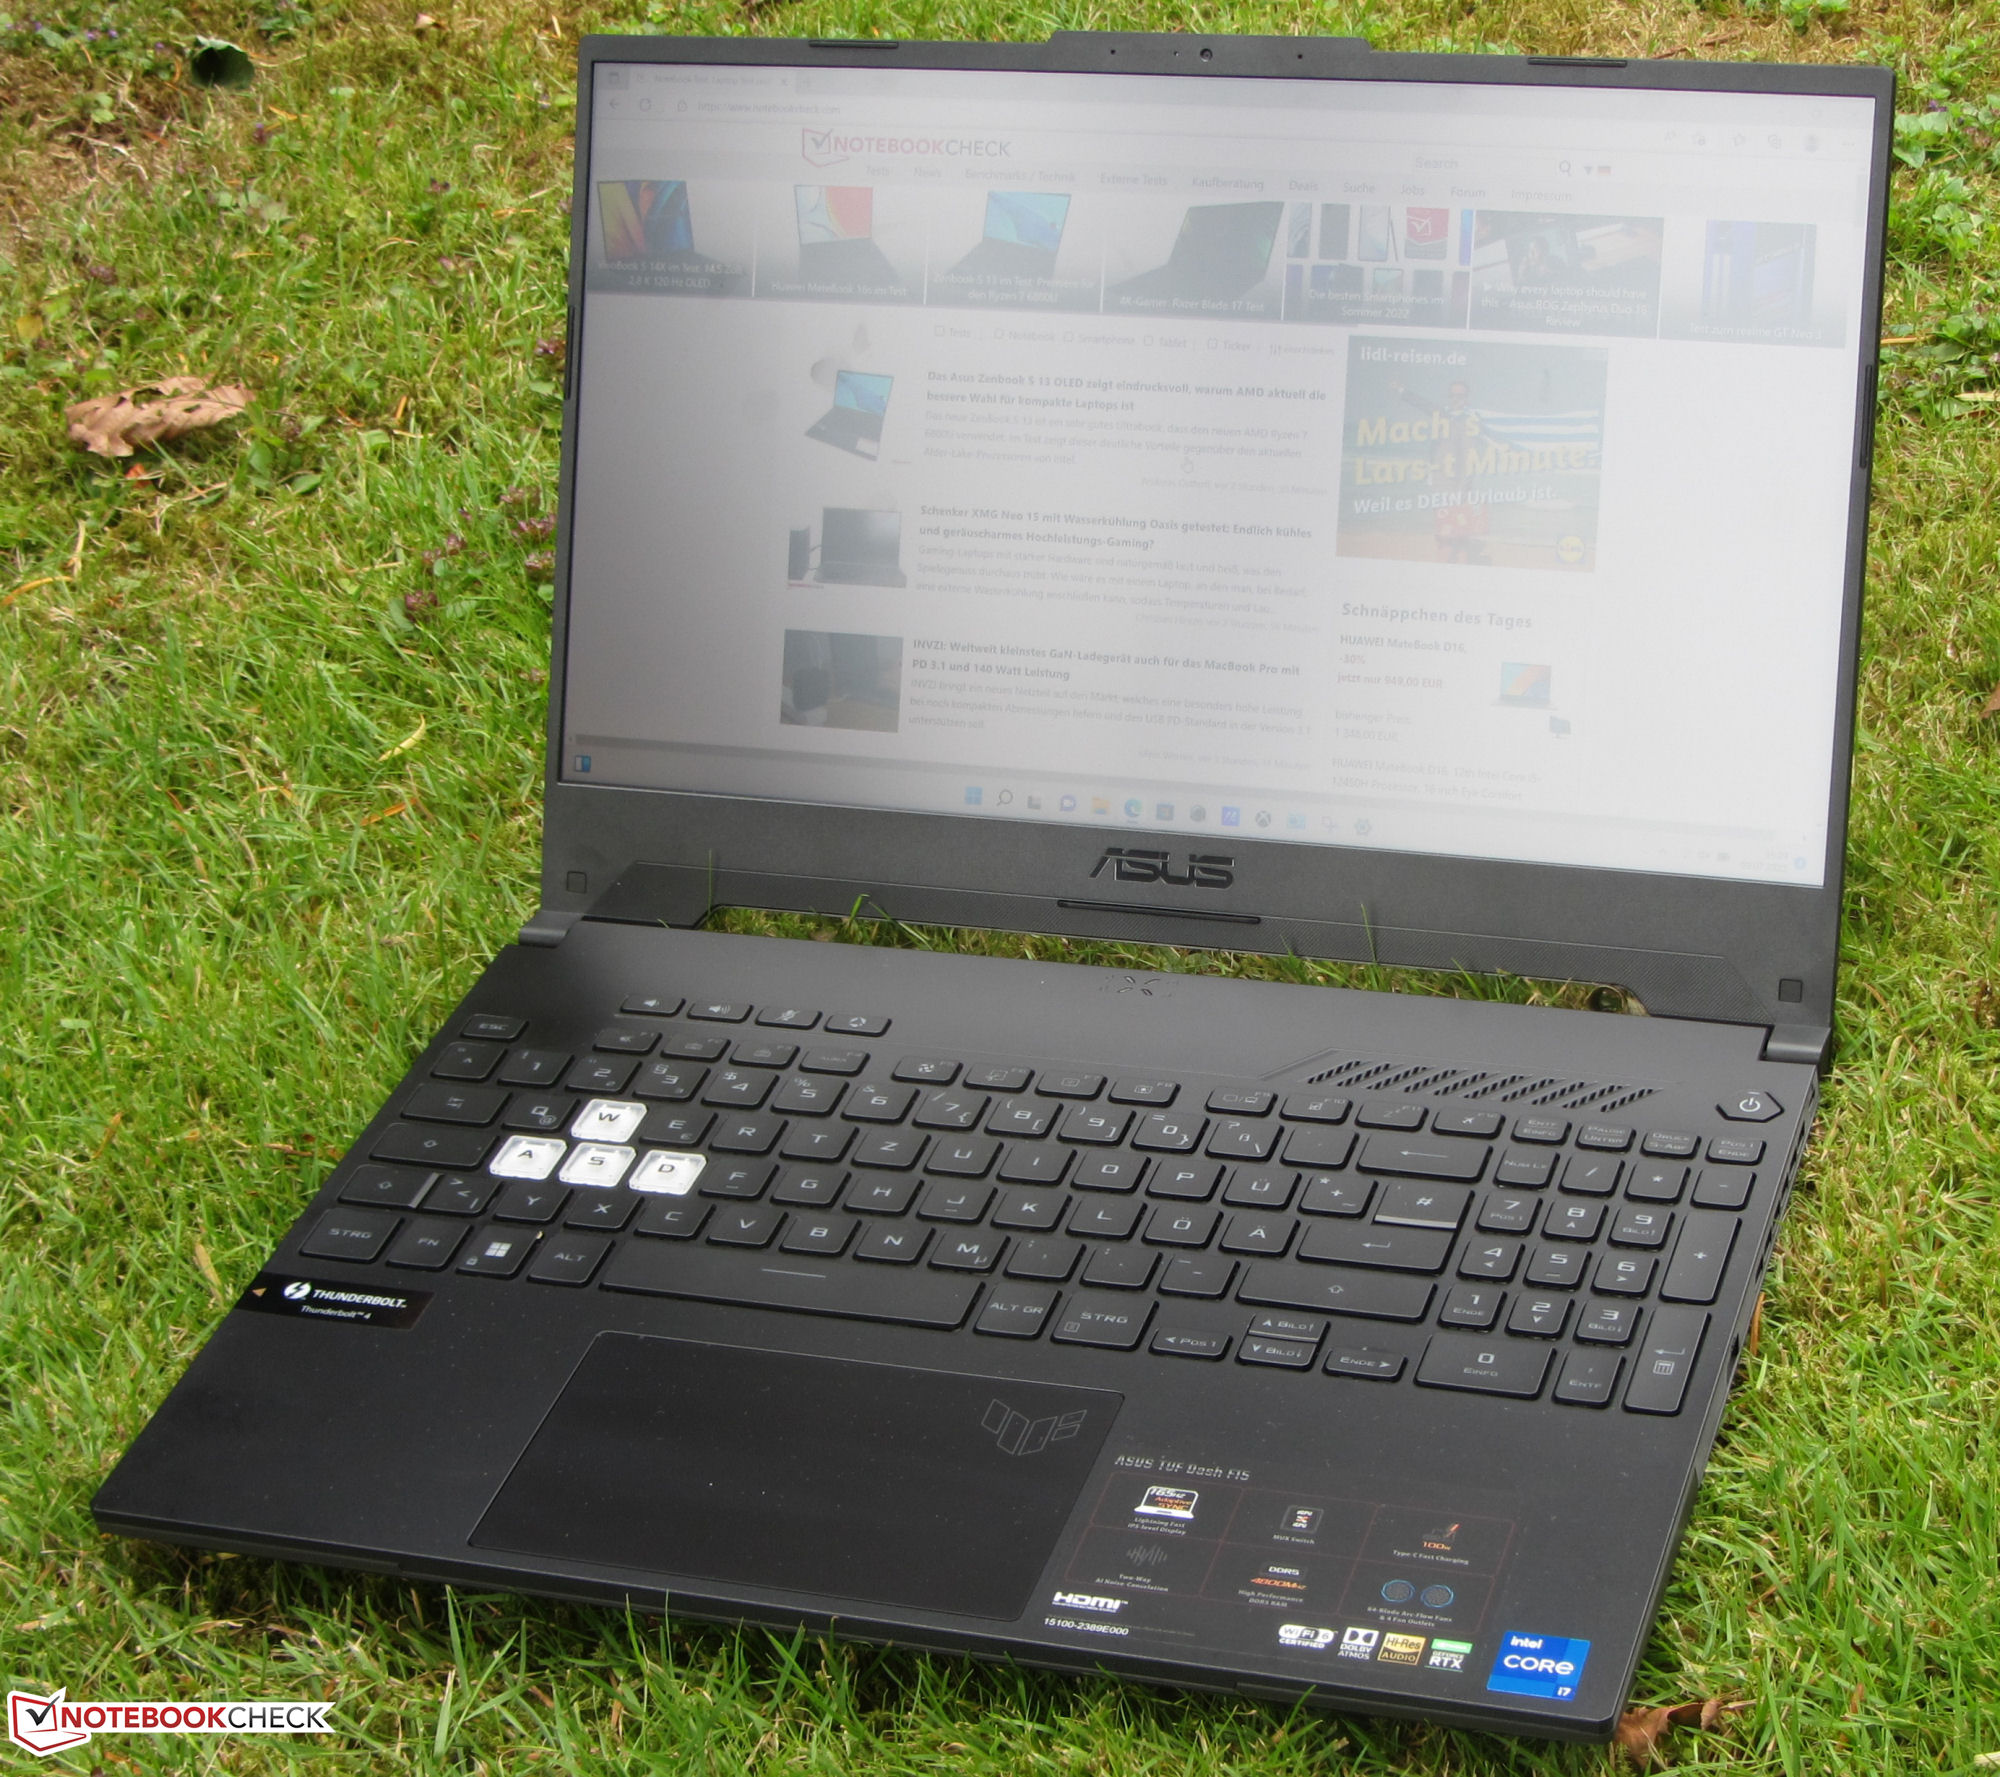
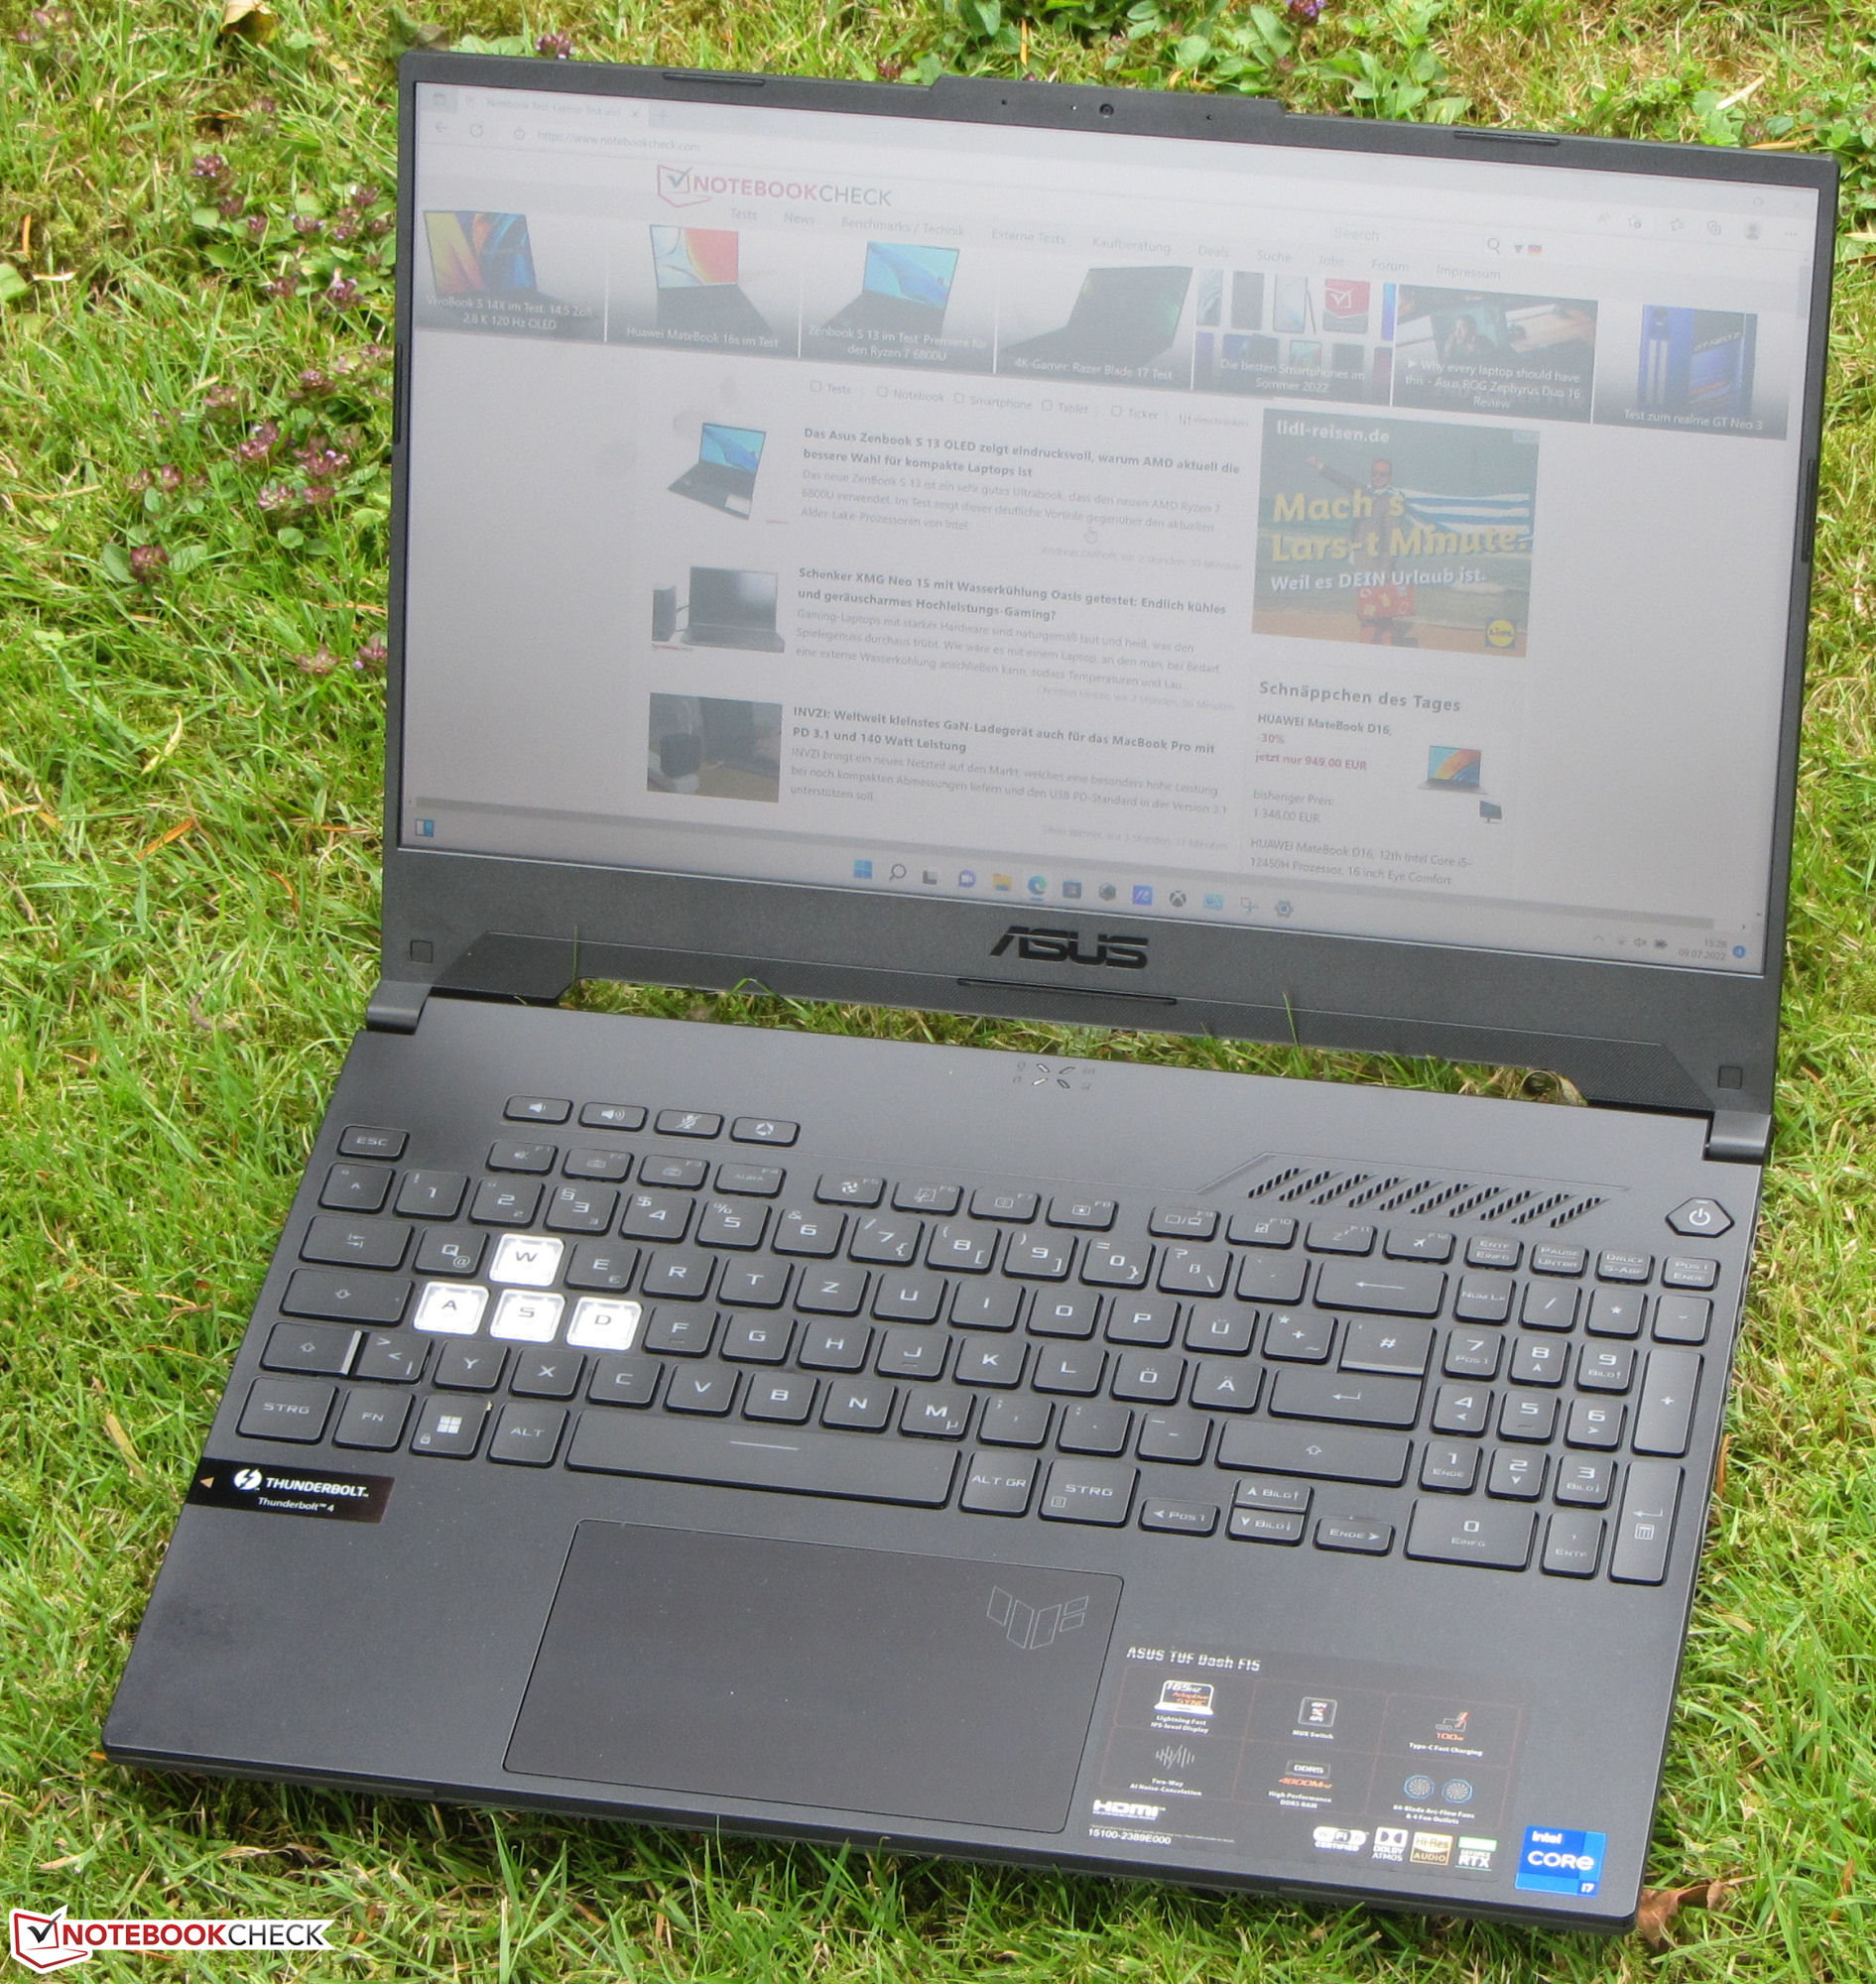
Caja - El portátil para juegos sólo pesa 2 kg
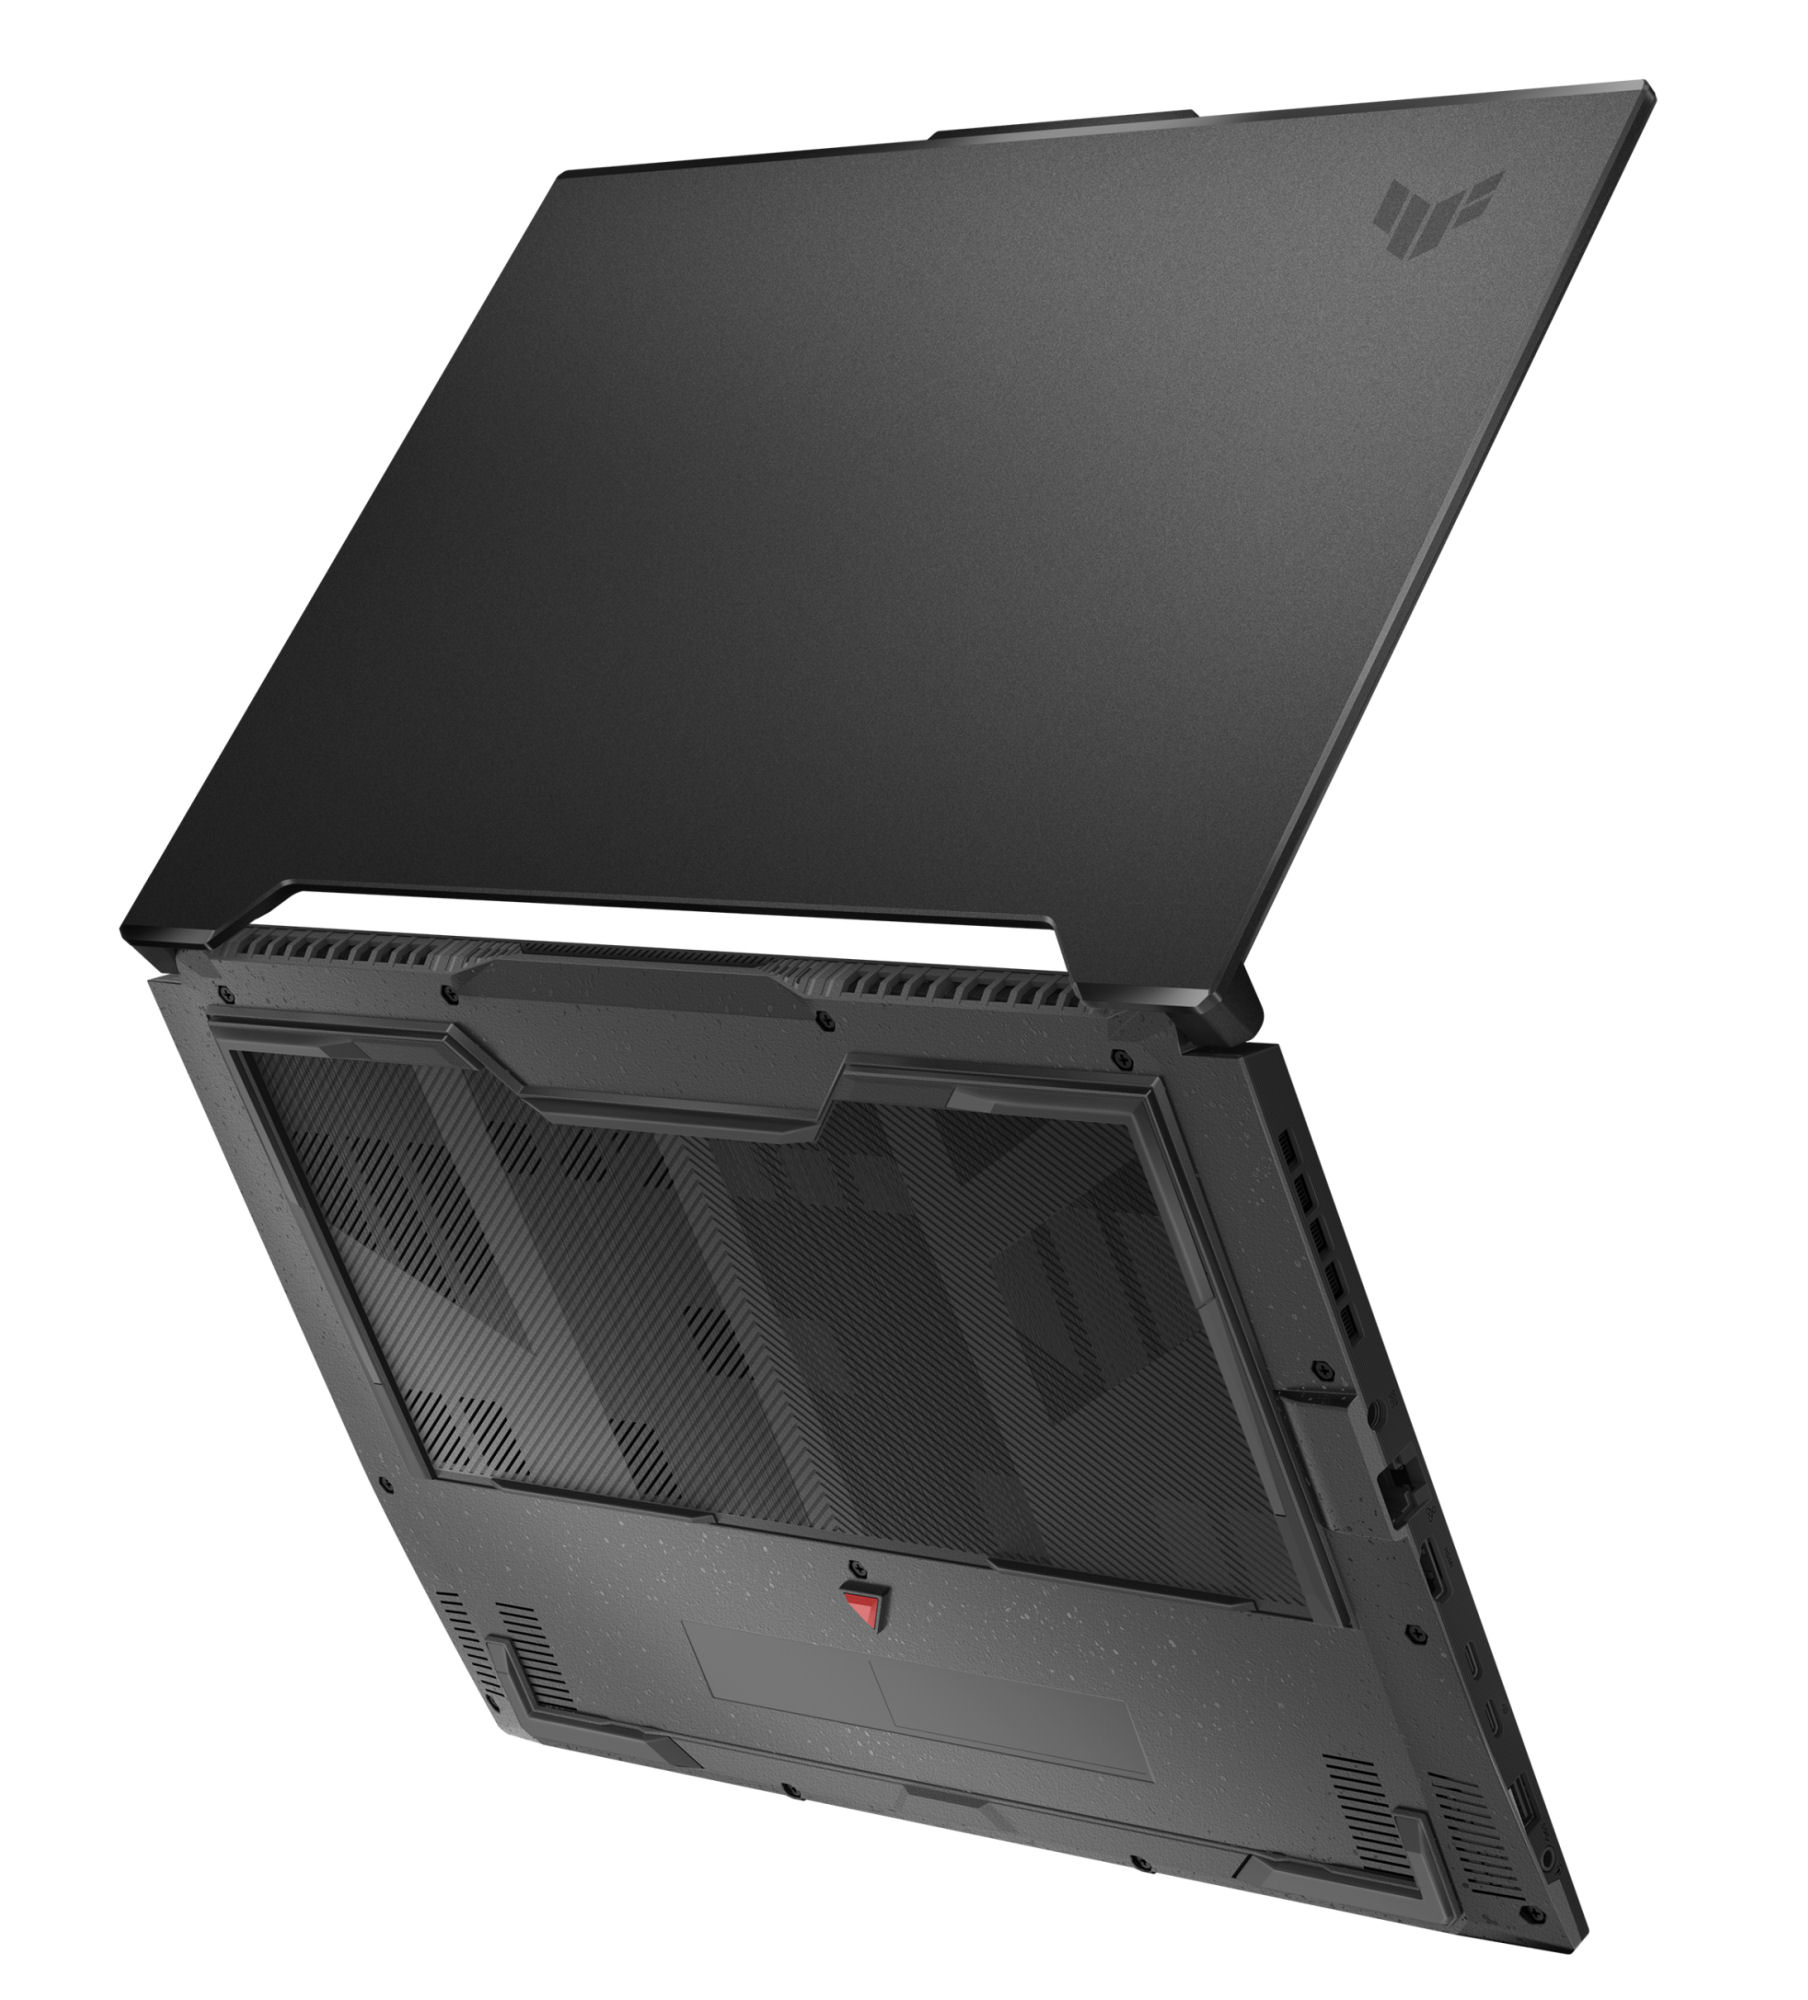
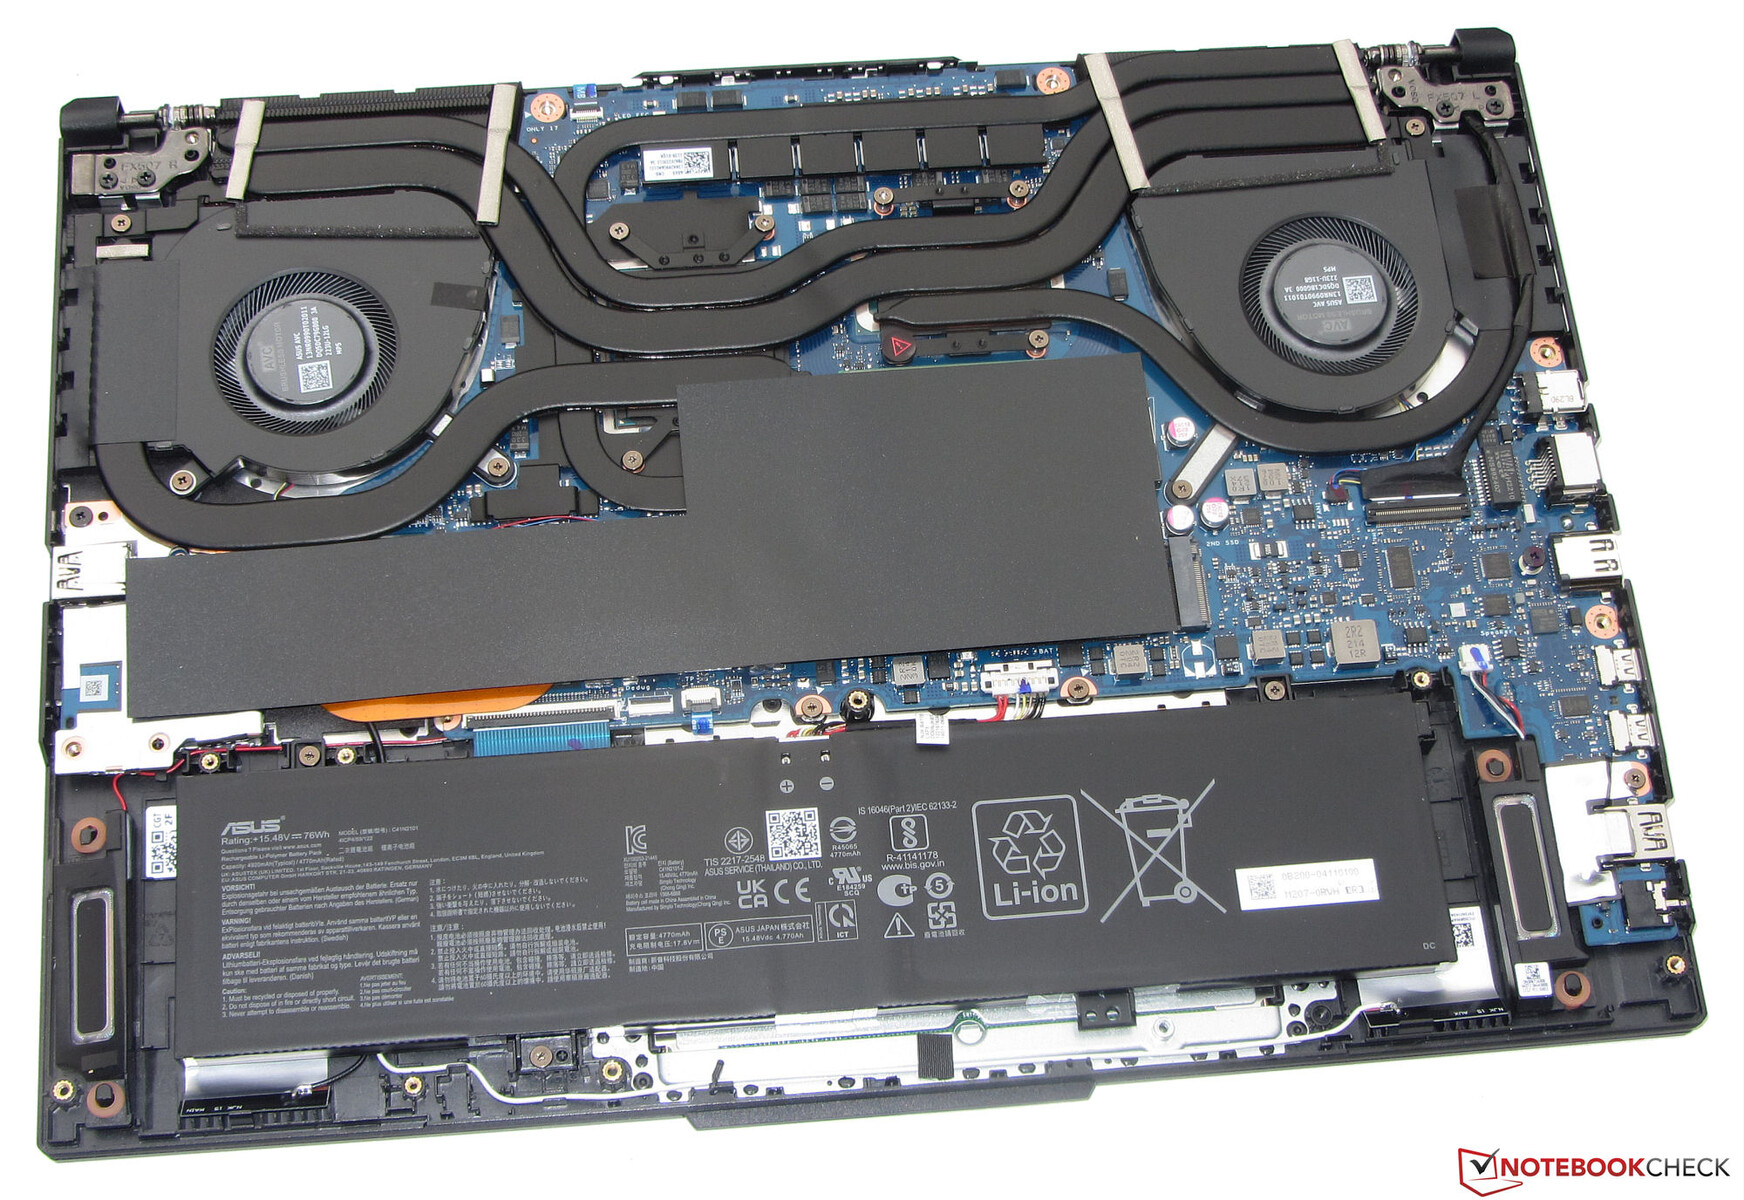
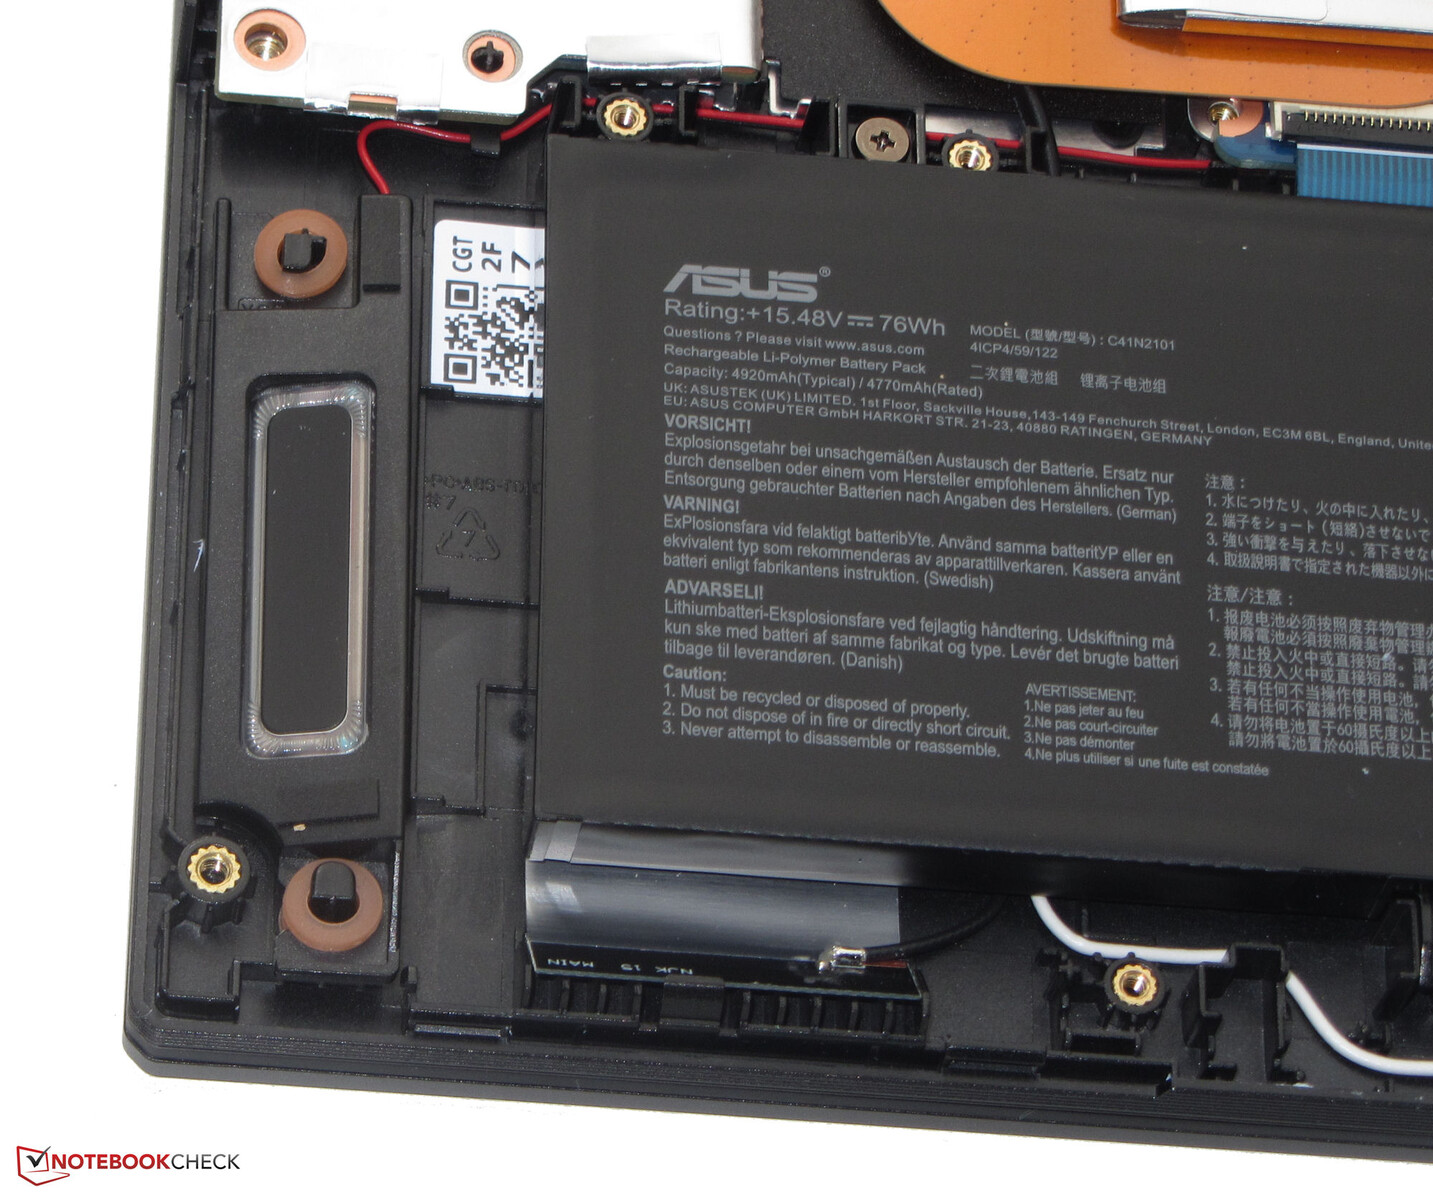
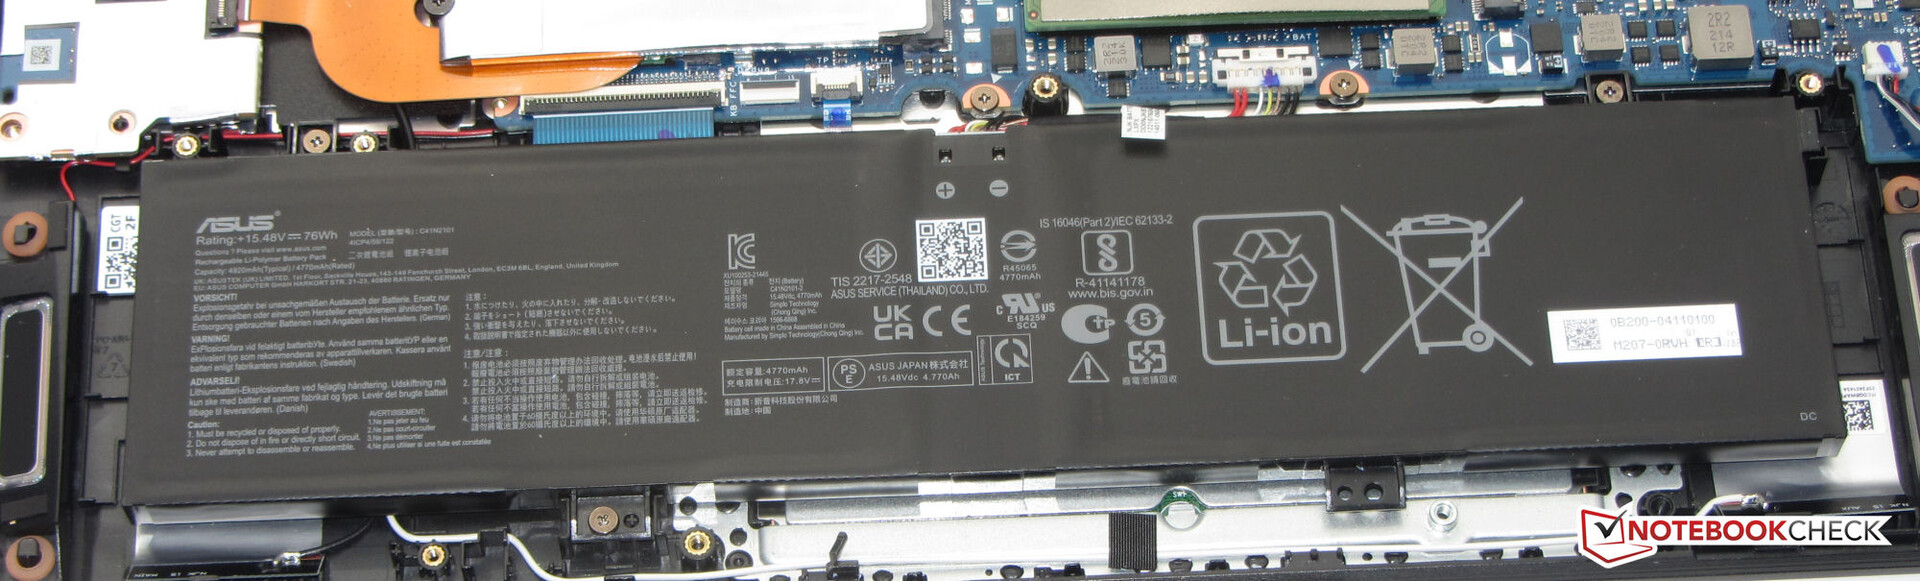
El chasis del F15 no presenta ningún color llamativo, a excepción del pequeño pie rojo en la parte inferior del dispositivo. Por lo demás, dominan el negro mate (tapa, cubierta superior) y el gris mate (cubierta inferior). Para la carcasa, Asus utiliza una mezcla de materiales de plástico (unidad base), y aluminio (parte trasera de la tapa). La batería está firmemente integrada en el dispositivo (atornillada, no pegada). Se puede acceder a las entrañas tras retirar la tapa inferior.
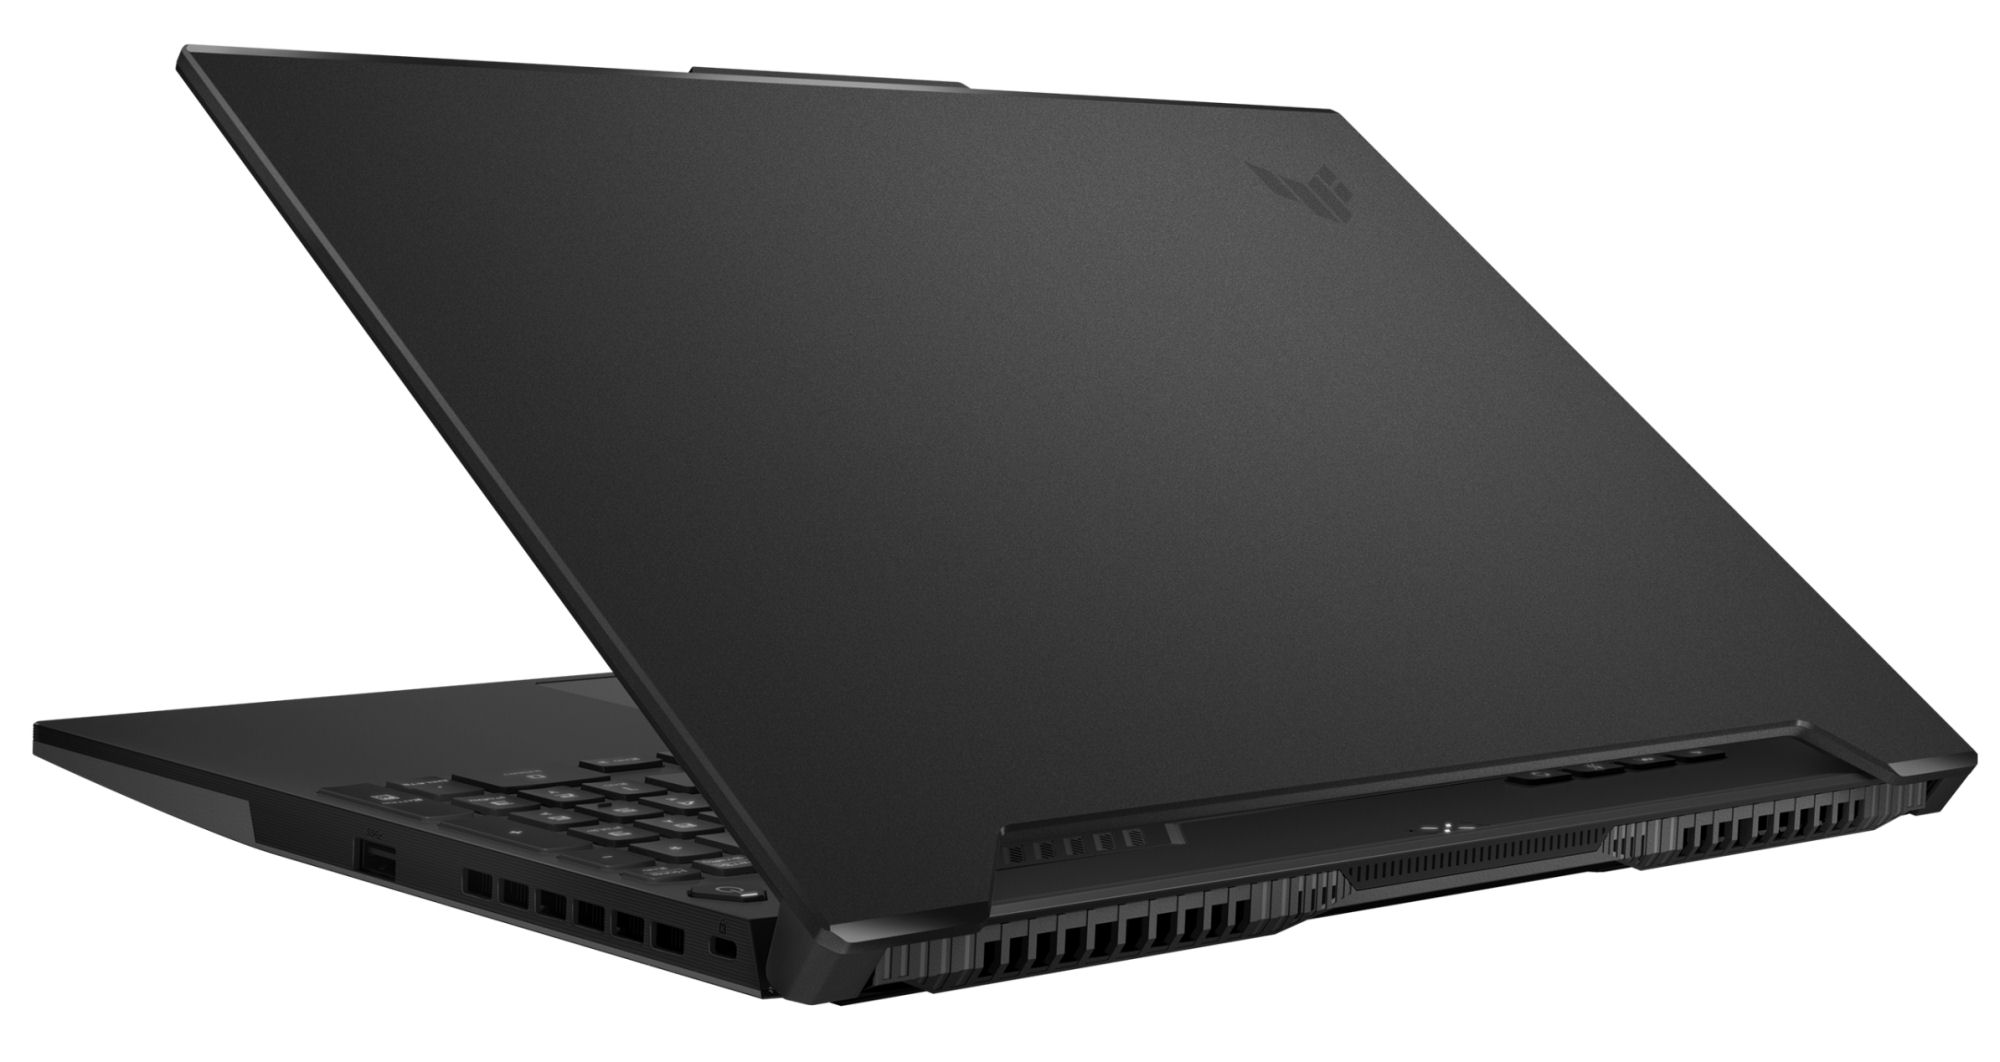
El portátil no revela ningún defecto de fabricación. Las dimensiones de los huecos son correctas y no se encuentran salientes de material. La unidad base y la tapa pueden retorcerse un poco - pero el conjunto sigue estando dentro de los límites. Las bisagras mantienen la tapa firmemente en su posición, mientras que el ángulo máximo de apertura es de unos 130 grados. Es posible abrir la tapa con una sola mano.

El MSI Delta 15y el portátil Asus son los dispositivos más ligeros de la comparativa. ElRazer Blade 15 está por delante en términos de dimensiones: Es el portátil más compacto
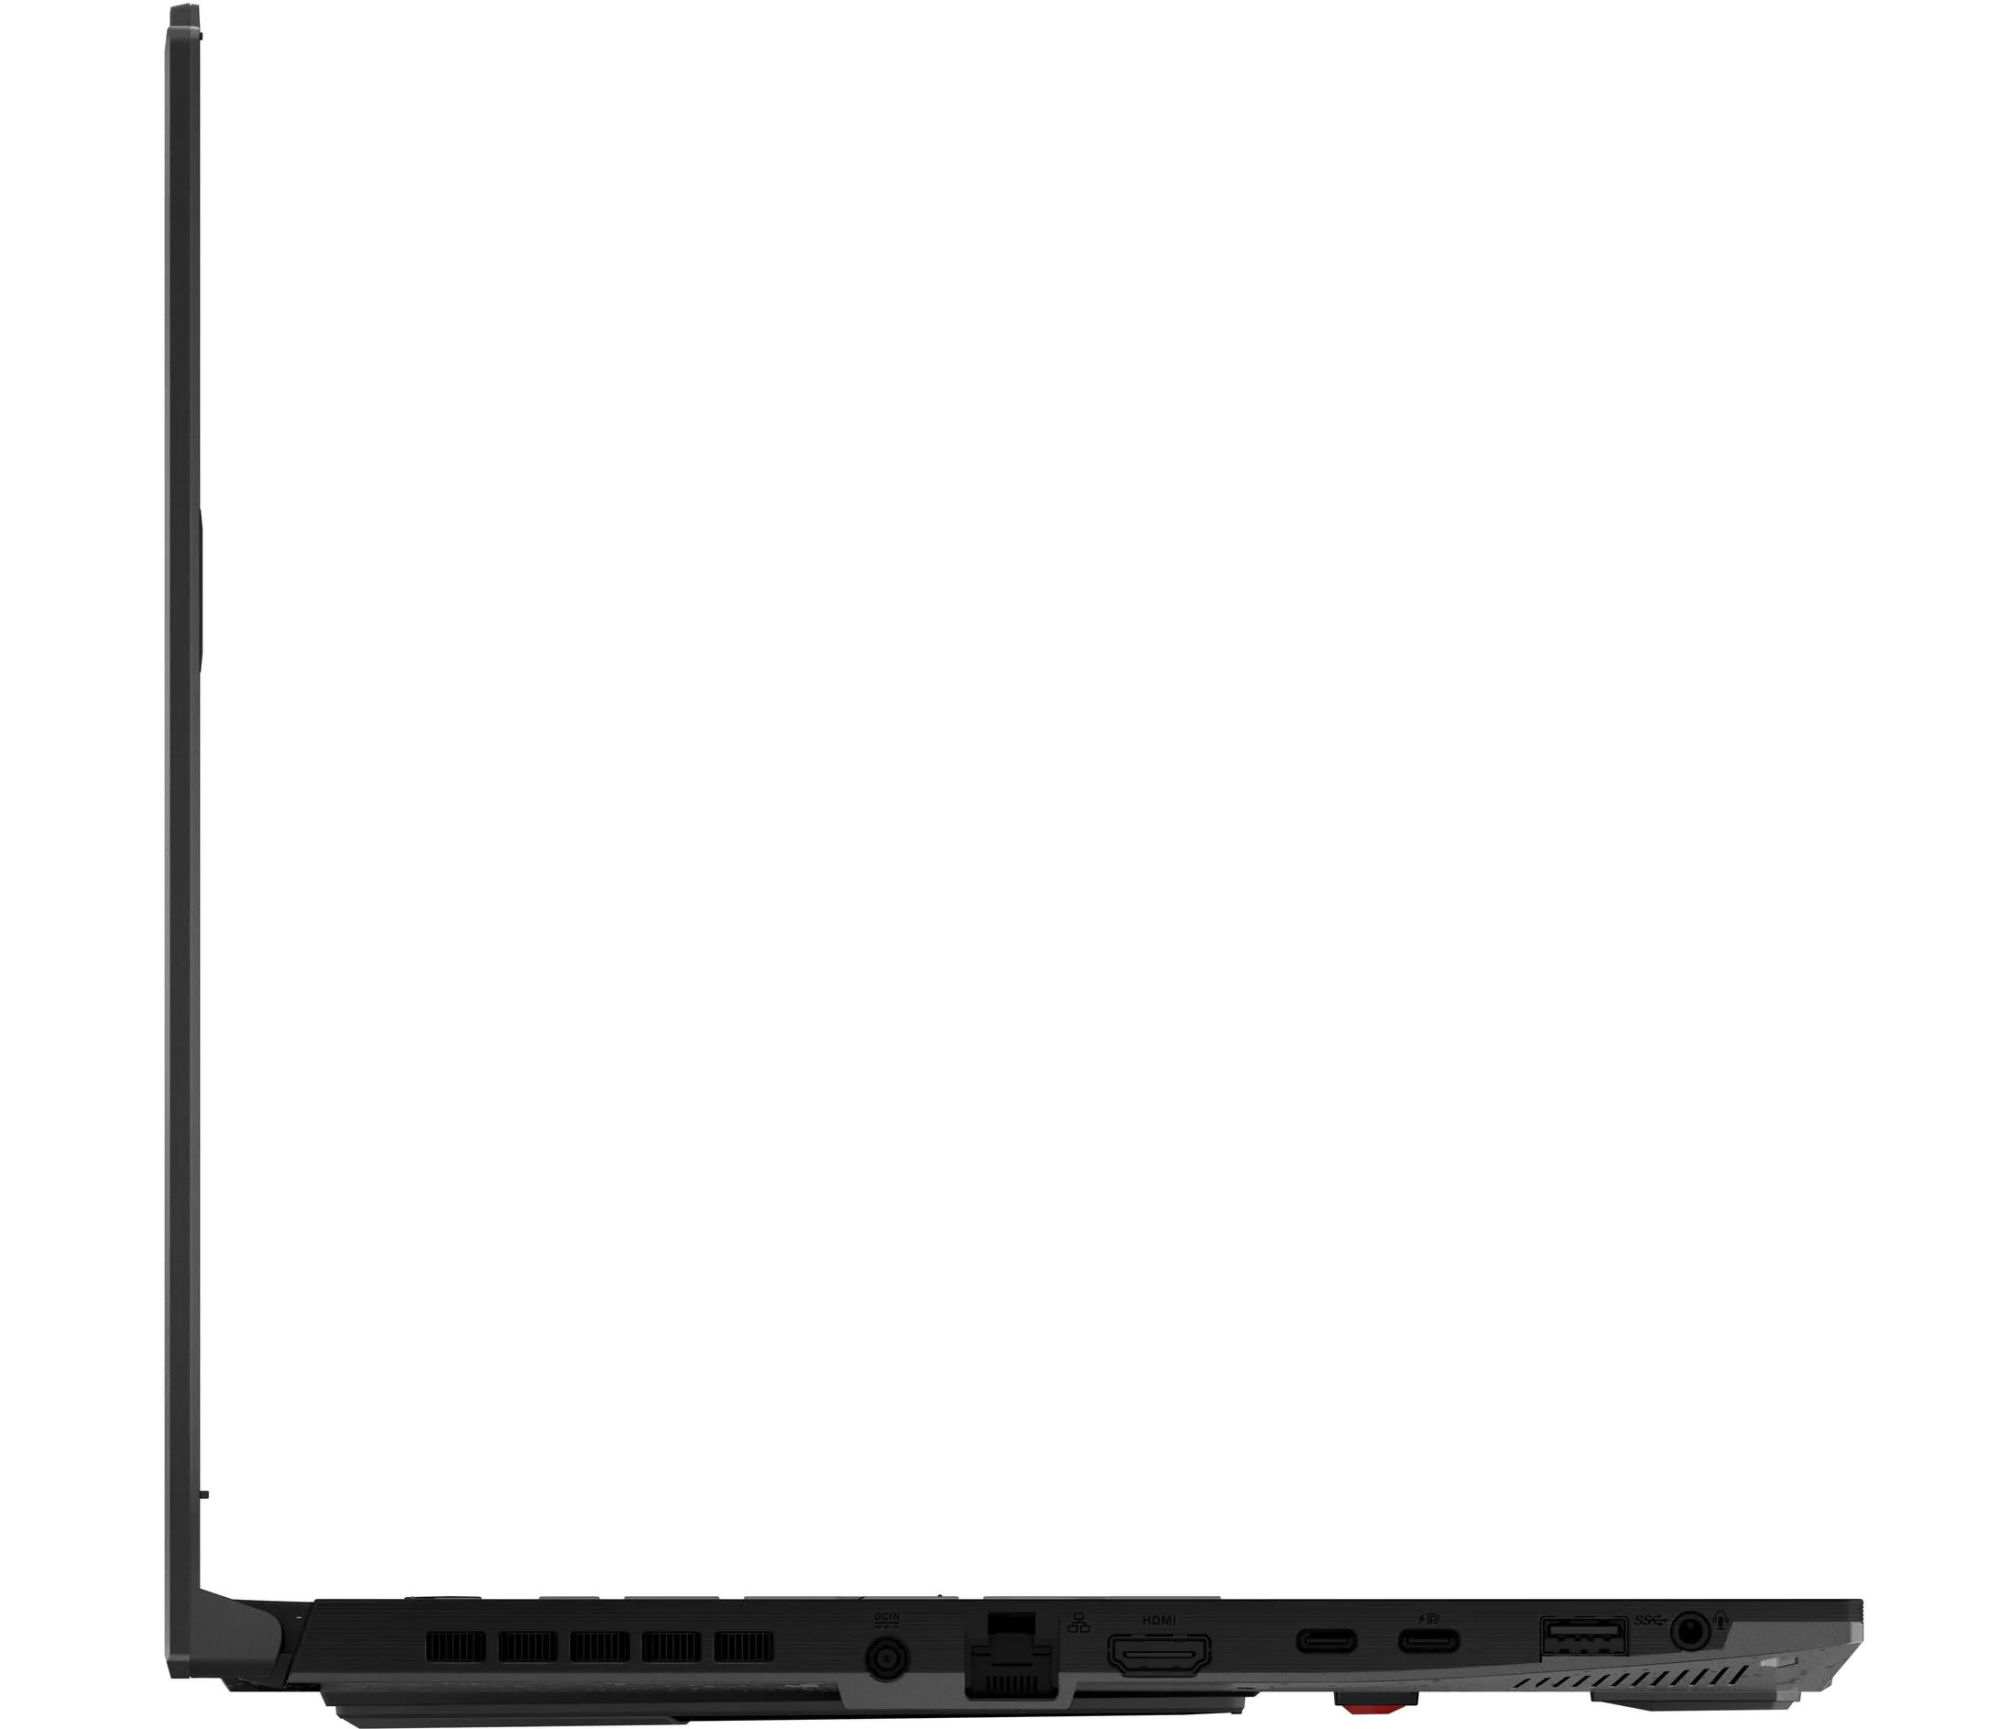
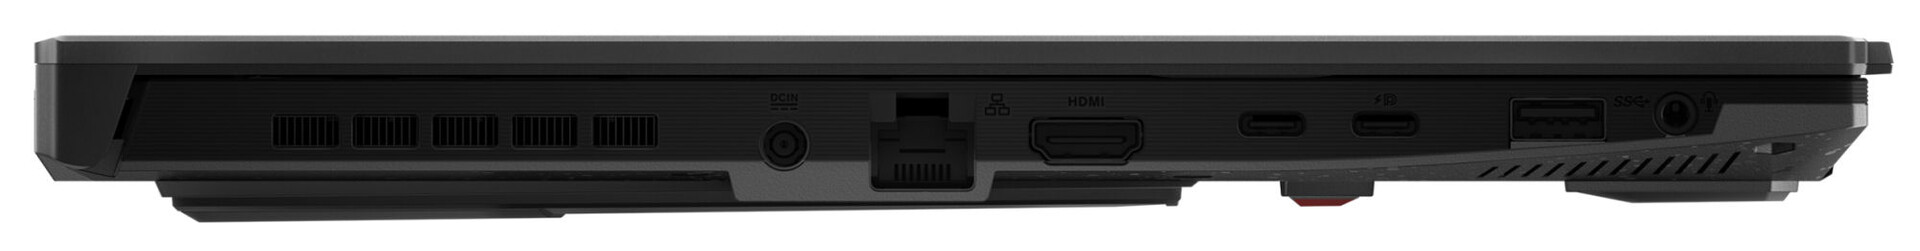
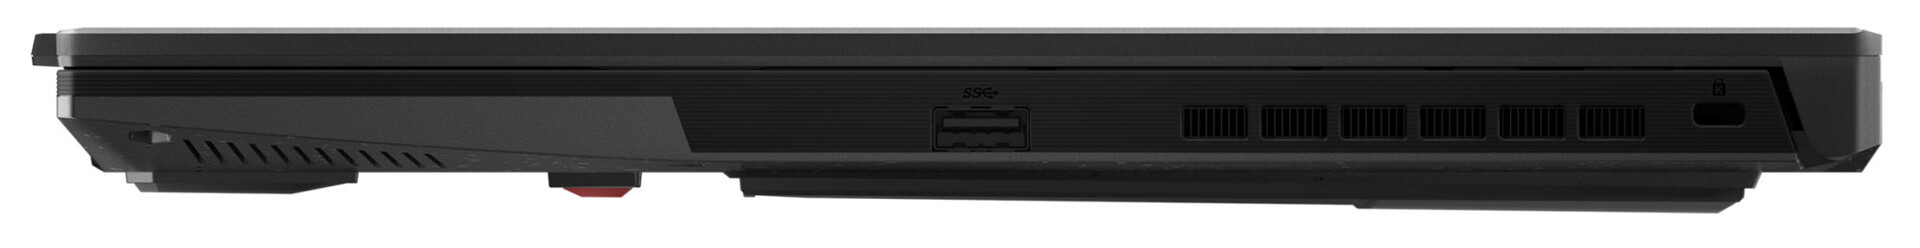
Conectividad - El FX517 viene con Thunderbolt 4
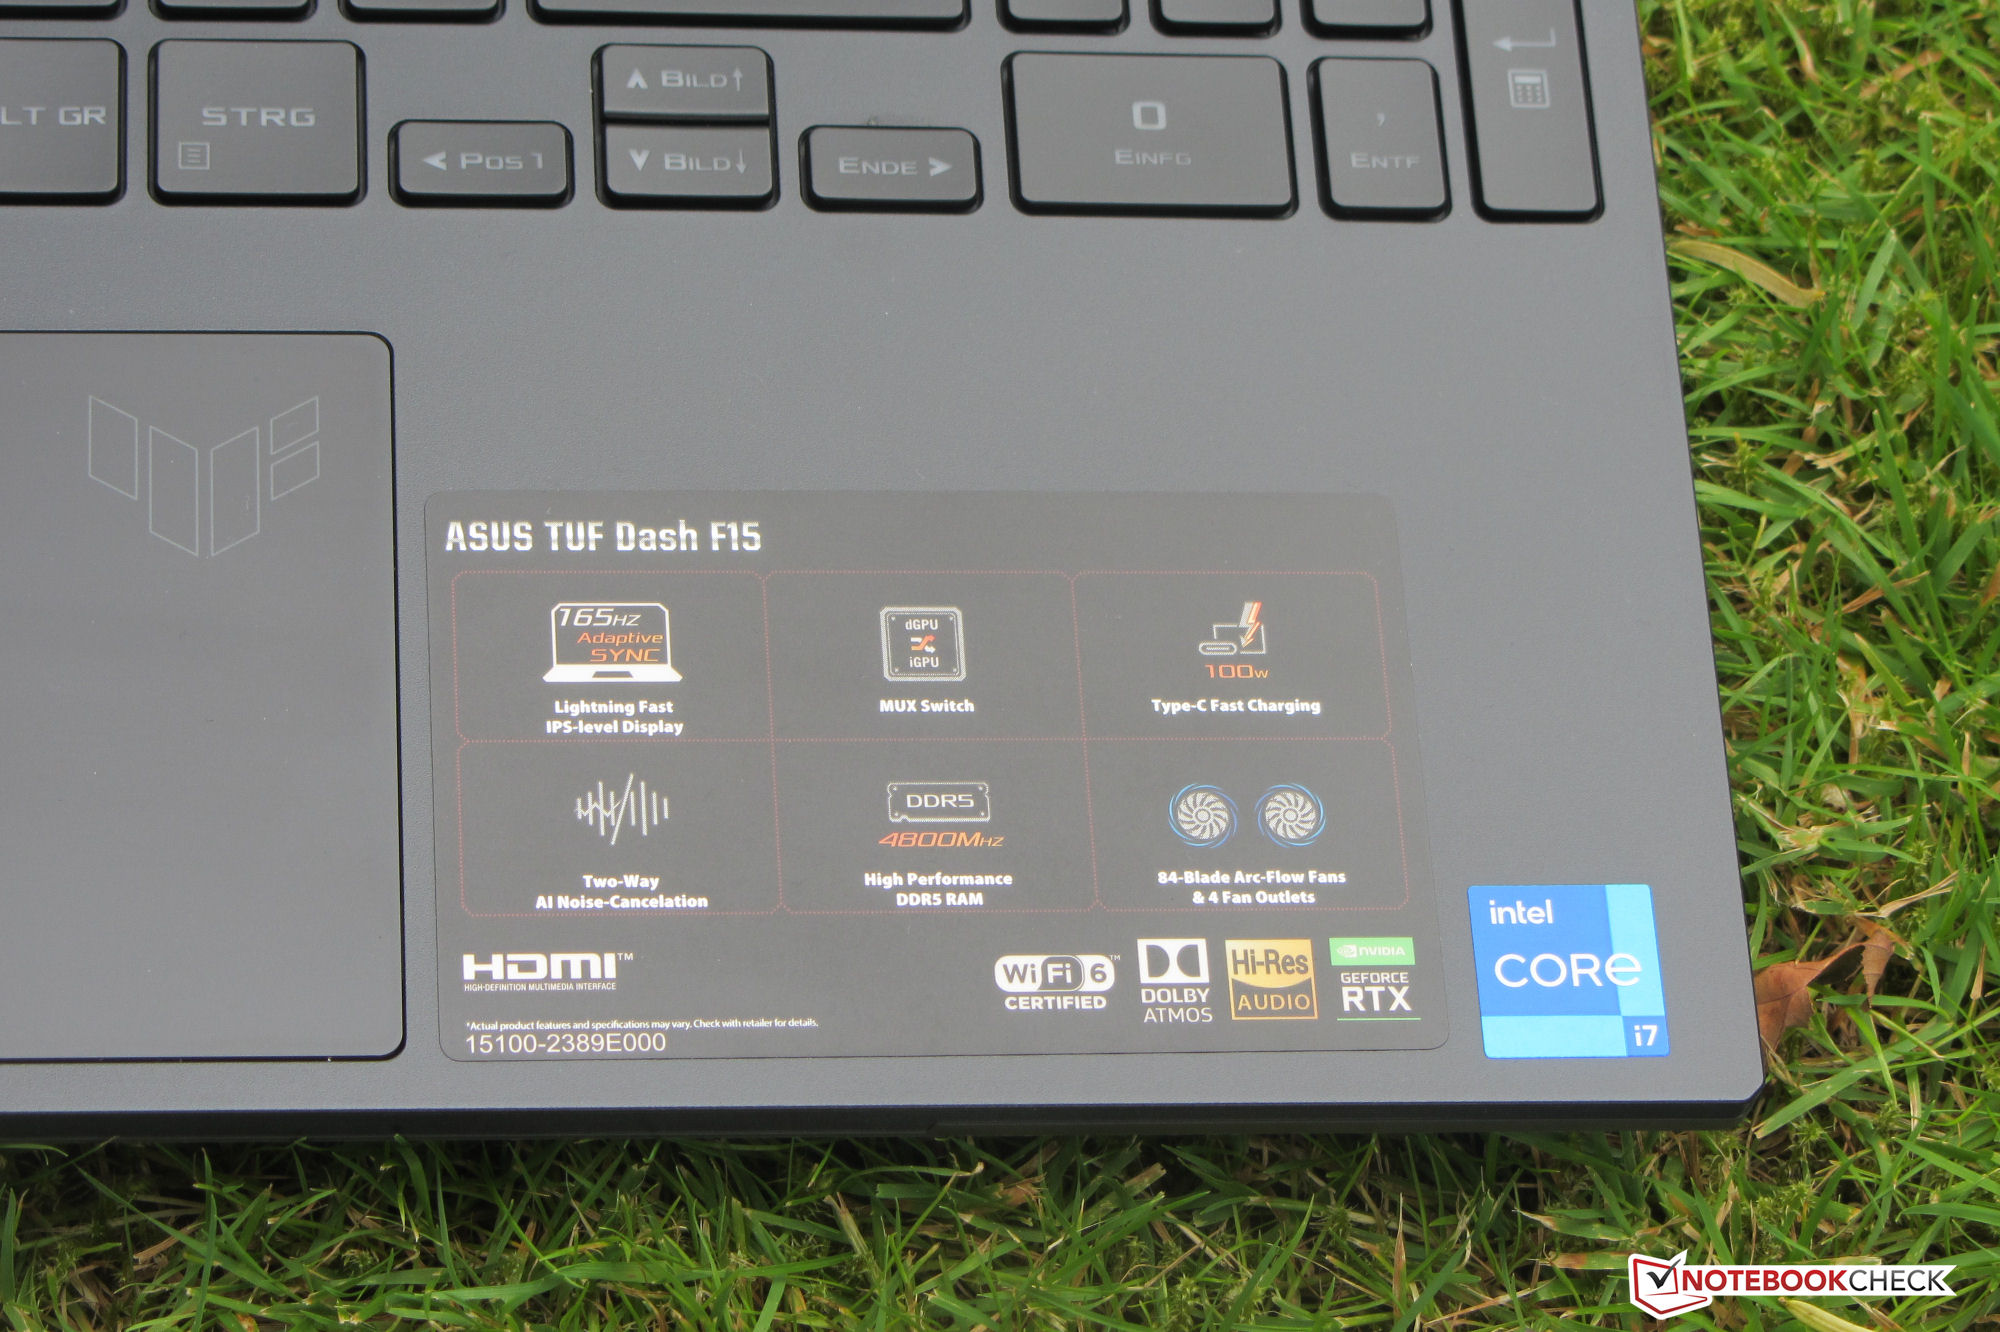
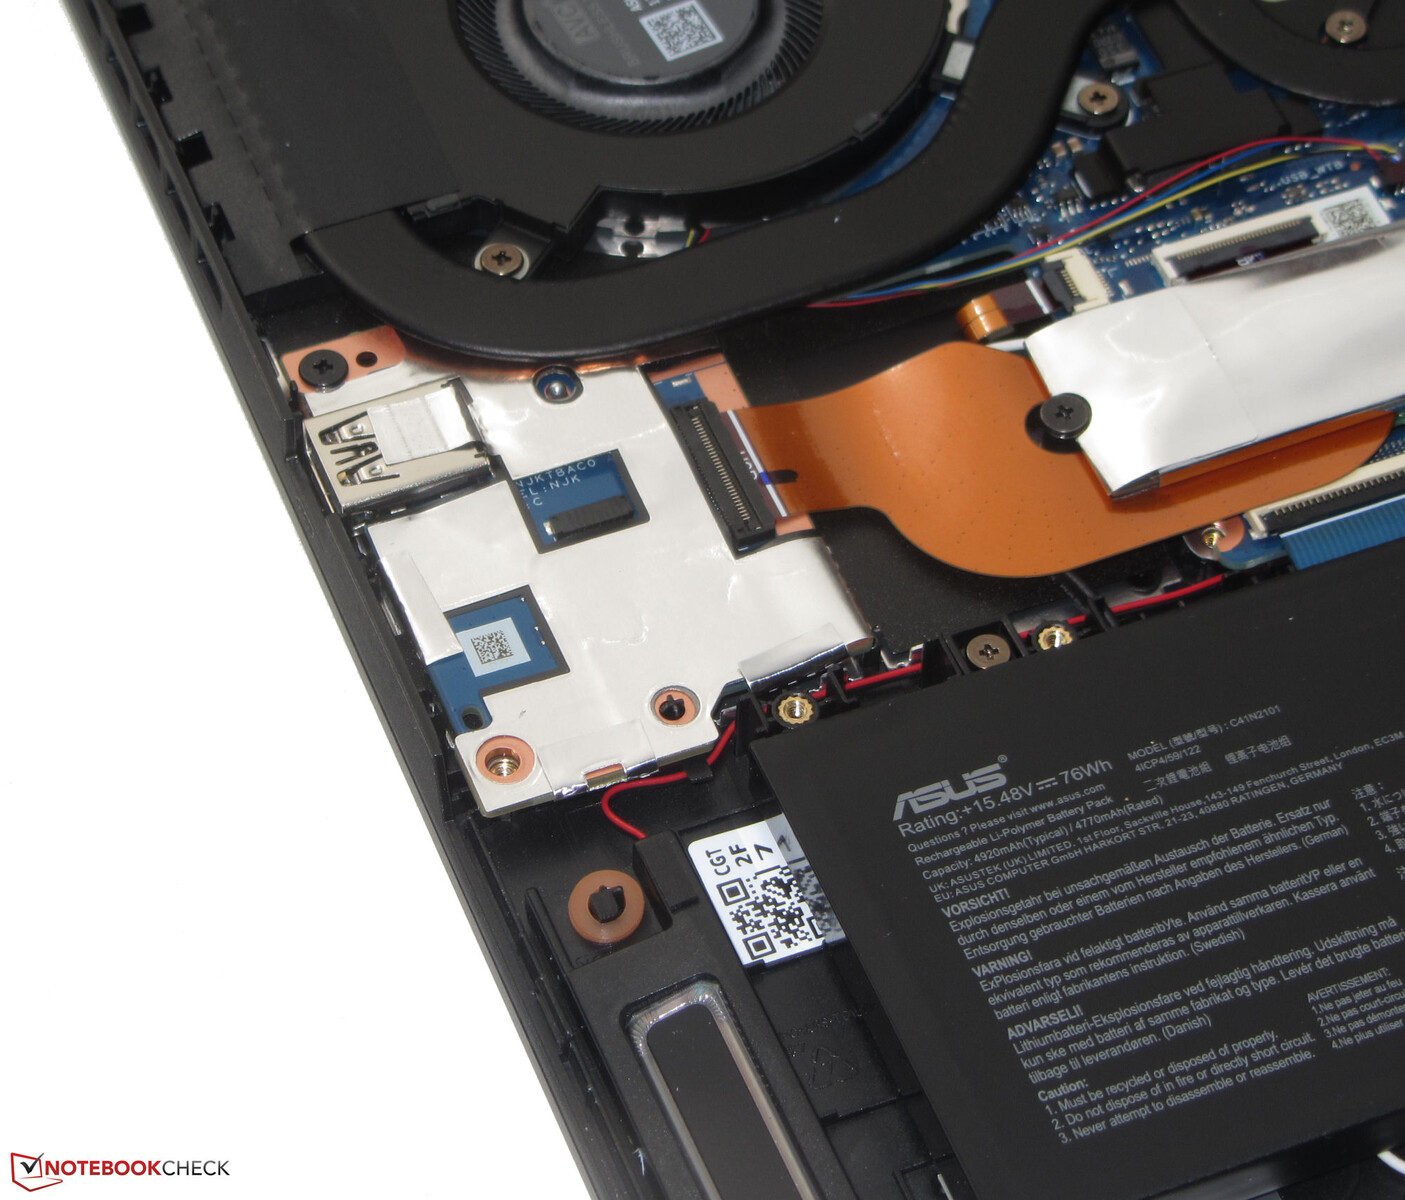
El TUF tiene dos puertos USB-A (USB 3.2 Gen 1), y dos puertos USB-C (1x Thunderbolt 4, 1x USB 3.2 Gen 2). Estos últimos soportan DisplayPort por USB-C, mientras que sólo el puerto USB 3.2 Gen 2 ofrece Power Delivery. El portátil tiene un total de tres salidas de vídeo (2x DP, 1x HDMI). Además, hay una toma de audio combinada, un puerto Gigabit Ethernet y una ranura para un bloqueo de cables. El ordenador Asus no tiene un lector de tarjetas de memoria.
La posición de los puertos no es óptima. Asus mete casi todos los puertos en la zona frontal del lado izquierdo de la carcasa. Uno o dos puertos deberían haberse colocado en el lado derecho de la carcasa.
Comunicación
Las velocidades de transferencia Wi-Fi determinadas en condiciones óptimas (sin otros dispositivos Wi-Fi cerca, distancia corta entre el portátil y el PC servidor) son excelentes y corresponden a las capacidades del chip Wi-Fi (Intel AX201; 802.11ax). De las conexiones de red por cable se encarga un chip Gigabit Ethernet (Intel I219-LM)
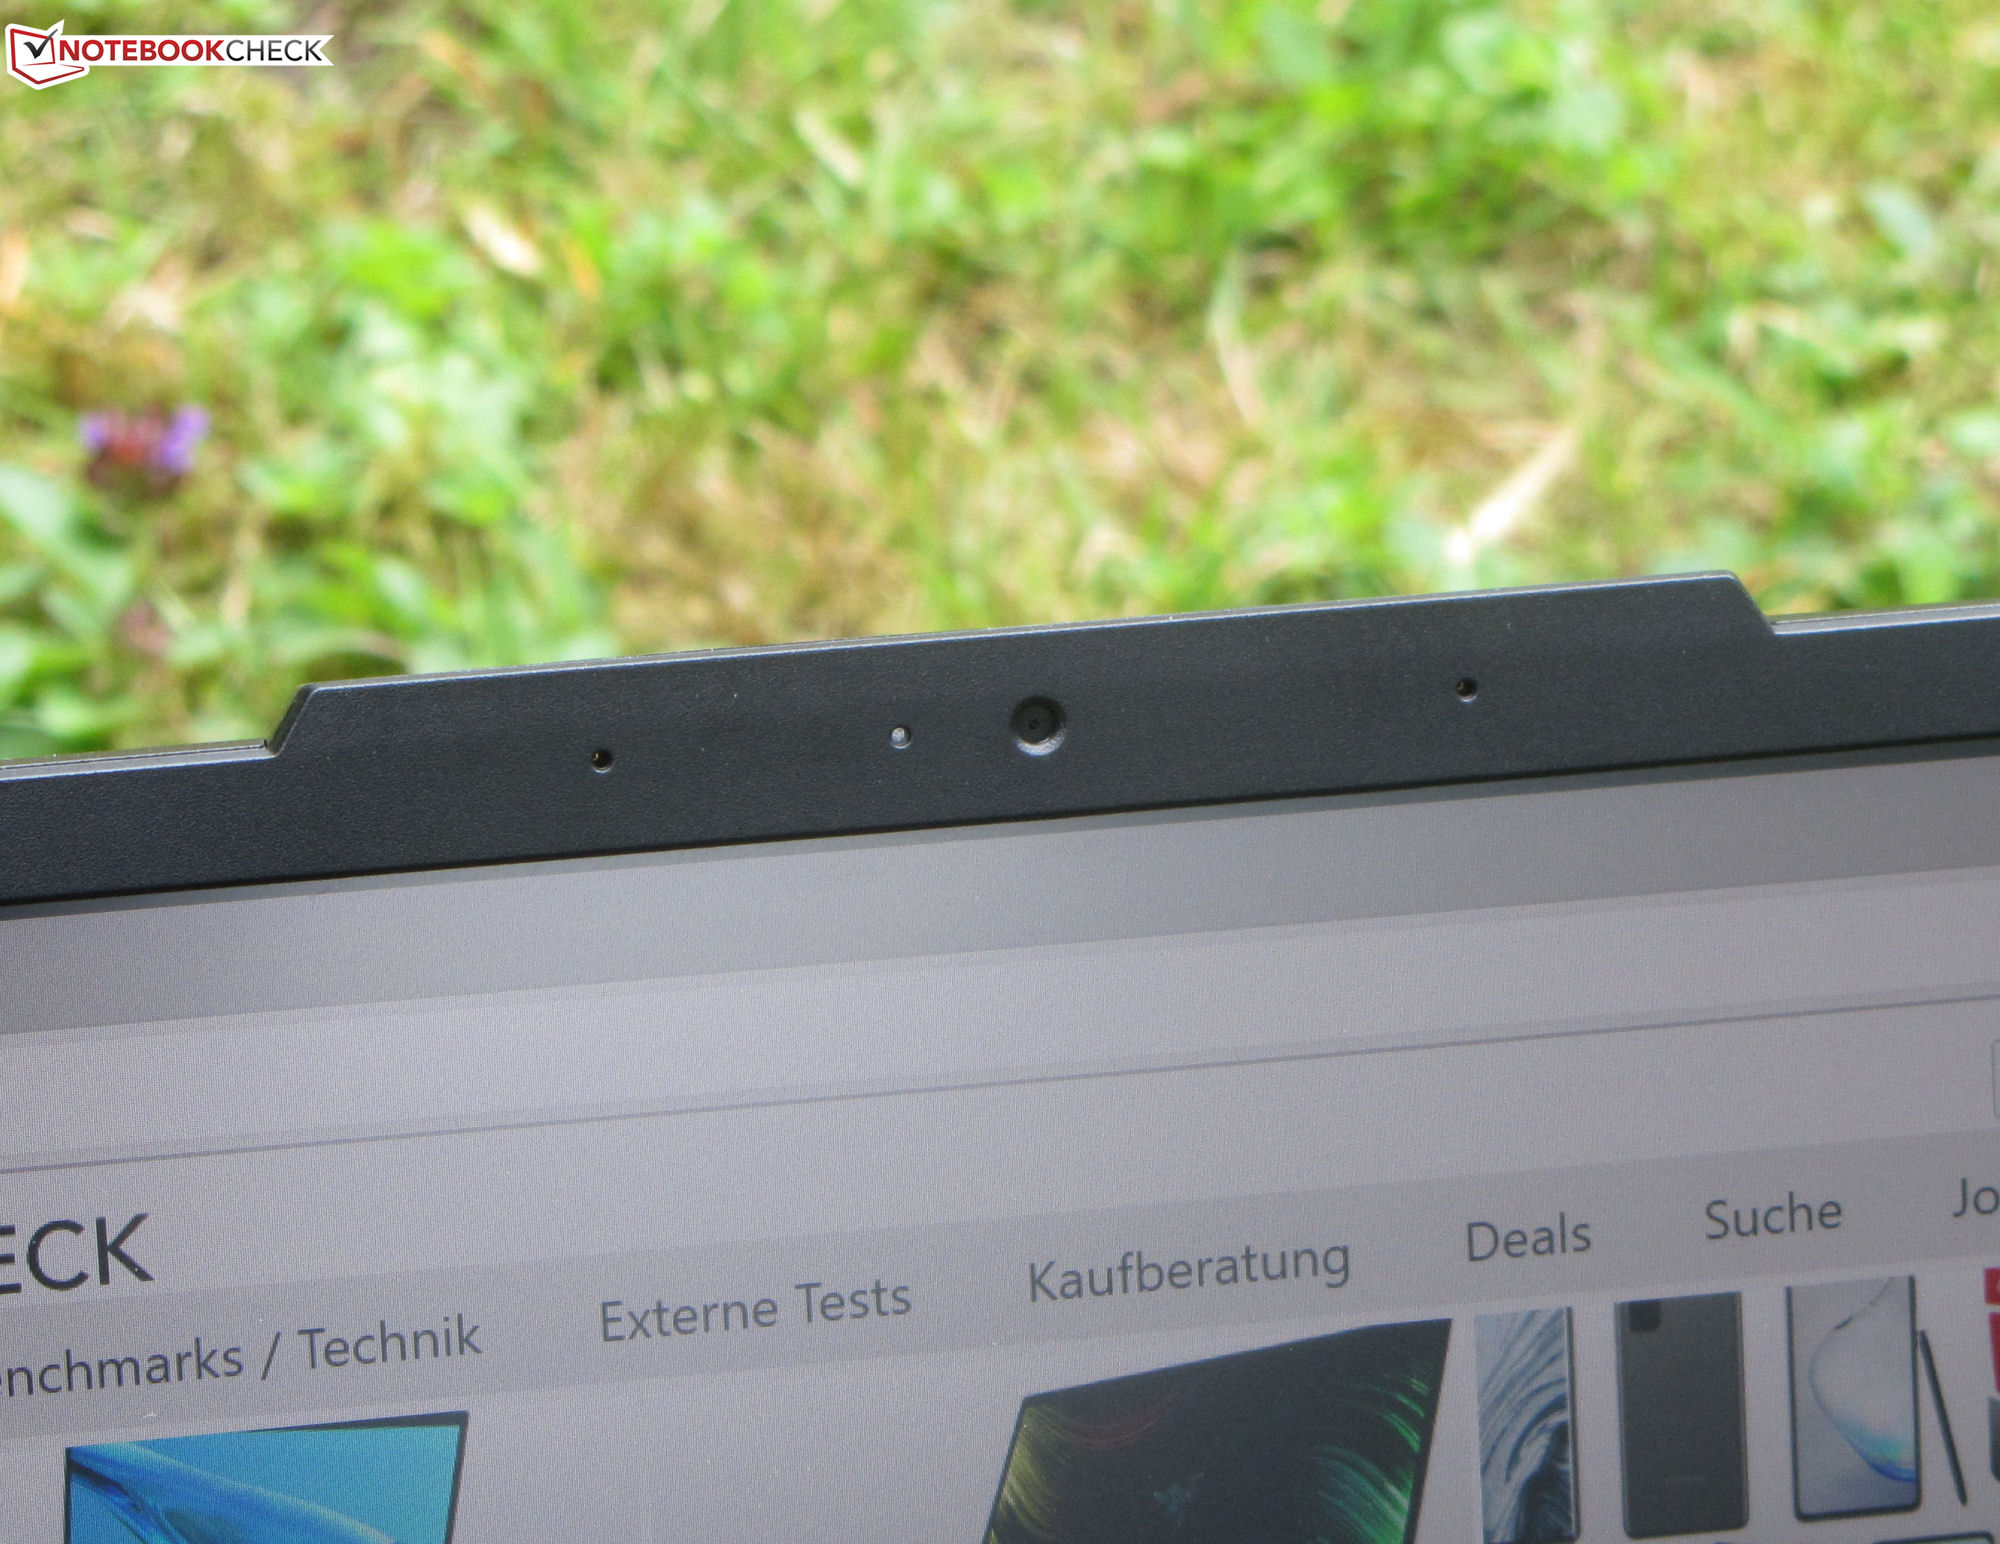
Cámara web
La cámara web (0,9 MP) genera imágenes en una resolución máxima de 1.280x720 píxeles. La precisión del color no es la mejor: Los colores se desvían del objetivo. La cámara no ofrece un obturador mecánico


Accesorios
Aparte de los documentos habituales (guía de inicio rápido, información sobre la garantía), no se incluye ningún otro accesorio con el portátil
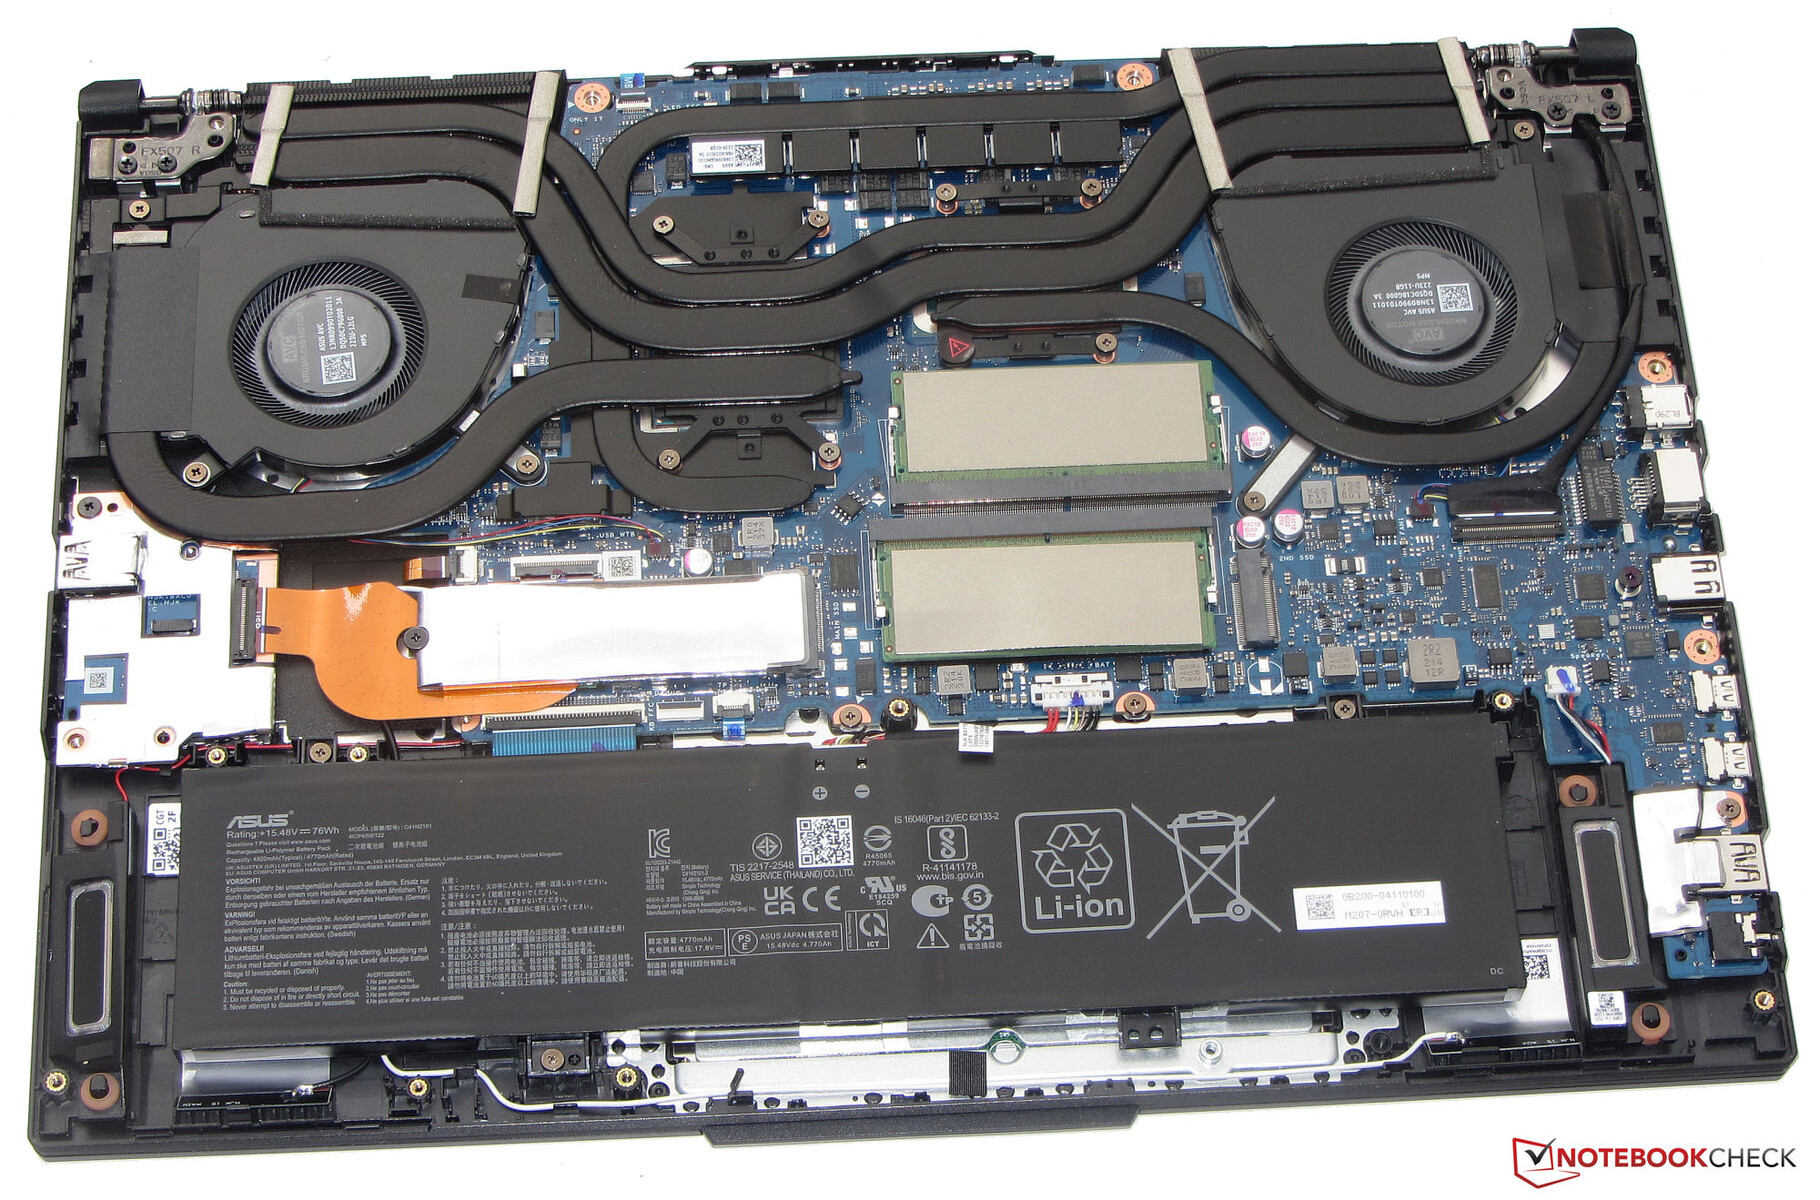
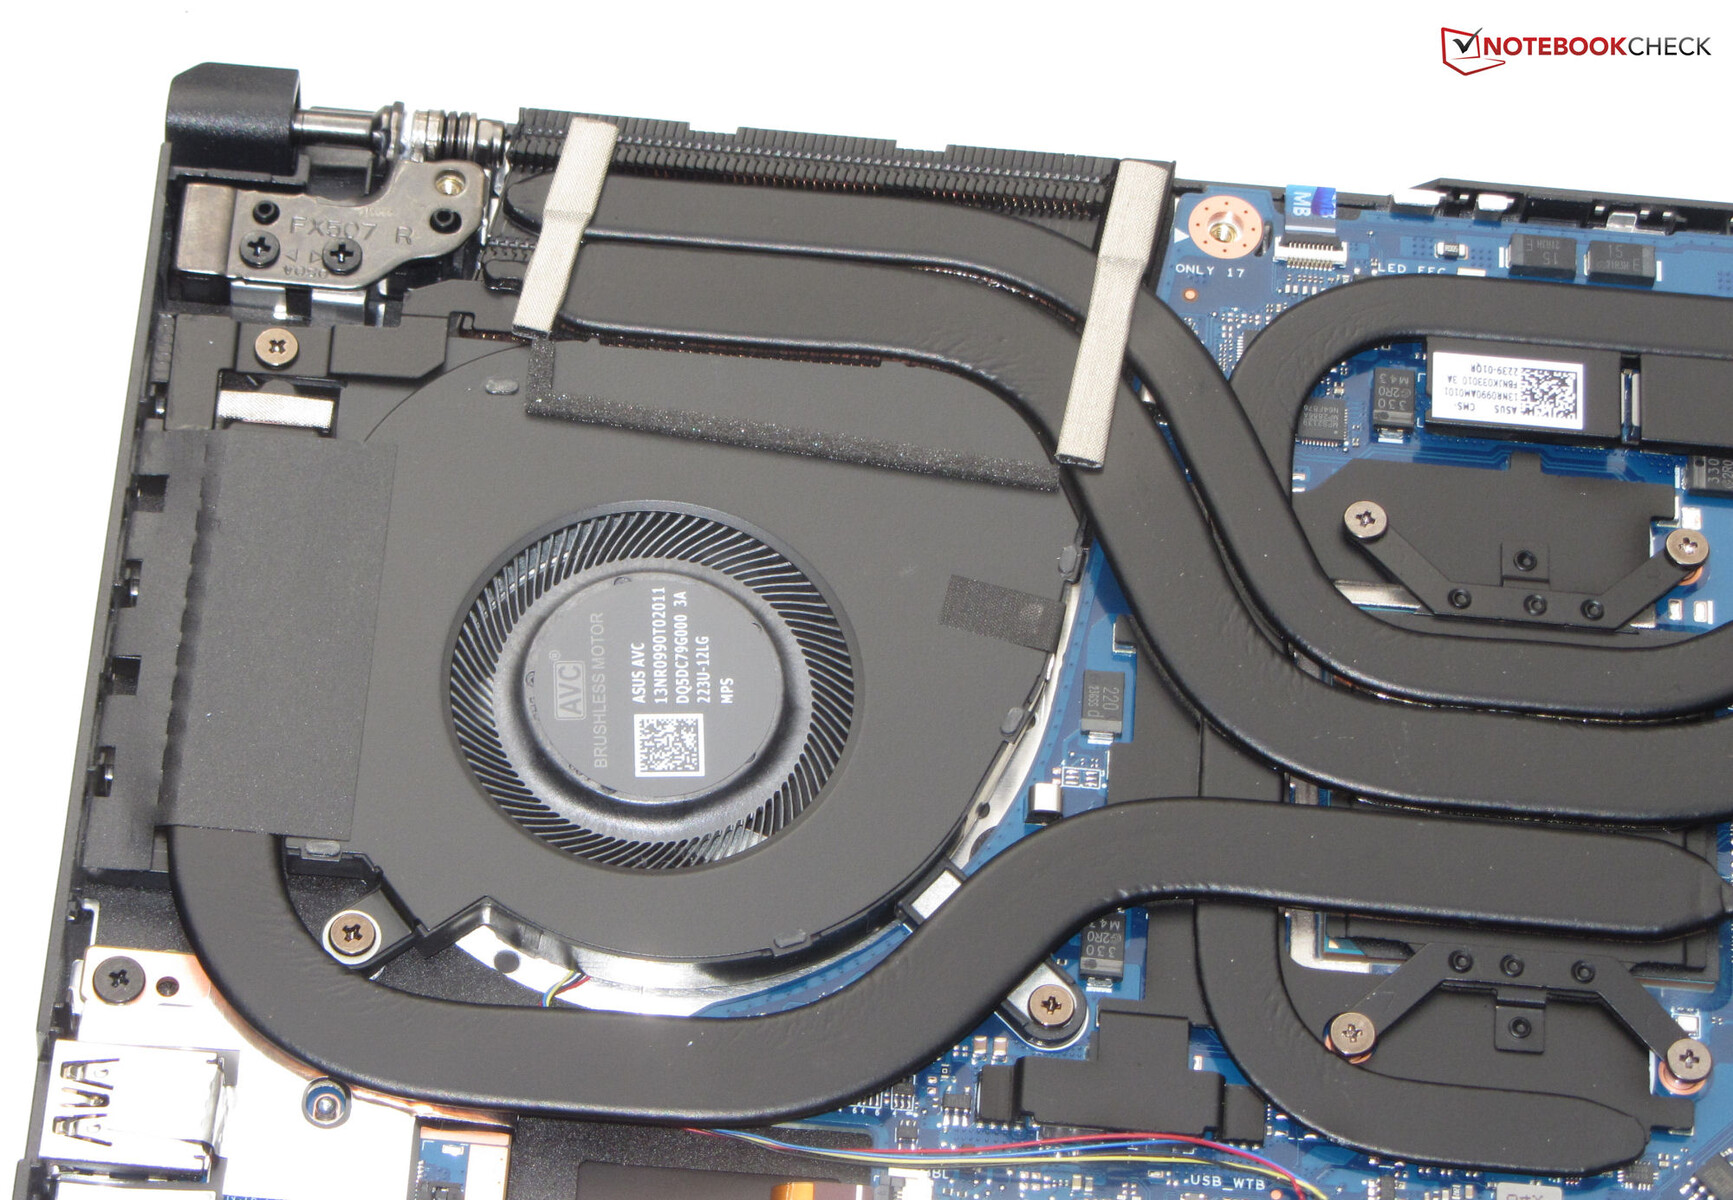
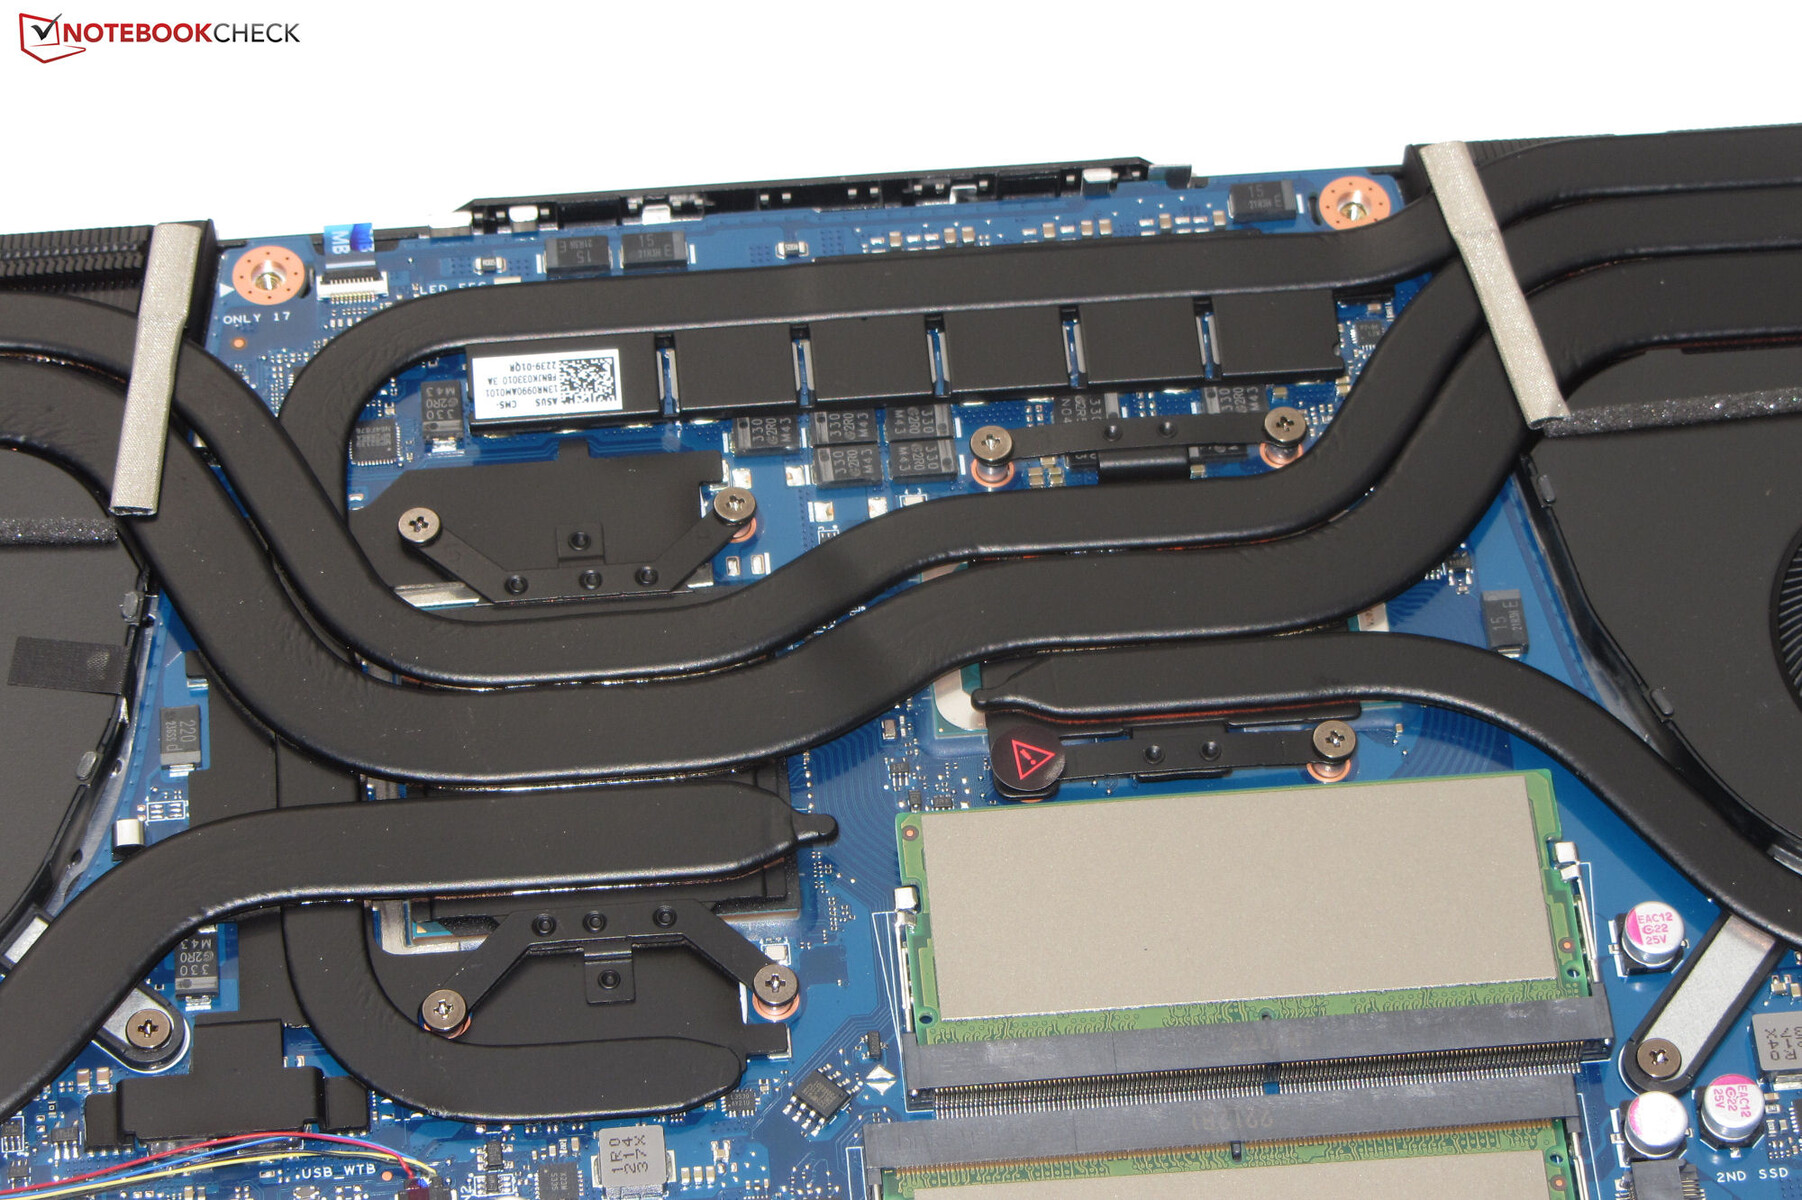
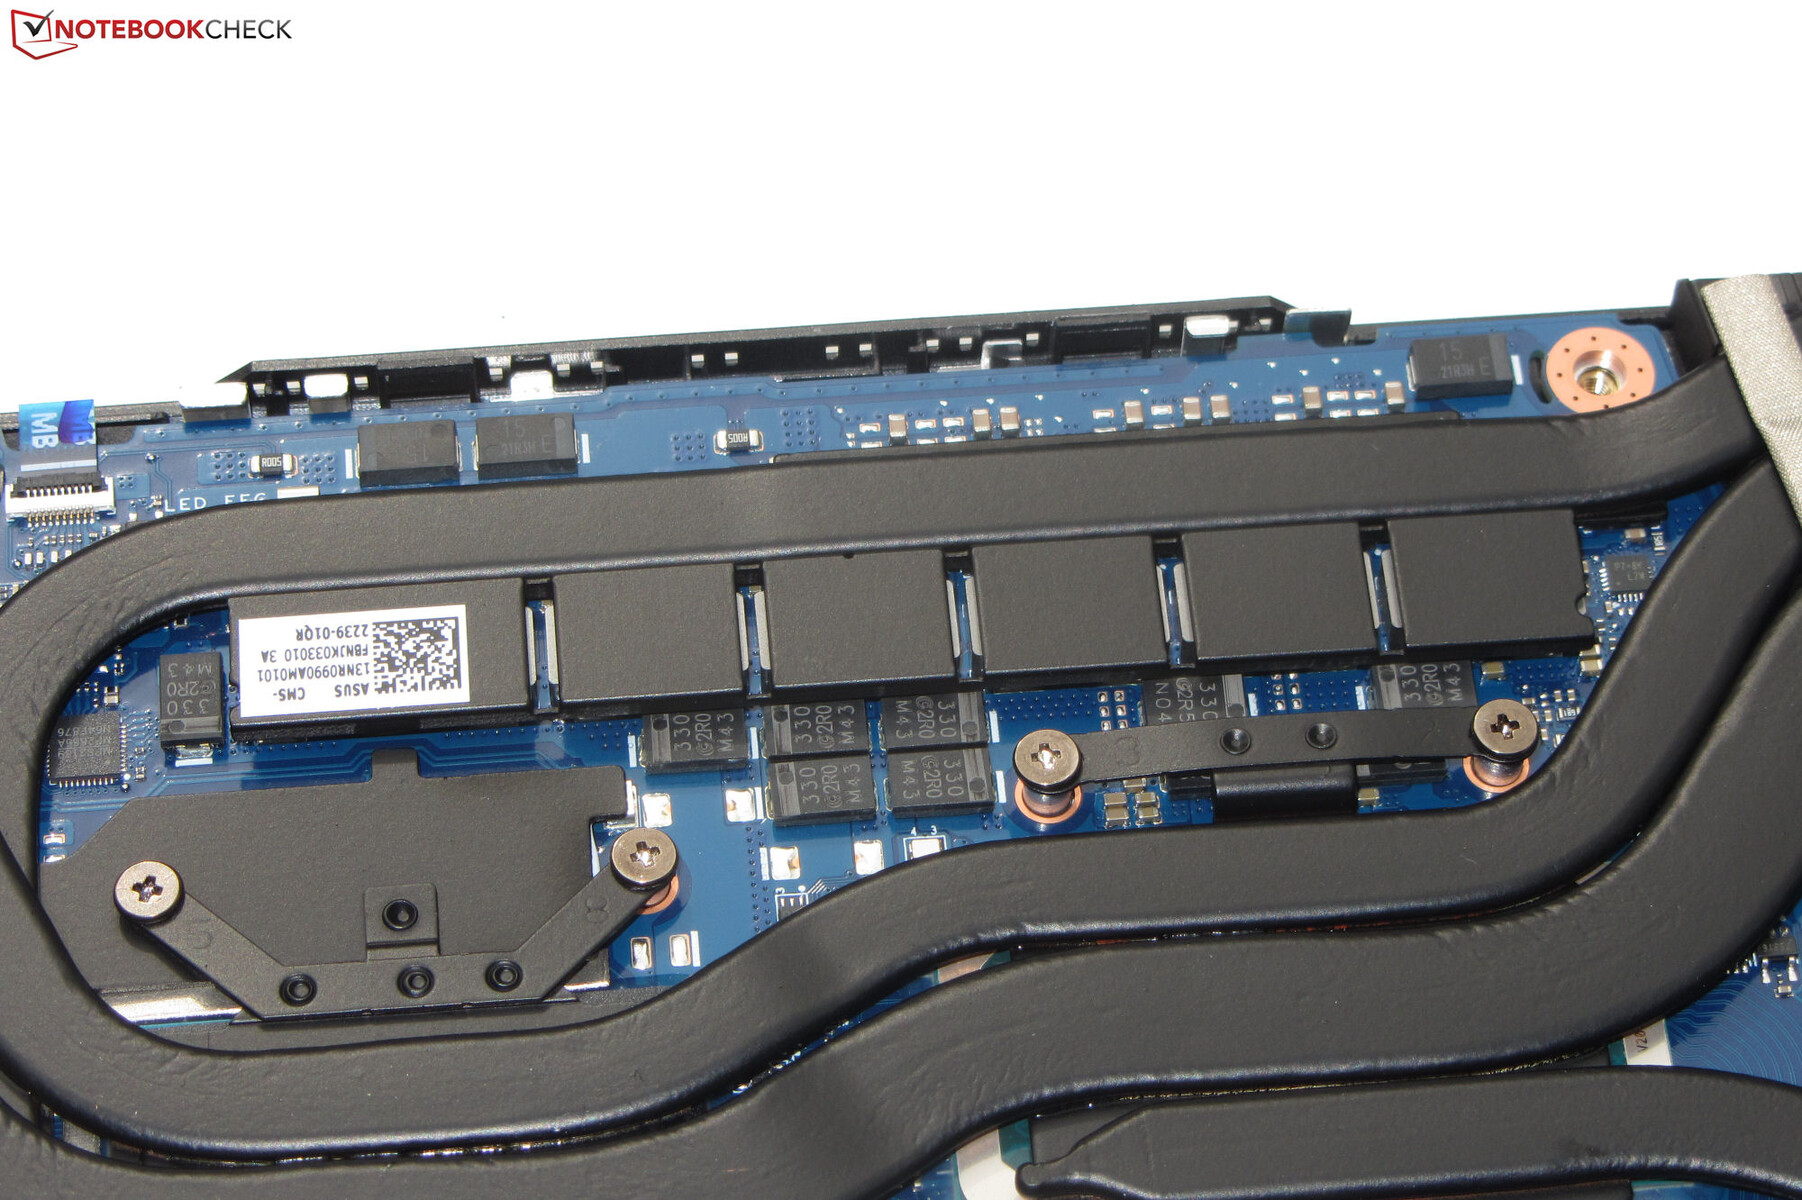
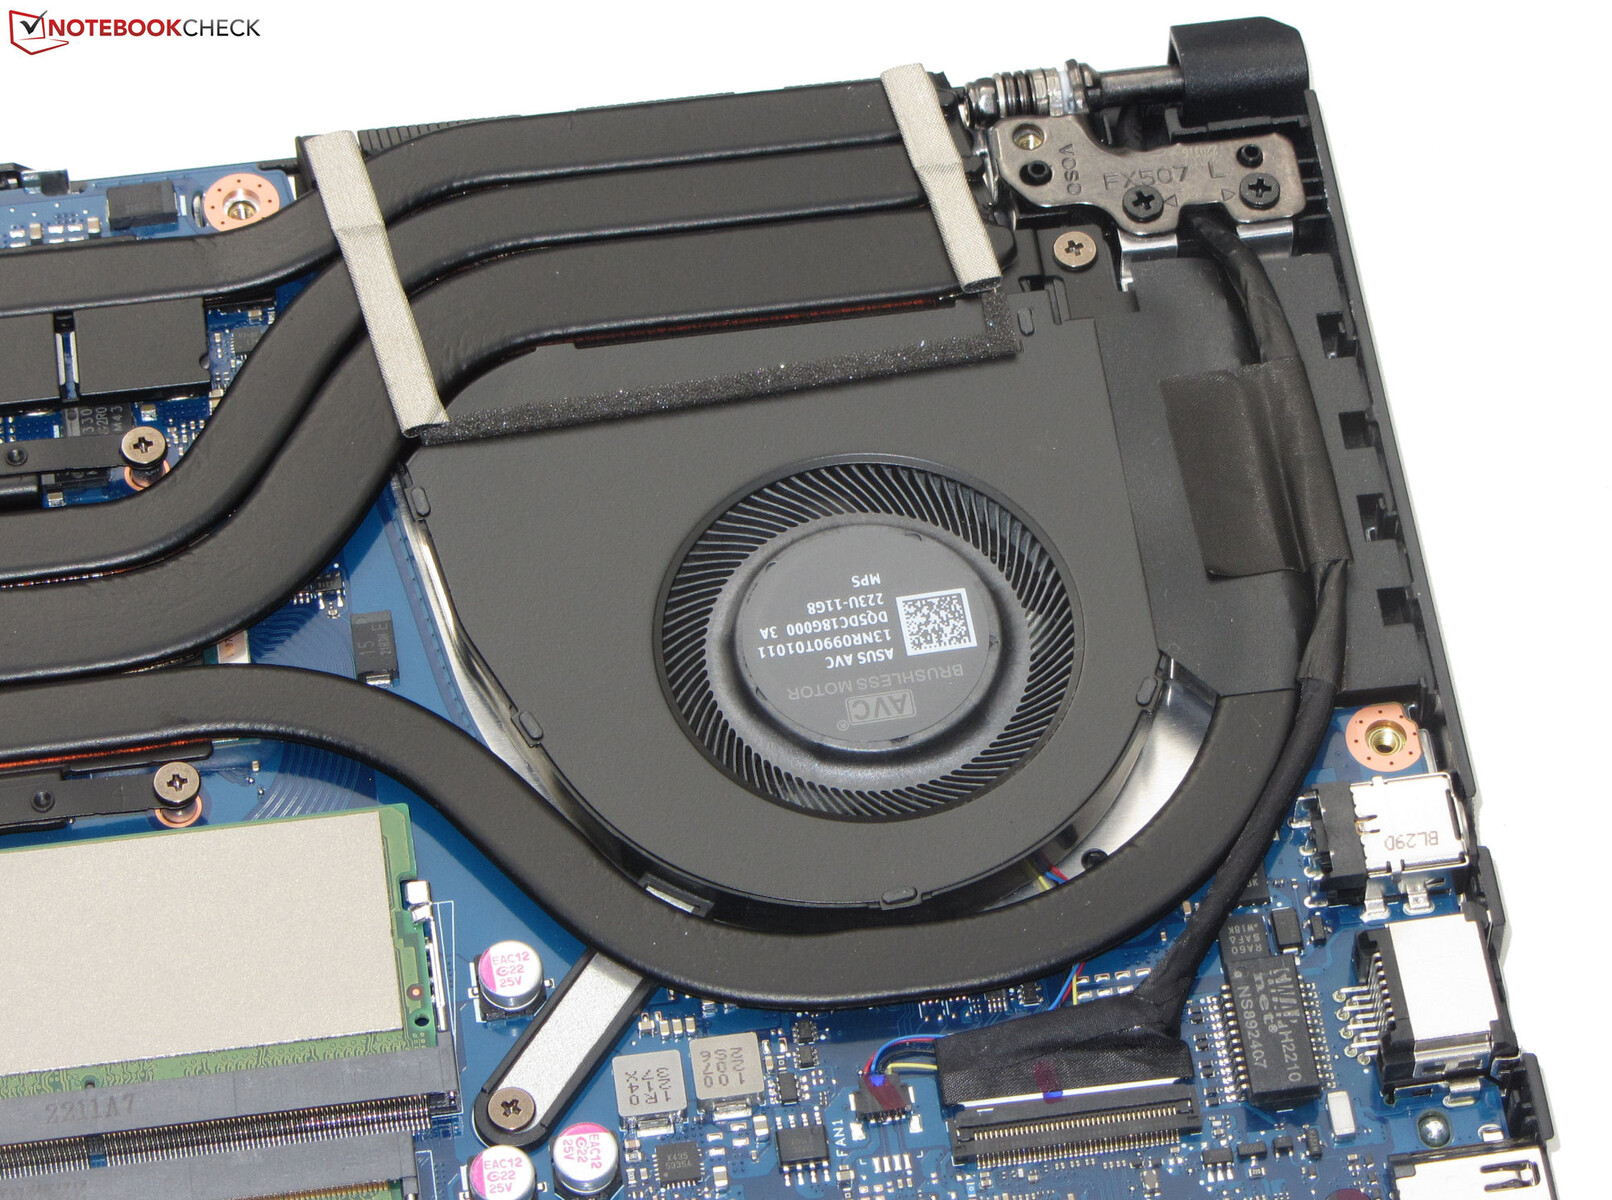
Mantenimiento
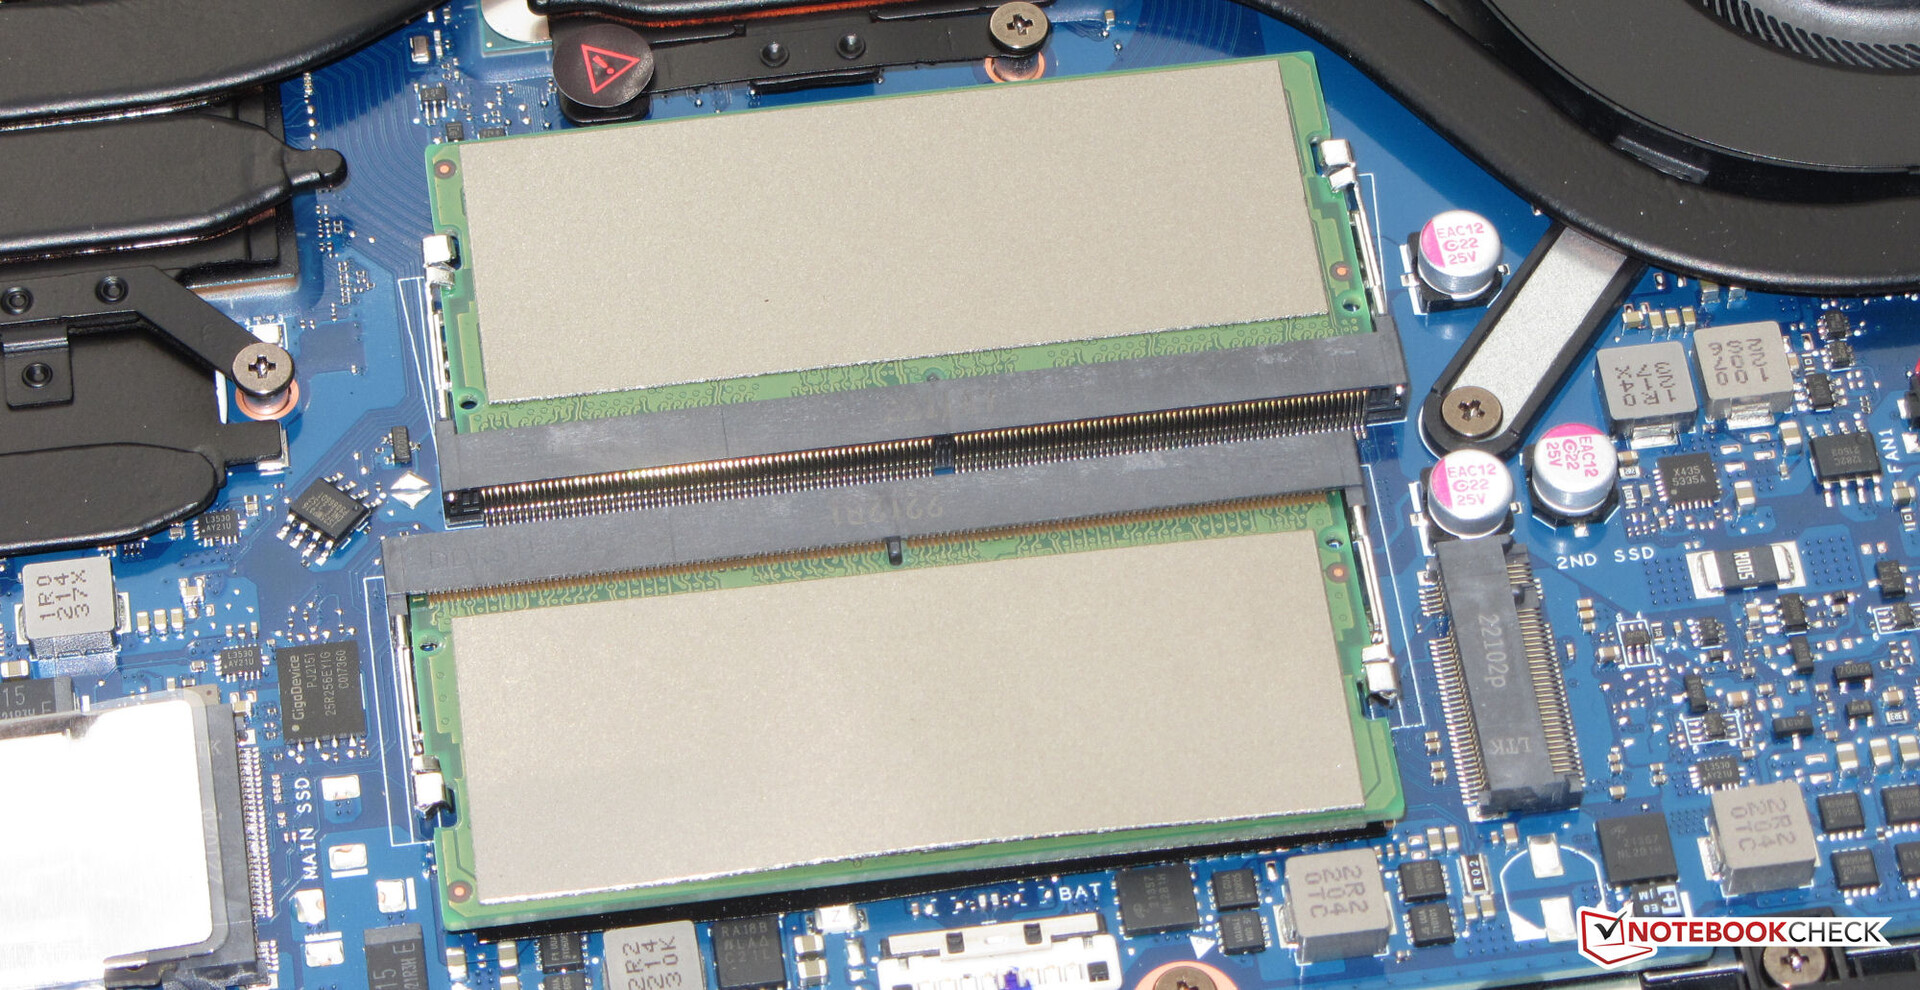
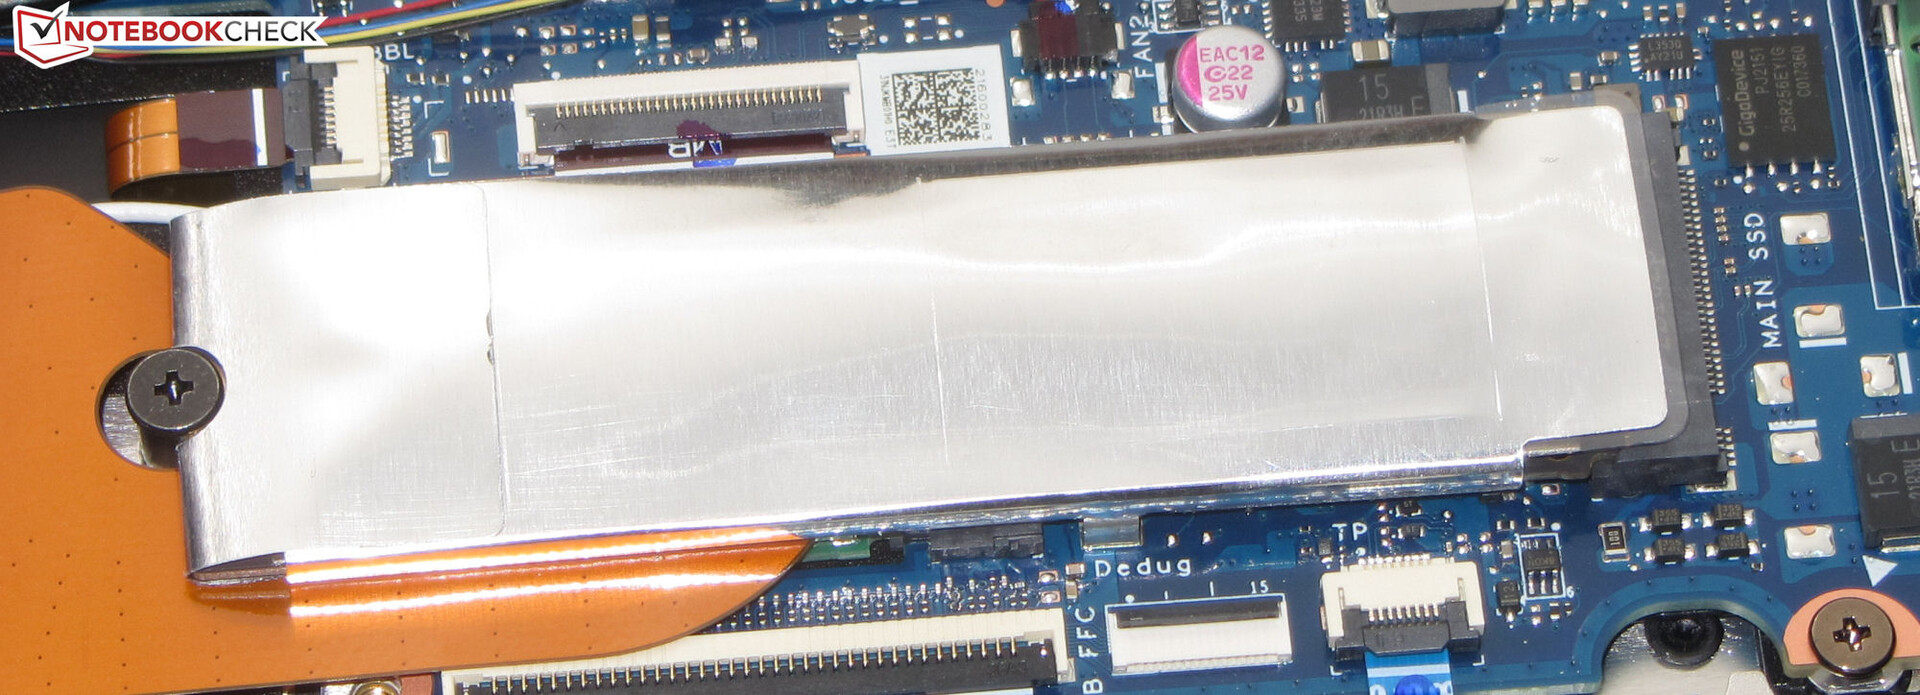
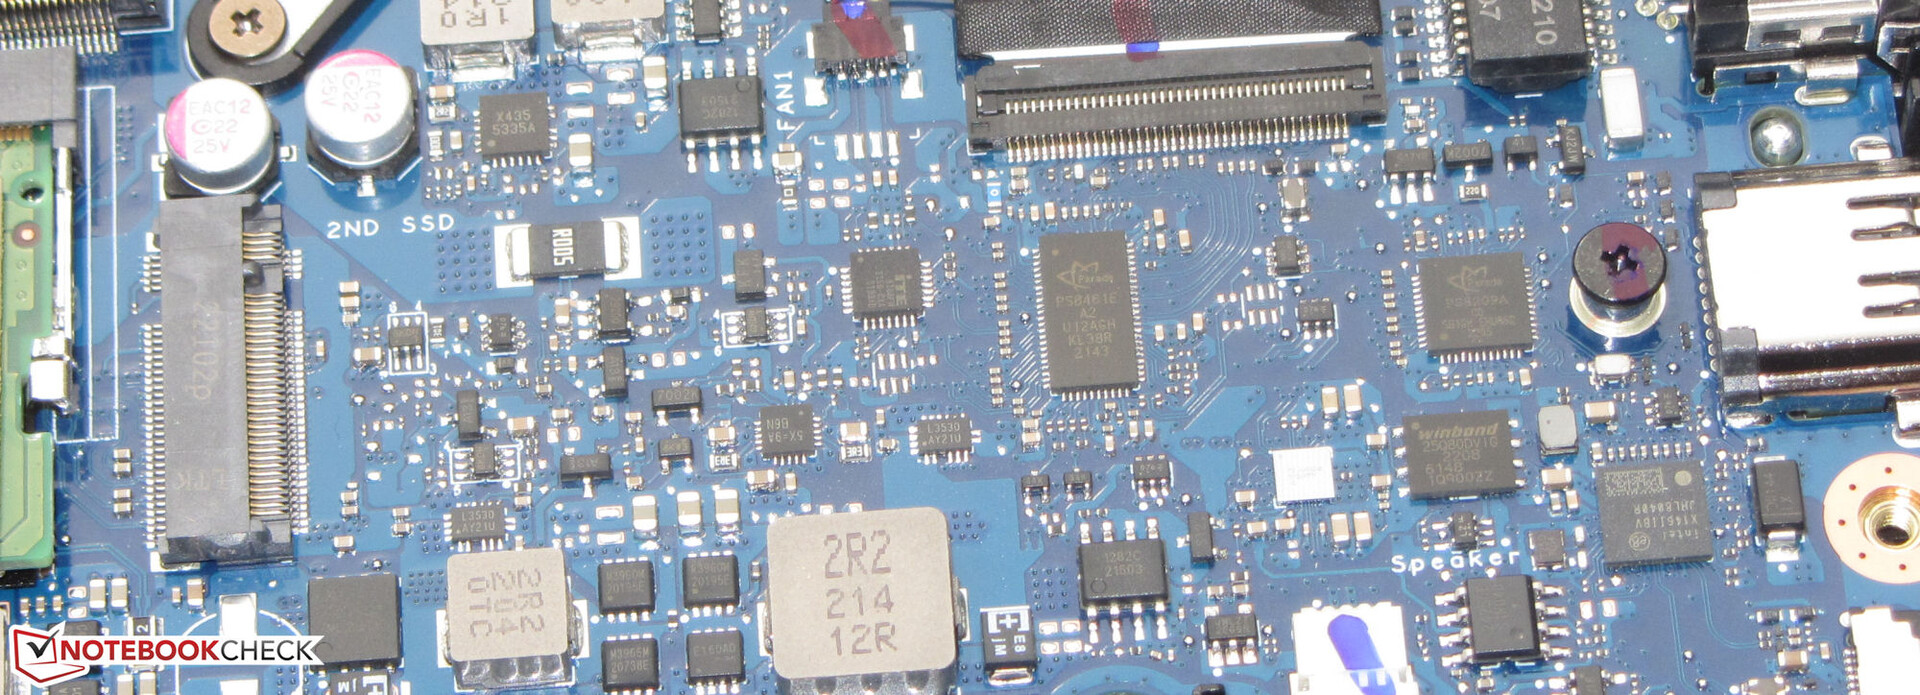
El interior del portátil es accesible después de retirar la cubierta inferior. Una vez aflojados todos los tornillos de la parte inferior del dispositivo, se pueden retirar los soportes de sujeción de la cubierta inferior con la ayuda de una espátula plana. Pero ten cuidado: Los soportes quedan bastante apretados. Entonces puedes acceder al SSD (PCIe 3, M.2 2280), la segunda ranura SSD (M.2 2280), el módulo Wi-Fi, la batería, la RAM, los altavoces y los ventiladores
Garantía
Asus ofrece el F15 con una garantía de dos años. Una extensión de tres años cuesta unos 129 euros
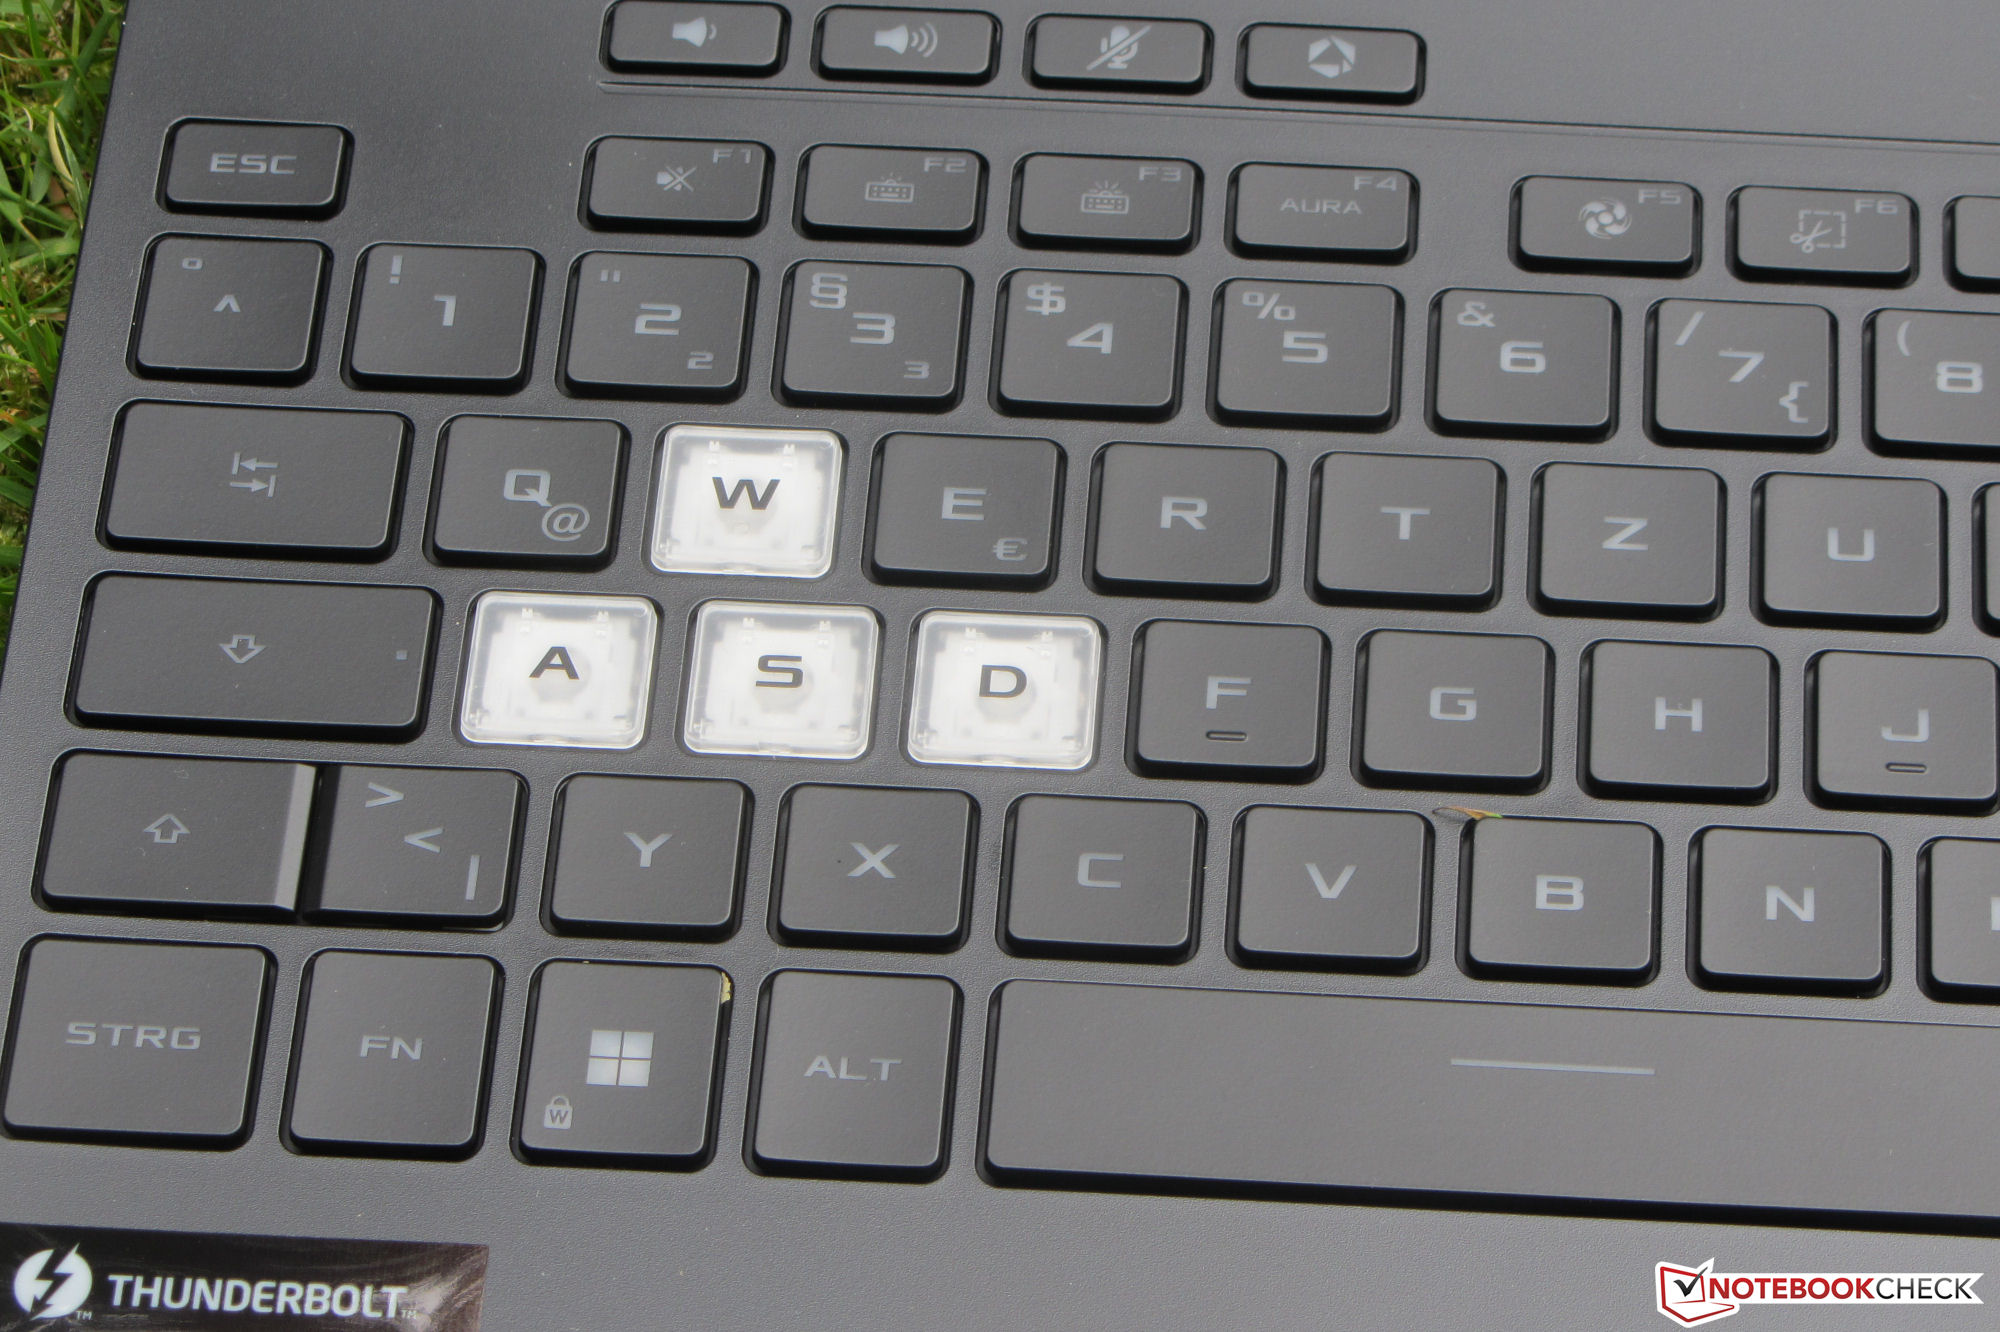
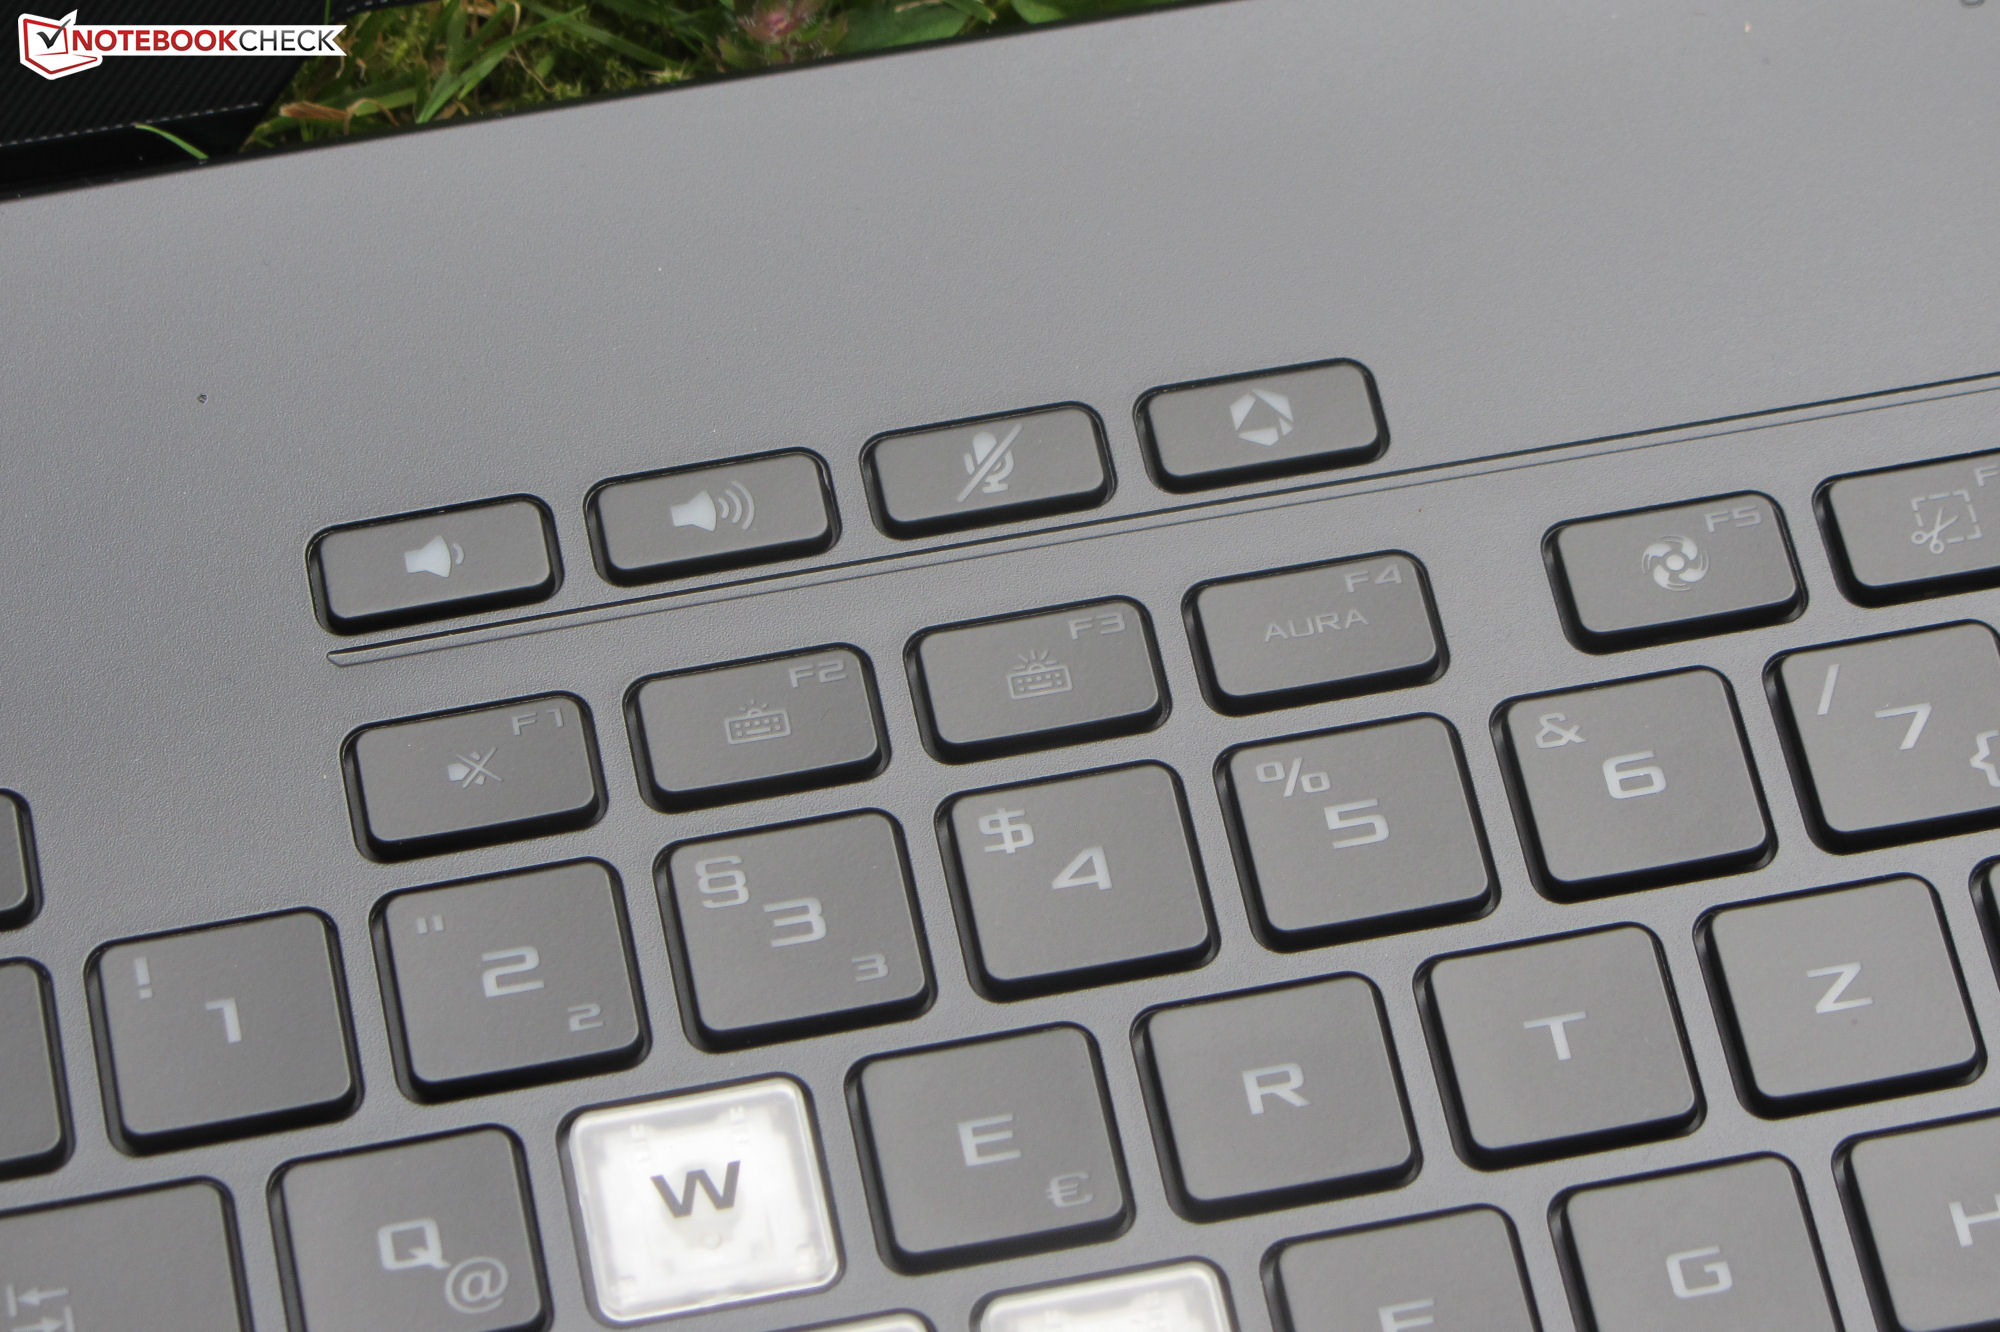
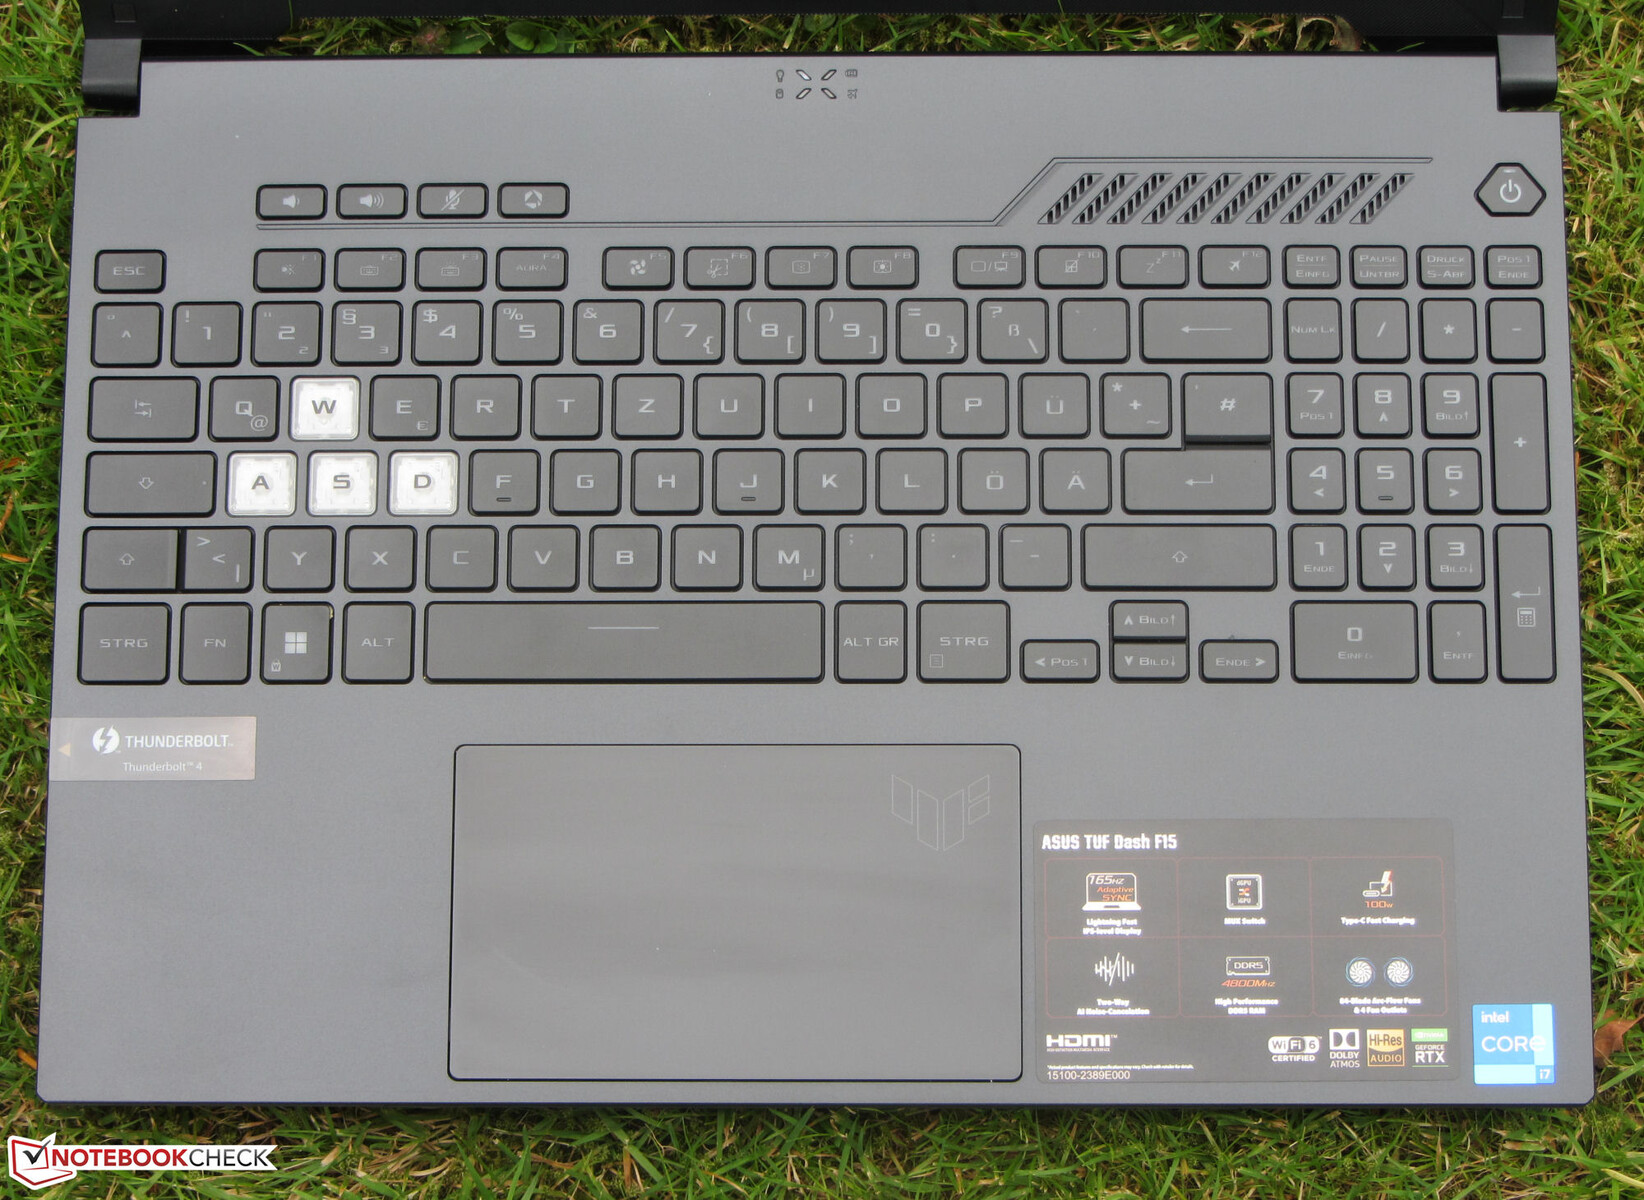
Dispositivos de entrada - TUF Dash con retroiluminación monocromática
Teclado
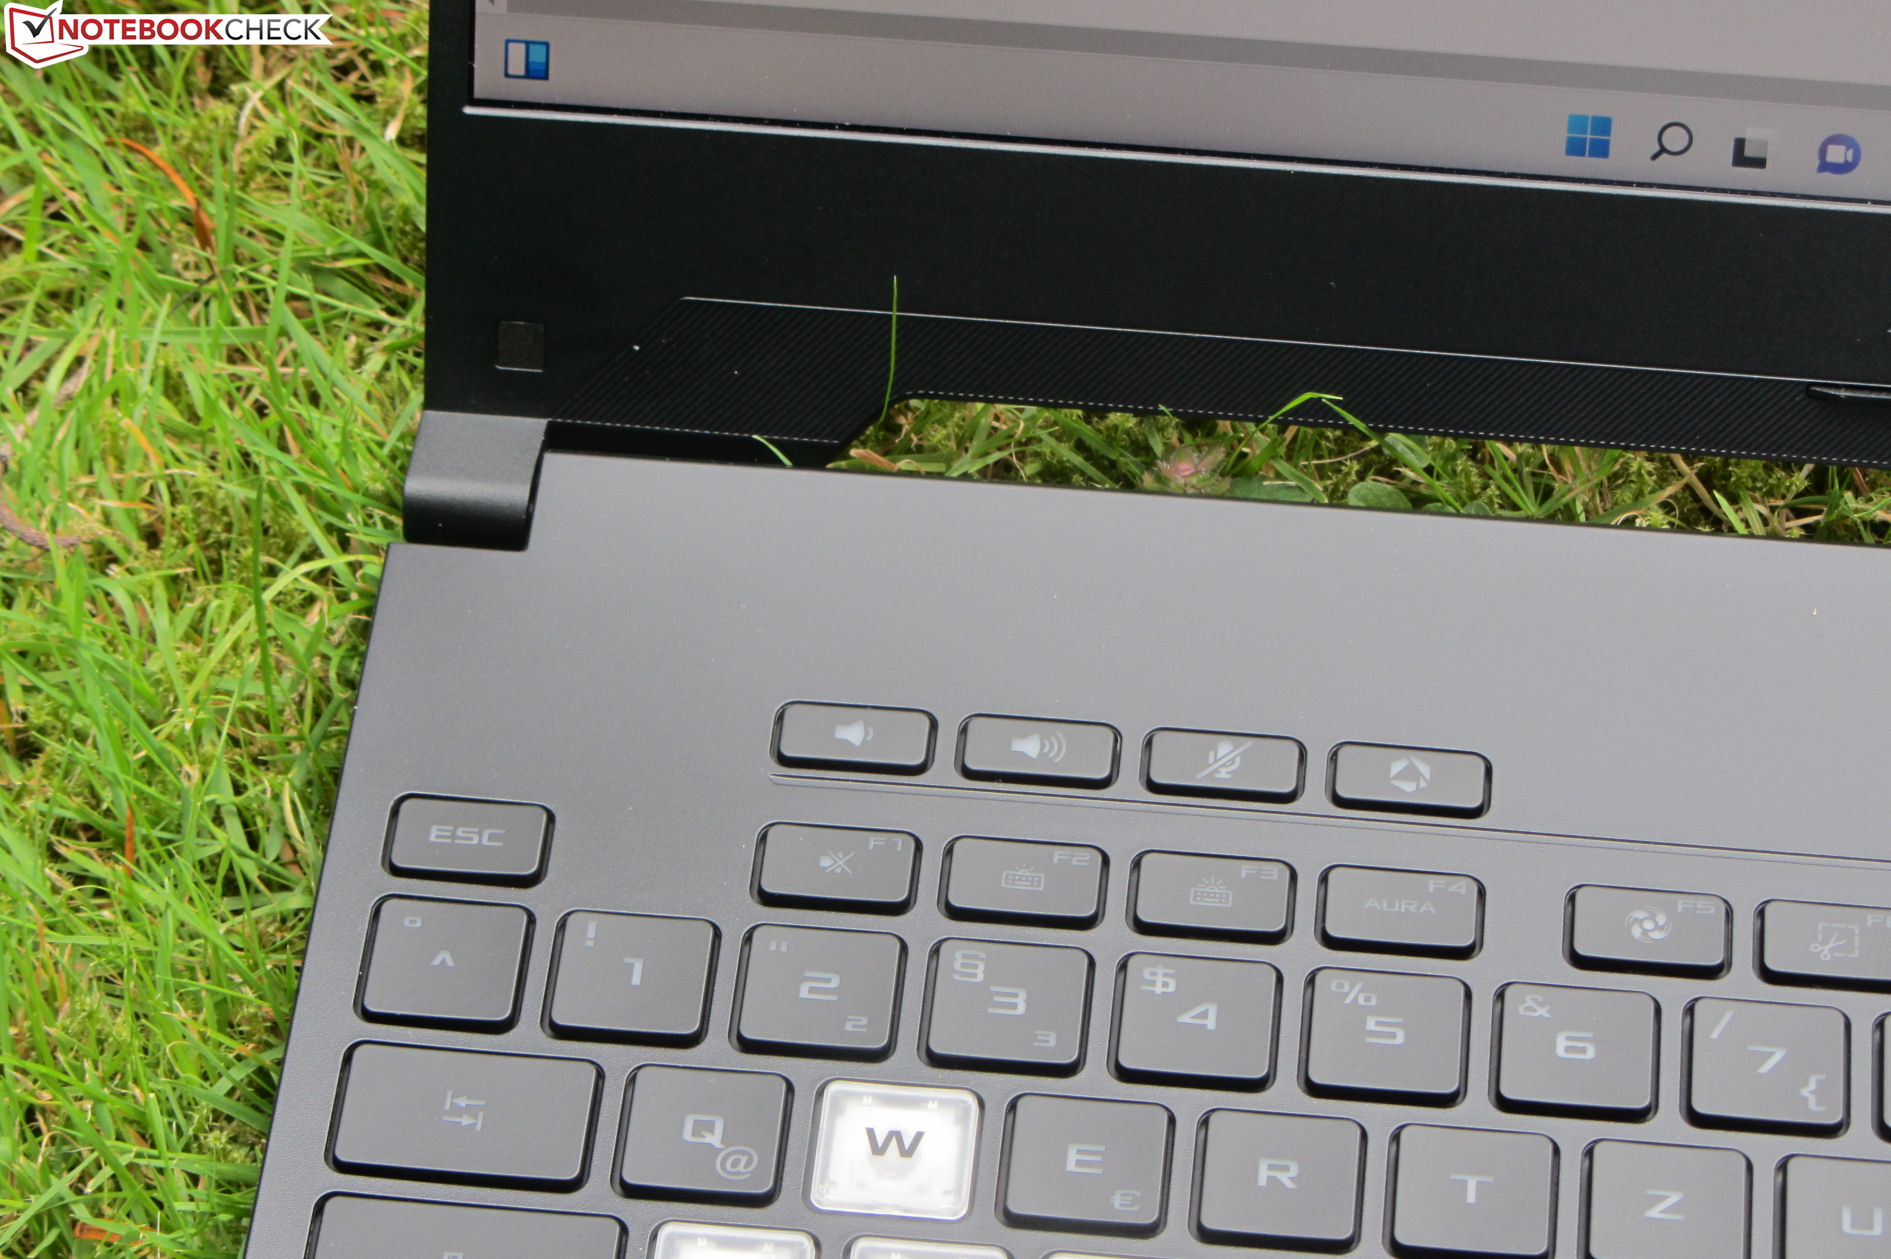
El teclado del F15 está formado por teclas cóncavas en su mayor parte. Unas pocas teclas (por ejemplo, Enter, Shift) son planas. Todas ofrecen un recorrido medio y un punto de presión claro. En cuanto a la distribución de las teclas, no puede calificarse necesariamente de óptima: Destacan las pequeñas teclas de flecha y la tecla "Enter" de una sola línea. La resistencia que ofrecen las teclas es aceptable. El teclado se tambalea un poco durante la escritura. Sin embargo, esto no resultó ser molesto. La retroiluminación de tres niveles (monocromo, blanco) se controla mediante dos teclas de función. En general, Asus ofrece un teclado adecuado para el uso diario
Teclado táctil
Un ClickPad multitáctil (de unos 13 x 7,7 cm) sirve de sustituto del ratón. Su suave superficie facilita el deslizamiento de los dedos sobre él. También responde a las entradas en las esquinas. El pad tiene un recorrido corto y un punto de presión claro
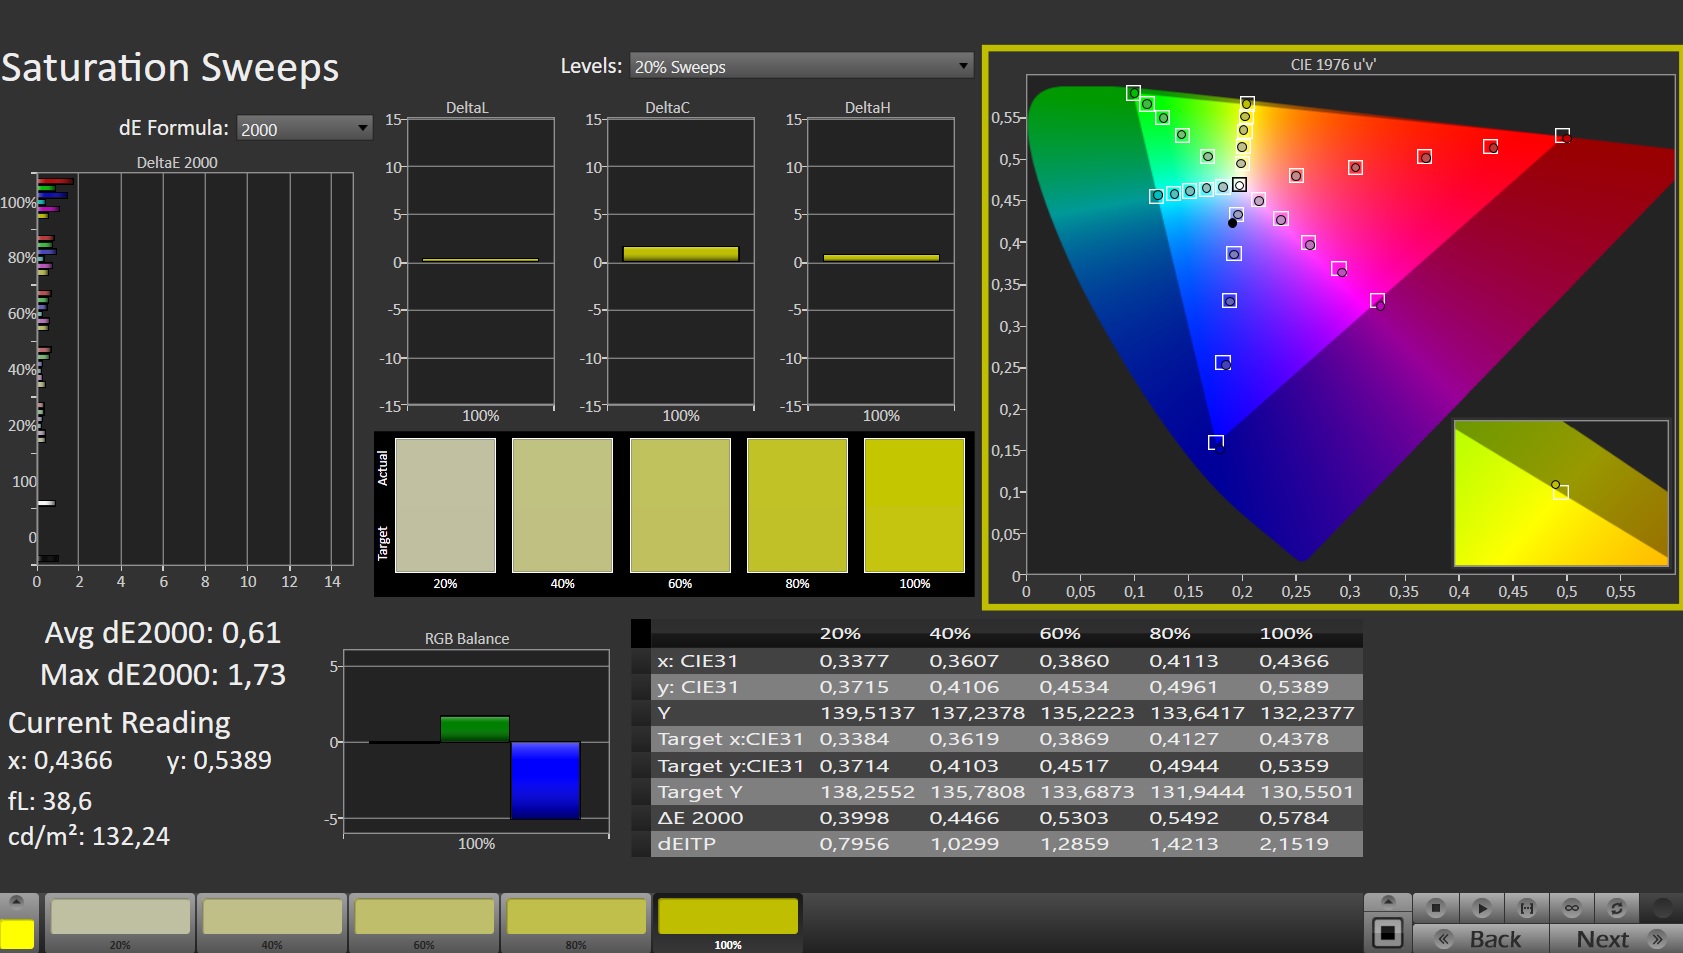
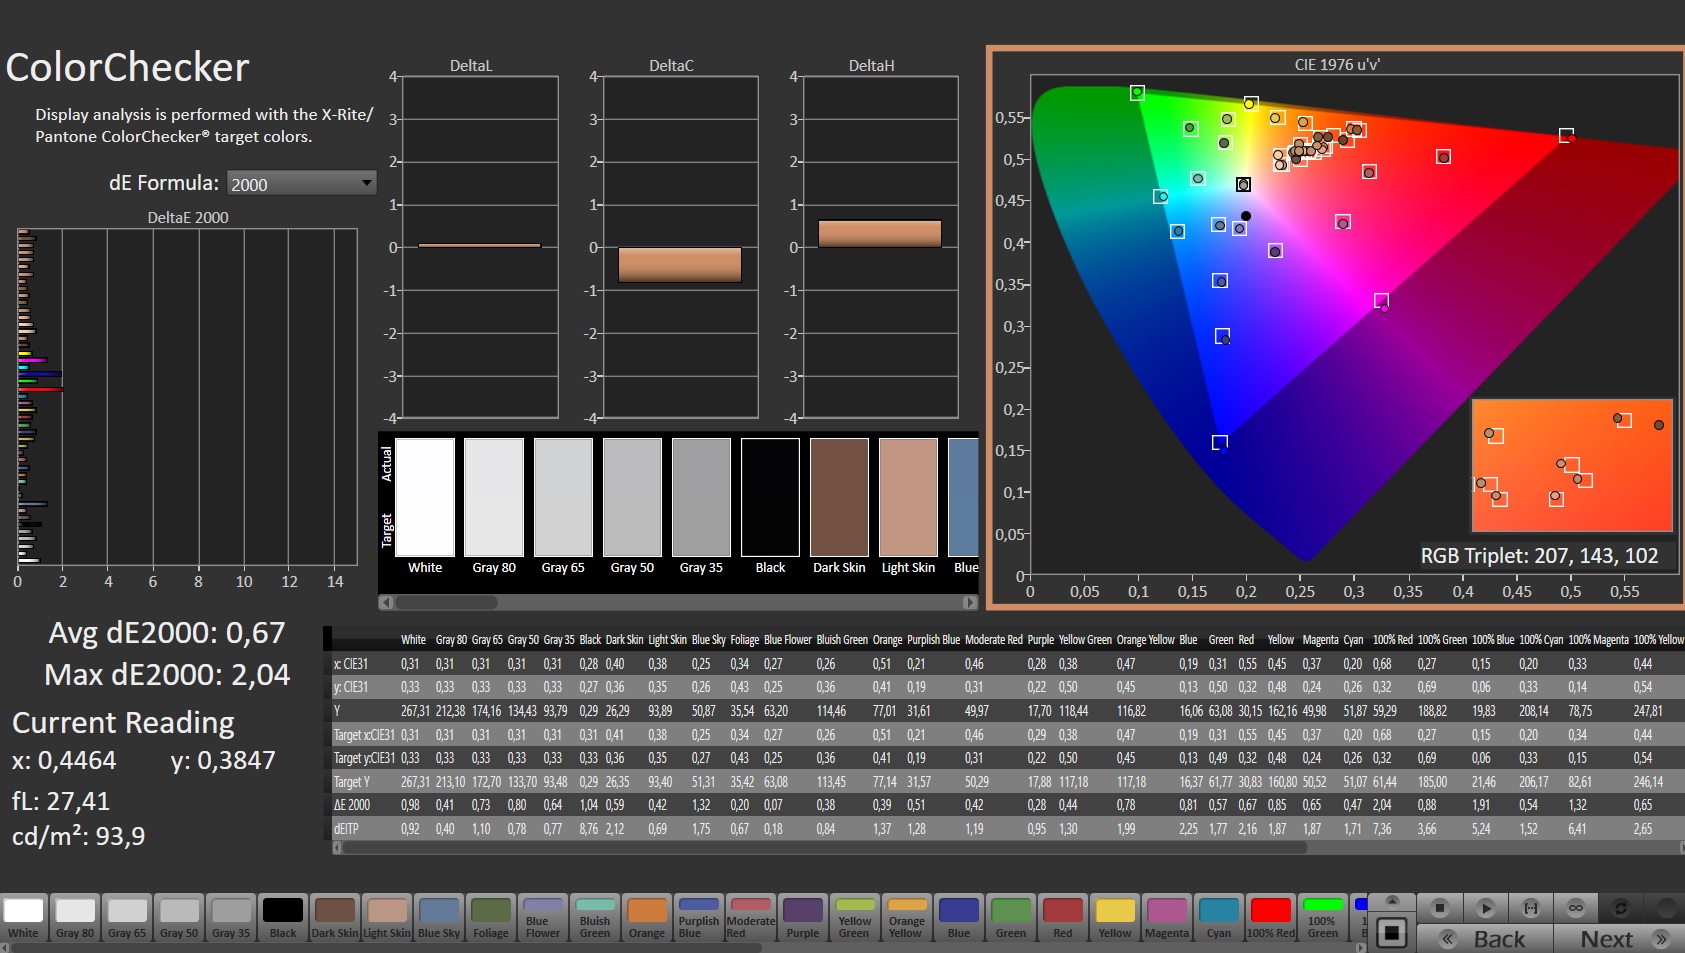
Pantalla - Responde, pero es demasiado tenue
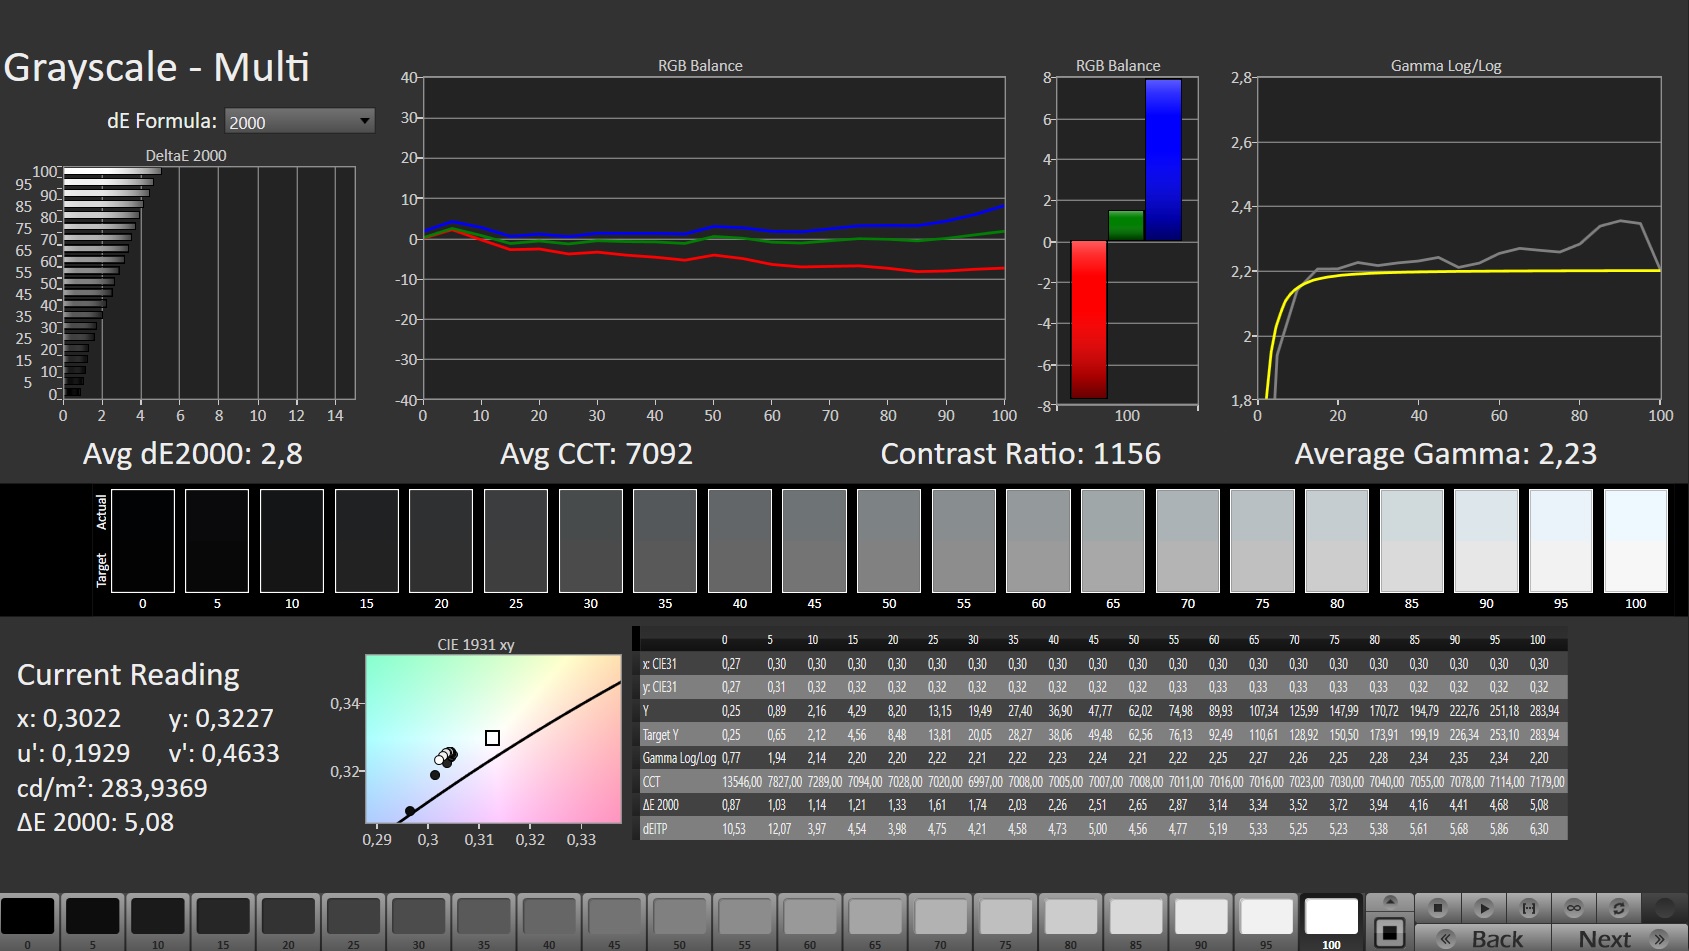
Aunque el contraste de la pantalla mate de 15,6 pulgadas (2.560x1.440 píxeles) (1.144:1) cumple el objetivo (> 1.000:1), su brillo máximo (266,2 cd/m²) es demasiado bajo. Consideramos que los valores superiores a 300 cd/m² son buenos. El panel de 165 Hz ofrece tiempos de respuesta rápidos. No se pudo detectar parpadeo PWM.
El display soporta la tecnología AdaptiveSync. Esto significa que las tasas de refresco de la pantalla y la GPU se ajustan dinámicamente entre sí. El objetivo es crear una imagen lo más fluida posible, especialmente en los juegos de ordenador.

| |||||||||||||||||||||||||
iluminación: 87 %
Brillo con batería: 286 cd/m²
Contraste: 1144:1 (Negro: 0.25 cd/m²)
ΔE ColorChecker Calman: 2.14 | ∀{0.5-29.43 Ø4.73}
calibrated: 0.67
ΔE Greyscale Calman: 2.8 | ∀{0.09-98 Ø4.97}
85.9% AdobeRGB 1998 (Argyll 3D)
99.9% sRGB (Argyll 3D)
98.4% Display P3 (Argyll 3D)
Gamma: 2.23
CCT: 7092 K
| Asus TUF Dash F15 FX517ZR BOE CQ NE156QHM-NY1, IPS, 2560x1440, 15.6" | Acer Nitro 5 AN515-58-72QR Chi Mei N156KME-GNA, IPS, 2560x1440, 15.6" | HP Omen 16-b1090ng BOE09E5, IPS, 2560x1440, 16.1" | MSI Delta 15 A5EFK LQ156M1JW03 (SHP155D), IPS-Level, 1920x1080, 15.6" | Razer Blade 15 Base Edition 2021, i7-10750H RTX 3060 BOE NV156FHM-N4K, IPS, 1920x1080, 15.6" | |
|---|---|---|---|---|---|
| Display | -1% | -15% | -18% | -22% | |
| Display P3 Coverage (%) | 98.4 | 95.6 -3% | 71 -28% | 66.5 -32% | 64.3 -35% |
| sRGB Coverage (%) | 99.9 | 99.8 0% | 97.9 -2% | 97.8 -2% | 91.8 -8% |
| AdobeRGB 1998 Coverage (%) | 85.9 | 85.2 -1% | 73.3 -15% | 67.6 -21% | 65.5 -24% |
| Response Times | -95% | -80% | -70% | -32% | |
| Response Time Grey 50% / Grey 80% * (ms) | 5.6 ? | 15.7 ? -180% | 14.5 ? -159% | 12.8 ? -129% | 8.8 ? -57% |
| Response Time Black / White * (ms) | 9.4 ? | 10.2 ? -9% | 9.4 ? -0% | 10.4 ? -11% | 10 ? -6% |
| PWM Frequency (Hz) | 23580 ? | 1000 ? | |||
| Screen | -20% | -45% | -27% | -55% | |
| Brightness middle (cd/m²) | 286 | 332 16% | 335 17% | 291 2% | 317.2 11% |
| Brightness (cd/m²) | 266 | 303 14% | 319 20% | 266 0% | 306 15% |
| Brightness Distribution (%) | 87 | 86 -1% | 90 3% | 88 1% | 89 2% |
| Black Level * (cd/m²) | 0.25 | 0.29 -16% | 0.28 -12% | 0.36 -44% | 0.31 -24% |
| Contrast (:1) | 1144 | 1145 0% | 1196 5% | 808 -29% | 1023 -11% |
| Colorchecker dE 2000 * | 2.14 | 3.61 -69% | 4.38 -105% | 2.98 -39% | 4.37 -104% |
| Colorchecker dE 2000 max. * | 5.22 | 7.71 -48% | 9.48 -82% | 7.59 -45% | 6.62 -27% |
| Colorchecker dE 2000 calibrated * | 0.67 | 0.59 12% | 1.33 -99% | 0.91 -36% | 2.67 -299% |
| Greyscale dE 2000 * | 2.8 | 5.2 -86% | 7 -150% | 4.2 -50% | 4.5 -61% |
| Gamma | 2.23 99% | 2.155 102% | 2.103 105% | 2.293 96% | 2.4 92% |
| CCT | 7092 92% | 6724 97% | 6244 104% | 7624 85% | 7418 88% |
| Color Space (Percent of AdobeRGB 1998) (%) | 59.2 | ||||
| Color Space (Percent of sRGB) (%) | 91.4 | ||||
| Media total (Programa/Opciones) | -39% /
-27% | -47% /
-43% | -38% /
-31% | -36% /
-45% |
* ... más pequeño es mejor
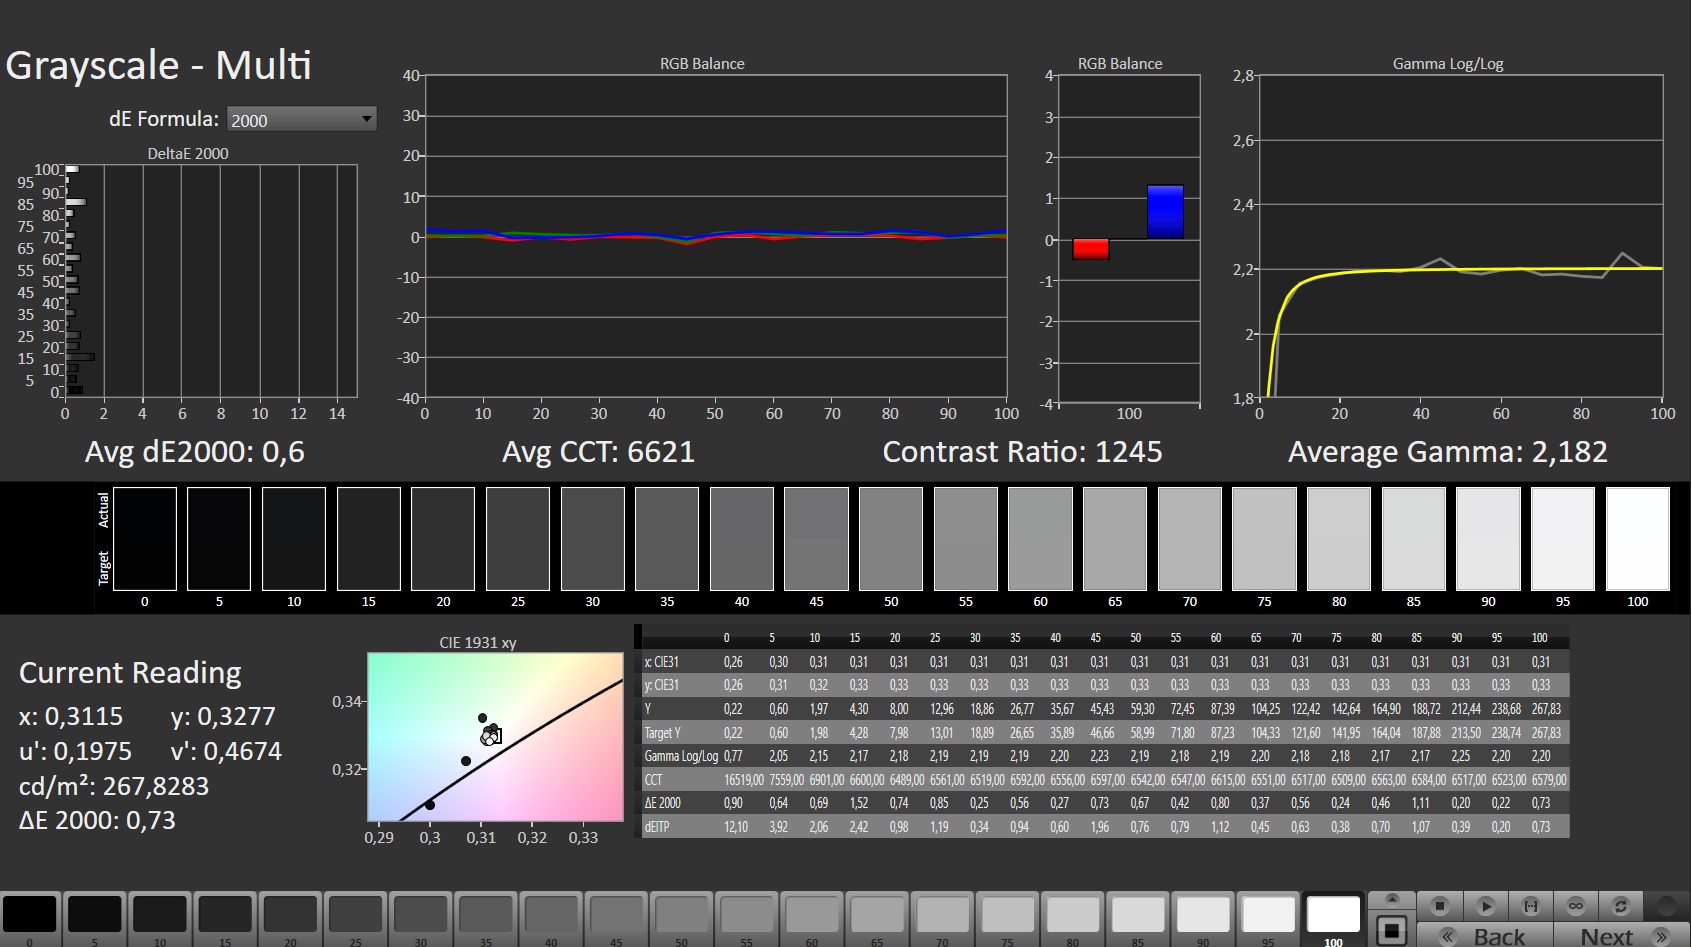
La pantalla muestra una buena reproducción del color desde el primer momento. El objetivo (DeltaE < 3) se cumple con un valor de 2,14. Esta pequeña desviación del color no es perceptible para los espectadores. La calibración aporta mejoras significativas: La escala de grises se muestra de forma más equilibrada y la desviación de color baja a 0,67. La pantalla puede reproducir los espacios de color sRGB (99,9%) y DCI-P3 (98%) casi por completo, mientras que el espacio de color AdobeRGB se reproduce al 86%.
Nota: El perfil de color proporcionado cambia la reproducción del color para que coincida con nuestra calibración.

Tiempos de respuesta del display
| ↔ Tiempo de respuesta de Negro a Blanco | ||
|---|---|---|
| 9.4 ms ... subida ↗ y bajada ↘ combinada | ↗ 5 ms subida | 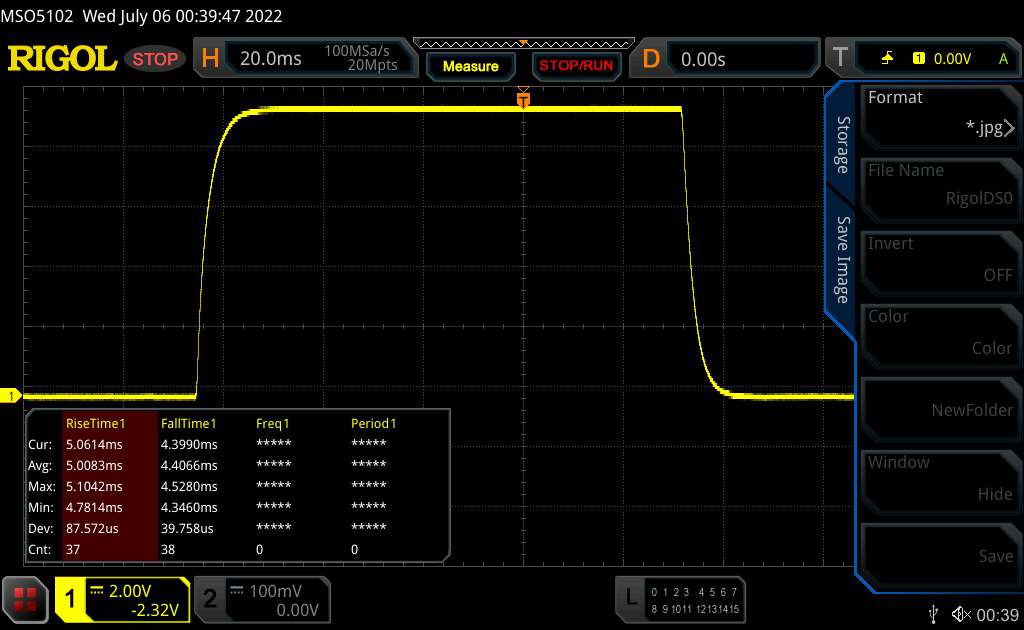 |
| ↘ 4.4 ms bajada | ||
| La pantalla mostró tiempos de respuesta rápidos en nuestros tests y debería ser adecuada para juegos. En comparación, todos los dispositivos de prueba van de ##min### (mínimo) a 240 (máximo) ms. » 26 % de todos los dispositivos son mejores. Esto quiere decir que el tiempo de respuesta medido es mejor que la media (19.9 ms) de todos los dispositivos testados. | ||
| ↔ Tiempo de respuesta 50% Gris a 80% Gris | ||
| 5.6 ms ... subida ↗ y bajada ↘ combinada | ↗ 2.4 ms subida | 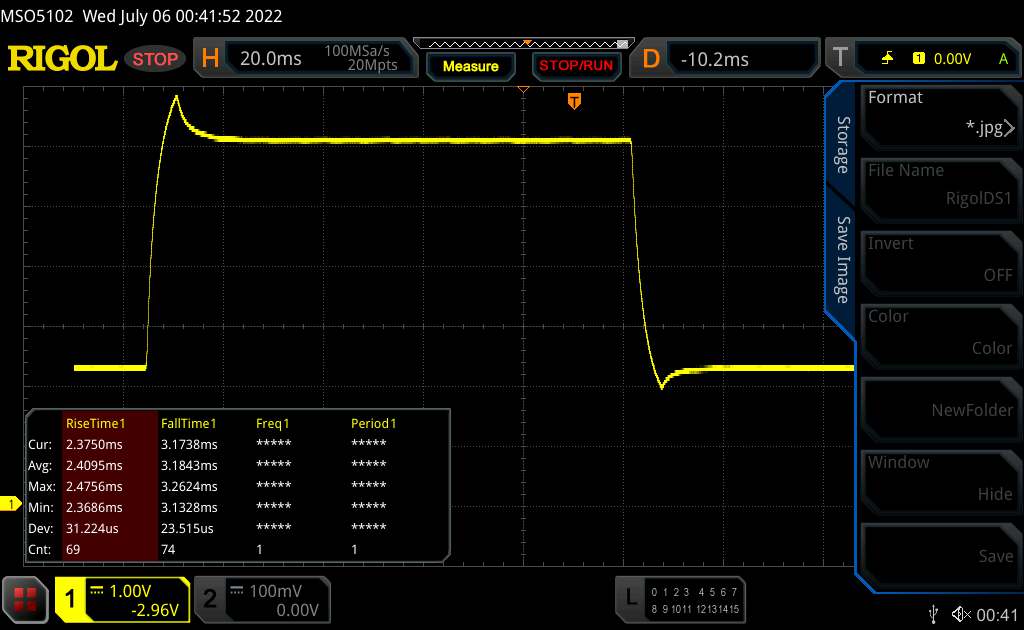 |
| ↘ 3.2 ms bajada | ||
| La pantalla mostró tiempos de respuesta muy rápidos en nuestros tests y debería ser adecuada para juegos frenéticos. En comparación, todos los dispositivos de prueba van de ##min### (mínimo) a 636 (máximo) ms. » 18 % de todos los dispositivos son mejores. Esto quiere decir que el tiempo de respuesta medido es mejor que la media (31.1 ms) de todos los dispositivos testados. | ||
Parpadeo de Pantalla / PWM (Pulse-Width Modulation)
| Parpadeo de Pantalla / PWM no detectado |  | ||
Comparación: 52 % de todos los dispositivos testados no usaron PWM para atenuar el display. Si se usó, medimos una media de 7798 (mínimo: 5 - máxmo: 343500) Hz. | |||
El panel IPS de ángulo de visión estable es legible desde cualquier posición. Es posible leer el contenido de la pantalla en exteriores cuando el sol no brilla demasiado

Rendimiento - El Asus F15 tiene un sólido hardware de gama media a bordo
Con el TUF Dash F15, Asus tiene un portátil de juegos de 15,6 pulgadas en su línea que lleva todos los juegos modernos con fluidez a la pantalla
Condiciones de la prueba
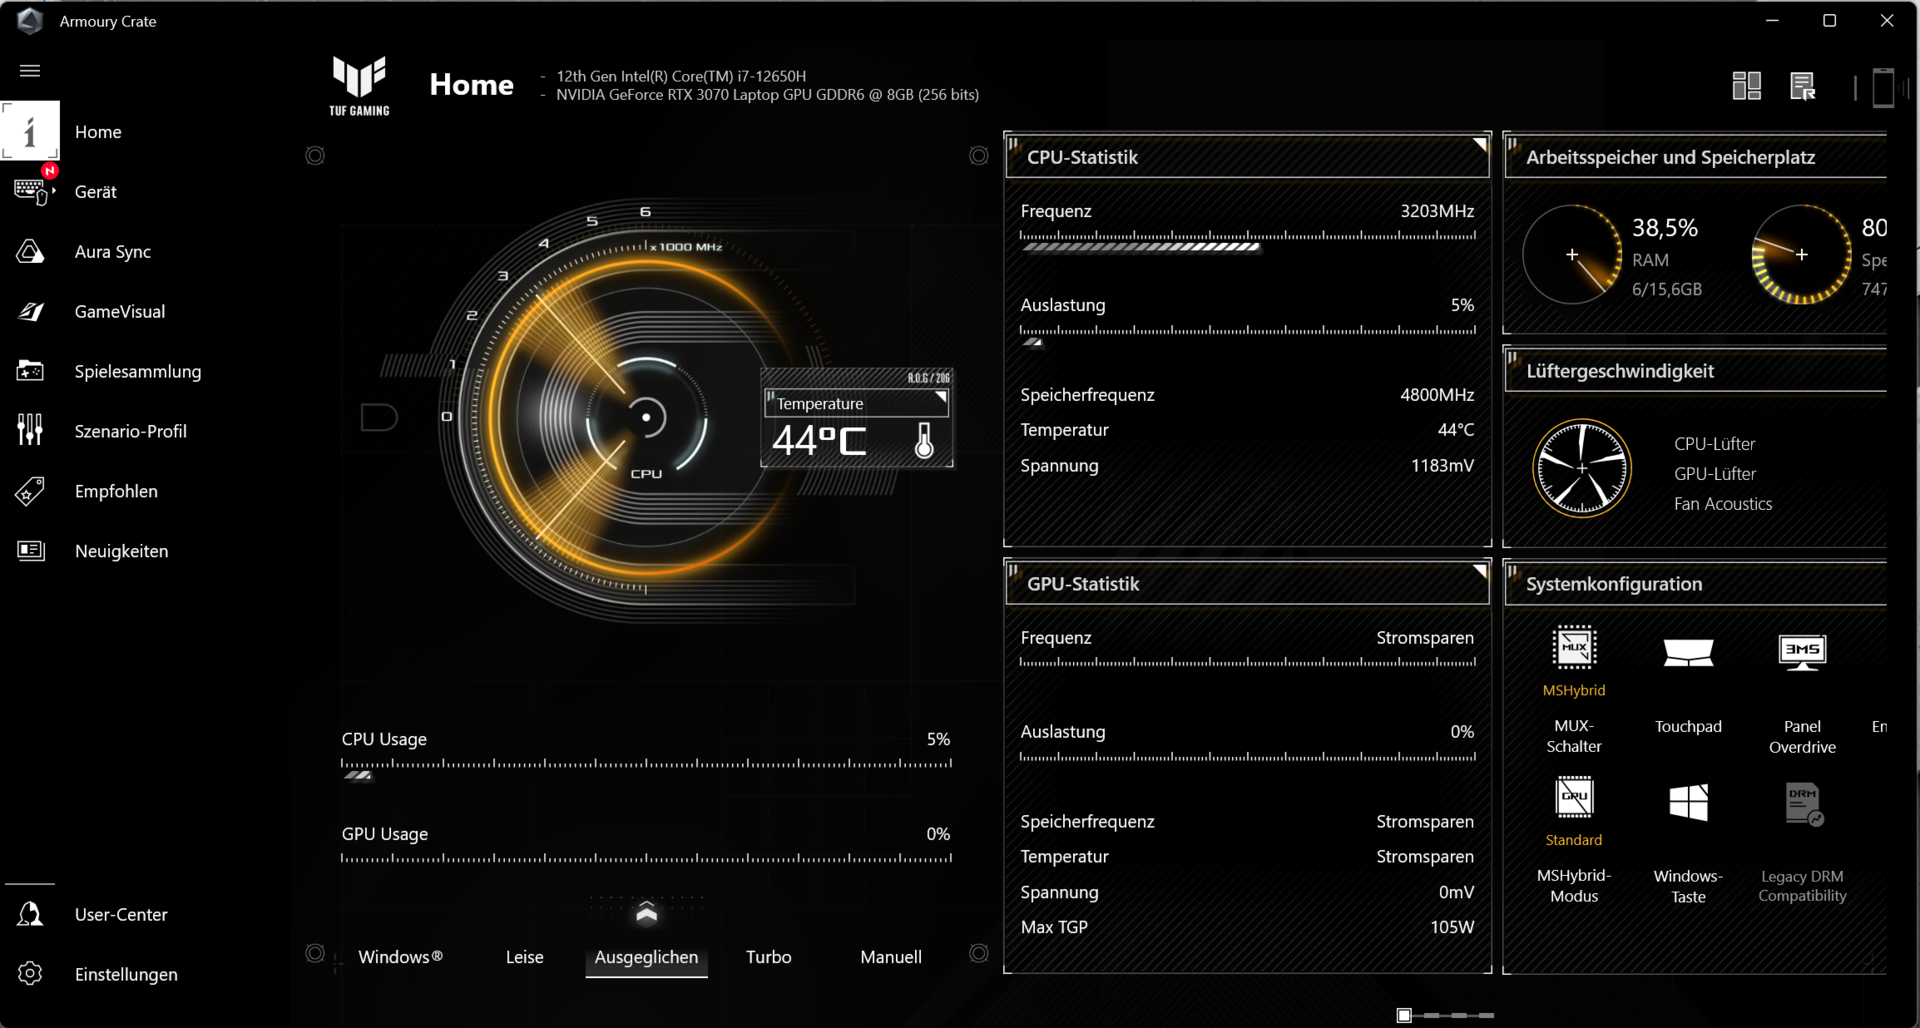
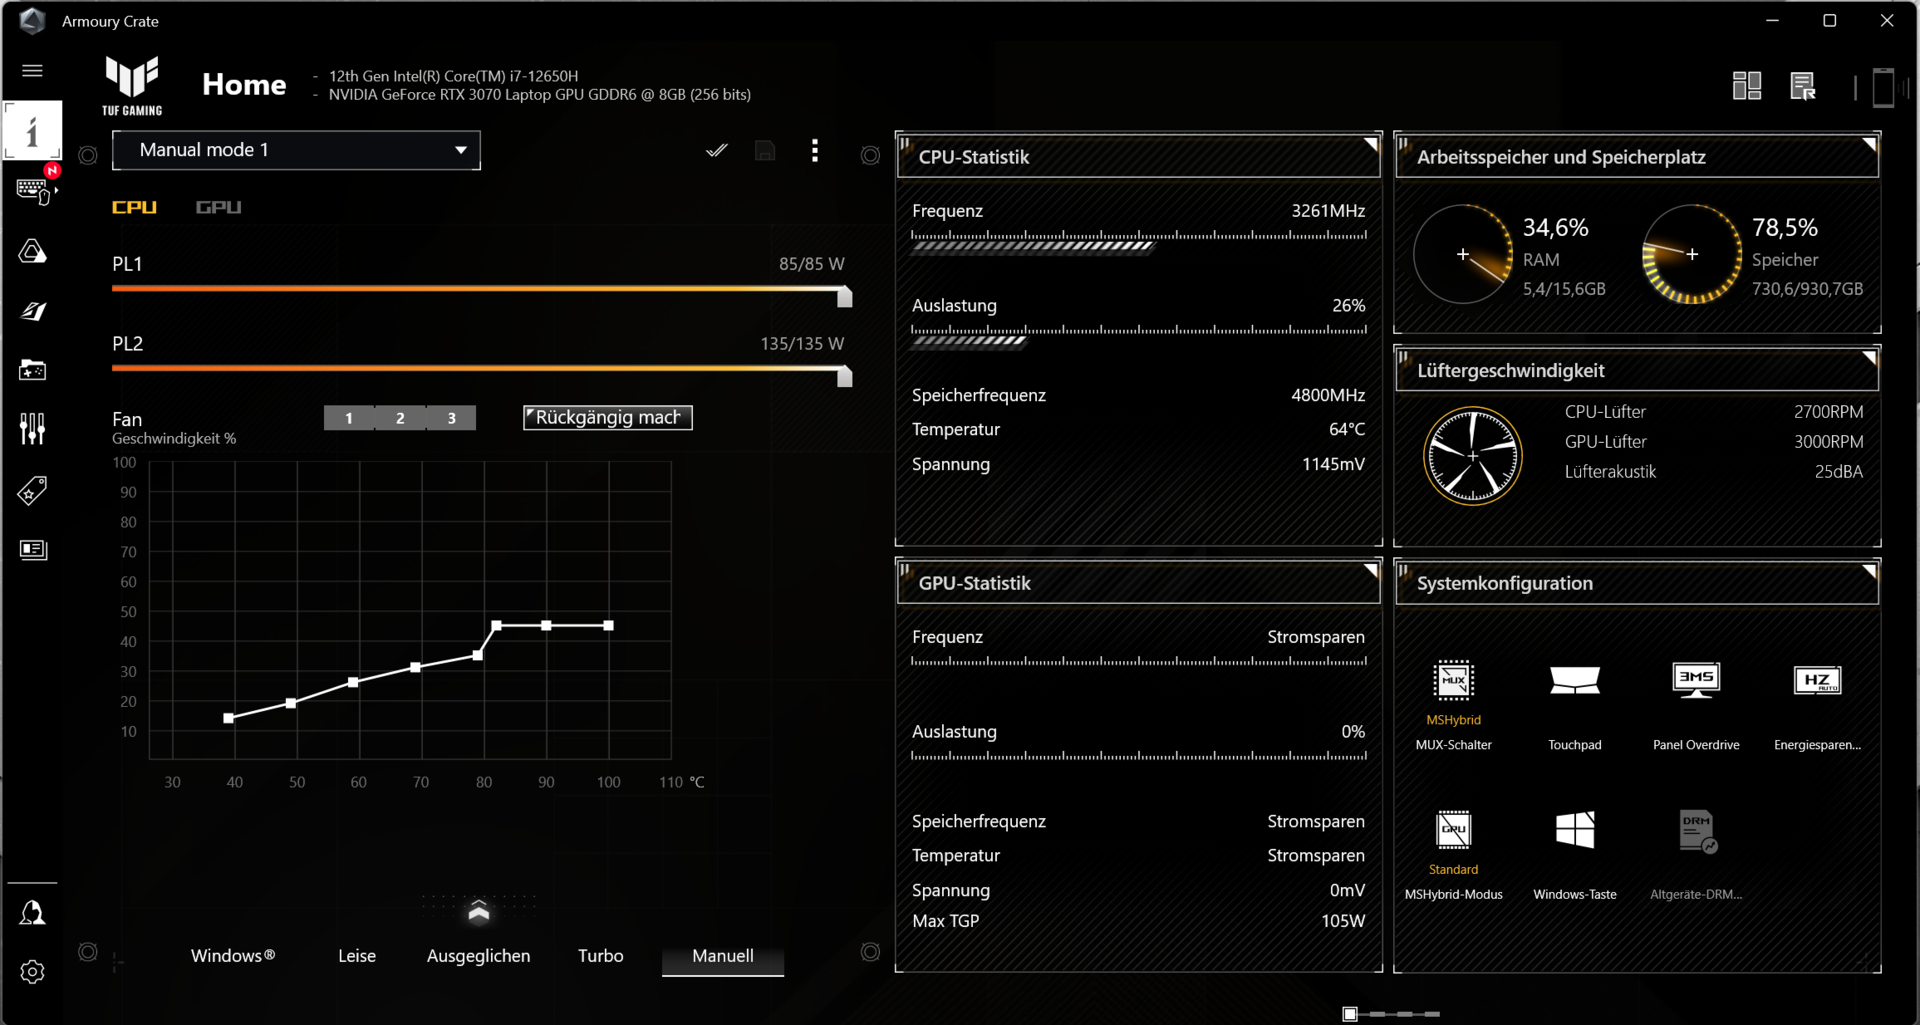
El portátil dispone de tres perfiles de rendimiento específicos del fabricante ("Silencio", "Equilibrado", "Turbo"), entre los que puedes alternar mediante la combinación de teclas "Fn" + "F5". El perfil "Turbo" sólo puede utilizarse cuando el dispositivo está enchufado. Las pruebas de batería se realizaron con el perfil "Silencioso", y los benchmarks se ejecutaron con el perfil "Equilibrado" (a menudo también llamado "Rendimiento", según la versión o el estado de actualización)
| Turbo | Equilibrado | Silencioso | |
|---|---|---|---|
| Límite de potencia 1 | 90 vatios | 80 vatios | 45 vatios |
| Límite de potencia 2 | 115 vatios | 100 vatios | 60 vatios |
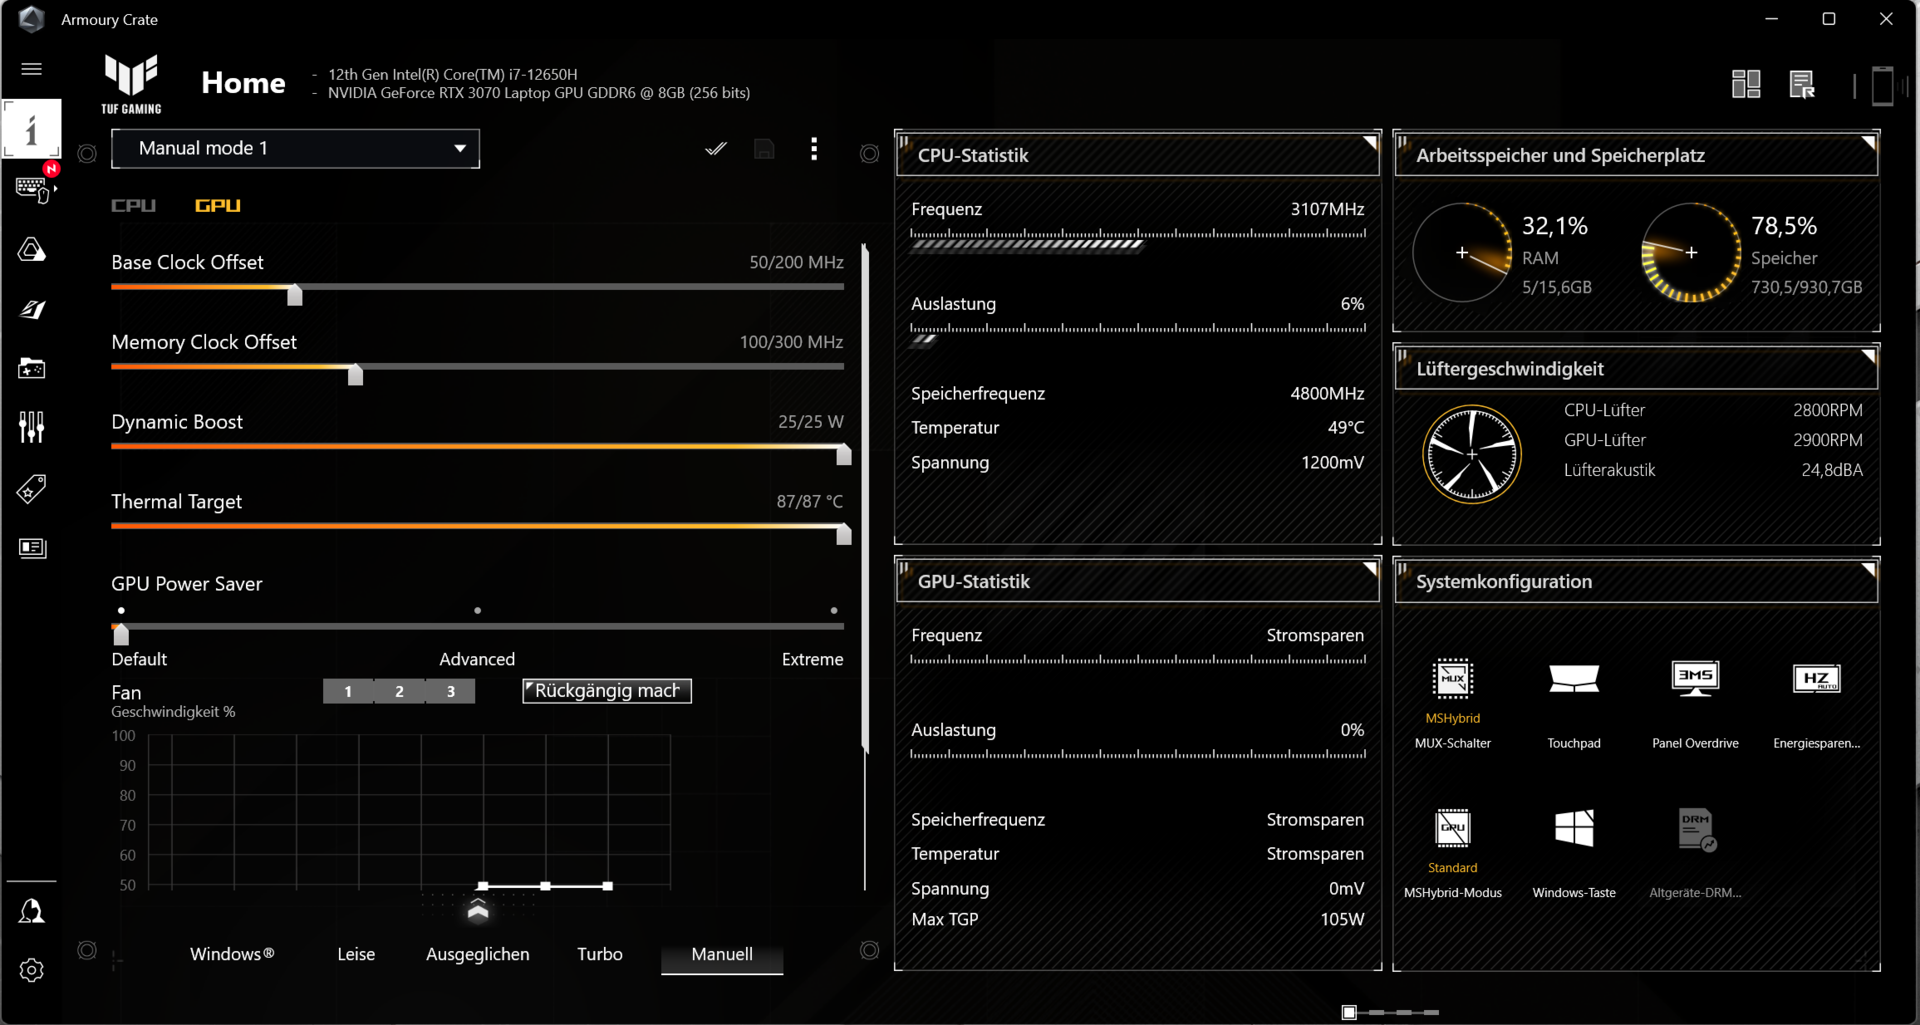
El centro de control principal preinstalado del portátil ("Armoury Crate") permite a los usuarios crear sus propios perfiles ("Manual"). Esto permitiría configurar individualmente los límites de potencia de la CPU y el Dynamic Boost de la GPU. También sería posible el overclocking de la GPU y de la memoria gráfica.


Procesador
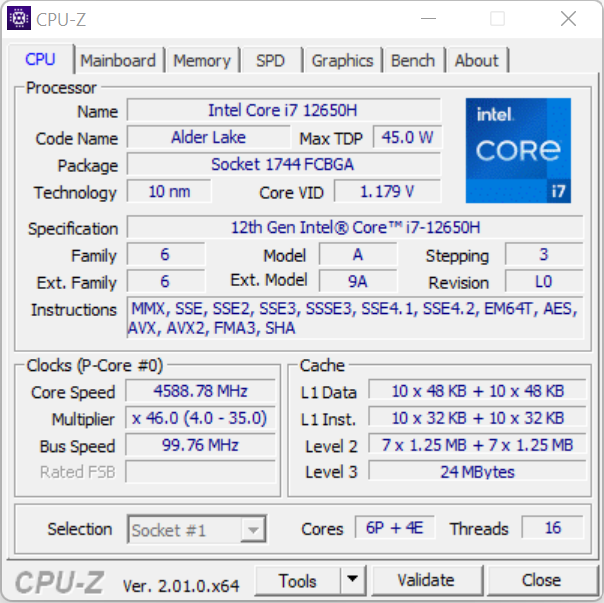
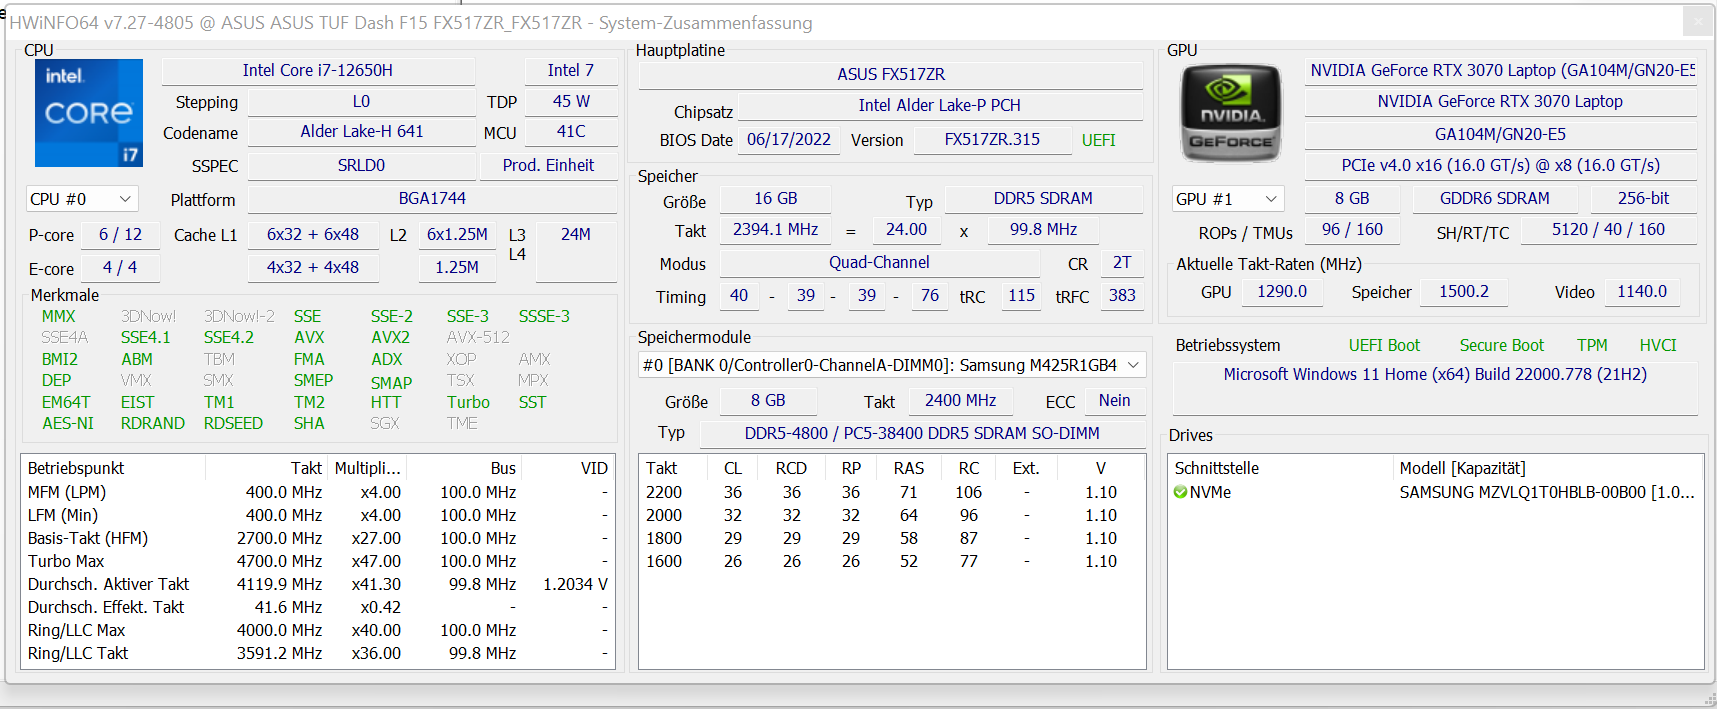
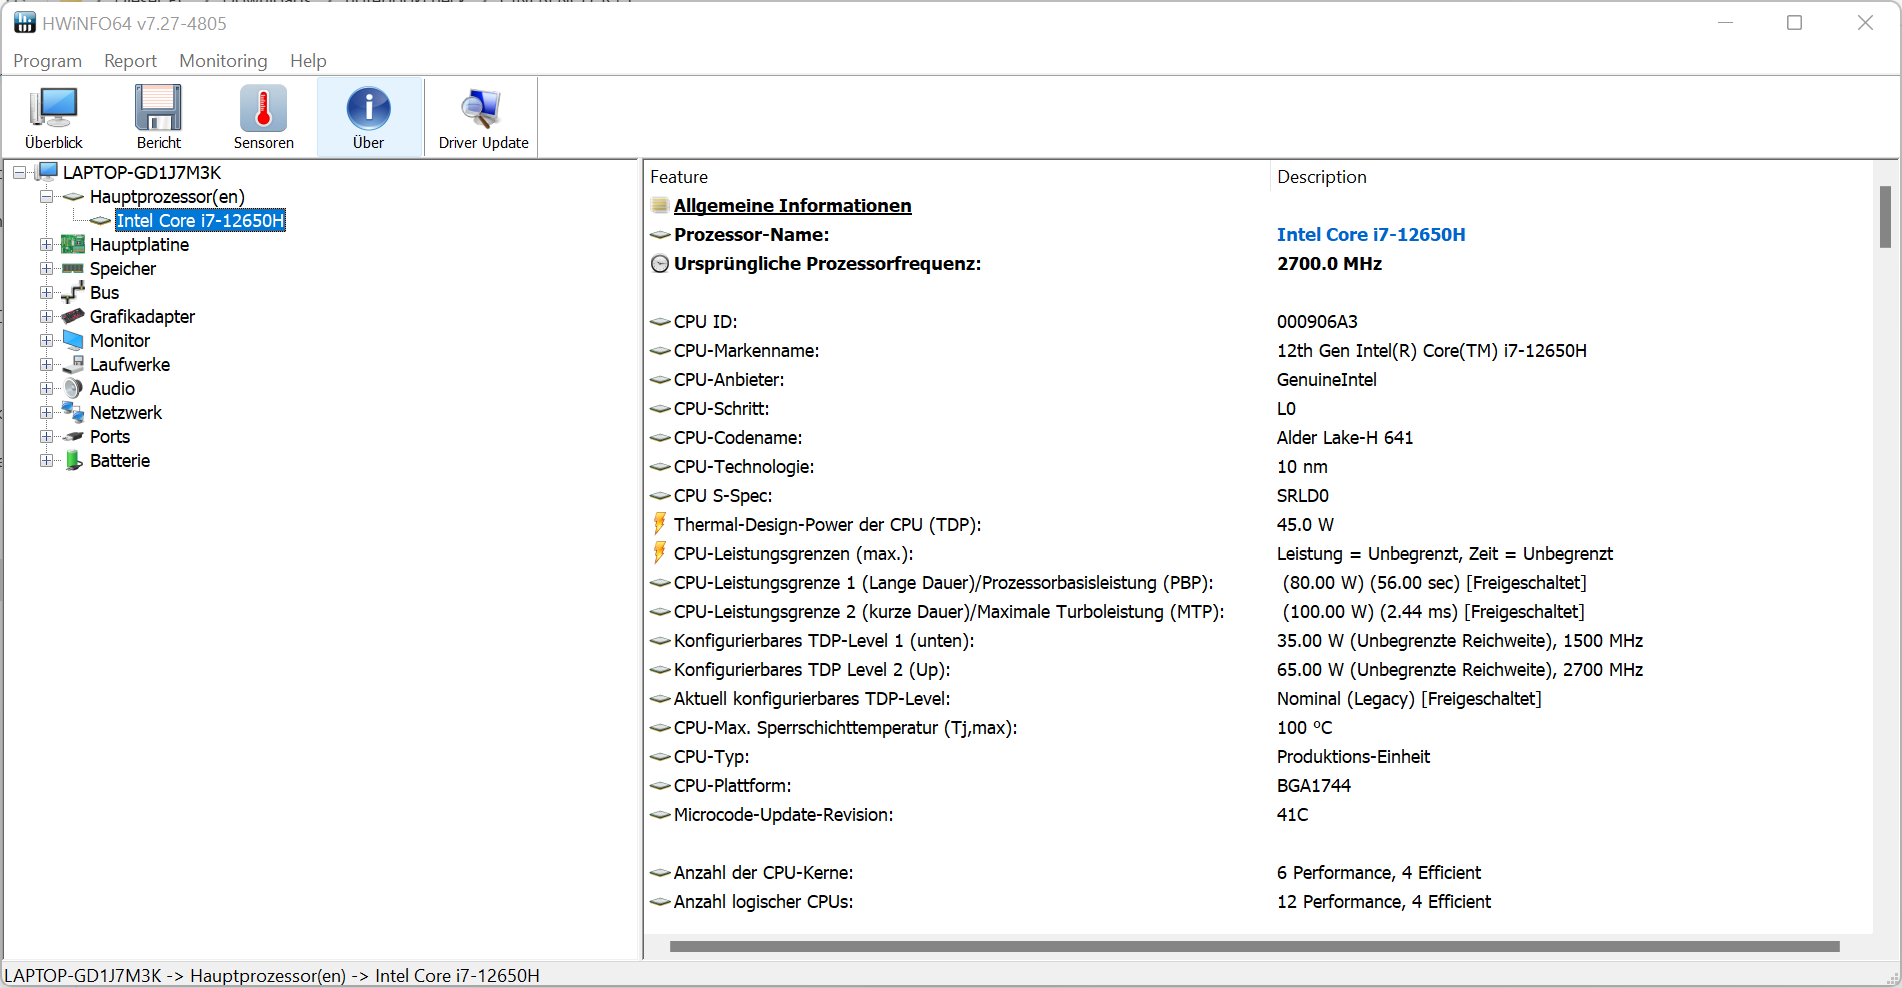
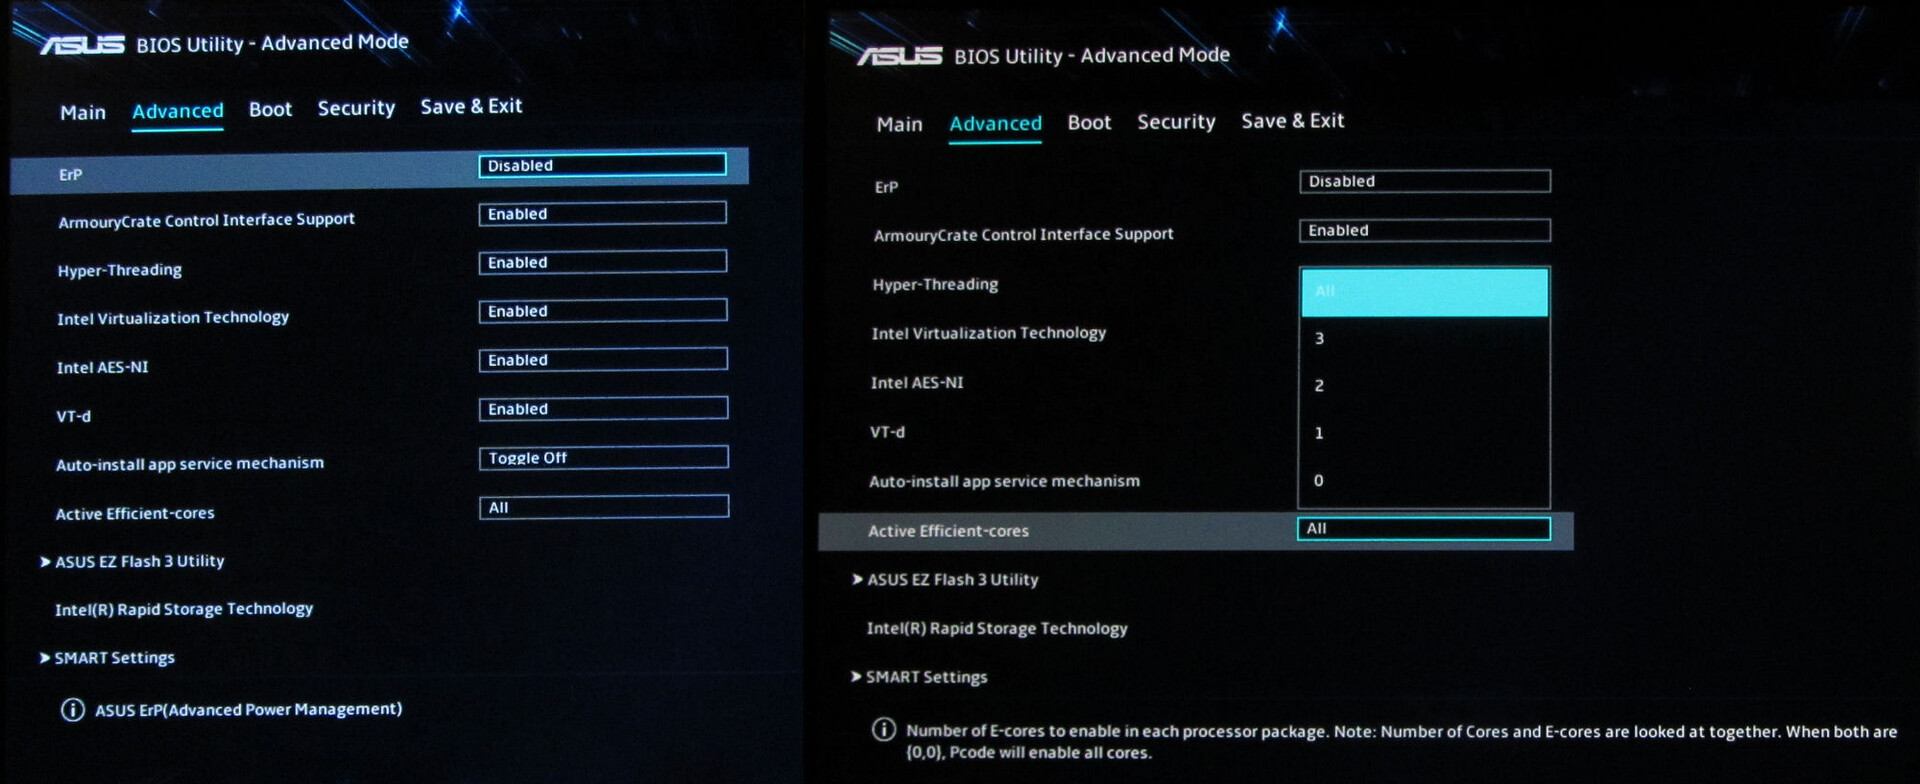
ElCore-i7-12650H (Alder Lake) está compuesto por seis núcleos de rendimiento (Hyper-Treading, de 2,3 a 4,7 GHz) y cuatro núcleos de eficiencia (sin Hyper-Threading, de 1,7 a 3,5 GHz). El resultado es un total de 16 núcleos lógicos de CPU
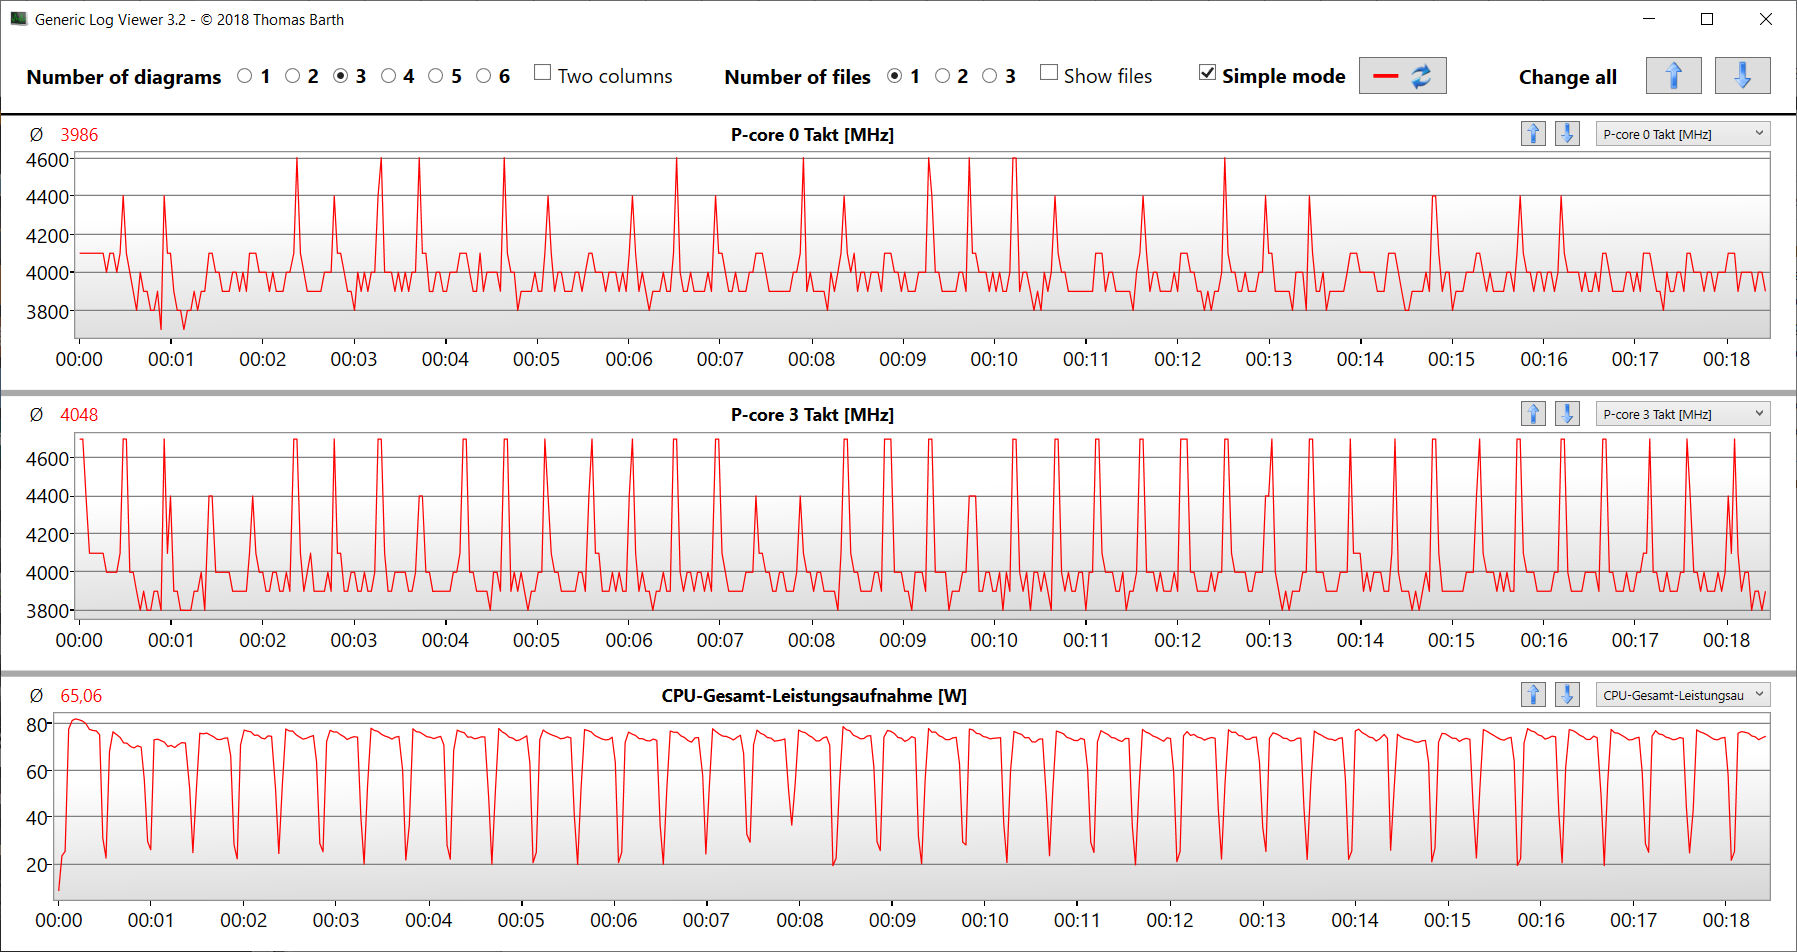
El perfil de rendimiento "equilibrado" proporciona velocidades que están en la parte delantera de la gama Turbo durante la prueba multihilo CB15 (núcleos P: 3,6 a 3,7 GHz, núcleos E: 3 a 3,1 GHz). La prueba monohilo se procesa a altas velocidades de reloj (núcleos P: 4,1 a 4,6 GHz, núcleos E: 3,5 GHz). En batería, las velocidades de reloj de un solo hilo (P-cores: 3,2 a 4,5 GHz, E-cores: 3 a 3,5 GHz) están a un nivel similar, mientras que las velocidades de reloj de varios hilos (P-cores: 2,7 GHz, E-cores: 2,4) son inferiores.
El portátil permite la desactivación completa de los núcleos E (más adelante). Por esta razón, también ejecutamos algunos benchmarks en este estado. Los resultados se pueden encontrar en las tablas de comparación.
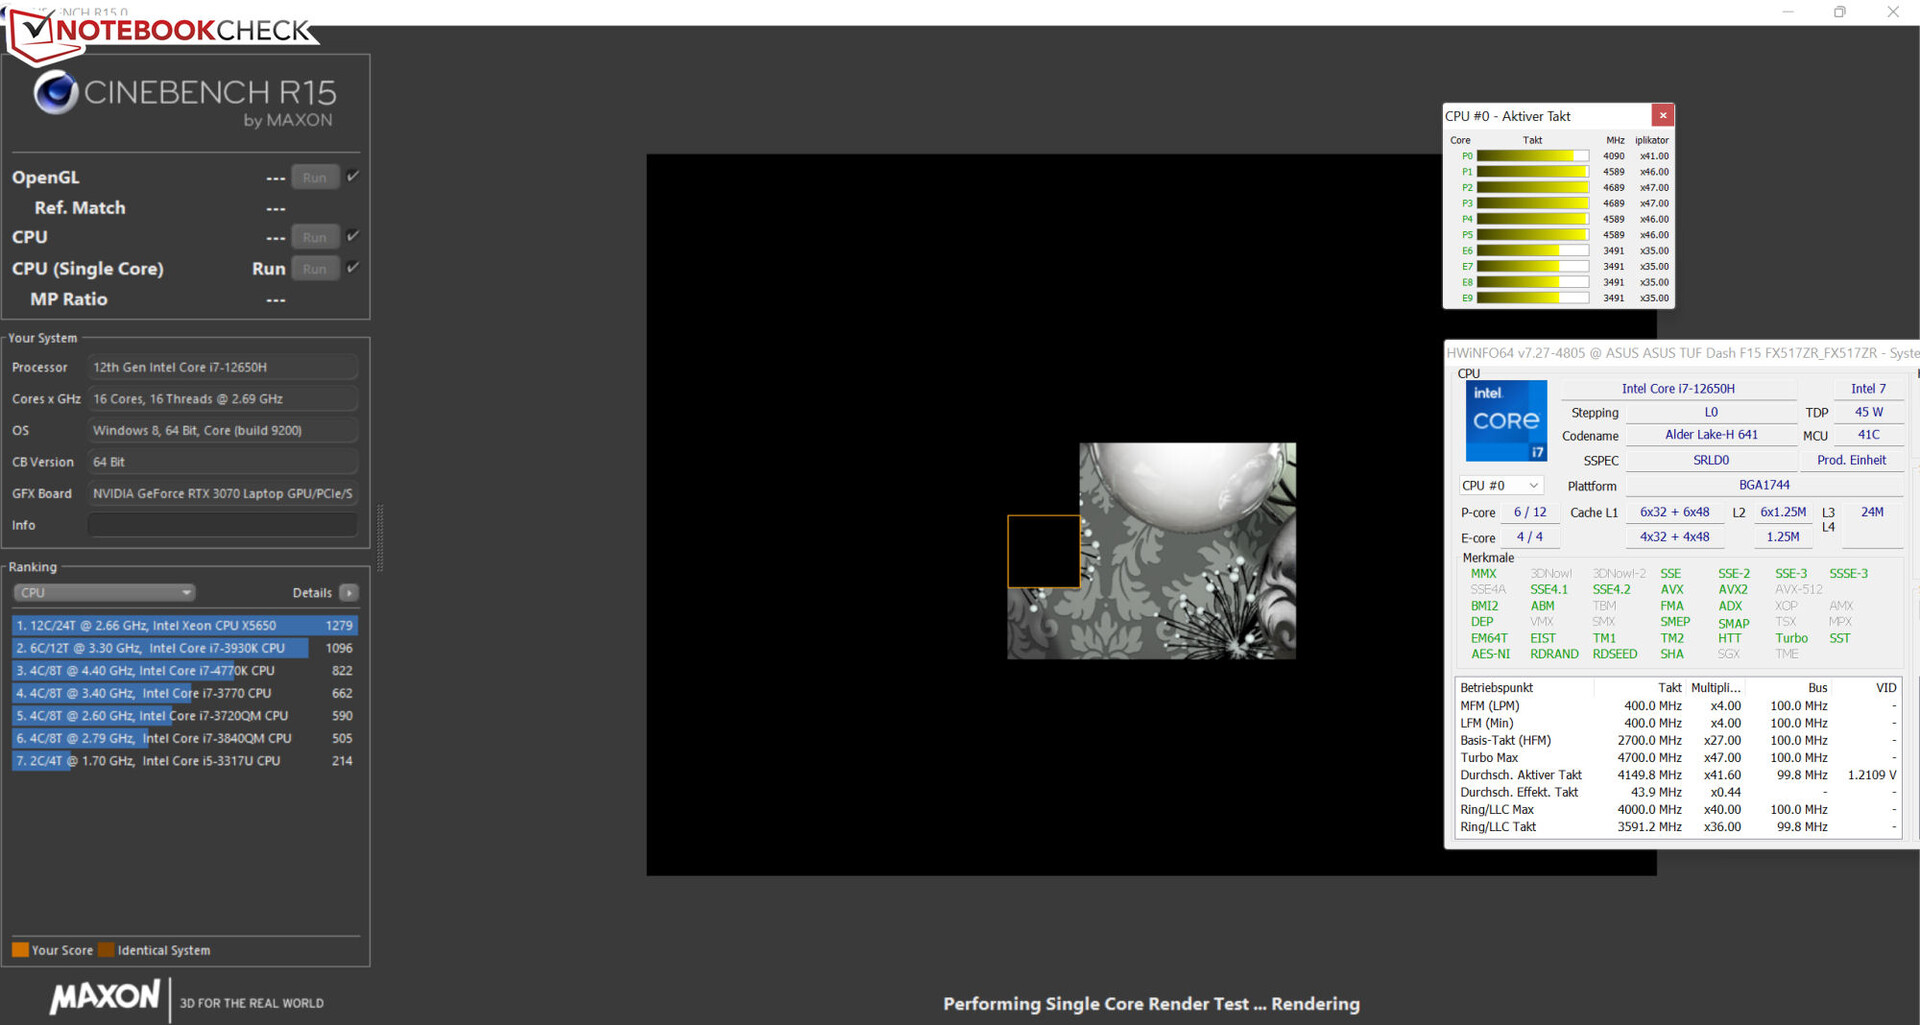
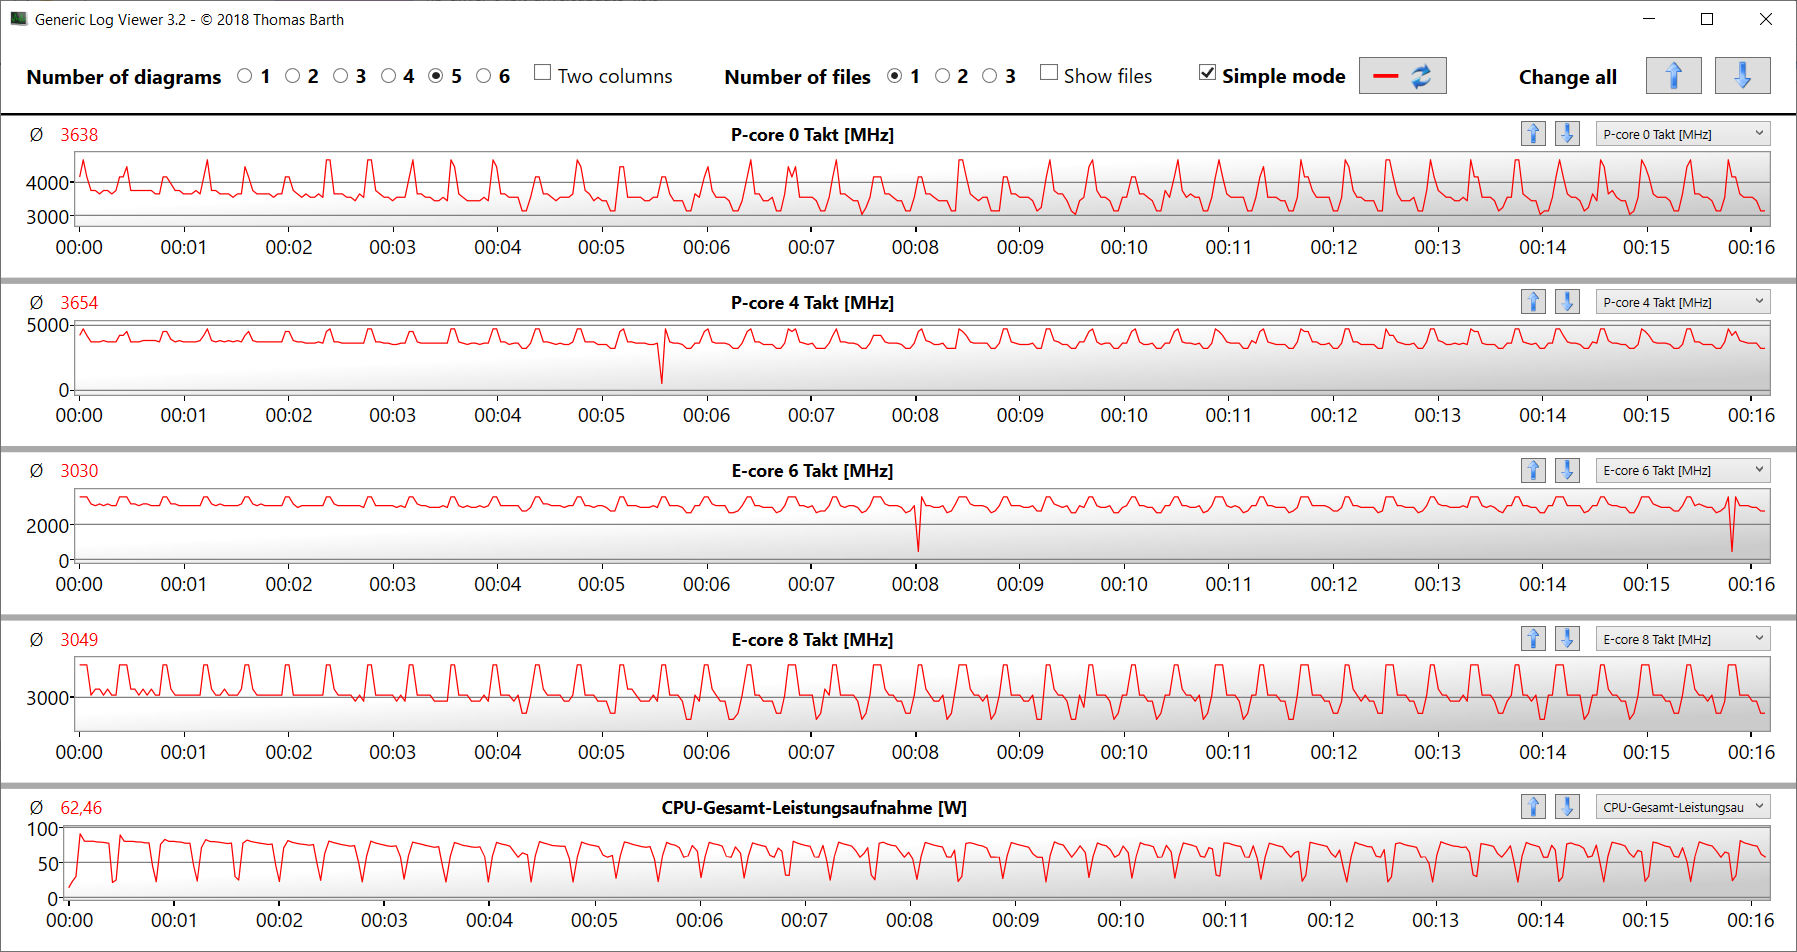
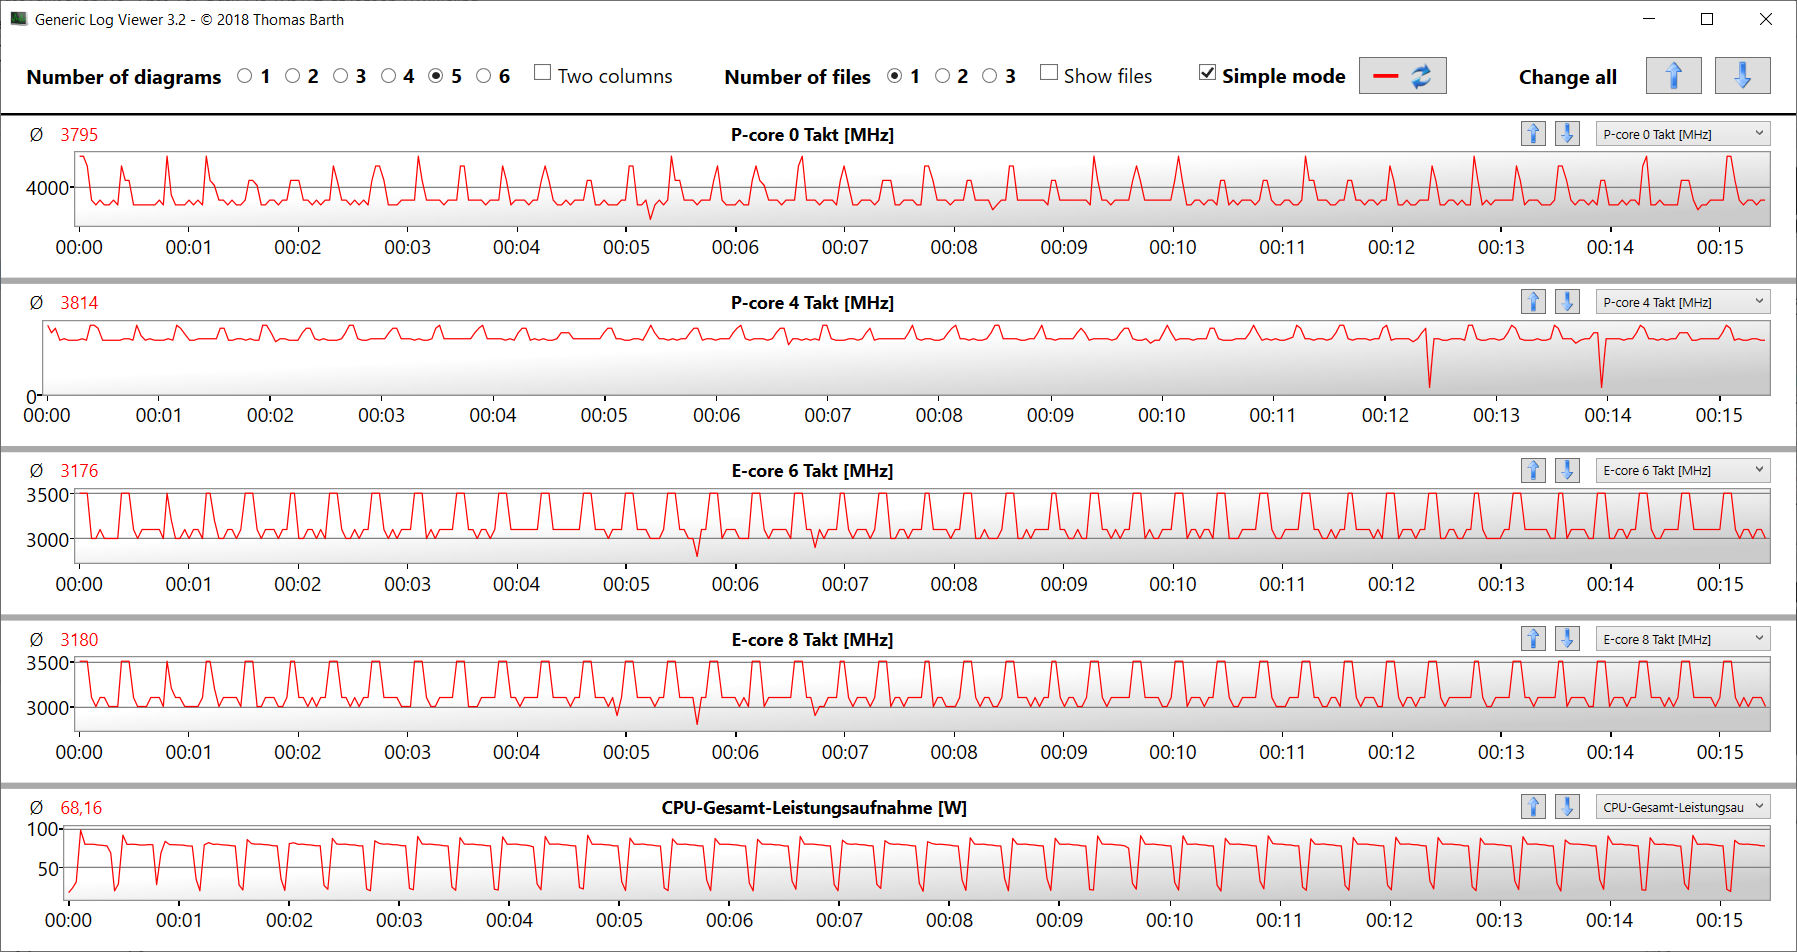
Verificamos si el Turbo de la CPU se utiliza de forma consistente cuando se conecta ejecutando la prueba multihilo del benchmark Cinebench R15 en un bucle. Las altas velocidades de reloj se pueden mantener durante periodos de tiempo más largos. El perfil "Turbo" asegura un desarrollo de rendimiento más suave a un nivel ligeramente superior.
Cinebench R15 Multi endurance test
| CPU Performance rating - Percent | |
| Media de la clase Gaming | |
| HP Omen 16-b1090ng | |
| Acer Nitro 5 AN515-58-72QR | |
| Asus TUF Dash F15 FX517ZR | |
| Asus TUF Dash F15 FX517ZR | |
| Asus TUF Dash F15 FX517ZR | |
| Asus TUF Dash F15 FX517ZR | |
| Medio Intel Core i7-12650H | |
| MSI Delta 15 A5EFK | |
| Razer Blade 15 Base Edition 2021, i7-10750H RTX 3060 | |
| Cinebench R23 | |
| Multi Core | |
| Media de la clase Gaming (10488 - 40970, n=113, últimos 2 años) | |
| Acer Nitro 5 AN515-58-72QR | |
| HP Omen 16-b1090ng | |
| Asus TUF Dash F15 FX517ZR (Turbo) | |
| Asus TUF Dash F15 FX517ZR | |
| Asus TUF Dash F15 FX517ZR (Leise) | |
| MSI Delta 15 A5EFK | |
| Asus TUF Dash F15 FX517ZR (P-Cores only, Turbo) | |
| Medio Intel Core i7-12650H (5362 - 15537, n=14) | |
| Razer Blade 15 Base Edition 2021, i7-10750H RTX 3060 | |
| Single Core | |
| Media de la clase Gaming (1166 - 2356, n=113, últimos 2 años) | |
| Acer Nitro 5 AN515-58-72QR | |
| Asus TUF Dash F15 FX517ZR | |
| HP Omen 16-b1090ng | |
| Asus TUF Dash F15 FX517ZR (Turbo) | |
| Asus TUF Dash F15 FX517ZR (Leise) | |
| Asus TUF Dash F15 FX517ZR (P-Cores only, Turbo) | |
| Medio Intel Core i7-12650H (1428 - 1808, n=14) | |
| MSI Delta 15 A5EFK | |
| Razer Blade 15 Base Edition 2021, i7-10750H RTX 3060 | |
| Cinebench R20 | |
| CPU (Multi Core) | |
| Media de la clase Gaming (4029 - 16108, n=112, últimos 2 años) | |
| Acer Nitro 5 AN515-58-72QR | |
| HP Omen 16-b1090ng | |
| Asus TUF Dash F15 FX517ZR (Turbo) | |
| Asus TUF Dash F15 FX517ZR | |
| Asus TUF Dash F15 FX517ZR (Leise) | |
| MSI Delta 15 A5EFK | |
| Asus TUF Dash F15 FX517ZR (P-Cores only, Turbo) | |
| Medio Intel Core i7-12650H (2106 - 6009, n=14) | |
| Razer Blade 15 Base Edition 2021, i7-10750H RTX 3060 | |
| CPU (Single Core) | |
| Media de la clase Gaming (442 - 895, n=112, últimos 2 años) | |
| Asus TUF Dash F15 FX517ZR | |
| HP Omen 16-b1090ng | |
| Acer Nitro 5 AN515-58-72QR | |
| Asus TUF Dash F15 FX517ZR (Turbo) | |
| Asus TUF Dash F15 FX517ZR (Leise) | |
| Asus TUF Dash F15 FX517ZR (P-Cores only, Turbo) | |
| Medio Intel Core i7-12650H (552 - 696, n=14) | |
| MSI Delta 15 A5EFK | |
| Razer Blade 15 Base Edition 2021, i7-10750H RTX 3060 | |
| Cinebench R15 | |
| CPU Multi 64Bit | |
| Media de la clase Gaming (1578 - 6271, n=113, últimos 2 años) | |
| HP Omen 16-b1090ng | |
| Acer Nitro 5 AN515-58-72QR | |
| Asus TUF Dash F15 FX517ZR (Turbo) | |
| Asus TUF Dash F15 FX517ZR | |
| MSI Delta 15 A5EFK | |
| Asus TUF Dash F15 FX517ZR (Leise) | |
| Asus TUF Dash F15 FX517ZR (P-Cores only, Turbo) | |
| Medio Intel Core i7-12650H (753 - 2253, n=14) | |
| Razer Blade 15 Base Edition 2021, i7-10750H RTX 3060 | |
| CPU Single 64Bit | |
| Media de la clase Gaming (188.8 - 343, n=112, últimos 2 años) | |
| Acer Nitro 5 AN515-58-72QR | |
| HP Omen 16-b1090ng | |
| Asus TUF Dash F15 FX517ZR | |
| Asus TUF Dash F15 FX517ZR (Turbo) | |
| Asus TUF Dash F15 FX517ZR (Leise) | |
| Asus TUF Dash F15 FX517ZR (P-Cores only, Turbo) | |
| Medio Intel Core i7-12650H (206 - 261, n=14) | |
| MSI Delta 15 A5EFK | |
| Razer Blade 15 Base Edition 2021, i7-10750H RTX 3060 | |
| Blender - v2.79 BMW27 CPU | |
| Razer Blade 15 Base Edition 2021, i7-10750H RTX 3060 | |
| Medio Intel Core i7-12650H (222 - 553, n=15) | |
| Asus TUF Dash F15 FX517ZR (P-Cores only, Turbo) | |
| Asus TUF Dash F15 FX517ZR (Leise) | |
| MSI Delta 15 A5EFK | |
| Asus TUF Dash F15 FX517ZR | |
| Asus TUF Dash F15 FX517ZR (Turbo) | |
| Acer Nitro 5 AN515-58-72QR | |
| HP Omen 16-b1090ng | |
| Media de la clase Gaming (80 - 330, n=110, últimos 2 años) | |
| 7-Zip 18.03 | |
| 7z b 4 | |
| Media de la clase Gaming (33491 - 148086, n=111, últimos 2 años) | |
| HP Omen 16-b1090ng | |
| Asus TUF Dash F15 FX517ZR (Turbo) | |
| MSI Delta 15 A5EFK | |
| Asus TUF Dash F15 FX517ZR | |
| Acer Nitro 5 AN515-58-72QR | |
| Asus TUF Dash F15 FX517ZR (Leise) | |
| Medio Intel Core i7-12650H (27053 - 59034, n=14) | |
| Asus TUF Dash F15 FX517ZR (P-Cores only, Turbo) | |
| Razer Blade 15 Base Edition 2021, i7-10750H RTX 3060 | |
| 7z b 4 -mmt1 | |
| Media de la clase Gaming (4199 - 7436, n=111, últimos 2 años) | |
| HP Omen 16-b1090ng | |
| Acer Nitro 5 AN515-58-72QR | |
| Asus TUF Dash F15 FX517ZR | |
| Asus TUF Dash F15 FX517ZR (Turbo) | |
| MSI Delta 15 A5EFK | |
| Medio Intel Core i7-12650H (5265 - 6116, n=14) | |
| Asus TUF Dash F15 FX517ZR (Leise) | |
| Asus TUF Dash F15 FX517ZR (P-Cores only, Turbo) | |
| Razer Blade 15 Base Edition 2021, i7-10750H RTX 3060 | |
| Geekbench 5.5 | |
| Multi-Core | |
| Media de la clase Gaming (6460 - 27010, n=111, últimos 2 años) | |
| HP Omen 16-b1090ng | |
| Asus TUF Dash F15 FX517ZR (Turbo) | |
| Asus TUF Dash F15 FX517ZR | |
| Acer Nitro 5 AN515-58-72QR | |
| Medio Intel Core i7-12650H (6478 - 11284, n=16) | |
| Asus TUF Dash F15 FX517ZR (Leise) | |
| Asus TUF Dash F15 FX517ZR (P-Cores only, Turbo) | |
| MSI Delta 15 A5EFK | |
| Razer Blade 15 Base Edition 2021, i7-10750H RTX 3060 | |
| Single-Core | |
| Media de la clase Gaming (986 - 2474, n=111, últimos 2 años) | |
| HP Omen 16-b1090ng | |
| Asus TUF Dash F15 FX517ZR (Turbo) | |
| Asus TUF Dash F15 FX517ZR (Leise) | |
| Asus TUF Dash F15 FX517ZR | |
| Acer Nitro 5 AN515-58-72QR | |
| Medio Intel Core i7-12650H (1590 - 1797, n=16) | |
| Asus TUF Dash F15 FX517ZR (P-Cores only, Turbo) | |
| MSI Delta 15 A5EFK | |
| Razer Blade 15 Base Edition 2021, i7-10750H RTX 3060 | |
| HWBOT x265 Benchmark v2.2 - 4k Preset | |
| Media de la clase Gaming (11.5 - 44.3, n=111, últimos 2 años) | |
| HP Omen 16-b1090ng | |
| Acer Nitro 5 AN515-58-72QR | |
| Asus TUF Dash F15 FX517ZR (Turbo) | |
| Asus TUF Dash F15 FX517ZR | |
| MSI Delta 15 A5EFK | |
| Asus TUF Dash F15 FX517ZR (Leise) | |
| Asus TUF Dash F15 FX517ZR (P-Cores only, Turbo) | |
| Medio Intel Core i7-12650H (6.62 - 17.4, n=16) | |
| Razer Blade 15 Base Edition 2021, i7-10750H RTX 3060 | |
| LibreOffice - 20 Documents To PDF | |
| MSI Delta 15 A5EFK | |
| Media de la clase Gaming (19 - 88.8, n=111, últimos 2 años) | |
| Razer Blade 15 Base Edition 2021, i7-10750H RTX 3060 | |
| Medio Intel Core i7-12650H (35.1 - 58.5, n=14) | |
| Asus TUF Dash F15 FX517ZR (P-Cores only, Turbo) | |
| Asus TUF Dash F15 FX517ZR (Leise) | |
| Acer Nitro 5 AN515-58-72QR | |
| HP Omen 16-b1090ng | |
| Asus TUF Dash F15 FX517ZR (Turbo) | |
| Asus TUF Dash F15 FX517ZR | |
| R Benchmark 2.5 - Overall mean | |
| Razer Blade 15 Base Edition 2021, i7-10750H RTX 3060 | |
| MSI Delta 15 A5EFK | |
| Asus TUF Dash F15 FX517ZR (P-Cores only, Turbo) | |
| Medio Intel Core i7-12650H (0.4584 - 0.515, n=14) | |
| Asus TUF Dash F15 FX517ZR (Leise) | |
| Asus TUF Dash F15 FX517ZR | |
| Asus TUF Dash F15 FX517ZR (Turbo) | |
| Acer Nitro 5 AN515-58-72QR | |
| HP Omen 16-b1090ng | |
| Media de la clase Gaming (0.3439 - 0.759, n=112, últimos 2 años) | |
* ... más pequeño es mejor
AIDA64: FP32 Ray-Trace | FPU Julia | CPU SHA3 | CPU Queen | FPU SinJulia | FPU Mandel | CPU AES | CPU ZLib | FP64 Ray-Trace | CPU PhotoWorxx
| Performance rating | |
| Media de la clase Gaming | |
| MSI Delta 15 A5EFK | |
| Asus TUF Dash F15 FX517ZR | |
| Asus TUF Dash F15 FX517ZR | |
| HP Omen 16-b1090ng | |
| Asus TUF Dash F15 FX517ZR | |
| Acer Nitro 5 AN515-58-72QR | |
| Asus TUF Dash F15 FX517ZR | |
| Medio Intel Core i7-12650H | |
| AIDA64 / FP32 Ray-Trace | |
| Media de la clase Gaming (10227 - 85542, n=110, últimos 2 años) | |
| MSI Delta 15 A5EFK (v6.33.5700) | |
| Asus TUF Dash F15 FX517ZR (v6.70.6000) | |
| Asus TUF Dash F15 FX517ZR (v6.70.6000, Turbo) | |
| Asus TUF Dash F15 FX517ZR (v6.70.6000, P-Cores only, Turbo) | |
| Asus TUF Dash F15 FX517ZR (v6.70.6000, Leise) | |
| Medio Intel Core i7-12650H (5422 - 15620, n=14) | |
| Acer Nitro 5 AN515-58-72QR (v6.50.5800) | |
| HP Omen 16-b1090ng (v6.50.5800) | |
| AIDA64 / FPU Julia | |
| Media de la clase Gaming (51376 - 238426, n=110, últimos 2 años) | |
| MSI Delta 15 A5EFK (v6.33.5700) | |
| Asus TUF Dash F15 FX517ZR (v6.70.6000, Turbo) | |
| Asus TUF Dash F15 FX517ZR (v6.70.6000) | |
| Asus TUF Dash F15 FX517ZR (v6.70.6000, Leise) | |
| Asus TUF Dash F15 FX517ZR (v6.70.6000, P-Cores only, Turbo) | |
| Medio Intel Core i7-12650H (26386 - 76434, n=14) | |
| Acer Nitro 5 AN515-58-72QR (v6.50.5800) | |
| HP Omen 16-b1090ng (v6.50.5800) | |
| AIDA64 / CPU SHA3 | |
| Media de la clase Gaming (2180 - 9817, n=110, últimos 2 años) | |
| MSI Delta 15 A5EFK (v6.33.5700) | |
| Acer Nitro 5 AN515-58-72QR (v6.50.5800) | |
| Asus TUF Dash F15 FX517ZR (v6.70.6000) | |
| Asus TUF Dash F15 FX517ZR (v6.70.6000, Turbo) | |
| HP Omen 16-b1090ng (v6.50.5800) | |
| Asus TUF Dash F15 FX517ZR (v6.70.6000, Leise) | |
| Medio Intel Core i7-12650H (1479 - 3244, n=14) | |
| Asus TUF Dash F15 FX517ZR (v6.70.6000, P-Cores only, Turbo) | |
| AIDA64 / CPU Queen | |
| Media de la clase Gaming (49785 - 173351, n=101, últimos 2 años) | |
| MSI Delta 15 A5EFK (v6.33.5700) | |
| HP Omen 16-b1090ng (v6.50.5800) | |
| Acer Nitro 5 AN515-58-72QR (v6.50.5800) | |
| Asus TUF Dash F15 FX517ZR (v6.70.6000) | |
| Asus TUF Dash F15 FX517ZR (v6.70.6000, Turbo) | |
| Asus TUF Dash F15 FX517ZR (v6.70.6000, Leise) | |
| Medio Intel Core i7-12650H (59278 - 89537, n=14) | |
| Asus TUF Dash F15 FX517ZR (v6.70.6000, P-Cores only, Turbo) | |
| AIDA64 / FPU SinJulia | |
| Media de la clase Gaming (4424 - 33636, n=110, últimos 2 años) | |
| MSI Delta 15 A5EFK (v6.33.5700) | |
| Acer Nitro 5 AN515-58-72QR (v6.50.5800) | |
| HP Omen 16-b1090ng (v6.50.5800) | |
| Asus TUF Dash F15 FX517ZR (v6.70.6000) | |
| Asus TUF Dash F15 FX517ZR (v6.70.6000, Turbo) | |
| Asus TUF Dash F15 FX517ZR (v6.70.6000, Leise) | |
| Asus TUF Dash F15 FX517ZR (v6.70.6000, P-Cores only, Turbo) | |
| Medio Intel Core i7-12650H (4690 - 8726, n=14) | |
| AIDA64 / FPU Mandel | |
| Media de la clase Gaming (25115 - 128721, n=110, últimos 2 años) | |
| MSI Delta 15 A5EFK (v6.33.5700) | |
| Asus TUF Dash F15 FX517ZR (v6.70.6000, Turbo) | |
| Asus TUF Dash F15 FX517ZR (v6.70.6000) | |
| Asus TUF Dash F15 FX517ZR (v6.70.6000, Leise) | |
| Asus TUF Dash F15 FX517ZR (v6.70.6000, P-Cores only, Turbo) | |
| Medio Intel Core i7-12650H (15001 - 37738, n=14) | |
| Acer Nitro 5 AN515-58-72QR | |
| HP Omen 16-b1090ng (v6.50.5800) | |
| AIDA64 / CPU AES | |
| MSI Delta 15 A5EFK (v6.33.5700) | |
| Media de la clase Gaming (39258 - 247074, n=110, últimos 2 años) | |
| HP Omen 16-b1090ng (v6.50.5800) | |
| Asus TUF Dash F15 FX517ZR (v6.70.6000, Turbo) | |
| Asus TUF Dash F15 FX517ZR (v6.70.6000) | |
| Acer Nitro 5 AN515-58-72QR (v6.50.5800) | |
| Medio Intel Core i7-12650H (32702 - 92530, n=14) | |
| Asus TUF Dash F15 FX517ZR (v6.70.6000, Leise) | |
| Asus TUF Dash F15 FX517ZR (v6.70.6000, P-Cores only, Turbo) | |
| AIDA64 / CPU ZLib | |
| Media de la clase Gaming (574 - 2531, n=110, últimos 2 años) | |
| Acer Nitro 5 AN515-58-72QR (v6.50.5800) | |
| HP Omen 16-b1090ng (v6.50.5800) | |
| Asus TUF Dash F15 FX517ZR (v6.70.6000) | |
| Asus TUF Dash F15 FX517ZR (v6.70.6000, Turbo) | |
| MSI Delta 15 A5EFK (v6.33.5700) | |
| Asus TUF Dash F15 FX517ZR (v6.70.6000, Leise) | |
| Medio Intel Core i7-12650H (443 - 891, n=14) | |
| Asus TUF Dash F15 FX517ZR (v6.70.6000, P-Cores only, Turbo) | |
| AIDA64 / FP64 Ray-Trace | |
| Media de la clase Gaming (5509 - 45446, n=110, últimos 2 años) | |
| MSI Delta 15 A5EFK (v6.33.5700) | |
| Asus TUF Dash F15 FX517ZR (v6.70.6000, Turbo) | |
| Asus TUF Dash F15 FX517ZR (v6.70.6000) | |
| Asus TUF Dash F15 FX517ZR (v6.70.6000, P-Cores only, Turbo) | |
| Asus TUF Dash F15 FX517ZR (v6.70.6000, Leise) | |
| Medio Intel Core i7-12650H (3096 - 8448, n=14) | |
| Acer Nitro 5 AN515-58-72QR (v6.50.5800) | |
| HP Omen 16-b1090ng (v6.50.5800) | |
| AIDA64 / CPU PhotoWorxx | |
| Media de la clase Gaming (12271 - 89891, n=110, últimos 2 años) | |
| HP Omen 16-b1090ng (v6.50.5800) | |
| Asus TUF Dash F15 FX517ZR (v6.70.6000) | |
| Asus TUF Dash F15 FX517ZR (v6.70.6000, Turbo) | |
| Asus TUF Dash F15 FX517ZR (v6.70.6000, Leise) | |
| Asus TUF Dash F15 FX517ZR (v6.70.6000, P-Cores only, Turbo) | |
| Medio Intel Core i7-12650H (22046 - 44164, n=14) | |
| Acer Nitro 5 AN515-58-72QR (v6.50.5800) | |
| MSI Delta 15 A5EFK (v6.33.5700) | |
Rendimiento del sistema
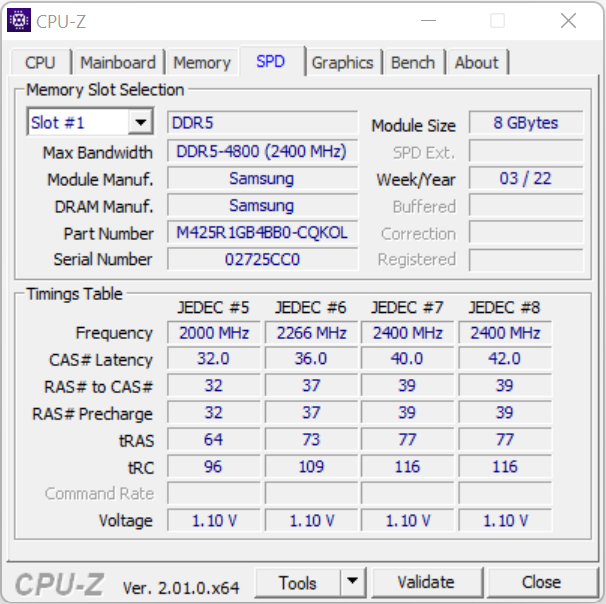
El sistema funciona bien y sin problemas. El hardware integrado ofrece suficiente potencia de cálculo para aplicaciones exigentes como el renderizado, la edición de vídeo y los juegos. Esto va acompañado de buenos resultados en PCMark. Las tasas de transferencia de la RAM son normales para una memoria DDR5-4800
CrossMark: Overall | Productivity | Creativity | Responsiveness
| PCMark 10 / Score | |
| Media de la clase Gaming (5828 - 11574, n=96, últimos 2 años) | |
| Asus TUF Dash F15 FX517ZR (dGPU, Turbo) | |
| HP Omen 16-b1090ng | |
| MSI Delta 15 A5EFK | |
| Medio Intel Core i7-12650H, NVIDIA GeForce RTX 3070 Laptop GPU (6854 - 7772, n=2) | |
| Acer Nitro 5 AN515-58-72QR | |
| Asus TUF Dash F15 FX517ZR | |
| Razer Blade 15 Base Edition 2021, i7-10750H RTX 3060 | |
| PCMark 10 / Essentials | |
| Asus TUF Dash F15 FX517ZR (dGPU, Turbo) | |
| Media de la clase Gaming (8810 - 12600, n=100, últimos 2 años) | |
| MSI Delta 15 A5EFK | |
| Medio Intel Core i7-12650H, NVIDIA GeForce RTX 3070 Laptop GPU (10028 - 10707, n=2) | |
| HP Omen 16-b1090ng | |
| Razer Blade 15 Base Edition 2021, i7-10750H RTX 3060 | |
| Asus TUF Dash F15 FX517ZR | |
| Acer Nitro 5 AN515-58-72QR | |
| PCMark 10 / Productivity | |
| Media de la clase Gaming (6845 - 18766, n=98, últimos 2 años) | |
| Asus TUF Dash F15 FX517ZR (dGPU, Turbo) | |
| Medio Intel Core i7-12650H, NVIDIA GeForce RTX 3070 Laptop GPU (9505 - 10187, n=2) | |
| HP Omen 16-b1090ng | |
| Asus TUF Dash F15 FX517ZR | |
| MSI Delta 15 A5EFK | |
| Acer Nitro 5 AN515-58-72QR | |
| Razer Blade 15 Base Edition 2021, i7-10750H RTX 3060 | |
| PCMark 10 / Digital Content Creation | |
| Media de la clase Gaming (7602 - 19657, n=98, últimos 2 años) | |
| Asus TUF Dash F15 FX517ZR (dGPU, Turbo) | |
| HP Omen 16-b1090ng | |
| MSI Delta 15 A5EFK | |
| Medio Intel Core i7-12650H, NVIDIA GeForce RTX 3070 Laptop GPU (9169 - 11679, n=2) | |
| Acer Nitro 5 AN515-58-72QR | |
| Asus TUF Dash F15 FX517ZR | |
| Razer Blade 15 Base Edition 2021, i7-10750H RTX 3060 | |
| CrossMark / Overall | |
| Media de la clase Gaming (1366 - 2409, n=98, últimos 2 años) | |
| Asus TUF Dash F15 FX517ZR | |
| Acer Nitro 5 AN515-58-72QR | |
| Medio Intel Core i7-12650H, NVIDIA GeForce RTX 3070 Laptop GPU (1715 - 1811, n=2) | |
| CrossMark / Productivity | |
| Media de la clase Gaming (1386 - 2254, n=98, últimos 2 años) | |
| Acer Nitro 5 AN515-58-72QR | |
| Asus TUF Dash F15 FX517ZR | |
| Medio Intel Core i7-12650H, NVIDIA GeForce RTX 3070 Laptop GPU (1645 - 1720, n=2) | |
| CrossMark / Creativity | |
| Media de la clase Gaming (1343 - 2729, n=98, últimos 2 años) | |
| Asus TUF Dash F15 FX517ZR | |
| Medio Intel Core i7-12650H, NVIDIA GeForce RTX 3070 Laptop GPU (1854 - 1987, n=2) | |
| Acer Nitro 5 AN515-58-72QR | |
| CrossMark / Responsiveness | |
| Media de la clase Gaming (1226 - 2334, n=98, últimos 2 años) | |
| Acer Nitro 5 AN515-58-72QR | |
| Asus TUF Dash F15 FX517ZR | |
| Medio Intel Core i7-12650H, NVIDIA GeForce RTX 3070 Laptop GPU (1538 - 1598, n=2) | |
| PCMark 8 Home Score Accelerated v2 | 5109 puntos | |
| PCMark 8 Creative Score Accelerated v2 | 6882 puntos | |
| PCMark 8 Work Score Accelerated v2 | 6110 puntos | |
| PCMark 10 Score | 6854 puntos | |
ayuda | ||
| AIDA64 / Memory Copy | |
| Media de la clase Gaming (21750 - 129946, n=110, últimos 2 años) | |
| HP Omen 16-b1090ng (v6.50.5800) | |
| Asus TUF Dash F15 FX517ZR (v6.70.6000, Turbo) | |
| Asus TUF Dash F15 FX517ZR (v6.70.6000) | |
| Medio Intel Core i7-12650H (43261 - 69735, n=14) | |
| Asus TUF Dash F15 FX517ZR (v6.70.6000, Leise) | |
| Acer Nitro 5 AN515-58-72QR (v6.50.5800) | |
| MSI Delta 15 A5EFK (v6.33.5700) | |
| AIDA64 / Memory Read | |
| Media de la clase Gaming (22956 - 118858, n=110, últimos 2 años) | |
| HP Omen 16-b1090ng (v6.50.5800) | |
| Asus TUF Dash F15 FX517ZR (v6.70.6000) | |
| Asus TUF Dash F15 FX517ZR (v6.70.6000, Turbo) | |
| Asus TUF Dash F15 FX517ZR (v6.70.6000, Leise) | |
| Medio Intel Core i7-12650H (47313 - 67412, n=14) | |
| MSI Delta 15 A5EFK (v6.33.5700) | |
| Acer Nitro 5 AN515-58-72QR (v6.50.5800) | |
| AIDA64 / Memory Write | |
| Media de la clase Gaming (22297 - 135096, n=110, últimos 2 años) | |
| HP Omen 16-b1090ng (v6.50.5800) | |
| Asus TUF Dash F15 FX517ZR (v6.70.6000, Turbo) | |
| Asus TUF Dash F15 FX517ZR (v6.70.6000, Leise) | |
| Asus TUF Dash F15 FX517ZR (v6.70.6000) | |
| Medio Intel Core i7-12650H (45617 - 59361, n=14) | |
| Acer Nitro 5 AN515-58-72QR (v6.50.5800) | |
| MSI Delta 15 A5EFK (v6.33.5700) | |
| AIDA64 / Memory Latency | |
| Media de la clase Gaming (75.3 - 259, n=110, últimos 2 años) | |
| Asus TUF Dash F15 FX517ZR (v6.70.6000, Leise) | |
| Asus TUF Dash F15 FX517ZR (v6.70.6000) | |
| Asus TUF Dash F15 FX517ZR (v6.70.6000, Turbo) | |
| HP Omen 16-b1090ng (v6.50.5800) | |
| Medio Intel Core i7-12650H (71.6 - 103.9, n=14) | |
| MSI Delta 15 A5EFK (v6.33.5700) | |
| Acer Nitro 5 AN515-58-72QR (v6.50.5800) | |
| Acer Nitro 5 AN515-58-72QR (v6.50.5800) | |
* ... más pequeño es mejor
Latencias del CPD
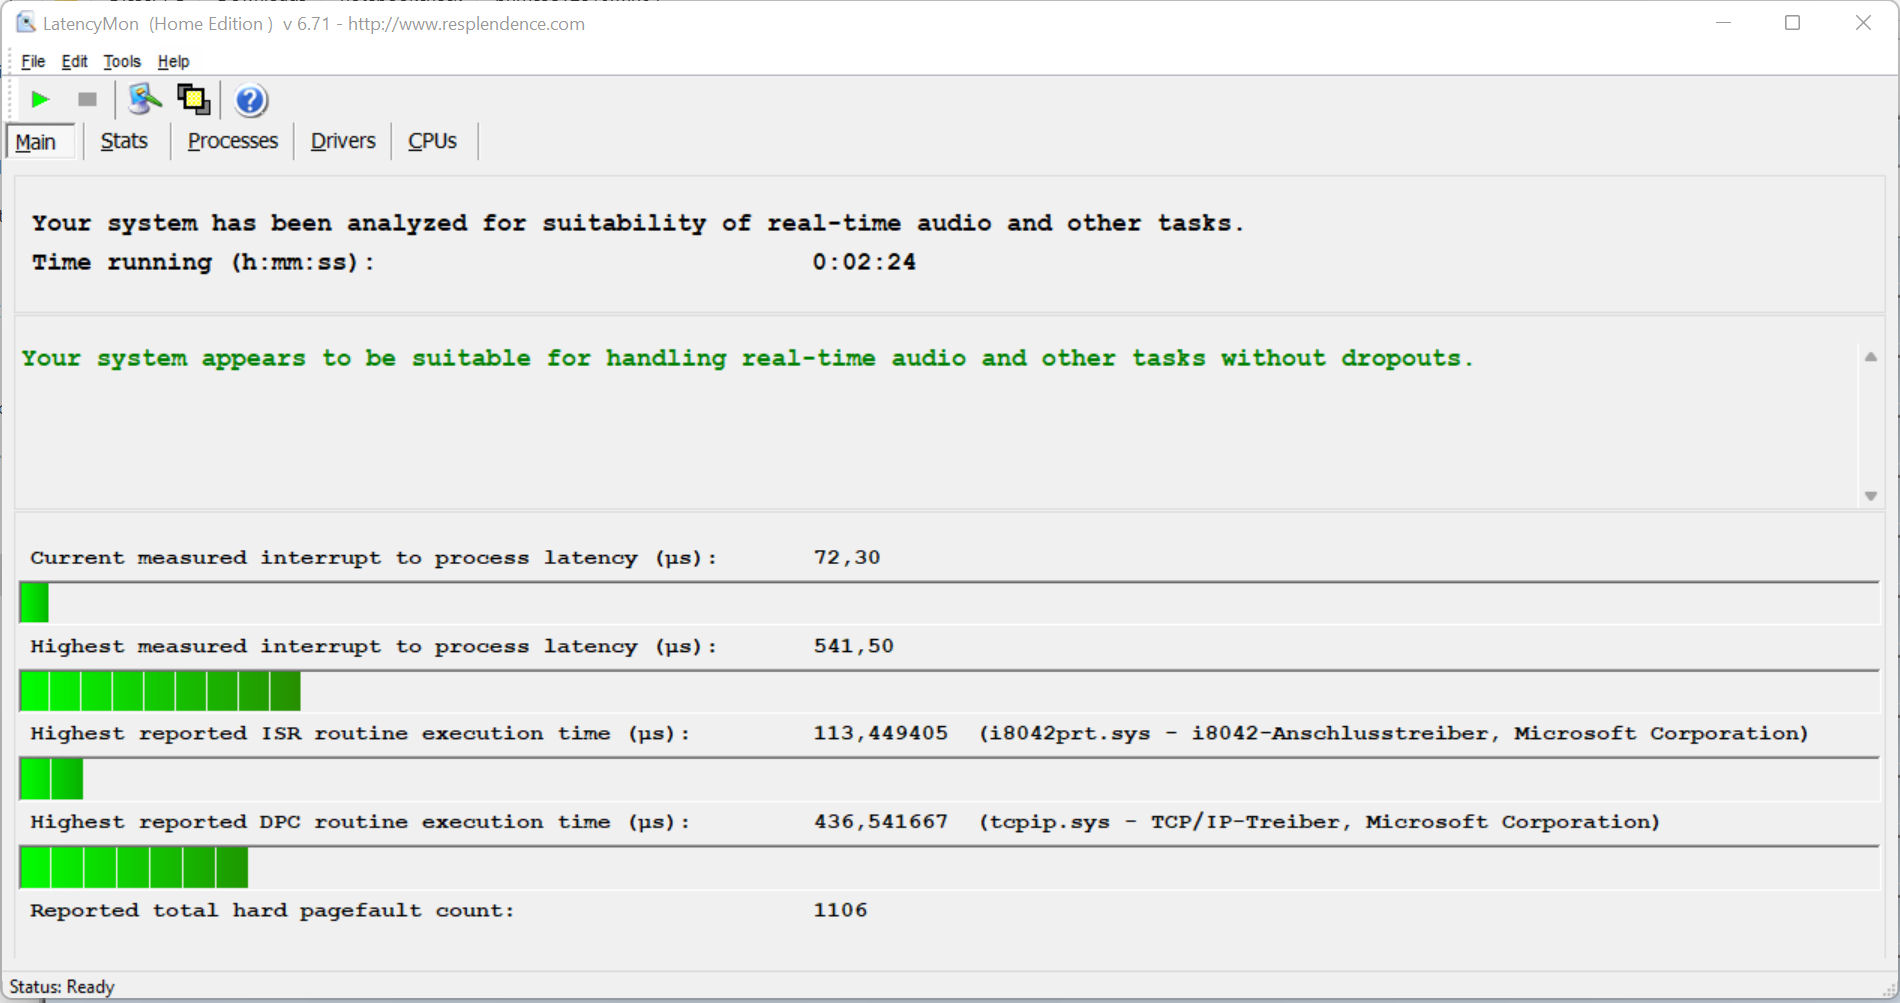
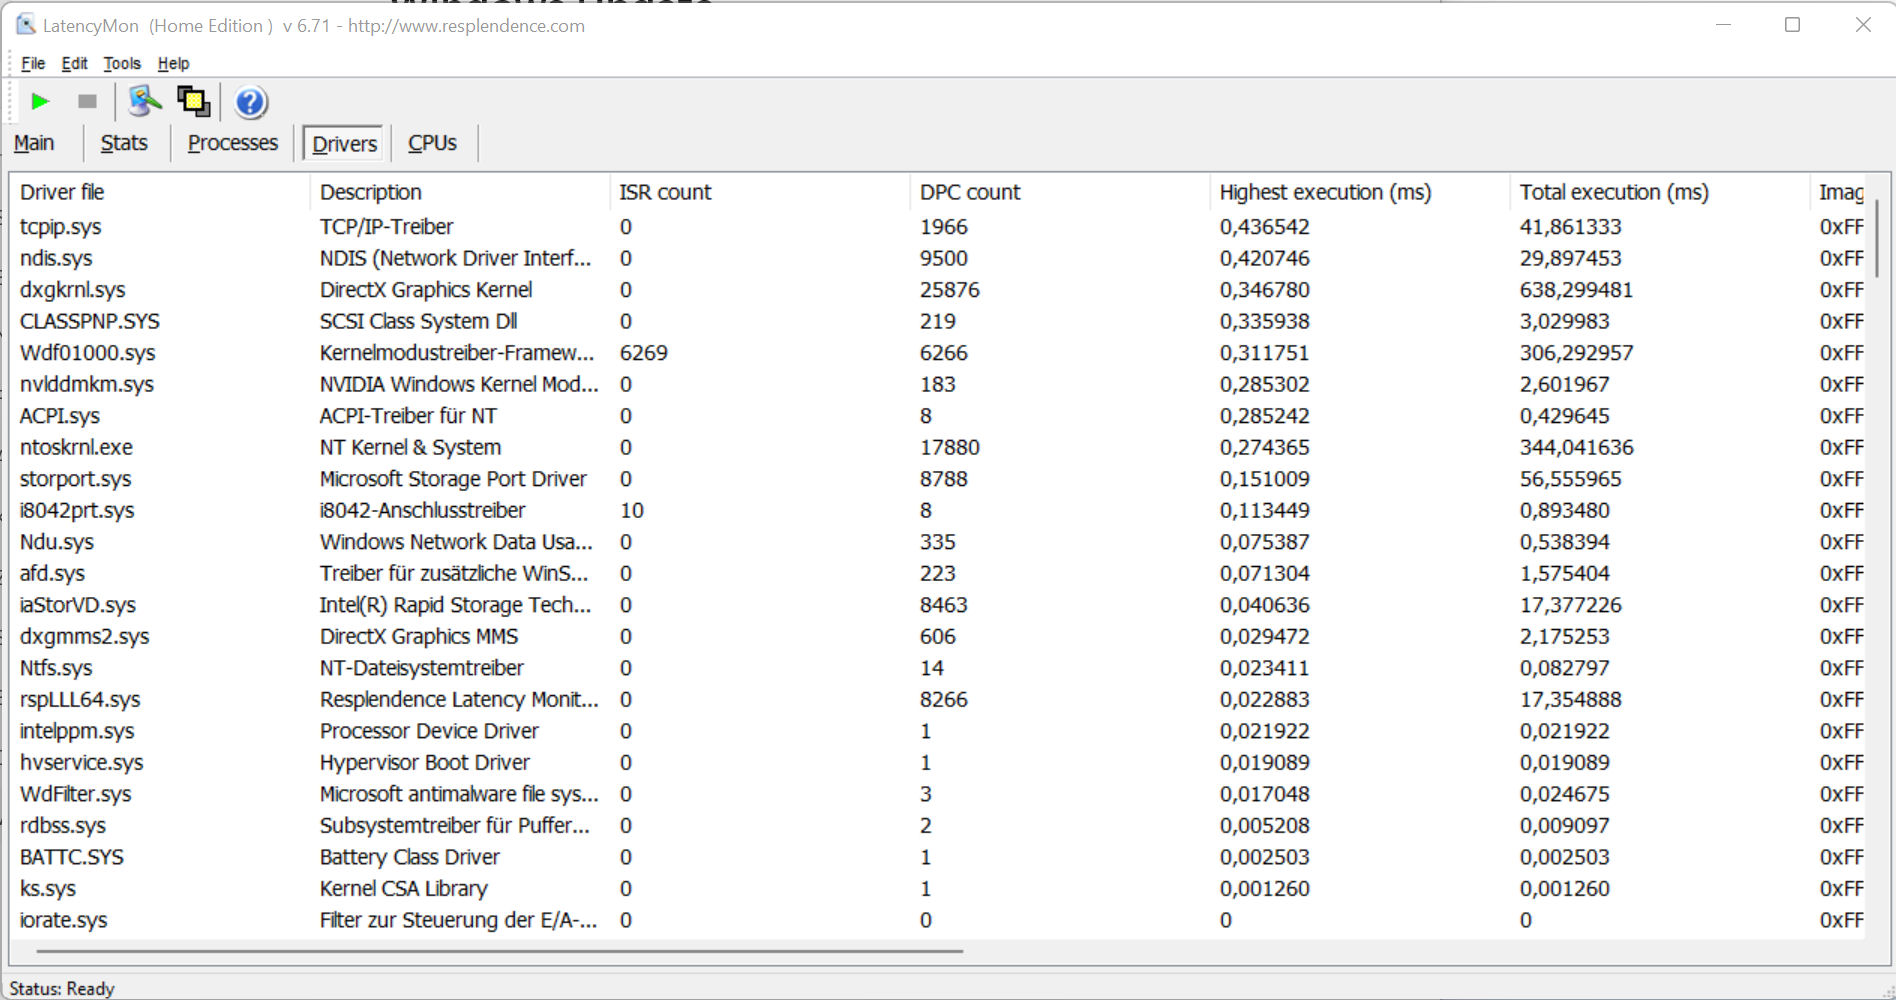
Nuestra prueba de monitorización de latencia estandarizada (navegación web, reproducción de vídeo 4K, Prime95 de alta carga) no reveló ninguna irregularidad en términos de latencias DPC. El sistema parece adecuado para la edición de vídeo y audio en tiempo real. Sin embargo, las futuras actualizaciones de software podrían mejorar o empeorar el rendimiento
| DPC Latencies / LatencyMon - interrupt to process latency (max), Web, Youtube, Prime95 | |
| MSI Vector GP66 12UGS | |
| Acer Nitro 5 AN515-58-72QR | |
| Lenovo Legion 5 Pro 16 G7 i7 RTX 3070Ti | |
| HP Omen 16-b1090ng | |
| Asus TUF Dash F15 FX517ZR | |
* ... más pequeño es mejor
Almacenamiento
Asus ha equipado el F15 con un SSD de 1 TB (PCIe 3, M.2 2280) de Samsung que ofrece buenas tasas de transferencia. Sin embargo, no está entre los mejores SSDs. El portátil ofrece espacio para un segundo SSD

* ... más pequeño es mejor
Continuous load read: DiskSpd Read Loop, Queue Depth 8
Tarjeta gráfica
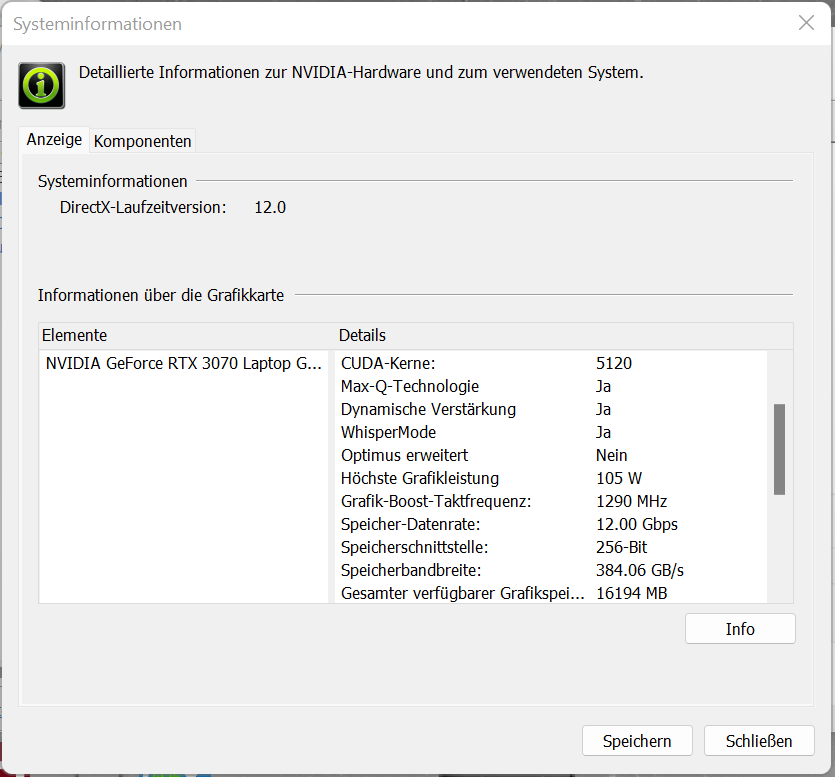
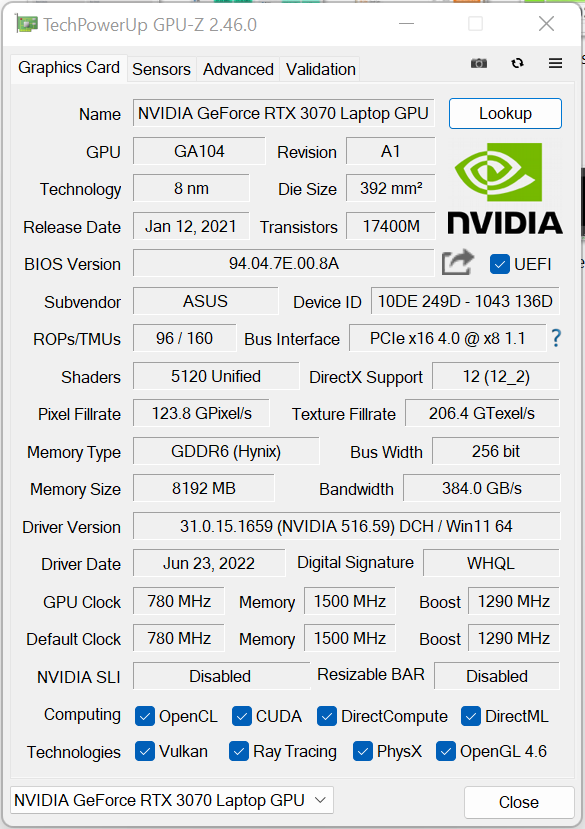
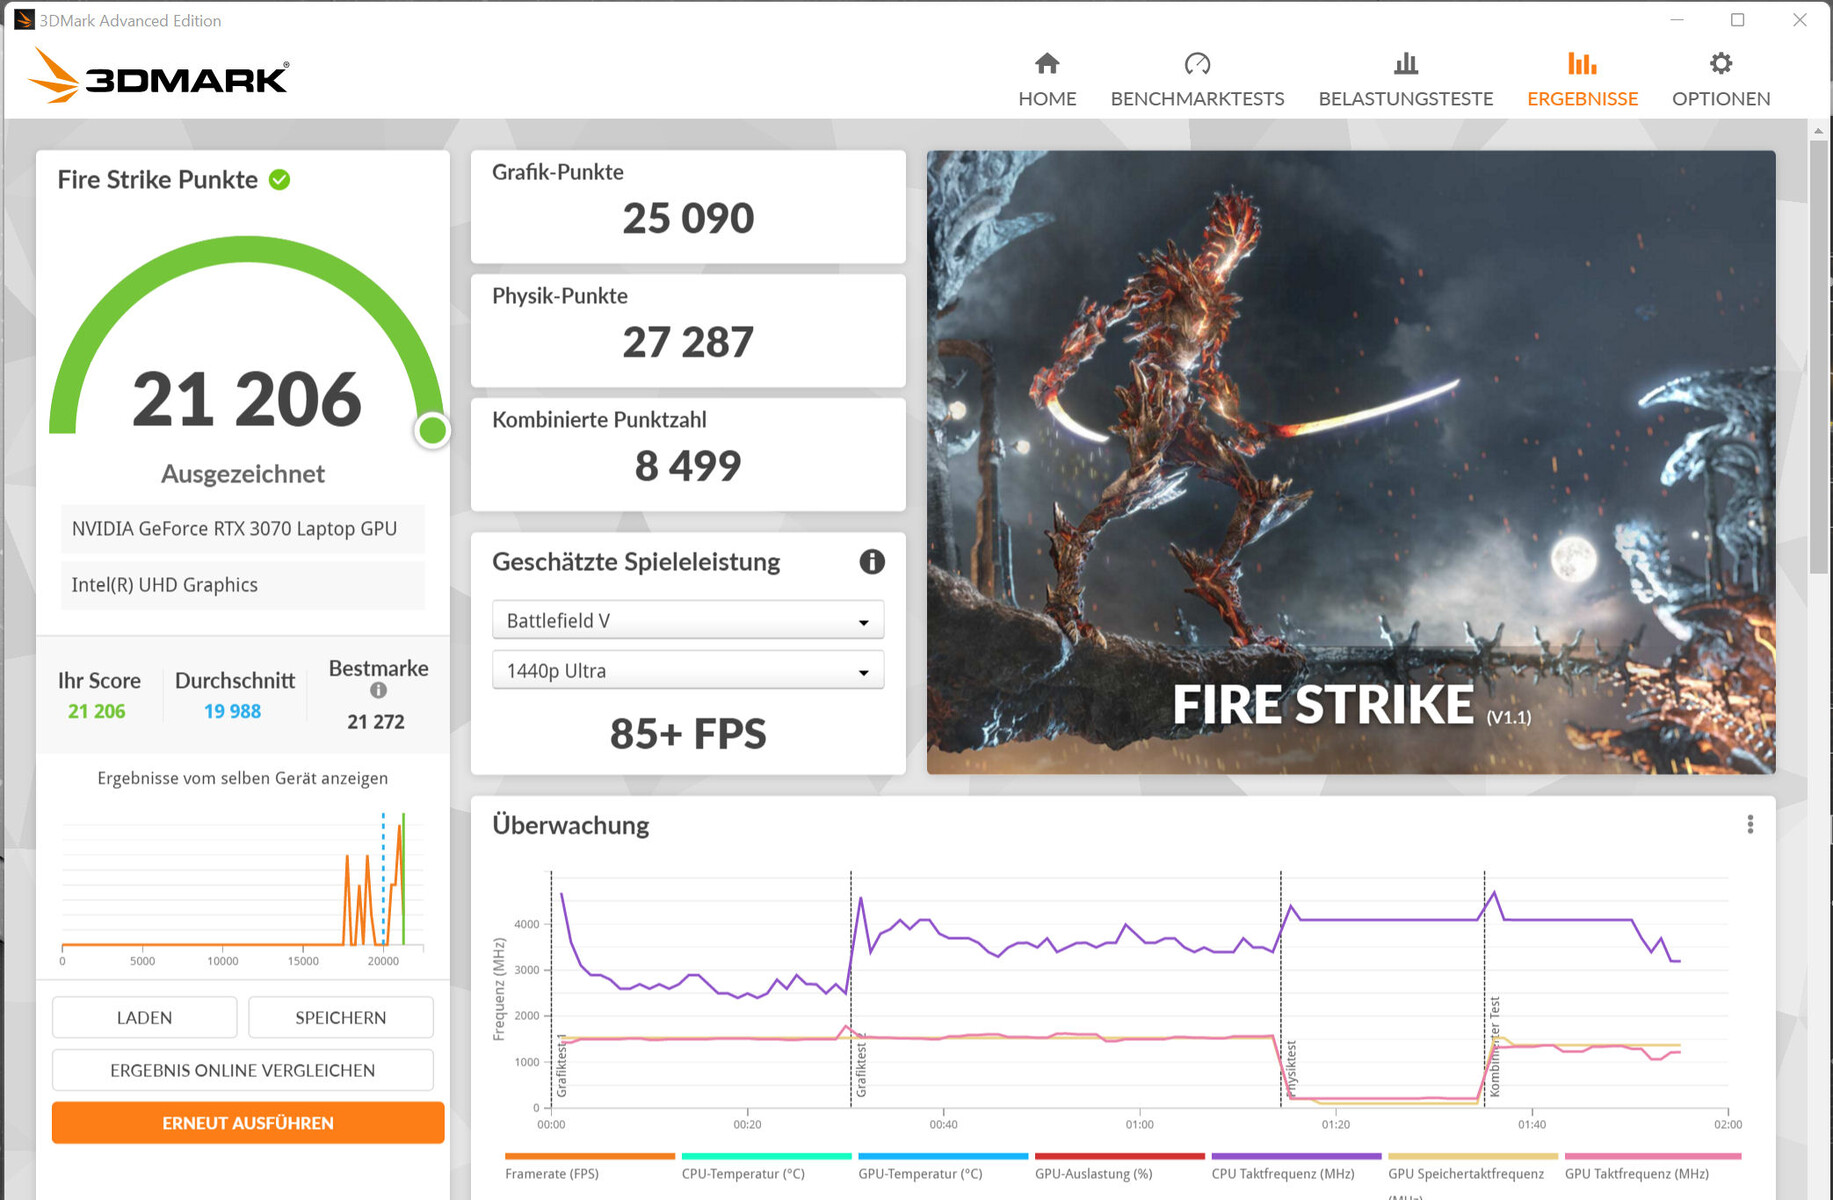
El rendimiento real de una GPU RTX 3000 dependerá de algunos factores: La refrigeración, la configuración de la memoria y el TGP máximo que el fabricante del portátil haya elegido dentro de los límites definidos por Nvidia. Asus ha concedido a laGeForce RTX 3070 para portátilesun TGP máximo de 105 vatios (80 vatios + 25 vatios de Dynamic Boost). La GPU tiene acceso a la rápida memoria gráfica GDDR6 (8.192 MB).
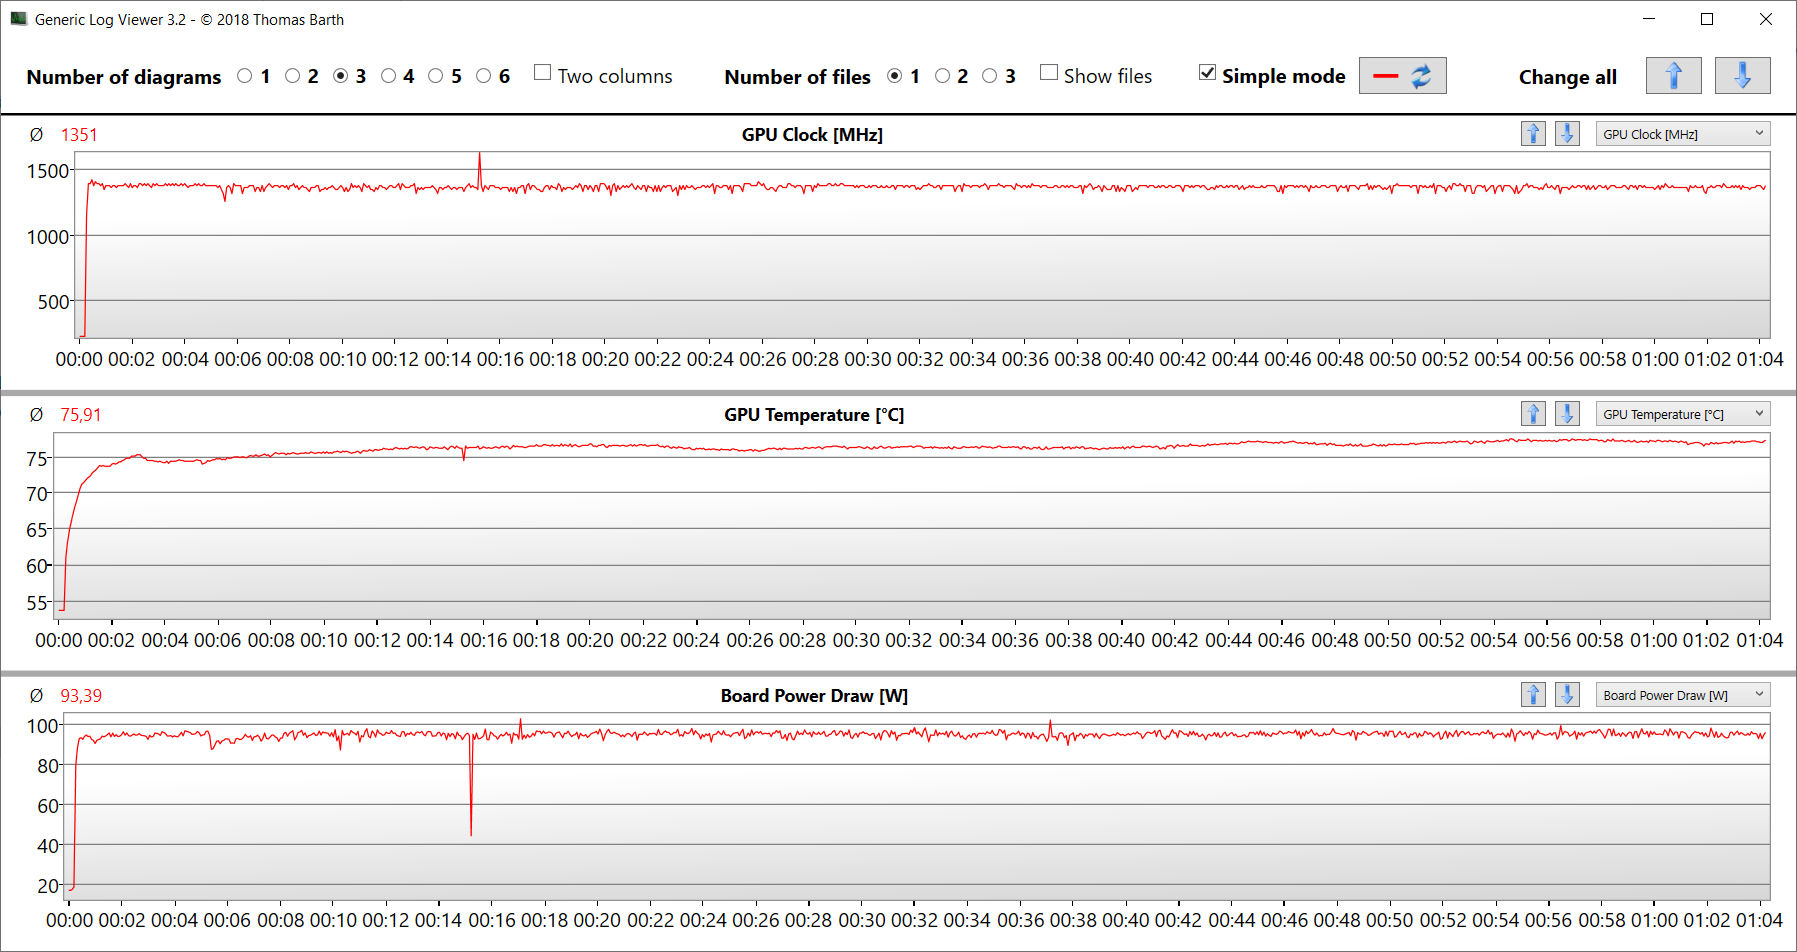
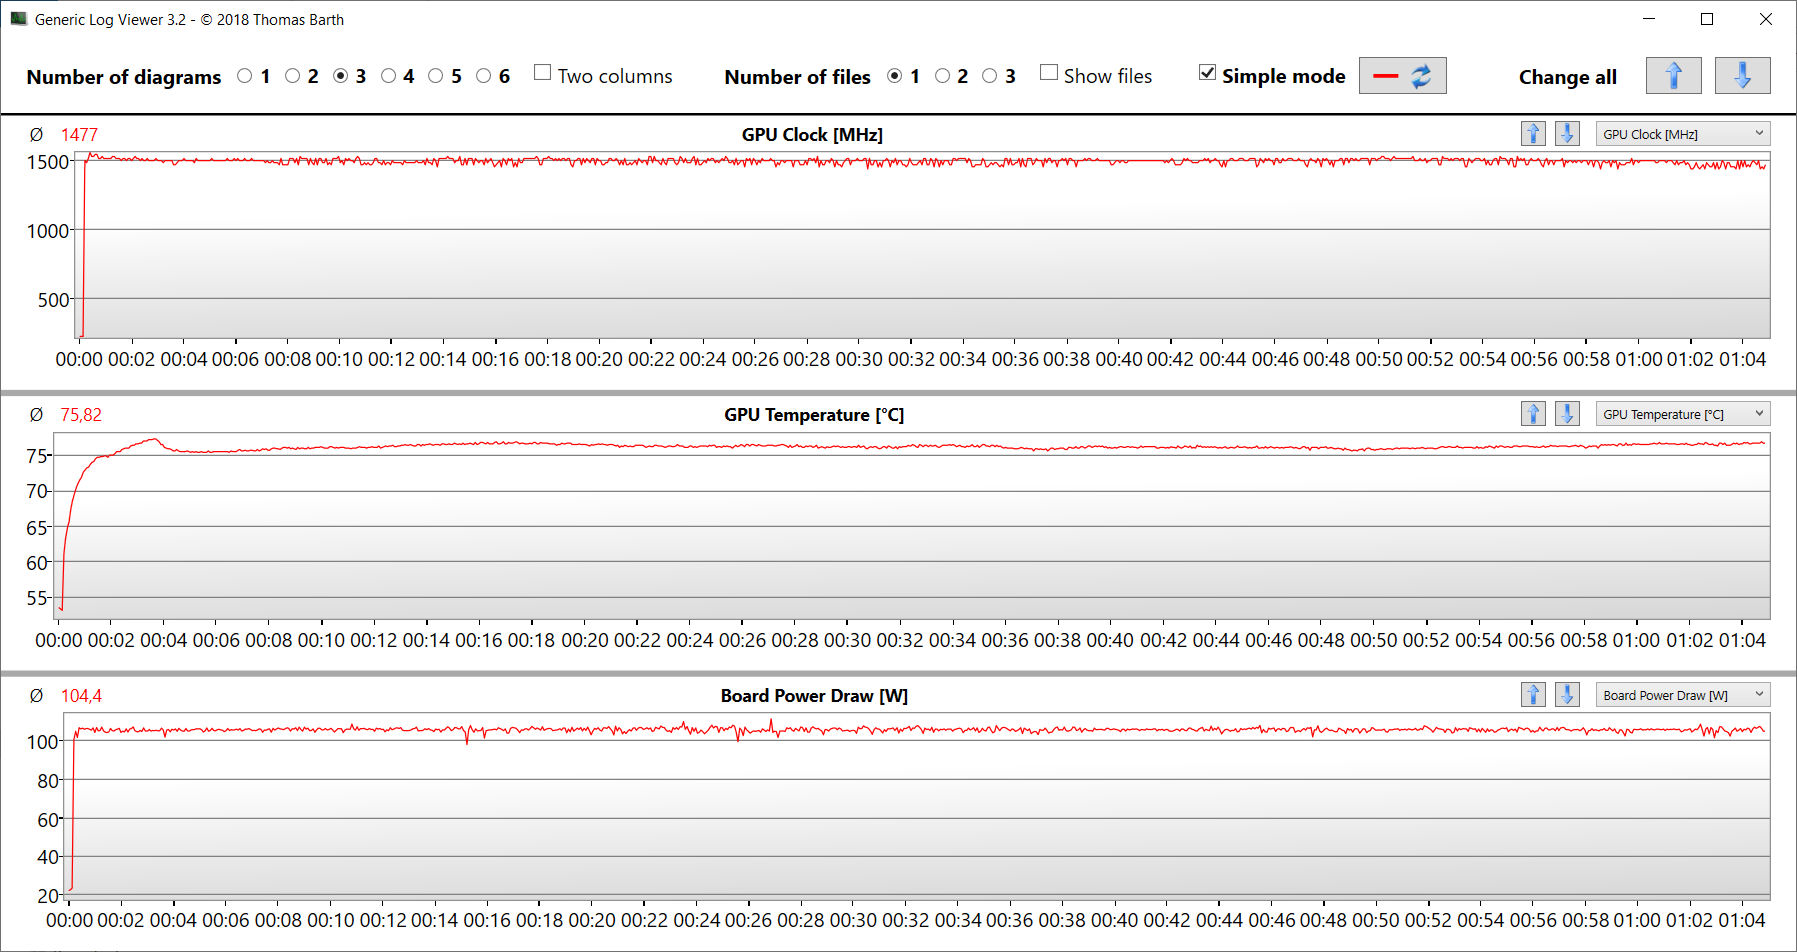
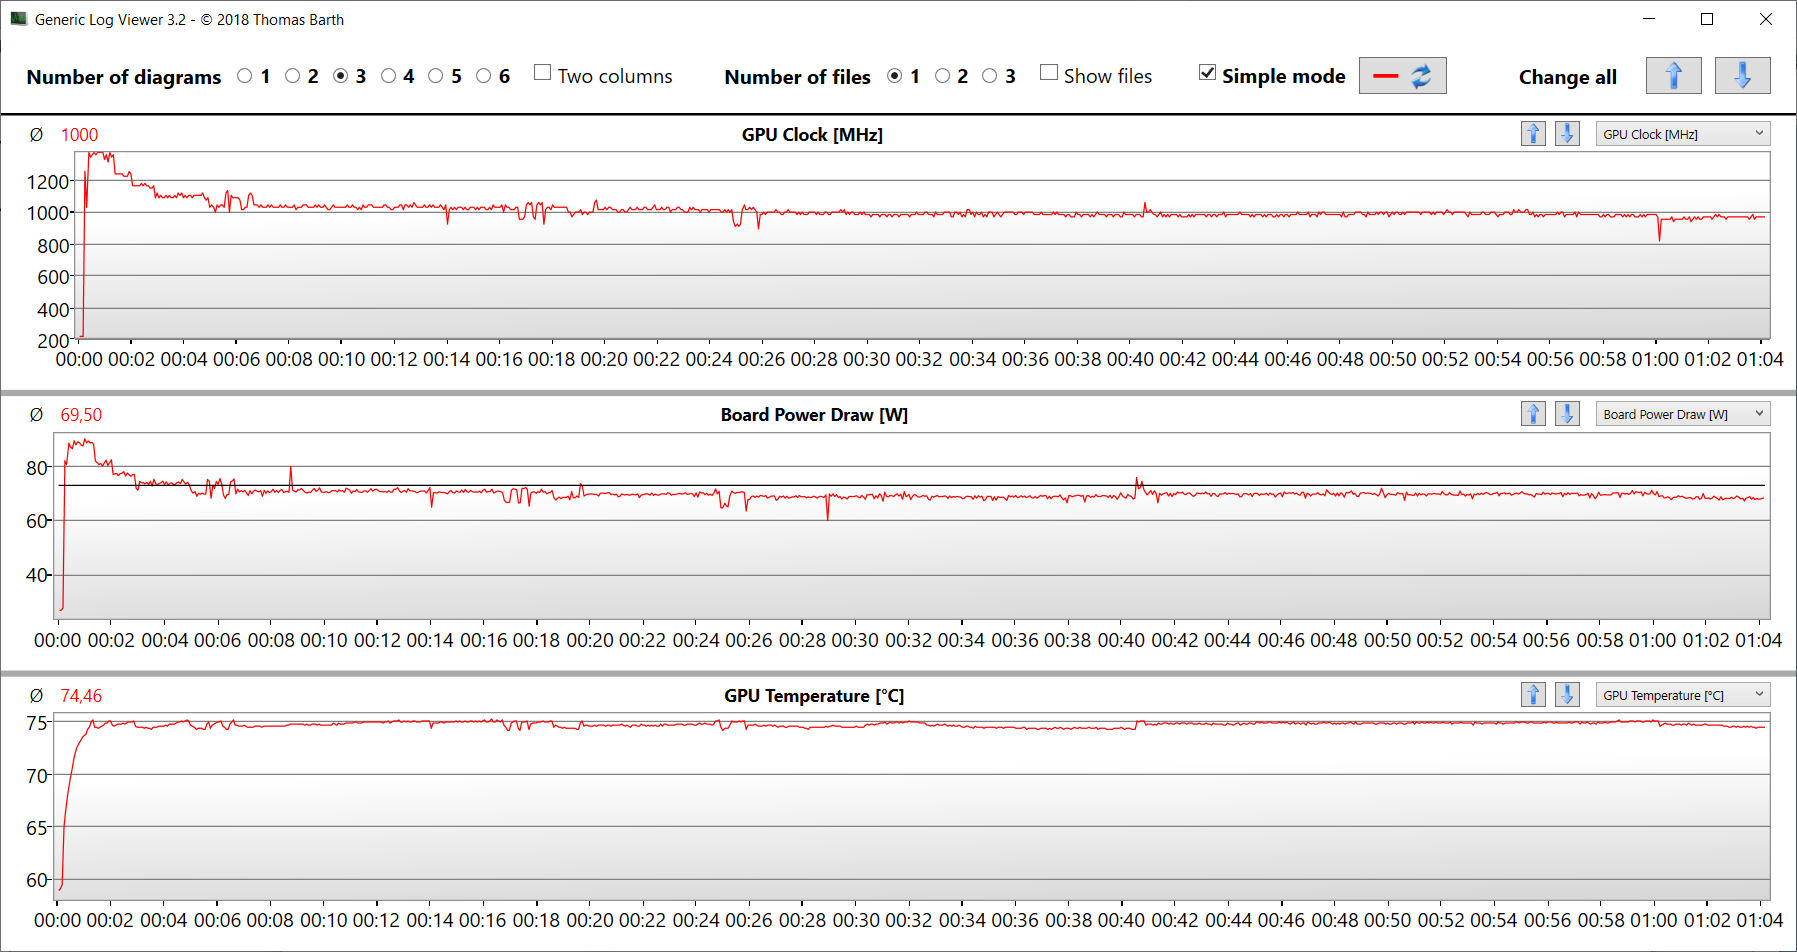
Un TGP en el extremo inferior de los límites no permite obtener el máximo rendimiento: Los resultados del benchmark están por debajo (modo Optimus) de la media de la RTX 3070 determinada hasta ahora, o justo por encima (modo dGPU). El TGP se aprovecha al máximo durante una salida de imagen directa a través de la GPU GeForce - esto se puede ver en nuestra prueba The Witcher 3.
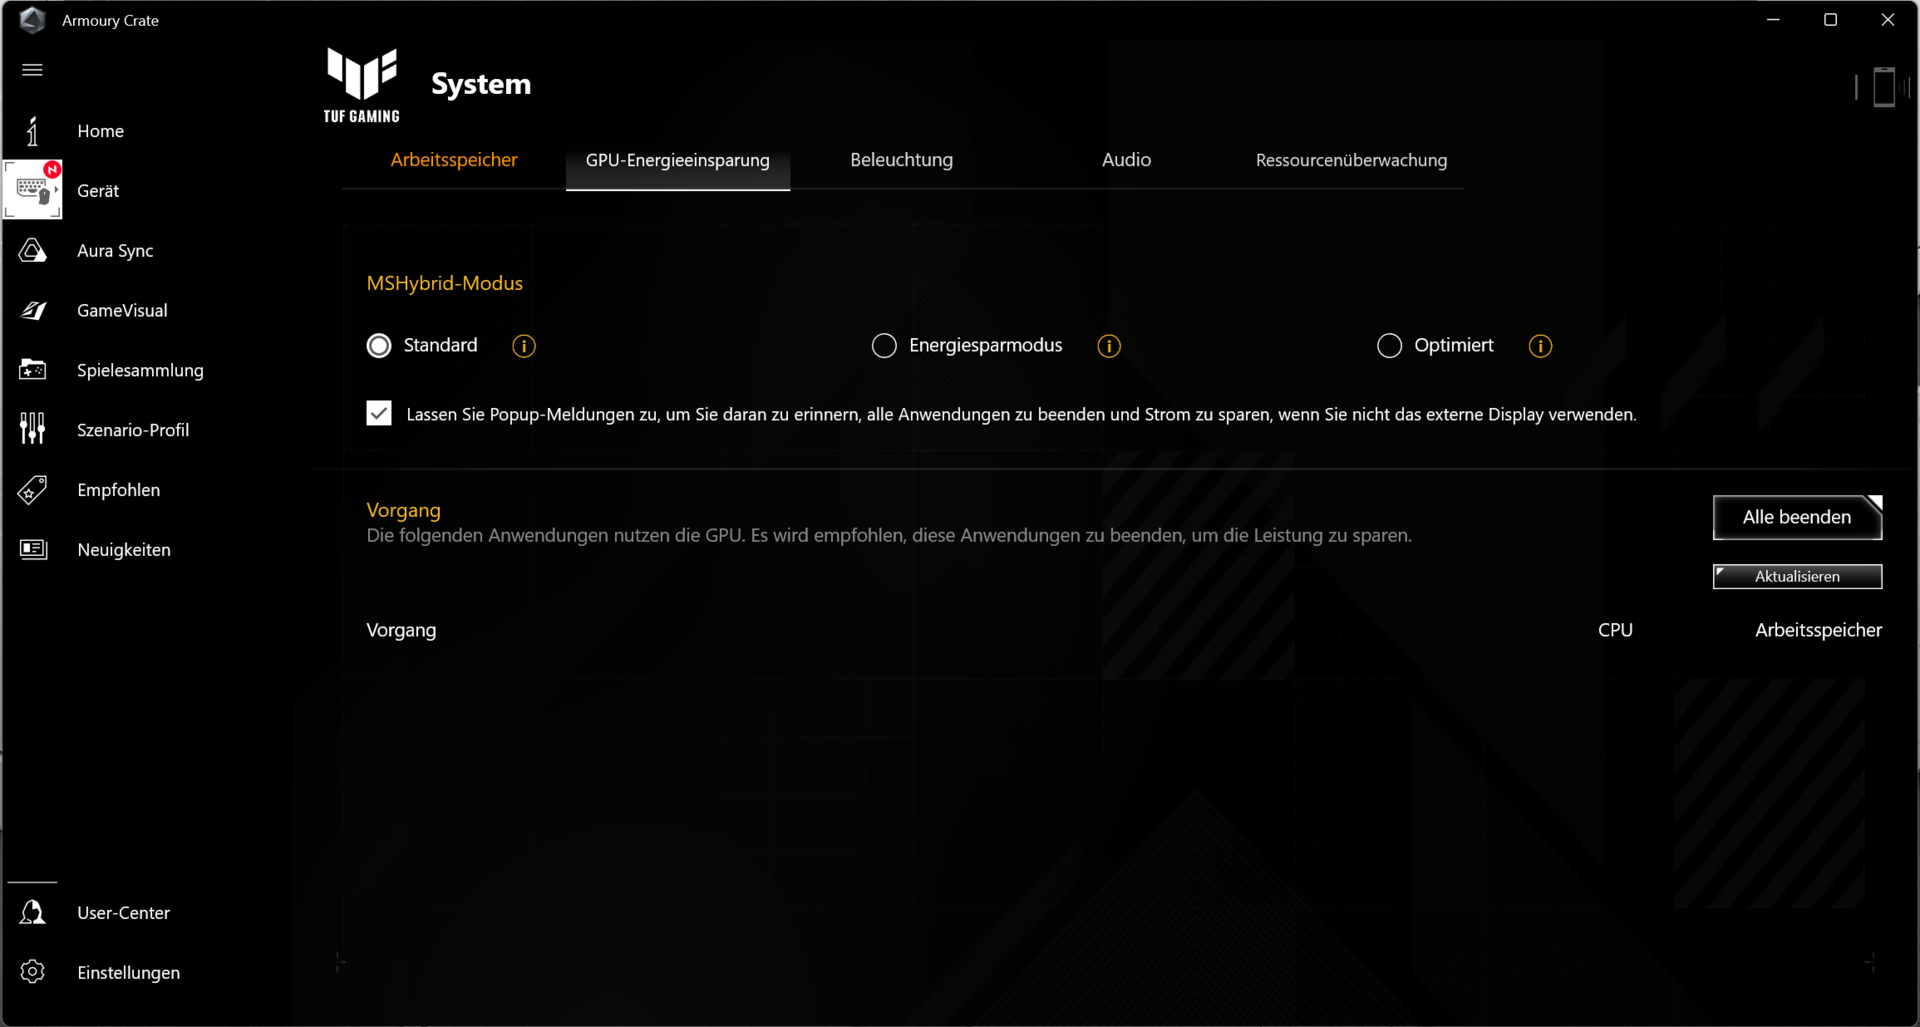
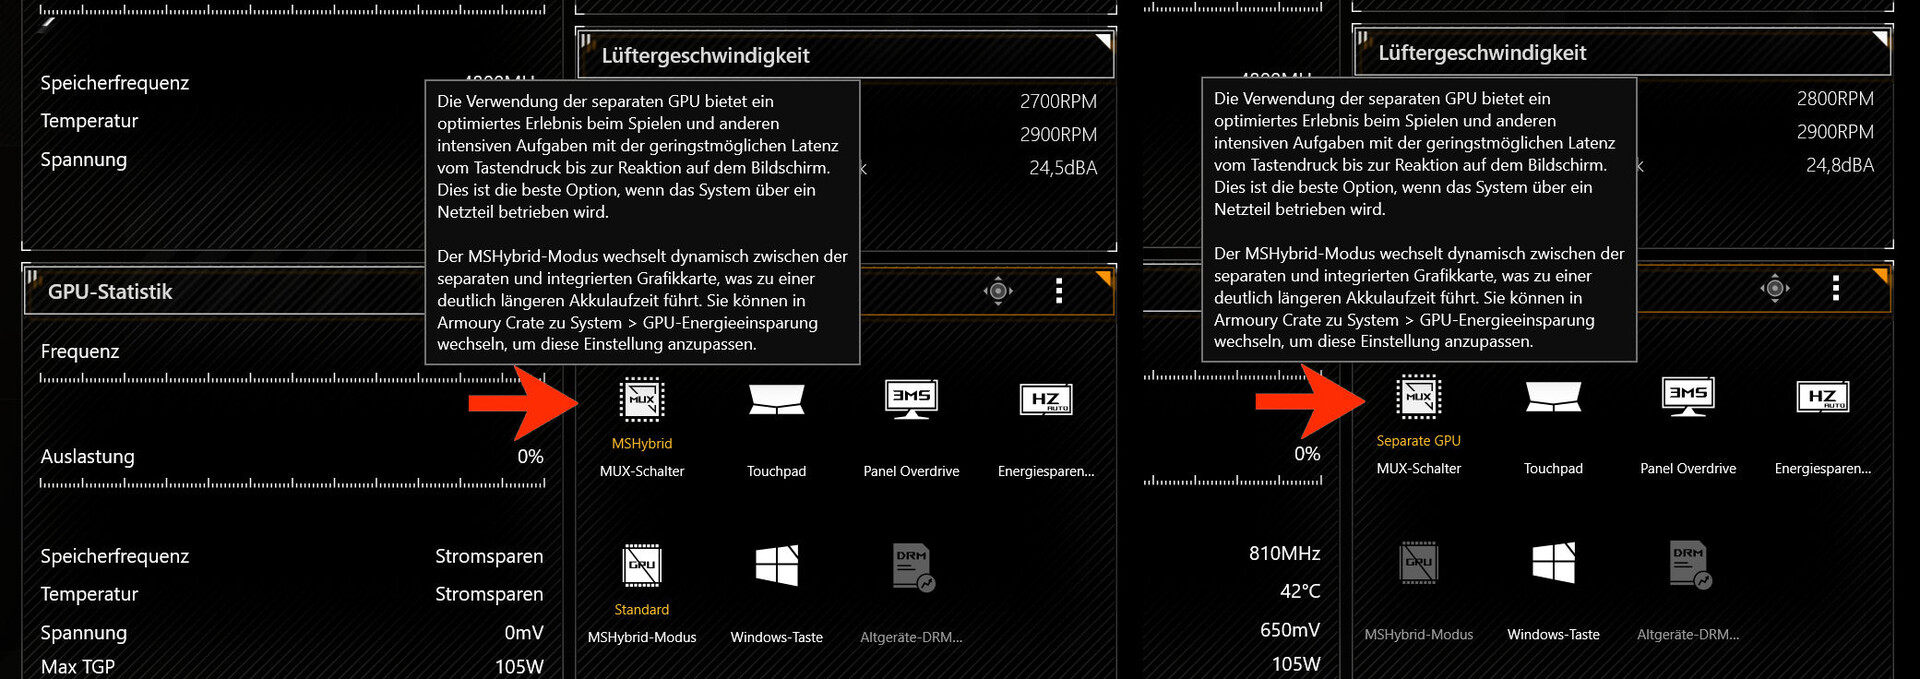
El cambio entre el modo Optimus ("MSHybrid") y el modo dGPU ("Separate GPU") puede hacerse con un clic del ratón en el software Armoury Crate (página de inicio, sección de configuración del sistema). Siempre es necesario reiniciar el portátil. Asus hace uso de un interruptor MUX - Advanced Optimus no es compatible. Para evitar confusiones: A diferencia de otras soluciones dGPU, la iGPU no se desactiva en el modo dGPU, y sigue apareciendo en el Administrador de dispositivos
| 3DMark Performance rating - Percent | |
| Media de la clase Gaming | |
| Acer Nitro 5 AN515-58-72QR | |
| MSI Delta 15 A5EFK -1! | |
| HP Omen 16-b1090ng | |
| Asus TUF Dash F15 FX517ZR | |
| Medio NVIDIA GeForce RTX 3070 Laptop GPU | |
| Asus TUF Dash F15 FX517ZR | |
| Asus TUF Dash F15 FX517ZR | |
| Razer Blade 15 Base Edition 2021, i7-10750H RTX 3060 | |
| 3DMark 11 - 1280x720 Performance GPU | |
| Media de la clase Gaming (21841 - 80022, n=109, últimos 2 años) | |
| Acer Nitro 5 AN515-58-72QR | |
| HP Omen 16-b1090ng | |
| MSI Delta 15 A5EFK | |
| Asus TUF Dash F15 FX517ZR (dGPU, Turbo) | |
| Medio NVIDIA GeForce RTX 3070 Laptop GPU (12535 - 38275, n=54) | |
| Asus TUF Dash F15 FX517ZR (Leise) | |
| Asus TUF Dash F15 FX517ZR | |
| Razer Blade 15 Base Edition 2021, i7-10750H RTX 3060 | |
V-Ray Benchmark Next 4.10: GPU | CPU
Geekbench 5.5: OpenCL Score
| V-Ray 5 Benchmark / GPU RTX | |
| Media de la clase Gaming (1146 - 4363, n=38, últimos 2 años) | |
| Acer Nitro 5 AN515-58-72QR (5.0.1) | |
| Medio NVIDIA GeForce RTX 3070 Laptop GPU (756 - 1764, n=23) | |
| Asus TUF Dash F15 FX517ZR (5.0.1, Turbo) | |
| Asus TUF Dash F15 FX517ZR (5.0.1, dGPU, Turbo) | |
| Asus TUF Dash F15 FX517ZR (5.0.1) | |
| Asus TUF Dash F15 FX517ZR (5.0.1, Leise) | |
| V-Ray 5 Benchmark / GPU CUDA | |
| Media de la clase Gaming (887 - 3288, n=38, últimos 2 años) | |
| Acer Nitro 5 AN515-58-72QR (5.0.1) | |
| Asus TUF Dash F15 FX517ZR (5.0.1, Turbo) | |
| Asus TUF Dash F15 FX517ZR (5.0.1, dGPU, Turbo) | |
| Asus TUF Dash F15 FX517ZR (5.0.1) | |
| Asus TUF Dash F15 FX517ZR (5.0.1, Leise) | |
| Medio NVIDIA GeForce RTX 3070 Laptop GPU (164 - 1283, n=22) | |
| V-Ray 5 Benchmark / CPU | |
| Media de la clase Gaming (5864 - 30302, n=37, últimos 2 años) | |
| Acer Nitro 5 AN515-58-72QR (5.0.1) | |
| Asus TUF Dash F15 FX517ZR (5.0.1, Turbo) | |
| Asus TUF Dash F15 FX517ZR (5.0.1, dGPU, Turbo) | |
| Asus TUF Dash F15 FX517ZR (5.0.1) | |
| Asus TUF Dash F15 FX517ZR (5.0.1, Leise) | |
| Medio NVIDIA GeForce RTX 3070 Laptop GPU (1690 - 12106, n=31) | |
| Razer Blade 15 Base Edition 2021, i7-10750H RTX 3060 (5.0.1) | |
| V-Ray Benchmark Next 4.10 / GPU | |
| Media de la clase Gaming (427 - 1333, n=106, últimos 2 años) | |
| Medio NVIDIA GeForce RTX 3070 Laptop GPU (55 - 533, n=47) | |
| Asus TUF Dash F15 FX517ZR (v4.10.07, Turbo) | |
| Asus TUF Dash F15 FX517ZR (v4.10.07, dGPU, Turbo) | |
| Asus TUF Dash F15 FX517ZR (v4.10.07 ) | |
| Acer Nitro 5 AN515-58-72QR (v4.10.07 ) | |
| HP Omen 16-b1090ng (v4.10.07 ) | |
| Asus TUF Dash F15 FX517ZR (v4.10.07, Leise) | |
| Razer Blade 15 Base Edition 2021, i7-10750H RTX 3060 (v4.10.07 ) | |
| MSI Delta 15 A5EFK (v4.10.07 ) | |
| V-Ray Benchmark Next 4.10 / CPU | |
| Media de la clase Gaming (10048 - 45327, n=105, últimos 2 años) | |
| HP Omen 16-b1090ng (v4.10.07 ) | |
| Acer Nitro 5 AN515-58-72QR (v4.10.07 ) | |
| Asus TUF Dash F15 FX517ZR (v4.10.07, Turbo) | |
| Asus TUF Dash F15 FX517ZR (v4.10.07, dGPU, Turbo) | |
| Asus TUF Dash F15 FX517ZR (v4.10.07 ) | |
| MSI Delta 15 A5EFK (v4.10.07 ) | |
| Asus TUF Dash F15 FX517ZR (v4.10.07, Leise) | |
| Medio NVIDIA GeForce RTX 3070 Laptop GPU (2741 - 18570, n=47) | |
| Razer Blade 15 Base Edition 2021, i7-10750H RTX 3060 (v4.10.07 ) | |
| Geekbench 5.5 / OpenCL Score | |
| Media de la clase Gaming (80702 - 277970, n=108, últimos 2 años) | |
| Acer Nitro 5 AN515-58-72QR | |
| Asus TUF Dash F15 FX517ZR (dGPU, Turbo) | |
| Asus TUF Dash F15 FX517ZR (Leise) | |
| Asus TUF Dash F15 FX517ZR (Turbo) | |
| HP Omen 16-b1090ng | |
| Asus TUF Dash F15 FX517ZR | |
| Medio NVIDIA GeForce RTX 3070 Laptop GPU (5732 - 125874, n=52) | |
| Razer Blade 15 Base Edition 2021, i7-10750H RTX 3060 | |
| MSI Delta 15 A5EFK | |
| 3DMark 06 Standard Score | 47705 puntos | |
| 3DMark 11 Performance | 26776 puntos | |
| 3DMark Cloud Gate Standard Score | 58266 puntos | |
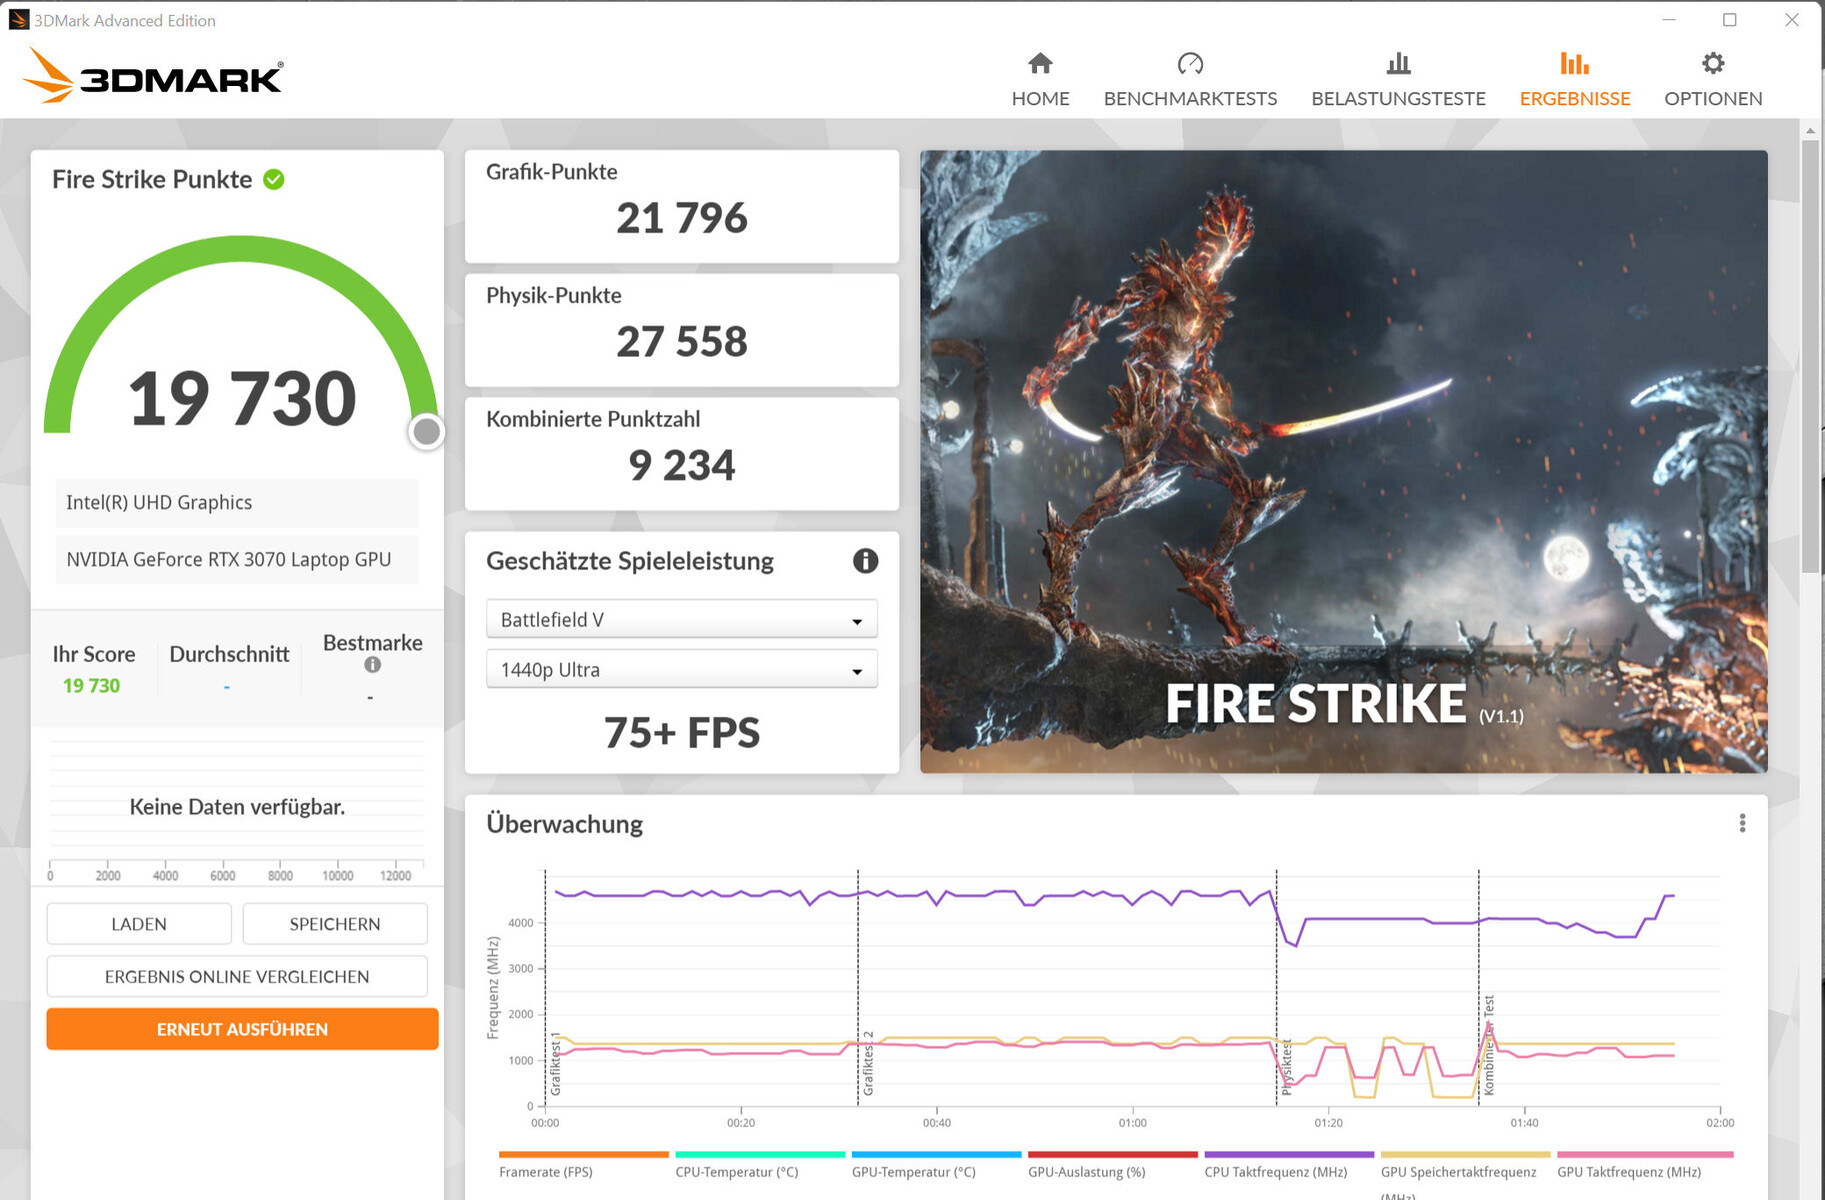
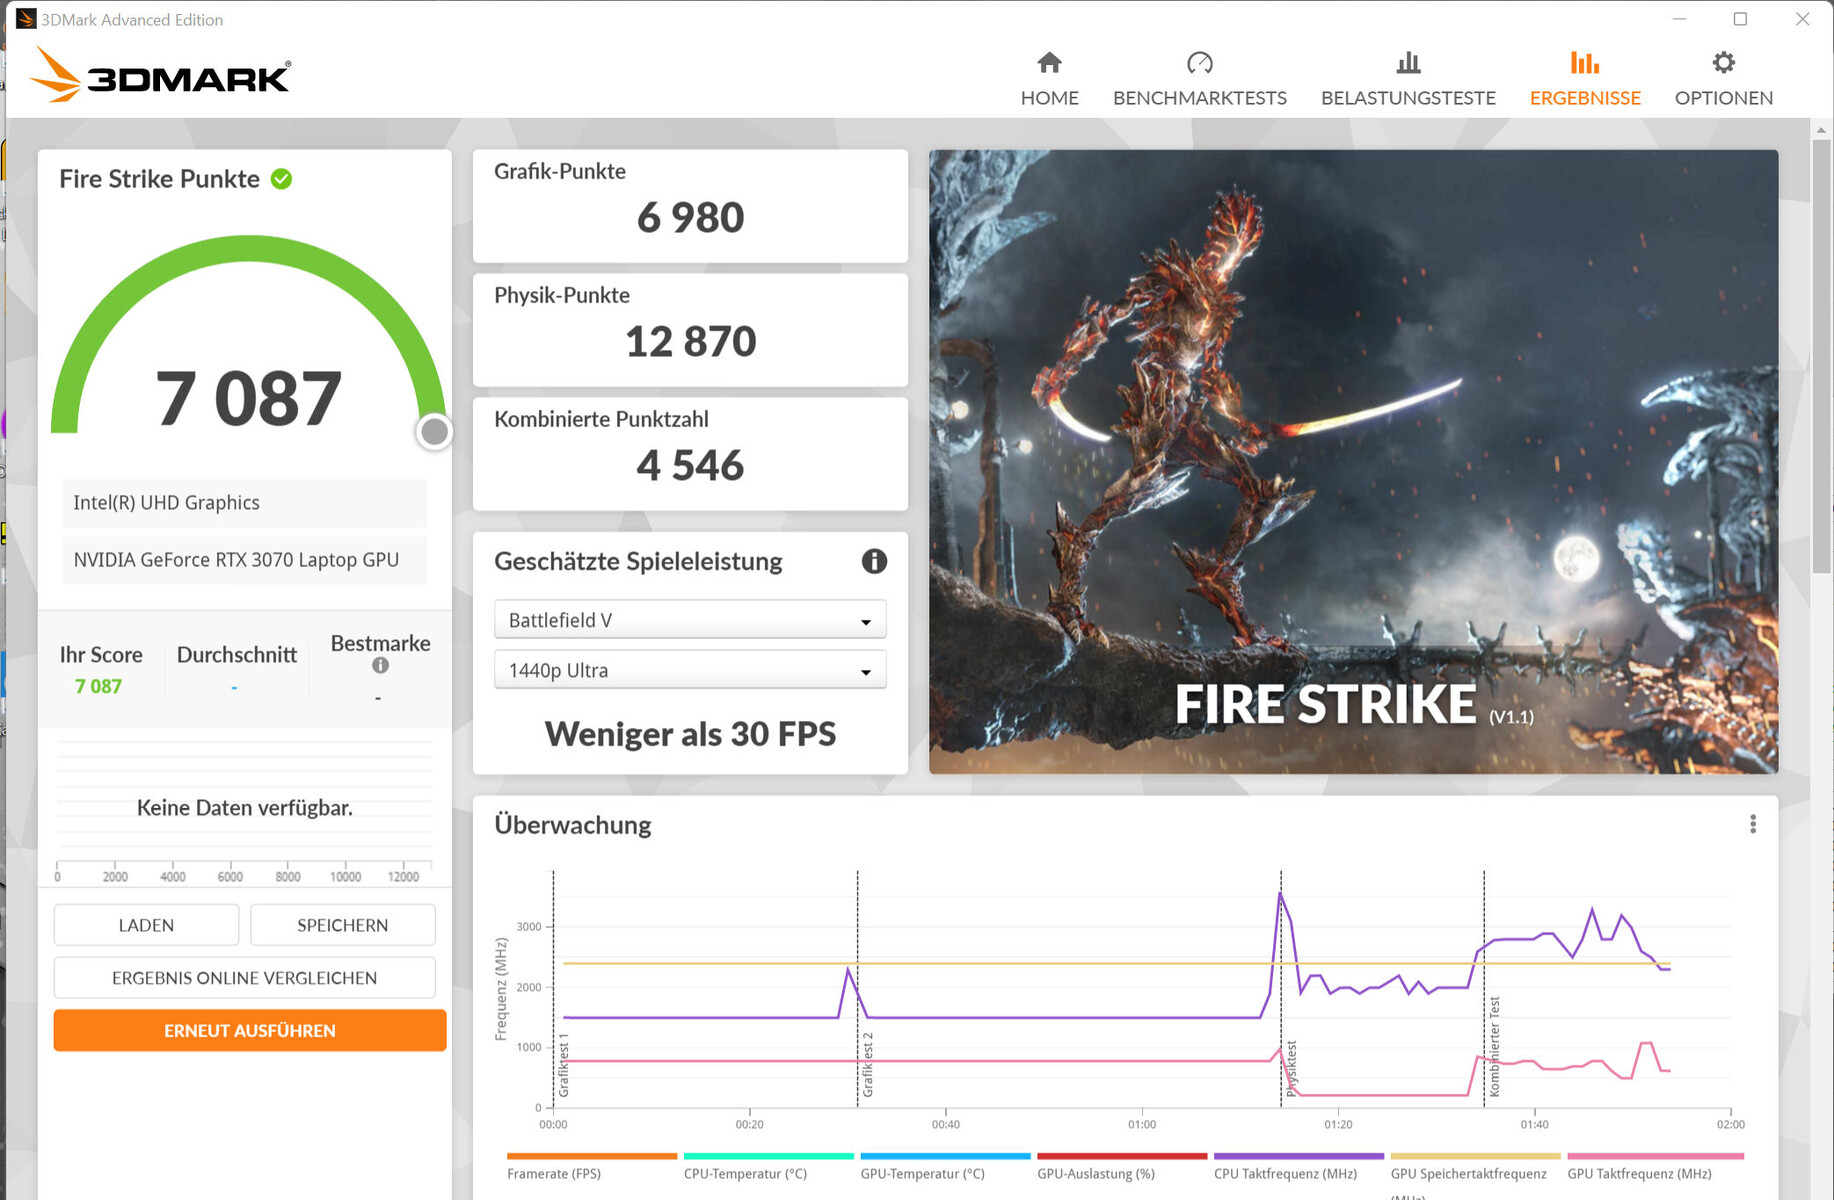
| 3DMark Fire Strike Score | 19730 puntos | |
| 3DMark Time Spy Score | 8210 puntos | |
ayuda | ||
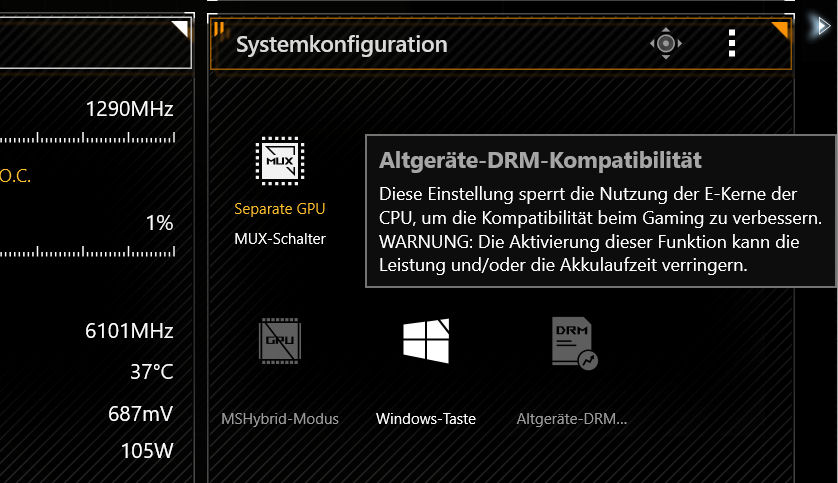
¿Problemas de DRM al jugar? Desactivar los núcleos E
Cuando se lanzó la plataforma Alder Lake, se conocieron problemas relacionados con los mecanismos de DRM de varios juegos: el software de DRM podía reconocer los núcleos E de la CPU como otro sistema y negarse a lanzar el juego como resultado. A estas alturas, estos problemas deberían haberse solucionado en gran medida gracias a diversas actualizaciones.
Si este último no es el caso para un determinado juego, el portátil Asus ofrece una solución: No utilizar los núcleos E. Esto se consigue haciendo clic en el botón "Legacy DRM Compatibility" dentro de Armoury Crate. Los núcleos siguen activos, pero no se utilizan.
La BIOS del dispositivo ofrece otra opción: Una desactivación completa de los núcleos E. Aquí se puede elegir entre 0 y 4 núcleos. Si se desactivan todos los núcleos E, el botón "Legacy Device DRM Compatibility" desaparece del software Armoury Crate.
Rendimiento de los juegos
El hardware puede manejar juegos QHD con ajustes altos y máximos. Las tasas de frames están por debajo de la media de la RTX 3070. Una salida de imagen directa a través de la GPU GeForce lleva a tasas más altas
| The Witcher 3 - 1920x1080 Ultra Graphics & Postprocessing (HBAO+) | |
| Media de la clase Gaming (95 - 240, n=8, últimos 2 años) | |
| Acer Nitro 5 AN515-58-72QR | |
| Asus TUF Dash F15 FX517ZR (dGPU, Turbo) | |
| HP Omen 16-b1090ng | |
| MSI Delta 15 A5EFK | |
| Medio NVIDIA GeForce RTX 3070 Laptop GPU (34.9 - 109, n=52) | |
| Asus TUF Dash F15 FX517ZR | |
| Razer Blade 15 Base Edition 2021, i7-10750H RTX 3060 | |
| Asus TUF Dash F15 FX517ZR (Leise) | |
| Dota 2 Reborn - 1920x1080 ultra (3/3) best looking | |
| Media de la clase Gaming (84.8 - 248, n=113, últimos 2 años) | |
| HP Omen 16-b1090ng | |
| Asus TUF Dash F15 FX517ZR (dGPU, Turbo) | |
| Acer Nitro 5 AN515-58-72QR | |
| Razer Blade 15 Base Edition 2021, i7-10750H RTX 3060 | |
| Medio NVIDIA GeForce RTX 3070 Laptop GPU (26.9 - 163.9, n=58) | |
| Asus TUF Dash F15 FX517ZR (Leise) | |
| MSI Delta 15 A5EFK | |
| Asus TUF Dash F15 FX517ZR | |
| X-Plane 11.11 - 1920x1080 high (fps_test=3) | |
| HP Omen 16-b1090ng | |
| Asus TUF Dash F15 FX517ZR (dGPU, Turbo) | |
| Asus TUF Dash F15 FX517ZR | |
| Media de la clase Gaming (52.1 - 143.5, n=116, últimos 2 años) | |
| Asus TUF Dash F15 FX517ZR (Leise) | |
| Acer Nitro 5 AN515-58-72QR | |
| Medio NVIDIA GeForce RTX 3070 Laptop GPU (12.4 - 118.8, n=61) | |
| Razer Blade 15 Base Edition 2021, i7-10750H RTX 3060 | |
| Final Fantasy XV Benchmark | |
| 1920x1080 High Quality | |
| Media de la clase Gaming (41 - 215, n=104, últimos 2 años) | |
| HP Omen 16-b1090ng | |
| Asus TUF Dash F15 FX517ZR (1.3, dGPU, Turbo) | |
| Acer Nitro 5 AN515-58-72QR (1.3) | |
| Medio NVIDIA GeForce RTX 3070 Laptop GPU (27.9 - 107, n=49) | |
| Asus TUF Dash F15 FX517ZR (1.3) | |
| MSI Delta 15 A5EFK | |
| Razer Blade 15 Base Edition 2021, i7-10750H RTX 3060 (1.3) | |
| Asus TUF Dash F15 FX517ZR (1.3, Leise) | |
| 2560x1440 High Quality | |
| Media de la clase Gaming (32.5 - 184.3, n=89, últimos 2 años) | |
| Asus TUF Dash F15 FX517ZR (1.3, dGPU, Turbo) | |
| Acer Nitro 5 AN515-58-72QR (1.3) | |
| Medio NVIDIA GeForce RTX 3070 Laptop GPU (19.8 - 79.9, n=25) | |
| Asus TUF Dash F15 FX517ZR (1.3) | |
| Asus TUF Dash F15 FX517ZR (1.3, Leise) | |
| GTA V | |
| 2560x1440 Highest AA:4xMSAA + FX AF:16x | |
| Media de la clase Gaming (36.9 - 183.9, n=75, últimos 2 años) | |
| Asus TUF Dash F15 FX517ZR (dGPU, Turbo) | |
| Medio NVIDIA GeForce RTX 3070 Laptop GPU (70.8 - 97.1, n=19) | |
| Acer Nitro 5 AN515-58-72QR | |
| Asus TUF Dash F15 FX517ZR | |
| Asus TUF Dash F15 FX517ZR (Leise) | |
| 1920x1080 Highest AA:4xMSAA + FX AF:16x | |
| Media de la clase Gaming (48.3 - 186.9, n=103, últimos 2 años) | |
| HP Omen 16-b1090ng | |
| Asus TUF Dash F15 FX517ZR (dGPU, Turbo) | |
| Asus TUF Dash F15 FX517ZR | |
| Acer Nitro 5 AN515-58-72QR | |
| Medio NVIDIA GeForce RTX 3070 Laptop GPU (21.7 - 125.8, n=50) | |
| Asus TUF Dash F15 FX517ZR (Leise) | |
| MSI Delta 15 A5EFK | |
| Razer Blade 15 Base Edition 2021, i7-10750H RTX 3060 | |
| Strange Brigade | |
| 2560x1440 ultra AA:ultra AF:16 | |
| Media de la clase Gaming (52.8 - 350, n=79, últimos 2 años) | |
| Acer Nitro 5 AN515-58-72QR (1.47.22.14 D3D12) | |
| Asus TUF Dash F15 FX517ZR (1.47.22.14 D3D12, dGPU, Turbo) | |
| Medio NVIDIA GeForce RTX 3070 Laptop GPU (82.3 - 140.5, n=18) | |
| Asus TUF Dash F15 FX517ZR (1.47.22.14 D3D12) | |
| Asus TUF Dash F15 FX517ZR (1.47.22.14 D3D12, Leise) | |
| 1920x1080 ultra AA:ultra AF:16 | |
| Media de la clase Gaming (76.3 - 456, n=94, últimos 2 años) | |
| Acer Nitro 5 AN515-58-72QR (1.47.22.14 D3D12) | |
| Asus TUF Dash F15 FX517ZR (1.47.22.14 D3D12, dGPU, Turbo) | |
| MSI Delta 15 A5EFK (1.47.22.14 D3D12) | |
| Medio NVIDIA GeForce RTX 3070 Laptop GPU (36.2 - 194, n=46) | |
| Asus TUF Dash F15 FX517ZR (1.47.22.14 D3D12) | |
| Asus TUF Dash F15 FX517ZR (1.47.22.14 D3D12, Leise) | |
| HP Omen 16-b1090ng (1.47.22.14 D3D12) | |
| Razer Blade 15 Base Edition 2021, i7-10750H RTX 3060 (1.47.22.14 D3D12) | |
| F1 2021 | |
| 2560x1440 Ultra High Preset + Raytracing AA:T AF:16x | |
| Asus TUF Dash F15 FX517ZR (874931, dGPU, Turbo) | |
| Medio NVIDIA GeForce RTX 3070 Laptop GPU (67.1 - 90.2, n=11) | |
| Acer Nitro 5 AN515-58-72QR (874931) | |
| Asus TUF Dash F15 FX517ZR (874931) | |
| Asus TUF Dash F15 FX517ZR (874931, Leise) | |
| 1920x1080 Ultra High Preset + Raytracing AA:T AF:16x | |
| Acer Nitro 5 AN515-58-72QR (874931) | |
| Asus TUF Dash F15 FX517ZR (874931, dGPU, Turbo) | |
| MSI Delta 15 A5EFK | |
| Medio NVIDIA GeForce RTX 3070 Laptop GPU (33.1 - 123.1, n=23) | |
| Asus TUF Dash F15 FX517ZR (874931) | |
| Asus TUF Dash F15 FX517ZR (874931, Leise) | |
| Far Cry 5 | |
| 2560x1440 Ultra Preset AA:T | |
| Media de la clase Gaming (90 - 149, n=8, últimos 2 años) | |
| Medio NVIDIA GeForce RTX 3070 Laptop GPU (81 - 101, n=18) | |
| Asus TUF Dash F15 FX517ZR (dGPU, Turbo) | |
| Asus TUF Dash F15 FX517ZR | |
| Acer Nitro 5 AN515-58-72QR | |
| 1920x1080 Ultra Preset AA:T | |
| Asus TUF Dash F15 FX517ZR (dGPU, Turbo) | |
| Media de la clase Gaming (70 - 151, n=10, últimos 2 años) | |
| Medio NVIDIA GeForce RTX 3070 Laptop GPU (89 - 140, n=36) | |
| Asus TUF Dash F15 FX517ZR | |
| MSI Delta 15 A5EFK | |
| Acer Nitro 5 AN515-58-72QR | |
| Tiny Tina's Wonderlands | |
| 1920x1080 Badass Preset (DX12) | |
| Media de la clase Gaming (55 - 159.4, n=5, últimos 2 años) | |
| HP Omen 16-b1090ng | |
| Medio NVIDIA GeForce RTX 3070 Laptop GPU (81.5 - 96, n=4) | |
| Asus TUF Dash F15 FX517ZR | |
| 2560x1440 Badass Preset (DX12) | |
| Media de la clase Gaming (58.9 - 111.2, n=3, últimos 2 años) | |
| HP Omen 16-b1090ng | |
| Medio NVIDIA GeForce RTX 3070 Laptop GPU (57.2 - 66.1, n=3) | |
| Asus TUF Dash F15 FX517ZR | |
| Cyberpunk 2077 1.6 | |
| 1920x1080 Ultra Preset | |
| Medio NVIDIA GeForce RTX 3070 Laptop GPU (61.5 - 93, n=8) | |
| Asus TUF Dash F15 FX517ZR | |
| 2560x1440 Ultra Preset | |
| Medio NVIDIA GeForce RTX 3070 Laptop GPU (43.5 - 49.5, n=7) | |
| Asus TUF Dash F15 FX517ZR | |
| 1920x1080 Ray Tracing Ultra Preset (DLSS off) | |
| Medio NVIDIA GeForce RTX 3070 Laptop GPU (28.6 - 35.4, n=5) | |
| Asus TUF Dash F15 FX517ZR | |
Para comprobar si la velocidad de fotogramas se mantiene prácticamente constante durante un periodo de tiempo prolongado, dejamos que el juego The Witcher 3 funcionara durante unos 60 minutos a resolución Full HD y con los ajustes de máxima calidad. El personaje no se mueve. No se encontró una caída de la tasa de imágenes por segundo
The Witcher 3 FPS diagram
| bajo | medio | alto | ultra | QHD | |
|---|---|---|---|---|---|
| GTA V (2015) | 186.9 | 182.8 | 165.3 | 104 | 79.7 |
| The Witcher 3 (2015) | 289 | 169.6 | 148 | 86.7 | |
| Dota 2 Reborn (2015) | 164.1 | 152.8 | 142.7 | 110.3 | |
| Final Fantasy XV Benchmark (2018) | 158.6 | 110.5 | 85.7 | 65.1 | |
| X-Plane 11.11 (2018) | 141.2 | 125.2 | 100.2 | ||
| Far Cry 5 (2018) | 133 | 116 | 111 | 104 | 81 |
| Strange Brigade (2018) | 373 | 203 | 171.5 | 151.5 | 112.9 |
| F1 2021 (2021) | 298 | 210 | 178.7 | 98.1 | 74.1 |
| Cyberpunk 2077 1.6 (2022) | 117.5 | 100.1 | 81.3 | 68.6 | 43.8 |
| Tiny Tina's Wonderlands (2022) | 174.7 | 142.9 | 103.4 | 81.5 | 57.2 |
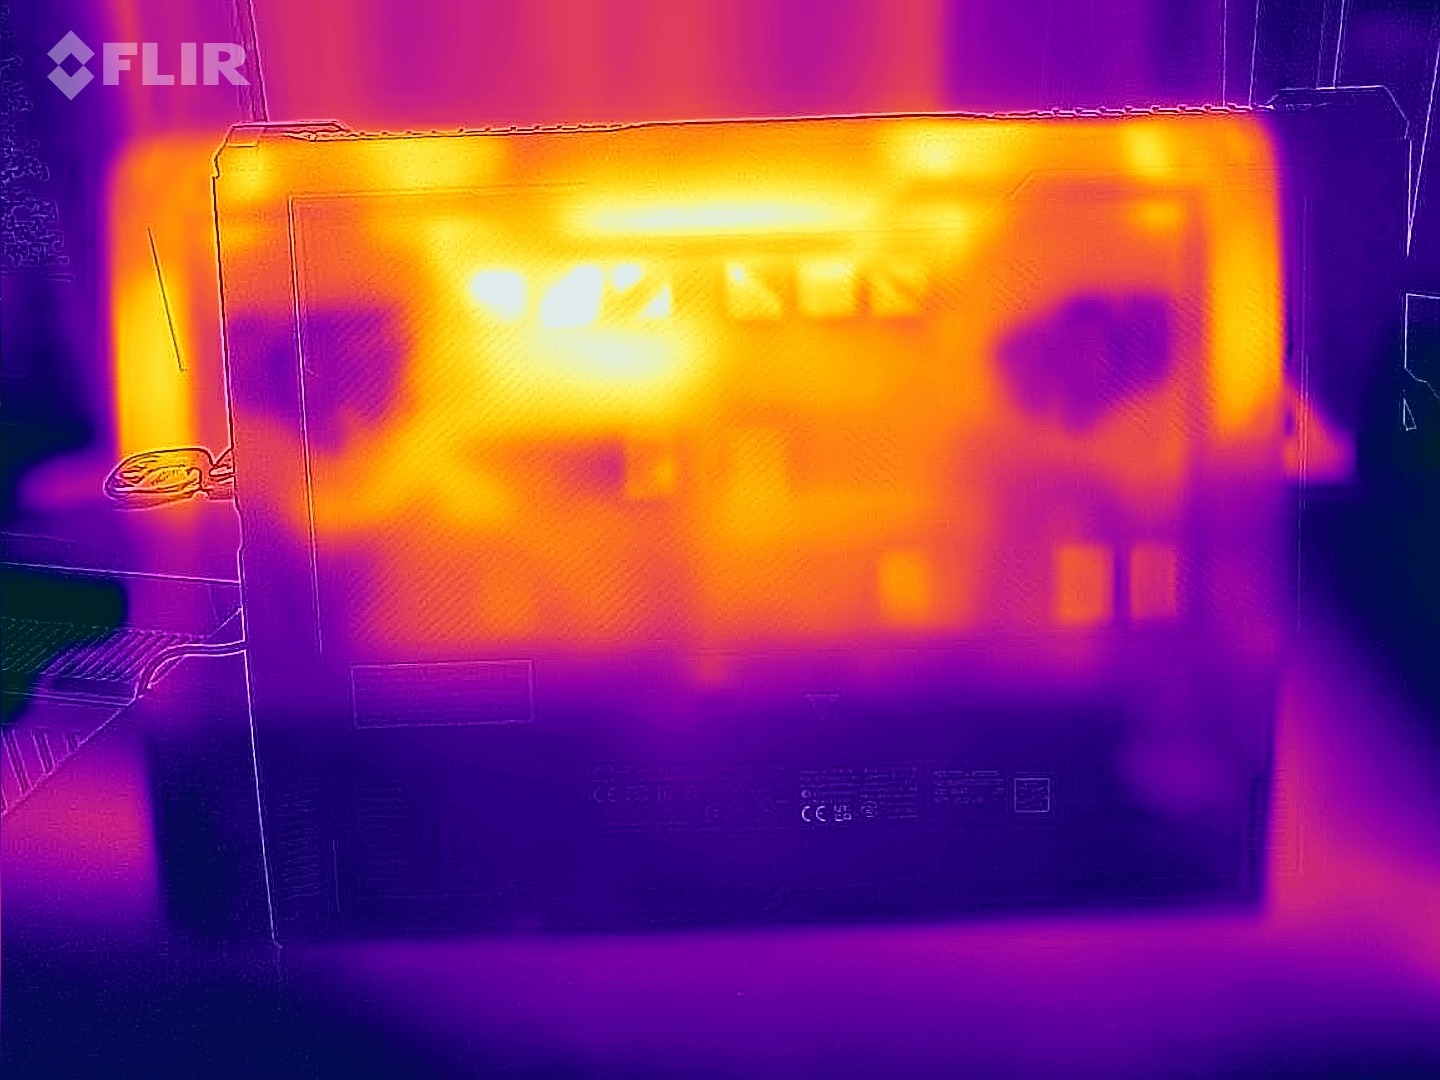
Emisiones - El FX517Z no genera un ruido excesivo
Emisiones acústicas
Los dos ventiladores sólo emiten poco ruido en el uso diario (oficina, Internet). Incluso se quedan quietos de vez en cuando. Sin embargo, la cosa se pone bastante ruidosa a plena carga con niveles máximos de presión sonora de 49 dB(A) (test de estrés) y 47 dB(A) (nuestro test The Witcher 3 ), respectivamente. Dicho esto, el FX517 se mantiene por debajo de los valores de la mayoría de sus rivales. Con todo, el ruido generado es soportable. El desarrollo del ruido bajo carga puede reducirse utilizando el perfil "Quiet", a costa del rendimiento.
Ruido
| Ocioso |
| 26 / 32 / 33 dB(A) |
| Carga |
| 48 / 49 dB(A) |
 | ||
30 dB silencioso 40 dB(A) audible 50 dB(A) ruidosamente alto |
||
min: | ||
| Asus TUF Dash F15 FX517ZR GeForce RTX 3070 Laptop GPU, i7-12650H, Samsung PM991a MZVLQ1T0HBLB | Acer Nitro 5 AN515-58-72QR GeForce RTX 3070 Ti Laptop GPU, i7-12700H, Samsung PM9A1 MZVL21T0HCLR | HP Omen 16-b1090ng GeForce RTX 3070 Ti Laptop GPU, i7-12700H, WDC PC SN810 1TB | MSI Delta 15 A5EFK Radeon RX 6700M, R9 5900HX, Micron 2210 MTFDHBA1T0QFD | Razer Blade 15 Base Edition 2021, i7-10750H RTX 3060 GeForce RTX 3060 Laptop GPU, i7-10750H, Samsung SSD PM981a MZVLB512HBJQ | |
|---|---|---|---|---|---|
| Noise | -1% | -6% | -2% | 9% | |
| apagado / medio ambiente * (dB) | 26 | 26 -0% | 26 -0% | 25 4% | 25.3 3% |
| Idle Minimum * (dB) | 26 | 26 -0% | 30 -15% | 25 4% | 25.4 2% |
| Idle Average * (dB) | 32 | 29 9% | 31 3% | 30 6% | 25.4 21% |
| Idle Maximum * (dB) | 33 | 33 -0% | 33 -0% | 40 -21% | 25.4 23% |
| Load Average * (dB) | 48 | 47 2% | 49 -2% | 47 2% | 42.5 11% |
| Witcher 3 ultra * (dB) | 47 | 53 -13% | 53 -13% | 48 -2% | 42 11% |
| Load Maximum * (dB) | 49 | 53 -8% | 57 -16% | 51 -4% | 52.2 -7% |
* ... más pequeño es mejor
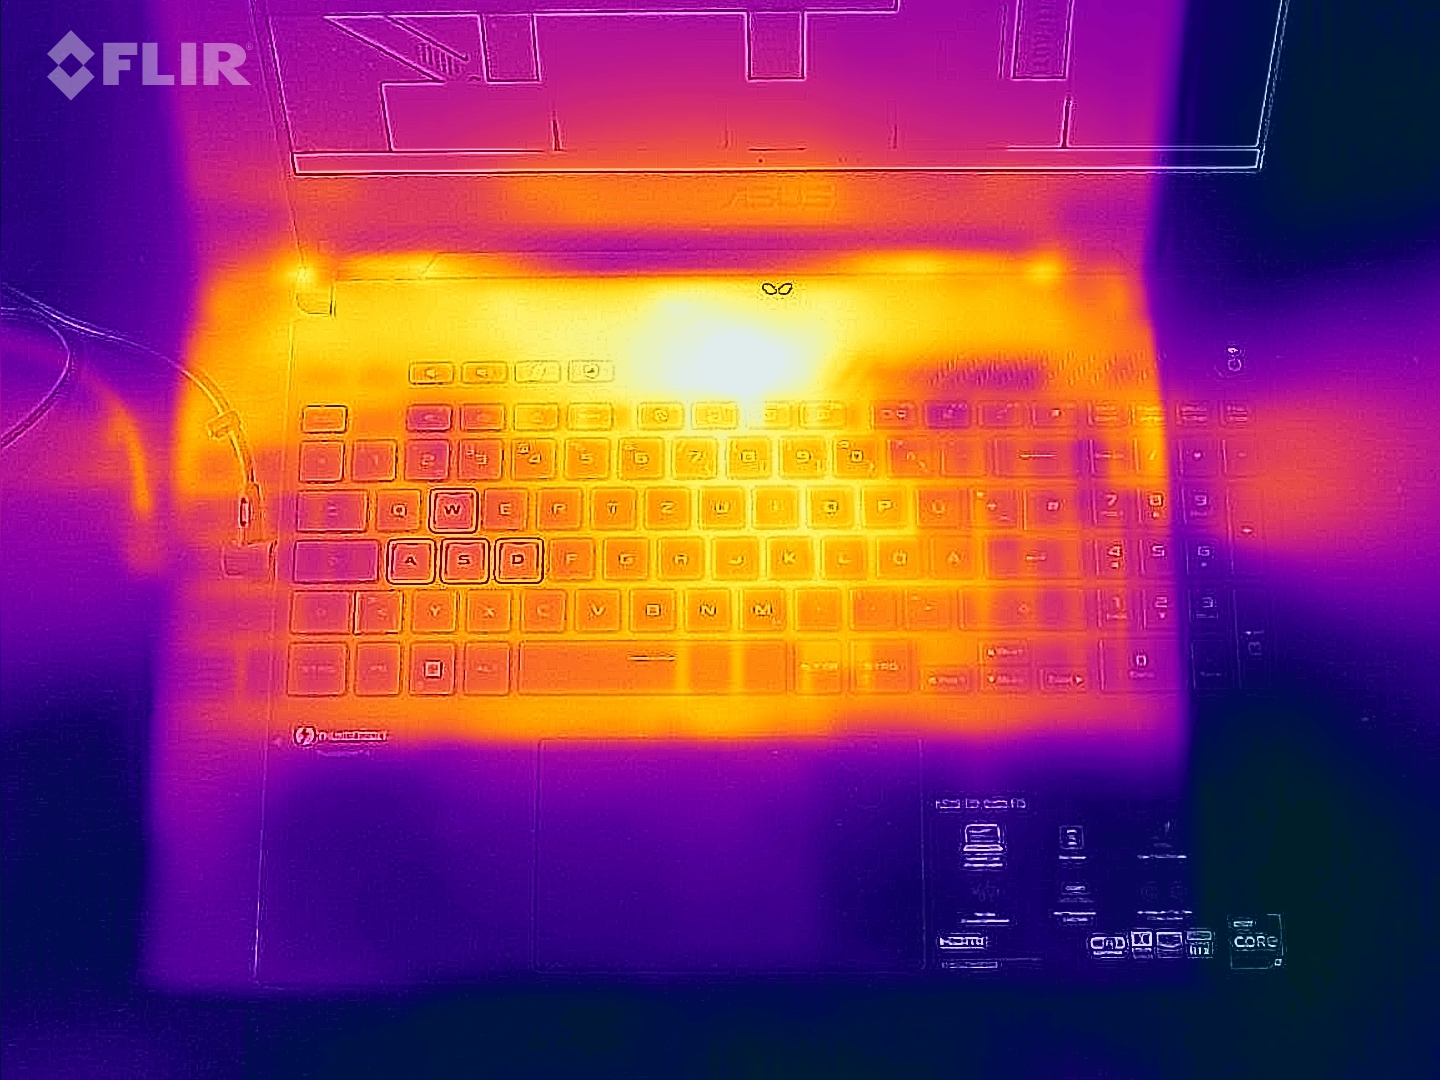
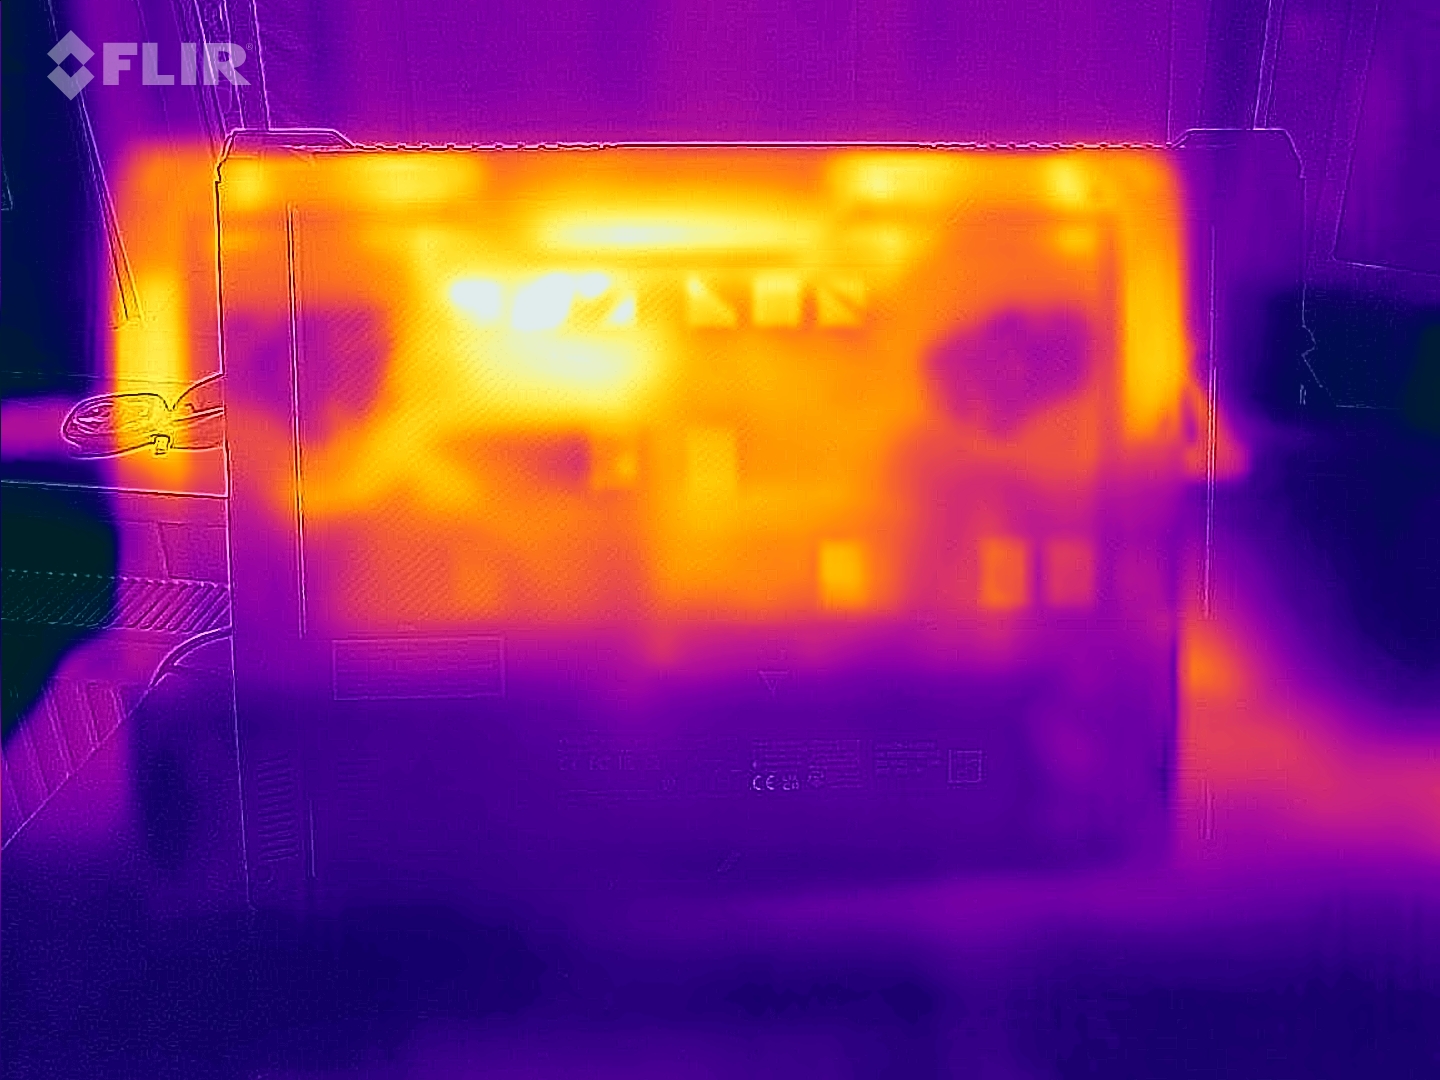
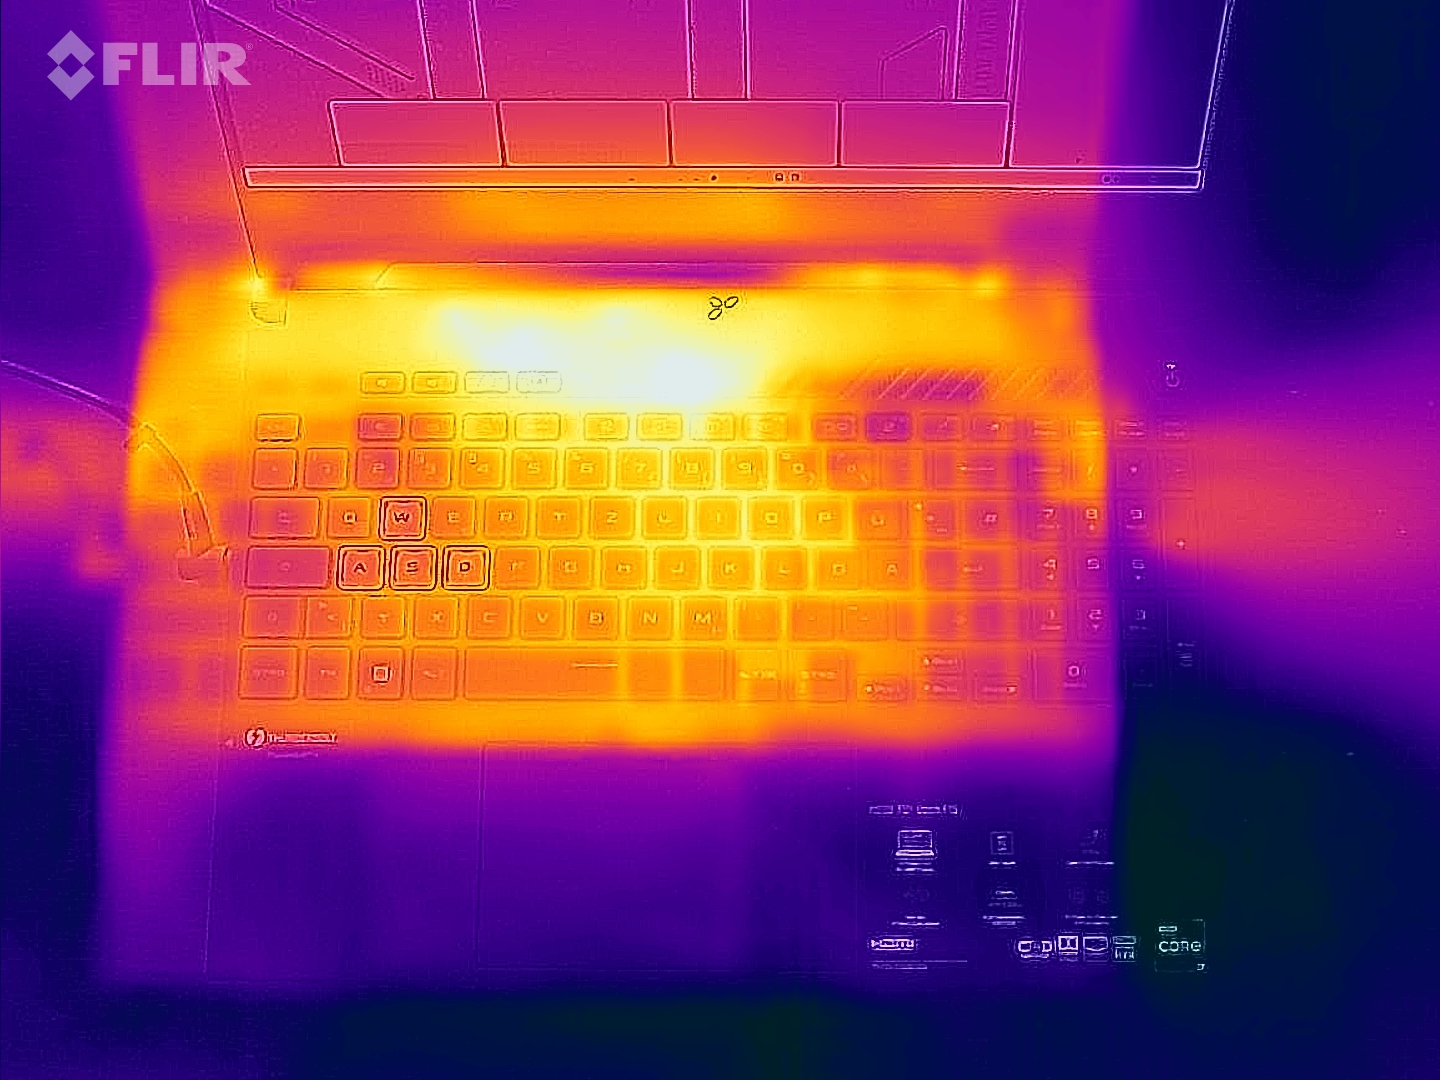
Temperatura
Las temperaturas de la carcasa se mantienen dentro de un rango aceptable en el uso diario (oficina, Internet). El portátil se calienta notablemente bajo carga (test de estrés, The Witcher 3 ), pero no excesivamente. Las temperaturas de la CPU no son motivo de preocupación
(-) La temperatura máxima en la parte superior es de 52 °C / 126 F, frente a la media de 40.4 °C / 105 F, que oscila entre 21.2 y 68.8 °C para la clase Gaming.
(-) El fondo se calienta hasta un máximo de 52 °C / 126 F, frente a la media de 43.2 °C / 110 F
(±) En reposo, la temperatura media de la parte superior es de 32.1 °C / 90# F, frente a la media del dispositivo de 33.9 °C / 93 F.
(-) Jugando a The Witcher 3, la temperatura media de la parte superior es de 45.3 °C / 114 F, frente a la media del dispositivo de 33.9 °C / 93 F.
(±) El reposamanos y el touchpad pueden calentarse mucho al tacto con un máximo de 39 °C / 102.2 F.
(-) La temperatura media de la zona del reposamanos de dispositivos similares fue de 28.8 °C / 83.8 F (-10.2 °C / -18.4 F).
| Asus TUF Dash F15 FX517ZR Intel Core i7-12650H, NVIDIA GeForce RTX 3070 Laptop GPU | Acer Nitro 5 AN515-58-72QR Intel Core i7-12700H, NVIDIA GeForce RTX 3070 Ti Laptop GPU | HP Omen 16-b1090ng Intel Core i7-12700H, NVIDIA GeForce RTX 3070 Ti Laptop GPU | MSI Delta 15 A5EFK AMD Ryzen 9 5900HX, AMD Radeon RX 6700M | Razer Blade 15 Base Edition 2021, i7-10750H RTX 3060 Intel Core i7-10750H, NVIDIA GeForce RTX 3060 Laptop GPU | |
|---|---|---|---|---|---|
| Heat | 4% | 14% | 5% | 4% | |
| Maximum Upper Side * (°C) | 52 | 48 8% | 41 21% | 50 4% | 45.2 13% |
| Maximum Bottom * (°C) | 52 | 51 2% | 62 -19% | 55 -6% | 48 8% |
| Idle Upper Side * (°C) | 33 | 34 -3% | 25 24% | 31 6% | 34.4 -4% |
| Idle Bottom * (°C) | 36 | 33 8% | 26 28% | 30 17% | 37.2 -3% |
* ... más pequeño es mejor
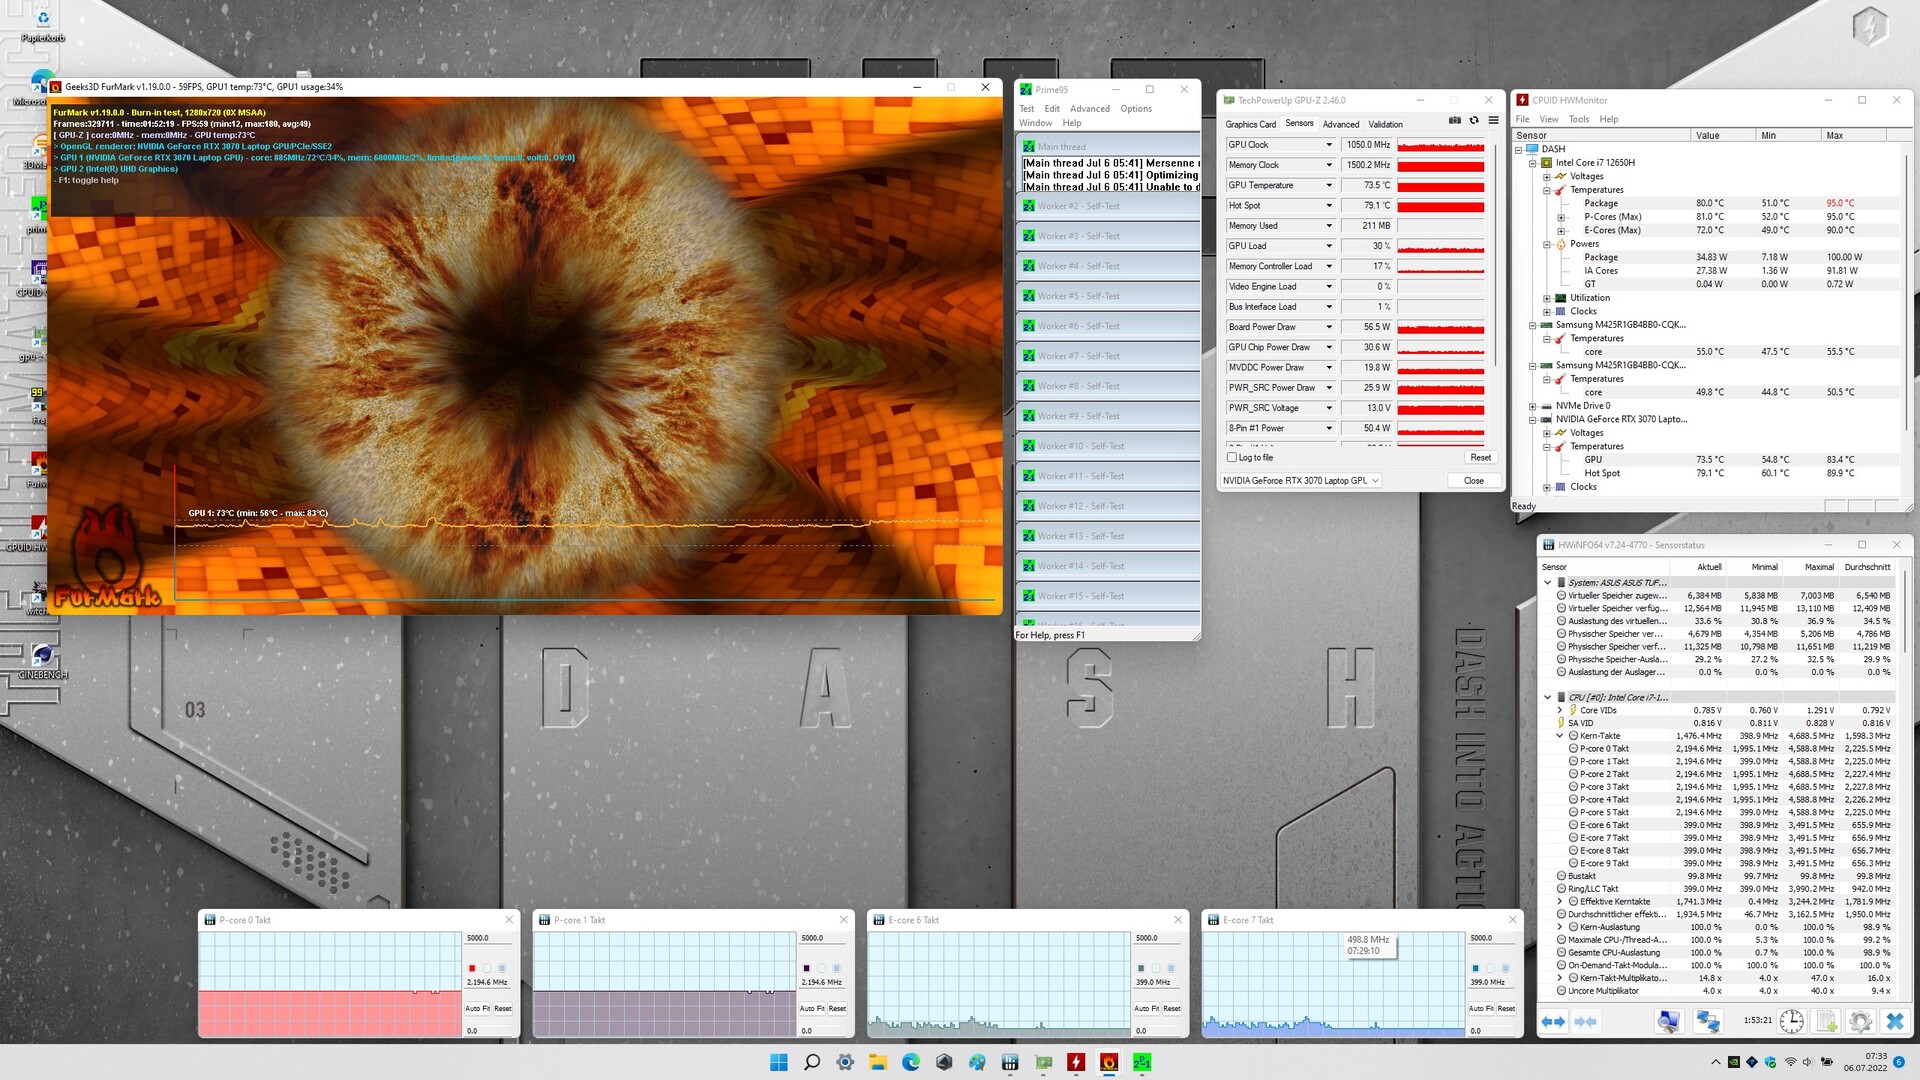
Prueba de esfuerzo
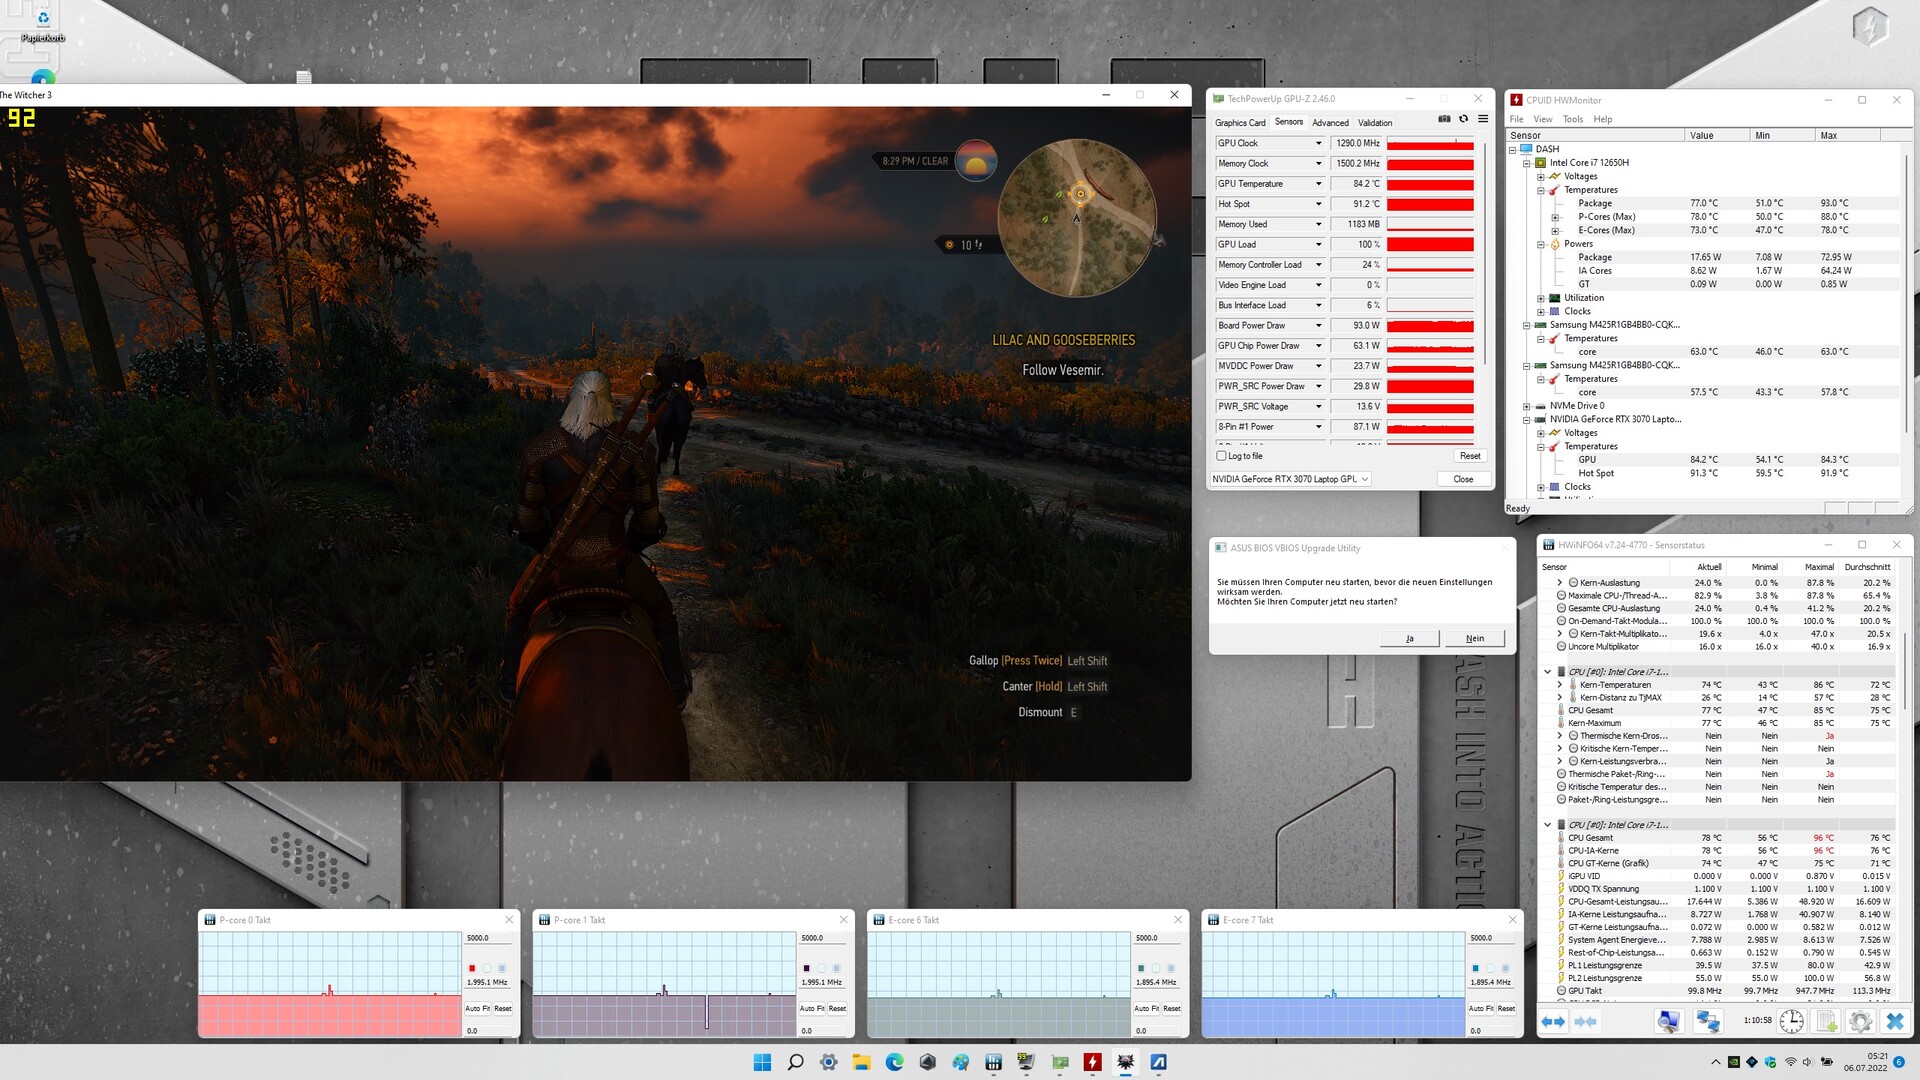
La CPU procesa la prueba de estrés (Prime95 y FurMark se ejecutan durante al menos una hora) a bajas velocidades de reloj (núcleos P: aprox. 2,2 GHz; núcleos E: aprox. 0,4 GHz). La GPU funciona a velocidades cercanas a los 1.050 MHz. La prueba de estrés representa un escenario extremo. Utilizamos esta prueba para comprobar que el sistema se mantiene estable a plena carga
Altavoces
Los altavoces estéreo producen un sonido decente que apenas puede presentar bajos. Se recomienda el uso de auriculares o altavoces externos para una mejor experiencia de sonido
Asus TUF Dash F15 FX517ZR análisis de audio
(±) | la sonoridad del altavoz es media pero buena (79 dB)
Graves 100 - 315 Hz
(-) | casi sin bajos - de media 19.2% inferior a la mediana
(±) | la linealidad de los graves es media (9.6% delta a frecuencia anterior)
Medios 400 - 2000 Hz
(+) | medios equilibrados - a sólo 2.7% de la mediana
(+) | los medios son lineales (5% delta a la frecuencia anterior)
Altos 2 - 16 kHz
(+) | máximos equilibrados - a sólo 2.2% de la mediana
(±) | la linealidad de los máximos es media (7.7% delta a frecuencia anterior)
Total 100 - 16.000 Hz
(±) | la linealidad del sonido global es media (15.3% de diferencia con la mediana)
En comparación con la misma clase
» 34% de todos los dispositivos probados de esta clase eran mejores, 6% similares, 60% peores
» El mejor tuvo un delta de 6%, la media fue 18%, el peor fue ###max##%
En comparación con todos los dispositivos probados
» 22% de todos los dispositivos probados eran mejores, 4% similares, 74% peores
» El mejor tuvo un delta de 4%, la media fue 24%, el peor fue ###max##%
Acer Nitro 5 AN515-58-72QR análisis de audio
(±) | la sonoridad del altavoz es media pero buena (77 dB)
Graves 100 - 315 Hz
(±) | lubina reducida - en promedio 14.4% inferior a la mediana
(±) | la linealidad de los graves es media (12.8% delta a frecuencia anterior)
Medios 400 - 2000 Hz
(+) | medios equilibrados - a sólo 1.2% de la mediana
(+) | los medios son lineales (3.2% delta a la frecuencia anterior)
Altos 2 - 16 kHz
(±) | máximos más altos - de media 5.4% más altos que la mediana
(±) | la linealidad de los máximos es media (10.4% delta a frecuencia anterior)
Total 100 - 16.000 Hz
(±) | la linealidad del sonido global es media (15.8% de diferencia con la mediana)
En comparación con la misma clase
» 37% de todos los dispositivos probados de esta clase eran mejores, 7% similares, 56% peores
» El mejor tuvo un delta de 6%, la media fue 18%, el peor fue ###max##%
En comparación con todos los dispositivos probados
» 24% de todos los dispositivos probados eran mejores, 5% similares, 71% peores
» El mejor tuvo un delta de 4%, la media fue 24%, el peor fue ###max##%
Gestión de la energía: el portátil Asus ofrece una duración de la batería pasable
Consumo de energía
El consumo general de energía es normal para el hardware instalado aquí. Nuestra prueba The Witcher 3 y la prueba de estrés hacen que el consumo de energía aumente hasta una media de 138,6 vatios y hasta 189 vatios, respectivamente. Mientras que nuestra prueba The Witcher 3 se ejecuta con un consumo de energía constante, fluctúa en el transcurso de la prueba de estrés. El adaptador de corriente incluido es suficientemente potente gracias a su potencia nominal de 200 vatios
| Off / Standby | |
| Ocioso | |
| Carga |
|
Clave:
min: | |
| Asus TUF Dash F15 FX517ZR i7-12650H, GeForce RTX 3070 Laptop GPU, Samsung PM991a MZVLQ1T0HBLB, IPS, 2560x1440, 15.6" | Acer Nitro 5 AN515-58-72QR i7-12700H, GeForce RTX 3070 Ti Laptop GPU, Samsung PM9A1 MZVL21T0HCLR, IPS, 2560x1440, 15.6" | HP Omen 16-b1090ng i7-12700H, GeForce RTX 3070 Ti Laptop GPU, WDC PC SN810 1TB, IPS, 2560x1440, 16.1" | MSI Delta 15 A5EFK R9 5900HX, Radeon RX 6700M, Micron 2210 MTFDHBA1T0QFD, IPS-Level, 1920x1080, 15.6" | Razer Blade 15 Base Edition 2021, i7-10750H RTX 3060 i7-10750H, GeForce RTX 3060 Laptop GPU, Samsung SSD PM981a MZVLB512HBJQ, IPS, 1920x1080, 15.6" | Medio NVIDIA GeForce RTX 3070 Laptop GPU | Media de la clase Gaming | |
|---|---|---|---|---|---|---|---|
| Power Consumption | -9% | 9% | -15% | -10% | -30% | -23% | |
| Idle Minimum * (Watt) | 10 | 7 30% | 4 60% | 10 -0% | 11.7 -17% | 15.6 ? -56% | 13.3 ? -33% |
| Idle Average * (Watt) | 14 | 15 -7% | 10 29% | 18 -29% | 16 -14% | 20.1 ? -44% | 19 ? -36% |
| Idle Maximum * (Watt) | 20 | 24 -20% | 19 5% | 25 -25% | 29.3 -47% | 29.4 ? -47% | 24.5 ? -23% |
| Load Average * (Watt) | 122 | 124 -2% | 114 7% | 101 17% | 95.6 22% | 110.8 ? 9% | 108.1 ? 11% |
| Witcher 3 ultra * (Watt) | 138.6 | 195.1 -41% | 183.2 -32% | 187 -35% | 141.3 -2% | ||
| Load Maximum * (Watt) | 189 | 220 -16% | 221 -17% | 217 -15% | 197 -4% | 214 ? -13% | 254 ? -34% |
* ... más pequeño es mejor
Energy consumption during The Witcher 3 / stress test
Energy consumption with an external monitor
Duración de la batería
El portátil de 15,6 pulgadas logra duraciones de 6:57 horas y 5:46 horas, respectivamente, en la prueba Wi-Fi (acceso a sitios web a través de un script) y la prueba de vídeo (cortometraje Big Buck Bunny (codificación H.264, Full HD) ejecutado en bucle). Las funciones de ahorro de energía del portátil están desactivadas durante ambas pruebas, y el brillo de la pantalla está ajustado a unos 150 cd/m². Además, los módulos inalámbricos están desactivados para la prueba de vídeo.
En general, el portátil ofrece unos tiempos de ejecución aceptables, pero queda por detrás de los muy buenos índices del predecesorque tiene la misma capacidad de batería. Las razones de esto se pueden identificar rápidamente: El FX517 tiene un procesador Alder Lake que generalmente consume mucha energía debido a sus seis núcleos de CPU adicionales, así como la pantalla QHD.
| Asus TUF Dash F15 FX517ZR i7-12650H, GeForce RTX 3070 Laptop GPU, 76 Wh | Acer Nitro 5 AN515-58-72QR i7-12700H, GeForce RTX 3070 Ti Laptop GPU, 57.5 Wh | HP Omen 16-b1090ng i7-12700H, GeForce RTX 3070 Ti Laptop GPU, 83 Wh | MSI Delta 15 A5EFK R9 5900HX, Radeon RX 6700M, 82 Wh | Razer Blade 15 Base Edition 2021, i7-10750H RTX 3060 i7-10750H, GeForce RTX 3060 Laptop GPU, 65 Wh | Media de la clase Gaming | |
|---|---|---|---|---|---|---|
| Duración de Batería | -40% | -14% | -5% | -31% | -3% | |
| Reader / Idle (h) | 10.8 | 5.7 -47% | 10.1 -6% | 11.1 3% | 7.8 -28% | 8.71 ? -19% |
| H.264 (h) | 5.8 | 4.7 -19% | 8.26 ? 42% | |||
| WiFi v1.3 (h) | 7 | 3.9 -44% | 5.6 -20% | 7.9 13% | 4.8 -31% | 7.01 ? 0% |
| Load (h) | 2.3 | 1.2 -48% | 1.9 -17% | 1.6 -30% | 1.5 -35% | 1.47 ? -36% |
Pro
Contra
Veredicto - Portátil para juegos

El Asus TUF Dash F15 está hecho para aplicaciones de alto rendimiento como la edición de vídeo, el renderizado y los juegos. El portátil puede gestionar esto último en resolución QHD y con ajustes altos o máximos. Sin embargo, el foco no está en el máximo rendimiento, sino que se trata de un compromiso entre rendimiento y portabilidad
El Asus TUF Dash F15 FX517ZR es un portátil de juegos ligero y portátil. El dispositivo no está diseñado para el máximo rendimiento.
ElCore i7-12650Hy laGeForce RTX 3070 son sólidos componentes de hardware de gama media alta, y pueden funcionar a velocidades de reloj consistentemente altas. Las tasas de rendimiento de la GPU están en la media de todos los portátiles RTX 3070 probados hasta ahora en el mejor de los casos (modo dGPU) - esto se debe al relativamente bajo TGP de 105 vatios.
El portátil pesa unos 2 kg; consigue duraciones en el mundo real de 6 a 7 horas con su batería de 76 Wh - tasas muy respetables, pero no increíbles. Bien: La batería puede cargarse con un adaptador de corriente universal USB-C (mín. 45 vatios, 20 voltios). Esto significa que el adaptador de corriente de 200 vatios no tiene que llevarse necesariamente.
La pantalla mate QHD (15.6 pulgadas, IPS, 165 Hz) causó una buena impresión en su mayor parte. Sólo el brillo es demasiado bajo. Un puerto Thunderbolt 4 abre opciones de expansión en forma de solución de anclaje o una GPU externa.
Una alternativa al F15 sería el MSI Delta 15. Su peso, compacidad y nivel de rendimiento están más o menos a la par con los del portátil Asus, pero el modelo MSI ofrece una duración de batería ligeramente mejor. Los puntos débiles: No hay puerto Thunderbolt, y las opciones de mantenimiento no son convincentes.
Precio y disponibilidad
En el momento de escribir este artículo, la configuración predominante del Asus TUF Dash F15 en los Estados Unidos que está equipado con el Core i7-12650H y la GeForce RTX 3070, está apoyado por 16 GB de RAM DDR5, 512 GB de almacenamiento SSD, y una pantalla de 15,6" Full HD 144 Hz. Puedes encontrar este modelo en la tienda online de Best Buy por 1.499 dólares. En el momento de publicar nuestro análisis, Best Buy lo tiene a 1.299 dólares (200 dólares de descuento).
También puedes buscar otras configuraciones posibles en Amazon.
Asus TUF Dash F15 FX517ZR
- 07/26/2022 v7 (old)
Sascha Mölck
Price comparison

