Análisis del Schenker XMG Fusion 15 (Mid 22): Portátil ligero RTX 3070 con buena duración de batería
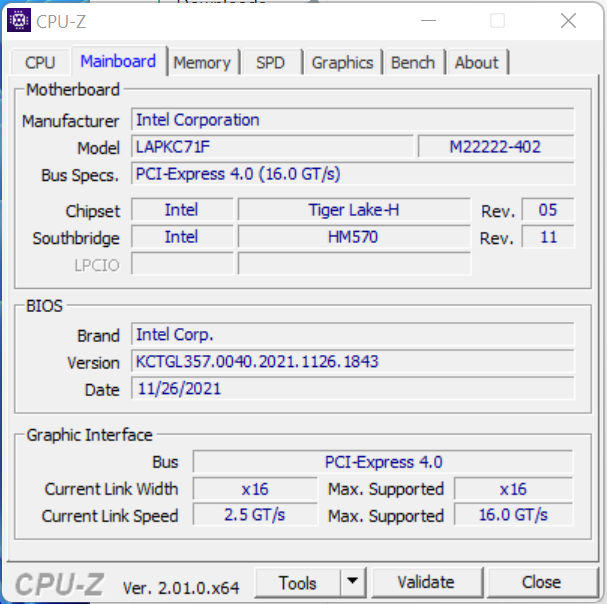
El Schenker XMG Fusion 15 es principalmente un portátil para juegos, pero también está diseñado para el sector creativo. El dispositivo ofrece un compromiso entre rendimiento, tamaño reducido y portabilidad: hardware de gama alta (Core i7-11800H,GeForce Portátil RTX 3070) se combina con una batería de 93 Wh y se introduce en una carcasa compacta. Todo el conjunto pesa algo menos de 2 kg. Un barebone de Intel (NUC X15 Laptop Kit C71FBF) sirve de base para el Fusion.
Sus competidores son dispositivos igualmente compactos y ligeros, como el Razer Blade 15 modelo basey elMSI Delta 15y elAsus TUF Dash F15 FX517ZR. El grupo más amplio de competidores incluye portátiles como el Acer Nitro 5 AN515-58y el HP Omen 16.
Posibles contendientes en la comparación
Valoración | Fecha | Modelo | Peso | Altura | Tamaño | Resolución | Precio |
|---|---|---|---|---|---|---|---|
| 87.4 % v7 (old) | 08/2022 | Schenker XMG Fusion 15 (Mid 22) i7-11800H, GeForce RTX 3070 Laptop GPU | 1.9 kg | 21.65 mm | 15.60" | 2560x1440 | |
| 85.8 % v7 (old) | 07/2022 | Asus TUF Dash F15 FX517ZR i7-12650H, GeForce RTX 3070 Laptop GPU | 2 kg | 20.7 mm | 15.60" | 2560x1440 | |
| 84 % v7 (old) | 06/2022 | Acer Nitro 5 AN515-58-72QR i7-12700H, GeForce RTX 3070 Ti Laptop GPU | 2.5 kg | 26.8 mm | 15.60" | 2560x1440 | |
| 85.5 % v7 (old) | 05/2022 | HP Omen 16-b1090ng i7-12700H, GeForce RTX 3070 Ti Laptop GPU | 2.3 kg | 23 mm | 16.10" | 2560x1440 | |
| 82.9 % v7 (old) | 10/2021 | MSI Delta 15 A5EFK R9 5900HX, Radeon RX 6700M | 2 kg | 19 mm | 15.60" | 1920x1080 | |
| 85.5 % v7 (old) | 03/2021 | Razer Blade 15 Base Edition 2021, i7-10750H RTX 3060 i7-10750H, GeForce RTX 3060 Laptop GPU | 2.1 kg | 19.9 mm | 15.60" | 1920x1080 |
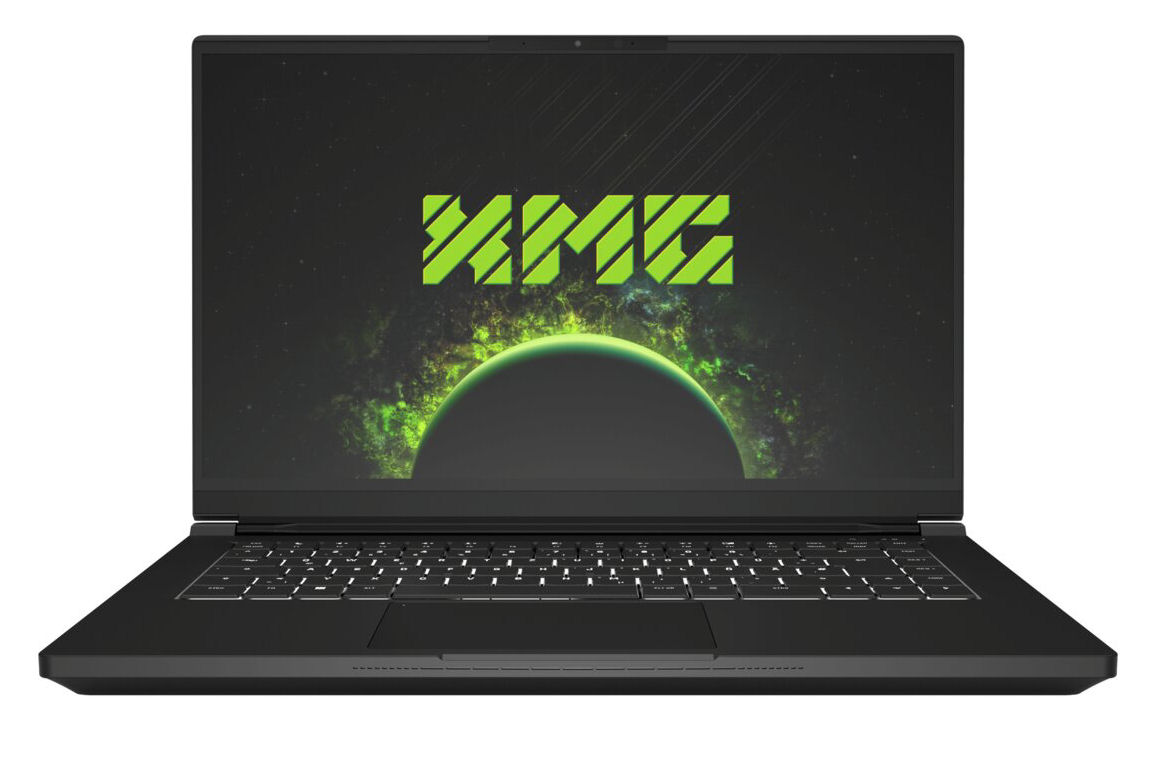
Caja - Un chasis de magnesio para el Fusion
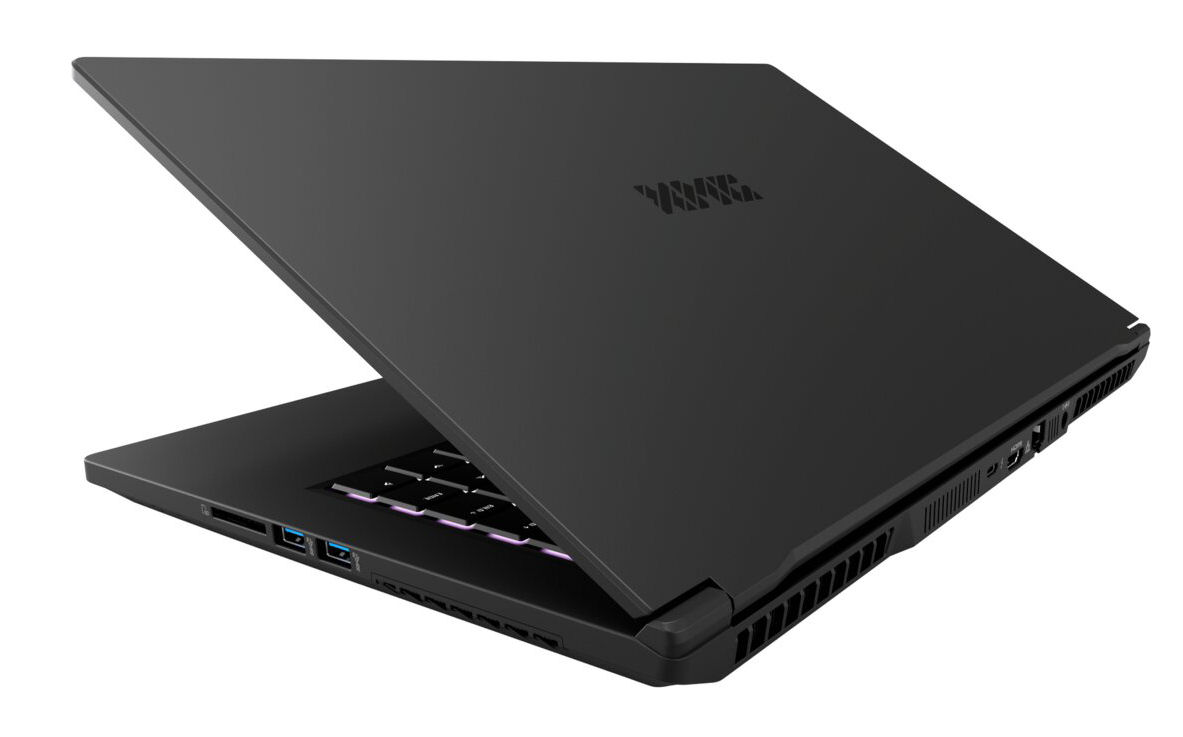
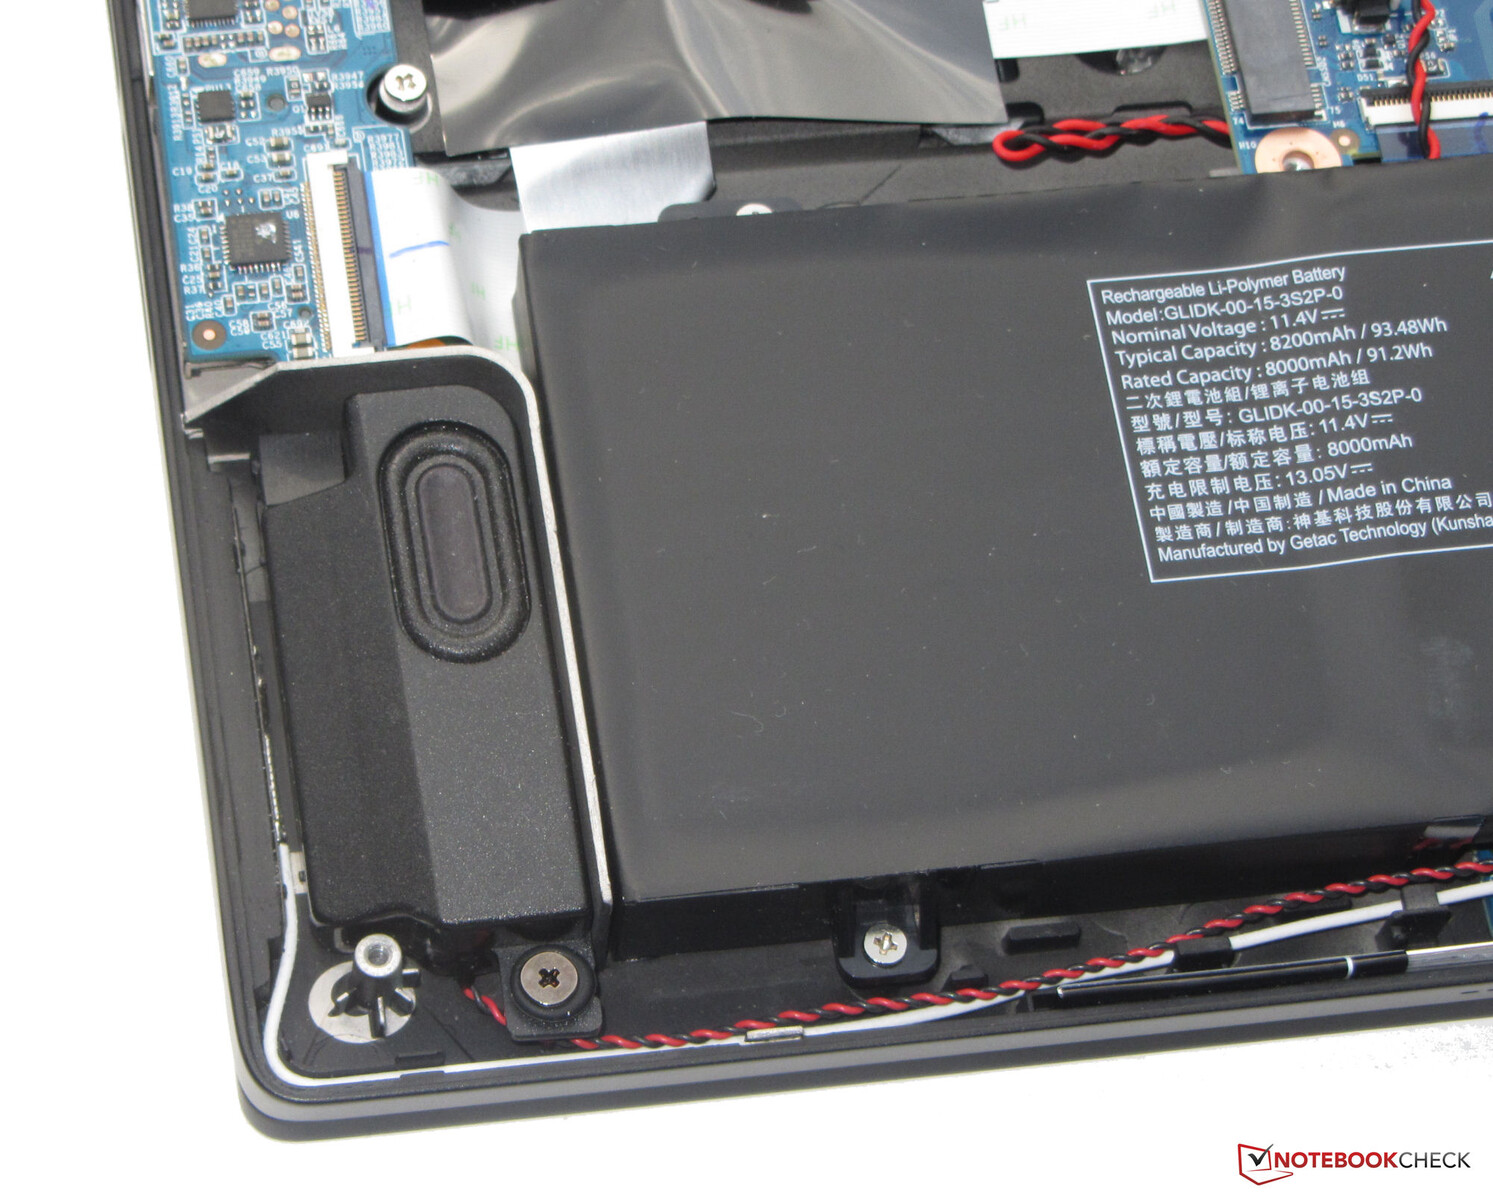
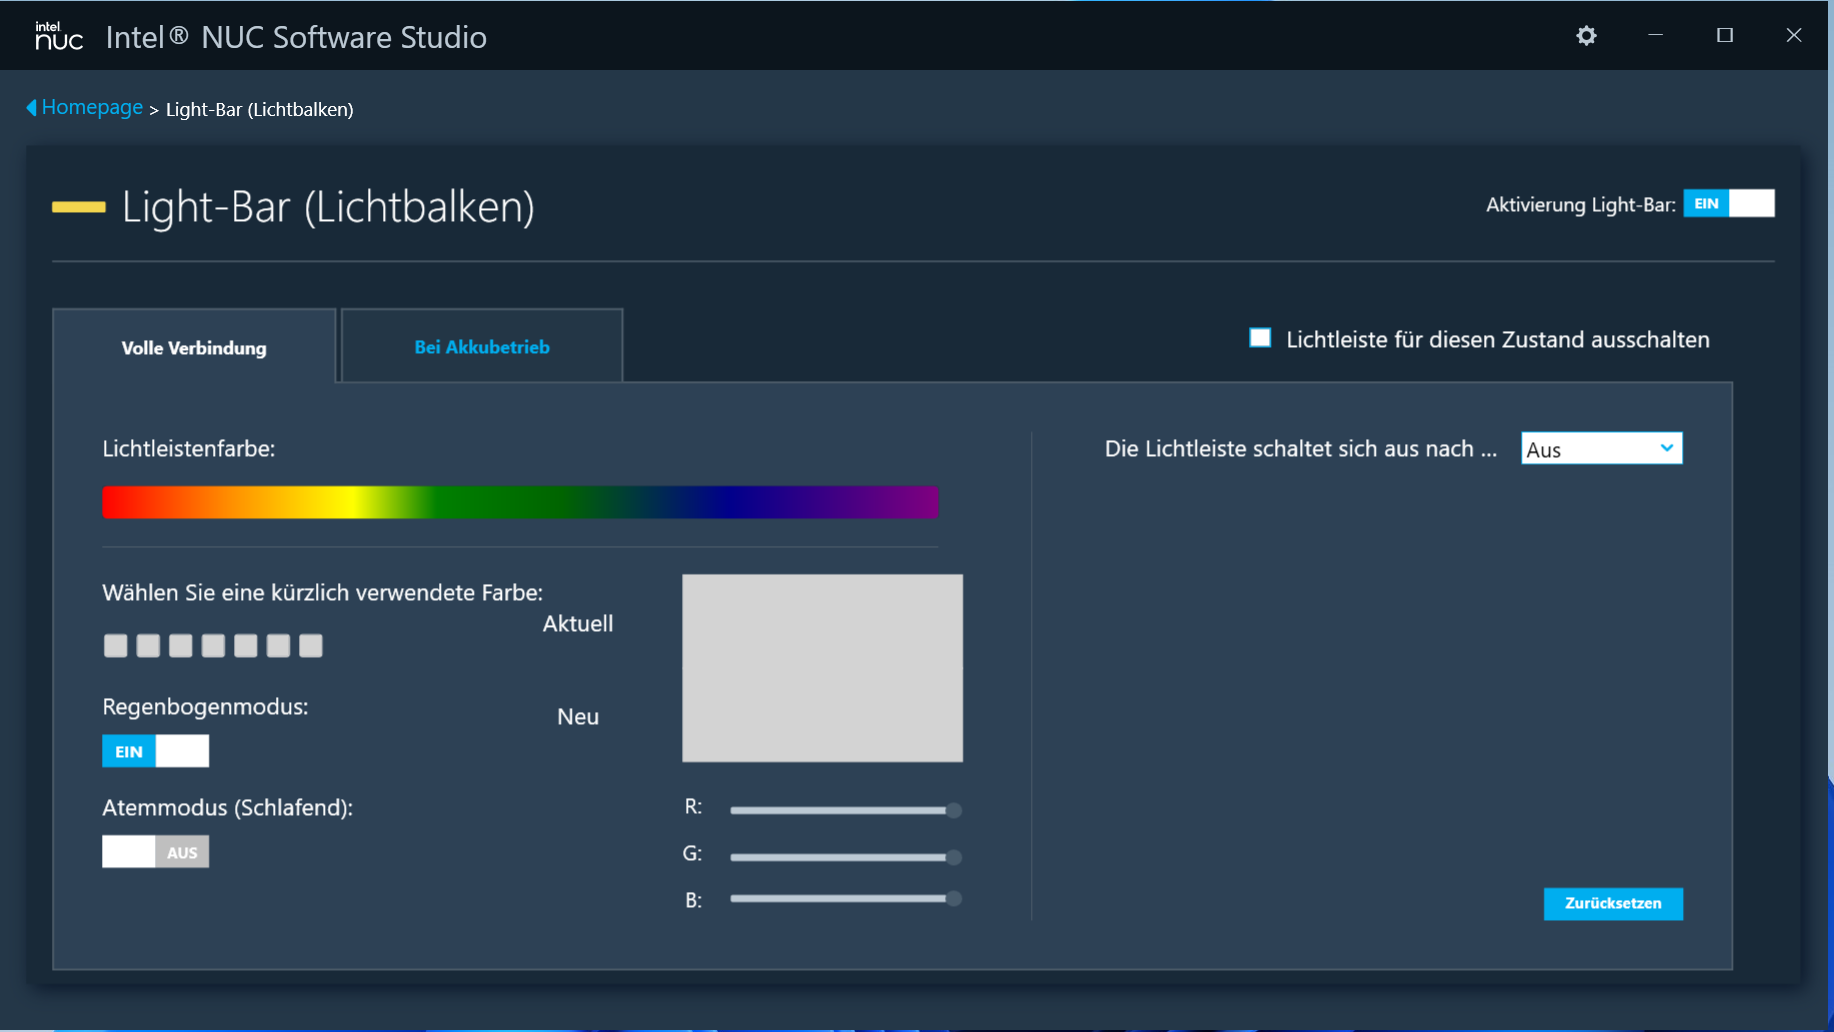
La carcasa negra mate está fabricada con una aleación de magnesio y ofrece un diseño elegante y sin florituras. Schenker opta por superficies lisas. Una tira de LED configurable (RGB) en el lado de la carcasa que está orientado hacia el usuario proporciona algo de color además de la iluminación del teclado. La batería está integrada en el dispositivo (atornillada, no pegada). Se puede acceder al interior tras retirar la tapa inferior.
El portátil no presenta ningún defecto de fabricación. Las dimensiones de los huecos son precisas, y no se encuentran salientes de material. La unidad base apenas se puede doblar, pero la tapa sí. Las bisagras mantienen la tapa firmemente en posición, y el ángulo máximo de apertura es de 180 grados. Es posible abrir la tapa con una sola mano.
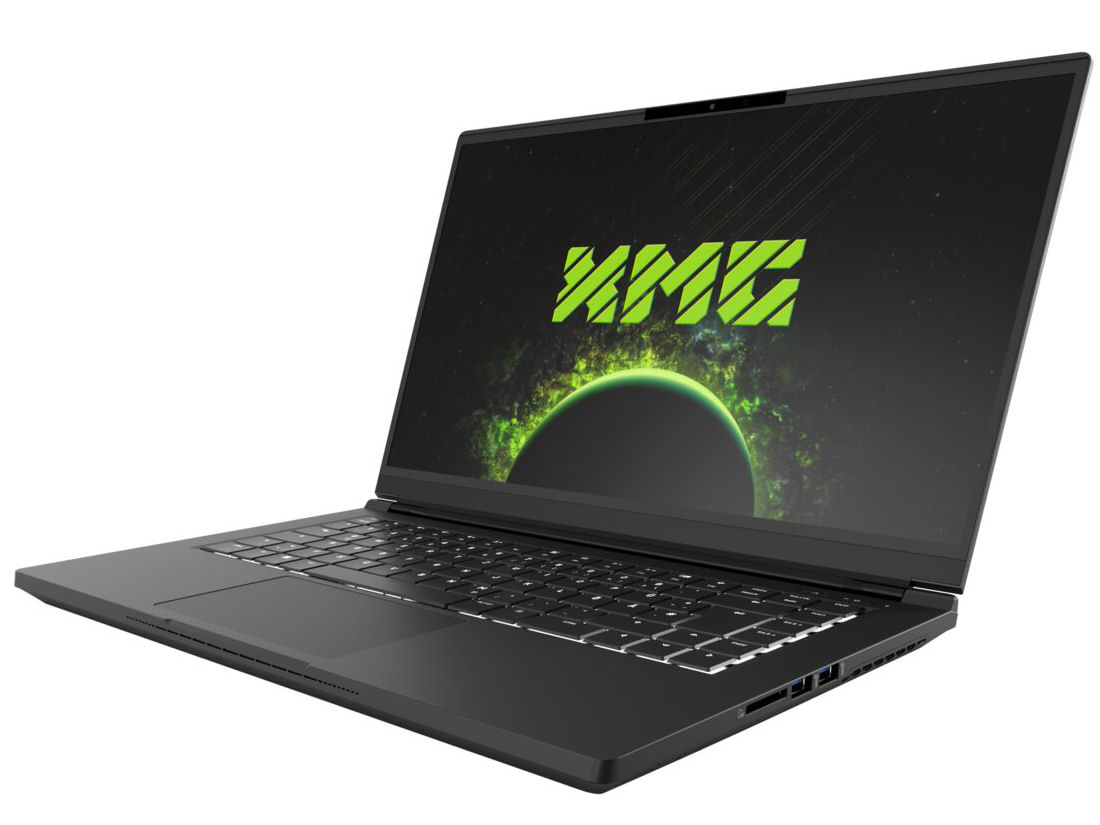

El Fusion no puede igualar las dimensiones compactas del Blade 15pero rebaja su peso en unos 200 gramos. Esto lo convierte en el dispositivo más ligero de la comparativa
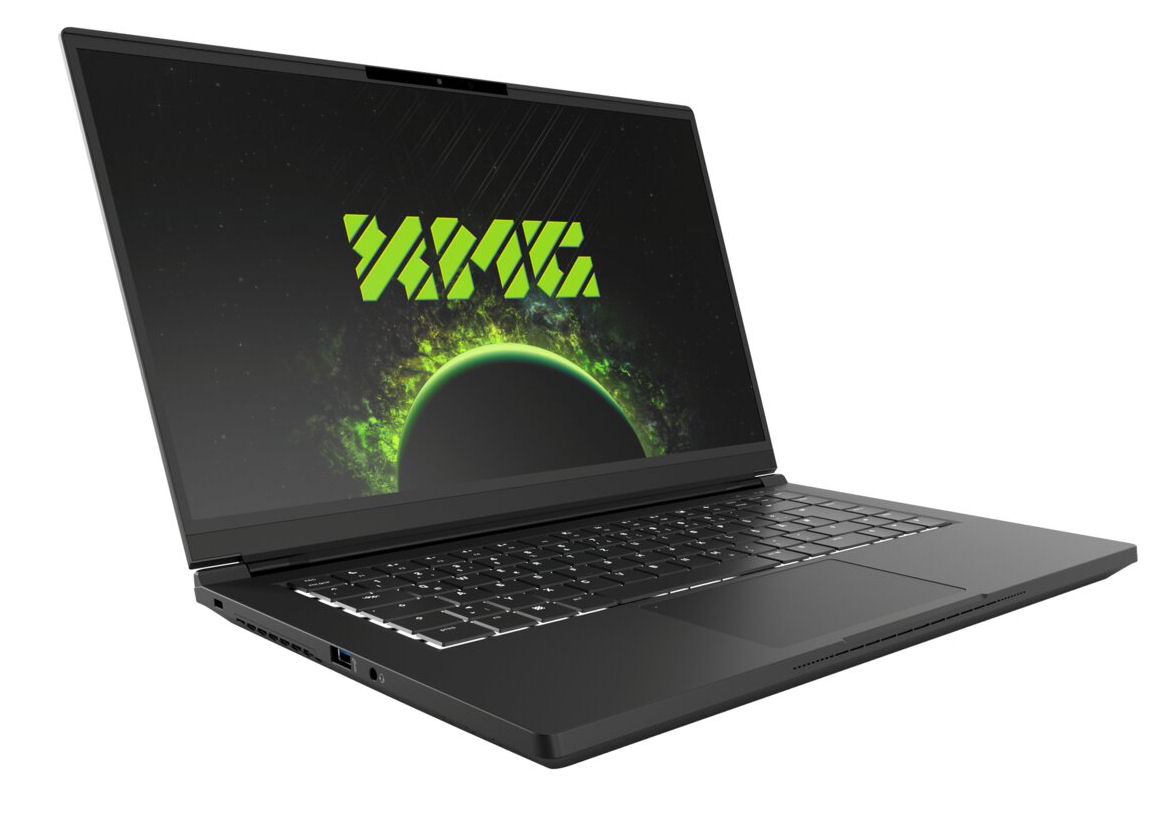
Conectividad - XMG 15 equipado con Thunderbolt 4
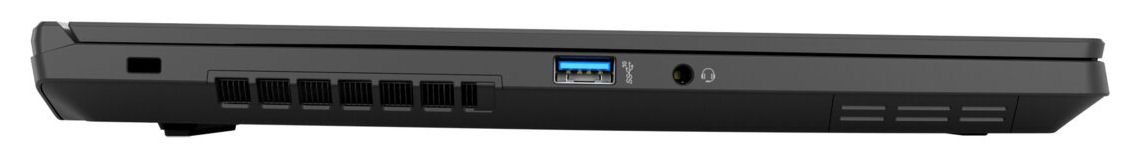
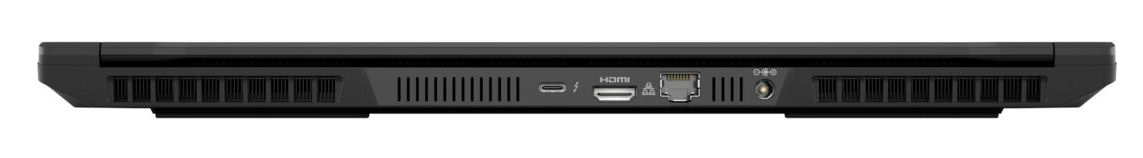
El Fusion tiene tres puertos USB-A (USB 3.2 Gen 2) y un puerto USB-C (Thunderbolt 4). Este último soporta DisplayPort vía USB-C. En total, el portátil ofrece dos salidas de vídeo (1x DP, 1x HDMI). Además, hay una clavija de audio combinada, un puerto Gigabit Ethernet y una ranura para un bloqueo de cable.
Los puertos están distribuidos en tres lados del portátil. Bien: Las salidas de vídeo, el puerto Ethernet y la conexión de alimentación se encuentran en la parte trasera del dispositivo. Por tanto, los cables correspondientes van hacia la parte trasera y no estorban.
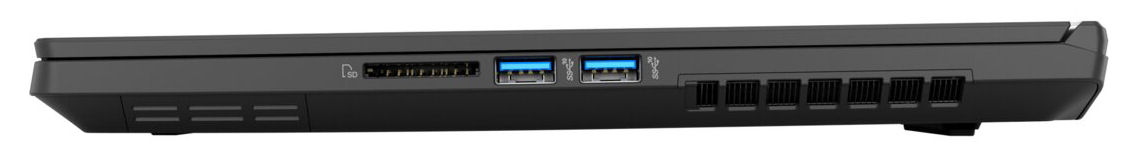
Lector de tarjetas SD
Con una velocidad máxima de transferencia de 77 MB/s (transferencia de 250 archivos de imagen jpg de unos 5 MB cada uno), el lector de tarjetas de memoria SD (tarjeta de referencia: AV PRO V60 microSD de 128 GB) presenta una velocidad media
| SD Card Reader - average JPG Copy Test (av. of 3 runs) | |
| Media de la clase Gaming (20.9 - 210, n=54, últimos 2 años) | |
| Schenker XMG Fusion 15 (Mid 22) (AV PRO microSD 128 GB V60) | |
| HP Omen 16-b1090ng (AV PRO microSD 128 GB V60) | |
Comunicación
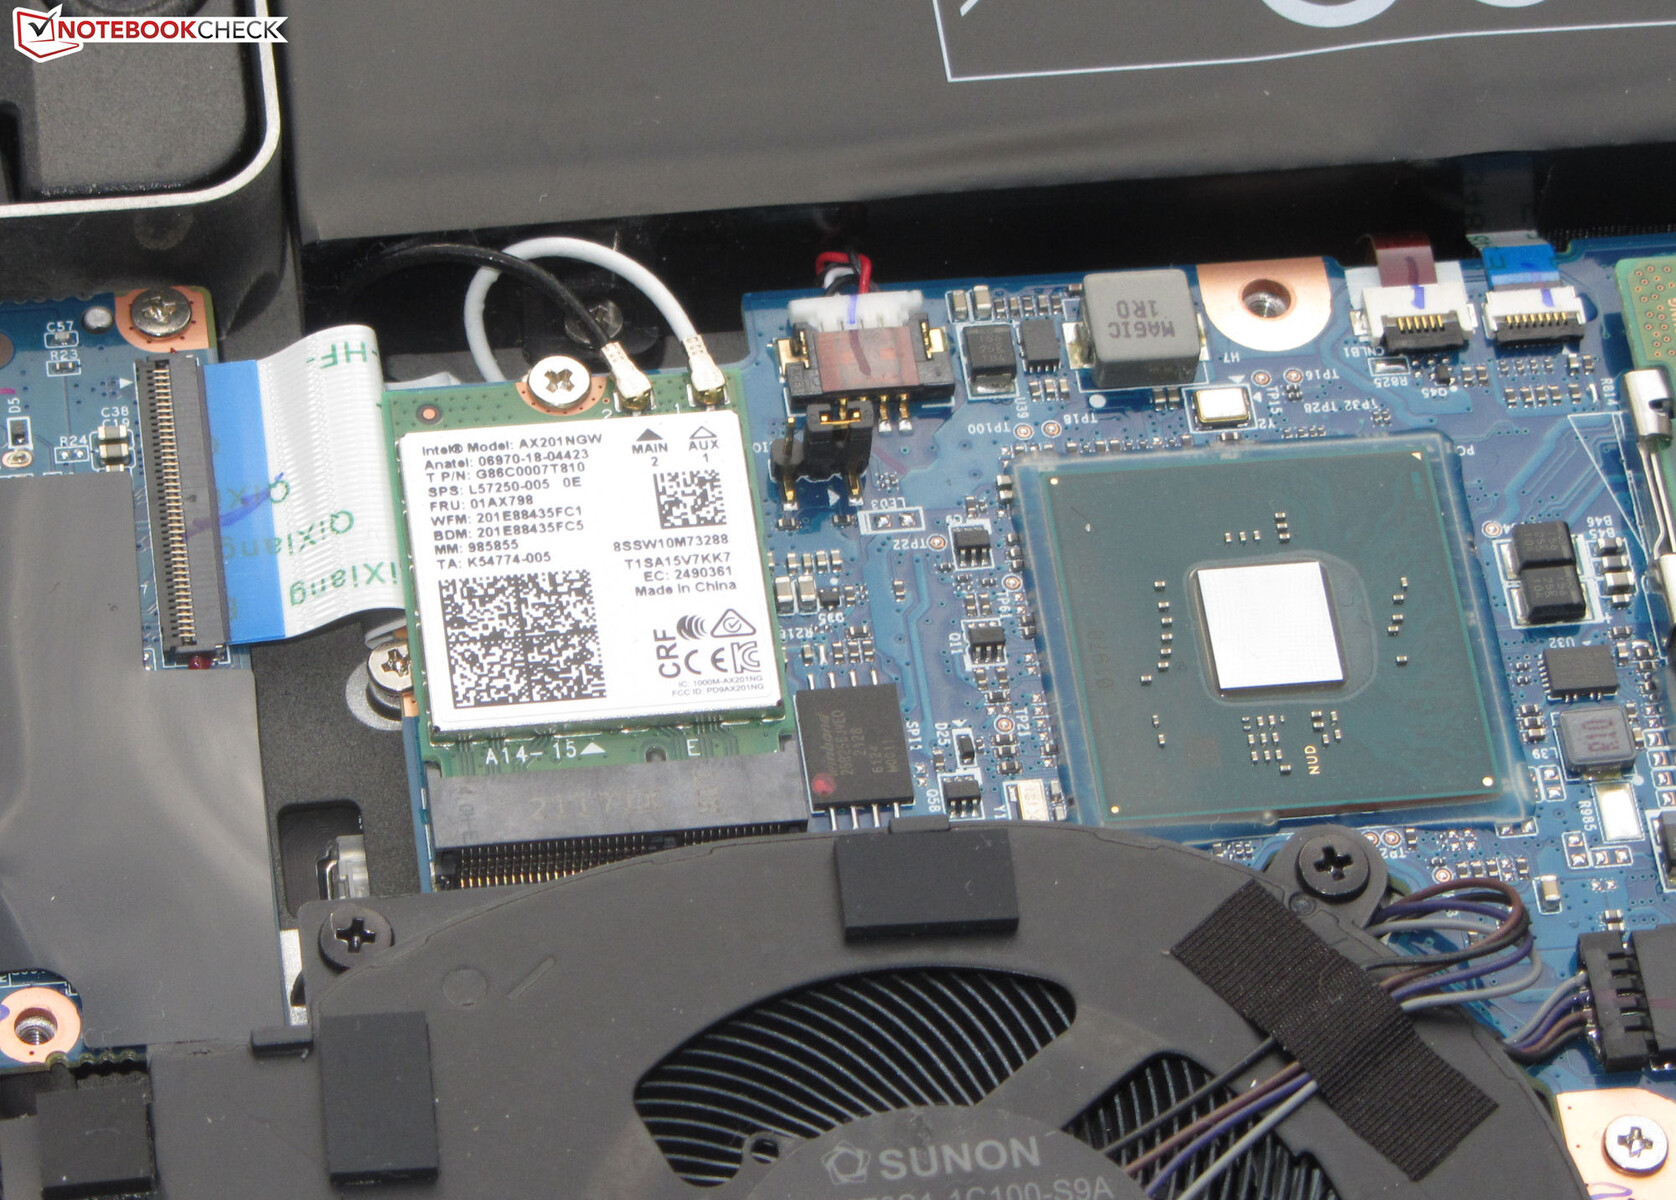
Las tasas de transferencia Wi-Fi determinadas en condiciones óptimas (sin otros dispositivos Wi-Fi cerca, distancia corta entre el portátil y el PC servidor) son muy buenas, y están en línea con las capacidades del chip Wi-Fi (Intel AX201; 802.11ax). Un chip Gigabit Ethernet (Intel I225-V, 2,5 gigabits) se encarga de las conexiones de red por cable
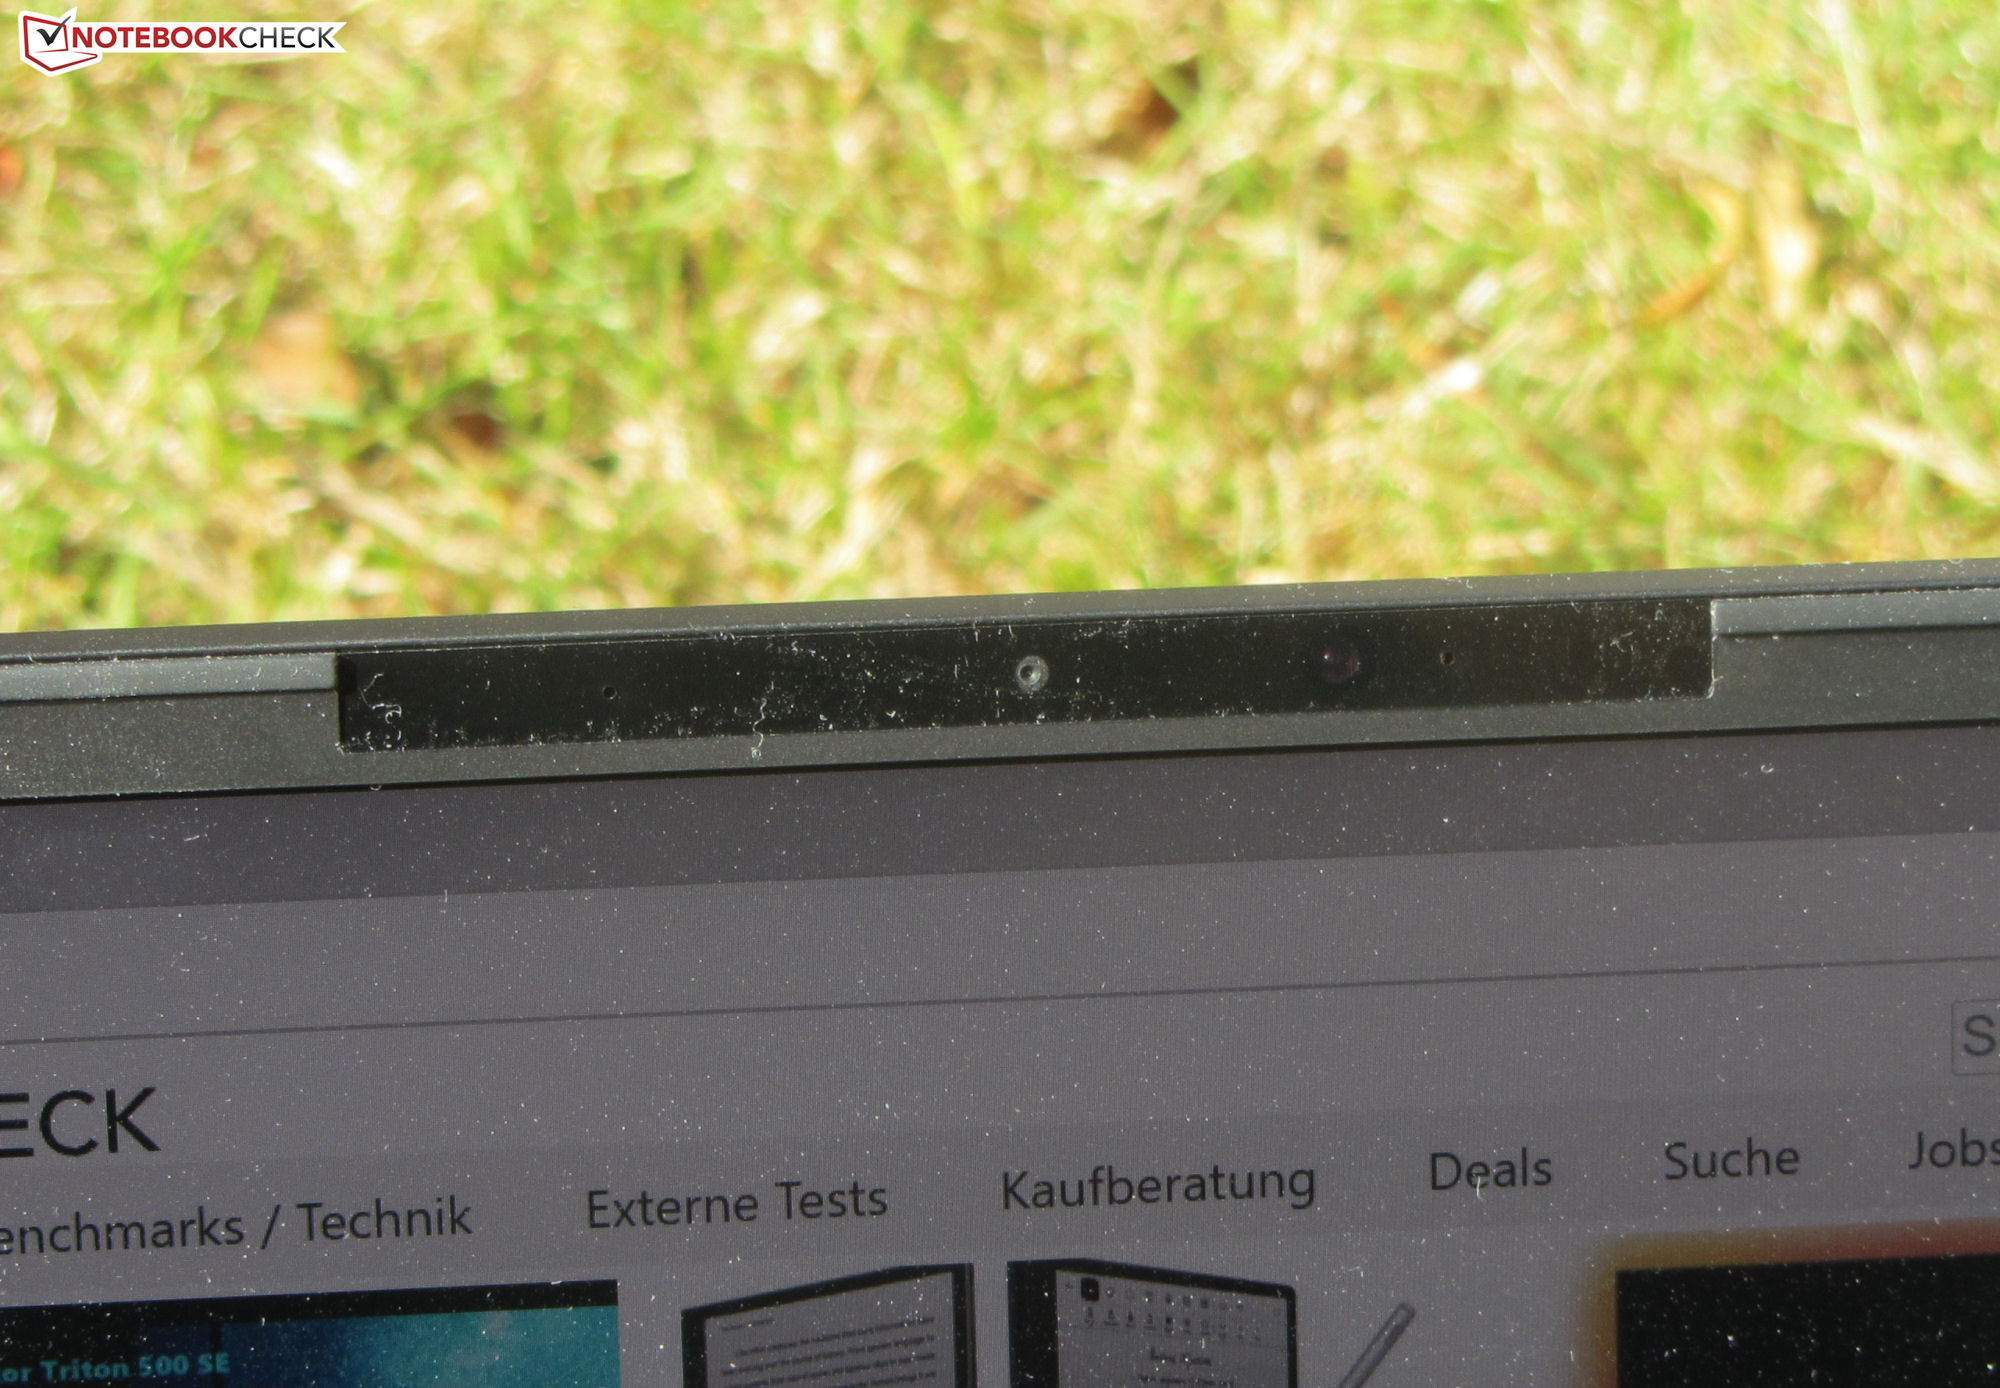
Cámara web
La cámara web (0,9 MP) produce imágenes con una resolución máxima de 1.280x720 píxeles. Hay problemas con la precisión del color: Los colores se desvían del objetivo. La cámara no tiene un obturador mecánico

 GeForce RTX 3070 Laptop GPU, i7-11800H, Samsung SSD 980 Pro 1TB MZ-V8P1T0BW")
 GeForce RTX 3070 Laptop GPU, i7-11800H, Samsung SSD 980 Pro 1TB MZ-V8P1T0BW")
Accesorios
Junto con la información sobre la garantía y un manual de usuario impreso, el portátil viene con una memoria USB (controladores, instrucciones), pegatinas y una alfombrilla de ratón
Mantenimiento
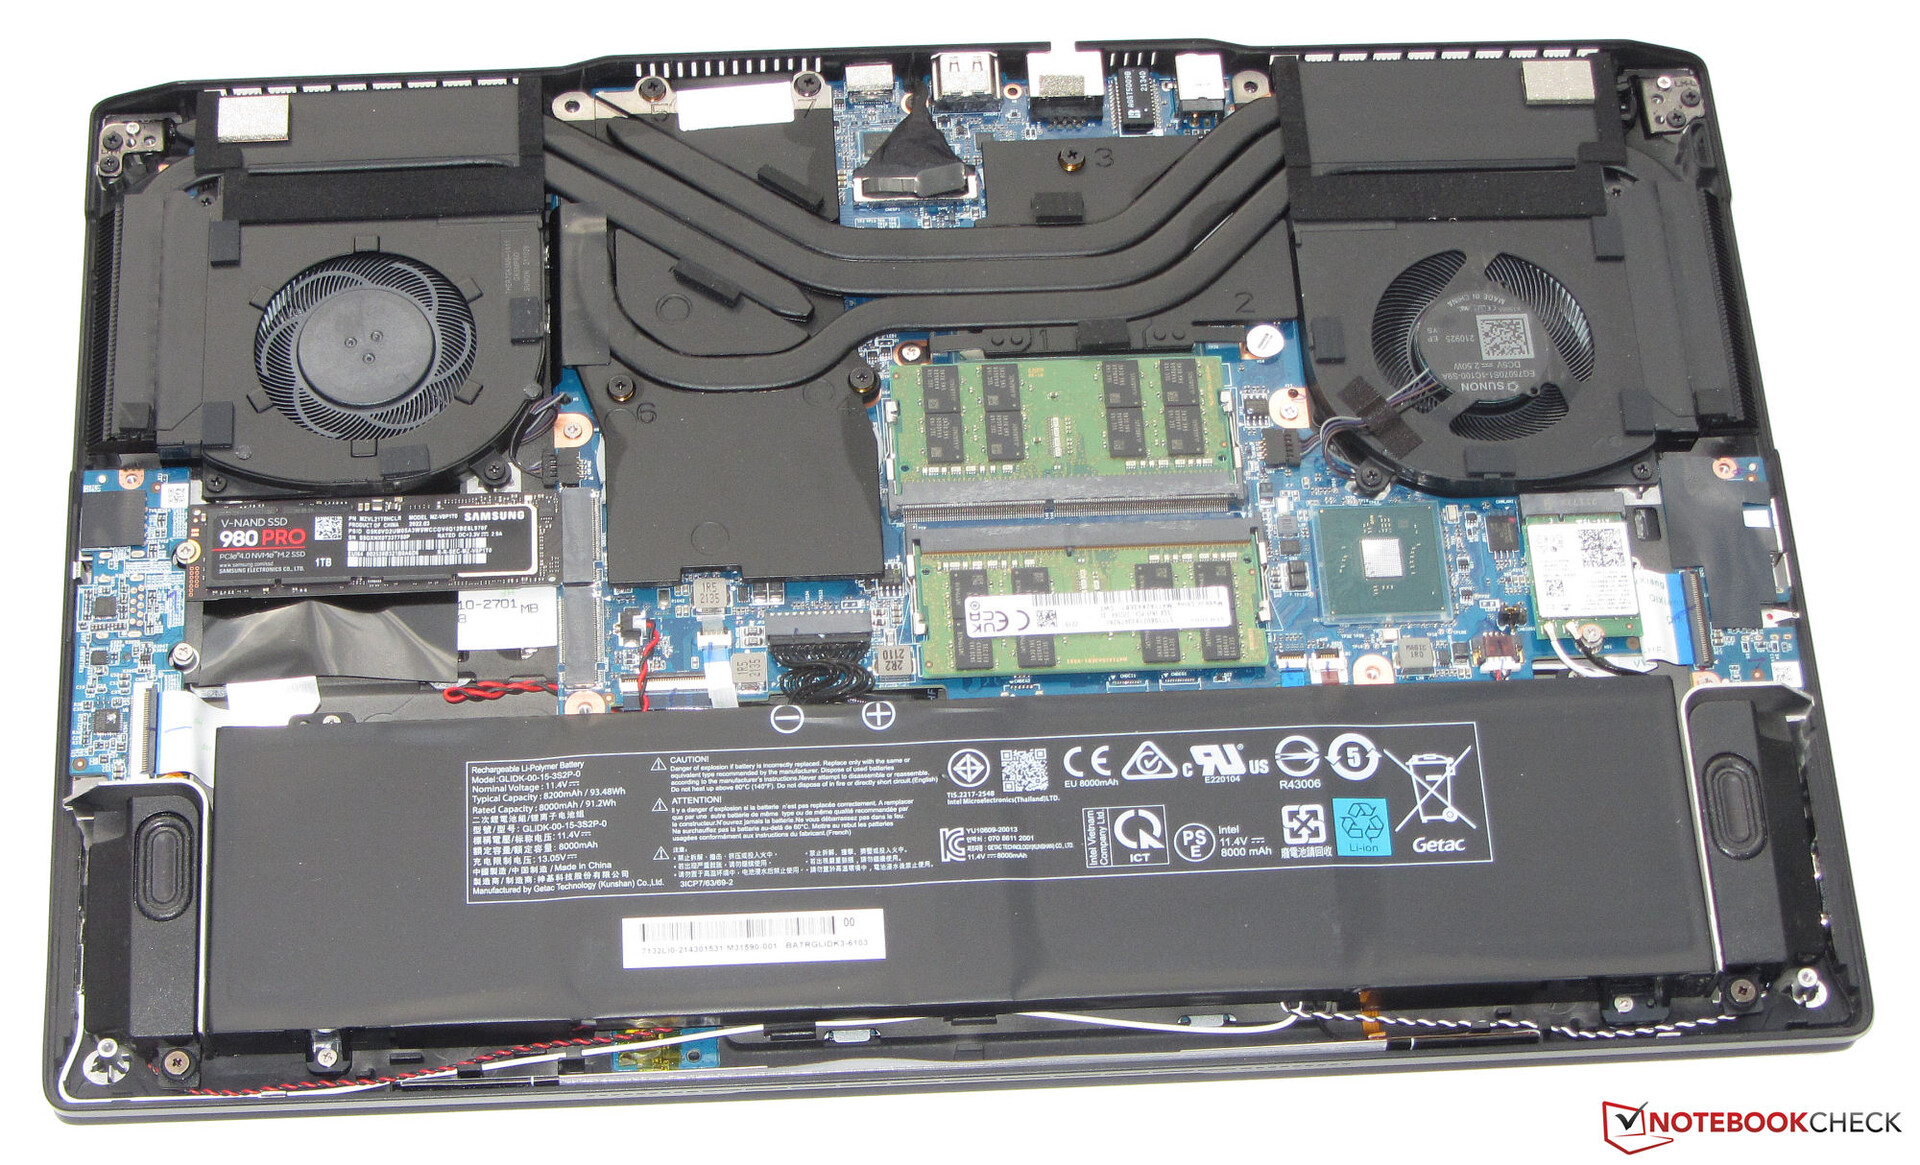
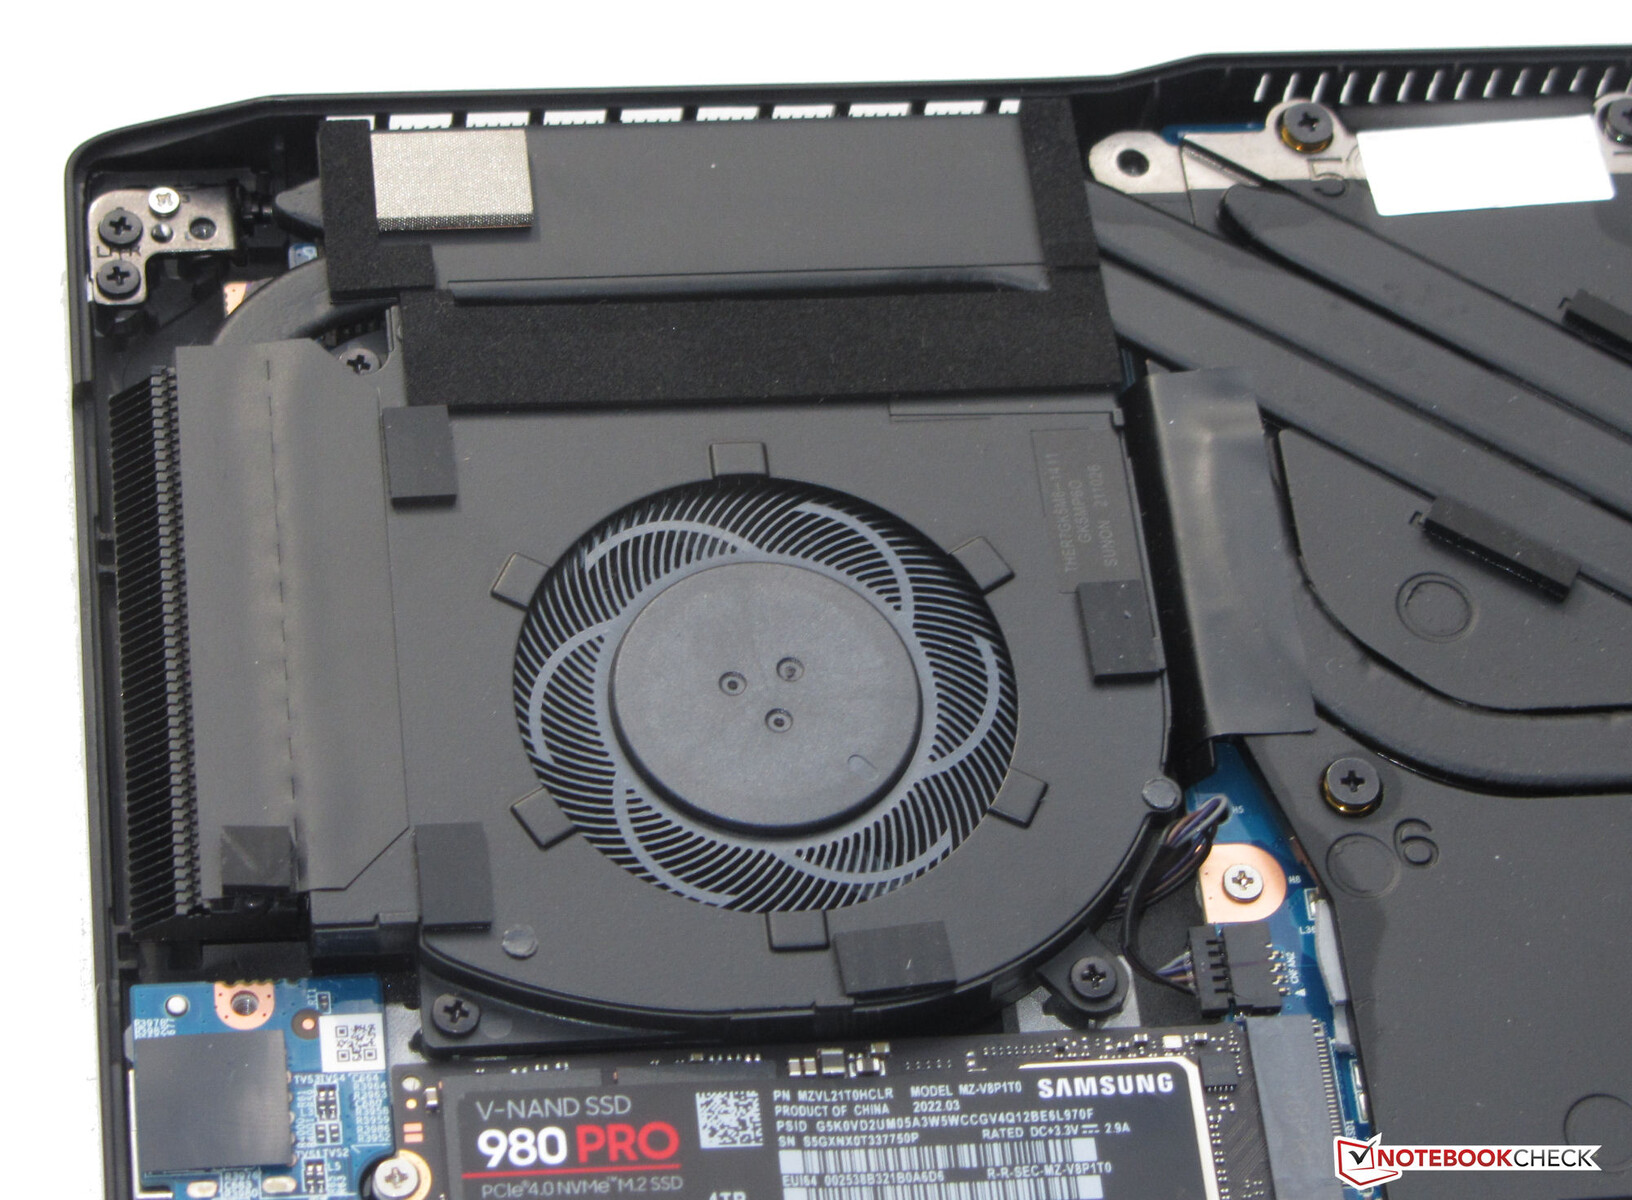
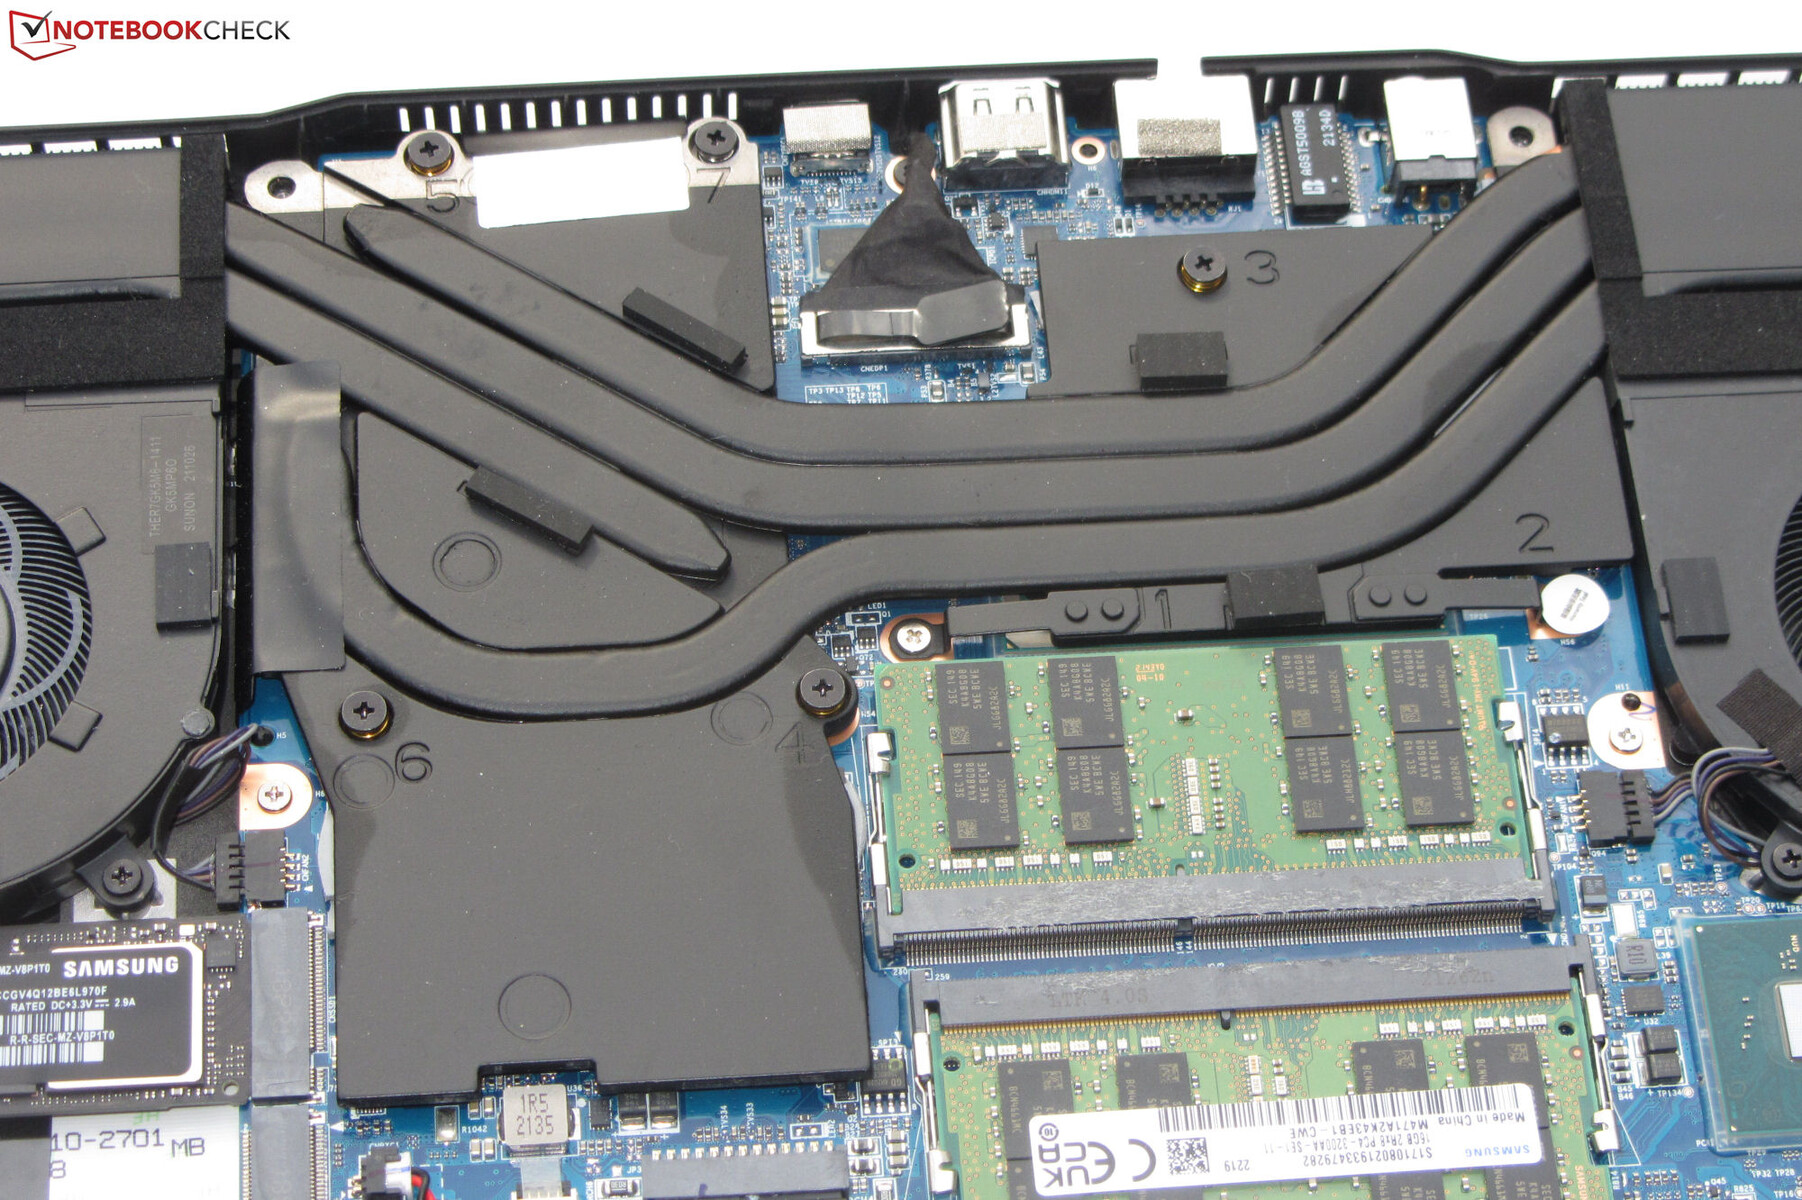
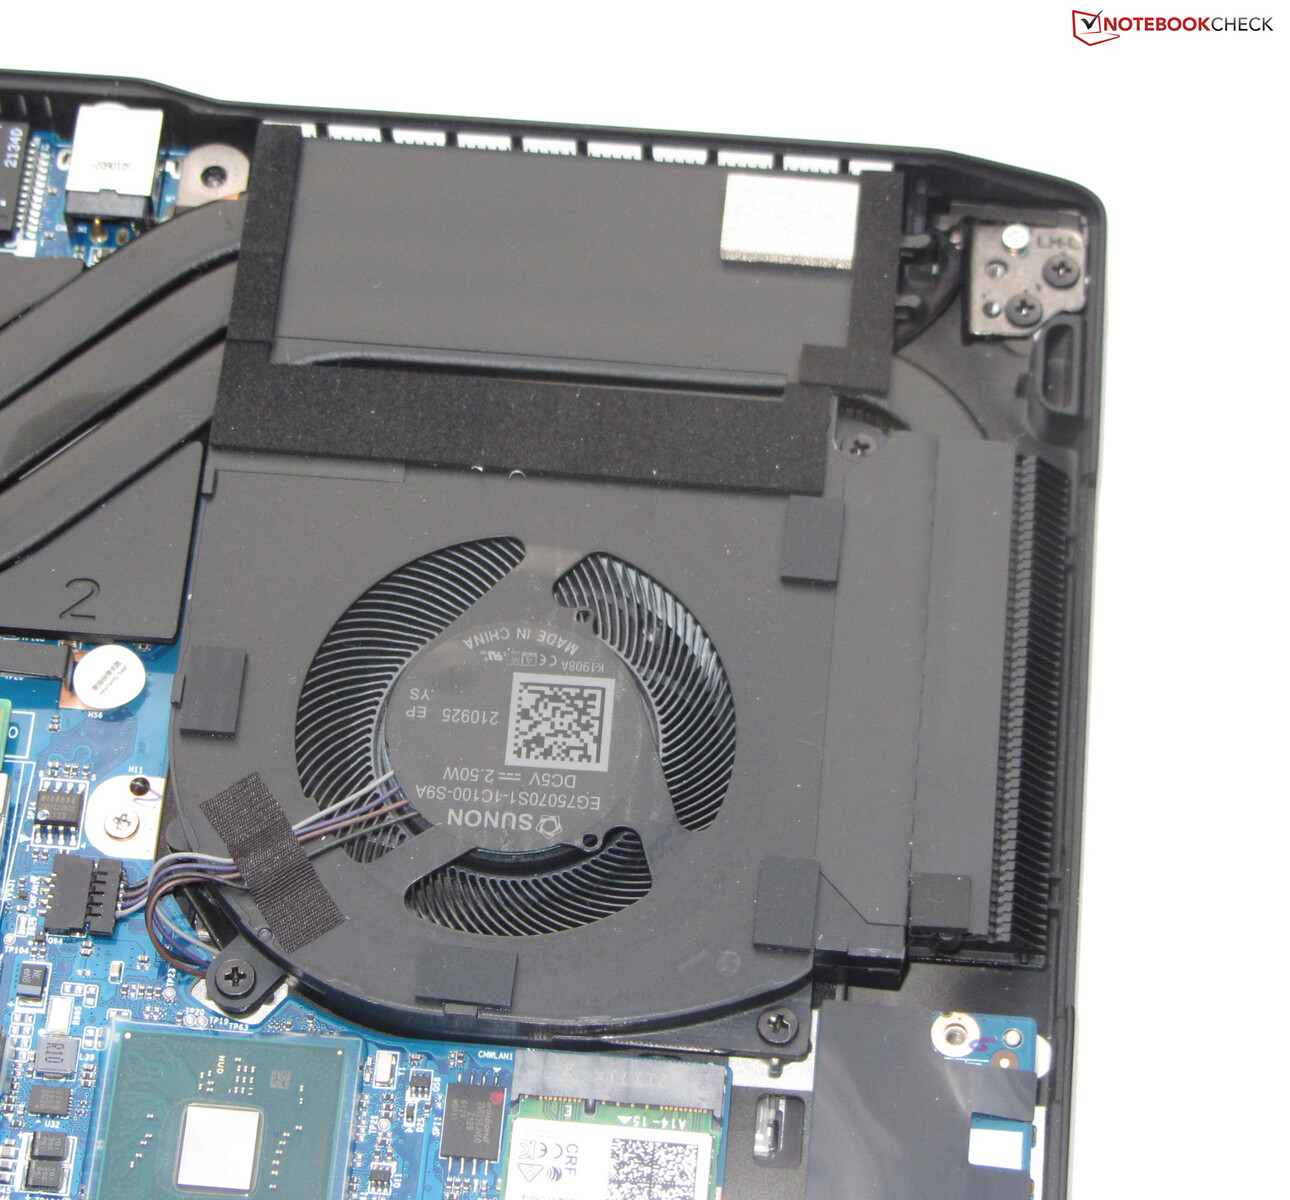
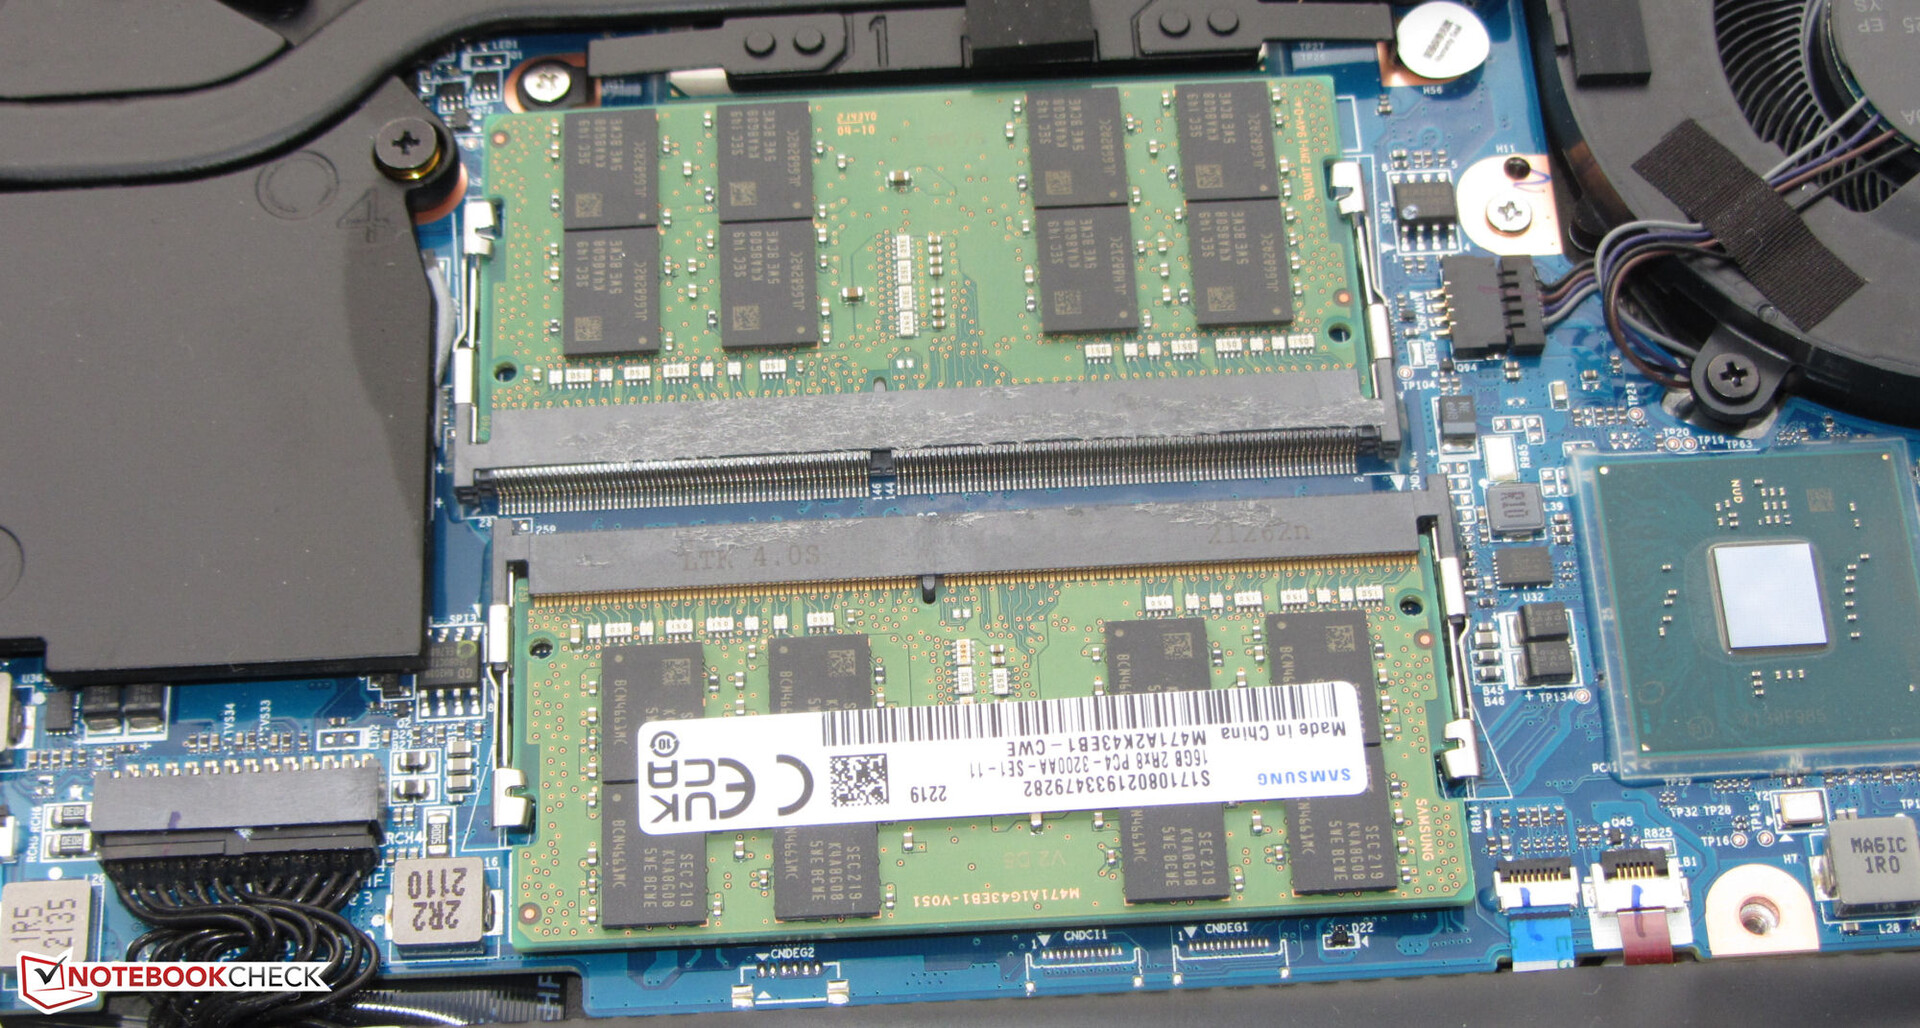
Los procedimientos de mantenimiento y actualización pueden llevarse a cabo sin problemas. Tras aflojar todos los tornillos de la parte inferior del dispositivo, la cubierta inferior se puede retirar con bastante facilidad. Entonces tienes acceso a las ranuras de RAM (ambas ocupadas), el SSD (PCIe 4), la segunda ranura M.2-2280 (PCIe 3/SATA), el módulo Wi-Fi, los ventiladores, la batería de la BIOS y la batería
Garantía
La garantía básica cubre dos años, incluyendo el servicio de recogida y 6 meses de reparación rápida (reparación en 48 horas). La garantía de 36 meses cuesta entre 100 y 149 euros (~99,53 y 148,30 dólares), dependiendo del periodo de reparación rápida seleccionado
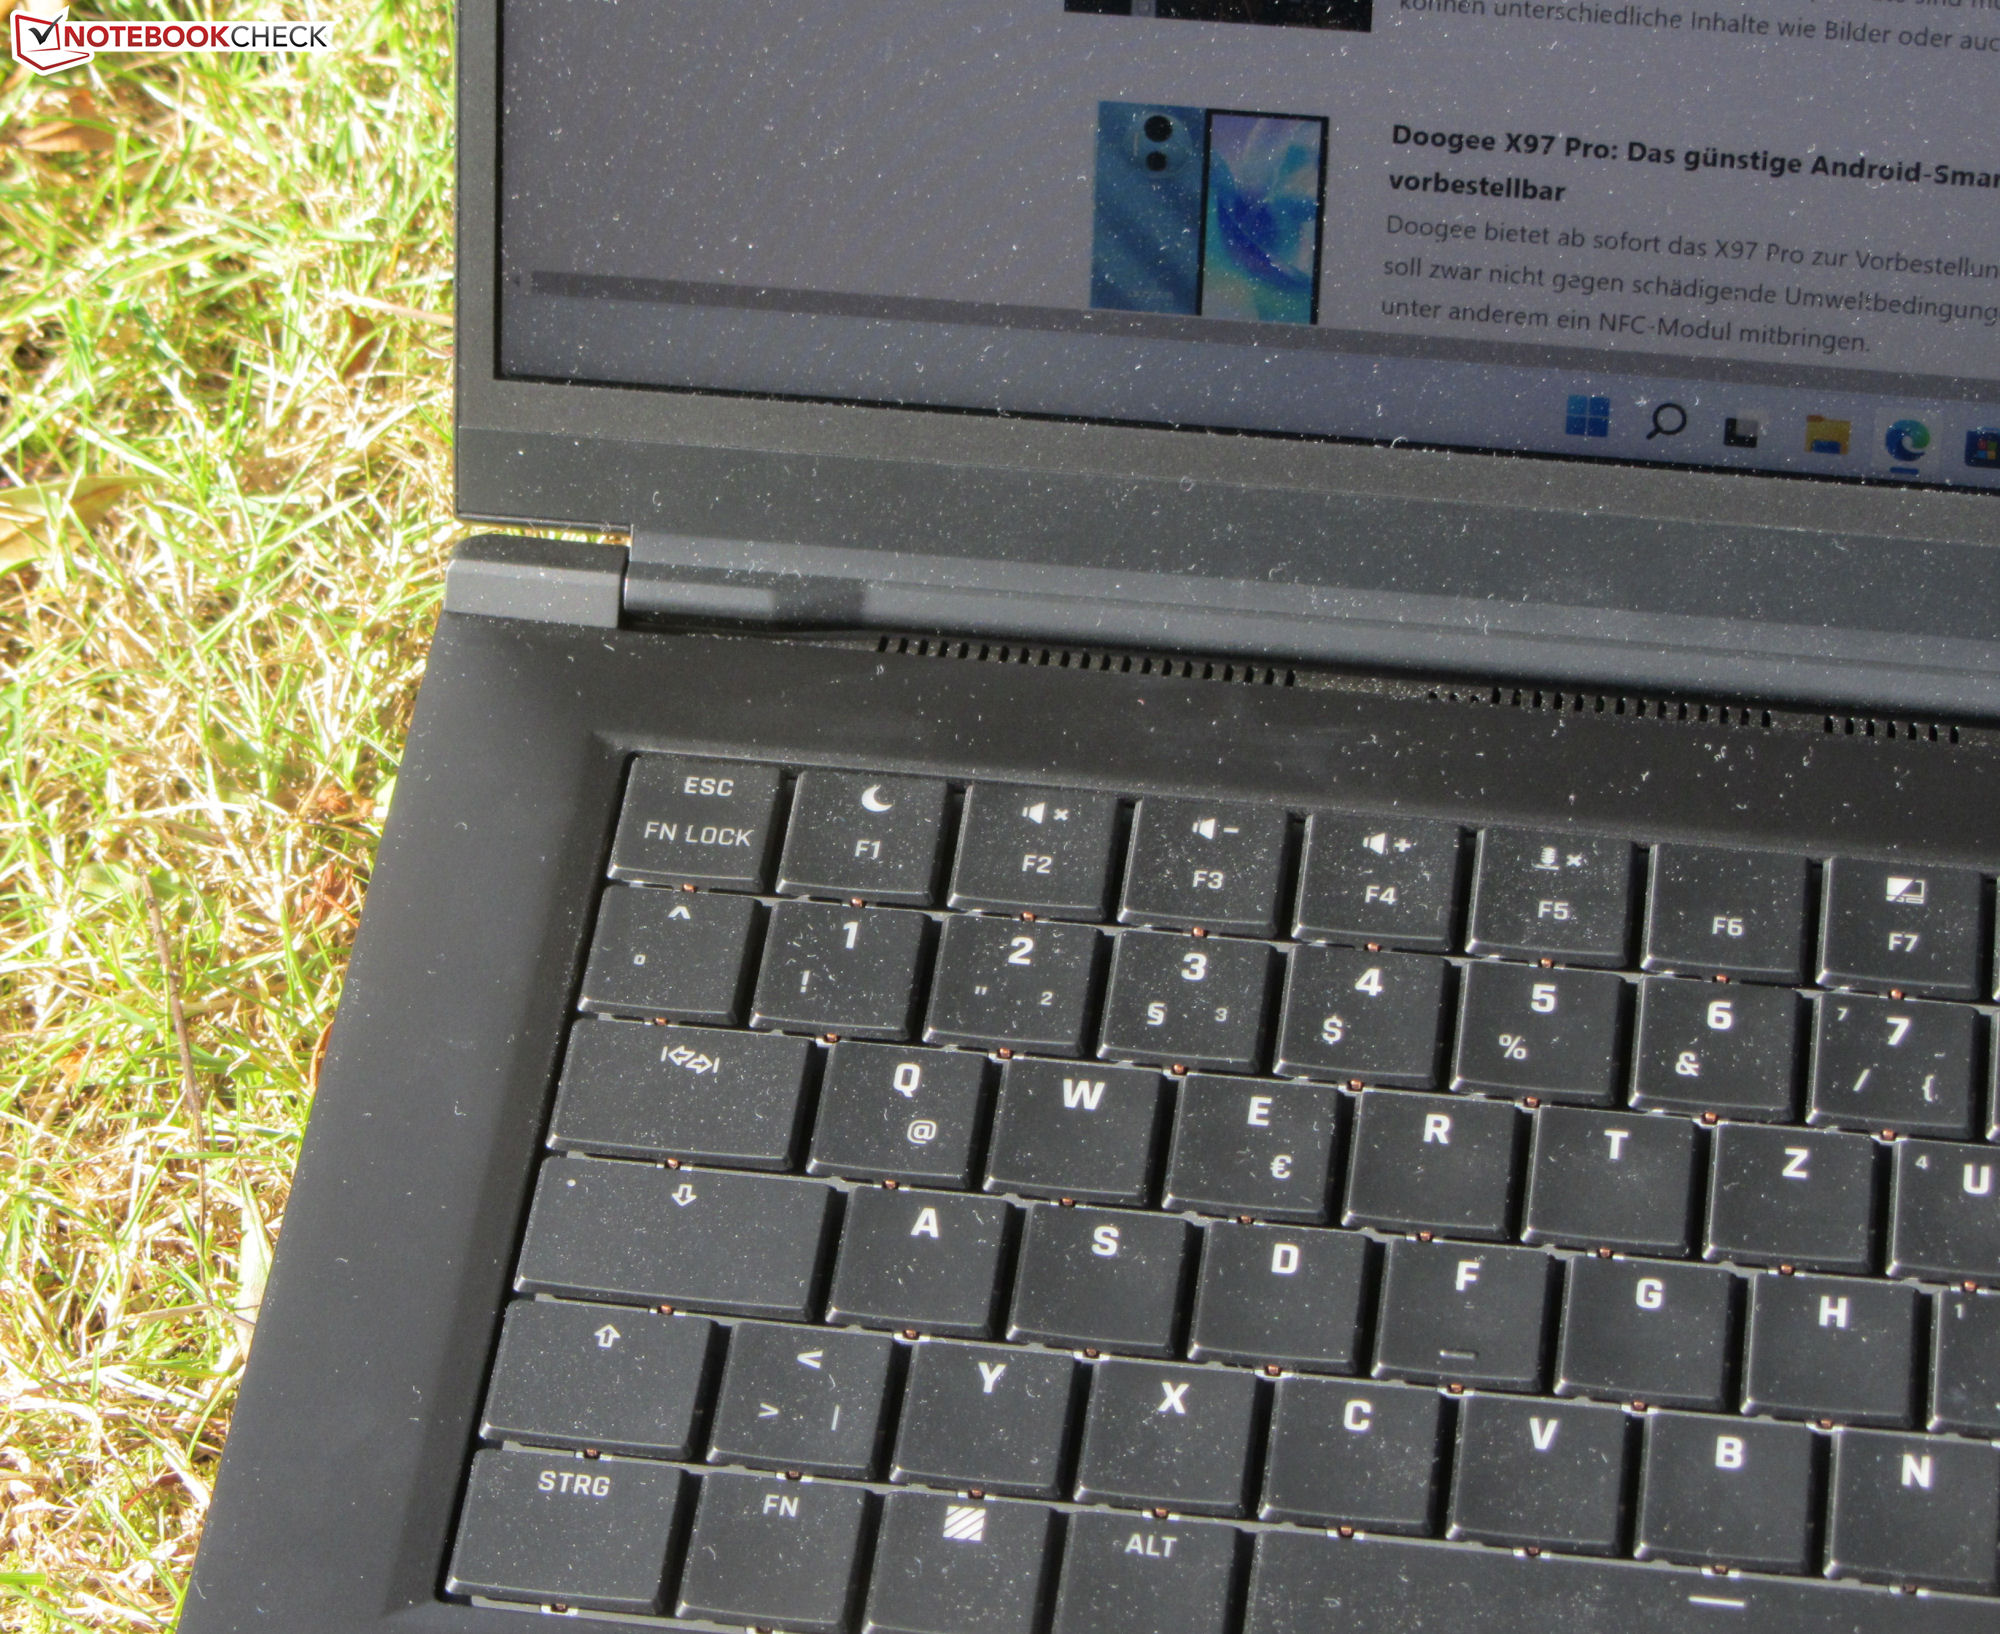
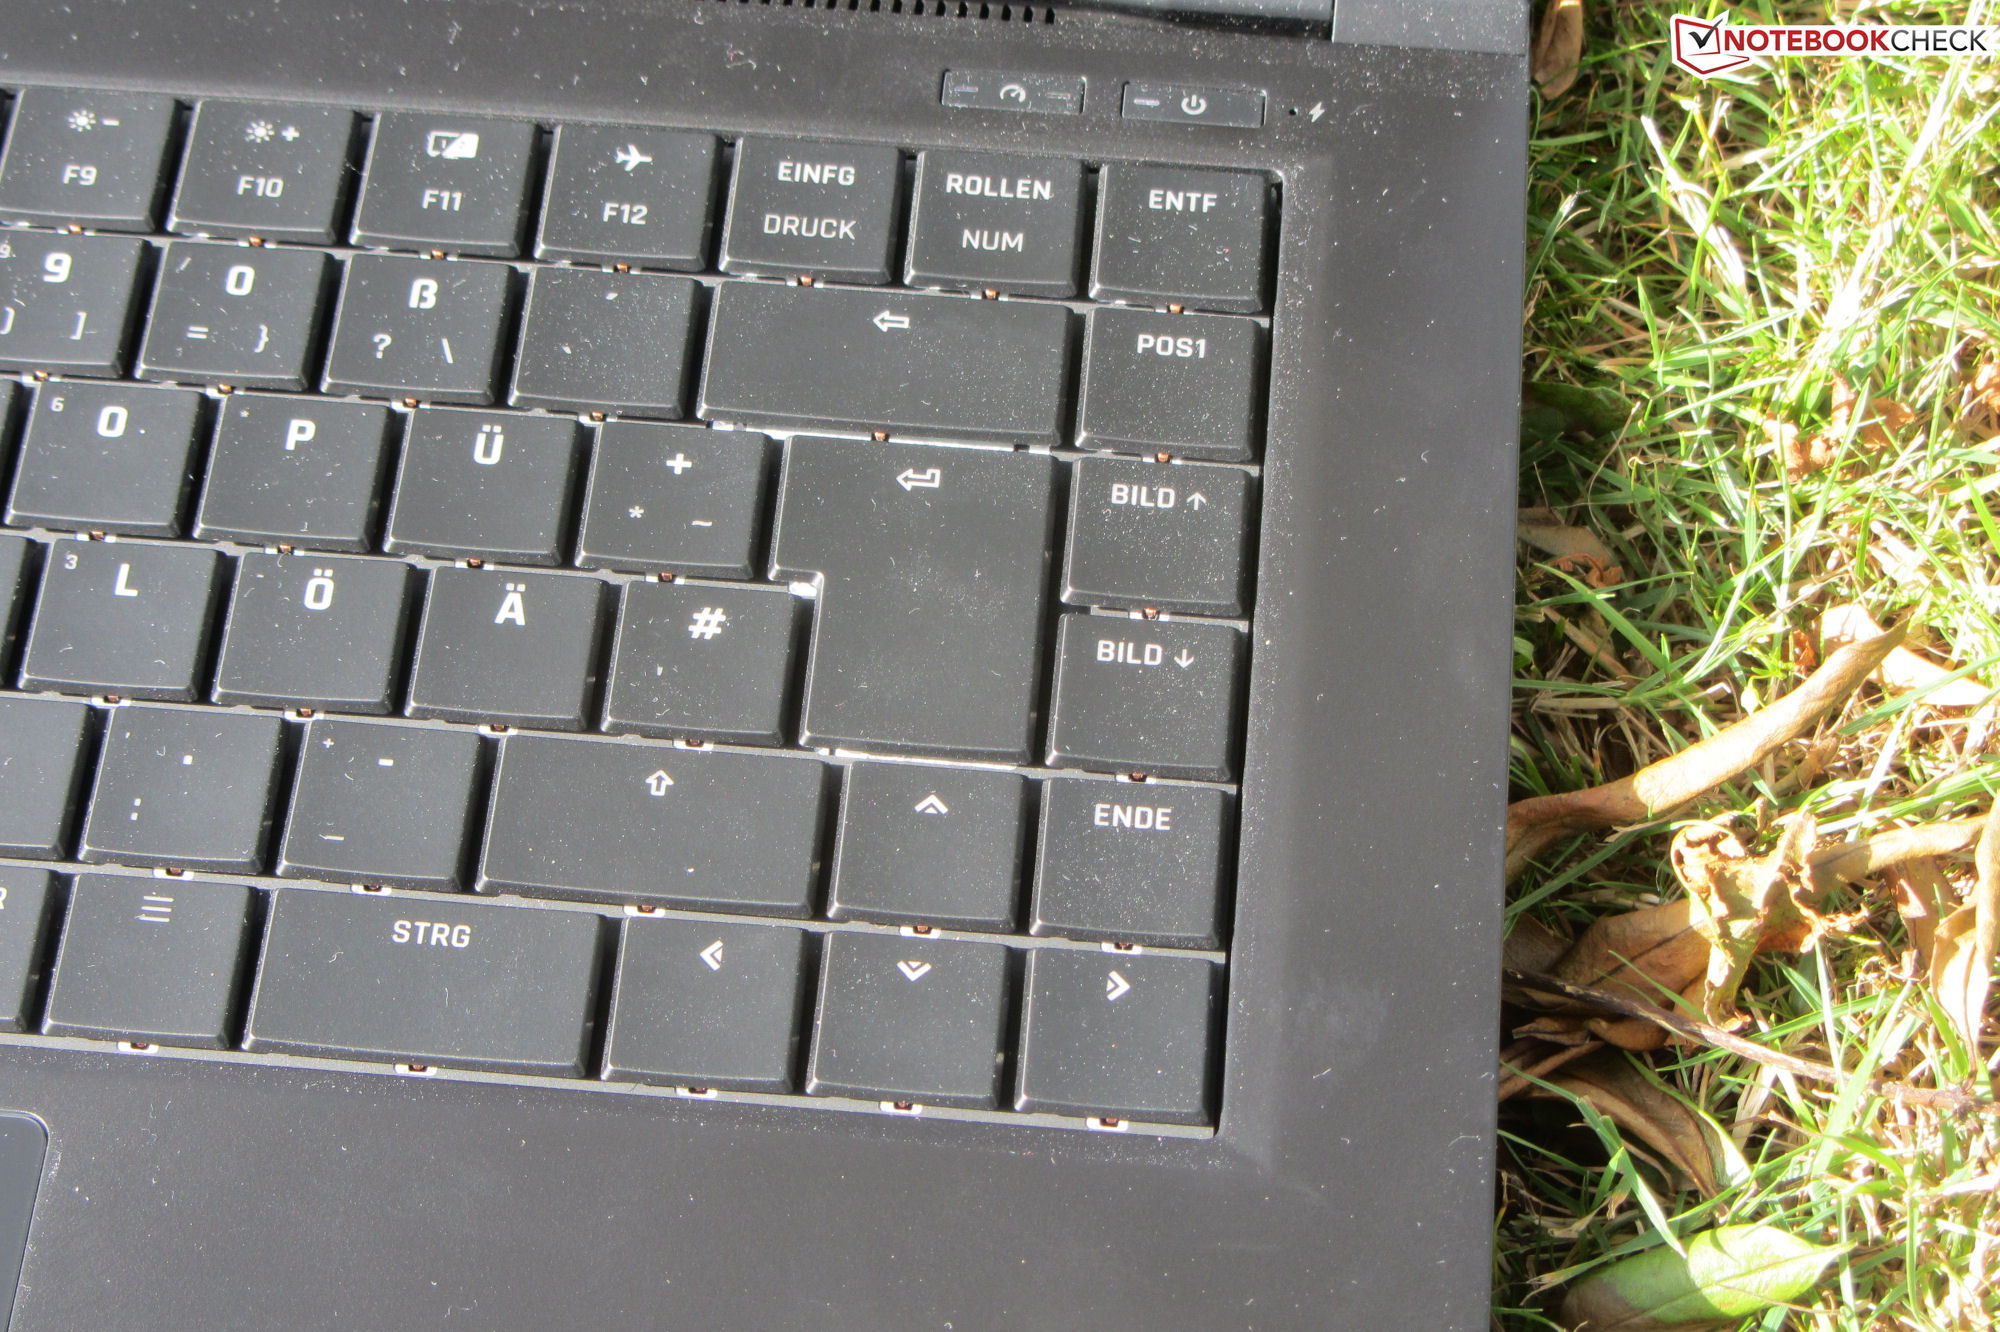
Dispositivos de entrada - El portátil Schenker viene con un teclado mecánico
Teclado
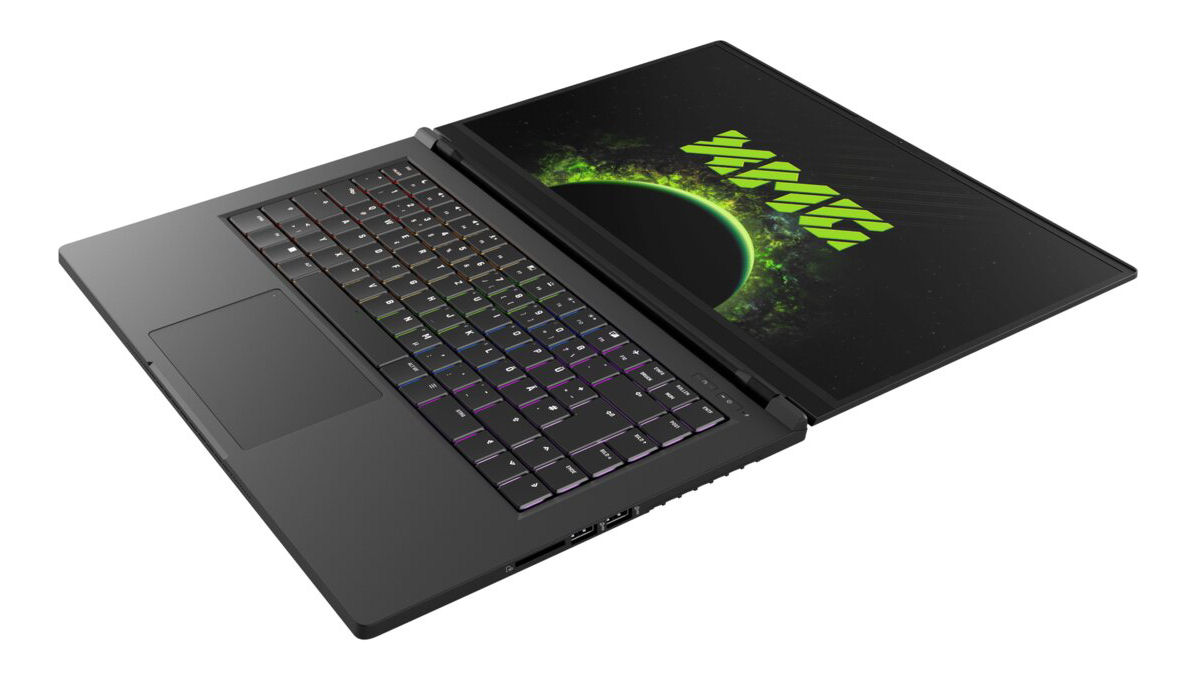
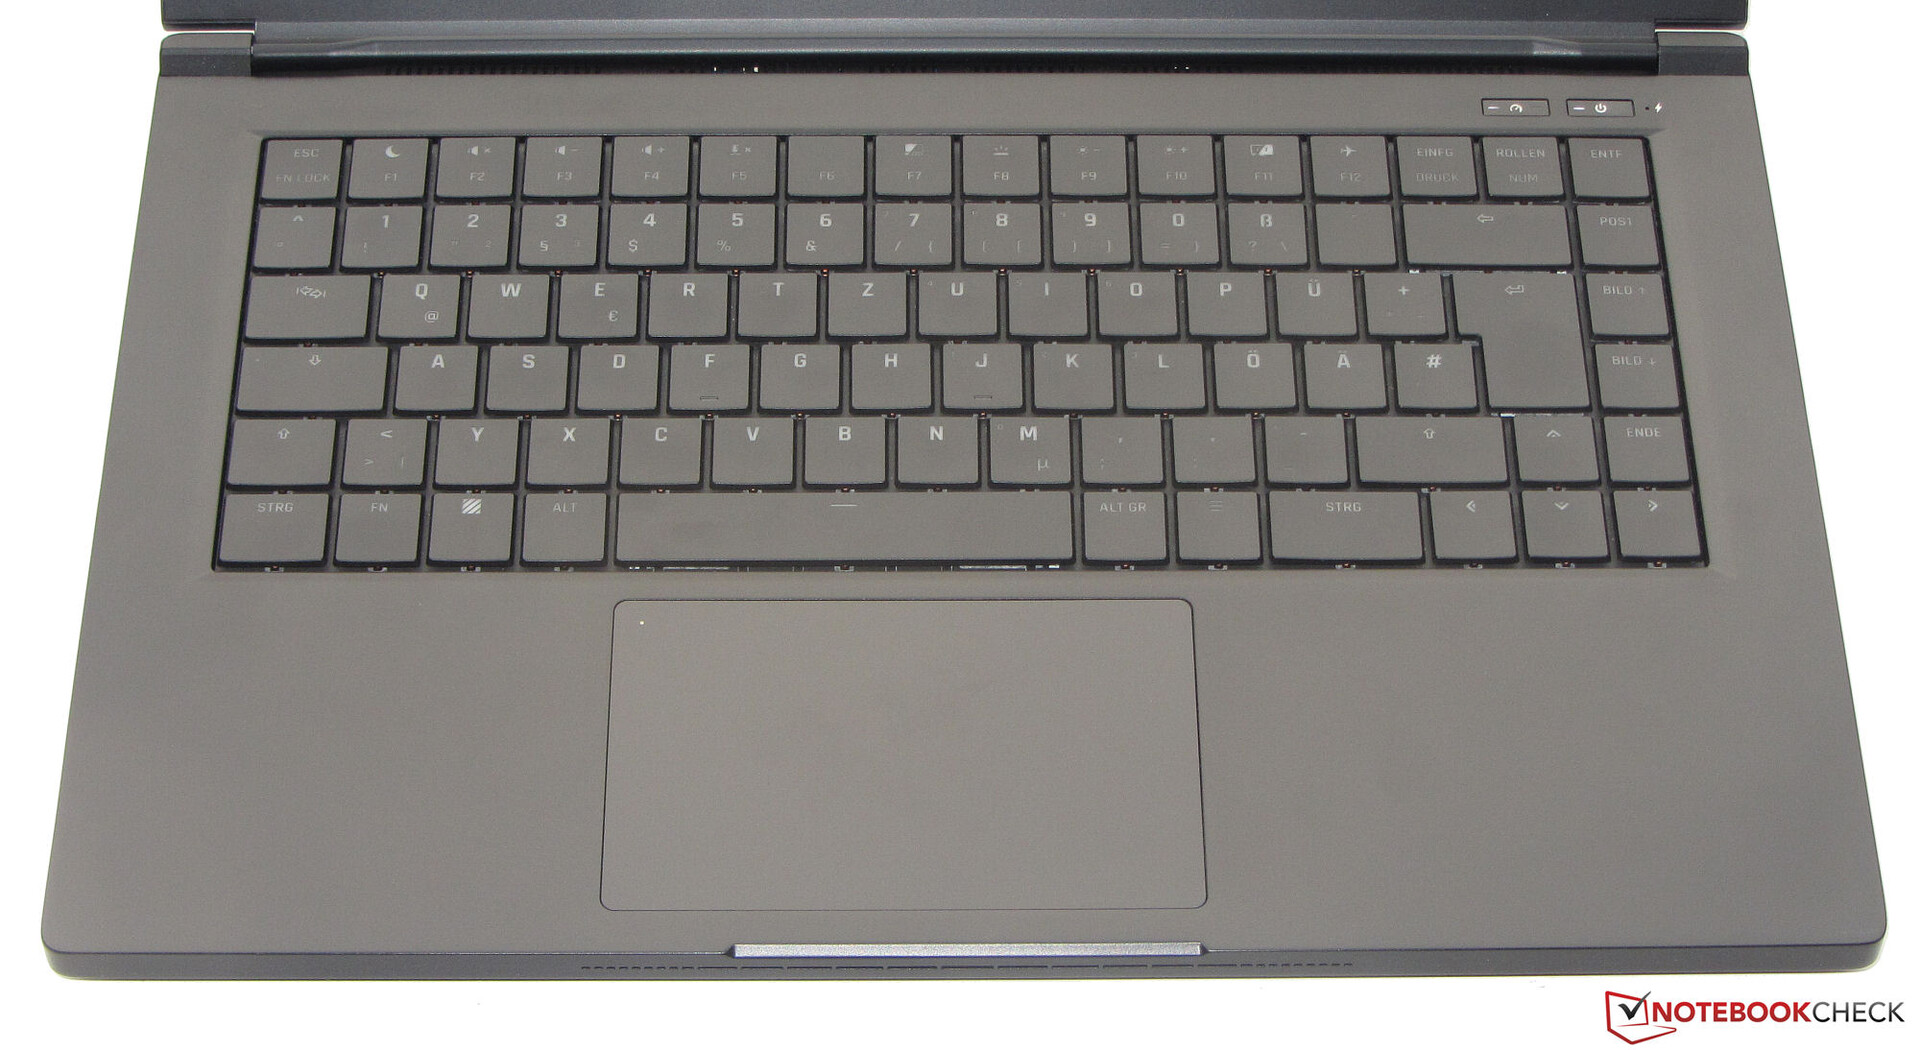
El teclado mecánico (con iluminación RGB de una sola tecla) consta de teclas curvadas de forma cóncava. Estas ofrecen un recorrido medio y tienen un punto de presión claramente audible y perceptible. El teclado no cede durante la escritura. La iluminación en dos fases se controla mediante una tecla de función. En general, es un teclado equilibrado y bien hecho
Teclado táctil
Un ClickPad multitáctil (de unos 11,7 x 7,2 cm) sirve de sustituto del ratón. Su superficie lisa facilita el deslizamiento de los dedos sobre ella. La almohadilla tiene un recorrido corto y un punto de presión claro. Al pulsar dos veces la esquina superior izquierda se enciende o apaga el pad (indicado por un LED)
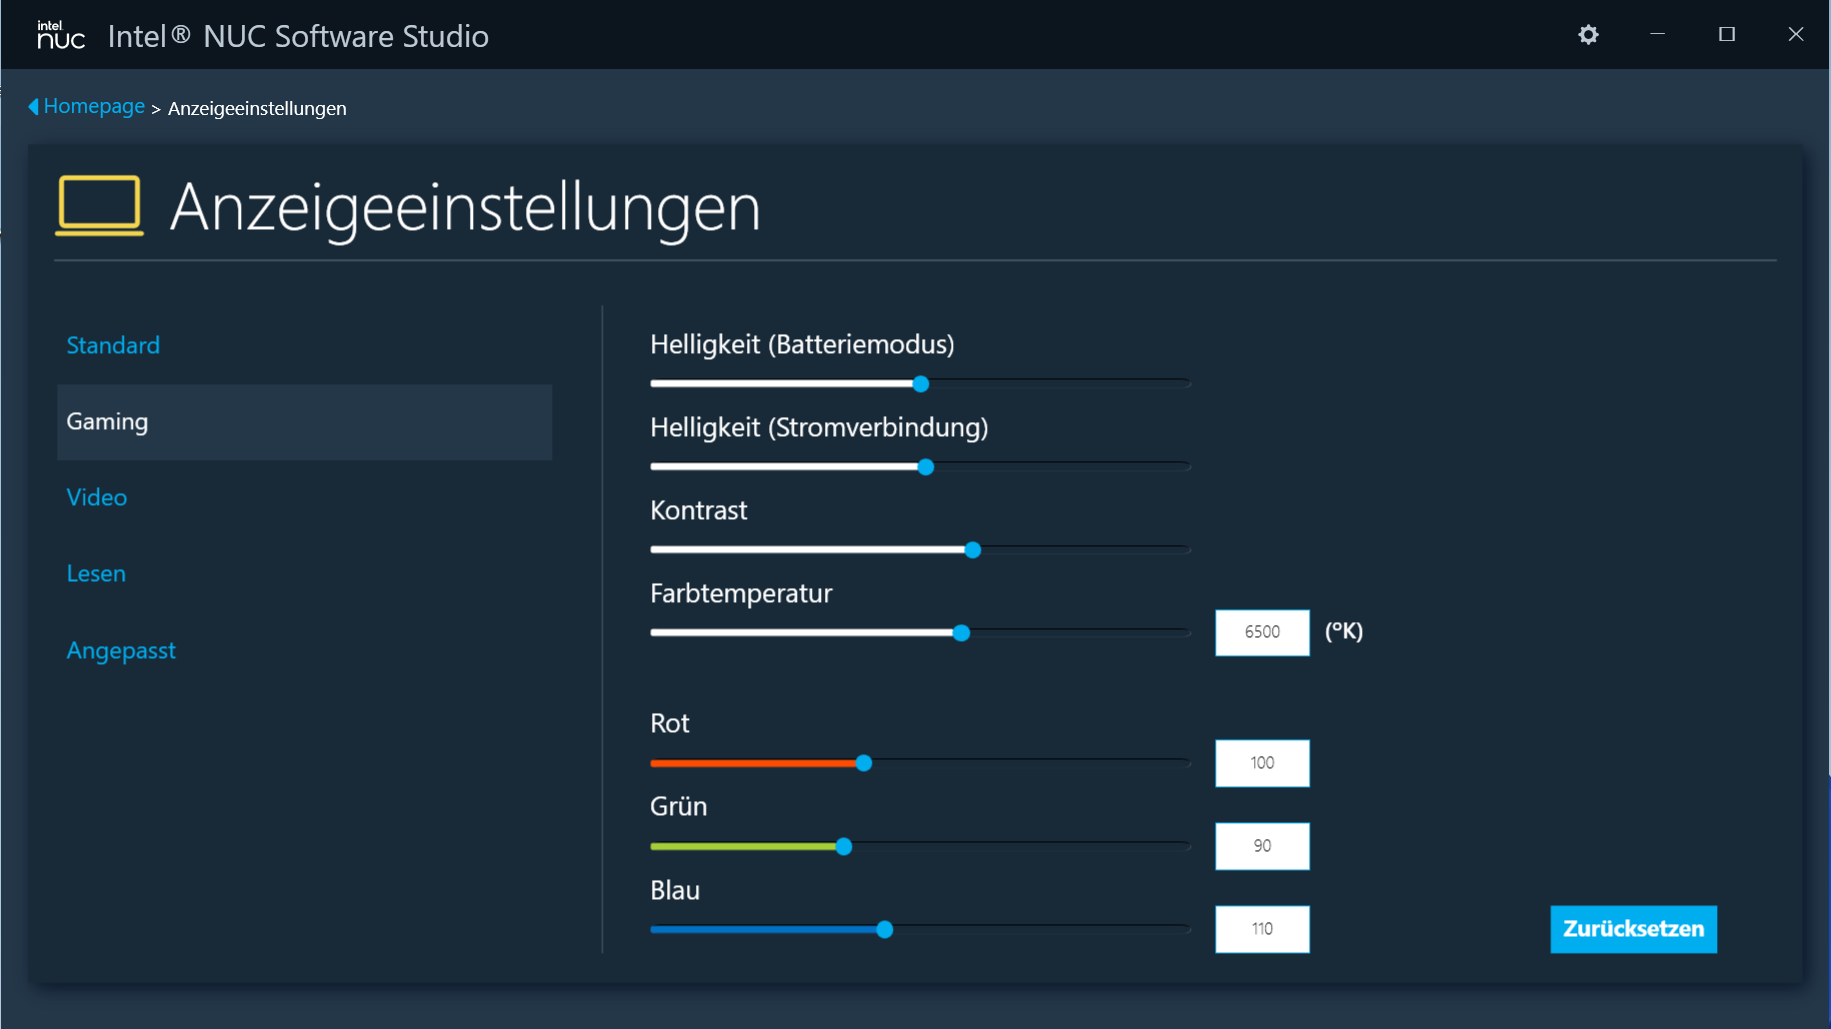
Pantalla - IPS a bordo
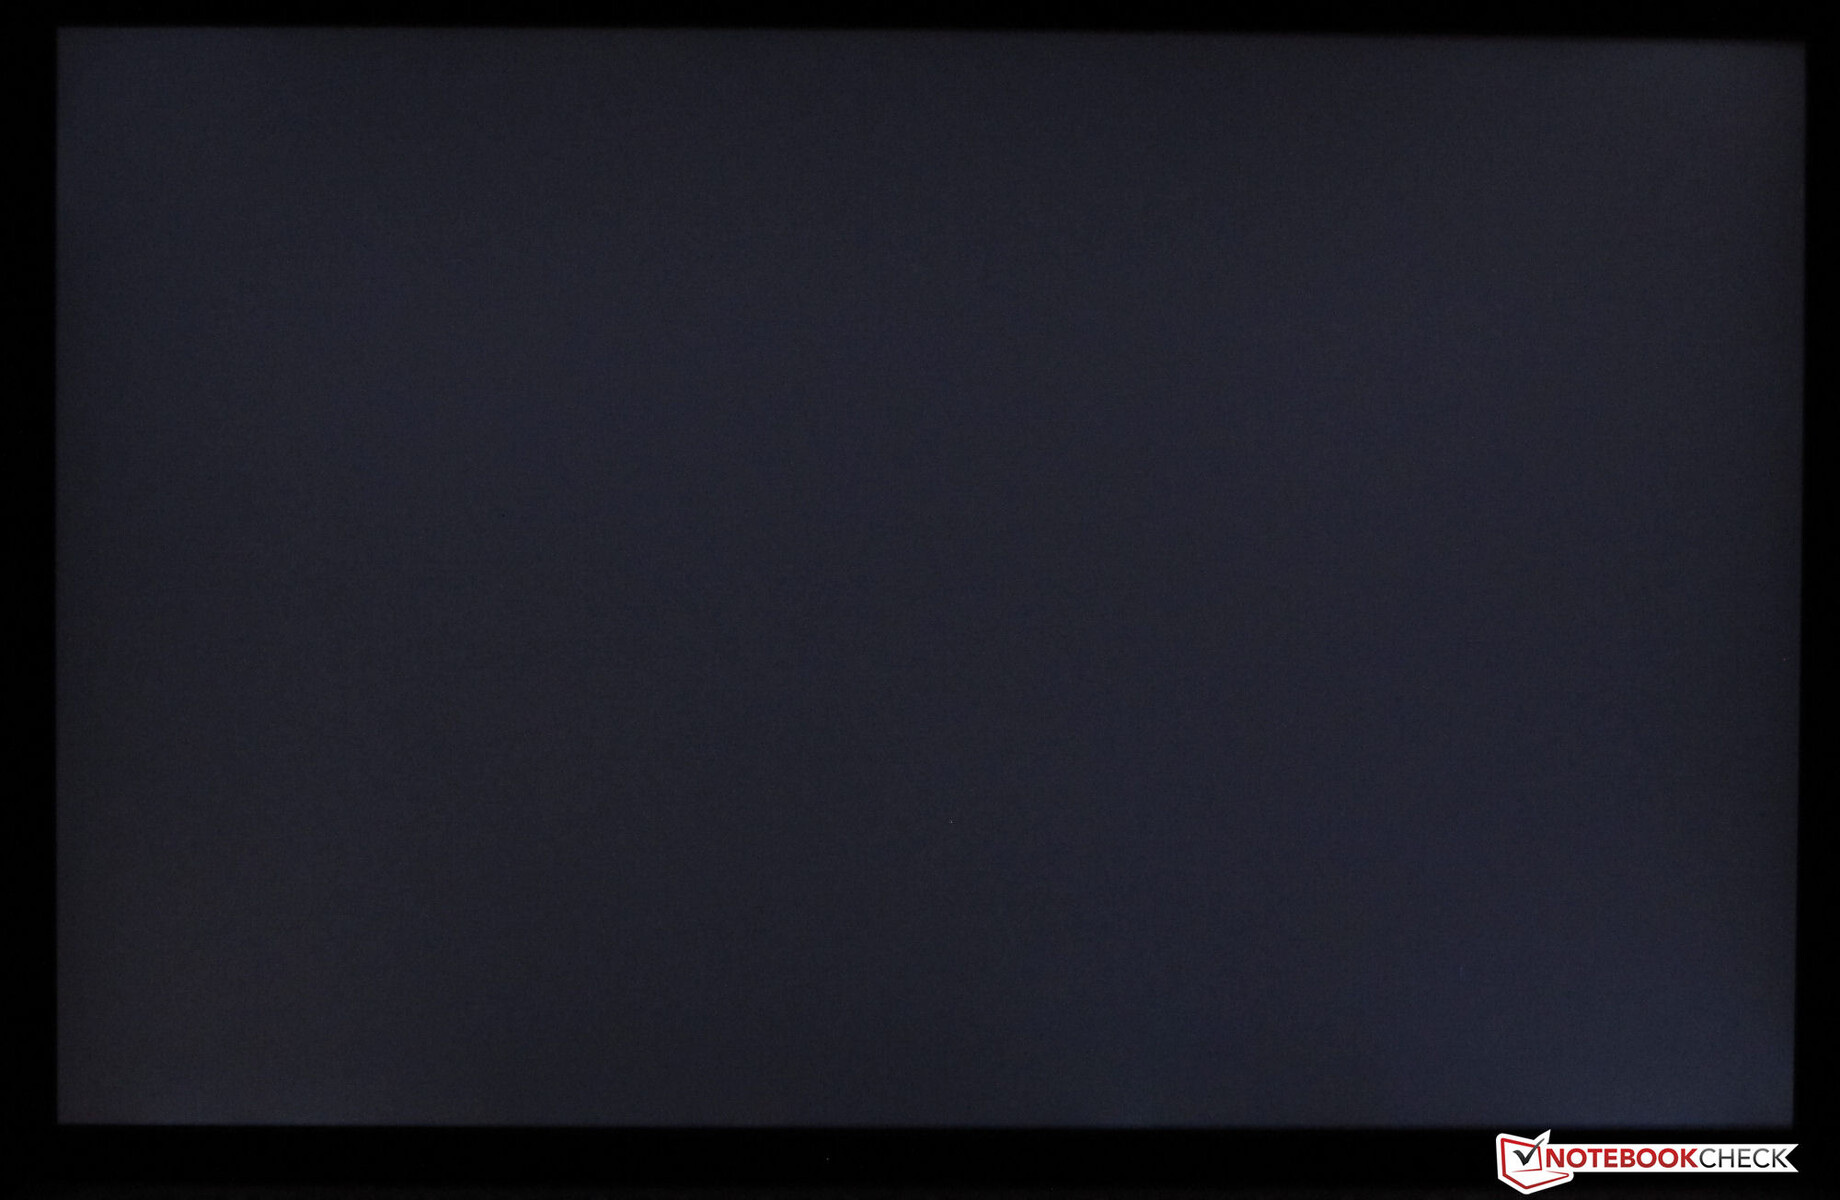
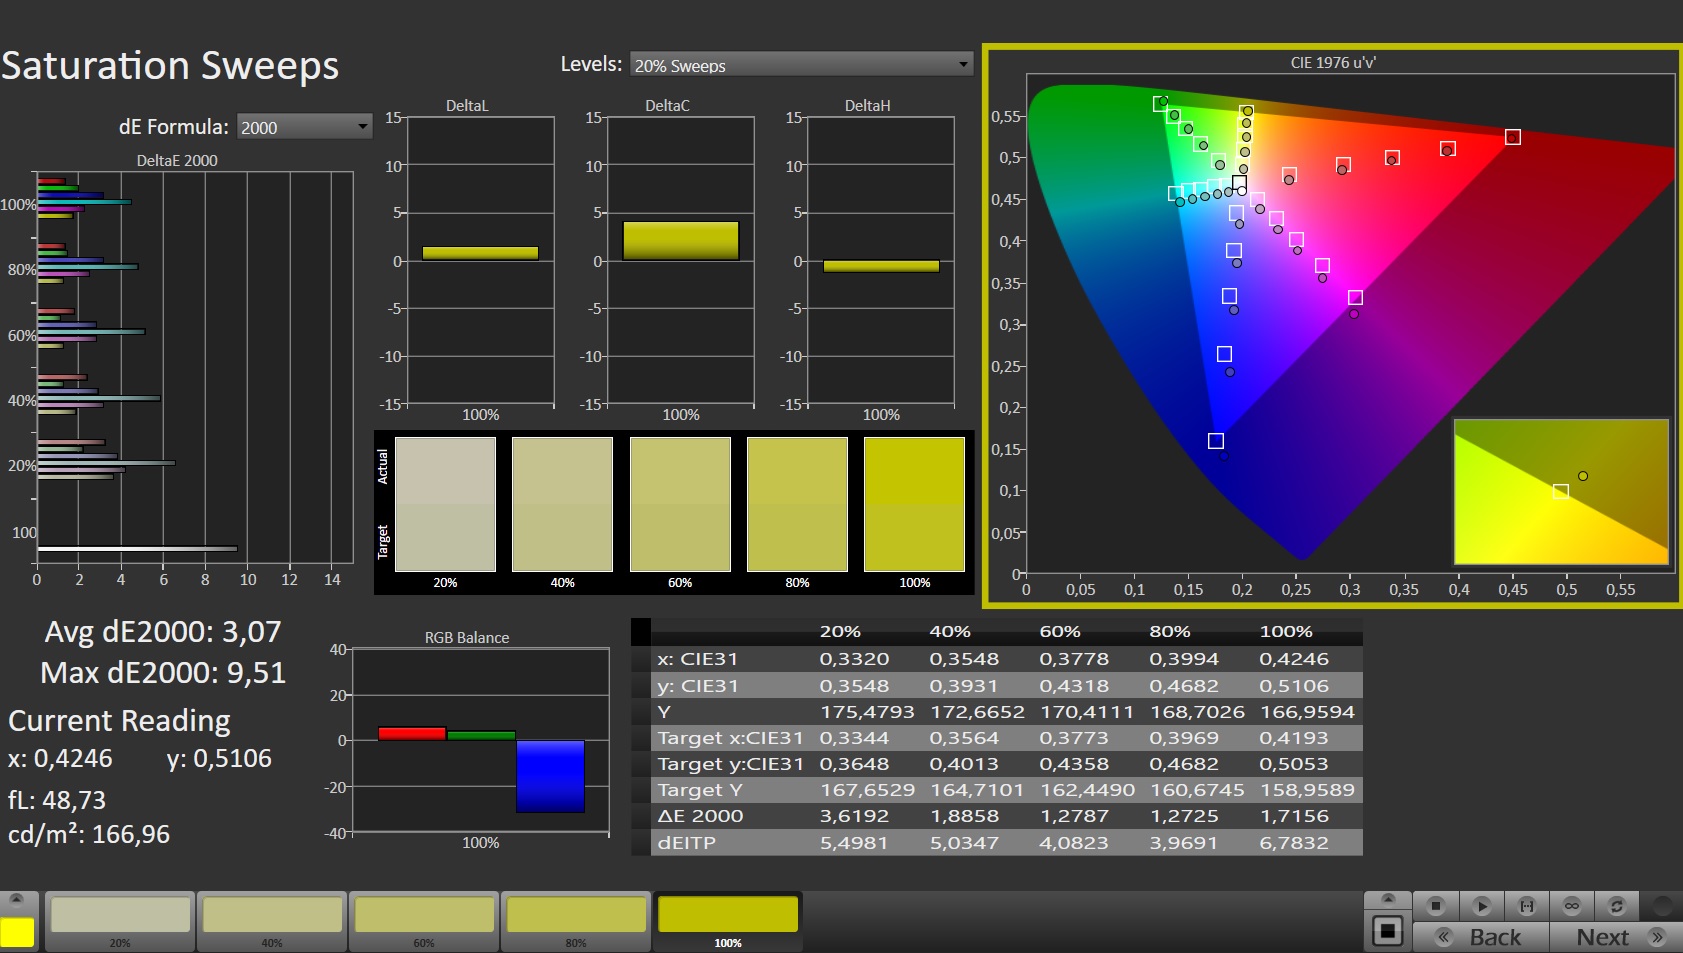
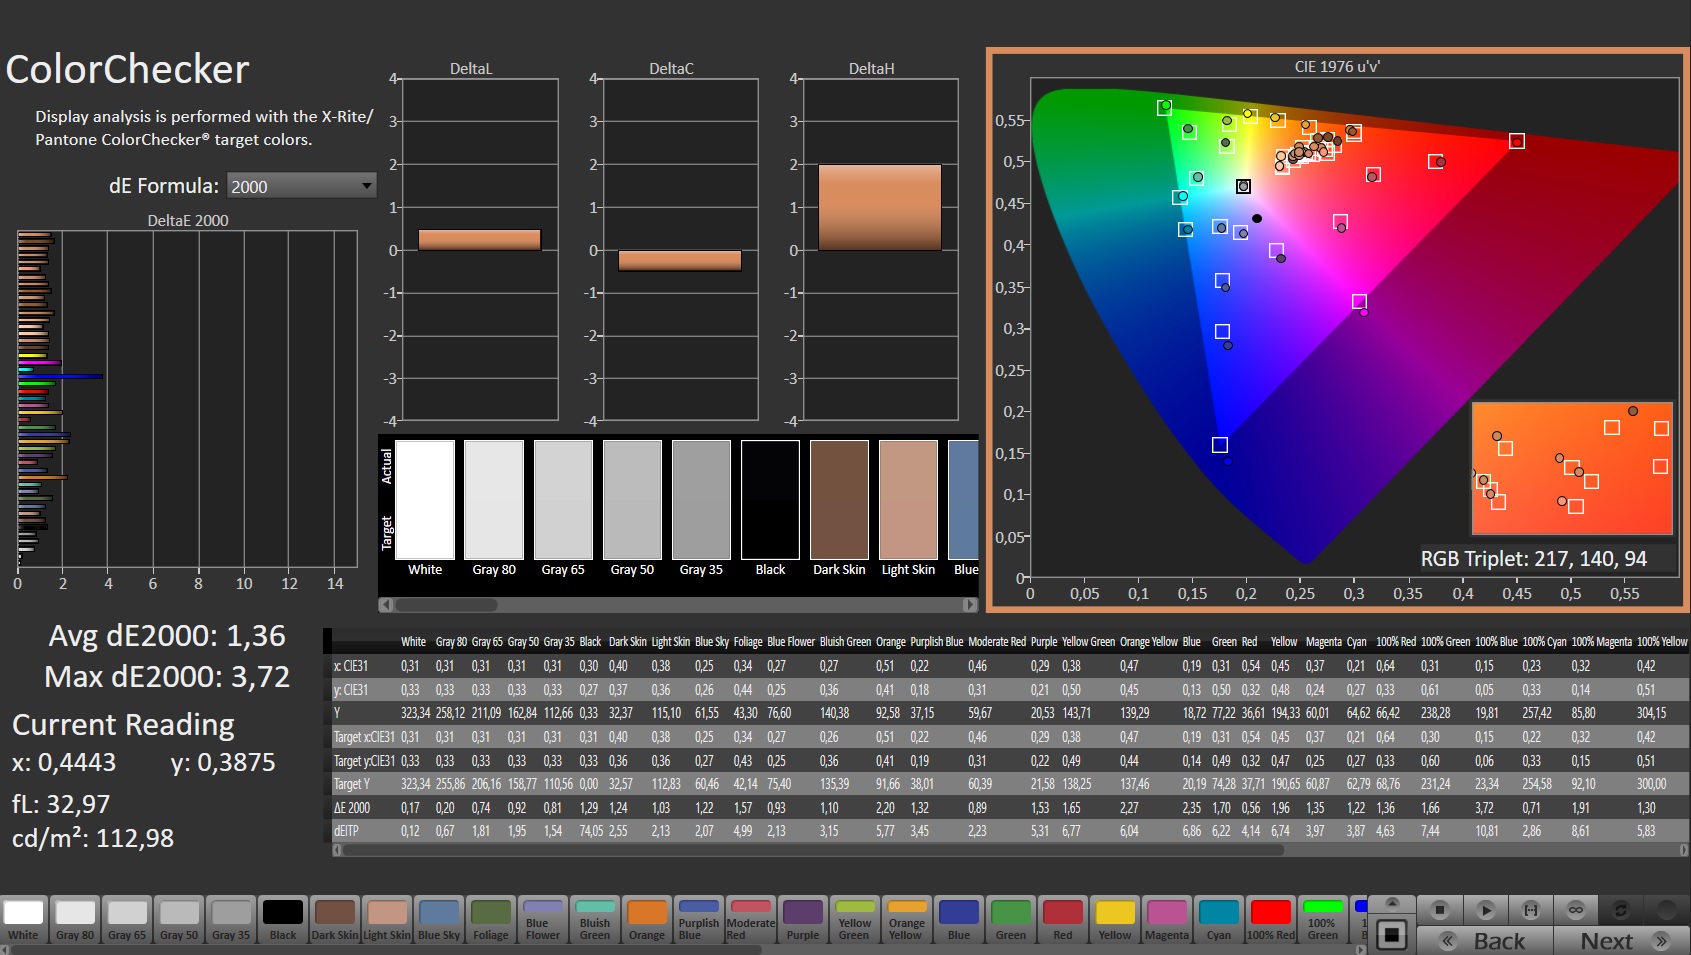
El brillo (303,1 cd/m²) y el contraste (988:1) de la pantalla mate de 15,6 pulgadas (2.560x1.440 píxeles) apenas cumplen sus respectivos objetivos. El panel de 165 Hz tiene tiempos de respuesta rápidos. No se detectó ningún parpadeo PWM
| |||||||||||||||||||||||||
iluminación: 89 %
Brillo con batería: 326 cd/m²
Contraste: 988:1 (Negro: 0.33 cd/m²)
ΔE ColorChecker Calman: 2.73 | ∀{0.5-29.43 Ø4.71}
calibrated: 1.36
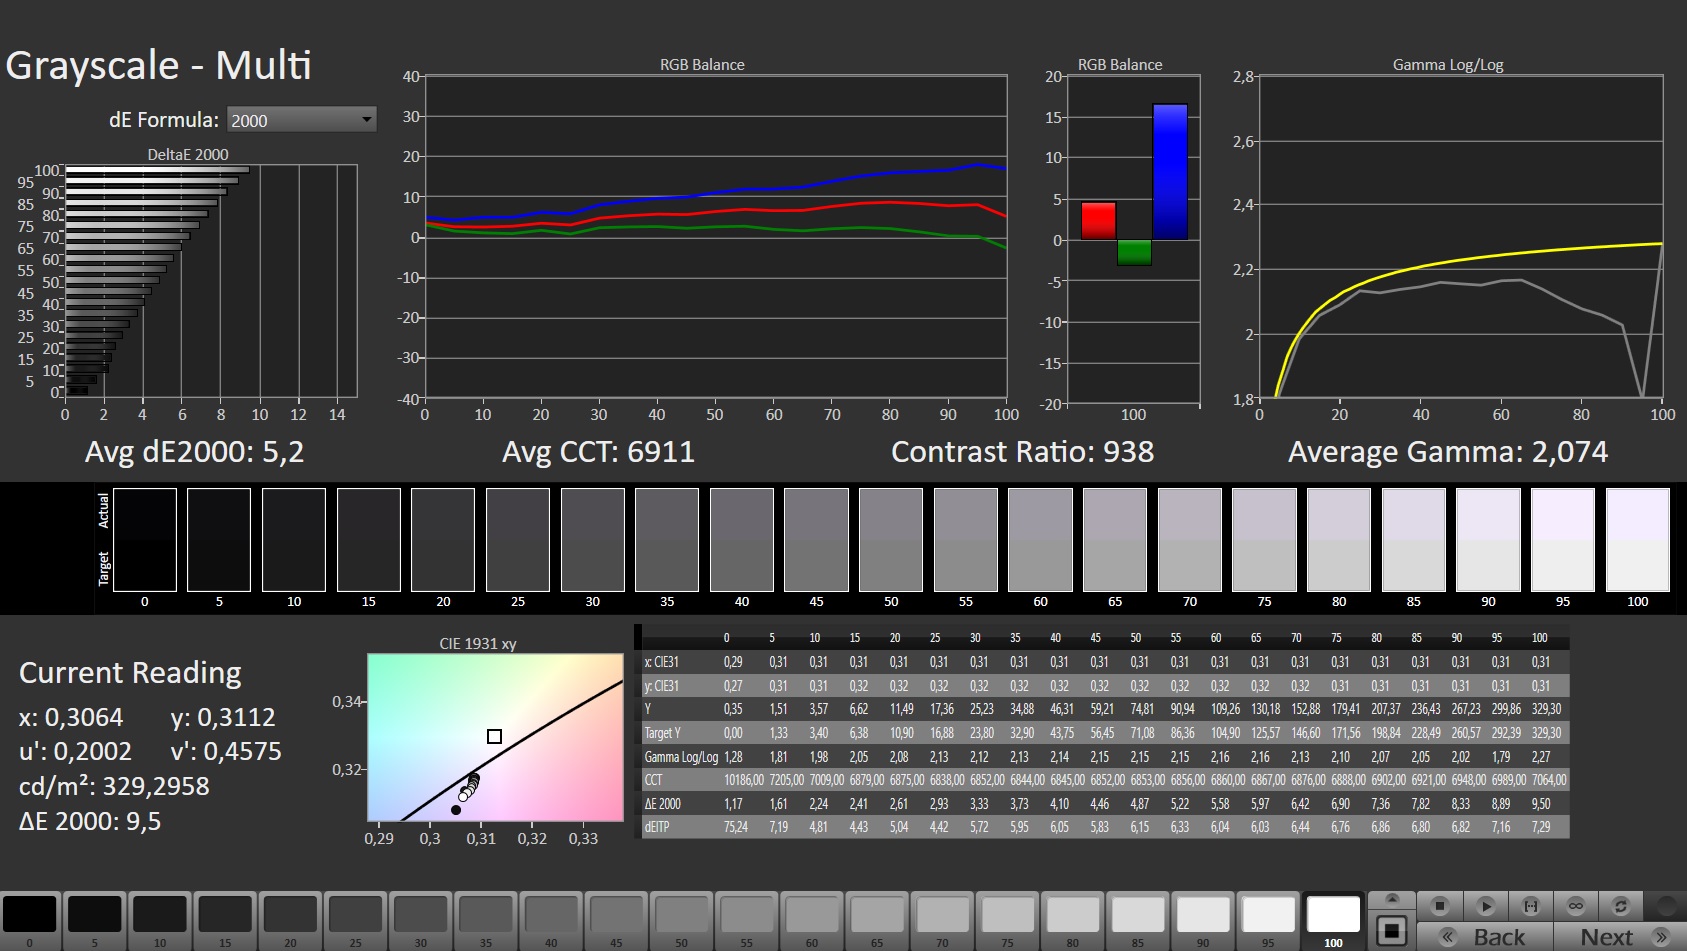
ΔE Greyscale Calman: 5.2 | ∀{0.09-98 Ø4.96}
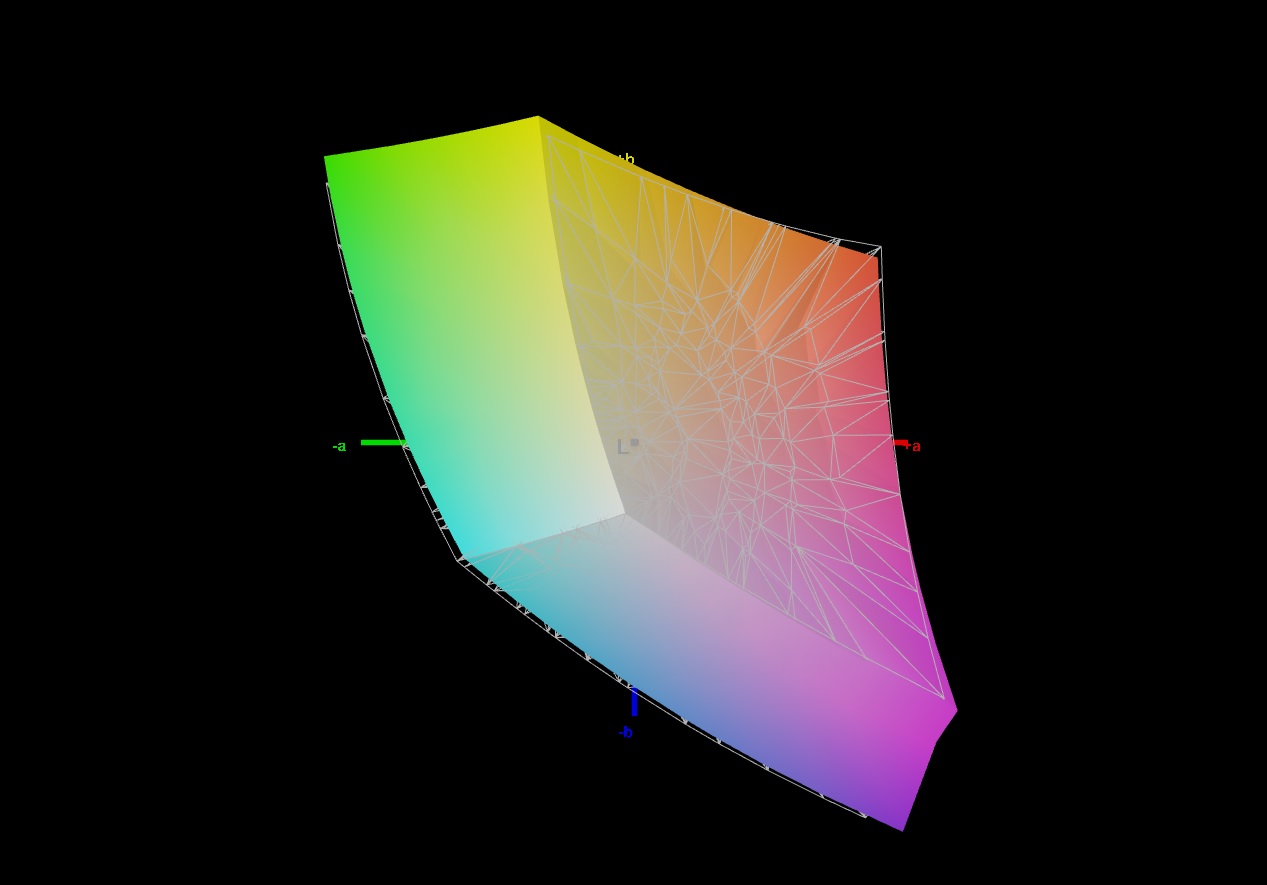
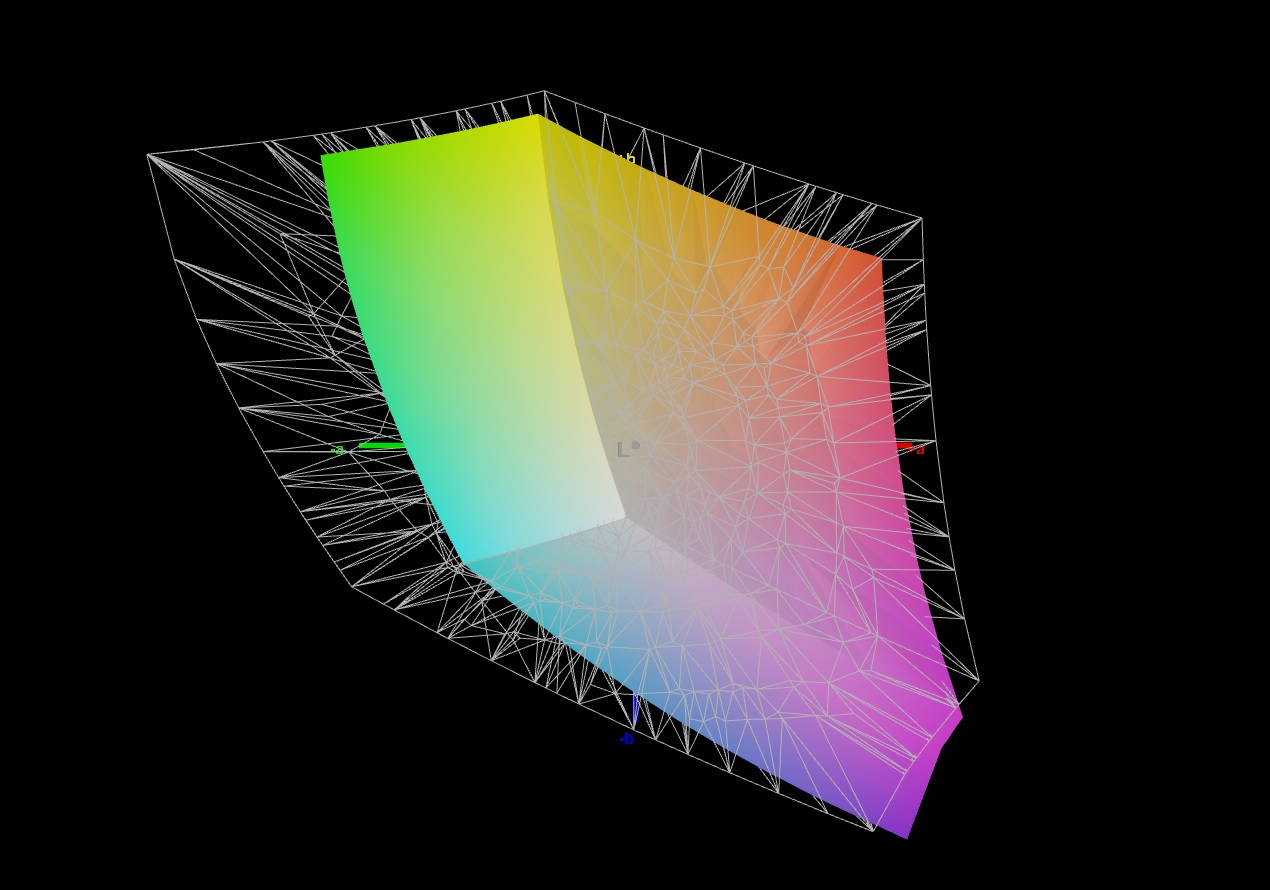
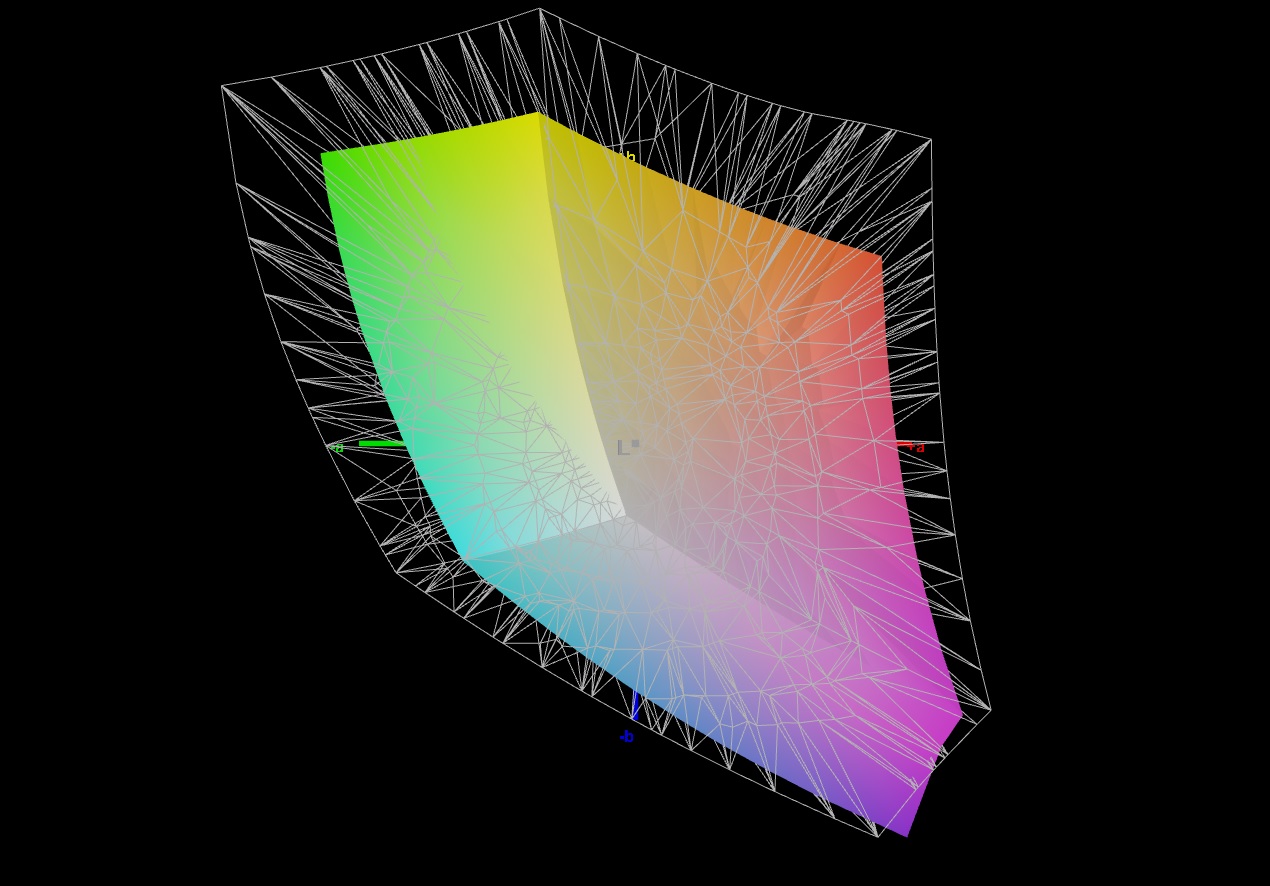
68.2% AdobeRGB 1998 (Argyll 3D)
96.7% sRGB (Argyll 3D)
67.3% Display P3 (Argyll 3D)
Gamma: 2.074
CCT: 6911 K
| Schenker XMG Fusion 15 (Mid 22) BOE CQ NE156QHM-NY2, IPS, 2560x1440, 15.6" | Asus TUF Dash F15 FX517ZR BOE CQ NE156QHM-NY1, IPS, 2560x1440, 15.6" | Acer Nitro 5 AN515-58-72QR Chi Mei N156KME-GNA, IPS, 2560x1440, 15.6" | HP Omen 16-b1090ng BOE09E5, IPS, 2560x1440, 16.1" | MSI Delta 15 A5EFK LQ156M1JW03 (SHP155D), IPS-Level, 1920x1080, 15.6" | Razer Blade 15 Base Edition 2021, i7-10750H RTX 3060 BOE NV156FHM-N4K, IPS, 1920x1080, 15.6" | |
|---|---|---|---|---|---|---|
| Display | 25% | 23% | 4% | -0% | -4% | |
| Display P3 Coverage (%) | 67.3 | 98.4 46% | 95.6 42% | 71 5% | 66.5 -1% | 64.3 -4% |
| sRGB Coverage (%) | 96.7 | 99.9 3% | 99.8 3% | 97.9 1% | 97.8 1% | 91.8 -5% |
| AdobeRGB 1998 Coverage (%) | 68.2 | 85.9 26% | 85.2 25% | 73.3 7% | 67.6 -1% | 65.5 -4% |
| Response Times | 9% | -41% | -30% | -30% | -10% | |
| Response Time Grey 50% / Grey 80% * (ms) | 11.6 ? | 5.6 ? 52% | 15.7 ? -35% | 14.5 ? -25% | 12.8 ? -10% | 8.8 ? 24% |
| Response Time Black / White * (ms) | 7 ? | 9.4 ? -34% | 10.2 ? -46% | 9.4 ? -34% | 10.4 ? -49% | 10 ? -43% |
| PWM Frequency (Hz) | 23580 ? | 1000 ? | ||||
| Screen | 20% | 8% | -5% | 1% | -12% | |
| Brightness middle (cd/m²) | 326 | 286 -12% | 332 2% | 335 3% | 291 -11% | 317.2 -3% |
| Brightness (cd/m²) | 303 | 266 -12% | 303 0% | 319 5% | 266 -12% | 306 1% |
| Brightness Distribution (%) | 89 | 87 -2% | 86 -3% | 90 1% | 88 -1% | 89 0% |
| Black Level * (cd/m²) | 0.33 | 0.25 24% | 0.29 12% | 0.28 15% | 0.36 -9% | 0.31 6% |
| Contrast (:1) | 988 | 1144 16% | 1145 16% | 1196 21% | 808 -18% | 1023 4% |
| Colorchecker dE 2000 * | 2.73 | 2.14 22% | 3.61 -32% | 4.38 -60% | 2.98 -9% | 4.37 -60% |
| Colorchecker dE 2000 max. * | 9.54 | 5.22 45% | 7.71 19% | 9.48 1% | 7.59 20% | 6.62 31% |
| Colorchecker dE 2000 calibrated * | 1.36 | 0.67 51% | 0.59 57% | 1.33 2% | 0.91 33% | 2.67 -96% |
| Greyscale dE 2000 * | 5.2 | 2.8 46% | 5.2 -0% | 7 -35% | 4.2 19% | 4.5 13% |
| Gamma | 2.074 106% | 2.23 99% | 2.155 102% | 2.103 105% | 2.293 96% | 2.4 92% |
| CCT | 6911 94% | 7092 92% | 6724 97% | 6244 104% | 7624 85% | 7418 88% |
| Color Space (Percent of AdobeRGB 1998) (%) | 59.2 | |||||
| Color Space (Percent of sRGB) (%) | 91.4 | |||||
| Media total (Programa/Opciones) | 18% /
19% | -3% /
4% | -10% /
-7% | -10% /
-3% | -9% /
-10% |
* ... más pequeño es mejor
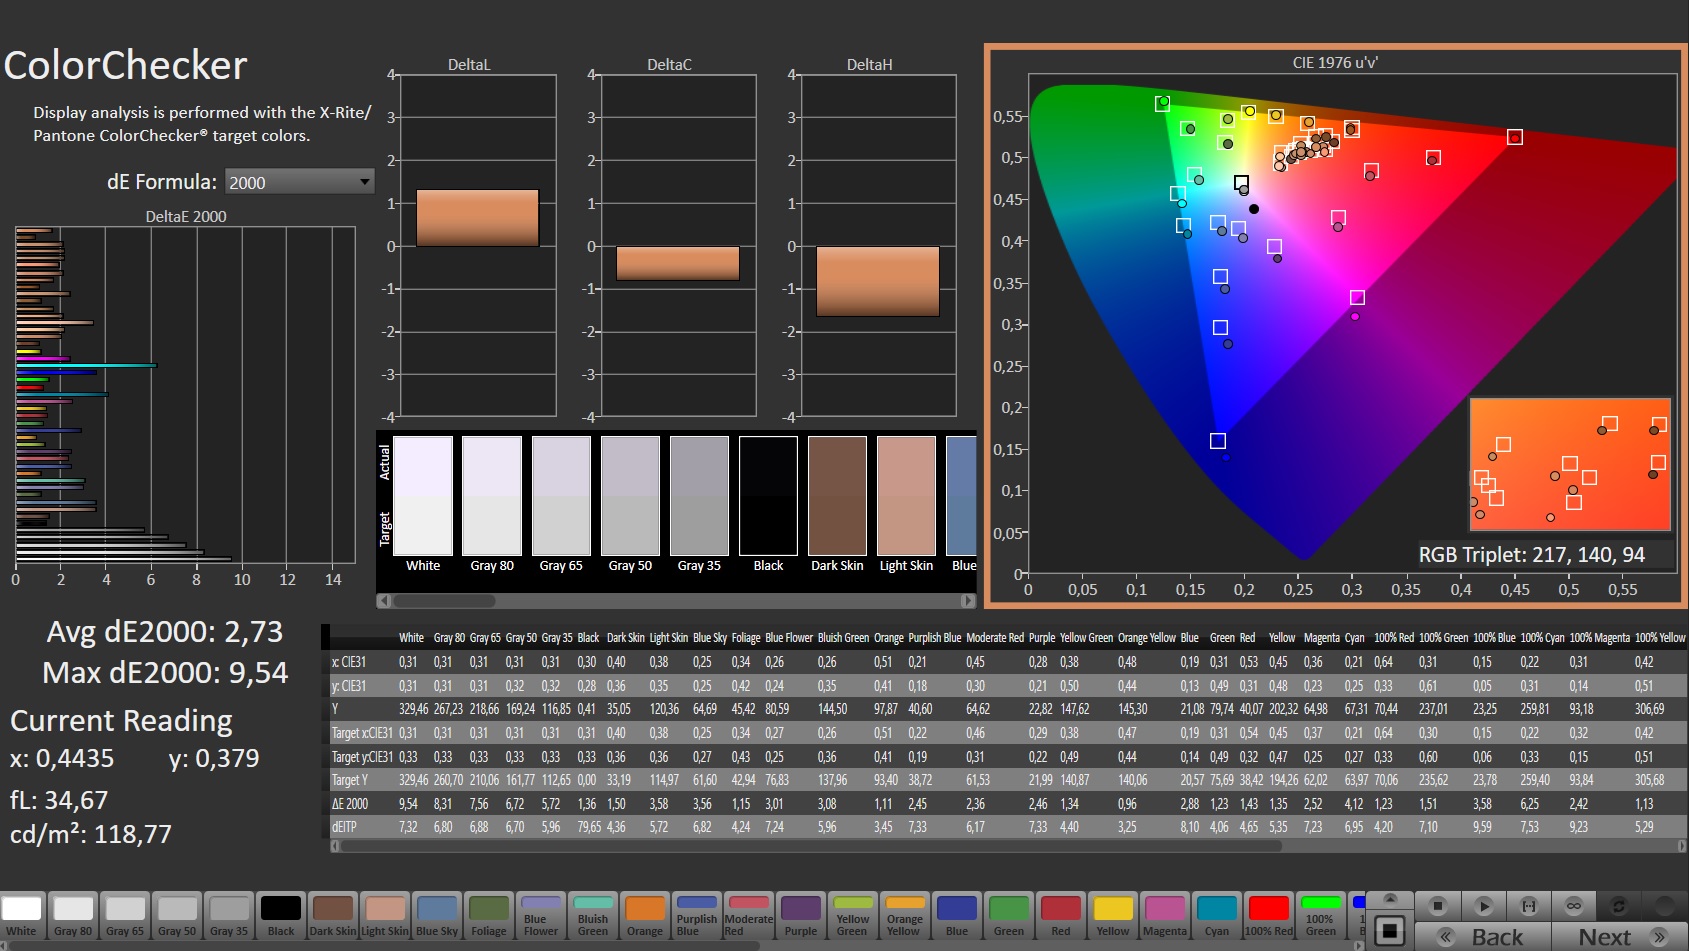
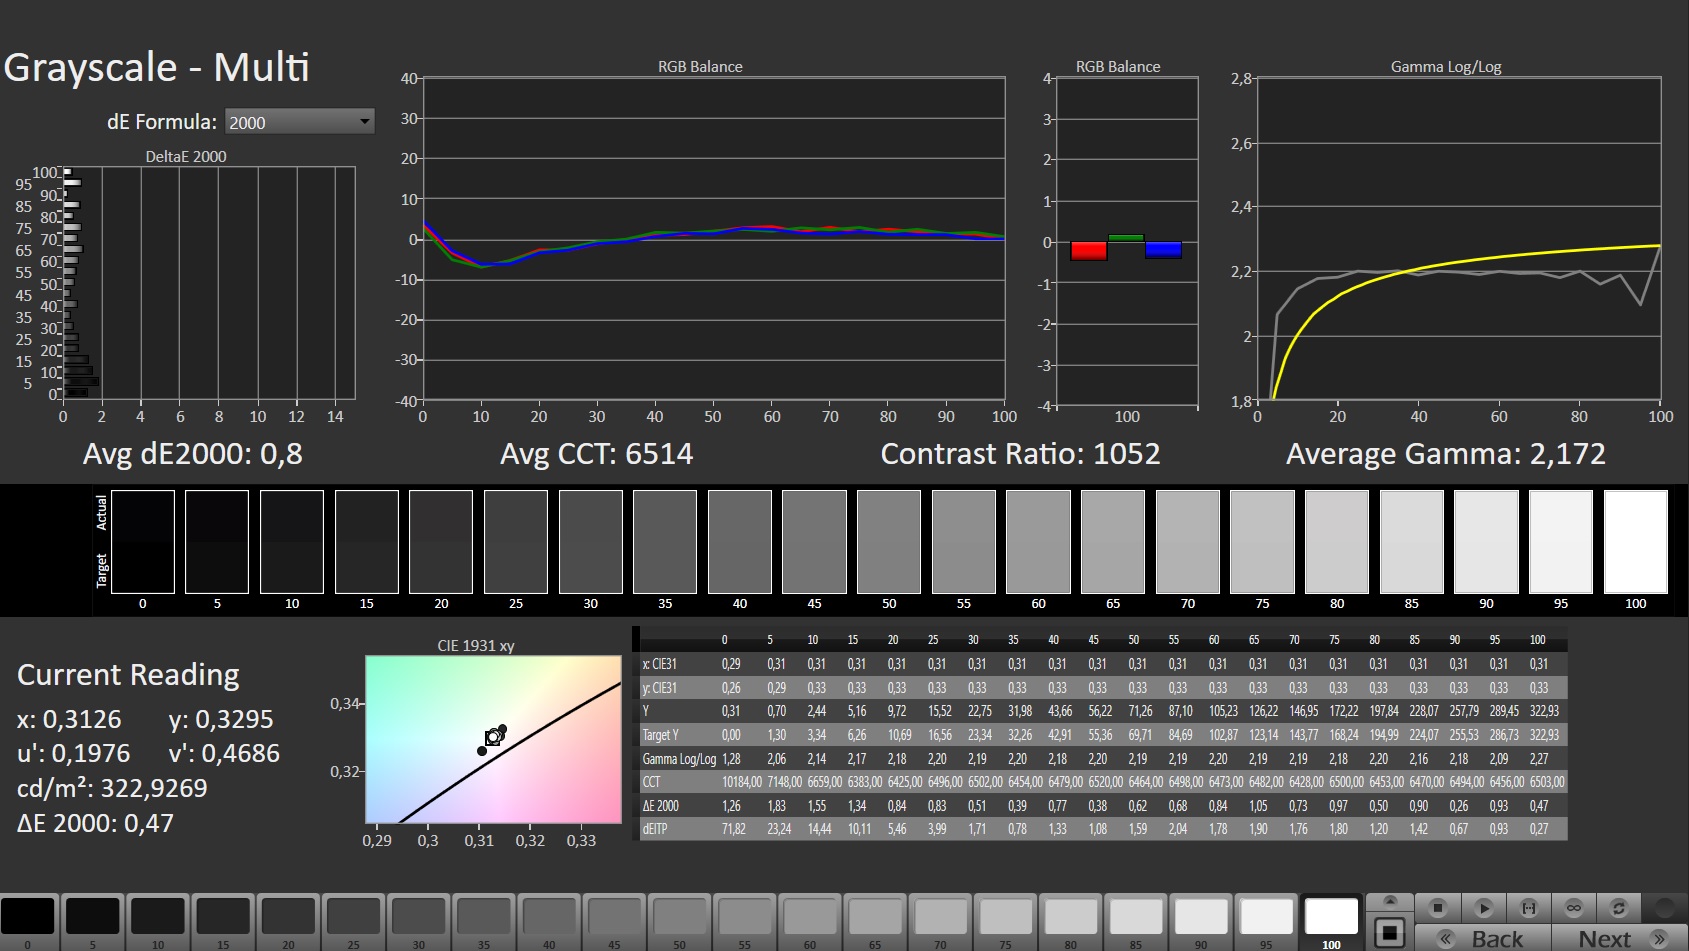
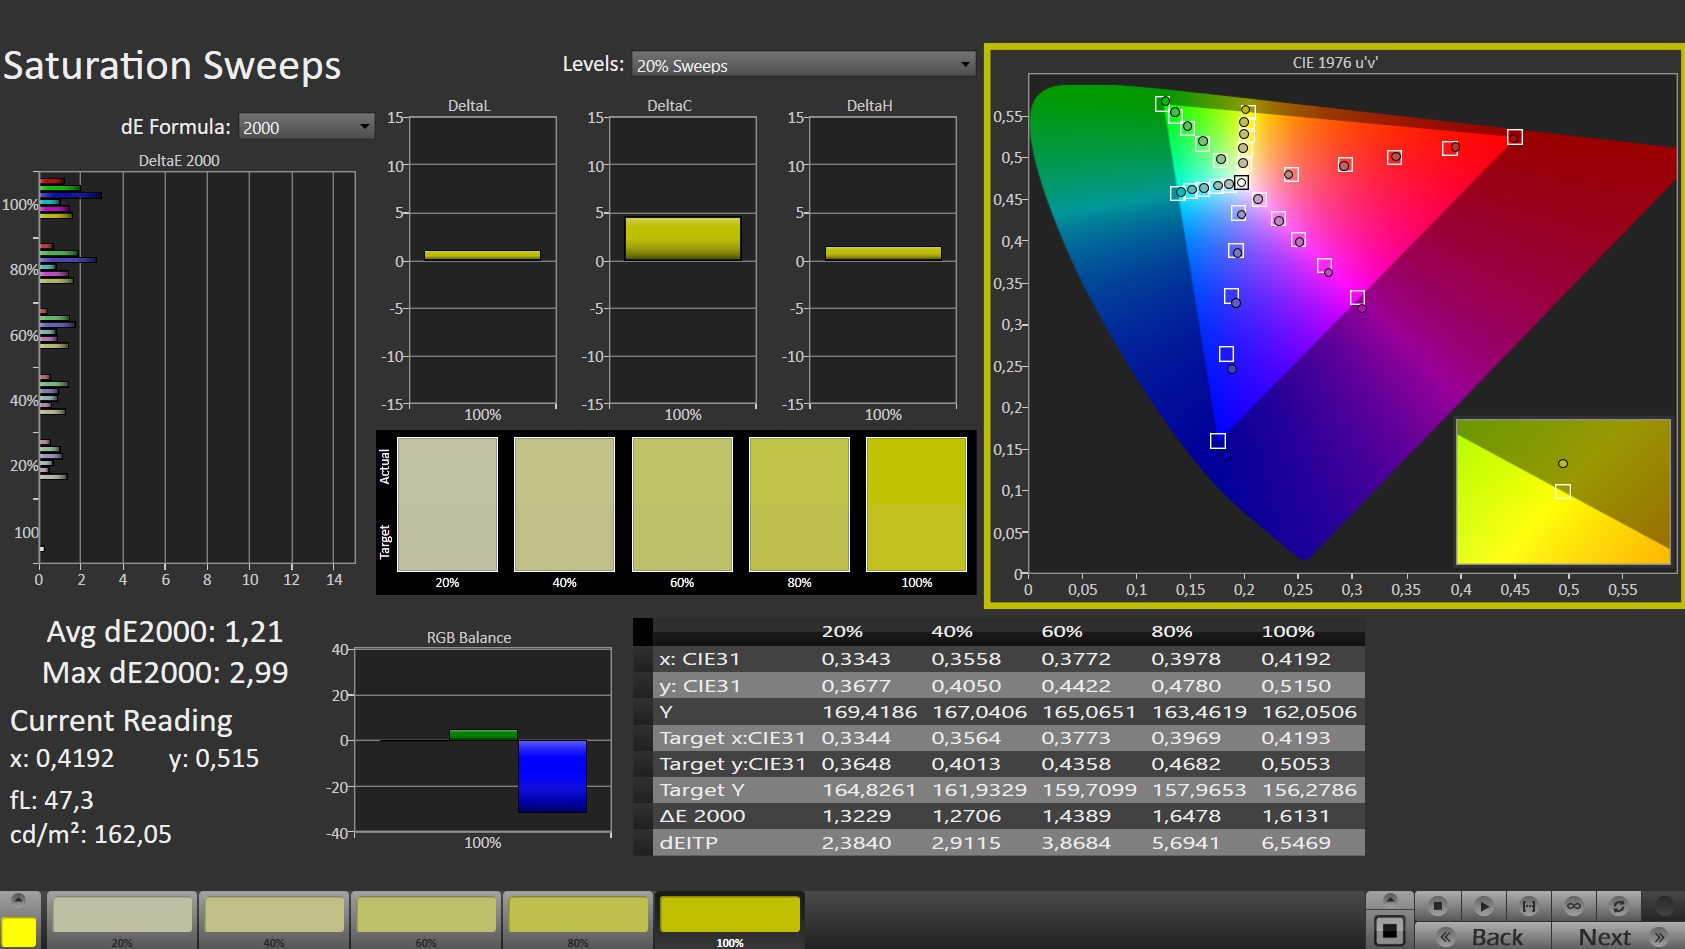
La pantalla reproduce bien los colores desde el primer momento. La desviación de 2,73 está dentro del rango objetivo (Delta E < 3) - esta pequeña desviación no es perceptible para los espectadores. La calibración conlleva mejoras: La desviación del color baja a 1,36, y la escala de grises se muestra de forma más equilibrada. La pantalla puede reproducir el espacio de color sRGB (96,7%) casi por completo; los espacios de color AdobeRGB y DCI-P3 se reproducen al 68% y al 67%, respectivamente
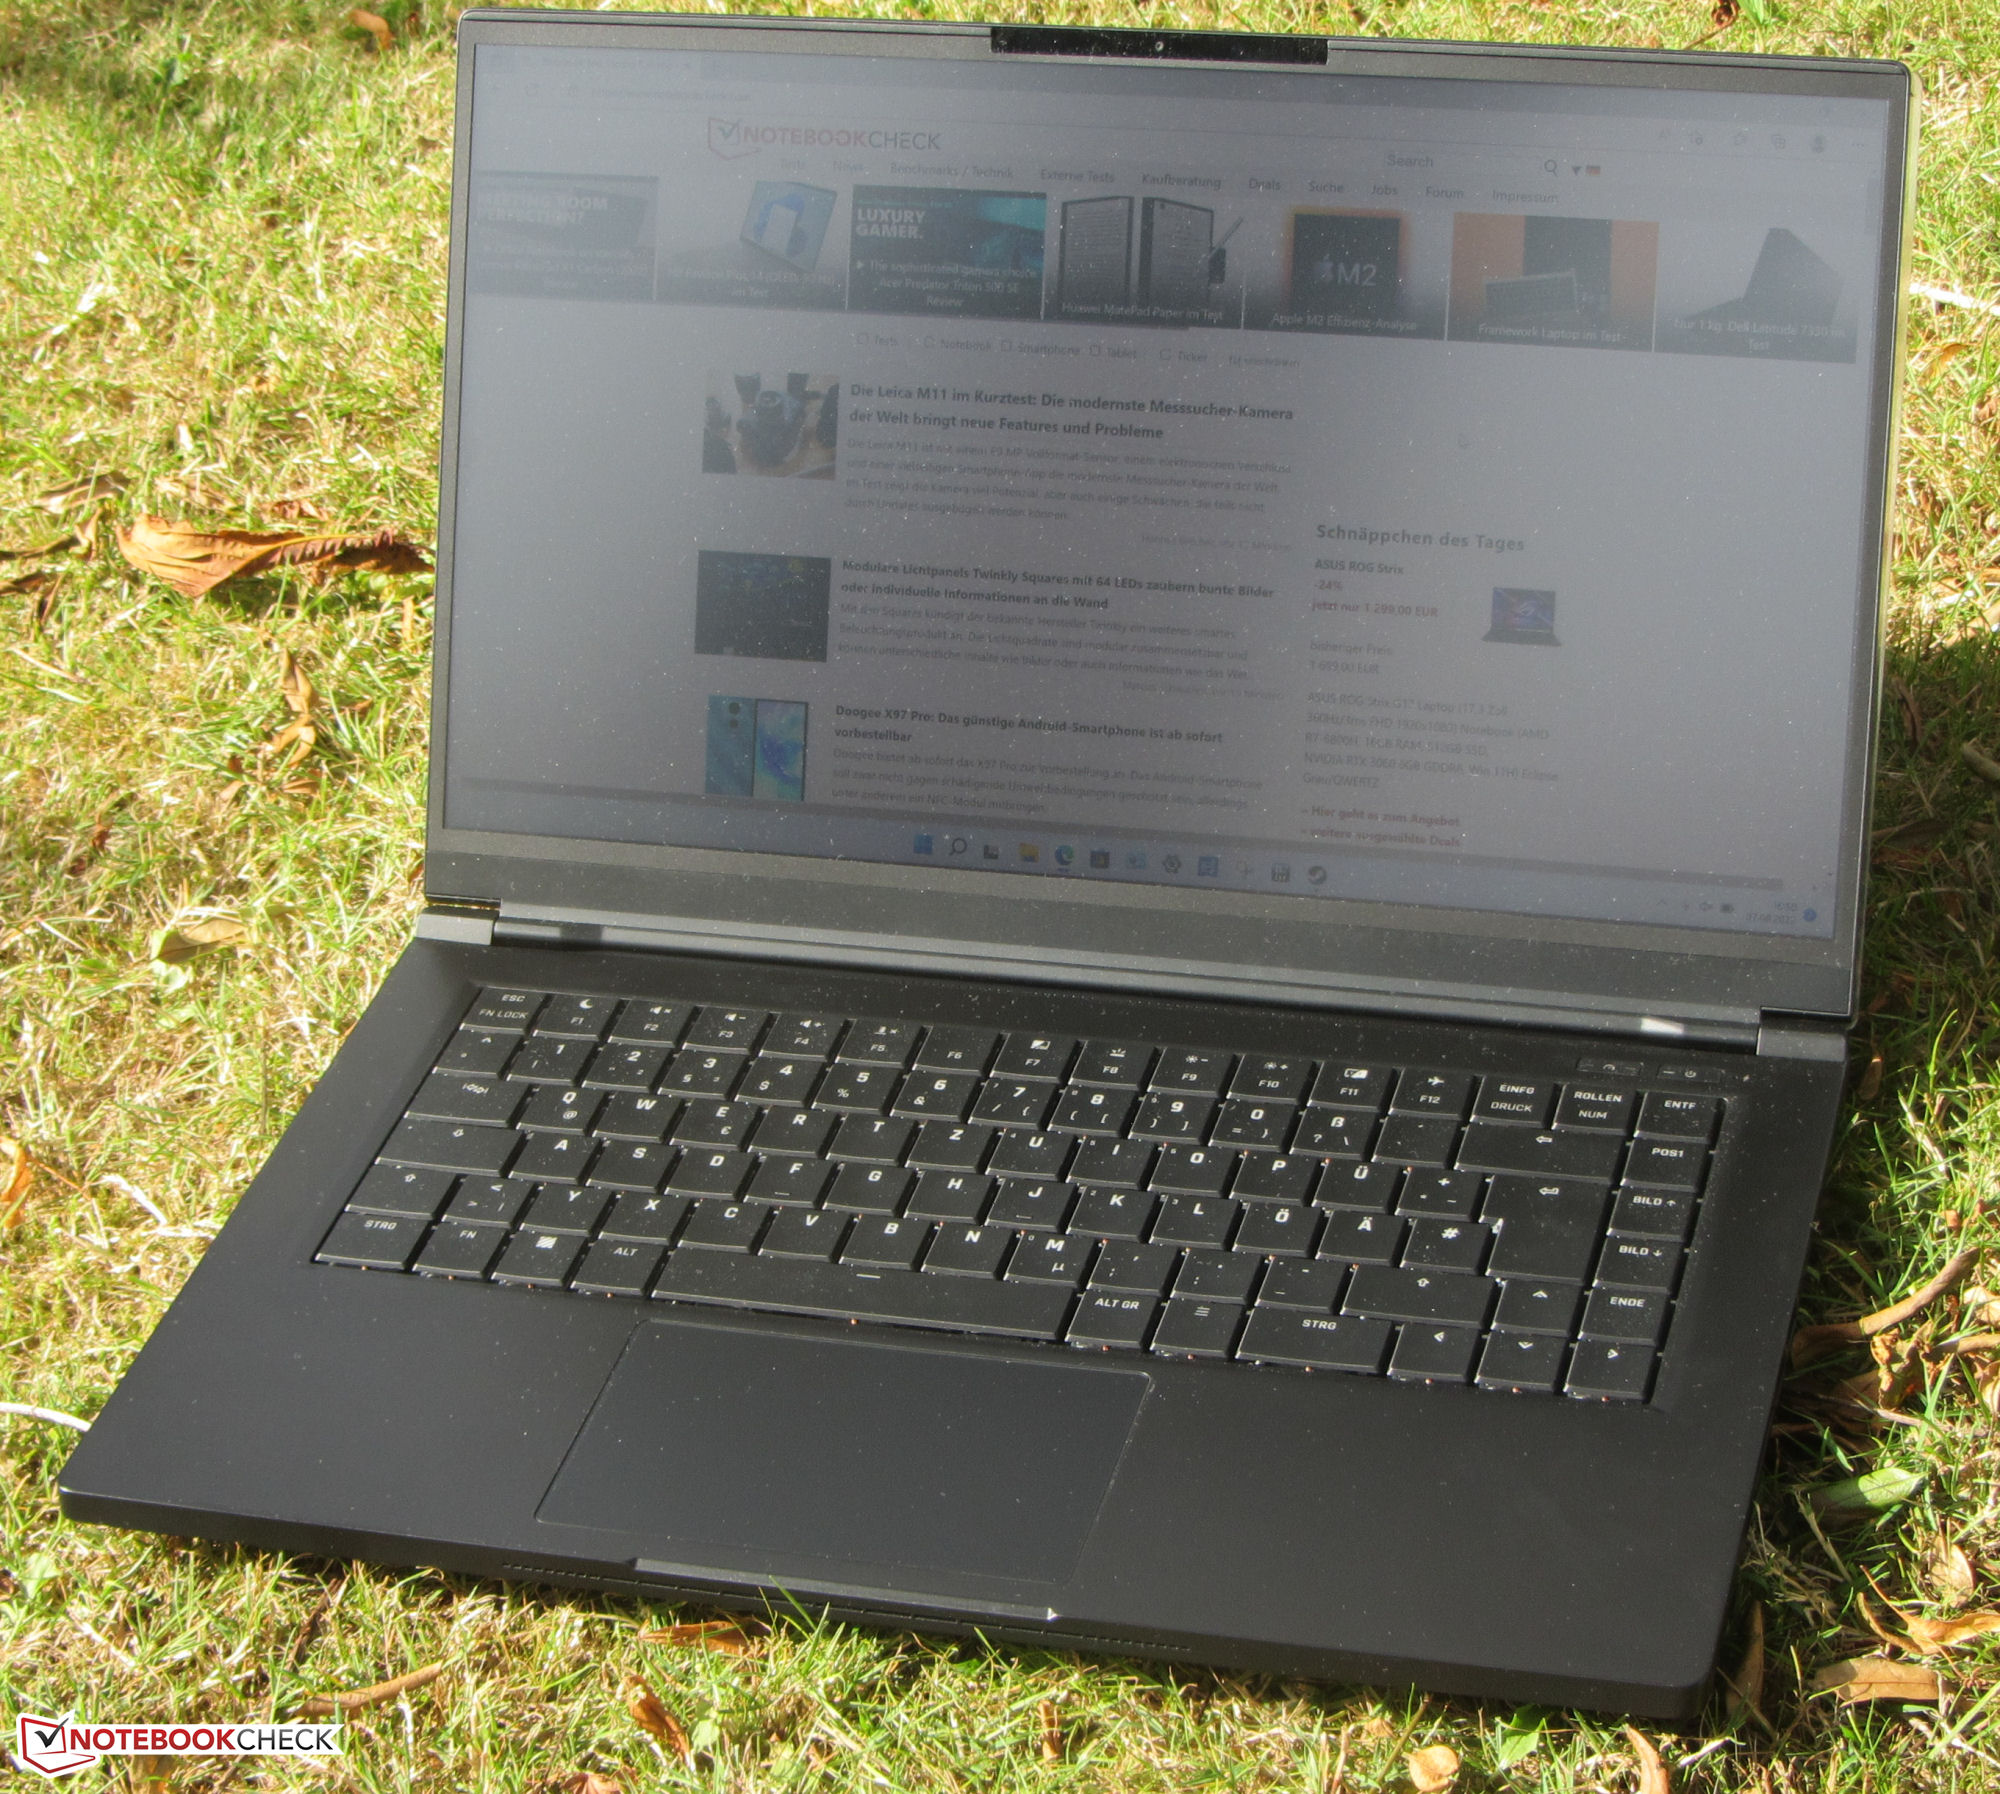
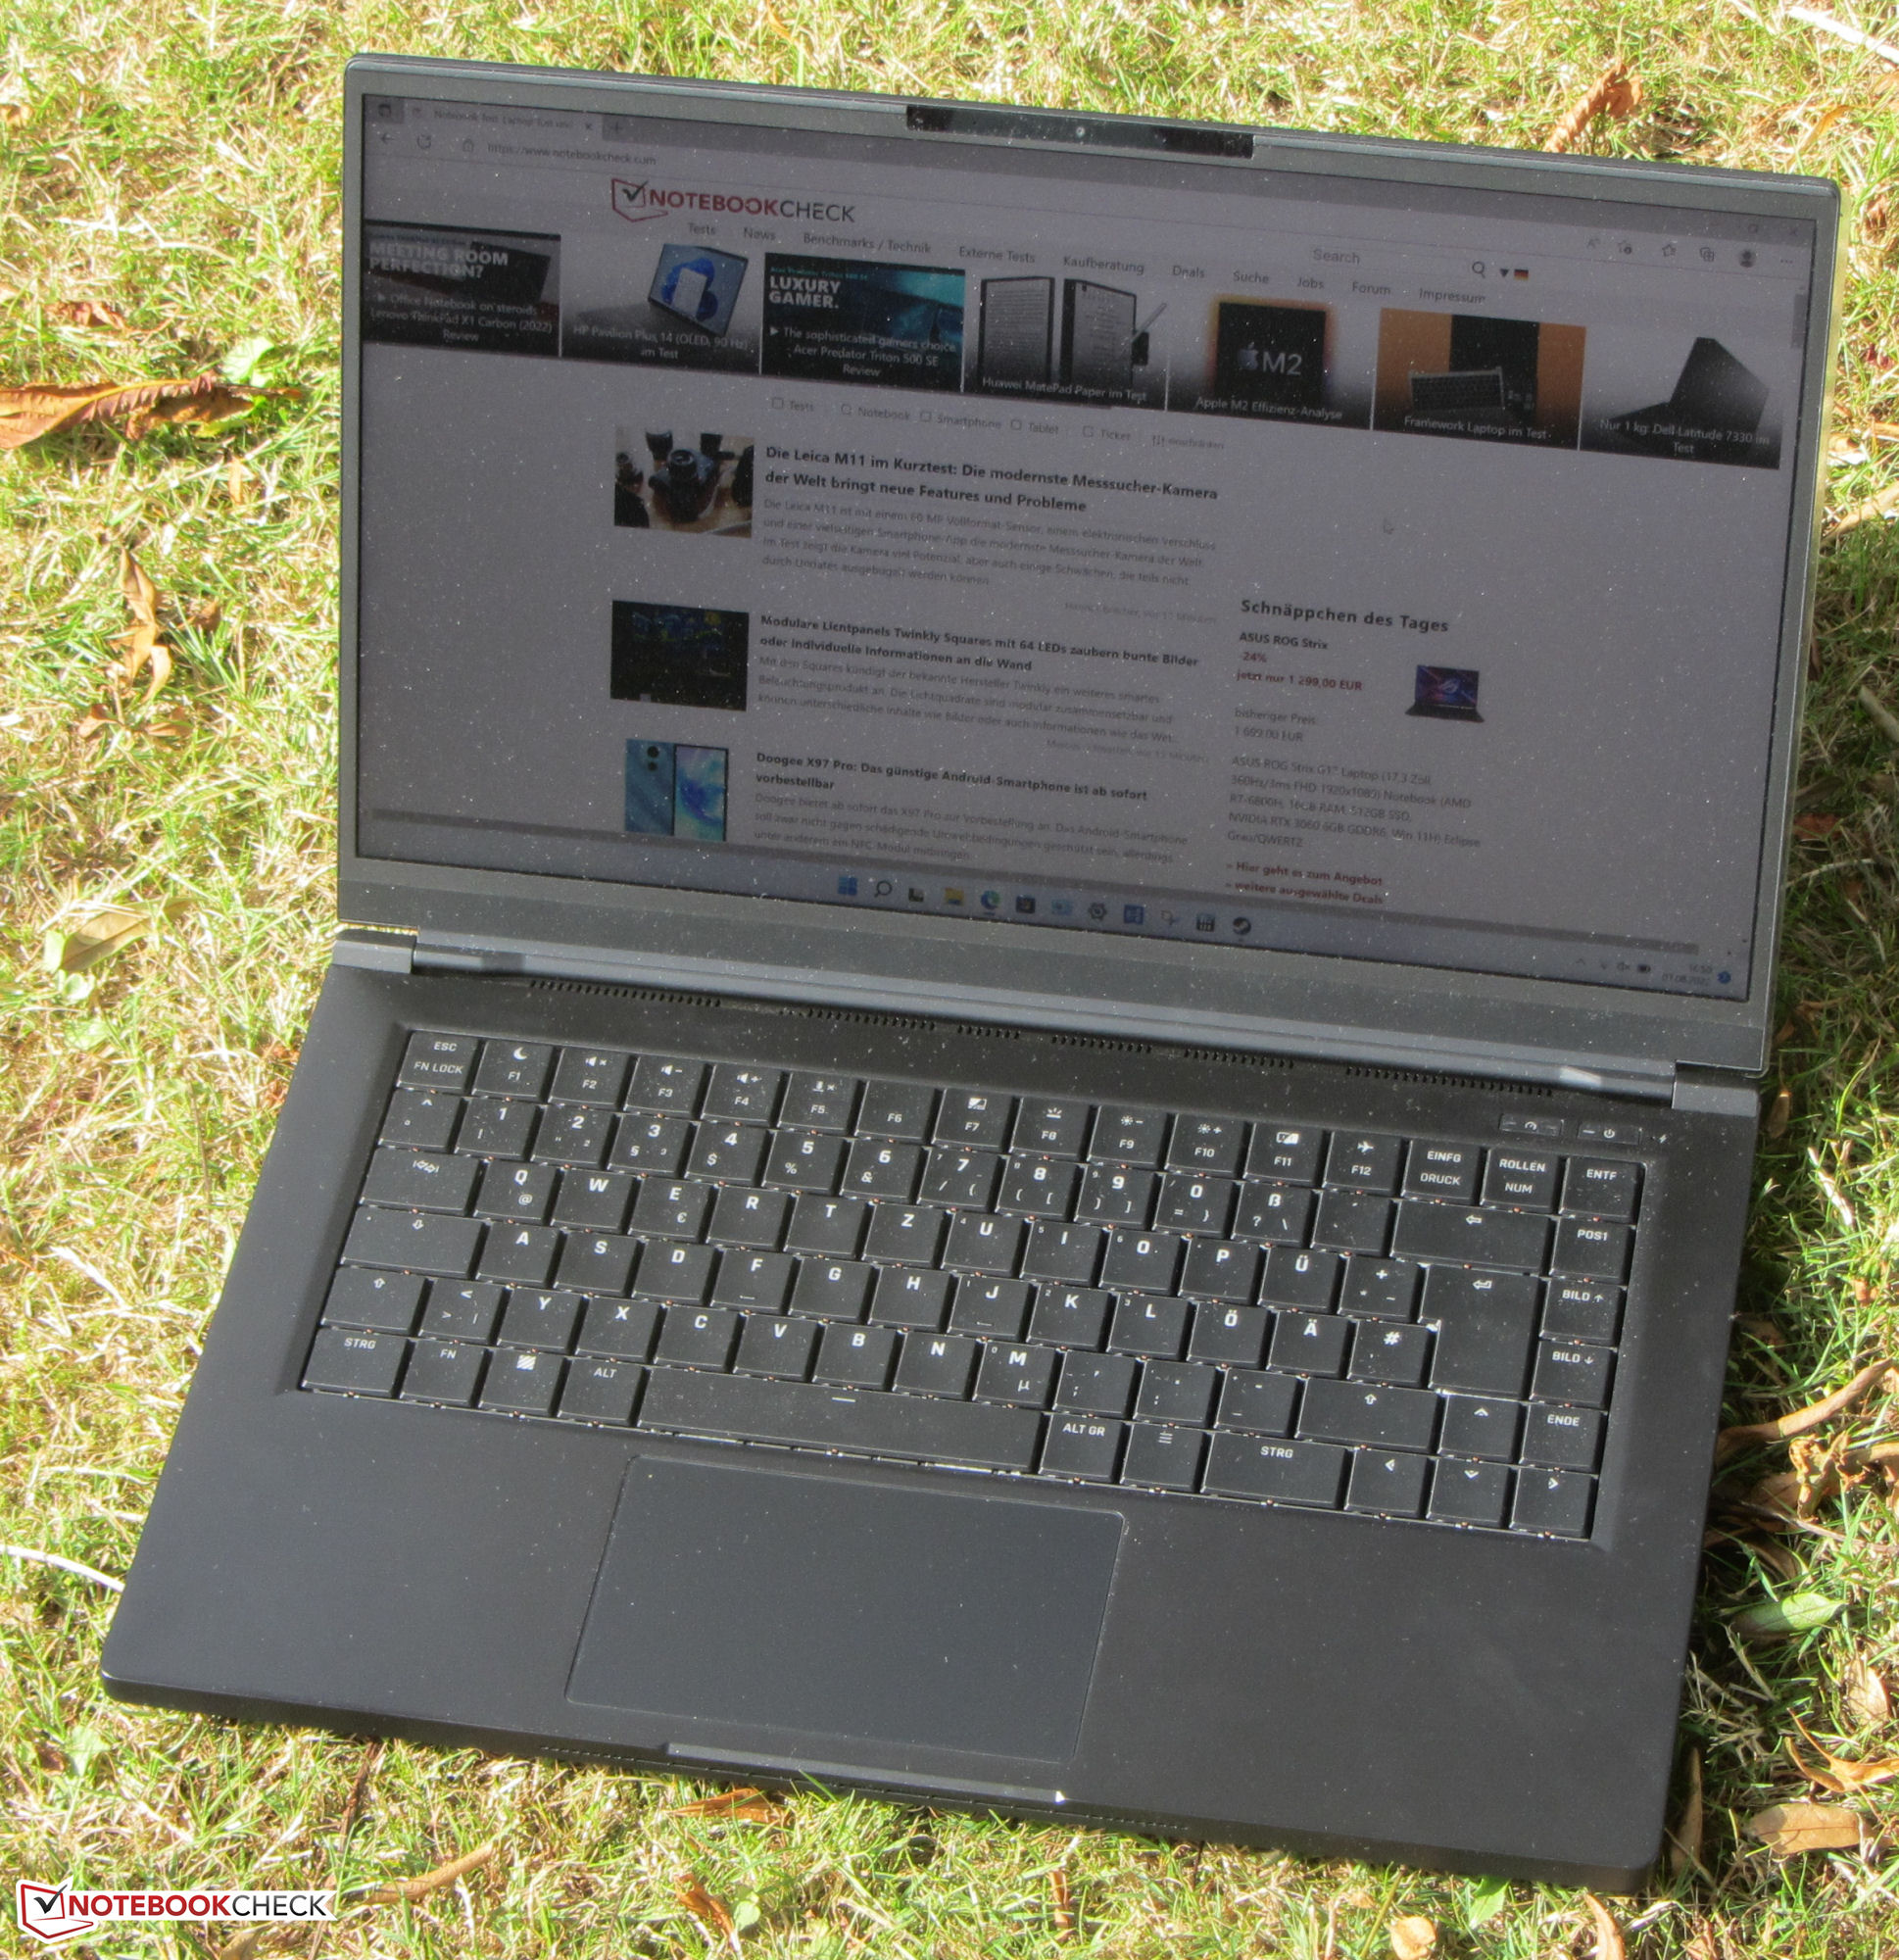
El panel IPS de ángulo de visión estable es legible desde cualquier posición. La legibilidad en exteriores es posible cuando el sol no brilla demasiado

Tiempos de respuesta del display
| ↔ Tiempo de respuesta de Negro a Blanco | ||
|---|---|---|
| 7 ms ... subida ↗ y bajada ↘ combinada | ↗ 3.3 ms subida | 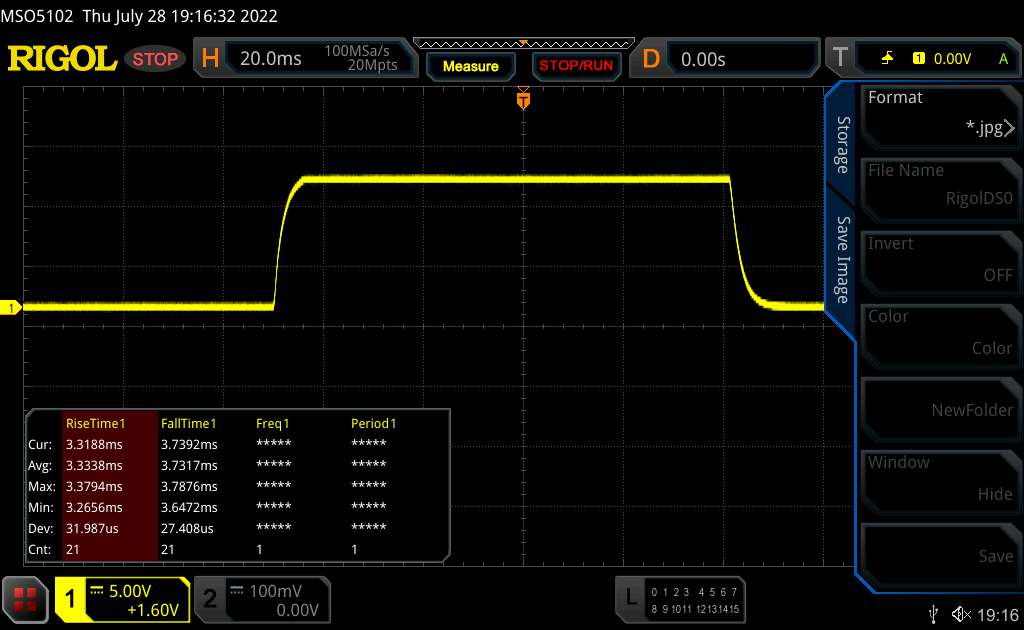 |
| ↘ 3.7 ms bajada | ||
| La pantalla mostró tiempos de respuesta muy rápidos en nuestros tests y debería ser adecuada para juegos frenéticos. En comparación, todos los dispositivos de prueba van de ##min### (mínimo) a 240 (máximo) ms. » 21 % de todos los dispositivos son mejores. Esto quiere decir que el tiempo de respuesta medido es mejor que la media (19.8 ms) de todos los dispositivos testados. | ||
| ↔ Tiempo de respuesta 50% Gris a 80% Gris | ||
| 11.6 ms ... subida ↗ y bajada ↘ combinada | ↗ 5.6 ms subida | 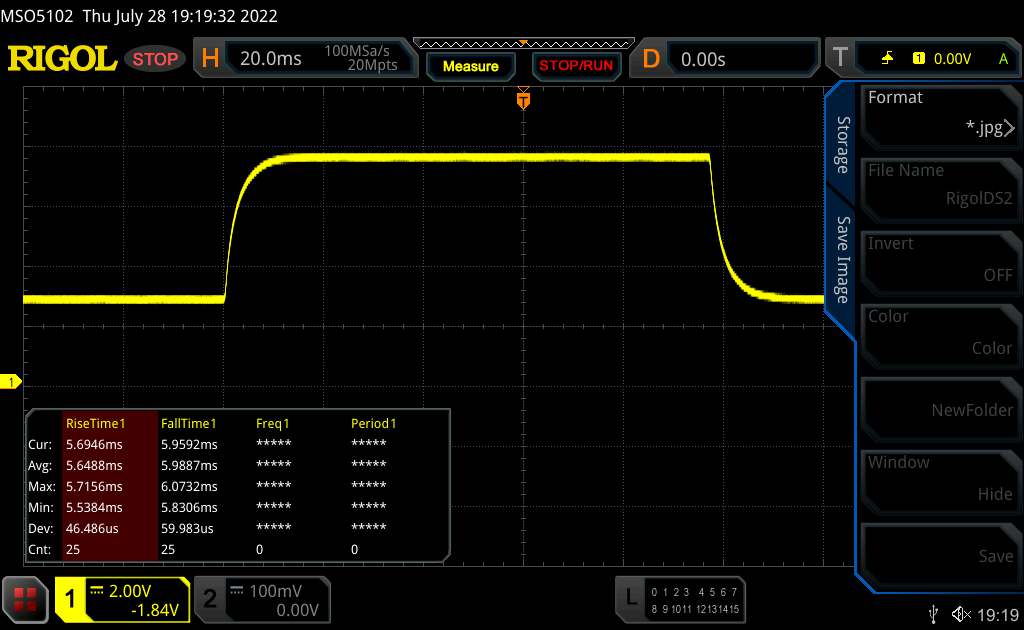 |
| ↘ 6 ms bajada | ||
| La pantalla mostró buenos tiempos de respuesta en nuestros tests pero podría ser demasiado lenta para los jugones competitivos. En comparación, todos los dispositivos de prueba van de ##min### (mínimo) a 636 (máximo) ms. » 25 % de todos los dispositivos son mejores. Esto quiere decir que el tiempo de respuesta medido es mejor que la media (31 ms) de todos los dispositivos testados. | ||
Parpadeo de Pantalla / PWM (Pulse-Width Modulation)
| Parpadeo de Pantalla / PWM no detectado | 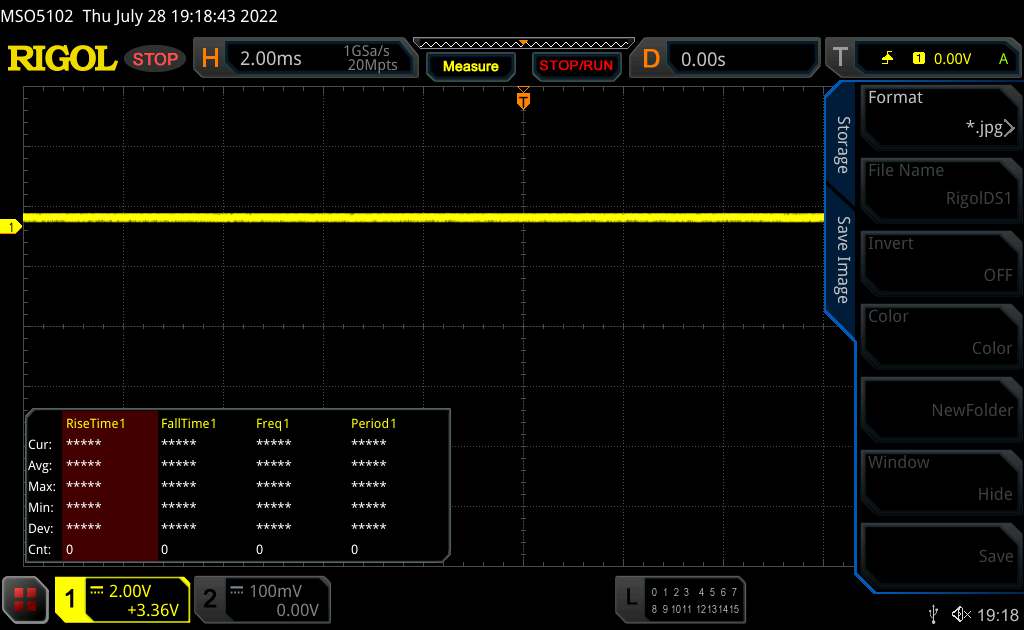 | ||
Comparación: 52 % de todos los dispositivos testados no usaron PWM para atenuar el display. Si se usó, medimos una media de 7754 (mínimo: 5 - máxmo: 343500) Hz. | |||
Rendimiento - Tiger Lake se encuentra con Ampere
Con el XMG Fusion 15, Schenker cuenta con un potente portátil de 15,6 pulgadas diseñado para diversas áreas de aplicación
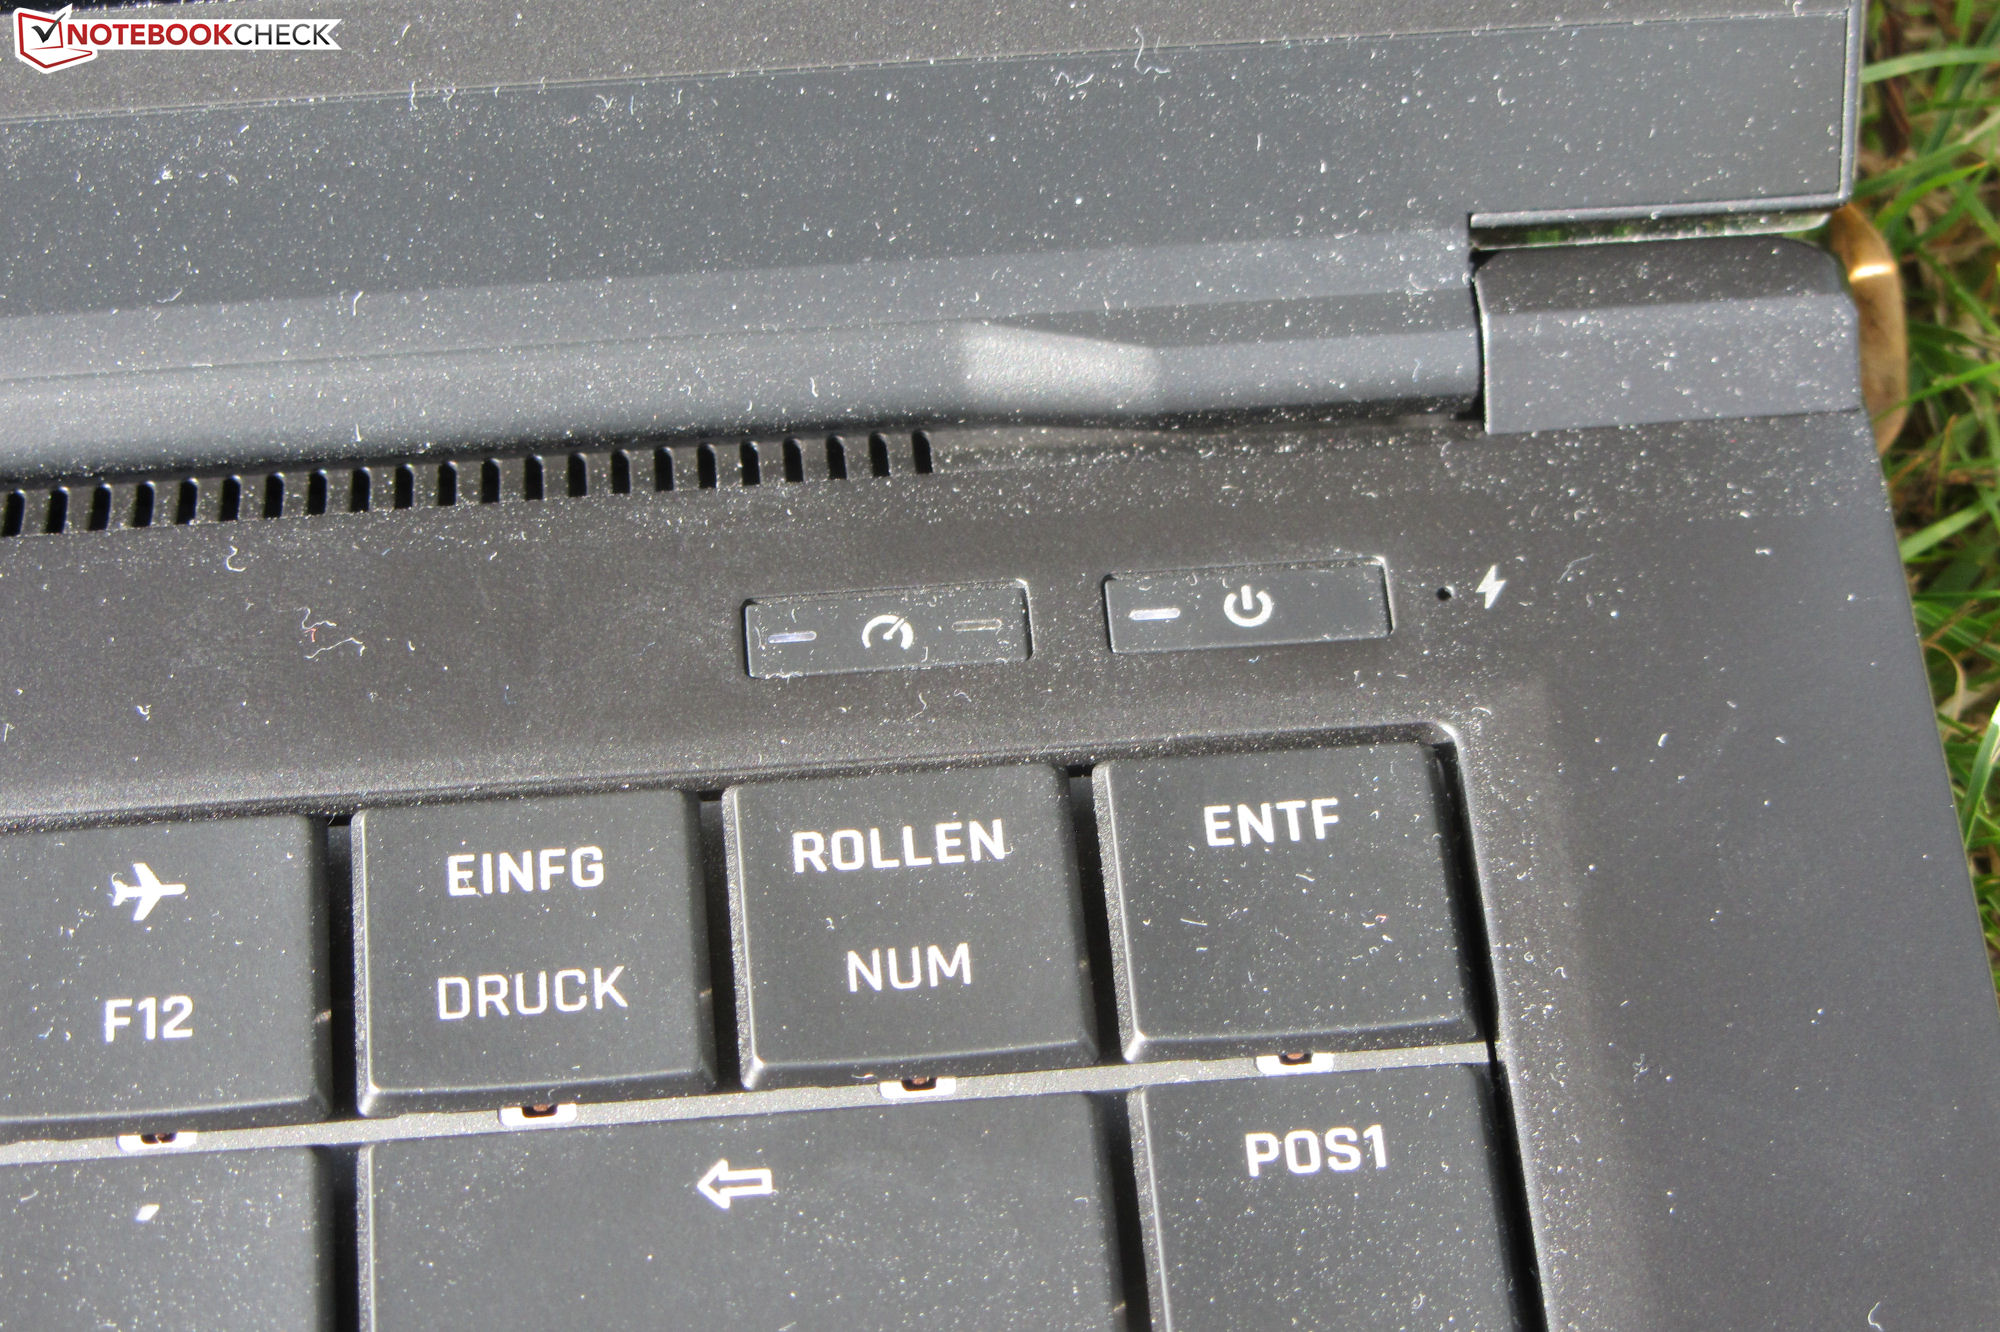
Condiciones de la prueba
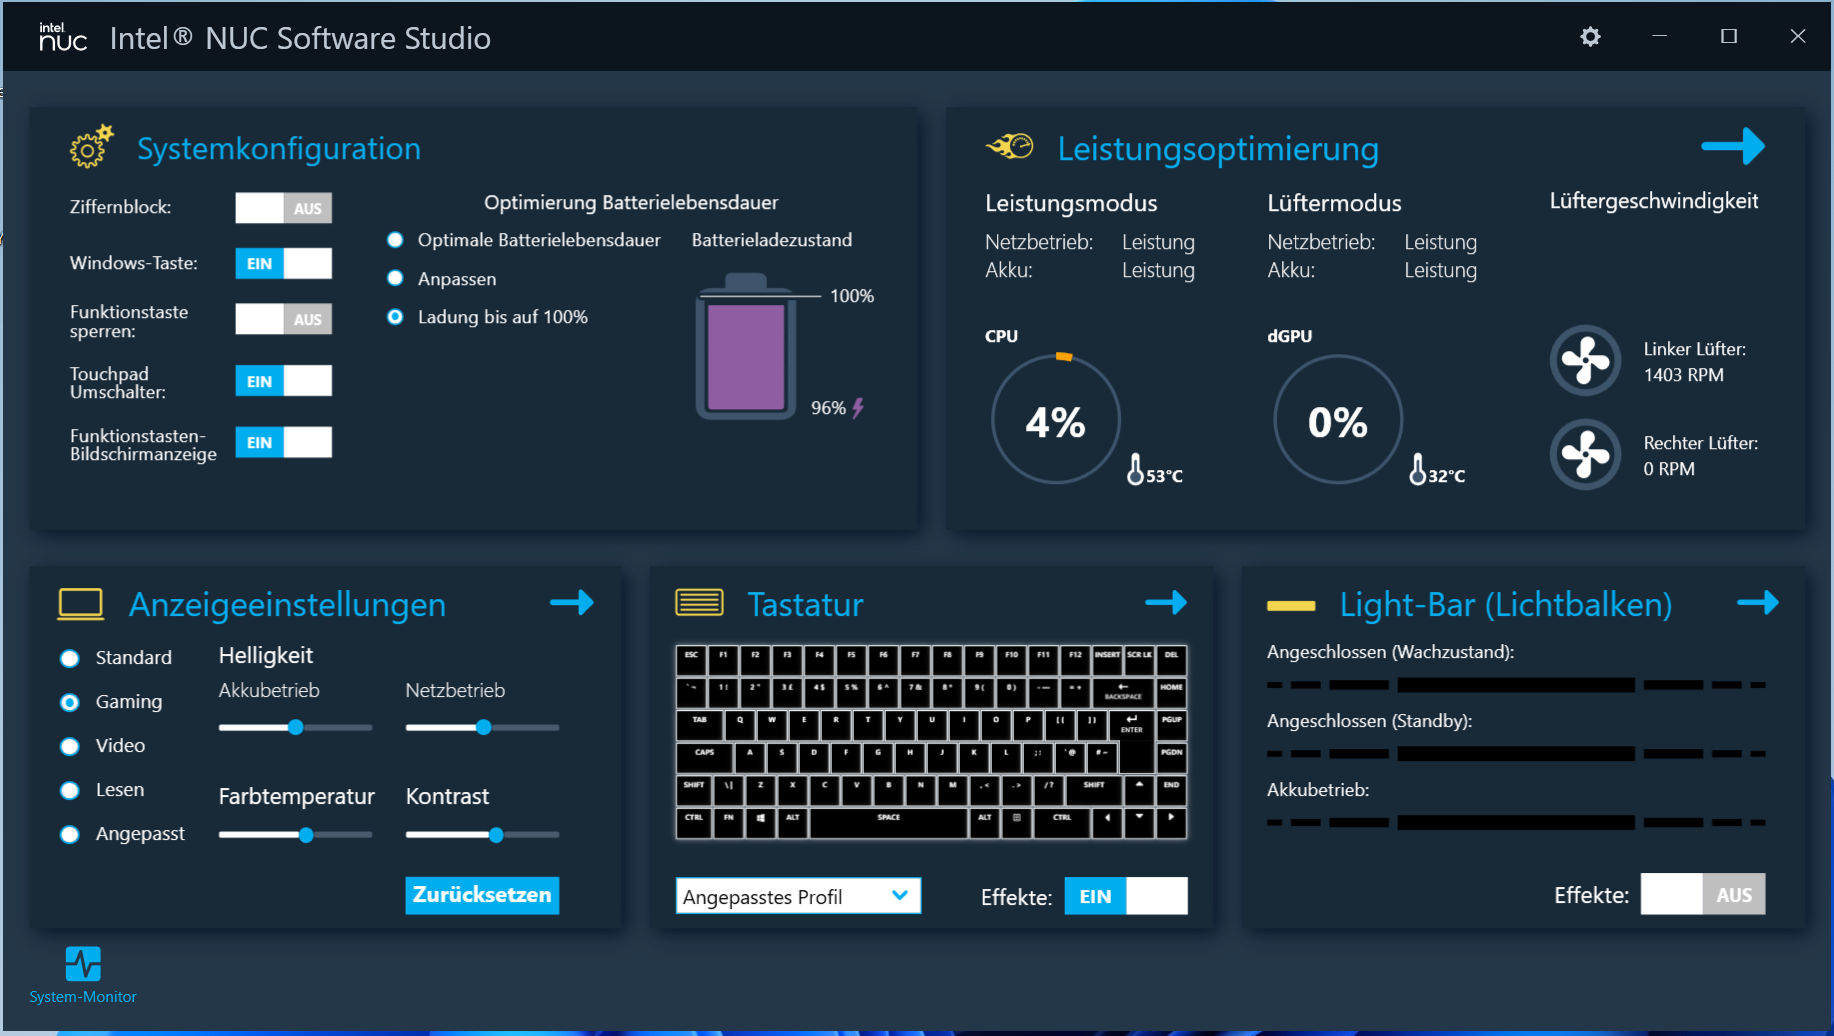
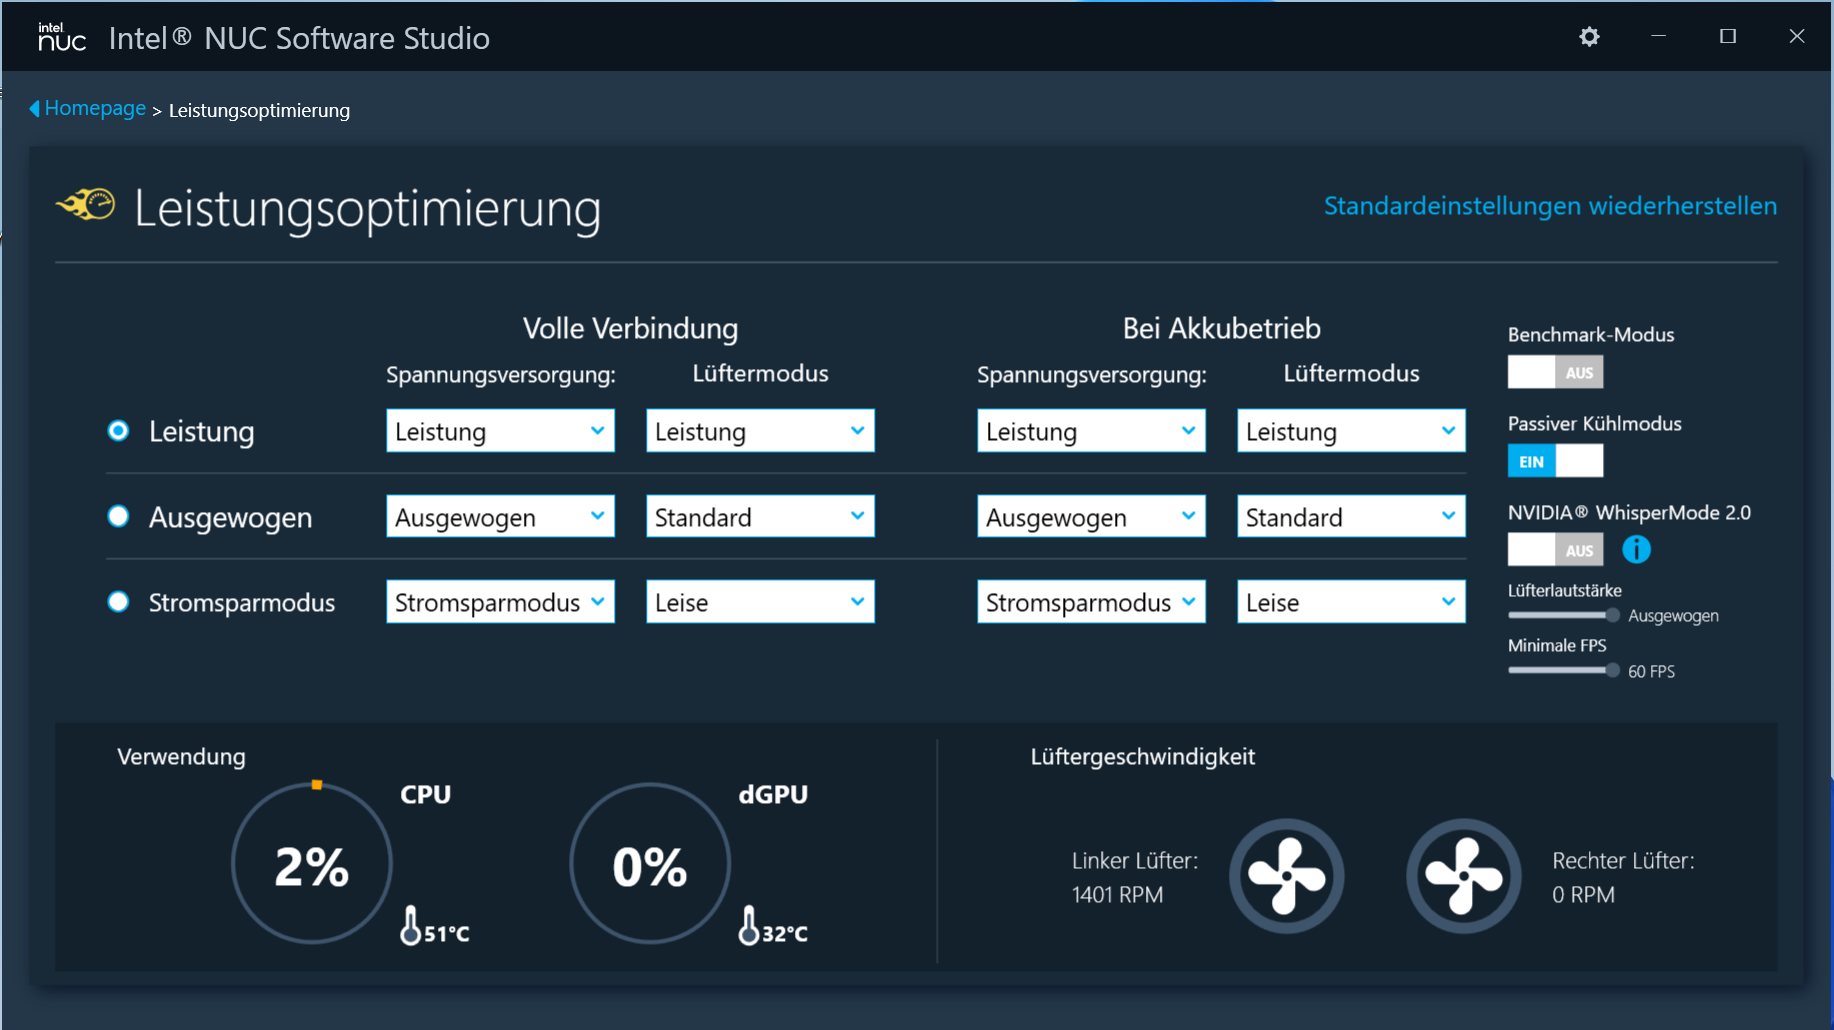
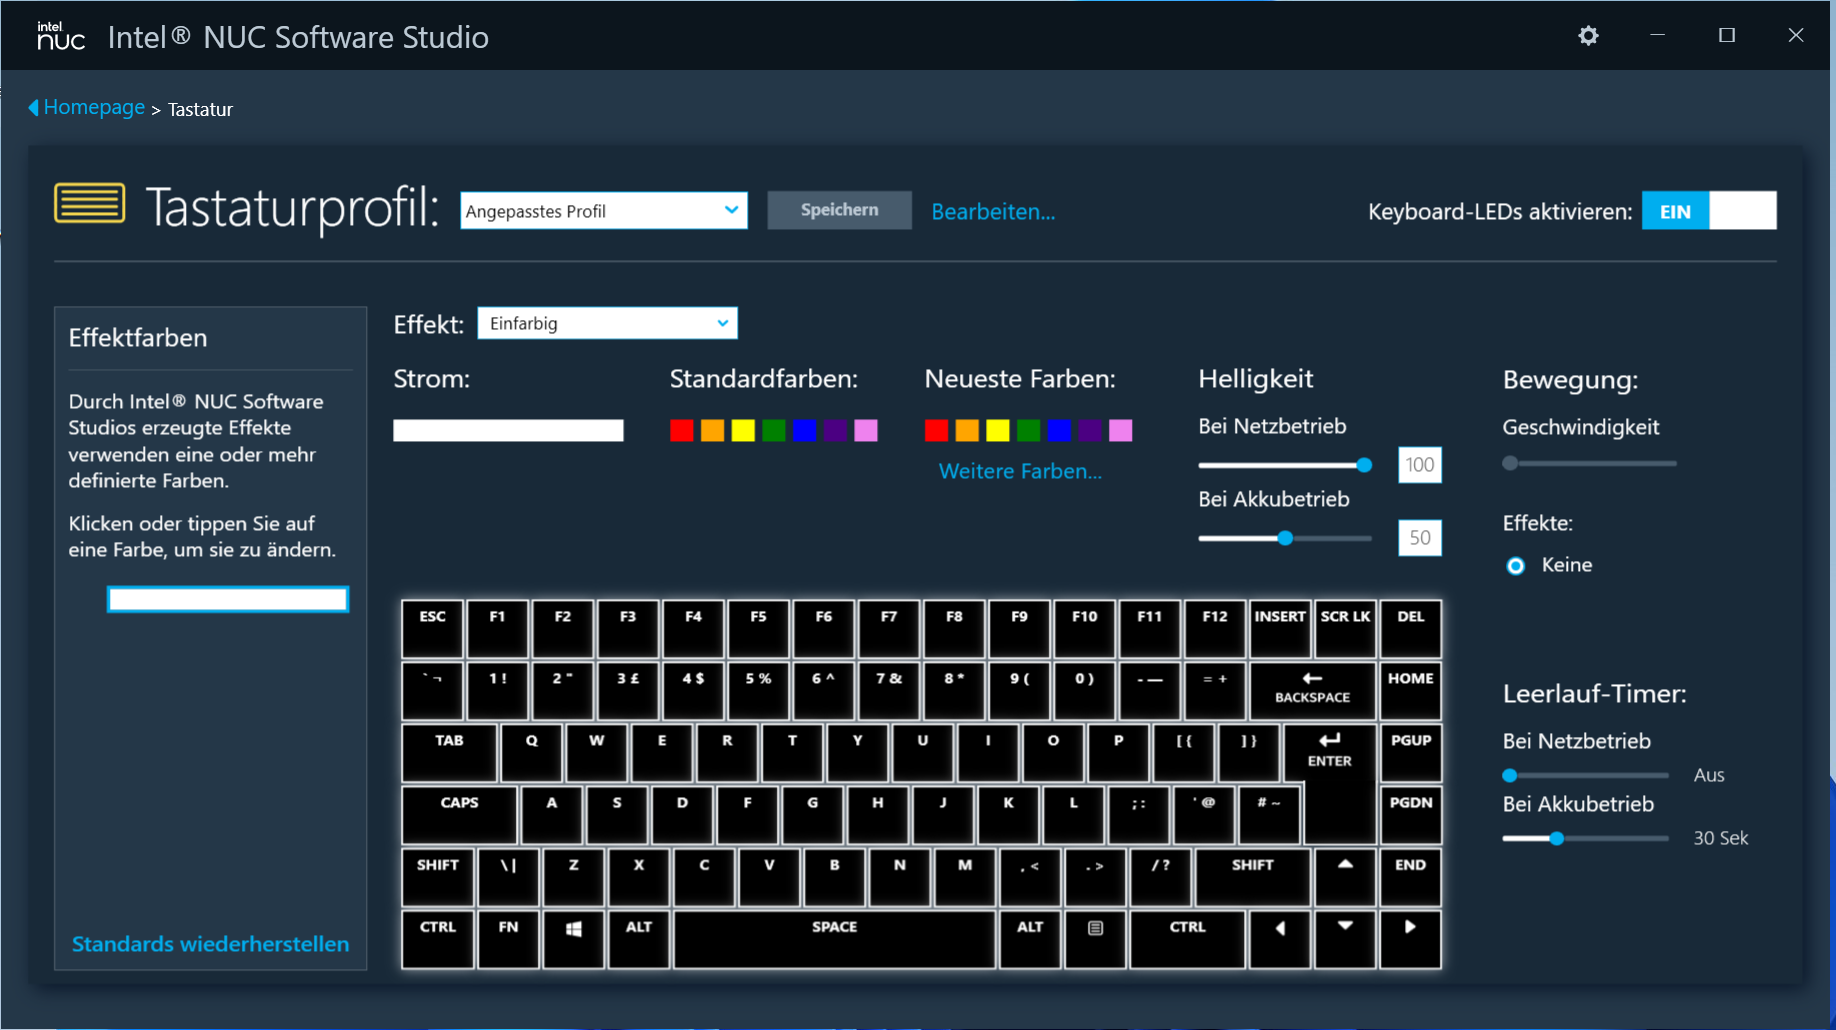
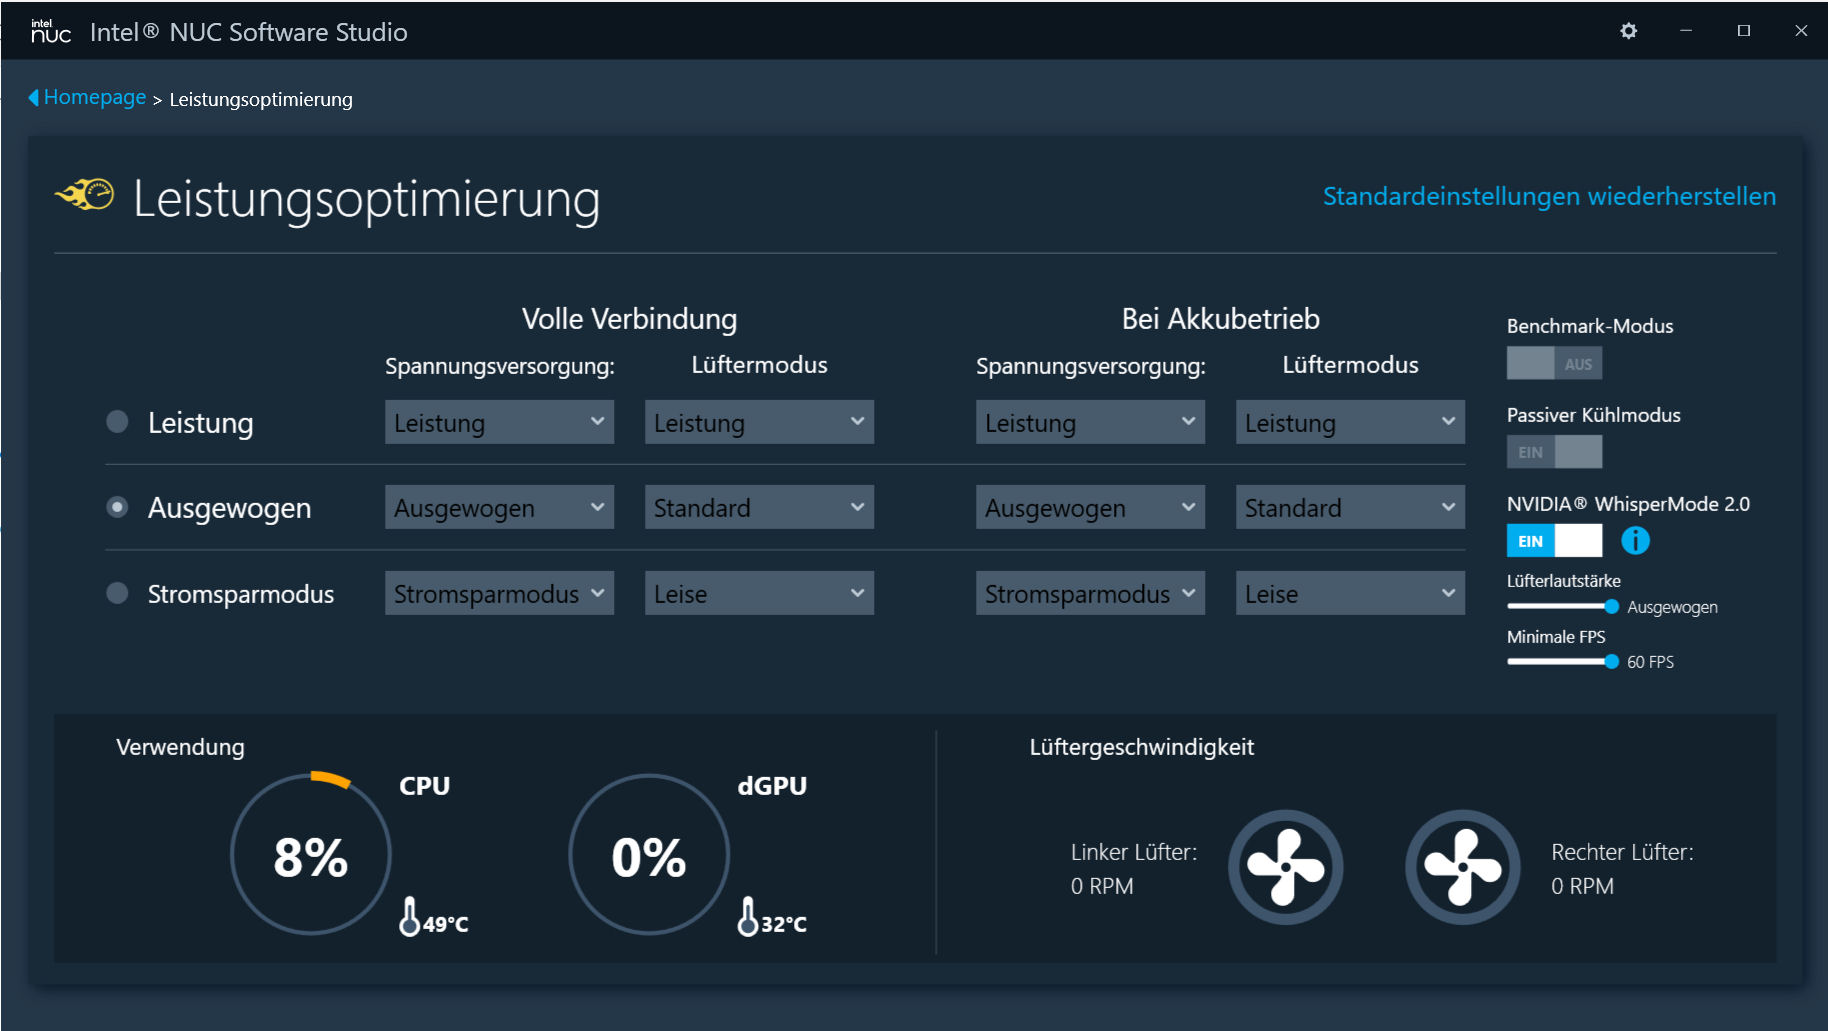
El centro de control preinstalado del portátil (Intel NUC Software Studio) permite a los usuarios ajustar el rendimiento, entre otras cosas. Hay tres perfiles de rendimiento disponibles, entre los que se puede cambiar dentro de la aplicación o mediante un botón independiente (junto al botón de encendido). Hay un cuarto perfil disponible dentro del centro, que sólo se puede activar con un clic del ratón: "Modo Benchmark". Este perfil libera el rendimiento máximo del hardware incorporado y permite que los ventiladores trabajen continuamente a plena potencia.
Nuestra prueba se realiza con el perfil "Equilibrado" y la función "Modo de refrigeración pasiva" activa. Estas son las configuraciones por defecto de la caja. El modo de refrigeración pasiva hace que los ventiladores se detengan en cuanto las temperaturas lo permiten. De lo contrario, el ventilador funcionaría permanentemente a baja velocidad.
| Rendimiento | Equilibrado | Ahorro de energía | Modo de referencia | |
|---|---|---|---|---|
| Límite de potencia 1 | 65 W | 45 W | 30 W | 100 W |
| Límite de potencia 2 | 90 W | 65 W | 60 W | 110 W |
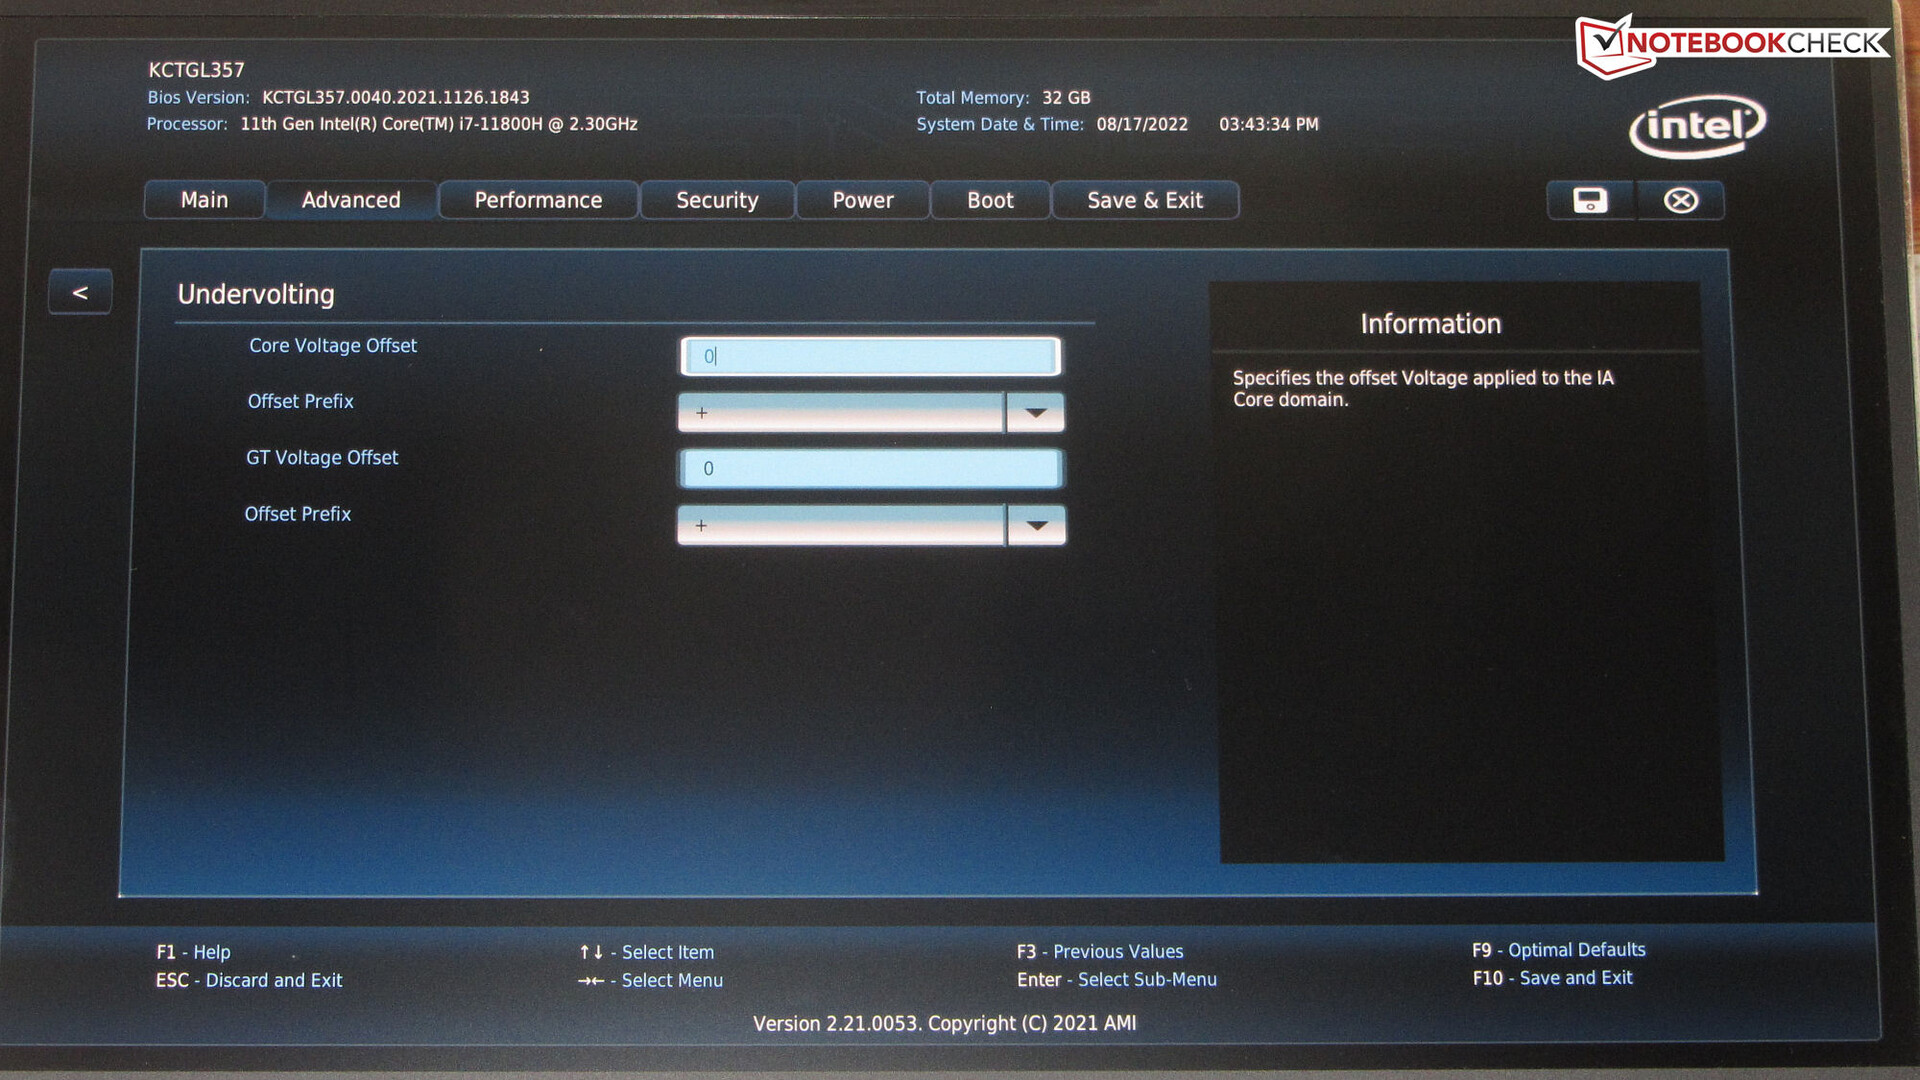
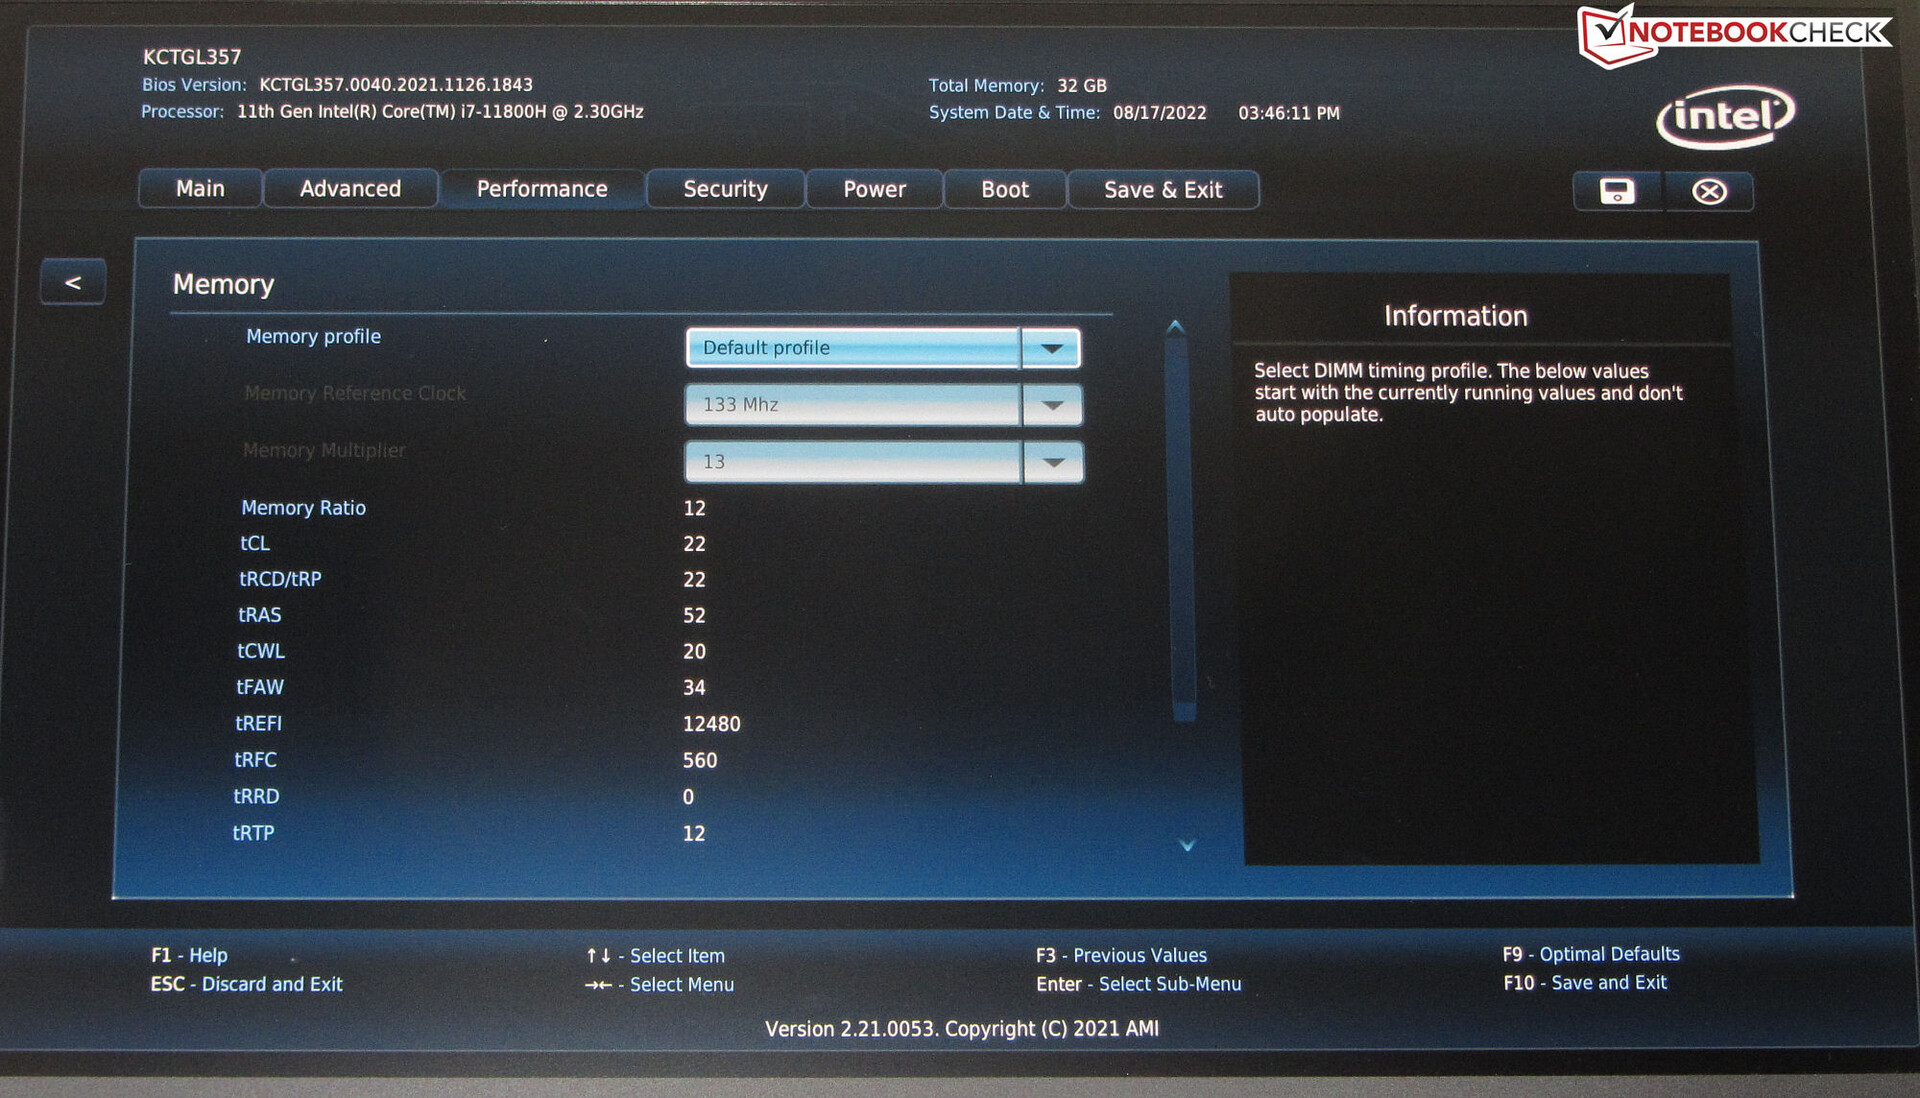
Subvoltaje a través de la BIOS
El procesador y la iGPU pueden funcionar con voltajes inferiores a los previstos por el fabricante (undervolting). Como resultado, el consumo de energía y el desarrollo de calor disminuyen. Pero ten cuidado: Bajar demasiado el voltaje puede conducir a un sistema inestable o defectuoso. En este caso, es necesario volver al nivel de tensión anterior. Bajar la tensión se hace bajo el riesgo del usuario
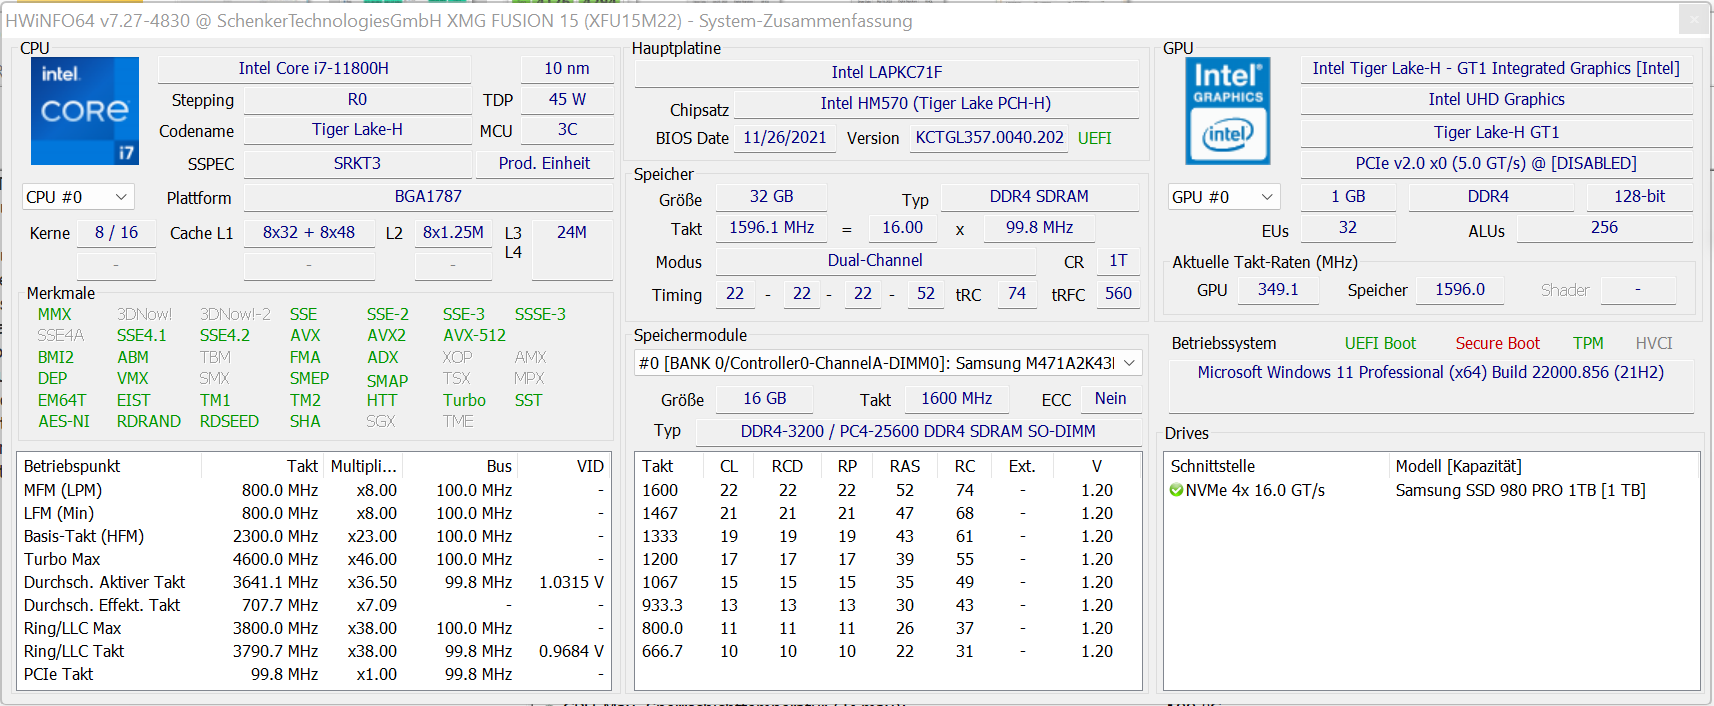
Procesador
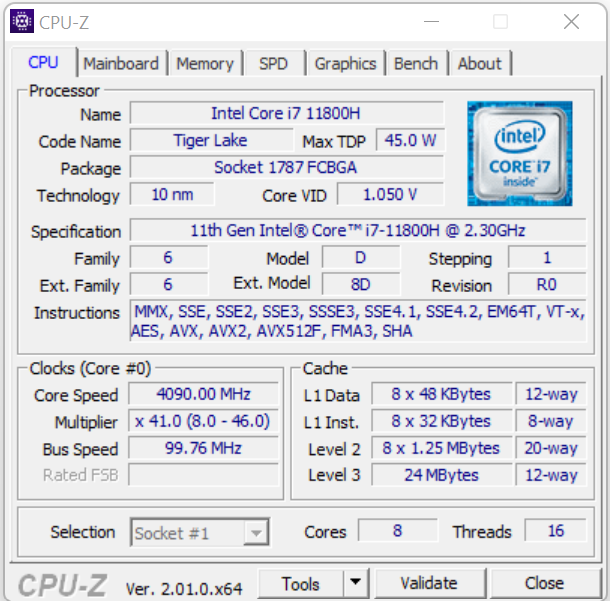
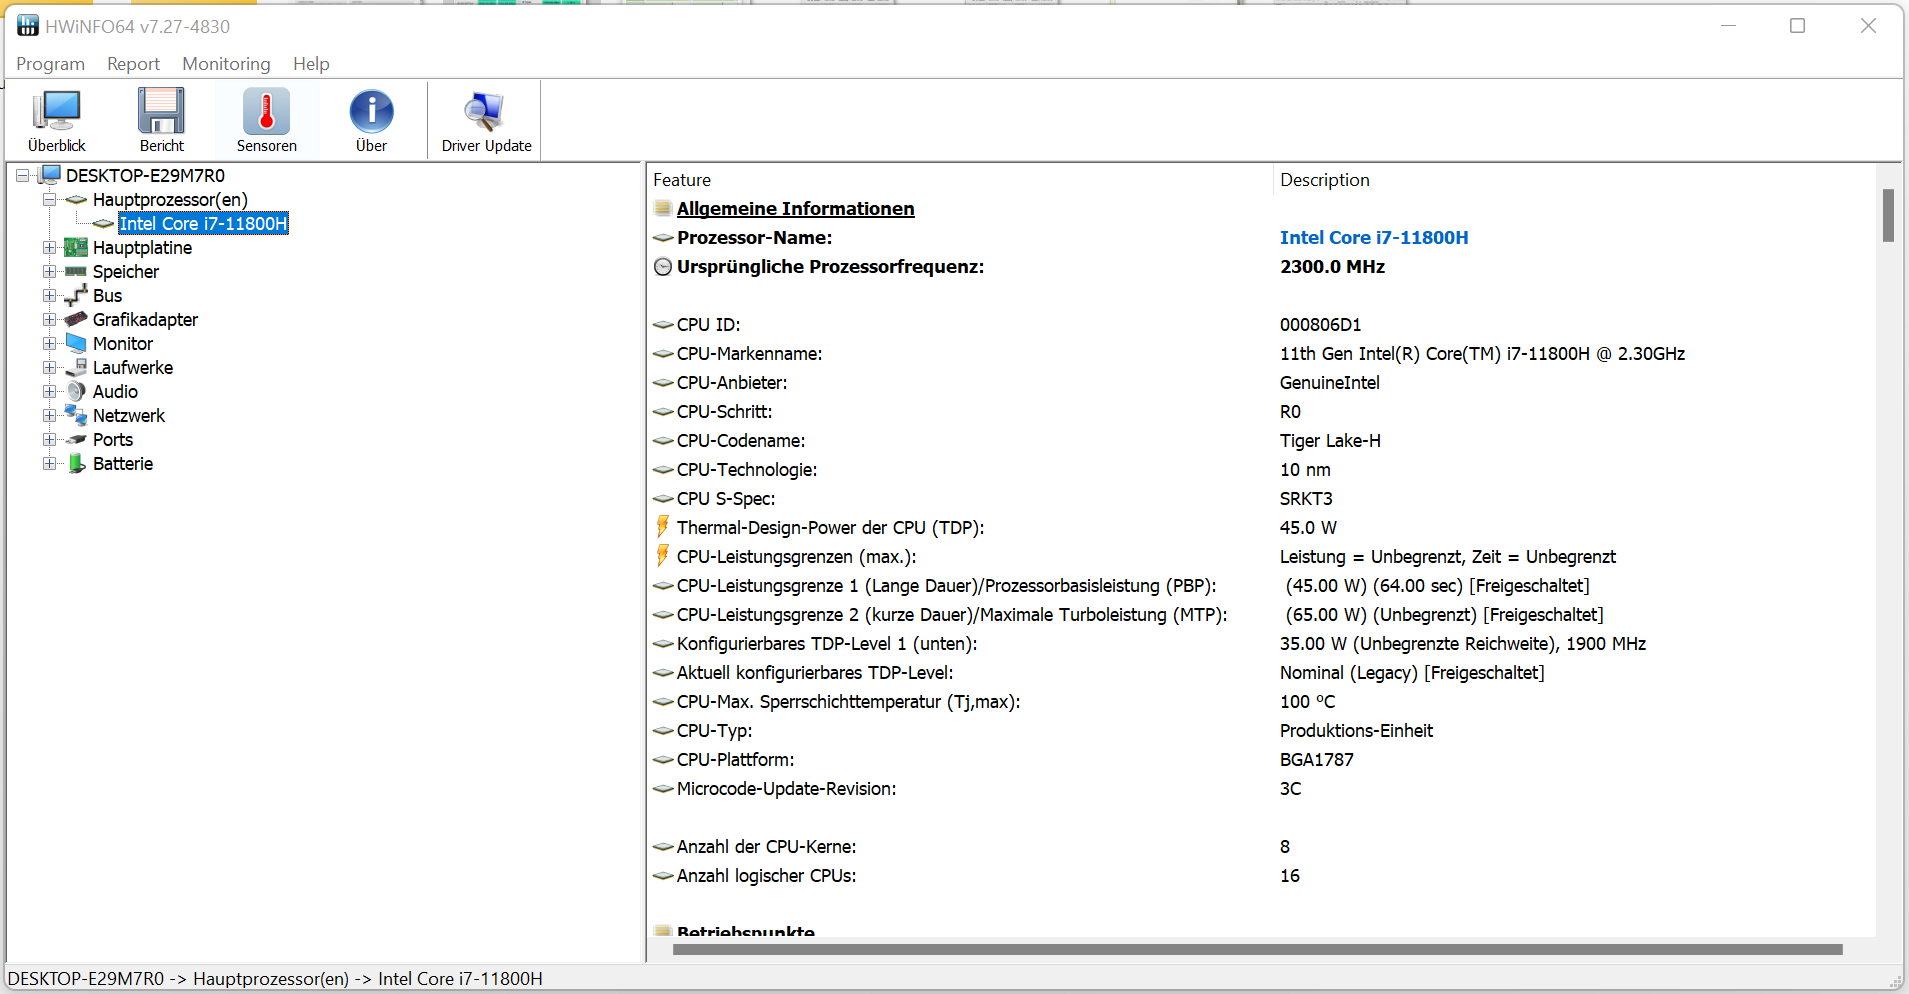
El procesador de cuatro núcleos
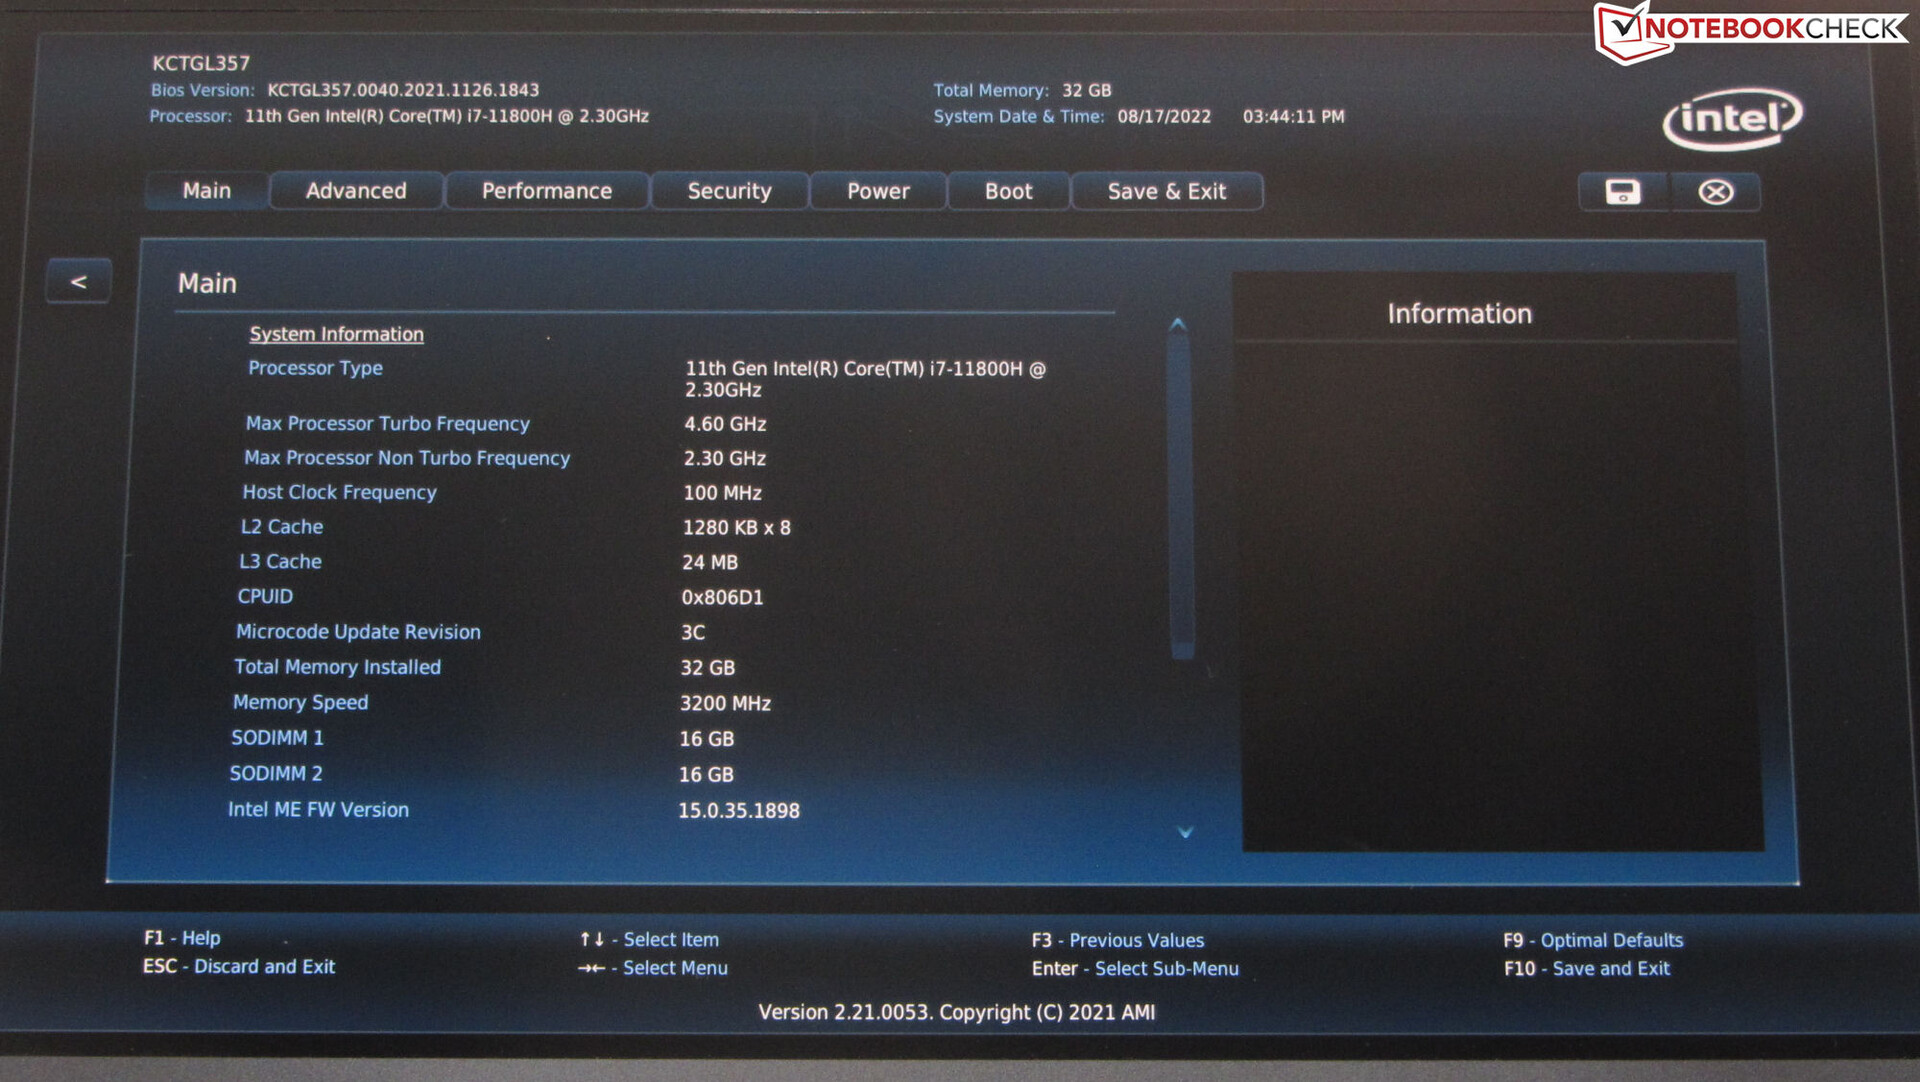
Core-i7-11800H (Tiger Lake) funciona a una velocidad de reloj base de 2,3 GHz. Se puede aumentar a 4,2 GHz (ocho núcleos) o a 4,6 GHz (un núcleo) mediante Turbo. Soporta Hyper-Threading (dos hilos por núcleo). </p> La prueba multihilo del benchmark Cinebench R15 se procesa entre 1,3 y 4,2 GHz, mientras que la prueba monohilo se ejecuta entre 1,1 y 4,6 GHz. Las velocidades de reloj se mantienen en un nivel similar en la batería.

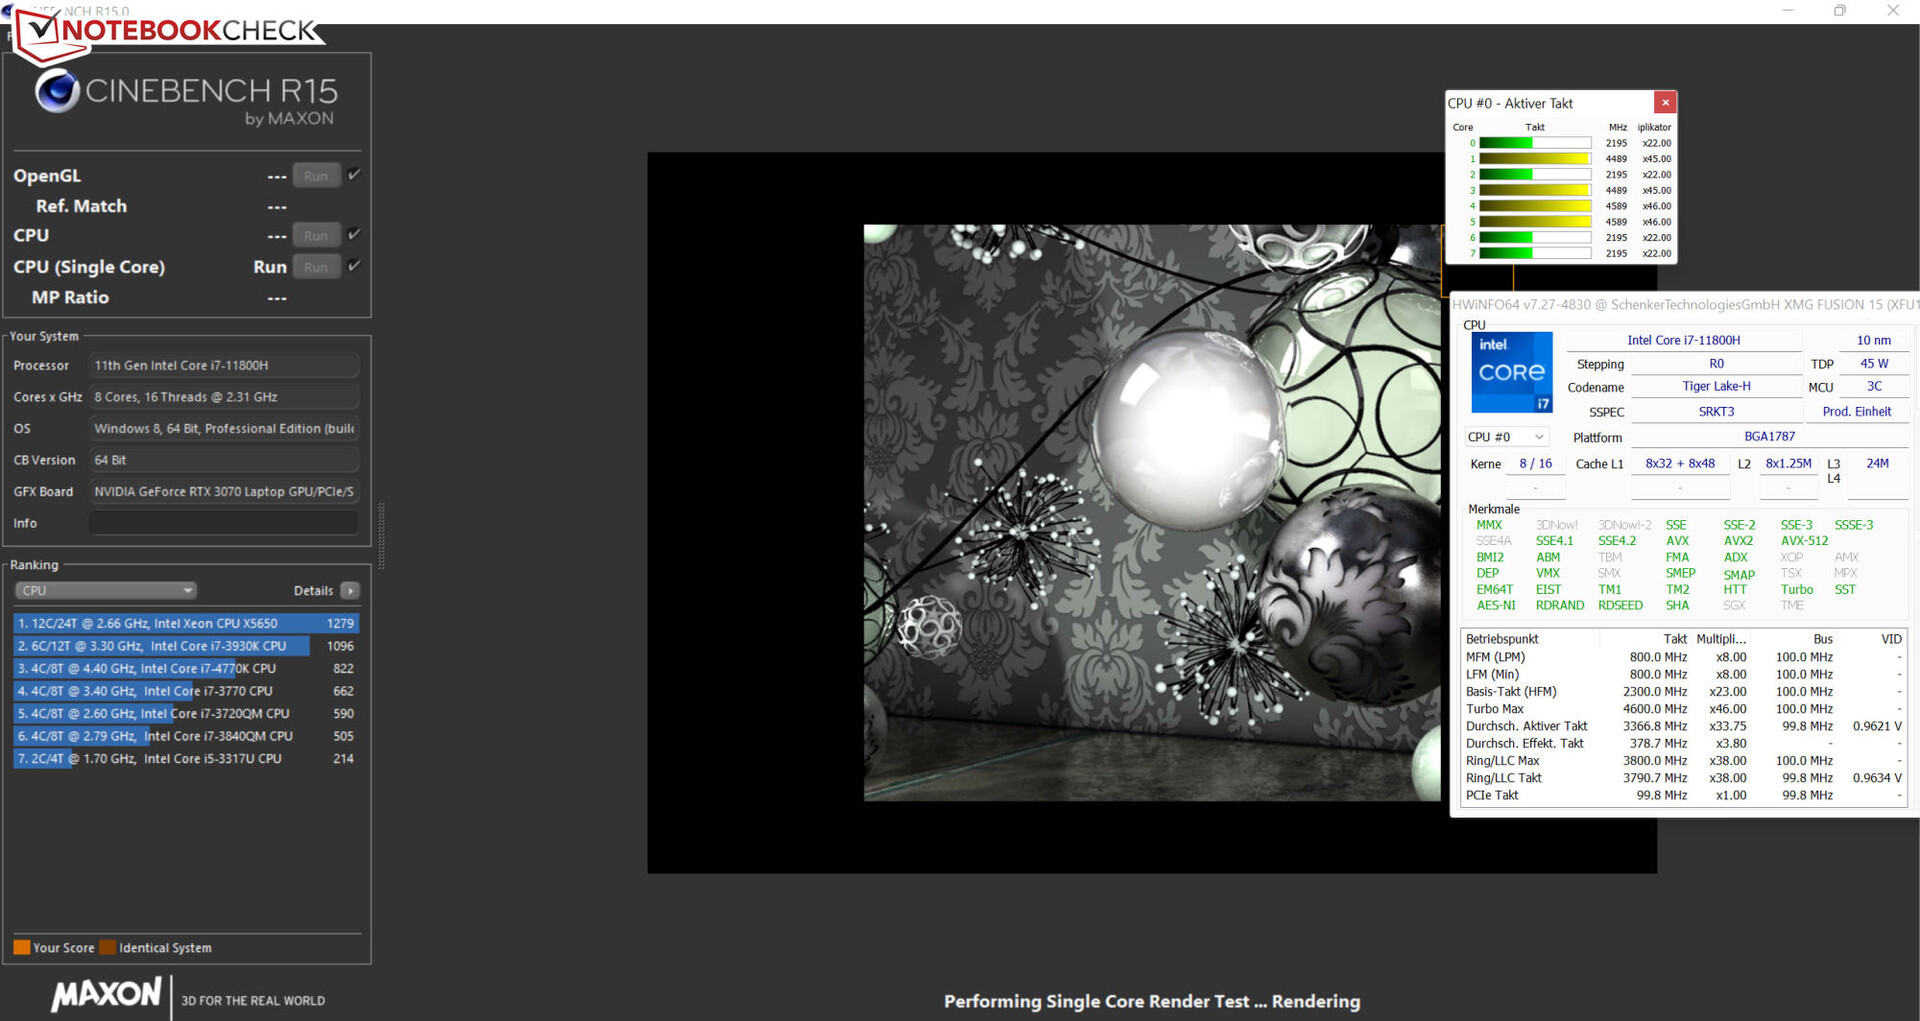
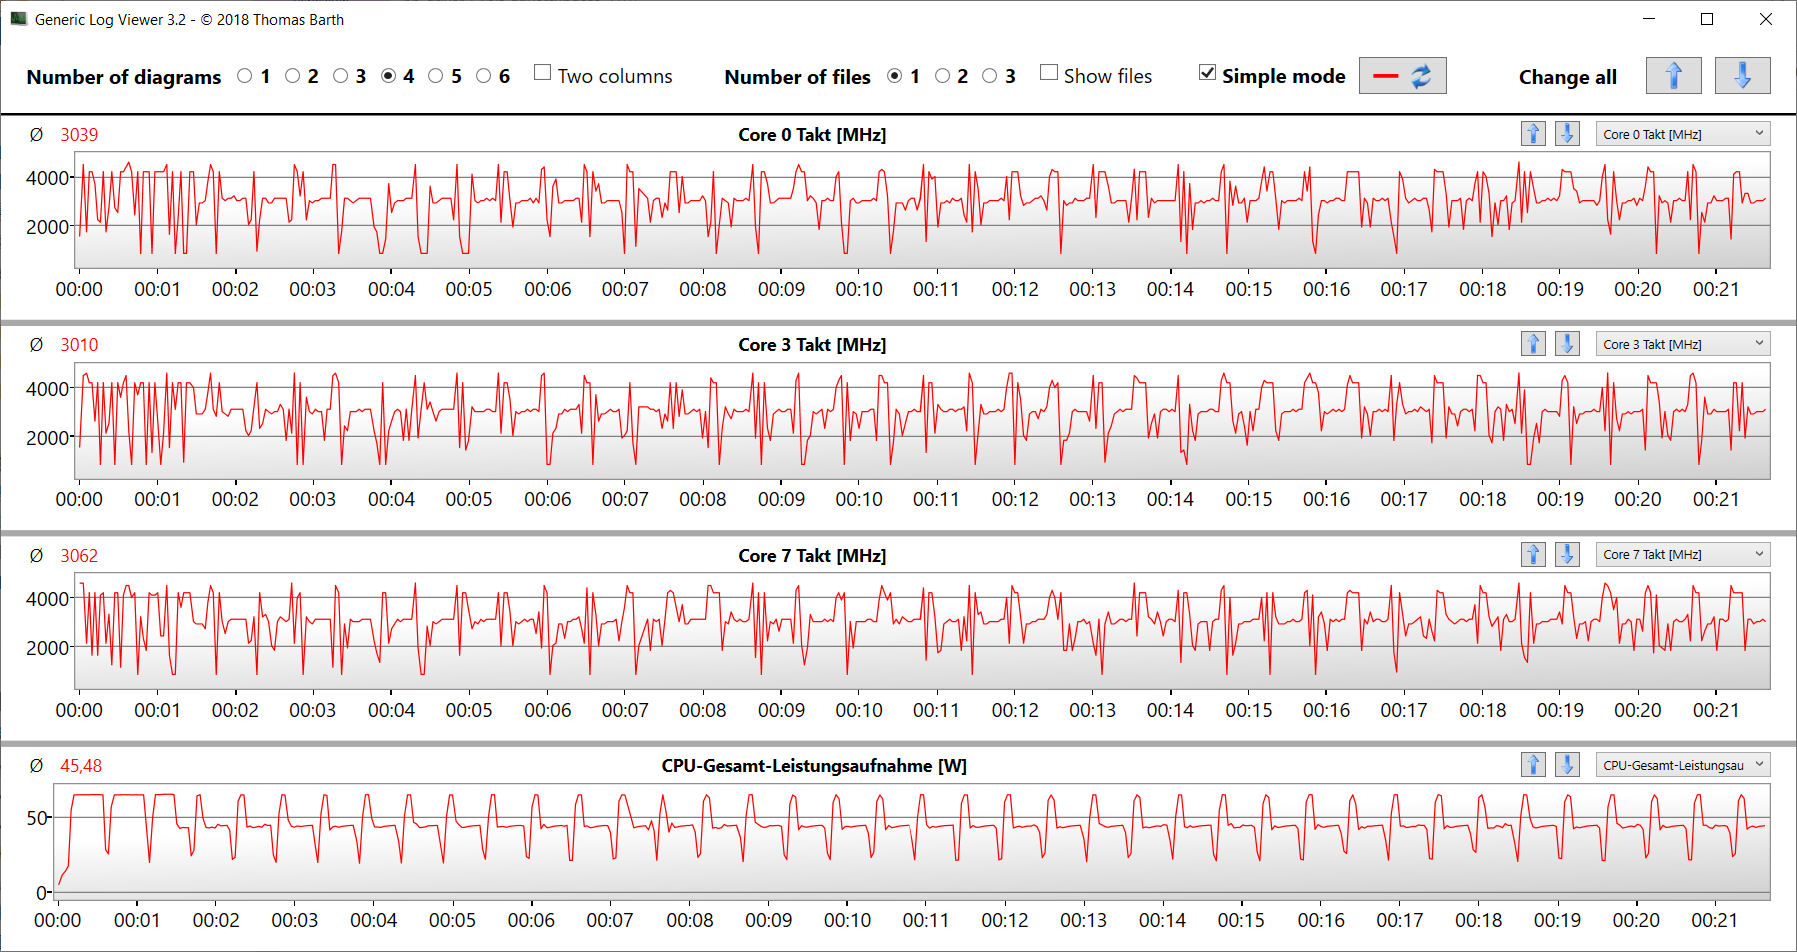
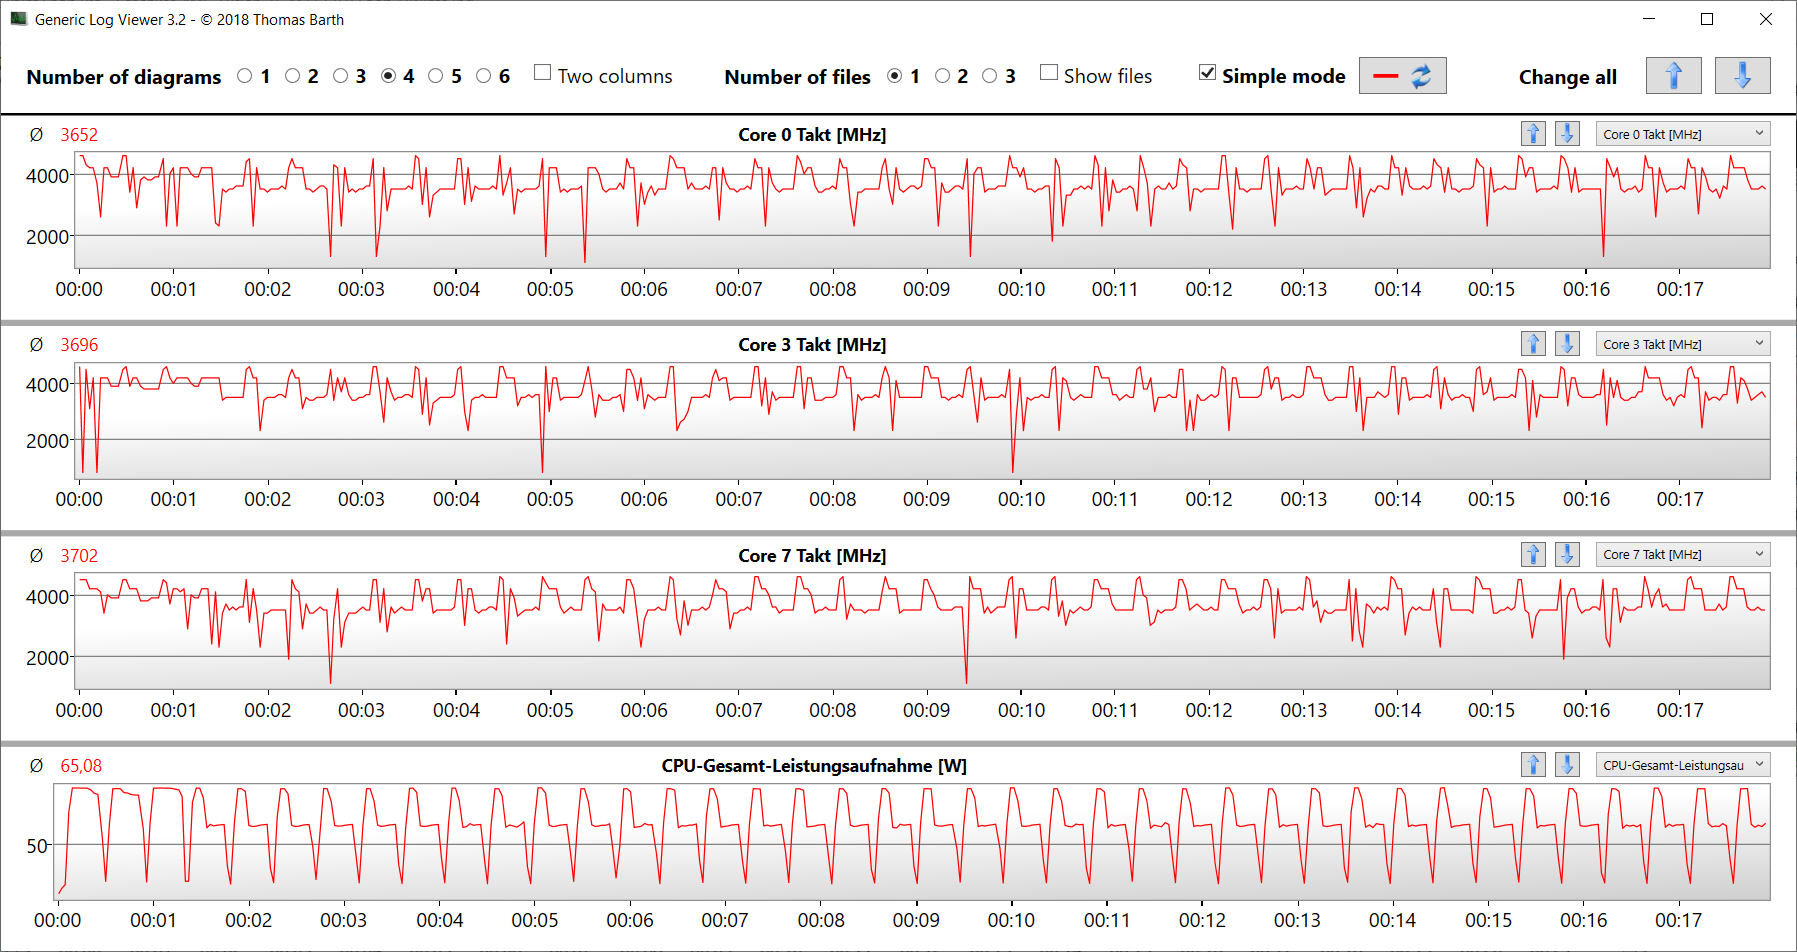
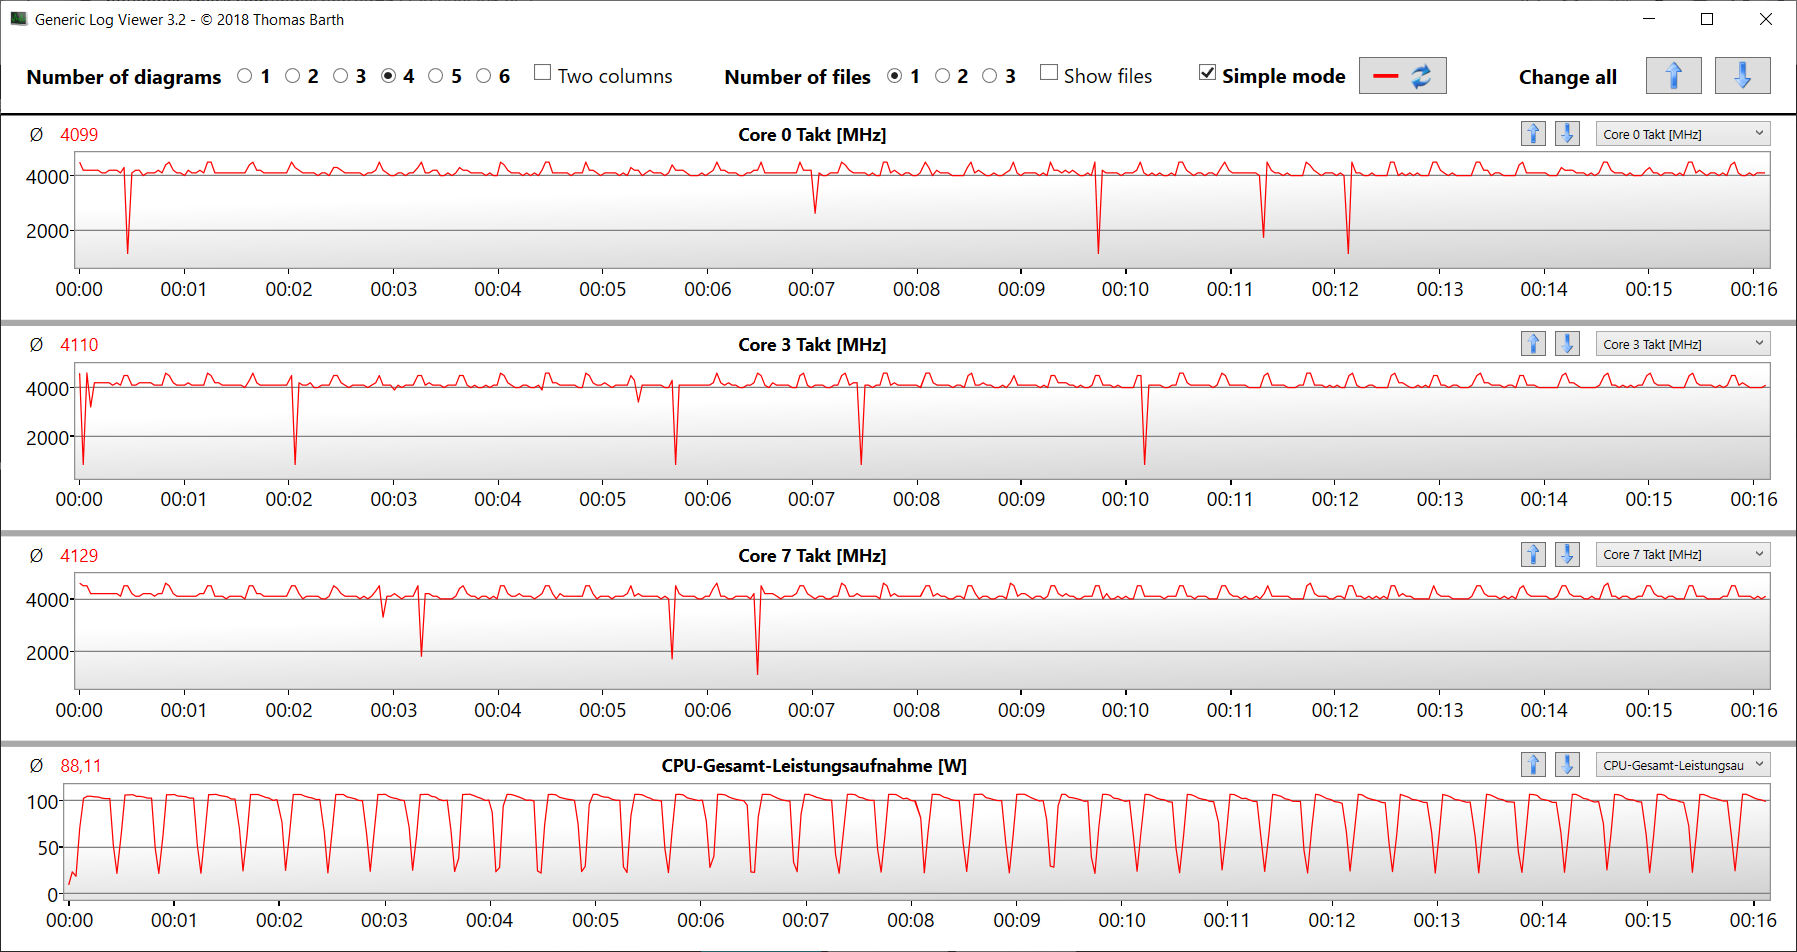
Verificamos si el Turbo de la CPU se usa consistentemente cuando se conecta ejecutando la prueba multihilo del benchmark Cinebench R15 durante al menos 30 minutos. El Turbo se usa en grado medio. El perfil "Modo Benchmark" explota el Turbo de la CPU casi por completo.
Cinebench R15 Multi endurance test
| CPU Performance rating - Percent | |
| Media de la clase Gaming | |
| HP Omen 16-b1090ng | |
| Acer Nitro 5 AN515-58-72QR | |
| Asus TUF Dash F15 FX517ZR | |
| Schenker XMG Fusion 15 (Mid 22) | |
| Schenker XMG Fusion 15 (Mid 22) | |
| MSI Delta 15 A5EFK | |
| Medio Intel Core i7-11800H | |
| Schenker XMG Fusion 15 (Mid 22) | |
| Schenker XMG Fusion 15 (Mid 22) | |
| Razer Blade 15 Base Edition 2021, i7-10750H RTX 3060 | |
| Cinebench R23 | |
| Multi Core | |
| Media de la clase Gaming (10488 - 42661, n=107, últimos 2 años) | |
| Acer Nitro 5 AN515-58-72QR | |
| HP Omen 16-b1090ng | |
| Asus TUF Dash F15 FX517ZR | |
| Schenker XMG Fusion 15 (Mid 22) (Benchmark-Modus) | |
| Schenker XMG Fusion 15 (Mid 22) (Leistung) | |
| MSI Delta 15 A5EFK | |
| Medio Intel Core i7-11800H (6508 - 14088, n=48) | |
| Schenker XMG Fusion 15 (Mid 22) | |
| Schenker XMG Fusion 15 (Mid 22) (Stromsparmodus) | |
| Razer Blade 15 Base Edition 2021, i7-10750H RTX 3060 | |
| Single Core | |
| Media de la clase Gaming (1166 - 2415, n=107, últimos 2 años) | |
| Acer Nitro 5 AN515-58-72QR | |
| Asus TUF Dash F15 FX517ZR | |
| HP Omen 16-b1090ng | |
| Schenker XMG Fusion 15 (Mid 22) | |
| Schenker XMG Fusion 15 (Mid 22) (Benchmark-Modus) | |
| Schenker XMG Fusion 15 (Mid 22) (Leistung) | |
| Medio Intel Core i7-11800H (1386 - 1522, n=45) | |
| Schenker XMG Fusion 15 (Mid 22) (Stromsparmodus) | |
| MSI Delta 15 A5EFK | |
| Razer Blade 15 Base Edition 2021, i7-10750H RTX 3060 | |
| Cinebench R20 | |
| CPU (Multi Core) | |
| Media de la clase Gaming (4029 - 16433, n=106, últimos 2 años) | |
| Acer Nitro 5 AN515-58-72QR | |
| HP Omen 16-b1090ng | |
| Asus TUF Dash F15 FX517ZR | |
| Schenker XMG Fusion 15 (Mid 22) (Benchmark-Modus) | |
| Schenker XMG Fusion 15 (Mid 22) (Leistung) | |
| MSI Delta 15 A5EFK | |
| Medio Intel Core i7-11800H (2498 - 5408, n=50) | |
| Schenker XMG Fusion 15 (Mid 22) | |
| Schenker XMG Fusion 15 (Mid 22) (Stromsparmodus) | |
| Razer Blade 15 Base Edition 2021, i7-10750H RTX 3060 | |
| CPU (Single Core) | |
| Media de la clase Gaming (442 - 913, n=106, últimos 2 años) | |
| Asus TUF Dash F15 FX517ZR | |
| HP Omen 16-b1090ng | |
| Acer Nitro 5 AN515-58-72QR | |
| Schenker XMG Fusion 15 (Mid 22) (Benchmark-Modus) | |
| Schenker XMG Fusion 15 (Mid 22) (Leistung) | |
| Schenker XMG Fusion 15 (Mid 22) | |
| MSI Delta 15 A5EFK | |
| Medio Intel Core i7-11800H (520 - 586, n=47) | |
| Schenker XMG Fusion 15 (Mid 22) (Stromsparmodus) | |
| Razer Blade 15 Base Edition 2021, i7-10750H RTX 3060 | |
| Cinebench R15 | |
| CPU Multi 64Bit | |
| Media de la clase Gaming (1578 - 6330, n=105, últimos 2 años) | |
| HP Omen 16-b1090ng | |
| Acer Nitro 5 AN515-58-72QR | |
| Asus TUF Dash F15 FX517ZR | |
| MSI Delta 15 A5EFK | |
| Schenker XMG Fusion 15 (Mid 22) (Benchmark-Modus) | |
| Schenker XMG Fusion 15 (Mid 22) (Leistung) | |
| Medio Intel Core i7-11800H (1342 - 2173, n=50) | |
| Schenker XMG Fusion 15 (Mid 22) | |
| Schenker XMG Fusion 15 (Mid 22) (Stromsparmodus) | |
| Razer Blade 15 Base Edition 2021, i7-10750H RTX 3060 | |
| CPU Single 64Bit | |
| Media de la clase Gaming (188.8 - 350, n=106, últimos 2 años) | |
| Acer Nitro 5 AN515-58-72QR | |
| HP Omen 16-b1090ng | |
| Asus TUF Dash F15 FX517ZR | |
| MSI Delta 15 A5EFK | |
| Schenker XMG Fusion 15 (Mid 22) | |
| Schenker XMG Fusion 15 (Mid 22) (Leistung) | |
| Schenker XMG Fusion 15 (Mid 22) (Benchmark-Modus) | |
| Medio Intel Core i7-11800H (201 - 231, n=46) | |
| Schenker XMG Fusion 15 (Mid 22) (Stromsparmodus) | |
| Razer Blade 15 Base Edition 2021, i7-10750H RTX 3060 | |
| Blender - v2.79 BMW27 CPU | |
| Razer Blade 15 Base Edition 2021, i7-10750H RTX 3060 | |
| Schenker XMG Fusion 15 (Mid 22) (Stromsparmodus) | |
| Schenker XMG Fusion 15 (Mid 22) | |
| Medio Intel Core i7-11800H (217 - 454, n=46) | |
| Schenker XMG Fusion 15 (Mid 22) (Leistung) | |
| MSI Delta 15 A5EFK | |
| Asus TUF Dash F15 FX517ZR | |
| Schenker XMG Fusion 15 (Mid 22) (Benchmark-Modus) | |
| Acer Nitro 5 AN515-58-72QR | |
| HP Omen 16-b1090ng | |
| Media de la clase Gaming (79 - 330, n=104, últimos 2 años) | |
| 7-Zip 18.03 | |
| 7z b 4 | |
| Media de la clase Gaming (33491 - 148086, n=105, últimos 2 años) | |
| HP Omen 16-b1090ng | |
| MSI Delta 15 A5EFK | |
| Asus TUF Dash F15 FX517ZR | |
| Acer Nitro 5 AN515-58-72QR | |
| Schenker XMG Fusion 15 (Mid 22) (Benchmark-Modus) | |
| Schenker XMG Fusion 15 (Mid 22) (Leistung) | |
| Medio Intel Core i7-11800H (33718 - 56758, n=46) | |
| Schenker XMG Fusion 15 (Mid 22) | |
| Schenker XMG Fusion 15 (Mid 22) (Stromsparmodus) | |
| Razer Blade 15 Base Edition 2021, i7-10750H RTX 3060 | |
| 7z b 4 -mmt1 | |
| Media de la clase Gaming (4199 - 7436, n=105, últimos 2 años) | |
| HP Omen 16-b1090ng | |
| Acer Nitro 5 AN515-58-72QR | |
| Asus TUF Dash F15 FX517ZR | |
| MSI Delta 15 A5EFK | |
| Schenker XMG Fusion 15 (Mid 22) (Benchmark-Modus) | |
| Schenker XMG Fusion 15 (Mid 22) | |
| Medio Intel Core i7-11800H (5138 - 5732, n=46) | |
| Schenker XMG Fusion 15 (Mid 22) (Leistung) | |
| Schenker XMG Fusion 15 (Mid 22) (Stromsparmodus) | |
| Razer Blade 15 Base Edition 2021, i7-10750H RTX 3060 | |
| Geekbench 5.5 | |
| Multi-Core | |
| Media de la clase Gaming (6460 - 28263, n=105, últimos 2 años) | |
| HP Omen 16-b1090ng | |
| Asus TUF Dash F15 FX517ZR | |
| Acer Nitro 5 AN515-58-72QR | |
| Schenker XMG Fusion 15 (Mid 22) (Benchmark-Modus) | |
| Schenker XMG Fusion 15 (Mid 22) (Leistung) | |
| MSI Delta 15 A5EFK | |
| Medio Intel Core i7-11800H (4655 - 9851, n=40) | |
| Schenker XMG Fusion 15 (Mid 22) | |
| Schenker XMG Fusion 15 (Mid 22) (Stromsparmodus) | |
| Razer Blade 15 Base Edition 2021, i7-10750H RTX 3060 | |
| Single-Core | |
| Media de la clase Gaming (986 - 2474, n=105, últimos 2 años) | |
| HP Omen 16-b1090ng | |
| Asus TUF Dash F15 FX517ZR | |
| Acer Nitro 5 AN515-58-72QR | |
| Schenker XMG Fusion 15 (Mid 22) (Benchmark-Modus) | |
| Schenker XMG Fusion 15 (Mid 22) (Leistung) | |
| Schenker XMG Fusion 15 (Mid 22) | |
| MSI Delta 15 A5EFK | |
| Medio Intel Core i7-11800H (1429 - 1625, n=40) | |
| Schenker XMG Fusion 15 (Mid 22) (Stromsparmodus) | |
| Razer Blade 15 Base Edition 2021, i7-10750H RTX 3060 | |
| HWBOT x265 Benchmark v2.2 - 4k Preset | |
| Media de la clase Gaming (11.5 - 44.4, n=105, últimos 2 años) | |
| HP Omen 16-b1090ng | |
| Acer Nitro 5 AN515-58-72QR | |
| Asus TUF Dash F15 FX517ZR | |
| Schenker XMG Fusion 15 (Mid 22) (Benchmark-Modus) | |
| Schenker XMG Fusion 15 (Mid 22) (Leistung) | |
| MSI Delta 15 A5EFK | |
| Medio Intel Core i7-11800H (7.38 - 17.4, n=46) | |
| Schenker XMG Fusion 15 (Mid 22) | |
| Schenker XMG Fusion 15 (Mid 22) (Stromsparmodus) | |
| Razer Blade 15 Base Edition 2021, i7-10750H RTX 3060 | |
| LibreOffice - 20 Documents To PDF | |
| MSI Delta 15 A5EFK | |
| Media de la clase Gaming (33.2 - 88.8, n=105, últimos 2 años) | |
| Razer Blade 15 Base Edition 2021, i7-10750H RTX 3060 | |
| Schenker XMG Fusion 15 (Mid 22) | |
| Medio Intel Core i7-11800H (38.6 - 59.9, n=45) | |
| Schenker XMG Fusion 15 (Mid 22) (Stromsparmodus) | |
| Schenker XMG Fusion 15 (Mid 22) (Benchmark-Modus) | |
| Schenker XMG Fusion 15 (Mid 22) (Leistung) | |
| Acer Nitro 5 AN515-58-72QR | |
| HP Omen 16-b1090ng | |
| Asus TUF Dash F15 FX517ZR | |
| R Benchmark 2.5 - Overall mean | |
| Razer Blade 15 Base Edition 2021, i7-10750H RTX 3060 | |
| Schenker XMG Fusion 15 (Mid 22) (Stromsparmodus) | |
| Medio Intel Core i7-11800H (0.548 - 0.615, n=46) | |
| Schenker XMG Fusion 15 (Mid 22) | |
| Schenker XMG Fusion 15 (Mid 22) (Leistung) | |
| Schenker XMG Fusion 15 (Mid 22) (Benchmark-Modus) | |
| MSI Delta 15 A5EFK | |
| Asus TUF Dash F15 FX517ZR | |
| Acer Nitro 5 AN515-58-72QR | |
| HP Omen 16-b1090ng | |
| Media de la clase Gaming (0.3439 - 0.759, n=106, últimos 2 años) | |
* ... más pequeño es mejor
AIDA64: FP32 Ray-Trace | FPU Julia | CPU SHA3 | CPU Queen | FPU SinJulia | FPU Mandel | CPU AES | CPU ZLib | FP64 Ray-Trace | CPU PhotoWorxx
| Performance rating | |
| Media de la clase Gaming | |
| MSI Delta 15 A5EFK | |
| Schenker XMG Fusion 15 (Mid 22) | |
| Schenker XMG Fusion 15 (Mid 22) | |
| Schenker XMG Fusion 15 (Mid 22) | |
| Asus TUF Dash F15 FX517ZR | |
| Medio Intel Core i7-11800H | |
| HP Omen 16-b1090ng | |
| Schenker XMG Fusion 15 (Mid 22) | |
| Acer Nitro 5 AN515-58-72QR | |
| AIDA64 / FP32 Ray-Trace | |
| Media de la clase Gaming (10227 - 85542, n=105, últimos 2 años) | |
| Schenker XMG Fusion 15 (Mid 22) (v6.70.6000, Benchmark-Modus) | |
| Schenker XMG Fusion 15 (Mid 22) (v6.70.6000, Leistung) | |
| MSI Delta 15 A5EFK (v6.33.5700) | |
| Asus TUF Dash F15 FX517ZR (v6.70.6000) | |
| Medio Intel Core i7-11800H (8772 - 15961, n=20) | |
| Schenker XMG Fusion 15 (Mid 22) (v6.70.6000) | |
| Schenker XMG Fusion 15 (Mid 22) (v6.70.6000, Stromsparmodus) | |
| Acer Nitro 5 AN515-58-72QR (v6.50.5800) | |
| HP Omen 16-b1090ng (v6.50.5800) | |
| AIDA64 / FPU Julia | |
| Media de la clase Gaming (51376 - 238426, n=105, últimos 2 años) | |
| MSI Delta 15 A5EFK (v6.33.5700) | |
| Asus TUF Dash F15 FX517ZR (v6.70.6000) | |
| Schenker XMG Fusion 15 (Mid 22) (v6.70.6000, Benchmark-Modus) | |
| Schenker XMG Fusion 15 (Mid 22) (v6.70.6000) | |
| Schenker XMG Fusion 15 (Mid 22) (v6.70.6000, Leistung) | |
| Medio Intel Core i7-11800H (39404 - 65636, n=20) | |
| Schenker XMG Fusion 15 (Mid 22) (v6.70.6000, Stromsparmodus) | |
| Acer Nitro 5 AN515-58-72QR (v6.50.5800) | |
| HP Omen 16-b1090ng (v6.50.5800) | |
| AIDA64 / CPU SHA3 | |
| Media de la clase Gaming (2180 - 10115, n=105, últimos 2 años) | |
| Schenker XMG Fusion 15 (Mid 22) (v6.70.6000, Benchmark-Modus) | |
| Schenker XMG Fusion 15 (Mid 22) (v6.70.6000, Leistung) | |
| Schenker XMG Fusion 15 (Mid 22) (v6.70.6000) | |
| Medio Intel Core i7-11800H (2599 - 4439, n=20) | |
| MSI Delta 15 A5EFK (v6.33.5700) | |
| Acer Nitro 5 AN515-58-72QR (v6.50.5800) | |
| Asus TUF Dash F15 FX517ZR (v6.70.6000) | |
| Schenker XMG Fusion 15 (Mid 22) (v6.70.6000, Stromsparmodus) | |
| HP Omen 16-b1090ng (v6.50.5800) | |
| AIDA64 / CPU Queen | |
| Media de la clase Gaming (49785 - 173351, n=90, últimos 2 años) | |
| MSI Delta 15 A5EFK (v6.33.5700) | |
| HP Omen 16-b1090ng (v6.50.5800) | |
| Acer Nitro 5 AN515-58-72QR (v6.50.5800) | |
| Schenker XMG Fusion 15 (Mid 22) (v6.70.6000, Leistung) | |
| Schenker XMG Fusion 15 (Mid 22) (v6.70.6000, Benchmark-Modus) | |
| Medio Intel Core i7-11800H (85233 - 91941, n=20) | |
| Asus TUF Dash F15 FX517ZR (v6.70.6000) | |
| Schenker XMG Fusion 15 (Mid 22) (v6.70.6000, Stromsparmodus) | |
| Schenker XMG Fusion 15 (Mid 22) | |
| AIDA64 / FPU SinJulia | |
| Media de la clase Gaming (4424 - 33636, n=105, últimos 2 años) | |
| MSI Delta 15 A5EFK (v6.33.5700) | |
| Acer Nitro 5 AN515-58-72QR (v6.50.5800) | |
| Schenker XMG Fusion 15 (Mid 22) (v6.70.6000, Benchmark-Modus) | |
| Schenker XMG Fusion 15 (Mid 22) (v6.70.6000, Leistung) | |
| HP Omen 16-b1090ng (v6.50.5800) | |
| Medio Intel Core i7-11800H (6420 - 9792, n=20) | |
| Schenker XMG Fusion 15 (Mid 22) (v6.70.6000) | |
| Asus TUF Dash F15 FX517ZR (v6.70.6000) | |
| Schenker XMG Fusion 15 (Mid 22) (v6.70.6000, Stromsparmodus) | |
| AIDA64 / FPU Mandel | |
| Media de la clase Gaming (25115 - 128721, n=105, últimos 2 años) | |
| MSI Delta 15 A5EFK (v6.33.5700) | |
| Schenker XMG Fusion 15 (Mid 22) (v6.70.6000, Benchmark-Modus) | |
| Schenker XMG Fusion 15 (Mid 22) (v6.70.6000, Leistung) | |
| Schenker XMG Fusion 15 (Mid 22) (v6.70.6000) | |
| Medio Intel Core i7-11800H (23365 - 39464, n=20) | |
| Asus TUF Dash F15 FX517ZR (v6.70.6000) | |
| Schenker XMG Fusion 15 (Mid 22) (v6.70.6000, Stromsparmodus) | |
| Acer Nitro 5 AN515-58-72QR | |
| HP Omen 16-b1090ng (v6.50.5800) | |
| AIDA64 / CPU AES | |
| Schenker XMG Fusion 15 (Mid 22) (v6.70.6000, Benchmark-Modus) | |
| Schenker XMG Fusion 15 (Mid 22) (v6.70.6000) | |
| Schenker XMG Fusion 15 (Mid 22) (v6.70.6000, Leistung) | |
| MSI Delta 15 A5EFK (v6.33.5700) | |
| Medio Intel Core i7-11800H (74617 - 149388, n=20) | |
| Media de la clase Gaming (39258 - 247074, n=105, últimos 2 años) | |
| Schenker XMG Fusion 15 (Mid 22) (v6.70.6000, Stromsparmodus) | |
| HP Omen 16-b1090ng (v6.50.5800) | |
| Asus TUF Dash F15 FX517ZR (v6.70.6000) | |
| Acer Nitro 5 AN515-58-72QR (v6.50.5800) | |
| AIDA64 / CPU ZLib | |
| Media de la clase Gaming (574 - 2531, n=105, últimos 2 años) | |
| Acer Nitro 5 AN515-58-72QR (v6.50.5800) | |
| HP Omen 16-b1090ng (v6.50.5800) | |
| Asus TUF Dash F15 FX517ZR (v6.70.6000) | |
| MSI Delta 15 A5EFK (v6.33.5700) | |
| Schenker XMG Fusion 15 (Mid 22) (v6.70.6000, Benchmark-Modus) | |
| Schenker XMG Fusion 15 (Mid 22) (v6.70.6000, Leistung) | |
| Schenker XMG Fusion 15 (Mid 22) (v6.70.6000) | |
| Schenker XMG Fusion 15 (Mid 22) (v6.70.6000, Stromsparmodus) | |
| Medio Intel Core i7-11800H (461 - 830, n=43) | |
| AIDA64 / FP64 Ray-Trace | |
| Media de la clase Gaming (5509 - 45446, n=105, últimos 2 años) | |
| Schenker XMG Fusion 15 (Mid 22) (v6.70.6000, Benchmark-Modus) | |
| Schenker XMG Fusion 15 (Mid 22) (v6.70.6000, Leistung) | |
| MSI Delta 15 A5EFK (v6.33.5700) | |
| Asus TUF Dash F15 FX517ZR (v6.70.6000) | |
| Medio Intel Core i7-11800H (4545 - 8717, n=21) | |
| Schenker XMG Fusion 15 (Mid 22) (v6.70.6000) | |
| Schenker XMG Fusion 15 (Mid 22) (v6.70.6000, Stromsparmodus) | |
| Acer Nitro 5 AN515-58-72QR (v6.50.5800) | |
| HP Omen 16-b1090ng (v6.50.5800) | |
| AIDA64 / CPU PhotoWorxx | |
| Media de la clase Gaming (12271 - 89891, n=105, últimos 2 años) | |
| HP Omen 16-b1090ng (v6.50.5800) | |
| Asus TUF Dash F15 FX517ZR (v6.70.6000) | |
| Schenker XMG Fusion 15 (Mid 22) (v6.70.6000, Benchmark-Modus) | |
| Schenker XMG Fusion 15 (Mid 22) (v6.70.6000, Leistung) | |
| Schenker XMG Fusion 15 (Mid 22) (v6.70.6000) | |
| Schenker XMG Fusion 15 (Mid 22) (v6.70.6000, Stromsparmodus) | |
| Medio Intel Core i7-11800H (11898 - 26757, n=21) | |
| Acer Nitro 5 AN515-58-72QR (v6.50.5800) | |
| MSI Delta 15 A5EFK (v6.33.5700) | |
Rendimiento del sistema
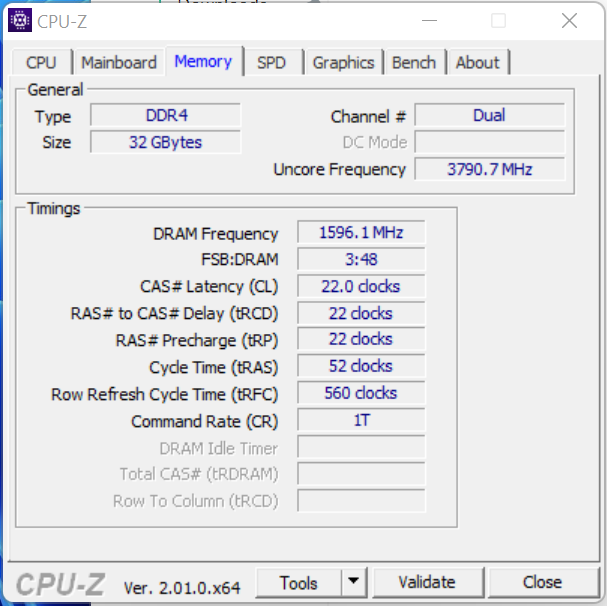
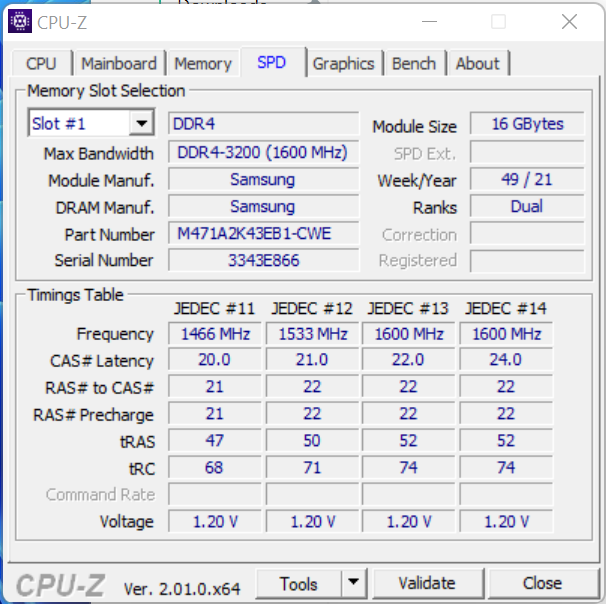
El sistema, muy completo y fluido, ofrece suficiente potencia de procesamiento para aplicaciones exigentes como el renderizado y los juegos. Los resultados de PCMark son buenos. Las tasas de transferencia de la RAM están a un nivel normal para una memoria DDR4-3200
CrossMark: Overall | Productivity | Creativity | Responsiveness
| PCMark 10 / Score | |
| Media de la clase Gaming (5828 - 12414, n=93, últimos 2 años) | |
| HP Omen 16-b1090ng | |
| MSI Delta 15 A5EFK | |
| Acer Nitro 5 AN515-58-72QR | |
| Medio Intel Core i7-11800H, NVIDIA GeForce RTX 3070 Laptop GPU (6126 - 7311, n=11) | |
| Asus TUF Dash F15 FX517ZR | |
| Schenker XMG Fusion 15 (Mid 22) (Benchmark-Modus) | |
| Razer Blade 15 Base Edition 2021, i7-10750H RTX 3060 | |
| Schenker XMG Fusion 15 (Mid 22) | |
| PCMark 10 / Essentials | |
| Media de la clase Gaming (8810 - 11935, n=97, últimos 2 años) | |
| MSI Delta 15 A5EFK | |
| HP Omen 16-b1090ng | |
| Razer Blade 15 Base Edition 2021, i7-10750H RTX 3060 | |
| Medio Intel Core i7-11800H, NVIDIA GeForce RTX 3070 Laptop GPU (9248 - 10832, n=11) | |
| Asus TUF Dash F15 FX517ZR | |
| Acer Nitro 5 AN515-58-72QR | |
| Schenker XMG Fusion 15 (Mid 22) (Benchmark-Modus) | |
| Schenker XMG Fusion 15 (Mid 22) | |
| PCMark 10 / Productivity | |
| Media de la clase Gaming (6845 - 25323, n=95, últimos 2 años) | |
| HP Omen 16-b1090ng | |
| Asus TUF Dash F15 FX517ZR | |
| MSI Delta 15 A5EFK | |
| Schenker XMG Fusion 15 (Mid 22) (Benchmark-Modus) | |
| Medio Intel Core i7-11800H, NVIDIA GeForce RTX 3070 Laptop GPU (8571 - 9669, n=11) | |
| Acer Nitro 5 AN515-58-72QR | |
| Schenker XMG Fusion 15 (Mid 22) | |
| Razer Blade 15 Base Edition 2021, i7-10750H RTX 3060 | |
| PCMark 10 / Digital Content Creation | |
| Media de la clase Gaming (7602 - 19954, n=95, últimos 2 años) | |
| HP Omen 16-b1090ng | |
| MSI Delta 15 A5EFK | |
| Acer Nitro 5 AN515-58-72QR | |
| Medio Intel Core i7-11800H, NVIDIA GeForce RTX 3070 Laptop GPU (7627 - 10851, n=11) | |
| Asus TUF Dash F15 FX517ZR | |
| Razer Blade 15 Base Edition 2021, i7-10750H RTX 3060 | |
| Schenker XMG Fusion 15 (Mid 22) (Benchmark-Modus) | |
| Schenker XMG Fusion 15 (Mid 22) | |
| CrossMark / Overall | |
| Media de la clase Gaming (1366 - 2409, n=94, últimos 2 años) | |
| Asus TUF Dash F15 FX517ZR | |
| Acer Nitro 5 AN515-58-72QR | |
| Schenker XMG Fusion 15 (Mid 22) | |
| Medio Intel Core i7-11800H, NVIDIA GeForce RTX 3070 Laptop GPU (1569 - 1656, n=3) | |
| CrossMark / Productivity | |
| Media de la clase Gaming (1386 - 2254, n=94, últimos 2 años) | |
| Acer Nitro 5 AN515-58-72QR | |
| Asus TUF Dash F15 FX517ZR | |
| Schenker XMG Fusion 15 (Mid 22) | |
| Medio Intel Core i7-11800H, NVIDIA GeForce RTX 3070 Laptop GPU (1573 - 1640, n=3) | |
| CrossMark / Creativity | |
| Media de la clase Gaming (1343 - 2786, n=94, últimos 2 años) | |
| Asus TUF Dash F15 FX517ZR | |
| Acer Nitro 5 AN515-58-72QR | |
| Schenker XMG Fusion 15 (Mid 22) | |
| Medio Intel Core i7-11800H, NVIDIA GeForce RTX 3070 Laptop GPU (1613 - 1692, n=3) | |
| CrossMark / Responsiveness | |
| Media de la clase Gaming (1226 - 2334, n=94, últimos 2 años) | |
| Acer Nitro 5 AN515-58-72QR | |
| Schenker XMG Fusion 15 (Mid 22) | |
| Asus TUF Dash F15 FX517ZR | |
| Medio Intel Core i7-11800H, NVIDIA GeForce RTX 3070 Laptop GPU (1435 - 1600, n=3) | |
| PCMark 8 Home Score Accelerated v2 | 4521 puntos | |
| PCMark 8 Creative Score Accelerated v2 | 6766 puntos | |
| PCMark 8 Work Score Accelerated v2 | 5851 puntos | |
| PCMark 10 Score | 6126 puntos | |
ayuda | ||
| AIDA64 / Memory Copy | |
| Media de la clase Gaming (21750 - 129946, n=105, últimos 2 años) | |
| HP Omen 16-b1090ng | |
| Asus TUF Dash F15 FX517ZR | |
| Schenker XMG Fusion 15 (Mid 22) | |
| Acer Nitro 5 AN515-58-72QR | |
| Medio Intel Core i7-11800H (24508 - 48144, n=21) | |
| MSI Delta 15 A5EFK | |
| AIDA64 / Memory Read | |
| Media de la clase Gaming (22956 - 118858, n=105, últimos 2 años) | |
| HP Omen 16-b1090ng | |
| Asus TUF Dash F15 FX517ZR | |
| Schenker XMG Fusion 15 (Mid 22) | |
| MSI Delta 15 A5EFK | |
| Medio Intel Core i7-11800H (25882 - 50365, n=20) | |
| Acer Nitro 5 AN515-58-72QR | |
| AIDA64 / Memory Write | |
| Media de la clase Gaming (22297 - 135096, n=105, últimos 2 años) | |
| HP Omen 16-b1090ng | |
| Asus TUF Dash F15 FX517ZR | |
| Schenker XMG Fusion 15 (Mid 22) | |
| Acer Nitro 5 AN515-58-72QR | |
| MSI Delta 15 A5EFK | |
| Medio Intel Core i7-11800H (22240 - 46214, n=20) | |
| AIDA64 / Memory Latency | |
| Media de la clase Gaming (75.3 - 259, n=105, últimos 2 años) | |
| Asus TUF Dash F15 FX517ZR | |
| Schenker XMG Fusion 15 (Mid 22) | |
| HP Omen 16-b1090ng | |
| MSI Delta 15 A5EFK | |
| Medio Intel Core i7-11800H (71.9 - 104.1, n=44) | |
| Acer Nitro 5 AN515-58-72QR | |
| Acer Nitro 5 AN515-58-72QR | |
* ... más pequeño es mejor
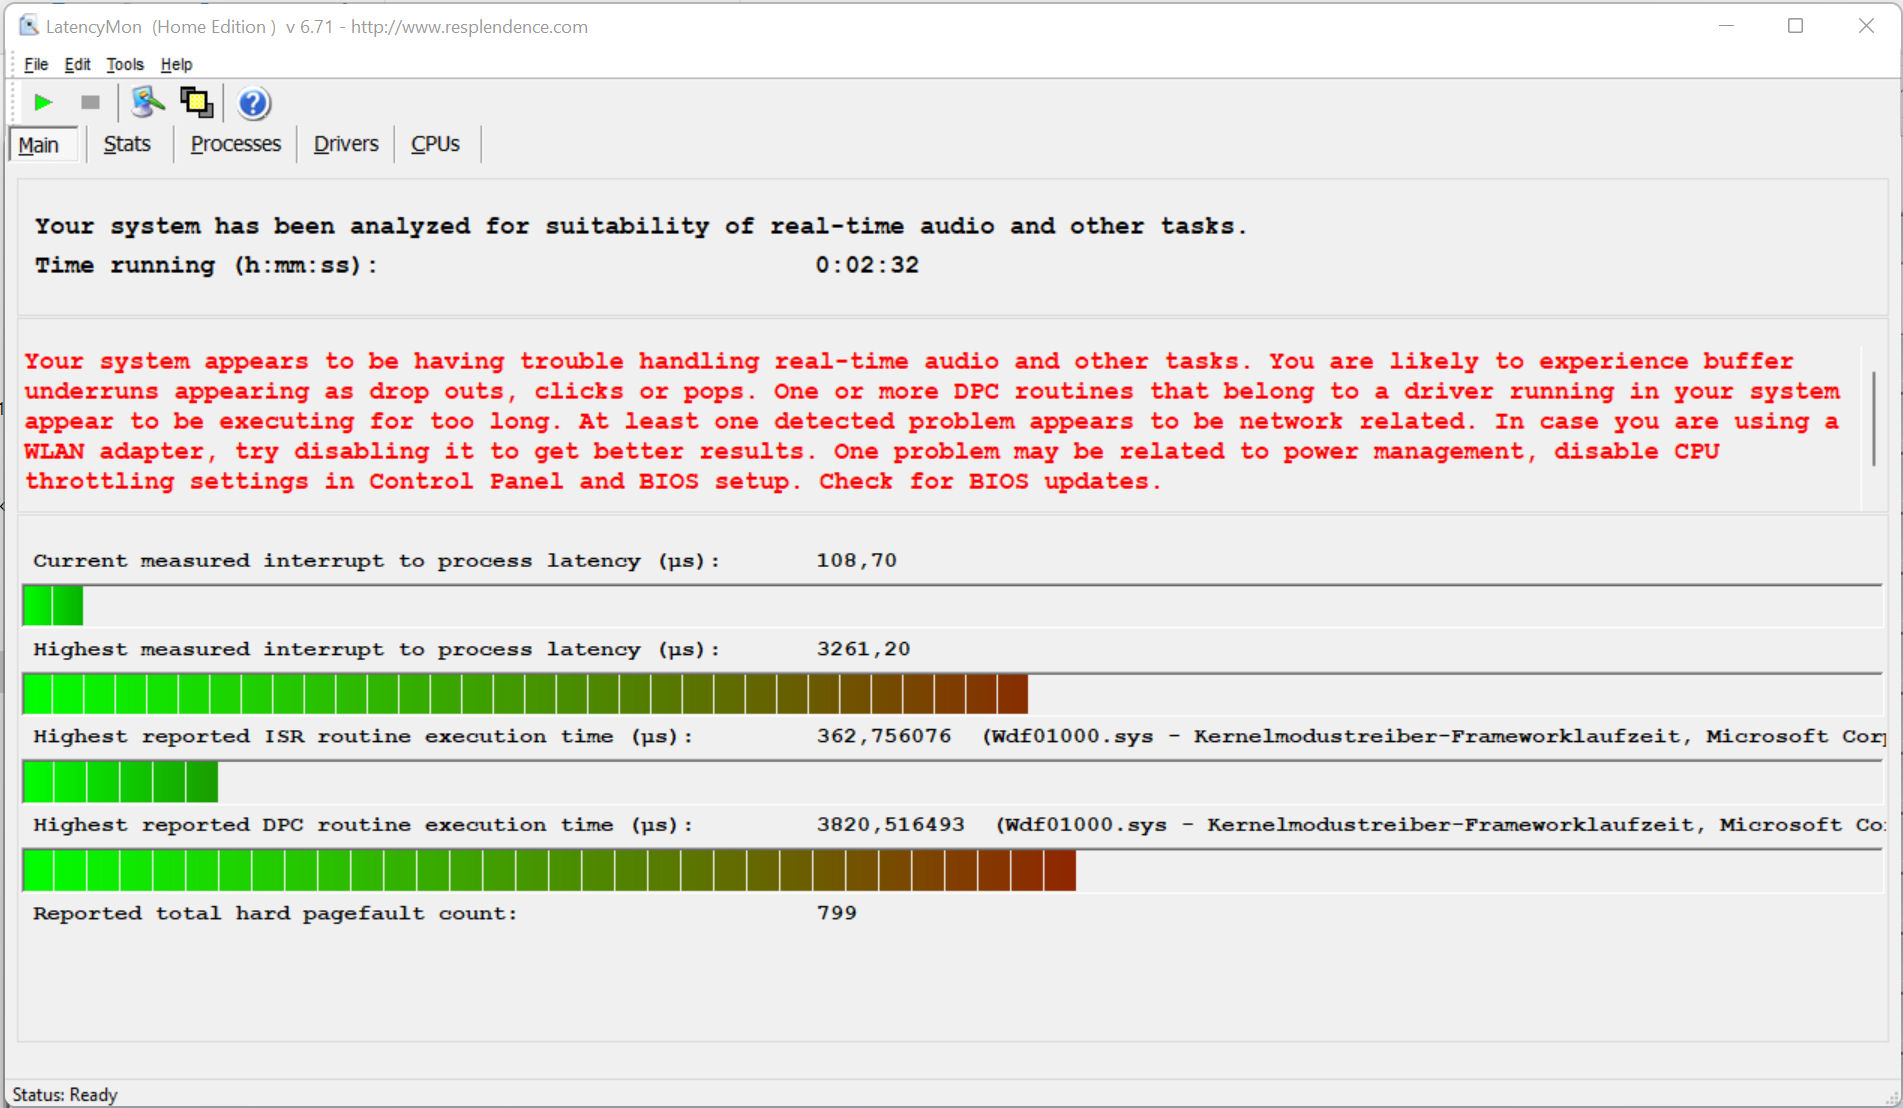
Latencias del CPD
La prueba de monitorización de latencia estandarizada (navegación web, reproducción de vídeo 4K, Prime95 de alta carga) reveló irregularidades con las latencias DPC. El sistema no parece adecuado para la edición de vídeo y audio en tiempo real. Las futuras actualizaciones de software podrían llevar a mejoras o a un peor rendimiento también
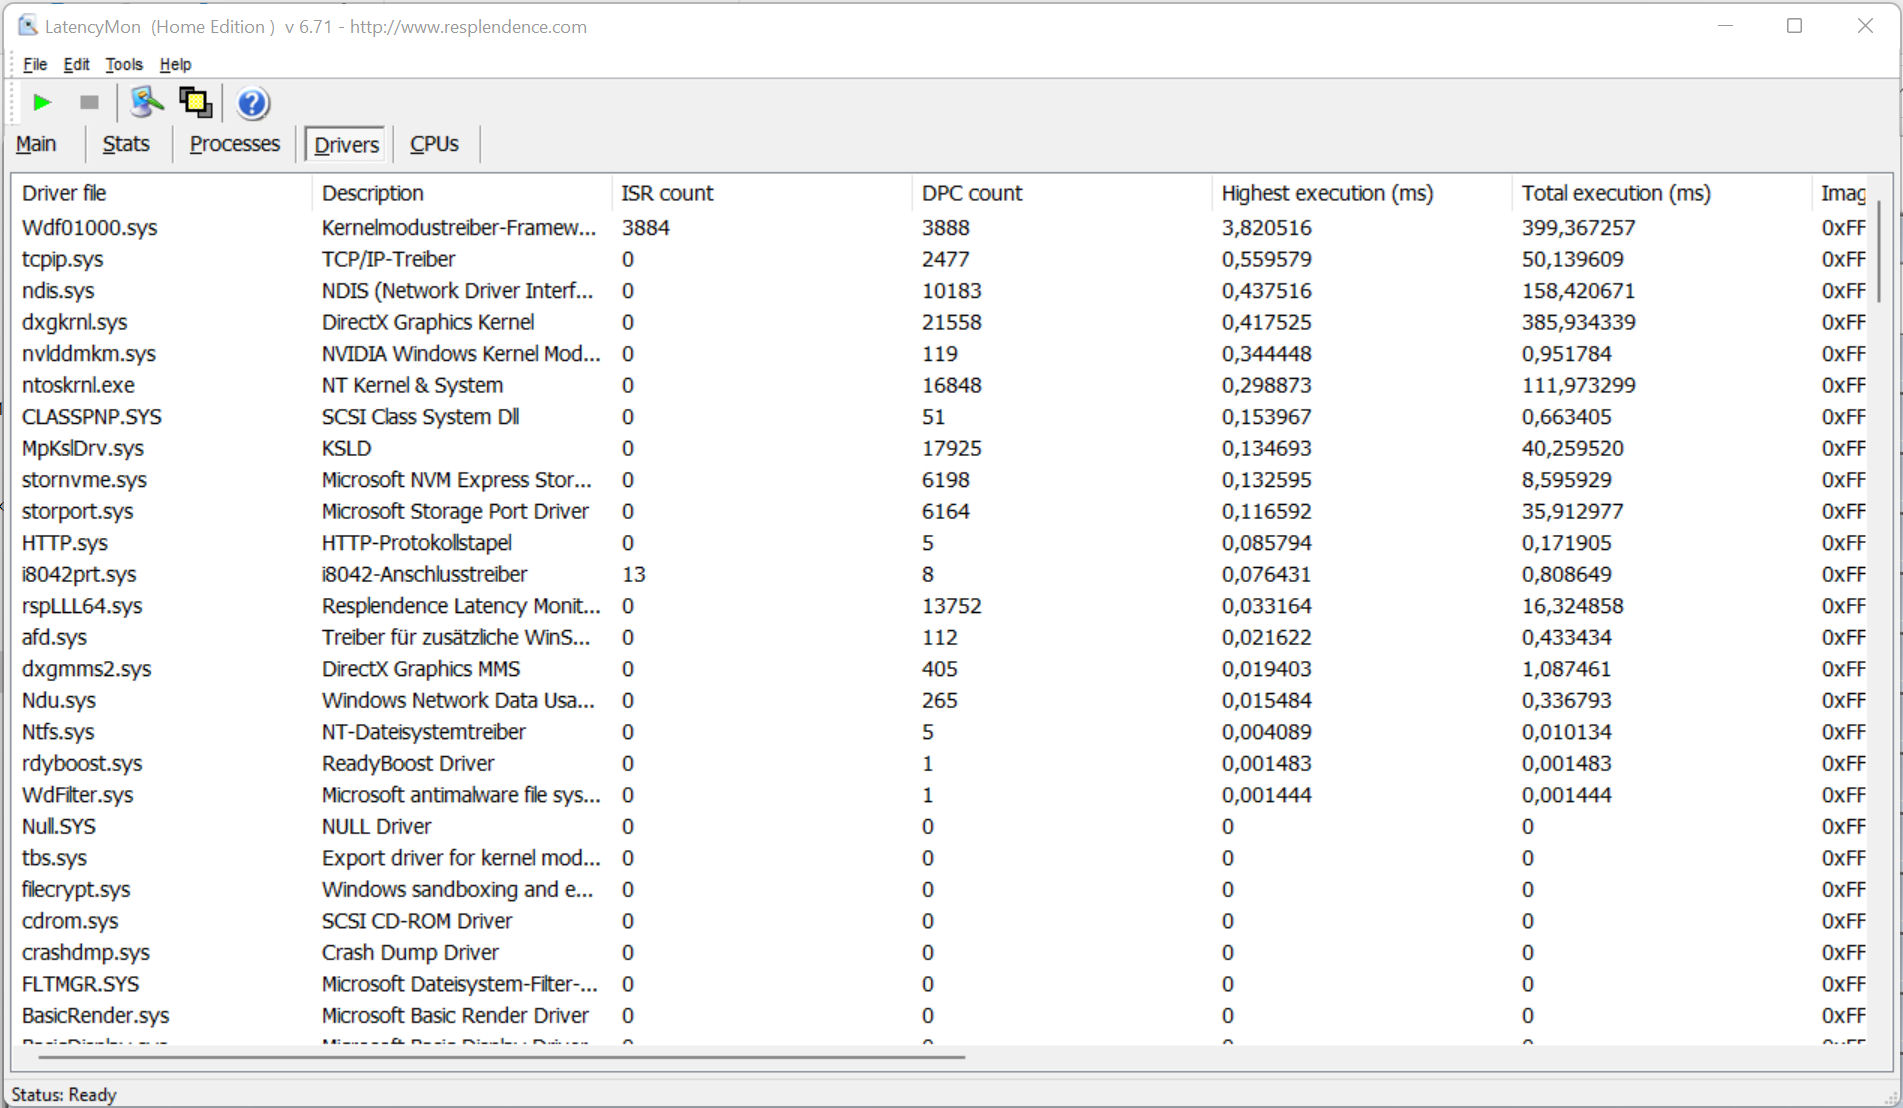
| DPC Latencies / LatencyMon - interrupt to process latency (max), Web, Youtube, Prime95 | |
| Schenker XMG Fusion 15 (Mid 22) | |
| MSI Delta 15 A5EFK | |
| Acer Nitro 5 AN515-58-72QR | |
| HP Omen 16-b1090ng | |
| Razer Blade 15 Base Edition 2021, i7-10750H RTX 3060 | |
| Asus TUF Dash F15 FX517ZR | |
* ... más pequeño es mejor
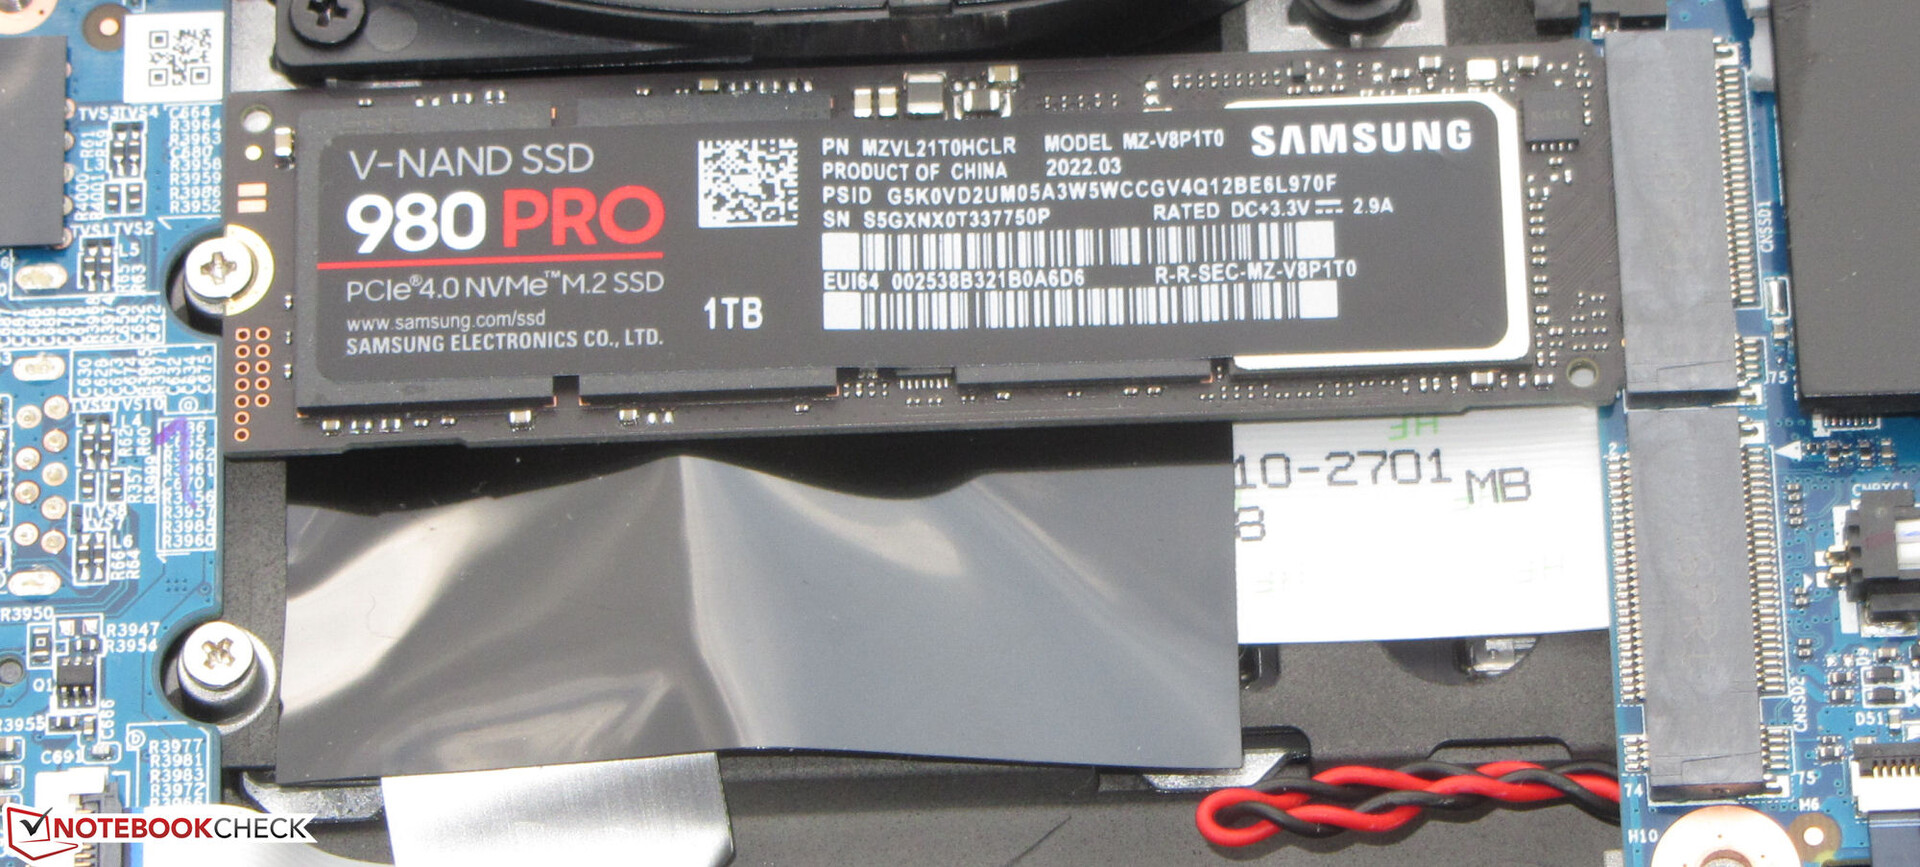
Almacenamiento
Schenker equipa el portátil con un SSD PCIe 4 (1 TB, M.2 2280) de Samsung que ofrece excelentes tasas de transferencia. El portátil tiene espacio para un total de dos SSD M.2-2280 (1x PCIe 4.0, 1x PCIe 3.0/SATA). Soporta RAID 0/1

* ... más pequeño es mejor
Continuous load read: DiskSpd Read Loop, Queue Depth 8
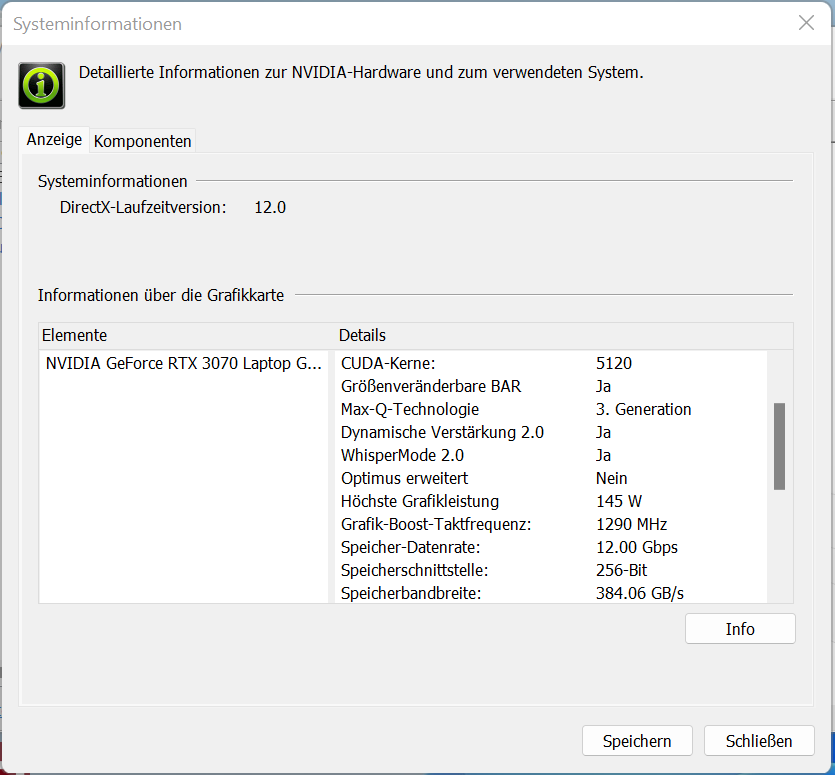
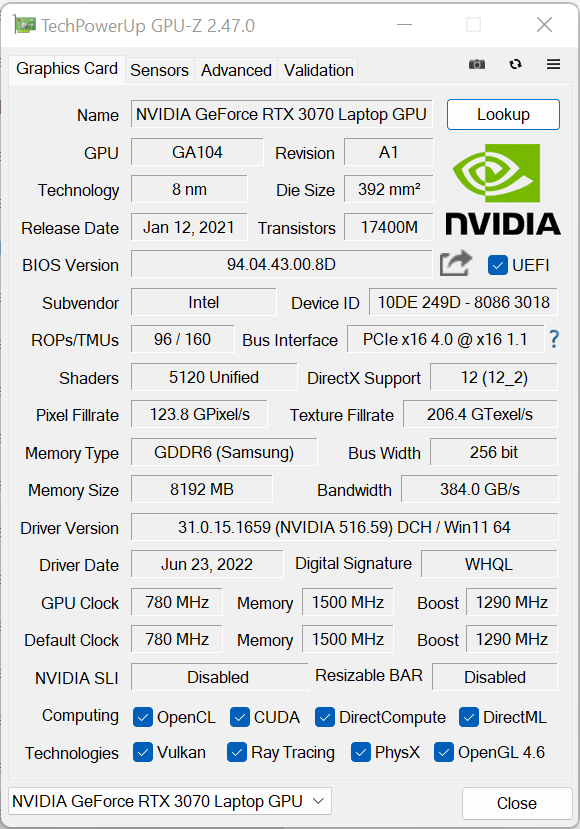
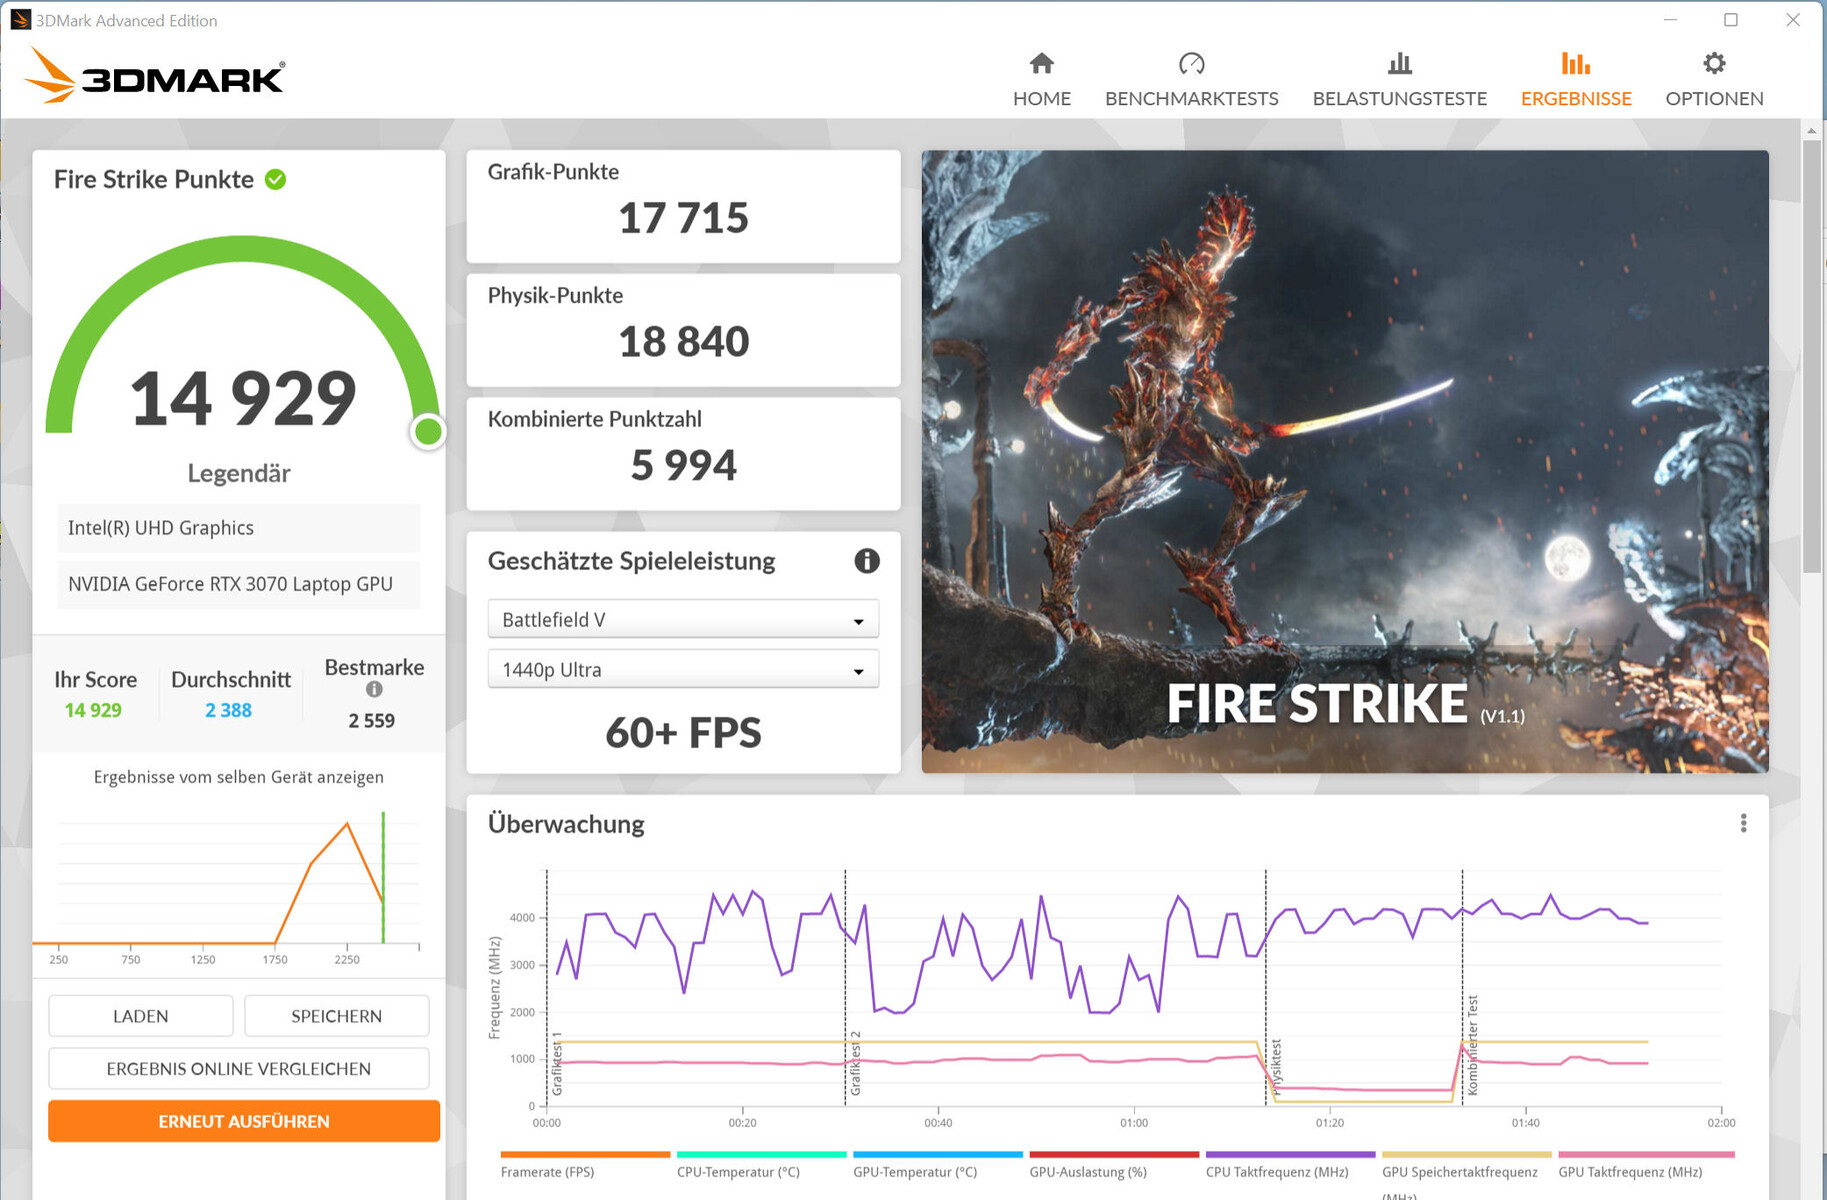
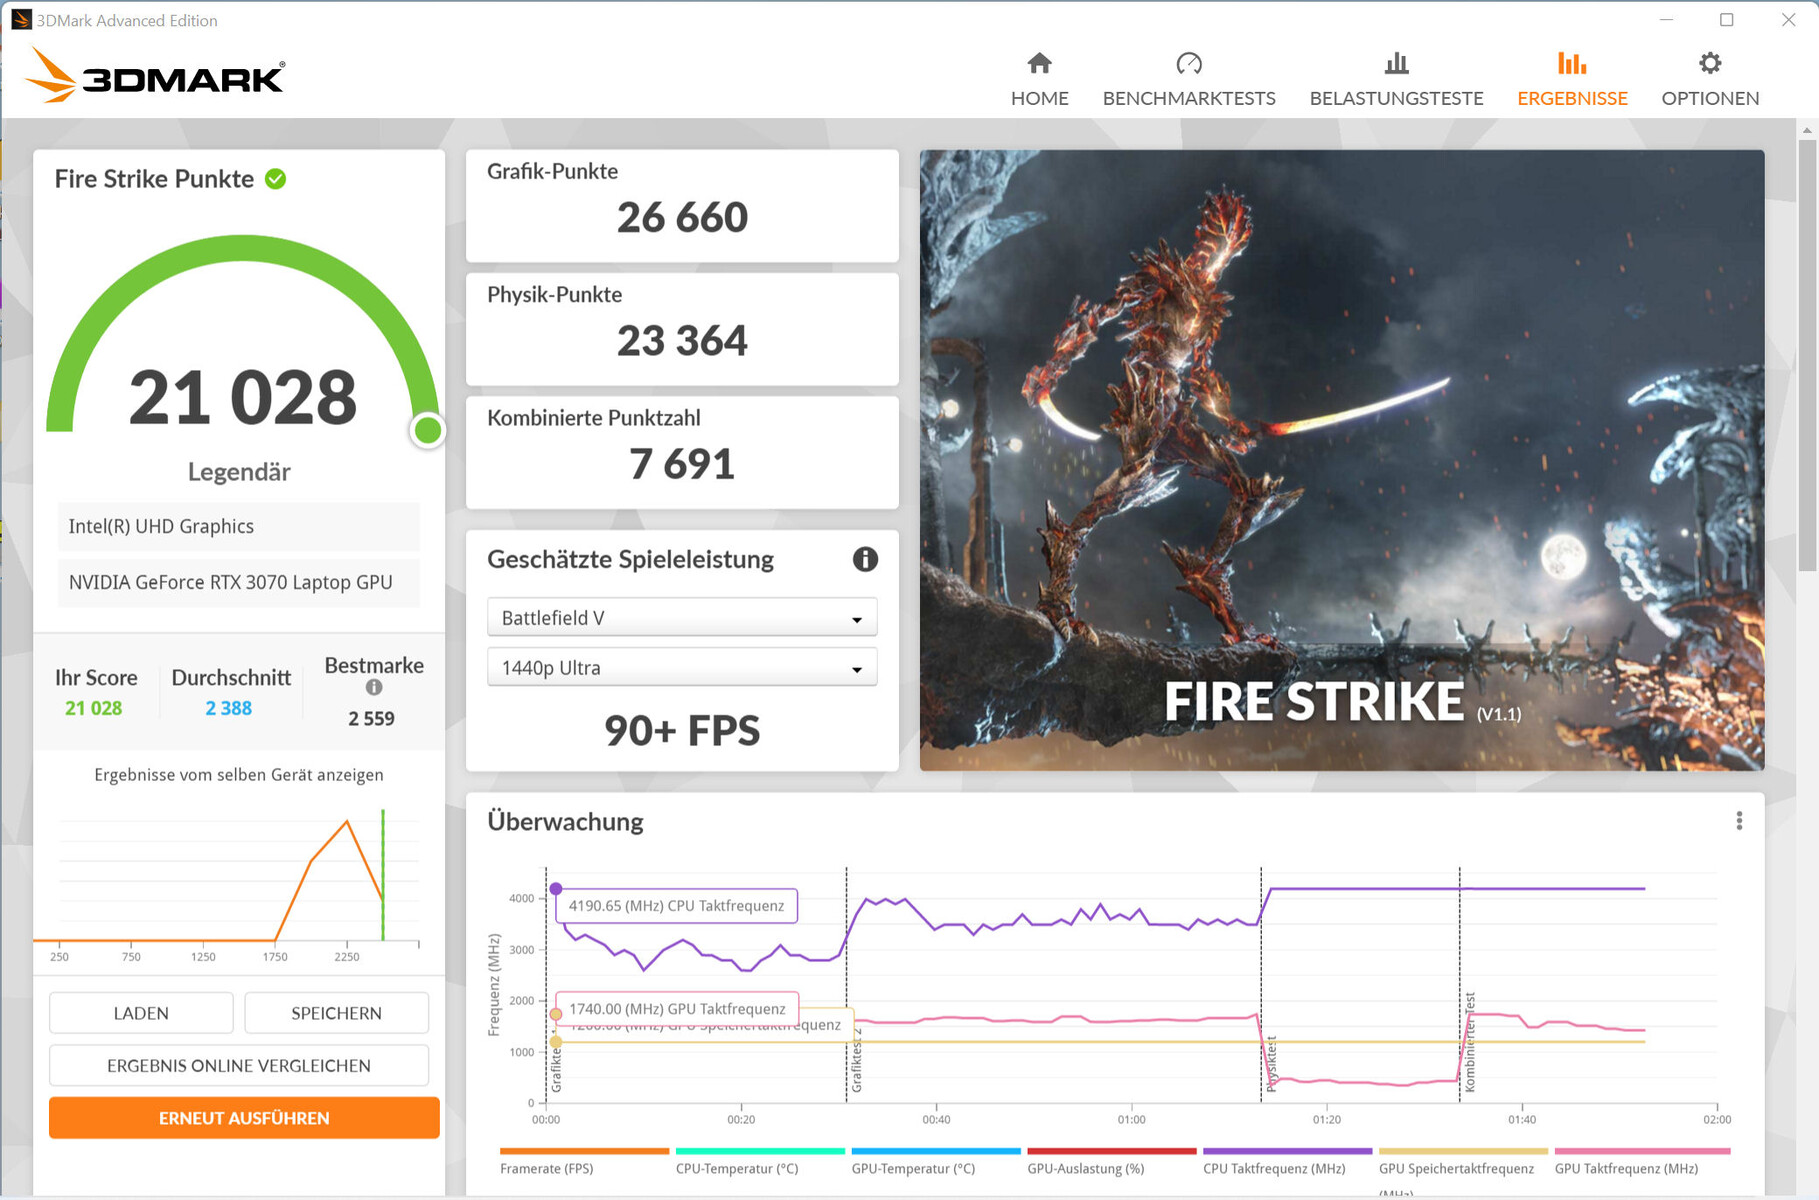
Tarjeta gráfica
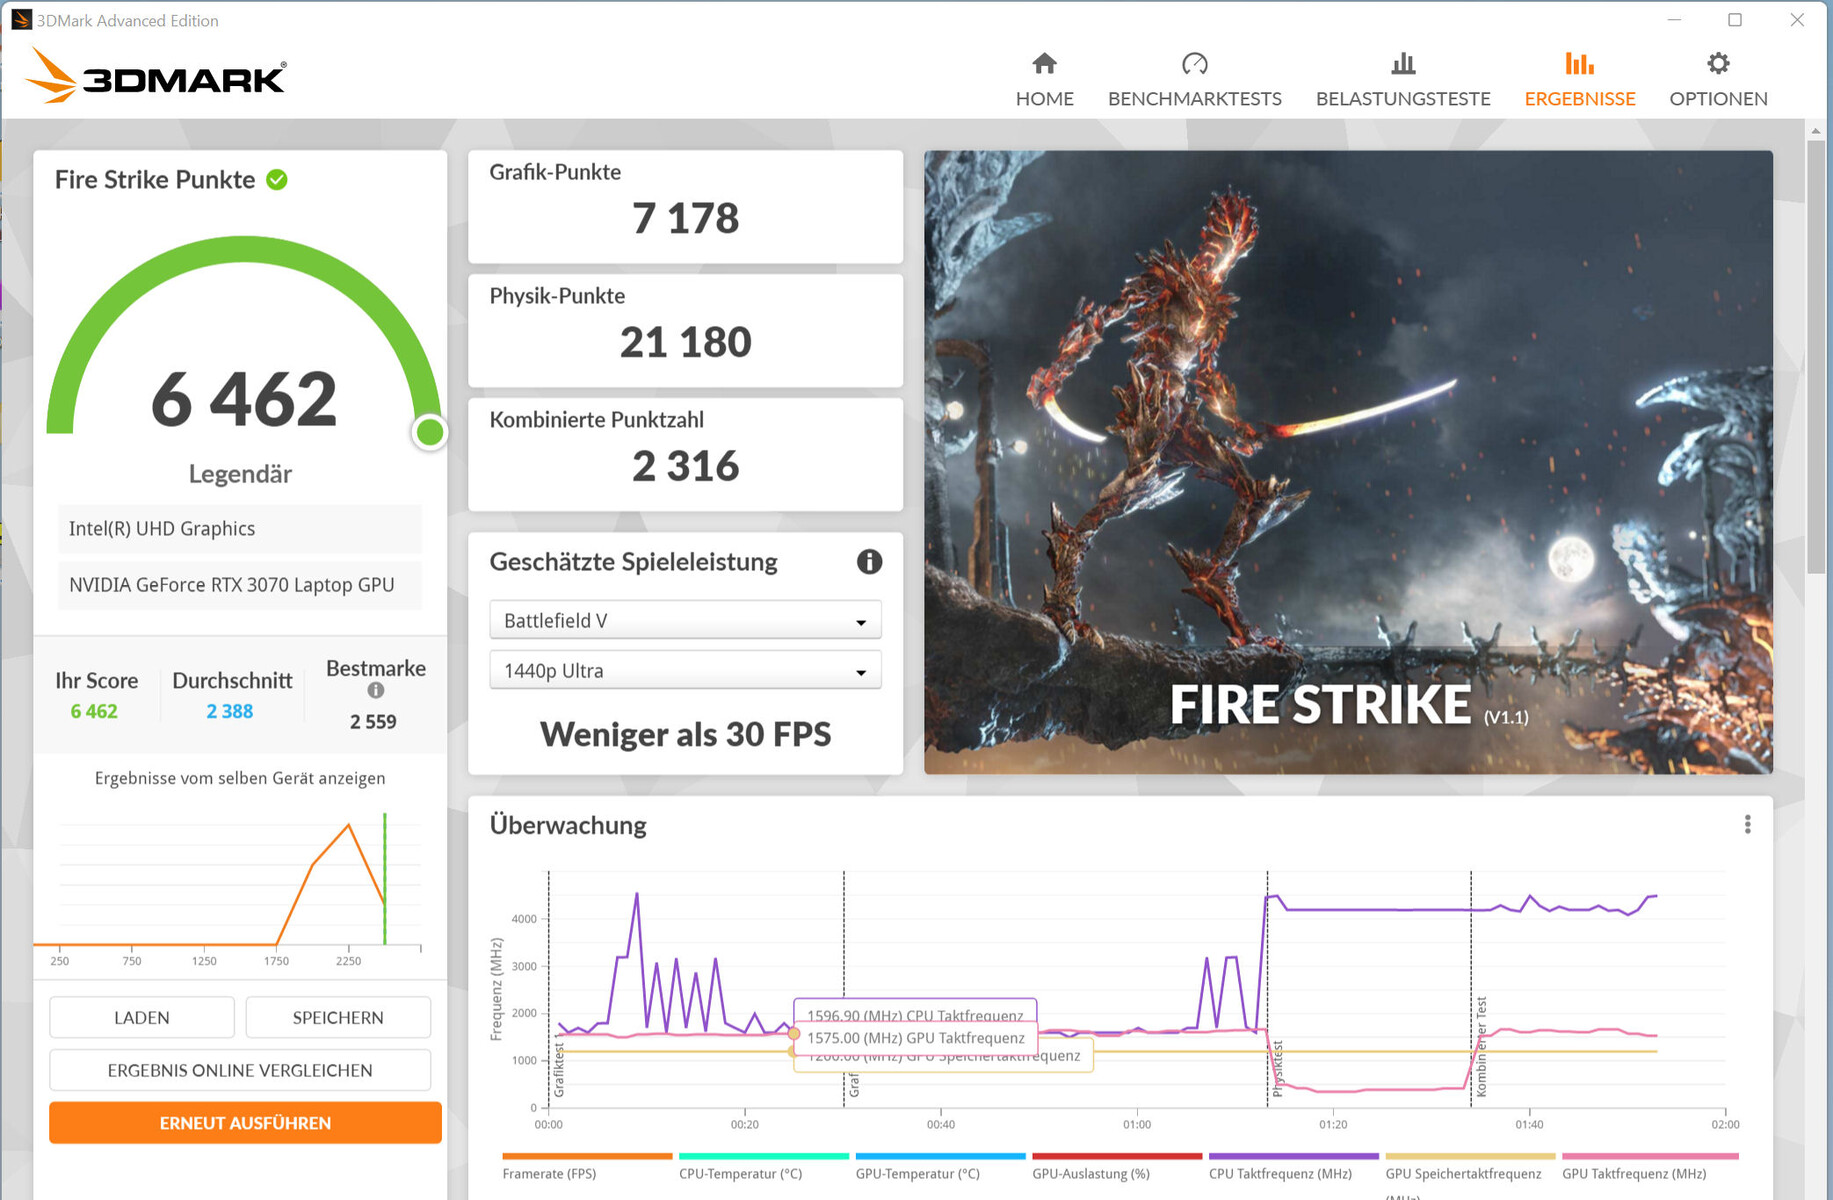
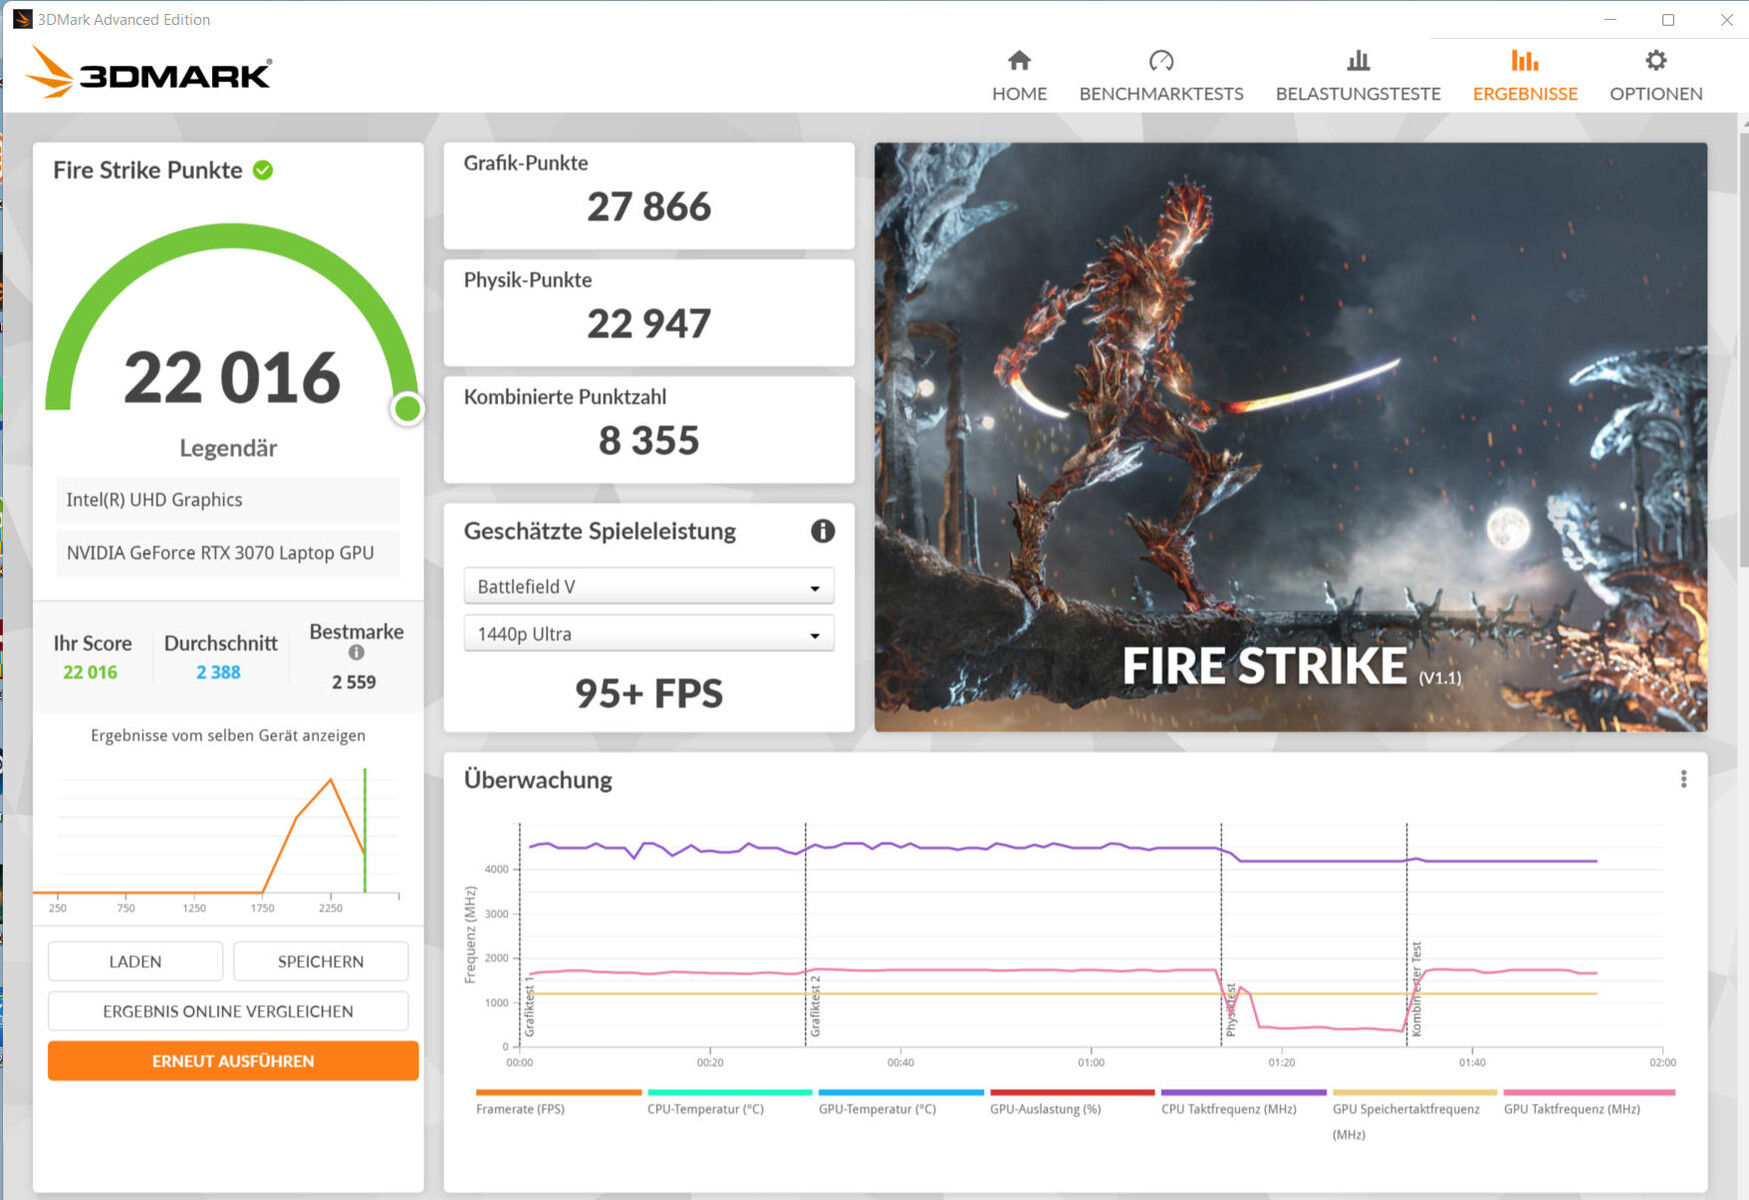
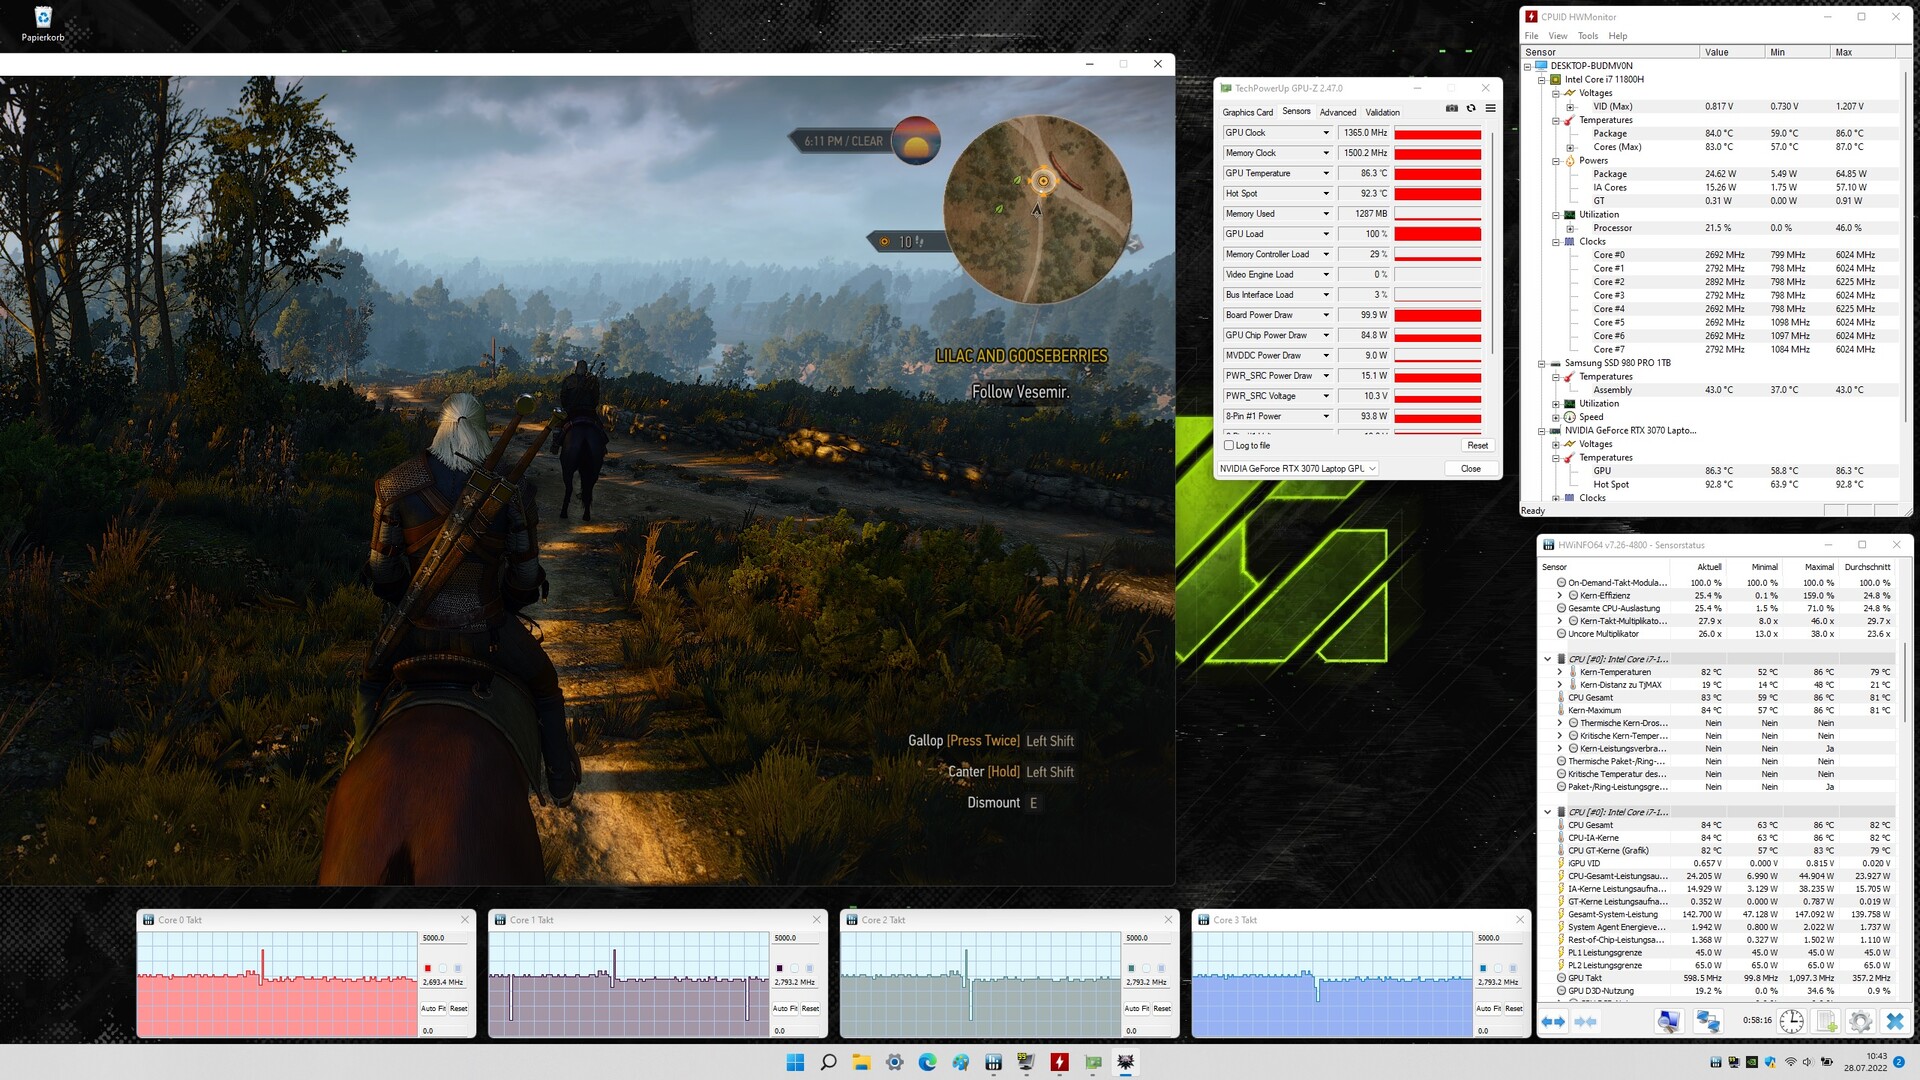
El rendimiento real de una GPU RTX 3000 depende de algunos factores: La refrigeración, la configuración de la memoria y el TGP máximo que seleccione el fabricante del portátil dentro de los límites definidos por Nvidia. Schenker proporciona laGeForce RTX 3070 para portátiles Con un TGP máximo de 145 vatios (125 vatios + 20 vatios de Dynamic Boost). Sin embargo, el Dynamic Boost sólo se utiliza cuando el perfil "Modo Benchmark" está activo. La GPU puede acceder a la rápida memoria gráfica GDDR6 (8.192 MB).
El perfil "Equilibrado" conduce a resultados de benchmark a la par de la media determinada anteriormente para la RTX 3070. El perfil "Modo Benchmark" permite aumentar los índices. Incluso entonces, el TGP máximo (145 W) no se aprovecha del todo, como demuestra nuestra prueba The Witcher 3. Sin embargo, se utiliza parte del Dynamic Boost.
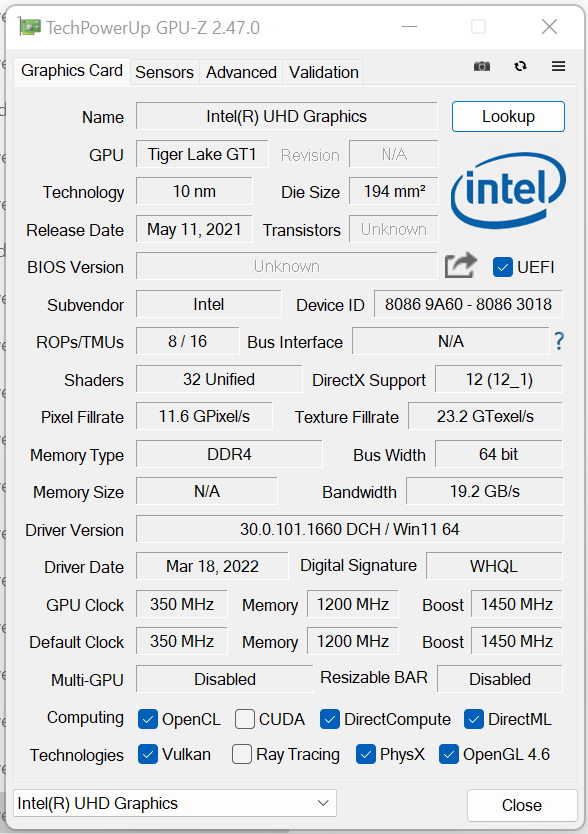
La pruebaUHD Graphics Xe 32EUs integrado en el procesador está activo, y el portátil funciona con la solución de conmutación de gráficos Optimus de Nvidia. El Fusion no ofrece la opción de salida de imagen directa a través de la GPU RTX 3070.

| 3DMark Performance rating - Percent | |
| Media de la clase Gaming | |
| Schenker XMG Fusion 15 (Mid 22) | |
| Acer Nitro 5 AN515-58-72QR | |
| MSI Delta 15 A5EFK -1! | |
| Schenker XMG Fusion 15 (Mid 22) | |
| HP Omen 16-b1090ng | |
| Medio NVIDIA GeForce RTX 3070 Laptop GPU | |
| Schenker XMG Fusion 15 (Mid 22) | |
| Asus TUF Dash F15 FX517ZR | |
| Razer Blade 15 Base Edition 2021, i7-10750H RTX 3060 | |
| Schenker XMG Fusion 15 (Mid 22) | |
| 3DMark 11 - 1280x720 Performance GPU | |
| Media de la clase Gaming (21841 - 80022, n=104, últimos 2 años) | |
| Schenker XMG Fusion 15 (Mid 22) (Benchmark-Modus) | |
| Acer Nitro 5 AN515-58-72QR | |
| Schenker XMG Fusion 15 (Mid 22) (Leistung) | |
| HP Omen 16-b1090ng | |
| MSI Delta 15 A5EFK | |
| Medio NVIDIA GeForce RTX 3070 Laptop GPU (12535 - 38275, n=54) | |
| Schenker XMG Fusion 15 (Mid 22) | |
| Asus TUF Dash F15 FX517ZR | |
| Razer Blade 15 Base Edition 2021, i7-10750H RTX 3060 | |
| Schenker XMG Fusion 15 (Mid 22) (Stromsparmodus) | |
| Geekbench 5.5 - OpenCL Score | |
| Media de la clase Gaming (80702 - 277970, n=101, últimos 2 años) | |
| Acer Nitro 5 AN515-58-72QR | |
| Schenker XMG Apex 15 Max | |
| Schenker XMG Fusion 15 (Mid 22) (Benchmark-Modus) | |
| Schenker XMG Fusion 15 (Mid 22) (Leistung) | |
| Schenker XMG Fusion 15 (Mid 22) | |
| HP Omen 16-b1090ng | |
| Asus TUF Dash F15 FX517ZR | |
| Medio NVIDIA GeForce RTX 3070 Laptop GPU (5732 - 125874, n=52) | |
| Razer Blade 15 Base Edition 2021, i7-10750H RTX 3060 | |
| MSI Delta 15 A5EFK | |
| Schenker XMG Fusion 15 (Mid 22) (Stromsparmodus) | |
| 3DMark 11 Performance | 26211 puntos | |
| 3DMark Cloud Gate Standard Score | 48271 puntos | |
| 3DMark Fire Strike Score | 20150 puntos | |
| 3DMark Time Spy Score | 9025 puntos | |
ayuda | ||
Rendimiento de los juegos
El hardware permite jugar en QHD con ajustes altos o máximos. También se pueden usar resoluciones más altas cuando se conecta una pantalla correspondiente - con ajustes reducidos a veces. Las tasas de frames están a la par con la media de la RTX 3070. El perfil "Modo Benchmark" lleva a un aumento de las tasas de frames
| The Witcher 3 - 1920x1080 Ultra Graphics & Postprocessing (HBAO+) | |
| Media de la clase Gaming (104.7 - 240, n=7, últimos 2 años) | |
| Schenker XMG Fusion 15 (Mid 22) (Benchmark-Modus) | |
| Acer Nitro 5 AN515-58-72QR | |
| HP Omen 16-b1090ng | |
| MSI Delta 15 A5EFK | |
| Schenker XMG Fusion 15 (Mid 22) | |
| Medio NVIDIA GeForce RTX 3070 Laptop GPU (34.9 - 109, n=52) | |
| Asus TUF Dash F15 FX517ZR | |
| Razer Blade 15 Base Edition 2021, i7-10750H RTX 3060 | |
| Dota 2 Reborn - 1920x1080 ultra (3/3) best looking | |
| Media de la clase Gaming (84.8 - 248, n=107, últimos 2 años) | |
| HP Omen 16-b1090ng | |
| Acer Nitro 5 AN515-58-72QR | |
| Schenker XMG Fusion 15 (Mid 22) | |
| Schenker XMG Fusion 15 (Mid 22) (Benchmark-Modus) | |
| Razer Blade 15 Base Edition 2021, i7-10750H RTX 3060 | |
| Medio NVIDIA GeForce RTX 3070 Laptop GPU (26.9 - 163.9, n=58) | |
| Schenker XMG Fusion 15 (Mid 22) (Leistung) | |
| MSI Delta 15 A5EFK | |
| Asus TUF Dash F15 FX517ZR | |
| Schenker XMG Fusion 15 (Mid 22) (Stromsparmodus) | |
| X-Plane 11.11 - 1920x1080 high (fps_test=3) | |
| HP Omen 16-b1090ng | |
| Asus TUF Dash F15 FX517ZR | |
| Media de la clase Gaming (55.5 - 143.5, n=109, últimos 2 años) | |
| Acer Nitro 5 AN515-58-72QR | |
| Schenker XMG Fusion 15 (Mid 22) | |
| Medio NVIDIA GeForce RTX 3070 Laptop GPU (12.4 - 118.8, n=61) | |
| Razer Blade 15 Base Edition 2021, i7-10750H RTX 3060 | |
| Schenker XMG Fusion 15 (Mid 22) (Benchmark-Modus) | |
| Schenker XMG Fusion 15 (Mid 22) (Leistung) | |
| Schenker XMG Fusion 15 (Mid 22) (Stromsparmodus) | |
| Final Fantasy XV Benchmark | |
| 1920x1080 High Quality | |
| Media de la clase Gaming (41 - 215, n=95, últimos 2 años) | |
| Schenker XMG Fusion 15 (Mid 22) (1.3, Benchmark-Modus) | |
| HP Omen 16-b1090ng | |
| Schenker XMG Fusion 15 (Mid 22) (1.3, Leistung) | |
| Schenker XMG Fusion 15 (Mid 22) (1.3) | |
| Acer Nitro 5 AN515-58-72QR (1.3) | |
| Medio NVIDIA GeForce RTX 3070 Laptop GPU (27.9 - 107, n=49) | |
| Asus TUF Dash F15 FX517ZR (1.3) | |
| MSI Delta 15 A5EFK | |
| Razer Blade 15 Base Edition 2021, i7-10750H RTX 3060 (1.3) | |
| Schenker XMG Fusion 15 (Mid 22) (1.3, Stromsparmodus) | |
| 2560x1440 High Quality | |
| Media de la clase Gaming (32.5 - 184.3, n=87, últimos 2 años) | |
| Schenker XMG Fusion 15 (Mid 22) (1.3, Benchmark-Modus) | |
| Schenker XMG Fusion 15 (Mid 22) (1.3, Leistung) | |
| Schenker XMG Fusion 15 (Mid 22) (1.3) | |
| Acer Nitro 5 AN515-58-72QR (1.3) | |
| Medio NVIDIA GeForce RTX 3070 Laptop GPU (19.8 - 79.9, n=25) | |
| Asus TUF Dash F15 FX517ZR (1.3) | |
| Schenker XMG Fusion 15 (Mid 22) (1.3, Stromsparmodus) | |
| GTA V | |
| 2560x1440 Highest AA:4xMSAA + FX AF:16x | |
| Media de la clase Gaming (36.9 - 183.9, n=72, últimos 2 años) | |
| Schenker XMG Fusion 15 (Mid 22) (Benchmark-Modus) | |
| Schenker XMG Fusion 15 (Mid 22) (Leistung) | |
| Schenker XMG Fusion 15 (Mid 22) | |
| Medio NVIDIA GeForce RTX 3070 Laptop GPU (70.8 - 97.1, n=19) | |
| Acer Nitro 5 AN515-58-72QR | |
| Asus TUF Dash F15 FX517ZR | |
| 1920x1080 Highest AA:4xMSAA + FX AF:16x | |
| Media de la clase Gaming (48.3 - 186.9, n=94, últimos 2 años) | |
| HP Omen 16-b1090ng | |
| Schenker XMG Fusion 15 (Mid 22) (Benchmark-Modus) | |
| Asus TUF Dash F15 FX517ZR | |
| Schenker XMG Fusion 15 (Mid 22) (Leistung) | |
| Schenker XMG Fusion 15 (Mid 22) | |
| Acer Nitro 5 AN515-58-72QR | |
| Medio NVIDIA GeForce RTX 3070 Laptop GPU (21.7 - 125.8, n=50) | |
| MSI Delta 15 A5EFK | |
| Razer Blade 15 Base Edition 2021, i7-10750H RTX 3060 | |
| Schenker XMG Fusion 15 (Mid 22) (Stromsparmodus) | |
| Strange Brigade | |
| 2560x1440 ultra AA:ultra AF:16 | |
| Media de la clase Gaming (52.8 - 354, n=76, últimos 2 años) | |
| Acer Nitro 5 AN515-58-72QR (1.47.22.14 D3D12) | |
| Schenker XMG Fusion 15 (Mid 22) (1.47.22.14 D3D12, Benchmark-Modus) | |
| Schenker XMG Fusion 15 (Mid 22) (1.47.22.14 D3D12) | |
| Medio NVIDIA GeForce RTX 3070 Laptop GPU (82.3 - 140.5, n=18) | |
| Asus TUF Dash F15 FX517ZR (1.47.22.14 D3D12) | |
| 1920x1080 ultra AA:ultra AF:16 | |
| Media de la clase Gaming (76.3 - 458, n=87, últimos 2 años) | |
| Schenker XMG Fusion 15 (Mid 22) (1.47.22.14 D3D12, Benchmark-Modus) | |
| Acer Nitro 5 AN515-58-72QR (1.47.22.14 D3D12) | |
| Schenker XMG Fusion 15 (Mid 22) (1.47.22.14 D3D12, Leistung) | |
| MSI Delta 15 A5EFK (1.47.22.14 D3D12) | |
| Schenker XMG Fusion 15 (Mid 22) (1.47.22.14 D3D12) | |
| Medio NVIDIA GeForce RTX 3070 Laptop GPU (36.2 - 194, n=46) | |
| Asus TUF Dash F15 FX517ZR (1.47.22.14 D3D12) | |
| HP Omen 16-b1090ng (1.47.22.14 D3D12) | |
| Razer Blade 15 Base Edition 2021, i7-10750H RTX 3060 (1.47.22.14 D3D12) | |
| Schenker XMG Fusion 15 (Mid 22) (1.47.22.14 D3D12, Stromsparmodus) | |
| F1 2021 | |
| 2560x1440 Ultra High Preset + Raytracing AA:T AF:16x | |
| Schenker XMG Fusion 15 (Mid 22) (874931, Benchmark-Modus) | |
| Schenker XMG Fusion 15 (Mid 22) (874931, Leistung) | |
| Medio NVIDIA GeForce RTX 3070 Laptop GPU (67.1 - 90.2, n=11) | |
| Acer Nitro 5 AN515-58-72QR (874931) | |
| Schenker XMG Fusion 15 (Mid 22) (874931) | |
| Asus TUF Dash F15 FX517ZR (874931) | |
| 1920x1080 Ultra High Preset + Raytracing AA:T AF:16x | |
| Schenker XMG Fusion 15 (Mid 22) (874931, Benchmark-Modus) | |
| Schenker XMG Fusion 15 (Mid 22) (874931, Leistung) | |
| Acer Nitro 5 AN515-58-72QR (874931) | |
| Schenker XMG Fusion 15 (Mid 22) (874931) | |
| MSI Delta 15 A5EFK | |
| Medio NVIDIA GeForce RTX 3070 Laptop GPU (33.1 - 123.1, n=23) | |
| Asus TUF Dash F15 FX517ZR (874931) | |
| Schenker XMG Fusion 15 (Mid 22) (874931, Stromsparmodus) | |
| Far Cry 5 | |
| 2560x1440 Ultra Preset AA:T | |
| Media de la clase Gaming (93 - 149, n=5, últimos 2 años) | |
| Schenker XMG Fusion 15 (Mid 22) (Benchmark-Modus) | |
| Medio NVIDIA GeForce RTX 3070 Laptop GPU (81 - 101, n=18) | |
| Schenker XMG Fusion 15 (Mid 22) | |
| Asus TUF Dash F15 FX517ZR | |
| Acer Nitro 5 AN515-58-72QR | |
| 1920x1080 Ultra Preset AA:T | |
| Media de la clase Gaming (70 - 151, n=6, últimos 2 años) | |
| Schenker XMG Fusion 15 (Mid 22) (Benchmark-Modus) | |
| Schenker XMG Fusion 15 (Mid 22) | |
| Medio NVIDIA GeForce RTX 3070 Laptop GPU (89 - 140, n=36) | |
| Asus TUF Dash F15 FX517ZR | |
| MSI Delta 15 A5EFK | |
| Acer Nitro 5 AN515-58-72QR | |
Para comprobar si la velocidad de fotogramas se mantiene prácticamente constante durante un periodo de tiempo prolongado, dejamos que el juego The Witcher 3 funcionara durante unos 60 minutos a resolución Full HD y con los ajustes de máxima calidad. El personaje no se mueve. No se encontró una caída de la tasa de imágenes por segundo
The Witcher 3 FPS diagram
| bajo | medio | alto | ultra | QHD | |
|---|---|---|---|---|---|
| GTA V (2015) | 183.5 | 177 | 168.5 | 100 | 83.4 |
| The Witcher 3 (2015) | 348 | 260 | 163.4 | 91.8 | |
| Dota 2 Reborn (2015) | 155.7 | 139.4 | 132.8 | 125.3 | |
| Final Fantasy XV Benchmark (2018) | 171.3 | 121.6 | 93.8 | 72.1 | |
| X-Plane 11.11 (2018) | 121.2 | 111 | 86.8 | ||
| Far Cry 5 (2018) | 152 | 122 | 115 | 109 | 89 |
| Strange Brigade (2018) | 389 | 232 | 188.8 | 165.6 | 124.1 |
| F1 2021 (2021) | 267 | 194.2 | 170.1 | 105 | 79.8 |
Emisiones - El portátil de Schenker se calienta con fuerza
Emisiones acústicas
Los dos ventiladores producen bastante poco ruido en el uso diario (oficina, Internet). Incluso se quedan quietos de vez en cuando. Las cosas se ponen ruidosas a plena carga con niveles máximos de presión sonora de 48 dB(A) (prueba de estrés) y 46 dB(A) (nuestra prueba The Witcher 3 ), respectivamente, pero esto no es excesivamente ruidoso. La mayoría de los competidores producen más ruido, y sólo elAsus TUF Dash F15 está a la par
El desarrollo del ruido bajo carga puede reducirse de dos maneras: Utilizando el perfil "Modo de ahorro de energía" o activando el "WhisperMode 2.0" de la GPU GeForce. Este último puede activarse en el Centro de Control (en la sección "Optimización del rendimiento"). Incorpora el perfil "Modo de ahorro de energía". El Modo Susurro debe lograr el menor nivel de ruido posible utilizando niveles de velocidad de fotogramas que sean suficientes para un juego de ordenador (al menos de 30 a 60 fps). La GPU no necesita trabajar a plena potencia; produce menos calor y los ventiladores pueden reducir su velocidad.
Unas palabras sobre el perfil del "Modo Benchmark": Los ventiladores funcionan continuamente a toda velocidad y son, como es lógico, claramente audibles. Todo esto se refleja en un silbido constante. Los ventiladores de nuestro modelo de pruebas no emiten ningún ruido de fondo desagradable.
Ruido
| Ocioso |
| 26 / 28 / 31 dB(A) |
| Carga |
| 45 / 48 dB(A) |
 | ||
30 dB silencioso 40 dB(A) audible 50 dB(A) ruidosamente alto |
||
min: | ||
| Schenker XMG Fusion 15 (Mid 22) i7-11800H, GeForce RTX 3070 Laptop GPU | Asus TUF Dash F15 FX517ZR i7-12650H, GeForce RTX 3070 Laptop GPU | Acer Nitro 5 AN515-58-72QR i7-12700H, GeForce RTX 3070 Ti Laptop GPU | HP Omen 16-b1090ng i7-12700H, GeForce RTX 3070 Ti Laptop GPU | MSI Delta 15 A5EFK R9 5900HX, Radeon RX 6700M | Razer Blade 15 Base Edition 2021, i7-10750H RTX 3060 i7-10750H, GeForce RTX 3060 Laptop GPU | |
|---|---|---|---|---|---|---|
| Noise | -4% | -6% | -11% | -6% | 5% | |
| apagado / medio ambiente * (dB) | 26 | 26 -0% | 26 -0% | 26 -0% | 25 4% | 25.3 3% |
| Idle Minimum * (dB) | 26 | 26 -0% | 26 -0% | 30 -15% | 25 4% | 25.4 2% |
| Idle Average * (dB) | 28 | 32 -14% | 29 -4% | 31 -11% | 30 -7% | 25.4 9% |
| Idle Maximum * (dB) | 31 | 33 -6% | 33 -6% | 33 -6% | 40 -29% | 25.4 18% |
| Load Average * (dB) | 45 | 48 -7% | 47 -4% | 49 -9% | 47 -4% | 42.5 6% |
| Witcher 3 ultra * (dB) | 46 | 47 -2% | 53 -15% | 53 -15% | 48 -4% | 42 9% |
| Load Maximum * (dB) | 48 | 49 -2% | 53 -10% | 57 -19% | 51 -6% | 52.2 -9% |
* ... más pequeño es mejor
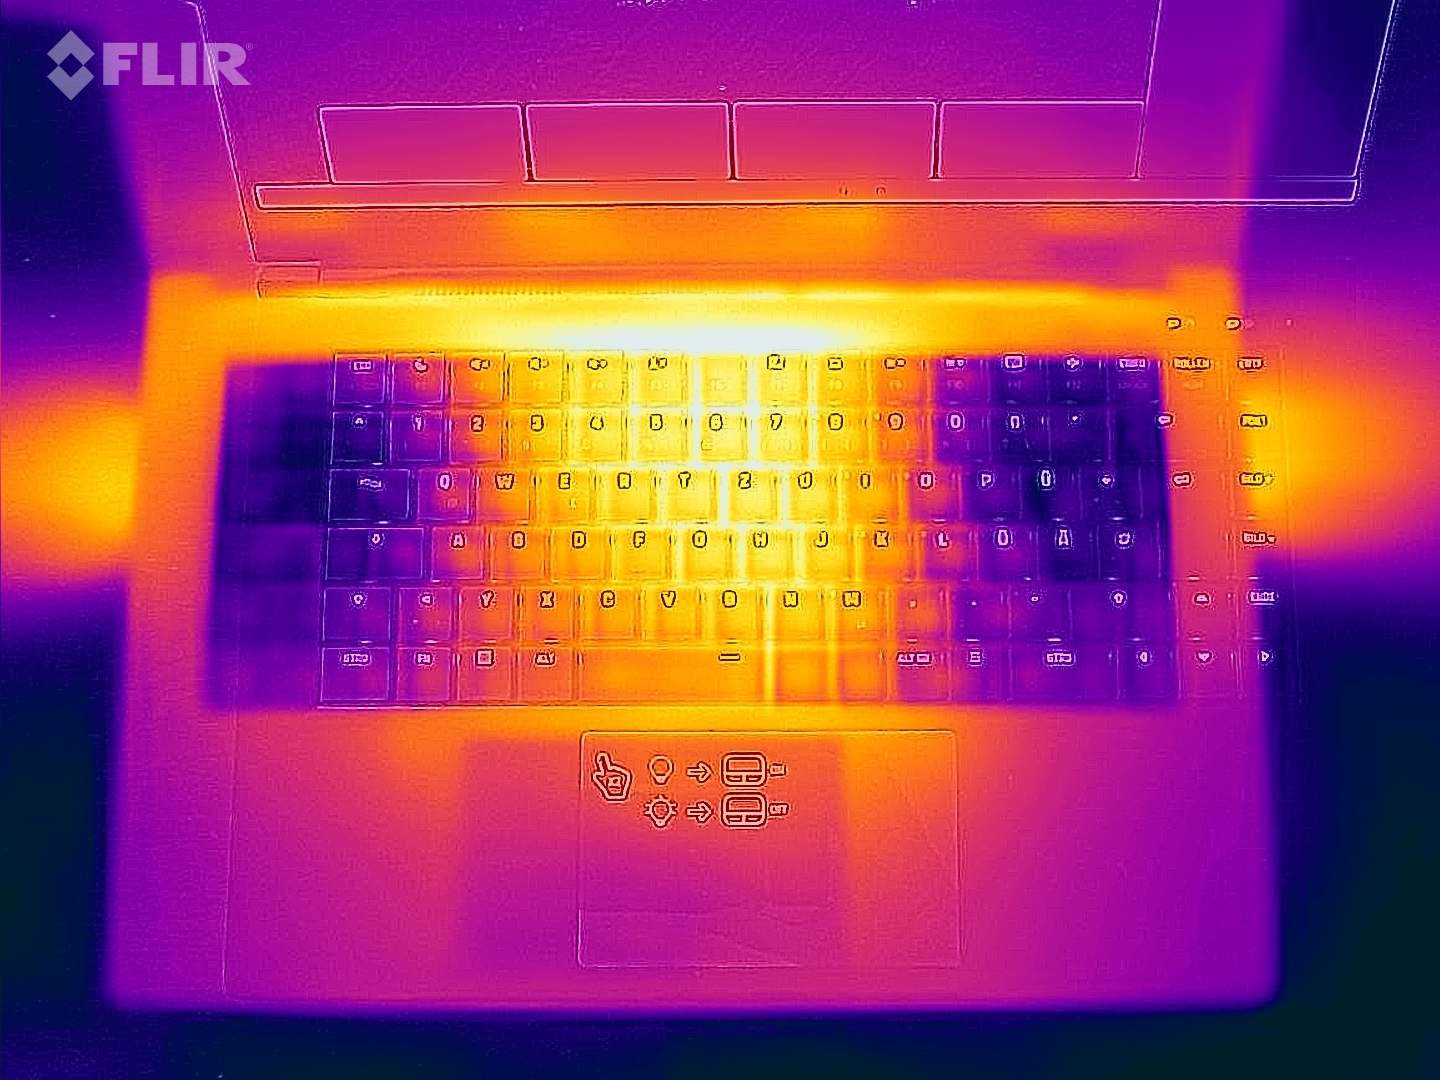
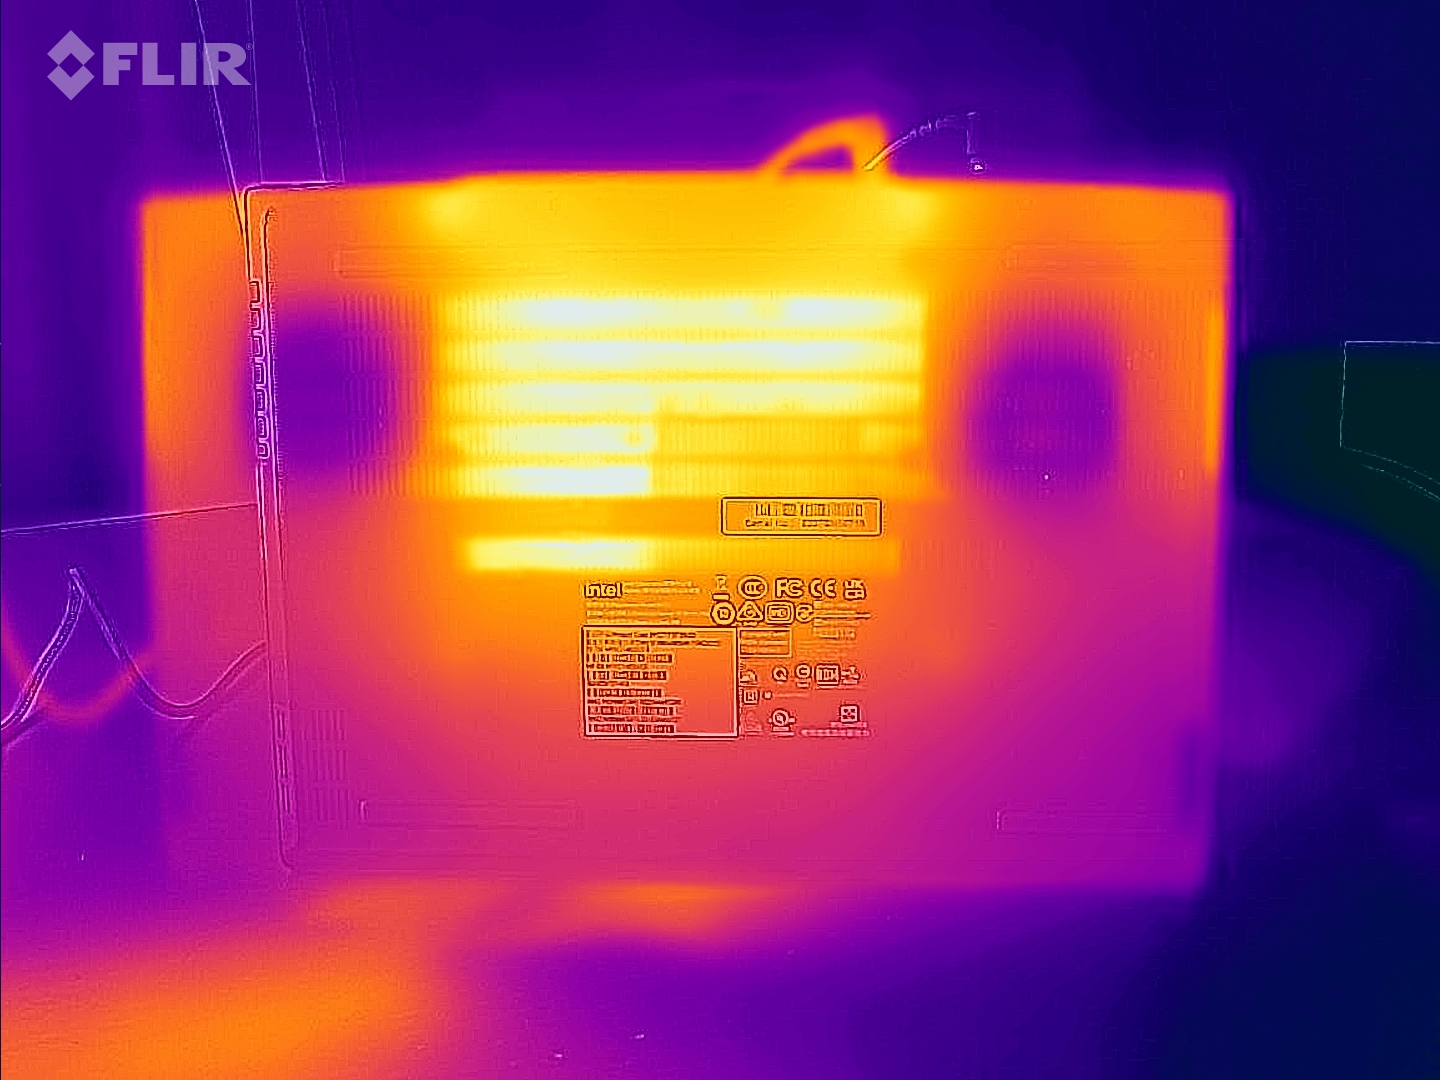
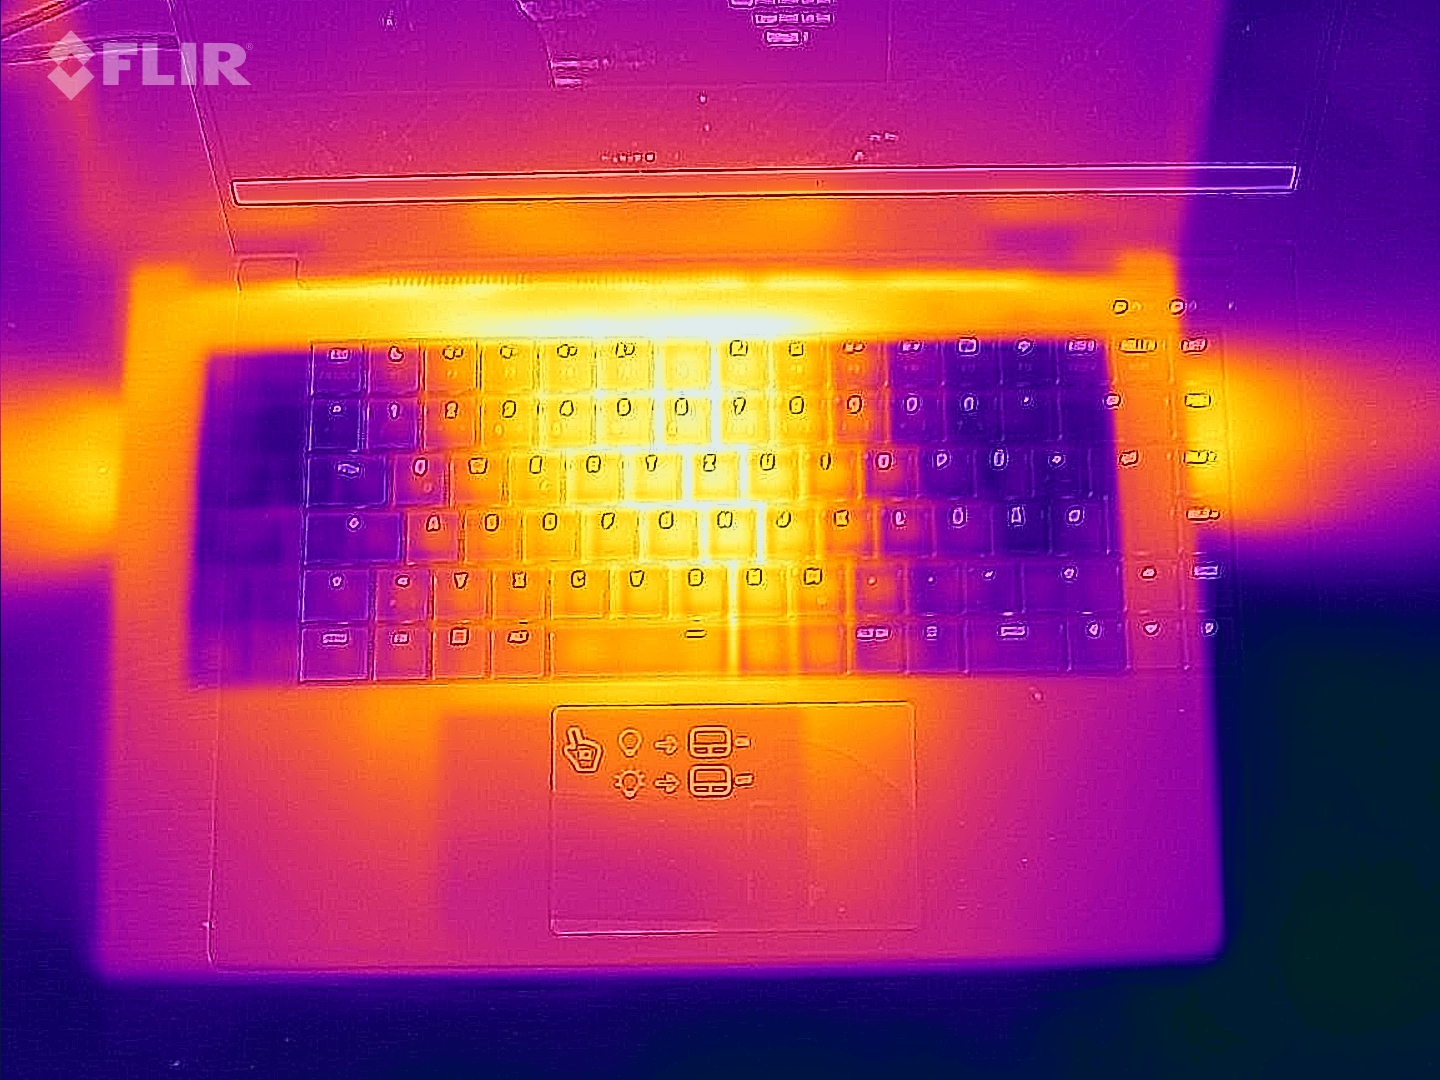
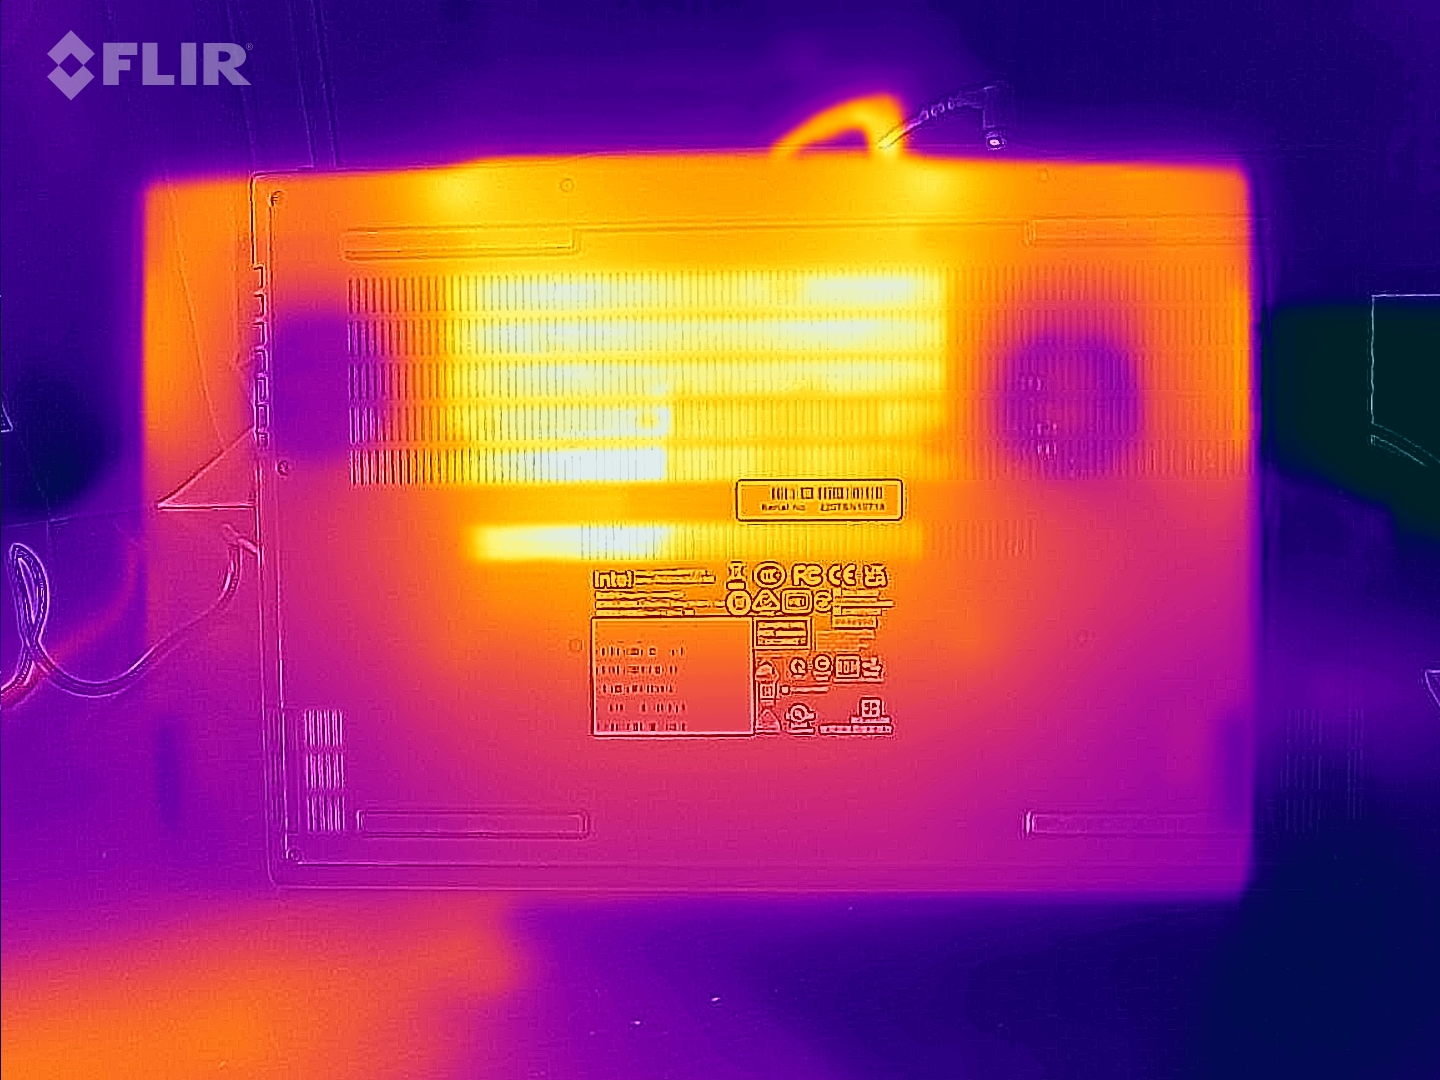
Temperatura
En el uso diario (oficina, Internet), las temperaturas de la carcasa se mantienen dentro de un rango aceptable. Sin embargo, el portátil se calienta mucho bajo carga (test de estrés, nuestro test Witcher 3 ). Se pueden registrar temperaturas justo por encima de los 60 °C en varios puntos de medición. Las temperaturas de la CPU no son motivo de preocupación
(-) La temperatura máxima en la parte superior es de 52 °C / 126 F, frente a la media de 40.4 °C / 105 F, que oscila entre 21.2 y 68.8 °C para la clase Gaming.
(-) El fondo se calienta hasta un máximo de 63 °C / 145 F, frente a la media de 43.2 °C / 110 F
(±) En reposo, la temperatura media de la parte superior es de 35.6 °C / 96# F, frente a la media del dispositivo de 33.9 °C / 93 F.
(-) Jugando a The Witcher 3, la temperatura media de la parte superior es de 48.8 °C / 120 F, frente a la media del dispositivo de 33.9 °C / 93 F.
(-) El reposamanos y el touchpad pueden calentarse mucho al tacto con un máximo de 46 °C / 114.8 F.
(-) La temperatura media de la zona del reposamanos de dispositivos similares fue de 28.8 °C / 83.8 F (-17.2 °C / -31 F).
| Schenker XMG Fusion 15 (Mid 22) Intel Core i7-11800H, NVIDIA GeForce RTX 3070 Laptop GPU | Asus TUF Dash F15 FX517ZR Intel Core i7-12650H, NVIDIA GeForce RTX 3070 Laptop GPU | Acer Nitro 5 AN515-58-72QR Intel Core i7-12700H, NVIDIA GeForce RTX 3070 Ti Laptop GPU | HP Omen 16-b1090ng Intel Core i7-12700H, NVIDIA GeForce RTX 3070 Ti Laptop GPU | MSI Delta 15 A5EFK AMD Ryzen 9 5900HX, AMD Radeon RX 6700M | Razer Blade 15 Base Edition 2021, i7-10750H RTX 3060 Intel Core i7-10750H, NVIDIA GeForce RTX 3060 Laptop GPU | |
|---|---|---|---|---|---|---|
| Heat | 8% | 12% | 22% | 14% | 12% | |
| Maximum Upper Side * (°C) | 52 | 52 -0% | 48 8% | 41 21% | 50 4% | 45.2 13% |
| Maximum Bottom * (°C) | 63 | 52 17% | 51 19% | 62 2% | 55 13% | 48 24% |
| Idle Upper Side * (°C) | 37 | 33 11% | 34 8% | 25 32% | 31 16% | 34.4 7% |
| Idle Bottom * (°C) | 38 | 36 5% | 33 13% | 26 32% | 30 21% | 37.2 2% |
* ... más pequeño es mejor
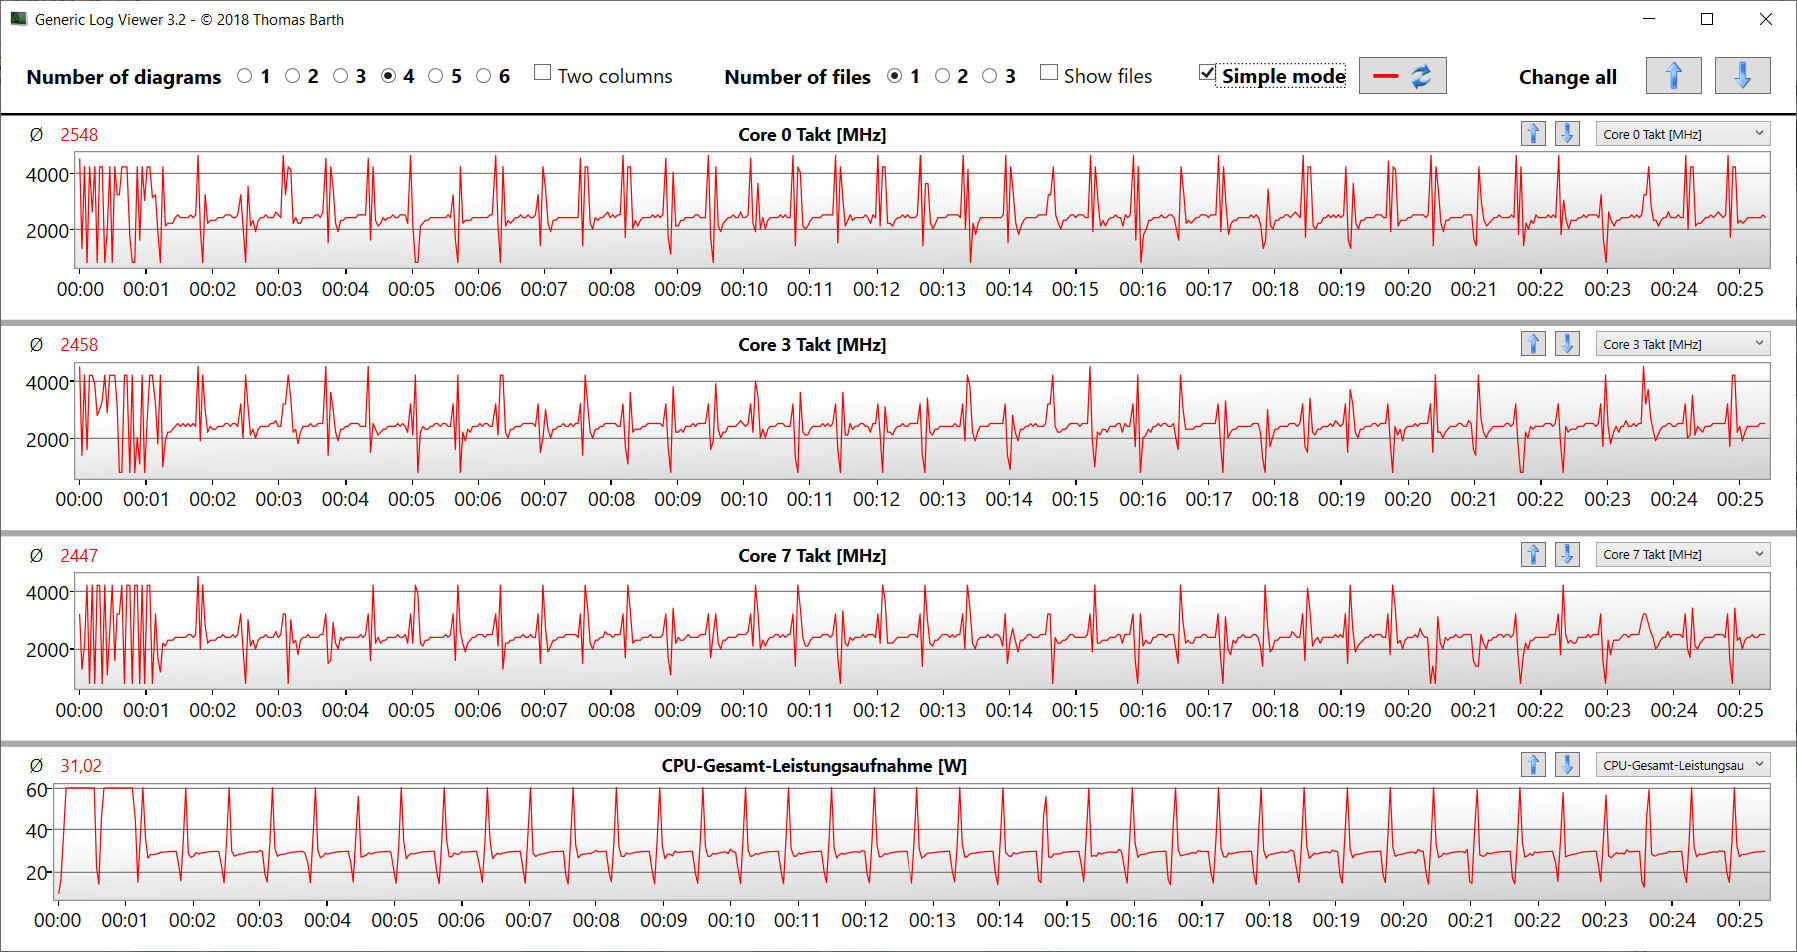
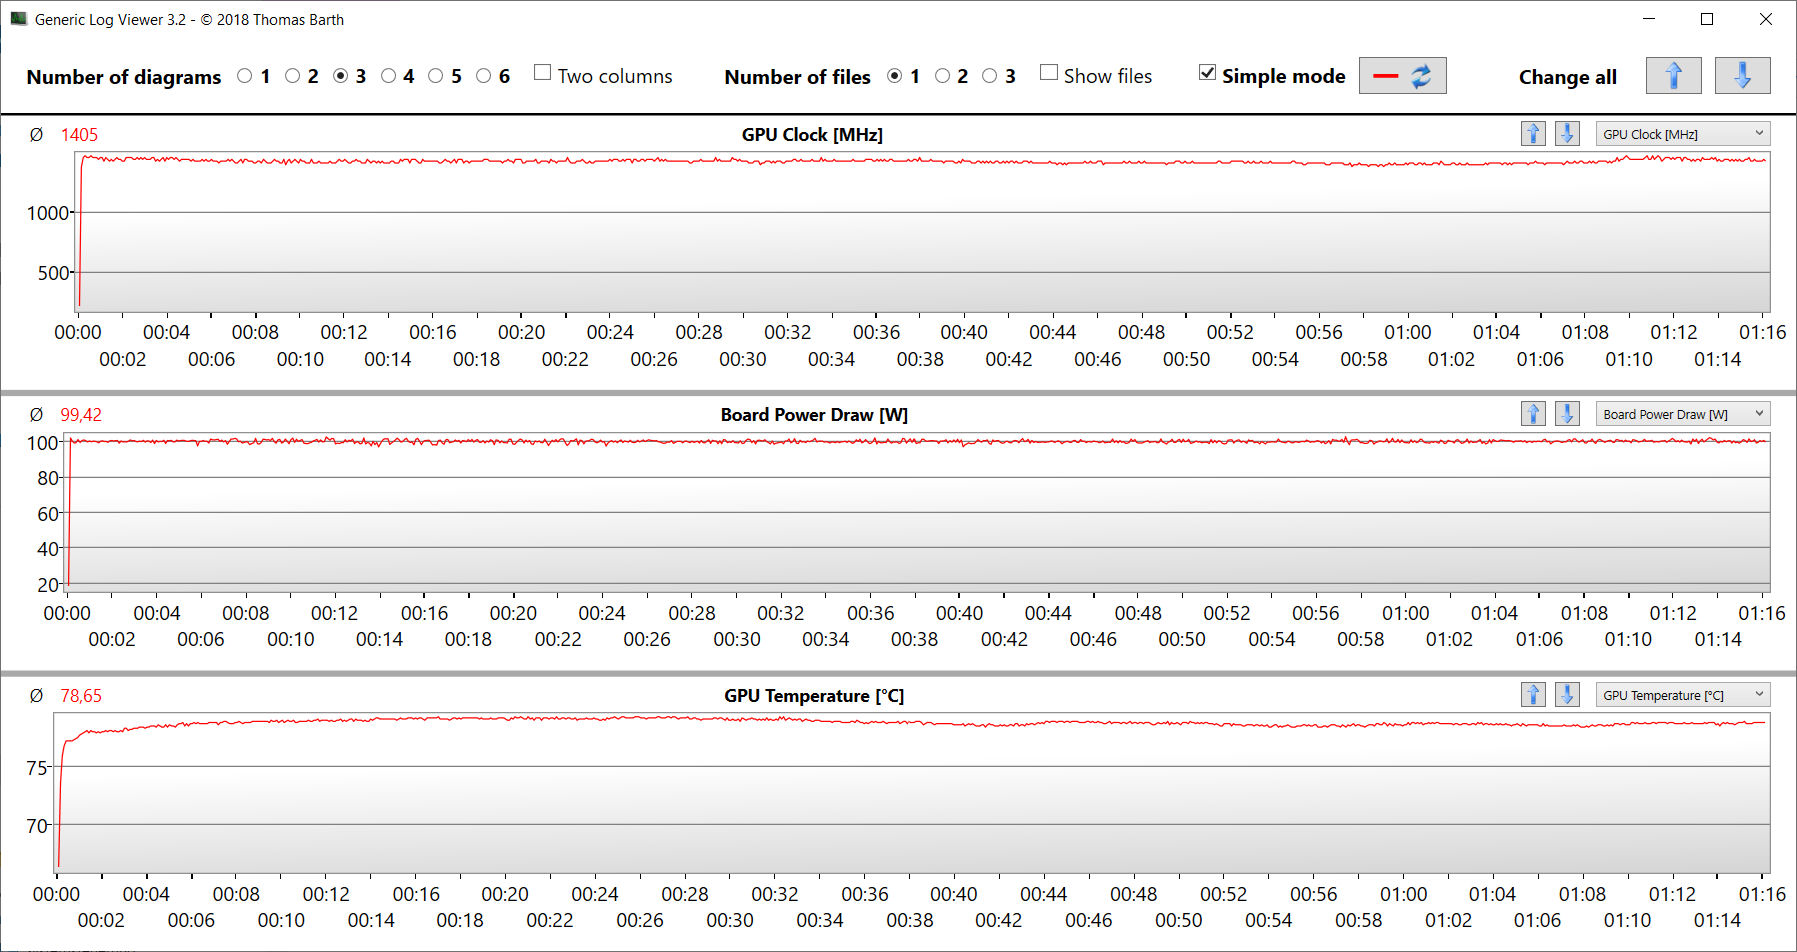
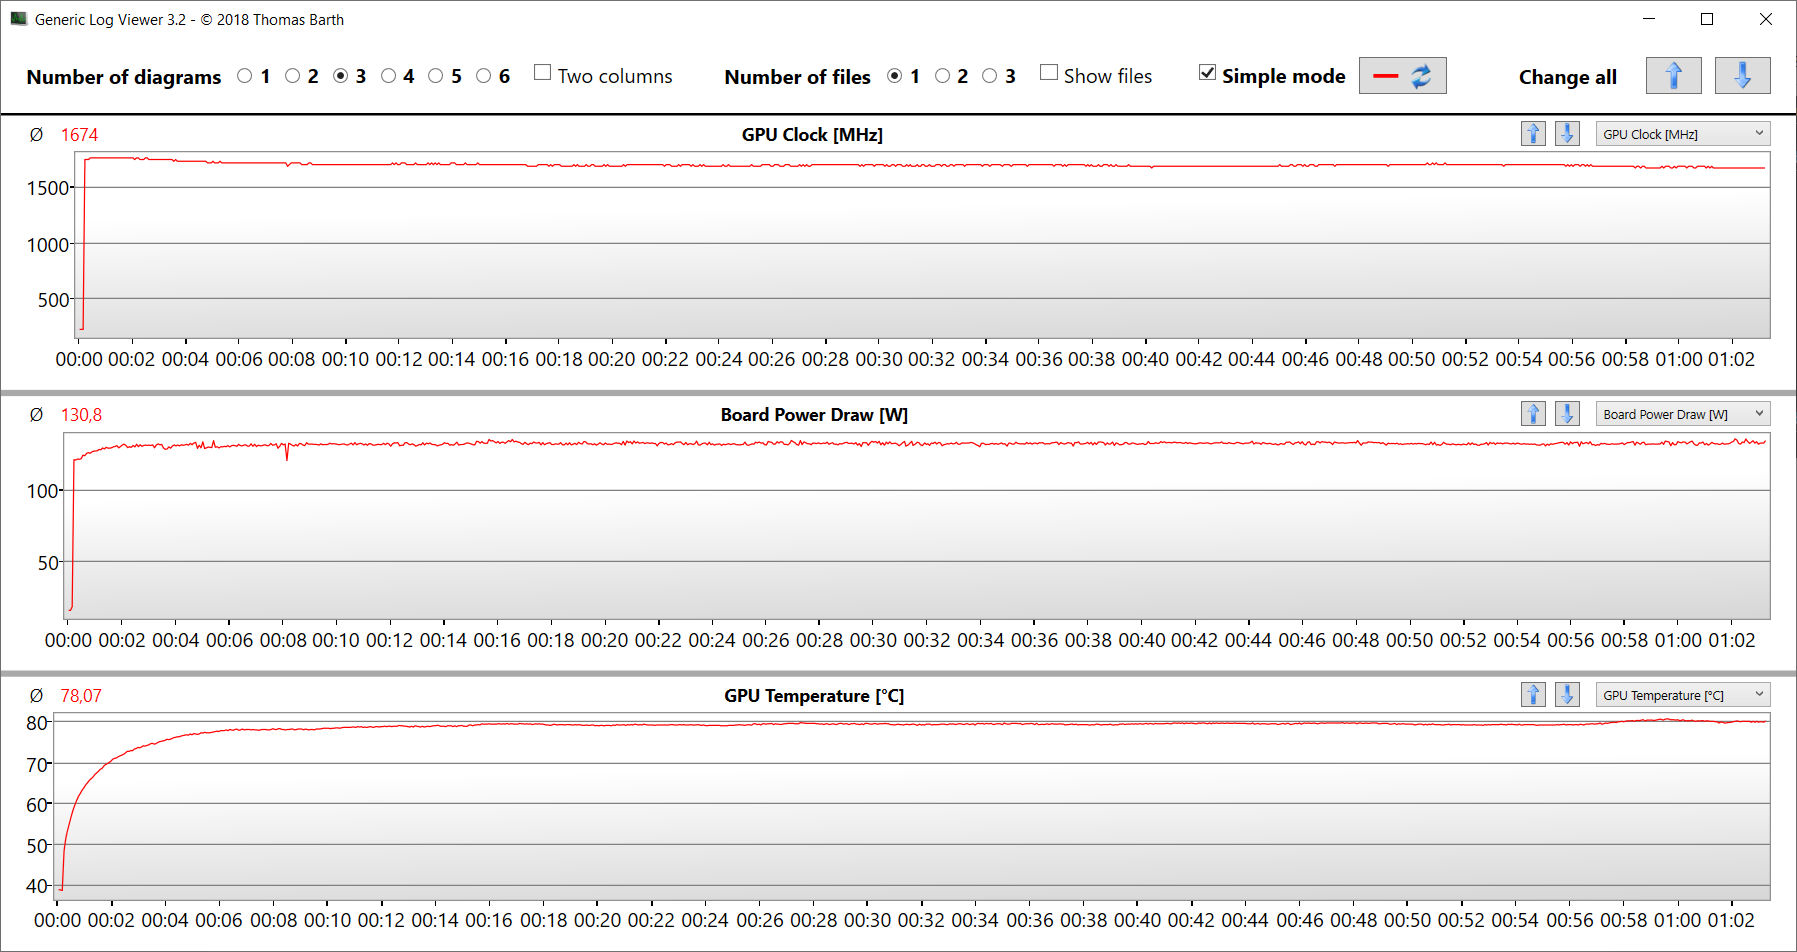
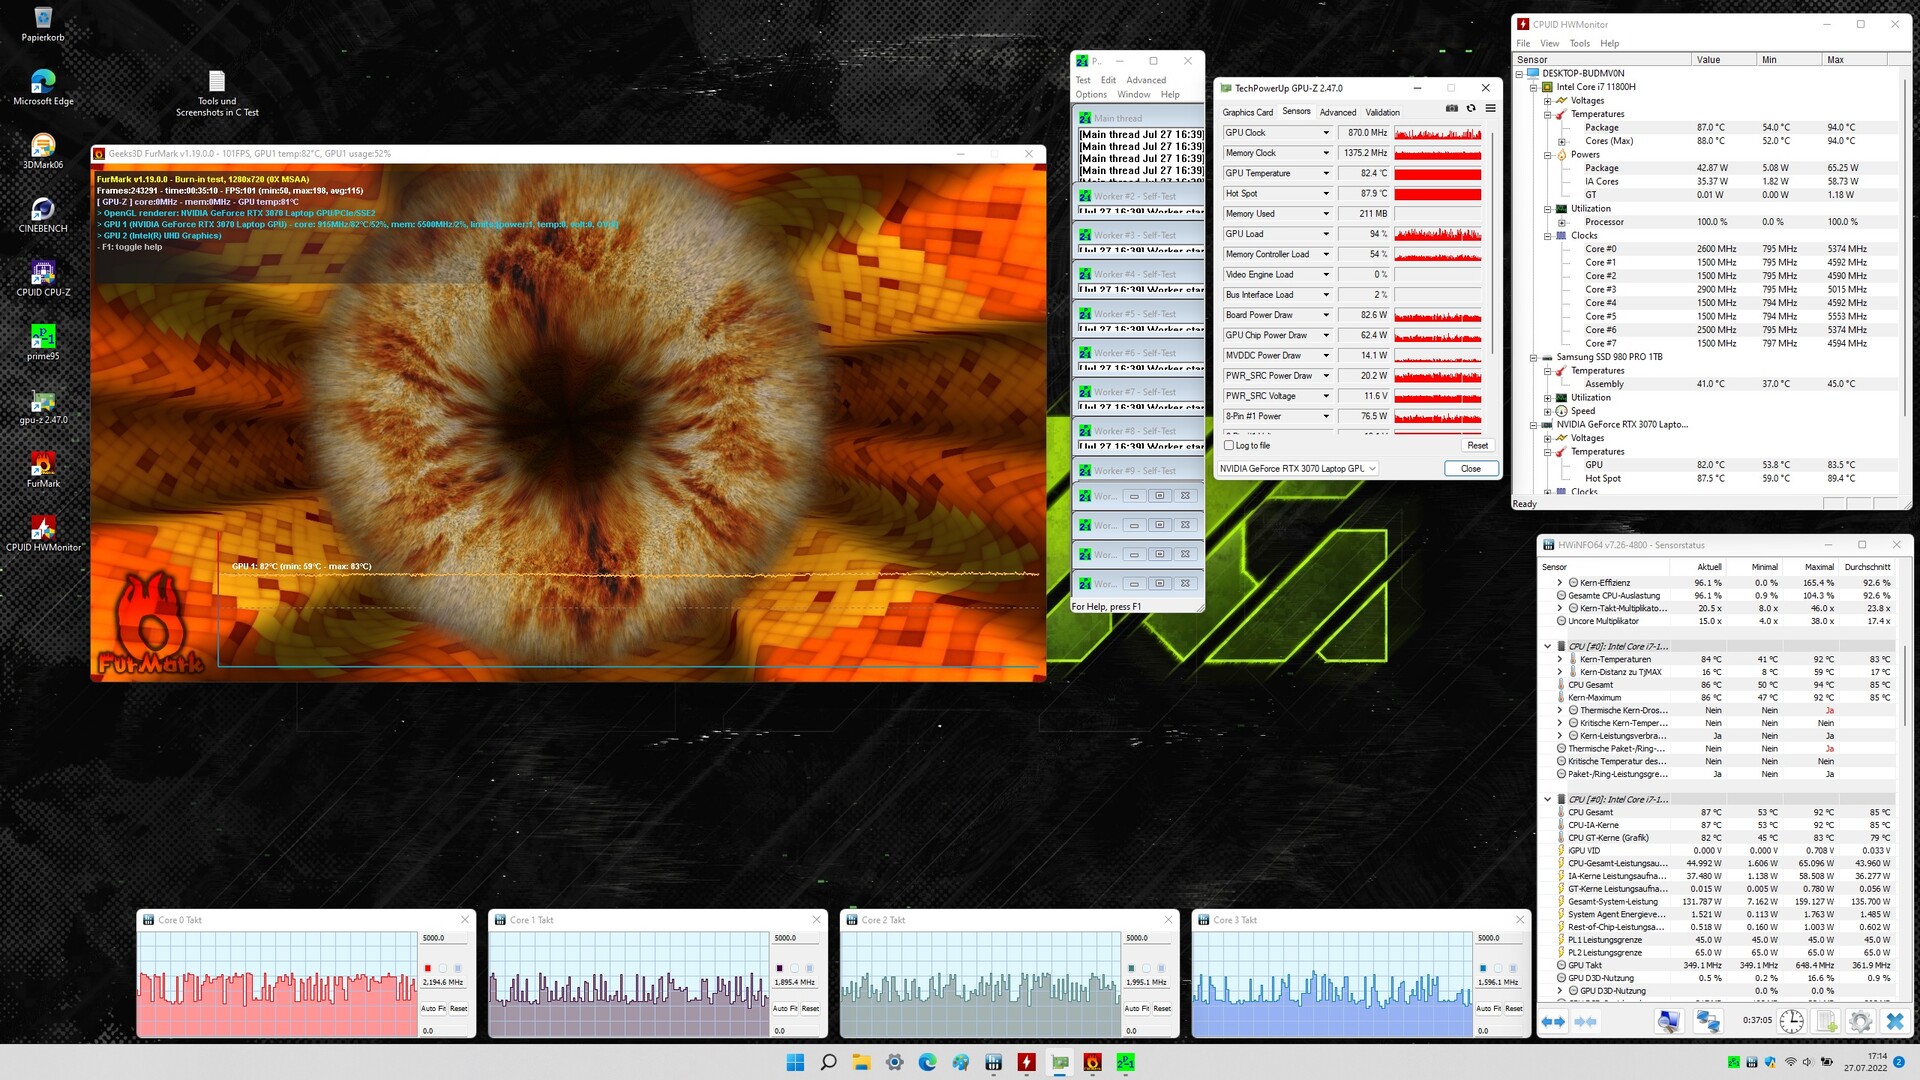
Prueba de esfuerzo
La CPU (de 1,8 a 4,2 GHz) y la GPU (de 1.000 a 1.700 MHz) inician la prueba de estrés (Prime95 y FurMark se ejecutan durante al menos una hora) con un alto nivel de fluctuación de las velocidades de funcionamiento. A medida que la prueba avanza, las velocidades de reloj disminuyen. La prueba de estrés representa un escenario extremo. Utilizamos esta prueba para verificar que el sistema se mantiene estable a plena carga.
Altavoces
Los altavoces estéreo ofrecen un sonido comparativamente bueno, pero apenas tiene bajos. Recomendamos usar auriculares o altavoces externos para una mejor experiencia de sonido
Schenker XMG Fusion 15 (Mid 22) análisis de audio
(+) | los altavoces pueden reproducir a un volumen relativamente alto (#82 dB)
Graves 100 - 315 Hz
(-) | casi sin bajos - de media 17.6% inferior a la mediana
(±) | la linealidad de los graves es media (12.1% delta a frecuencia anterior)
Medios 400 - 2000 Hz
(+) | medios equilibrados - a sólo 3% de la mediana
(+) | los medios son lineales (3.9% delta a la frecuencia anterior)
Altos 2 - 16 kHz
(+) | máximos equilibrados - a sólo 2.8% de la mediana
(+) | los máximos son lineales (5.5% delta a la frecuencia anterior)
Total 100 - 16.000 Hz
(+) | el sonido global es lineal (13.3% de diferencia con la mediana)
En comparación con la misma clase
» 19% de todos los dispositivos probados de esta clase eran mejores, 5% similares, 76% peores
» El mejor tuvo un delta de 6%, la media fue 18%, el peor fue ###max##%
En comparación con todos los dispositivos probados
» 14% de todos los dispositivos probados eran mejores, 3% similares, 83% peores
» El mejor tuvo un delta de 4%, la media fue 23%, el peor fue ###max##%
Gestión de la energía: NUC ofrece una buena duración de la batería
Consumo de energía
En general, el consumo de energía está en un nivel normal para el hardware instalado aquí. Nuestra prueba The Witcher 3 y la prueba de estrés, respectivamente, dan como resultado un consumo medio de energía de 208 vatios y hasta 160 vatios, respectivamente. Mientras que nuestra prueba The Witcher 3 se ejecuta con un consumo de energía constante, la demanda fluctúa y desciende en el transcurso de la prueba de estrés. La fuente de alimentación incluida (230 vatios) tiene capacidad suficiente
| Off / Standby | |
| Ocioso | |
| Carga |
|
Clave:
min: | |
| Schenker XMG Fusion 15 (Mid 22) i7-11800H, GeForce RTX 3070 Laptop GPU | Asus TUF Dash F15 FX517ZR i7-12650H, GeForce RTX 3070 Laptop GPU | Acer Nitro 5 AN515-58-72QR i7-12700H, GeForce RTX 3070 Ti Laptop GPU | HP Omen 16-b1090ng i7-12700H, GeForce RTX 3070 Ti Laptop GPU | MSI Delta 15 A5EFK R9 5900HX, Radeon RX 6700M | Razer Blade 15 Base Edition 2021, i7-10750H RTX 3060 i7-10750H, GeForce RTX 3060 Laptop GPU | Medio NVIDIA GeForce RTX 3070 Laptop GPU | Media de la clase Gaming | |
|---|---|---|---|---|---|---|---|---|
| Power Consumption | 10% | 2% | 17% | -2% | 2% | -16% | -10% | |
| Idle Minimum * (Watt) | 12 | 10 17% | 7 42% | 4 67% | 10 17% | 11.7 2% | 15.6 ? -30% | 13 ? -8% |
| Idle Average * (Watt) | 17 | 14 18% | 15 12% | 10 41% | 18 -6% | 16 6% | 20.1 ? -18% | 19 ? -12% |
| Idle Maximum * (Watt) | 24 | 20 17% | 24 -0% | 19 21% | 25 -4% | 29.3 -22% | 29.4 ? -22% | 24.6 ? -3% |
| Load Average * (Watt) | 106 | 122 -15% | 124 -17% | 114 -8% | 101 5% | 95.6 10% | 110.8 ? -5% | 110.7 ? -4% |
| Witcher 3 ultra * (Watt) | 159.9 | 138.6 13% | 195.1 -22% | 183.2 -15% | 187 -17% | 141.3 12% | ||
| Load Maximum * (Watt) | 208 | 189 9% | 220 -6% | 221 -6% | 217 -4% | 197 5% | 214 ? -3% | 259 ? -25% |
* ... más pequeño es mejor
Energy consumption during The Witcher 3 / Stress test
Energy consumption with an external monitor
Duración de la batería
El portátil de Schenker ofrece la mejor duración de la batería en el campo de la comparación, lo que no es ninguna sorpresa: El portátil tiene la mayor capacidad de batería (93 Wh). El portátil de 15,6 pulgadas logra duraciones de 7:26 horas y 7:28 horas en nuestras pruebas de Wi-Fi (acceso a sitios web mediante un script) y de vídeo (cortometraje Big Buck Bunny (codificación H.264, Full HD) ejecutado en bucle), respectivamente. Las funciones de ahorro de energía del portátil están desactivadas durante ambas pruebas, y el brillo de la pantalla está ajustado a unos 150 cd/m². Además, los módulos inalámbricos están desactivados para la prueba de vídeo
| Schenker XMG Fusion 15 (Mid 22) i7-11800H, GeForce RTX 3070 Laptop GPU, 93.48 Wh | Asus TUF Dash F15 FX517ZR i7-12650H, GeForce RTX 3070 Laptop GPU, 76 Wh | Acer Nitro 5 AN515-58-72QR i7-12700H, GeForce RTX 3070 Ti Laptop GPU, 57.5 Wh | HP Omen 16-b1090ng i7-12700H, GeForce RTX 3070 Ti Laptop GPU, 83 Wh | MSI Delta 15 A5EFK R9 5900HX, Radeon RX 6700M, 82 Wh | Razer Blade 15 Base Edition 2021, i7-10750H RTX 3060 i7-10750H, GeForce RTX 3060 Laptop GPU, 65 Wh | Media de la clase Gaming | |
|---|---|---|---|---|---|---|---|
| Duración de Batería | -8% | -45% | -18% | -11% | -34% | -14% | |
| Reader / Idle (h) | 15.5 | 10.8 -30% | 5.7 -63% | 10.1 -35% | 11.1 -28% | 7.8 -50% | 8.27 ? -47% |
| H.264 (h) | 7.5 | 5.8 -23% | 4.7 -37% | 8.32 ? 11% | |||
| WiFi v1.3 (h) | 7.4 | 7 -5% | 3.9 -47% | 5.6 -24% | 7.9 7% | 4.8 -35% | 7.11 ? -4% |
| Load (h) | 1.8 | 2.3 28% | 1.2 -33% | 1.9 6% | 1.6 -11% | 1.5 -17% | 1.502 ? -17% |
Pro
Contra
Veredicto - Compacto y potente
El renderizado y los juegos son algunas de las principales competencias de este portátil compacto y ligero. Es posible jugar en QHD con ajustes altos y máximos. No se centra en el máximo rendimiento, sino en un compromiso entre rendimiento y portabilidad.
Con el XMG Fusion 15 (Mid 22), Schenker ofrece un portátil de juego compacto muy completo. Sin embargo, no obtendrá ningún punto de estilo.
El Core i7-11800H y la GeForce RTX 3070 pueden funcionar a velocidades de reloj consistentemente altas. Dependiendo de los ajustes, las tasas de rendimiento de la GPU se sitúan en la media de la RTX 3070 o por encima de ella. El portátil se calienta mucho bajo carga, y el desarrollo de ruido alcanza el nivel habitual de la clase. El dispositivo puede funcionar silenciosamente en el uso diario.
Una batería de 93 Wh garantiza una duración práctica de unas 7:30 horas, un ritmo bastante bueno. Lástima: la batería no puede cargarse a través del puerto USB-C (Thunderbolt 4). Esto habría sido una característica muy útil, especialmente para un dispositivo que está diseñado para la movilidad. Sin embargo, el puerto Thunderbolt 4 abre opciones de expansión en forma de solución de acoplamiento o una GPU externa.
El teclado mecánico (con retroiluminación RGB de una sola tecla) dejó una buena impresión, y es probable que sea un criterio importante para muchos compradores potenciales. La pantalla mate QHD (15,6 pulgadas, IPS, 165 Hz) no sufre de ninguna debilidad importante, pero tampoco es una pantalla superior. El panel gana puntos con una buena reproducción del color, una cobertura del espacio de color muy decente y tiempos de respuesta rápidos.
Una alternativa al Fusion sería el Asus TUF Dash F15 FX517ZRque también es ligero y compacto. El portátil ofrece una mejor cobertura del espacio de color, Adaptive Sync, un modo dGPU y Power Delivery. Sin embargo, el rendimiento de la GPU está ligeramente por detrás del Fusion 15.
Precio y disponibilidad
El Schenker XMG Fusion 15 (Mid 2022) puede personalizarse en la tienda online de Schenker. La variante de configuración que nos han proporcionado (Core i7-11800H, GeForce RTX 3070 Laptop, 32 GB de RAM, 1 TB SSD, pantalla QHD) está disponible por algo menos de 2.000 euros (~1.991 dólares). Los modelos básicos están disponibles a partir de unos 1.500 euros.
Consejo: En el momento de escribir este artículo, la tienda online ofrece un descuento de 150 euros en todas las configuraciones del Fusion. El descuento se aplica en la cesta de la compra.
Schenker XMG Fusion 15 (Mid 22)
- 08/21/2022 v7 (old)
Sascha Mölck
Price comparison

