Análisis del portátil MSI Katana GF66 12UGS: La actualización a Alder Lake aporta un rendimiento significativamente mayor
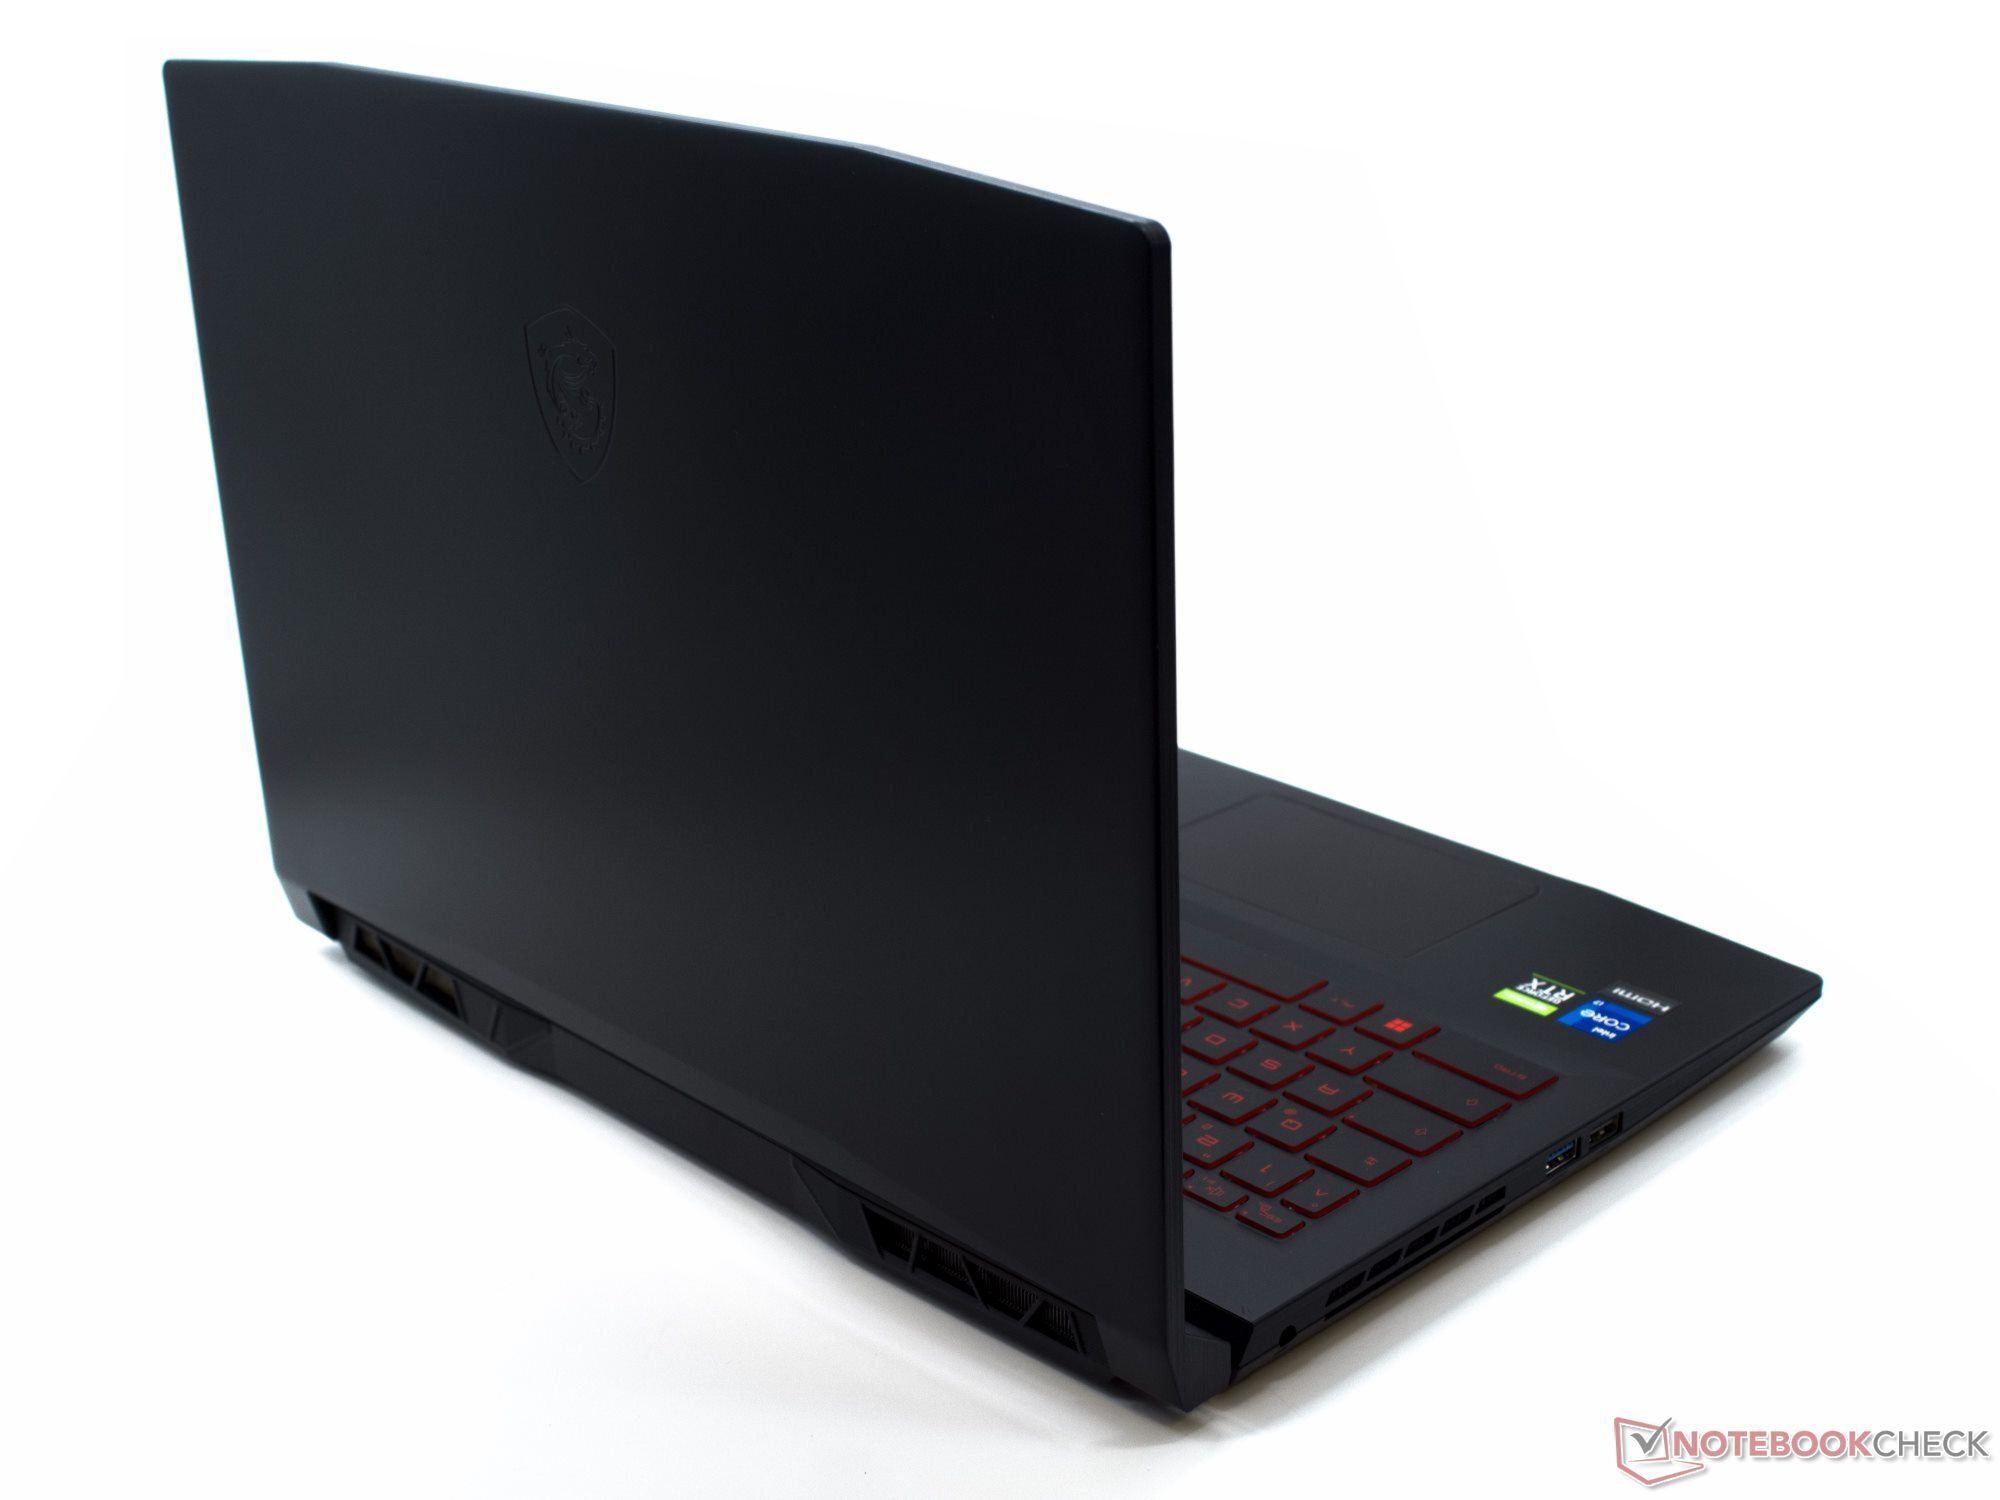
En términos de rendimiento informático, MSI ha mejorado significativamente el Katana GF66 que probamos el año pasado. El Intel Core i7-11800H y la Nvidia GeForce RTX 3070 fueron sustituidos por los chips más actuales, y en este momento un Core i7-12700H y una RTX 3070 Ti conforman el rendimiento informático. Nada ha cambiado en el exterior del elegante portátil para juegos, y el diseño de Nagano Tsuyoshi se mantuvo sin cambios.
Además de las actualizaciones del hardware, la pantalla también fue reemplazada por otro panel. Sin embargo, esto parece ser más un descenso que una mejora, y la evaluación de la pantalla del GF66 12UGS resulta significativamente peor que la del GF66 11UG.
Para un portátil con la potente Nvidia GeForce RTX 3070 Ti, el Katana es relativamente asequible a unos 2000 euros (~2142 dólares). A ese precio, también vemos varios portátiles para juegos con configuraciones supuestamente más débiles entre nuestros dispositivos de comparación. Sin embargo, una vez más vemos la poderosa influencia de los valores TDP y TGP en el rendimiento informático. En varios benchmarks, algunos portátiles como el Asus TUF Gaming F15 o el Lenovo Legion 5son capaces de superar significativamente al actual Katana GF66 y a su hermano mayor, el GF76.
Posibles contendientes en la comparación
Valoración | Fecha | Modelo | Peso | Altura | Tamaño | Resolución | Precio |
|---|---|---|---|---|---|---|---|
| 80.3 % v7 (old) | 06/2022 | MSI Katana GF66 12UGS i7-12700H, GeForce RTX 3070 Ti Laptop GPU | 2.3 kg | 27.5 mm | 15.60" | 1920x1080 | |
| 79.2 % v7 (old) | 09/2021 | MSI Katana GF66 11UG-220 i7-11800H, GeForce RTX 3070 Laptop GPU | 2.3 kg | 25 mm | 15.60" | 1920x1080 | |
| 82.6 % v7 (old) | 05/2022 | MSI Katana GF76 12UGS i7-12700H, GeForce RTX 3070 Ti Laptop GPU | 2.7 kg | 25.2 mm | 17.30" | 1920x1080 | |
| 87.2 % v7 (old) | 03/2022 | Asus TUF Gaming F15 FX507ZM i7-12700H, GeForce RTX 3060 Laptop GPU | 2.1 kg | 24.95 mm | 15.60" | 1920x1080 | |
| 85 % v7 (old) | 07/2021 | Asus TUF Gaming A15 FA506QR-AZ061T R7 5800H, GeForce RTX 3070 Laptop GPU | 2.3 kg | 24 mm | 15.60" | 1920x1080 | |
| 84 % v7 (old) | 06/2022 | Acer Nitro 5 AN515-58-72QR i7-12700H, GeForce RTX 3070 Ti Laptop GPU | 2.5 kg | 26.8 mm | 15.60" | 2560x1440 | |
| 82.6 % v7 (old) | 05/2022 | Lenovo Legion 5 15ACH6A-82NW0010GE R5 5600H, Radeon RX 6600M | 2.5 kg | 25.75 mm | 15.60" | 1920x1080 |
Maletín y equipo - Aquí faltan actualizaciones
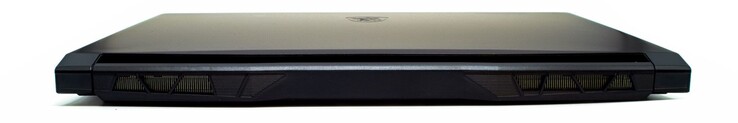
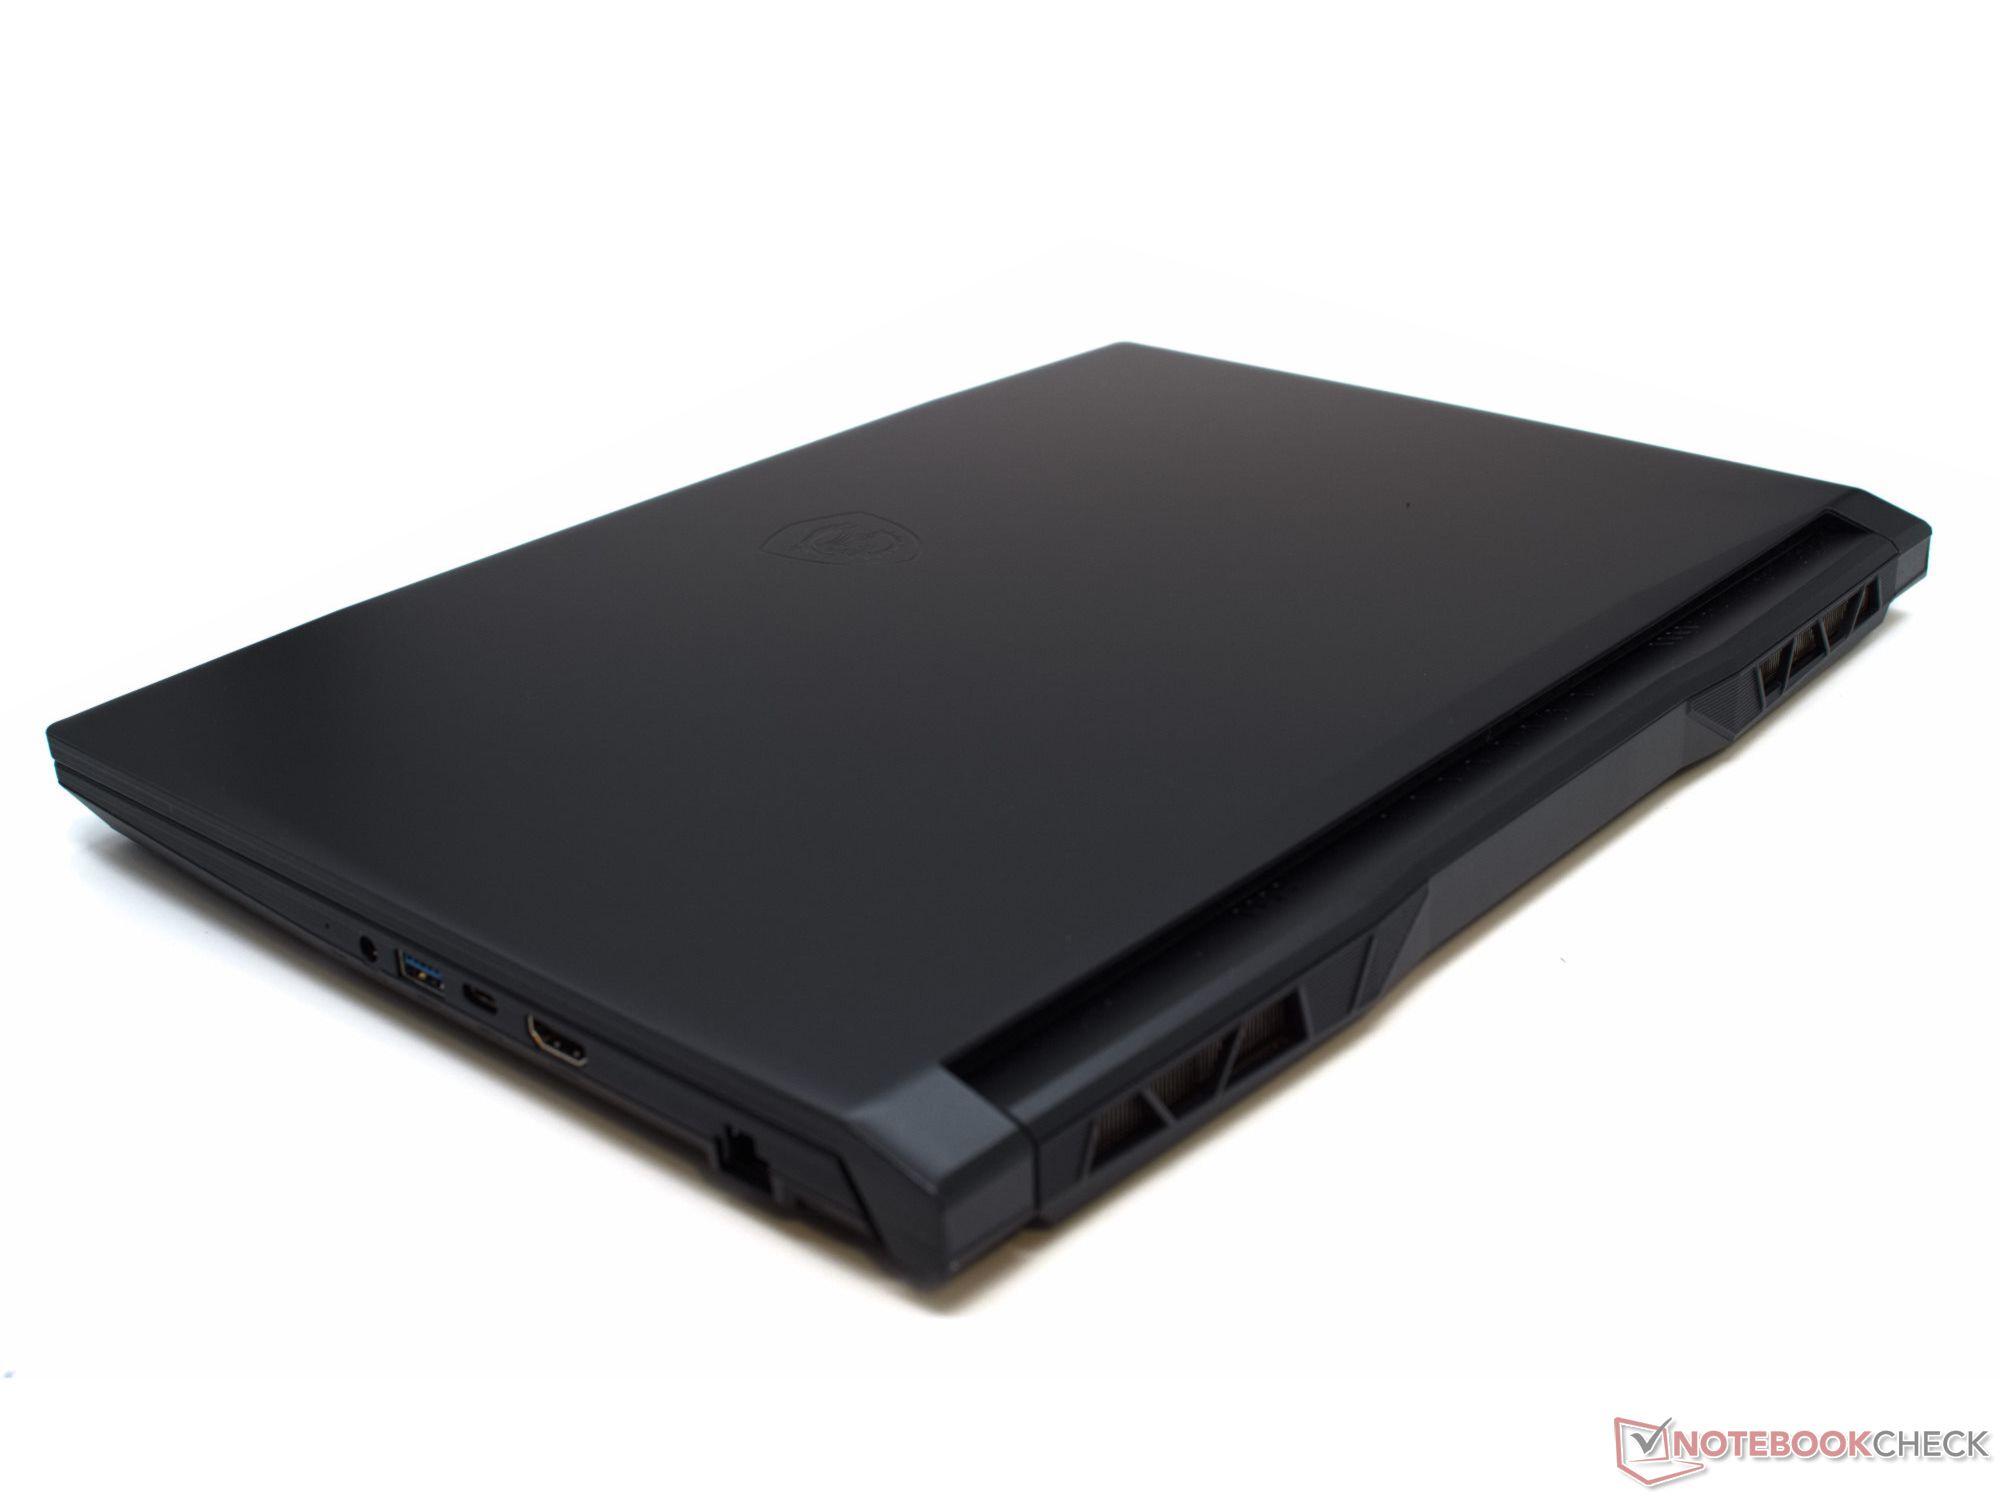
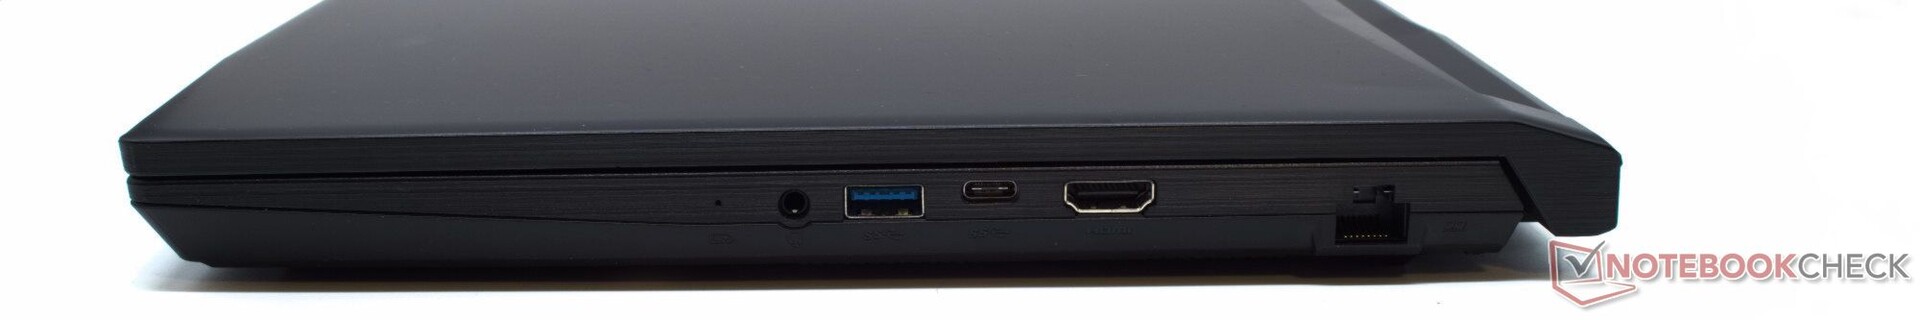
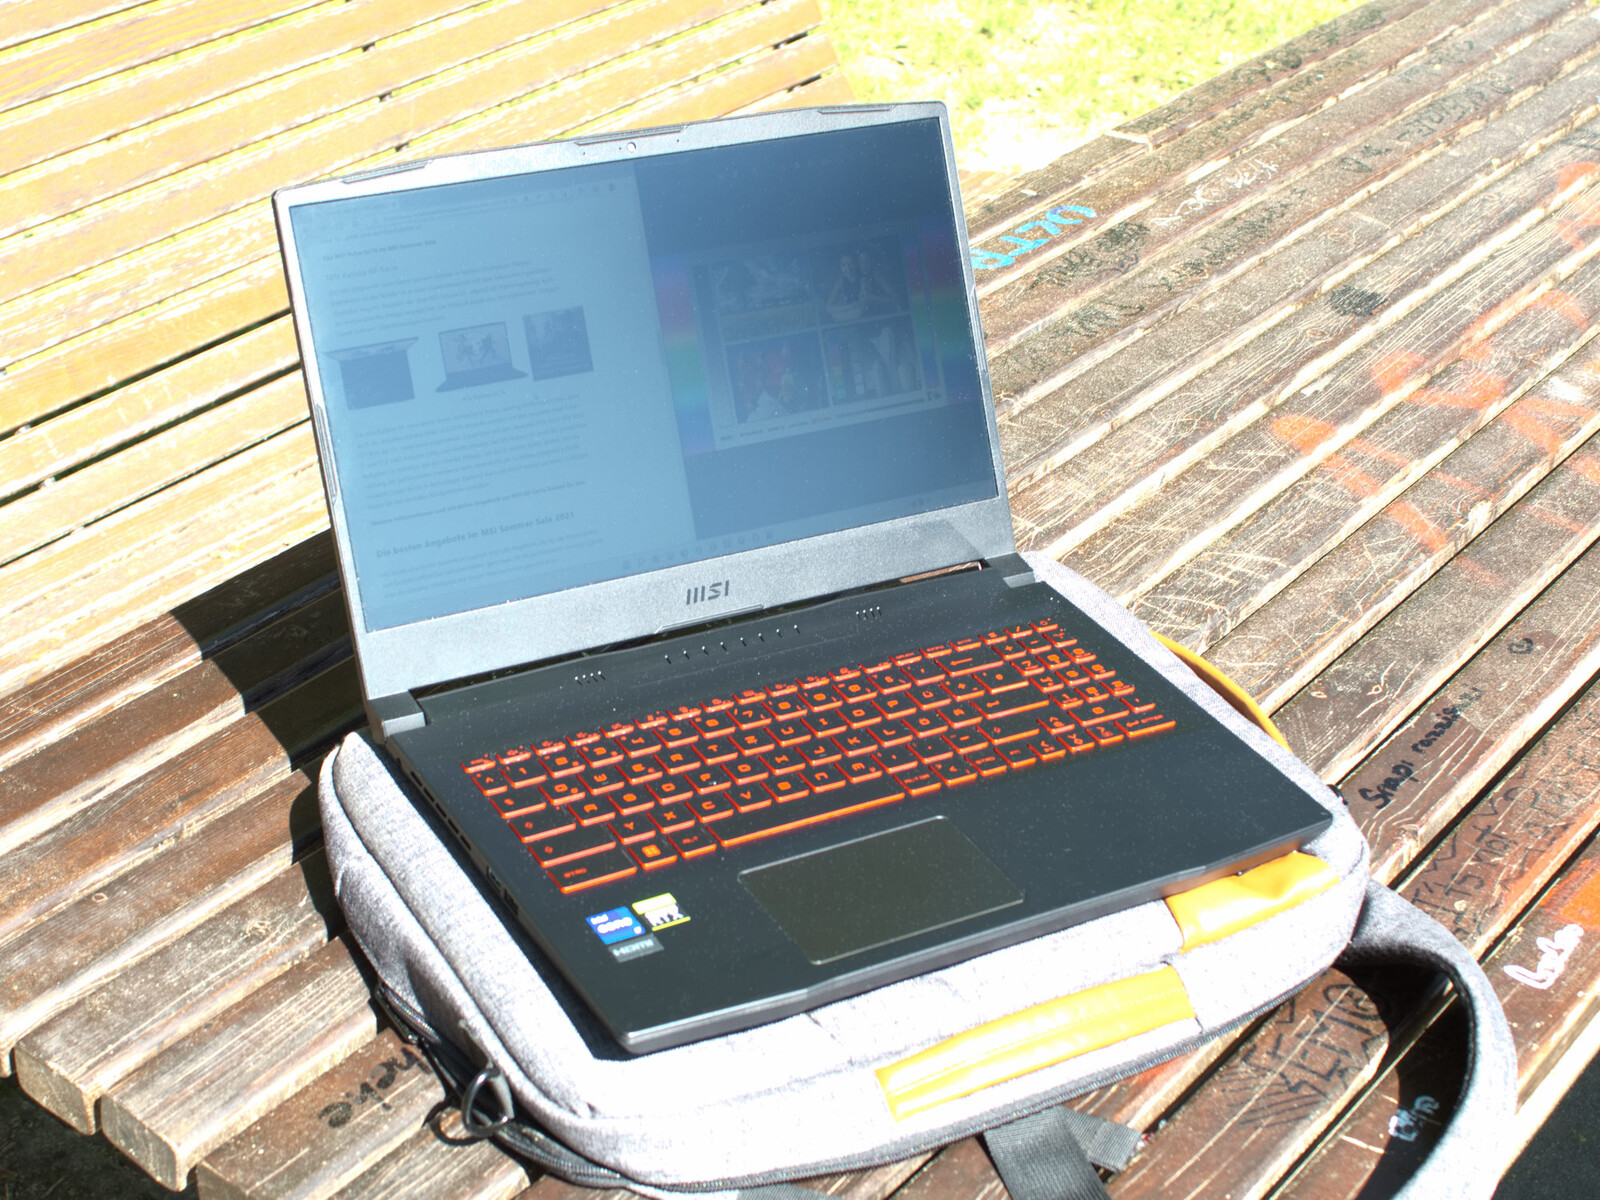
En comparación con el GF66 11UGno hay cambios en la carcasa ni en el equipo de conexión. El diseño sigue siendo elegante y discreto, y la cantidad, la posición y los tipos de las conexiones también siguen siendo los mismos. Esto significa que seguimos echando de menos Thunderbolt y DisplayPort en la conexión USB-C del portátil para juegos. Puedes encontrar una descripción más detallada de la carcasa y el equipo de conexión en nuestro análisis del MSI Katana GF66 11UG.
Hay algunas ligeras mejoras en la mejor webcam y la estabilidad de las bisagras de la pantalla, que ahora ofrecen más resistencia que las del predecesor, sujetando mejor la pantalla en su sitio.

En términos de tamaño y peso, el Katana GF66 12UGS se sitúa en medio del campo de los competidores. Como es típico en los portátiles para juegos, el peso es de más de 2 kilogramos.
Equipo de conexión
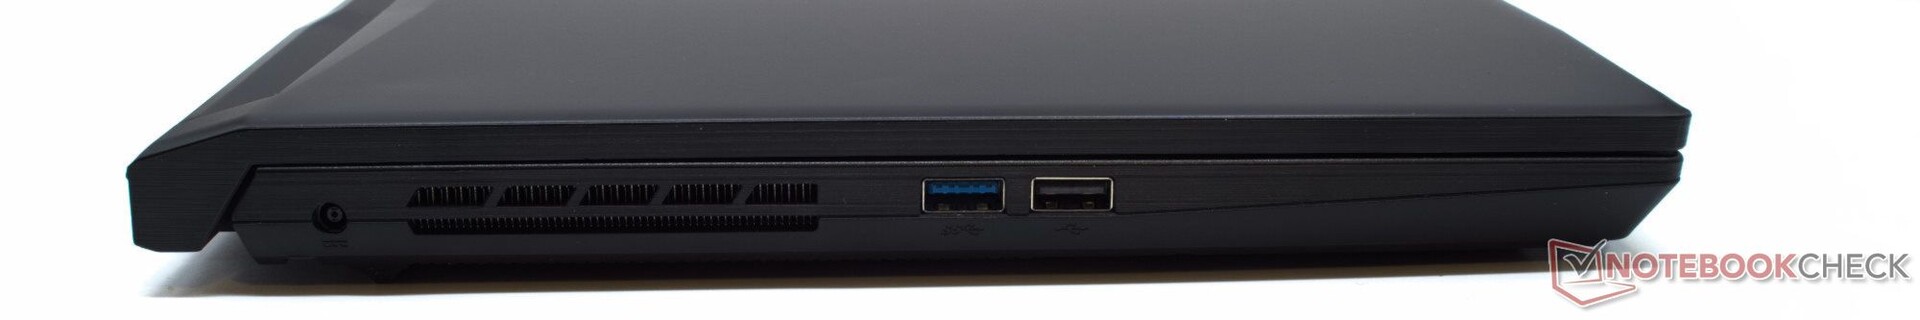
El MSI Katana no ofrece mucho en términos de conexiones. El puerto USB-2.0 del lado izquierdo muestra claramente que MSI recortó algunas esquinas en las conexiones. Otra equipación de la que carece es un lector de tarjetas o un puerto USB-C completamente equipado.
Comunicación
El módulo Intel AX201 sigue ofreciendo las funcionalidades WLAN-ax y Bluetooth 5.2. Las altas tasas de transferencia que medimos en nuestro test con el ROG Rapture GT-AXE11000 apuntan a potentes antenas en el portátil de juego.
Cámara web
Aunque la calidad de la cámara web sigue dejando que desear, la cámara del GF66 ha mejorado ligeramente en comparación con el año pasado. Por ejemplo, las desviaciones de color son ahora ligeramente menores, y el contraste y la nitidez han mejorado ligeramente.


Mantenimiento
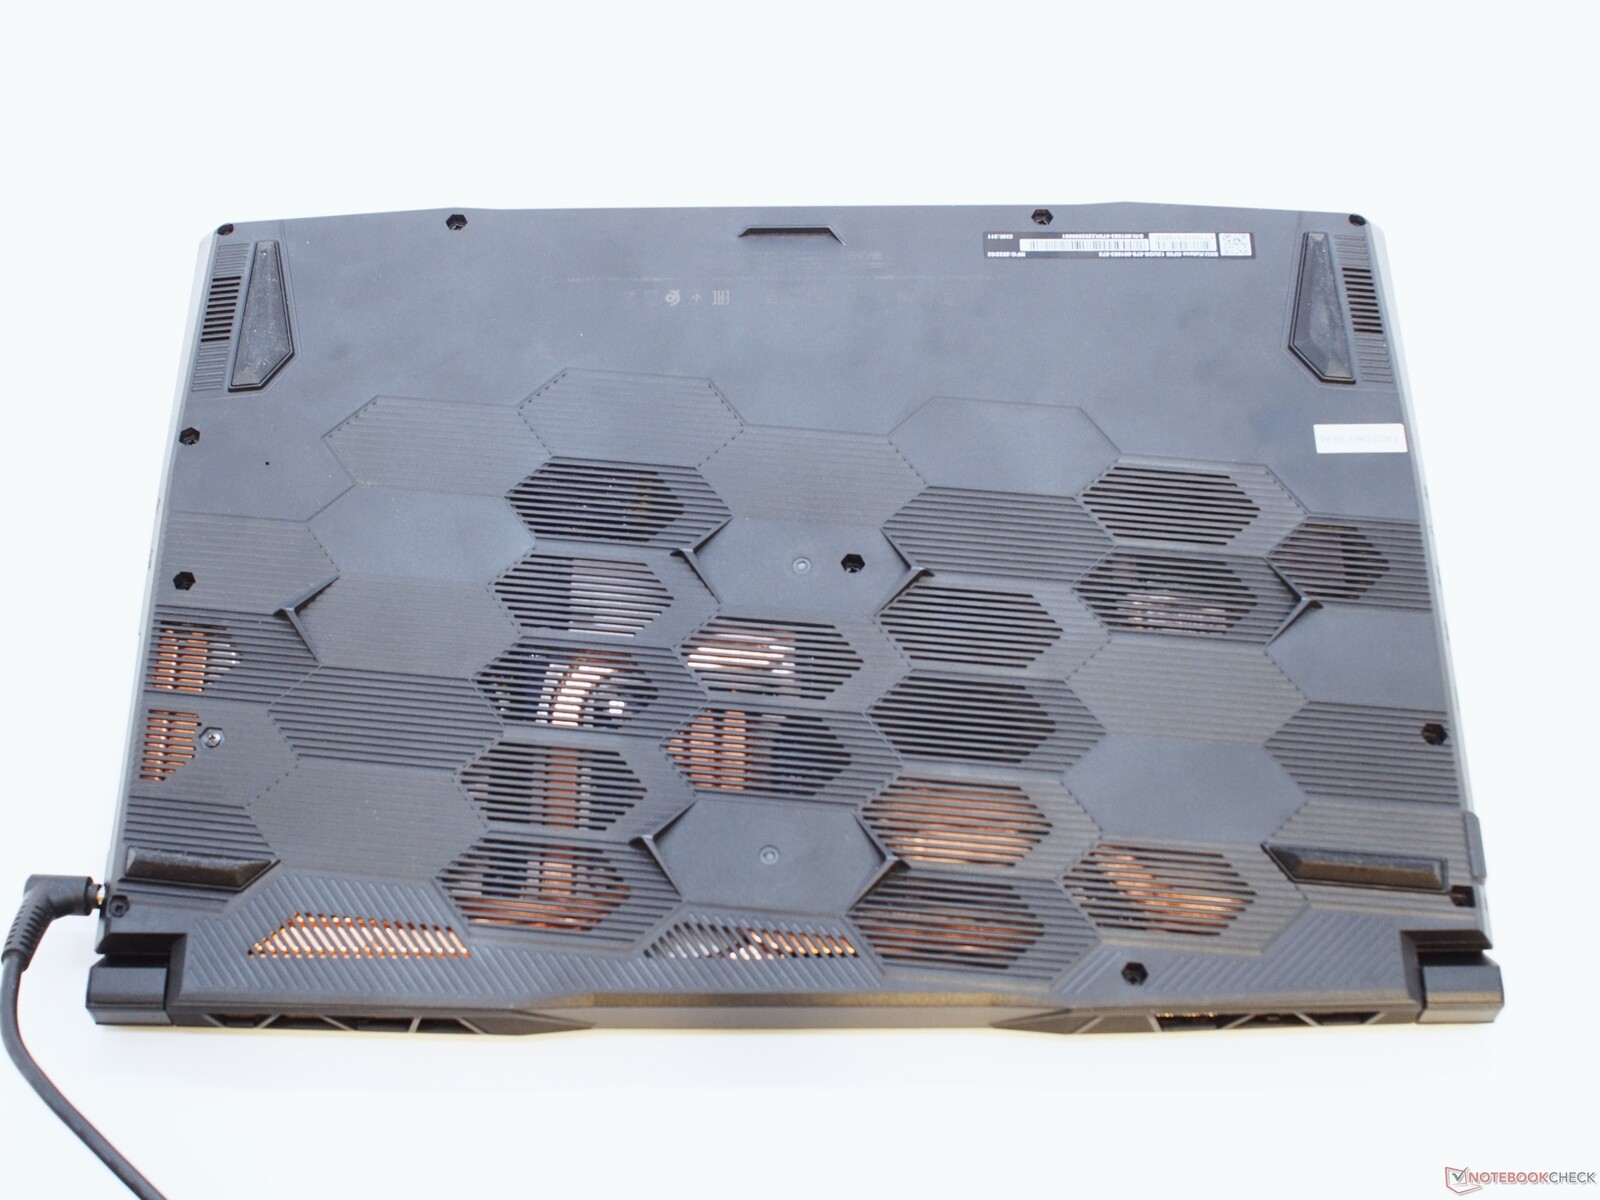
Aunque el MSI Katana GF66 debería ser realmente fácil de abrir, MSI esconde al menos uno de los tornillos bajo una pegatina de sellado la mayor parte del tiempo. Aunque este sello debería ser fácil de quitar, no lo hicimos, ya que nuestra unidad de prueba es un préstamo. Bajo la cubierta de la base, la memoria de trabajo, el módulo WLAN, y los SSDs M.2-NVMe pueden reemplazarse o ampliarse, ya que el portátil de juego también ofrece una ranura M.2 libre.
Garantía
MSI ofrece el GF66 en Europa con una garantía de fabricante de 24 meses. Los dispositivos defectuosos serán recogidos y reparados en una ubicación central, desde donde se envían de vuelta al cliente. Por cierto, quitar la pegatina del sello no afectará a la garantía del dispositivo. El sello sólo sirve para indicar al cliente si el aparato está en su estado original.
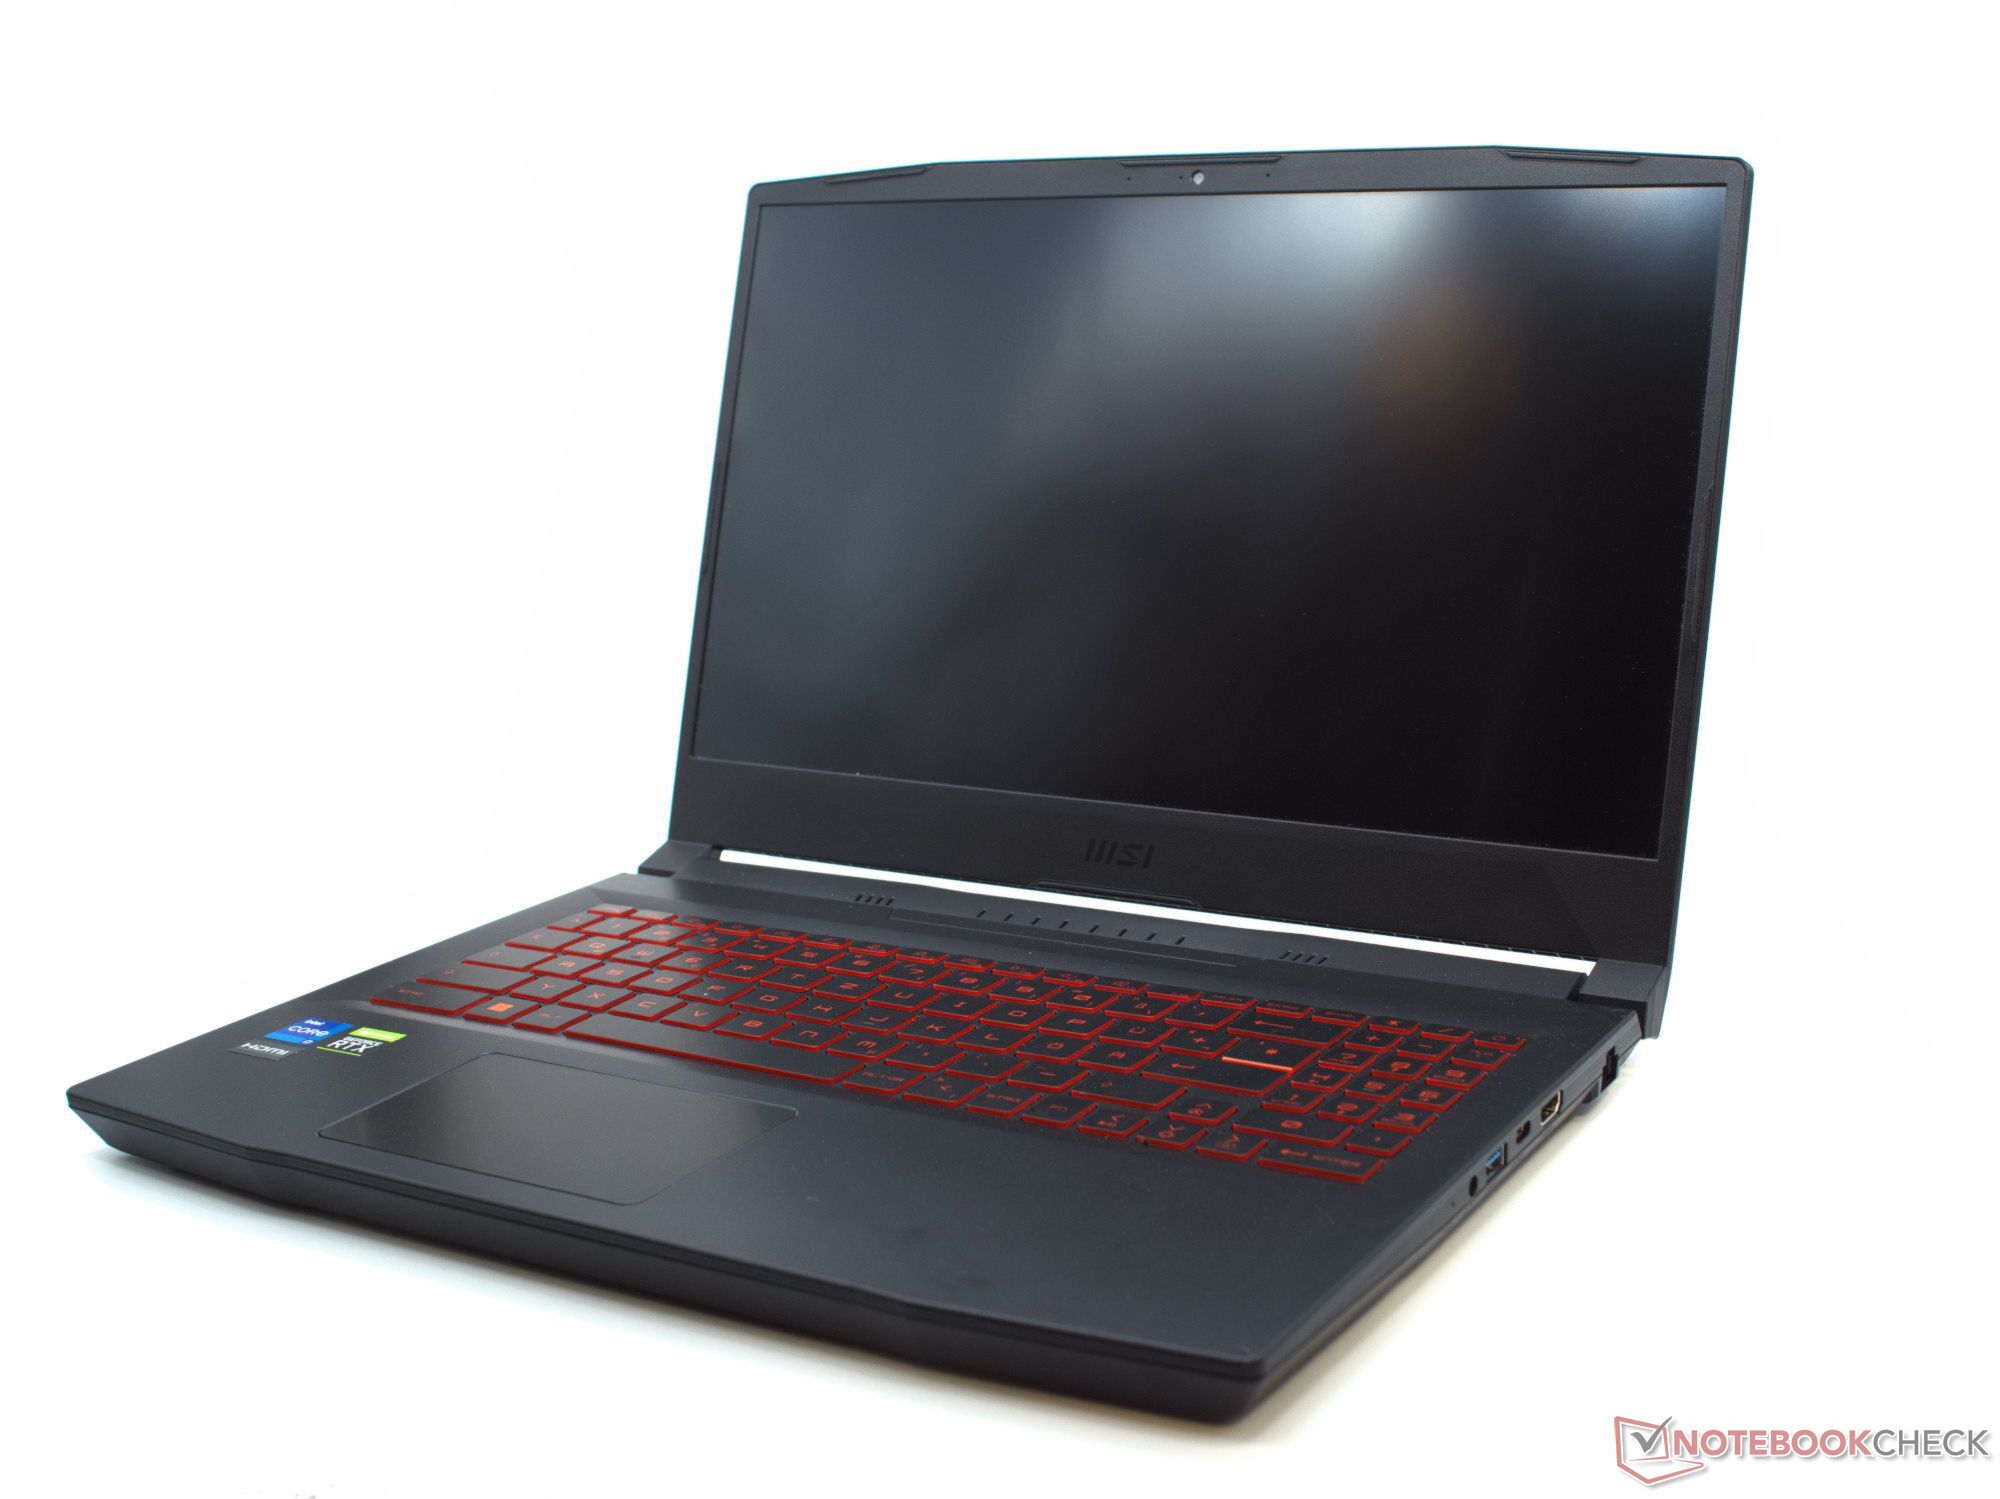
Dispositivos de entrada - Nada nuevo aquí
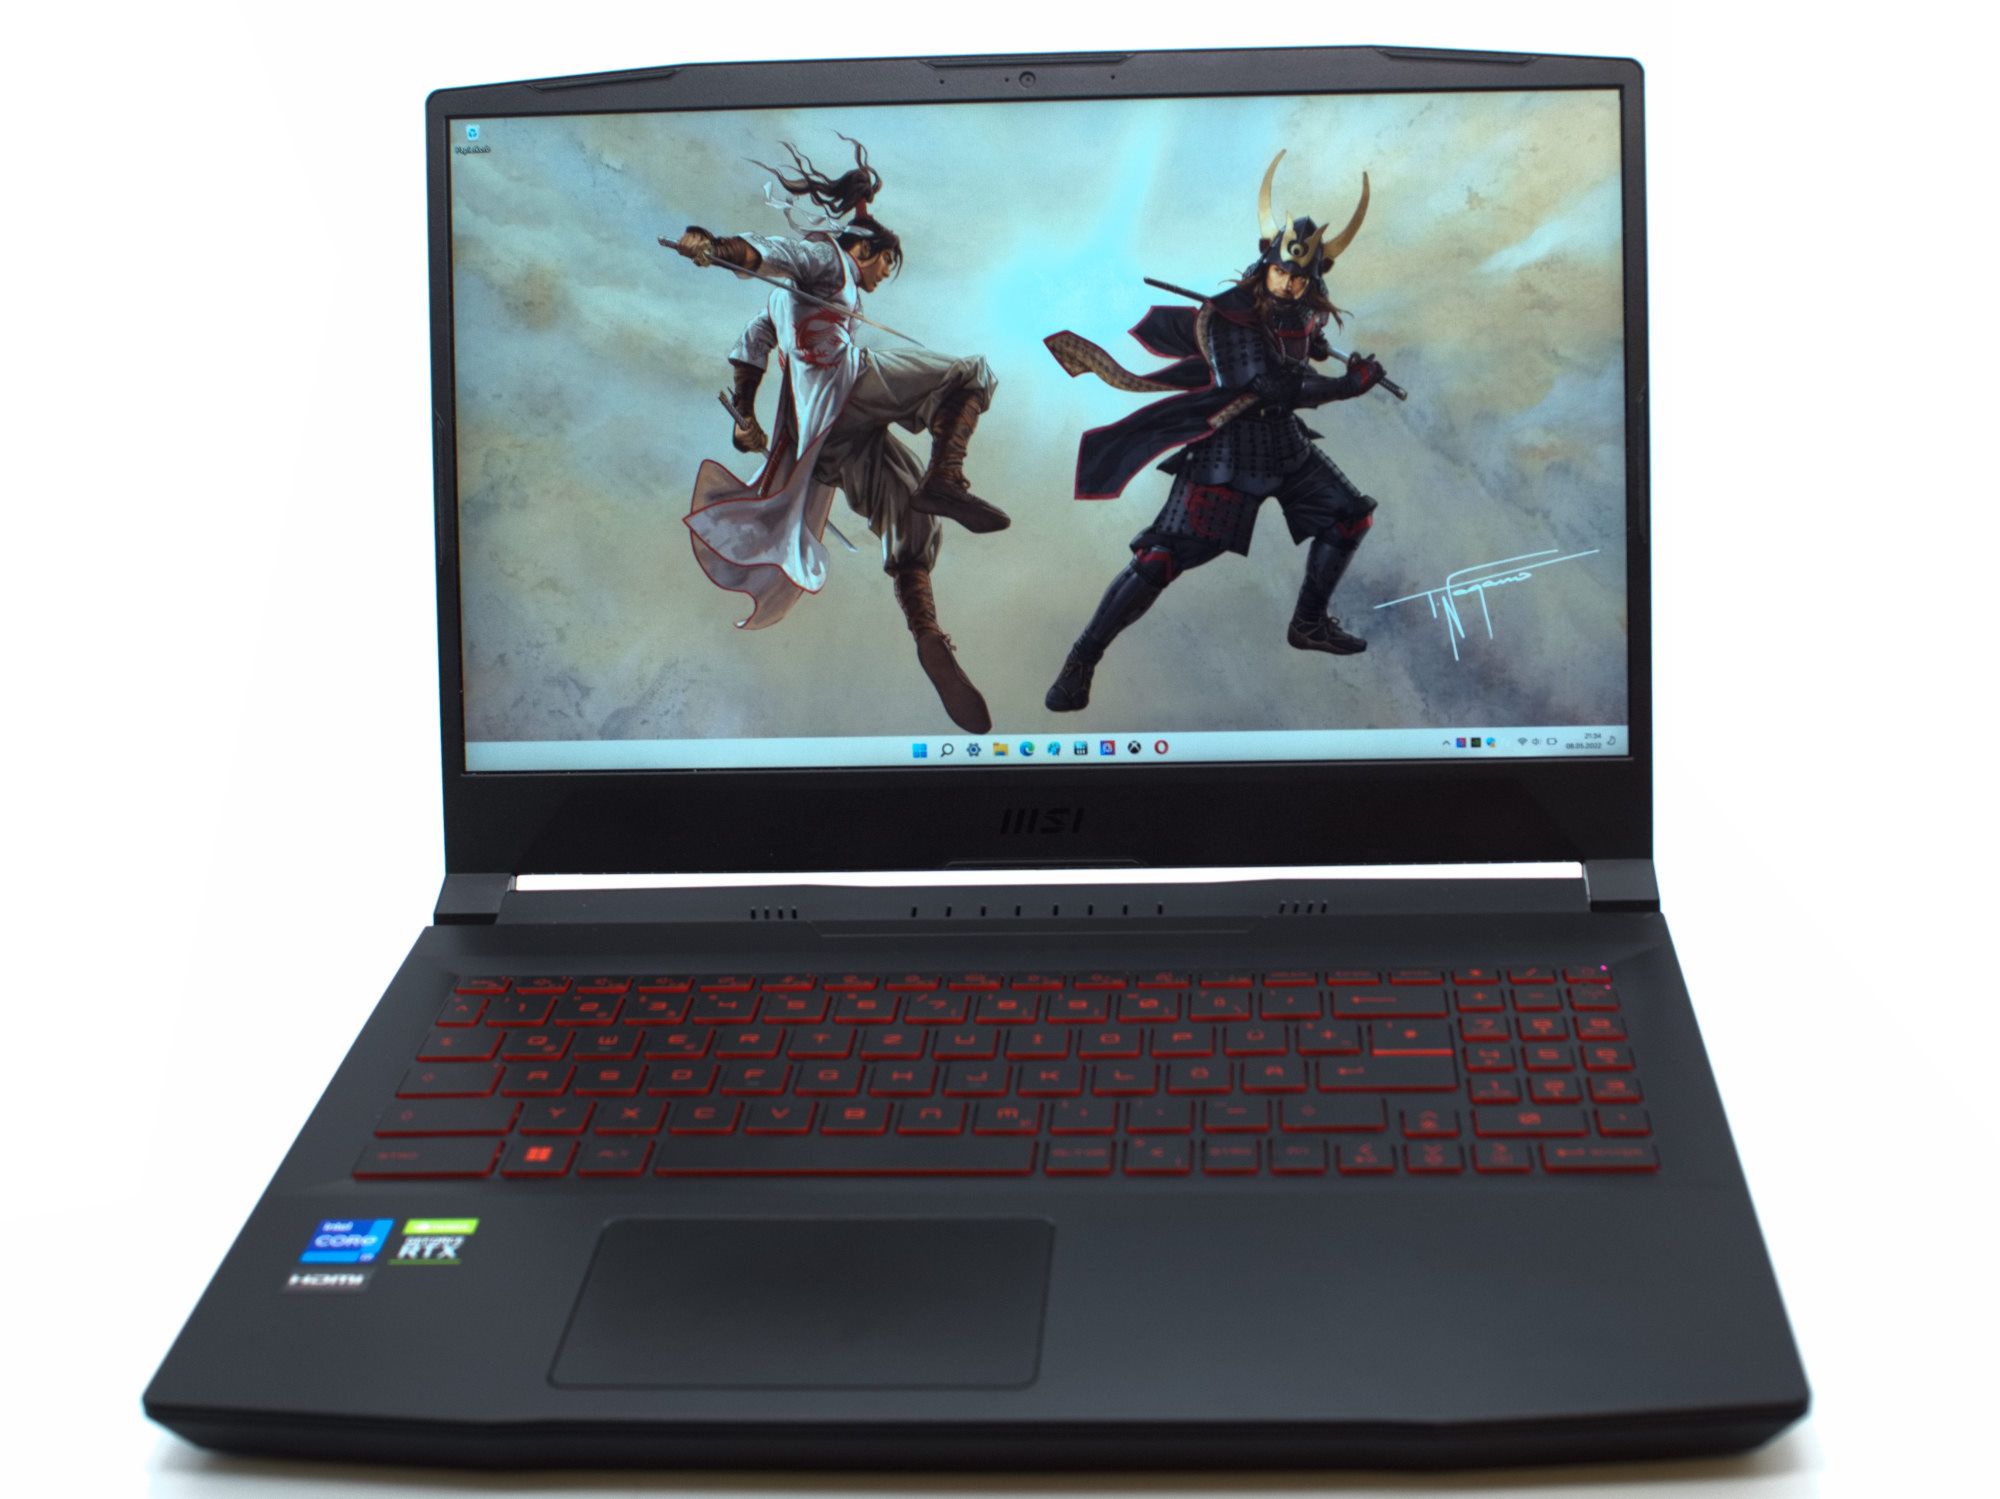
El teclado y el touchpad del portátil para juegos no muestran cambios en comparación con la competencia. Las teclas tienen un tamaño cómodo, y la iluminación de fondo roja del teclado puede ajustarse sin reflejos. Por desgracia, el tamaño del touchpad, bastante pequeño, no se ha aumentado, pero el touchpad responde a las entradas sin problemas.
En este punto, hay controladores que funcionan para todas las teclas de función, por lo que puedes controlar la webcam, el micrófono y el MSI Center a través de la pulsación de teclas, y la superposición de la cruz de objetivo también funciona ahora, facilitando la puntería en muchos juegos.
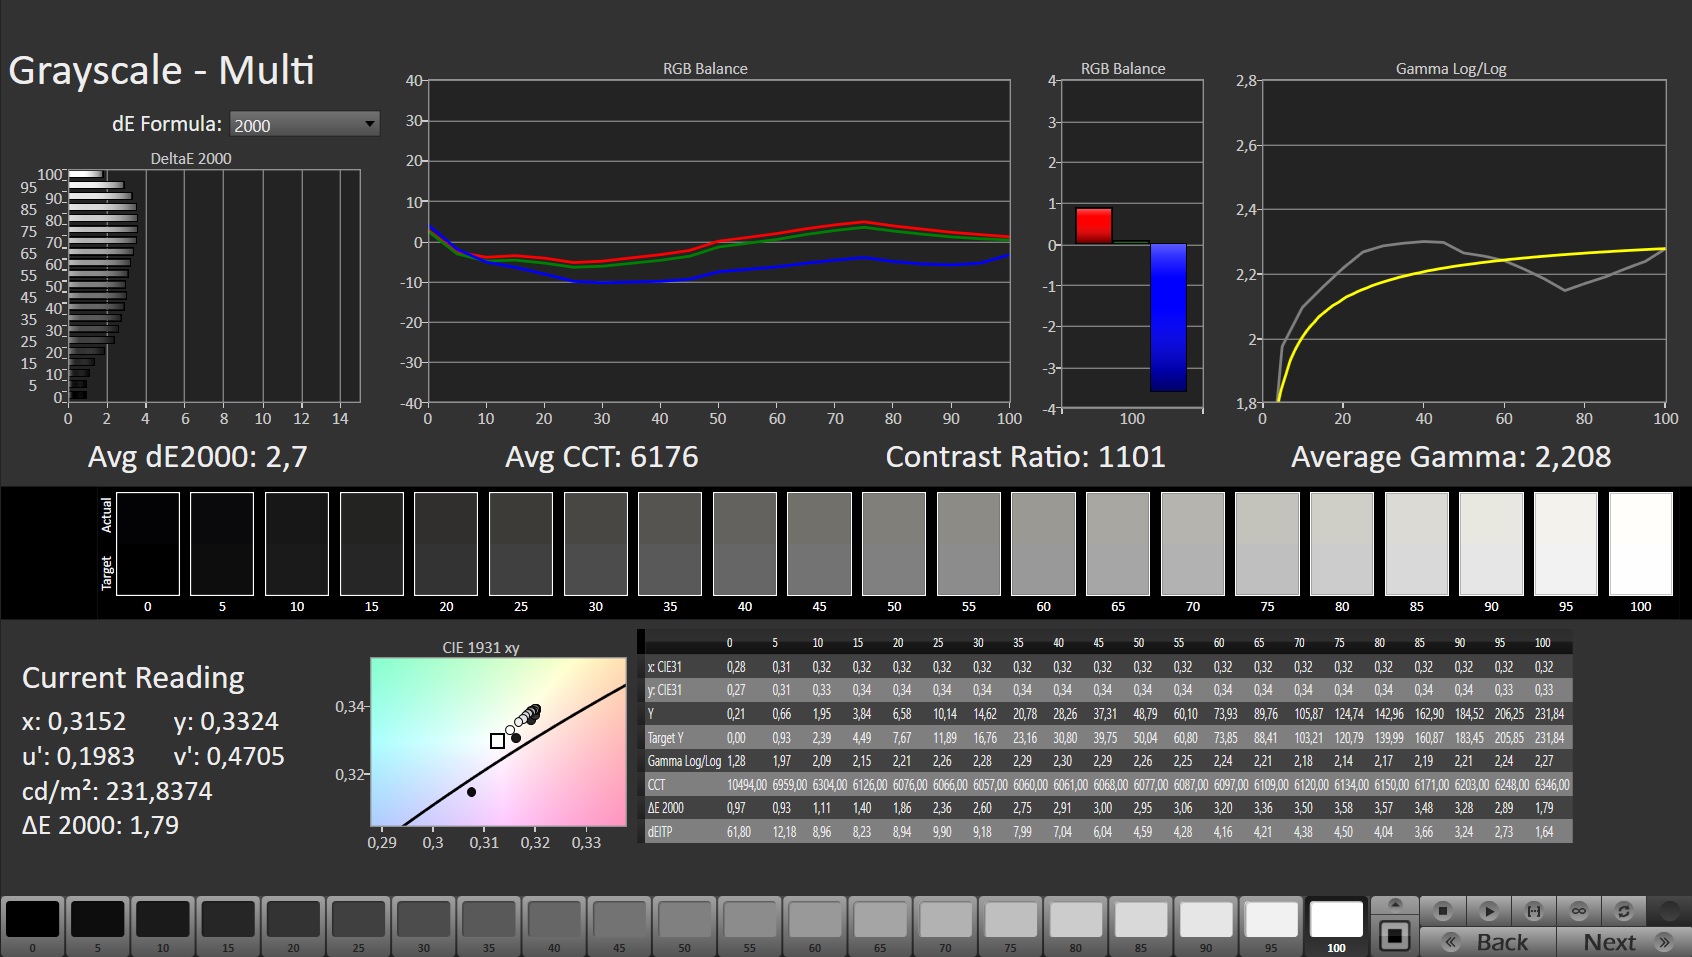
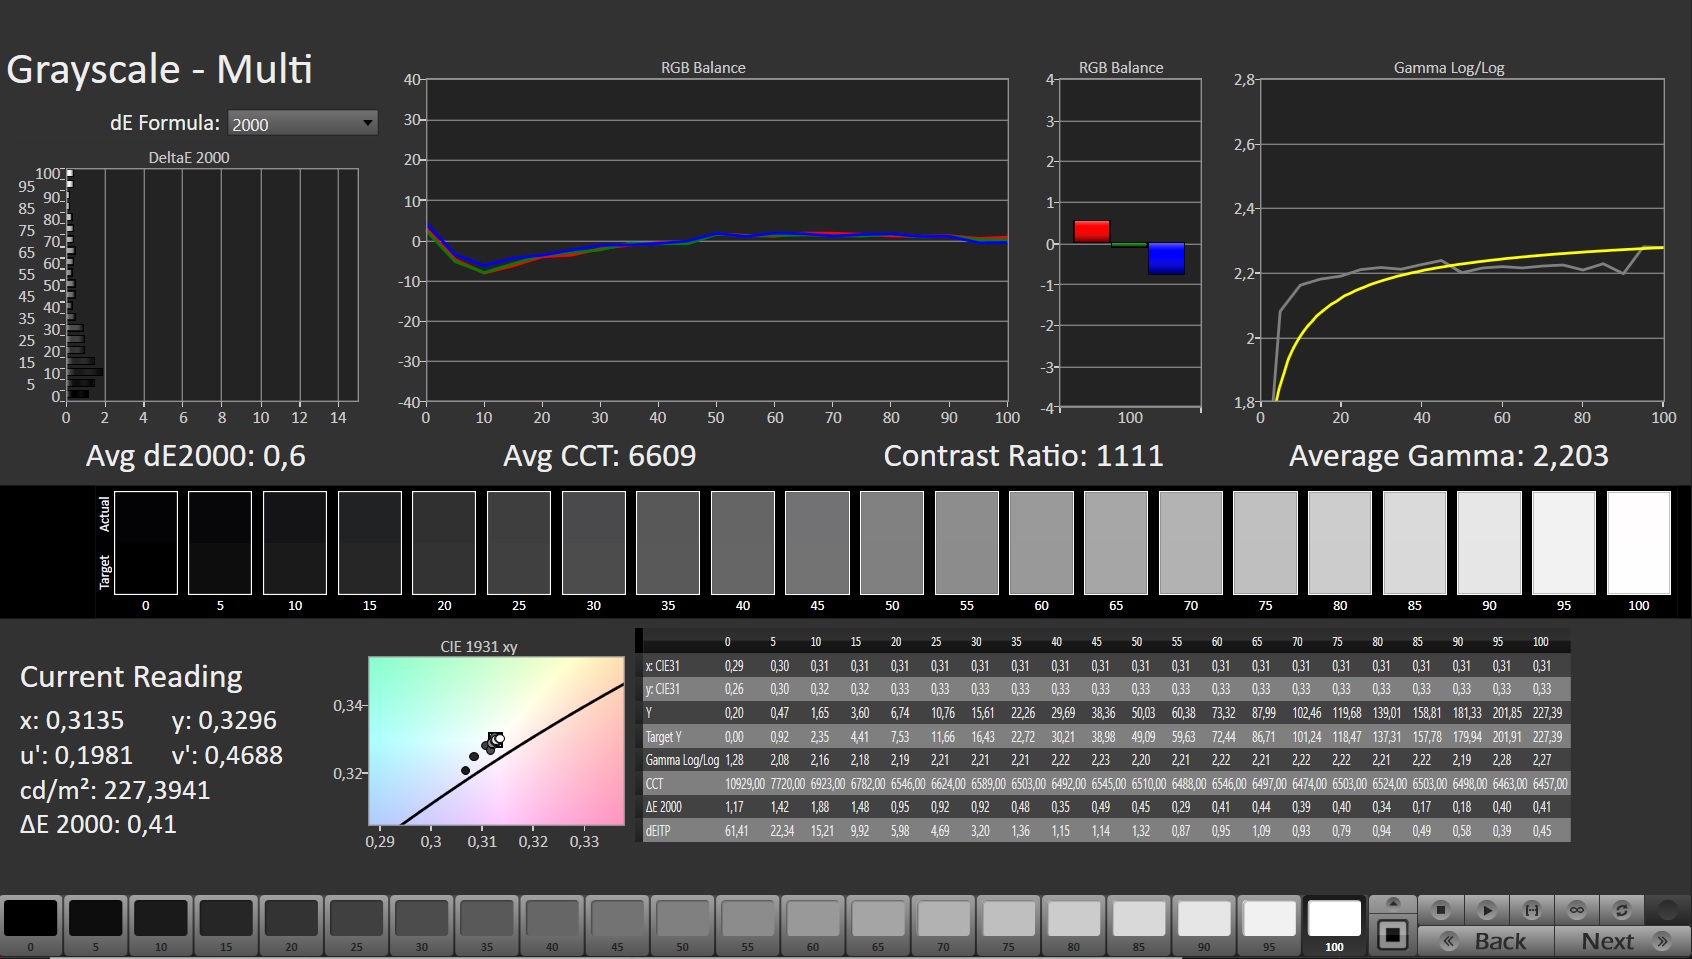
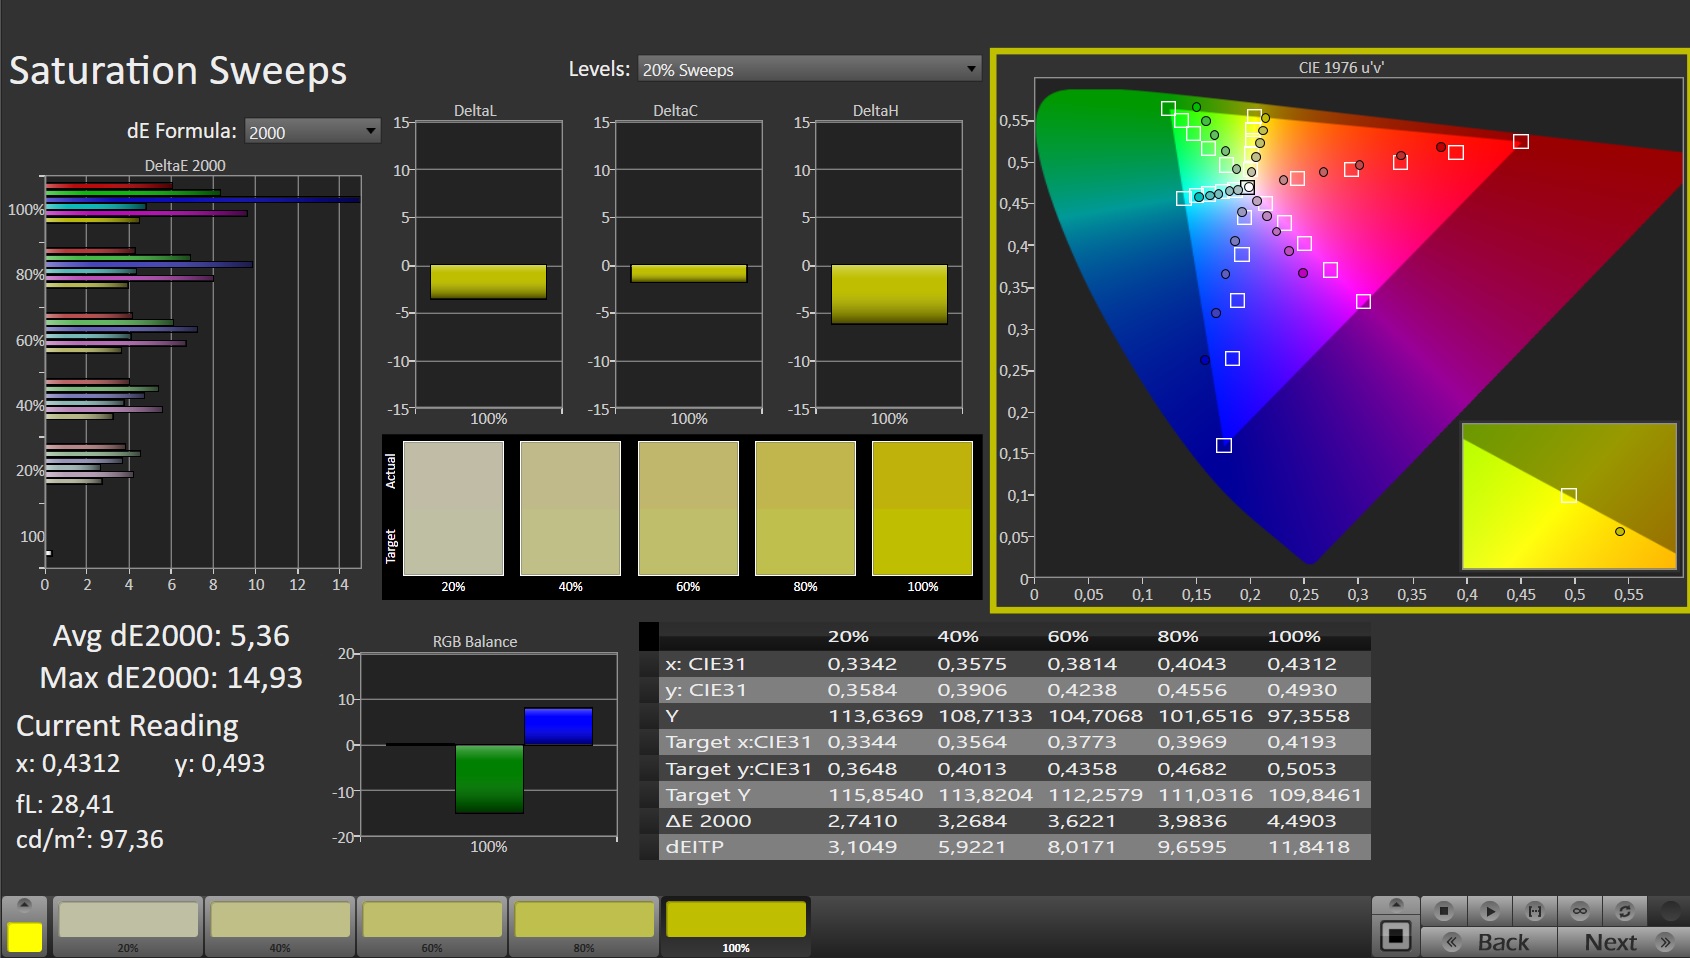
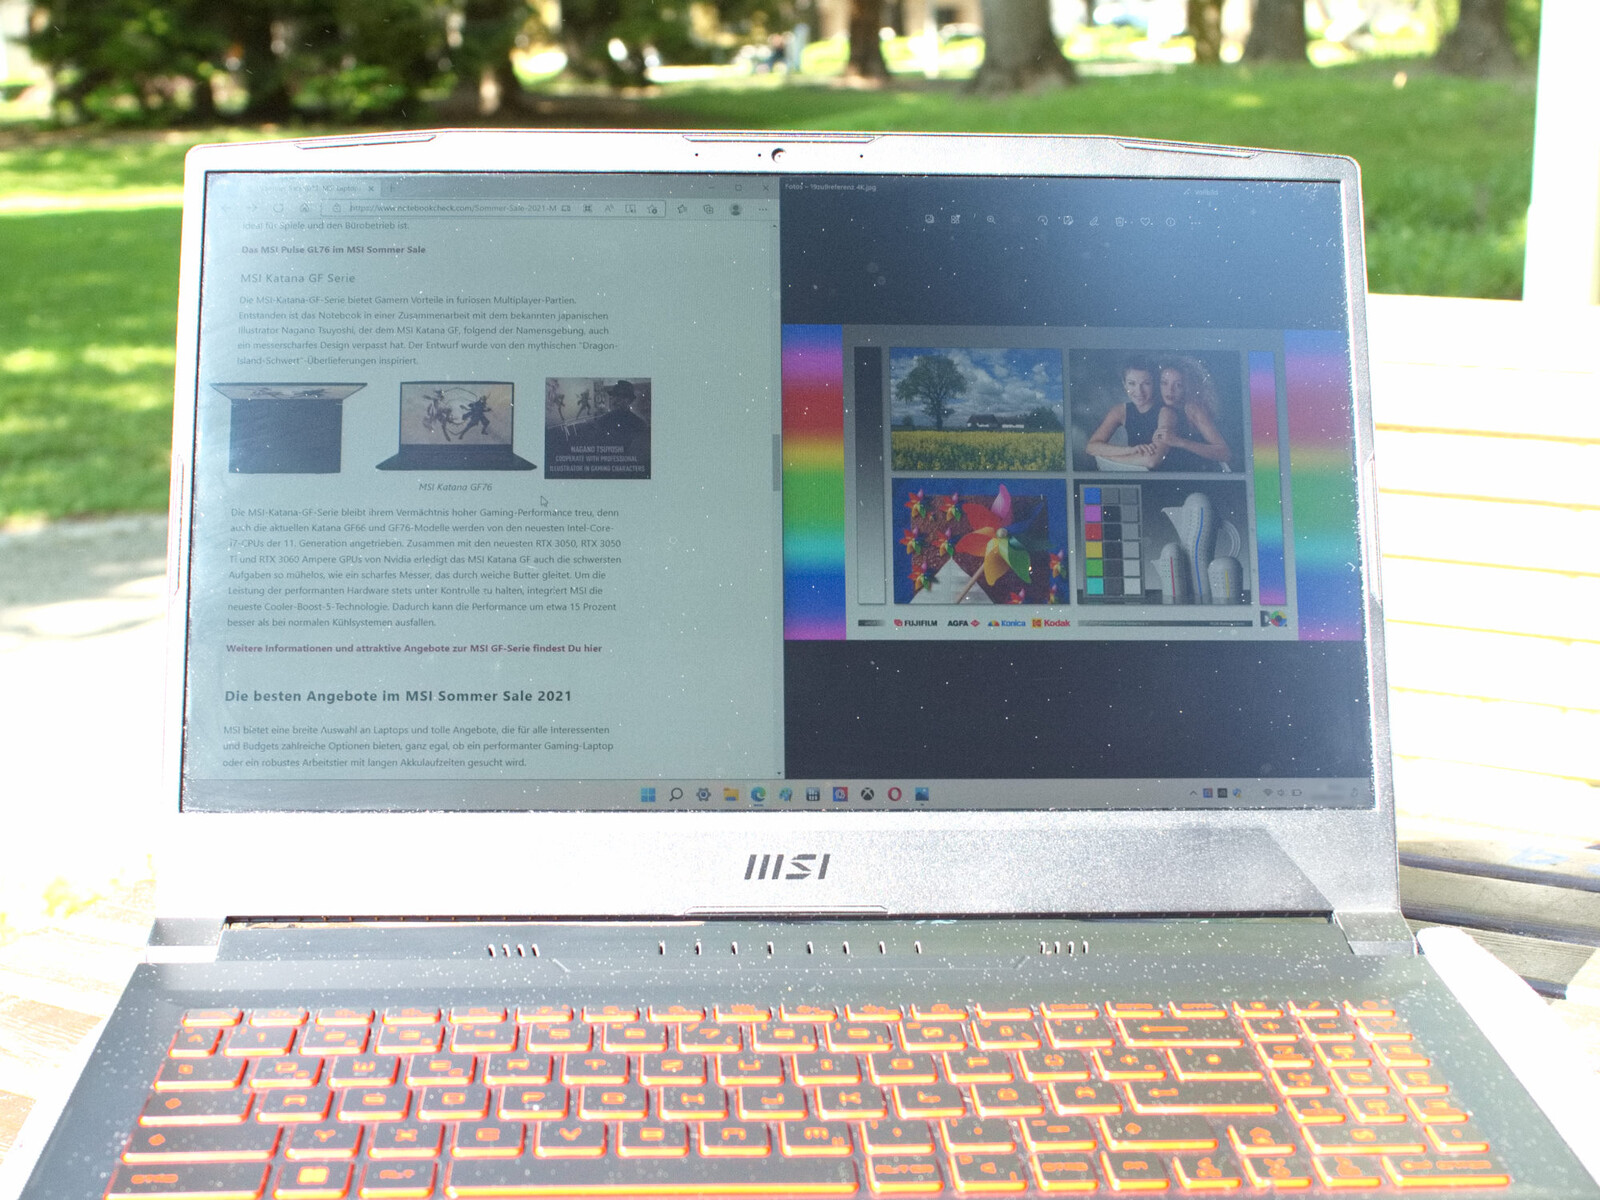
Pantalla - MSI realiza un claro downgrade aquí

La pantalla del GF66 12UGS es significativamente peor que la del GF66 11UG. Mientras que 144 Hz y una resolución Full-HD son adecuados para un portátil de juego con la GeForce RTX 3070 Ti, el resto de valores del panel no admiten su uso como monitor de juego. Con un 58.3%, la cobertura del espacio de color sRGB del nuevo panel de AU Optronics es peor que la del panel del modelo predecesor; con una media de 225 cd/m², el brillo es peor; y los tiempos de respuesta también son peores. MSI realizó un claro downgrade aquí.
El ratio de contraste de 1081:1 es bueno, pero sólo el Asus TUF Gaming A15 tiene un valor inferior en nuestro campo de comparación. Aparte de los 144 Hz, la pantalla del portátil para juegos ofrece valores que son más apropiados para un portátil de oficina.
| |||||||||||||||||||||||||
iluminación: 90 %
Brillo con batería: 227 cd/m²
Contraste: 1081:1 (Negro: 0.21 cd/m²)
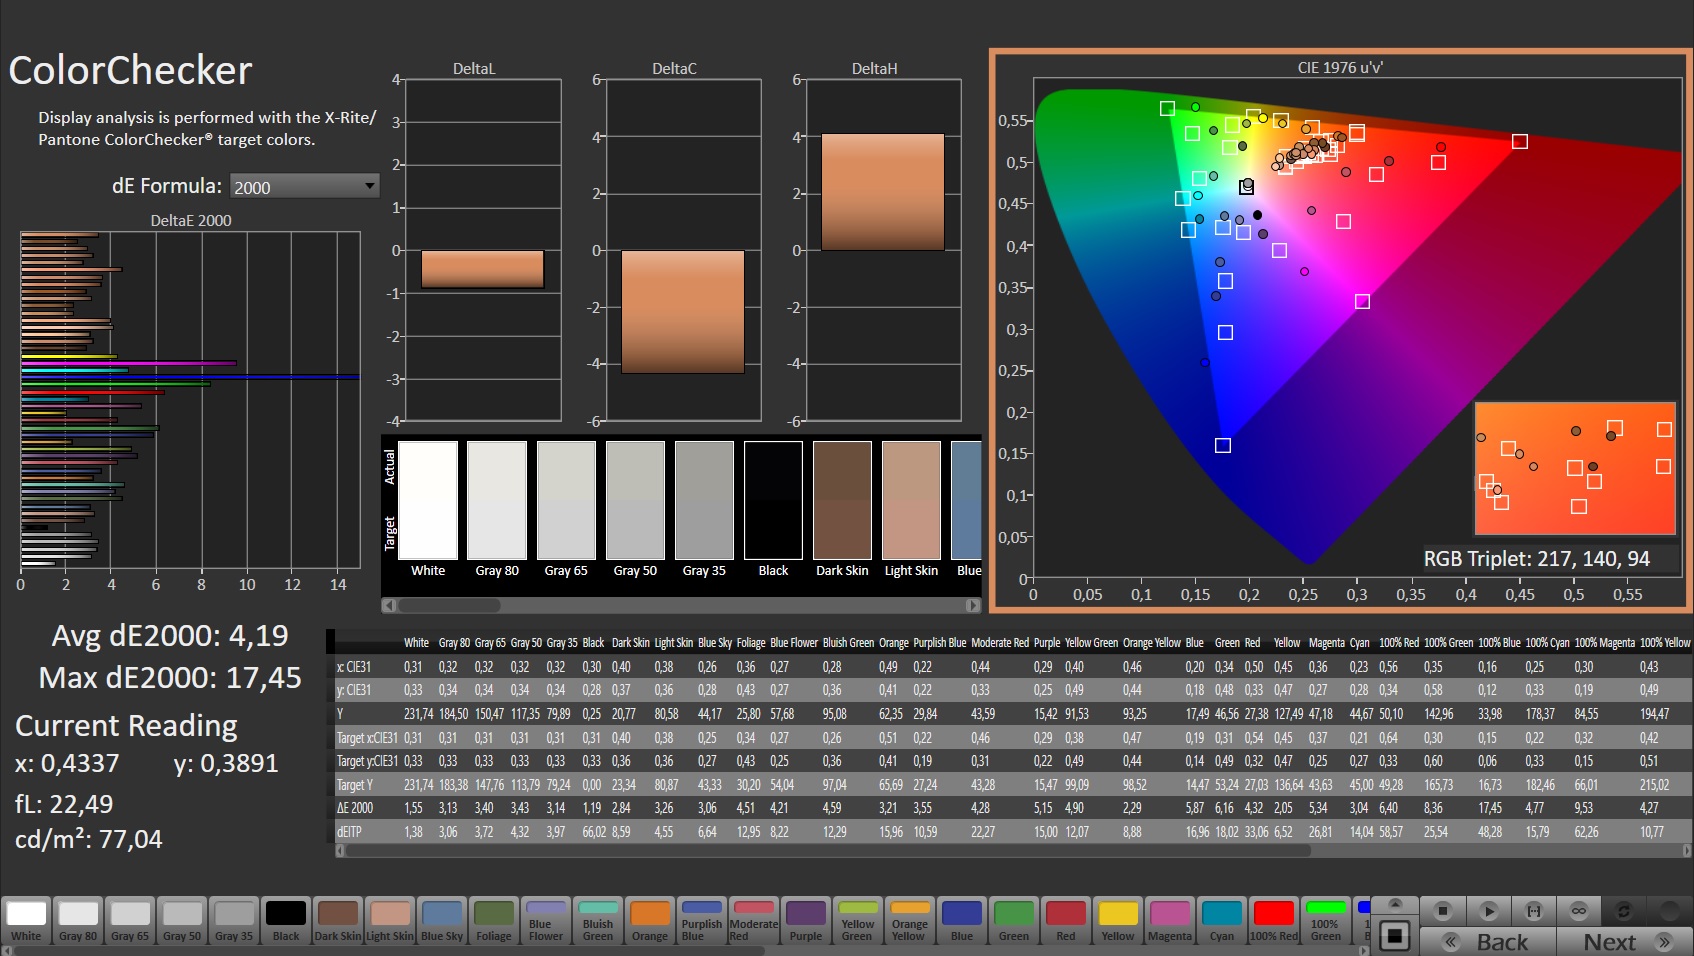
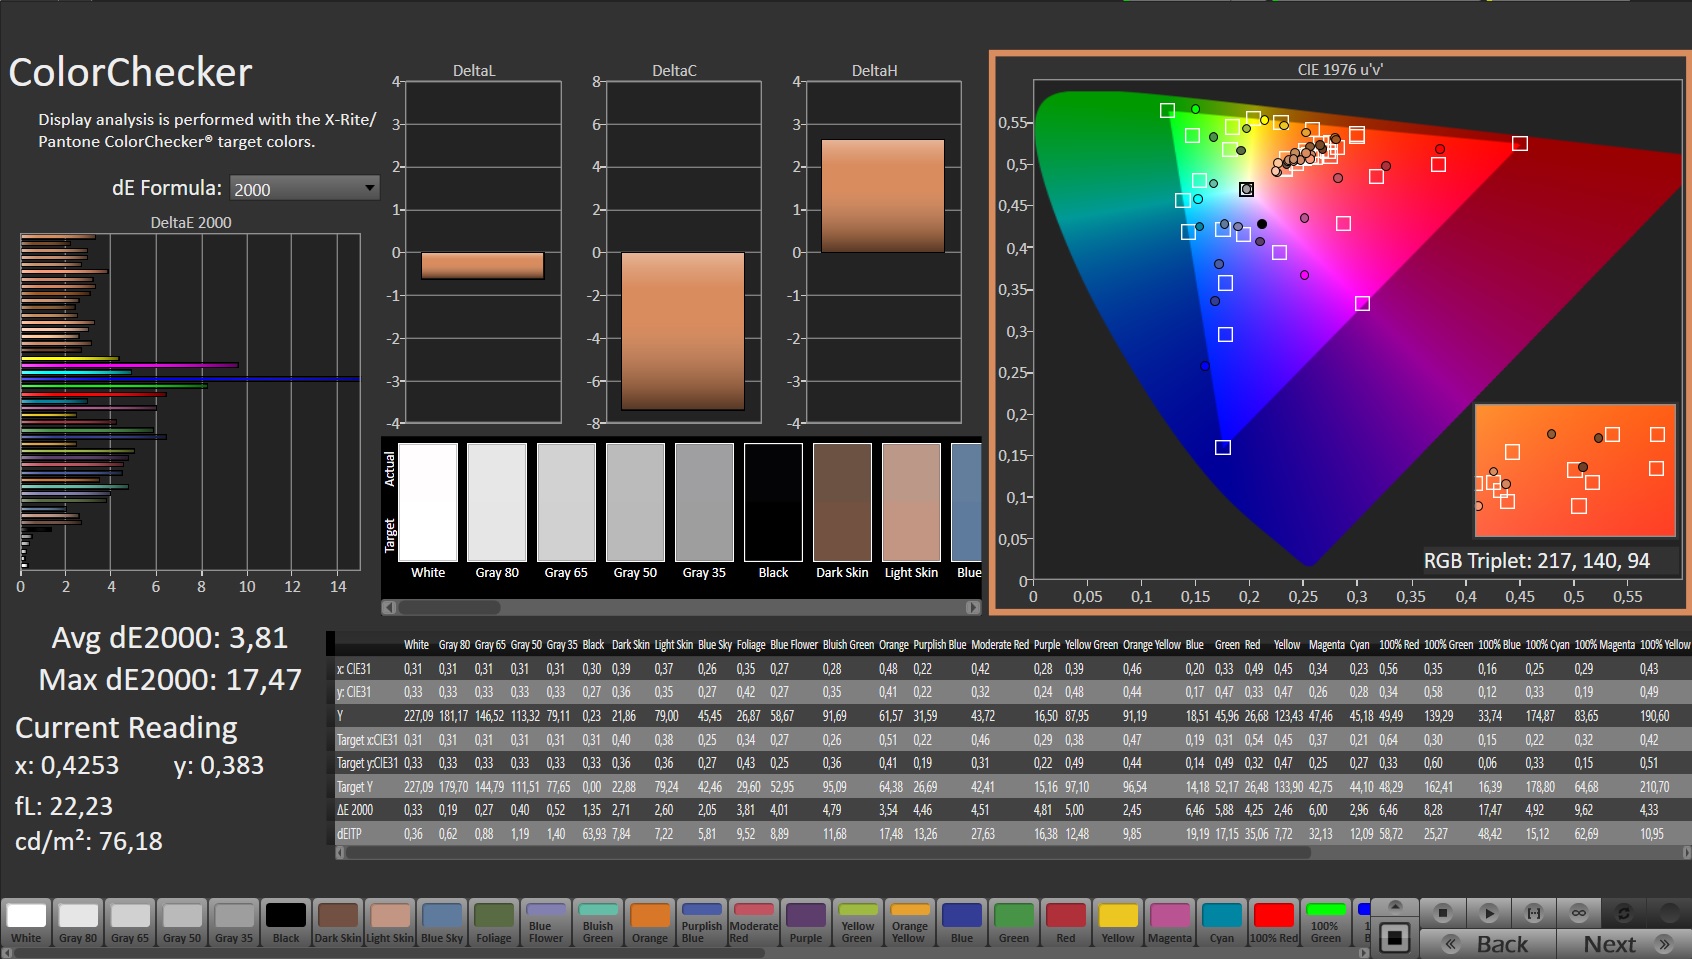
ΔE ColorChecker Calman: 4.19 | ∀{0.5-29.43 Ø4.71}
calibrated: 3.81
ΔE Greyscale Calman: 2.7 | ∀{0.09-98 Ø4.96}
40.4% AdobeRGB 1998 (Argyll 3D)
58.3% sRGB (Argyll 3D)
39.1% Display P3 (Argyll 3D)
Gamma: 2.208
CCT: 6176 K
| MSI Katana GF66 12UGS AU Optronics AUOAF90, IPS, 1920x1080, 15.6" | MSI Katana GF66 11UG-220 AU Optronics B156HAN08.0, IPS, 1920x1080, 15.6" | MSI Katana GF76 12UGS AU Optronics B173HAN04.9, IPS, 1920x1080, 17.3" | Asus TUF Gaming F15 FX507ZM TL156VDXP0101, IPS, 1920x1080, 15.6" | Asus TUF Gaming A15 FA506QR-AZ061T Sharp SHP1532, IPS, 1920x1080, 15.6" | Acer Nitro 5 AN515-58-72QR Chi Mei N156KME-GNA, IPS, 2560x1440, 15.6" | Lenovo Legion 5 15ACH6A-82NW0010GE LGD06A5, IPS, 1920x1080, 15.6" | |
|---|---|---|---|---|---|---|---|
| Display | 63% | -1% | 69% | 109% | 77% | ||
| Display P3 Coverage (%) | 39.1 | 65.4 67% | 38.5 -2% | 66.4 70% | 95.6 145% | 71.1 82% | |
| sRGB Coverage (%) | 58.3 | 91.3 57% | 57.8 -1% | 97 66% | 99.8 71% | 99.1 70% | |
| AdobeRGB 1998 Coverage (%) | 40.4 | 66.7 65% | 39.8 -1% | 68.5 70% | 85.2 111% | 72.3 79% | |
| Response Times | 71% | 3% | 71% | 71% | 63% | 71% | |
| Response Time Grey 50% / Grey 80% * (ms) | 40 ? | 7.4 ? 81% | 40.6 ? -2% | 5.6 ? 86% | 12 ? 70% | 15.7 ? 61% | 15 ? 62% |
| Response Time Black / White * (ms) | 28.4 ? | 11.2 ? 61% | 26.4 ? 7% | 12.8 ? 55% | 8 ? 72% | 10.2 ? 64% | 6 ? 79% |
| PWM Frequency (Hz) | 1250 ? | ||||||
| Screen | 7% | 23% | 32% | 30% | 12% | 15% | |
| Brightness middle (cd/m²) | 227 | 307 35% | 281 24% | 353.7 56% | 297 31% | 332 46% | 371 63% |
| Brightness (cd/m²) | 225 | 321 43% | 264 17% | 340 51% | 268 19% | 303 35% | 328 46% |
| Brightness Distribution (%) | 90 | 83 -8% | 88 -2% | 89 -1% | 84 -7% | 86 -4% | 85 -6% |
| Black Level * (cd/m²) | 0.21 | 0.27 -29% | 0.2 5% | 0.34 -62% | 0.22 -5% | 0.29 -38% | 0.32 -52% |
| Contrast (:1) | 1081 | 1137 5% | 1405 30% | 1040 -4% | 1350 25% | 1145 6% | 1159 7% |
| Colorchecker dE 2000 * | 4.19 | 4.67 -11% | 3.69 12% | 1.74 58% | 1.36 68% | 3.61 14% | 3.25 22% |
| Colorchecker dE 2000 max. * | 17.45 | 7.53 57% | 8.46 52% | 3.63 79% | 3.82 78% | 7.71 56% | 6.33 64% |
| Colorchecker dE 2000 calibrated * | 3.81 | 2.41 37% | 3.61 5% | 0.5 87% | 0.59 85% | 1.11 71% | |
| Greyscale dE 2000 * | 2.7 | 4.5 -67% | 0.94 65% | 2.1 22% | 1.88 30% | 5.2 -93% | 4.94 -83% |
| Gamma | 2.208 100% | 2.276 97% | 2.42 91% | 2.3 96% | 2.48 89% | 2.155 102% | 2.45 90% |
| CCT | 6176 105% | 6824 95% | 6443 101% | 6257 104% | 6768 96% | 6724 97% | 6064 107% |
| Color Space (Percent of AdobeRGB 1998) (%) | 63 | ||||||
| Color Space (Percent of sRGB) (%) | 99 | ||||||
| Media total (Programa/Opciones) | 47% /
28% | 8% /
15% | 57% /
45% | 51% /
38% | 61% /
40% | 54% /
36% |
* ... más pequeño es mejor
La cobertura del espacio de color y la reproducción del color del MSI Katana GF66 12UGS es poco convincente. Casi todos los colores están fuera de la gama de reproducción de color natural, e incluso puedes notar desviaciones de color con tus propios ojos. Debido a la baja cobertura del espacio de color, incluso una calibración con CalMan y el colorímetro X-Rite i1 apenas aportará mejoras.

Tiempos de respuesta del display
| ↔ Tiempo de respuesta de Negro a Blanco | ||
|---|---|---|
| 28.4 ms ... subida ↗ y bajada ↘ combinada | ↗ 15.2 ms subida |  |
| ↘ 13.2 ms bajada | ||
| La pantalla mostró tiempos de respuesta relativamente lentos en nuestros tests pero podría ser demasiado lenta para los jugones. En comparación, todos los dispositivos de prueba van de ##min### (mínimo) a 240 (máximo) ms. » 75 % de todos los dispositivos son mejores. Eso quiere decir que el tiempo de respuesta es peor que la media (19.8 ms) de todos los dispositivos testados. | ||
| ↔ Tiempo de respuesta 50% Gris a 80% Gris | ||
| 40 ms ... subida ↗ y bajada ↘ combinada | ↗ 18.8 ms subida |  |
| ↘ 21.2 ms bajada | ||
| La pantalla mostró tiempos de respuesta lentos en nuestros tests y podría ser demasiado lenta para los jugones. En comparación, todos los dispositivos de prueba van de ##min### (mínimo) a 636 (máximo) ms. » 61 % de todos los dispositivos son mejores. Eso quiere decir que el tiempo de respuesta es peor que la media (31 ms) de todos los dispositivos testados. | ||
Parpadeo de Pantalla / PWM (Pulse-Width Modulation)
| Parpadeo de Pantalla / PWM no detectado |  | ||
Comparación: 52 % de todos los dispositivos testados no usaron PWM para atenuar el display. Si se usó, medimos una media de 7754 (mínimo: 5 - máxmo: 343500) Hz. | |||
A la luz del sol, el contenido de la imagen sólo puede leerse de forma limitada. Para poder leerlo con facilidad, la pantalla tendría que ofrecer una mayor luminosidad.
En el análisis de los ángulos de visión, el MSI GF66 12UGS hace justicia a la especificación Wide View (nivel IPS) de la hoja de datos. Sólo hay desviaciones mínimas en los colores y el contraste desde todos los ángulos de visión. Por otro lado, el brillo percibido cae relativamente rápido, aunque esto parece exagerado en la imagen de la cámara.

Rendimiento - La actual generación de CPUs
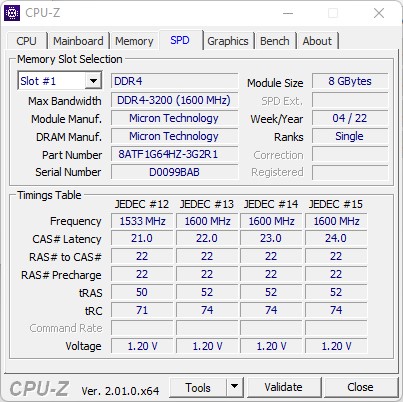
Los portátiles para juegos MSI Katana GF66 12U están disponibles en una amplia variedad de configuraciones. O bien elIntel Core i5-12500Ho eli7-12700Hasí como 8 o 16 GB de memoria de trabajo DDR4-3200. MSI también ofrece varias configuraciones de chips gráficos, desde el Nvidia GeForce RTX 3050 hasta el RTX 3070 Ti. En el sistema operativo preinstalado, también se puede elegir entre FreeDos o Windows 11 Home.
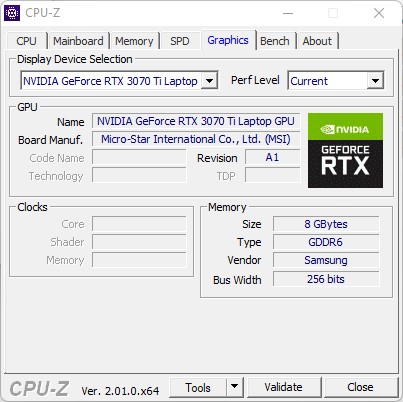
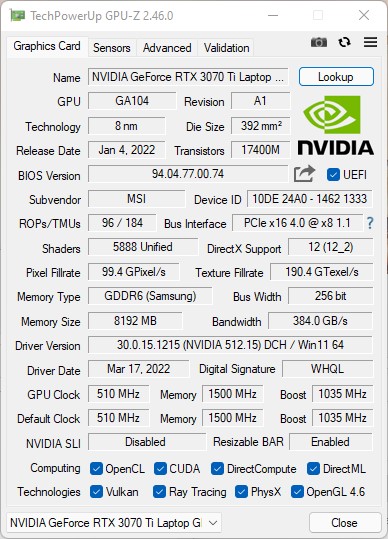
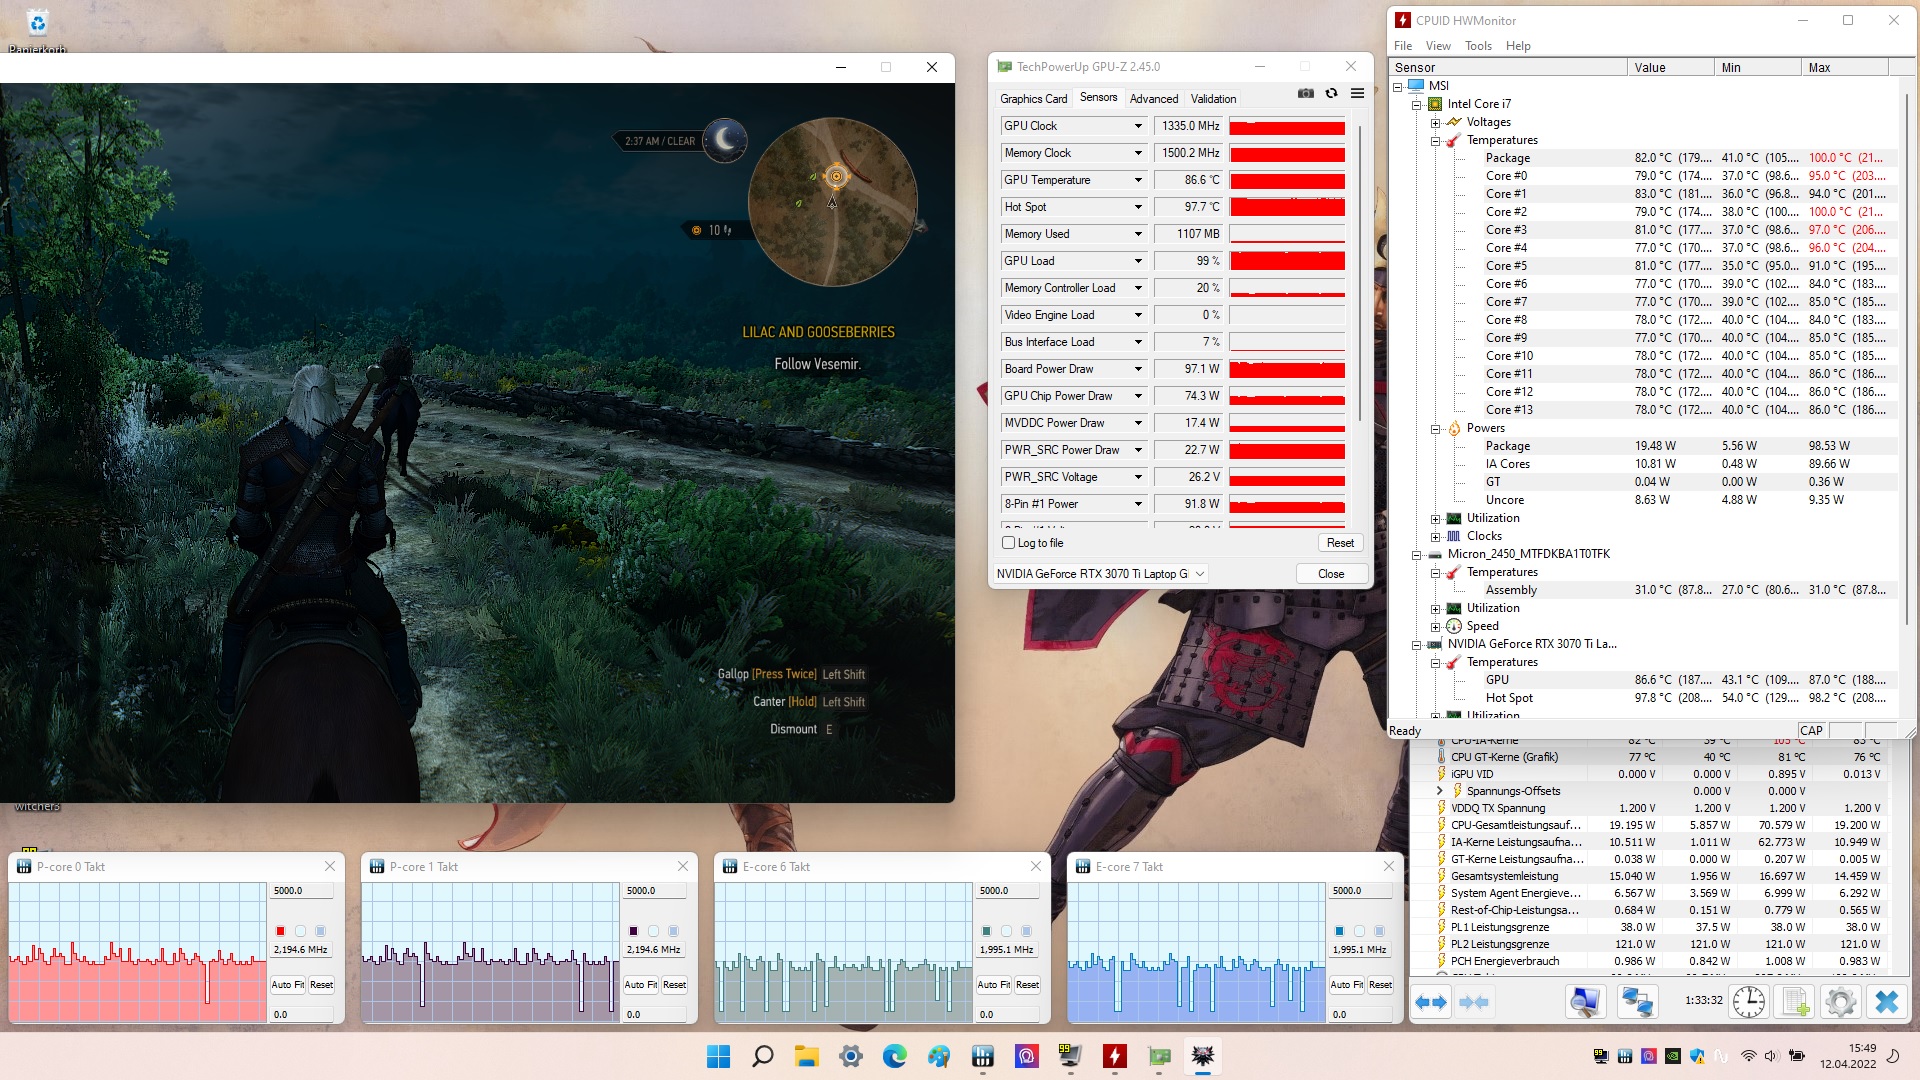
Nuestra unidad de prueba ofrece una potente configuración con la Nvidia GeForce RTX 3070 Ti, Intel Core i7-12700Hy 16 GB de RAM. Con esto, el portátil está claramente orientado a los juegos. Gracias a la potente tarjeta gráfica, incluso los juegos gráficamente exigentes pueden jugarse a altas frecuencias de cuadro.
Condiciones de la prueba
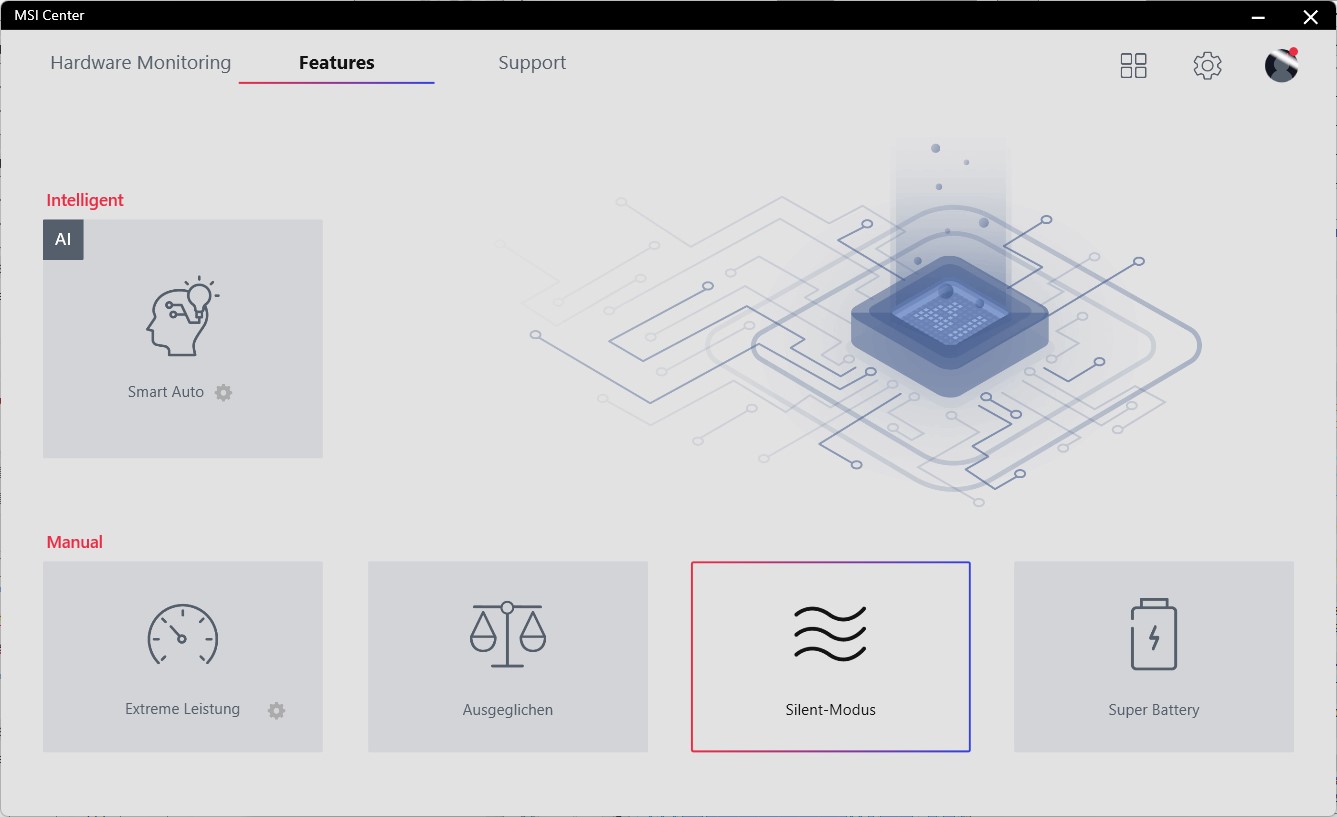
Gracias al control de rendimiento inteligente, básicamente no necesitas configurar nada manualmente en el MSI Katana GF66. En este modo de rendimiento, el portátil cambia automáticamente a uno de los modos preinstalados entre Silencio y Rendimiento Extremo
Los límites de rendimiento del PL1 están entre 85 y 23 vatios. En funcionamiento con batería, el PL1 también puede reducirse a 13 vatios en el modo Super Battery
Todas las pruebas se realizaron en el modo de rendimiento Smart Auto. El consumo del procesador a largo plazo se sitúa aquí en unos 38 vatios, pero el portátil también es capaz de aumentar este rendimiento significativamente durante los juegos o en otros escenarios.
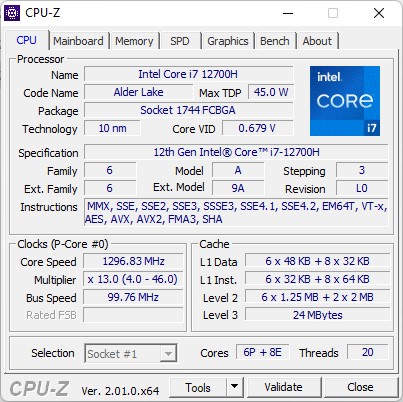
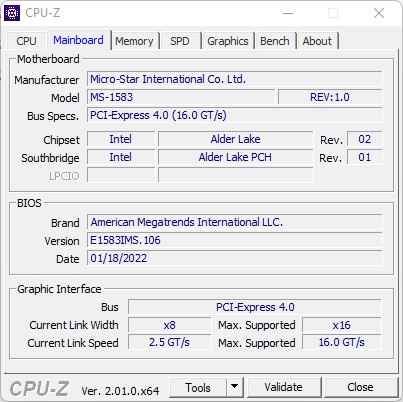
Procesador
El Intel Core i7-12700H pertenece a las CPUs de gama alta de la nueva generación Alder Lake. El procesador ofrece seis núcleos de rendimiento y ocho de eficiencia. De este modo, la CPU es capaz de funcionar con 20 hilos. Con un TDP configurable hasta 45 vatios en PL1, el procesador es adecuado para los portátiles más grandes con un sistema de refrigeración potente.
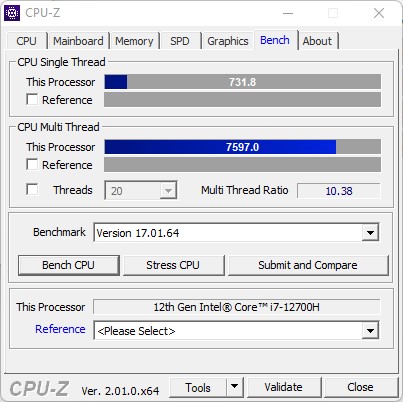
En nuestra prueba, el Katana GF66 es capaz de mostrar un rendimiento significativamente mayor en algunas áreas que su predecesor. Incluso en el modo de rendimiento AI, supera a su hermano mayor en la mayoría de los benchmarks de procesadores genéricos. Probamos el MSI Katana GF76que está equipado con el mismo hardware, en el modo de rendimiento extremo. Mientras que ese portátil muestra un mayor rendimiento bajo carga prolongada en este modo, rinde al nivel de los ojos en los benchmarks con cargas a corto plazo. La comparación entre el GF66 11U y el GF66 12UGS es más interesante. En el modo AI, bastante equilibrado, el Intel Core i7-12700H del GF66 alcanza más o menos el mismo rendimiento que su predecesor en el modo de rendimiento extremo.
Cinebench R15 Multi Constant Load Test
* ... más pequeño es mejor
AIDA64: FP32 Ray-Trace | FPU Julia | CPU SHA3 | CPU Queen | FPU SinJulia | FPU Mandel | CPU AES | CPU ZLib | FP64 Ray-Trace | CPU PhotoWorxx
| Performance rating | |
| Media de la clase Gaming | |
| Medio Intel Core i7-12700H | |
| MSI Katana GF76 12UGS | |
| MSI Katana GF66 12UGS | |
| Asus TUF Gaming A15 FA506QR-AZ061T | |
| Lenovo Legion 5 15ACH6A-82NW0010GE | |
| Acer Nitro 5 AN515-58-72QR | |
| MSI Katana GF66 11UG-220 -9! | |
| AIDA64 / FP32 Ray-Trace | |
| Media de la clase Gaming (10227 - 85542, n=105, últimos 2 años) | |
| Asus TUF Gaming A15 FA506QR-AZ061T | |
| Lenovo Legion 5 15ACH6A-82NW0010GE | |
| Medio Intel Core i7-12700H (2585 - 17957, n=64) | |
| MSI Katana GF66 12UGS | |
| MSI Katana GF76 12UGS | |
| Acer Nitro 5 AN515-58-72QR | |
| AIDA64 / FPU Julia | |
| Media de la clase Gaming (51376 - 238426, n=105, últimos 2 años) | |
| Lenovo Legion 5 15ACH6A-82NW0010GE | |
| Asus TUF Gaming A15 FA506QR-AZ061T | |
| Medio Intel Core i7-12700H (12439 - 90760, n=64) | |
| Acer Nitro 5 AN515-58-72QR | |
| MSI Katana GF66 12UGS | |
| MSI Katana GF76 12UGS | |
| AIDA64 / CPU SHA3 | |
| Media de la clase Gaming (2180 - 10115, n=105, últimos 2 años) | |
| MSI Katana GF76 12UGS | |
| Medio Intel Core i7-12700H (833 - 4242, n=64) | |
| MSI Katana GF66 12UGS | |
| Acer Nitro 5 AN515-58-72QR | |
| Lenovo Legion 5 15ACH6A-82NW0010GE | |
| Asus TUF Gaming A15 FA506QR-AZ061T | |
| AIDA64 / CPU Queen | |
| Media de la clase Gaming (49785 - 173351, n=90, últimos 2 años) | |
| MSI Katana GF76 12UGS | |
| MSI Katana GF66 12UGS | |
| Acer Nitro 5 AN515-58-72QR | |
| Medio Intel Core i7-12700H (57923 - 103202, n=63) | |
| Asus TUF Gaming A15 FA506QR-AZ061T | |
| Lenovo Legion 5 15ACH6A-82NW0010GE | |
| AIDA64 / FPU SinJulia | |
| Media de la clase Gaming (4424 - 33636, n=105, últimos 2 años) | |
| Asus TUF Gaming A15 FA506QR-AZ061T | |
| Acer Nitro 5 AN515-58-72QR | |
| MSI Katana GF66 12UGS | |
| MSI Katana GF76 12UGS | |
| Medio Intel Core i7-12700H (3249 - 9939, n=64) | |
| Lenovo Legion 5 15ACH6A-82NW0010GE | |
| AIDA64 / FPU Mandel | |
| Media de la clase Gaming (25115 - 128721, n=105, últimos 2 años) | |
| Lenovo Legion 5 15ACH6A-82NW0010GE | |
| Asus TUF Gaming A15 FA506QR-AZ061T | |
| Medio Intel Core i7-12700H (7135 - 44760, n=64) | |
| Acer Nitro 5 AN515-58-72QR | |
| MSI Katana GF66 12UGS | |
| MSI Katana GF76 12UGS | |
| AIDA64 / CPU AES | |
| Media de la clase Gaming (39258 - 247074, n=105, últimos 2 años) | |
| Lenovo Legion 5 15ACH6A-82NW0010GE | |
| MSI Katana GF76 12UGS | |
| MSI Katana GF66 12UGS | |
| Medio Intel Core i7-12700H (31839 - 144360, n=64) | |
| Asus TUF Gaming A15 FA506QR-AZ061T | |
| Acer Nitro 5 AN515-58-72QR | |
| AIDA64 / CPU ZLib | |
| Media de la clase Gaming (574 - 2531, n=105, últimos 2 años) | |
| Acer Nitro 5 AN515-58-72QR | |
| MSI Katana GF76 12UGS | |
| MSI Katana GF66 12UGS | |
| Medio Intel Core i7-12700H (305 - 1171, n=64) | |
| Asus TUF Gaming A15 FA506QR-AZ061T | |
| Lenovo Legion 5 15ACH6A-82NW0010GE | |
| MSI Katana GF66 11UG-220 | |
| AIDA64 / FP64 Ray-Trace | |
| Media de la clase Gaming (5509 - 45446, n=105, últimos 2 años) | |
| Asus TUF Gaming A15 FA506QR-AZ061T | |
| Lenovo Legion 5 15ACH6A-82NW0010GE | |
| Medio Intel Core i7-12700H (1437 - 9692, n=64) | |
| Acer Nitro 5 AN515-58-72QR | |
| MSI Katana GF76 12UGS | |
| MSI Katana GF66 12UGS | |
| AIDA64 / CPU PhotoWorxx | |
| Media de la clase Gaming (12271 - 89891, n=105, últimos 2 años) | |
| Medio Intel Core i7-12700H (12863 - 52207, n=64) | |
| MSI Katana GF66 12UGS | |
| MSI Katana GF76 12UGS | |
| Acer Nitro 5 AN515-58-72QR | |
| Asus TUF Gaming A15 FA506QR-AZ061T | |
| Lenovo Legion 5 15ACH6A-82NW0010GE | |
Rendimiento del sistema
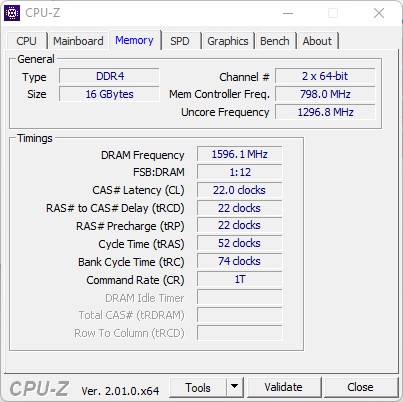
Aunque el Katana GF66 es capaz de ofrecer un sólido rendimiento en los benchmarks PCMark10 y CrossMark, es incapaz de superar a todos los competidores. La responsabilidad de esto debería recaer principalmente en la memoria de trabajo relativamente lenta y el TDP/TGP ligeramente limitado. La latencia medida de la memoria de trabajo resulta extremadamente alta con 95,7 ns.
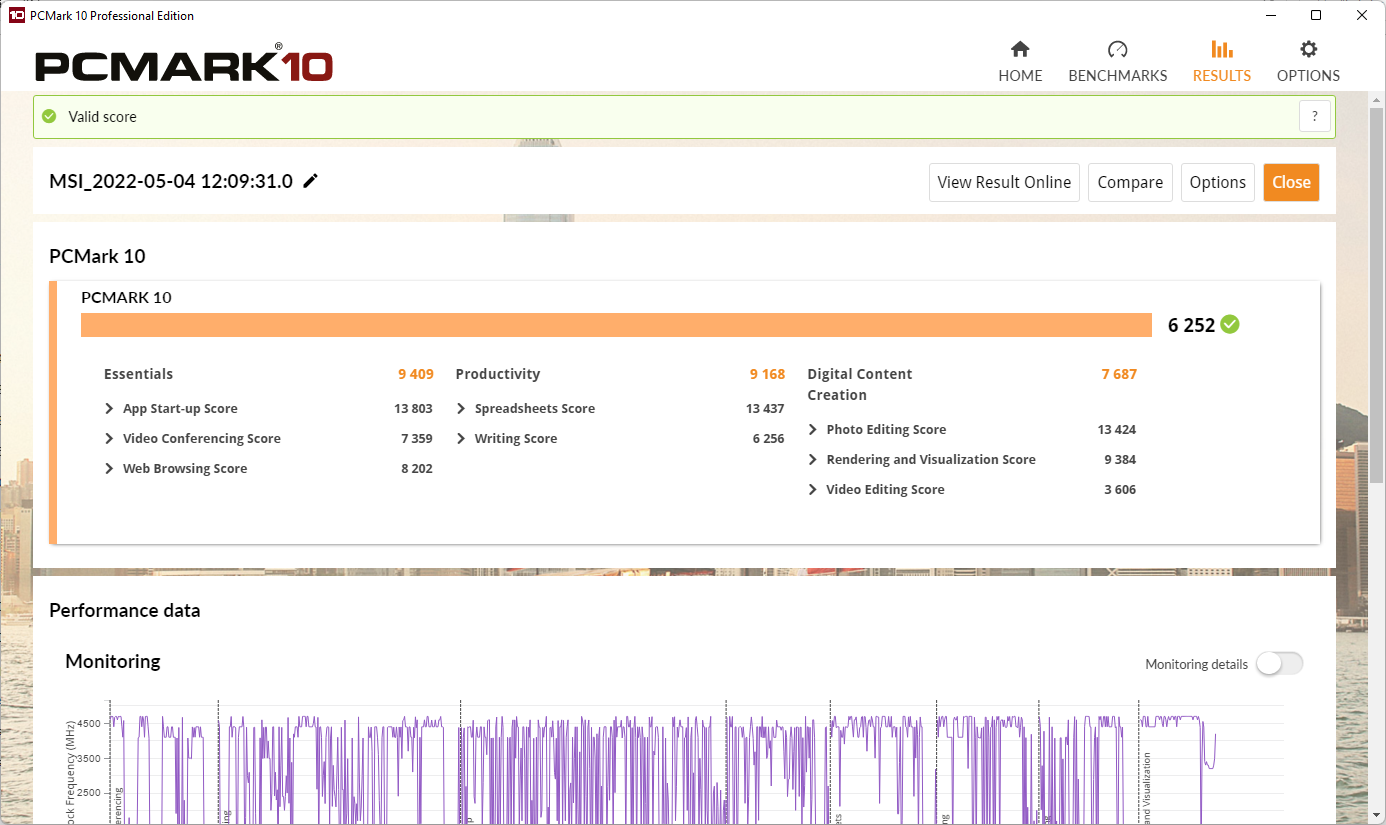
A pesar del funcionamiento en batería, el MSI Katana GF66 es capaz de alcanzar un valor relativamente bueno en PCMark 10, como muestra una prueba de referencia adicional. Con 9409 y 9168 puntos en los segmentos Essentials y Productivity respectivamente, el portátil de juegos alcanza un alto número de puntos incluso en funcionamiento con batería.
CrossMark: Overall | Productivity | Creativity | Responsiveness
| PCMark 10 / Score | |
| Media de la clase Gaming (5828 - 12414, n=93, últimos 2 años) | |
| MSI Katana GF76 12UGS | |
| Medio Intel Core i7-12700H, NVIDIA GeForce RTX 3070 Ti Laptop GPU (6941 - 7947, n=11) | |
| MSI Katana GF66 12UGS | |
| Asus TUF Gaming F15 FX507ZM | |
| Lenovo Legion 5 15ACH6A-82NW0010GE | |
| Acer Nitro 5 AN515-58-72QR | |
| Asus TUF Gaming A15 FA506QR-AZ061T | |
| MSI Katana GF66 11UG-220 | |
| PCMark 10 / Essentials | |
| MSI Katana GF76 12UGS | |
| Media de la clase Gaming (8810 - 11935, n=97, últimos 2 años) | |
| Medio Intel Core i7-12700H, NVIDIA GeForce RTX 3070 Ti Laptop GPU (9892 - 10935, n=11) | |
| Lenovo Legion 5 15ACH6A-82NW0010GE | |
| Asus TUF Gaming F15 FX507ZM | |
| MSI Katana GF66 12UGS | |
| Asus TUF Gaming A15 FA506QR-AZ061T | |
| Acer Nitro 5 AN515-58-72QR | |
| MSI Katana GF66 11UG-220 | |
| PCMark 10 / Productivity | |
| Media de la clase Gaming (6845 - 25323, n=95, últimos 2 años) | |
| MSI Katana GF76 12UGS | |
| MSI Katana GF66 12UGS | |
| Medio Intel Core i7-12700H, NVIDIA GeForce RTX 3070 Ti Laptop GPU (9024 - 10638, n=11) | |
| Asus TUF Gaming A15 FA506QR-AZ061T | |
| Lenovo Legion 5 15ACH6A-82NW0010GE | |
| MSI Katana GF66 11UG-220 | |
| Asus TUF Gaming F15 FX507ZM | |
| Acer Nitro 5 AN515-58-72QR | |
| PCMark 10 / Digital Content Creation | |
| Media de la clase Gaming (7602 - 19954, n=95, últimos 2 años) | |
| Asus TUF Gaming F15 FX507ZM | |
| Medio Intel Core i7-12700H, NVIDIA GeForce RTX 3070 Ti Laptop GPU (10165 - 12546, n=11) | |
| MSI Katana GF66 12UGS | |
| MSI Katana GF76 12UGS | |
| Acer Nitro 5 AN515-58-72QR | |
| Lenovo Legion 5 15ACH6A-82NW0010GE | |
| MSI Katana GF66 11UG-220 | |
| Asus TUF Gaming A15 FA506QR-AZ061T | |
| CrossMark / Overall | |
| Media de la clase Gaming (1366 - 2409, n=94, últimos 2 años) | |
| MSI Katana GF66 12UGS | |
| MSI Katana GF76 12UGS | |
| Medio Intel Core i7-12700H, NVIDIA GeForce RTX 3070 Ti Laptop GPU (974 - 2000, n=12) | |
| Acer Nitro 5 AN515-58-72QR | |
| CrossMark / Productivity | |
| MSI Katana GF66 12UGS | |
| MSI Katana GF76 12UGS | |
| Media de la clase Gaming (1386 - 2254, n=94, últimos 2 años) | |
| Medio Intel Core i7-12700H, NVIDIA GeForce RTX 3070 Ti Laptop GPU (907 - 1962, n=12) | |
| Acer Nitro 5 AN515-58-72QR | |
| CrossMark / Creativity | |
| Media de la clase Gaming (1343 - 2786, n=94, últimos 2 años) | |
| MSI Katana GF66 12UGS | |
| Medio Intel Core i7-12700H, NVIDIA GeForce RTX 3070 Ti Laptop GPU (1027 - 2057, n=12) | |
| Acer Nitro 5 AN515-58-72QR | |
| MSI Katana GF76 12UGS | |
| CrossMark / Responsiveness | |
| MSI Katana GF66 12UGS | |
| MSI Katana GF76 12UGS | |
| Medio Intel Core i7-12700H, NVIDIA GeForce RTX 3070 Ti Laptop GPU (1029 - 2142, n=12) | |
| Media de la clase Gaming (1226 - 2334, n=94, últimos 2 años) | |
| Acer Nitro 5 AN515-58-72QR | |
| PCMark 10 Score | 7458 puntos | |
ayuda | ||
| AIDA64 / Memory Copy | |
| Media de la clase Gaming (21750 - 129946, n=105, últimos 2 años) | |
| Medio Intel Core i7-12700H (25615 - 80511, n=64) | |
| Asus TUF Gaming F15 FX507ZM | |
| MSI Katana GF76 12UGS | |
| MSI Katana GF66 12UGS | |
| Acer Nitro 5 AN515-58-72QR | |
| Asus TUF Gaming A15 FA506QR-AZ061T | |
| Lenovo Legion 5 15ACH6A-82NW0010GE | |
| AIDA64 / Memory Read | |
| Media de la clase Gaming (22956 - 118858, n=105, últimos 2 años) | |
| Asus TUF Gaming F15 FX507ZM | |
| Medio Intel Core i7-12700H (25586 - 79442, n=64) | |
| MSI Katana GF76 12UGS | |
| MSI Katana GF66 12UGS | |
| Asus TUF Gaming A15 FA506QR-AZ061T | |
| Acer Nitro 5 AN515-58-72QR | |
| Lenovo Legion 5 15ACH6A-82NW0010GE | |
| AIDA64 / Memory Write | |
| Media de la clase Gaming (22297 - 135096, n=105, últimos 2 años) | |
| Asus TUF Gaming F15 FX507ZM | |
| Medio Intel Core i7-12700H (23679 - 88660, n=64) | |
| MSI Katana GF76 12UGS | |
| MSI Katana GF66 12UGS | |
| Acer Nitro 5 AN515-58-72QR | |
| Asus TUF Gaming A15 FA506QR-AZ061T | |
| Lenovo Legion 5 15ACH6A-82NW0010GE | |
| AIDA64 / Memory Latency | |
| Media de la clase Gaming (75.3 - 259, n=105, últimos 2 años) | |
| MSI Katana GF66 12UGS | |
| MSI Katana GF76 12UGS | |
| Lenovo Legion 5 15ACH6A-82NW0010GE | |
| Asus TUF Gaming A15 FA506QR-AZ061T | |
| Medio Intel Core i7-12700H (76.2 - 133.9, n=62) | |
| MSI Katana GF66 11UG-220 | |
| MSI Katana GF66 11UG-220 | |
| Asus TUF Gaming F15 FX507ZM | |
| Acer Nitro 5 AN515-58-72QR | |
| Acer Nitro 5 AN515-58-72QR | |
* ... más pequeño es mejor
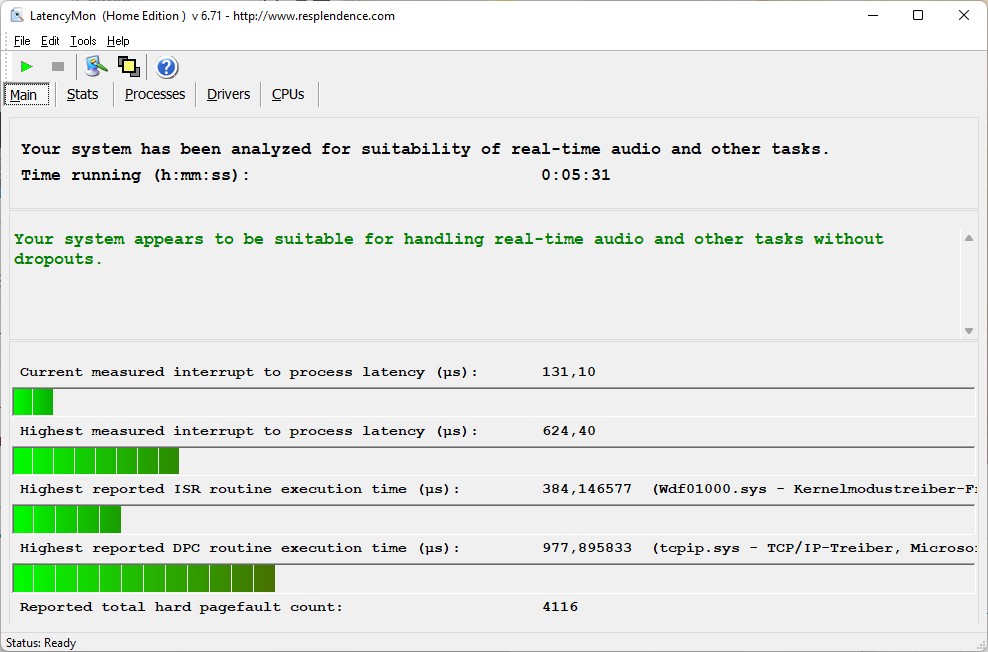
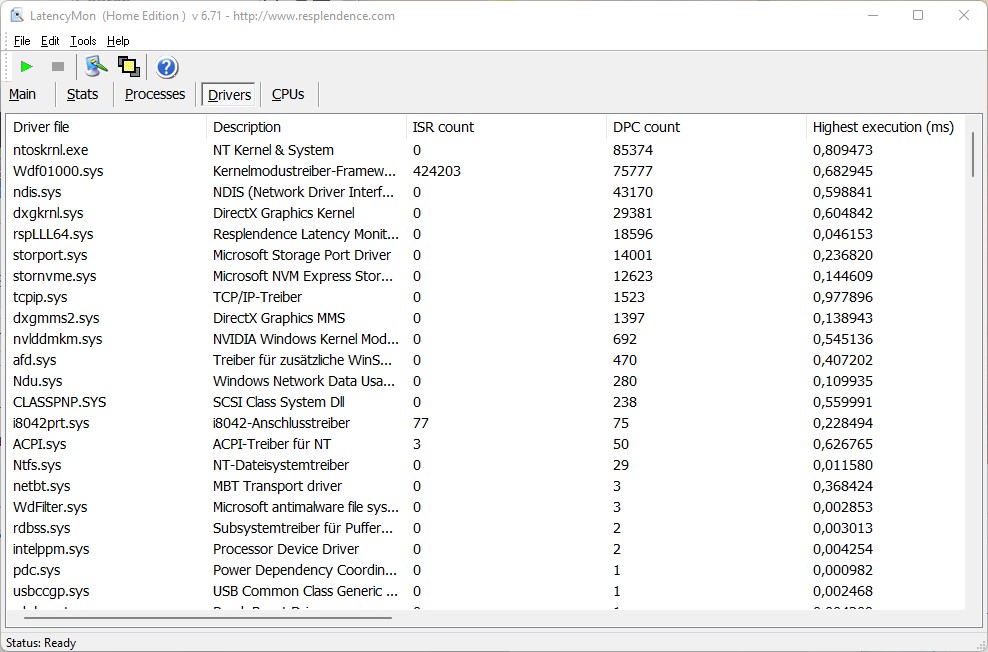
Latencias del CPD
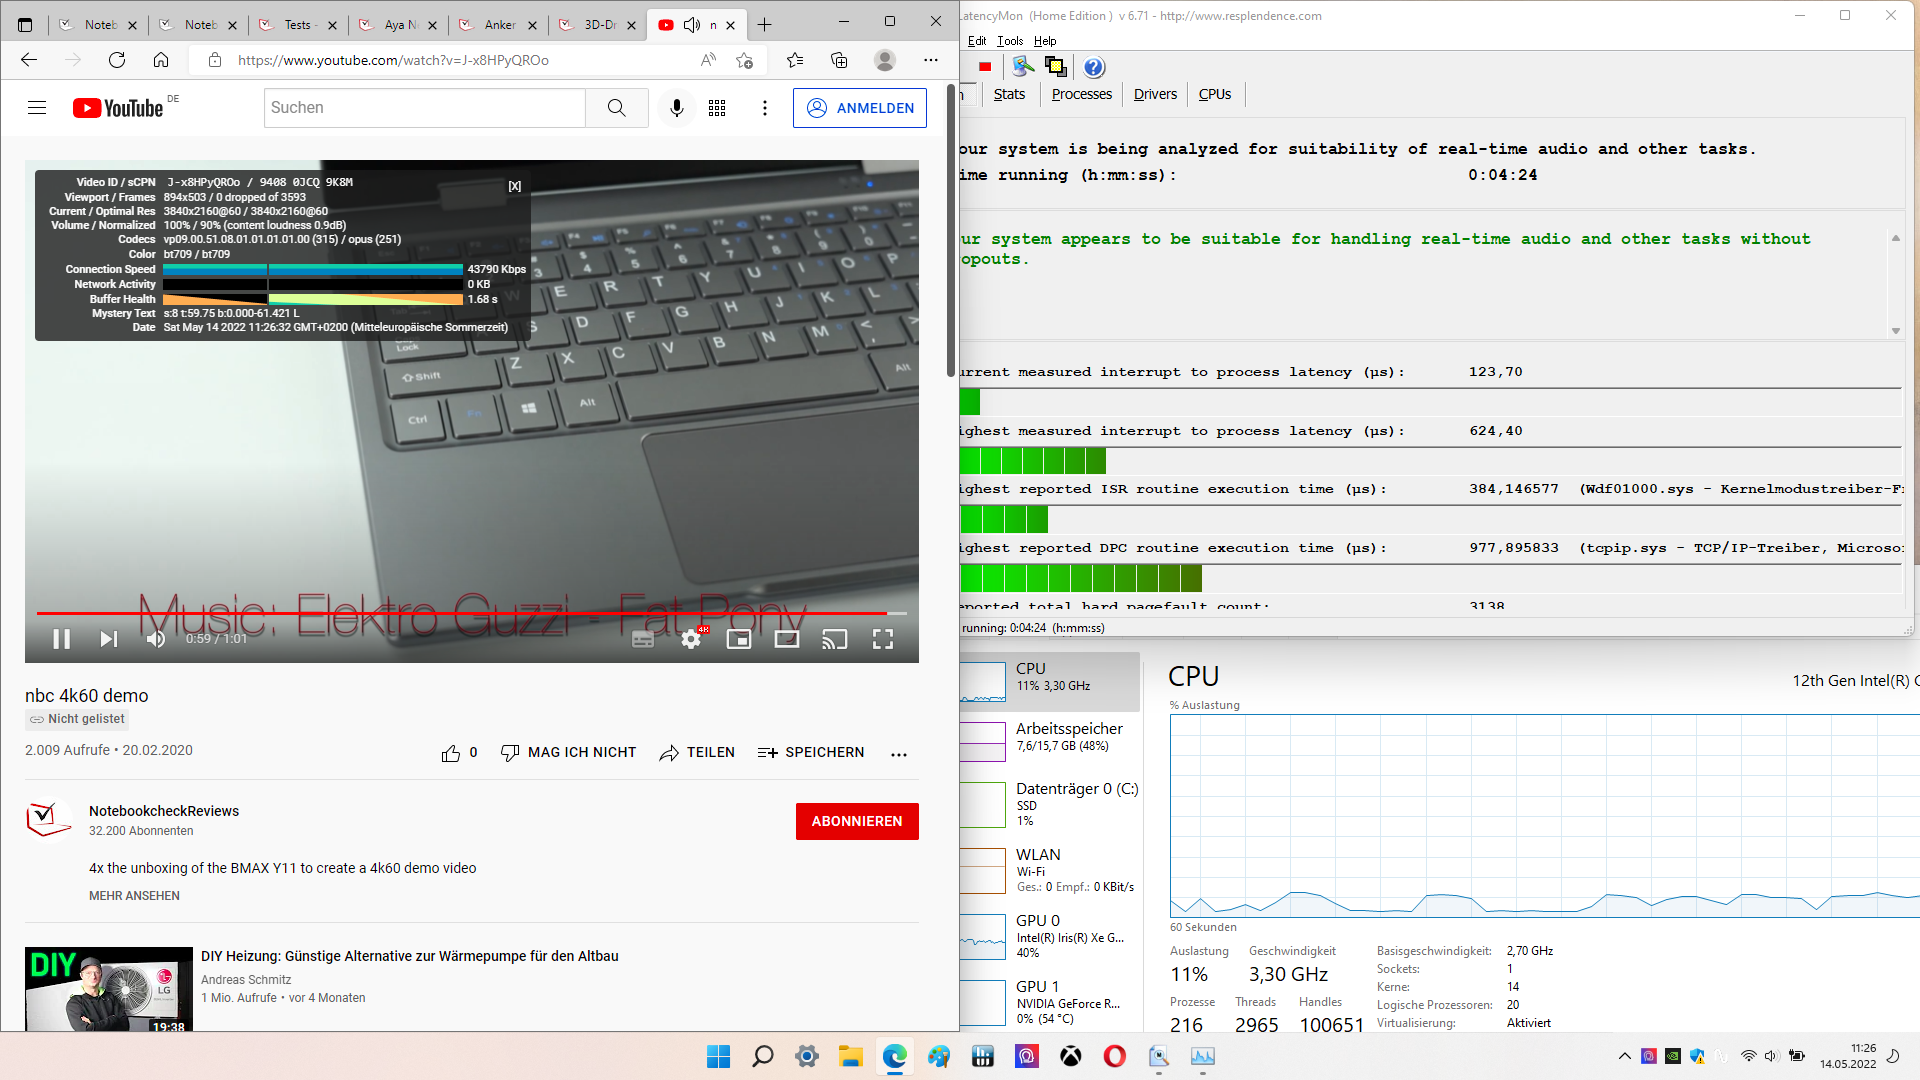
Las latencias cuando se ejecutan procedimientos de tiempo crítico son relativamente bajas, por lo que el Katana GF66 en la configuración de nuestra unidad de prueba también debería ser adecuado para aplicaciones en tiempo real. En el vídeo de prueba 4K 60Hz de Youtube, no hubo caídas de fotogramas. Las actualizaciones de los controladores y otros factores pueden influir significativamente en los valores.
| DPC Latencies / LatencyMon - interrupt to process latency (max), Web, Youtube, Prime95 | |
| MSI Katana GF76 12UGS | |
| Asus TUF Gaming A15 FA506QR-AZ061T | |
| MSI Katana GF66 11UG-220 | |
| Lenovo Legion 5 15ACH6A-82NW0010GE | |
| Acer Nitro 5 AN515-58-72QR | |
| MSI Katana GF66 12UGS | |
* ... más pequeño es mejor
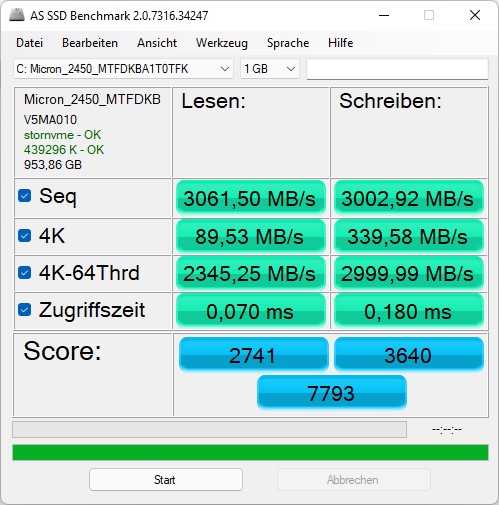
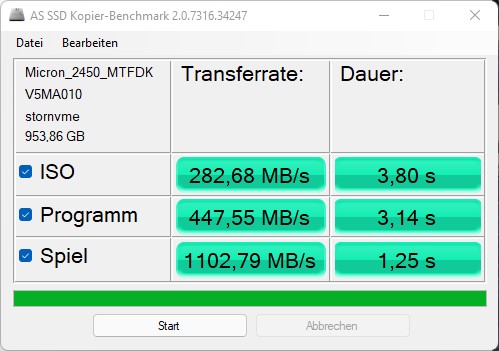
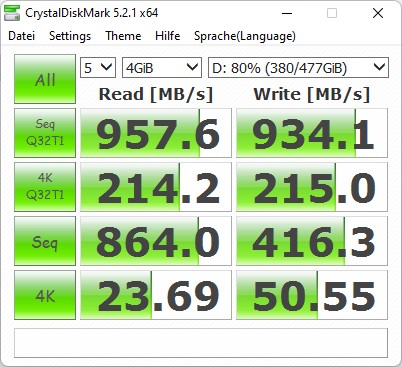
Solución de almacenamiento
Aunque el SSD Micron 2450 NVMe con 1 TB de almacenamiento utilizado aquí es capaz de alcanzar uno de los primeros puestos en nuestro campo de comparación, se sitúa más bien en la mitad del campo en nuestra tabla de SSDs y HDDs. Si bien los resultados en los benchmarks de almacenamiento individual son buenos, no son sobresalientes.

* ... más pequeño es mejor
Constant Performance Reading: DiskSpd Read Loop, Queue Depth 8
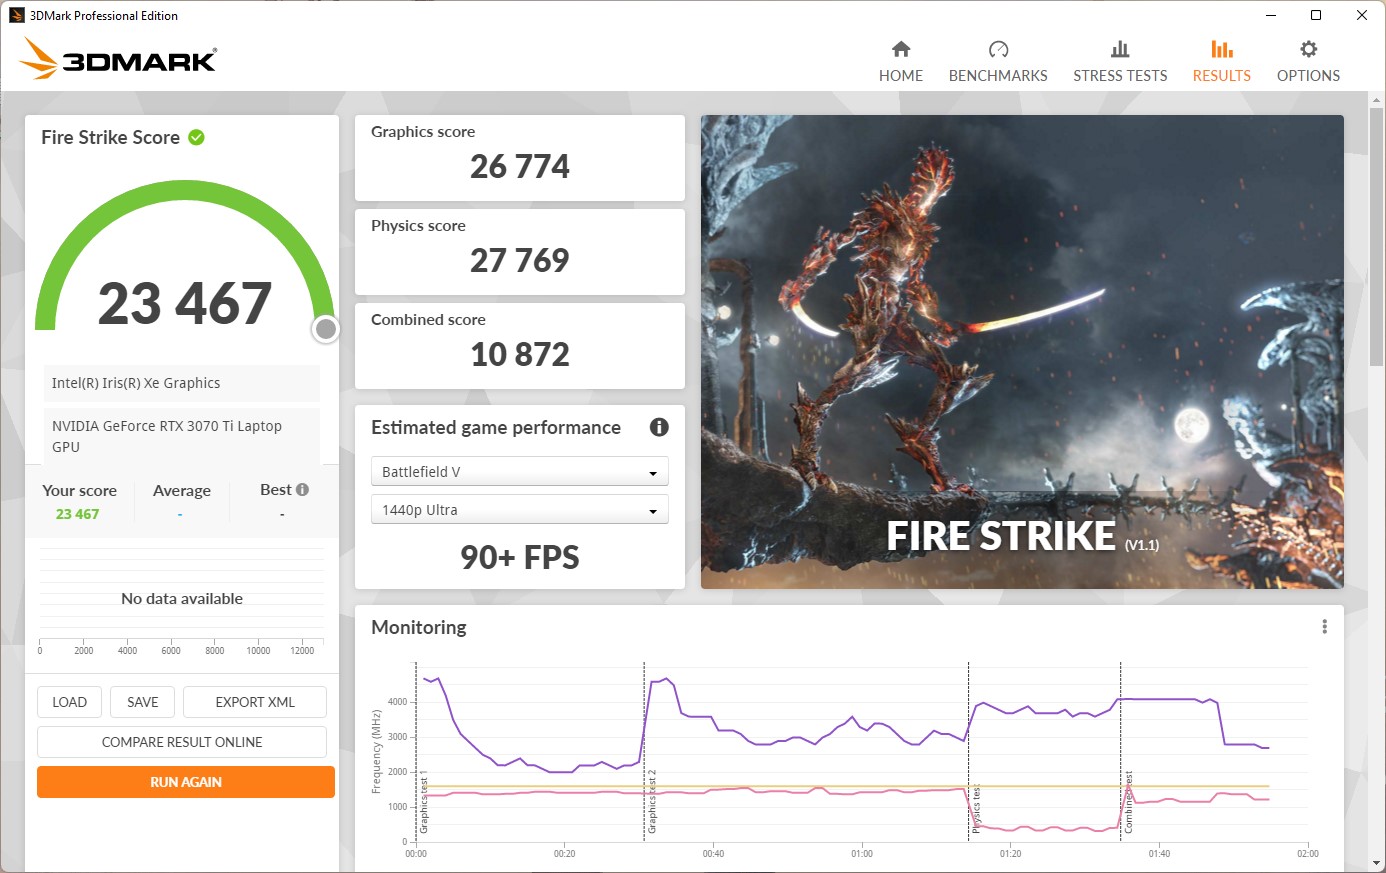
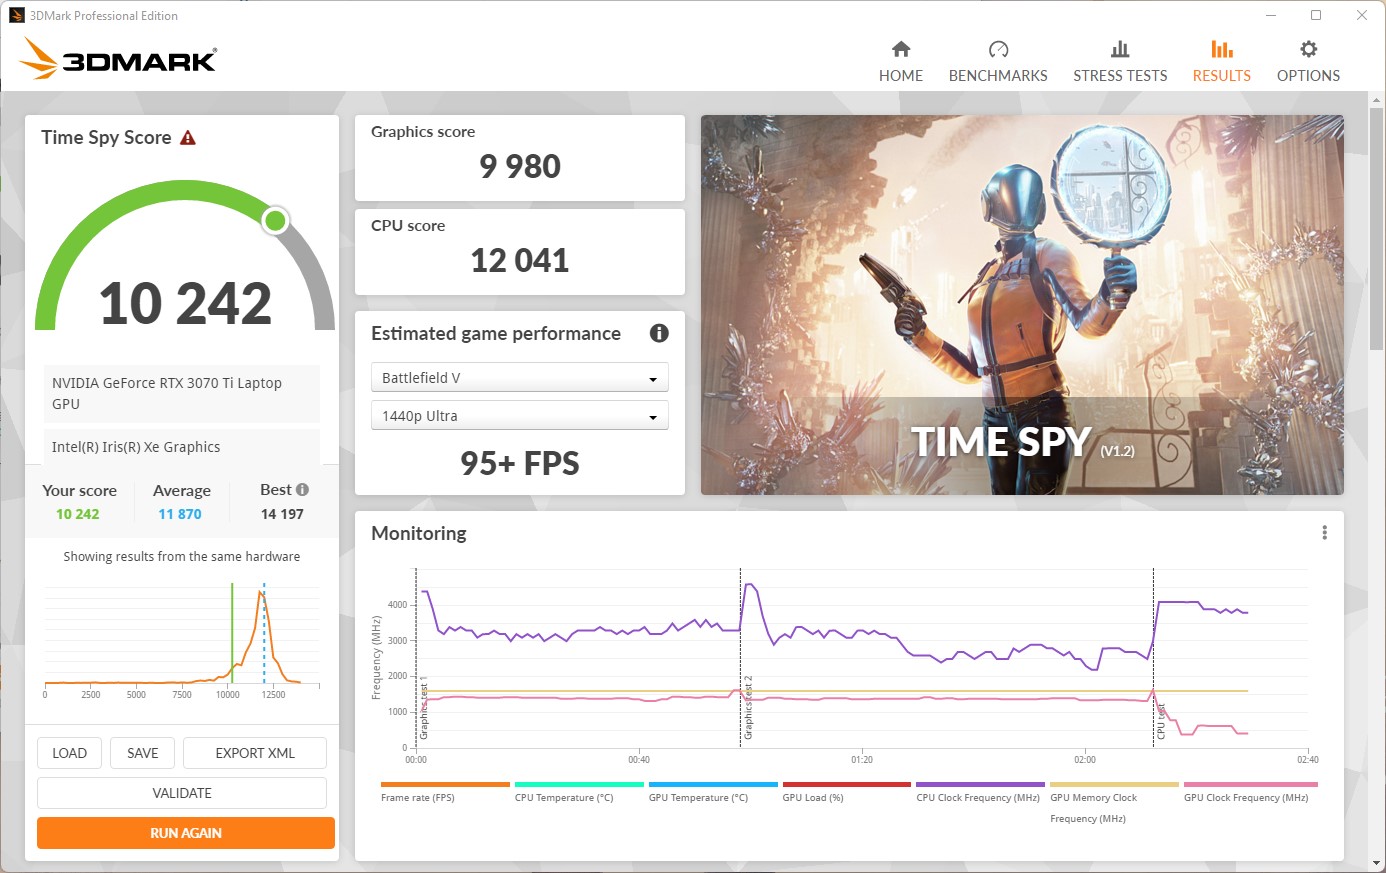
Tarjeta gráfica
Como una de las tarjetas gráficas para portátiles más potentes, la Nvidia Geforce RTX 3070 Ti es capaz de alcanzar altas velocidades de fotogramas en muchos juegos. Sin embargo, en nuestra unidad de pruebas, el rendimiento de la tarjeta gráfica está muy limitado, ya que la RTX 3070 Ti sólo funciona a unos 90 vatios durante un periodo de tiempo más largo. Esto queda especialmente claro en el benchmark Time Spy, donde el rendimiento está unos 600 puntos por debajo de la media de todos los dispositivos con hardware similar. Pero en nuestra comparación con los competidores del mismo segmento de precios, el portátil gaming de MSI sigue ofreciendo resultados potentes.
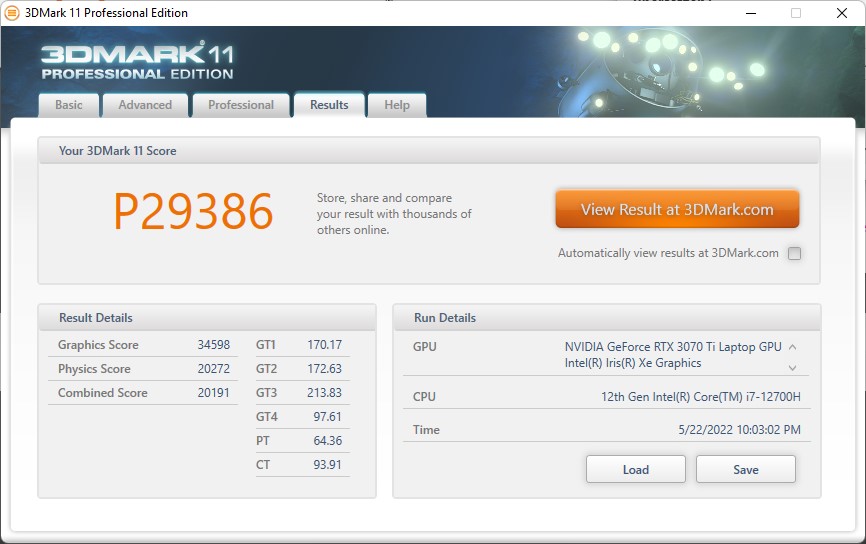
| 3DMark 11 Performance | 29386 puntos | |
| 3DMark Fire Strike Score | 23467 puntos | |
| 3DMark Time Spy Score | 10242 puntos | |
ayuda | ||
Rendimiento de los juegos
El MSI Katana GF66 11UGS es capaz de llevar a la pantalla casi todos los juegos que probamos en todos los niveles de calidad y resolución Full-HD a más de 100 FPS. Esto lo convierte en un portátil para juegos muy versátil.
| Far Cry 6 | |
| 1920x1080 High Graphics Quality AA:T | |
| Media de la clase Gaming (n=1últimos 2 años) | |
| Medio NVIDIA GeForce RTX 3070 Ti Laptop GPU (89 - 108, n=3) | |
| MSI Katana GF66 12UGS | |
| Lenovo Legion 5 15ACH6A-82NW0010GE | |
| Lenovo Legion 5 15ACH6A-82NW0010GE | |
| 1920x1080 Ultra Graphics Quality + HD Textures AA:T | |
| Media de la clase Gaming (n=1últimos 2 años) | |
| Medio NVIDIA GeForce RTX 3070 Ti Laptop GPU (82 - 95.3, n=4) | |
| MSI Katana GF66 12UGS | |
| Lenovo Legion 5 15ACH6A-82NW0010GE | |
| Lenovo Legion 5 15ACH6A-82NW0010GE | |
| Ghostwire Tokyo | |
| 1920x1080 High Settings | |
| Medio NVIDIA GeForce RTX 3070 Ti Laptop GPU (123.9 - 152, n=4) | |
| MSI Katana GF66 12UGS | |
| 1920x1080 Highest Settings | |
| Medio NVIDIA GeForce RTX 3070 Ti Laptop GPU (115.4 - 145.1, n=4) | |
| MSI Katana GF66 12UGS | |
Aunque la tasa de imágenes por segundo desciende ligeramente después de un rato en la prueba de carga constante con"The Witcher 3"(FHD/Ultra), luego se mantiene bastante constante en un nivel relativamente alto de 80 a 90 FPS.
The Witcher 3 FPS Chart
| bajo | medio | alto | ultra | QHD | 4K | |
|---|---|---|---|---|---|---|
| GTA V (2015) | 180.7 | 175.2 | 168 | 102.5 | ||
| The Witcher 3 (2015) | 403 | 139.7 | 96.8 | |||
| Dota 2 Reborn (2015) | 180.4 | 165.1 | 148.1 | 138.1 | ||
| Final Fantasy XV Benchmark (2018) | 174.3 | 120.6 | 89.5 | 68.2 | 39.6 | |
| X-Plane 11.11 (2018) | 139 | 126.4 | 102.5 | |||
| Far Cry 5 (2018) | 131 | 124 | 117 | |||
| Strange Brigade (2018) | 435 | 232 | 193.4 | 171.2 | ||
| Far Cry 6 (2021) | 99 | 89 | 82 | |||
| Ghostwire Tokyo (2022) | 127 | 124 | 123.9 | 115.4 |
Emisiones - Un portátil para juegos bastante silencioso
Emisiones acústicas
En el modo AI, el Katana GF66 se mantiene significativamente más silencioso de lo que cabría esperar de un portátil para juegos. Con un máximo de 45 dB(A), el nivel de ruido del portátil apenas es molesto.
Ruido
| Ocioso |
| 27 / 28 / 31 dB(A) |
| Carga |
| 44 / 45 dB(A) |
 | ||
30 dB silencioso 40 dB(A) audible 50 dB(A) ruidosamente alto |
||
min: | ||
| MSI Katana GF66 12UGS i7-12700H, GeForce RTX 3070 Ti Laptop GPU | MSI Katana GF76 12UGS i7-12700H, GeForce RTX 3070 Ti Laptop GPU | Asus TUF Gaming F15 FX507ZM i7-12700H, GeForce RTX 3060 Laptop GPU | Asus TUF Gaming A15 FA506QR-AZ061T R7 5800H, GeForce RTX 3070 Laptop GPU | Acer Nitro 5 AN515-58-72QR i7-12700H, GeForce RTX 3070 Ti Laptop GPU | Lenovo Legion 5 15ACH6A-82NW0010GE R5 5600H, Radeon RX 6600M | |
|---|---|---|---|---|---|---|
| Noise | -11% | 3% | 1% | -7% | -3% | |
| apagado / medio ambiente * (dB) | 26 | 23 12% | 23.2 11% | 26 -0% | 26 -0% | 25 4% |
| Idle Minimum * (dB) | 27 | 28.41 -5% | 23.6 13% | 26 4% | 26 4% | 25 7% |
| Idle Average * (dB) | 28 | 28.41 -1% | 23.6 16% | 26 7% | 29 -4% | 25 11% |
| Idle Maximum * (dB) | 31 | 36.71 -18% | 25.4 18% | 27.4 12% | 33 -6% | 34.5 -11% |
| Load Average * (dB) | 44 | 53.04 -21% | 38 14% | 46.6 -6% | 47 -7% | 51.1 -16% |
| Witcher 3 ultra * (dB) | 44 | 54.22 -23% | 54.1 -23% | 53 -20% | ||
| Load Maximum * (dB) | 45 | 54.38 -21% | 57.2 -27% | 49.3 -10% | 53 -18% | 51.3 -14% |
* ... más pequeño es mejor
Temperaturas
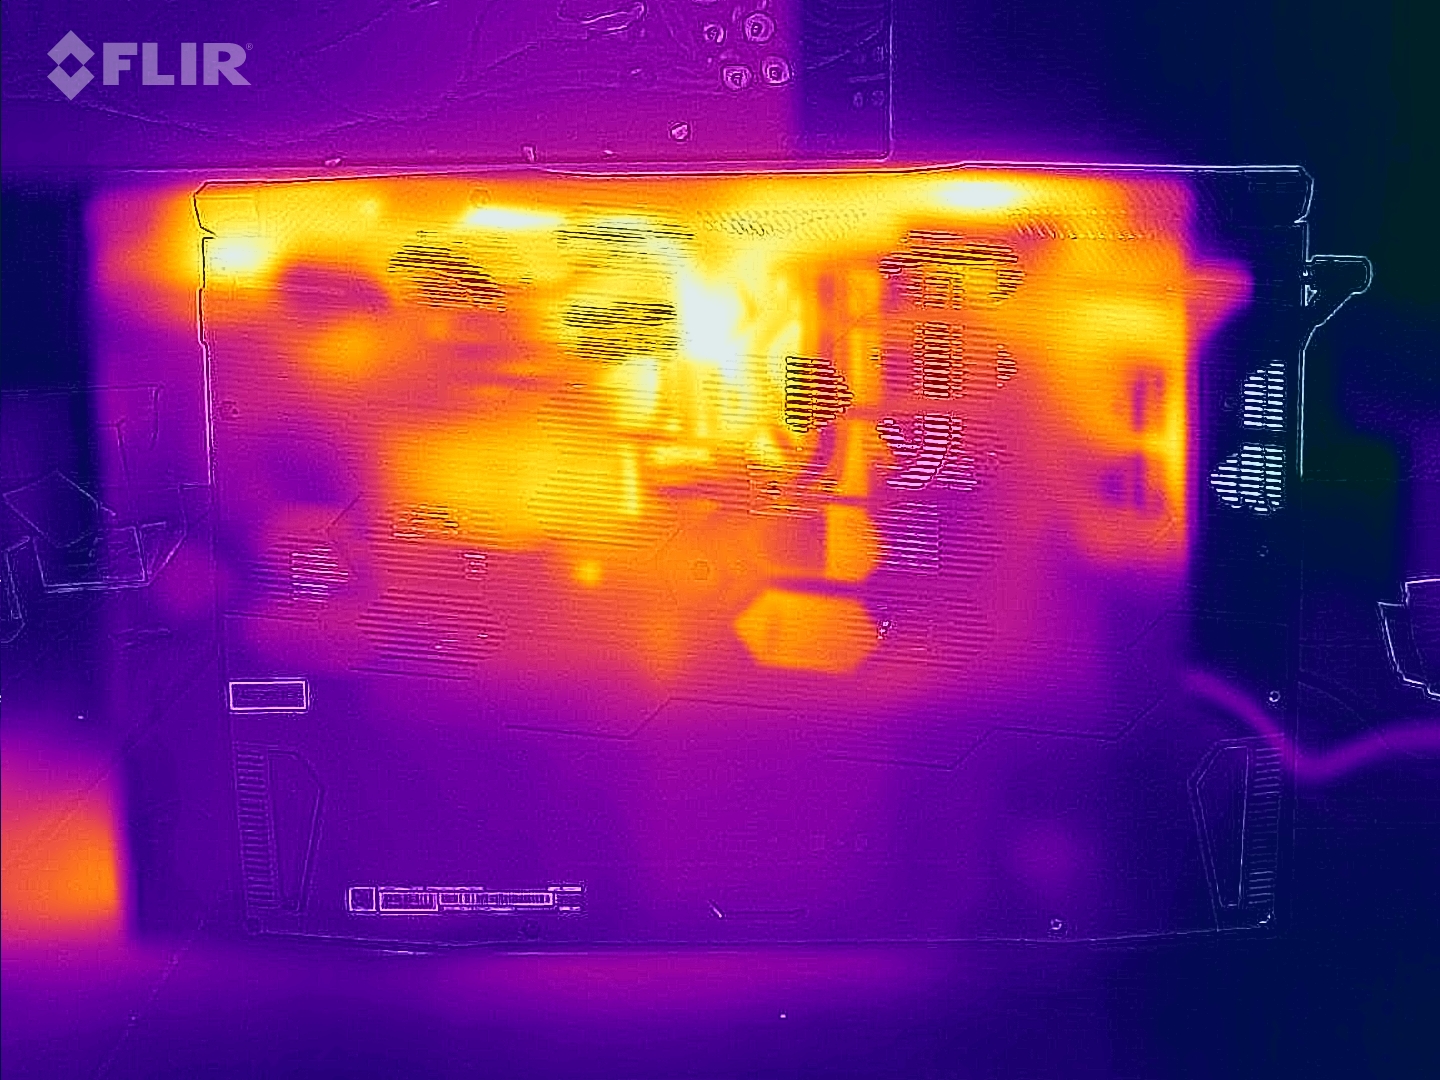
Al menos, las teclas WASD no alcanzan las temperaturas más altas del dispositivo durante la prueba de estrés, aunque los más de 50 °C que medimos aquí no son muy atractivos para largas sesiones de juego. Por otro lado, las altas temperaturas superficiales son un problema de muchos portátiles para juegos. Así que también para el MSI Katana GF66 se recomienda usar un teclado externo.
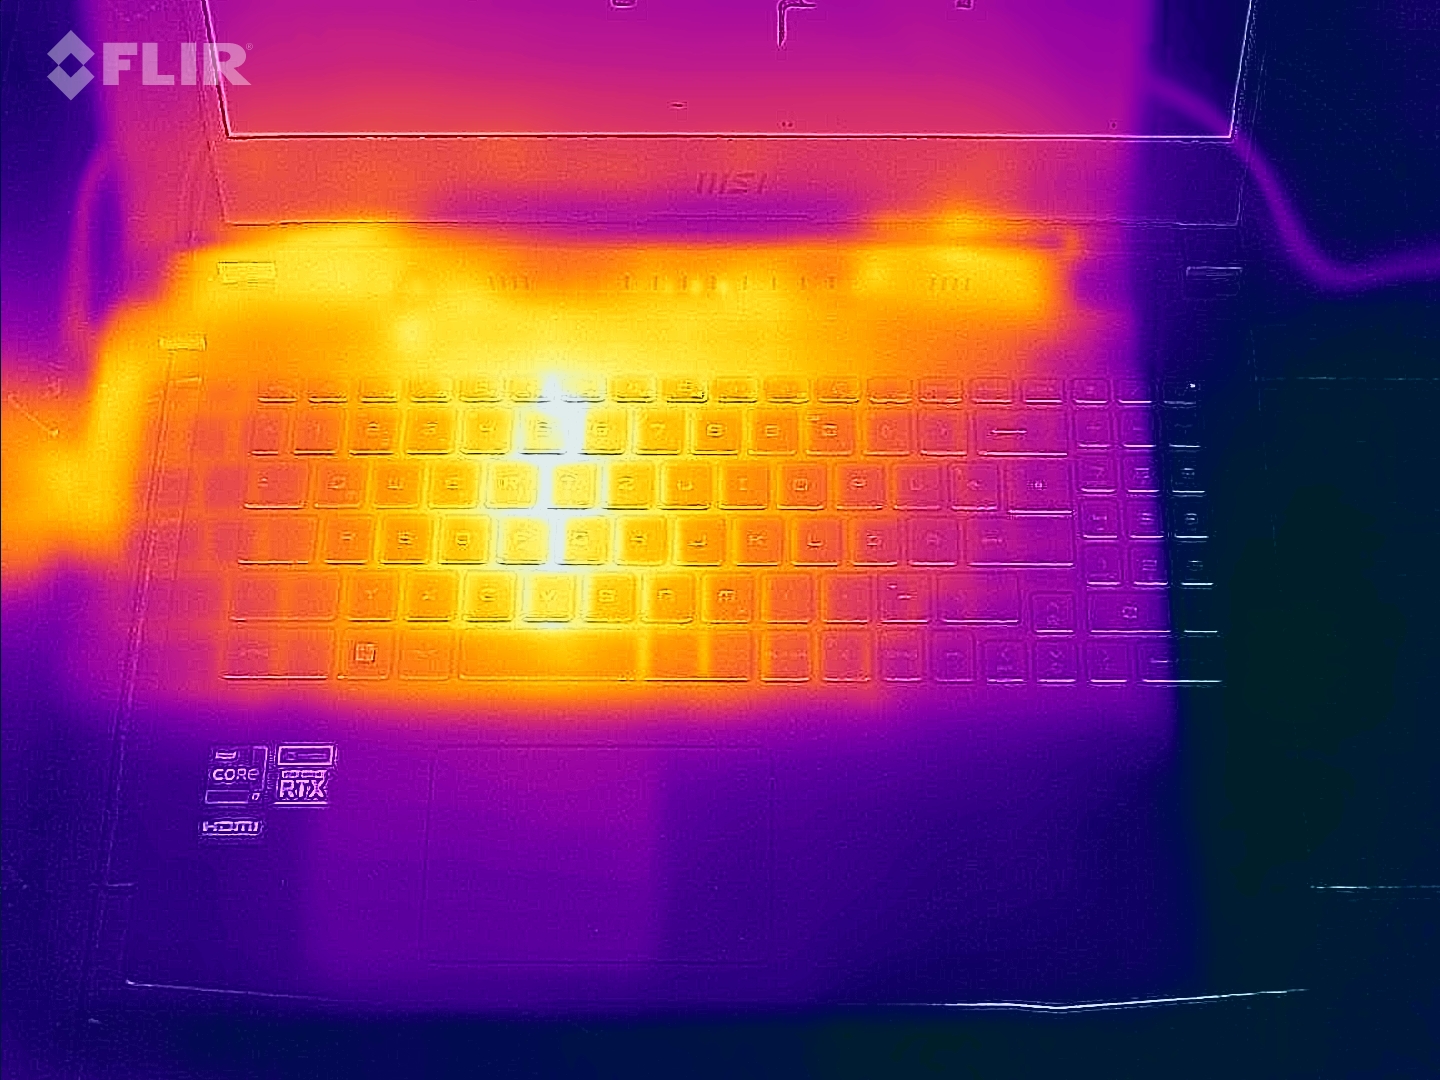
(-) La temperatura máxima en la parte superior es de 61 °C / 142 F, frente a la media de 40.4 °C / 105 F, que oscila entre 21.2 y 68.8 °C para la clase Gaming.
(-) El fondo se calienta hasta un máximo de 55 °C / 131 F, frente a la media de 43.2 °C / 110 F
(±) En reposo, la temperatura media de la parte superior es de 33.9 °C / 93# F, frente a la media del dispositivo de 33.9 °C / 93 F.
(-) Jugando a The Witcher 3, la temperatura media de la parte superior es de 46.8 °C / 116 F, frente a la media del dispositivo de 33.9 °C / 93 F.
(-) El reposamanos y el touchpad pueden calentarse mucho al tacto con un máximo de 43 °C / 109.4 F.
(-) La temperatura media de la zona del reposamanos de dispositivos similares fue de 28.8 °C / 83.8 F (-14.2 °C / -25.6 F).
| MSI Katana GF66 12UGS i7-12700H, GeForce RTX 3070 Ti Laptop GPU | MSI Katana GF66 11UG-220 i7-11800H, GeForce RTX 3070 Laptop GPU | MSI Katana GF76 12UGS i7-12700H, GeForce RTX 3070 Ti Laptop GPU | Asus TUF Gaming F15 FX507ZM i7-12700H, GeForce RTX 3060 Laptop GPU | Asus TUF Gaming A15 FA506QR-AZ061T R7 5800H, GeForce RTX 3070 Laptop GPU | Acer Nitro 5 AN515-58-72QR i7-12700H, GeForce RTX 3070 Ti Laptop GPU | Lenovo Legion 5 15ACH6A-82NW0010GE R5 5600H, Radeon RX 6600M | |
|---|---|---|---|---|---|---|---|
| Heat | 15% | 8% | 12% | 9% | 16% | 23% | |
| Maximum Upper Side * (°C) | 61 | 56 8% | 51 16% | 44.4 27% | 46.7 23% | 48 21% | 39.9 35% |
| Maximum Bottom * (°C) | 55 | 49 11% | 55 -0% | 48.8 11% | 55.9 -2% | 51 7% | 43.8 20% |
| Idle Upper Side * (°C) | 43 | 36 16% | 37 14% | 37.8 12% | 37.1 14% | 34 21% | 34.1 21% |
| Idle Bottom * (°C) | 38 | 28 26% | 38 -0% | 39.6 -4% | 38.1 -0% | 33 13% | 31.7 17% |
* ... más pequeño es mejor
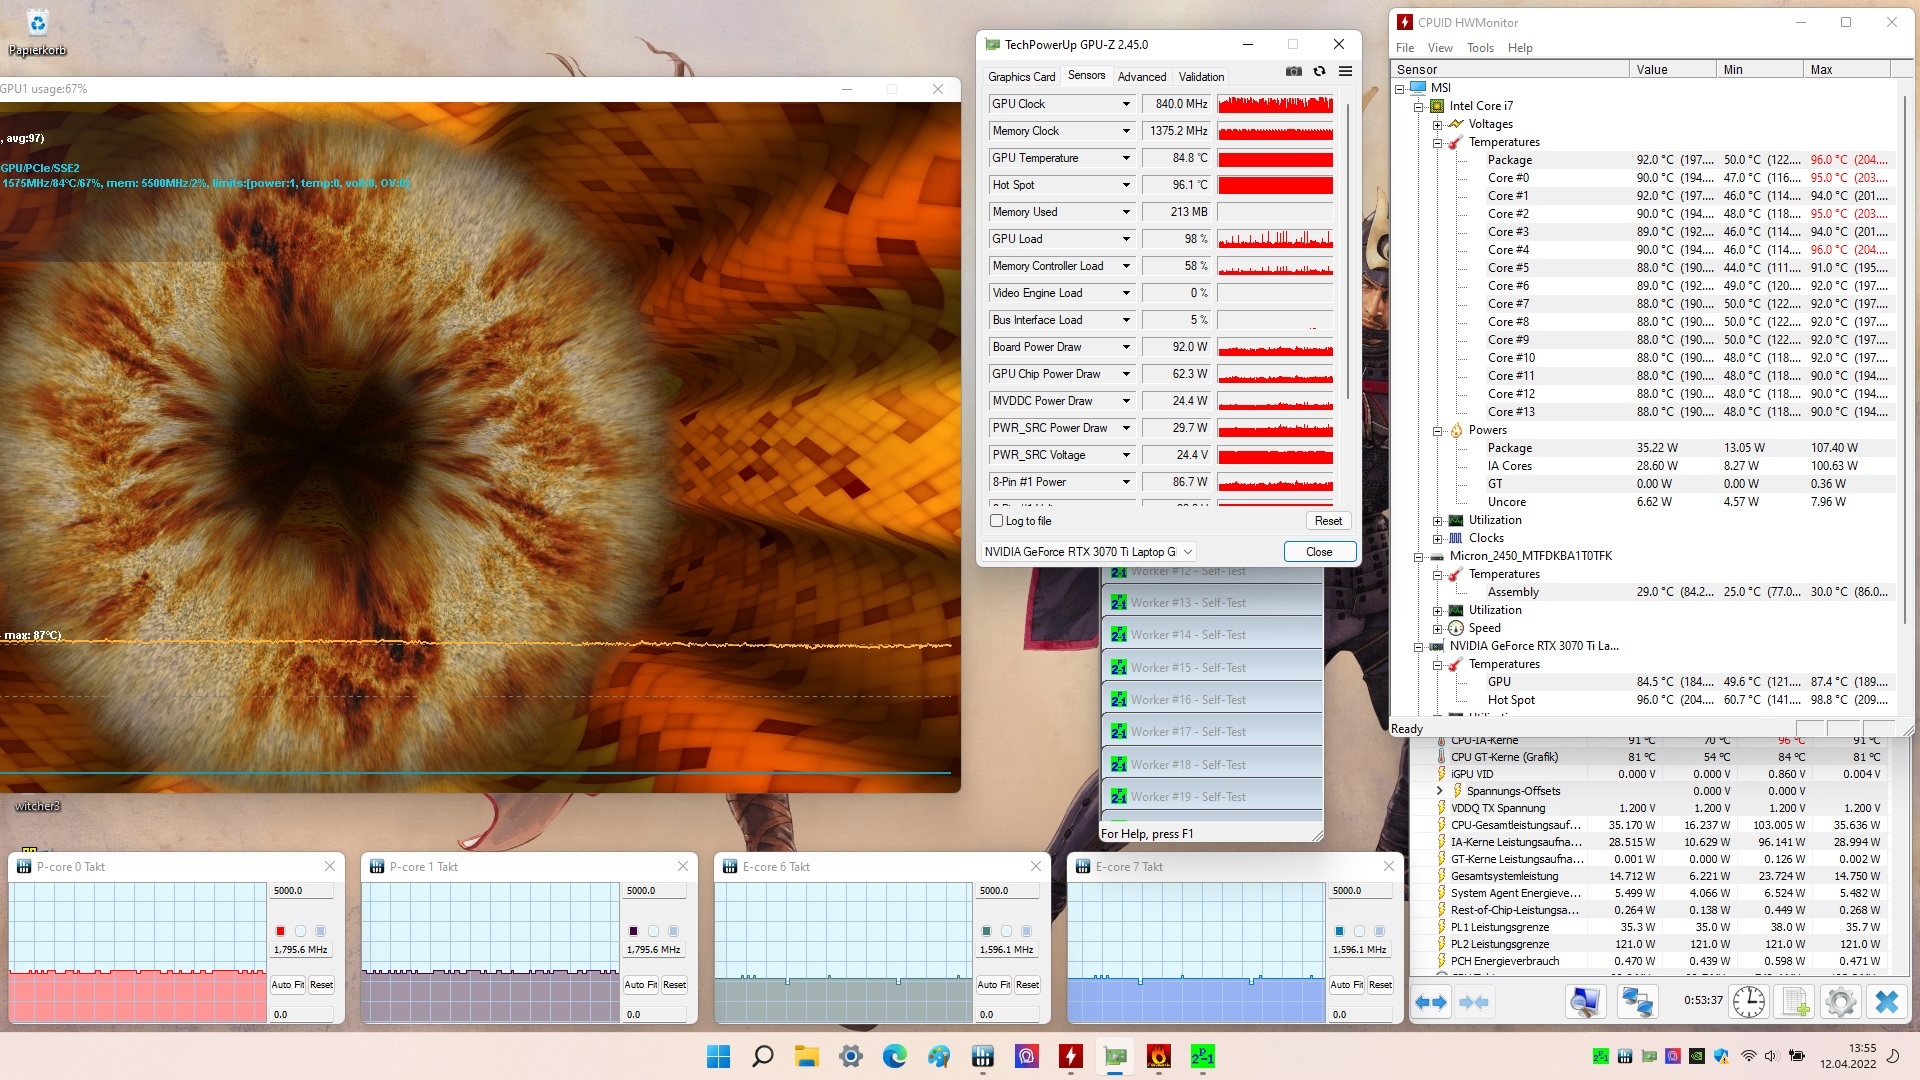
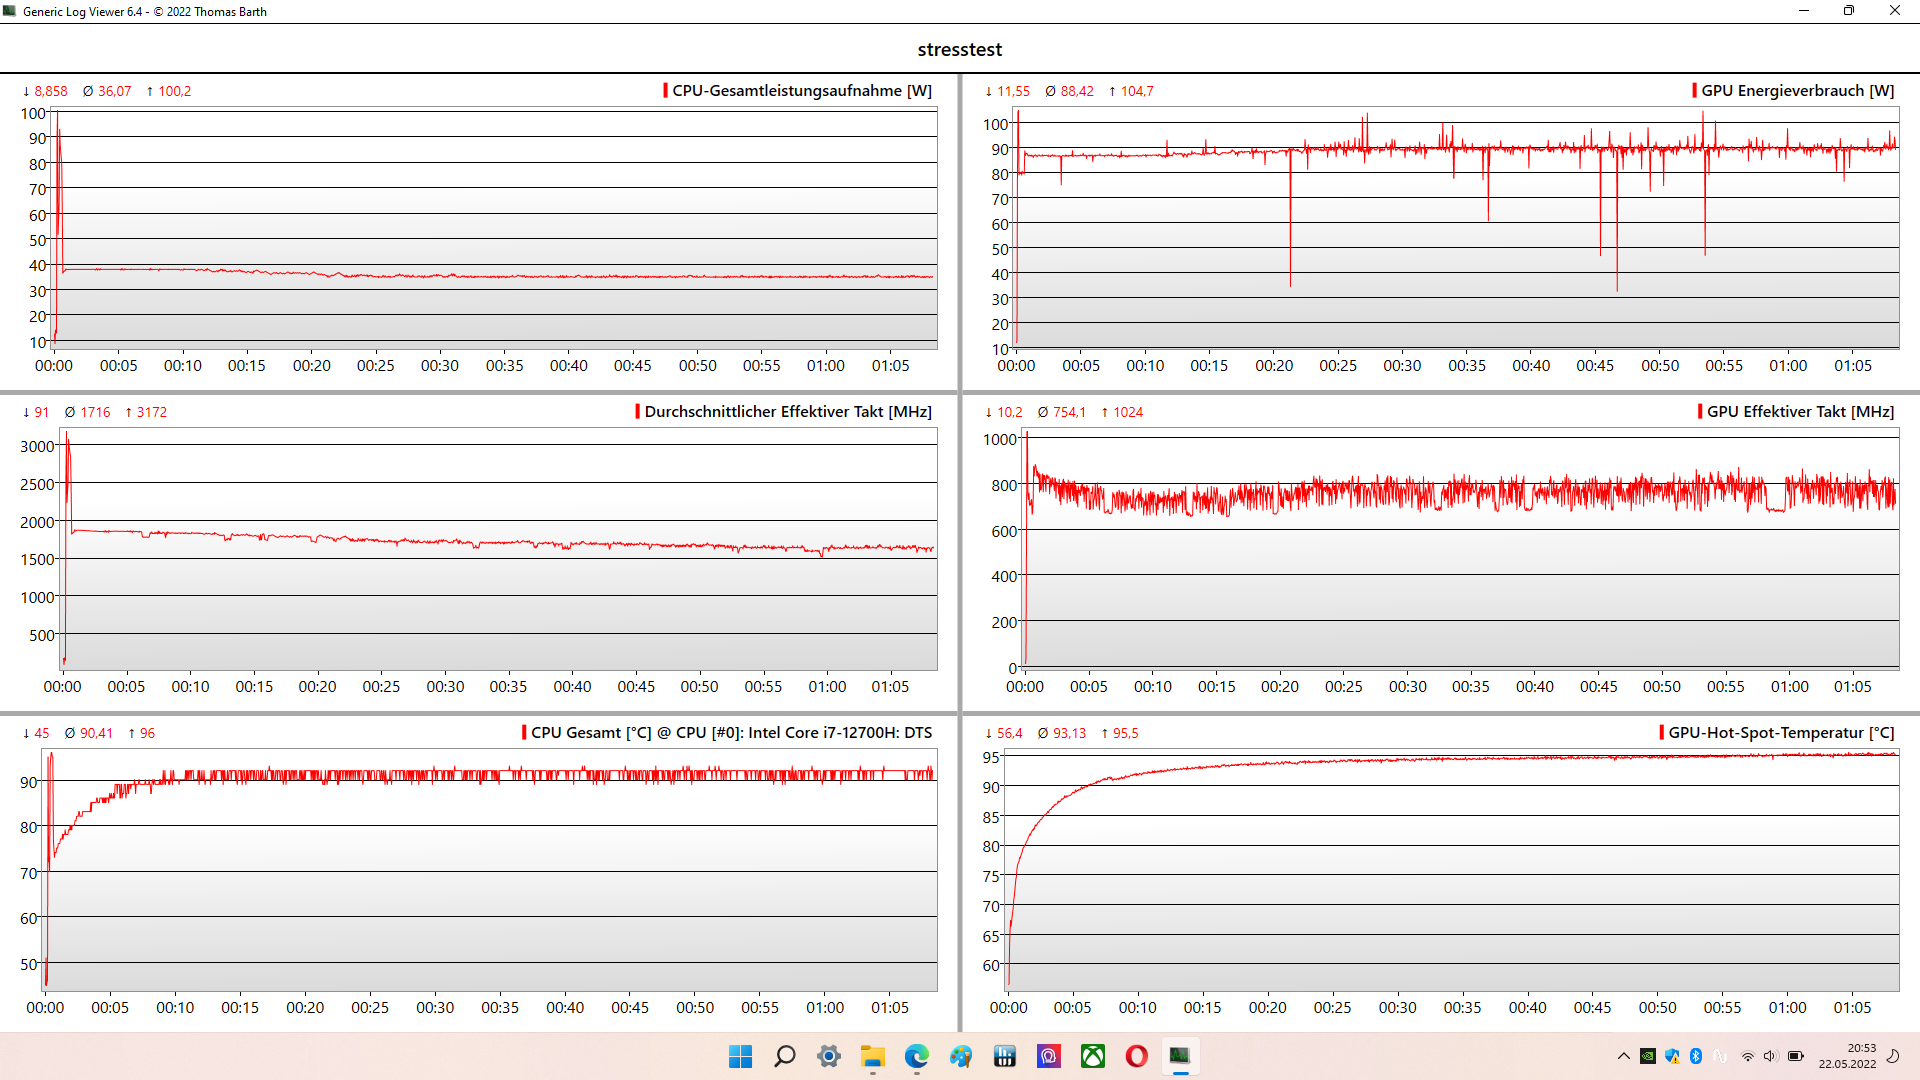
Prueba de esfuerzo
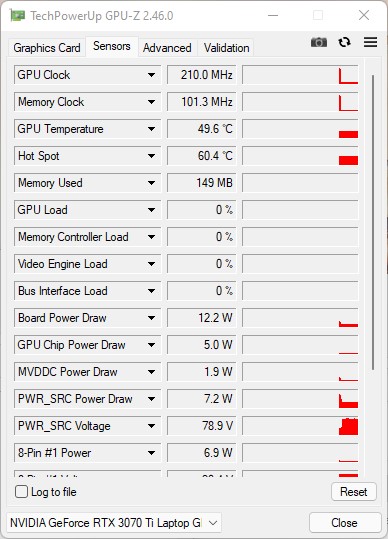
En un periodo de tiempo más largo, el consumo de la CPU durante la prueba de estrés es de 33 vatios, mientras que en los primeros 10 minutos de la prueba de estrés, aún es capaz de utilizar 45 vatios. Sin embargo, la CPU y la GPU simplemente cambian un poco el consumo común compartido, que se sitúa en torno a los 120 vatios. No notamos ningún problema significativo en las temperaturas de ambos chips. A 90 y 95 °C respectivamente (194 y 203 °F), ambos caen en un rango alto pero aún no crítico y pueden mantenerse de forma estable.
Altavoces
Un volumen máximo elevado y una buena reproducción general de la música y la voz garantizan una imagen sonora sólida. Podemos perdonar la ligera debilidad de los bajos del portátil. Una reducción del volumen asegura un sonido más equilibrado.
MSI Katana GF66 12UGS análisis de audio
(±) | la sonoridad del altavoz es media pero buena (80 dB)
Graves 100 - 315 Hz
(-) | casi sin bajos - de media 17.3% inferior a la mediana
(±) | la linealidad de los graves es media (9.9% delta a frecuencia anterior)
Medios 400 - 2000 Hz
(±) | medias más altas - de media 6.8% más altas que la mediana
(±) | la linealidad de los medios es media (8.3% delta respecto a la frecuencia anterior)
Altos 2 - 16 kHz
(+) | máximos equilibrados - a sólo 1.1% de la mediana
(+) | los máximos son lineales (4.2% delta a la frecuencia anterior)
Total 100 - 16.000 Hz
(±) | la linealidad del sonido global es media (16.5% de diferencia con la mediana)
En comparación con la misma clase
» 42% de todos los dispositivos probados de esta clase eran mejores, 7% similares, 51% peores
» El mejor tuvo un delta de 6%, la media fue 18%, el peor fue ###max##%
En comparación con todos los dispositivos probados
» 28% de todos los dispositivos probados eran mejores, 6% similares, 66% peores
» El mejor tuvo un delta de 4%, la media fue 23%, el peor fue ###max##%
Apple MacBook Pro 16 2021 M1 Pro análisis de audio
(+) | los altavoces pueden reproducir a un volumen relativamente alto (#84.7 dB)
Graves 100 - 315 Hz
(+) | buen bajo - sólo 3.8% lejos de la mediana
(+) | el bajo es lineal (5.2% delta a la frecuencia anterior)
Medios 400 - 2000 Hz
(+) | medios equilibrados - a sólo 1.3% de la mediana
(+) | los medios son lineales (2.1% delta a la frecuencia anterior)
Altos 2 - 16 kHz
(+) | máximos equilibrados - a sólo 1.9% de la mediana
(+) | los máximos son lineales (2.7% delta a la frecuencia anterior)
Total 100 - 16.000 Hz
(+) | el sonido global es lineal (4.6% de diferencia con la mediana)
En comparación con la misma clase
» 0% de todos los dispositivos probados de esta clase eran mejores, 0% similares, 100% peores
» El mejor tuvo un delta de 5%, la media fue 17%, el peor fue ###max##%
En comparación con todos los dispositivos probados
» 0% de todos los dispositivos probados eran mejores, 0% similares, 100% peores
» El mejor tuvo un delta de 4%, la media fue 23%, el peor fue ###max##%
Gestión de la energía - Una escasa duración de la batería
Consumo de energía
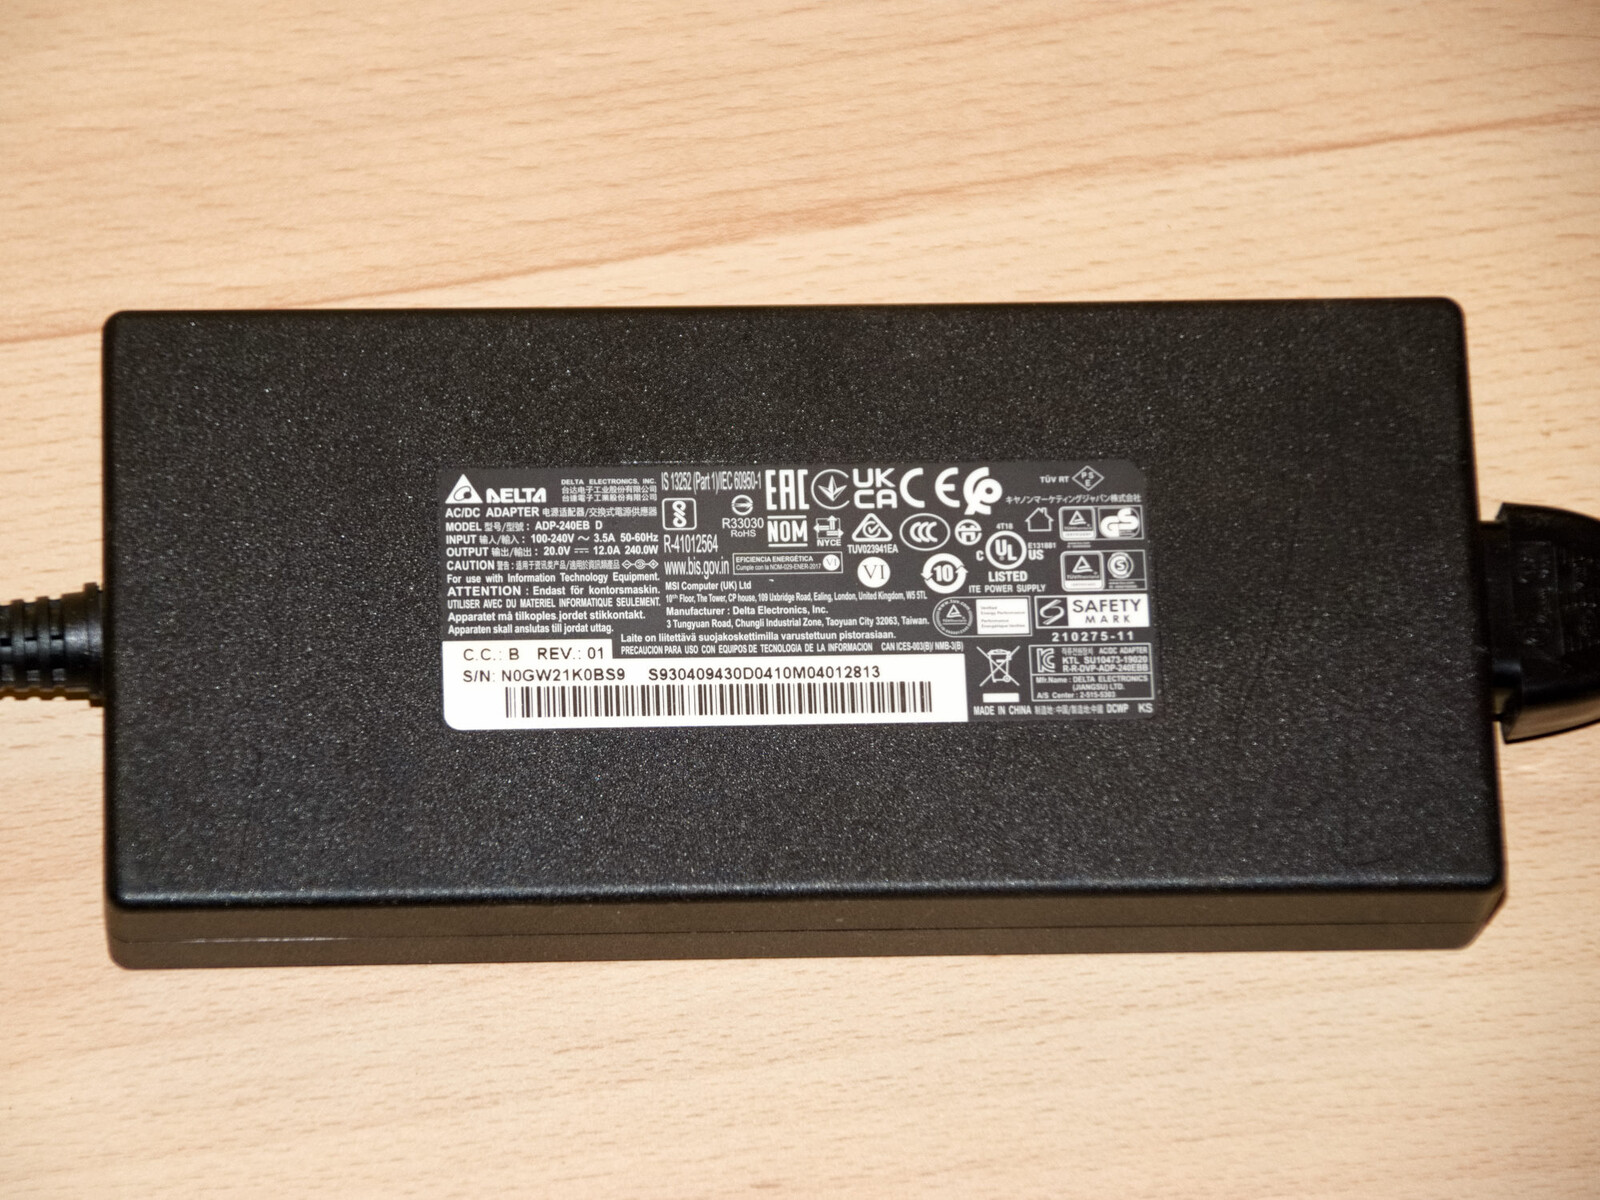
Mientras que la fuente de alimentación seguía teniendo un tamaño muy ajustado en el predecesor, MSI lo ha aumentado significativamente aquí y ha incluido una fuente de alimentación con un rendimiento adecuado de 240 vatios. Esto significa que el portátil para juegos no llegará a los límites de la fuente de alimentación incluso bajo carga máxima
En términos de consumo de energía, el portátil se encuentra en un nivel que está por debajo de la media de los portátiles para juegos.
| Off / Standby | |
| Ocioso | |
| Carga |
|
Clave:
min: | |
| MSI Katana GF66 12UGS i7-12700H, GeForce RTX 3070 Ti Laptop GPU | MSI Katana GF76 12UGS i7-12700H, GeForce RTX 3070 Ti Laptop GPU | Asus TUF Gaming F15 FX507ZM i7-12700H, GeForce RTX 3060 Laptop GPU | Asus TUF Gaming A15 FA506QR-AZ061T R7 5800H, GeForce RTX 3070 Laptop GPU | Acer Nitro 5 AN515-58-72QR i7-12700H, GeForce RTX 3070 Ti Laptop GPU | Lenovo Legion 5 15ACH6A-82NW0010GE R5 5600H, Radeon RX 6600M | Media de la clase Gaming | |
|---|---|---|---|---|---|---|---|
| Power Consumption | -19% | -4% | 1% | -12% | -13% | -29% | |
| Idle Minimum * (Watt) | 9 | 14.2 -58% | 6.3 30% | 10.2 -13% | 7 22% | 10 -11% | 13 ? -44% |
| Idle Average * (Watt) | 13 | 18 -38% | 9.8 25% | 12.8 2% | 15 -15% | 13.2 -2% | 19 ? -46% |
| Idle Maximum * (Watt) | 20 | 22 -10% | 26.5 -33% | 15 25% | 24 -20% | 15.6 22% | 24.6 ? -23% |
| Load Average * (Watt) | 100 | 98 2% | 103.8 -4% | 130 -30% | 124 -24% | 178 -78% | 110.7 ? -11% |
| Witcher 3 ultra * (Watt) | 149 | 159 -7% | 189 -27% | 137 8% | 195.1 -31% | 181 -21% | |
| Load Maximum * (Watt) | 212 | 219 -3% | 241.9 -14% | 184 13% | 220 -4% | 180 15% | 259 ? -22% |
* ... más pequeño es mejor
Power Consumption The Witcher 3 / Stress Test
{
Duración de la batería
Por otro lado, el MSI Katana GF66 12UGS tampoco es realmente eficiente. Por lo tanto, no es sorprendente que el portátil para juegos sólo ofrezca una corta duración de la batería. Sin embargo, la duración de la batería sigue estando dentro de un rango que es normal para los competidores de portátiles para juegos.
| MSI Katana GF66 12UGS i7-12700H, GeForce RTX 3070 Ti Laptop GPU, 52 Wh | MSI Katana GF76 12UGS i7-12700H, GeForce RTX 3070 Ti Laptop GPU, 53.5 Wh | Asus TUF Gaming F15 FX507ZM i7-12700H, GeForce RTX 3060 Laptop GPU, 90 Wh | Asus TUF Gaming A15 FA506QR-AZ061T R7 5800H, GeForce RTX 3070 Laptop GPU, 90 Wh | Acer Nitro 5 AN515-58-72QR i7-12700H, GeForce RTX 3070 Ti Laptop GPU, 57.5 Wh | Lenovo Legion 5 15ACH6A-82NW0010GE R5 5600H, Radeon RX 6600M, 80 Wh | Media de la clase Gaming | |
|---|---|---|---|---|---|---|---|
| Duración de Batería | 34% | 40% | 223% | 25% | 163% | 102% | |
| Reader / Idle (h) | 15.8 | 17.4 | 5.7 | 12.8 | 8.27 ? | ||
| WiFi v1.3 (h) | 2.4 | 3.7 54% | 4.8 100% | 11.4 375% | 3.9 63% | 9.2 283% | 7.11 ? 196% |
| Load (h) | 1.4 | 1.6 14% | 1.1 -21% | 2.4 71% | 1.2 -14% | 2 43% | 1.502 ? 7% |
| H.264 (h) | 3.3 | 4.7 | 8.32 ? |
Pro
Contra
Veredicto
MSI hizo mejoras en muchas áreas en el Katana GF66, mostrando incluso sin valores máximos en los límites de TDP configurados que el juego también se puede hacer relativamente asequible. Sin embargo, la Nvidia RTX 3070 Ti y el Intel Core i7-12700H siguen siendo una pequeña farsa. Este es otro caso en el que nos hubiera gustado que el fabricante nos diera especificaciones más claras sobre el TDP. Pero el verdadero problema para los jugadores exigentes es la mala pantalla. Con sus lentos tiempos de respuesta y su mala reproducción del color, la pantalla no es realmente adecuada al 100% para los juegos.
El MSI Katana GF66 12UGS es un portátil con una relación precio-rendimiento equilibrada, que ofrece una entrada bastante asequible en la clase superior de los juegos móviles.
Aunque la "espada de plástico" no puede brillar con los mejores equipos, es básicamente sólida. Los que no tengan demasiadas exigencias para un portátil de juegos encontrarán un buen compañero en este dispositivo. A pesar del TGP/TDP ligeramente limitado, la tarjeta gráfica y el procesador son muy potentes, lo que permite que el Katana GF66 12UGS cumpla su principal cometido como portátil para juegos.
Precio y disponibilidad
El MSI Katana GF66 está disponible en muchas configuraciones en Estados Unidos, la mayoría de ellas todavía con procesadores de 11ª generación. Una configuración con un procesador i7 de 12ª generación y la RTX 3050 Ti está actualmente disponible en Amazon por 1150 dólares y con un procesador i5 por 1130 dólares. Una configuración de gama más alta del GF76 está disponible en Amazon, por ejemplo, por 1960 dólares.
MSI Katana GF66 12UGS
- 05/31/2022 v7 (old)
Marc Herter
Price comparison

