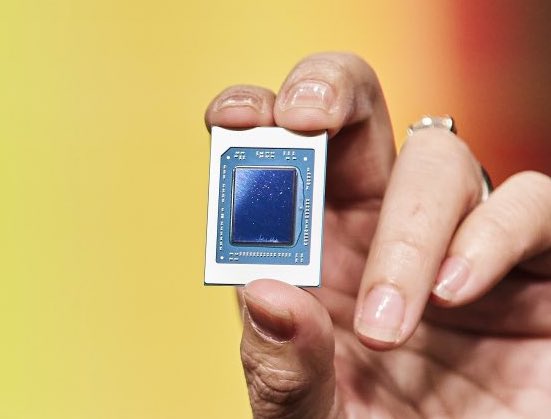
Análisis para el AMD Ryzen 7 6800H procesador
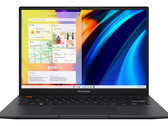
Análisis del portátil Asus VivoBook S15: la iGPU aumenta el rendimiento
Incluso sin una GPU dedicada, el VivoBook S15 consigue ofrecer un rendimiento que rivaliza con el de algunos portátiles para juegos de gama básica. Gracias a la pantalla OLED, está especialmente bien equipado para manejar trabajos de edición de fotos y vídeo. La máquina también es capaz de ofrecer un rendimiento asombrosamente bueno en otras áreas.
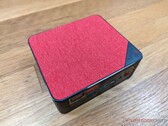
AMD Ryzen 7 6800H, Radeon 680M, 15.6", 1.9 kgAnálisis de Beelink SER6 Pro: La AMD Radeon 680M es impresionante en un mini PC
Por unos 650 dólares con almacenamiento y 32 GB de RAM, el Beelink SER6 Pro ofrece un gran rendimiento por dólar en comparación con los mini PC de la competencia. Su GPU, en particular, es una de las más rápidas entre las soluciones integradas.
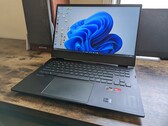
AMD Ryzen 7 6800H, Radeon 680M, 511 gAnálisis del Schenker XMG Core 15 M22: Gama media para juegos con conexión de agua
El Schenker XMG Core 15 es un portátil gaming compacto de gama media-alta con refrigeración externa por agua y una batería de larga duración para la clase. Además, el gamer también puede funcionar silenciosamente con refrigeración por aire, tiene una RTX 3060 con 140 W TGP y una pantalla WQHD de 165 Hz con gran capacidad de respuesta.
AMD Ryzen 7 6800H, NVIDIA GeForce RTX 3060 Laptop GPU, 15.6", 2.1 kgDebut del rendimiento de la Radeon RX 6650M: Análisis del portátil HP Omen 16 2022
El Omen 16 es uno de los pocos portátiles de 16 pulgadas para juegos que ofrece configuraciones totalmente AMD, incluyendo incluso la GPU Radeon RX 6650M, raramente evaluada. El rendimiento general es competitivo frente a las opciones convencionales de Nvidia, siempre que mantengas tus expectativas bajo control.
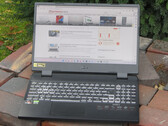
AMD Ryzen 7 6800H, Radeon RX 6650M, 16.1", 2.4 kgAnálisis de Acer Nitro 5 AN515-46: potente juego FHD con USB 4
El Nitro 5 destaca por su gran rendimiento en juegos y sus temperaturas comparativamente bajas. El portátil admite dos SSD PCIe-4 y cuenta con un puerto USB 4.
AMD Ryzen 7 6800H, NVIDIA GeForce RTX 3070 Ti Laptop GPU, 15.6", 2.5 kgLenovo Legion 5 Pro 16ARH7H RTX 3070 Ti: NVIDIA GeForce RTX 3070 Ti Laptop GPU, 16.00", 2.6 kg
análise » Análisis del portátil Lenovo Legion 5 Pro Gen 7: ¿Ryzen 7 6800H o Ryzen 9 6900HX?
Alienware m15 R7, 6800H RTX 3060: NVIDIA GeForce RTX 3060 Laptop GPU, 15.60", 2.7 kg
análise externo » Alienware m15 R7, 6800H RTX 3060
HP Omen 16-n0005ns: NVIDIA GeForce RTX 3060 Laptop GPU, 16.10", 2.3 kg
análise externo » HP Omen 16-n0005ns
Lenovo Legion 5 Pro 16ARH7H, R7 6800H RTX 3070: NVIDIA GeForce RTX 3070 Laptop GPU, 16.00", 2.5 kg
análise externo » Lenovo Legion 5 Pro 16ARH7H, R7 6800H RTX 3070
Asus VivoBook S14 OLED M3402RA: AMD Radeon 680M, 14.00", 1.4 kg
análise externo » Asus VivoBook S14 OLED M3402RA
HP Victus 16-e1021ns: NVIDIA GeForce RTX 3050 4GB Laptop GPU, 16.10", 2.5 kg
análise externo » HP Victus 16-e1021ns
Asus TUF Gaming A15 FA507RR-HQ008: NVIDIA GeForce RTX 3070 Laptop GPU, 15.60", 2.2 kg
análise externo » Asus TUF Gaming A15 FA507RR-HQ008
Origin PC EVO16-S, R7 6800H RX 6650M XT: AMD Radeon RX 6650M XT, 16.10", 2.3 kg
análise externo » Origin PC EVO16-S, R7 6800H RX 6650M XT
HP Omen 16-n0033dx: AMD Radeon RX 6650M, 16.10", 2.4 kg
análise externo » HP Omen 16-n0033dx
ADATA XPG Xenia 16 RX, R7 6800H RX 6650M XT: AMD Radeon RX 6650M XT, 16.10", 2.4 kg
análise externo » ADATA XPG Xenia 16 RX, R7 6800H RX 6650M XT
Acer Nitro 5 AN515-46-R74X: NVIDIA GeForce RTX 3060 Laptop GPU, 15.60", 2.5 kg
análise externo » Acer Nitro 5 AN515-46-R74X
Asus Vivobook S 16X M5602, R7 6800H: AMD Radeon 680M, 16.00", 1.9 kg
análise externo » Asus Vivobook S 16X M5602, R7 6800H
Asus TUF Gaming A17 FA707RE-HX030W: NVIDIA GeForce RTX 3050 Ti Laptop GPU, 17.30", 2.6 kg
análise externo » Asus TUF Gaming A17 FA707RE-HX030W
Asus Vivobook Pro 14 M6400, 6800H RTX 3050: NVIDIA GeForce RTX 3050 4GB Laptop GPU, 14.00", 1.5 kg
análise externo » Asus Vivobook Pro 14 M6400, 6800H RTX 3050
Asus TUF Gaming A15 FA507RM-ES73: NVIDIA GeForce RTX 3060 Laptop GPU, 15.60", 2.2 kg
análise externo » Asus TUF Gaming A15 FA507RM-ES73
Lenovo Legion 5 Pro 16ARH7H RTX 3070 Ti: NVIDIA GeForce RTX 3070 Ti Laptop GPU, 16.00", 2.6 kg
análise externo » Lenovo Legion 5 Pro 16ARH7H RTX 3070 Ti
Asus ROG Strix G15 G513RM-HQ261: NVIDIA GeForce RTX 3060 Laptop GPU, 15.60", 2.3 kg
análise externo » Asus ROG Strix G15 G513RM-HQ261
HP Omen 16-n0000ns: NVIDIA GeForce RTX 3050 Ti Laptop GPU, 16.10", 2.3 kg
análise externo » HP Omen 16-n0000ns
Acer Nitro 5 AN517-42-R5A1: NVIDIA GeForce RTX 3060 Laptop GPU, 17.30", 3 kg
análise externo » Acer Nitro 5 AN517-42-R5A1
Lenovo Ideapad Gaming 3 15ARH7-82SB0073GE: NVIDIA GeForce RTX 3050 Ti Laptop GPU, 15.60", 2.3 kg
análise externo » Lenovo Ideapad Gaming 3 15ARH7-82SB0073GE
Asus TUF Gaming A15 FA507RM-HN003: NVIDIA GeForce RTX 3060 Laptop GPU, 15.60", 2.2 kg
análise externo » Asus TUF Gaming A15 FA507RM-HN003
Lenovo Legion 7 16ARHA7-82UH0008GE: AMD Radeon RX 6850M XT, 16.00", 2.5 kg
análise externo » Lenovo Legion 7 16ARHA7-82UH0008GE
Acer Nitro 5 AN515-46-R606: NVIDIA GeForce RTX 3070 Ti Laptop GPU, 15.60", 2.5 kg
análise externo » Acer Nitro 5 AN515-46-R606
HP Victus 16-e1007ns: NVIDIA GeForce RTX 3050 4GB Laptop GPU, 16.10", 2.5 kg
análise externo » HP Victus 16-e1007ns
Asus TUF Gaming A15 FA507RR-HN003: NVIDIA GeForce RTX 3070 Laptop GPU, 15.60", 2.2 kg
análise externo » Asus TUF Gaming A15 FA507RR-HN003
Lenovo Legion 5 15ARH7H-82RD001LGE: NVIDIA GeForce RTX 3060 Laptop GPU, 15.60", 2.4 kg
análise externo » Lenovo Legion 5 15ARH7H-82RD001LGE
Lenovo Legion 5 Pro 16 G7 AMD 82RG001GUS: NVIDIA GeForce RTX 3060 Laptop GPU, 16.00", 2.5 kg
análise externo » Lenovo Legion 5 Pro 16 G7 AMD 82RG001GUS
HP Victus 16-e1085cl: NVIDIA GeForce RTX 3050 Ti Laptop GPU, 16.10", 2.5 kg
análise externo » HP Victus 16-e1085cl
Xiaomi RedmiBook Pro 15 2022, R7 6800H: AMD Radeon 680M, 15.60", 1.8 kg
análise externo » Xiaomi RedmiBook Pro 15 2022, R7 6800H
HP Omen 16-n0023dx: NVIDIA GeForce RTX 3060 Laptop GPU, 16.10", 2.4 kg
análise externo » HP Omen 16-n0023dx
Asus TUF Gaming A15 FA507RR-HQ083W: NVIDIA GeForce RTX 3060 Ti, 16.00", 2.2 kg
análise externo » Asus TUF Gaming A15 FA507RR-HQ083W
Lenovo Legion 7 16ARHA7-82UH0006GE: AMD Radeon RX 6700M, 16.00", 2.5 kg
análise externo » Lenovo Legion 7 16ARHA7-82UH0006GE
Asus ROG Strix G15 G513RM-HQ003W: NVIDIA GeForce RTX 3060 Laptop GPU, 15.60", 2.3 kg
análise externo » Asus ROG Strix G15 G513RM-HQ003W
Asus TUF Gaming A15 FA507RM-HQ028W: NVIDIA GeForce RTX 3060 Laptop GPU, 15.60", 2.2 kg
análise externo » Asus TUF Gaming A15 FA507RM-HQ028W
Asus TUF Gaming A15 FA507RR-HQ007W: NVIDIA GeForce RTX 3070 Laptop GPU, 15.60", 2.2 kg
análise externo » Asus TUF Gaming A15 FA507RR-HQ007W
Asus TUF Gaming A17 FA707RR: NVIDIA GeForce RTX 3070 Laptop GPU, 17.30", 2.6 kg
análise externo » Asus TUF Gaming A17 FA707RR
Asus ROG Strix G17 G713RM-KH093W: NVIDIA GeForce RTX 3060 Laptop GPU, 17.30", 2.8 kg
análise externo » Asus ROG Strix G17 G713RM-KH093W
Asus ROG Strix G15 G513RC: NVIDIA GeForce RTX 3050 4GB Laptop GPU, 15.60", 2.1 kg
análise externo » Asus ROG Strix G15 G513RC
Acer Nitro 5 AN515-58, R7 6800H RTX 3060: NVIDIA GeForce RTX 3060 Laptop GPU, 15.60", 2 kg
análise externo » Acer Nitro 5 AN515-58, R7 6800H RTX 3060
Asus VivoBook S15 M3502RA-L1029W: AMD Radeon 680M, 15.60", 1.9 kg
» Multimedia sin GPU dedicada: Asus VivoBook S15 ofrece un gran rendimiento gráfico
Lenovo Legion 5 Pro 16ARH7H RTX 3070 Ti: NVIDIA GeForce RTX 3070 Ti Laptop GPU, 16.00", 2.6 kg
» El Ryzen 9 6900HX es un desperdicio de dinero en comparación con el Ryzen 7 6800H y los benchmarks son la prueba