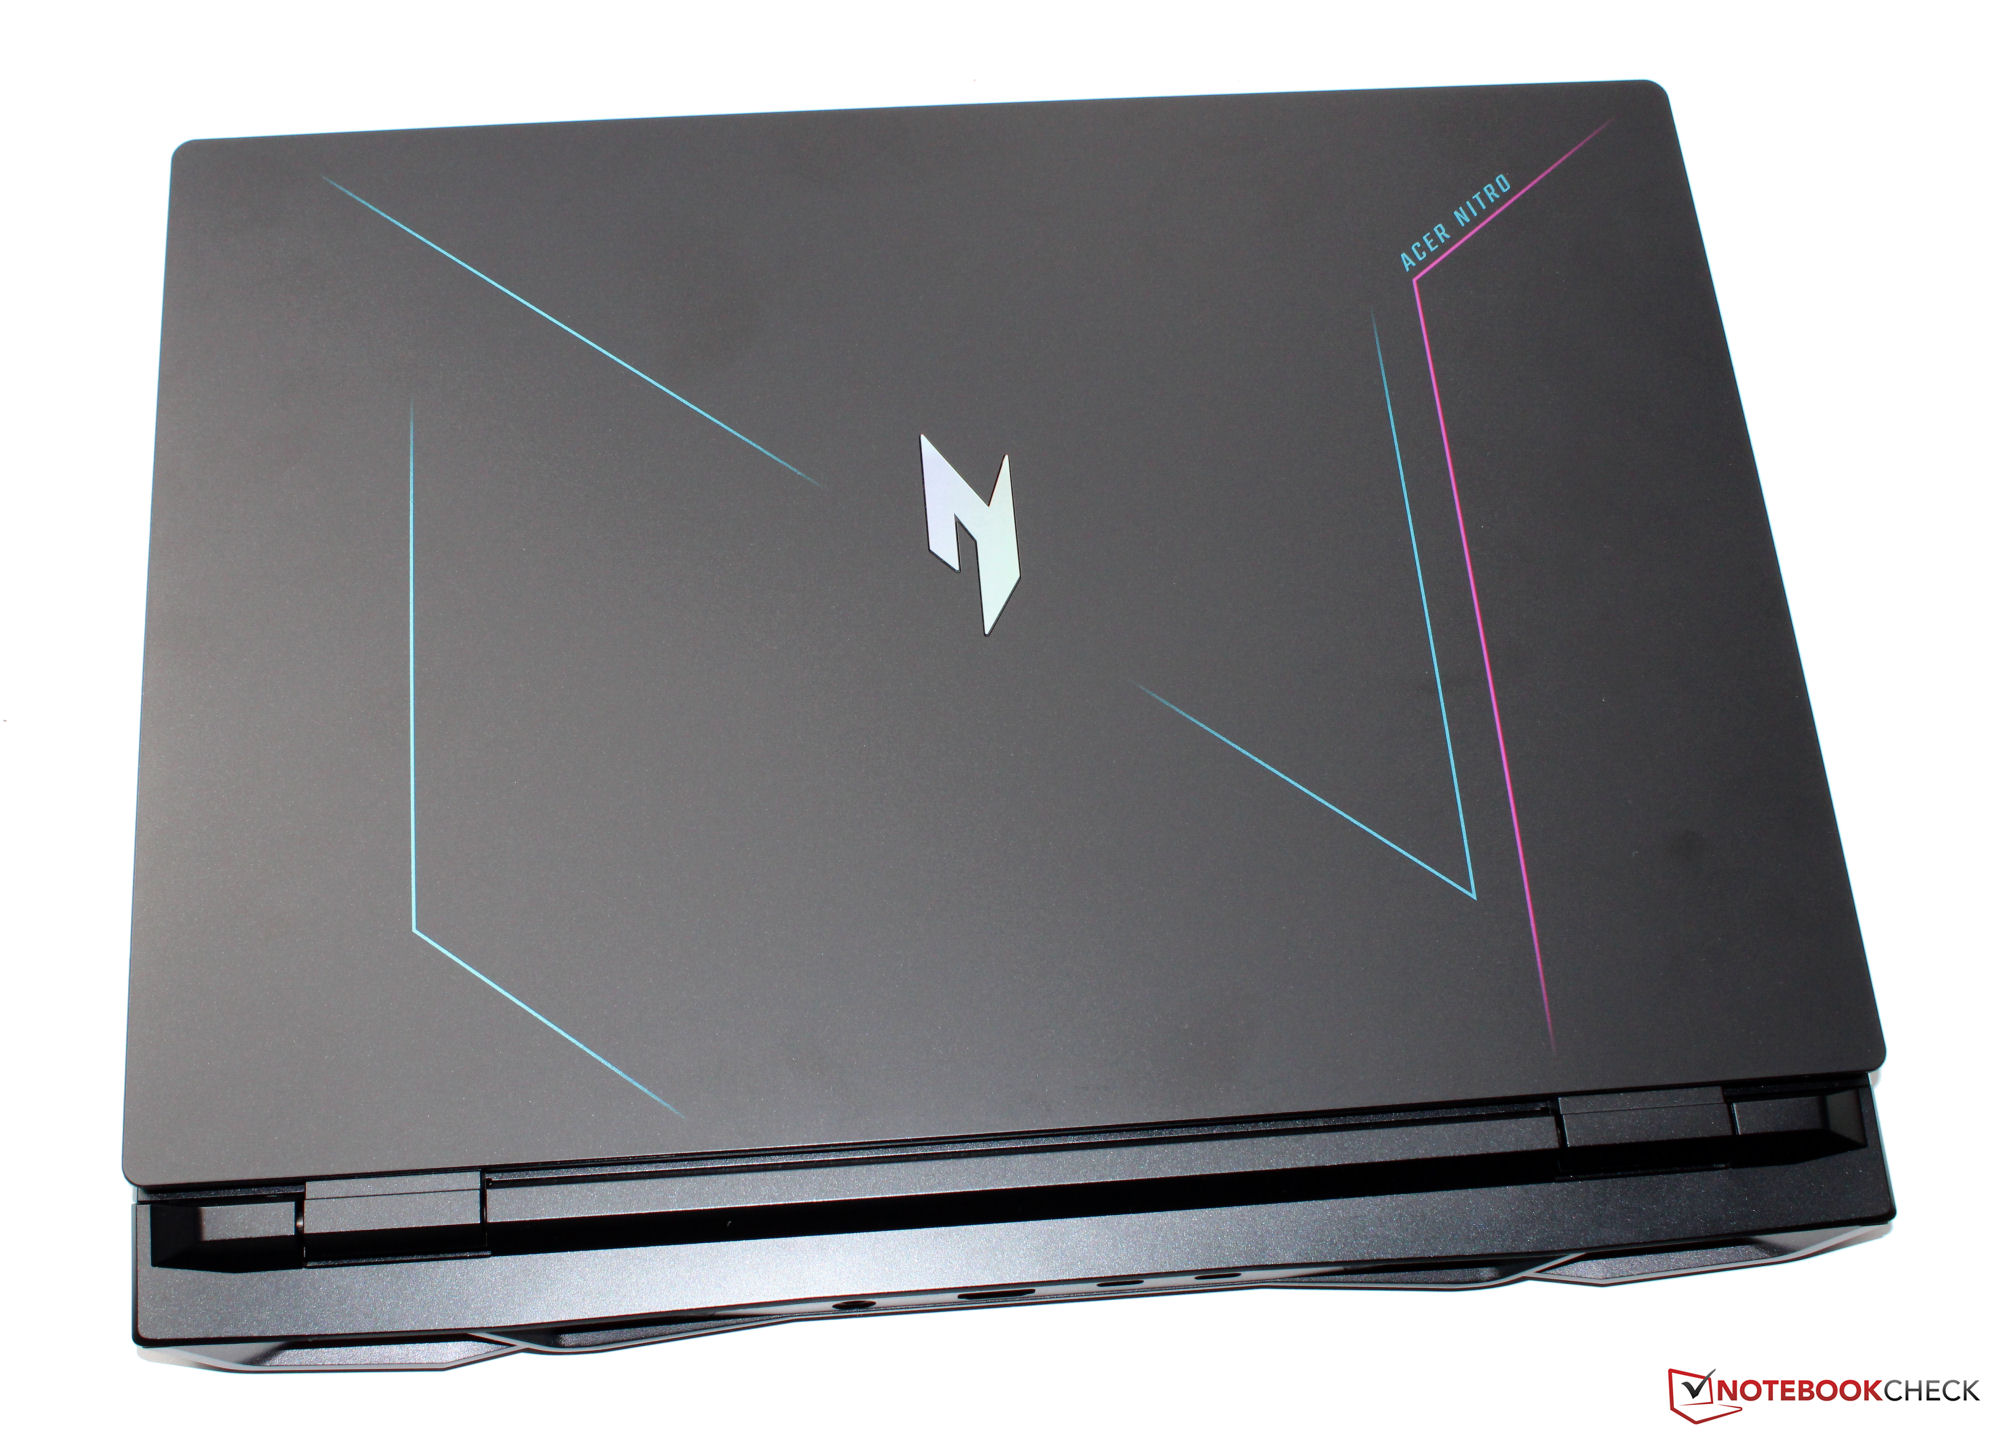
Análisis del Acer Nitro 16 AN16-41: Portátil gaming asequible con RTX 4050 y larga autonomía
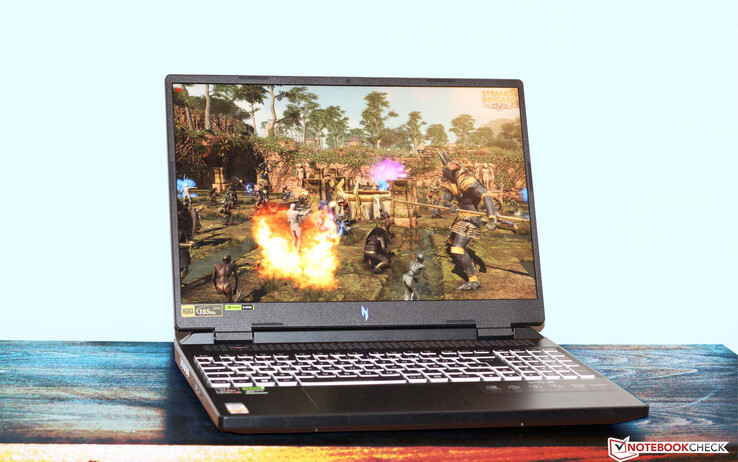
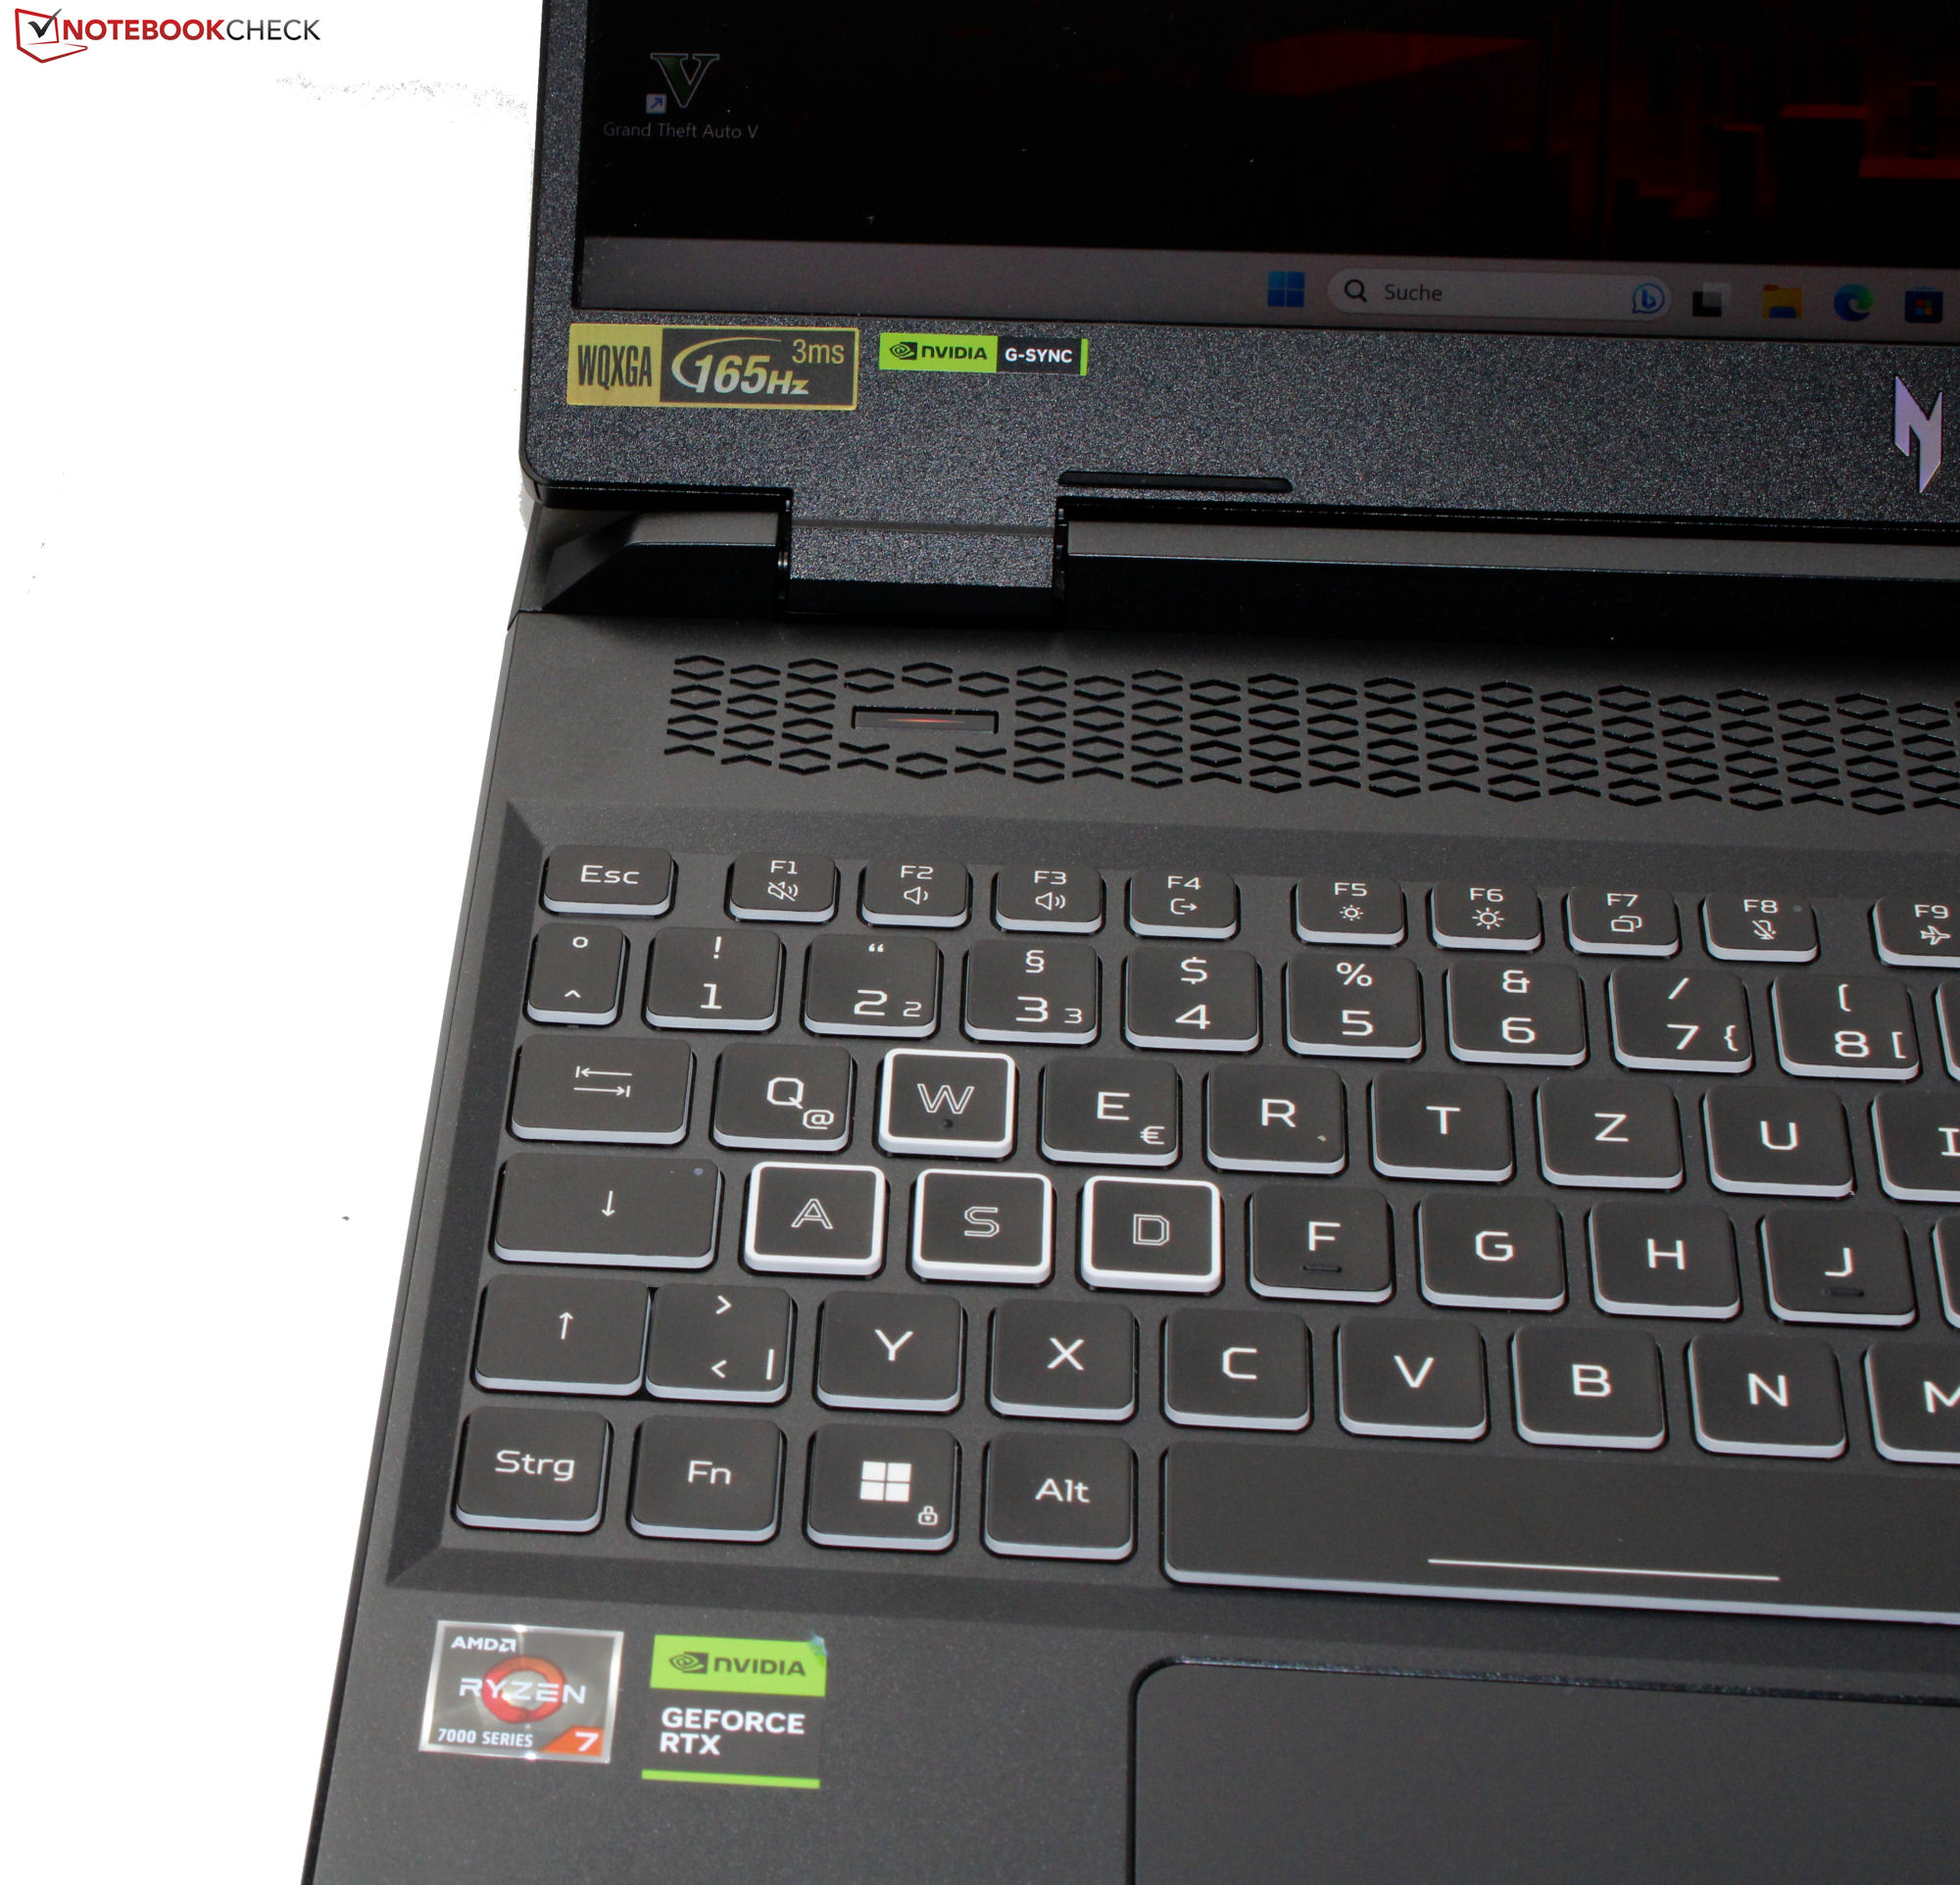
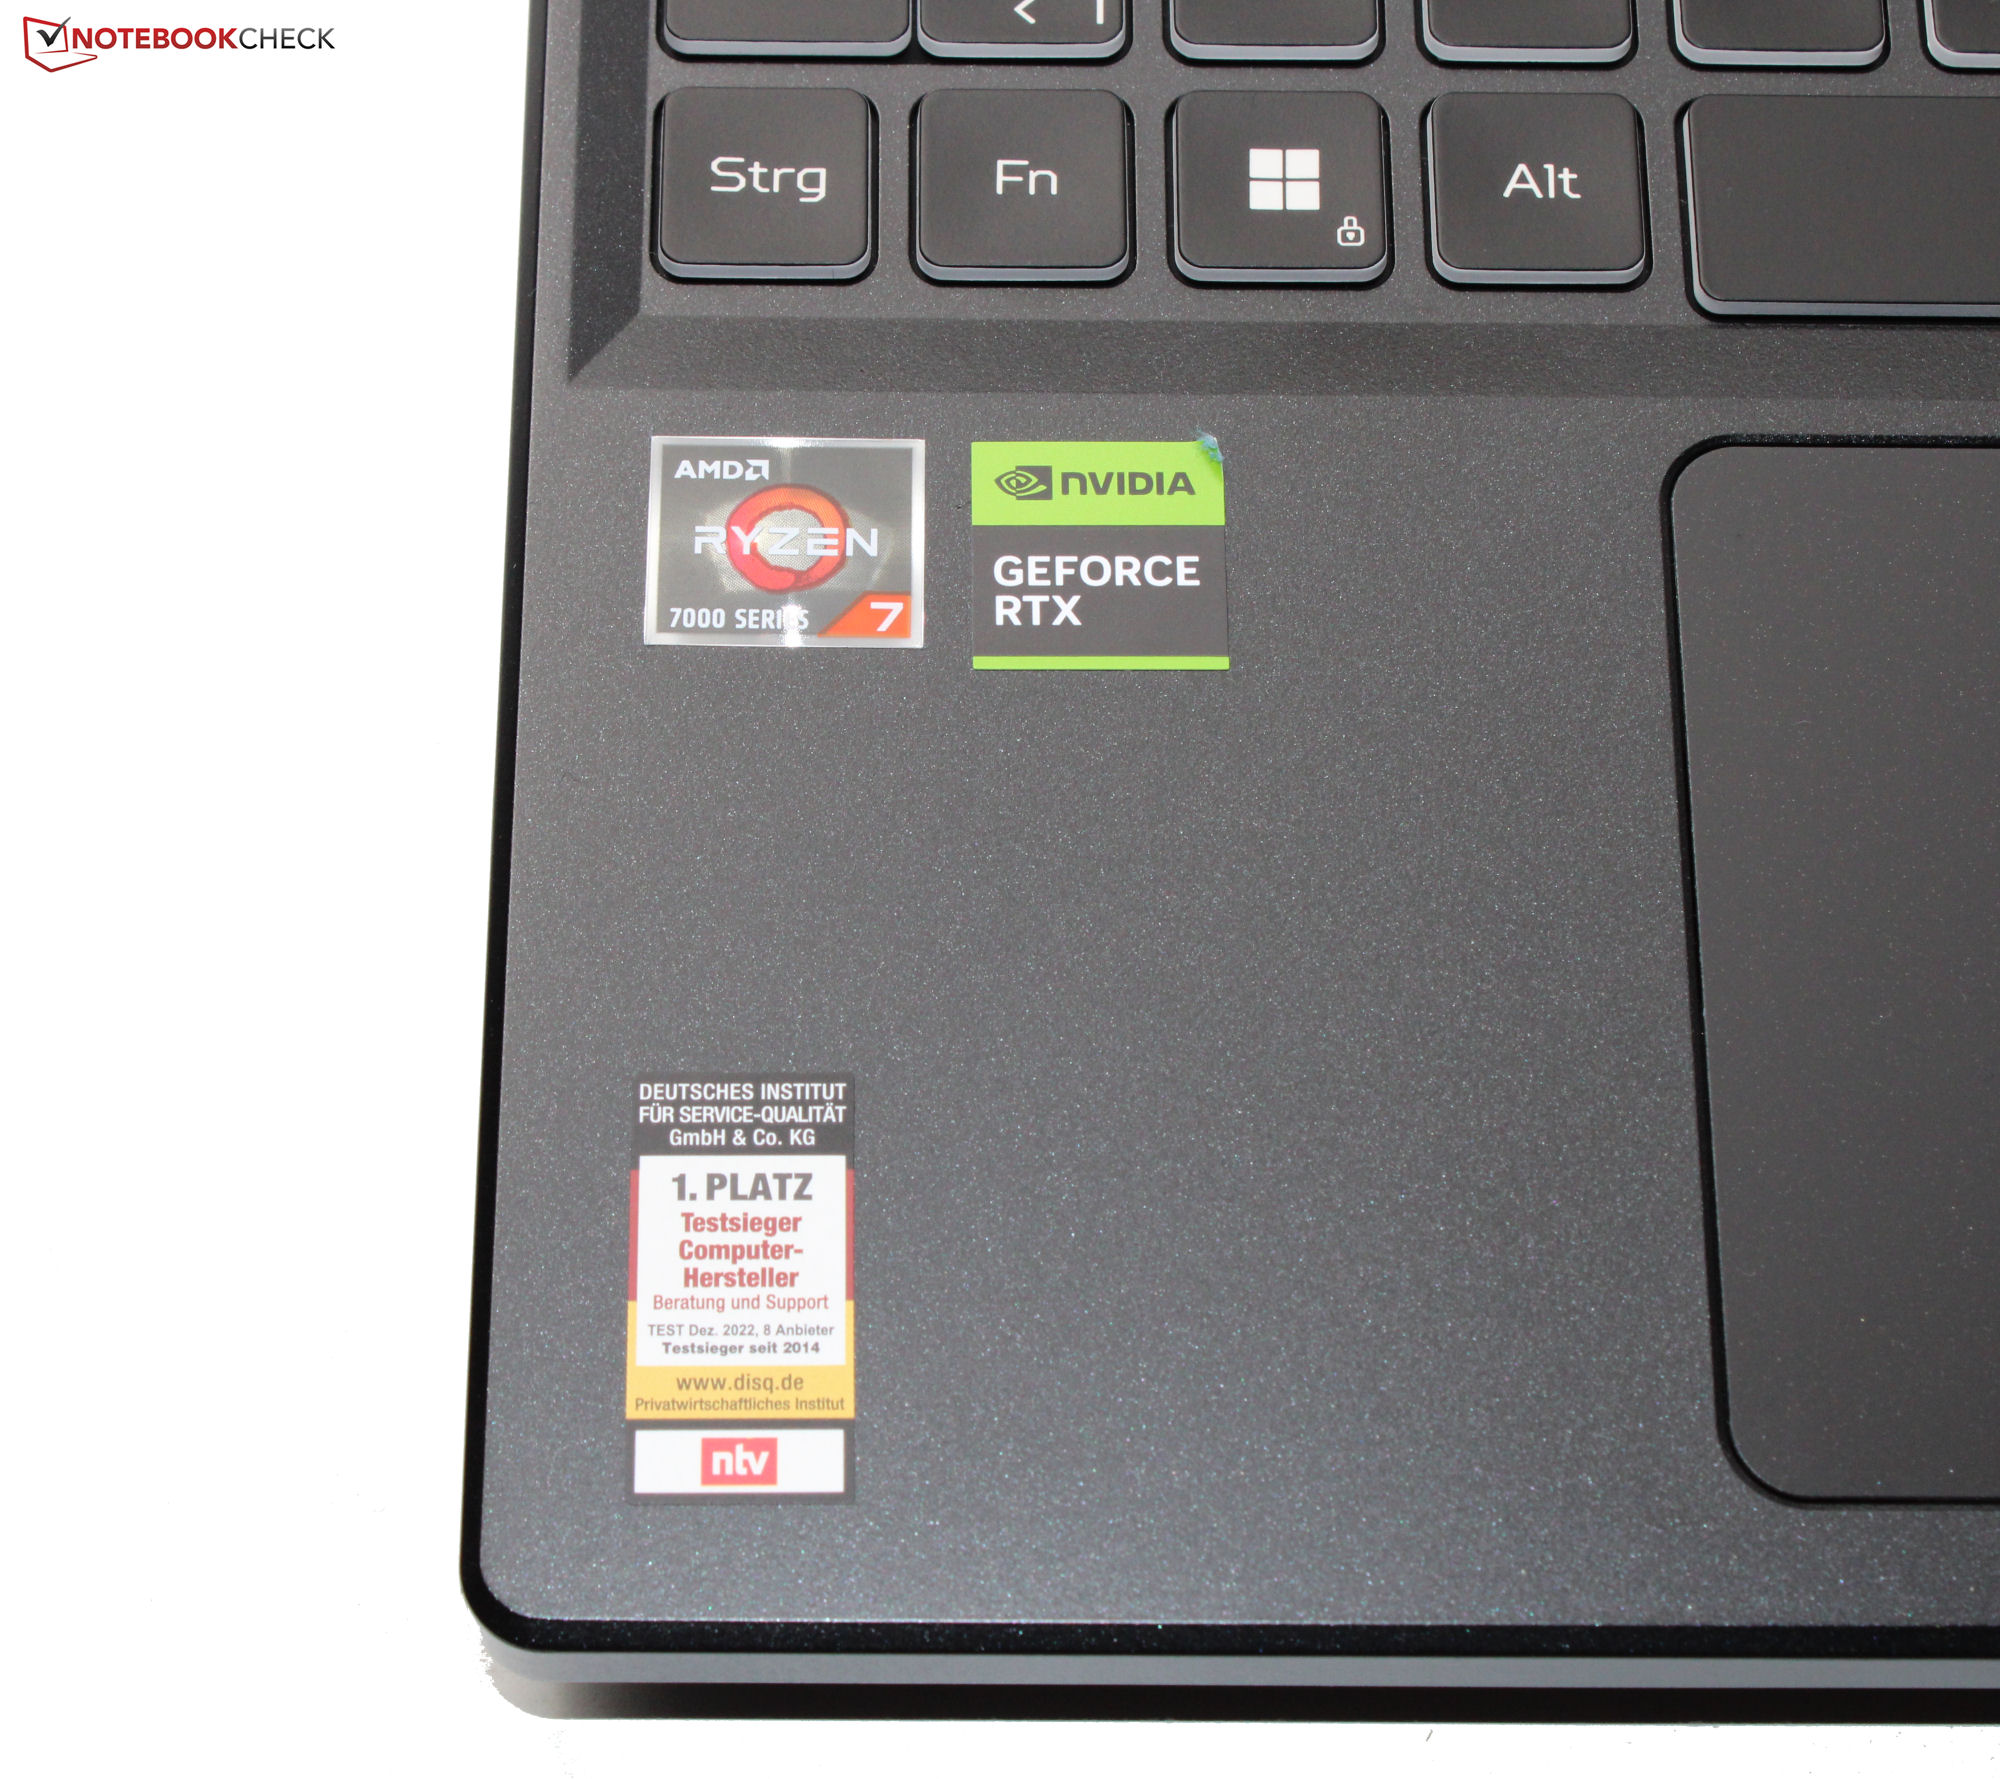
Con un precio de poco menos de 1.250 euros, la configuración actual del Acer Nitro 16 pertenece al segmento de portátiles para juegos de precio más bajo. Nuestra unidad Nitro 16 está alimentada por un AMD Ryzen 5 7535HS Y una GPU Nvidia GeForce RTX 4050 para portátiles.
La competencia incluye dispositivos como el Asus TUF Gaming A16 FA617XS, Schenker XMG Focus 15 (E23), Gigabyte G7 KE, Asus TUF A15 FA507y el Medion Erazer Scout E20.
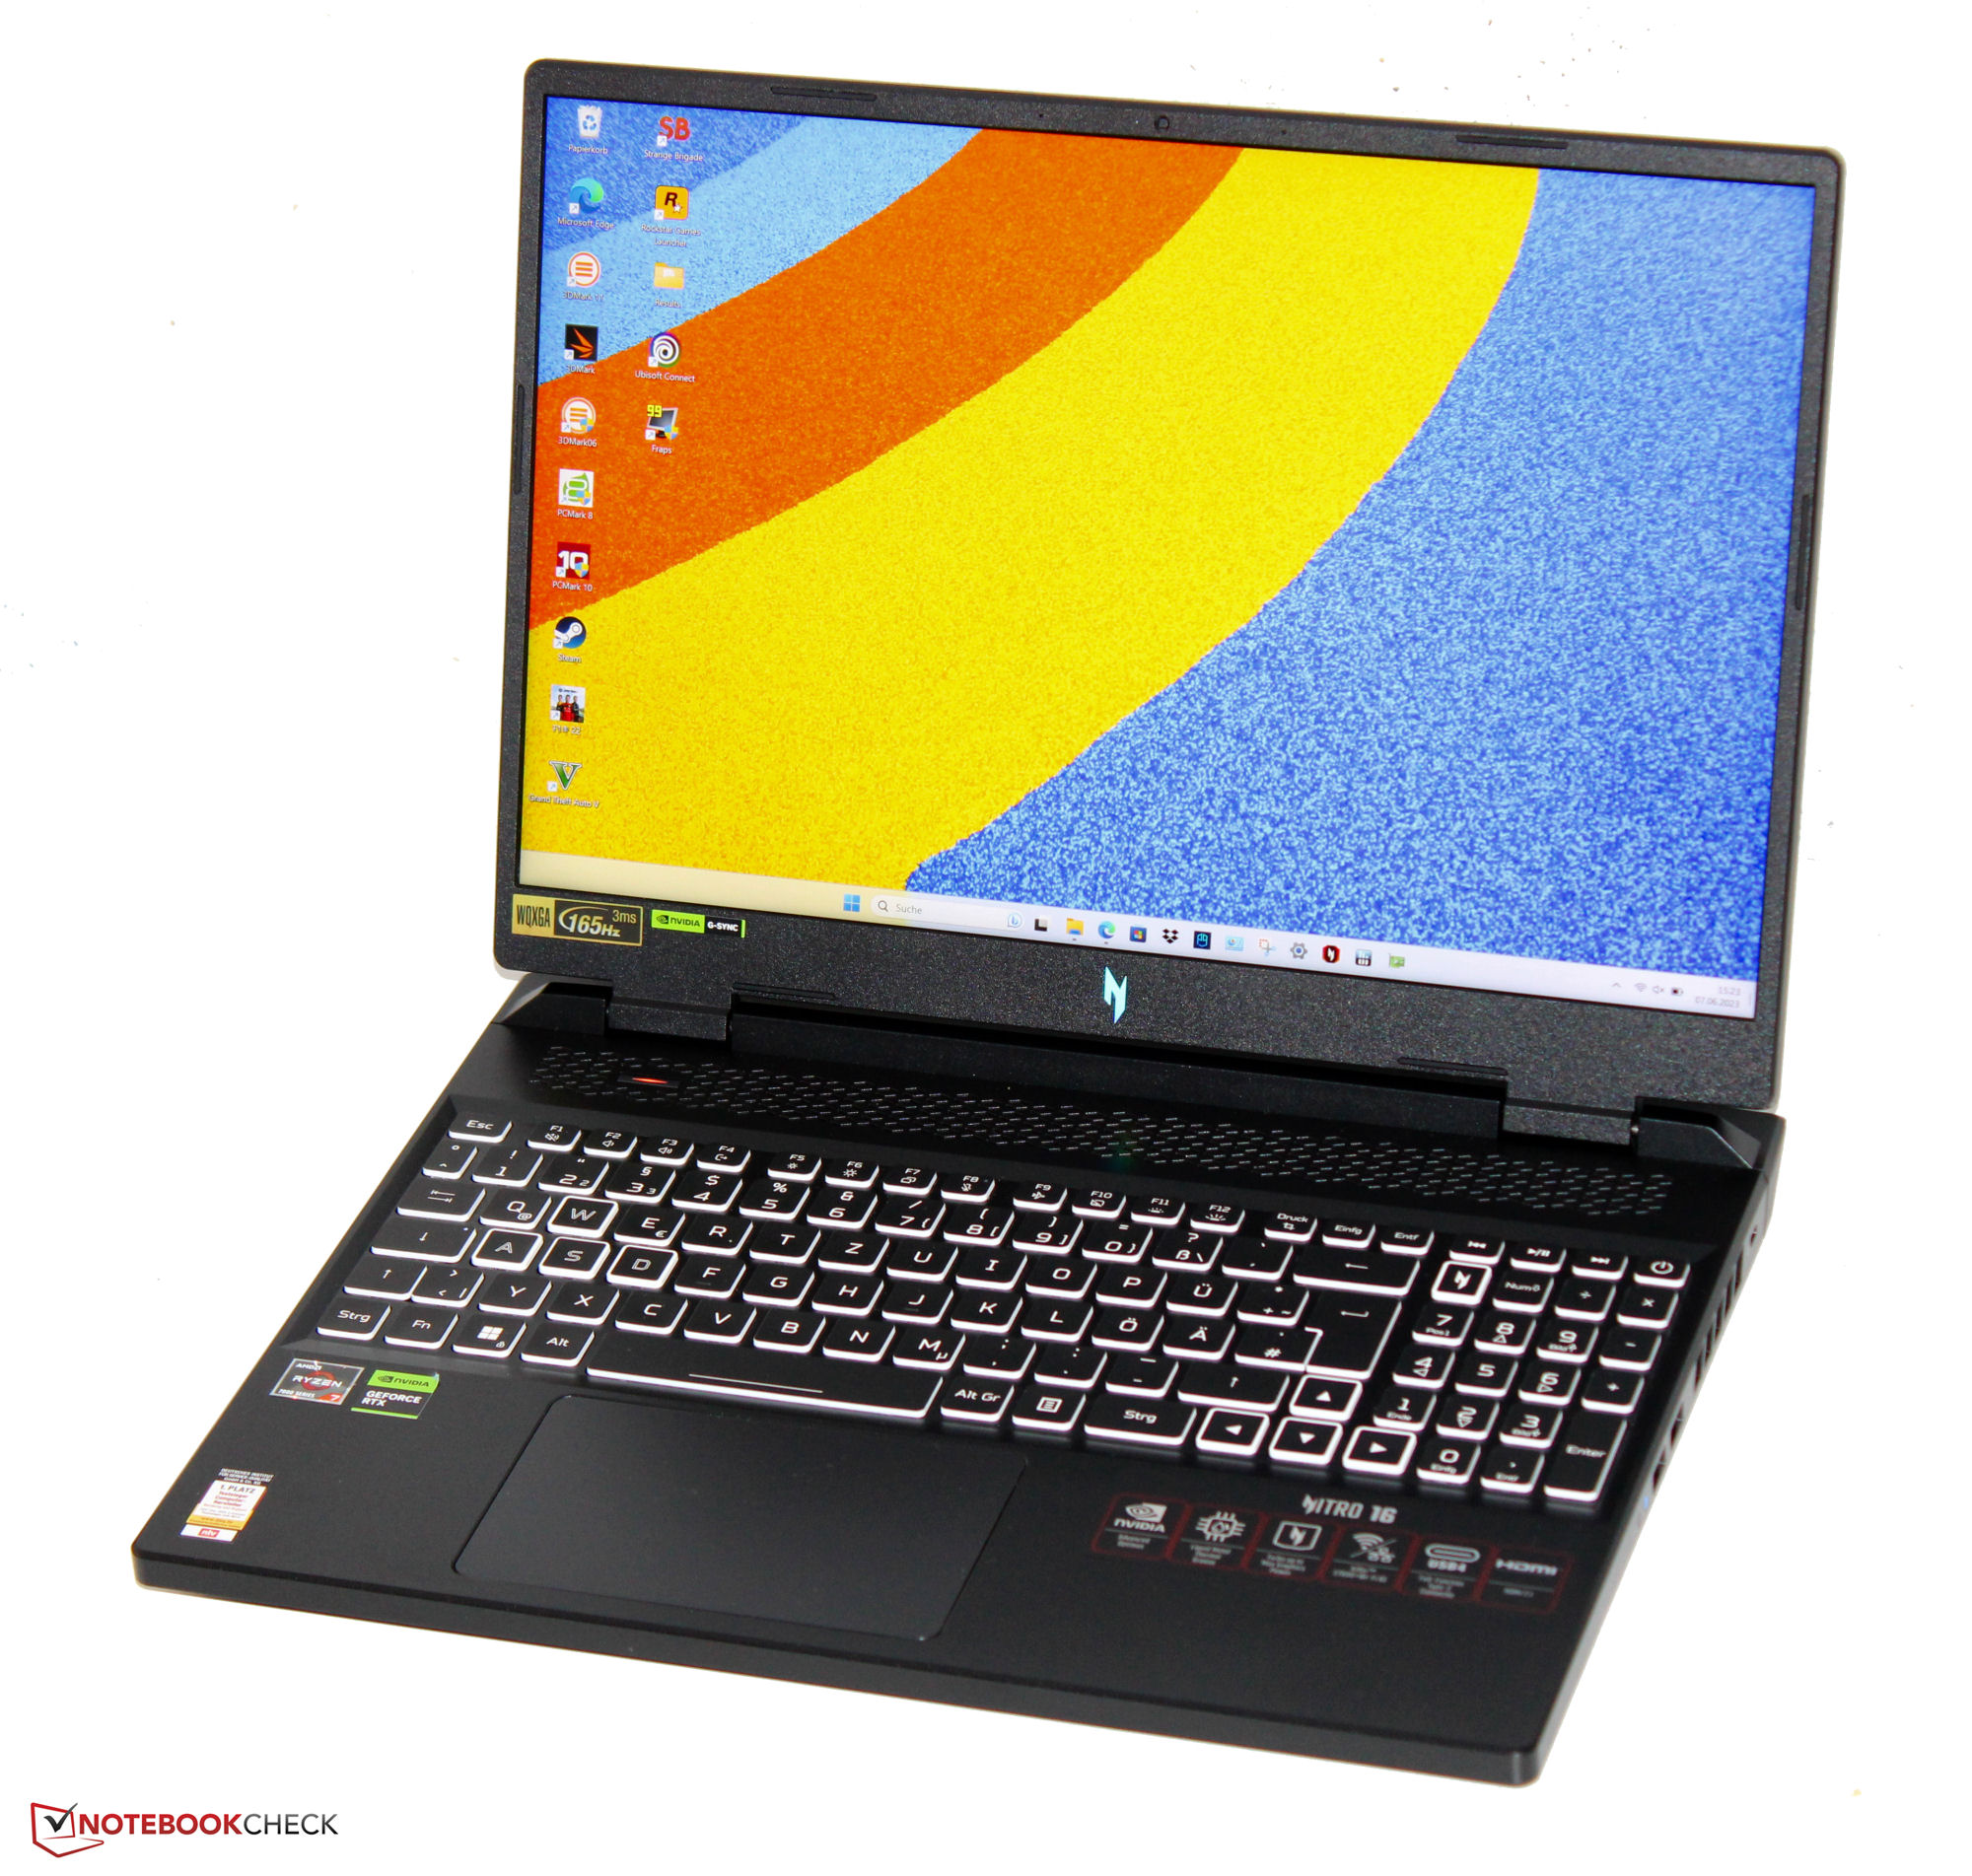
Puede encontrar información sobre la carcasa, el equipo y los dispositivos de entrada en nuestro análisis del modelo hermano de idéntica construcción modelo hermanoque cuenta con un Ryzen 7 7735HS y una GPU RTX 4070 para portátiles.
Posibles contendientes en la comparación
Valoración | Fecha | Modelo | Peso | Altura | Tamaño | Resolución | Precio |
|---|---|---|---|---|---|---|---|
| 86.7 % v7 (old) | 08/2023 | Acer Nitro 16 AN16-41-R7YE R5 7535HS, GeForce RTX 4050 Laptop GPU | 2.6 kg | 27.9 mm | 16.00" | 1920x1200 | |
| 86.9 % v7 (old) | 06/2023 | Asus TUF Gaming A16 FA617XS R9 7940HS, Radeon RX 7600S | 2.2 kg | 22.1 mm | 16.00" | 1920x1200 | |
| 85.1 % v7 (old) | 07/2023 | Schenker XMG Focus 15 (E23) i9-13900HX, GeForce RTX 4050 Laptop GPU | 2.4 kg | 26.9 mm | 15.60" | 2569x1440 | |
| 83.3 % v7 (old) | 01/2023 | Gigabyte G7 KE i5-12500H, GeForce RTX 3060 Laptop GPU | 2.6 kg | 25 mm | 17.30" | 1920x1080 | |
| 86.3 % v7 (old) | 06/2023 | Asus TUF A15 FA507 R7 7735HS, GeForce RTX 4050 Laptop GPU | 2.2 kg | 24.9 mm | 15.60" | 1920x1080 | |
| 83 % v7 (old) | 05/2023 | Medion Erazer Scout E20 i7-13700H, GeForce RTX 4050 Laptop GPU | 2.8 kg | 29 mm | 17.30" | 1920x1080 |
| SD Card Reader | |
| average JPG Copy Test (av. of 3 runs) | |
| Media de la clase Gaming (20.9 - 210, n=54, últimos 2 años) | |
| Acer Nitro 16 AN16-41-R7YE (AV PRO microSD 128 GB V60) | |
| Acer Nitro 16 AN16-41 (AV Pro SD microSD 128 GB V60) | |
| maximum AS SSD Seq Read Test (1GB) | |
| Media de la clase Gaming (25.5 - 261, n=51, últimos 2 años) | |
| Schenker XMG Focus 15 (E23) | |
| Gigabyte G7 KE (AV PRO microSD 128 GB V60) | |
| Acer Nitro 16 AN16-41 (AV Pro SD microSD 128 GB V60) | |
| Acer Nitro 16 AN16-41-R7YE (AV PRO microSD 128 GB V60) | |


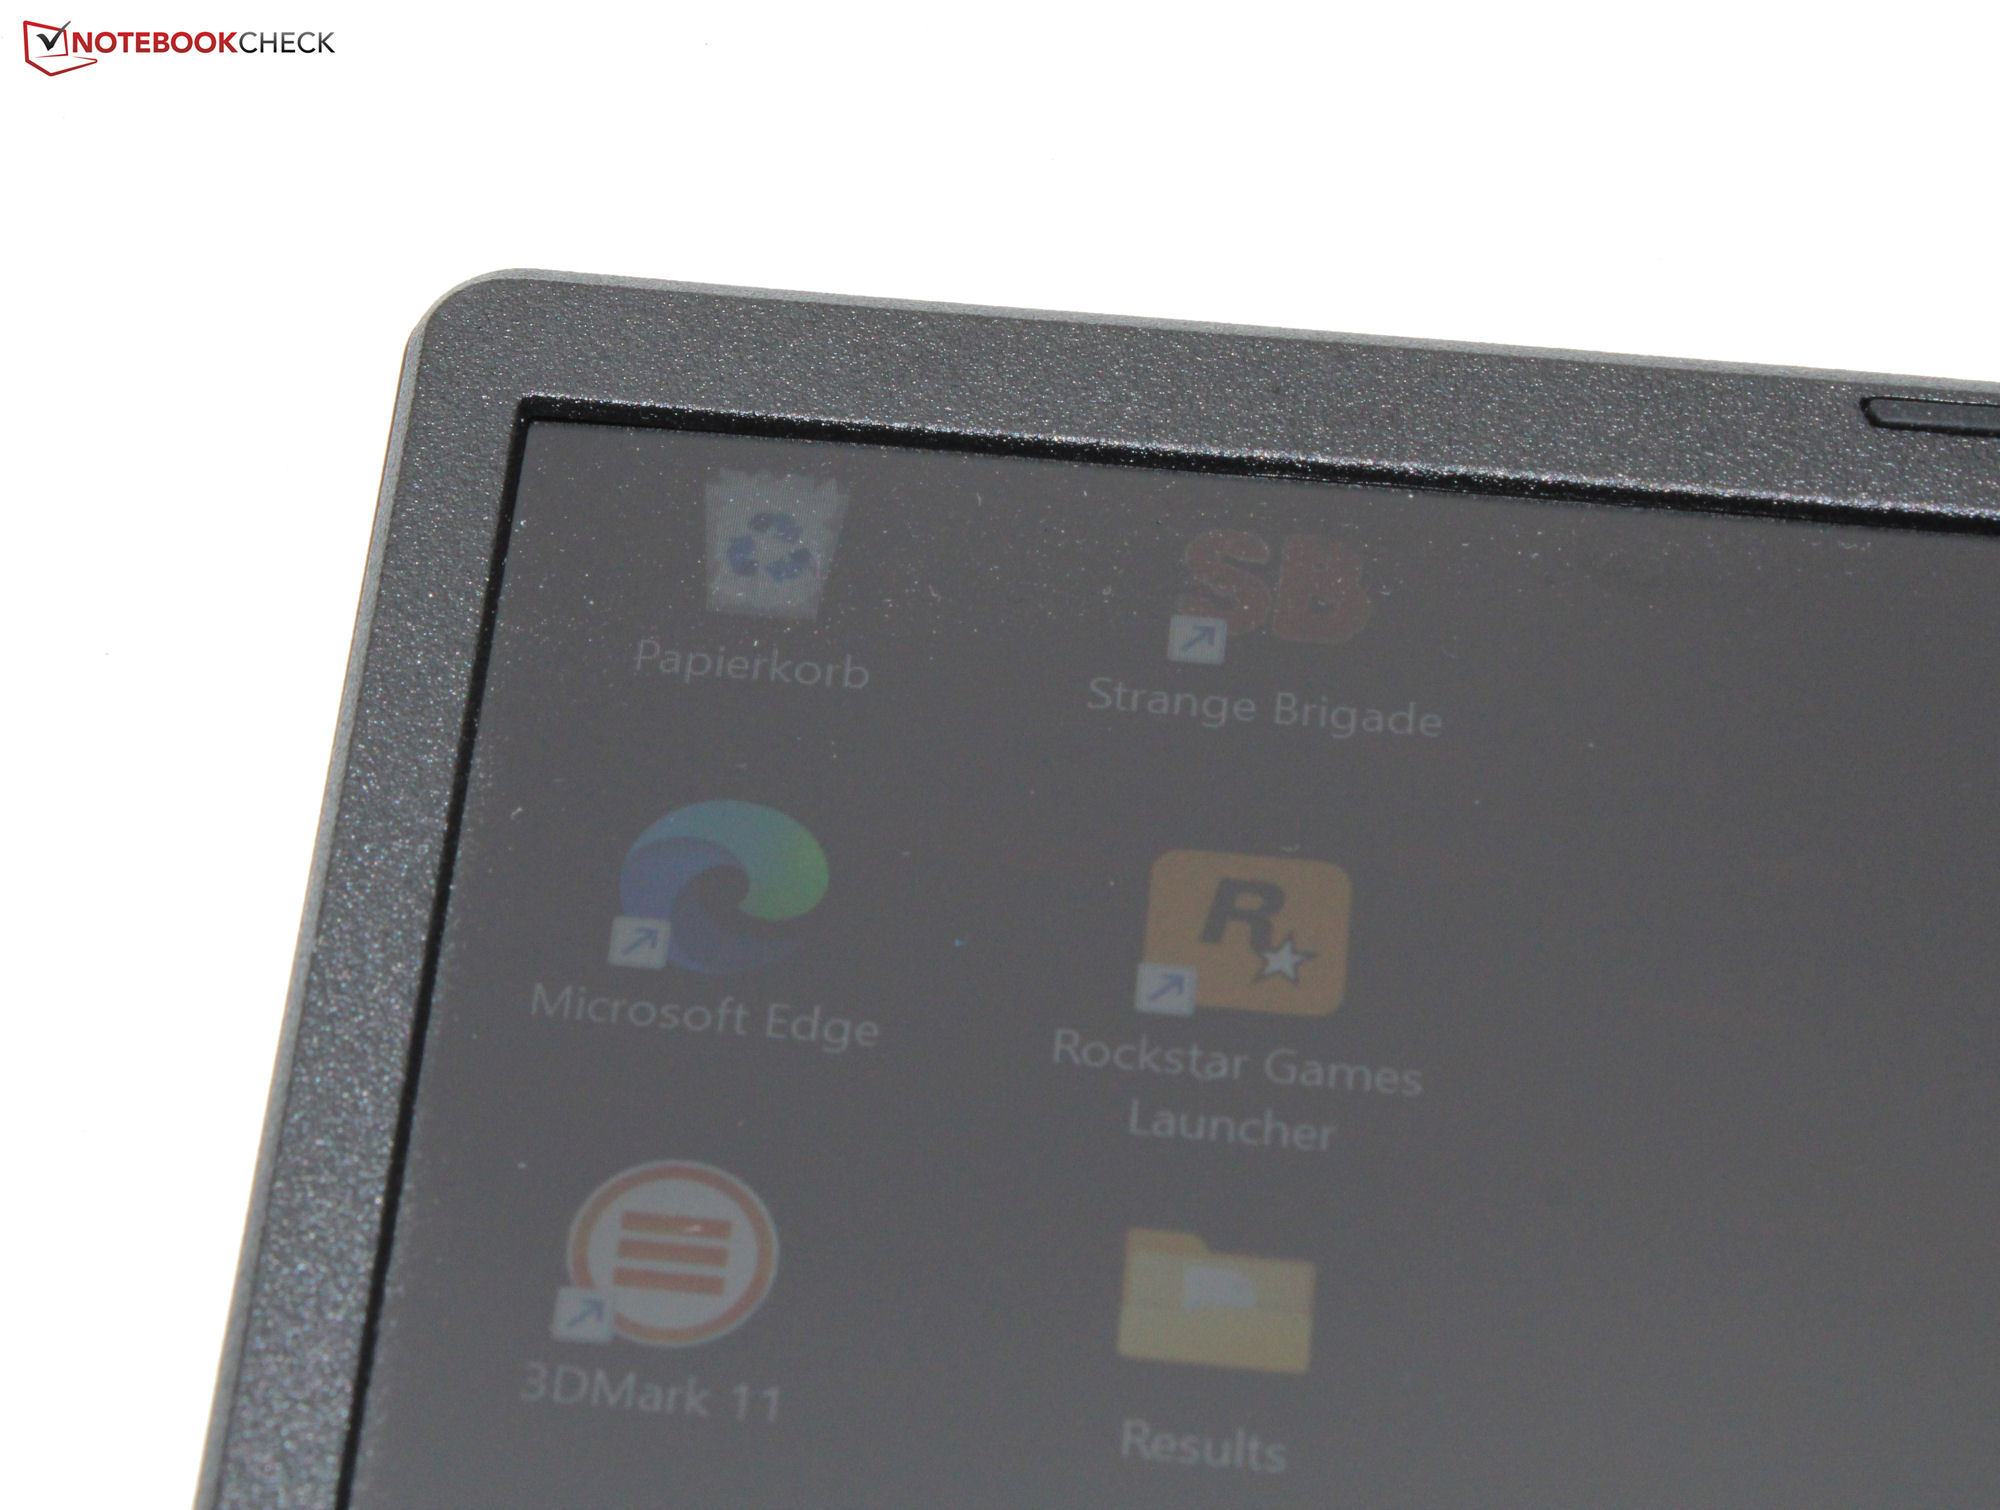
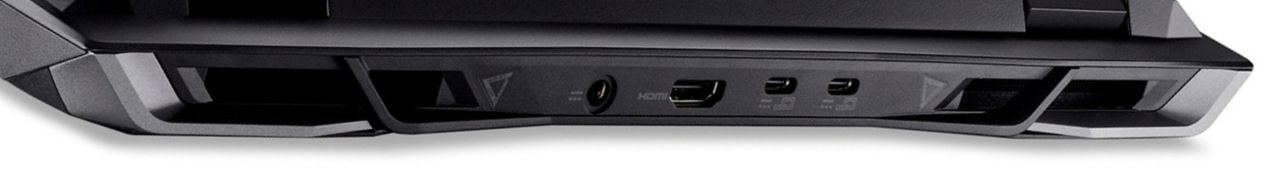
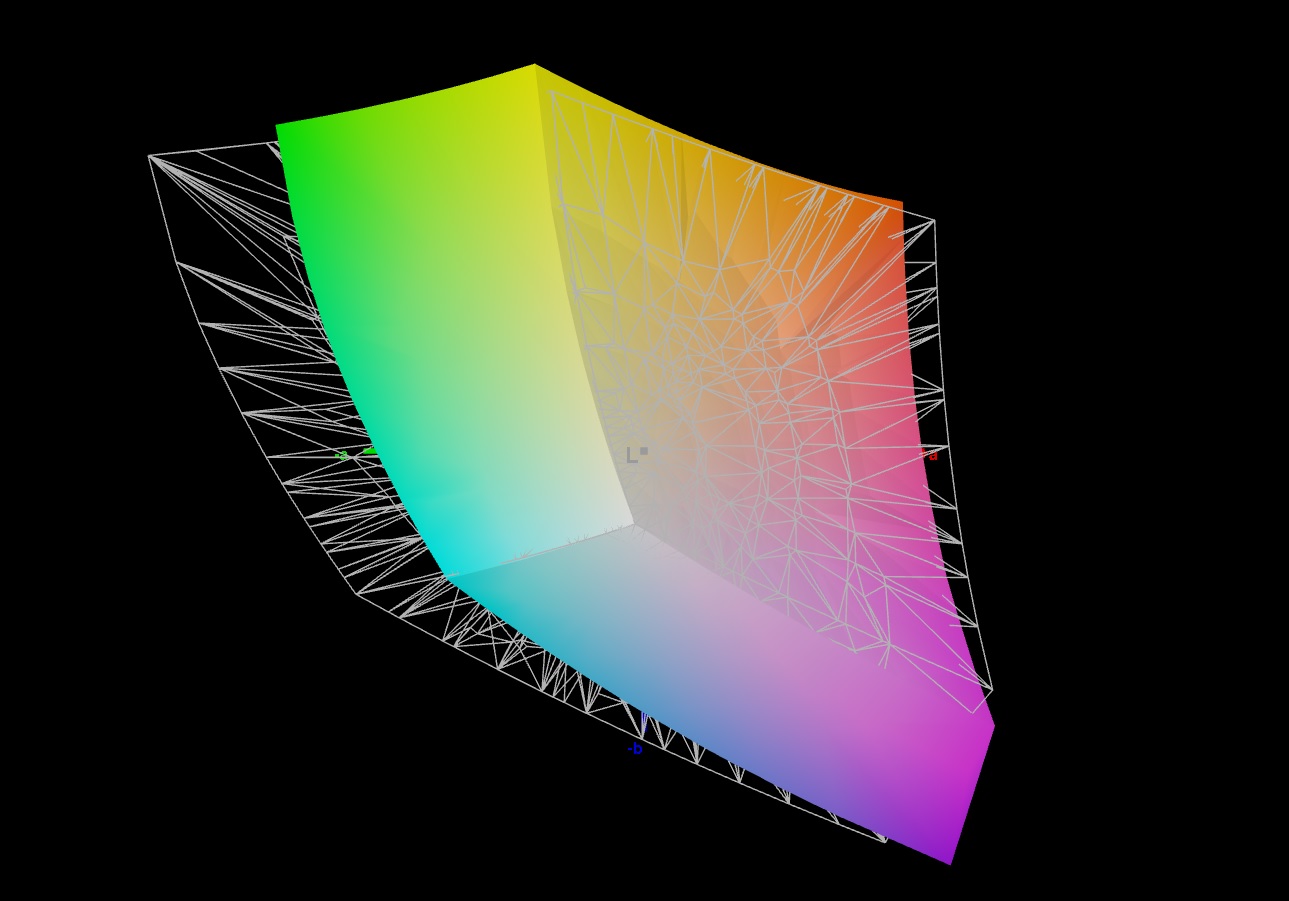
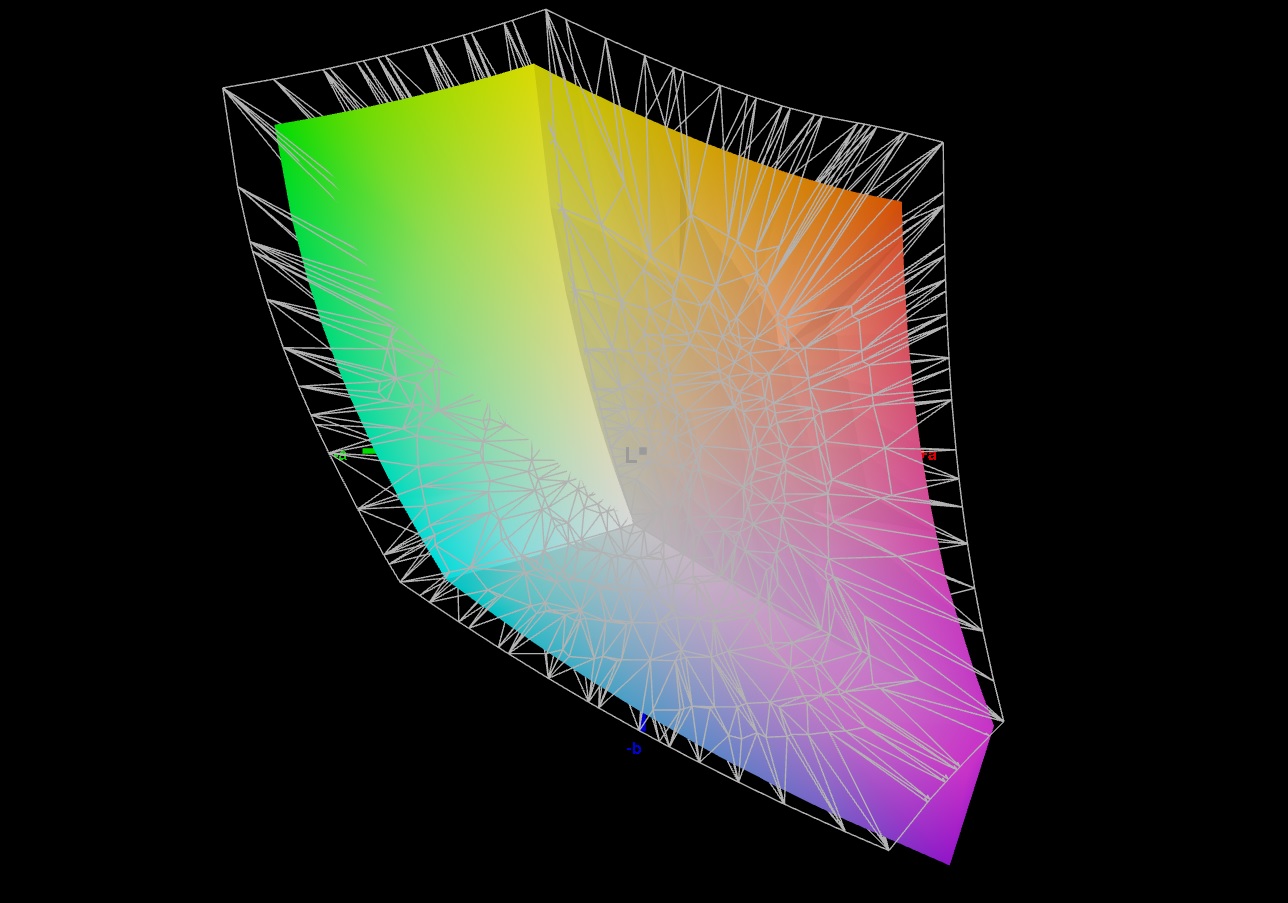
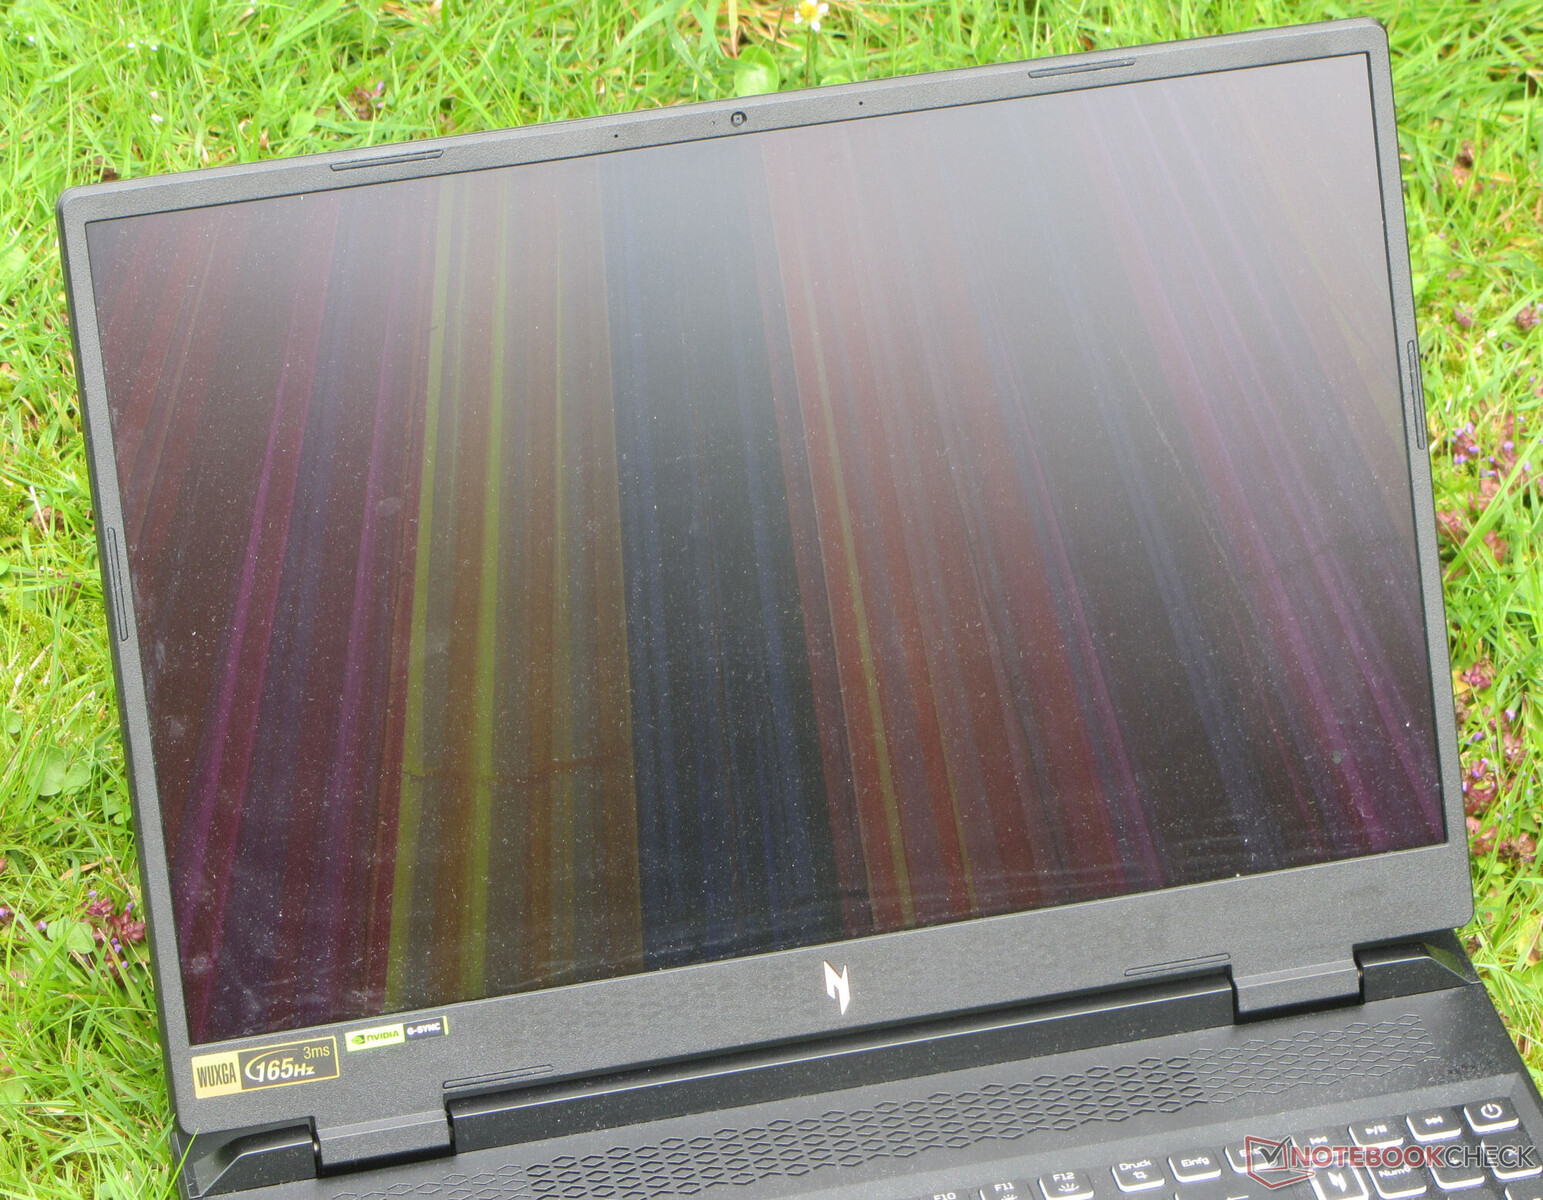
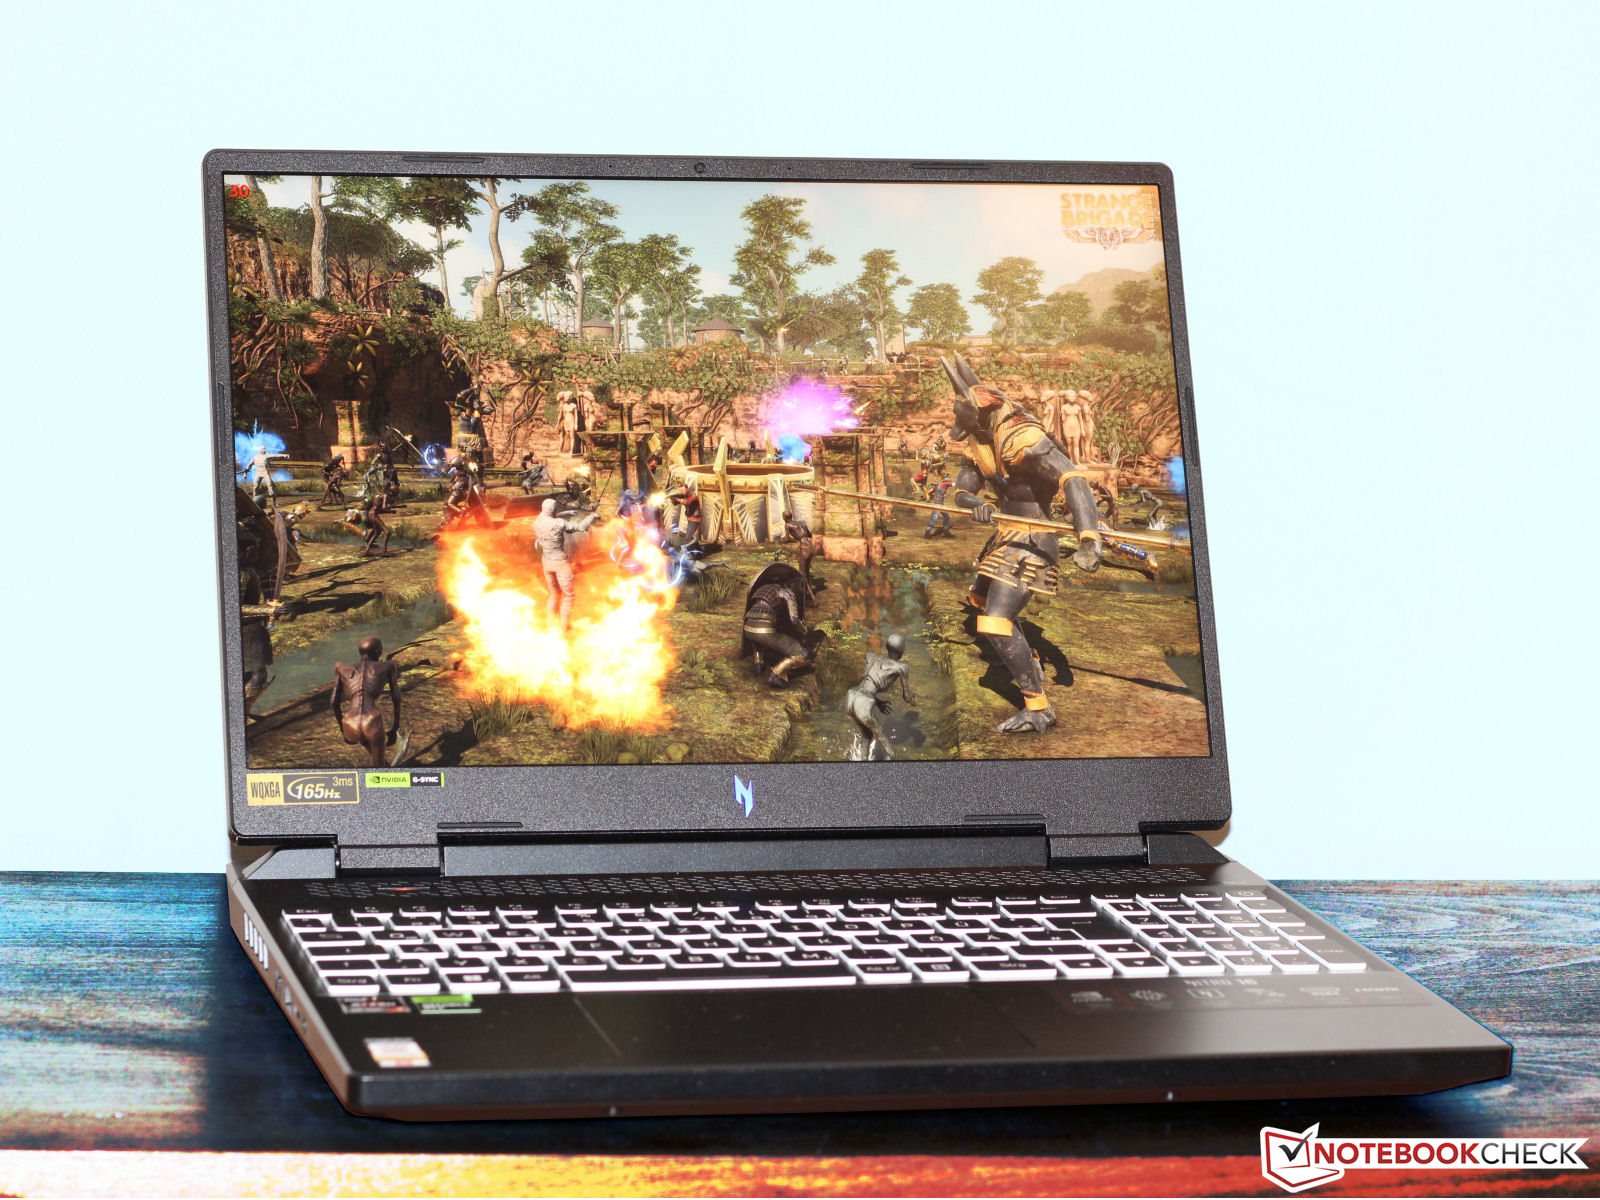
Pantalla: panel 16:10 con cobertura sRGB
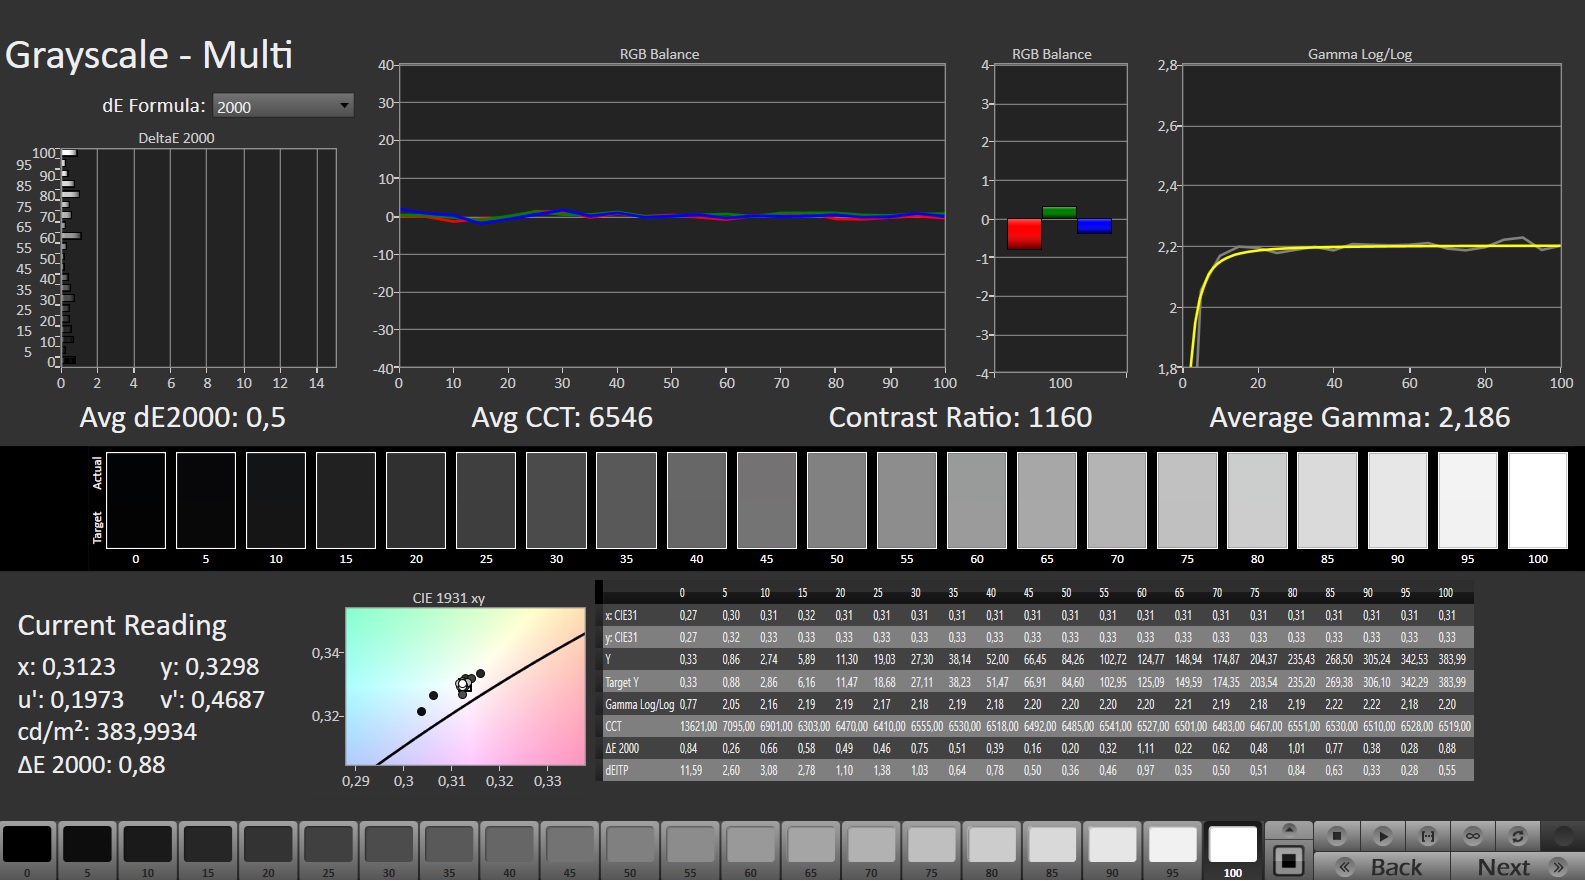
Los puntos positivos de la pantalla mate IPS de 16 pulgadas y 1.920 x 1.200 en formato 16:10 incluyen el soporte G-Sync, la ausencia de parpadeo PWM y los cortos tiempos de respuesta. El brillo y el contraste del panel de 165 Hz cumplen los objetivos respectivos (> 300 cd/m² y 1.000:1, respectivamente).
No hay muchas diferencias aparte de éstas cuando se compara con el panel WQXGA (2.560 x 1.600 píxeles) del modelo hermanoaunque este último ofrece un brillo máximo superior (casi 500 cd/m²).
| |||||||||||||||||||||||||
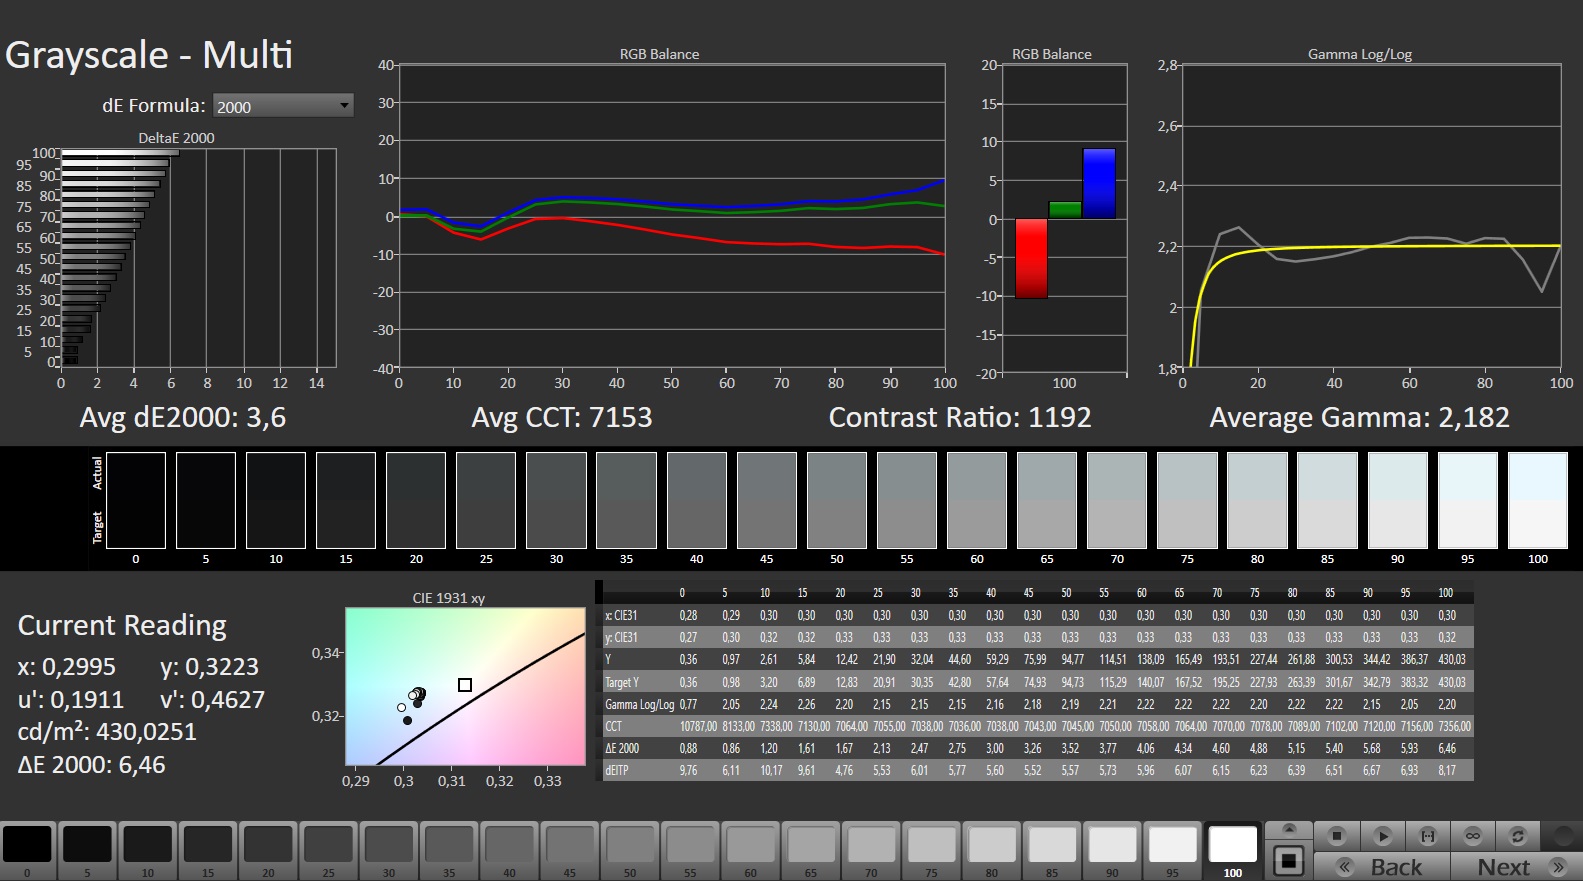
iluminación: 84 %
Brillo con batería: 415 cd/m²
Contraste: 1153:1 (Negro: 0.36 cd/m²)
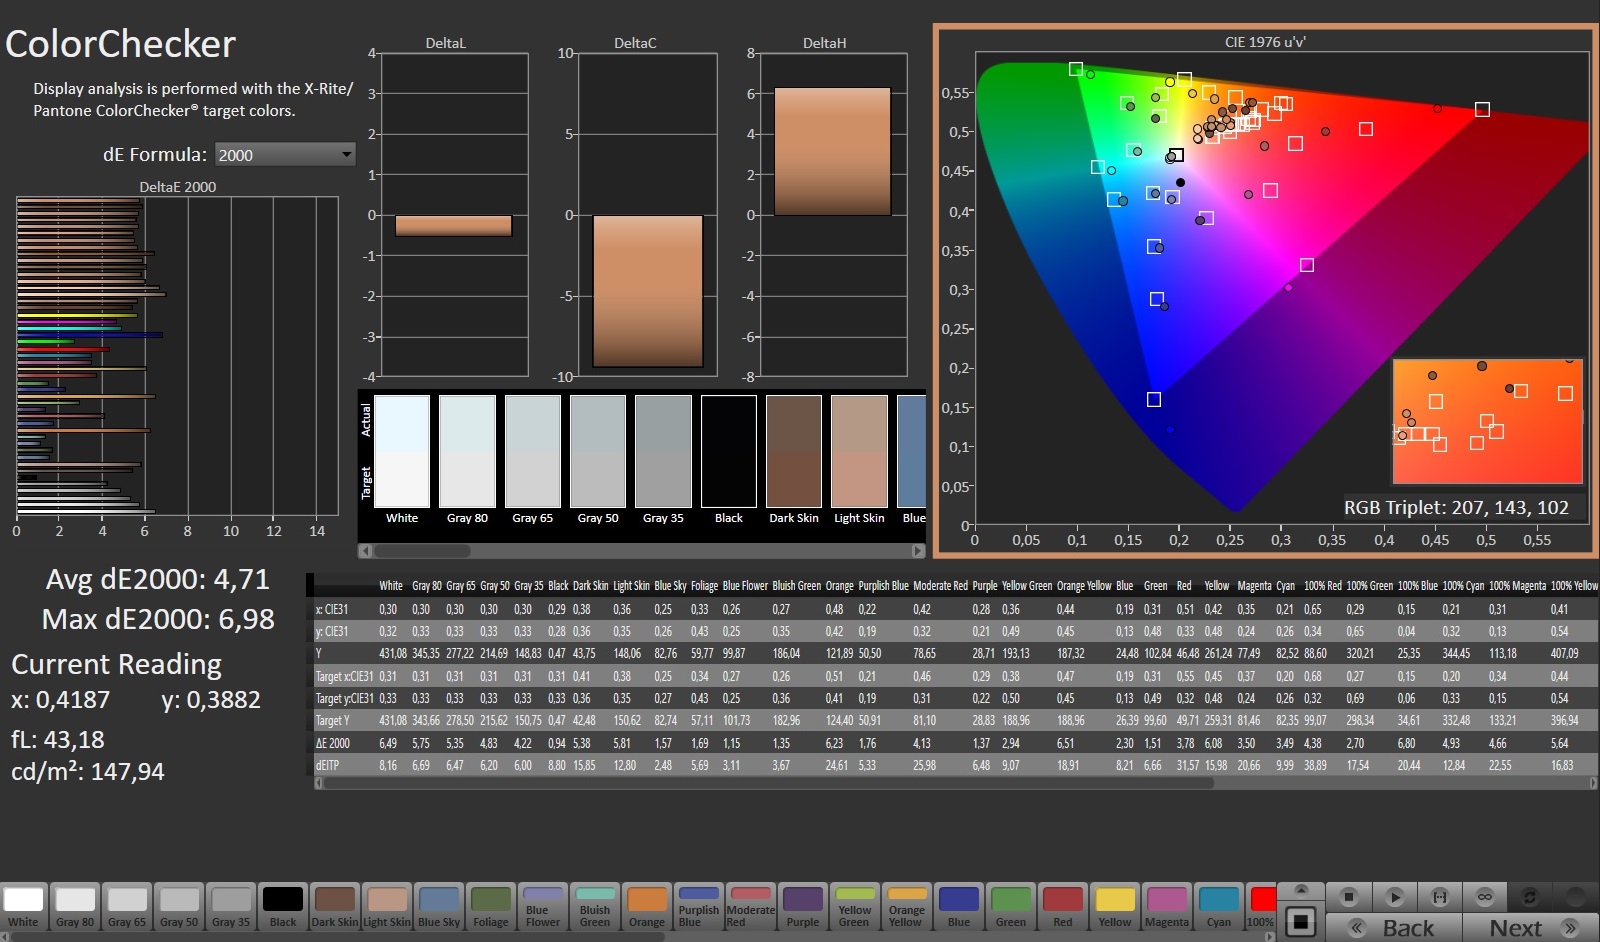
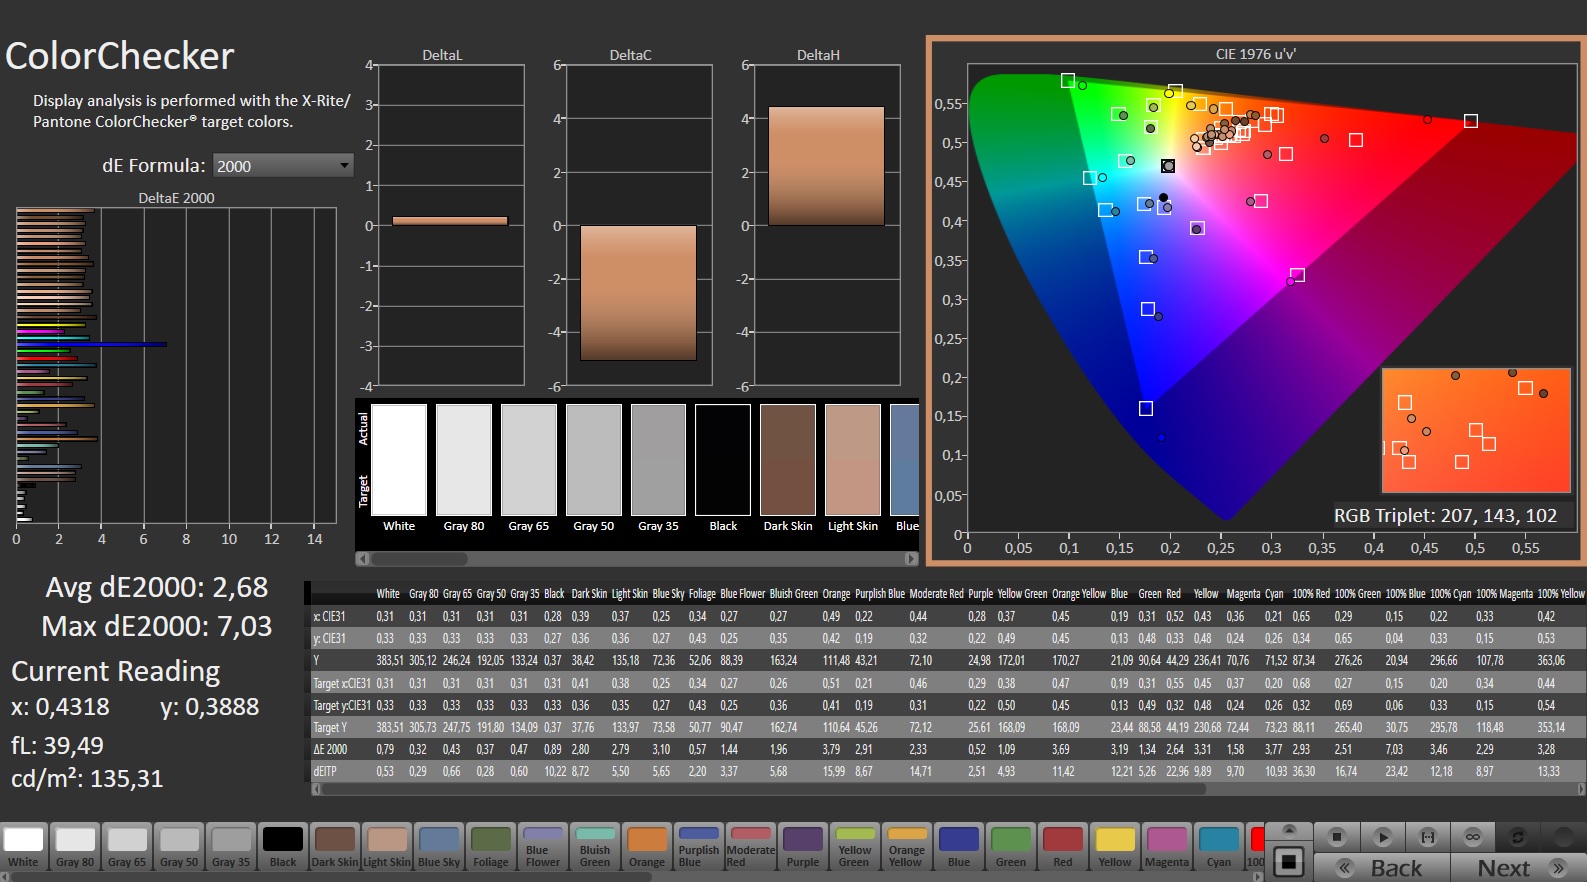
ΔE ColorChecker Calman: 4.71 | ∀{0.5-29.43 Ø4.71}
calibrated: 2.68
ΔE Greyscale Calman: 3.6 | ∀{0.09-98 Ø4.96}
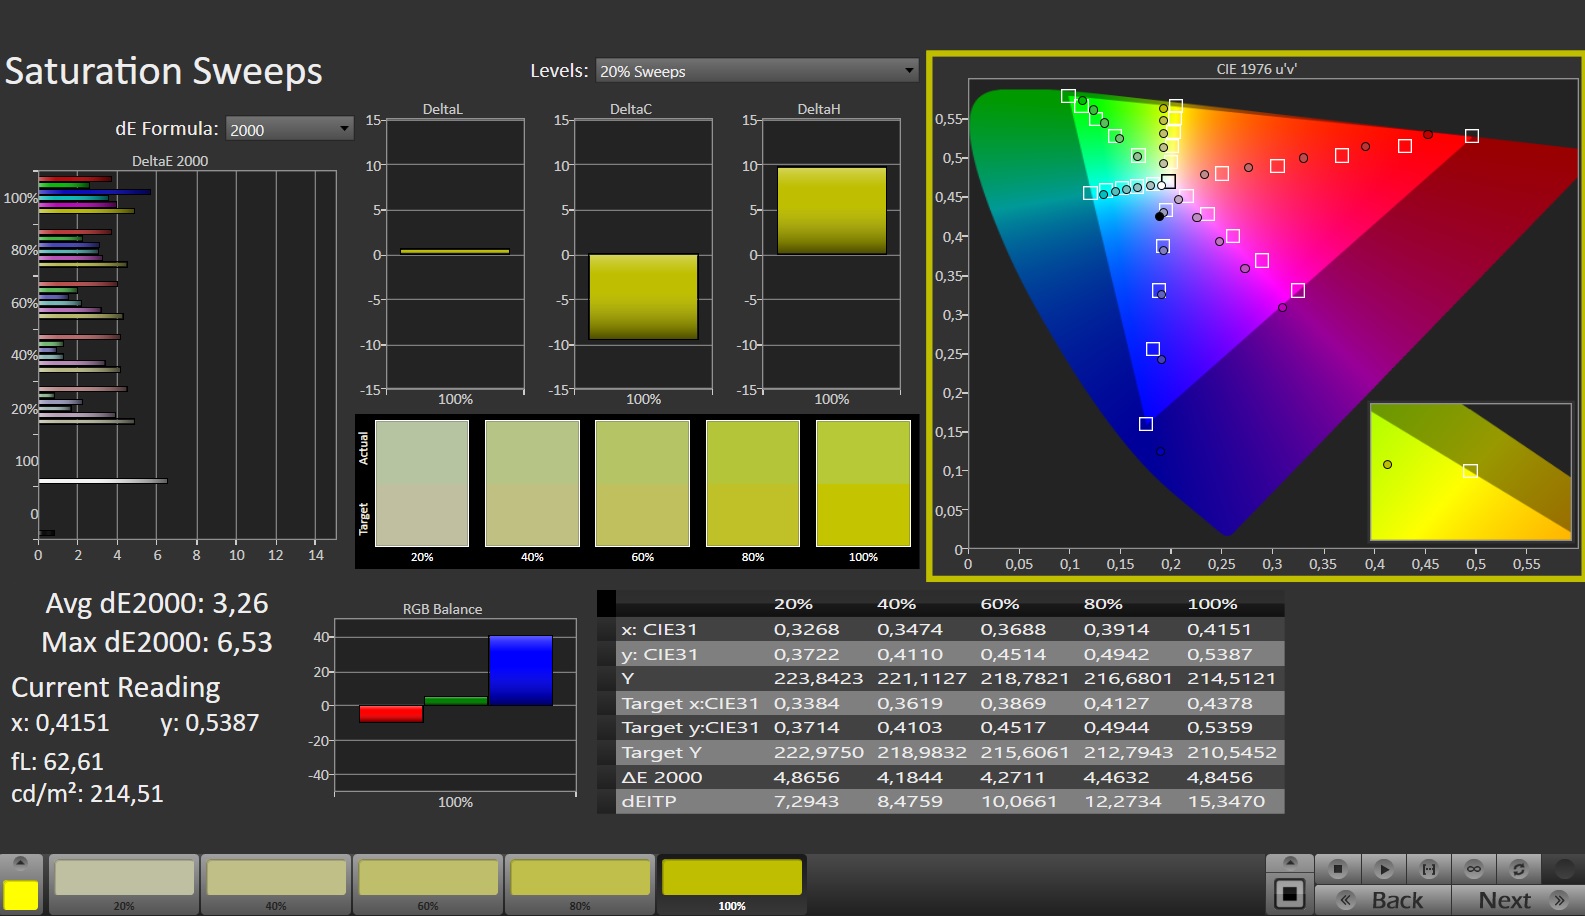
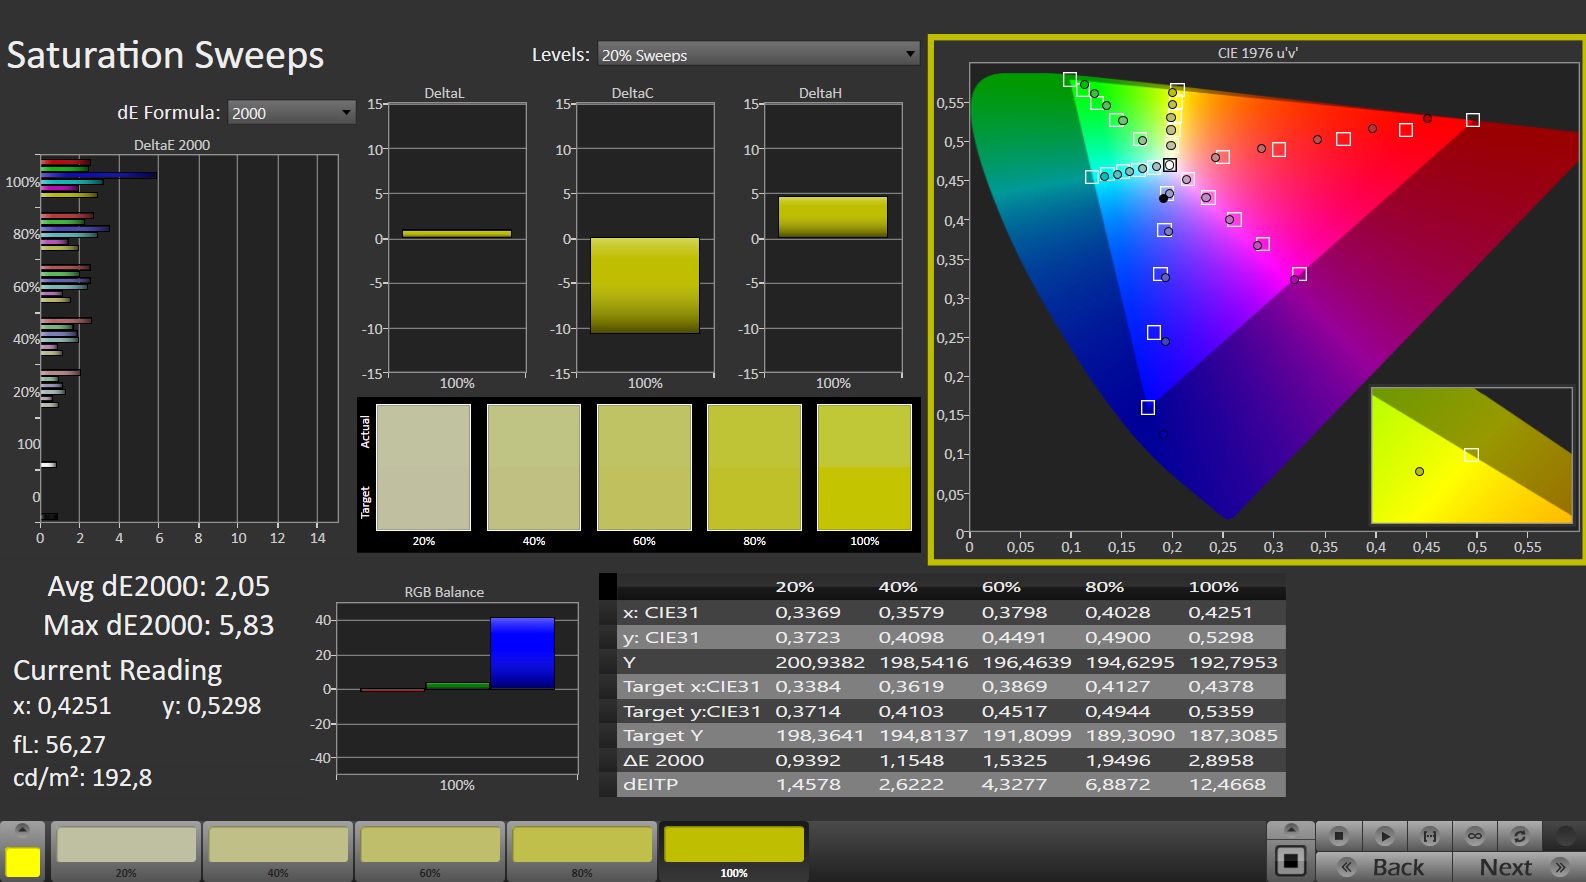
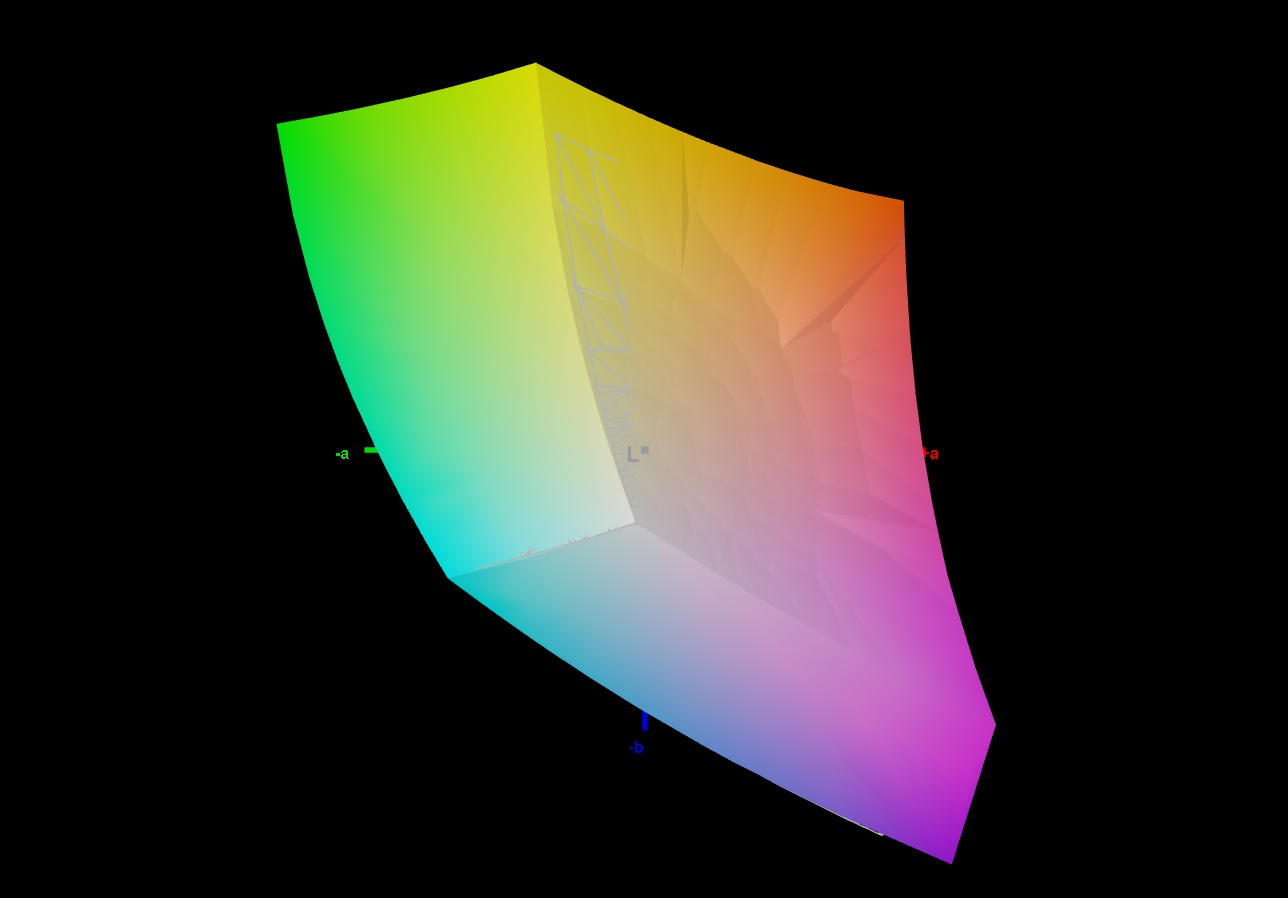
77.4% AdobeRGB 1998 (Argyll 3D)
99.4% sRGB (Argyll 3D)
80% Display P3 (Argyll 3D)
Gamma: 2.182
CCT: 7153 K
| Acer Nitro 16 AN16-41-R7YE AU Optronics B160UAN01.Q, IPS, 1920x1200, 16" | Asus TUF Gaming A16 FA617XS BOE NE160WUM-NX2, IPS, 1920x1200, 16" | Schenker XMG Focus 15 (E23) BOE0AD1, IPS, 2569x1440, 15.6" | Gigabyte G7 KE AU Optronics B173HAN05.1, IPS, 1920x1080, 17.3" | Asus TUF A15 FA507 N156HMA-GA1, IPS, 1920x1080, 15.6" | Medion Erazer Scout E20 LG Philips LGD0611, IPS, 1920x1080, 17.3" | Acer Nitro 16 AN16-41 BOE CQ NE16QDM-NY1, IPS, 2560x1600, 16" | |
|---|---|---|---|---|---|---|---|
| Display | -8% | 12% | -6% | -12% | -12% | -8% | |
| Display P3 Coverage (%) | 80 | 69.3 -13% | 98.6 23% | 70.4 -12% | 64.9 -19% | 65.1 -19% | 67.9 -15% |
| sRGB Coverage (%) | 99.4 | 97.3 -2% | 99.9 1% | 99.8 0% | 96.5 -3% | 96.7 -3% | 99.1 0% |
| AdobeRGB 1998 Coverage (%) | 77.4 | 70.7 -9% | 86.3 11% | 71.7 -7% | 66.6 -14% | 66.5 -14% | 69.9 -10% |
| Response Times | -66% | -81% | -3% | -236% | -66% | 3% | |
| Response Time Grey 50% / Grey 80% * (ms) | 11.2 ? | 15.6 ? -39% | 15.6 ? -39% | 5 ? 55% | 30.4 ? -171% | 14.8 ? -32% | 11 ? 2% |
| Response Time Black / White * (ms) | 5.2 ? | 10 ? -92% | 11.6 ? -123% | 8.3 ? -60% | 20.8 ? -300% | 10.4 ? -100% | 5 ? 4% |
| PWM Frequency (Hz) | |||||||
| Screen | 25% | -2% | 28% | 28% | 14% | 27% | |
| Brightness middle (cd/m²) | 415 | 301 -27% | 302 -27% | 307 -26% | 288 -31% | 312 -25% | 520 25% |
| Brightness (cd/m²) | 380 | 294 -23% | 278 -27% | 301 -21% | 271 -29% | 303 -20% | 494 30% |
| Brightness Distribution (%) | 84 | 94 12% | 85 1% | 93 11% | 91 8% | 91 8% | 91 8% |
| Black Level * (cd/m²) | 0.36 | 0.21 42% | 0.36 -0% | 0.2 44% | 0.17 53% | 0.25 31% | 0.39 -8% |
| Contrast (:1) | 1153 | 1433 24% | 839 -27% | 1535 33% | 1694 47% | 1248 8% | 1333 16% |
| Colorchecker dE 2000 * | 4.71 | 1.79 62% | 2.24 52% | 1.32 72% | 1.9 60% | 2.65 44% | 1.94 59% |
| Colorchecker dE 2000 max. * | 6.98 | 3.48 50% | 5.52 21% | 4.6 34% | 3.3 53% | 6.44 8% | 5.62 19% |
| Colorchecker dE 2000 calibrated * | 2.68 | 1.2 55% | 1.03 62% | 0.9 66% | 0.96 64% | 0.74 72% | |
| Greyscale dE 2000 * | 3.6 | 2.5 31% | 3.87 -8% | 2.1 42% | 2.7 25% | 3.2 11% | 2.94 18% |
| Gamma | 2.182 101% | 2.265 97% | 2.42 91% | 2.247 98% | 2.32 95% | 2.246 98% | 2.37 93% |
| CCT | 7153 91% | 6157 106% | 6936 94% | 6815 95% | 6535 99% | 7258 90% | 6443 101% |
| Media total (Programa/Opciones) | -16% /
5% | -24% /
-11% | 6% /
16% | -73% /
-18% | -21% /
-3% | 7% /
16% |
* ... más pequeño es mejor
La pantalla muestra una reproducción del color decente de fábrica - con una desviación de unos 4,7, el objetivo (DeltaE < 3) no se ajusta exactamente. Un calibrado reduce la desviación a 2,68 y asegura niveles de escala de grises más equilibrados. El panel puede reproducir completamente la gama de colores sRGB, pero no los espacios de color Adobe RGB y Display P3.
Este es el caso del panel WQXGA de la gama ootra variante del Nitro 16, así como las pantallas de la mayoría de los competidores. Sólo la pantalla del XMG Focus 15 ofrece una buena cobertura DCI-P3.
Tiempos de respuesta del display
| ↔ Tiempo de respuesta de Negro a Blanco | ||
|---|---|---|
| 5.2 ms ... subida ↗ y bajada ↘ combinada | ↗ 1.9 ms subida | 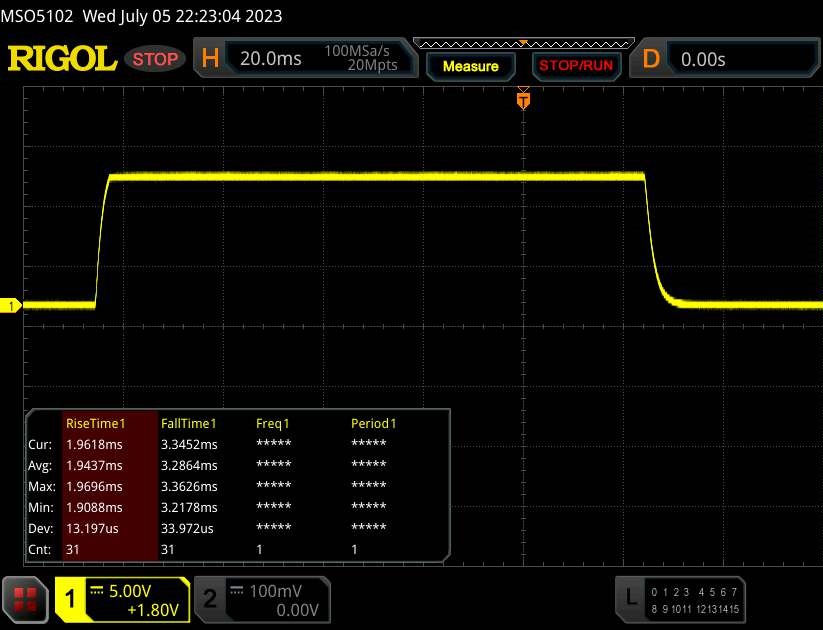 |
| ↘ 3.3 ms bajada | ||
| La pantalla mostró tiempos de respuesta muy rápidos en nuestros tests y debería ser adecuada para juegos frenéticos. En comparación, todos los dispositivos de prueba van de ##min### (mínimo) a 240 (máximo) ms. » 18 % de todos los dispositivos son mejores. Esto quiere decir que el tiempo de respuesta medido es mejor que la media (19.8 ms) de todos los dispositivos testados. | ||
| ↔ Tiempo de respuesta 50% Gris a 80% Gris | ||
| 11.2 ms ... subida ↗ y bajada ↘ combinada | ↗ 5.3 ms subida | 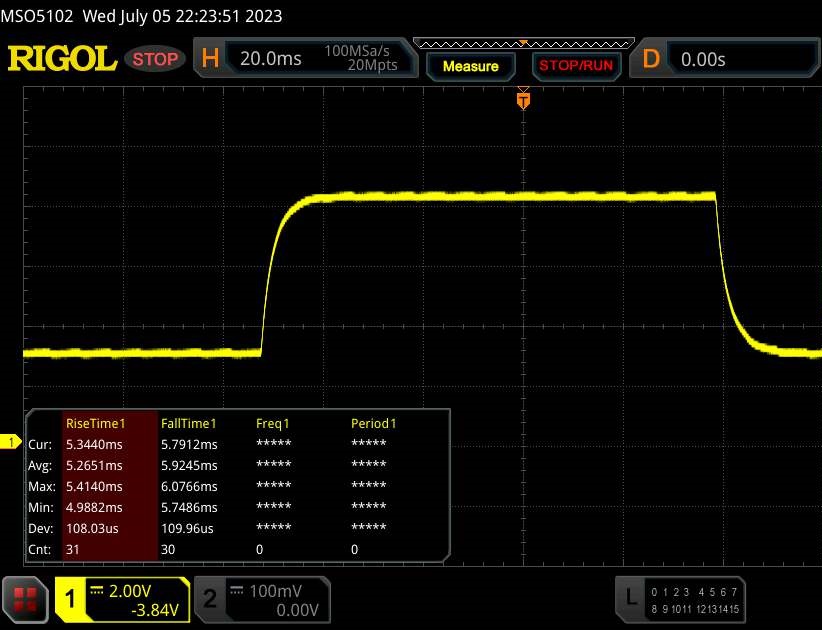 |
| ↘ 5.9 ms bajada | ||
| La pantalla mostró buenos tiempos de respuesta en nuestros tests pero podría ser demasiado lenta para los jugones competitivos. En comparación, todos los dispositivos de prueba van de ##min### (mínimo) a 636 (máximo) ms. » 25 % de todos los dispositivos son mejores. Esto quiere decir que el tiempo de respuesta medido es mejor que la media (31 ms) de todos los dispositivos testados. | ||
Parpadeo de Pantalla / PWM (Pulse-Width Modulation)
| Parpadeo de Pantalla / PWM no detectado | 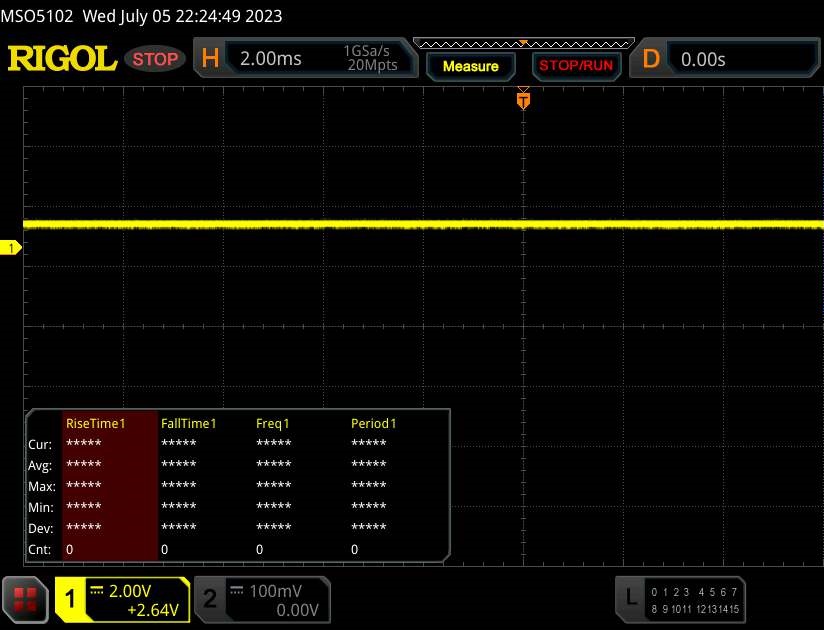 | ||
Comparación: 52 % de todos los dispositivos testados no usaron PWM para atenuar el display. Si se usó, medimos una media de 7757 (mínimo: 5 - máxmo: 343500) Hz. | |||
El panel IPS ofrece ángulos de visión estables que se pueden leer desde cualquier posición. El brillo del panel es lo bastante bueno para ser legible en exteriores si el sol no brilla demasiado.

Actuación: Acer se centra en Rembrandt y Ada Lovelace
La serie Nitro 16 combina GPU Ada-Lovelace con CPU de Intel o AMD. El modelo actual apuesta por AMD y está disponible por unos 1.250 euros (~1.500 dólares). Por tanto, actualmente es el representante más barato de la serie.
Condiciones de la prueba
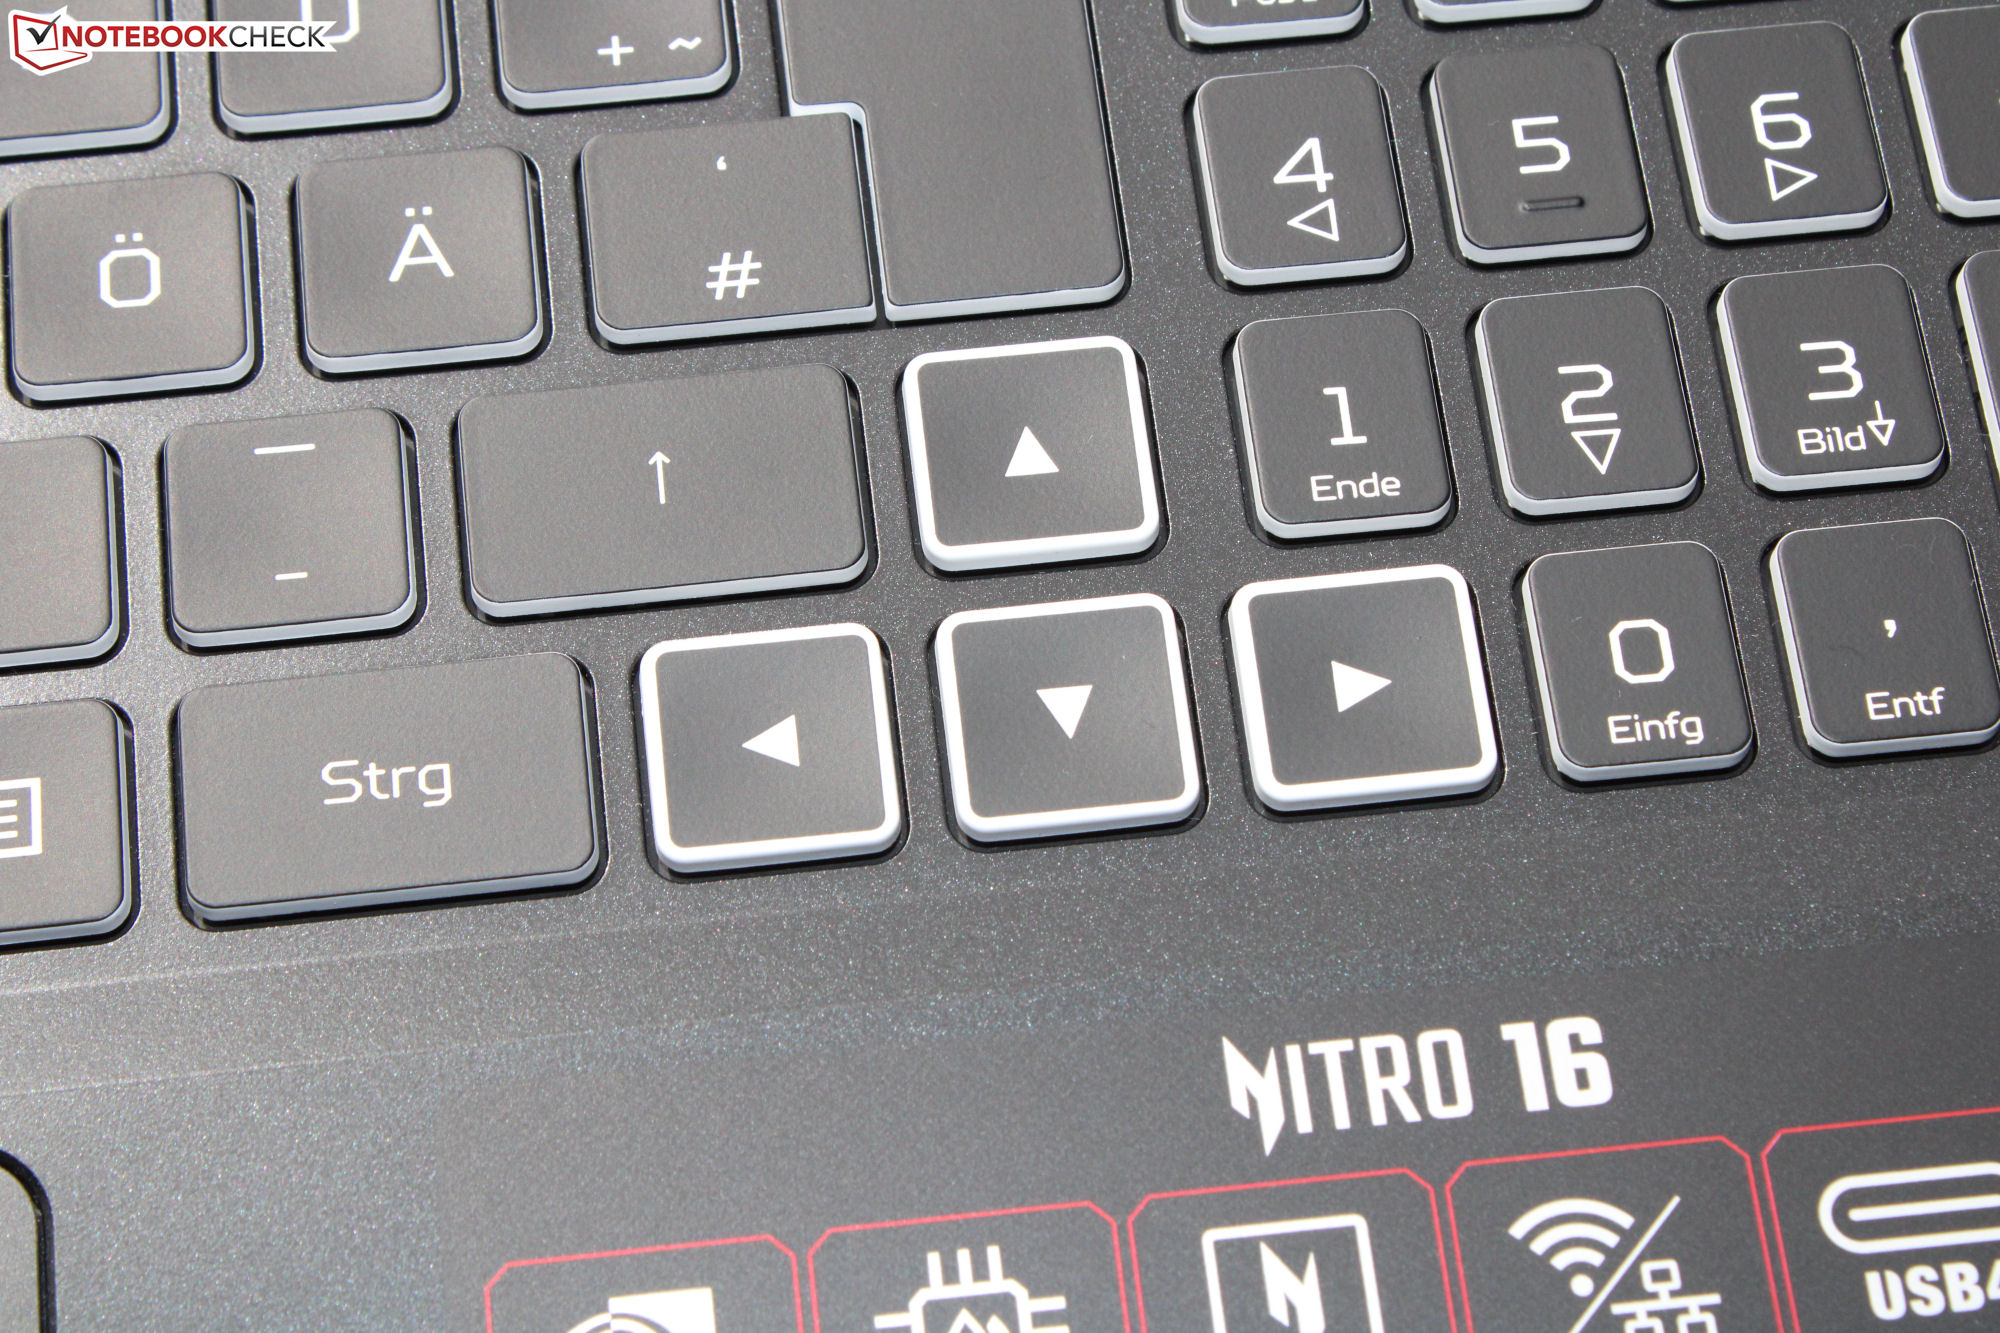
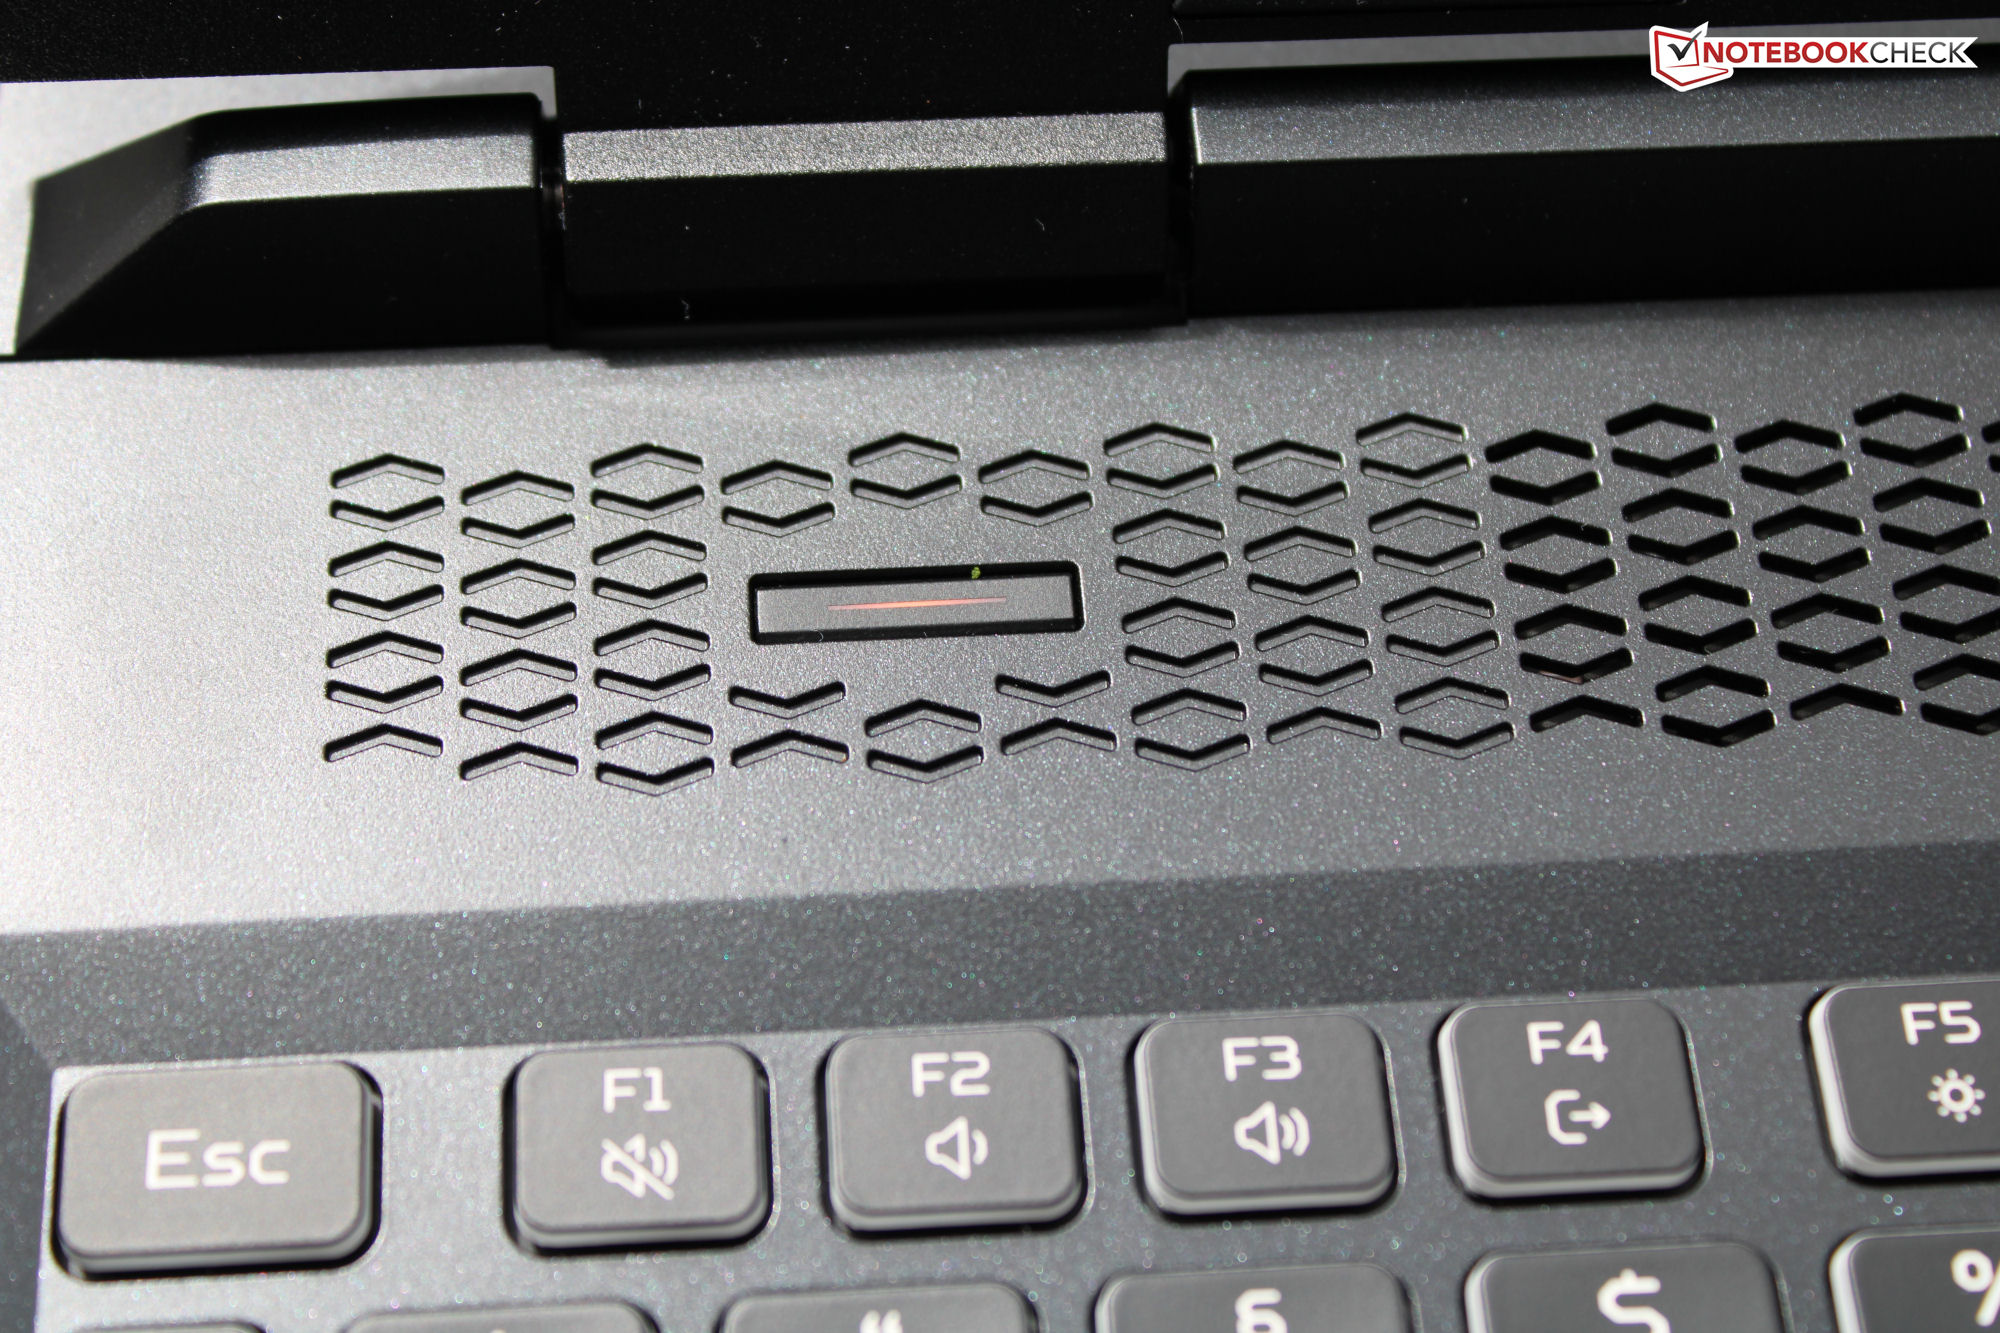
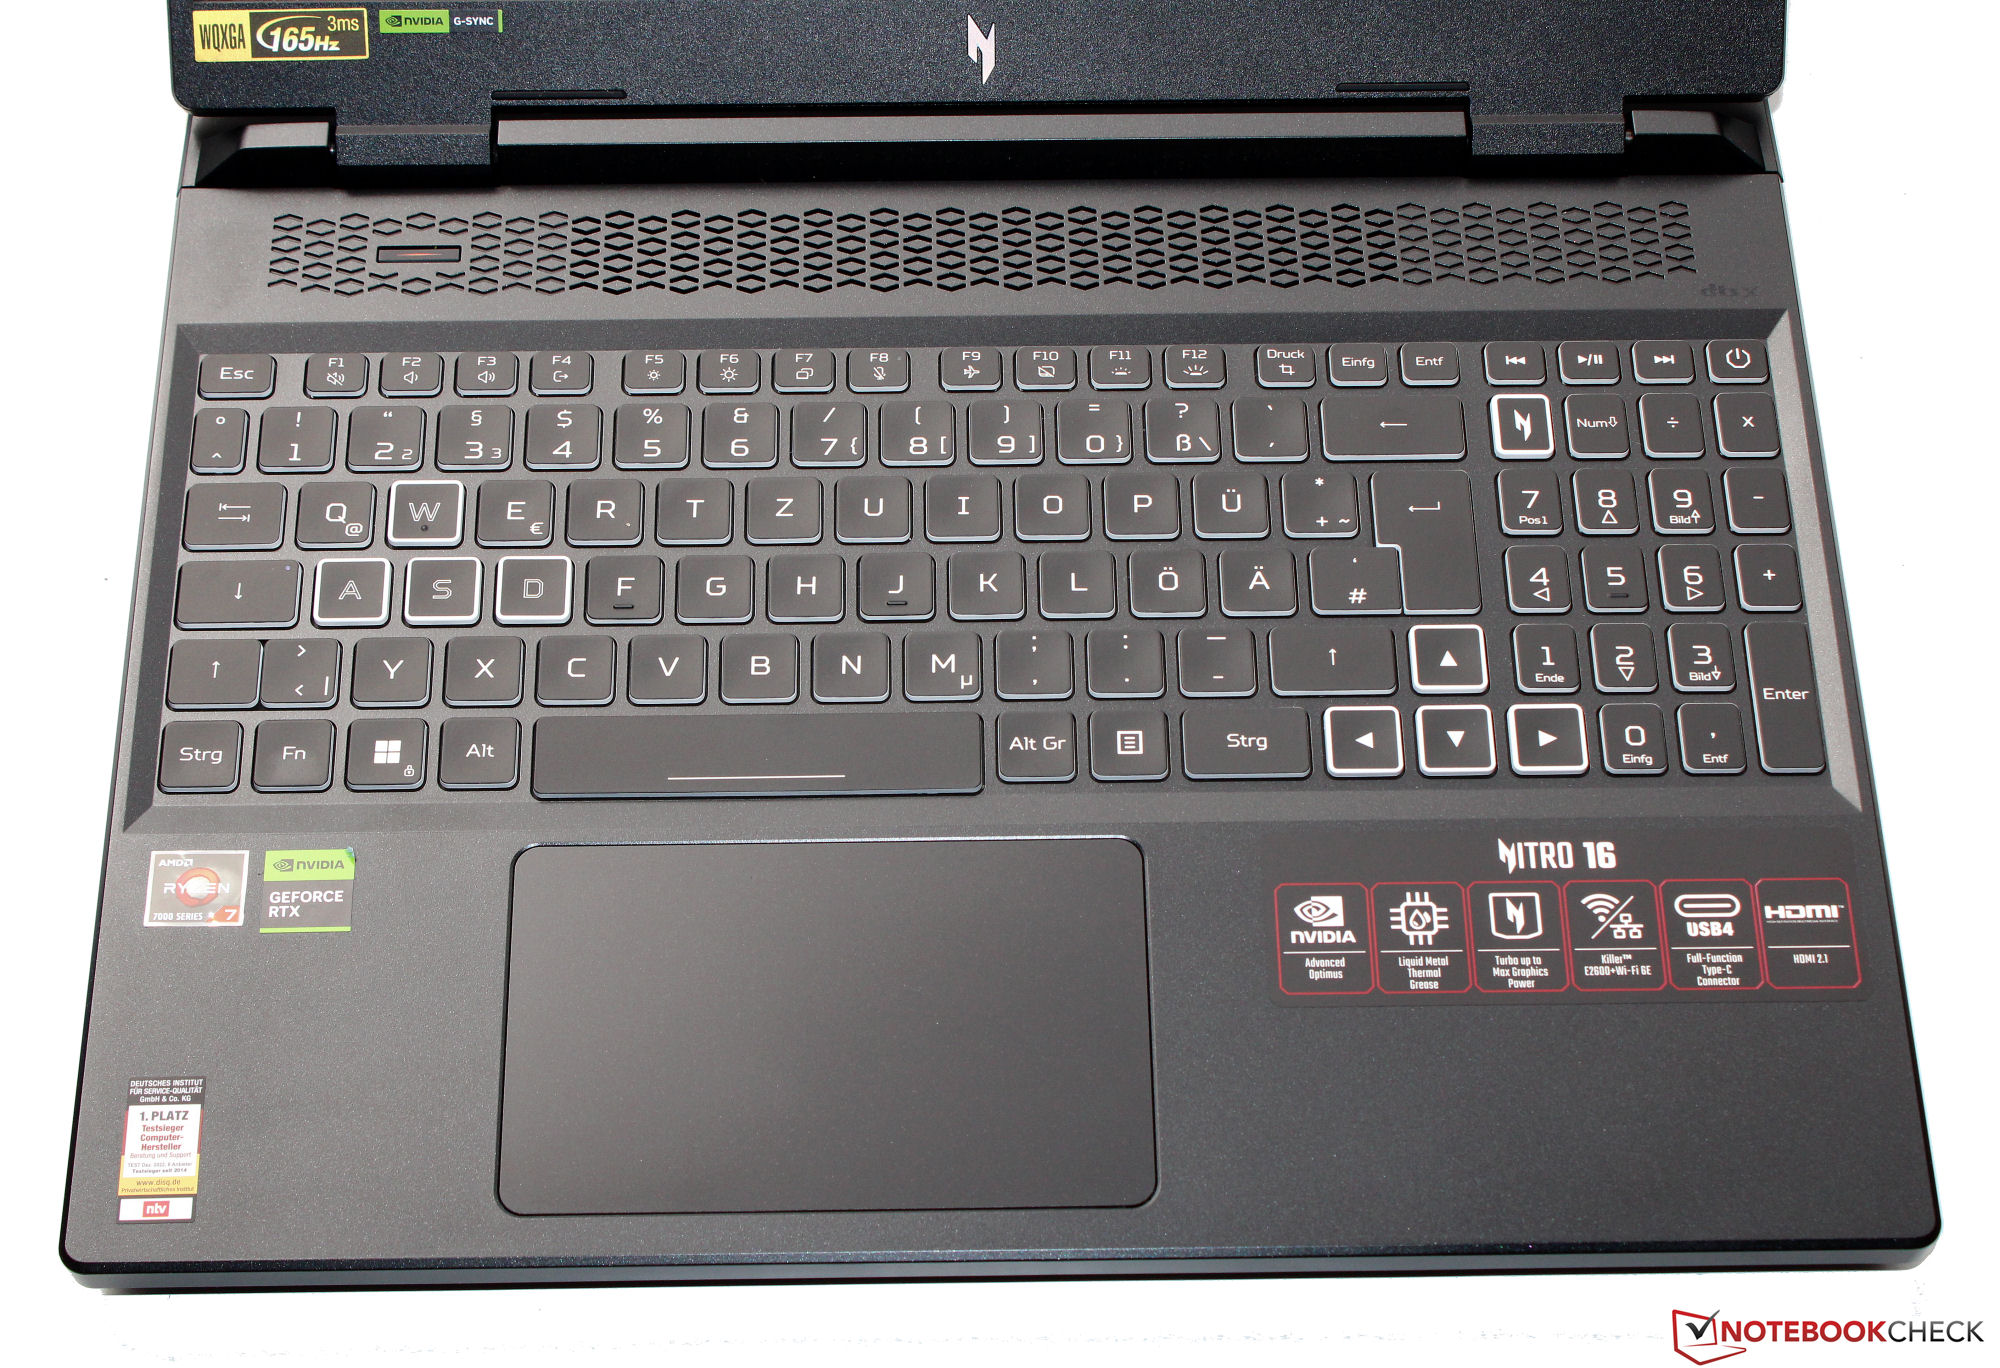
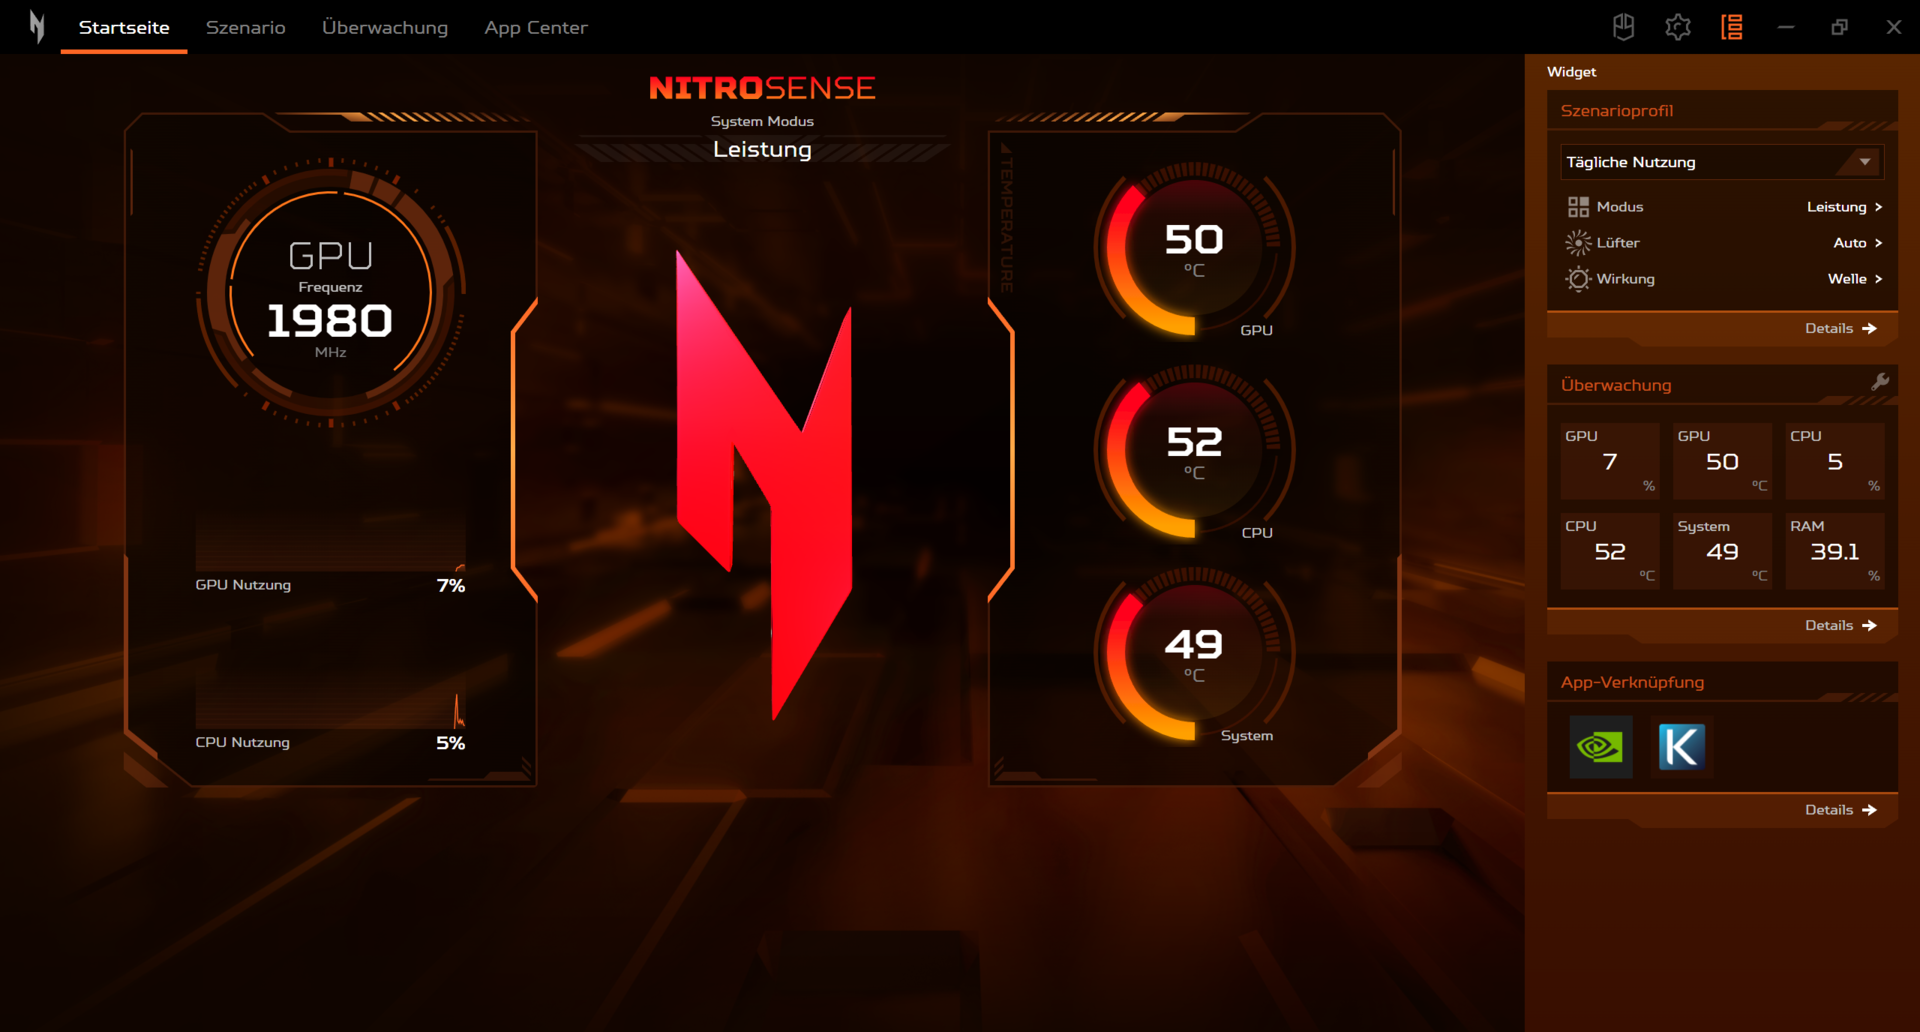
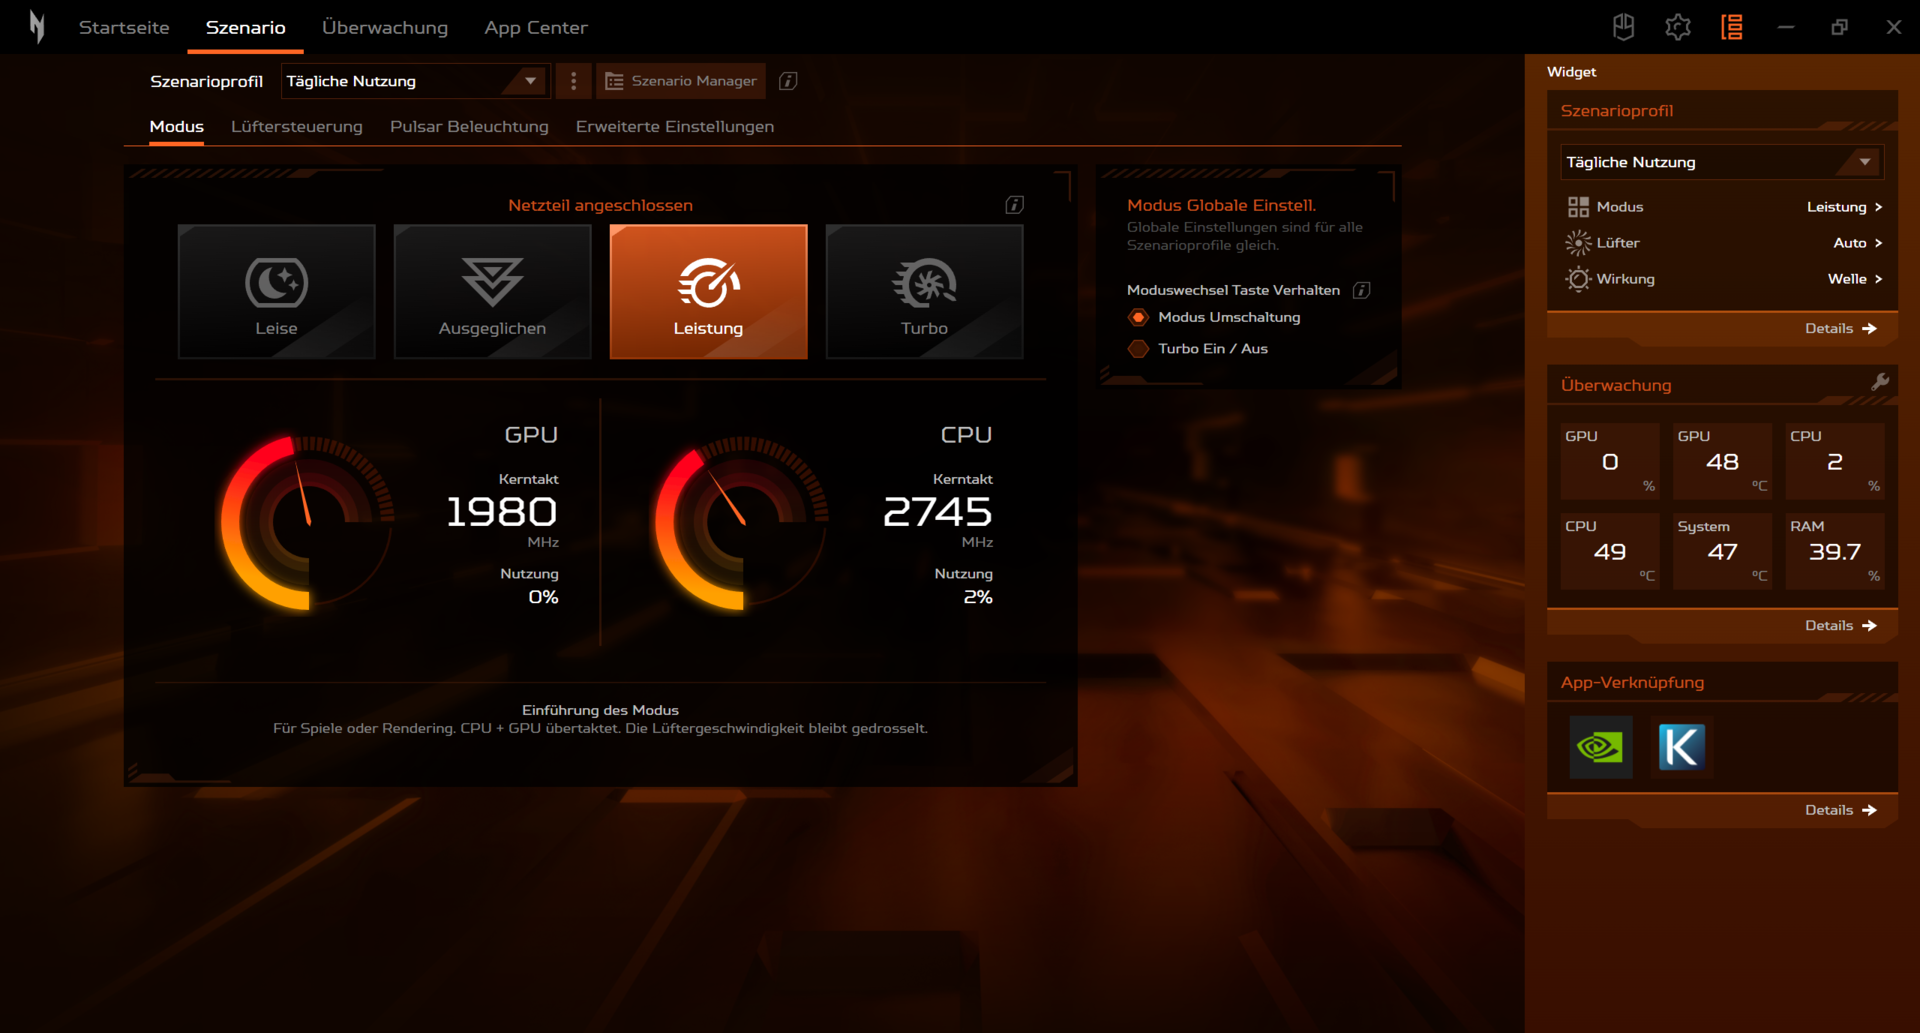
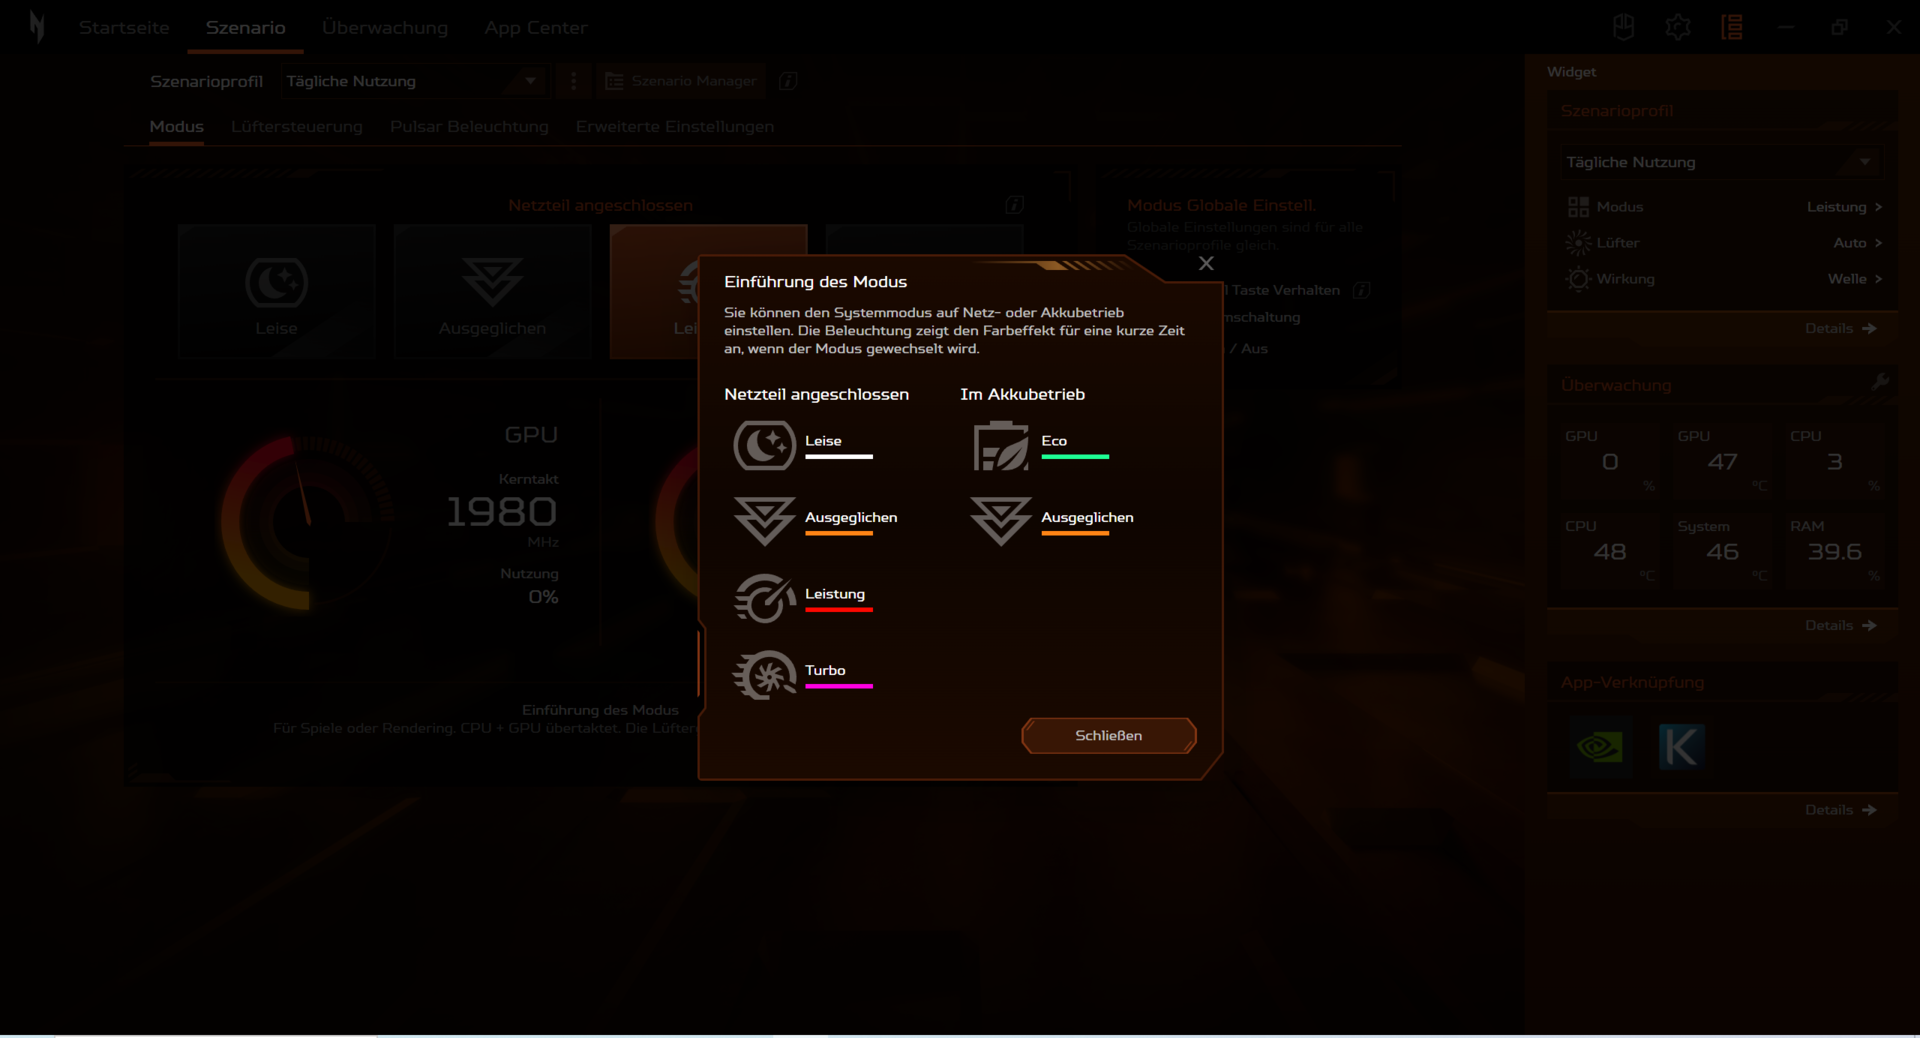
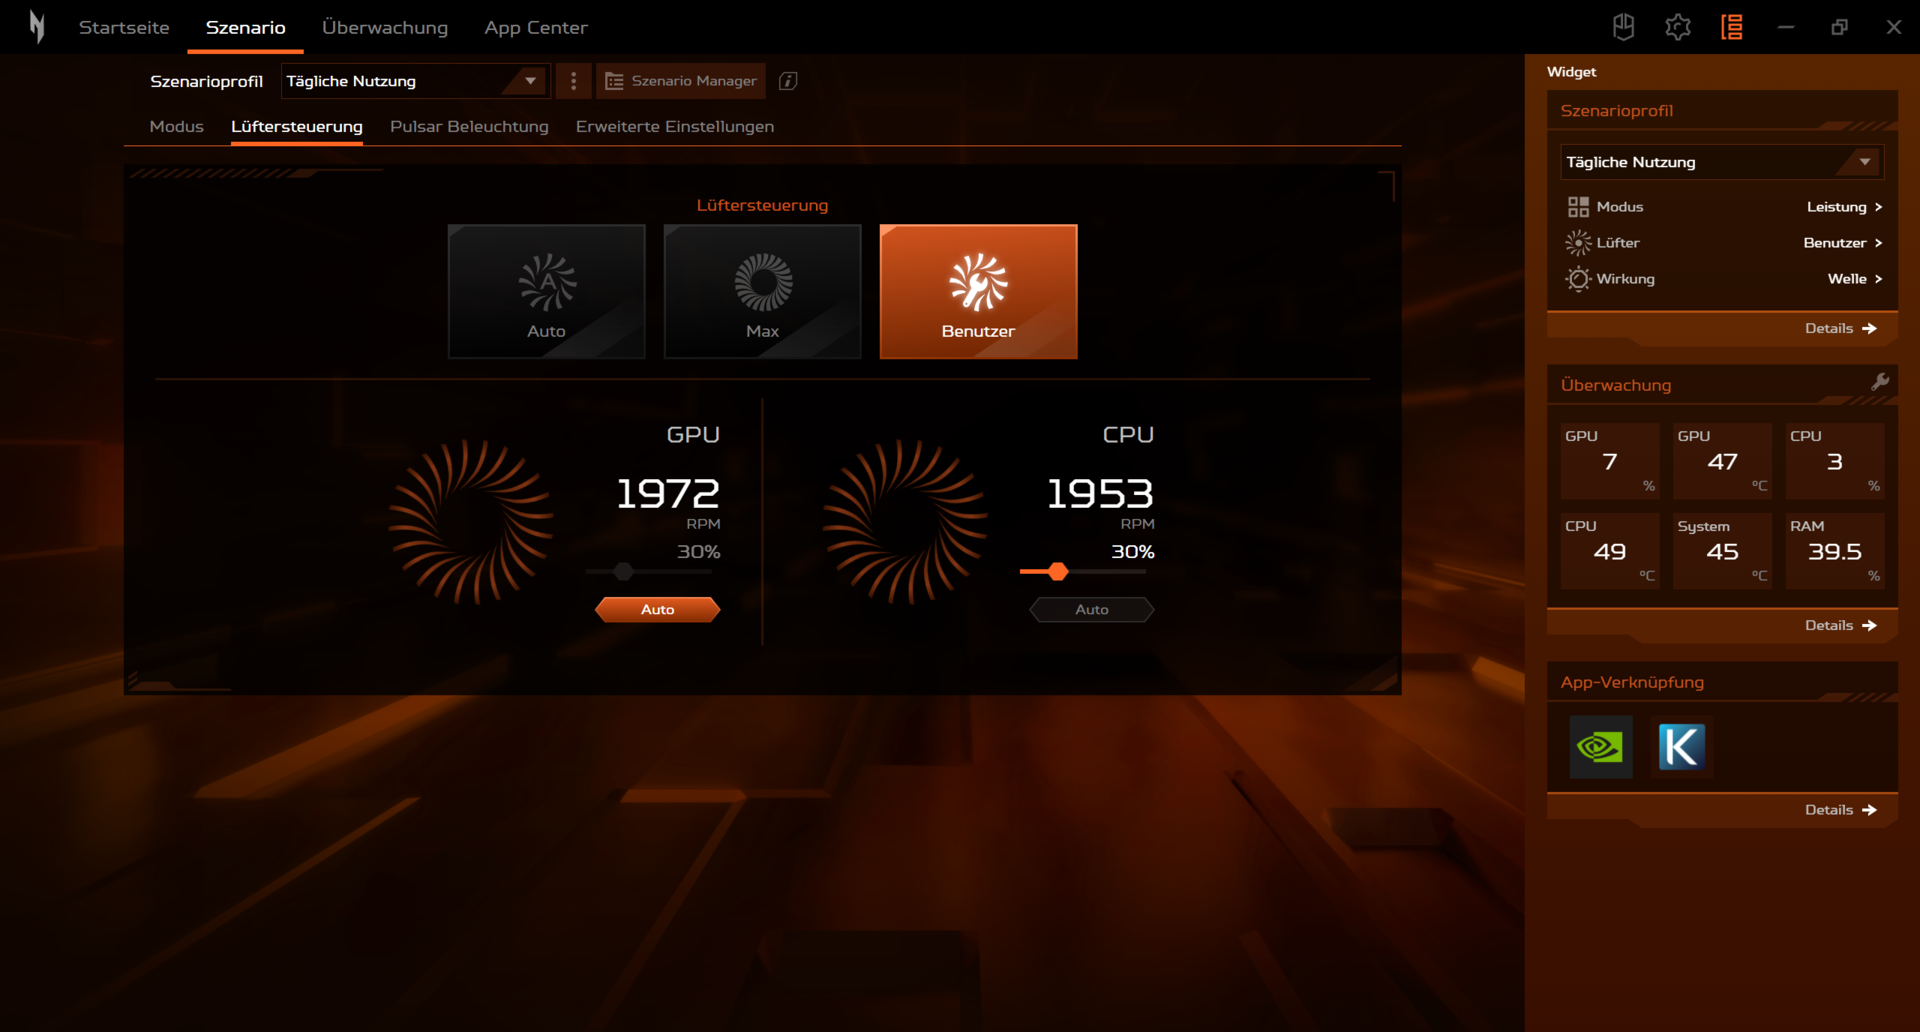
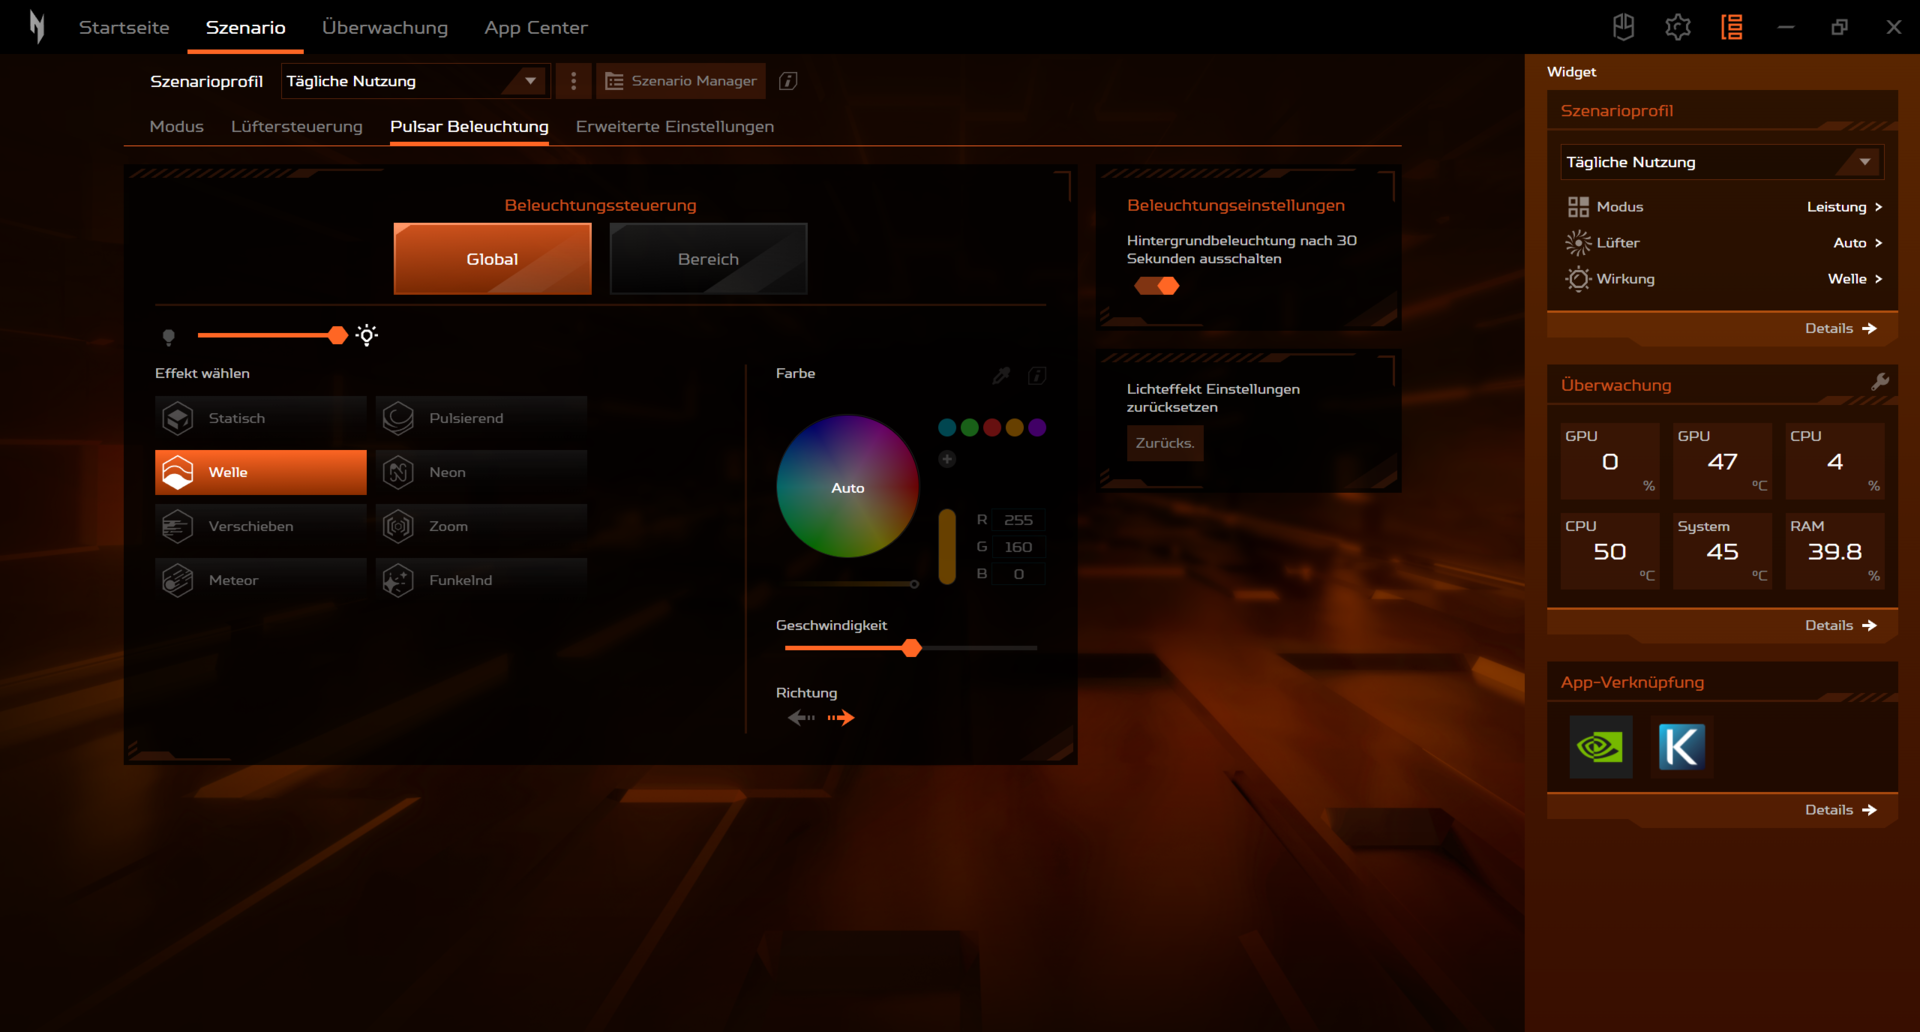
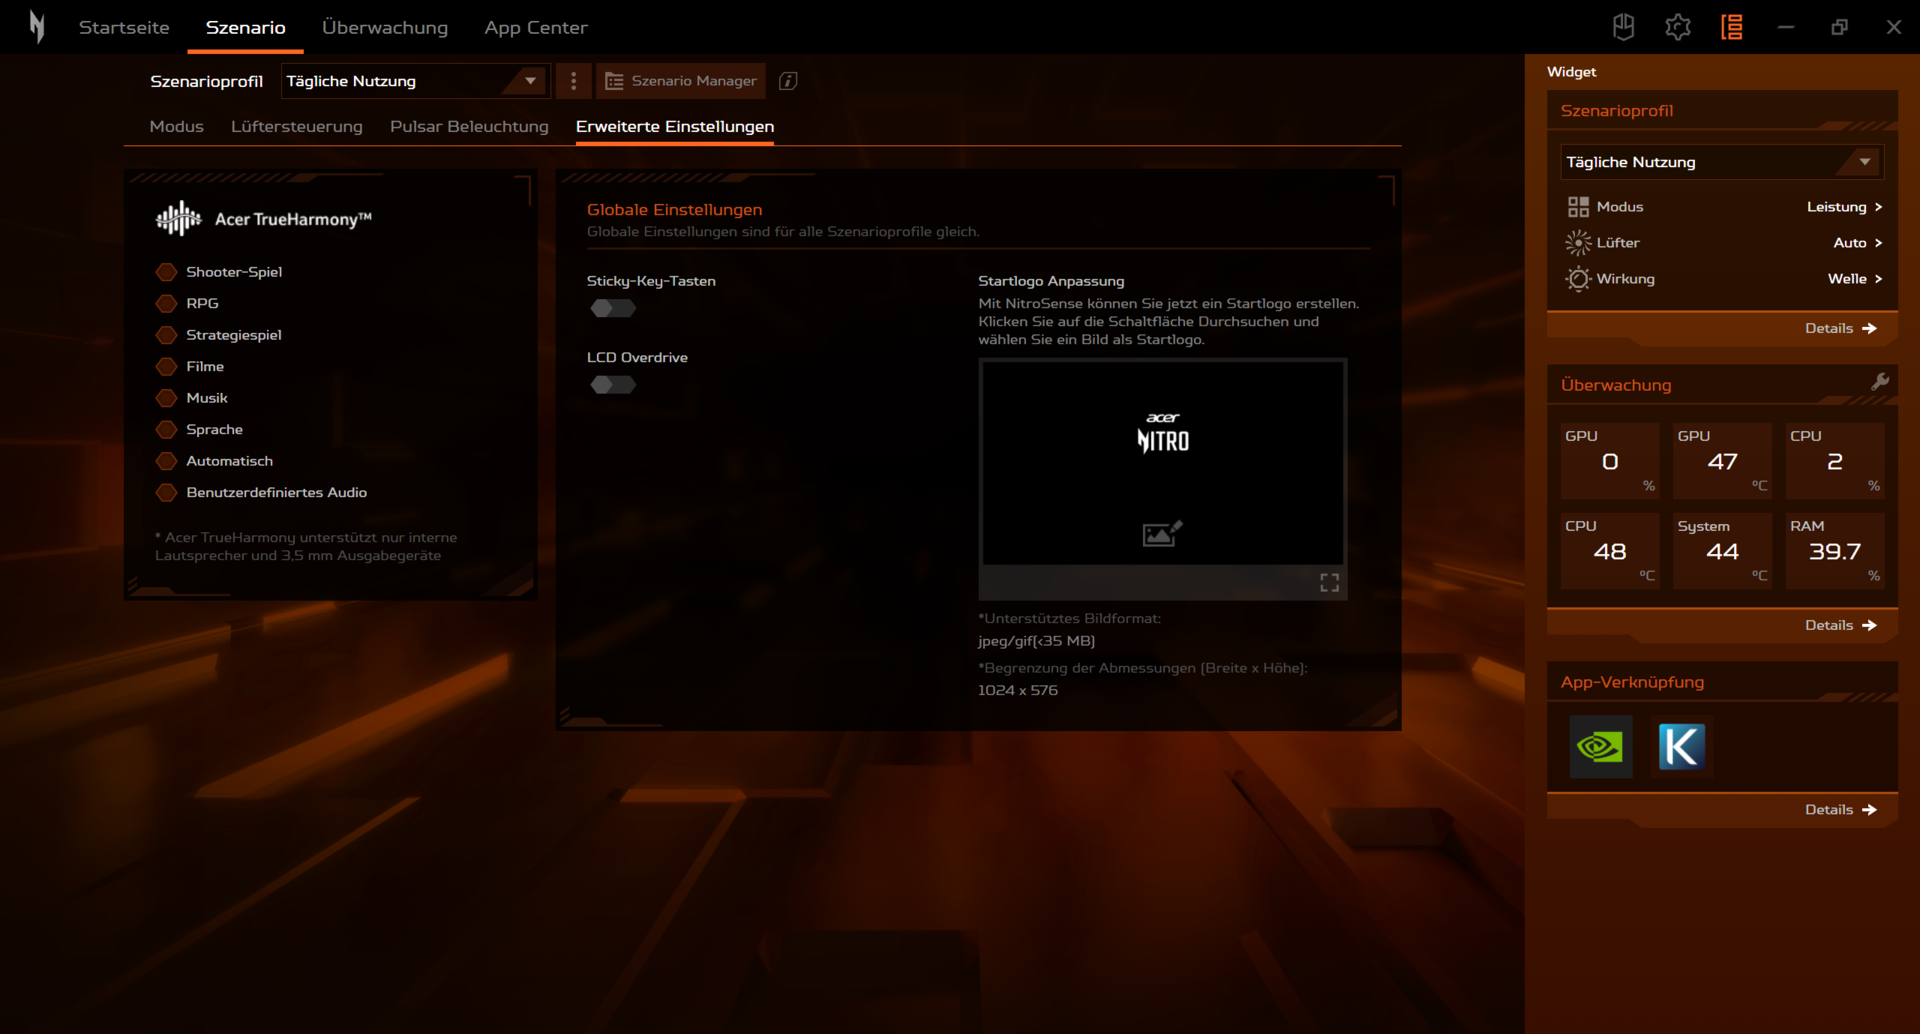
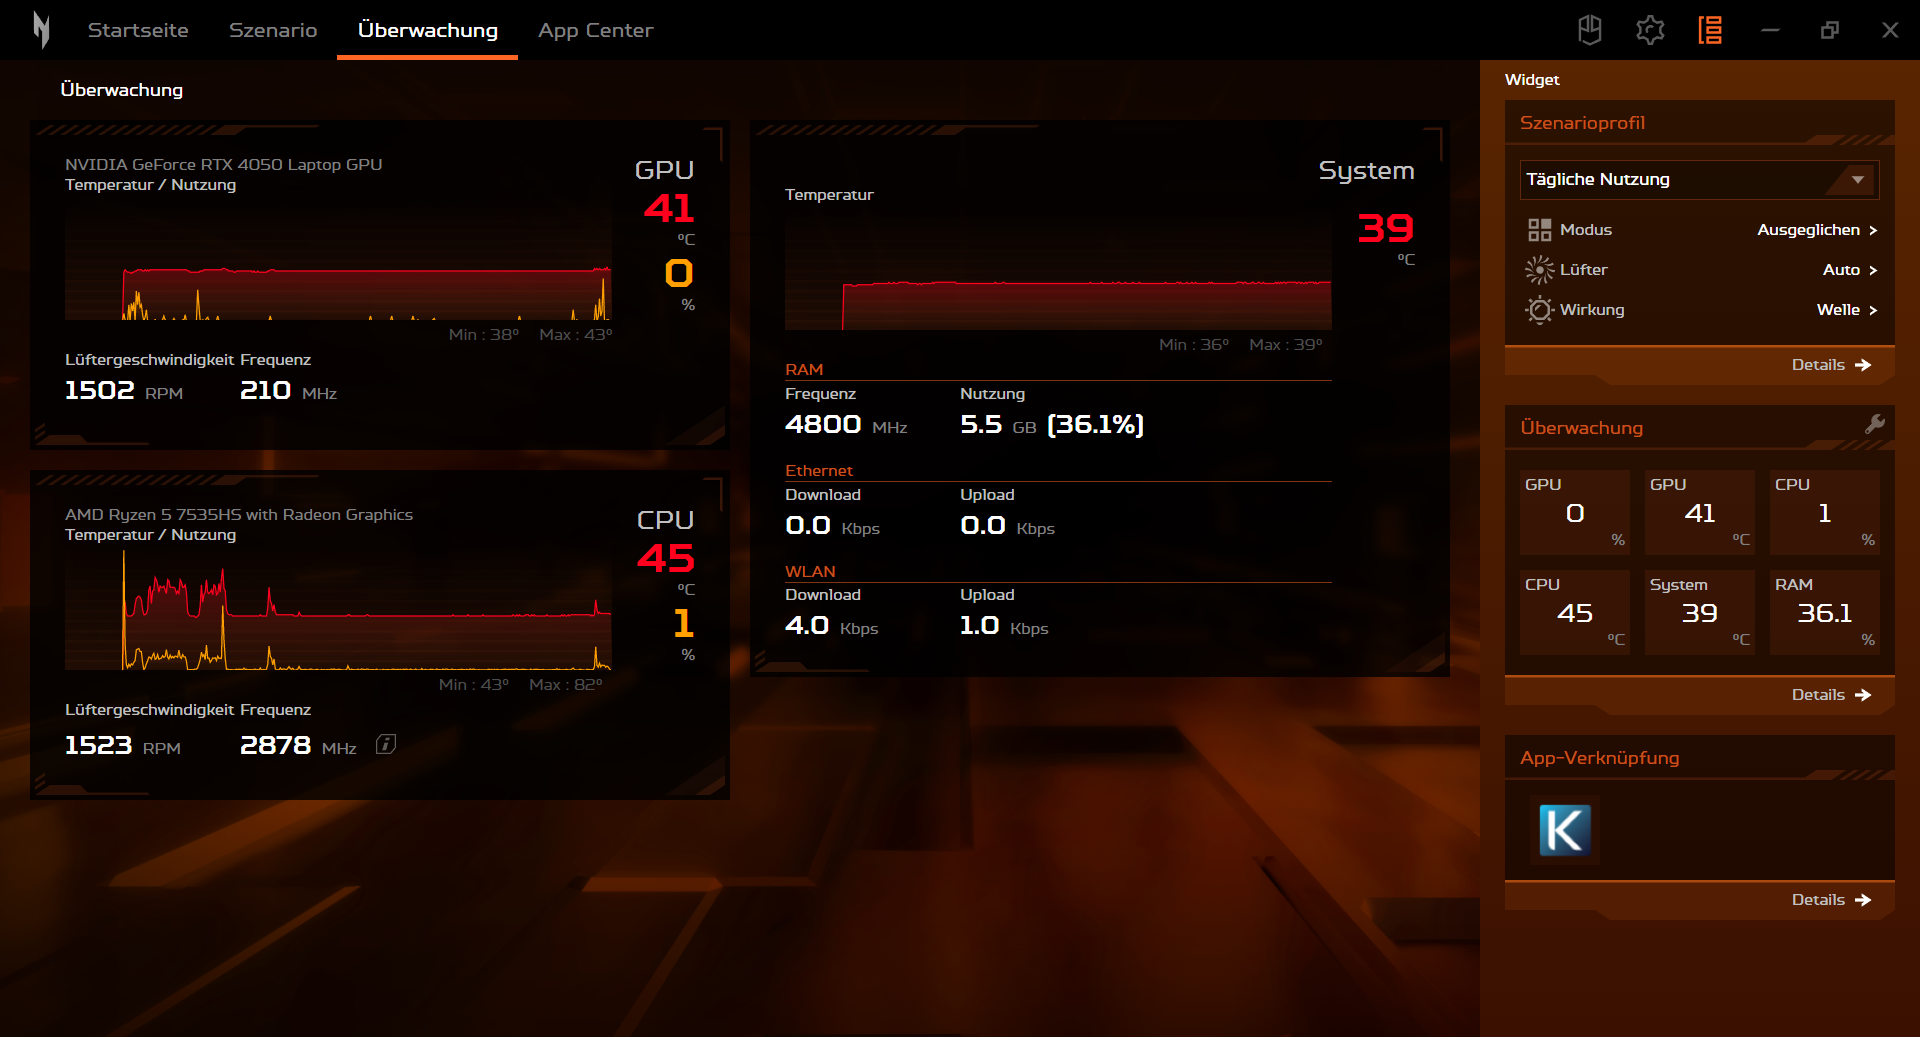
De los seis modos de rendimiento específicos del fabricante (véase la tabla siguiente), se utilizaron los modos "Equilibrado" (para pruebas de rendimiento) y "Eco" (para pruebas de batería). "Turbo" y "Rendimiento" sólo están disponibles en funcionamiento con red eléctrica (nivel de batería > 30%). Un botón encima del teclado permite cambiar entre los modos. También se puede hacer a través del software NitroSense (centro de control del portátil). Un LED indica el modo activo.
Nota: Mientras que el otro Nitro 16 modelo fue probado con el modo Optimus activo, el modo dGPU (= la iGPU está desactivada) se utiliza en el dispositivo de prueba actual. Sin embargo, las pruebas de batería son una excepción. Por tanto, los resultados de las pruebas no siempre son directamente comparables.
| Turbo | Potencia | Equilibrada | Silenciosa | Equilibrada (batería) | Eco (batería) | |
|---|---|---|---|---|---|---|
| Límite de potencia 1 (HWInfo) | 95 vatios | 75 vatios | 65 vatios | 45 vatios | 25 vatios | 25 vatios |
| Límite de potencia 2 (HWInfo) | 100 vatios | 100 vatios | 100 vatios | 100 vatios | 25 vatios | 25 vatios |
| Rendimiento (Witcher 3 ) | ~84 fps | ~83 fps | ~82 fps | ~74 fps | - | - |
| Ruido (Witcher 3 ) | 61 dB(A) | 56 dB(A) | 45 dB(A) | 35 dB(A) | - | - |
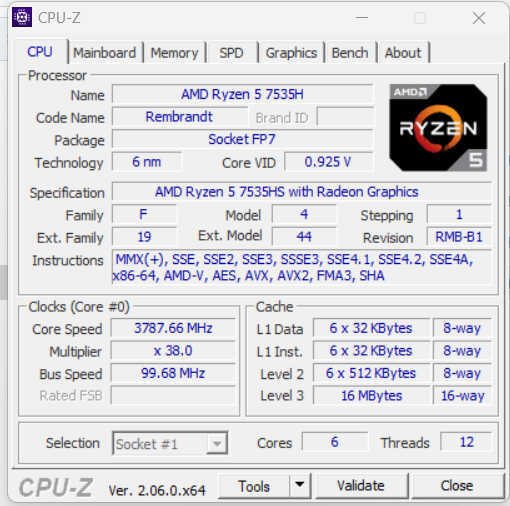
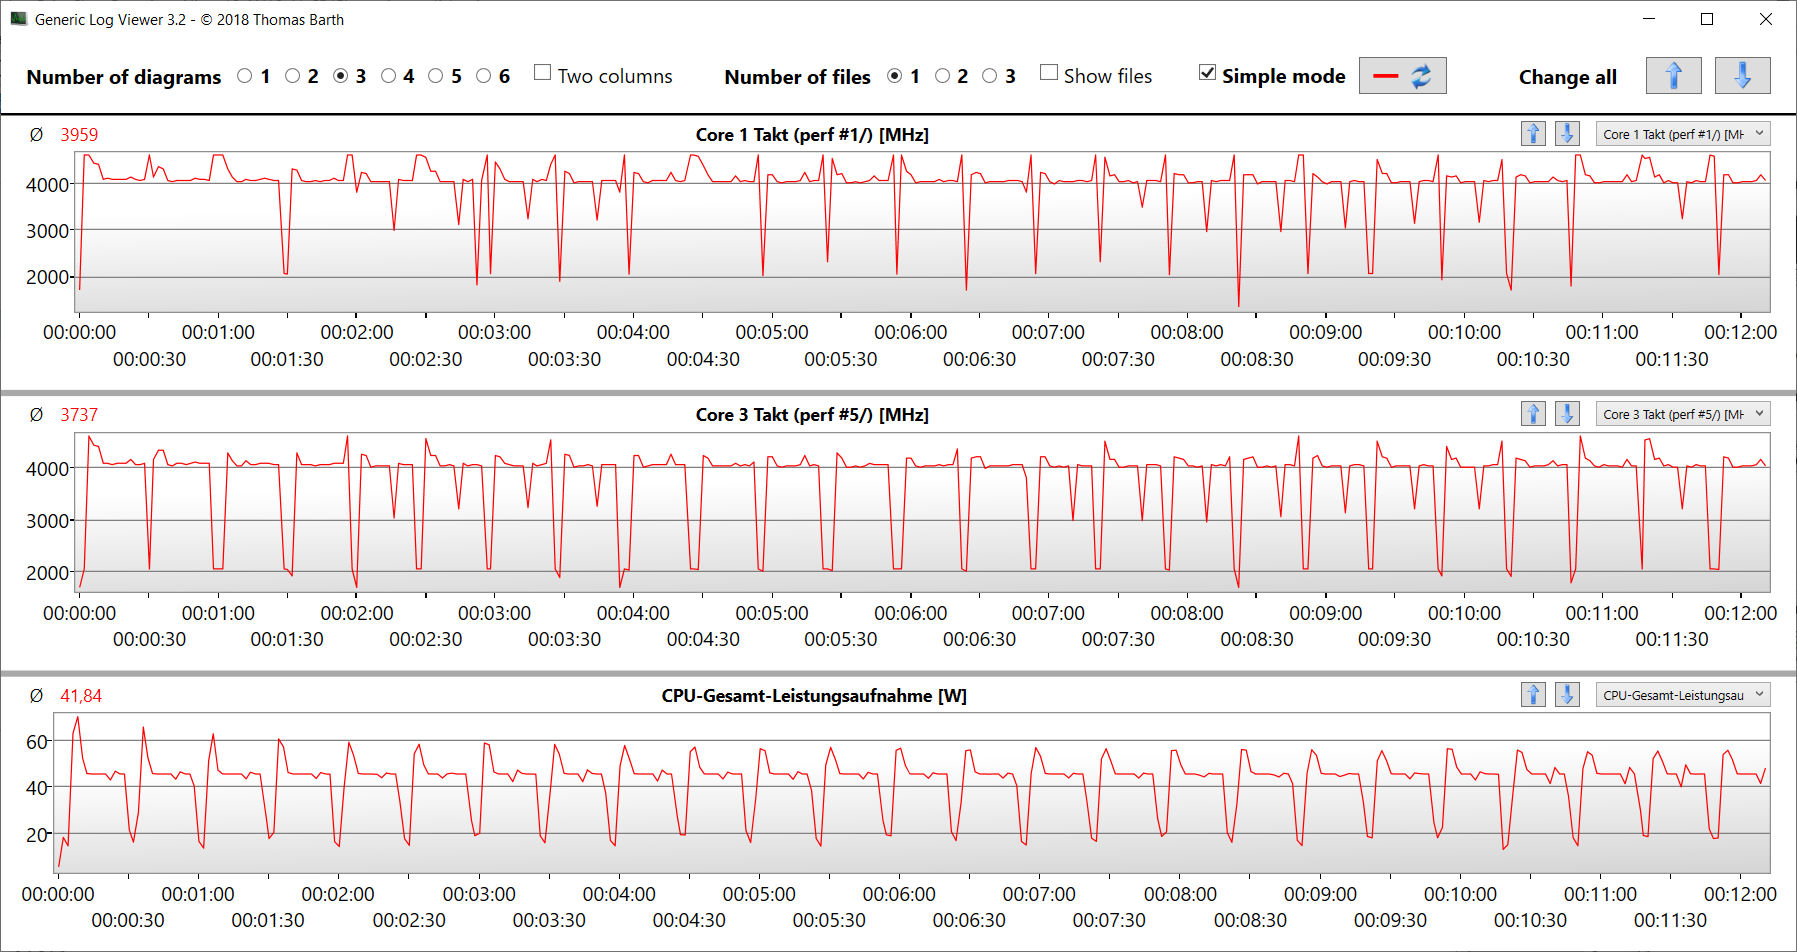
Procesador
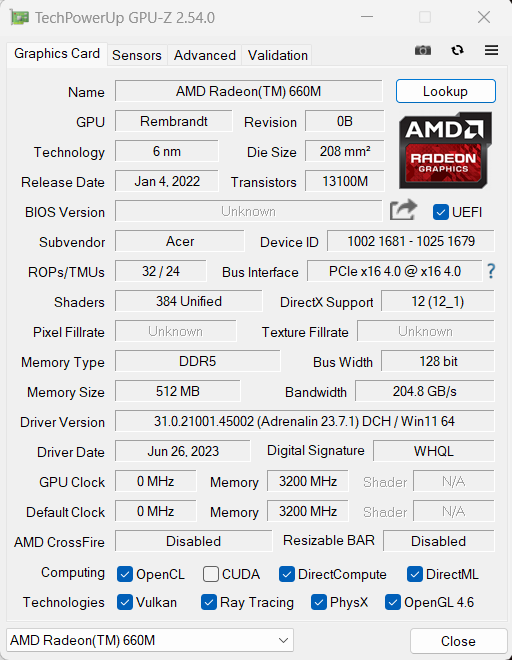
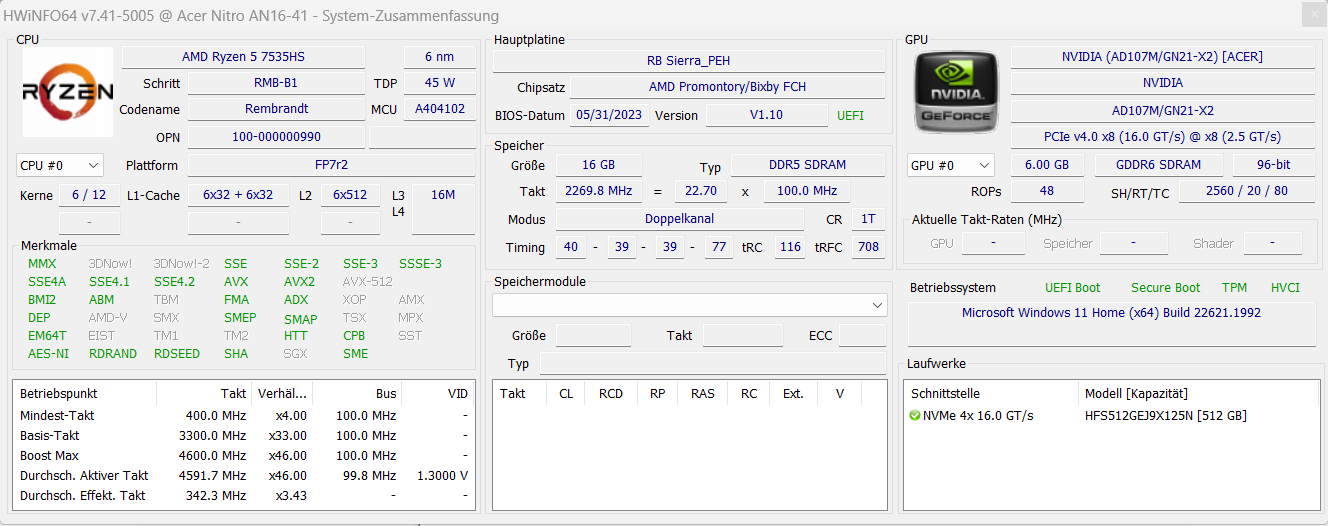
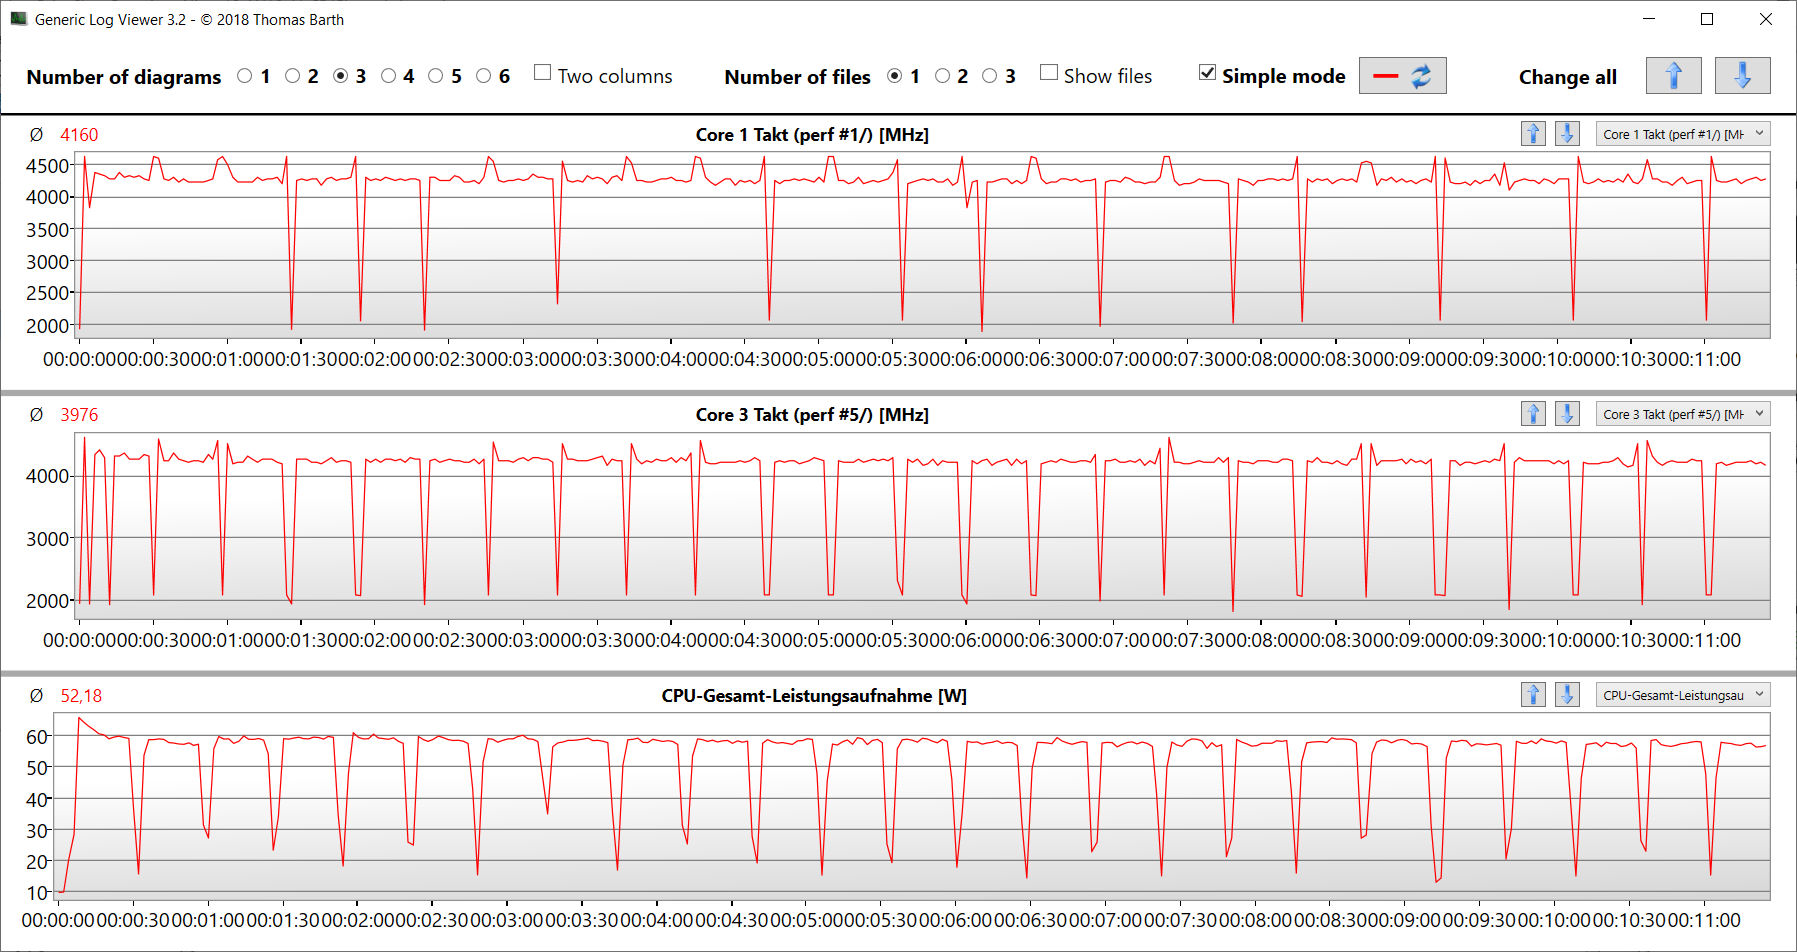
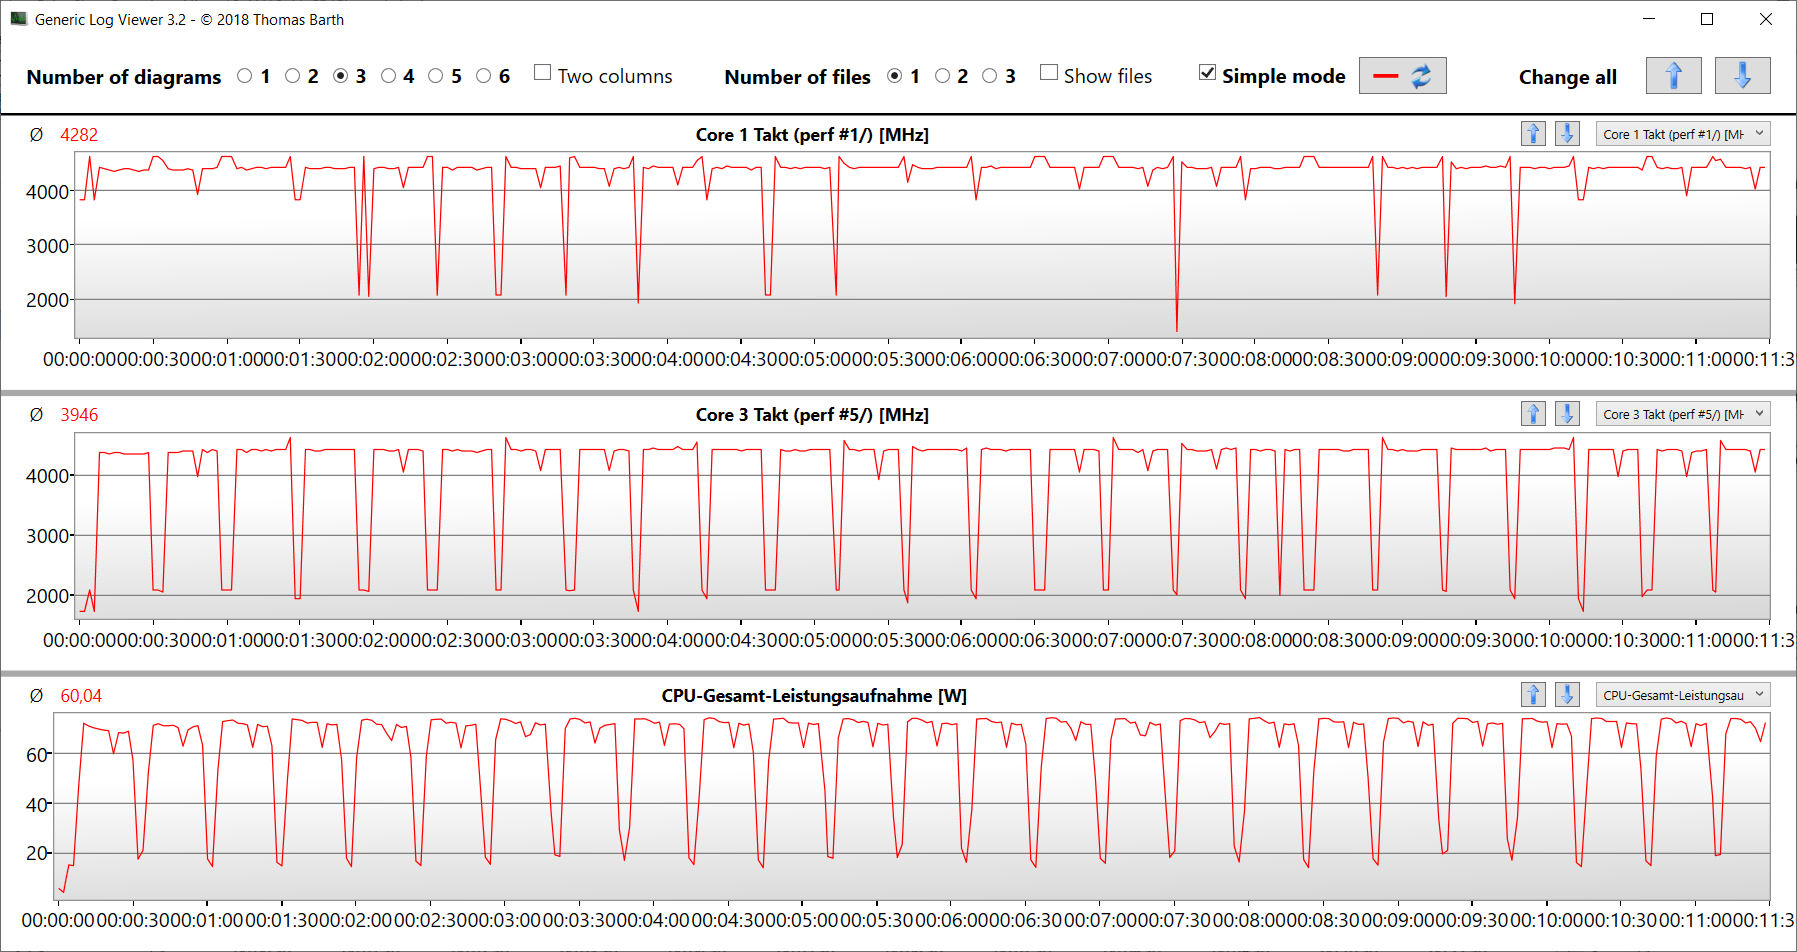
El Ryzen 5 7535HS(Zen 3+, Rembrandt-R) ofrece seis núcleos de CPU con un total de 12 subprocesos a un aumento máximo de un solo núcleo de 4,55 GHz. La CPU reconoce la carga multihilo permanente (CB15 Loop) con un Turbo clock constantemente alto - independientemente del modo de sistema seleccionado. Las diferencias entre los modos son pequeñas.
No sorprende que la APU Ryzen 7 del modelo hermano ofrece mayor rendimiento multihilo - después de todo, tiene 8 núcleos de CPU. En términos de rendimiento monohilo, que es más relevante en el uso diario, las APUs están casi a la par.
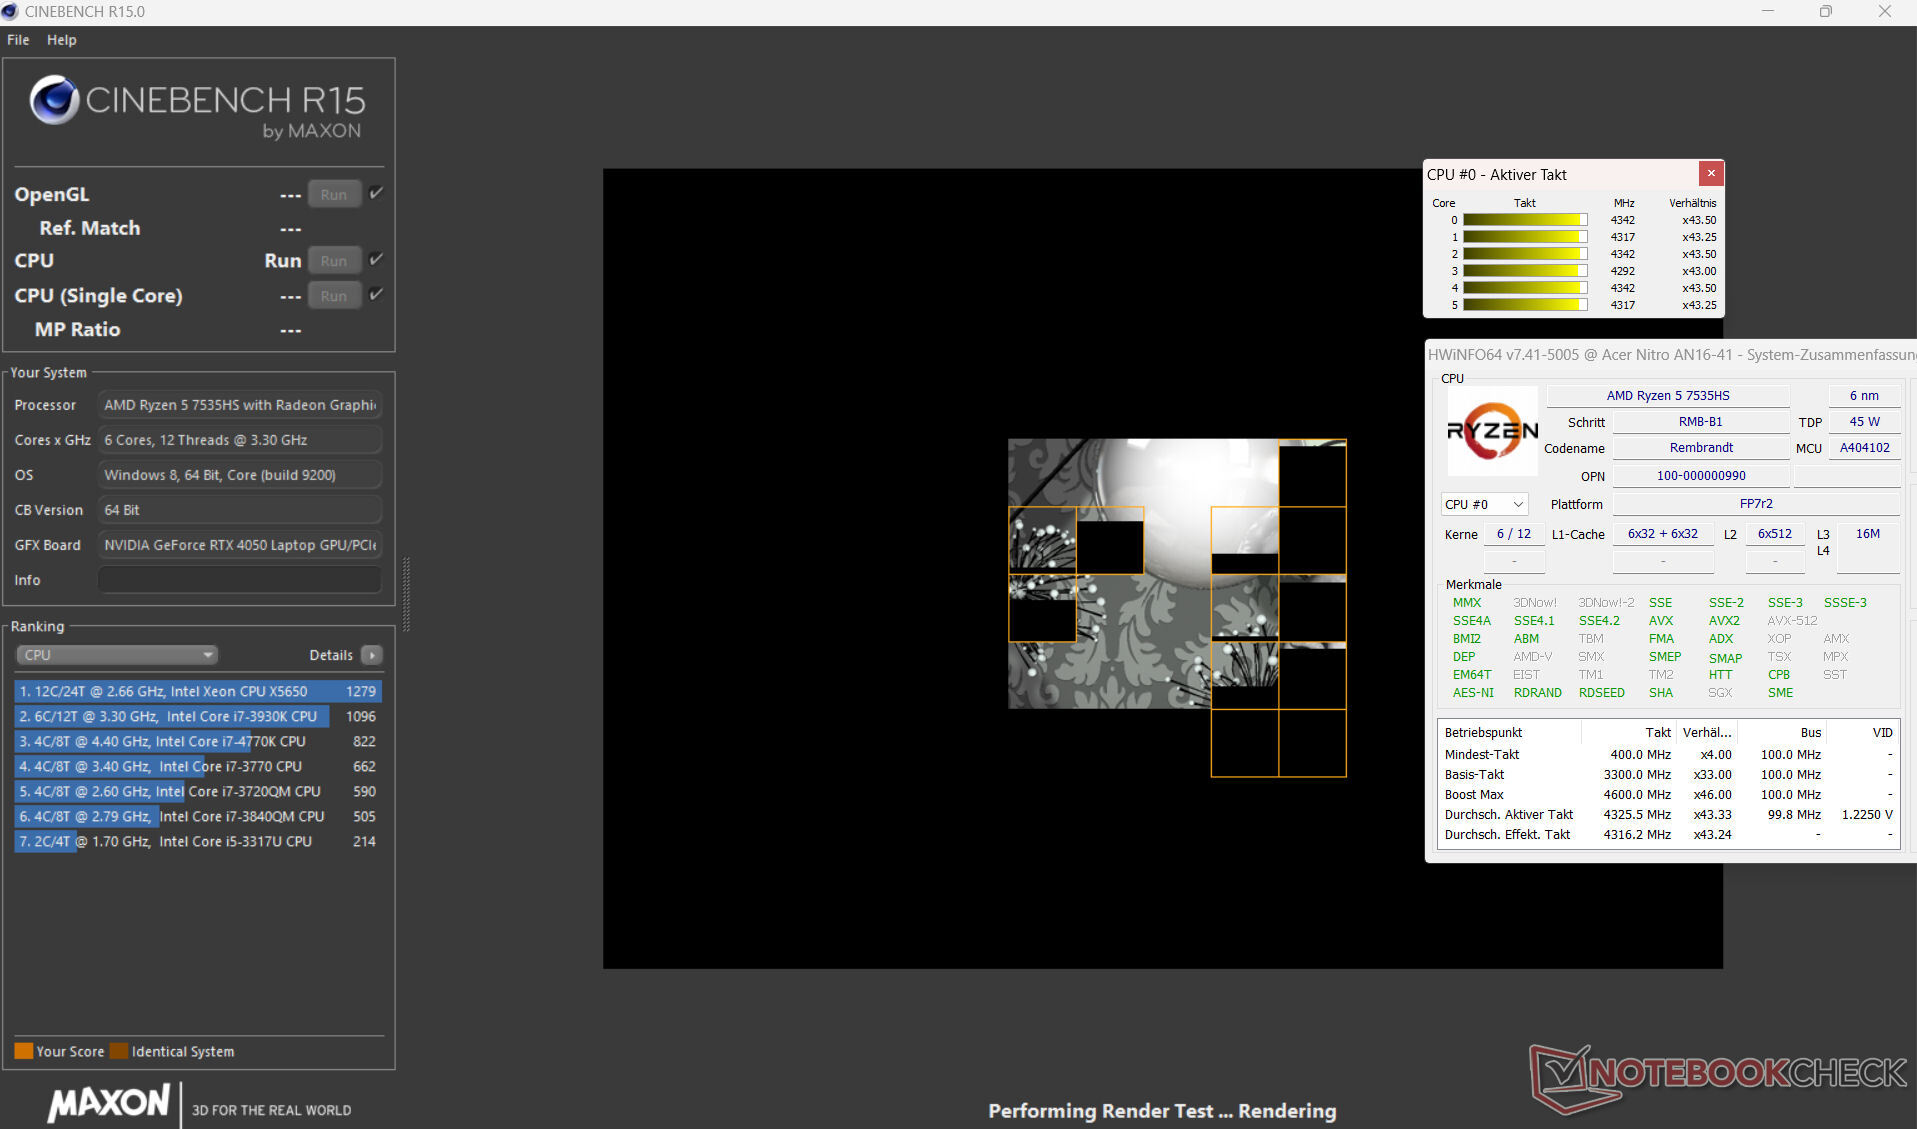
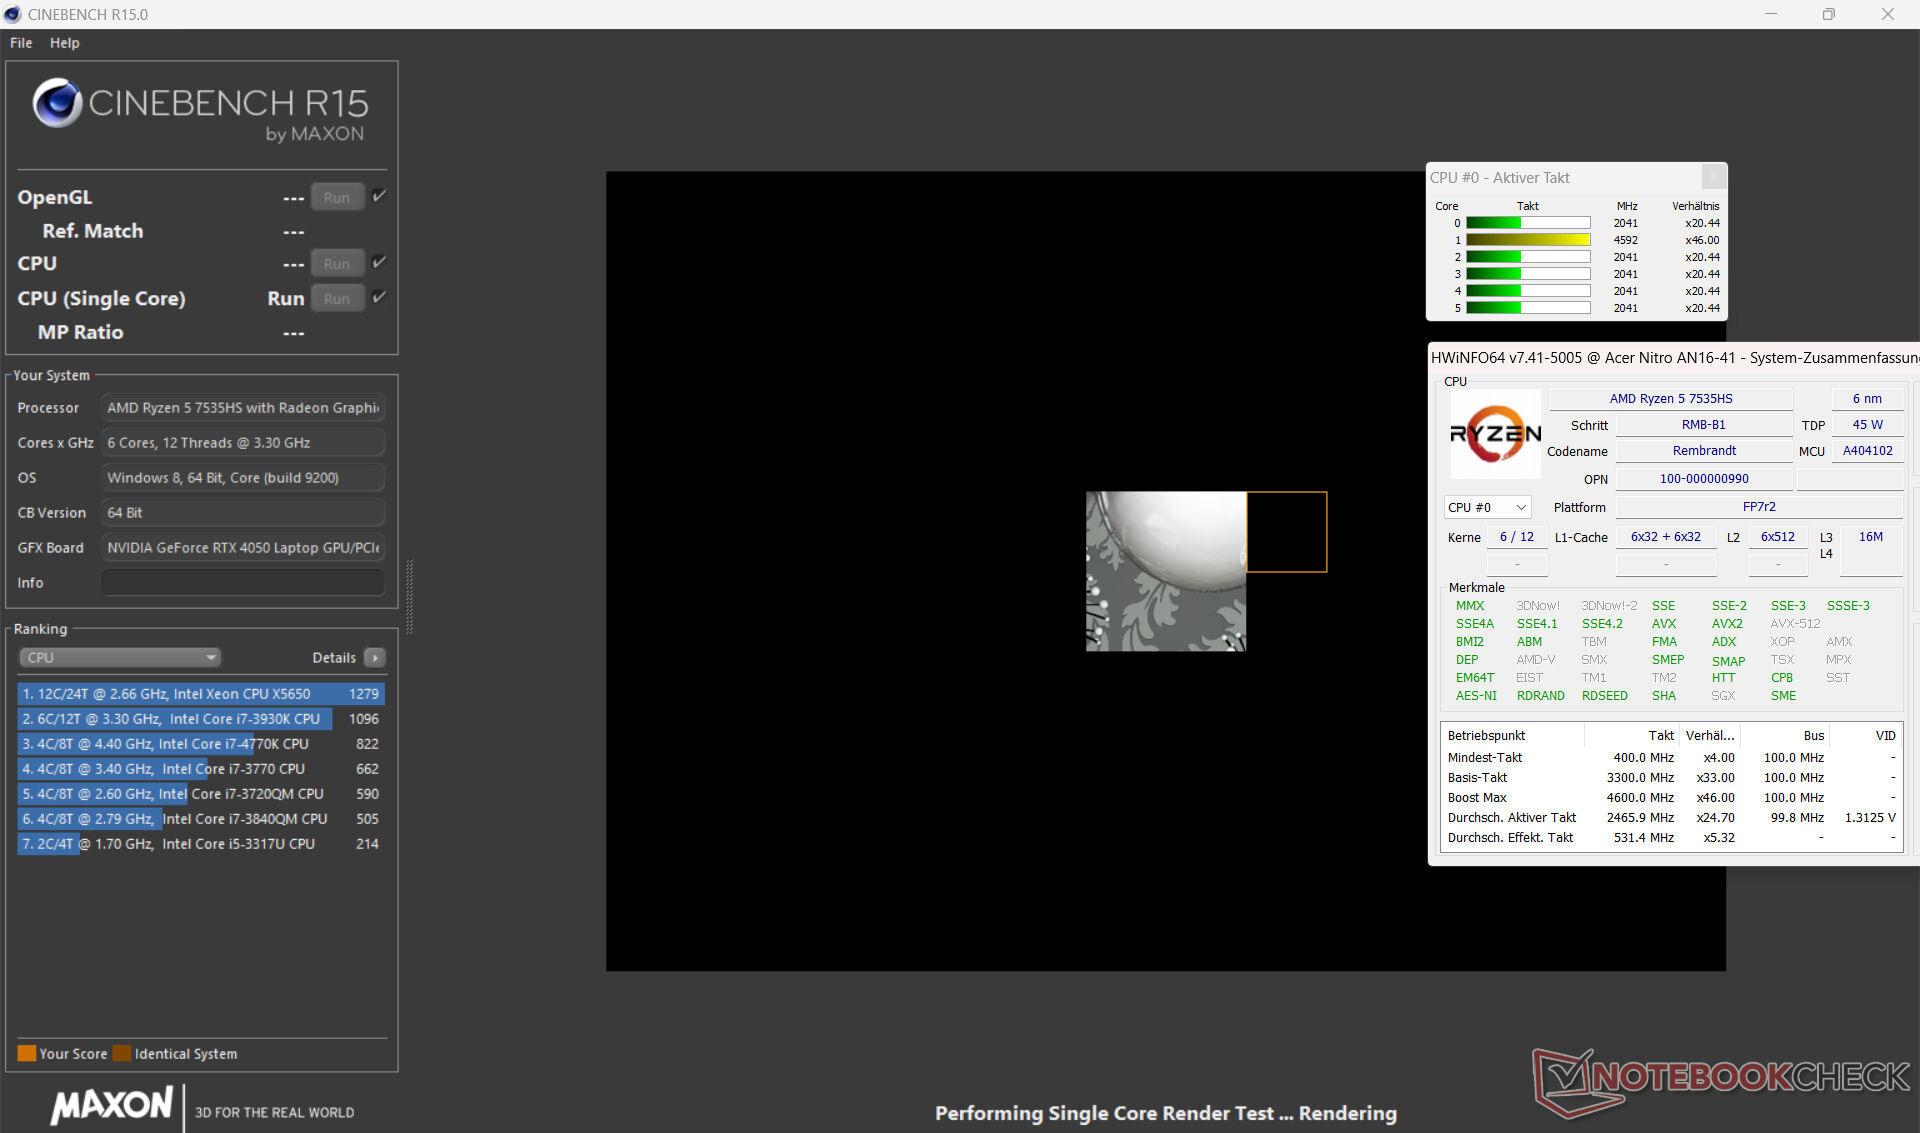
Cinebench R15 multi-core loop
* ... más pequeño es mejor
AIDA64: FP32 Ray-Trace | FPU Julia | CPU SHA3 | CPU Queen | FPU SinJulia | FPU Mandel | CPU AES | CPU ZLib | FP64 Ray-Trace | CPU PhotoWorxx
| Performance rating | |
| Media de la clase Gaming | |
| Schenker XMG Focus 15 (E23) | |
| Asus TUF Gaming A16 FA617XS | |
| Acer Nitro 16 AN16-41 | |
| Asus TUF A15 FA507 | |
| Medion Erazer Scout E20 | |
| Acer Nitro 16 AN16-41-R7YE | |
| Gigabyte G7 KE | |
| Medio AMD Ryzen 5 7535HS | |
| AIDA64 / FP32 Ray-Trace | |
| Media de la clase Gaming (10227 - 85542, n=105, últimos 2 años) | |
| Asus TUF Gaming A16 FA617XS | |
| Schenker XMG Focus 15 (E23) | |
| Acer Nitro 16 AN16-41 | |
| Asus TUF A15 FA507 | |
| Medion Erazer Scout E20 | |
| Gigabyte G7 KE | |
| Acer Nitro 16 AN16-41-R7YE | |
| Medio AMD Ryzen 5 7535HS (9617 - 12945, n=3) | |
| AIDA64 / FPU Julia | |
| Media de la clase Gaming (51376 - 238426, n=105, últimos 2 años) | |
| Asus TUF Gaming A16 FA617XS | |
| Schenker XMG Focus 15 (E23) | |
| Acer Nitro 16 AN16-41 | |
| Asus TUF A15 FA507 | |
| Acer Nitro 16 AN16-41-R7YE | |
| Medion Erazer Scout E20 | |
| Medio AMD Ryzen 5 7535HS (61244 - 79252, n=3) | |
| Gigabyte G7 KE | |
| AIDA64 / CPU SHA3 | |
| Media de la clase Gaming (2180 - 10115, n=105, últimos 2 años) | |
| Schenker XMG Focus 15 (E23) | |
| Asus TUF Gaming A16 FA617XS | |
| Acer Nitro 16 AN16-41 | |
| Asus TUF A15 FA507 | |
| Gigabyte G7 KE | |
| Medion Erazer Scout E20 | |
| Acer Nitro 16 AN16-41-R7YE | |
| Medio AMD Ryzen 5 7535HS (2075 - 2679, n=3) | |
| AIDA64 / CPU Queen | |
| Schenker XMG Focus 15 (E23) | |
| Asus TUF Gaming A16 FA617XS | |
| Media de la clase Gaming (49785 - 173351, n=90, últimos 2 años) | |
| Acer Nitro 16 AN16-41 | |
| Medion Erazer Scout E20 | |
| Asus TUF A15 FA507 | |
| Acer Nitro 16 AN16-41-R7YE | |
| Gigabyte G7 KE | |
| Medio AMD Ryzen 5 7535HS (73548 - 82540, n=3) | |
| AIDA64 / FPU SinJulia | |
| Asus TUF Gaming A16 FA617XS | |
| Media de la clase Gaming (4424 - 33636, n=105, últimos 2 años) | |
| Schenker XMG Focus 15 (E23) | |
| Acer Nitro 16 AN16-41 | |
| Asus TUF A15 FA507 | |
| Acer Nitro 16 AN16-41-R7YE | |
| Medion Erazer Scout E20 | |
| Medio AMD Ryzen 5 7535HS (8792 - 9786, n=3) | |
| Gigabyte G7 KE | |
| AIDA64 / FPU Mandel | |
| Media de la clase Gaming (25115 - 128721, n=105, últimos 2 años) | |
| Asus TUF Gaming A16 FA617XS | |
| Acer Nitro 16 AN16-41 | |
| Asus TUF A15 FA507 | |
| Schenker XMG Focus 15 (E23) | |
| Acer Nitro 16 AN16-41-R7YE | |
| Medio AMD Ryzen 5 7535HS (34054 - 43495, n=3) | |
| Medion Erazer Scout E20 | |
| Gigabyte G7 KE | |
| AIDA64 / CPU AES | |
| Gigabyte G7 KE | |
| Media de la clase Gaming (39258 - 247074, n=105, últimos 2 años) | |
| Acer Nitro 16 AN16-41-R7YE | |
| Schenker XMG Focus 15 (E23) | |
| Asus TUF Gaming A16 FA617XS | |
| Medion Erazer Scout E20 | |
| Asus TUF A15 FA507 | |
| Medio AMD Ryzen 5 7535HS (35651 - 105083, n=3) | |
| Acer Nitro 16 AN16-41 | |
| AIDA64 / CPU ZLib | |
| Schenker XMG Focus 15 (E23) | |
| Media de la clase Gaming (574 - 2531, n=105, últimos 2 años) | |
| Asus TUF Gaming A16 FA617XS | |
| Medion Erazer Scout E20 | |
| Gigabyte G7 KE | |
| Acer Nitro 16 AN16-41 | |
| Acer Nitro 16 AN16-41-R7YE | |
| Asus TUF A15 FA507 | |
| Medio AMD Ryzen 5 7535HS (545 - 665, n=3) | |
| AIDA64 / FP64 Ray-Trace | |
| Media de la clase Gaming (5509 - 45446, n=105, últimos 2 años) | |
| Asus TUF Gaming A16 FA617XS | |
| Schenker XMG Focus 15 (E23) | |
| Acer Nitro 16 AN16-41 | |
| Asus TUF A15 FA507 | |
| Medion Erazer Scout E20 | |
| Gigabyte G7 KE | |
| Acer Nitro 16 AN16-41-R7YE | |
| Medio AMD Ryzen 5 7535HS (5170 - 6899, n=3) | |
| AIDA64 / CPU PhotoWorxx | |
| Schenker XMG Focus 15 (E23) | |
| Media de la clase Gaming (12271 - 89891, n=105, últimos 2 años) | |
| Medion Erazer Scout E20 | |
| Asus TUF Gaming A16 FA617XS | |
| Gigabyte G7 KE | |
| Acer Nitro 16 AN16-41-R7YE | |
| Asus TUF A15 FA507 | |
| Acer Nitro 16 AN16-41 | |
| Medio AMD Ryzen 5 7535HS (24728 - 28865, n=3) | |
Rendimiento del sistema
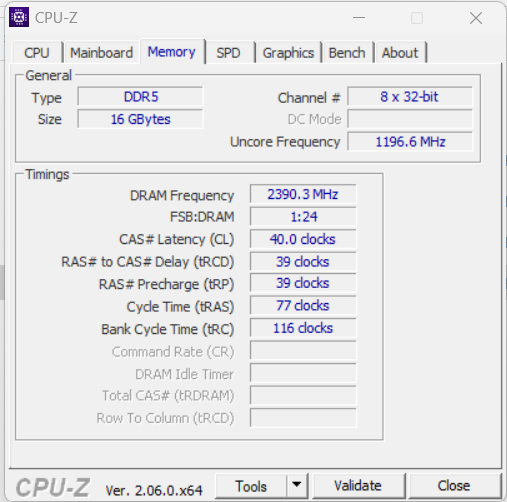
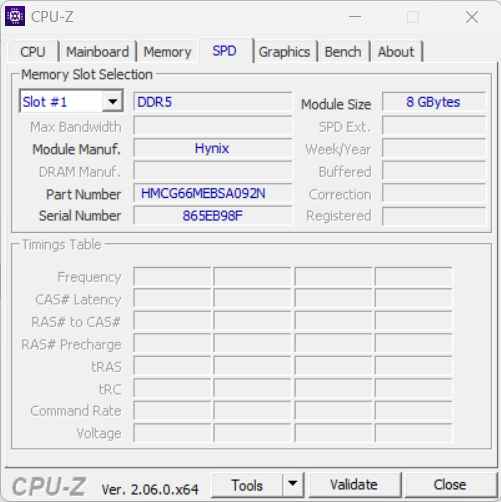
El buen funcionamiento del sistema proporciona suficiente potencia de cálculo para aplicaciones exigentes como renderizado, edición de vídeo y juegos. Las tasas de transferencia de la memoria de trabajo (DDR5-4800) se quedan por debajo del potencial, en comparación con los valores del Asus TUF Gaming A16 muestra.
CrossMark: Overall | Productivity | Creativity | Responsiveness
| PCMark 10 / Score | |
| Media de la clase Gaming (5828 - 12414, n=93, últimos 2 años) | |
| Asus TUF Gaming A16 FA617XS | |
| Medion Erazer Scout E20 | |
| Acer Nitro 16 AN16-41 | |
| Asus TUF A15 FA507 | |
| Schenker XMG Focus 15 (E23) | |
| Acer Nitro 16 AN16-41-R7YE | |
| Medio AMD Ryzen 5 7535HS, NVIDIA GeForce RTX 4050 Laptop GPU (n=1) | |
| Gigabyte G7 KE | |
| PCMark 10 / Essentials | |
| Medion Erazer Scout E20 | |
| Asus TUF Gaming A16 FA617XS | |
| Media de la clase Gaming (8810 - 11935, n=97, últimos 2 años) | |
| Acer Nitro 16 AN16-41 | |
| Asus TUF A15 FA507 | |
| Gigabyte G7 KE | |
| Acer Nitro 16 AN16-41-R7YE | |
| Medio AMD Ryzen 5 7535HS, NVIDIA GeForce RTX 4050 Laptop GPU (n=1) | |
| Schenker XMG Focus 15 (E23) | |
| PCMark 10 / Productivity | |
| Media de la clase Gaming (6845 - 25323, n=95, últimos 2 años) | |
| Asus TUF Gaming A16 FA617XS | |
| Medion Erazer Scout E20 | |
| Schenker XMG Focus 15 (E23) | |
| Asus TUF A15 FA507 | |
| Acer Nitro 16 AN16-41 | |
| Gigabyte G7 KE | |
| Acer Nitro 16 AN16-41-R7YE | |
| Medio AMD Ryzen 5 7535HS, NVIDIA GeForce RTX 4050 Laptop GPU (n=1) | |
| PCMark 10 / Digital Content Creation | |
| Media de la clase Gaming (7602 - 19954, n=95, últimos 2 años) | |
| Asus TUF Gaming A16 FA617XS | |
| Medion Erazer Scout E20 | |
| Acer Nitro 16 AN16-41 | |
| Asus TUF A15 FA507 | |
| Acer Nitro 16 AN16-41-R7YE | |
| Medio AMD Ryzen 5 7535HS, NVIDIA GeForce RTX 4050 Laptop GPU (n=1) | |
| Schenker XMG Focus 15 (E23) | |
| Gigabyte G7 KE | |
| CrossMark / Overall | |
| Schenker XMG Focus 15 (E23) | |
| Media de la clase Gaming (1366 - 2409, n=94, últimos 2 años) | |
| Medion Erazer Scout E20 | |
| Gigabyte G7 KE | |
| Asus TUF Gaming A16 FA617XS | |
| Asus TUF A15 FA507 | |
| Acer Nitro 16 AN16-41 | |
| Acer Nitro 16 AN16-41-R7YE | |
| Medio AMD Ryzen 5 7535HS, NVIDIA GeForce RTX 4050 Laptop GPU (n=1) | |
| CrossMark / Productivity | |
| Schenker XMG Focus 15 (E23) | |
| Medion Erazer Scout E20 | |
| Media de la clase Gaming (1386 - 2254, n=94, últimos 2 años) | |
| Gigabyte G7 KE | |
| Asus TUF Gaming A16 FA617XS | |
| Asus TUF A15 FA507 | |
| Acer Nitro 16 AN16-41 | |
| Acer Nitro 16 AN16-41-R7YE | |
| Medio AMD Ryzen 5 7535HS, NVIDIA GeForce RTX 4050 Laptop GPU (n=1) | |
| CrossMark / Creativity | |
| Schenker XMG Focus 15 (E23) | |
| Media de la clase Gaming (1343 - 2786, n=94, últimos 2 años) | |
| Medion Erazer Scout E20 | |
| Asus TUF Gaming A16 FA617XS | |
| Gigabyte G7 KE | |
| Asus TUF A15 FA507 | |
| Acer Nitro 16 AN16-41 | |
| Acer Nitro 16 AN16-41-R7YE | |
| Medio AMD Ryzen 5 7535HS, NVIDIA GeForce RTX 4050 Laptop GPU (n=1) | |
| CrossMark / Responsiveness | |
| Gigabyte G7 KE | |
| Medion Erazer Scout E20 | |
| Schenker XMG Focus 15 (E23) | |
| Media de la clase Gaming (1226 - 2334, n=94, últimos 2 años) | |
| Asus TUF Gaming A16 FA617XS | |
| Acer Nitro 16 AN16-41-R7YE | |
| Medio AMD Ryzen 5 7535HS, NVIDIA GeForce RTX 4050 Laptop GPU (n=1) | |
| Acer Nitro 16 AN16-41 | |
| Asus TUF A15 FA507 | |
| PCMark 8 Home Score Accelerated v2 | 5548 puntos | |
| PCMark 8 Work Score Accelerated v2 | 5810 puntos | |
| PCMark 10 Score | 6690 puntos | |
ayuda | ||
| AIDA64 / Memory Copy | |
| Schenker XMG Focus 15 (E23) | |
| Media de la clase Gaming (21750 - 129946, n=105, últimos 2 años) | |
| Asus TUF Gaming A16 FA617XS | |
| Medion Erazer Scout E20 | |
| Medio AMD Ryzen 5 7535HS (48040 - 49119, n=3) | |
| Acer Nitro 16 AN16-41-R7YE | |
| Asus TUF A15 FA507 | |
| Acer Nitro 16 AN16-41 | |
| Gigabyte G7 KE | |
| AIDA64 / Memory Read | |
| Schenker XMG Focus 15 (E23) | |
| Media de la clase Gaming (22956 - 118858, n=105, últimos 2 años) | |
| Medion Erazer Scout E20 | |
| Asus TUF Gaming A16 FA617XS | |
| Acer Nitro 16 AN16-41-R7YE | |
| Acer Nitro 16 AN16-41 | |
| Asus TUF A15 FA507 | |
| Gigabyte G7 KE | |
| Medio AMD Ryzen 5 7535HS (40044 - 50259, n=3) | |
| AIDA64 / Memory Write | |
| Schenker XMG Focus 15 (E23) | |
| Media de la clase Gaming (22297 - 135096, n=105, últimos 2 años) | |
| Asus TUF Gaming A16 FA617XS | |
| Medion Erazer Scout E20 | |
| Asus TUF A15 FA507 | |
| Acer Nitro 16 AN16-41-R7YE | |
| Acer Nitro 16 AN16-41 | |
| Medio AMD Ryzen 5 7535HS (48854 - 54982, n=3) | |
| Gigabyte G7 KE | |
| AIDA64 / Memory Latency | |
| Media de la clase Gaming (75.3 - 259, n=105, últimos 2 años) | |
| Medio AMD Ryzen 5 7535HS (87.7 - 110.3, n=3) | |
| Medion Erazer Scout E20 | |
| Acer Nitro 16 AN16-41 | |
| Asus TUF Gaming A16 FA617XS | |
| Gigabyte G7 KE | |
| Acer Nitro 16 AN16-41-R7YE | |
| Schenker XMG Focus 15 (E23) | |
| Asus TUF A15 FA507 | |
* ... más pequeño es mejor
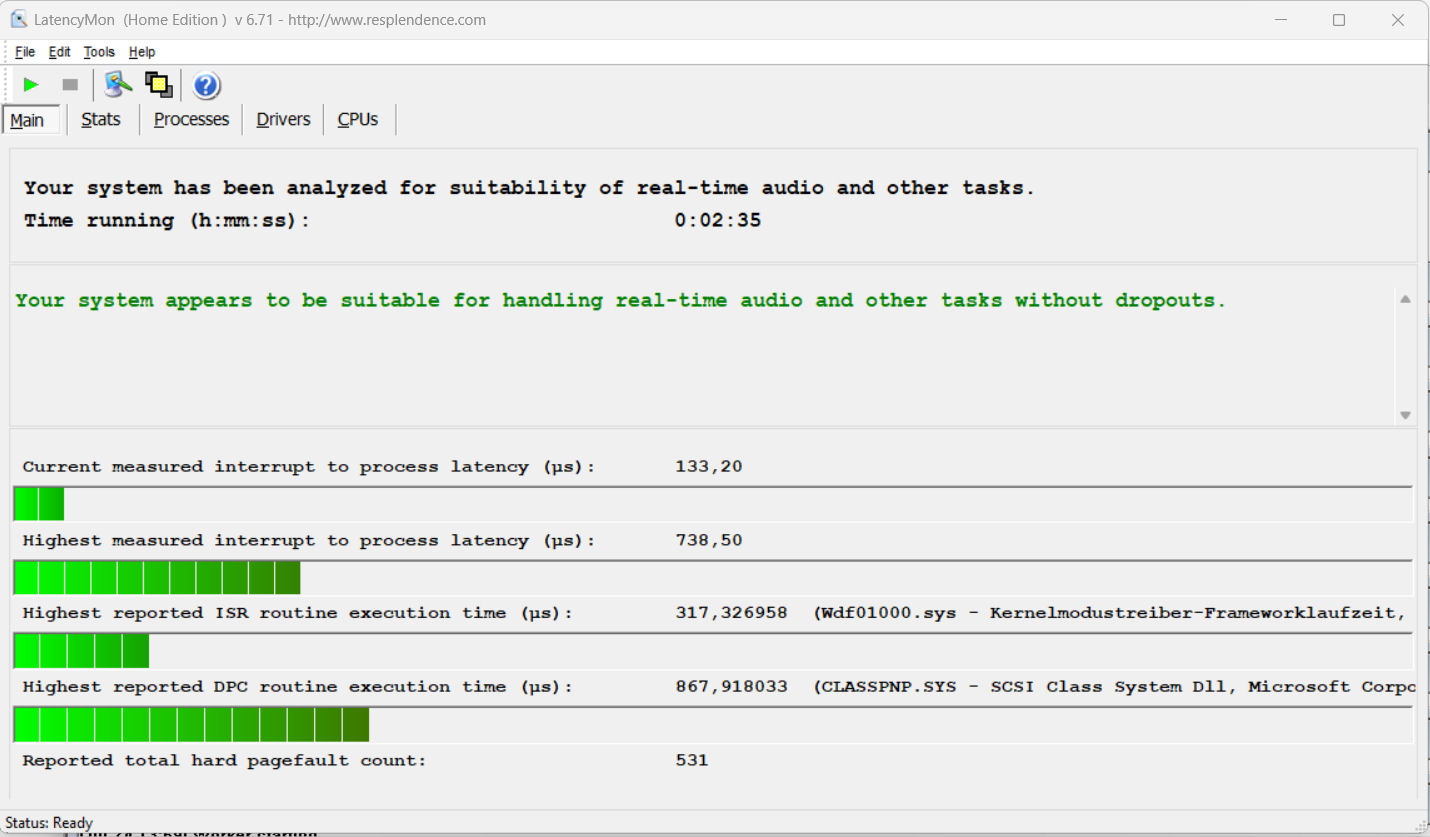
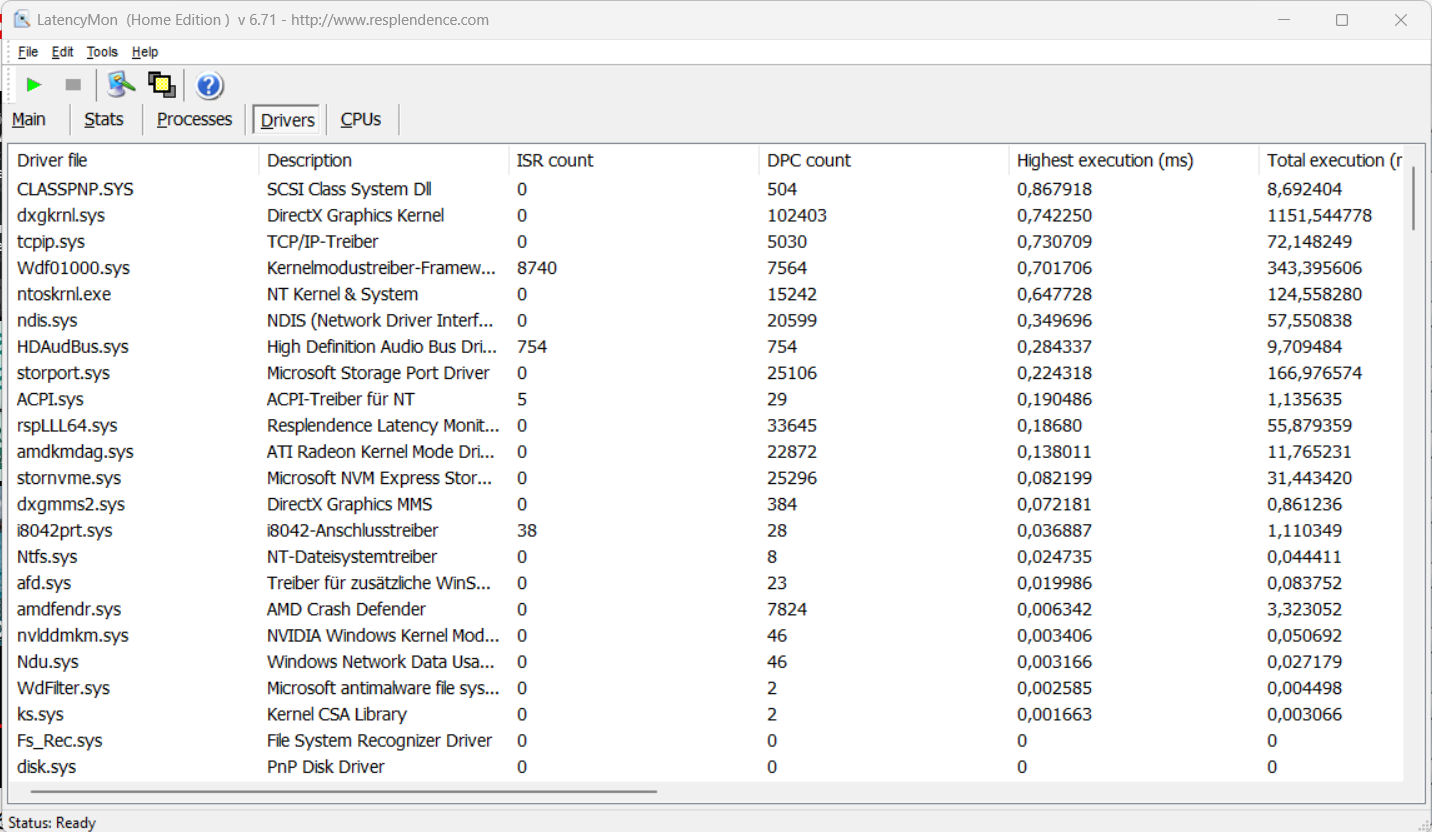
Latencia del CPD
La prueba de monitorización de latencia estandarizada (navegación web, reproducción de vídeo 4k, FFTs grandes en Prime95) no reveló ninguna anomalía. El sistema parece adecuado para la edición de vídeo y audio en tiempo real. Futuras actualizaciones del software podrían suponer mejoras o incluso degradaciones.
| DPC Latencies / LatencyMon - interrupt to process latency (max), Web, Youtube, Prime95 | |
| Schenker XMG Focus 15 (E23) | |
| Medion Erazer Scout E20 | |
| Gigabyte G7 KE | |
| Acer Nitro 16 AN16-41 | |
| Asus TUF Gaming A16 FA617XS | |
| Acer Nitro 16 AN16-41-R7YE | |
* ... más pequeño es mejor
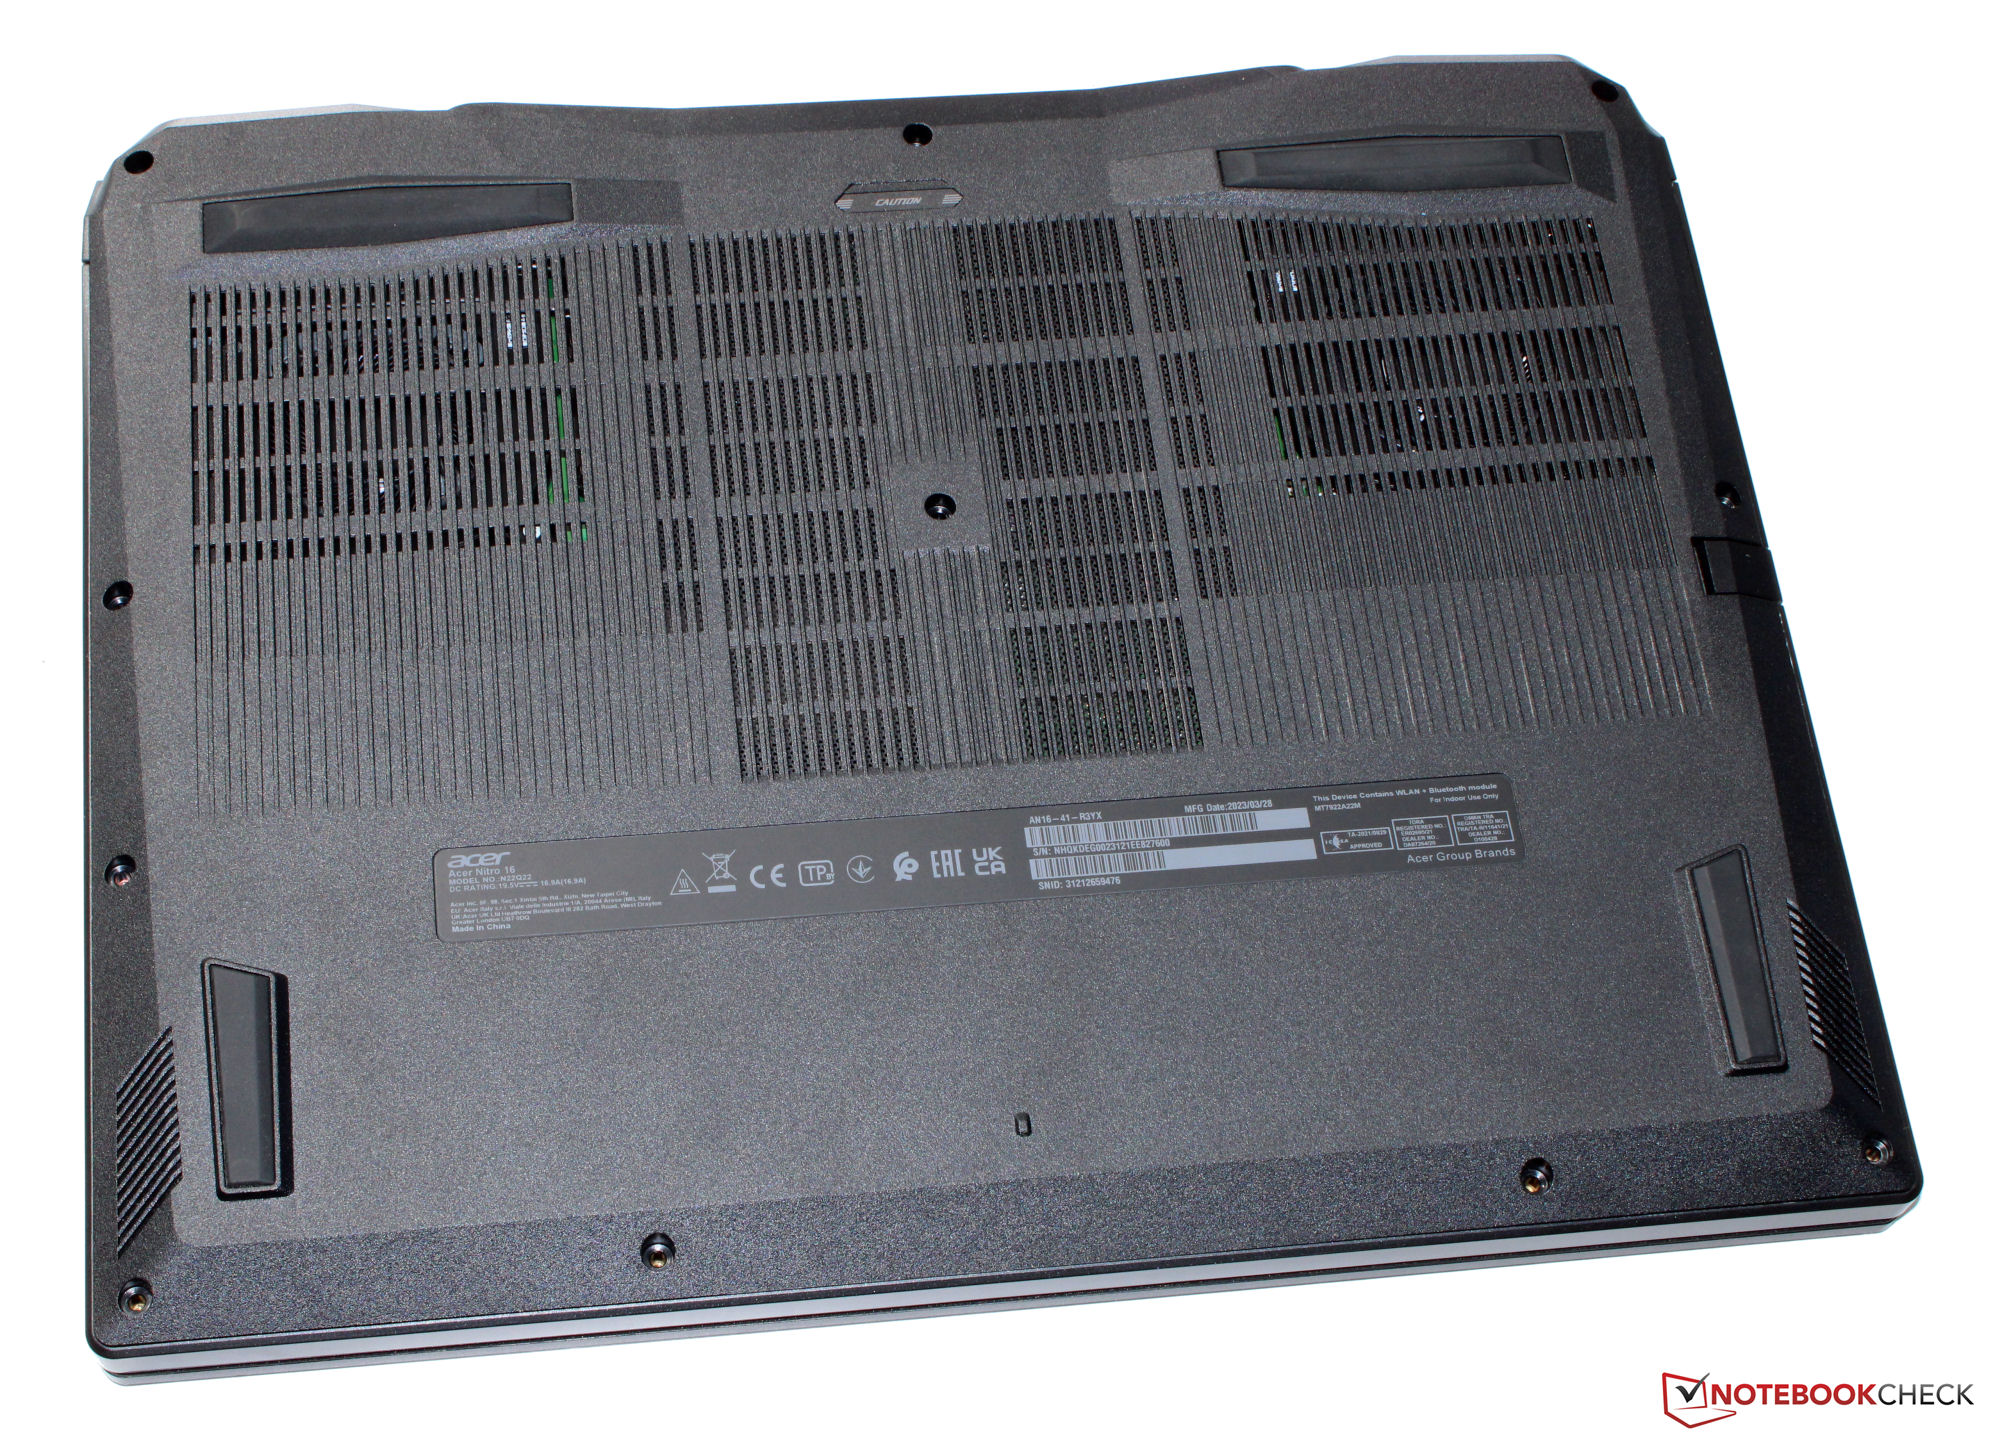
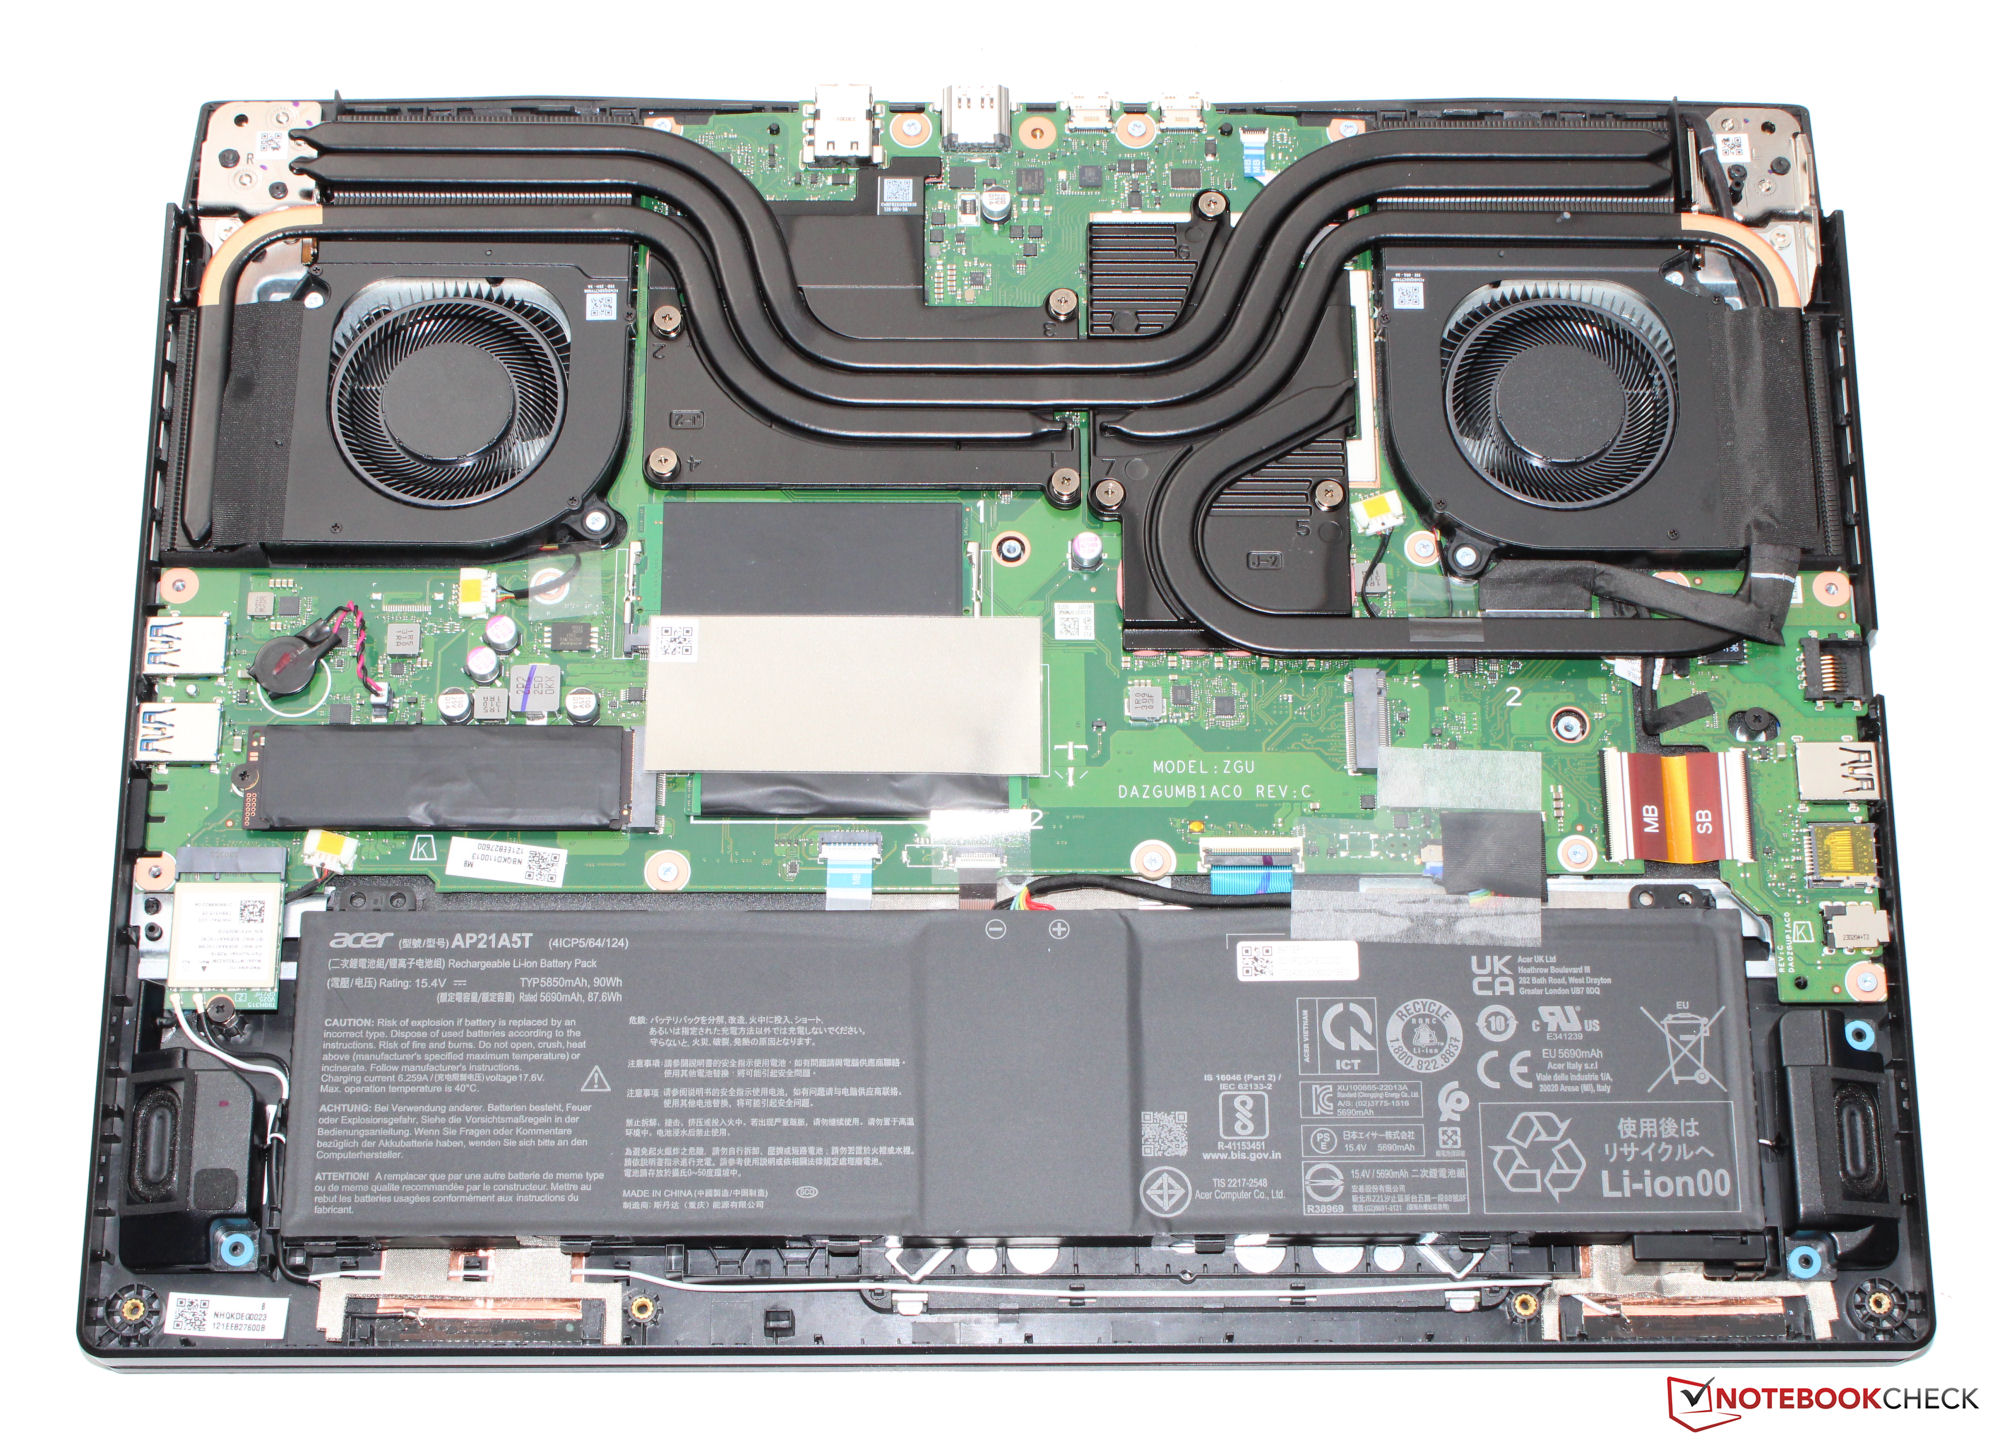
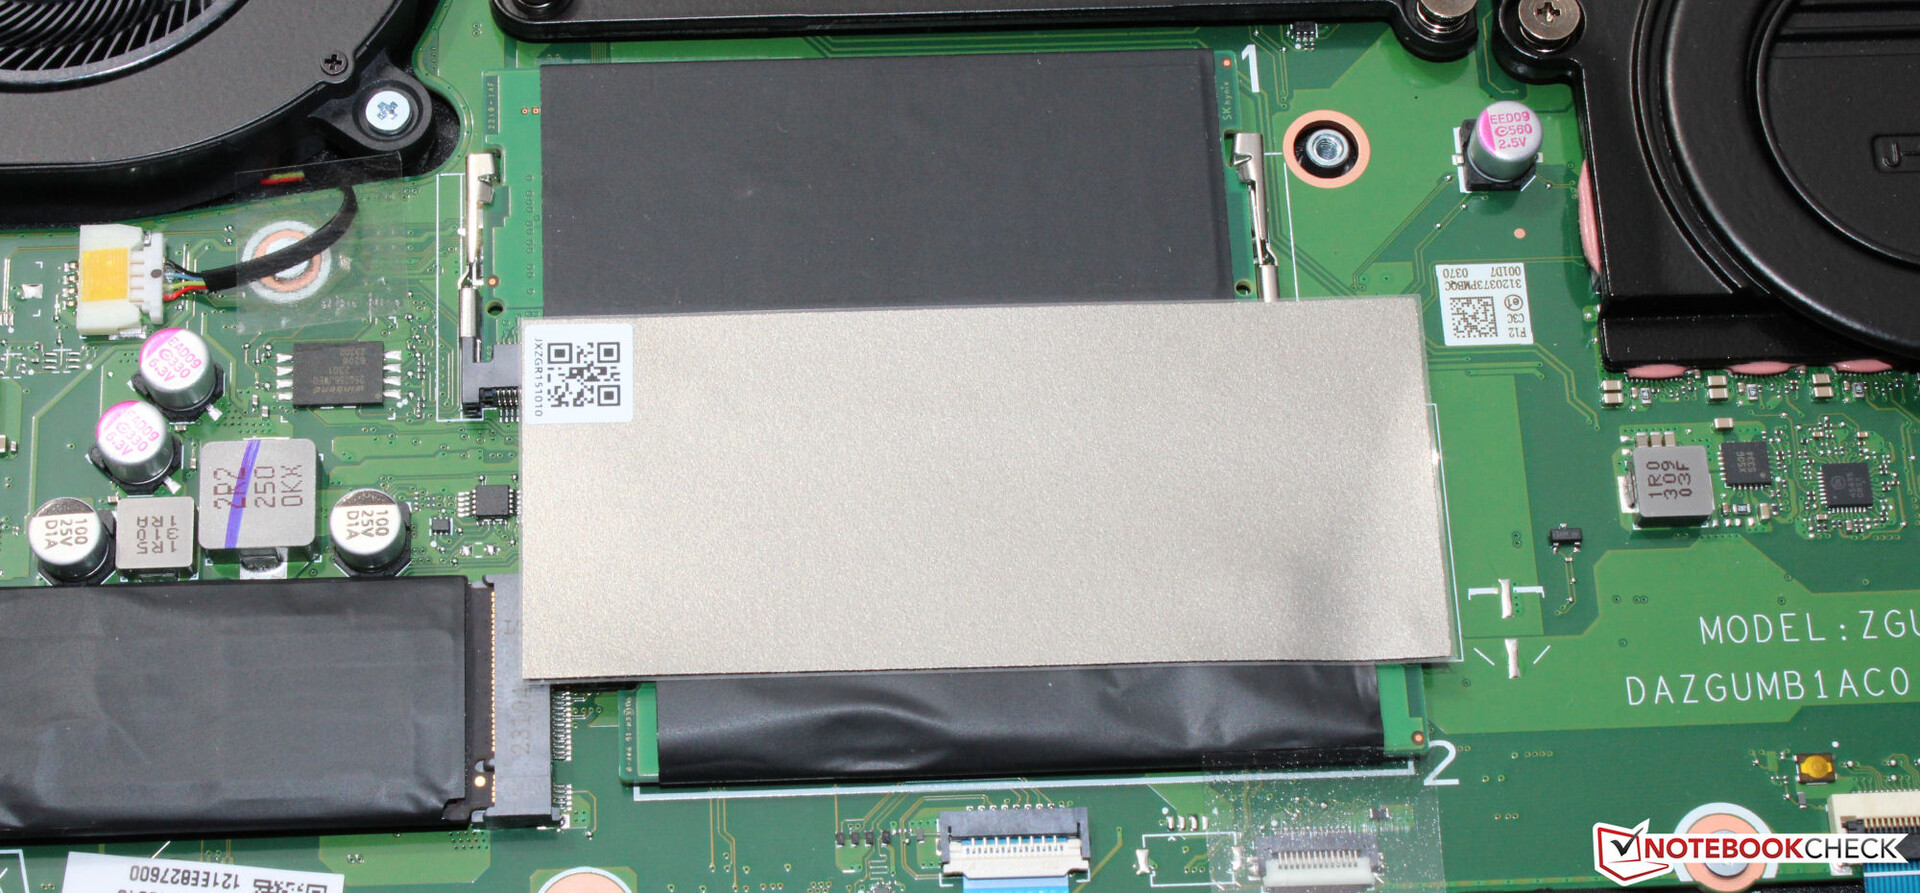
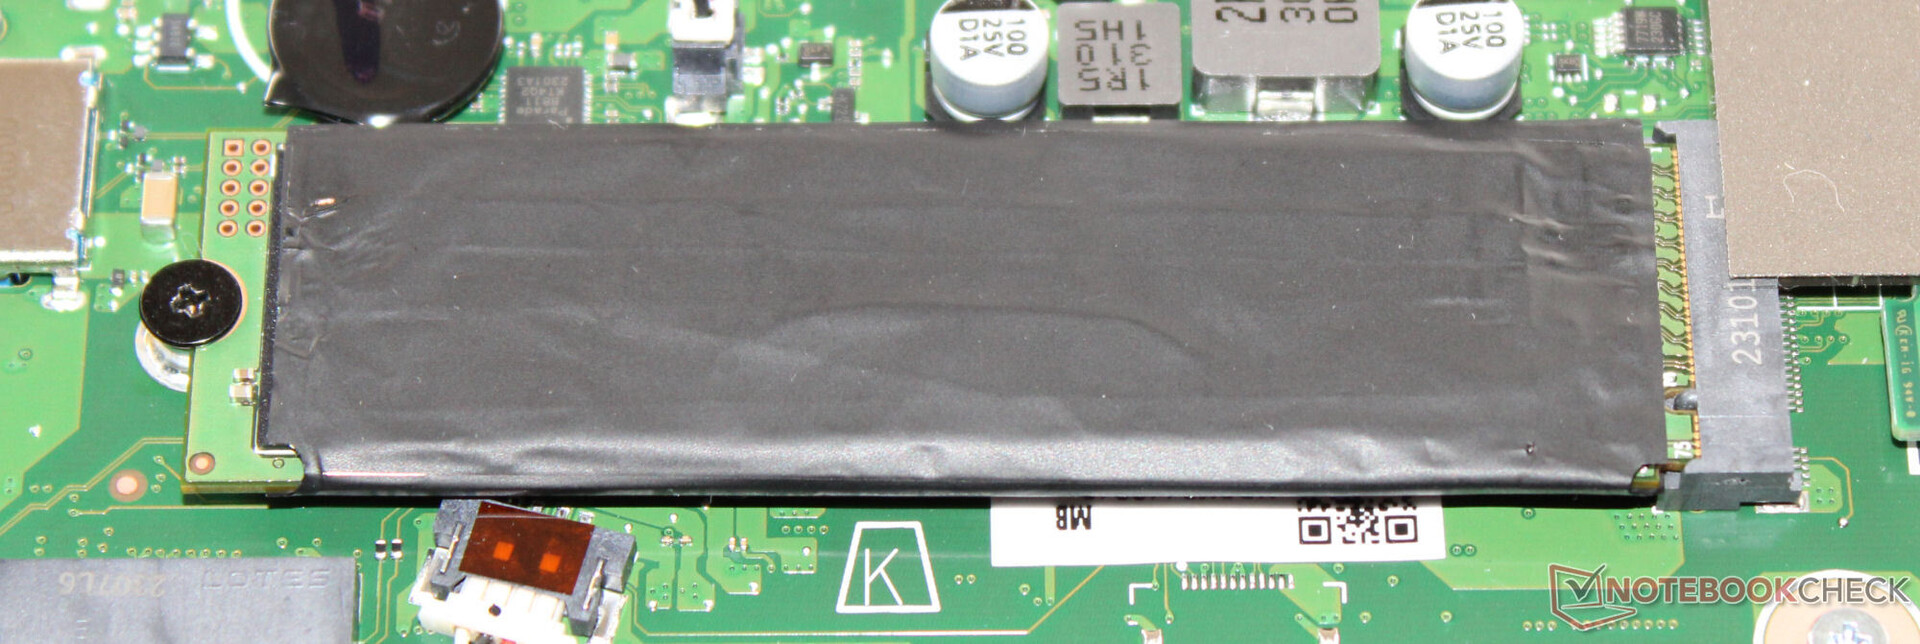
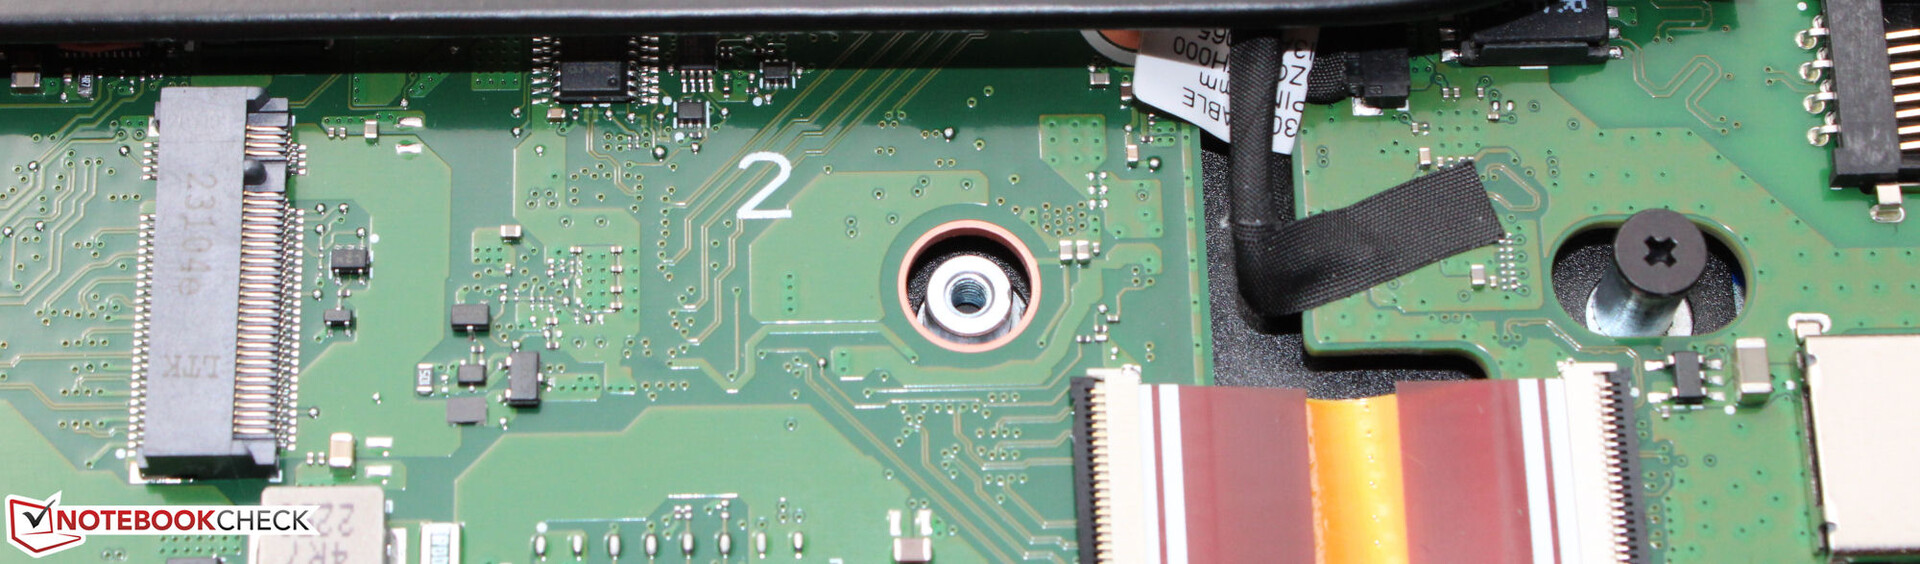
Almacenamiento masivo
Acer equipa el Nitro 16 con un SSD de 512 GB (PCIe 4, M.2-2280) de SK Hynix. Ofrece buenas velocidades de datos, pero no está entre los modelos SSD de mayor rendimiento. Un aspecto negativo es que se producen caídas de rendimiento debido a la ralentización térmica. El portátil tiene espacio para un segundo SSD PCIe Gen 4.

* ... más pequeño es mejor
Drive throttling: DiskSpd Read Loop, Queue Depth 8
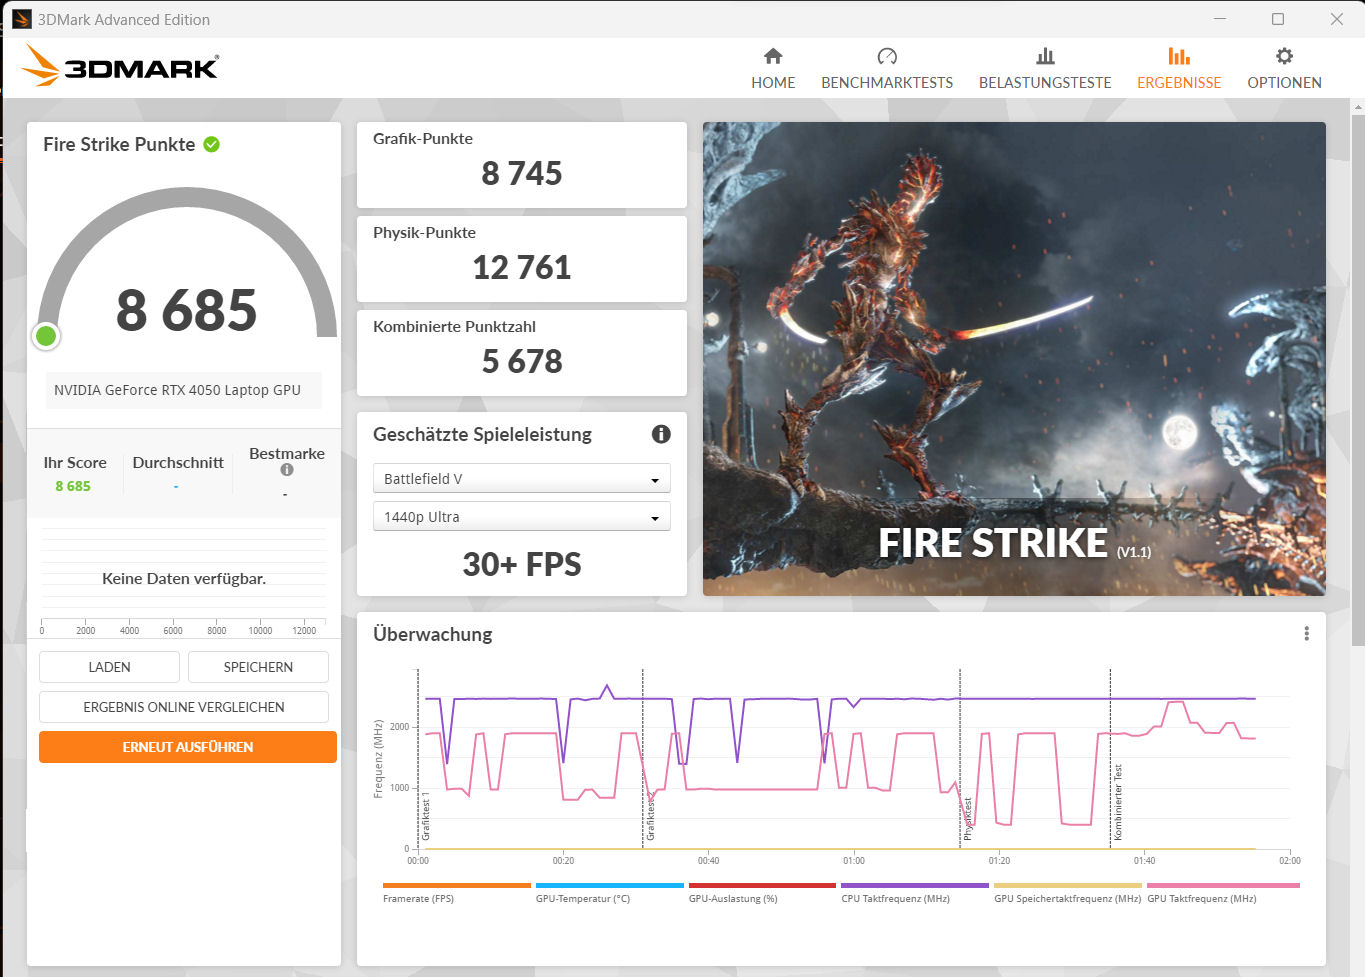
Tarjeta gráfica
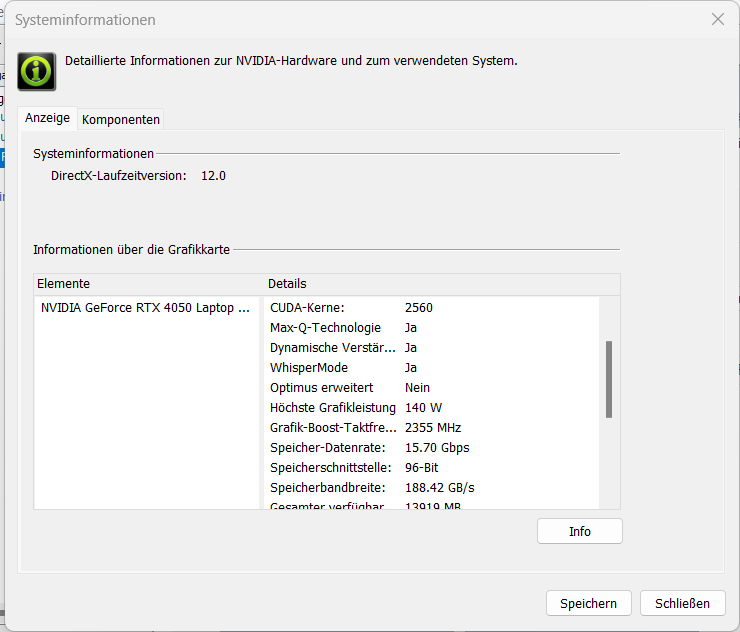
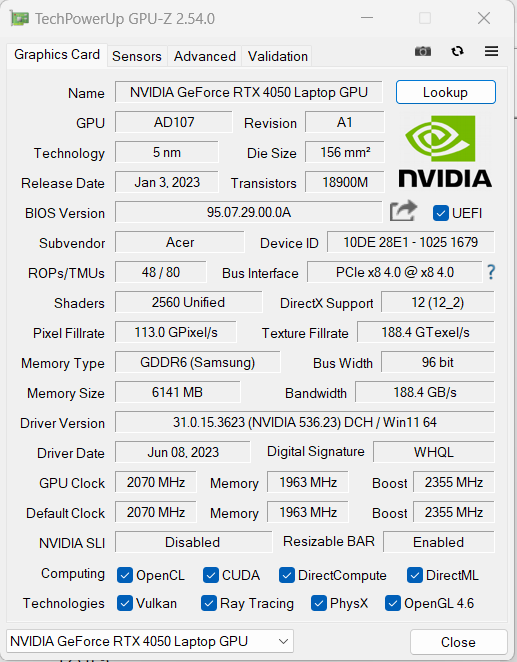
Los resultados de la GeForce RTX 4050 están por encima de los resultados medios de la RTX 4050 ("Equilibrado"). los modos "Rendimiento" y "Turbo" resultan en un aumento mínimo del rendimiento en el mejor de los casos.
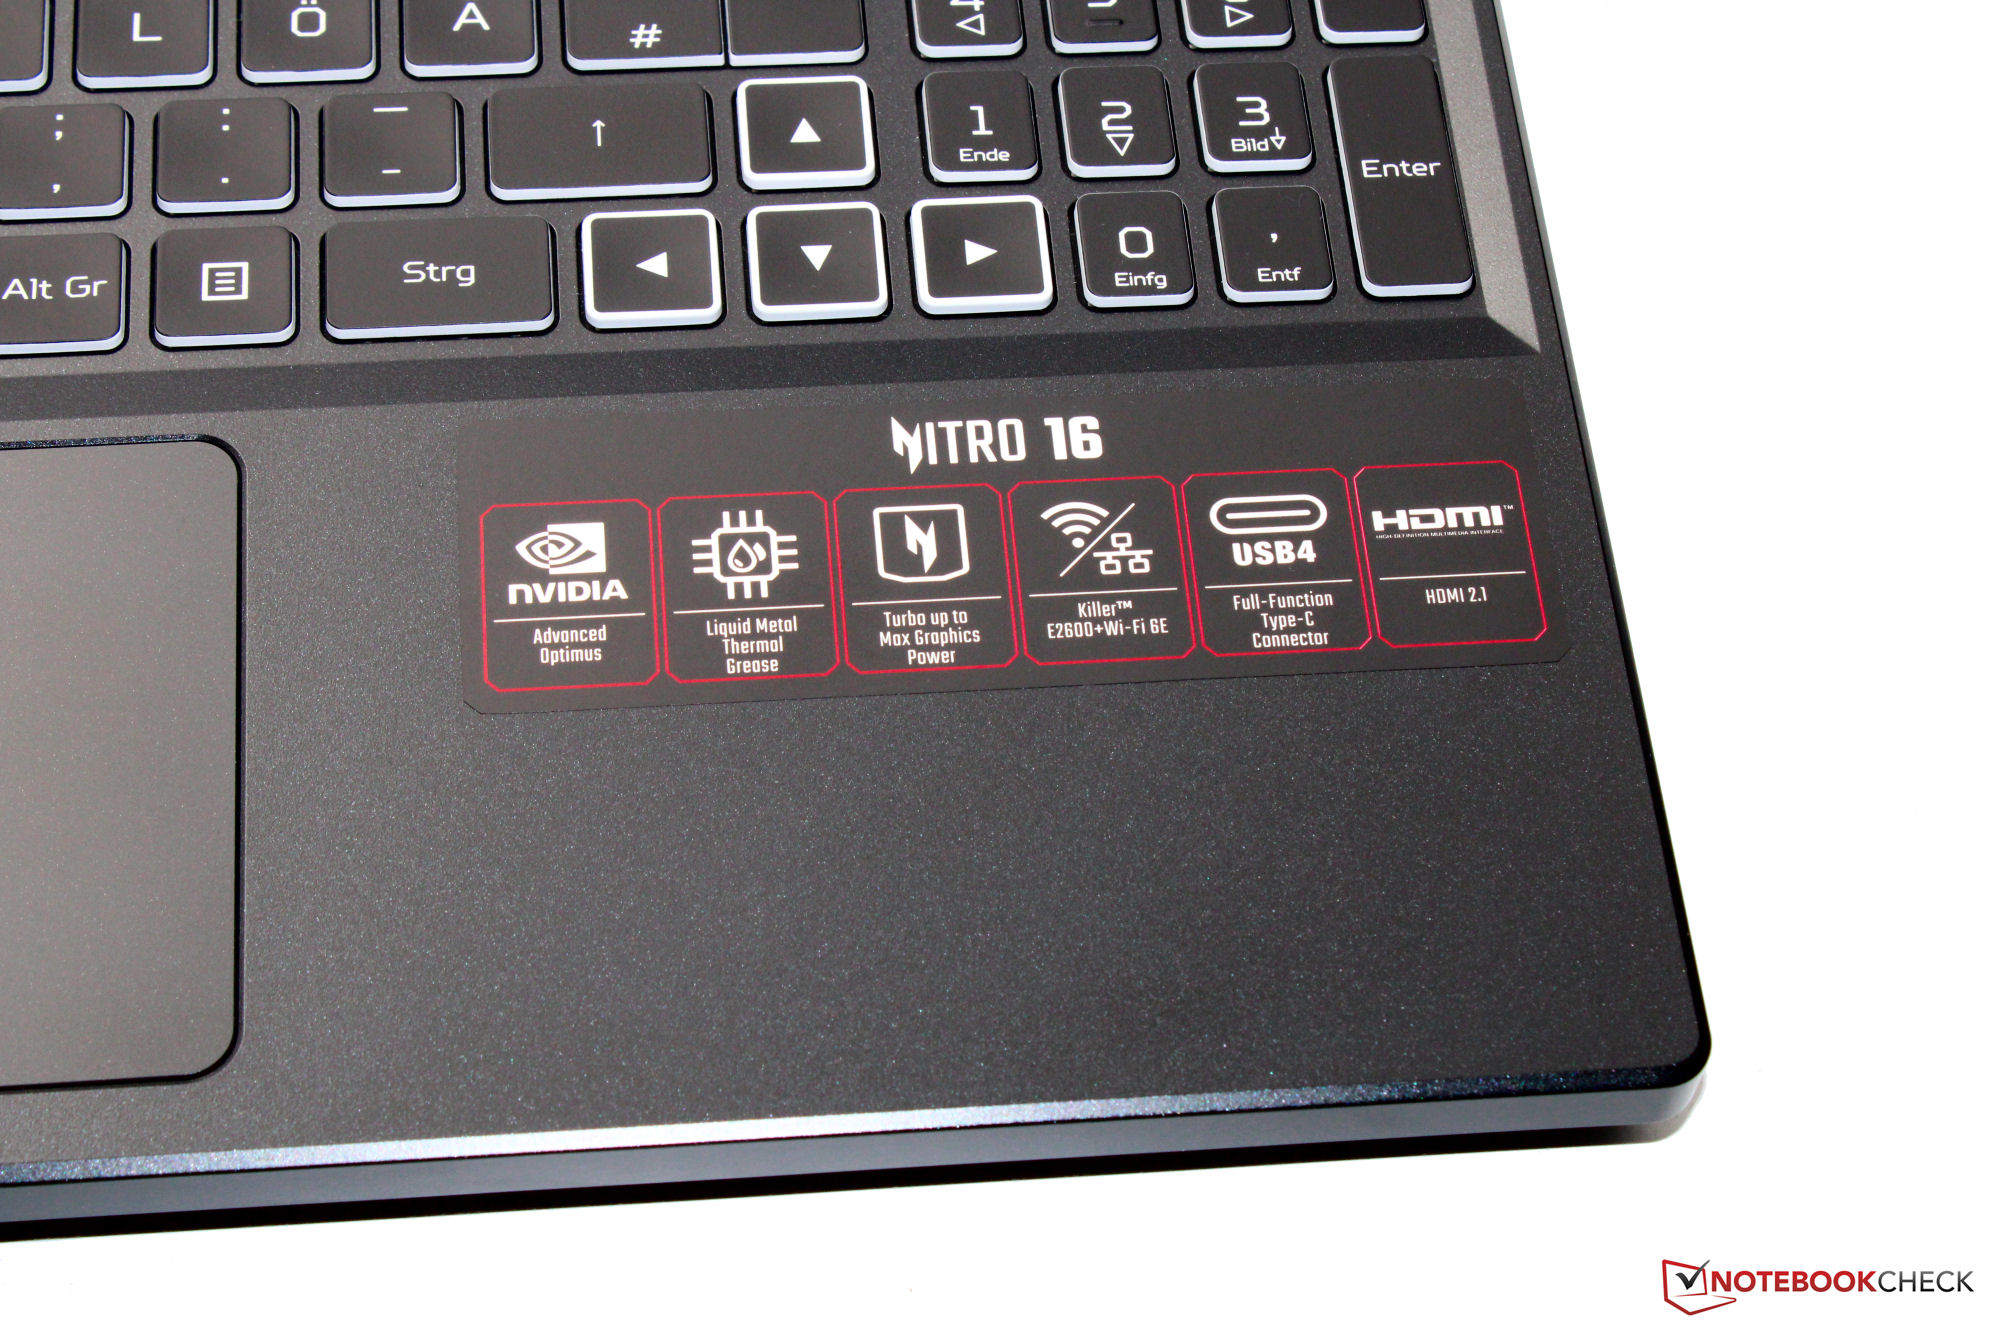
Acer ha fijado el TGP máximo en 140 W - no es posible un vataje superior. Según el test Witcher 3, no está ni cerca de agotarse. Cambiar entre dGPU y Optimus no requiere reiniciar ya que soporta Advanced Optimus.

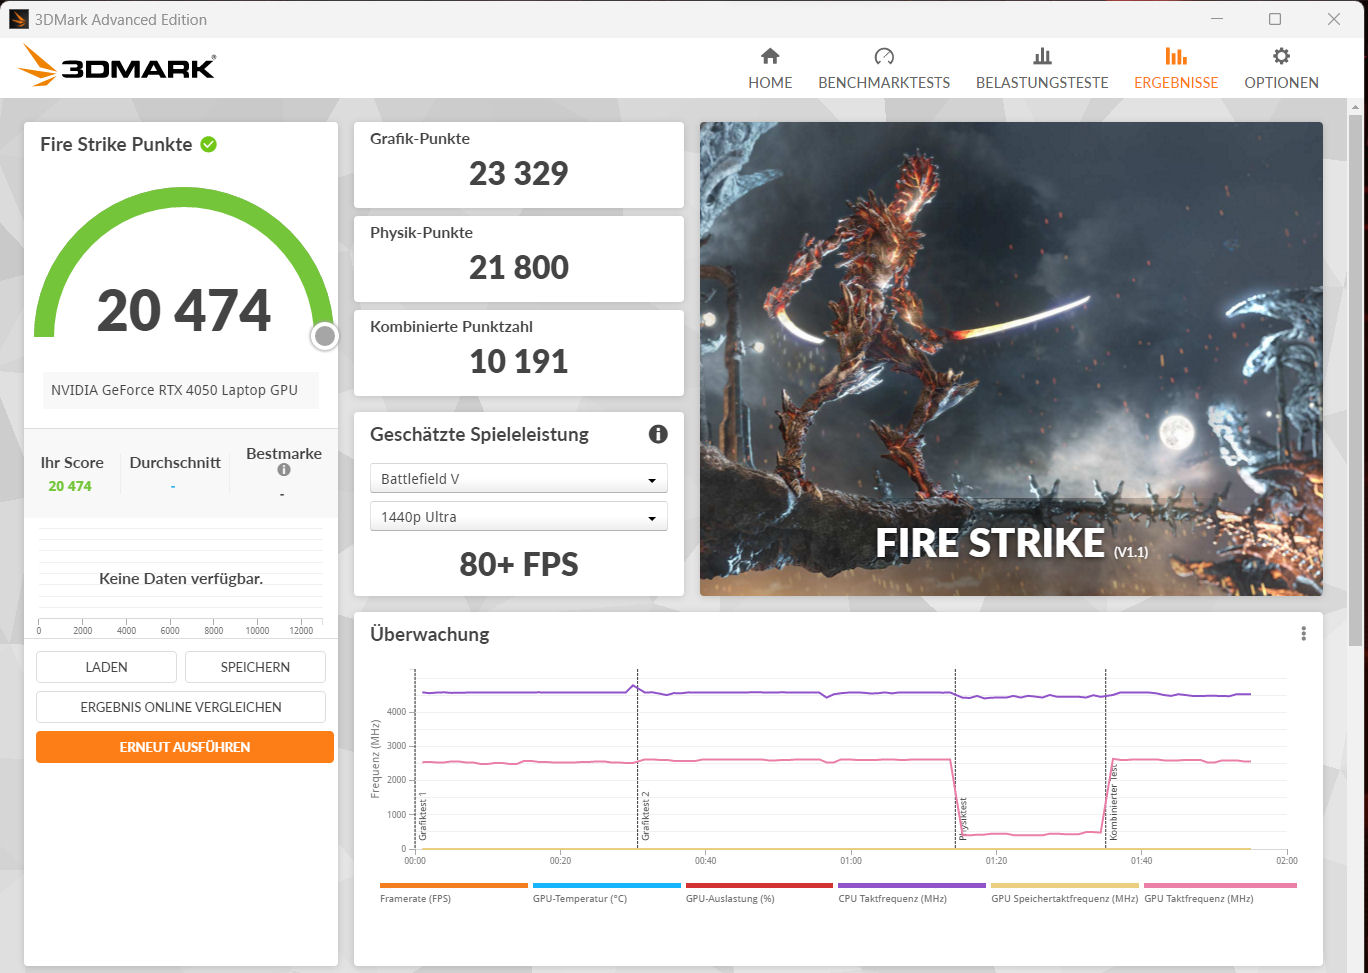
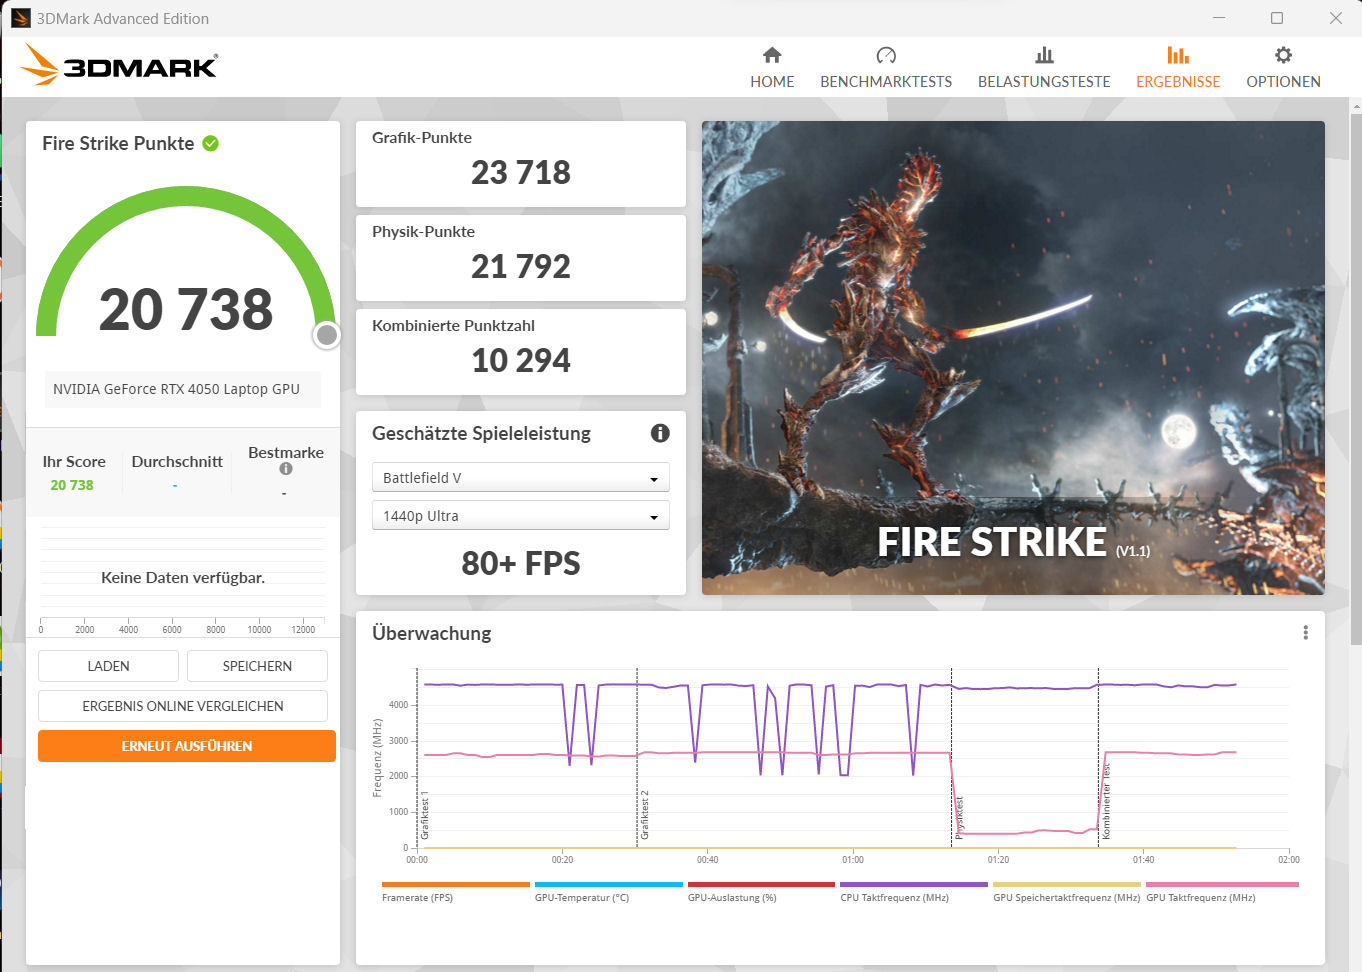
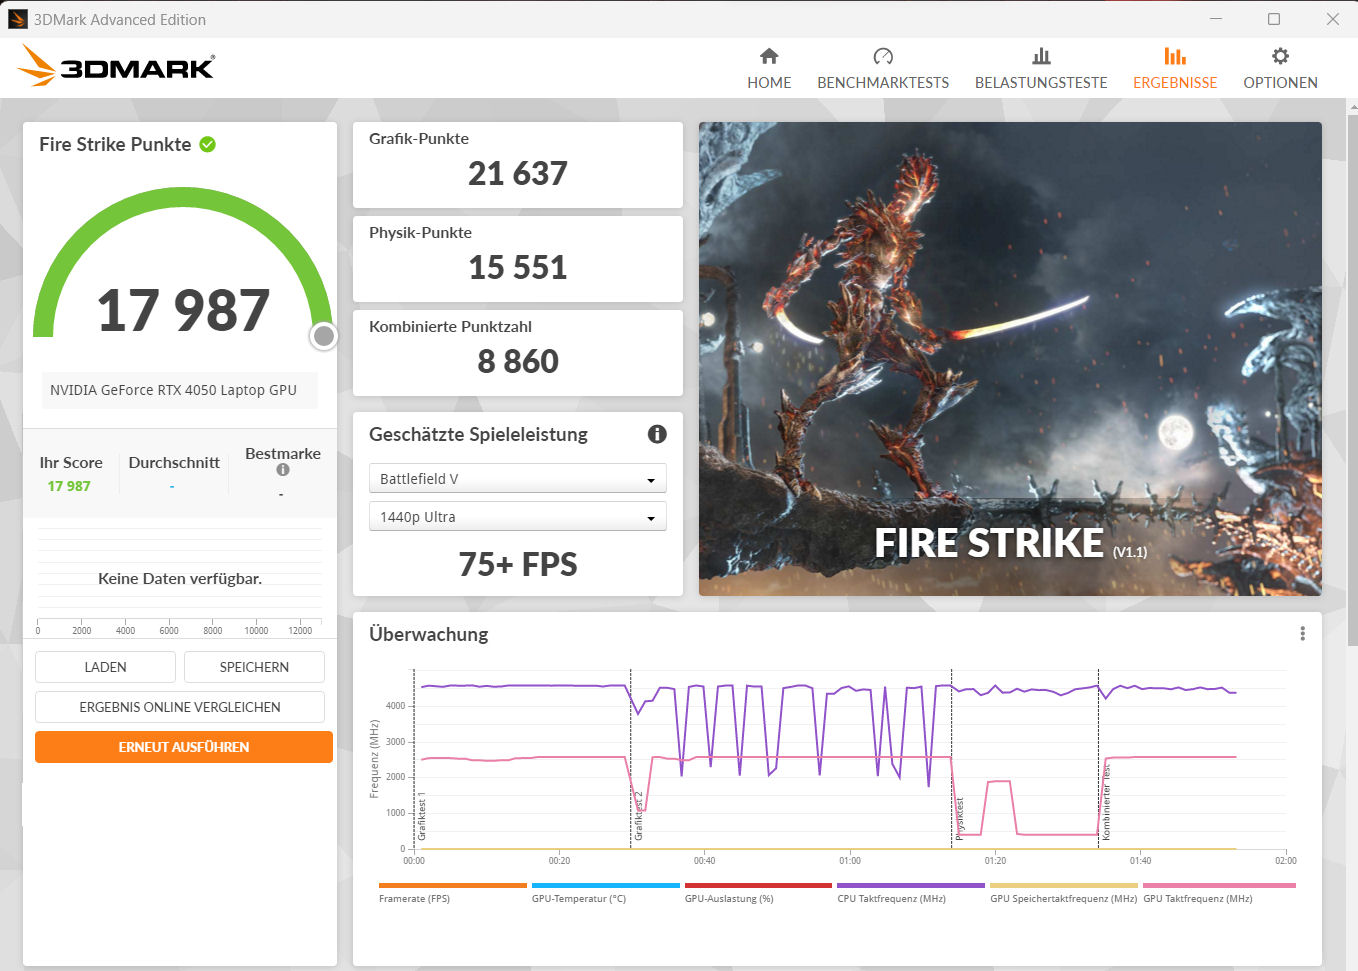
| 3DMark 06 Standard Score | 43233 puntos | |
| 3DMark 11 Performance | 24596 puntos | |
| 3DMark Cloud Gate Standard Score | 47710 puntos | |
| 3DMark Fire Strike Score | 20291 puntos | |
| 3DMark Time Spy Score | 8227 puntos | |
ayuda | ||
* ... más pequeño es mejor
Rendimiento de juego
El hardware está diseñado para juegos FHD con ajustes de altos a máximos. De este modo, se pueden aprovechar al máximo las altas frecuencias de cuadro con la resolución FHD de la pantalla, y se alcanzan frecuencias de cuadro superiores a la media determinada de RTX 4050.
La tecnología DLSS de Nvidia puede proporcionar un aumento de las frecuencias de cuadro. Si está activa, la GPU calcula un juego en una resolución inferior y luego lo escala a la resolución deseada mediante IA. DLSS tiene que ser compatible explícitamente con un juego. Hemos probado algunos títulos correspondientes a modo de prueba.
| Raytracing (FHD, Ultra) | Raytracing (FHD, Ultra) + DLSS (Calidad) | Raytracing (FHD, Ultra) + DLSS (Equilibrado) | Raytracing (FHD, Ultra) + DLSS (Rendimiento) | |
|---|---|---|---|---|
| Cyberpunk 2077 V1.6 | ||||
| Spider-Man: Miles Morales | ||||
| The Witcher 3 V4.00 | ||||
| Ellegado de Hogwarts | ||||
| Returnal | 66 fps | 81 fps |
| The Witcher 3 - 1920x1080 Ultra Graphics & Postprocessing (HBAO+) | |
| Media de la clase Gaming (104.7 - 240, n=7, últimos 2 años) | |
| Acer Nitro 16 AN16-41 | |
| Asus TUF Gaming A16 FA617XS | |
| Acer Nitro 16 AN16-41-R7YE | |
| Medion Erazer Scout E20 | |
| Gigabyte G7 KE | |
| Asus TUF A15 FA507 | |
| Medio NVIDIA GeForce RTX 4050 Laptop GPU (18.5 - 94.7, n=40) | |
| Schenker XMG Focus 15 (E23) | |
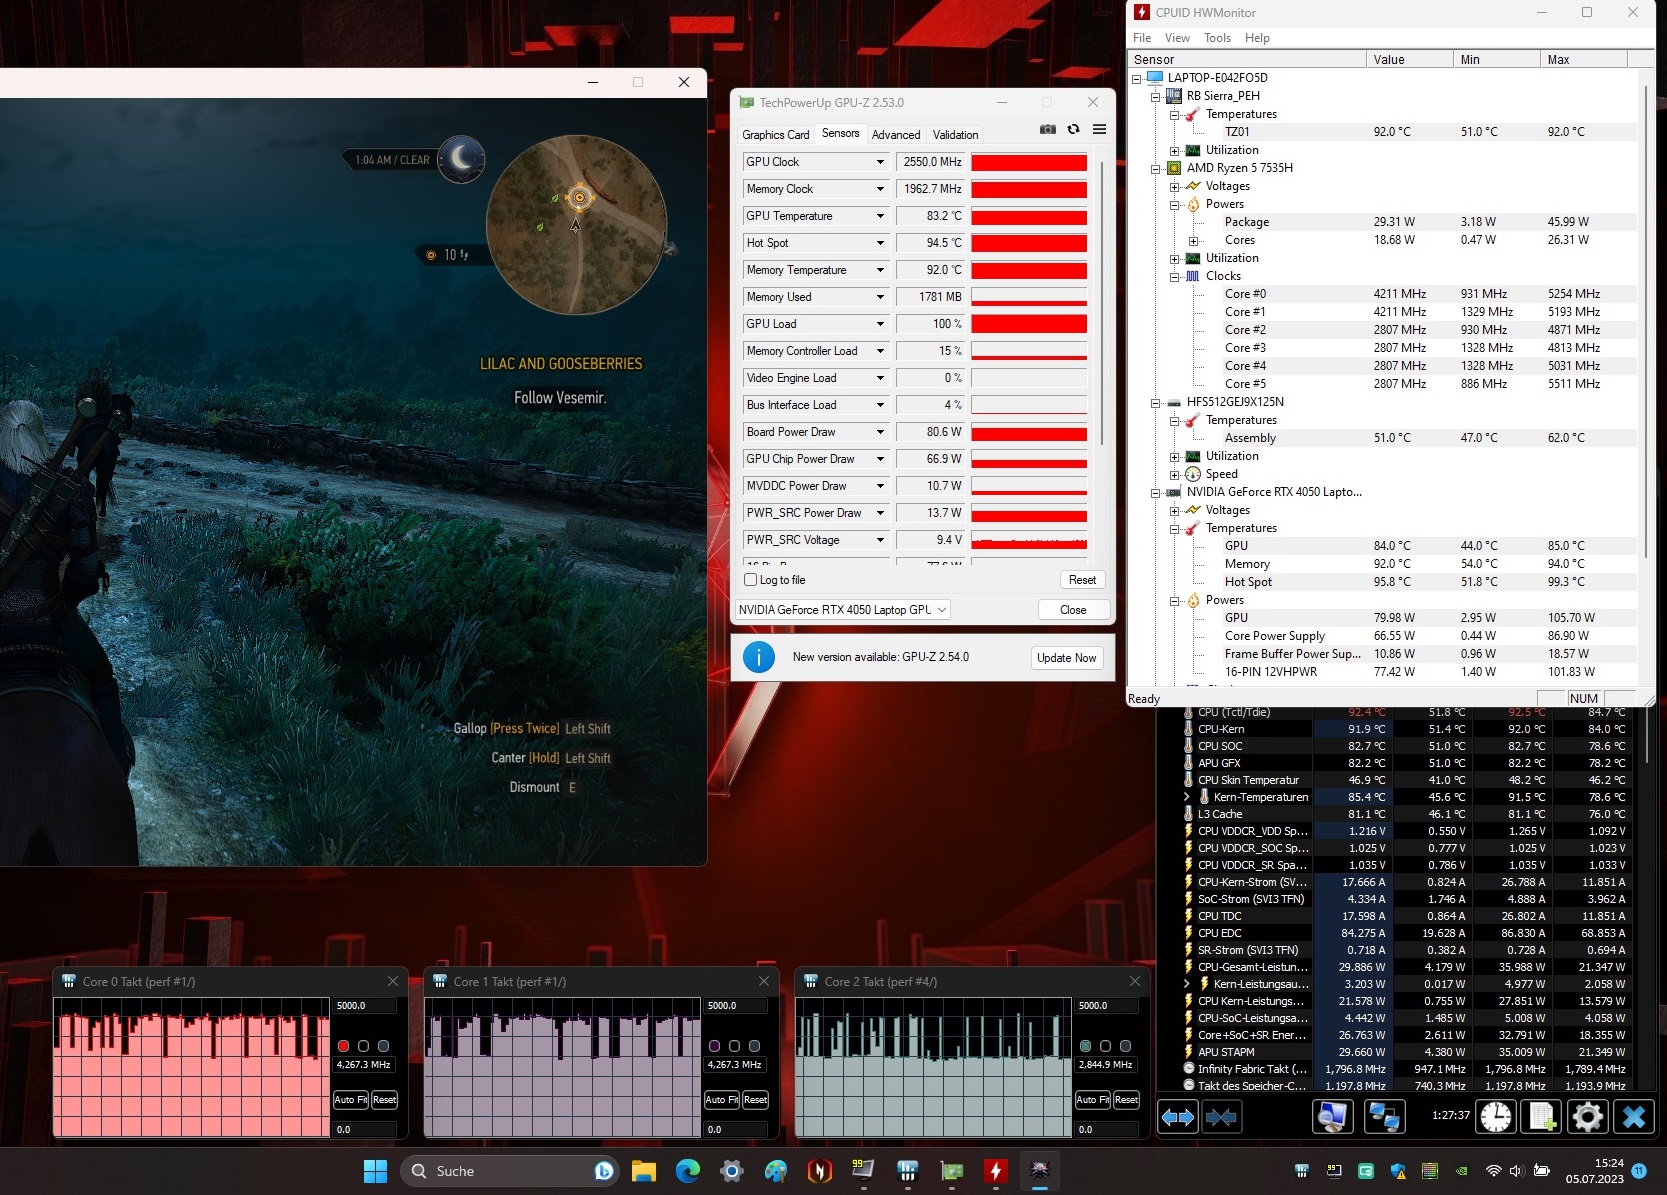
Para comprobar si las frecuencias de cuadro se mantienen constantes durante más tiempo, ejecutamos The Witcher 3 durante unos 60 minutos con resolución Full HD y ajustes de máxima calidad. El personaje del juego no se mueve. No se aprecia una caída de la velocidad de fotogramas.
The Witcher 3 FPS Chart
| bajo | medio | alto | ultra | |
|---|---|---|---|---|
| The Witcher 3 (2015) | 307.8 | 262.4 | 156.2 | 83.9 |
| Dota 2 Reborn (2015) | 151 | 136.5 | 132.1 | 125.2 |
| Final Fantasy XV Benchmark (2018) | 187.4 | 116.2 | 83.5 | |
| X-Plane 11.11 (2018) | 115.3 | 101.6 | 81.4 | |
| Far Cry 5 (2018) | 131 | 114 | 108 | 102 |
| Strange Brigade (2018) | 355 | 209 | 169.3 | 146.8 |
| F1 22 (2022) | 207 | 198.1 | 166.8 | 52.9 |
Emisiones: El Acer Nitro 16 se calienta significativamente
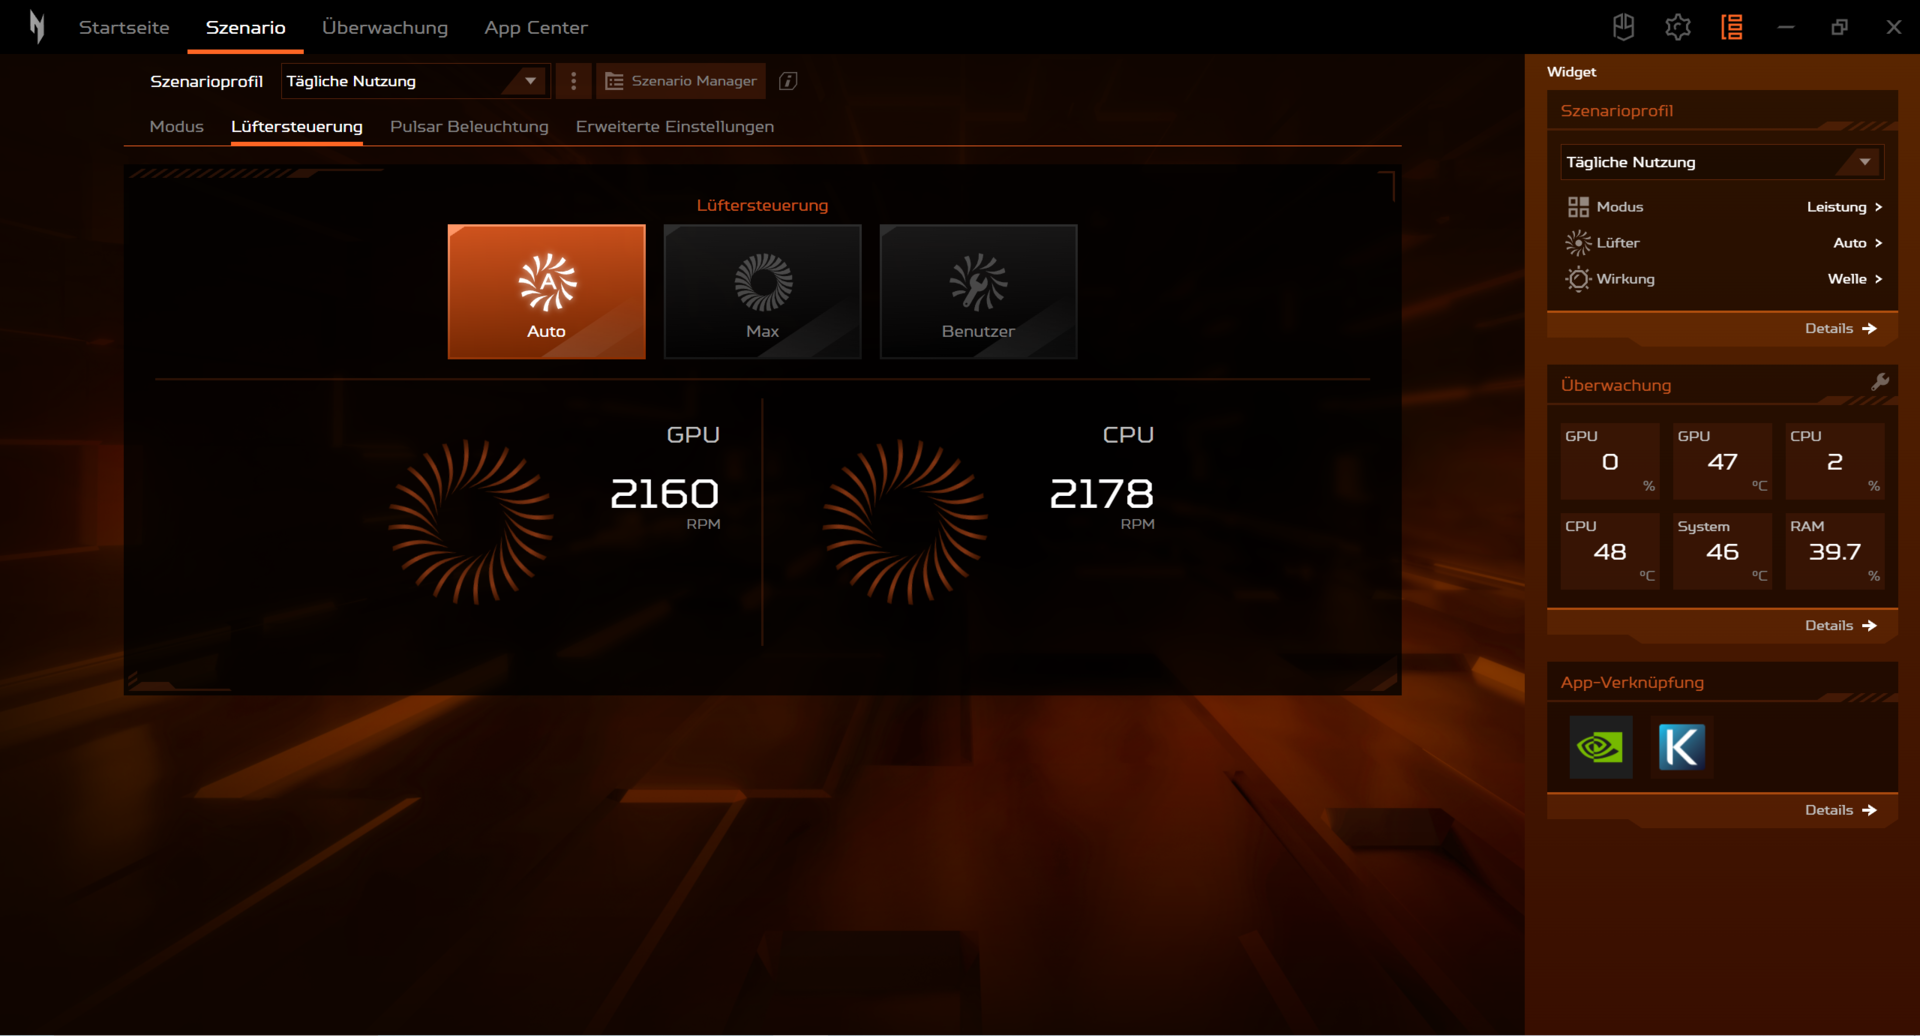
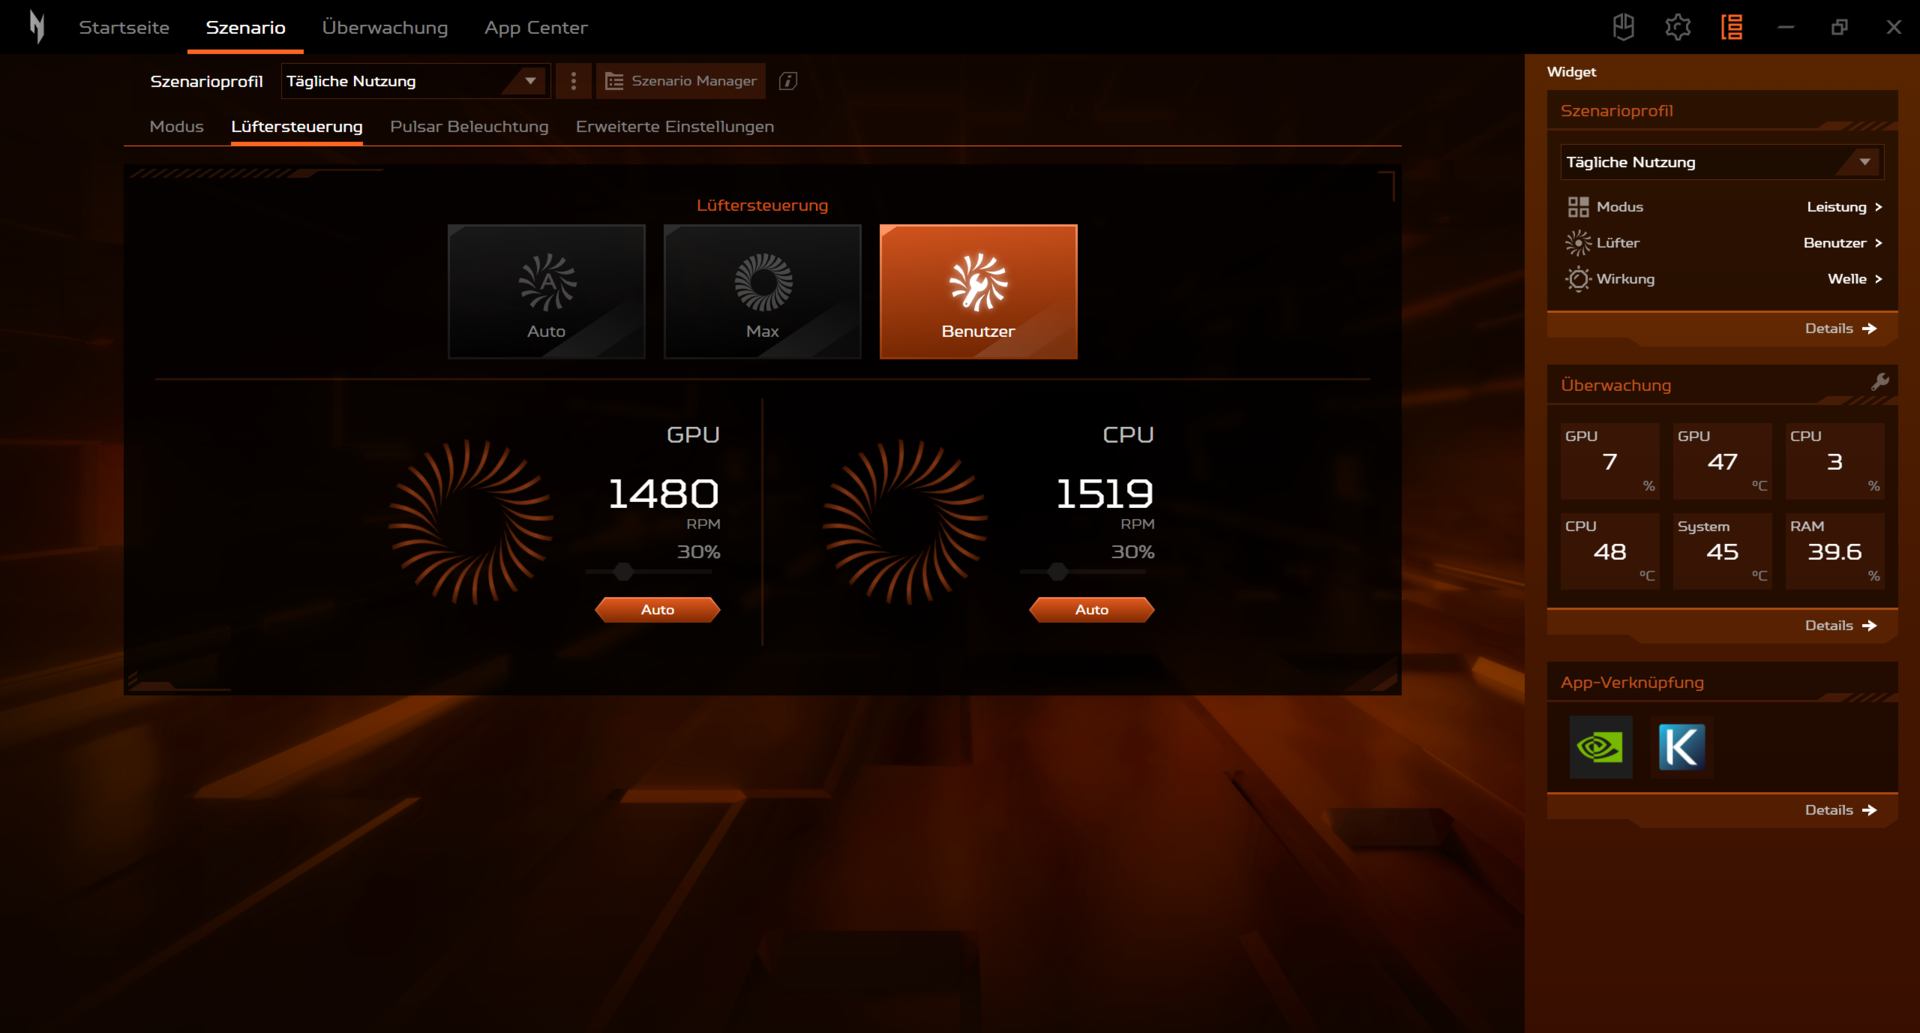
Emisiones sonoras
A pesar de la dGPU permanentemente activa, el portátil es silencioso en el uso diario (oficina, Internet, etc.). Como era de esperar, esto cambia en el modo de juego.
Niveles de presión sonora de hasta 61 dB(A) ("Turbo") o 56 dB(A) ("Rendimiento") requieren el uso de auriculares. El modo "Equilibrado" que usamos sale a 45 dB(A). Se puede conseguir un menor desarrollo general del ruido usando el modo "Silencioso", pero a costa del rendimiento informático, claro.
Ruido
| Ocioso |
| 25 / 26 / 27 dB(A) |
| Carga |
| 42 / 45 dB(A) |
 | ||
30 dB silencioso 40 dB(A) audible 50 dB(A) ruidosamente alto |
||
min: | ||
| Acer Nitro 16 AN16-41-R7YE R5 7535HS, GeForce RTX 4050 Laptop GPU | Asus TUF Gaming A16 FA617XS R9 7940HS, Radeon RX 7600S | Schenker XMG Focus 15 (E23) i9-13900HX, GeForce RTX 4050 Laptop GPU | Gigabyte G7 KE i5-12500H, GeForce RTX 3060 Laptop GPU | Asus TUF A15 FA507 R7 7735HS, GeForce RTX 4050 Laptop GPU | Medion Erazer Scout E20 i7-13700H, GeForce RTX 4050 Laptop GPU | Acer Nitro 16 AN16-41 R7 7735HS, GeForce RTX 4070 Laptop GPU | |
|---|---|---|---|---|---|---|---|
| Noise | -7% | -15% | -26% | 10% | -16% | -4% | |
| apagado / medio ambiente * (dB) | 24 | 25 -4% | 24 -0% | 27 -13% | 23.3 3% | 25 -4% | 25.7 -7% |
| Idle Minimum * (dB) | 25 | 25 -0% | 24 4% | 27 -8% | 23.3 7% | 26 -4% | 25.7 -3% |
| Idle Average * (dB) | 26 | 26 -0% | 25.14 3% | 35 -35% | 23.3 10% | 27 -4% | 25.7 1% |
| Idle Maximum * (dB) | 27 | 28 -4% | 35.14 -30% | 38 -41% | 23.3 14% | 32 -19% | 26.3 3% |
| Load Average * (dB) | 42 | 43 -2% | 55.93 -33% | 52 -24% | 29.6 30% | 57 -36% | 33.9 19% |
| Witcher 3 ultra * (dB) | 43 | 51 -19% | 54.62 -27% | 56 -30% | 43 -0% | 50 -16% | |
| Load Maximum * (dB) | 45 | 53 -18% | 56.34 -25% | 59 -31% | 43 4% | 57 -27% | 62 -38% |
* ... más pequeño es mejor
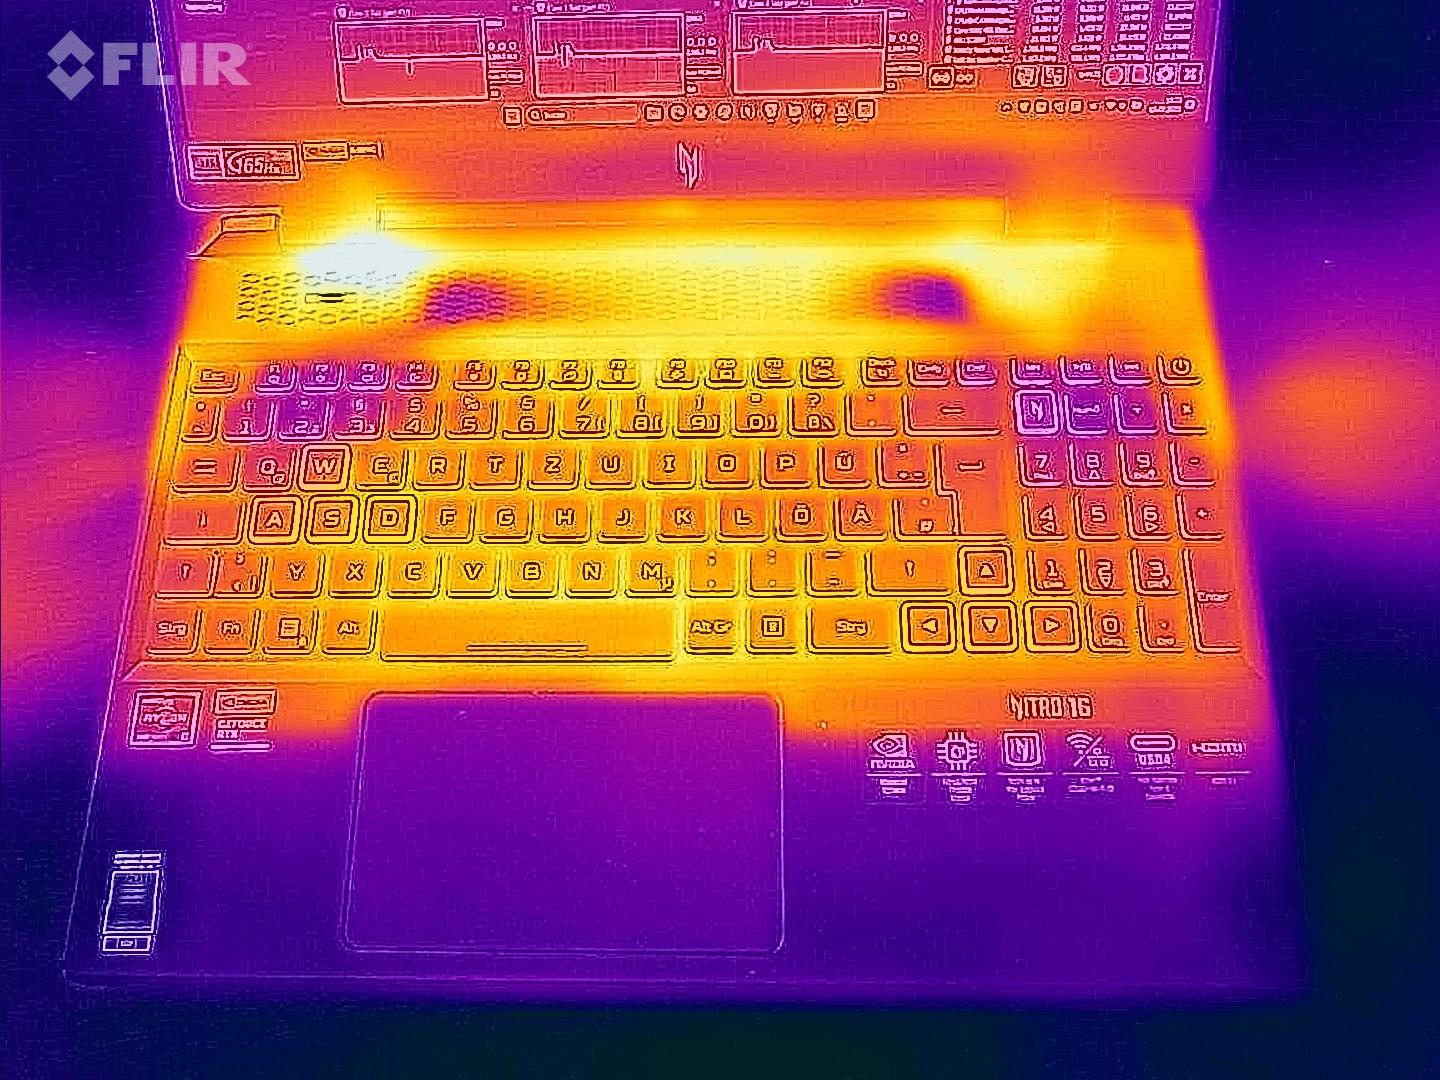
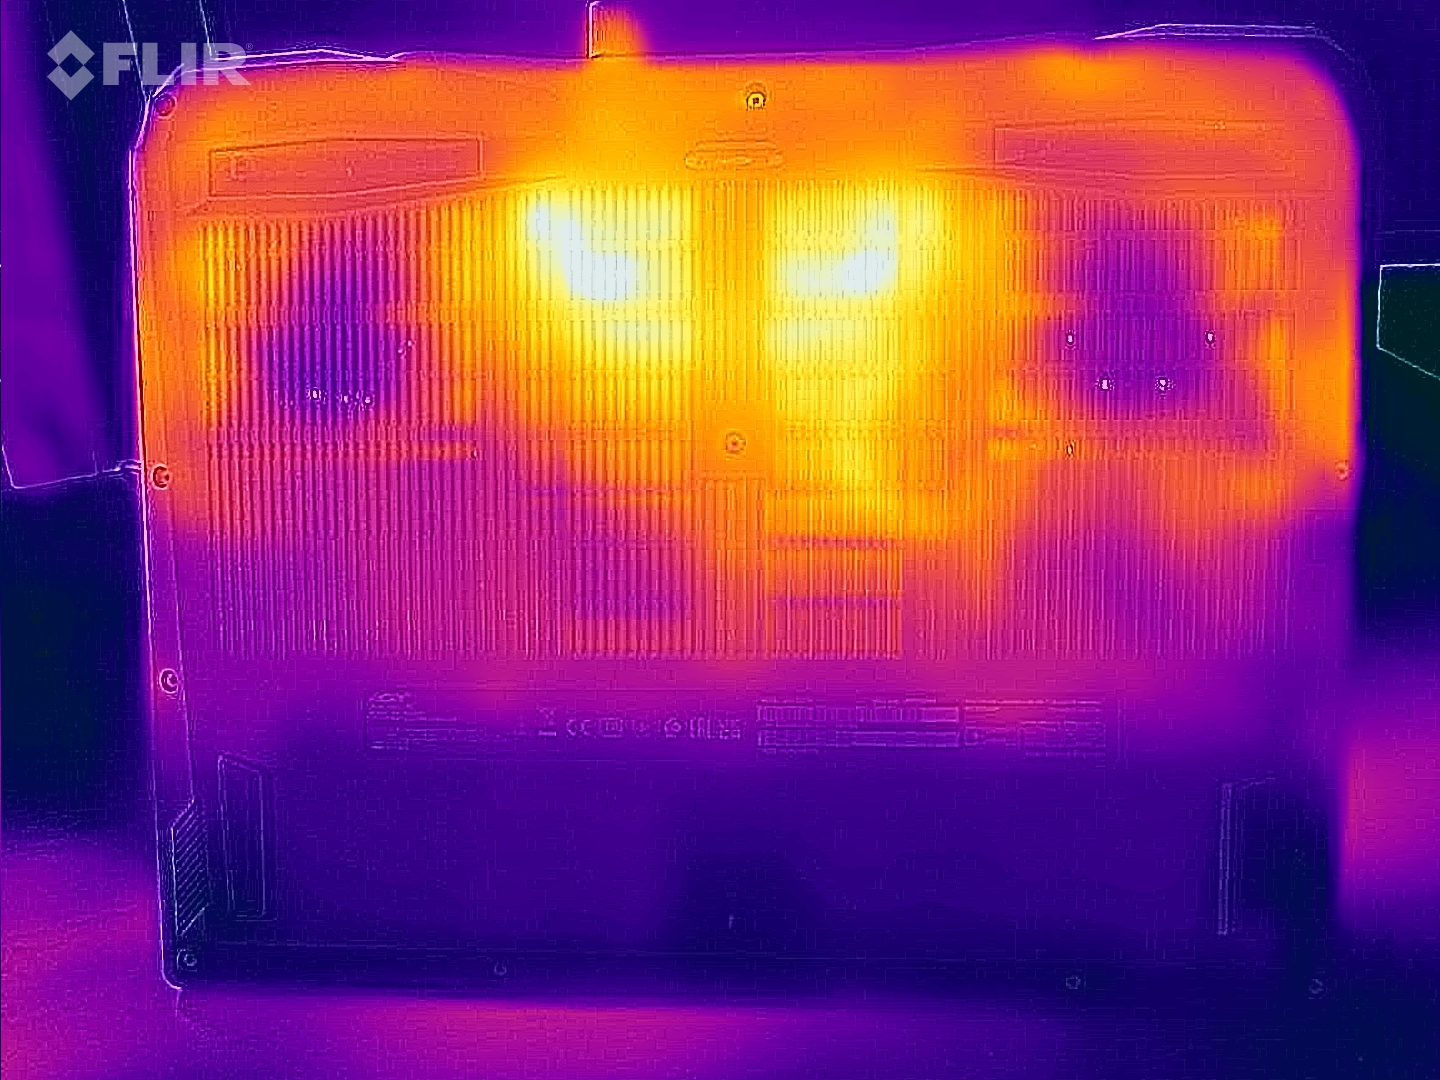
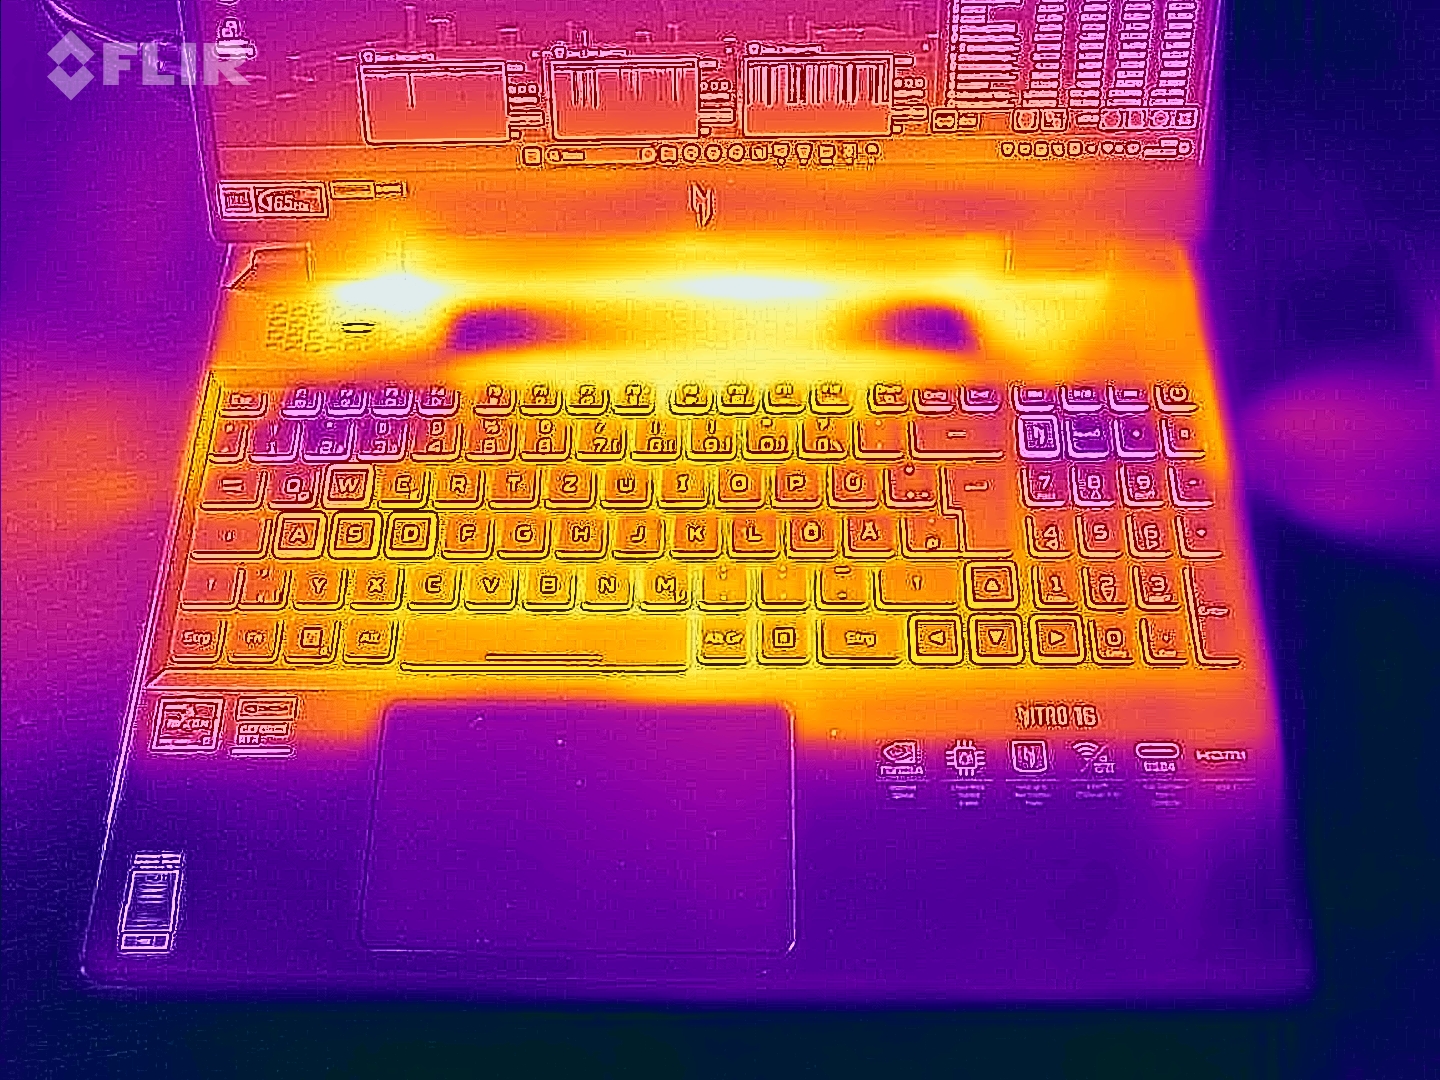
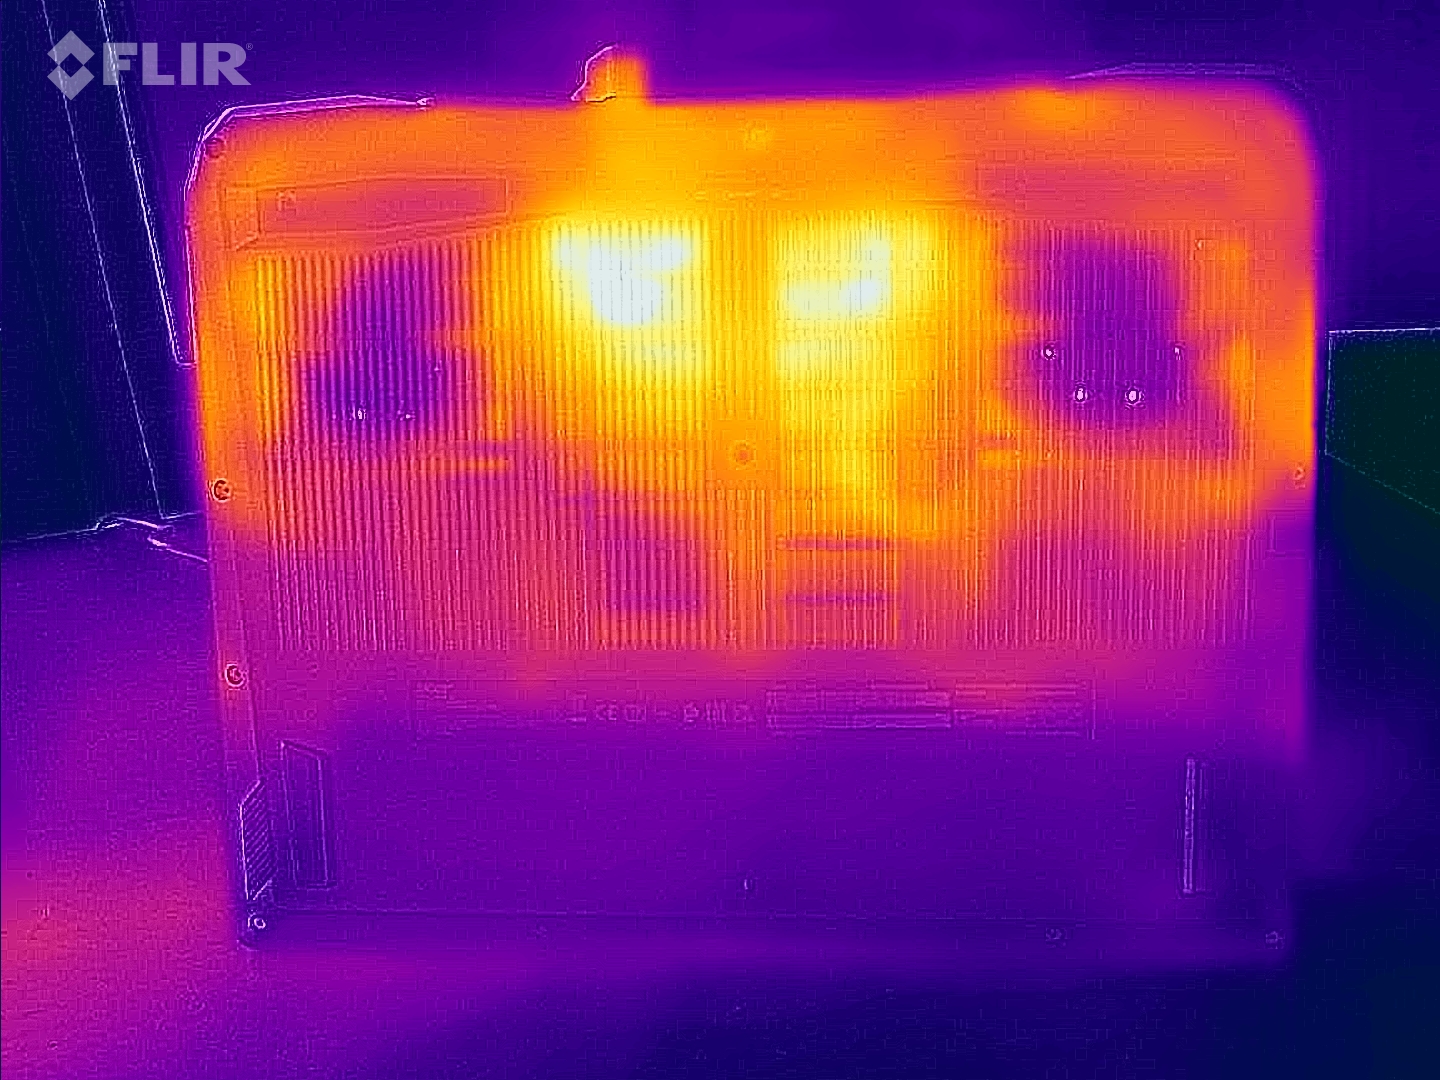
Temperatura
El Nitro 16 se calienta notablemente bajo carga. Se alcanza una temperatura de más de 60 °C en un punto de medición.
Las temperaturas están dentro de la zona verde en el uso diario, pero son más altas que en el modelo hermano debido al modo dGPU activo.
(-) La temperatura máxima en la parte superior es de 51 °C / 124 F, frente a la media de 40.4 °C / 105 F, que oscila entre 21.2 y 68.8 °C para la clase Gaming.
(-) El fondo se calienta hasta un máximo de 63 °C / 145 F, frente a la media de 43.2 °C / 110 F
(+) En reposo, la temperatura media de la parte superior es de 31.6 °C / 89# F, frente a la media del dispositivo de 33.9 °C / 93 F.
(-) Jugando a The Witcher 3, la temperatura media de la parte superior es de 42.8 °C / 109 F, frente a la media del dispositivo de 33.9 °C / 93 F.
(-) El reposamanos y el touchpad pueden calentarse mucho al tacto con un máximo de 42 °C / 107.6 F.
(-) La temperatura media de la zona del reposamanos de dispositivos similares fue de 28.8 °C / 83.8 F (-13.2 °C / -23.8 F).
| Acer Nitro 16 AN16-41-R7YE AMD Ryzen 5 7535HS, NVIDIA GeForce RTX 4050 Laptop GPU | Asus TUF Gaming A16 FA617XS AMD Ryzen 9 7940HS, AMD Radeon RX 7600S | Schenker XMG Focus 15 (E23) Intel Core i9-13900HX, NVIDIA GeForce RTX 4050 Laptop GPU | Gigabyte G7 KE Intel Core i5-12500H, NVIDIA GeForce RTX 3060 Laptop GPU | Asus TUF A15 FA507 AMD Ryzen 7 7735HS, NVIDIA GeForce RTX 4050 Laptop GPU | Medion Erazer Scout E20 Intel Core i7-13700H, NVIDIA GeForce RTX 4050 Laptop GPU | Acer Nitro 16 AN16-41 AMD Ryzen 7 7735HS, NVIDIA GeForce RTX 4070 Laptop GPU | |
|---|---|---|---|---|---|---|---|
| Heat | 10% | 9% | 8% | 17% | 19% | 9% | |
| Maximum Upper Side * (°C) | 51 | 53 -4% | 51 -0% | 52 -2% | 48.9 4% | 41 20% | 41.5 19% |
| Maximum Bottom * (°C) | 63 | 48 24% | 53 16% | 54 14% | 44.6 29% | 39 38% | 51.8 18% |
| Idle Upper Side * (°C) | 34 | 30 12% | 29 15% | 28 18% | 27.1 20% | 31 9% | 31.6 7% |
| Idle Bottom * (°C) | 32 | 30 6% | 30 6% | 32 -0% | 27.5 14% | 29 9% | 34.5 -8% |
* ... más pequeño es mejor
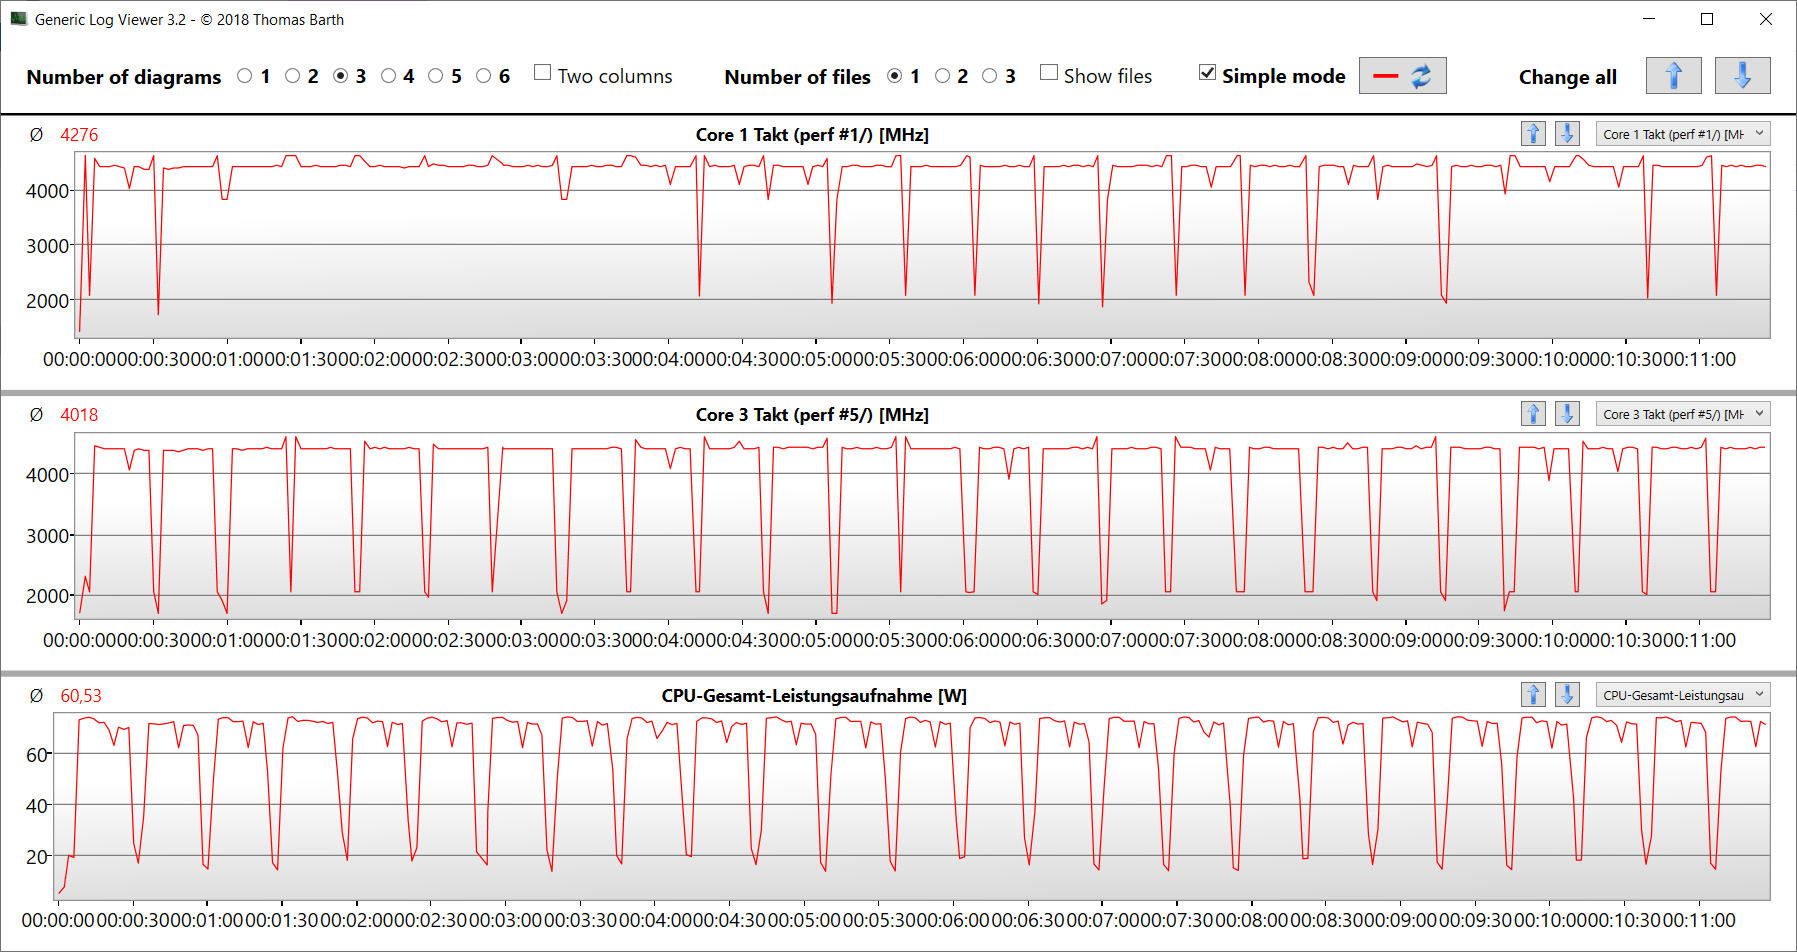
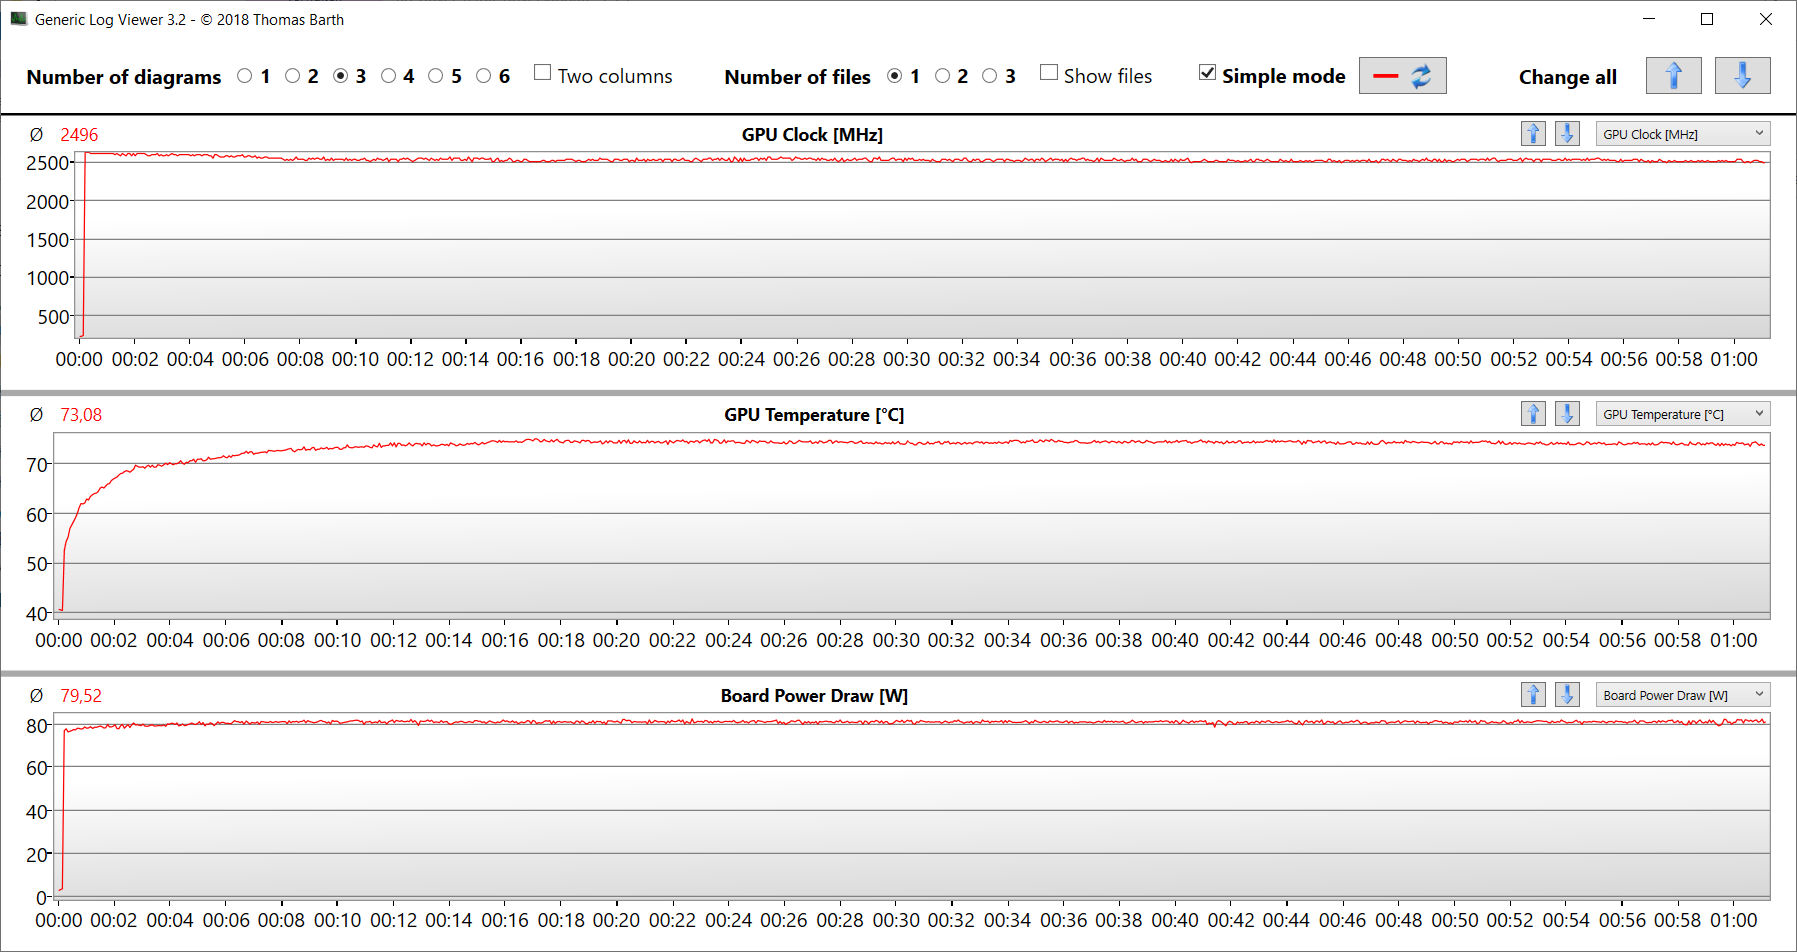
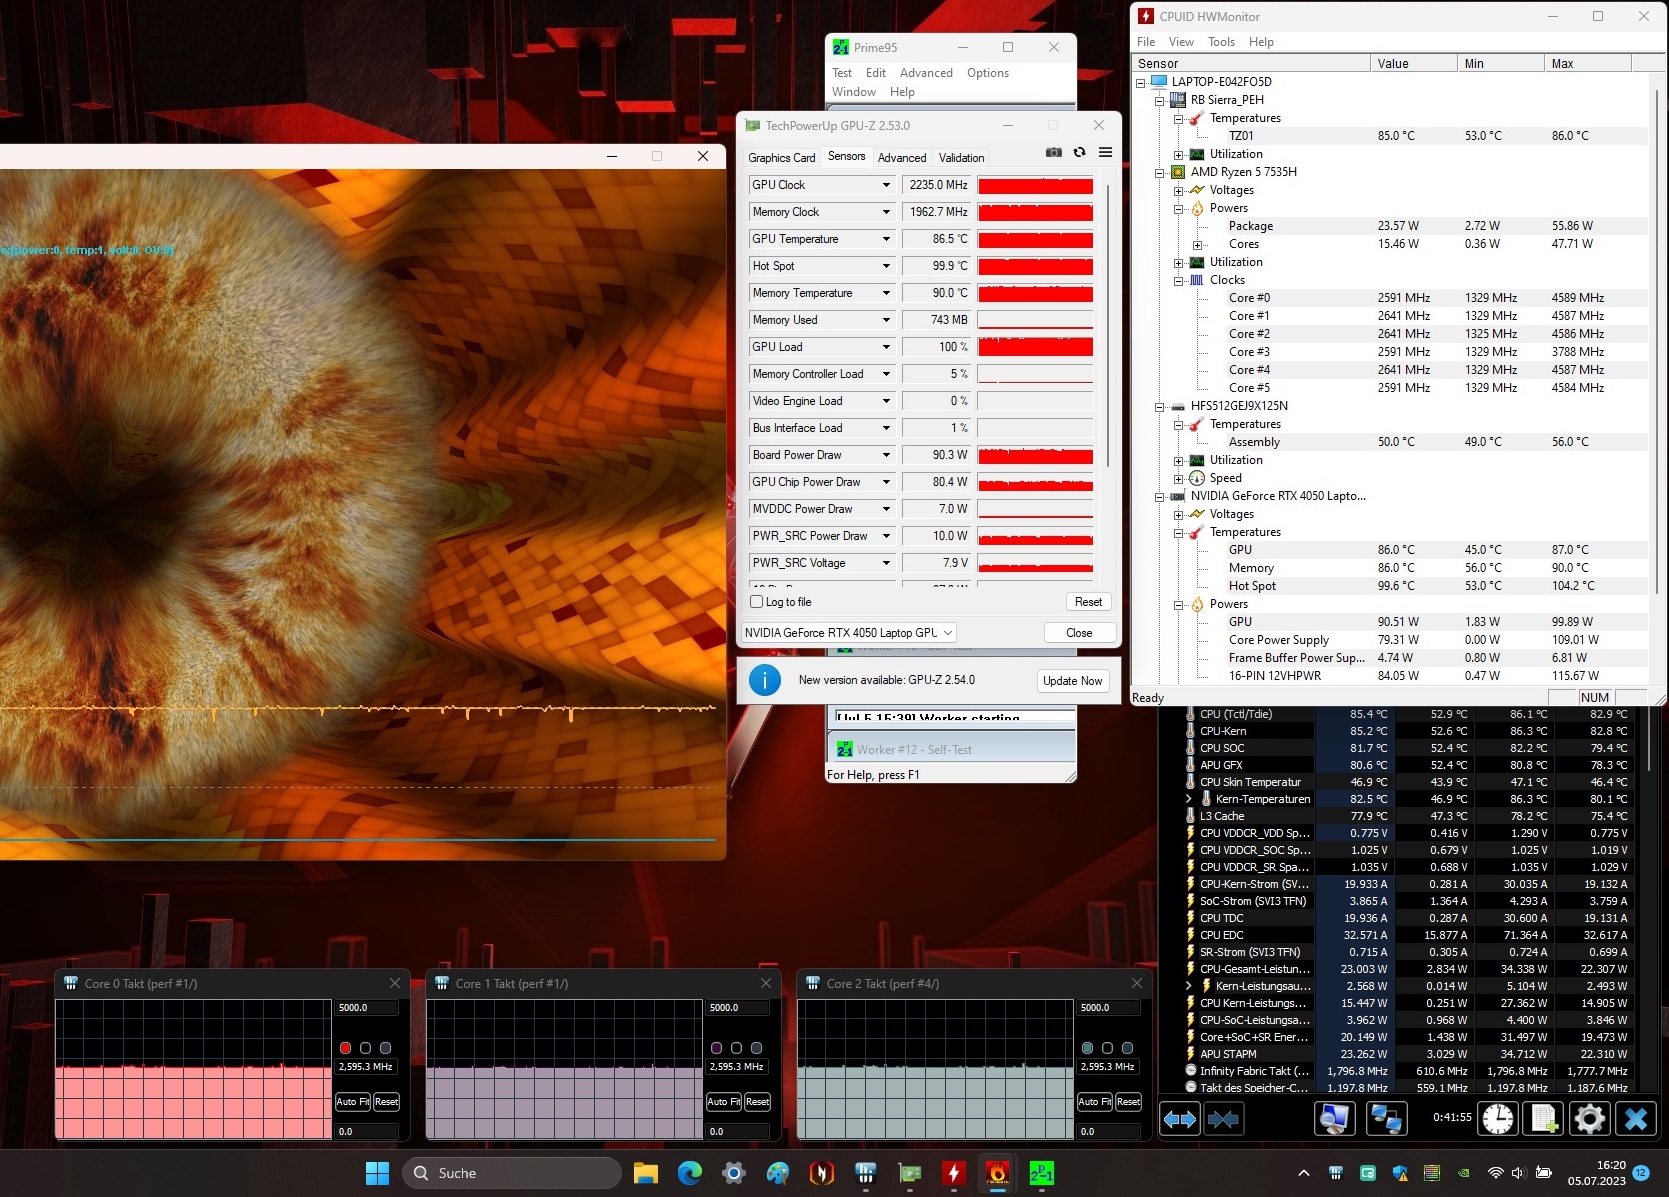
Prueba de esfuerzo
La prueba de estrés (Prime95 y Furmark en funcionamiento continuo) es un escenario extremo para probar la estabilidad del sistema a plena carga. La CPU comienza la prueba de estrés con frecuencias de reloj de 4,1 a 4,2 GHz, el núcleo gráfico funciona a 2,3 o 2,4 GHz. Las frecuencias descienden a 2,6 GHz (procesador) y 2,2 GHz (núcleo gráfico) en el transcurso de la prueba.
Altavoz
Los altavoces estéreo producen un sonido decente, en gran medida sin graves. Se podría conseguir una mejor experiencia de sonido con auriculares o altavoces externos.
Acer Nitro 16 AN16-41-R7YE análisis de audio
(+) | los altavoces pueden reproducir a un volumen relativamente alto (#82 dB)
Graves 100 - 315 Hz
(-) | casi sin bajos - de media 28.2% inferior a la mediana
(±) | la linealidad de los graves es media (12.9% delta a frecuencia anterior)
Medios 400 - 2000 Hz
(+) | medios equilibrados - a sólo 2.2% de la mediana
(+) | los medios son lineales (3.8% delta a la frecuencia anterior)
Altos 2 - 16 kHz
(+) | máximos equilibrados - a sólo 3.5% de la mediana
(+) | los máximos son lineales (4.6% delta a la frecuencia anterior)
Total 100 - 16.000 Hz
(±) | la linealidad del sonido global es media (17.3% de diferencia con la mediana)
En comparación con la misma clase
» 47% de todos los dispositivos probados de esta clase eran mejores, 12% similares, 41% peores
» El mejor tuvo un delta de 6%, la media fue 18%, el peor fue ###max##%
En comparación con todos los dispositivos probados
» 32% de todos los dispositivos probados eran mejores, 8% similares, 59% peores
» El mejor tuvo un delta de 4%, la media fue 23%, el peor fue ###max##%
Asus TUF Gaming A16 FA617XS análisis de audio
(±) | la sonoridad del altavoz es media pero buena (79 dB)
Graves 100 - 315 Hz
(±) | lubina reducida - en promedio 11.6% inferior a la mediana
(±) | la linealidad de los graves es media (7% delta a frecuencia anterior)
Medios 400 - 2000 Hz
(±) | medias más altas - de media 5.7% más altas que la mediana
(+) | los medios son lineales (3.8% delta a la frecuencia anterior)
Altos 2 - 16 kHz
(+) | máximos equilibrados - a sólo 2.6% de la mediana
(+) | los máximos son lineales (6.5% delta a la frecuencia anterior)
Total 100 - 16.000 Hz
(±) | la linealidad del sonido global es media (15.4% de diferencia con la mediana)
En comparación con la misma clase
» 34% de todos los dispositivos probados de esta clase eran mejores, 7% similares, 59% peores
» El mejor tuvo un delta de 6%, la media fue 18%, el peor fue ###max##%
En comparación con todos los dispositivos probados
» 23% de todos los dispositivos probados eran mejores, 4% similares, 73% peores
» El mejor tuvo un delta de 4%, la media fue 23%, el peor fue ###max##%
Gestión de la energía: El Nitro 16 puede lograr tiempos de ejecución muy buenos
Consumo de energía
El consumo de energía es normal para el hardware instalado. El modo dGPU es el responsable del mayor consumo en reposo en comparación con el modelo modelo hermano. El test de estrés y el test Witcher 3 se ejecutan con un consumo de energía constante. La fuente de alimentación suministrada (230 W) puede alimentar completamente el portátil bajo carga.
| Off / Standby | |
| Ocioso | |
| Carga |
|
Clave:
min: | |
| Acer Nitro 16 AN16-41-R7YE R5 7535HS, GeForce RTX 4050 Laptop GPU | Asus TUF Gaming A16 FA617XS R9 7940HS, Radeon RX 7600S | Schenker XMG Focus 15 (E23) i9-13900HX, GeForce RTX 4050 Laptop GPU | Gigabyte G7 KE i5-12500H, GeForce RTX 3060 Laptop GPU | Asus TUF A15 FA507 R7 7735HS, GeForce RTX 4050 Laptop GPU | Medion Erazer Scout E20 i7-13700H, GeForce RTX 4050 Laptop GPU | Acer Nitro 16 AN16-41 R7 7735HS, GeForce RTX 4070 Laptop GPU | Media de la clase Gaming | |
|---|---|---|---|---|---|---|---|---|
| Power Consumption | 20% | -32% | -10% | 23% | 13% | -7% | -10% | |
| Idle Minimum * (Watt) | 19 | 7 63% | 11.4 40% | 15 21% | 8 58% | 5 74% | 11.6 39% | 13 ? 32% |
| Idle Average * (Watt) | 20 | 10 50% | 16.7 16% | 17 15% | 12.1 39% | 11 45% | 15.6 22% | 19 ? 5% |
| Idle Maximum * (Watt) | 23 | 15 35% | 25.8 -12% | 24 -4% | 12.5 46% | 22 4% | 16.5 28% | 24.6 ? -7% |
| Load Average * (Watt) | 80 | 86 -8% | 139 -74% | 111 -39% | 74.9 6% | 96 -20% | 155 -94% | 110.7 ? -38% |
| Witcher 3 ultra * (Watt) | 125.8 | 160.6 -28% | 265 -111% | 174.1 -38% | 136.6 -9% | 145.2 -15% | 154.8 -23% | |
| Load Maximum * (Watt) | 184 | 172 7% | 280 -52% | 208 -13% | 185 -1% | 201 -9% | 205 -11% | 259 ? -41% |
* ... más pequeño es mejor
Power consumption: The Witcher 3 / Stress test
Power consumption: External monitor
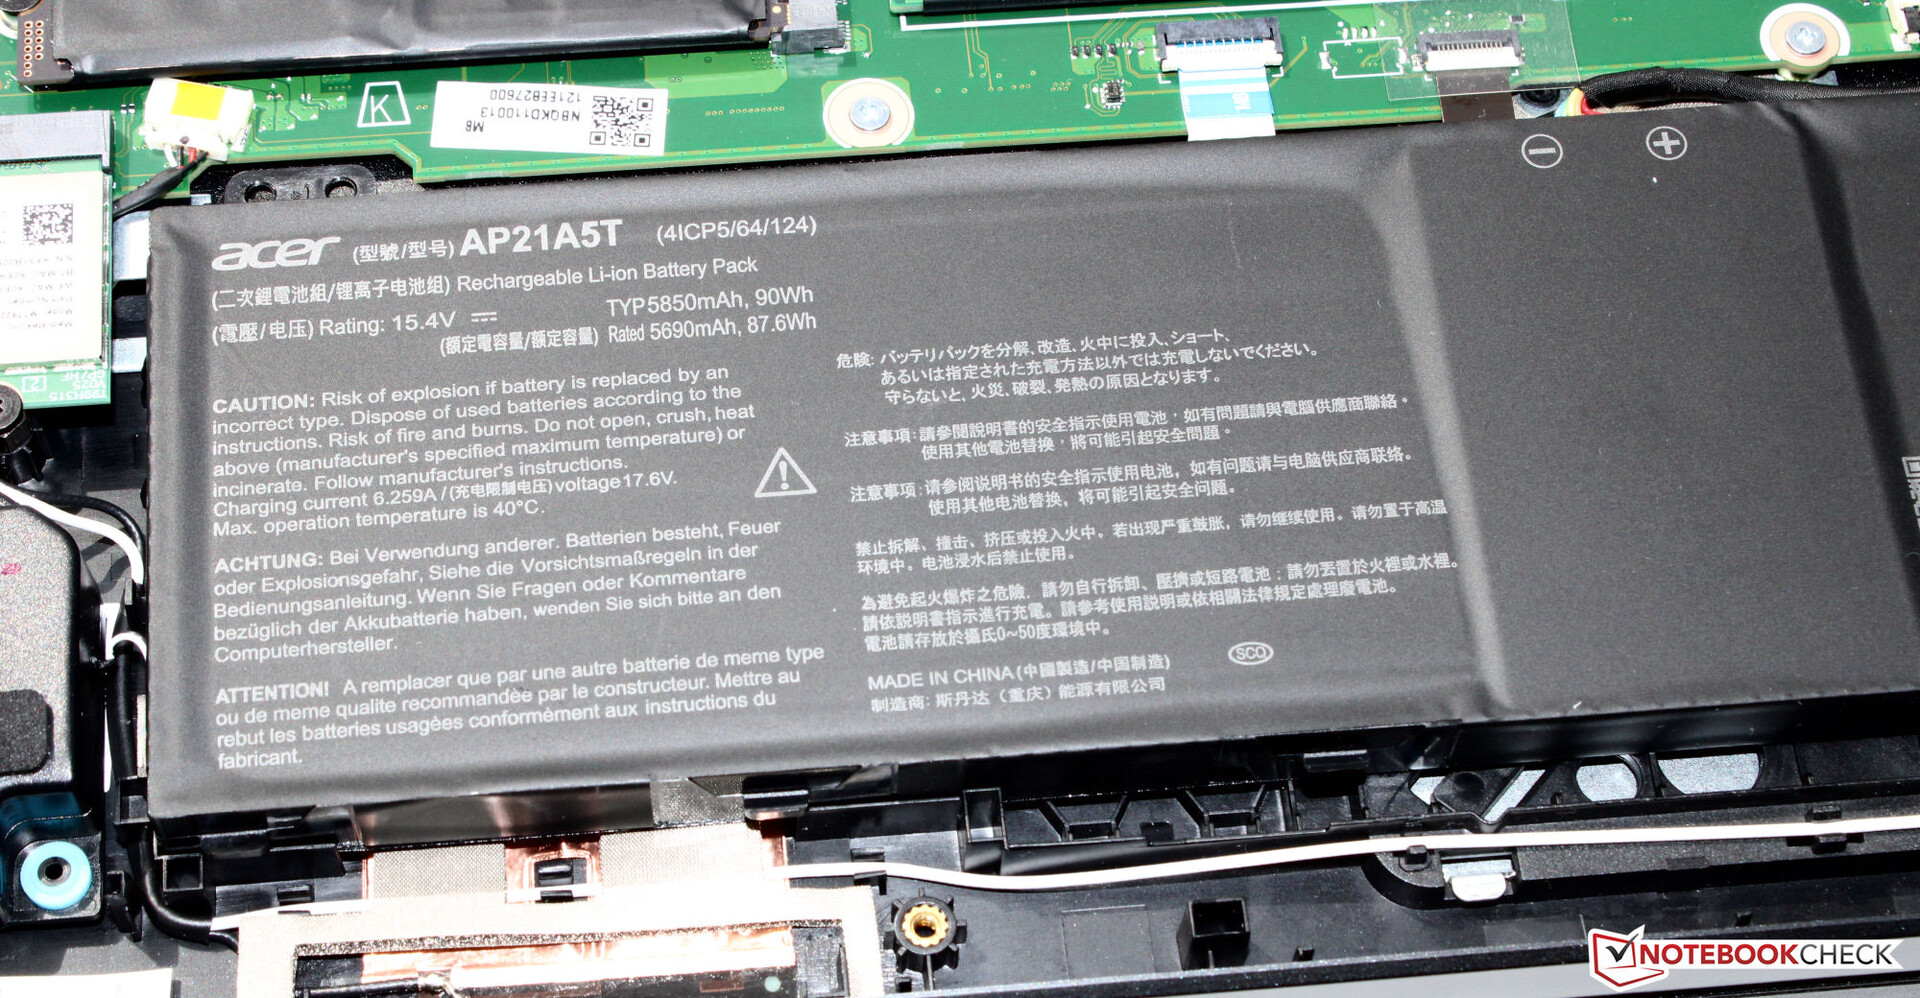
Duración de la batería
El Nitro 16 logra tiempos de ejecución de 11:00 h y 10:50 h en la prueba WLAN (llamada a sitios web a través de un script) y la prueba de vídeo (película corta Big Buck Bunny FHD codificación H.264 en bucle), respectivamente. Durante ambas pruebas, las funciones de ahorro de energía del portátil están desactivadas y el brillo de la pantalla está ajustado a unos 150 cd/m². Los módulos inalámbricos también están desactivados para la prueba de vídeo.
Nota: El Nitro muestra un mayor consumo de energía en modo batería bajo Windows 11 (instalación Acer, instalación propia). En consecuencia, los tiempos de funcionamiento quedan por detrás de los del modelo hermano Análisis del Acer Nitro 16 AN16-41: Un portátil gaming RTX 4070 con buena duración de batería (WLAN: 5.5 vs. 9 h) con las mismas capacidades de batería. Por tanto, los tiempos de ejecución se determinaron bajo Windows 10. El problema no se da aquí.
No podemos dar una razón para el mayor consumo de energía. Podría ser un problema de nuestro dispositivo de pruebas.
| Acer Nitro 16 AN16-41-R7YE R5 7535HS, GeForce RTX 4050 Laptop GPU, 90 Wh | Asus TUF Gaming A16 FA617XS R9 7940HS, Radeon RX 7600S, 90 Wh | Schenker XMG Focus 15 (E23) i9-13900HX, GeForce RTX 4050 Laptop GPU, 73 Wh | Gigabyte G7 KE i5-12500H, GeForce RTX 3060 Laptop GPU, 54 Wh | Asus TUF A15 FA507 R7 7735HS, GeForce RTX 4050 Laptop GPU, 90 Wh | Medion Erazer Scout E20 i7-13700H, GeForce RTX 4050 Laptop GPU, 53.35 Wh | Acer Nitro 16 AN16-41 R7 7735HS, GeForce RTX 4070 Laptop GPU, 90 Wh | Media de la clase Gaming | |
|---|---|---|---|---|---|---|---|---|
| Duración de Batería | 10% | -44% | -54% | -11% | -48% | -10% | -30% | |
| Reader / Idle (h) | 12 | 20.3 69% | 7.1 -41% | 6.7 -44% | 12.2 2% | 8.27 ? -31% | ||
| H.264 (h) | 10.8 | 12.4 15% | 2.2 -80% | 12.5 16% | 4.6 -57% | 10.2 -6% | 8.32 ? -23% | |
| WiFi v1.3 (h) | 11 | 12.4 13% | 5.9 -46% | 5.3 -52% | 11.7 6% | 4.7 -57% | 9 -18% | 7.11 ? -35% |
| Load (h) | 2.2 | 0.9 -59% | 1.3 -41% | 1.3 -41% | 1 -55% | 1.5 -32% | 1.8 -18% | 1.502 ? -32% |
Pro
Contra
Veredicto: Entrada barata en el mundo de los videojuegos
El Acer Nitro 16 está diseñado para juegos FHD con configuraciones altas o máximas, pero también da la talla en otras áreas (edición de vídeo, renderizado). ElRyzen 5 7535HS y GeForce RTX 4050ofrece el rendimiento necesario, y CPU y GPU pueden trabajar a frecuencias constantemente altas.
Acer presenta un portátil de juego bien redondeado en el segmento básico con el Nitro 16.
Sorprendentemente, el portátil se calienta más bajo carga que su modelo hermano equipado con hardware más potente. Los modelos Nitro no tienen mucho en común en cuanto a desarrollo de ruido. El modo "Equilibrado" proporciona un ruido de fondo moderado.
La pantalla de 16 pulgadas (WUXGA) es apenas inferior al panel (WQXGA) del modelo hermano. Este último ofrece un brillo máximo superior (400 nits frente a 500 nits). Los ya buenos tiempos de ejecución del Ryzen 7 Nitro quedan superados por el modelo actual, aunque sólo bajo Windows 10. La capacidad de almacenamiento (512 GB) es escasa para un portátil de juego.
Una alternativa es el Asus TUF A15 FA507. Ofrece más rendimiento de CPU con una duración de batería ligeramente mejor. El Gigabyte G7 KE sería la alternativa económica en la que un menor nivel de rendimiento se vería contrarrestado por un precio de compra más bajo (1.050 euros). Sin embargo, no incluye sistema operativo Windows.
Precio y disponibilidad
En EE.UU., los usuarios pueden pedir algunas variantes del Acer Nitro 16 AN16-41 en Amazon, que tienen configuraciones más potentes que la que hemos analizado.
Acer Nitro 16 AN16-41-R7YE
- 08/01/2023 v7 (old)
Sascha Mölck
Transparencia
La selección de los dispositivos que se van a reseñar corre a cargo de nuestro equipo editorial. La muestra de prueba fue proporcionada al autor en calidad de préstamo por el fabricante o el minorista a los efectos de esta reseña. El prestamista no tuvo ninguna influencia en esta reseña, ni el fabricante recibió una copia de la misma antes de su publicación. No había ninguna obligación de publicar esta reseña. Como empresa de medios independiente, Notebookcheck no está sujeta a la autoridad de fabricantes, minoristas o editores.
Así es como prueba Notebookcheck
Cada año, Notebookcheck revisa de forma independiente cientos de portátiles y smartphones utilizando procedimientos estandarizados para asegurar que todos los resultados son comparables. Hemos desarrollado continuamente nuestros métodos de prueba durante unos 20 años y hemos establecido los estándares de la industria en el proceso. En nuestros laboratorios de pruebas, técnicos y editores experimentados utilizan equipos de medición de alta calidad. Estas pruebas implican un proceso de validación en varias fases. Nuestro complejo sistema de clasificación se basa en cientos de mediciones y puntos de referencia bien fundamentados, lo que mantiene la objetividad.Price comparison
