Análisis del portátil de juegos económico Schenker XMG Focus 15 (E23): Mucho rendimiento a un precio menor que el Pro 15

Primero probamos elXMG Focus 15a finales de 2021. El Focus 15 era un portátil que impulsaba la entonces recién estrenadaRTX 3050 Ti para portátilesa sus límites. A pesar de su refrigeración, el XMG Focus 15 solo mostró un rendimiento por encima de la media a altas temperaturas.
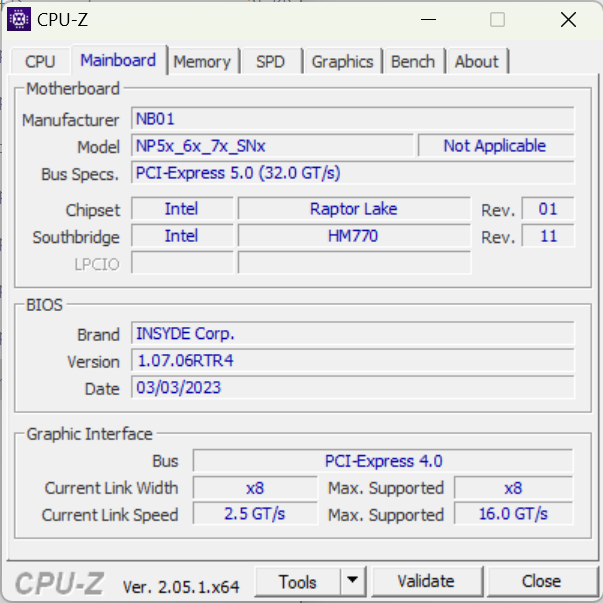
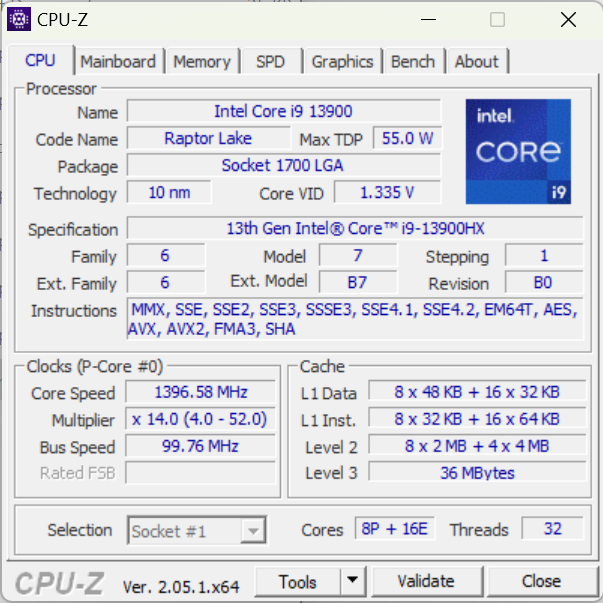
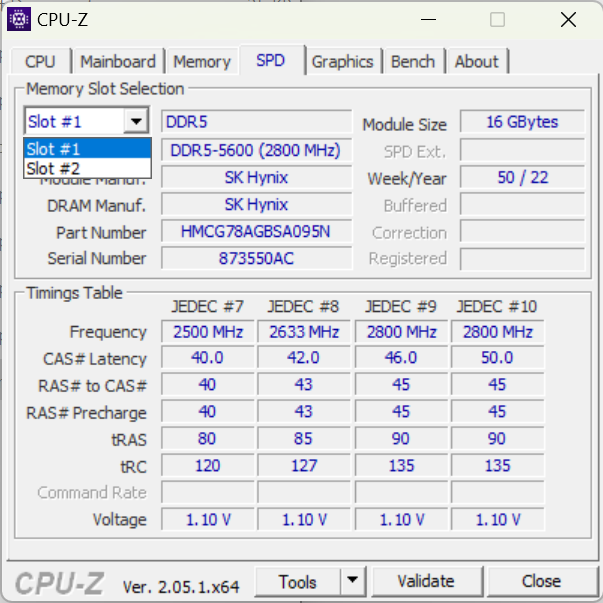
Schenker vuelve a confiar en un barebone de Clevo para el Focus 15 actual, y esta vez es el chasis NP50SNC. Al igual que el recientemente probadoXMG Pro 15encontramos unIntel Core i9-13900HXinstalado en el nuevo Focus 15.
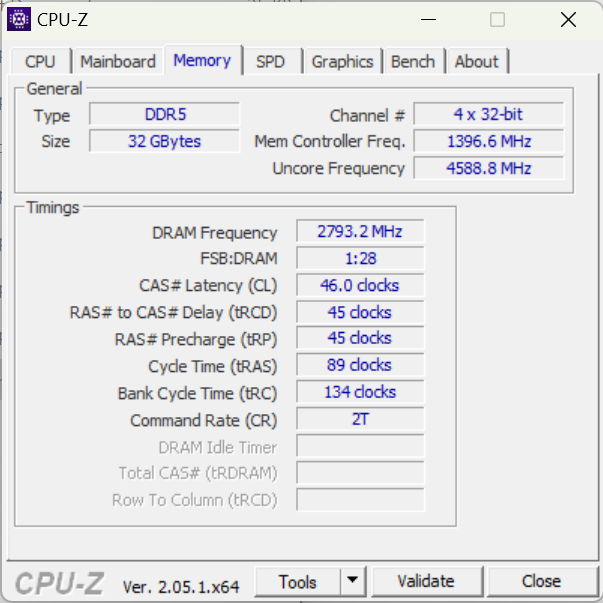
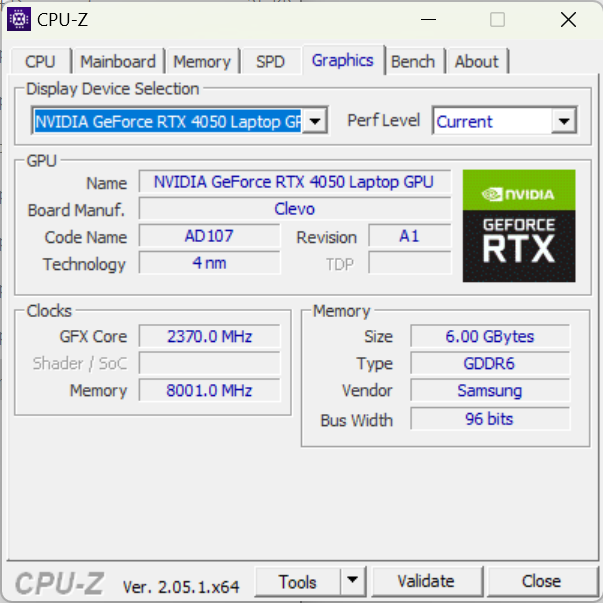
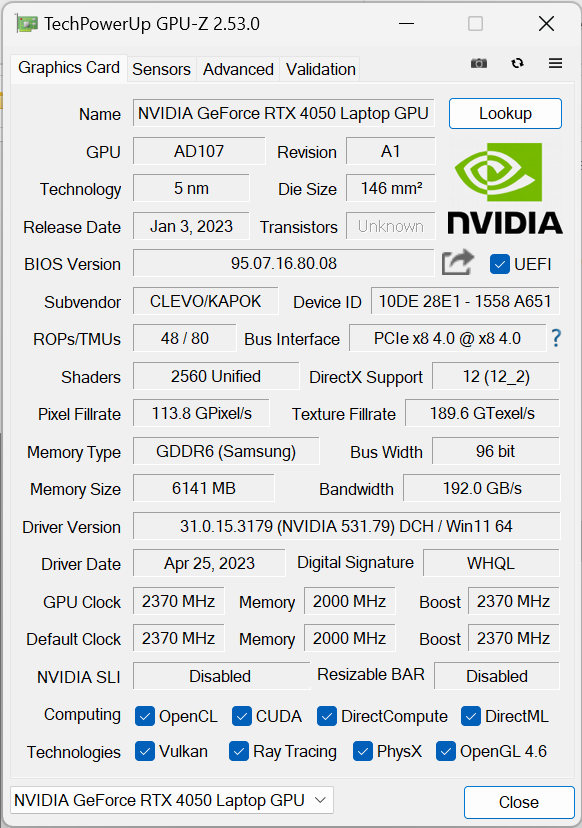
El procesador de gama alta del Focus 15 se complementa con una GPU básica, laGPU Nvidia GeForce RTX 4050 para portátiles32 GB de memoria de trabajo y un SSD Crucial NVMe de 1 TB.
Como es habitual, Schenker ofrece una amplia gama de opciones de configuración. Los compradores también pueden configurar el Focus 15 con unaGPU RTX 4060 para portátilo unaGPU RTX 4070 para portátiljunto con opciones adicionales de RAM.
Debido a la gráfica básica de nuestro modelo de pruebas, clasificamos el XMG Pro 15 como portátil gaming básico. Sin embargo, los portátiles para juegos de gama básica no suelen tener un procesador de tan alto rendimiento ni más de 16 GB de memoria de trabajo, por lo que también buscamos dispositivos de comparación correspondientes entre los portátiles multimedia de gama alta.
Entre ellos se encuentran dispositivos como elMSI Katana 15o elAsus TUF A15como portátiles para juegos y elSamsung Galaxy Book3 Ultra 16o elAcer Swift X SFX14-71Gcomo portátiles multimedia. ElXMG Pro 15el portátil más caro de Schenker sólo difiere de su primo más barato en algunos aspectos.
Posibles contendientes en la comparación
Valoración | Fecha | Modelo | Peso | Altura | Tamaño | Resolución | Precio |
|---|---|---|---|---|---|---|---|
| 85.1 % v7 (old) | 07/2023 | Schenker XMG Focus 15 (E23) i9-13900HX, GeForce RTX 4050 Laptop GPU | 2.4 kg | 26.9 mm | 15.60" | 2569x1440 | |
| 86.2 % v7 (old) | 07/2023 | Schenker XMG Pro 15 (E23) i9-13900HX, GeForce RTX 4060 Laptop GPU | 2.4 kg | 24.9 mm | 15.60" | 2560x1440 | |
| 86.3 % v7 (old) | 06/2023 | Asus TUF A15 FA507 R7 7735HS, GeForce RTX 4050 Laptop GPU | 2.2 kg | 24.9 mm | 15.60" | 1920x1080 | |
| 82.9 % v7 (old) | 03/2023 | MSI Katana 15 B12VEK i7-12650H, GeForce RTX 4050 Laptop GPU | 2.3 kg | 24.9 mm | 15.60" | 1920x1080 | |
| 86.3 % v7 (old) | 07/2023 | Acer Swift X SFX14-71G i7-13700H, GeForce RTX 4050 Laptop GPU | 1.5 kg | 17.9 mm | 14.50" | 2880x1800 | |
| 89.4 % v7 (old) | 04/2023 | Samsung Galaxy Book3 Ultra 16 i7-13700H, GeForce RTX 4050 Laptop GPU | 1.8 kg | 16.5 mm | 16.00" | 2880x1800 | |
| 89.4 % v7 (old) | 05/2023 | Gigabyte Aero 14 OLED BMF i7-13700H, GeForce RTX 4050 Laptop GPU | 1.4 kg | 17 mm | 14.00" | 2880x1800 |
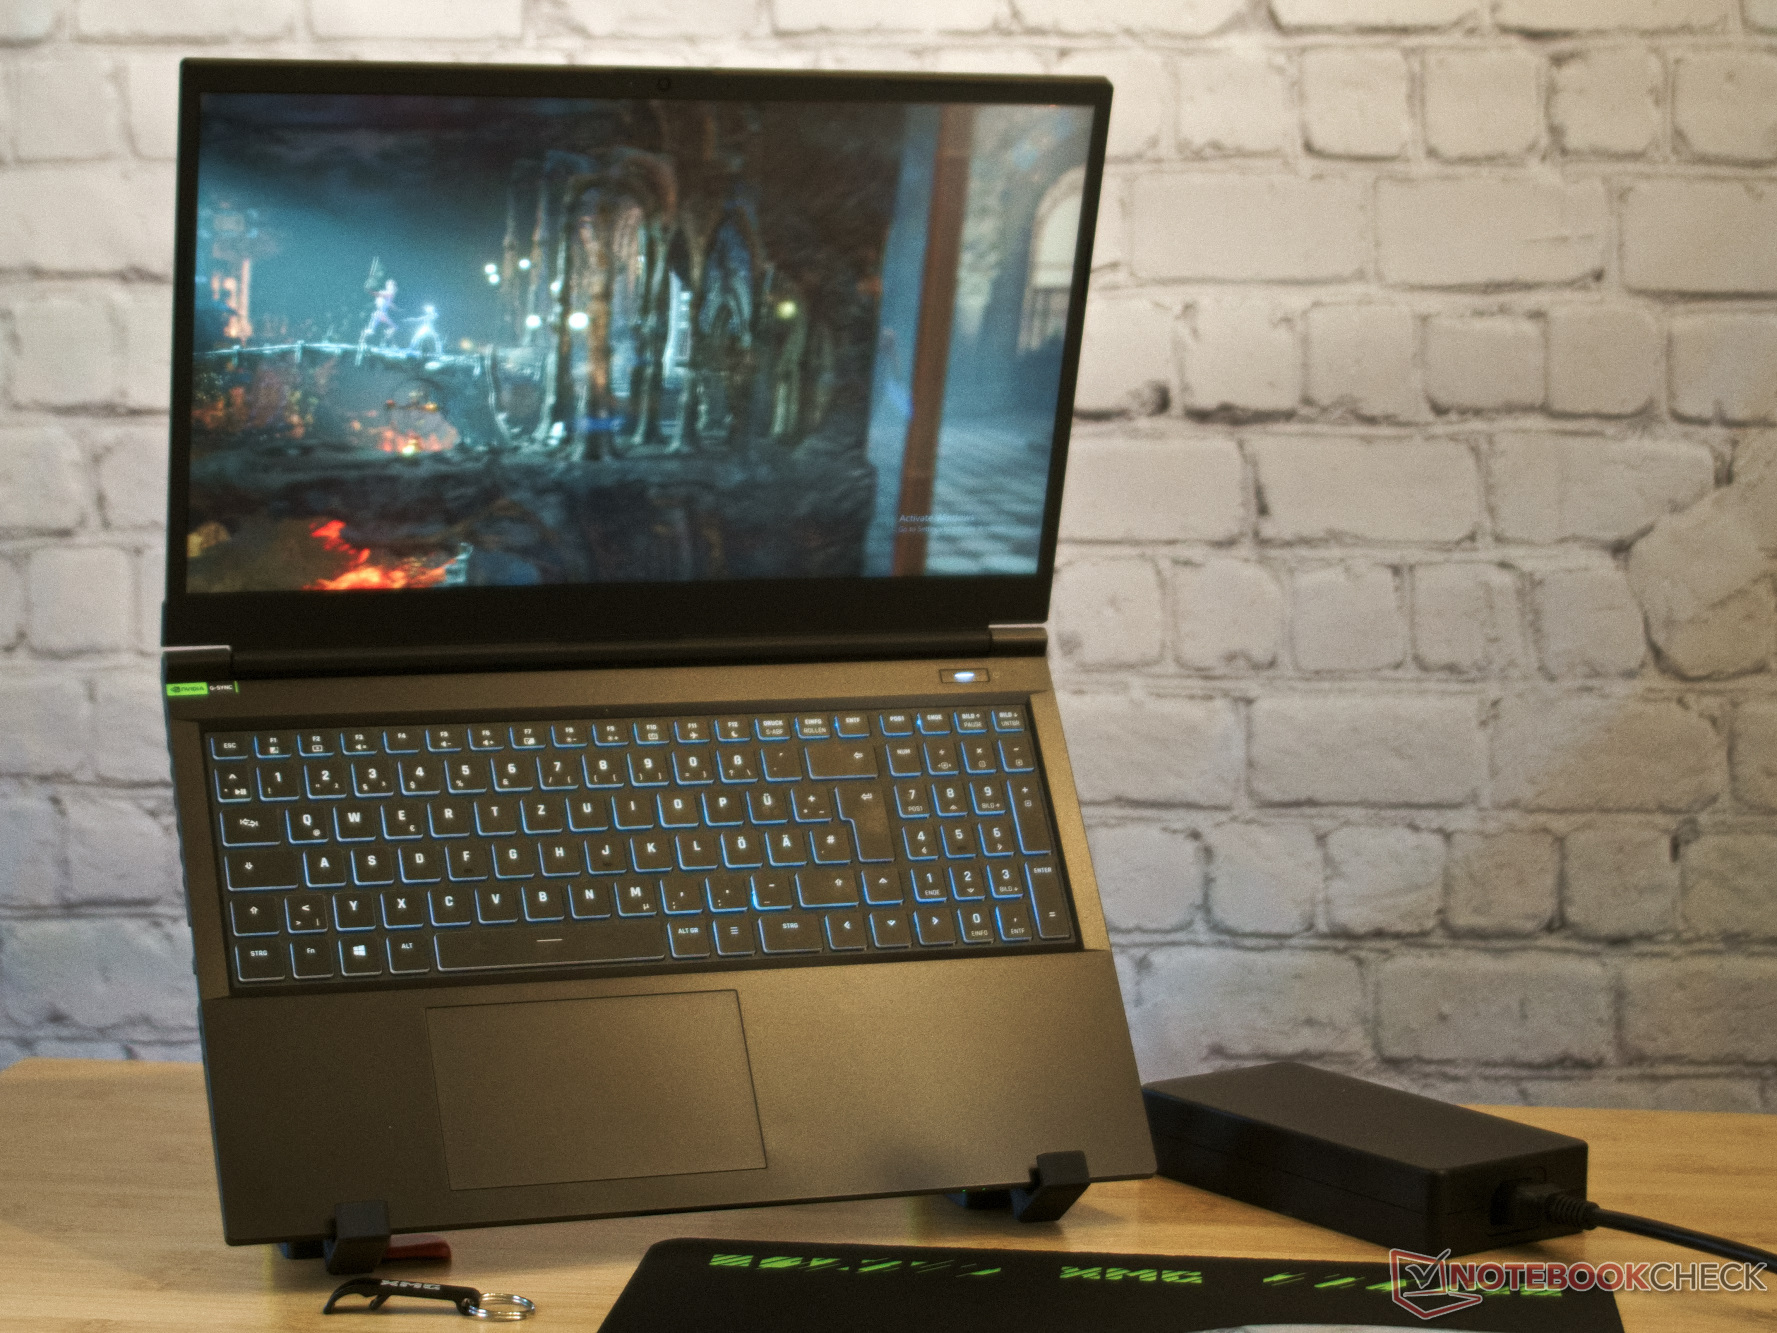
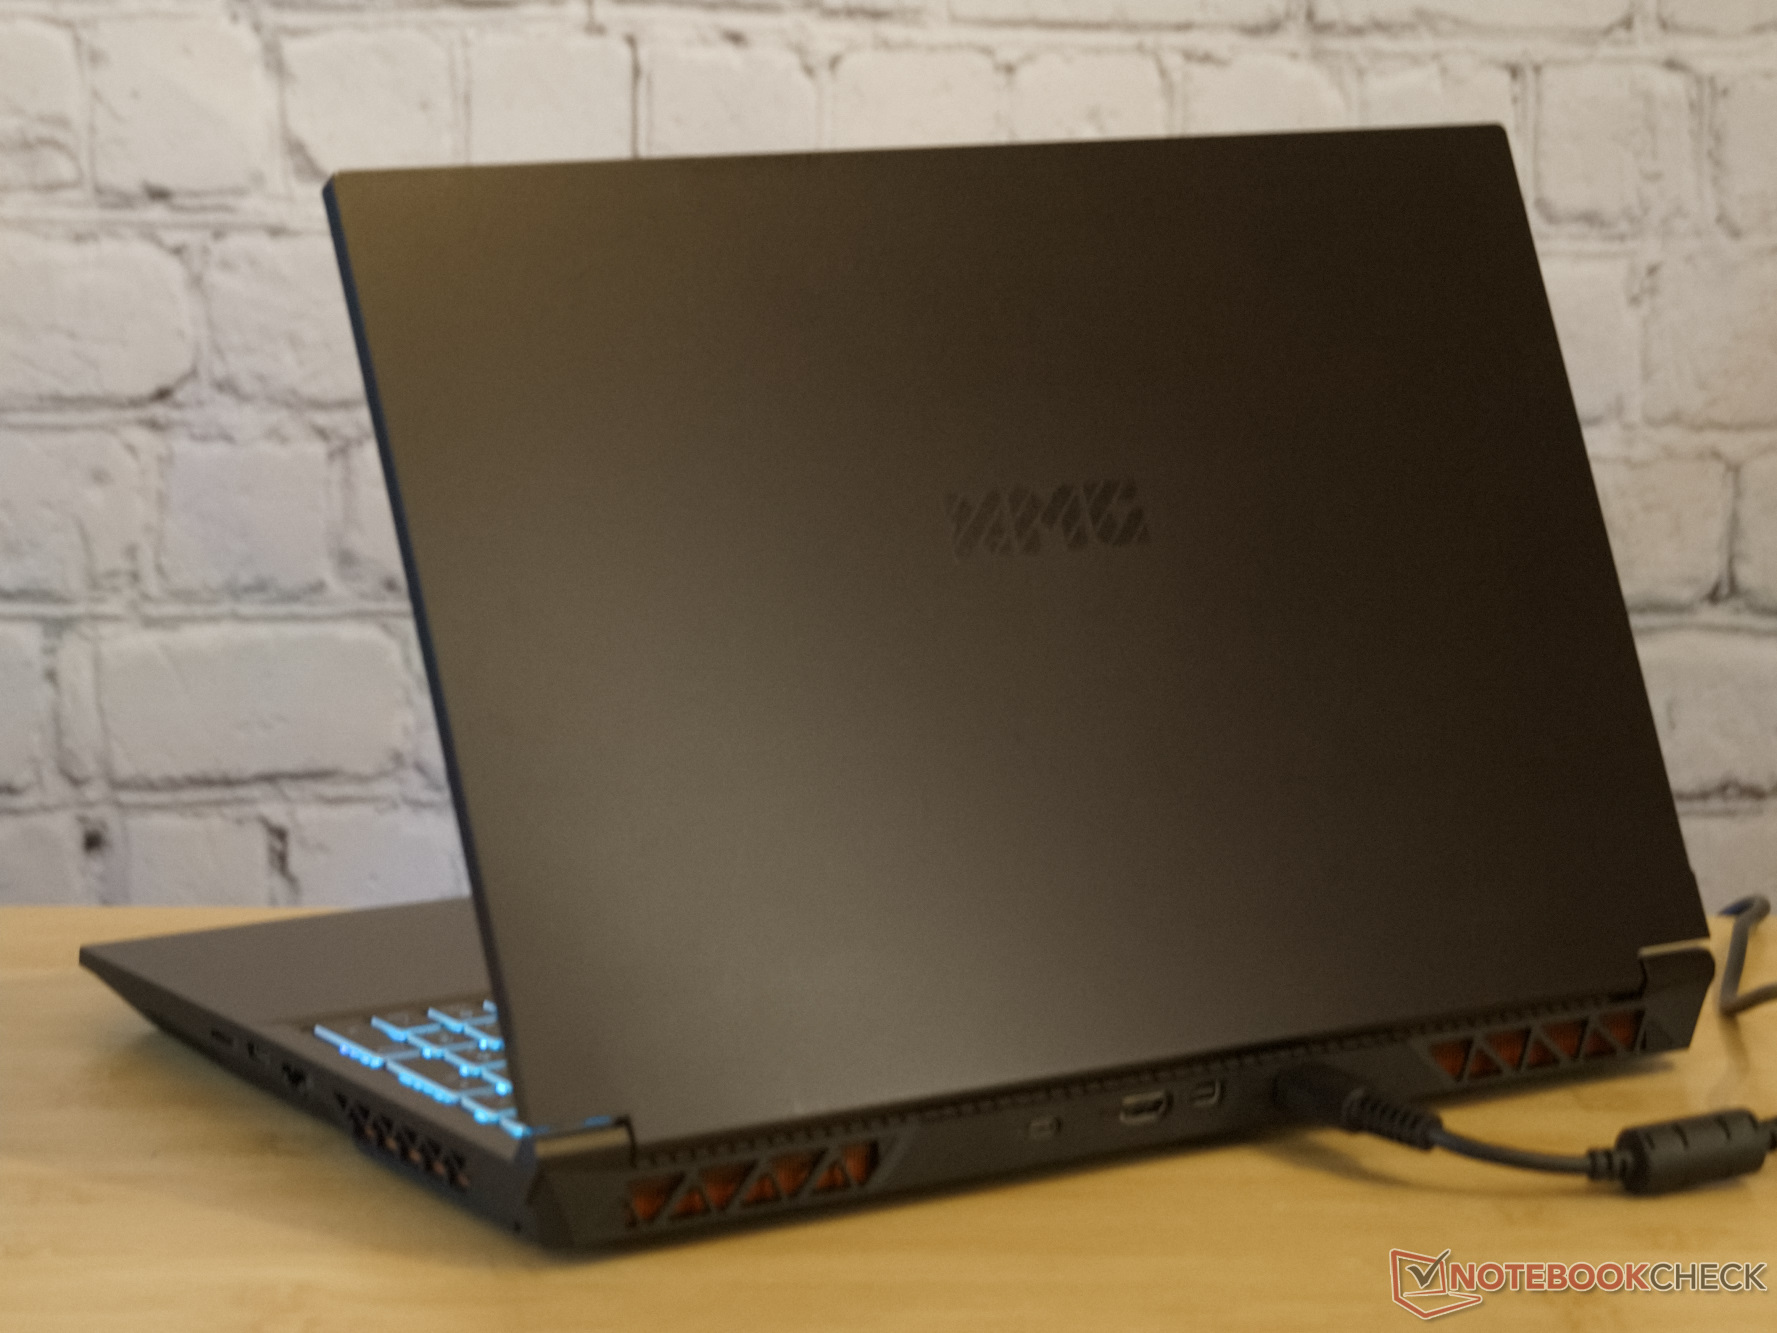
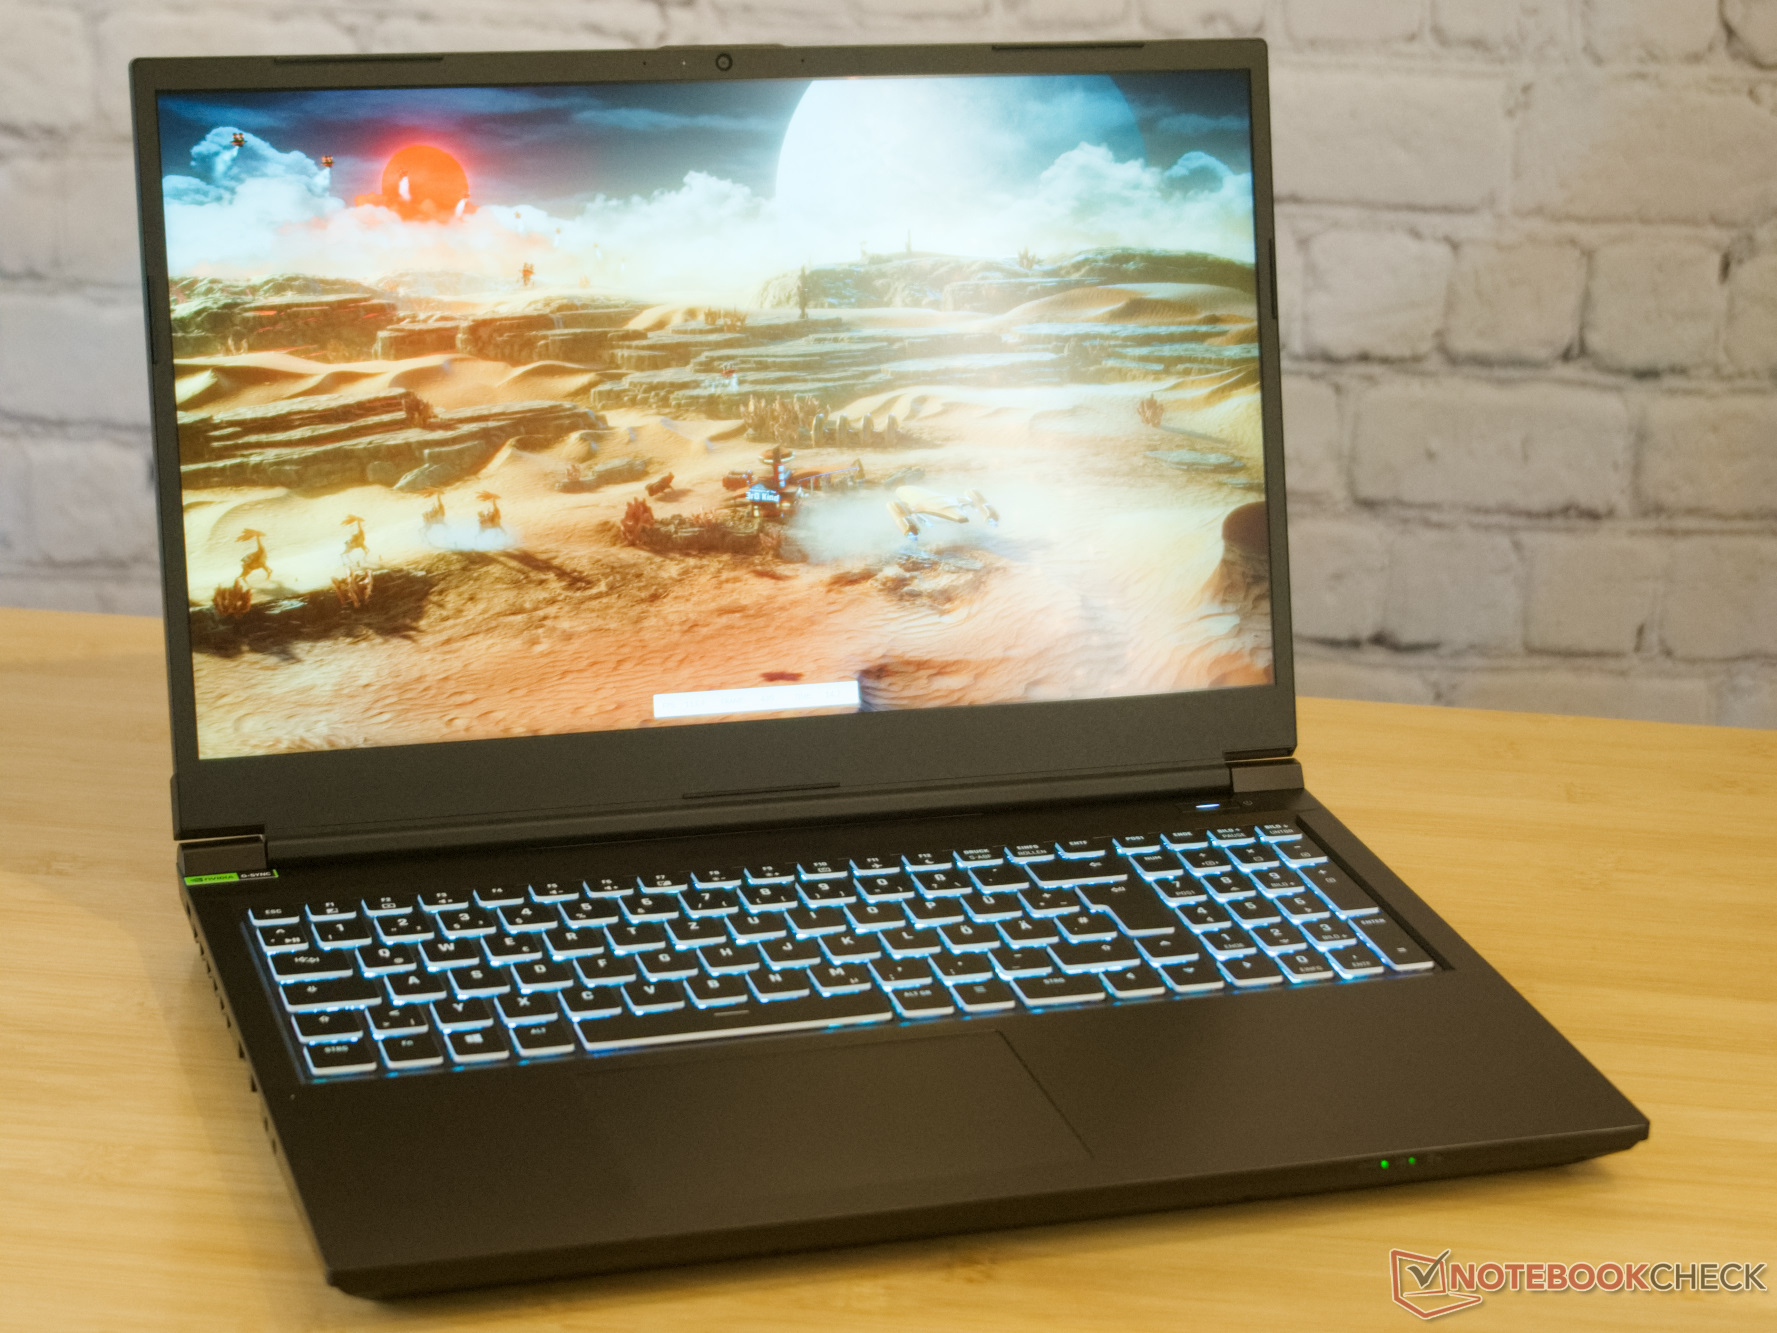
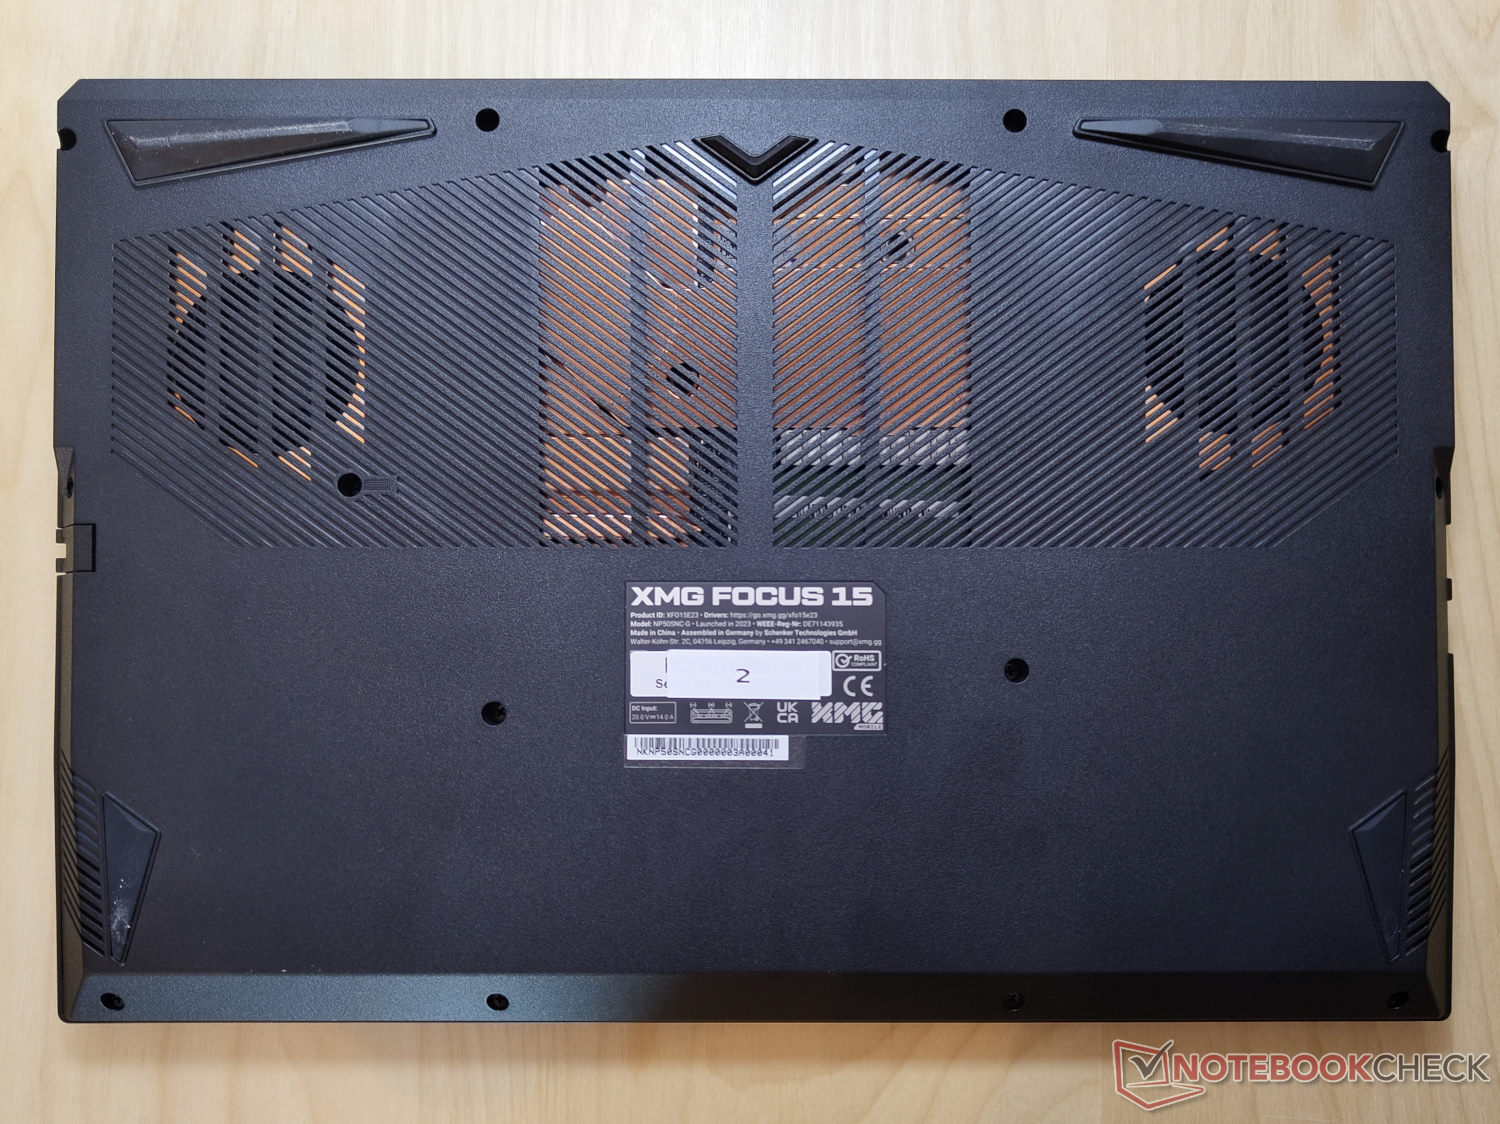
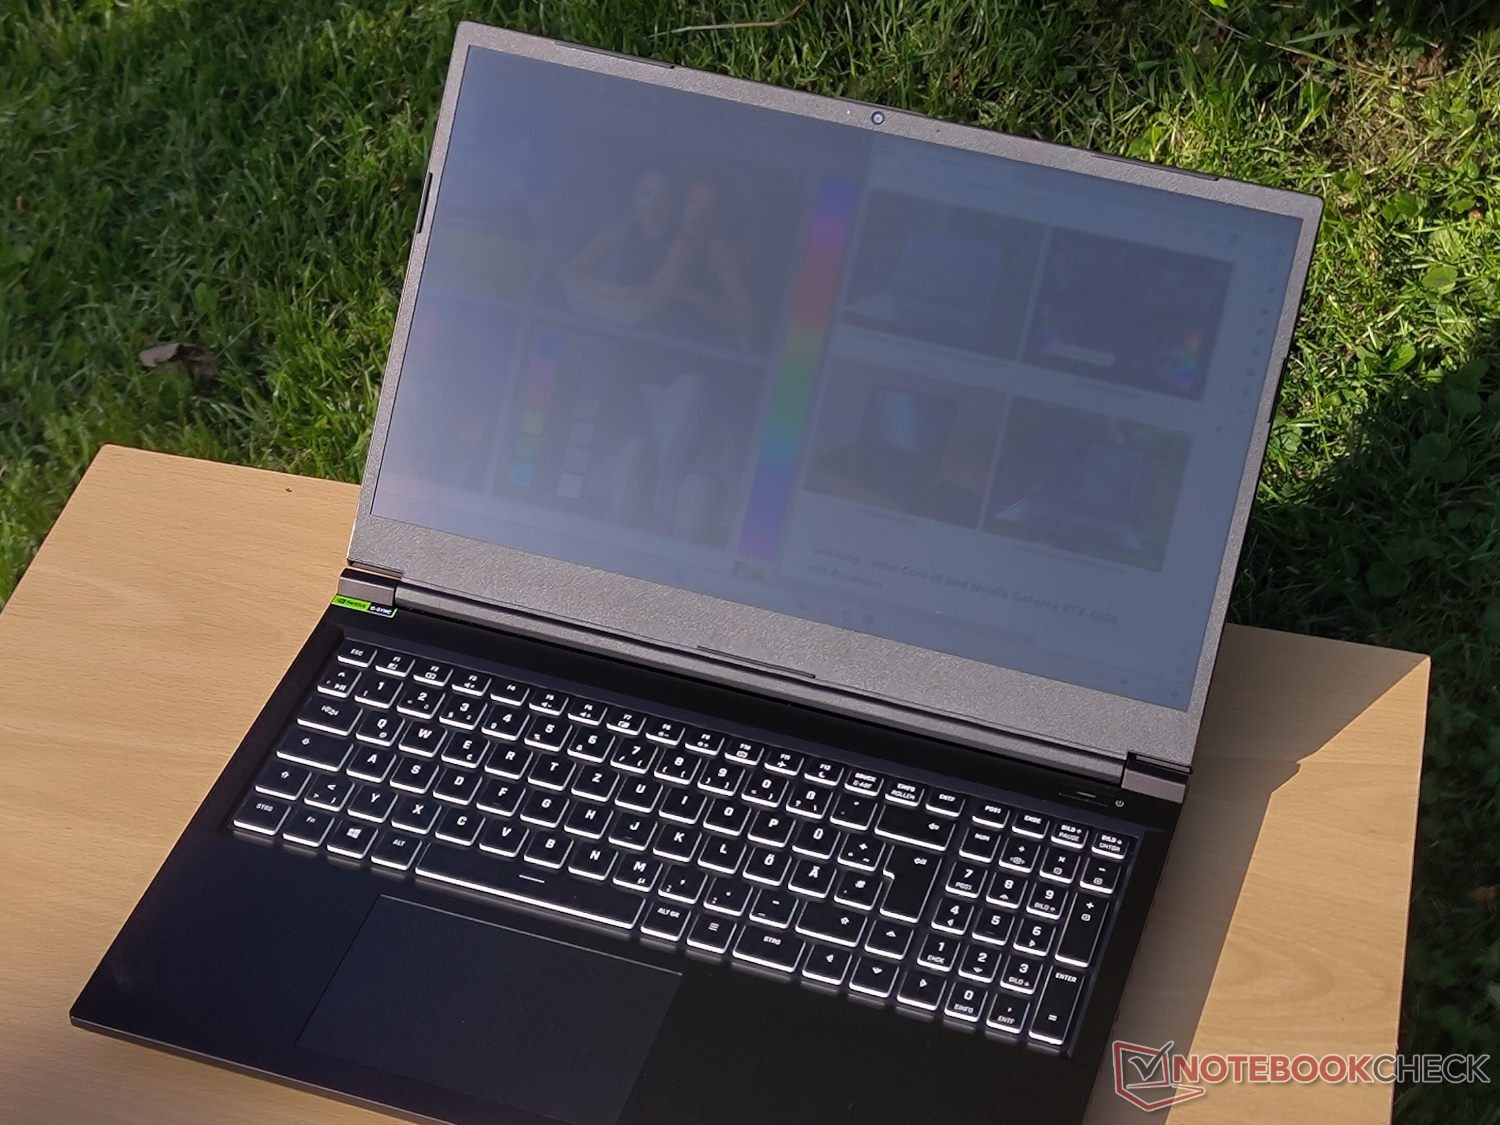
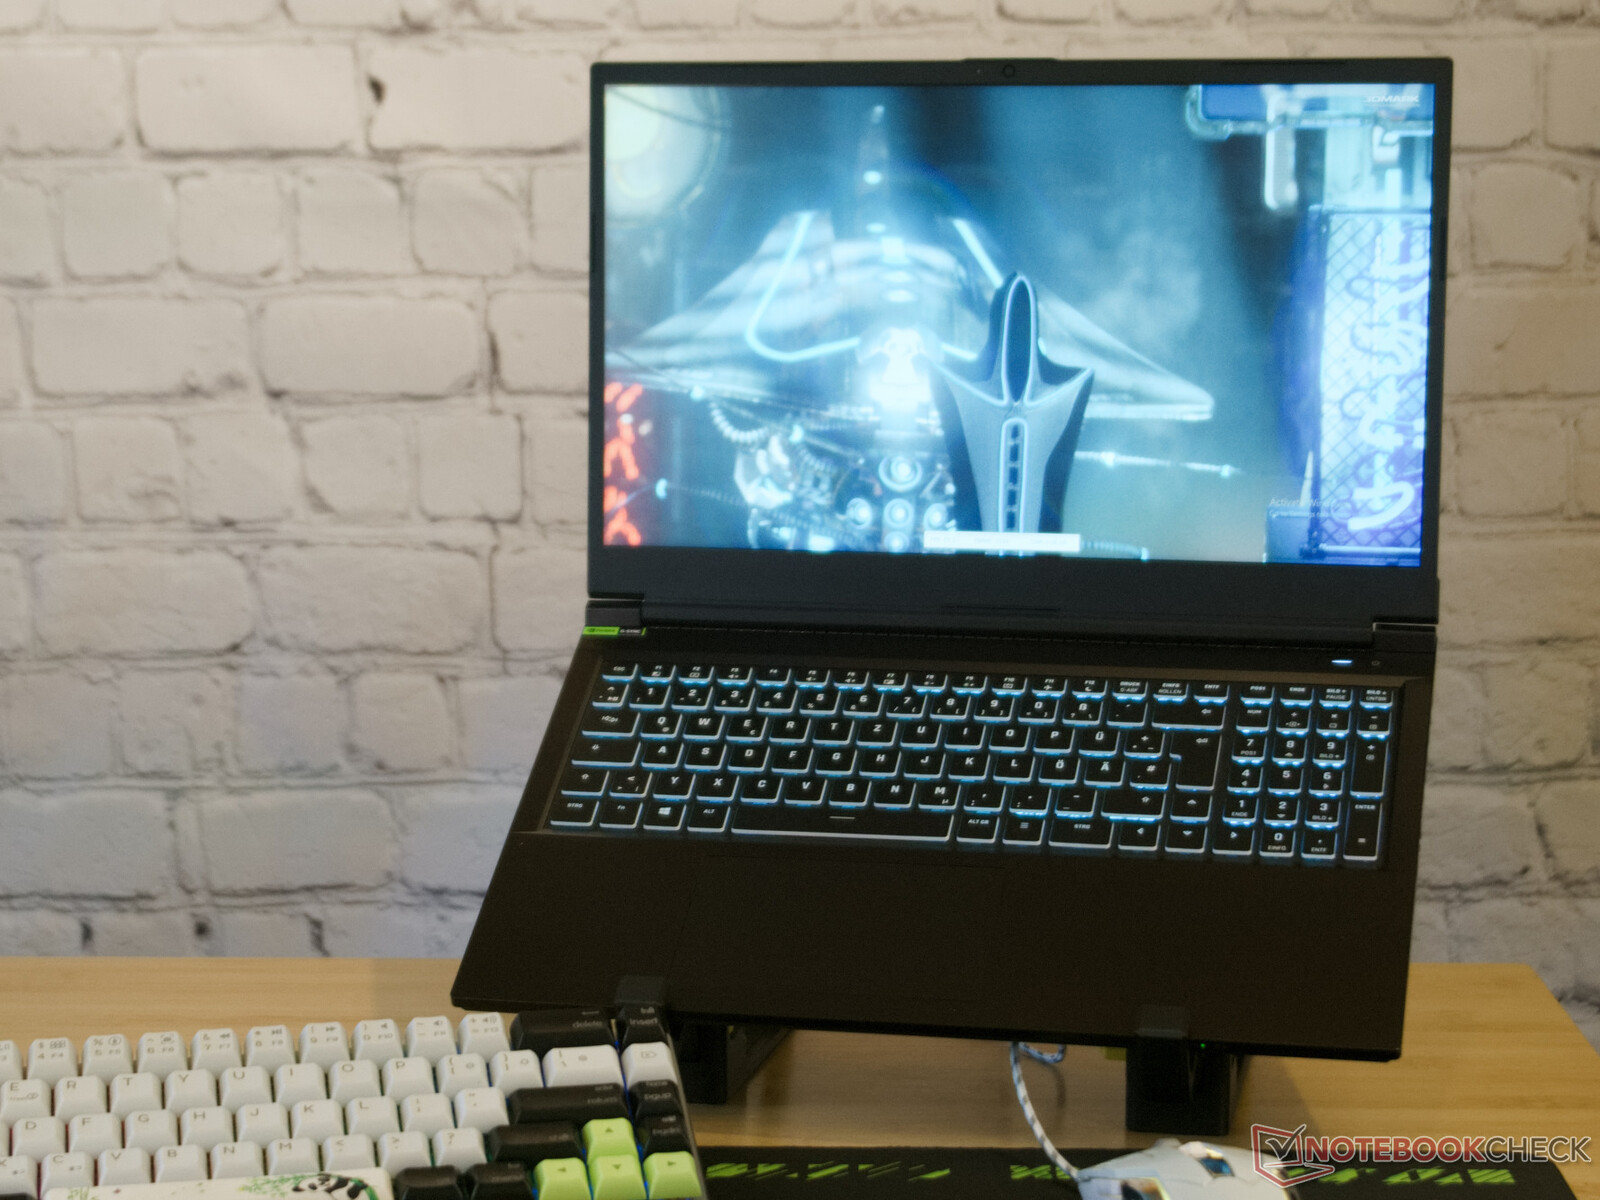
Chasis: Plástico robusto
La carcasa del portátil es completamente de plástico robusto. El metal sólo es visible desde el exterior detrás de las rejillas en forma de disipador de calor. Clevo y Schenker han mantenido el diseño bastante sencillo. La marca sólo se encuentra en forma del logotipo XMG negro sobre un fondo negro.
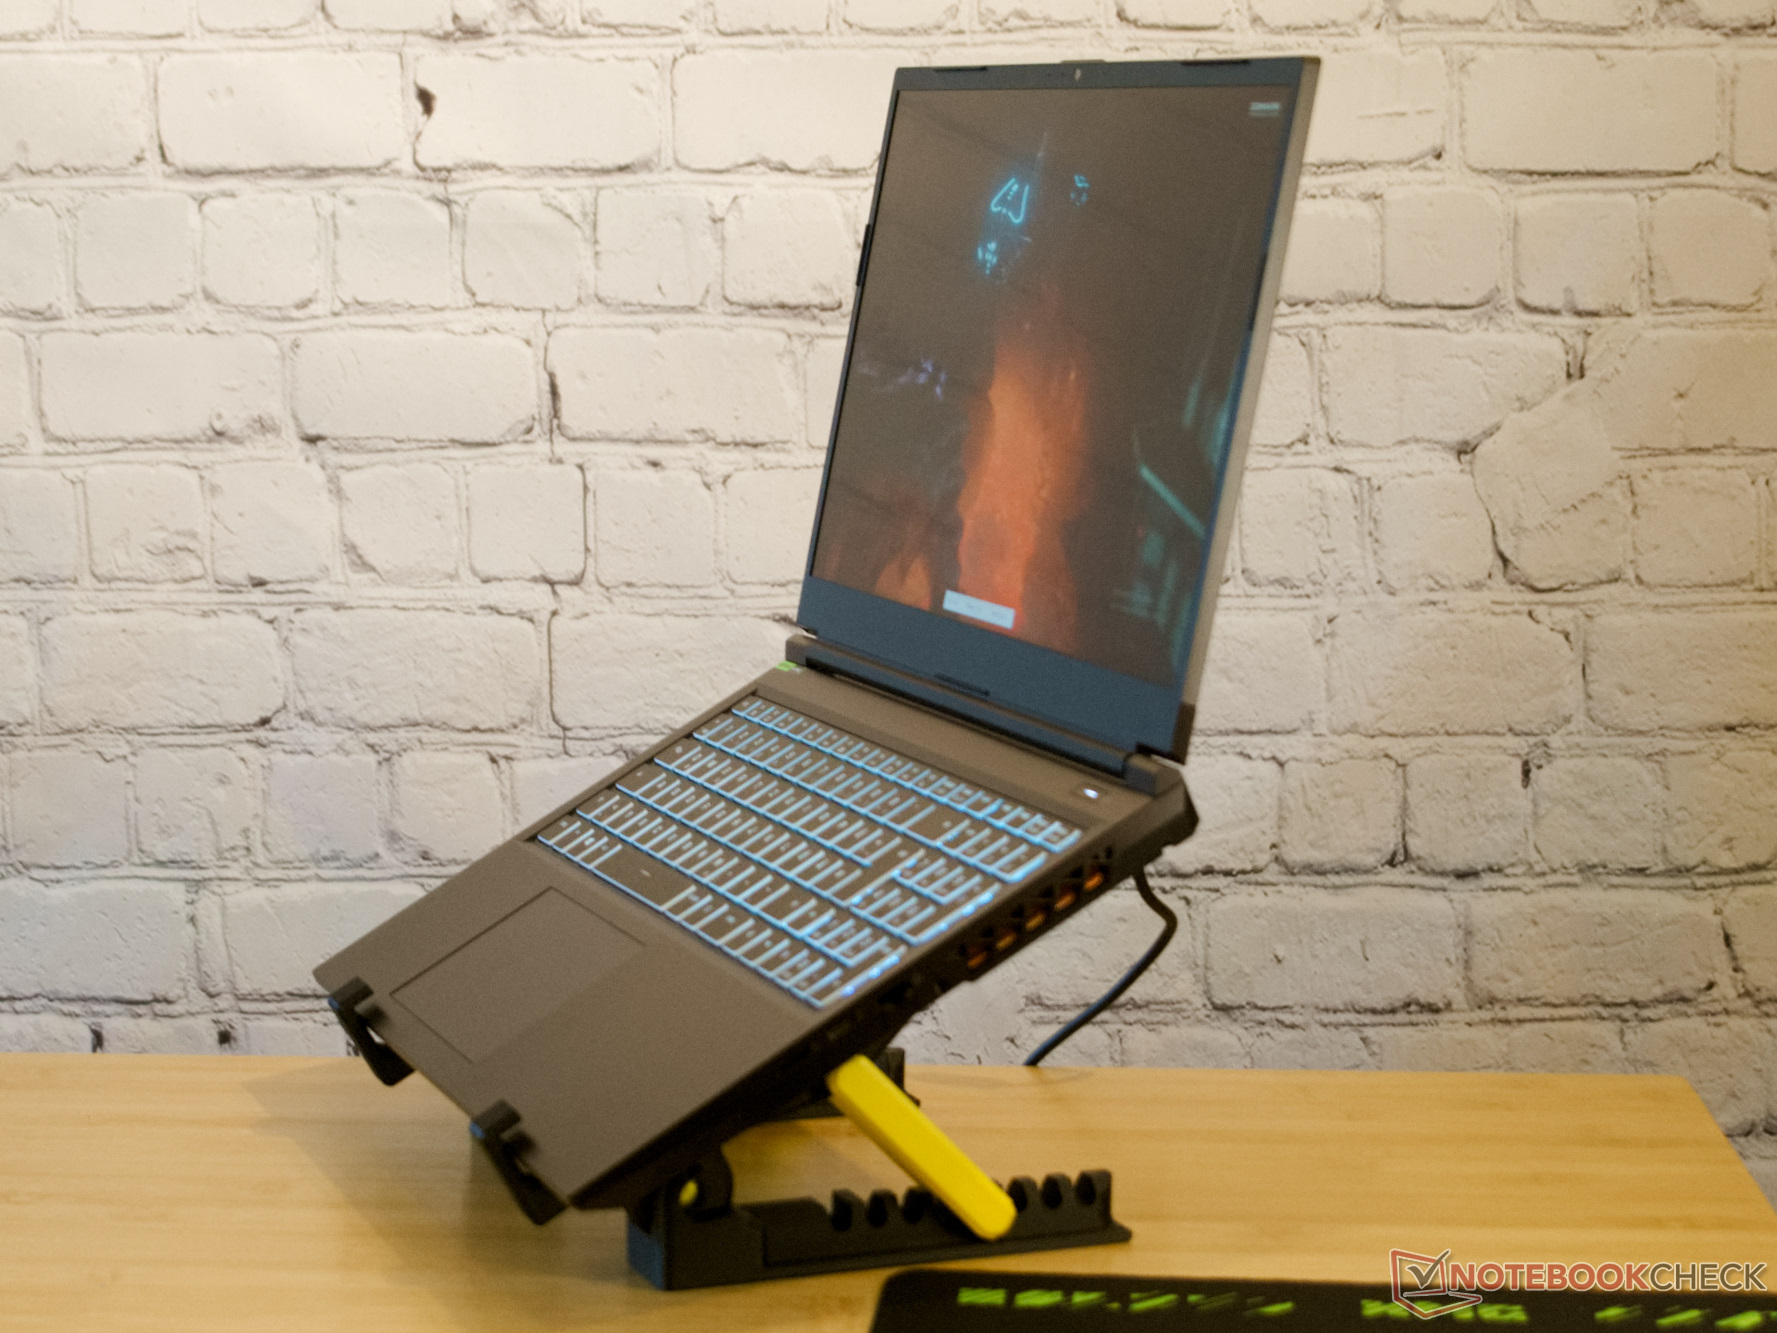
Aunque la carcasa está hecha principalmente de plástico, no encontramos ningún punto débil en términos de calidad. El portátil parece resistente en todos los aspectos, no cruje al girarlo y muestra huecos muy estrechos y uniformes. La tapa de la pantalla puede abrirse a unos 140° con una mano y mantiene su posición en todo momento.
Ni el peso ni el grosor son atípicos para un portátil de juegos de 15,6 pulgadas en formato 16:10. Sin embargo, una comparación con otros portátiles multimedia muestra que los que tienen un hardware similar también podrían ser algo más delgados.
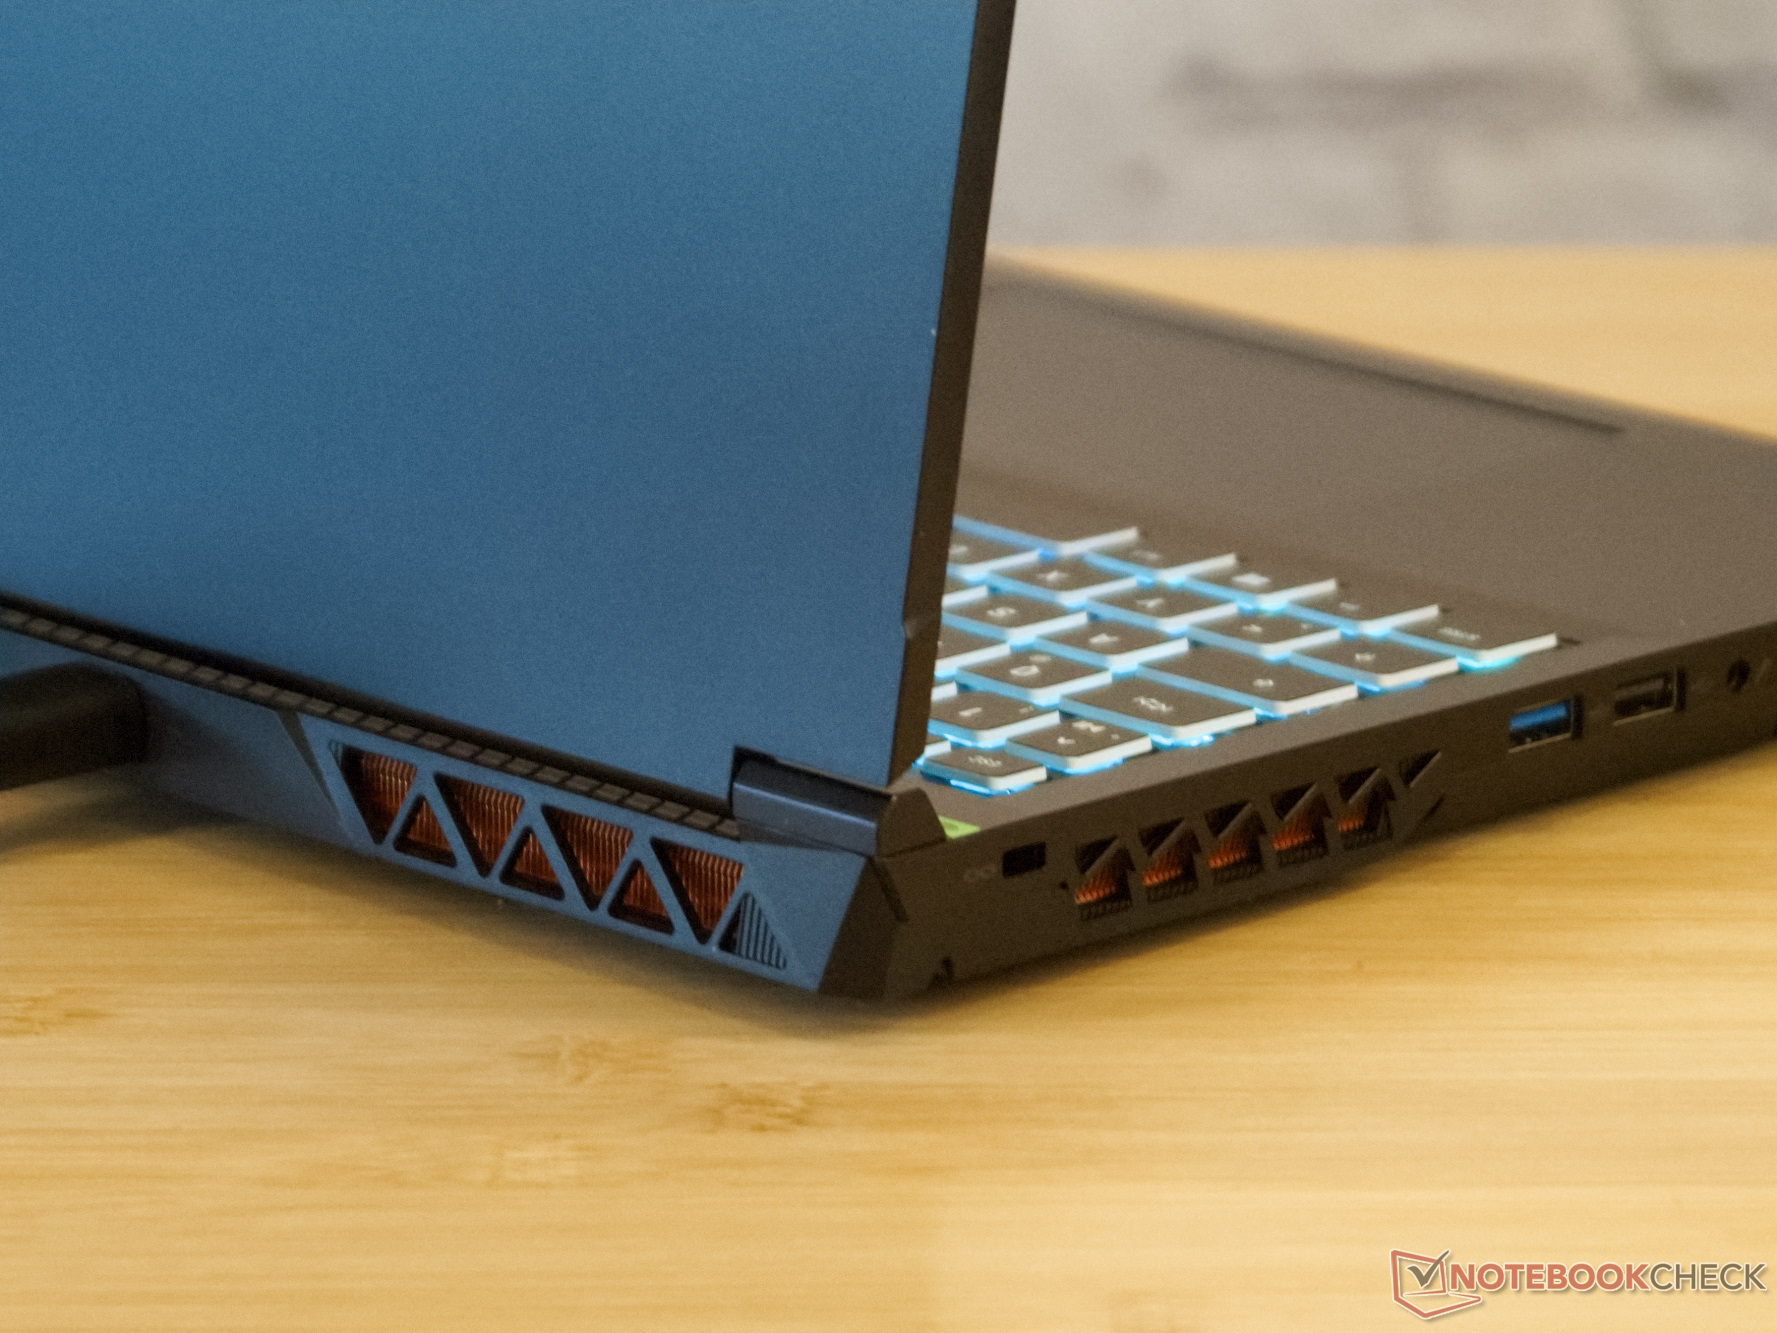
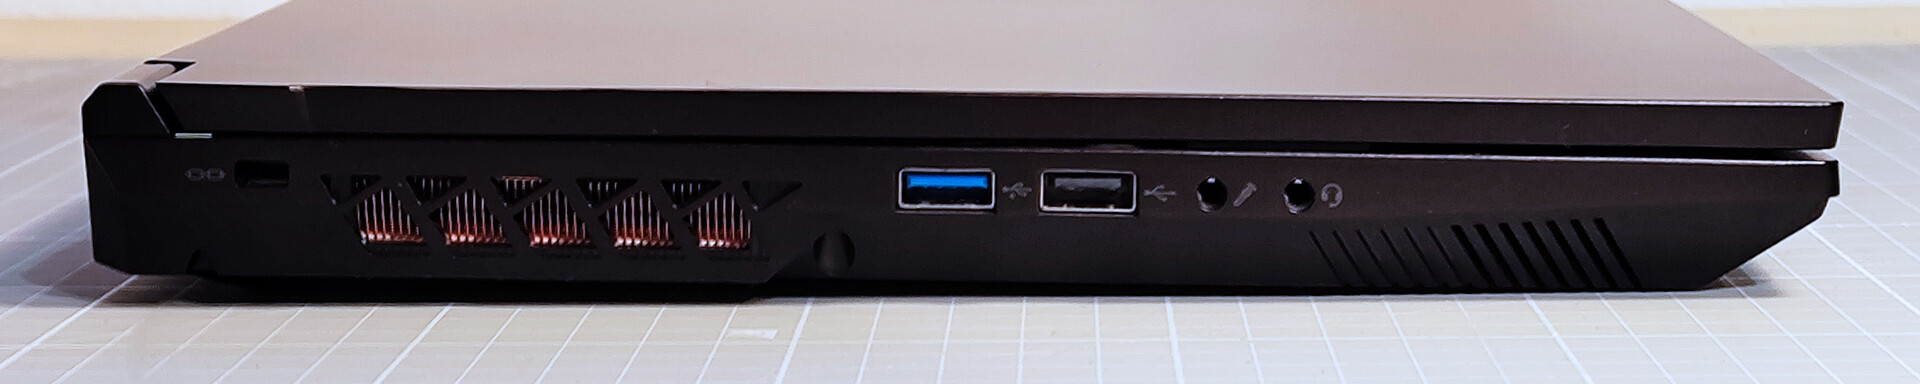
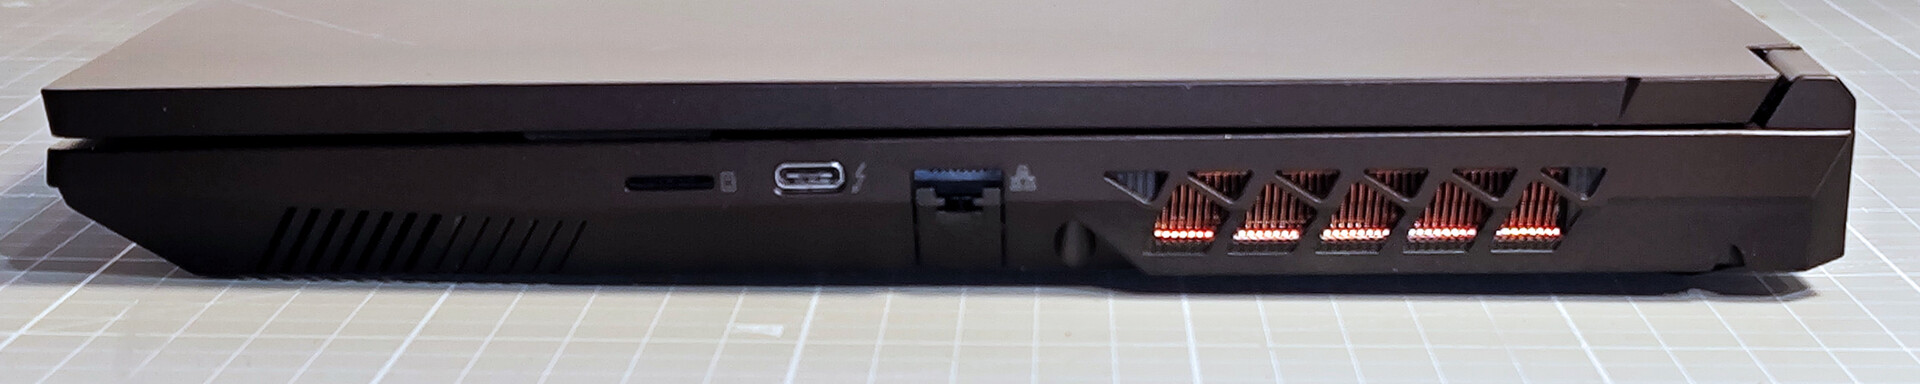
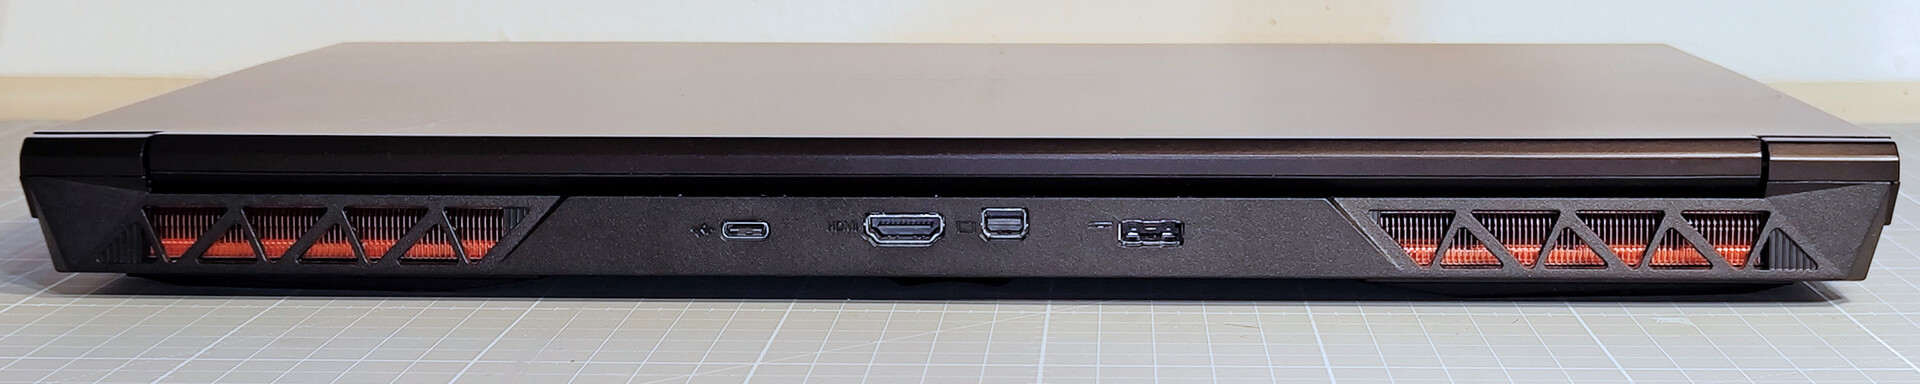
Equipamiento: Puertos USB en tres lados
Los aspectos de conectividad del XMG Focus 15 apenas han cambiado desde nuestro último análisis. La única novedad es otro puerto USB-C, pero el lector de tarjetas SD se ha reducido al formato microSD.
Ambos puertos USB Type-C no ofrecen alimentación. Así, probablemente siempre tendrás que llevarte el adaptador de corriente, que pesa casi un kg.
Lector de tarjetas SD
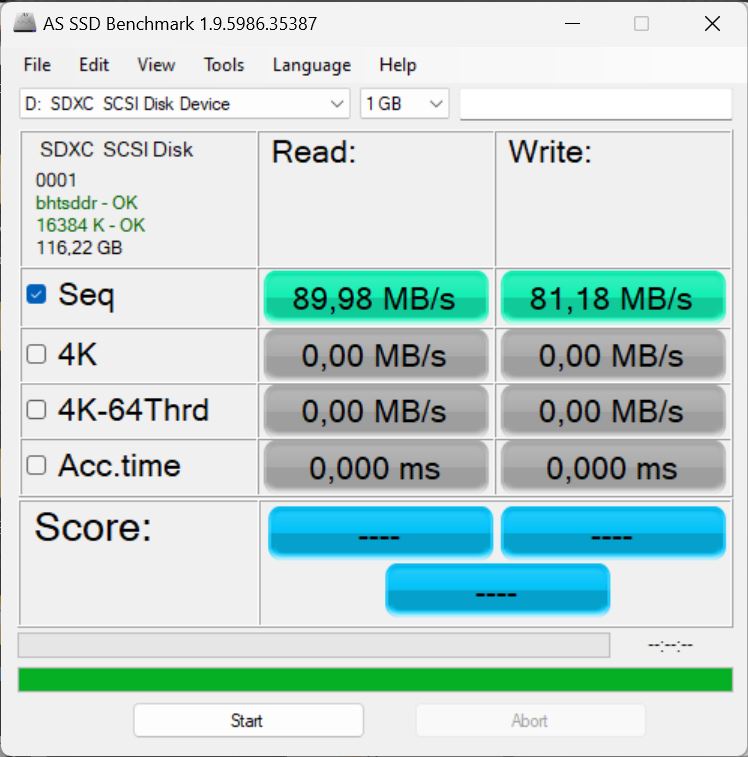
Las velocidades de transferencia de las tarjetas SD son buenas utilizando la microSD AV PRO de 128 GB V60 con nuestro dispositivo de prueba o el Pro 15aunque no sobresalientes.
Los otros dos portátiles para juegos de nuestra comparativa vienen sin lector de tarjetas.
| SD Card Reader - maximum AS SSD Seq Read Test (1GB) | |
| Gigabyte Aero 14 OLED BMF | |
| Media de la clase Gaming (25.5 - 261, n=52, últimos 2 años) | |
| Schenker XMG Focus 15 (E23) | |
| Acer Swift X SFX14-71G (Angelbird AV Pro V60) | |
| Samsung Galaxy Book3 Ultra 16 (AV PRO microSD 128 GB V60) | |
Comunicación
El módulo Wi-Fi Intel AX211 del Focus 15 ofrece altas velocidades de transmisión en la red Wi-Fi 6E con nuestro router de referencia Asus ROG Rapture AXE-GT11000.
Por otro lado, las velocidades de transmisión en la red Wi-Fi 6 de 5 GHz parecen por debajo de la media con la misma configuración de pruebas.
Cámara web
La webcam Full HD del nuevo Focus 15 sólo enfoca perfectamente el centro de la imagen. Por tanto, el centro es nítido y rico en contraste, mientras que los bordes se ven un poco desvaídos.
Las altas desviaciones de color de la cámara son molestas, y los tonos de piel en particular se reproducen mal.

 GeForce RTX 4050 Laptop GPU, i9-13900HX, Crucial P5 Plus 1TB CT1000P5PSSD8")
 GeForce RTX 4050 Laptop GPU, i9-13900HX, Crucial P5 Plus 1TB CT1000P5PSSD8")
Seguridad
No hay opciones de autenticación biométrica para el Focus 15. Una ranura de seguridad Kensington proporciona protección contra el robo físico.
TPM 2.0 y SecureBoot pueden proteger contra el acceso no autorizado a datos.
Accesorios
En la caja encontramos un amplio paquete de accesorios, además de la fuente de alimentación y la documentación. Incluye una alfombrilla de ratón grande con el logotipo de XMG y un abridor de botellas a juego, además de un CD de instalación y una memoria USB con Windows y los programas y controladores correspondientes.
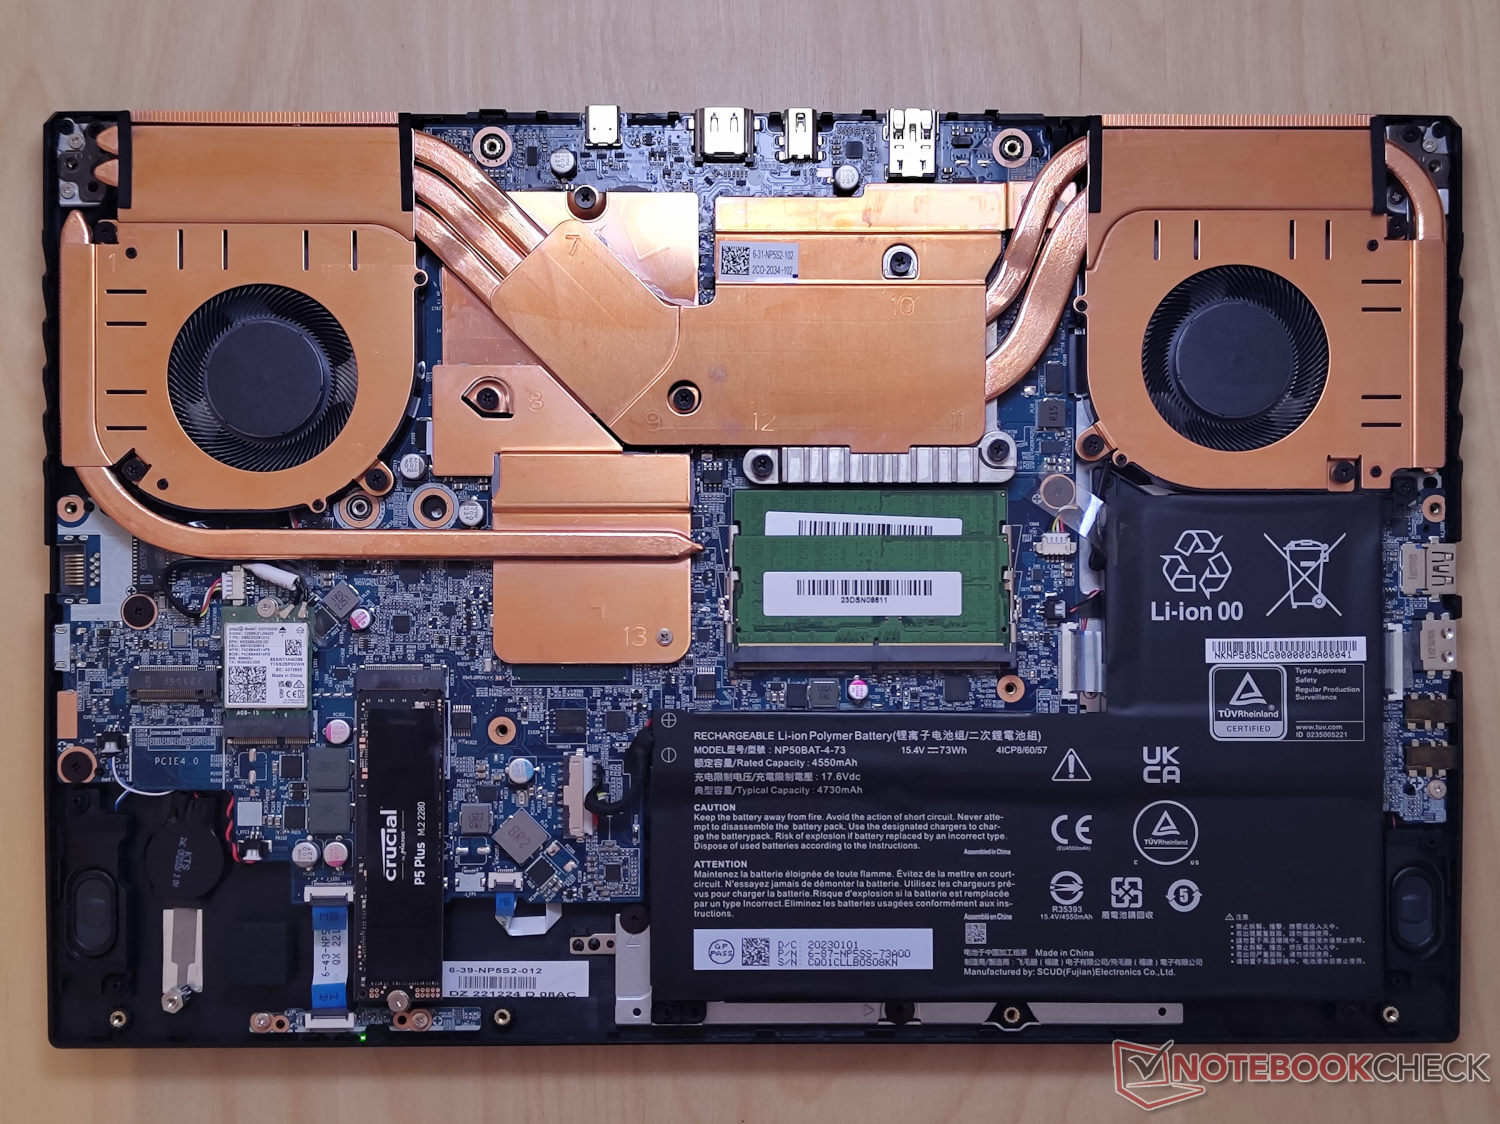
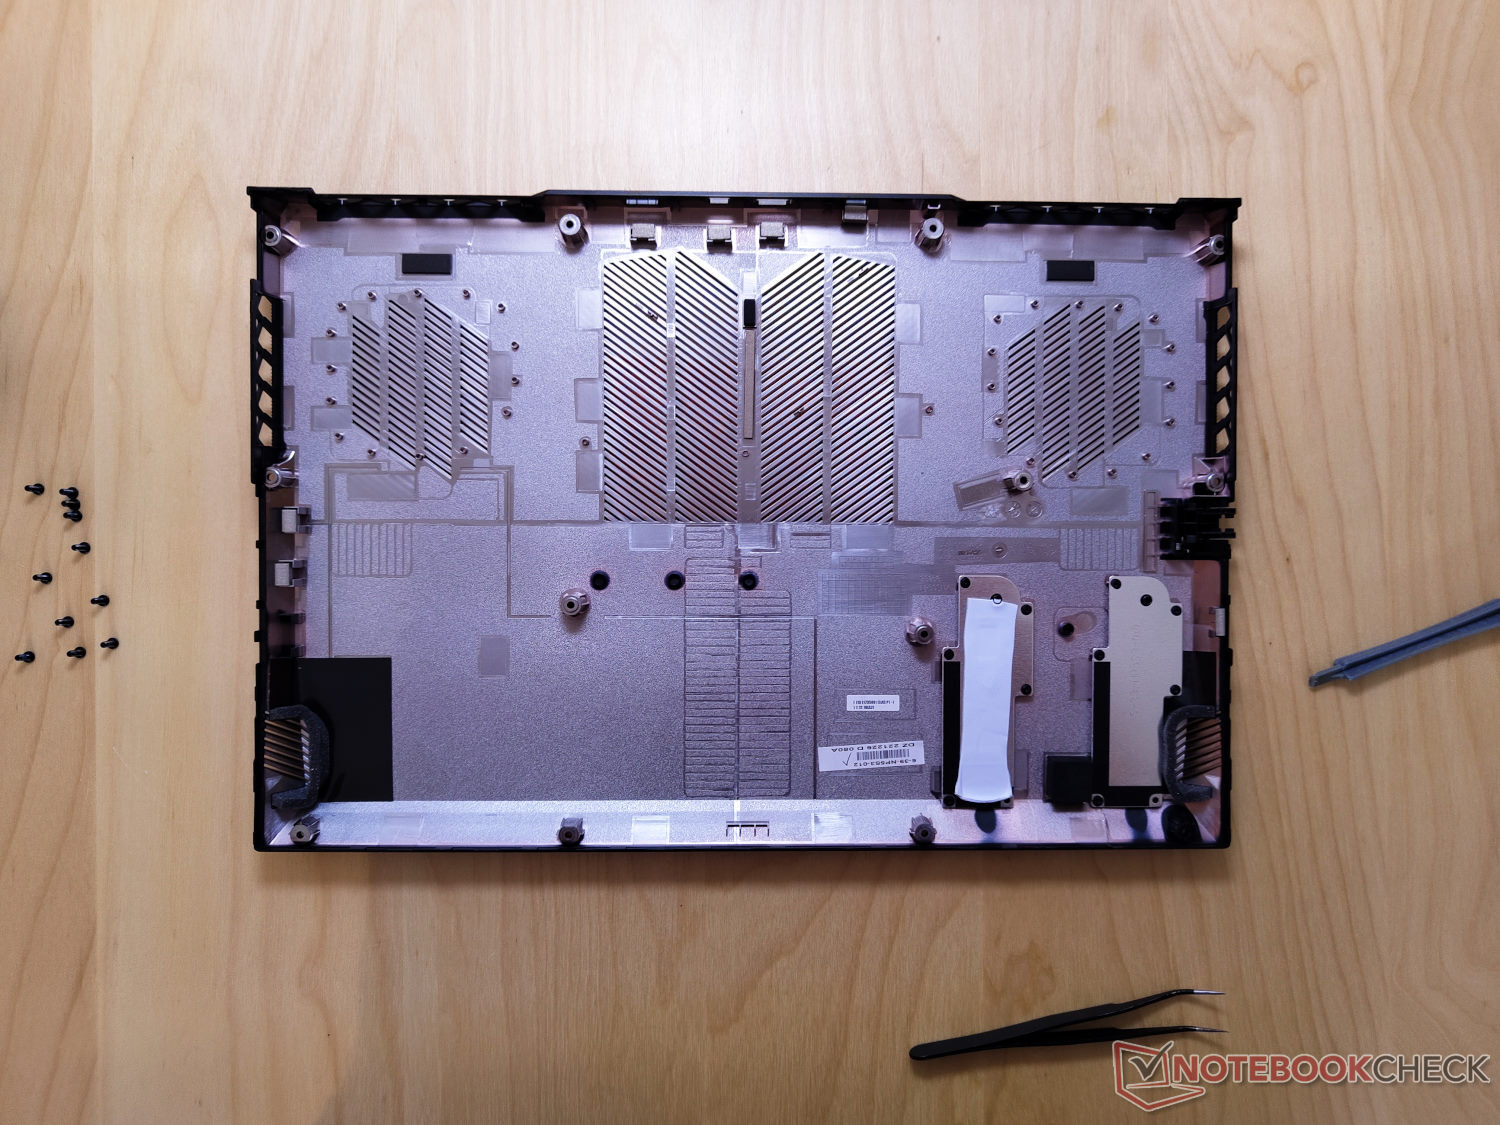
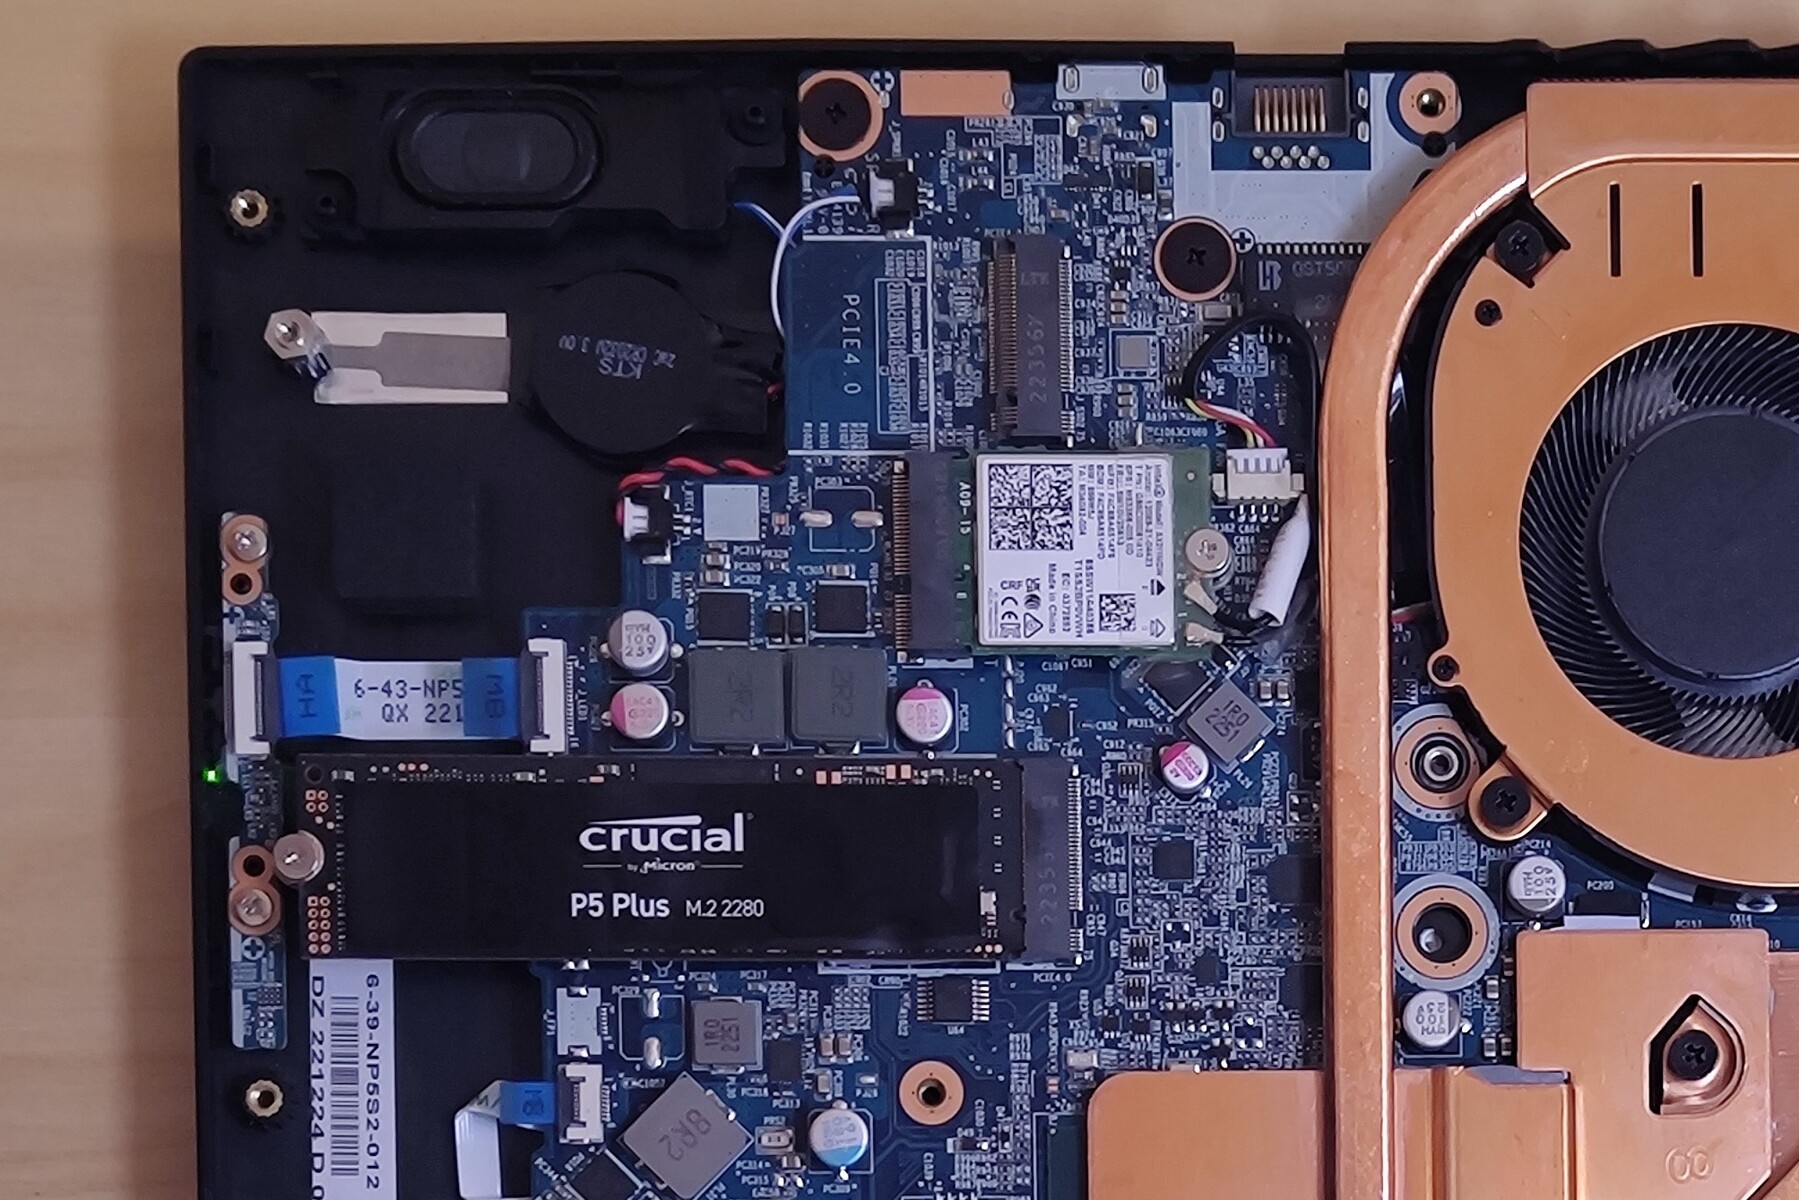
Mantenimiento
El SSD, la memoria de trabajo y el módulo WLAN del XMG Focus 15 son reemplazables. Hay una ranura M.2 PCIe 4.0 libre en nuestro dispositivo de pruebas.
Toda la placa base del portátil está asegurada con 11 tornillos PH0 y se puede sacar con bastante facilidad para acceder a los componentes correspondientes. Tras aflojar los tornillos, la tapa puede sacarse sin problemas.
Garantía
Schenker concede una garantía básica gratuita de 24 meses para el portátil. Se pueden añadir más opciones de garantía a través de Bestware durante el proceso de compra.
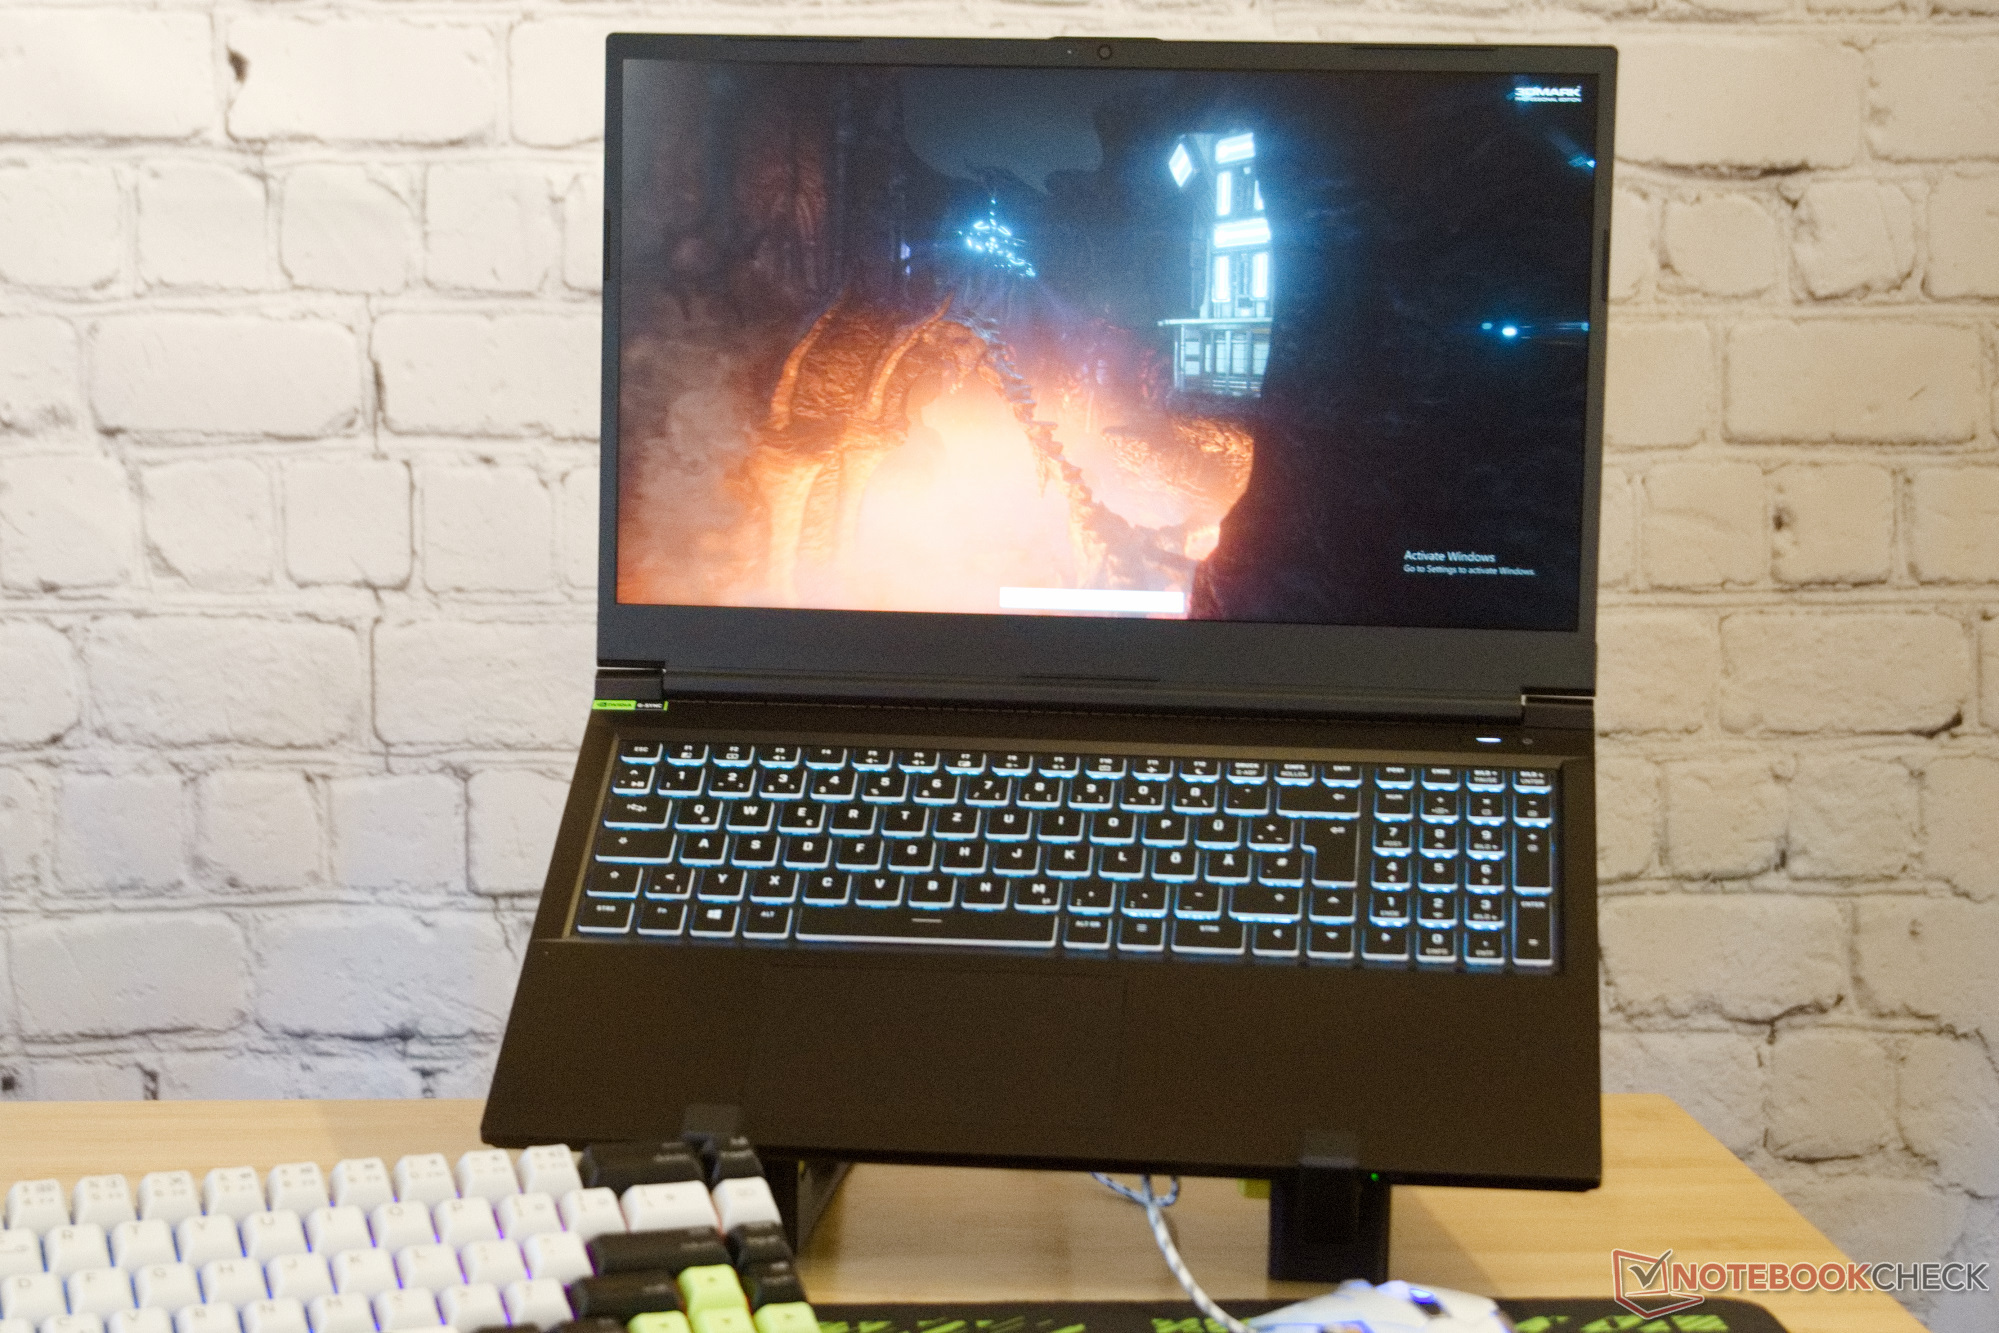
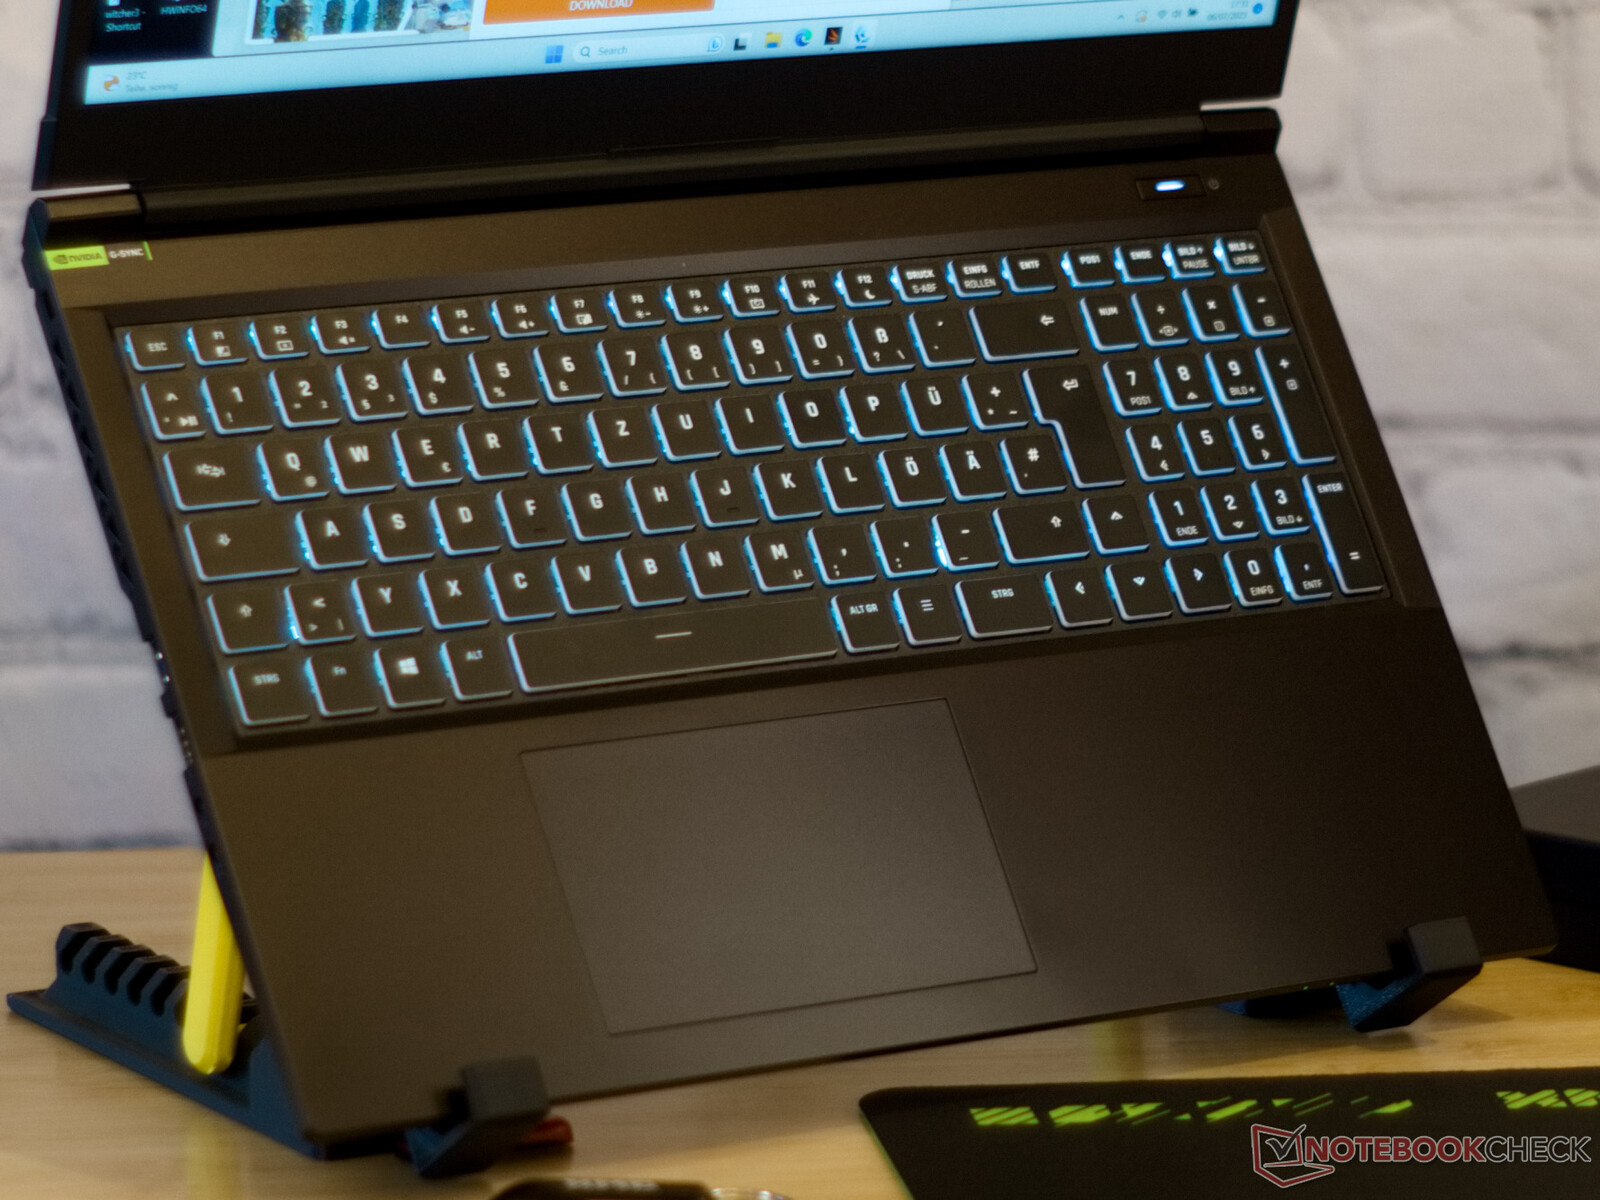
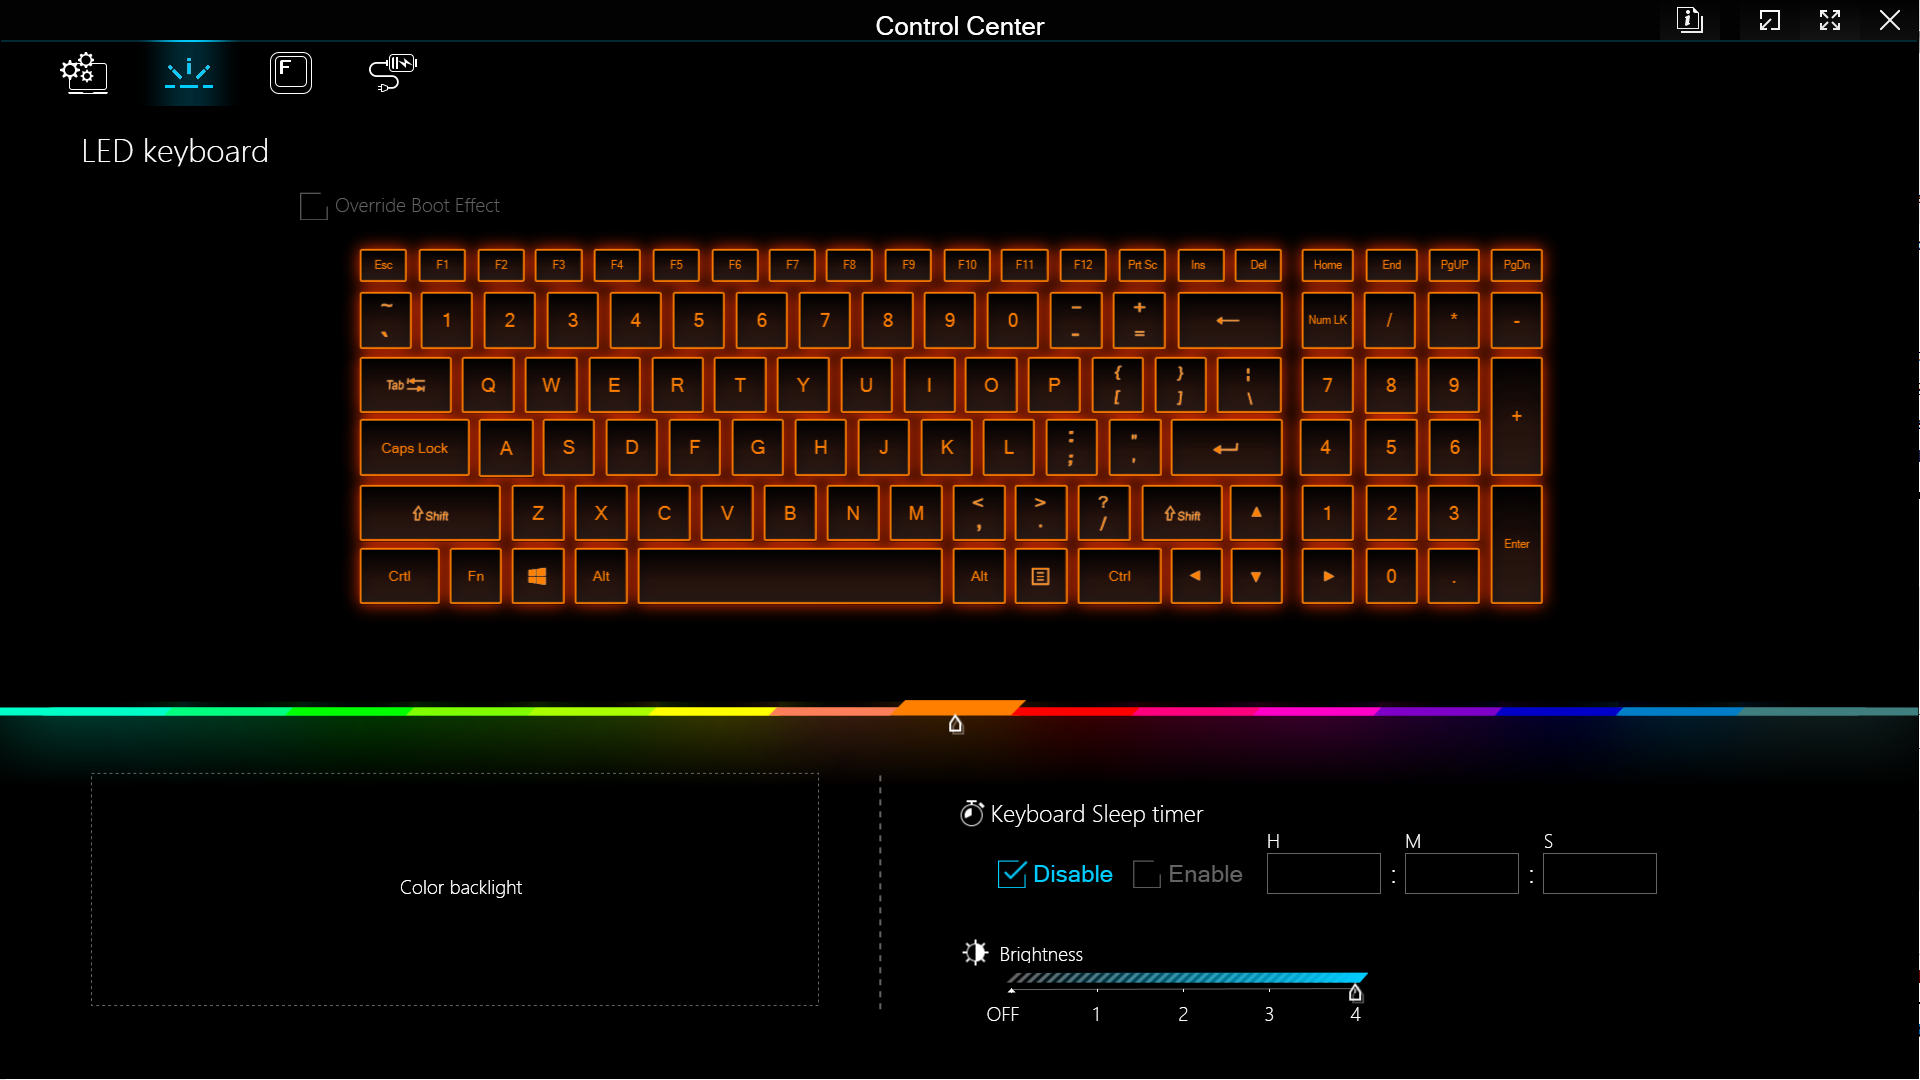
Input devices: RGB keyboard
Teclado
El teclado negro del portátil, con teclas de letras blancas, permite escribir con facilidad gracias a una respuesta táctil potente y un recorrido de tecla de 1,5 mm. Bajo pedido, Schenker graba con láser en la superficie negra todos los idiomas imaginables. La iluminación RGB permite que el teclado brille en el color deseado.
Panel táctil
Con unos 7 cm × 12 cm, el touchpad del Focus 15 es más pequeño que el de la mayoría de portátiles para juegos. Sin embargo, es lo bastante grande como para navegar cómodamente por toda la pantalla con varios dedos sobre él y realizar todos los gestos multitáctiles posibles.
La posición y el tamaño del touchpad también ofrecen espacio suficiente para evitar entradas erróneas con el talón de la mano. La superficie lisa y los cómodos clics hacen que la entrada del ratón sea fluida.
Pantalla: QHD a 240 Hz
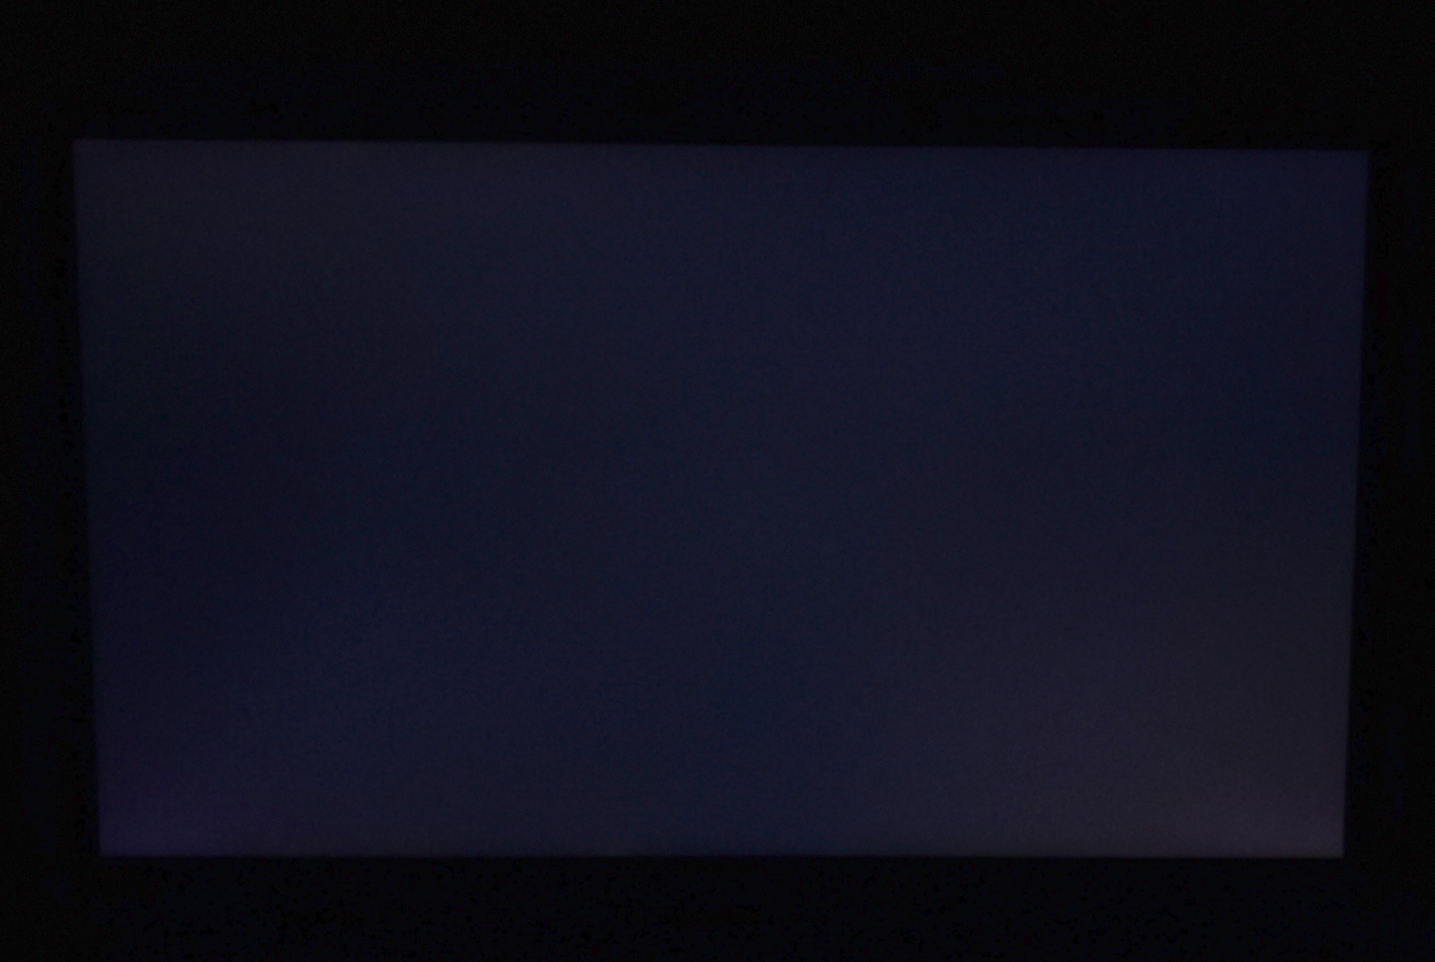
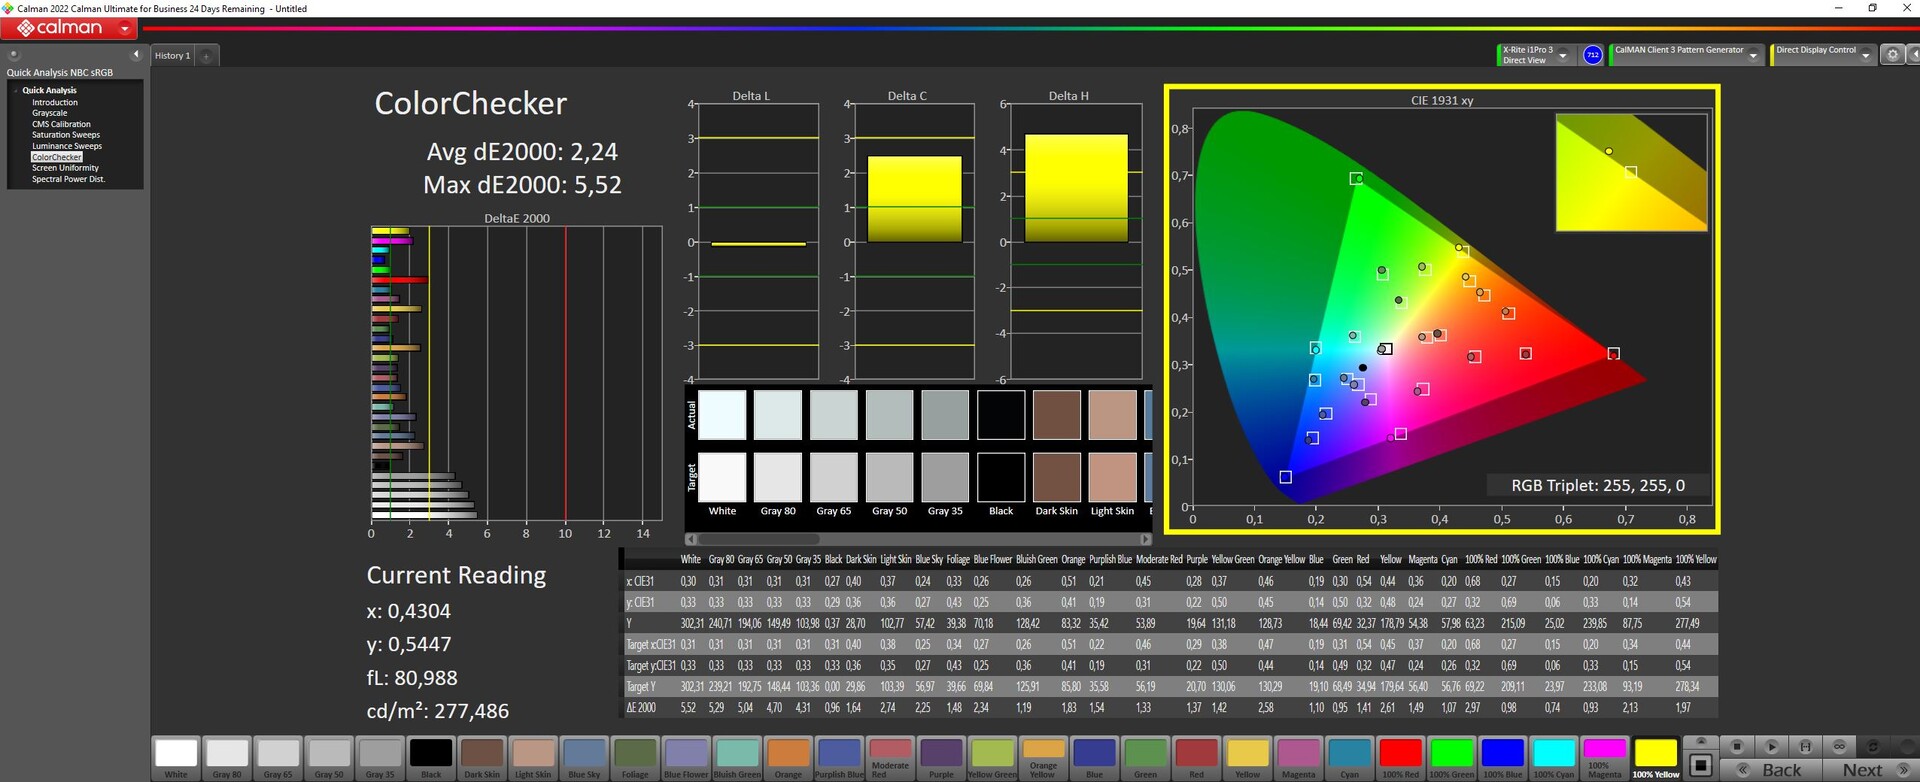
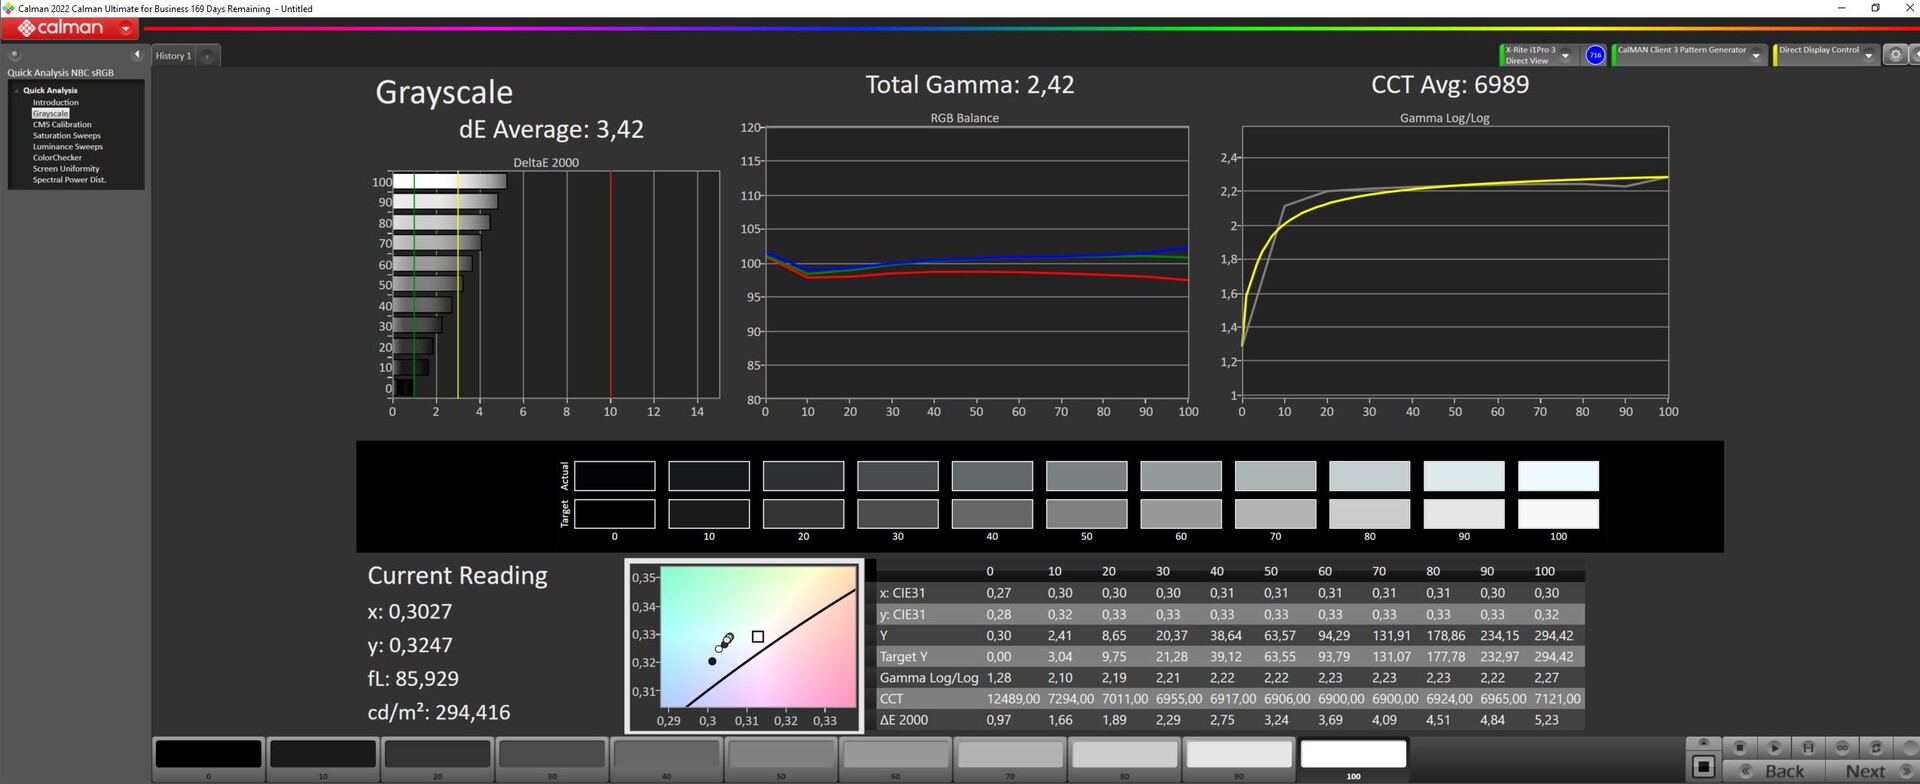
El Focus 15 usa el mismo panel IPS de alta calidad que el XMG Pro 15. Sin embargo, es ligeramente más oscuro que el del Pro 15, con un brillo medio de 302 cd/m² en nuestro modelo de pruebas. La pantalla tiene una tasa de refresco de 240 Hz y una resolución de 2.560 × 1.440 píxeles.
El valor de negro y el contraste de la pantalla mate son aceptables, y la iluminación también es buena. Apenas se aprecia sangrado de retroiluminación en la pantalla.
Además de la pantalla QHD, Schenker también ofrece una opción de pantalla Full HD para el XMG Focus 15. Tiene una frecuencia de actualización de 165 Hz. Esta tiene una tasa de refresco de 165 Hz y sólo representa el 95% del espacio de color sRGB según Schenker. Sin embargo, ambas opciones de display soportan G-Sync.
Los que compren el portátil como dispositivo de juego puro y quieran usarlo con la tarjeta RTX 4050 deberían plantearse elegir la pantalla Full HD, unos 80 € más barata. La mayoría de juegos sólo soportan el espacio de color sRGB de todos modos y pueden usar completamente las capacidades del display en combinación con la RTX 4050.
Los juegos QHD o 4K solo son posibles hasta cierto punto con la gráfica básica de Nvidia.
| |||||||||||||||||||||||||
iluminación: 85 %
Brillo con batería: 302 cd/m²
Contraste: 839:1 (Negro: 0.36 cd/m²)
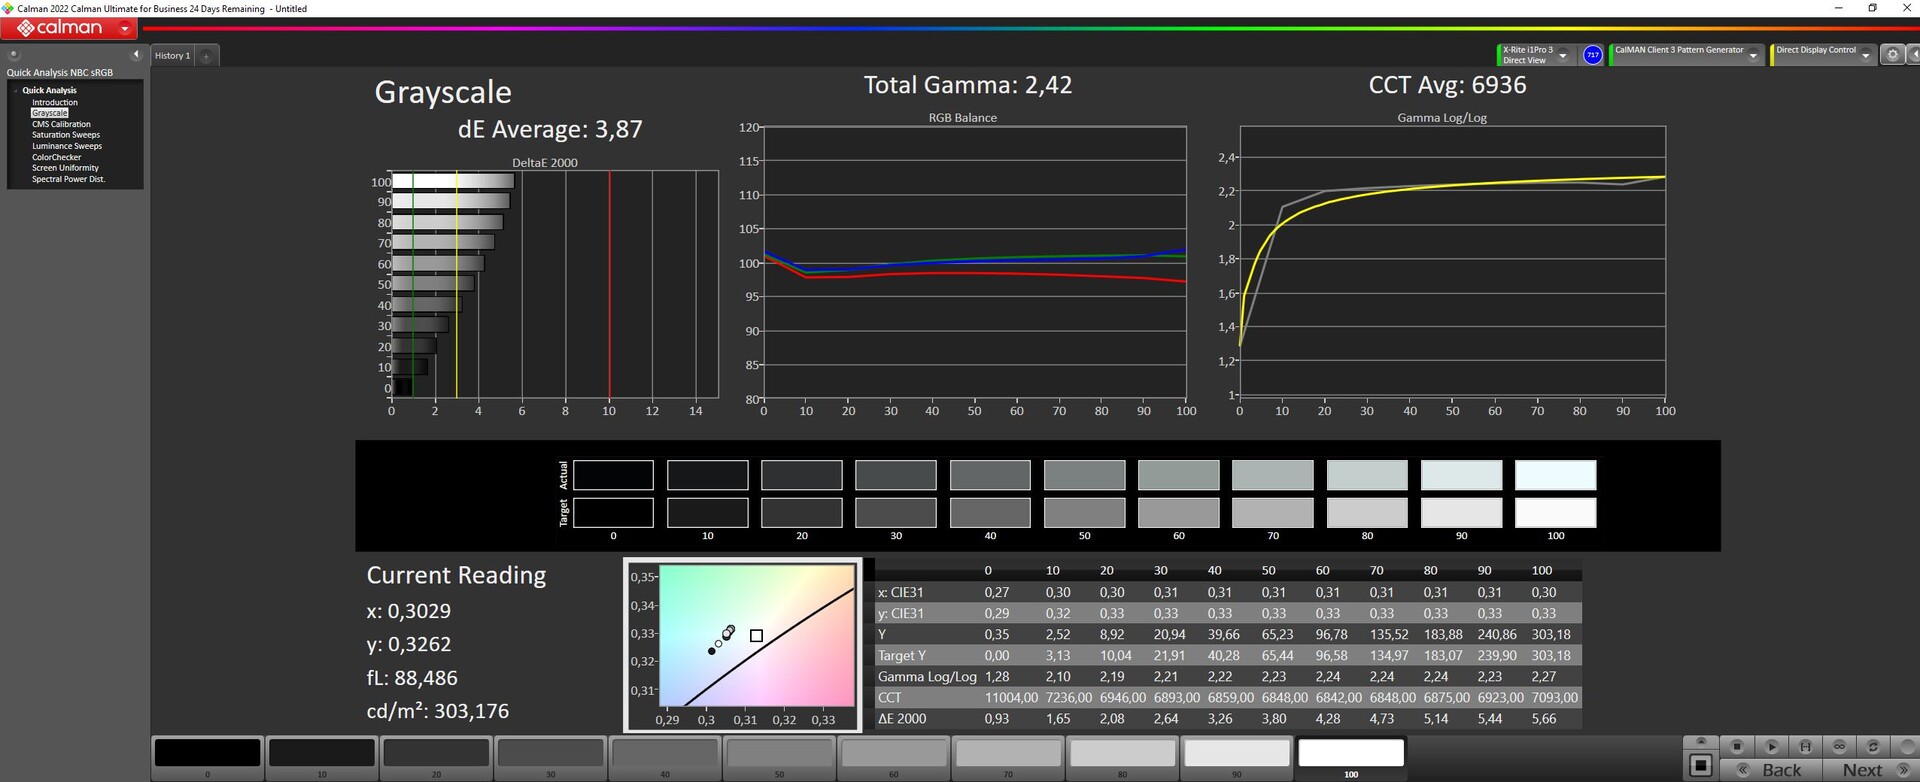
ΔE ColorChecker Calman: 2.24 | ∀{0.5-29.43 Ø4.71}
ΔE Greyscale Calman: 3.87 | ∀{0.09-98 Ø4.96}
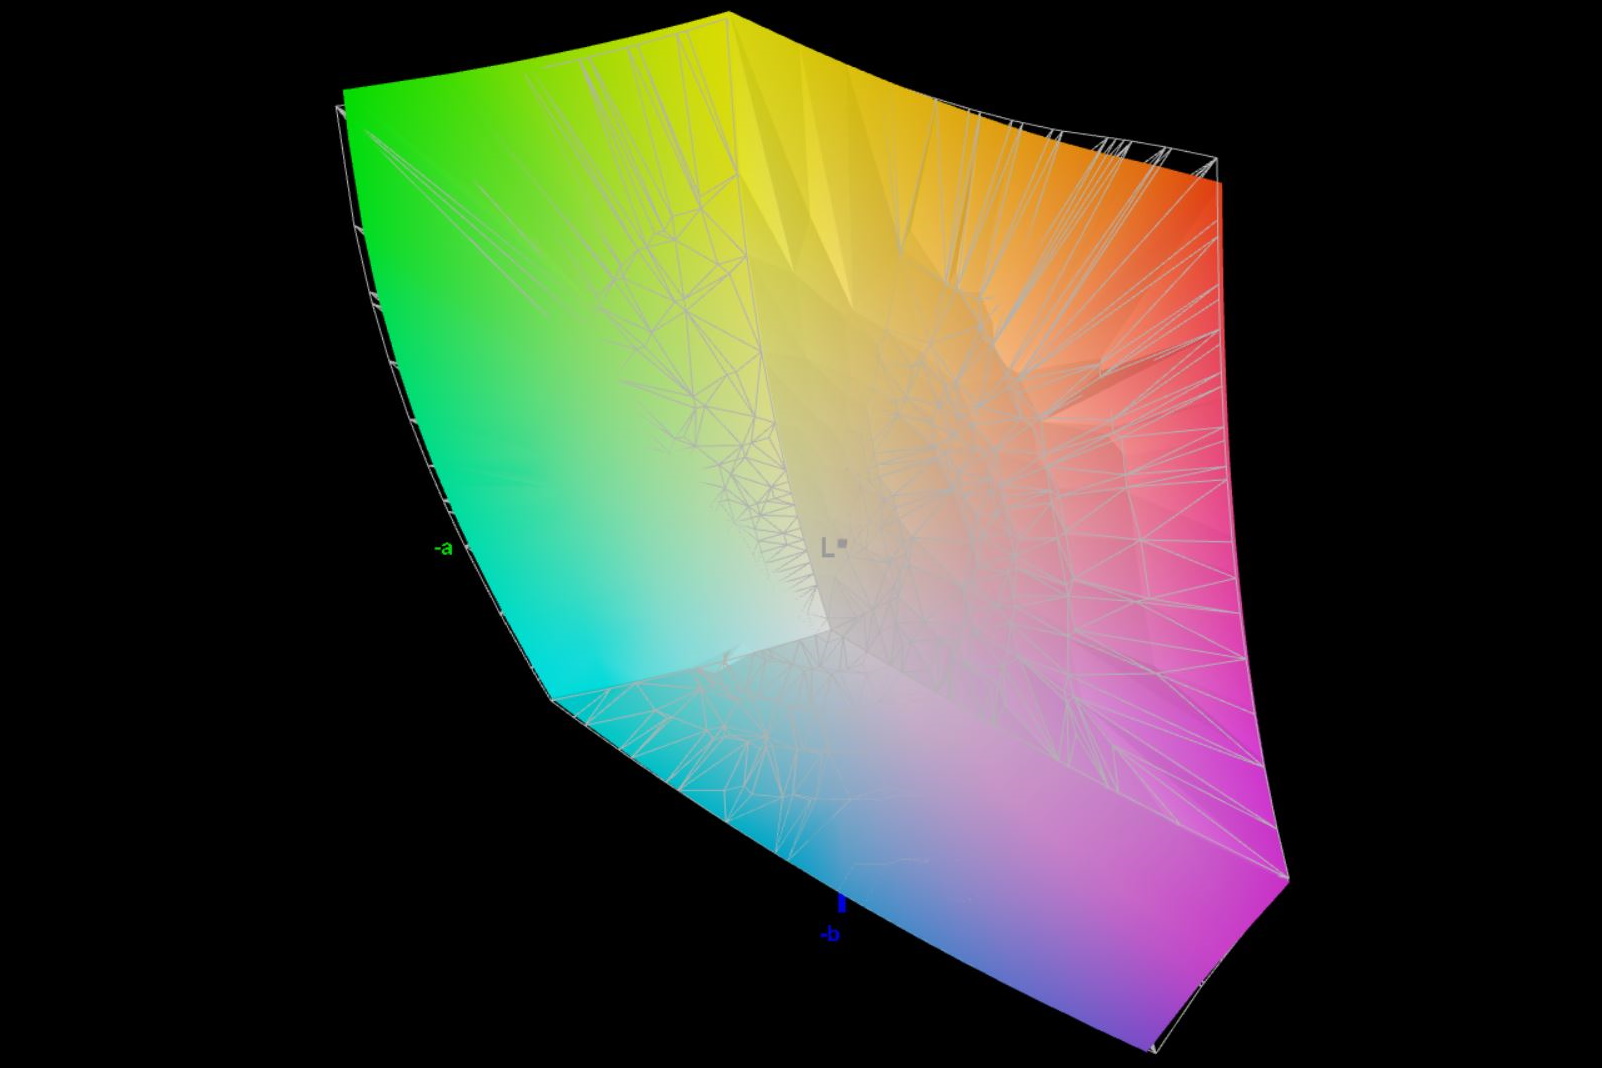
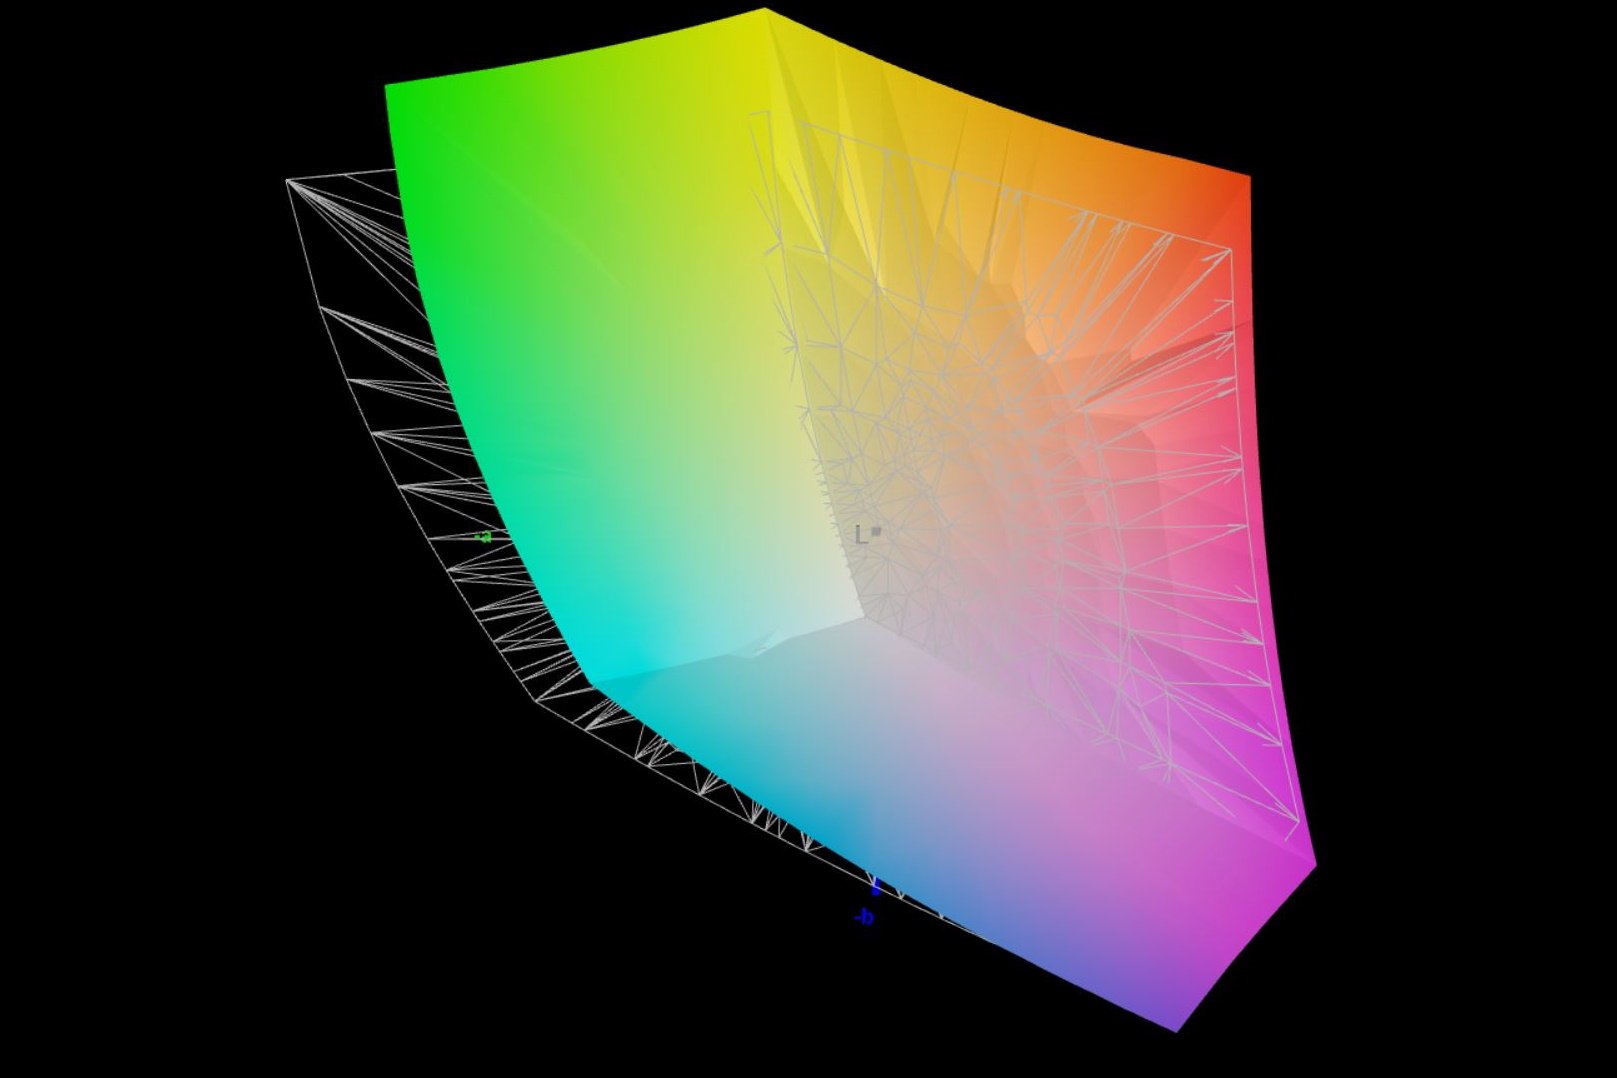
86.3% AdobeRGB 1998 (Argyll 3D)
99.9% sRGB (Argyll 3D)
98.6% Display P3 (Argyll 3D)
Gamma: 2.42
CCT: 6936 K
| Schenker XMG Focus 15 (E23) BOE0AD1, IPS, 2569x1440, 15.6" | Schenker XMG Pro 15 (E23) BOE0AD1, IPS, 2560x1440, 15.6" | Asus TUF A15 FA507 N156HMA-GA1, IPS, 1920x1080, 15.6" | MSI Katana 15 B12VEK AUOAF90 (B156HAN08.4), IPS, 1920x1080, 15.6" | Acer Swift X SFX14-71G ATNA45AF03-0, OLED, 2880x1800, 14.5" | Samsung Galaxy Book3 Ultra 16 Samsung ATNA60CL03-0, AMOLED, 2880x1800, 16" | Gigabyte Aero 14 OLED BMF Samsung SDC4192 (ATNA40YK14-0), OLED, 2880x1800, 14" | |
|---|---|---|---|---|---|---|---|
| Display | -1% | -20% | -53% | 4% | 4% | 1% | |
| Display P3 Coverage (%) | 98.6 | 97.8 -1% | 64.9 -34% | 38.1 -61% | 99.9 1% | 99.9 1% | 99.8 1% |
| sRGB Coverage (%) | 99.9 | 99.9 0% | 96.5 -3% | 56.8 -43% | 99.9 0% | 100 0% | 100 0% |
| AdobeRGB 1998 Coverage (%) | 86.3 | 85.4 -1% | 66.6 -23% | 39.3 -54% | 96.2 11% | 96.3 12% | 88.7 3% |
| Response Times | 14% | -87% | -140% | 96% | 96% | 82% | |
| Response Time Grey 50% / Grey 80% * (ms) | 15.6 ? | 14 ? 10% | 30.4 ? -95% | 38.8 ? -149% | 0.4 ? 97% | 0.49 ? 97% | 2.4 ? 85% |
| Response Time Black / White * (ms) | 11.6 ? | 9.6 ? 17% | 20.8 ? -79% | 26.8 ? -131% | 0.6 ? 95% | 0.65 ? 94% | 2.4 ? 79% |
| PWM Frequency (Hz) | 240 ? | 240 ? | 300 | ||||
| Screen | 10% | 30% | -38% | 30% | 215% | 103% | |
| Brightness middle (cd/m²) | 302 | 322 7% | 288 -5% | 261 -14% | 388 28% | 400 32% | 423 40% |
| Brightness (cd/m²) | 278 | 301 8% | 271 -3% | 258 -7% | 390 40% | 399 44% | 427 54% |
| Brightness Distribution (%) | 85 | 85 0% | 91 7% | 92 8% | 98 15% | 93 9% | 98 15% |
| Black Level * (cd/m²) | 0.36 | 0.36 -0% | 0.17 53% | 0.19 47% | 0.03 92% | 0.1 72% | |
| Contrast (:1) | 839 | 894 7% | 1694 102% | 1374 64% | 13333 1489% | 4230 404% | |
| Colorchecker dE 2000 * | 2.24 | 1.98 12% | 1.9 15% | 5.57 -149% | 2.2 2% | 2.3 -3% | 0.55 75% |
| Colorchecker dE 2000 max. * | 5.52 | 5.24 5% | 3.3 40% | 20.6 -273% | 3.9 29% | 4.15 25% | 1.15 79% |
| Greyscale dE 2000 * | 3.87 | 2.44 37% | 2.7 30% | 3.19 18% | 1.4 64% | 2.7 30% | 0.69 82% |
| Gamma | 2.42 91% | 2.42 91% | 2.32 95% | 2.45 90% | 2.22 99% | 2.266 97% | 2.42 91% |
| CCT | 6936 94% | 6984 93% | 6535 99% | 6146 106% | 6380 102% | 7047 92% | 6479 100% |
| Colorchecker dE 2000 calibrated * | 1.98 | 0.9 | 4.63 | 1.9 | 1.66 | 1.15 | |
| Media total (Programa/Opciones) | 8% /
8% | -26% /
0% | -77% /
-57% | 43% /
35% | 105% /
148% | 62% /
76% |
* ... más pequeño es mejor
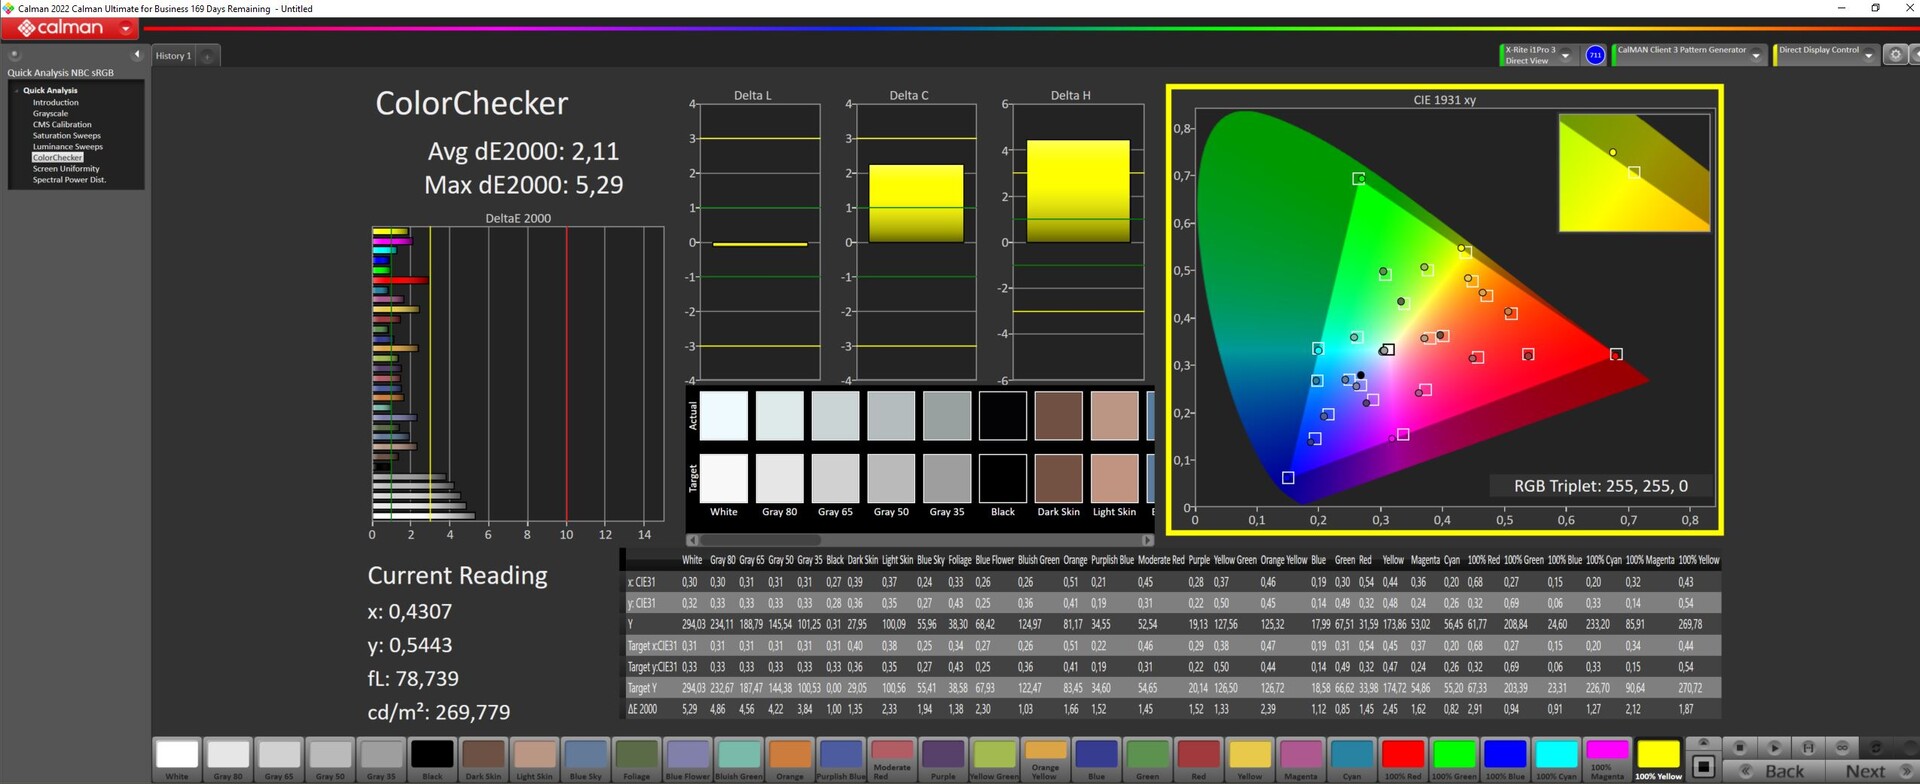
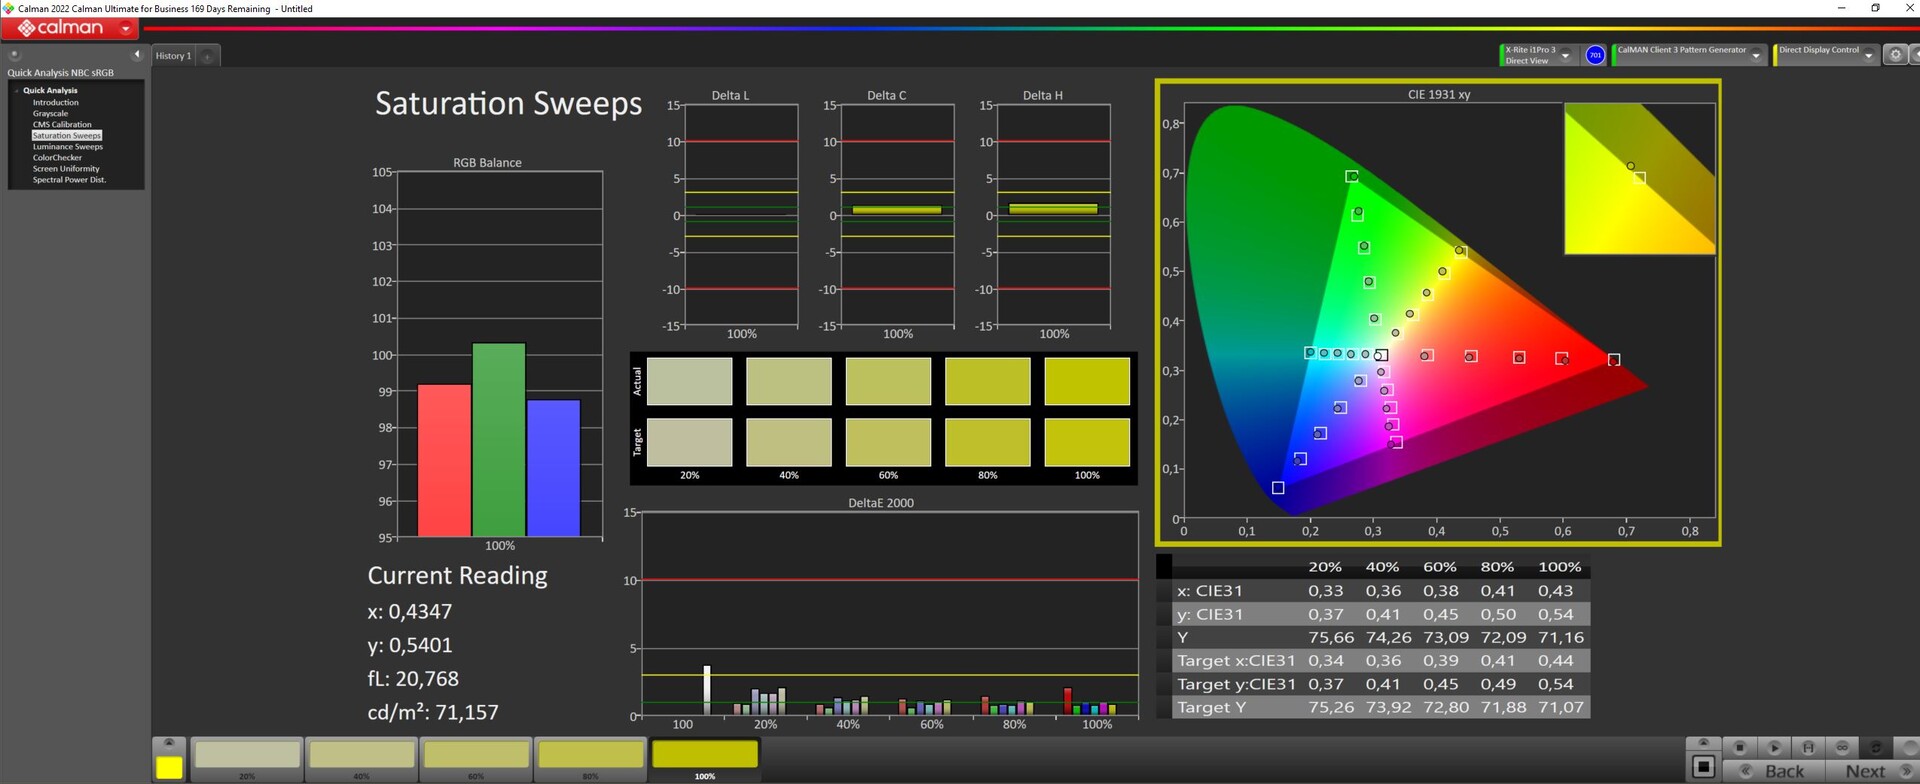
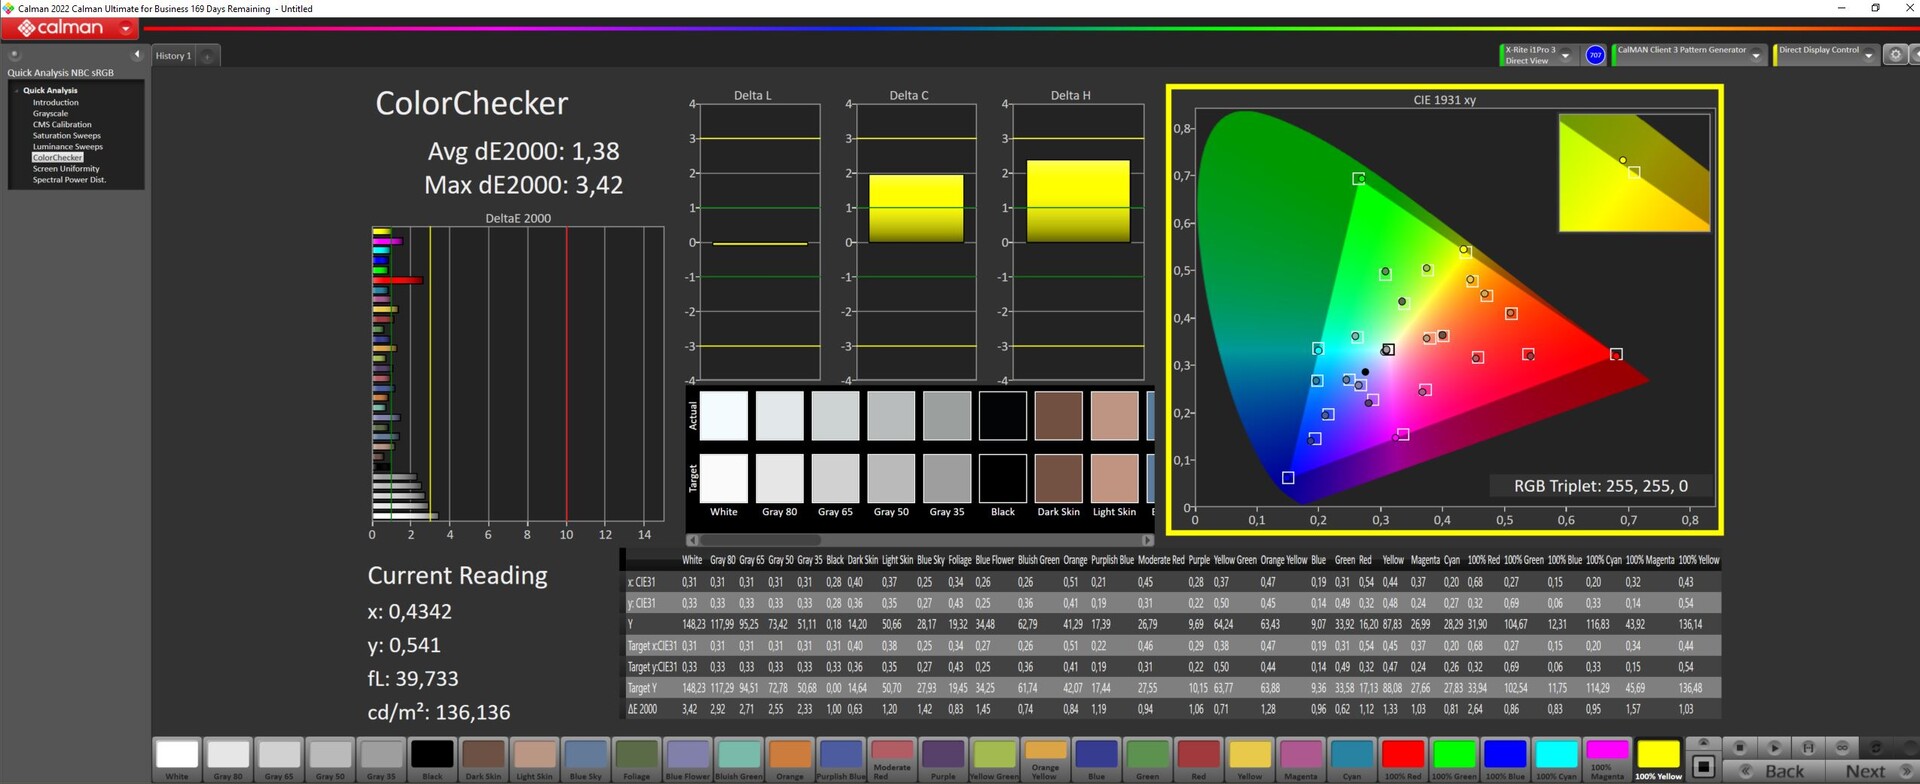
Para los videógrafos y creadores de contenidos, la cobertura casi completa del espacio de color Display P3 en el XMG Focus 15 debería ser una ventaja. El espacio de color AdobeRGB es más importante para la edición e impresión de fotos, y el Focus 15 sólo logra reproducir el 88% de éste.
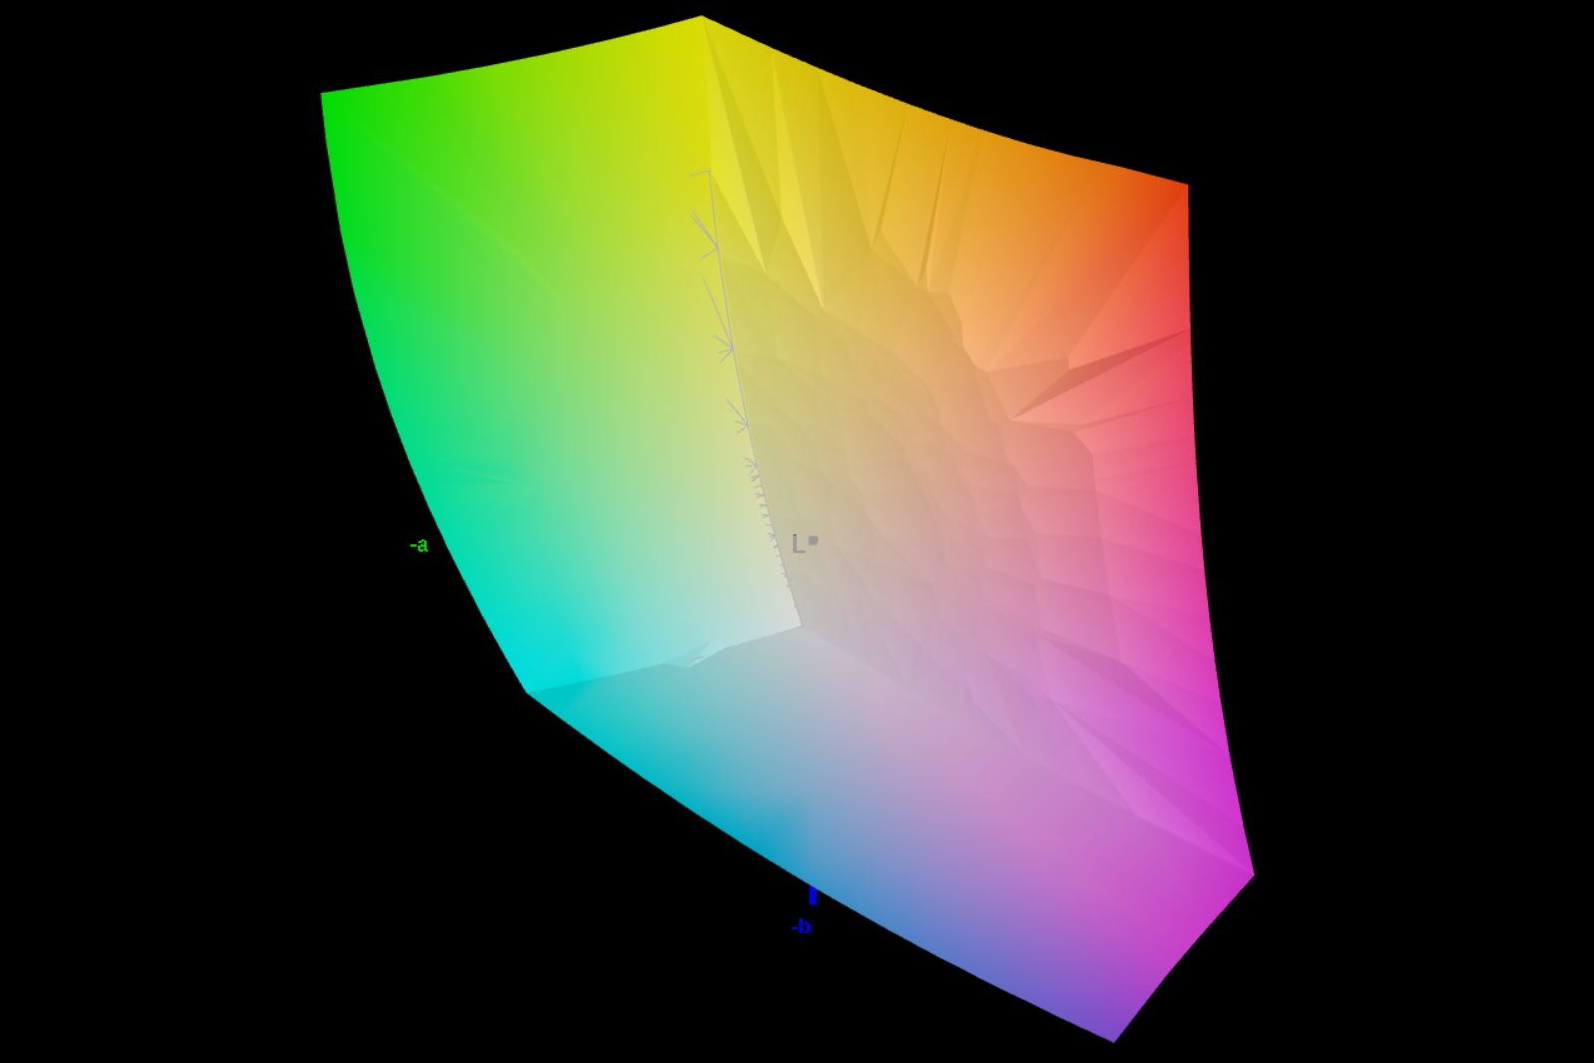
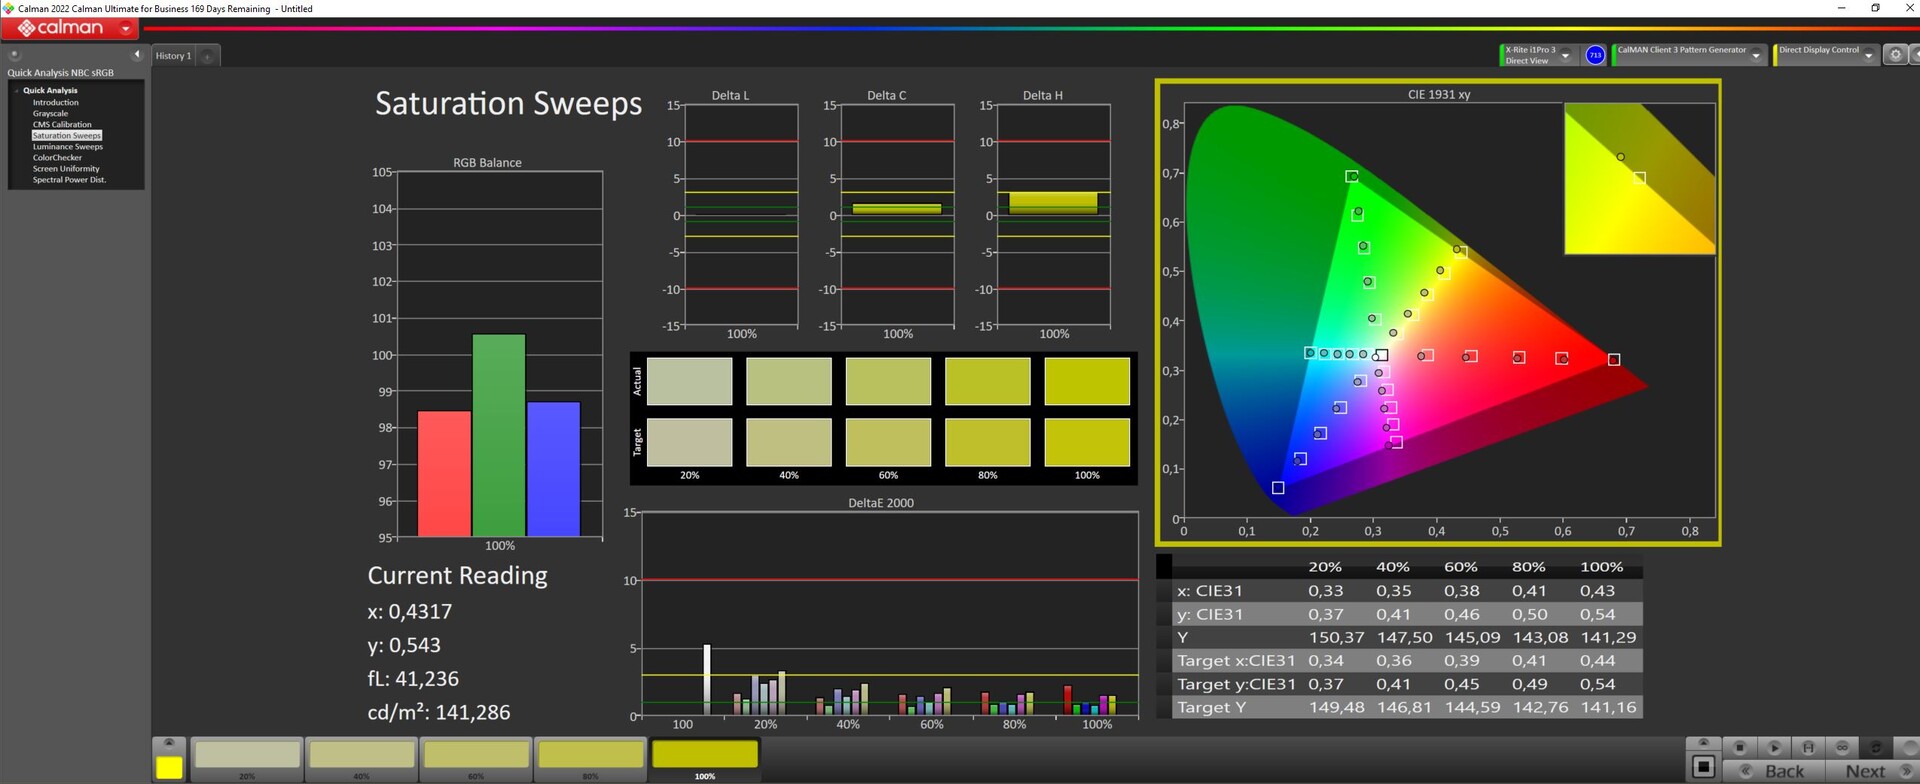
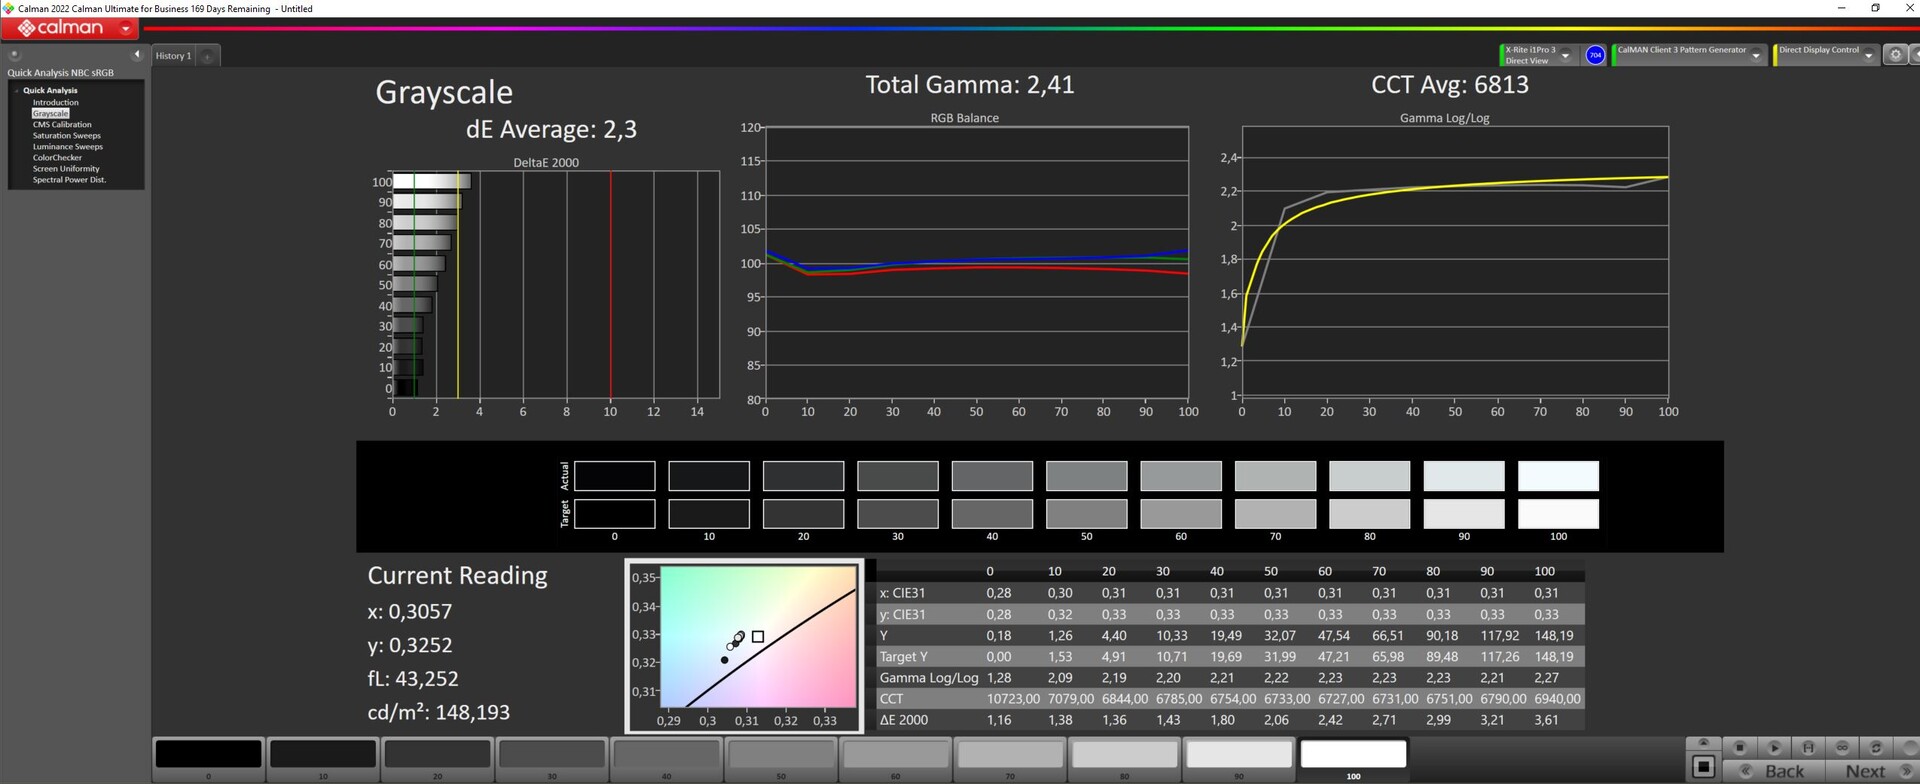
La pantalla de nuestro dispositivo de pruebas tiene una buena reproducción del color con una desviación media del color de ΔΕ 2,24 de fábrica. Los valores mejoran aún más tras el calibrado.
Descubrimos que la reproducción del color también podía mejorar cuando la iluminación se ajustaba a 150 nits.

Tiempos de respuesta del display
| ↔ Tiempo de respuesta de Negro a Blanco | ||
|---|---|---|
| 11.6 ms ... subida ↗ y bajada ↘ combinada | ↗ 5.8 ms subida | 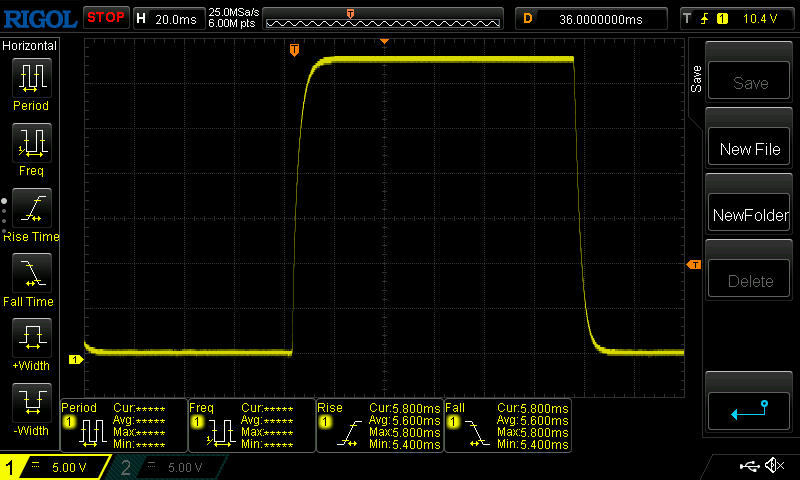 |
| ↘ 5.8 ms bajada | ||
| La pantalla mostró buenos tiempos de respuesta en nuestros tests pero podría ser demasiado lenta para los jugones competitivos. En comparación, todos los dispositivos de prueba van de ##min### (mínimo) a 240 (máximo) ms. » 31 % de todos los dispositivos son mejores. Esto quiere decir que el tiempo de respuesta medido es mejor que la media (19.8 ms) de todos los dispositivos testados. | ||
| ↔ Tiempo de respuesta 50% Gris a 80% Gris | ||
| 15.6 ms ... subida ↗ y bajada ↘ combinada | ↗ 7.4 ms subida | 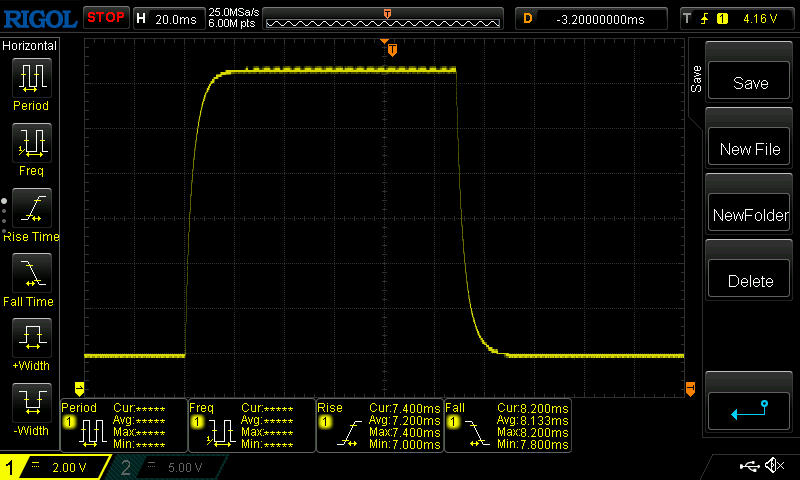 |
| ↘ 8.2 ms bajada | ||
| La pantalla mostró buenos tiempos de respuesta en nuestros tests pero podría ser demasiado lenta para los jugones competitivos. En comparación, todos los dispositivos de prueba van de ##min### (mínimo) a 636 (máximo) ms. » 30 % de todos los dispositivos son mejores. Esto quiere decir que el tiempo de respuesta medido es mejor que la media (31 ms) de todos los dispositivos testados. | ||
Parpadeo de Pantalla / PWM (Pulse-Width Modulation)
| Parpadeo de Pantalla / PWM no detectado |  | ||
Comparación: 52 % de todos los dispositivos testados no usaron PWM para atenuar el display. Si se usó, medimos una media de 7751 (mínimo: 5 - máxmo: 343500) Hz. | |||
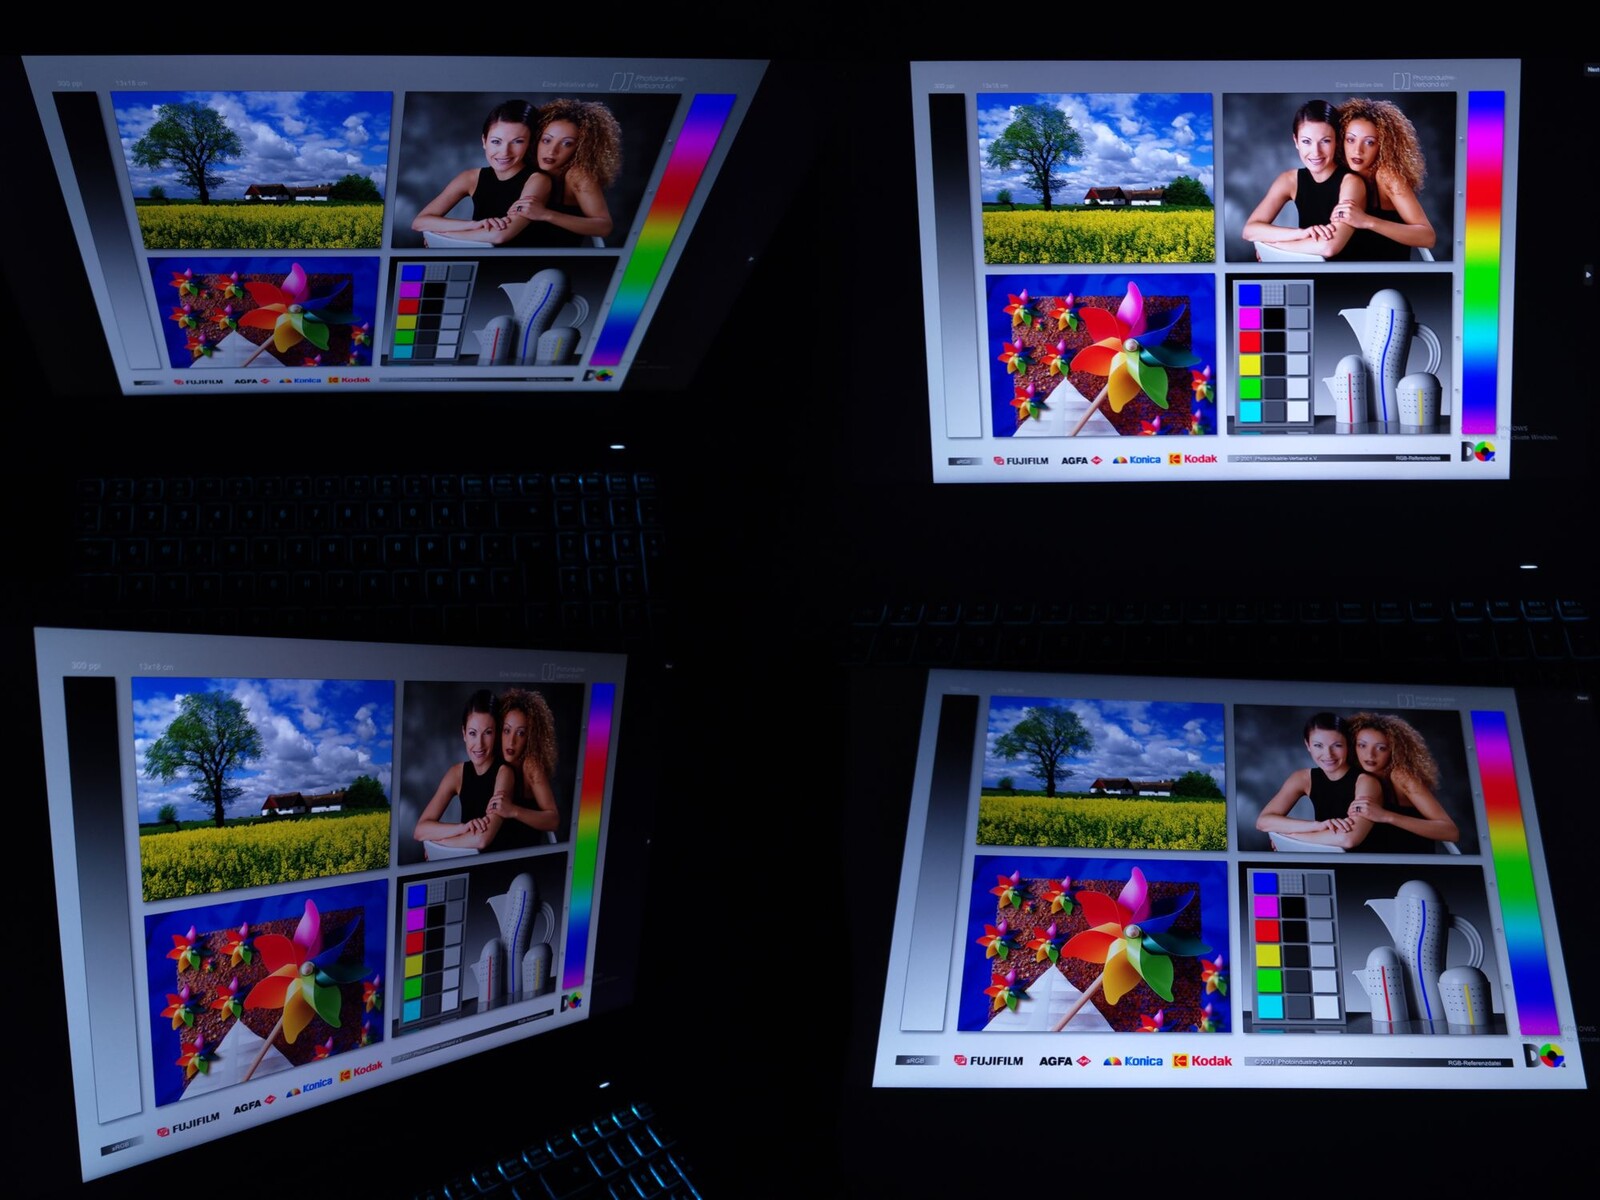
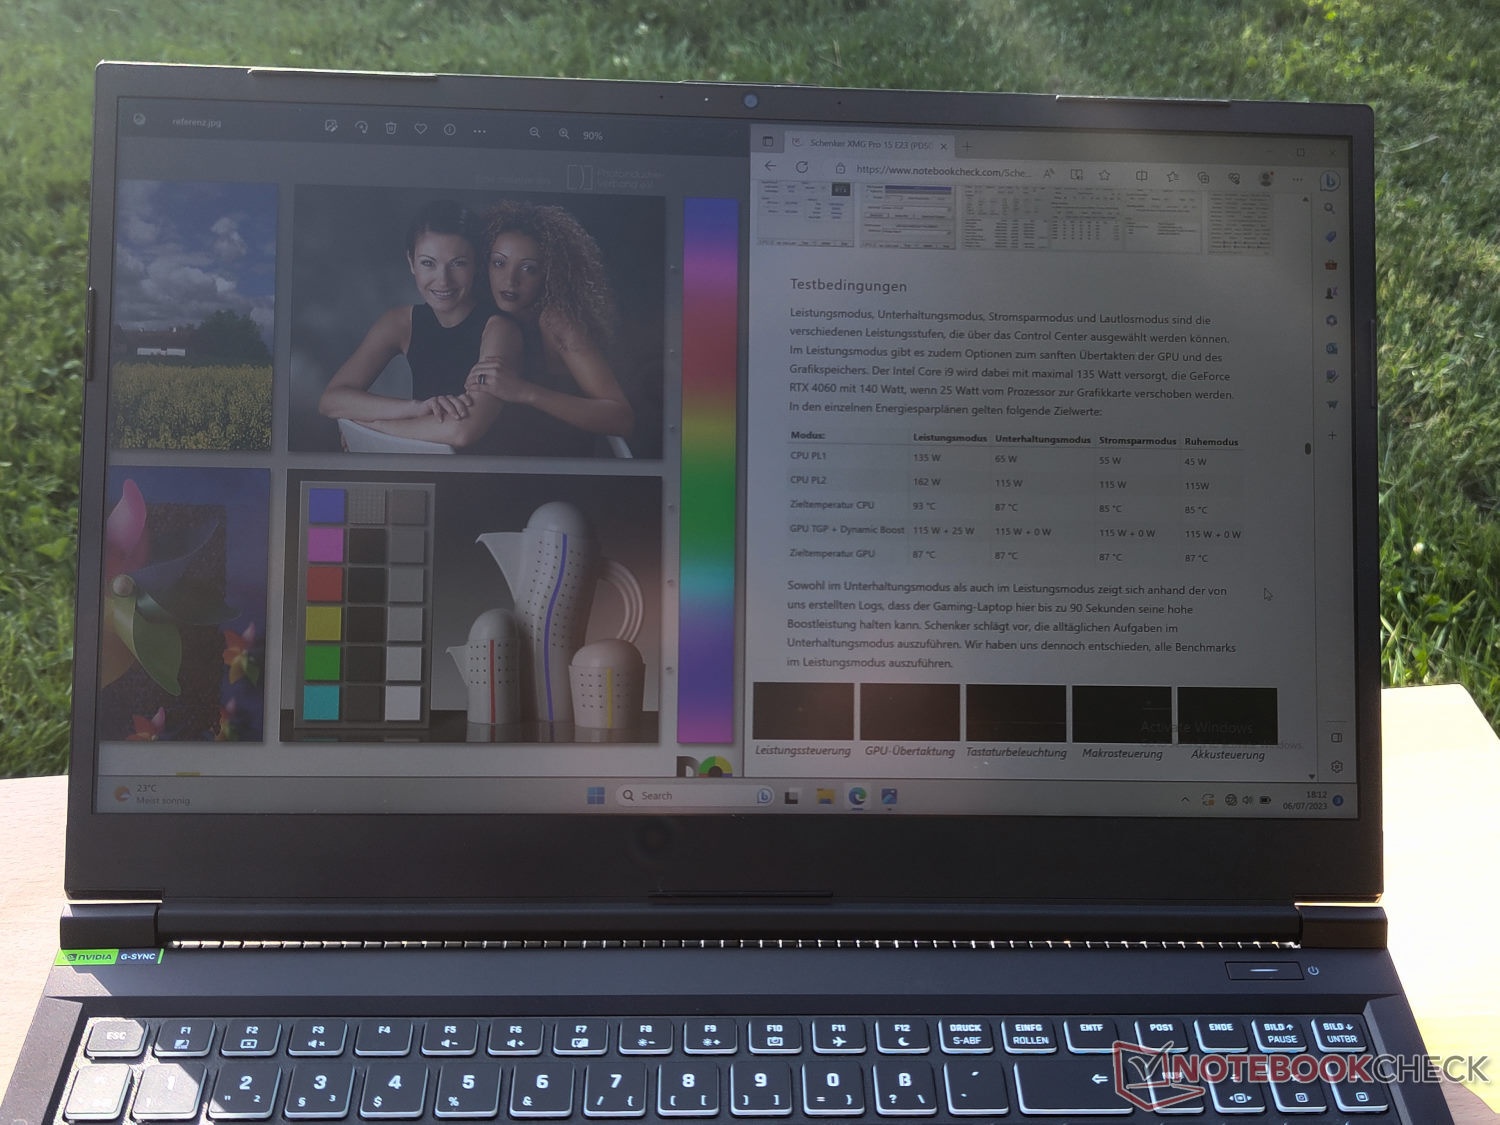
Con su superficie mate, la pantalla razonablemente brillante también es utilizable en exteriores siempre que se tenga en cuenta la ubicación y el ángulo con respecto al sol. Afortunadamente, normalmente se puede encontrar una posición favorable, ya que los ángulos de visión de la pantalla son bastante estables.
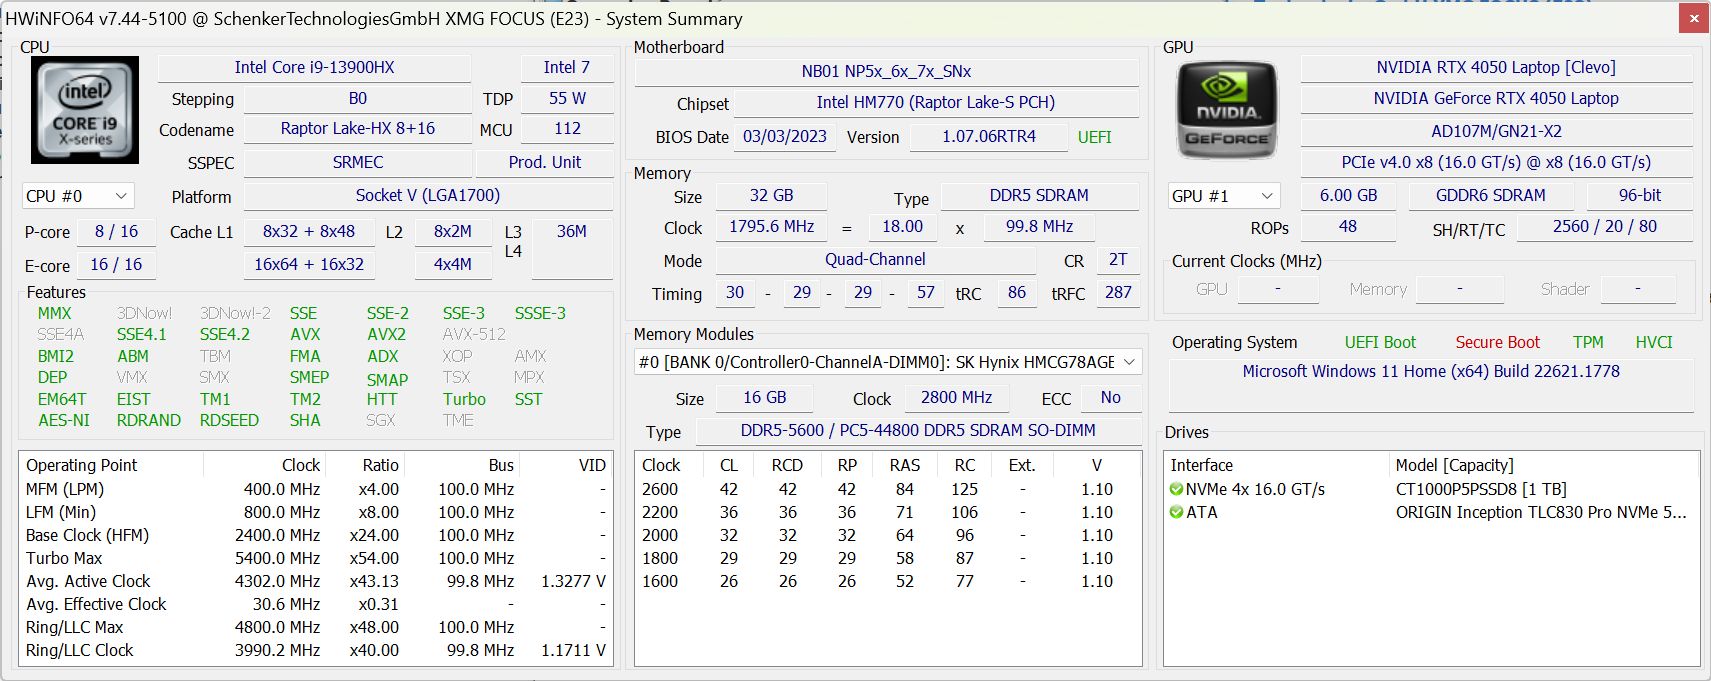
Rendimiento: Core i9 de rendimiento extremo
Schenker ofrece una amplia gama de opciones de configuración para el XMG Focus 15. El procesador en todas ellas es el Intel Core i9-13900HX. Este es apoyado por un chip Nvidia con GeForce RTX 4050, RTX 4060 o RTX 4070disponibles en el proceso de configuración en Bestware junto con varias opciones de memoria.
Nuestro dispositivo de pruebas está equipado con la GPU Nvidia GeForce RTX 4050 para portátiles y 32 GB de memoria de trabajo. Con el chip gráfico más bajo de la generación Ada Lovelace, el portátil es capaz de jugar a muchos juegos actuales sin problemas, aunque probablemente tendrás que limitar los ajustes de calidad si quieres usar la resolución QHD completa de la pantalla.
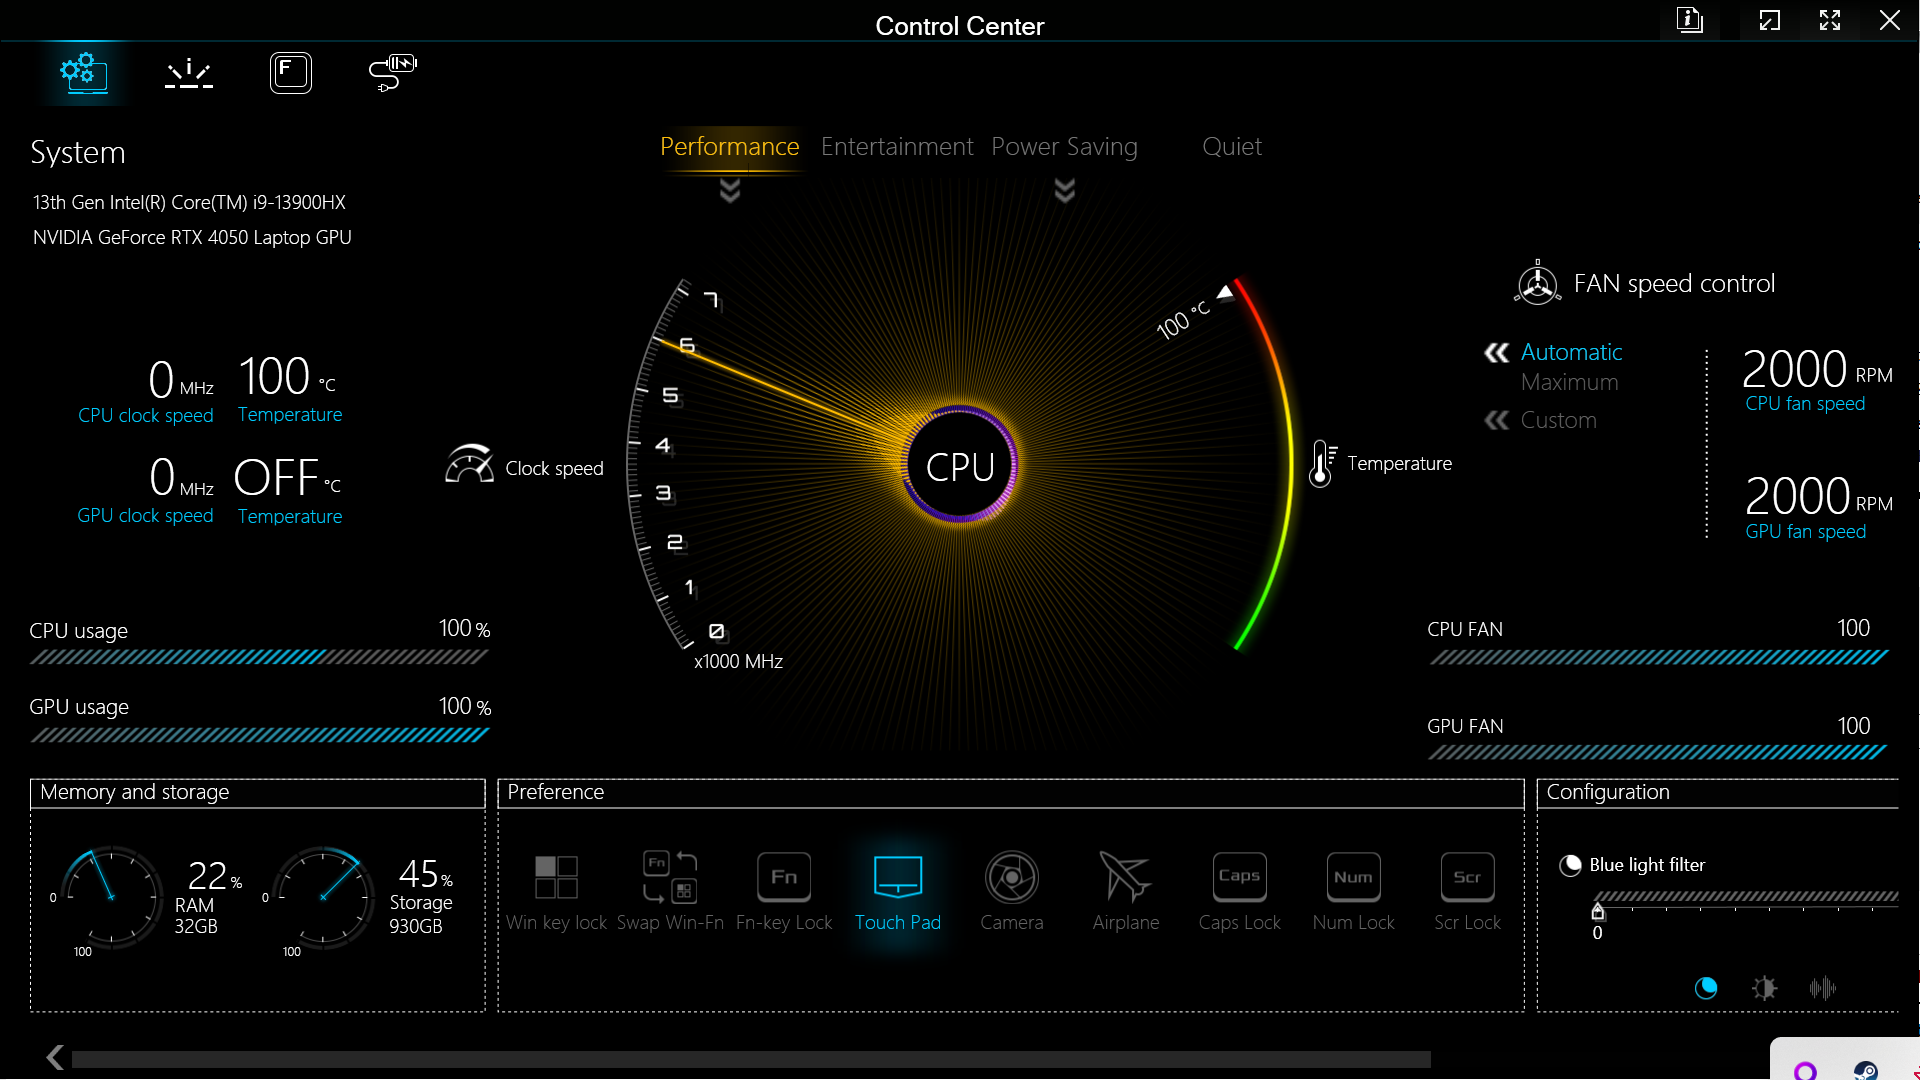
Condiciones de la prueba
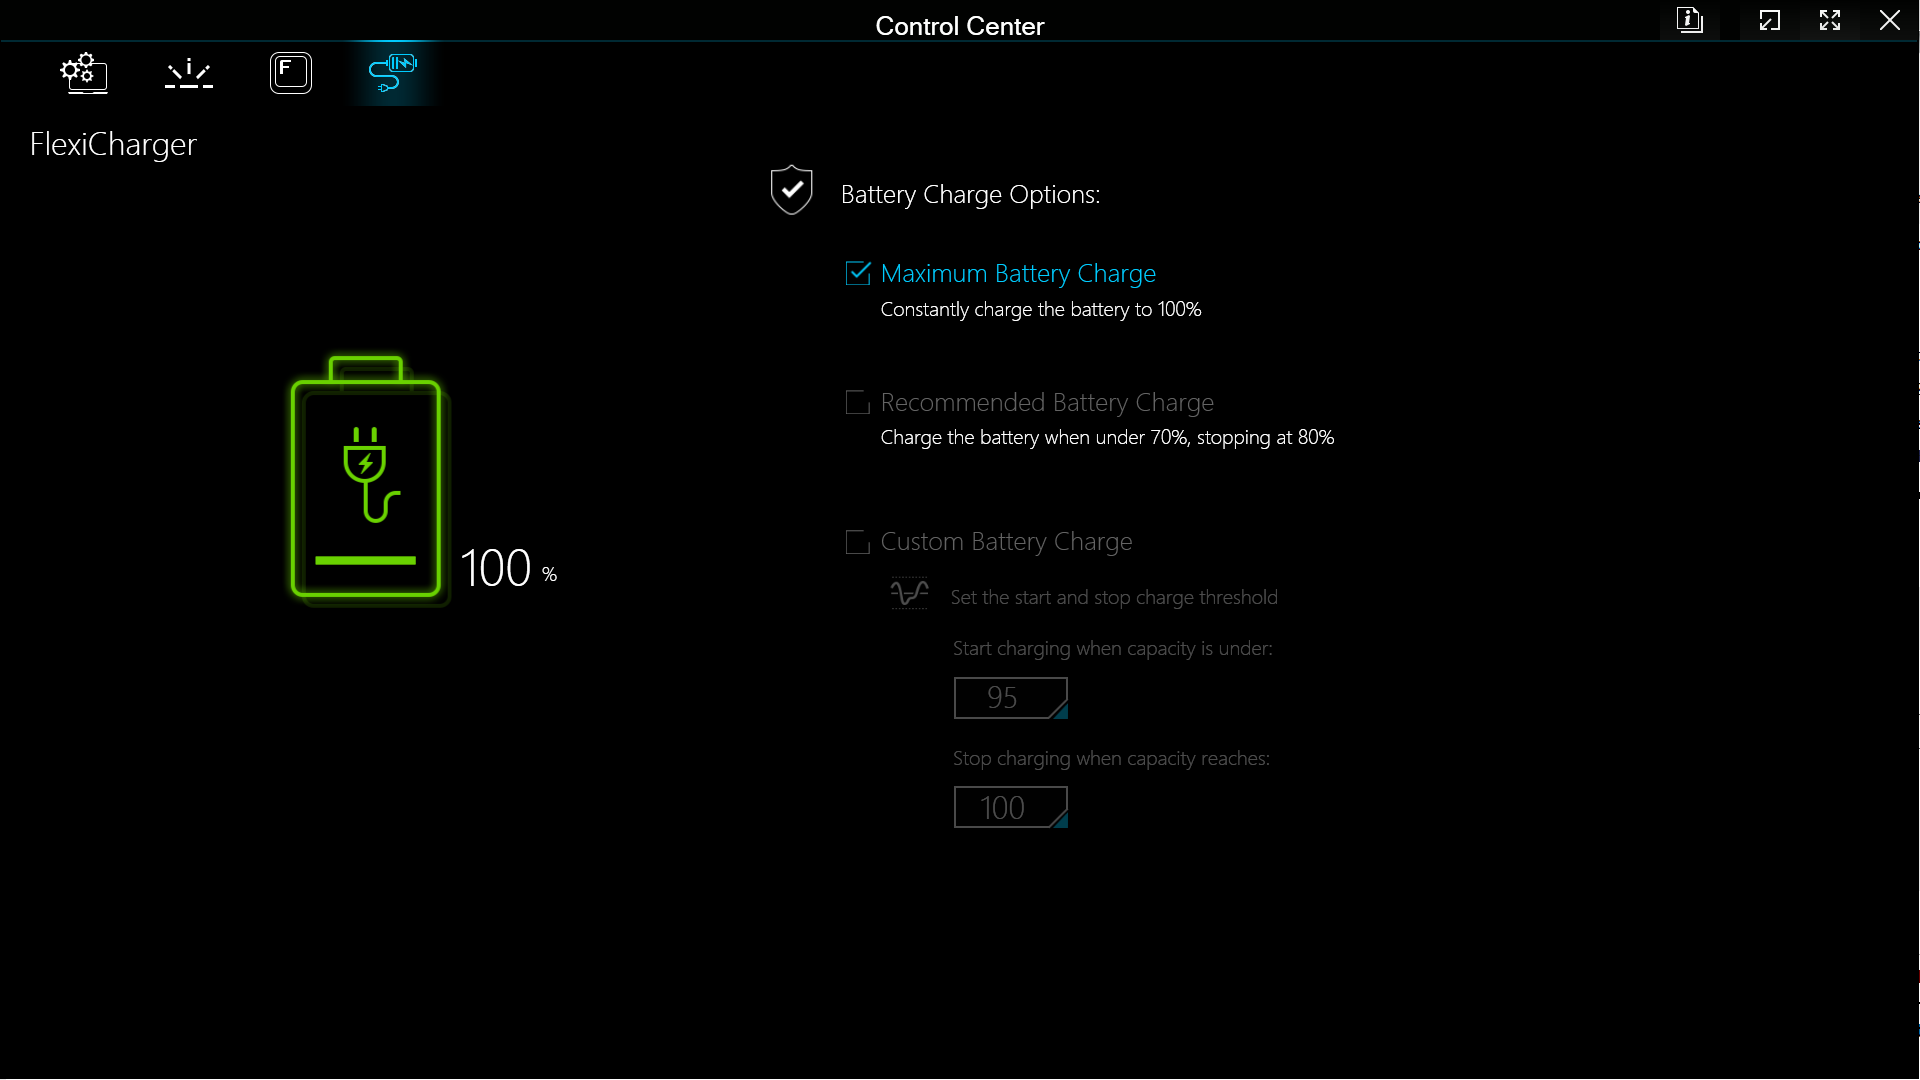
Se puede acceder a cuatro planes de rendimiento diferentes a través del Centro de Control de Schenker. Mientras que los modos Ahorro de energía y Reposo limitan notablemente el rendimiento del dispositivo de pruebas, las pruebas de los modos Rendimiento y Entretenimiento suelen estar bastante cerca entre sí cuando se exige mucho rendimiento al portátil durante periodos largos.
Dicho esto, la fase de aceleración del procesador dura bastante más en el modo Rendimiento. Con casi 1,5 minutos en boost, el procesador supera fácilmente pruebas como Cinebench R23 o Blender. Los límites de potencia en los modos individuales son los siguientes:
| Modo: | Modo de alimentación | Modo de entretenimiento | Modo de ahorro de energía |
|---|---|---|---|
| CPU PL1 | 135 W | 55 W | 15 W |
| CPU PL2 | 162 W | 130 W | 30 W |
| Temperatura objetivo CPU | 93 °C | 87 °C | 85 °C |
| GPU TGP + Dynamic Boost | 115 W + 25 W | 115 W + 0 W | 115 W + 0 W |
| Temperatura objetivo GPU | 87 °C | 87 °C | 87 °C |
En nuestras pruebas, el portátil puede alcanzar los altos índices del modo Rendimiento. Estos corresponden exactamente a los valores que Schenker también alcanzó con el XMG Pro 15. Por tanto, el rendimiento de los dos procesadores en Focus y Pro es casi idéntico.
Para poder comparar mejor los dos dispositivos, decidimos ejecutar todas las pruebas en modo Rendimiento también en el XMG Focus 15 .
Procesador
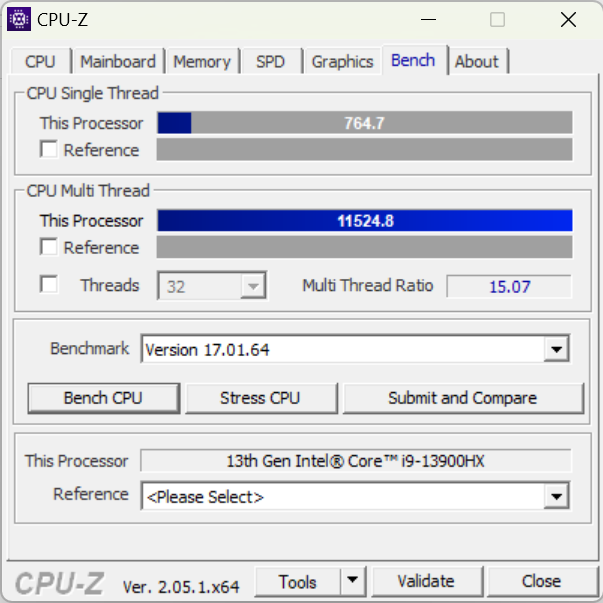
Con el Intel Core i9-13900HXuno de los procesadores para portátiles de gama más alta de la generación Raptor Lake-HX está instalado en el XMG Focus 15. Aquí el procesador es incluso ligeramente más rápido que el del Pro 15.
La diferencia es más perceptible en el ámbito de la suavidad de funcionamiento de los procesadores modernos. Con 8 núcleos P y 16 núcleos E, el procesador tiene 32 hilos que proporcionan una multitarea extrema. El Focus 15 y el Pro 15 están a la cabeza de los dispositivos de comparación.
Cinebench R15 Multi Loop Test
Cinebench R23: Multi Core | Single Core
Cinebench R20: CPU (Multi Core) | CPU (Single Core)
Cinebench R15: CPU Multi 64Bit | CPU Single 64Bit
Blender: v2.79 BMW27 CPU
7-Zip 18.03: 7z b 4 | 7z b 4 -mmt1
Geekbench 5.5: Multi-Core | Single-Core
HWBOT x265 Benchmark v2.2: 4k Preset
LibreOffice : 20 Documents To PDF
R Benchmark 2.5: Overall mean
| CPU Performance rating | |
| Medio Intel Core i9-13900HX | |
| Media de la clase Gaming | |
| Schenker XMG Focus 15 (E23) | |
| Schenker XMG Pro 15 (E23) | |
| Gigabyte Aero 14 OLED BMF | |
| Acer Swift X SFX14-71G | |
| Samsung Galaxy Book3 Ultra 16 | |
| MSI Katana 15 B12VEK | |
| Asus TUF A15 FA507 | |
| Cinebench R23 / Multi Core | |
| Medio Intel Core i9-13900HX (24270 - 32623, n=23) | |
| Media de la clase Gaming (10488 - 42661, n=108, últimos 2 años) | |
| Schenker XMG Pro 15 (E23) | |
| Schenker XMG Focus 15 (E23) | |
| Acer Swift X SFX14-71G | |
| MSI Katana 15 B12VEK | |
| Samsung Galaxy Book3 Ultra 16 | |
| Gigabyte Aero 14 OLED BMF | |
| Asus TUF A15 FA507 | |
| Cinebench R23 / Single Core | |
| Medio Intel Core i9-13900HX (1867 - 2105, n=20) | |
| Media de la clase Gaming (1166 - 2415, n=108, últimos 2 años) | |
| Schenker XMG Focus 15 (E23) | |
| Acer Swift X SFX14-71G | |
| Schenker XMG Pro 15 (E23) | |
| Gigabyte Aero 14 OLED BMF | |
| Samsung Galaxy Book3 Ultra 16 | |
| MSI Katana 15 B12VEK | |
| Asus TUF A15 FA507 | |
| Cinebench R20 / CPU (Multi Core) | |
| Medio Intel Core i9-13900HX (9152 - 12541, n=21) | |
| Media de la clase Gaming (4029 - 16433, n=107, últimos 2 años) | |
| Schenker XMG Pro 15 (E23) | |
| Schenker XMG Focus 15 (E23) | |
| Acer Swift X SFX14-71G | |
| MSI Katana 15 B12VEK | |
| Samsung Galaxy Book3 Ultra 16 | |
| Gigabyte Aero 14 OLED BMF | |
| Asus TUF A15 FA507 | |
| Cinebench R20 / CPU (Single Core) | |
| Medio Intel Core i9-13900HX (722 - 810, n=21) | |
| Media de la clase Gaming (442 - 913, n=107, últimos 2 años) | |
| Schenker XMG Focus 15 (E23) | |
| Acer Swift X SFX14-71G | |
| Schenker XMG Pro 15 (E23) | |
| Gigabyte Aero 14 OLED BMF | |
| Samsung Galaxy Book3 Ultra 16 | |
| MSI Katana 15 B12VEK | |
| Asus TUF A15 FA507 | |
| Cinebench R15 / CPU Multi 64Bit | |
| Medio Intel Core i9-13900HX (3913 - 4970, n=22) | |
| Media de la clase Gaming (1578 - 6330, n=106, últimos 2 años) | |
| Schenker XMG Focus 15 (E23) | |
| Schenker XMG Pro 15 (E23) | |
| Samsung Galaxy Book3 Ultra 16 | |
| Gigabyte Aero 14 OLED BMF | |
| Acer Swift X SFX14-71G | |
| Asus TUF A15 FA507 | |
| MSI Katana 15 B12VEK | |
| Cinebench R15 / CPU Single 64Bit | |
| Media de la clase Gaming (188.8 - 350, n=107, últimos 2 años) | |
| Medio Intel Core i9-13900HX (247 - 304, n=22) | |
| Acer Swift X SFX14-71G | |
| Schenker XMG Focus 15 (E23) | |
| Gigabyte Aero 14 OLED BMF | |
| Asus TUF A15 FA507 | |
| MSI Katana 15 B12VEK | |
| Schenker XMG Pro 15 (E23) | |
| Samsung Galaxy Book3 Ultra 16 | |
| Blender / v2.79 BMW27 CPU | |
| Acer Swift X SFX14-71G | |
| MSI Katana 15 B12VEK | |
| Gigabyte Aero 14 OLED BMF | |
| Asus TUF A15 FA507 | |
| Samsung Galaxy Book3 Ultra 16 | |
| Media de la clase Gaming (79 - 330, n=105, últimos 2 años) | |
| Schenker XMG Pro 15 (E23) | |
| Schenker XMG Focus 15 (E23) | |
| Medio Intel Core i9-13900HX (101 - 153, n=22) | |
| 7-Zip 18.03 / 7z b 4 | |
| Medio Intel Core i9-13900HX (90675 - 127283, n=21) | |
| Schenker XMG Focus 15 (E23) | |
| Media de la clase Gaming (33491 - 148086, n=106, últimos 2 años) | |
| Schenker XMG Pro 15 (E23) | |
| Samsung Galaxy Book3 Ultra 16 | |
| Asus TUF A15 FA507 | |
| MSI Katana 15 B12VEK | |
| Gigabyte Aero 14 OLED BMF | |
| Acer Swift X SFX14-71G | |
| 7-Zip 18.03 / 7z b 4 -mmt1 | |
| Medio Intel Core i9-13900HX (6340 - 7177, n=21) | |
| Media de la clase Gaming (4199 - 7436, n=106, últimos 2 años) | |
| Schenker XMG Focus 15 (E23) | |
| Schenker XMG Pro 15 (E23) | |
| Acer Swift X SFX14-71G | |
| Gigabyte Aero 14 OLED BMF | |
| Asus TUF A15 FA507 | |
| MSI Katana 15 B12VEK | |
| Samsung Galaxy Book3 Ultra 16 | |
| Geekbench 5.5 / Multi-Core | |
| Medio Intel Core i9-13900HX (17614 - 21075, n=22) | |
| Schenker XMG Focus 15 (E23) | |
| Schenker XMG Pro 15 (E23) | |
| Media de la clase Gaming (6460 - 28263, n=106, últimos 2 años) | |
| Acer Swift X SFX14-71G | |
| Samsung Galaxy Book3 Ultra 16 | |
| MSI Katana 15 B12VEK | |
| Gigabyte Aero 14 OLED BMF | |
| Asus TUF A15 FA507 | |
| Geekbench 5.5 / Single-Core | |
| Media de la clase Gaming (986 - 2474, n=106, últimos 2 años) | |
| Medio Intel Core i9-13900HX (1345 - 2093, n=22) | |
| Gigabyte Aero 14 OLED BMF | |
| Acer Swift X SFX14-71G | |
| Schenker XMG Pro 15 (E23) | |
| Samsung Galaxy Book3 Ultra 16 | |
| MSI Katana 15 B12VEK | |
| Asus TUF A15 FA507 | |
| Schenker XMG Focus 15 (E23) | |
| HWBOT x265 Benchmark v2.2 / 4k Preset | |
| Medio Intel Core i9-13900HX (23.5 - 34.4, n=22) | |
| Media de la clase Gaming (11.5 - 44.4, n=106, últimos 2 años) | |
| Schenker XMG Focus 15 (E23) | |
| Schenker XMG Pro 15 (E23) | |
| MSI Katana 15 B12VEK | |
| Asus TUF A15 FA507 | |
| Samsung Galaxy Book3 Ultra 16 | |
| Gigabyte Aero 14 OLED BMF | |
| Acer Swift X SFX14-71G | |
| LibreOffice / 20 Documents To PDF | |
| Schenker XMG Pro 15 (E23) | |
| Asus TUF A15 FA507 | |
| Media de la clase Gaming (33.2 - 88.8, n=106, últimos 2 años) | |
| Samsung Galaxy Book3 Ultra 16 | |
| MSI Katana 15 B12VEK | |
| Medio Intel Core i9-13900HX (32.8 - 51.1, n=21) | |
| Gigabyte Aero 14 OLED BMF | |
| Acer Swift X SFX14-71G | |
| Schenker XMG Focus 15 (E23) | |
| R Benchmark 2.5 / Overall mean | |
| Asus TUF A15 FA507 | |
| MSI Katana 15 B12VEK | |
| Samsung Galaxy Book3 Ultra 16 | |
| Schenker XMG Pro 15 (E23) | |
| Gigabyte Aero 14 OLED BMF | |
| Acer Swift X SFX14-71G | |
| Schenker XMG Focus 15 (E23) | |
| Media de la clase Gaming (0.3439 - 0.759, n=107, últimos 2 años) | |
| Medio Intel Core i9-13900HX (0.375 - 0.4564, n=22) | |
* ... más pequeño es mejor
AIDA64: FP32 Ray-Trace | FPU Julia | CPU SHA3 | CPU Queen | FPU SinJulia | FPU Mandel | CPU AES | CPU ZLib | FP64 Ray-Trace | CPU PhotoWorxx
| Performance rating | |
| Media de la clase Gaming | |
| Medio Intel Core i9-13900HX | |
| Schenker XMG Focus 15 (E23) | |
| Schenker XMG Pro 15 (E23) | |
| Asus TUF A15 FA507 | |
| Gigabyte Aero 14 OLED BMF | |
| Samsung Galaxy Book3 Ultra 16 | |
| MSI Katana 15 B12VEK | |
| Acer Swift X SFX14-71G | |
| AIDA64 / FP32 Ray-Trace | |
| Media de la clase Gaming (10227 - 85542, n=106, últimos 2 años) | |
| Medio Intel Core i9-13900HX (17589 - 27615, n=22) | |
| Schenker XMG Focus 15 (E23) | |
| Schenker XMG Pro 15 (E23) | |
| Asus TUF A15 FA507 | |
| MSI Katana 15 B12VEK | |
| Samsung Galaxy Book3 Ultra 16 | |
| Gigabyte Aero 14 OLED BMF | |
| Acer Swift X SFX14-71G | |
| AIDA64 / FPU Julia | |
| Media de la clase Gaming (51376 - 372155, n=106, últimos 2 años) | |
| Medio Intel Core i9-13900HX (88686 - 137015, n=22) | |
| Schenker XMG Focus 15 (E23) | |
| Asus TUF A15 FA507 | |
| Schenker XMG Pro 15 (E23) | |
| MSI Katana 15 B12VEK | |
| Samsung Galaxy Book3 Ultra 16 | |
| Gigabyte Aero 14 OLED BMF | |
| Acer Swift X SFX14-71G | |
| AIDA64 / CPU SHA3 | |
| Media de la clase Gaming (2180 - 10115, n=106, últimos 2 años) | |
| Medio Intel Core i9-13900HX (4362 - 7029, n=22) | |
| Schenker XMG Focus 15 (E23) | |
| Schenker XMG Pro 15 (E23) | |
| Asus TUF A15 FA507 | |
| Samsung Galaxy Book3 Ultra 16 | |
| MSI Katana 15 B12VEK | |
| Gigabyte Aero 14 OLED BMF | |
| Acer Swift X SFX14-71G | |
| AIDA64 / CPU Queen | |
| Schenker XMG Focus 15 (E23) | |
| Medio Intel Core i9-13900HX (125644 - 141385, n=22) | |
| Schenker XMG Pro 15 (E23) | |
| Media de la clase Gaming (49785 - 173351, n=90, últimos 2 años) | |
| Gigabyte Aero 14 OLED BMF | |
| Acer Swift X SFX14-71G | |
| Asus TUF A15 FA507 | |
| Samsung Galaxy Book3 Ultra 16 | |
| MSI Katana 15 B12VEK | |
| AIDA64 / FPU SinJulia | |
| Medio Intel Core i9-13900HX (12334 - 17179, n=22) | |
| Media de la clase Gaming (4424 - 33636, n=106, últimos 2 años) | |
| Schenker XMG Focus 15 (E23) | |
| Asus TUF A15 FA507 | |
| Schenker XMG Pro 15 (E23) | |
| Samsung Galaxy Book3 Ultra 16 | |
| Gigabyte Aero 14 OLED BMF | |
| MSI Katana 15 B12VEK | |
| Acer Swift X SFX14-71G | |
| AIDA64 / FPU Mandel | |
| Media de la clase Gaming (25115 - 196829, n=106, últimos 2 años) | |
| Medio Intel Core i9-13900HX (43850 - 69202, n=22) | |
| Asus TUF A15 FA507 | |
| Schenker XMG Focus 15 (E23) | |
| Schenker XMG Pro 15 (E23) | |
| MSI Katana 15 B12VEK | |
| Samsung Galaxy Book3 Ultra 16 | |
| Gigabyte Aero 14 OLED BMF | |
| Acer Swift X SFX14-71G | |
| AIDA64 / CPU AES | |
| Medio Intel Core i9-13900HX (89413 - 237881, n=22) | |
| Gigabyte Aero 14 OLED BMF | |
| Media de la clase Gaming (39258 - 247074, n=106, últimos 2 años) | |
| Schenker XMG Focus 15 (E23) | |
| Schenker XMG Pro 15 (E23) | |
| Acer Swift X SFX14-71G | |
| Samsung Galaxy Book3 Ultra 16 | |
| MSI Katana 15 B12VEK | |
| Asus TUF A15 FA507 | |
| AIDA64 / CPU ZLib | |
| Medio Intel Core i9-13900HX (1284 - 1958, n=22) | |
| Schenker XMG Focus 15 (E23) | |
| Media de la clase Gaming (574 - 2531, n=106, últimos 2 años) | |
| Schenker XMG Pro 15 (E23) | |
| Samsung Galaxy Book3 Ultra 16 | |
| MSI Katana 15 B12VEK | |
| Gigabyte Aero 14 OLED BMF | |
| Acer Swift X SFX14-71G | |
| Asus TUF A15 FA507 | |
| AIDA64 / FP64 Ray-Trace | |
| Media de la clase Gaming (5509 - 45446, n=106, últimos 2 años) | |
| Medio Intel Core i9-13900HX (9481 - 15279, n=22) | |
| Schenker XMG Focus 15 (E23) | |
| Schenker XMG Pro 15 (E23) | |
| Asus TUF A15 FA507 | |
| MSI Katana 15 B12VEK | |
| Samsung Galaxy Book3 Ultra 16 | |
| Gigabyte Aero 14 OLED BMF | |
| Acer Swift X SFX14-71G | |
| AIDA64 / CPU PhotoWorxx | |
| Gigabyte Aero 14 OLED BMF | |
| Schenker XMG Focus 15 (E23) | |
| Schenker XMG Pro 15 (E23) | |
| Medio Intel Core i9-13900HX (42994 - 51994, n=22) | |
| Samsung Galaxy Book3 Ultra 16 | |
| Media de la clase Gaming (12271 - 89891, n=106, últimos 2 años) | |
| Acer Swift X SFX14-71G | |
| MSI Katana 15 B12VEK | |
| Asus TUF A15 FA507 | |
Rendimiento del sistema
Con la GPU básica de Nvidia, la GeForce RTX 4050el Focus no consigue tantos puntos en la prueba PCMark 10 como el Pro 15. Aun así, el Focus 15 consigue mantenerse a la altura de los otros dispositivos de la comparación.
El procesador ligeramente más rápido del Focus 15 se vuelve a notar en la prueba CrossMark. El modelo de pruebas obtiene una puntuación ligeramente superior a la del Pro 15. CrossMark considera el rendimiento de la tarjeta gráfica mucho menos que PCMark.
CrossMark: Overall | Productivity | Creativity | Responsiveness
| PCMark 10 / Score | |
| Media de la clase Gaming (5828 - 12414, n=94, últimos 2 años) | |
| Schenker XMG Pro 15 (E23) | |
| Gigabyte Aero 14 OLED BMF | |
| Acer Swift X SFX14-71G | |
| Asus TUF A15 FA507 | |
| Schenker XMG Focus 15 (E23) | |
| Medio Intel Core i9-13900HX, NVIDIA GeForce RTX 4050 Laptop GPU (n=1) | |
| MSI Katana 15 B12VEK | |
| Samsung Galaxy Book3 Ultra 16 | |
| PCMark 10 / Essentials | |
| Gigabyte Aero 14 OLED BMF | |
| Schenker XMG Pro 15 (E23) | |
| Acer Swift X SFX14-71G | |
| Media de la clase Gaming (8810 - 11935, n=98, últimos 2 años) | |
| Asus TUF A15 FA507 | |
| Samsung Galaxy Book3 Ultra 16 | |
| MSI Katana 15 B12VEK | |
| Schenker XMG Focus 15 (E23) | |
| Medio Intel Core i9-13900HX, NVIDIA GeForce RTX 4050 Laptop GPU (n=1) | |
| PCMark 10 / Productivity | |
| Media de la clase Gaming (6845 - 25323, n=96, últimos 2 años) | |
| Schenker XMG Pro 15 (E23) | |
| MSI Katana 15 B12VEK | |
| Schenker XMG Focus 15 (E23) | |
| Medio Intel Core i9-13900HX, NVIDIA GeForce RTX 4050 Laptop GPU (n=1) | |
| Acer Swift X SFX14-71G | |
| Gigabyte Aero 14 OLED BMF | |
| Asus TUF A15 FA507 | |
| Samsung Galaxy Book3 Ultra 16 | |
| PCMark 10 / Digital Content Creation | |
| Media de la clase Gaming (7602 - 19954, n=96, últimos 2 años) | |
| Asus TUF A15 FA507 | |
| Acer Swift X SFX14-71G | |
| Gigabyte Aero 14 OLED BMF | |
| Schenker XMG Pro 15 (E23) | |
| Schenker XMG Focus 15 (E23) | |
| Medio Intel Core i9-13900HX, NVIDIA GeForce RTX 4050 Laptop GPU (n=1) | |
| Samsung Galaxy Book3 Ultra 16 | |
| MSI Katana 15 B12VEK | |
| CrossMark / Overall | |
| Schenker XMG Focus 15 (E23) | |
| Medio Intel Core i9-13900HX, NVIDIA GeForce RTX 4050 Laptop GPU (n=1) | |
| Media de la clase Gaming (1366 - 2409, n=95, últimos 2 años) | |
| Schenker XMG Pro 15 (E23) | |
| Acer Swift X SFX14-71G | |
| Gigabyte Aero 14 OLED BMF | |
| MSI Katana 15 B12VEK | |
| Samsung Galaxy Book3 Ultra 16 | |
| Asus TUF A15 FA507 | |
| CrossMark / Productivity | |
| Schenker XMG Focus 15 (E23) | |
| Medio Intel Core i9-13900HX, NVIDIA GeForce RTX 4050 Laptop GPU (n=1) | |
| Acer Swift X SFX14-71G | |
| Media de la clase Gaming (1386 - 2254, n=95, últimos 2 años) | |
| Schenker XMG Pro 15 (E23) | |
| Gigabyte Aero 14 OLED BMF | |
| MSI Katana 15 B12VEK | |
| Asus TUF A15 FA507 | |
| Samsung Galaxy Book3 Ultra 16 | |
| CrossMark / Creativity | |
| Schenker XMG Focus 15 (E23) | |
| Medio Intel Core i9-13900HX, NVIDIA GeForce RTX 4050 Laptop GPU (n=1) | |
| Media de la clase Gaming (1343 - 2786, n=95, últimos 2 años) | |
| Schenker XMG Pro 15 (E23) | |
| Acer Swift X SFX14-71G | |
| Gigabyte Aero 14 OLED BMF | |
| MSI Katana 15 B12VEK | |
| Asus TUF A15 FA507 | |
| Samsung Galaxy Book3 Ultra 16 | |
| CrossMark / Responsiveness | |
| Acer Swift X SFX14-71G | |
| Schenker XMG Focus 15 (E23) | |
| Medio Intel Core i9-13900HX, NVIDIA GeForce RTX 4050 Laptop GPU (n=1) | |
| Schenker XMG Pro 15 (E23) | |
| Gigabyte Aero 14 OLED BMF | |
| Media de la clase Gaming (1226 - 2334, n=95, últimos 2 años) | |
| MSI Katana 15 B12VEK | |
| Samsung Galaxy Book3 Ultra 16 | |
| Asus TUF A15 FA507 | |
| PCMark 10 Score | 6926 puntos | |
ayuda | ||
| AIDA64 / Memory Copy | |
| Gigabyte Aero 14 OLED BMF | |
| Schenker XMG Focus 15 (E23) | |
| Schenker XMG Pro 15 (E23) | |
| Medio Intel Core i9-13900HX (67716 - 79193, n=22) | |
| Media de la clase Gaming (21750 - 129946, n=106, últimos 2 años) | |
| Samsung Galaxy Book3 Ultra 16 | |
| Acer Swift X SFX14-71G | |
| MSI Katana 15 B12VEK | |
| Asus TUF A15 FA507 | |
| AIDA64 / Memory Read | |
| Schenker XMG Focus 15 (E23) | |
| Schenker XMG Pro 15 (E23) | |
| Medio Intel Core i9-13900HX (73998 - 88462, n=22) | |
| Gigabyte Aero 14 OLED BMF | |
| Media de la clase Gaming (22956 - 118858, n=106, últimos 2 años) | |
| Samsung Galaxy Book3 Ultra 16 | |
| MSI Katana 15 B12VEK | |
| Acer Swift X SFX14-71G | |
| Asus TUF A15 FA507 | |
| AIDA64 / Memory Write | |
| Gigabyte Aero 14 OLED BMF | |
| Samsung Galaxy Book3 Ultra 16 | |
| Schenker XMG Focus 15 (E23) | |
| Media de la clase Gaming (22297 - 135096, n=106, últimos 2 años) | |
| Schenker XMG Pro 15 (E23) | |
| Medio Intel Core i9-13900HX (65472 - 77045, n=22) | |
| Acer Swift X SFX14-71G | |
| MSI Katana 15 B12VEK | |
| Asus TUF A15 FA507 | |
| AIDA64 / Memory Latency | |
| Media de la clase Gaming (75.3 - 259, n=106, últimos 2 años) | |
| Acer Swift X SFX14-71G | |
| Samsung Galaxy Book3 Ultra 16 | |
| MSI Katana 15 B12VEK | |
| Gigabyte Aero 14 OLED BMF | |
| Medio Intel Core i9-13900HX (75.3 - 91.1, n=22) | |
| Schenker XMG Focus 15 (E23) | |
| Schenker XMG Pro 15 (E23) | |
| Asus TUF A15 FA507 | |
* ... más pequeño es mejor
Latencia del CPD
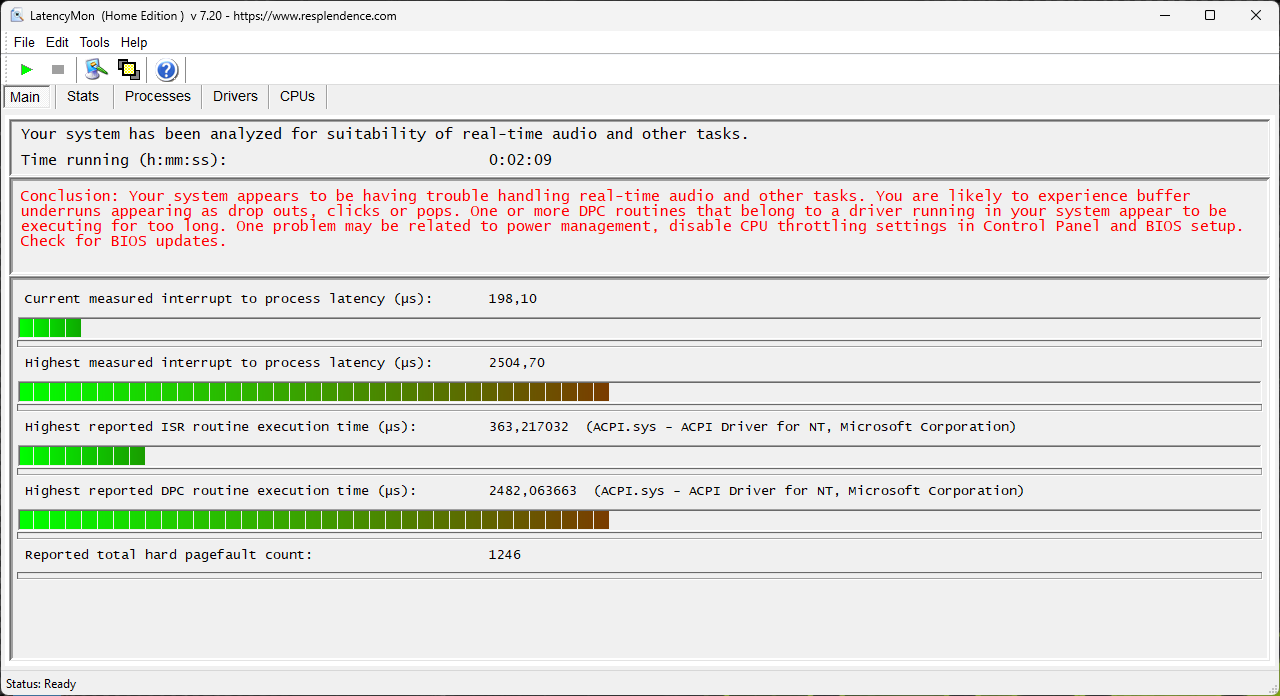
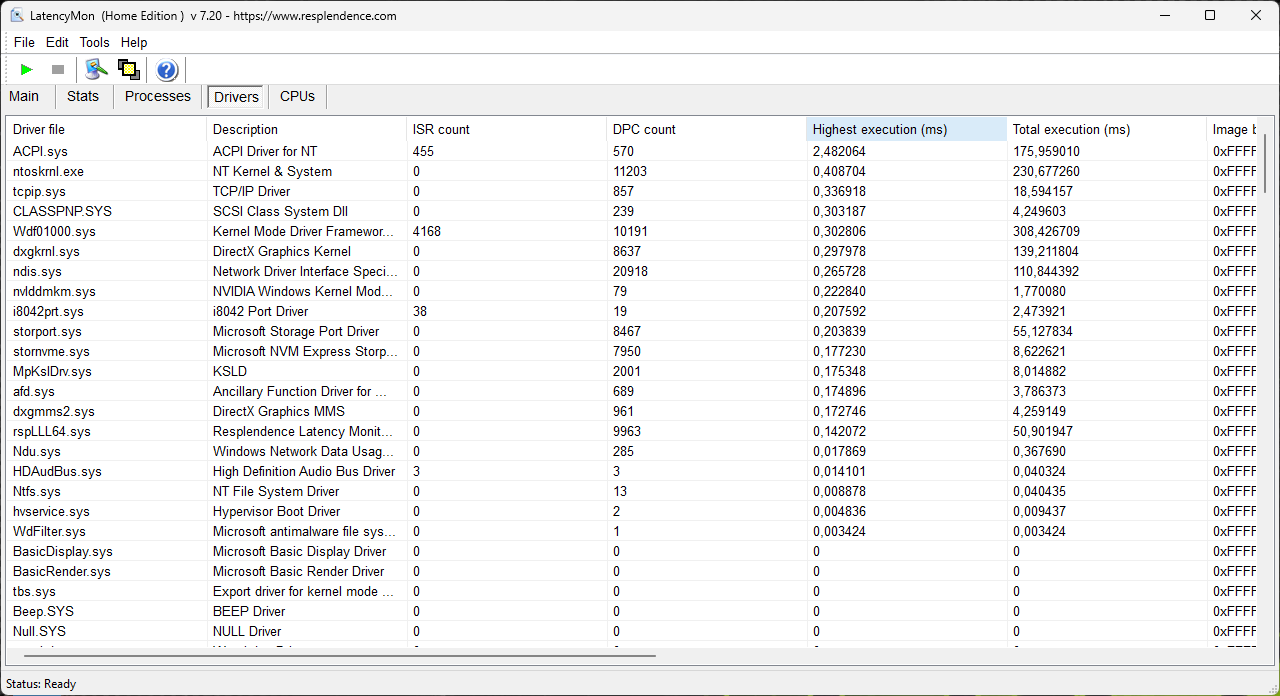
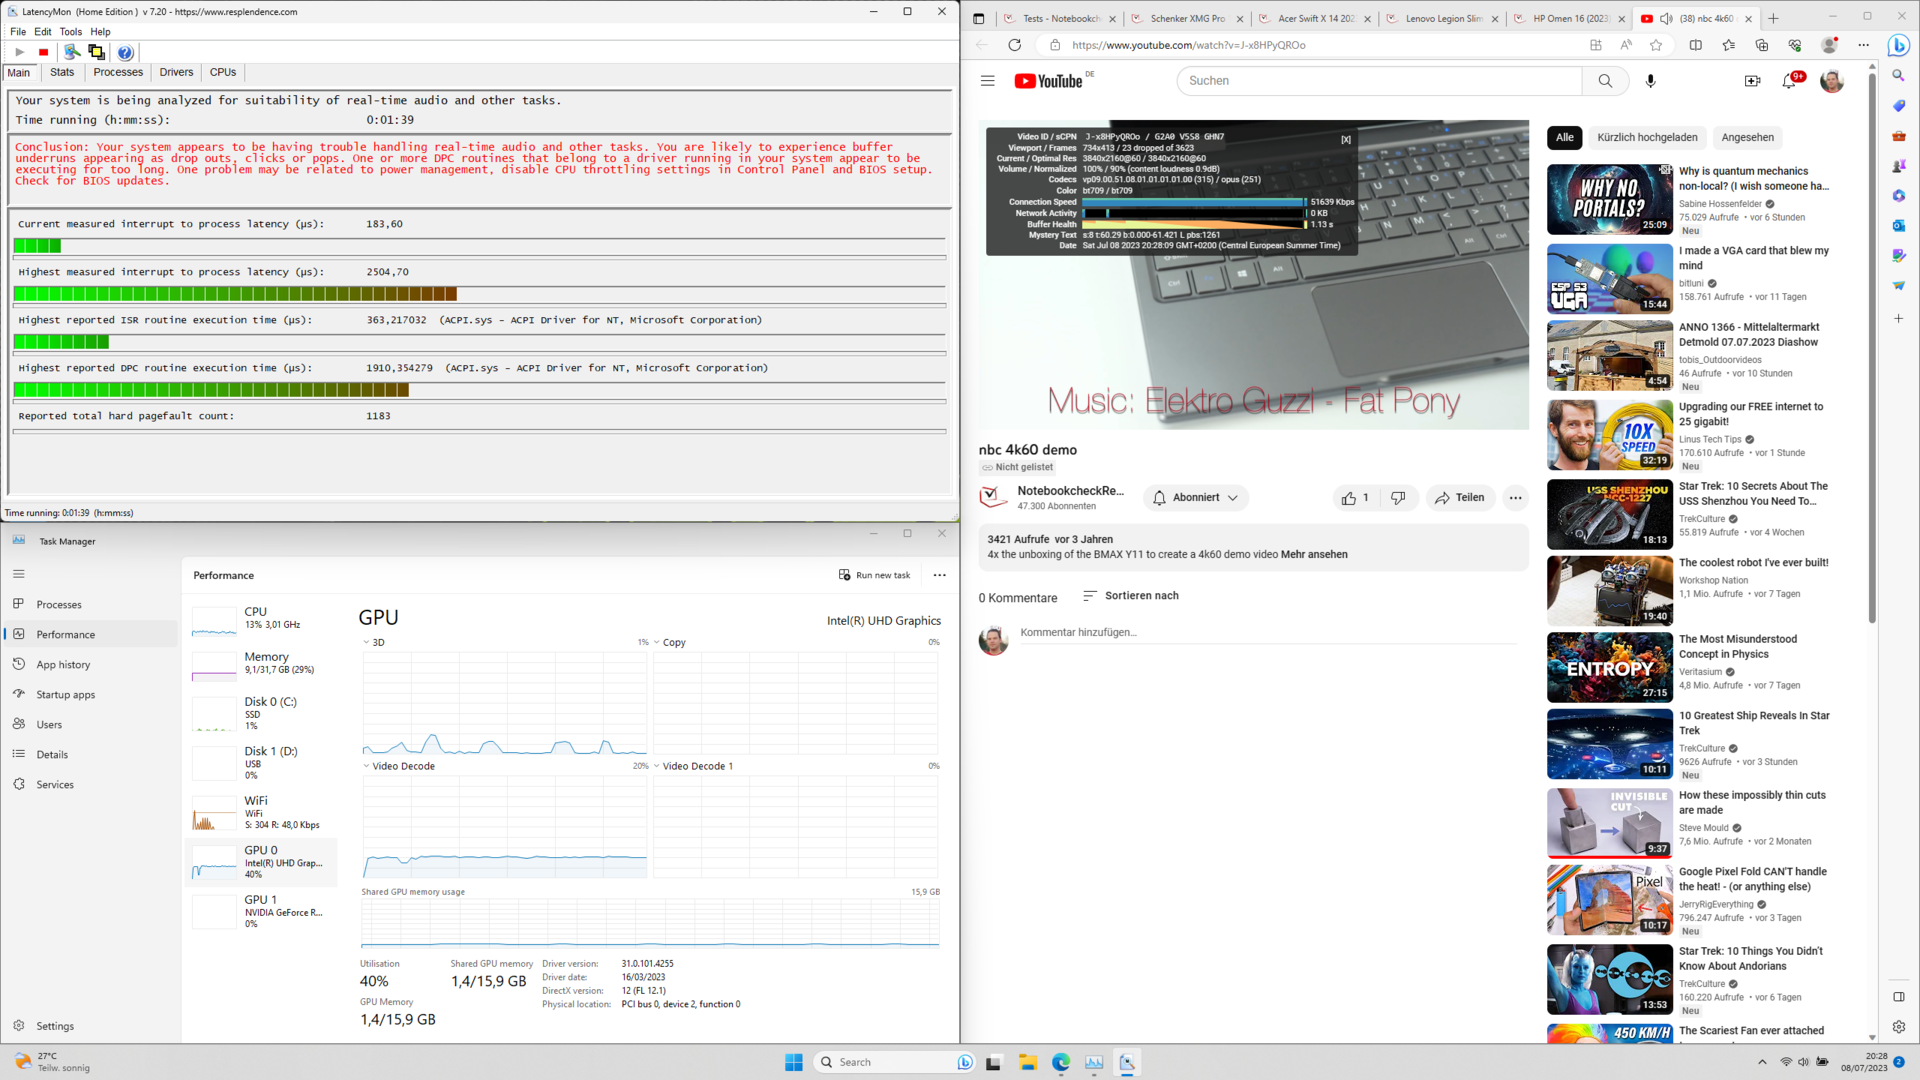
Nuestro test de latencia con varias pestañas de navegador, reproducción de YouTube, y Prime95 muestra que el portátil de juego desafortunadamente tiene latencias DPC bastante altas.
El driver ACPI, que establece la conexión entre BIOS/UEFI y Windows, es conspicuo aquí. Una actualización UEFI no mejoró esto.
| DPC Latencies / LatencyMon - interrupt to process latency (max), Web, Youtube, Prime95 | |
| MSI Katana 15 B12VEK | |
| Acer Swift X SFX14-71G | |
| Samsung Galaxy Book3 Ultra 16 | |
| Schenker XMG Focus 15 (E23) | |
| Gigabyte Aero 14 OLED BMF | |
| Schenker XMG Pro 15 (E23) | |
* ... más pequeño es mejor
Almacenamiento masivo
ElCrucial P5 Plus en el dispositivo de prueba ofrece buenas velocidades de transferencia. Sin embargo, aparentemente se sobrecalienta durante cargas más largas.
En nuestro test a largo plazo de la velocidad de escritura, el SSD NVMe pierde rendimiento claramente tras algún tiempo.

* ... más pequeño es mejor
Disk throttling: DiskSpd Read Loop, Queue Depth 8
Tarjeta gráfica
En nuestra muestra Focus 15, el rendimiento del chip gráfico es entre un 15 y un 20% inferior al de laRTX 4060 del Pro 15. Un vistazo al Aorus 15X ASF también muestra dónde está el rendimiento del Focus 15 en combinación con una RTX 4070 podría estar. Dado que los tres portátiles tienen valores TGP equivalentes, los rendimientos deberían ser comparables aquí cuando los portátiles están equipados con el mismo chip gráfico.
La GPU Nvidia RTX 4050 tiene un TGP de hasta 140 W. Este valor está en la parte superior de las configuraciones TGP recomendadas por Nvidia. Sin embargo, esto no da a la tarjeta gráfica ninguna ventaja sobre los demás portátiles para juegos en todas las pruebas.
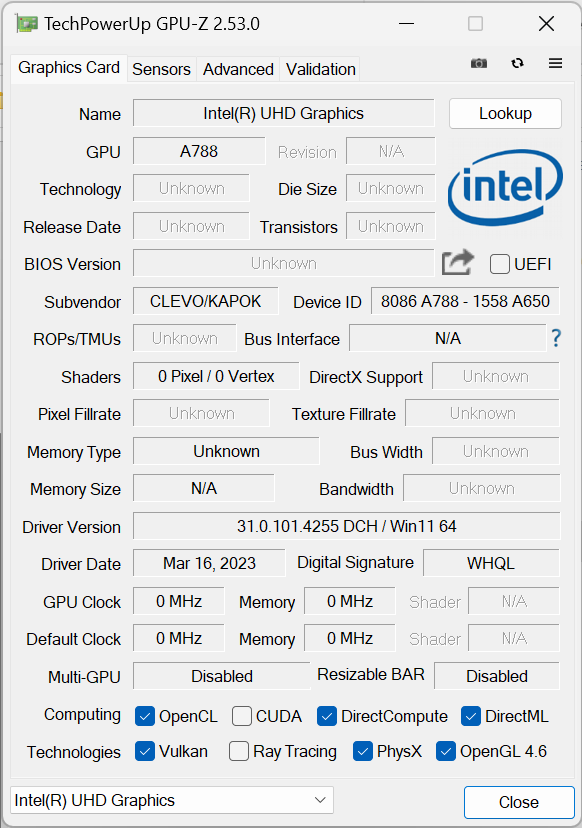
El chip gráfico se puede seleccionar directamente en el Focus 15 a través de los interruptores Optimus y MUX - la iGPU del Core i9 también está disponible. Dicho esto, el Intel UHD Graphics 770 con 32 EUs en el 13900HX es una de las opciones gráficas más débiles que Intel ofrece en los procesadores actuales. Por tanto, sólo puede realizar tareas básicas.
| 3DMark 11 Performance | 27613 puntos | |
| 3DMark Ice Storm Standard Score | 134251 puntos | |
| 3DMark Cloud Gate Standard Score | 52615 puntos | |
| 3DMark Fire Strike Score | 20964 puntos | |
| 3DMark Time Spy Score | 9236 puntos | |
ayuda | ||
| Geekbench 6.7 - GPU OpenCL | |
| Media de la clase Gaming (67235 - 253130, n=104, últimos 2 años) | |
| Schenker XMG Focus 15 (E23) | |
| Medio NVIDIA GeForce RTX 4050 Laptop GPU (60815 - 86892, n=21) | |
* ... más pequeño es mejor
Rendimiento de juego
Como se indicó anteriormente, los gráficos pueden ser manejados por el chip de Intel o la Nvidia GeForce RTX 4050. En realidad queríamos usar el modo de doble GPU con cambio automático para todas las pruebas. Sin embargo, la selección automática no funcionó bien en todos los casos. Por lo tanto, nuestras pruebas de juegos se ejecutaron en modo sólo dGPU.
Entre los dispositivos de comparación con la RTX 4050, el Focus 15 muestra el mejor rendimiento en juegos. Con la excepción de The Witcher 3 , la RTX 4050 produce aquí fps ligeramente superiores a lo habitual. Los resultados deDota 2 Renacido y X-Plane 11pueden parecer llamativos. El Focus 15 consigue más fps en ambos juegos que elPro 15 con la potente RTX 4060.
Sin embargo, ambos juegos están ahora más limitados por el rendimiento de la CPU que por el de la GPU. Esto queda especialmente claro cuando se compara el rendimiento de la Galaxy Book3 Ultra 16 con el Acer Swift Go. Ambos dispositivos utilizan elIntel Core i7-13700H con valores de TDP similares y pueden mostrar fps similares en Dota 2 Reborn.
| The Witcher 3 - 1920x1080 Ultra Graphics & Postprocessing (HBAO+) | |
| Media de la clase Gaming (104.7 - 240, n=7, últimos 2 años) | |
| Schenker XMG Pro 15 (E23) | |
| MSI Katana 15 B12VEK | |
| Asus TUF A15 FA507 | |
| Gigabyte Aero 14 OLED BMF | |
| Gigabyte Aero 14 OLED BMF | |
| Schenker XMG Focus 15 (E23) | |
| Samsung Galaxy Book3 Ultra 16 | |
| Acer Swift X SFX14-71G | |
| Acer Swift Go SFG16-71 | |
| Final Fantasy XV Benchmark - 1920x1080 High Quality | |
| Media de la clase Gaming (41 - 215, n=95, últimos 2 años) | |
| Schenker XMG Focus 15 (E23) | |
| MSI Katana 15 B12VEK | |
| Asus TUF A15 FA507 | |
| Acer Swift X SFX14-71G | |
| Gigabyte Aero 14 OLED BMF | |
| Samsung Galaxy Book3 Ultra 16 | |
| Acer Swift Go SFG16-71 | |
| bajo | medio | alto | ultra | QHD | 4K | |
|---|---|---|---|---|---|---|
| GTA V (2015) | 185.6 | 175.8 | 93.7 | |||
| The Witcher 3 (2015) | 64 | |||||
| Dota 2 Reborn (2015) | 193.2 | 181.6 | 175.8 | 160.7 | 106.6 | |
| Final Fantasy XV Benchmark (2018) | 114.1 | 85 | 58.5 | |||
| X-Plane 11.11 (2018) | 165.2 | 144.9 | 117 | 108.6 | ||
| Far Cry 5 (2018) | 141 | 131 | 123 | 86 | ||
| Strange Brigade (2018) | 417 | 218 | 175.4 | 151.2 | ||
| F1 22 (2022) | 244 | 234 | 174.7 | 55.7 | ||
| F1 23 (2023) | 259 | 235 | 164.5 | 45.3 | 36.9 |
Emisiones: Reposamanos derecho caliente
Emisiones sonoras
El Focus 15 tiene niveles de ruido de ventilador típicos de los portátiles para juegos. Con hasta 55 dB(A) medidos a una distancia de 15 cm, el dispositivo de pruebas a veces se vuelve desagradablemente ruidoso en el modo Rendimiento.
El modo Entretenimiento muestra emisiones de ruido en torno a los 50 dB(A). También puedes hacer funcionar el portátil casi en silencio con el modo Sleep a costa de perder bastante potencia de cálculo.
Ruido
| Ocioso |
| 24 / 25.14 / 35.14 dB(A) |
| Carga |
| 55.93 / 56.34 dB(A) |
 | ||
30 dB silencioso 40 dB(A) audible 50 dB(A) ruidosamente alto |
||
min: | ||
| Schenker XMG Focus 15 (E23) GeForce RTX 4050 Laptop GPU, i9-13900HX, Crucial P5 Plus 1TB CT1000P5PSSD8 | Schenker XMG Pro 15 (E23) GeForce RTX 4060 Laptop GPU, i9-13900HX, Crucial P5 Plus 1TB CT1000P5PSSD8 | Asus TUF A15 FA507 GeForce RTX 4050 Laptop GPU, R7 7735HS, Micron 2400 MTFDKBA512QFM | MSI Katana 15 B12VEK GeForce RTX 4050 Laptop GPU, i7-12650H, Micron 2400 MTFDKBA1T0QFM | Acer Swift X SFX14-71G GeForce RTX 4050 Laptop GPU, i7-13700H, Samsung PM9A1 MZVL21T0HCLR | Samsung Galaxy Book3 Ultra 16 GeForce RTX 4050 Laptop GPU, i7-13700H, Samsung PM9A1 MZVL2512HCJQ | Gigabyte Aero 14 OLED BMF GeForce RTX 4050 Laptop GPU, i7-13700H, Gigabyte AG470S1TB-SI B10 | |
|---|---|---|---|---|---|---|---|
| Noise | 7% | 20% | 13% | 1% | 12% | 6% | |
| apagado / medio ambiente * (dB) | 24 | 24 -0% | 23.3 3% | 24 -0% | 24.8 -3% | 25 -4% | 24 -0% |
| Idle Minimum * (dB) | 24 | 24 -0% | 23.3 3% | 24 -0% | 28.2 -18% | 26 -8% | 24 -0% |
| Idle Average * (dB) | 25.14 | 24 5% | 23.3 7% | 24 5% | 31.8 -26% | 27 -7% | 24 5% |
| Idle Maximum * (dB) | 35.14 | 24 32% | 23.3 34% | 24 32% | 31.8 10% | 28 20% | 35.71 -2% |
| Load Average * (dB) | 55.93 | 53.65 4% | 29.6 47% | 37.71 33% | 38.2 32% | 40 28% | |
| Witcher 3 ultra * (dB) | 54.62 | 53.53 2% | 43 21% | 45.75 16% | 50 8% | 39 29% | 40.22 26% |
| Load Maximum * (dB) | 56.34 | 53.65 5% | 43 24% | 54.55 3% | 52.2 7% | 41 27% | 51.93 8% |
* ... más pequeño es mejor
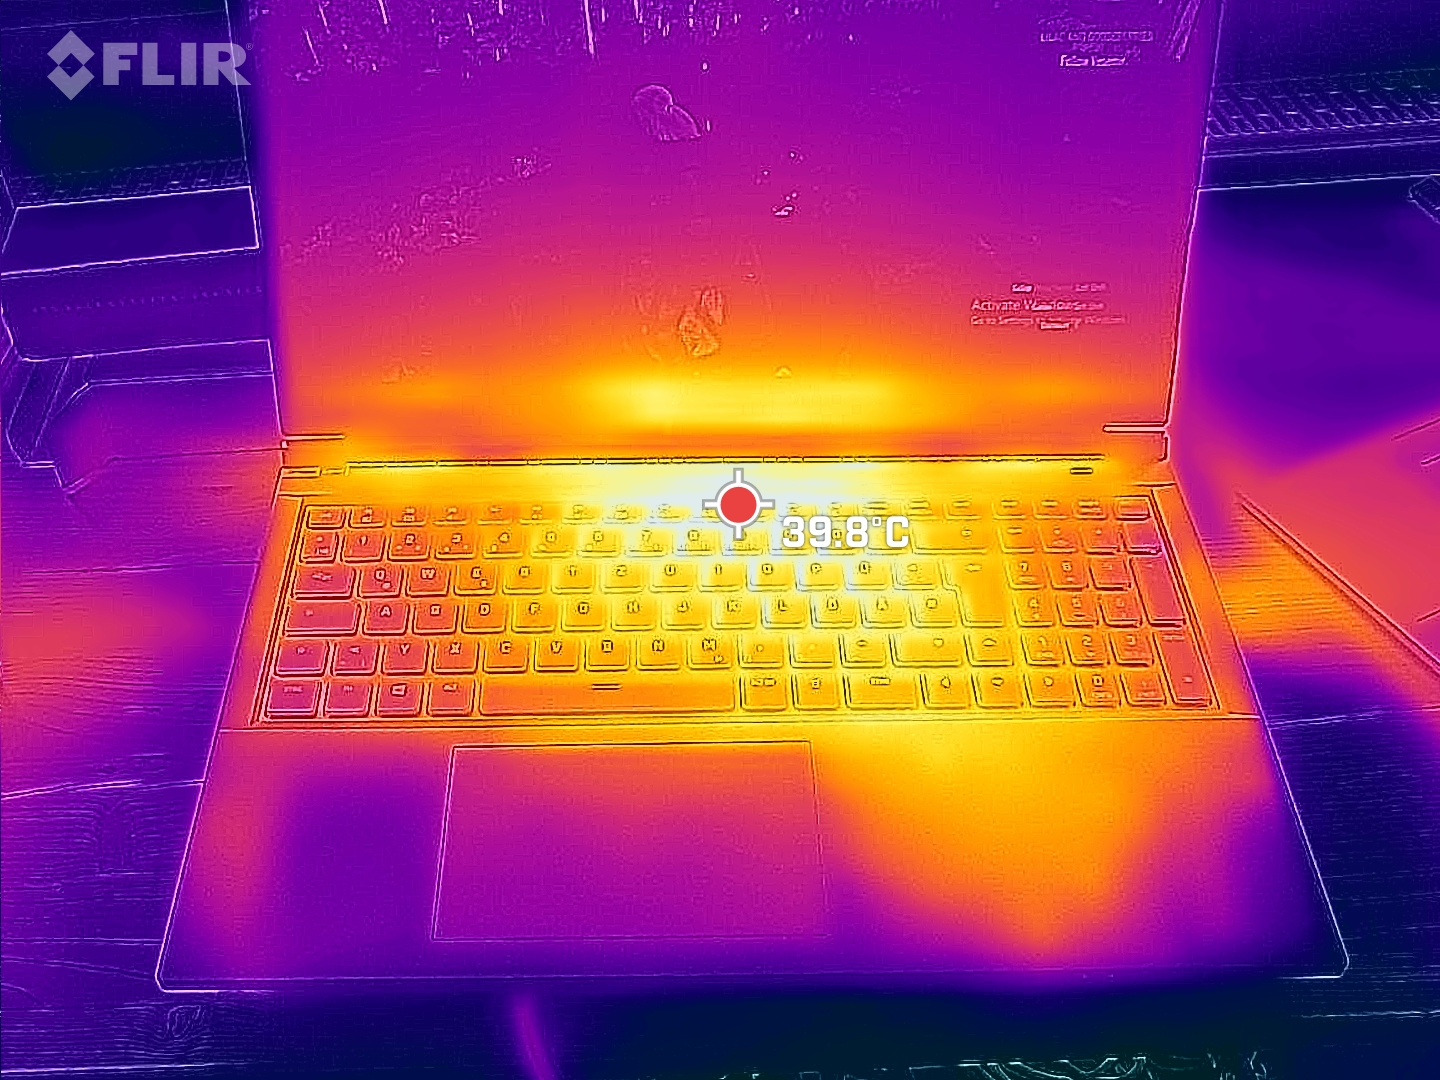
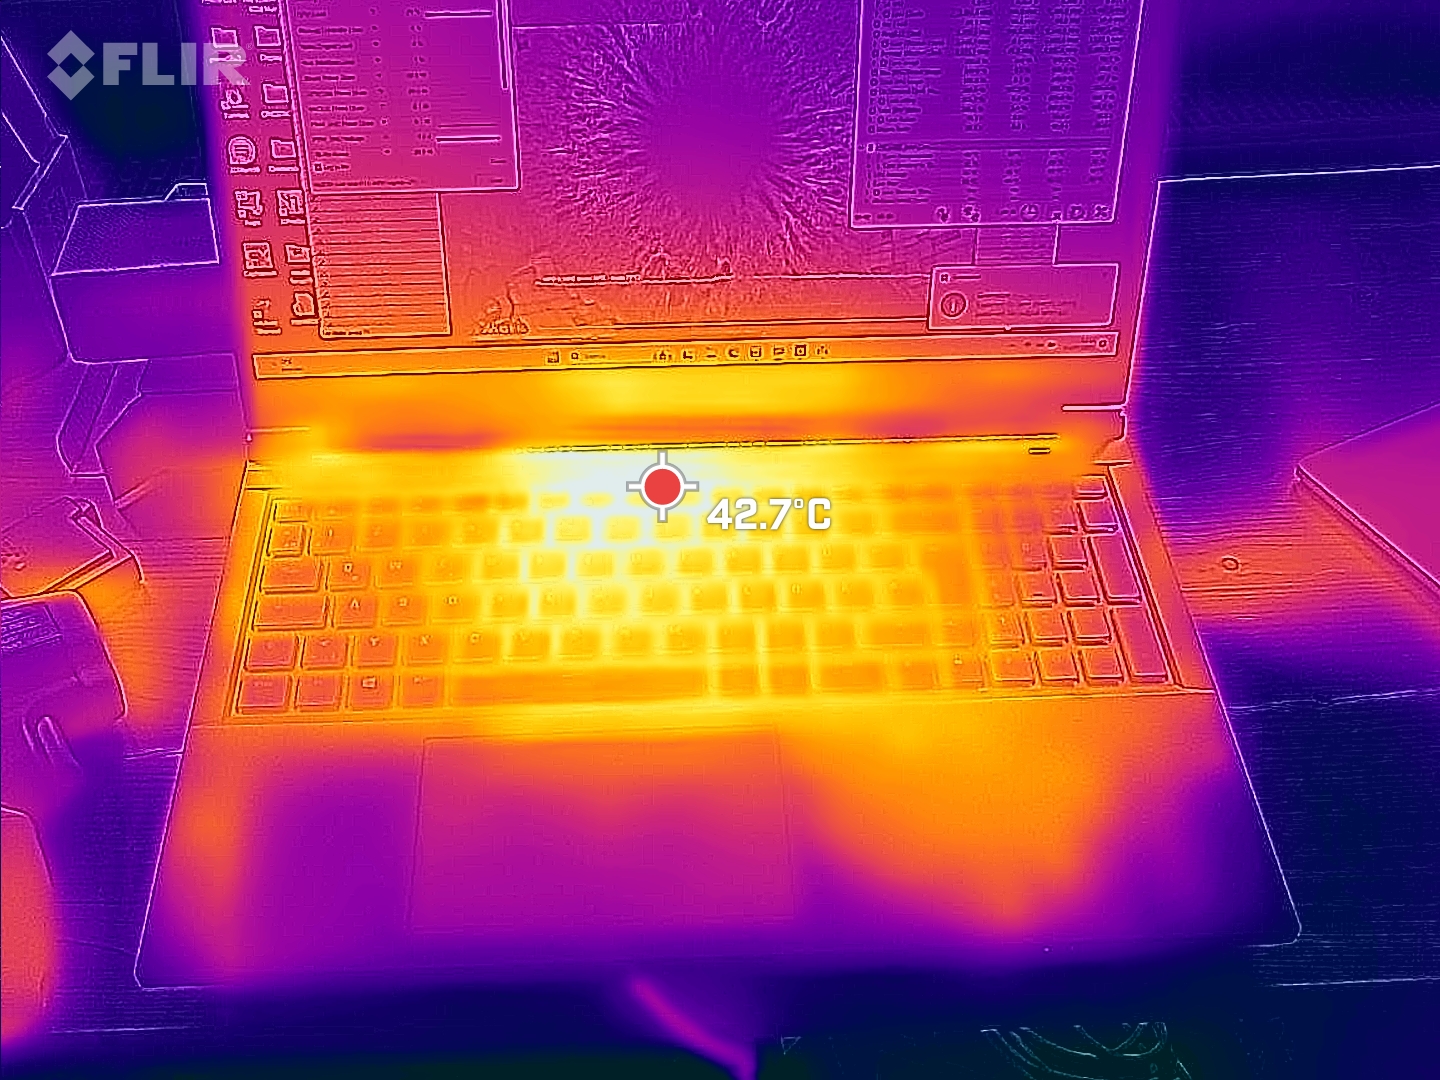
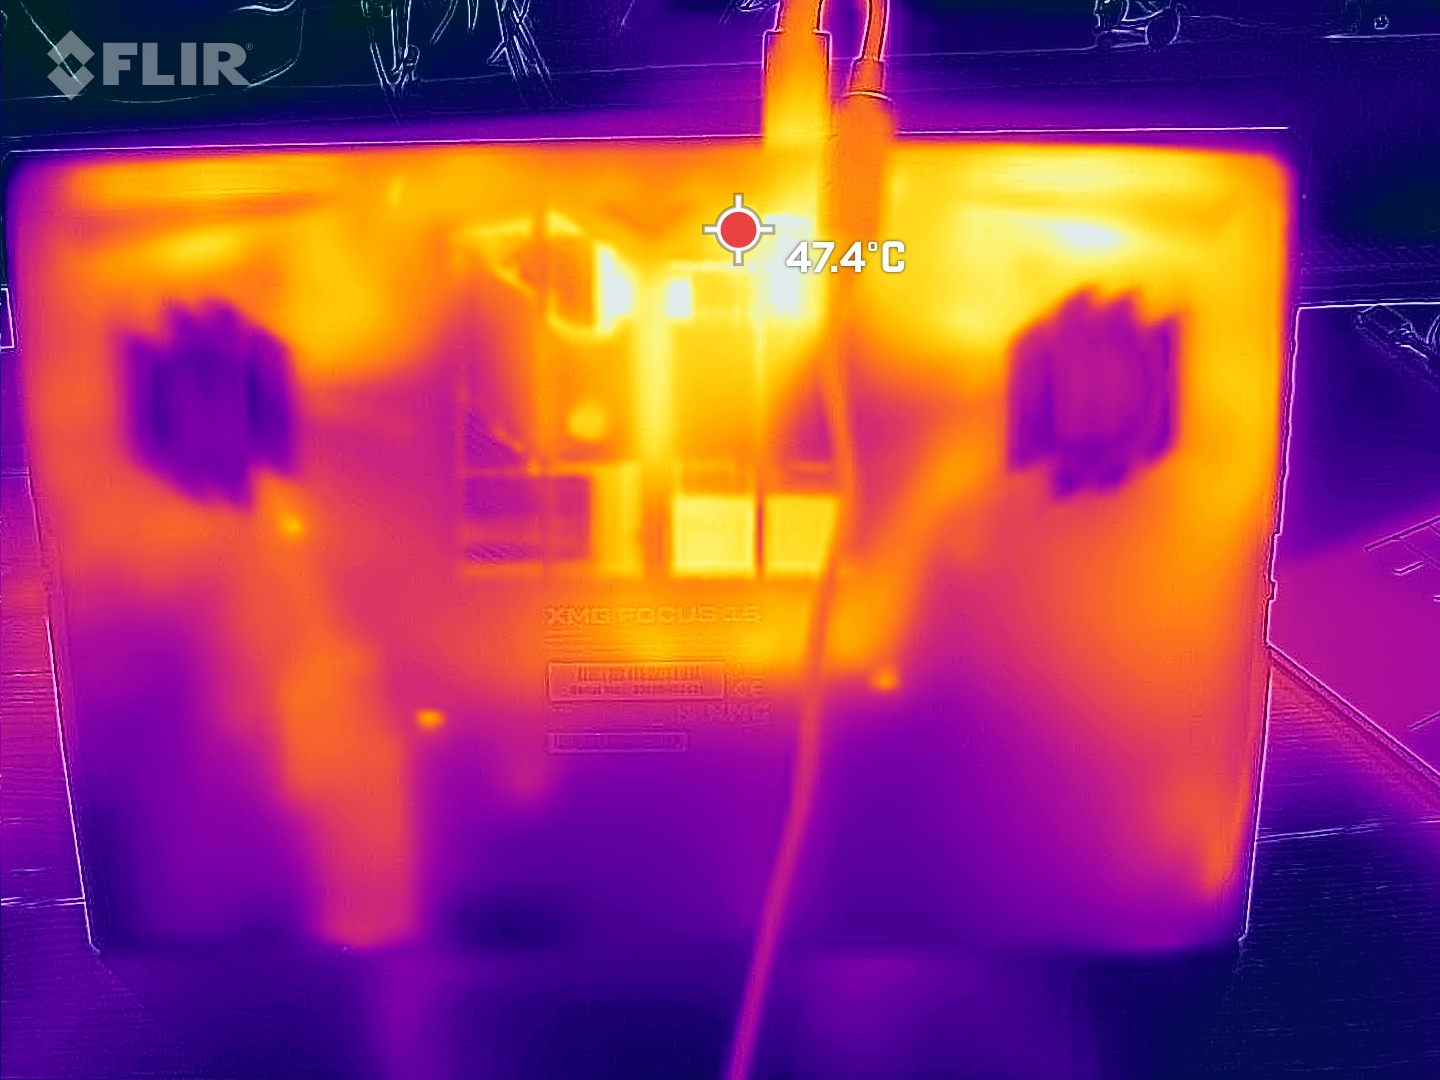
Temperatura
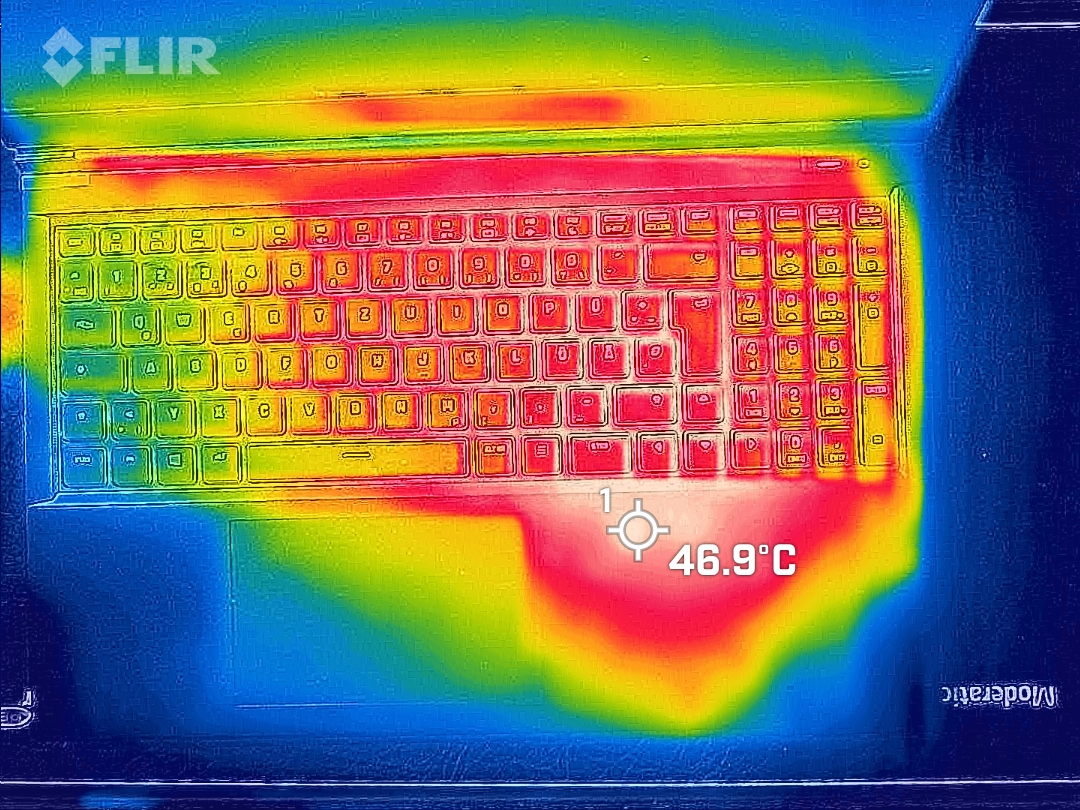
Las temperaturas superficiales de este portátil gaming no son nada frescas. Medimos puntos calientes de 51 °C, pero afortunadamente están lejos de los puntos de contacto habituales.
Sin embargo, el portátil también se calienta mucho en el reposamanos derecho durante el uso. Dado que normalmente usas un ratón externo para jugar, esto probablemente no sea un gran problema para los diestros. El reposamanos izquierdo y las teclas W, A, S, D se mantienen frescas.
Incluso la mayor carga del SSD NVMe instalado parece suficiente para aumentar la temperatura del reposamanos de forma significativa. Alcanzó casi 46 °C cuando instalamos nuestros juegos de prueba.
(-) La temperatura máxima en la parte superior es de 51 °C / 124 F, frente a la media de 40.4 °C / 105 F, que oscila entre 21.2 y 68.8 °C para la clase Gaming.
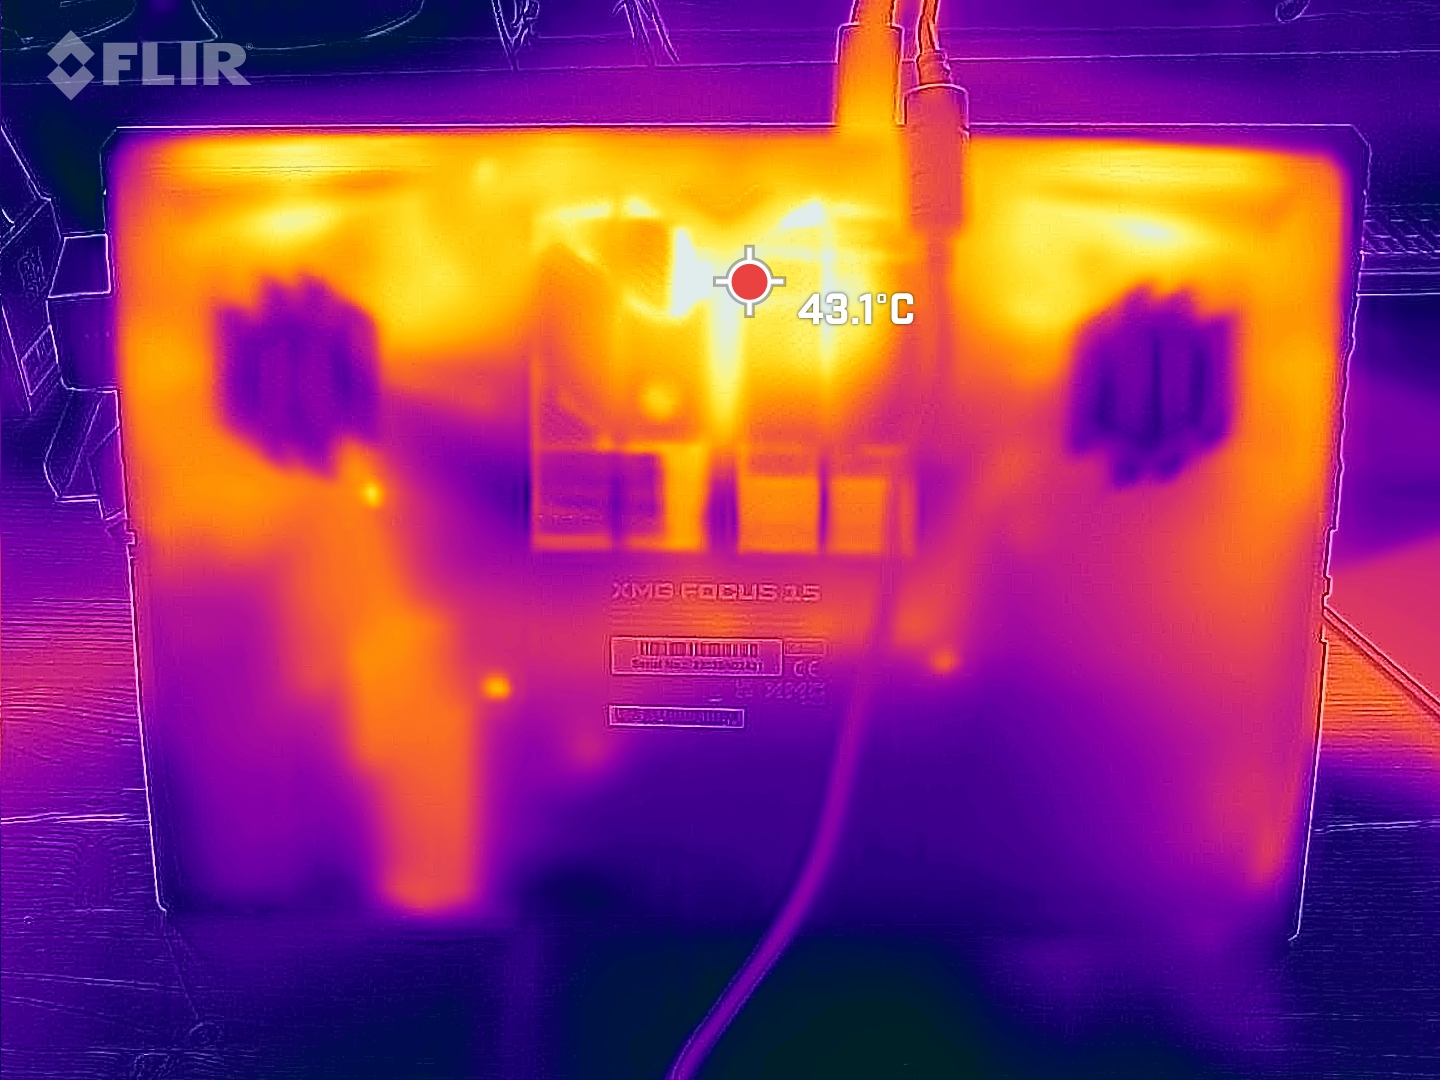
(-) El fondo se calienta hasta un máximo de 53 °C / 127 F, frente a la media de 43.2 °C / 110 F
(+) En reposo, la temperatura media de la parte superior es de 25.8 °C / 78# F, frente a la media del dispositivo de 33.9 °C / 93 F.
(±) Jugando a The Witcher 3, la temperatura media de la parte superior es de 36.2 °C / 97 F, frente a la media del dispositivo de 33.9 °C / 93 F.
(±) El reposamanos y el touchpad pueden calentarse mucho al tacto con un máximo de 36 °C / 96.8 F.
(-) La temperatura media de la zona del reposamanos de dispositivos similares fue de 28.8 °C / 83.8 F (-7.2 °C / -13 F).
| Schenker XMG Focus 15 (E23) Intel Core i9-13900HX, NVIDIA GeForce RTX 4050 Laptop GPU | Schenker XMG Pro 15 (E23) Intel Core i9-13900HX, NVIDIA GeForce RTX 4060 Laptop GPU | Asus TUF A15 FA507 AMD Ryzen 7 7735HS, NVIDIA GeForce RTX 4050 Laptop GPU | MSI Katana 15 B12VEK Intel Core i7-12650H, NVIDIA GeForce RTX 4050 Laptop GPU | Acer Swift X SFX14-71G Intel Core i7-13700H, NVIDIA GeForce RTX 4050 Laptop GPU | Samsung Galaxy Book3 Ultra 16 Intel Core i7-13700H, NVIDIA GeForce RTX 4050 Laptop GPU | Gigabyte Aero 14 OLED BMF Intel Core i7-13700H, NVIDIA GeForce RTX 4050 Laptop GPU | |
|---|---|---|---|---|---|---|---|
| Heat | -3% | 9% | -8% | 9% | 18% | 10% | |
| Maximum Upper Side * (°C) | 51 | 50 2% | 48.9 4% | 47 8% | 46.4 9% | 41 20% | 42 18% |
| Maximum Bottom * (°C) | 53 | 50 6% | 44.6 16% | 48 9% | 49 8% | 44 17% | 52 2% |
| Idle Upper Side * (°C) | 29 | 33 -14% | 27.1 7% | 35 -21% | 26.5 9% | 23 21% | 26 10% |
| Idle Bottom * (°C) | 30 | 32 -7% | 27.5 8% | 38 -27% | 26.6 11% | 26 13% | 27 10% |
* ... más pequeño es mejor
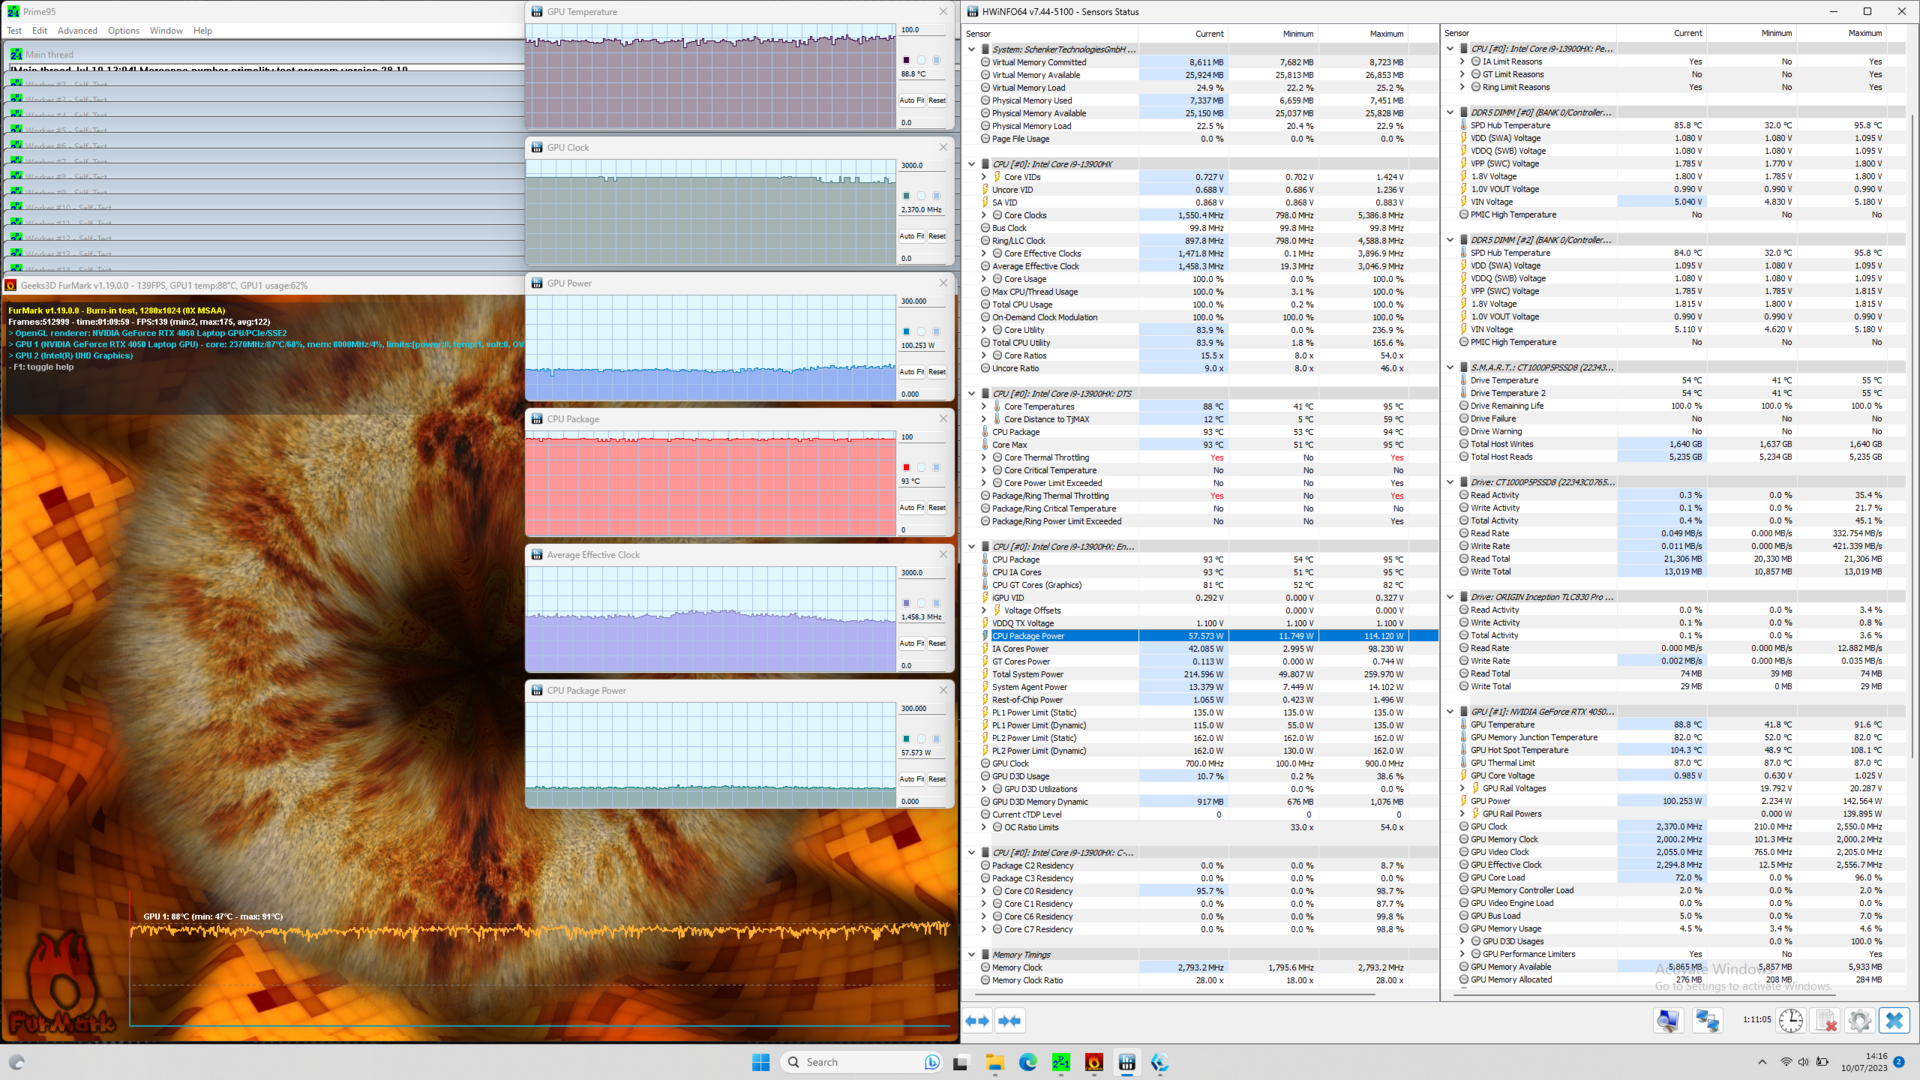
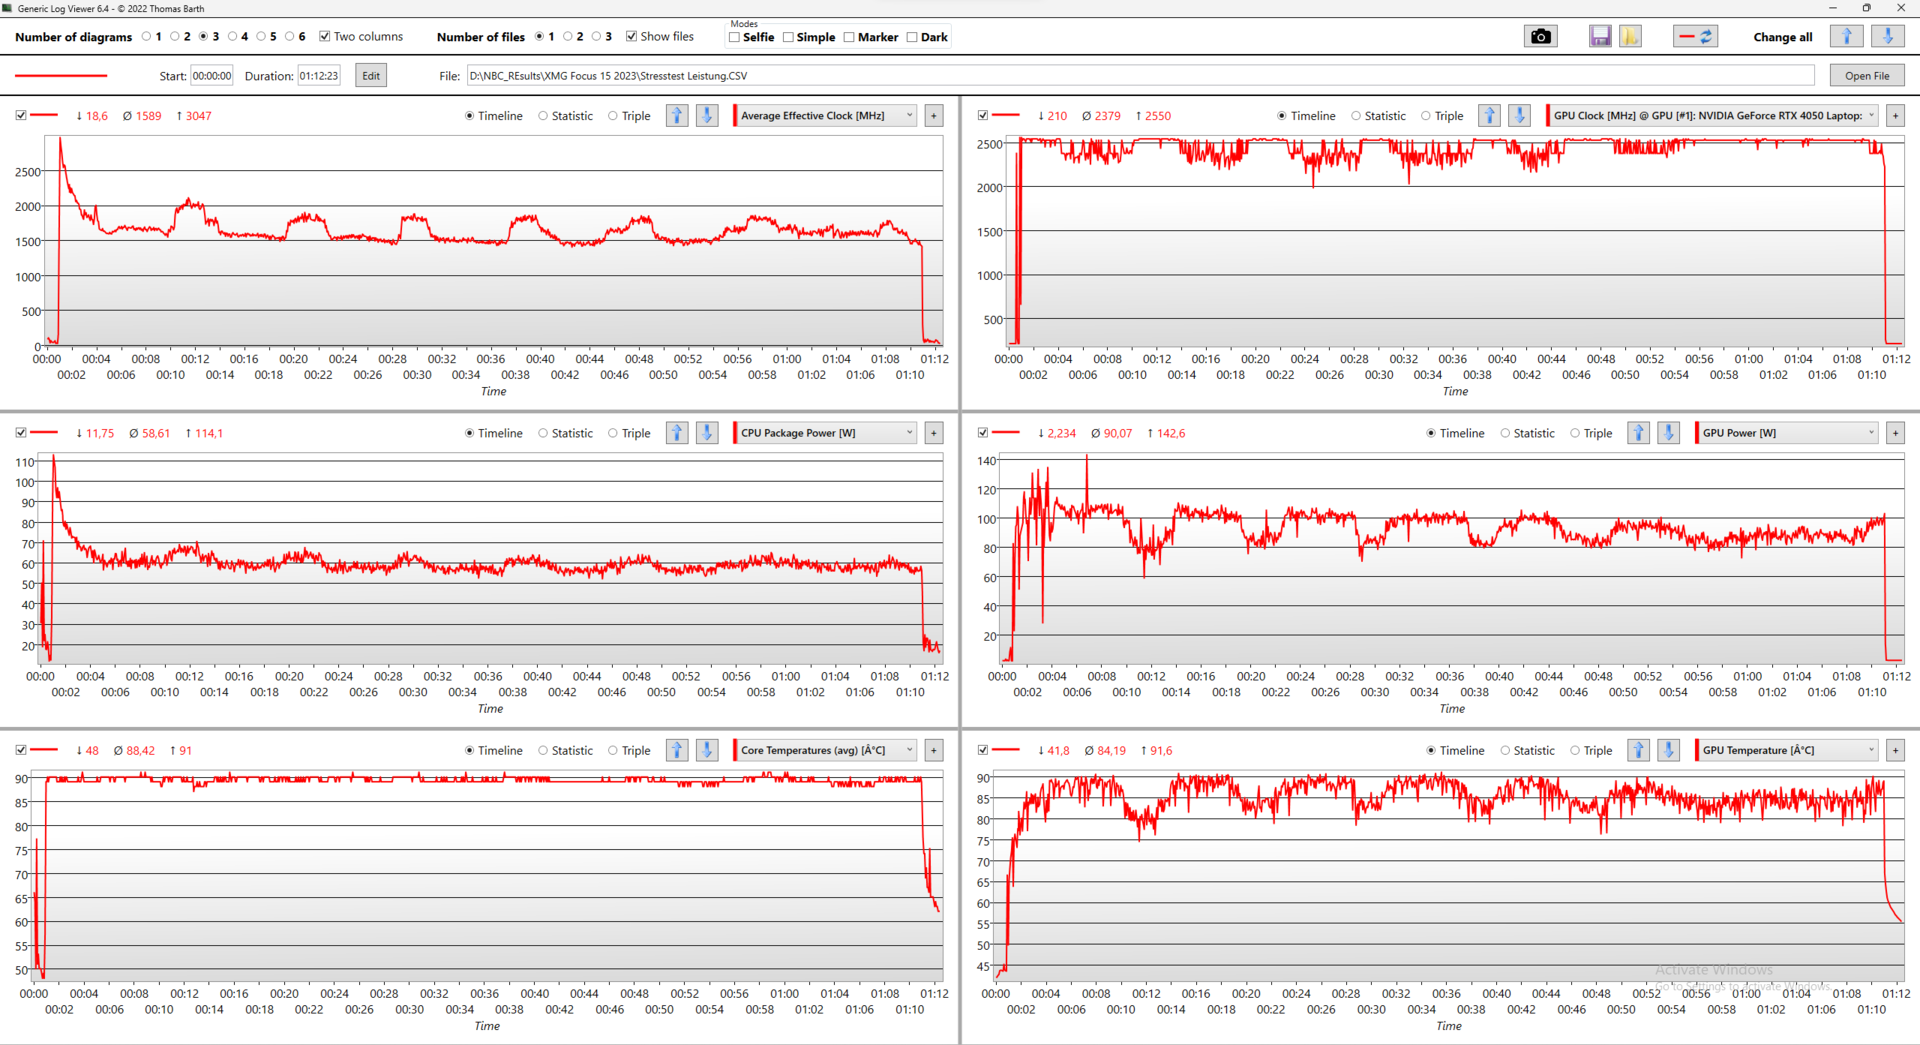
Prueba de esfuerzo
El XMG Focus 15 sobrevive a la prueba de estrés con Prime95 y Furmark a altas temperaturas con un rendimiento constante. No pudimos determinar una caída de las frecuencias CPU o GPU tras la fase boost.
A cambio, las temperaturas del Core i9 son relativamente altas, en torno a los 90 °C. Sin embargo, mirando los registros de la prueba de estrés, tenemos que notar que los valores declarados por Schenker no se mantienen a largo plazo.
Tras unos 10 minutos en la prueba de estrés, el rendimiento de la CPU se asienta en torno a los 60 W y el consumo de energía de la GPU en 100 W. Mientras tanto, el Dynamic Boost de 15 W se alterna entre el procesador y el chip gráfico de vez en cuando.
Altavoz
Los altavoces del Focus 15 presentan relativamente bien los medios y los agudos, pero apenas sirven para los graves. Así, el Focus 15 suena un poco mejor que el Pro 15.
Si los altavoces integrados te parecen insuficientes, siempre puedes usar dispositivos externos conectados por Bluetooth o el conector de 3,5 mm.
Schenker XMG Focus 15 (E23) análisis de audio
(±) | la sonoridad del altavoz es media pero buena (77.39 dB)
Graves 100 - 315 Hz
(-) | casi sin bajos - de media 29% inferior a la mediana
(±) | la linealidad de los graves es media (9.5% delta a frecuencia anterior)
Medios 400 - 2000 Hz
(±) | medias más altas - de media 5.2% más altas que la mediana
(±) | la linealidad de los medios es media (7.2% delta respecto a la frecuencia anterior)
Altos 2 - 16 kHz
(±) | máximos más altos - de media 5.4% más altos que la mediana
(+) | los máximos son lineales (3.4% delta a la frecuencia anterior)
Total 100 - 16.000 Hz
(±) | la linealidad del sonido global es media (24.9% de diferencia con la mediana)
En comparación con la misma clase
» 89% de todos los dispositivos probados de esta clase eran mejores, 3% similares, 7% peores
» El mejor tuvo un delta de 6%, la media fue 18%, el peor fue ###max##%
En comparación con todos los dispositivos probados
» 76% de todos los dispositivos probados eran mejores, 5% similares, 19% peores
» El mejor tuvo un delta de 4%, la media fue 23%, el peor fue ###max##%
Schenker XMG Pro 15 (E23) análisis de audio
(±) | la sonoridad del altavoz es media pero buena (72.52 dB)
Graves 100 - 315 Hz
(±) | lubina reducida - en promedio 12.9% inferior a la mediana
(±) | la linealidad de los graves es media (7.2% delta a frecuencia anterior)
Medios 400 - 2000 Hz
(±) | medias más altas - de media 6.2% más altas que la mediana
(±) | la linealidad de los medios es media (7.8% delta respecto a la frecuencia anterior)
Altos 2 - 16 kHz
(+) | máximos equilibrados - a sólo 2.5% de la mediana
(+) | los máximos son lineales (4.6% delta a la frecuencia anterior)
Total 100 - 16.000 Hz
(±) | la linealidad del sonido global es media (18% de diferencia con la mediana)
En comparación con la misma clase
» 56% de todos los dispositivos probados de esta clase eran mejores, 9% similares, 36% peores
» El mejor tuvo un delta de 6%, la media fue 18%, el peor fue ###max##%
En comparación con todos los dispositivos probados
» 38% de todos los dispositivos probados eran mejores, 8% similares, 54% peores
» El mejor tuvo un delta de 4%, la media fue 23%, el peor fue ###max##%
Gestión de la energía: Portátil para juegos que consume mucha energía
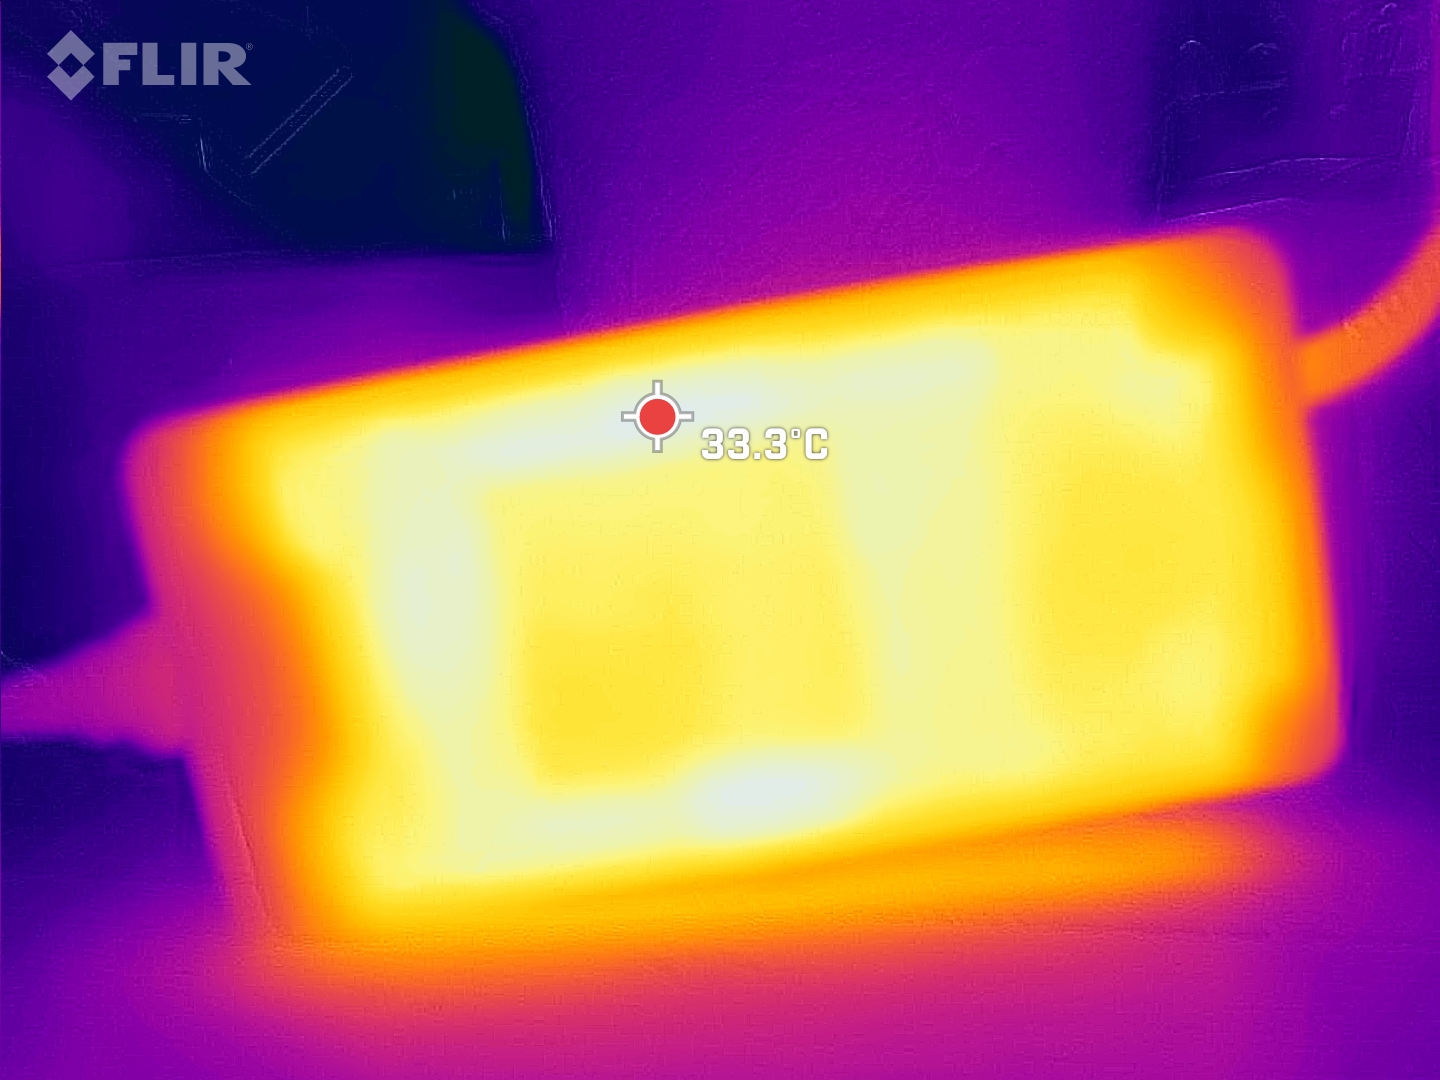
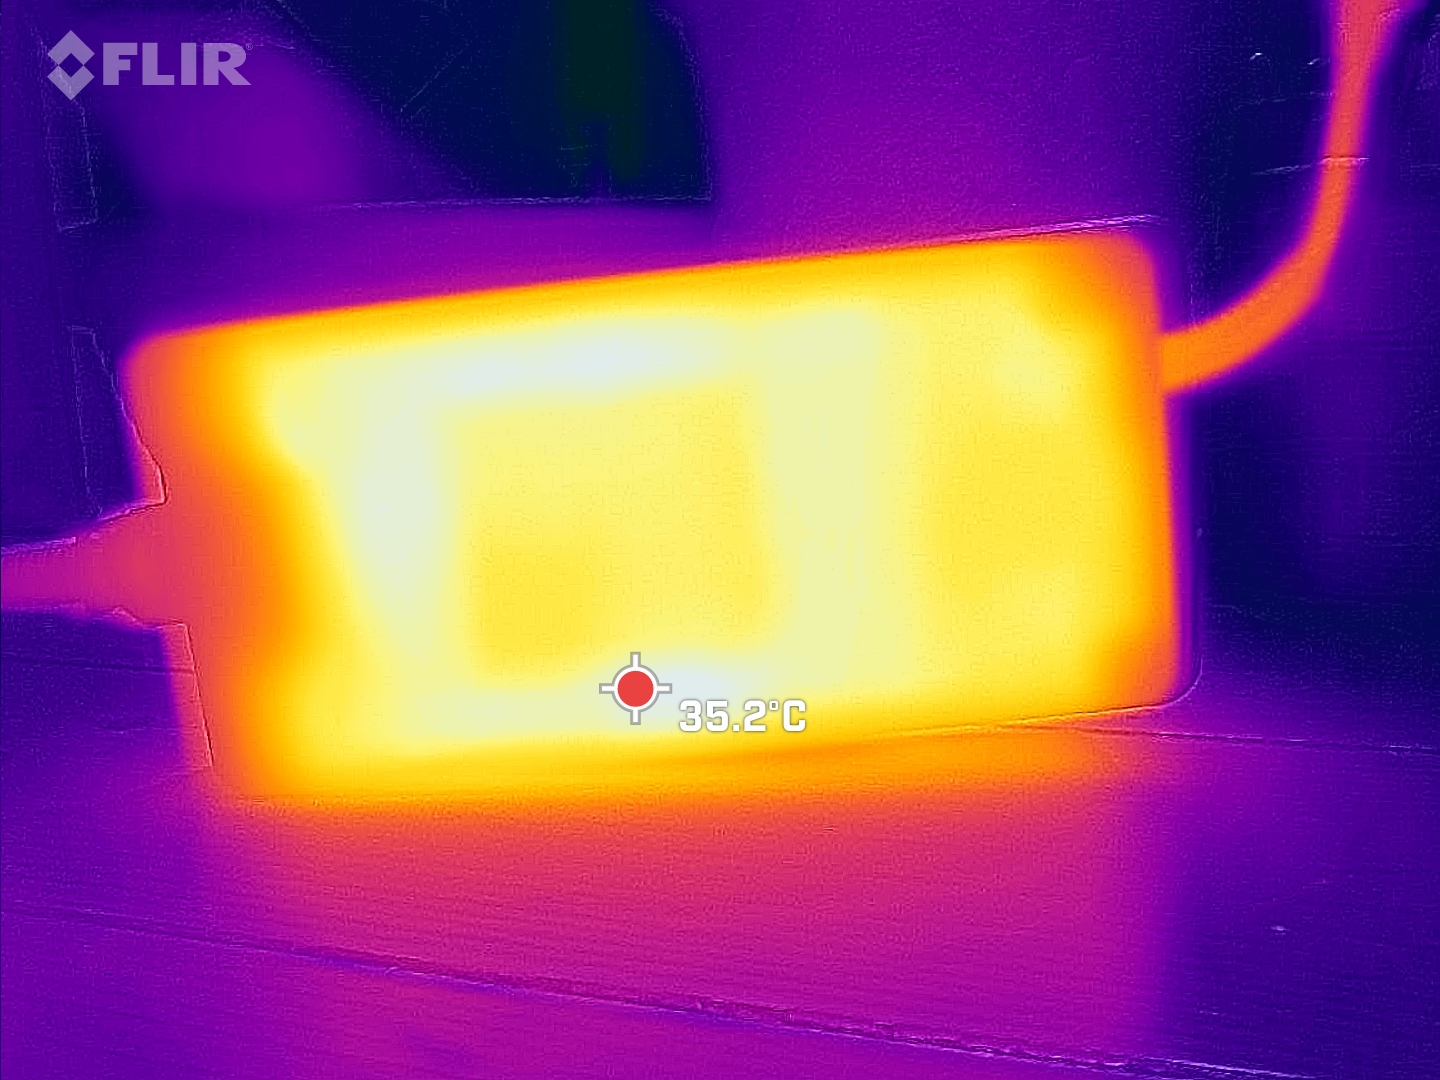
Consumo de energía
El Schenker XMG Focus 15 viene con un hambre de energía de clase estándar. Incluye una gran fuente de alimentación que puede suministrar hasta 280 W.
Curiosamente, el consumo máximo de carga es mayor en el Focus 15 que en el Pro 15, por lo que la potencia de la fuente de alimentación también se aprovecha al máximo.
Cuando funciona con un monitor externo, el portátil es incluso estable por encima de 280 W en la prueba de estrés. Con el monitor interno, el consumo de energía bajó un poco en poco tiempo.
| Off / Standby | |
| Ocioso | |
| Carga |
|
Clave:
min: | |
| Schenker XMG Focus 15 (E23) i9-13900HX, GeForce RTX 4050 Laptop GPU, Crucial P5 Plus 1TB CT1000P5PSSD8, IPS, 2569x1440, 15.6" | Schenker XMG Pro 15 (E23) i9-13900HX, GeForce RTX 4060 Laptop GPU, Crucial P5 Plus 1TB CT1000P5PSSD8, IPS, 2560x1440, 15.6" | Asus TUF A15 FA507 R7 7735HS, GeForce RTX 4050 Laptop GPU, Micron 2400 MTFDKBA512QFM, IPS, 1920x1080, 15.6" | MSI Katana 15 B12VEK i7-12650H, GeForce RTX 4050 Laptop GPU, Micron 2400 MTFDKBA1T0QFM, IPS, 1920x1080, 15.6" | Acer Swift X SFX14-71G i7-13700H, GeForce RTX 4050 Laptop GPU, Samsung PM9A1 MZVL21T0HCLR, OLED, 2880x1800, 14.5" | Samsung Galaxy Book3 Ultra 16 i7-13700H, GeForce RTX 4050 Laptop GPU, Samsung PM9A1 MZVL2512HCJQ, AMOLED, 2880x1800, 16" | Gigabyte Aero 14 OLED BMF i7-13700H, GeForce RTX 4050 Laptop GPU, Gigabyte AG470S1TB-SI B10, OLED, 2880x1800, 14" | Medio NVIDIA GeForce RTX 4050 Laptop GPU | Media de la clase Gaming | |
|---|---|---|---|---|---|---|---|---|---|
| Power Consumption | -39% | 40% | 41% | 47% | 64% | 54% | 23% | 1% | |
| Idle Minimum * (Watt) | 11.4 | 21.6 -89% | 8 30% | 8.5 25% | 8.4 26% | 3 74% | 7.4 35% | 9.95 ? 13% | 13 ? -14% |
| Idle Average * (Watt) | 16.7 | 29 -74% | 12.1 28% | 10.2 39% | 11.5 31% | 5 70% | 8.3 50% | 15.8 ? 5% | 19 ? -14% |
| Idle Maximum * (Watt) | 25.8 | 42.7 -66% | 12.5 52% | 11.3 56% | 11.9 54% | 11 57% | 8.7 66% | 20.1 ? 22% | 24.6 ? 5% |
| Load Average * (Watt) | 139 | 190 -37% | 74.9 46% | 84 40% | 84.9 39% | 72 48% | 76 45% | 88 ? 37% | 110.7 ? 20% |
| Witcher 3 ultra * (Watt) | 265 | 189 29% | 136.6 48% | 128 52% | 83.6 68% | 69.7 74% | 70 74% | ||
| Load Maximum * (Watt) | 280 | 269 4% | 185 34% | 189 32% | 104.2 63% | 108 61% | 132 53% | 176.3 ? 37% | 259 ? 7% |
* ... más pequeño es mejor
Power consumption: The Witcher 3 / Stress test
Power consumption: External Monitor
Duración de la batería
Determinamos casi seis horas de autonomía en la prueba práctica de navegación web por Wi-Fi. Así, el dispositivo de pruebas está sólo dos minutos por debajo de la media de portátiles para juegos.
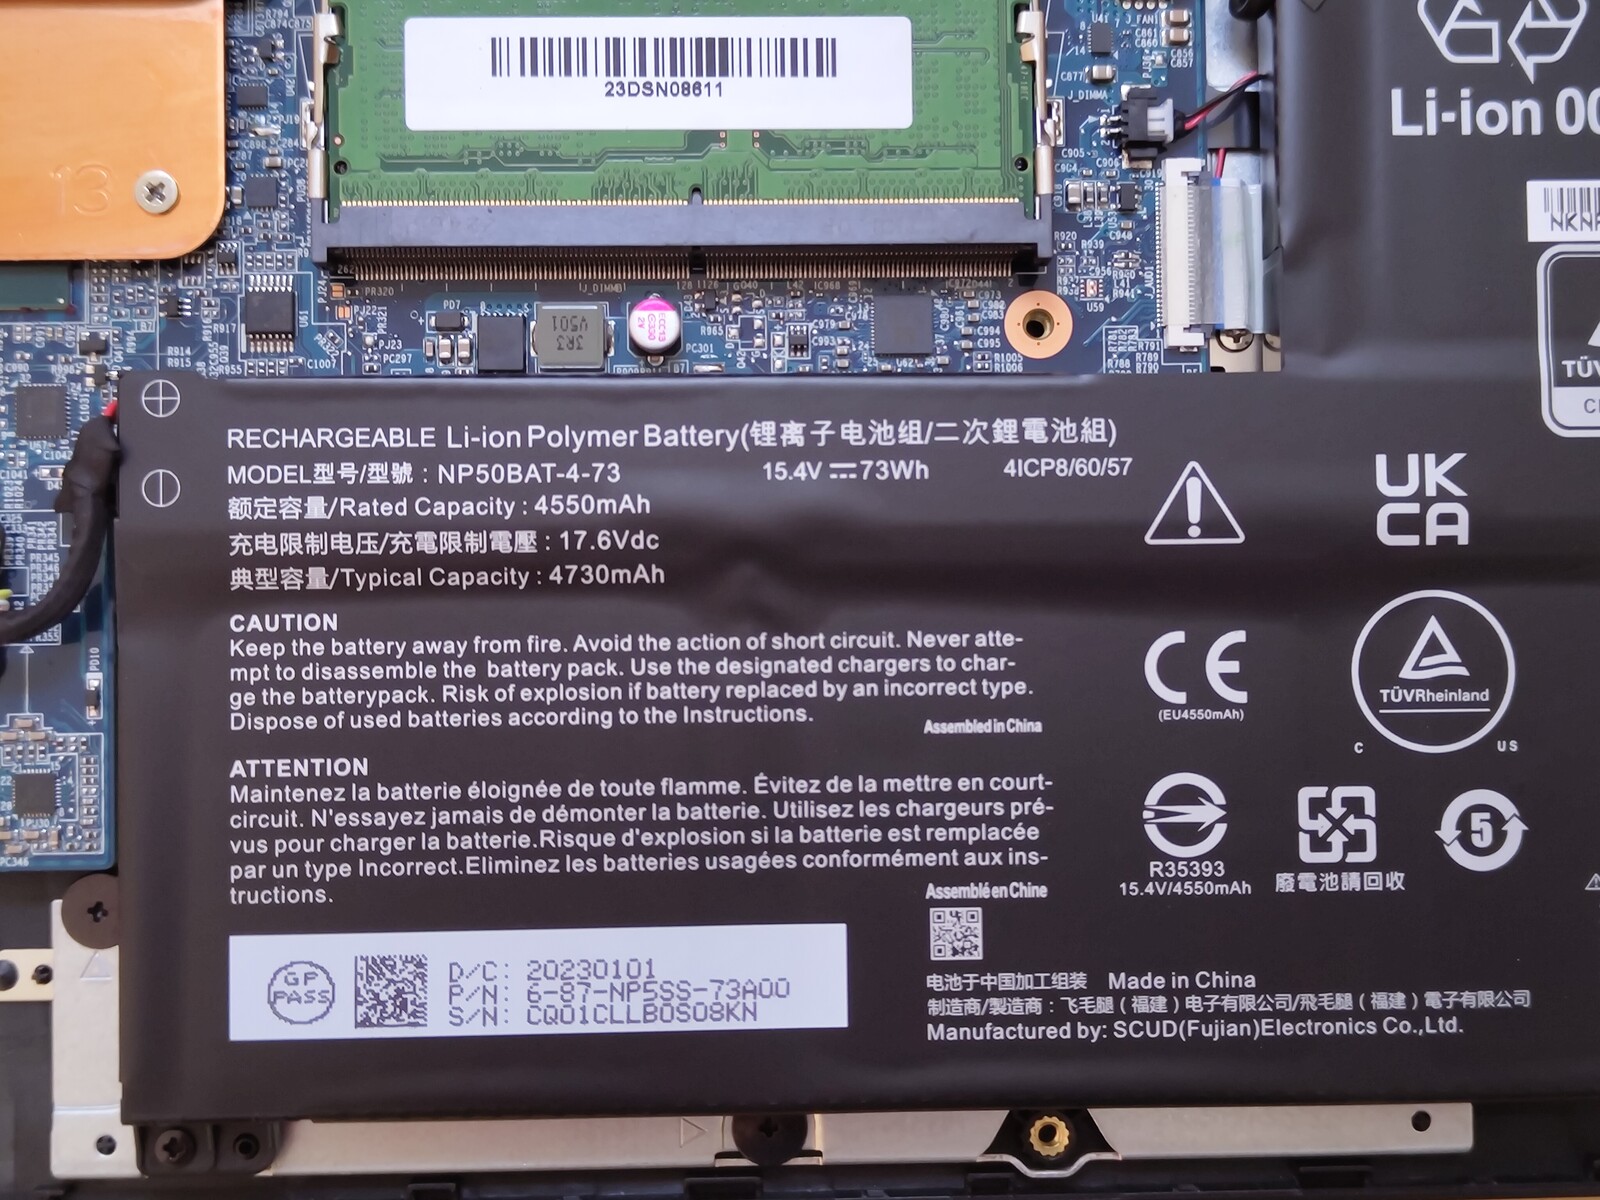
Mientras tanto, los jugadores pueden conseguir duraciones mucho mayores en modo batería. Sin embargo, los 73 Wh de capacidad de la batería se agotan con bastante rapidez.
| Schenker XMG Focus 15 (E23) i9-13900HX, GeForce RTX 4050 Laptop GPU, 73 Wh | Schenker XMG Pro 15 (E23) i9-13900HX, GeForce RTX 4060 Laptop GPU, 80 Wh | Asus TUF A15 FA507 R7 7735HS, GeForce RTX 4050 Laptop GPU, 90 Wh | MSI Katana 15 B12VEK i7-12650H, GeForce RTX 4050 Laptop GPU, 53.5 Wh | Acer Swift X SFX14-71G i7-13700H, GeForce RTX 4050 Laptop GPU, 76 Wh | Samsung Galaxy Book3 Ultra 16 i7-13700H, GeForce RTX 4050 Laptop GPU, 76 Wh | Gigabyte Aero 14 OLED BMF i7-13700H, GeForce RTX 4050 Laptop GPU, 63 Wh | Media de la clase Gaming | |
|---|---|---|---|---|---|---|---|---|
| Duración de Batería | 22% | 38% | -6% | -8% | 51% | 22% | 19% | |
| WiFi v1.3 (h) | 5.9 | 5.7 -3% | 11.7 98% | 4.3 -27% | 7.7 31% | 9.6 63% | 7.6 29% | 7.11 ? 21% |
| Load (h) | 1.3 | 1.9 46% | 1 -23% | 1.5 15% | 0.7 -46% | 1.8 38% | 1.5 15% | 1.502 ? 16% |
| H.264 (h) | 12.5 | 4.4 | 9.5 | 13.4 | 8.32 ? | |||
| Reader / Idle (h) | 18.2 | 11.3 | 8.27 ? |
Pro
Contra
Veredicto: XMG captura la esencia del juego
Si quieres un portátil de 15,6 pulgadas con una GPU Nvidia actual de Schenker o XMG, puedes elegir entre elXMG Apex 15 Max y Focus, así como los Schenker Key y Media. El XMG Pro 15 y el XMG Focus 15 están muy cerca el uno del otro en la prueba.
El Focus 15 se centra en lo básico. El portátil para juegos convence principalmente con un hardware informático de alto rendimiento. ElIntel Core i9-13900HX y Nvidia GeForce RTX 4050 funcionan a un nivel de rendimiento muy alto. Si bien esto resulta en altas puntuaciones en los benchmarks, también contribuye a altas temperaturas superficiales, ventiladores más ruidosos, y menor duración de batería comparado con muchos de sus contemporáneos, como el Asus TUF A15.
Si el chasis tiene que venir con mucho metal como el Pro 15 o si puede ser de plástico es cuestión de gustos. Desde fuera, el Pro 15 y el Focus 15 parecen muy similares. Sin embargo, el modelo de pruebas ofrece menos conectividad y carece de puerto USB Type-C con Power Delivery.
El XMG Focus 15 cumple los requisitos básicos de un portátil gaming. Gracias a las muchas opciones de configuración, se puede adaptar a las necesidades del usuario.
Al igual que con el Pro 15, solo se pueden encontrar unos pocos puntos negativos en el Focus 15. Esto se debe a que todos los inconvenientes que muestra el portátil son típicos para su clase de precio y rendimiento.
Comparado con otros portátiles de juego más baratos como el Asus TUF A15 o el MSI Katana 15, el potentísimo Core i9-13900HX y la buena pantalla QHD del XMG Focus destacan positivamente.
Precio y disponibilidad
El XMG Focus 15 se puede configurar libremente en Bestware. Hay disponibles dos opciones de pantalla, tres GPU y varias combinaciones de memoria. En la configuración básica absoluta, con sólo 8 GB de memoria de trabajo y sin SSD ni Windows, el precio de entrada ronda los 1.440 Euros.
Para una configuración con pantalla Full HD, 16 GB de memoria de trabajo y un SSD Samsung de 1 TB, Bestware cobra unos 1.560 euros. Nuestra configuración de prueba cuesta unos 300 euros más. Si planeas ir a por todas y seleccionar los componentes más caros, espera gastar más de 3.500 € por este portátil.
Schenker XMG Focus 15 (E23)
- 07/10/2023 v7 (old)
Marc Herter
Transparencia
La selección de los dispositivos que se van a reseñar corre a cargo de nuestro equipo editorial. La muestra de prueba fue proporcionada al autor en calidad de préstamo por el fabricante o el minorista a los efectos de esta reseña. El prestamista no tuvo ninguna influencia en esta reseña, ni el fabricante recibió una copia de la misma antes de su publicación. No había ninguna obligación de publicar esta reseña. Como empresa de medios independiente, Notebookcheck no está sujeta a la autoridad de fabricantes, minoristas o editores.
Así es como prueba Notebookcheck
Cada año, Notebookcheck revisa de forma independiente cientos de portátiles y smartphones utilizando procedimientos estandarizados para asegurar que todos los resultados son comparables. Hemos desarrollado continuamente nuestros métodos de prueba durante unos 20 años y hemos establecido los estándares de la industria en el proceso. En nuestros laboratorios de pruebas, técnicos y editores experimentados utilizan equipos de medición de alta calidad. Estas pruebas implican un proceso de validación en varias fases. Nuestro complejo sistema de clasificación se basa en cientos de mediciones y puntos de referencia bien fundamentados, lo que mantiene la objetividad.Price comparison
