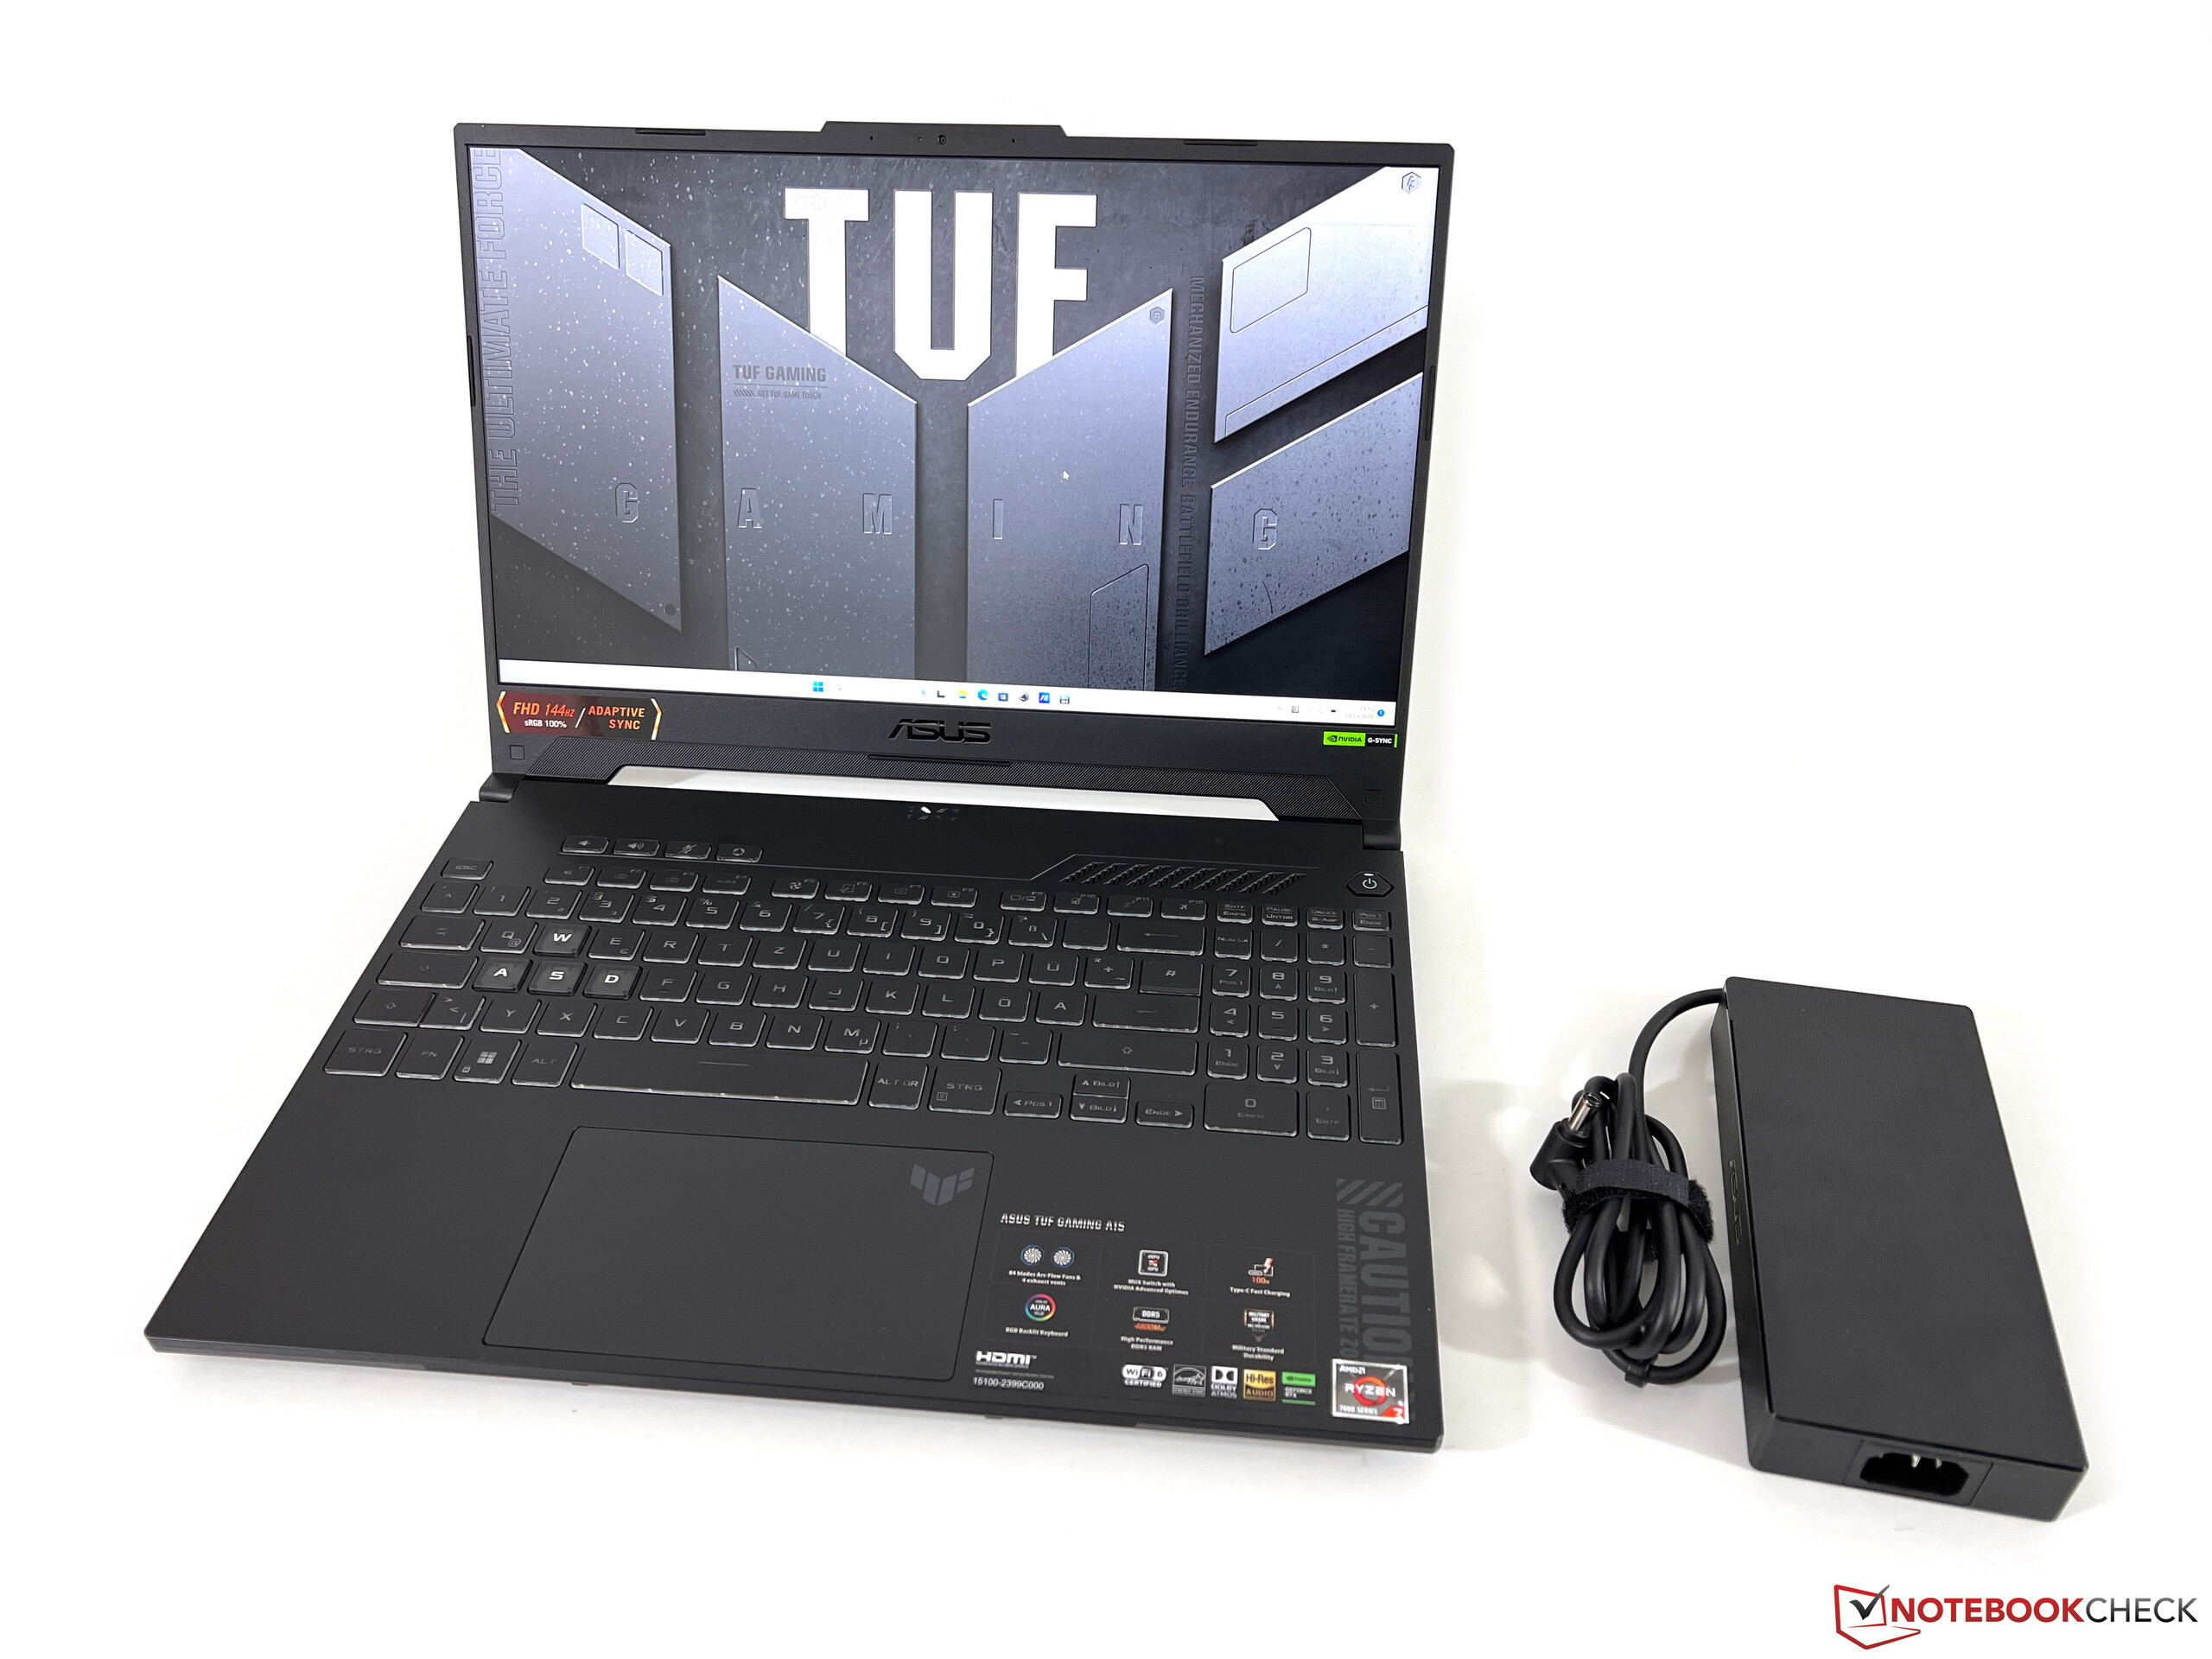
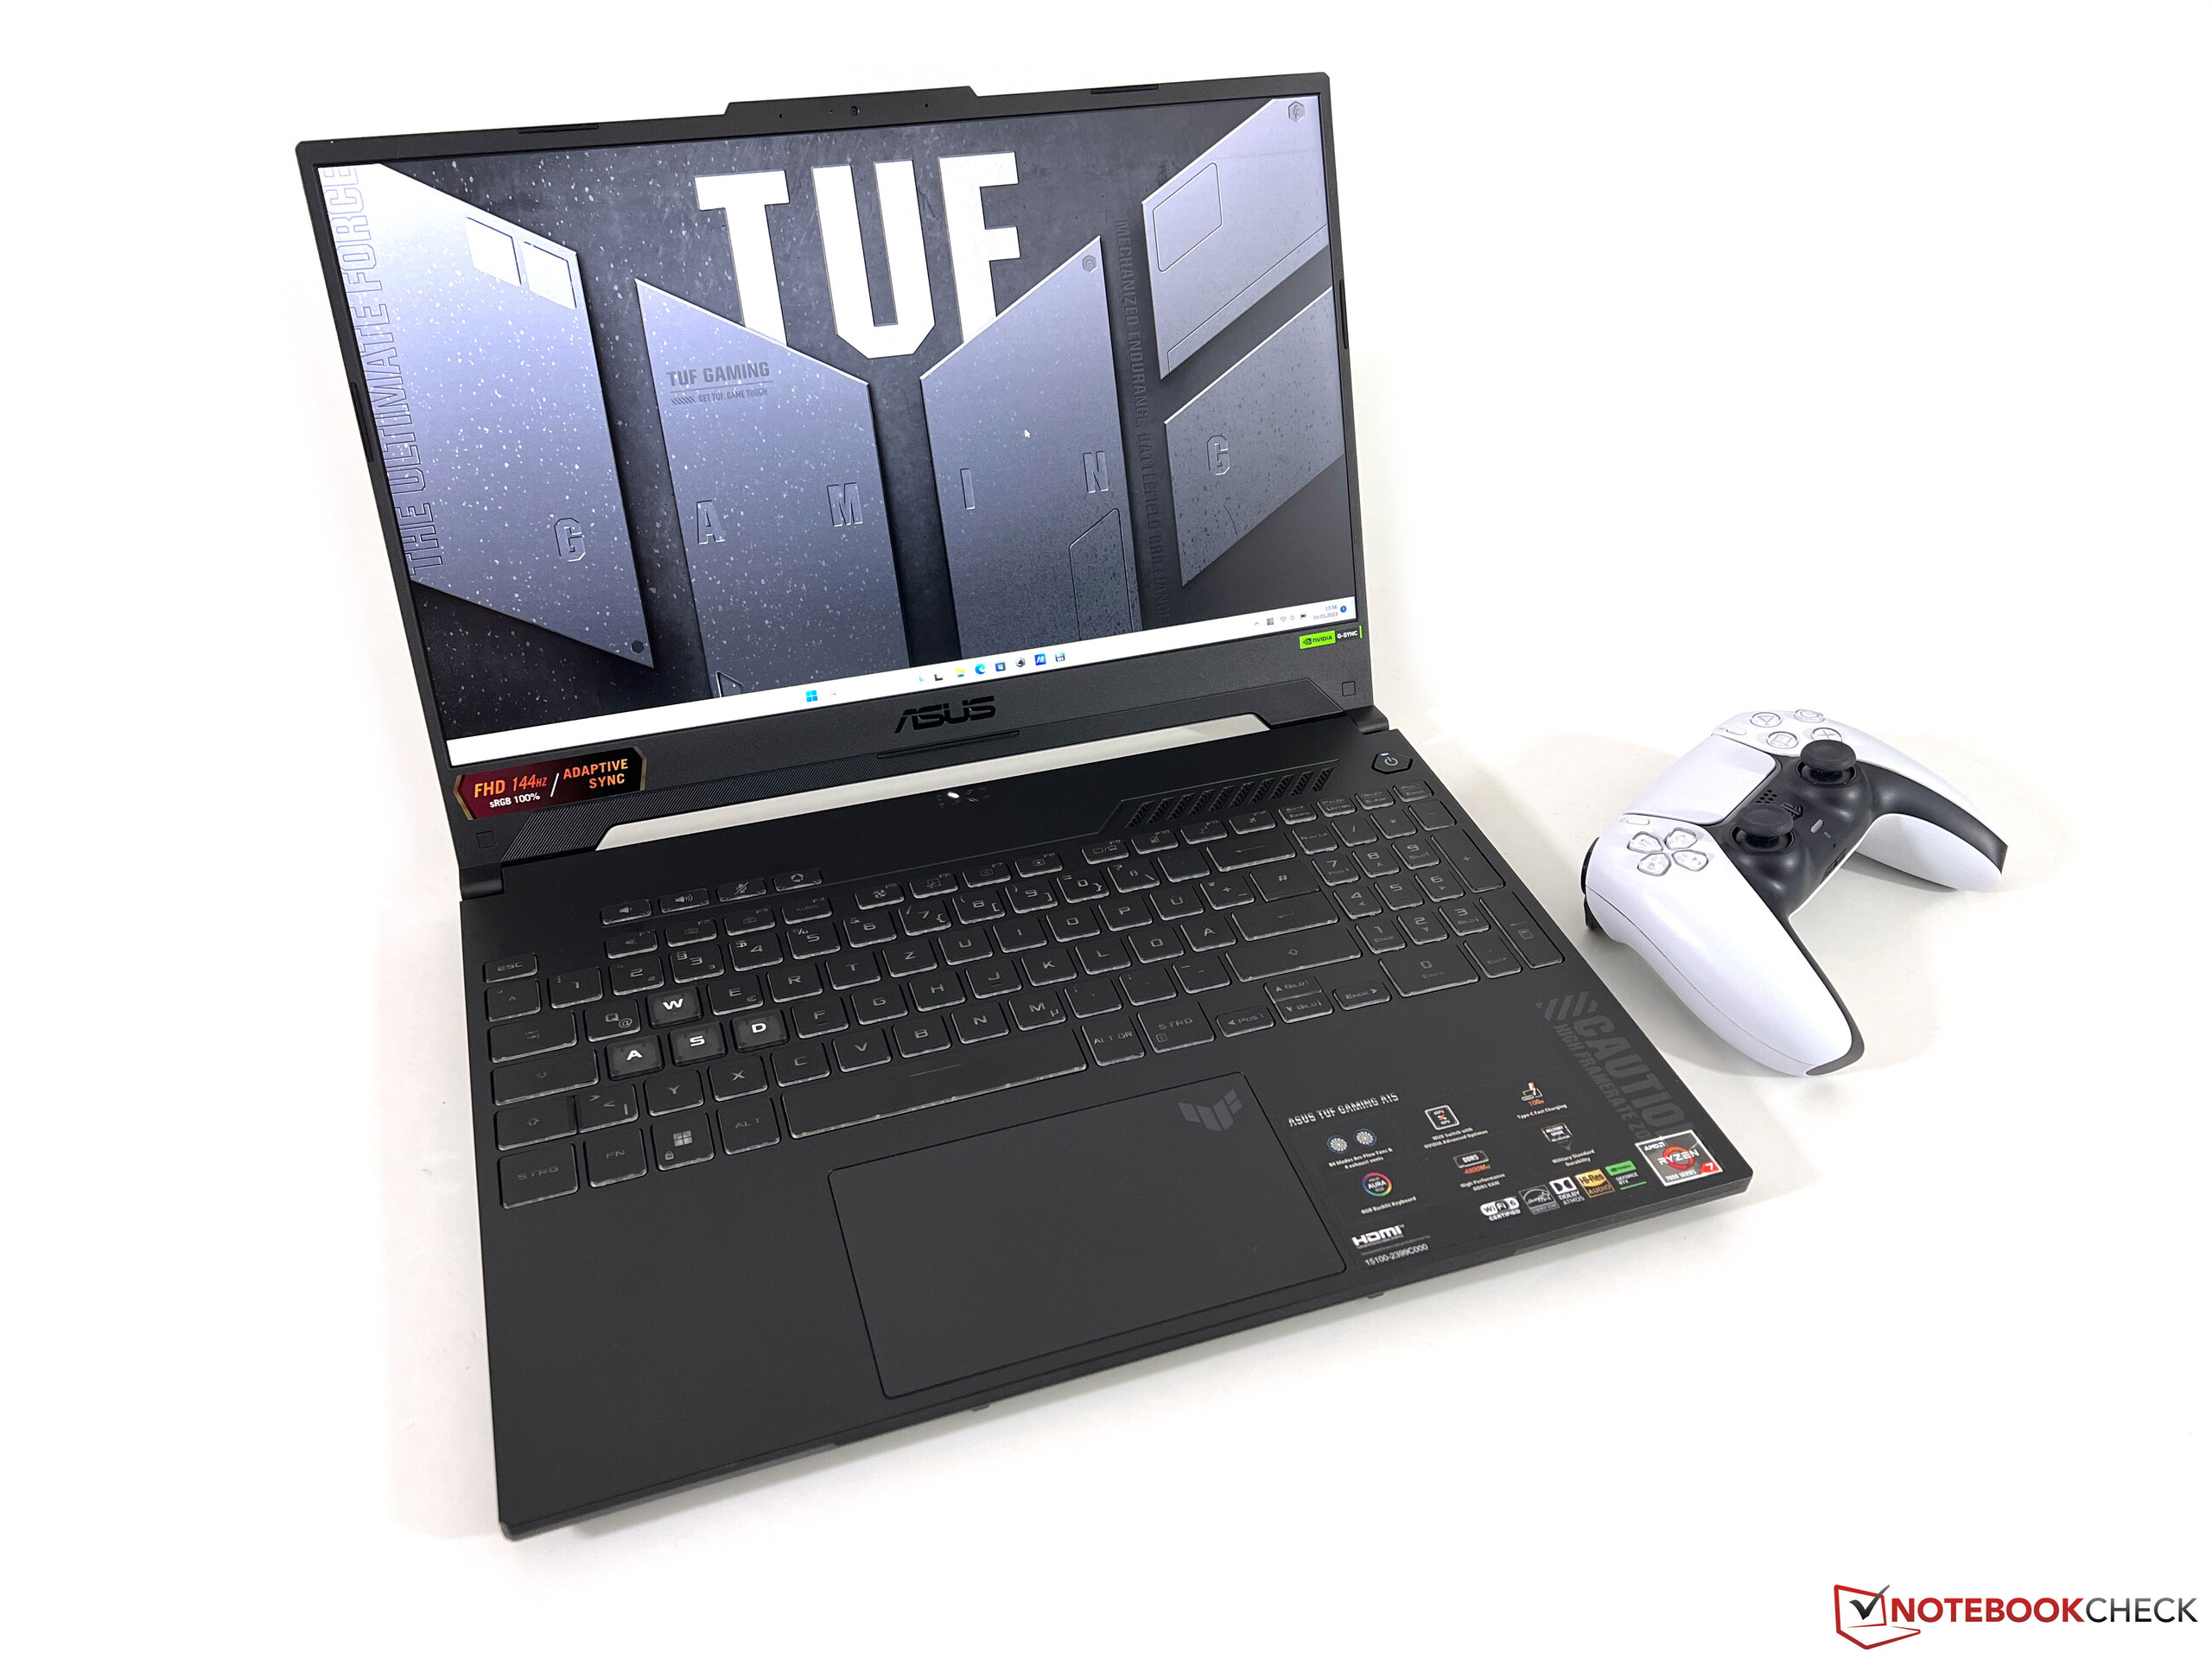
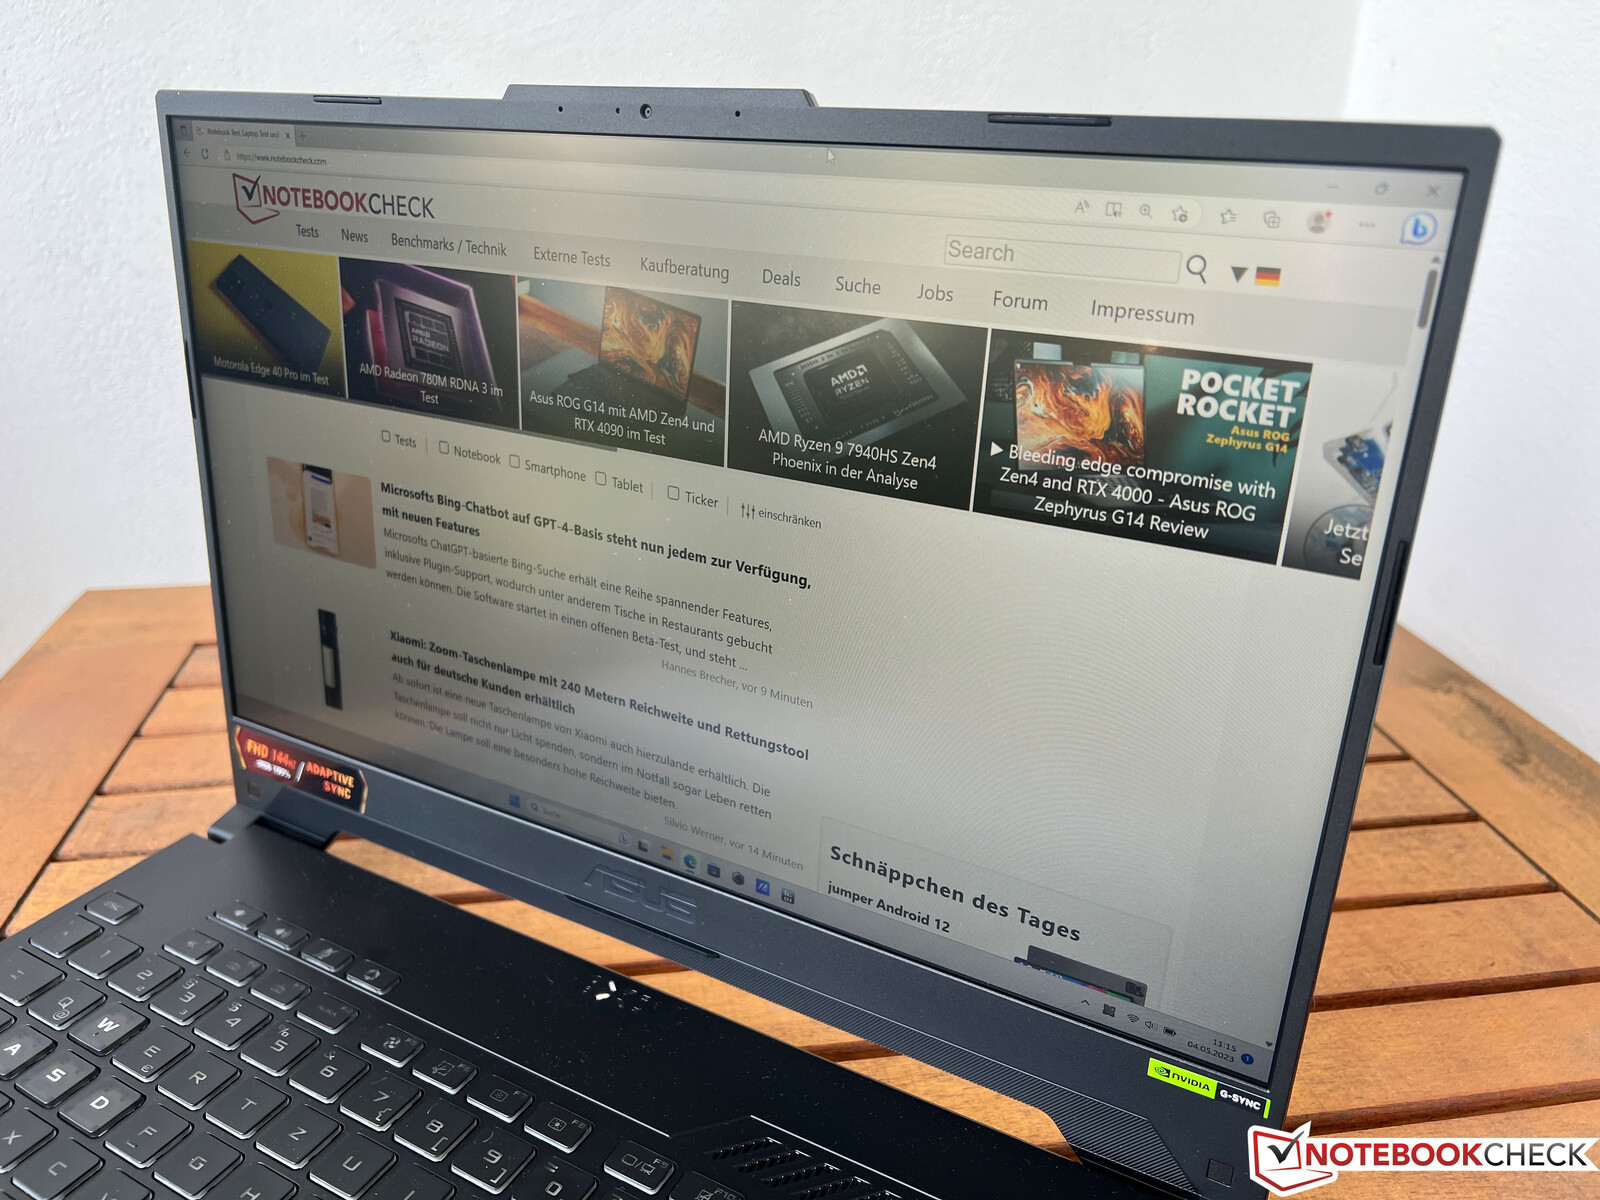
Análisis del portátil Asus TUF Gaming A15 - Un gamer económico con una RTX 4050 y una pantalla de 144 Hz
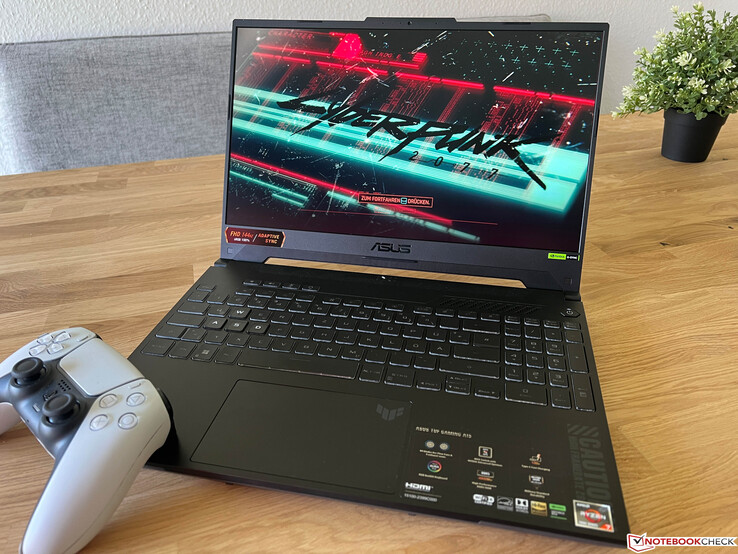
Situada por debajo de la serie ROG, la serie TUF Gaming de Asus se propone ofrecer una opción de portátil más barata para los jugadores. Hace poco probamos el modelomodelo de 16 pulgadas con hardware AMDy ahora es el momento de echar un vistazo a la versión de 15 pulgadas: el TUF Gaming A15 con procesador AMD (Ryzen 7 7735HS) y tarjeta gráfica Nvidia actual (GeForce RTX 4050 portátil). Tiene un MRSP de alrededor de $ 1,300 y actualmente se puede encontrar en línea por $ 1,169. Además, el dispositivo cuenta con un panel IPS mate con una frecuencia de actualización de 144 Hz, 16 GB de RAM y un SSD NVMe de 512 GB. La versión de venta al público del FA507NU-LP031 viene sin sistema operativo, pero el nuestro ya tenía Windows 11 Home instalado cuando lo recibimos.
Posibles contendientes en la comparación
Valoración | Fecha | Modelo | Peso | Altura | Tamaño | Resolución | Precio |
|---|---|---|---|---|---|---|---|
| 86.3 % v7 (old) | 06/2023 | Asus TUF A15 FA507 R7 7735HS, GeForce RTX 4050 Laptop GPU | 2.2 kg | 24.9 mm | 15.60" | 1920x1080 | |
| 81.8 % v7 (old) | 04/2023 | Gigabyte G5 KE i5-12500H, GeForce RTX 3060 Laptop GPU | 2 kg | 23.9 mm | 15.60" | 1920x1080 | |
| 87.9 % v7 (old) | 01/2023 | Schenker XMG Core 15 (M22) R7 6800H, GeForce RTX 3060 Laptop GPU | 2.1 kg | 23 mm | 15.60" | 2560x1440 | |
| 82.9 % v7 (old) | 03/2023 | MSI Katana 15 B12VEK i7-12650H, GeForce RTX 4050 Laptop GPU | 2.3 kg | 24.9 mm | 15.60" | 1920x1080 | |
| 81 % v7 (old) | 01/2023 | HP Victus 15 fa0020nr i7-12700H, GeForce RTX 3050 Ti Laptop GPU | 2.3 kg | 23.6 mm | 15.60" | 1920x1080 | |
| 82.8 % v7 (old) | 10/2022 | Lenovo IdeaPad Gaming 3 15IAH7 i5-12500H, GeForce RTX 3050 Ti Laptop GPU | 2.4 kg | 26 mm | 15.60" | 1920x1080 | |
| 87.2 % v7 (old) | 03/2022 | Asus TUF Gaming F15 FX507ZM i7-12700H, GeForce RTX 3060 Laptop GPU | 2.1 kg | 24.95 mm | 15.60" | 1920x1080 |
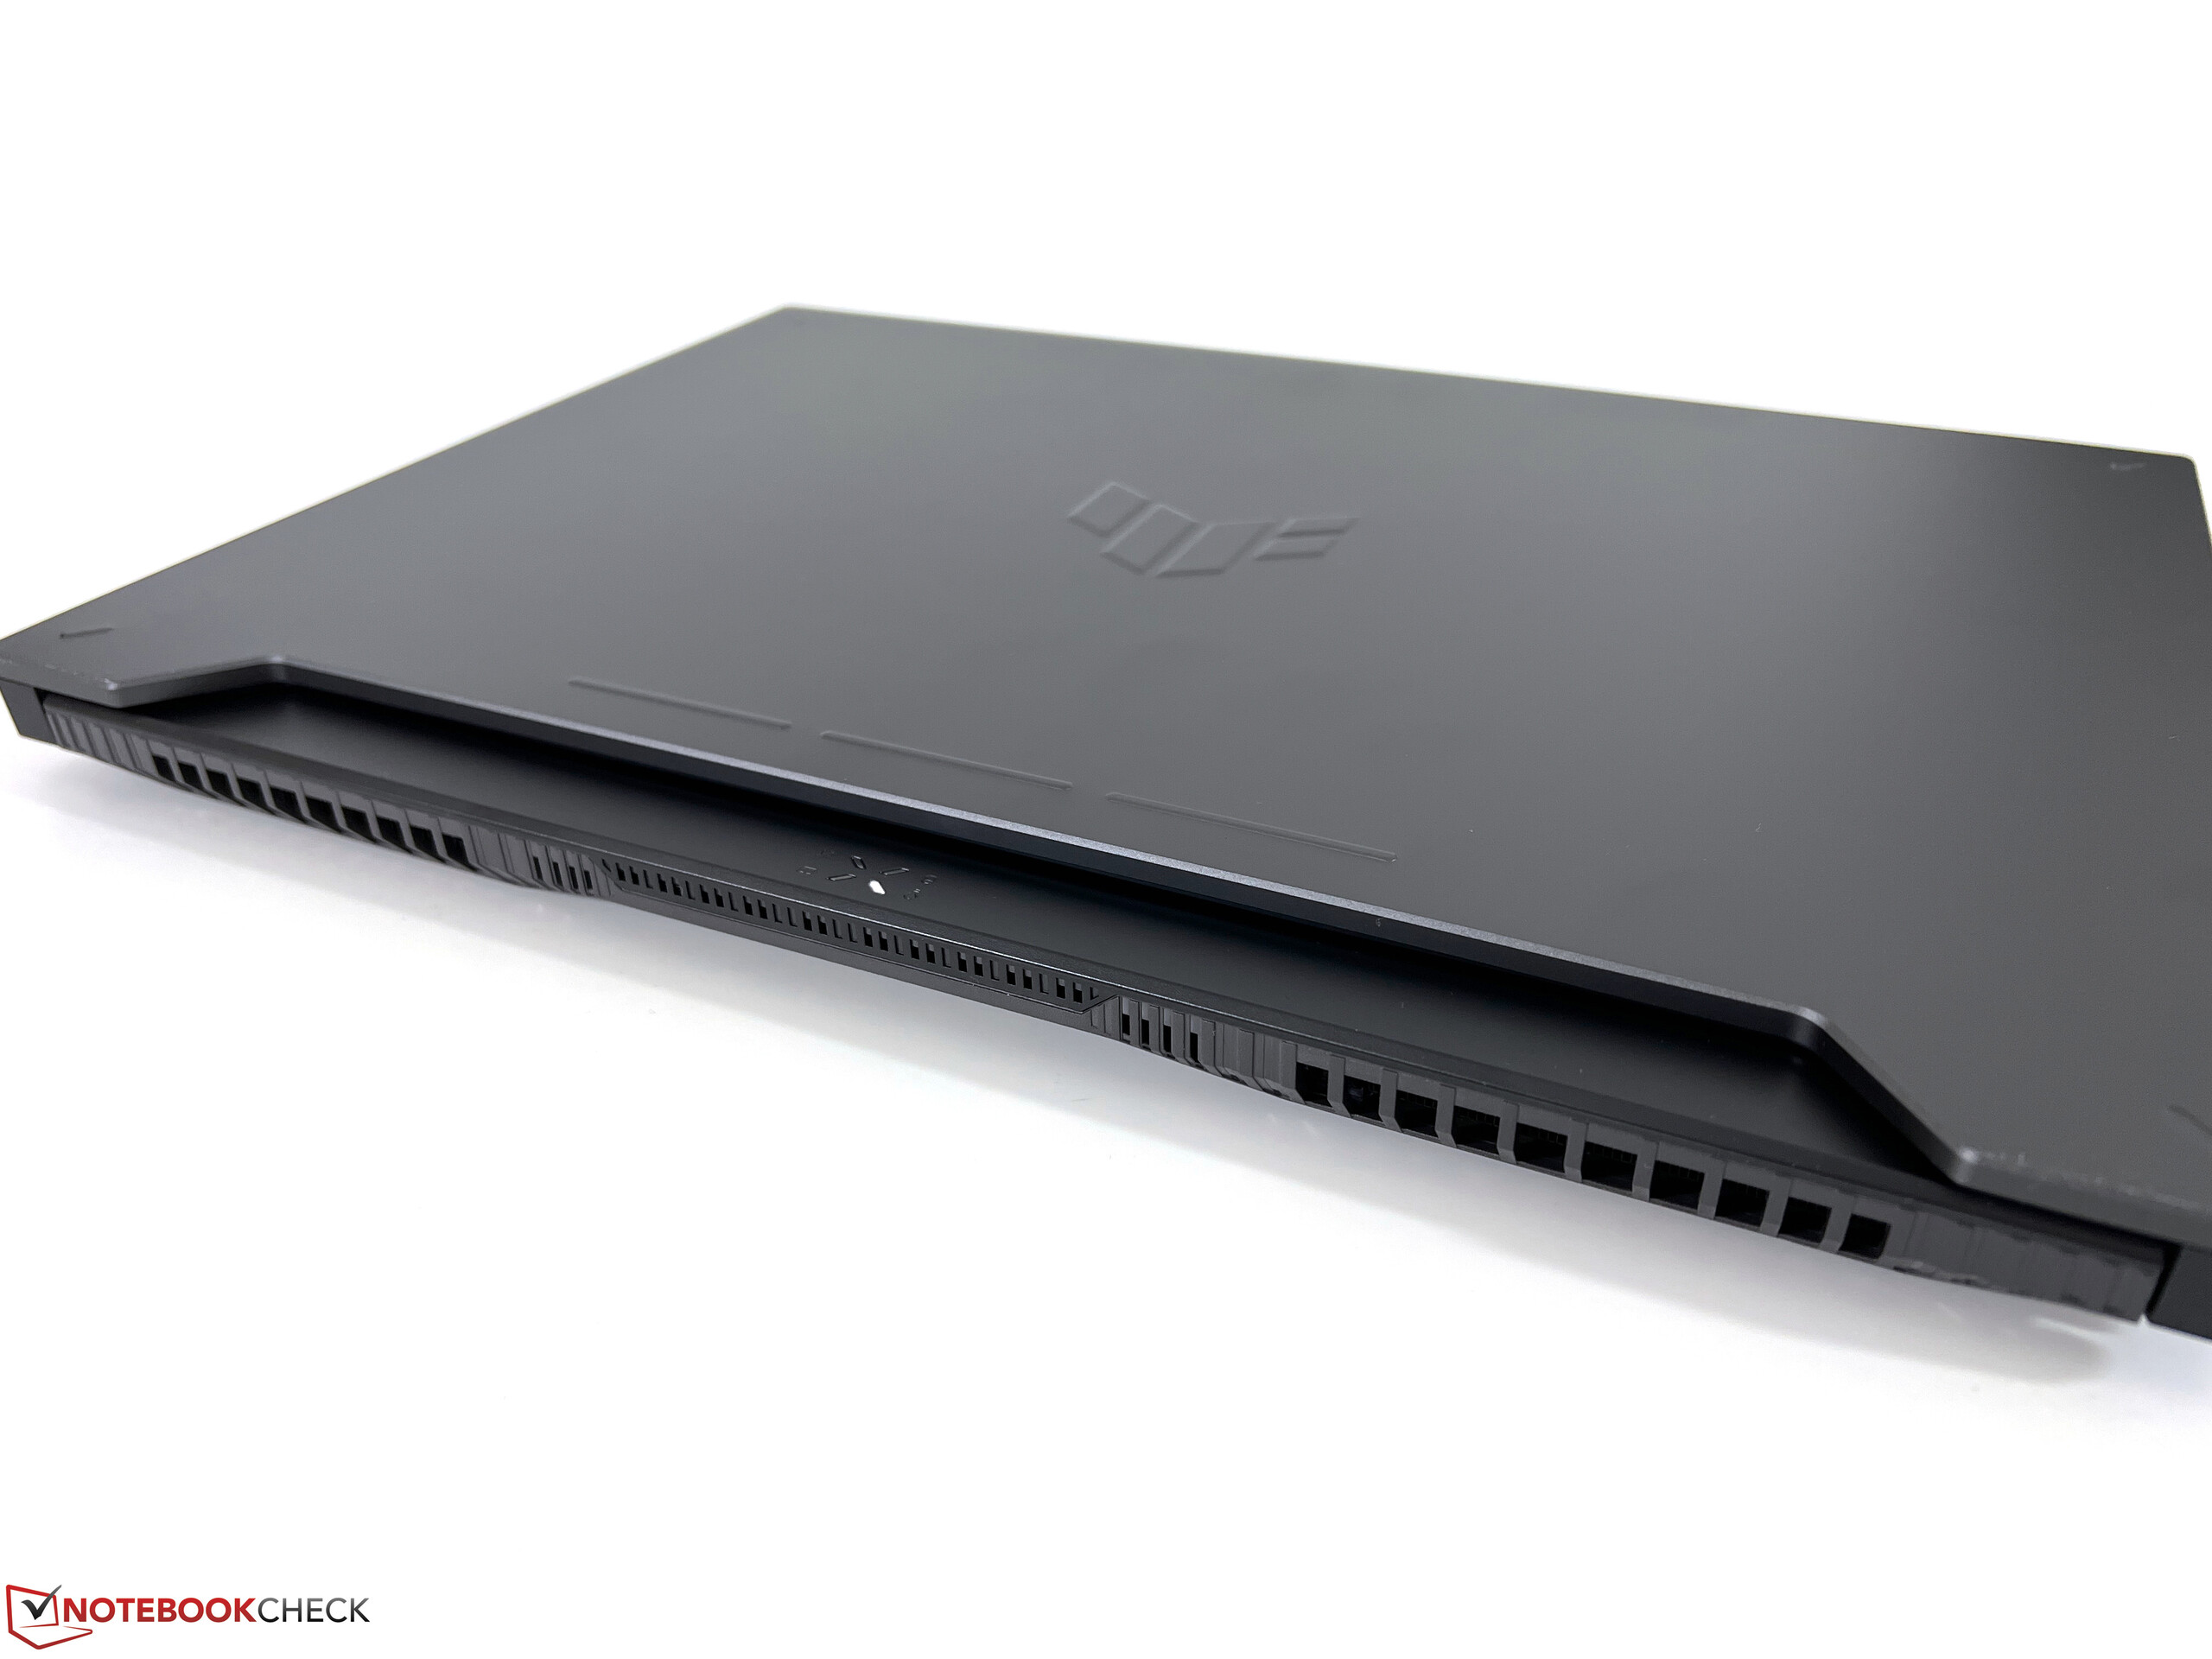
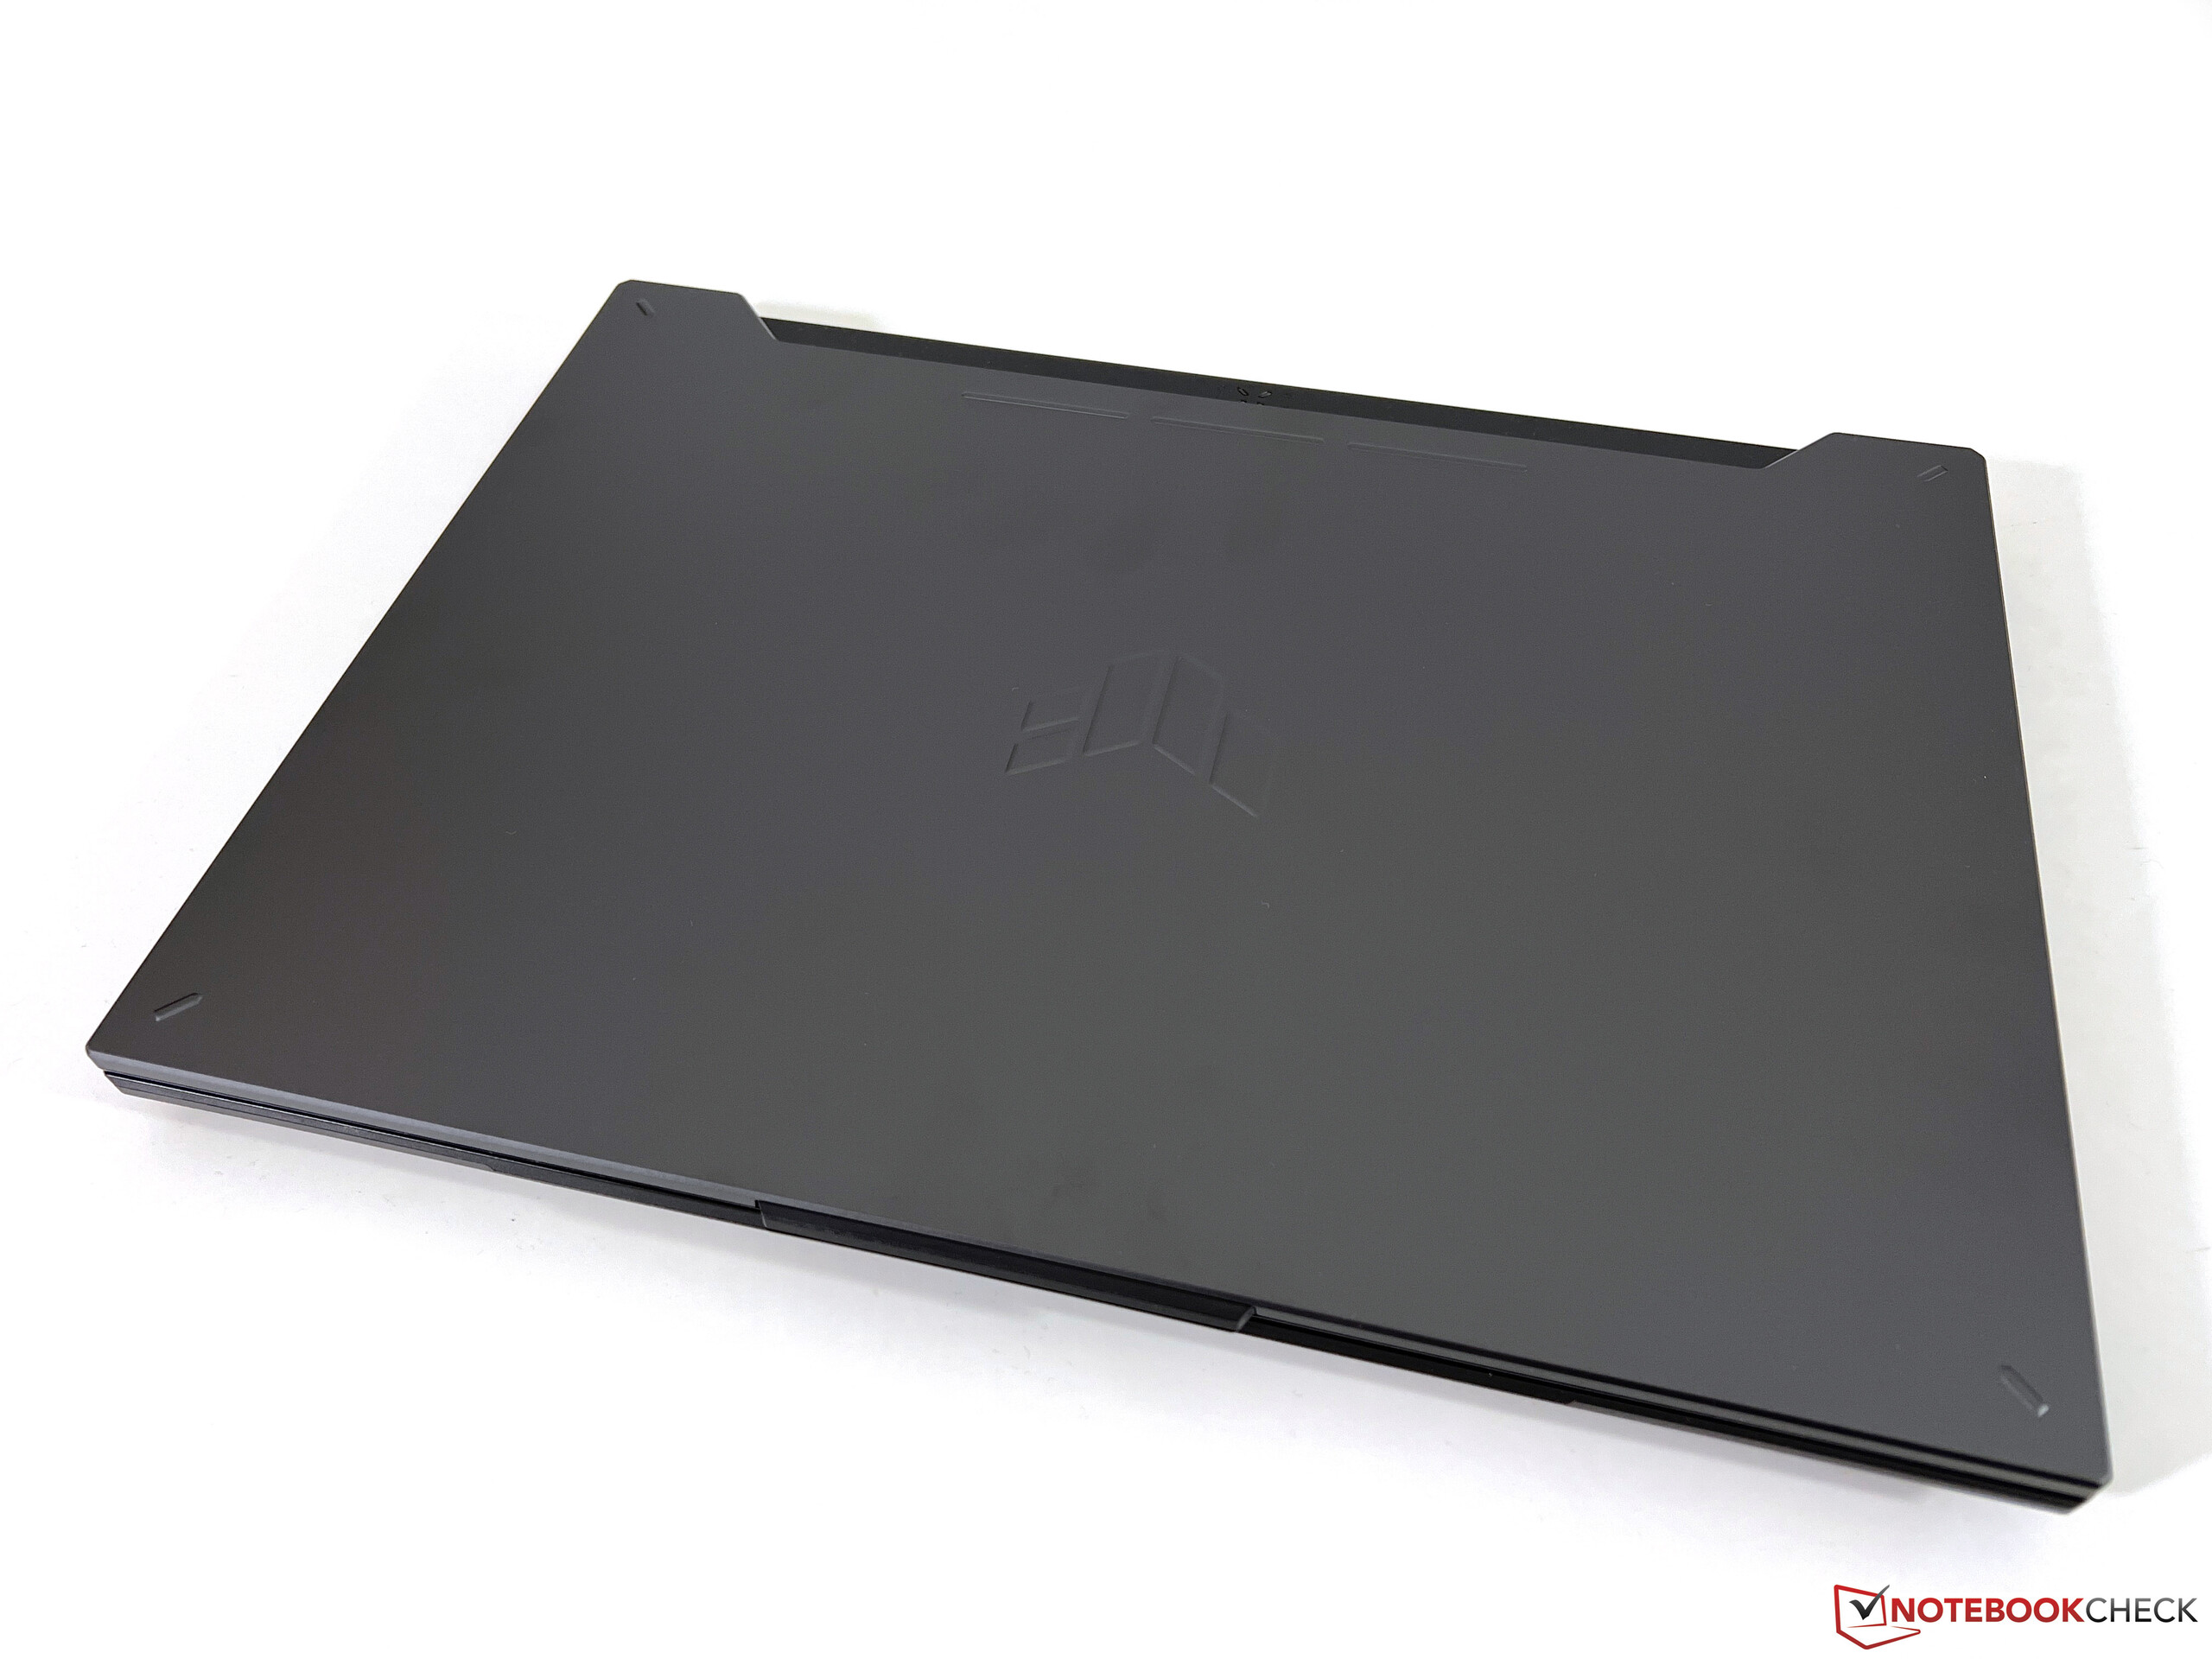
Maletín - Un discreto portátil para juegos sin iluminación
Comparado con su predecesor con procesador Intel, elTUF Gaming F15el diseño de la carcasa de este portátil permanece prácticamente inalterado. Sólo hay pequeñas diferencias, como que las teclas WASD ya no son blancas y las cuatro esquinas de la tapa ahora presentan pequeñas barras en lugar de círculos. El modelo actual sigue sin incorporar ninguna función de iluminación extravagante y, en general, el portátil ha adquirido un aspecto bastante discreto con su color gris oscuro. Especialmente el borde inferior a lo largo de la pantalla es bastante grande, ya que el portátil sigue utilizando un ratio 16:9. Es probable que tengas que limpiar sus superficies oscuras con bastante frecuencia, ya que son propensas a acumular marcas de huellas dactilares.
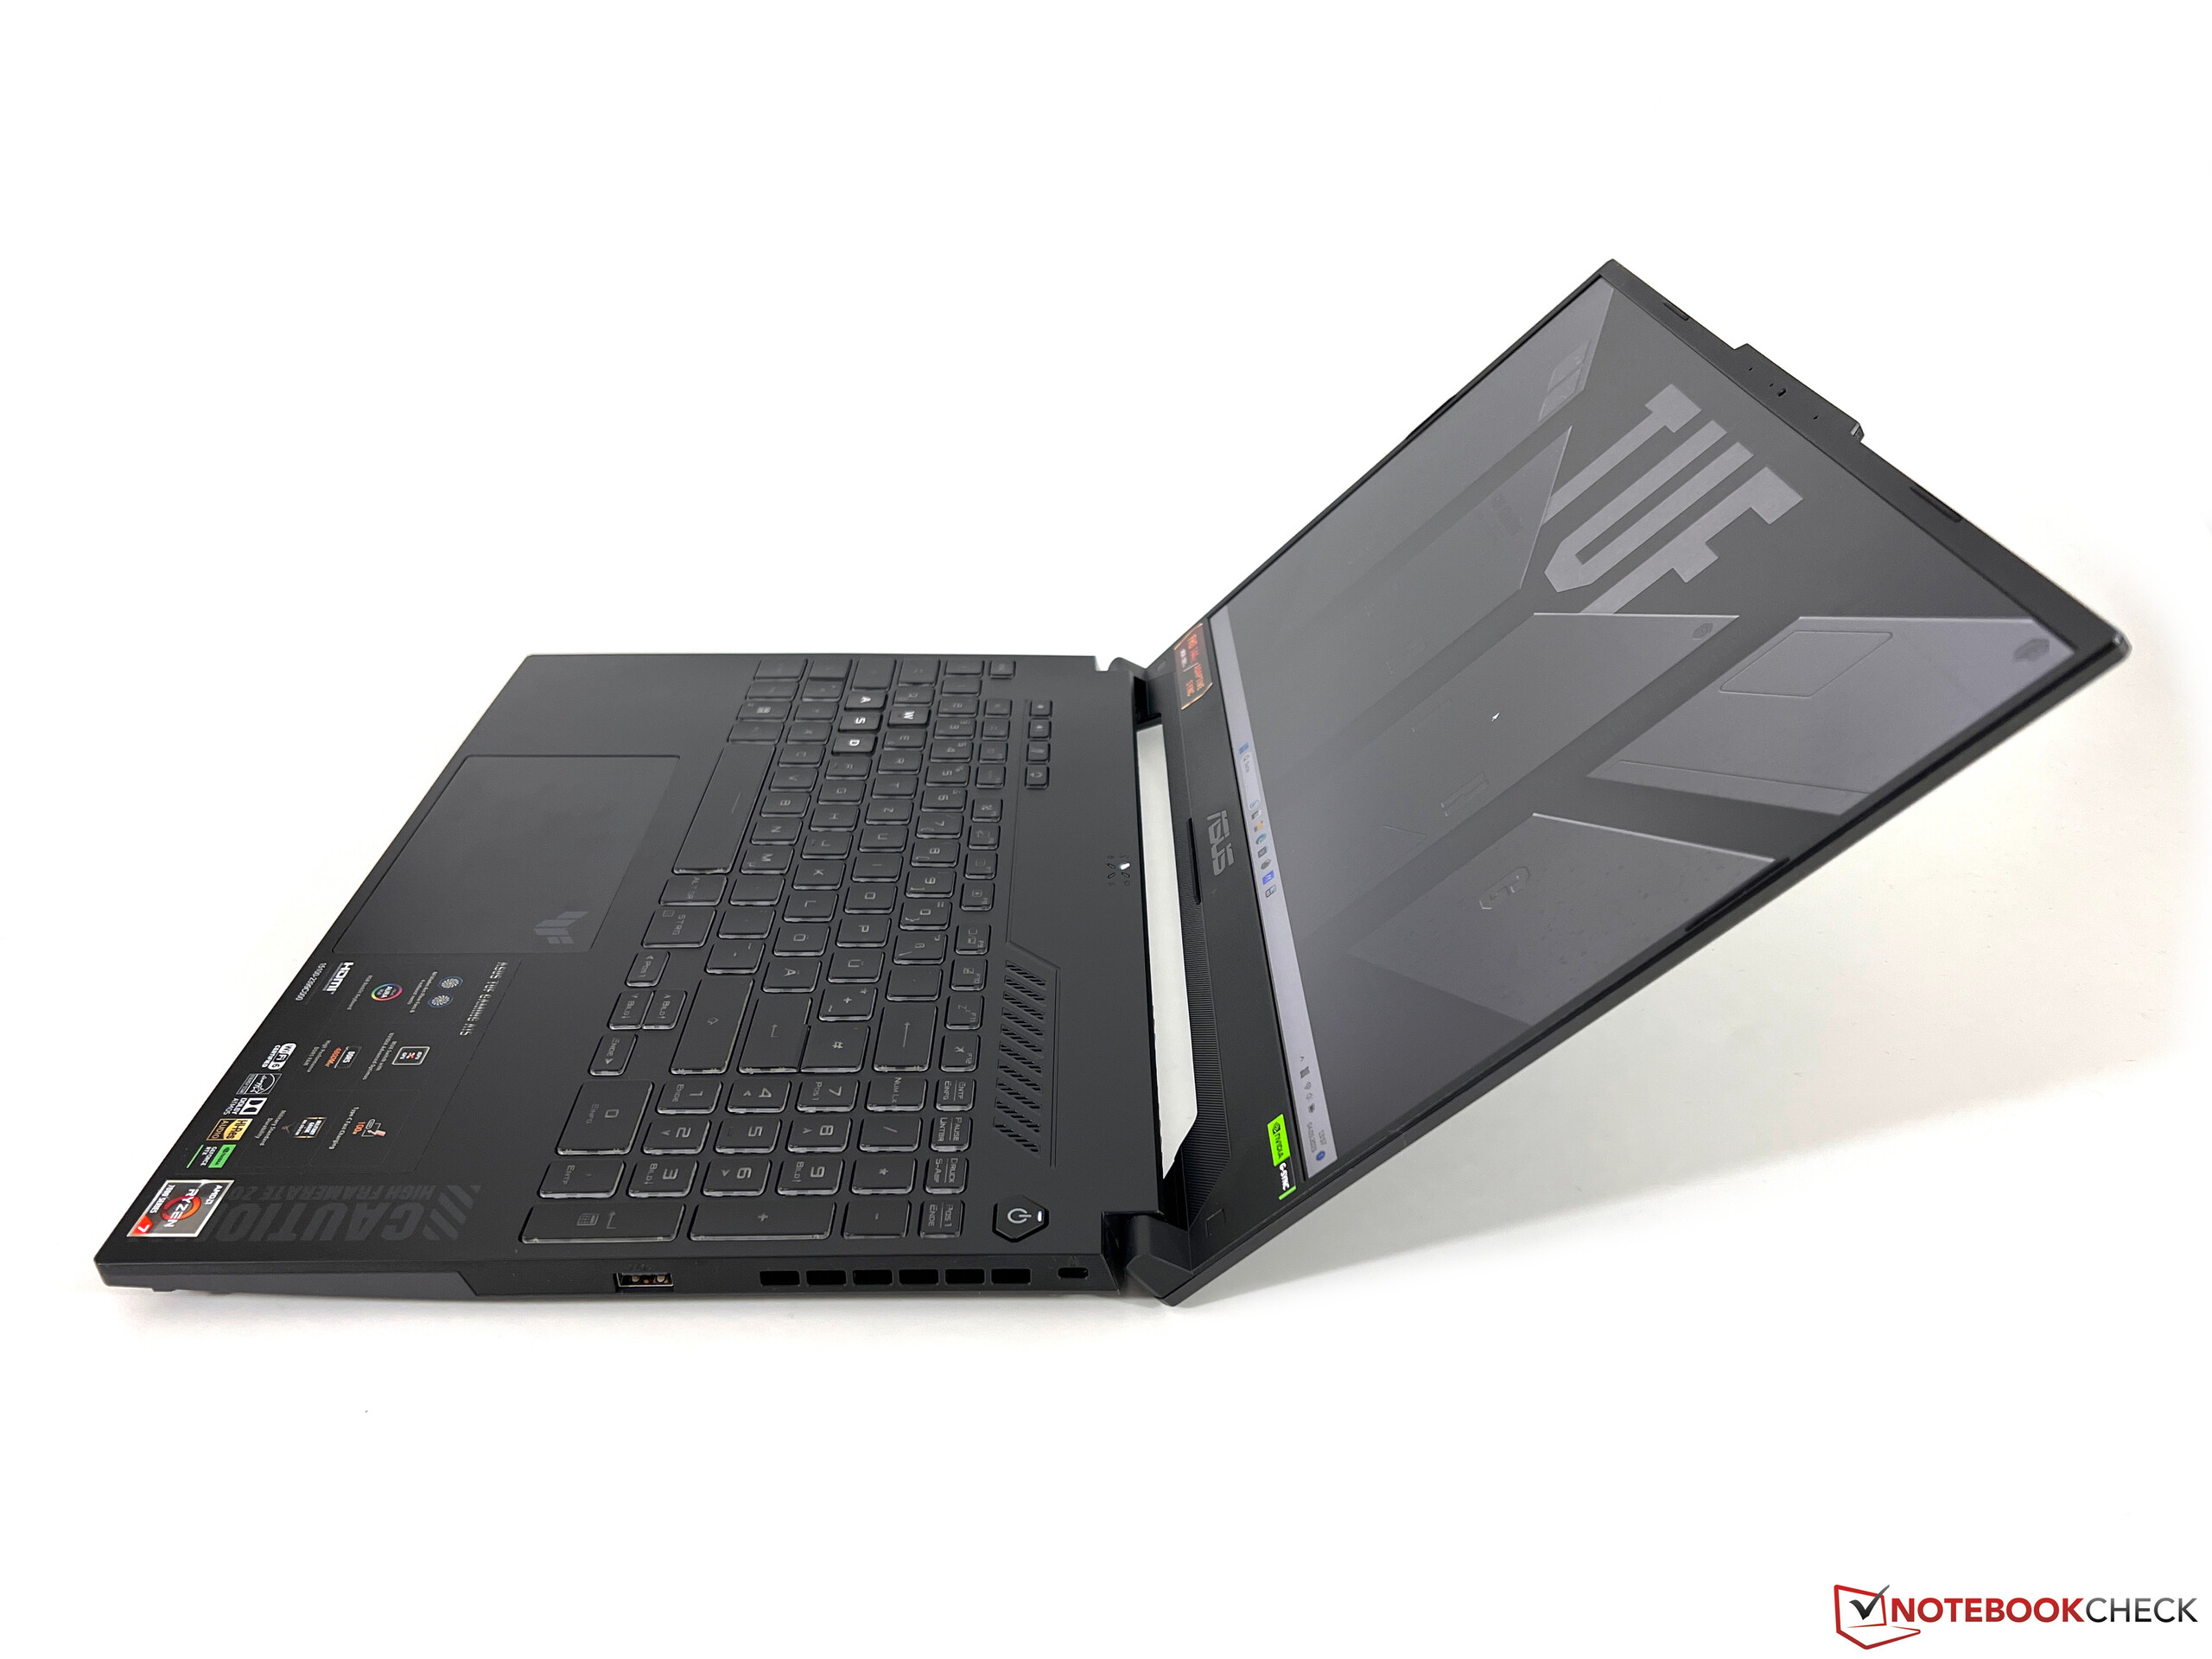
La tapa del portátil es de metal y el resto de la carcasa es de plástico. La unidad base es bastante estable, pero se puede empujar en el centro del teclado con bastante facilidad. Sin embargo, no hace ningún ruido chirriante cuando intentas girar y doblar el dispositivo. Su fina tapa no es lo mejor, ya que la pantalla ya empieza a mostrar molestias cuando la presionas con poca fuerza o intentas cambiar el ángulo de apertura (máx. ~ 135 grados).
En cuanto al tamaño, todos los competidores son bastante similares, pero el TUF Gaming A15 tiene el diseño más pequeño. Pesa poco más de 2,1 kg, por lo que el portátil es relativamente portátil y lo más probable es que puedas meterlo en la mayoría de mochilas o bolsas. La fuente de alimentación de 240 vatios incluida pesa 735 gramos más.
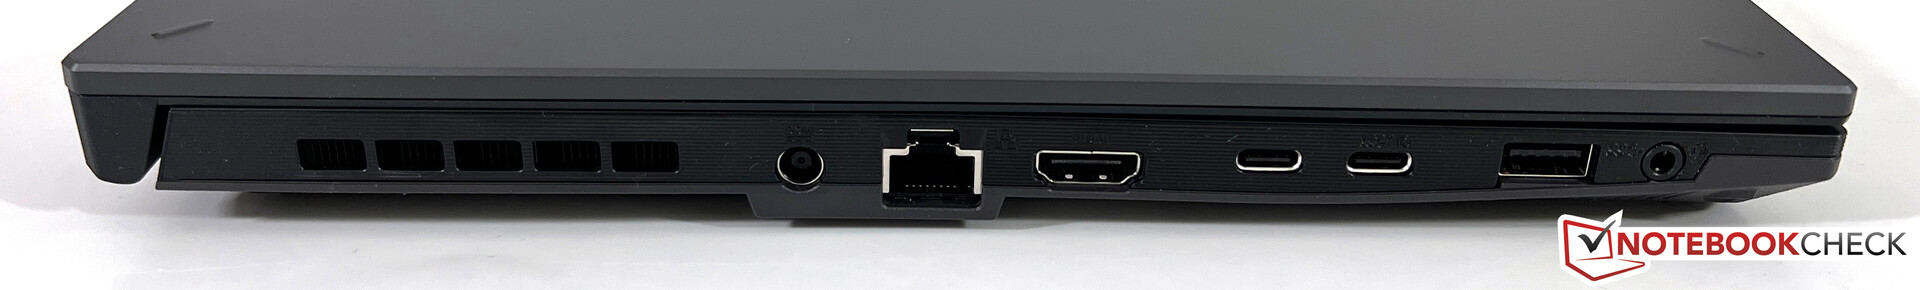
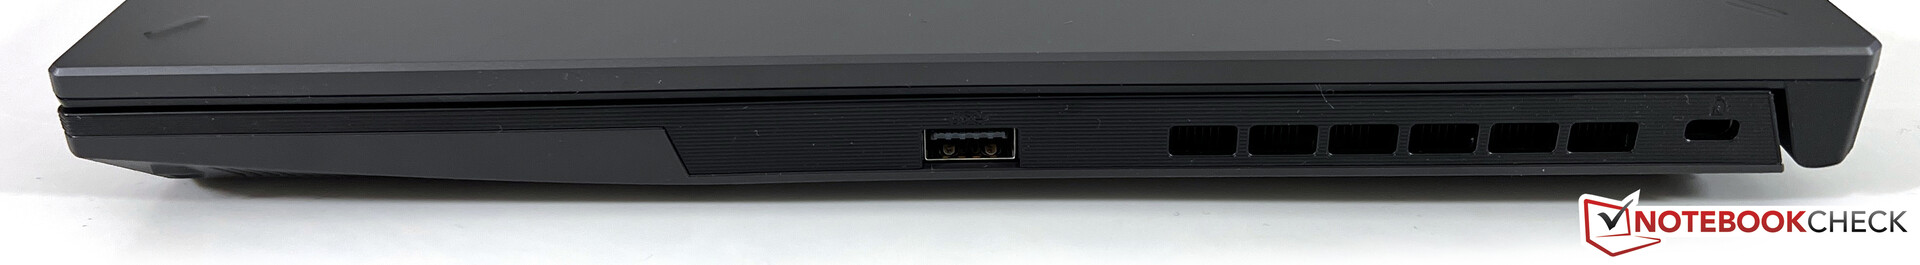
Conectividad - Asus ha incluido USB 4
La parte trasera de la unidad base está ocupada por la unidad de refrigeración y casi todos los puertos están situados en el lado izquierdo del dispositivo. Sólo un puerto USB está en el lado derecho. Si se usan todos los puertos, el espacio puede resultar un poco reducido. Hay dos puertos USB-C de los cuales uno soporta USB 4.0 y el otro soporta G-Sync si conectas un monitor correspondiente.
Comunicación
Además de un puerto Gigabit Ethernet, el portátil también utiliza un módulo WLAN MediaTek MT7921 que admite conexiones Wi-Fi 6 y banda de 160 MHz. Sin embargo, sus tasas de transferencia máximas son de 1.200 Bit/s. En nuestra prueba con un router de referencia de Asus, estas tasas se confirmaron y, aunque son decentes, hay módulos WLAN definitivamente más rápidos en el mercado. A fin de cuentas, esto no debería causar problemas en el uso diario (por ejemplo, al descargar contenidos).
| Networking | |
| Asus TUF A15 FA507 | |
| iperf3 transmit AXE11000 | |
| iperf3 receive AXE11000 | |
| Gigabyte G5 KE | |
| iperf3 transmit AXE11000 | |
| iperf3 receive AXE11000 | |
| Schenker XMG Core 15 (M22) | |
| iperf3 transmit AXE11000 | |
| iperf3 receive AXE11000 | |
| iperf3 transmit AXE11000 6GHz | |
| iperf3 receive AXE11000 6GHz | |
| MSI Katana 15 B12VEK | |
| iperf3 transmit AXE11000 | |
| iperf3 receive AXE11000 | |
| HP Victus 15 fa0020nr | |
| iperf3 transmit AXE11000 | |
| iperf3 receive AXE11000 | |
| Lenovo IdeaPad Gaming 3 15IAH7 | |
| iperf3 receive AXE11000 | |
| Asus TUF Gaming F15 FX507ZM | |
| iperf3 transmit AX12 | |
| iperf3 receive AX12 | |
Cámara web
A pesar de que la cámara del TUF Gaming A15 tiene una protuberancia, sólo es capaz de 720p lo que lucha para tomar fotos decentes incluso en buenas condiciones de iluminación. Su nitidez es mínima y los colores tampoco se representan con mucha precisión.


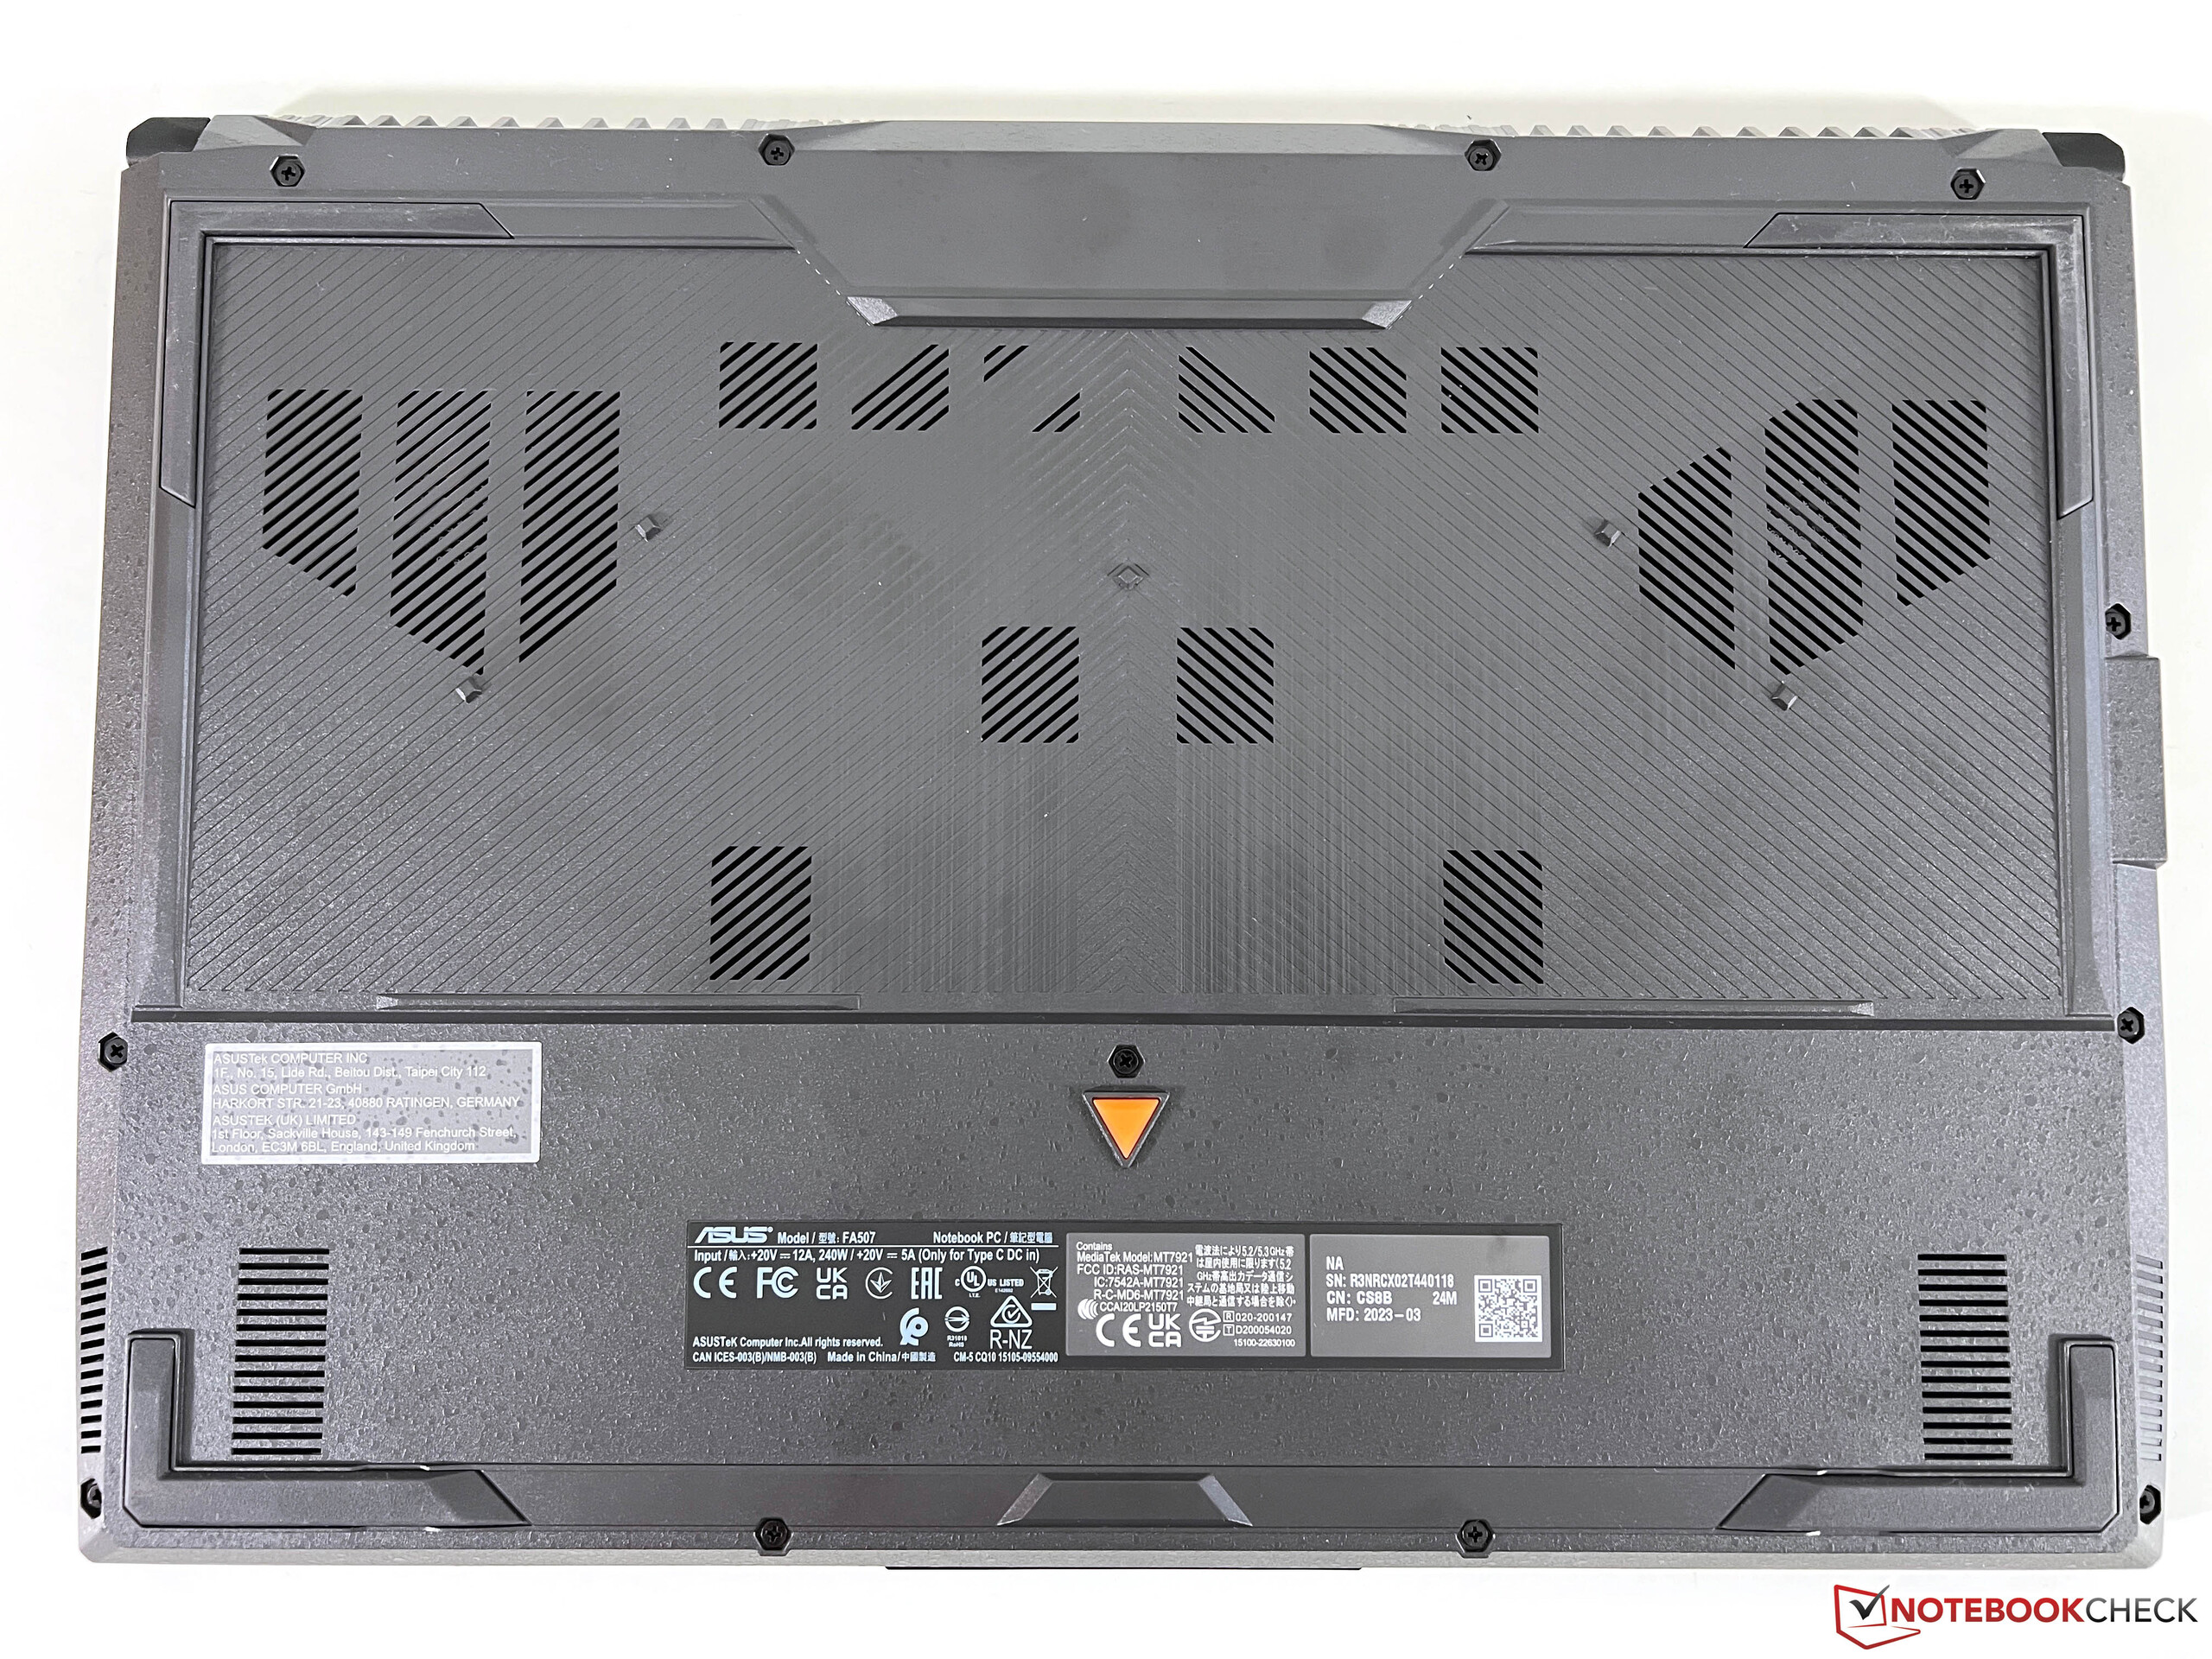
Mantenimiento
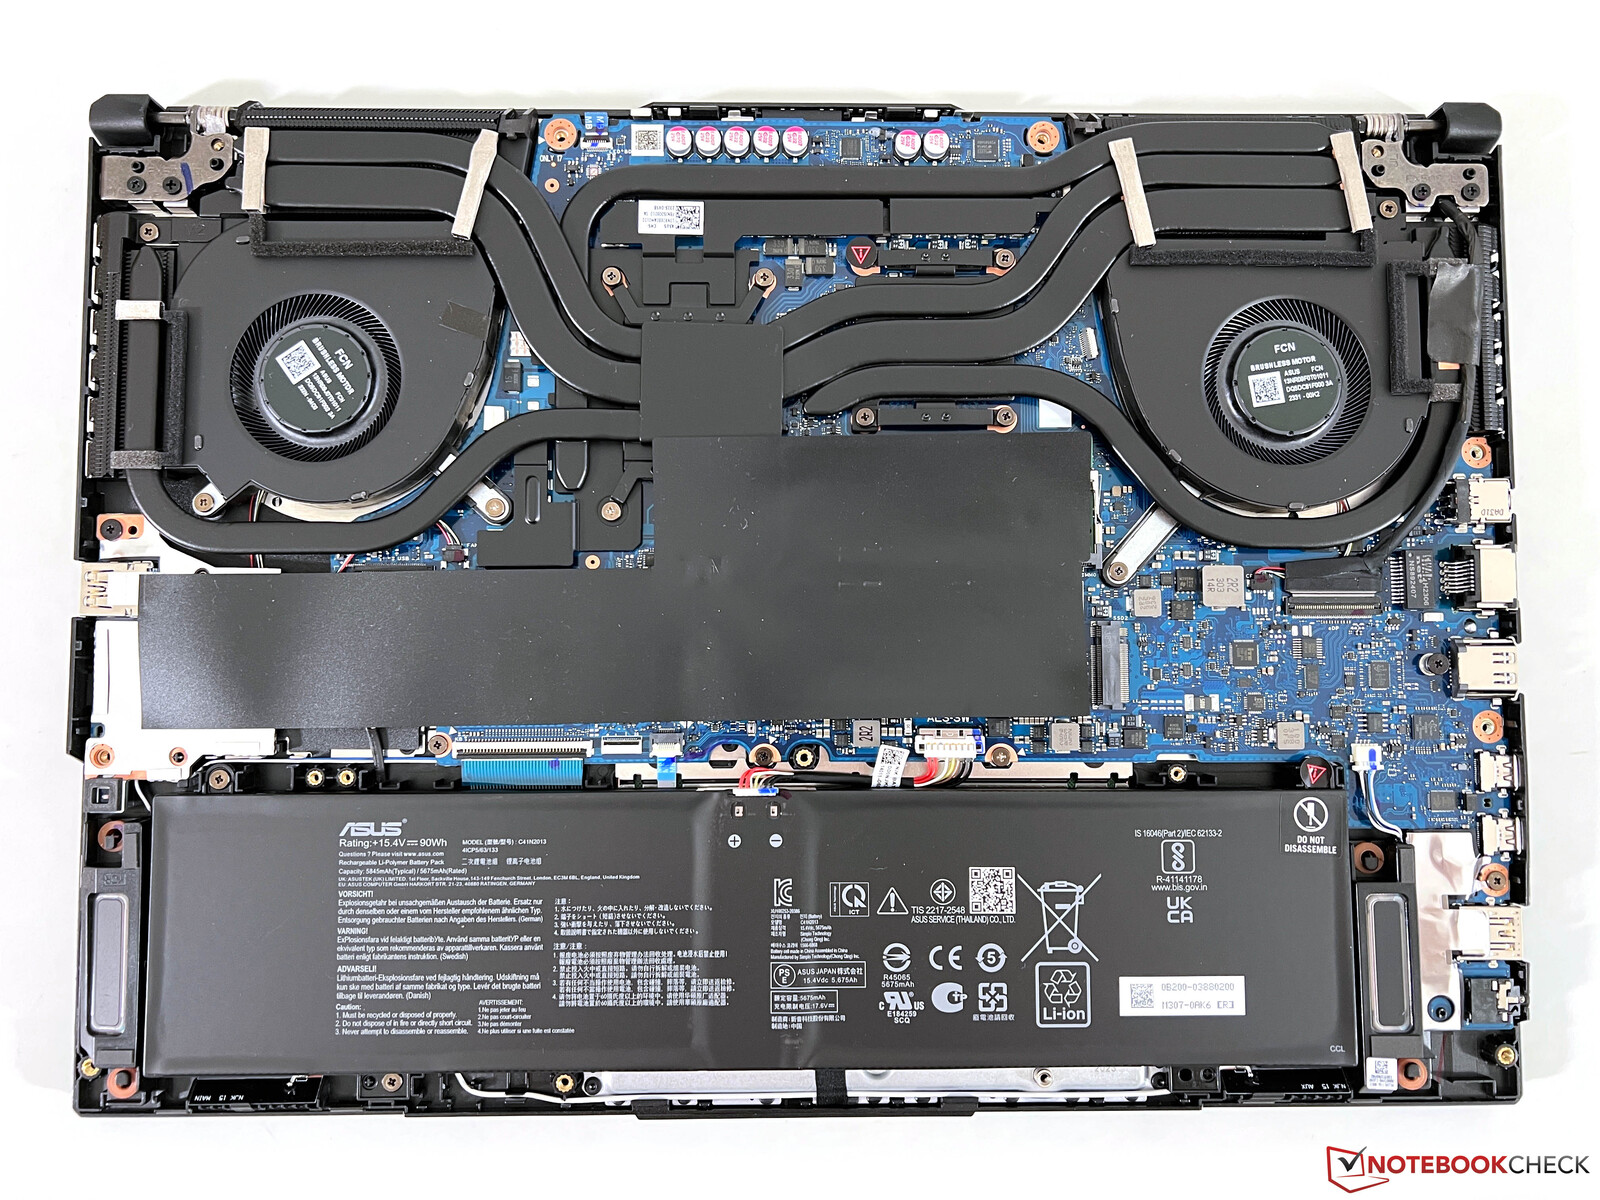
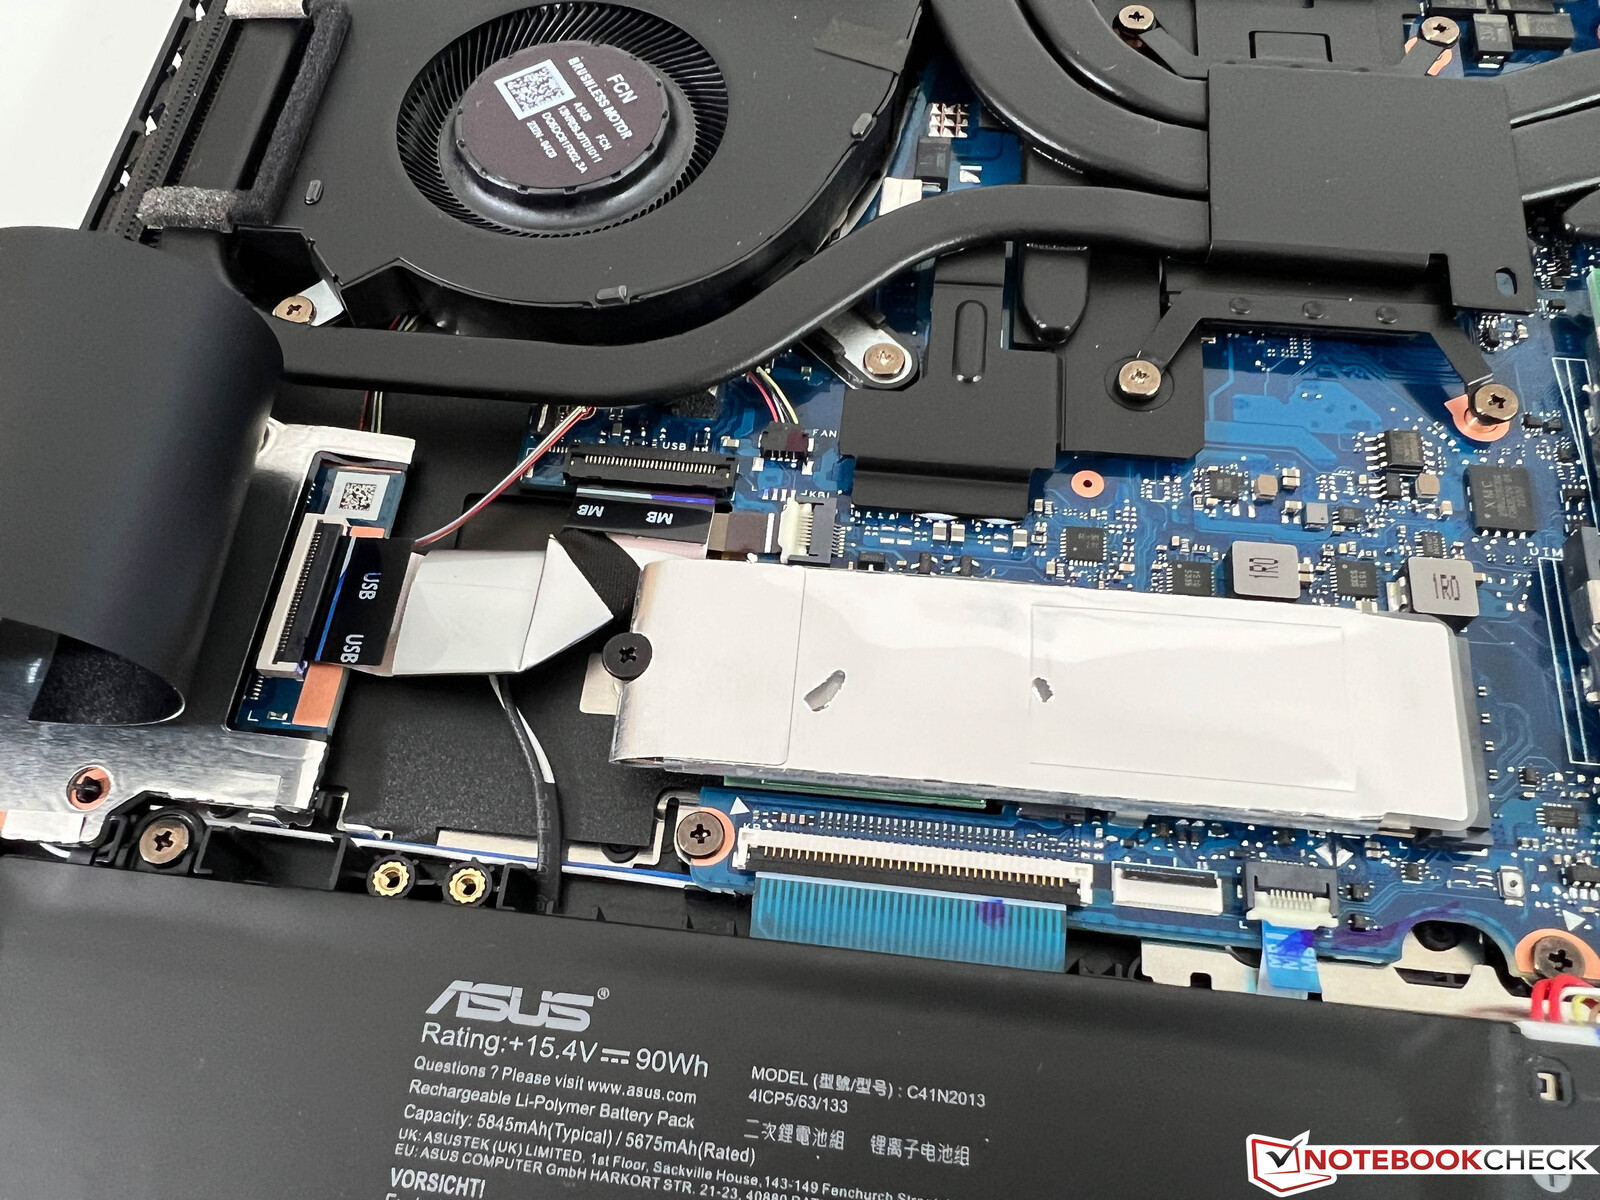
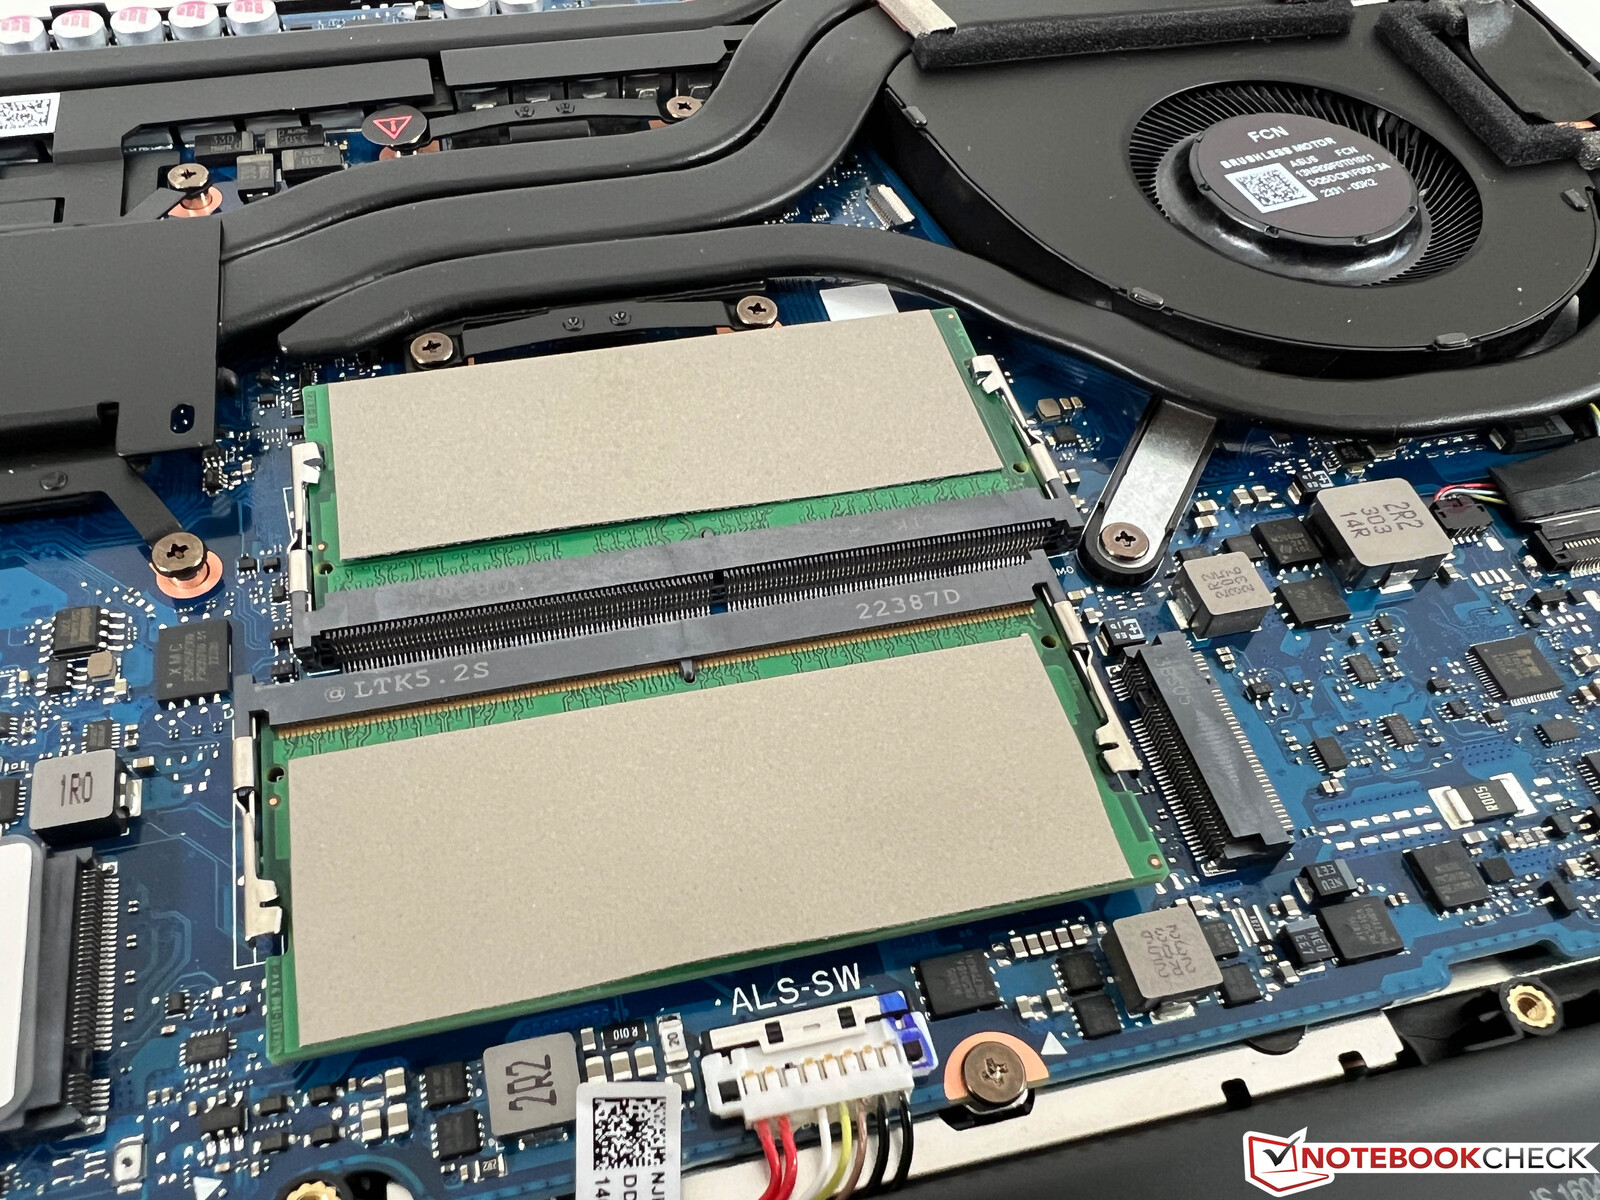
La tapa inferior de la carcasa está bastante unida al resto del dispositivo, incluso después de soltar los tornillos. Retirar esta parte de la carcasa resulta un poco complicado. Una vez hecho esto, puedes acceder a las dos ranuras de RAM, la batería, los ventiladores y el SSD M.2 2280.
Dispositivos de entrada - Teclado grande con teclado numérico
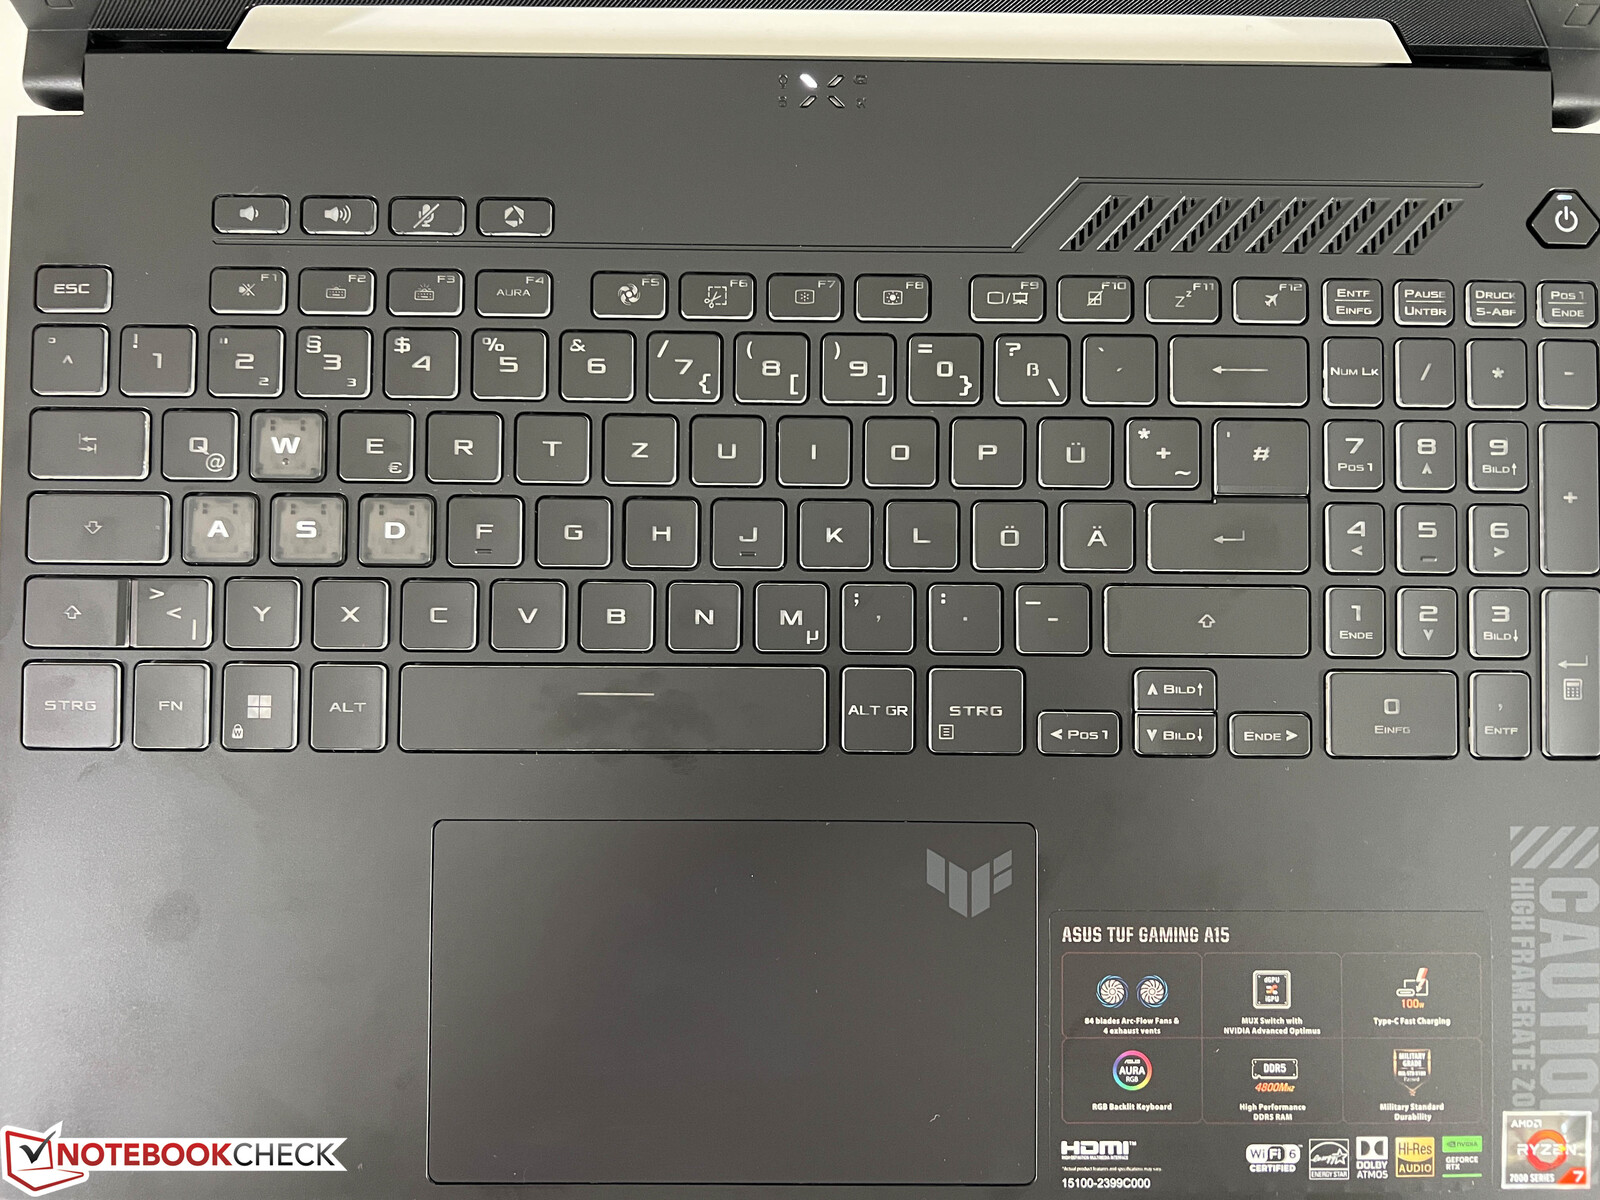
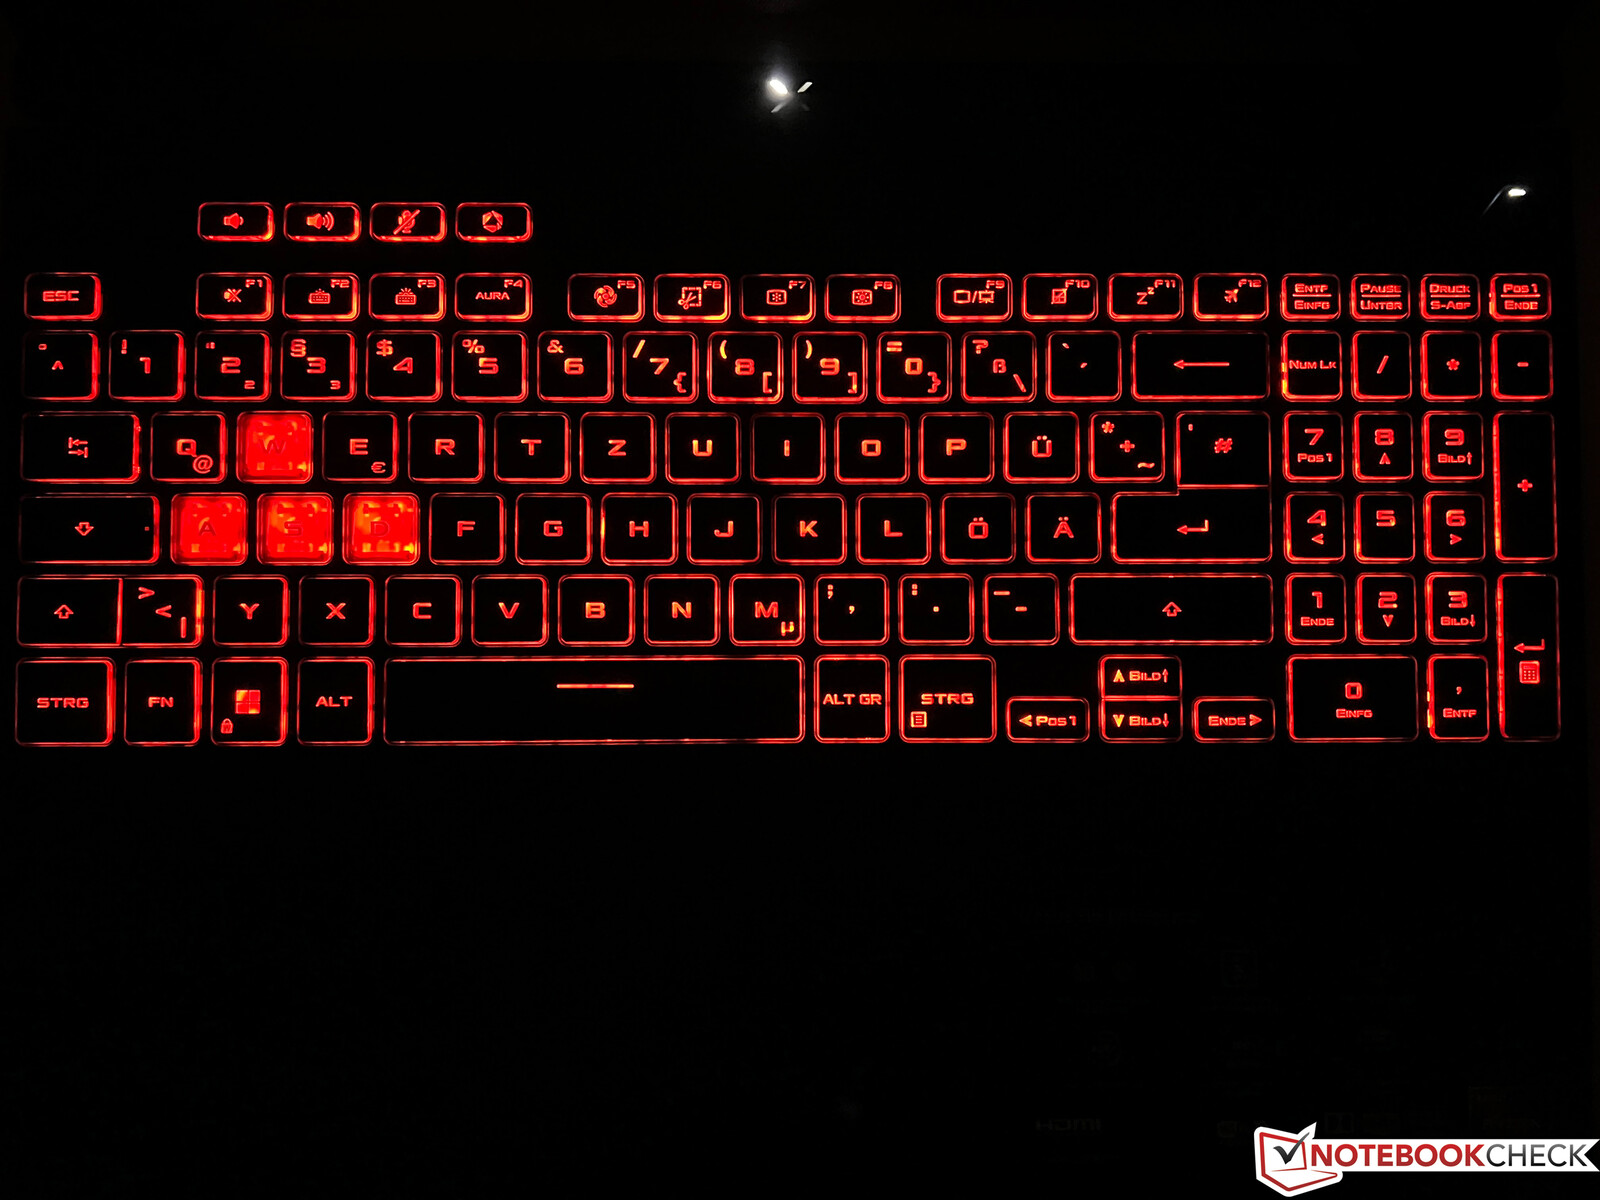
El teclado cuenta con un teclado numérico dedicado y es cómodo escribir en él. El problema, sin embargo, radica en el etiquetado del teclado. Aparte de las teclas WASD, que son blancas, todas las demás tienen etiquetas transparentes. Incluso en condiciones de luz decentes, a menudo es más cómodo activar la retroiluminación. Hay tres niveles de iluminación y también puedes elegir tu propio color, dentro de una zona. Su diseño está bien, pero hay que acostumbrarse a la tecla Intro de una sola fila. Encima del teclado normal también hay cuatro teclas especiales: Tres sirven para controlar el volumen y una se puede asignar personalmente. Hay que decir que las teclas de dirección son particularmente pequeñas para un portátil de juegos.
El touchpad funciona bien - los movimientos habituales de los dedos se introducen sin problemas y su superficie tiene un tacto agradable. Su ruido de clic es agradable y silencioso. En total, un rendimiento sólido y, por supuesto, la mayoría de los usuarios recurrirán al uso de un ratón externo o un mando.
Pantalla: un panel IPS de 144 Hz
El portátil tiene un panel IPS mate relativamente sencillo en resolución Full HD (1.920 x 1.080 píxeles) y en formato 16:9. Subjetivamente, nos dejó una impresión bastante buena - los contenidos se representaron con bastante nitidez y las áreas más claras no parecían granuladas. Su frecuencia de actualización de 144 Hz ayuda con los movimientos rápidos y no hay parpadeo PWM, pero en total, la pantalla no tiene nada que destacar demasiado.
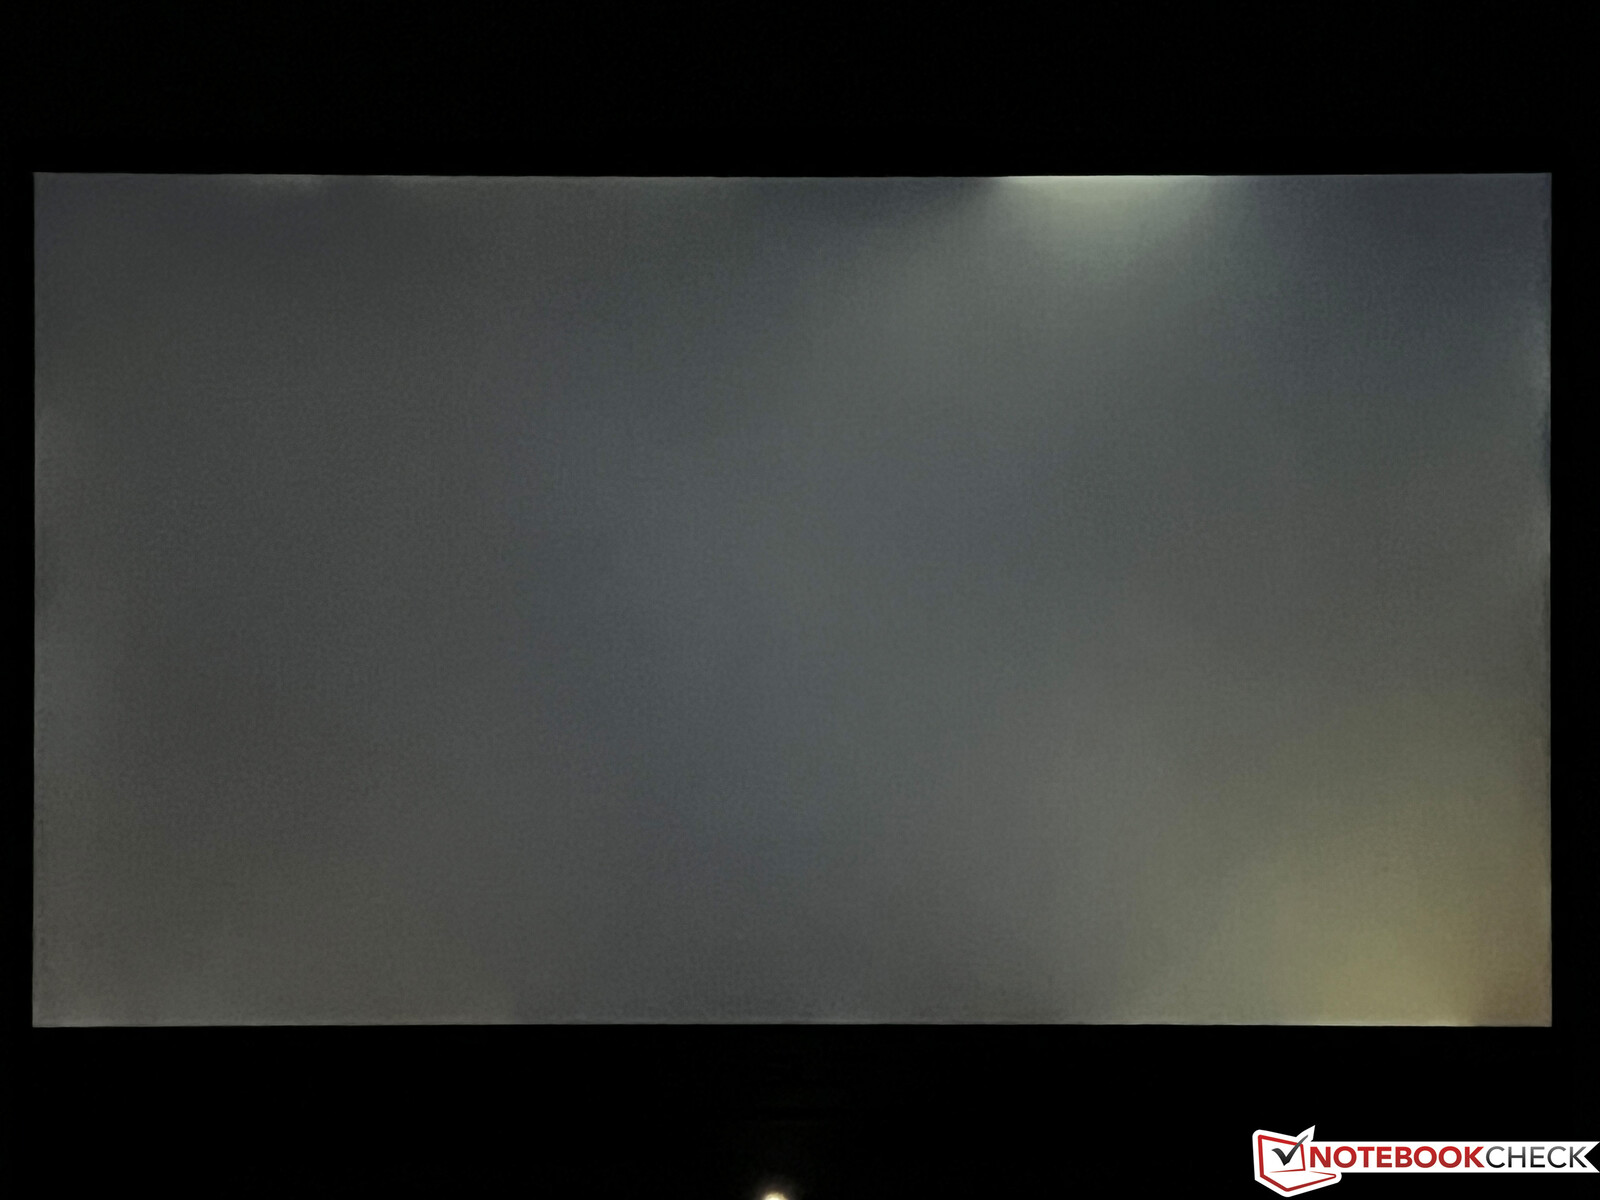
El brillo anunciado es de 250 cd/m², pero hemos medido 270 cd/m² (de media). Por supuesto, no es el mejor, pero es suficiente para un uso en interior y en exterior si no hace demasiado sol. A su vez, su valor de negro es mediocre, lo que significa que sus niveles de contraste sólo miden ~1.700:1 en el mejor de los casos. Las velocidades de reacción del dispositivo son un poco lentas para un portátil de juego y, cuando la pantalla está completamente a oscuras, se aprecia cierto sangrado visible de la retroiluminación. En el uso diario, esto no debería ser una molestia demasiado grande.
| |||||||||||||||||||||||||
iluminación: 91 %
Brillo con batería: 288 cd/m²
Contraste: 1694:1 (Negro: 0.17 cd/m²)
ΔE ColorChecker Calman: 1.9 | ∀{0.5-29.43 Ø4.71}
calibrated: 0.9
ΔE Greyscale Calman: 2.7 | ∀{0.09-98 Ø4.96}
66.6% AdobeRGB 1998 (Argyll 3D)
96.5% sRGB (Argyll 3D)
64.9% Display P3 (Argyll 3D)
Gamma: 2.32
CCT: 6535 K
| Asus TUF A15 FA507 N156HMA-GA1, IPS, 1920x1080, 15.6" | Gigabyte G5 KE Chi Mei N156HRA-EA1, IPS, 1920x1080, 15.6" | Schenker XMG Core 15 (M22) CSOT MNF601CA1-1, IPS, 2560x1440, 15.6" | MSI Katana 15 B12VEK AUOAF90 (B156HAN08.4), IPS, 1920x1080, 15.6" | HP Victus 15 fa0020nr CMN1521, IPS, 1920x1080, 15.6" | Lenovo IdeaPad Gaming 3 15IAH7 Lenovo LEN156FHD, IPS, 1920x1080, 15.6" | Asus TUF Gaming F15 FX507ZM TL156VDXP0101, IPS, 1920x1080, 15.6" | |
|---|---|---|---|---|---|---|---|
| Display | -37% | 5% | -41% | -35% | 5% | 2% | |
| Display P3 Coverage (%) | 64.9 | 40.7 -37% | 68.8 6% | 38.1 -41% | 42 -35% | 69.1 6% | 66.4 2% |
| sRGB Coverage (%) | 96.5 | 61 -37% | 99.3 3% | 56.8 -41% | 62.7 -35% | 99.2 3% | 97 1% |
| AdobeRGB 1998 Coverage (%) | 66.6 | 42.1 -37% | 69.9 5% | 39.3 -41% | 43.4 -35% | 69.9 5% | 68.5 3% |
| Response Times | 11% | 55% | -29% | -24% | 59% | 60% | |
| Response Time Grey 50% / Grey 80% * (ms) | 30.4 ? | 26.64 ? 12% | 16 ? 47% | 38.8 ? -28% | 35.2 ? -16% | 13 ? 57% | 5.6 ? 82% |
| Response Time Black / White * (ms) | 20.8 ? | 18.65 ? 10% | 7.6 ? 63% | 26.8 ? -29% | 27.2 ? -31% | 8.4 ? 60% | 12.8 ? 38% |
| PWM Frequency (Hz) | |||||||
| Screen | -129% | -48% | -133% | -82% | -45% | -3% | |
| Brightness middle (cd/m²) | 288 | 269 -7% | 378 31% | 261 -9% | 284.3 -1% | 338 17% | 353.7 23% |
| Brightness (cd/m²) | 271 | 248 -8% | 371 37% | 258 -5% | 262 -3% | 329 21% | 340 25% |
| Brightness Distribution (%) | 91 | 85 -7% | 93 2% | 92 1% | 87 -4% | 92 1% | 89 -2% |
| Black Level * (cd/m²) | 0.17 | 0.5 -194% | 0.33 -94% | 0.19 -12% | 0.17 -0% | 0.27 -59% | 0.34 -100% |
| Contrast (:1) | 1694 | 538 -68% | 1145 -32% | 1374 -19% | 1672 -1% | 1252 -26% | 1040 -39% |
| Colorchecker dE 2000 * | 1.9 | 4.54 -139% | 2.84 -49% | 5.57 -193% | 4.52 -138% | 2.88 -52% | 1.74 8% |
| Colorchecker dE 2000 max. * | 3.3 | 17.28 -424% | 5.51 -67% | 20.6 -524% | 18.67 -466% | 9.35 -183% | 3.63 -10% |
| Colorchecker dE 2000 calibrated * | 0.9 | 3.34 -271% | 2.75 -206% | 4.63 -414% | 1.55 -72% | 1.22 -36% | 0.5 44% |
| Greyscale dE 2000 * | 2.7 | 3.8 -41% | 4.08 -51% | 3.19 -18% | 4.1 -52% | 5 -85% | 2.1 22% |
| Gamma | 2.32 95% | 2.17 101% | 2.4 92% | 2.45 90% | 2.3 96% | 2.162 102% | 2.3 96% |
| CCT | 6535 99% | 7408 88% | 5841 111% | 6146 106% | 6529 100% | 7497 87% | 6257 104% |
| Media total (Programa/Opciones) | -52% /
-89% | 4% /
-22% | -68% /
-98% | -47% /
-64% | 6% /
-19% | 20% /
7% |
* ... más pequeño es mejor
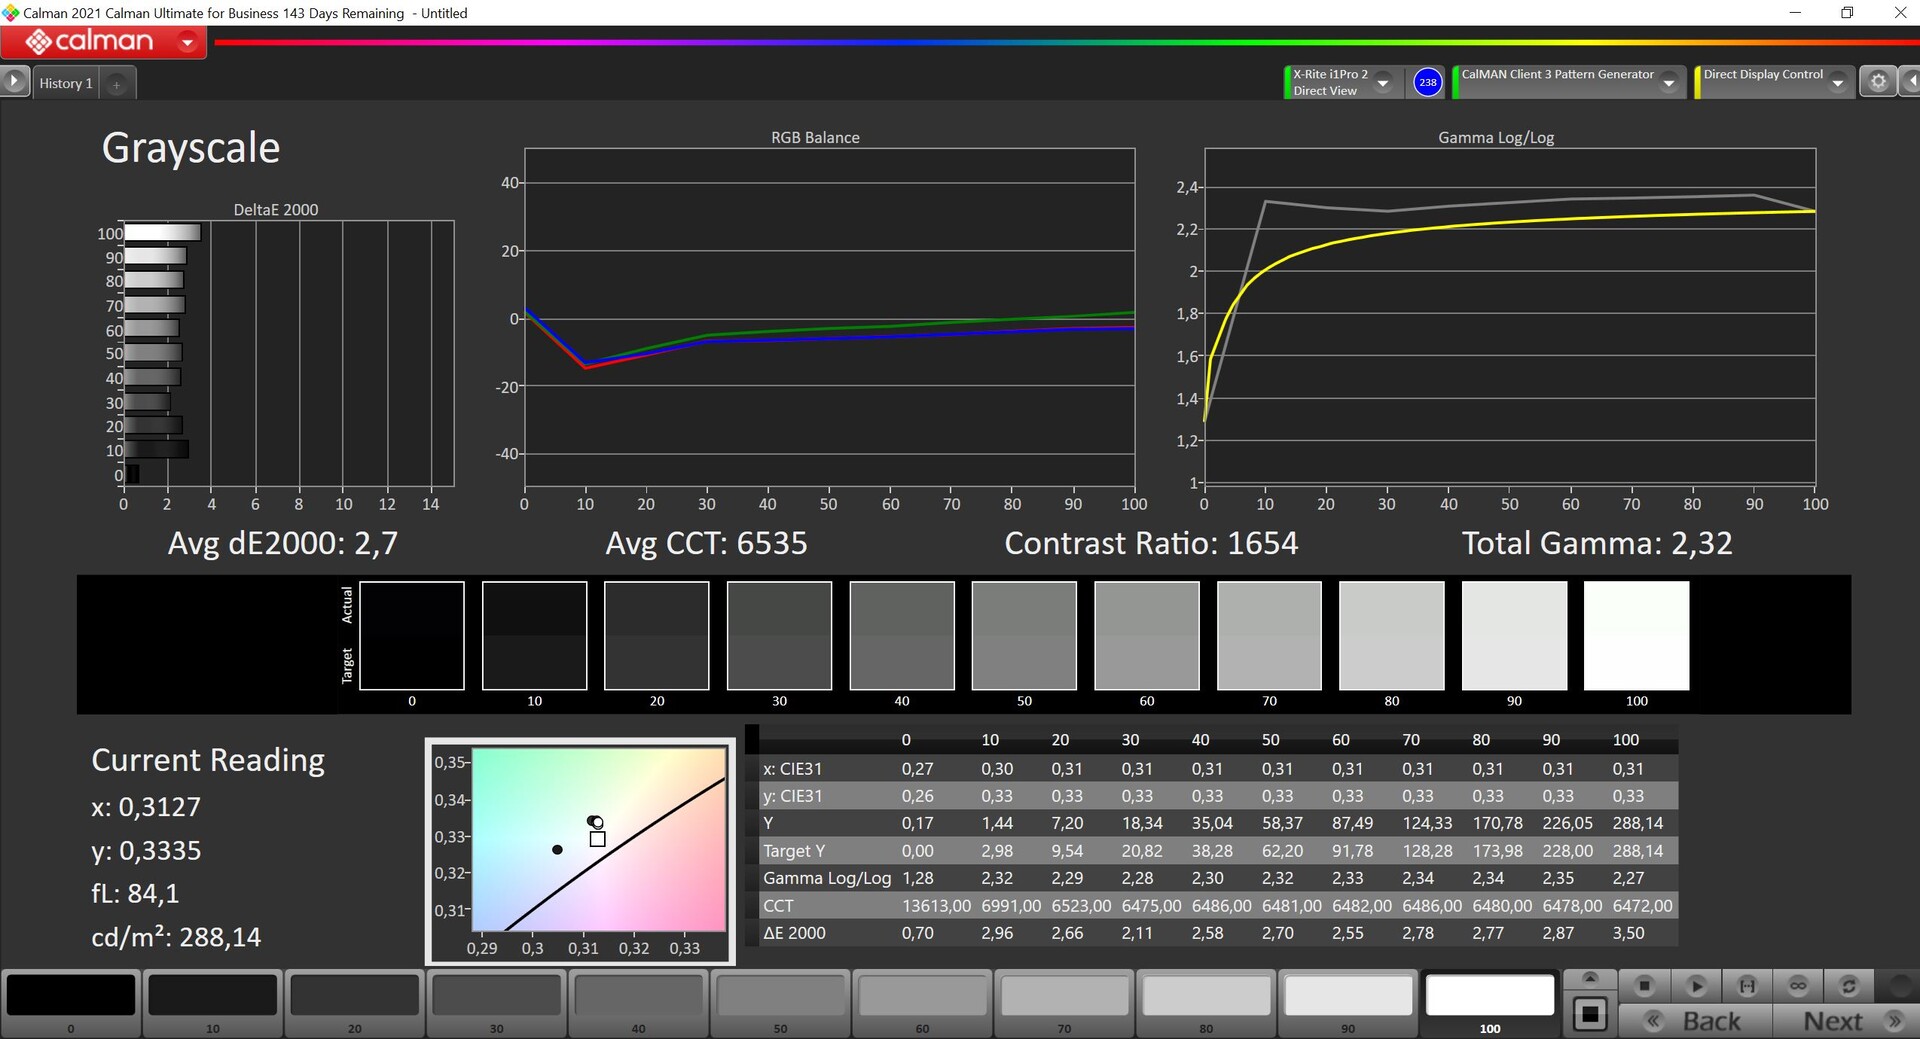
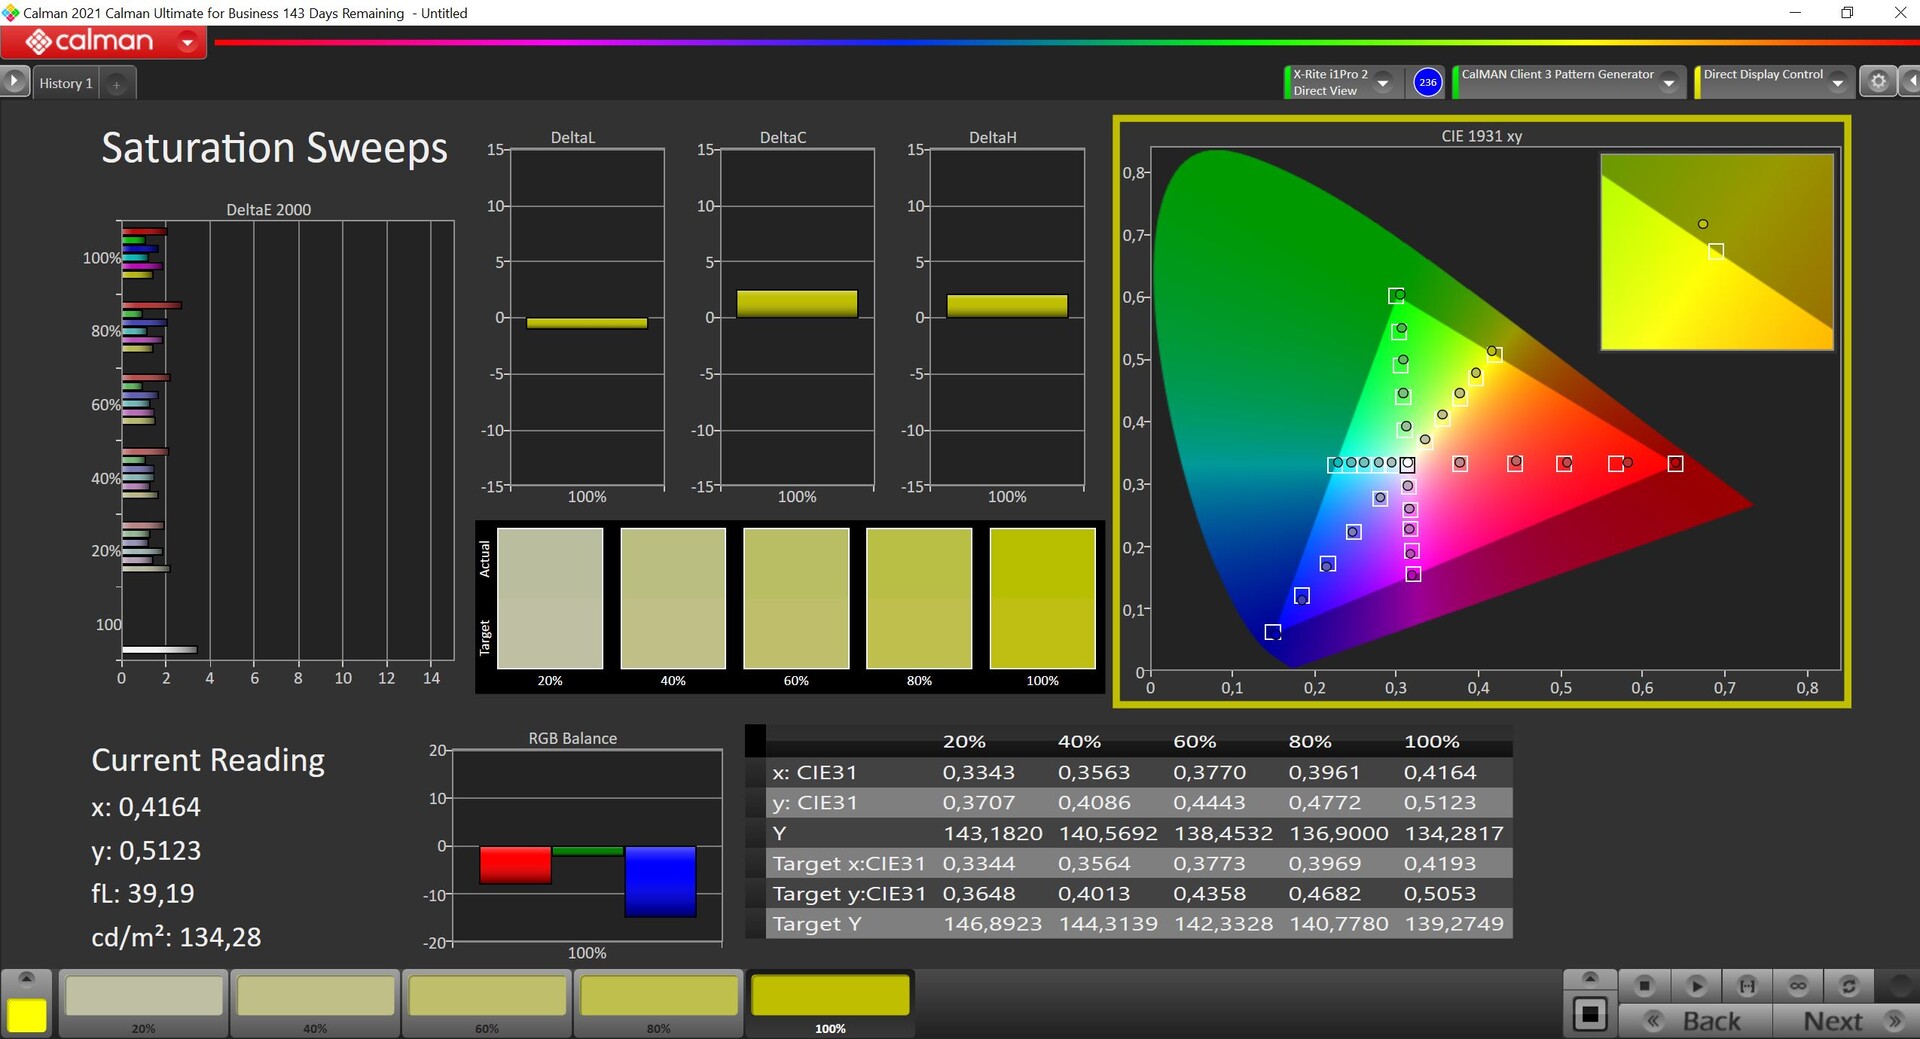
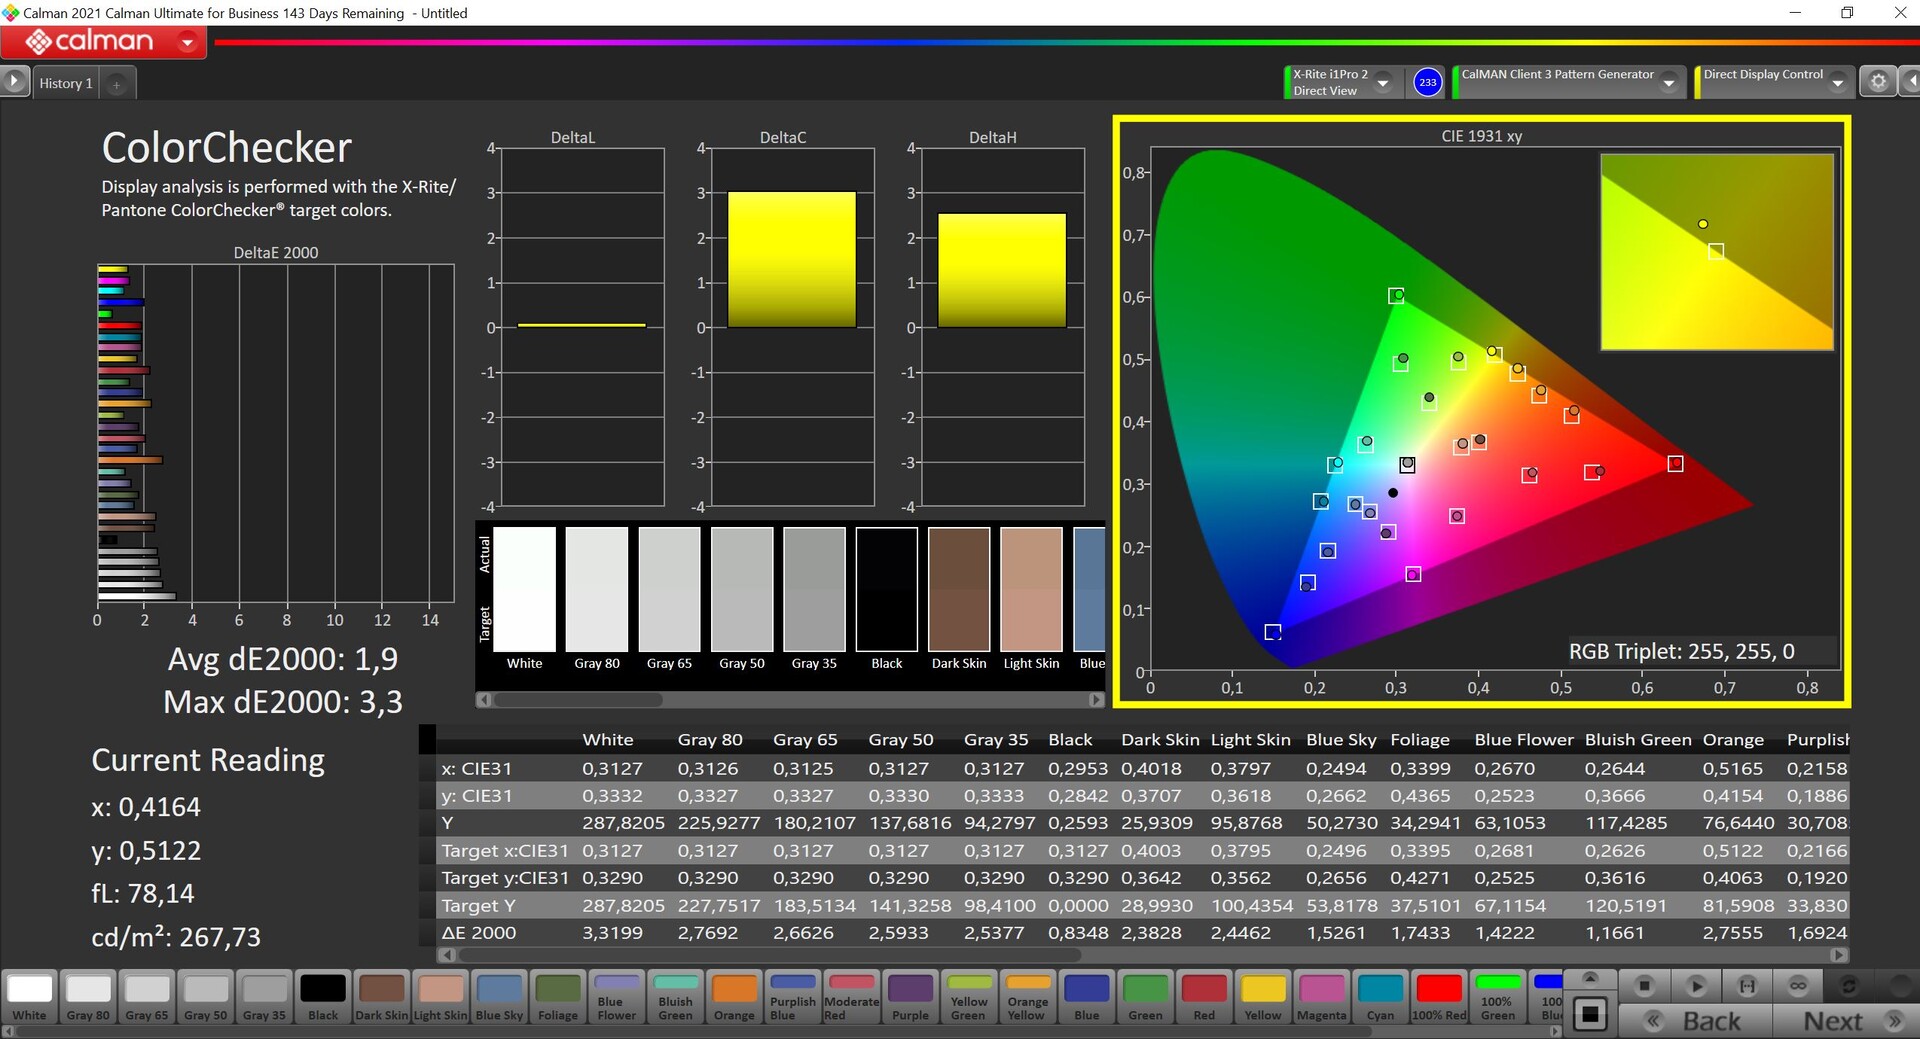
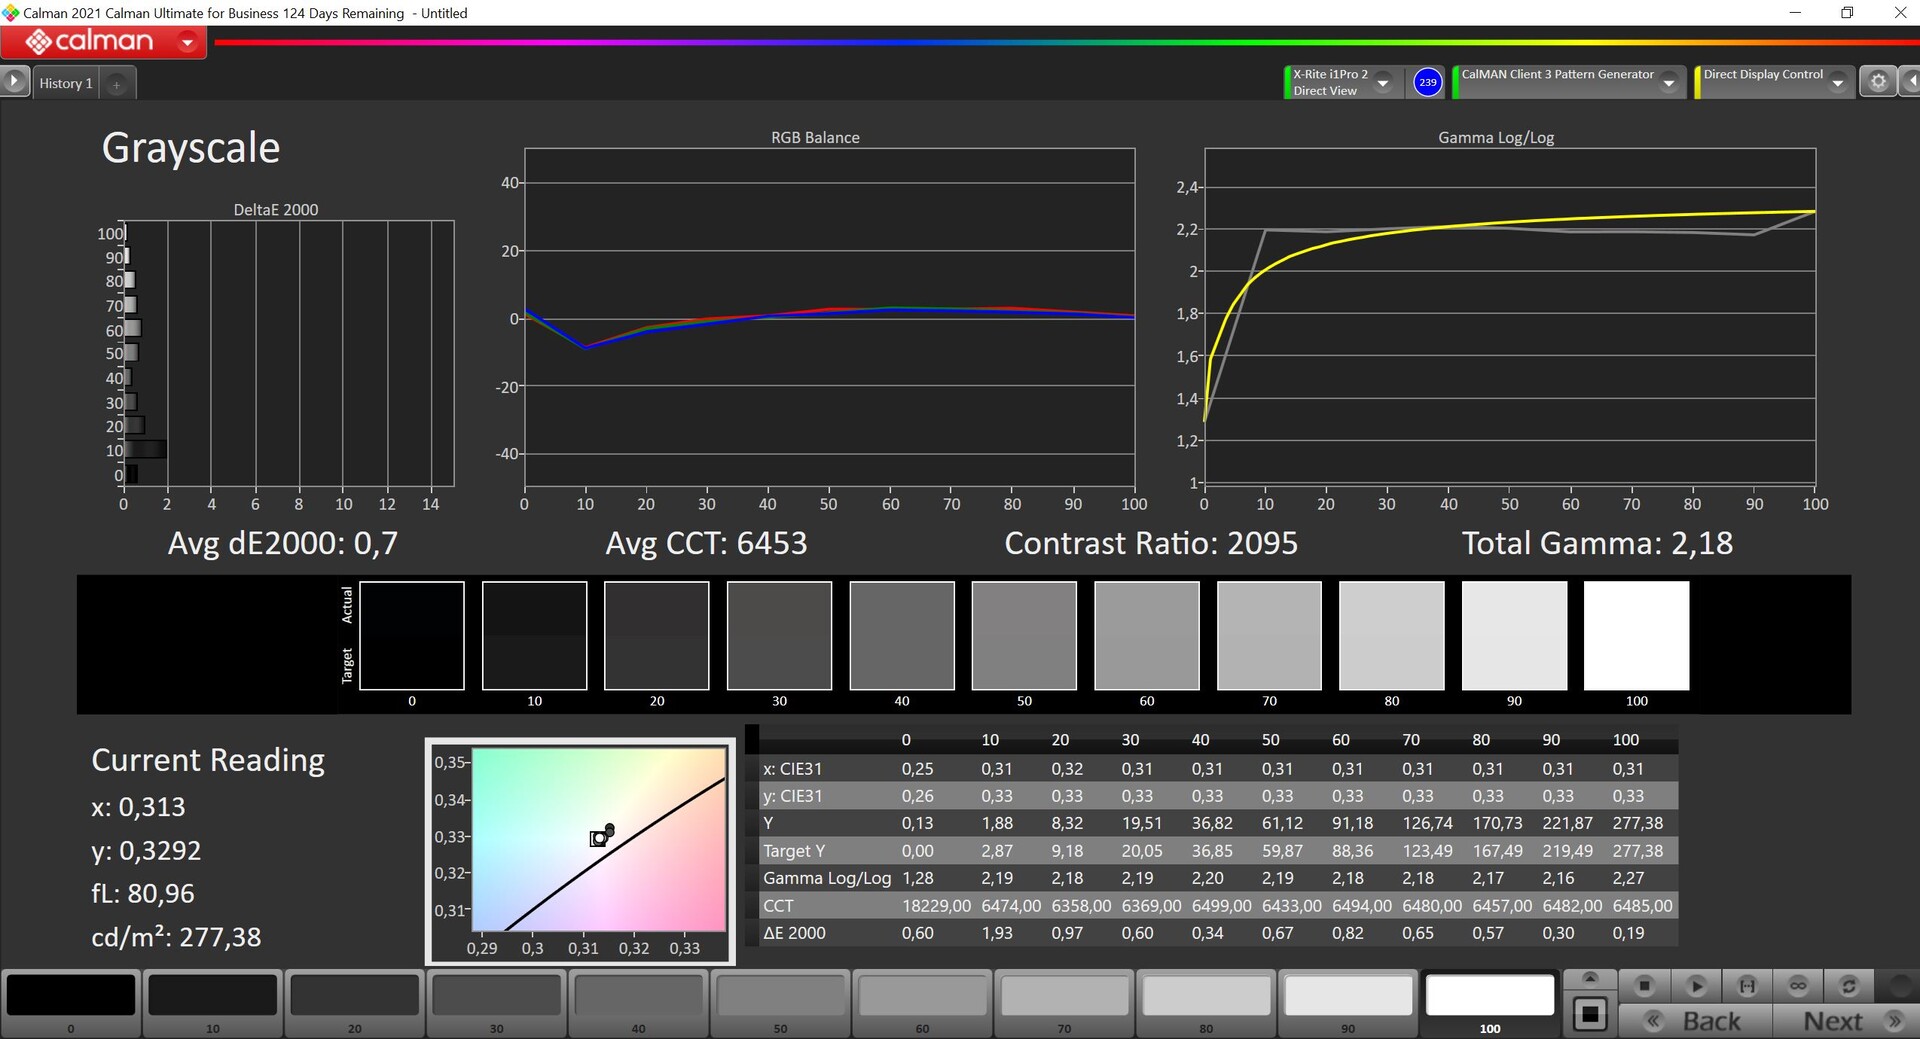


Usando el software profesional CalMAN (X-Rite i1 Pro 2), medimos el panel y su rendimiento fue excelente nada más sacarlo de la caja. No había tinte de color y su representación del color ya era muy precisa, lo que significa que se puede empezar a trabajar en la edición de imágenes de inmediato (al menos dentro del espacio de color sRGB más pequeño). Después de nuestro propio calibrado (puedes descargarte este perfil gratuitamente), pudimos mejorarlo ligeramente, pero no es necesario, sobre todo para jugar.
Tiempos de respuesta del display
| ↔ Tiempo de respuesta de Negro a Blanco | ||
|---|---|---|
| 20.8 ms ... subida ↗ y bajada ↘ combinada | ↗ 11.7 ms subida | 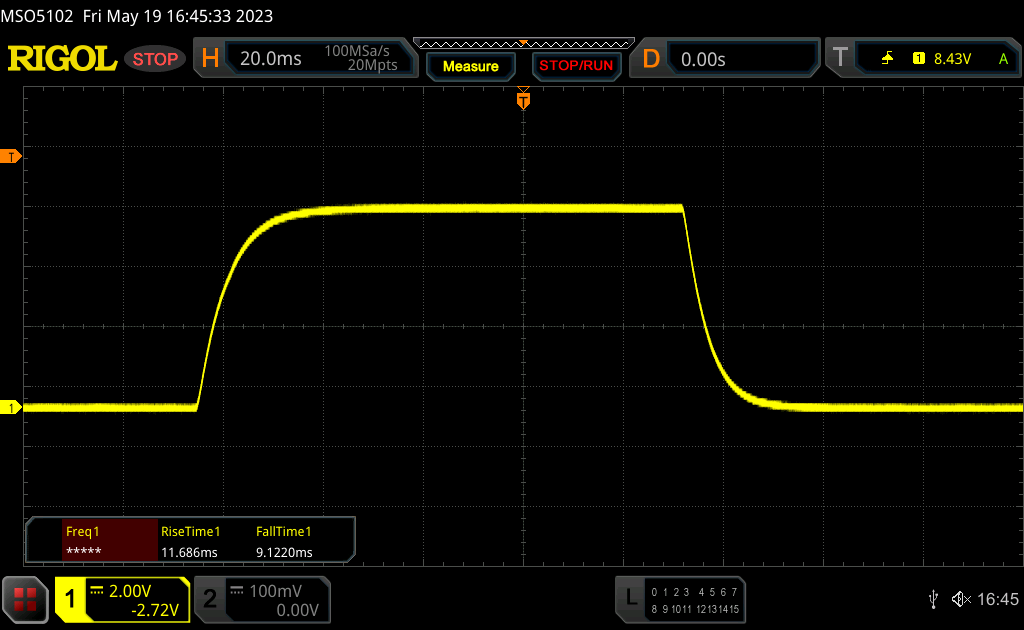 |
| ↘ 9.1 ms bajada | ||
| La pantalla mostró buenos tiempos de respuesta en nuestros tests pero podría ser demasiado lenta para los jugones competitivos. En comparación, todos los dispositivos de prueba van de ##min### (mínimo) a 240 (máximo) ms. » 46 % de todos los dispositivos son mejores. Eso quiere decir que el tiempo de respuesta es similar al dispositivo testado medio (19.8 ms). | ||
| ↔ Tiempo de respuesta 50% Gris a 80% Gris | ||
| 30.4 ms ... subida ↗ y bajada ↘ combinada | ↗ 14.8 ms subida | 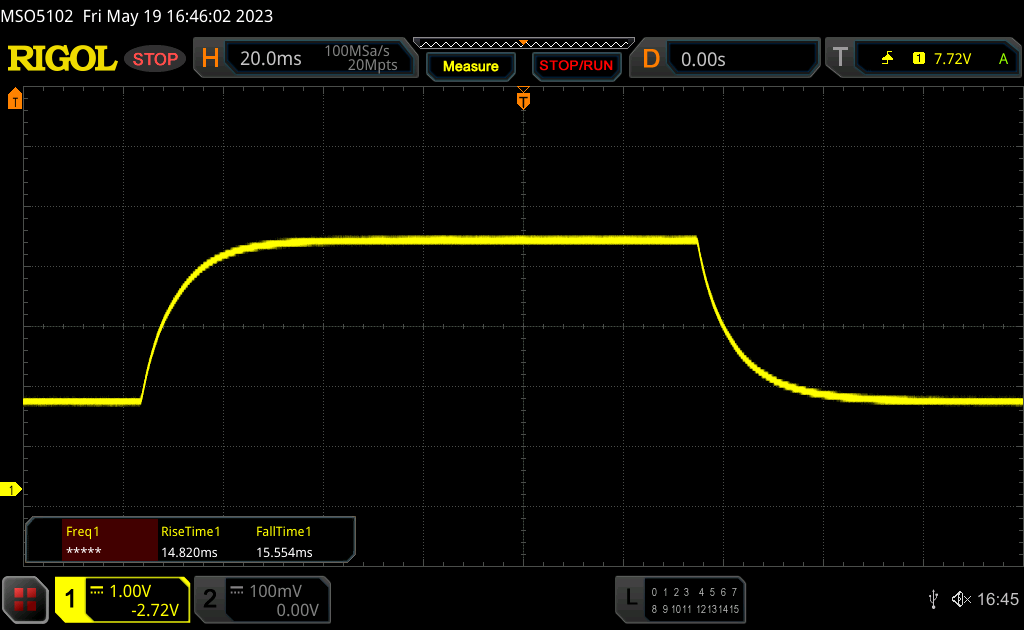 |
| ↘ 15.6 ms bajada | ||
| La pantalla mostró tiempos de respuesta lentos en nuestros tests y podría ser demasiado lenta para los jugones. En comparación, todos los dispositivos de prueba van de ##min### (mínimo) a 636 (máximo) ms. » 41 % de todos los dispositivos son mejores. Eso quiere decir que el tiempo de respuesta es similar al dispositivo testado medio (31 ms). | ||
Parpadeo de Pantalla / PWM (Pulse-Width Modulation)
| Parpadeo de Pantalla / PWM no detectado | 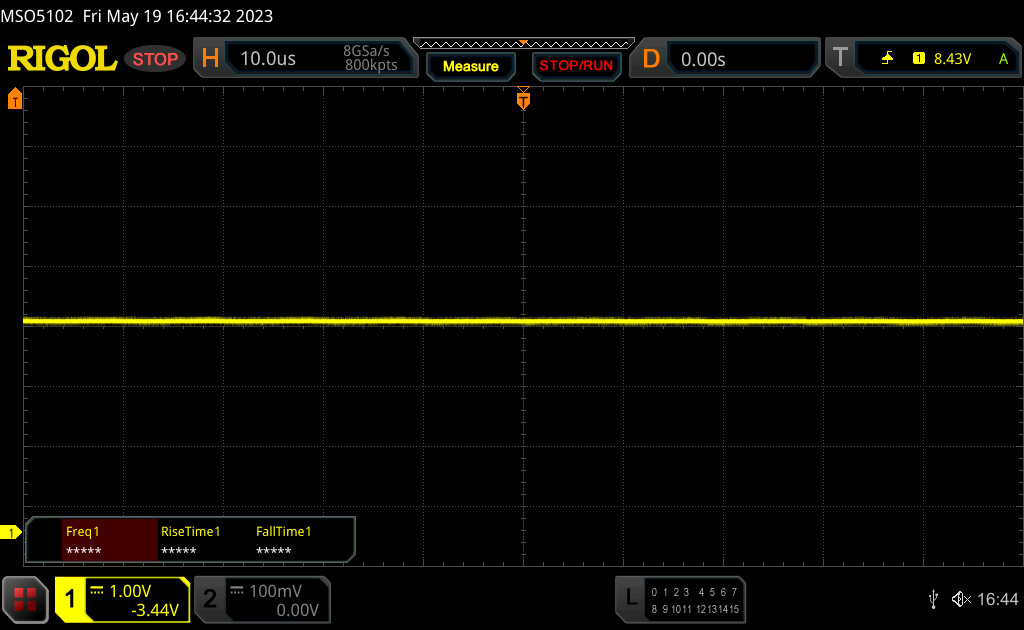 | ||
Comparación: 52 % de todos los dispositivos testados no usaron PWM para atenuar el display. Si se usó, medimos una media de 7757 (mínimo: 5 - máxmo: 343500) Hz. | |||

En exteriores, la pantalla es mate, pero si hay demasiada luz, te costará ver el contenido. El brillo de la pantalla podría ser más brillante. La estabilidad del ángulo de visión del panel IPS es buena - sin embargo, desde ciertos ángulos, la pantalla a veces parece demasiado clara (especialmente desde la parte superior y lateral).

Rendimiento - El TUF Gaming combina un Ryzen 7 con una RTX 4050
Nuestra configuración de prueba es el modelo más débil de la serie - opcionalmente, el Asus TUF Gaming A15 puede ser equipado con un más recienteRyzen 9 7940HSy unGeForce Portátil RTX 4070en el mejor de los casos. Por supuesto, el portátil costará bastante más en esta configuración.
Condiciones de ensayo
Asus usa el software Armoury Crate para sus portátiles de juego, en el que también hay diferentes perfiles de energía. Sin embargo, el modo Turbo opcional no lleva a un aumento de rendimiento en nuestra configuración, por lo que realizamos todas las mediciones y pruebas en modo Rendimiento. Además, Advanced Optimus estaba activo, lo que, sin embargo, lleva a ligeros trastabilles al cambiar de gráfica (por ejemplo, al iniciar juegos). Si no quieres esto, puedes desactivar la iGPU permanentemente o usar la función Optimus normal.
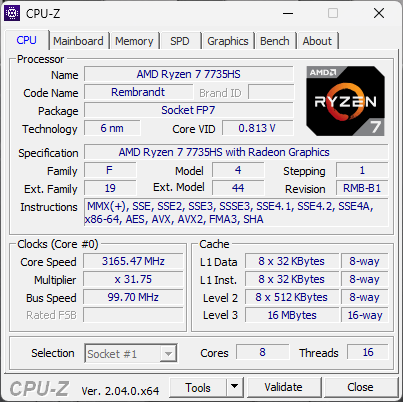
Procesador - Ryzen 7 7735HS
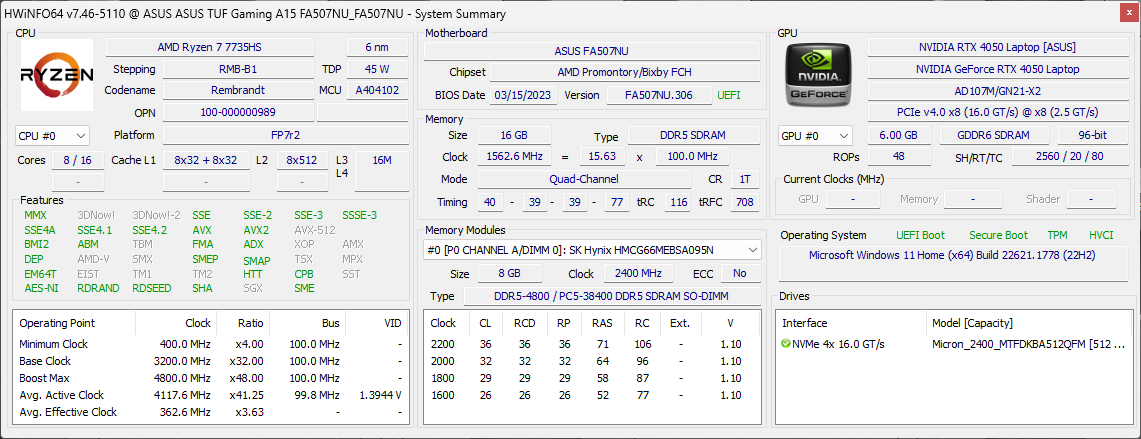
EnAMD Ryzen 7 7735HS se utiliza como procesador del portátil, que es básicamente el antiguoRyzen 7 6800HS pero con un reloj máximo 50 MHz superior. El chip Zen3+ tiene 8 núcleos y puede procesar 16 hilos simultáneamente. Los límites de potencia del TUF Gaming A15 son 80/65 vatios, lo que permite un rendimiento multi-core decente que a menudo queda por delante de los competidores con CPUs Alder Lake. En las pruebas mononúcleo, empero, los chips Intel con los núcleos de rendimiento tuvieron una clara ventaja. Como era de esperar, el 7735HS está a la par con elSchenker XMG Core 15'sRyzen 7 6800H. En general, la CPU es una elección decente para un portátil de juegos económico. En batería, la CPU consume brevemente 45 vatios y luego vuelve a 32 vatios, por lo que el rendimiento multi-core cae un 20%. Más pruebas de rendimiento de la CPU aquí.
Cinebench R15 Multi continuous test
Cinebench R23: Multi Core | Single Core
Cinebench R20: CPU (Multi Core) | CPU (Single Core)
Cinebench R15: CPU Multi 64Bit | CPU Single 64Bit
Blender: v2.79 BMW27 CPU
7-Zip 18.03: 7z b 4 | 7z b 4 -mmt1
Geekbench 5.5: Multi-Core | Single-Core
HWBOT x265 Benchmark v2.2: 4k Preset
LibreOffice : 20 Documents To PDF
R Benchmark 2.5: Overall mean
| CPU Performance rating | |
| Media de la clase Gaming | |
| Asus TUF Gaming F15 FX507ZM | |
| HP Victus 15 fa0020nr | |
| MSI Katana 15 B12VEK | |
| Asus TUF A15 FA507 | |
| Schenker XMG Core 15 (M22) | |
| Lenovo IdeaPad Gaming 3 15IAH7 | |
| Gigabyte G5 KE | |
| Medio AMD Ryzen 7 7735HS | |
| Cinebench R23 / Multi Core | |
| Media de la clase Gaming (10488 - 42661, n=107, últimos 2 años) | |
| Asus TUF Gaming F15 FX507ZM | |
| MSI Katana 15 B12VEK | |
| HP Victus 15 fa0020nr | |
| Lenovo IdeaPad Gaming 3 15IAH7 | |
| Schenker XMG Core 15 (M22) | |
| Asus TUF A15 FA507 | |
| Gigabyte G5 KE | |
| Medio AMD Ryzen 7 7735HS (10283 - 14131, n=15) | |
| Cinebench R23 / Single Core | |
| Media de la clase Gaming (1166 - 2415, n=107, últimos 2 años) | |
| Asus TUF Gaming F15 FX507ZM | |
| HP Victus 15 fa0020nr | |
| MSI Katana 15 B12VEK | |
| Lenovo IdeaPad Gaming 3 15IAH7 | |
| Gigabyte G5 KE | |
| Schenker XMG Core 15 (M22) | |
| Asus TUF A15 FA507 | |
| Medio AMD Ryzen 7 7735HS (1288 - 1570, n=15) | |
| Cinebench R20 / CPU (Multi Core) | |
| Media de la clase Gaming (4029 - 16433, n=106, últimos 2 años) | |
| Asus TUF Gaming F15 FX507ZM | |
| MSI Katana 15 B12VEK | |
| HP Victus 15 fa0020nr | |
| Lenovo IdeaPad Gaming 3 15IAH7 | |
| Schenker XMG Core 15 (M22) | |
| Asus TUF A15 FA507 | |
| Gigabyte G5 KE | |
| Medio AMD Ryzen 7 7735HS (3968 - 5502, n=15) | |
| Cinebench R20 / CPU (Single Core) | |
| Media de la clase Gaming (442 - 913, n=106, últimos 2 años) | |
| HP Victus 15 fa0020nr | |
| Asus TUF Gaming F15 FX507ZM | |
| Lenovo IdeaPad Gaming 3 15IAH7 | |
| MSI Katana 15 B12VEK | |
| Gigabyte G5 KE | |
| Schenker XMG Core 15 (M22) | |
| Asus TUF A15 FA507 | |
| Medio AMD Ryzen 7 7735HS (502 - 613, n=15) | |
| Cinebench R15 / CPU Multi 64Bit | |
| Media de la clase Gaming (1578 - 6330, n=105, últimos 2 años) | |
| Asus TUF Gaming F15 FX507ZM | |
| HP Victus 15 fa0020nr | |
| Schenker XMG Core 15 (M22) | |
| Asus TUF A15 FA507 | |
| Lenovo IdeaPad Gaming 3 15IAH7 | |
| MSI Katana 15 B12VEK | |
| Medio AMD Ryzen 7 7735HS (1758 - 2355, n=17) | |
| Gigabyte G5 KE | |
| Cinebench R15 / CPU Single 64Bit | |
| Media de la clase Gaming (188.8 - 350, n=106, últimos 2 años) | |
| HP Victus 15 fa0020nr | |
| Asus TUF Gaming F15 FX507ZM | |
| Schenker XMG Core 15 (M22) | |
| Asus TUF A15 FA507 | |
| Lenovo IdeaPad Gaming 3 15IAH7 | |
| MSI Katana 15 B12VEK | |
| Medio AMD Ryzen 7 7735HS (206 - 255, n=16) | |
| Gigabyte G5 KE | |
| Blender / v2.79 BMW27 CPU | |
| Medio AMD Ryzen 7 7735HS (214 - 351, n=15) | |
| HP Victus 15 fa0020nr | |
| MSI Katana 15 B12VEK | |
| Gigabyte G5 KE | |
| Lenovo IdeaPad Gaming 3 15IAH7 | |
| Asus TUF A15 FA507 | |
| Schenker XMG Core 15 (M22) | |
| Asus TUF Gaming F15 FX507ZM | |
| Media de la clase Gaming (79 - 330, n=104, últimos 2 años) | |
| 7-Zip 18.03 / 7z b 4 | |
| Media de la clase Gaming (33491 - 148086, n=105, últimos 2 años) | |
| Asus TUF Gaming F15 FX507ZM | |
| Schenker XMG Core 15 (M22) | |
| Asus TUF A15 FA507 | |
| MSI Katana 15 B12VEK | |
| Medio AMD Ryzen 7 7735HS (43455 - 63698, n=15) | |
| Gigabyte G5 KE | |
| HP Victus 15 fa0020nr | |
| Lenovo IdeaPad Gaming 3 15IAH7 | |
| 7-Zip 18.03 / 7z b 4 -mmt1 | |
| Media de la clase Gaming (4199 - 7436, n=105, últimos 2 años) | |
| HP Victus 15 fa0020nr | |
| Asus TUF A15 FA507 | |
| Schenker XMG Core 15 (M22) | |
| Medio AMD Ryzen 7 7735HS (4779 - 5849, n=15) | |
| MSI Katana 15 B12VEK | |
| Lenovo IdeaPad Gaming 3 15IAH7 | |
| Gigabyte G5 KE | |
| Asus TUF Gaming F15 FX507ZM | |
| Geekbench 5.5 / Multi-Core | |
| Media de la clase Gaming (6460 - 28263, n=105, últimos 2 años) | |
| Asus TUF Gaming F15 FX507ZM | |
| MSI Katana 15 B12VEK | |
| HP Victus 15 fa0020nr | |
| Gigabyte G5 KE | |
| Schenker XMG Core 15 (M22) | |
| Asus TUF A15 FA507 | |
| Medio AMD Ryzen 7 7735HS (7151 - 10258, n=15) | |
| Lenovo IdeaPad Gaming 3 15IAH7 | |
| Geekbench 5.5 / Single-Core | |
| Media de la clase Gaming (986 - 2474, n=105, últimos 2 años) | |
| HP Victus 15 fa0020nr | |
| Asus TUF Gaming F15 FX507ZM | |
| MSI Katana 15 B12VEK | |
| Gigabyte G5 KE | |
| Lenovo IdeaPad Gaming 3 15IAH7 | |
| Schenker XMG Core 15 (M22) | |
| Medio AMD Ryzen 7 7735HS (1327 - 1615, n=15) | |
| Asus TUF A15 FA507 | |
| HWBOT x265 Benchmark v2.2 / 4k Preset | |
| Media de la clase Gaming (11.5 - 44.4, n=105, últimos 2 años) | |
| Asus TUF Gaming F15 FX507ZM | |
| Schenker XMG Core 15 (M22) | |
| MSI Katana 15 B12VEK | |
| Asus TUF A15 FA507 | |
| Gigabyte G5 KE | |
| HP Victus 15 fa0020nr | |
| Lenovo IdeaPad Gaming 3 15IAH7 | |
| Medio AMD Ryzen 7 7735HS (10.8 - 17.9, n=15) | |
| LibreOffice / 20 Documents To PDF | |
| Schenker XMG Core 15 (M22) | |
| Gigabyte G5 KE | |
| Medio AMD Ryzen 7 7735HS (44.3 - 63.9, n=15) | |
| Asus TUF A15 FA507 | |
| Asus TUF Gaming F15 FX507ZM | |
| Media de la clase Gaming (33.2 - 88.8, n=105, últimos 2 años) | |
| HP Victus 15 fa0020nr | |
| Lenovo IdeaPad Gaming 3 15IAH7 | |
| MSI Katana 15 B12VEK | |
| R Benchmark 2.5 / Overall mean | |
| Lenovo IdeaPad Gaming 3 15IAH7 | |
| Medio AMD Ryzen 7 7735HS (0.4822 - 0.585, n=15) | |
| Asus TUF A15 FA507 | |
| MSI Katana 15 B12VEK | |
| Gigabyte G5 KE | |
| Schenker XMG Core 15 (M22) | |
| HP Victus 15 fa0020nr | |
| Asus TUF Gaming F15 FX507ZM | |
| Media de la clase Gaming (0.3439 - 0.759, n=106, últimos 2 años) | |
* ... más pequeño es mejor
AIDA64: FP32 Ray-Trace | FPU Julia | CPU SHA3 | CPU Queen | FPU SinJulia | FPU Mandel | CPU AES | CPU ZLib | FP64 Ray-Trace | CPU PhotoWorxx
| Performance rating | |
| Media de la clase Gaming | |
| Schenker XMG Core 15 (M22) | |
| Asus TUF A15 FA507 | |
| Medio AMD Ryzen 7 7735HS | |
| MSI Katana 15 B12VEK | |
| Gigabyte G5 KE | |
| Asus TUF Gaming F15 FX507ZM | |
| Lenovo IdeaPad Gaming 3 15IAH7 | |
| HP Victus 15 fa0020nr | |
| AIDA64 / FP32 Ray-Trace | |
| Media de la clase Gaming (10227 - 85542, n=105, últimos 2 años) | |
| Schenker XMG Core 15 (M22) | |
| Asus TUF A15 FA507 | |
| MSI Katana 15 B12VEK | |
| Medio AMD Ryzen 7 7735HS (11831 - 17161, n=16) | |
| Lenovo IdeaPad Gaming 3 15IAH7 | |
| HP Victus 15 fa0020nr | |
| Gigabyte G5 KE | |
| Asus TUF Gaming F15 FX507ZM | |
| AIDA64 / FPU Julia | |
| Media de la clase Gaming (51376 - 238426, n=105, últimos 2 años) | |
| Schenker XMG Core 15 (M22) | |
| Asus TUF A15 FA507 | |
| Medio AMD Ryzen 7 7735HS (75370 - 105483, n=16) | |
| MSI Katana 15 B12VEK | |
| Lenovo IdeaPad Gaming 3 15IAH7 | |
| Gigabyte G5 KE | |
| HP Victus 15 fa0020nr | |
| Asus TUF Gaming F15 FX507ZM | |
| AIDA64 / CPU SHA3 | |
| Media de la clase Gaming (2180 - 10115, n=105, últimos 2 años) | |
| Schenker XMG Core 15 (M22) | |
| Asus TUF A15 FA507 | |
| Lenovo IdeaPad Gaming 3 15IAH7 | |
| Asus TUF Gaming F15 FX507ZM | |
| MSI Katana 15 B12VEK | |
| Gigabyte G5 KE | |
| Medio AMD Ryzen 7 7735HS (2499 - 3494, n=16) | |
| HP Victus 15 fa0020nr | |
| AIDA64 / CPU Queen | |
| Media de la clase Gaming (49785 - 173351, n=90, últimos 2 años) | |
| Asus TUF A15 FA507 | |
| HP Victus 15 fa0020nr | |
| Medio AMD Ryzen 7 7735HS (87486 - 108729, n=15) | |
| Asus TUF Gaming F15 FX507ZM | |
| Schenker XMG Core 15 (M22) | |
| MSI Katana 15 B12VEK | |
| Lenovo IdeaPad Gaming 3 15IAH7 | |
| Gigabyte G5 KE | |
| AIDA64 / FPU SinJulia | |
| Media de la clase Gaming (4424 - 33636, n=105, últimos 2 años) | |
| Schenker XMG Core 15 (M22) | |
| Asus TUF A15 FA507 | |
| Medio AMD Ryzen 7 7735HS (11233 - 13097, n=16) | |
| Asus TUF Gaming F15 FX507ZM | |
| MSI Katana 15 B12VEK | |
| HP Victus 15 fa0020nr | |
| Gigabyte G5 KE | |
| Lenovo IdeaPad Gaming 3 15IAH7 | |
| AIDA64 / FPU Mandel | |
| Media de la clase Gaming (25115 - 128721, n=105, últimos 2 años) | |
| Schenker XMG Core 15 (M22) | |
| Asus TUF A15 FA507 | |
| Medio AMD Ryzen 7 7735HS (41400 - 58232, n=16) | |
| MSI Katana 15 B12VEK | |
| Lenovo IdeaPad Gaming 3 15IAH7 | |
| Gigabyte G5 KE | |
| HP Victus 15 fa0020nr | |
| Asus TUF Gaming F15 FX507ZM | |
| AIDA64 / CPU AES | |
| Lenovo IdeaPad Gaming 3 15IAH7 | |
| Gigabyte G5 KE | |
| Media de la clase Gaming (39258 - 247074, n=105, últimos 2 años) | |
| Medio AMD Ryzen 7 7735HS (44013 - 137629, n=16) | |
| Schenker XMG Core 15 (M22) | |
| MSI Katana 15 B12VEK | |
| Asus TUF Gaming F15 FX507ZM | |
| Asus TUF A15 FA507 | |
| HP Victus 15 fa0020nr | |
| AIDA64 / CPU ZLib | |
| Media de la clase Gaming (574 - 2531, n=105, últimos 2 años) | |
| Asus TUF Gaming F15 FX507ZM | |
| Gigabyte G5 KE | |
| Lenovo IdeaPad Gaming 3 15IAH7 | |
| Schenker XMG Core 15 (M22) | |
| MSI Katana 15 B12VEK | |
| HP Victus 15 fa0020nr | |
| Medio AMD Ryzen 7 7735HS (651 - 906, n=16) | |
| Asus TUF A15 FA507 | |
| AIDA64 / FP64 Ray-Trace | |
| Media de la clase Gaming (5509 - 45446, n=105, últimos 2 años) | |
| Schenker XMG Core 15 (M22) | |
| Asus TUF A15 FA507 | |
| MSI Katana 15 B12VEK | |
| Medio AMD Ryzen 7 7735HS (1459 - 9094, n=16) | |
| Lenovo IdeaPad Gaming 3 15IAH7 | |
| Gigabyte G5 KE | |
| HP Victus 15 fa0020nr | |
| Asus TUF Gaming F15 FX507ZM | |
| AIDA64 / CPU PhotoWorxx | |
| Media de la clase Gaming (12271 - 89891, n=105, últimos 2 años) | |
| MSI Katana 15 B12VEK | |
| Asus TUF Gaming F15 FX507ZM | |
| Schenker XMG Core 15 (M22) | |
| Gigabyte G5 KE | |
| Asus TUF A15 FA507 | |
| Medio AMD Ryzen 7 7735HS (17524 - 30542, n=16) | |
| HP Victus 15 fa0020nr | |
| Lenovo IdeaPad Gaming 3 15IAH7 | |
Rendimiento del sistema
El TUF Gaming A15 rindió bien en los benchmarks sintéticos de sistema y fue capaz de situarse en el medio campo superior durante la prueba PCMark 10. En general, no hubo mucha diferencia entre los contendientes y subjetivamente, todos nos dejaron una buena impresión en lo que respecta al rendimiento. Aparte de los ligeros tartamudeos antes mencionados durante el cambio de GPU (que son normales), el sistema siempre funcionó sin problemas en la prueba.
CrossMark: Overall | Productivity | Creativity | Responsiveness
| PCMark 10 / Score | |
| Media de la clase Gaming (5828 - 12414, n=93, últimos 2 años) | |
| Asus TUF Gaming F15 FX507ZM | |
| Schenker XMG Core 15 (M22) | |
| Asus TUF A15 FA507 | |
| Medio AMD Ryzen 7 7735HS, NVIDIA GeForce RTX 4050 Laptop GPU (n=1) | |
| Gigabyte G5 KE | |
| HP Victus 15 fa0020nr | |
| MSI Katana 15 B12VEK | |
| Lenovo IdeaPad Gaming 3 15IAH7 | |
| PCMark 10 / Essentials | |
| Gigabyte G5 KE | |
| Schenker XMG Core 15 (M22) | |
| Media de la clase Gaming (8810 - 11935, n=97, últimos 2 años) | |
| Asus TUF A15 FA507 | |
| Medio AMD Ryzen 7 7735HS, NVIDIA GeForce RTX 4050 Laptop GPU (n=1) | |
| Asus TUF Gaming F15 FX507ZM | |
| HP Victus 15 fa0020nr | |
| MSI Katana 15 B12VEK | |
| Lenovo IdeaPad Gaming 3 15IAH7 | |
| PCMark 10 / Productivity | |
| Media de la clase Gaming (6845 - 25323, n=95, últimos 2 años) | |
| MSI Katana 15 B12VEK | |
| Schenker XMG Core 15 (M22) | |
| Lenovo IdeaPad Gaming 3 15IAH7 | |
| Gigabyte G5 KE | |
| Asus TUF A15 FA507 | |
| Medio AMD Ryzen 7 7735HS, NVIDIA GeForce RTX 4050 Laptop GPU (n=1) | |
| Asus TUF Gaming F15 FX507ZM | |
| HP Victus 15 fa0020nr | |
| PCMark 10 / Digital Content Creation | |
| Media de la clase Gaming (7602 - 19954, n=95, últimos 2 años) | |
| Asus TUF Gaming F15 FX507ZM | |
| Asus TUF A15 FA507 | |
| Medio AMD Ryzen 7 7735HS, NVIDIA GeForce RTX 4050 Laptop GPU (n=1) | |
| Schenker XMG Core 15 (M22) | |
| Gigabyte G5 KE | |
| HP Victus 15 fa0020nr | |
| MSI Katana 15 B12VEK | |
| Lenovo IdeaPad Gaming 3 15IAH7 | |
| CrossMark / Overall | |
| Media de la clase Gaming (1366 - 2409, n=94, últimos 2 años) | |
| Gigabyte G5 KE | |
| MSI Katana 15 B12VEK | |
| HP Victus 15 fa0020nr | |
| Schenker XMG Core 15 (M22) | |
| Asus TUF A15 FA507 | |
| Medio AMD Ryzen 7 7735HS, NVIDIA GeForce RTX 4050 Laptop GPU (n=1) | |
| CrossMark / Productivity | |
| Media de la clase Gaming (1386 - 2254, n=94, últimos 2 años) | |
| Gigabyte G5 KE | |
| MSI Katana 15 B12VEK | |
| HP Victus 15 fa0020nr | |
| Schenker XMG Core 15 (M22) | |
| Asus TUF A15 FA507 | |
| Medio AMD Ryzen 7 7735HS, NVIDIA GeForce RTX 4050 Laptop GPU (n=1) | |
| CrossMark / Creativity | |
| Media de la clase Gaming (1343 - 2786, n=94, últimos 2 años) | |
| MSI Katana 15 B12VEK | |
| HP Victus 15 fa0020nr | |
| Gigabyte G5 KE | |
| Schenker XMG Core 15 (M22) | |
| Asus TUF A15 FA507 | |
| Medio AMD Ryzen 7 7735HS, NVIDIA GeForce RTX 4050 Laptop GPU (n=1) | |
| CrossMark / Responsiveness | |
| Gigabyte G5 KE | |
| Media de la clase Gaming (1226 - 2334, n=94, últimos 2 años) | |
| MSI Katana 15 B12VEK | |
| HP Victus 15 fa0020nr | |
| Schenker XMG Core 15 (M22) | |
| Asus TUF A15 FA507 | |
| Medio AMD Ryzen 7 7735HS, NVIDIA GeForce RTX 4050 Laptop GPU (n=1) | |
| PCMark 10 Score | 7210 puntos | |
ayuda | ||
| AIDA64 / Memory Copy | |
| Media de la clase Gaming (21750 - 129946, n=105, últimos 2 años) | |
| MSI Katana 15 B12VEK | |
| Asus TUF Gaming F15 FX507ZM | |
| Schenker XMG Core 15 (M22) | |
| Asus TUF A15 FA507 | |
| Medio AMD Ryzen 7 7735HS (30324 - 52012, n=16) | |
| Gigabyte G5 KE | |
| HP Victus 15 fa0020nr | |
| Lenovo IdeaPad Gaming 3 15IAH7 | |
| AIDA64 / Memory Read | |
| Media de la clase Gaming (22956 - 118858, n=105, últimos 2 años) | |
| MSI Katana 15 B12VEK | |
| Asus TUF Gaming F15 FX507ZM | |
| Schenker XMG Core 15 (M22) | |
| Asus TUF A15 FA507 | |
| Gigabyte G5 KE | |
| HP Victus 15 fa0020nr | |
| Medio AMD Ryzen 7 7735HS (33938 - 51856, n=16) | |
| Lenovo IdeaPad Gaming 3 15IAH7 | |
| AIDA64 / Memory Write | |
| Media de la clase Gaming (22297 - 135096, n=105, últimos 2 años) | |
| Asus TUF Gaming F15 FX507ZM | |
| MSI Katana 15 B12VEK | |
| Schenker XMG Core 15 (M22) | |
| Asus TUF A15 FA507 | |
| Medio AMD Ryzen 7 7735HS (33175 - 55284, n=16) | |
| Gigabyte G5 KE | |
| HP Victus 15 fa0020nr | |
| Lenovo IdeaPad Gaming 3 15IAH7 | |
| AIDA64 / Memory Latency | |
| Media de la clase Gaming (75.3 - 259, n=105, últimos 2 años) | |
| Gigabyte G5 KE | |
| MSI Katana 15 B12VEK | |
| Lenovo IdeaPad Gaming 3 15IAH7 | |
| Medio AMD Ryzen 7 7735HS (78.2 - 109.8, n=16) | |
| Schenker XMG Core 15 (M22) | |
| Asus TUF A15 FA507 | |
| HP Victus 15 fa0020nr | |
| Asus TUF Gaming F15 FX507ZM | |
* ... más pequeño es mejor
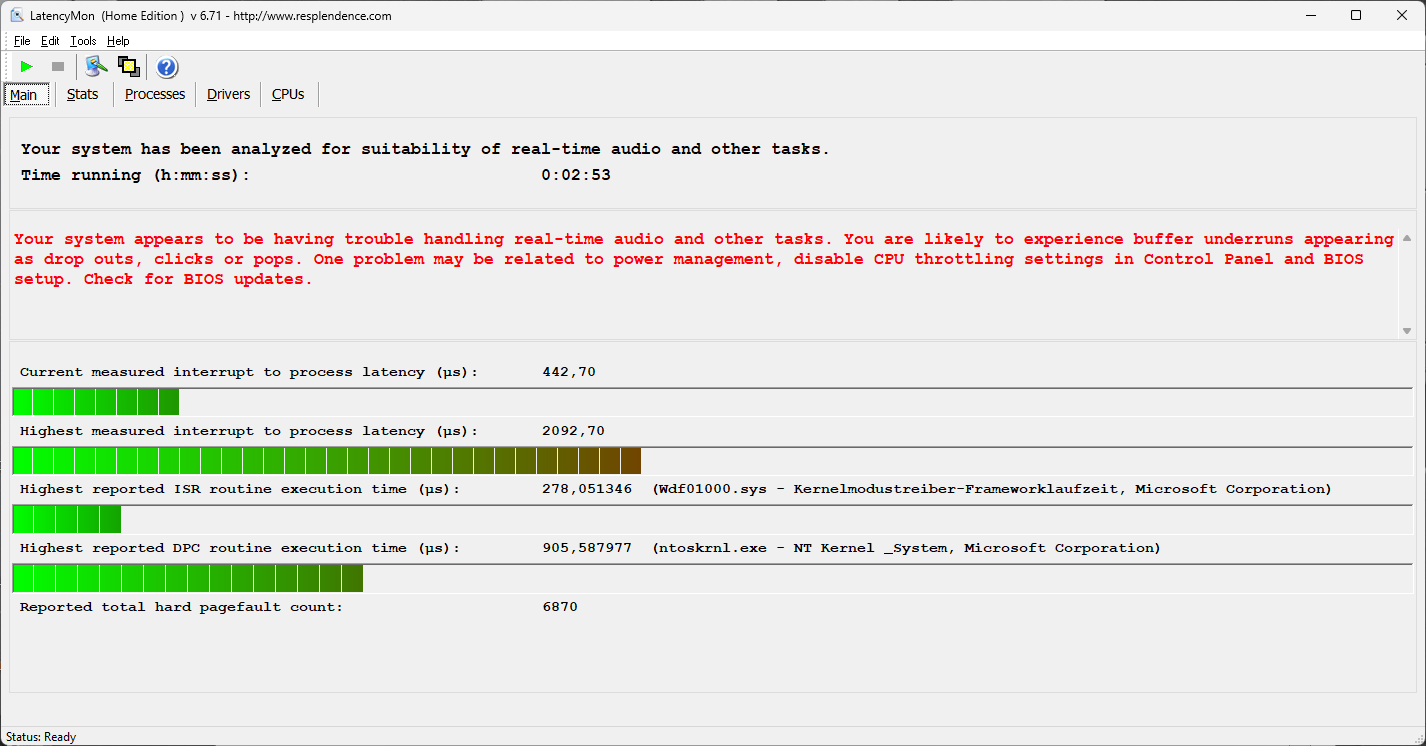
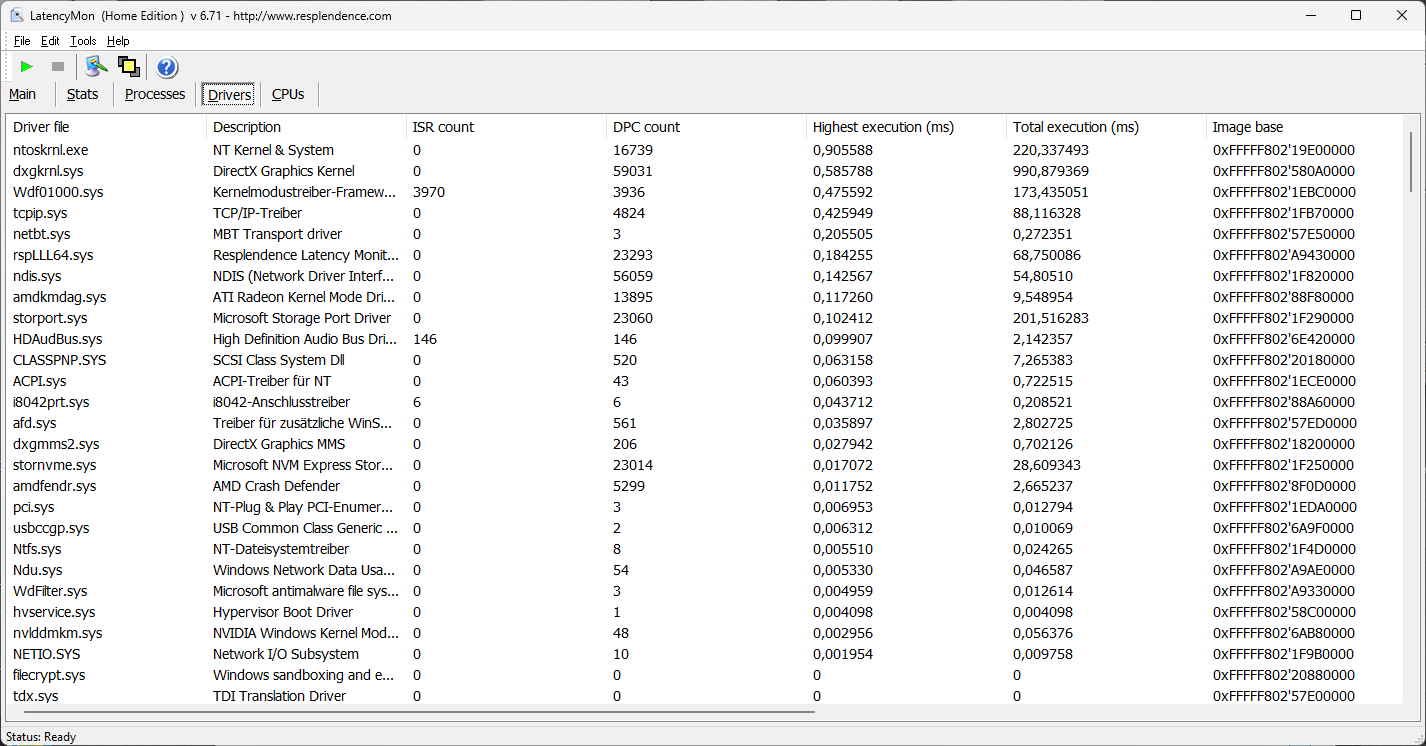
Latencia del CPD
En nuestra prueba de latencia estandarizada (navegación web, reproducción 4K de YouTube, carga de la CPU), el dispositivo de prueba mostró algunas limitaciones con la versión actual de la BIOS y, por tanto, no es adecuado para software de audio en tiempo real sin restricciones.
| DPC Latencies / LatencyMon - interrupt to process latency (max), Web, Youtube, Prime95 | |
| MSI Katana 15 B12VEK | |
| Schenker XMG Core 15 (M22) | |
| HP Victus 15 fa0020nr | |
| Lenovo IdeaPad Gaming 3 15IAH7 | |
| Gigabyte G5 KE | |
| Asus TUF Gaming F15 FX507ZM | |
* ... más pequeño es mejor
Dispositivos de almacenamiento
El SSD instalado es una unidad PCIe 4.0 de Micron (2400). La unidad M.2 2280 tiene una capacidad de almacenamiento de 512 GB, con 420 GB disponibles tras el primer arranque. La tasa de transferencia máxima del QLC-SSD es de 4.200 MB/s, que también coincide con las tasas de nuestras pruebas. En general, su rendimiento es bueno y estable incluso bajo cargas prolongadas. Más pruebas de SSD aquí.

* ... más pequeño es mejor
reading continuous performance: DiskSpd Read Loop, Queue Depth 8
Tarjeta gráfica - GeForce RTX 4050 Portátil
En el uso cotidiano, el procesamiento de gráficos corre a cargo de la tarjeta integradaAMD Radeon 680M- para esfuerzos mayores, cambia automáticamente a la dedicadaPortátil Nvidia GeForce RTX 4050. Este último tiene 6 GB de RAM y, según el controlador, se trata de la versión de 140 vatios. Sin embargo, esta especificación es un poco engañosa, ya que la nueva GPU consume un máximo de ~ 95 vatios mientras se juega de todos modos. Por tanto, es la versión más rápida del portátil RTX 4050. Esto también se refleja en los benchmarks, donde el TUF Gaming A15 rindió un 10% más rápido de media que los valores medios que tenemos para esta GPU en nuestra base de datos.
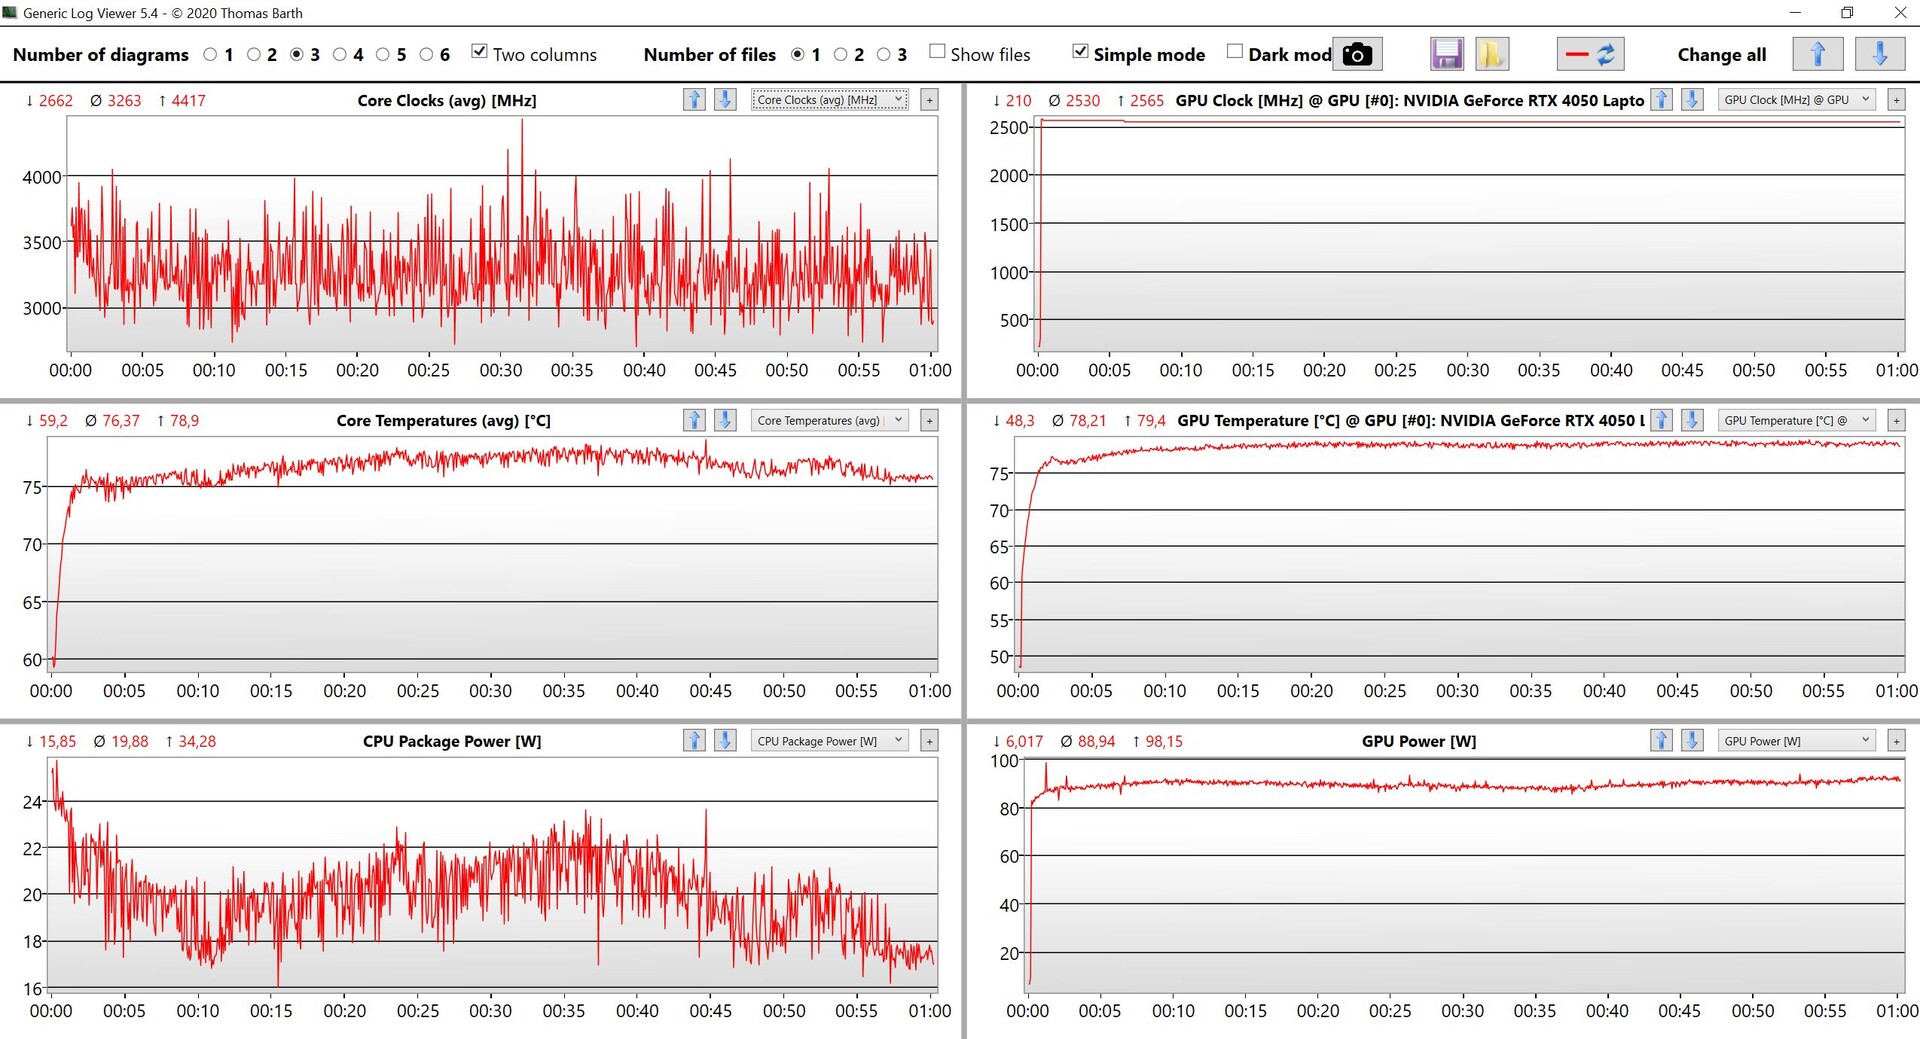
Esto significa que el portátil RTX 4050 también se acerca mucho a la antigua RTX 3060que también consume bastante más energía dentro de los dispositivos de comparación (entre 115 y 140 vatios TGP). En general, su rendimiento es muy bueno y no hubo caída de rendimiento ni siquiera bajo carga permanente - la prueba de estrés Time Spy se ejecutó sin problemas con una tasa de aprobados del 99,3%. En modo batería, el consumo de energía de la GPU se limita a unos 50 vatios, por lo que el rendimiento gráfico cae en torno a un 30%. Más información enPruebas de GPU en nuestra sección de tecnología.
| 3DMark Performance rating - Percent | |
| Media de la clase Gaming | |
| Asus TUF Gaming F15 FX507ZM -4! | |
| MSI Katana 15 B12VEK -3! | |
| Gigabyte G5 KE -3! | |
| Asus TUF A15 FA507 | |
| Schenker XMG Core 15 (M22) -1! | |
| Medio NVIDIA GeForce RTX 4050 Laptop GPU | |
| Lenovo IdeaPad Gaming 3 15IAH7 -3! | |
| HP Victus 15 fa0020nr -2! | |
| Geekbench 6.0 - GPU OpenCL 6.0 | |
| Media de la clase Gaming (155885 - 241981, n=3, últimos 2 años) | |
| Asus TUF A15 FA507 | |
| Medio NVIDIA GeForce RTX 4050 Laptop GPU (66574 - 84452, n=13) | |
| 3DMark 11 Performance | 26692 puntos | |
| 3DMark Fire Strike Score | 20183 puntos | |
| 3DMark Time Spy Score | 8902 puntos | |
ayuda | ||
| Blender / v3.3 Classroom HIP/AMD | |
| Schenker XMG Core 15 (M22) | |
| Asus TUF A15 FA507 | |
| Asus TUF A15 FA507 | |
| Medio NVIDIA GeForce RTX 4050 Laptop GPU (345 - 345, n=2) | |
| Blender / v3.3 Classroom OPTIX/RTX | |
| Lenovo IdeaPad Gaming 3 15IAH7 | |
| HP Victus 15 fa0020nr | |
| Schenker XMG Core 15 (M22) | |
| Gigabyte G5 KE | |
| Medio NVIDIA GeForce RTX 4050 Laptop GPU (25 - 37, n=40) | |
| MSI Katana 15 B12VEK | |
| Asus TUF A15 FA507 | |
| Asus TUF A15 FA507 | |
| Media de la clase Gaming (9 - 32, n=106, últimos 2 años) | |
| Blender / v3.3 Classroom CUDA | |
| Lenovo IdeaPad Gaming 3 15IAH7 | |
| HP Victus 15 fa0020nr | |
| Medio NVIDIA GeForce RTX 4050 Laptop GPU (47 - 68, n=39) | |
| Schenker XMG Core 15 (M22) | |
| MSI Katana 15 B12VEK | |
| Gigabyte G5 KE | |
| Asus TUF A15 FA507 | |
| Asus TUF A15 FA507 | |
| Media de la clase Gaming (15 - 228, n=106, últimos 2 años) | |
| Blender / v3.3 Classroom CPU | |
| MSI Katana 15 B12VEK | |
| Gigabyte G5 KE | |
| HP Victus 15 fa0020nr | |
| Medio NVIDIA GeForce RTX 4050 Laptop GPU (243 - 907, n=40) | |
| Lenovo IdeaPad Gaming 3 15IAH7 | |
| Asus TUF A15 FA507 | |
| Asus TUF A15 FA507 | |
| Schenker XMG Core 15 (M22) | |
| Media de la clase Gaming (122 - 565, n=102, últimos 2 años) | |
* ... más pequeño es mejor
Rendimiento de juego
Nuestra variante base del rendimiento gaming del TUF Gaming A15 fue muy buena - más que suficiente para la resolución nativa 1080p incluso al jugar a juegos modernos como Hogwarts Legacy o Cyberpunk 2077 con los ajustes de detalle al máximo. Sin embargo, si quieres usar el trazado de rayos, tienes que usar el escalado DLSS. Por ejemplo, Cyberpunk 2077 solo iba a 24 FPS en 1080p con trazado de rayos en Ultra, mientras que iba a 74 FPS con DLSS. Sin embargo, la diferencia puede ser menor en otros juegos. Básicamente, se pueden ejecutar todos los juegos modernos y la VRAM de 6 GB es actualmente suficiente para 1080p. La prueba Witcher 3 prueba también muestra que el rendimiento de juego se mantiene estable incluso durante sesiones más largas.
| The Witcher 3 - 1920x1080 Ultra Graphics & Postprocessing (HBAO+) | |
| Media de la clase Gaming (104.7 - 240, n=7, últimos 2 años) | |
| Asus TUF Gaming F15 FX507ZM | |
| Gigabyte G5 KE | |
| MSI Katana 15 B12VEK | |
| Asus TUF A15 FA507 | |
| Schenker XMG Core 15 (M22) | |
| Lenovo IdeaPad Gaming 3 15IAH7 | |
| HP Victus 15 fa0020nr | |
| Final Fantasy XV Benchmark - 1920x1080 High Quality | |
| Media de la clase Gaming (41 - 215, n=95, últimos 2 años) | |
| Asus TUF Gaming F15 FX507ZM | |
| Schenker XMG Core 15 (M22) | |
| Gigabyte G5 KE | |
| MSI Katana 15 B12VEK | |
| Asus TUF A15 FA507 | |
| Lenovo IdeaPad Gaming 3 15IAH7 | |
| HP Victus 15 fa0020nr | |
| Dota 2 Reborn - 1920x1080 ultra (3/3) best looking | |
| Media de la clase Gaming (84.8 - 248, n=107, últimos 2 años) | |
| Asus TUF Gaming F15 FX507ZM | |
| MSI Katana 15 B12VEK | |
| Gigabyte G5 KE | |
| HP Victus 15 fa0020nr | |
| Asus TUF A15 FA507 | |
| Schenker XMG Core 15 (M22) | |
| Lenovo IdeaPad Gaming 3 15IAH7 | |
| The Witcher 3 - 1920x1080 Ultra Graphics & Postprocessing (HBAO+) | |
| Media de la clase Gaming (104.7 - 240, n=7, últimos 2 años) | |
| Asus TUF Gaming F15 FX507ZM | |
| Gigabyte G5 KE | |
| MSI Katana 15 B12VEK | |
| Asus TUF A15 FA507 | |
| Schenker XMG Core 15 (M22) | |
| Medio NVIDIA GeForce RTX 4050 Laptop GPU (18.5 - 94.7, n=40) | |
| Lenovo IdeaPad Gaming 3 15IAH7 | |
| HP Victus 15 fa0020nr | |
| F1 22 | |
| 1920x1080 High Preset AA:T AF:16x | |
| Media de la clase Gaming (99.3 - 271, n=4, últimos 2 años) | |
| Asus TUF A15 FA507 | |
| Gigabyte G5 KE | |
| Medio NVIDIA GeForce RTX 4050 Laptop GPU (94.4 - 174.7, n=22) | |
| Lenovo IdeaPad Gaming 3 15IAH7 | |
| 1920x1080 Ultra High Preset AA:T AF:16x | |
| Media de la clase Gaming (40.1 - 121.2, n=4, últimos 2 años) | |
| Asus TUF A15 FA507 | |
| Gigabyte G5 KE | |
| Medio NVIDIA GeForce RTX 4050 Laptop GPU (10.9 - 56.4, n=24) | |
| Lenovo IdeaPad Gaming 3 15IAH7 | |
| Cyberpunk 2077 1.6 | |
| 1920x1080 High Preset | |
| Gigabyte G5 KE | |
| Asus TUF A15 FA507 | |
| Medio NVIDIA GeForce RTX 4050 Laptop GPU (48 - 91.3, n=14) | |
| HP Victus 15 fa0020nr | |
| 1920x1080 Ultra Preset | |
| Gigabyte G5 KE | |
| Asus TUF A15 FA507 | |
| Medio NVIDIA GeForce RTX 4050 Laptop GPU (44.4 - 79.4, n=14) | |
| HP Victus 15 fa0020nr | |
| Hogwarts Legacy | |
| 1920x1080 High Preset AA:High T | |
| Asus TUF A15 FA507 | |
| Medio NVIDIA GeForce RTX 4050 Laptop GPU (44.8 - 93.6, n=8) | |
| 1920x1080 Ultra Preset AA:High T | |
| Media de la clase Gaming (n=1últimos 2 años) | |
| Medio NVIDIA GeForce RTX 4050 Laptop GPU (39 - 77.3, n=8) | |
| Asus TUF A15 FA507 | |
Witcher 3 FPS diagram
| bajo | medio | alto | ultra | |
|---|---|---|---|---|
| GTA V (2015) | 168.6 | 153.1 | 83.5 | |
| The Witcher 3 (2015) | 171 | 82.2 | ||
| Dota 2 Reborn (2015) | 137.4 | 127.2 | 115.8 | |
| Final Fantasy XV Benchmark (2018) | 178.9 | 115.5 | 81.5 | |
| X-Plane 11.11 (2018) | 103.5 | 97 | 77.8 | |
| Far Cry 5 (2018) | 111 | 105 | 99 | |
| Strange Brigade (2018) | 211 | 171 | 147 | |
| F1 2021 (2021) | 283 | 260 | 209 | 110.3 |
| Cyberpunk 2077 1.6 (2022) | 103 | 82 | 71 | 66 |
| F1 22 (2022) | 192.7 | 191.4 | 161.2 | 56.4 |
| Hogwarts Legacy (2023) | 122 | 109 | 89 | 49 |
Emissions - Un portátil para juegos con un teclado genial
Emisiones sonoras
Para ser un portátil de juegos, nuestro dispositivo de pruebas era comparativamente silencioso. Durante tareas sencillas, el disipador era a menudo completamente silencioso e incluso bajo carga, nos sorprendió positivamente: Durante la prueba de estrés, los ventiladores alcanzaron un nivel de ruido máximo de 43 dB(A). Mientras jugábamos, medimos entre 40-43 dB(A), lo que significa que el TUF Gaming A15 sigue siendo más silencioso que sus competidores. Suponemos que las configuraciones más potentes tendrán ventiladores ligeramente más ruidosos. No notamos ningún otro ruido electrónico.
Ruido
| Ocioso |
| 23.3 / 23.3 / 23.3 dB(A) |
| Carga |
| 29.6 / 43 dB(A) |
 | ||
30 dB silencioso 40 dB(A) audible 50 dB(A) ruidosamente alto |
||
min: | ||
| Asus TUF A15 FA507 GeForce RTX 4050 Laptop GPU, R7 7735HS, Micron 2400 MTFDKBA512QFM | Gigabyte G5 KE GeForce RTX 3060 Laptop GPU, i5-12500H, Gigabyte AG4512G-SI B10 | Schenker XMG Core 15 (M22) GeForce RTX 3060 Laptop GPU, R7 6800H, Samsung SSD 980 Pro 1TB MZ-V8P1T0BW | MSI Katana 15 B12VEK GeForce RTX 4050 Laptop GPU, i7-12650H, Micron 2400 MTFDKBA1T0QFM | HP Victus 15 fa0020nr GeForce RTX 3050 Ti Laptop GPU, i7-12700H, Samsung PM9A1 MZVL2512HCJQ | Lenovo IdeaPad Gaming 3 15IAH7 GeForce RTX 3050 Ti Laptop GPU, i5-12500H, Intel SSD 660p SSDPEKNW512G8 | Asus TUF Gaming F15 FX507ZM GeForce RTX 3060 Laptop GPU, i7-12700H, SK Hynix HFM001TD3JX013N | |
|---|---|---|---|---|---|---|---|
| Noise | -33% | -13% | -10% | -10% | -25% | -14% | |
| apagado / medio ambiente * (dB) | 23.3 | 19.52 16% | 23 1% | 24 -3% | 24.8 -6% | 25 -7% | 23.2 -0% |
| Idle Minimum * (dB) | 23.3 | 31.05 -33% | 23 1% | 24 -3% | 26.2 -12% | 29 -24% | 23.6 -1% |
| Idle Average * (dB) | 23.3 | 31.05 -33% | 23 1% | 24 -3% | 29.2 -25% | 30 -29% | 23.6 -1% |
| Idle Maximum * (dB) | 23.3 | 31.05 -33% | 23 1% | 24 -3% | 29.4 -26% | 32 -37% | 25.4 -9% |
| Load Average * (dB) | 29.6 | 55.66 -88% | 42.41 -43% | 37.71 -27% | 29.9 -1% | 42 -42% | 38 -28% |
| Witcher 3 ultra * (dB) | 43 | 55.7 -30% | 54.71 -27% | 45.75 -6% | 41.1 4% | 46 -7% | 54.1 -26% |
| Load Maximum * (dB) | 43 | 55.51 -29% | 55.05 -28% | 54.55 -27% | 45.5 -6% | 54 -26% | 57.2 -33% |
* ... más pequeño es mejor
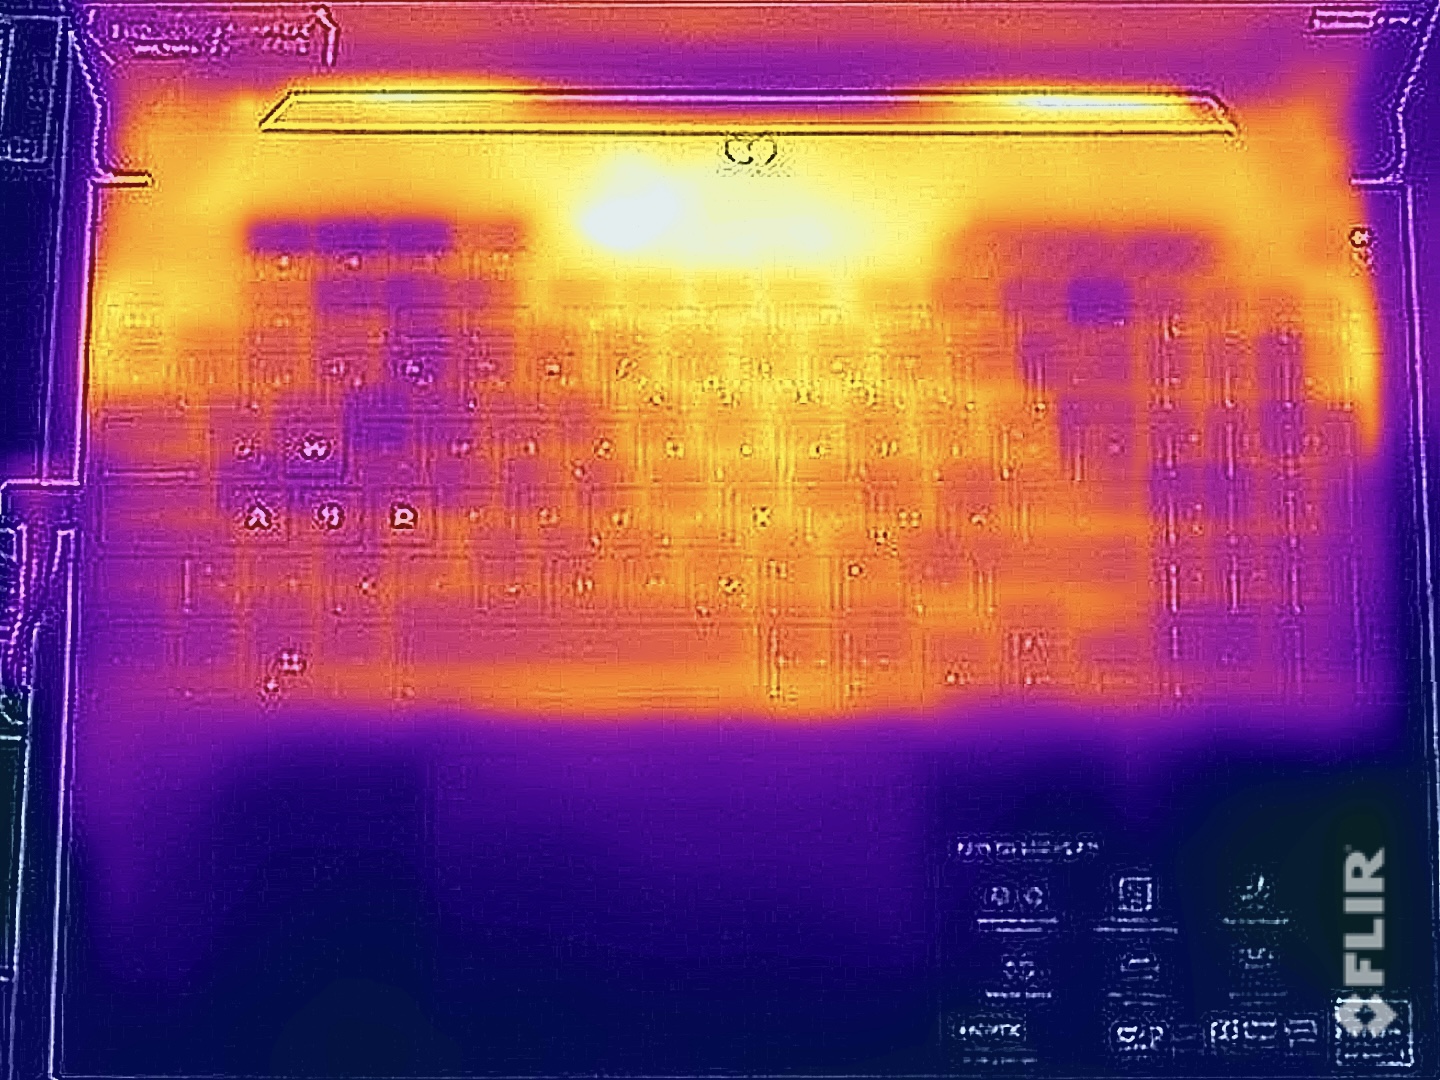
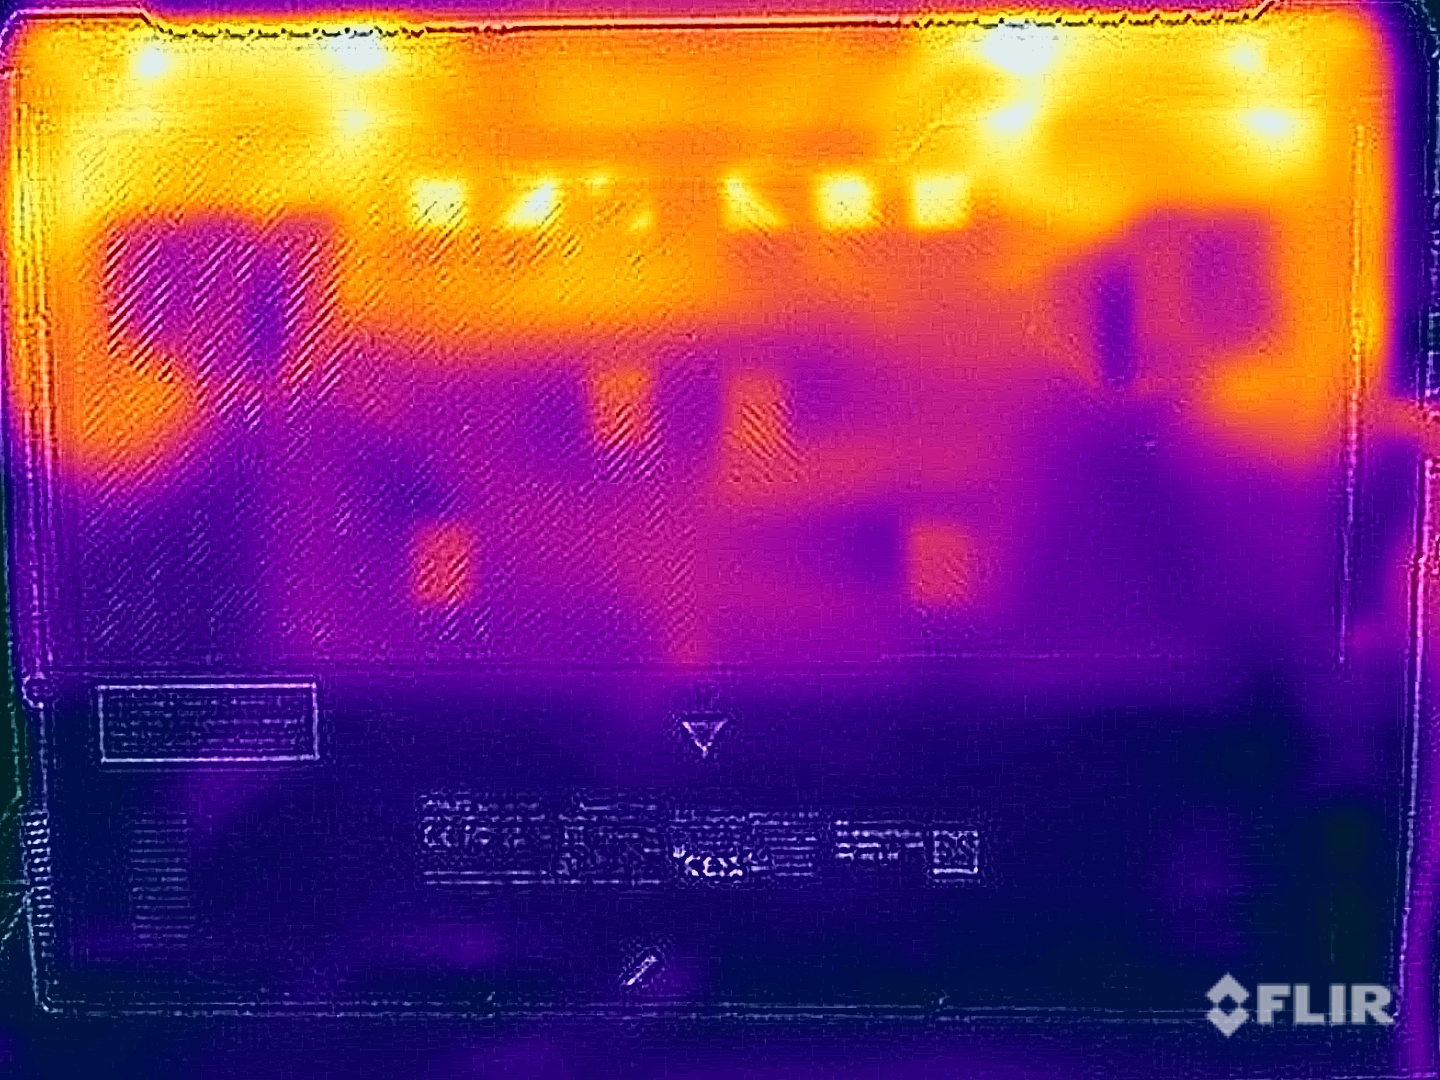
Temperatura
No hubo problemas de temperatura durante las tareas diarias e incluso bajo carga, el portátil Asus tuvo sus temperaturas superficiales bajo control. El área superior central de la unidad base se calentó mucho con casi 50 °C, pero este punto caliente está sobre el teclado y especialmente el área de la tecla WASD se mantuvo muy fresca, lo que es importante al jugar. En la parte inferior, medimos un máximo de 44 °C en la zona trasera, e incluso puedes poner el portátil sobre los muslos sin problemas.
Como era de esperar, la dGPU se vio favorecida durante la prueba de estrés. Aún hubo ligeras fluctuaciones en los primeros 15 minutos antes de que el procesador y la tarjeta gráfica se estabilizaran en 35 y 80 vatios, respectivamente.
(-) La temperatura máxima en la parte superior es de 48.9 °C / 120 F, frente a la media de 40.4 °C / 105 F, que oscila entre 21.2 y 68.8 °C para la clase Gaming.
(±) El fondo se calienta hasta un máximo de 44.6 °C / 112 F, frente a la media de 43.2 °C / 110 F
(+) En reposo, la temperatura media de la parte superior es de 26.2 °C / 79# F, frente a la media del dispositivo de 33.9 °C / 93 F.
(±) Jugando a The Witcher 3, la temperatura media de la parte superior es de 36.9 °C / 98 F, frente a la media del dispositivo de 33.9 °C / 93 F.
(+) El reposamanos y el panel táctil están a una temperatura inferior a la de la piel, con un máximo de 30.6 °C / 87.1 F y, por tanto, son fríos al tacto.
(±) La temperatura media de la zona del reposamanos de dispositivos similares fue de 28.8 °C / 83.8 F (-1.8 °C / -3.3 F).
| Asus TUF A15 FA507 AMD Ryzen 7 7735HS, NVIDIA GeForce RTX 4050 Laptop GPU | Gigabyte G5 KE Intel Core i5-12500H, NVIDIA GeForce RTX 3060 Laptop GPU | Schenker XMG Core 15 (M22) AMD Ryzen 7 6800H, NVIDIA GeForce RTX 3060 Laptop GPU | MSI Katana 15 B12VEK Intel Core i7-12650H, NVIDIA GeForce RTX 4050 Laptop GPU | HP Victus 15 fa0020nr Intel Core i7-12700H, NVIDIA GeForce RTX 3050 Ti Laptop GPU | Lenovo IdeaPad Gaming 3 15IAH7 Intel Core i5-12500H, NVIDIA GeForce RTX 3050 Ti Laptop GPU | Asus TUF Gaming F15 FX507ZM Intel Core i7-12700H, NVIDIA GeForce RTX 3060 Laptop GPU | |
|---|---|---|---|---|---|---|---|
| Heat | -25% | -9% | -18% | 20% | 2% | -21% | |
| Maximum Upper Side * (°C) | 48.9 | 52.6 -8% | 48 2% | 47 4% | 37.2 24% | 47 4% | 44.4 9% |
| Maximum Bottom * (°C) | 44.6 | 62.4 -40% | 51 -14% | 48 -8% | 35.4 21% | 52 -17% | 48.8 -9% |
| Idle Upper Side * (°C) | 27.1 | 33.6 -24% | 28 -3% | 35 -29% | 22.4 17% | 25 8% | 37.8 -39% |
| Idle Bottom * (°C) | 27.5 | 34.8 -27% | 33 -20% | 38 -38% | 22.6 18% | 24 13% | 39.6 -44% |
* ... más pequeño es mejor
Altavoces
El TUF Gaming A15 ciertamente no puede presumir de un sonido asombroso y los dos altavoces estéreo son bastante medios - pero este suele ser el caso de los portátiles de juego baratos. La música y las películas no son realmente divertidas de escuchar y ver - recomendaríamos usar auriculares cuando se juega de todos modos, ya que los ventiladores pueden ser molestos de otro modo.
Asus TUF A15 FA507 análisis de audio
(±) | la sonoridad del altavoz es media pero buena (79.3 dB)
Graves 100 - 315 Hz
(±) | lubina reducida - en promedio 13.7% inferior a la mediana
(+) | el bajo es lineal (6.2% delta a la frecuencia anterior)
Medios 400 - 2000 Hz
(±) | medias más altas - de media 7.6% más altas que la mediana
(±) | la linealidad de los medios es media (7.3% delta respecto a la frecuencia anterior)
Altos 2 - 16 kHz
(+) | máximos equilibrados - a sólo 2.1% de la mediana
(±) | la linealidad de los máximos es media (7.5% delta a frecuencia anterior)
Total 100 - 16.000 Hz
(±) | la linealidad del sonido global es media (17.2% de diferencia con la mediana)
En comparación con la misma clase
» 47% de todos los dispositivos probados de esta clase eran mejores, 11% similares, 42% peores
» El mejor tuvo un delta de 6%, la media fue 18%, el peor fue ###max##%
En comparación con todos los dispositivos probados
» 32% de todos los dispositivos probados eran mejores, 8% similares, 60% peores
» El mejor tuvo un delta de 4%, la media fue 23%, el peor fue ###max##%
Schenker XMG Core 15 (M22) análisis de audio
(±) | la sonoridad del altavoz es media pero buena (81.28 dB)
Graves 100 - 315 Hz
(-) | casi sin bajos - de media 19.8% inferior a la mediana
(+) | el bajo es lineal (6.4% delta a la frecuencia anterior)
Medios 400 - 2000 Hz
(±) | medias más altas - de media 6.2% más altas que la mediana
(±) | la linealidad de los medios es media (7.9% delta respecto a la frecuencia anterior)
Altos 2 - 16 kHz
(+) | máximos equilibrados - a sólo 1.8% de la mediana
(+) | los máximos son lineales (4.8% delta a la frecuencia anterior)
Total 100 - 16.000 Hz
(±) | la linealidad del sonido global es media (17.1% de diferencia con la mediana)
En comparación con la misma clase
» 46% de todos los dispositivos probados de esta clase eran mejores, 12% similares, 43% peores
» El mejor tuvo un delta de 6%, la media fue 18%, el peor fue ###max##%
En comparación con todos los dispositivos probados
» 31% de todos los dispositivos probados eran mejores, 8% similares, 61% peores
» El mejor tuvo un delta de 4%, la media fue 23%, el peor fue ###max##%
Gestión de la energía - Larga autonomía gracias a una gran batería
Consumo de energía
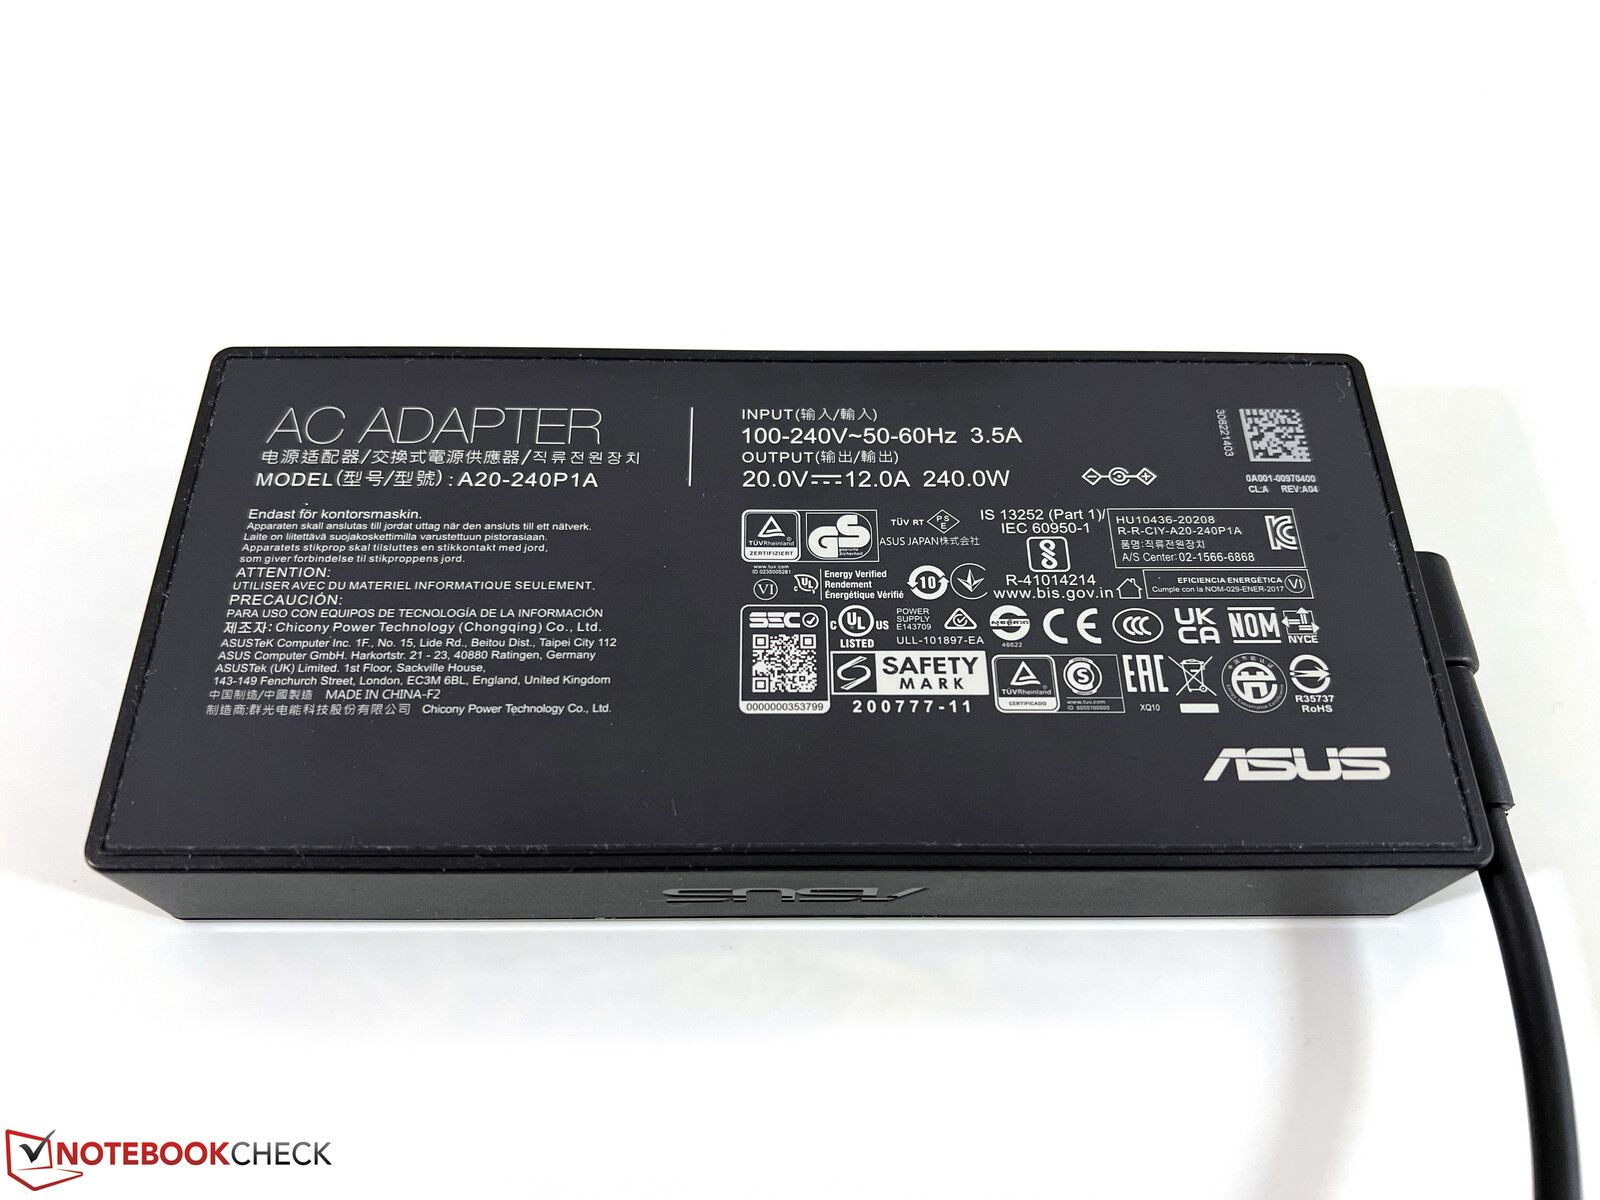
En nuestras mediciones de consumo, el modelo de pruebas siguió siendo muy frugal e incluso jugando, el A15 siguió siendo mucho más eficiente que los portátiles RTX-3060, que tampoco ofrecen mucha más potencia. Determinamos un máximo de 185 vatios en la prueba de estrés, que luego se asentó rápidamente en torno a los 155 vatios. A la vista de estos valores, la fuente de alimentación de 240w incluida está casi sobredimensionada para la variante base y el módulo más compacto de 200w del actualZenbook Pro 14 habría bastado perfectamente.
| Off / Standby | |
| Ocioso | |
| Carga |
|
Clave:
min: | |
| Asus TUF A15 FA507 R7 7735HS, GeForce RTX 4050 Laptop GPU, Micron 2400 MTFDKBA512QFM, IPS, 1920x1080, 15.6" | Gigabyte G5 KE i5-12500H, GeForce RTX 3060 Laptop GPU, Gigabyte AG4512G-SI B10, IPS, 1920x1080, 15.6" | Schenker XMG Core 15 (M22) R7 6800H, GeForce RTX 3060 Laptop GPU, Samsung SSD 980 Pro 1TB MZ-V8P1T0BW, IPS, 2560x1440, 15.6" | MSI Katana 15 B12VEK i7-12650H, GeForce RTX 4050 Laptop GPU, Micron 2400 MTFDKBA1T0QFM, IPS, 1920x1080, 15.6" | HP Victus 15 fa0020nr i7-12700H, GeForce RTX 3050 Ti Laptop GPU, Samsung PM9A1 MZVL2512HCJQ, IPS, 1920x1080, 15.6" | Lenovo IdeaPad Gaming 3 15IAH7 i5-12500H, GeForce RTX 3050 Ti Laptop GPU, Intel SSD 660p SSDPEKNW512G8, IPS, 1920x1080, 15.6" | Asus TUF Gaming F15 FX507ZM i7-12700H, GeForce RTX 3060 Laptop GPU, SK Hynix HFM001TD3JX013N, IPS, 1920x1080, 15.6" | Medio NVIDIA GeForce RTX 4050 Laptop GPU | Media de la clase Gaming | |
|---|---|---|---|---|---|---|---|---|---|
| Power Consumption | -19% | -31% | 2% | -11% | -7% | -30% | -26% | -61% | |
| Idle Minimum * (Watt) | 8 | 7.66 4% | 11.8 -48% | 8.5 -6% | 5.1 36% | 8 -0% | 6.3 21% | 9.95 ? -24% | 13 ? -63% |
| Idle Average * (Watt) | 12.1 | 10.3 15% | 14.7 -21% | 10.2 16% | 15.1 -25% | 10 17% | 9.8 19% | 15.8 ? -31% | 19 ? -57% |
| Idle Maximum * (Watt) | 12.5 | 16.05 -28% | 15 -20% | 11.3 10% | 18.9 -51% | 16 -28% | 26.5 -112% | 20.1 ? -61% | 24.6 ? -97% |
| Load Average * (Watt) | 74.9 | 115.8 -55% | 100 -34% | 84 -12% | 114.5 -53% | 99 -32% | 103.8 -39% | 88 ? -17% | 110.7 ? -48% |
| Witcher 3 ultra * (Watt) | 136.6 | 168.7 -23% | 184 -35% | 128 6% | 113.9 17% | 144.6 -6% | 189 -38% | ||
| Load Maximum * (Watt) | 185 | 234.6 -27% | 237 -28% | 189 -2% | 165.8 10% | 168 9% | 241.9 -31% | 176.3 ? 5% | 259 ? -40% |
* ... más pequeño es mejor
power consumption Witcher 3 / stress test
power consumption with external monitor
Tiempos de ejecución
La batería de 90 Wh del portátil ofrece una duración muy buena. Salvo por unos pocos minutos, no hubo diferencia en nuestras pruebas si la pantalla estaba en modo 60 Hz o 144 Hz. En el test WLAN a 150 cd/m² (que corresponde al 73% del brillo máximo), notamos algo más de 11.5 horas y a brillo máximo aún algo más de 9.5 horas. En el test de vídeo a 150 cd/m², medimos más de 12,5 horas. Un proceso de carga completo tarda 106 minutos cuando el dispositivo está encendido. La curva de carga sólo se nivela al 70%, lo que ocurre tras ~44 minutos.
| Asus TUF A15 FA507 R7 7735HS, GeForce RTX 4050 Laptop GPU, 90 Wh | Gigabyte G5 KE i5-12500H, GeForce RTX 3060 Laptop GPU, 54 Wh | Schenker XMG Core 15 (M22) R7 6800H, GeForce RTX 3060 Laptop GPU, 62 Wh | MSI Katana 15 B12VEK i7-12650H, GeForce RTX 4050 Laptop GPU, 53.5 Wh | HP Victus 15 fa0020nr i7-12700H, GeForce RTX 3050 Ti Laptop GPU, 70 Wh | Lenovo IdeaPad Gaming 3 15IAH7 i5-12500H, GeForce RTX 3050 Ti Laptop GPU, 60 Wh | Asus TUF Gaming F15 FX507ZM i7-12700H, GeForce RTX 3060 Laptop GPU, 90 Wh | Media de la clase Gaming | |
|---|---|---|---|---|---|---|---|---|
| Duración de Batería | -44% | -12% | -26% | -36% | -50% | -25% | -7% | |
| H.264 (h) | 12.5 | 2.2 -82% | 4.4 -65% | 8.32 ? -33% | ||||
| WiFi v1.3 (h) | 11.7 | 5.7 -51% | 7.8 -33% | 4.3 -63% | 2.1 -82% | 5.9 -50% | 4.8 -59% | 7.11 ? -39% |
| Load (h) | 1 | 1 0% | 1.1 10% | 1.5 50% | 1.1 10% | 1.1 10% | 1.502 ? 50% | |
| Witcher 3 ultra (h) | 1.3 | |||||||
| Reader / Idle (h) | 2.6 | 15.8 | 8.27 ? |
Pro
Contra
Veredicto - Un buen portátil para jugar a 1080p

Con el lanzamiento del TUF Gaming A15, Asos se ha concentrado en lo esencial: el rendimiento para juegos. Nuestra versión base, que se puede conseguir por unos 1.169 dólares, ya ofrecía potencia suficiente para jugar con fluidez a los juegos actuales en una resolución nativa de 1080p y con el máximo detalle -gracias a su nuevoPortátil Nvidia GeForce RTX 4050. Si utiliza el escalado ascendente, puede incluso llegar a ejecutar el trazado de rayos. Su procesador Zen3+ es un viejo conocido, pero aún así, se las arregla para ofrecer un rendimiento sólido. La RAM y el SSD se pueden ampliar, aunque 16 GB y 512 GB son suficientes para empezar.
La calidad de la carcasa del portátil está bien; no cuenta con ningún tipo de iluminación extravagante (lo que no tiene por qué ser malo). Las etiquetas del teclado tienen poco contraste y a menudo hay que recurrir a la retroiluminación para verlas con claridad. Sin embargo, el teclado se mantiene fresco mientras juegas y los ventiladores no hacen demasiado ruido.
La versión base del nuevo Asus TUF Gaming A15 es un buen portátil para juegos y su RTX 4050 ofrece suficiente rendimiento para la pantalla 1080p.
La pantalla hace lo que se supone que debe hacer. Su panel IPS mate 16:9 tiene tasas de refresco de 144 Hz y buena precisión de color, pero sus tiempos de reacción y brillo podrían mejorar un poco. Medimos 300 cd/m² para este último. Sus opciones de conectividad incluyen incluso USB 4.0 y se puede conectar un monitor G-Sync. El único problema es que casi todos los puertos del portátil están en la parte frontal izquierda y central del dispositivo.
El portátil no mostró ningún punto débil, pero hay que tener en cuenta que la versión básica viene sin sistema operativo instalado. En muchas áreas, el dispositivo ofrece prestaciones estándar (WLAN, altavoces, webcam), pero en todas las áreas básicas, su rendimiento es satisfactorio. Su precio de unos 1.169 dólares también es bastante competitivo.
Precio y disponibilidad
El dispositivo que probamos se puede encontrar por unos 1.169 dólares en Amazon.
Asus TUF A15 FA507
- 06/13/2023 v7 (old)
Andreas Osthoff
Transparencia
La selección de los dispositivos que se van a reseñar corre a cargo de nuestro equipo editorial. La muestra de prueba fue proporcionada al autor en calidad de préstamo por el fabricante o el minorista a los efectos de esta reseña. El prestamista no tuvo ninguna influencia en esta reseña, ni el fabricante recibió una copia de la misma antes de su publicación. No había ninguna obligación de publicar esta reseña. Como empresa de medios independiente, Notebookcheck no está sujeta a la autoridad de fabricantes, minoristas o editores.
Así es como prueba Notebookcheck
Cada año, Notebookcheck revisa de forma independiente cientos de portátiles y smartphones utilizando procedimientos estandarizados para asegurar que todos los resultados son comparables. Hemos desarrollado continuamente nuestros métodos de prueba durante unos 20 años y hemos establecido los estándares de la industria en el proceso. En nuestros laboratorios de pruebas, técnicos y editores experimentados utilizan equipos de medición de alta calidad. Estas pruebas implican un proceso de validación en varias fases. Nuestro complejo sistema de clasificación se basa en cientos de mediciones y puntos de referencia bien fundamentados, lo que mantiene la objetividad.Price comparison

