Análisis del Asus TUF Gaming A16 Advantage Edition FA617XS: El portátil AMD con hasta 20 horas de autonomía
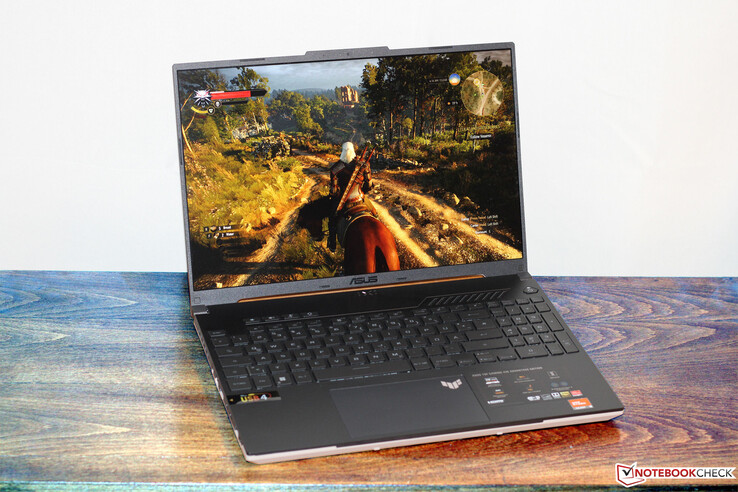
El Asus TUF Gaming A16 Advantage Edition -un portátil gaming de gama media- apuesta por hardware AMD: ARyzen-9-7940HSaPU yRadeon-RX-7600SgPU. La competencia incluye elLenovo Legion Pro 5 16IRX8elMSI Katana 15 B12VEKelMedion Erazer Defender P40y el Gigabyte G5 KE.
Si desea información más detallada sobre la carcasa, la conectividad y los dispositivos de entrada del portátil, eche un vistazo a nuestro análisis del modelo hermano del A16, de idéntica construcción Análisis del Asus TUF Gaming A16 Advantage Edition: Portátil AMD bajo los auspicios del 7 .
Posibles contendientes en la comparación
Valoración | Fecha | Modelo | Peso | Altura | Tamaño | Resolución | Precio |
|---|---|---|---|---|---|---|---|
| 86.9 % v7 (old) | 06/2023 | Asus TUF Gaming A16 FA617XS R9 7940HS, Radeon RX 7600S | 2.2 kg | 22.1 mm | 16.00" | 1920x1200 | |
| 87.9 % v7 (old) | 05/2023 | Lenovo Legion Pro 5 16IRX8 i7-13700HX, GeForce RTX 4060 Laptop GPU | 2.5 kg | 26.8 mm | 16.00" | 2560x1600 | |
| 82.9 % v7 (old) | 03/2023 | MSI Katana 15 B12VEK i7-12650H, GeForce RTX 4050 Laptop GPU | 2.3 kg | 24.9 mm | 15.60" | 1920x1080 | |
| 84.6 % v7 (old) | 05/2023 | Medion Erazer Defender P40 i7-13700HX, GeForce RTX 4060 Laptop GPU | 2.9 kg | 33 mm | 17.30" | 2560x1440 | |
| 81.8 % v7 (old) | 04/2023 | Gigabyte G5 KE i5-12500H, GeForce RTX 3060 Laptop GPU | 2 kg | 23.9 mm | 15.60" | 1920x1080 |
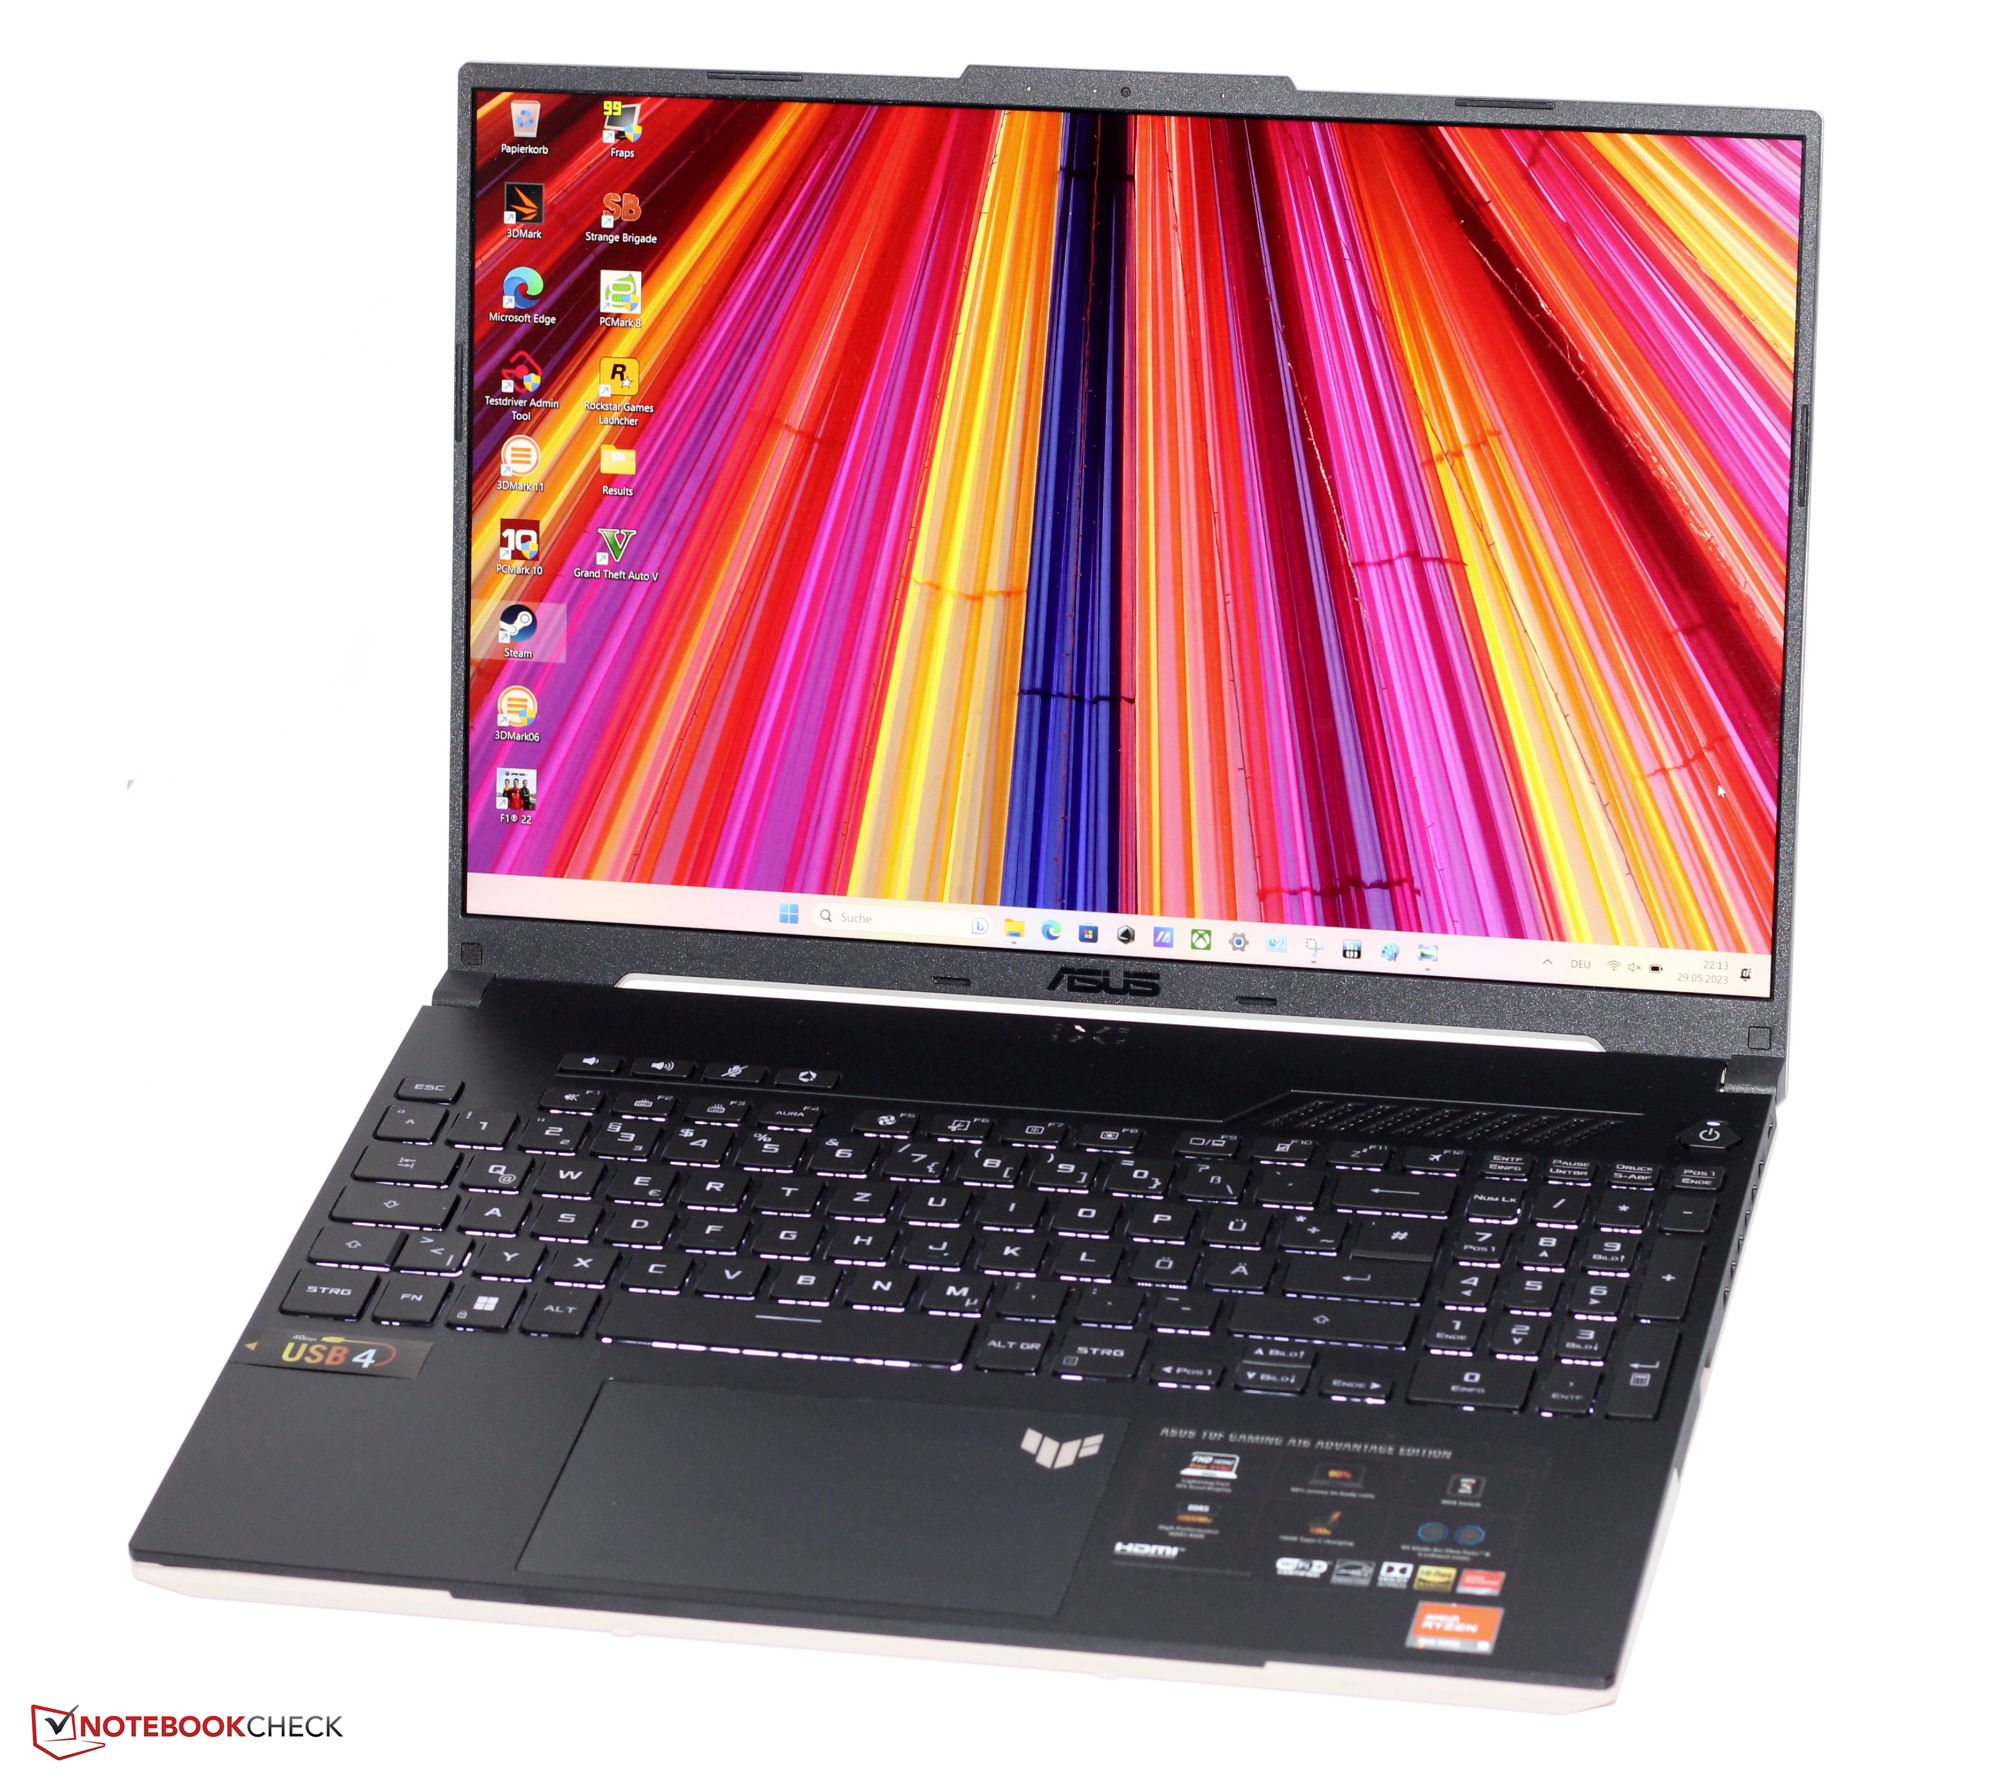
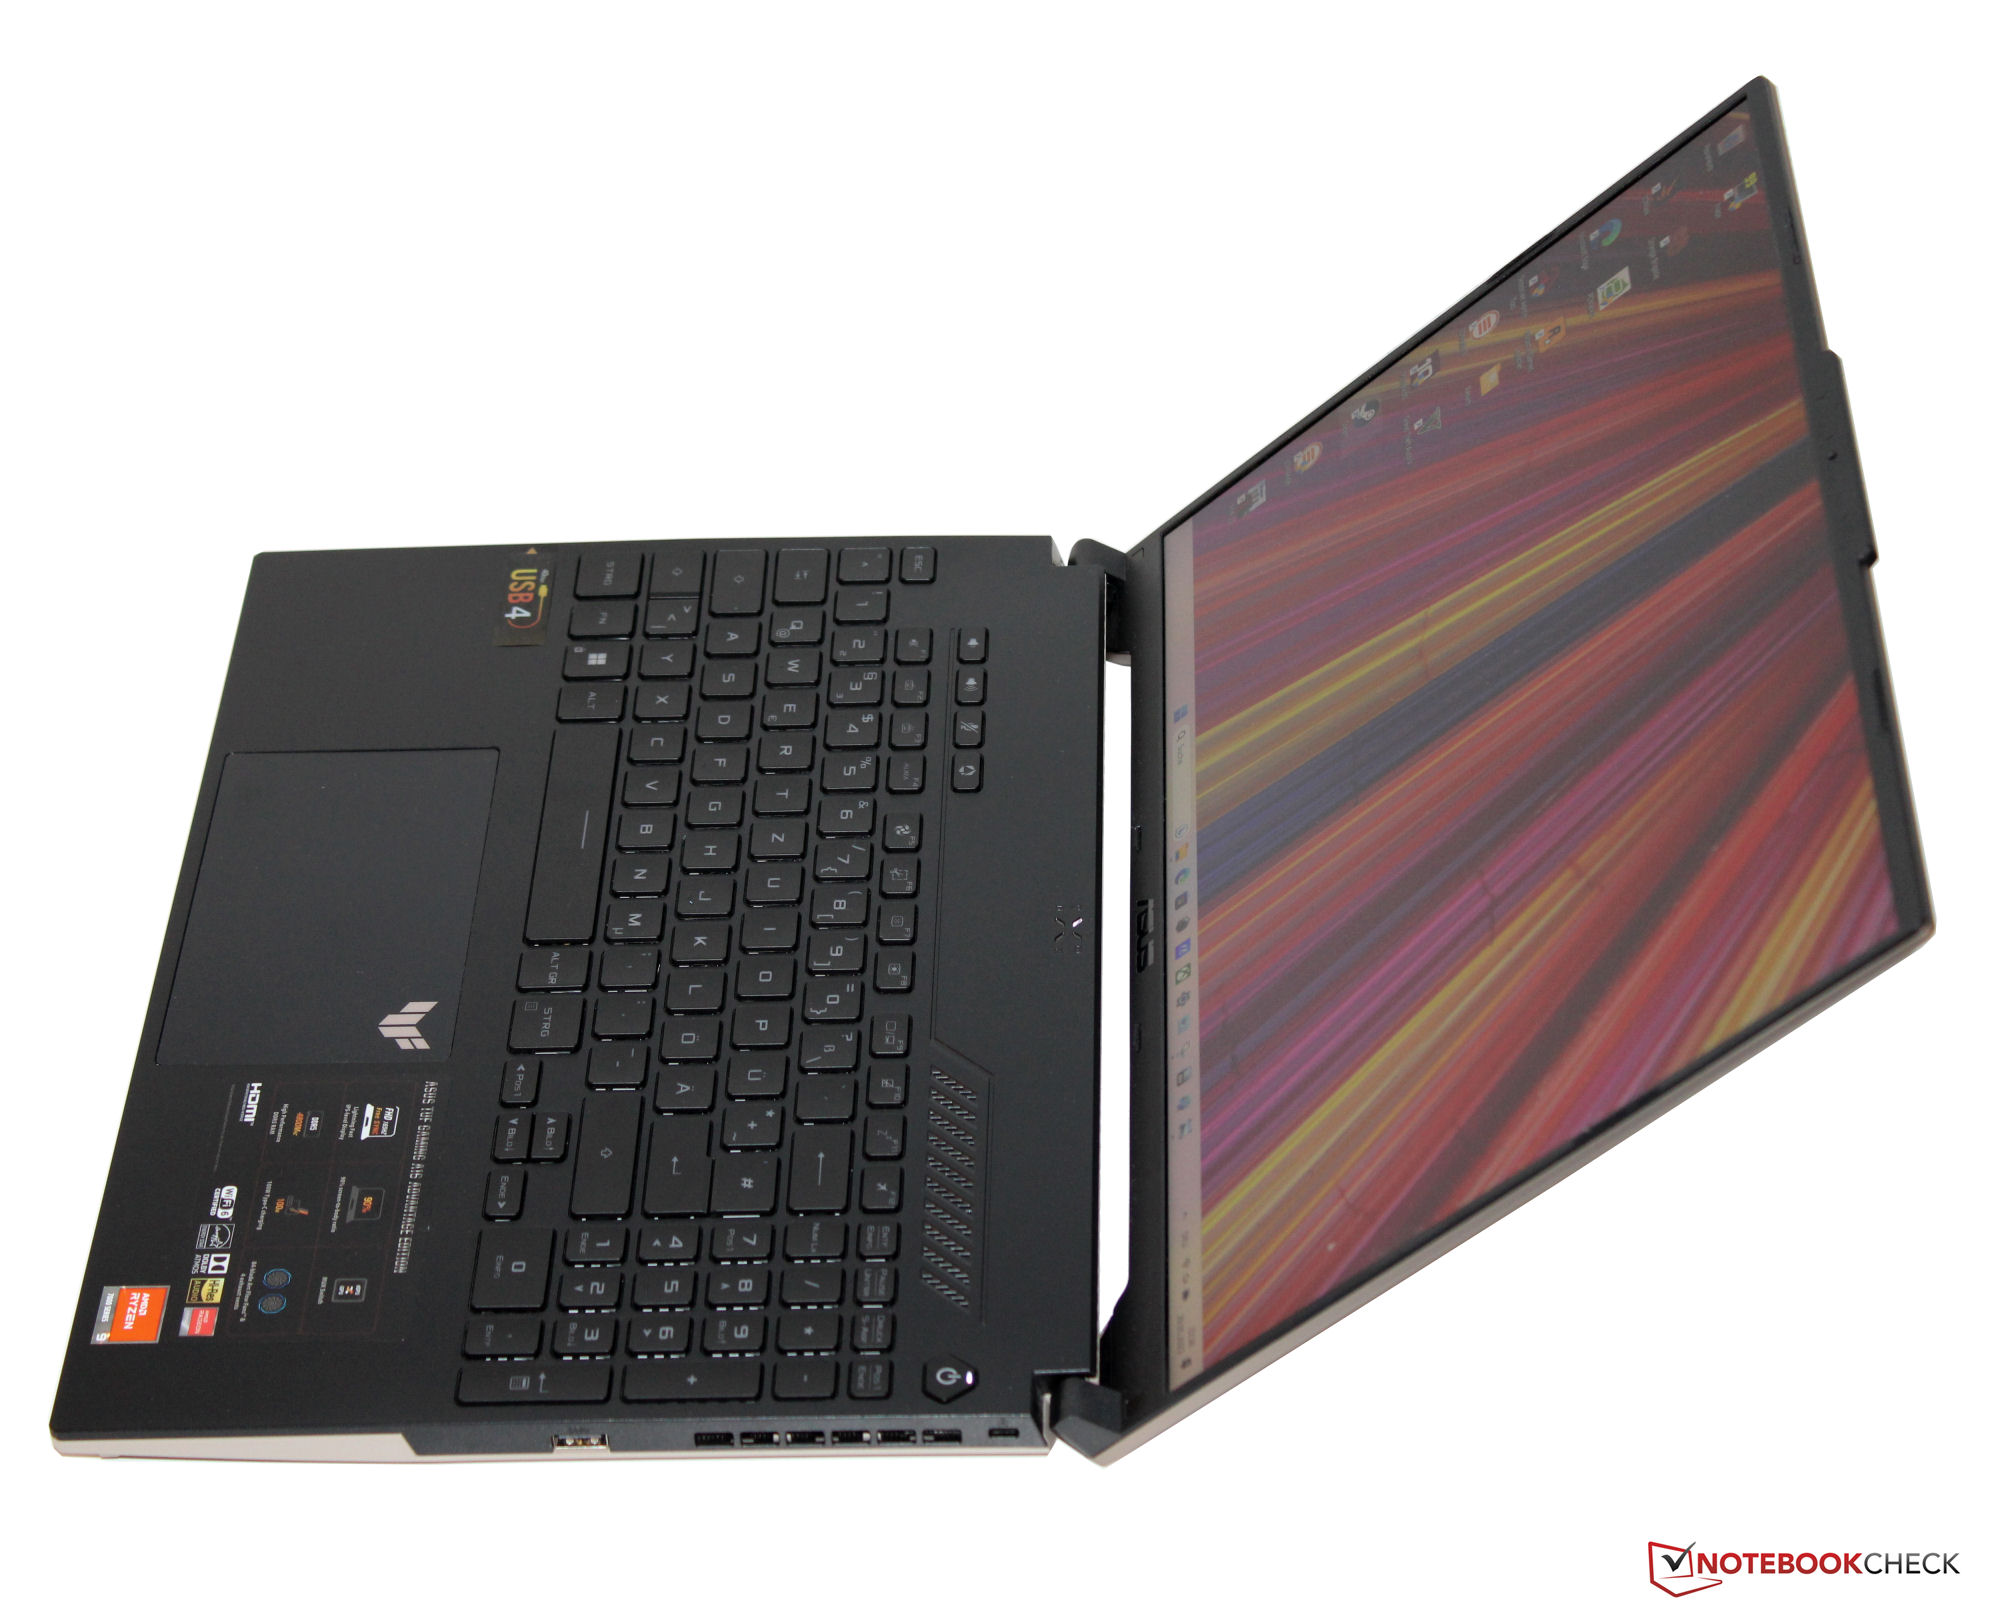
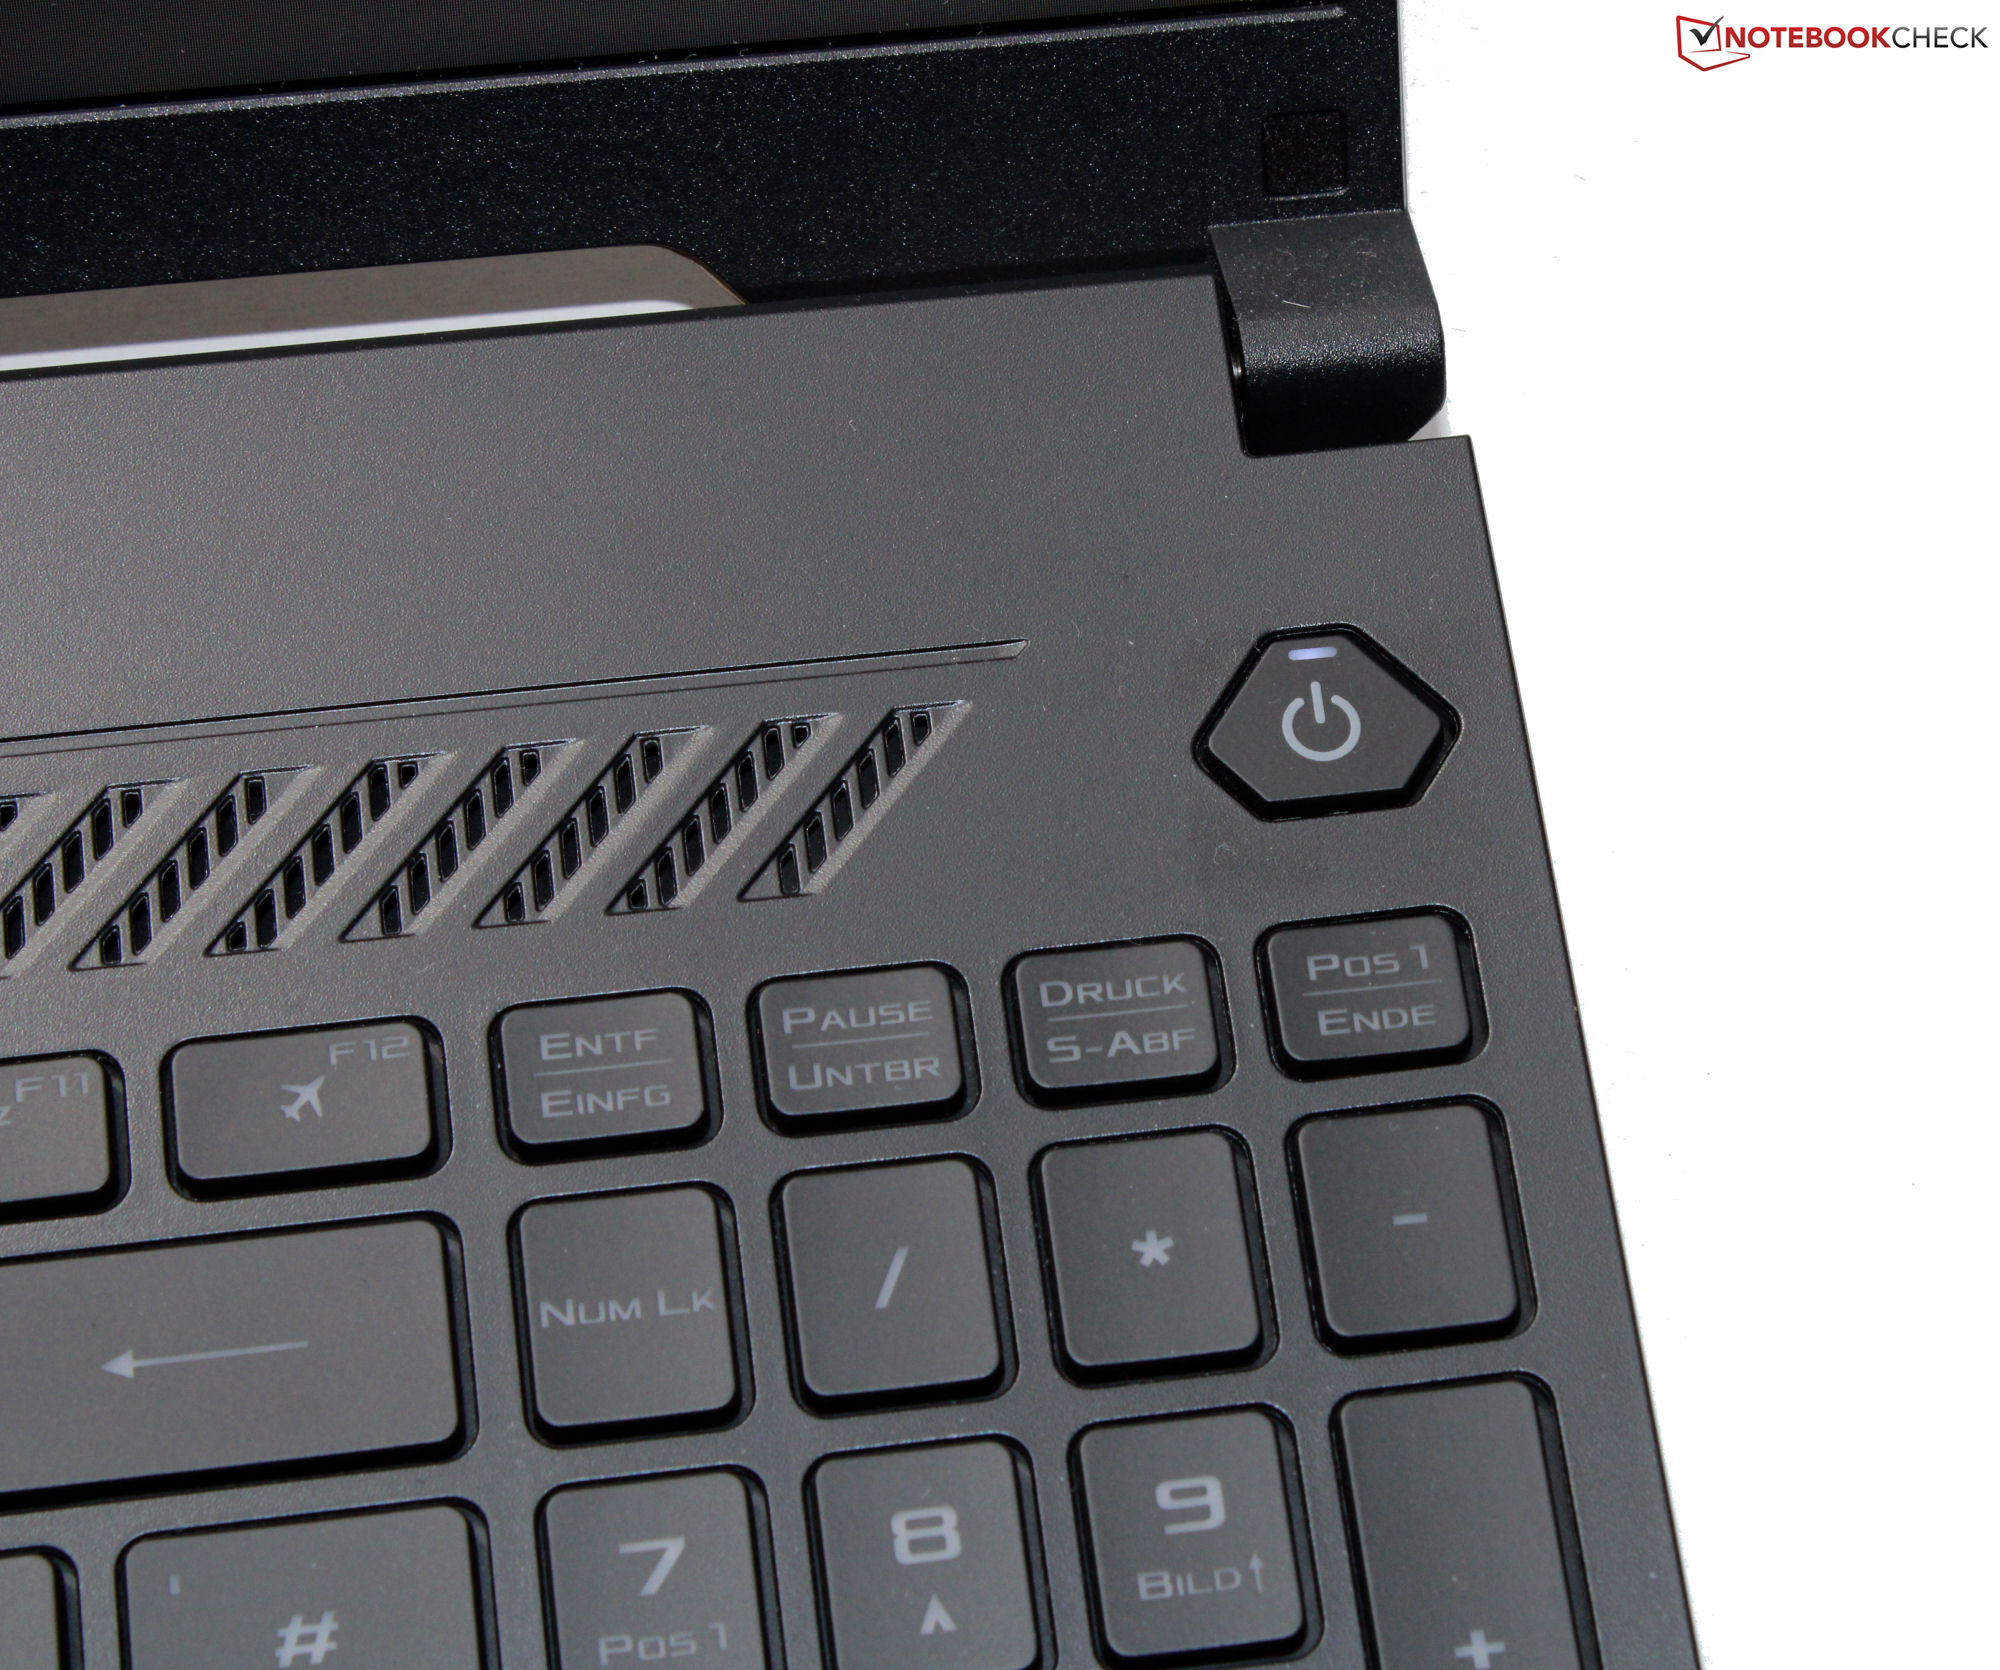
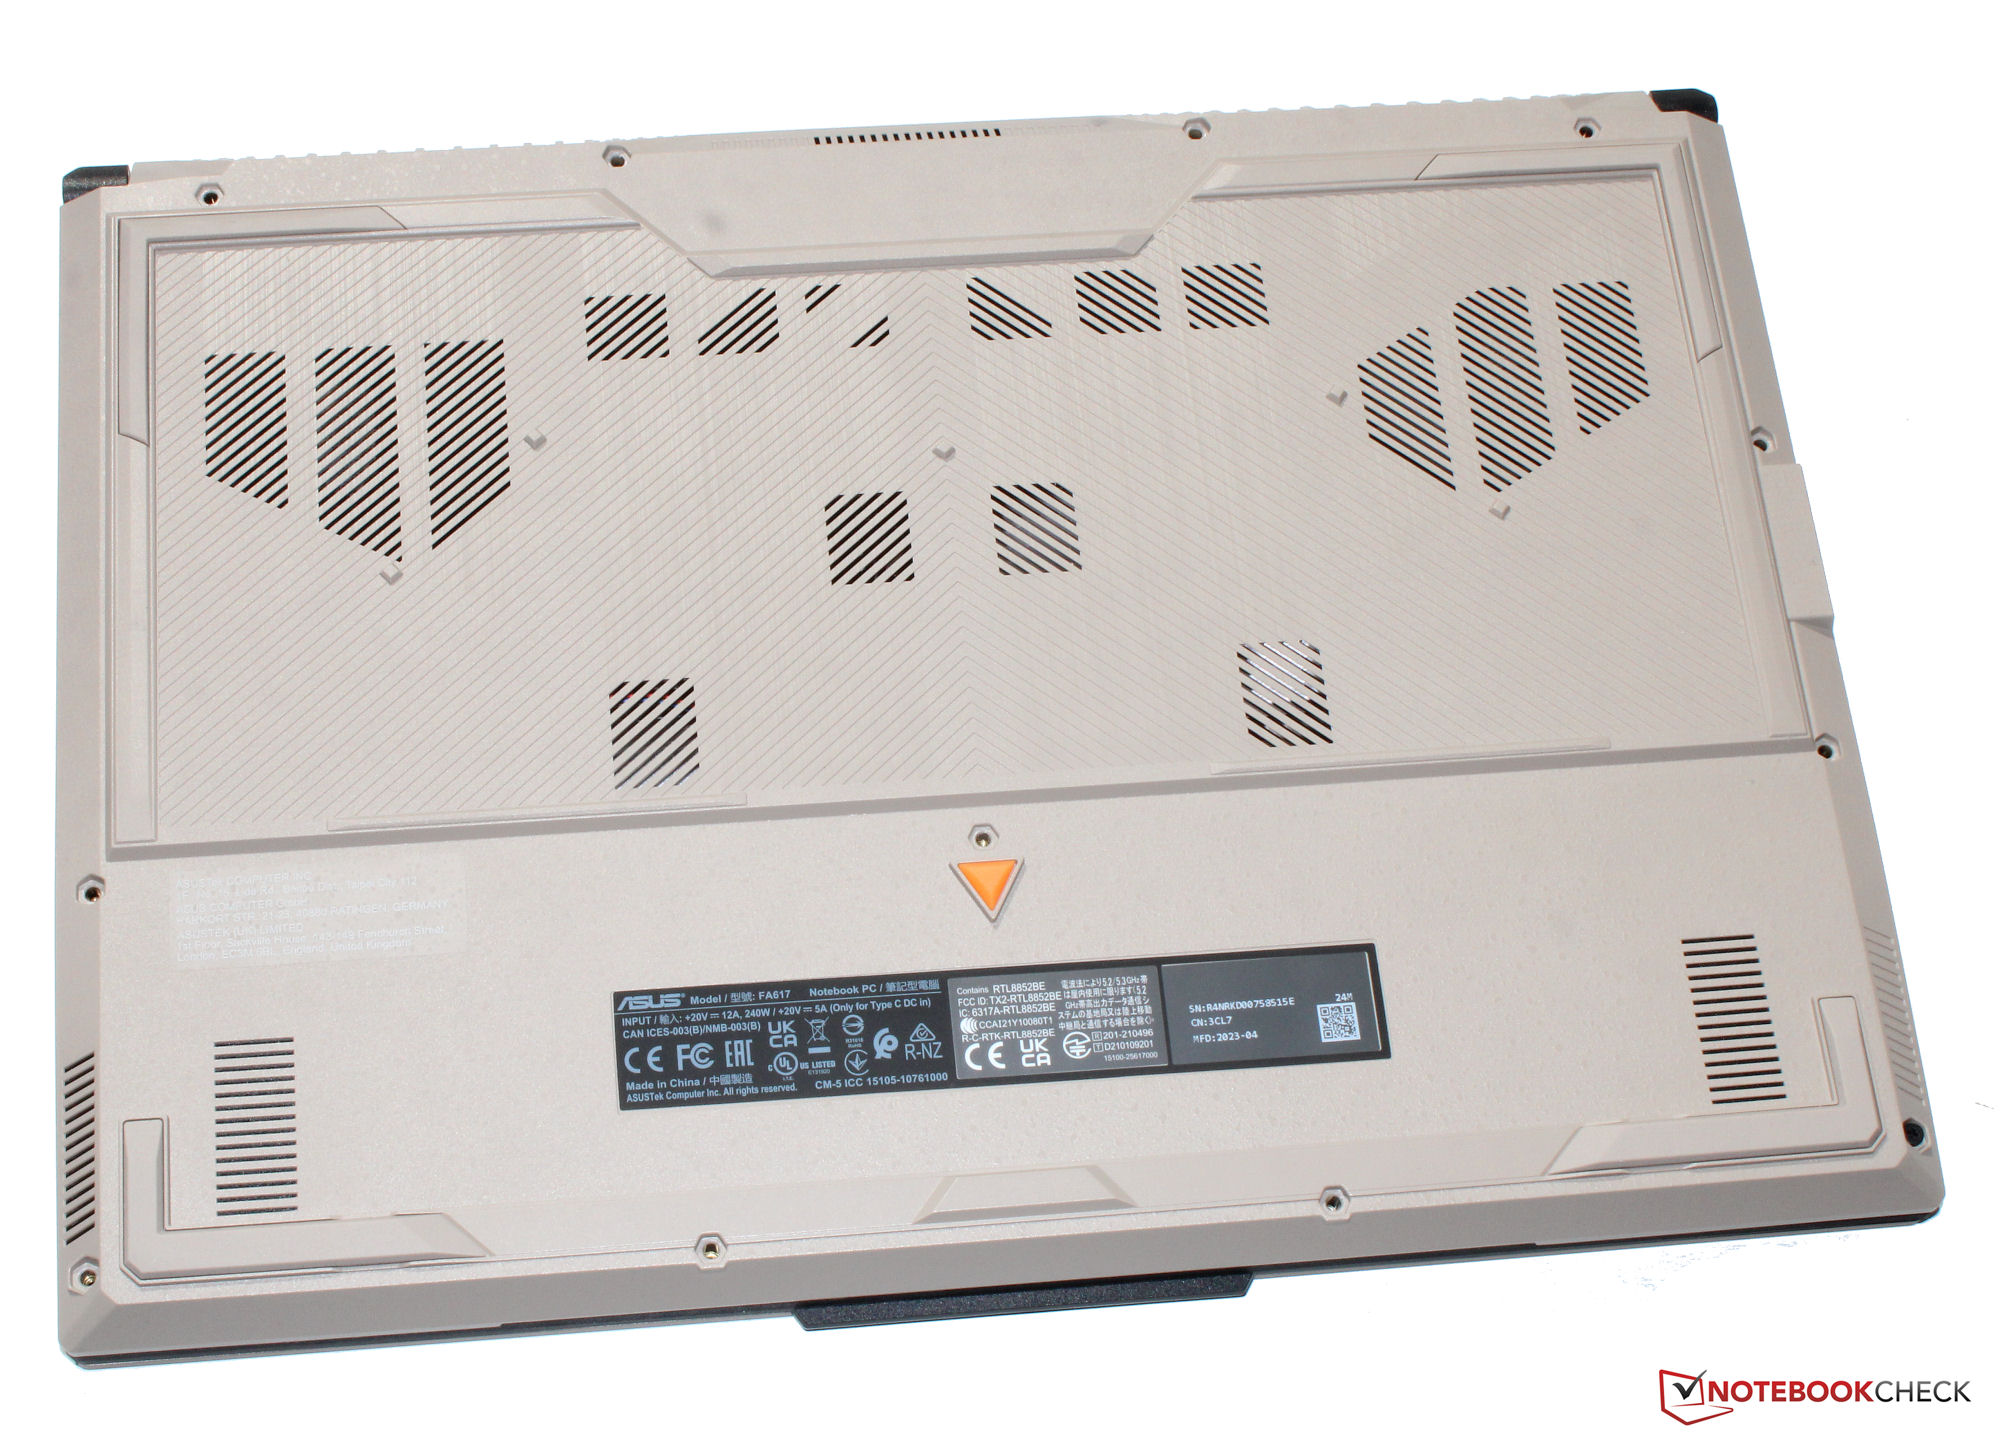
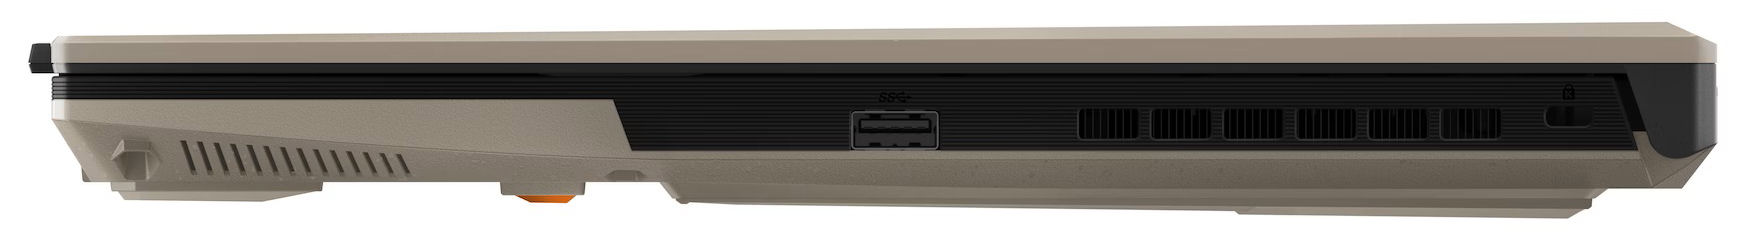
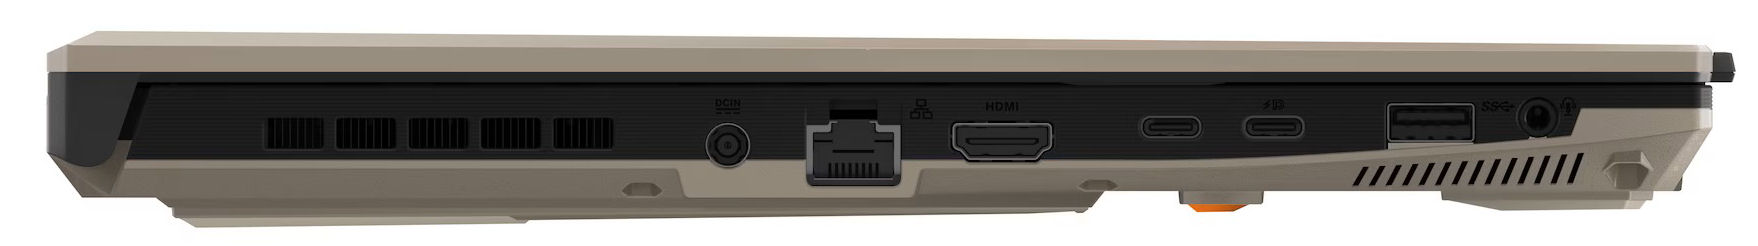
Carcasa y conectividad: pequeños cambios con respecto a su modelo hermano
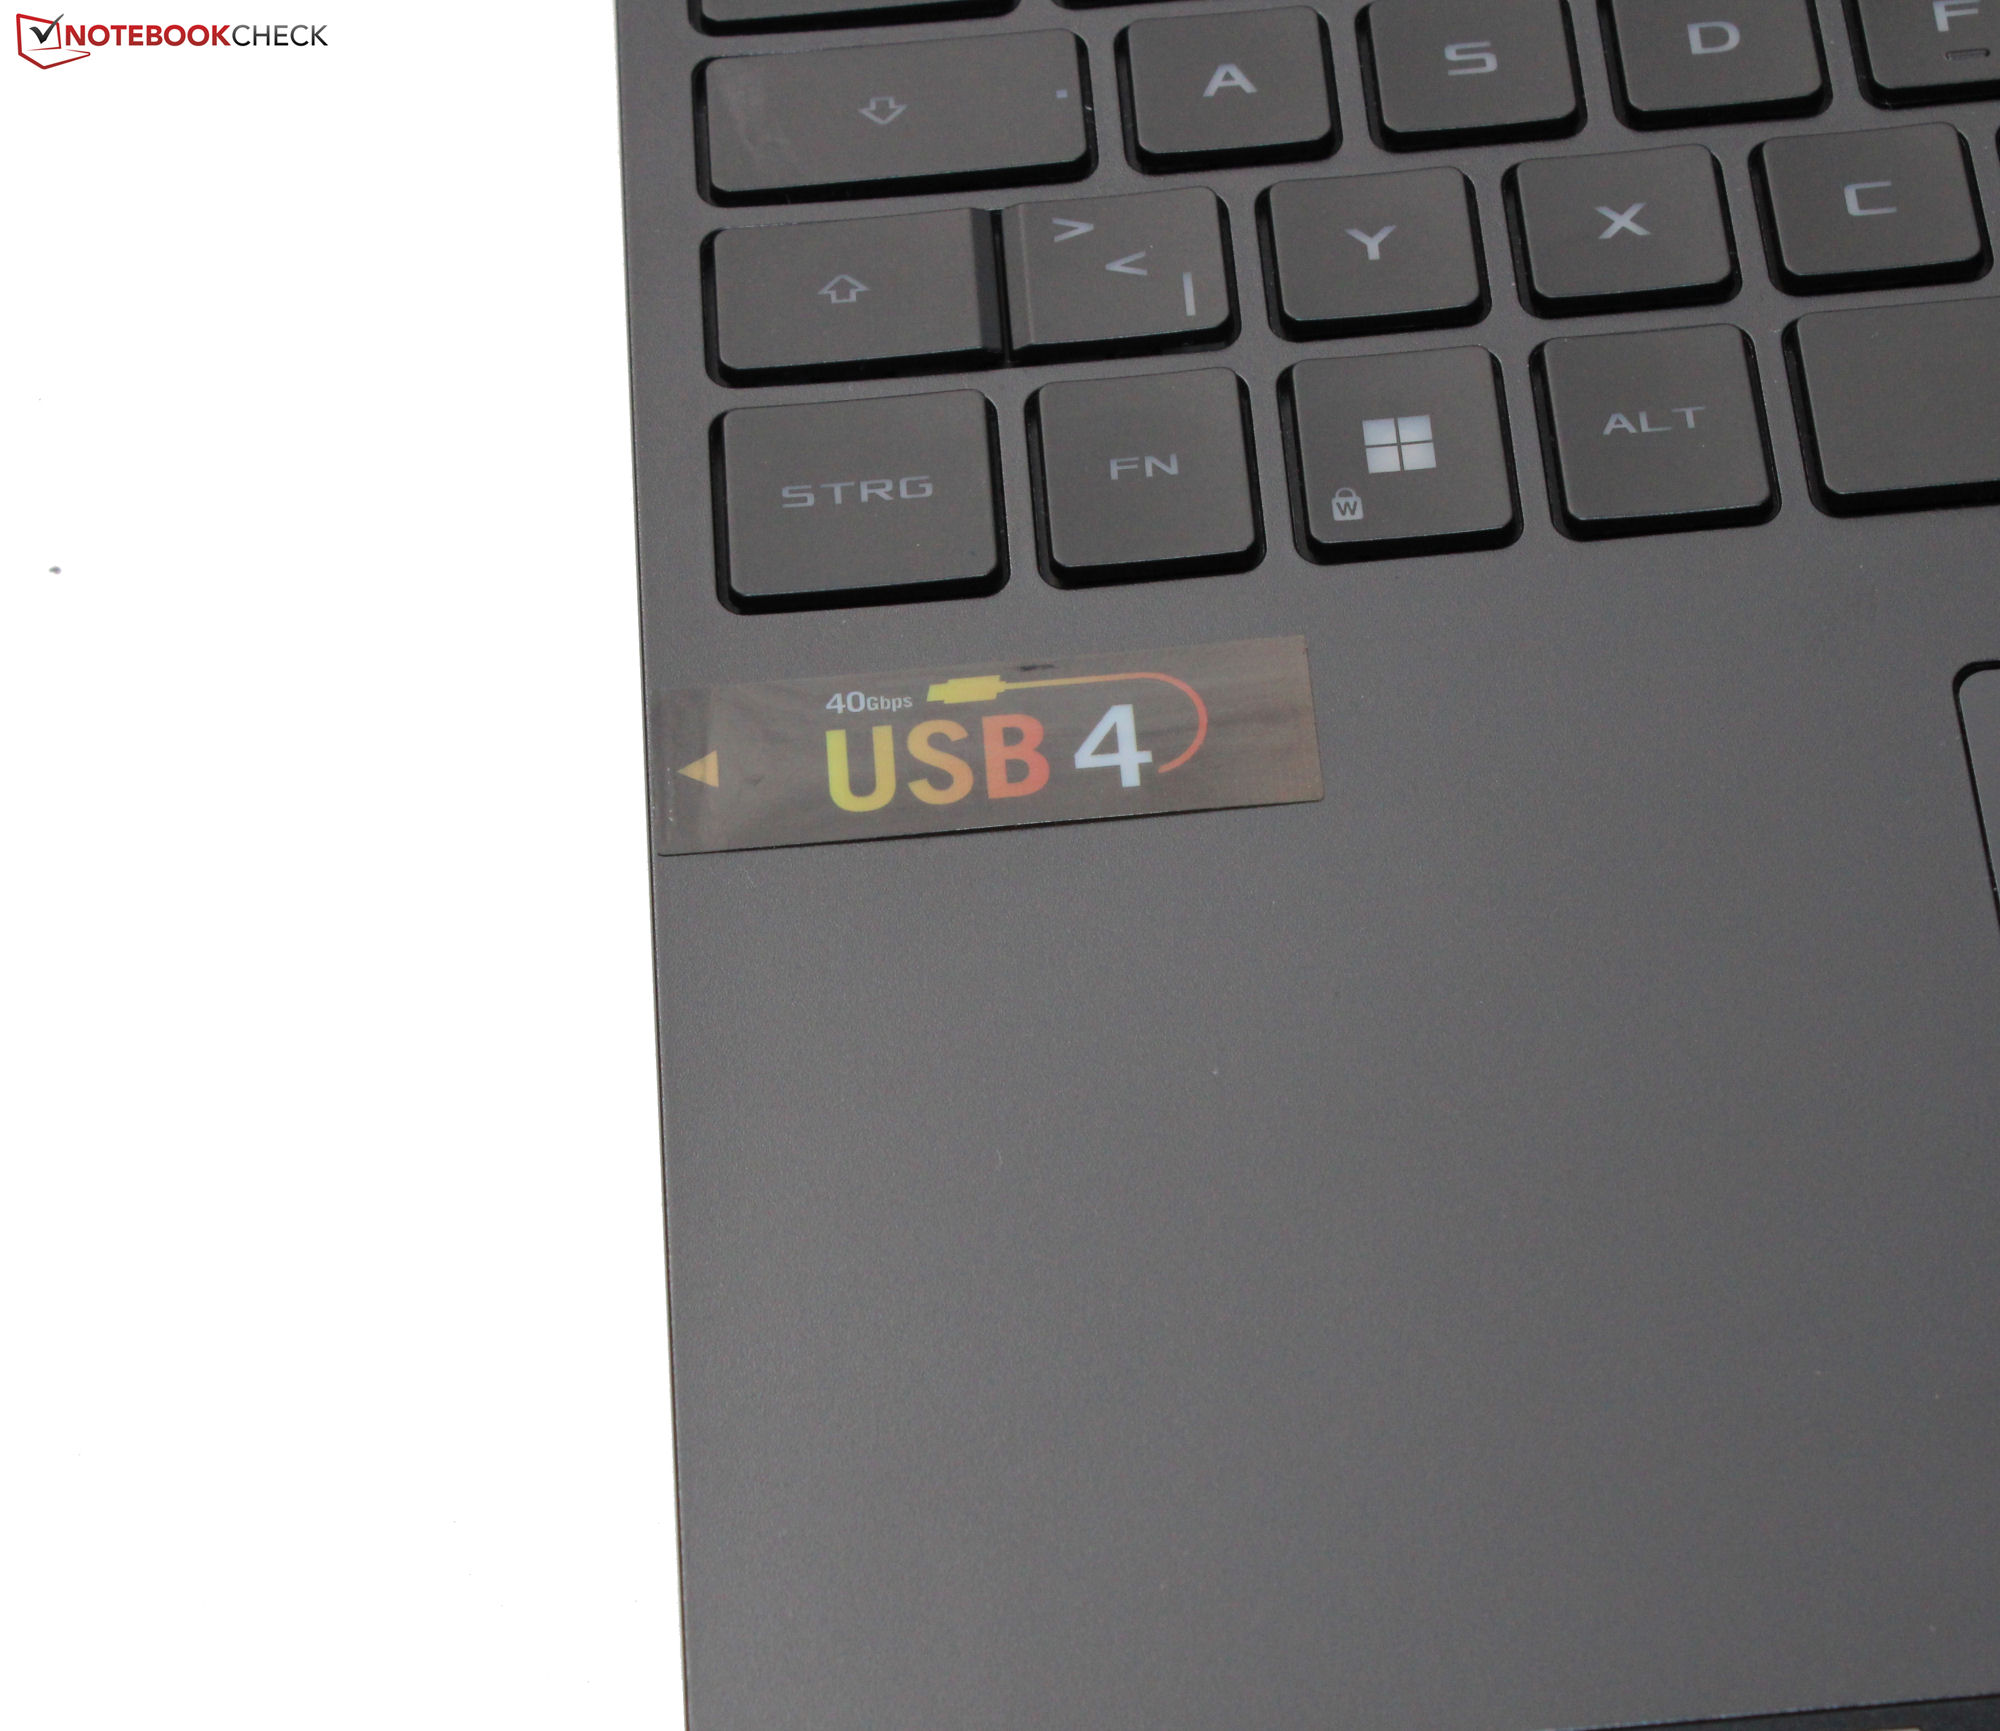
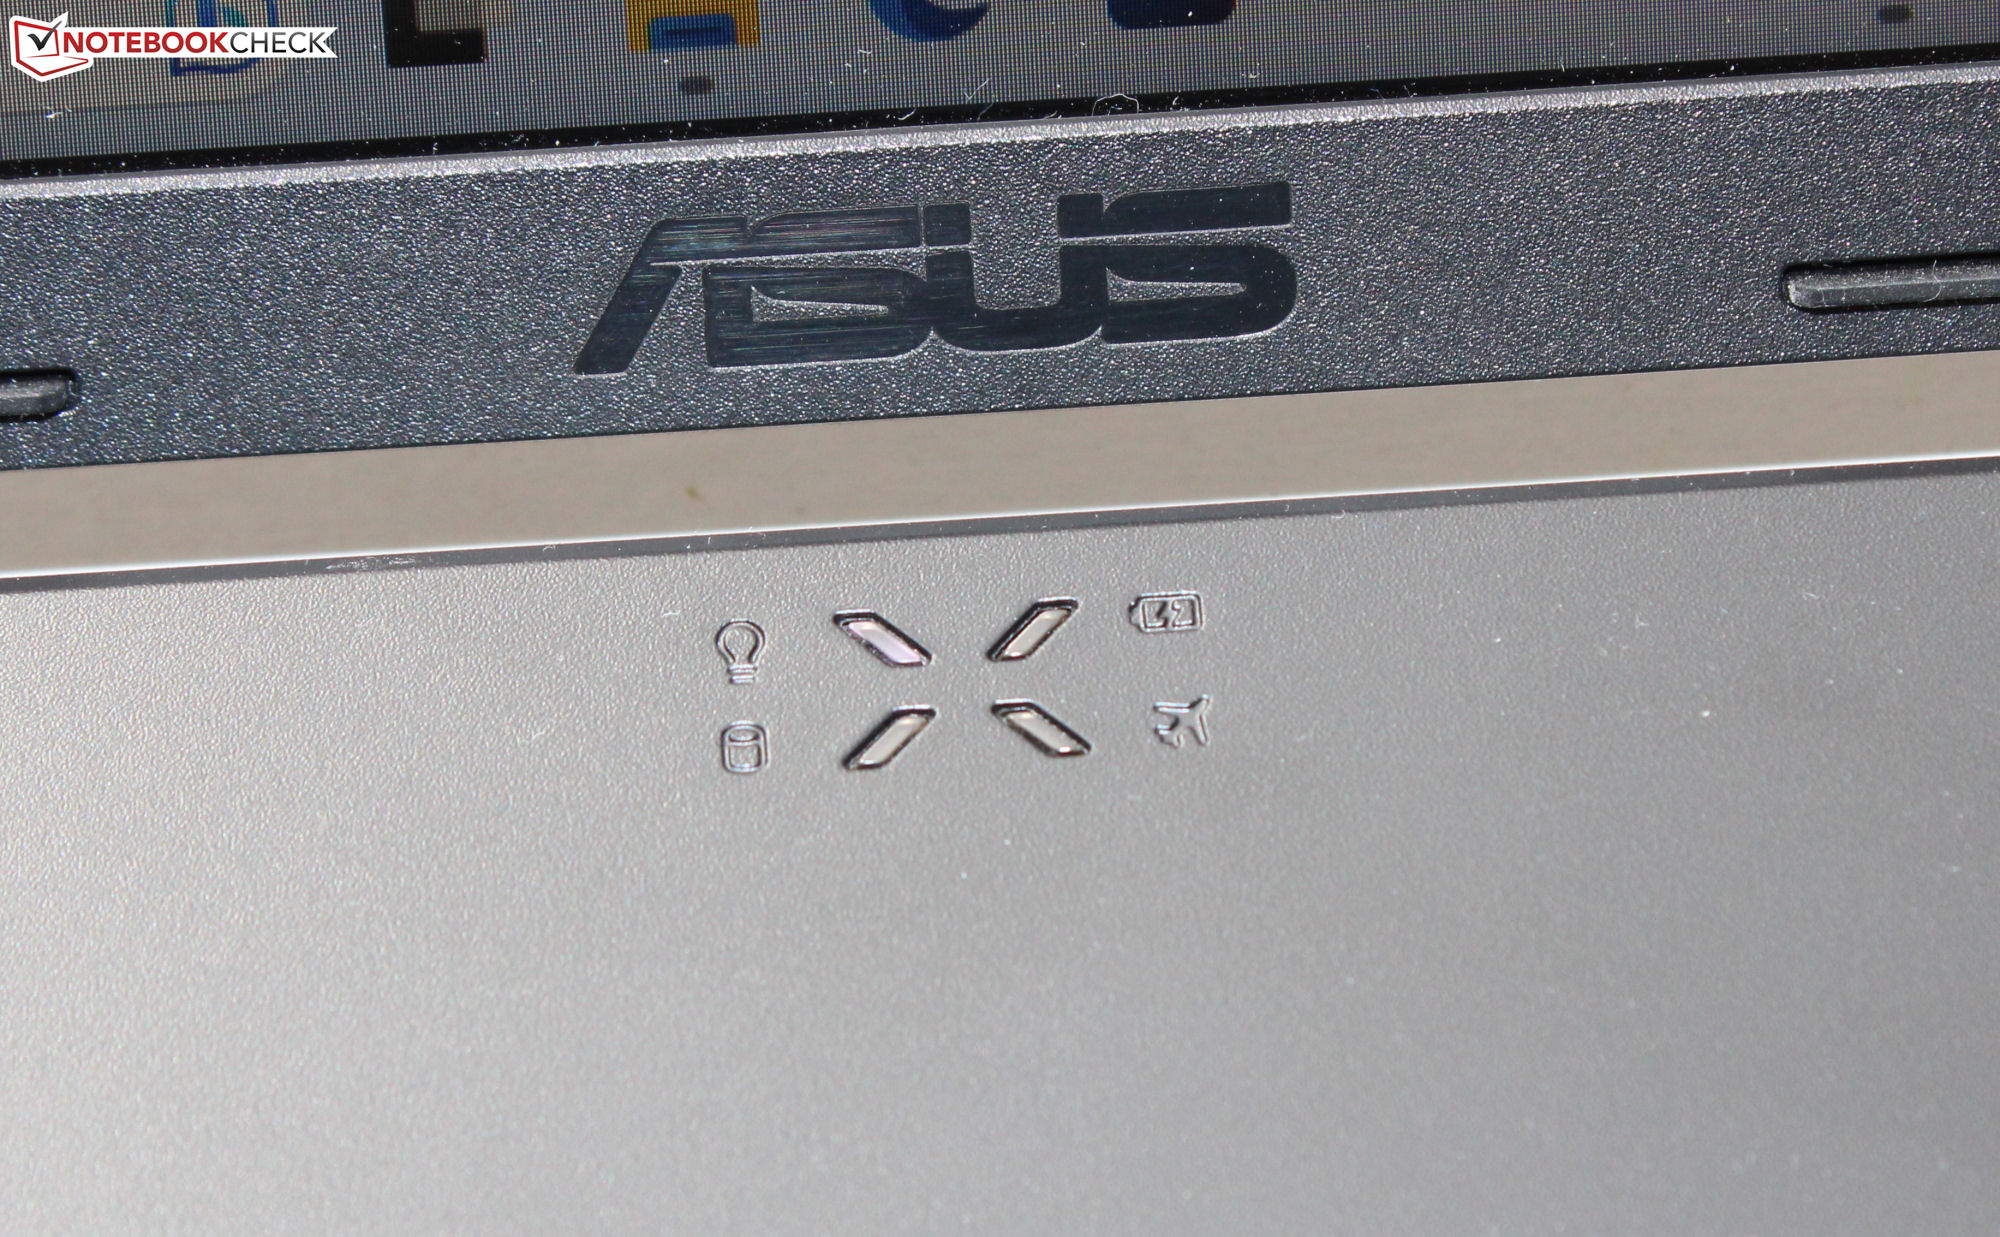
En comparación con su modelo hermanoconocida carcasa negra, el A16 tiene una carcasa de dos tonos. La parte trasera de la tapa y la parte inferior de la carcasa son de color arena ("Sandstorm"). Las opciones de conectividad también son un poco diferentes: Uno de los dos puertos USB-C se ha actualizado al estándar USB-4.


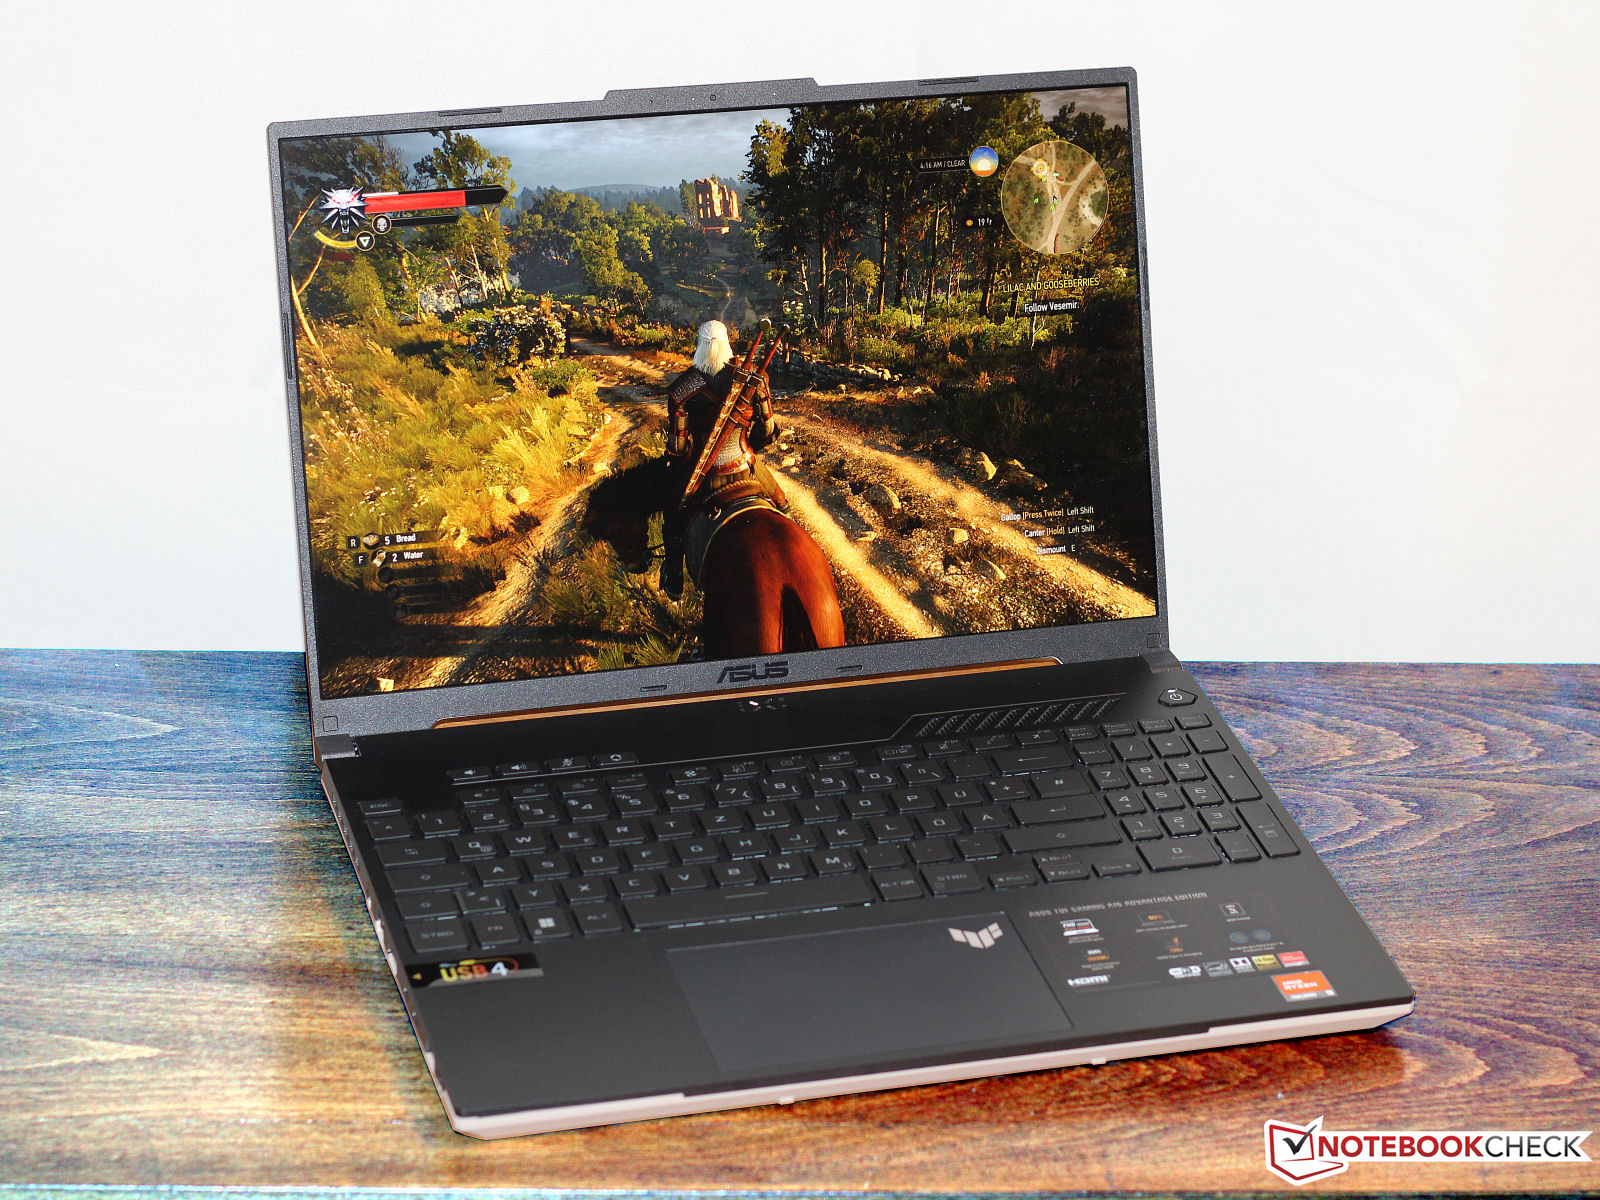
Pantalla: panel 16:10 con cobertura sRGB
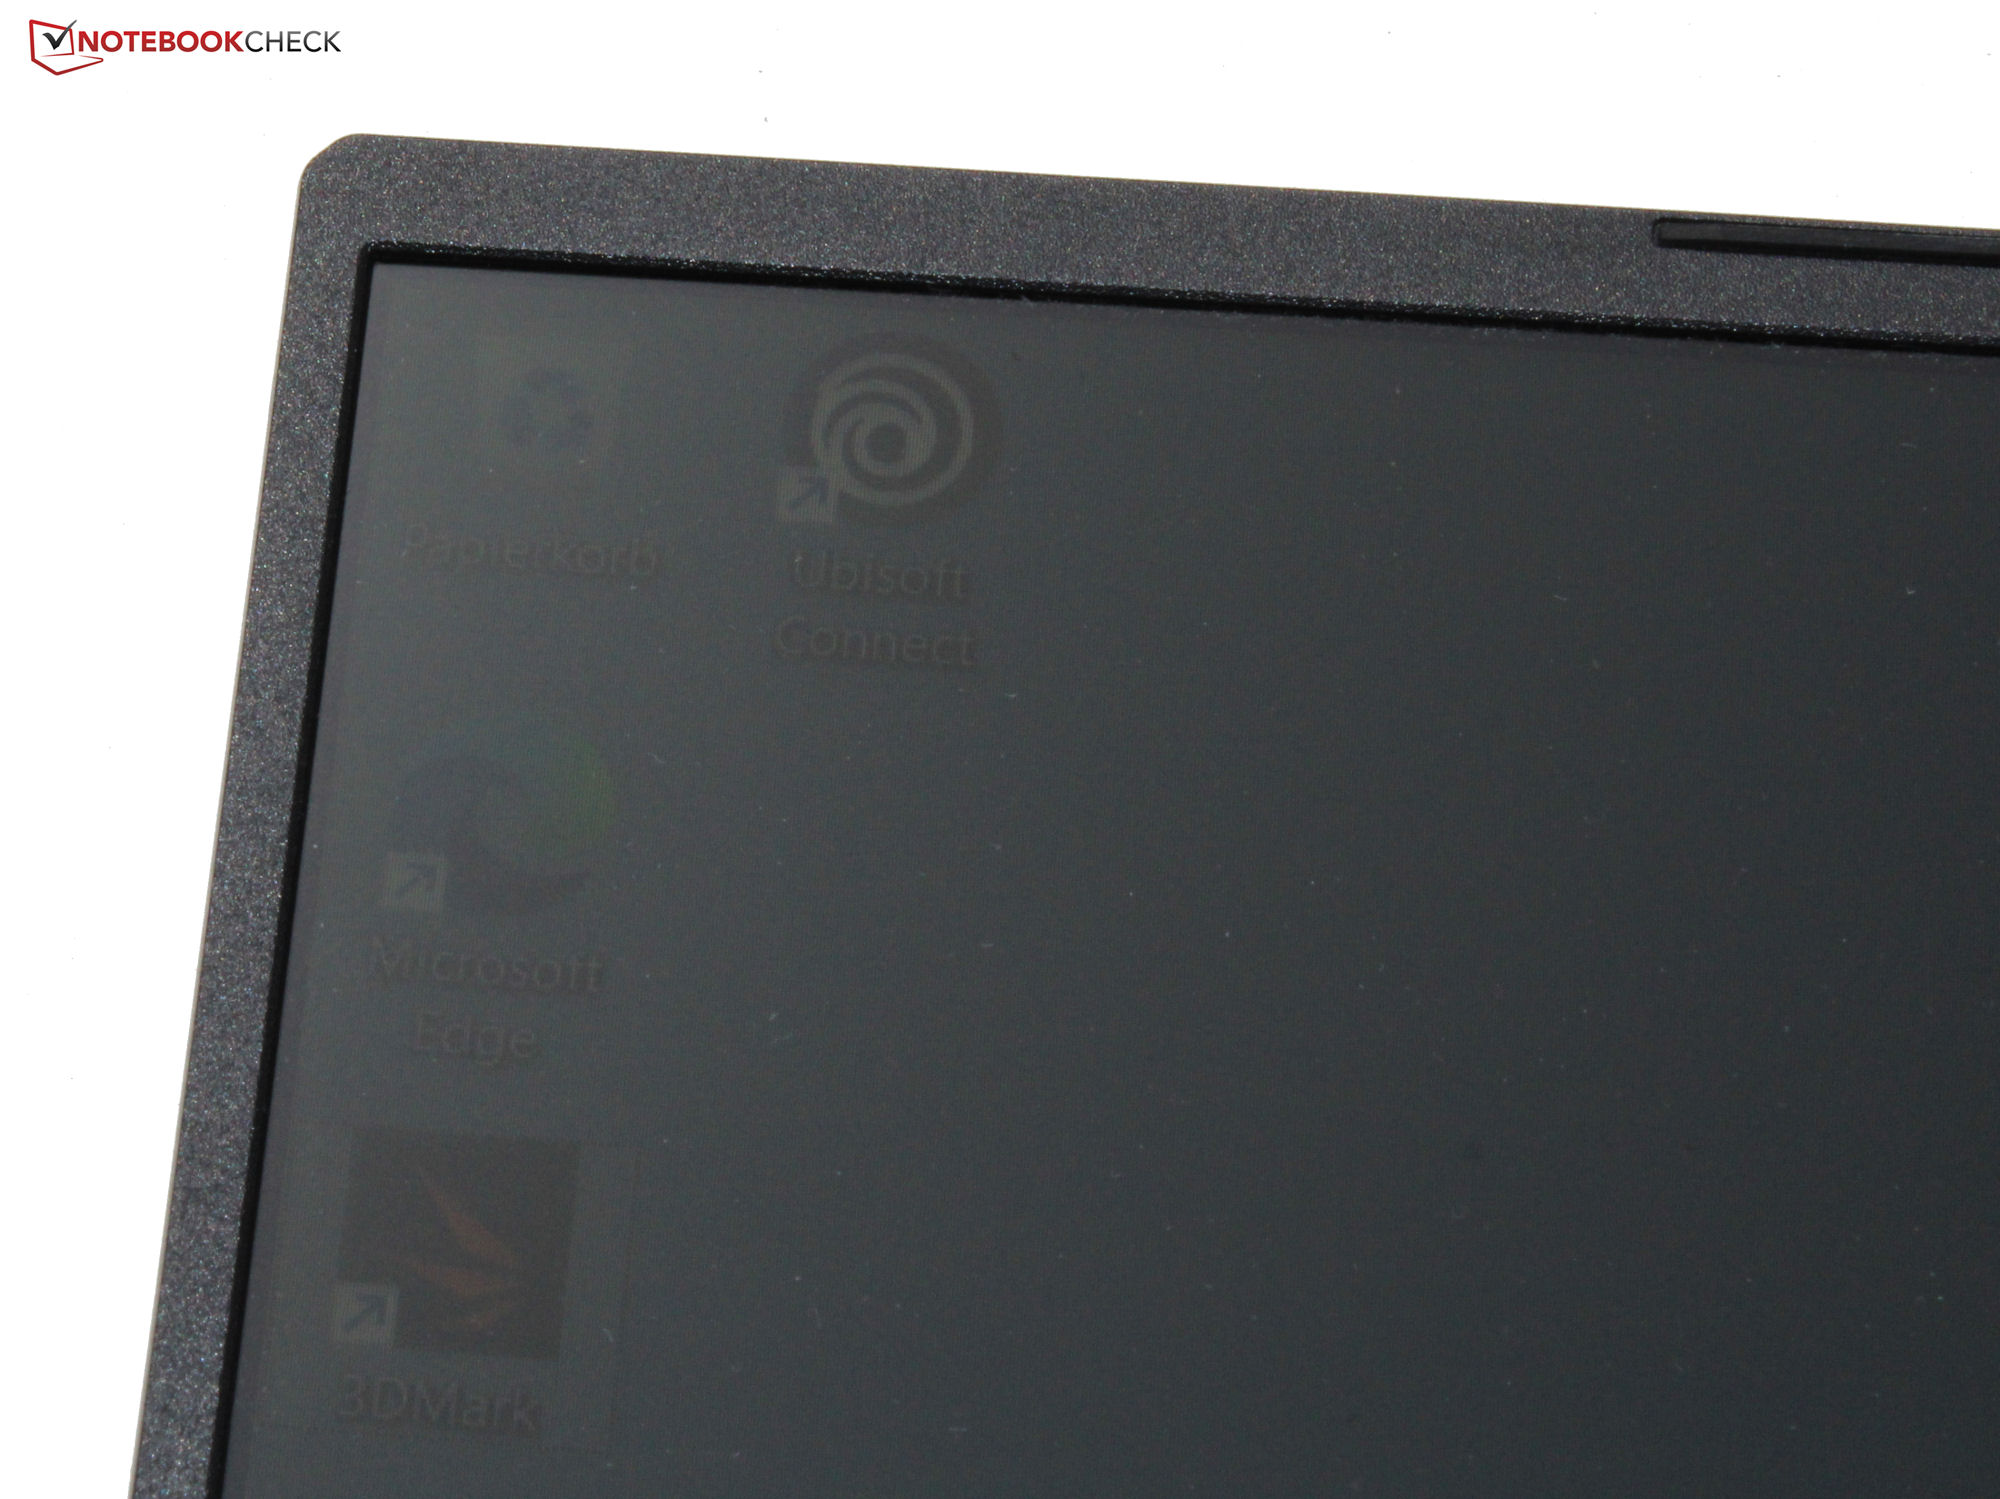
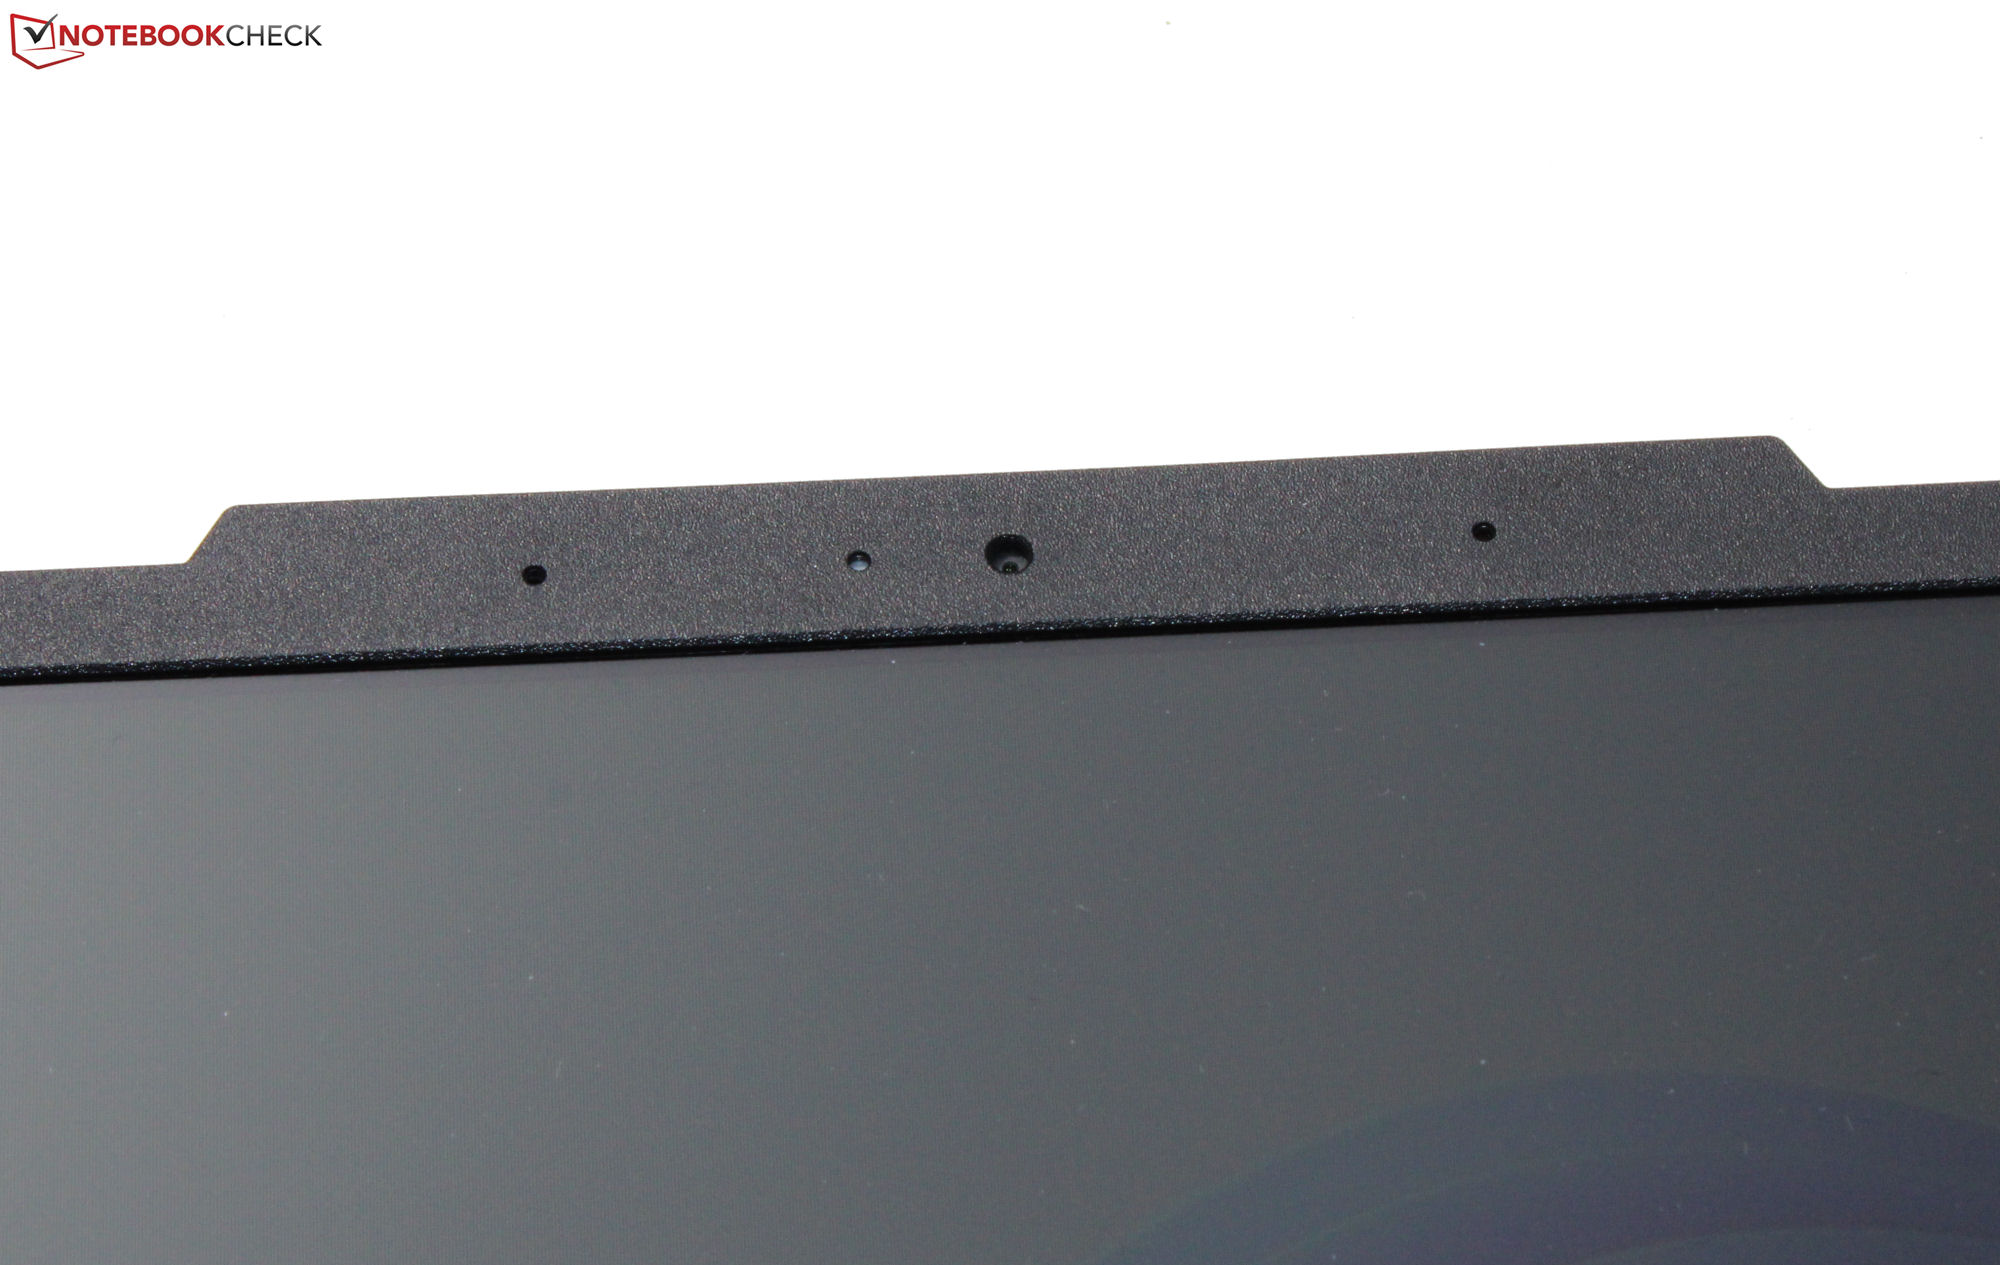
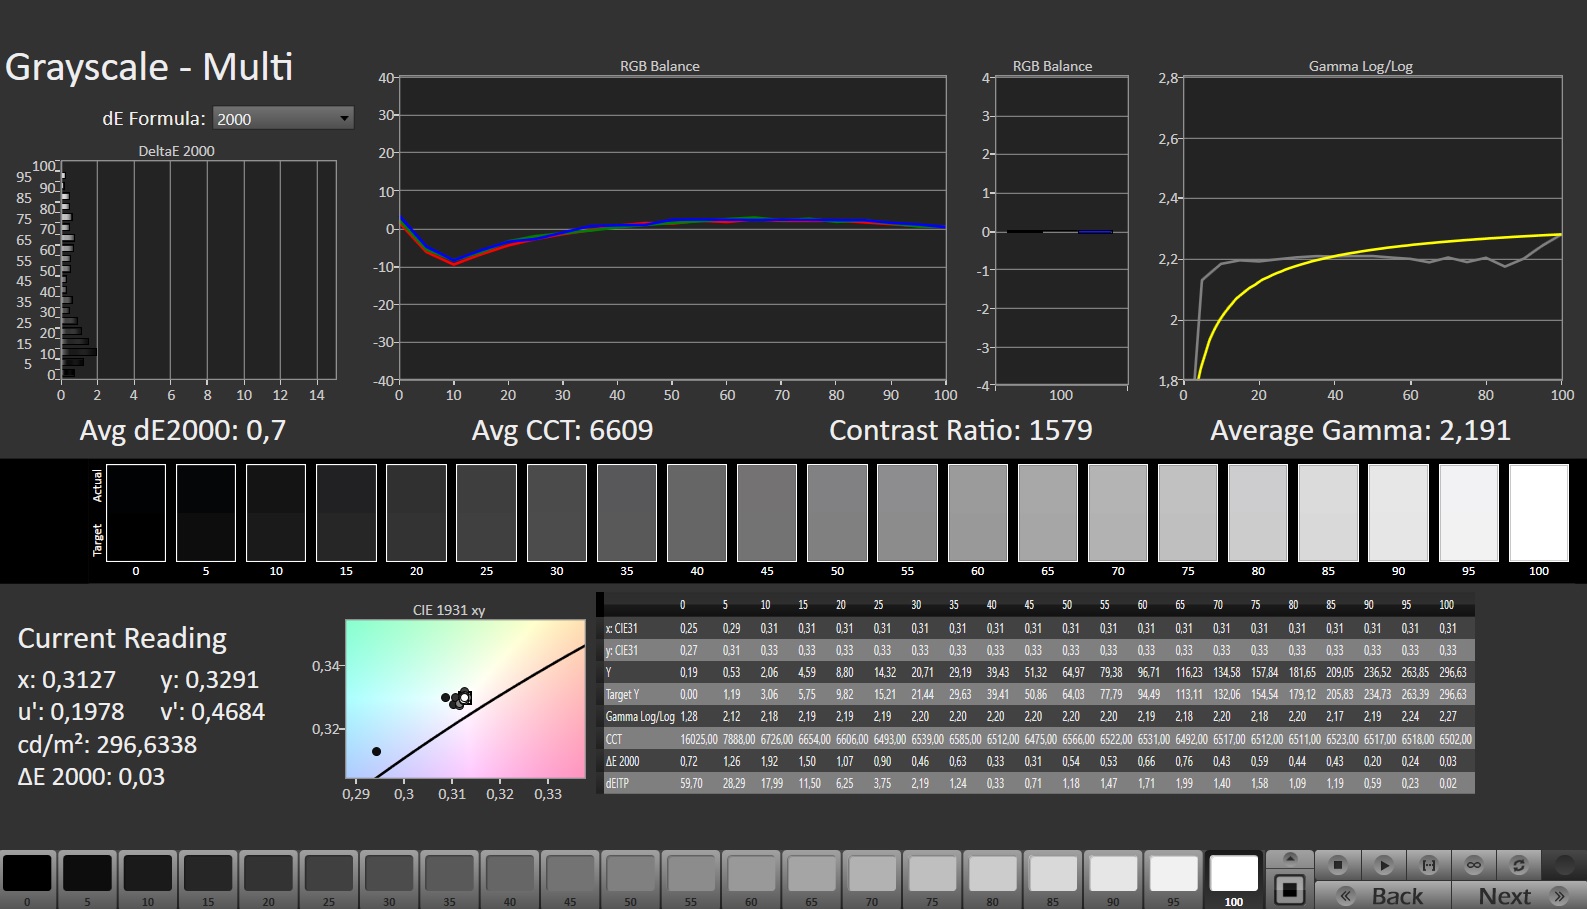
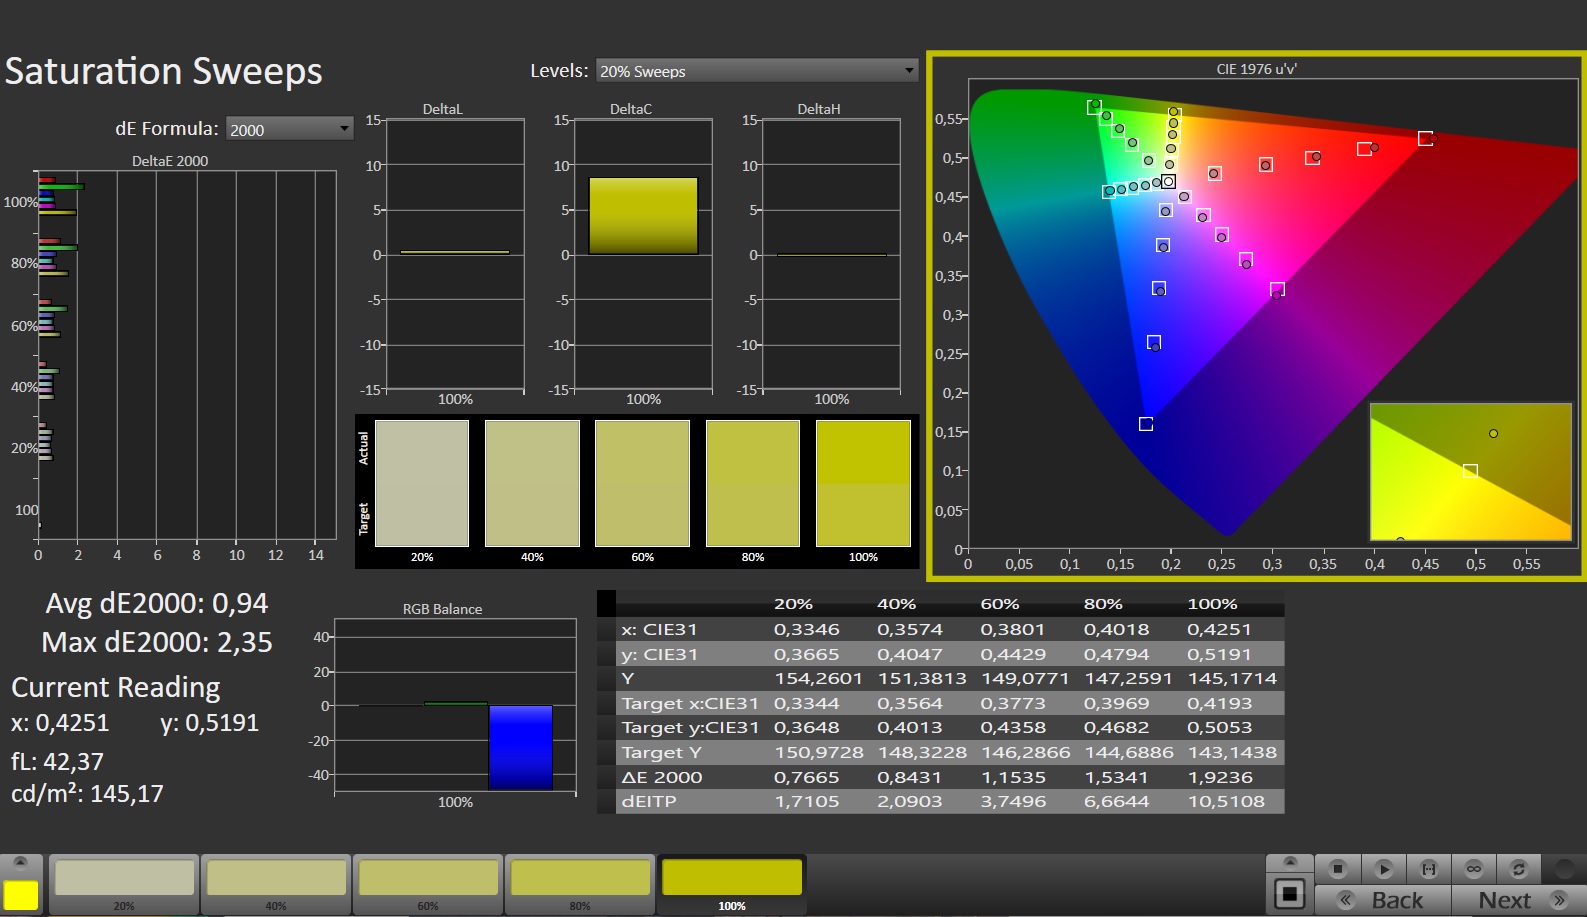
El A16 está equipado con el mismo panel de 165 Hz que se puede encontrar en su modelo hermano. Su pantalla mate de 16 pulgadas (1.920 x 1.200 píxeles, IPS) tiene un formato 16:10 y gana puntos gracias a su compatibilidad con FreeSync, la ausencia de parpadeo PWM y la rapidez de reacción. Aunque su contraste es aceptable, su brillo podría ser un poco mejor.
| |||||||||||||||||||||||||
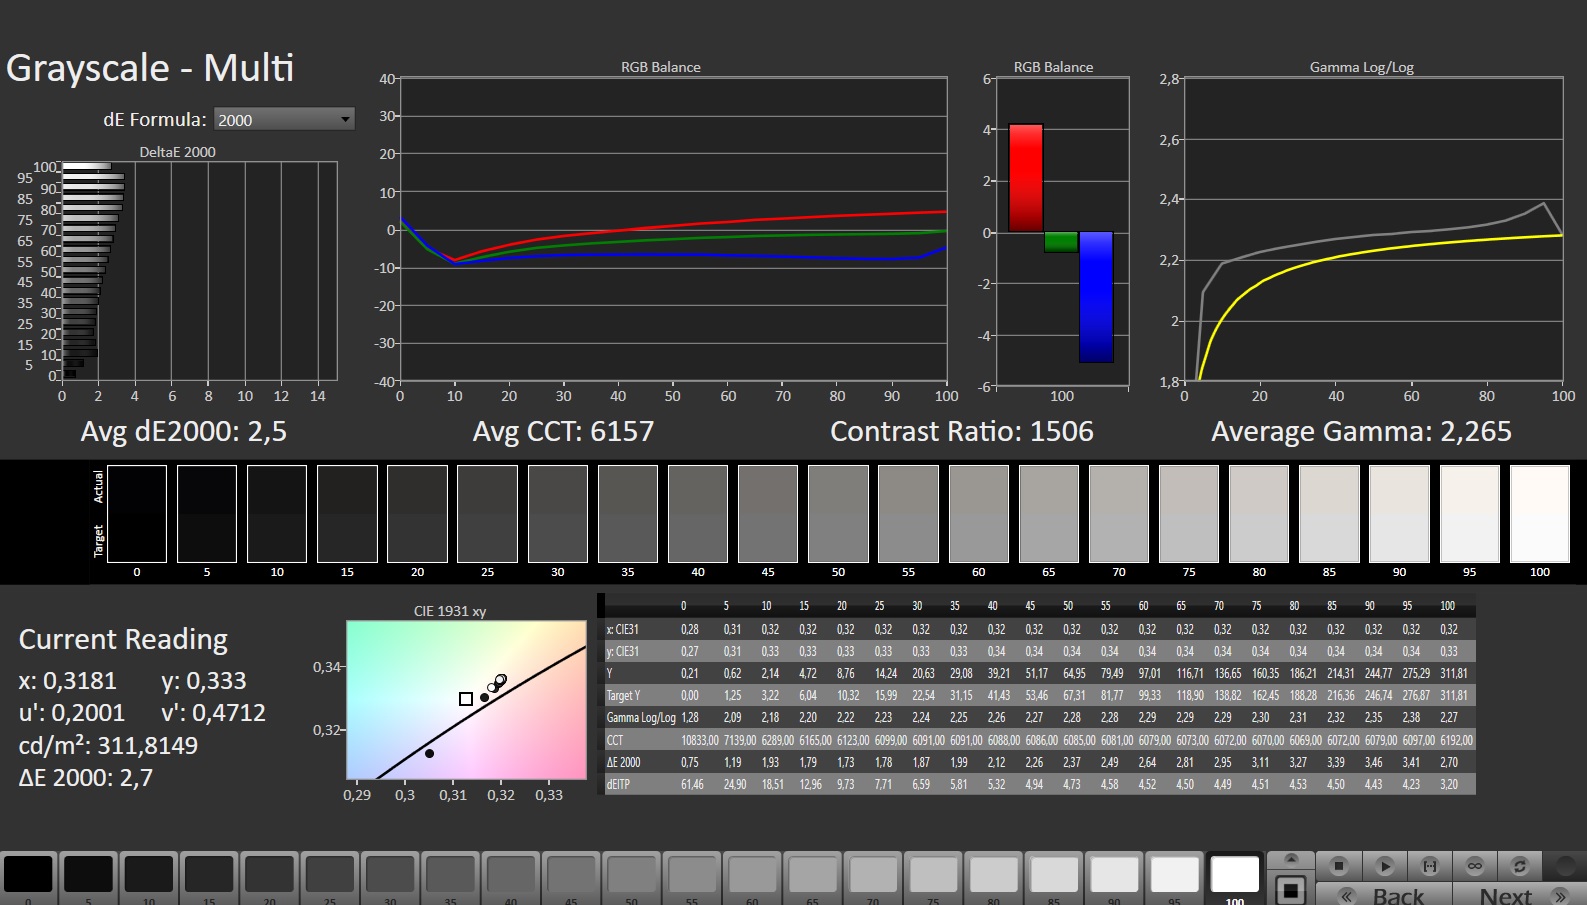
iluminación: 94 %
Brillo con batería: 301 cd/m²
Contraste: 1433:1 (Negro: 0.21 cd/m²)
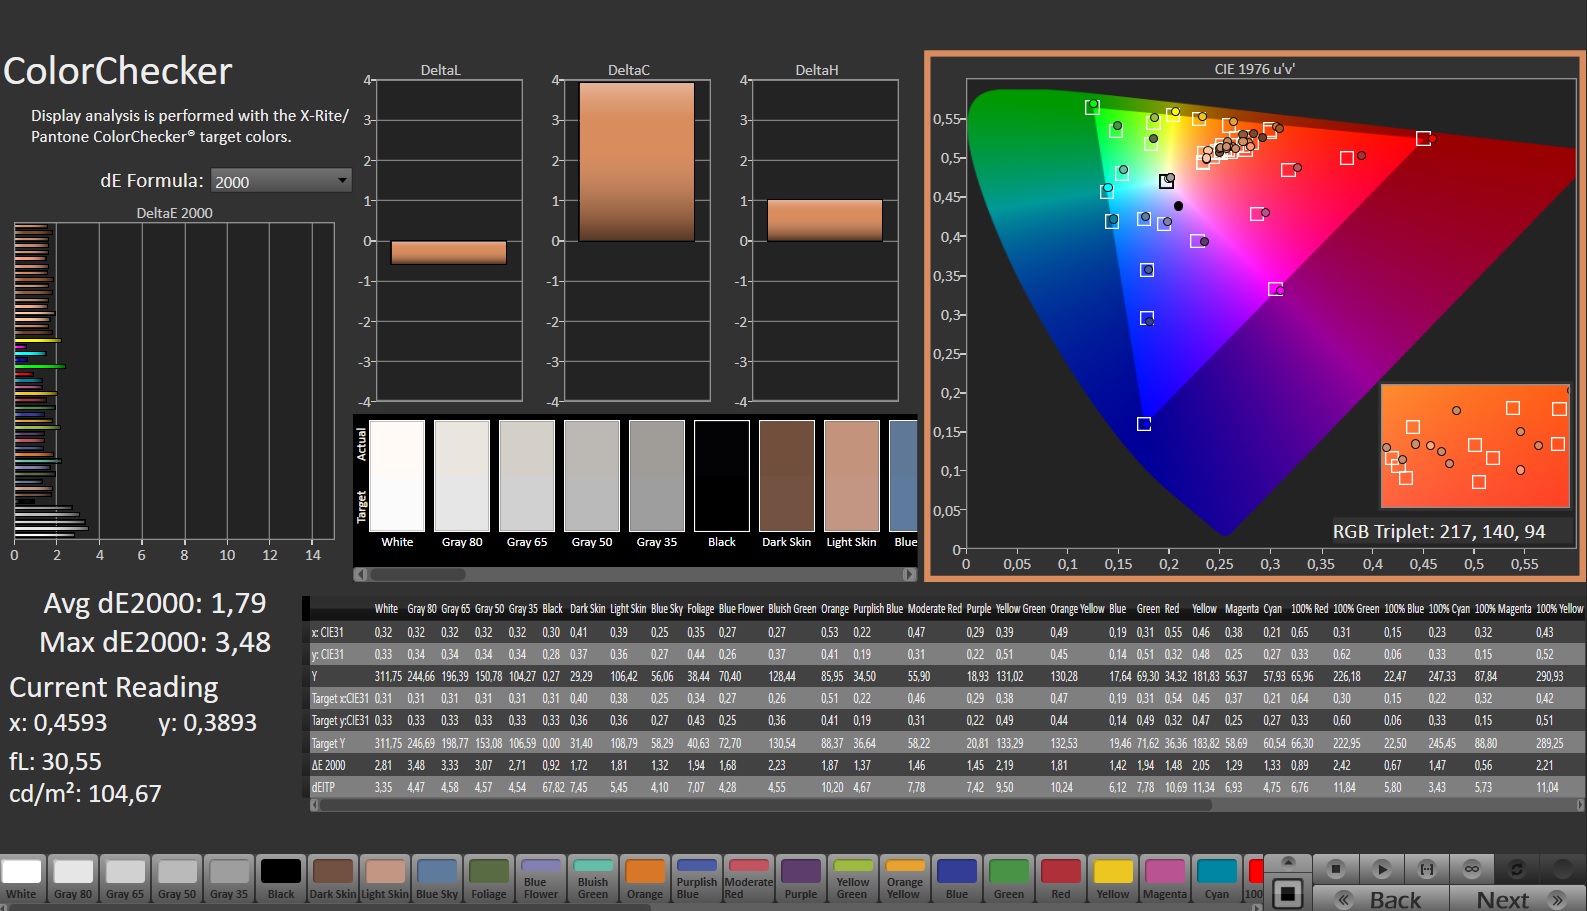
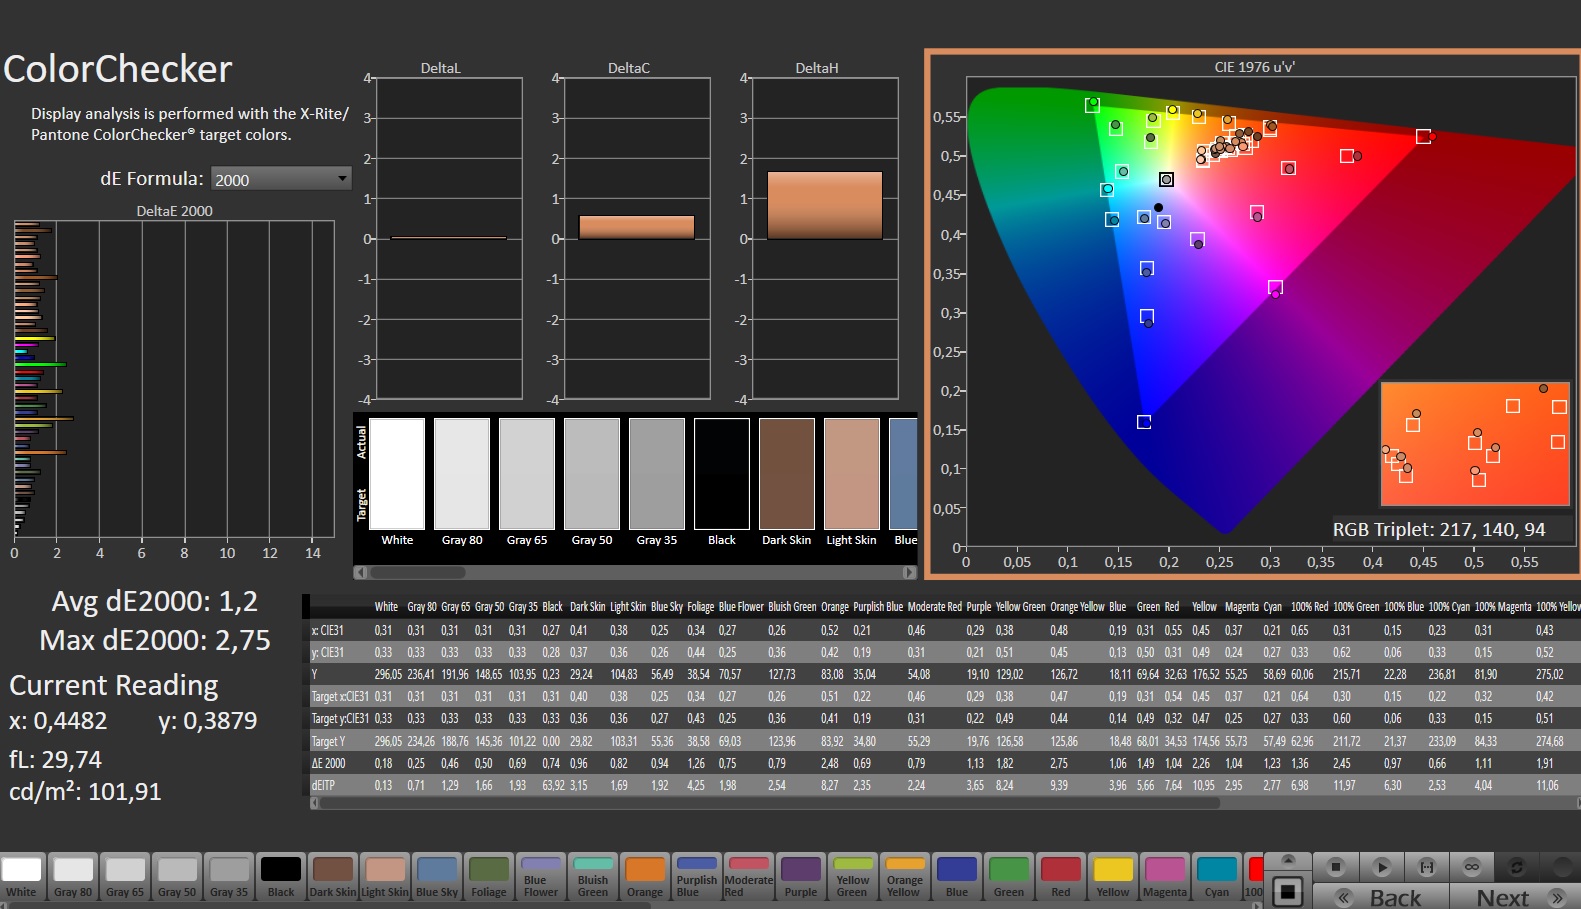
ΔE ColorChecker Calman: 1.79 | ∀{0.5-29.43 Ø4.72}
calibrated: 1.2
ΔE Greyscale Calman: 2.5 | ∀{0.09-98 Ø4.97}
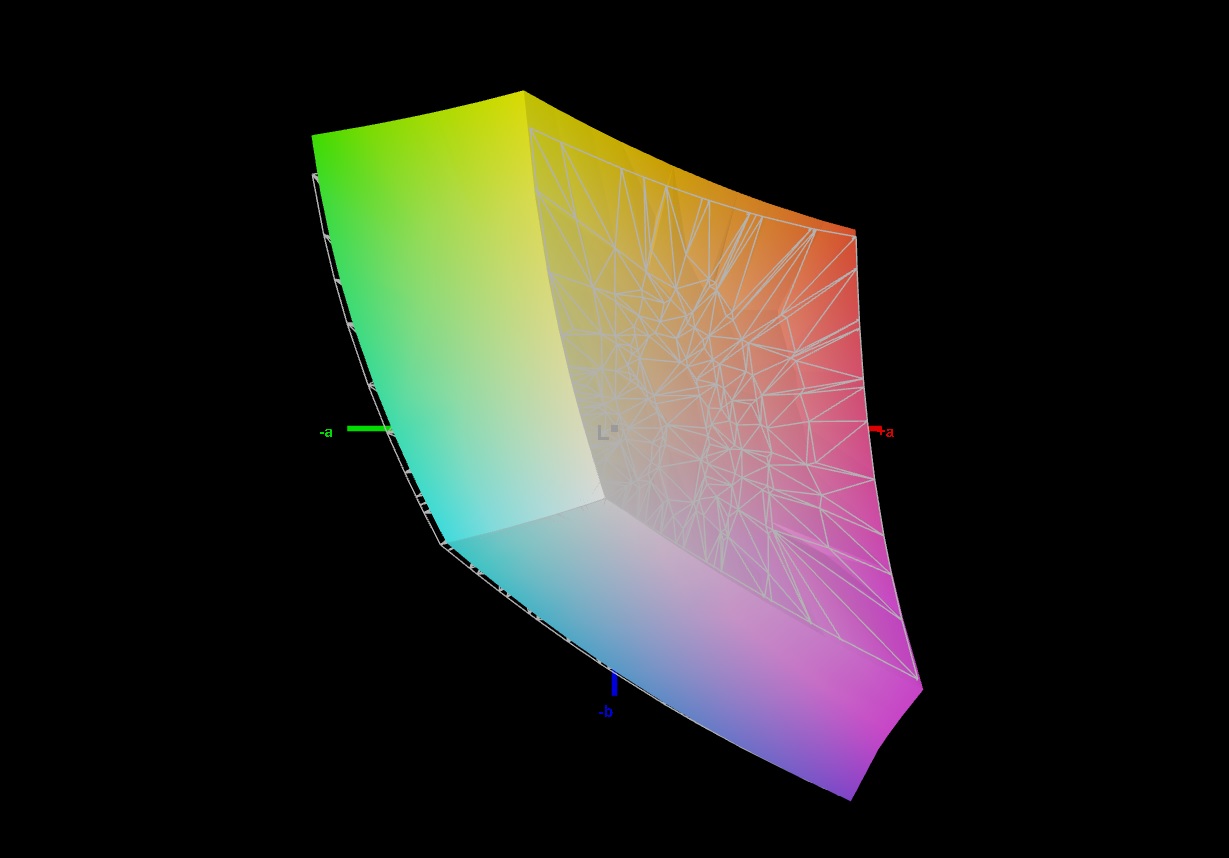
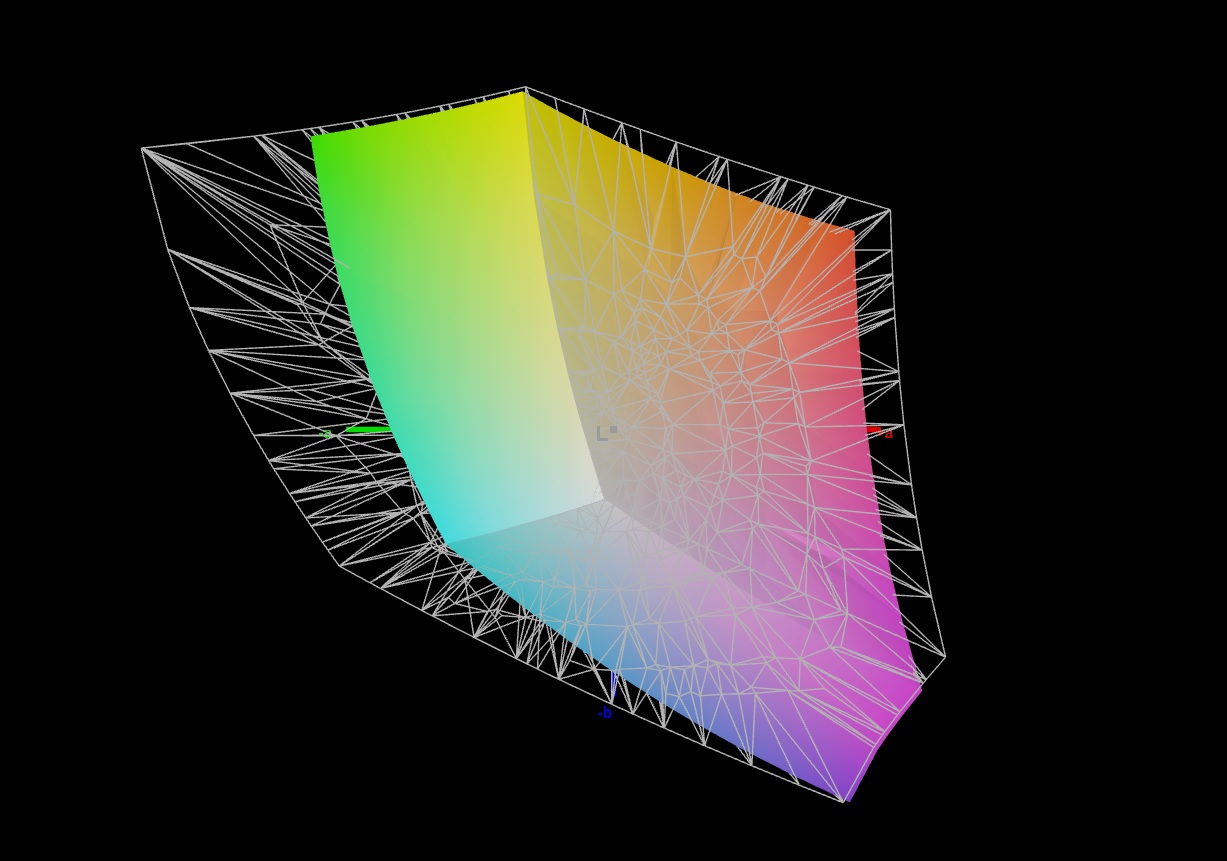
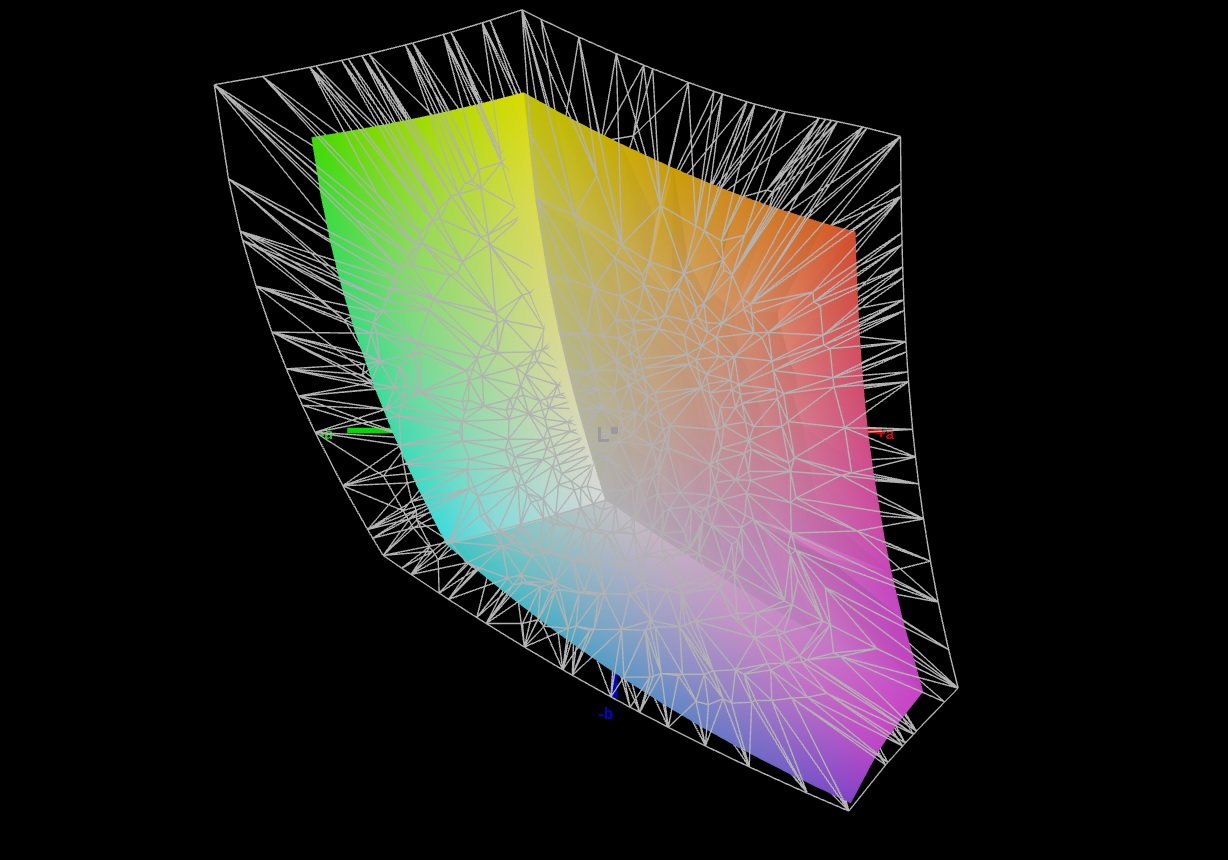
70.7% AdobeRGB 1998 (Argyll 3D)
97.3% sRGB (Argyll 3D)
69.3% Display P3 (Argyll 3D)
Gamma: 2.265
CCT: 6157 K
| Asus TUF Gaming A16 FA617XS BOE NE160WUM-NX2, IPS, 1920x1200, 16" | Lenovo Legion Pro 5 16IRX8 AU Optronics B160QAN03.1, IPS, 2560x1600, 16" | MSI Katana 15 B12VEK AUOAF90 (B156HAN08.4), IPS, 1920x1080, 15.6" | Medion Erazer Defender P40 BOE CQ NE173QHM-NZ3, IPS, 2560x1440, 17.3" | Gigabyte G5 KE Chi Mei N156HRA-EA1, IPS, 1920x1080, 15.6" | Asus TUF Gaming A16 FA617 NE160WUM-NX2 (BOE0B33), IPS-Level, 1920x1200, 16" | |
|---|---|---|---|---|---|---|
| Display | 3% | -44% | -0% | -39% | 0% | |
| Display P3 Coverage (%) | 69.3 | 71.2 3% | 38.1 -45% | 68.3 -1% | 40.7 -41% | 69.4 0% |
| sRGB Coverage (%) | 97.3 | 98.8 2% | 56.8 -42% | 98.1 1% | 61 -37% | 97.8 1% |
| AdobeRGB 1998 Coverage (%) | 70.7 | 73.3 4% | 39.3 -44% | 69.8 -1% | 42.1 -40% | 70.9 0% |
| Response Times | 2% | -159% | 10% | -79% | -5% | |
| Response Time Grey 50% / Grey 80% * (ms) | 15.6 ? | 14.5 ? 7% | 38.8 ? -149% | 14.6 ? 6% | 26.64 ? -71% | 17 ? -9% |
| Response Time Black / White * (ms) | 10 ? | 10.4 ? -4% | 26.8 ? -168% | 8.7 ? 13% | 18.65 ? -86% | 10.1 ? -1% |
| PWM Frequency (Hz) | ||||||
| Screen | 5% | -115% | 7% | -113% | 4% | |
| Brightness middle (cd/m²) | 301 | 405.7 35% | 261 -13% | 364 21% | 269 -11% | 308 2% |
| Brightness (cd/m²) | 294 | 368 25% | 258 -12% | 343 17% | 248 -16% | 293 0% |
| Brightness Distribution (%) | 94 | 87 -7% | 92 -2% | 86 -9% | 85 -10% | 90 -4% |
| Black Level * (cd/m²) | 0.21 | 0.38 -81% | 0.19 10% | 0.28 -33% | 0.5 -138% | 0.23 -10% |
| Contrast (:1) | 1433 | 1068 -25% | 1374 -4% | 1300 -9% | 538 -62% | 1339 -7% |
| Colorchecker dE 2000 * | 1.79 | 1.65 8% | 5.57 -211% | 1.67 7% | 4.54 -154% | 1.47 18% |
| Colorchecker dE 2000 max. * | 3.48 | 4.2 -21% | 20.6 -492% | 2.78 20% | 17.28 -397% | 2.98 14% |
| Colorchecker dE 2000 calibrated * | 1.2 | 0.53 56% | 4.63 -286% | 1.14 5% | 3.34 -178% | 1.02 15% |
| Greyscale dE 2000 * | 2.5 | 1.2 52% | 3.19 -28% | 1.4 44% | 3.8 -52% | 2.2 12% |
| Gamma | 2.265 97% | 2.3 96% | 2.45 90% | 2.091 105% | 2.17 101% | 2.228 99% |
| CCT | 6157 106% | 6453 101% | 6146 106% | 6568 99% | 7408 88% | 6228 104% |
| Media total (Programa/Opciones) | 3% /
4% | -106% /
-106% | 6% /
6% | -77% /
-92% | -0% /
2% |
* ... más pequeño es mejor
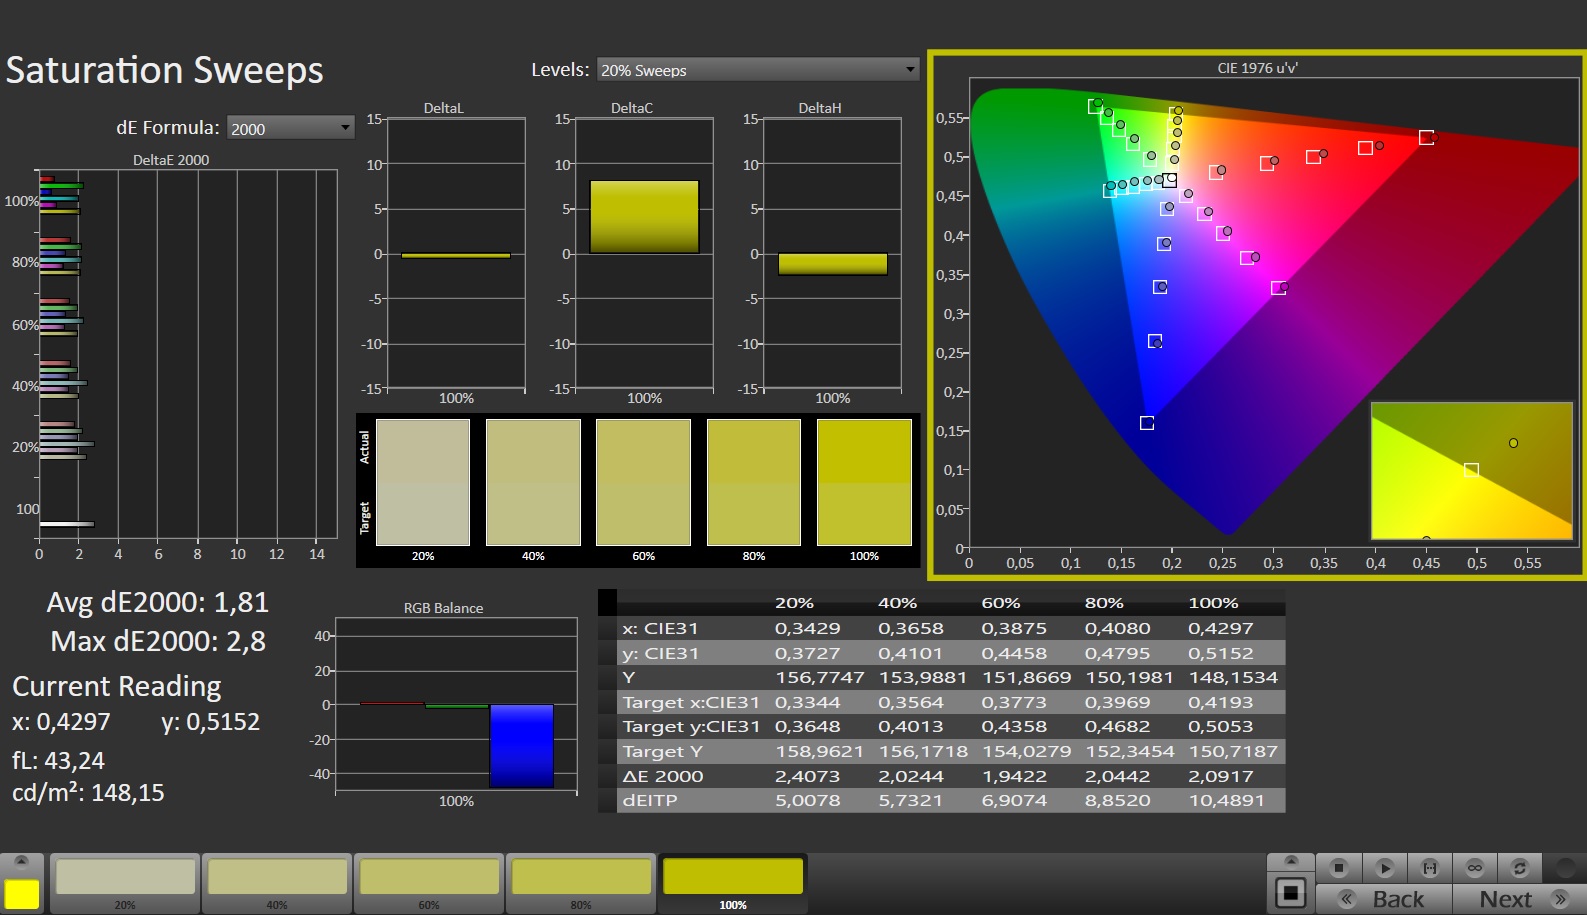
Ex funciona, la pantalla presenta una buena representación del color: Una desviación de alrededor de 1,8 es aceptable (DeltaE < 3). La calibración reduce este índice a 1,2 y da lugar a tonos grises más equilibrados. El panel puede representar todo el espacio de color sRGB, pero no los espacios AdobeRGB y DCI P3. Esto es similar a la mayoría de las pantallas de sus competidores.
Tiempos de respuesta del display
| ↔ Tiempo de respuesta de Negro a Blanco | ||
|---|---|---|
| 10 ms ... subida ↗ y bajada ↘ combinada | ↗ 5.7 ms subida | 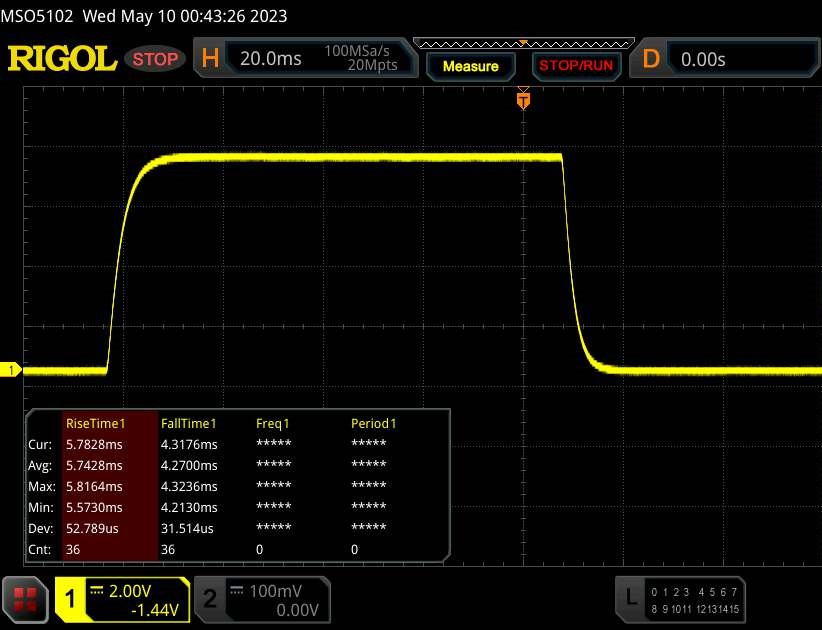 |
| ↘ 4.3 ms bajada | ||
| La pantalla mostró buenos tiempos de respuesta en nuestros tests pero podría ser demasiado lenta para los jugones competitivos. En comparación, todos los dispositivos de prueba van de ##min### (mínimo) a 240 (máximo) ms. » 27 % de todos los dispositivos son mejores. Esto quiere decir que el tiempo de respuesta medido es mejor que la media (19.8 ms) de todos los dispositivos testados. | ||
| ↔ Tiempo de respuesta 50% Gris a 80% Gris | ||
| 15.6 ms ... subida ↗ y bajada ↘ combinada | ↗ 7.3 ms subida | 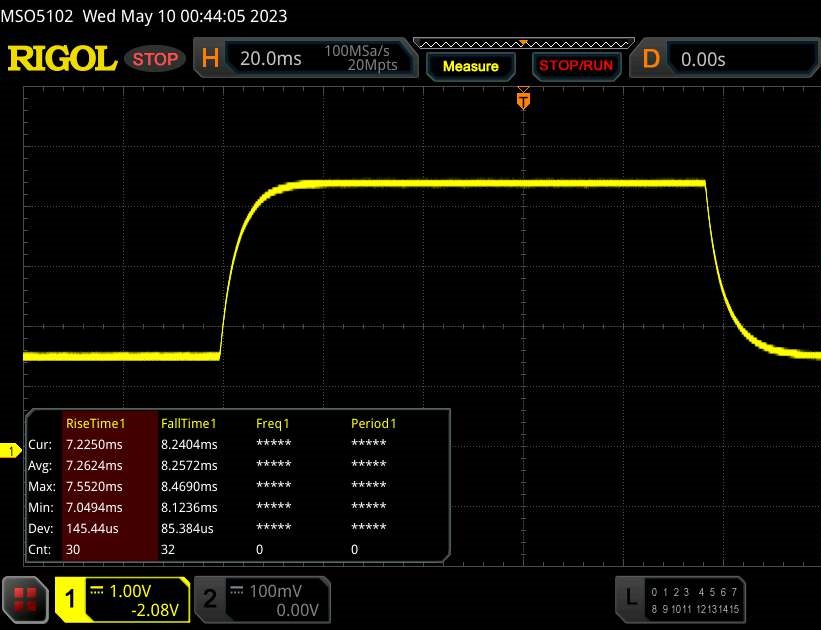 |
| ↘ 8.3 ms bajada | ||
| La pantalla mostró buenos tiempos de respuesta en nuestros tests pero podría ser demasiado lenta para los jugones competitivos. En comparación, todos los dispositivos de prueba van de ##min### (mínimo) a 636 (máximo) ms. » 30 % de todos los dispositivos son mejores. Esto quiere decir que el tiempo de respuesta medido es mejor que la media (31 ms) de todos los dispositivos testados. | ||
Parpadeo de Pantalla / PWM (Pulse-Width Modulation)
| Parpadeo de Pantalla / PWM no detectado |  | ||
Comparación: 52 % de todos los dispositivos testados no usaron PWM para atenuar el display. Si se usó, medimos una media de 7781 (mínimo: 5 - máxmo: 343500) Hz. | |||
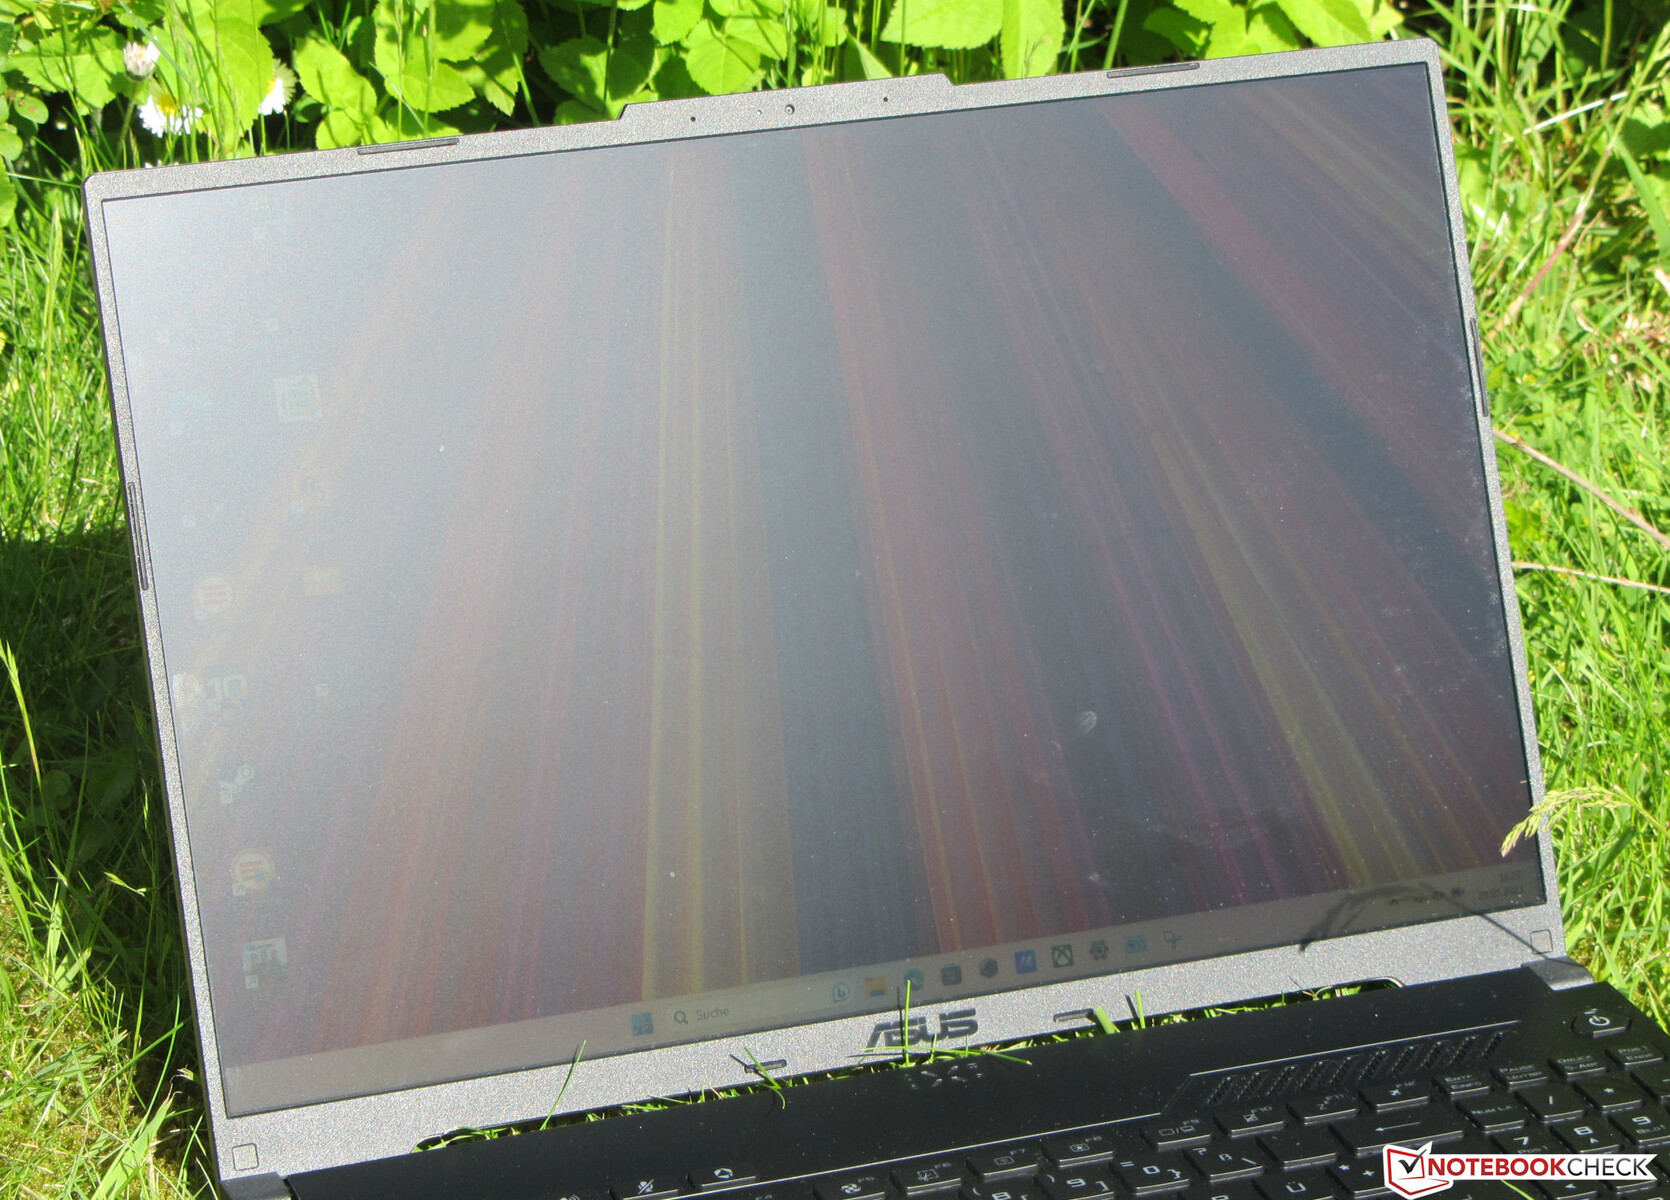
El panel IPS con ángulo de visión estable del portátil sigue siendo legible desde cualquier ángulo. Es posible ver el panel en exteriores, siempre que el sol no brille demasiado.

Rendimiento - Asus aprovecha la potencia de AMD
El Asus TUF Gaming A16 Advantage Edition FA617XS es un portátil para juegos de gama media. El hardware AMD proporciona la potencia de cálculo necesaria. El modelo actual puede comprarse por unos 1.700 $.
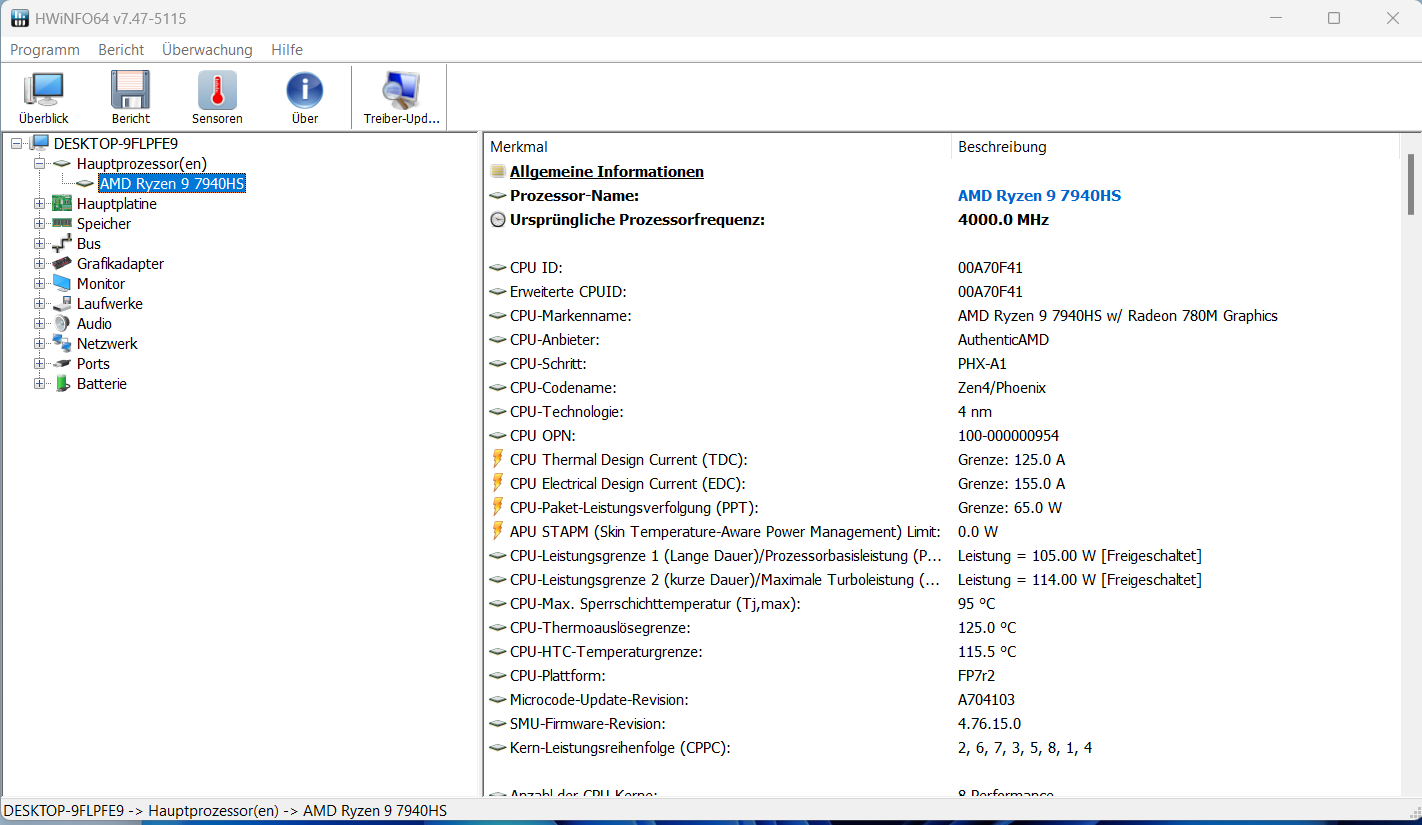
Condiciones de ensayo
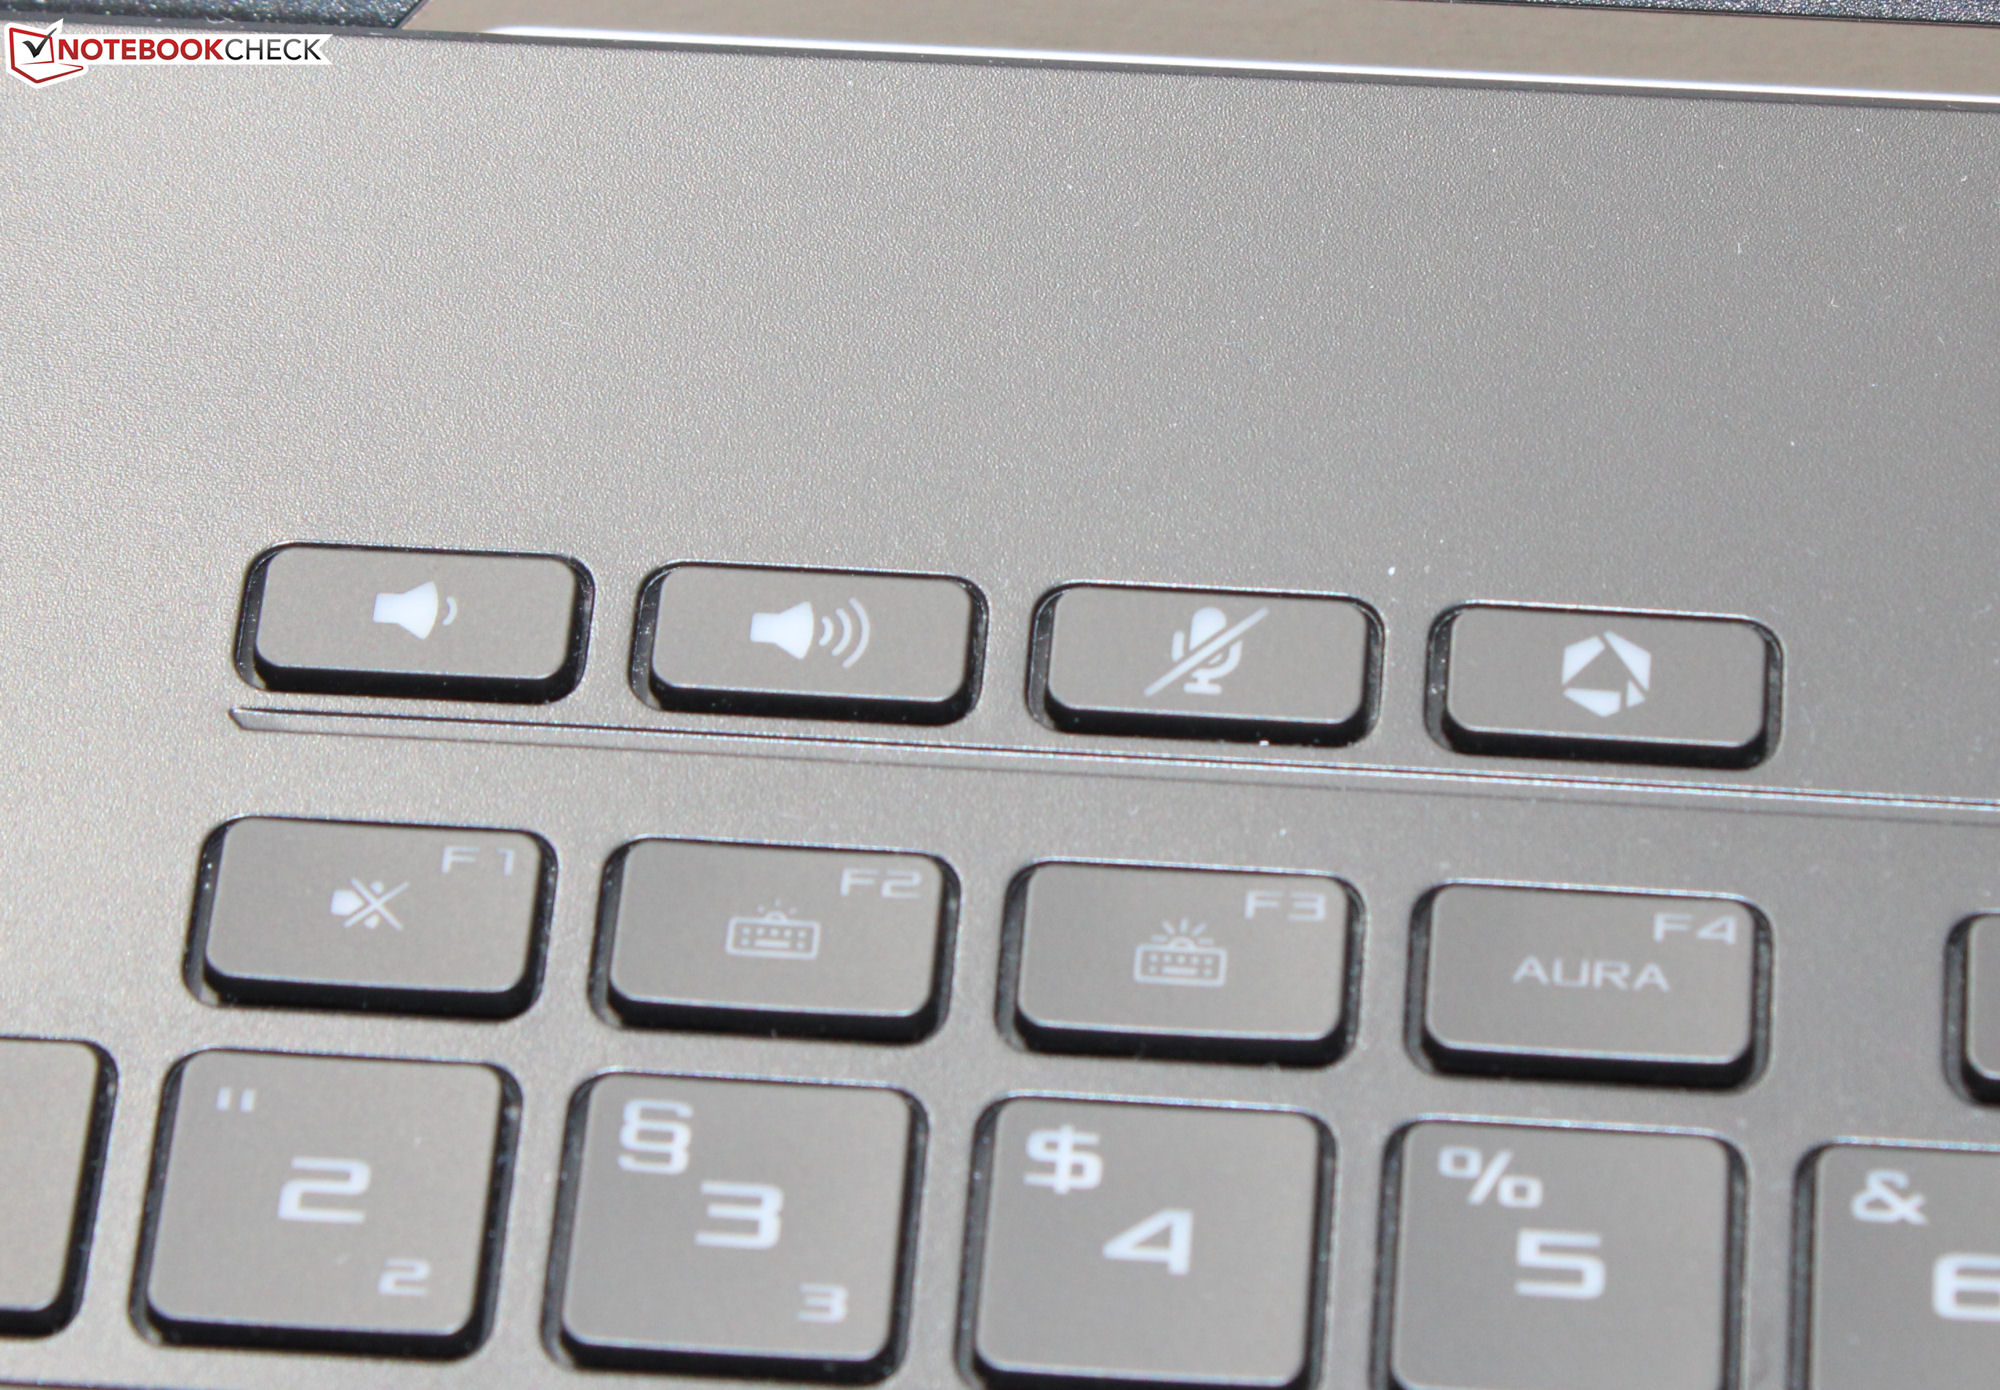
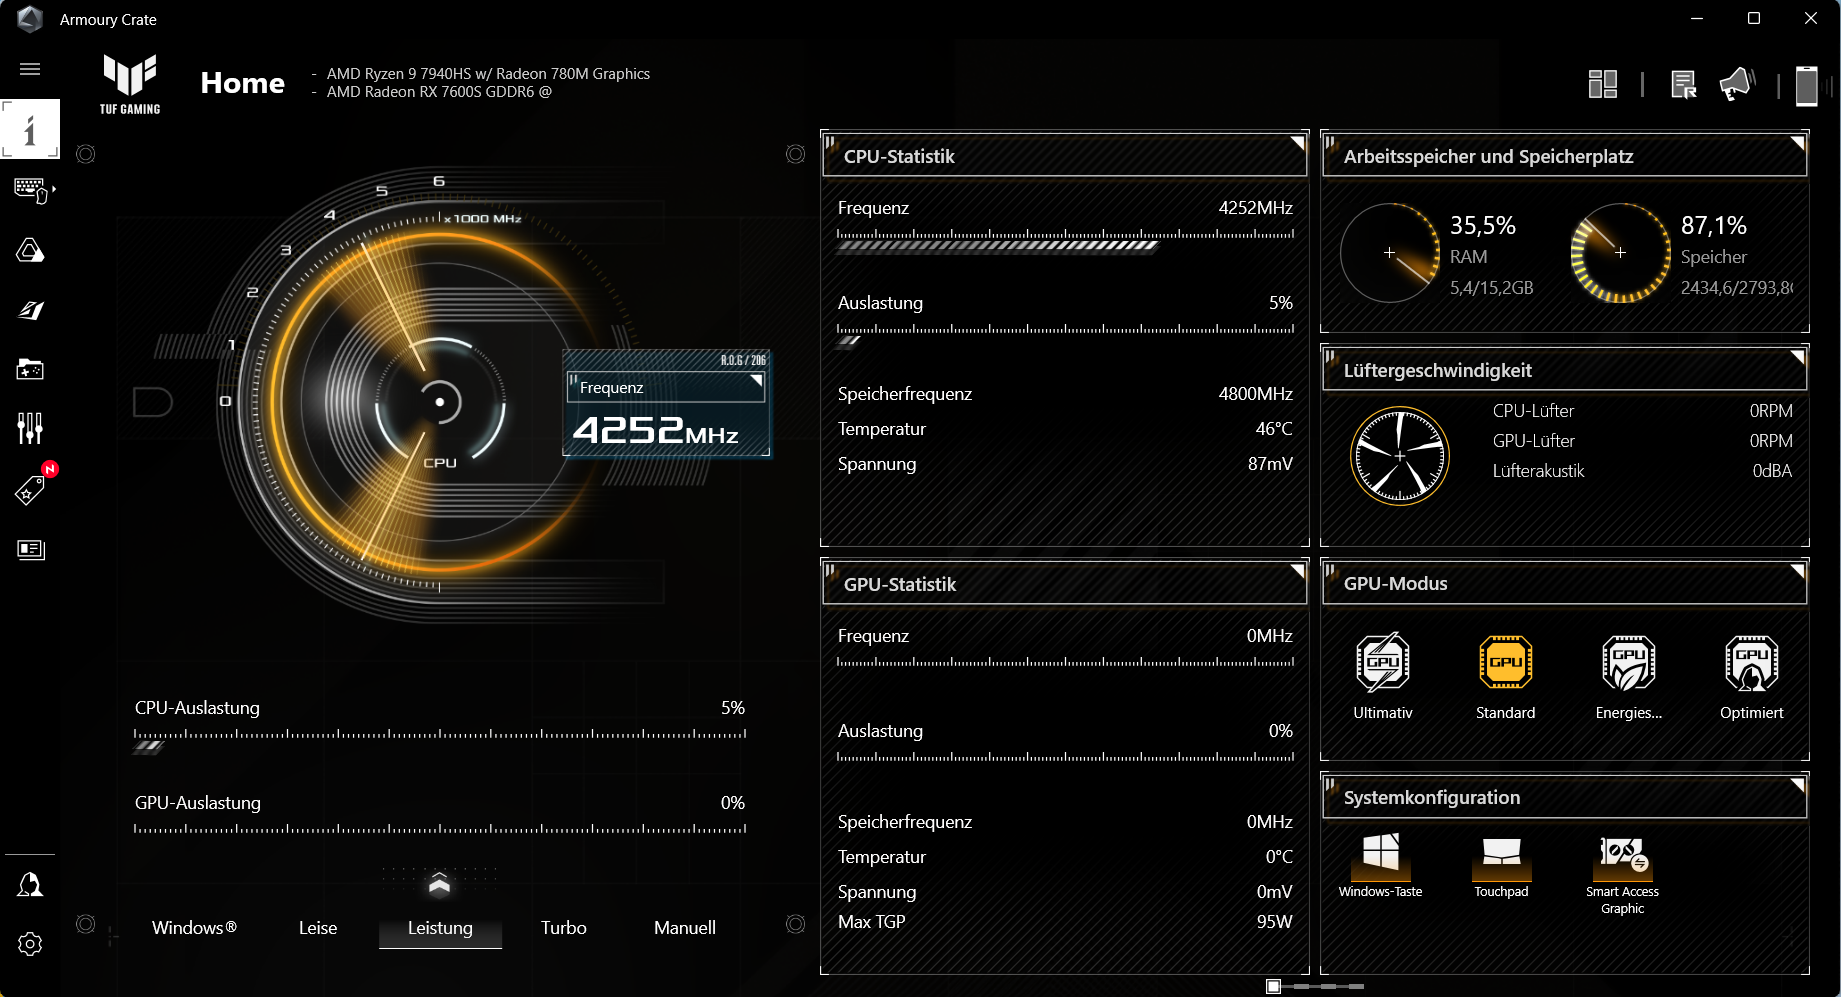
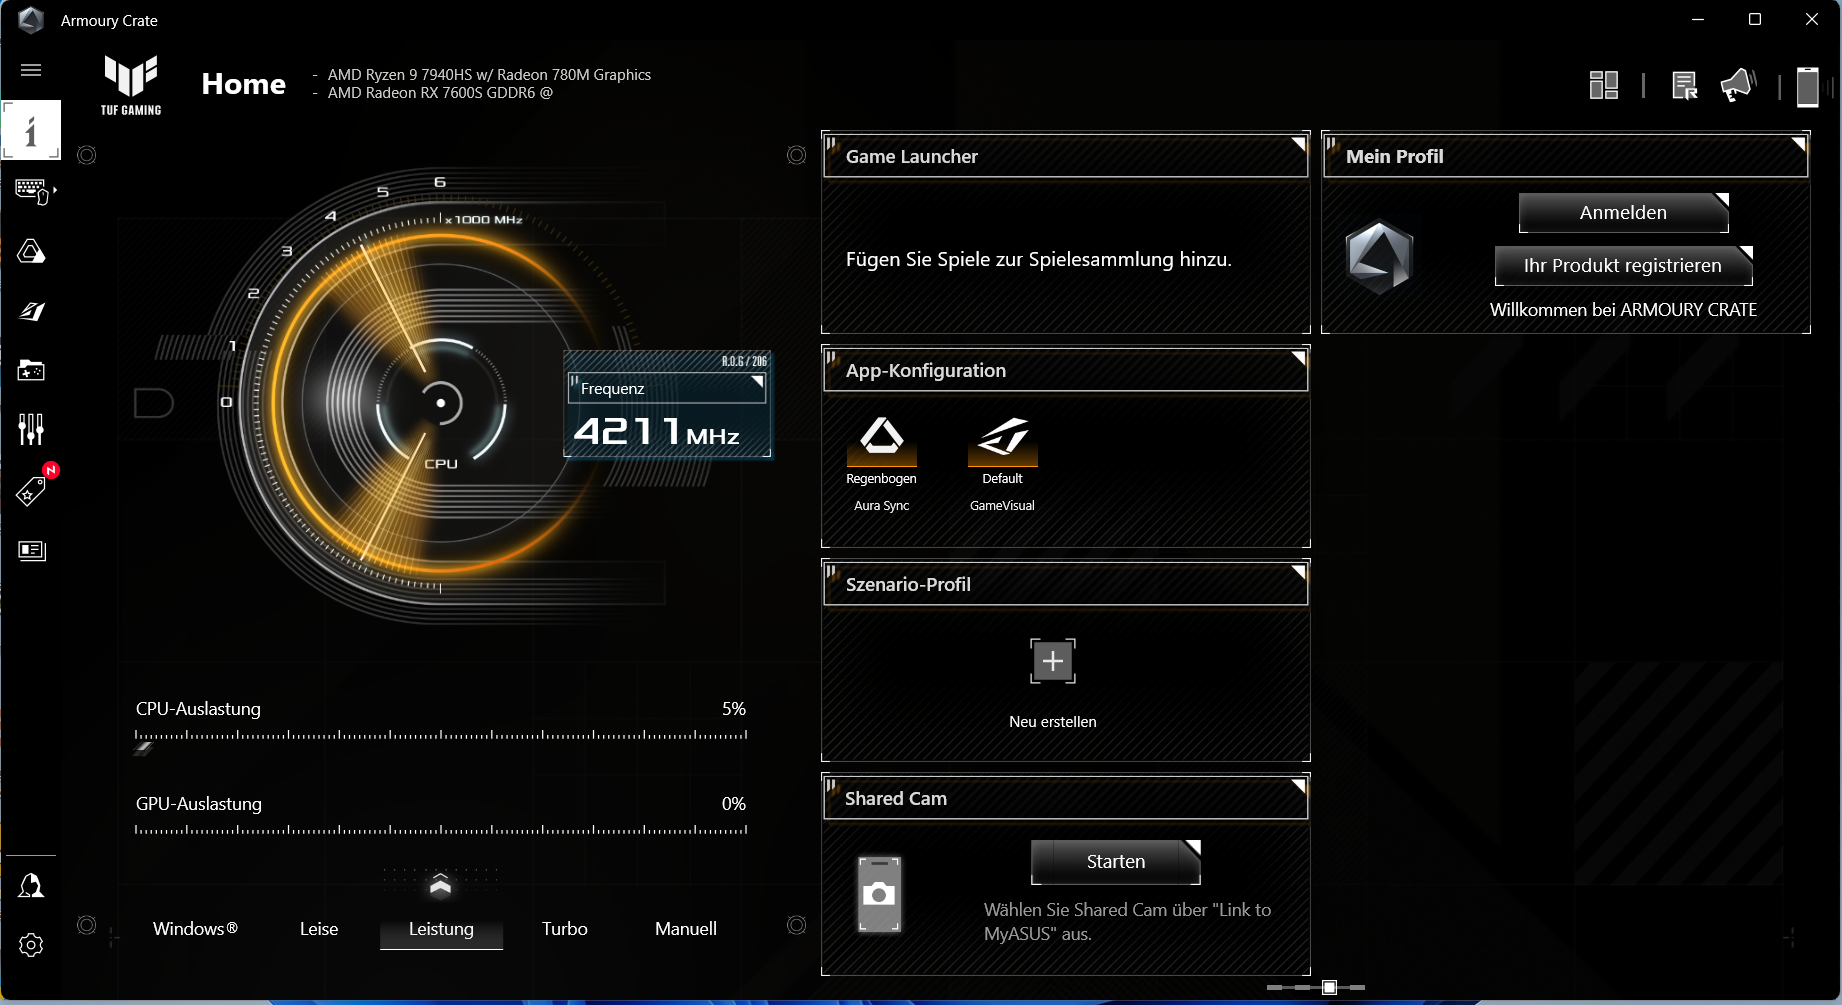
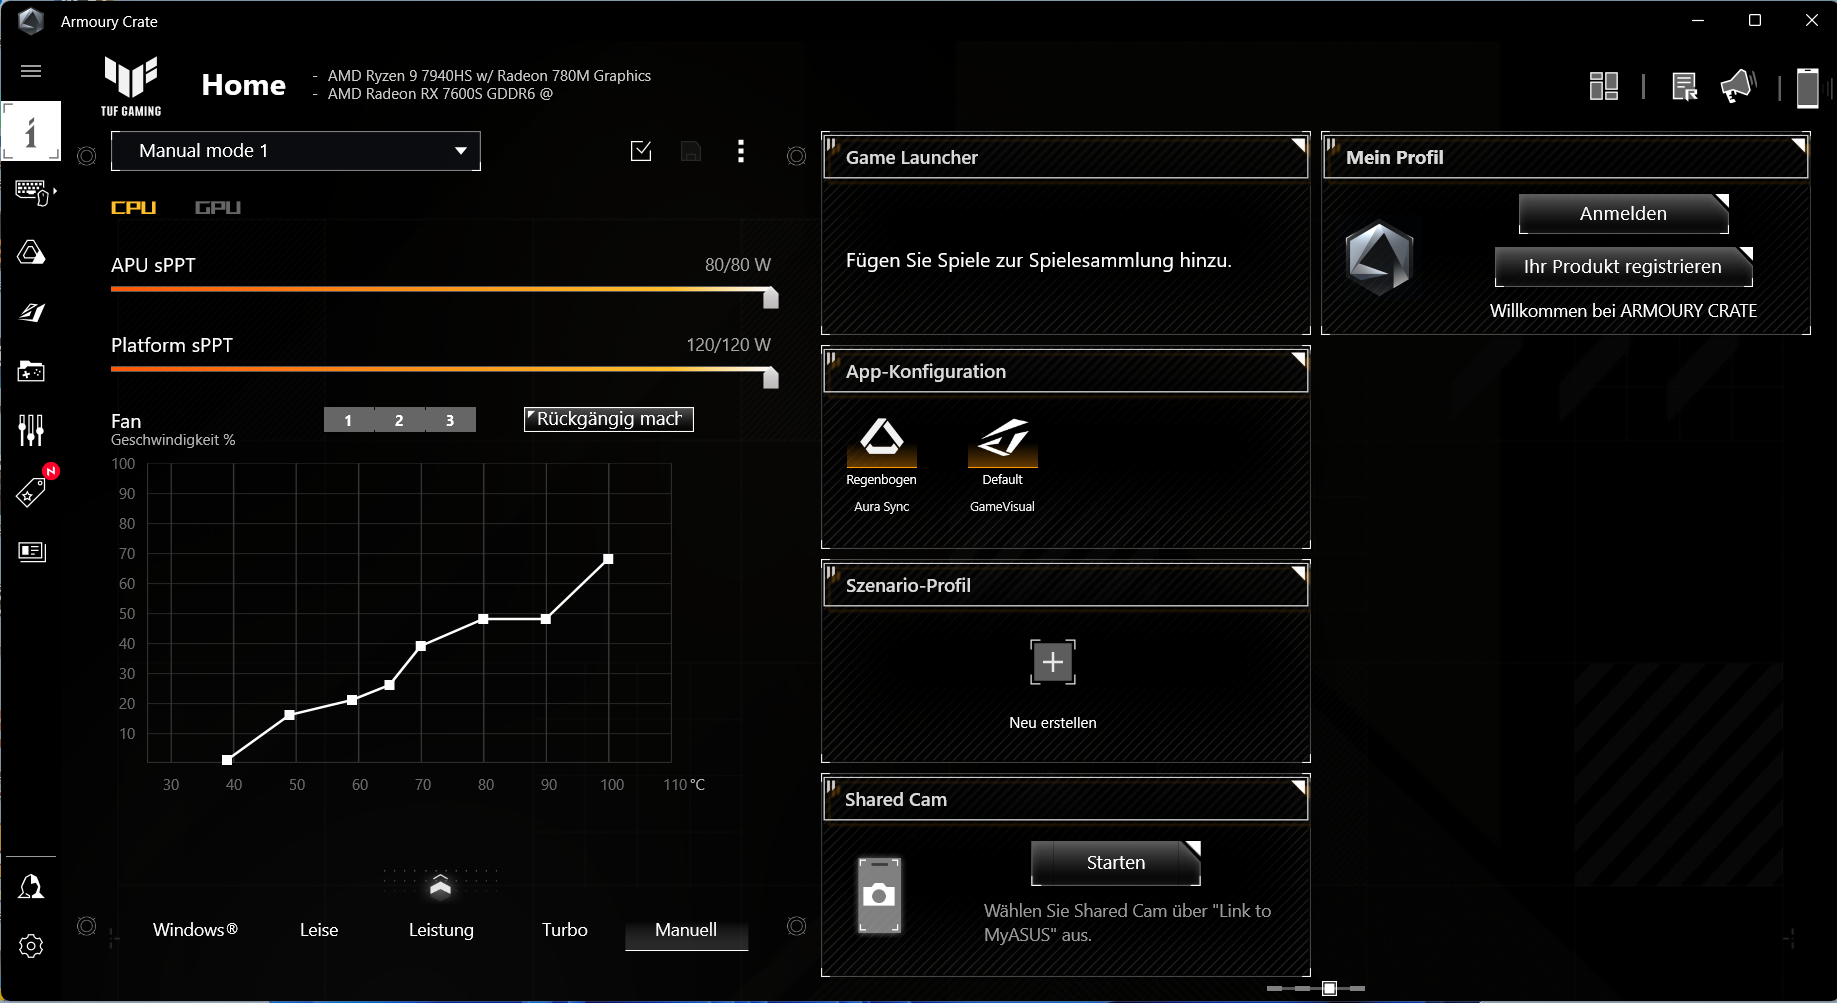
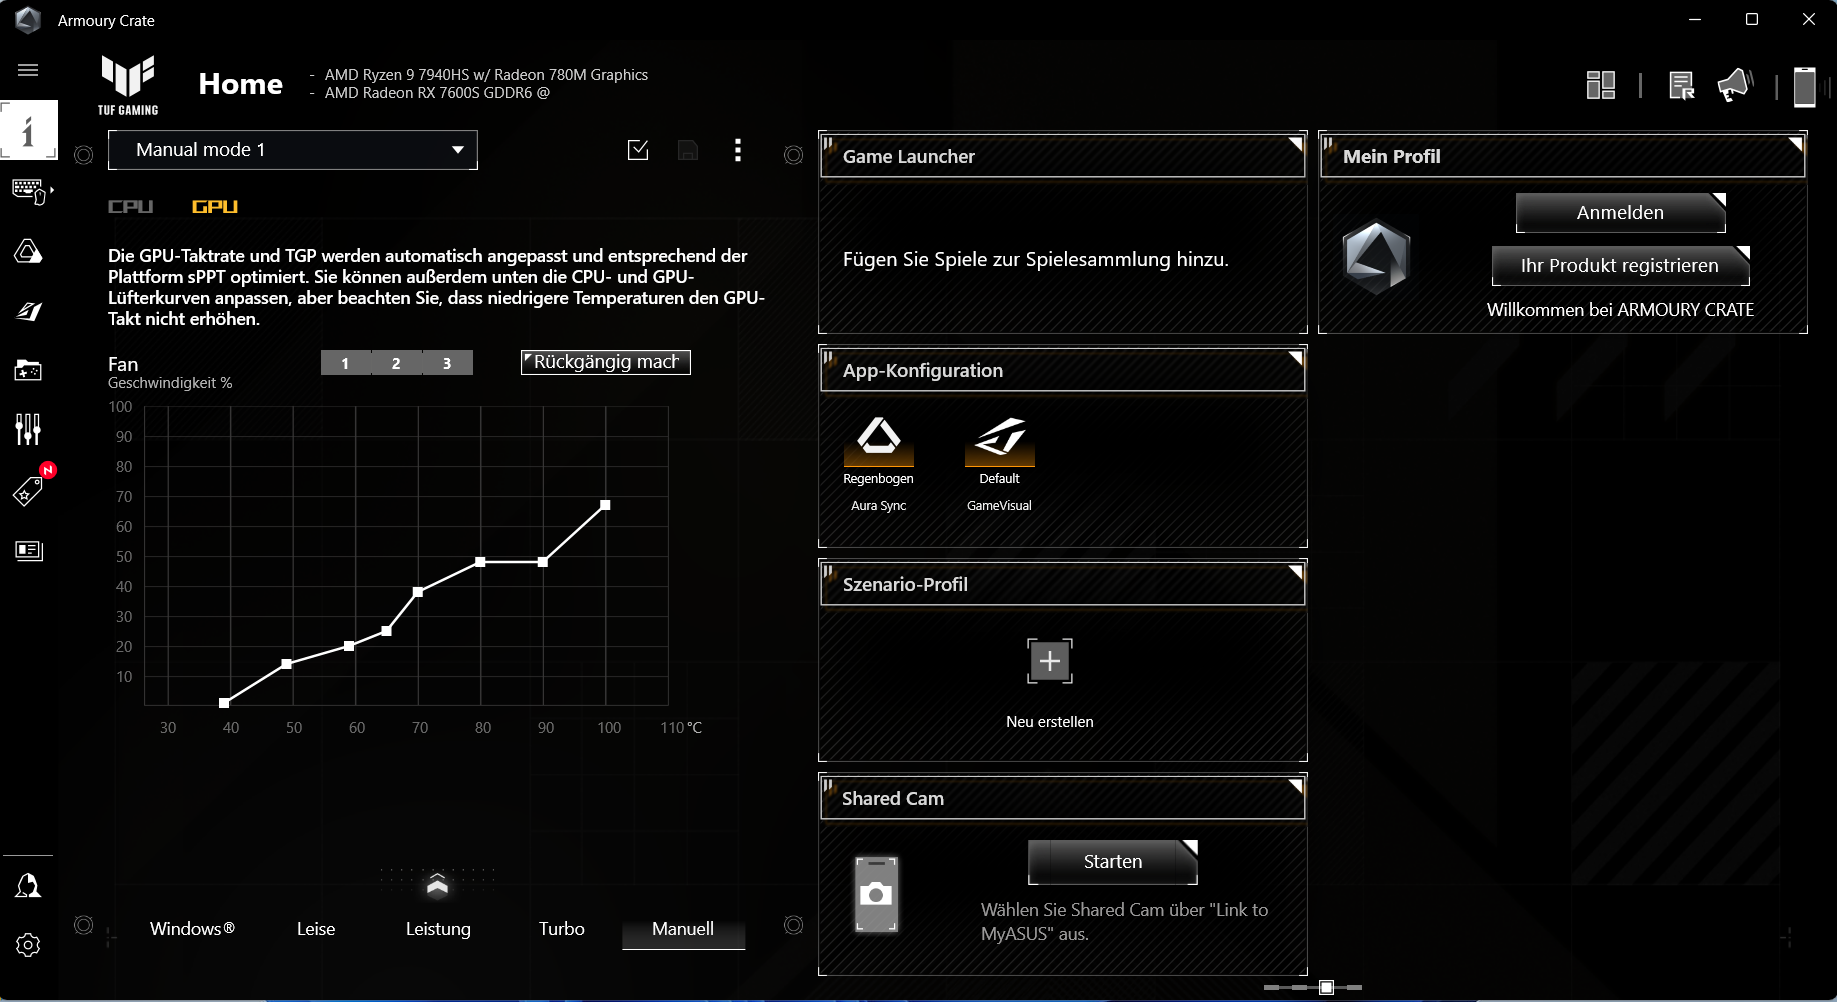
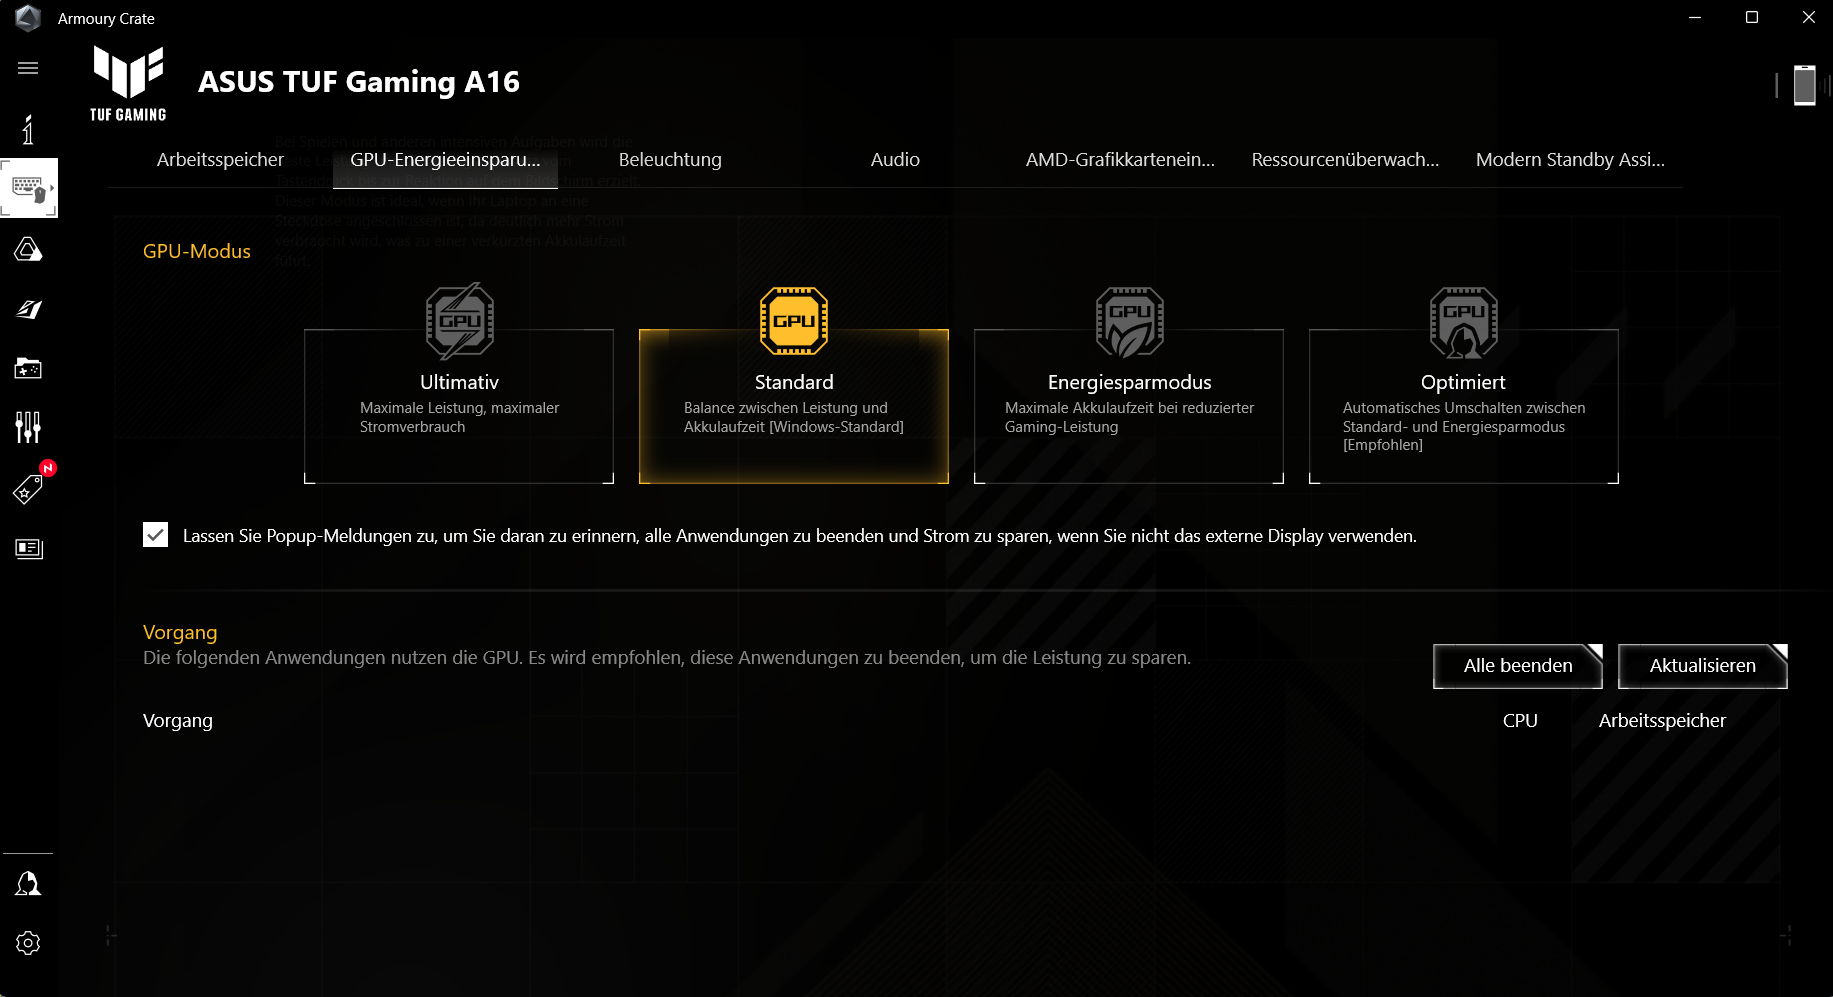
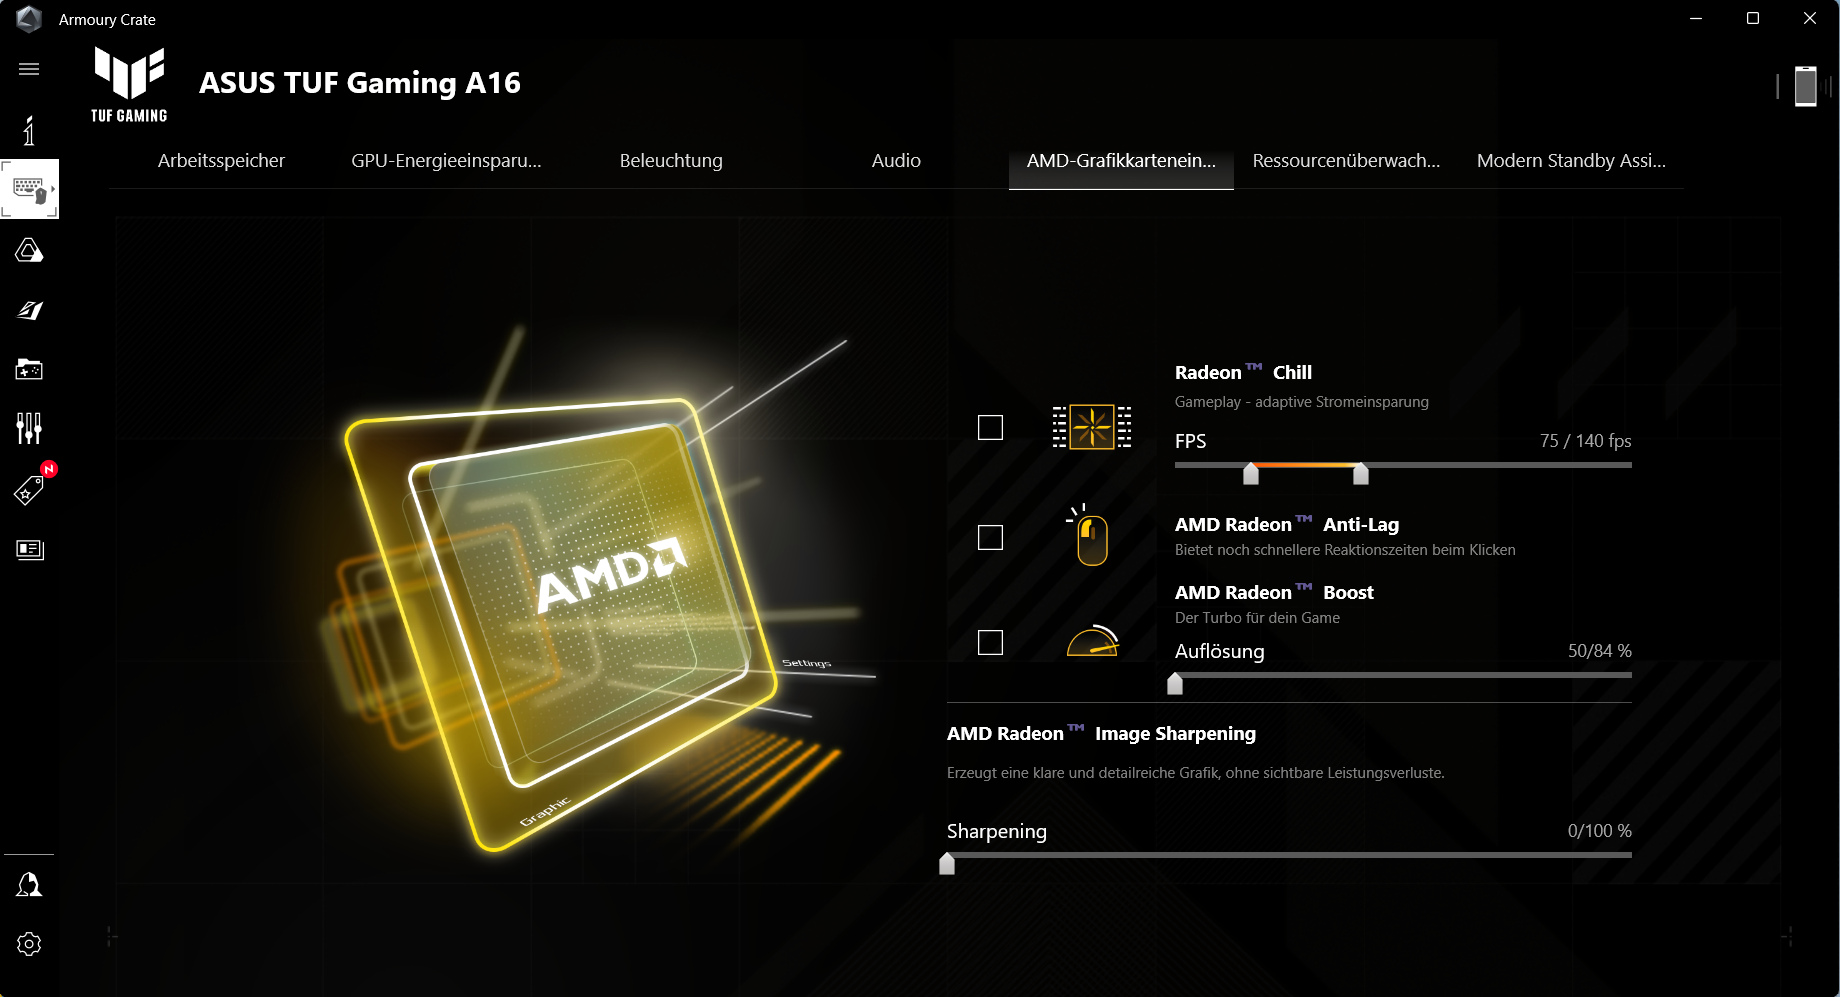
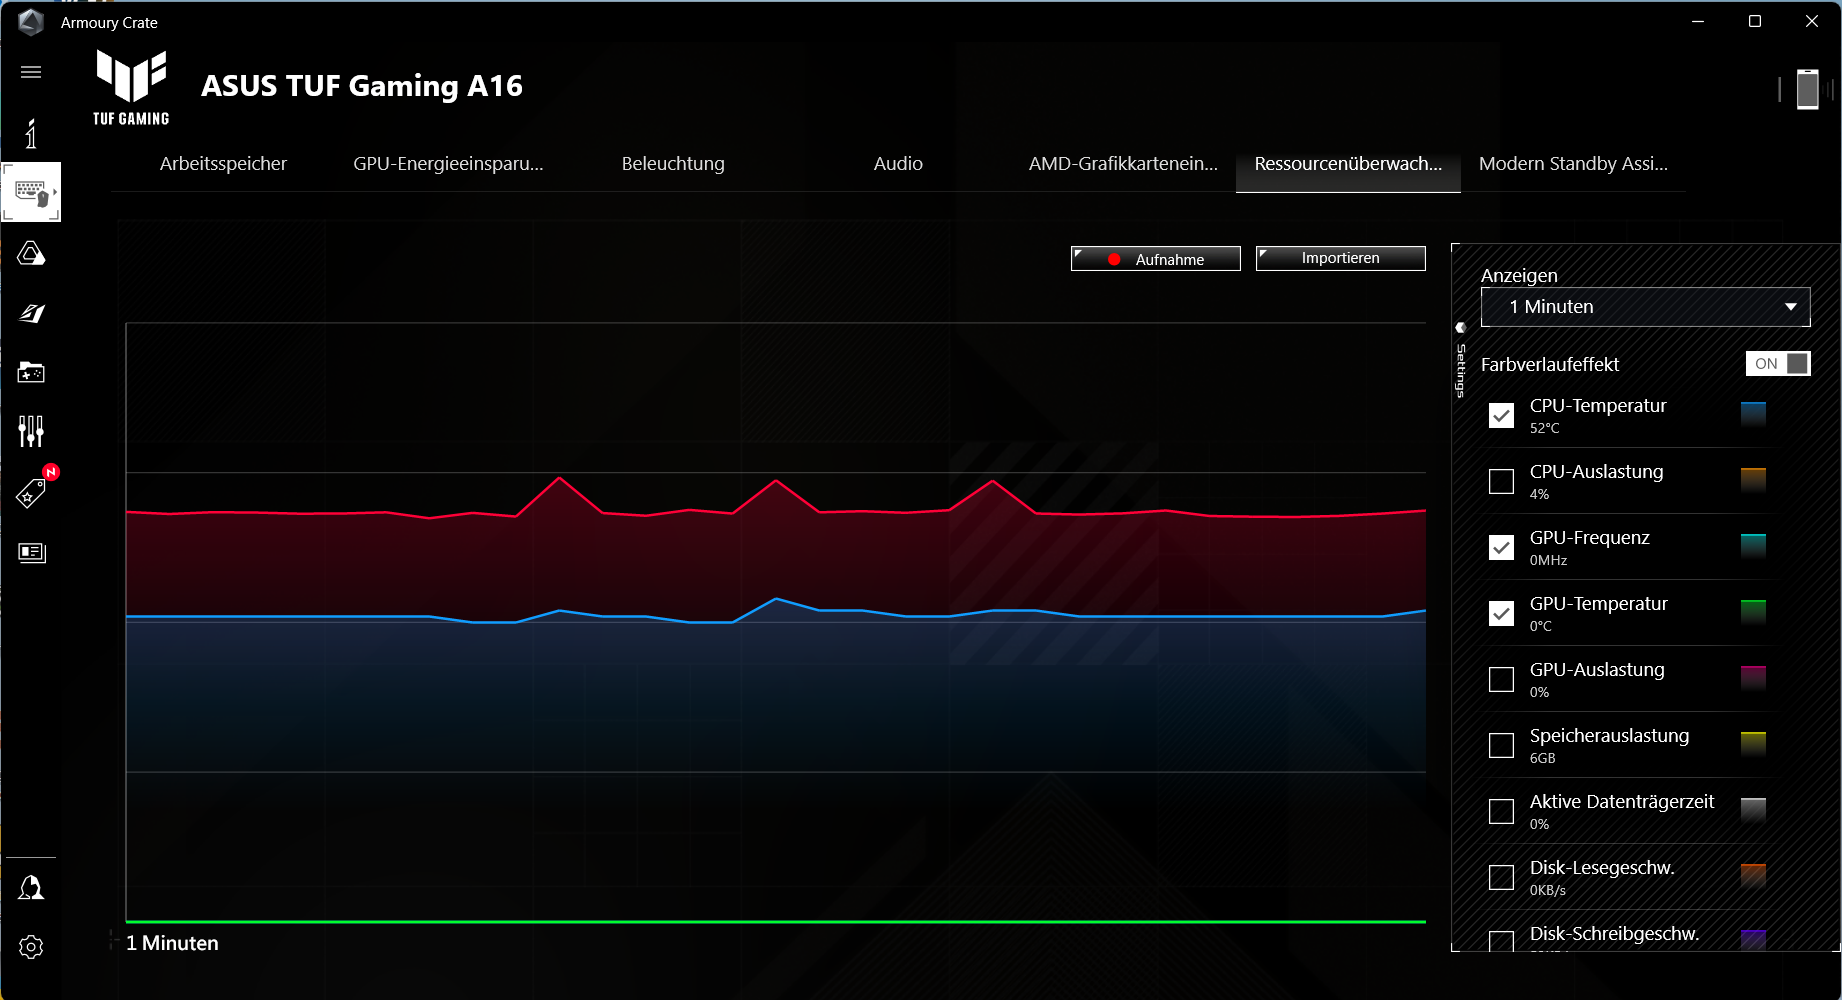
Se puede cambiar entre los tres perfiles de rendimiento específicos del fabricante (ver tabla) mediante la combinación de teclas "Fn" + "F5". Se utilizaron los perfiles "Rendimiento" (benchmarks) y "Silencioso" (pruebas de batería). El modo de GPU se ajustó a "Estándar" (= conmutación de gráficos). El centro de control del portátil ("Armoury Crate") permite crear perfiles individuales ("Manual"), que incluyen la configuración de las curvas PPT y del ventilador.
| Turbo | Rendimiento | Silencioso | |
|---|---|---|---|
| Límite de potencia 1 (HWInfo) | 120 vatios | 105 vatios | 75 vatios |
| Límite de potencia 2 (HWInfo) | 144 vatios | 114 vatios | 90 vatios |
| Ruido (Wichter 3) | 53 dB(A) | 51 dB(A) | 46 dB(A) |
| Rendimiento (Witcher 3) | ~100 fps | ~100 fps | ~94 fps |
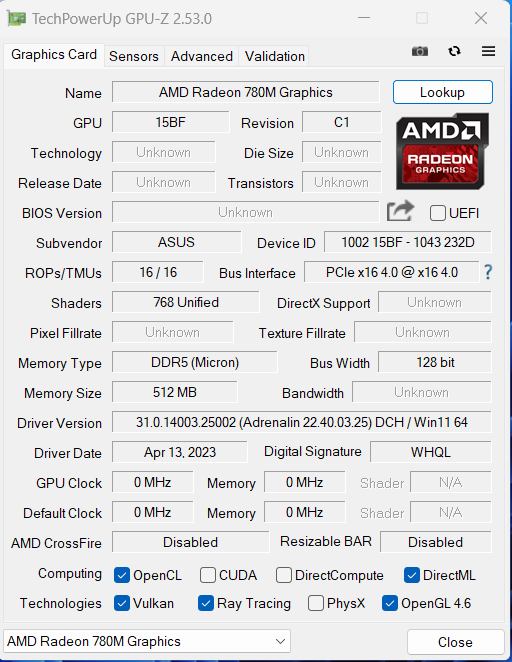
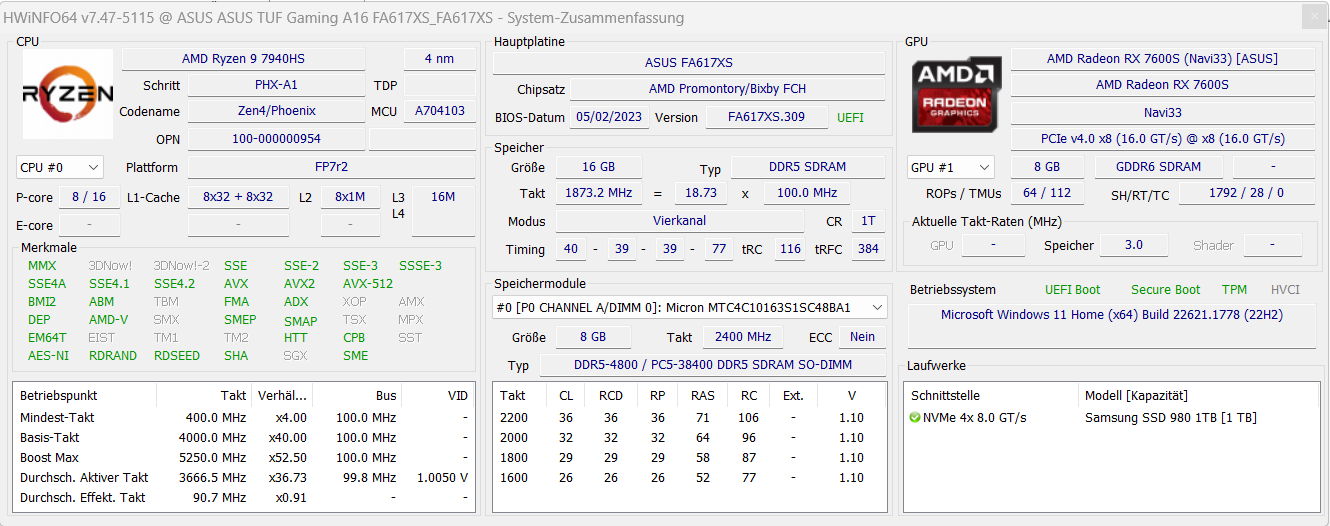
Procesador
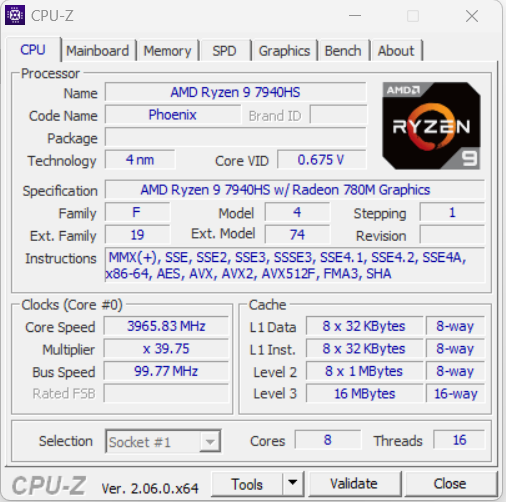
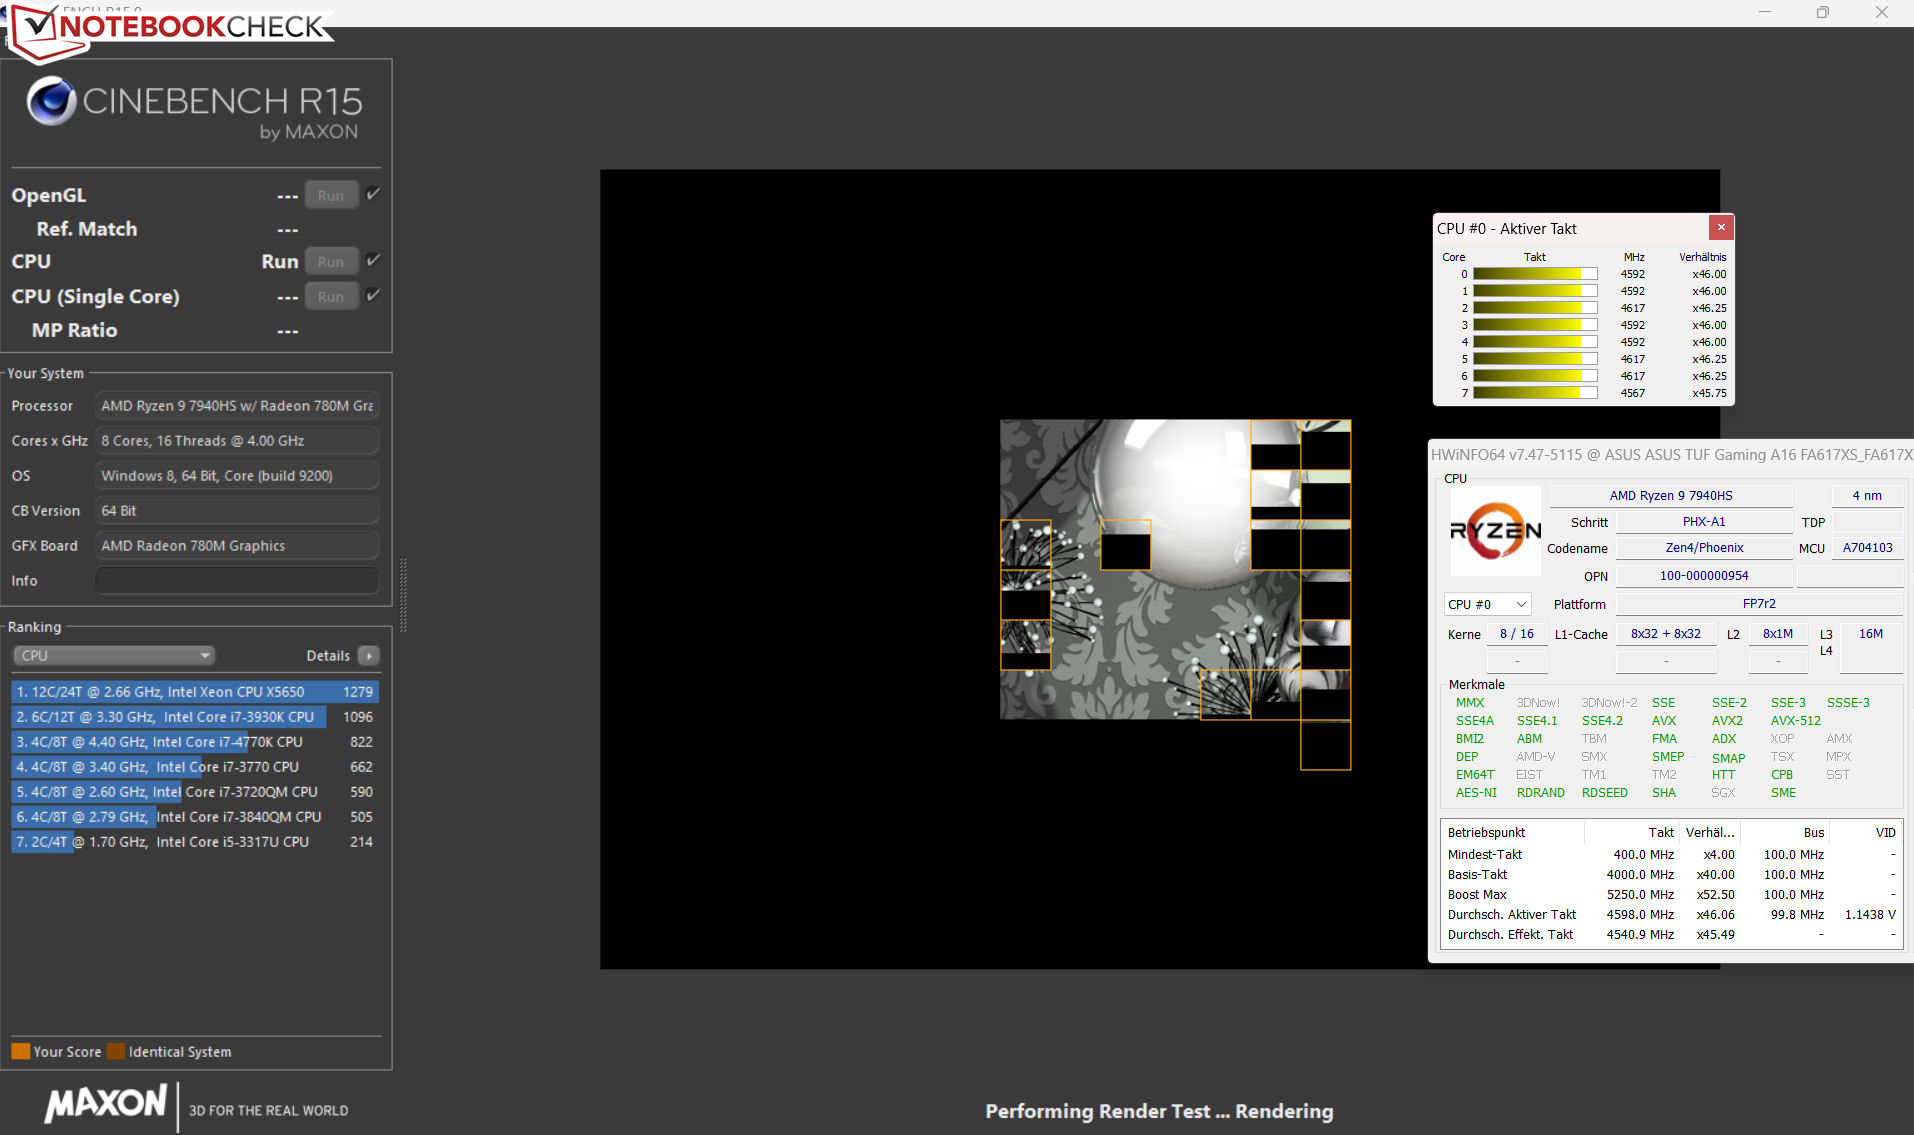
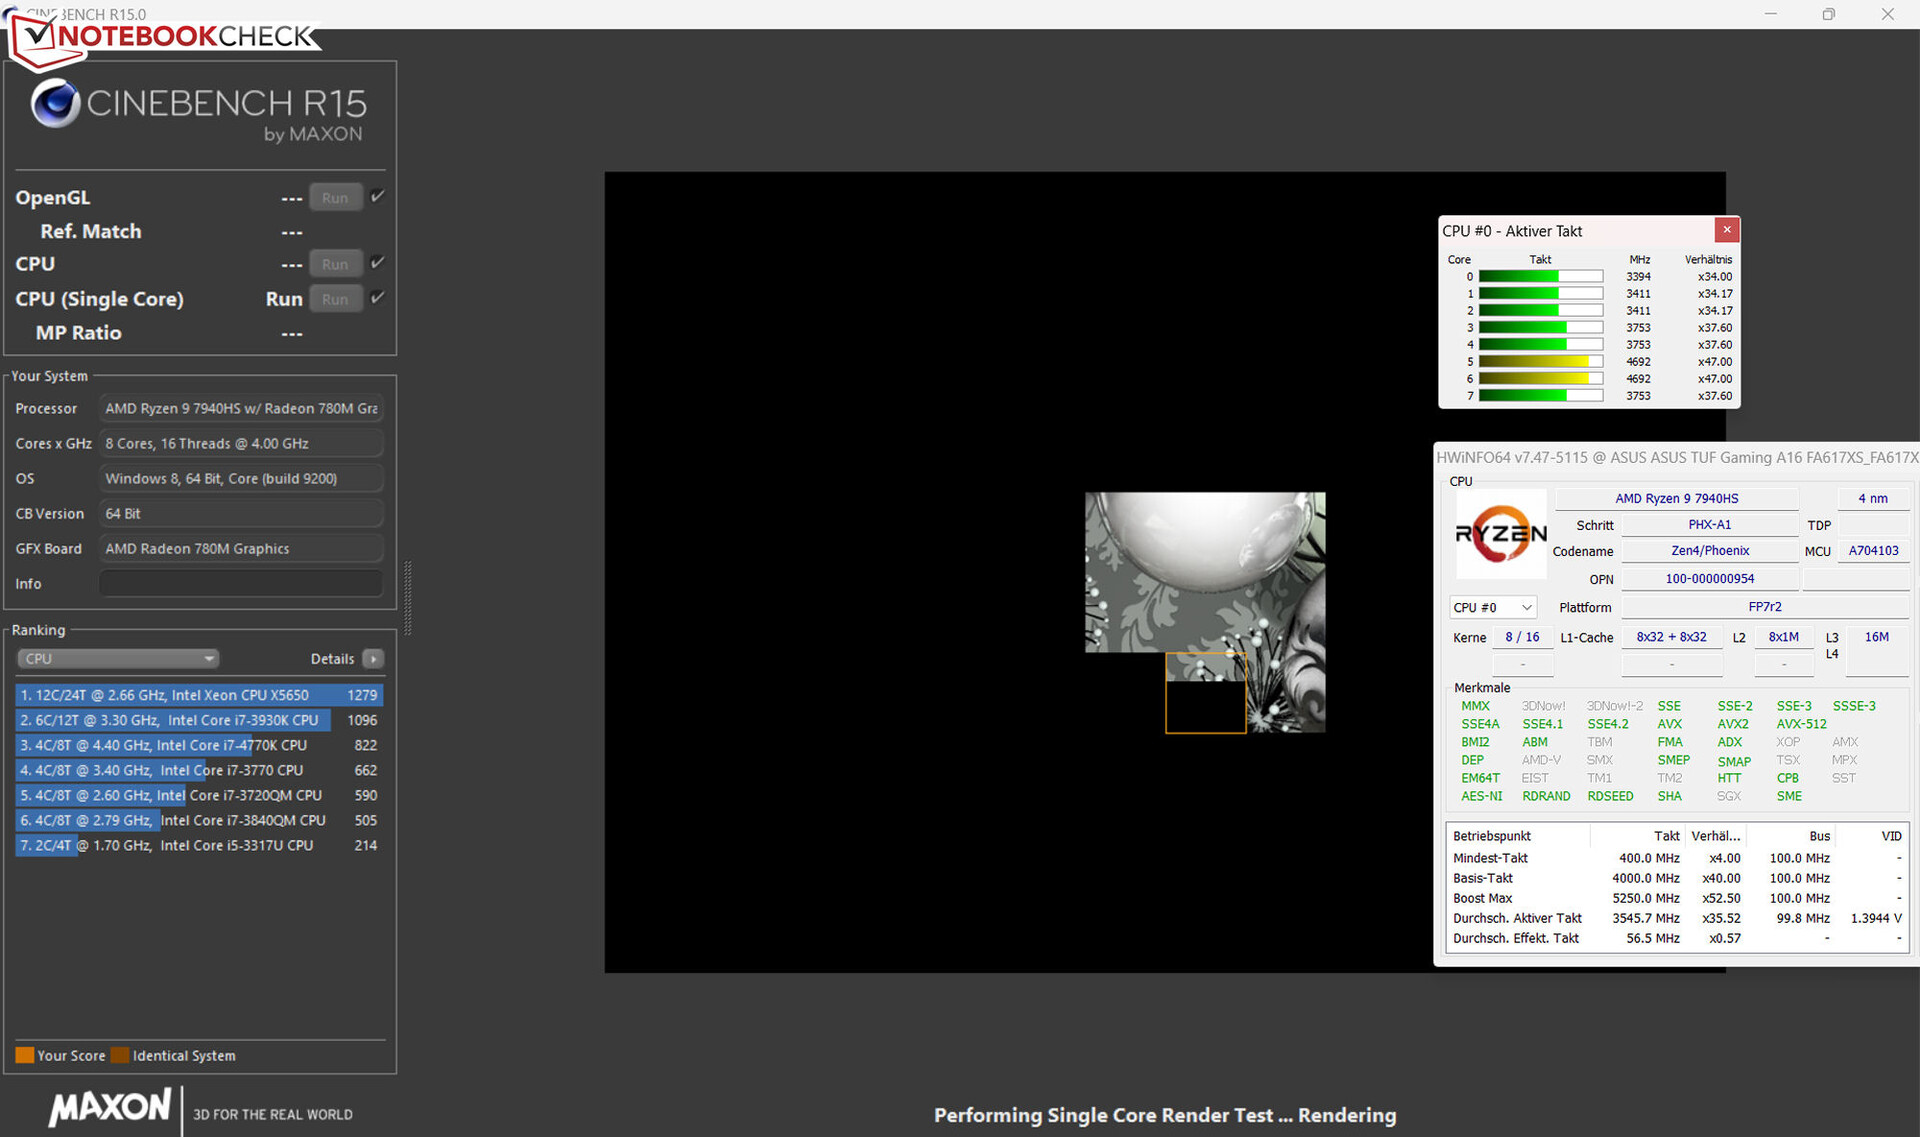
La parte de la CPU delRyzen-9-7940HS-APU (Phoenix, Zen 4) cuenta con ocho núcleos de procesamiento con 16 hilos. La velocidad de reloj base de 4 GHz puede aumentarse hasta 5,25 GHz (un núcleo). Nuestros resultados medidos en las pruebas de rendimiento son más o menos los mismos que los de los portátiles 7940HS probados anteriormente. Usando el perfil "Turbo" se consigue un rendimiento algo mejor (4-5 por ciento).
El Ryzen-7-7735HS-APU (Rembrandt R, Zen 3+) del modelo hermano queda claramente derrotado por el Ryzen 9, incluso con el mismo número de núcleos y los mismos límites de potencia. Gracias a su mejor arquitectura y mayor velocidad de reloj, su rendimiento por vatio es mayor.
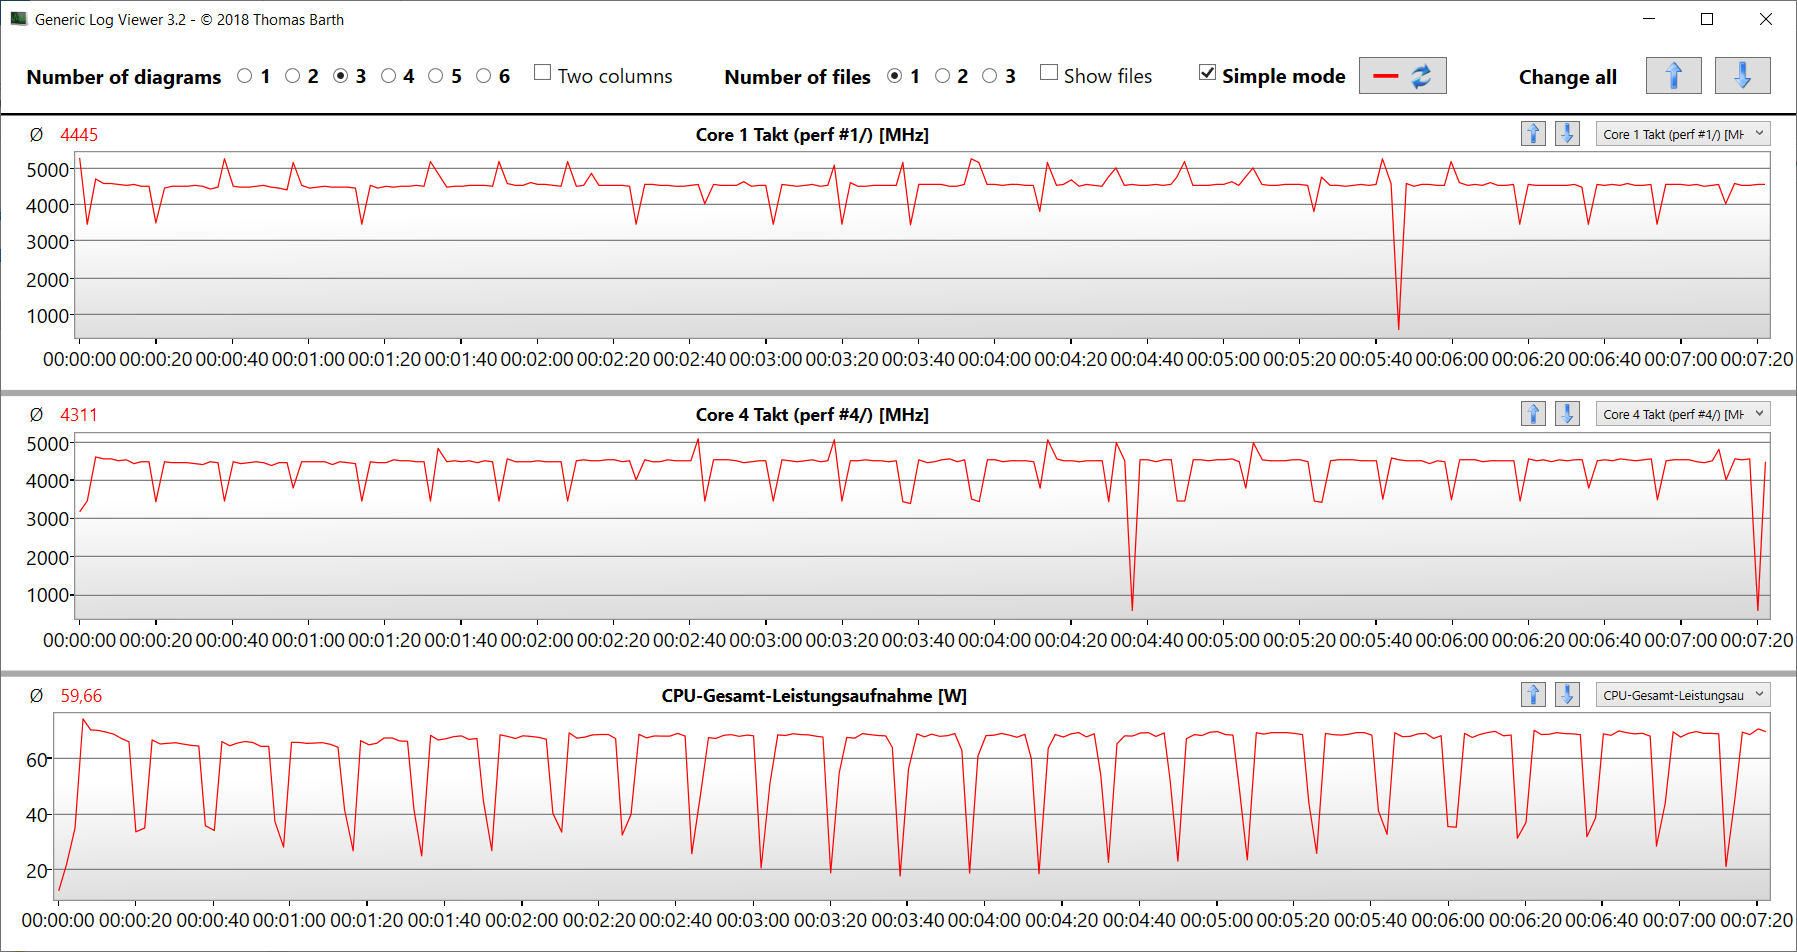
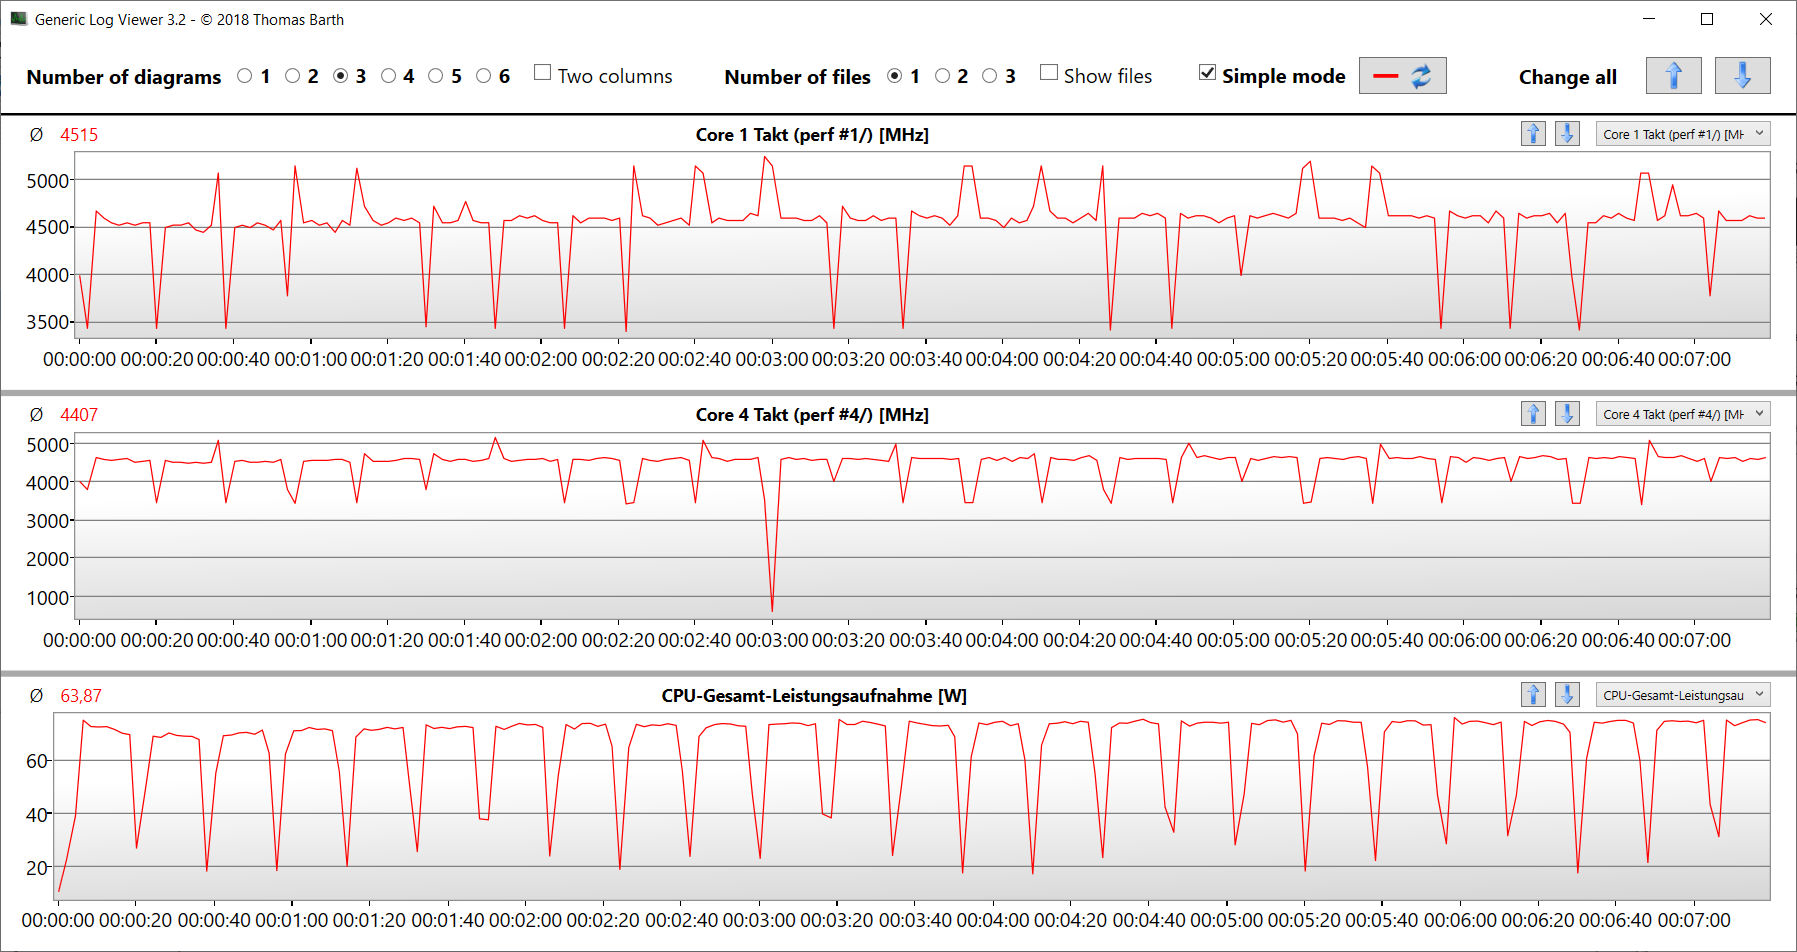
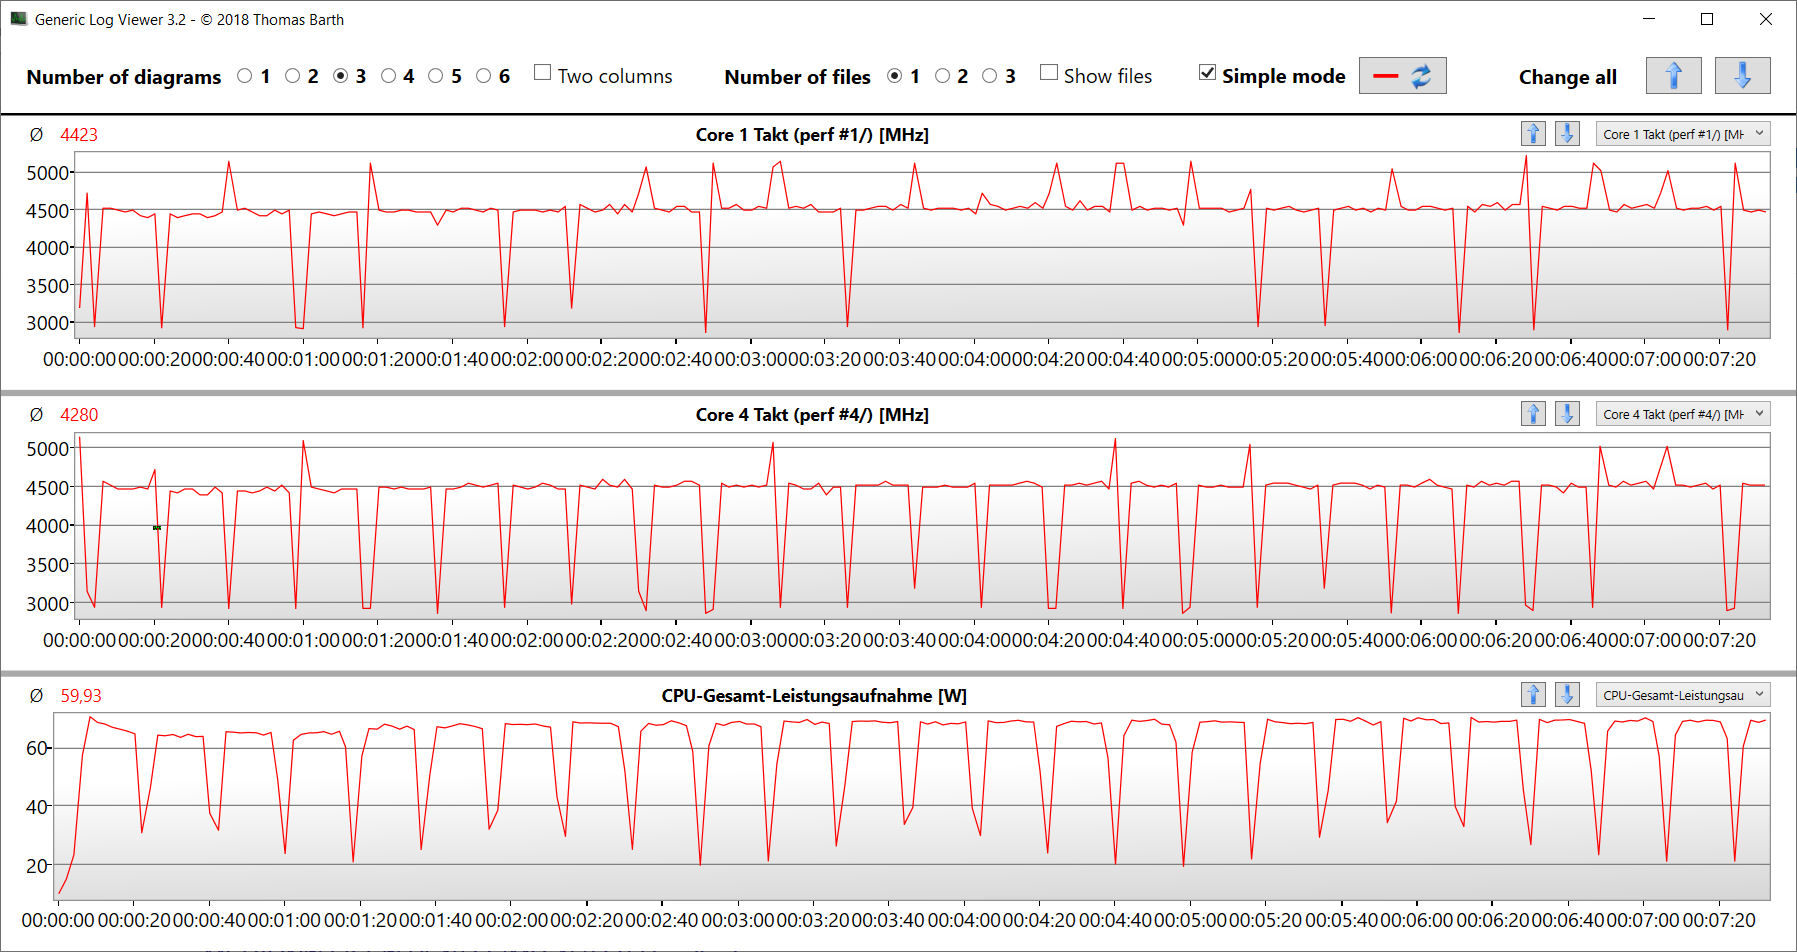
La prueba de bucle CB15 lo demuestra: La carga multihilo continua lleva a la CPU a trabajar con velocidades de reloj turbo constantemente altas, independientemente del perfil de rendimiento elegido.
Nota: Puede leerse información detallada sobre la APU instalada y su arquitectura en nuestro artículo de análisisZen4.
Cinebench R15 multi continuous test
* ... más pequeño es mejor
AIDA64: FP32 Ray-Trace | FPU Julia | CPU SHA3 | CPU Queen | FPU SinJulia | FPU Mandel | CPU AES | CPU ZLib | FP64 Ray-Trace | CPU PhotoWorxx
| Performance rating | |
| Media de la clase Gaming | |
| Medio AMD Ryzen 9 7940HS | |
| Asus TUF Gaming A16 FA617XS | |
| Lenovo Legion Pro 5 16IRX8 | |
| Asus TUF Gaming A16 FA617 | |
| Medion Erazer Defender P40 | |
| MSI Katana 15 B12VEK | |
| Gigabyte G5 KE | |
| AIDA64 / FP32 Ray-Trace | |
| Media de la clase Gaming (10227 - 85542, n=107, últimos 2 años) | |
| Asus TUF Gaming A16 FA617XS (v6.75.6100) | |
| Medio AMD Ryzen 9 7940HS (25226 - 29109, n=10) | |
| Lenovo Legion Pro 5 16IRX8 (v6.85.6300) | |
| Asus TUF Gaming A16 FA617 (v6.85.6300) | |
| MSI Katana 15 B12VEK (v6.85.6300) | |
| Medion Erazer Defender P40 (v6.75.6100) | |
| Gigabyte G5 KE (v6.75.6100) | |
| AIDA64 / FPU Julia | |
| Media de la clase Gaming (51376 - 238426, n=107, últimos 2 años) | |
| Asus TUF Gaming A16 FA617XS (v6.75.6100) | |
| Medio AMD Ryzen 9 7940HS (106512 - 123214, n=10) | |
| Lenovo Legion Pro 5 16IRX8 (v6.85.6300) | |
| Asus TUF Gaming A16 FA617 (v6.85.6300) | |
| Medion Erazer Defender P40 (v6.75.6100) | |
| MSI Katana 15 B12VEK (v6.85.6300) | |
| Gigabyte G5 KE (v6.75.6100) | |
| AIDA64 / CPU SHA3 | |
| Media de la clase Gaming (2180 - 9817, n=107, últimos 2 años) | |
| Medio AMD Ryzen 9 7940HS (4566 - 5119, n=10) | |
| Lenovo Legion Pro 5 16IRX8 (v6.85.6300) | |
| Asus TUF Gaming A16 FA617XS (v6.75.6100) | |
| Asus TUF Gaming A16 FA617 (v6.85.6300) | |
| Medion Erazer Defender P40 (v6.75.6100) | |
| MSI Katana 15 B12VEK (v6.85.6300) | |
| Gigabyte G5 KE (v6.75.6100) | |
| AIDA64 / CPU Queen | |
| Asus TUF Gaming A16 FA617XS (v6.75.6100) | |
| Medio AMD Ryzen 9 7940HS (118174 - 124783, n=10) | |
| Media de la clase Gaming (49785 - 173351, n=98, últimos 2 años) | |
| Lenovo Legion Pro 5 16IRX8 (v6.85.6300) | |
| Medion Erazer Defender P40 (v6.75.6100) | |
| Asus TUF Gaming A16 FA617 (v6.85.6300) | |
| MSI Katana 15 B12VEK (v6.85.6300) | |
| Gigabyte G5 KE (v6.75.6100) | |
| AIDA64 / FPU SinJulia | |
| Asus TUF Gaming A16 FA617XS (v6.75.6100) | |
| Medio AMD Ryzen 9 7940HS (14663 - 15551, n=10) | |
| Media de la clase Gaming (4424 - 33636, n=107, últimos 2 años) | |
| Lenovo Legion Pro 5 16IRX8 (v6.85.6300) | |
| Asus TUF Gaming A16 FA617 (v6.85.6300) | |
| Medion Erazer Defender P40 (v6.75.6100) | |
| MSI Katana 15 B12VEK (v6.85.6300) | |
| Gigabyte G5 KE (v6.75.6100) | |
| AIDA64 / FPU Mandel | |
| Media de la clase Gaming (25115 - 128721, n=107, últimos 2 años) | |
| Asus TUF Gaming A16 FA617XS (v6.75.6100) | |
| Medio AMD Ryzen 9 7940HS (56839 - 66238, n=10) | |
| Asus TUF Gaming A16 FA617 (v6.85.6300) | |
| Lenovo Legion Pro 5 16IRX8 (v6.85.6300) | |
| Medion Erazer Defender P40 (v6.75.6100) | |
| MSI Katana 15 B12VEK (v6.85.6300) | |
| Gigabyte G5 KE (v6.75.6100) | |
| AIDA64 / CPU AES | |
| Medio AMD Ryzen 9 7940HS (86309 - 171350, n=10) | |
| Gigabyte G5 KE (v6.75.6100) | |
| Media de la clase Gaming (39258 - 247074, n=107, últimos 2 años) | |
| Lenovo Legion Pro 5 16IRX8 (v6.85.6300) | |
| Asus TUF Gaming A16 FA617XS (v6.75.6100) | |
| Medion Erazer Defender P40 (v6.75.6100) | |
| MSI Katana 15 B12VEK (v6.85.6300) | |
| Asus TUF Gaming A16 FA617 (v6.85.6300) | |
| AIDA64 / CPU ZLib | |
| Media de la clase Gaming (574 - 2531, n=107, últimos 2 años) | |
| Lenovo Legion Pro 5 16IRX8 (v6.85.6300) | |
| Asus TUF Gaming A16 FA617XS (v6.75.6100) | |
| Medio AMD Ryzen 9 7940HS (866 - 1152, n=10) | |
| Medion Erazer Defender P40 (v6.75.6100) | |
| Gigabyte G5 KE (v6.75.6100) | |
| Asus TUF Gaming A16 FA617 (v6.85.6300) | |
| MSI Katana 15 B12VEK (v6.85.6300) | |
| AIDA64 / FP64 Ray-Trace | |
| Media de la clase Gaming (5509 - 45446, n=107, últimos 2 años) | |
| Asus TUF Gaming A16 FA617XS (v6.75.6100) | |
| Medio AMD Ryzen 9 7940HS (13175 - 15675, n=10) | |
| Lenovo Legion Pro 5 16IRX8 (v6.85.6300) | |
| Asus TUF Gaming A16 FA617 (v6.85.6300) | |
| MSI Katana 15 B12VEK (v6.85.6300) | |
| Medion Erazer Defender P40 (v6.75.6100) | |
| Gigabyte G5 KE (v6.75.6100) | |
| AIDA64 / CPU PhotoWorxx | |
| Media de la clase Gaming (12271 - 89891, n=107, últimos 2 años) | |
| MSI Katana 15 B12VEK (v6.85.6300) | |
| Lenovo Legion Pro 5 16IRX8 (v6.85.6300) | |
| Medion Erazer Defender P40 (v6.75.6100) | |
| Medio AMD Ryzen 9 7940HS (22477 - 41567, n=10) | |
| Asus TUF Gaming A16 FA617XS (v6.75.6100) | |
| Gigabyte G5 KE (v6.75.6100) | |
| Asus TUF Gaming A16 FA617 (v6.85.6300) | |
Rendimiento del sistema
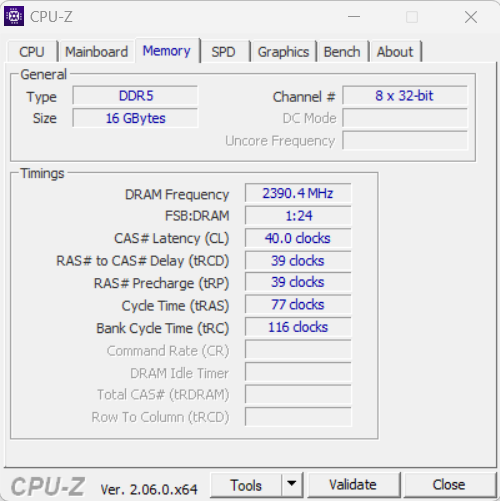
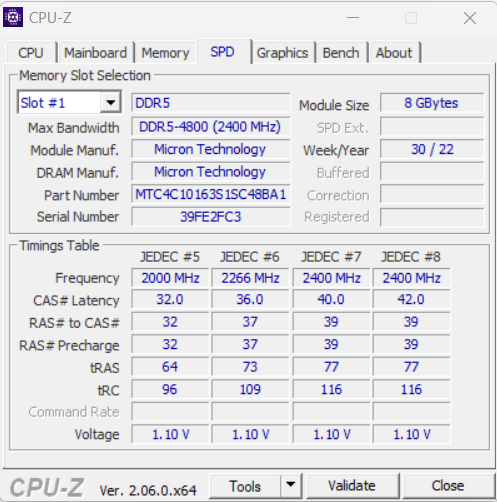
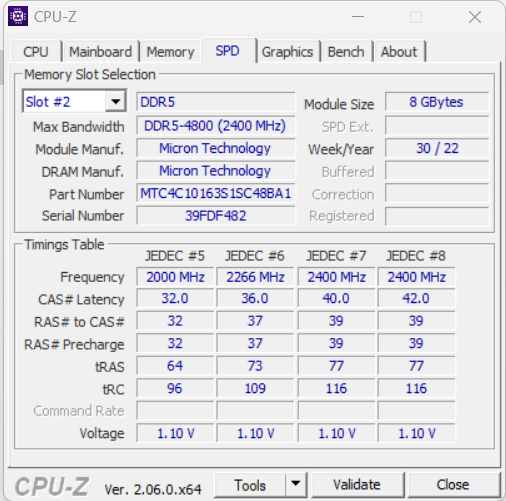
El buen funcionamiento del sistema proporciona rendimiento suficiente para áreas de uso exigentes, como renderizado, edición de vídeo y juegos - los buenos resultados de PCMark pueden confirmarlo. Las tasas de transferencia de RAM están en un nivel normal para RAM DDR5 4800. Es importante tener en cuenta: El cambio automático entre dGPU e iGPU (Smart Access Graphic) siempre tarda uno o dos segundos. Durante este tiempo, el sistema se congela.
CrossMark: Overall | Productivity | Creativity | Responsiveness
| PCMark 10 / Score | |
| Media de la clase Gaming (5828 - 11574, n=95, últimos 2 años) | |
| Asus TUF Gaming A16 FA617XS | |
| Medio AMD Ryzen 9 7940HS, AMD Radeon RX 7600S (n=1) | |
| Lenovo Legion Pro 5 16IRX8 | |
| Asus TUF Gaming A16 FA617 | |
| Gigabyte G5 KE | |
| Medion Erazer Defender P40 | |
| MSI Katana 15 B12VEK | |
| PCMark 10 / Essentials | |
| Gigabyte G5 KE | |
| Lenovo Legion Pro 5 16IRX8 | |
| Asus TUF Gaming A16 FA617XS | |
| Medio AMD Ryzen 9 7940HS, AMD Radeon RX 7600S (n=1) | |
| Media de la clase Gaming (8810 - 12600, n=99, últimos 2 años) | |
| Asus TUF Gaming A16 FA617 | |
| MSI Katana 15 B12VEK | |
| Medion Erazer Defender P40 | |
| PCMark 10 / Productivity | |
| Media de la clase Gaming (6845 - 18766, n=97, últimos 2 años) | |
| Asus TUF Gaming A16 FA617XS | |
| Medio AMD Ryzen 9 7940HS, AMD Radeon RX 7600S (n=1) | |
| Medion Erazer Defender P40 | |
| MSI Katana 15 B12VEK | |
| Gigabyte G5 KE | |
| Asus TUF Gaming A16 FA617 | |
| Lenovo Legion Pro 5 16IRX8 | |
| PCMark 10 / Digital Content Creation | |
| Media de la clase Gaming (7602 - 19657, n=97, últimos 2 años) | |
| Lenovo Legion Pro 5 16IRX8 | |
| Asus TUF Gaming A16 FA617XS | |
| Medio AMD Ryzen 9 7940HS, AMD Radeon RX 7600S (n=1) | |
| Asus TUF Gaming A16 FA617 | |
| Gigabyte G5 KE | |
| Medion Erazer Defender P40 | |
| MSI Katana 15 B12VEK | |
| CrossMark / Overall | |
| Media de la clase Gaming (1366 - 2409, n=96, últimos 2 años) | |
| Medion Erazer Defender P40 | |
| Asus TUF Gaming A16 FA617XS | |
| Medio AMD Ryzen 9 7940HS, AMD Radeon RX 7600S (n=1) | |
| Gigabyte G5 KE | |
| MSI Katana 15 B12VEK | |
| Lenovo Legion Pro 5 16IRX8 | |
| CrossMark / Productivity | |
| Media de la clase Gaming (1386 - 2254, n=96, últimos 2 años) | |
| Gigabyte G5 KE | |
| Asus TUF Gaming A16 FA617XS | |
| Medio AMD Ryzen 9 7940HS, AMD Radeon RX 7600S (n=1) | |
| MSI Katana 15 B12VEK | |
| Medion Erazer Defender P40 | |
| Lenovo Legion Pro 5 16IRX8 | |
| CrossMark / Creativity | |
| Media de la clase Gaming (1343 - 2729, n=96, últimos 2 años) | |
| Medion Erazer Defender P40 | |
| Asus TUF Gaming A16 FA617XS | |
| Medio AMD Ryzen 9 7940HS, AMD Radeon RX 7600S (n=1) | |
| MSI Katana 15 B12VEK | |
| Gigabyte G5 KE | |
| Lenovo Legion Pro 5 16IRX8 | |
| CrossMark / Responsiveness | |
| Gigabyte G5 KE | |
| Media de la clase Gaming (1226 - 2334, n=96, últimos 2 años) | |
| Lenovo Legion Pro 5 16IRX8 | |
| Medion Erazer Defender P40 | |
| MSI Katana 15 B12VEK | |
| Asus TUF Gaming A16 FA617XS | |
| Medio AMD Ryzen 9 7940HS, AMD Radeon RX 7600S (n=1) | |
| PCMark 8 Home Score Accelerated v2 | 5937 puntos | |
| PCMark 8 Work Score Accelerated v2 | 6458 puntos | |
| PCMark 10 Score | 7927 puntos | |
ayuda | ||
| AIDA64 / Memory Copy | |
| Media de la clase Gaming (21750 - 129946, n=107, últimos 2 años) | |
| Medio AMD Ryzen 9 7940HS (35327 - 78739, n=10) | |
| Asus TUF Gaming A16 FA617XS | |
| Lenovo Legion Pro 5 16IRX8 | |
| Medion Erazer Defender P40 | |
| MSI Katana 15 B12VEK | |
| Asus TUF Gaming A16 FA617 | |
| Gigabyte G5 KE | |
| AIDA64 / Memory Read | |
| Media de la clase Gaming (22956 - 118858, n=107, últimos 2 años) | |
| Lenovo Legion Pro 5 16IRX8 | |
| Medion Erazer Defender P40 | |
| MSI Katana 15 B12VEK | |
| Asus TUF Gaming A16 FA617XS | |
| Medio AMD Ryzen 9 7940HS (30769 - 61836, n=10) | |
| Asus TUF Gaming A16 FA617 | |
| Gigabyte G5 KE | |
| AIDA64 / Memory Write | |
| Medio AMD Ryzen 9 7940HS (42217 - 91567, n=10) | |
| Media de la clase Gaming (22297 - 135096, n=107, últimos 2 años) | |
| Asus TUF Gaming A16 FA617XS | |
| Lenovo Legion Pro 5 16IRX8 | |
| Medion Erazer Defender P40 | |
| MSI Katana 15 B12VEK | |
| Asus TUF Gaming A16 FA617 | |
| Gigabyte G5 KE | |
| AIDA64 / Memory Latency | |
| Media de la clase Gaming (75.3 - 259, n=107, últimos 2 años) | |
| Gigabyte G5 KE | |
| MSI Katana 15 B12VEK | |
| Medion Erazer Defender P40 | |
| Medio AMD Ryzen 9 7940HS (87.6 - 111.1, n=10) | |
| Asus TUF Gaming A16 FA617XS | |
| Asus TUF Gaming A16 FA617 | |
| Lenovo Legion Pro 5 16IRX8 | |
* ... más pequeño es mejor
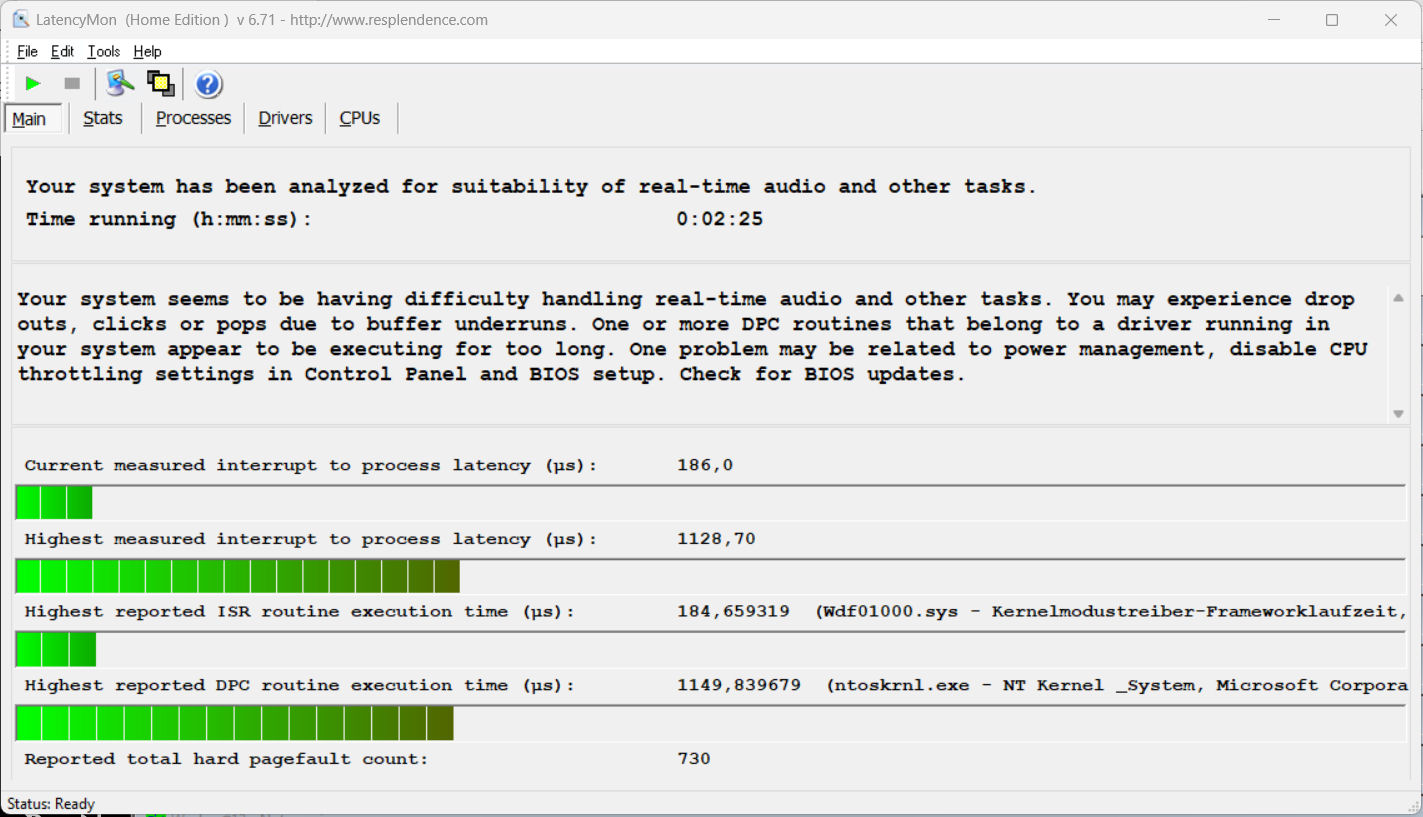
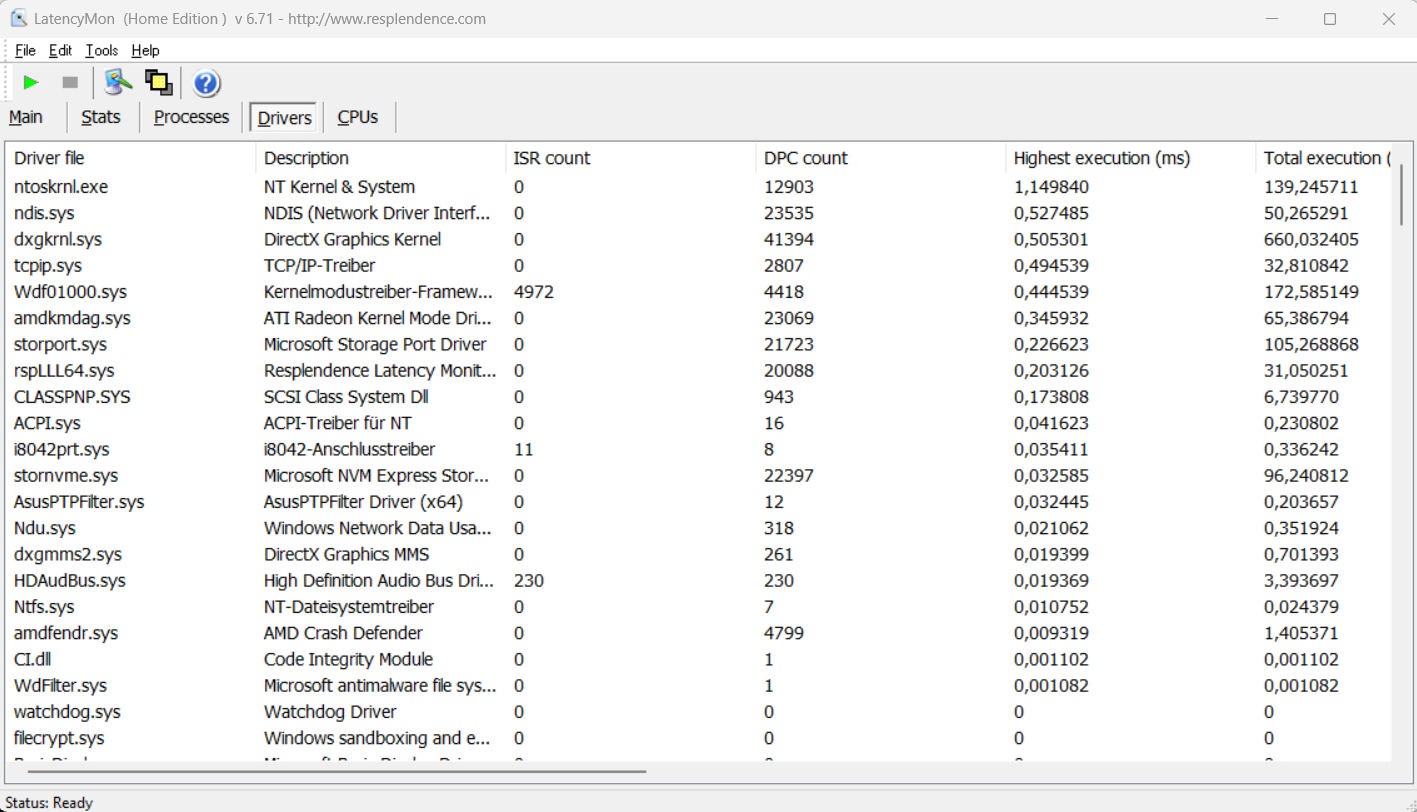
Latencia del CPD
La prueba de monitorización de latencia estandarizada (navegación web, reproducción de vídeo 4k, Prime95 a alta carga) reveló algunas anomalías. El sistema no parece adecuado para la edición de vídeo y audio en tiempo real. Futuras actualizaciones de software podrían suponer mejoras o incluso degradaciones.
| DPC Latencies / LatencyMon - interrupt to process latency (max), Web, Youtube, Prime95 | |
| MSI Katana 15 B12VEK | |
| Medion Erazer Defender P40 | |
| Asus TUF Gaming A16 FA617XS | |
| Gigabyte G5 KE | |
| Lenovo Legion Pro 5 16IRX8 | |
| Asus TUF Gaming A16 FA617 | |
* ... más pequeño es mejor
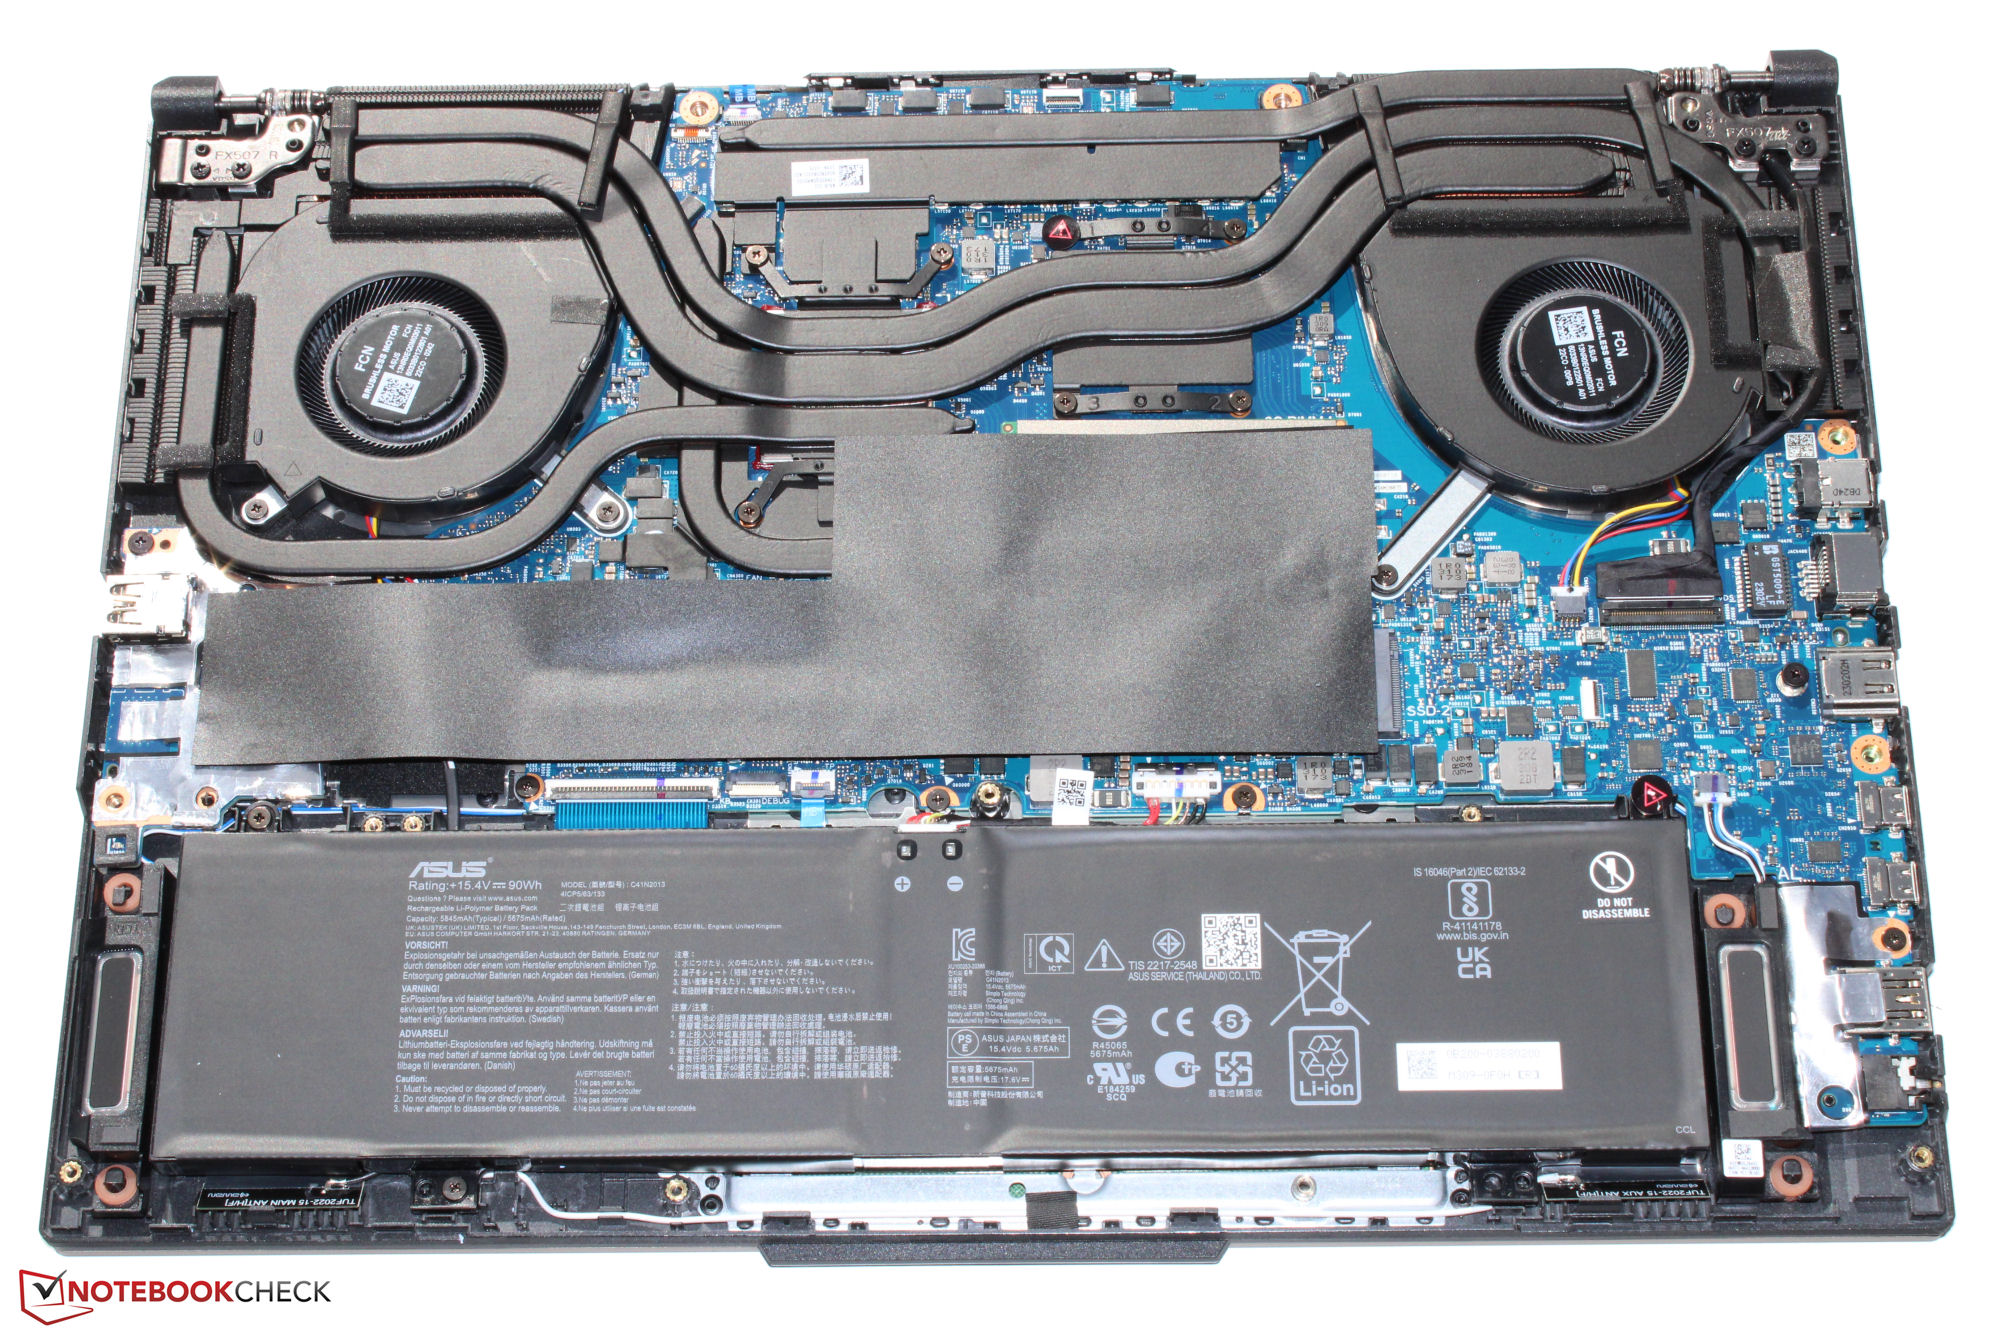
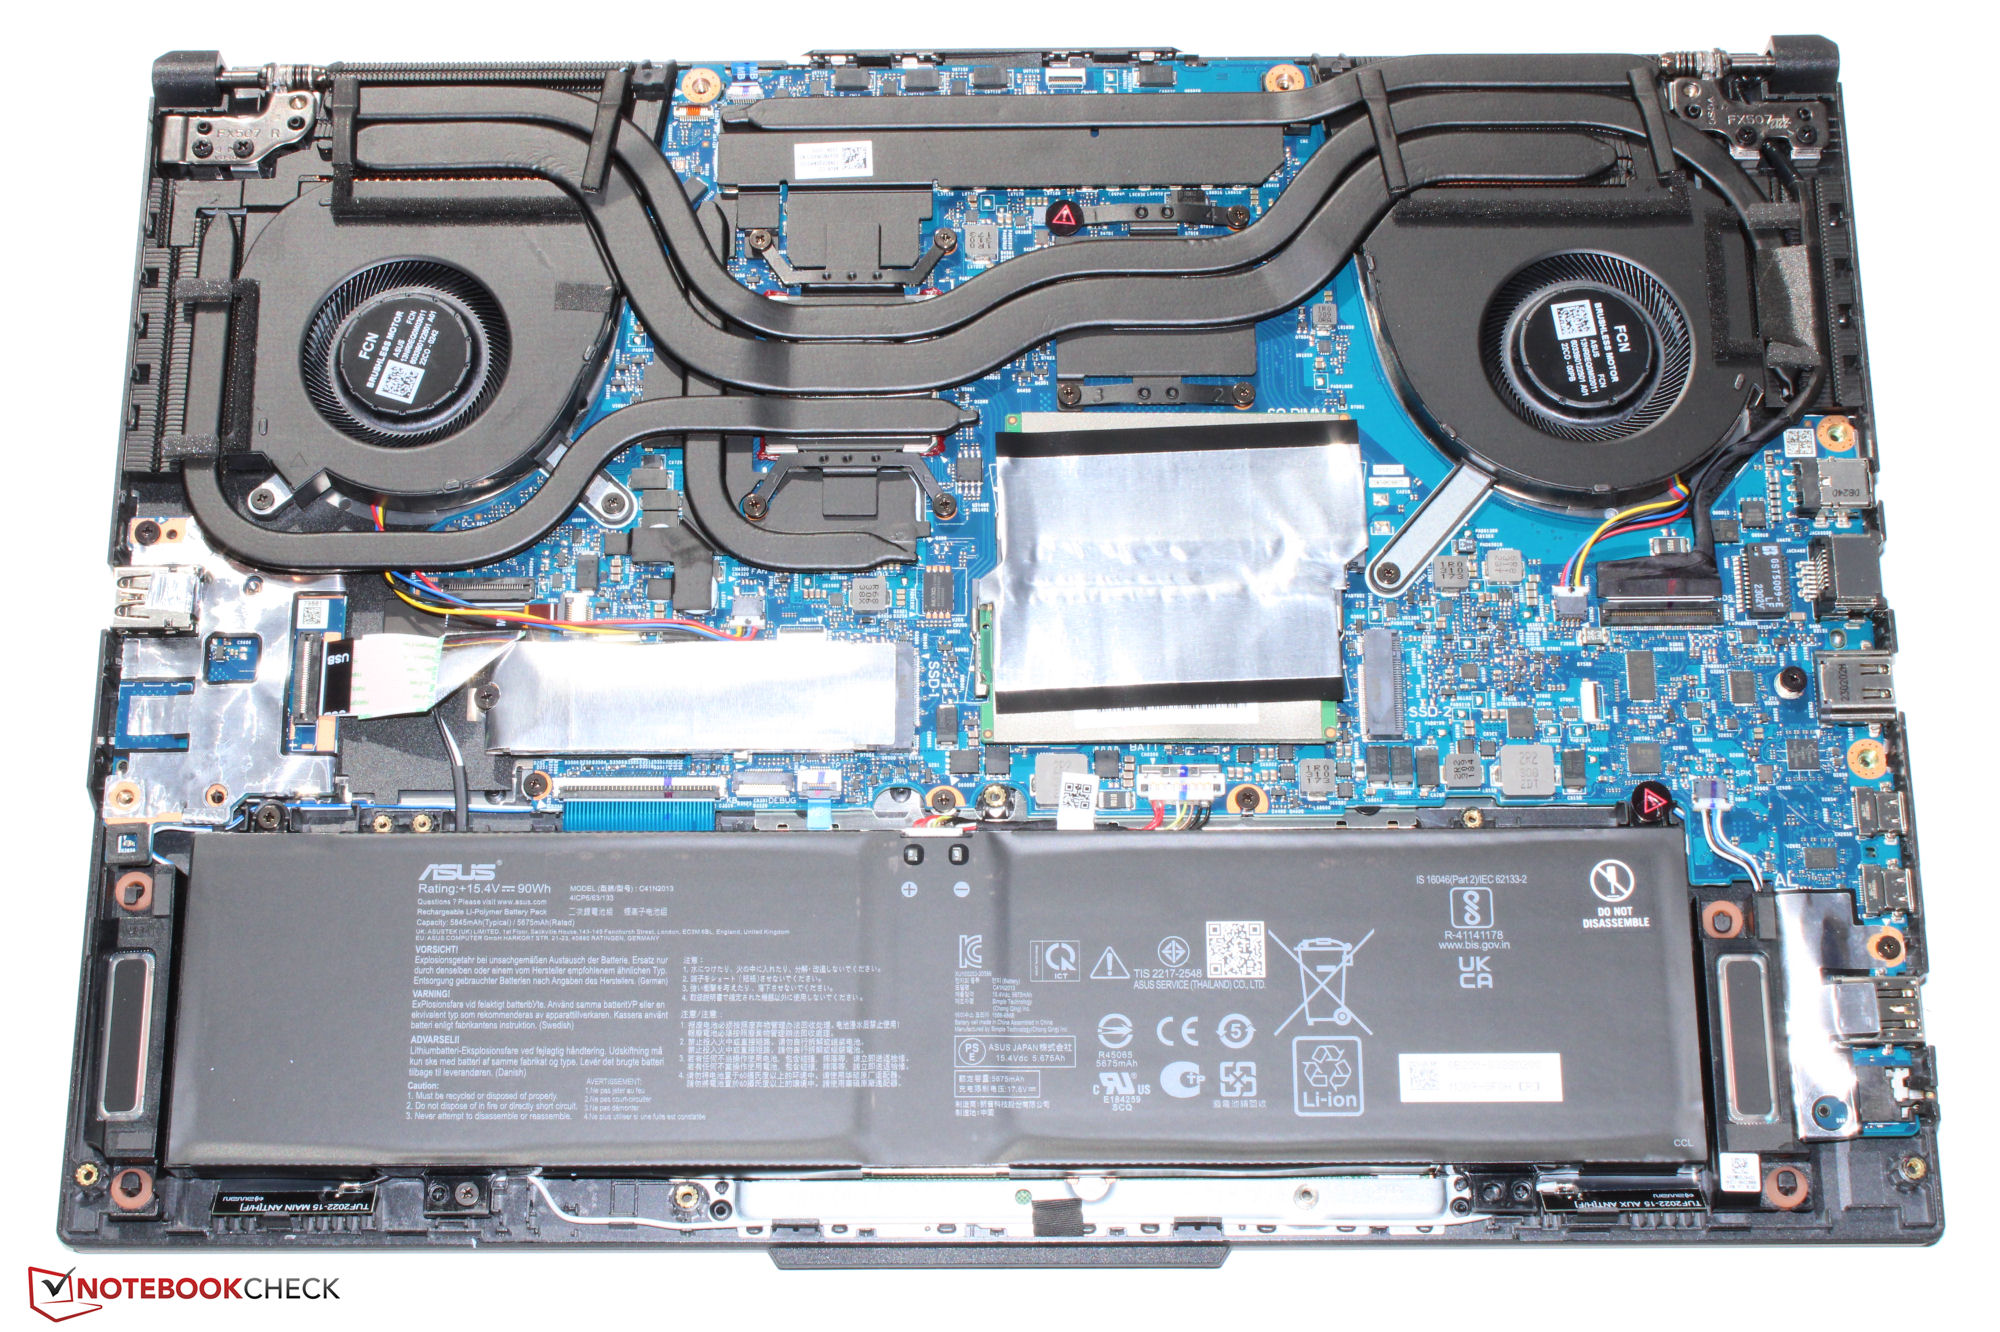
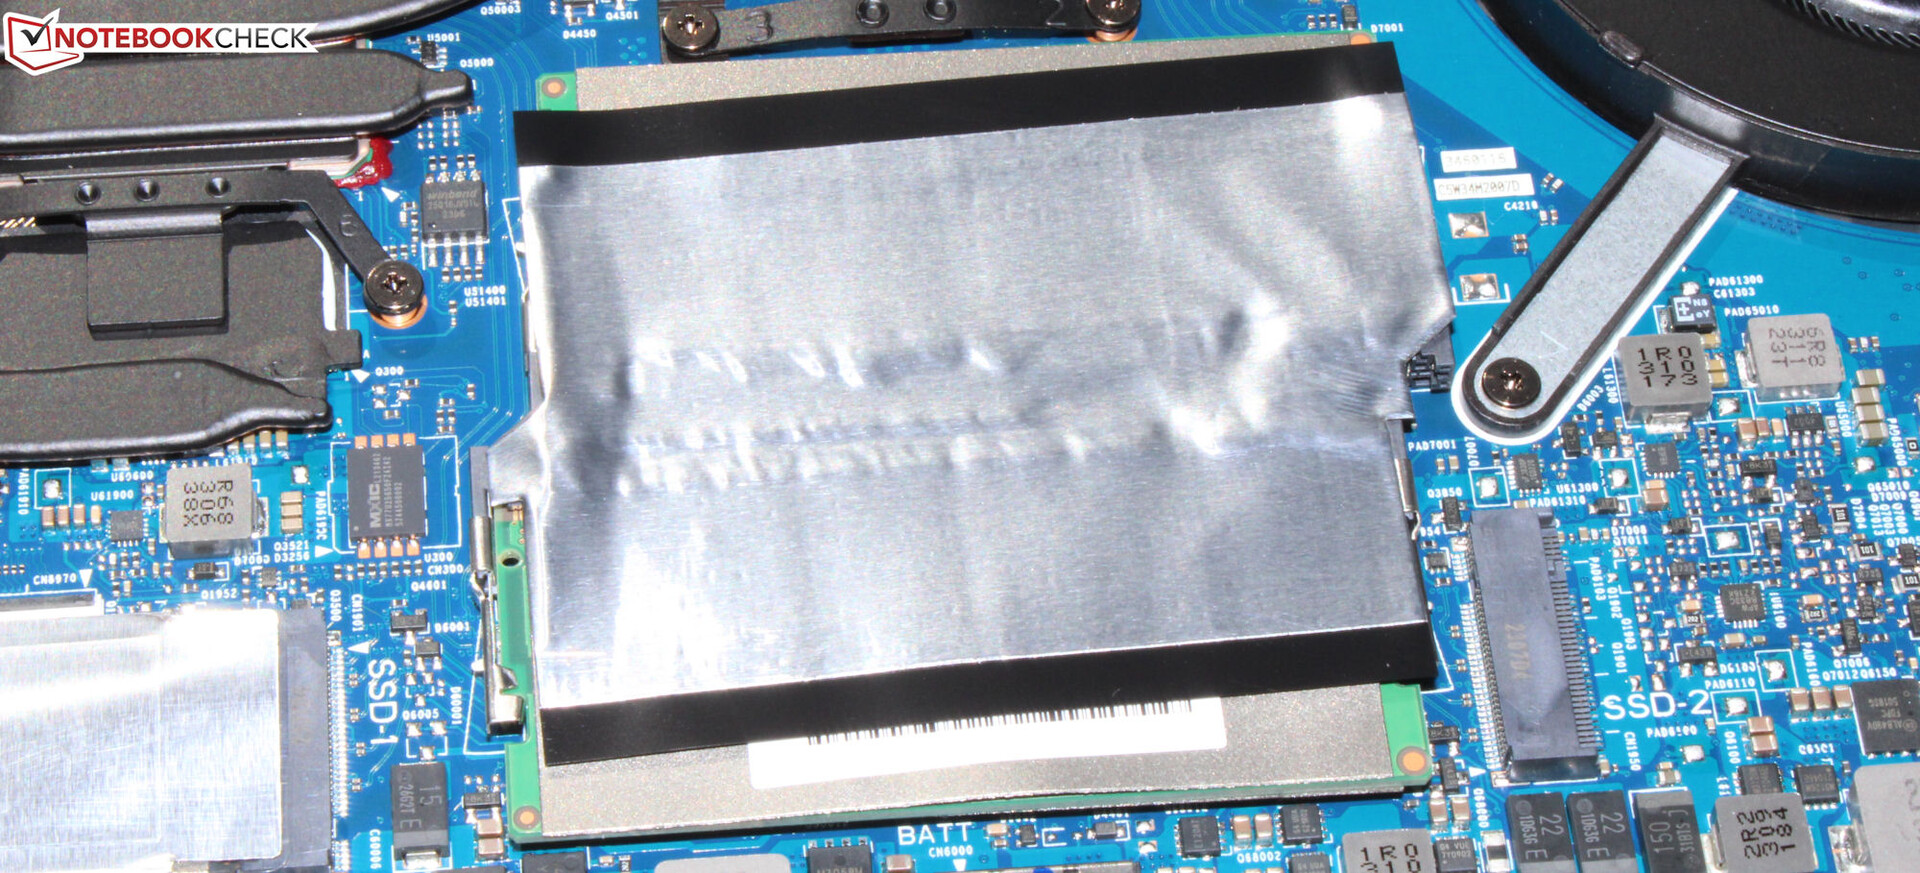
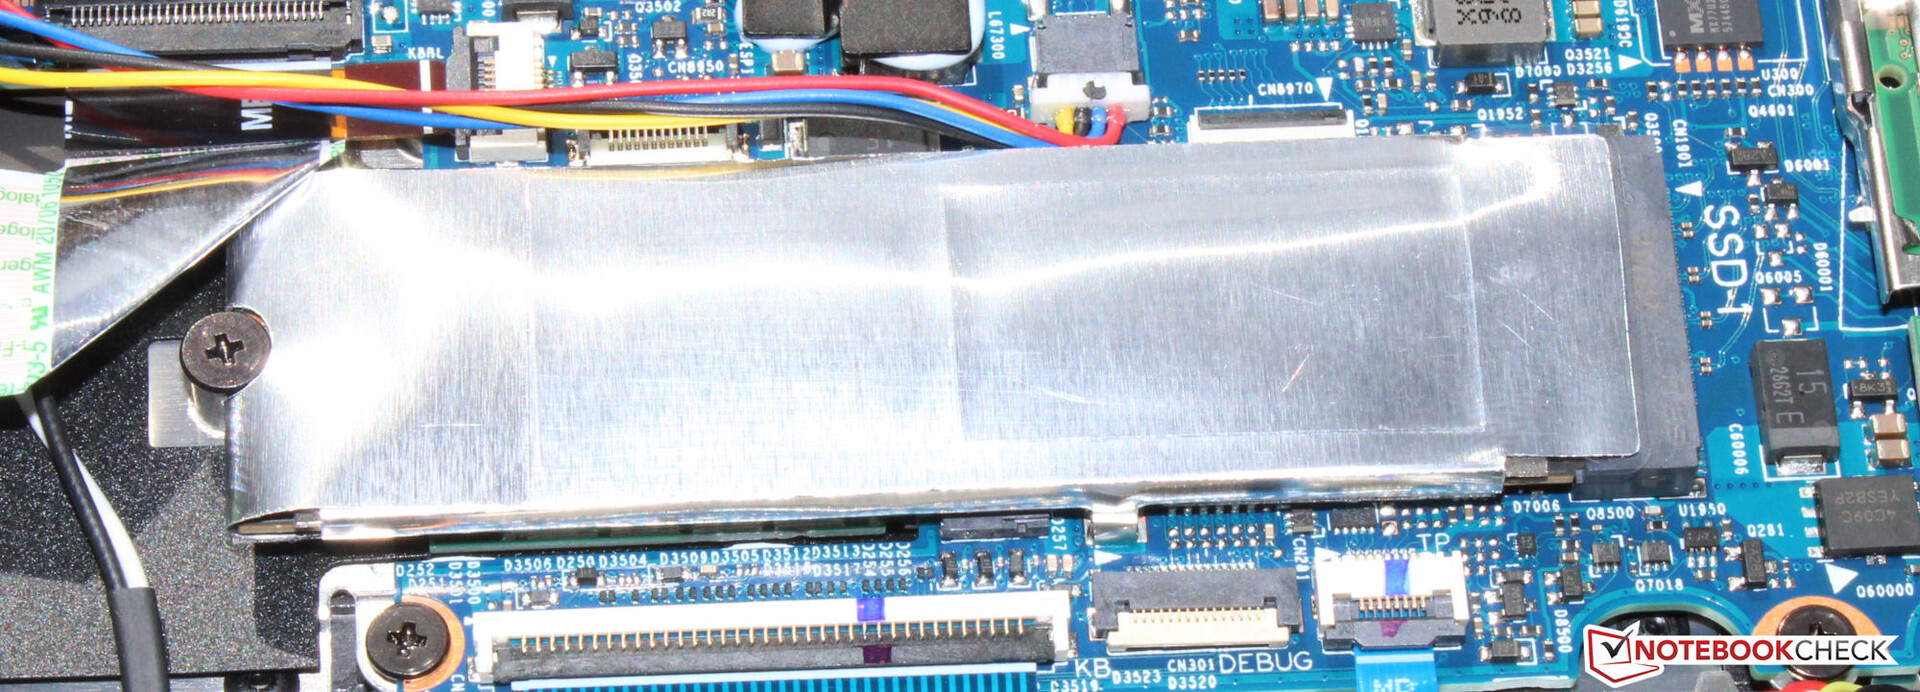
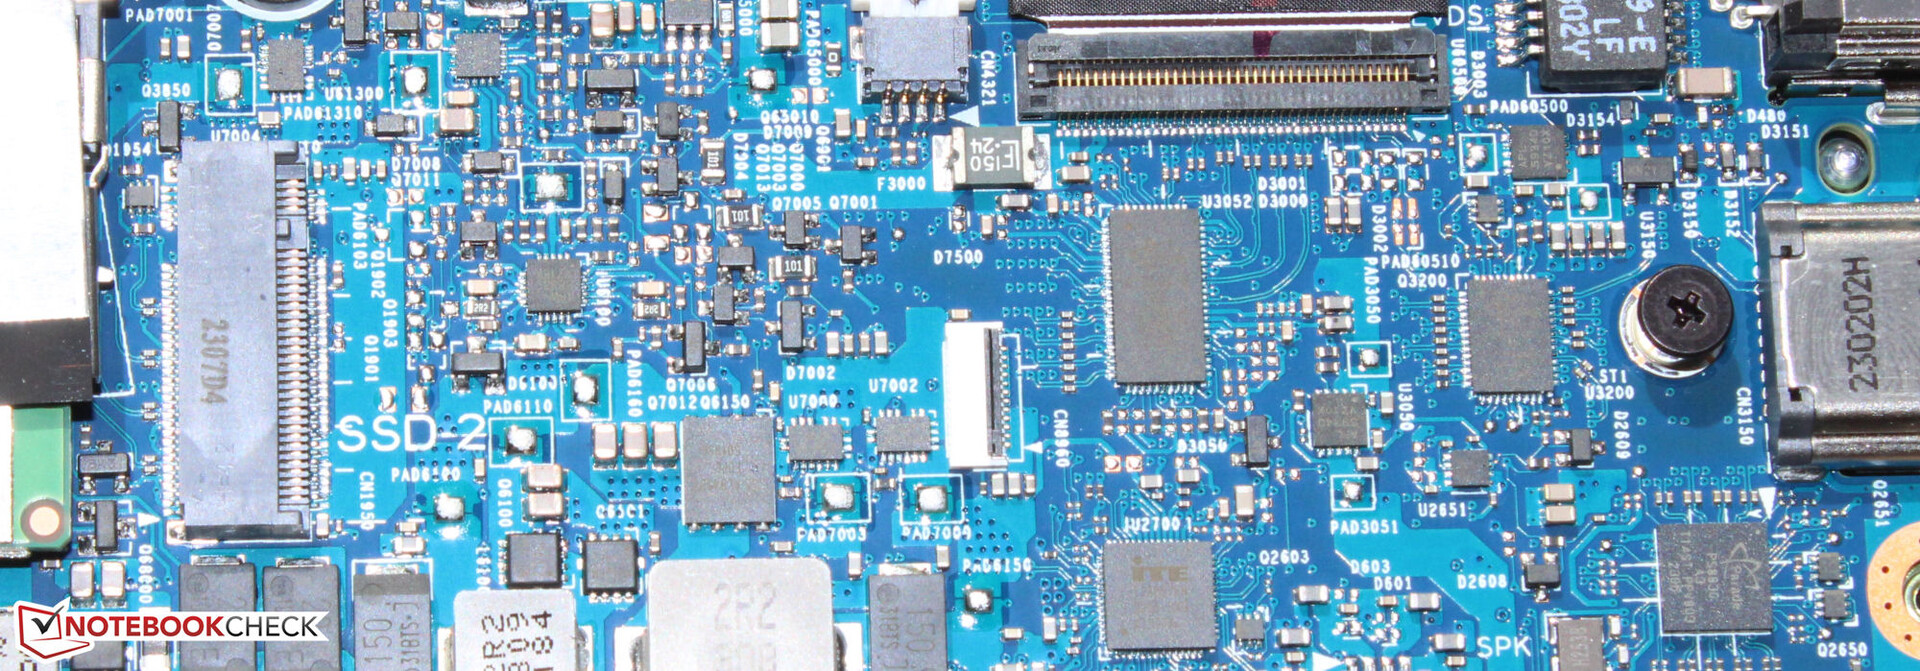
Dispositivos de almacenamiento
Asus ha equipado al A16 con un SSD de 512 GB (PCIe 4, M.2-2280) de Micron - (demasiado) poco espacio de almacenamiento para un portátil de juegos. Ofrece tasas de datos decentes, pero no es uno de los mejores modelos entre todos los SSDs disponibles. Especialmente las tasas de escritura están muy por debajo de las posibilidades actuales.

* ... más pequeño es mejor
reading continuous performance: DiskSpd Read Loop, Queue Depth 8
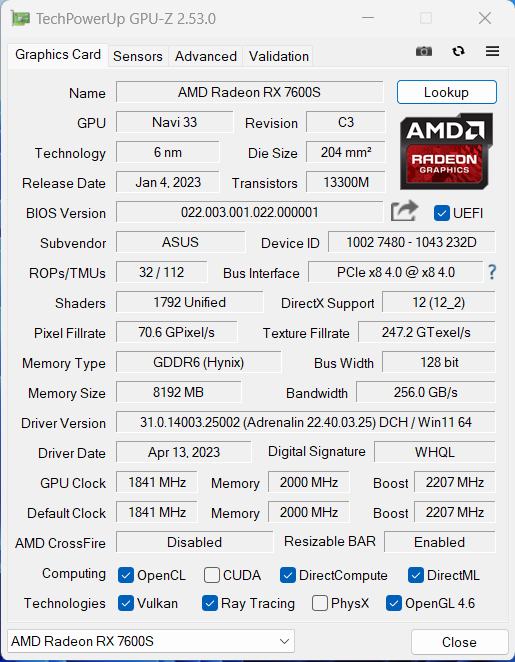
Tarjeta gráfica
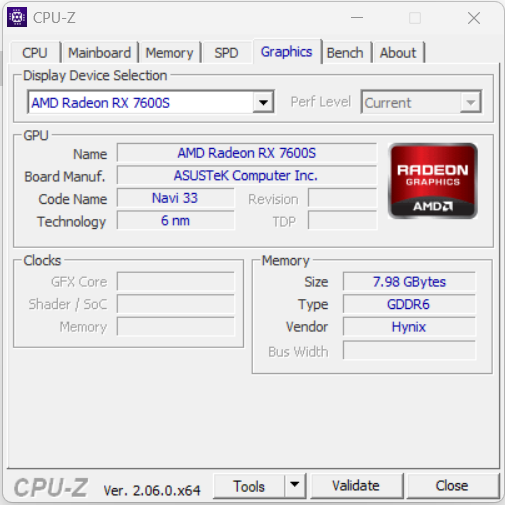
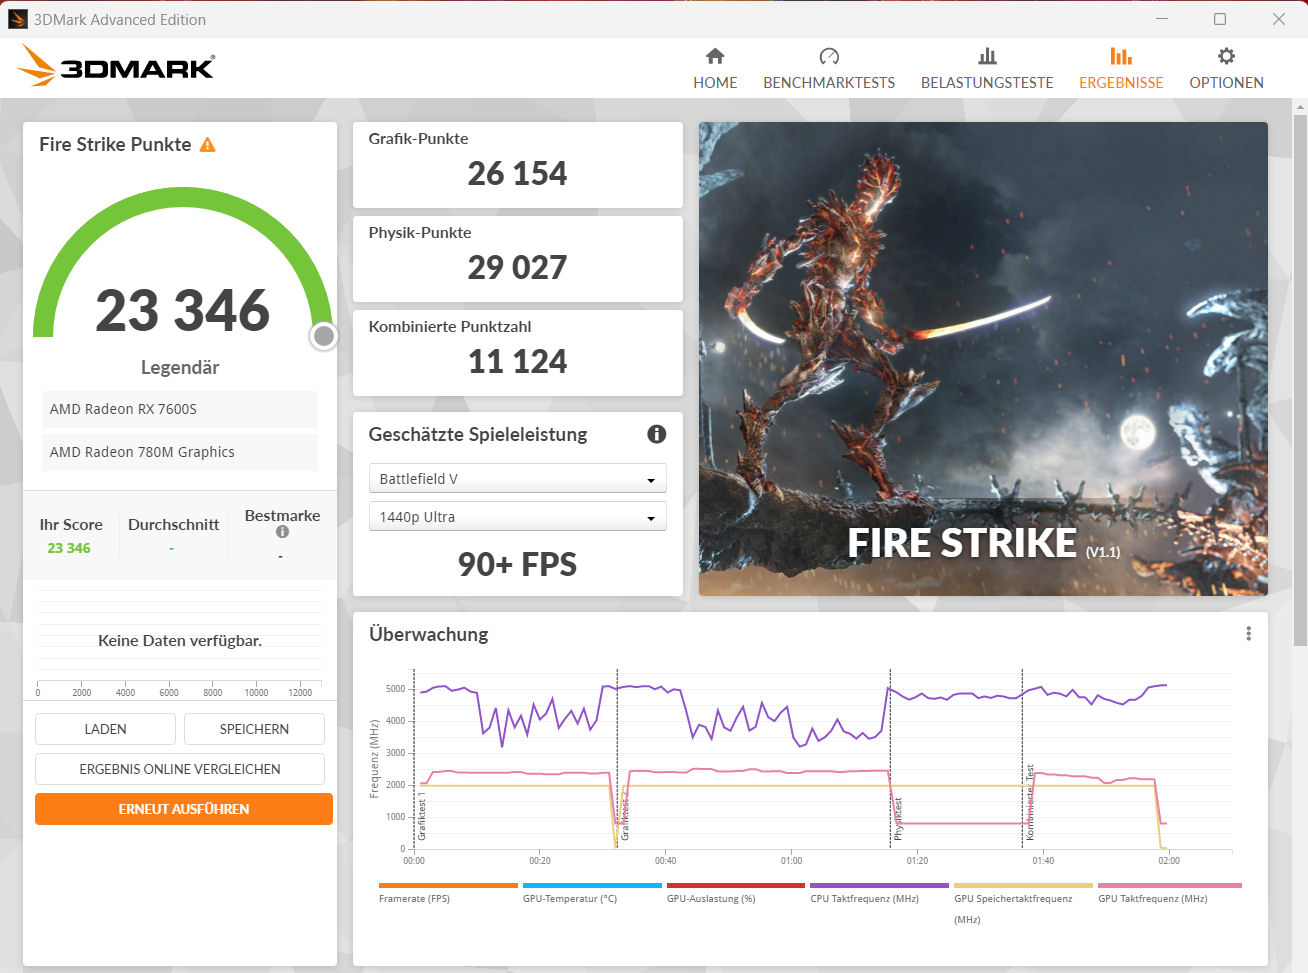
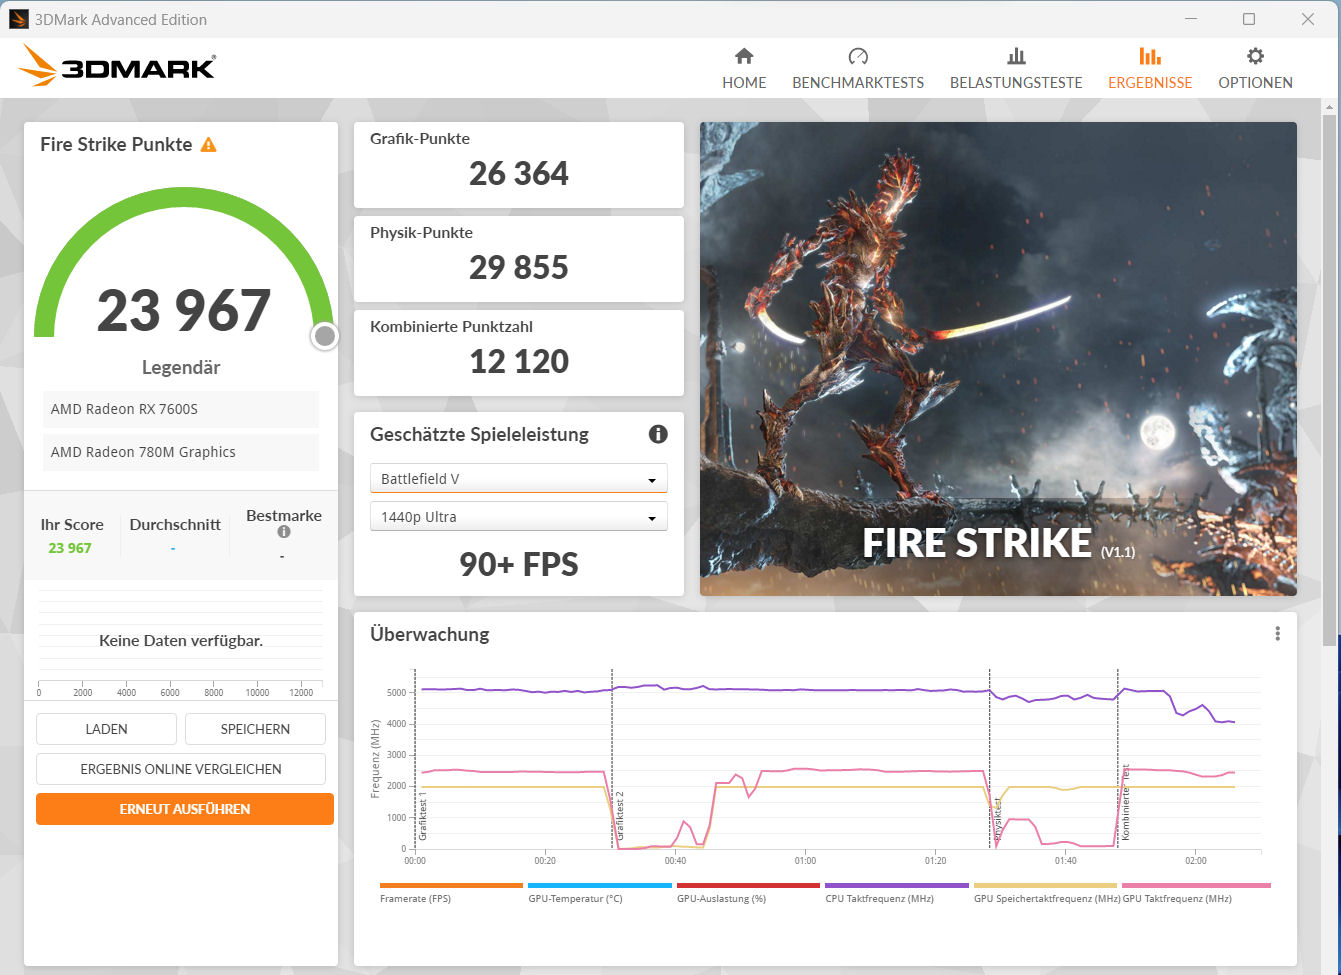
La Radeon RX 7600S de AMDcuenta con 1.792 shaders, un bus de 128 bits de ancho y un rápido almacenamiento GDDR6 (8.192 MB). Su TGP máximo (95 vatios) no se utiliza en todo su potencial según la Witcher 3 prueba. Los resultados del benchmark son exactamente los esperados y el uso del perfil "Turbo" no mejora el rendimiento.
Los competidores de la GPU de gama media se encuentran en los modelos GeForce RTX 4060,RTX 4050y RTX 3060(= TGP máximo). Aunque no puede seguir el ritmo de la RTX 4060, lo hizo mejor en las pruebas 3DMark que los otros dos modelos de GeForce. En el uso práctico en juegos, no pudimos obtener una imagen consistente: Dependiendo del juego, a veces una GPU lo hacía mejor y a veces la otra, al menos en los juegos que probamos.


| 3DMark 06 Standard Score | 55435 puntos | |
| 3DMark 11 Performance | 28721 puntos | |
| 3DMark Cloud Gate Standard Score | 64441 puntos | |
| 3DMark Fire Strike Score | 23346 puntos | |
| 3DMark Time Spy Score | 9530 puntos | |
ayuda | ||
| V-Ray 5 Benchmark | |
| GPU RTX | |
| Media de la clase Gaming (1146 - 4363, n=35, últimos 2 años) | |
| Lenovo Legion Pro 5 16IRX8 (5.0.1) | |
| Medion Erazer Defender P40 (5.0.1) | |
| Gigabyte G7 KE (5.0.1) | |
| GPU CUDA | |
| Media de la clase Gaming (887 - 3288, n=35, últimos 2 años) | |
| Lenovo Legion Pro 5 16IRX8 (5.0.1) | |
| Medion Erazer Defender P40 (5.0.1) | |
| Gigabyte G7 KE (5.0.1) | |
| Asus TUF Gaming A16 FA617XS (5.0.1) | |
| Medio AMD Radeon RX 7600S (n=1) | |
| CPU | |
| Media de la clase Gaming (5864 - 30302, n=34, últimos 2 años) | |
| Lenovo Legion Pro 5 16IRX8 (5.0.1) | |
| Medion Erazer Defender P40 (5.0.1) | |
| Asus TUF Gaming A16 FA617XS (5.0.1) | |
| Medio AMD Radeon RX 7600S (n=1) | |
| Gigabyte G7 KE (5.0.1) | |
| V-Ray Benchmark Next 4.10 | |
| GPU | |
| Media de la clase Gaming (427 - 1333, n=103, últimos 2 años) | |
| Medion Erazer Defender P40 (v4.10.07 ) | |
| MSI Katana 15 B12VEK (v4.10.07 ) | |
| Gigabyte G5 KE (v4.10.07 ) | |
| Gigabyte G7 KE (v4.10.07 ) | |
| Asus TUF Gaming A16 FA617XS (v4.10.07 ) | |
| Medio AMD Radeon RX 7600S (83 - 96, n=2) | |
| Asus TUF Gaming A16 FA617 (v4.10.07 ) | |
| CPU | |
| Media de la clase Gaming (10048 - 45327, n=102, últimos 2 años) | |
| Medion Erazer Defender P40 (v4.10.07 ) | |
| Asus TUF Gaming A16 FA617XS (v4.10.07 ) | |
| Medio AMD Radeon RX 7600S (14759 - 17623, n=2) | |
| Asus TUF Gaming A16 FA617 (v4.10.07 ) | |
| Gigabyte G7 KE (v4.10.07 ) | |
| Gigabyte G5 KE (v4.10.07 ) | |
| MSI Katana 15 B12VEK (v4.10.07 ) | |
Rendimiento de juego
El FA617 está diseñado para jugar con ajustes altos o máximos. Puede utilizarse la resolución de pantalla completa (1.920 x 1.200 píxeles). Las resoluciones más altas se pueden utilizar cuando se conecta una pantalla correspondiente, con ajustes parcialmente reducidos. El perfil "Turbo" no aumenta la velocidad de fotogramas.
| The Witcher 3 - 1920x1080 Ultra Graphics & Postprocessing (HBAO+) | |
| Media de la clase Gaming (95 - 240, n=8, últimos 2 años) | |
| Lenovo Legion Pro 5 16IRX8 | |
| Medion Erazer Defender P40 | |
| Asus TUF Gaming A16 FA617XS (neu) | |
| Medio AMD Radeon RX 7600S (91 - 98.1, n=2) | |
| Asus TUF Gaming A16 FA617 | |
| Gigabyte G5 KE | |
| MSI Katana 15 B12VEK | |
| Final Fantasy XV Benchmark - 1920x1080 High Quality | |
| Media de la clase Gaming (41 - 215, n=101, últimos 2 años) | |
| Lenovo Legion Pro 5 16IRX8 (1.3) | |
| Medion Erazer Defender P40 (1.3) | |
| Gigabyte G5 KE (1.3) | |
| Asus TUF Gaming A16 FA617XS (1.3) | |
| MSI Katana 15 B12VEK (1.3) | |
| Medio AMD Radeon RX 7600S (78.2 - 85.2, n=2) | |
| Asus TUF Gaming A16 FA617 (1.3) | |
| Strange Brigade - 1920x1080 ultra AA:ultra AF:16 | |
| Media de la clase Gaming (76.3 - 456, n=91, últimos 2 años) | |
| Medion Erazer Defender P40 (1.47.22.14 D3D12) | |
| Asus TUF Gaming A16 FA617XS (1.47.22.14 D3D12) | |
| Medio AMD Radeon RX 7600S (162.7 - 163.3, n=2) | |
| Asus TUF Gaming A16 FA617 (1.47.22.14 D3D12) | |
| Gigabyte G5 KE (1.47.22.14 D3D12) | |
| MSI Katana 15 B12VEK (1.47.22.14 D3D12) | |
| Returnal | |
| 1920x1080 Epic Preset | |
| Lenovo Legion Pro 5 16IRX8 | |
| Asus TUF Gaming A16 FA617XS | |
| Medio AMD Radeon RX 7600S (n=1) | |
| 1920x1080 Epic Preset + Epic Ray-Tracing | |
| Asus TUF Gaming A16 FA617XS | |
| Medio AMD Radeon RX 7600S (n=1) | |
| Atomic Heart - 1920x1080 Atomic Preset | |
| Asus TUF Gaming A16 FA617XS | |
| Medio AMD Radeon RX 7600S (n=1) | |
| Sons of the Forest - 1920x1080 Ultra Preset AA:T | |
| Asus TUF Gaming A16 FA617XS | |
| Medio AMD Radeon RX 7600S (n=1) | |
| Resident Evil 4 Remake - 1920x1080 Max Preset | |
| Medion Erazer Defender P40 | |
| Asus TUF Gaming A16 FA617XS | |
| Medio AMD Radeon RX 7600S (n=1) | |
| The Last of Us - 1920x1080 Ultra Preset | |
| Asus TUF Gaming A16 FA617XS | |
| Medio AMD Radeon RX 7600S (n=1) | |
| Hogwarts Legacy | |
| 1920x1080 Ultra Preset AA:High T | |
| Media de la clase Gaming (76 - 108.3, n=2, últimos 2 años) | |
| Asus TUF Gaming A16 FA617XS | |
| Medio AMD Radeon RX 7600S (n=1) | |
| 1920x1080 Ultra Preset + Full Ray Tracing AA:High T | |
| Asus TUF Gaming A16 FA617XS | |
| Medio AMD Radeon RX 7600S (n=1) | |
| Company of Heroes 3 - 1920x1080 Maximum Settings | |
| Asus TUF Gaming A16 FA617XS | |
| Medio AMD Radeon RX 7600S (n=1) | |
| Dead Island 2 - 1920x1080 Ultra Preset AA:High T | |
| Medion Erazer Defender P40 | |
| Asus TUF Gaming A16 FA617XS | |
| Medio AMD Radeon RX 7600S (n=1) | |
| Flight Simulator 2020 - 1920x1080 Ultra AA:TAA AF:16x | |
| Asus TUF Gaming A16 FA617XS | |
| Medio AMD Radeon RX 7600S (n=1) | |
| Far Cry 6 | |
| 1920x1080 Ultra Graphics Quality + HD Textures AA:T | |
| Media de la clase Gaming (96.3 - 135.7, n=3, últimos 2 años) | |
| Asus TUF Gaming A16 FA617XS | |
| Medio AMD Radeon RX 7600S (n=1) | |
| 1920x1080 Ultra Graphics Quality + HD Textures + DXR AA:T | |
| Media de la clase Gaming (n=1últimos 2 años) | |
| Asus TUF Gaming A16 FA617XS | |
| Medio AMD Radeon RX 7600S (n=1) | |
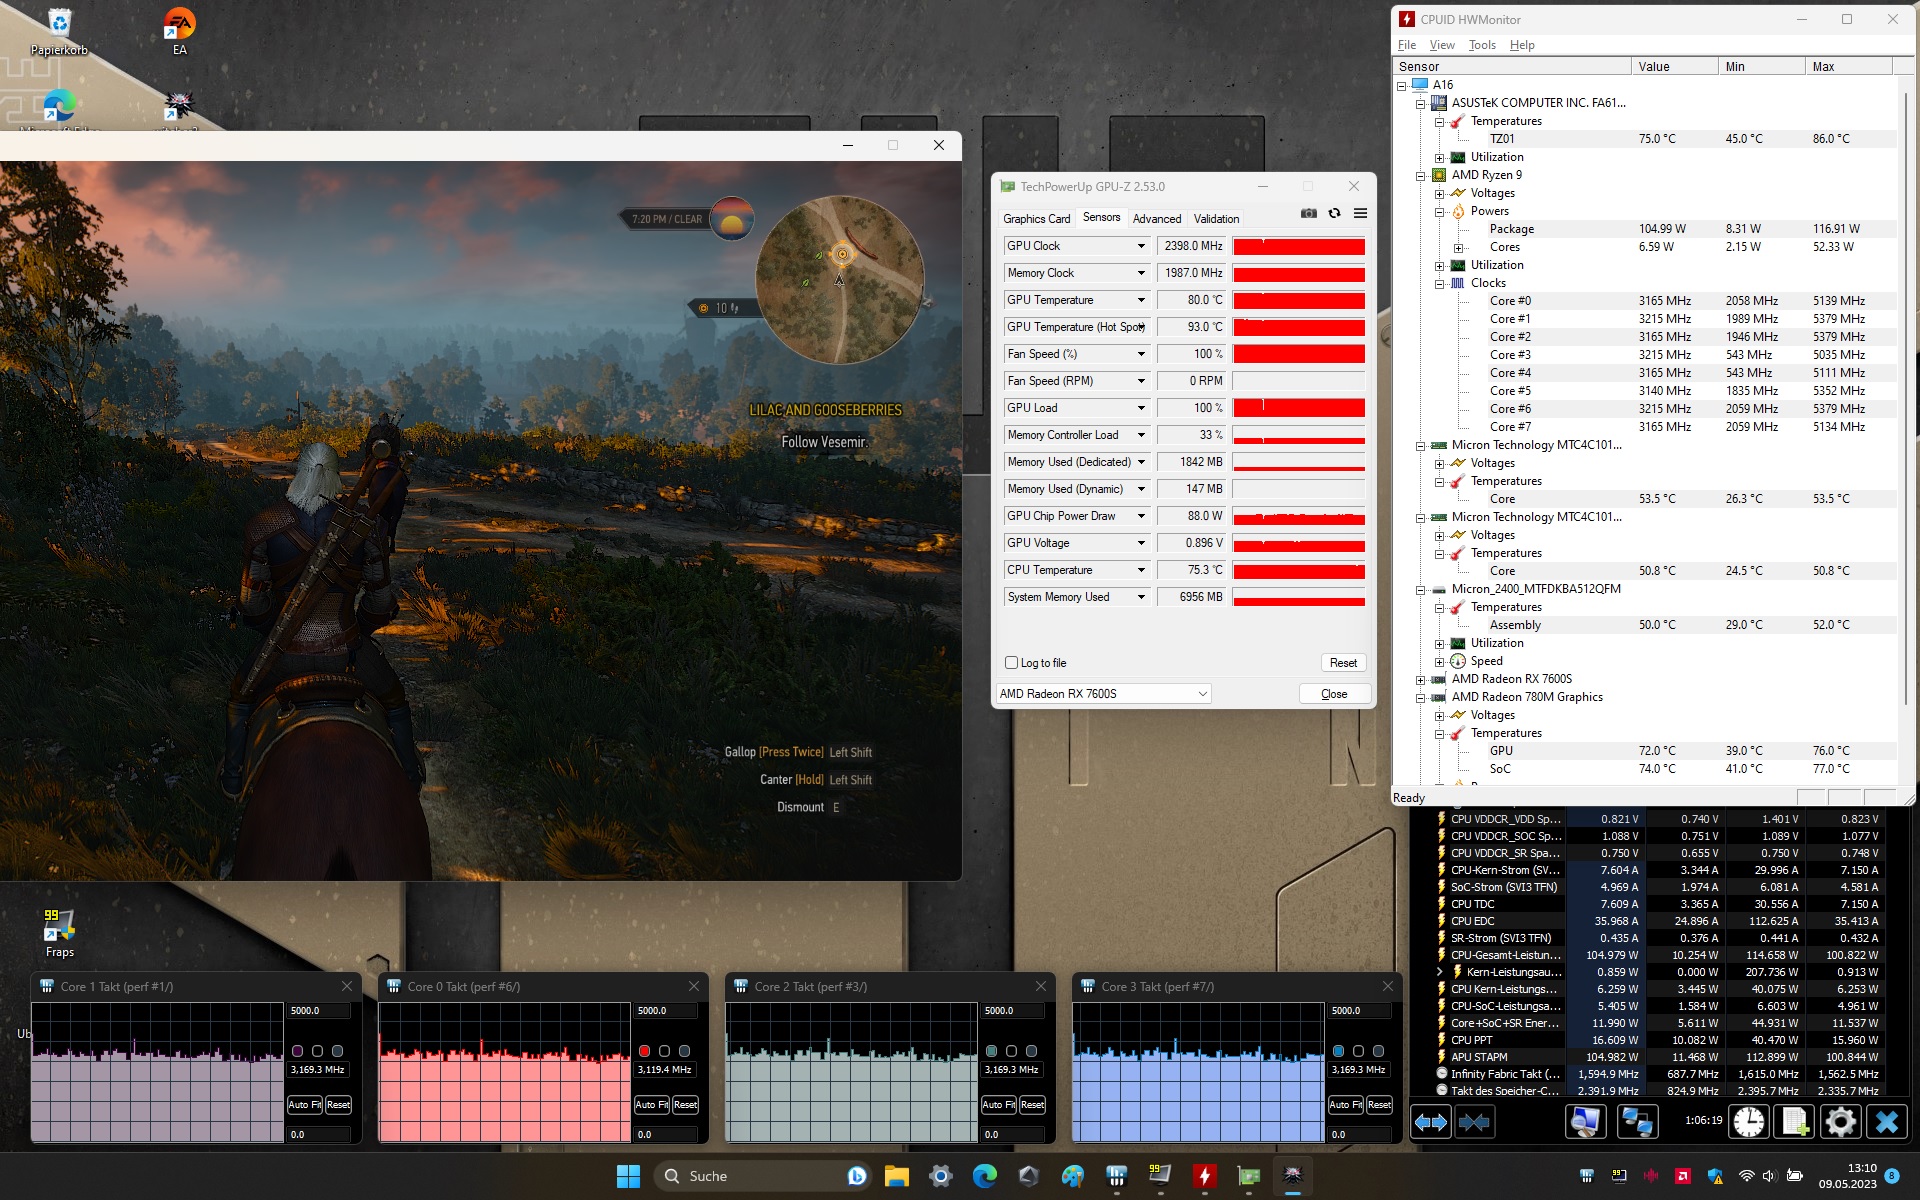
Para comprobar si las frecuencias de cuadro se mantienen constantes durante un periodo más largo, ejecutamos el juego The Witcher 3 durante unos 60 minutos en resolución Full HD y ajustes de máxima calidad. El personaje del juego no se movió. No se observó ninguna disminución del rendimiento.
Witcher 3 FPS diagram
| bajo | medio | alto | ultra | |
|---|---|---|---|---|
| GTA V (2015) | 184.7 | 171.7 | 92.9 | |
| The Witcher 3 (2015) | 382 | 166.5 | 98.1 | |
| Dota 2 Reborn (2015) | 157.5 | 143.1 | 132.2 | 121.6 |
| Final Fantasy XV Benchmark (2018) | 215 | 117.2 | 85.2 | |
| X-Plane 11.11 (2018) | 85.1 | 72 | 57.3 | |
| Far Cry 5 (2018) | 135 | 120 | 115 | 108 |
| Strange Brigade (2018) | 440 | 228 | 190.8 | 163.3 |
| Metro Exodus (2019) | 187.3 | 116.5 | ||
| The Division 2 (2019) | 232 | 167 | 131 | 95 |
| Control (2019) | 235 | 116.6 | 83.5 | |
| Doom Eternal (2020) | 376 | 209 | 184.3 | 179 |
| Gears Tactics (2020) | 381.4 | 216.1 | 138.1 | 95.4 |
| Death Stranding (2020) | 189.5 | 144.1 | 133.6 | 129.6 |
| Flight Simulator 2020 (2020) | 134.9 | 85.5 | 60.1 | 42.7 |
| Crysis Remastered (2020) | 294 | 190.9 | 90.6 | 38.6 |
| Watch Dogs Legion (2020) | 122.6 | 118.5 | 106.6 | 69.5 |
| Assassin´s Creed Valhalla (2020) | 203 | 124 | 102 | 88 |
| Hitman 3 (2021) | 270 | 178.2 | 157.4 | 145.7 |
| Far Cry 6 (2021) | 151 | 133 | 119 | 104.7 |
| Forza Horizon 5 (2021) | 197 | 144 | 135 | 74 |
| GRID Legends (2022) | 214.9 | 182.8 | 156.5 | 129.3 |
| Tiny Tina's Wonderlands (2022) | 198.1 | 156.8 | 105.7 | 82.2 |
| F1 22 (2022) | 263 | 244 | 190 | 50.5 |
| A Plague Tale Requiem (2022) | 98.2 | 78 | 66.1 | 55.4 |
| Hogwarts Legacy (2023) | 118.4 | 88.7 | 72 | 55.4 |
| Returnal (2023) | 91 | 88 | 78 | 67 |
| Atomic Heart (2023) | 167.1 | 125.5 | 71.6 | 56.6 |
| Company of Heroes 3 (2023) | 143.4 | 125.9 | 97.4 | 97.2 |
| Sons of the Forest (2023) | 93.2 | 81.4 | 78 | 76.7 |
| Resident Evil 4 Remake (2023) | 107.4 | 83.2 | 78.9 | 52.3 |
| The Last of Us (2023) | 81.4 | 67.6 | 60.2 | 51.5 |
| Dead Island 2 (2023) | 201 | 168.1 | 122.7 | 113.1 |
Emisiones - El FA617XS puede ser bastante ruidoso
Emisiones sonoras
En el uso diario (oficina, Internet, etc.), el A16 suele funcionar en silencio, a menudo en silencio, independientemente del perfil seleccionado. El nivel de presión sonora puede aumentar hasta 53 dB(A) ("Turbo") o 51 dB(A) ("Rendimiento") en modo de juego. Con el perfil "Silencioso" se consigue una emisión de ruido más baja. En este caso, la potencia de cálculo se reduce muy poco.
Ruido
| Ocioso |
| 25 / 26 / 28 dB(A) |
| Carga |
| 43 / 53 dB(A) |
 | ||
30 dB silencioso 40 dB(A) audible 50 dB(A) ruidosamente alto |
||
min: | ||
| Asus TUF Gaming A16 FA617XS R9 7940HS, Radeon RX 7600S | Lenovo Legion Pro 5 16IRX8 i7-13700HX, GeForce RTX 4060 Laptop GPU | MSI Katana 15 B12VEK i7-12650H, GeForce RTX 4050 Laptop GPU | Medion Erazer Defender P40 i7-13700HX, GeForce RTX 4060 Laptop GPU | Gigabyte G5 KE i5-12500H, GeForce RTX 3060 Laptop GPU | Asus TUF Gaming A16 FA617 R7 7735HS, Radeon RX 7600S | |
|---|---|---|---|---|---|---|
| Noise | 8% | 7% | -11% | -11% | 3% | |
| apagado / medio ambiente * (dB) | 25 | 23 8% | 24 4% | 25 -0% | 19.52 22% | 24 4% |
| Idle Minimum * (dB) | 25 | 23.1 8% | 24 4% | 26 -4% | 31.05 -24% | 24 4% |
| Idle Average * (dB) | 26 | 23.1 11% | 24 8% | 27 -4% | 31.05 -19% | 25 4% |
| Idle Maximum * (dB) | 28 | 26.6 5% | 24 14% | 32 -14% | 31.05 -11% | 28 -0% |
| Load Average * (dB) | 43 | 34.7 19% | 37.71 12% | 53 -23% | 55.66 -29% | 42 2% |
| Witcher 3 ultra * (dB) | 51 | 47.6 7% | 45.75 10% | 56 -10% | 55.7 -9% | 50 2% |
| Load Maximum * (dB) | 53 | 54.8 -3% | 54.55 -3% | 64 -21% | 55.51 -5% | 50 6% |
* ... más pequeño es mejor
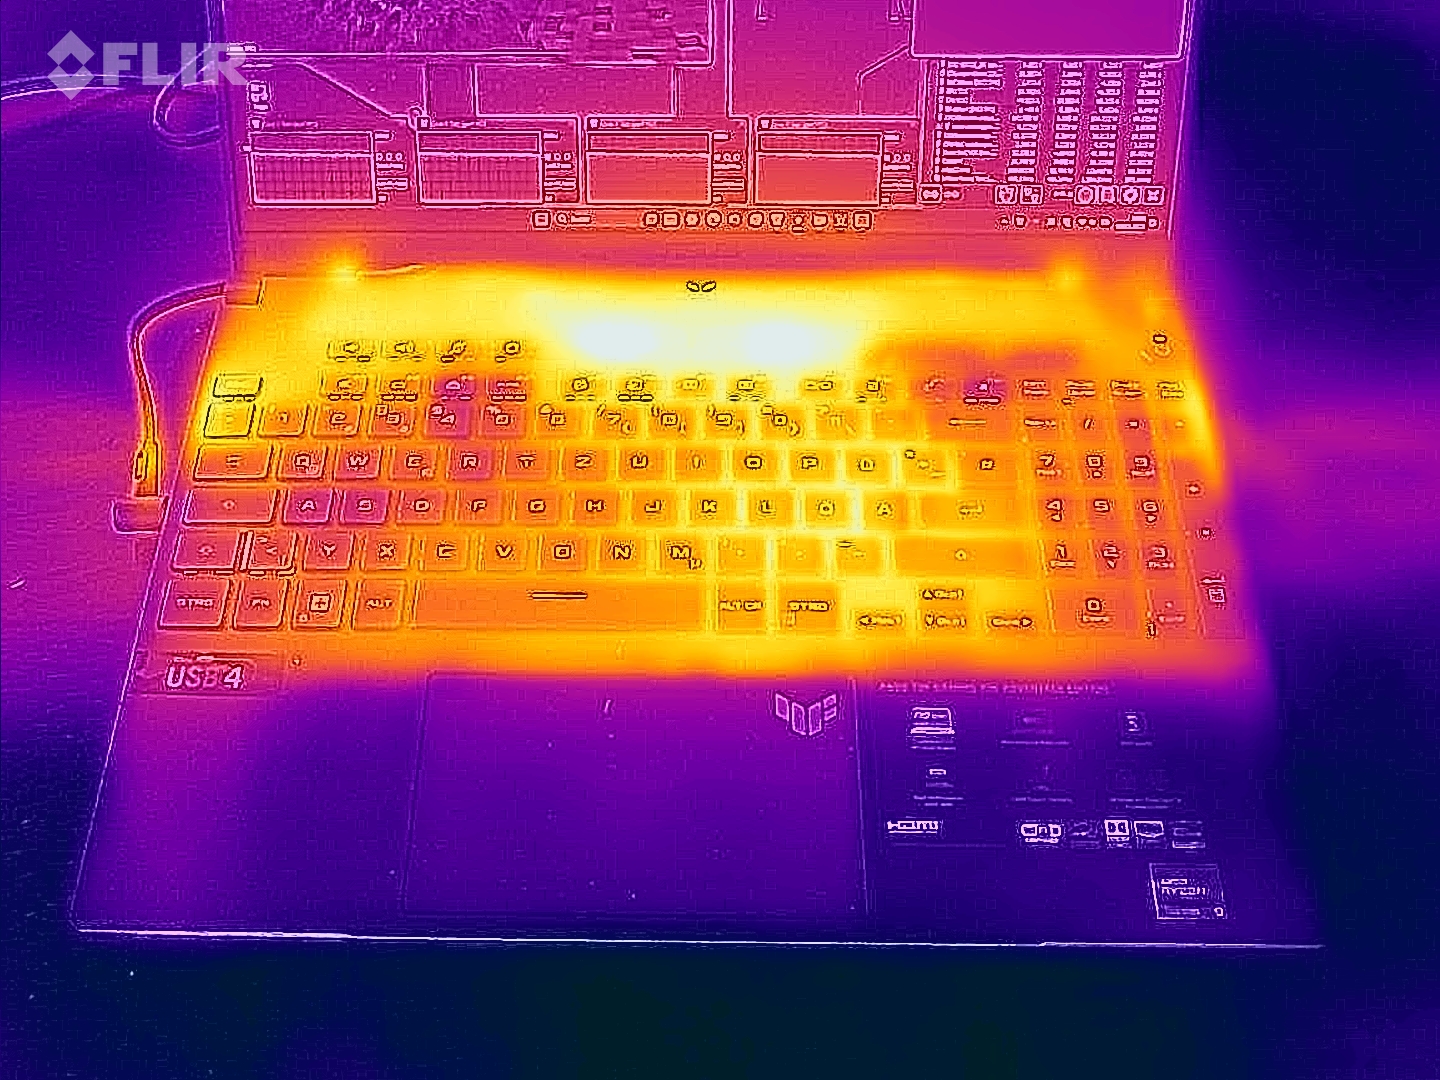
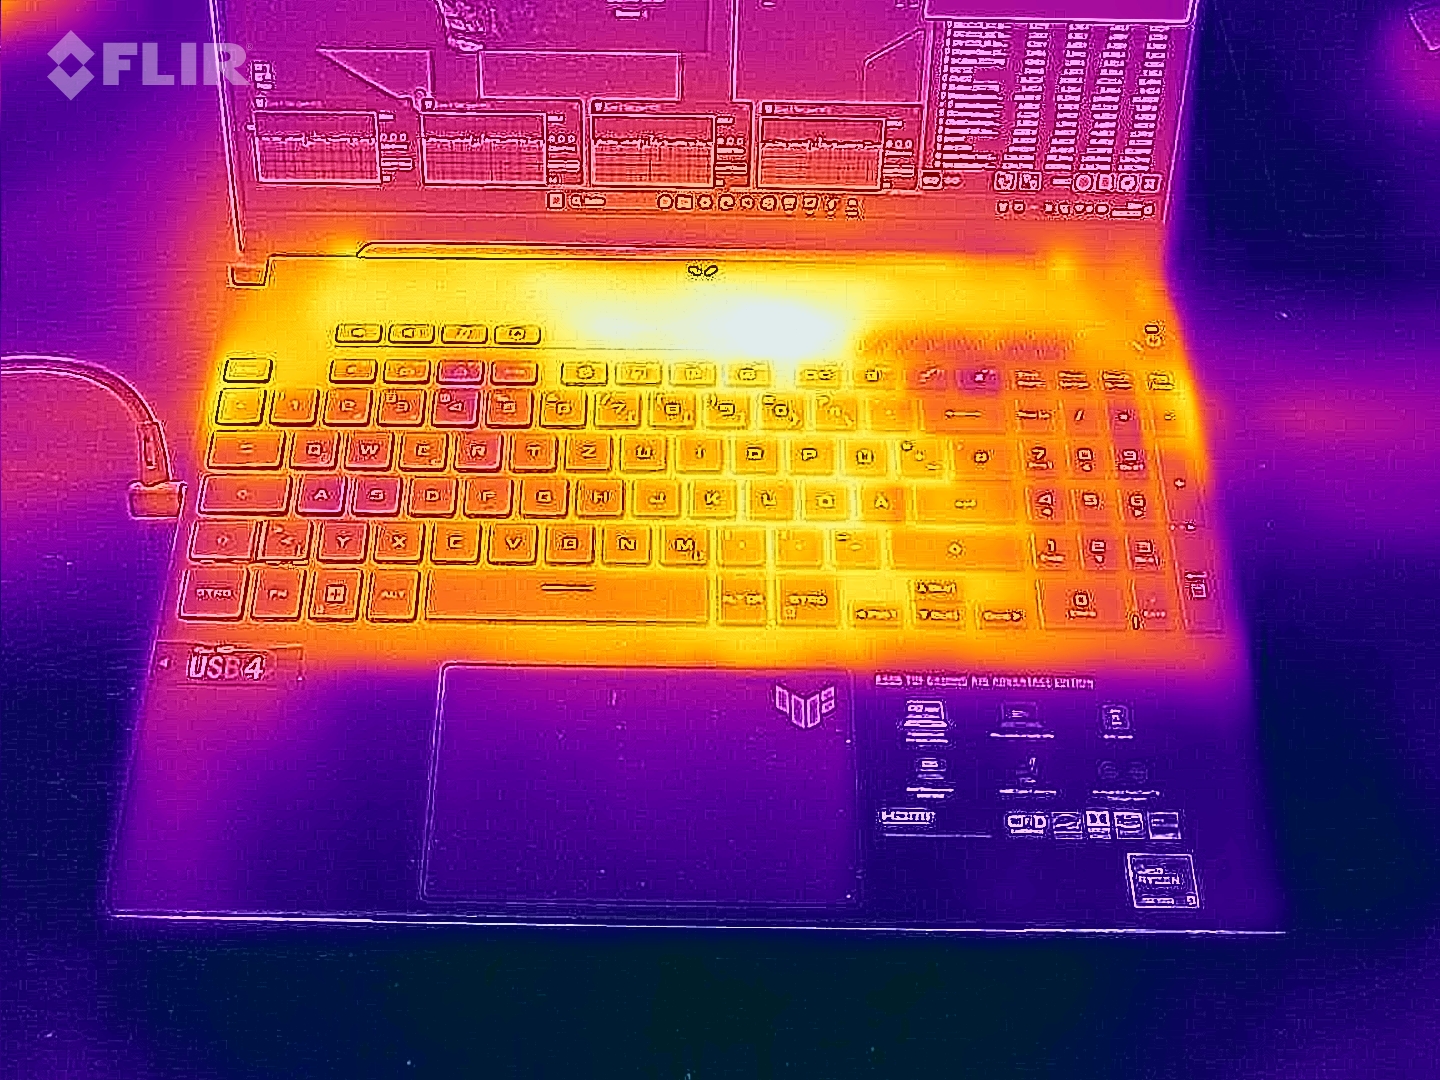
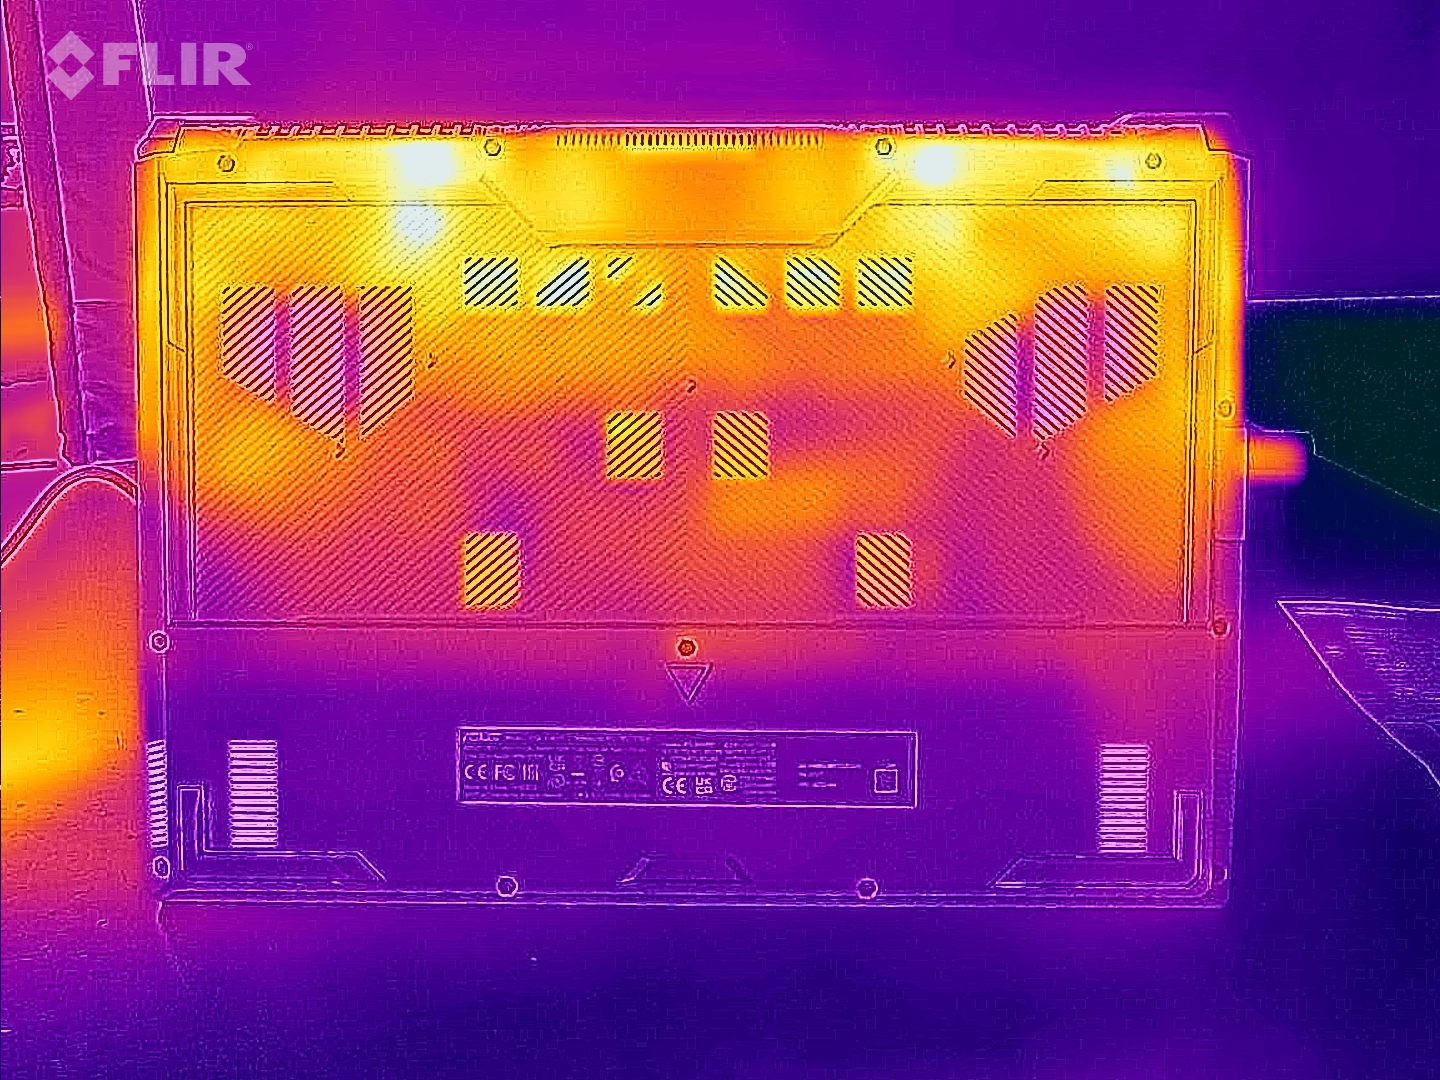
Temperatura
El portátil se calienta notablemente bajo carga, pero no en exceso. Las temperaturas están dentro de una zona verde en el uso diario. Esto último no ocurría en el modelo hermano- suponemos un error/defecto del aparato.
(-) La temperatura máxima en la parte superior es de 53 °C / 127 F, frente a la media de 40.4 °C / 105 F, que oscila entre 21.2 y 68.8 °C para la clase Gaming.
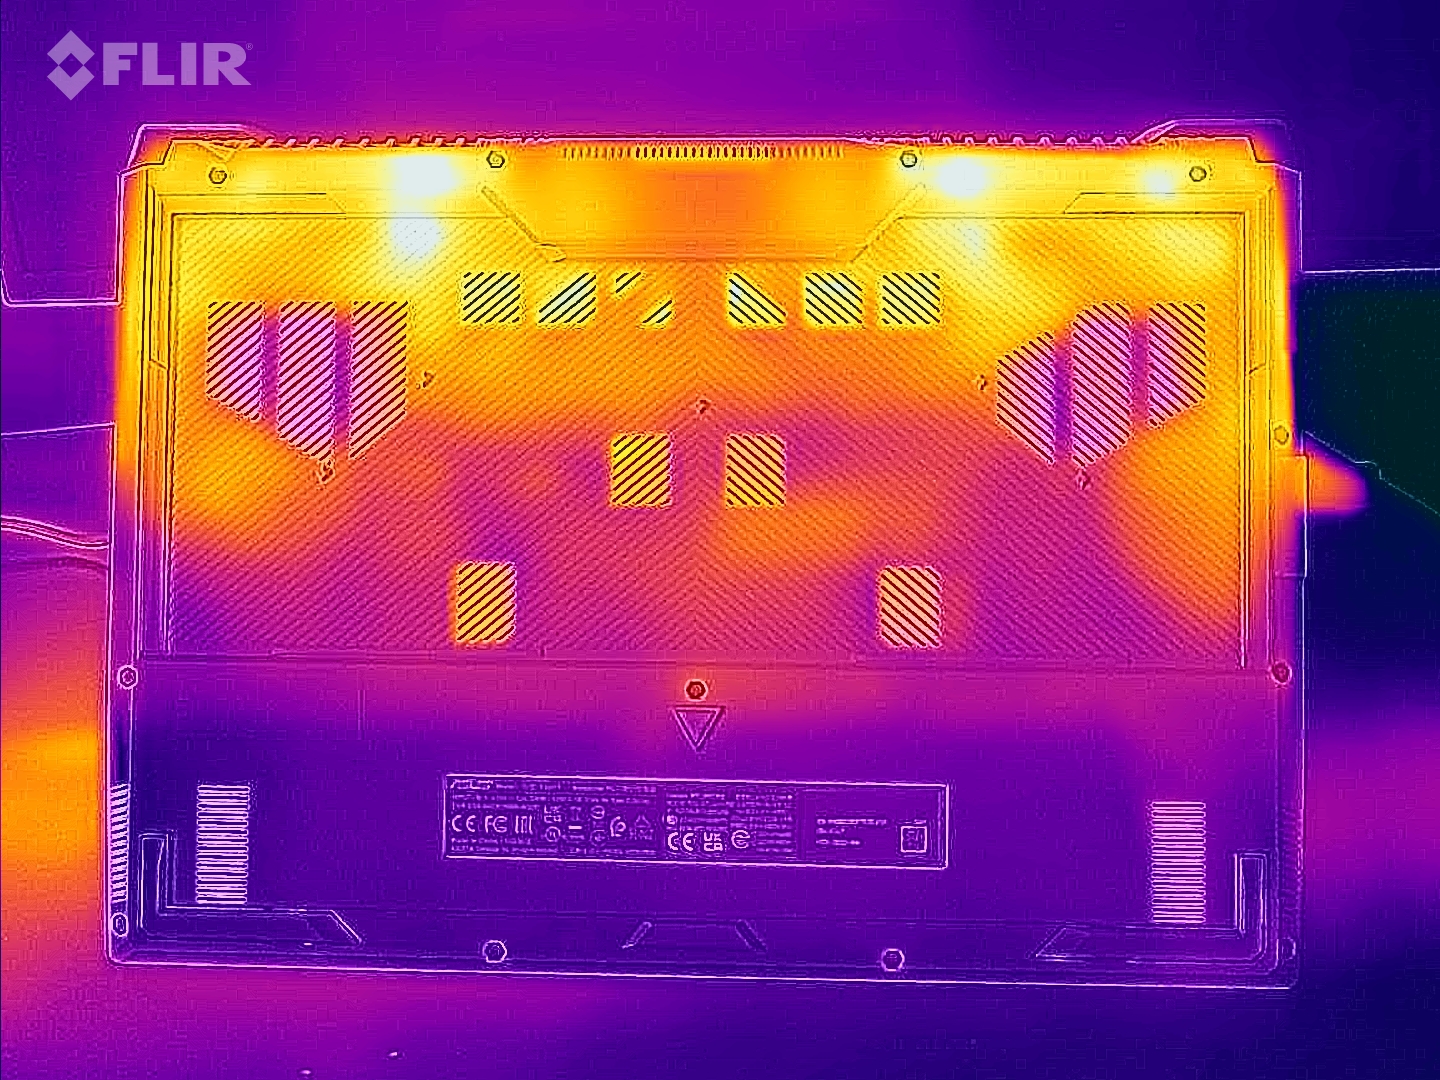
(-) El fondo se calienta hasta un máximo de 48 °C / 118 F, frente a la media de 43.2 °C / 110 F
(+) En reposo, la temperatura media de la parte superior es de 28.8 °C / 84# F, frente a la media del dispositivo de 33.9 °C / 93 F.
(-) Jugando a The Witcher 3, la temperatura media de la parte superior es de 40 °C / 104 F, frente a la media del dispositivo de 33.9 °C / 93 F.
(±) El reposamanos y el touchpad pueden calentarse mucho al tacto con un máximo de 38 °C / 100.4 F.
(-) La temperatura media de la zona del reposamanos de dispositivos similares fue de 28.8 °C / 83.8 F (-9.2 °C / -16.6 F).
| Asus TUF Gaming A16 FA617XS AMD Ryzen 9 7940HS, AMD Radeon RX 7600S | Lenovo Legion Pro 5 16IRX8 Intel Core i7-13700HX, NVIDIA GeForce RTX 4060 Laptop GPU | MSI Katana 15 B12VEK Intel Core i7-12650H, NVIDIA GeForce RTX 4050 Laptop GPU | Medion Erazer Defender P40 Intel Core i7-13700HX, NVIDIA GeForce RTX 4060 Laptop GPU | Gigabyte G5 KE Intel Core i5-12500H, NVIDIA GeForce RTX 3060 Laptop GPU | Asus TUF Gaming A16 FA617 AMD Ryzen 7 7735HS, AMD Radeon RX 7600S | |
|---|---|---|---|---|---|---|
| Heat | 1% | -8% | 9% | -14% | -17% | |
| Maximum Upper Side * (°C) | 53 | 42.8 19% | 47 11% | 42 21% | 52.6 1% | 54 -2% |
| Maximum Bottom * (°C) | 48 | 50 -4% | 48 -0% | 45 6% | 62.4 -30% | 47 2% |
| Idle Upper Side * (°C) | 30 | 29.6 1% | 35 -17% | 28 7% | 33.6 -12% | 40 -33% |
| Idle Bottom * (°C) | 30 | 34 -13% | 38 -27% | 30 -0% | 34.8 -16% | 40 -33% |
* ... más pequeño es mejor
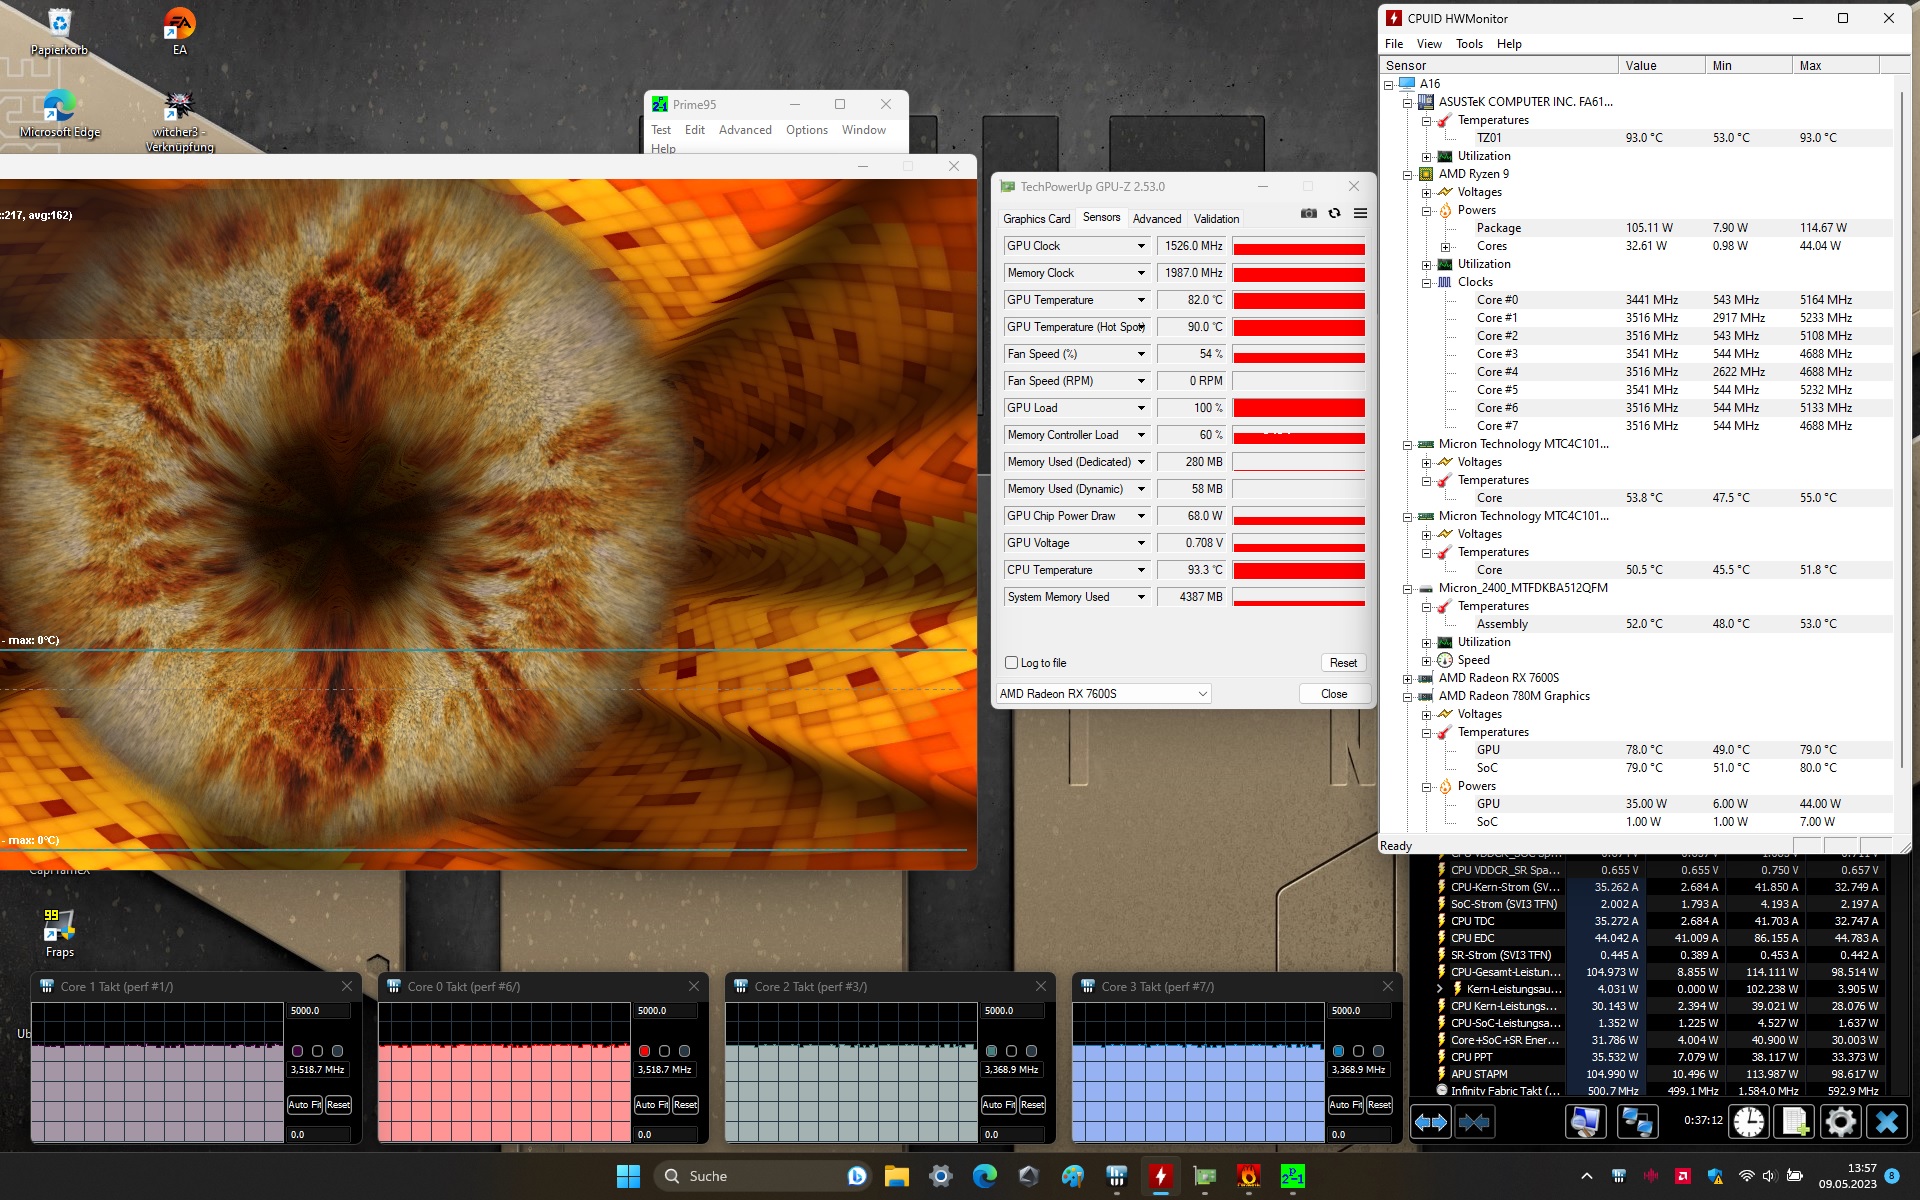
Prueba de esfuerzo
La prueba de estrés (Prime95 y Furmark en funcionamiento continuo) simula un escenario extremo para comprobar la estabilidad del sistema a plena carga. La CPU (de 3,4 a 3,5 GHz) y la GPU (~1.500 MHz) se sometieron a la prueba con frecuencias de reloj inferiores a sus respectivos relojes base.
Altavoces
Los altavoces estéreo producen un sonido decente en general.
Asus TUF Gaming A16 FA617XS análisis de audio
(±) | la sonoridad del altavoz es media pero buena (79 dB)
Graves 100 - 315 Hz
(±) | lubina reducida - en promedio 11.6% inferior a la mediana
(±) | la linealidad de los graves es media (7% delta a frecuencia anterior)
Medios 400 - 2000 Hz
(±) | medias más altas - de media 5.7% más altas que la mediana
(+) | los medios son lineales (3.8% delta a la frecuencia anterior)
Altos 2 - 16 kHz
(+) | máximos equilibrados - a sólo 2.6% de la mediana
(+) | los máximos son lineales (6.5% delta a la frecuencia anterior)
Total 100 - 16.000 Hz
(±) | la linealidad del sonido global es media (15.4% de diferencia con la mediana)
En comparación con la misma clase
» 34% de todos los dispositivos probados de esta clase eran mejores, 7% similares, 59% peores
» El mejor tuvo un delta de 6%, la media fue 18%, el peor fue ###max##%
En comparación con todos los dispositivos probados
» 22% de todos los dispositivos probados eran mejores, 4% similares, 73% peores
» El mejor tuvo un delta de 4%, la media fue 24%, el peor fue ###max##%
Lenovo Legion Pro 5 16IRX8 análisis de audio
(±) | la sonoridad del altavoz es media pero buena (72.7 dB)
Graves 100 - 315 Hz
(-) | casi sin bajos - de media 23.7% inferior a la mediana
(±) | la linealidad de los graves es media (10.7% delta a frecuencia anterior)
Medios 400 - 2000 Hz
(+) | medios equilibrados - a sólo 3.8% de la mediana
(±) | la linealidad de los medios es media (7.1% delta respecto a la frecuencia anterior)
Altos 2 - 16 kHz
(+) | máximos equilibrados - a sólo 3.7% de la mediana
(+) | los máximos son lineales (6.7% delta a la frecuencia anterior)
Total 100 - 16.000 Hz
(±) | la linealidad del sonido global es media (21.9% de diferencia con la mediana)
En comparación con la misma clase
» 79% de todos los dispositivos probados de esta clase eran mejores, 6% similares, 16% peores
» El mejor tuvo un delta de 6%, la media fue 18%, el peor fue ###max##%
En comparación con todos los dispositivos probados
» 63% de todos los dispositivos probados eran mejores, 7% similares, 31% peores
» El mejor tuvo un delta de 4%, la media fue 24%, el peor fue ###max##%
Gestión de la energía: el portátil para juegos con mayor autonomía
Consumo de energía
No hay anomalías en cuanto al consumo de energía. Los índices se sitúan en un nivel normal para el hardware instalado. La prueba de estrés y la Witcher 3 test se ejecutaron con un consumo de energía constante. La fuente de alimentación (240 vatios) es más que suficiente.
| Off / Standby | |
| Ocioso | |
| Carga |
|
Clave:
min: | |
| Asus TUF Gaming A16 FA617XS R9 7940HS, Radeon RX 7600S | Lenovo Legion Pro 5 16IRX8 i7-13700HX, GeForce RTX 4060 Laptop GPU | MSI Katana 15 B12VEK i7-12650H, GeForce RTX 4050 Laptop GPU | Medion Erazer Defender P40 i7-13700HX, GeForce RTX 4060 Laptop GPU | Gigabyte G5 KE i5-12500H, GeForce RTX 3060 Laptop GPU | Asus TUF Gaming A16 FA617 R7 7735HS, Radeon RX 7600S | Medio AMD Radeon RX 7600S | Media de la clase Gaming | |
|---|---|---|---|---|---|---|---|---|
| Power Consumption | -107% | 2% | -25% | -16% | -7% | -4% | -63% | |
| Idle Minimum * (Watt) | 7 | 24.5 -250% | 8.5 -21% | 8 -14% | 7.66 -9% | 8 -14% | 7.5 ? -7% | 13.2 ? -89% |
| Idle Average * (Watt) | 10 | 29.2 -192% | 10.2 -2% | 12 -20% | 10.3 -3% | 11 -10% | 10.5 ? -5% | 18.9 ? -89% |
| Idle Maximum * (Watt) | 15 | 34.3 -129% | 11.3 25% | 18 -20% | 16.05 -7% | 16 -7% | 15.5 ? -3% | 24.3 ? -62% |
| Load Average * (Watt) | 86 | 98.7 -15% | 84 2% | 101 -17% | 115.8 -35% | 97 -13% | 91.5 ? -6% | 108.3 ? -26% |
| Witcher 3 ultra * (Watt) | 160.6 | 178.6 -11% | 128 20% | 180.8 -13% | 168.7 -5% | 161.5 -1% | ||
| Load Maximum * (Watt) | 172 | 249.6 -45% | 189 -10% | 284 -65% | 234.6 -36% | 168 2% | 170 ? 1% | 254 ? -48% |
* ... más pequeño es mejor
power consumption Witcher 3 / stress test
power consumption with external monitor
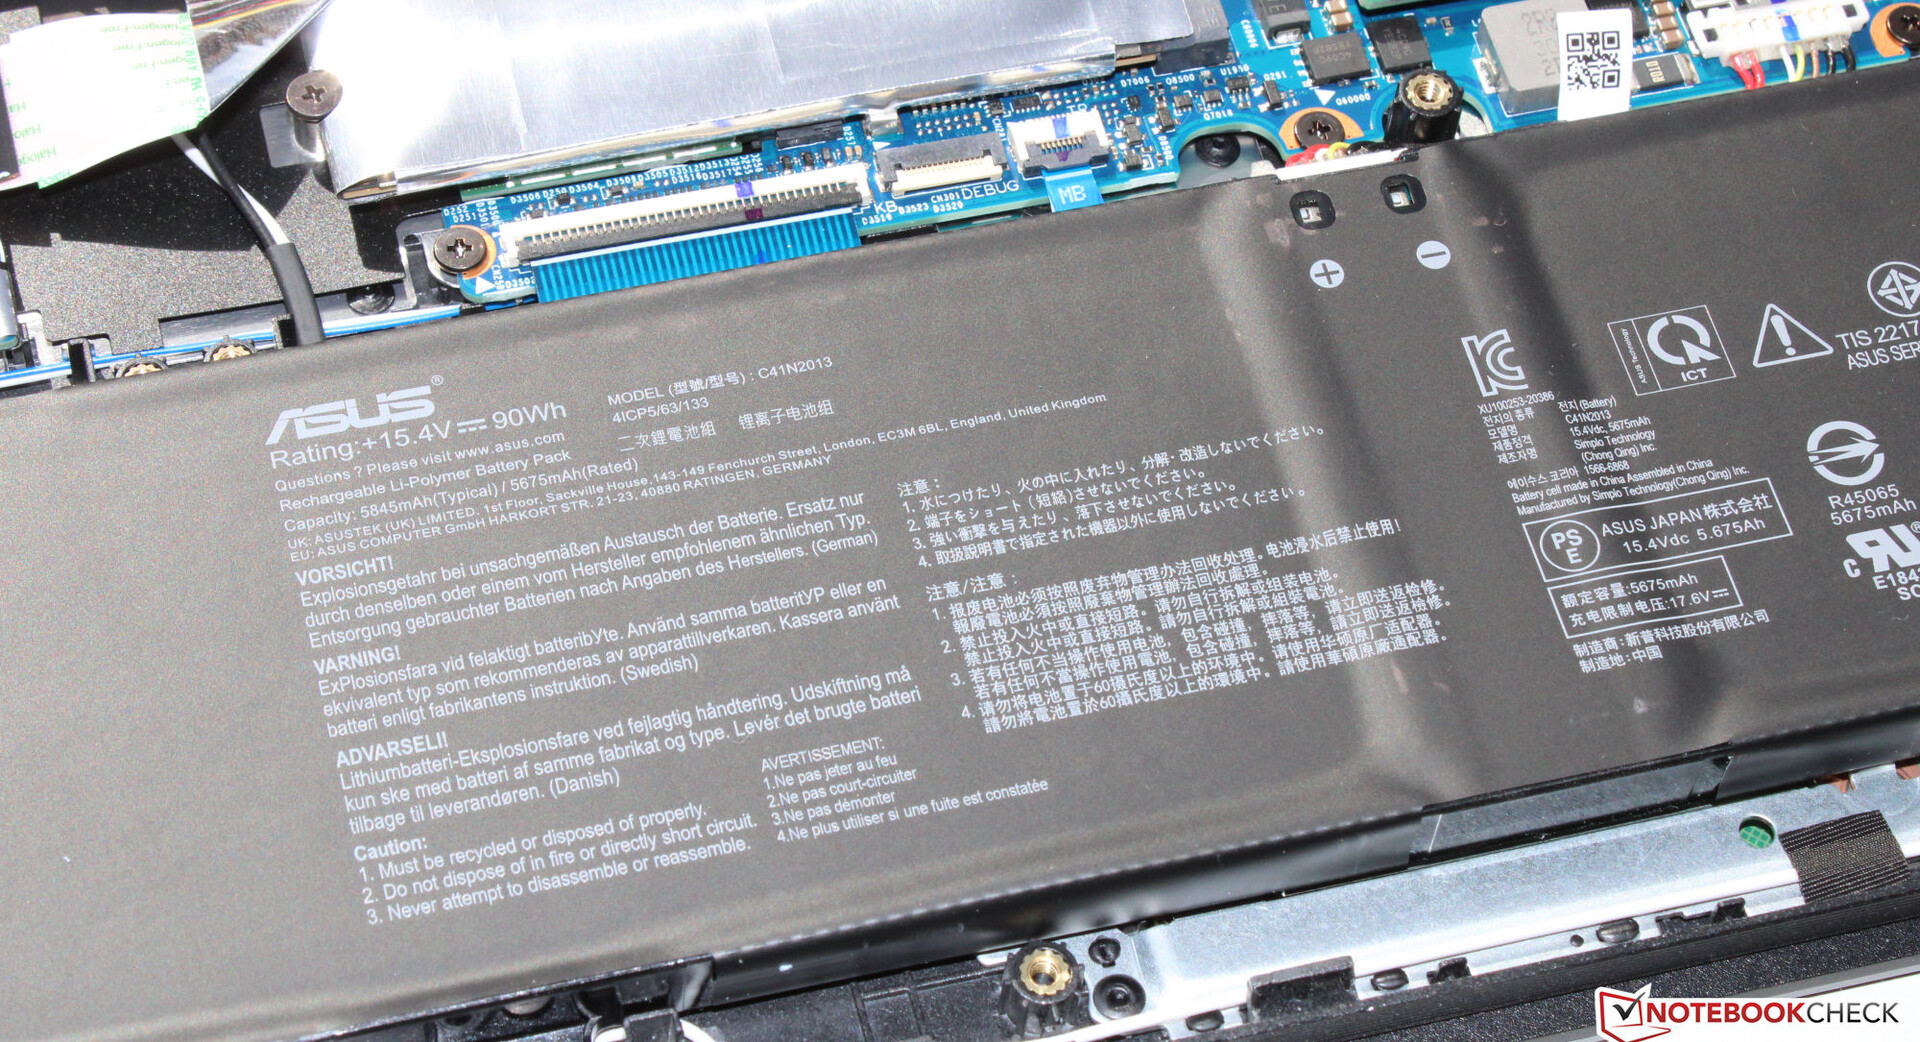
Duración de la batería
El dispositivo de 16 pulgadas logró tiempos de ejecución de 12:25 h y 12:26 h en nuestra prueba WLAN (llamando a sitios web a través de un script) y la prueba de vídeo (película corta Big Buck Bunny (codificación H.264, FHD) en un bucle), respectivamente. Durante ambas pruebas, las funciones de ahorro de energía del portátil estuvieron desactivadas y el brillo de la pantalla se ajustó a unos 150 cd/m². Los módulos inalámbricos también se desactivaron para la prueba de vídeo
El FA617 ofreció unos tiempos de ejecución excelentes y dejó a la competencia por los suelos. La combinación de una APU frugal y una batería de gran capacidad merece la pena.
| Asus TUF Gaming A16 FA617XS R9 7940HS, Radeon RX 7600S, 90 Wh | Lenovo Legion Pro 5 16IRX8 i7-13700HX, GeForce RTX 4060 Laptop GPU, 80 Wh | MSI Katana 15 B12VEK i7-12650H, GeForce RTX 4050 Laptop GPU, 53.5 Wh | Medion Erazer Defender P40 i7-13700HX, GeForce RTX 4060 Laptop GPU, 73 Wh | Gigabyte G5 KE i5-12500H, GeForce RTX 3060 Laptop GPU, 54 Wh | Asus TUF Gaming A16 FA617 R7 7735HS, Radeon RX 7600S, 90 Wh | Media de la clase Gaming | |
|---|---|---|---|---|---|---|---|
| Duración de Batería | -54% | -21% | -29% | -42% | 22% | -18% | |
| Reader / Idle (h) | 20.3 | 6.7 -67% | 8.8 -57% | 20.2 0% | 8.71 ? -57% | ||
| H.264 (h) | 12.4 | 4.4 -65% | 5.7 -54% | 2.2 -82% | 8.26 ? -33% | ||
| WiFi v1.3 (h) | 12.4 | 3.4 -73% | 4.3 -65% | 6.2 -50% | 5.7 -54% | 12.1 -2% | 7.04 ? -43% |
| Load (h) | 0.9 | 0.7 -22% | 1.5 67% | 1.3 44% | 1 11% | 1.5 67% | 1.47 ? 63% |
| Witcher 3 ultra (h) | 1.3 |
Pro
Contra
Veredicto - El portátil Asus con (demasiado) poco almacenamiento
La A16 está preparada para juegos WUXGA con ajustes altos o máximos, pero debería ser útil en muchos otros campos, como la edición y el renderizado de vídeo. Un equipo AMD formado por unRyzen 9 7940HSyRadeon RX 7600Sproporcionan al portátil su rendimiento necesario. Ambos componentes funcionan con frecuencias de reloj consistentemente altas.
El Asus TUF Gaming A16 Advantage Edition es un portátil gaming de gama media muy completo cuya impresionante duración de batería es su orgullo.
Comparado con elRyzen-7-7735HSque se encuentra en sumodelo hermanola 7940HS-APU ofrece un rendimiento de CPU considerablemente mejor a pesar de tener el mismo número de núcleos y los mismos límites de potencia. Aquí, su moderna arquitectura (Zen 4 frente a Zen 3+) y sus mayores frecuencias de reloj se hacen notar.
Las sorprendentes duraciones del dispositivo son ciertamente su único punto de venta: Sus prácticas mediciones de alrededor de 12.5 h no suelen ser alcanzadas por muchos otros portátiles de oficina. Un punto positivo: La batería se puede cargar usando una fuente de alimentación USB-C (mín. 65 vatios, 20 V) - un puerto USB-C soporta Power Delivery. La fuente de alimentación propietaria no tendría que llevarse necesariamente encima.
La pantalla IPS instalada (16 pulgadas, 1,920 x 1,200 pixels) tiene un ratio de trabajo de 16:10 y en general nos dejó una buena impresión - si acaso, el brillo podría ser un poco más fuerte. El SSD básico instalado sería perfectamente adecuado para un simple portátil de oficina - pero no para un portátil de juego de 1.700 $. El almacenamiento ofrecido (512 GB) y los datos no están a la altura de las necesidades de los usuarios ni de sus expectativas.
ElLegion Pro 5 16IRX8podría ser una alternativa adecuada. Ofrece mejor rendimiento y una pantalla más brillante que el A16 - pero está claro que no tiene los mismos impresionantes tiempos de ejecución que ofrecer. ElGigabyte G5 KEpodría ser una buena alternativa económica: Consigues un nivel similar de rendimiento gráfico por un precio mucho menor. Aunque: Este portátil no viene con un sistema operativo Windows preinstalado.
Precio y disponibilidad
La versión del A16 con 16 GB de RAM y un SSD de 512 GB puede adquirirse en el sitio web de Asus https://uk.store.asus.com/asus-tuf-gaming-a16-advantage-edition-2023-9415-22280.html por unos 1.371 dólares.
Asus TUF Gaming A16 FA617XS
- 06/05/2023 v7 (old)
Sascha Mölck
Transparencia
La selección de los dispositivos que se van a reseñar corre a cargo de nuestro equipo editorial. La muestra de prueba fue proporcionada al autor en calidad de préstamo por el fabricante o el minorista a los efectos de esta reseña. El prestamista no tuvo ninguna influencia en esta reseña, ni el fabricante recibió una copia de la misma antes de su publicación. No había ninguna obligación de publicar esta reseña. Como empresa de medios independiente, Notebookcheck no está sujeta a la autoridad de fabricantes, minoristas o editores.
Así es como prueba Notebookcheck
Cada año, Notebookcheck revisa de forma independiente cientos de portátiles y smartphones utilizando procedimientos estandarizados para asegurar que todos los resultados son comparables. Hemos desarrollado continuamente nuestros métodos de prueba durante unos 20 años y hemos establecido los estándares de la industria en el proceso. En nuestros laboratorios de pruebas, técnicos y editores experimentados utilizan equipos de medición de alta calidad. Estas pruebas implican un proceso de validación en varias fases. Nuestro complejo sistema de clasificación se basa en cientos de mediciones y puntos de referencia bien fundamentados, lo que mantiene la objetividad.Price comparison

