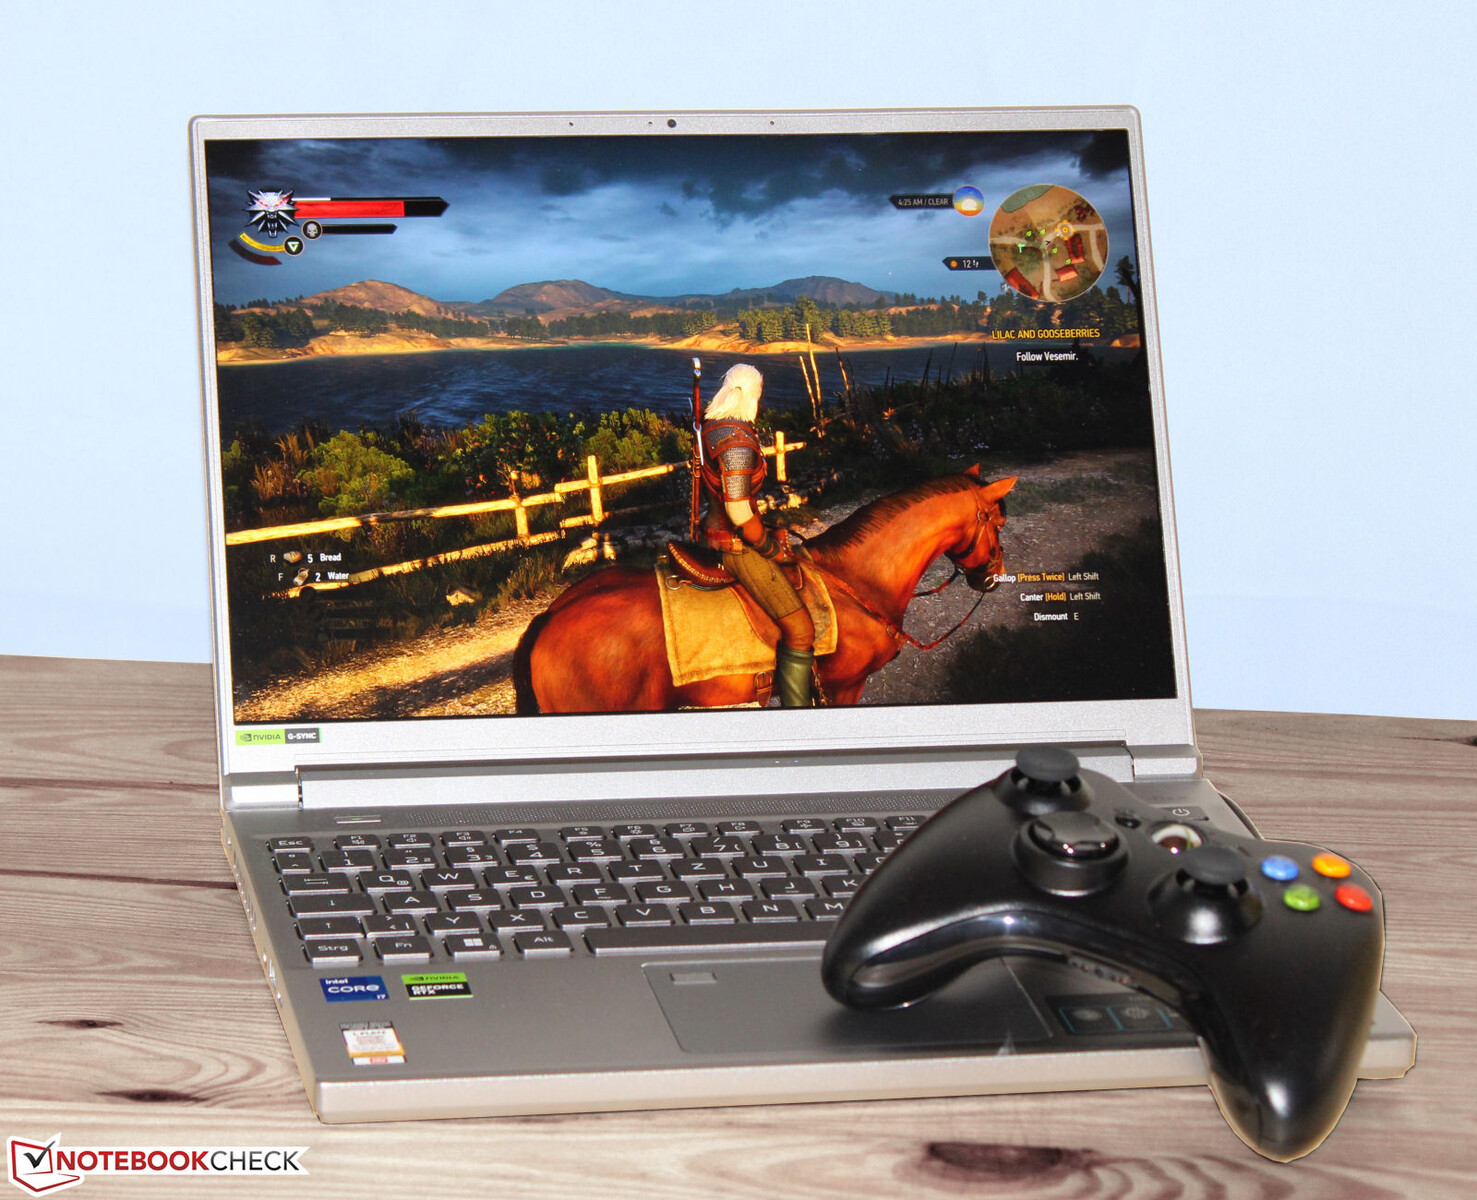
Análisis del Acer Predator Triton 14: Un portátil para juegos de 14 pulgadas con una pantalla brillante y una RTX 4050
El portátil de juegos compacto representa el estado actual de la técnica: Raptor Lake, Ada Lovelace, LPDDR5, PCIe 4, Thunderbolt 4. Estamos ante el sucesor casi idéntico del ya analizado Acer Predator Triton 300 SE. Sus competidores son el Razer Blade 14elMSI Stealth 14 Studio A13Vy elGigabyte Aero 14 OLED BMFelApple MacBook Pro 14 2023 M2 Pro Entryy elAsus ROG Zephyrus G14 GA402RJ.
Posibles contendientes en la comparación
Valoración | Fecha | Modelo | Peso | Altura | Tamaño | Resolución | Precio |
|---|---|---|---|---|---|---|---|
| 87.3 % v7 (old) | 07/2023 | Acer Predator Triton 14 PT14-51 i7-13700H, GeForce RTX 4050 Laptop GPU | 1.7 kg | 19.81 mm | 14.00" | 2560x1600 | |
| 88.7 % v7 (old) | 06/2023 | Razer Blade 14 RTX 4070 R9 7940HS, GeForce RTX 4070 Laptop GPU | 1.8 kg | 17.99 mm | 14.00" | 2560x1600 | |
| 86.4 % v7 (old) | 10/2022 | Asus ROG Zephyrus G14 GA402RJ R7 6800HS, Radeon RX 6700S | 1.7 kg | 19.5 mm | 14.00" | 2560x1600 | |
| 85.4 % v7 (old) | 07/2023 | MSI Stealth 14 Studio A13V i7-13700H, GeForce RTX 4050 Laptop GPU | 1.7 kg | 19 mm | 14.00" | 2560x1600 | |
| 89.4 % v7 (old) | 05/2023 | Gigabyte Aero 14 OLED BMF i7-13700H, GeForce RTX 4050 Laptop GPU | 1.4 kg | 17 mm | 14.00" | 2880x1800 | |
| 93.4 % v7 (old) | 03/2023 | Apple MacBook Pro 14 2023 M2 Pro Entry M2 Pro 10-Core, M2 Pro 16-Core GPU | 1.6 kg | 15.5 mm | 14.20" | 3024x1964 |
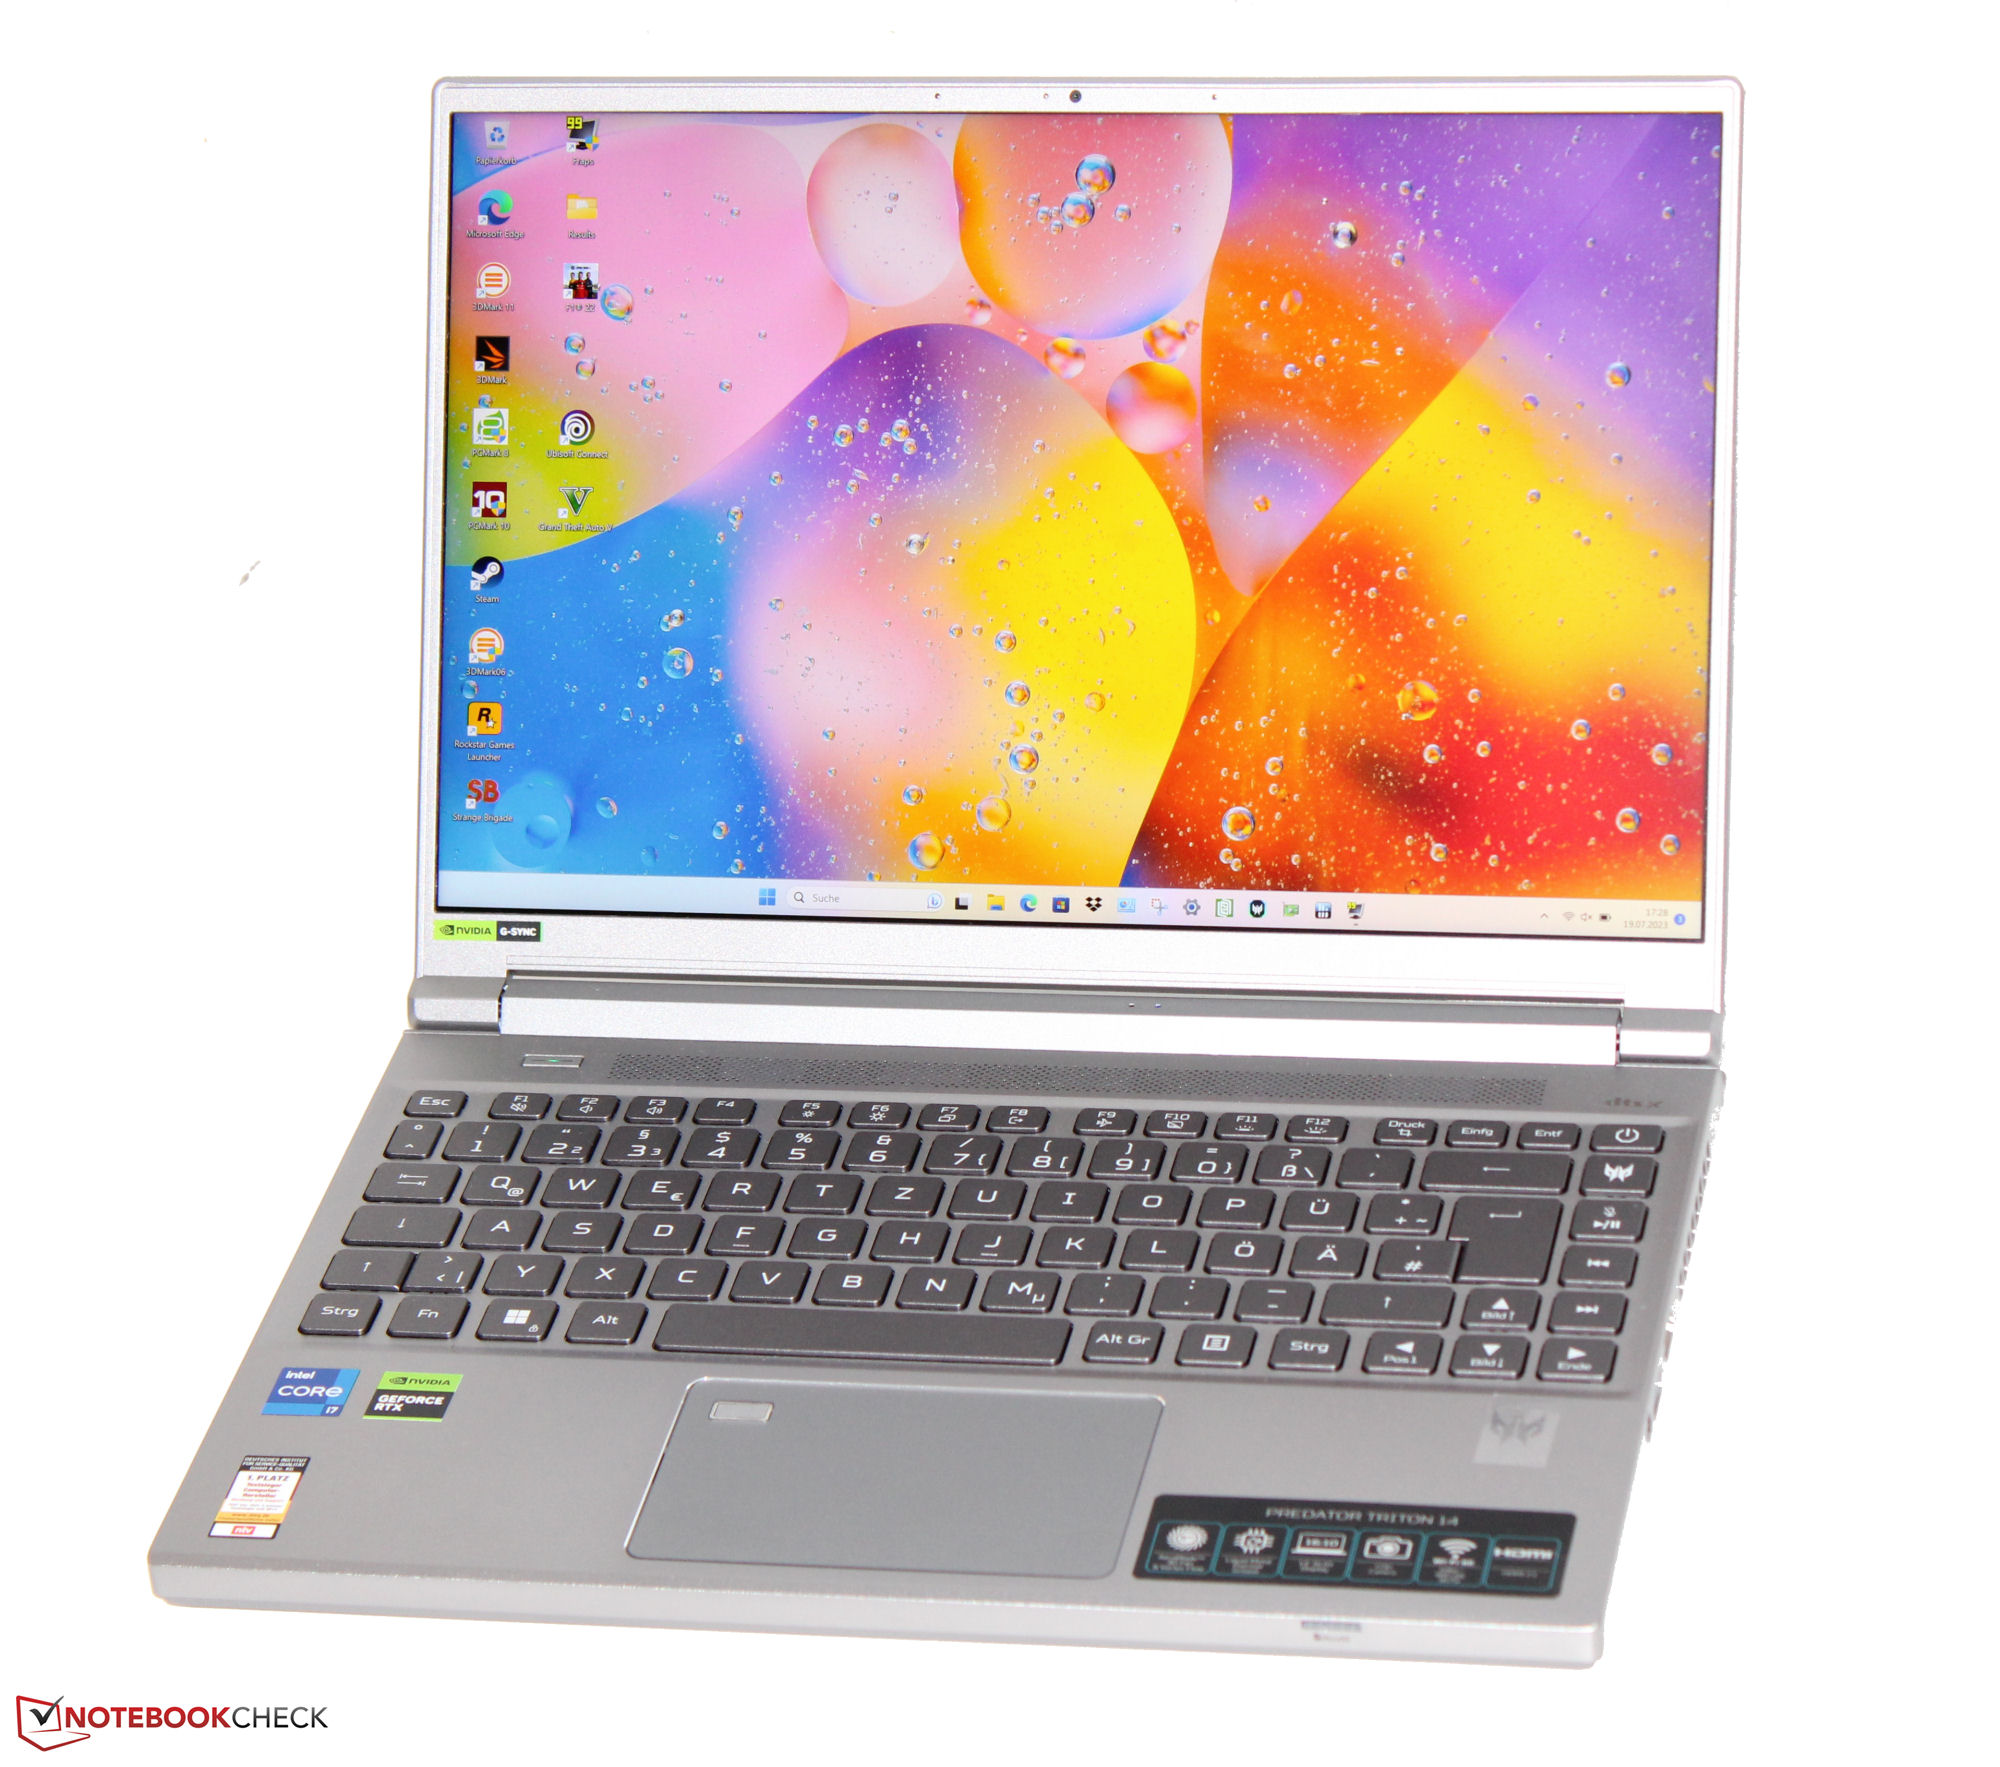
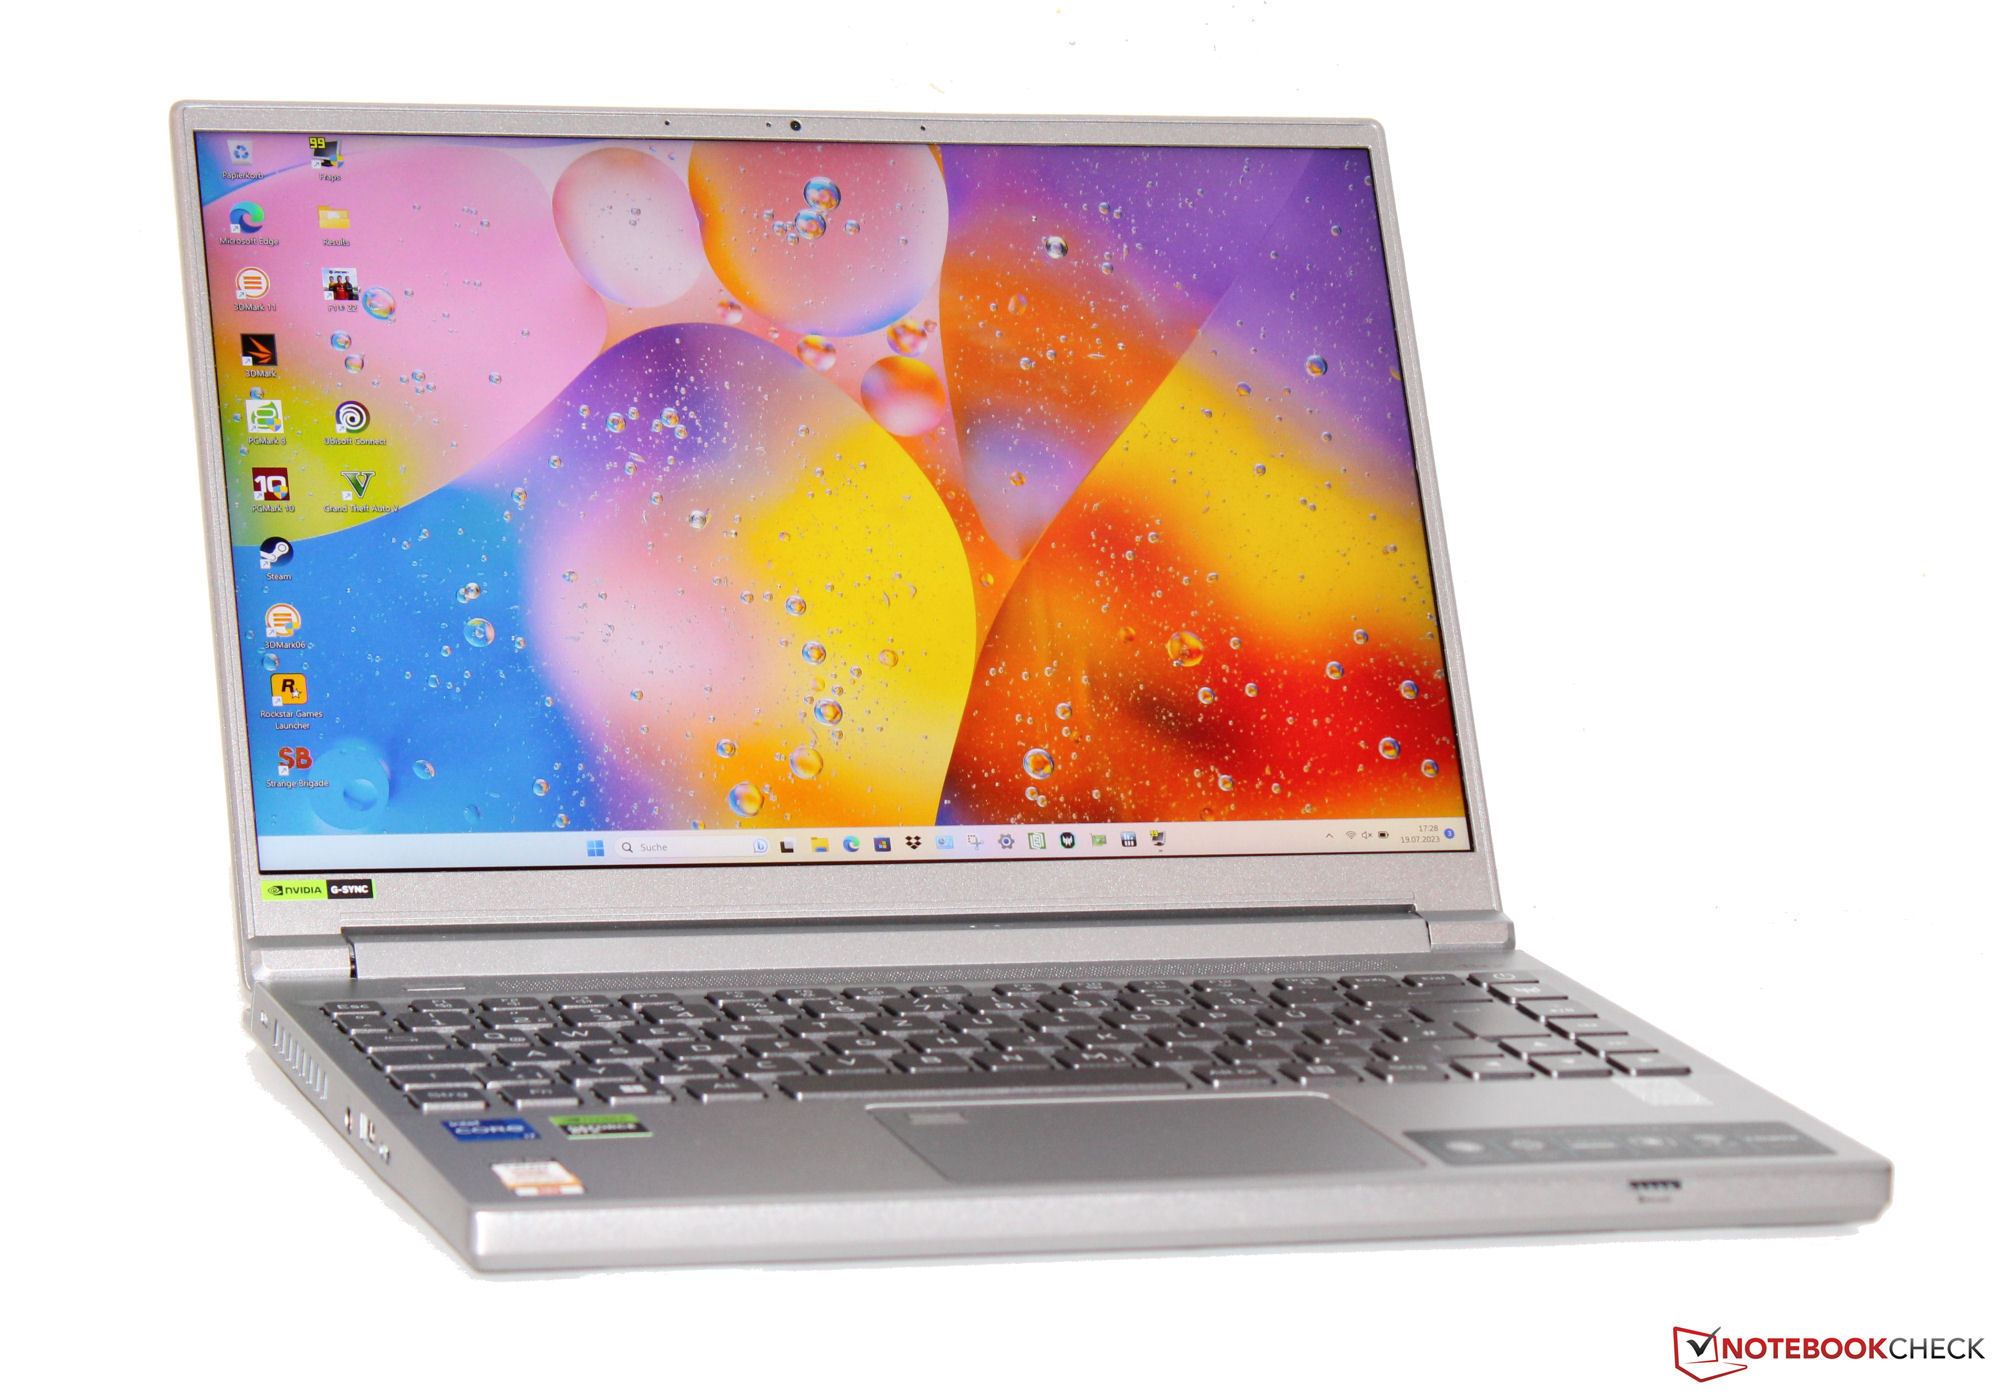
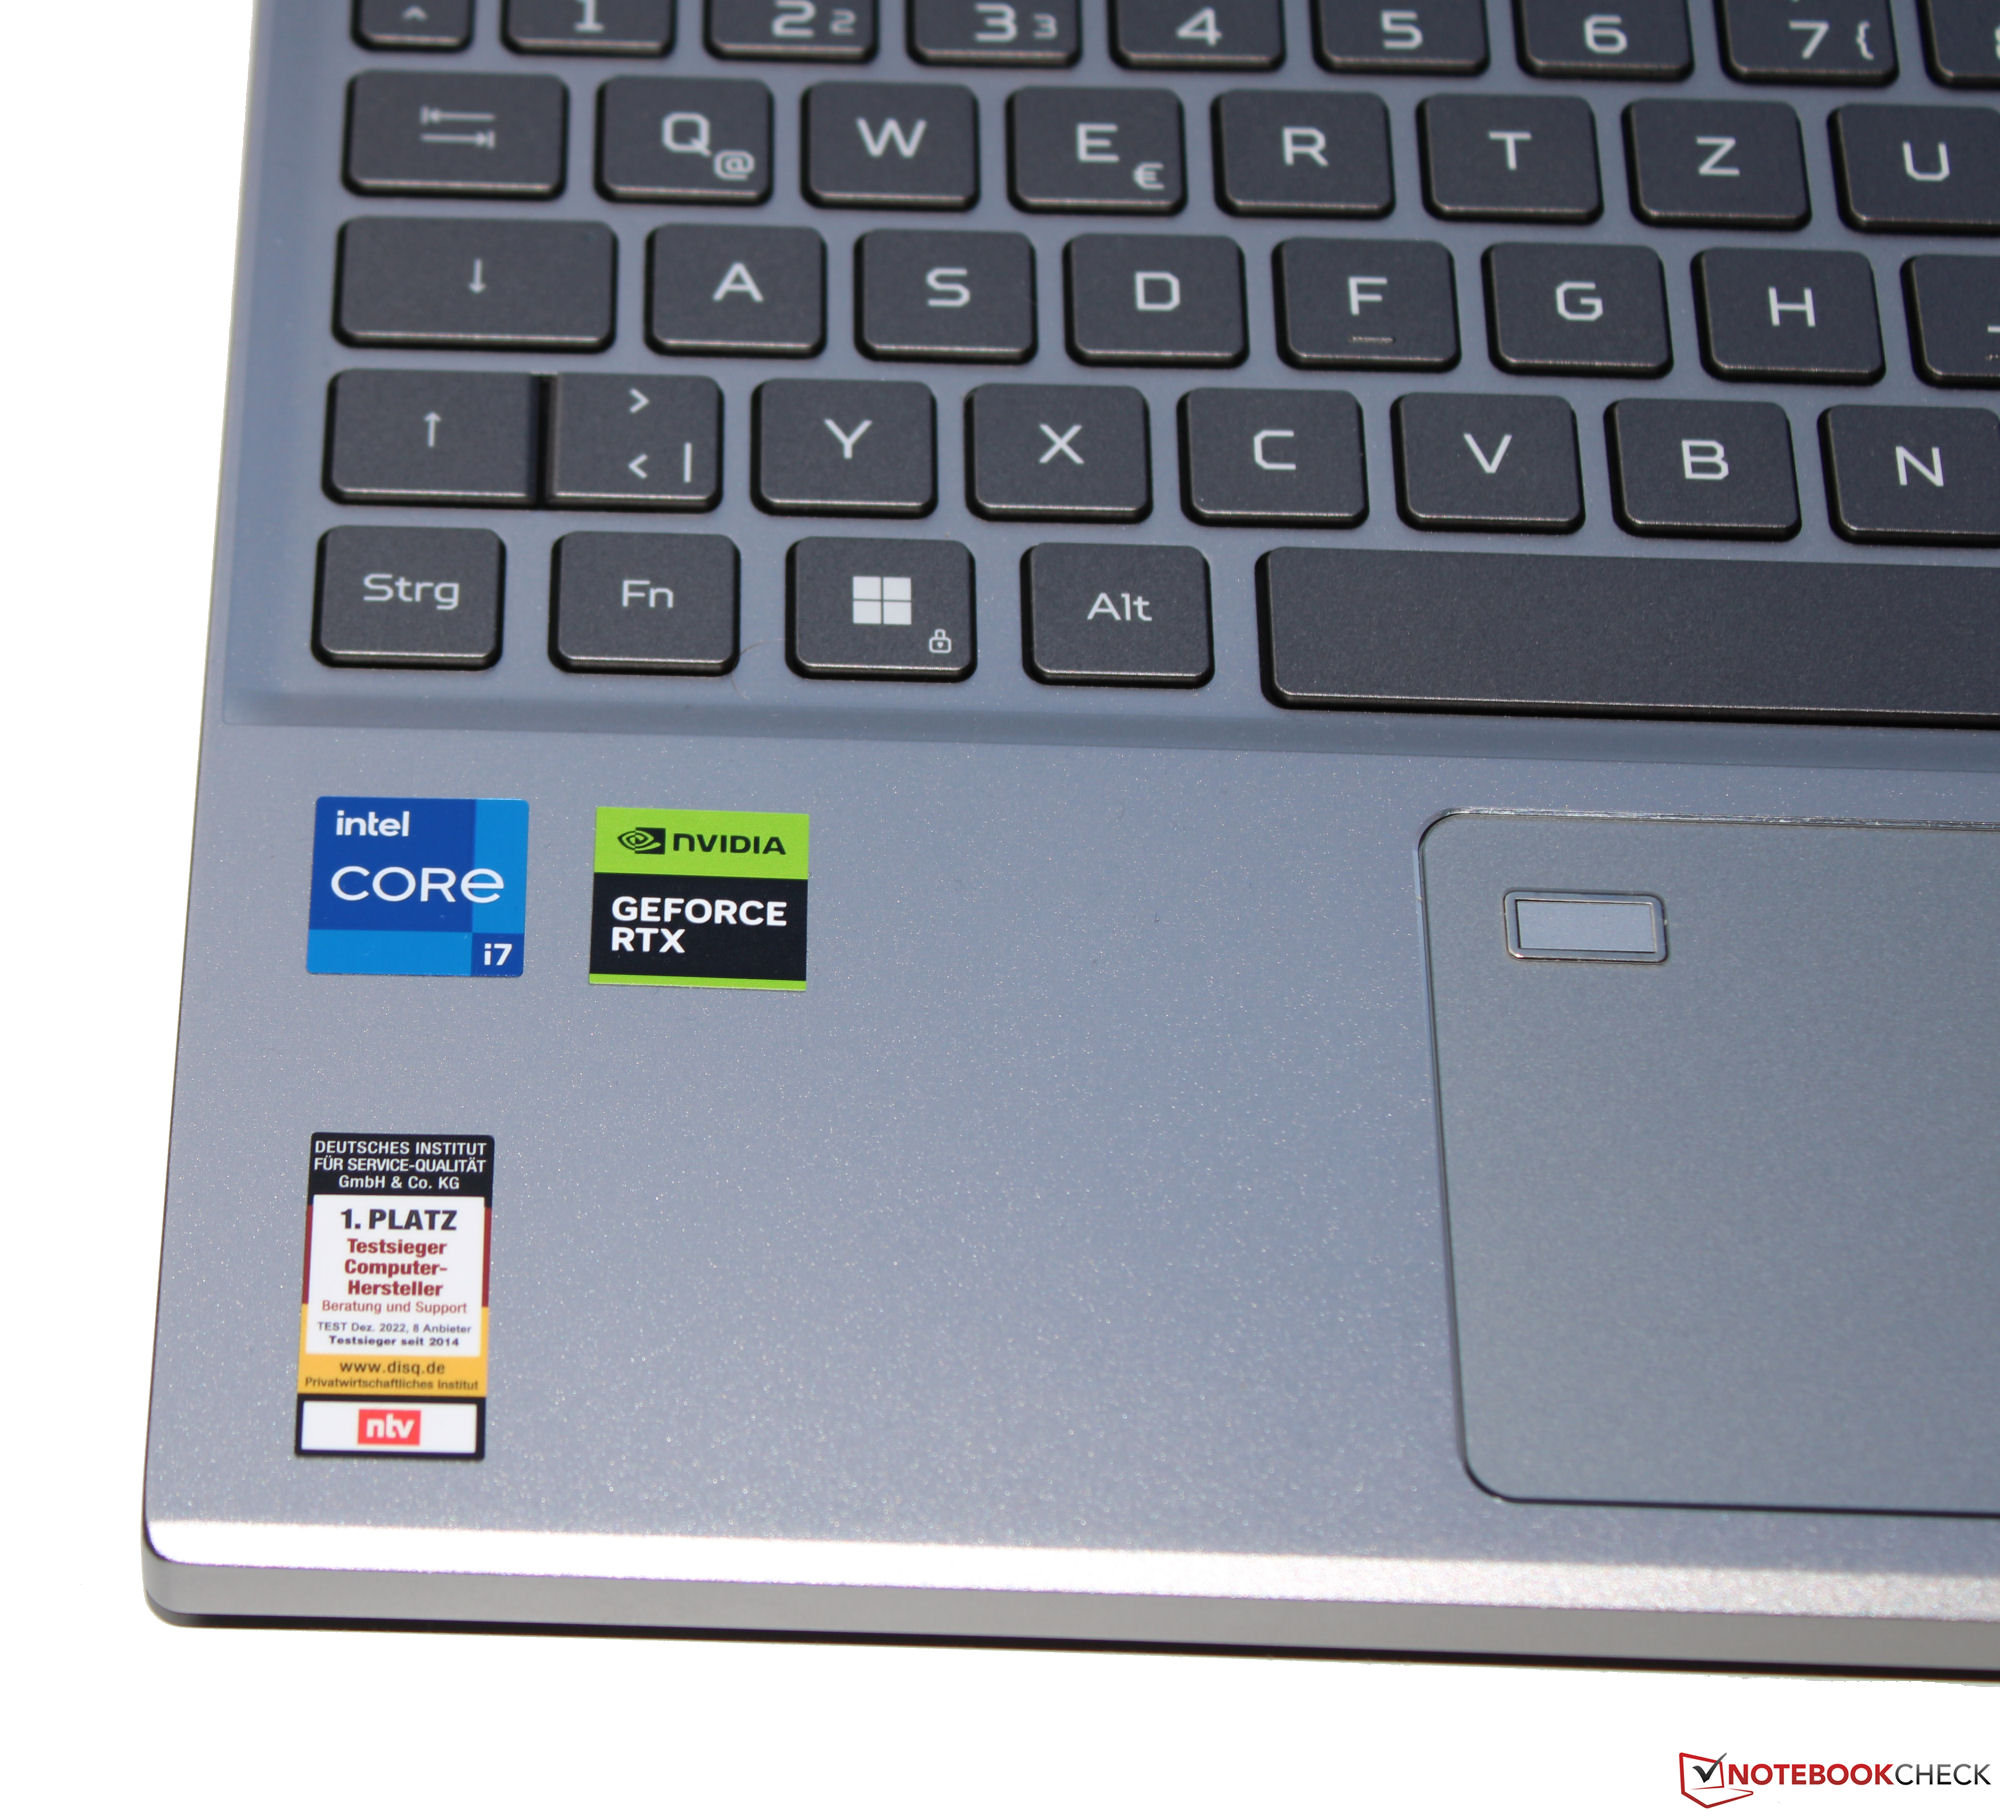
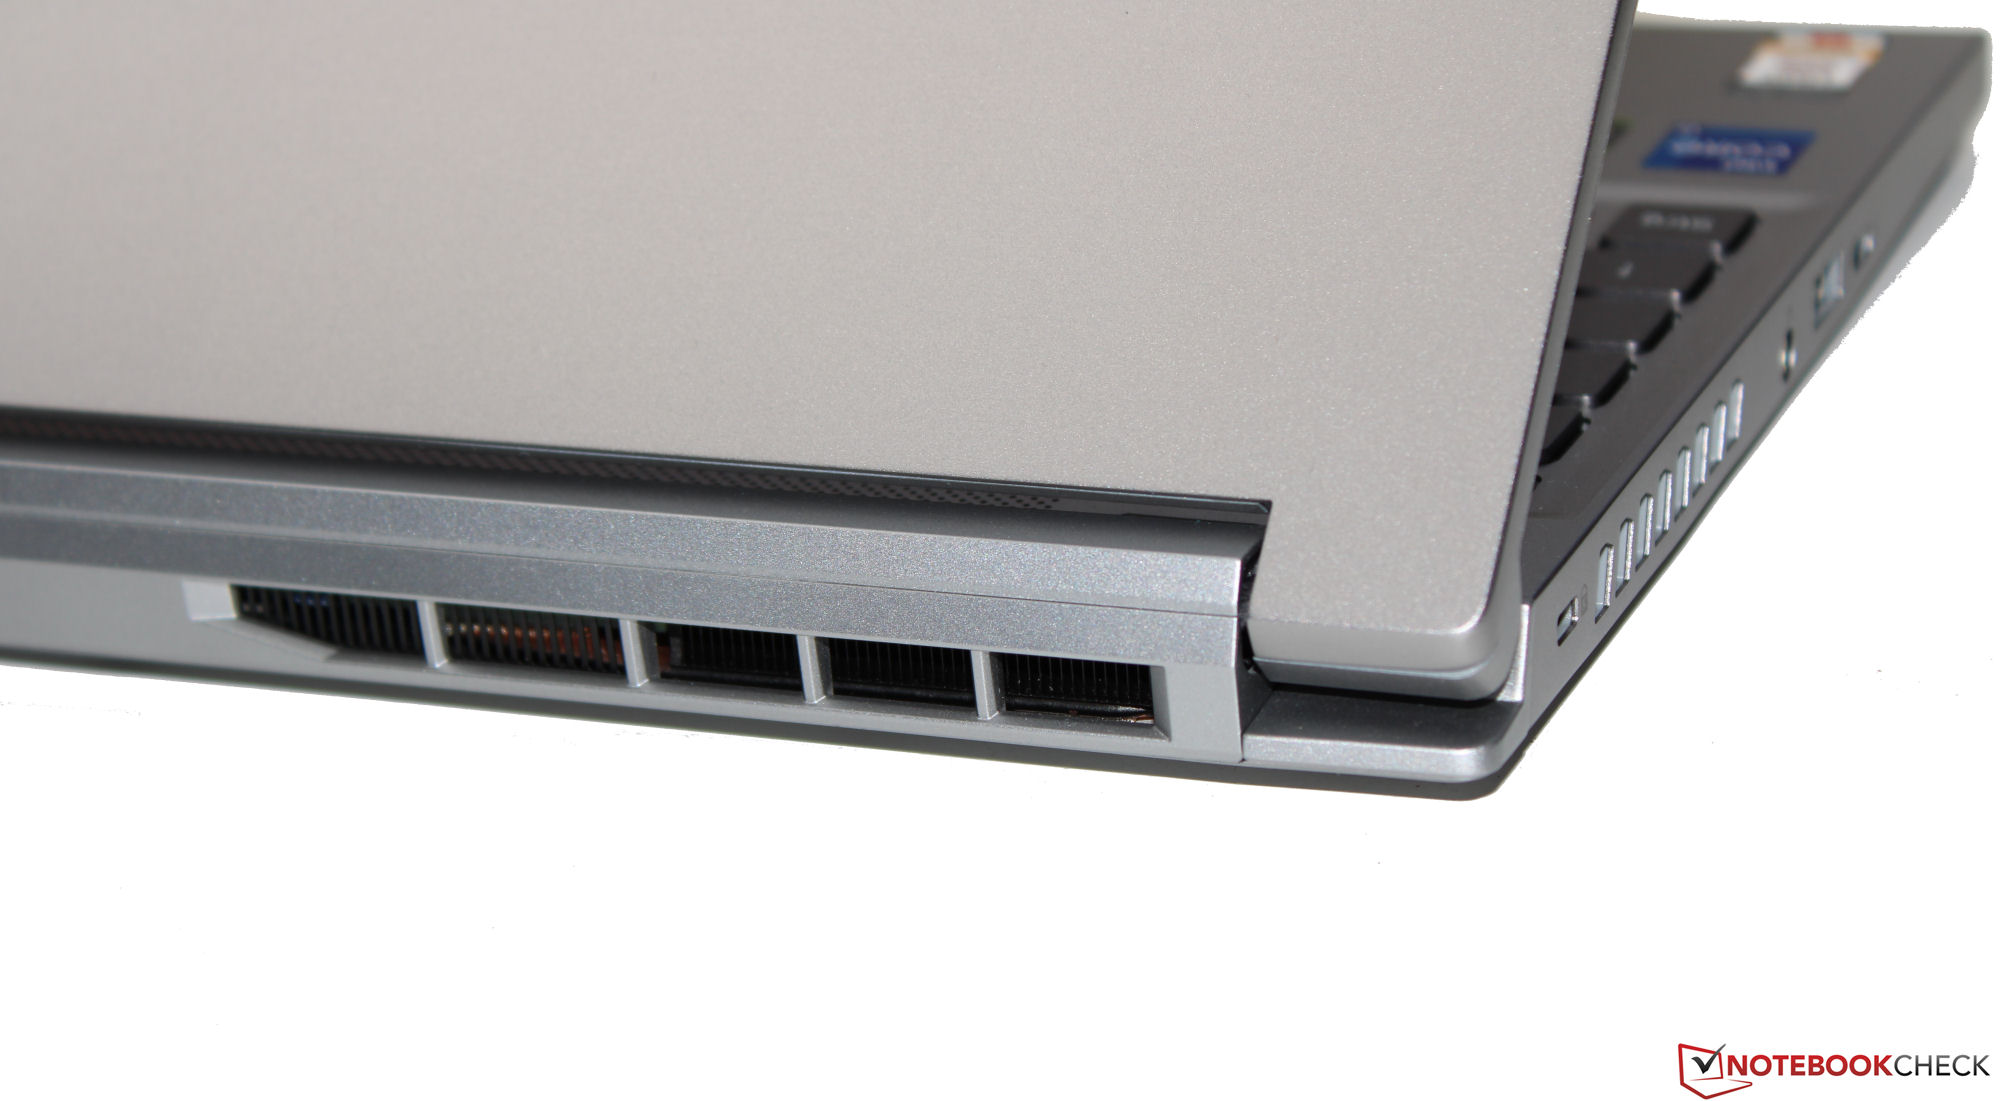
Carcasa - Acer ha dotado al Triton de un chasis metálico
La tecnología del portátil se aloja en una carcasa metálica de color gris plateado. Acer ha optado por superficies lisas y mates. El ordenador compacto no ofrece ningún elemento de diseño llamativo, lo que significa que también puede pasar por un portátil de oficina. Tampoco hay extravagantes barras de LED. Además de la iluminación de las teclas, un pequeño logotipo Predator iluminado en el reposamanos mezcla las cosas en cuanto al color.
El Triton no muestra signos de defectos de fabricación. Las dimensiones del hueco son correctas y no sobresale material del dispositivo. La unidad base y la tapa se pueden torcer ligeramente pero todo dentro de un rango aceptable. La presión ejercida sobre la parte posterior de la tapa no provoca distorsiones de la imagen. Las bisagras mantienen la tapa firmemente en su sitio y el ángulo máximo de apertura es de unos 175 grados. Se puede abrir con una sola mano.
En cuanto a las dimensiones, no hay mucho que elegir entre la mayoría de los dispositivos de la competencia. ElMSI Stealth 14 Studio A13Ves la excepción a la regla: ocupa más espacio que la competencia. En cuanto al peso, el portátil Acer se encuentra en medio del pelotón.
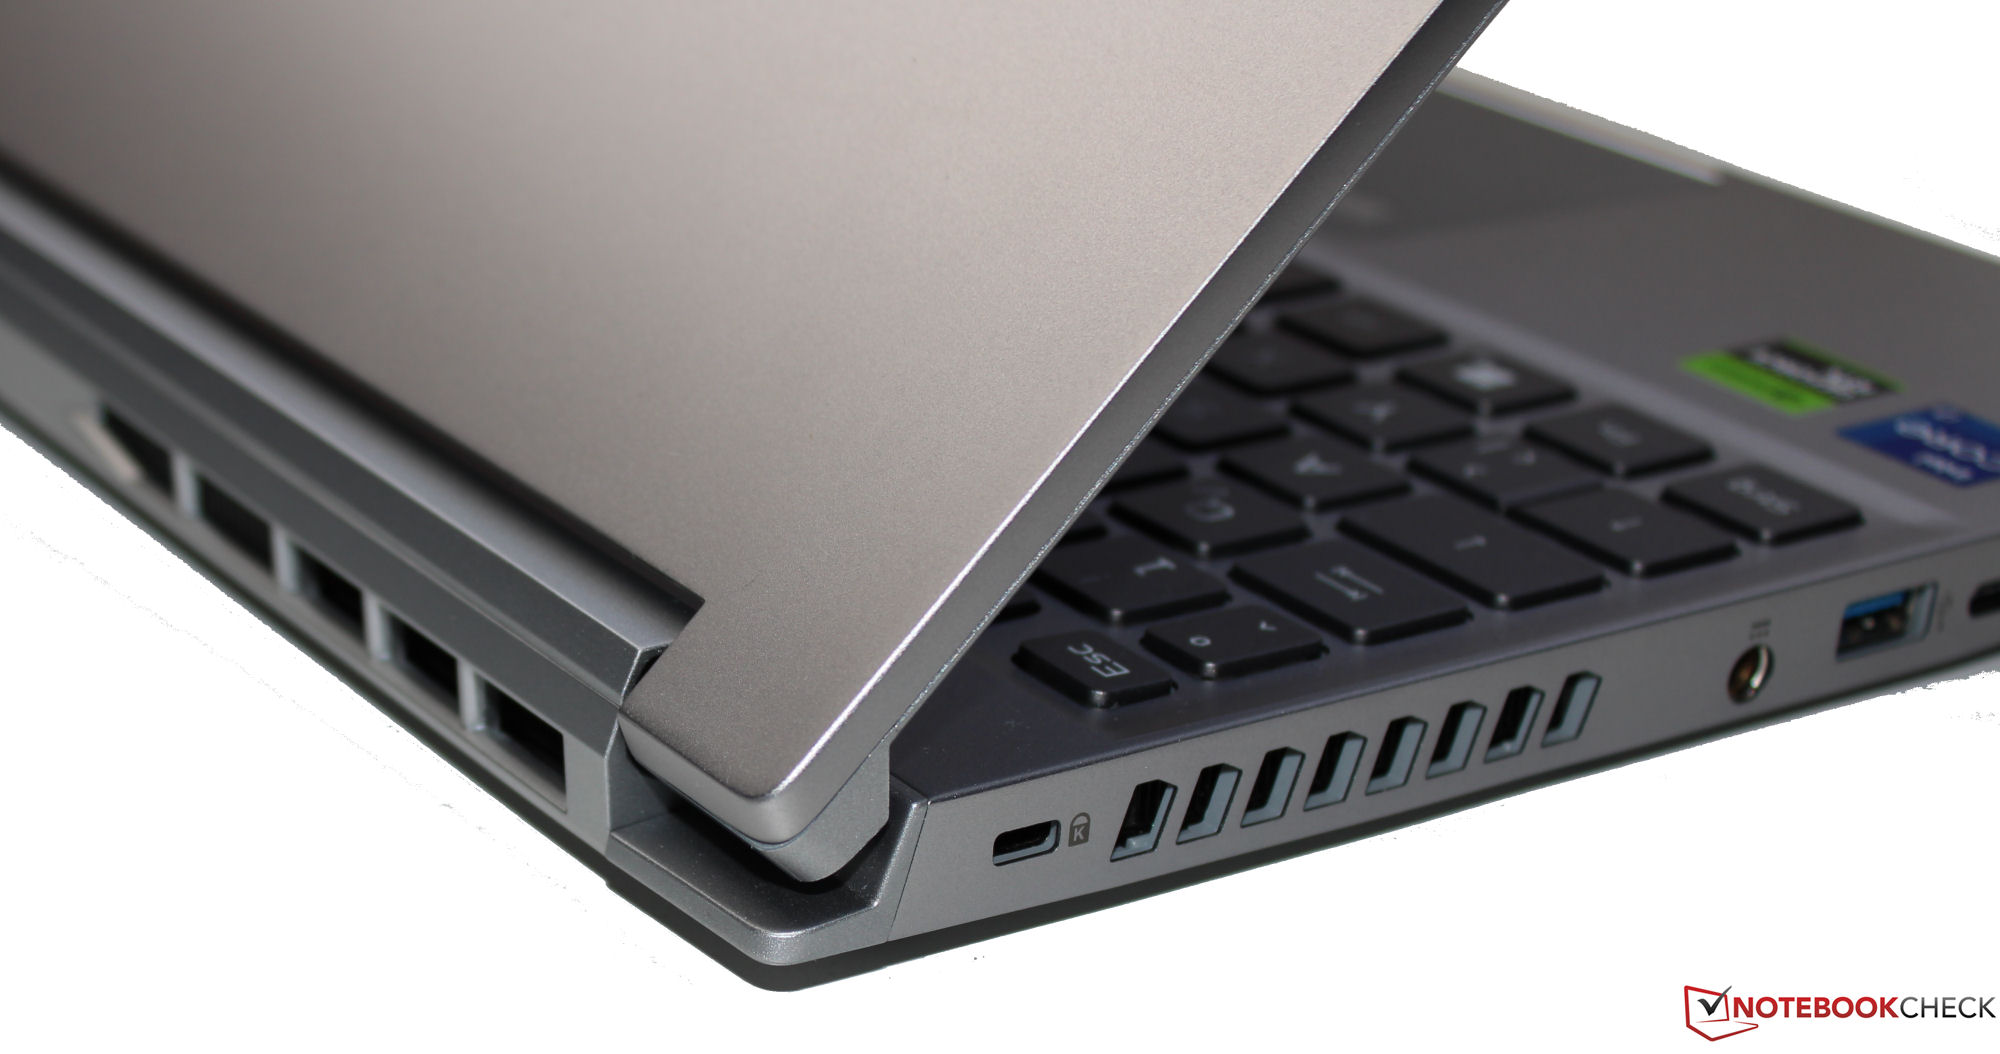
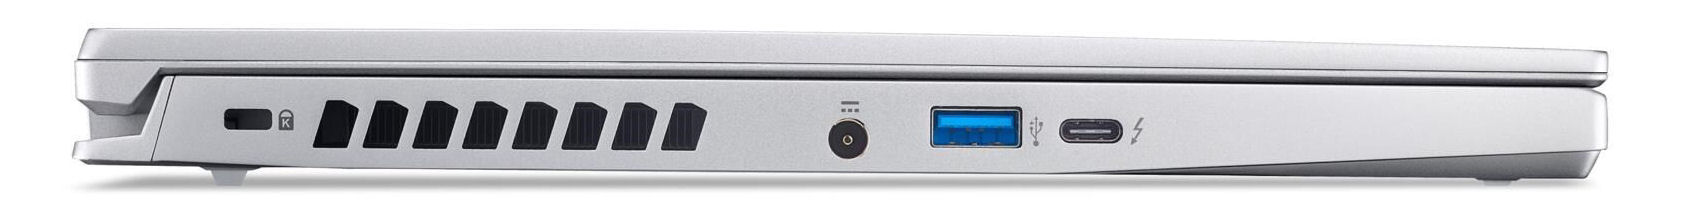
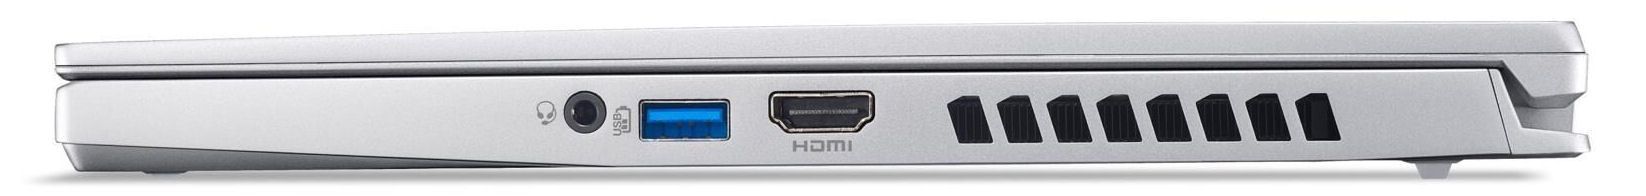
Características - El PT14 ofrece Thunderbolt 4
La selección de puertos es bastante limitada: El PT14 puede llamar suyos a dos puertos USB-A (USB 3.2 Gen 2) y un puerto USB-C (Thunderbolt 4). El puerto USB-C soporta Power Delivery y puede dar salida a una señal Displayport. Hay un total de dos salidas de vídeo (HDMI 2.1, DP). Una clavija de audio completa el paquete.
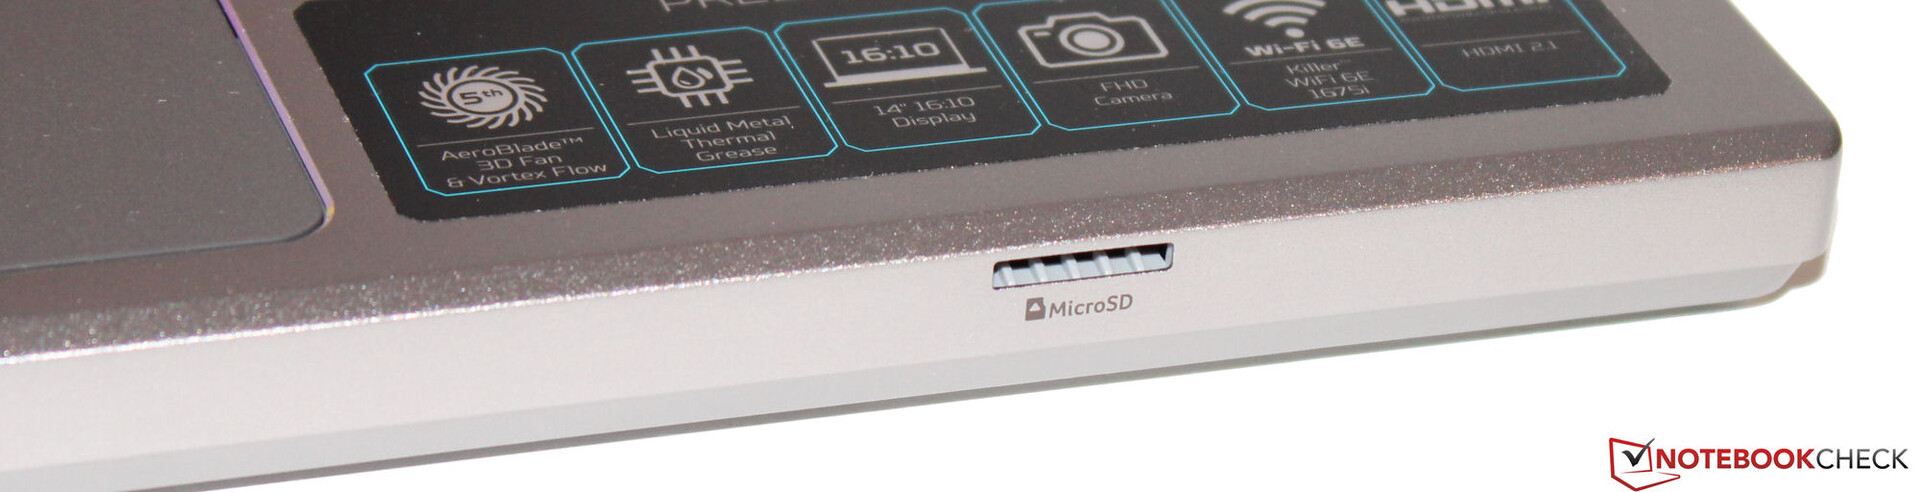
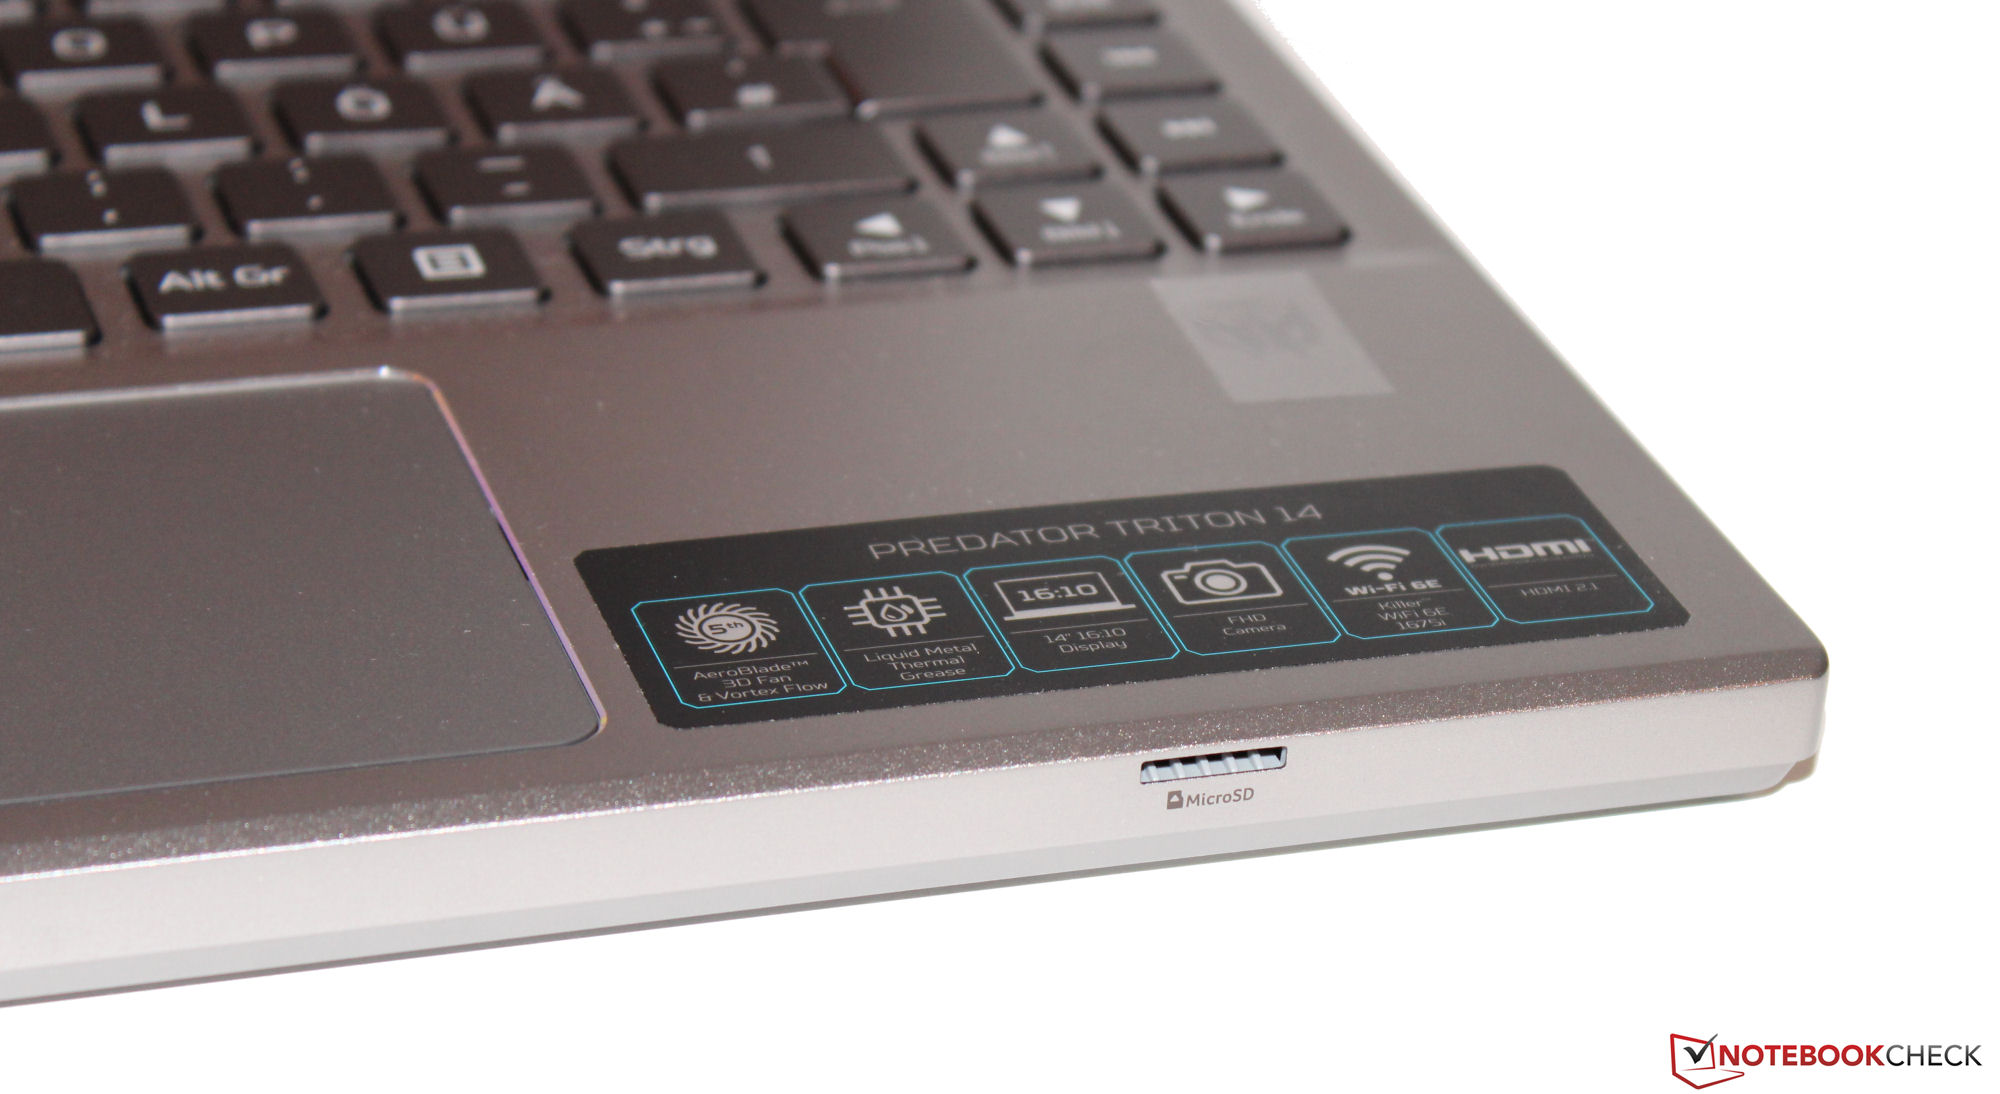
Lector de tarjetas SD
El lector de tarjetas de memoria MicroSD (tarjeta de referencia: AV PRO microSD 128 GB V60) pertenece a los modelos más lentos con sus velocidades máximas de transferencia de 19 MB/s (la transferencia de 250 archivos de imagen jpg de unos 5 MB cada uno) y 26 MB/s (la copia de grandes bloques de datos).
| SD Card Reader | |
| average JPG Copy Test (av. of 3 runs) | |
| Gigabyte Aero 14 OLED BMF | |
| Asus ROG Zephyrus G14 GA402RJ (AV PRO microSD 128 GB V60) | |
| Media de la clase Gaming (20.9 - 210, n=55, últimos 2 años) | |
| Acer Predator Triton 14 PT14-51 (AV PRO microSD 128 GB V60) | |
| maximum AS SSD Seq Read Test (1GB) | |
| Gigabyte Aero 14 OLED BMF | |
| Asus ROG Zephyrus G14 GA402RJ (AV PRO microSD 128 GB V60) | |
| Media de la clase Gaming (25.5 - 261, n=52, últimos 2 años) | |
| Acer Predator Triton 14 PT14-51 (AV PRO microSD 128 GB V60) | |
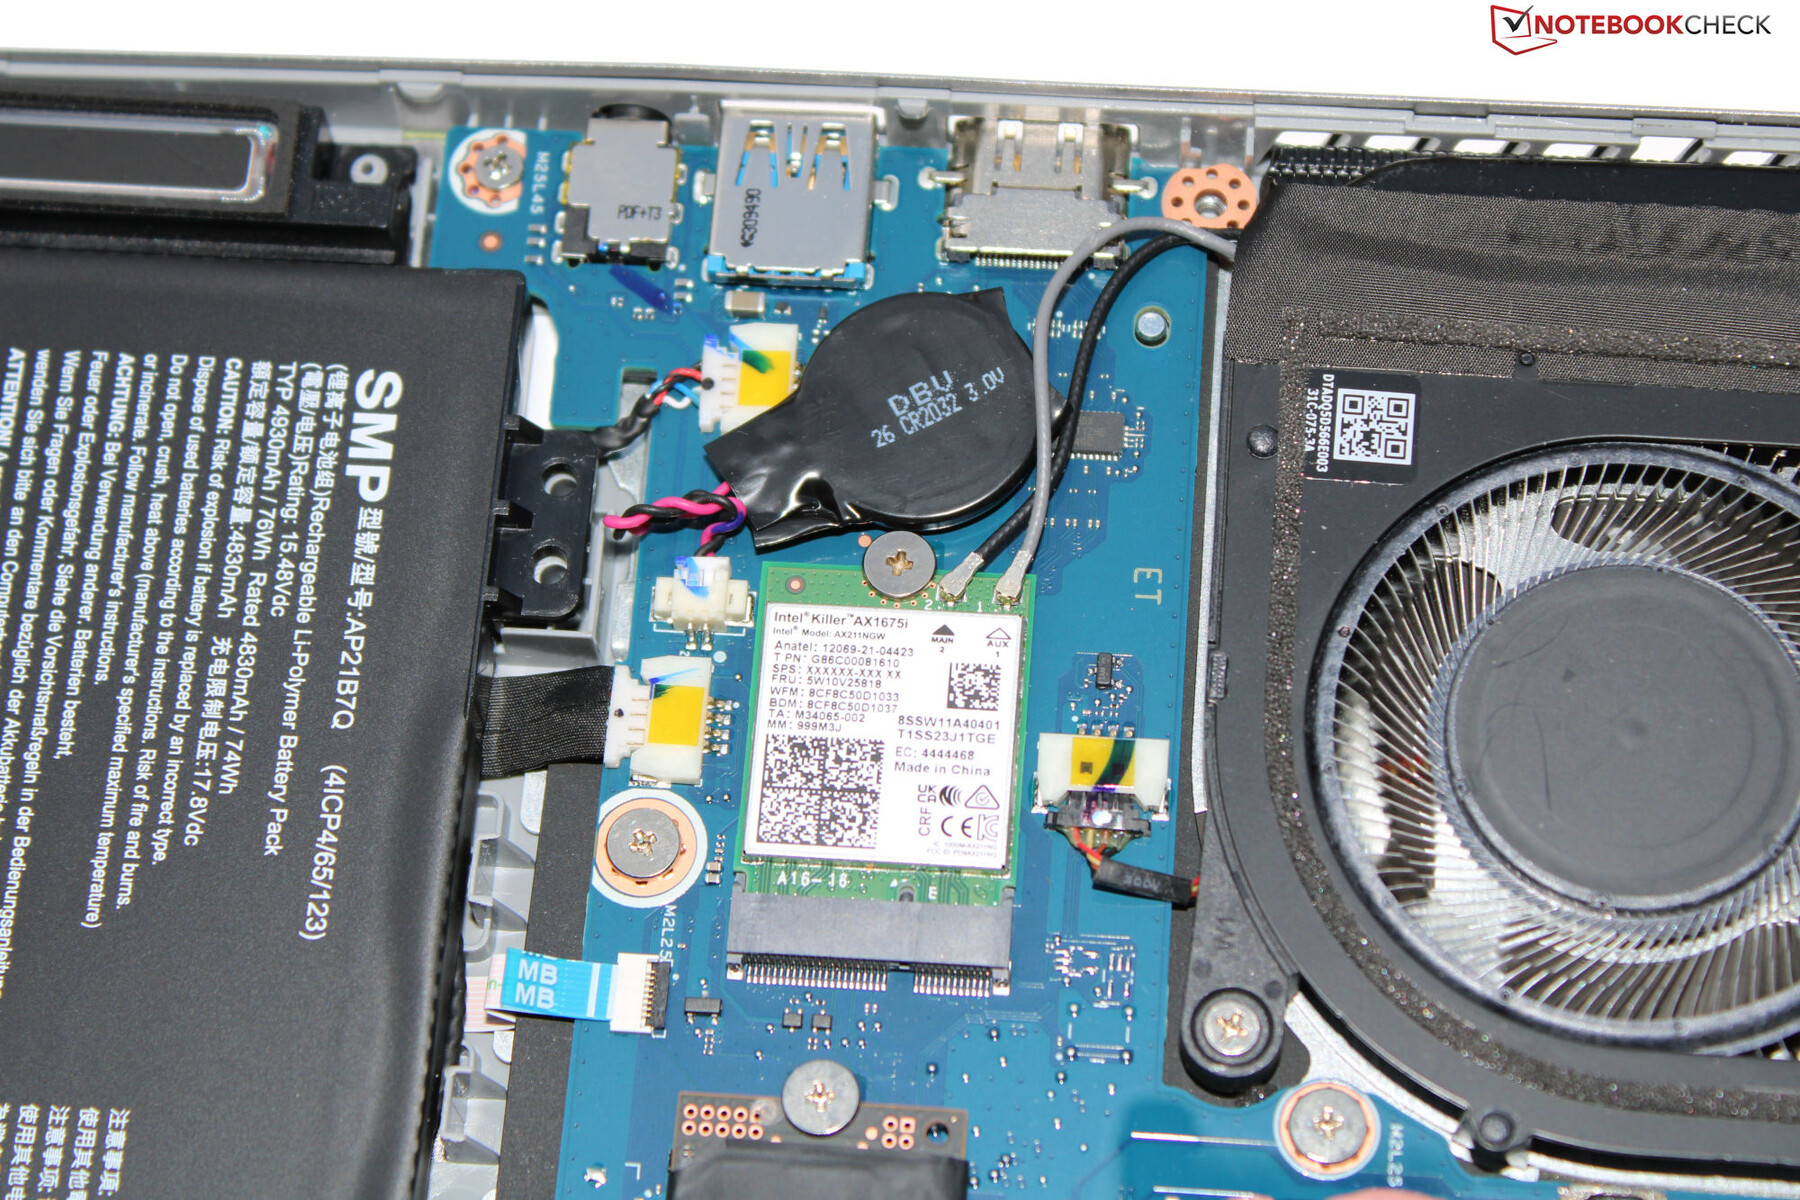
Comunicación
En condiciones óptimas (sin dispositivos Wi-Fi cerca, una distancia corta entre el portátil y el PC servidor), se pueden alcanzar velocidades de datos Wi-Fi maravillosas. El portátil lleva a bordo un chip Wi-Fi 6E (Killer AX1675i). No dispone de puerto Ethernet.
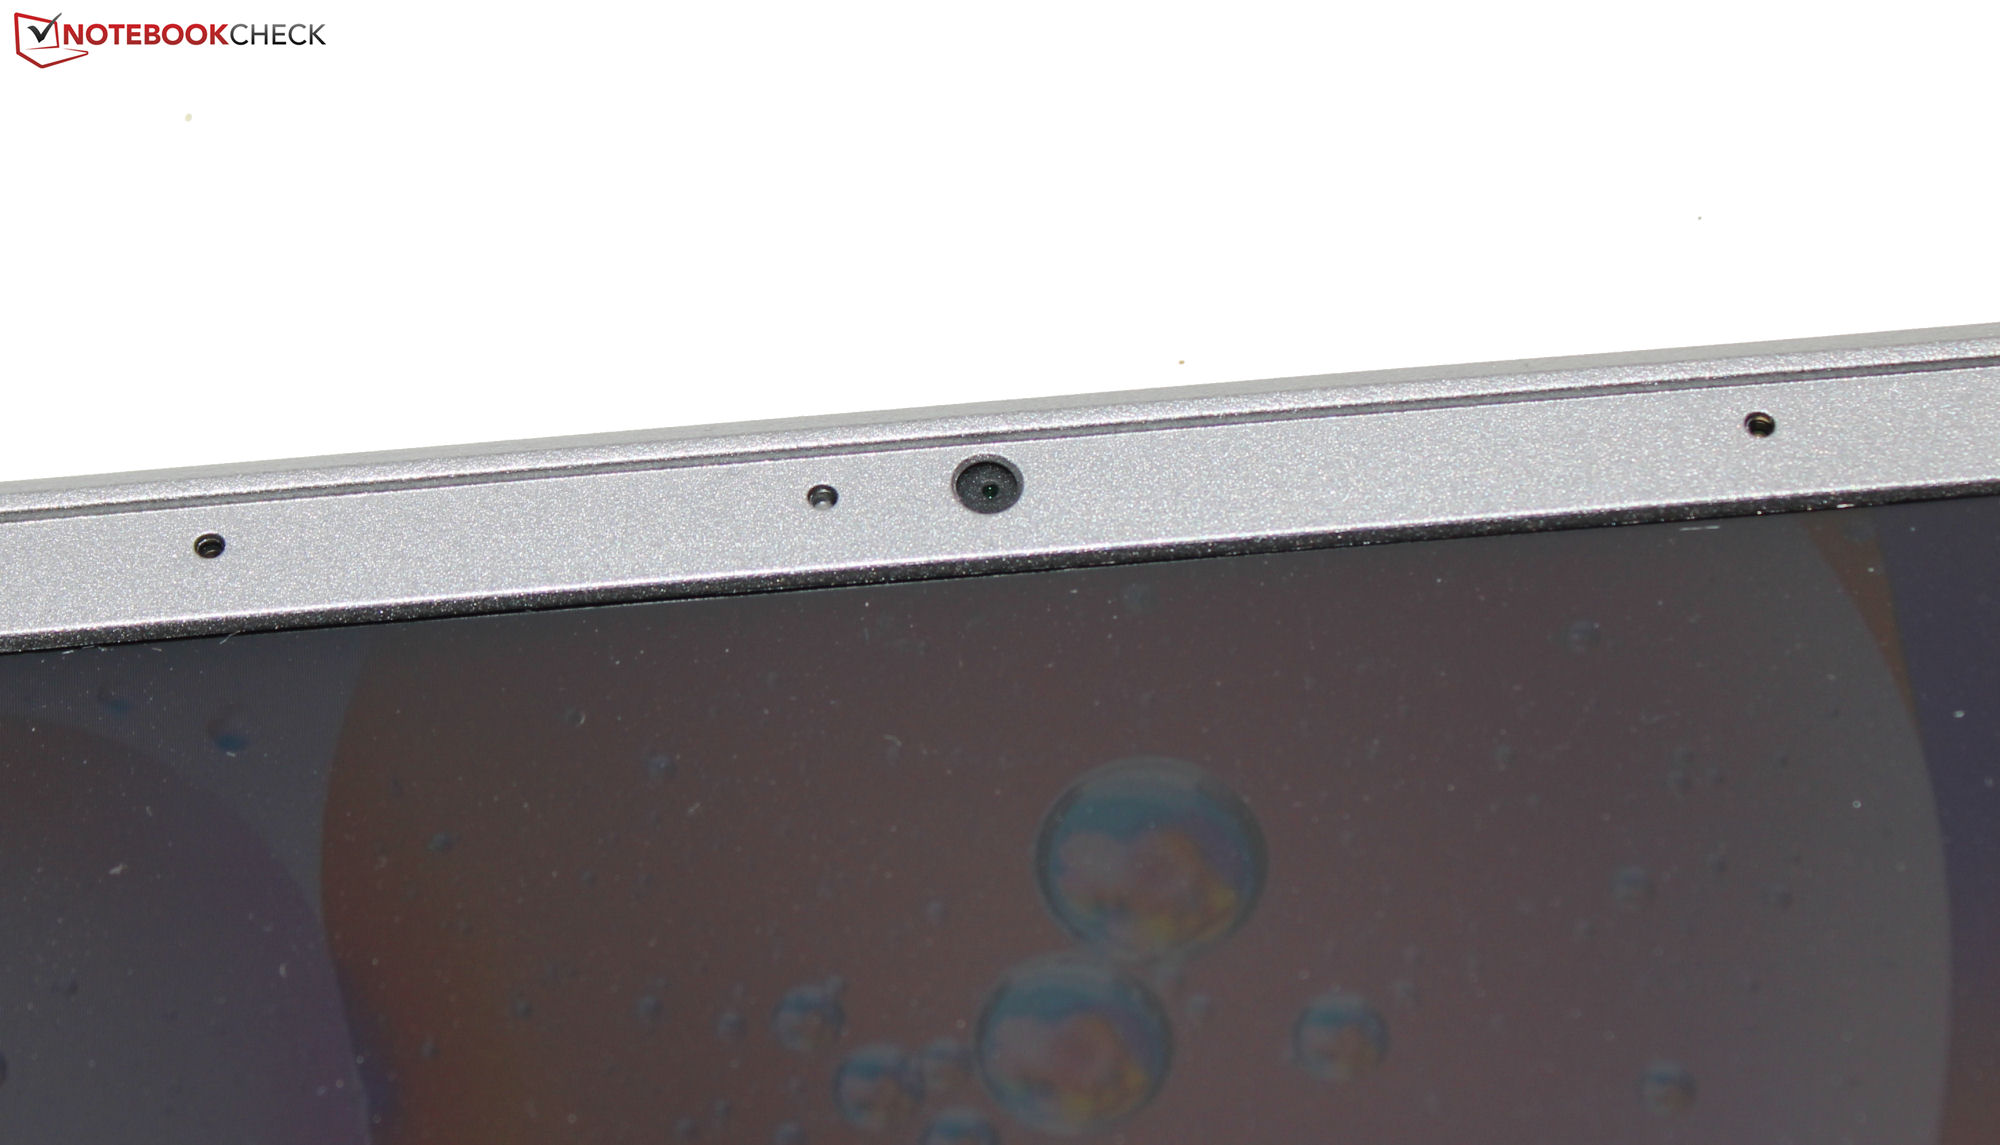
Cámara web
La webcam (2,1 MP, máx. 1.920 x 1.080 píxeles) no viene con obturador mecánico. Sin embargo, en términos de calidad, no puede desmarcarse de la competencia. Flaquea en el ámbito de la precisión cromática, ya que los colores se desvían de su valor objetivo.


Accesorios
Además de los documentos habituales (guía de inicio rápido e información sobre la garantía), el portátil no incluye ningún accesorio adicional.
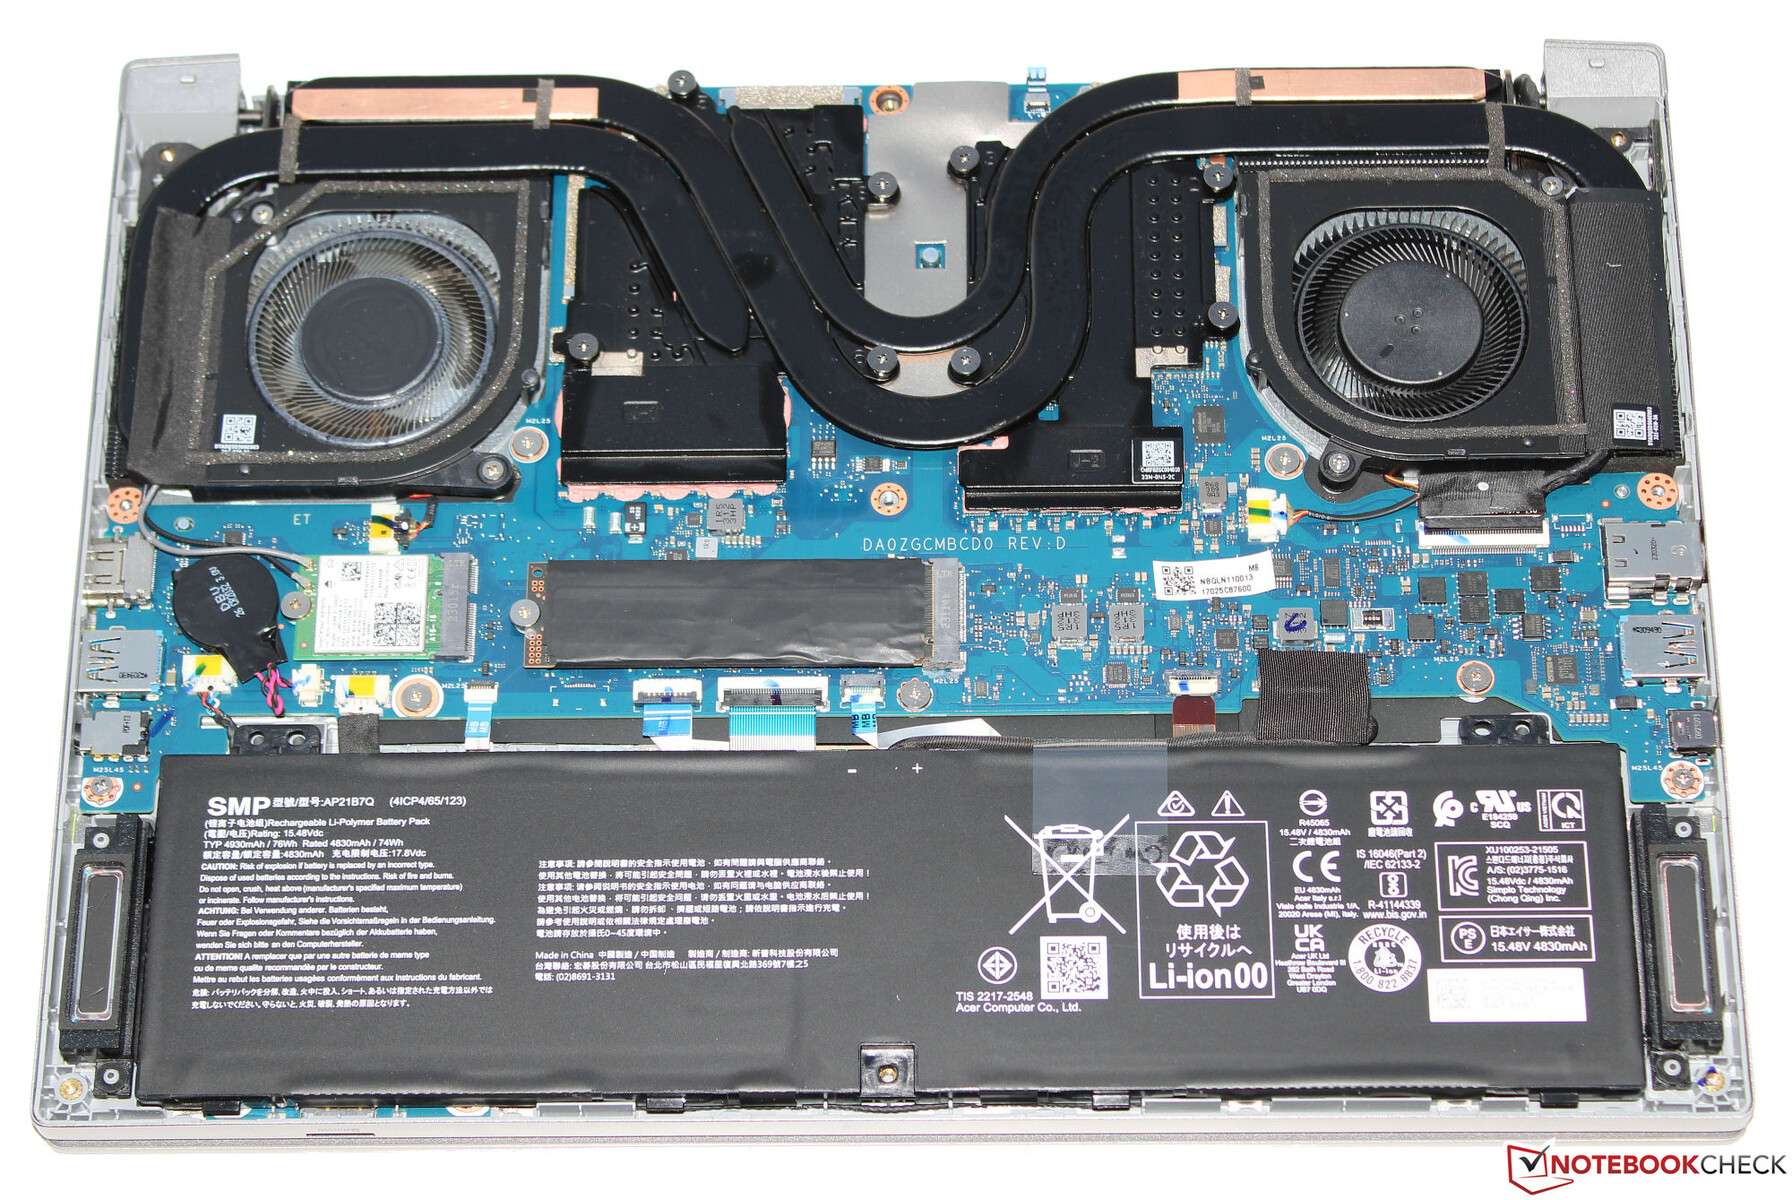
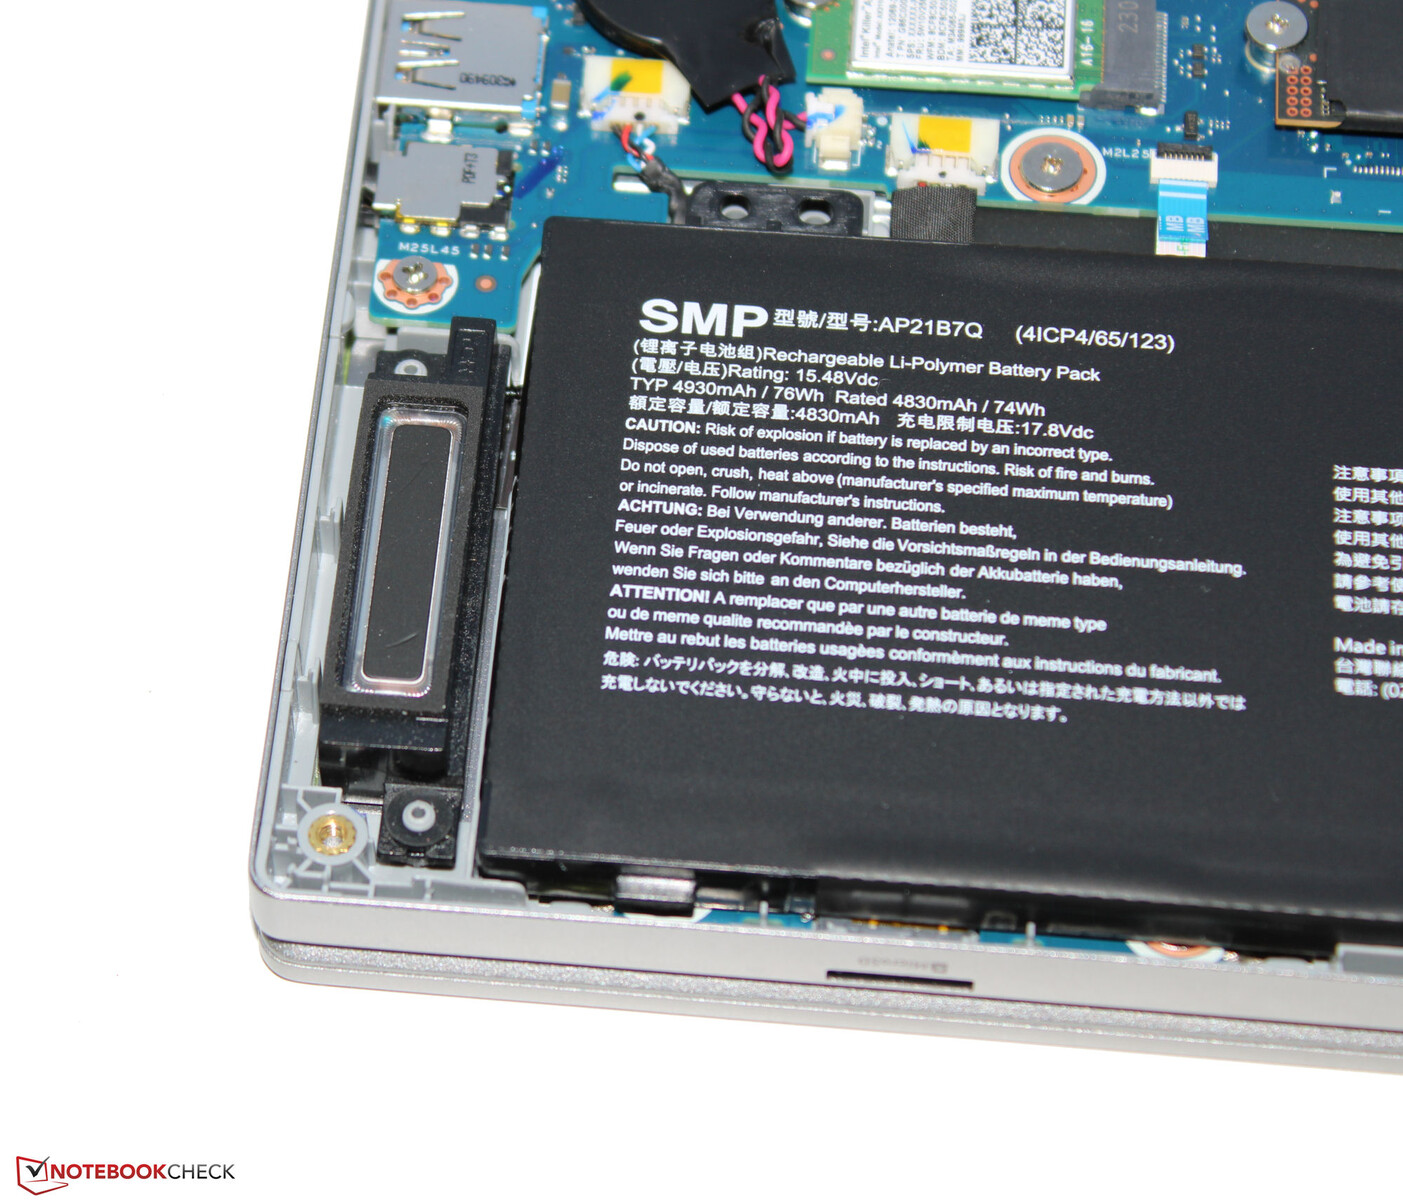
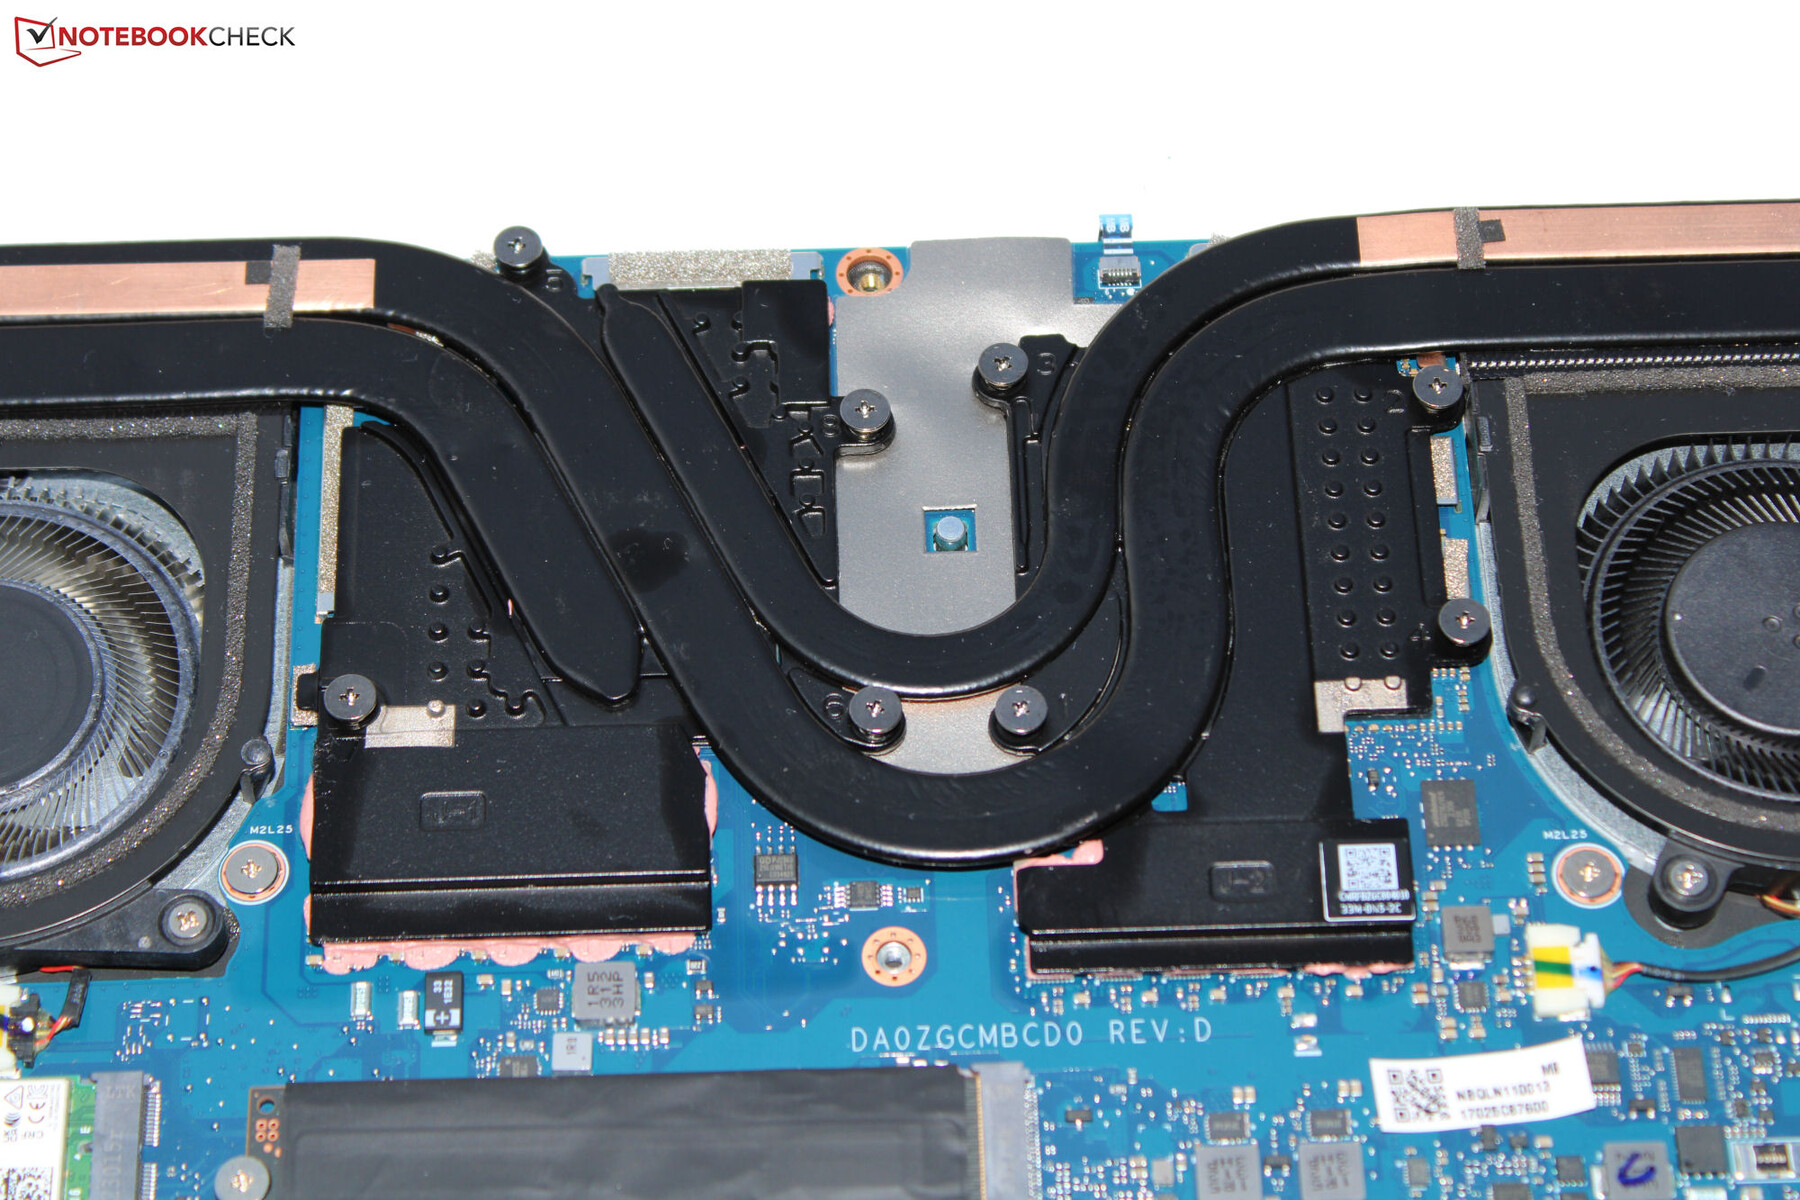
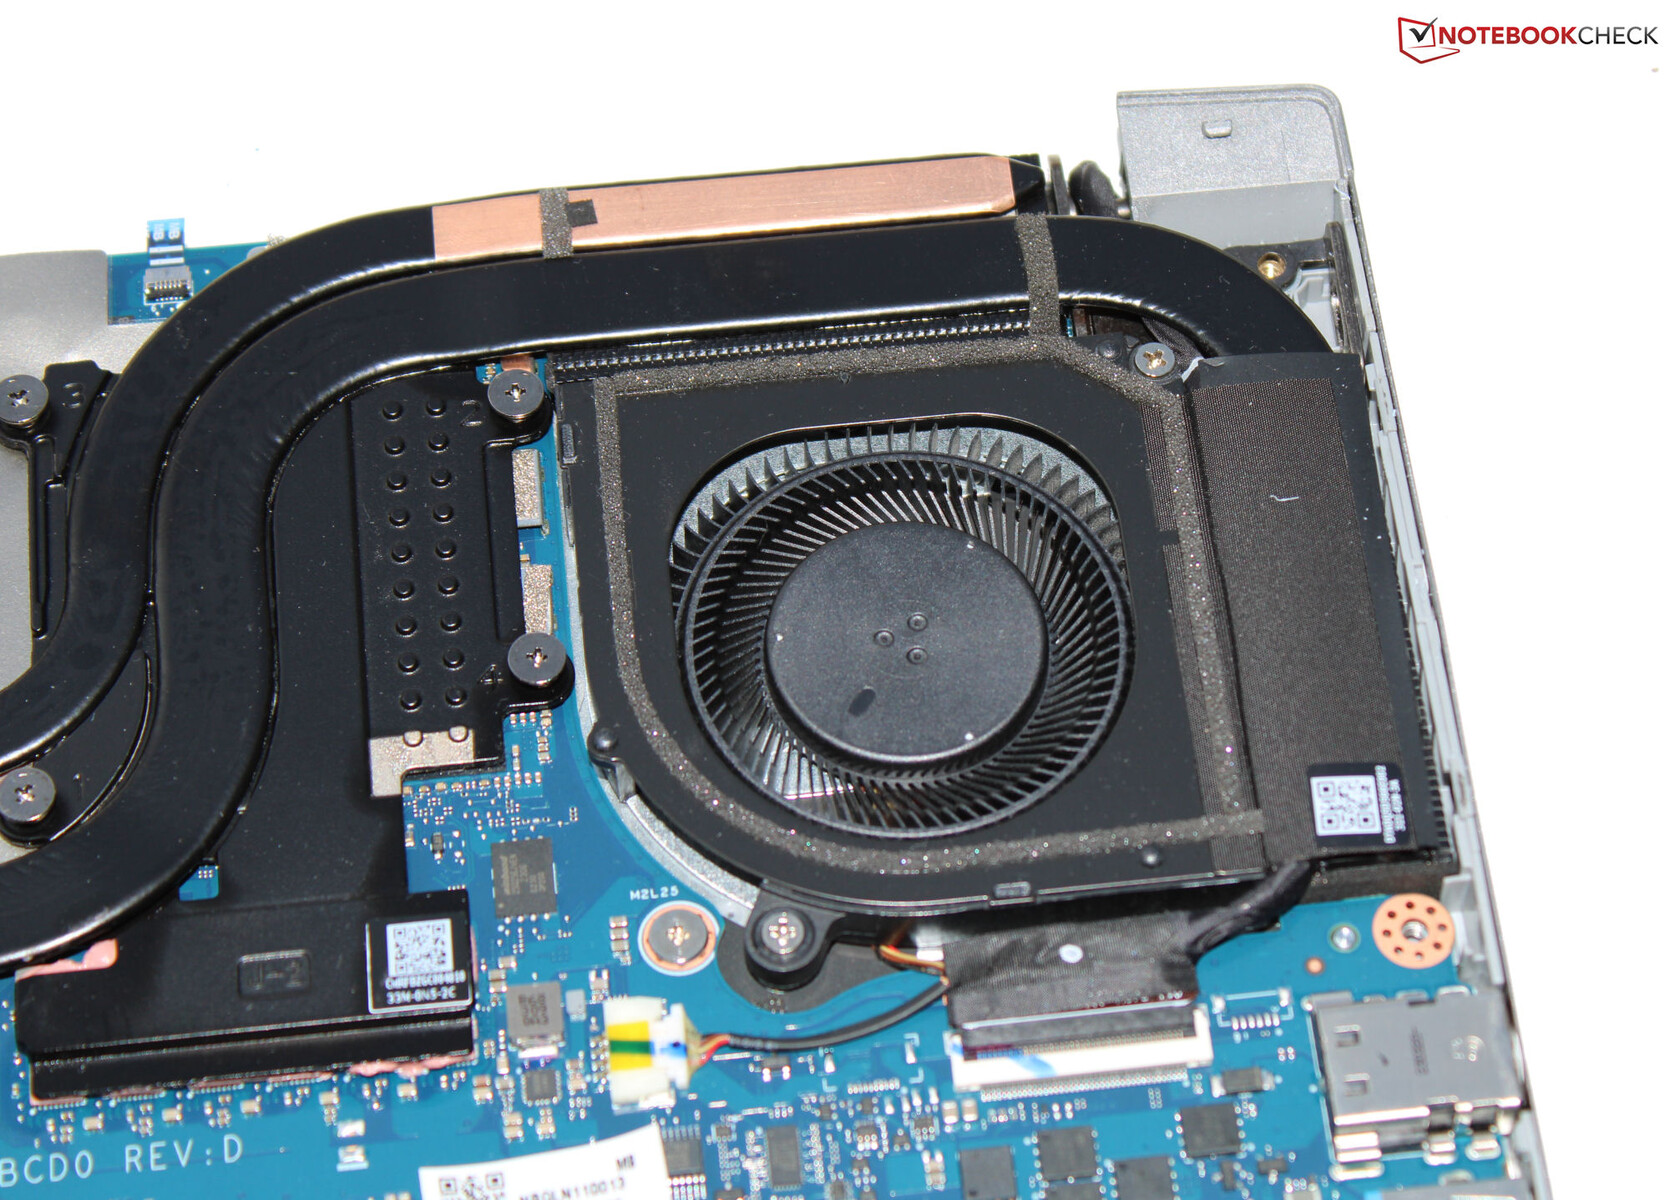
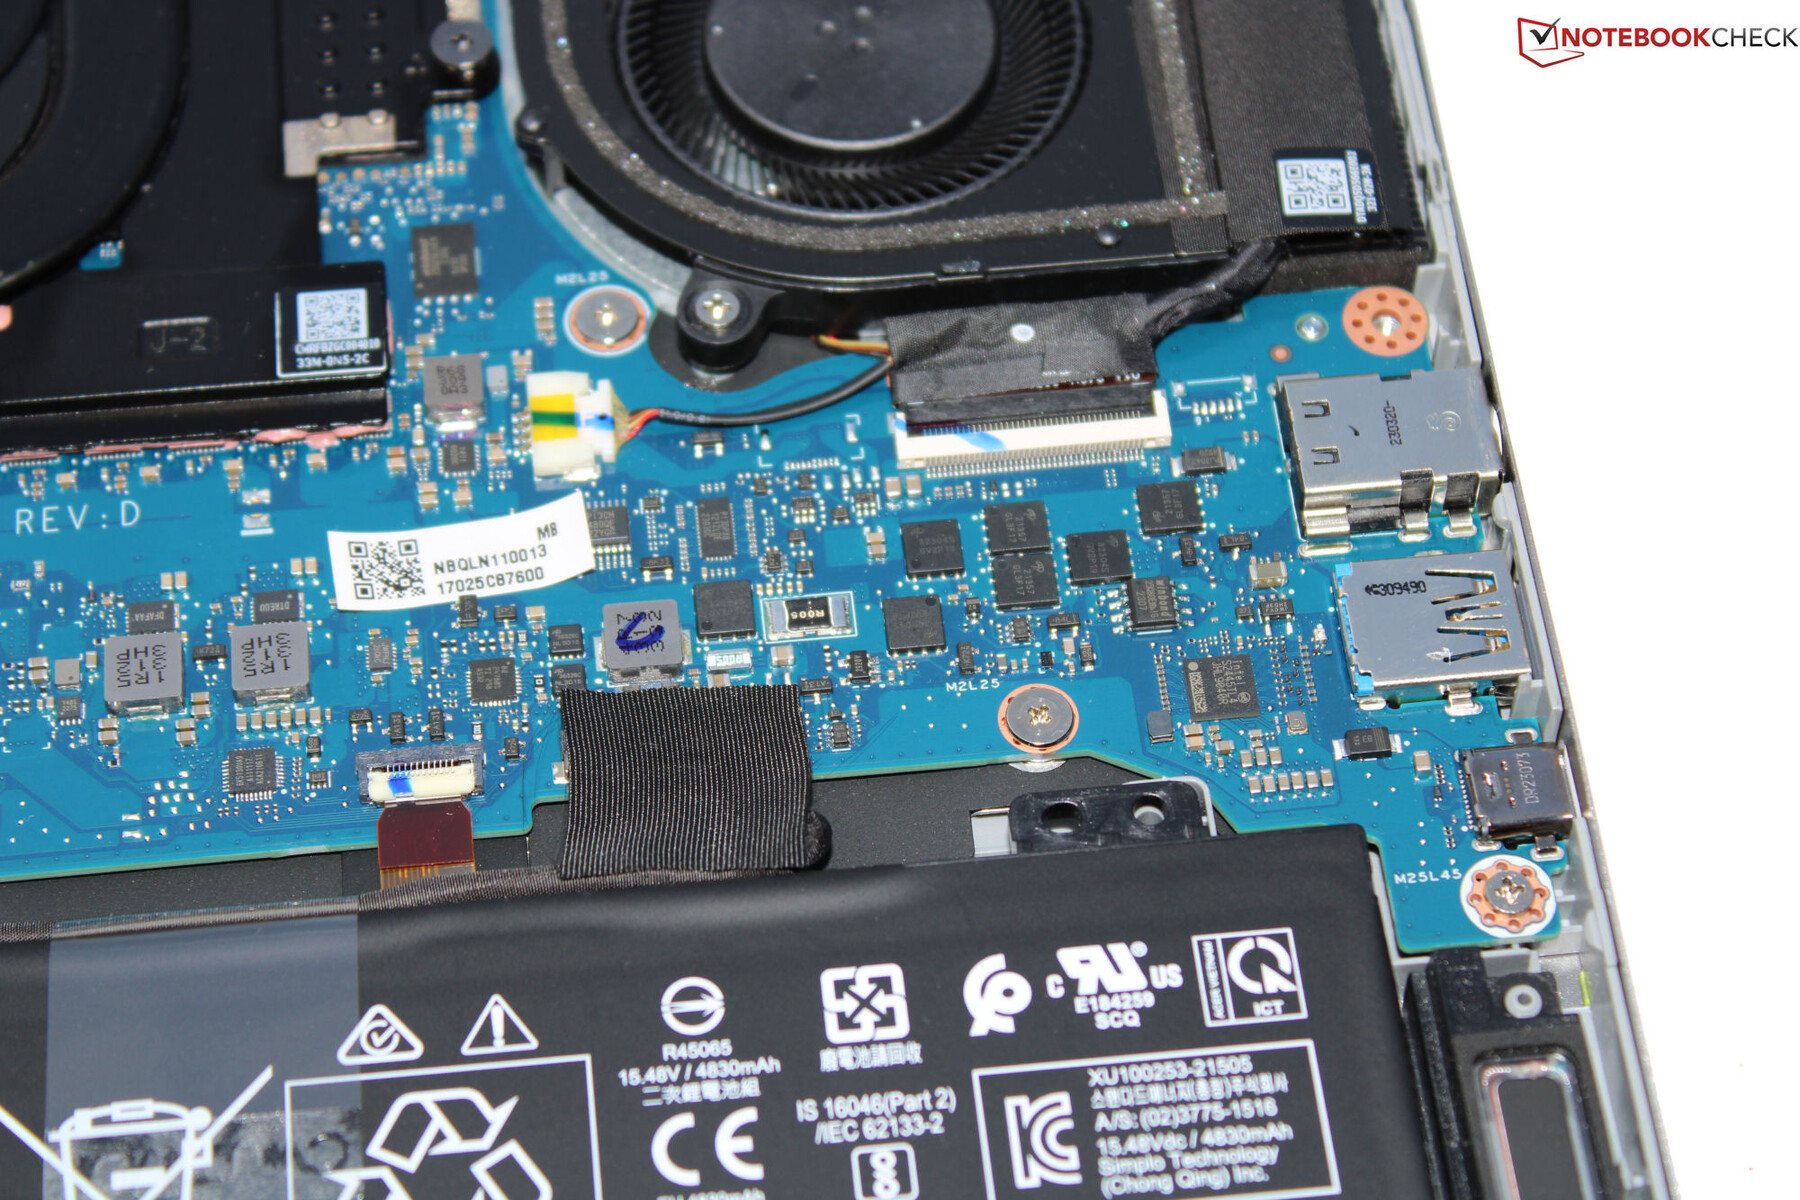
Mantenimiento
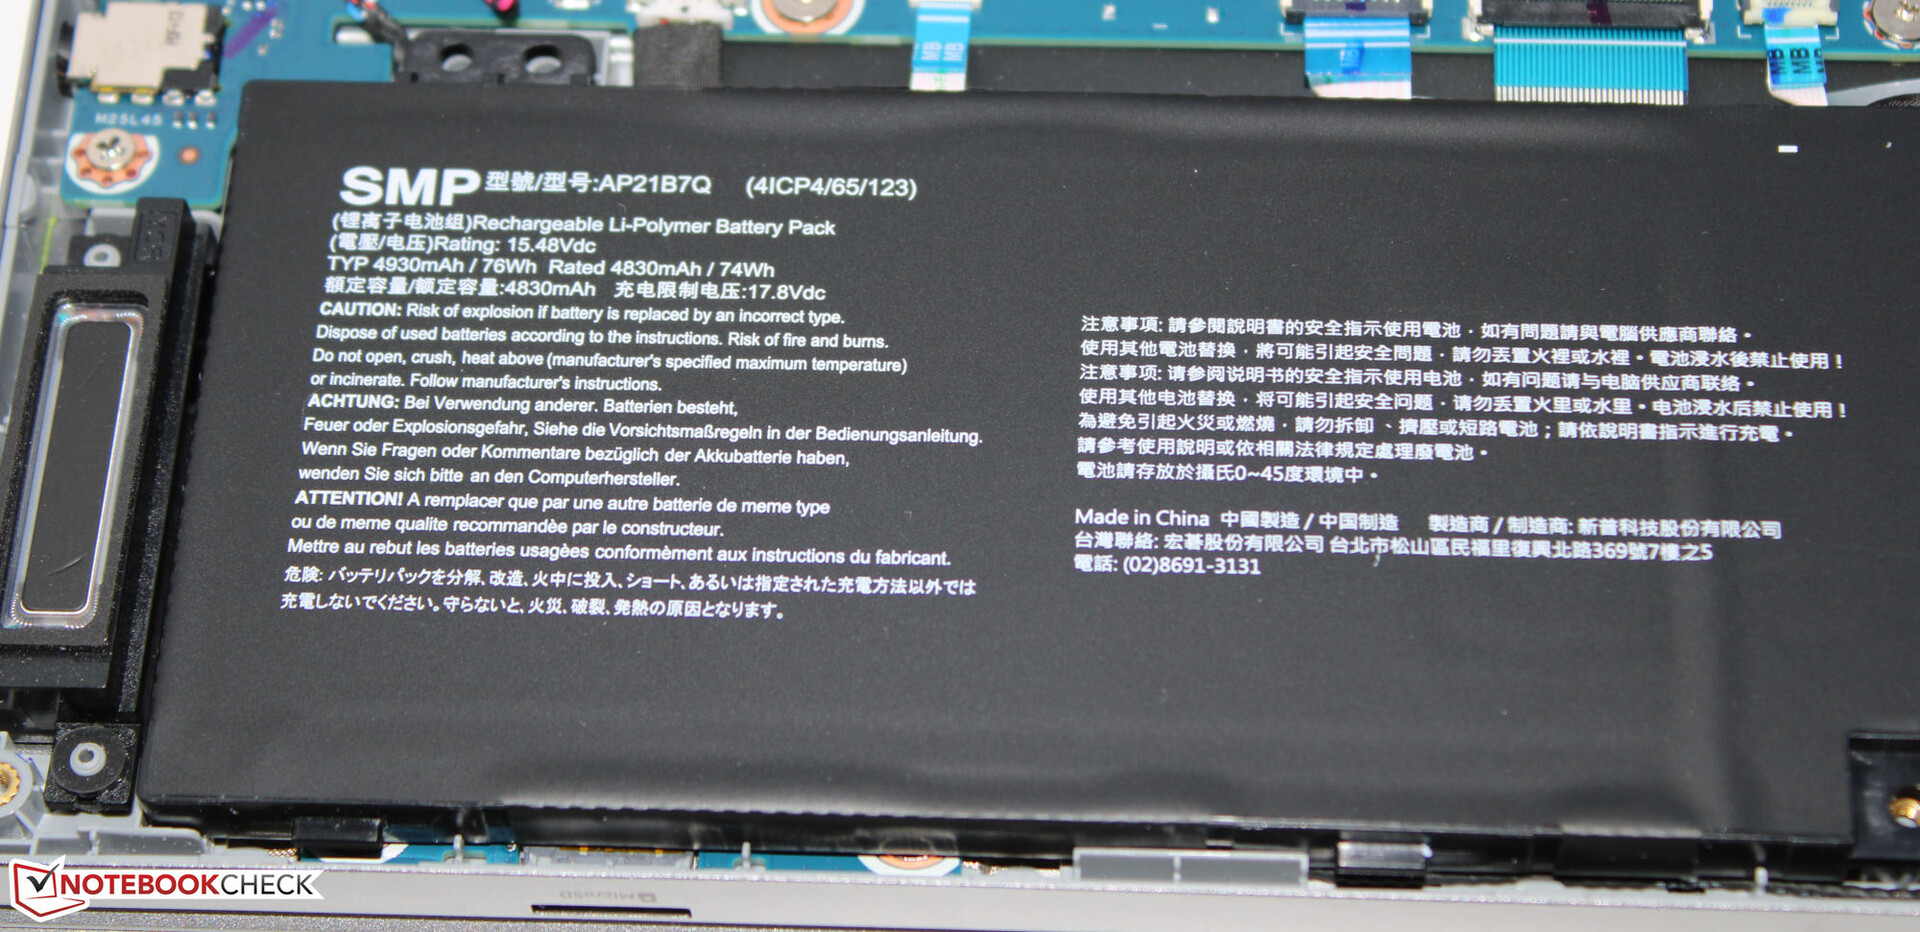
Tras quitar todos los tornillos de la base del dispositivo, se puede retirar la carcasa inferior con la ayuda de una púa. Esto permite acceder al SSD (PCIe 4, M.2 2280), la batería de la BIOS, el módulo Wi-Fi, los ventiladores, los altavoces y la batería.

Garantía
Acer ha concedido al dispositivo de 14 pulgadas una garantía de dos años. Ampliarla a tres años cuesta casi 100 dólares.
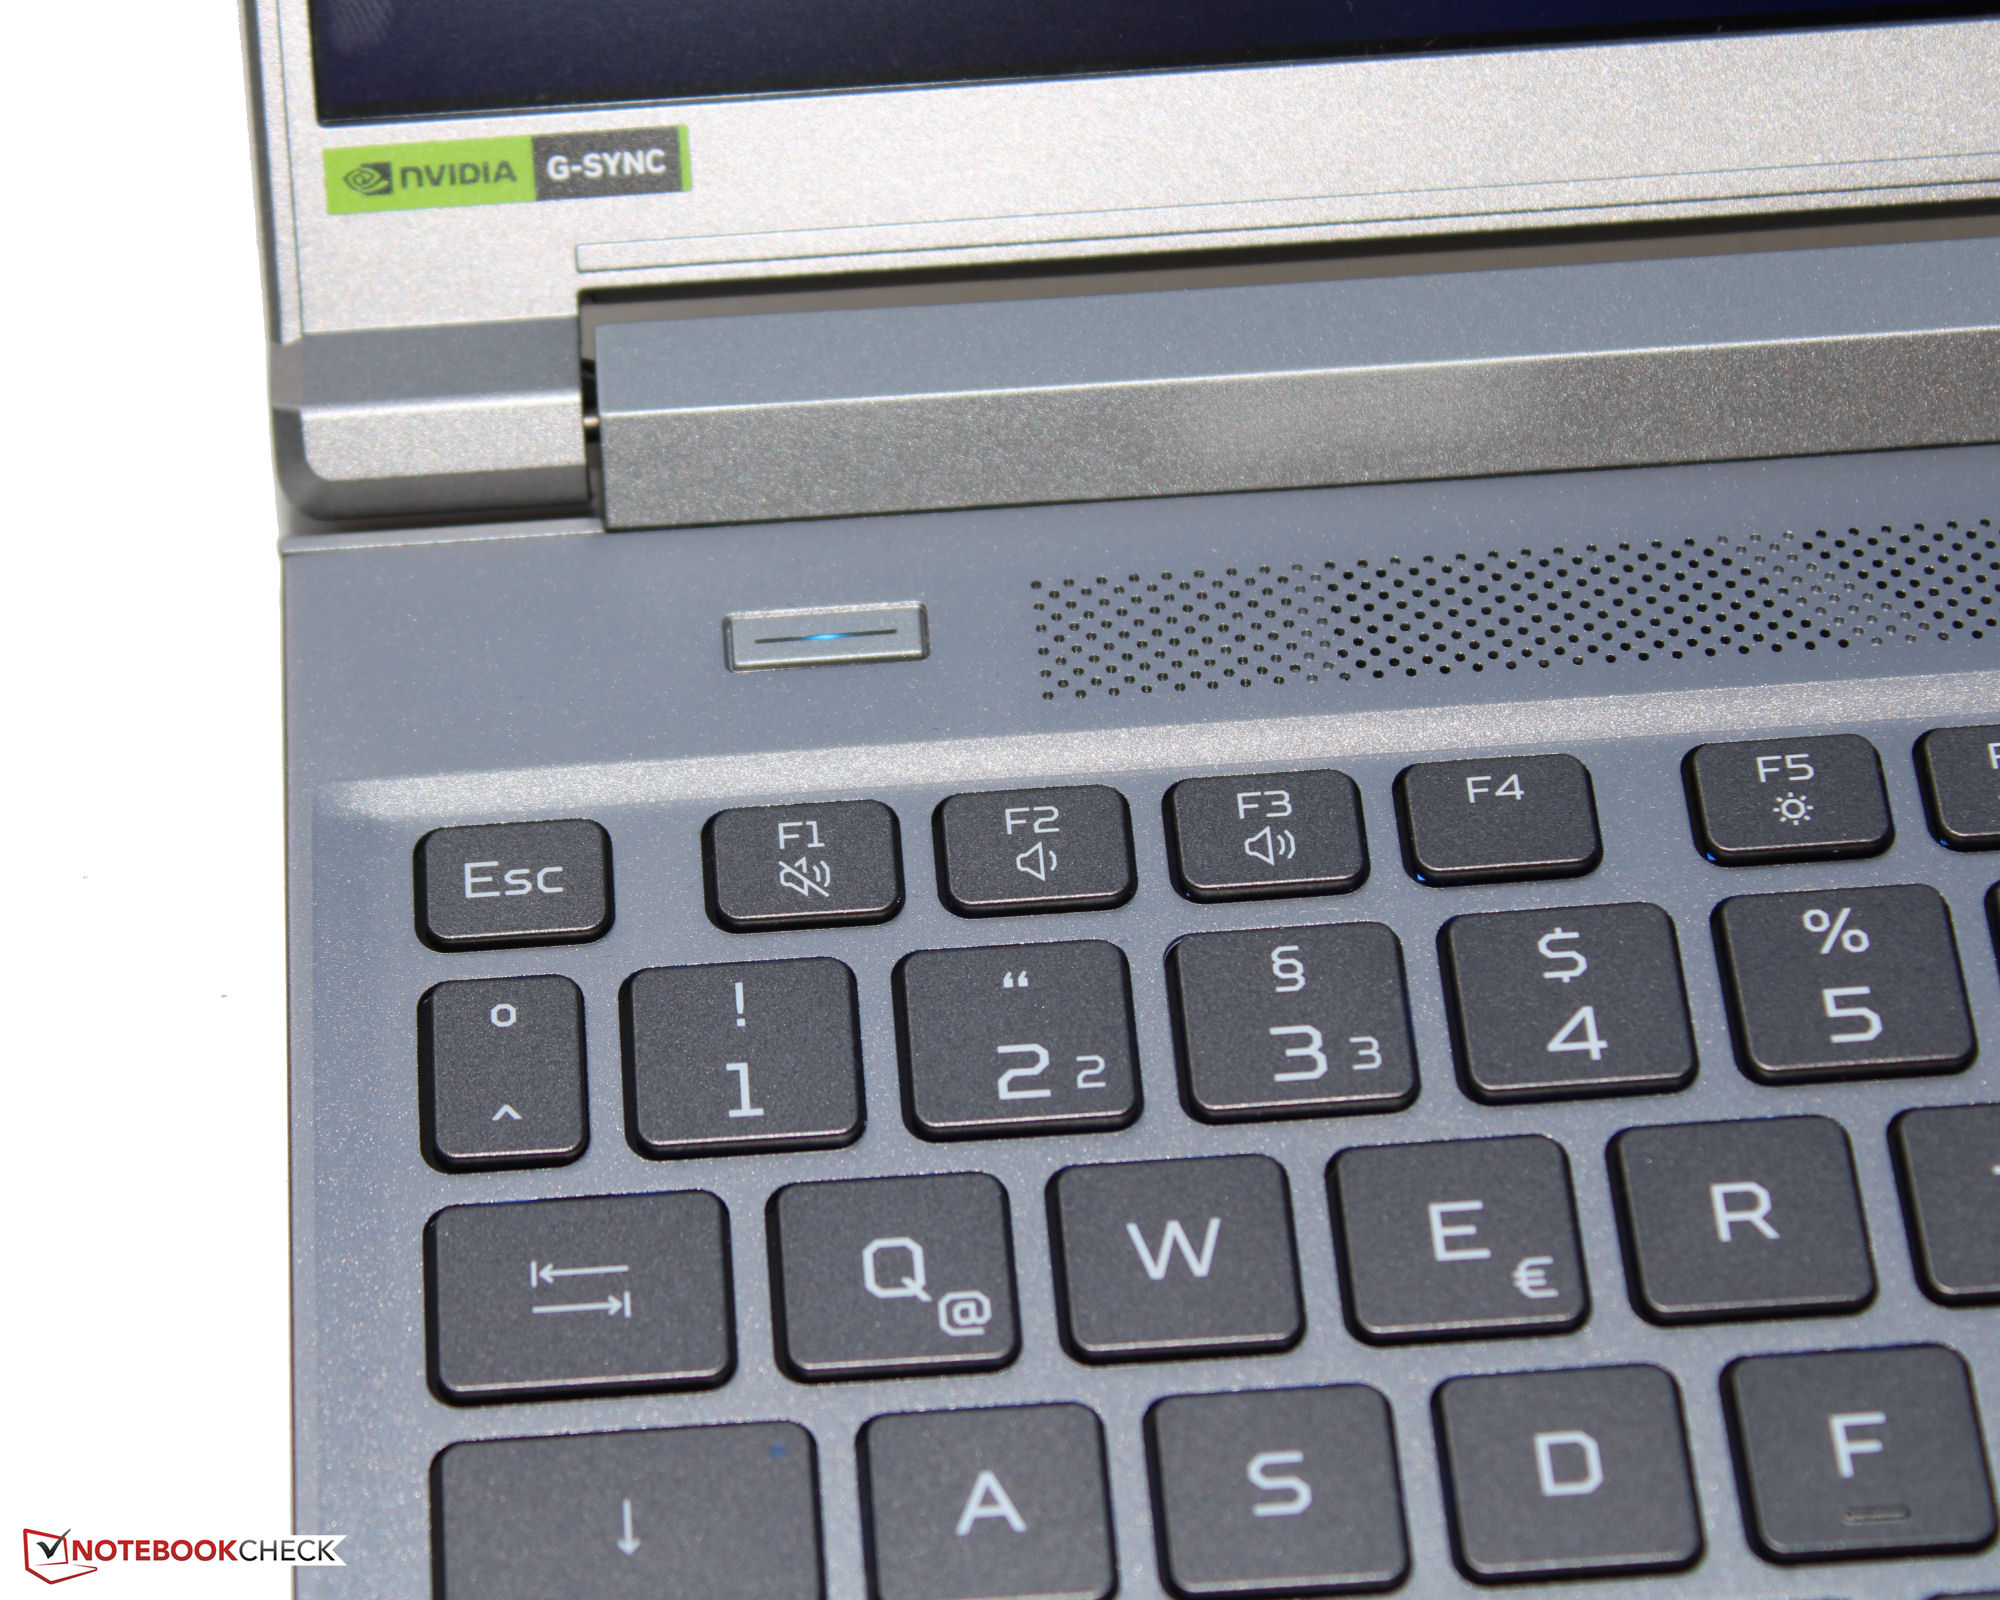
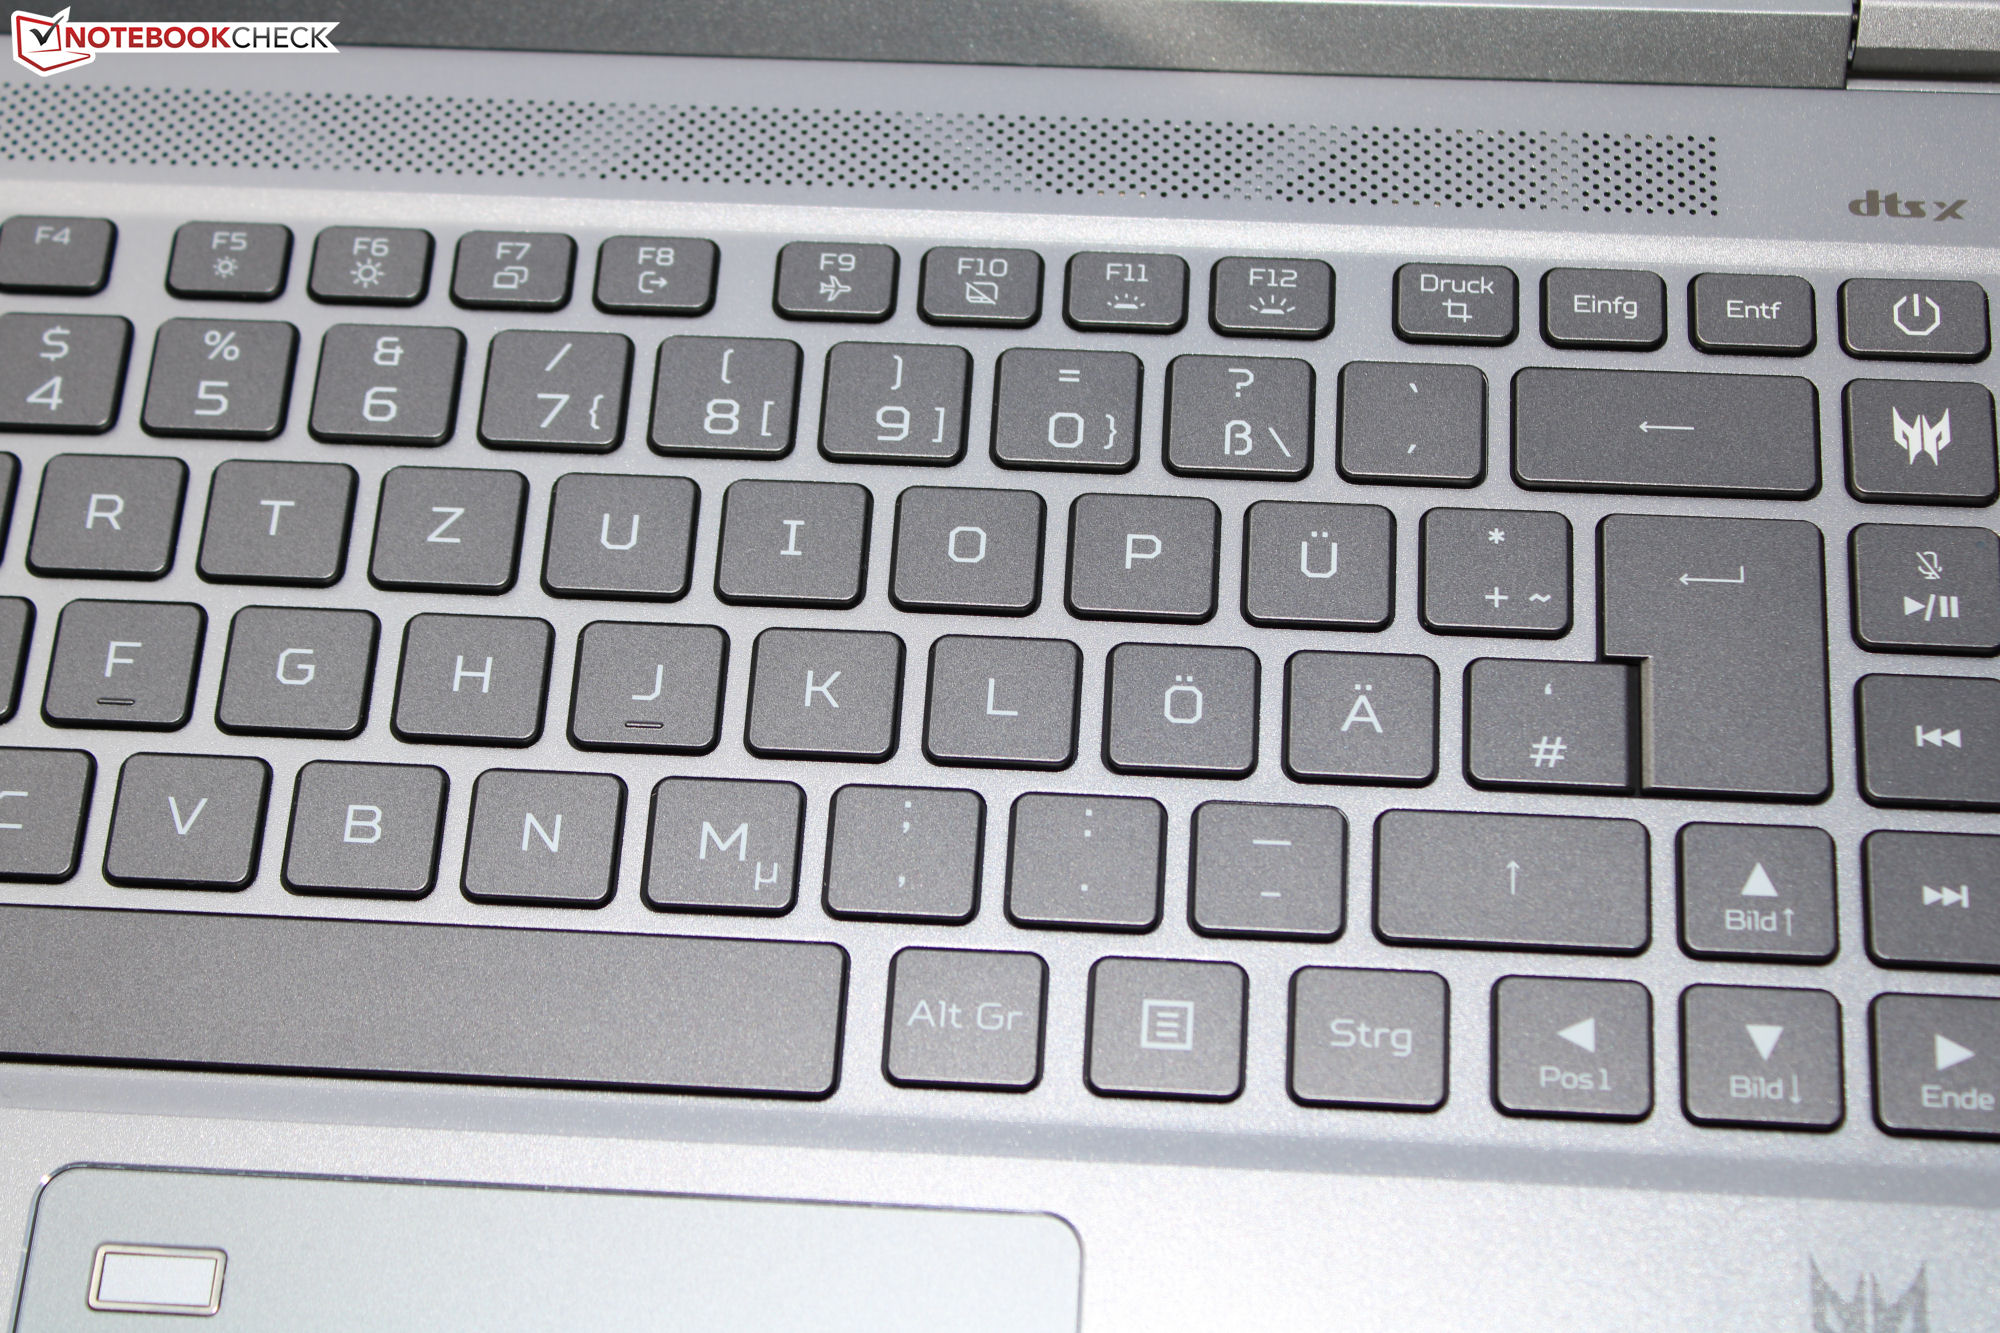
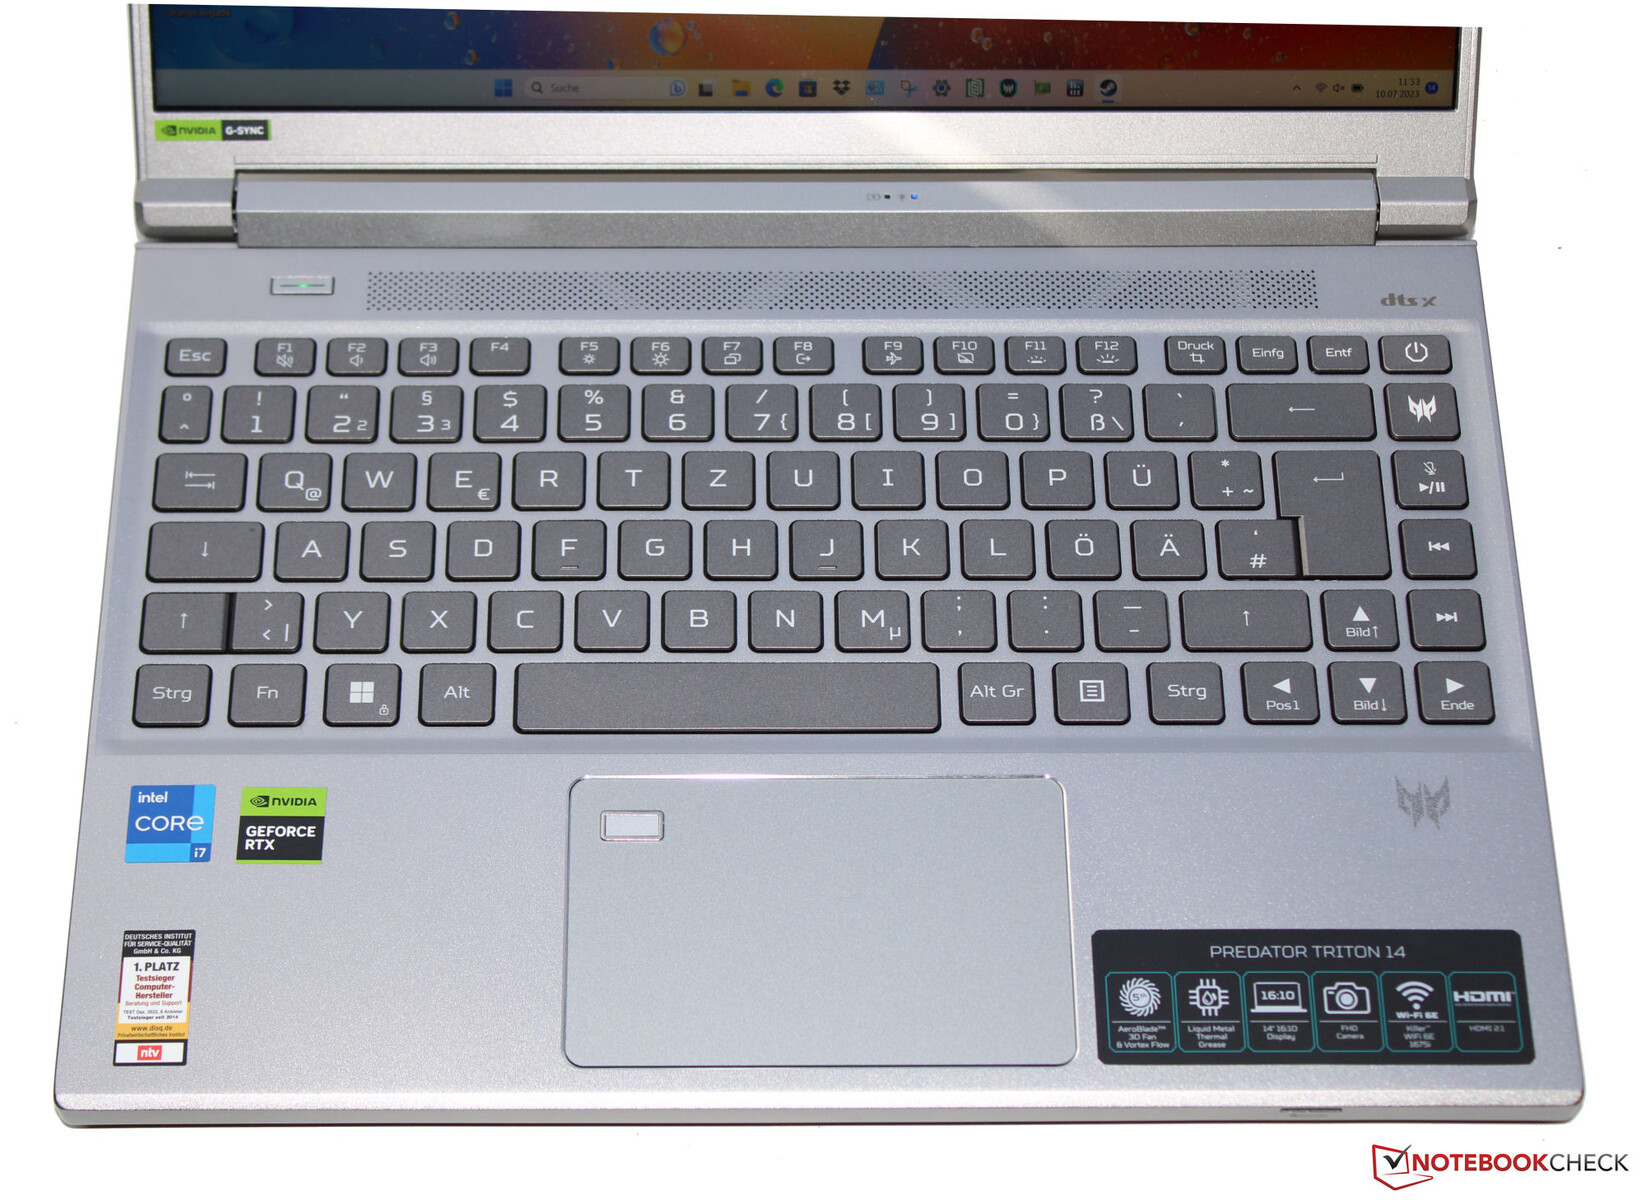
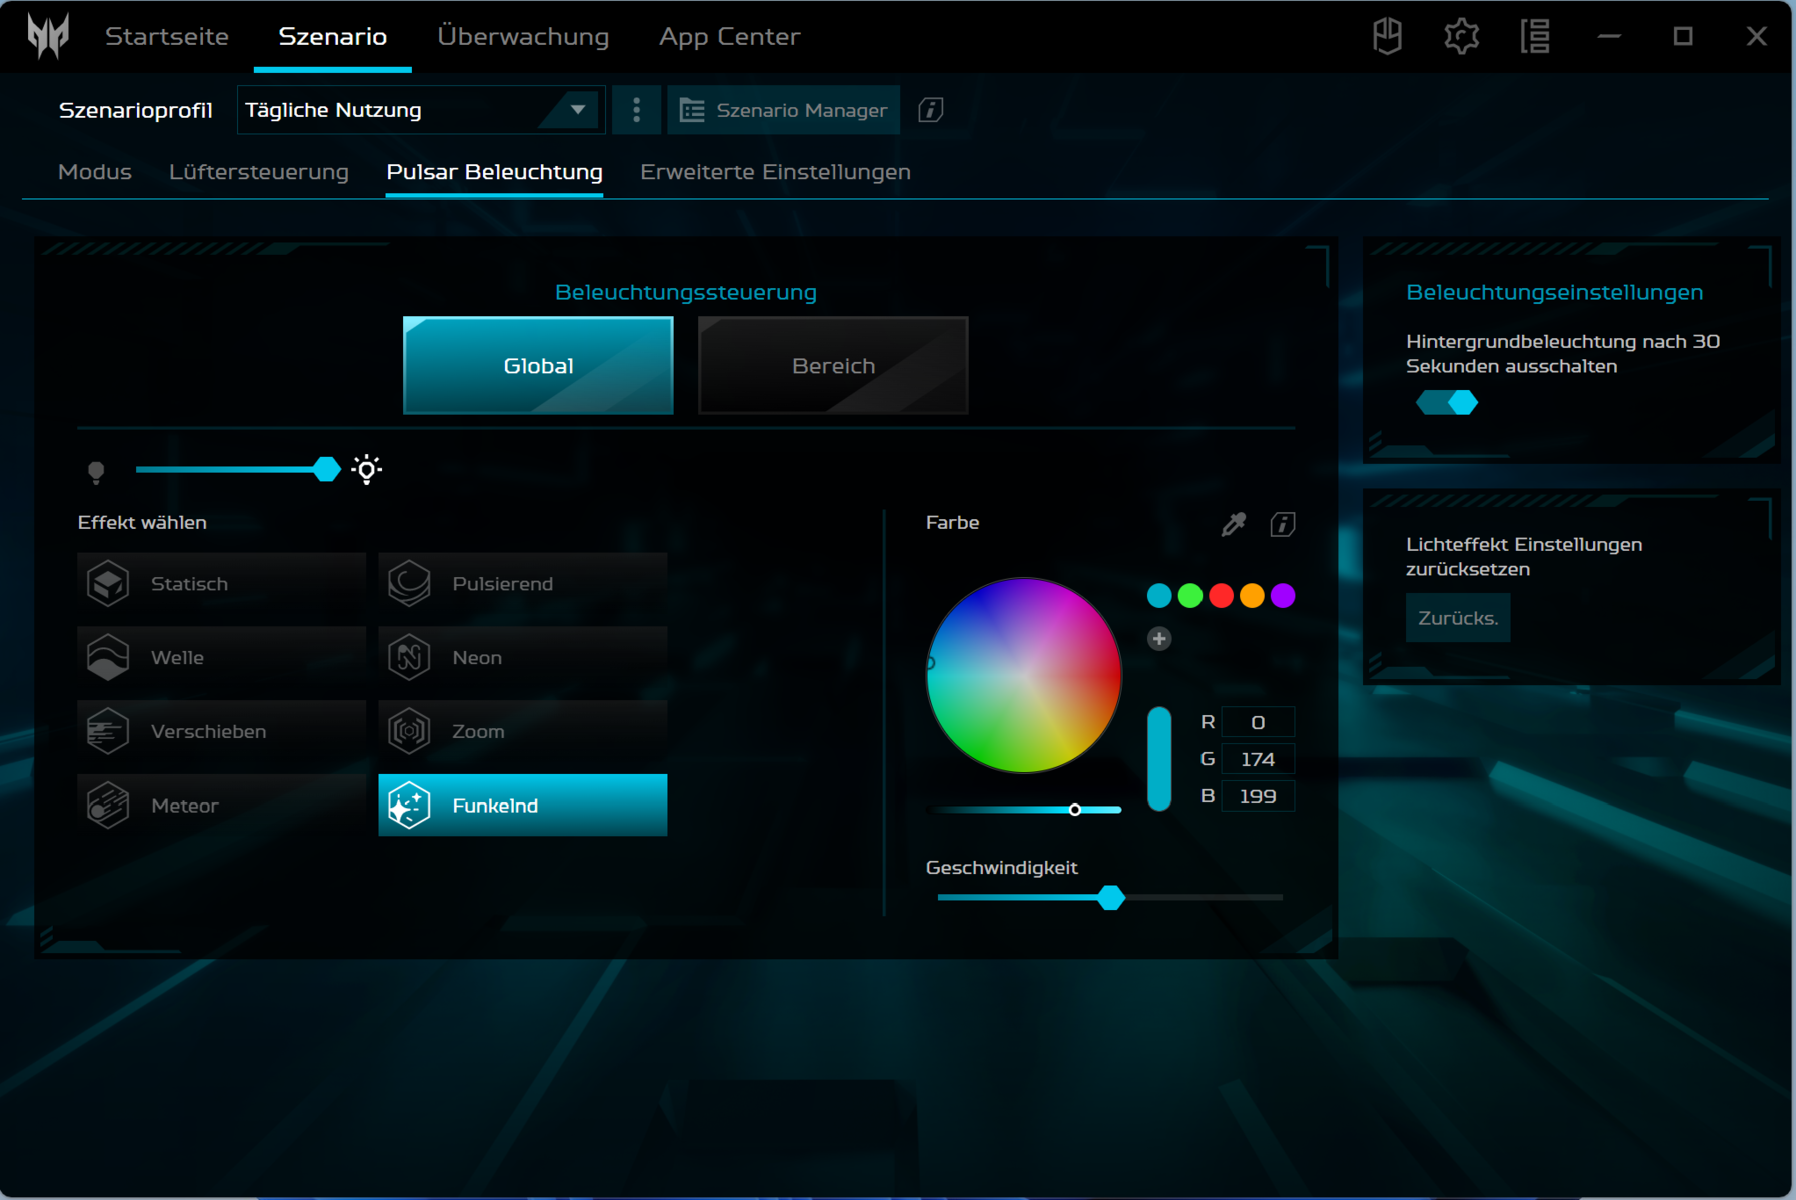
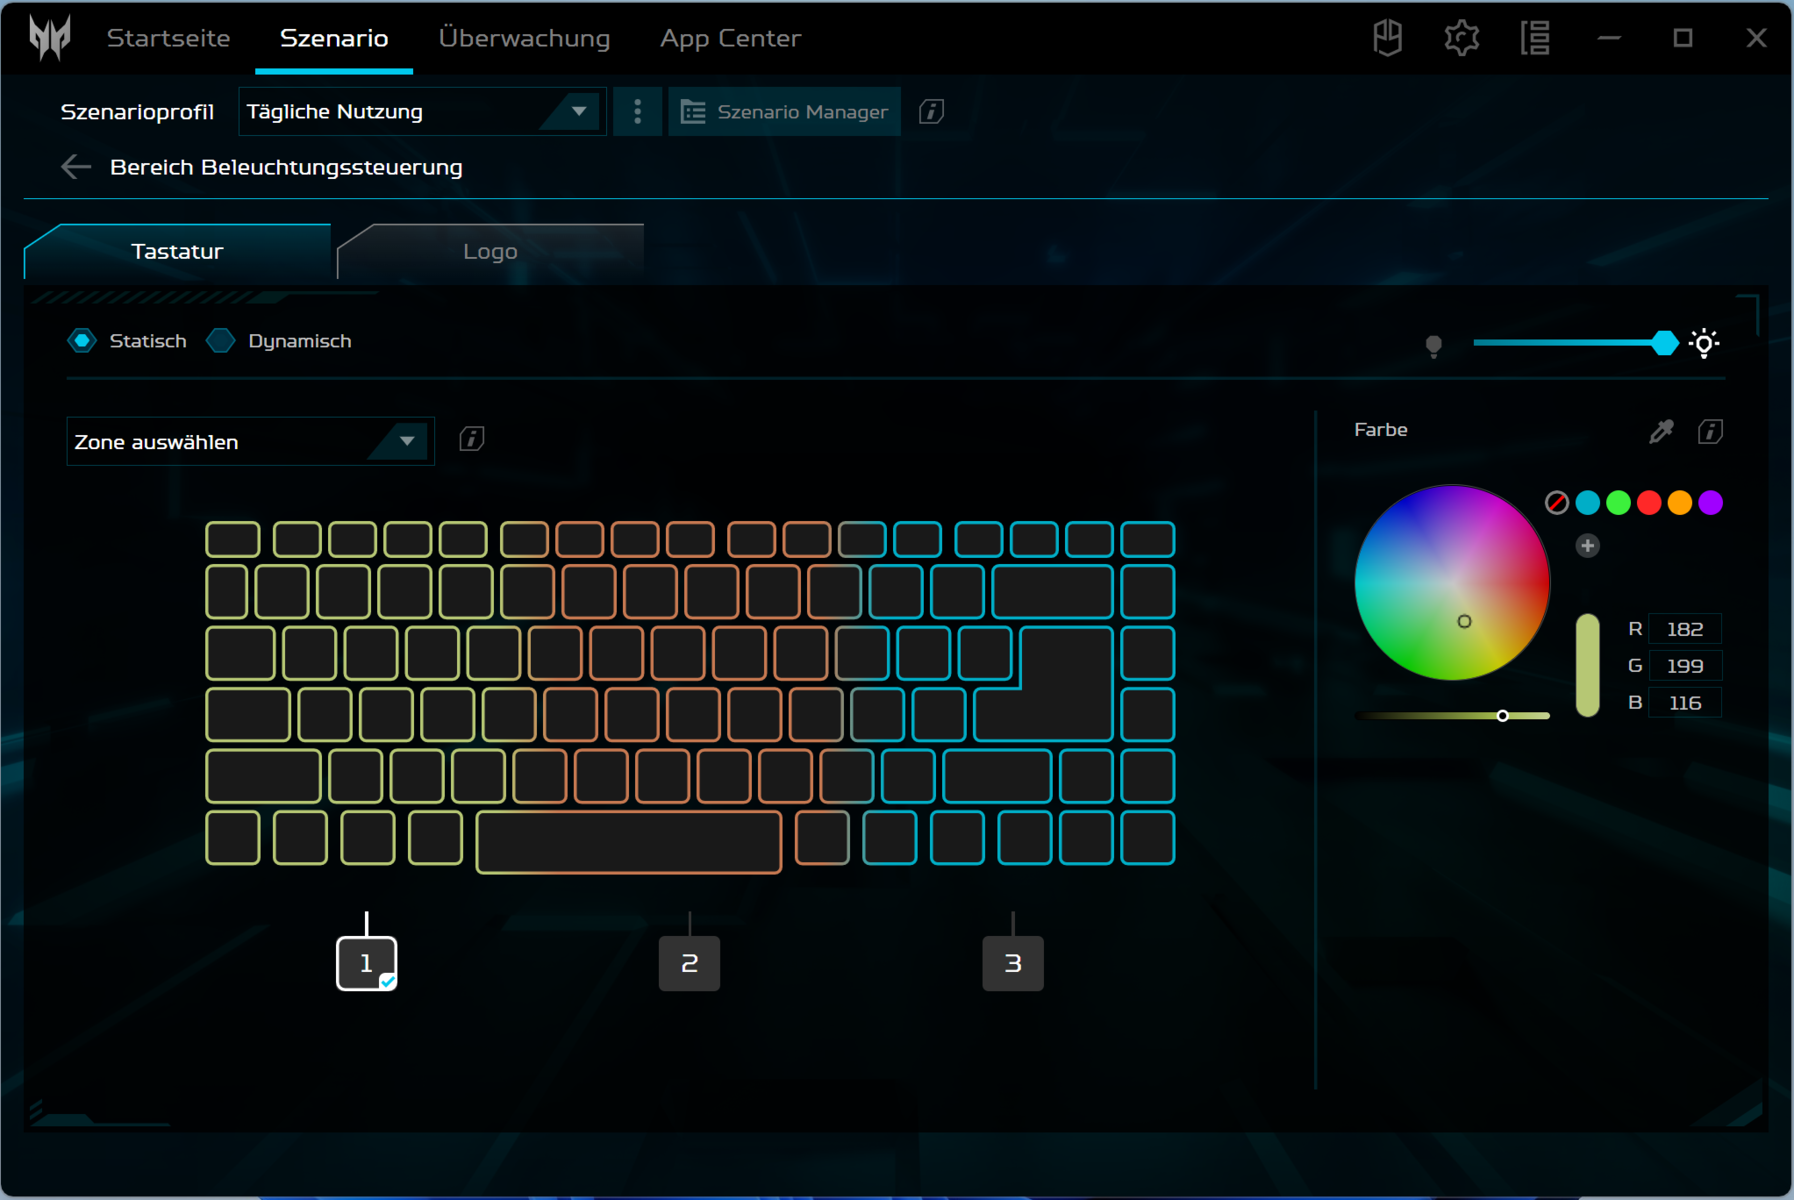
Dispositivos de entrada - Acer Predator incluye iluminación RGB en las teclas
Teclado
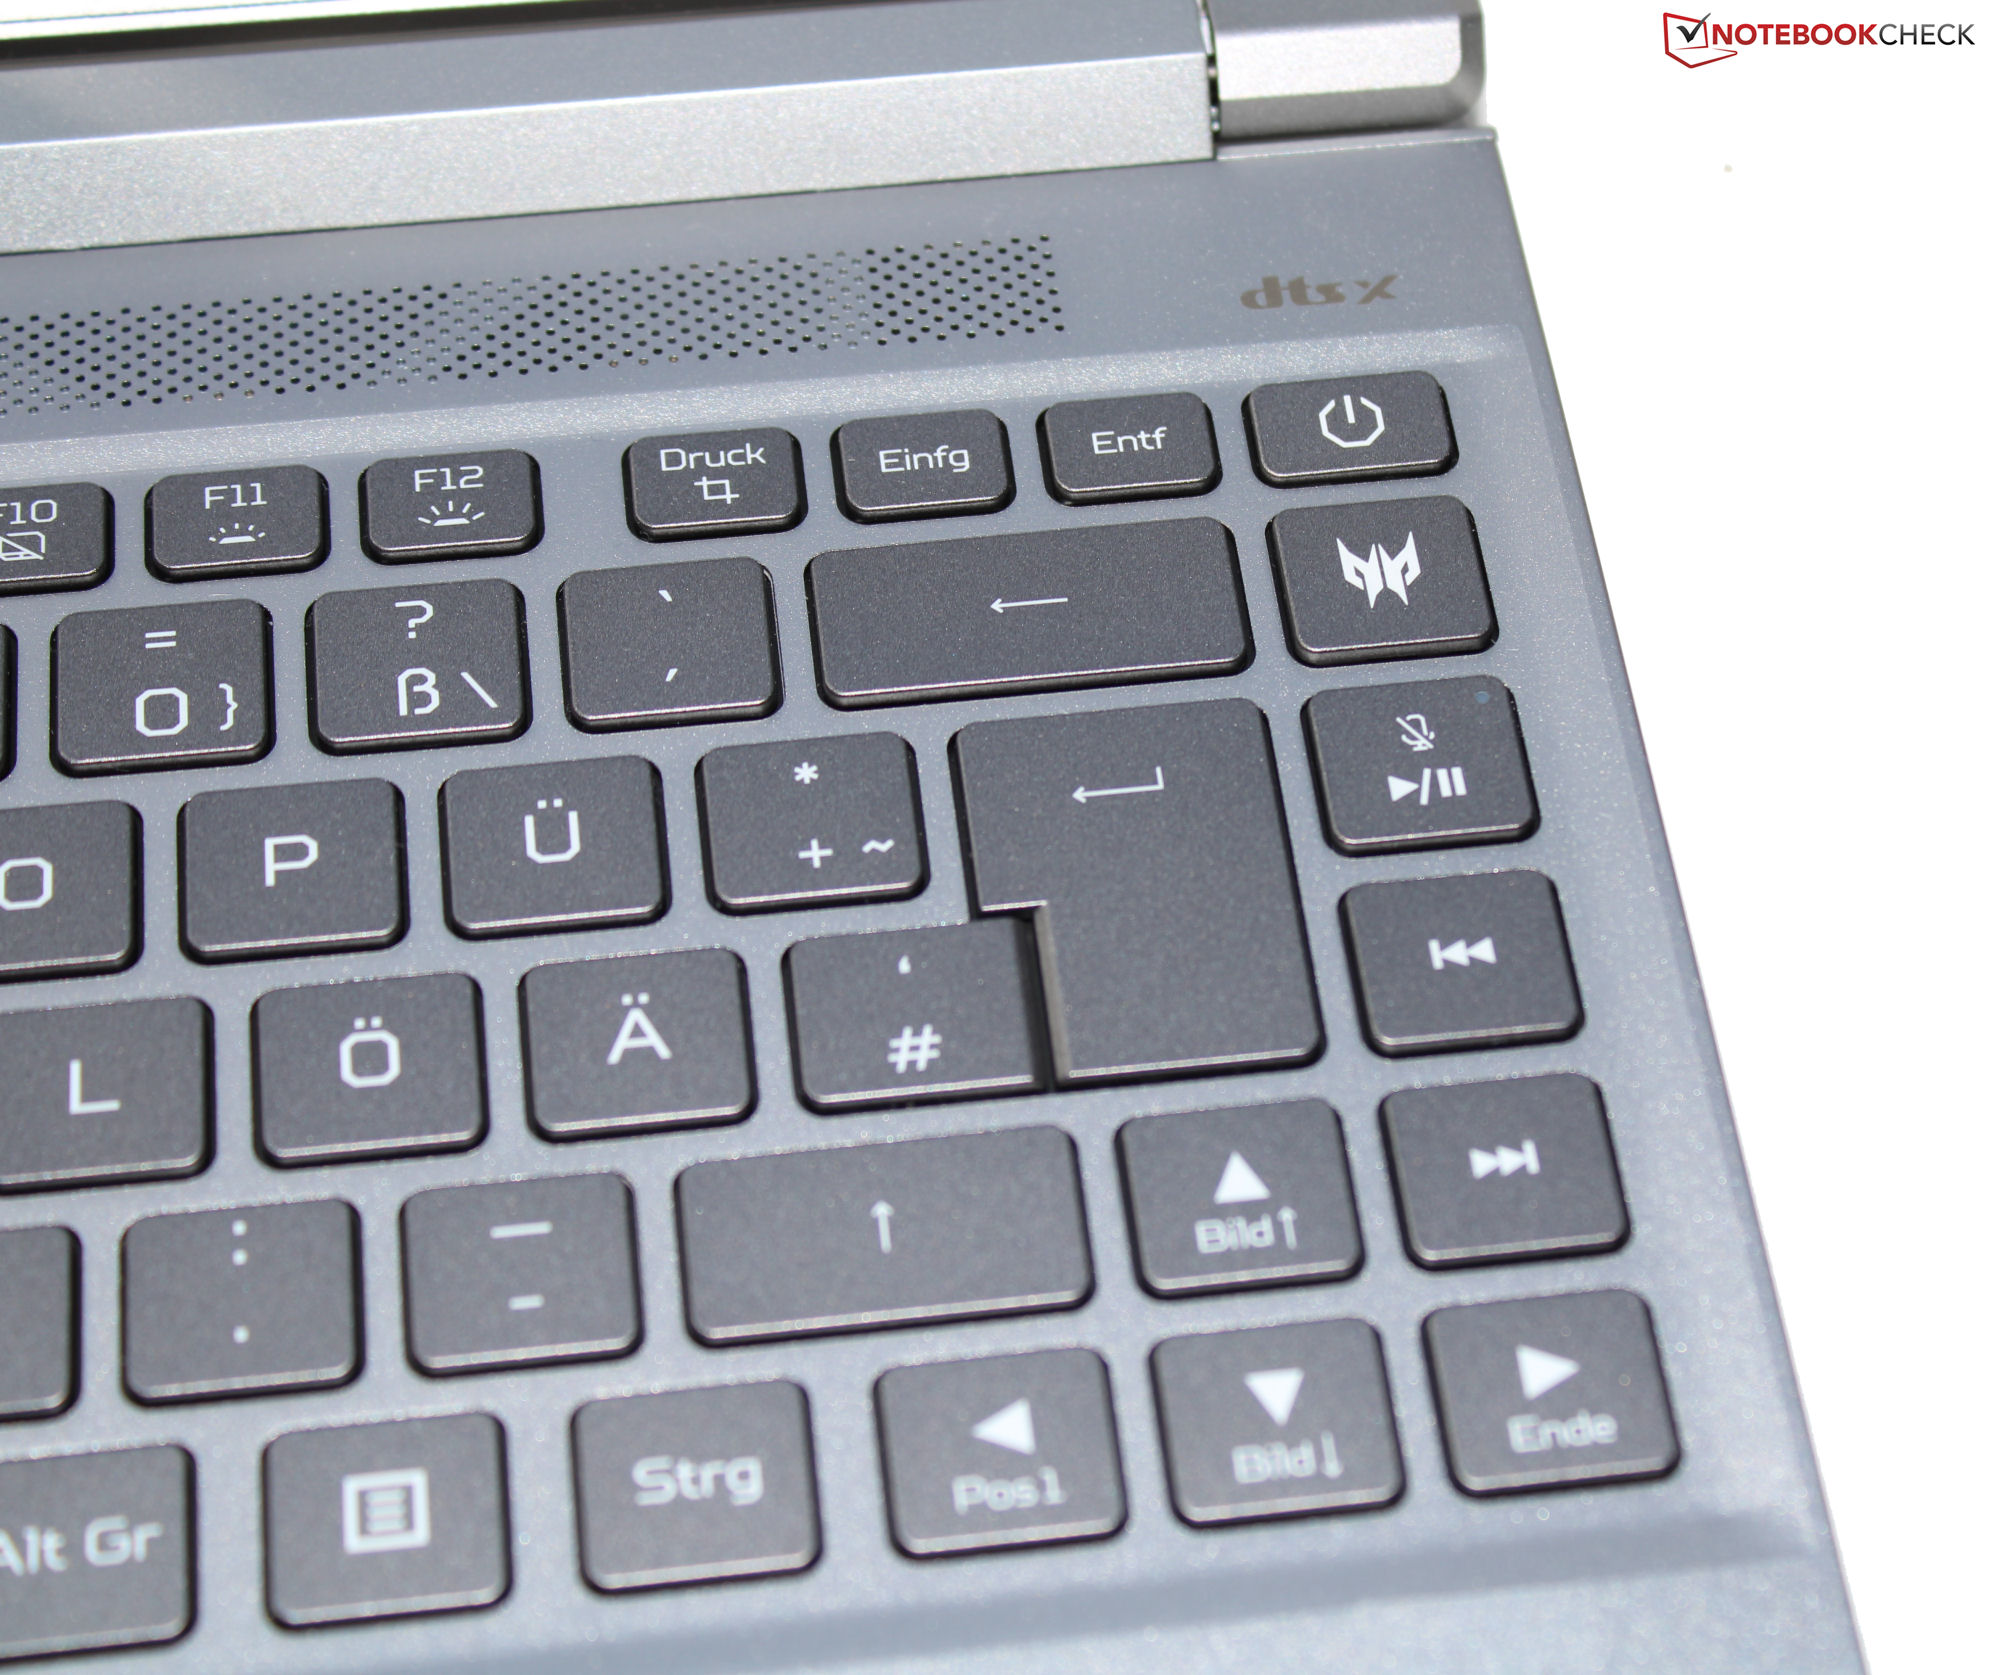
Las teclas planas y suaves del teclado chiclet (con iluminación RGB) tienen un recorrido corto y un punto de presión claramente definido, así como una buena resistencia de las teclas. Al escribir, el teclado no se tambalea. Bien: Las cuatro teclas de dirección son de tamaño normal. En general, Acer ha proporcionado un teclado adecuado para el uso diario.
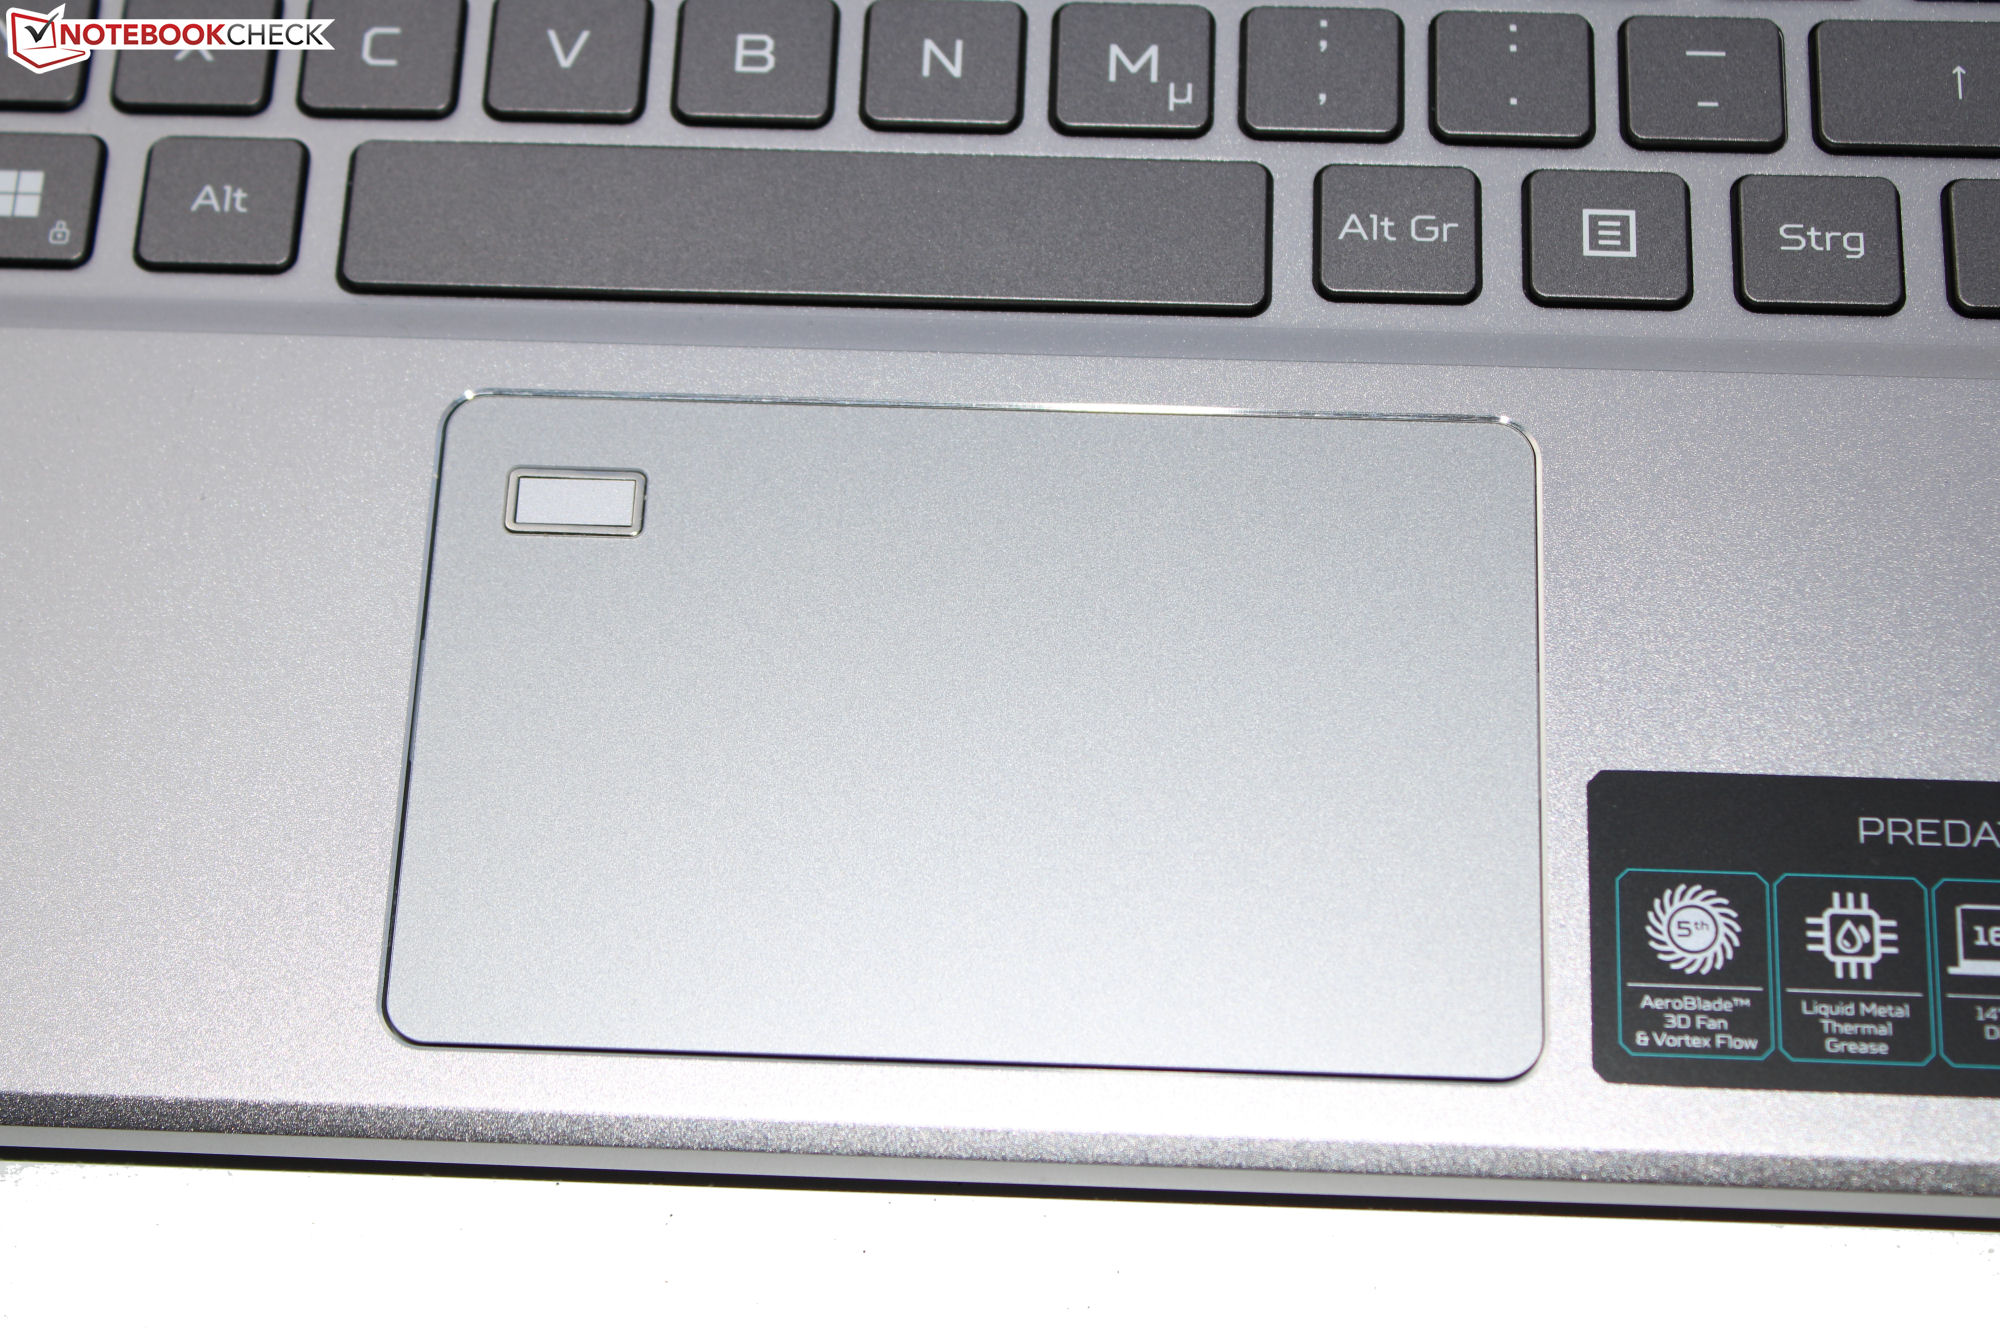
Panel táctil
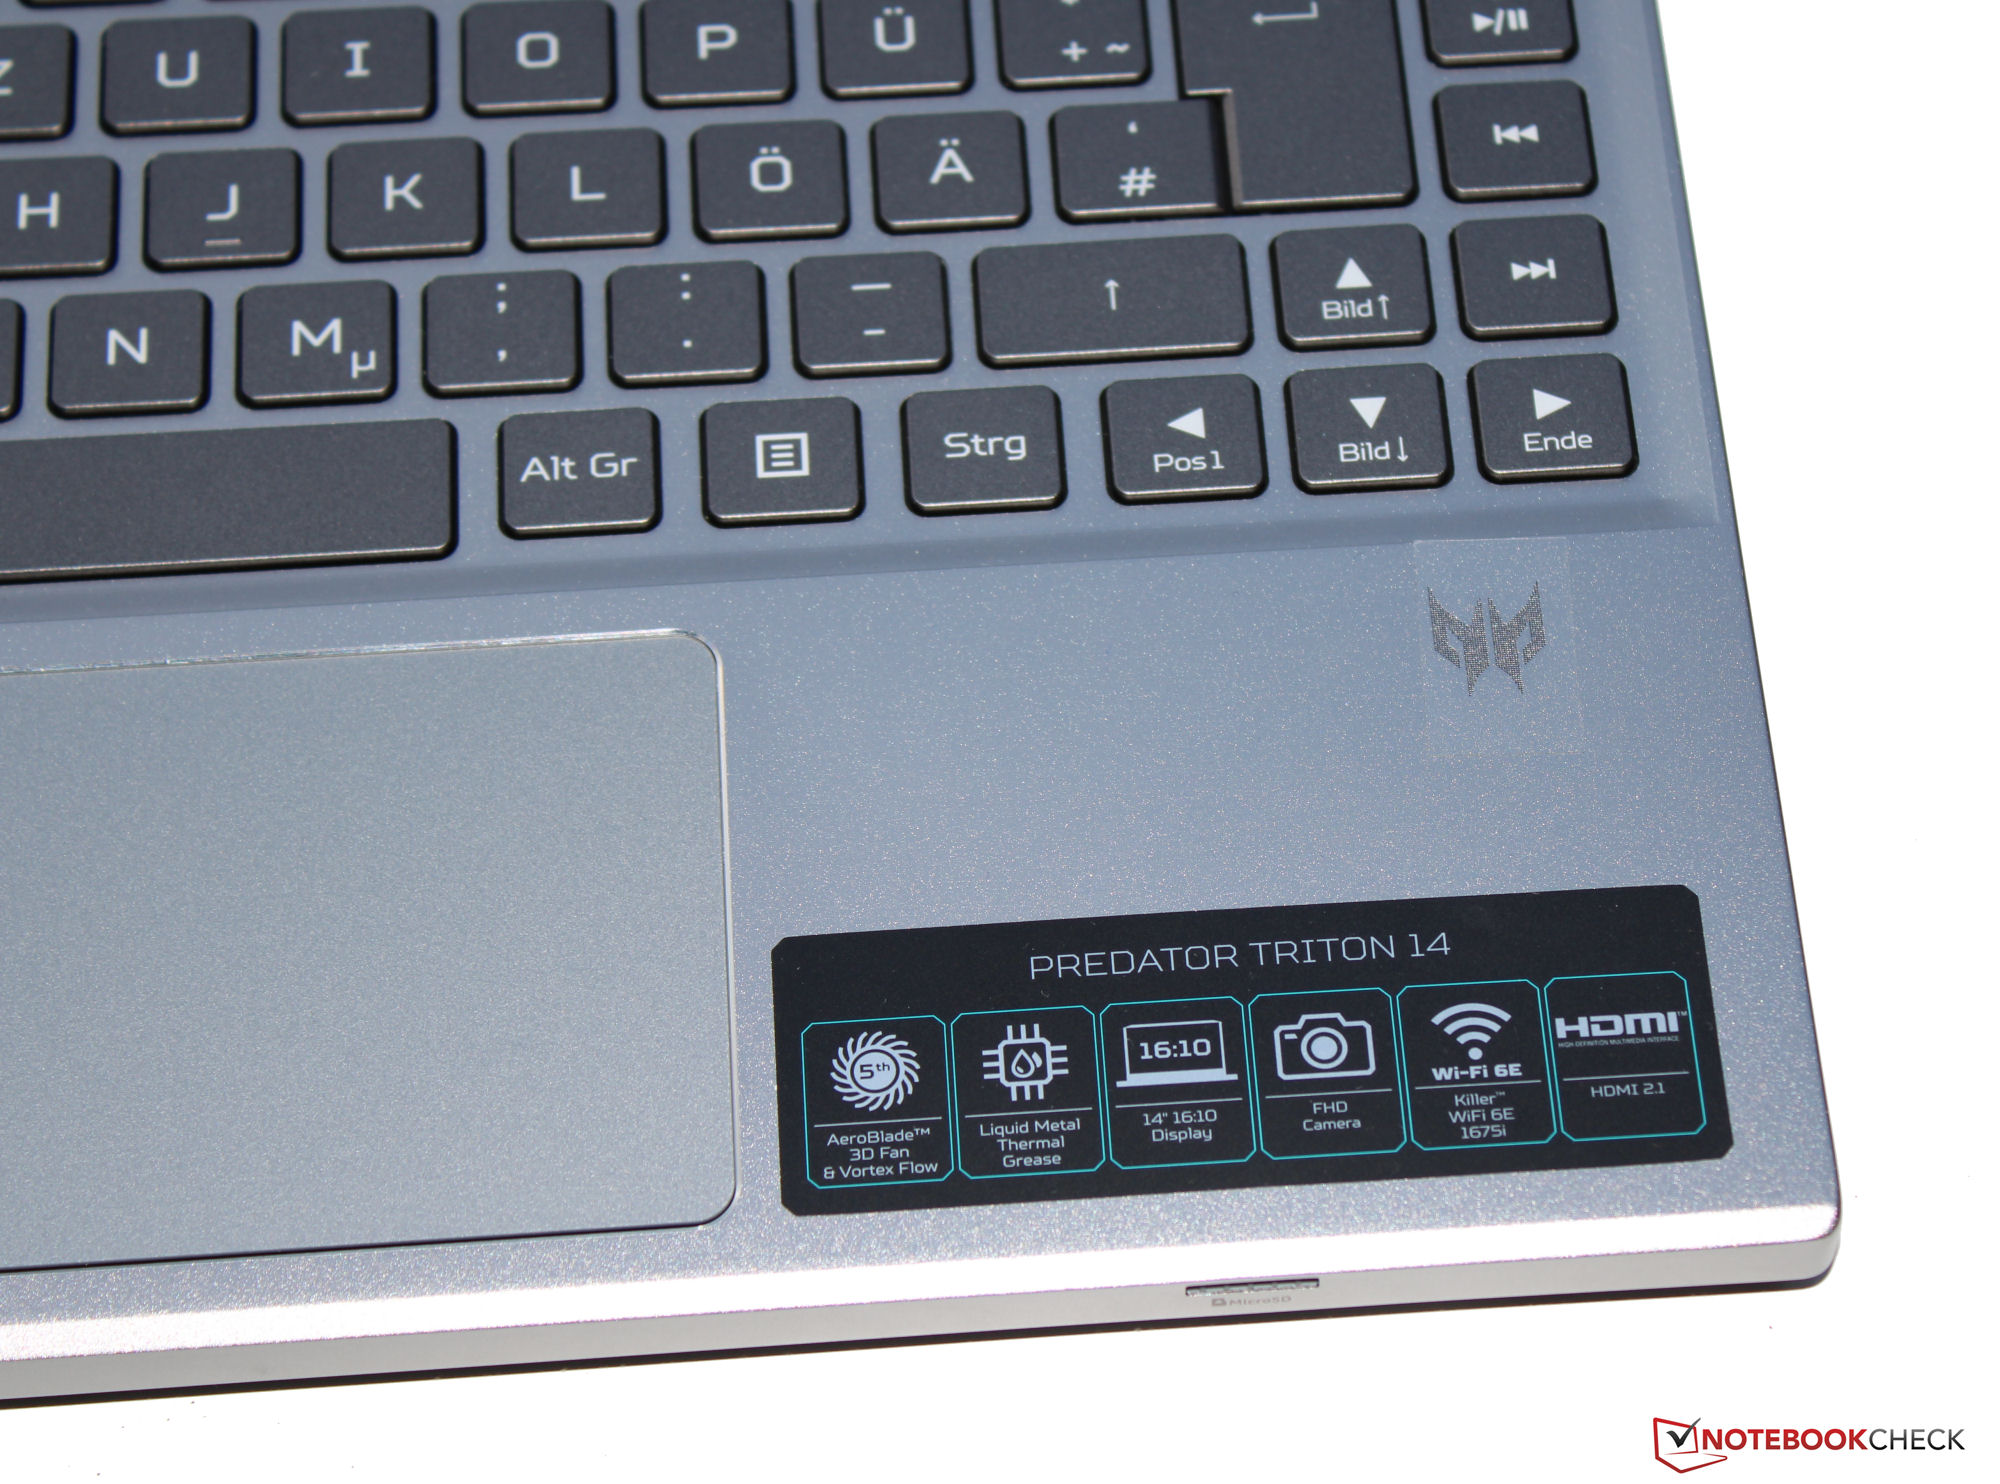
El ratón alternativo es un Clickpad multitáctil (de unos 10,5 x 6,5 cm) por el que los dedos del usuario pasan sin esfuerzo. Tiene un recorrido corto y un punto de presión claramente definido.
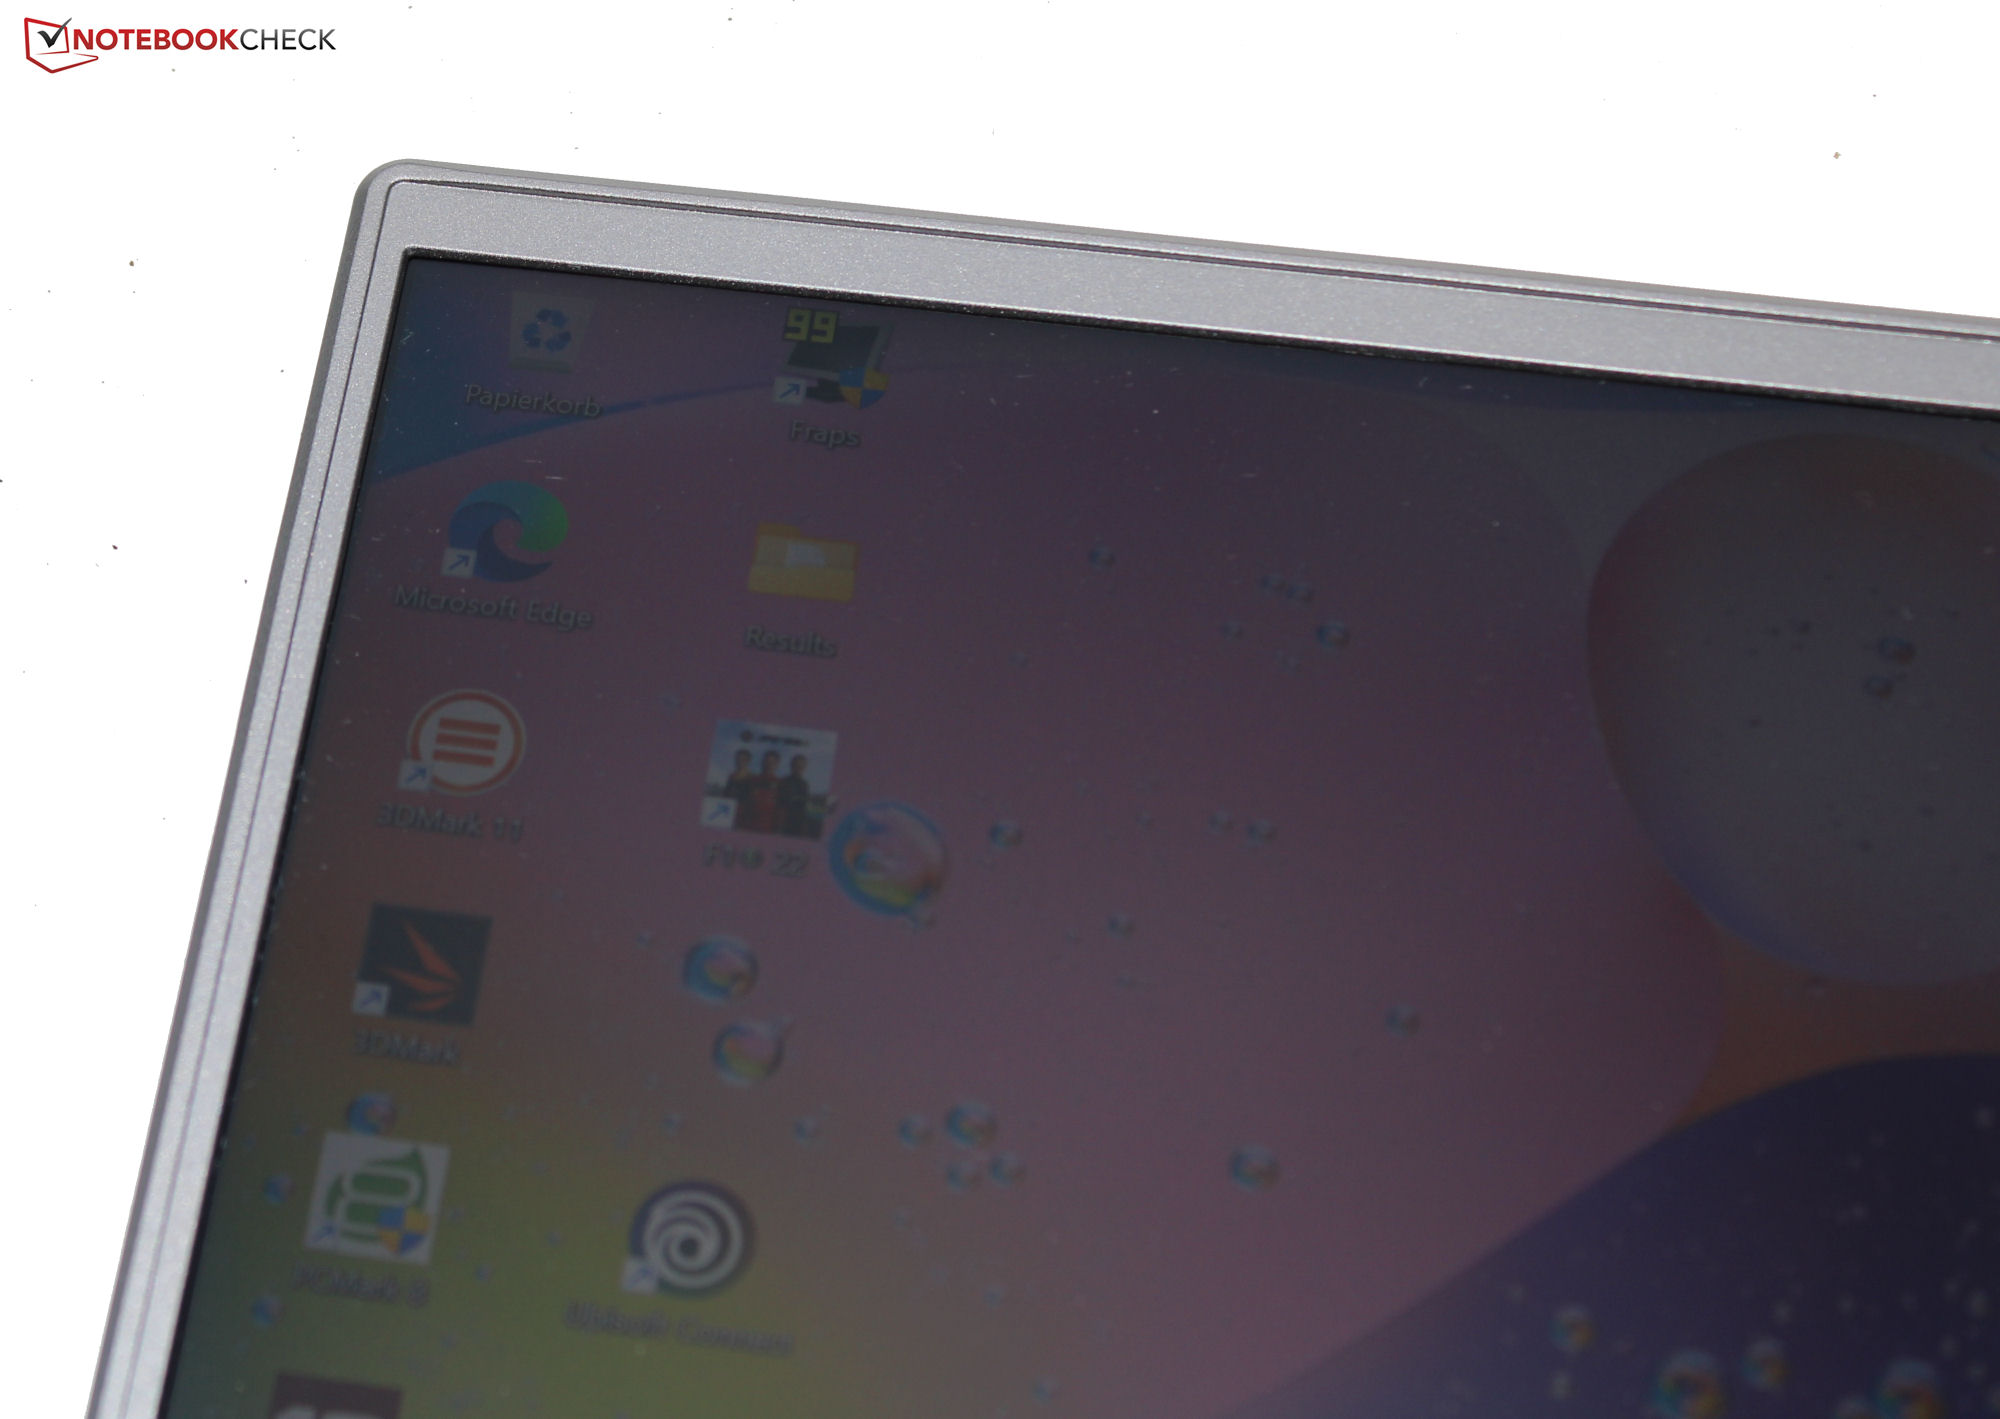
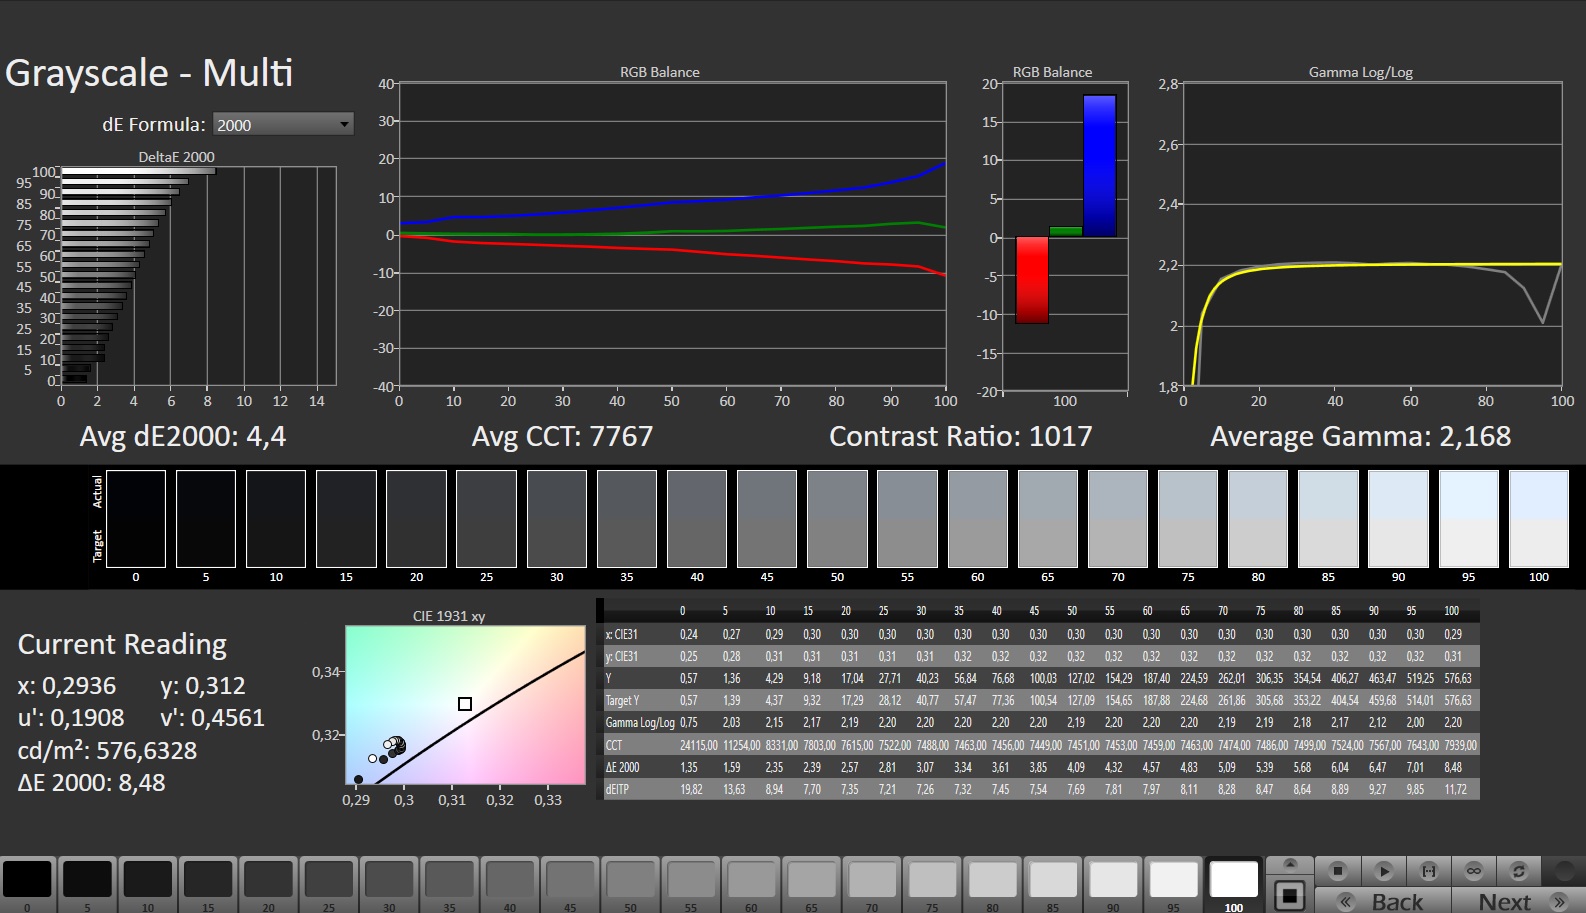
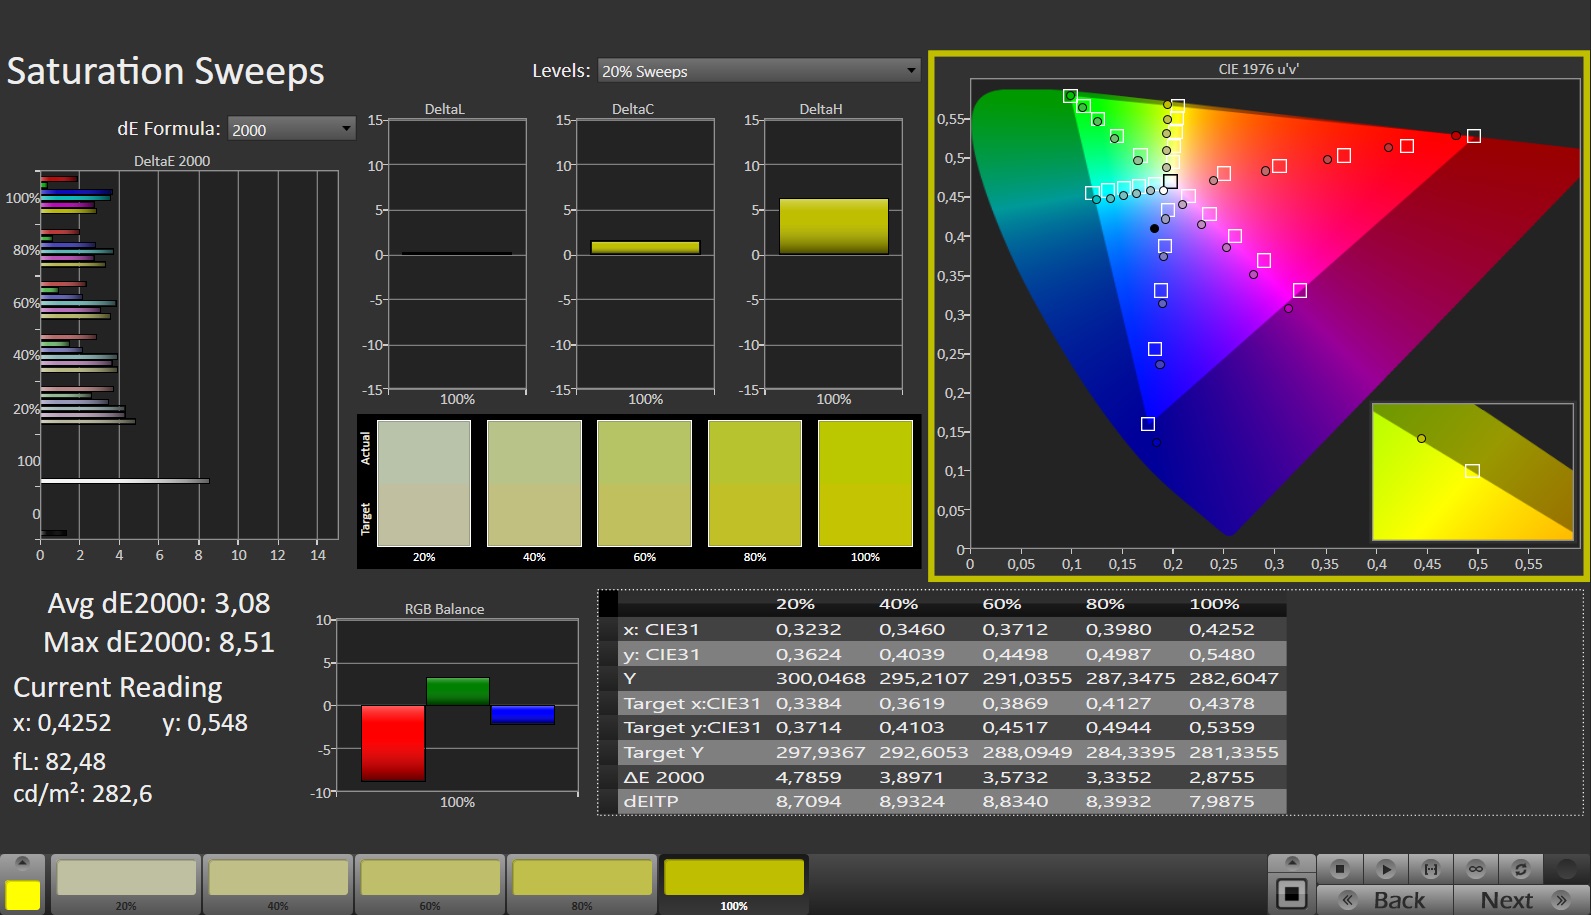
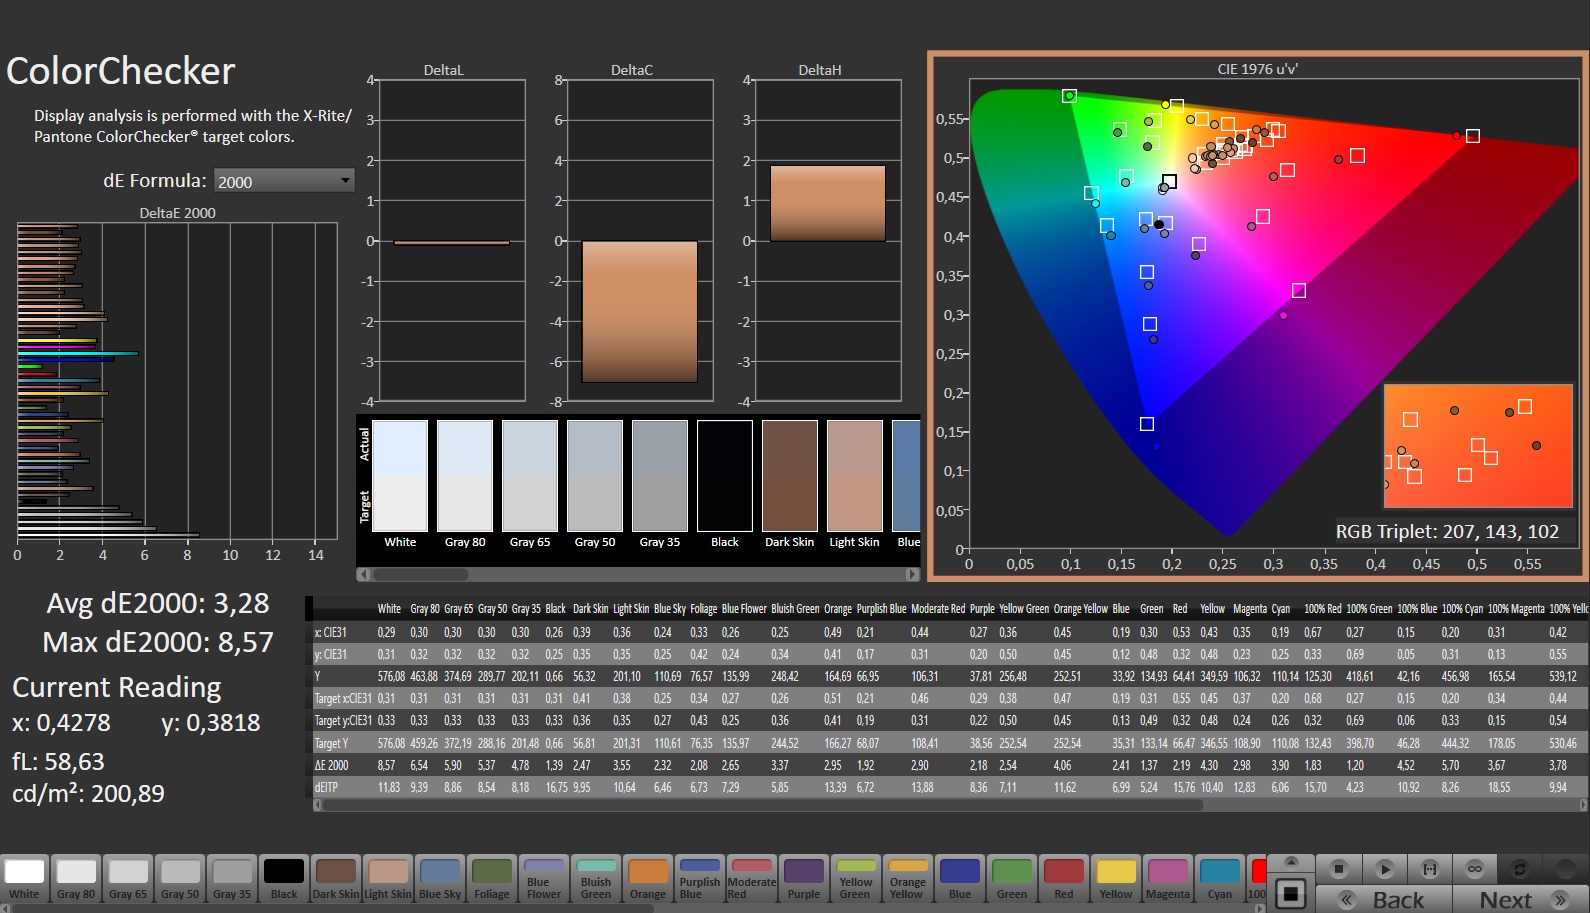
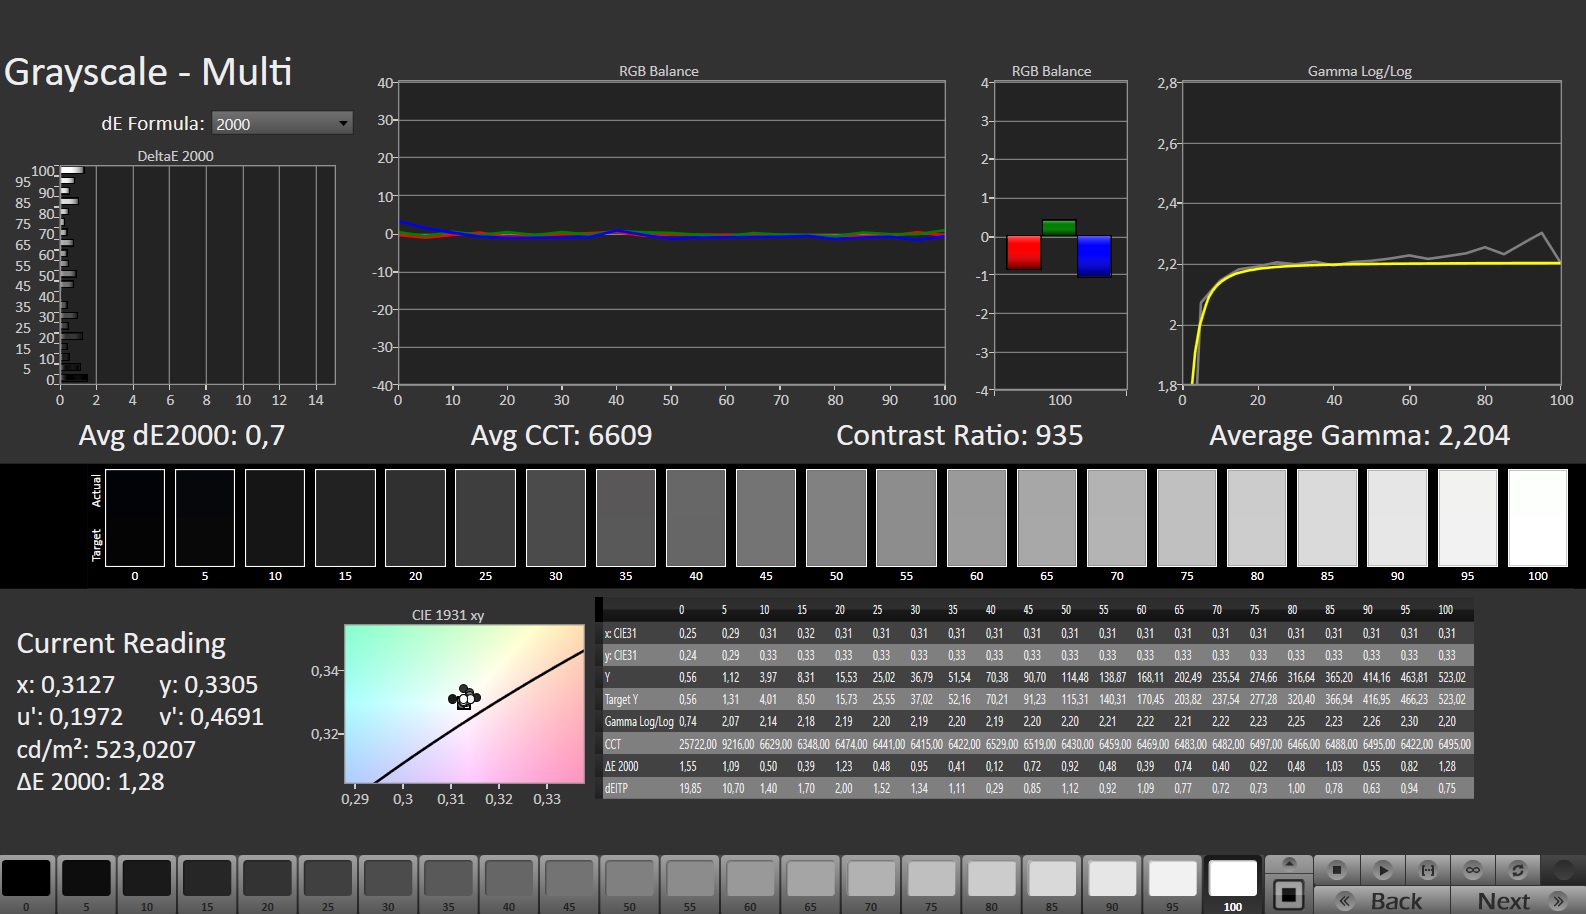
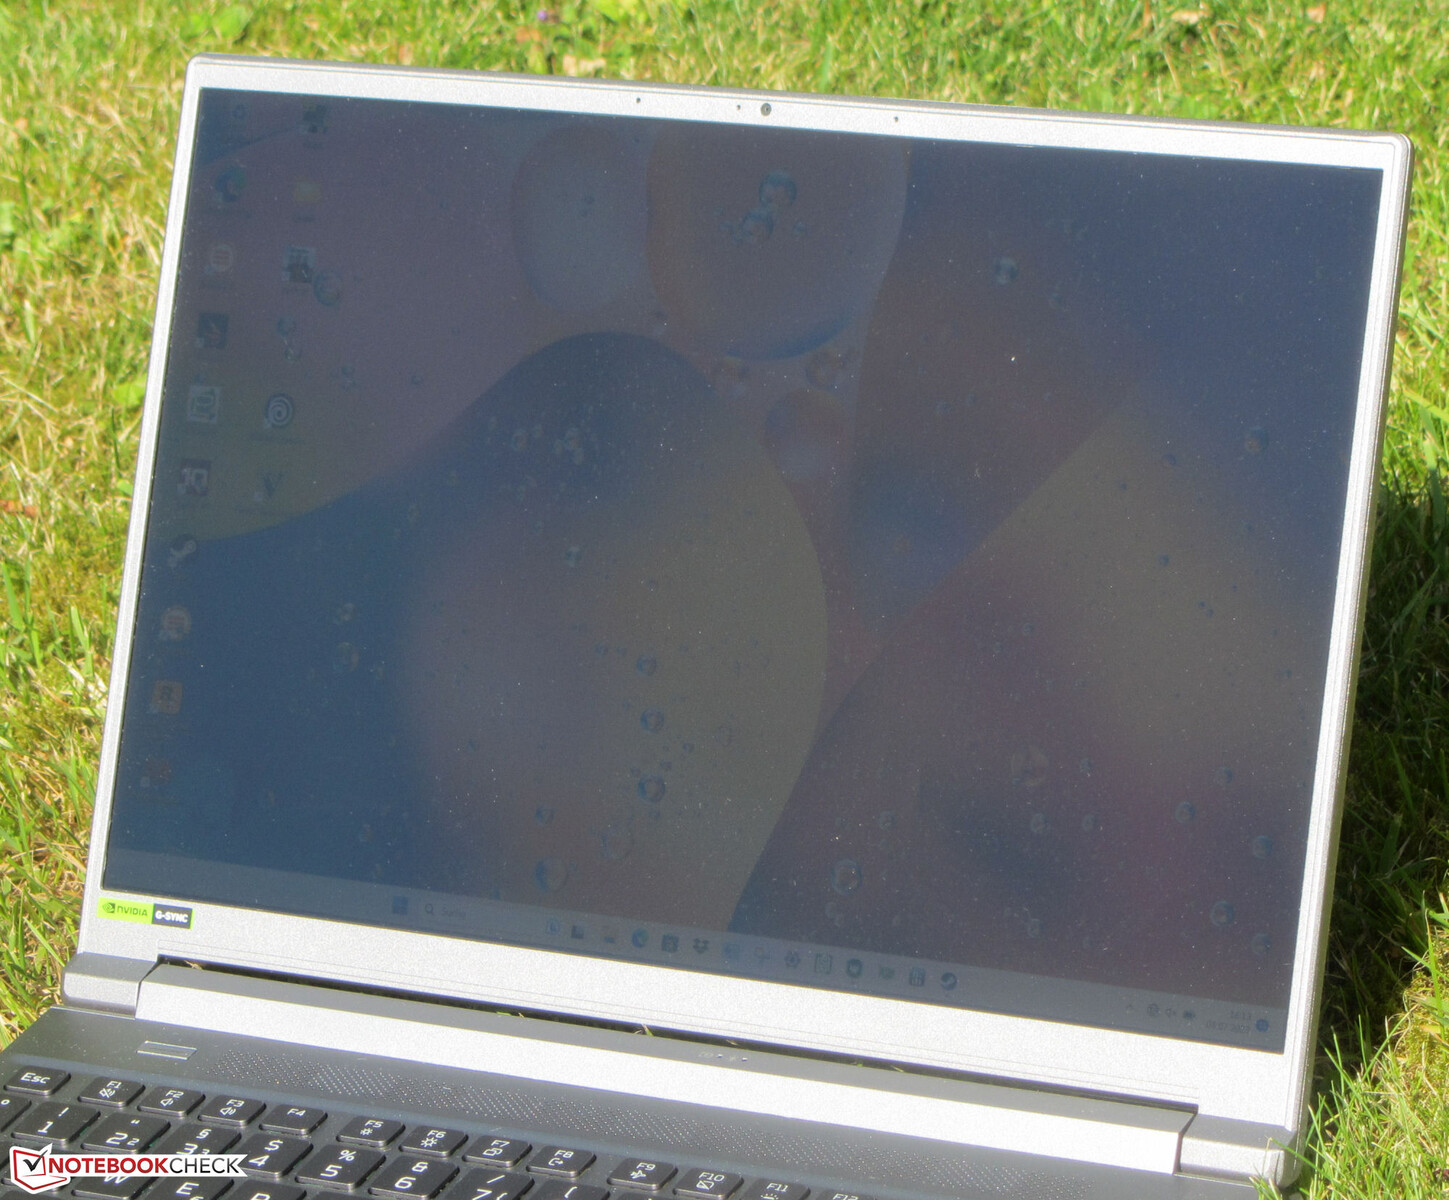
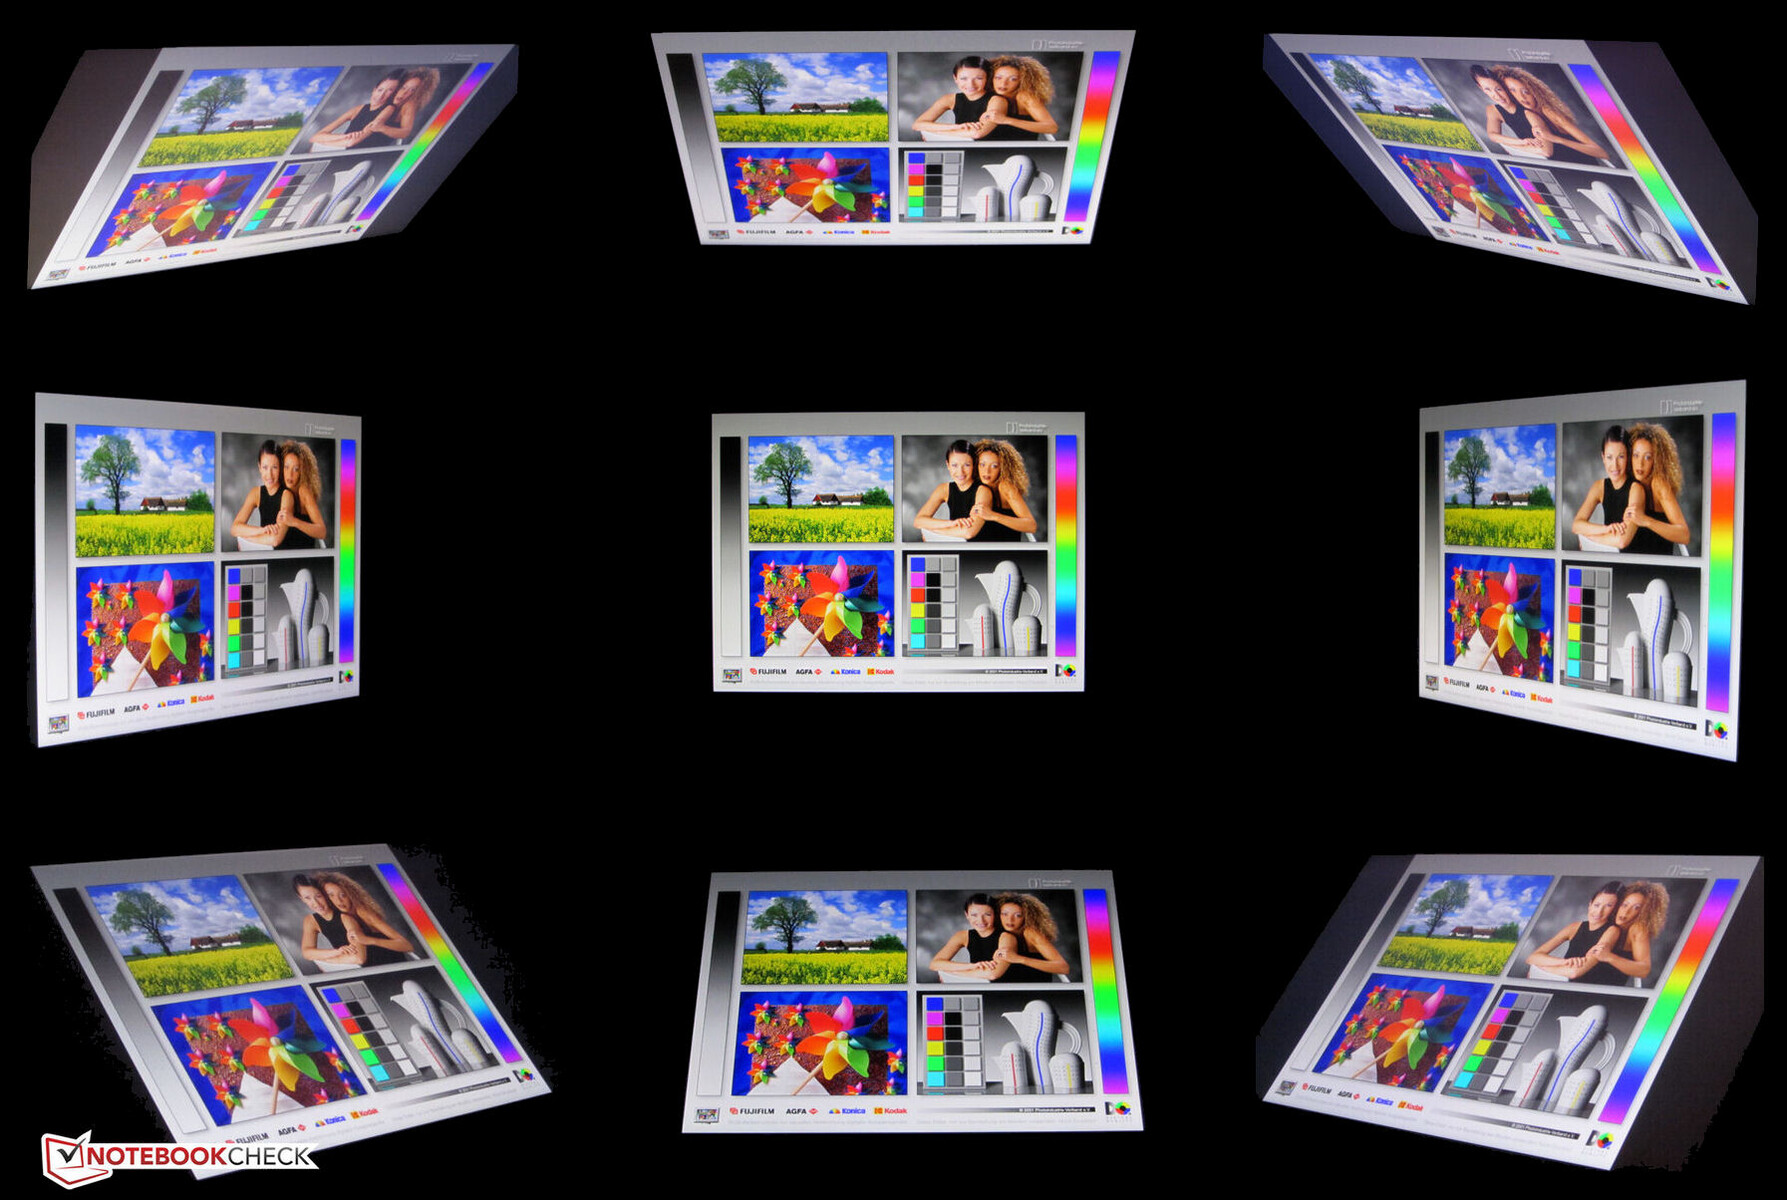
Pantalla - Muy brillante con cobertura de color DCI P3
Acer ha equipado a su Predator con un display de 14 pulgadas (2.560 x 1.600 pixels) en una relación de aspecto 16:10 que facilita el trabajo. En el lado positivo, hay soporte G-Sync, ausencia de parpadeo PWM, cortos tiempos de respuesta y un elevado brillo de (516.2 cd/m²). El ratio de contraste (944:1) apenas alcanza su valor objetivo (> 1.000:1).
La pantalla mini-LED disponible alternativamente (2.560 x 1.600 pixels) debería tener un contraste significativamente mayor y viene con una certificación DisplayHDR 600.
| |||||||||||||||||||||||||
iluminación: 88 %
Brillo con batería: 547 cd/m²
Contraste: 977:1 (Negro: 0.56 cd/m²)
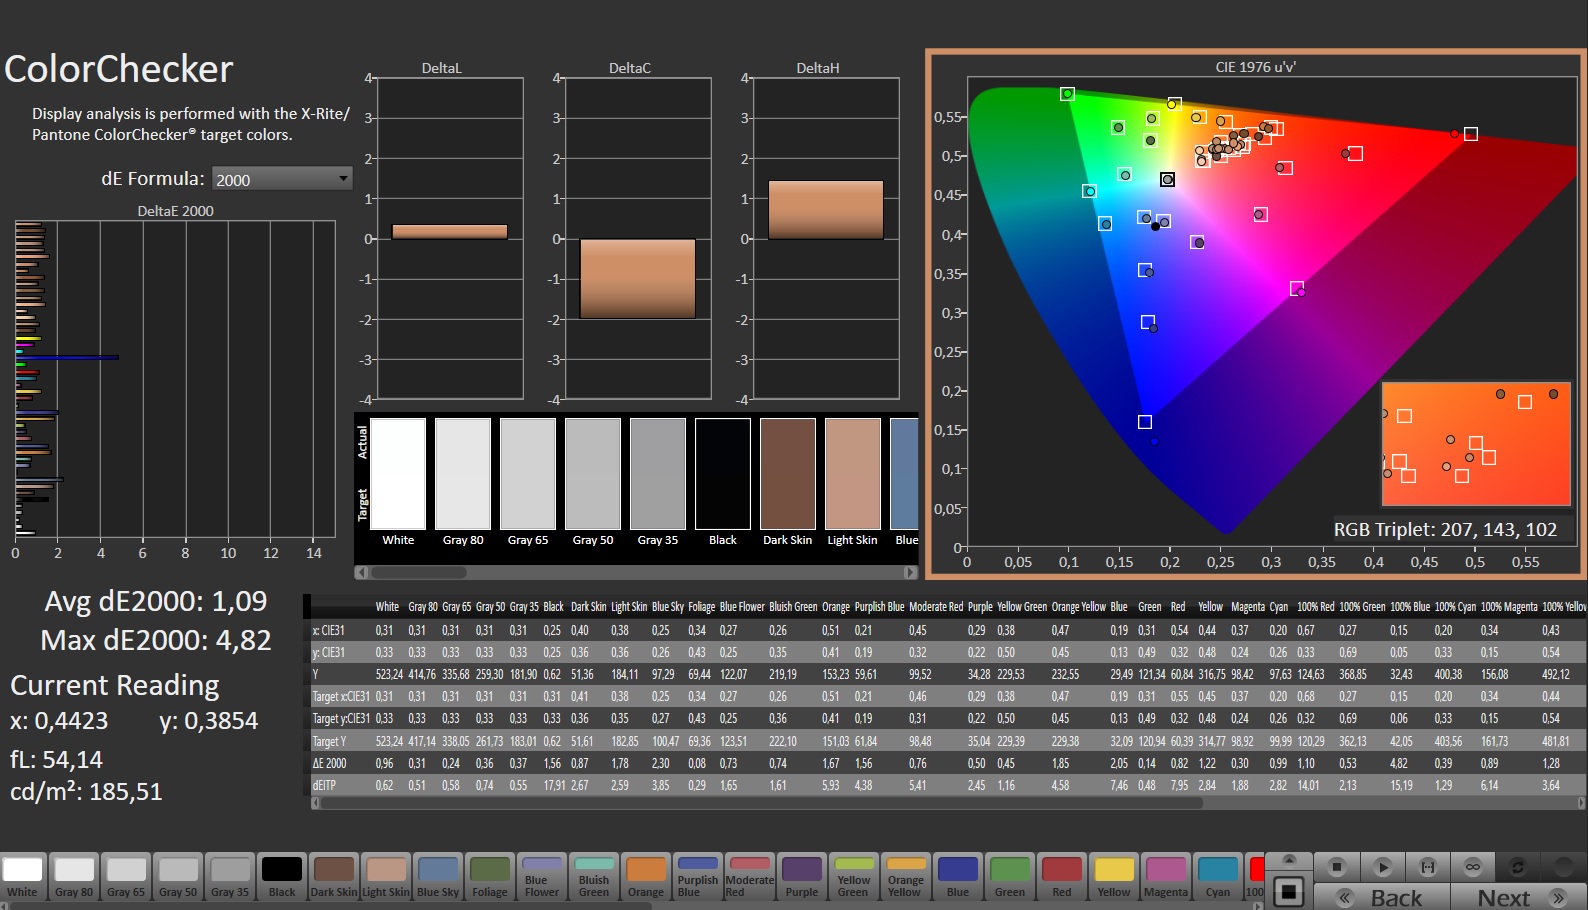
ΔE ColorChecker Calman: 3.28 | ∀{0.5-29.43 Ø4.71}
calibrated: 1.09
ΔE Greyscale Calman: 4.4 | ∀{0.09-98 Ø4.96}
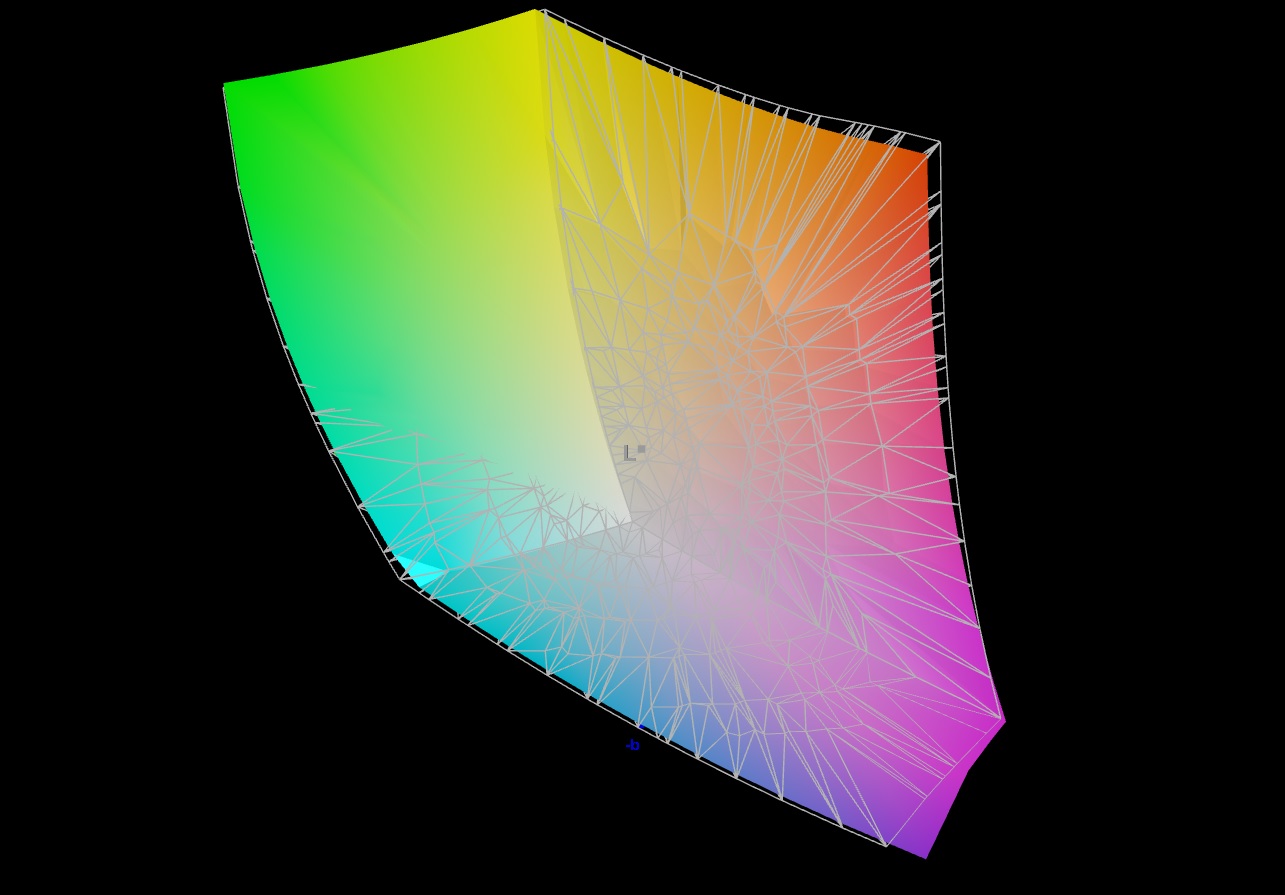
85.5% AdobeRGB 1998 (Argyll 3D)
99.9% sRGB (Argyll 3D)
96.9% Display P3 (Argyll 3D)
Gamma: 2.168
CCT: 7767 K
| Acer Predator Triton 14 PT14-51 BOE NE140QDM-NY1, IPS, 2560x1600, 14" | Razer Blade 14 RTX 4070 AU Optronics B140QAN06.U, IPS, 2560x1600, 14" | Asus ROG Zephyrus G14 GA402RJ BOEhydis NE140QDM-NX1, IPS, 2560x1600, 14" | MSI Stealth 14 Studio A13V B140QAN06.T, IPS, 2560x1600, 14" | Gigabyte Aero 14 OLED BMF Samsung SDC4192 (ATNA40YK14-0), OLED, 2880x1800, 14" | Apple MacBook Pro 14 2023 M2 Pro Entry Mini-LED, 3024x1964, 14.2" | |
|---|---|---|---|---|---|---|
| Display | 0% | 0% | -0% | 2% | ||
| Display P3 Coverage (%) | 96.9 | 97.3 0% | 97.6 1% | 96.2 -1% | 99.8 3% | |
| sRGB Coverage (%) | 99.9 | 99.8 0% | 99.9 0% | 99.6 0% | 100 0% | |
| AdobeRGB 1998 Coverage (%) | 85.5 | 85.3 0% | 85.6 0% | 85.3 0% | 88.7 4% | |
| Response Times | -9% | 21% | 32% | 72% | ||
| Response Time Grey 50% / Grey 80% * (ms) | 15.1 ? | 11.9 ? 21% | 8.3 ? 45% | 5.5 ? 64% | 2.4 ? 84% | |
| Response Time Black / White * (ms) | 5.8 ? | 8 ? -38% | 6 ? -3% | 5.8 ? -0% | 2.4 ? 59% | |
| PWM Frequency (Hz) | 26191 ? | 300 | ||||
| Screen | 3% | 12% | 9% | 70% | ||
| Brightness middle (cd/m²) | 547 | 559.3 2% | 500 -9% | 419 -23% | 423 -23% | |
| Brightness (cd/m²) | 516 | 560 9% | 470 -9% | 402 -22% | 427 -17% | |
| Brightness Distribution (%) | 88 | 88 0% | 85 -3% | 89 1% | 98 11% | |
| Black Level * (cd/m²) | 0.56 | 0.44 21% | 0.42 25% | 0.43 23% | 0.1 82% | |
| Contrast (:1) | 977 | 1271 30% | 1190 22% | 974 0% | 4230 333% | |
| Colorchecker dE 2000 * | 3.28 | 4.44 -35% | 2.45 25% | 2.3 30% | 0.55 83% | |
| Colorchecker dE 2000 max. * | 8.57 | 9.3 -9% | 5.34 38% | 5.8 32% | 1.15 87% | |
| Colorchecker dE 2000 calibrated * | 1.09 | 0.39 64% | 1.2 -10% | 0.9 17% | 1.15 -6% | |
| Greyscale dE 2000 * | 4.4 | 6.8 -55% | 3.1 30% | 3.3 25% | 0.69 84% | |
| Gamma | 2.168 101% | 2.3 96% | 2.213 99% | 2.14 103% | 2.42 91% | |
| CCT | 7767 84% | 6242 104% | 7251 90% | 6550 99% | 6479 100% | |
| Media total (Programa/Opciones) | -2% /
1% | 11% /
11% | 14% /
10% | 48% /
56% |
* ... más pequeño es mejor
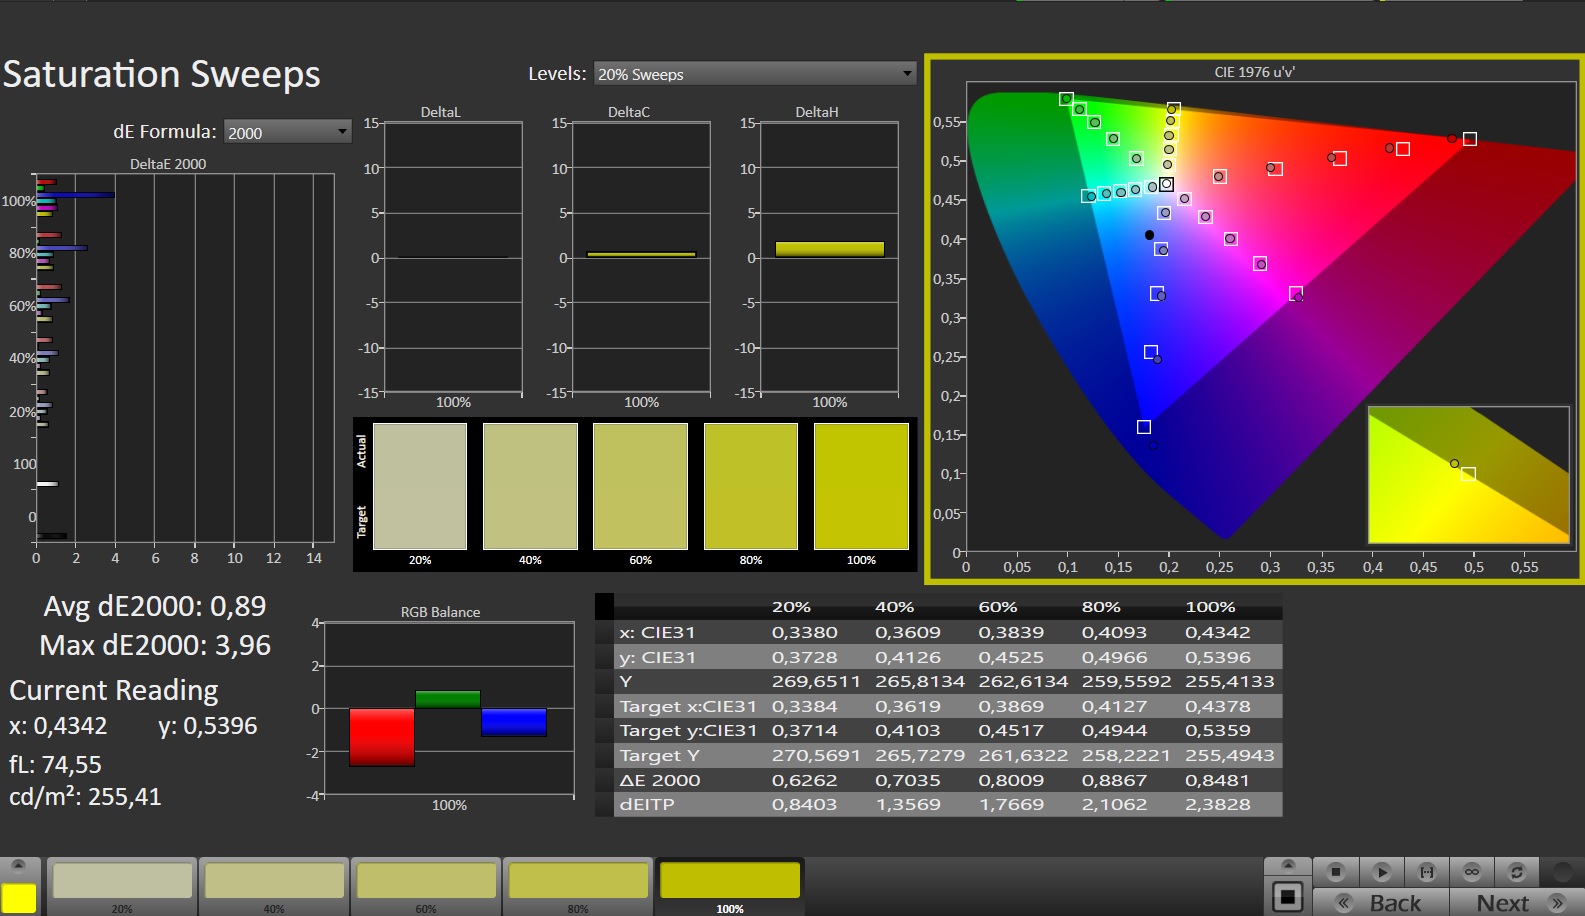
Al sacarla de la caja, la pantalla tiene una reproducción del color decente: Con una desviación de alrededor de 3,3, el valor objetivo (DeltaE < 3) no se alcanza por poco. Un calibrado reduce este valor a 1,1 y garantiza escalas de grises equilibradas. La precisión del color está dada: El panel reproduce completamente los espacios de color sRGB y DCI P3 y el espacio AdobeRGB al 86 por ciento. Las pantallas de la competencia cuentan la misma historia.
Hemos creado nuestro propio perfil de color, que se puede descargar y utilizar. Encontrarás un enlace en la bandeja de entrada "Pantalla".


Tiempos de respuesta del display
| ↔ Tiempo de respuesta de Negro a Blanco | ||
|---|---|---|
| 5.8 ms ... subida ↗ y bajada ↘ combinada | ↗ 2.1 ms subida | 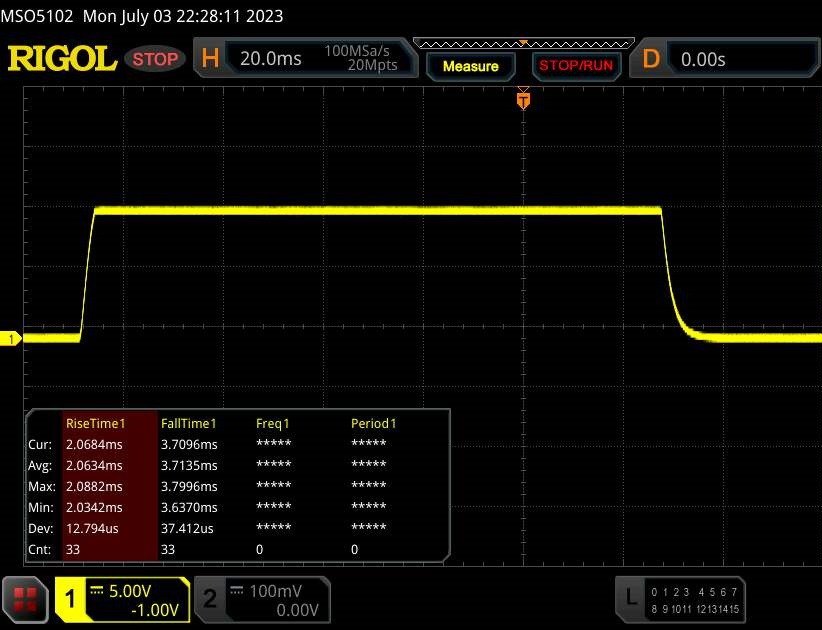 |
| ↘ 3.7 ms bajada | ||
| La pantalla mostró tiempos de respuesta muy rápidos en nuestros tests y debería ser adecuada para juegos frenéticos. En comparación, todos los dispositivos de prueba van de ##min### (mínimo) a 240 (máximo) ms. » 18 % de todos los dispositivos son mejores. Esto quiere decir que el tiempo de respuesta medido es mejor que la media (19.8 ms) de todos los dispositivos testados. | ||
| ↔ Tiempo de respuesta 50% Gris a 80% Gris | ||
| 15.1 ms ... subida ↗ y bajada ↘ combinada | ↗ 6.8 ms subida | 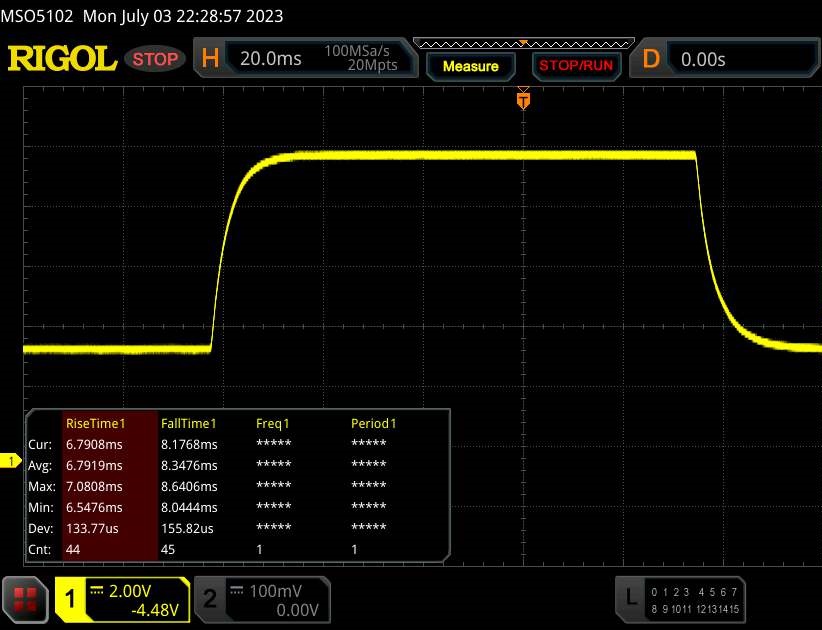 |
| ↘ 8.3 ms bajada | ||
| La pantalla mostró buenos tiempos de respuesta en nuestros tests pero podría ser demasiado lenta para los jugones competitivos. En comparación, todos los dispositivos de prueba van de ##min### (mínimo) a 636 (máximo) ms. » 29 % de todos los dispositivos son mejores. Esto quiere decir que el tiempo de respuesta medido es mejor que la media (30.9 ms) de todos los dispositivos testados. | ||
Parpadeo de Pantalla / PWM (Pulse-Width Modulation)
| Parpadeo de Pantalla / PWM no detectado | 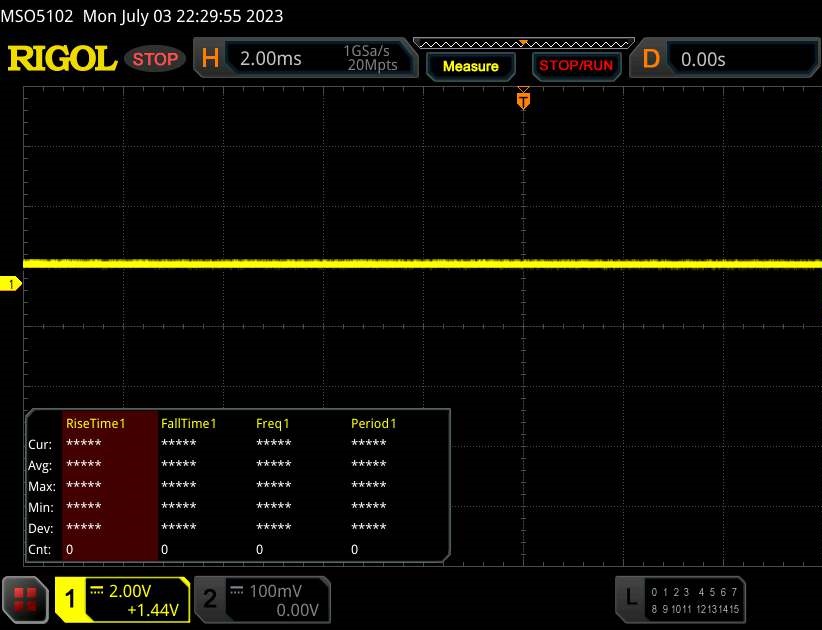 | ||
Comparación: 52 % de todos los dispositivos testados no usaron PWM para atenuar el display. Si se usó, medimos una media de 7748 (mínimo: 5 - máxmo: 343500) Hz. | |||
El panel IPS tiene ángulos de visión estables y es legible desde cualquier posición. Gracias al alto brillo de la pantalla, también se puede ver en exteriores.
Rendimiento - Raptor Lake y Ada Lovelace impulsan el portátil Acer
Con el Predator Triton 14, Acer tiene un portátil de 14 pulgadas hecho para jugar y renderizar. ElCore i7-13700Hy GeForce RTX 4050ofrecen la potencia de cálculo necesaria. Las variantes de mayor rendimiento tienen un GeForce RTX 4070a bordo.

Condiciones de la prueba
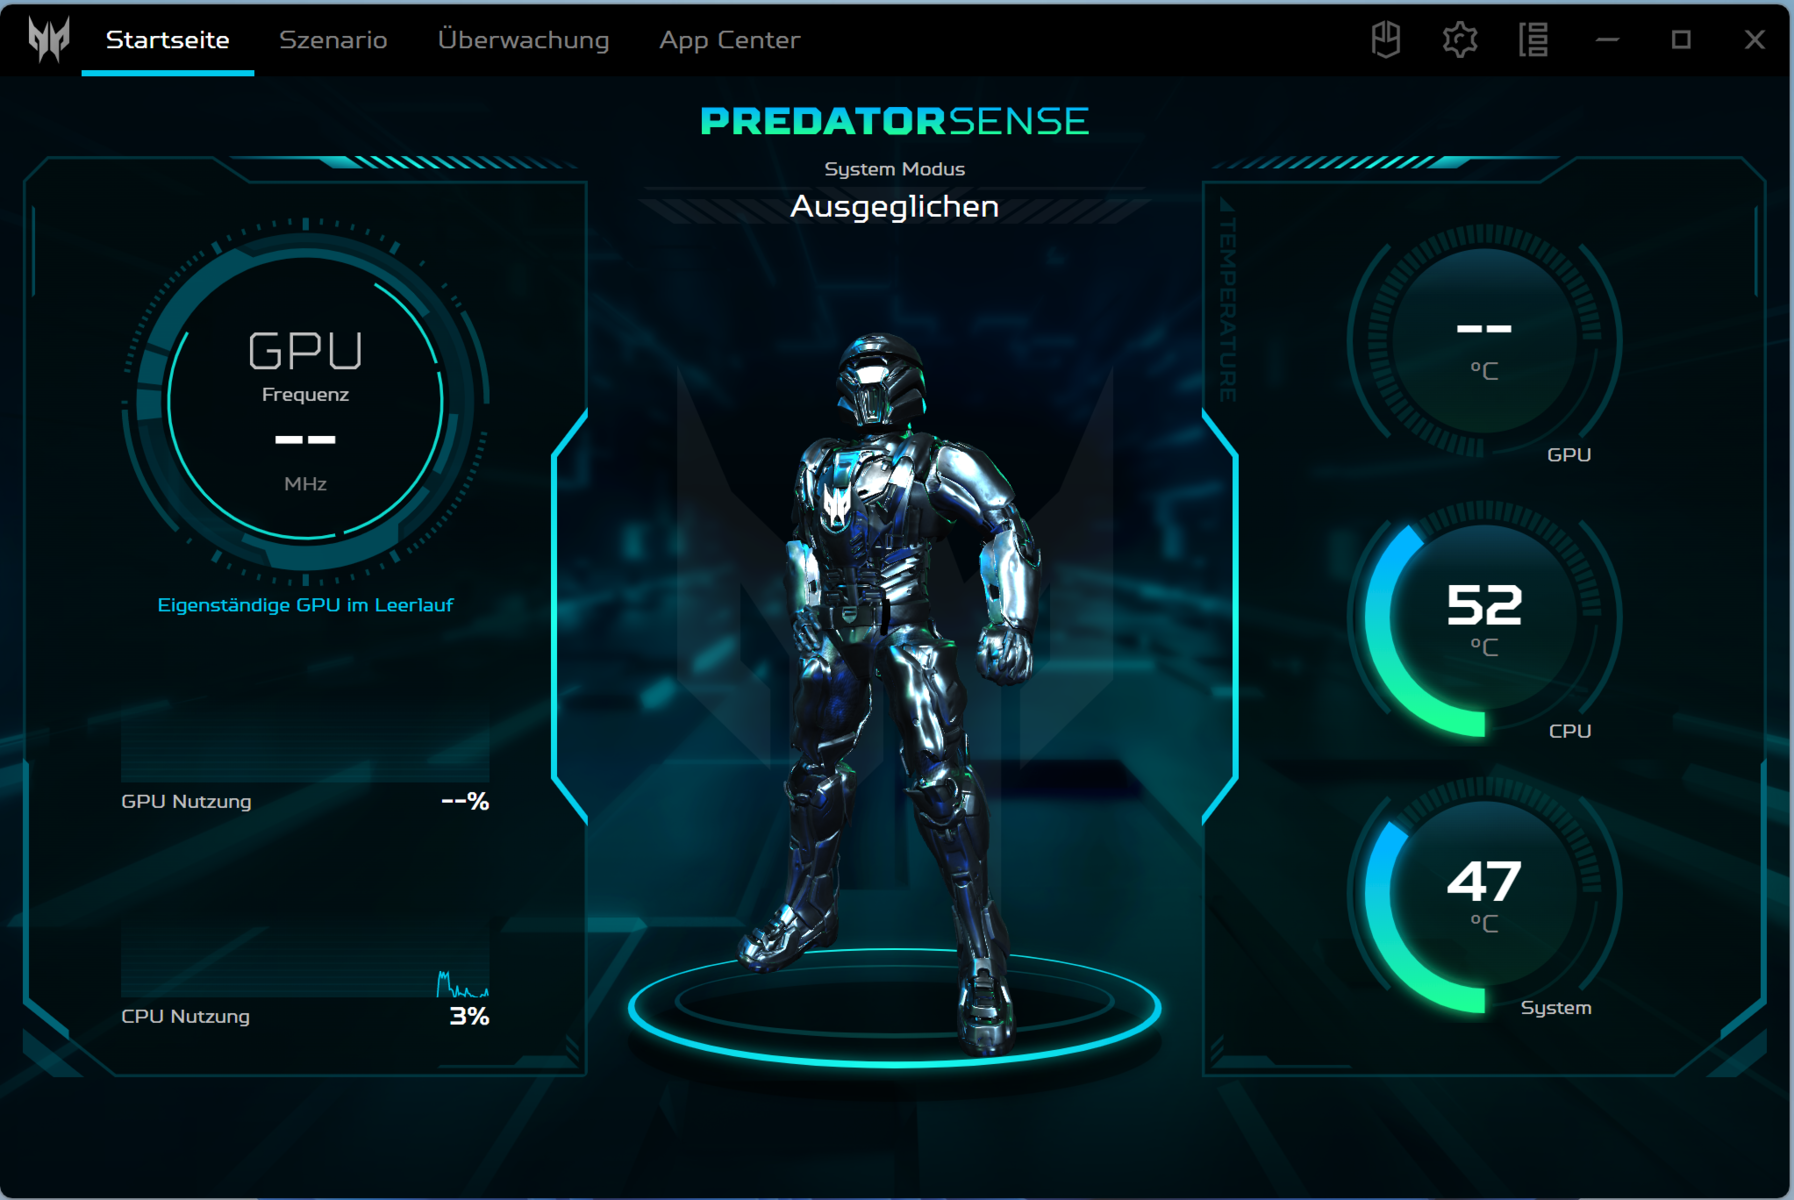
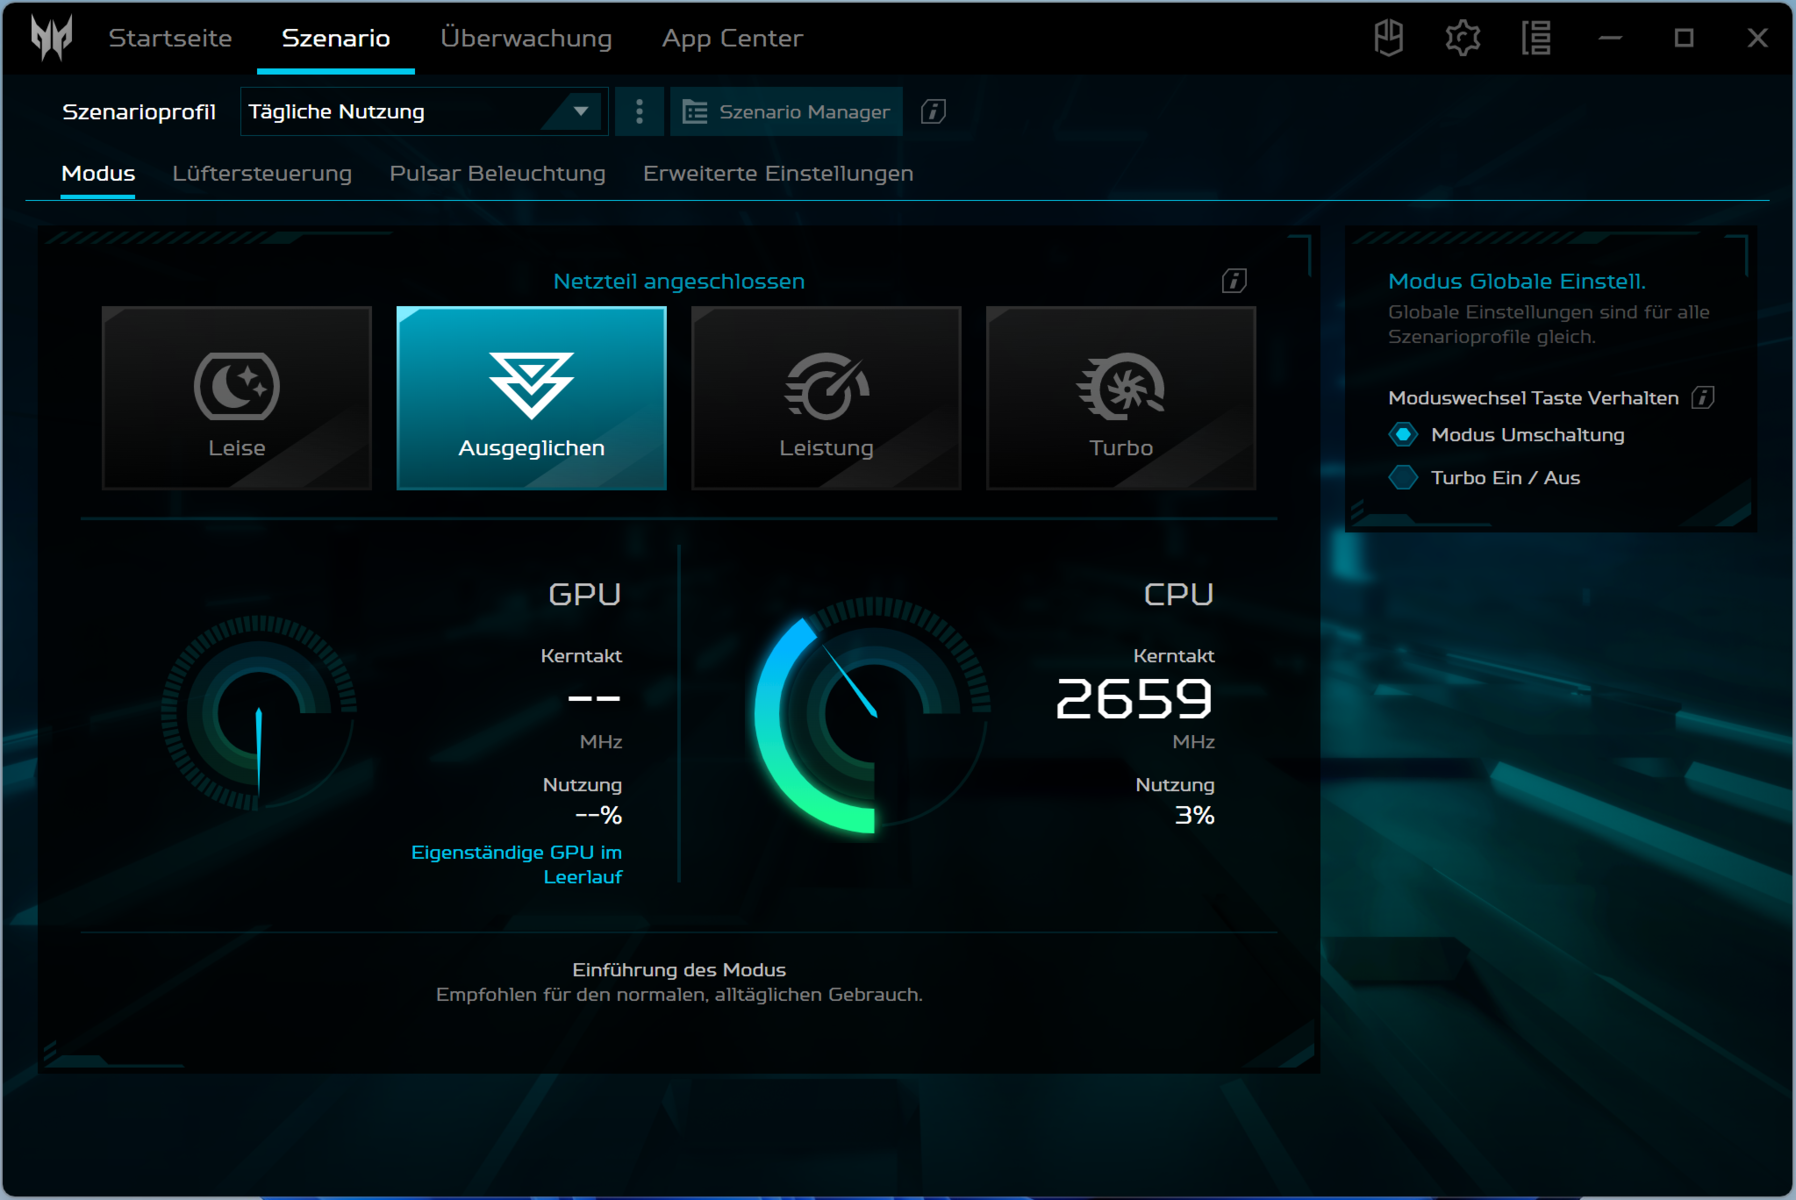
El portátil ofrece seis modos de sistema específicos del fabricante - cuatro en funcionamiento de red y dos en modo batería (ver tabla). Usamos los modos "Equilibrado" (pruebas de rendimiento) y "Eco" (pruebas de batería). "Turbo" y "Rendimiento" sólo están disponibles cuando está enchufado a la pared (nivel de batería > 30 %).
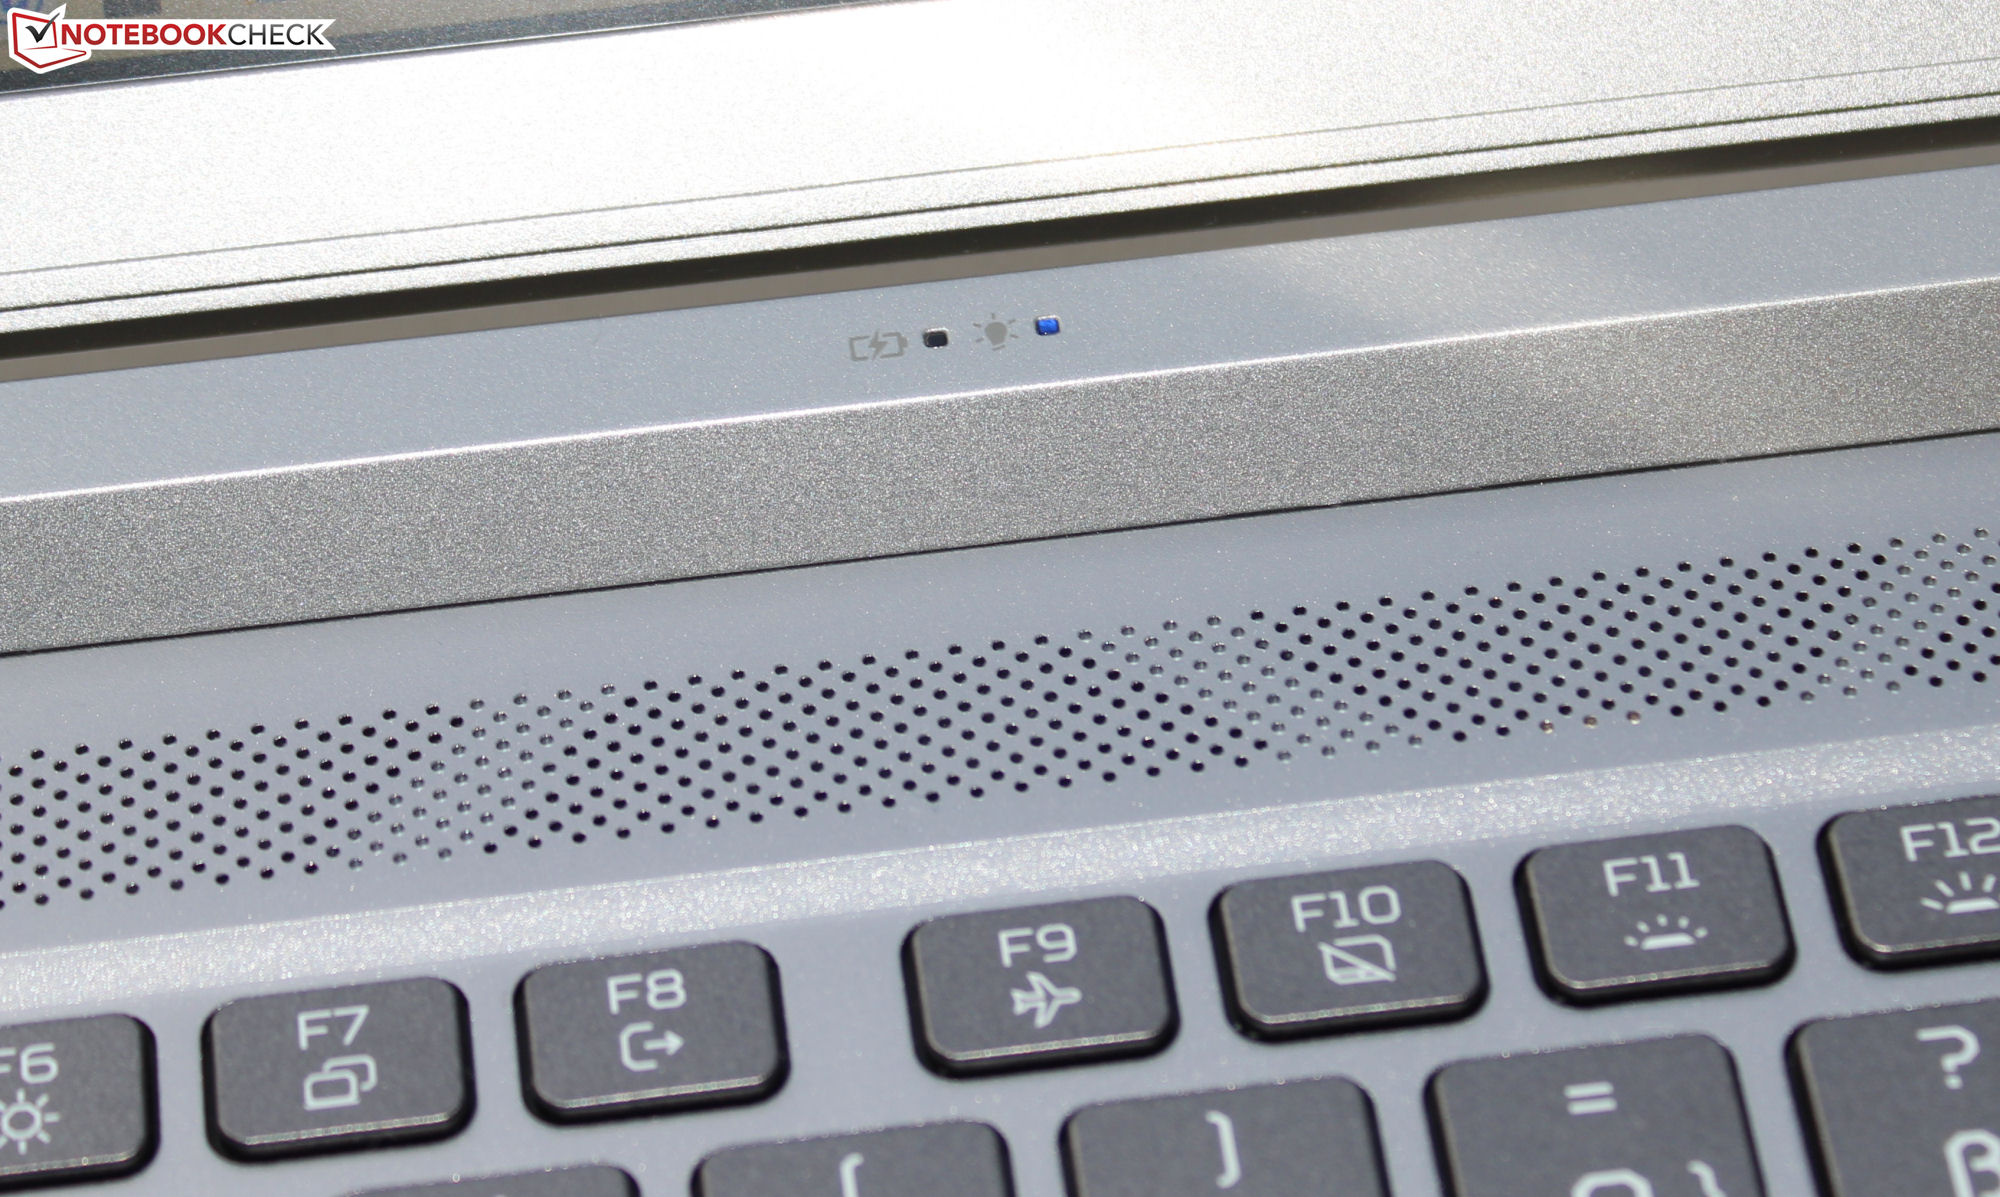
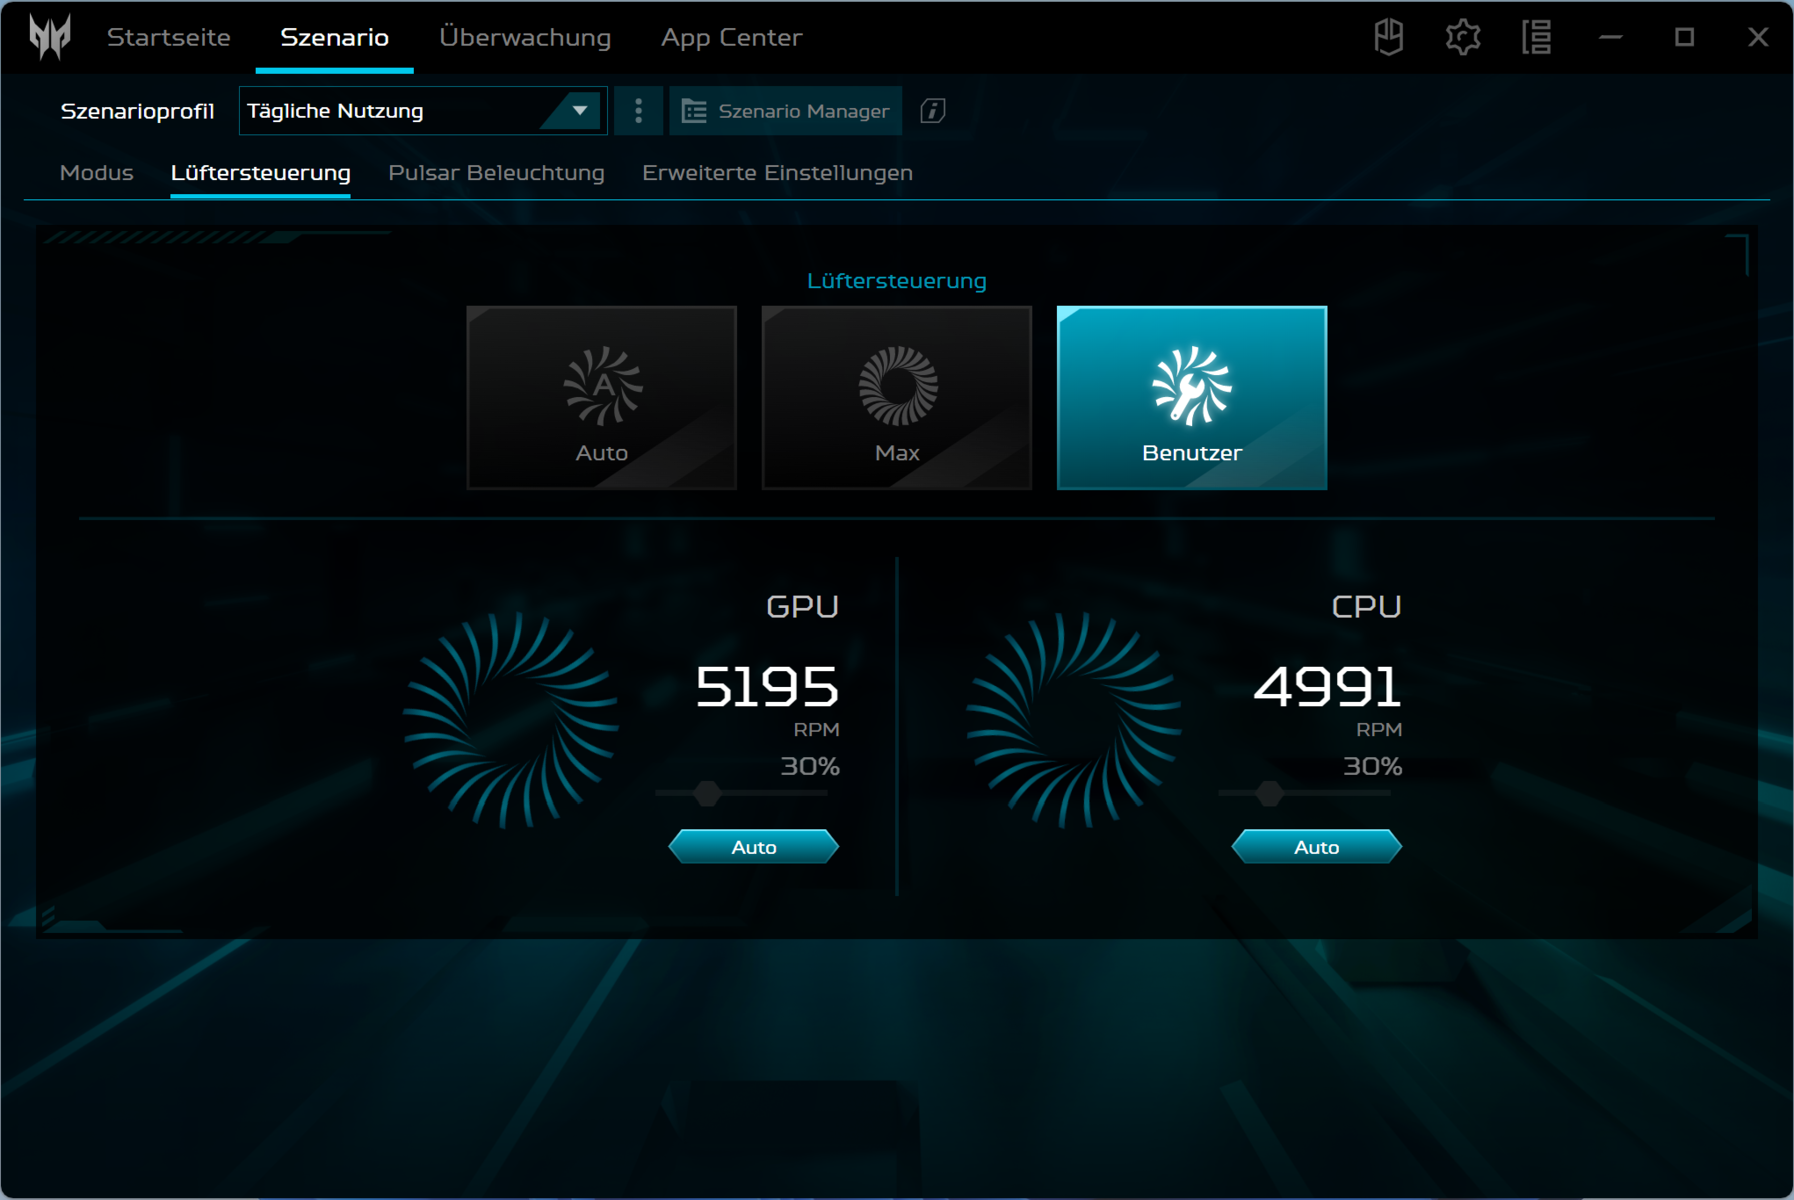
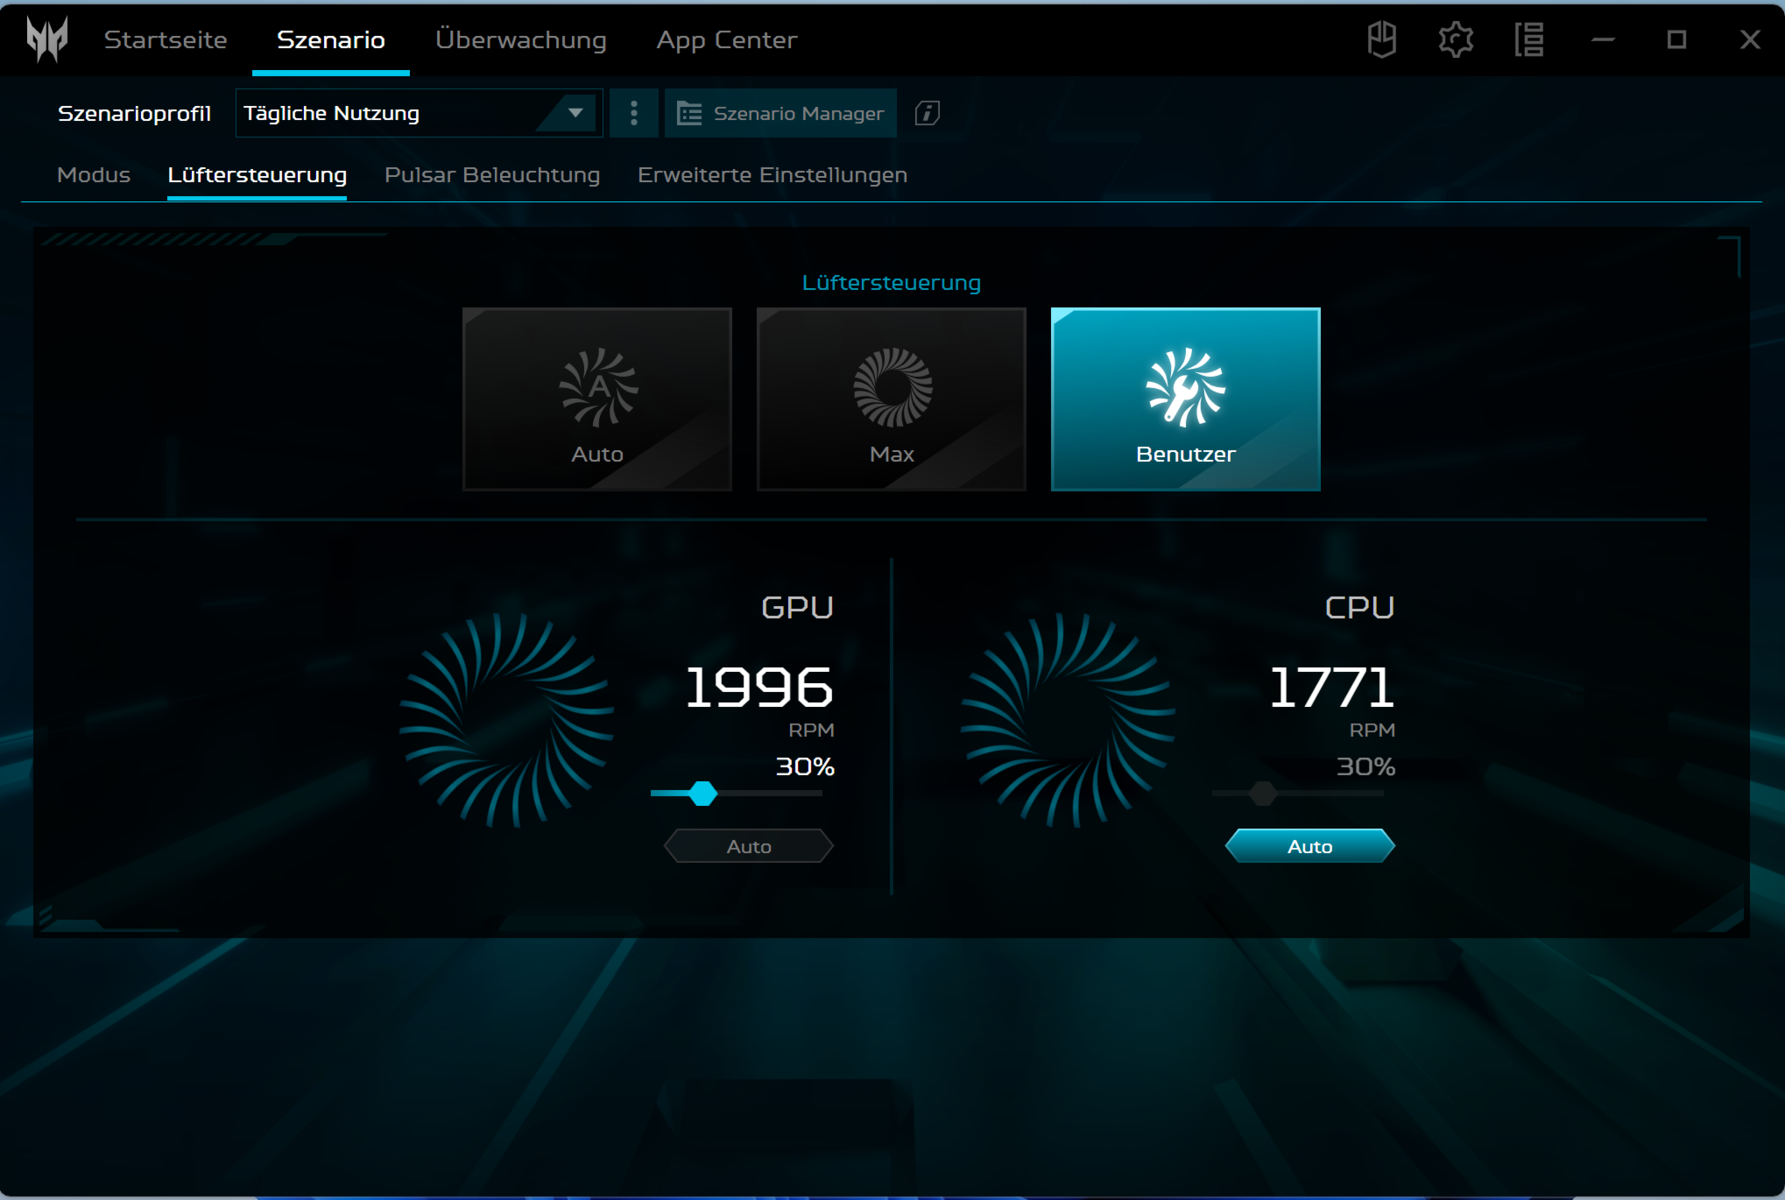
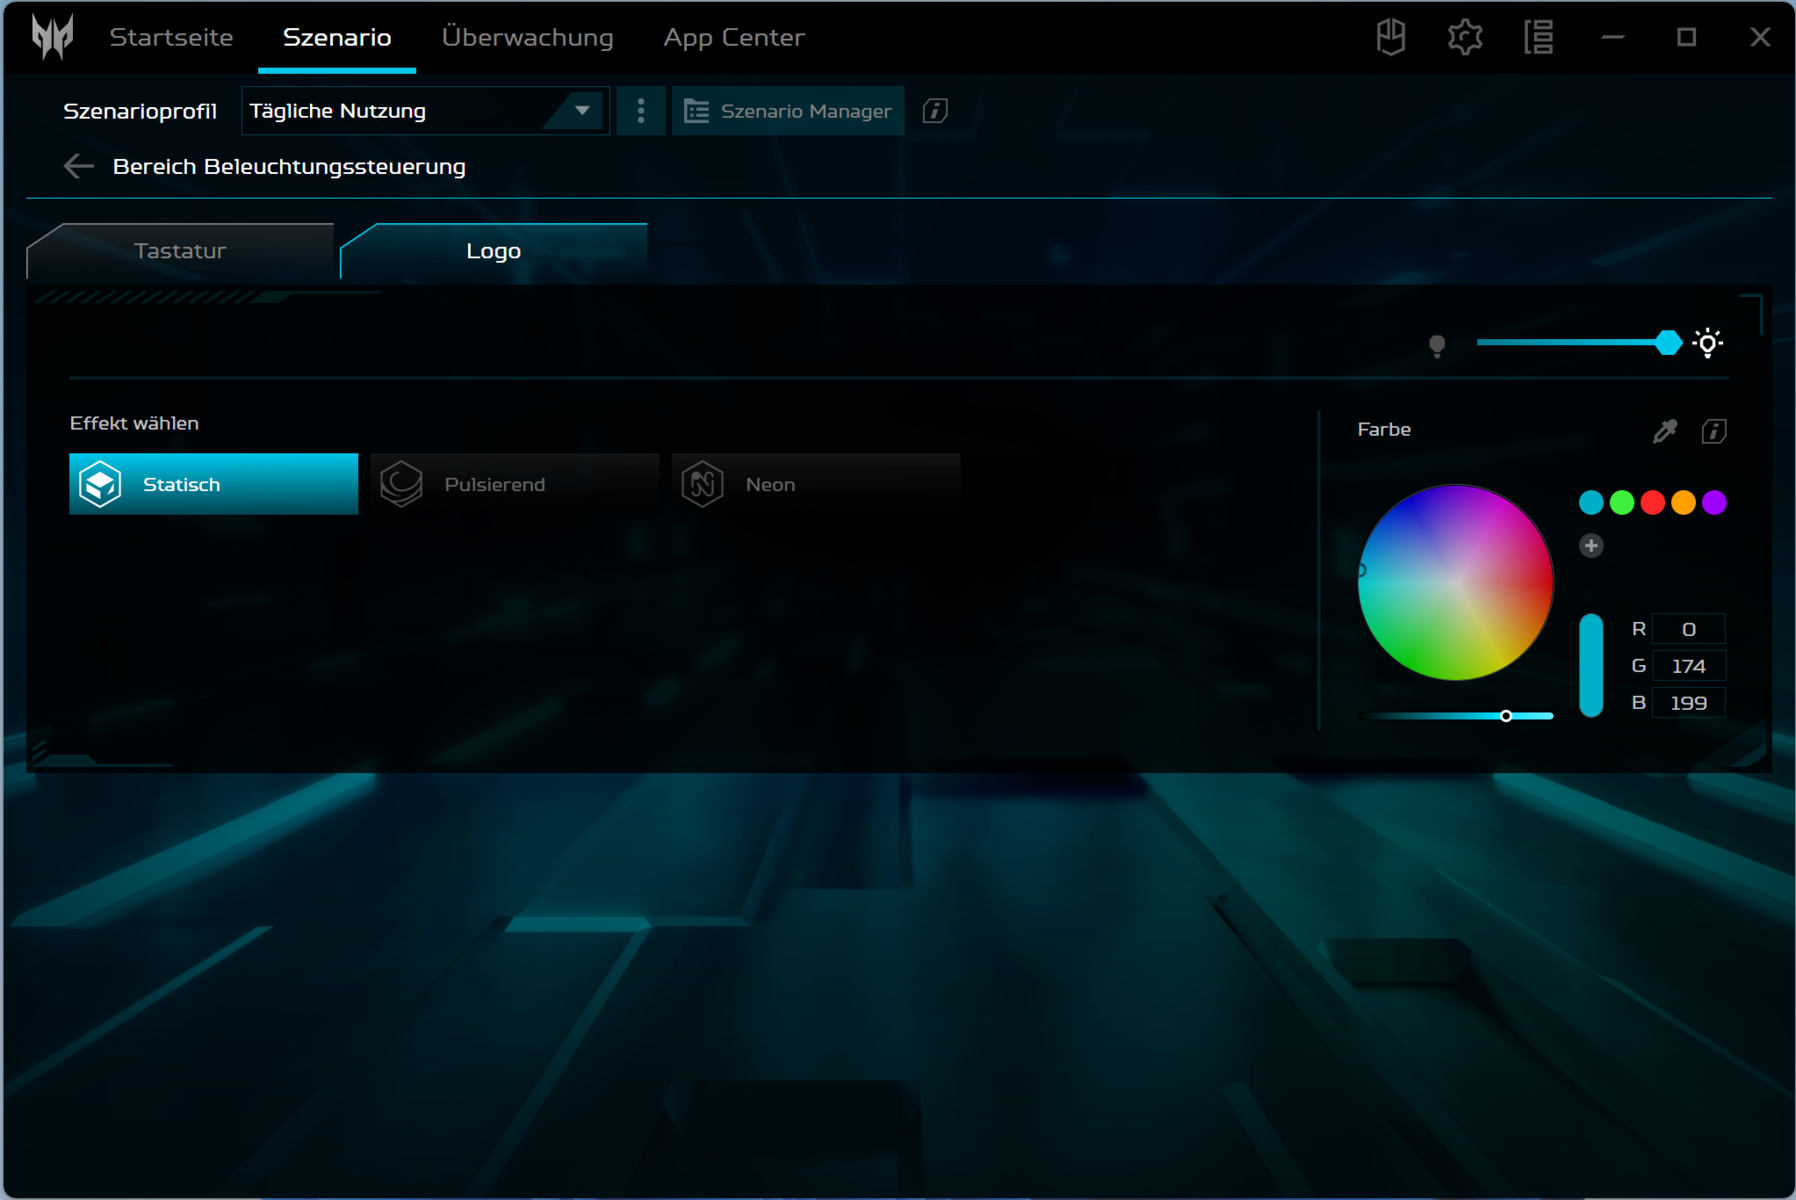
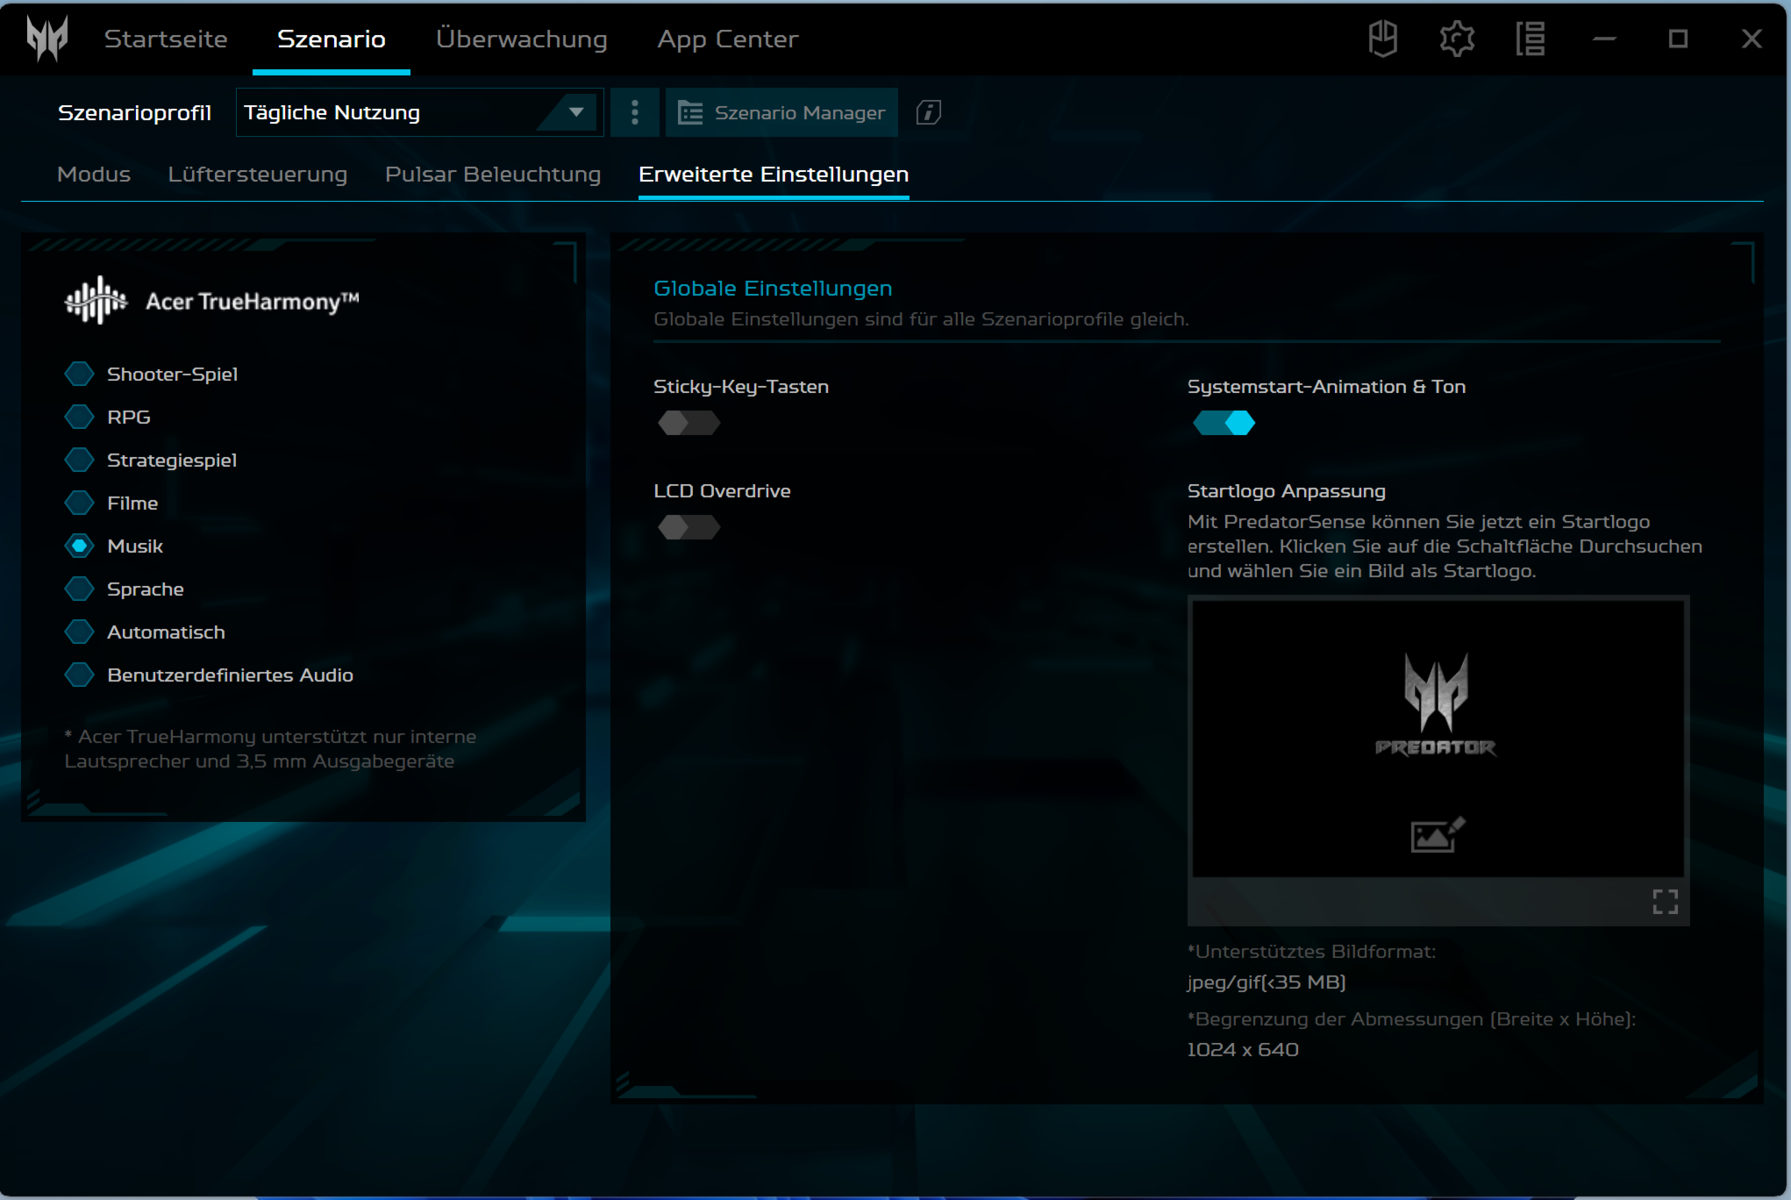
Una tecla situada encima del teclado se encarga de cambiar rápidamente entre los modos. Alternativamente, se puede hacer a través del software PredatorSense (el centro de control del portátil). Un LED muestra el modo activo.
| Turbo | Rendimiento | Equilibrado | Silencioso | Equilibrado (Batería) | Eco (Batería) | |
|---|---|---|---|---|---|---|
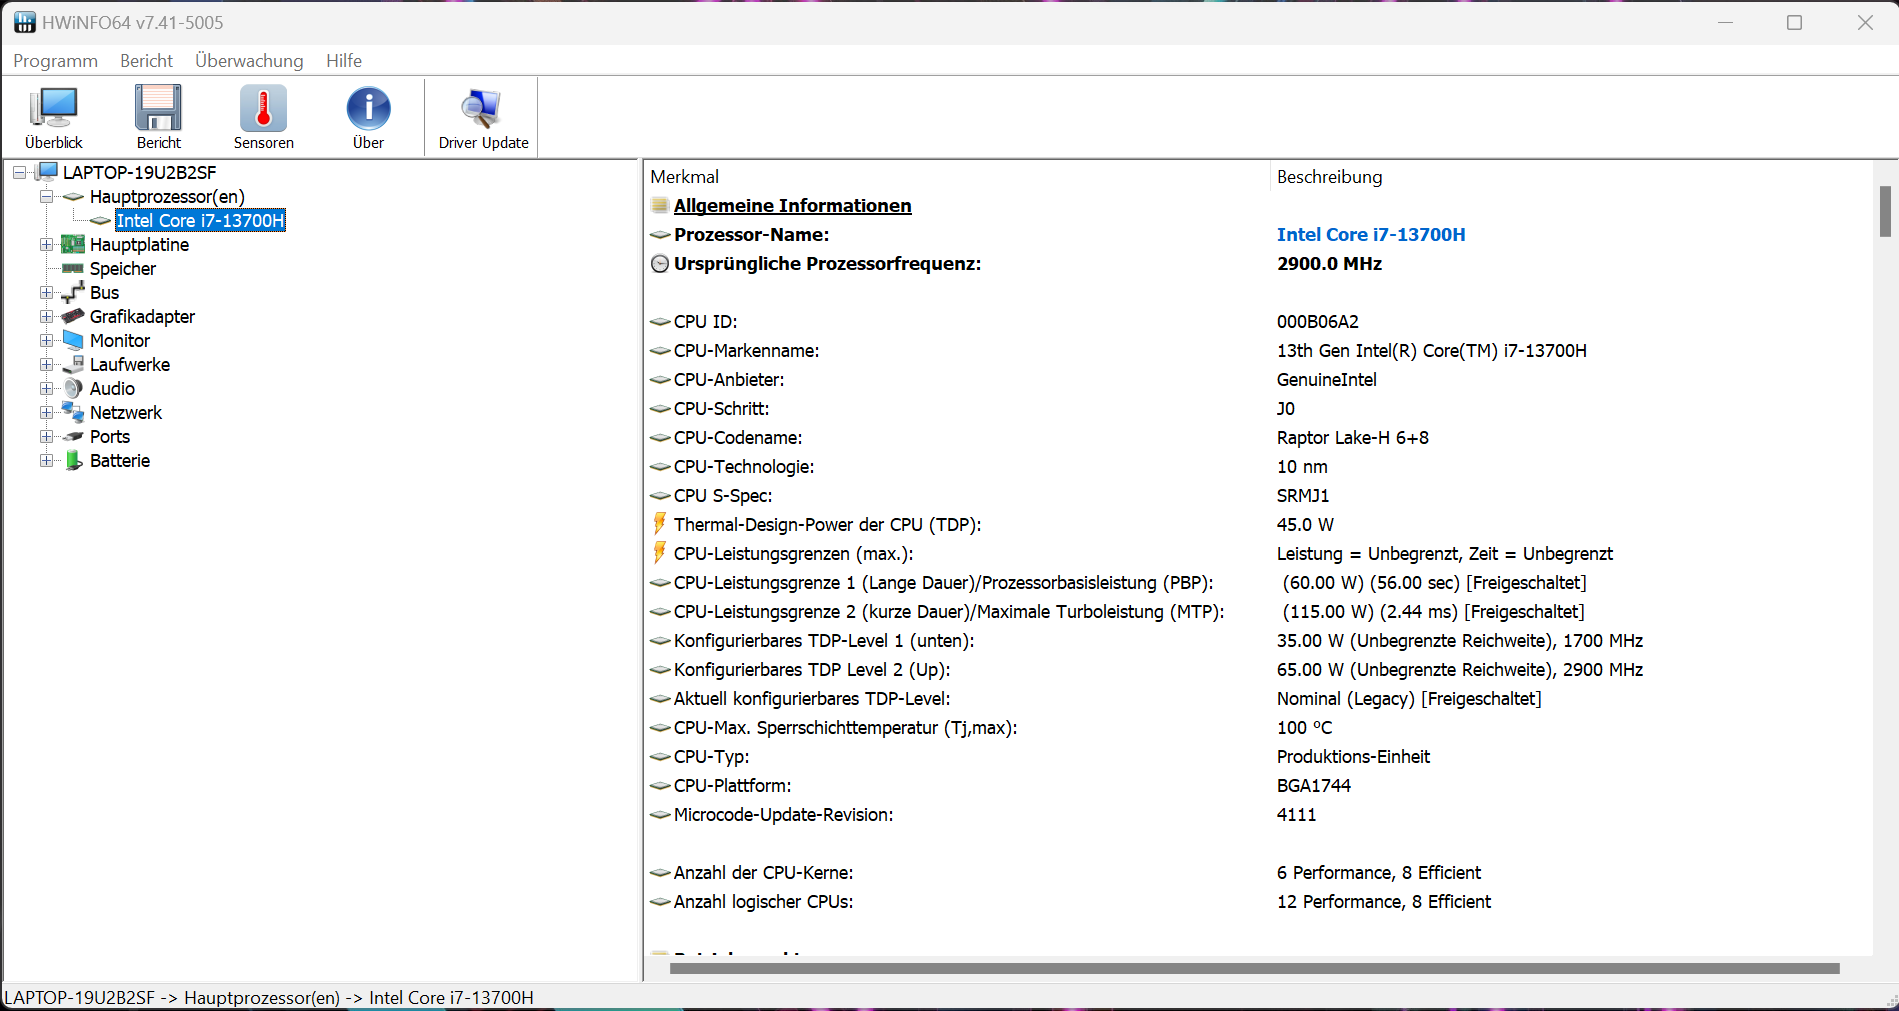
| Límite de potencia 1 (HWInfo) | 80 vatios | 75 vatios | 60 vatios | 50 vatios | 60 vatios | 25 vatios |
| Límite de potencia 2 (HWInfo) | 115 vatios | 115 vatios | 115 vatios | 115 vatios | 115 vatios | 30 vatios |
| Ruido (Witcher 3) | 56 dB(A) | 53 dB(A) | 43 dB(A) | 36 dB(A) | - | - |
| Rendimiento (Witcher 3) | ~86 fps | ~83 fps | ~82 fps | ~58 fps | - | - |

Procesador
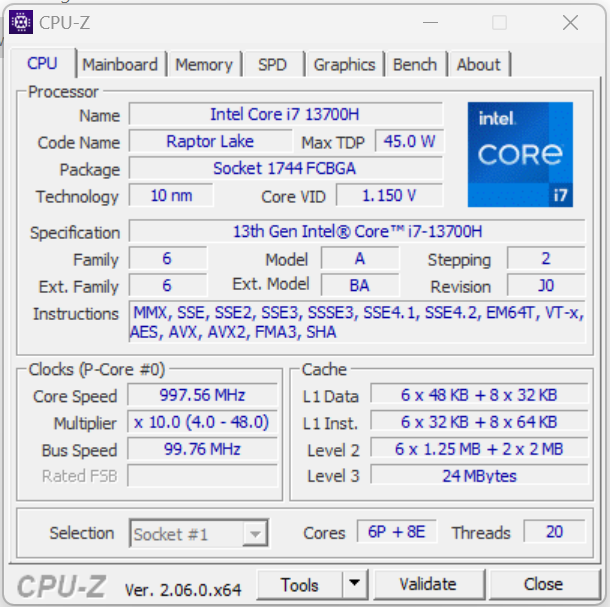
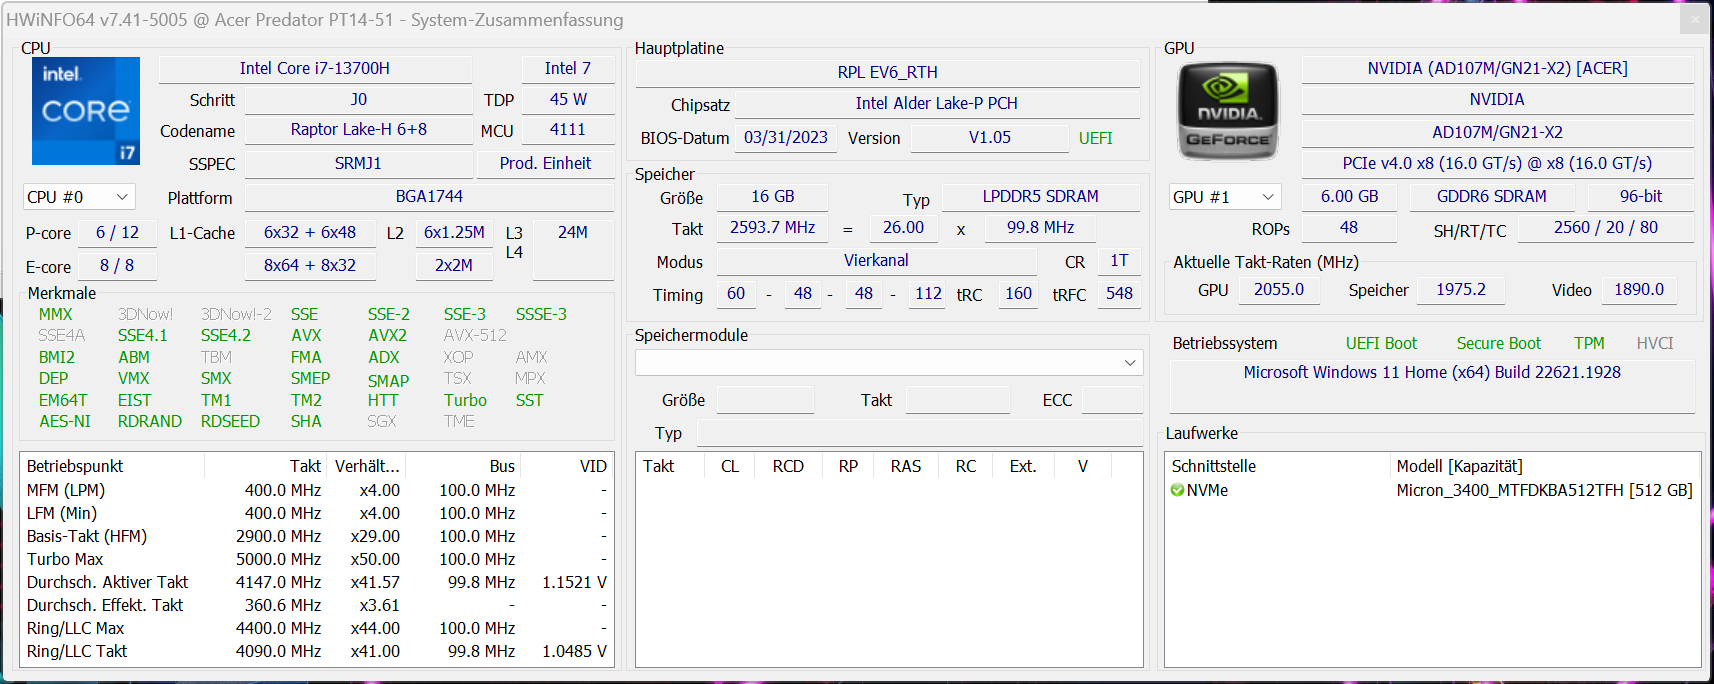
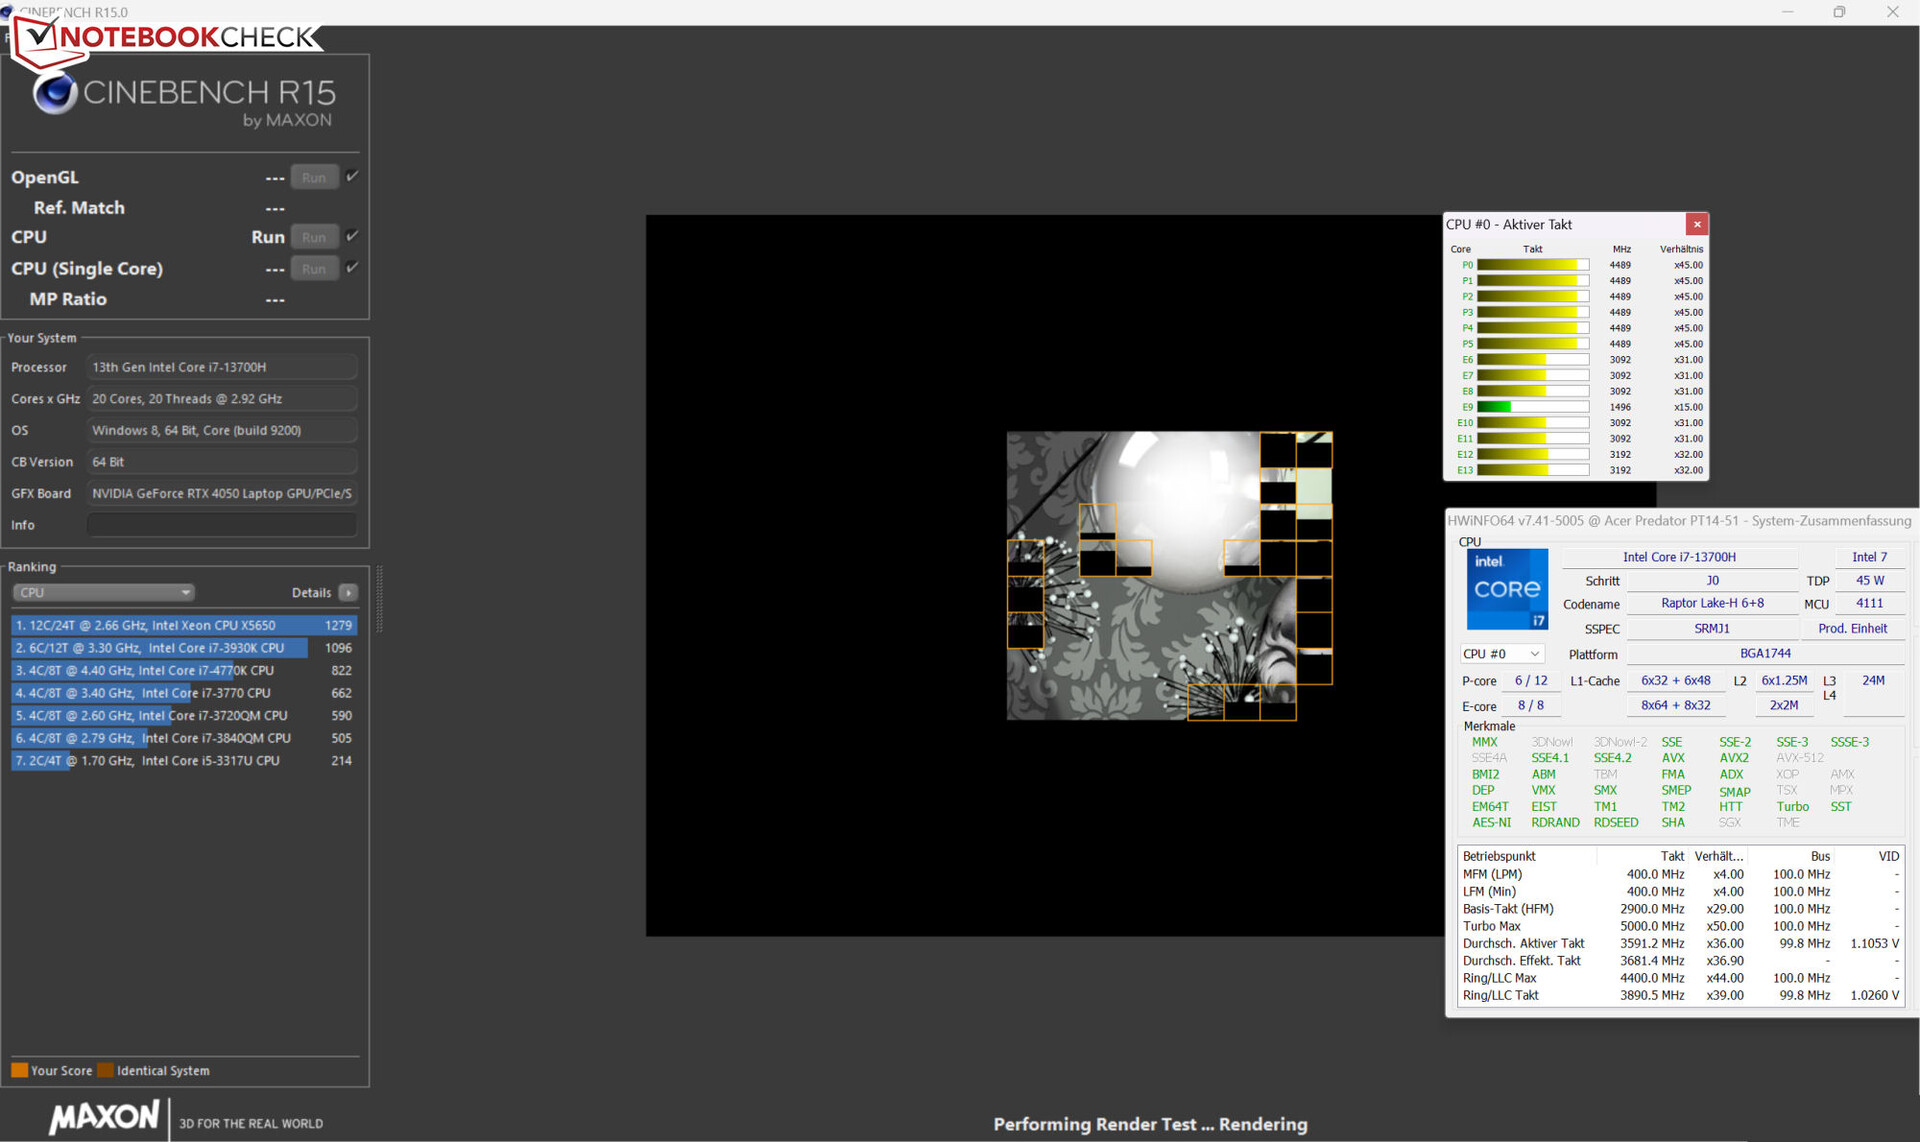
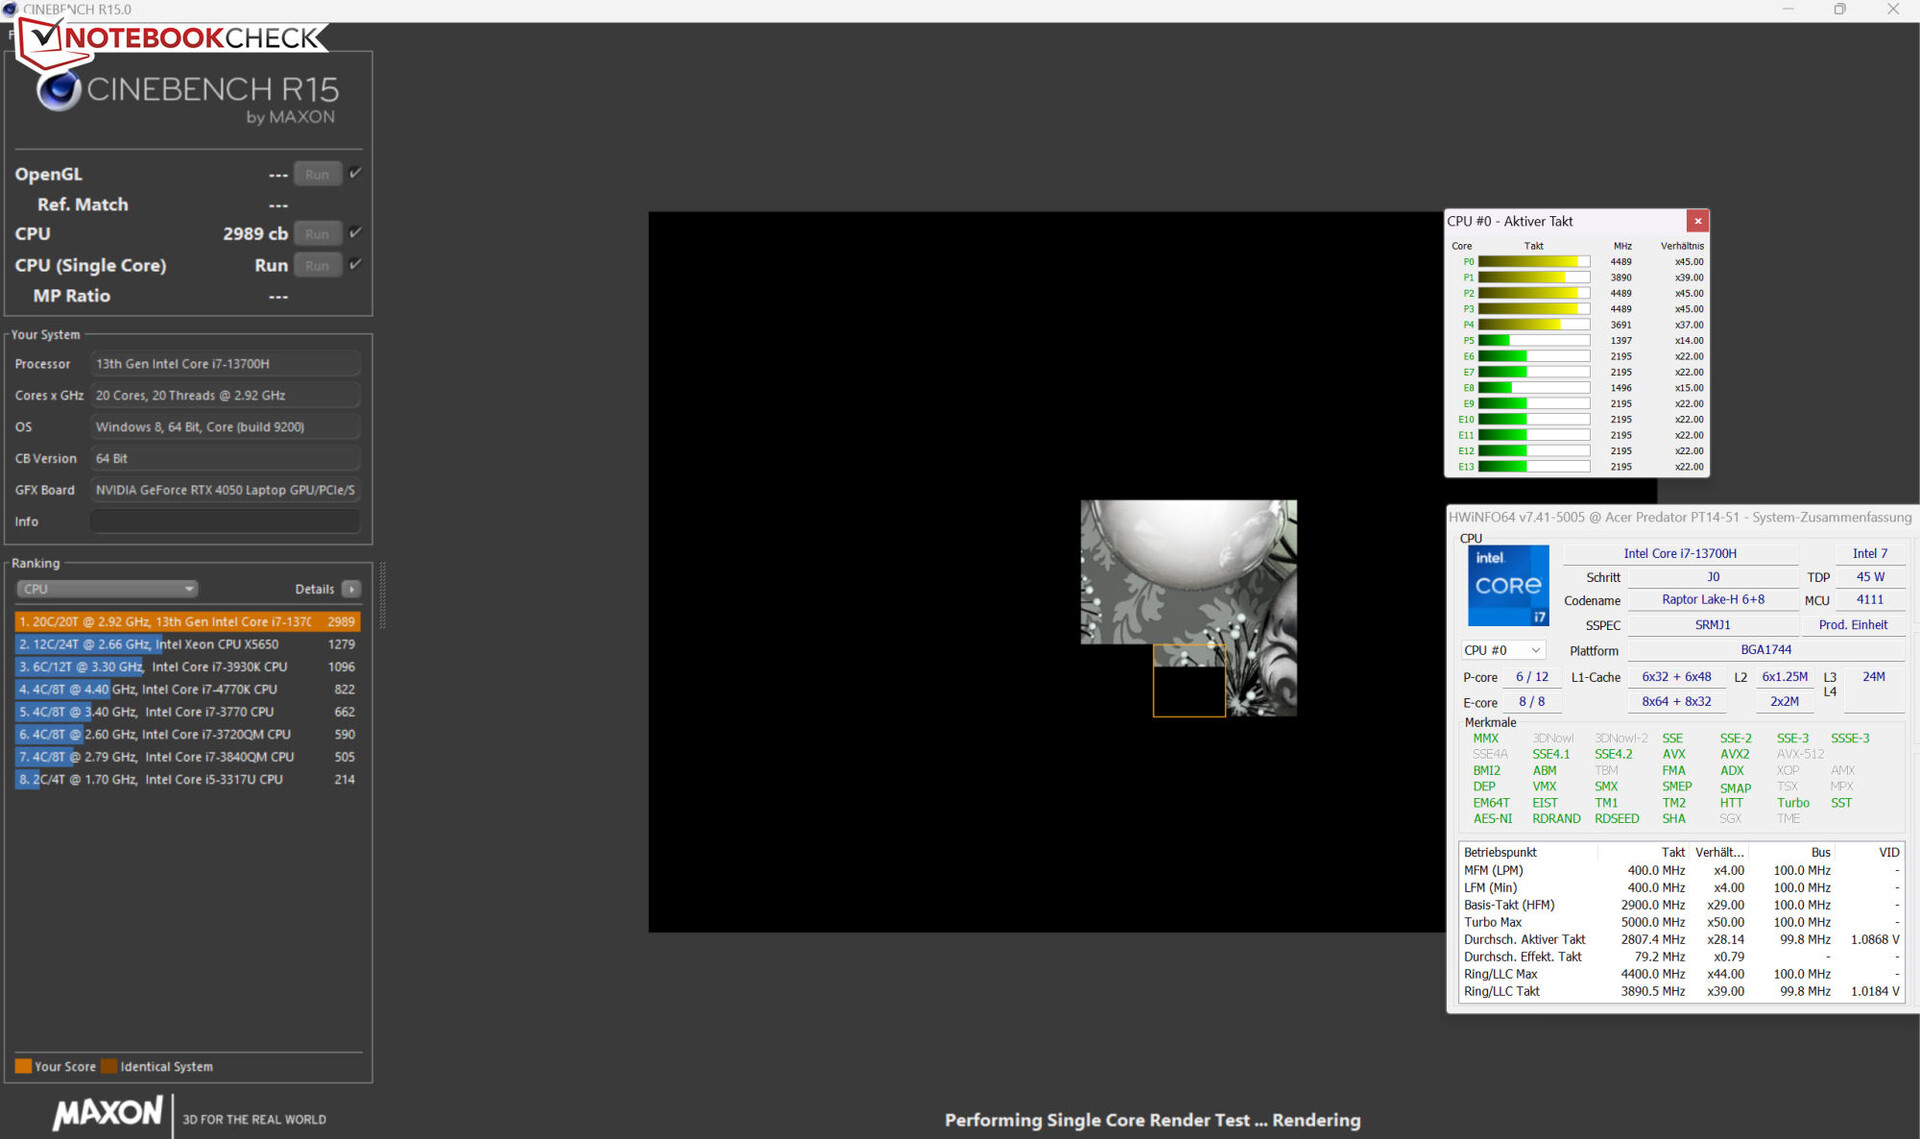
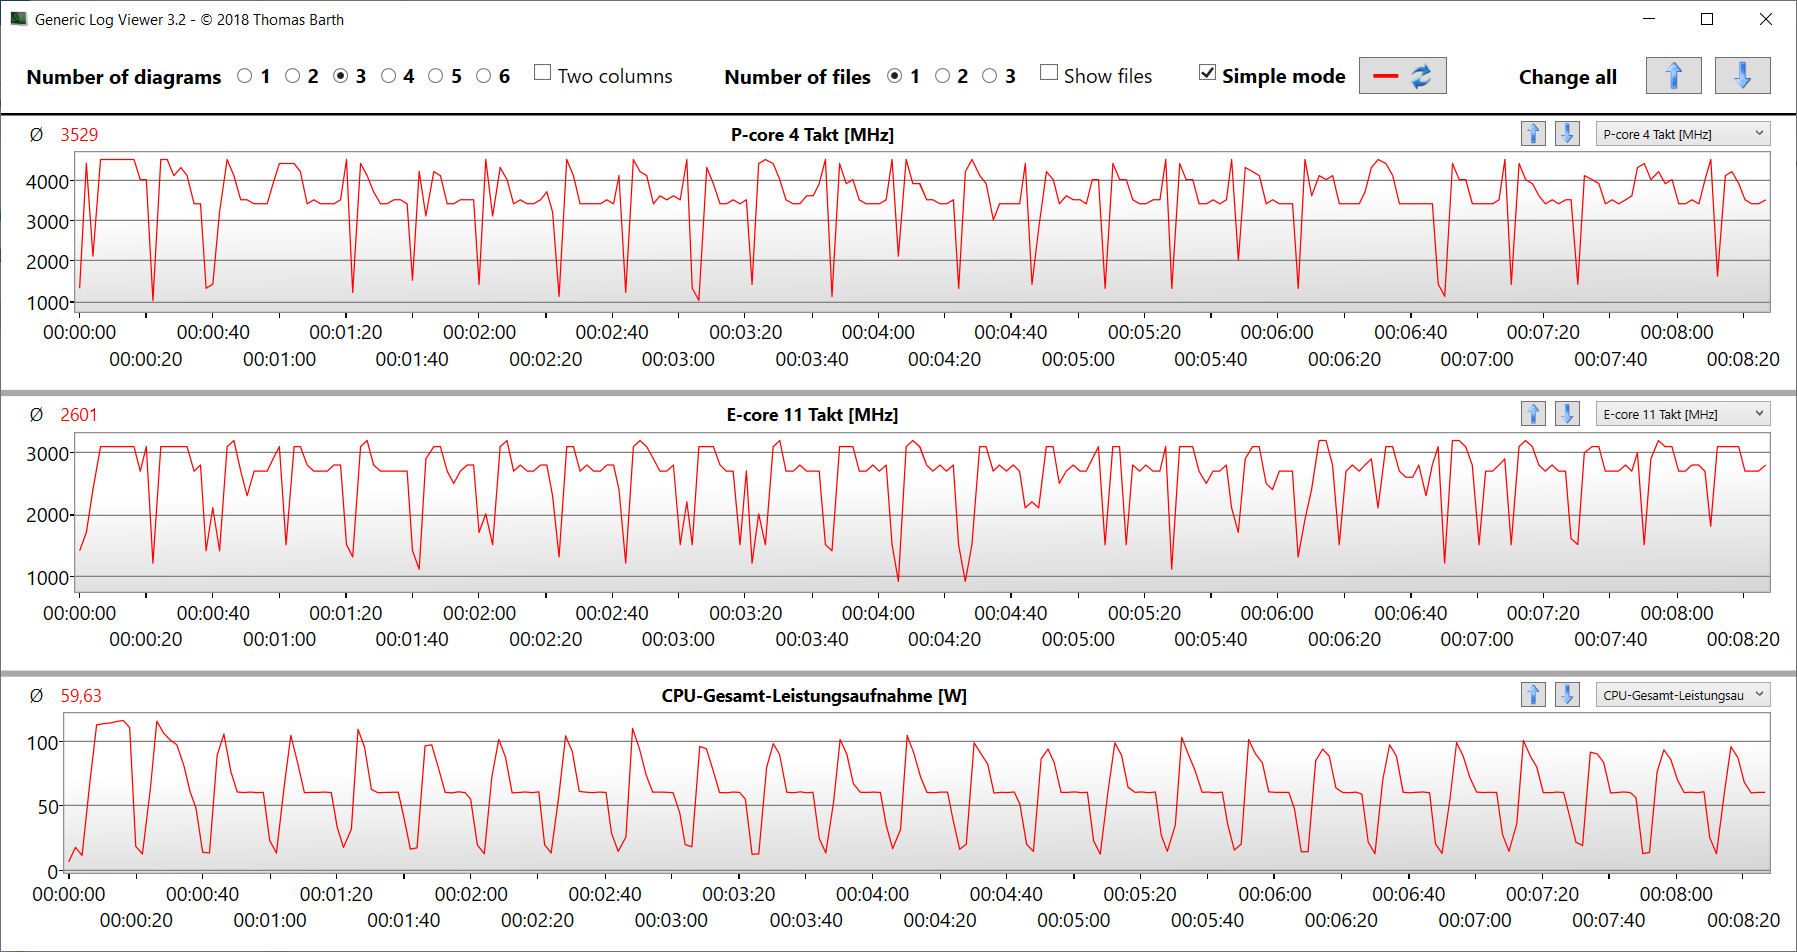
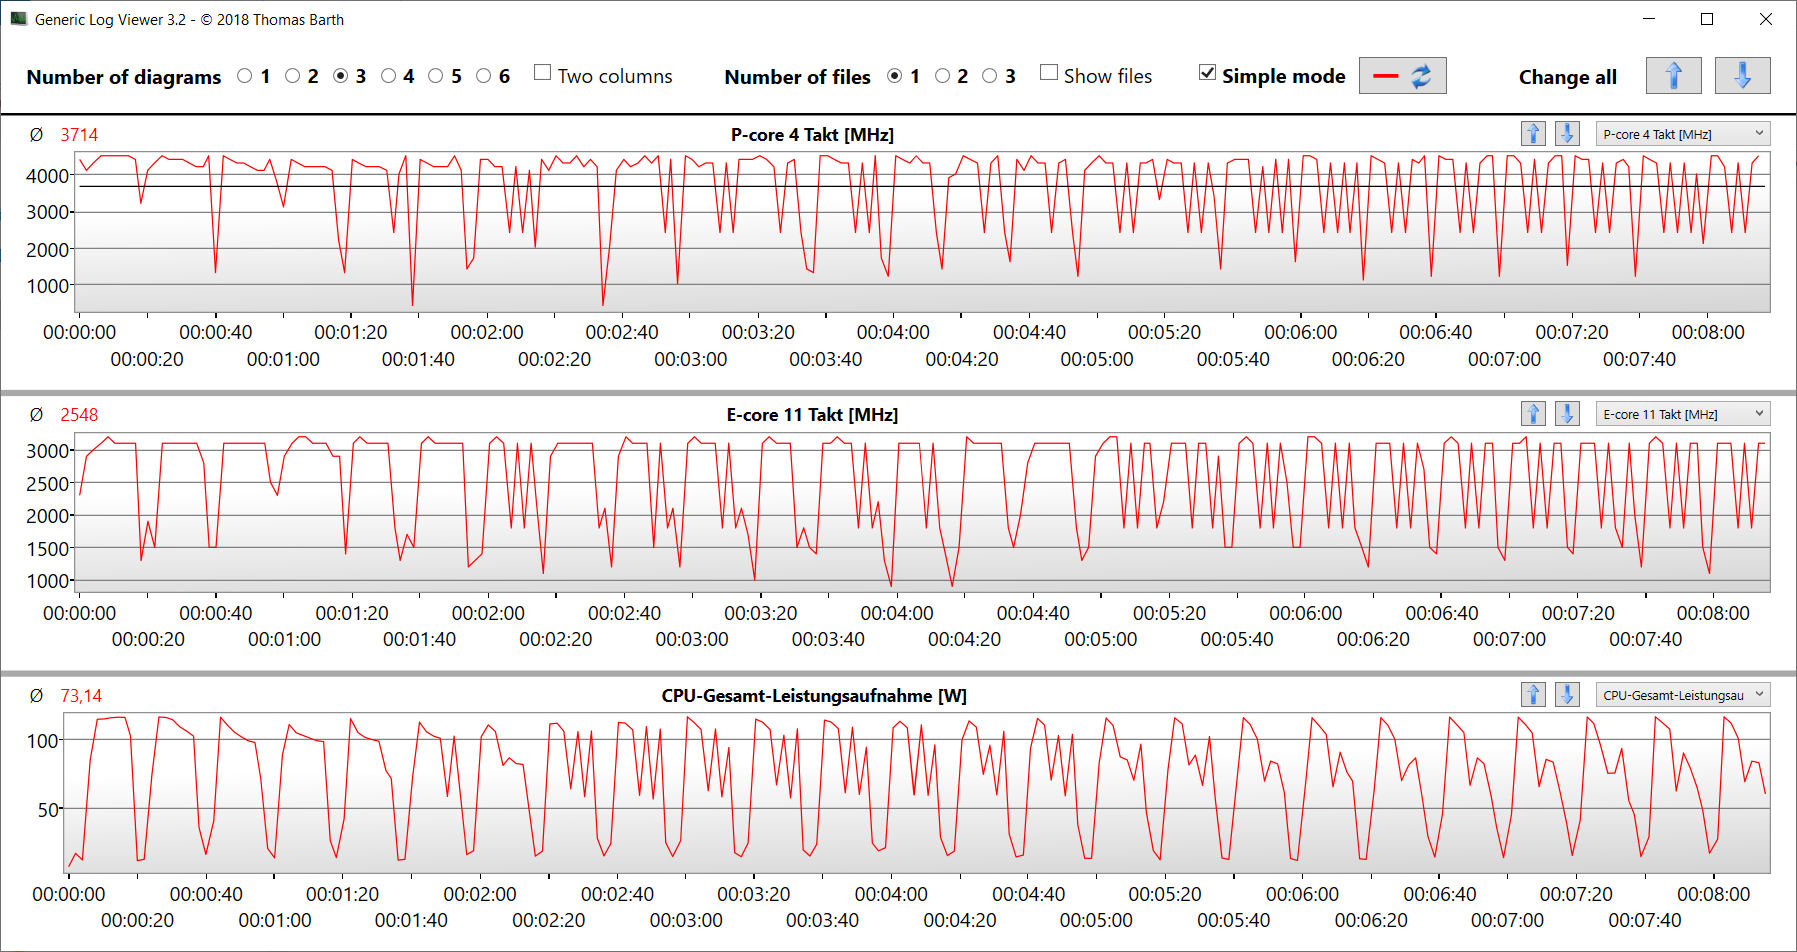
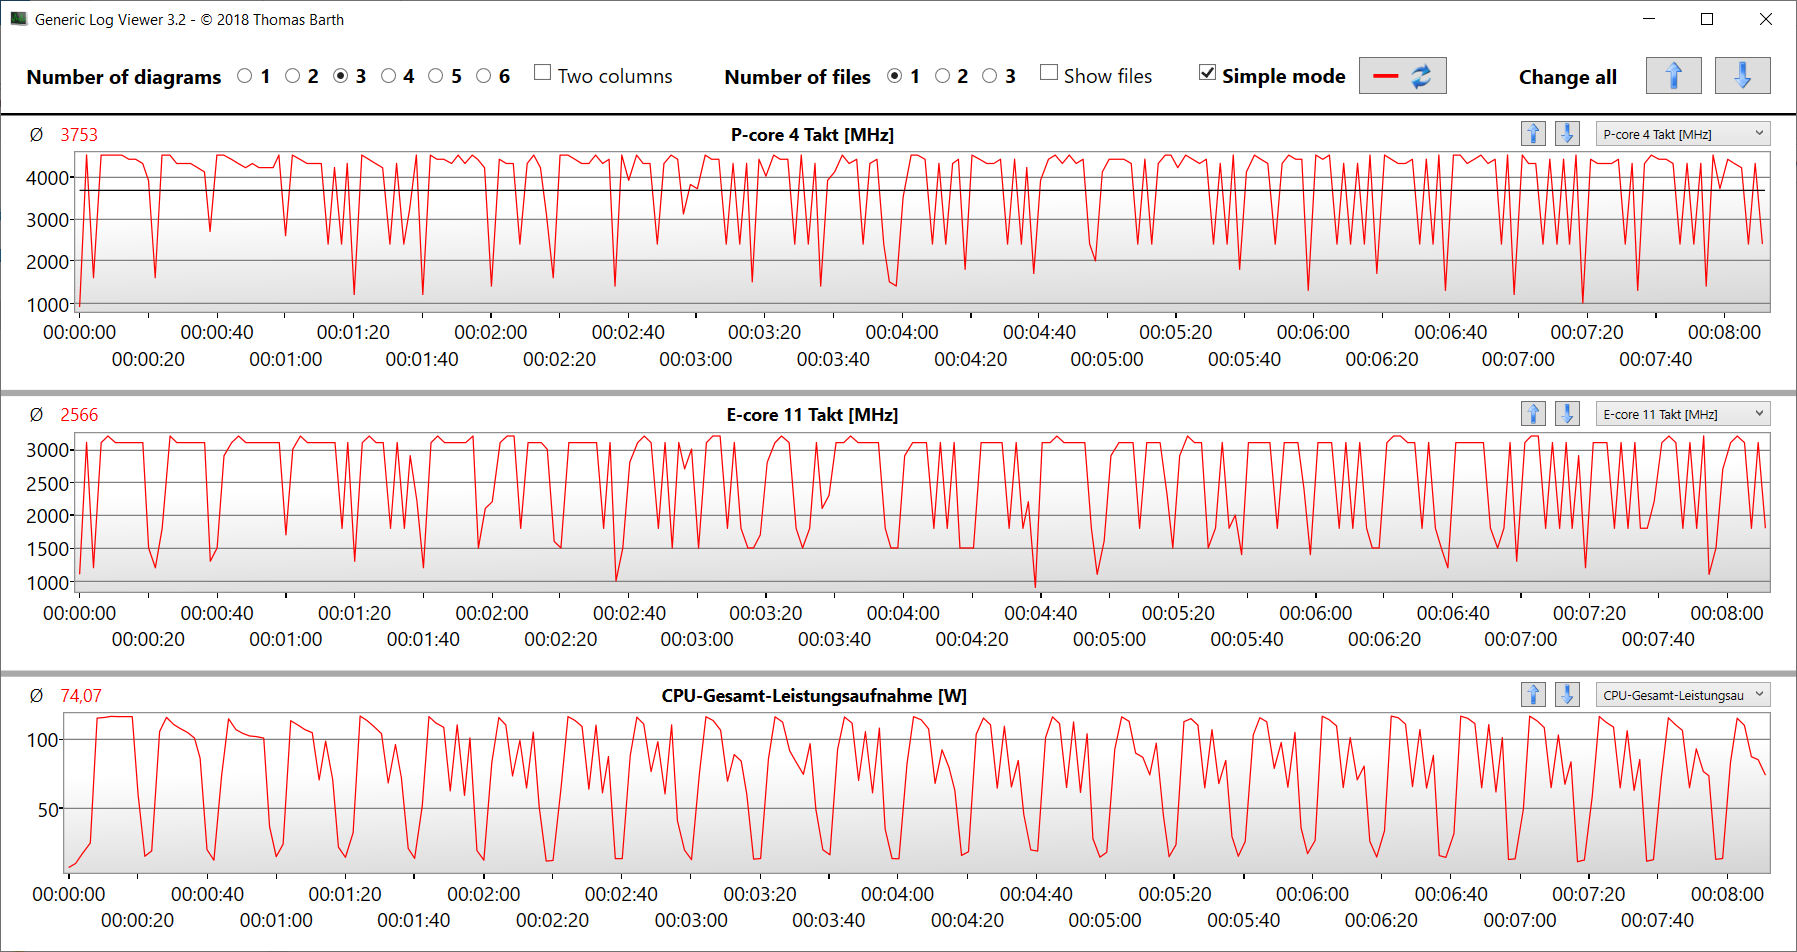
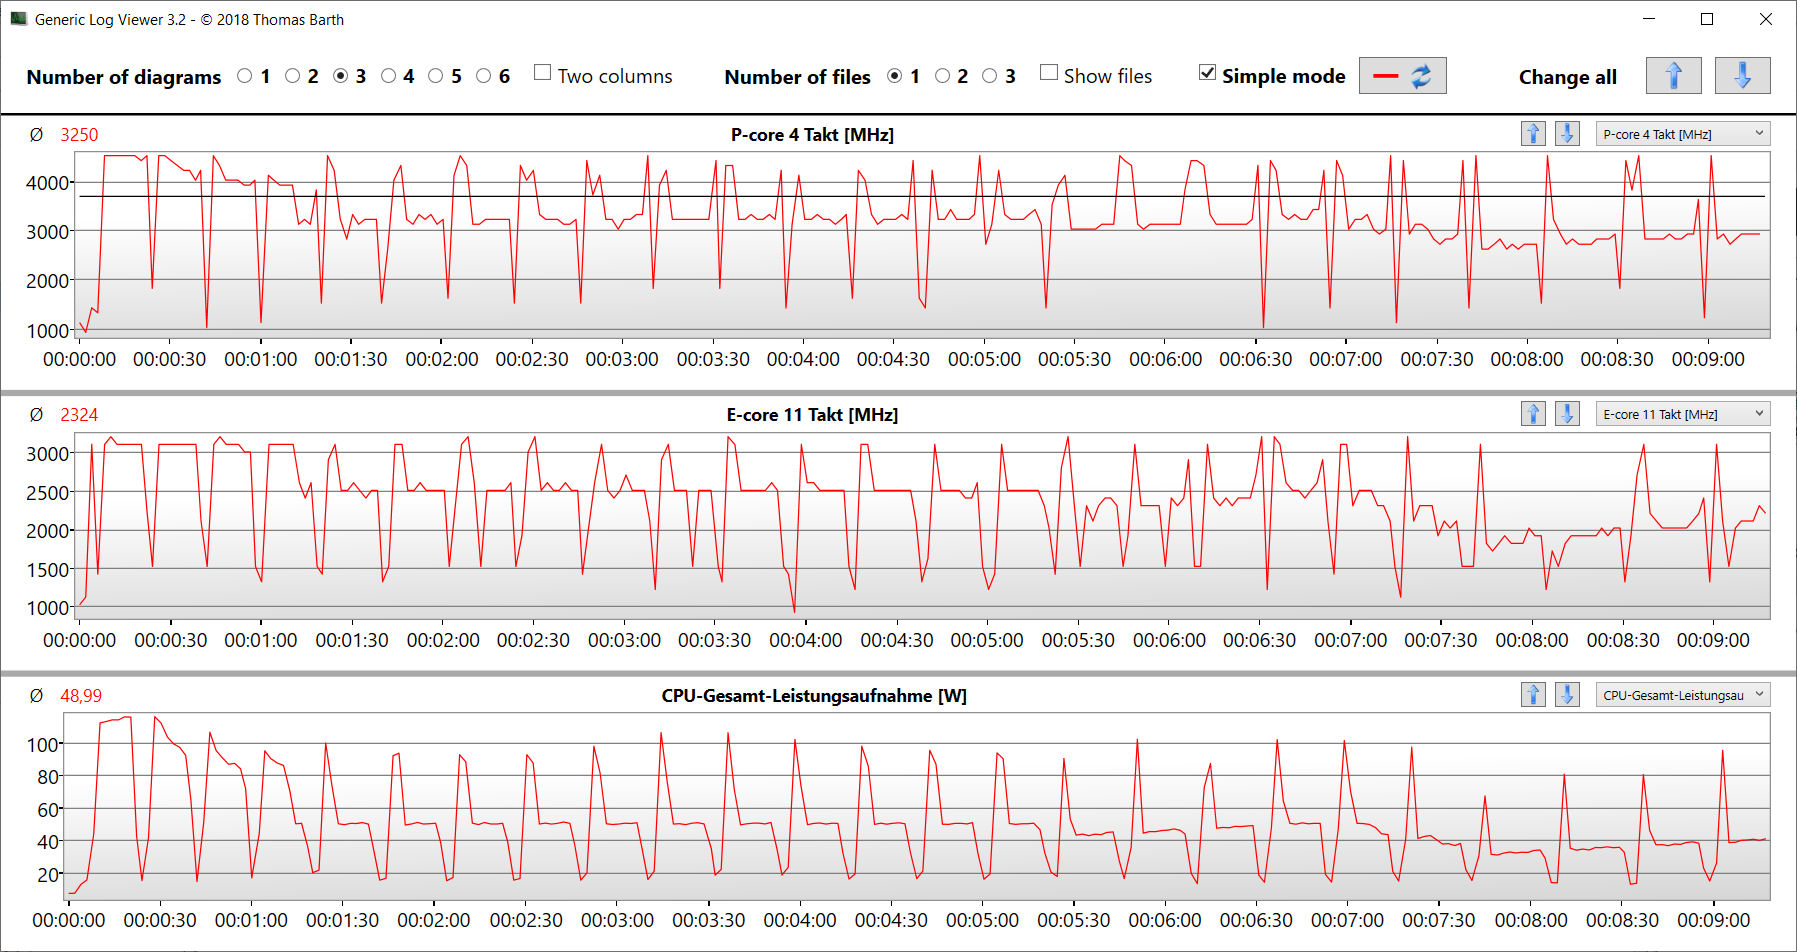
ElCore-i7-13700H(Raptor Lake) consta de ocho núcleos de eficiencia (sin hyperthreading, de 1,8 a 3,7 GHz) y seis núcleos de rendimiento (hyperthreading, de 2,4 a 5 GHz). En total, esto representa un total de 20 núcleos lógicos de CPU.
Los resultados del benchmark están por encima de la media típica de CPU, independientemente del modo de rendimiento seleccionado. El rendimiento relevante de un solo hilo (179 puntos) cae menos en modo batería que el rendimiento multihilo (992 puntos).
Bajo carga multihilo continua (bucle CB15), la velocidad de reloj del turbo cae de la primera a la tercera ejecución. Posteriormente, se mantiene un nivel constante. El perfil "Turbo" garantiza unos resultados mínimamente superiores. En general, la diferencia entre los modos es muy pequeña.
Cinebench R15 Multi Continuous Test
* ... más pequeño es mejor
AIDA64: FP32 Ray-Trace | FPU Julia | CPU SHA3 | CPU Queen | FPU SinJulia | FPU Mandel | CPU AES | CPU ZLib | FP64 Ray-Trace | CPU PhotoWorxx
| Performance rating | |
| Media de la clase Gaming | |
| Razer Blade 14 RTX 4070 | |
| Acer Predator Triton 14 PT14-51 | |
| MSI Stealth 14 Studio A13V | |
| Asus ROG Zephyrus G14 GA402RJ | |
| Gigabyte Aero 14 OLED BMF | |
| Medio Intel Core i7-13700H | |
| AIDA64 / FP32 Ray-Trace | |
| Media de la clase Gaming (10227 - 85542, n=106, últimos 2 años) | |
| Razer Blade 14 RTX 4070 | |
| MSI Stealth 14 Studio A13V | |
| Acer Predator Triton 14 PT14-51 | |
| Medio Intel Core i7-13700H (4986 - 18908, n=29) | |
| Asus ROG Zephyrus G14 GA402RJ | |
| Gigabyte Aero 14 OLED BMF | |
| AIDA64 / FPU Julia | |
| Media de la clase Gaming (51376 - 372155, n=106, últimos 2 años) | |
| Razer Blade 14 RTX 4070 | |
| Asus ROG Zephyrus G14 GA402RJ | |
| Acer Predator Triton 14 PT14-51 | |
| MSI Stealth 14 Studio A13V | |
| Medio Intel Core i7-13700H (25360 - 92359, n=29) | |
| Gigabyte Aero 14 OLED BMF | |
| AIDA64 / CPU SHA3 | |
| Media de la clase Gaming (2180 - 10115, n=106, últimos 2 años) | |
| Razer Blade 14 RTX 4070 | |
| Acer Predator Triton 14 PT14-51 | |
| MSI Stealth 14 Studio A13V | |
| Medio Intel Core i7-13700H (1339 - 4224, n=29) | |
| Gigabyte Aero 14 OLED BMF | |
| Asus ROG Zephyrus G14 GA402RJ | |
| AIDA64 / CPU Queen | |
| Razer Blade 14 RTX 4070 | |
| Media de la clase Gaming (49785 - 173351, n=90, últimos 2 años) | |
| Gigabyte Aero 14 OLED BMF | |
| MSI Stealth 14 Studio A13V | |
| Asus ROG Zephyrus G14 GA402RJ | |
| Acer Predator Triton 14 PT14-51 | |
| Medio Intel Core i7-13700H (59324 - 107159, n=29) | |
| AIDA64 / FPU SinJulia | |
| Razer Blade 14 RTX 4070 | |
| Media de la clase Gaming (4424 - 33636, n=106, últimos 2 años) | |
| Asus ROG Zephyrus G14 GA402RJ | |
| MSI Stealth 14 Studio A13V | |
| Acer Predator Triton 14 PT14-51 | |
| Medio Intel Core i7-13700H (4800 - 11050, n=29) | |
| Gigabyte Aero 14 OLED BMF | |
| AIDA64 / FPU Mandel | |
| Media de la clase Gaming (25115 - 196829, n=106, últimos 2 años) | |
| Razer Blade 14 RTX 4070 | |
| Asus ROG Zephyrus G14 GA402RJ | |
| MSI Stealth 14 Studio A13V | |
| Acer Predator Triton 14 PT14-51 | |
| Medio Intel Core i7-13700H (12321 - 45118, n=29) | |
| Gigabyte Aero 14 OLED BMF | |
| AIDA64 / CPU AES | |
| Acer Predator Triton 14 PT14-51 | |
| Asus ROG Zephyrus G14 GA402RJ | |
| Gigabyte Aero 14 OLED BMF | |
| Media de la clase Gaming (39258 - 247074, n=106, últimos 2 años) | |
| Razer Blade 14 RTX 4070 | |
| MSI Stealth 14 Studio A13V | |
| Medio Intel Core i7-13700H (28769 - 151254, n=29) | |
| AIDA64 / CPU ZLib | |
| Media de la clase Gaming (574 - 2531, n=106, últimos 2 años) | |
| Acer Predator Triton 14 PT14-51 | |
| Razer Blade 14 RTX 4070 | |
| MSI Stealth 14 Studio A13V | |
| Medio Intel Core i7-13700H (389 - 1215, n=29) | |
| Gigabyte Aero 14 OLED BMF | |
| Asus ROG Zephyrus G14 GA402RJ | |
| AIDA64 / FP64 Ray-Trace | |
| Media de la clase Gaming (5509 - 45446, n=106, últimos 2 años) | |
| Razer Blade 14 RTX 4070 | |
| MSI Stealth 14 Studio A13V | |
| Acer Predator Triton 14 PT14-51 | |
| Medio Intel Core i7-13700H (2540 - 10135, n=29) | |
| Asus ROG Zephyrus G14 GA402RJ | |
| Gigabyte Aero 14 OLED BMF | |
| AIDA64 / CPU PhotoWorxx | |
| Gigabyte Aero 14 OLED BMF | |
| Acer Predator Triton 14 PT14-51 | |
| Media de la clase Gaming (12271 - 89891, n=106, últimos 2 años) | |
| Medio Intel Core i7-13700H (12872 - 52727, n=29) | |
| MSI Stealth 14 Studio A13V | |
| Razer Blade 14 RTX 4070 | |
| Asus ROG Zephyrus G14 GA402RJ | |
Rendimiento del sistema
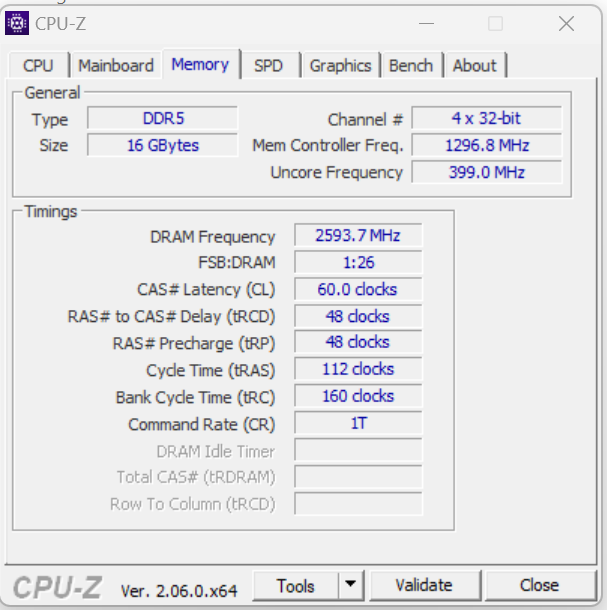
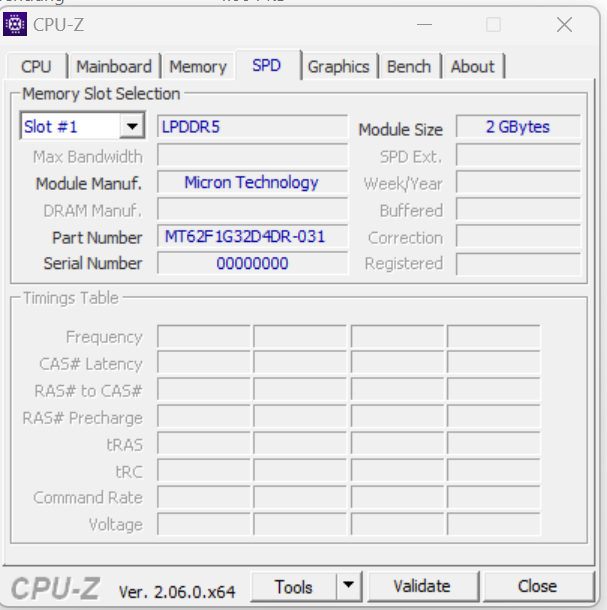
El sistema funciona con fluidez y dispone de potencia suficiente para aplicaciones exigentes como el renderizado y los juegos, algo que confirman los buenos resultados de PC Mark. Las tasas de transferencia de la RAM están dentro de lo normal para una RAM LPDDR5 6000.
CrossMark: Overall | Productivity | Creativity | Responsiveness
| PCMark 10 / Score | |
| Media de la clase Gaming (5828 - 12414, n=94, últimos 2 años) | |
| Razer Blade 14 RTX 4070 | |
| Acer Predator Triton 14 PT14-51 | |
| Asus ROG Zephyrus G14 GA402RJ | |
| Gigabyte Aero 14 OLED BMF | |
| Medio Intel Core i7-13700H, NVIDIA GeForce RTX 4050 Laptop GPU (6822 - 7556, n=7) | |
| MSI Stealth 14 Studio A13V | |
| PCMark 10 / Essentials | |
| Gigabyte Aero 14 OLED BMF | |
| Razer Blade 14 RTX 4070 | |
| Medio Intel Core i7-13700H, NVIDIA GeForce RTX 4050 Laptop GPU (10283 - 11549, n=7) | |
| Media de la clase Gaming (8810 - 11935, n=98, últimos 2 años) | |
| Acer Predator Triton 14 PT14-51 | |
| MSI Stealth 14 Studio A13V | |
| Asus ROG Zephyrus G14 GA402RJ | |
| PCMark 10 / Productivity | |
| Media de la clase Gaming (6845 - 25323, n=96, últimos 2 años) | |
| Razer Blade 14 RTX 4070 | |
| Acer Predator Triton 14 PT14-51 | |
| Asus ROG Zephyrus G14 GA402RJ | |
| Gigabyte Aero 14 OLED BMF | |
| Medio Intel Core i7-13700H, NVIDIA GeForce RTX 4050 Laptop GPU (8368 - 9836, n=7) | |
| MSI Stealth 14 Studio A13V | |
| PCMark 10 / Digital Content Creation | |
| Media de la clase Gaming (7602 - 19954, n=96, últimos 2 años) | |
| Razer Blade 14 RTX 4070 | |
| Asus ROG Zephyrus G14 GA402RJ | |
| Acer Predator Triton 14 PT14-51 | |
| MSI Stealth 14 Studio A13V | |
| Medio Intel Core i7-13700H, NVIDIA GeForce RTX 4050 Laptop GPU (9527 - 10643, n=7) | |
| Gigabyte Aero 14 OLED BMF | |
| CrossMark / Overall | |
| Media de la clase Gaming (1366 - 2409, n=95, últimos 2 años) | |
| Acer Predator Triton 14 PT14-51 | |
| Gigabyte Aero 14 OLED BMF | |
| Razer Blade 14 RTX 4070 | |
| Apple MacBook Pro 14 2023 M2 Pro Entry | |
| MSI Stealth 14 Studio A13V | |
| Medio Intel Core i7-13700H, NVIDIA GeForce RTX 4050 Laptop GPU (1205 - 1937, n=9) | |
| CrossMark / Productivity | |
| Media de la clase Gaming (1386 - 2254, n=95, últimos 2 años) | |
| Gigabyte Aero 14 OLED BMF | |
| Razer Blade 14 RTX 4070 | |
| Acer Predator Triton 14 PT14-51 | |
| Medio Intel Core i7-13700H, NVIDIA GeForce RTX 4050 Laptop GPU (1158 - 1877, n=9) | |
| MSI Stealth 14 Studio A13V | |
| Apple MacBook Pro 14 2023 M2 Pro Entry | |
| CrossMark / Creativity | |
| Media de la clase Gaming (1343 - 2786, n=95, últimos 2 años) | |
| Apple MacBook Pro 14 2023 M2 Pro Entry | |
| Acer Predator Triton 14 PT14-51 | |
| Razer Blade 14 RTX 4070 | |
| Gigabyte Aero 14 OLED BMF | |
| MSI Stealth 14 Studio A13V | |
| Medio Intel Core i7-13700H, NVIDIA GeForce RTX 4050 Laptop GPU (1293 - 2044, n=9) | |
| CrossMark / Responsiveness | |
| Acer Predator Triton 14 PT14-51 | |
| Gigabyte Aero 14 OLED BMF | |
| Media de la clase Gaming (1226 - 2334, n=95, últimos 2 años) | |
| Medio Intel Core i7-13700H, NVIDIA GeForce RTX 4050 Laptop GPU (1097 - 1929, n=9) | |
| Razer Blade 14 RTX 4070 | |
| MSI Stealth 14 Studio A13V | |
| Apple MacBook Pro 14 2023 M2 Pro Entry | |
| PCMark 8 Home Score Accelerated v2 | 5120 puntos | |
| PCMark 8 Work Score Accelerated v2 | 5617 puntos | |
| PCMark 10 Score | 7402 puntos | |
ayuda | ||
| AIDA64 / Memory Copy | |
| Gigabyte Aero 14 OLED BMF | |
| Acer Predator Triton 14 PT14-51 | |
| Media de la clase Gaming (21750 - 129946, n=106, últimos 2 años) | |
| Medio Intel Core i7-13700H (24334 - 78081, n=29) | |
| Razer Blade 14 RTX 4070 | |
| MSI Stealth 14 Studio A13V | |
| Asus ROG Zephyrus G14 GA402RJ | |
| AIDA64 / Memory Read | |
| Gigabyte Aero 14 OLED BMF | |
| Media de la clase Gaming (22956 - 118858, n=106, últimos 2 años) | |
| MSI Stealth 14 Studio A13V | |
| Acer Predator Triton 14 PT14-51 | |
| Medio Intel Core i7-13700H (23681 - 79656, n=29) | |
| Razer Blade 14 RTX 4070 | |
| Asus ROG Zephyrus G14 GA402RJ | |
| AIDA64 / Memory Write | |
| Gigabyte Aero 14 OLED BMF | |
| Acer Predator Triton 14 PT14-51 | |
| Razer Blade 14 RTX 4070 | |
| Media de la clase Gaming (22297 - 135096, n=106, últimos 2 años) | |
| Medio Intel Core i7-13700H (22986 - 99898, n=29) | |
| Asus ROG Zephyrus G14 GA402RJ | |
| MSI Stealth 14 Studio A13V | |
| AIDA64 / Memory Latency | |
| Media de la clase Gaming (75.3 - 259, n=106, últimos 2 años) | |
| Acer Predator Triton 14 PT14-51 | |
| Medio Intel Core i7-13700H (82.4 - 136.8, n=29) | |
| Gigabyte Aero 14 OLED BMF | |
| Asus ROG Zephyrus G14 GA402RJ | |
| Razer Blade 14 RTX 4070 | |
| MSI Stealth 14 Studio A13V | |
* ... más pequeño es mejor
Latencias del CPD
La prueba estandarizada Latency Monitor (navegación por internet, reproducción de vídeo 4k, Prime95 High Load) reveló anomalías. El sistema no parece adecuado para la edición de vídeo y audio en tiempo real. Futuras actualizaciones de software podrían mejorar o empeorar las cosas.
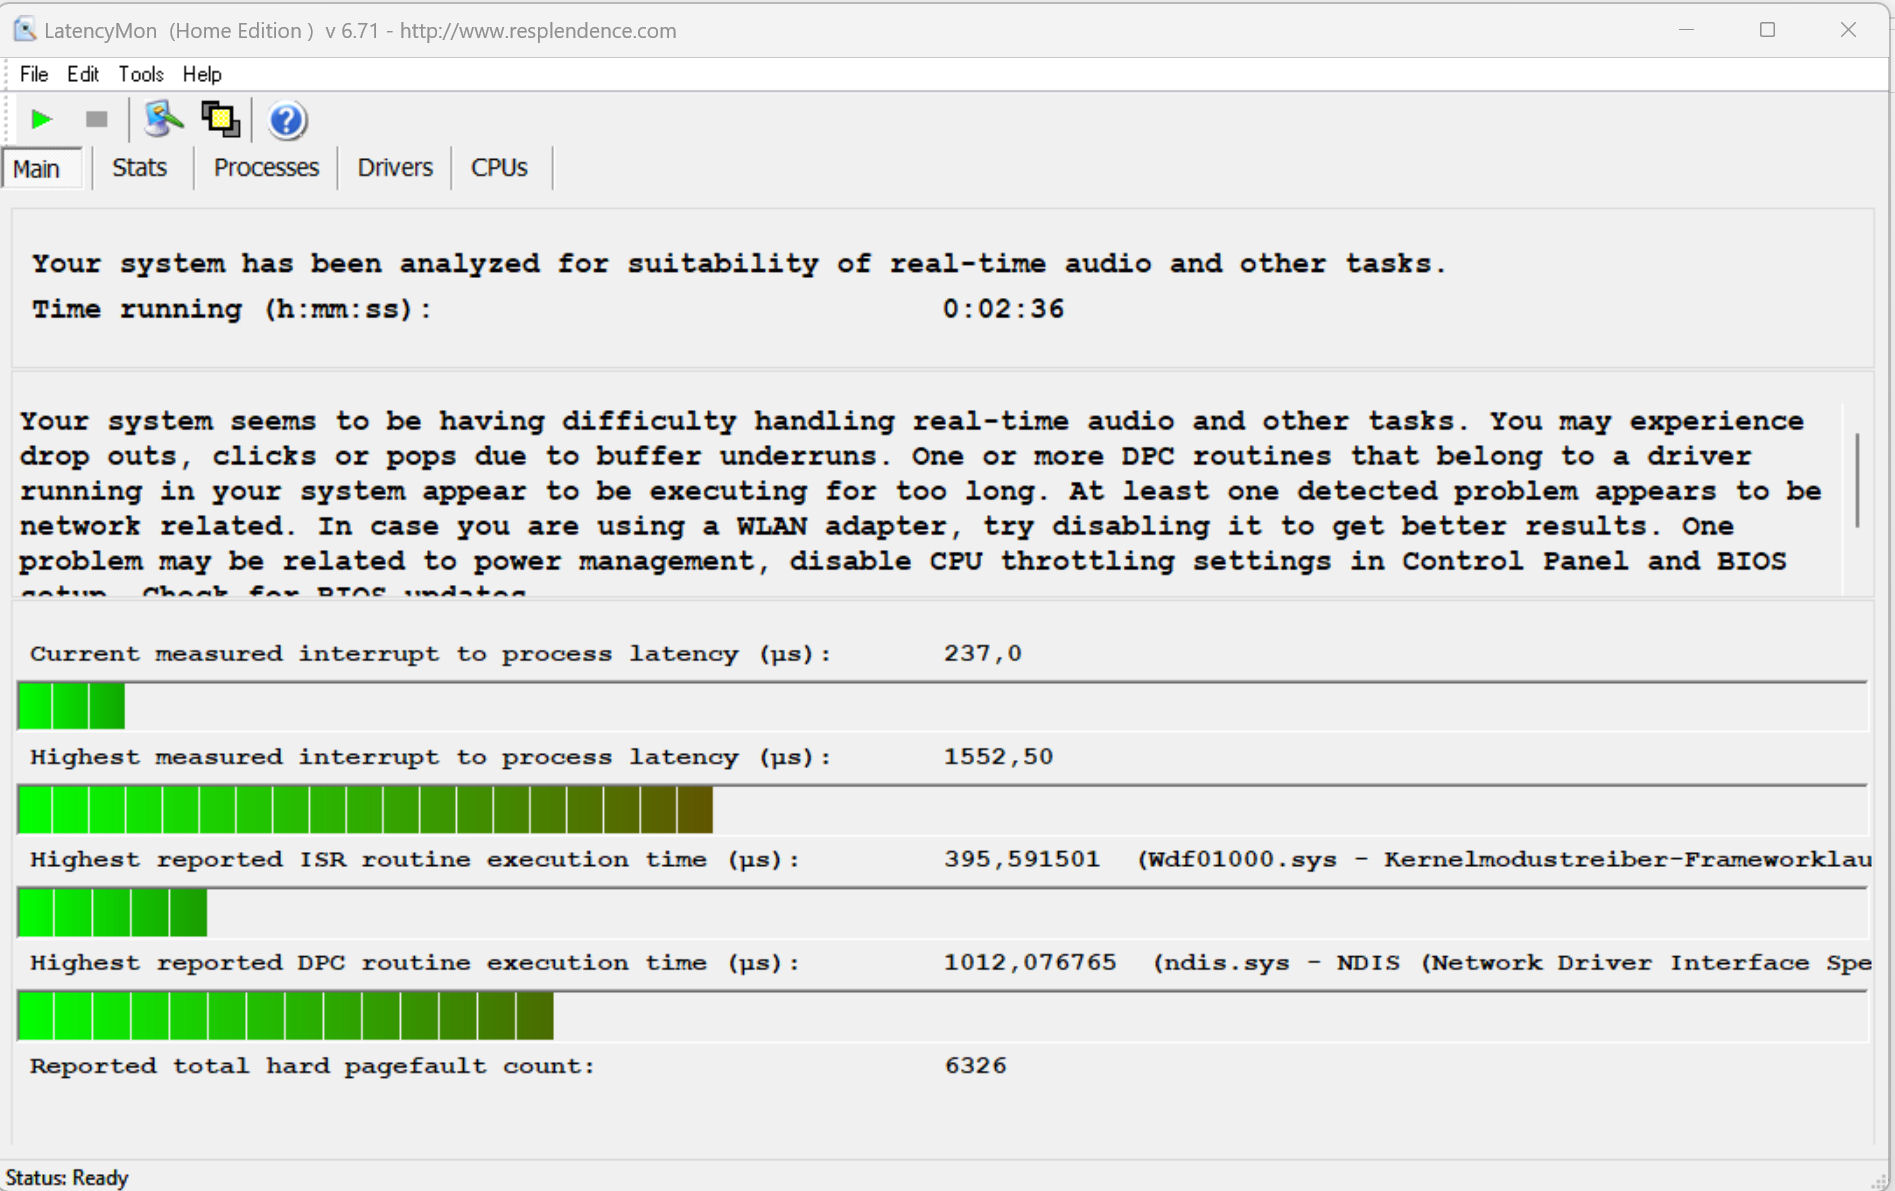
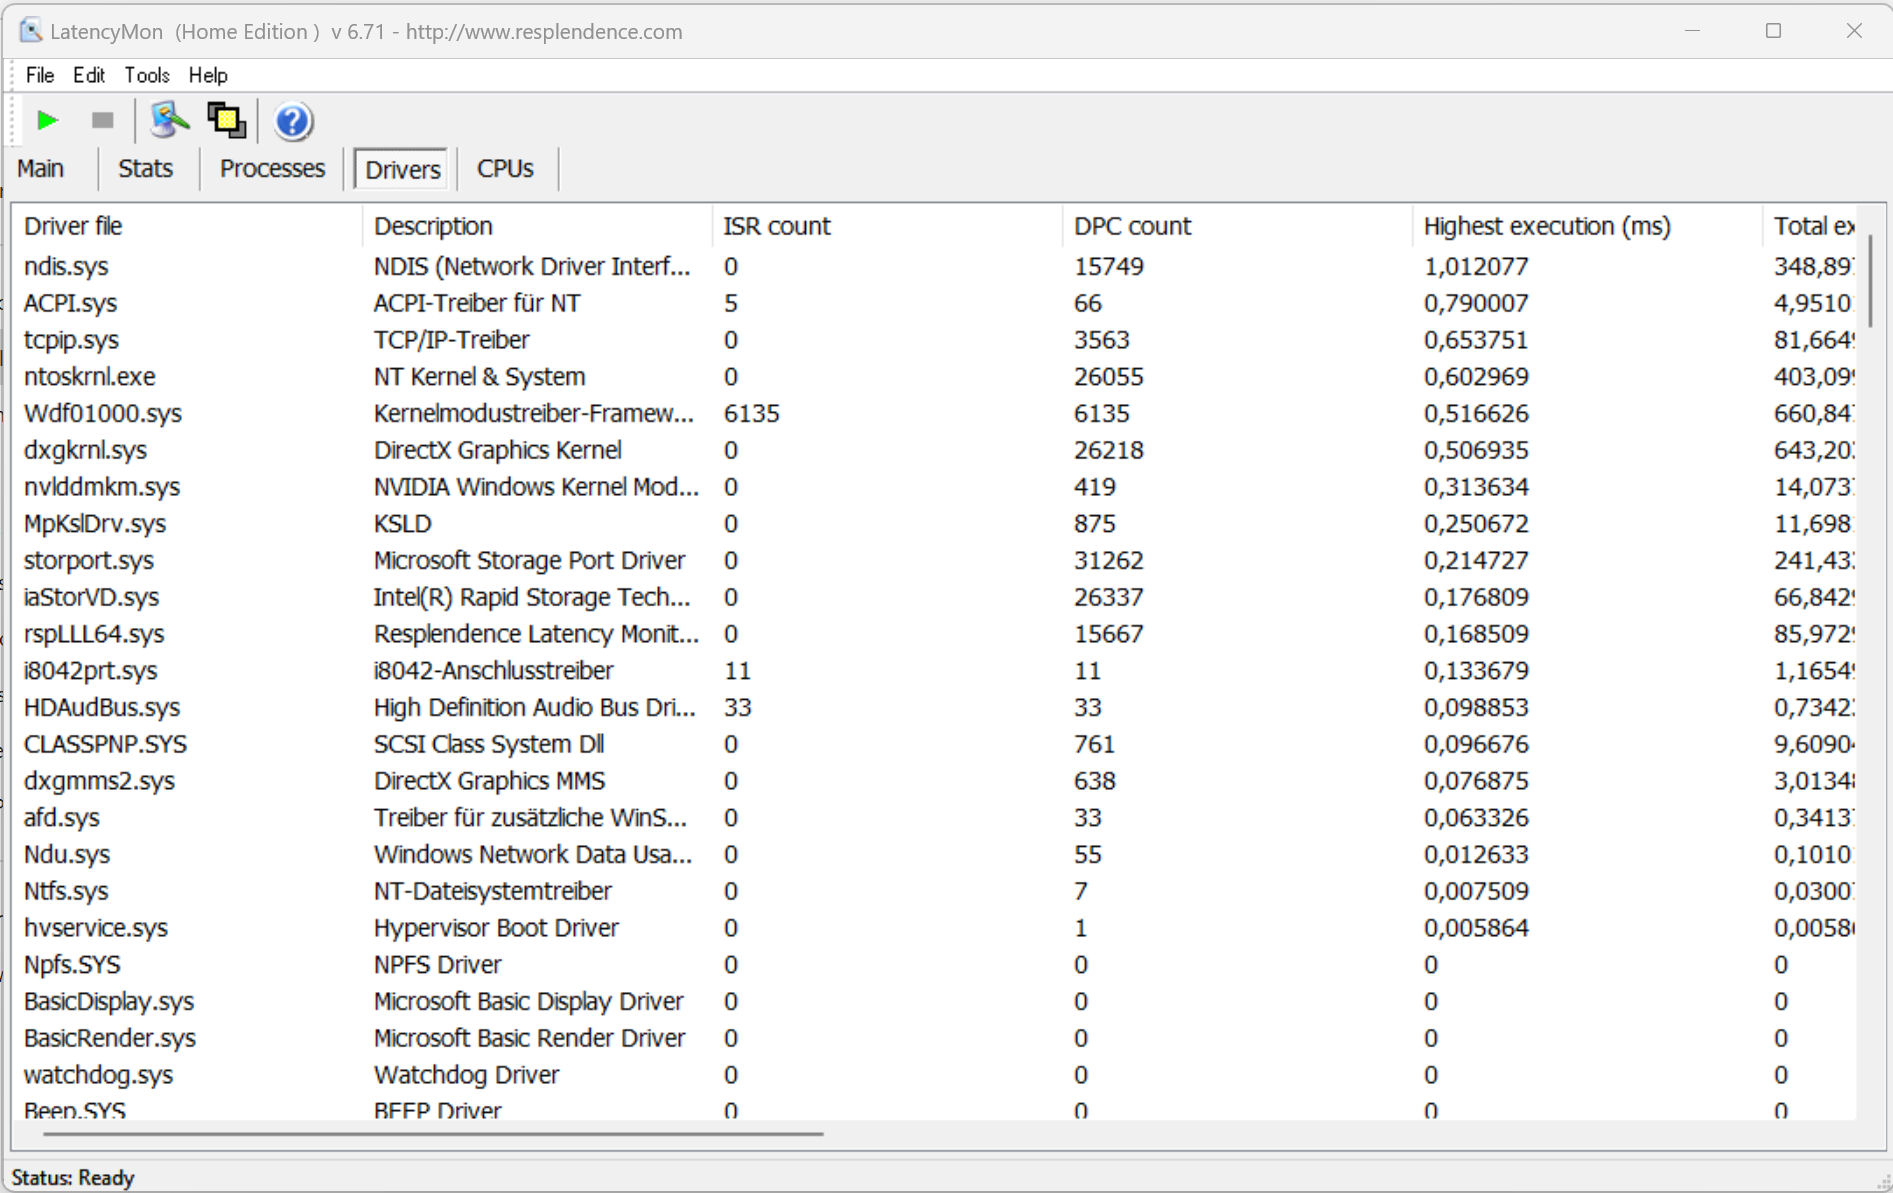
| DPC Latencies / LatencyMon - interrupt to process latency (max), Web, Youtube, Prime95 | |
| Gigabyte Aero 14 OLED BMF | |
| MSI Stealth 14 Studio A13V | |
| Acer Predator Triton 14 PT14-51 | |
| Asus ROG Zephyrus G14 GA402RJ | |
| Razer Blade 14 RTX 4070 | |
* ... más pequeño es mejor
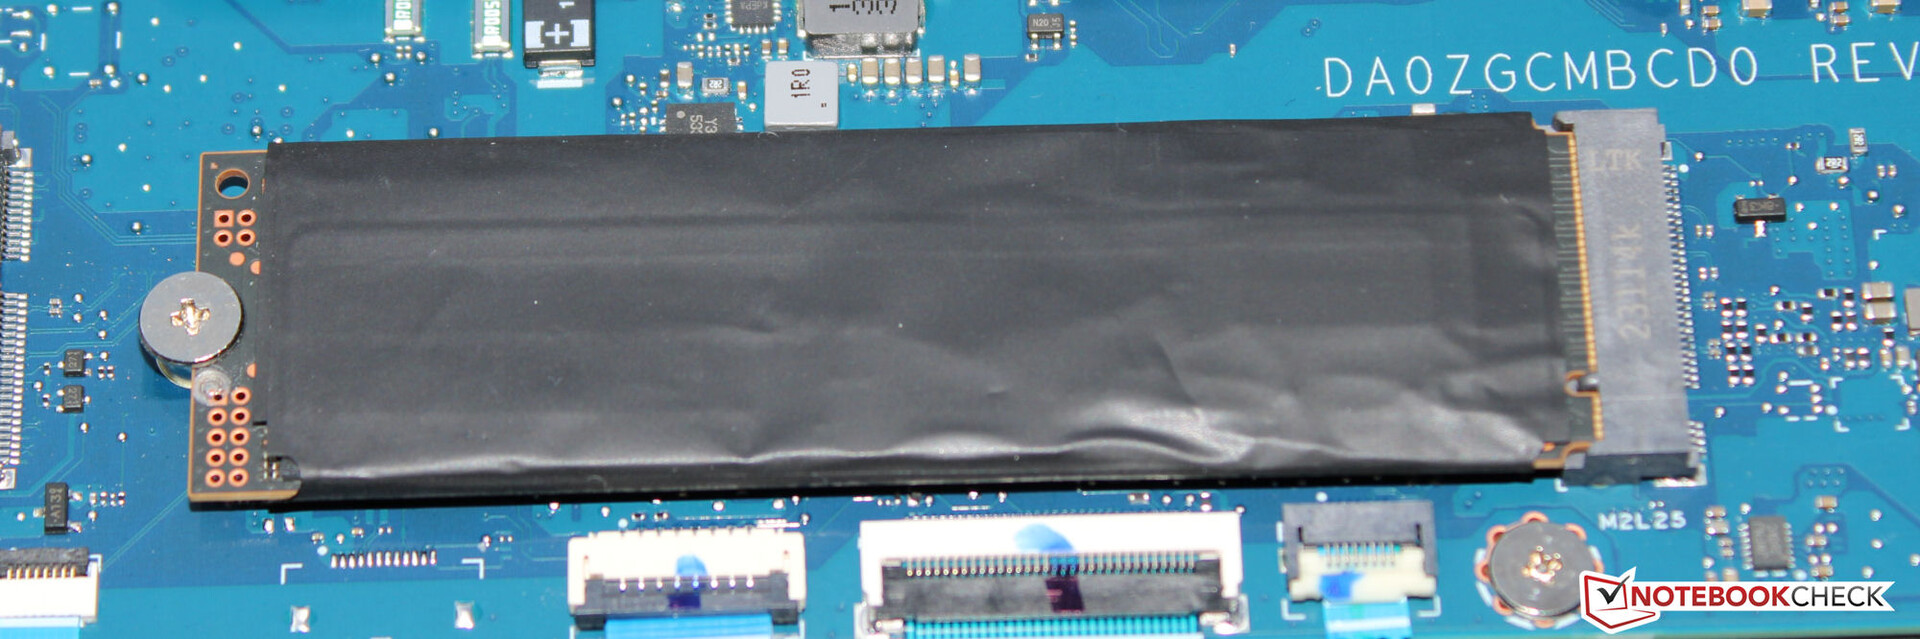
Almacenamiento masivo
Tacañería de almacenamiento en Acer: El SSD PCIe 4 instalado (M.2 2280) tiene una capacidad de sólo 512 GB - insuficiente para un portátil de juegos y especialmente uno de esta categoría de precio. El SSD Micron es muy decente pero no tiene velocidades de transferencia sobresalientes. Contras: En el transcurso del bucle DiskSpd, hay caídas de rendimiento debido al ahogo térmico. No hay espacio para un medio de almacenamiento adicional.

* ... más pequeño es mejor
Continuous Performance Read: DiskSpd Read Loop, Queue Depth 8
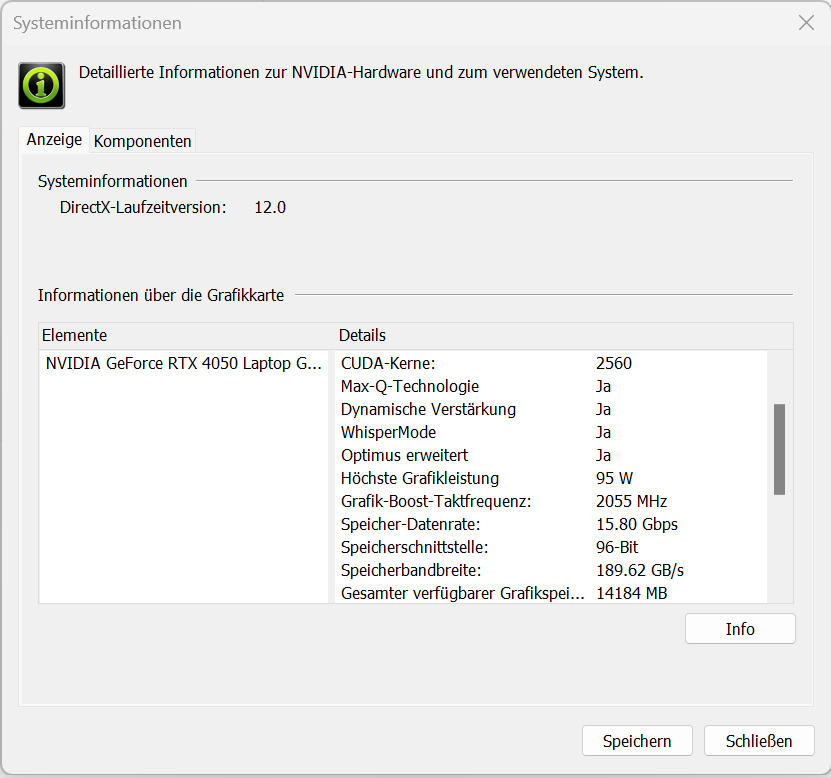
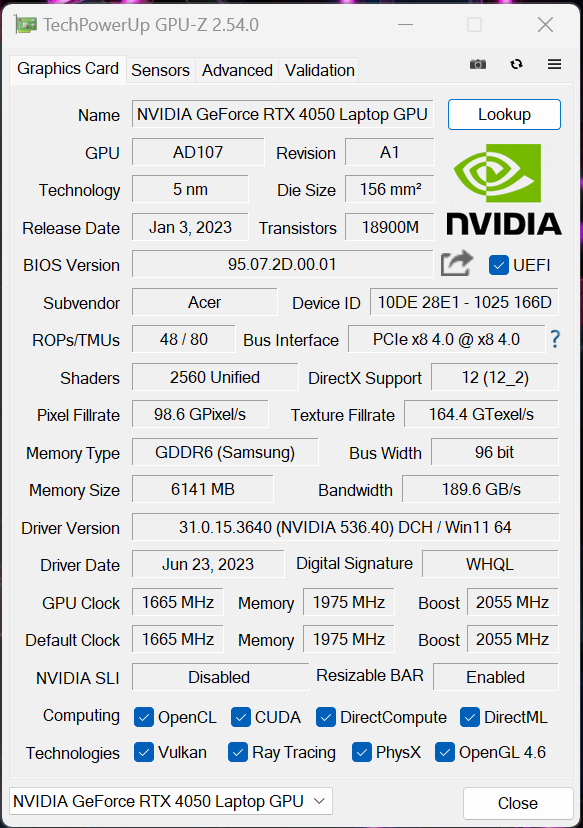
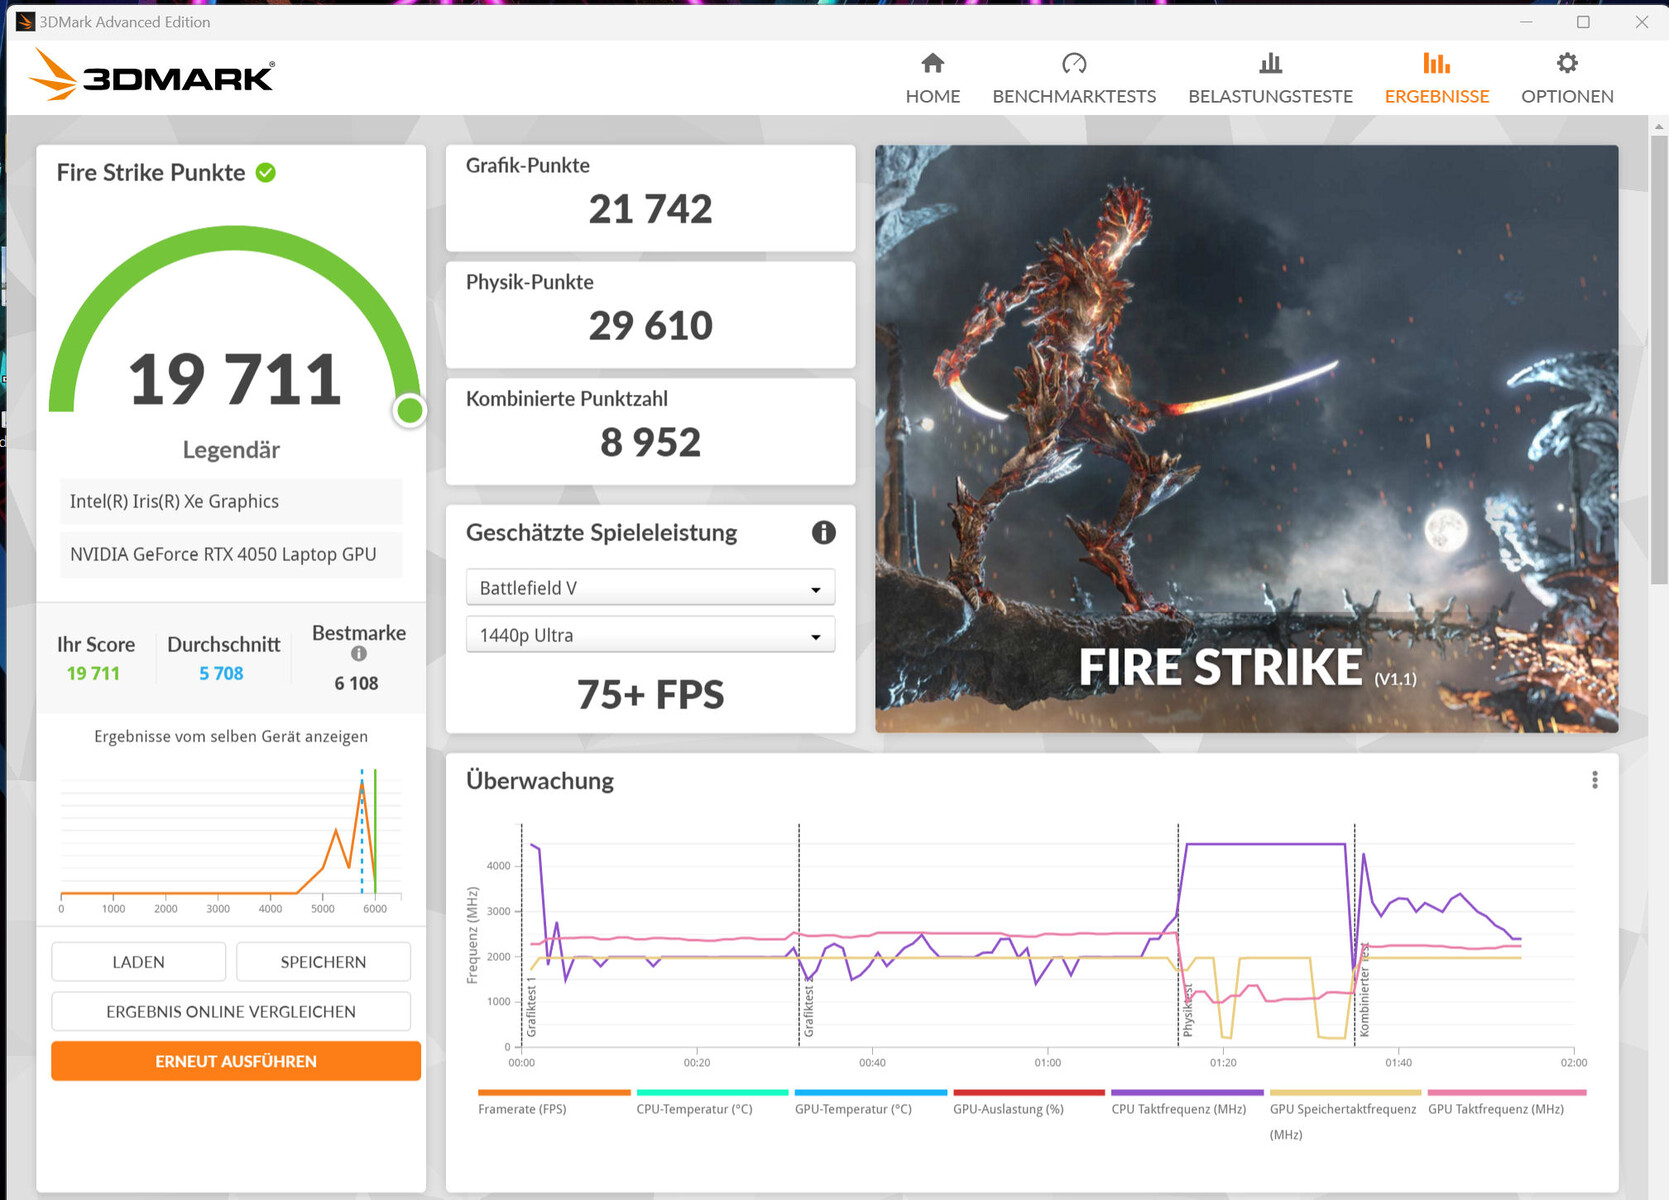
Tarjeta gráfica
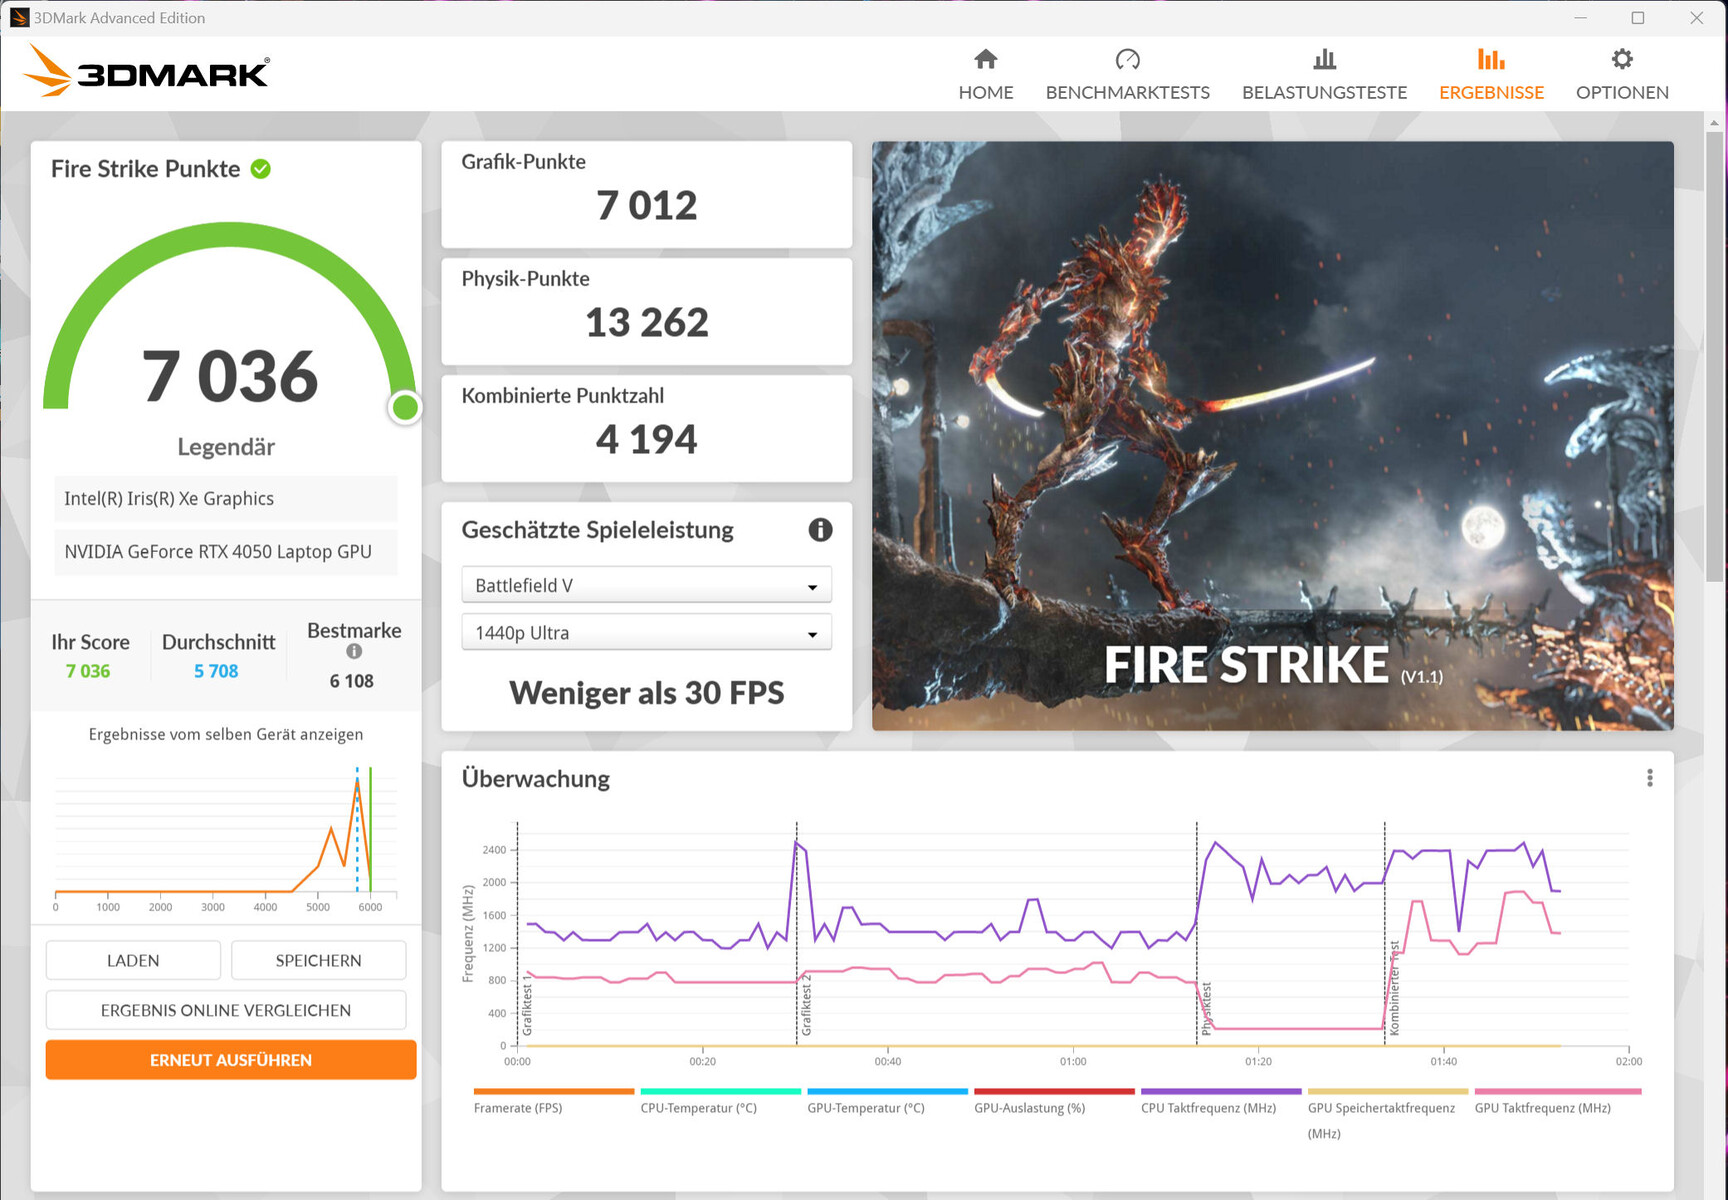
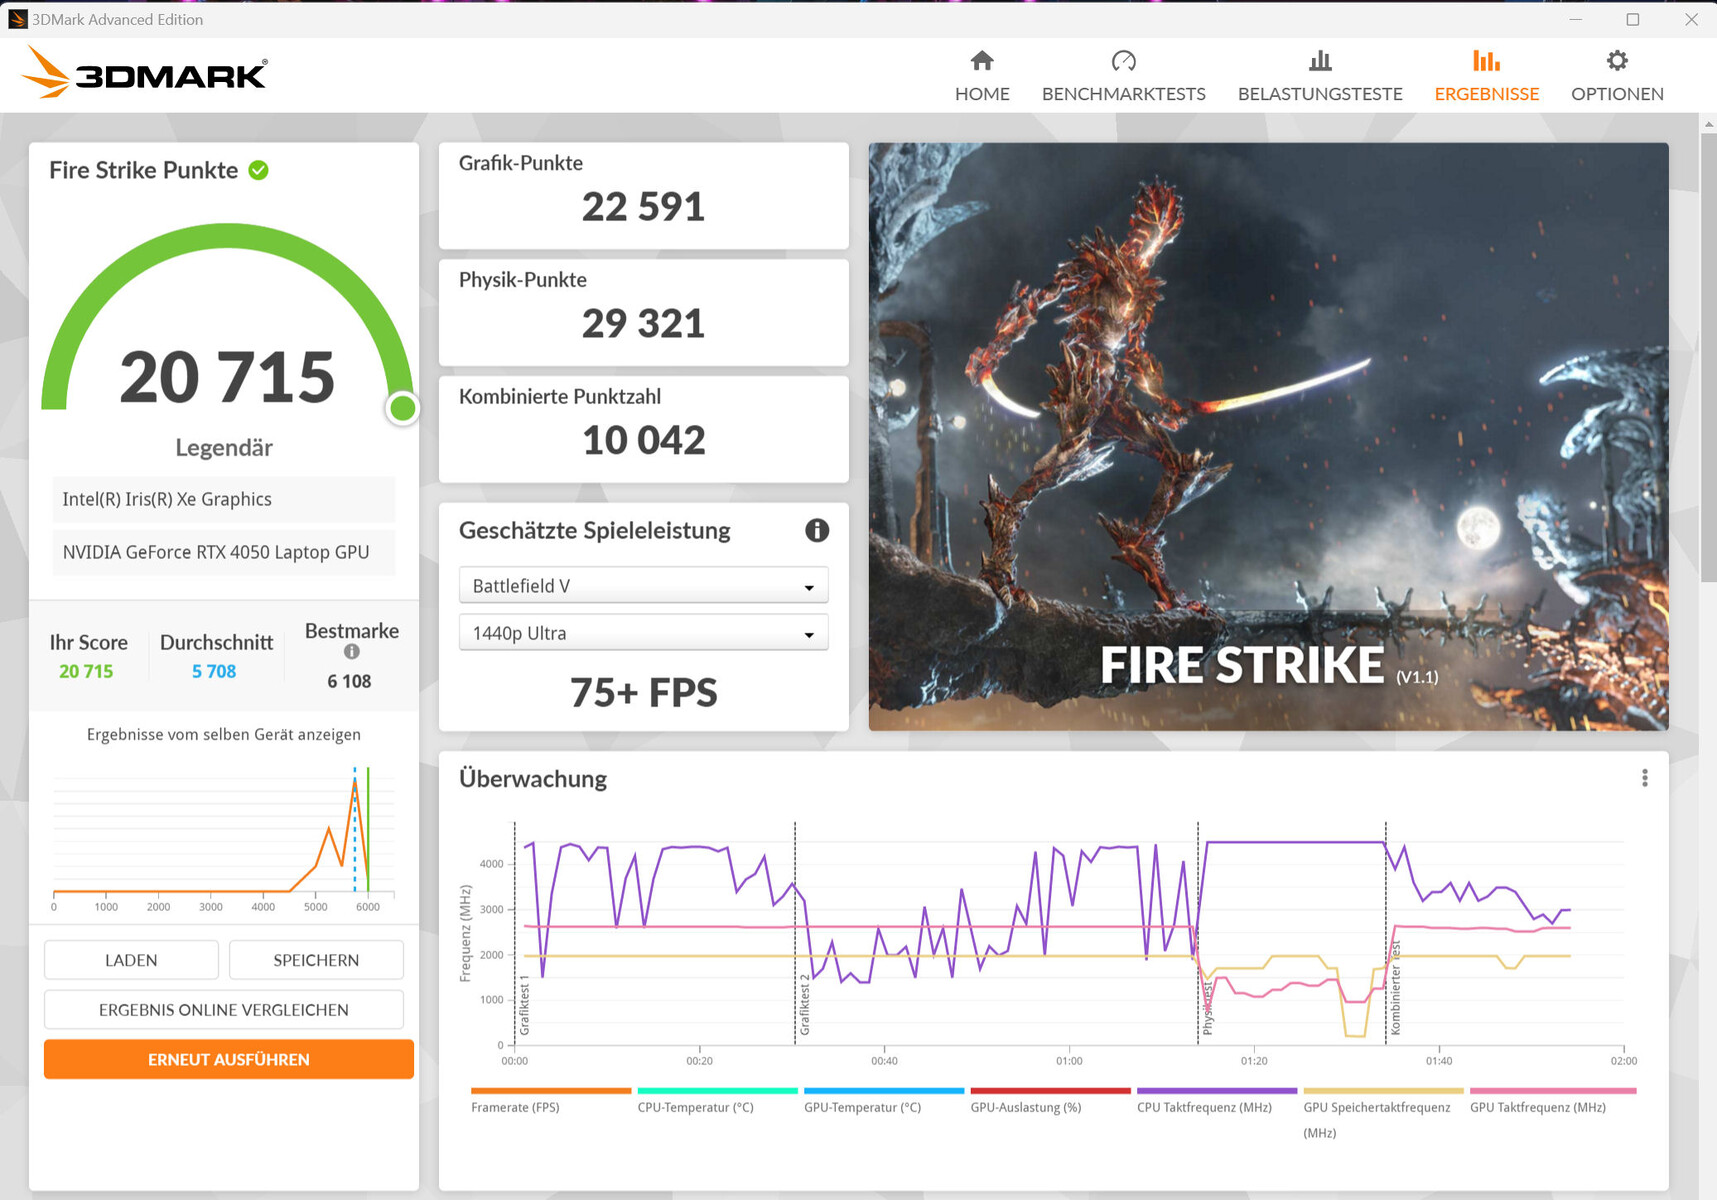
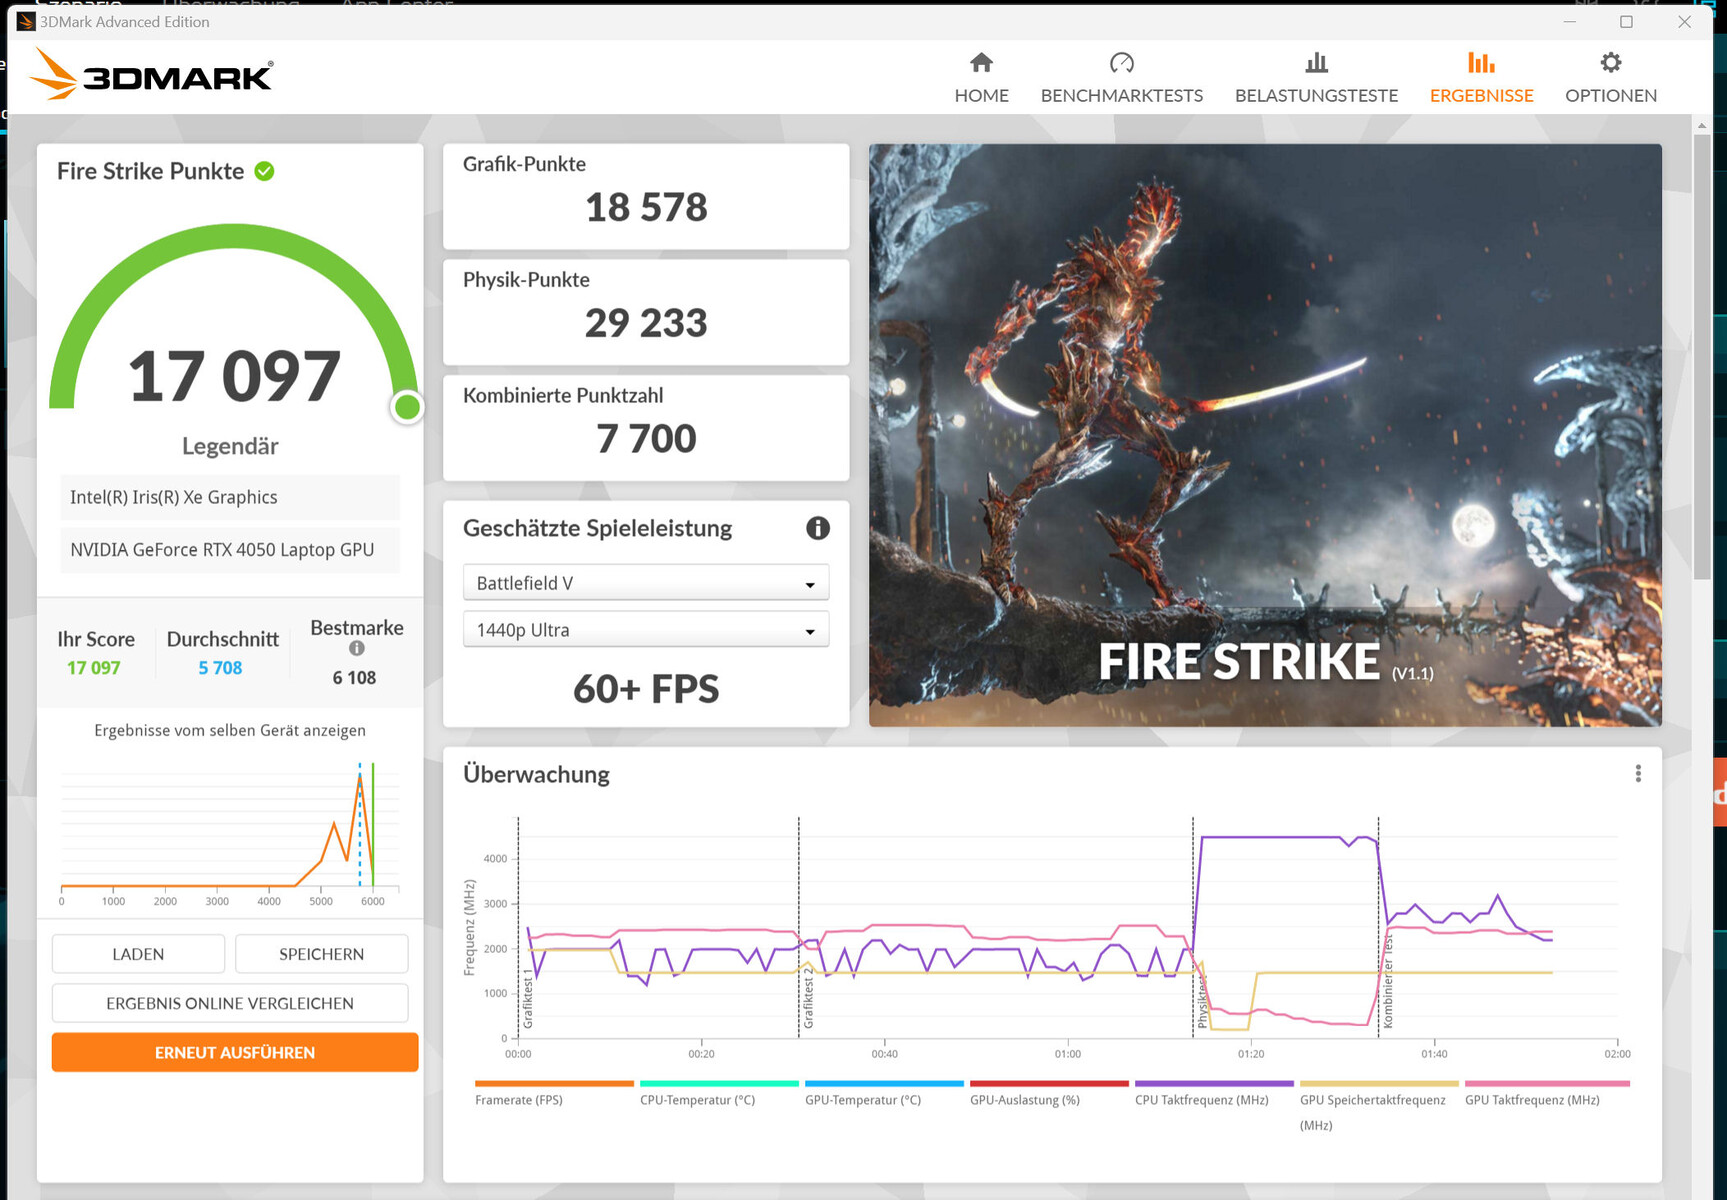
LaGeForce RTX 4050para portátiles ofrece 2.560 shaders, un bus de 96 bits de ancho y una rápida RAM GDDR6 (6.144 MB). Acer ha fijado el TGP máximo en 95 vatios. Según el test Witcher 3, el TGP no está al máximo.
Los resultados del benchmark están por encima de la media de la RTX 4050. Sin embargo, esto no se aplica cuando se usa el modo "Silencioso". La salida directa de vídeo a través de la GPU GeForce no proporciona un aumento de rendimiento y el cambio entre la dGPU y Optimus no requiere reiniciar - Advanced Optimus es compatible.

| 3DMark 06 Standard Score | 52667 puntos | |
| 3DMark 11 Performance | 27364 puntos | |
| 3DMark Cloud Gate Standard Score | 61034 puntos | |
| 3DMark Fire Strike Score | 19711 puntos | |
| 3DMark Time Spy Score | 8580 puntos | |
ayuda | ||
| Geekbench 6.7 - GPU OpenCL | |
| Media de la clase Gaming (67235 - 253130, n=104, últimos 2 años) | |
| Acer Predator Triton 14 PT14-51 | |
| Medio NVIDIA GeForce RTX 4050 Laptop GPU (60815 - 86892, n=21) | |
* ... más pequeño es mejor
Rendimiento de juego
El hardware del Predator está pensado para juegos FHD con ajustes de altos a máximos. No obstante, se puede aprovechar la resolución máxima de la pantalla (2.560 x 1.600 pixels) - a veces con configuraciones más bajas. Medimos frame rates por encima de la media de la RTX 4050.
| The Last of Us - 1920x1080 Ultra Preset | |
| Razer Blade 14 RTX 4070 | |
| Medio NVIDIA GeForce RTX 4050 Laptop GPU (35.7 - 50.2, n=3) | |
| Acer Predator Triton 14 PT14-51 | |
| Gigabyte Aero 14 OLED BMF | |
| The Callisto Protocol | |
| 2560x1440 Ultra Preset (without FSR Upscaling) | |
| Acer Predator Triton 14 PT14-51 | |
| Medio NVIDIA GeForce RTX 4050 Laptop GPU (29.5 - 46.7, n=3) | |
| 1920x1080 Ultra Preset (without FSR Upscaling) | |
| Acer Predator Triton 14 PT14-51 | |
| Medio NVIDIA GeForce RTX 4050 Laptop GPU (41.4 - 63.1, n=3) | |
| 1920x1080 Ultra Preset (without FSR Upscaling) + Full Ray-Tracing | |
| Acer Predator Triton 14 PT14-51 | |
| Medio NVIDIA GeForce RTX 4050 Laptop GPU (31 - 49.9, n=3) | |
| Star Wars Jedi Survivor | |
| 1920x1080 Epic Preset | |
| Medio NVIDIA GeForce RTX 4050 Laptop GPU (48.4 - 56, n=7) | |
| Medion Erazer Scout E20 | |
| Acer Predator Triton 14 PT14-51 | |
| 2560x1440 Epic Preset | |
| Medio NVIDIA GeForce RTX 4050 Laptop GPU (30.4 - 35, n=4) | |
| Acer Predator Triton 14 PT14-51 | |
| 1920x1080 Epic Preset + Ray Tracing | |
| Medio NVIDIA GeForce RTX 4050 Laptop GPU (38.6 - 42, n=4) | |
| Medion Erazer Scout E20 | |
| Acer Predator Triton 14 PT14-51 | |
| F1 23 | |
| 1920x1080 Ultra High Preset AA:T AF:16x | |
| Medio NVIDIA GeForce RTX 4050 Laptop GPU (25.7 - 60.8, n=14) | |
| Acer Predator Triton 14 PT14-51 | |
| 2560x1440 Ultra High Preset AA:T AF:16x | |
| Medio NVIDIA GeForce RTX 4050 Laptop GPU (16.7 - 40.8, n=11) | |
| Acer Predator Triton 14 PT14-51 | |
| Dead Island 2 | |
| 2560x1440 Ultra Preset AA:High T | |
| Medio NVIDIA GeForce RTX 4050 Laptop GPU (61.8 - 76.5, n=2) | |
| Acer Predator Triton 14 PT14-51 | |
| 1920x1080 Ultra Preset AA:High T | |
| Medion Erazer Scout E20 | |
| Medio NVIDIA GeForce RTX 4050 Laptop GPU (90.9 - 133.5, n=3) | |
| Acer Predator Triton 14 PT14-51 | |
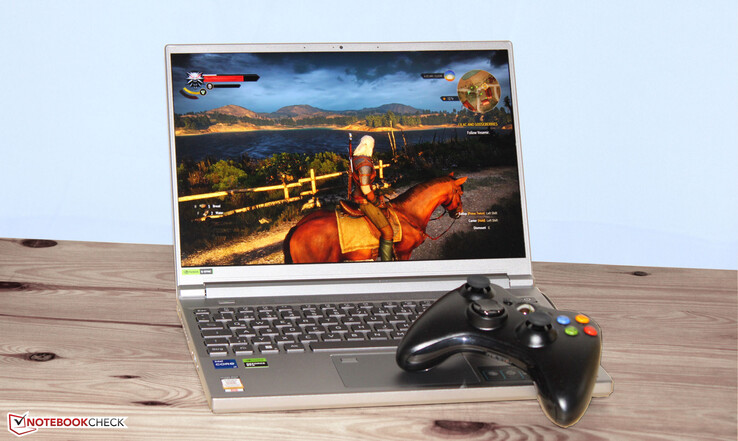
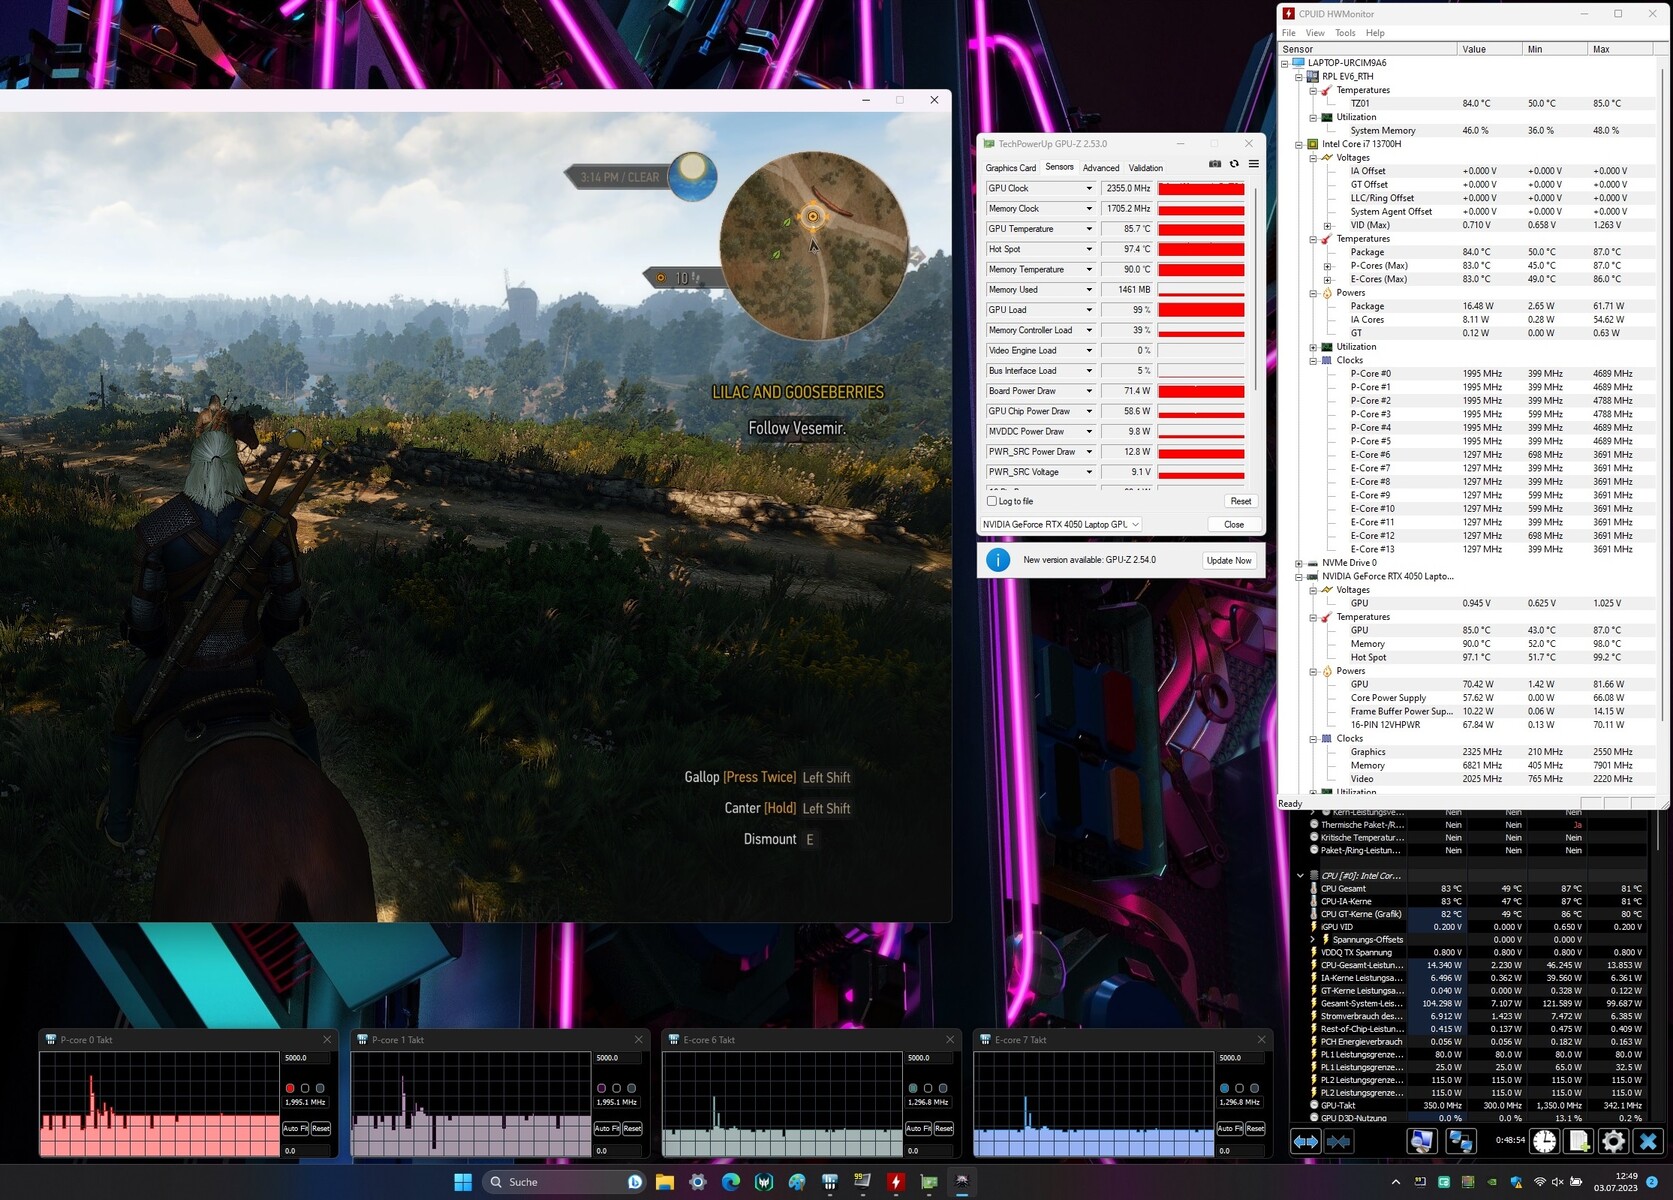
Para comprobar si las frecuencias de cuadro se mantienen estables durante más tiempo, ejecutamos el juego Witcher 3 durante unos 60 minutos a resolución FullHD y ajustes de máxima calidad. El personaje del juego no se movió y no detectamos ninguna caída en la frecuencia de imagen.
Witcher 3 FPS diagram
| bajo | medio | alto | ultra | QHD | |
|---|---|---|---|---|---|
| The Witcher 3 (2015) | 393.7 | 253.3 | 149.7 | 80.1 | |
| Dota 2 Reborn (2015) | 159.4 | 141.8 | 132.6 | 127.2 | |
| Final Fantasy XV Benchmark (2018) | 183 | 110.5 | 79.2 | 58.2 | |
| X-Plane 11.11 (2018) | 138.1 | 128.6 | 100.2 | ||
| Far Cry 5 (2018) | 174 | 131 | 122 | 113 | 79 |
| Strange Brigade (2018) | 467 | 194.8 | 159.4 | 137 | 94.9 |
| F1 22 (2022) | 210 | 194.4 | 147.2 | 48.5 | 31 |
| The Callisto Protocol (2022) | 119 | 96 | 93.3 | 63.1 | 46.7 |
| The Last of Us (2023) | 82.2 | 67.4 | 56.2 | 42.8 | |
| Dead Island 2 (2023) | 201 | 171.8 | 125.9 | 90.9 | 61.8 |
| Star Wars Jedi Survivor (2023) | 60.6 | 54.6 | 51.6 | 48.4 | 30.4 |
| F1 23 (2023) | 197.9 | 194.8 | 139.8 | 40.5 | 31 |
Emisiones - El portátil Acer puede funcionar silenciosamente
Emisiones sonoras
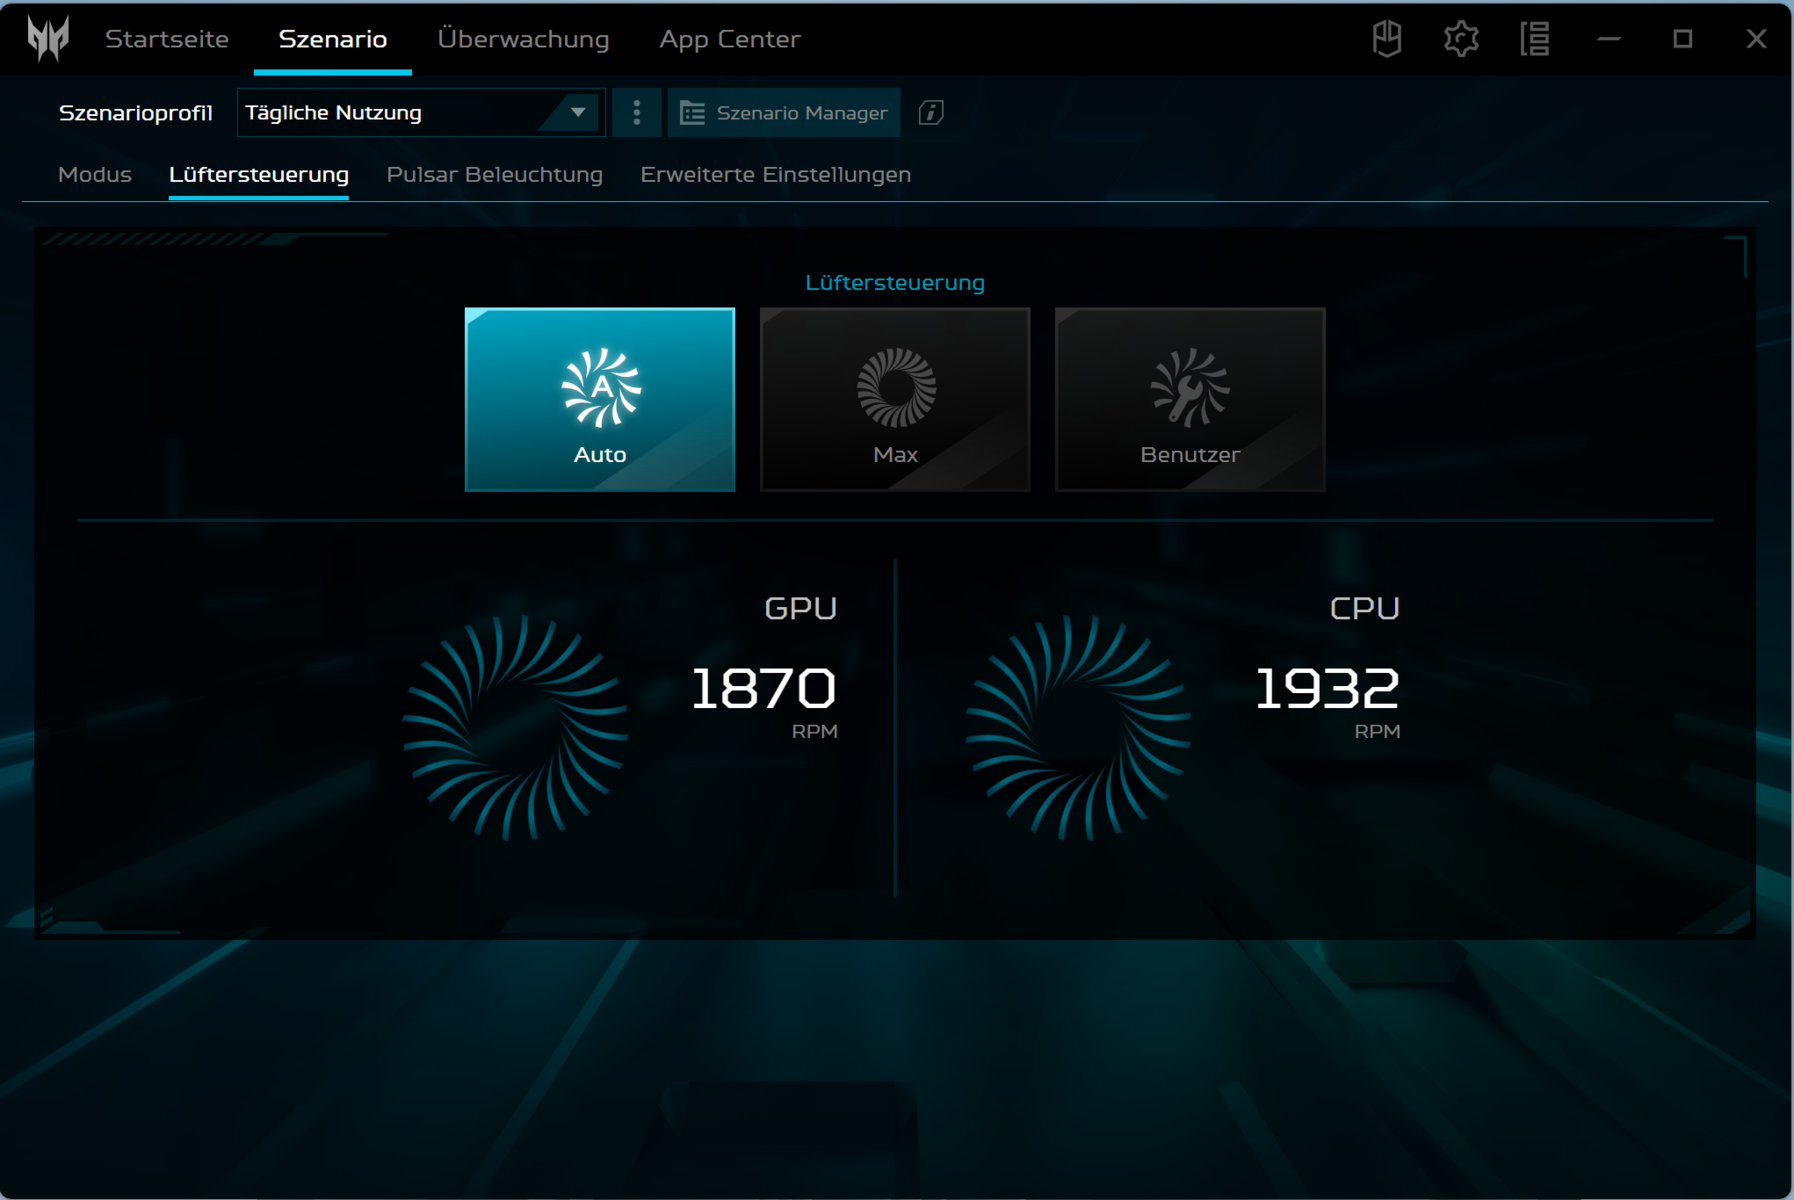
En el uso diario (oficina, Internet, ...), la Triton suele funcionar silenciosamente, independientemente del modo seleccionado. El nivel de ruido puede aumentar hasta 56 dB(A) ("Turbo") y 53 dB(A) ("Performance"), respectivamente. Nosotros utilizamos el "Equilibrado" y registramos unos moderados 43 dB(A). En general, se puede conseguir una menor producción de ruido aplicando el modo "Silencioso", con un descenso relativamente pequeño del rendimiento.
Ruido
| Ocioso |
| 27 / 29 / 31 dB(A) |
| Carga |
| 42 / 45 dB(A) |
 | ||
30 dB silencioso 40 dB(A) audible 50 dB(A) ruidosamente alto |
||
min: | ||
| Acer Predator Triton 14 PT14-51 i7-13700H, GeForce RTX 4050 Laptop GPU | Razer Blade 14 RTX 4070 R9 7940HS, GeForce RTX 4070 Laptop GPU | Asus ROG Zephyrus G14 GA402RJ R7 6800HS, Radeon RX 6700S | MSI Stealth 14 Studio A13V i7-13700H, GeForce RTX 4050 Laptop GPU | Gigabyte Aero 14 OLED BMF i7-13700H, GeForce RTX 4050 Laptop GPU | Apple MacBook Pro 14 2023 M2 Pro Entry M2 Pro 10-Core, M2 Pro 16-Core GPU | |
|---|---|---|---|---|---|---|
| Noise | 6% | 2% | -3% | 1% | 16% | |
| apagado / medio ambiente * (dB) | 25 | 22.7 9% | 25 -0% | 25.3 -1% | 24 4% | 23.6 6% |
| Idle Minimum * (dB) | 27 | 23.4 13% | 25 7% | 25.3 6% | 24 11% | 23.6 13% |
| Idle Average * (dB) | 29 | 23.4 19% | 26 10% | 25 14% | 24 17% | 23.6 19% |
| Idle Maximum * (dB) | 31 | 23.4 25% | 29 6% | 33.7 -9% | 35.71 -15% | 23.6 24% |
| Load Average * (dB) | 42 | 33 21% | 45 -7% | 42.2 -0% | 24.2 42% | |
| Witcher 3 ultra * (dB) | 43 | 51.8 -20% | 43 -0% | 51 -19% | 40.22 6% | |
| Load Maximum * (dB) | 45 | 55.6 -24% | 45 -0% | 51 -13% | 51.93 -15% | 47.5 -6% |
* ... más pequeño es mejor
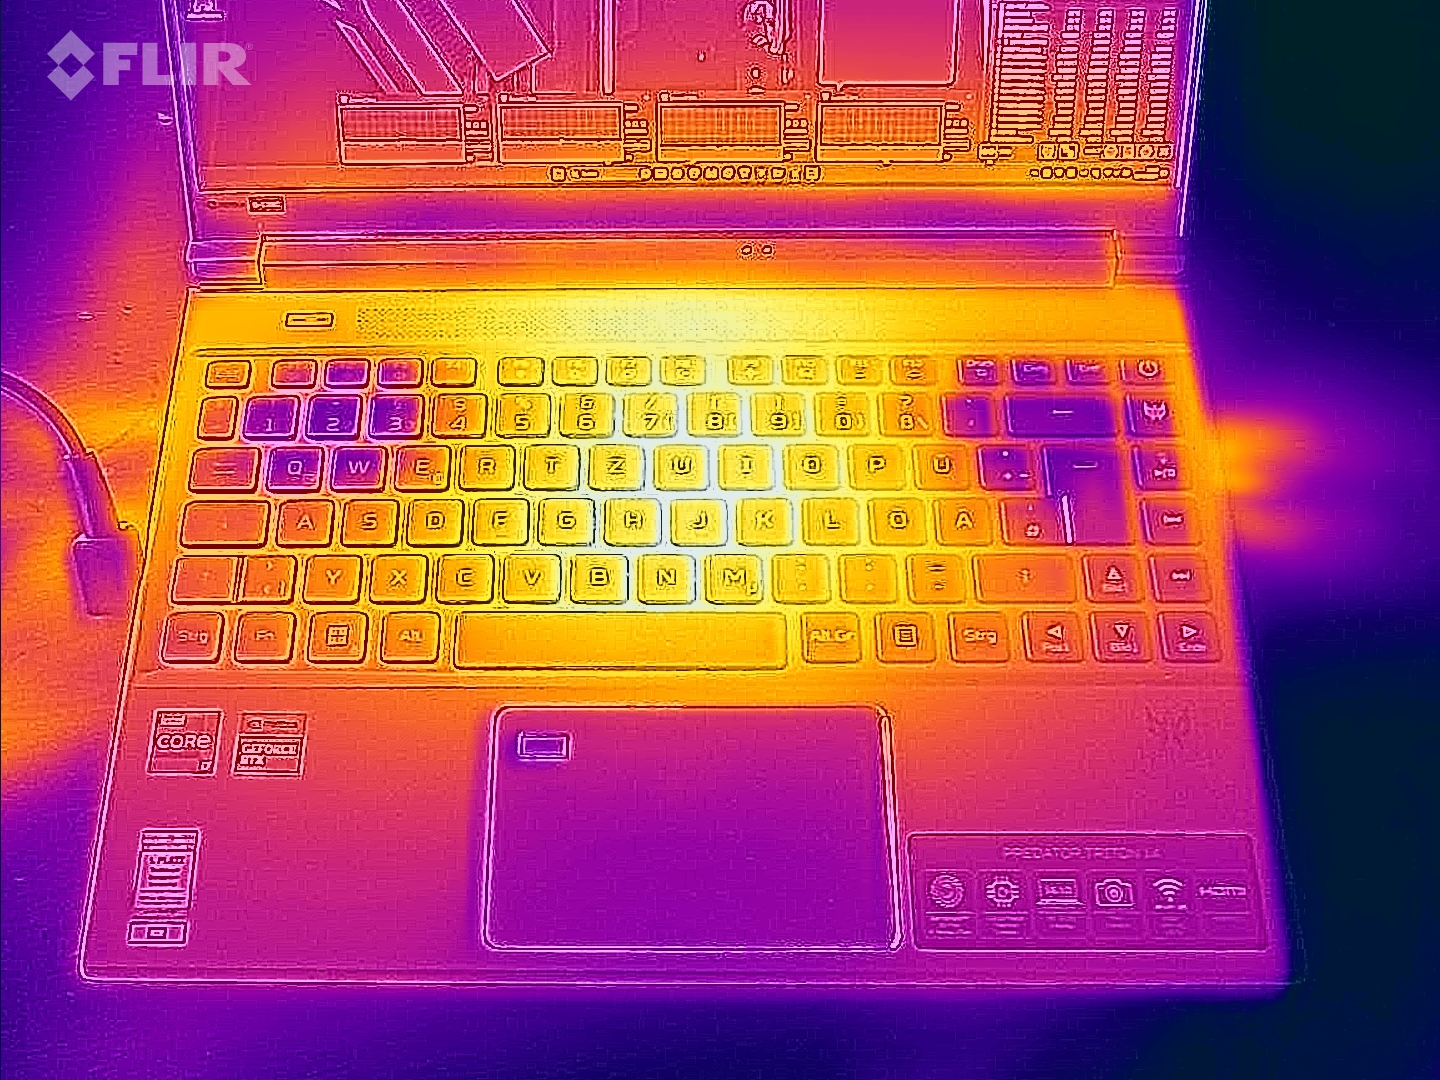
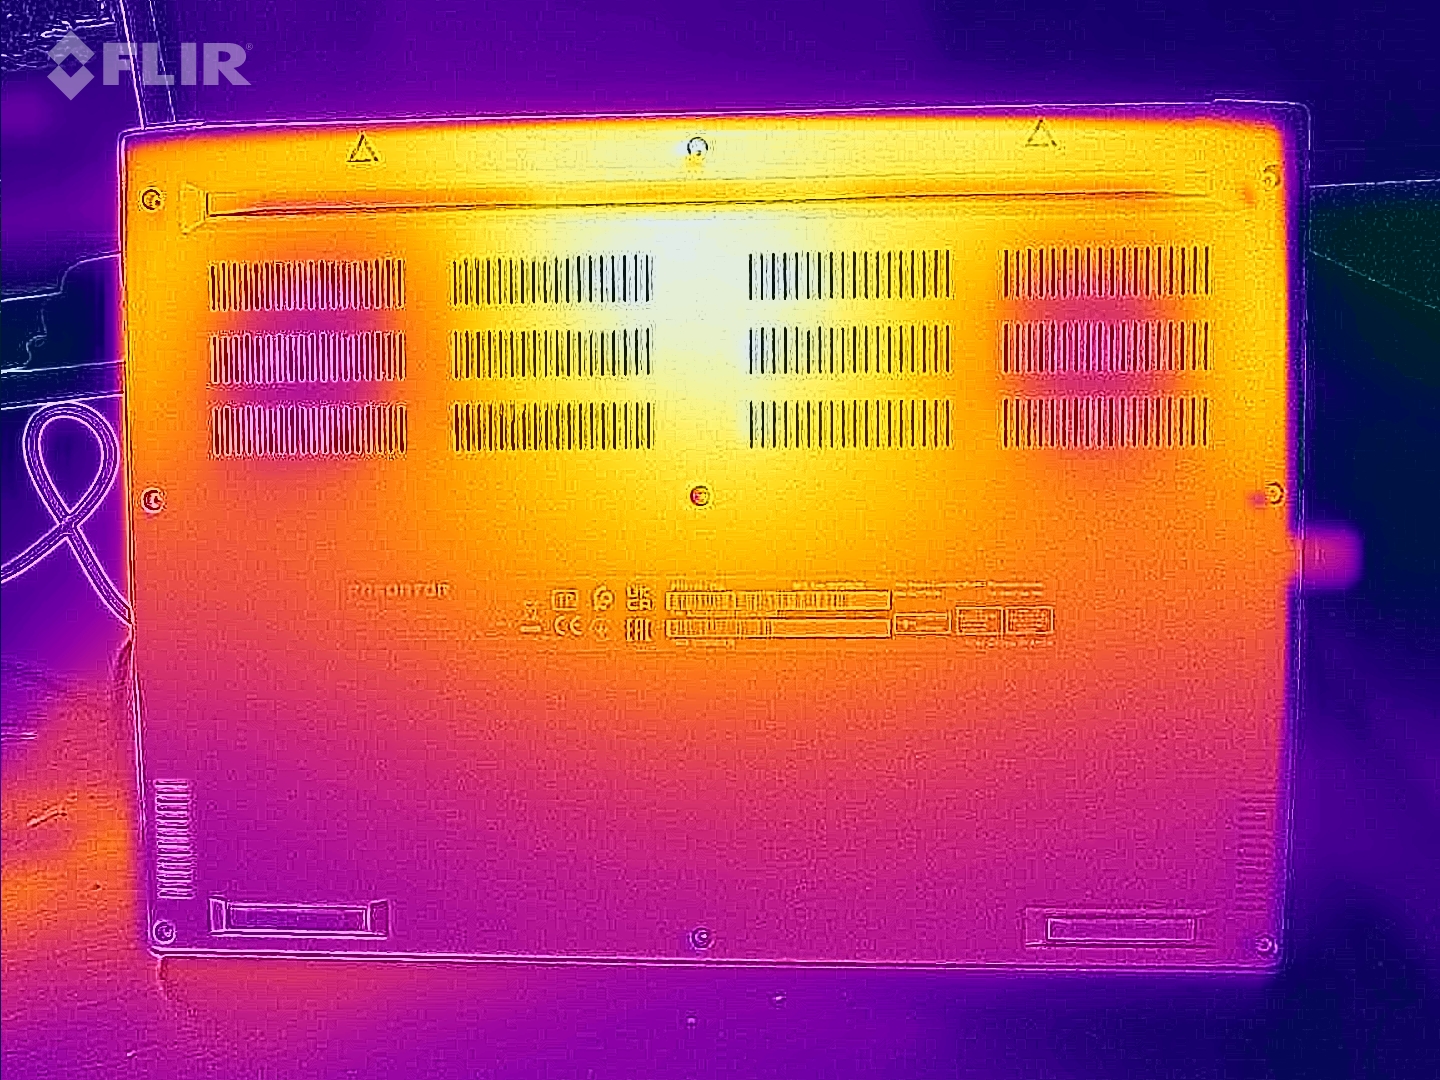
Temperatura
Bajo carga, el portátil se calienta notablemente. En varios puntos de medición, registramos temperaturas de entre 50 y 56 °C. Cuando se trata del uso diario, estas cifras están en la zona verde.
(-) La temperatura máxima en la parte superior es de 54 °C / 129 F, frente a la media de 40.4 °C / 105 F, que oscila entre 21.2 y 68.8 °C para la clase Gaming.
(-) El fondo se calienta hasta un máximo de 56 °C / 133 F, frente a la media de 43.2 °C / 110 F
(+) En reposo, la temperatura media de la parte superior es de 29.1 °C / 84# F, frente a la media del dispositivo de 33.9 °C / 93 F.
(-) Jugando a The Witcher 3, la temperatura media de la parte superior es de 46.7 °C / 116 F, frente a la media del dispositivo de 33.9 °C / 93 F.
(-) El reposamanos y el touchpad pueden calentarse mucho al tacto con un máximo de 41 °C / 105.8 F.
(-) La temperatura media de la zona del reposamanos de dispositivos similares fue de 28.8 °C / 83.8 F (-12.2 °C / -22 F).
| Acer Predator Triton 14 PT14-51 Intel Core i7-13700H, NVIDIA GeForce RTX 4050 Laptop GPU | Razer Blade 14 RTX 4070 AMD Ryzen 9 7940HS, NVIDIA GeForce RTX 4070 Laptop GPU | Asus ROG Zephyrus G14 GA402RJ AMD Ryzen 7 6800HS, AMD Radeon RX 6700S | MSI Stealth 14 Studio A13V Intel Core i7-13700H, NVIDIA GeForce RTX 4050 Laptop GPU | Gigabyte Aero 14 OLED BMF Intel Core i7-13700H, NVIDIA GeForce RTX 4050 Laptop GPU | Apple MacBook Pro 14 2023 M2 Pro Entry Apple M2 Pro 10-Core, Apple M2 Pro 16-Core GPU | |
|---|---|---|---|---|---|---|
| Heat | 11% | -7% | -5% | 15% | 24% | |
| Maximum Upper Side * (°C) | 54 | 37.4 31% | 53 2% | 46.9 13% | 42 22% | 47 13% |
| Maximum Bottom * (°C) | 56 | 35.2 37% | 54 4% | 56.1 -0% | 52 7% | 42.8 24% |
| Idle Upper Side * (°C) | 31 | 33.2 -7% | 34 -10% | 33.8 -9% | 26 16% | 22.3 28% |
| Idle Bottom * (°C) | 31 | 36.2 -17% | 38 -23% | 37.9 -22% | 27 13% | 21.7 30% |
* ... más pequeño es mejor
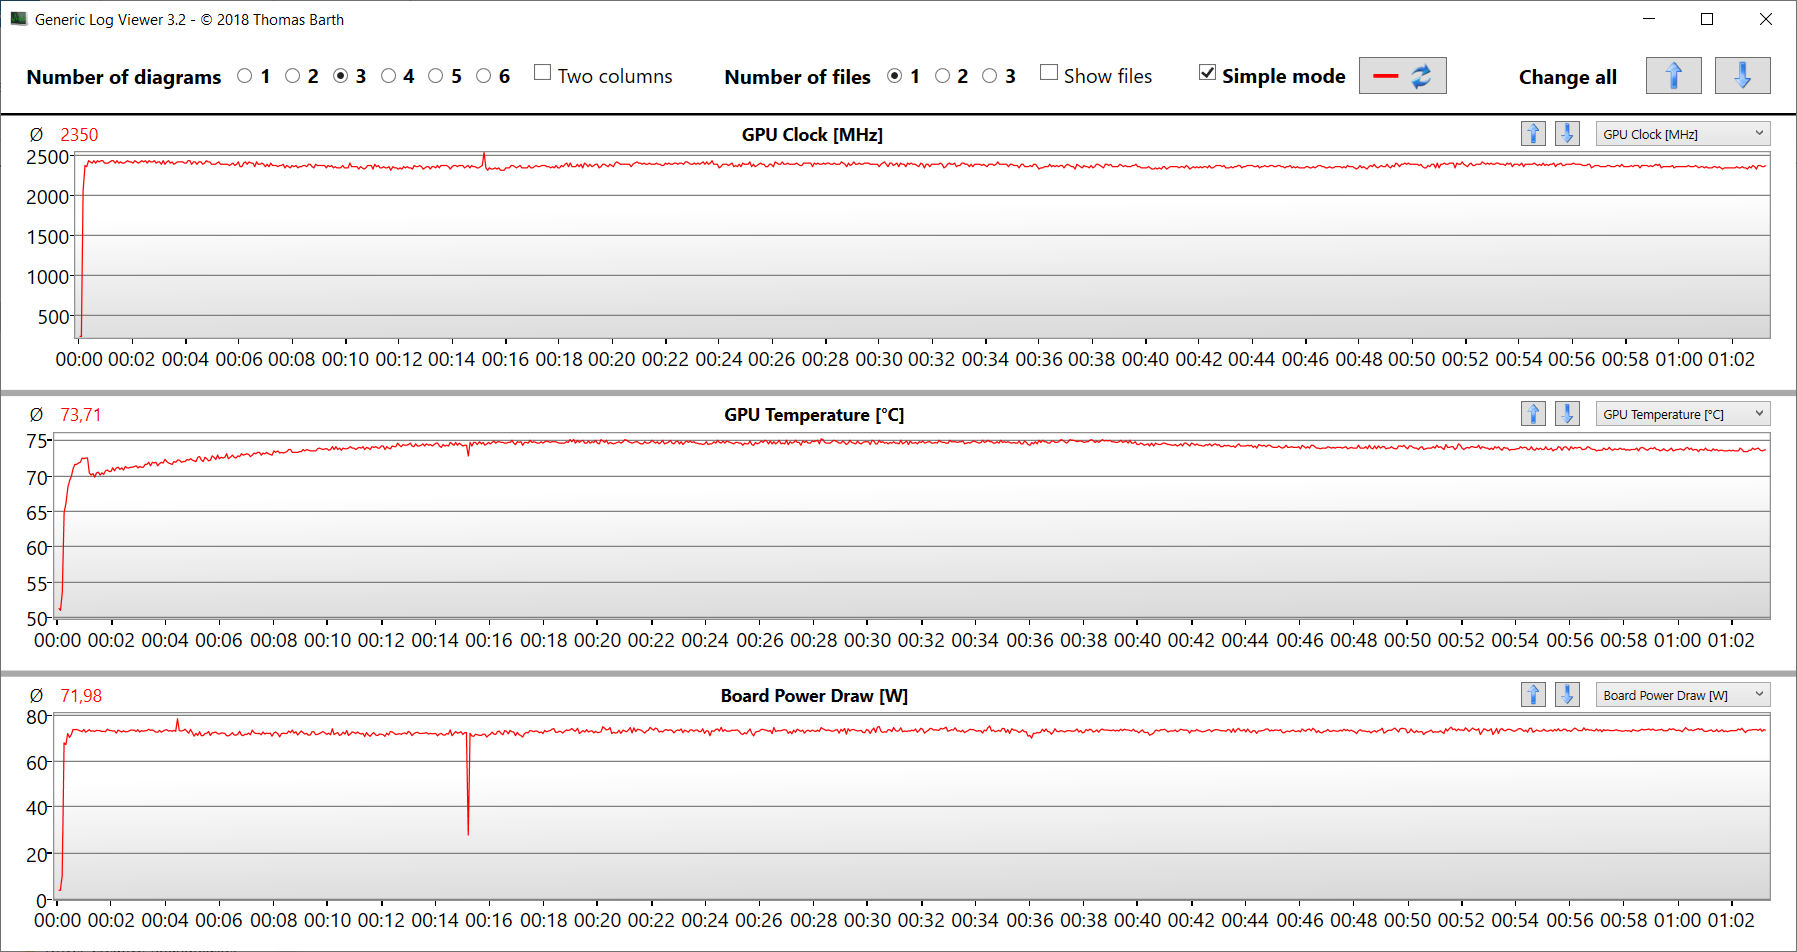
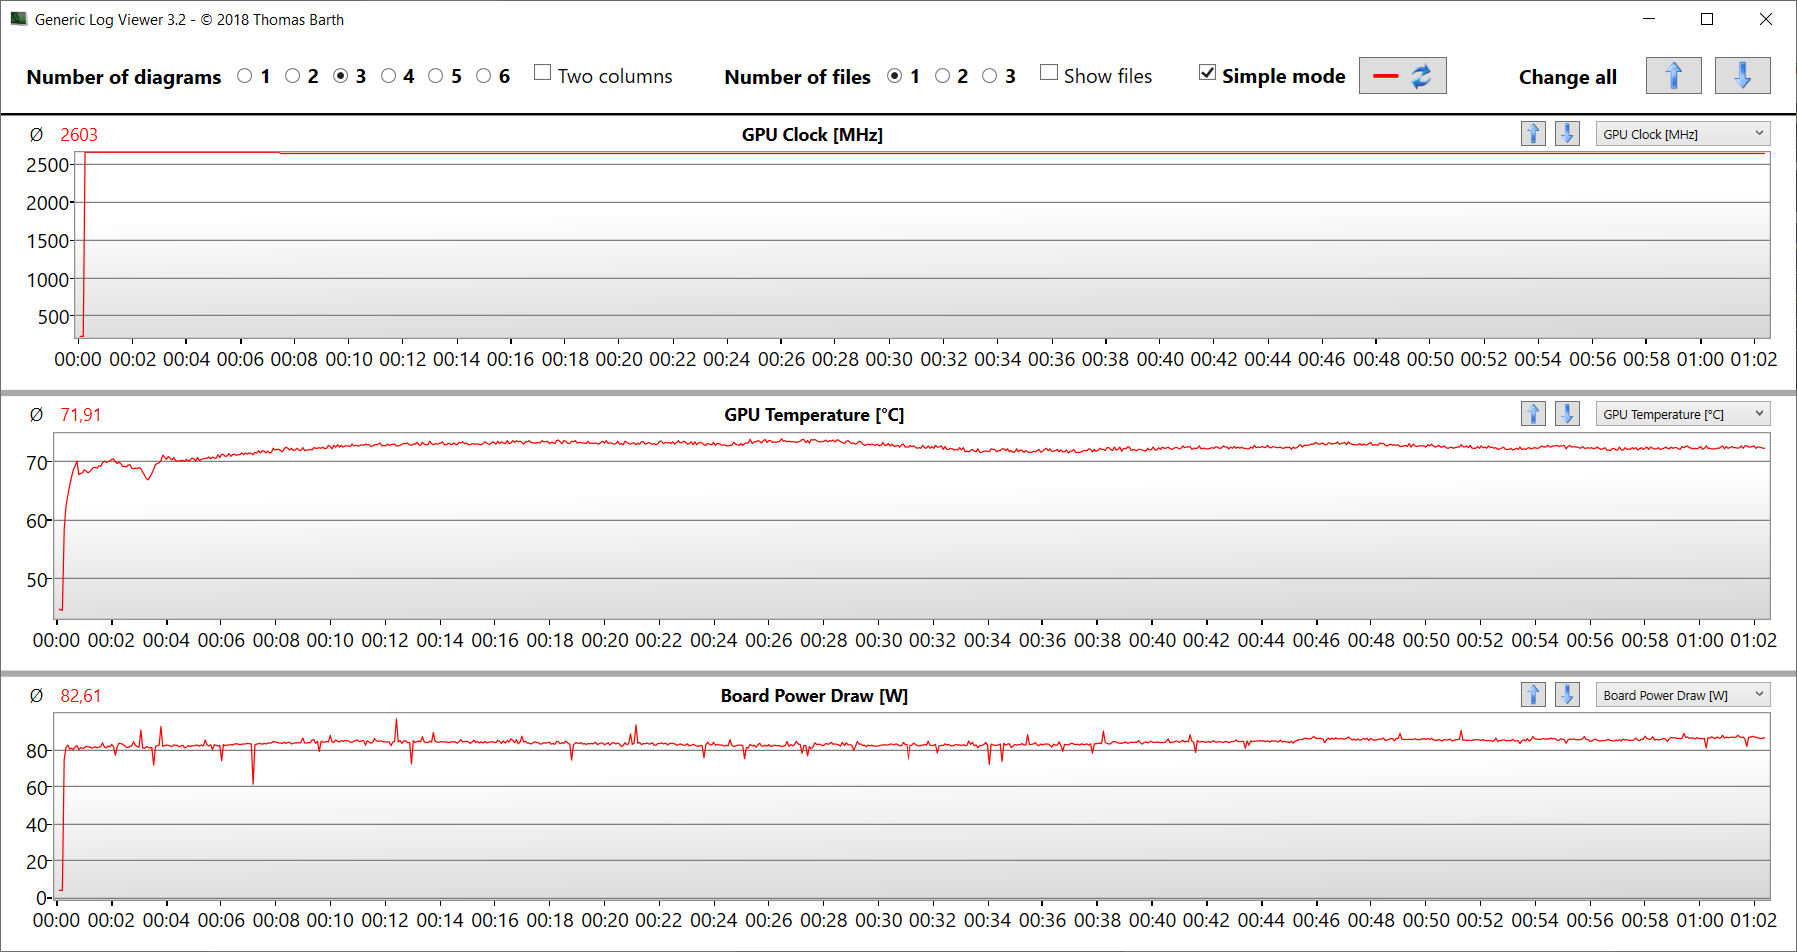
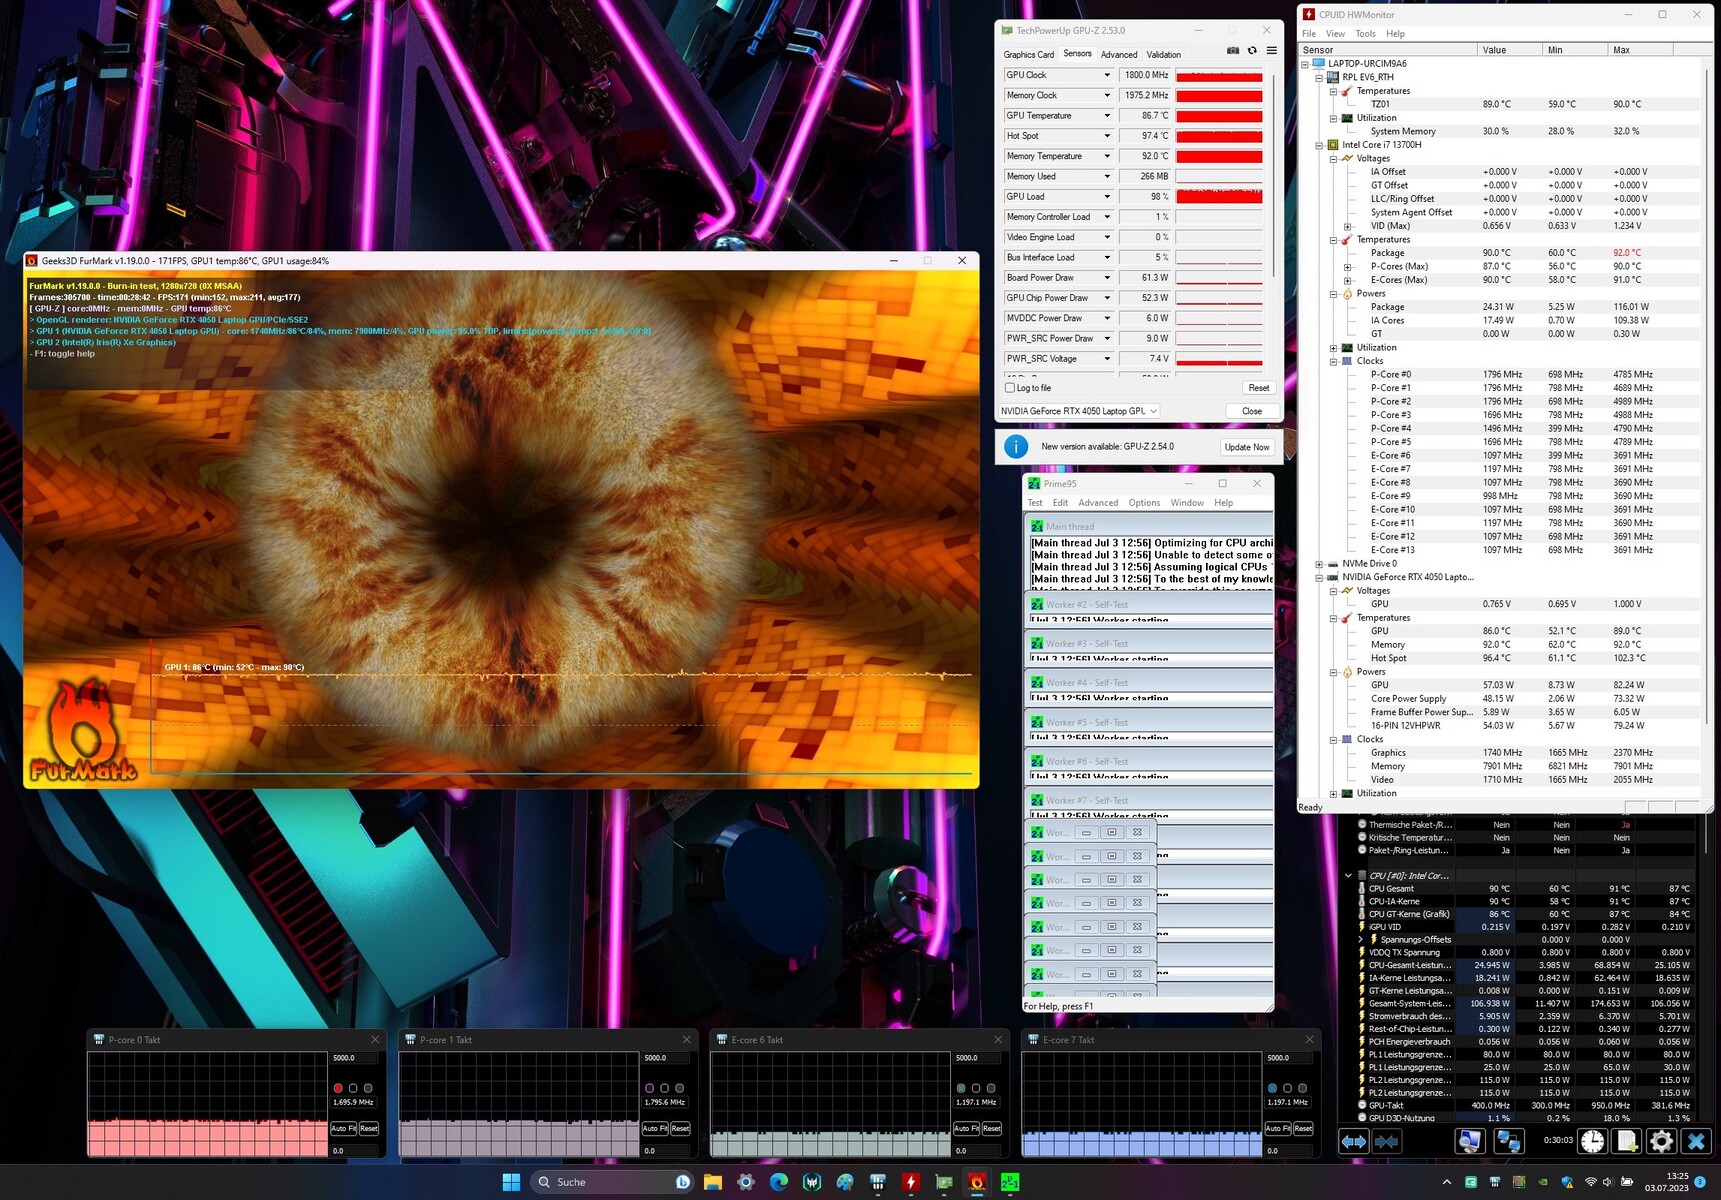
Prueba de esfuerzo
La prueba de estrés (Prime95 y Furmark en funcionamiento continuo) es un escenario extremo que examina la estabilidad del sistema a plena carga. La velocidad de reloj de la CPU cae inicialmente de 4,4 a 4,5 GHz (P) y 3,1 GHz (E) y luego gradualmente de 2,1 a 2,2 GHz (P) y 1,3 GHz (E). La velocidad de reloj de la GPU se estabiliza en 1.750 a 1.800 MHz.
Altavoces
Los altavoces estéreo producen un sonido decente que carece de graves. Se podría conseguir una mejor experiencia de audio usando auriculares o un altavoz externo.
Acer Predator Triton 14 PT14-51 análisis de audio
(±) | la sonoridad del altavoz es media pero buena (80 dB)
Graves 100 - 315 Hz
(-) | casi sin bajos - de media 18% inferior a la mediana
(±) | la linealidad de los graves es media (11.8% delta a frecuencia anterior)
Medios 400 - 2000 Hz
(+) | medios equilibrados - a sólo 3.7% de la mediana
(+) | los medios son lineales (4% delta a la frecuencia anterior)
Altos 2 - 16 kHz
(+) | máximos equilibrados - a sólo 2.9% de la mediana
(±) | la linealidad de los máximos es media (7.2% delta a frecuencia anterior)
Total 100 - 16.000 Hz
(±) | la linealidad del sonido global es media (15.4% de diferencia con la mediana)
En comparación con la misma clase
» 34% de todos los dispositivos probados de esta clase eran mejores, 7% similares, 59% peores
» El mejor tuvo un delta de 6%, la media fue 18%, el peor fue ###max##%
En comparación con todos los dispositivos probados
» 23% de todos los dispositivos probados eran mejores, 4% similares, 73% peores
» El mejor tuvo un delta de 4%, la media fue 23%, el peor fue ###max##%
Razer Blade 14 RTX 4070 análisis de audio
(+) | los altavoces pueden reproducir a un volumen relativamente alto (#82.7 dB)
Graves 100 - 315 Hz
(-) | casi sin bajos - de media 15.9% inferior a la mediana
(±) | la linealidad de los graves es media (12.3% delta a frecuencia anterior)
Medios 400 - 2000 Hz
(+) | medios equilibrados - a sólo 4.3% de la mediana
(+) | los medios son lineales (3.1% delta a la frecuencia anterior)
Altos 2 - 16 kHz
(±) | máximos más altos - de media 6.2% más altos que la mediana
(+) | los máximos son lineales (5.5% delta a la frecuencia anterior)
Total 100 - 16.000 Hz
(±) | la linealidad del sonido global es media (16.7% de diferencia con la mediana)
En comparación con la misma clase
» 43% de todos los dispositivos probados de esta clase eran mejores, 10% similares, 47% peores
» El mejor tuvo un delta de 6%, la media fue 18%, el peor fue ###max##%
En comparación con todos los dispositivos probados
» 29% de todos los dispositivos probados eran mejores, 7% similares, 64% peores
» El mejor tuvo un delta de 4%, la media fue 23%, el peor fue ###max##%
Gestión de la energía - El ordenador Acer alcanza niveles de resistencia decentes
Consumo de energía
No se puede decir nada anormal respecto al consumo de energía del ordenador. Los resultados se encuentran en un rango normal para el hardware instalado. Las pruebas de estrés y Witcher 3 se ejecutaron con un consumo de energía constante o decreciente. La fuente de alimentación (230 vatios) tiene un tamaño más que adecuado.
| Off / Standby | |
| Ocioso | |
| Carga |
|
Clave:
min: | |
| Acer Predator Triton 14 PT14-51 i7-13700H, GeForce RTX 4050 Laptop GPU | Razer Blade 14 RTX 4070 R9 7940HS, GeForce RTX 4070 Laptop GPU | Asus ROG Zephyrus G14 GA402RJ R7 6800HS, Radeon RX 6700S | MSI Stealth 14 Studio A13V i7-13700H, GeForce RTX 4050 Laptop GPU | Gigabyte Aero 14 OLED BMF i7-13700H, GeForce RTX 4050 Laptop GPU | Apple MacBook Pro 14 2023 M2 Pro Entry M2 Pro 10-Core, M2 Pro 16-Core GPU | Medio NVIDIA GeForce RTX 4050 Laptop GPU | Media de la clase Gaming | |
|---|---|---|---|---|---|---|---|---|
| Power Consumption | -30% | -10% | -4% | 40% | 52% | 9% | -17% | |
| Idle Minimum * (Watt) | 12 | 19.5 -63% | 12 -0% | 10.4 13% | 7.4 38% | 2.5 79% | 9.95 ? 17% | 13 ? -8% |
| Idle Average * (Watt) | 14 | 24.7 -76% | 18 -29% | 19.1 -36% | 8.3 41% | 12.1 14% | 15.8 ? -13% | 19 ? -36% |
| Idle Maximum * (Watt) | 26 | 27 -4% | 26 -0% | 19.4 25% | 8.7 67% | 12.3 53% | 20.1 ? 23% | 24.5 ? 6% |
| Load Average * (Watt) | 88 | 83.2 5% | 88 -0% | 95.9 -9% | 76 14% | 49.8 43% | 88 ? -0% | 111.1 ? -26% |
| Witcher 3 ultra * (Watt) | 114.9 | 165.8 -44% | 157.7 -37% | 141.6 -23% | 70 39% | 46.6 59% | ||
| Load Maximum * (Watt) | 213 | 204.5 4% | 194 9% | 203 5% | 132 38% | 71.4 66% | 176.3 ? 17% | 260 ? -22% |
* ... más pequeño es mejor
Power consumption Witcher 3 / stress test
Power consumption with an external monitor
Duración de la batería
En la prueba Wi-Fi (carga de sitios web con ayuda de un guión) y la prueba de vídeo (el corto Big Buck Bunny (codificación H.264, FHD) en bucle), el dispositivo de 14 pulgadas logró duraciones de 5 horas y 2 minutos y 8 horas y 59 minutos, respectivamente. Durante ambas pruebas, se desactivaron las funciones de ahorro de energía del portátil y se ajustó el brillo de la pantalla a unos 150 cd/m². Además, la prueba de vídeo se realizó con el módulo de radio apagado.
| Acer Predator Triton 14 PT14-51 i7-13700H, GeForce RTX 4050 Laptop GPU, 76.3 Wh | Razer Blade 14 RTX 4070 R9 7940HS, GeForce RTX 4070 Laptop GPU, 68 Wh | Asus ROG Zephyrus G14 GA402RJ R7 6800HS, Radeon RX 6700S, 76 Wh | MSI Stealth 14 Studio A13V i7-13700H, GeForce RTX 4050 Laptop GPU, 72 Wh | Gigabyte Aero 14 OLED BMF i7-13700H, GeForce RTX 4050 Laptop GPU, 63 Wh | Apple MacBook Pro 14 2023 M2 Pro Entry M2 Pro 10-Core, M2 Pro 16-Core GPU, 70 Wh | Media de la clase Gaming | |
|---|---|---|---|---|---|---|---|
| Duración de Batería | -14% | 104% | -11% | 12% | 120% | -2% | |
| Reader / Idle (h) | 11.2 | 8.6 -23% | 11.3 1% | 8.27 ? -26% | |||
| H.264 (h) | 9 | 6.6 -27% | 16.4 82% | 8.32 ? -8% | |||
| WiFi v1.3 (h) | 5 | 6.2 24% | 10.2 104% | 6.3 26% | 7.6 52% | 12.9 158% | 7.11 ? 42% |
| Load (h) | 1.8 | 1 -44% | 1.2 -33% | 1.5 -17% | 1.502 ? -17% |
Pro
Contra
Veredicto: una potencia compacta
Las principales aplicaciones del portátil de 14 pulgadas deberían estar en las áreas de renderizado y juegos. El Core i7-13700H y el GeForce RTX 4050 proporcionan la potencia necesaria con ambos chips funcionando a una velocidad de reloj constantemente alta. Si se necesita más potencia gráfica, Acer también ofrece variantes de GeForce RTX 4070.
Una tonelada de potencia de cálculo en un chasis de 14 pulgadas: Con el Predator Triton 14, Acer ha entregado un portátil potente.
El portátil se calienta notablemente y puede producir una cantidad considerable de ruido. Usamos principalmente el modo de sistema "Equilibrado" y aseguró sólo un ruido de fondo moderado con una pérdida de rendimiento relativamente pequeña.
En general, el display 16:10 (2,560 x 1,600 pixels, IPS, 165 Hz, G-Sync) es impresionante. Destacan su alto brillo y la cobertura DCI P3. A ello se añade una autonomía real de 5 a 9 horas. Ventajas: La batería se puede cargar con el adaptador de corriente USB-C (mín. 65 vatios, 20 V). Es compatible con Power Delivery. Esto significa que no tienes que ir acompañado de la fuente de alimentación propietaria (230 vatios) allá donde vayas.
Los puntos débiles del Predator residen principalmente en su almacenamiento: Una escasa capacidad SSD (512 GB), sin espacio para SSDs adicionales, RAM soldada sin posibilidades de expansión y un lector de tarjetas de memoria muy lento. En definitiva, se debería esperar más de un portátil de esta categoría de precio.
Una alternativa podría ser elMSI Stealth 14 Studio A13V. Está equipado con la misma CPU y GPU, ofrece un poco más de potencia que el Predator y gana puntos extra por sus dos bancos de RAM. Sin embargo, con un precio que ronda los 2.000 dólares, no es uno de los dispositivos más baratos.
Precio y disponibilidad
La variante con especificaciones de revisión del portátil de Acer puede adquirirse actualmente en Amazon por 1.440 dólares.
Acer Predator Triton 14 PT14-51
- 07/24/2023 v7 (old)
Sascha Mölck
Transparencia
La selección de los dispositivos que se van a reseñar corre a cargo de nuestro equipo editorial. La muestra de prueba fue proporcionada al autor en calidad de préstamo por el fabricante o el minorista a los efectos de esta reseña. El prestamista no tuvo ninguna influencia en esta reseña, ni el fabricante recibió una copia de la misma antes de su publicación. No había ninguna obligación de publicar esta reseña. Como empresa de medios independiente, Notebookcheck no está sujeta a la autoridad de fabricantes, minoristas o editores.
Así es como prueba Notebookcheck
Cada año, Notebookcheck revisa de forma independiente cientos de portátiles y smartphones utilizando procedimientos estandarizados para asegurar que todos los resultados son comparables. Hemos desarrollado continuamente nuestros métodos de prueba durante unos 20 años y hemos establecido los estándares de la industria en el proceso. En nuestros laboratorios de pruebas, técnicos y editores experimentados utilizan equipos de medición de alta calidad. Estas pruebas implican un proceso de validación en varias fases. Nuestro complejo sistema de clasificación se basa en cientos de mediciones y puntos de referencia bien fundamentados, lo que mantiene la objetividad.Price comparison

