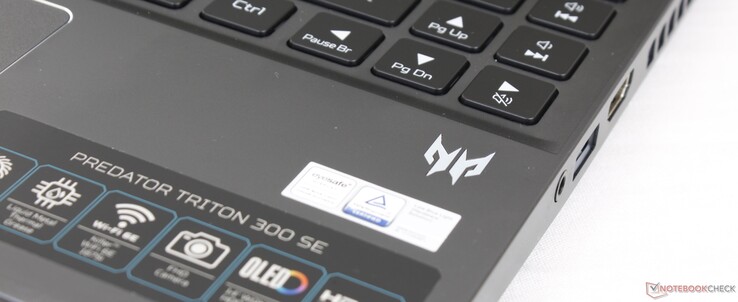
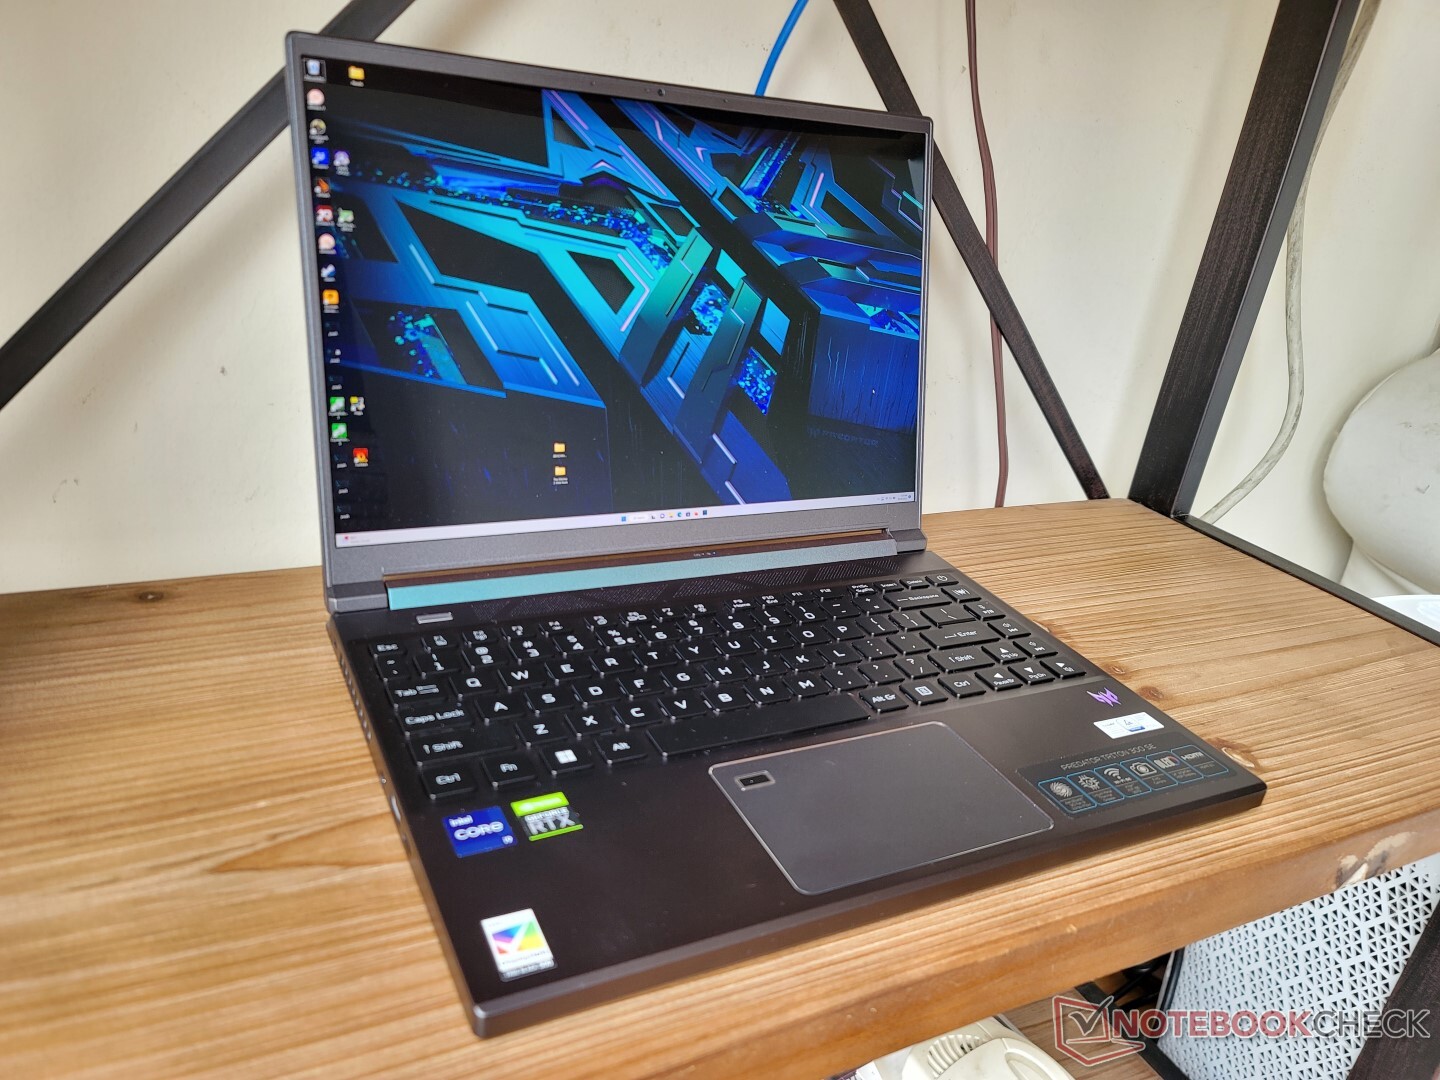
Análisis del Acer Predator Triton 300 SE PT314: Refrigeración por metal líquido para un portátil de 14 pulgadas
Han pasado dos años desde que el último análisis del Predator Triton 300. Este último modelo, llamado Predator Triton 300 SE, utiliza las nuevas CPUs Core de la serie H de 12ª generación y las GPU Nvidia Ampere RTX junto con un diseño de chasis más pequeño de 14 pulgadas. Compite así con algunos de los portátiles para juegos más pequeños del mercado, como el Razer Blade 14, Asus Zephyrus G14y el Alienware x14.
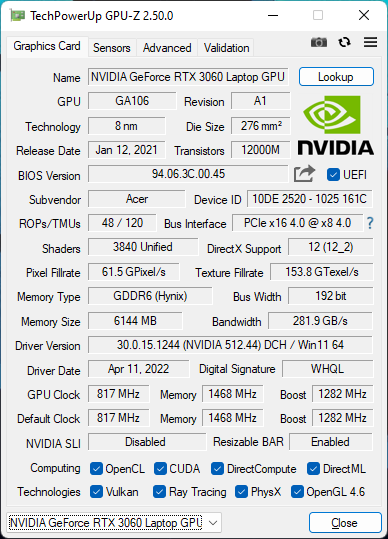
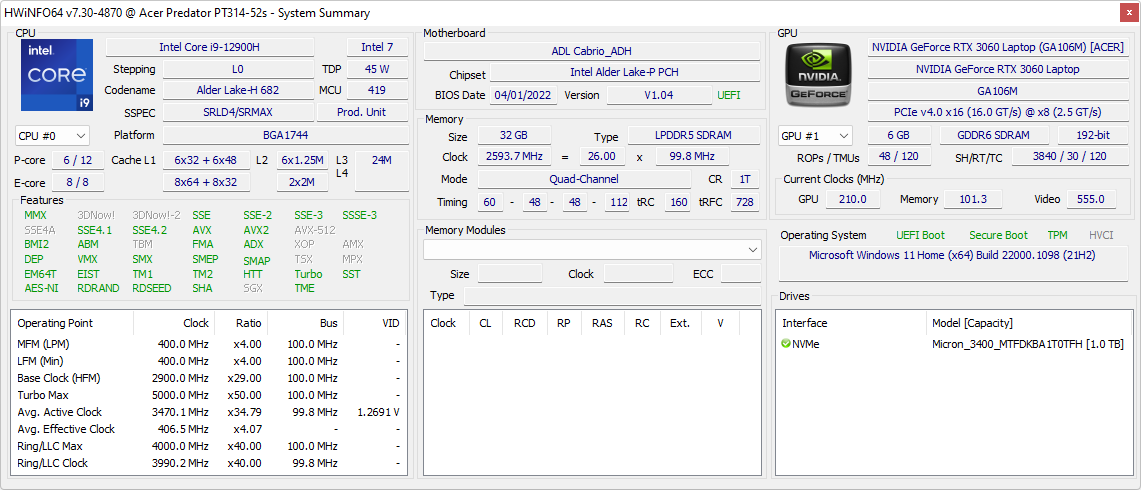
Nuestra unidad de revisión es una SKU de gama alta con la CPU Core i9-12900H y pantalla OLED de 90 Hz 1800p por aproximadamente $1950 USD. Hay otra configuración disponible con la CPU Core i7-12700H, pantalla IPS de 165 Hz 1200p, y la mitad de RAM y almacenamiento por cientos de dólares menos. Por lo demás, todas las opciones vienen con la misma GPU GeForce RTX 3060 de 95 W
Hay una versión más grande de 16 pulgadas que comparte el mismo nombre Predator Triton 300 SE pero con un número de modelo diferente (PT316 frente a PT314)
Más análisis de Acer:
Posibles contendientes en la comparación
Valoración | Fecha | Modelo | Peso | Altura | Tamaño | Resolución | Precio |
|---|---|---|---|---|---|---|---|
| 86 % v7 (old) | 11/2022 | Acer Predator Triton 300 SE i9-12900H, GeForce RTX 3060 Laptop GPU | 1.7 kg | 19.8 mm | 14.00" | 2880x1800 | |
| 86.4 % v7 (old) | 10/2022 | Asus ROG Zephyrus G14 GA402RJ R7 6800HS, Radeon RX 6700S | 1.7 kg | 19.5 mm | 14.00" | 2560x1600 | |
| 89.4 % v7 (old) | 05/2022 | Razer Blade 14 Ryzen 9 6900HX R9 6900HX, GeForce RTX 3070 Ti Laptop GPU | 1.8 kg | 16.8 mm | 14.00" | 2560x1440 | |
| 86.7 % v7 (old) | 03/2022 | Alienware x14 i7 RTX 3060 i7-12700H, GeForce RTX 3060 Laptop GPU | 1.8 kg | 14.5 mm | 14.00" | 1920x1080 | |
| 87.2 % v7 (old) | 09/2022 | Dell Inspiron 14 Plus 7420 i7-12700H, GeForce RTX 3050 4GB Laptop GPU | 1.7 kg | 18.87 mm | 14.00" | 2240x1400 | |
| 87.7 % v7 (old) | 01/2022 | Schenker Vision 14 i7-11370H, GeForce RTX 3050 Ti Laptop GPU | 1.1 kg | 15.6 mm | 14.00" | 2880x1800 |
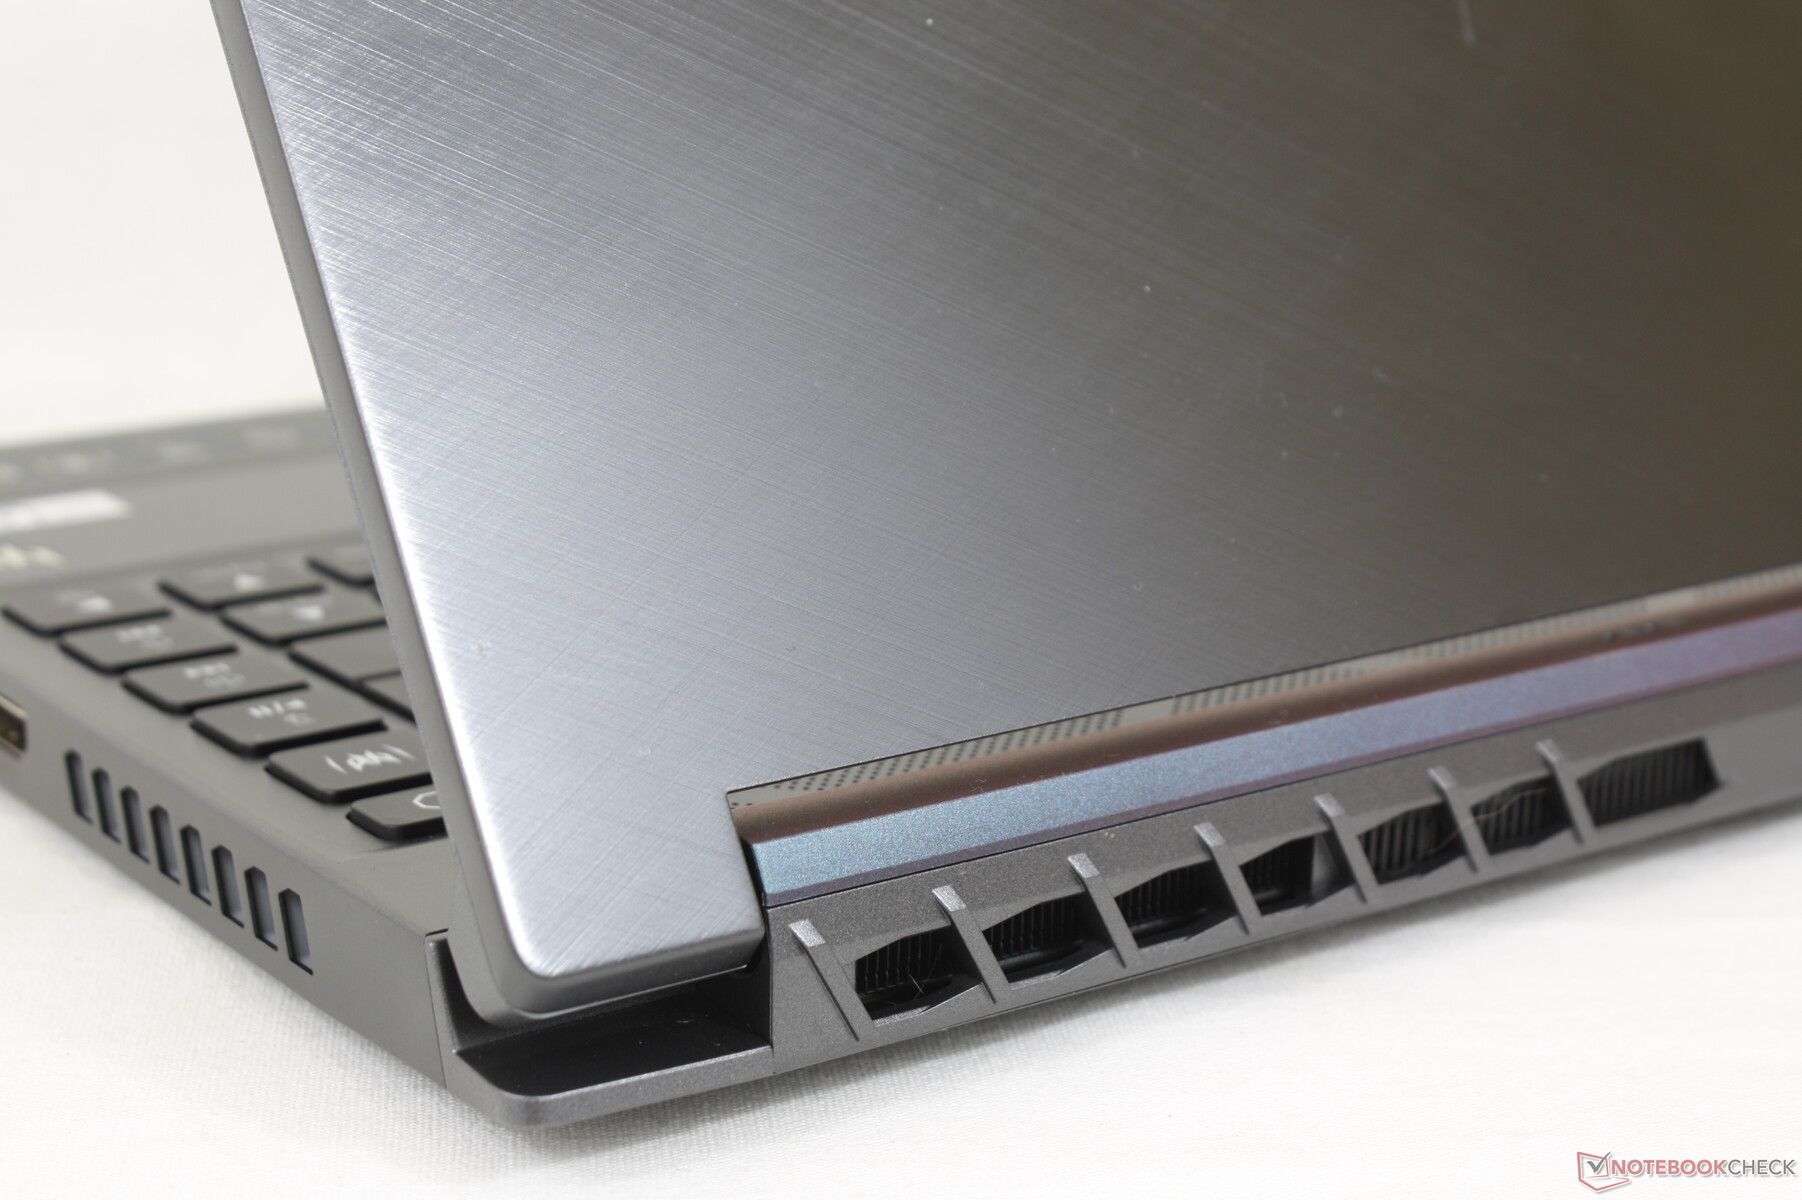
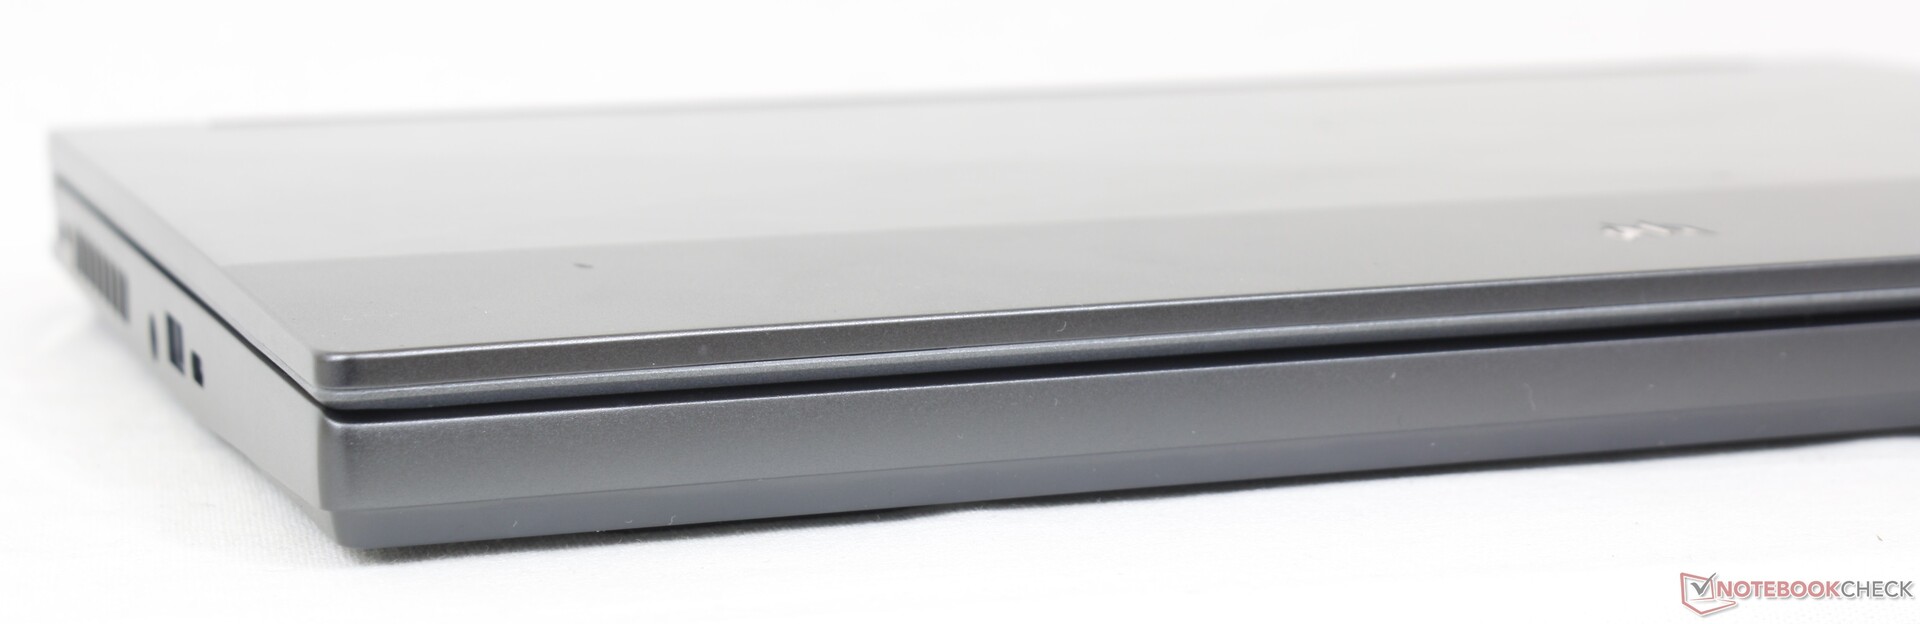
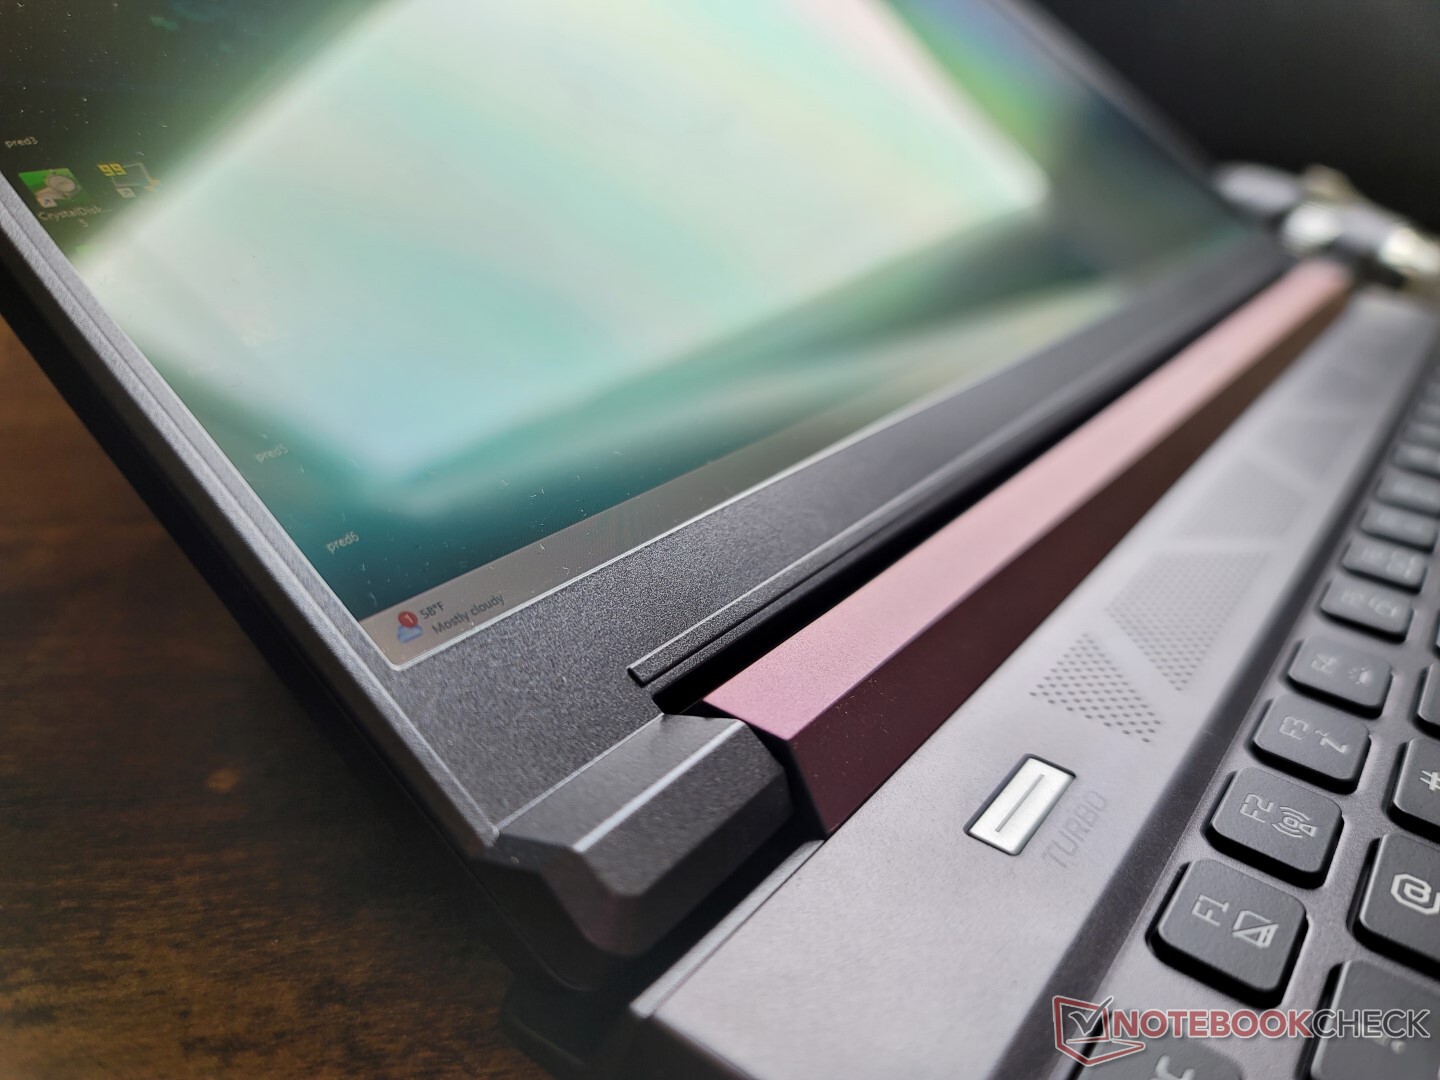
Caja - De tamaño similar al Zephyrus G14
La base metálica es resistente, con mínimos signos de torsión o deformación y sin crujidos al aplicar presión a lo largo del centro del teclado o las esquinas. No es tan rígida como la del Razer Blade 14, pero tampoco parece barata
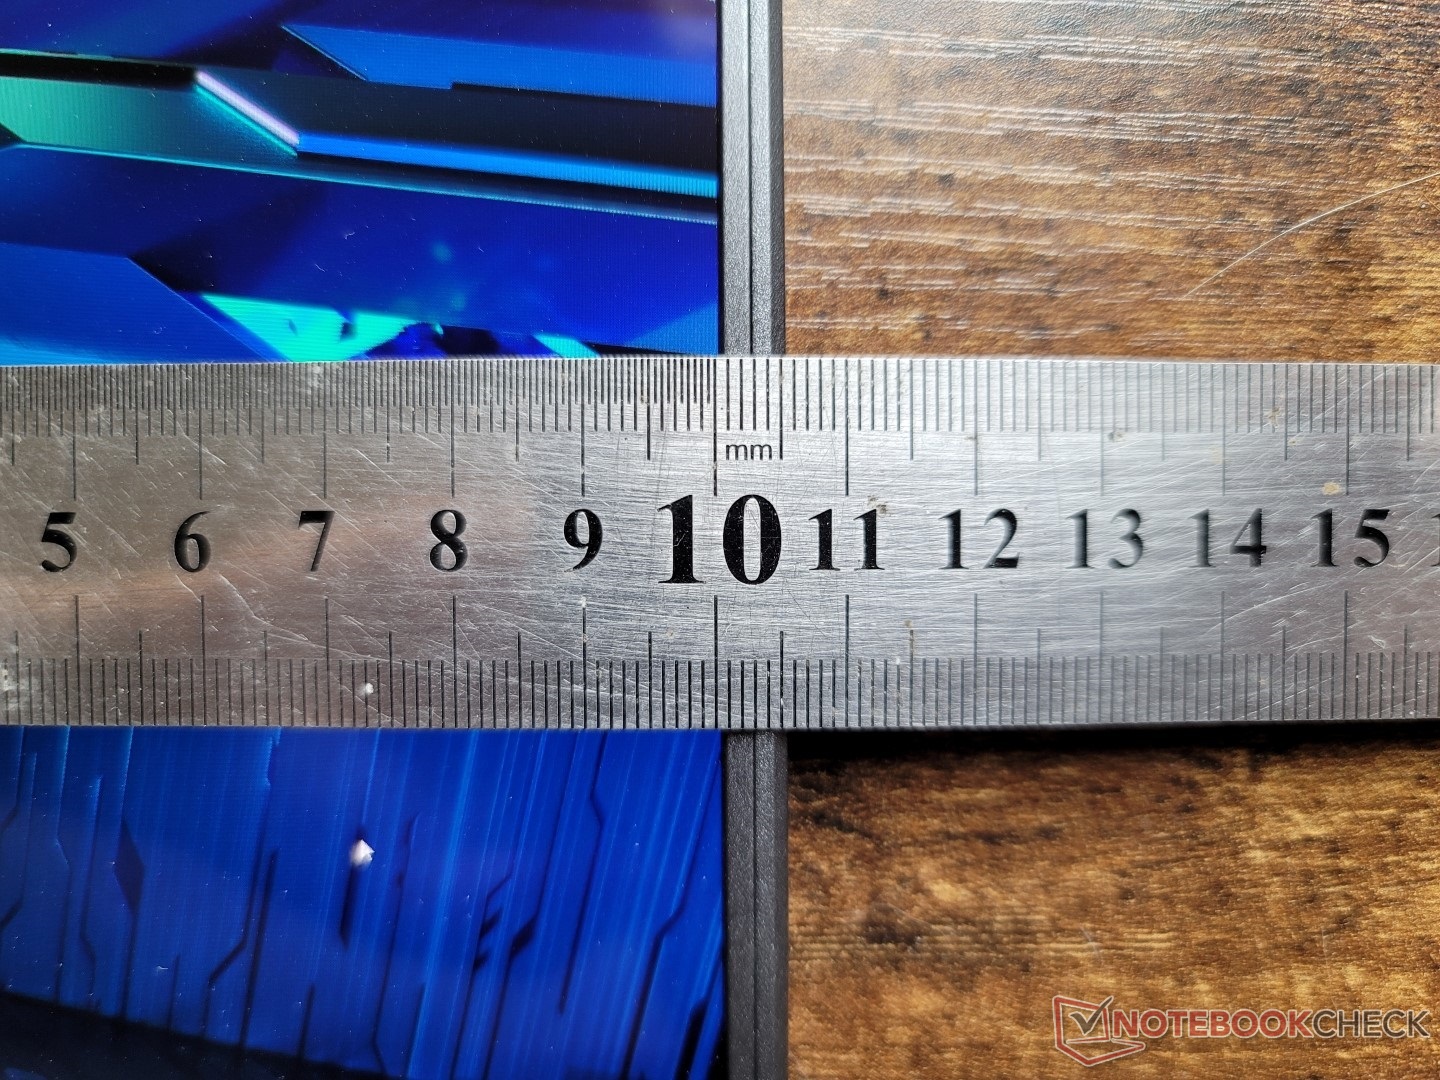
El área más débil del chasis es su pantalla. Aunque esto es común en la mayoría de los portátiles, la pantalla del Acer es particularmente delgada y notablemente más susceptible a la deformación que las pantallas del Zephyrus G14 o Blade 14. Apreciamos que la pantalla pueda abrirse casi en 180 grados a diferencia de los modelos Asus o Razer antes mencionados, pero las bisagras del Acer parecen más débiles y tienen tendencia a tambalearse más en comparación.
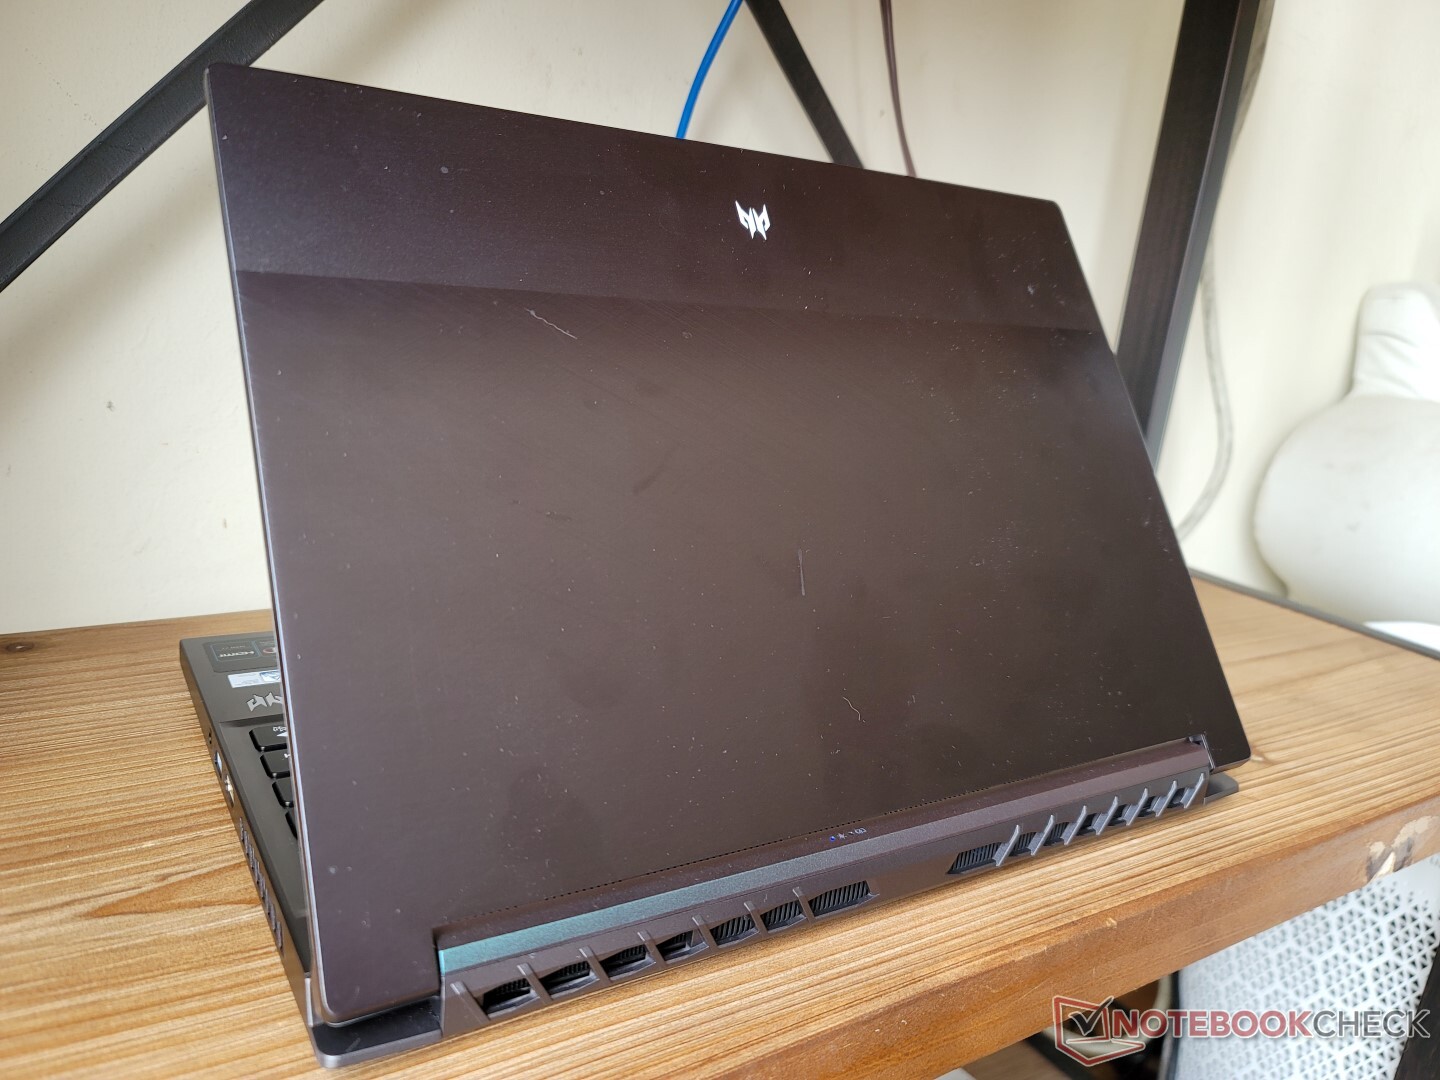
Casualmente, tanto el peso como las dimensiones son casi idénticos a los del Asus Zephyrus G14. El Blade 14 y el Alienware x14 son notablemente más delgados, pero tienen mayores dimensiones para compensar. La mayoría de los Ultrabooks de 14 pulgadas normales, como elSchenker Vision 14 pueden ser significativamente más ligeros en más de medio kilo, pero sin las ventajas de rendimiento.
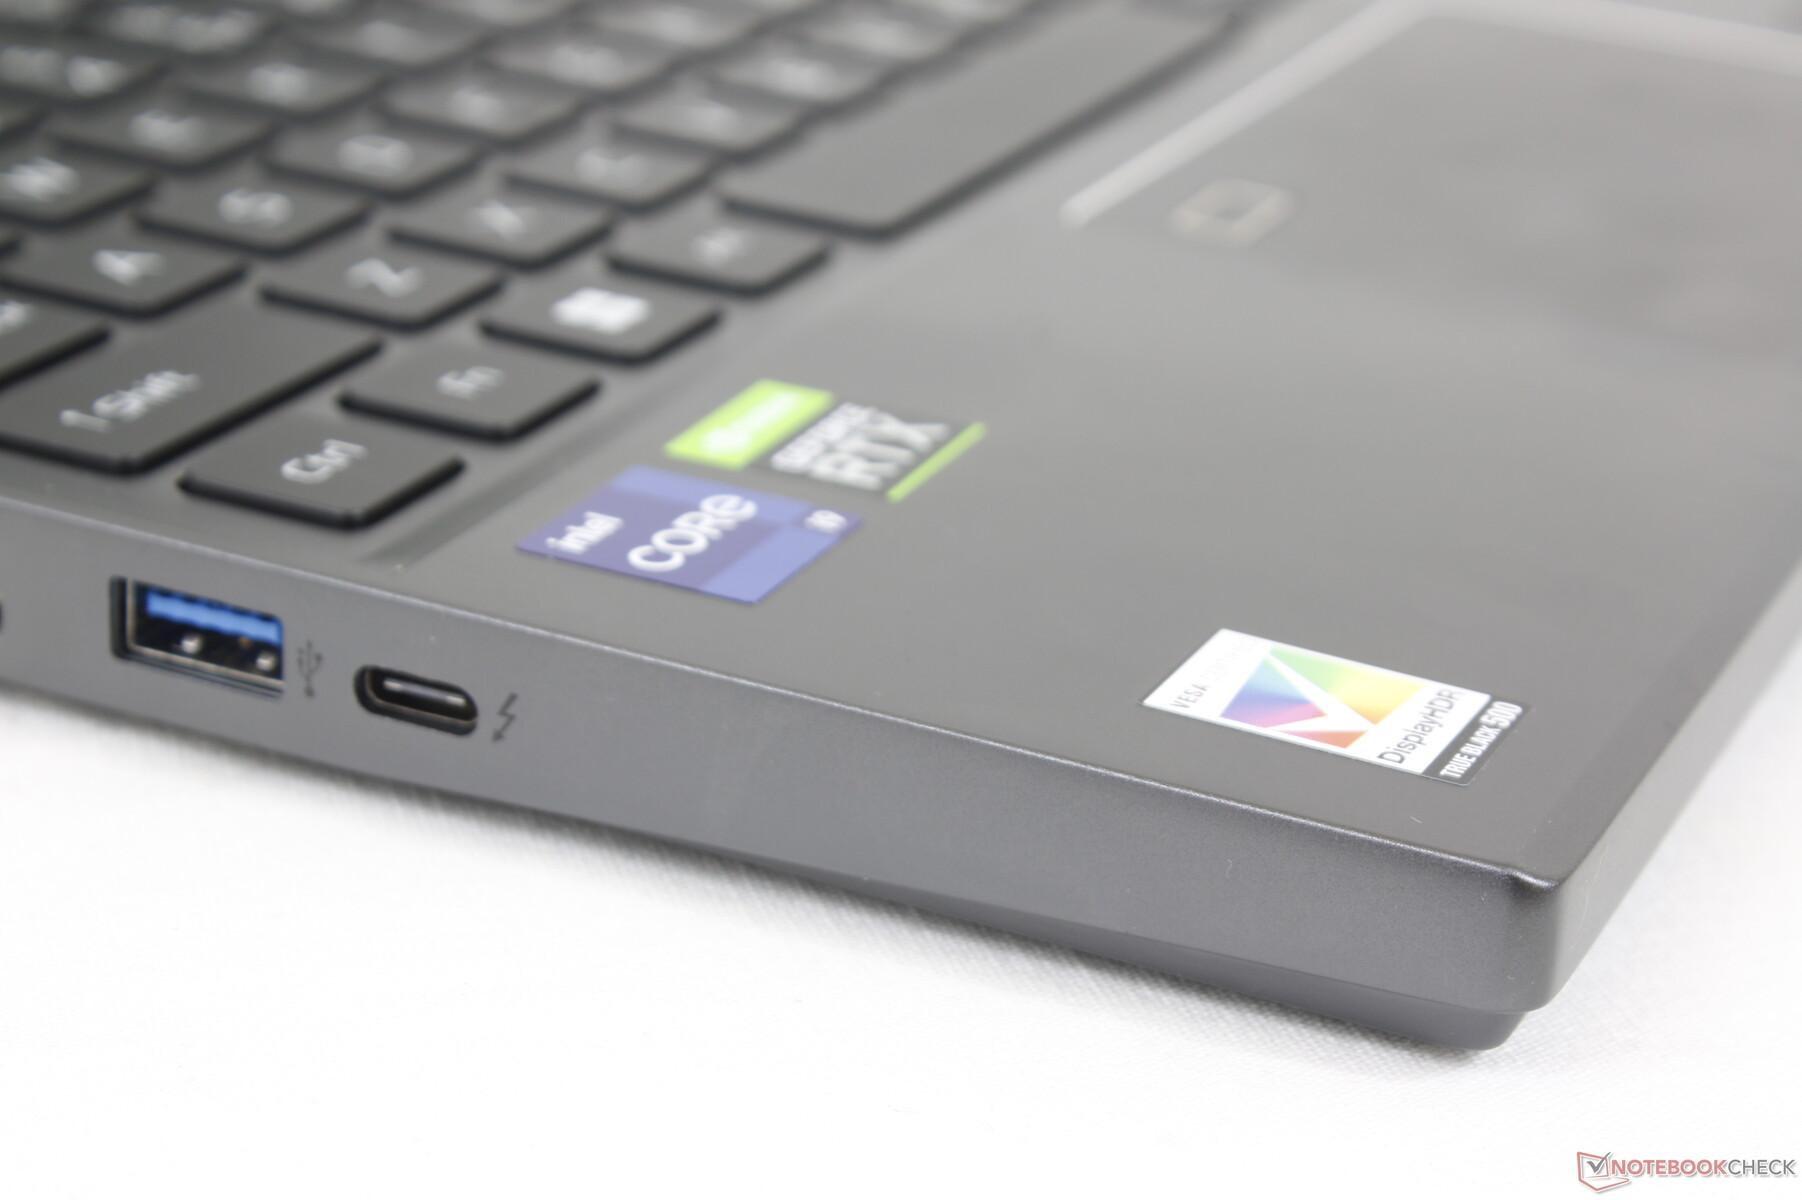
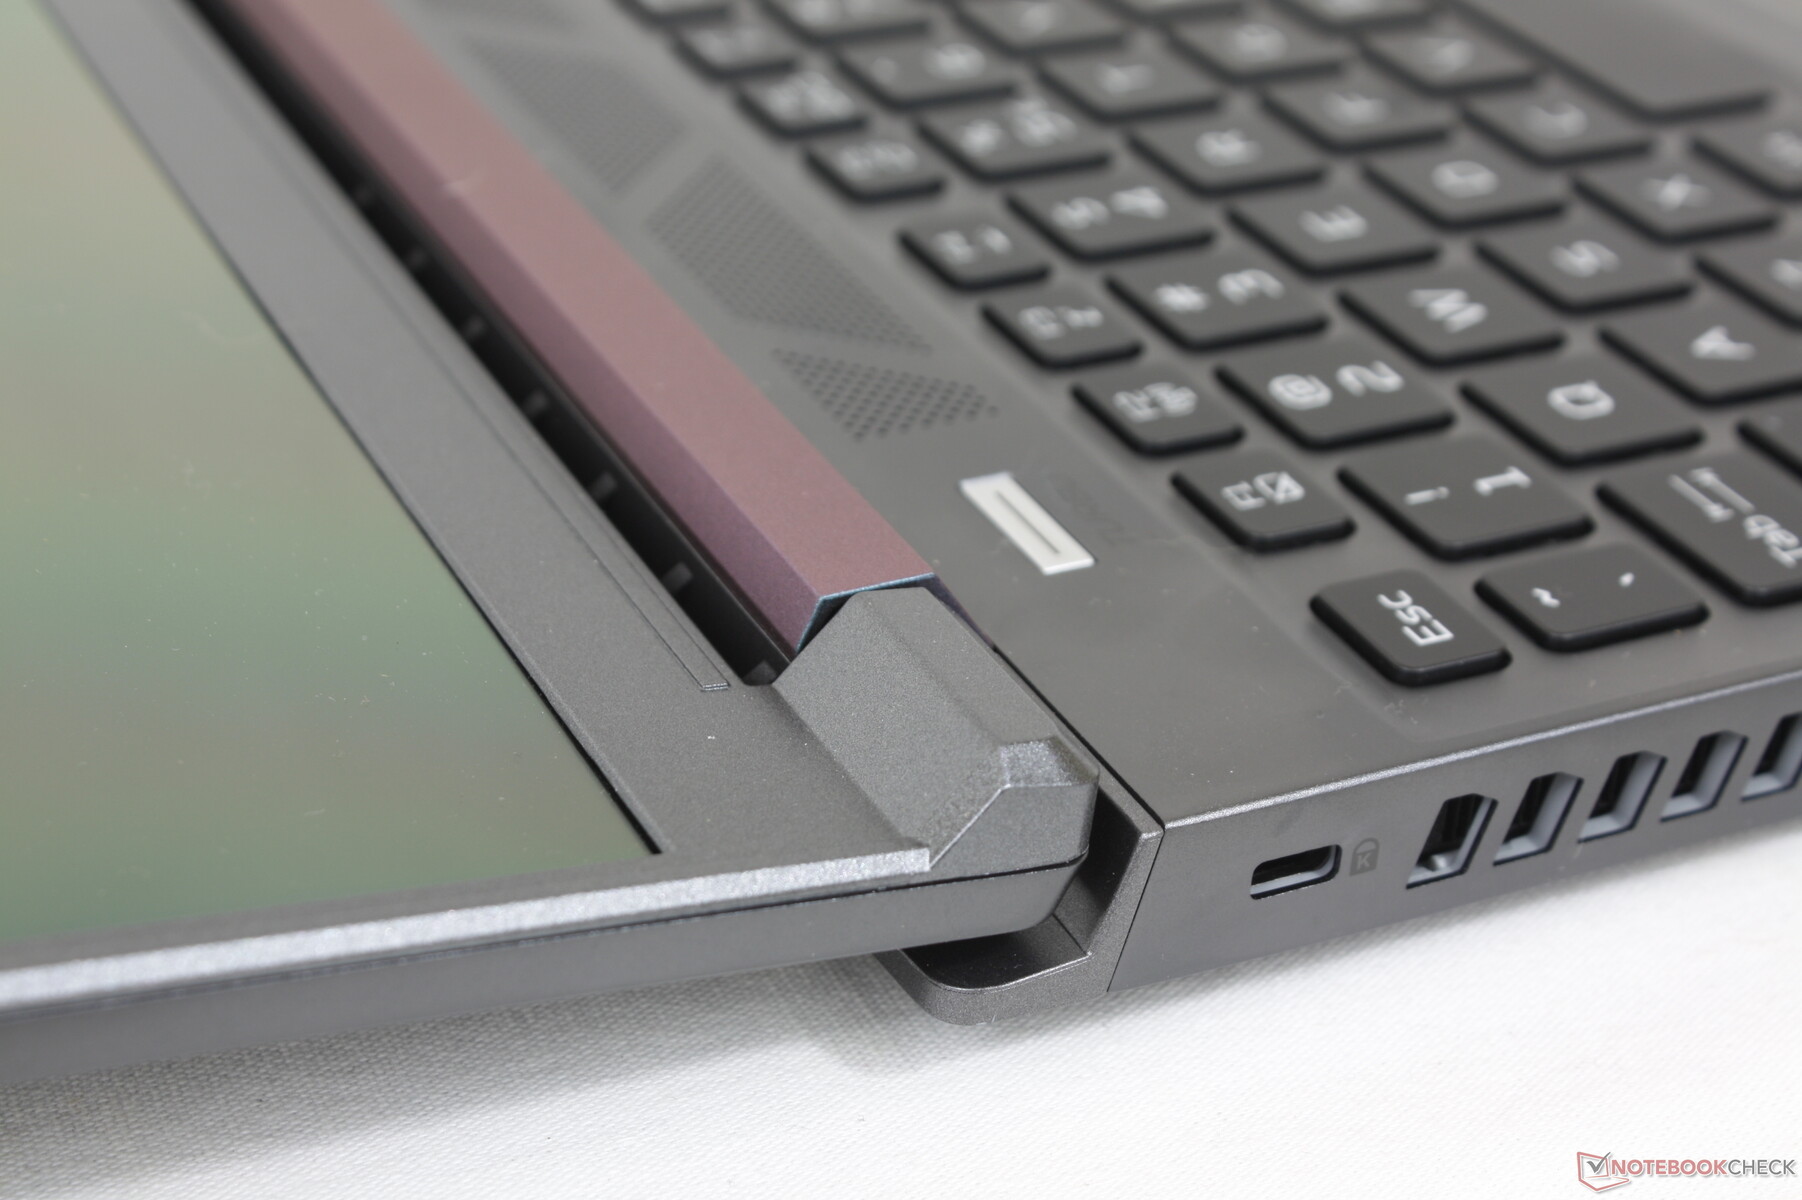
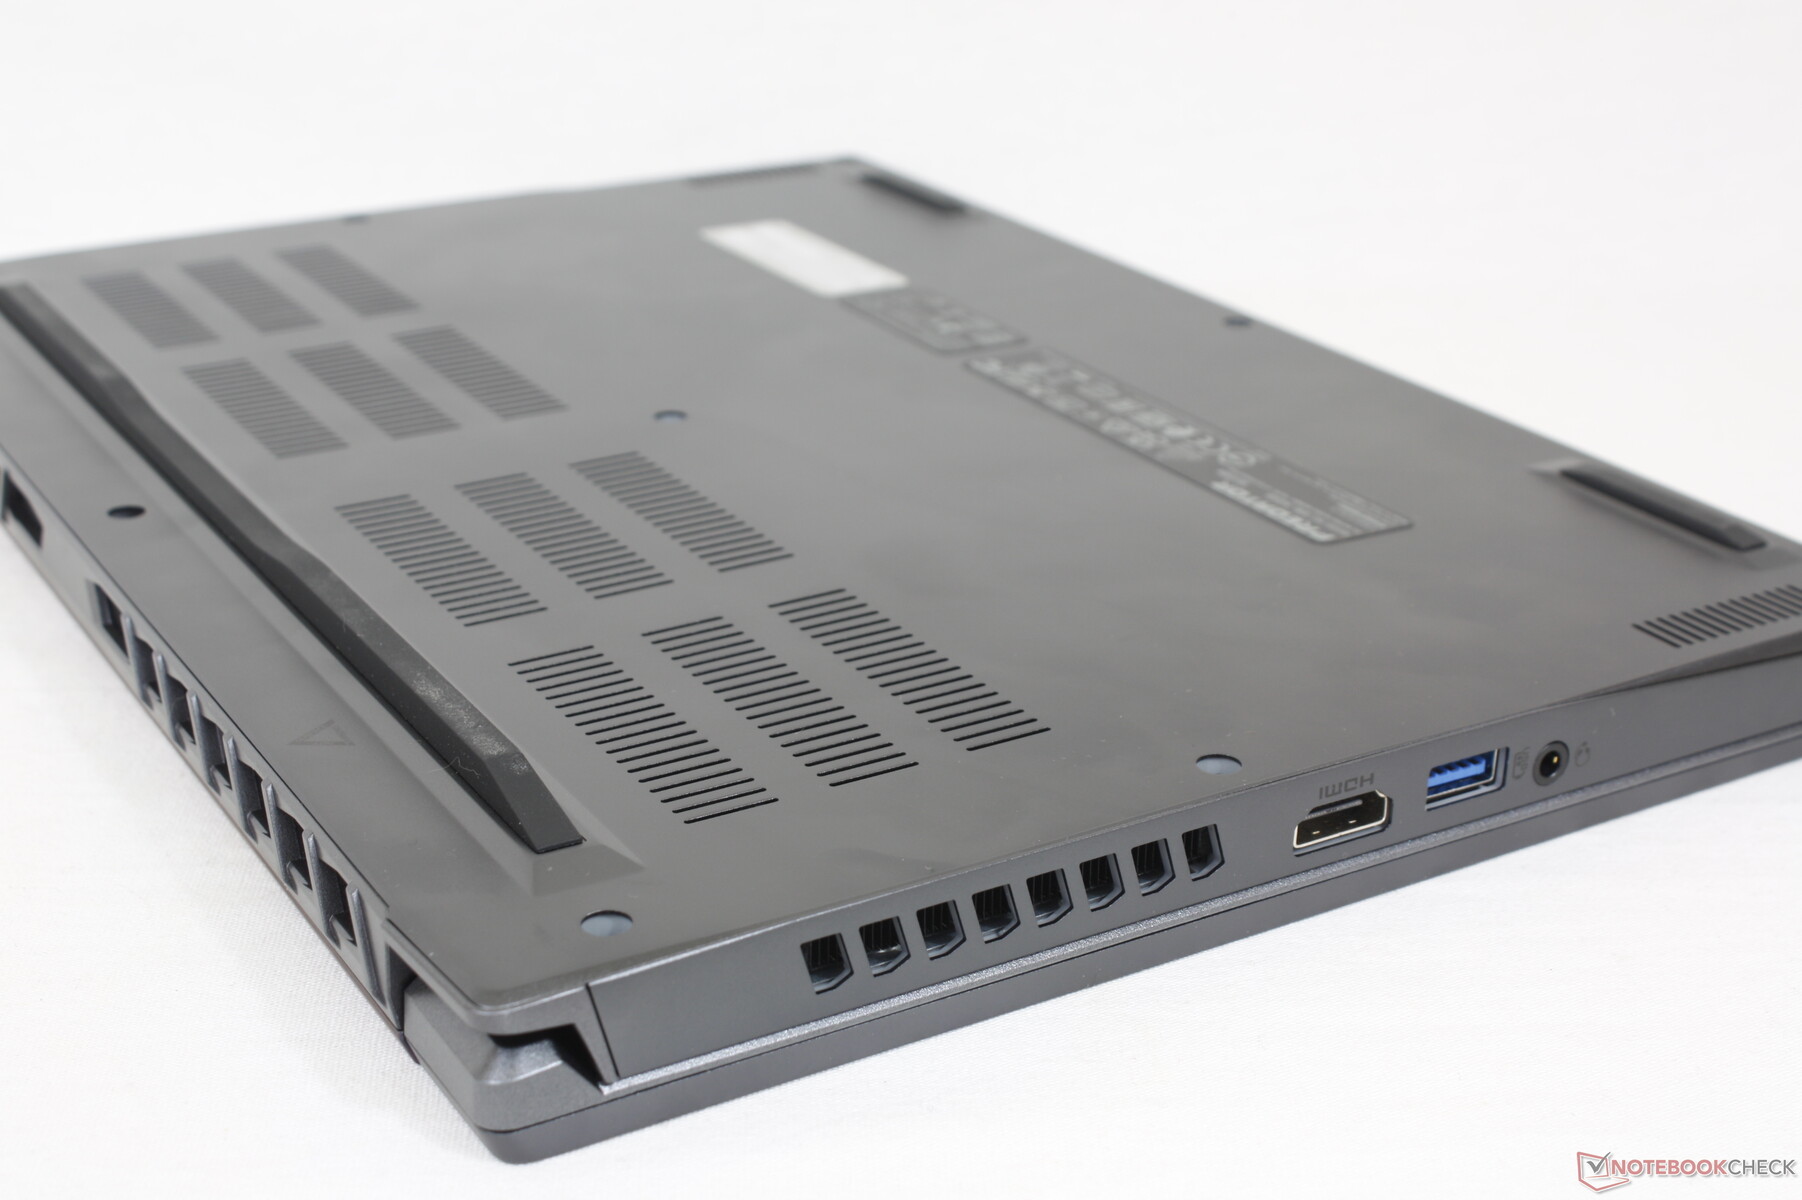
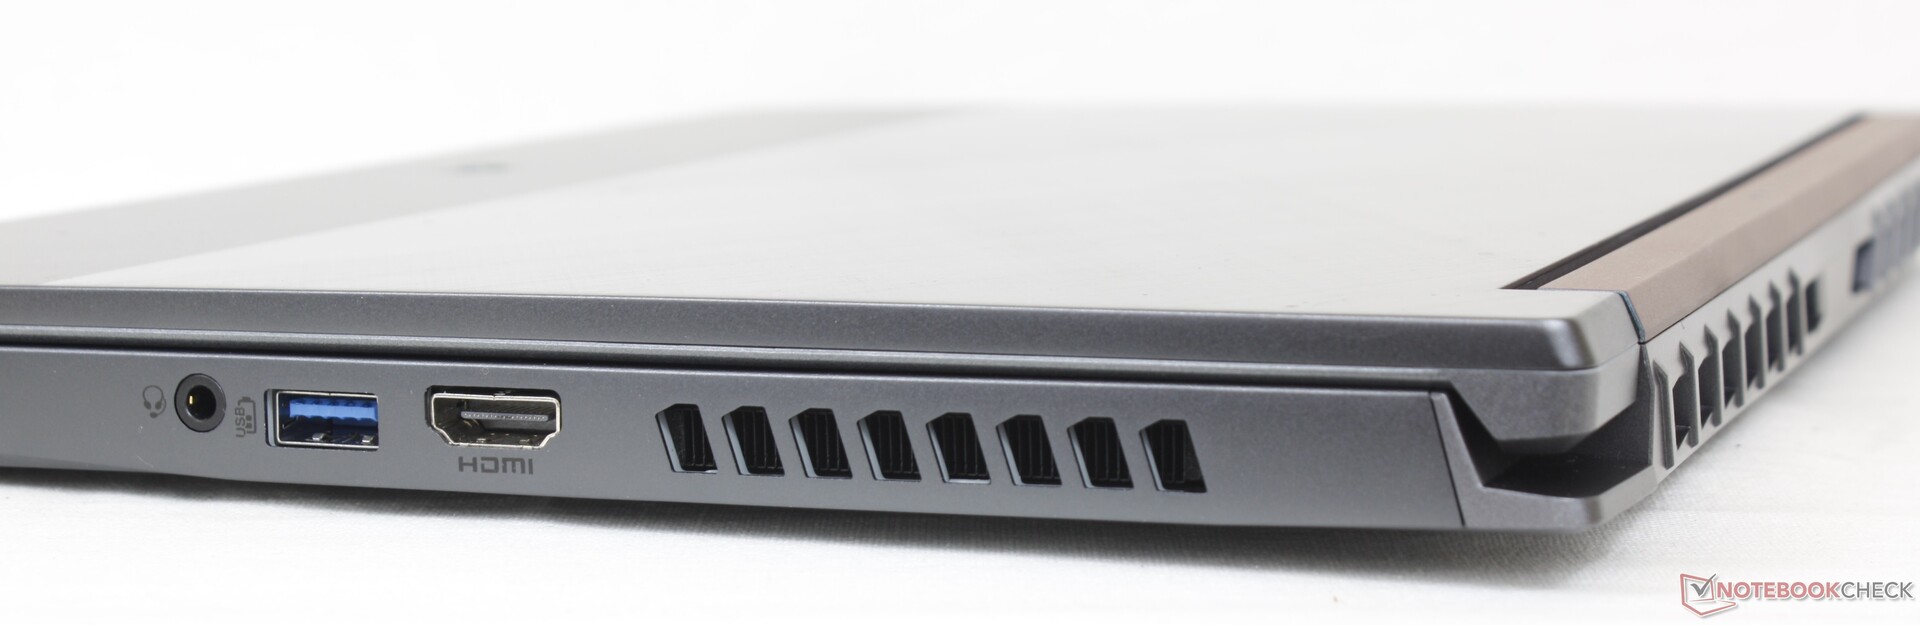
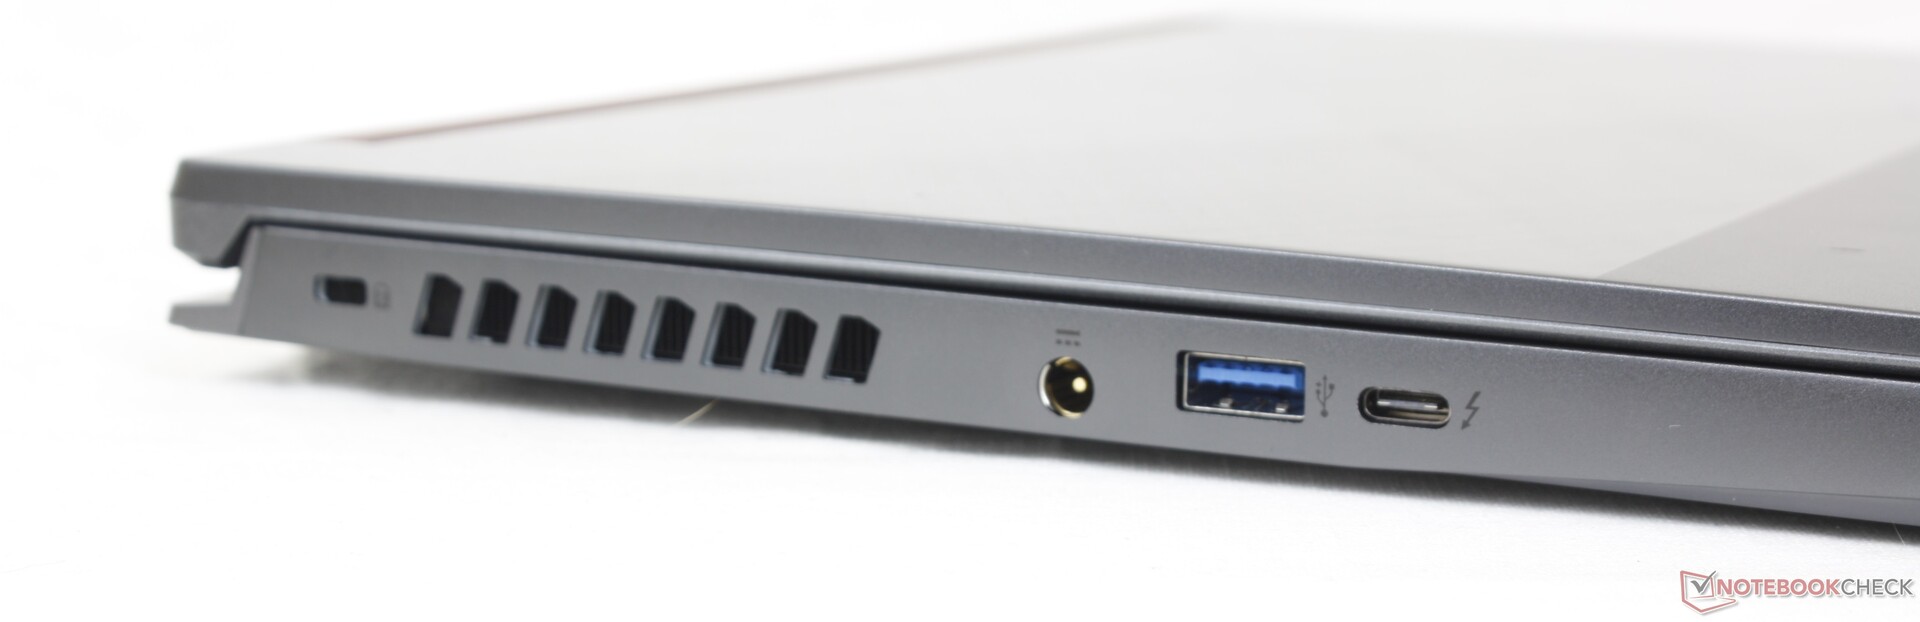
Conectividad - Soporte de Thunderbolt 4
Las opciones de puerto son más limitadas que en el Asus Zephyrus G14 o el Razer Blade 14 ya que cada alternativa integra un puerto USB-C más que nuestro Acer. La posición de los puertos también es algo desfavorable porque los puertos están apretados y relativamente cerca del borde frontal. Está claro que las grandes rejillas de ventilación alrededor del chasis quitan espacio valioso a los puertos.
Comunicación
Un Intel AX1675i viene de serie para la conectividad Wi-Fi 6E y Bluetooth 5.2. Experimentamos velocidades de transferencia rápidas y constantes cuando se emparejó a nuestra red de 6 GHz.
| Networking | |
| iperf3 transmit AX12 | |
| Alienware x14 i7 RTX 3060 | |
| Schenker Vision 14 | |
| Razer Blade 14 Ryzen 9 6900HX | |
| iperf3 receive AX12 | |
| Schenker Vision 14 | |
| Razer Blade 14 Ryzen 9 6900HX | |
| Alienware x14 i7 RTX 3060 | |
| iperf3 receive AXE11000 6GHz | |
| Acer Predator Triton 300 SE | |
| Dell Inspiron 14 Plus 7420 | |
| iperf3 receive AXE11000 | |
| Asus ROG Zephyrus G14 GA402RJ | |
| iperf3 transmit AXE11000 6GHz | |
| Acer Predator Triton 300 SE | |
| Dell Inspiron 14 Plus 7420 | |
Cámara web
Una cámara de 2 MP viene de serie para ser comparable a muchos Ultrabooks de gama media. No hay sensor de infrarrojos o incluso un obturador de privacidad.


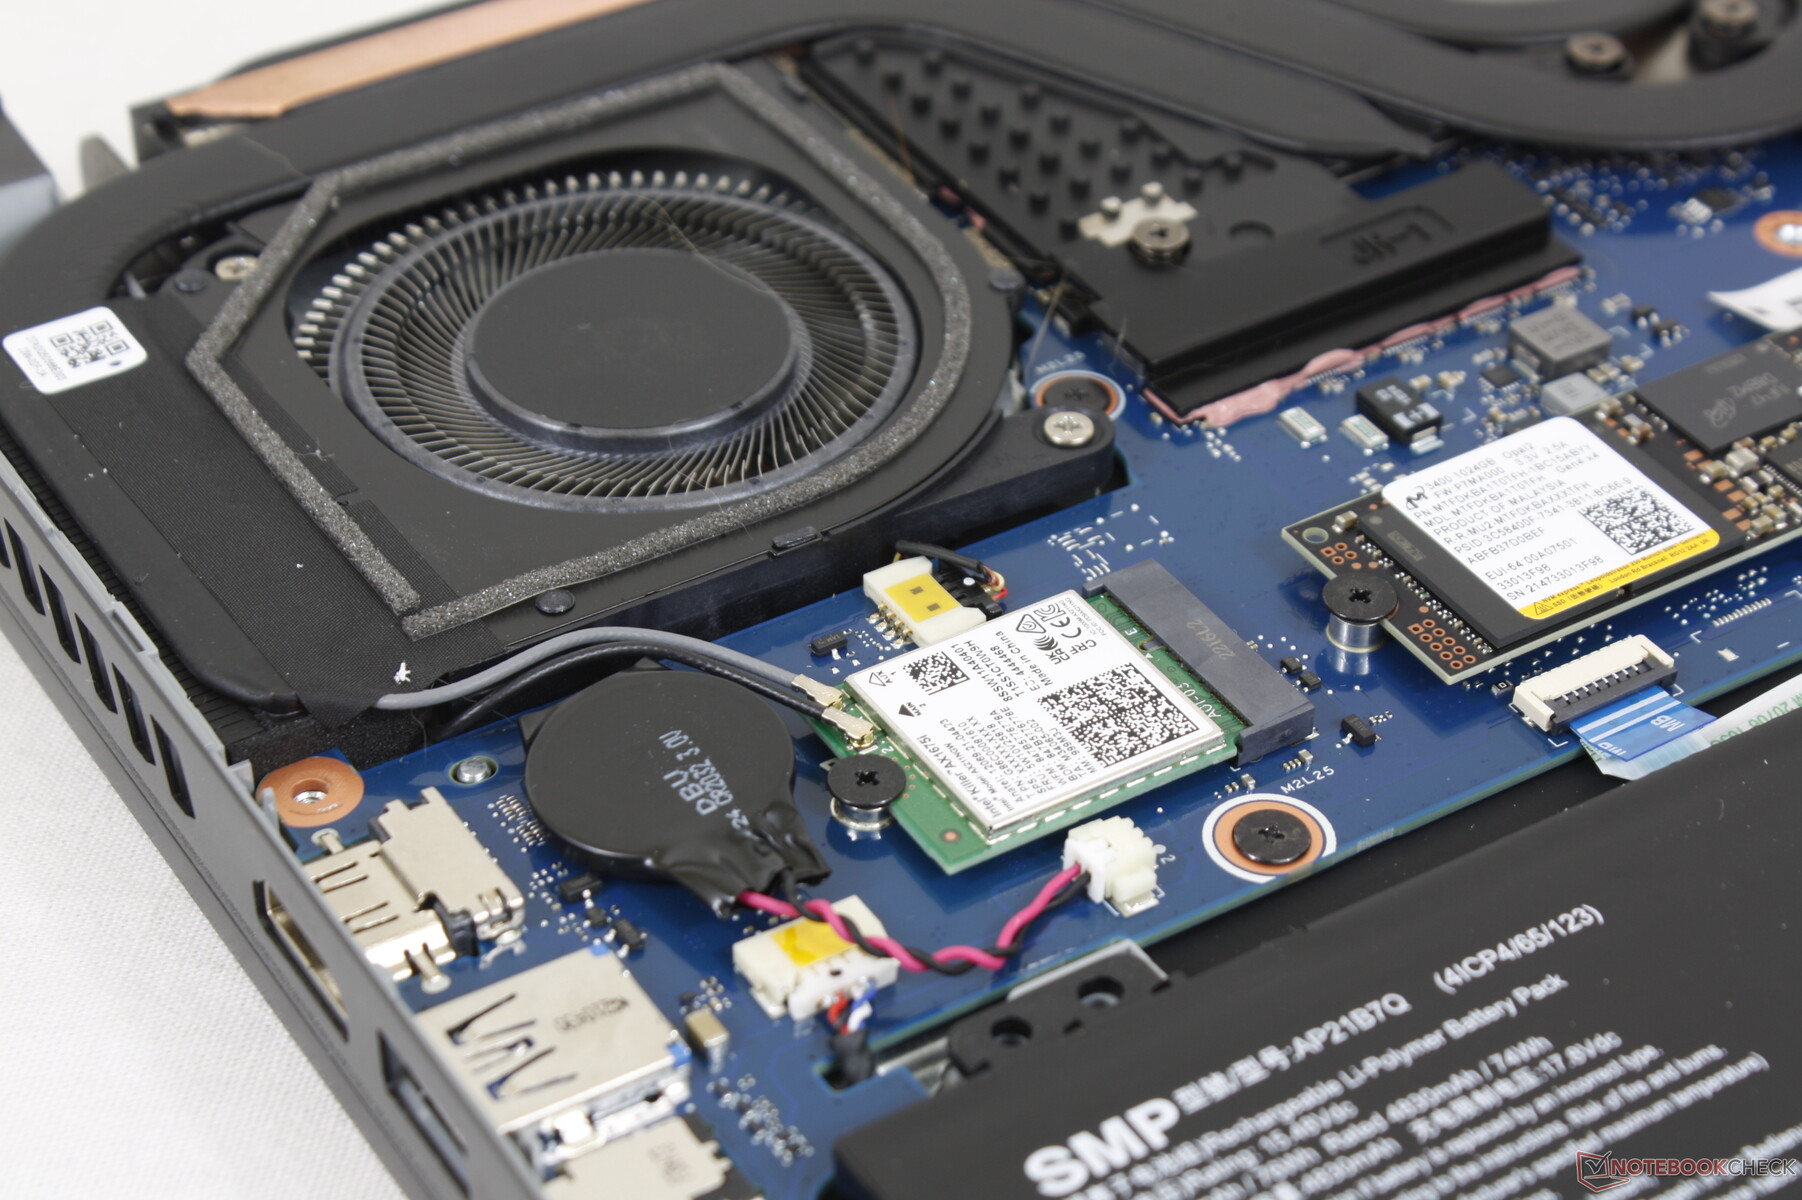
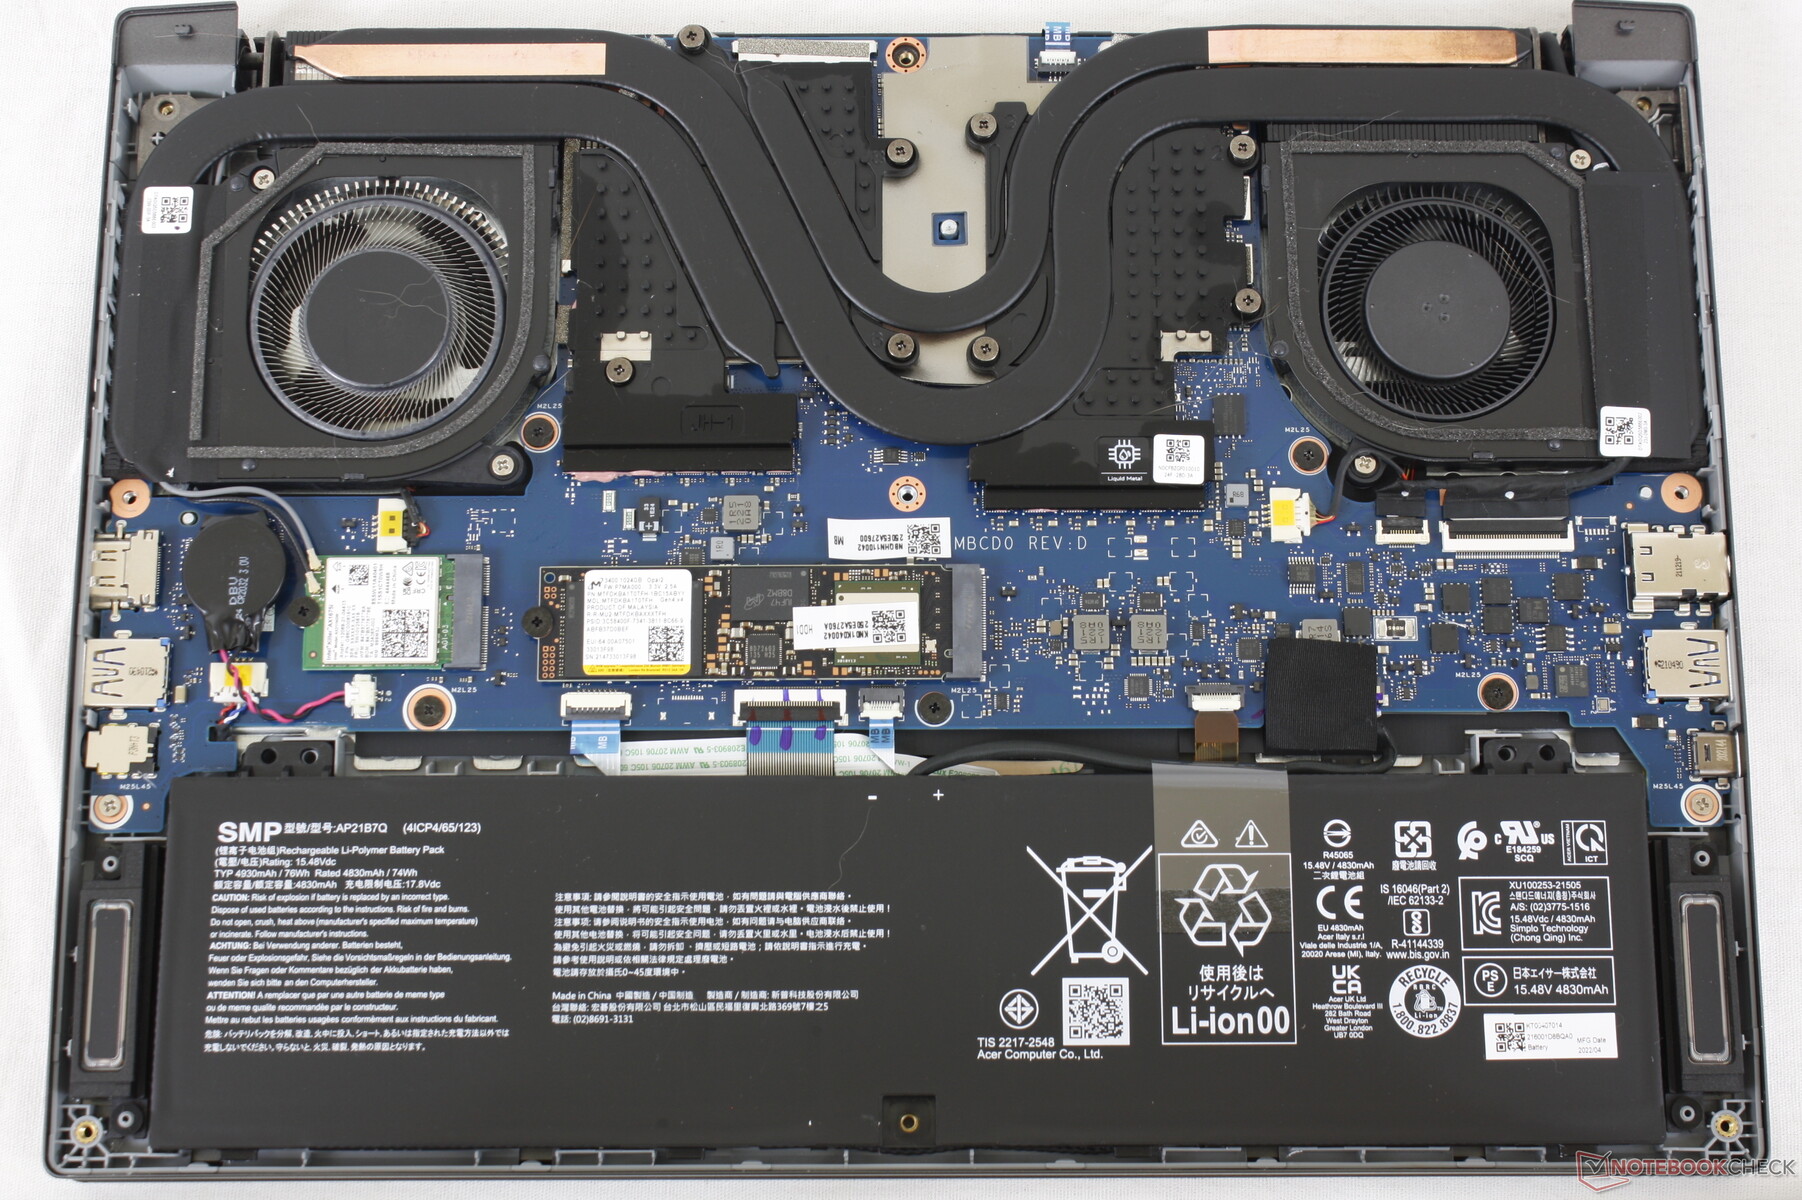
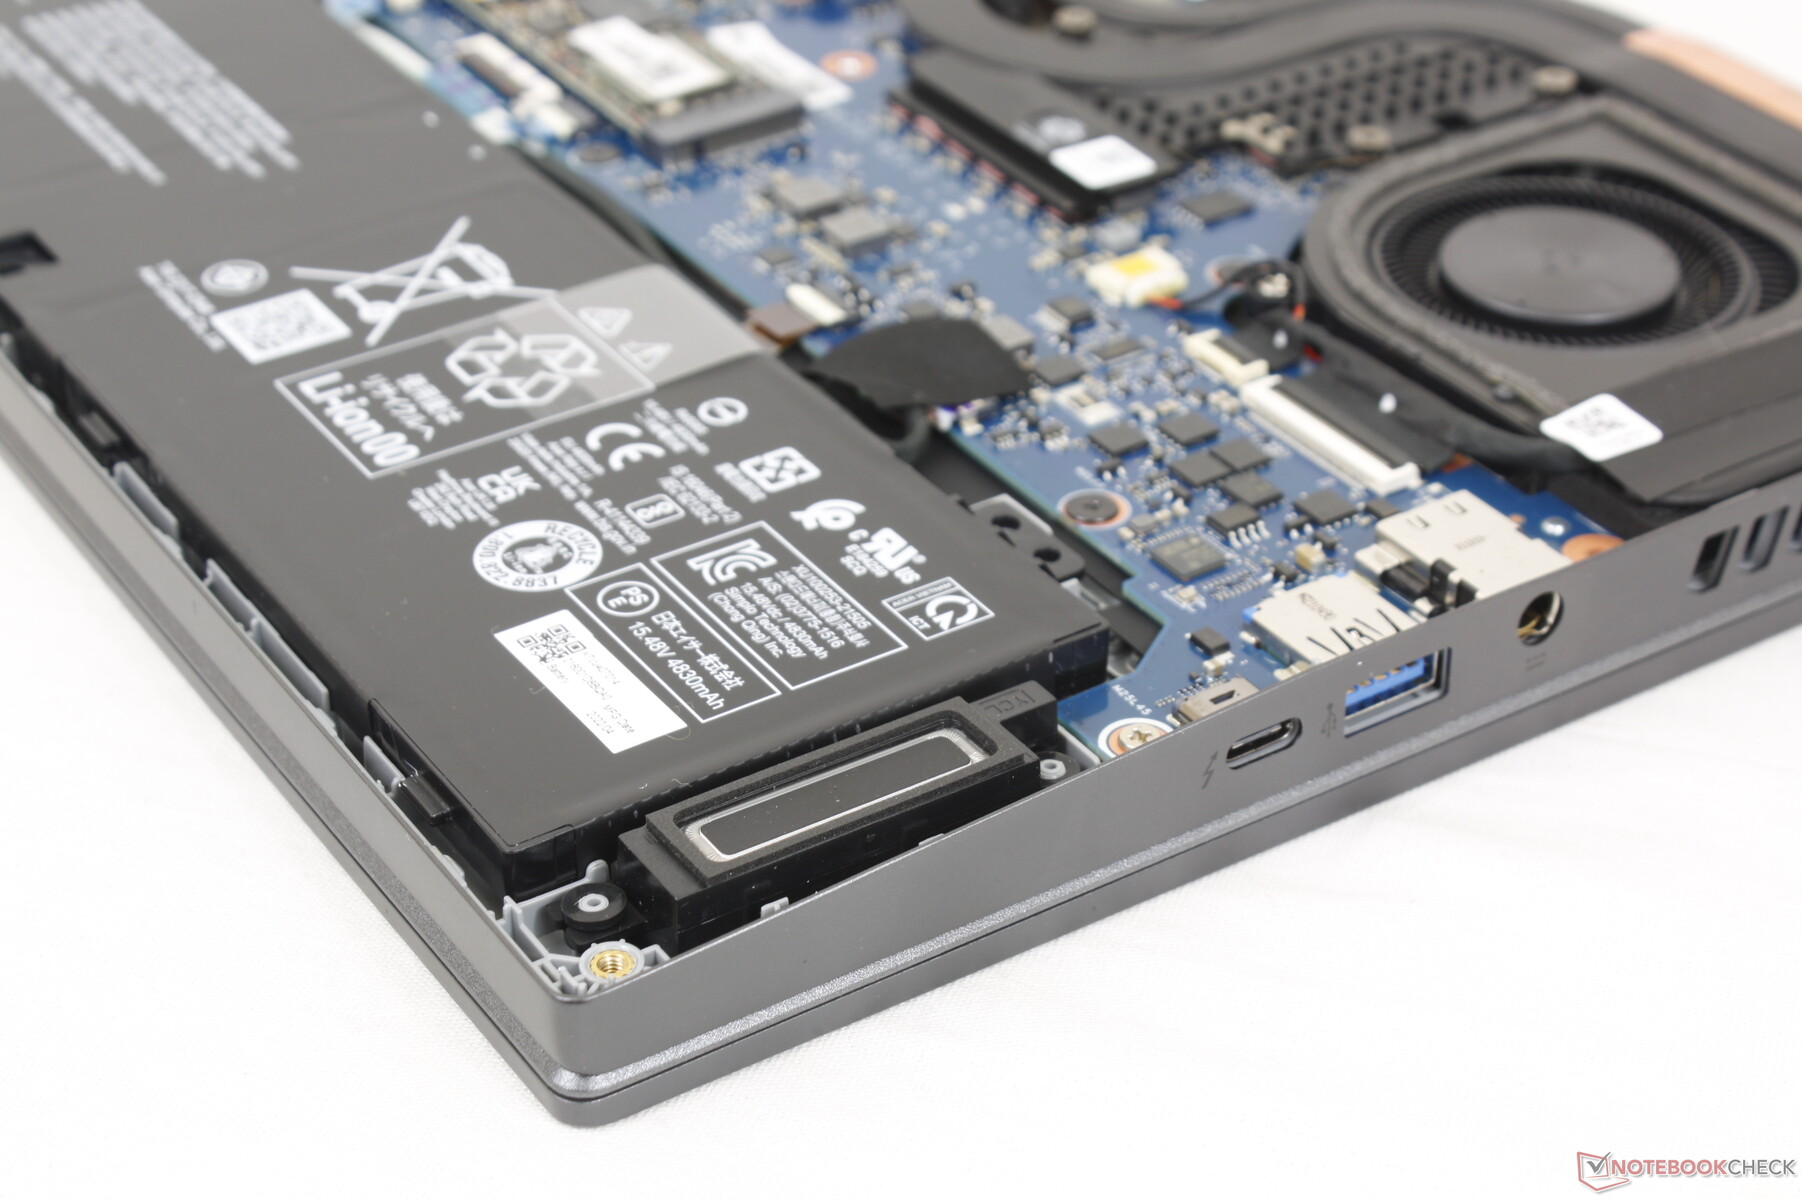
Mantenimiento
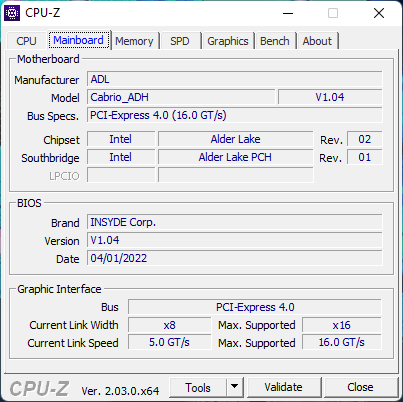
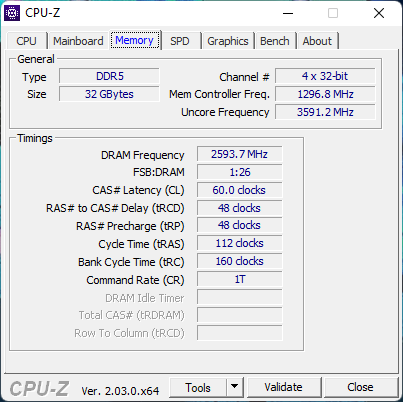
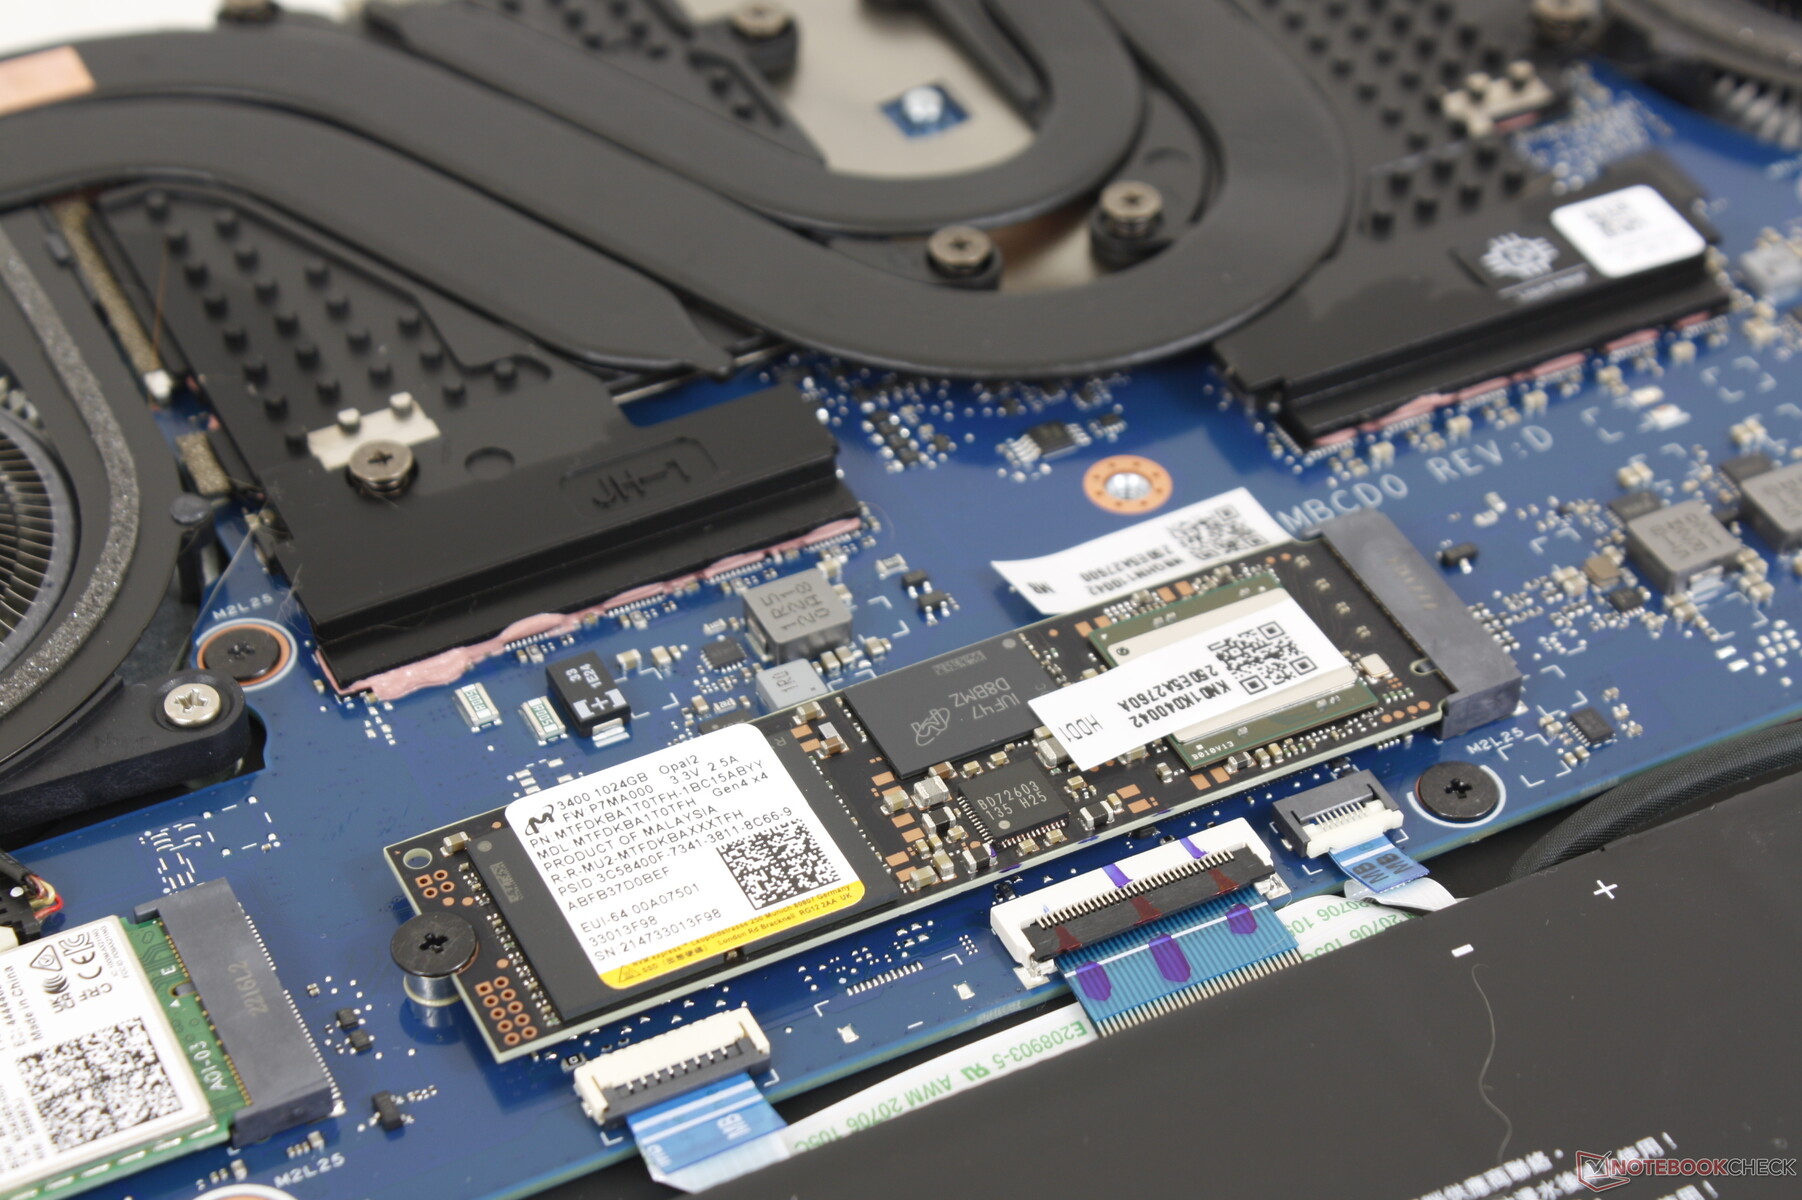
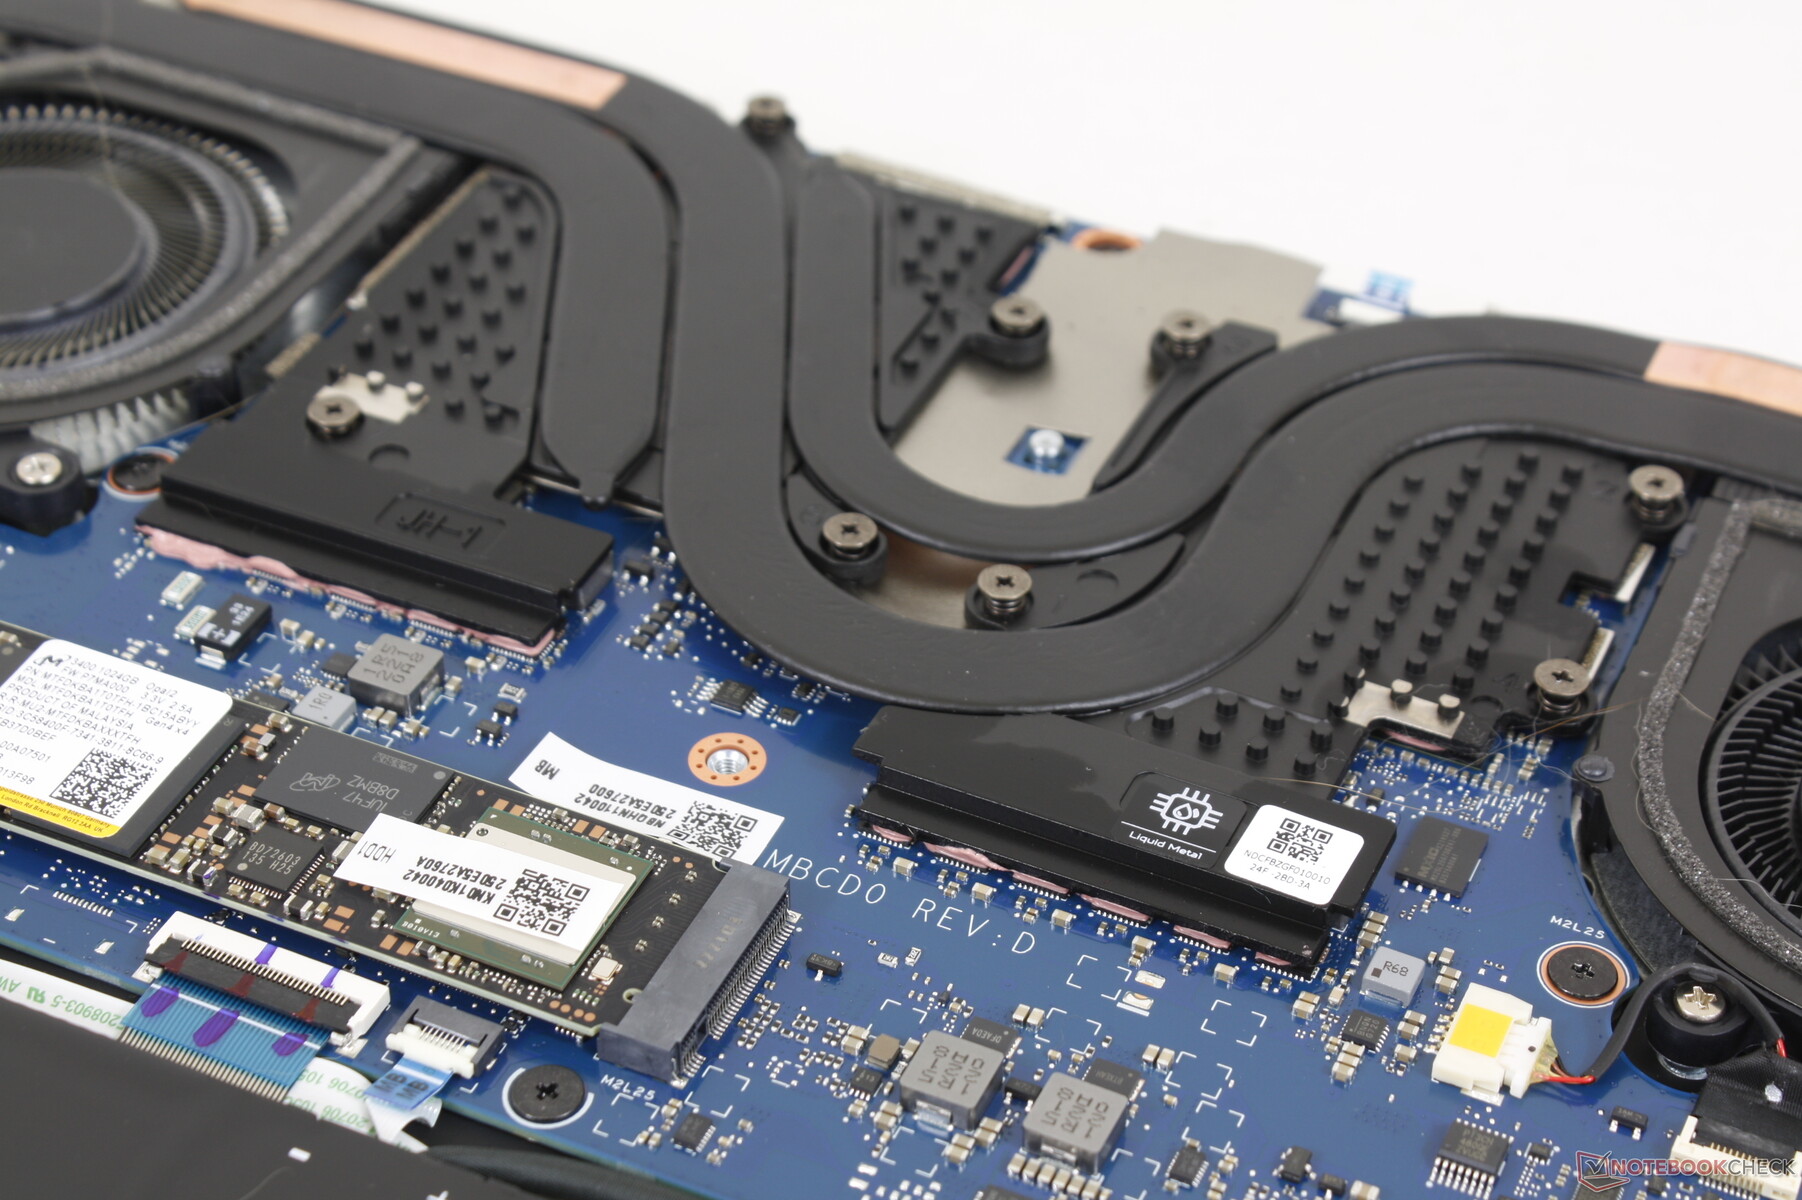
El panel inferior está asegurado por nueve tornillos T6 Torx para un mantenimiento relativamente fácil. Los usuarios sólo pueden actualizar el SSD, el módulo WLAN y la batería. Los módulos RAM están soldados, a diferencia del modelo de la generación anterior.
Accesorios y garantía
La caja de venta incluye un práctico estuche de transporte, además del adaptador de CA y la documentación. Otros fabricantes ya no suelen incluir estuches de transporte sin cargos adicionales. Se aplica la habitual garantía limitada de un año del fabricante si se adquiere en Estados Unidos.
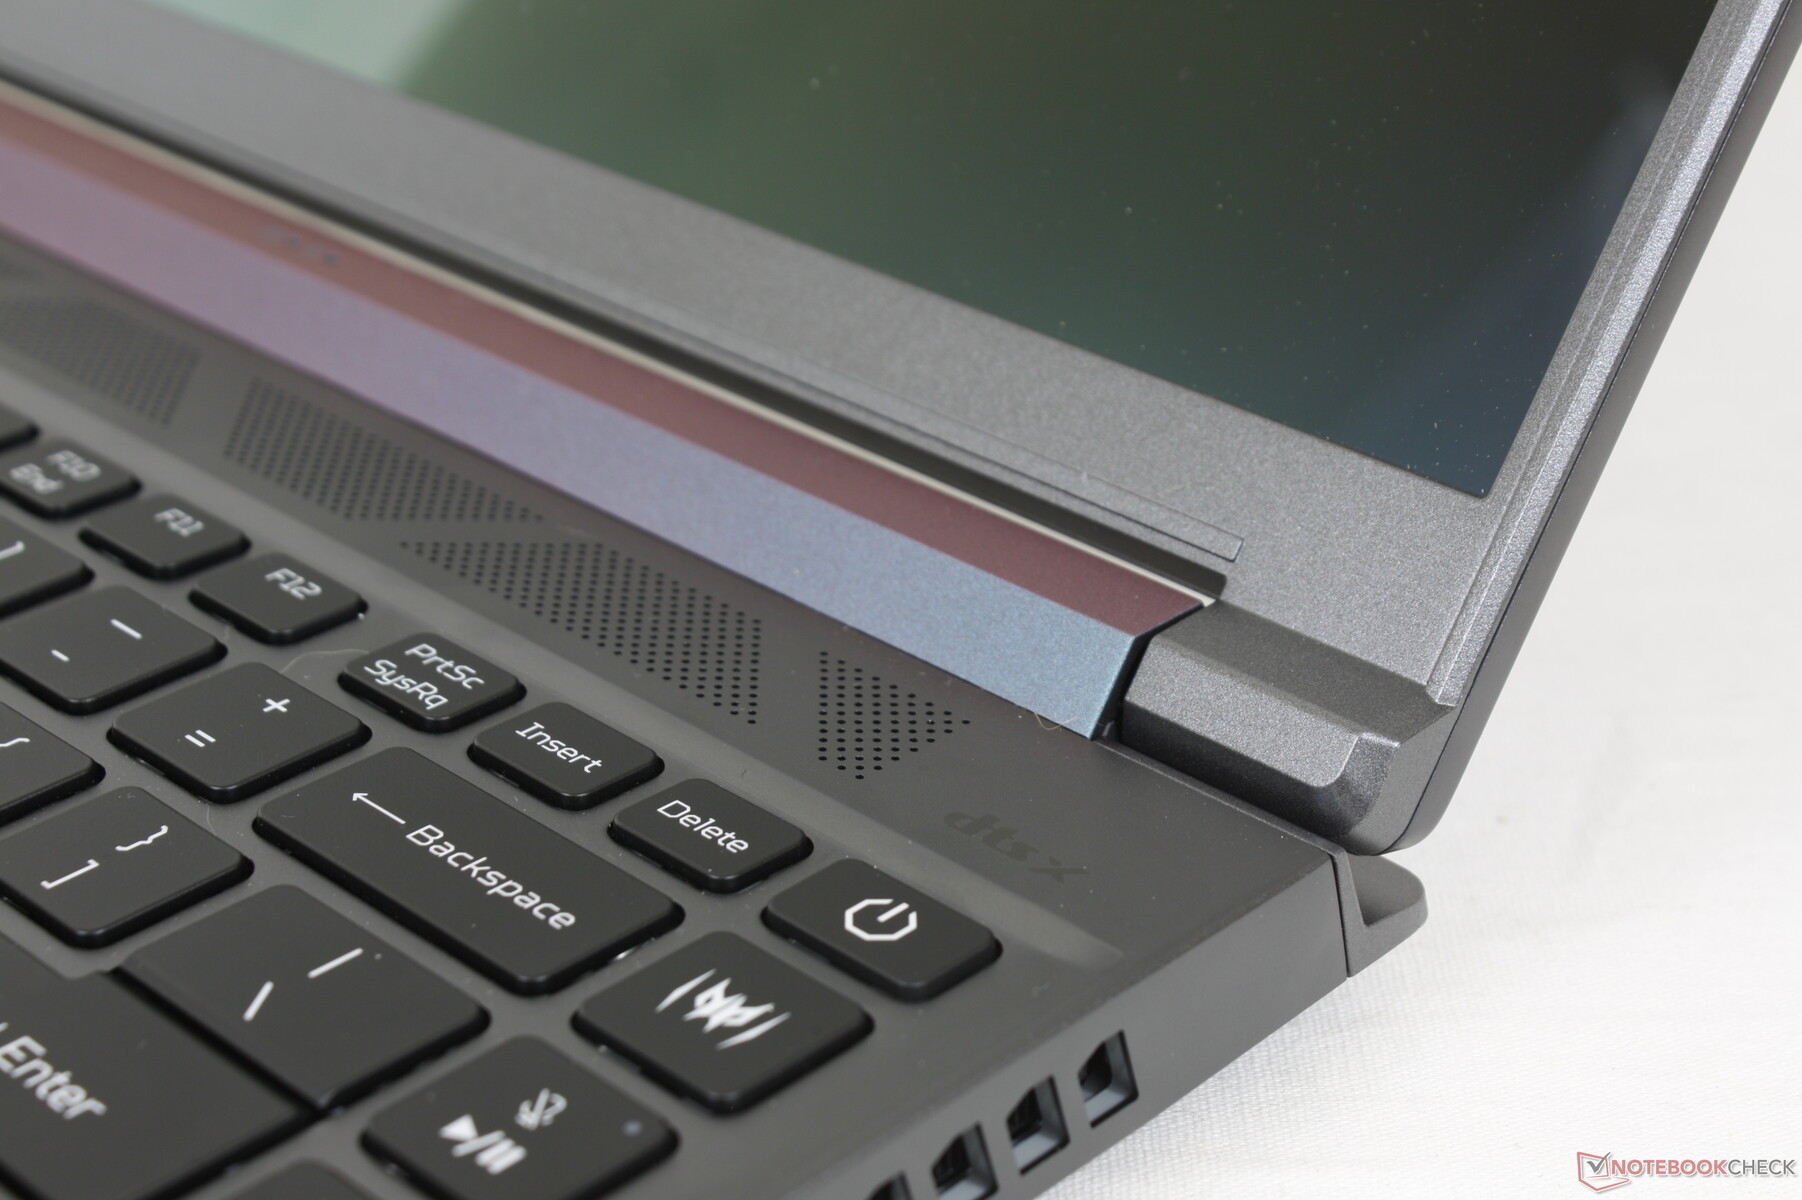
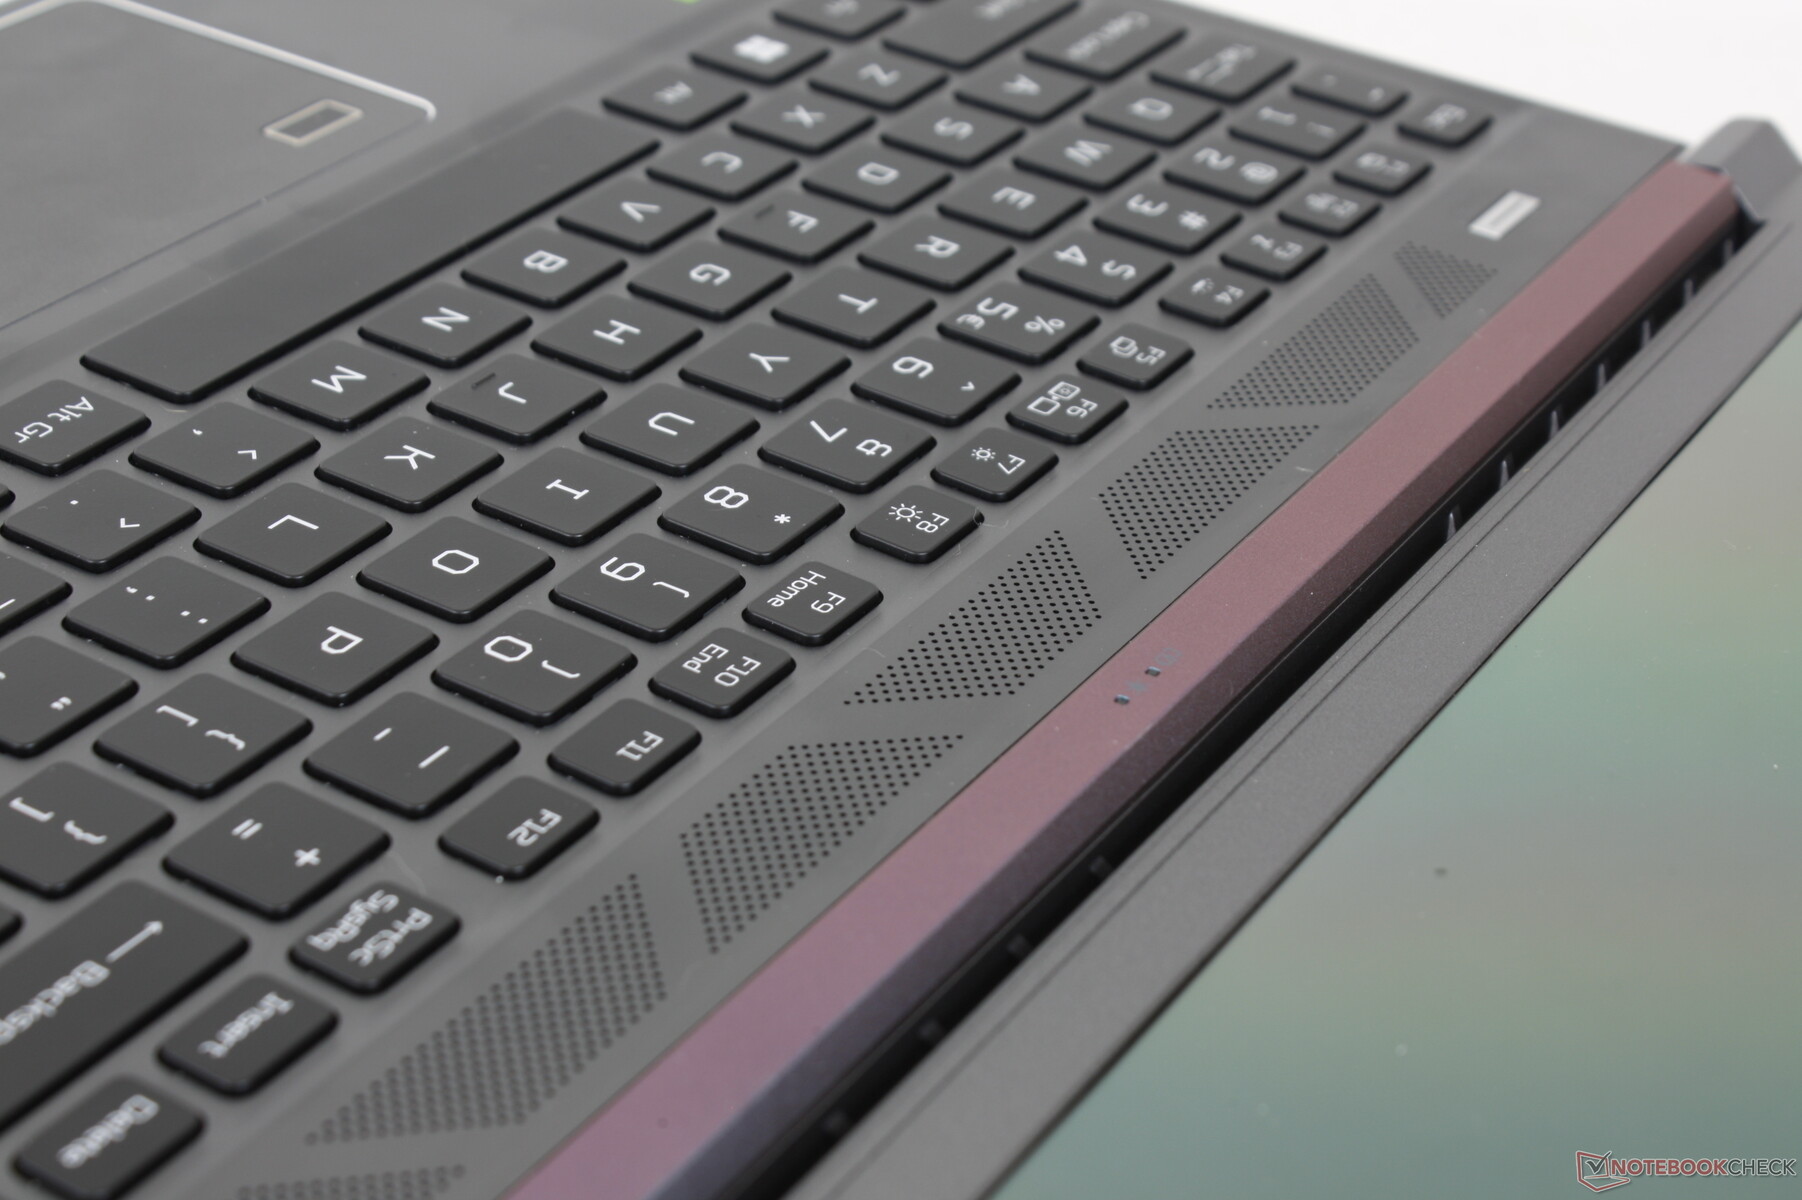
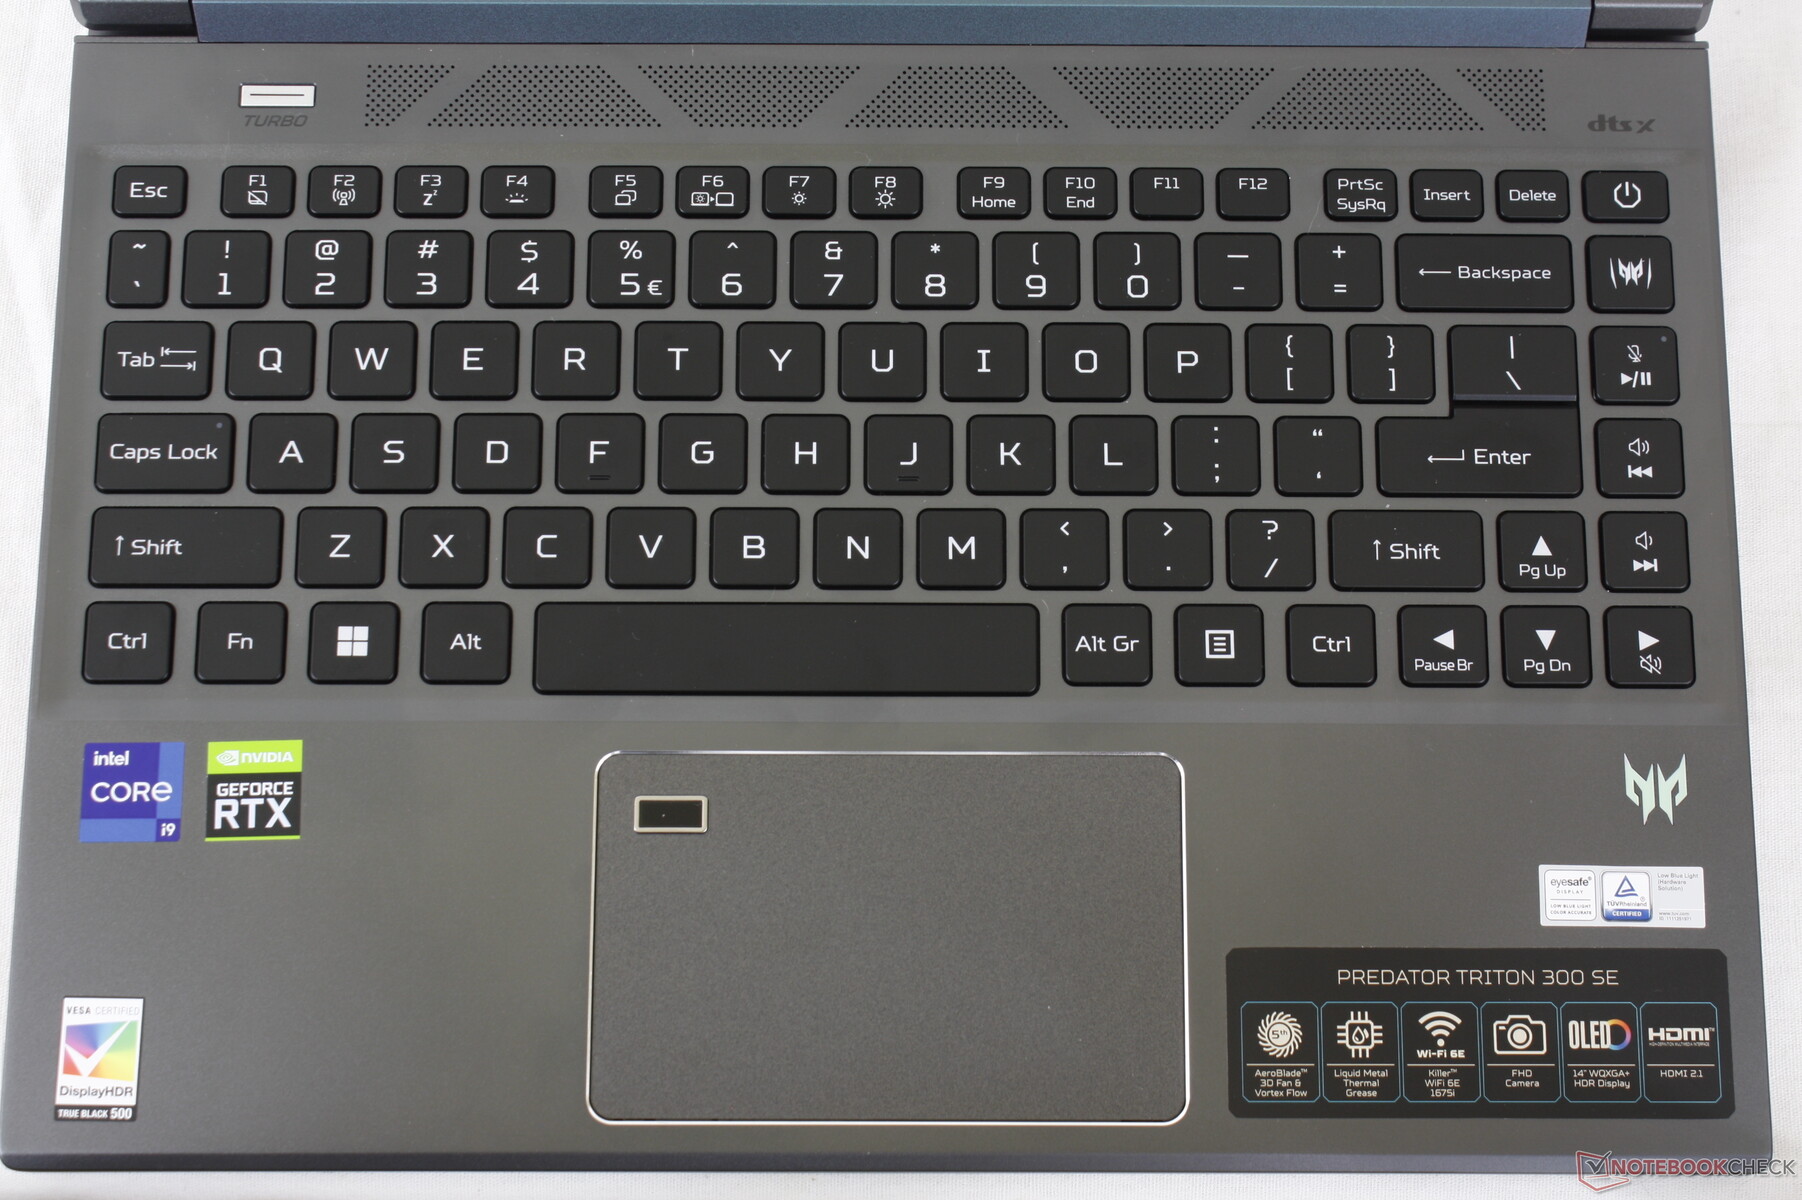
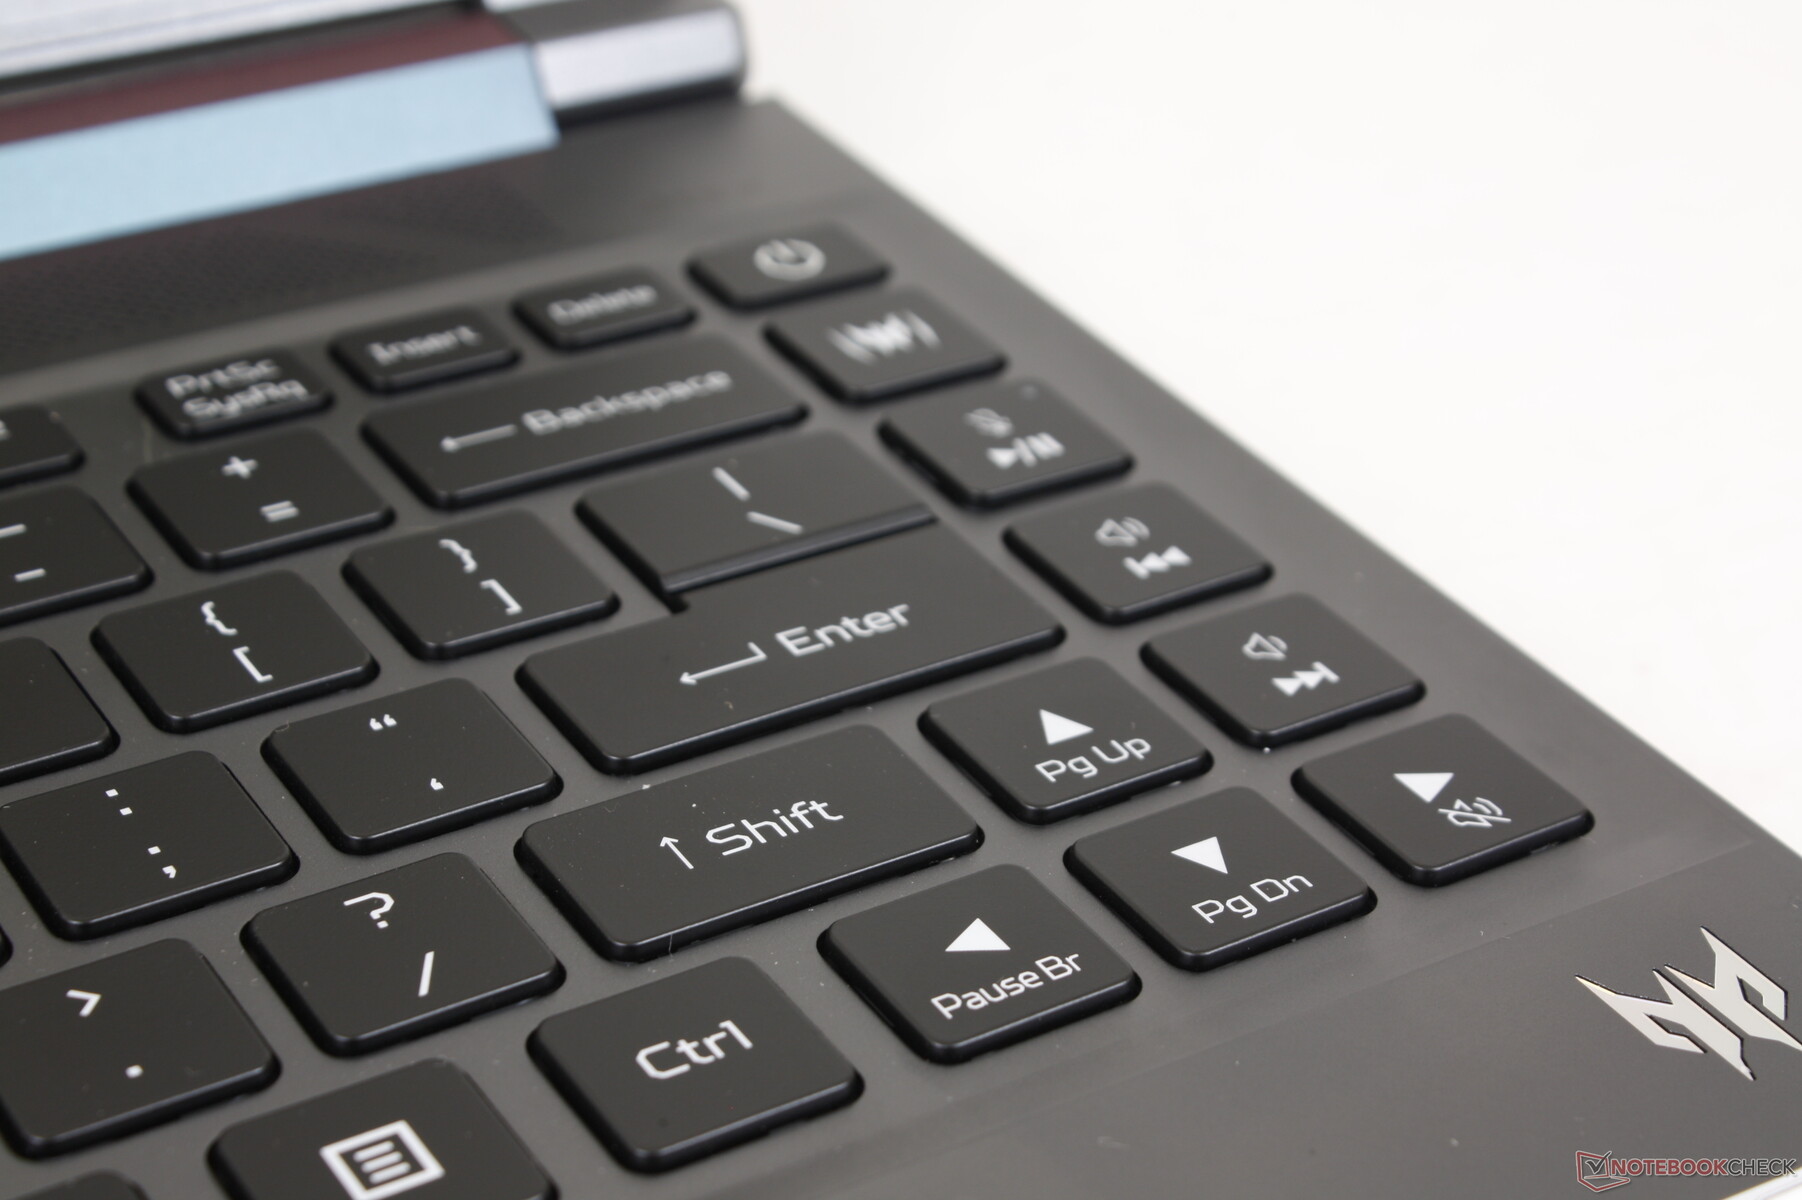
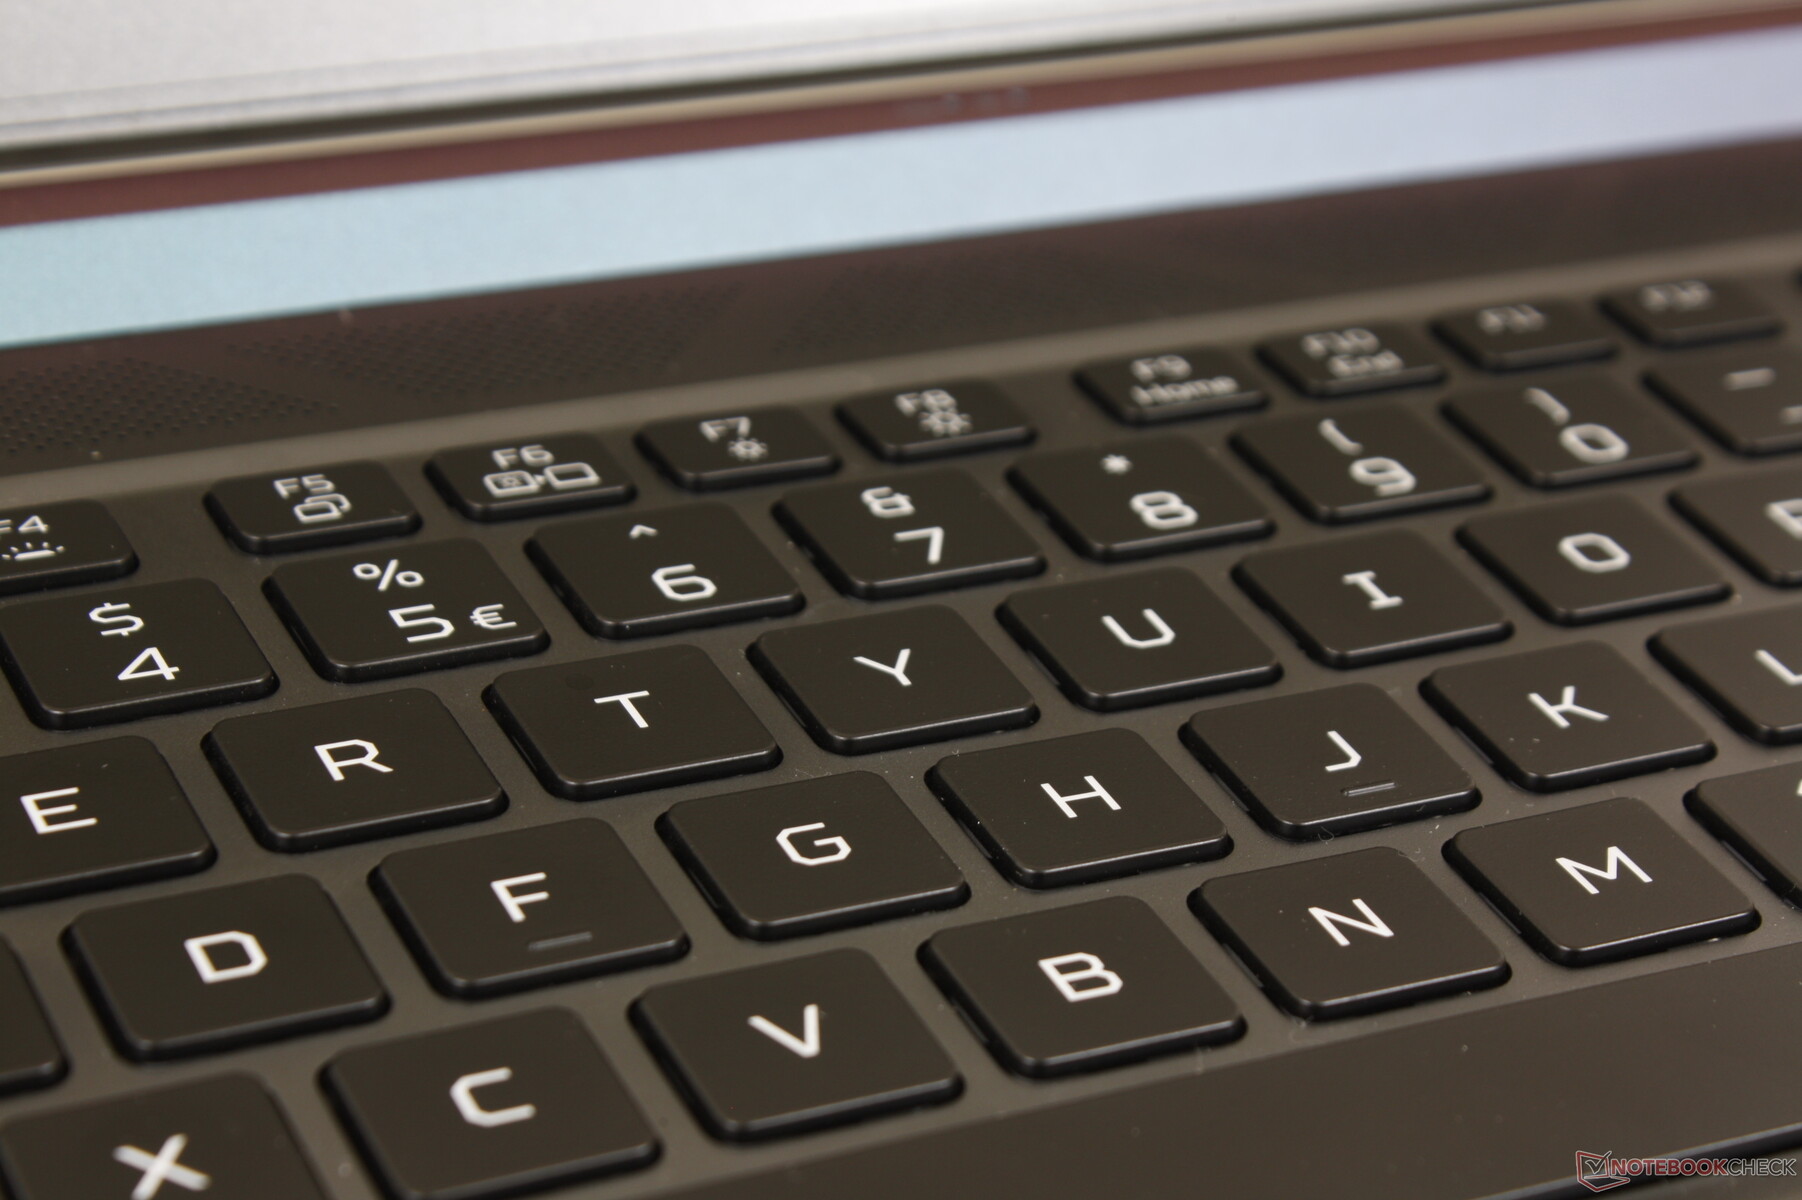
Dispositivos de entrada - Teclas suaves y silenciosas
Teclado
Las teclas tienen un recorrido poco profundo y una respuesta relativamente débil, similar a la de las teclas del Blade 14 y de muchos Utlrabooks económicos como el Asus VivoBook S14. Si has tecleado antes en un Ultrabook, entonces sabrás qué esperar aquí. La retroalimentación puede ser relativamente silenciosa, pero no es tan nítida y firme como las teclas de un ThinkPad o EliteBook centrado en la empresa
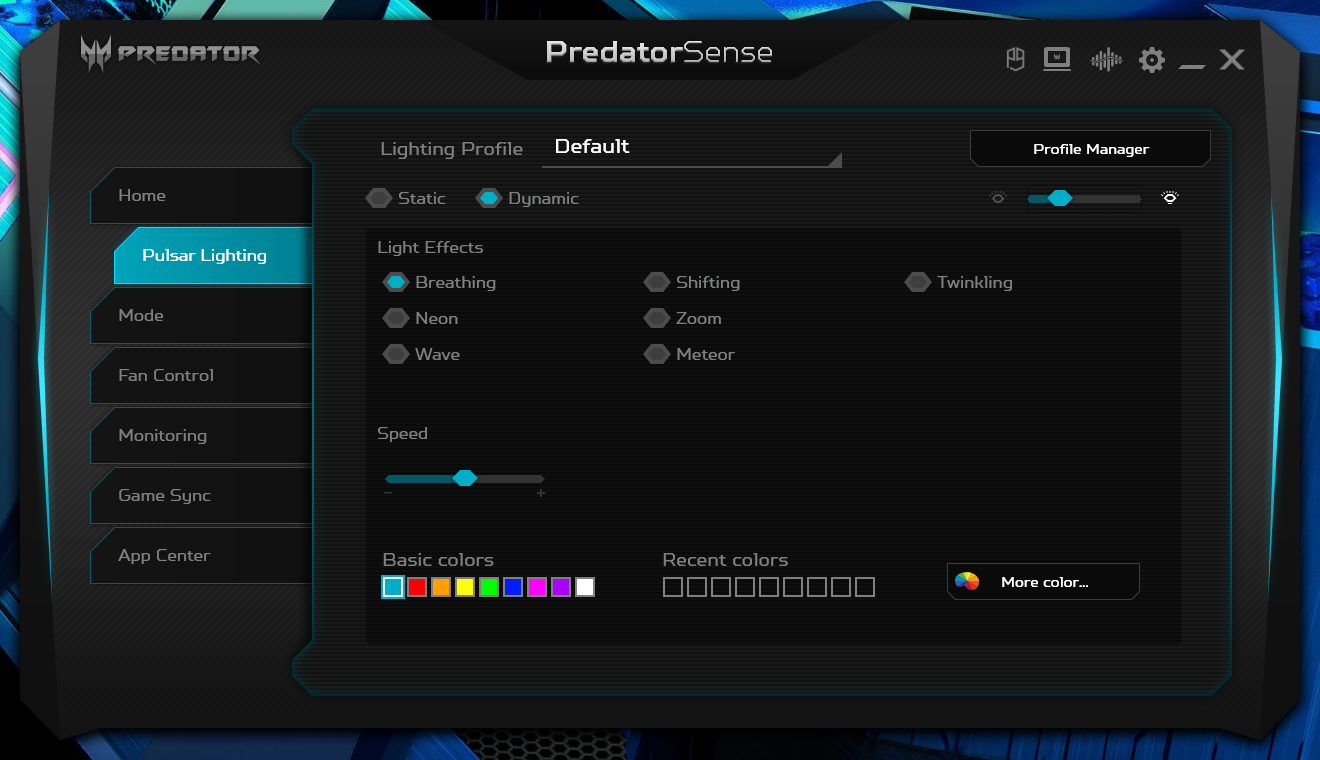
La retroiluminación RGB de tres zonas viene de serie, mientras que el Blade 14 incluye iluminación RGB por tecla. Todas las teclas y símbolos están retroiluminados.
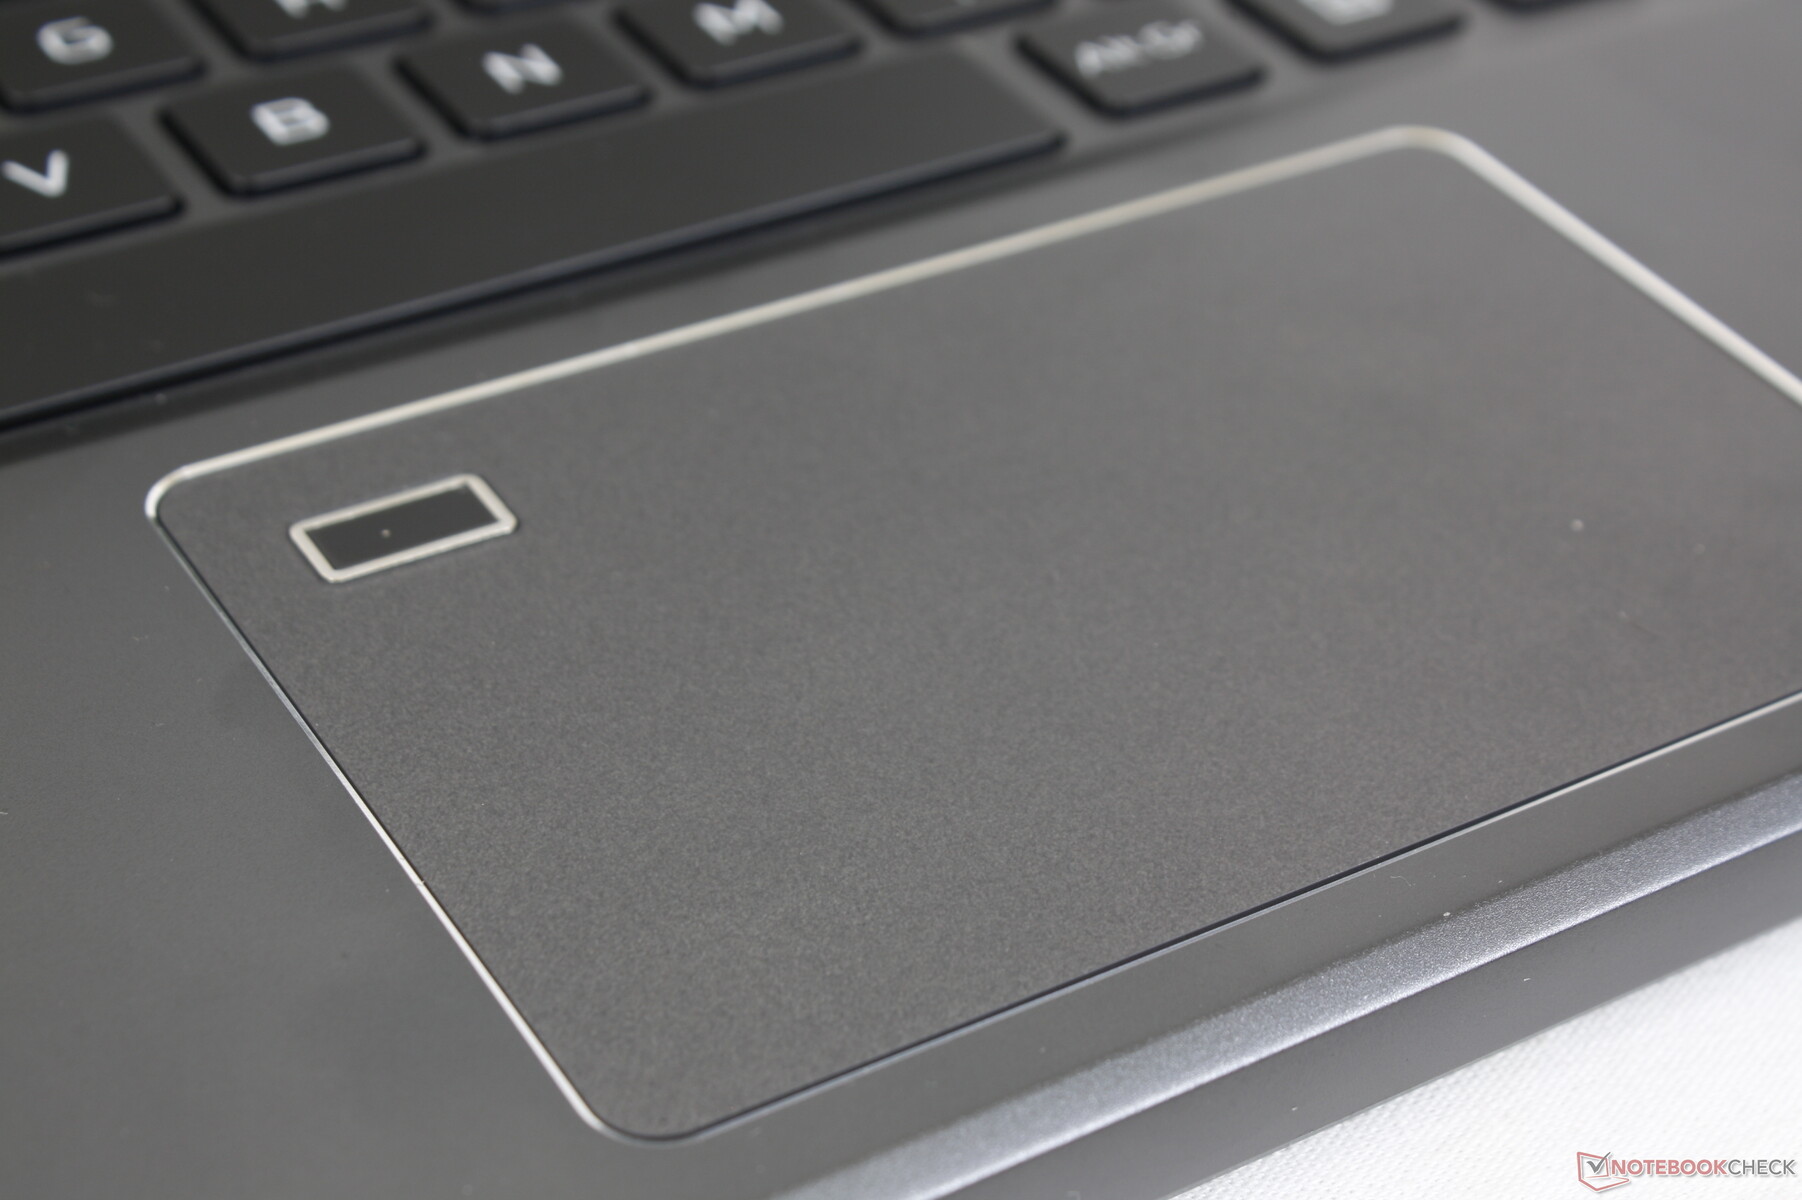
Teclado táctil
El clickpad es ligeramente más grande que el del Zephyrus G14 (10,5 x 6,5 cm frente a 10,5 x 6 cm). Sin embargo, el lector de huellas dactilares en la esquina reduce el espacio efectivo para el control del cursor o las entradas multitáctiles, por lo que el clickpad puede parecer más pequeño. La mayoría de los otros portátiles han reubicado el lector de huellas dactilares en áreas más convenientes como el botón de encendido o el teclado. El Predator Triton 300 SE puede parecer un diseño de chasis antiguo en este sentido.
La retroalimentación al hacer clic en el clickpad es suave y muy poco profunda para una impresión débil. Definitivamente querrás usar un ratón USB siempre que sea posible.
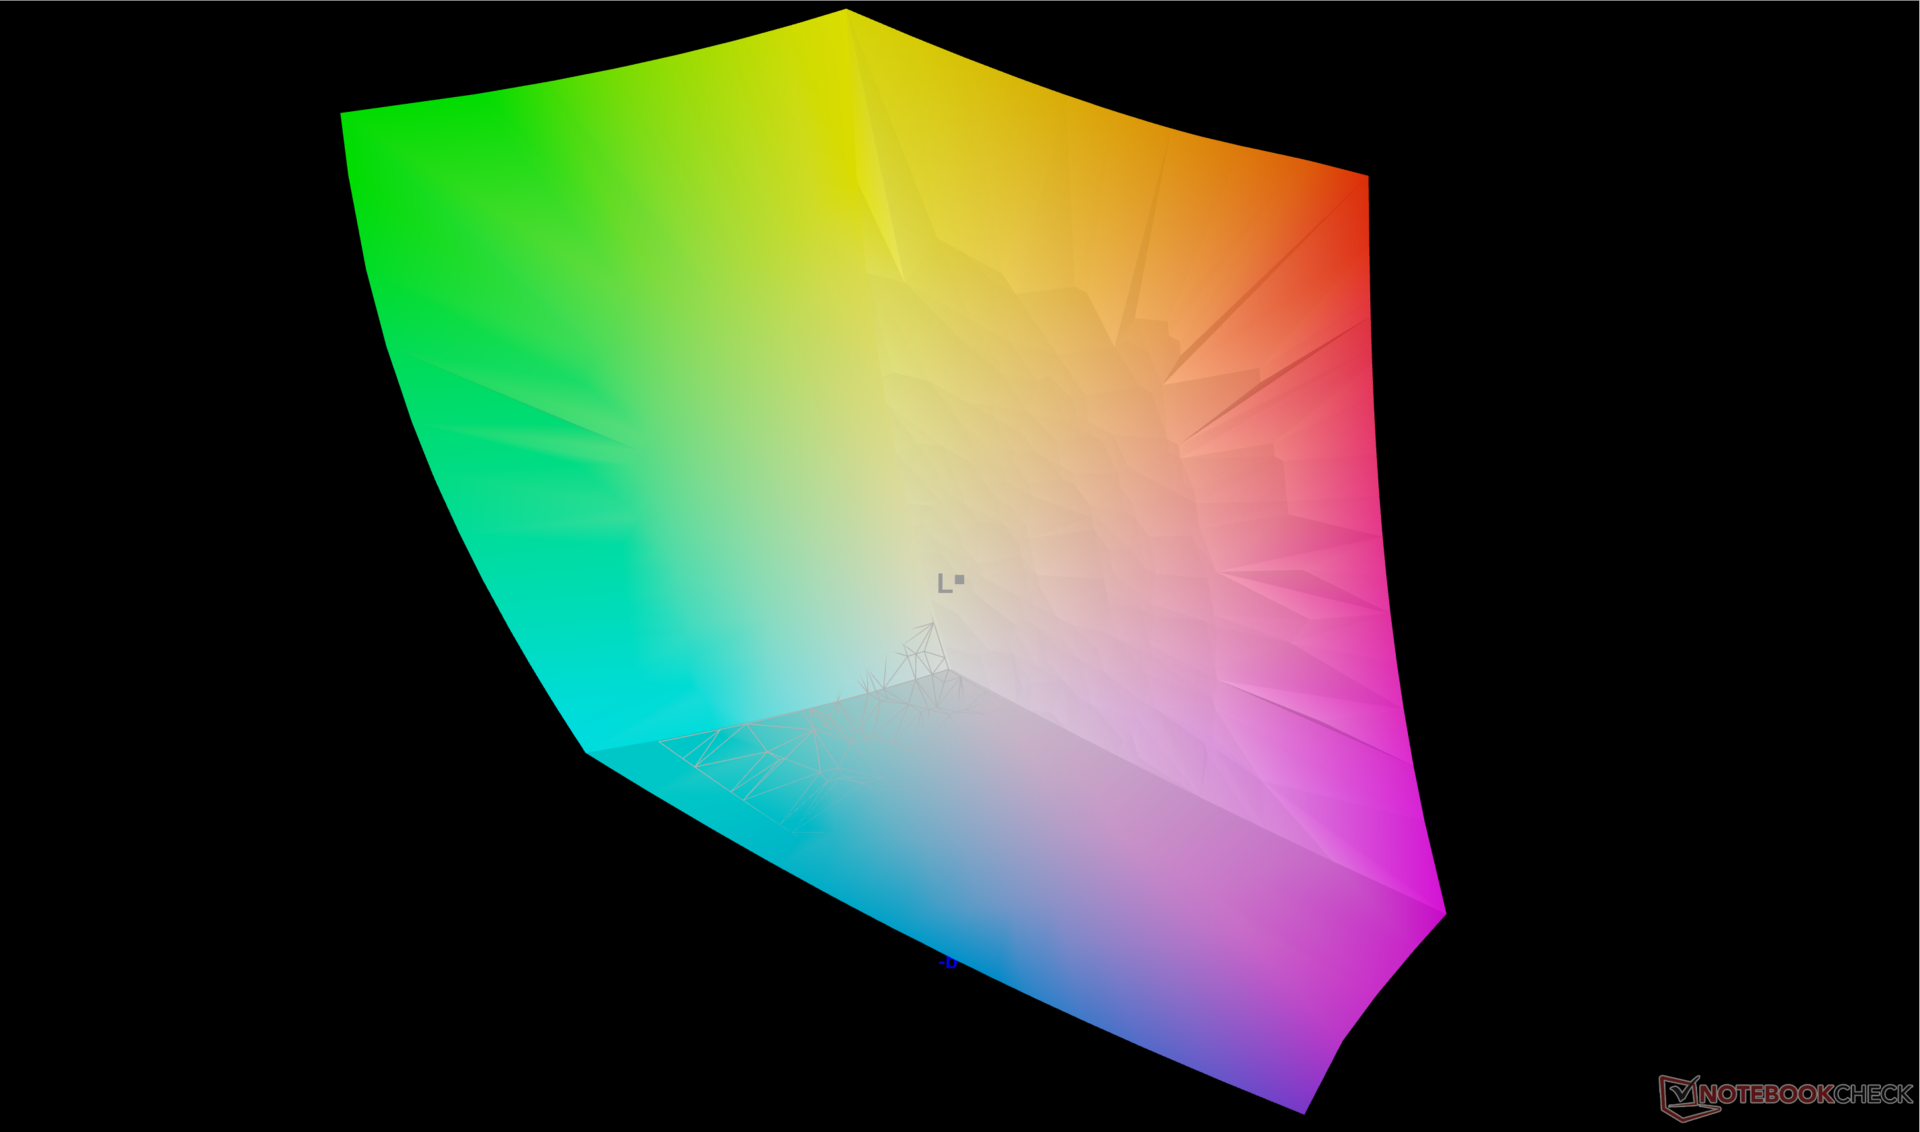
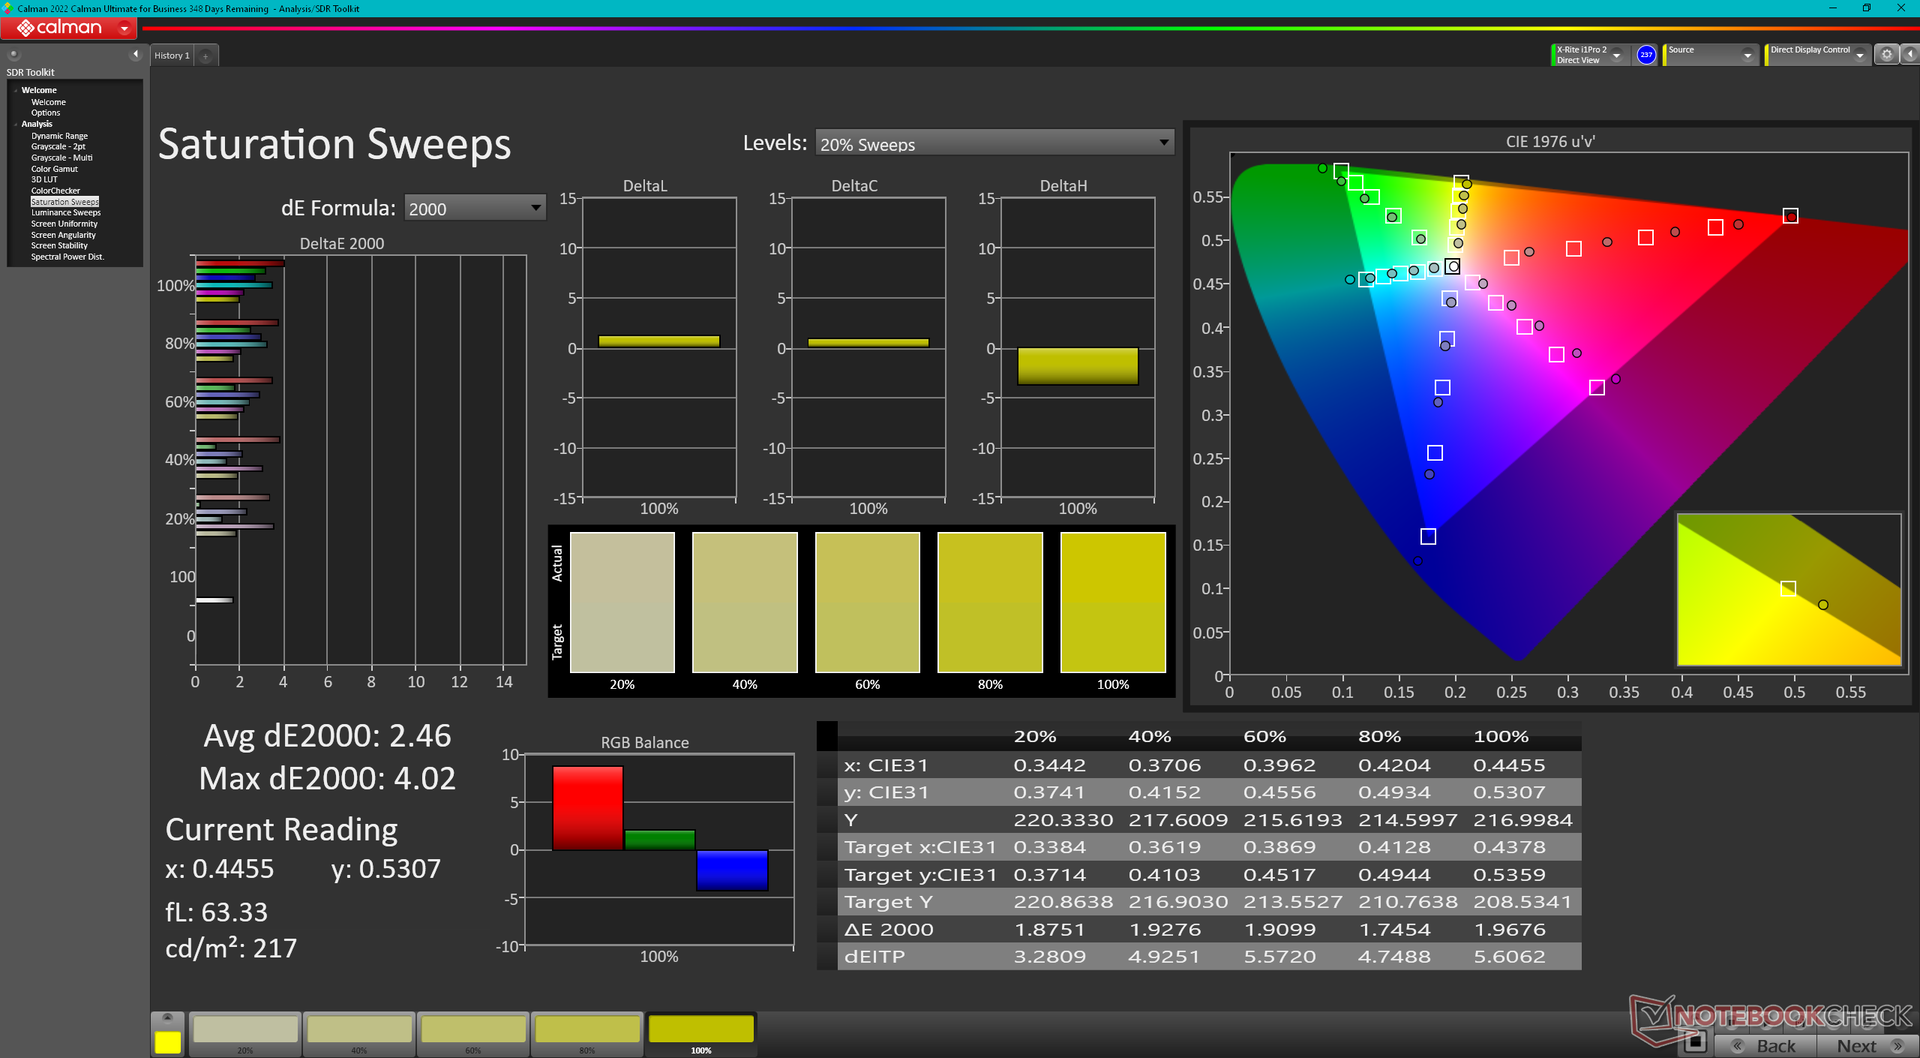
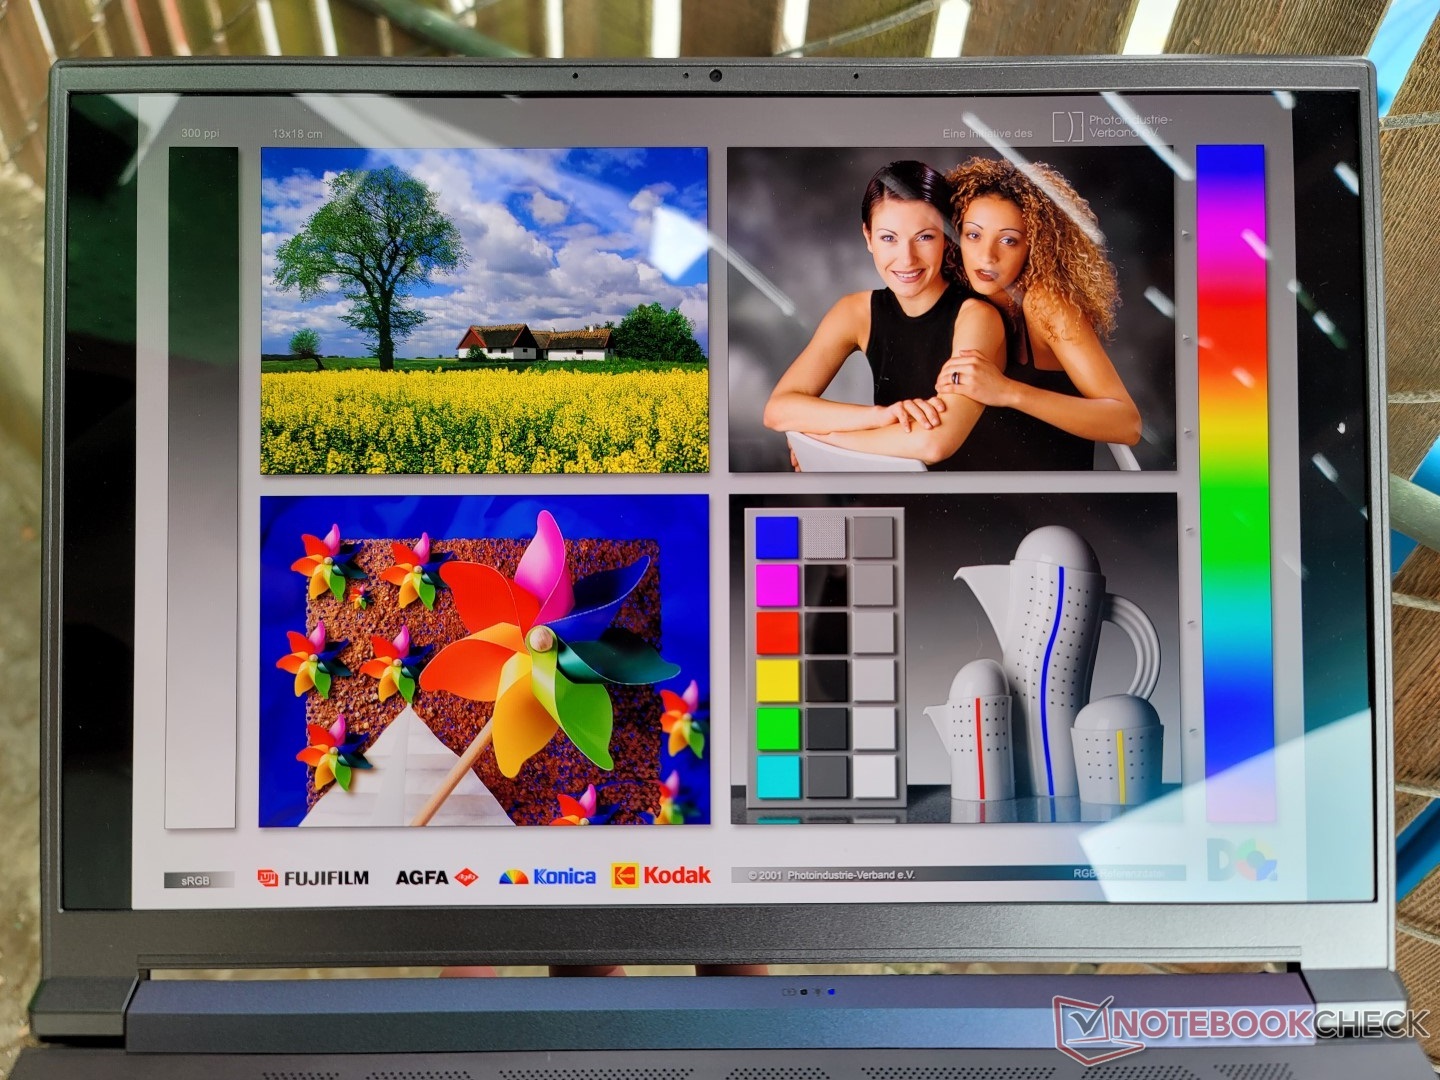
Pantalla - Opciones OLED e IPS
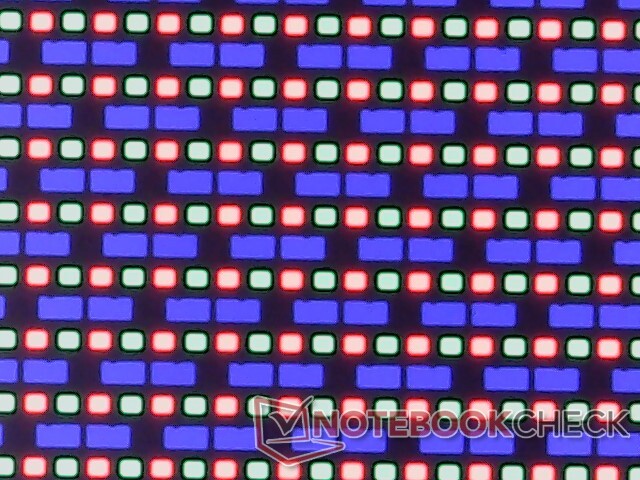
El Predator Triton 300 SE es uno de los pocos portátiles OLED para juegos que ofrece tanto colores DCI-P3 completos como una frecuencia de actualización relativamente rápida de 90 Hz. Algunas alternativas IPS pueden tener frecuencias de actualización aún más rápidas, como el panel del Blade 14pero normalmente sólo prometen una cobertura sRGB.
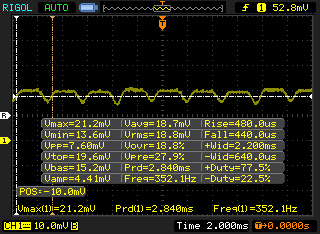
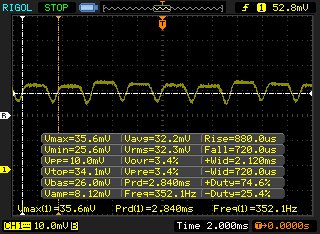
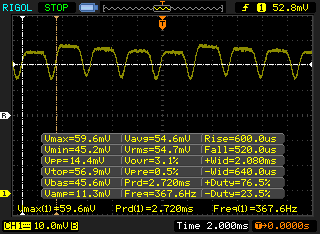
La falta de compatibilidad con la sincronización adaptativa es un inconveniente notable del Predator Triton 300 SE de 14 pulgadas. Aunque el ghosting puede ser casi inexistente, el panel OLED definitivamente conlleva su propio conjunto de desventajas en comparación con el IPS. Una frecuencia de parpadeo de unos 352 Hz, por ejemplo, sigue presente en todos los niveles de brillo, similar a lo que hemos registrado en otros portátiles OLED de 14 pulgadas como el Asus VivoBook 14.
Acer ofrece un SKU IPS de 1200p de menor resolución con soporte MUX y una frecuencia de refresco más rápida de 165 Hz. Si la cobertura de color P3 completa no es importante para sus tareas, entonces la alternativa IPS puede valer la pena considerar especialmente para propósitos de juego.
| |||||||||||||||||||||||||
iluminación: 99 %
Brillo con batería: 414.3 cd/m²
Contraste: ∞:1 (Negro: 0 cd/m²)
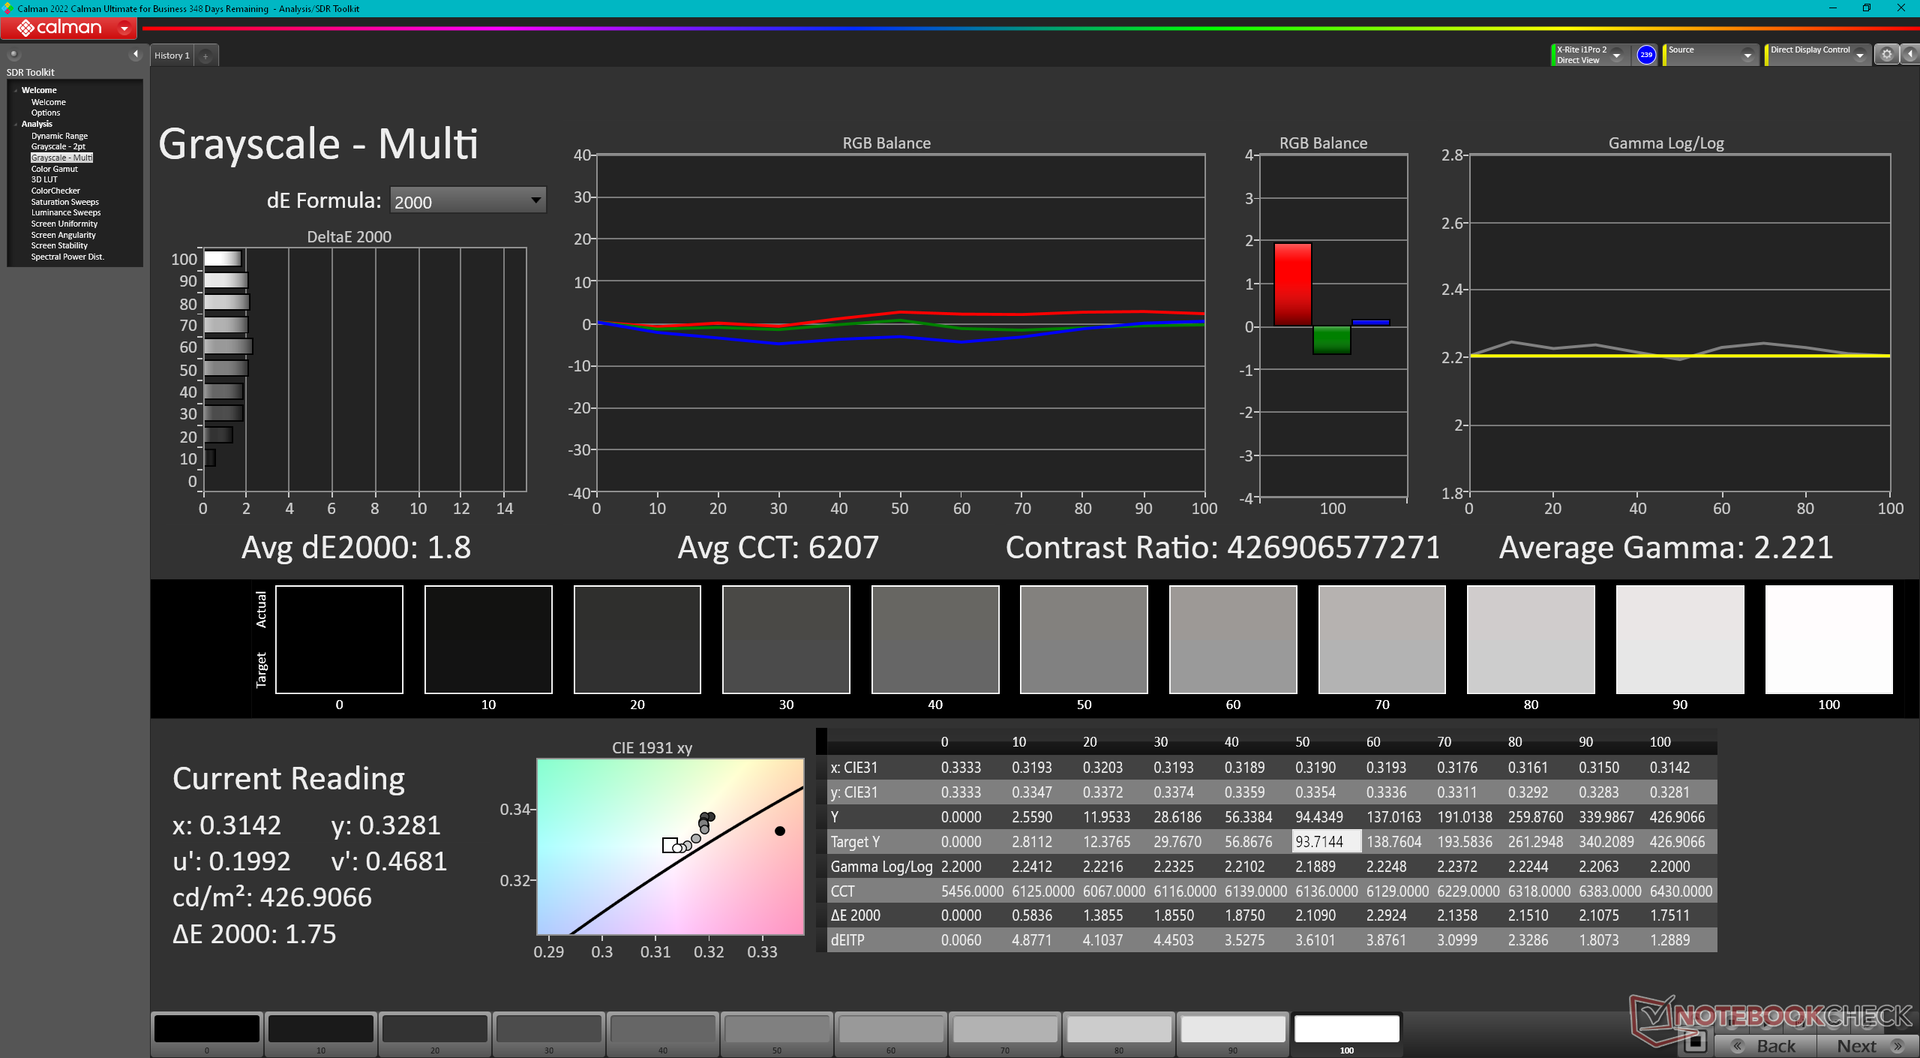
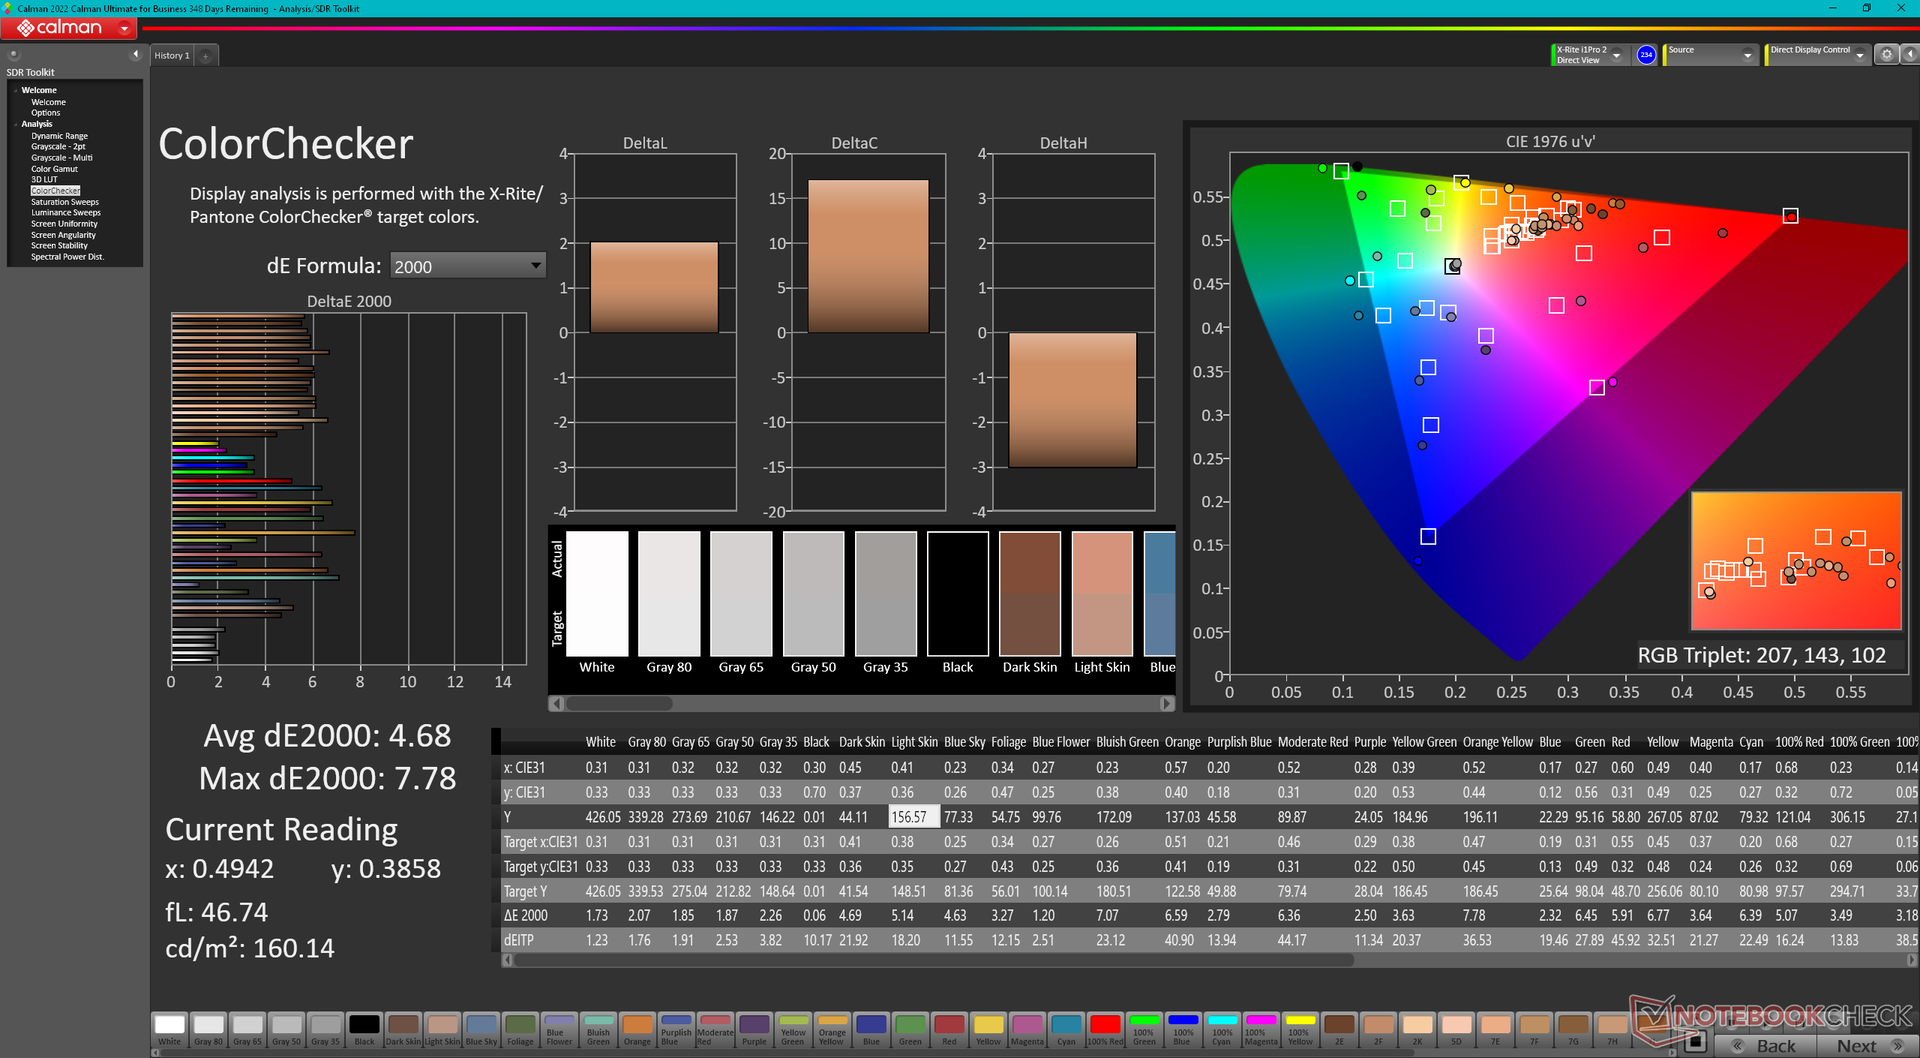
ΔE ColorChecker Calman: 4.68 | ∀{0.5-29.43 Ø4.71}
ΔE Greyscale Calman: 1.8 | ∀{0.09-98 Ø4.96}
99% AdobeRGB 1998 (Argyll 3D)
100% sRGB (Argyll 3D)
99.9% Display P3 (Argyll 3D)
Gamma: 2.22
CCT: 6207 K
| Acer Predator Triton 300 SE Samsung ATNA40YK07-0, OLED, 2880x1800, 14" | Asus ROG Zephyrus G14 GA402RJ BOEhydis NE140QDM-NX1, IPS, 2560x1600, 14" | Razer Blade 14 Ryzen 9 6900HX TL140BDXP02-0, IPS, 2560x1440, 14" | Alienware x14 i7 RTX 3060 SHP154D, IPS, 1920x1080, 14" | Dell Inspiron 14 Plus 7420 InfoVision 140NWHE, IPS, 2240x1400, 14" | Schenker Vision 14 MNE007ZA1, IPS, 2880x1800, 14" | |
|---|---|---|---|---|---|---|
| Display | -5% | -5% | -4% | -21% | -17% | |
| Display P3 Coverage (%) | 99.9 | 97.6 -2% | 97.2 -3% | 99.6 0% | 68.8 -31% | 74.3 -26% |
| sRGB Coverage (%) | 100 | 99.9 0% | 99.9 0% | 100 0% | 99.3 -1% | 97.6 -2% |
| AdobeRGB 1998 Coverage (%) | 99 | 85.6 -14% | 85.7 -13% | 87.6 -12% | 69.5 -30% | 75.7 -24% |
| Response Times | -426% | -1077% | -533% | -1944% | -2062% | |
| Response Time Grey 50% / Grey 80% * (ms) | 1.36 ? | 8.3 ? -510% | 16.8 ? -1135% | 9.6 ? -606% | 32.8 ? -2312% | 40.4 ? -2871% |
| Response Time Black / White * (ms) | 1.36 ? | 6 ? -341% | 15.2 ? -1018% | 7.6 ? -459% | 22.8 ? -1576% | 18.4 ? -1253% |
| PWM Frequency (Hz) | 367.6 ? | 26191 ? | ||||
| Screen | 5% | 13% | -24% | -12% | 5% | |
| Brightness middle (cd/m²) | 414.3 | 500 21% | 354 -15% | 434 5% | 331.1 -20% | 407 -2% |
| Brightness (cd/m²) | 416 | 470 13% | 328 -21% | 411 -1% | 326 -22% | 407 -2% |
| Brightness Distribution (%) | 99 | 85 -14% | 86 -13% | 89 -10% | 85 -14% | 94 -5% |
| Black Level * (cd/m²) | 0.42 | 0.37 | 0.25 | 0.29 | 0.25 | |
| Colorchecker dE 2000 * | 4.68 | 2.45 48% | 1.66 65% | 3 36% | 2.23 52% | 2.6 44% |
| Colorchecker dE 2000 max. * | 7.78 | 5.34 31% | 3.83 51% | 7.1 9% | 5.44 30% | 4.4 43% |
| Greyscale dE 2000 * | 1.8 | 3.1 -72% | 1.6 11% | 5.1 -183% | 3.6 -100% | 2.7 -50% |
| Gamma | 2.22 99% | 2.213 99% | 2.23 99% | 2.19 100% | 2.21 100% | 2.18 101% |
| CCT | 6207 105% | 7251 90% | 6542 99% | 6204 105% | 6022 108% | 6316 103% |
| Contrast (:1) | 1190 | 957 | 1736 | 1142 | 1628 | |
| Colorchecker dE 2000 calibrated * | 1.2 | 0.7 | 0.63 | 2 | ||
| Media total (Programa/Opciones) | -142% /
-76% | -356% /
-190% | -187% /
-111% | -659% /
-366% | -691% /
-377% |
* ... más pequeño es mejor
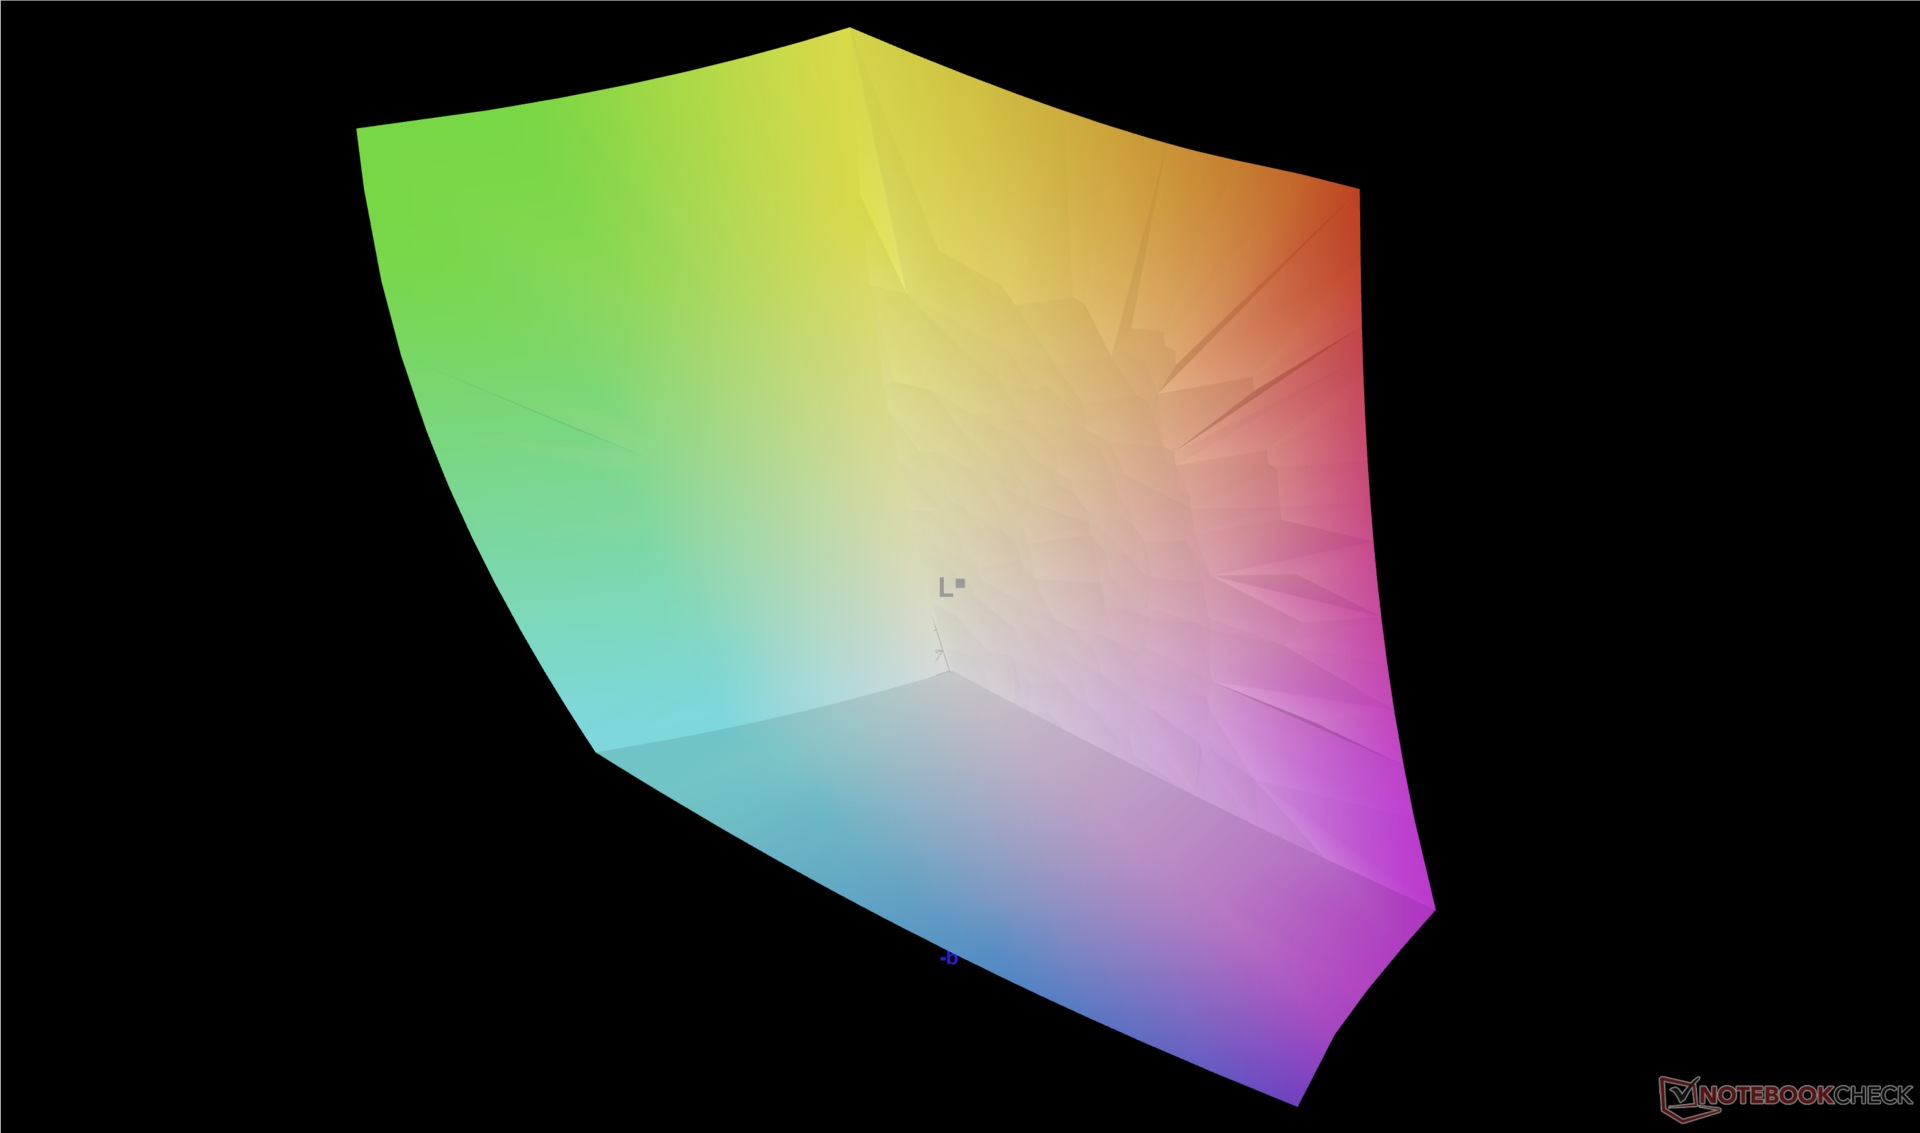
El panel está decentemente calibrado fuera de la caja contra el estándar P3 con valores promedio de escala de grises y color deltaE de sólo 1,8 y 4,68, respectivamente.
Tiempos de respuesta del display
| ↔ Tiempo de respuesta de Negro a Blanco | ||
|---|---|---|
| 1.36 ms ... subida ↗ y bajada ↘ combinada | ↗ 0.52 ms subida | 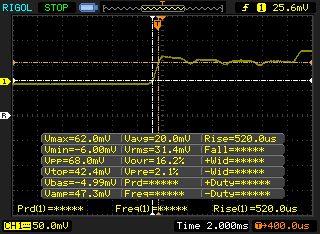 |
| ↘ 0.84 ms bajada | ||
| La pantalla mostró tiempos de respuesta muy rápidos en nuestros tests y debería ser adecuada para juegos frenéticos. En comparación, todos los dispositivos de prueba van de ##min### (mínimo) a 240 (máximo) ms. » 8 % de todos los dispositivos son mejores. Esto quiere decir que el tiempo de respuesta medido es mejor que la media (19.8 ms) de todos los dispositivos testados. | ||
| ↔ Tiempo de respuesta 50% Gris a 80% Gris | ||
| 1.36 ms ... subida ↗ y bajada ↘ combinada | ↗ 0.68 ms subida | 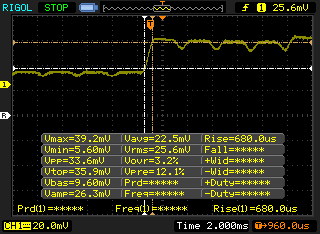 |
| ↘ 0.68 ms bajada | ||
| La pantalla mostró tiempos de respuesta muy rápidos en nuestros tests y debería ser adecuada para juegos frenéticos. En comparación, todos los dispositivos de prueba van de ##min### (mínimo) a 636 (máximo) ms. » 6 % de todos los dispositivos son mejores. Esto quiere decir que el tiempo de respuesta medido es mejor que la media (30.9 ms) de todos los dispositivos testados. | ||
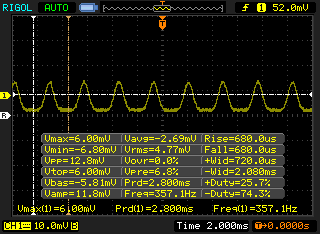
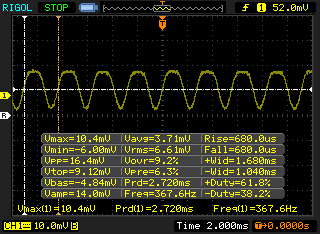
Parpadeo de Pantalla / PWM (Pulse-Width Modulation)
| Parpadeo de Pantalla / PWM detectado | 367.6 Hz | ≤ 100 % de brillo |  |
La retroiluminación del display parpadea a 367.6 Hz (seguramente usa PWM - Pulse-Width Modulation) a un brillo del 100 % e inferior. Sobre este nivel de brillo no debería darse parpadeo / PWM. La frecuencia de 367.6 Hz es relativamente alta, por lo que la mayoría de gente no debería ver parpadeo o tener fatiga visual. Sin embargo, hay informes de que algunas personas pueden seguir viendo parpadeos a 500 Hz y superior, por lo que cuidado. Comparación: 52 % de todos los dispositivos testados no usaron PWM para atenuar el display. Si se usó, medimos una media de 7748 (mínimo: 5 - máxmo: 343500) Hz. | |||
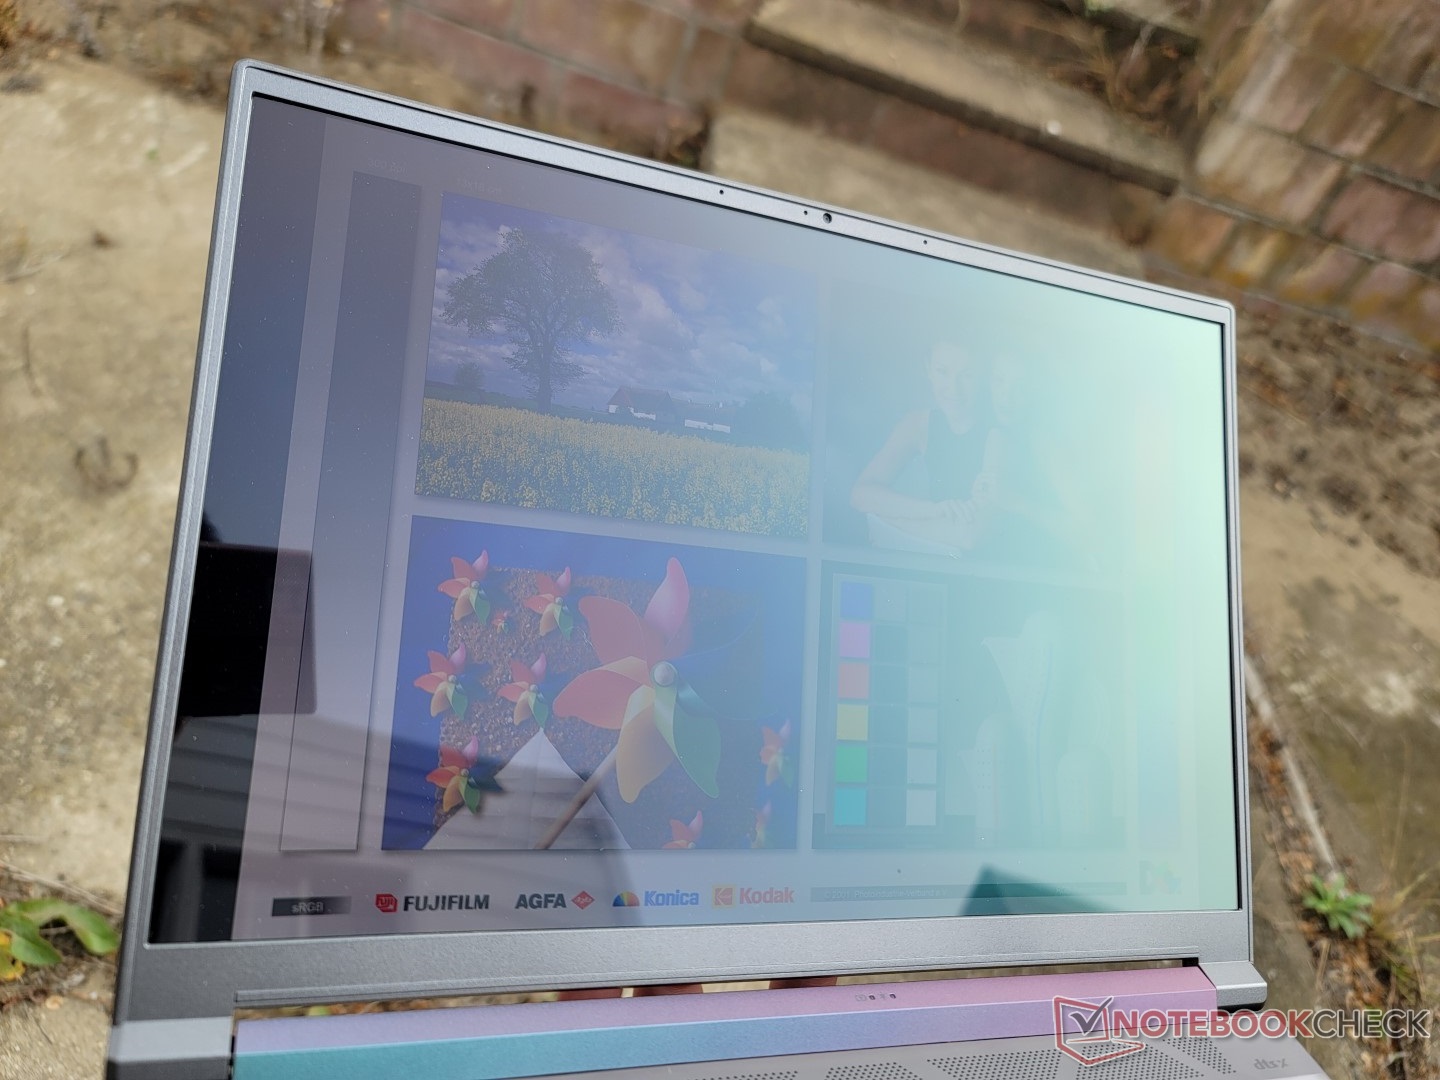
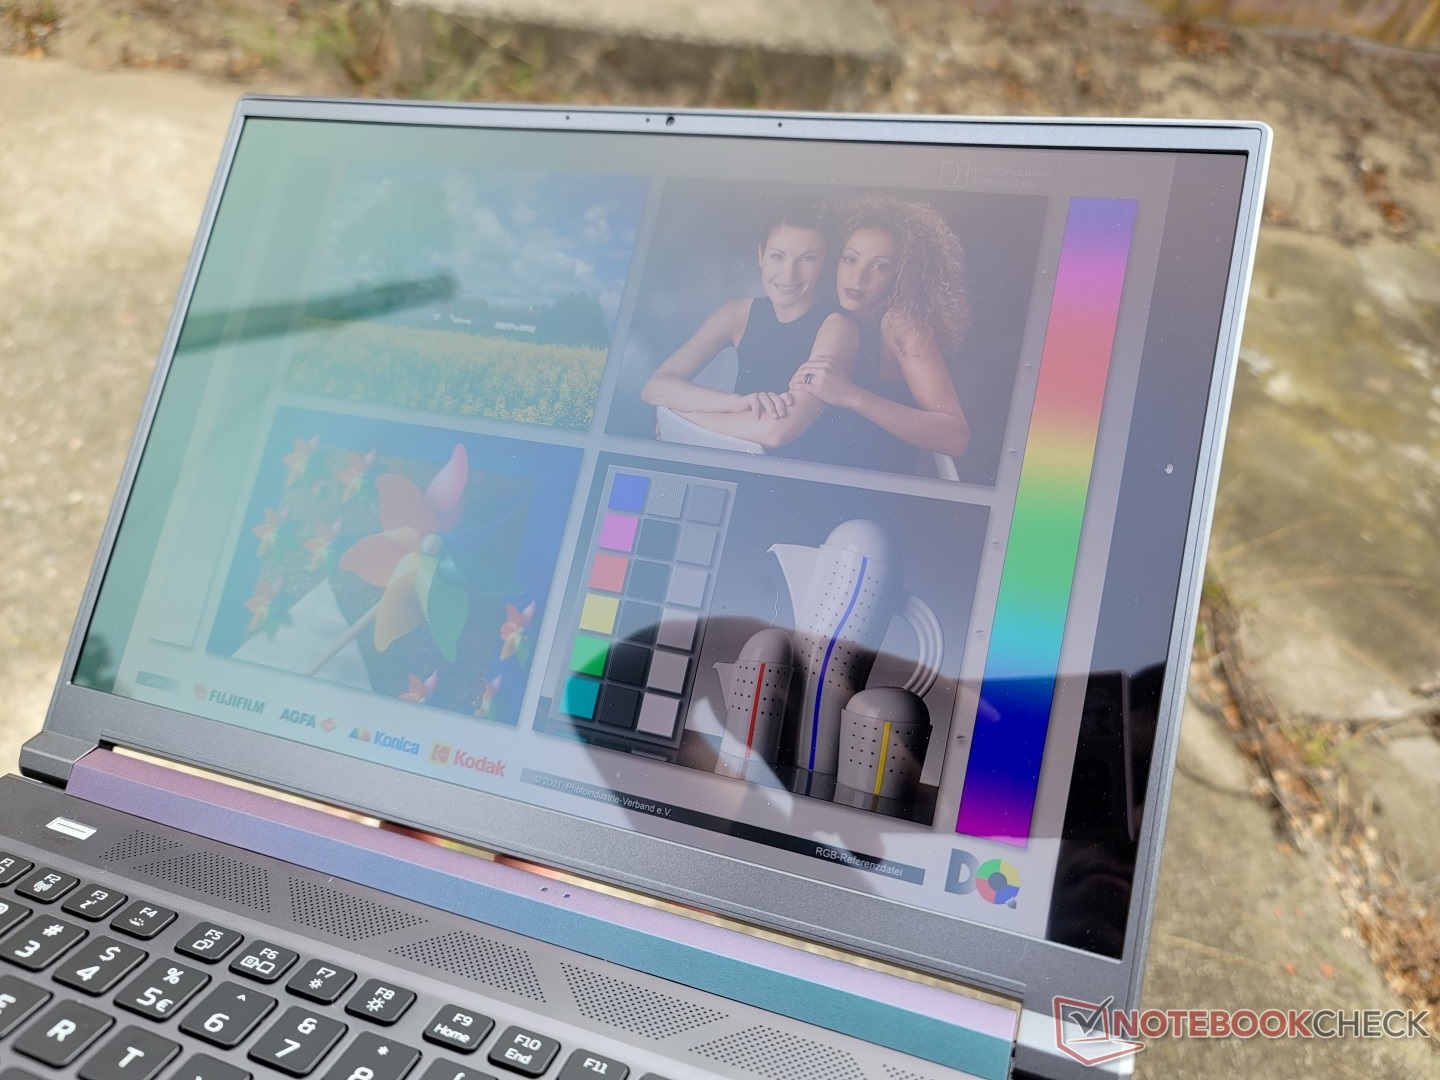
La visibilidad en exteriores es decente si está a la sombra debido a los profundos niveles de negro y los colores del panel OLED brillante. Sin embargo, los reflejos son inevitables en la mayoría de las condiciones. La pantalla mate del Zephyrus G14 es unos 100 nits más brillante para facilitar la lectura.
Rendimiento - Core i9 de 12ª generación
Condiciones de la prueba
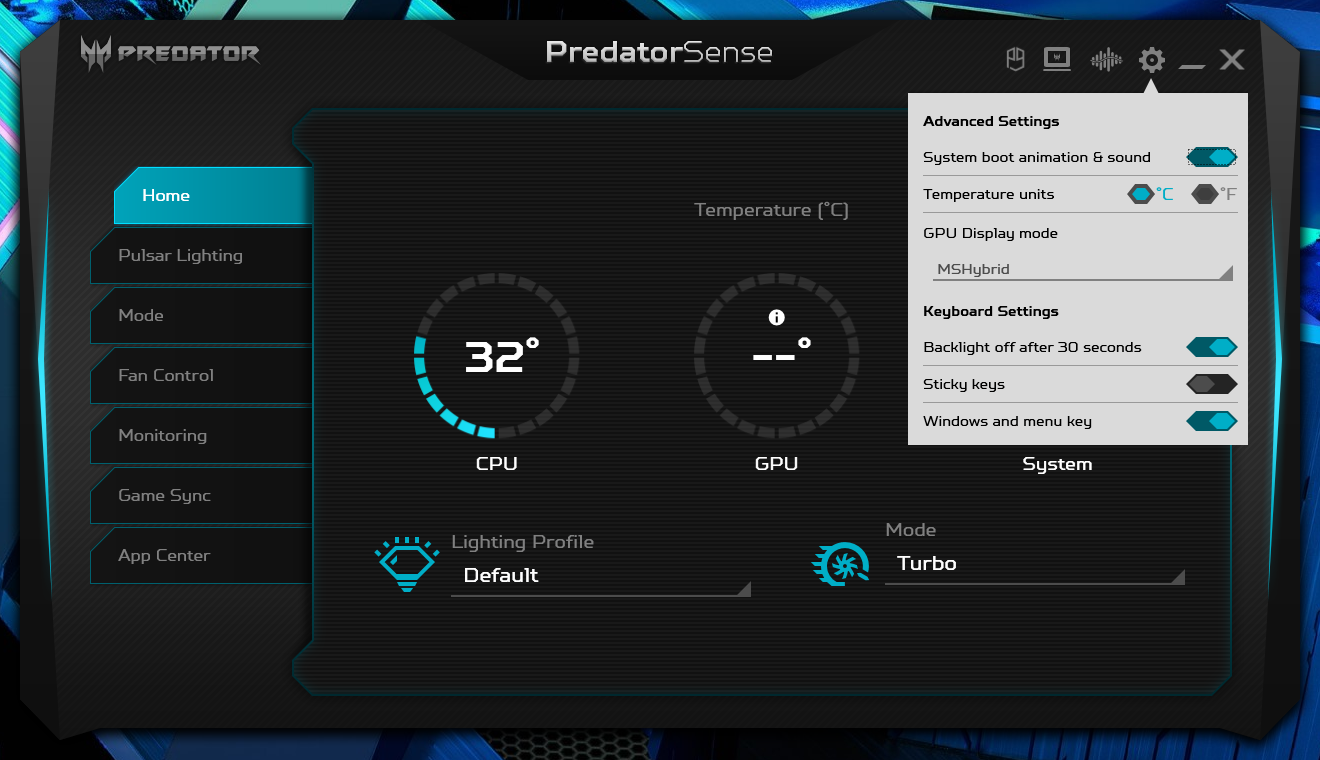
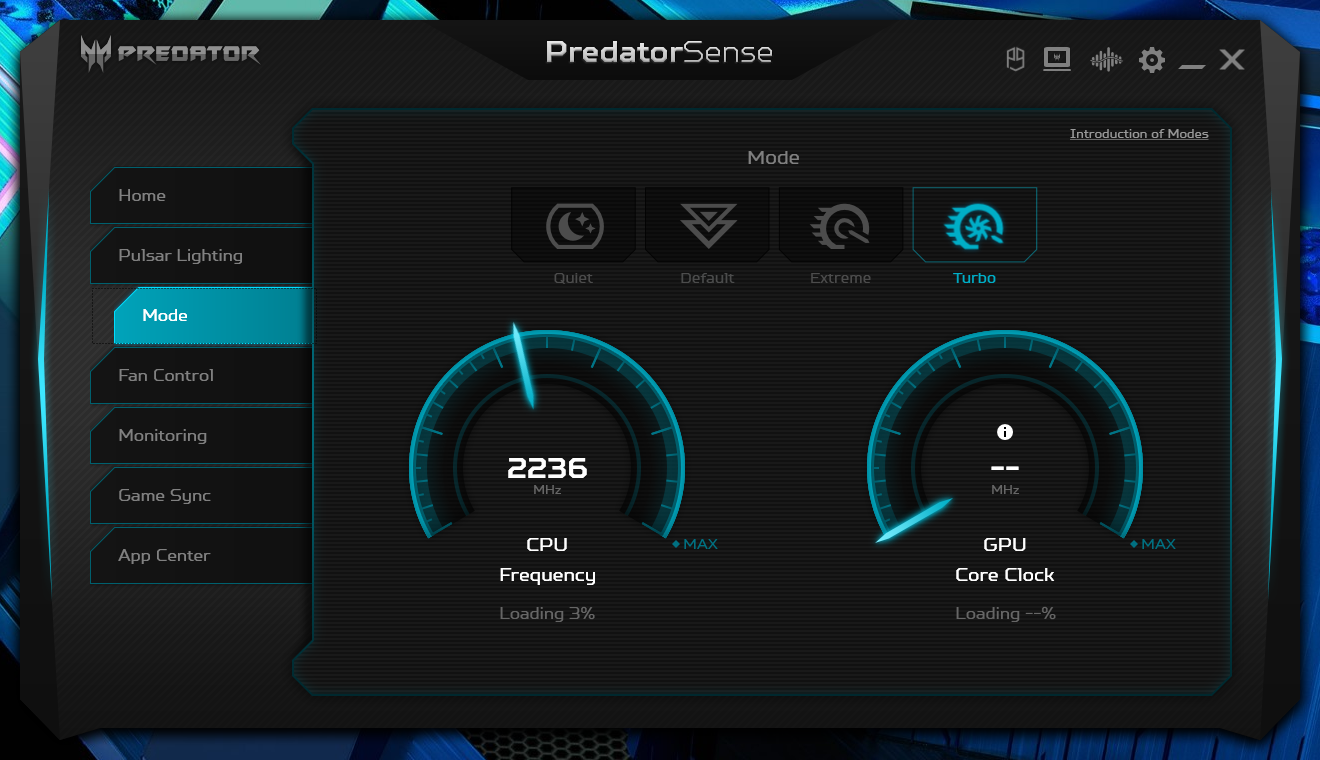
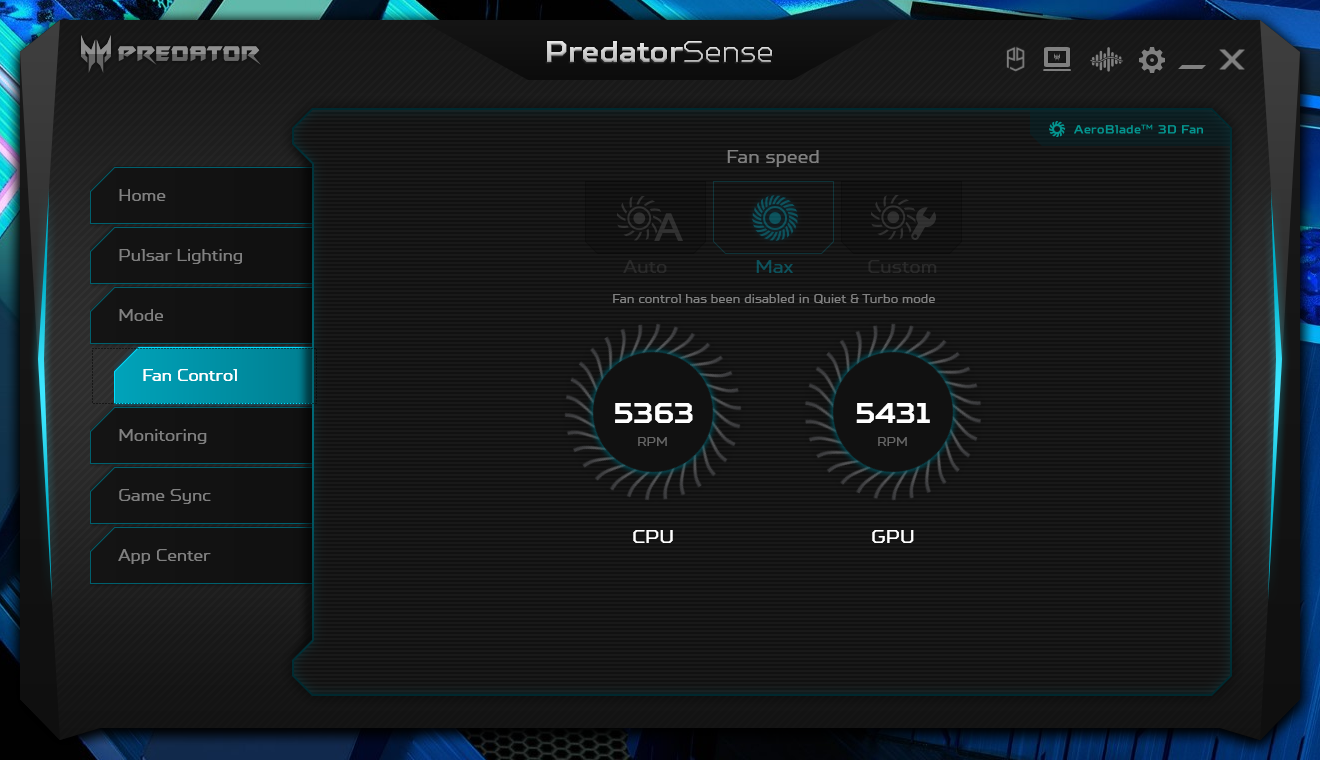
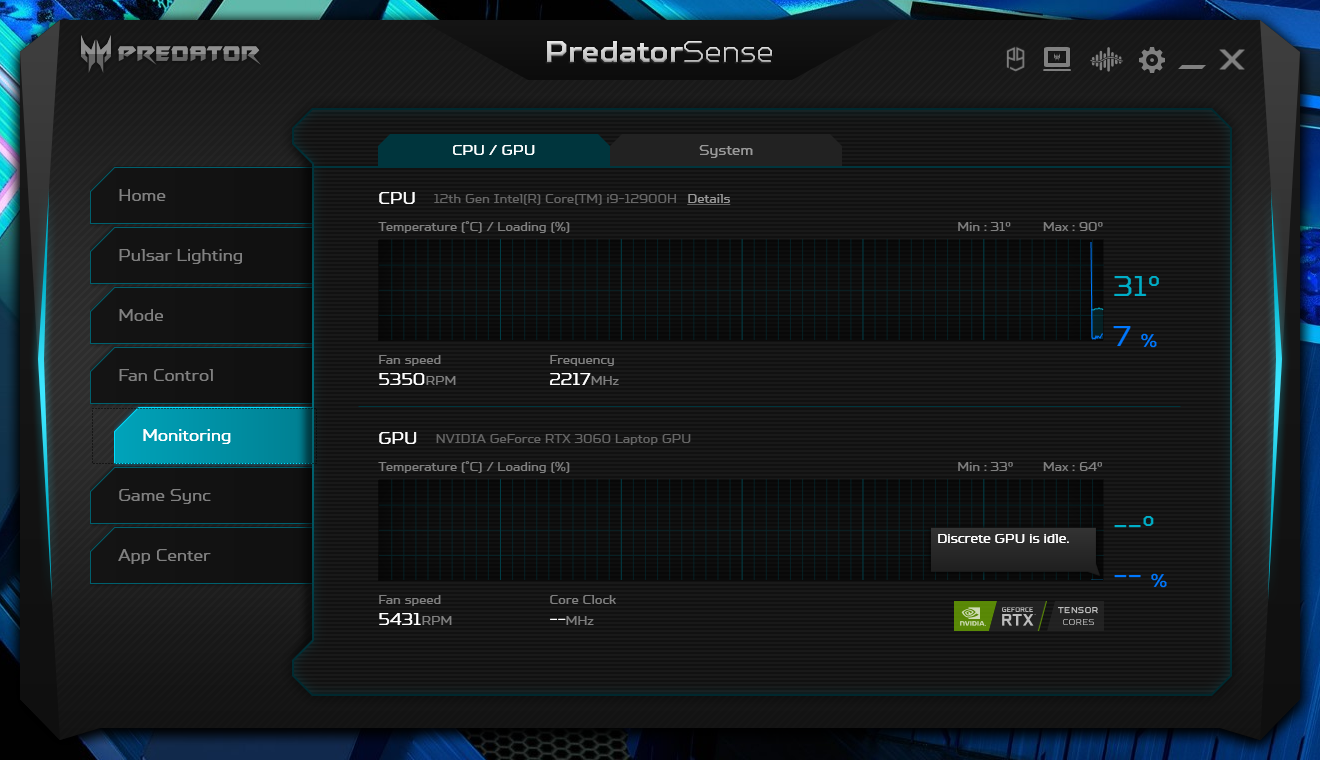
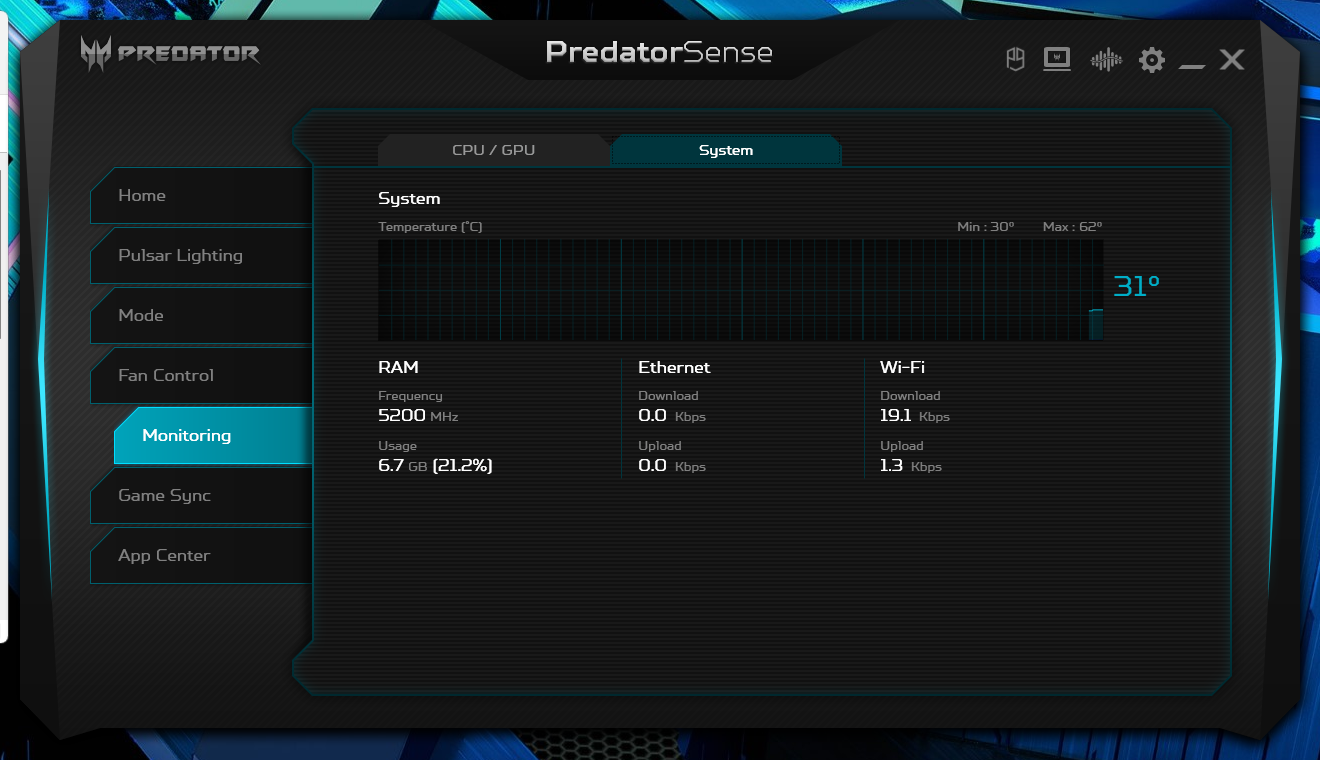
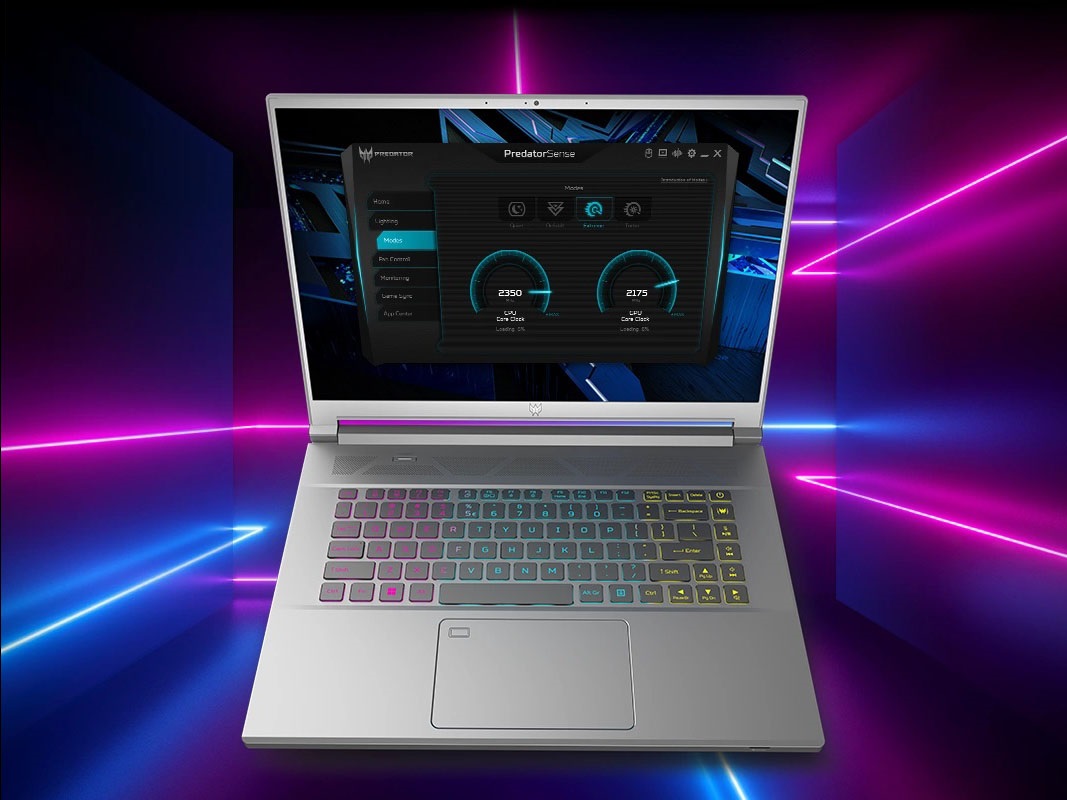
Hemos configurado nuestra unidad en el modo "Mejor rendimiento" a través de Windows y en el modo "Turbo" a través del software PredatorSense preinstalado antes de ejecutar cualquier prueba de rendimiento. Se recomienda que los propietarios se familiaricen con PredatorSense, ya que es el principal centro de control para ajustar la retroiluminación del teclado, los ventiladores, la configuración de arranque, y más, como se muestra en las capturas de pantalla a continuación
Desafortunadamente, MUX sólo está disponible en los SKUs no-OLED como ha confirmado Acer. Al intentar salir del modo MSHybrid a través de PredatorSense, nuestra unidad se bloqueó.
Procesador
El rendimiento de la CPU es uno de los más rápidos de cualquier portátil de 14 pulgadas para juegos. Para algo significativamente más rápido, tendrías que considerar modelos más grandes como el MSI GE77 con elCore i9-12900HX. Aun así, el Core i9-12900H de nuestro Acer de 14 pulgadas es incapaz de mantener velocidades de reloj Turbo Boost muy altas durante periodos prolongados, como mostrará nuestra sección de pruebas de estrés más adelante
El cambio al Core i7-12700H Sólo puede suponer un déficit de rendimiento de entre el 1 y el 2 por ciento, según el tiempo que hemos pasado con el Alienware x14. Los compradores potenciales pueden ahorrar unos cientos de dólares de esta manera y recibir esencialmente el mismo rendimiento del procesador que el más caro Core i9-12900H.
Cinebench R15 Multi Loop
Cinebench R23: Multi Core | Single Core
Cinebench R15: CPU Multi 64Bit | CPU Single 64Bit
Blender: v2.79 BMW27 CPU
7-Zip 18.03: 7z b 4 | 7z b 4 -mmt1
Geekbench 5.5: Multi-Core | Single-Core
HWBOT x265 Benchmark v2.2: 4k Preset
LibreOffice : 20 Documents To PDF
R Benchmark 2.5: Overall mean
| Cinebench R20 / CPU (Multi Core) | |
| MSI Raider GE77 HX 12UHS | |
| Acer Predator Triton 300 SE | |
| Alienware x14 i7 RTX 3060 | |
| Medio Intel Core i9-12900H (2681 - 7471, n=28) | |
| Lenovo IdeaPad Gaming 3 15IAH7 | |
| Razer Blade 14 Ryzen 9 6900HX | |
| Acer Nitro 5 AN515-46-R1A1 | |
| Razer Blade 14 Ryzen 9 RTX 3070 | |
| Asus ROG Zephyrus G14 GA402RJ | |
| Asus ZenBook 14X UM5401QA-KN162 | |
| Lenovo Legion 5 Pro 16 ARH7H-82RG0047GE | |
| Schenker Vision 14 | |
| Cinebench R20 / CPU (Single Core) | |
| MSI Raider GE77 HX 12UHS | |
| Acer Predator Triton 300 SE | |
| Medio Intel Core i9-12900H (624 - 738, n=28) | |
| Alienware x14 i7 RTX 3060 | |
| Lenovo IdeaPad Gaming 3 15IAH7 | |
| Acer Nitro 5 AN515-46-R1A1 | |
| Razer Blade 14 Ryzen 9 6900HX | |
| Schenker Vision 14 | |
| Lenovo Legion 5 Pro 16 ARH7H-82RG0047GE | |
| Asus ROG Zephyrus G14 GA402RJ | |
| Asus ZenBook 14X UM5401QA-KN162 | |
| Razer Blade 14 Ryzen 9 RTX 3070 | |
| Cinebench R23 / Multi Core | |
| MSI Raider GE77 HX 12UHS | |
| Acer Predator Triton 300 SE | |
| Alienware x14 i7 RTX 3060 | |
| Medio Intel Core i9-12900H (7359 - 19648, n=28) | |
| Lenovo IdeaPad Gaming 3 15IAH7 | |
| Razer Blade 14 Ryzen 9 6900HX | |
| Acer Nitro 5 AN515-46-R1A1 | |
| Razer Blade 14 Ryzen 9 RTX 3070 | |
| Asus ROG Zephyrus G14 GA402RJ | |
| Asus ZenBook 14X UM5401QA-KN162 | |
| Lenovo Legion 5 Pro 16 ARH7H-82RG0047GE | |
| Schenker Vision 14 | |
| Cinebench R23 / Single Core | |
| Acer Predator Triton 300 SE | |
| MSI Raider GE77 HX 12UHS | |
| Medio Intel Core i9-12900H (1634 - 1930, n=28) | |
| Alienware x14 i7 RTX 3060 | |
| Lenovo IdeaPad Gaming 3 15IAH7 | |
| Acer Nitro 5 AN515-46-R1A1 | |
| Razer Blade 14 Ryzen 9 6900HX | |
| Schenker Vision 14 | |
| Lenovo Legion 5 Pro 16 ARH7H-82RG0047GE | |
| Asus ROG Zephyrus G14 GA402RJ | |
| Asus ZenBook 14X UM5401QA-KN162 | |
| Razer Blade 14 Ryzen 9 RTX 3070 | |
| Cinebench R15 / CPU Multi 64Bit | |
| MSI Raider GE77 HX 12UHS | |
| Alienware x14 i7 RTX 3060 | |
| Medio Intel Core i9-12900H (1395 - 3077, n=28) | |
| Acer Predator Triton 300 SE | |
| Razer Blade 14 Ryzen 9 6900HX | |
| Lenovo IdeaPad Gaming 3 15IAH7 | |
| Acer Nitro 5 AN515-46-R1A1 | |
| Razer Blade 14 Ryzen 9 RTX 3070 | |
| Asus ROG Zephyrus G14 GA402RJ | |
| Asus ZenBook 14X UM5401QA-KN162 | |
| Lenovo Legion 5 Pro 16 ARH7H-82RG0047GE | |
| Schenker Vision 14 | |
| Schenker Vision 14 | |
| Cinebench R15 / CPU Single 64Bit | |
| MSI Raider GE77 HX 12UHS | |
| Acer Predator Triton 300 SE | |
| Medio Intel Core i9-12900H (235 - 277, n=29) | |
| Alienware x14 i7 RTX 3060 | |
| Acer Nitro 5 AN515-46-R1A1 | |
| Lenovo IdeaPad Gaming 3 15IAH7 | |
| Razer Blade 14 Ryzen 9 6900HX | |
| Lenovo Legion 5 Pro 16 ARH7H-82RG0047GE | |
| Asus ROG Zephyrus G14 GA402RJ | |
| Schenker Vision 14 | |
| Asus ZenBook 14X UM5401QA-KN162 | |
| Razer Blade 14 Ryzen 9 RTX 3070 | |
| Blender / v2.79 BMW27 CPU | |
| Schenker Vision 14 | |
| Lenovo Legion 5 Pro 16 ARH7H-82RG0047GE | |
| Asus ZenBook 14X UM5401QA-KN162 | |
| Asus ROG Zephyrus G14 GA402RJ | |
| Razer Blade 14 Ryzen 9 RTX 3070 | |
| Acer Nitro 5 AN515-46-R1A1 | |
| Medio Intel Core i9-12900H (160 - 451, n=28) | |
| Alienware x14 i7 RTX 3060 | |
| Lenovo IdeaPad Gaming 3 15IAH7 | |
| Razer Blade 14 Ryzen 9 6900HX | |
| Acer Predator Triton 300 SE | |
| MSI Raider GE77 HX 12UHS | |
| 7-Zip 18.03 / 7z b 4 | |
| MSI Raider GE77 HX 12UHS | |
| Alienware x14 i7 RTX 3060 | |
| Acer Predator Triton 300 SE | |
| Razer Blade 14 Ryzen 9 6900HX | |
| Acer Nitro 5 AN515-46-R1A1 | |
| Medio Intel Core i9-12900H (34684 - 76677, n=28) | |
| Asus ROG Zephyrus G14 GA402RJ | |
| Asus ZenBook 14X UM5401QA-KN162 | |
| Razer Blade 14 Ryzen 9 RTX 3070 | |
| Lenovo Legion 5 Pro 16 ARH7H-82RG0047GE | |
| Lenovo IdeaPad Gaming 3 15IAH7 | |
| Schenker Vision 14 | |
| 7-Zip 18.03 / 7z b 4 -mmt1 | |
| MSI Raider GE77 HX 12UHS | |
| Medio Intel Core i9-12900H (5302 - 6289, n=28) | |
| Razer Blade 14 Ryzen 9 6900HX | |
| Acer Nitro 5 AN515-46-R1A1 | |
| Alienware x14 i7 RTX 3060 | |
| Acer Predator Triton 300 SE | |
| Lenovo Legion 5 Pro 16 ARH7H-82RG0047GE | |
| Schenker Vision 14 | |
| Asus ROG Zephyrus G14 GA402RJ | |
| Lenovo IdeaPad Gaming 3 15IAH7 | |
| Asus ZenBook 14X UM5401QA-KN162 | |
| Razer Blade 14 Ryzen 9 RTX 3070 | |
| Geekbench 5.5 / Multi-Core | |
| MSI Raider GE77 HX 12UHS | |
| Alienware x14 i7 RTX 3060 | |
| Acer Predator Triton 300 SE | |
| Medio Intel Core i9-12900H (8519 - 14376, n=31) | |
| Razer Blade 14 Ryzen 9 6900HX | |
| Acer Nitro 5 AN515-46-R1A1 | |
| Asus ROG Zephyrus G14 GA402RJ | |
| Asus ZenBook 14X UM5401QA-KN162 | |
| Lenovo IdeaPad Gaming 3 15IAH7 | |
| Lenovo Legion 5 Pro 16 ARH7H-82RG0047GE | |
| Schenker Vision 14 | |
| Geekbench 5.5 / Single-Core | |
| MSI Raider GE77 HX 12UHS | |
| Acer Predator Triton 300 SE | |
| Medio Intel Core i9-12900H (1631 - 1897, n=31) | |
| Alienware x14 i7 RTX 3060 | |
| Lenovo IdeaPad Gaming 3 15IAH7 | |
| Schenker Vision 14 | |
| Razer Blade 14 Ryzen 9 6900HX | |
| Acer Nitro 5 AN515-46-R1A1 | |
| Asus ROG Zephyrus G14 GA402RJ | |
| Lenovo Legion 5 Pro 16 ARH7H-82RG0047GE | |
| Asus ZenBook 14X UM5401QA-KN162 | |
| HWBOT x265 Benchmark v2.2 / 4k Preset | |
| MSI Raider GE77 HX 12UHS | |
| Acer Predator Triton 300 SE | |
| Razer Blade 14 Ryzen 9 6900HX | |
| Alienware x14 i7 RTX 3060 | |
| Medio Intel Core i9-12900H (8.05 - 22.5, n=28) | |
| Acer Nitro 5 AN515-46-R1A1 | |
| Lenovo IdeaPad Gaming 3 15IAH7 | |
| Razer Blade 14 Ryzen 9 RTX 3070 | |
| Asus ROG Zephyrus G14 GA402RJ | |
| Lenovo Legion 5 Pro 16 ARH7H-82RG0047GE | |
| Asus ZenBook 14X UM5401QA-KN162 | |
| Schenker Vision 14 | |
| LibreOffice / 20 Documents To PDF | |
| Lenovo Legion 5 Pro 16 ARH7H-82RG0047GE | |
| Razer Blade 14 Ryzen 9 RTX 3070 | |
| Asus ROG Zephyrus G14 GA402RJ | |
| Asus ZenBook 14X UM5401QA-KN162 | |
| Acer Nitro 5 AN515-46-R1A1 | |
| Razer Blade 14 Ryzen 9 6900HX | |
| Lenovo IdeaPad Gaming 3 15IAH7 | |
| Schenker Vision 14 | |
| MSI Raider GE77 HX 12UHS | |
| Medio Intel Core i9-12900H (36.8 - 59.8, n=28) | |
| Acer Predator Triton 300 SE | |
| Alienware x14 i7 RTX 3060 | |
| R Benchmark 2.5 / Overall mean | |
| Razer Blade 14 Ryzen 9 RTX 3070 | |
| Schenker Vision 14 | |
| Asus ZenBook 14X UM5401QA-KN162 | |
| Asus ROG Zephyrus G14 GA402RJ | |
| Lenovo IdeaPad Gaming 3 15IAH7 | |
| Lenovo Legion 5 Pro 16 ARH7H-82RG0047GE | |
| Acer Nitro 5 AN515-46-R1A1 | |
| Razer Blade 14 Ryzen 9 6900HX | |
| Alienware x14 i7 RTX 3060 | |
| Medio Intel Core i9-12900H (0.4218 - 0.506, n=28) | |
| Acer Predator Triton 300 SE | |
| MSI Raider GE77 HX 12UHS | |
* ... más pequeño es mejor
AIDA64: FP32 Ray-Trace | FPU Julia | CPU SHA3 | CPU Queen | FPU SinJulia | FPU Mandel | CPU AES | CPU ZLib | FP64 Ray-Trace | CPU PhotoWorxx
| Performance rating | |
| Razer Blade 14 Ryzen 9 6900HX | |
| Acer Predator Triton 300 SE | |
| Asus ROG Zephyrus G14 GA402RJ | |
| Medio Intel Core i9-12900H | |
| Dell Inspiron 14 Plus 7420 | |
| Alienware x14 i7 RTX 3060 | |
| Schenker Vision 14 | |
| AIDA64 / FP32 Ray-Trace | |
| Razer Blade 14 Ryzen 9 6900HX | |
| Acer Predator Triton 300 SE | |
| Asus ROG Zephyrus G14 GA402RJ | |
| Dell Inspiron 14 Plus 7420 | |
| Medio Intel Core i9-12900H (4074 - 18289, n=29) | |
| Schenker Vision 14 | |
| Alienware x14 i7 RTX 3060 | |
| AIDA64 / FPU Julia | |
| Razer Blade 14 Ryzen 9 6900HX | |
| Asus ROG Zephyrus G14 GA402RJ | |
| Acer Predator Triton 300 SE | |
| Dell Inspiron 14 Plus 7420 | |
| Medio Intel Core i9-12900H (22307 - 93236, n=29) | |
| Alienware x14 i7 RTX 3060 | |
| Schenker Vision 14 | |
| AIDA64 / CPU SHA3 | |
| Acer Predator Triton 300 SE | |
| Razer Blade 14 Ryzen 9 6900HX | |
| Medio Intel Core i9-12900H (1378 - 4215, n=29) | |
| Asus ROG Zephyrus G14 GA402RJ | |
| Alienware x14 i7 RTX 3060 | |
| Dell Inspiron 14 Plus 7420 | |
| Schenker Vision 14 | |
| AIDA64 / CPU Queen | |
| Acer Predator Triton 300 SE | |
| Razer Blade 14 Ryzen 9 6900HX | |
| Asus ROG Zephyrus G14 GA402RJ | |
| Medio Intel Core i9-12900H (78172 - 111241, n=28) | |
| Alienware x14 i7 RTX 3060 | |
| Dell Inspiron 14 Plus 7420 | |
| Schenker Vision 14 | |
| AIDA64 / FPU SinJulia | |
| Razer Blade 14 Ryzen 9 6900HX | |
| Asus ROG Zephyrus G14 GA402RJ | |
| Acer Predator Triton 300 SE | |
| Alienware x14 i7 RTX 3060 | |
| Medio Intel Core i9-12900H (5709 - 10410, n=29) | |
| Dell Inspiron 14 Plus 7420 | |
| Schenker Vision 14 | |
| AIDA64 / FPU Mandel | |
| Razer Blade 14 Ryzen 9 6900HX | |
| Asus ROG Zephyrus G14 GA402RJ | |
| Acer Predator Triton 300 SE | |
| Dell Inspiron 14 Plus 7420 | |
| Medio Intel Core i9-12900H (11257 - 45581, n=29) | |
| Alienware x14 i7 RTX 3060 | |
| Schenker Vision 14 | |
| AIDA64 / CPU AES | |
| Razer Blade 14 Ryzen 9 6900HX | |
| Acer Predator Triton 300 SE | |
| Asus ROG Zephyrus G14 GA402RJ | |
| Alienware x14 i7 RTX 3060 | |
| Medio Intel Core i9-12900H (31935 - 151546, n=29) | |
| Schenker Vision 14 | |
| Dell Inspiron 14 Plus 7420 | |
| AIDA64 / CPU ZLib | |
| Acer Predator Triton 300 SE | |
| Alienware x14 i7 RTX 3060 | |
| Dell Inspiron 14 Plus 7420 | |
| Medio Intel Core i9-12900H (449 - 1193, n=29) | |
| Razer Blade 14 Ryzen 9 6900HX | |
| Asus ROG Zephyrus G14 GA402RJ | |
| Schenker Vision 14 | |
| AIDA64 / FP64 Ray-Trace | |
| Razer Blade 14 Ryzen 9 6900HX | |
| Acer Predator Triton 300 SE | |
| Asus ROG Zephyrus G14 GA402RJ | |
| Dell Inspiron 14 Plus 7420 | |
| Medio Intel Core i9-12900H (2235 - 10511, n=29) | |
| Alienware x14 i7 RTX 3060 | |
| Schenker Vision 14 | |
| AIDA64 / CPU PhotoWorxx | |
| Acer Predator Triton 300 SE | |
| Alienware x14 i7 RTX 3060 | |
| Medio Intel Core i9-12900H (20960 - 48269, n=30) | |
| Dell Inspiron 14 Plus 7420 | |
| Razer Blade 14 Ryzen 9 6900HX | |
| Schenker Vision 14 | |
| Asus ROG Zephyrus G14 GA402RJ | |
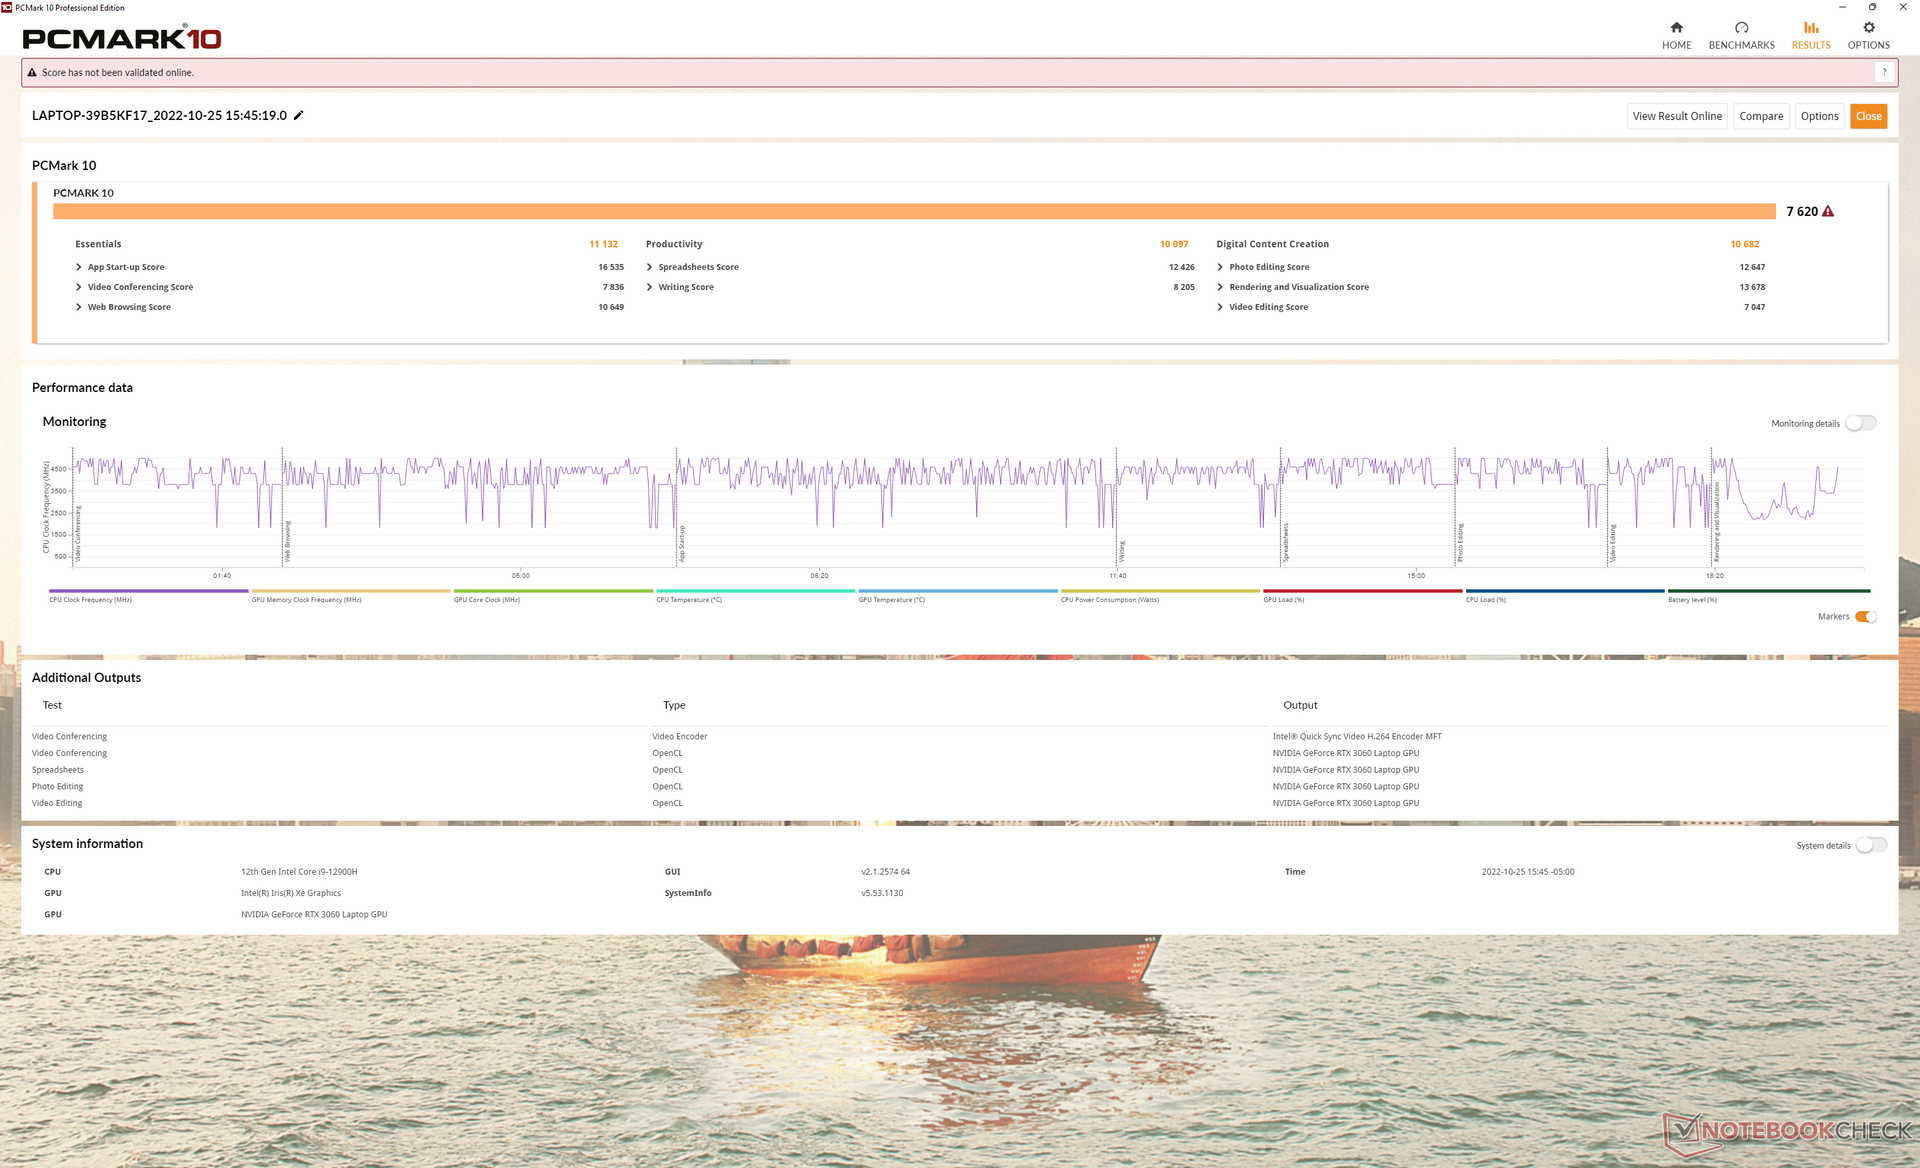
Rendimiento del sistema
Los resultados de PCMark son casi un 50% más rápidos que los del Predator Triton 300 de 2020, ya que el modelo anterior tenía una puntuación inusualmente baja en Creación de Contenido Digital. Las puntuaciones están ahora donde deberían estar en relación a otros portátiles de juego con las últimas CPUs Zen 3+ o Core H de 12ª generación como elDell G16.
CrossMark: Overall | Productivity | Creativity | Responsiveness
| CrossMark / Overall | |
| Acer Predator Triton 300 SE | |
| Alienware x14 i7 RTX 3060 | |
| Dell Inspiron 14 Plus 7420 | |
| Schenker Vision 14 | |
| CrossMark / Productivity | |
| Acer Predator Triton 300 SE | |
| Alienware x14 i7 RTX 3060 | |
| Dell Inspiron 14 Plus 7420 | |
| Schenker Vision 14 | |
| CrossMark / Creativity | |
| Acer Predator Triton 300 SE | |
| Alienware x14 i7 RTX 3060 | |
| Dell Inspiron 14 Plus 7420 | |
| Schenker Vision 14 | |
| CrossMark / Responsiveness | |
| Acer Predator Triton 300 SE | |
| Alienware x14 i7 RTX 3060 | |
| Schenker Vision 14 | |
| Dell Inspiron 14 Plus 7420 | |
| PCMark 10 Score | 7620 puntos | |
ayuda | ||
| AIDA64 / Memory Copy | |
| Alienware x14 i7 RTX 3060 | |
| Acer Predator Triton 300 SE | |
| Medio Intel Core i9-12900H (34438 - 74264, n=29) | |
| Dell Inspiron 14 Plus 7420 | |
| Razer Blade 14 Ryzen 9 6900HX | |
| Asus ROG Zephyrus G14 GA402RJ | |
| Schenker Vision 14 | |
| AIDA64 / Memory Read | |
| Alienware x14 i7 RTX 3060 | |
| Acer Predator Triton 300 SE | |
| Dell Inspiron 14 Plus 7420 | |
| Medio Intel Core i9-12900H (36365 - 74642, n=29) | |
| Razer Blade 14 Ryzen 9 6900HX | |
| Asus ROG Zephyrus G14 GA402RJ | |
| Schenker Vision 14 | |
| AIDA64 / Memory Write | |
| Alienware x14 i7 RTX 3060 | |
| Acer Predator Triton 300 SE | |
| Medio Intel Core i9-12900H (32276 - 67858, n=29) | |
| Dell Inspiron 14 Plus 7420 | |
| Asus ROG Zephyrus G14 GA402RJ | |
| Razer Blade 14 Ryzen 9 6900HX | |
| Schenker Vision 14 | |
| AIDA64 / Memory Latency | |
| Dell Inspiron 14 Plus 7420 | |
| Alienware x14 i7 RTX 3060 | |
| Acer Predator Triton 300 SE | |
| Asus ROG Zephyrus G14 GA402RJ | |
| Medio Intel Core i9-12900H (74.7 - 118.1, n=28) | |
| Razer Blade 14 Ryzen 9 6900HX | |
| Schenker Vision 14 | |
* ... más pequeño es mejor
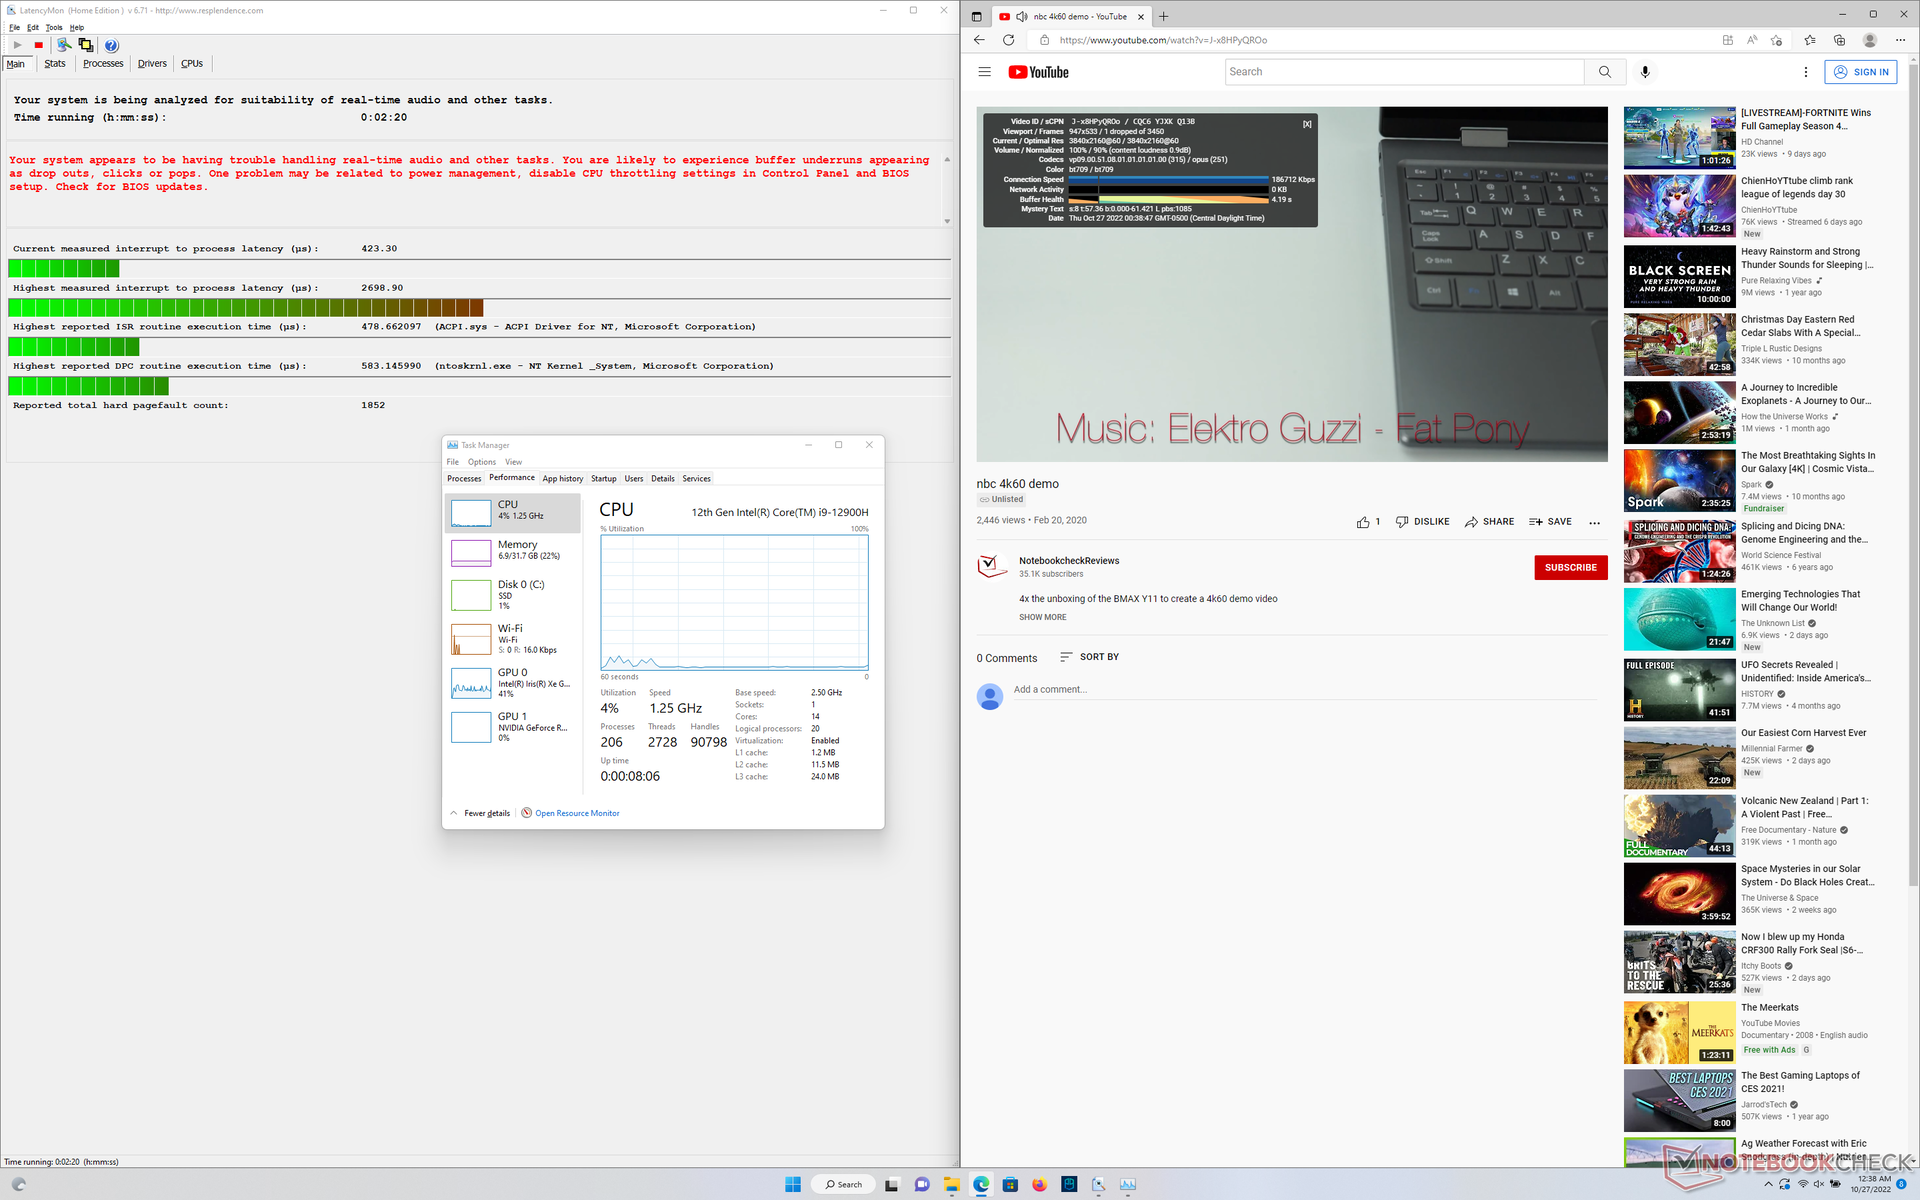
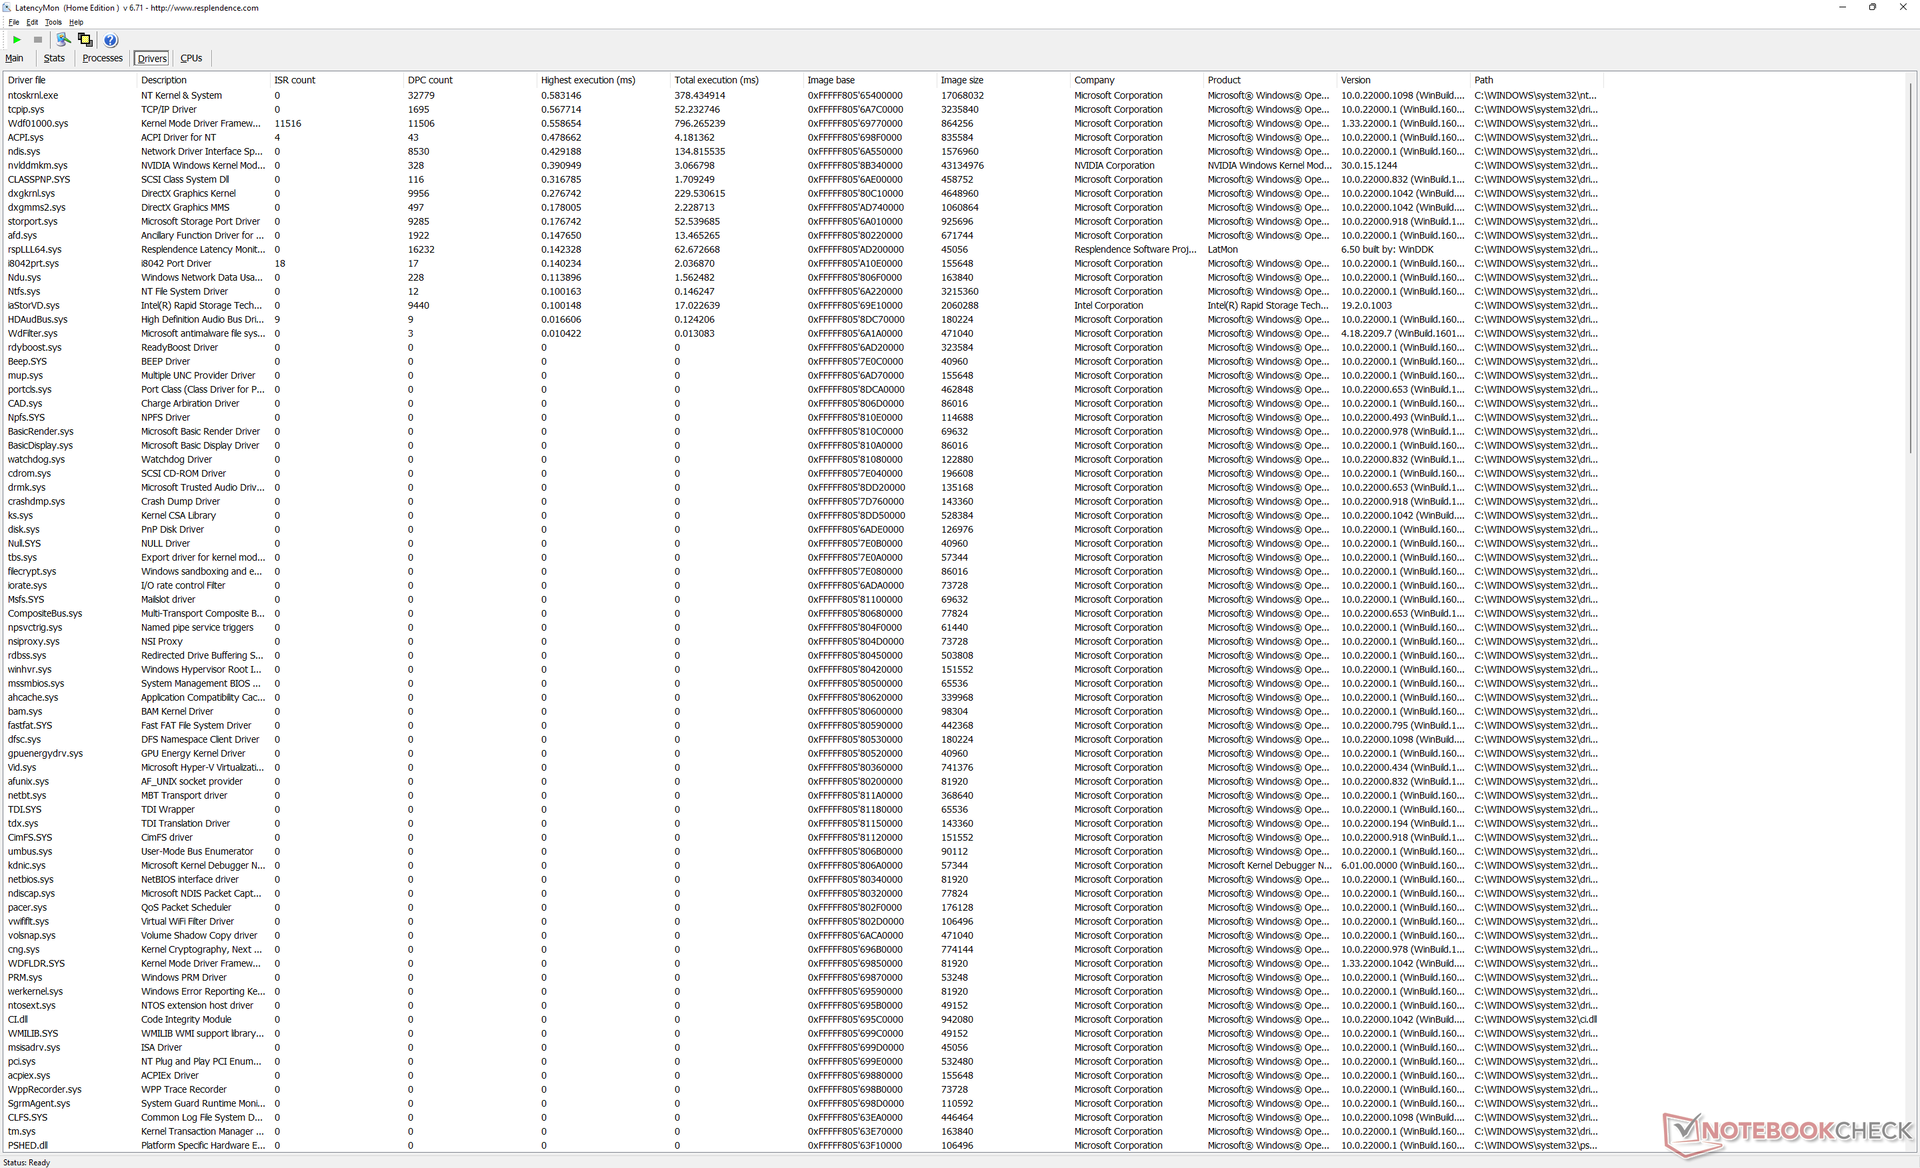
Latencia del CPD
LatencyMon revela problemas de CPD al abrir varias pestañas del navegador de nuestra página web. El 2020 Predator Triton 300 también sufría problemas de DPC similares, por lo que es un poco decepcionante ver que esto no se soluciona. Aparte de eso, no hay grandes saltos de frames al reproducir vídeo 4K60.
| DPC Latencies / LatencyMon - interrupt to process latency (max), Web, Youtube, Prime95 | |
| Acer Predator Triton 300 SE | |
| Razer Blade 14 Ryzen 9 6900HX | |
| Alienware x14 i7 RTX 3060 | |
| Asus ROG Zephyrus G14 GA402RJ | |
| Schenker Vision 14 | |
| Dell Inspiron 14 Plus 7420 | |
* ... más pequeño es mejor
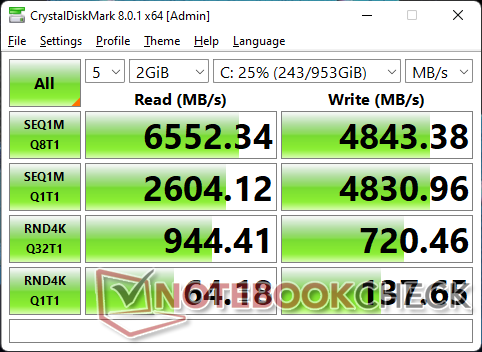
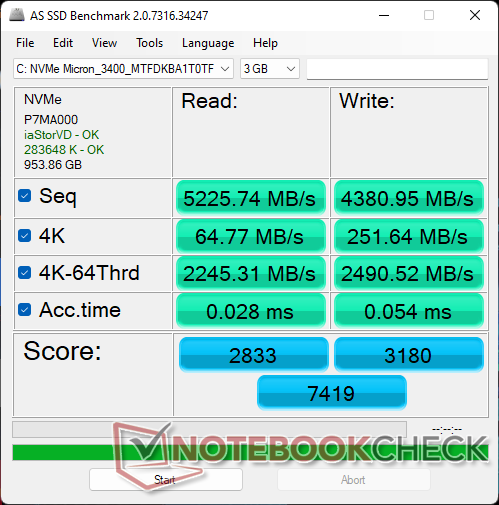
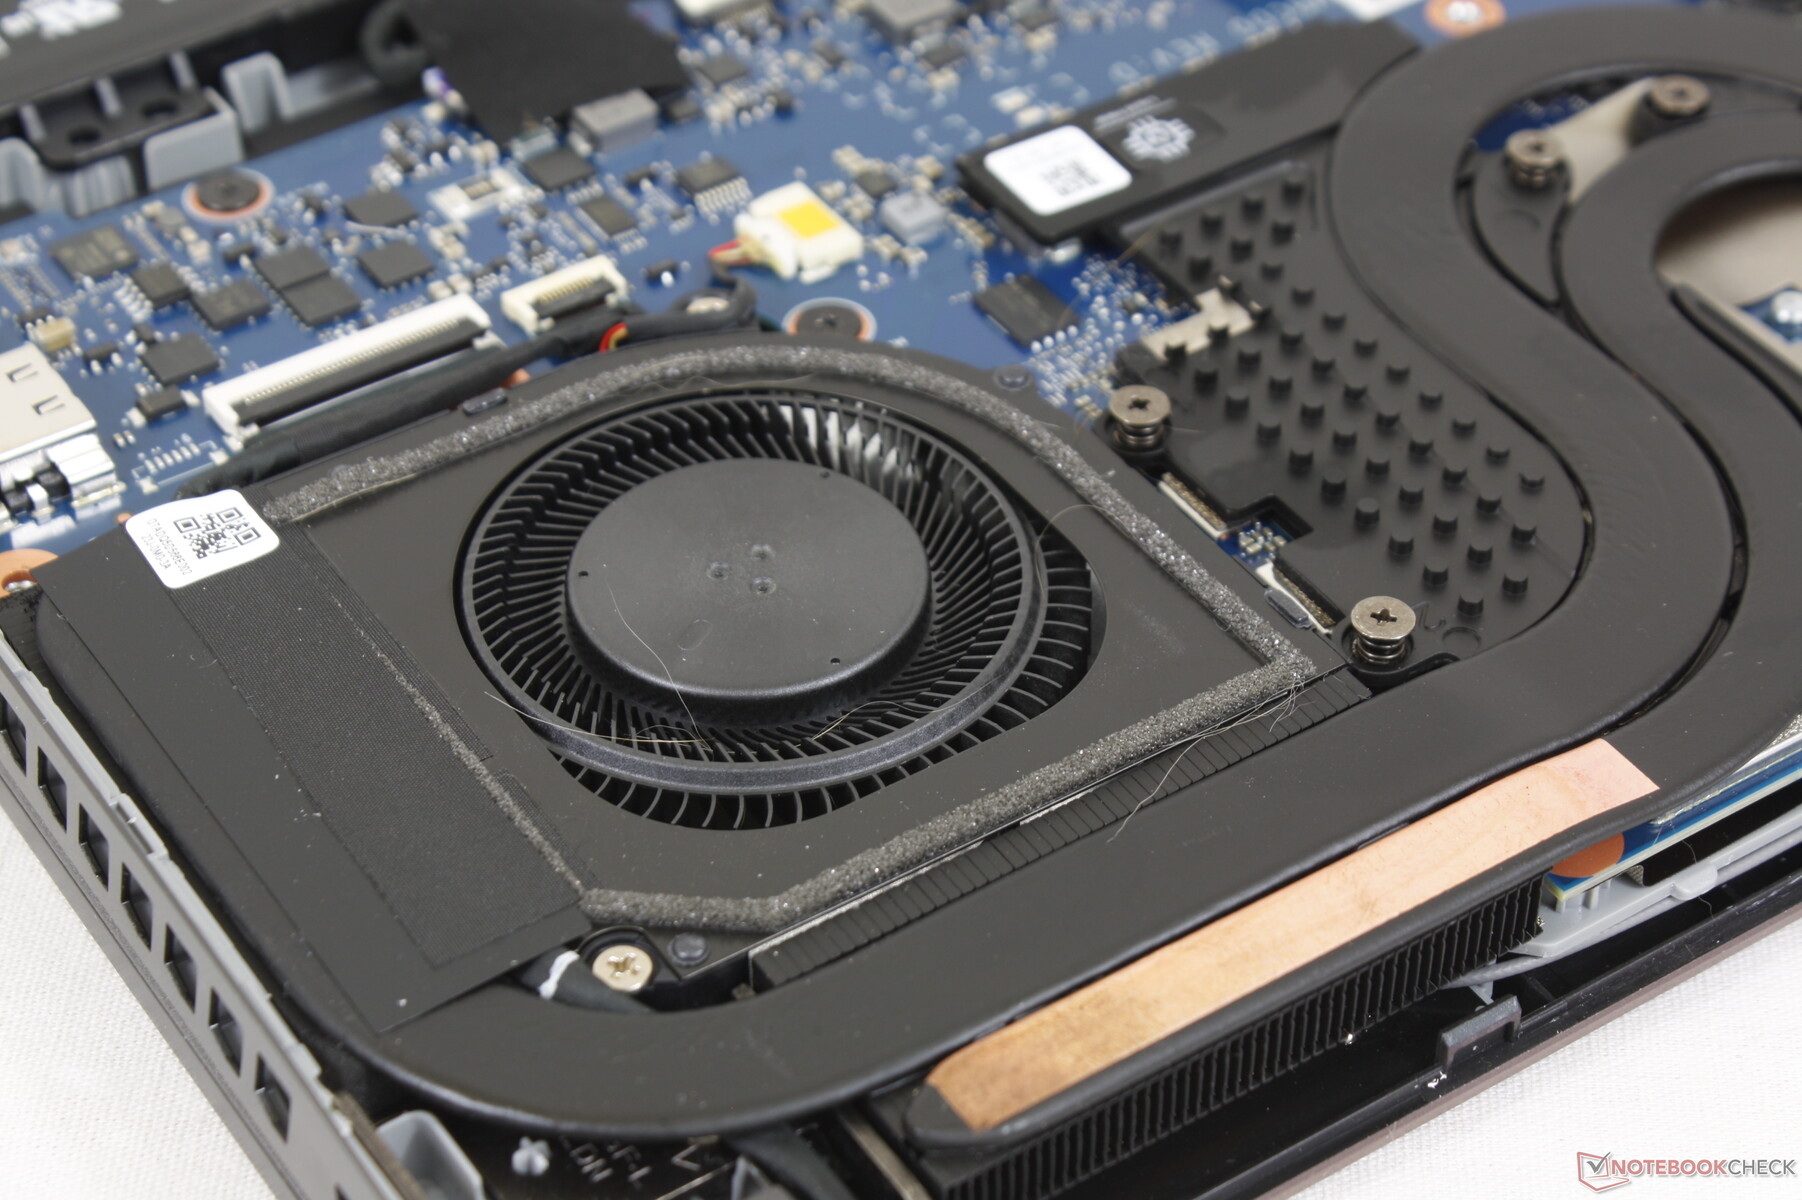
Dispositivos de almacenamiento - No se incluye el disipador de calor
Nuestra unidad de prueba viene con un 1 TB Micron 3400 PCIe4 NVMe SSD para velocidades de lectura y escritura secuenciales de hasta 6600 MB/s y 5000 MB/s, respectivamente. Por desgracia, la unidad es incapaz de mantener velocidades tan rápidas durante periodos prolongados, probablemente debido a la falta de un disipador de calor. Los resultados de nuestro bucle DiskSpd muestran tasas de lectura de hasta 6.500 MB/s durante el inicio de la prueba antes de caer a sólo 1.700 MB/s o incluso 400 MB/s con el tiempo. Competidores como el Razer Blade 14 son mucho mejores a la hora de mantener tasas de transferencia de SSD más rápidas en comparación.

| Drive Performance rating - Percent | |
| Razer Blade 14 Ryzen 9 6900HX | |
| Schenker Vision 14 | |
| Acer Predator Triton 300 SE -11! | |
| Alienware x14 i7 RTX 3060 | |
| Asus ROG Zephyrus G14 GA402RJ | |
| Dell Inspiron 14 Plus 7420 | |
* ... más pequeño es mejor
Disk Throttling: DiskSpd Read Loop, Queue Depth 8
Rendimiento de la GPU - 95 W TGP
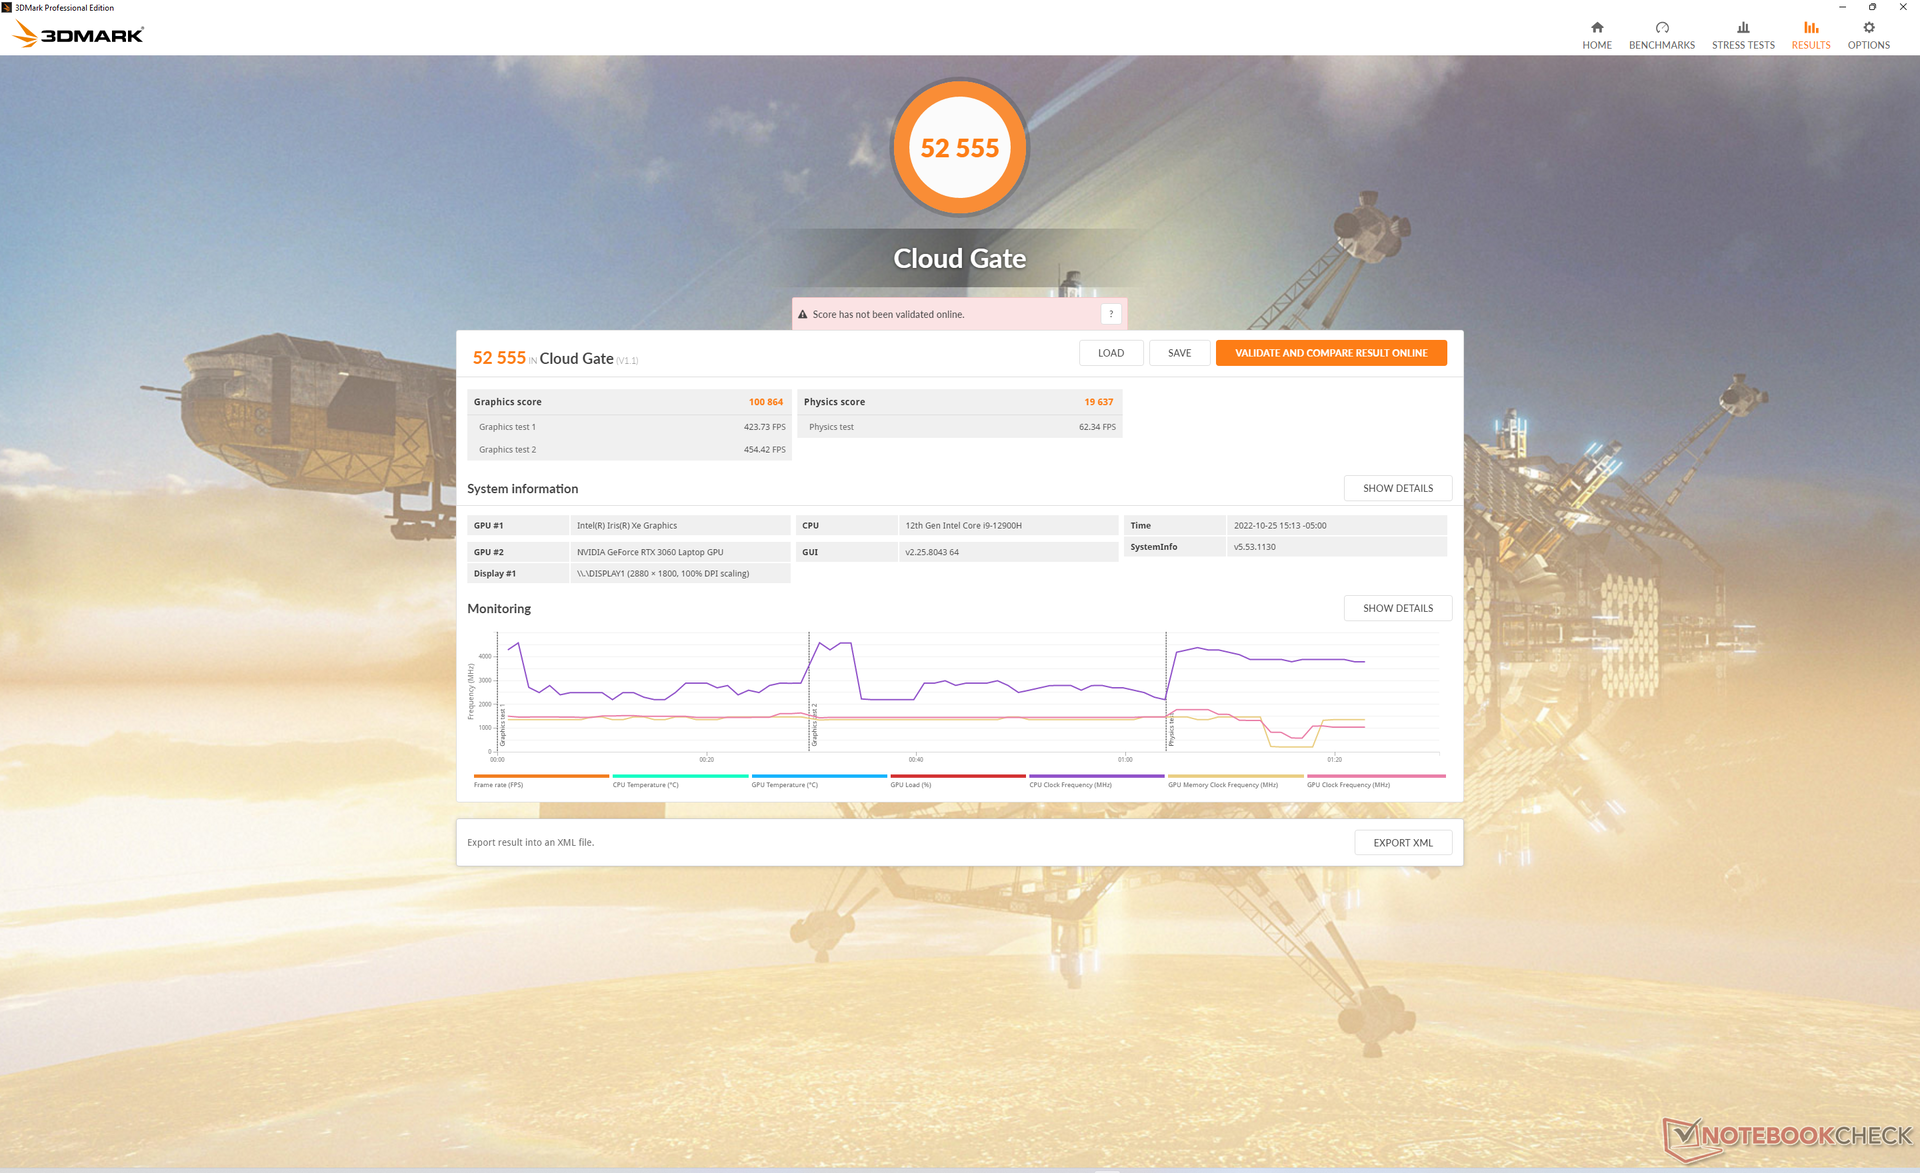
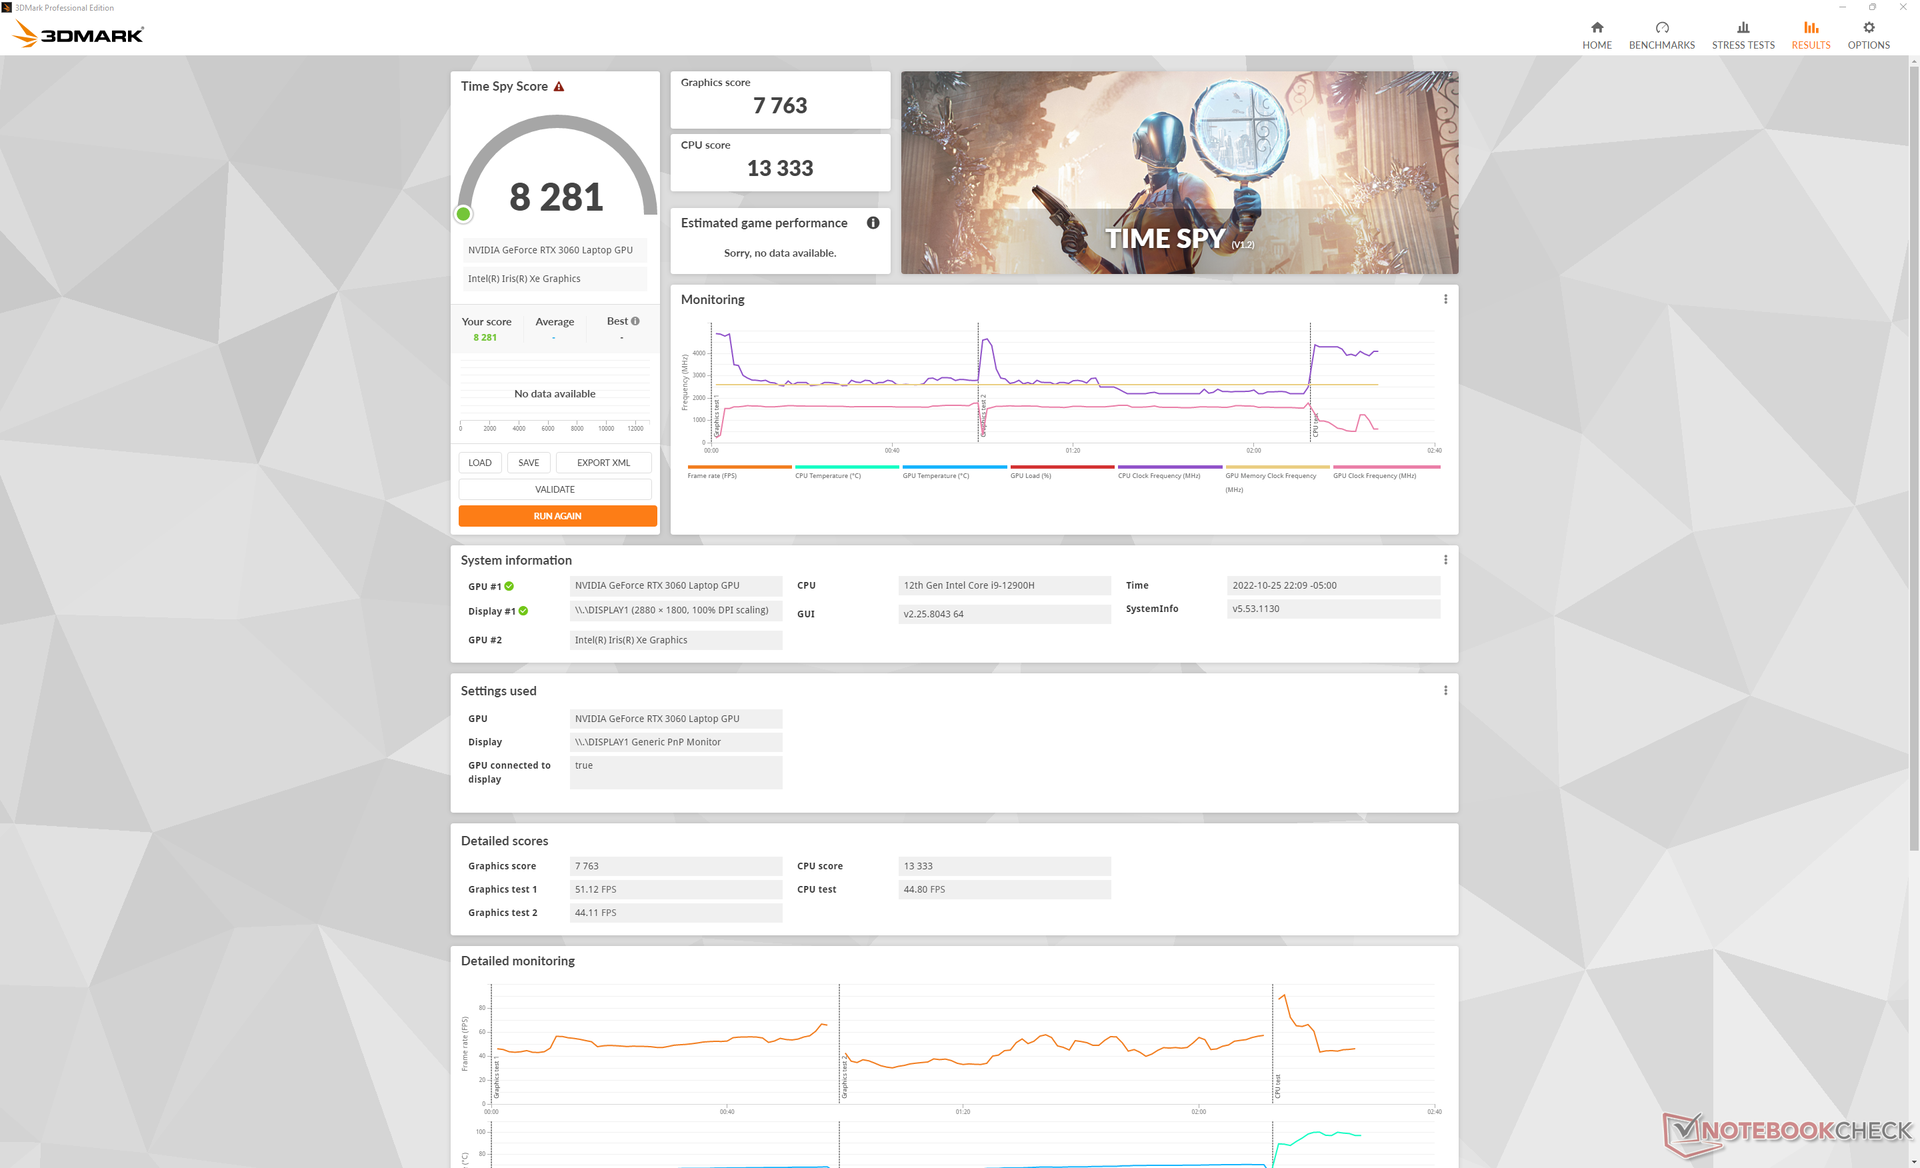
El rendimiento gráfico está entre el 1 y el 2 por ciento de la media de los portátiles de nuestra base de datos equipados con la misma GeForce RTX 3060 Incluso cuando se ejecuta en modo Turbo. Si el modo Turbo está desactivado, el rendimiento bajaría entre un 5 y un 6 por ciento para ser más lento que la media. Por tanto, los usuarios deben ejecutar el Predator Triton 300 SE en su configuración más fuerte si quieren sacar el máximo provecho del portátil cuando juegan.
El rendimiento general sigue siendo más rápido que el de la antigua RTX 2060 en el predator Triton 300 2020 en torno a un 25 o 30 por ciento. La mayoría de los juegos son estables a 1080p, excepto los títulos más exigentes como Cyberpunk 2077. El rendimiento empieza a flaquear en la resolución nativa de 1800p y, por desgracia, no hay soporte G-Sync aquí para aliviar el ritmo de fotogramas desigual. Encontramos que 1800p en configuraciones medias a medias-altas es el punto dulce para esta máquina.
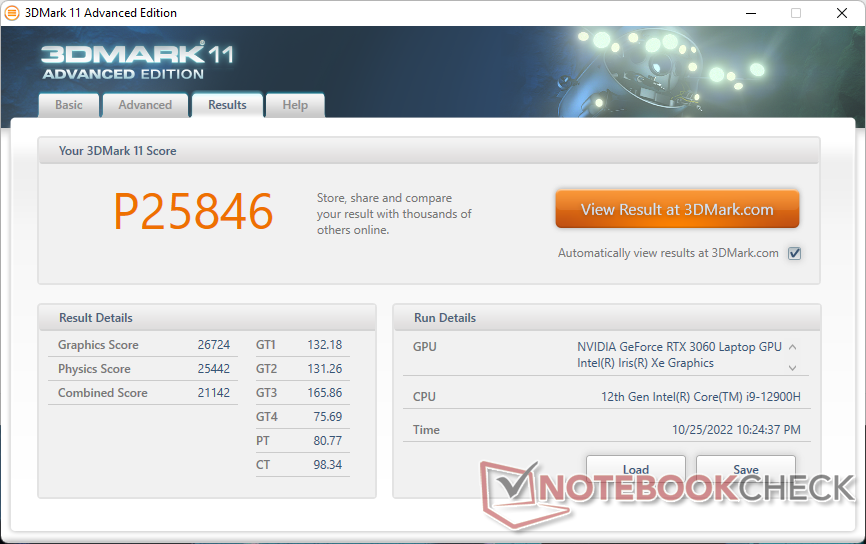

| 3DMark 11 Performance | 25846 puntos | |
| 3DMark Cloud Gate Standard Score | 52555 puntos | |
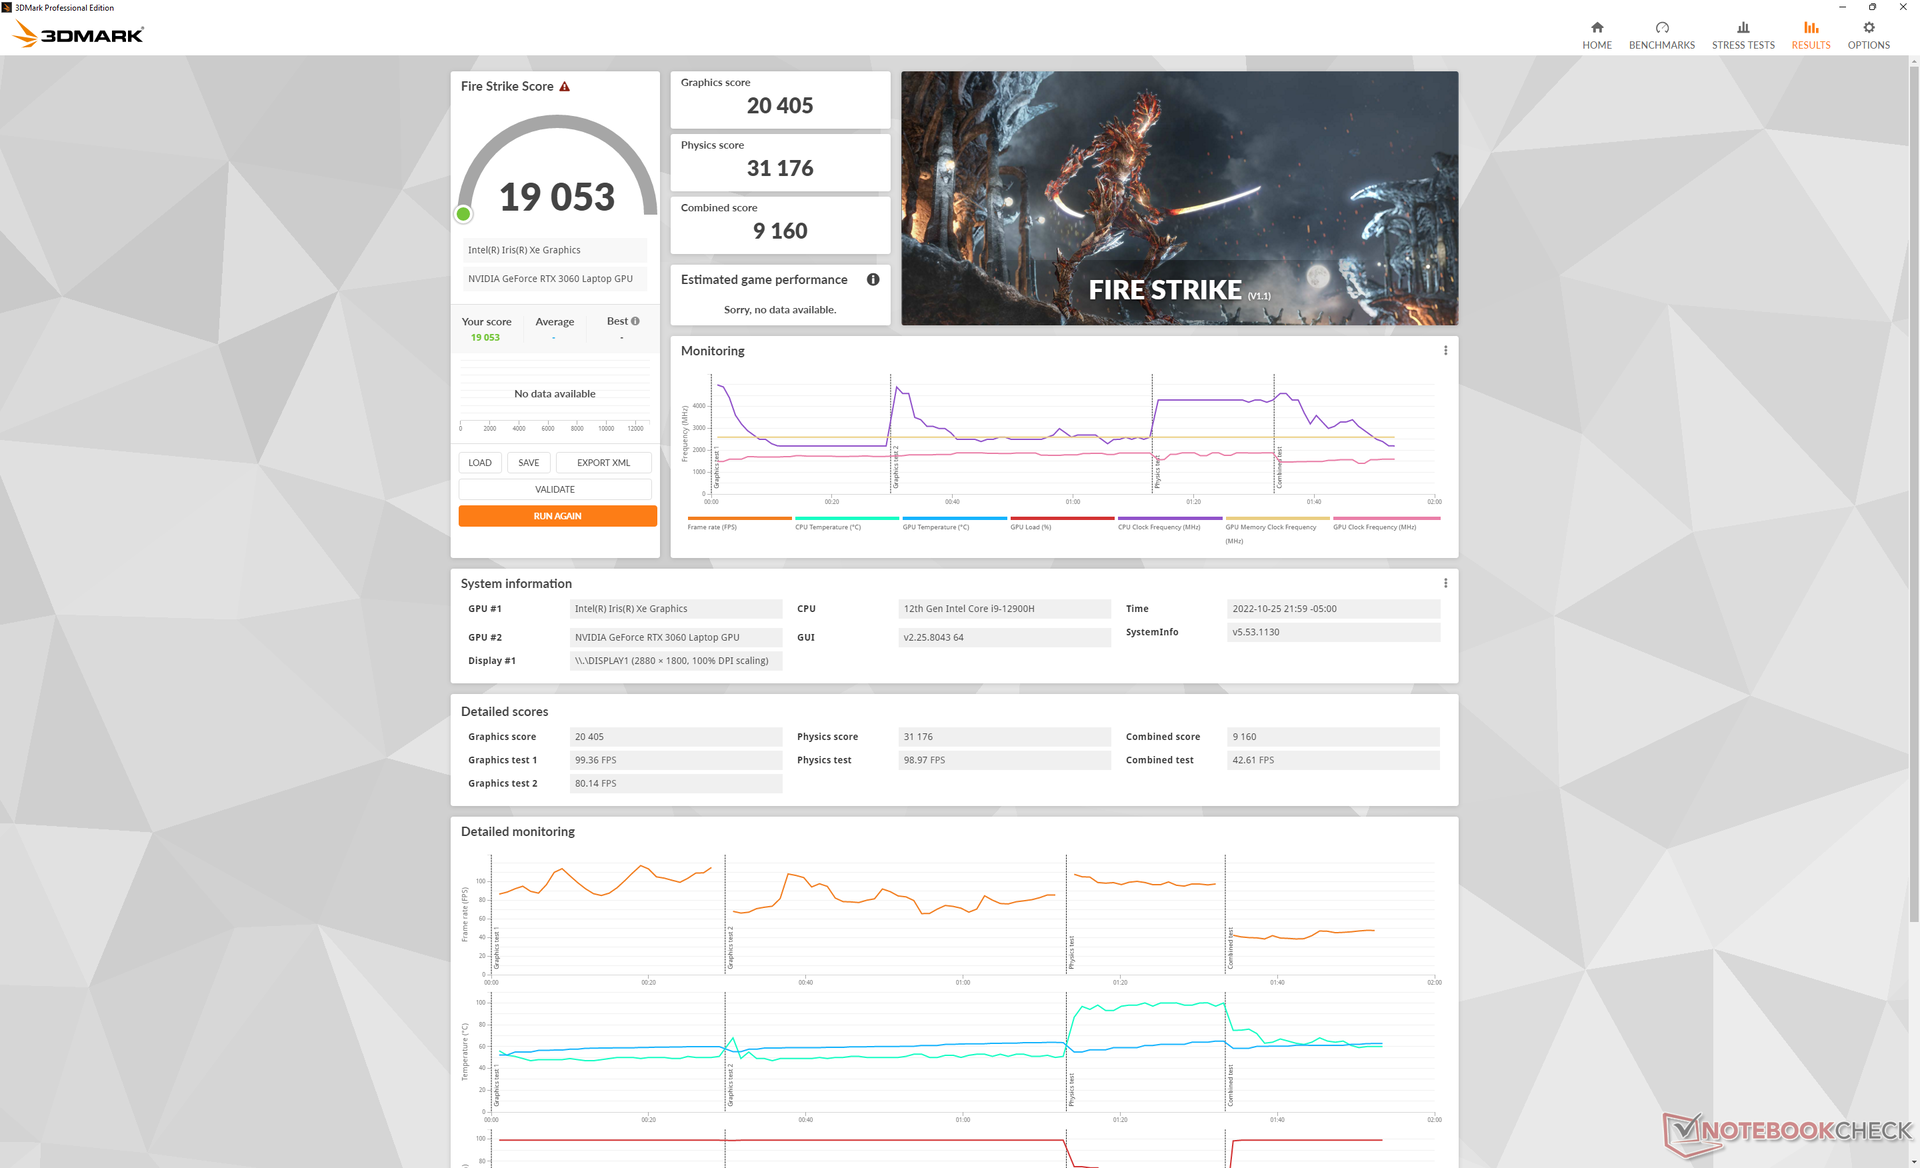
| 3DMark Fire Strike Score | 19053 puntos | |
| 3DMark Time Spy Score | 8281 puntos | |
ayuda | ||
| Blender | |
| v3.3 Classroom OPTIX/RTX | |
| Dell Inspiron 14 Plus 7420 | |
| Acer Predator Triton 300 SE | |
| Medio NVIDIA GeForce RTX 3060 Laptop GPU (30 - 56, n=15) | |
| v3.3 Classroom CUDA | |
| Dell Inspiron 14 Plus 7420 | |
| Acer Predator Triton 300 SE | |
| Medio NVIDIA GeForce RTX 3060 Laptop GPU (51 - 89, n=15) | |
| v3.3 Classroom CPU | |
| Dell Inspiron 14 Plus 7420 | |
| Medio NVIDIA GeForce RTX 3060 Laptop GPU (291 - 508, n=15) | |
| Acer Predator Triton 300 SE | |
* ... más pequeño es mejor
Witcher 3 FPS Chart
| bajo | medio | alto | ultra | QHD | |
|---|---|---|---|---|---|
| GTA V (2015) | 185.9 | 181.8 | 172.3 | 99.6 | 75.2 |
| The Witcher 3 (2015) | 341.1 | 230 | 145.6 | 75 | |
| Dota 2 Reborn (2015) | 185 | 169.2 | 162.1 | 153.6 | |
| Final Fantasy XV Benchmark (2018) | 176.4 | 105.1 | 79.1 | 60.5 | |
| X-Plane 11.11 (2018) | 141.8 | 126.1 | 101 | ||
| Strange Brigade (2018) | 389 | 196.7 | 157.8 | 138.6 | 100.8 |
| Cyberpunk 2077 1.6 (2022) | 109.8 | 71.9 | 70.4 | 57.7 | 36 |
Emisiones - Ruidosas cuando se juega
Ruido del sistema
Los modos de ventilador de PredatorSense incluyen Silencio, Predeterminado y Turbo. Los ventiladores pulsan con frecuencia si se configuran en Predeterminado o superior, por lo que se recomienda configurar el sistema en Silencioso si se navega por Internet o se hace streaming de vídeo. De lo contrario, el ruido del ventilador puede llegar a ser de 34 dB(A) contra un fondo silencioso de 24 dB(A) cuando se ejecutan cargas poco exigentes.
Hay una gran diferencia en el ruido del ventilador entre las configuraciones del modo Default y Turbo. El ruido del ventilador cuando se ejecuta Witcher 3 en el modo predeterminado alcanza un máximo de 47 dB(A) en comparación con 60 dB(A) si está en el modo Turbo. 60 dB(A) es significativamente más ruidoso que la mayoría de los portátiles, independientemente de su tamaño, como se muestra en la siguiente tabla. Como ya hemos dicho, activar el modo Turbo es obligatorio para aprovechar al máximo la GPU TGP de 95 W. No obstante, los usuarios pueden considerar jugar en el modo Default en su lugar por el ruido más silencioso del ventilador aunque suponga una caída del rendimiento del 5 al 6 por ciento.
Ruido
| Ocioso |
| 23.8 / 23.8 / 30.6 dB(A) |
| Carga |
| 44.2 / 60 dB(A) |
 | ||
30 dB silencioso 40 dB(A) audible 50 dB(A) ruidosamente alto |
||
min: | ||
| Acer Predator Triton 300 SE GeForce RTX 3060 Laptop GPU, i9-12900H, Micron 3400 1TB MTFDKBA1T0TFH | Asus ROG Zephyrus G14 GA402RJ Radeon RX 6700S, R7 6800HS, Micron 2450 1TB MTFDKBA1T0TFK | Razer Blade 14 Ryzen 9 6900HX GeForce RTX 3070 Ti Laptop GPU, R9 6900HX, Samsung PM9A1 MZVL21T0HCLR | Alienware x14 i7 RTX 3060 GeForce RTX 3060 Laptop GPU, i7-12700H, WDC PC SN810 1TB | Dell Inspiron 14 Plus 7420 GeForce RTX 3050 4GB Laptop GPU, i7-12700H, SK Hynix BC711 512GB HFM512GD3GX013N | Schenker Vision 14 GeForce RTX 3050 Ti Laptop GPU, i7-11370H, Samsung SSD 980 Pro 1TB MZ-V8P1T0BW | |
|---|---|---|---|---|---|---|
| Noise | 5% | 16% | 4% | 8% | 8% | |
| apagado / medio ambiente * (dB) | 23.8 | 25 -5% | 23.3 2% | 24.7 -4% | 23.2 3% | 24.3 -2% |
| Idle Minimum * (dB) | 23.8 | 25 -5% | 23.3 2% | 24.7 -4% | 23.2 3% | 24.3 -2% |
| Idle Average * (dB) | 23.8 | 26 -9% | 23.3 2% | 24.7 -4% | 23.2 3% | 24.3 -2% |
| Idle Maximum * (dB) | 30.6 | 29 5% | 23.3 24% | 30.9 -1% | 23.2 24% | 25.9 15% |
| Load Average * (dB) | 44.2 | 45 -2% | 34.7 21% | 40 10% | 47.5 -7% | 43.3 2% |
| Witcher 3 ultra * (dB) | 60.1 | 43 28% | 42.1 30% | 51.5 14% | 51.7 14% | 44.6 26% |
| Load Maximum * (dB) | 60 | 45 25% | 42.1 30% | 51.5 14% | 51.7 14% | 49.5 17% |
* ... más pequeño es mejor
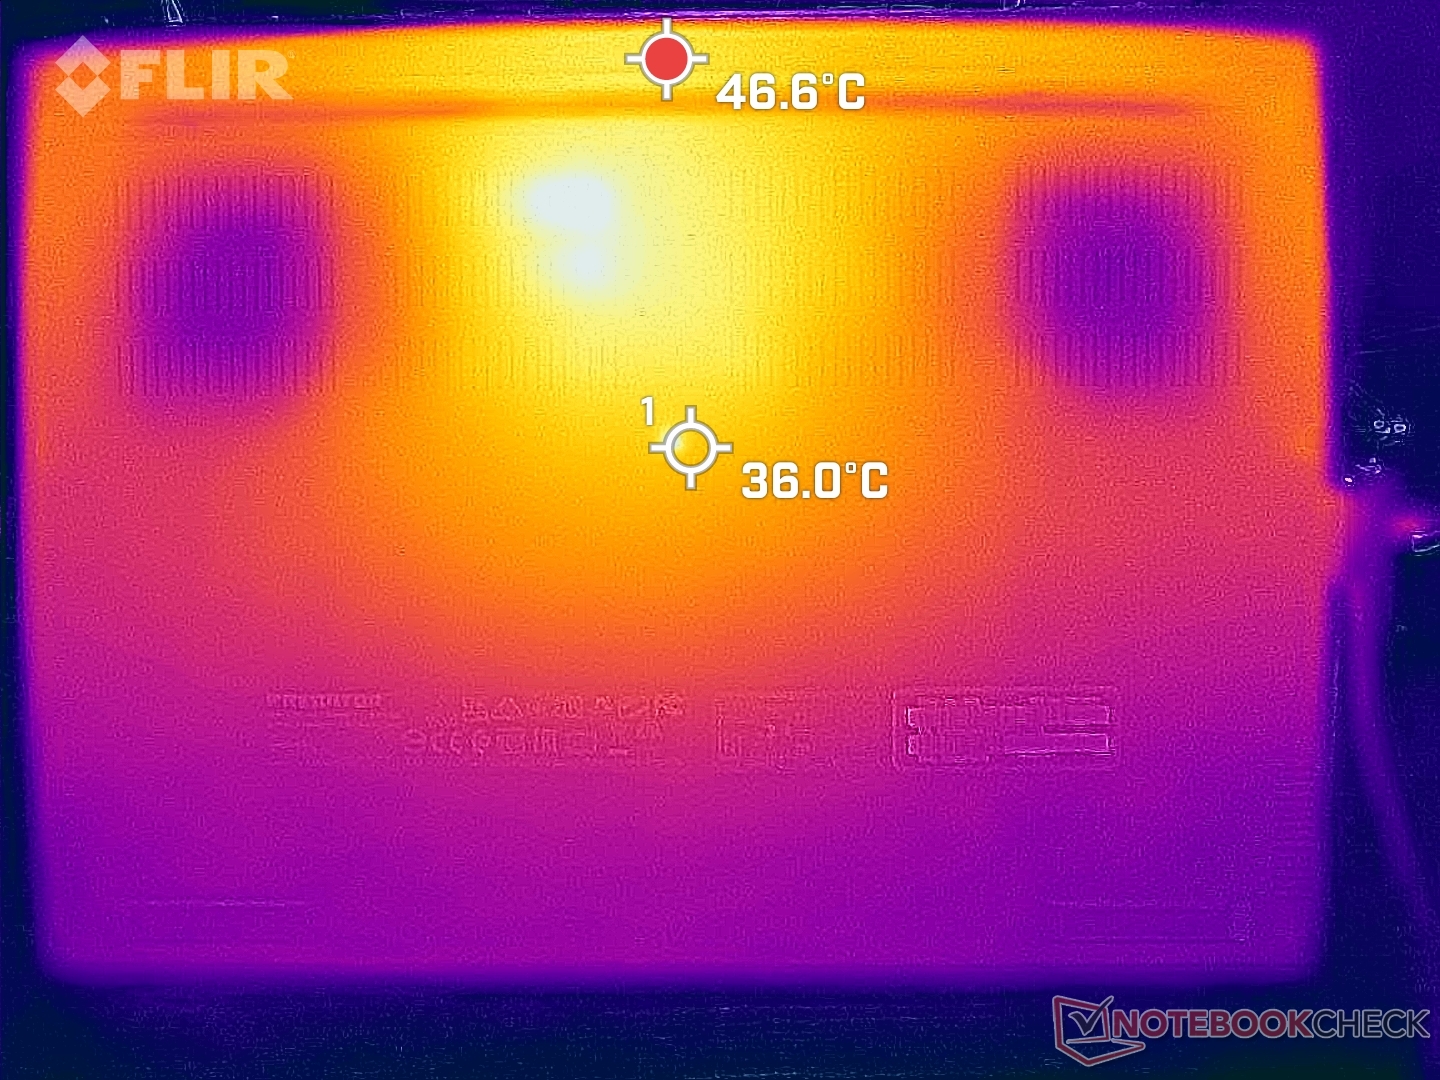
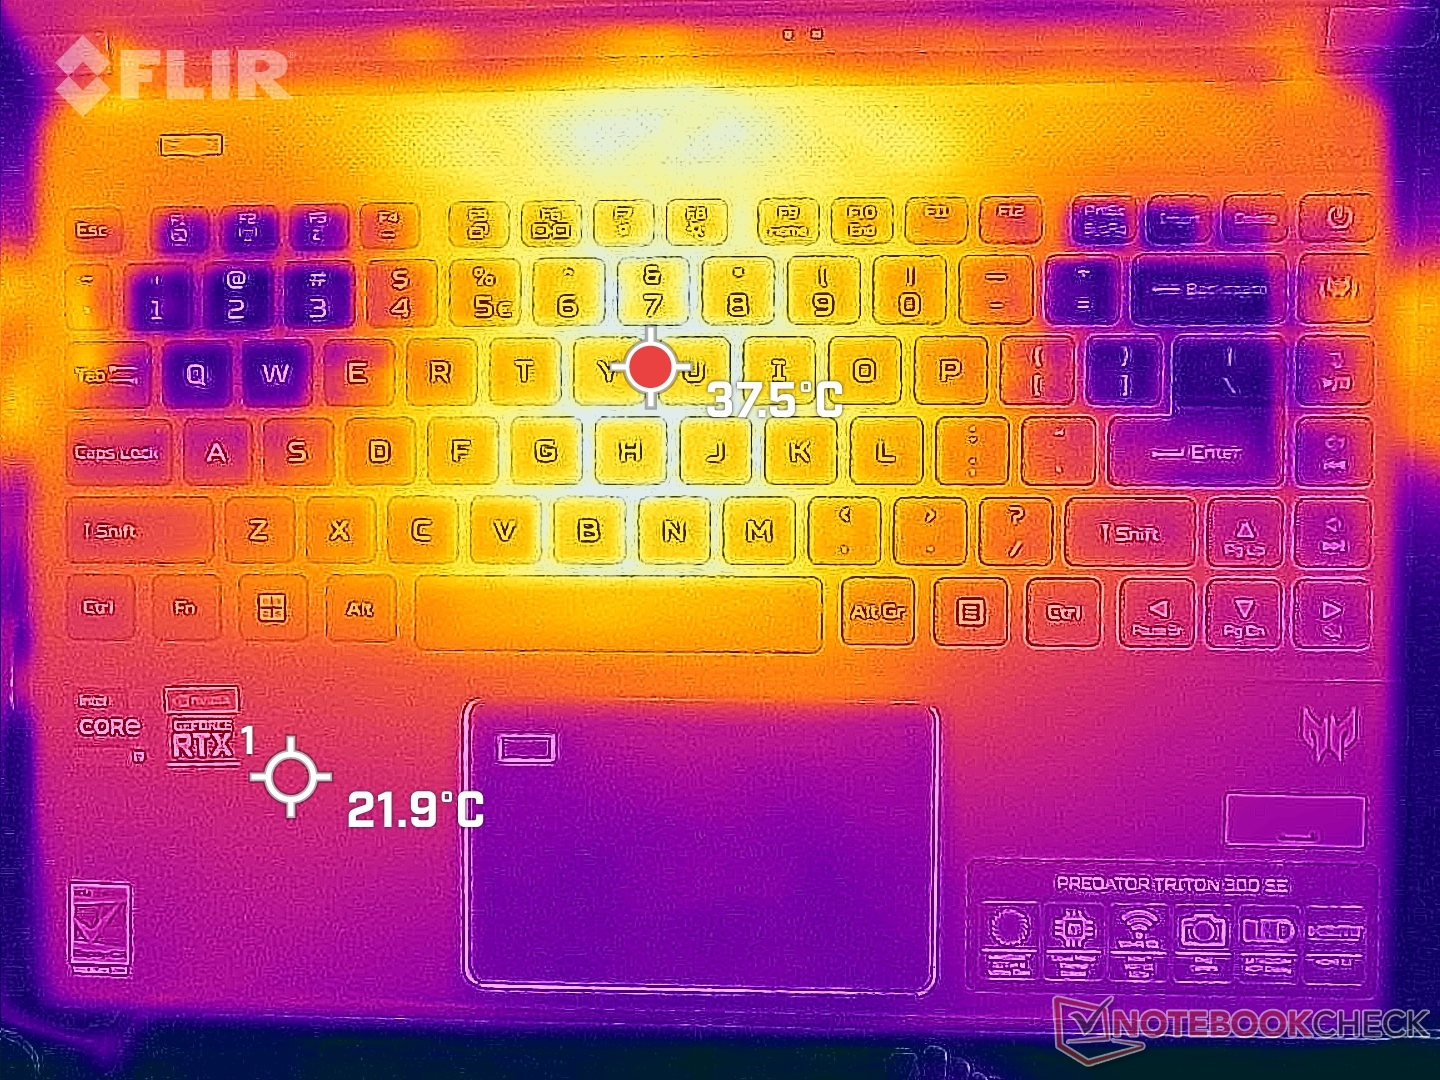
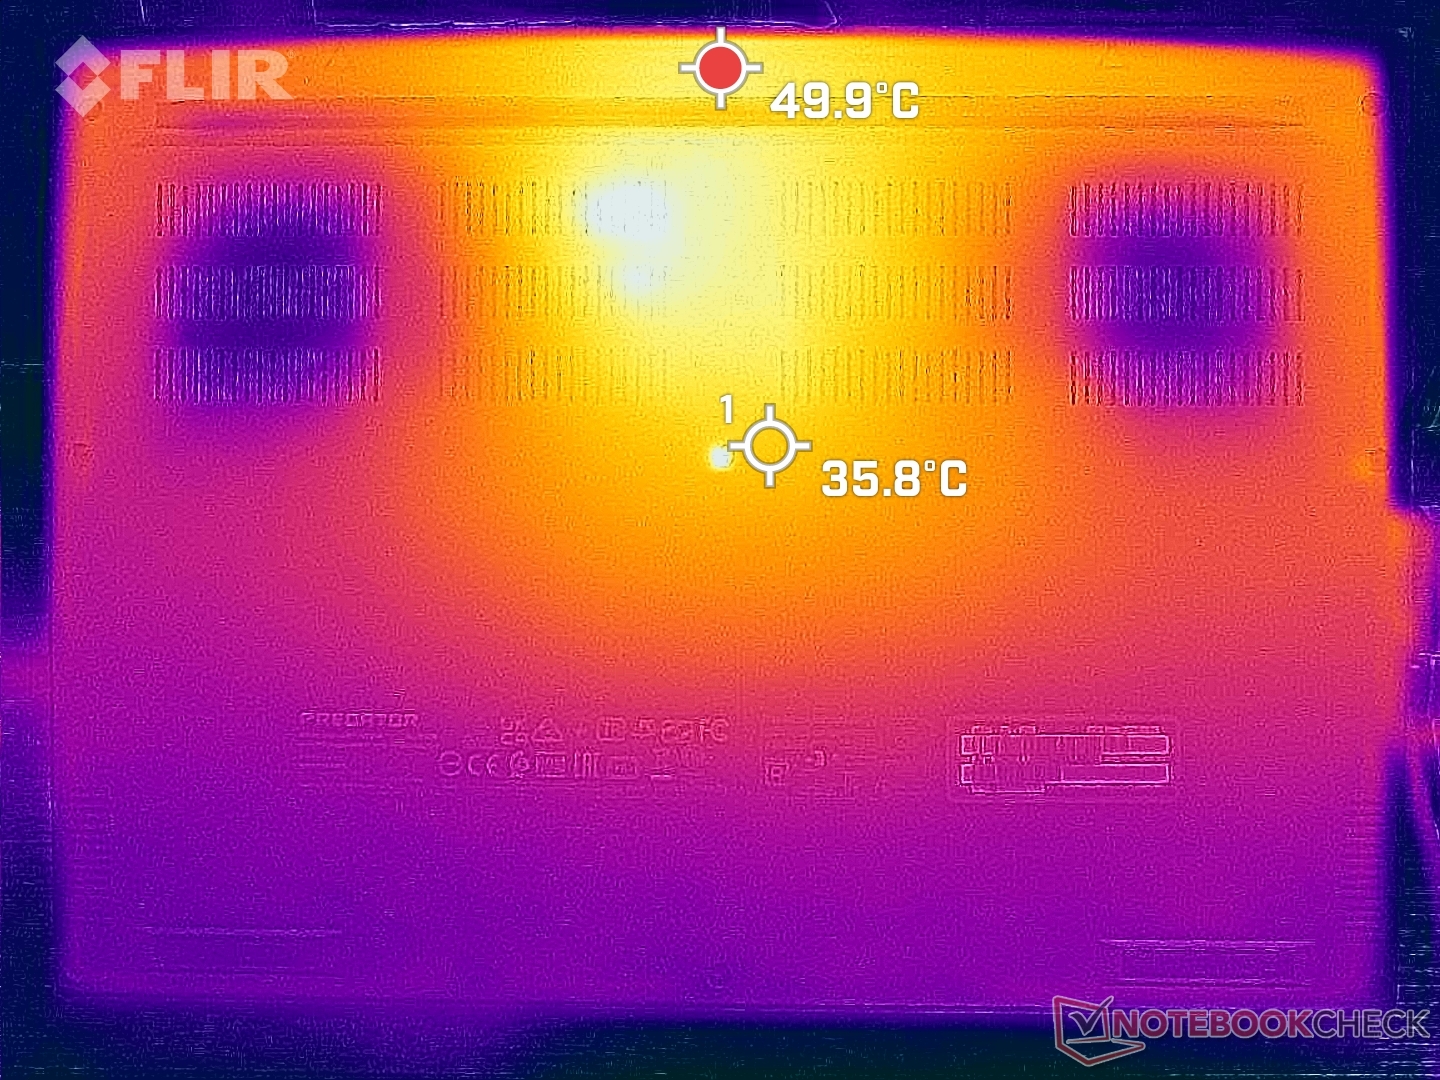
Temperatura
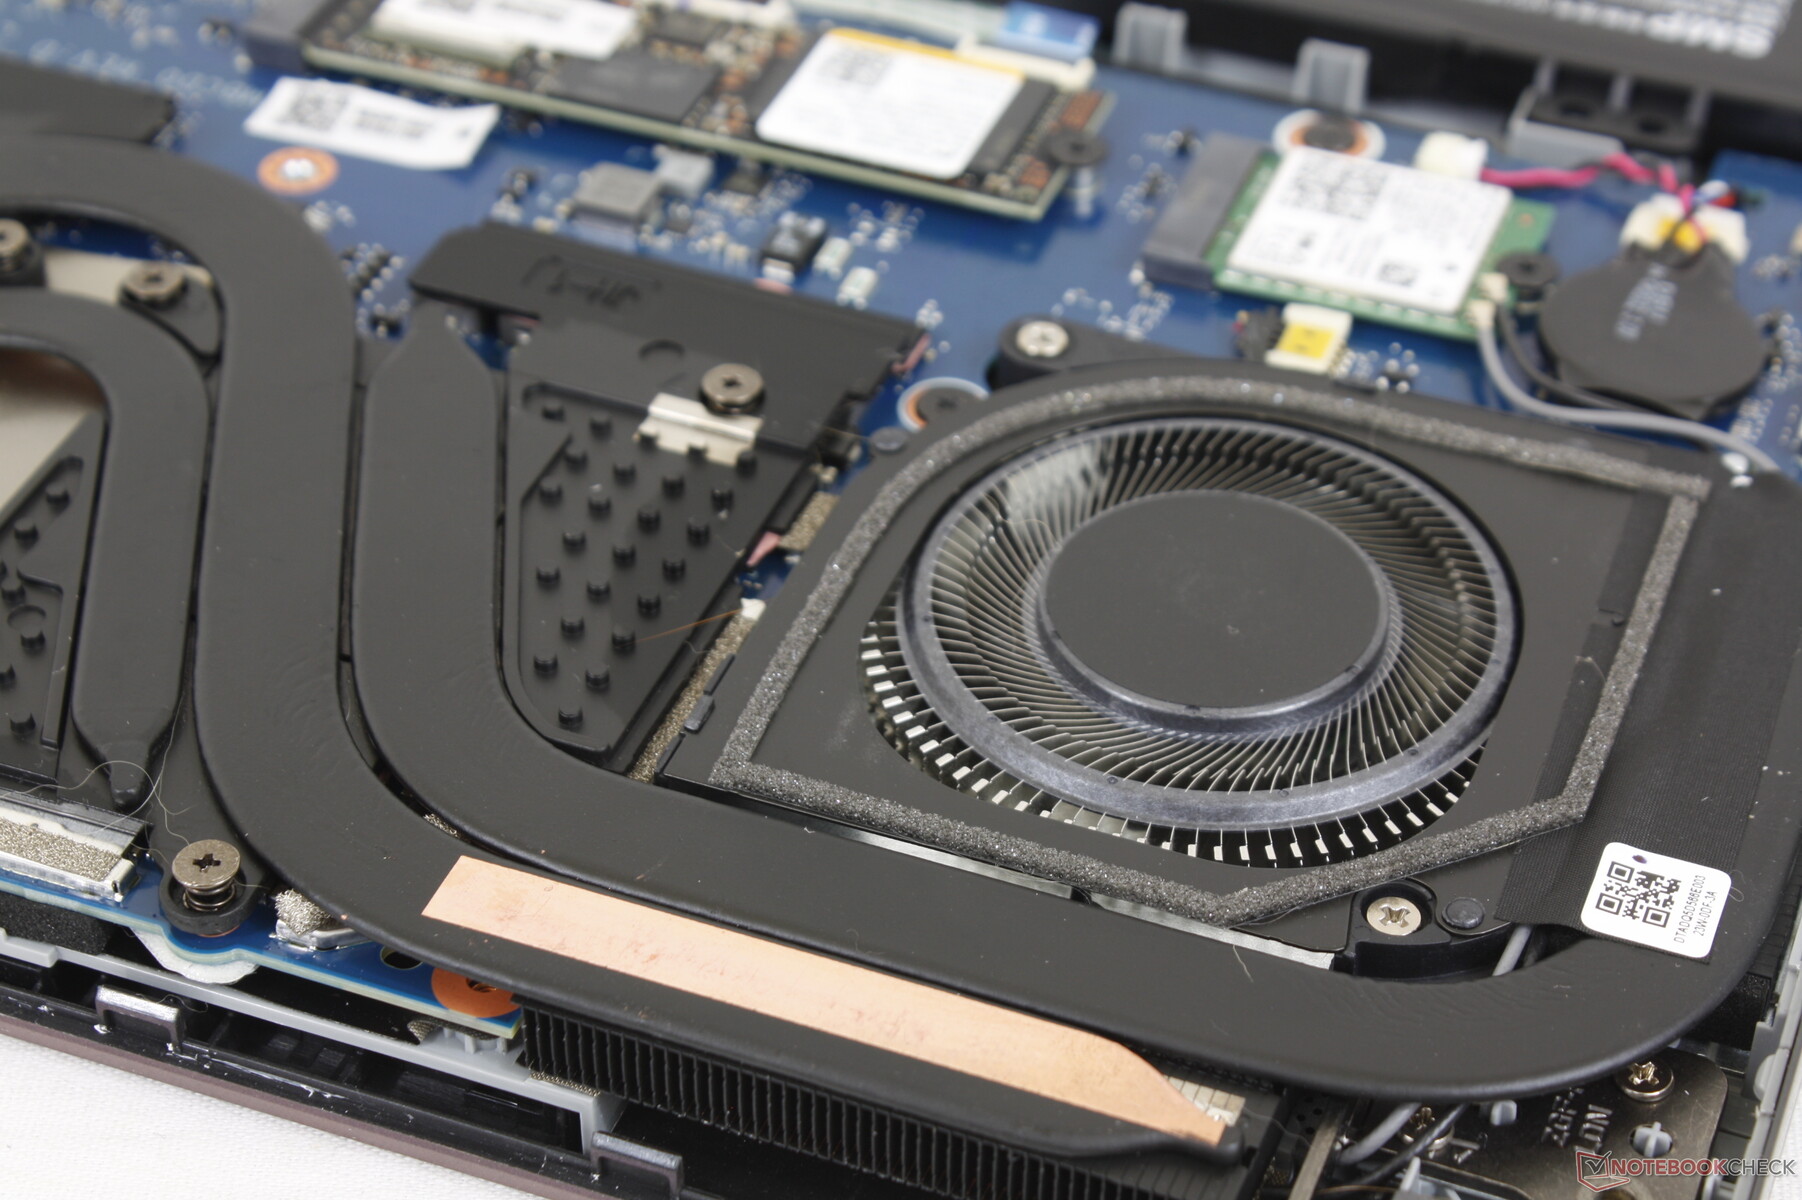
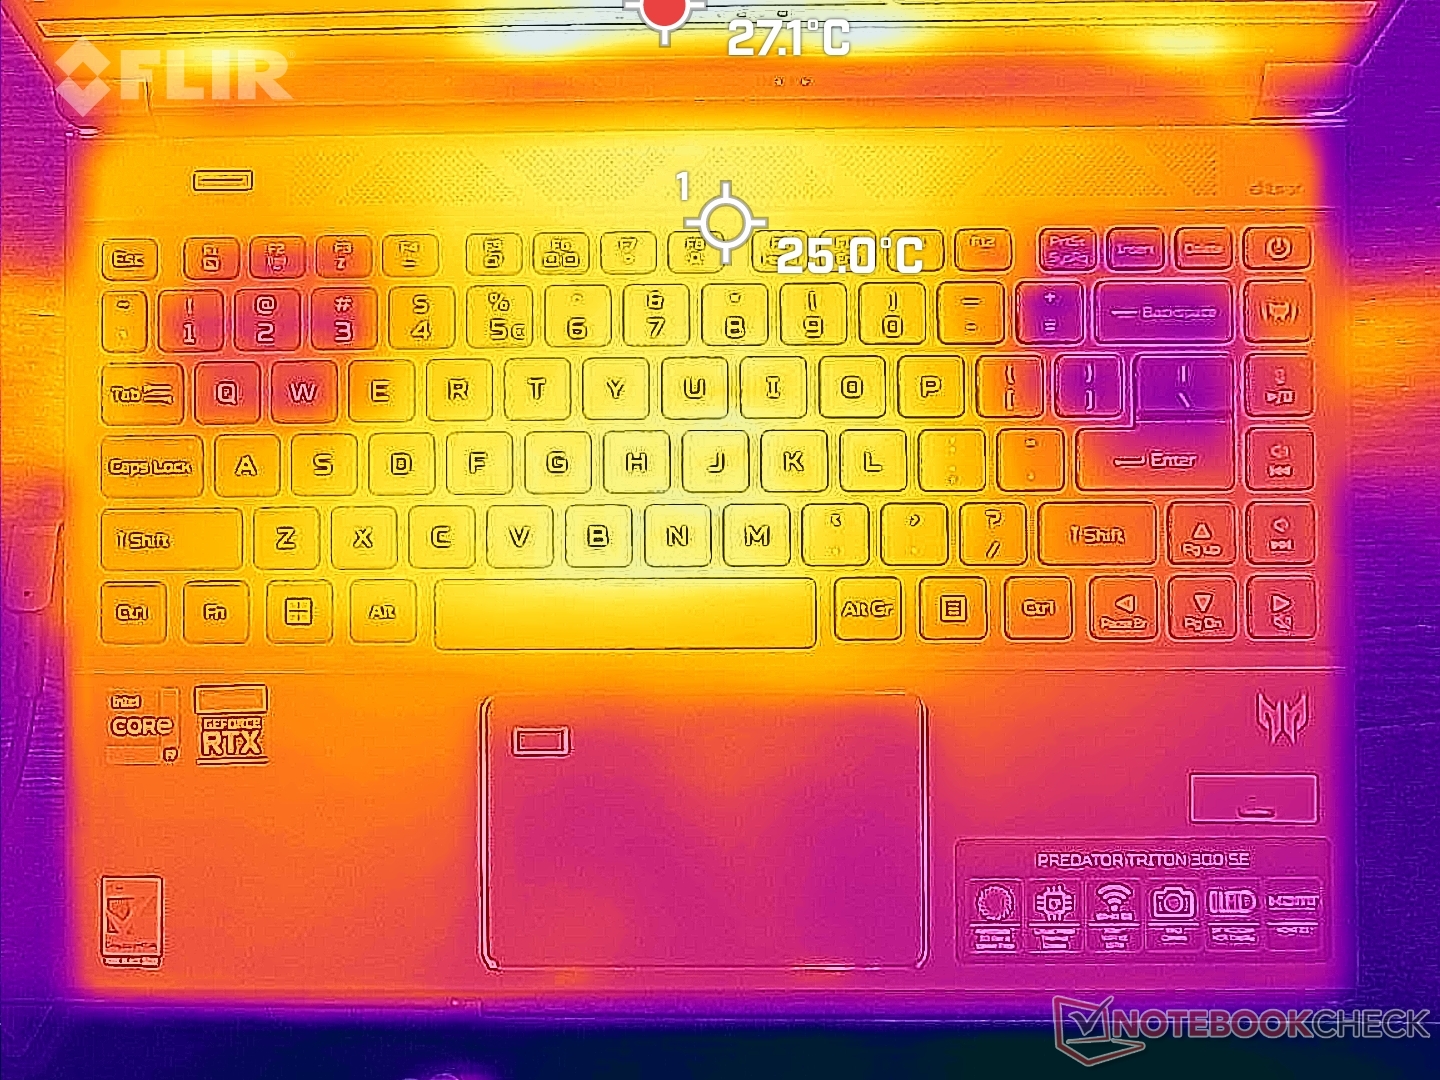
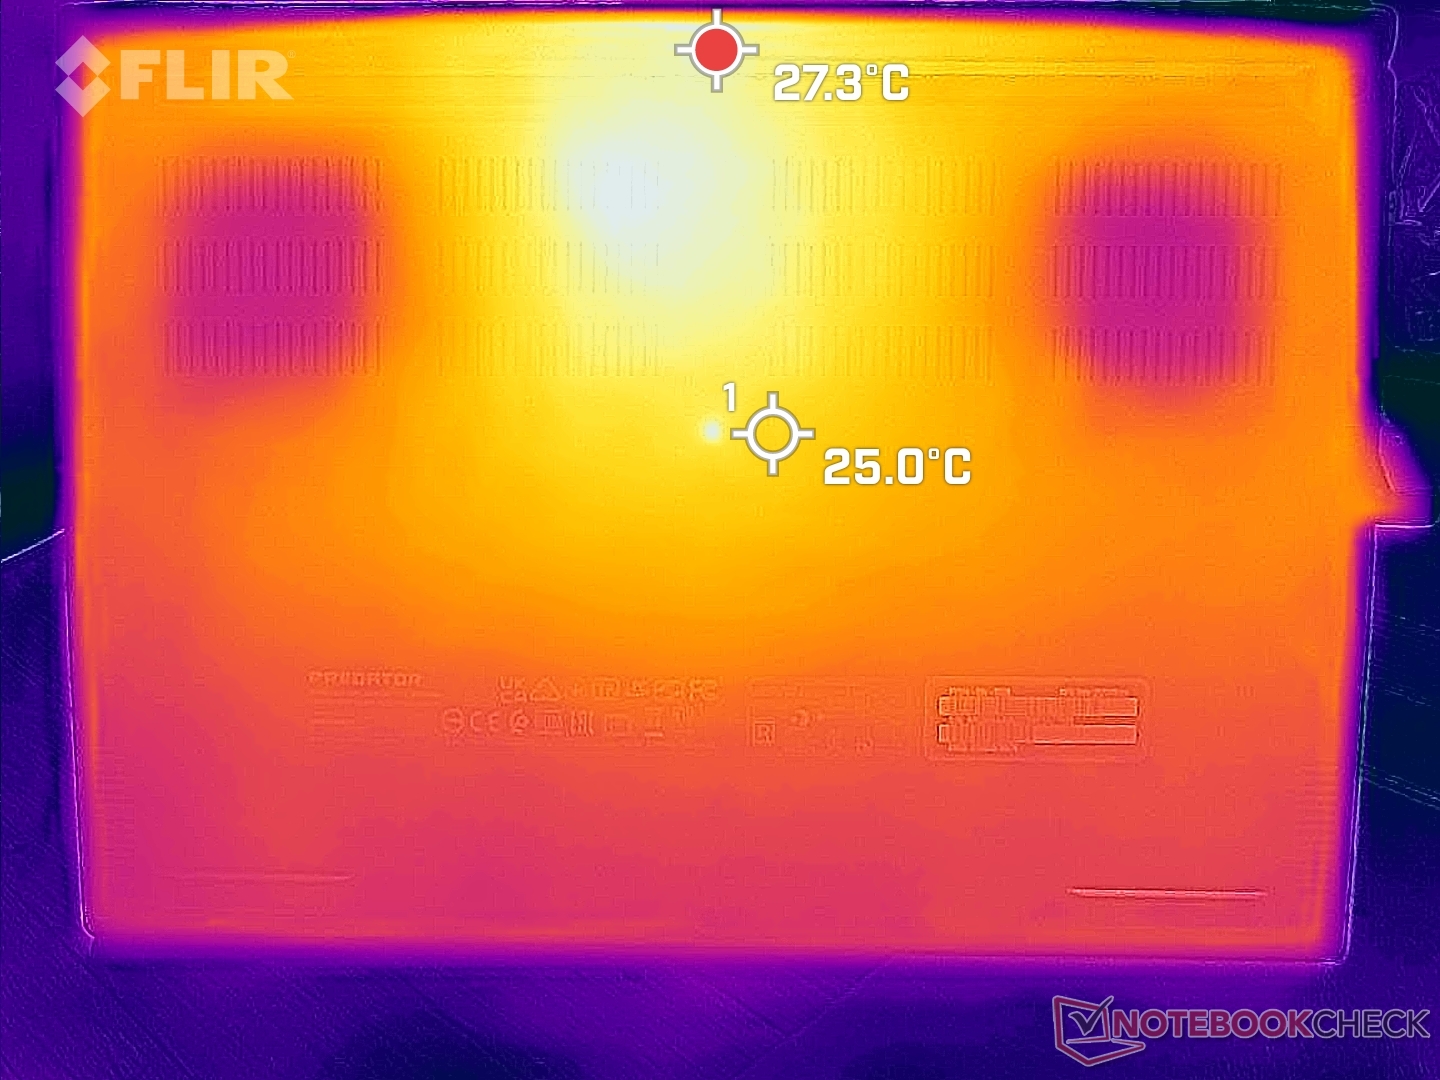
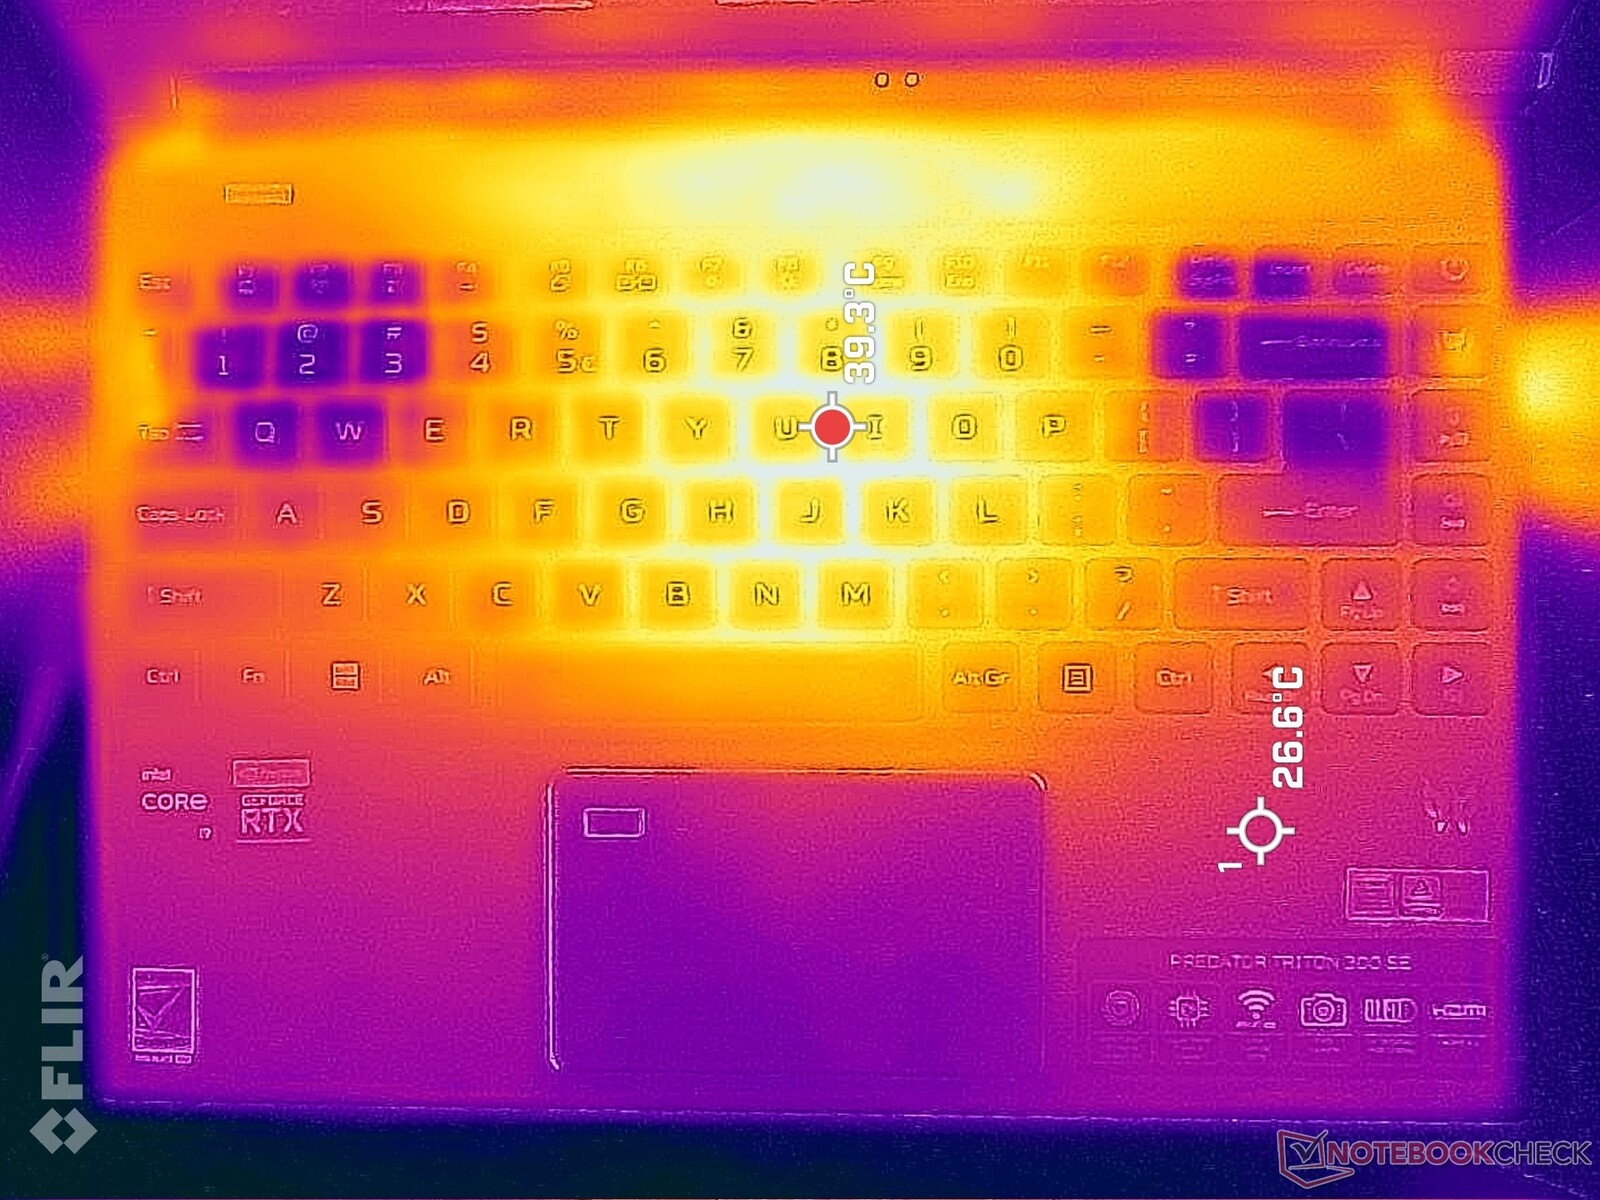
Los puntos calientes pueden alcanzar hasta 43 C y 46 C en la parte superior e inferior, respectivamente, hacia la parte trasera del chasis, como muestran los mapas de calor de abajo. Las temperaturas superficiales generales son notablemente más frías que las que registramos en el Zephyrus G14 o el Alienware x14 donde los puntos calientes pueden alcanzar fácilmente más de 50 C en condiciones similares
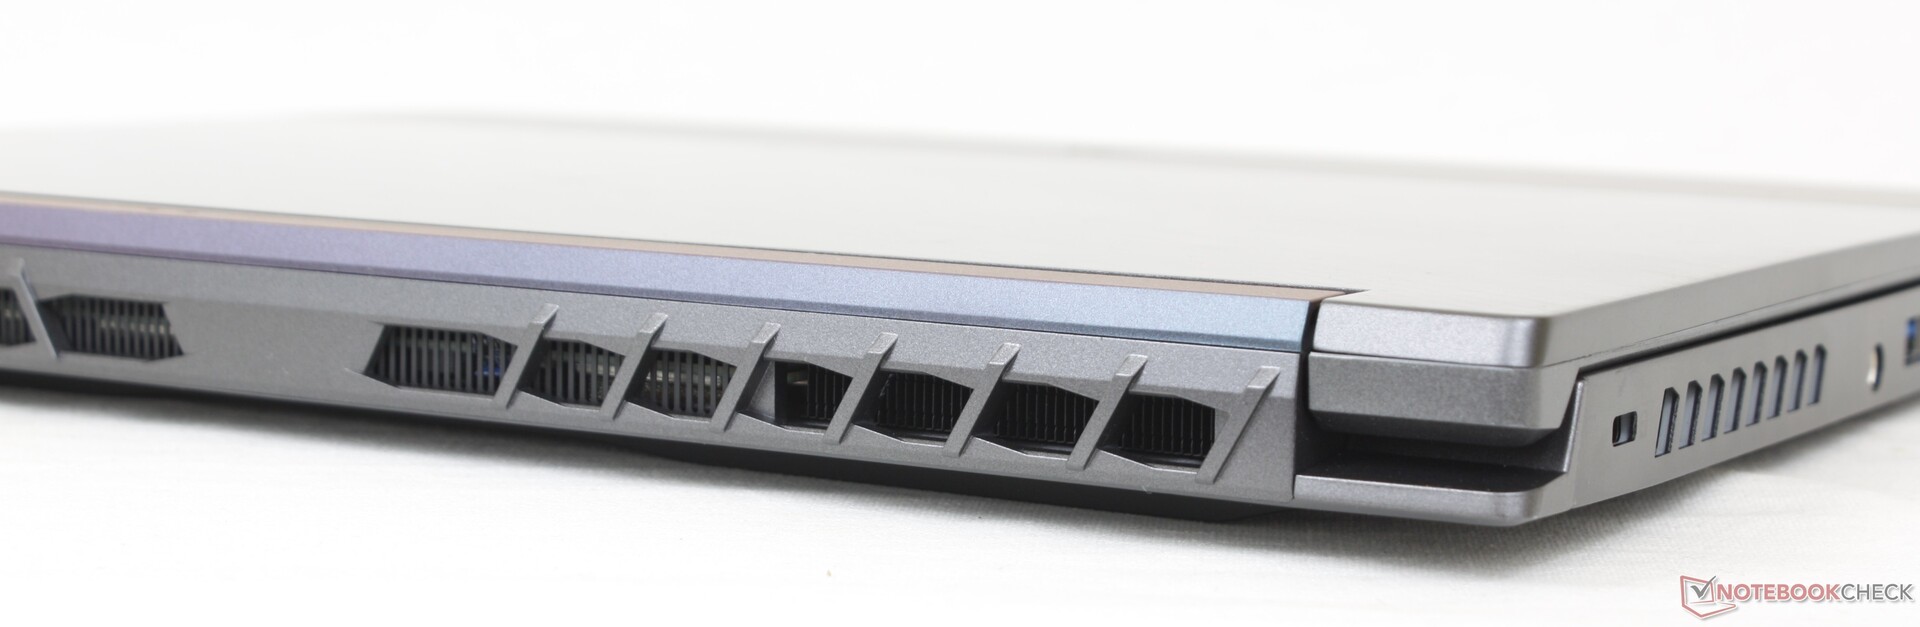
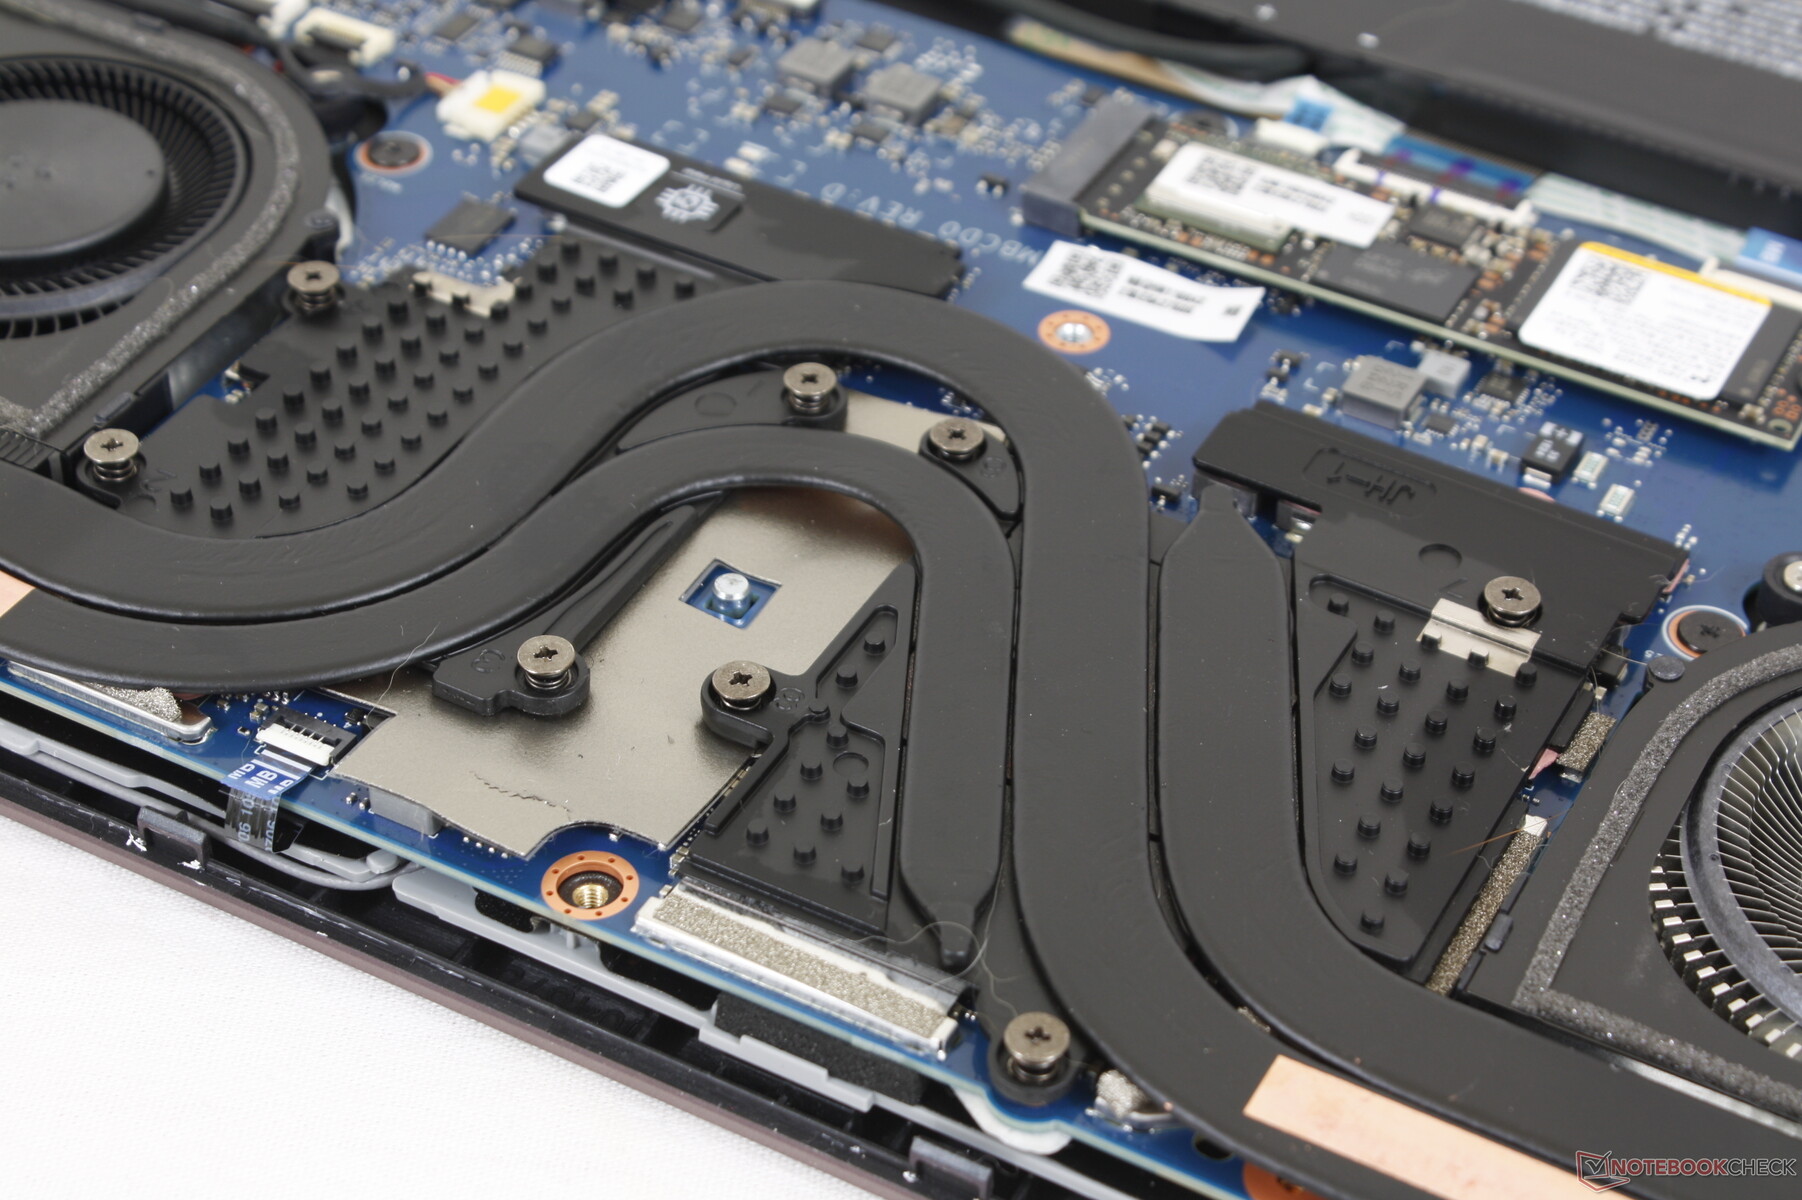
Casi la mitad del chasis está dedicada a la ventilación, incluyendo los bordes, la parte trasera, la parte inferior y los lados del teclado. Asegúrate de no bloquear accidentalmente ninguna de las rejillas de ventilación para preservar una refrigeración óptima.
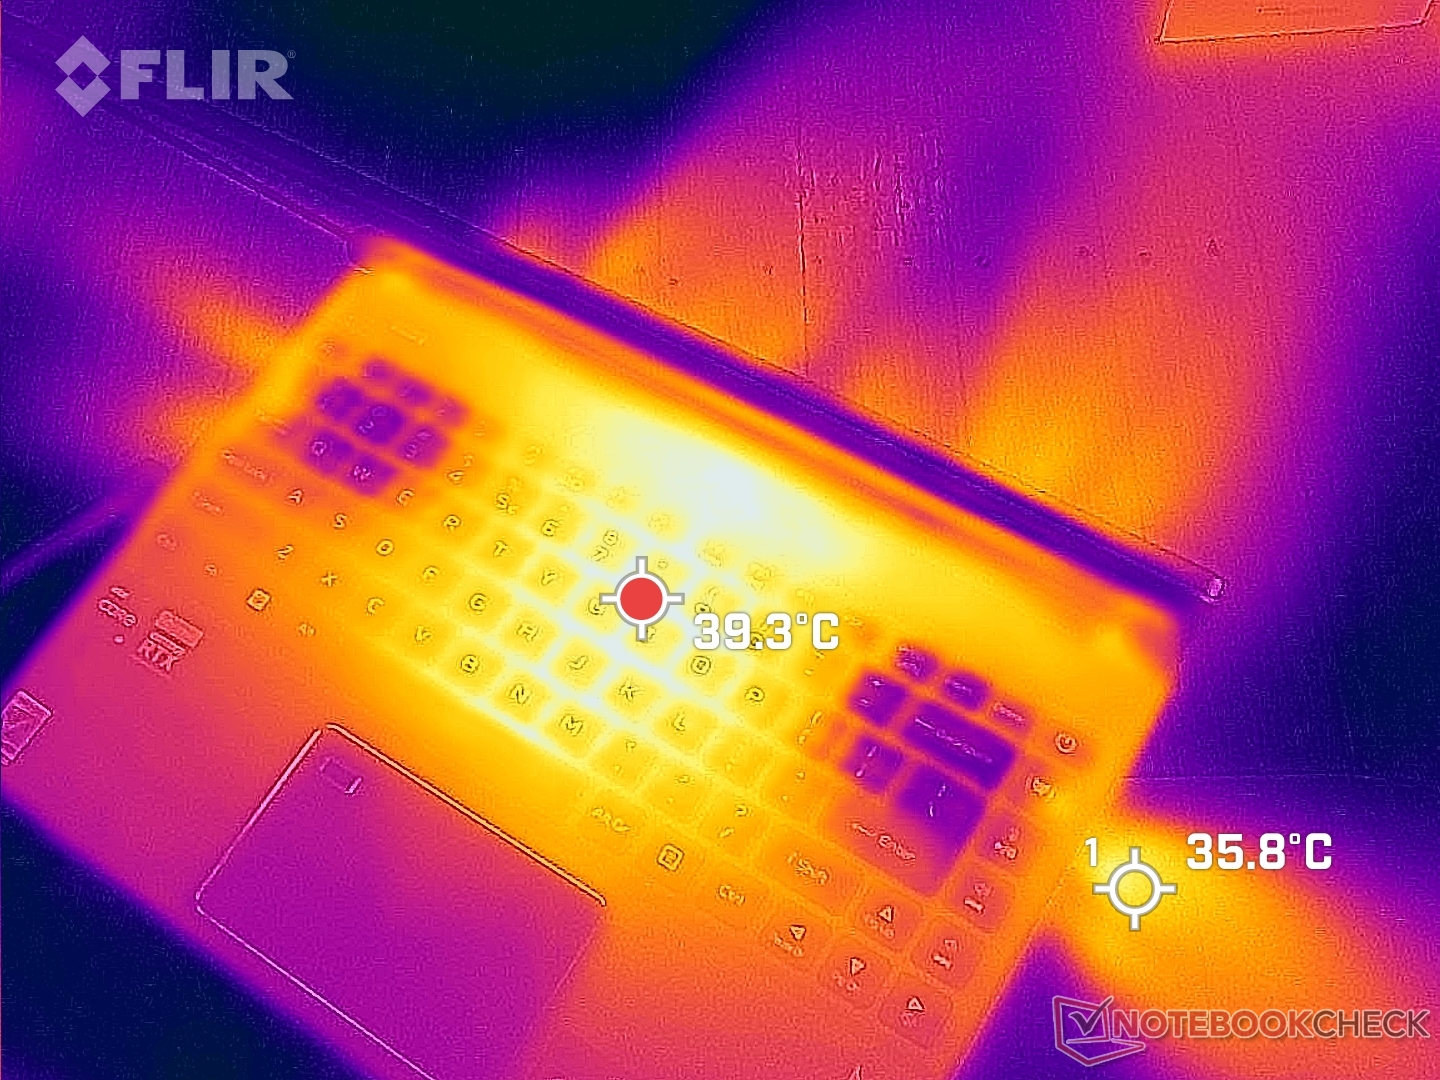
(±) La temperatura máxima en la parte superior es de 43 °C / 109 F, frente a la media de 40.4 °C / 105 F, que oscila entre 21.2 y 68.8 °C para la clase Gaming.
(-) El fondo se calienta hasta un máximo de 46.4 °C / 116 F, frente a la media de 43.2 °C / 110 F
(+) En reposo, la temperatura media de la parte superior es de 26 °C / 79# F, frente a la media del dispositivo de 33.9 °C / 93 F.
(±) Jugando a The Witcher 3, la temperatura media de la parte superior es de 37.1 °C / 99 F, frente a la media del dispositivo de 33.9 °C / 93 F.
(+) Los reposamanos y el panel táctil alcanzan como máximo la temperatura de la piel (32 °C / 89.6 F) y, por tanto, no están calientes.
(-) La temperatura media de la zona del reposamanos de dispositivos similares fue de 28.8 °C / 83.8 F (-3.2 °C / -5.8 F).
| Acer Predator Triton 300 SE Intel Core i9-12900H, NVIDIA GeForce RTX 3060 Laptop GPU | Asus ROG Zephyrus G14 GA402RJ AMD Ryzen 7 6800HS, AMD Radeon RX 6700S | Razer Blade 14 Ryzen 9 6900HX AMD Ryzen 9 6900HX, NVIDIA GeForce RTX 3070 Ti Laptop GPU | Alienware x14 i7 RTX 3060 Intel Core i7-12700H, NVIDIA GeForce RTX 3060 Laptop GPU | Dell Inspiron 14 Plus 7420 Intel Core i7-12700H, NVIDIA GeForce RTX 3050 4GB Laptop GPU | Schenker Vision 14 Intel Core i7-11370H, NVIDIA GeForce RTX 3050 Ti Laptop GPU | |
|---|---|---|---|---|---|---|
| Heat | -24% | -13% | -1% | 8% | -12% | |
| Maximum Upper Side * (°C) | 43 | 53 -23% | 40.6 6% | 51.3 -19% | 40 7% | 49.7 -16% |
| Maximum Bottom * (°C) | 46.4 | 54 -16% | 42.6 8% | 44.4 4% | 36.4 22% | 56 -21% |
| Idle Upper Side * (°C) | 28.2 | 34 -21% | 38 -35% | 27.2 4% | 27 4% | 28.8 -2% |
| Idle Bottom * (°C) | 28.4 | 38 -34% | 37 -30% | 26.6 6% | 29.2 -3% | 30.6 -8% |
* ... más pequeño es mejor
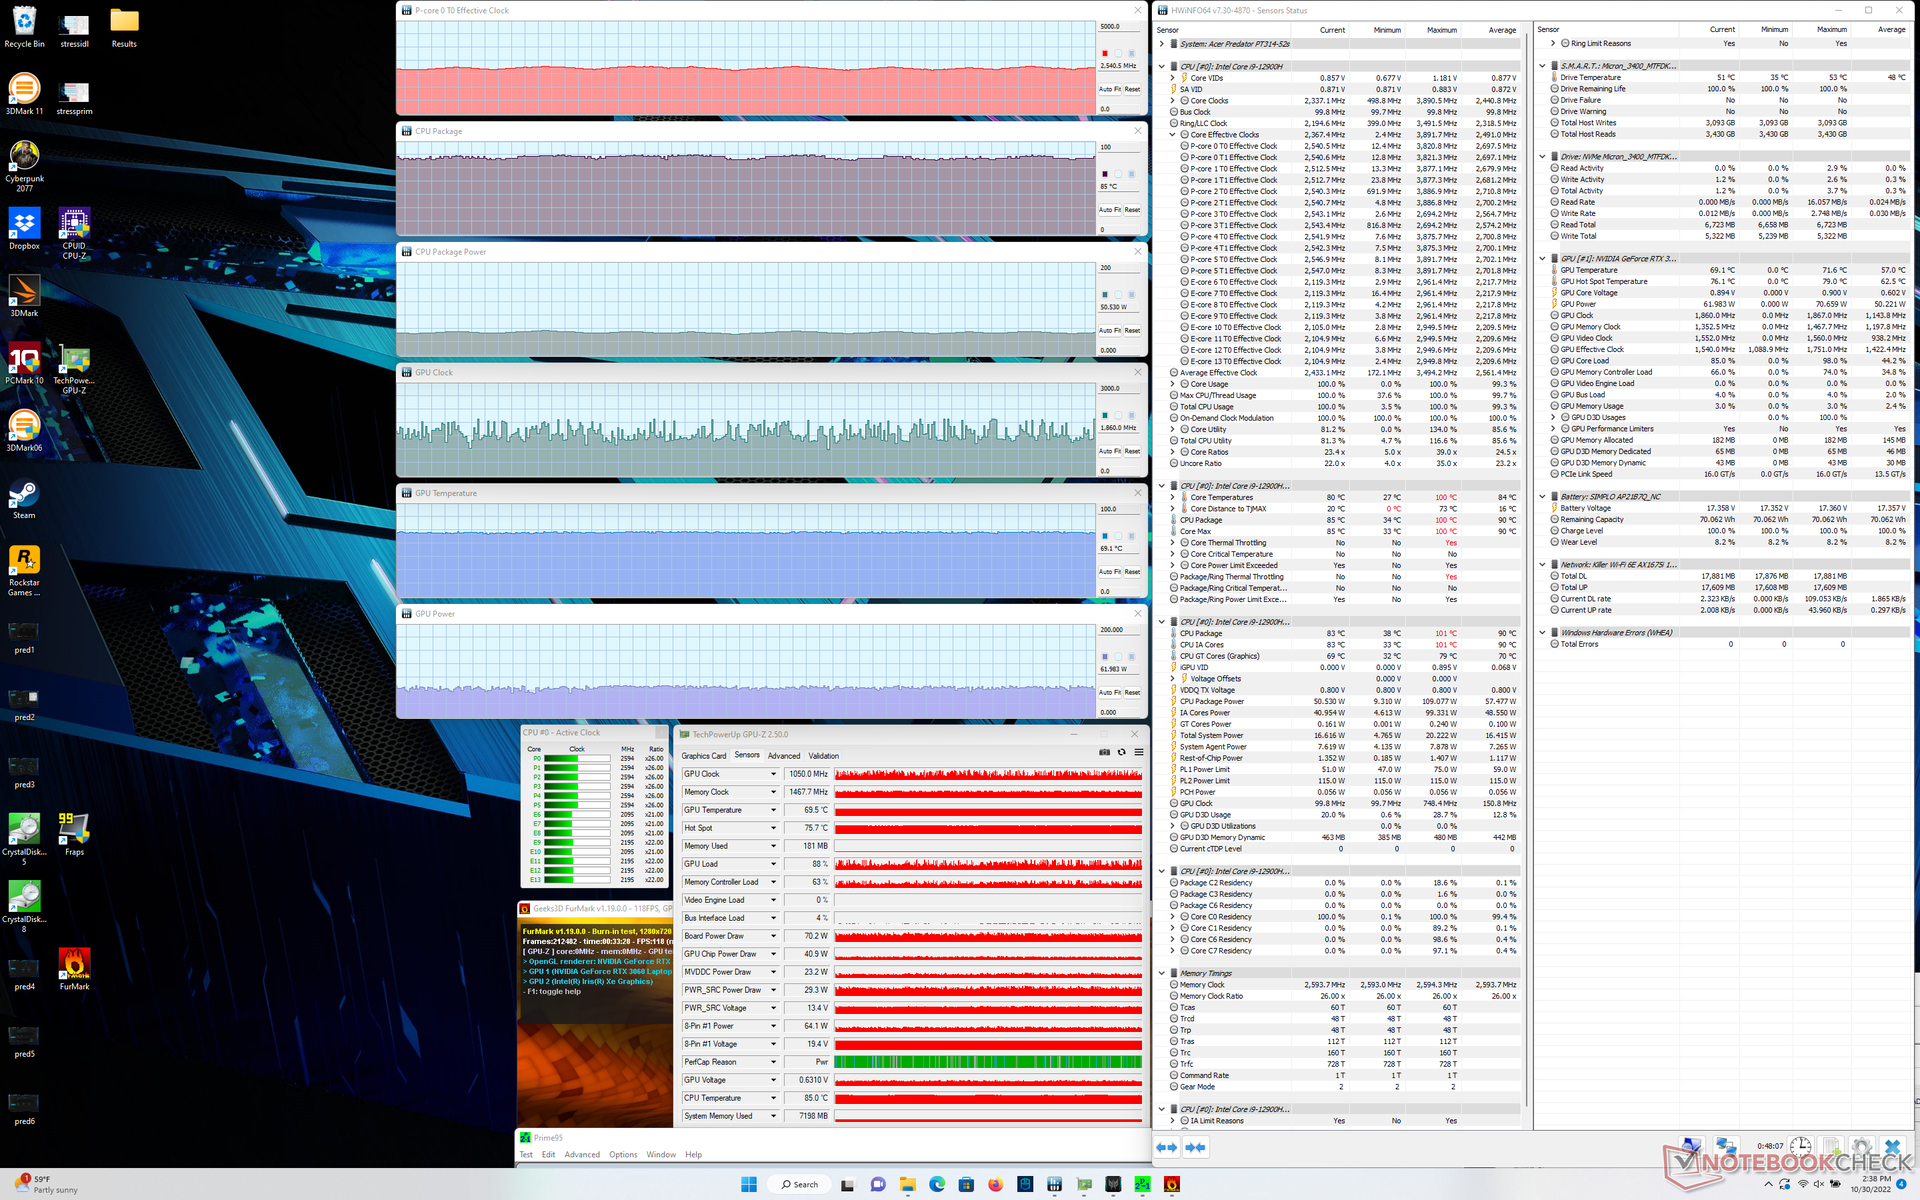
Prueba de esfuerzo
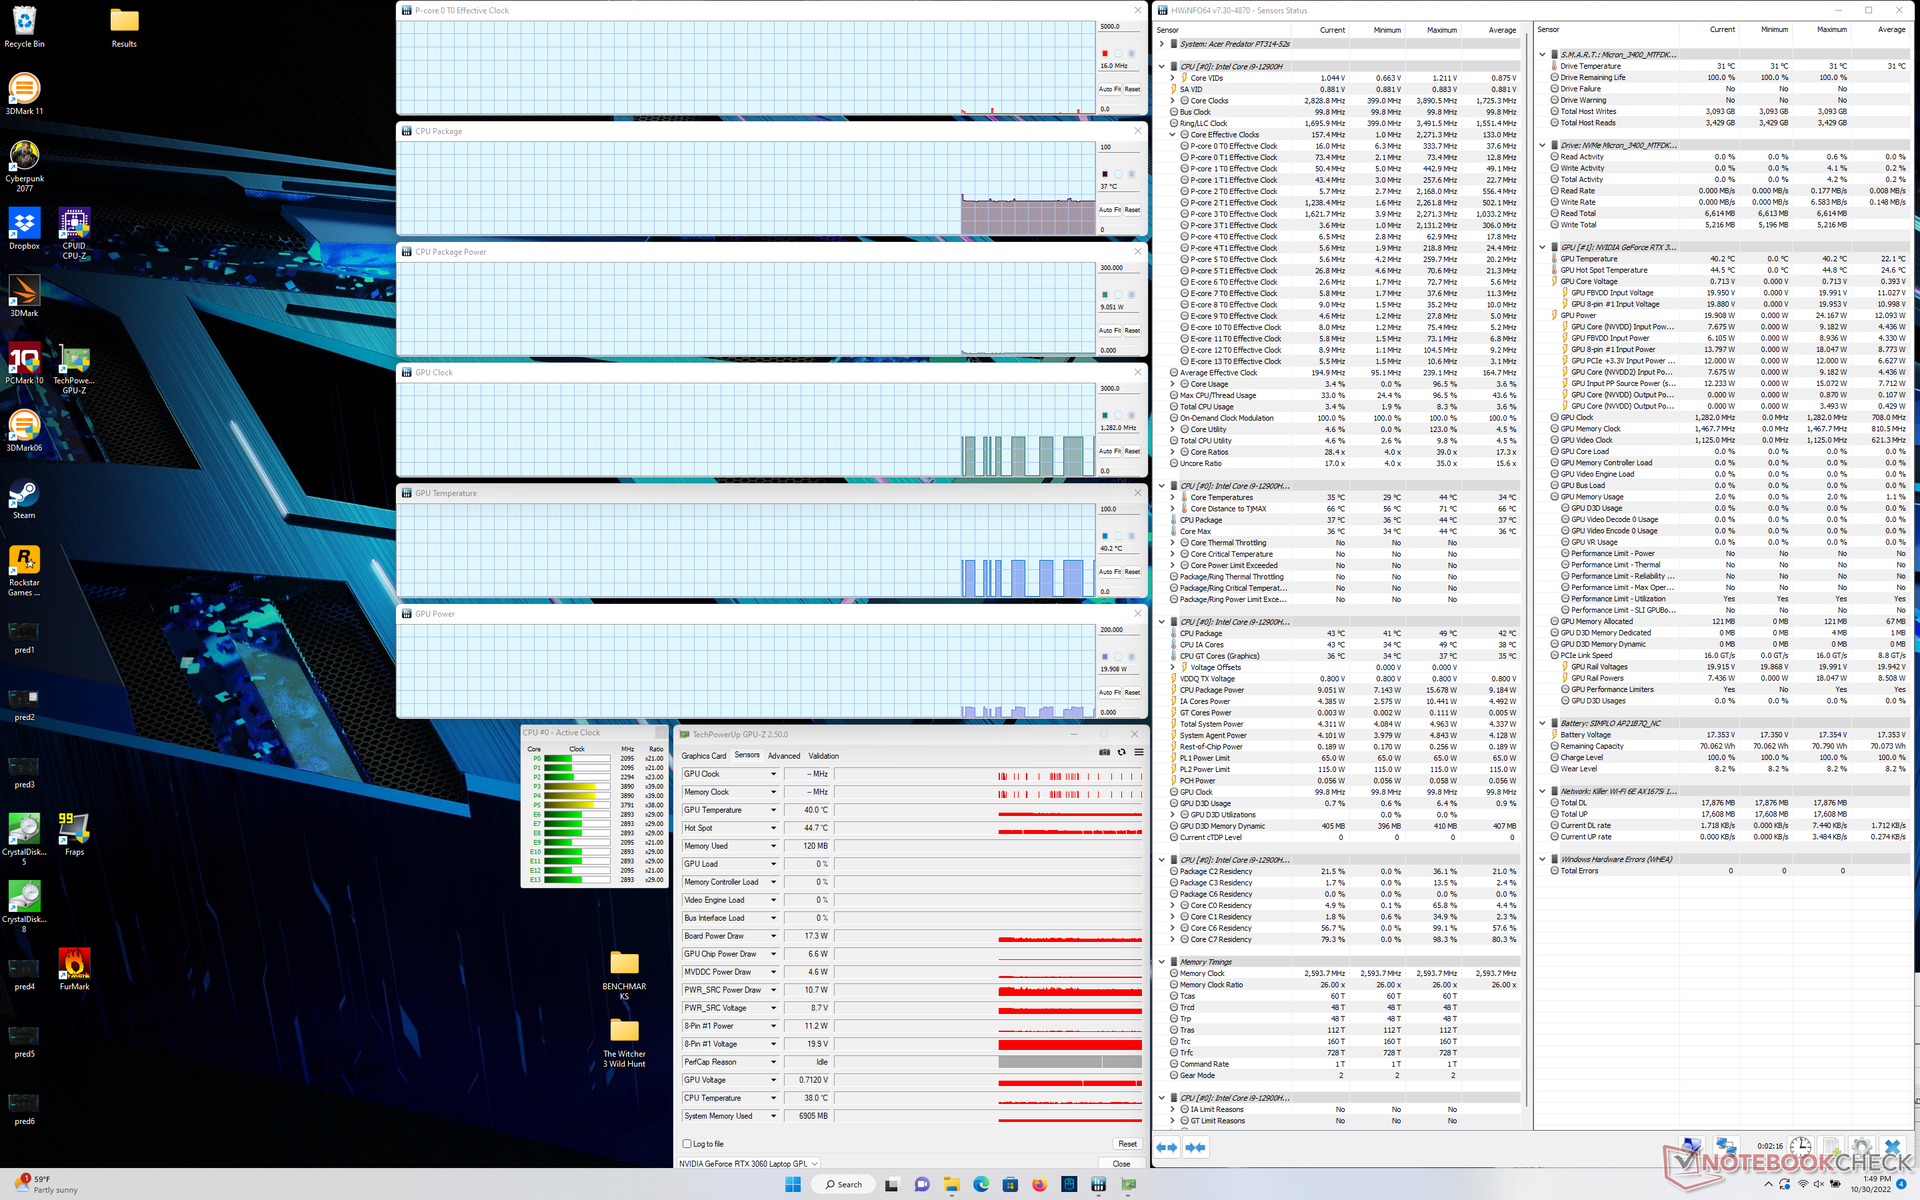
La velocidad de reloj de la CPU, la temperatura y el consumo de energía de la placa se disparan a 3,7 GHz, 100 C y 108 W, respectivamente, al iniciar el estrés de Prime95. Sin embargo, después de un par de segundos, la velocidad de reloj y el consumo de energía empezaron a caer antes de estabilizarse a sólo 3,0 GHz y 69 W, respectivamente, manteniendo una temperatura del núcleo de 100 C. Muy pocas CPUs de portátiles se estabilizan en rangos de temperatura superiores a 90 C, por lo que es un poco alarmante ver esto en el Acer. El Dell Precision 5470 con la misma CPU Core i9-12900H, por ejemplo, se estabilizaría a 2,4 GHz y 80 C en condiciones similares. Está claro que el sistema de Acer está llevando la CPU Core i9 tan lejos como la solución de refrigeración puede permitir.
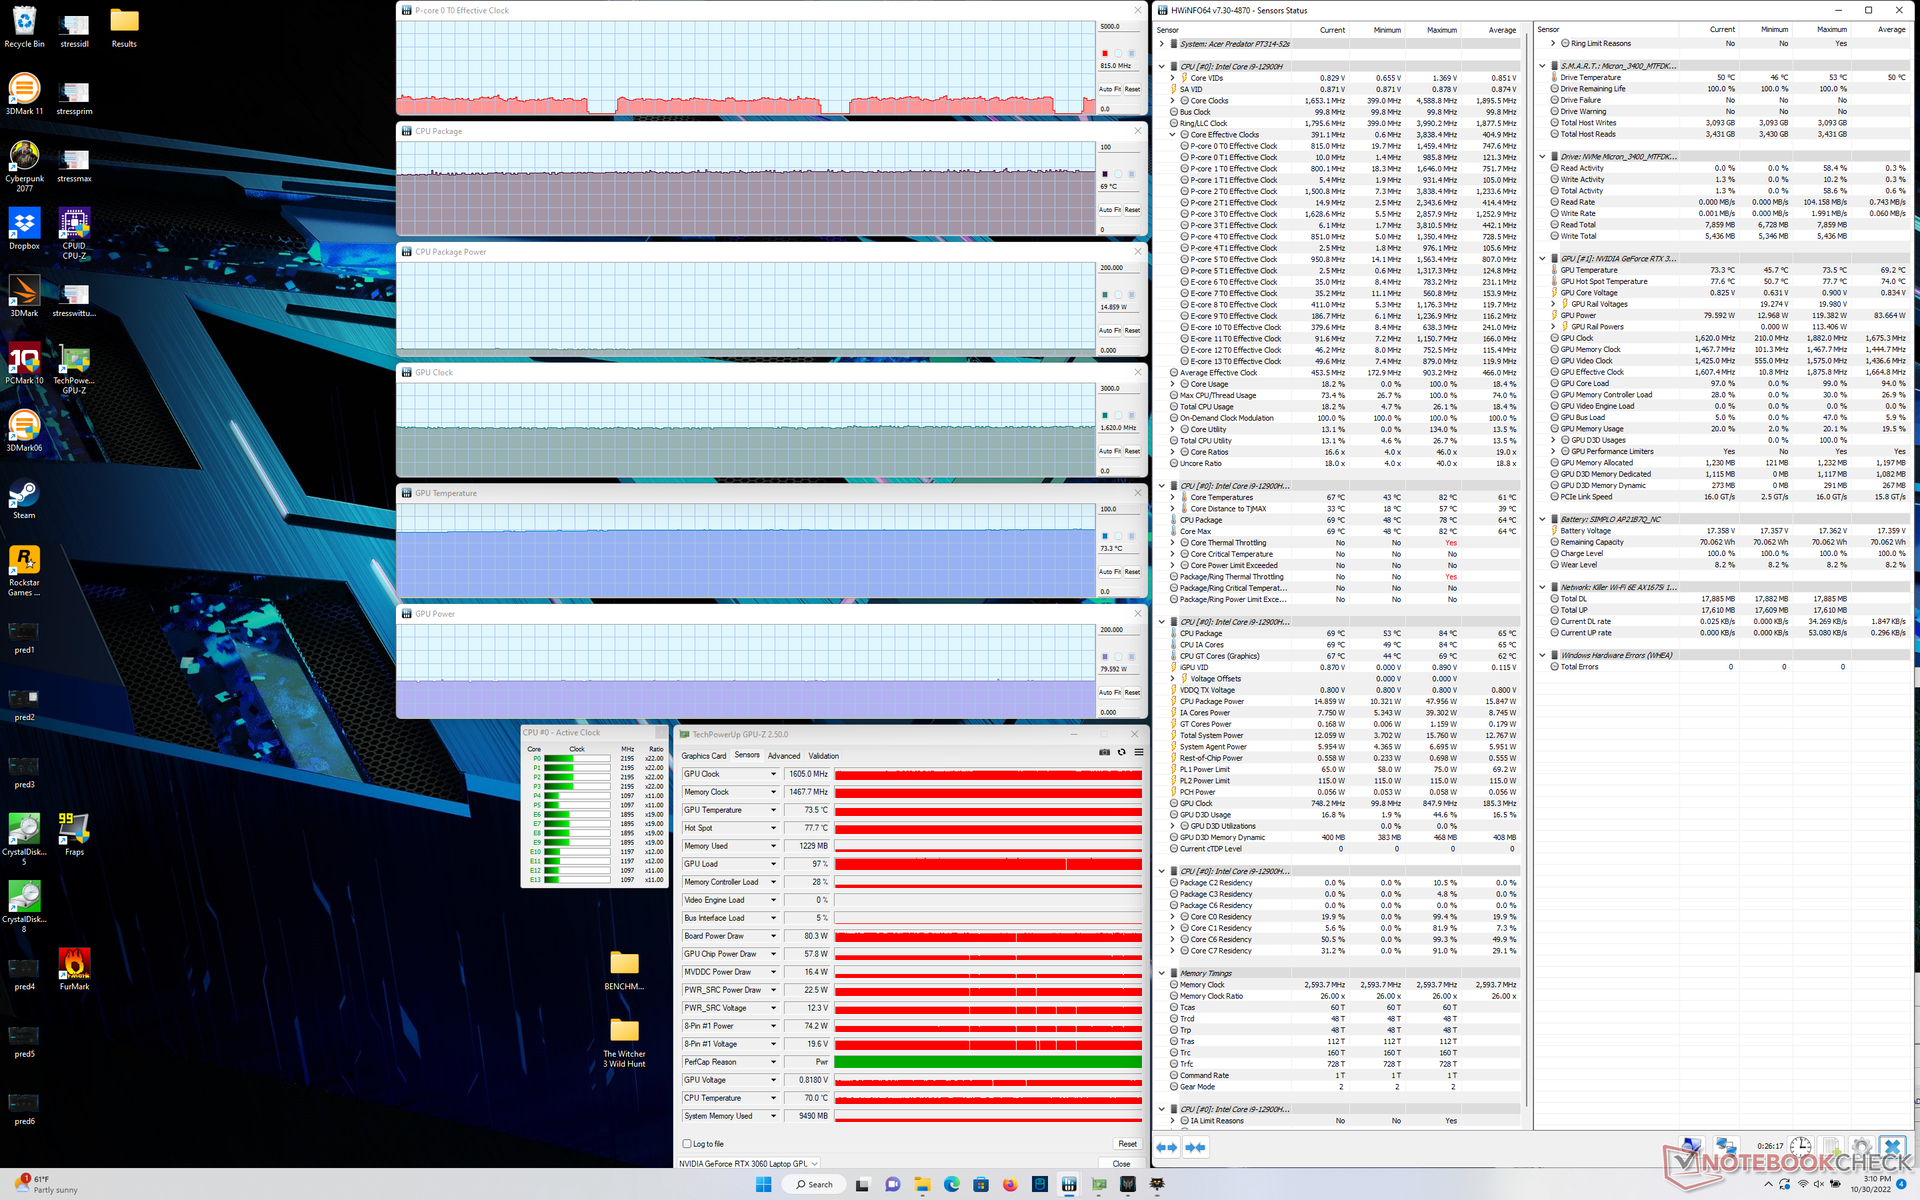
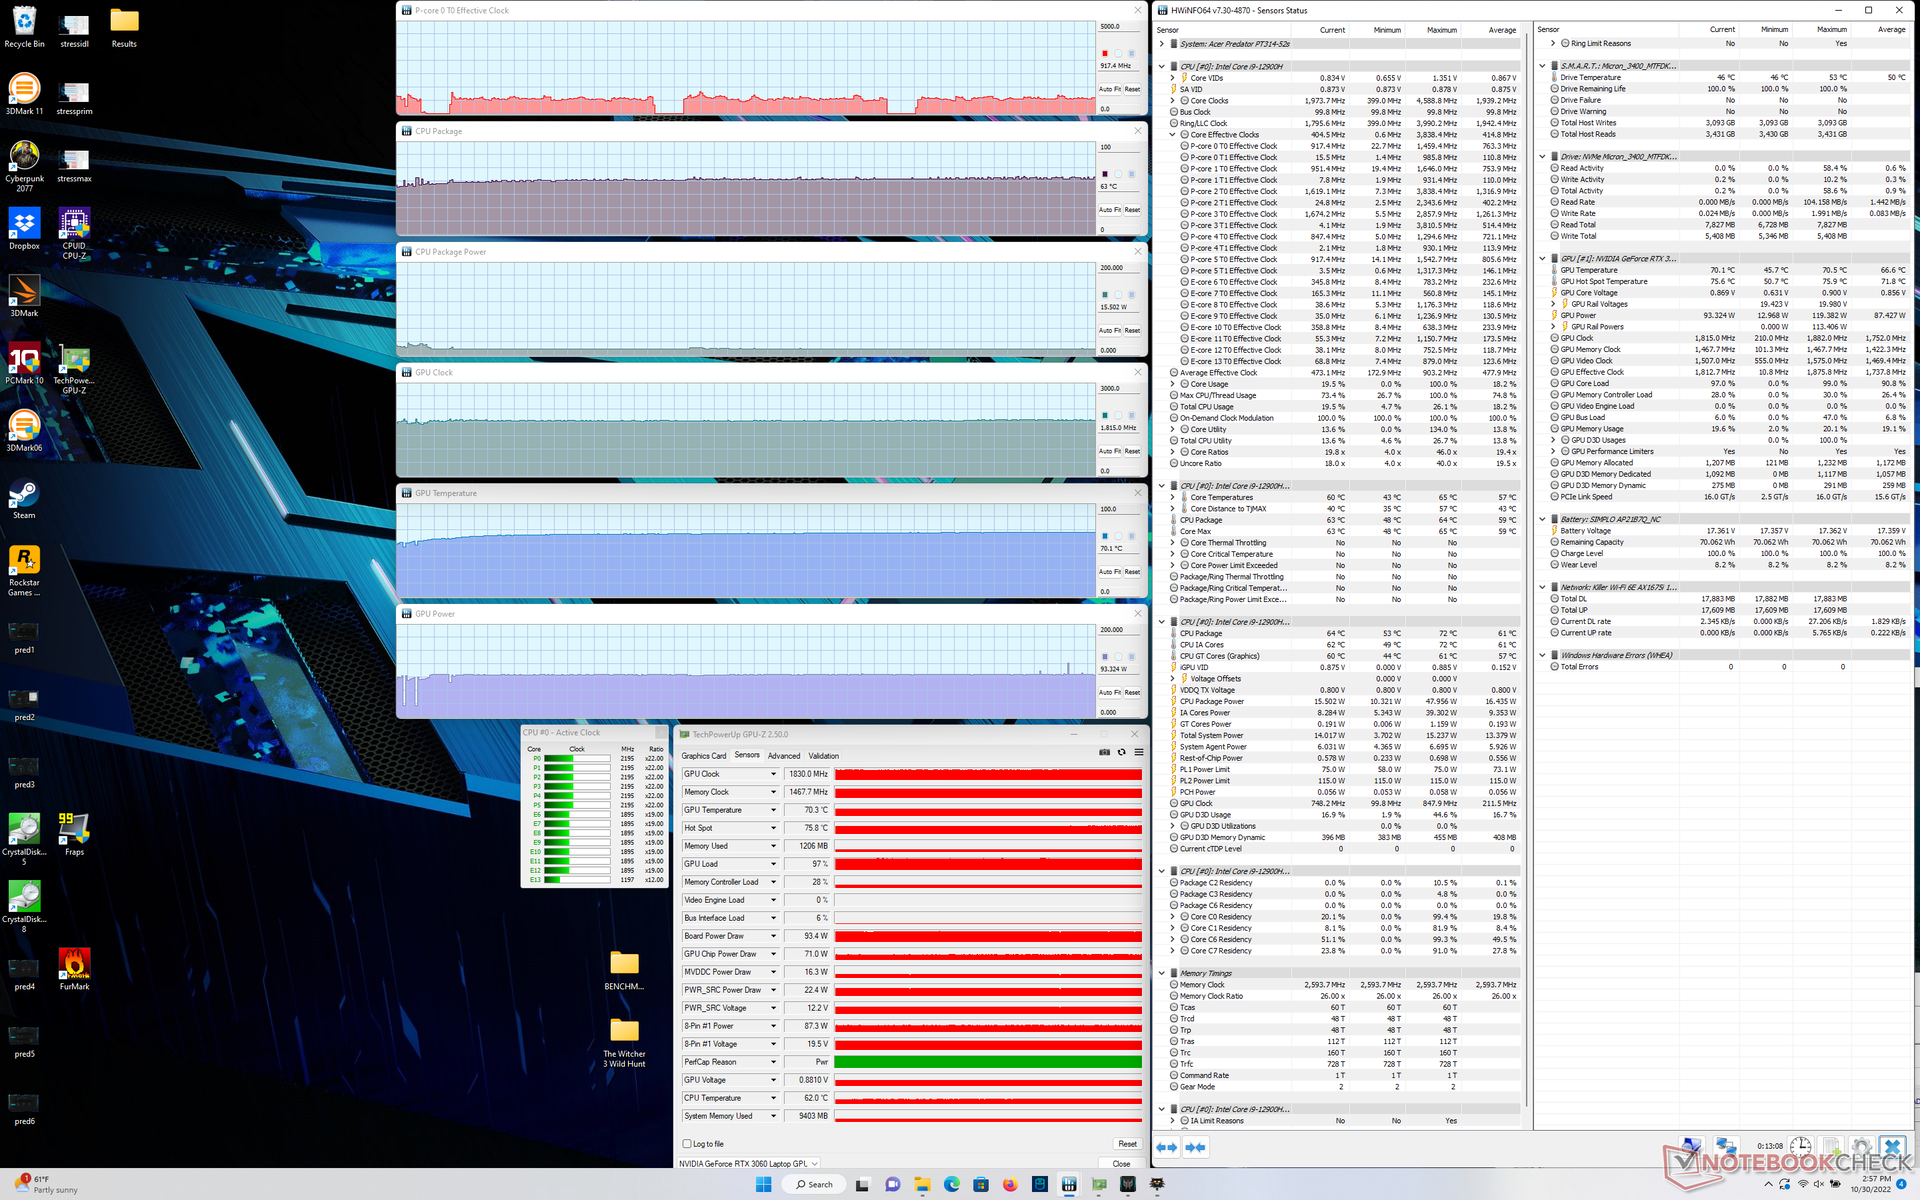
La ejecución de Witcher 3 en modo Turbo hace que la GPU Nvidia se estabilice en 1830 MHz, 70 C y 93 W. Si se desactiva el modo Turbo, las velocidades de reloj y el consumo de energía de la placa bajarían a 1605 MHz y 80 W, respectivamente, mientras que la temperatura subiría ligeramente a 73 C debido al menor techo del ventilador. Por tanto, los usuarios deben activar el modo Turbo si desean aprovechar al máximo la GPU TGP de 95 W.
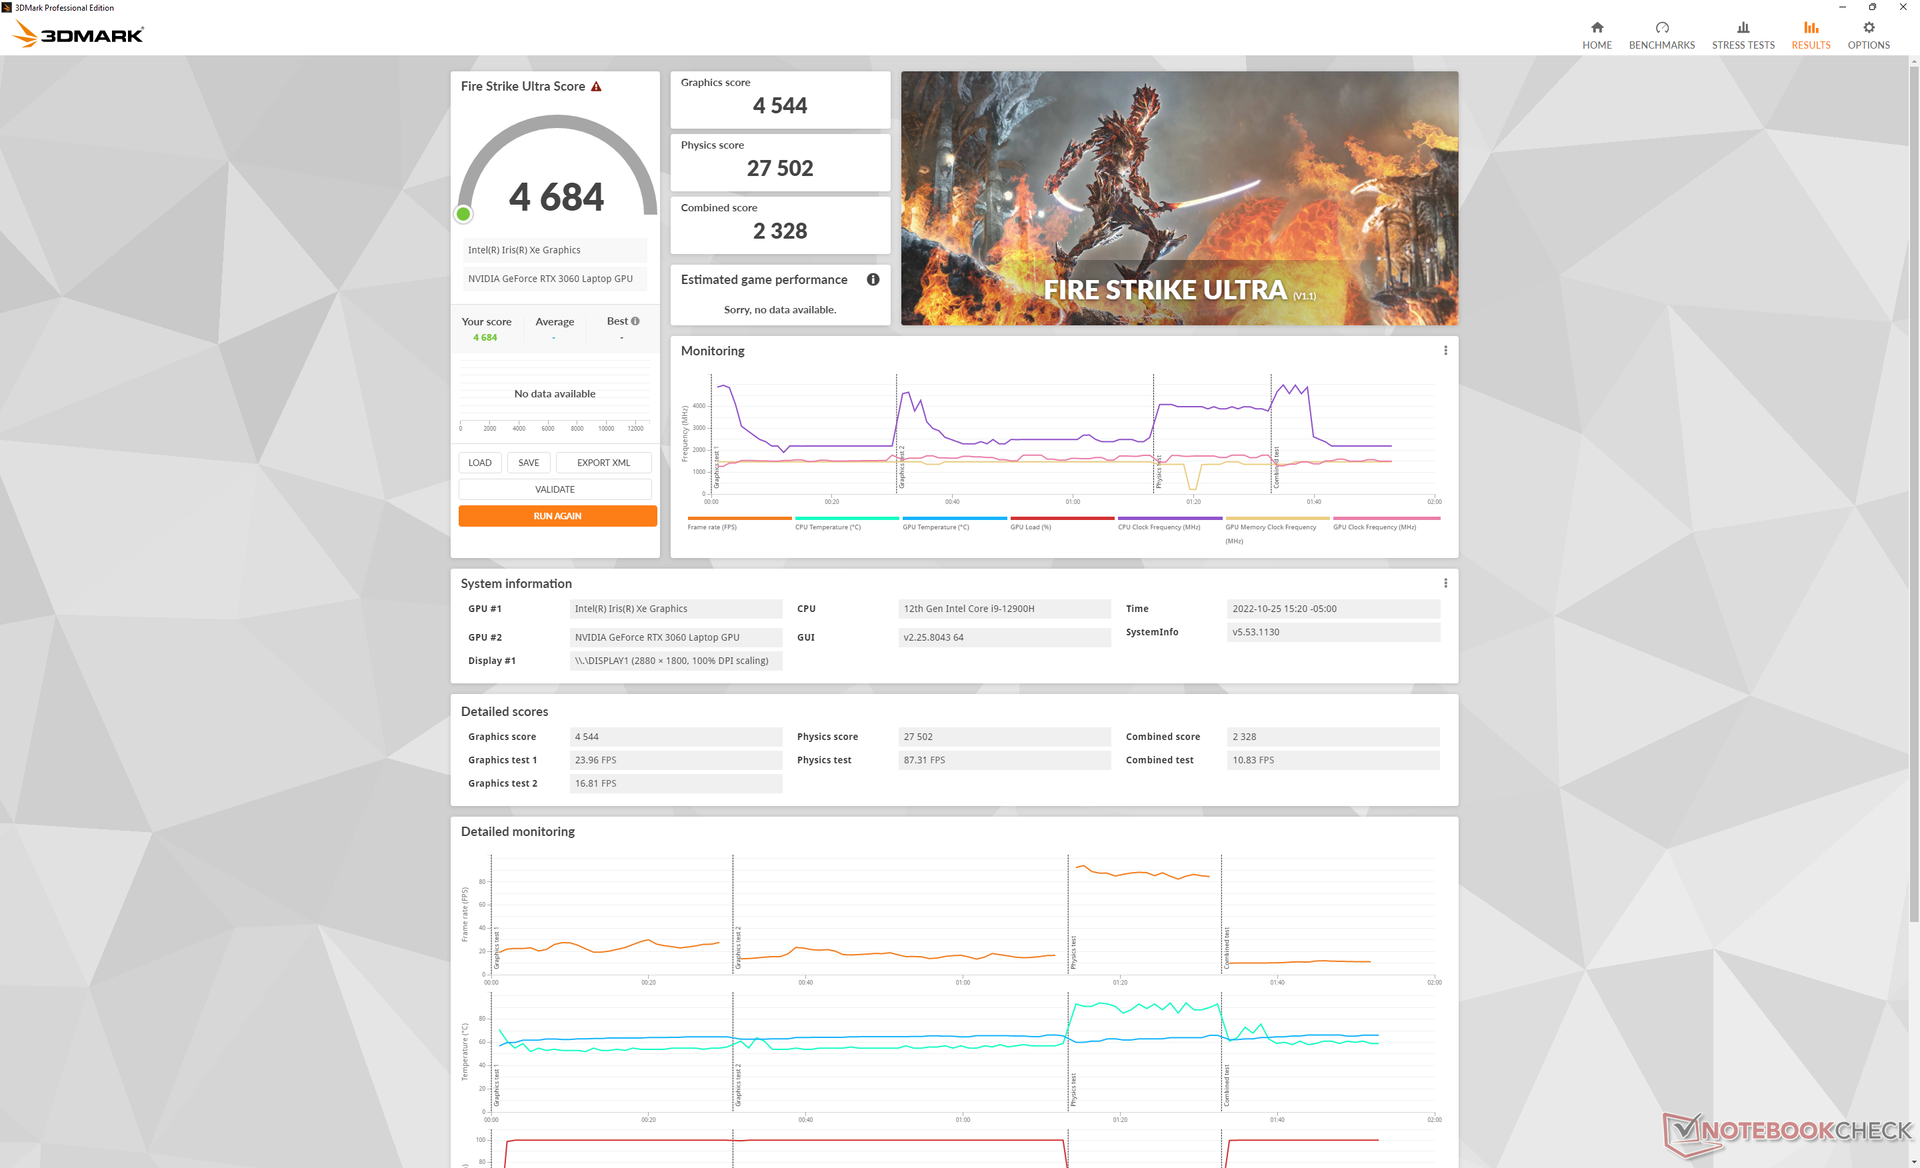
Funcionar con batería limita el rendimiento, especialmente porque el modo Turbo requiere red eléctrica. Una prueba de Fire Strike en baterías devolvería puntuaciones de Física y Gráficos de 14166 y 11131 puntos, respectivamente, comparado con 31176 y 20405 puntos cuando está conectado a la red.
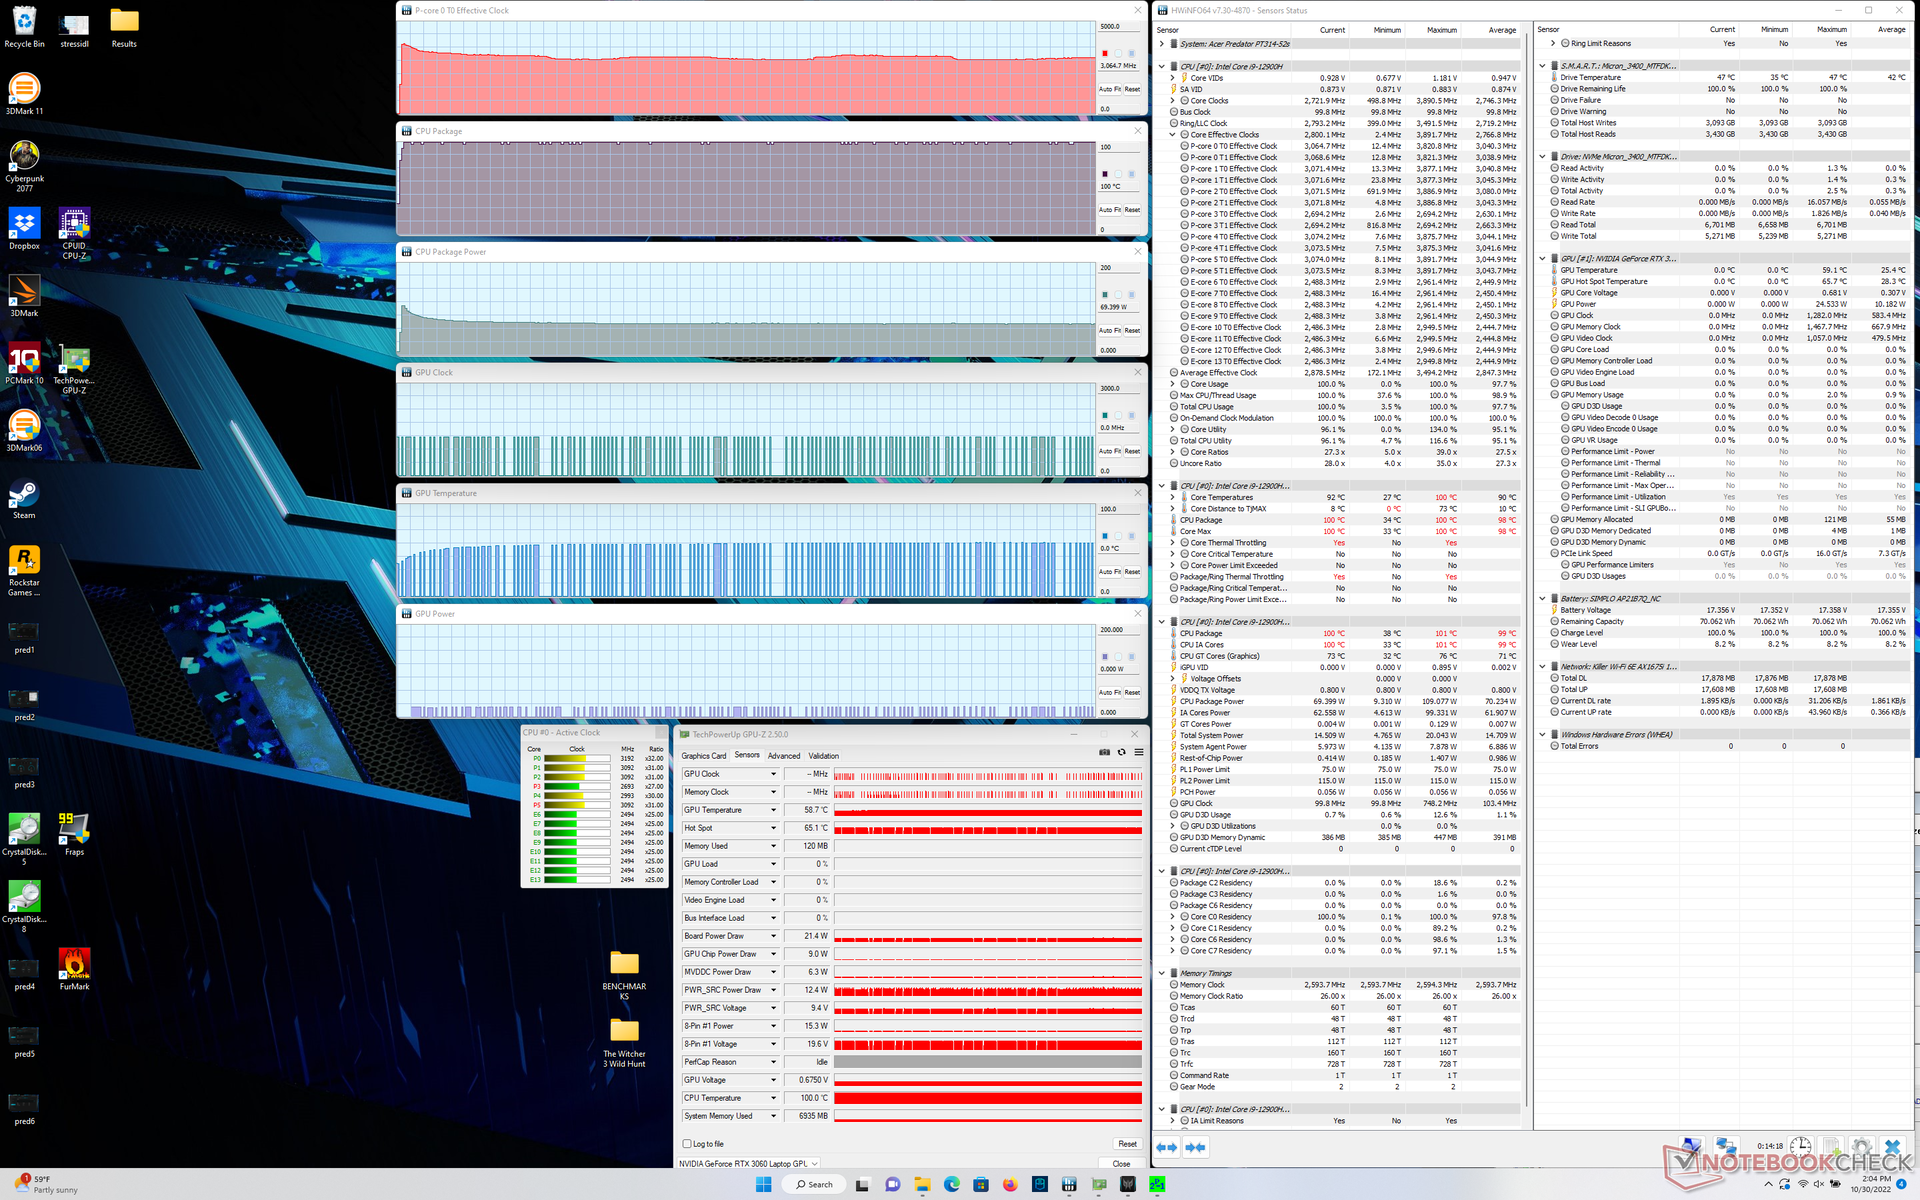
| Reloj dela CPU (GHz) | Reloj de la GPU (MHz) | Temperatura media dela CPU (°C) | Temperatura media de la GPU (°C) | |
| Sistema en reposo | -- | -- | 37 | 40 |
| Prime95 Stress | 3.0 - 3.1 | -- | 100 | 59 |
| Prime95+ FurMark Stress | 2.5 | ~1050 | 85 | 69 |
| Witcher 3 Estrés (Turbooff) | ~0,8 | 1605 | 69 | 73 |
| Witcher 3 Estrés(Turbo on) | ~0,8 | 1830 | 63 | 70 |
Altavoces
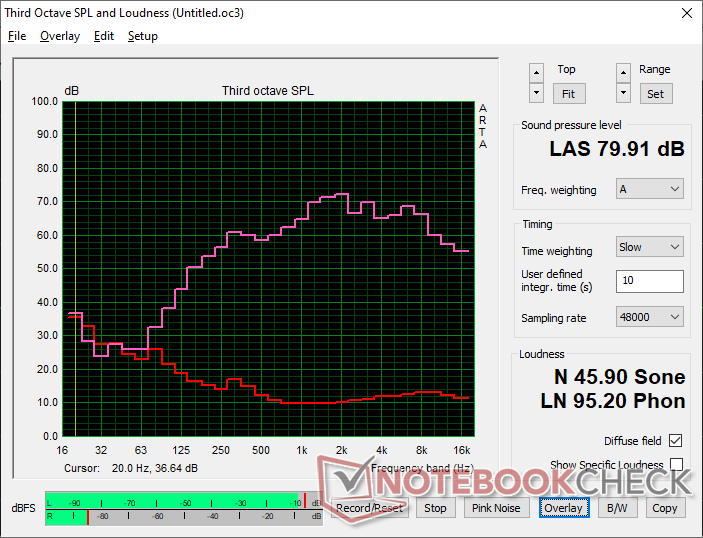
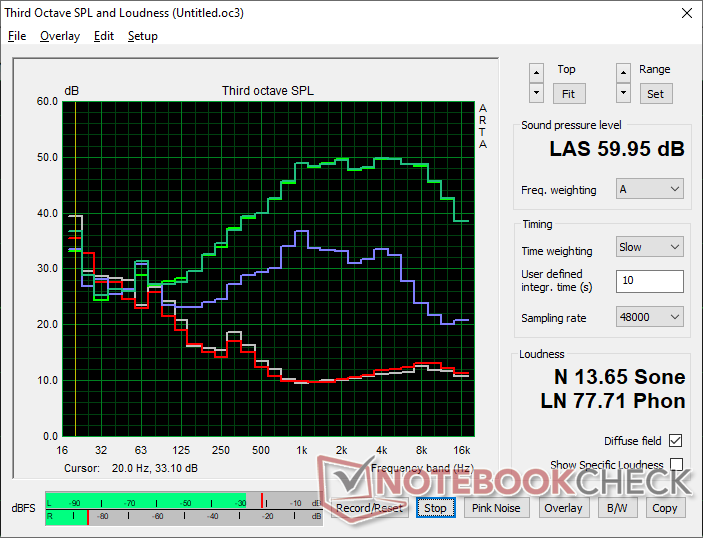
Acer Predator Triton 300 SE análisis de audio
(±) | la sonoridad del altavoz es media pero buena (79.9 dB)
Graves 100 - 315 Hz
(±) | lubina reducida - en promedio 10.3% inferior a la mediana
(±) | la linealidad de los graves es media (9.7% delta a frecuencia anterior)
Medios 400 - 2000 Hz
(±) | medias más altas - de media 5% más altas que la mediana
(+) | los medios son lineales (4% delta a la frecuencia anterior)
Altos 2 - 16 kHz
(±) | máximos más altos - de media 5.5% más altos que la mediana
(±) | la linealidad de los máximos es media (7.6% delta a frecuencia anterior)
Total 100 - 16.000 Hz
(±) | la linealidad del sonido global es media (15.1% de diferencia con la mediana)
En comparación con la misma clase
» 32% de todos los dispositivos probados de esta clase eran mejores, 6% similares, 61% peores
» El mejor tuvo un delta de 6%, la media fue 18%, el peor fue ###max##%
En comparación con todos los dispositivos probados
» 21% de todos los dispositivos probados eran mejores, 4% similares, 75% peores
» El mejor tuvo un delta de 4%, la media fue 23%, el peor fue ###max##%
Apple MacBook Pro 16 2021 M1 Pro análisis de audio
(+) | los altavoces pueden reproducir a un volumen relativamente alto (#84.7 dB)
Graves 100 - 315 Hz
(+) | buen bajo - sólo 3.8% lejos de la mediana
(+) | el bajo es lineal (5.2% delta a la frecuencia anterior)
Medios 400 - 2000 Hz
(+) | medios equilibrados - a sólo 1.3% de la mediana
(+) | los medios son lineales (2.1% delta a la frecuencia anterior)
Altos 2 - 16 kHz
(+) | máximos equilibrados - a sólo 1.9% de la mediana
(+) | los máximos son lineales (2.7% delta a la frecuencia anterior)
Total 100 - 16.000 Hz
(+) | el sonido global es lineal (4.6% de diferencia con la mediana)
En comparación con la misma clase
» 0% de todos los dispositivos probados de esta clase eran mejores, 0% similares, 100% peores
» El mejor tuvo un delta de 5%, la media fue 17%, el peor fue ###max##%
En comparación con todos los dispositivos probados
» 0% de todos los dispositivos probados eran mejores, 0% similares, 100% peores
» El mejor tuvo un delta de 4%, la media fue 23%, el peor fue ###max##%
Gestión de la energía
Consumo de energía: más eficiente que el modelo de última generación
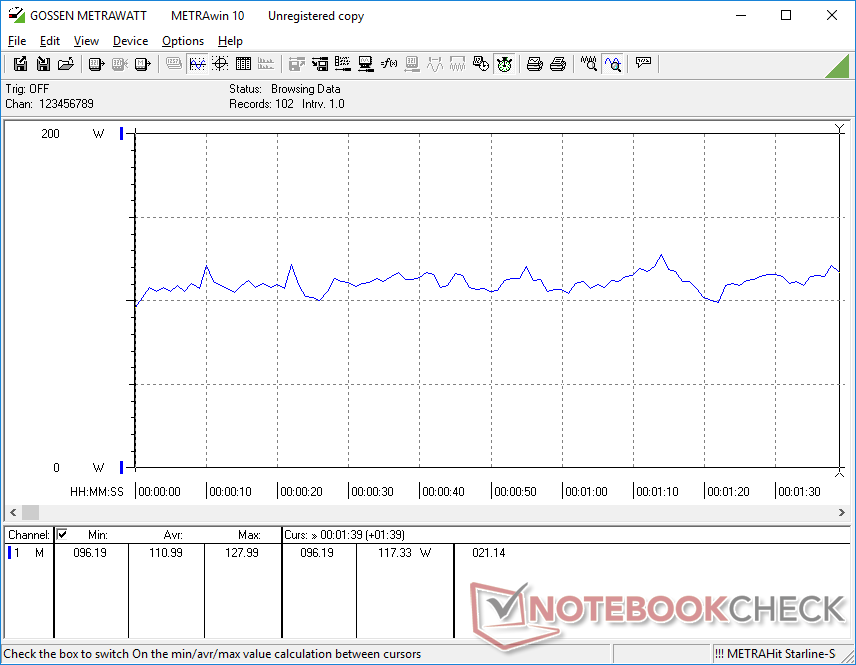
El consumo general es bastante similar al del Alienware x14 que viene con opciones similares de CPU y GPU. En el escritorio, el modo de ahorro de energía y el ajuste de brillo más bajo consumirían sólo 8 W, mientras que el modo de rendimiento más alto y los ajustes de brillo consumirían alrededor de 18 W. Tenga en cuenta que el consumo de energía y, por tanto, la duración de la batería son sensibles a los colores en pantalla, a diferencia de los paneles IPS, como se muestra en nuestras mediciones de consumo de energía OLED aquí.
Si se ejecuta Witcher 3para representar la carga de juego consume alrededor de un 14 por ciento menos de energía que en el 2020 Predator Triton 300 mientras que proporciona un rendimiento gráfico hasta un 30 por ciento más rápido para un aumento significativo en el rendimiento por vatio. Sin embargo, la CPU de la 12ª generación consume ahora más energía que antes.
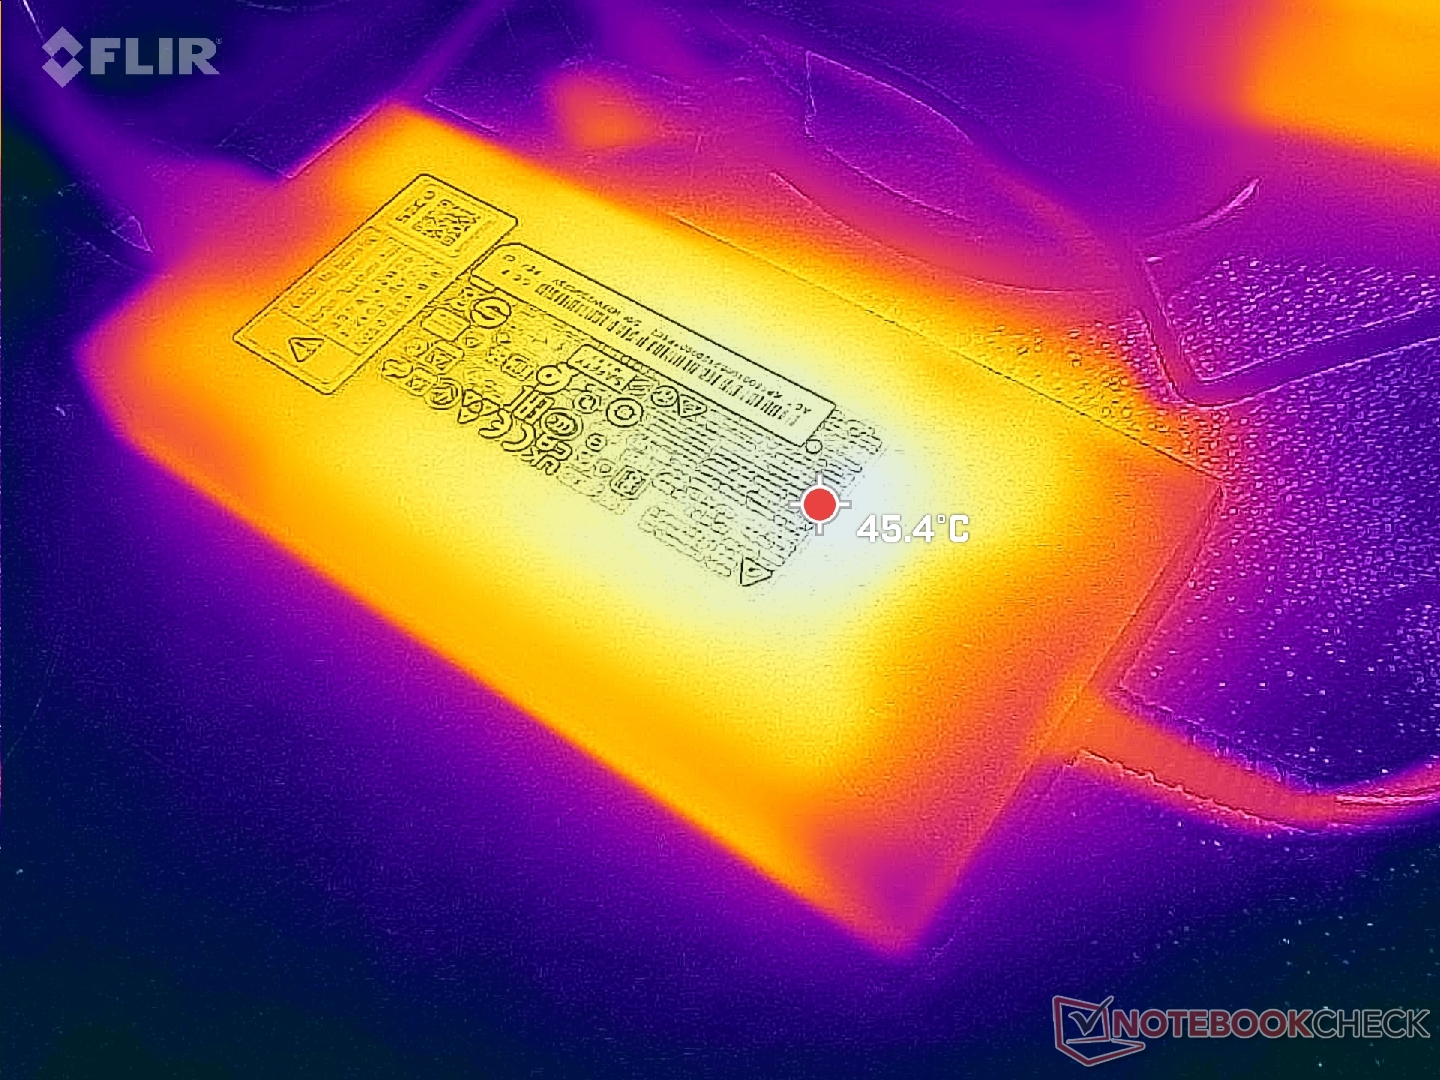
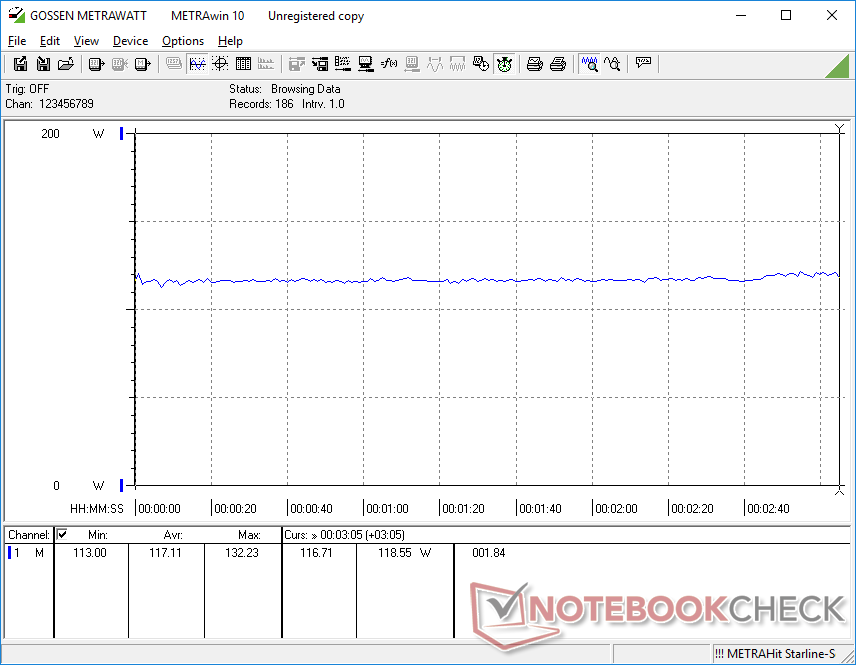
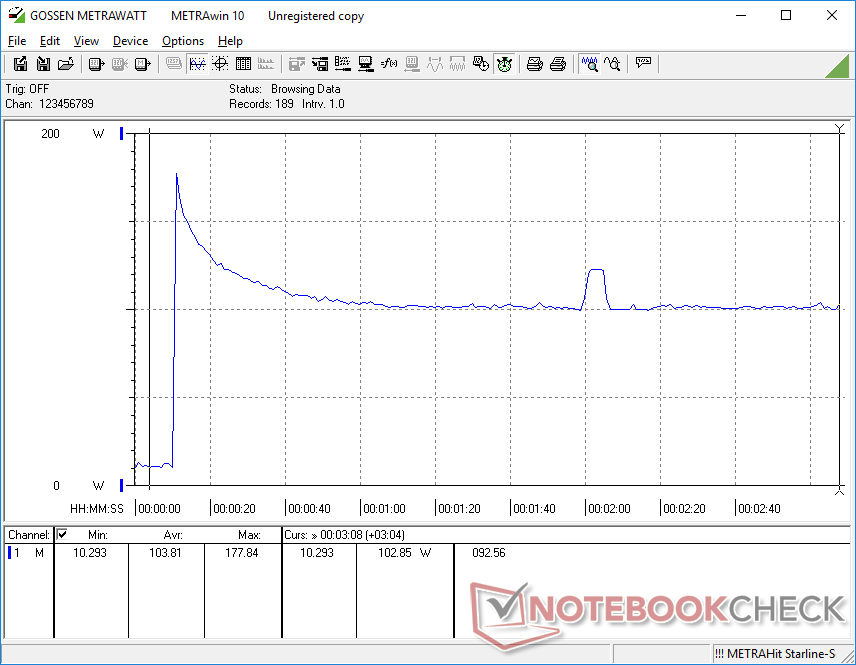
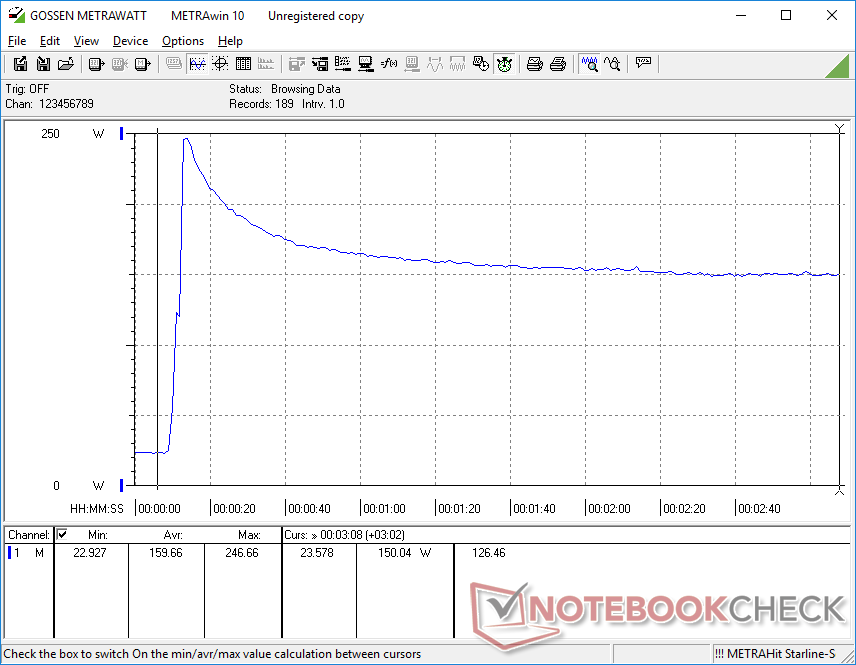
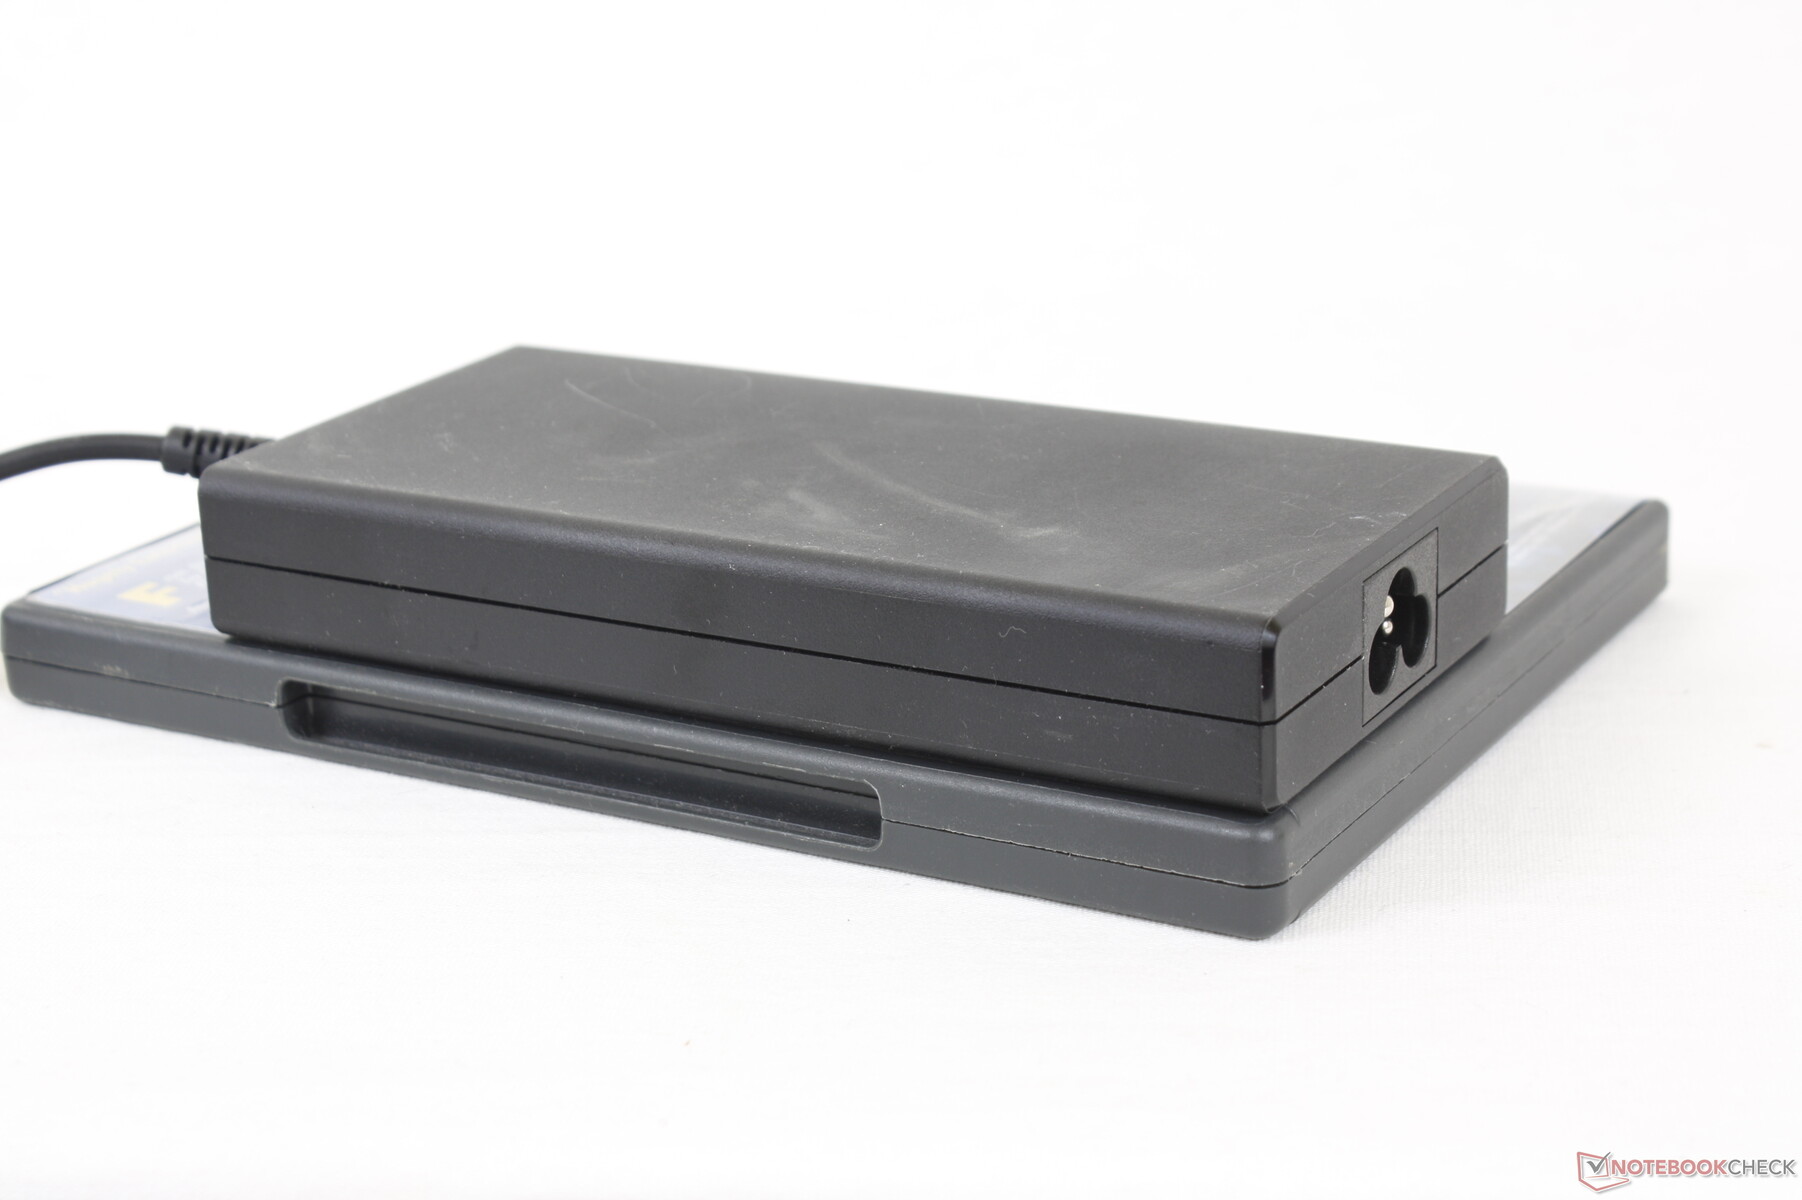
Hemos podido registrar un consumo máximo temporal de 246 W en el adaptador de CA de 200 W de tamaño medio (~15,1 x 7,2 x 2,3 cm) cuando la CPU y la GPU están cada una al 100 por ciento de utilización. Esta tasa bajaría rápidamente y se estabilizaría en un nivel más seguro de 150 W, como muestra nuestro gráfico de abajo, debido a las preocupaciones térmicas. El sistema puede seguir recargándose a un ritmo razonable mientras se juega.
| Off / Standby | |
| Ocioso | |
| Carga |
|
Clave:
min: | |
| Acer Predator Triton 300 SE i9-12900H, GeForce RTX 3060 Laptop GPU, Micron 3400 1TB MTFDKBA1T0TFH, OLED, 2880x1800, 14" | Asus ROG Zephyrus G14 GA402RJ R7 6800HS, Radeon RX 6700S, Micron 2450 1TB MTFDKBA1T0TFK, IPS, 2560x1600, 14" | Razer Blade 14 Ryzen 9 6900HX R9 6900HX, GeForce RTX 3070 Ti Laptop GPU, Samsung PM9A1 MZVL21T0HCLR, IPS, 2560x1440, 14" | Alienware x14 i7 RTX 3060 i7-12700H, GeForce RTX 3060 Laptop GPU, WDC PC SN810 1TB, IPS, 1920x1080, 14" | Schenker Vision 14 i7-11370H, GeForce RTX 3050 Ti Laptop GPU, Samsung SSD 980 Pro 1TB MZ-V8P1T0BW, IPS, 2880x1800, 14" | Acer Predator Triton 300 PT315-52-79LP i7-10750H, GeForce RTX 2060 Mobile, WDC PC SN730 SDBQNTY-1T00, IPS, 1920x1080, 15.6" | |
|---|---|---|---|---|---|---|
| Power Consumption | -24% | -34% | 15% | 22% | 12% | |
| Idle Minimum * (Watt) | 7.6 | 12 -58% | 10.2 -34% | 7.9 -4% | 6.7 12% | 4 47% |
| Idle Average * (Watt) | 12.3 | 18 -46% | 26 -111% | 11.1 10% | 12.6 -2% | 10 19% |
| Idle Maximum * (Watt) | 17.6 | 26 -48% | 26.7 -52% | 11.8 33% | 15.4 12% | 19 -8% |
| Load Average * (Watt) | 111 | 88 21% | 89.3 20% | 107.4 3% | 85.7 23% | 96 14% |
| Witcher 3 ultra * (Watt) | 117.1 | 157.7 -35% | 158.7 -36% | 111 5% | 83 29% | 136 -16% |
| Load Maximum * (Watt) | 245.8 | 194 21% | 227.5 7% | 140.4 43% | 110.9 55% | 214 13% |
* ... más pequeño es mejor
Power Consumption Witcher 3 / Stresstest
Power Consumption external Monitor
Duración de la batería - No está mal para el tamaño y la potencia
La duración media es de poco más de 6 horas de navegación WLAN en el mundo real con el perfil de energía equilibrado. No obstante, la mayoría de otros portátiles de 14 pulgadas pueden durar incluso más, incluyendo el Asus ROG Zephyrus G14 o el Razer Blade 14, con varias horas más cada uno. La CPU Intel, que consume más energía, y el panel OLED son probablemente los responsables de la menor duración de la batería.
La carga desde el vacío hasta la capacidad total es relativamente lenta: 2 horas. Además, el sistema no puede recargarse por USB-C.
| Acer Predator Triton 300 SE i9-12900H, GeForce RTX 3060 Laptop GPU, 76 Wh | Asus ROG Zephyrus G14 GA402RJ R7 6800HS, Radeon RX 6700S, 76 Wh | Razer Blade 14 Ryzen 9 6900HX R9 6900HX, GeForce RTX 3070 Ti Laptop GPU, 62 Wh | Alienware x14 i7 RTX 3060 i7-12700H, GeForce RTX 3060 Laptop GPU, 80 Wh | Dell Inspiron 14 Plus 7420 i7-12700H, GeForce RTX 3050 4GB Laptop GPU, 64 Wh | Schenker Vision 14 i7-11370H, GeForce RTX 3050 Ti Laptop GPU, 53 Wh | |
|---|---|---|---|---|---|---|
| Duración de Batería | 65% | 42% | 3% | 11% | -2% | |
| Reader / Idle (h) | 8.1 | 12.2 51% | 11.9 47% | |||
| WiFi v1.3 (h) | 6.2 | 10.2 65% | 9.5 53% | 8.9 44% | 7.2 16% | 5.5 -11% |
| Load (h) | 1.3 | 1.6 23% | 0.8 -38% | 0.9 -31% | 1.4 8% | |
| H.264 (h) | 9.4 | 6.8 | ||||
| Witcher 3 ultra (h) | 0.8 |
Pro
Contra
Veredicto: bueno, pero no lo suficientemente bueno
El Predator Triton 300 SE de 14 pulgadas tiene una dura competencia con el Asus Zephyrus G14, Razer Blade 14y el Alienware x14. Cuando se compara con el Zephyrus G14, el portátil Asus es frecuentemente en venta por cientos de dólares menos, ofreciendo el mismo nivel de rendimiento gráfico y un peso y dimensiones casi idénticos. En comparación con el Blade 14, el portátil de Razer es posiblemente más elegante con su diseño más fino y la iluminación RGB por tecla. Y por último, el Alienware x14 integra teclas de teclado más firmes y un perfil aún más delgado. Todas estas máquinas tienen también un mejor rendimiento de SSD que el Acer.
El Acer Predator Triton 300 SE es un portátil para juegos especialmente potente independientemente de su tamaño. Sin embargo, otros portátiles de 14 pulgadas para juegos lo superan en lo que respecta al ruido del ventilador y al rendimiento del SSD.
El sistema de Acer también es más ruidoso que las tres alternativas mencionadas anteriormente cuando se ejecutan juegos. Entendemos que el modo Turbo va a ser ruidoso pase lo que pase, pero el hecho de que sea mucho más ruidoso que la competencia hace mella en el sistema. El modo Turbo debe estar activado para explotar al máximo la GPU del Acer.
Hay algunas cualidades redentoras como el panel OLED 16:10 90 Hz, la rápida CPU Core i9 y el soporte para Thunderbolt 4, todo lo cual no está disponible en el Razer Blade 14 ni en la mayoría de los modelos Asus Zephyrus G14. De hecho, el Predator Triton 300 SE es uno de los únicos portátiles para juegos 16:10 en la categoría de 14 pulgadas en este momento. Sin embargo, si estas características únicas no son una prioridad, vale la pena considerar el Zephyrus G14, el Blade 14 o el Alienware x14.
Precio y disponibilidad
El Predator Triton 300 SE de 14 pulgadas ya está disponible en tiendas como Amazon, Best Buyy Newegg por unos 2.000 dólares si se configura como nuestra unidad de análisis. Hay disponibles SKUs más pequeñoscon la CPU Core i7 están disponibles por $1600 USD.
Acer Predator Triton 300 SE
- 11/02/2022 v7 (old)
Allen Ngo
Price comparison

