Análisis del portátil Gigabyte Aero 14 OLED BMF: Portátil de estudio compacto con pantalla en color real

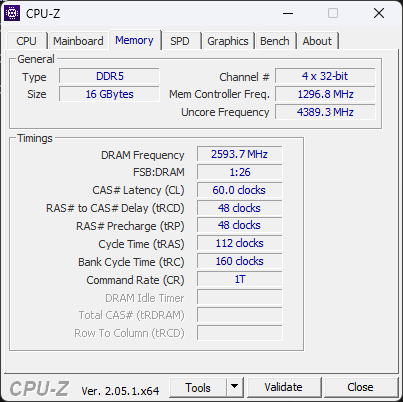
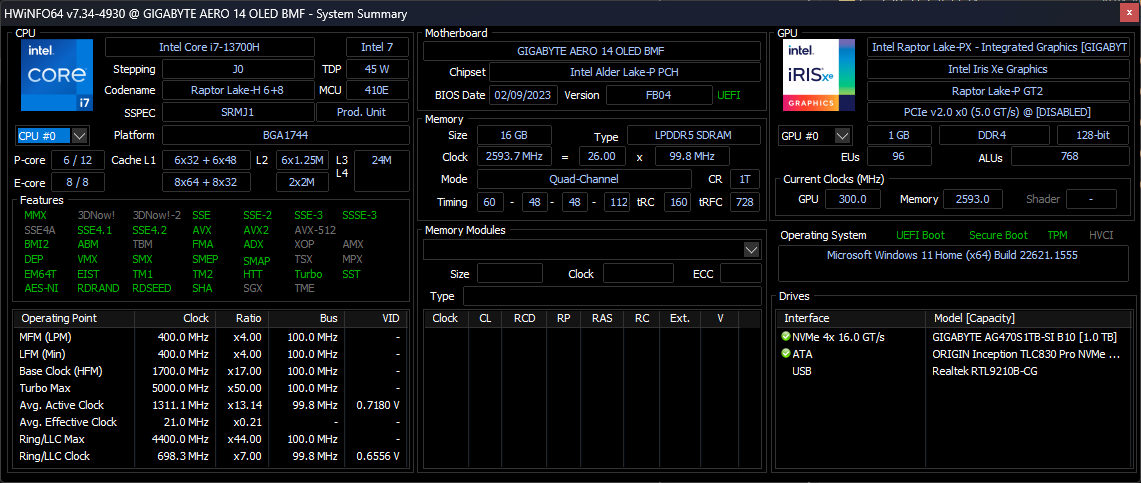
Gigabyte no sólo abastece a los jugadores con hardware de alto rendimiento, ya que el fabricante taiwanés también diseña su marca Aero para su uso en el campo creativo. Hay placas base y tarjetas gráficas, así como portátiles con mucho rendimiento sin RGB ni un diseño demasiado agresivo. El Gigabyte Aero 14 es el representante más pequeño de la serie de portátiles. Pero el tamaño no es siempre lo único que importa. El pequeño Aero 14 OLED BMF contiene unIntel Core i7-13700H y una Nvidia GeForce RTX 4050también tiene 16 GB de RAM y un SSD NVMe con 1 TB de espacio de almacenamiento. Como pantalla se usa un panel OLED de alta resolución de Samsung. Una batería de 63 Wh garantiza una buena autonomía lejos del enchufe. Todo ello se aloja en un delgado chasis de aluminio.
Así, el portátil es un compañero pequeño, portátil y potente para las mentes creativas. Pero el Aero 14 no está solo entre los modelos de 14 pulgadas: la competencia es fuerte y a menudo ofrece sus propias características interesantes. ElSchenker Vision 14tiene una enorme batería de 99 Wh. El Asus Zephyrus G14viene con procesadores AMD y una RTX 3060. La RTX 4090 del Zephyrus G14también podría ser interesante. El Acer Swift X 14 también ofrece un rendimiento razonable para usuarios preocupados por el precio. Las críticas del MSI Stealth 14 Studio y el Lenovo Yoga Pro 7están actualmente en curso.
Posibles contendientes en la comparación
Valoración | Fecha | Modelo | Peso | Altura | Tamaño | Resolución | Precio |
|---|---|---|---|---|---|---|---|
| 89.4 % v7 (old) | 05/2023 | Gigabyte Aero 14 OLED BMF i7-13700H, GeForce RTX 4050 Laptop GPU | 1.4 kg | 17 mm | 14.00" | 2880x1800 | |
| 88.8 % v7 (old) | 10/2022 | Schenker Vision 14 2022 RTX 3050 Ti i7-12700H, GeForce RTX 3050 Ti Laptop GPU | 1.3 kg | 16.6 mm | 14.00" | 2880x1800 | |
| 85.4 % v7 (old) | 07/2023 | MSI Stealth 14 Studio A13V i7-13700H, GeForce RTX 4050 Laptop GPU | 1.7 kg | 19 mm | 14.00" | 2560x1600 | |
| 90.2 % v7 (old) | 05/2023 | Lenovo Yoga Pro 7 14IRH G8 i7-13700H, GeForce RTX 4050 Laptop GPU | 1.5 kg | 15.6 mm | 14.50" | 3072x1920 | |
| 83.5 % v7 (old) | 06/2021 | Asus Zephyrus G14 GA401QM R9 5900HS, GeForce RTX 3060 Laptop GPU | 1.7 kg | 19.9 mm | 14.00" | 1920x1080 | |
| 86 % v7 (old) | 11/2022 | Acer Predator Triton 300 SE i9-12900H, GeForce RTX 3060 Laptop GPU | 1.7 kg | 19.8 mm | 14.00" | 2880x1800 | |
| 85.9 % v7 (old) | 11/2022 | Acer Swift X SFX14-51G-5876 i5-1240P, GeForce RTX 3050 4GB Laptop GPU | 1.4 kg | 18.3 mm | 14.00" | 2240x1400 |
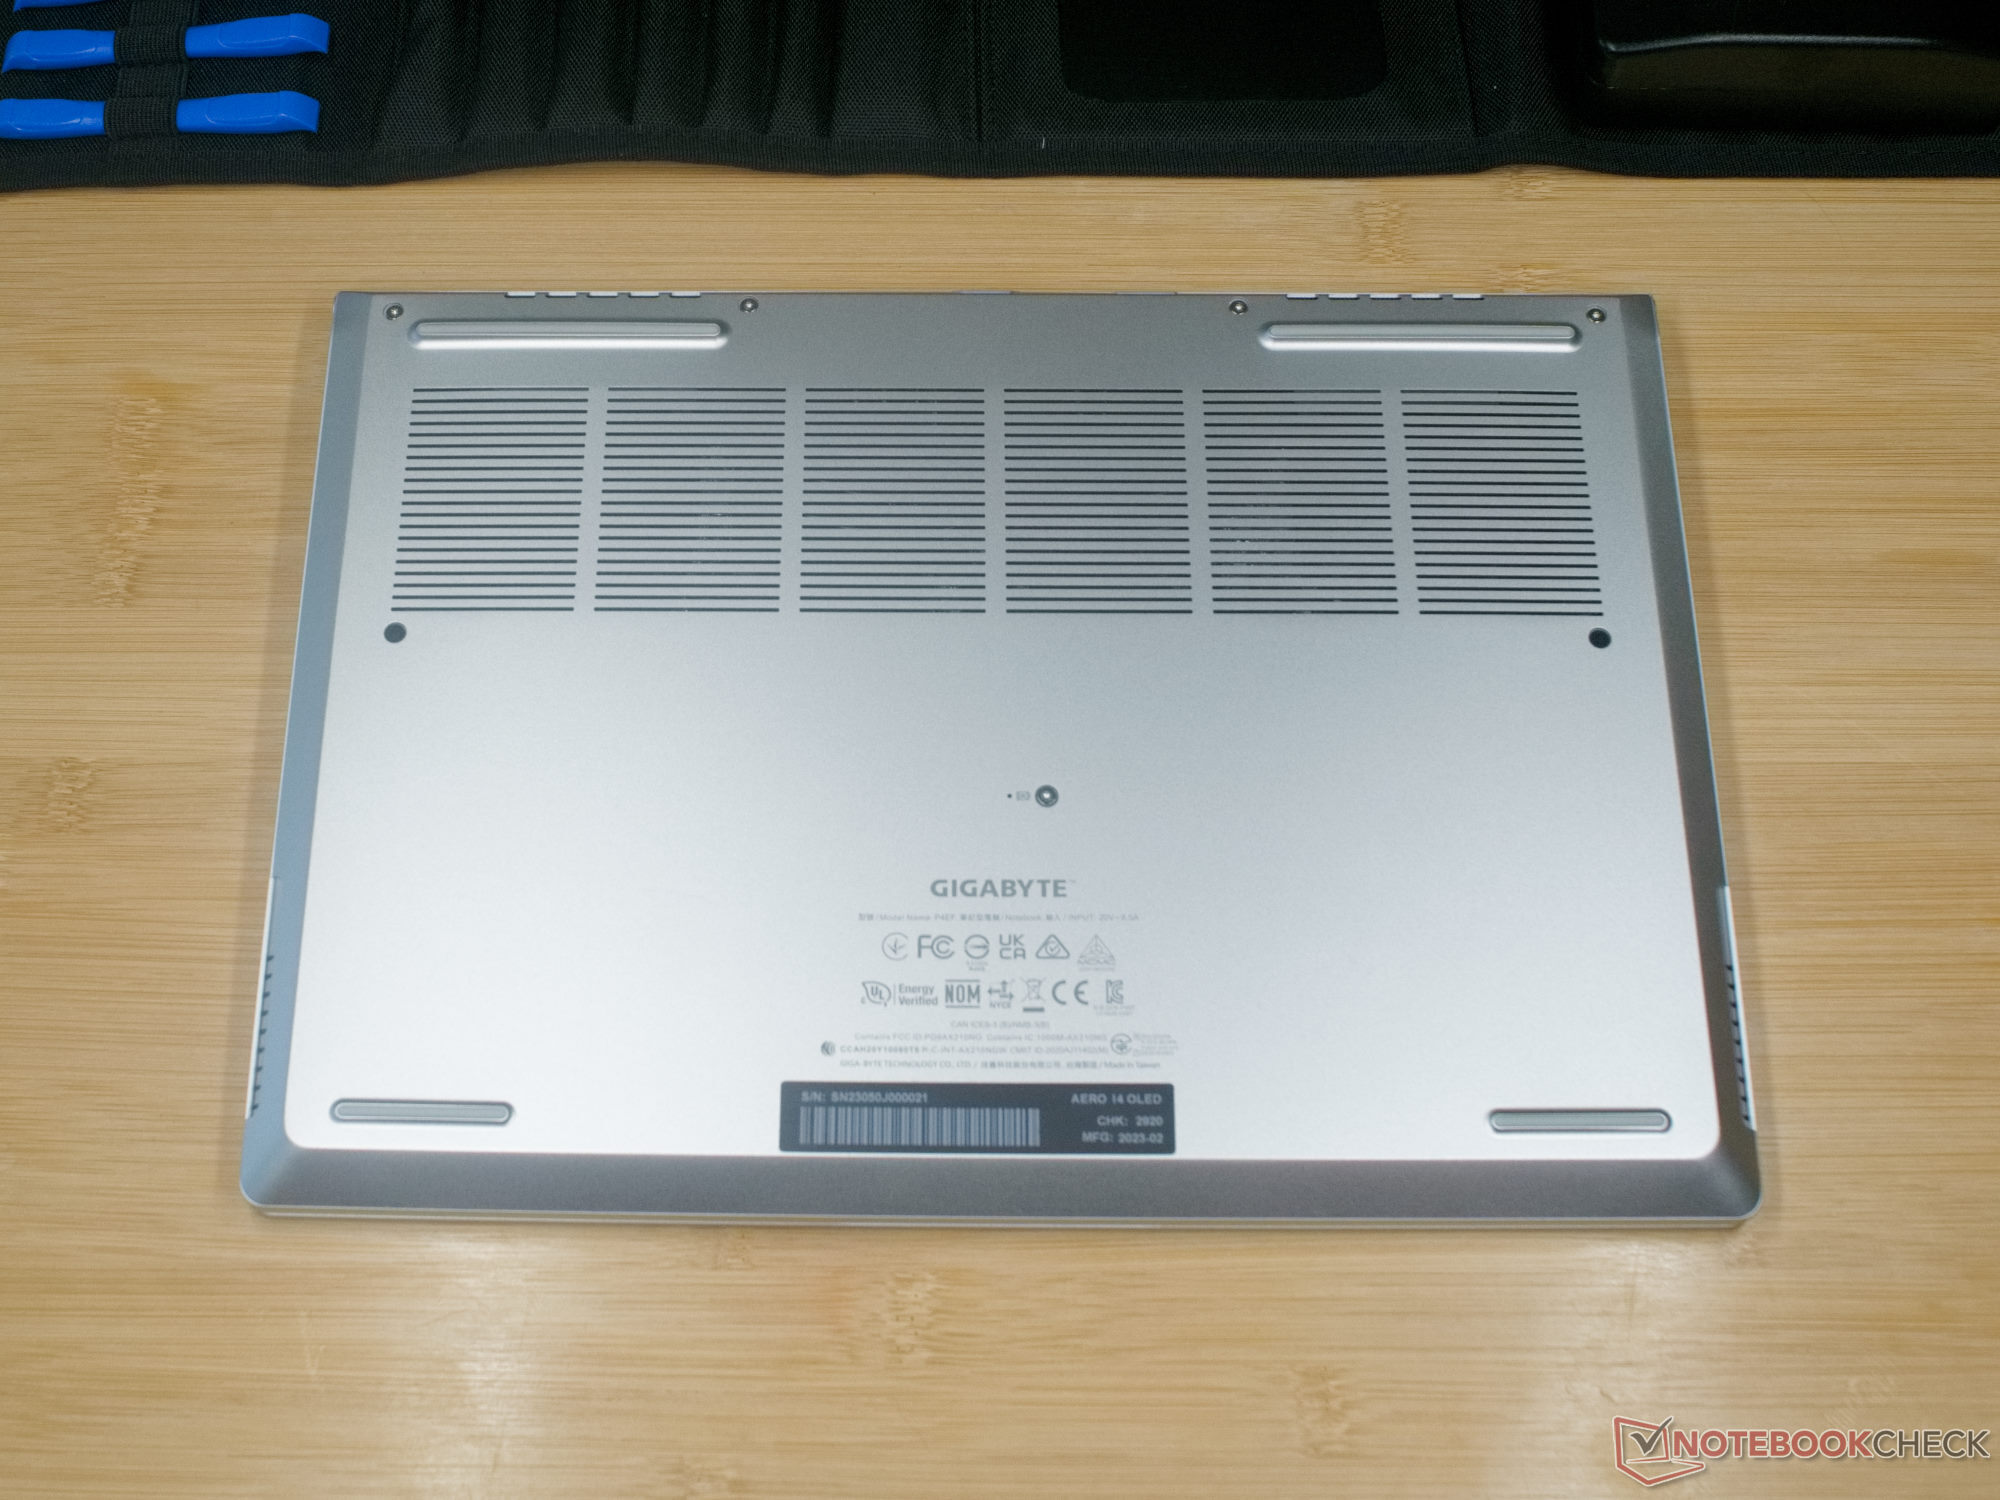
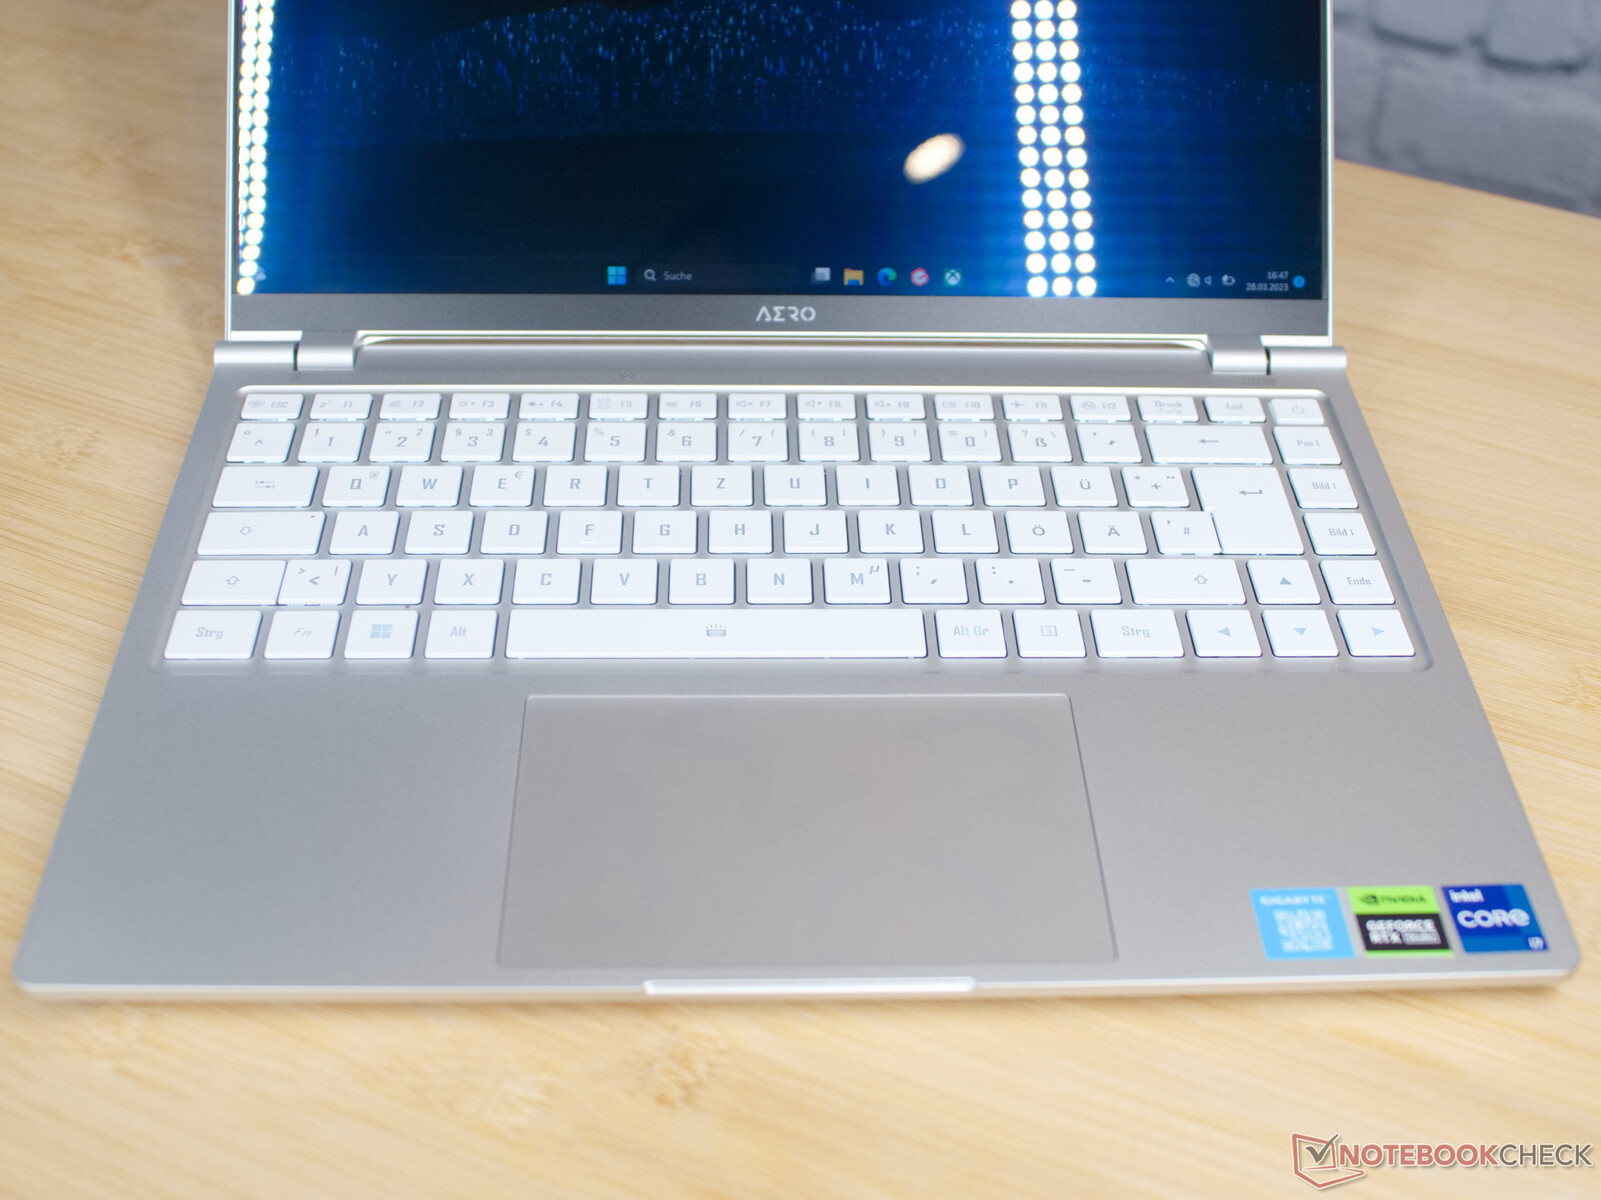
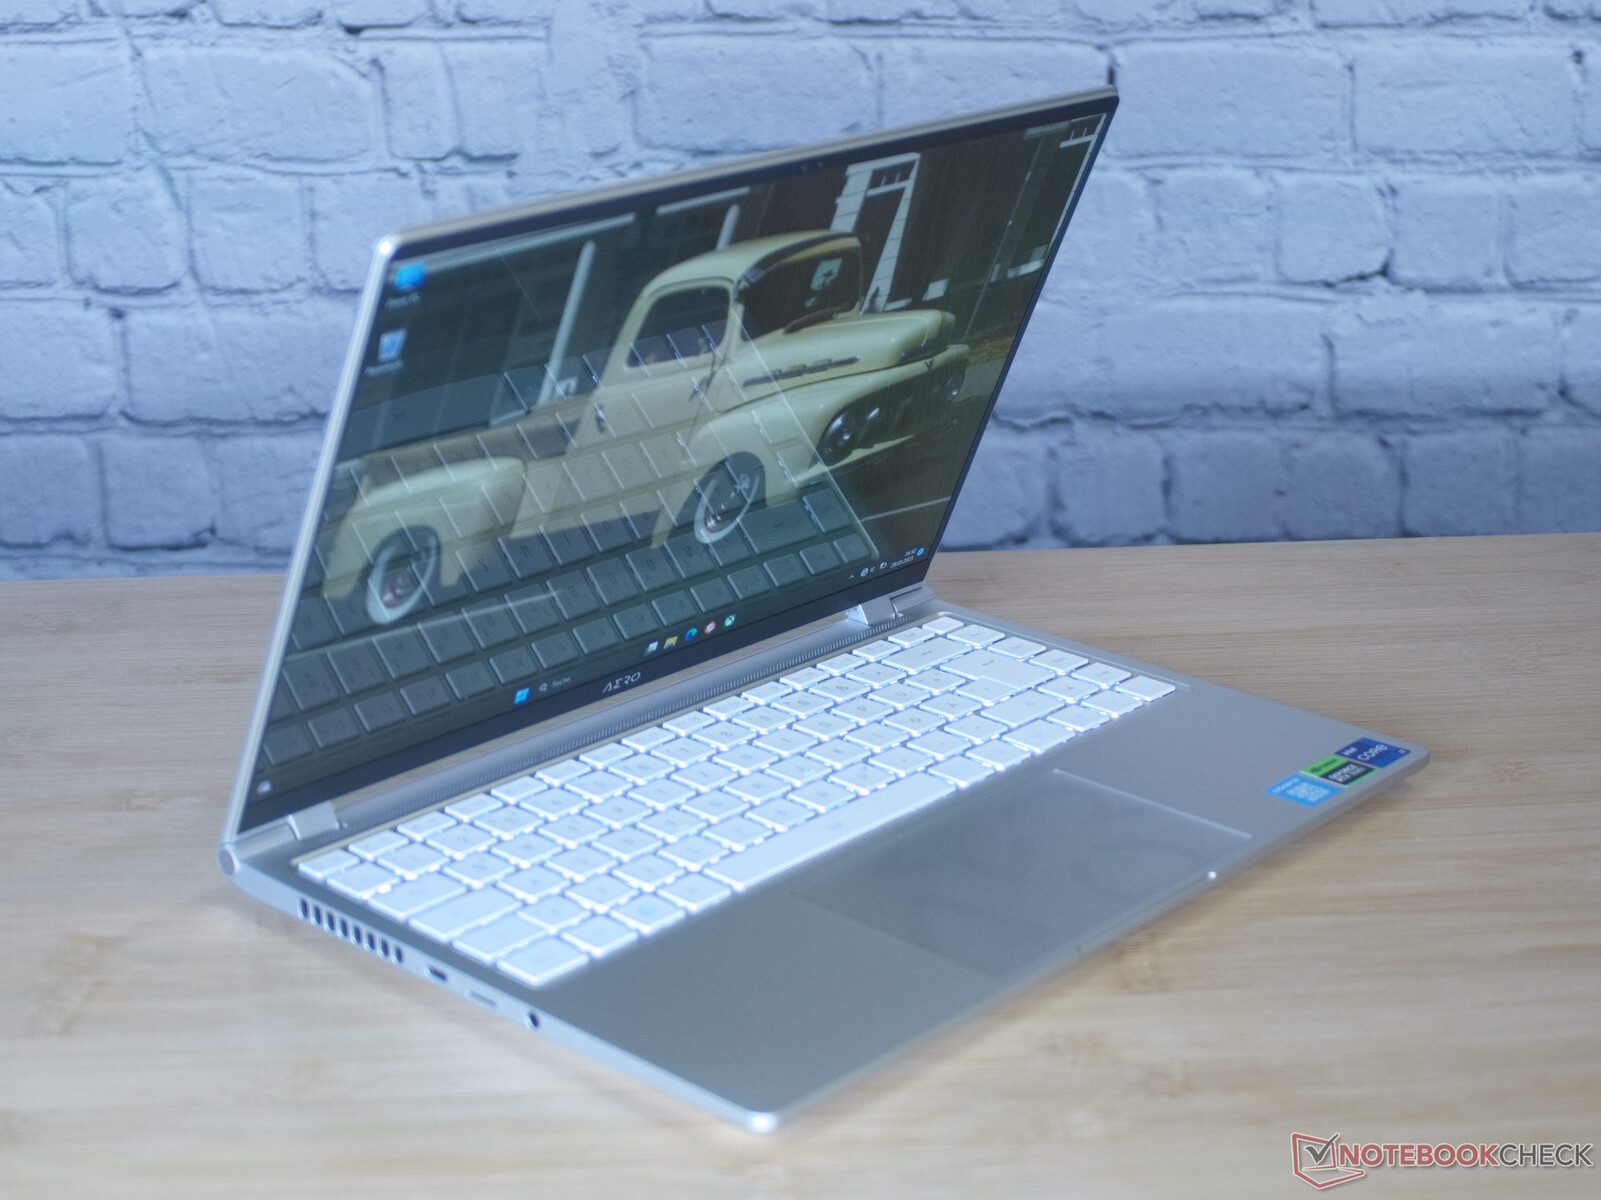
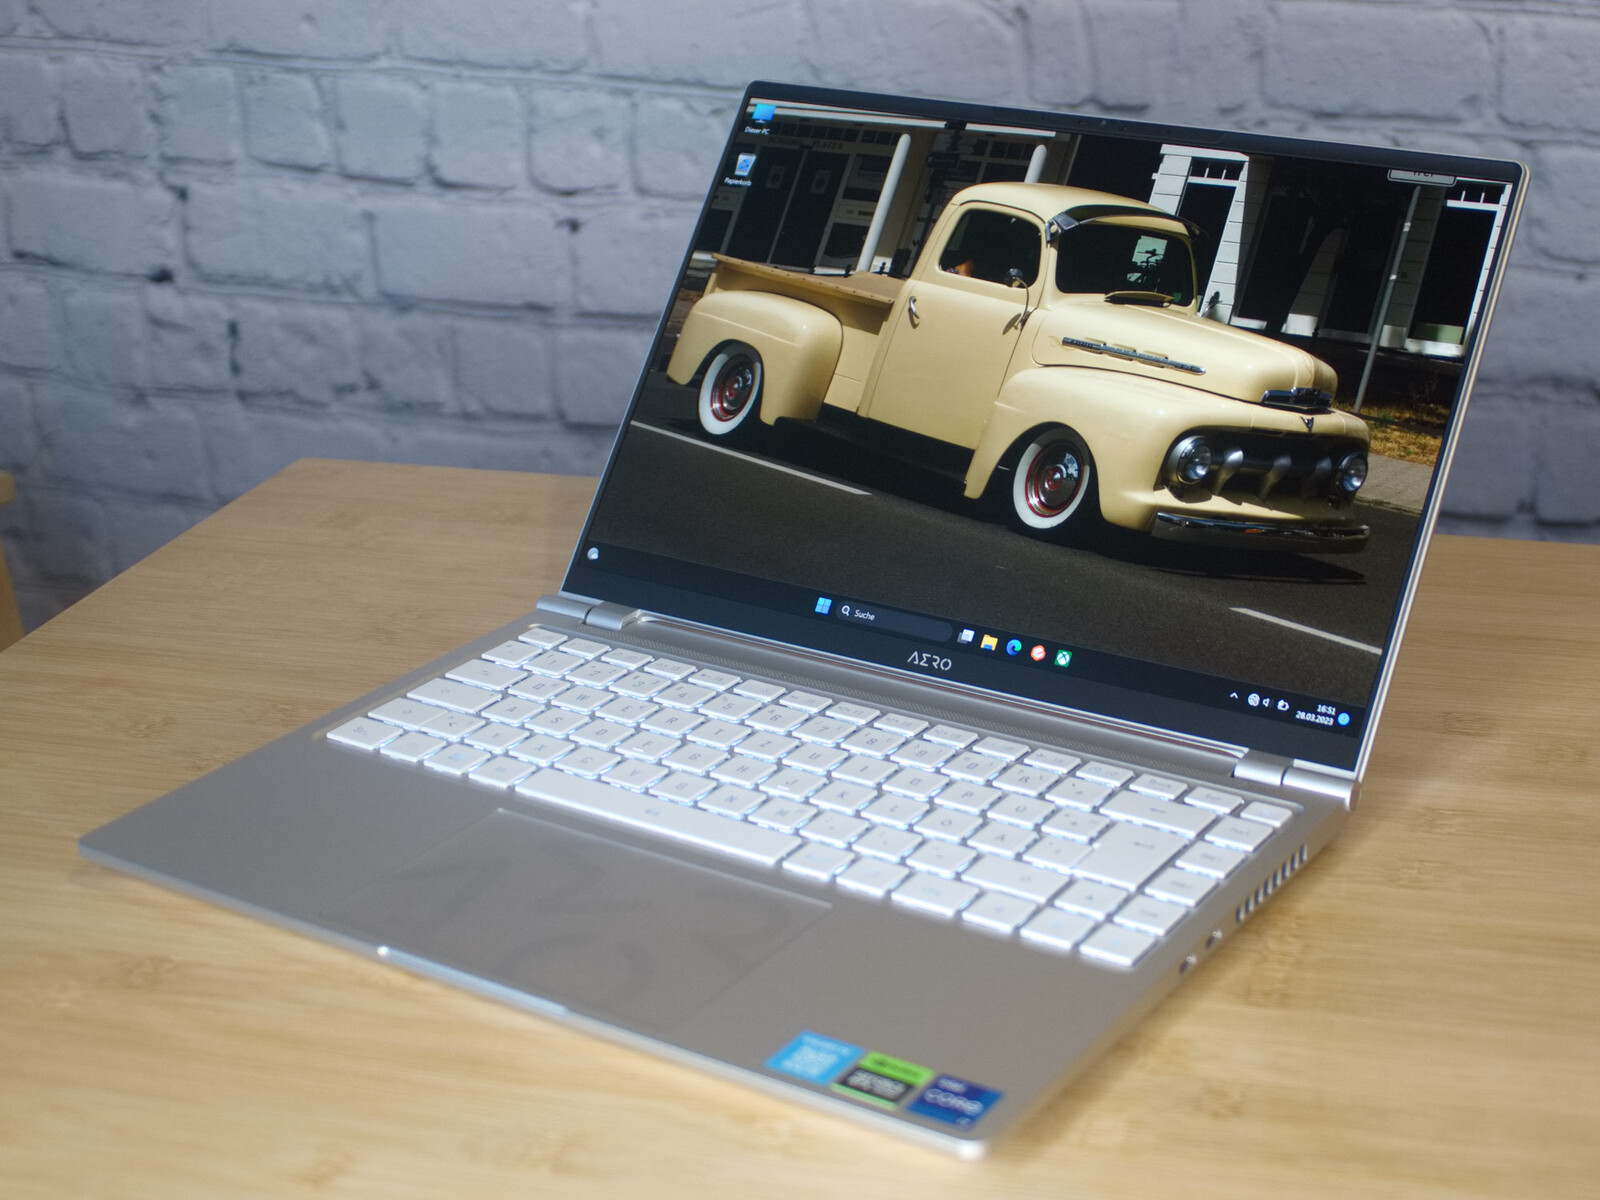
Caja - Aluminio resistente
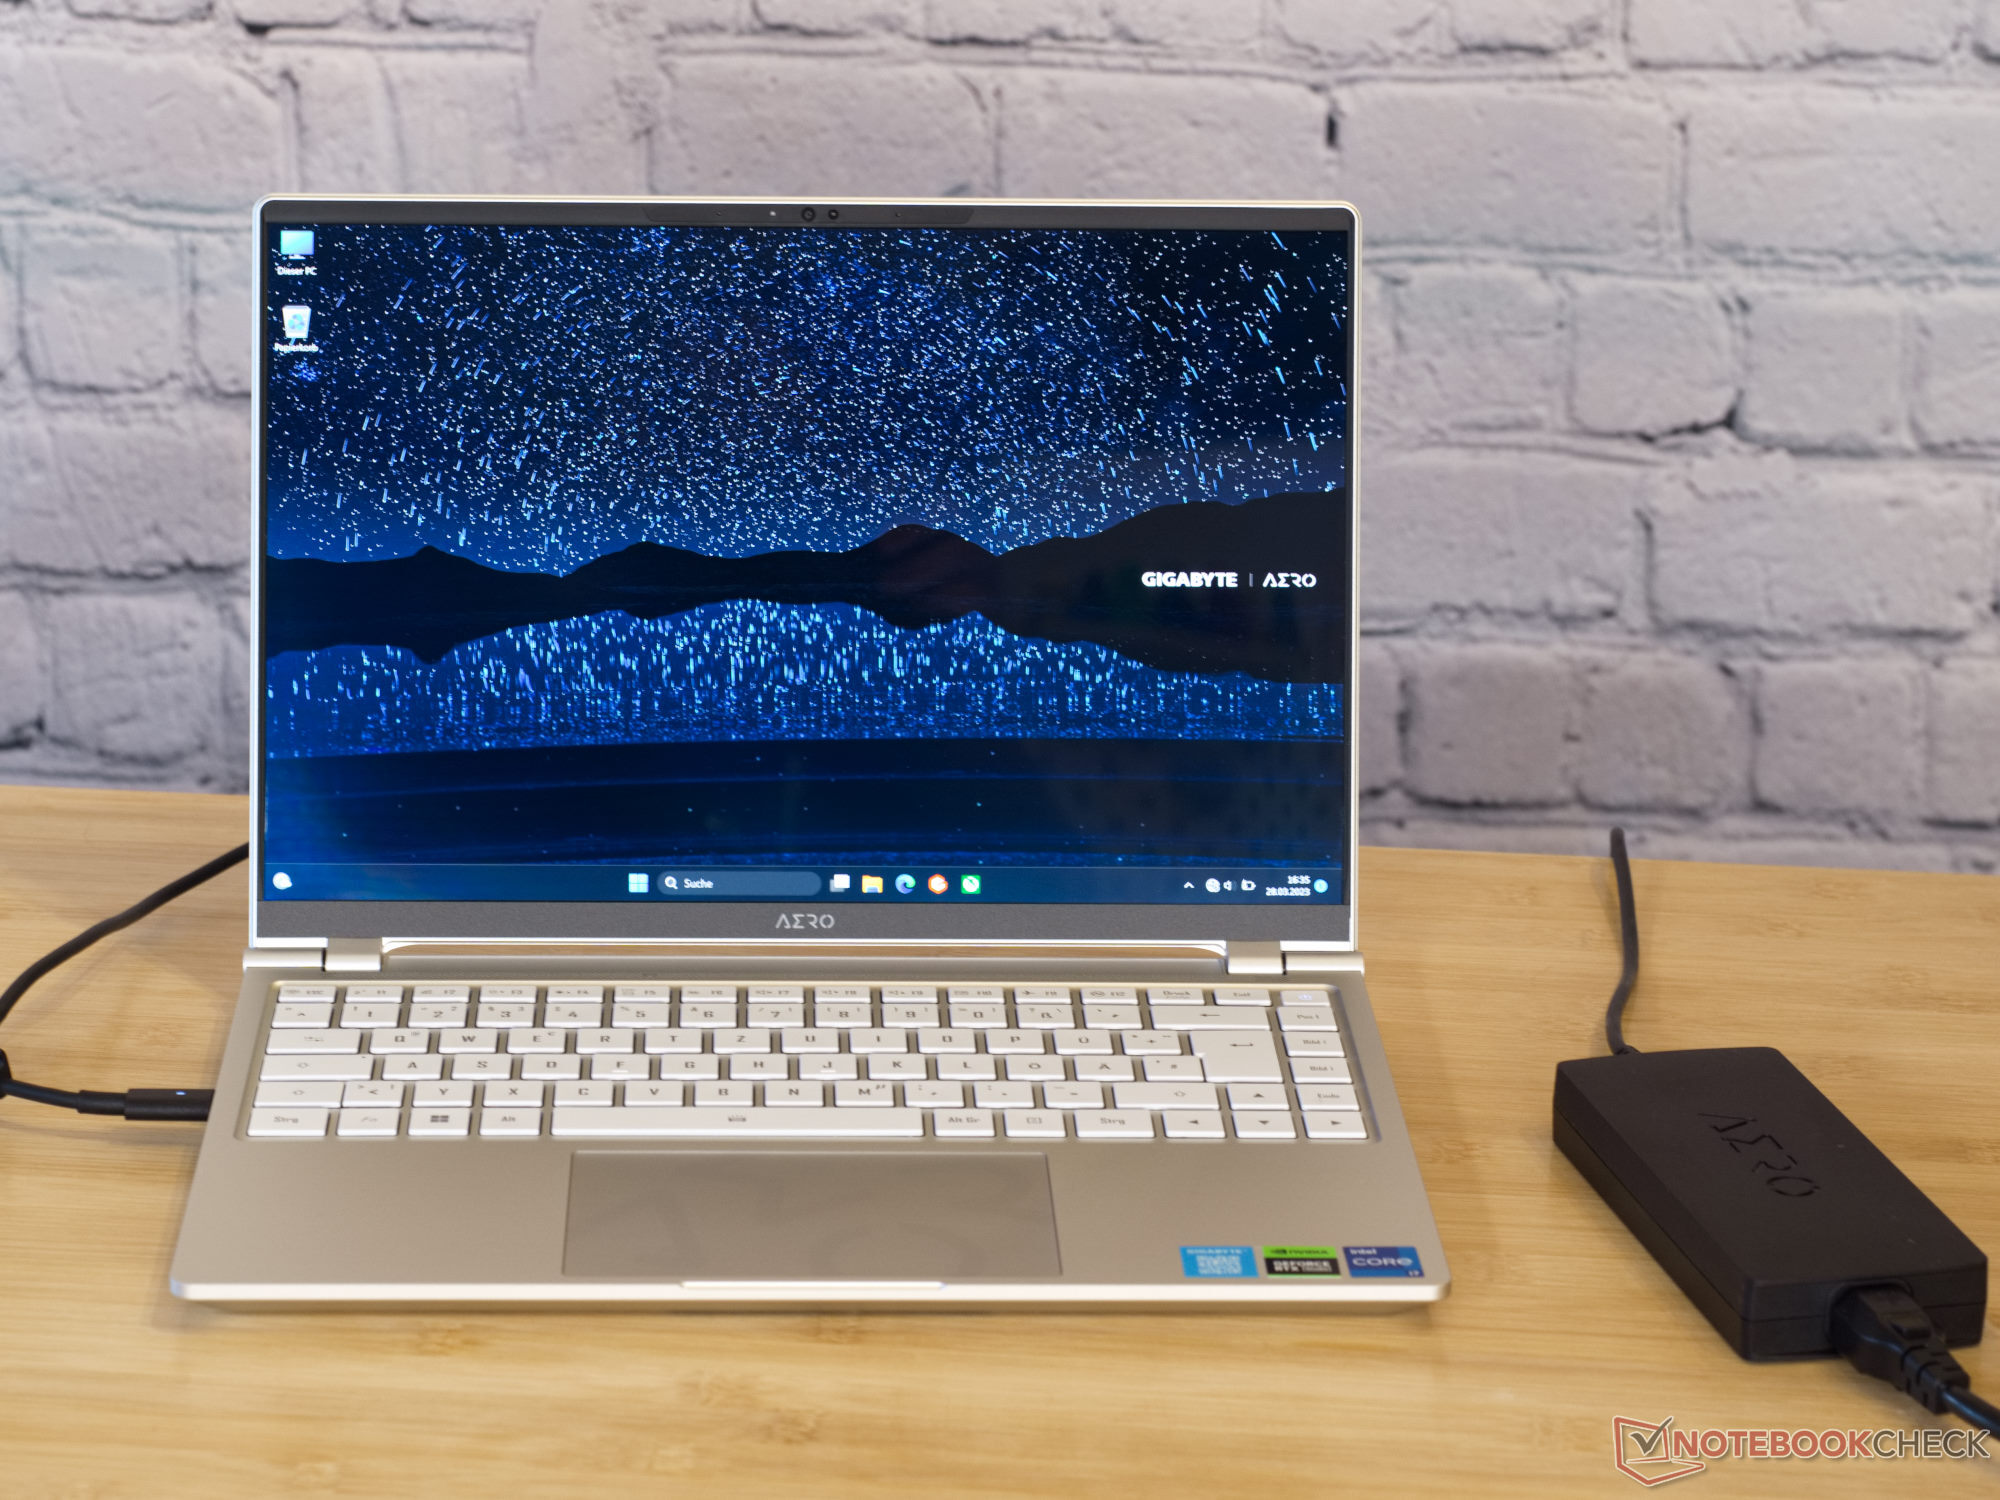
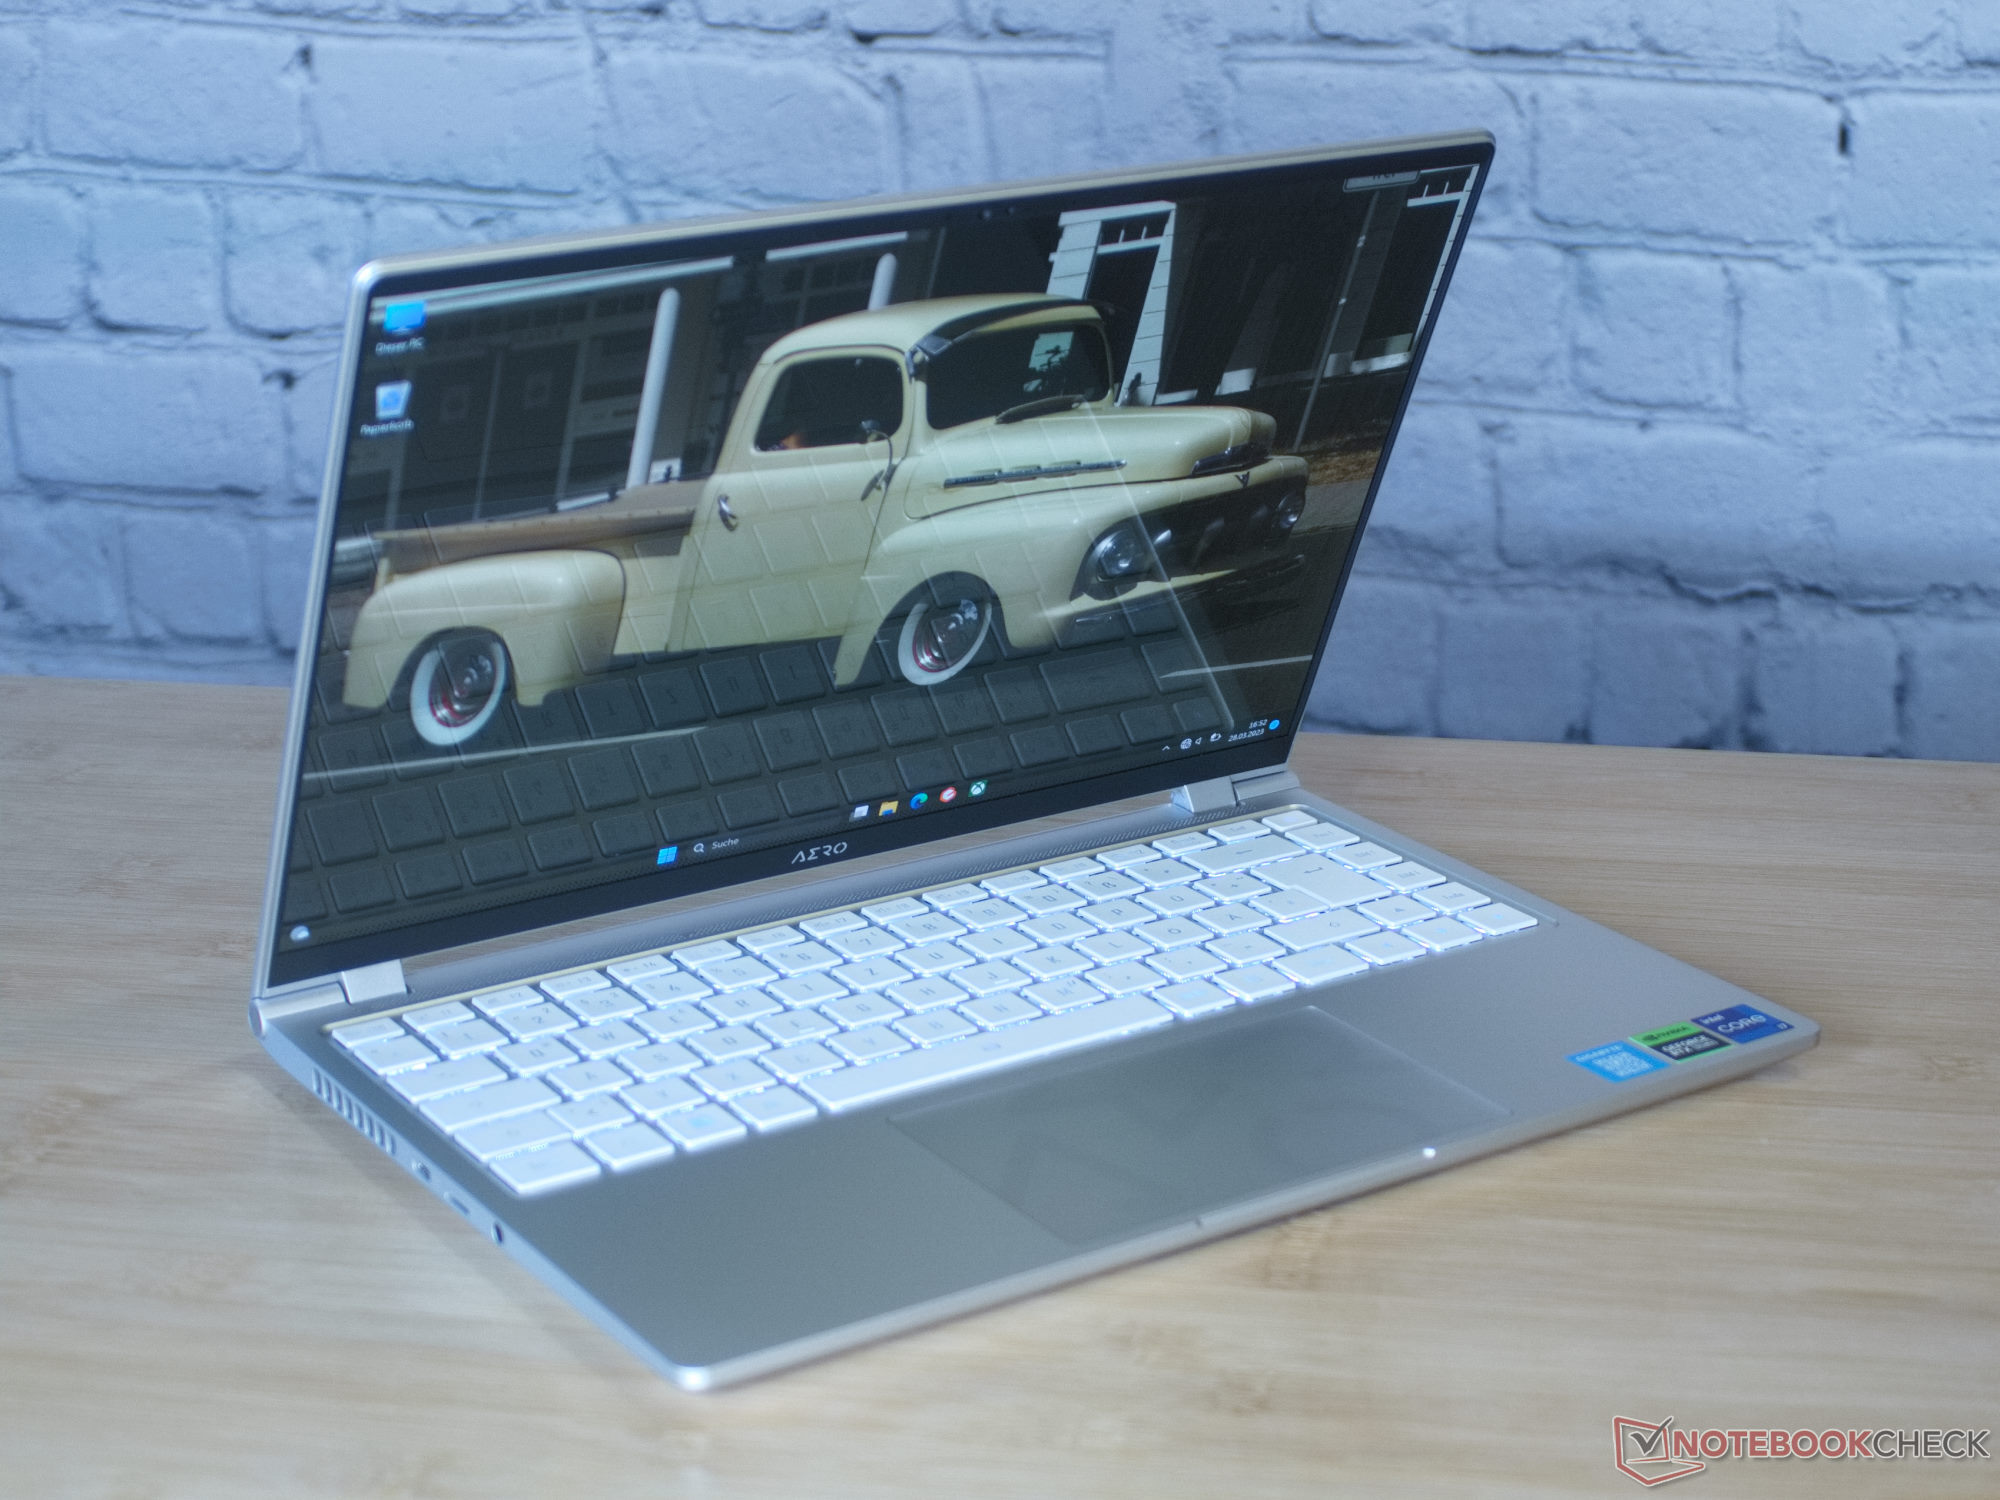
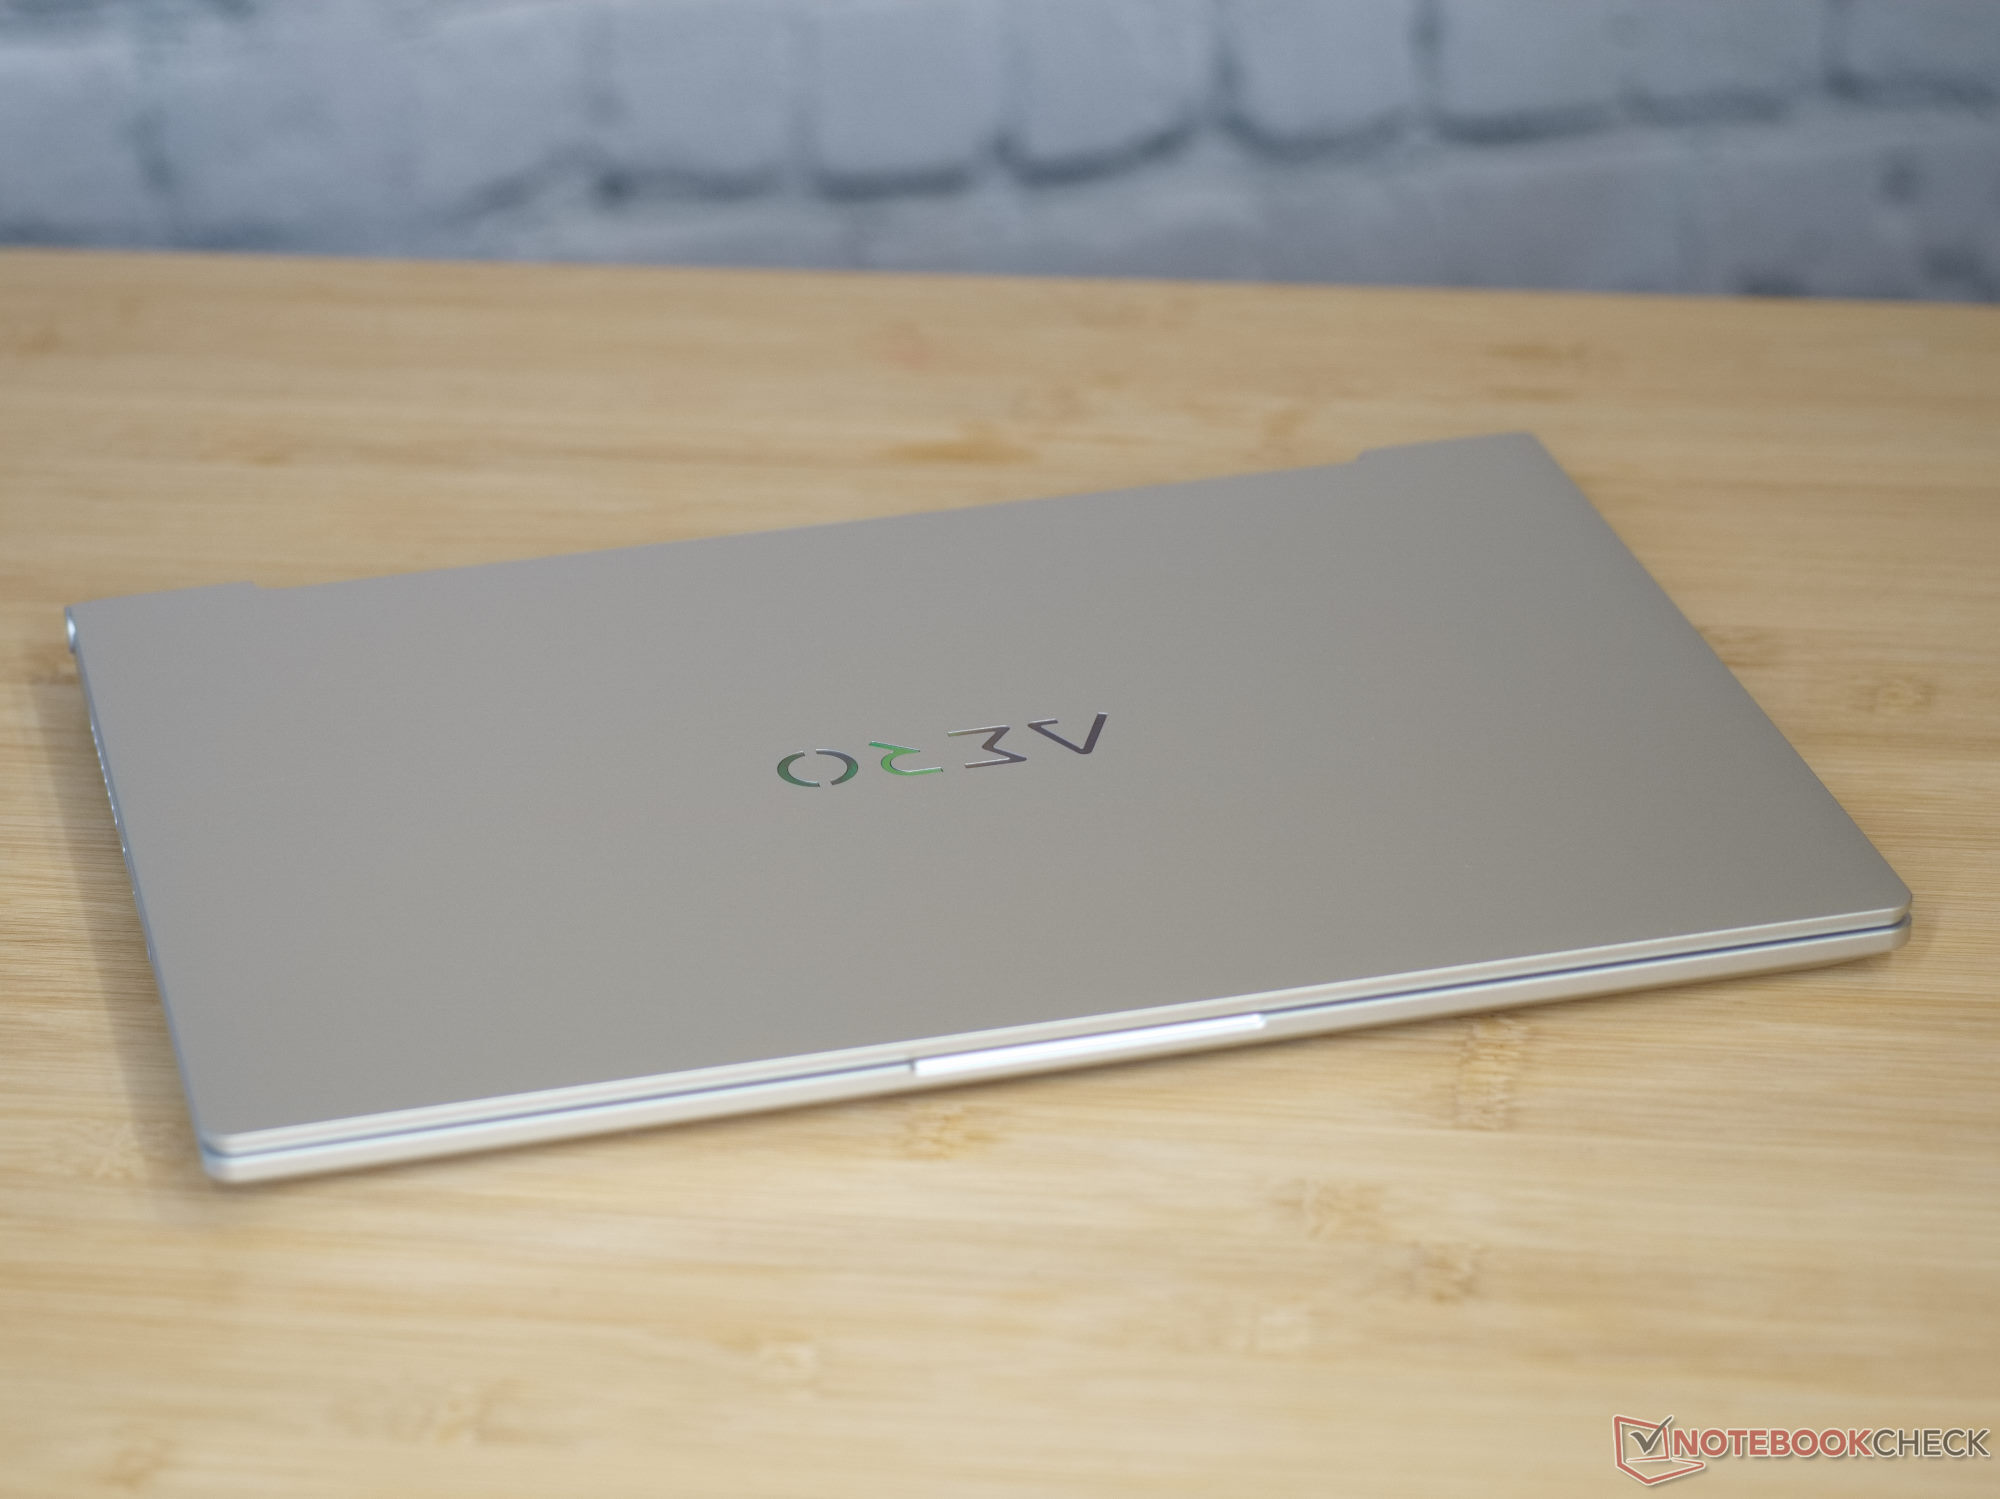
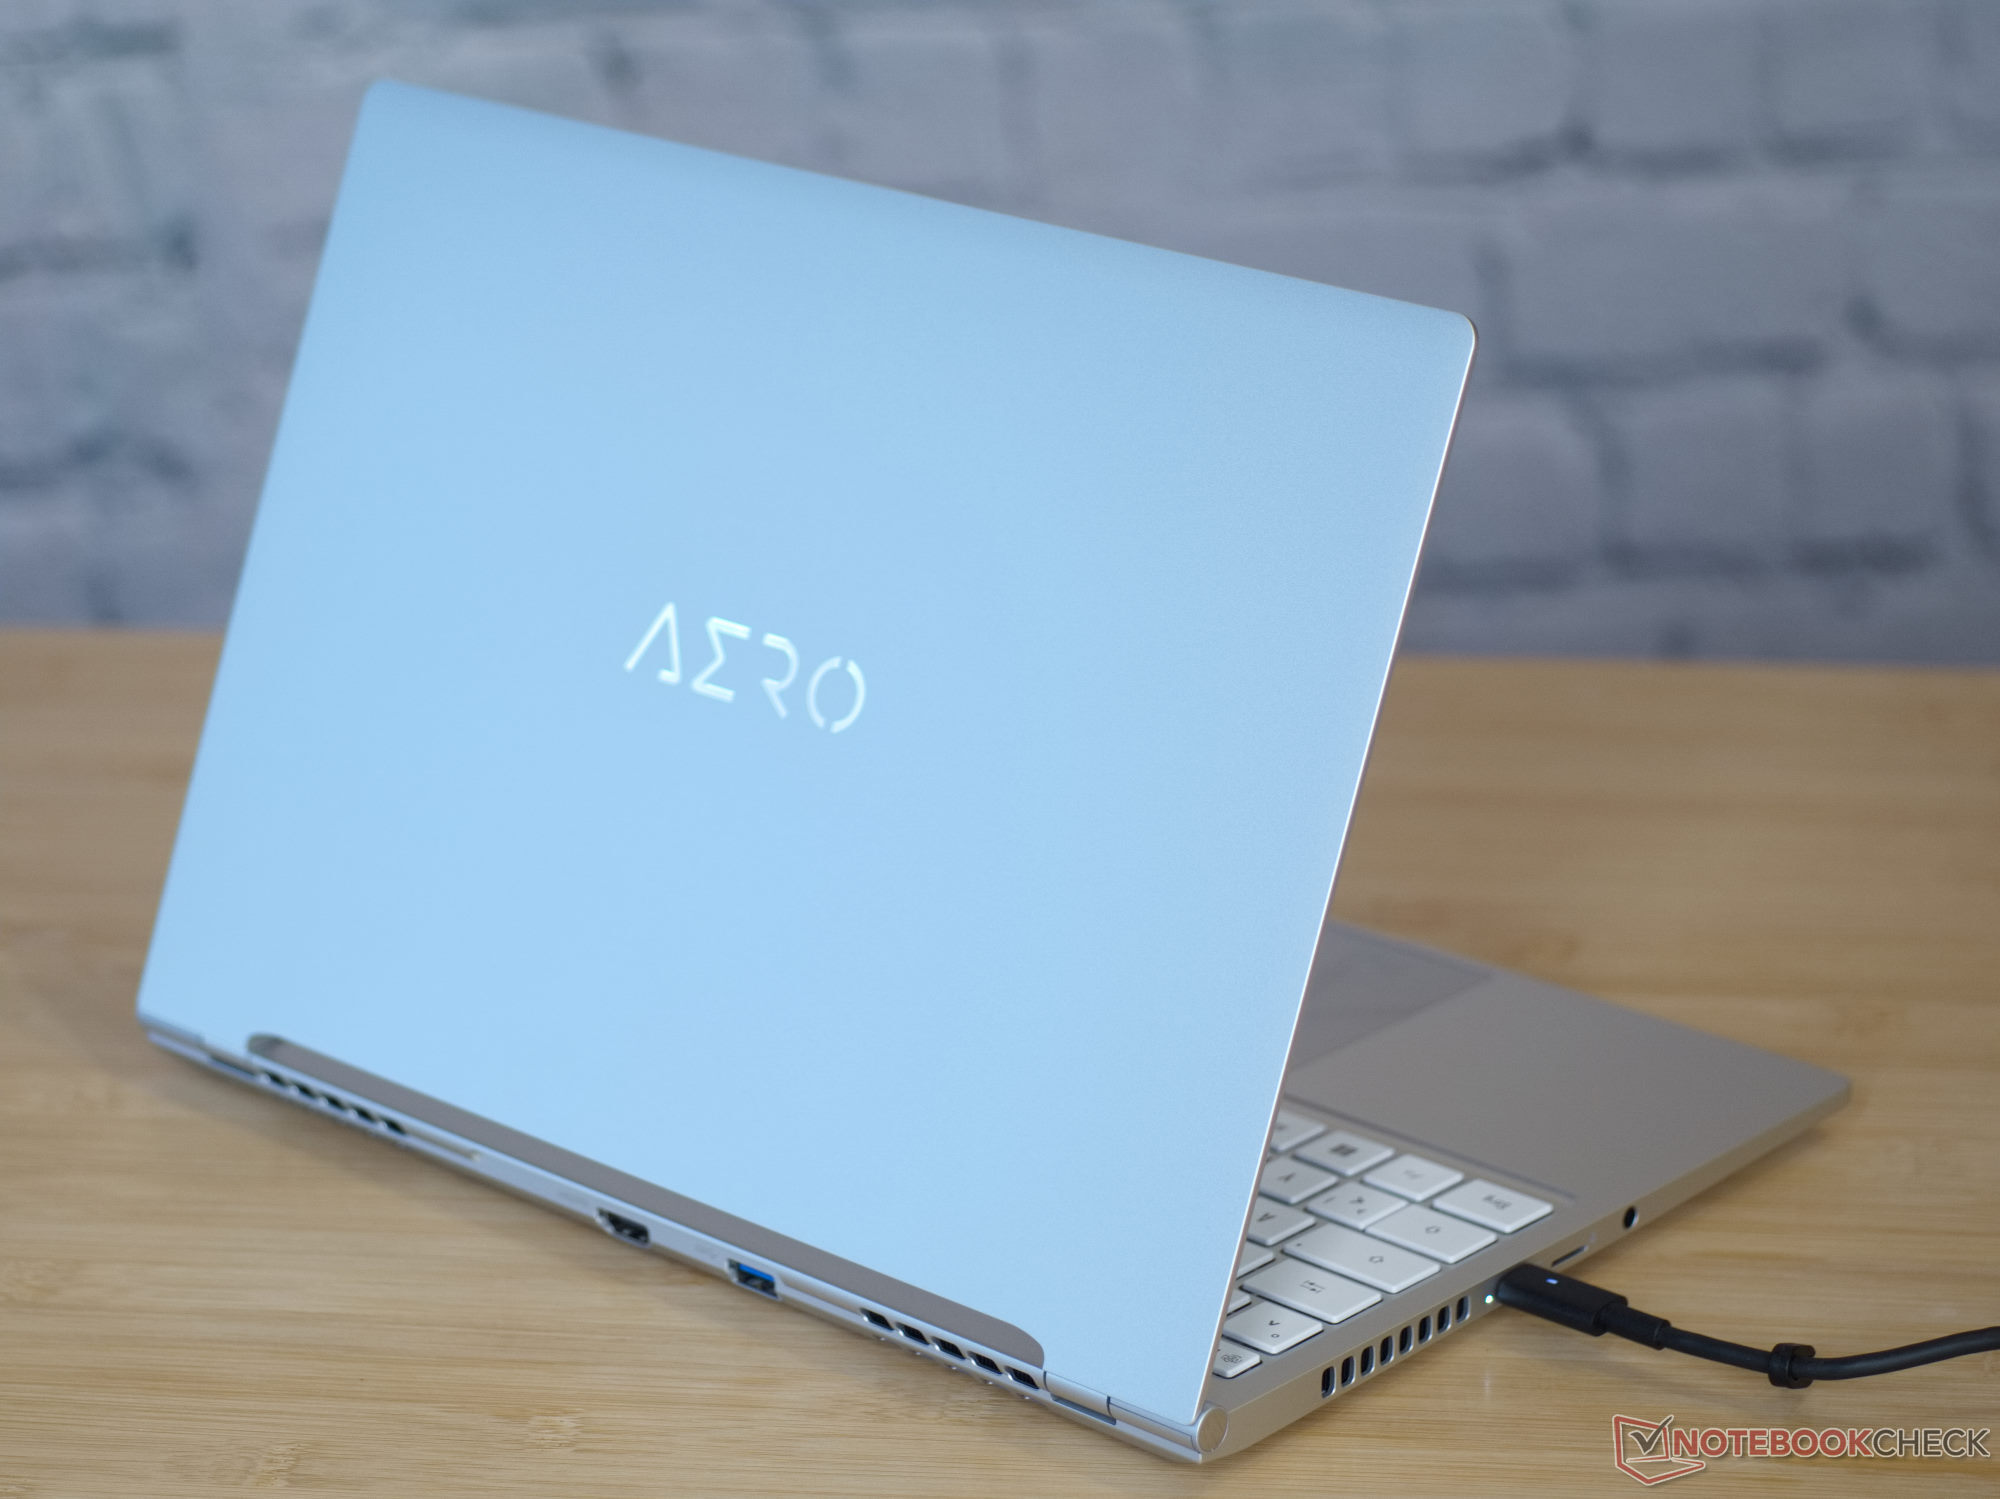
Todas las superficies principales del portátil son de aluminio. Esto hace que todo el dispositivo parezca robusto y de alta calidad sin ser demasiado pesado. El diseño del portátil es sencillo a primera vista, pero tiene muchos pequeños elementos de diseño que aflojan el portátil sin ser molestos. Por ejemplo, Gigabyte pone pequeños logos en las bisagras de la pantalla o esconde las letras AΣRO en el touchpad. Sólo las letras iluminadas de la tapa de la pantalla llaman realmente la atención.
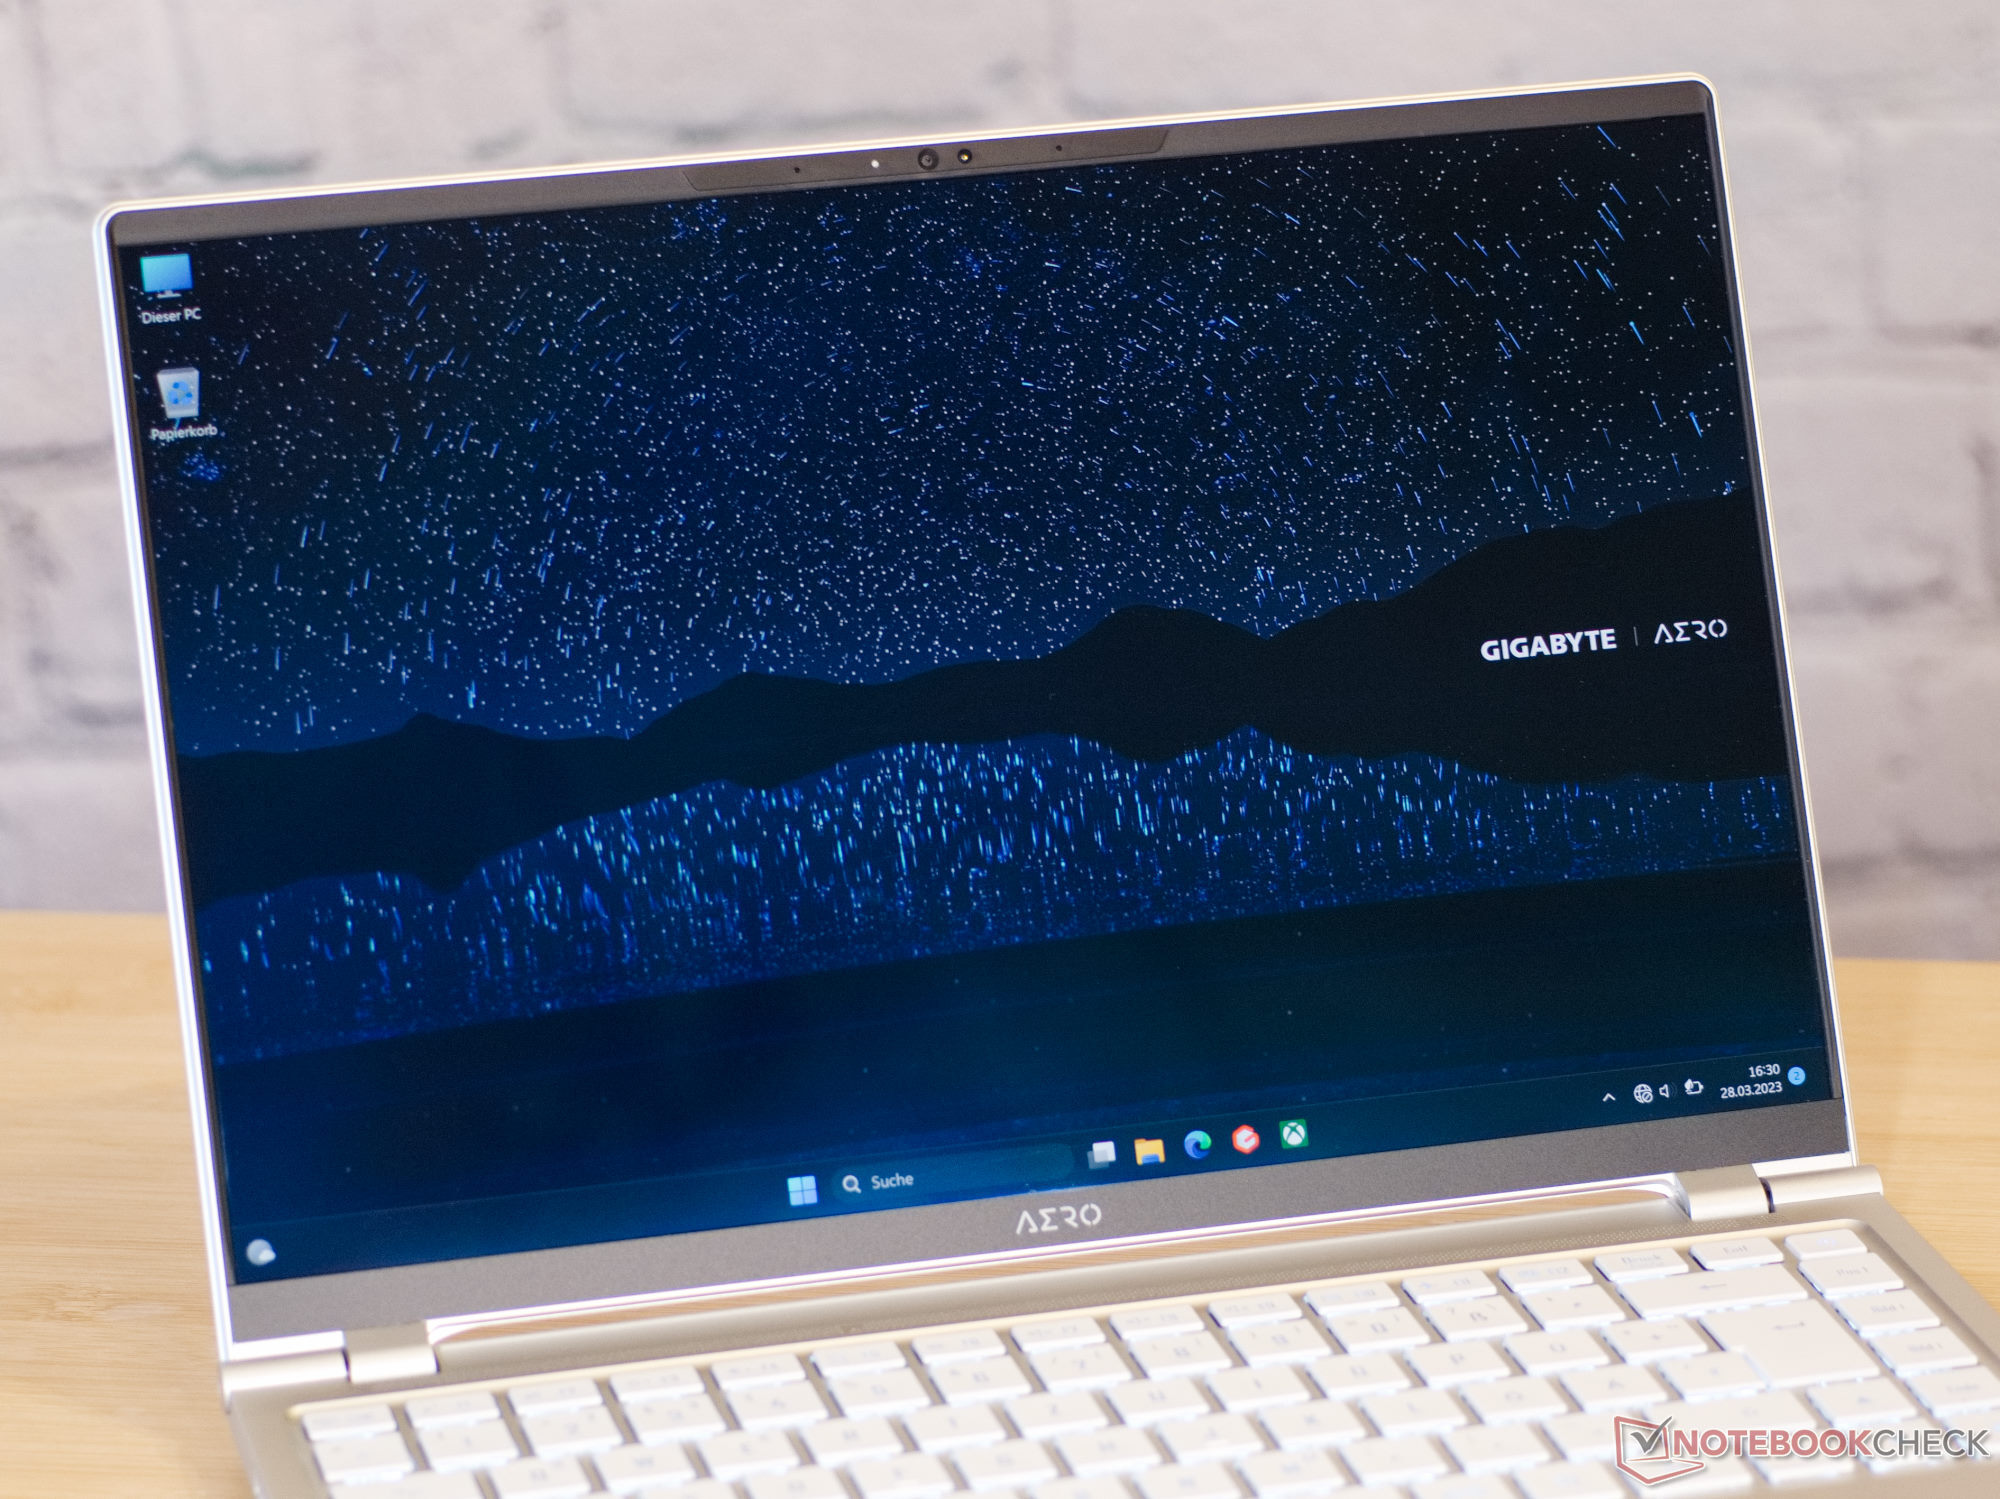
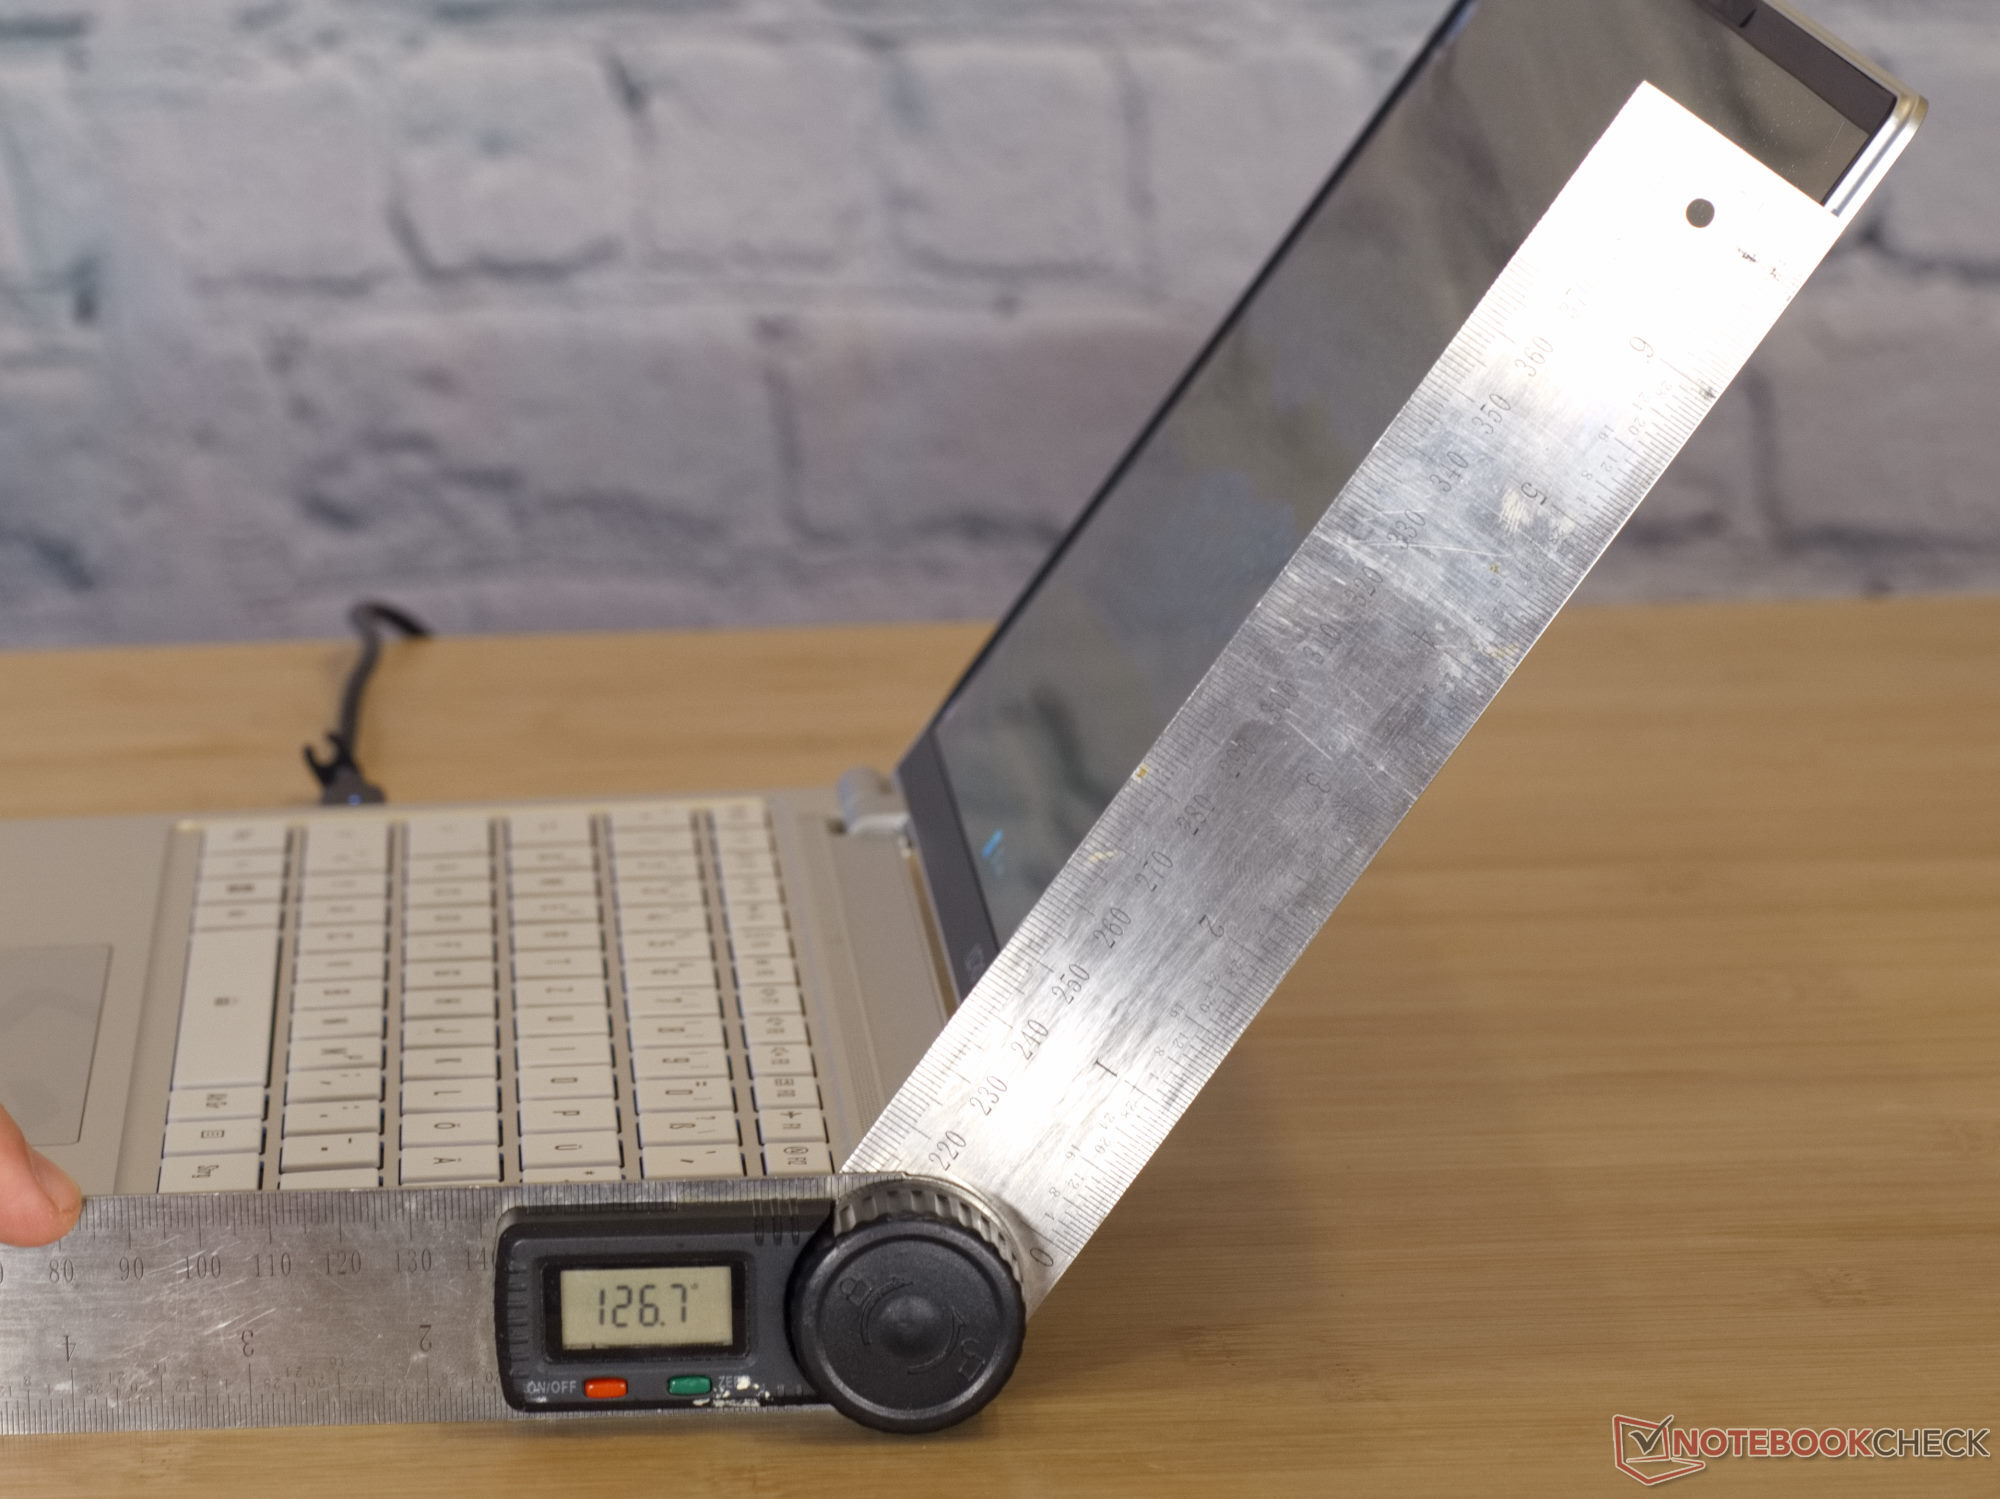
Los estrechos bordes de la pantalla hacen que casi no tenga bordes. Un pequeño punto de crítica son las bisagras de la pantalla: aunque son de funcionamiento suave y siempre mantienen la pantalla en posición, el ángulo máximo de apertura de la pantalla es de sólo 126°. Esto significa que a veces se tiene un ángulo de visión bastante pronunciado de la pantalla cuando se utiliza el pequeño portátil en el regazo.
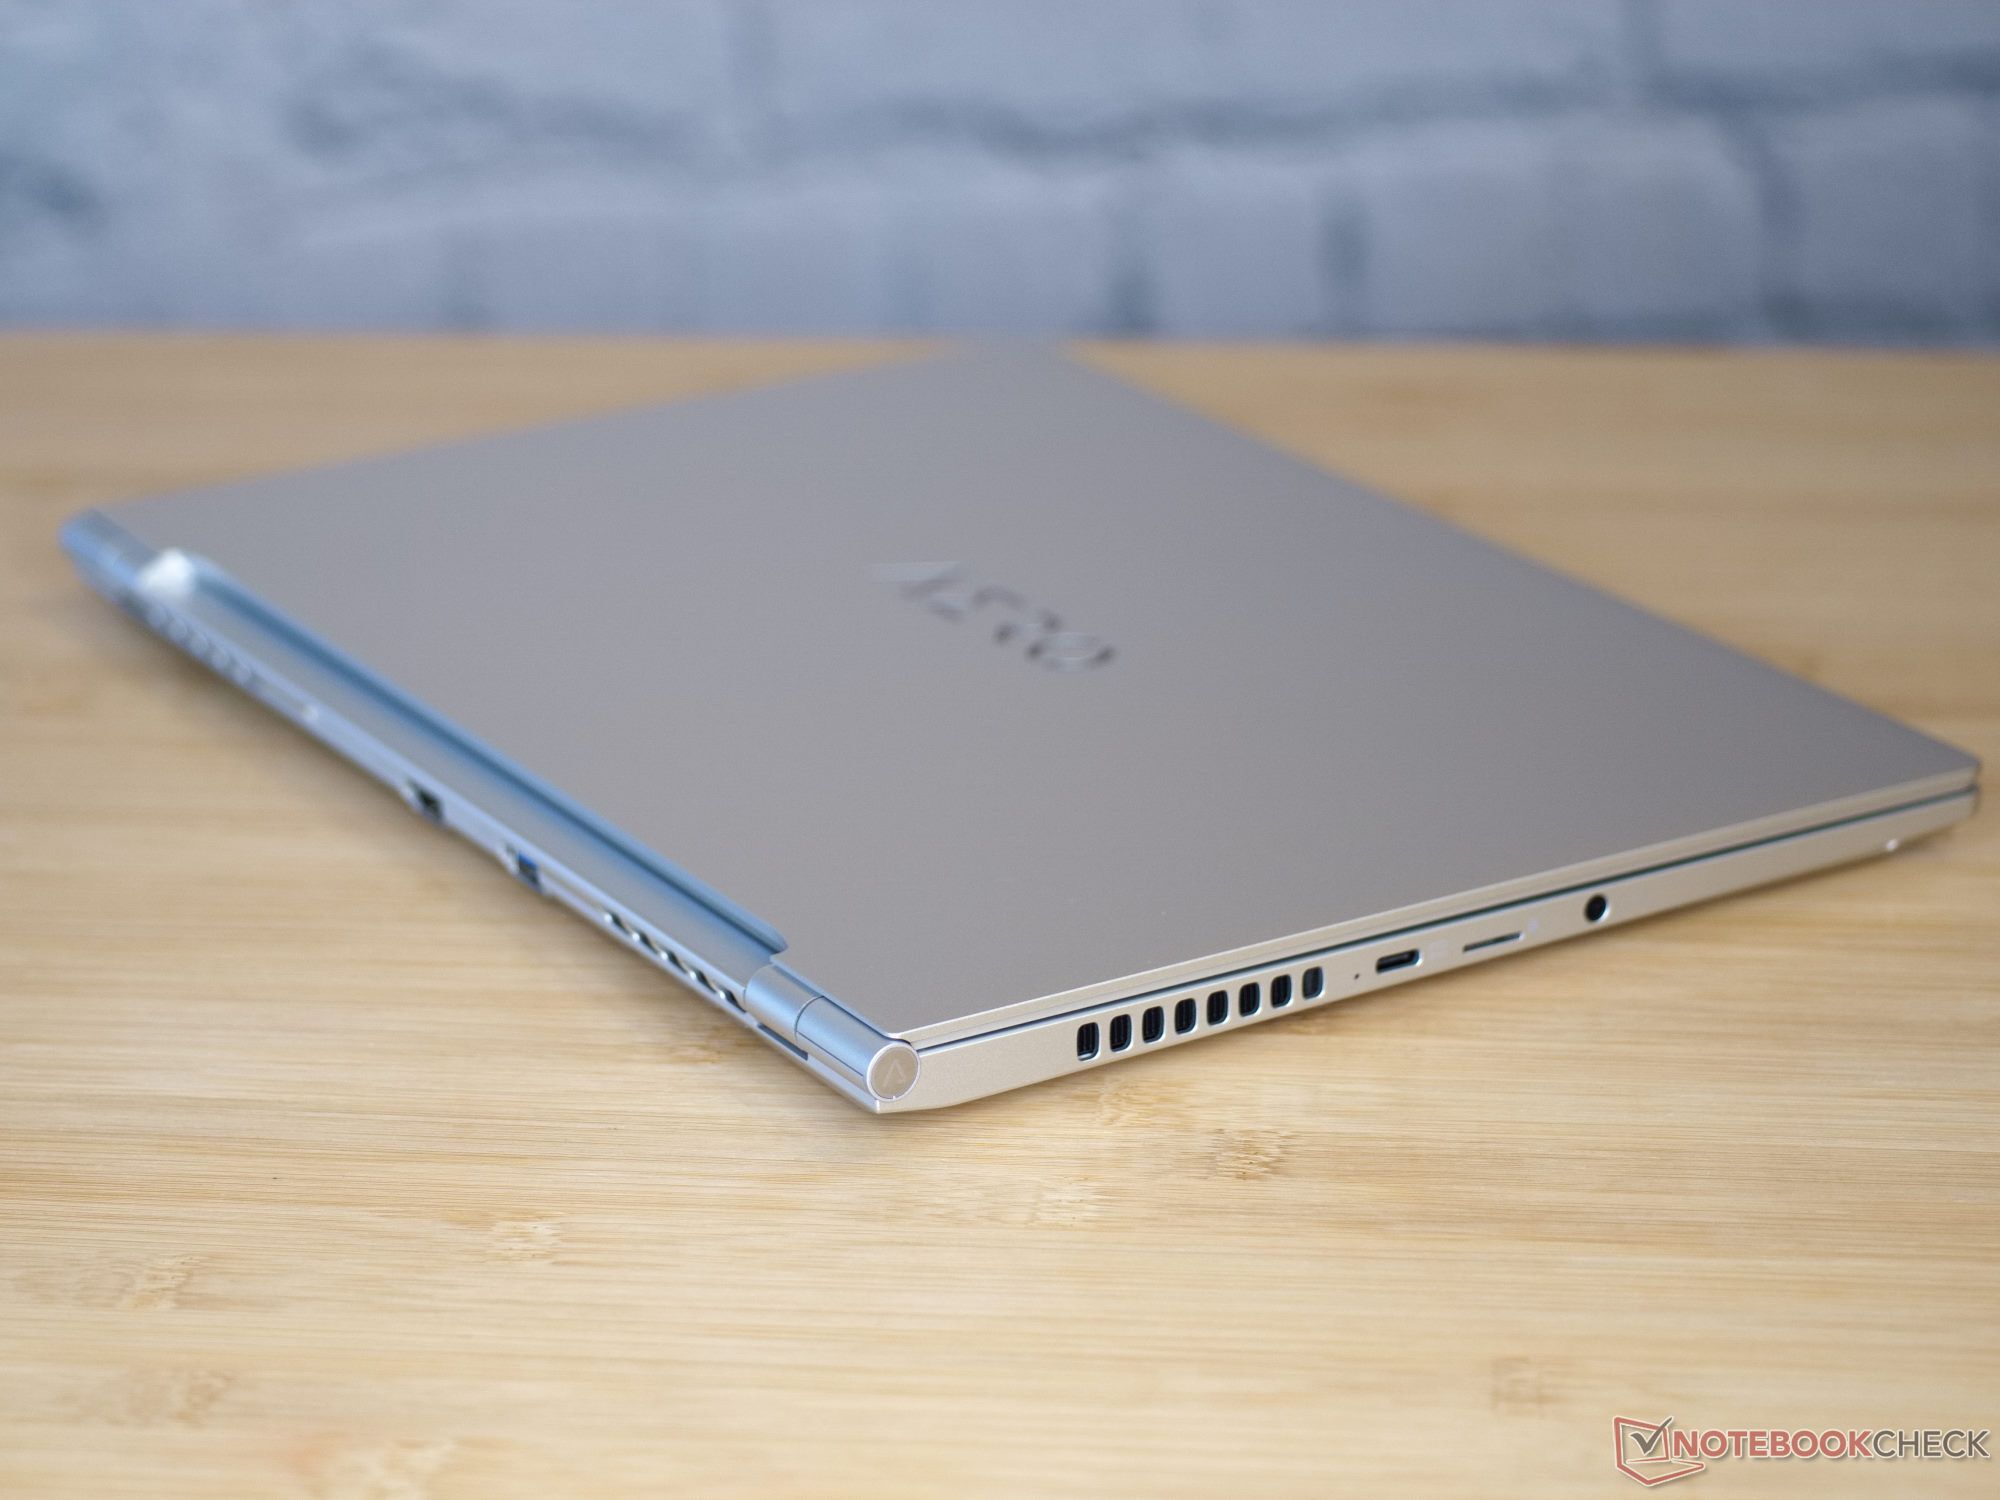
Con sólo 1,4 kg, el Gigabyte Aero 14 es más ligero que la mayoría de sus rivales; sólo el Schenker Visionpesa 100 gramos menos. Con una diferencia de unos pocos milímetros, todos los portátiles están muy por debajo de los dos centímetros de grosor. Aquí también, el Schenker Vision es el dispositivo más delgado de la comparativa, seguido de cerca por nuestro dispositivo de prueba.
Equipo - Thunderbolt 4 sin PowerDelivery
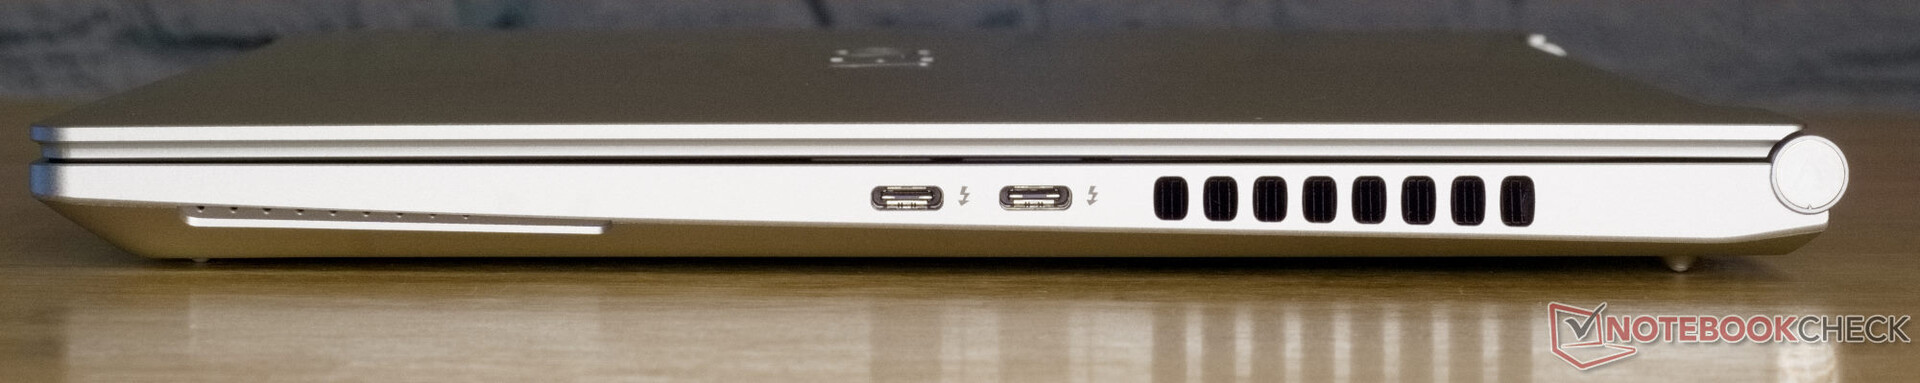
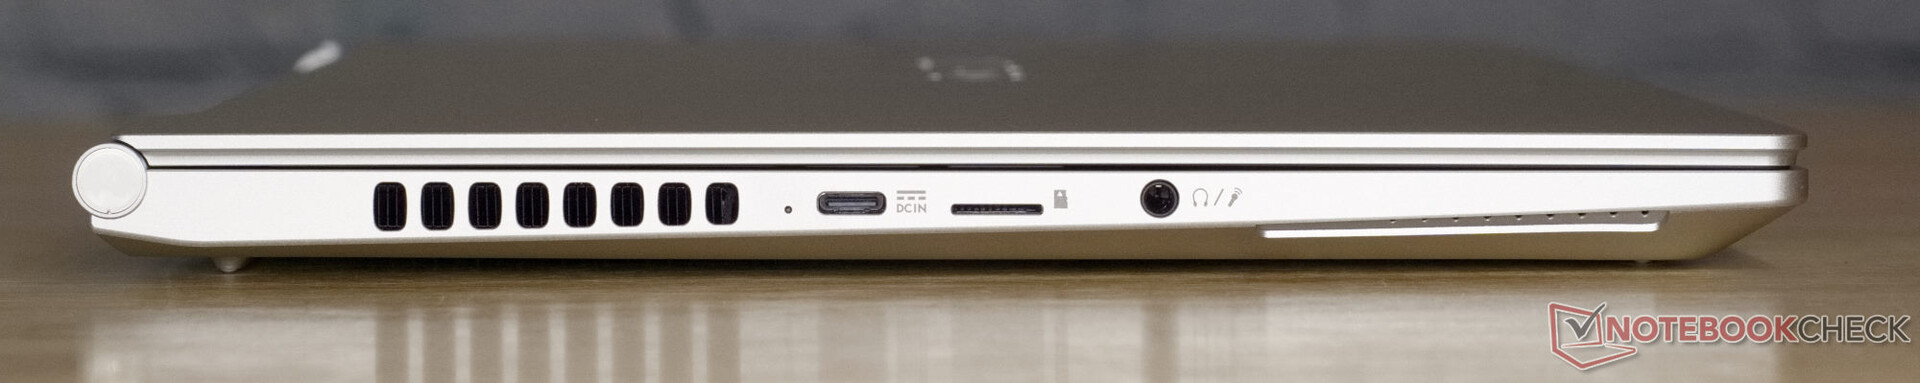
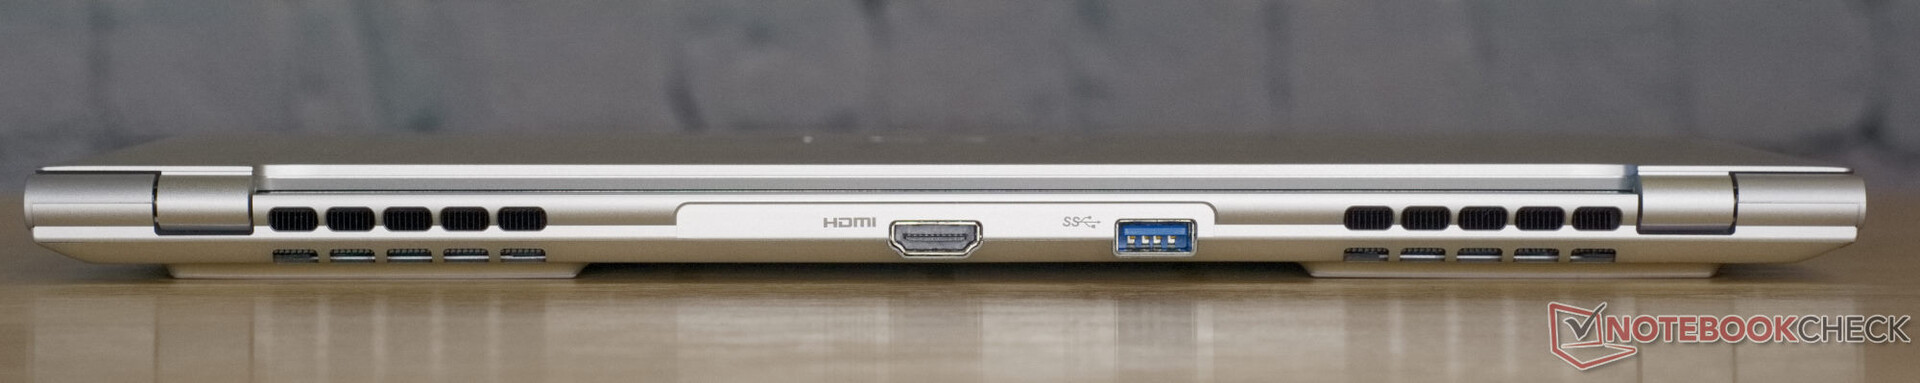
Gigabyte distribuye una gran selección de puertos en tres lados del pequeño portátil. USB Type-C a izquierda y derecha así como USB Type-A y HDMI en la trasera deberían permitir una buena gestión de cables. Sin embargo, un vistazo más de cerca revela que el puerto USB-C de la izquierda está etiquetado como DCIN, que no soporta ni Thunderbolt ni DisplayPort y sólo puede usarse para la fuente de alimentación además de la funcionalidad USB. En nuestras pruebas, se probaron fuentes de alimentación USB-C PD y cables de diferentes fabricantes y clases de rendimiento. Por desgracia, el portátil sólo aceptó alimentación a través del adaptador de corriente suministrado. Tampoco se pudo conectar una base entre el adaptador de corriente y el portátil. Las tomas USB-C de la derecha soportan Thunderbolt 4 y DisplayPort, pero no tienen USB Power Delivery. Por tanto, una solución de enchufe único para el escritorio con base acoplable y monitor externo no es posible aquí.
Lector de tarjetas SD
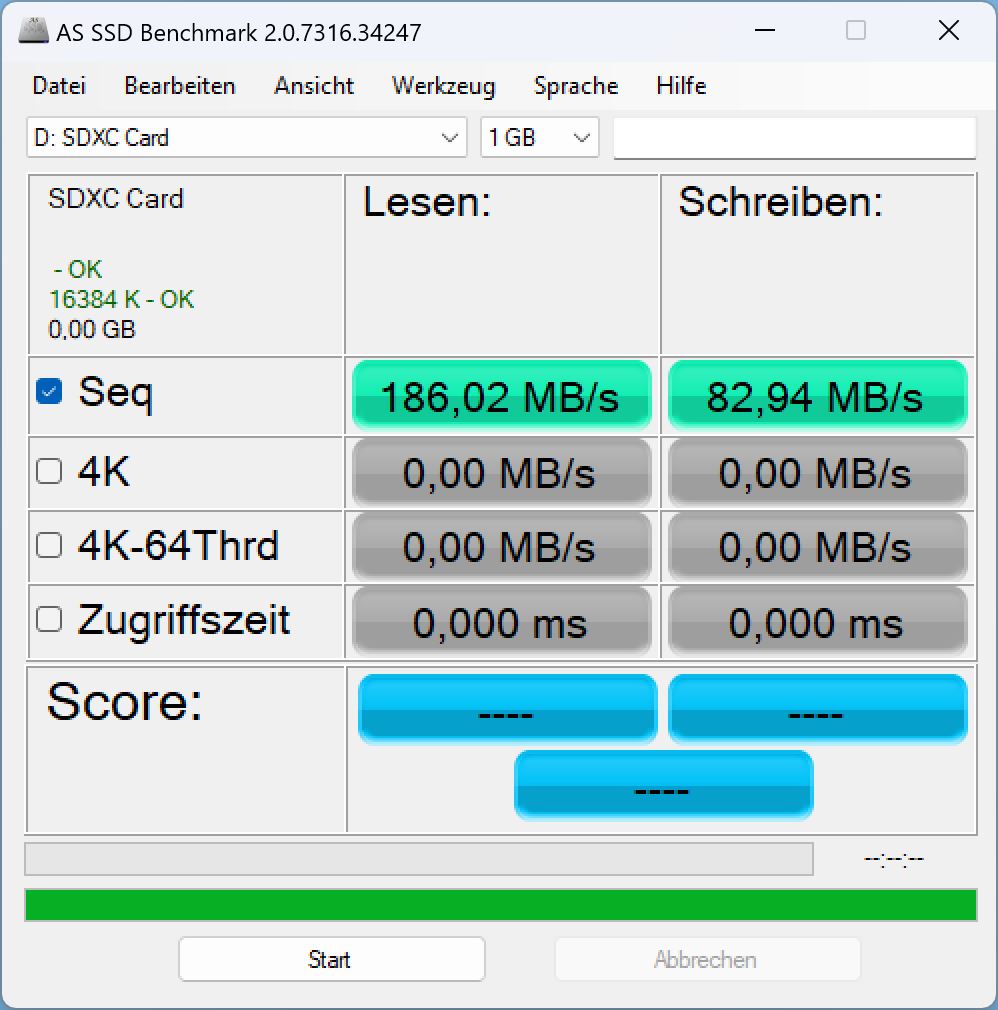
El lector de tarjetas microSD del Gigabyte Aero 14 no aprovecha al máximo las posibles velocidades de transferencia de nuestra microSD AV PRO de 128 GB, pero las velocidades de lectura y escritura alcanzadas son excepcionalmente buenas. El lector de tarjetas es capaz de transferir más de 180 MB/s.
De los dispositivos de la competencia, sólo el Schenker Vision tiene un lector de tarjetas SD. Sin embargo, es considerablemente más lento que el de nuestro dispositivo de prueba.
| SD Card Reader | |
| average JPG Copy Test (av. of 3 runs) | |
| Gigabyte Aero 14 OLED BMF | |
| Media de la clase Multimedia (23 - 531, n=37, últimos 2 años) | |
| Schenker Vision 14 2022 RTX 3050 Ti | |
| maximum AS SSD Seq Read Test (1GB) | |
| Media de la clase Multimedia (37.3 - 1455, n=36, últimos 2 años) | |
| Gigabyte Aero 14 OLED BMF | |
| Schenker Vision 14 2022 RTX 3050 Ti | |
Comunicación
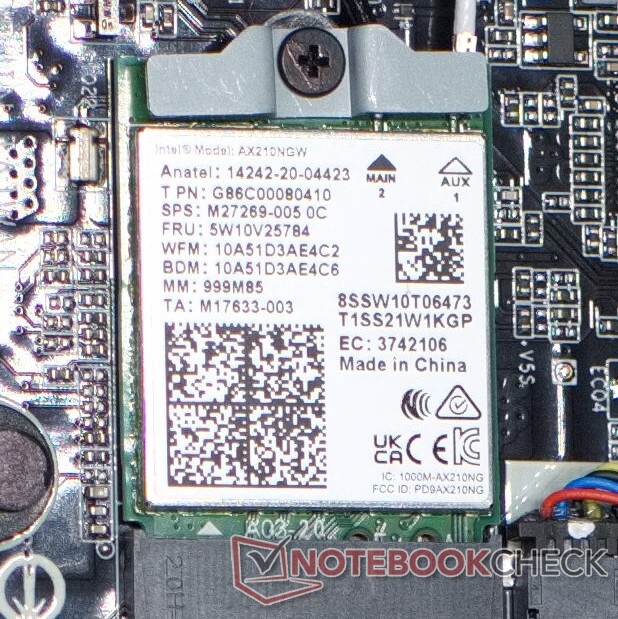
Gigabyte instala el módulo Intel AX210. Éste soporta los últimos estándares con WiFi 6E y Bluetooth 5.2. Las velocidades de transferencia están por encima de la media y son superiores a las de los dispositivos de la competencia. Sin embargo, no hay diferencias significativas entre las redes de 5 GHz y 6 GHz. Las velocidades de transmisión en carga y descarga apenas difieren en la red WiFi 6 y WiFi 6E de nuestro router AX11000.
Cámara web
La webcam del portátil de estudio admite reconocimiento facial a través de Windows Hello y tiene una resolución de 2,1 MP (Full HD). En buenas condiciones de luz, la calidad de imagen es bastante convincente. Sin embargo, una mirada más de cerca a nuestra foto de prueba revela bordes borrosos y una imagen ligeramente borrosa en general. Si las condiciones de iluminación no son óptimas, la cámara tiende rápidamente a hacer ruido.


Seguridad
El Gigabyte Aero 14 sólo ofrece reconocimiento facial para la autenticación de usuario. El dispositivo no ofrece sensor de huellas ni otras características de seguridad como una ranura Kensington Lock. Sólo están activas las características de seguridad del Intel Core i7 con TPM 2.0.
Accesorios
En el embalaje del portátil de Gigabyte, sólo encontramos los documentos habituales y el obligatorio adaptador de corriente.
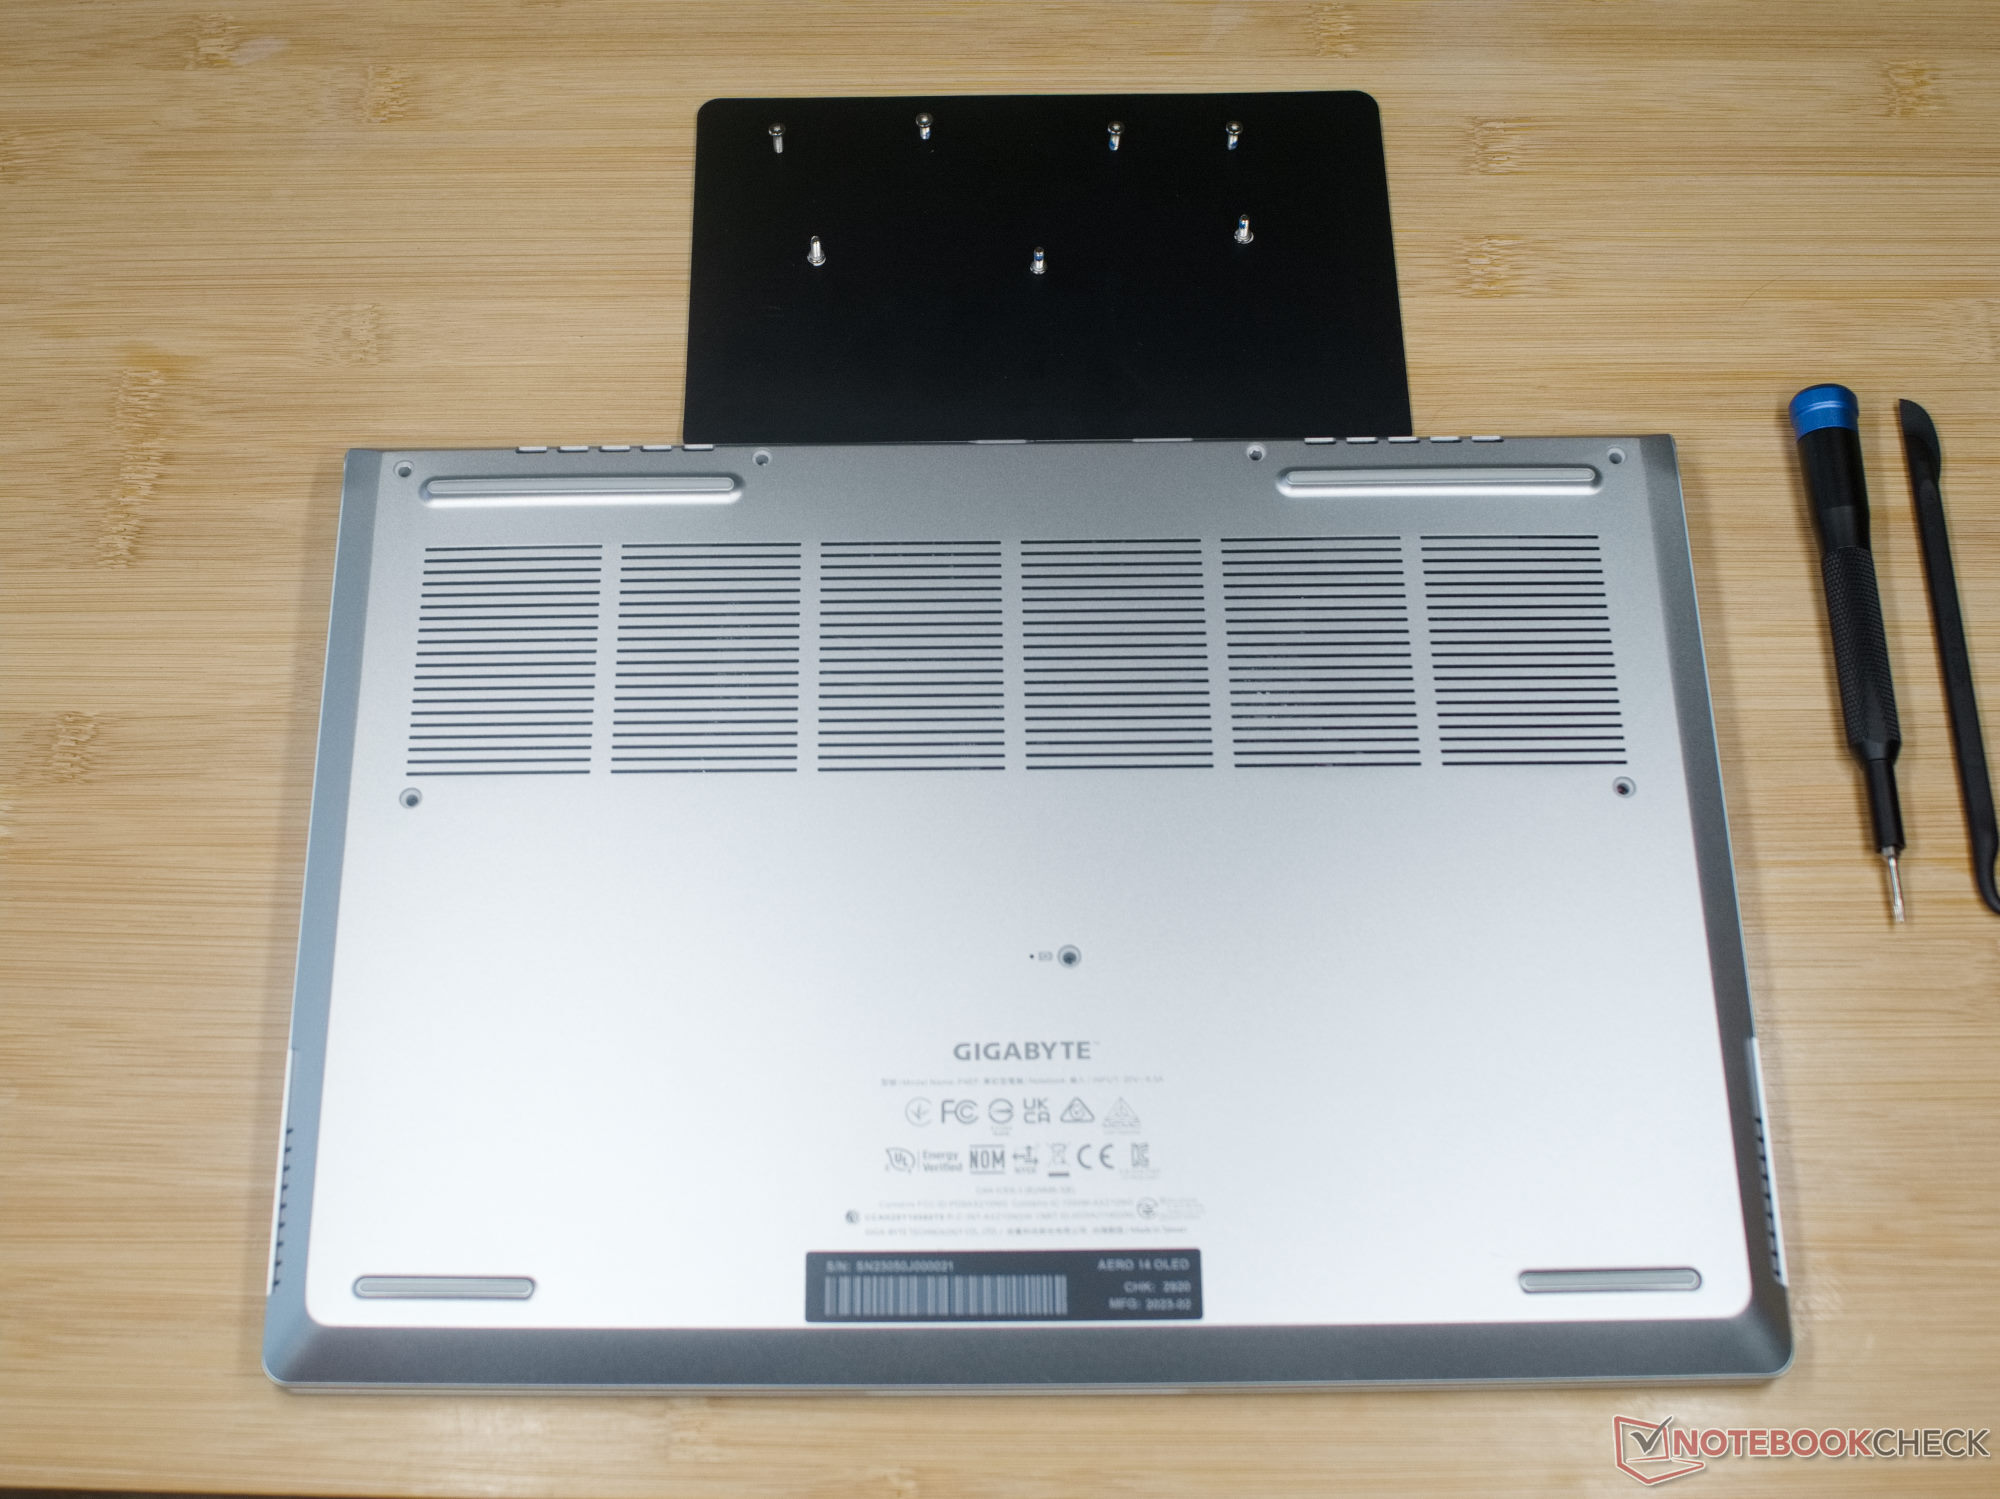
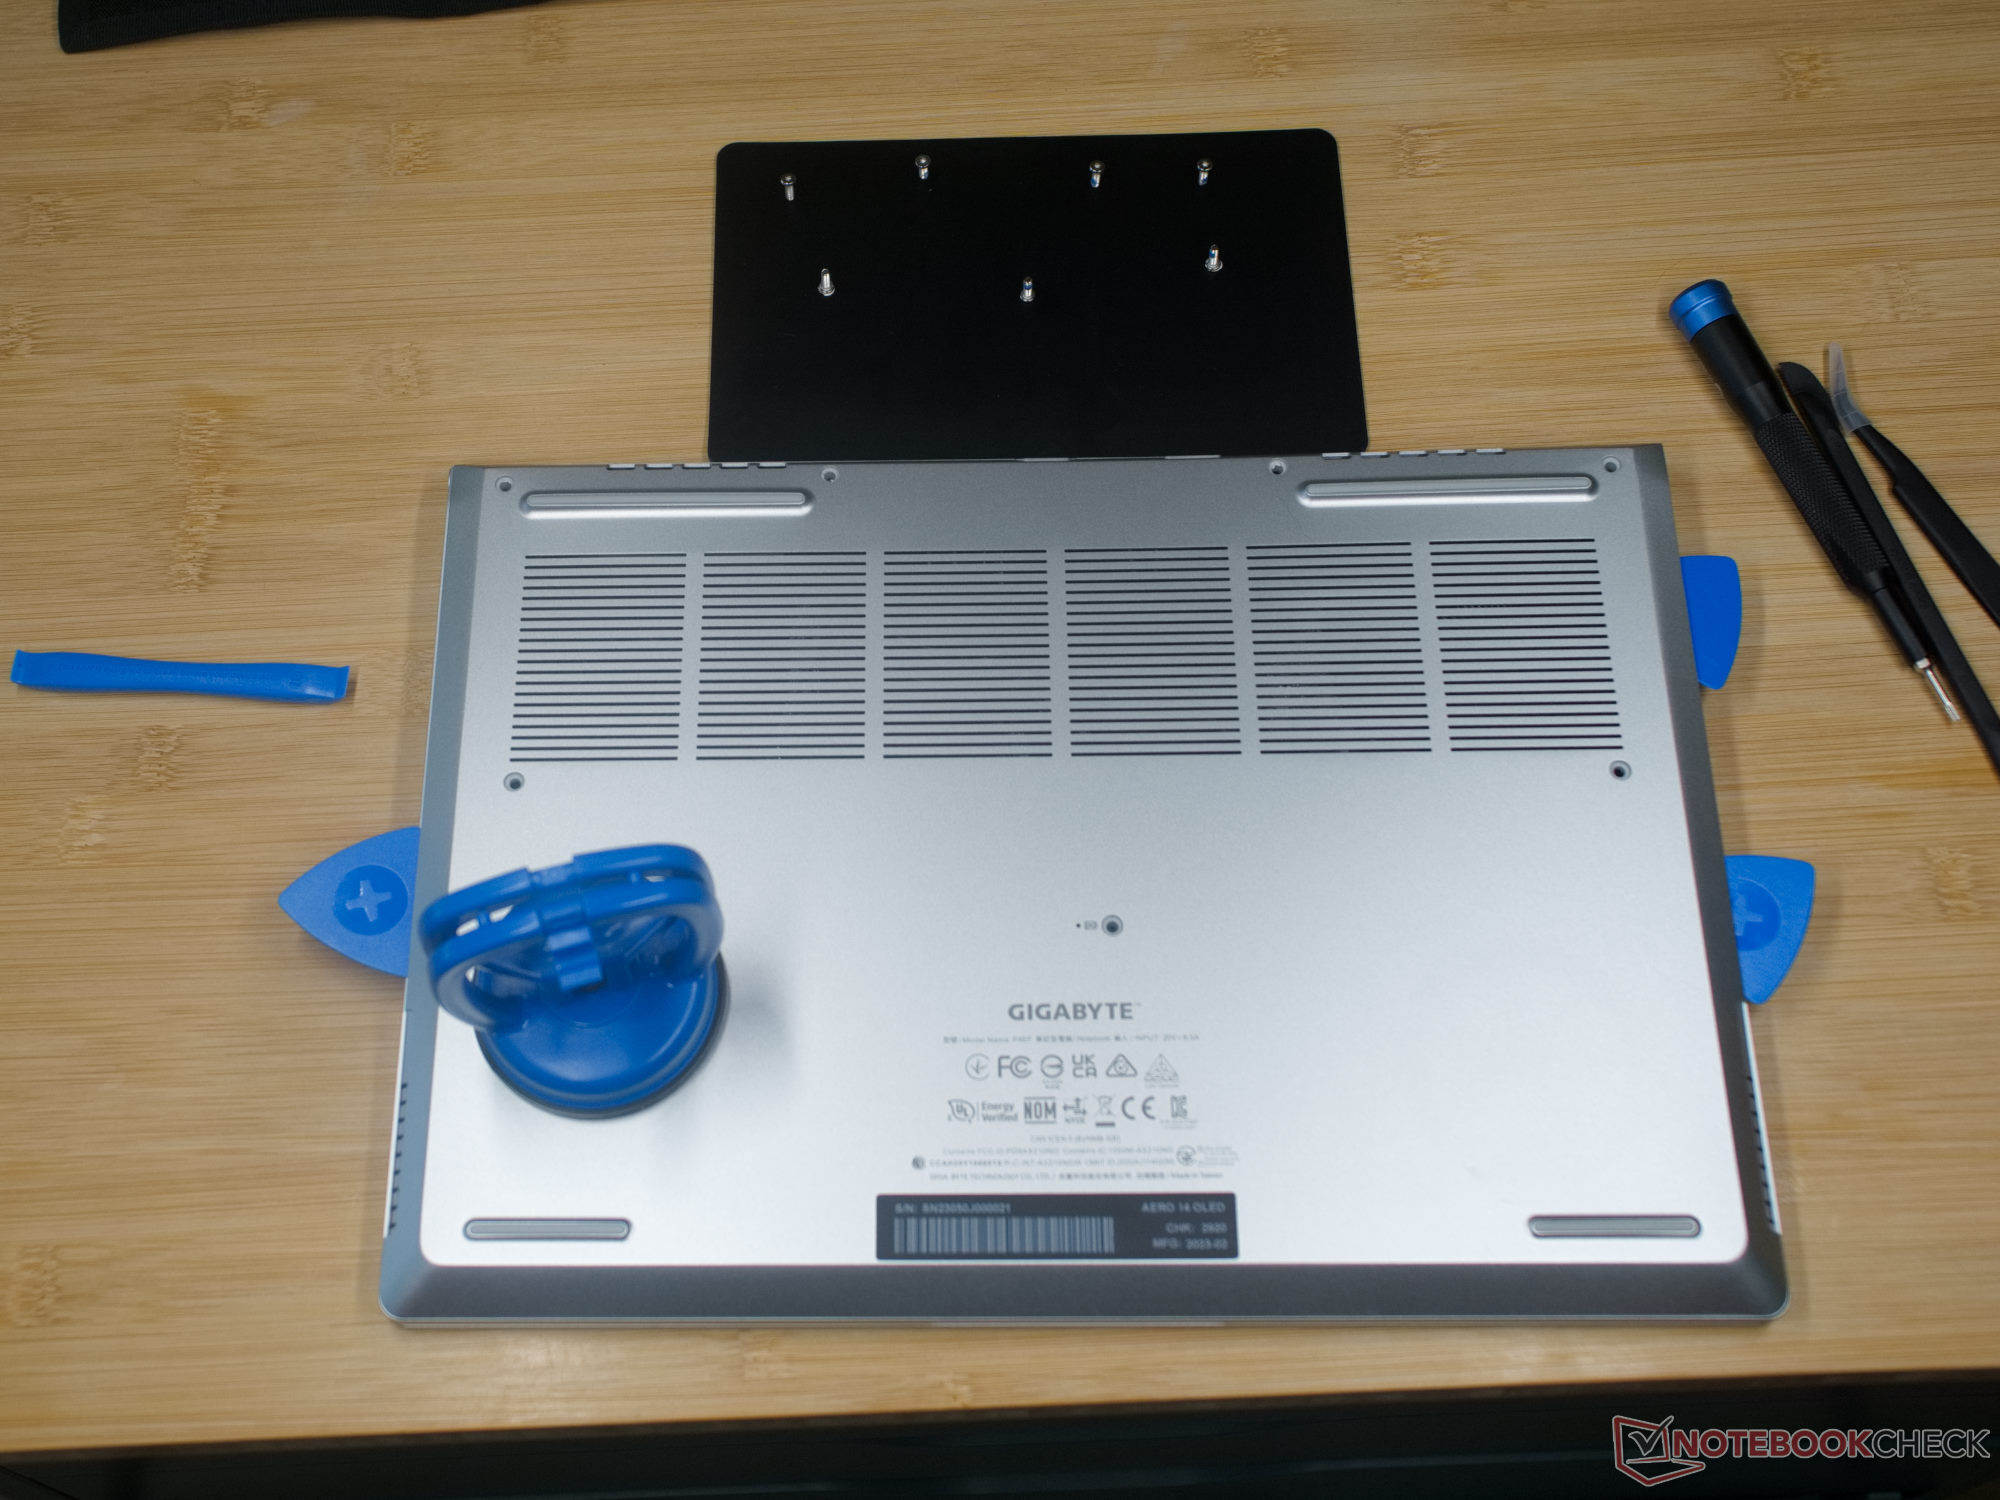
Mantenimiento
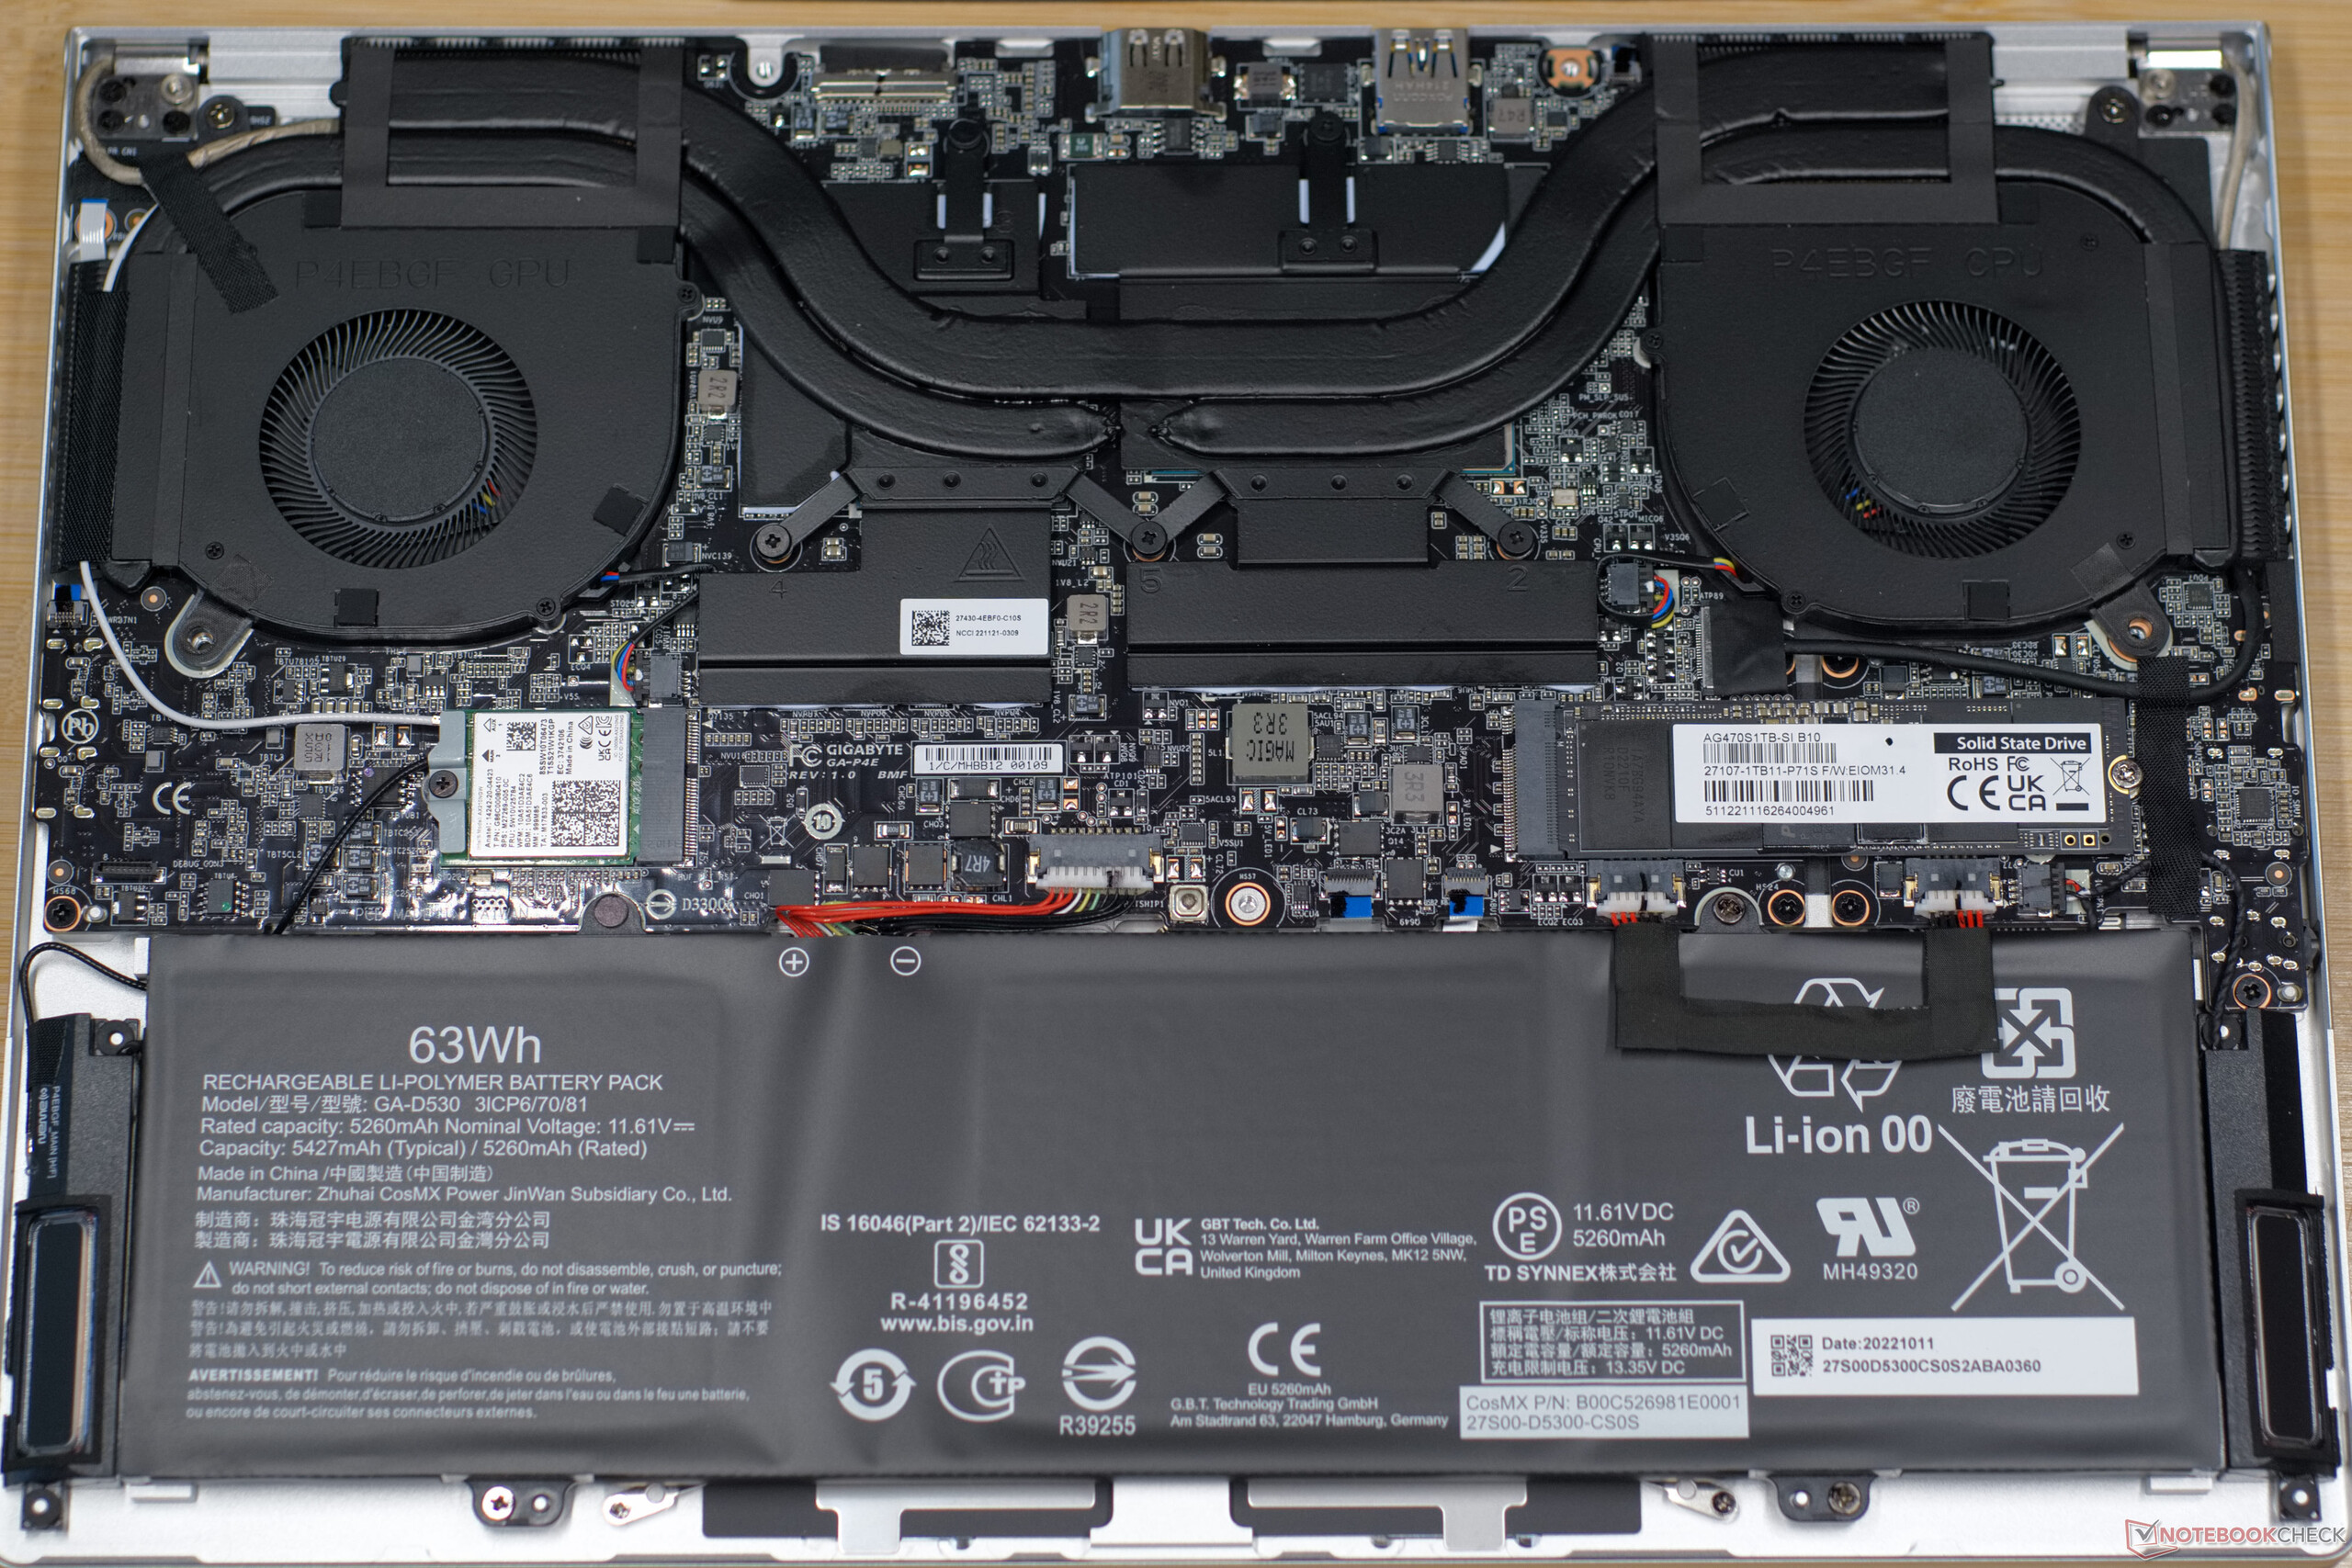
Ocho pequeños tornillos TORX sujetan la base del portátil. Una vez desatornillados, unos clips de plástico sujetan la base. Se puede utilizar una herramienta de apertura de plástico o una ventosa fuerte para abrirse camino desde la parte posterior y sobre los lados hasta la parte delantera. En la parte delantera, la tapa de la base se engancha por debajo. Una vez liberada en los laterales y la parte trasera, se puede levantar un poco y retirarla hacia la parte posterior.
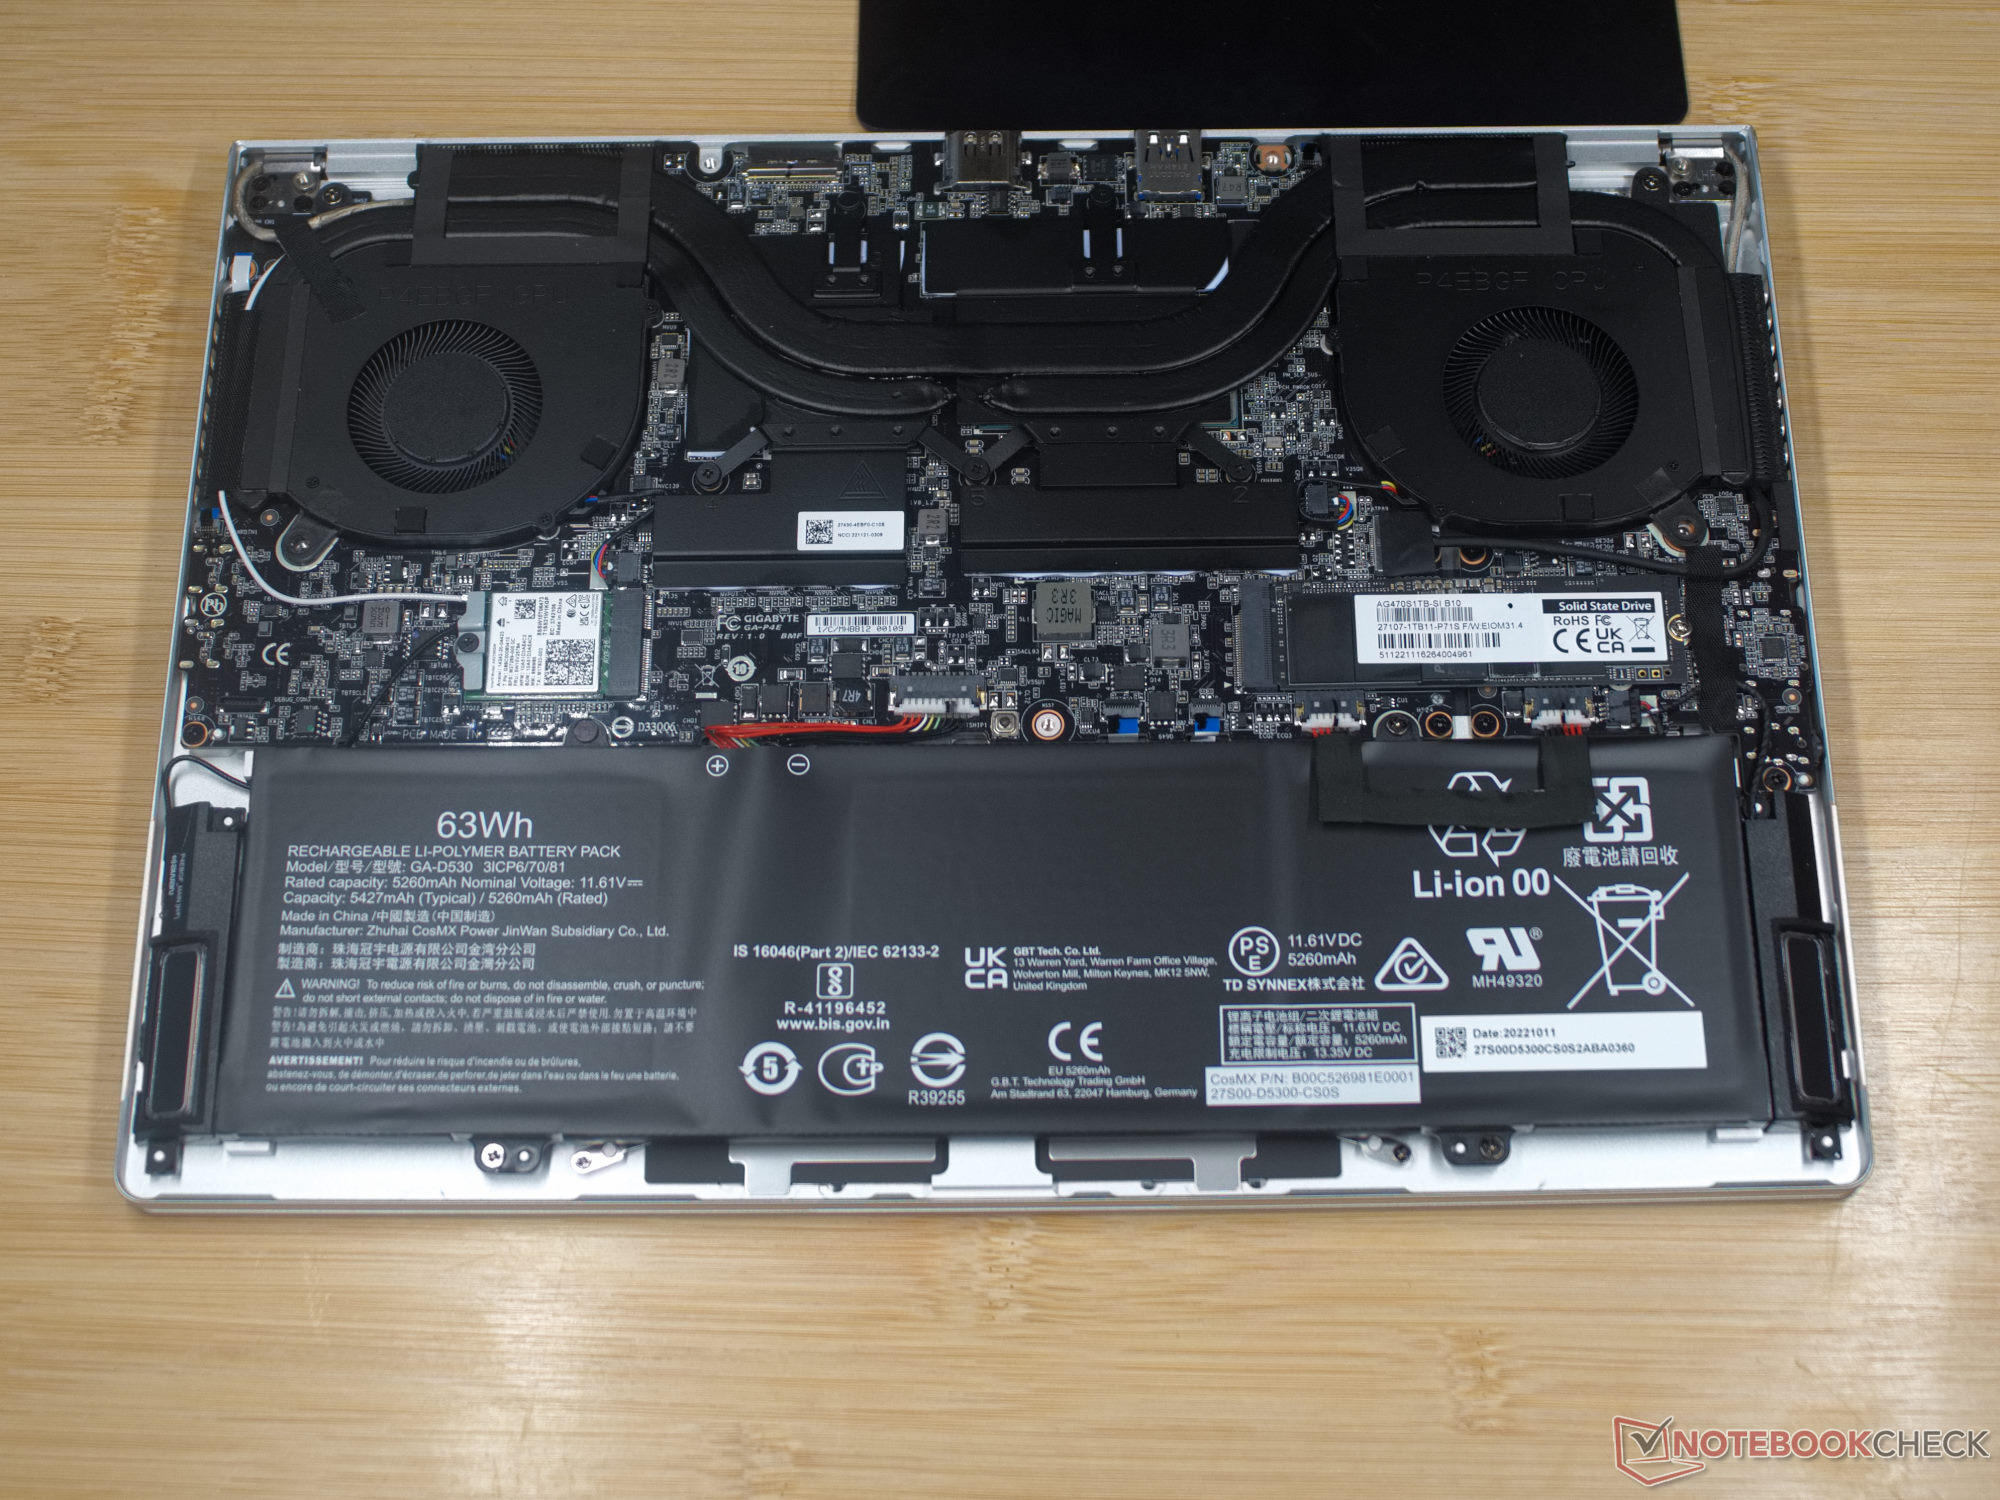
Dentro, encontramos un SSD M.2 NVMe intercambiable y el módulo M.2 WLAN. La memoria de trabajo de 16 GB está soldada. La batería de polímero de litio del portátil está asegurada con dos tornillos más. Si bien los ventiladores del portátil pueden limpiarse fácilmente, sólo puedes acceder a las aletas de ventilación desmontando todo el sistema de ventilación.
Garantía
Por desgracia, la declaración de garantía de Gigabyte deja abierta la cuestión de cuánto tiempo está cubierto el portátil por la garantía y remite a los distribuidores. En Alemania, es probable que se trate de los 24 meses legales. Esto, por supuesto, puede diferir en otros países, así que los compradores interesados deberían comprobarlo antes de comprar.
El fabricante especifica un periodo de garantía mundial de un año para la batería.
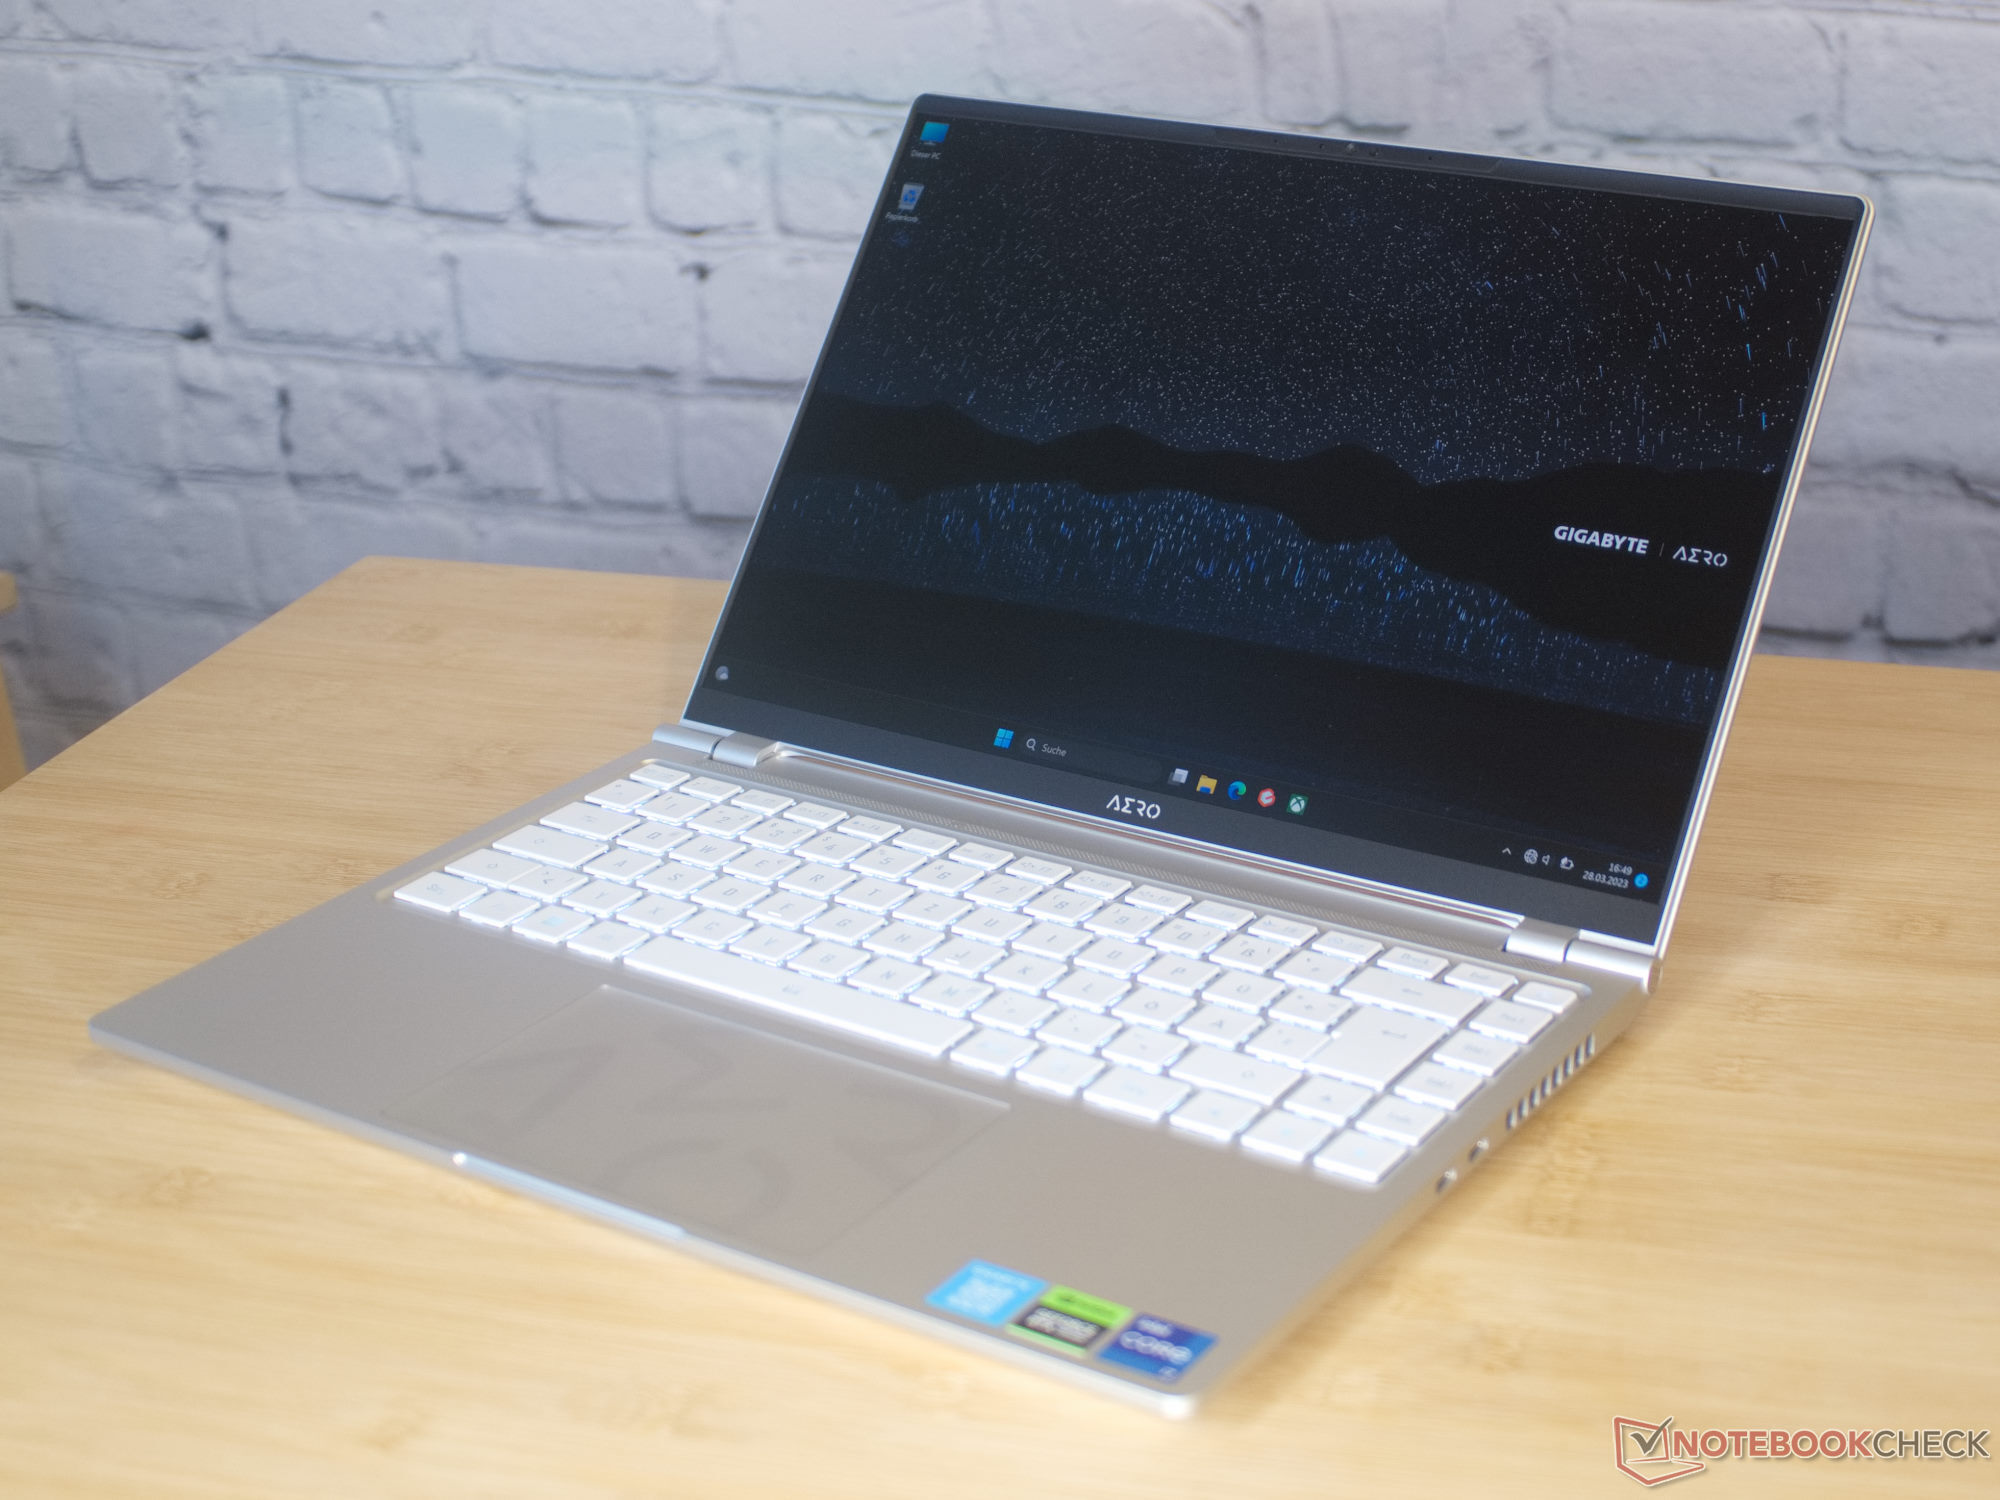
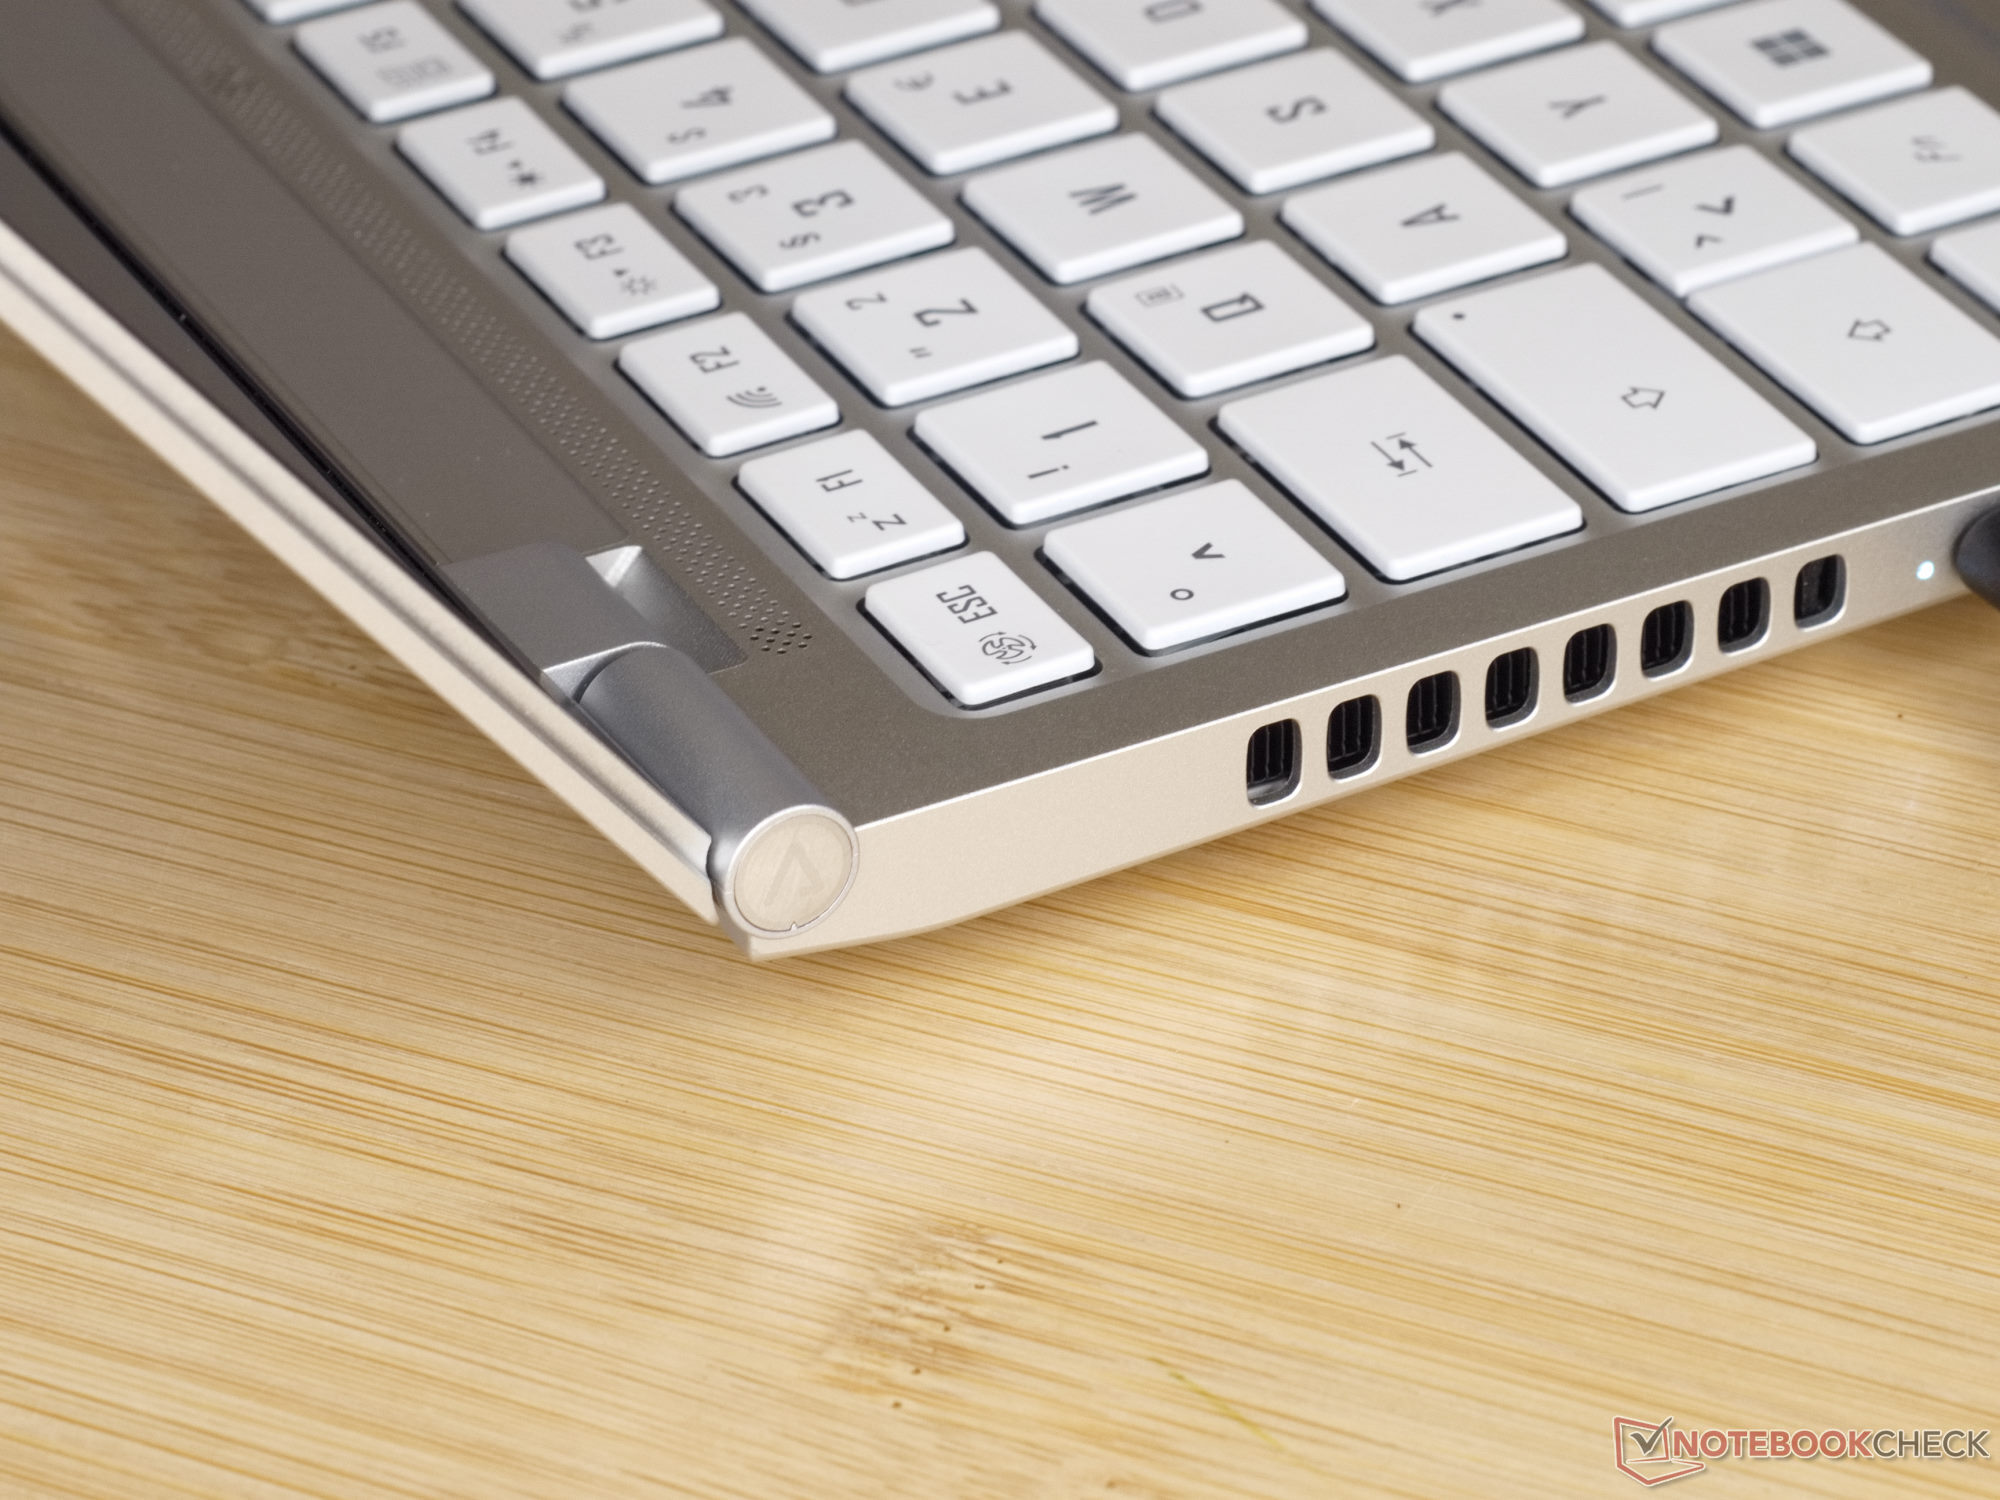
Input Devices - Remarkable 1.7 mm key travel
Teclado
El Gigabyte Aero 14 BMF tiene un excelente teclado retroiluminado con 1,7 mm de recorrido de tecla. Esto no es ninguna tontería, especialmente en un portátil tan delgado. En combinación con una fuerte respuesta háptica, esto permite una buena dinámica de trabajo. Sólo las letras del teclado podrían tener un poco más de contraste.
Otro inconveniente de la retroiluminación del teclado es su control de brillo. Si no se ajusta a brillo máximo, se oye un ligero zumbido.
Panel táctil
El touchpad del Gigabyte Aero 14 es agradablemente grande con 12.1 × 7.8 cm. Se sitúa en el centro de la carcasa y deja espacio suficiente para el talón de la mano. Como el touchpad es de vidrio esmerilado, debería conservar su agradable textura superficial durante mucho tiempo. Dependiendo del ángulo de visión, las letras de la marca AΣRO son más o menos visibles.
Pantalla - OLED en color real
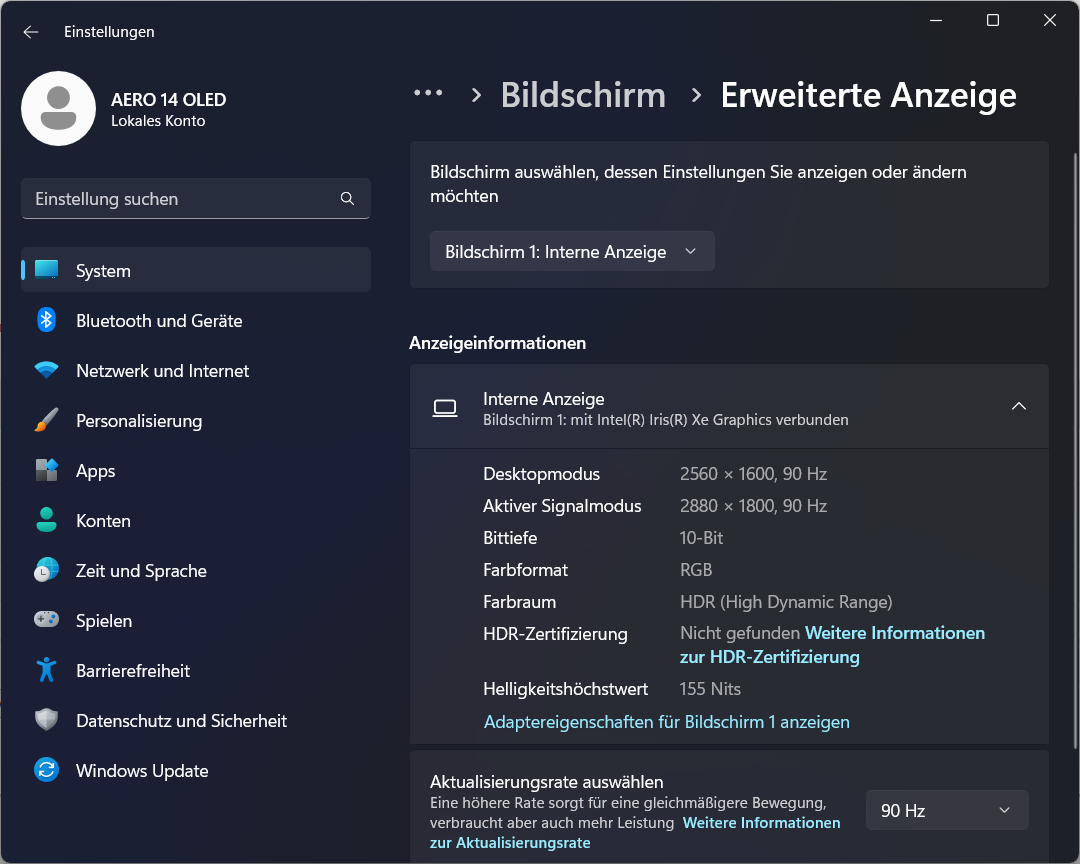
El Gigabyte Aero 14 lleva instalado un panel OLED de Samsung. Viene con numerosos certificados: está validado por Pantone, certificado por X-Rite, certificado por TÜV Rheinland y cumple el estándar Eyesafe 2.0. La densidad de píxeles es de 243 ppp con una resolución de 3K. Medimos un brillo máximo de 430 cd/m² en la pantalla. Según Gigabyte, soporta VESA DisplayHDR 600 True Black, por lo que debería alcanzar un brillo puntual de hasta 600 cd/m². Windows no permite el funcionamiento HDR en modo batería, pero el botón HDR en los ajustes de pantalla permanece en gris también en funcionamiento enchufado. Windows tampoco encuentra el certificado HDR de la pantalla.
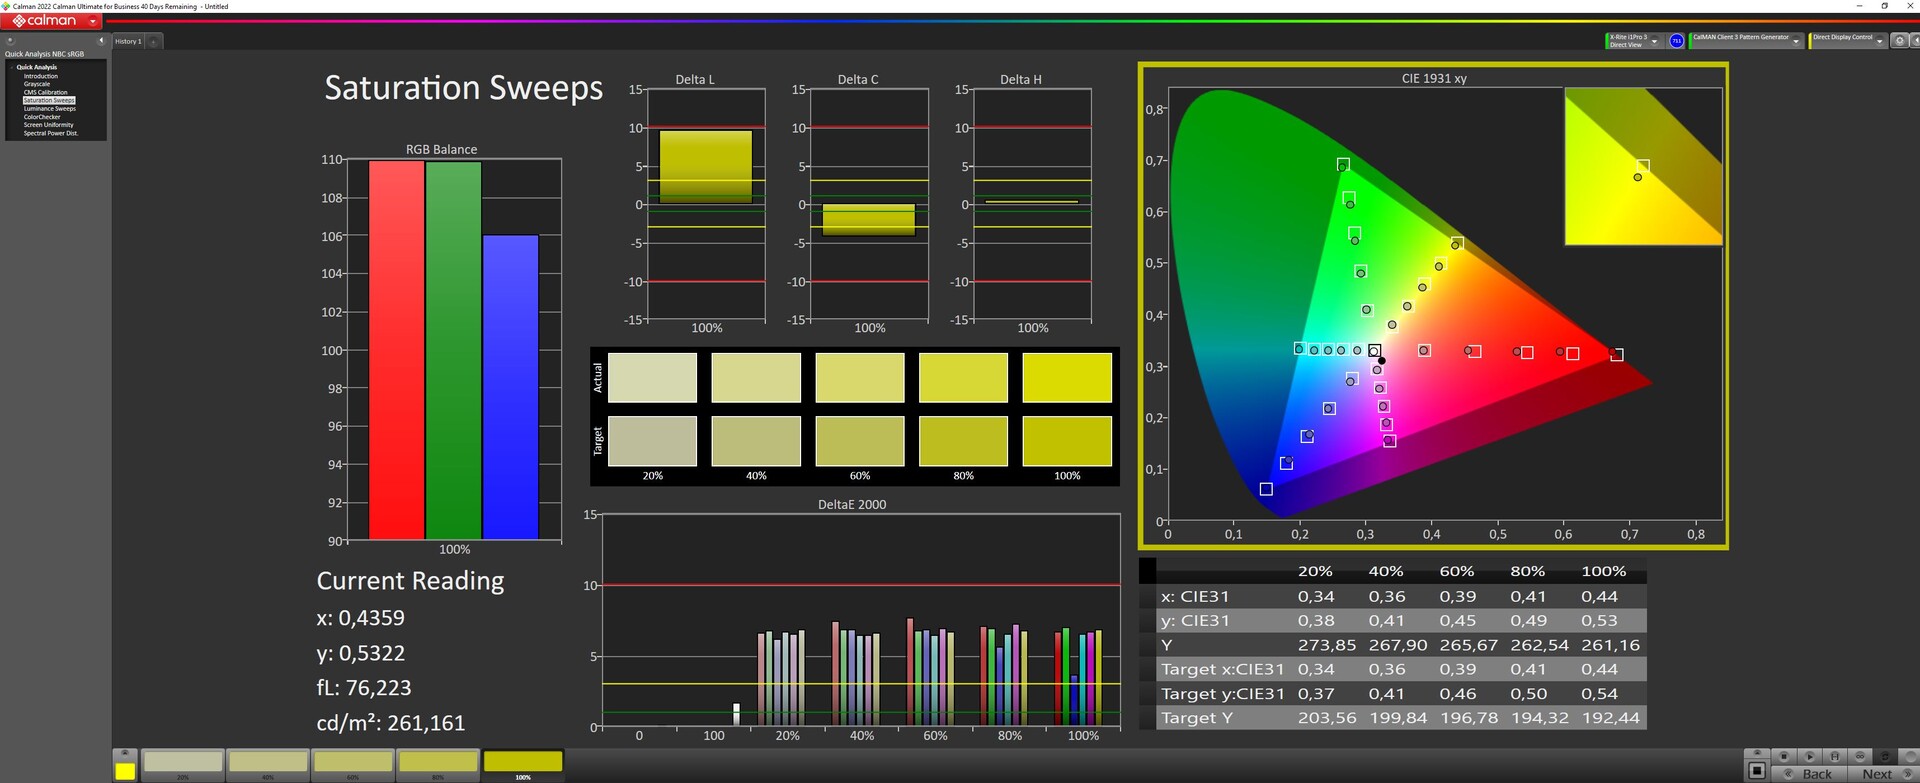
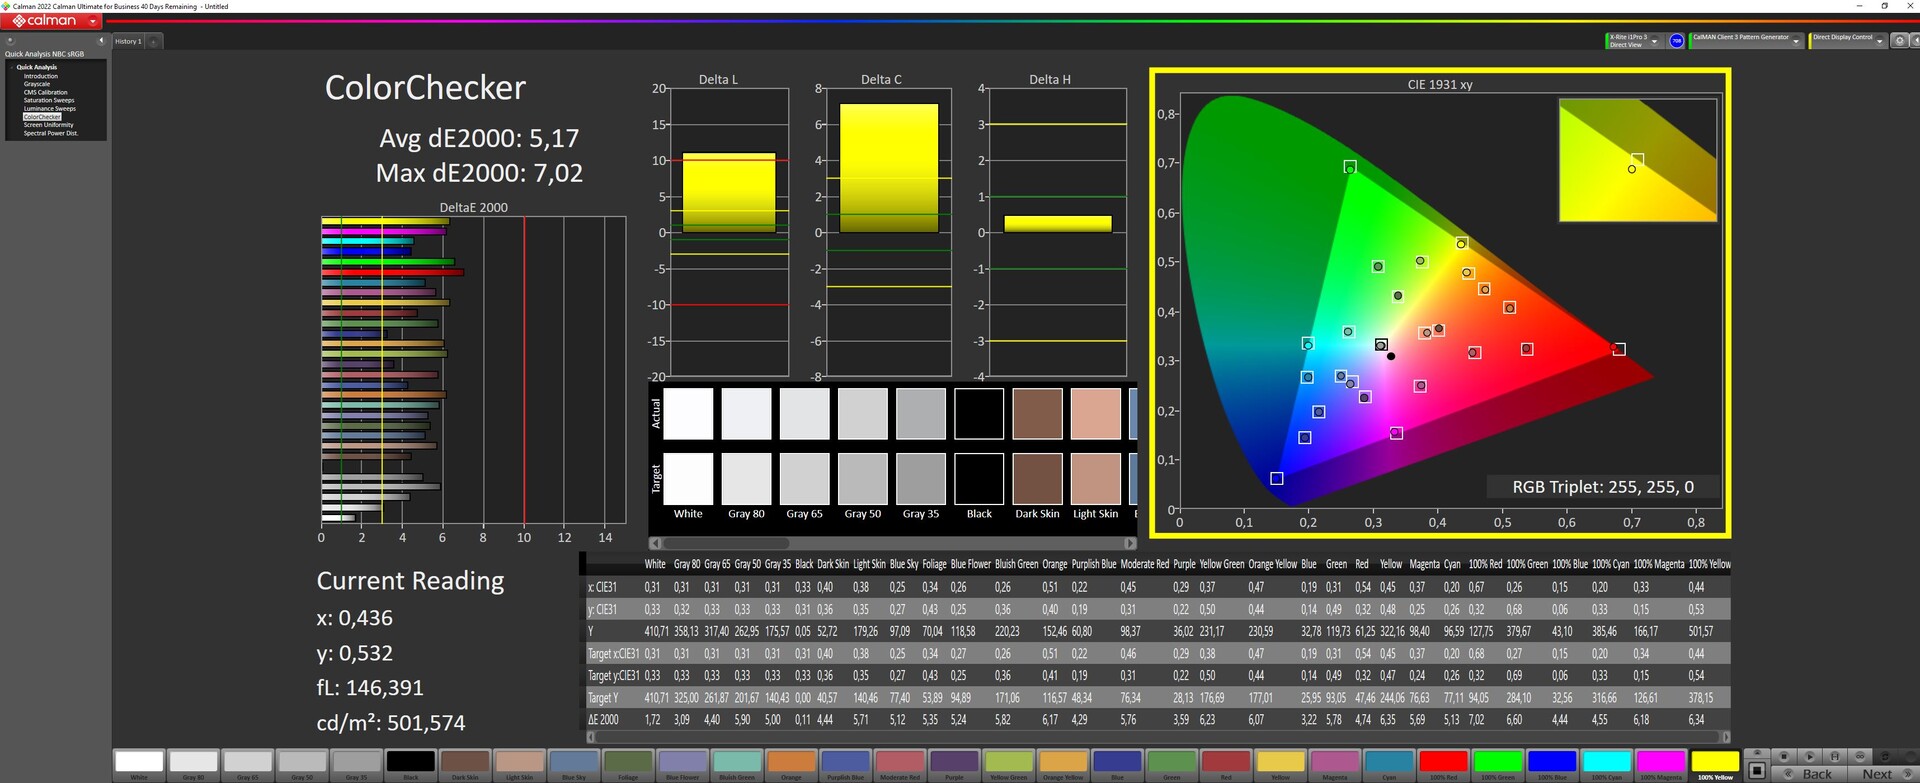
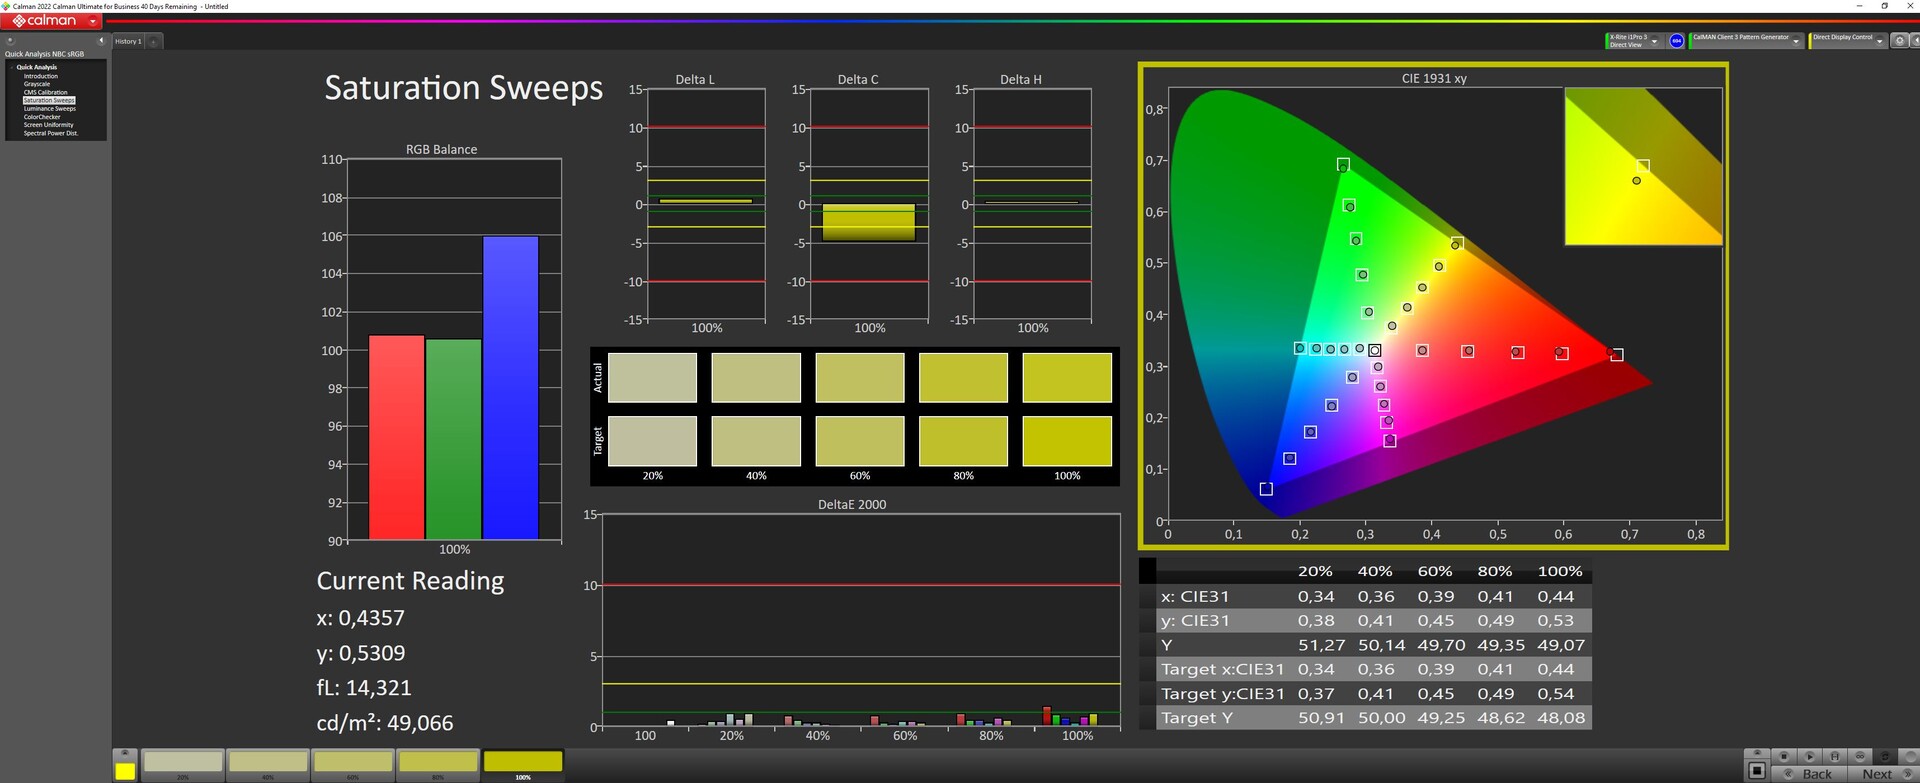
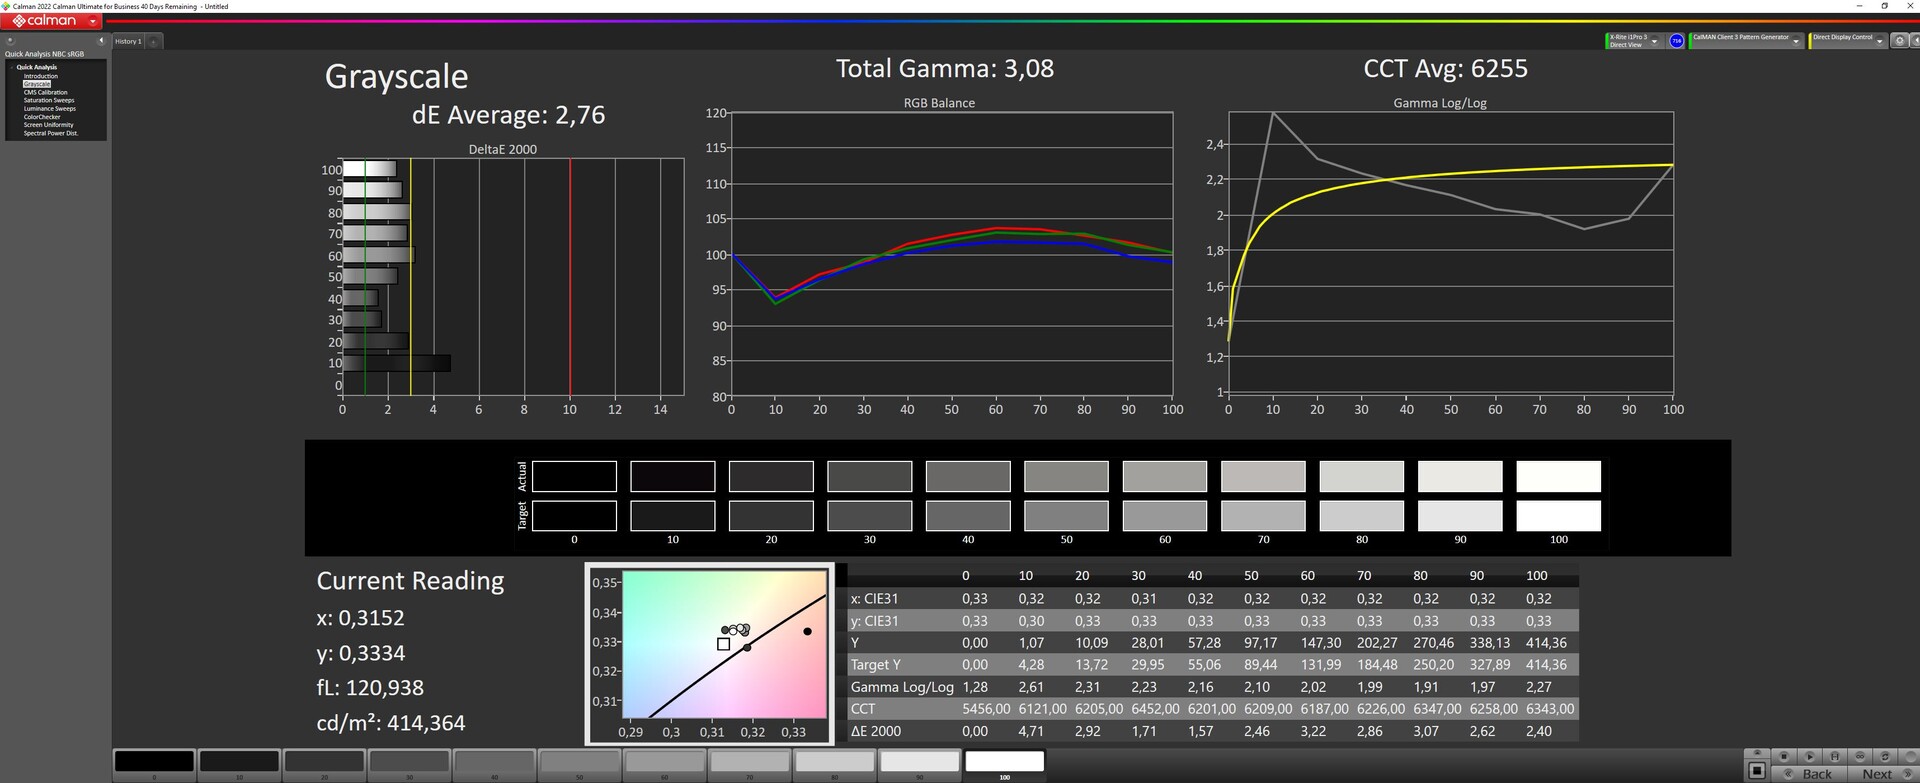
Como pantalla OLED, el panel convence con negro real y por tanto no permite errores de iluminación. Gigabyte ha preinstalado el X-Rite Color Assistant y por tanto promete desviaciones de color extremadamente bajas de DeltaE por debajo de 1.15. Aquí puedes elegir entre diferentes perfiles de color: AdobeRGB, Display P3, sRGB y Rec. 709. Hay informes en la aplicación para todos los perfiles que describen la reproducción del color. Ninguno de los perfiles tiene una desviación media del color superior a DeltaE 1. El punto conflictivo aquí es el brillo calibrado: la pantalla del Gigabyte Aero 14 está certificada con 161.348 cd/m² (62% de brillo de pantalla). Si se ajusta un brillo mayor, las desviaciones de color aumentan significativamente. Los perfiles de color no están disponibles en modo HDR.
| |||||||||||||||||||||||||
iluminación: 98 %
Brillo con batería: 424 cd/m²
Contraste: 4230:1 (Negro: 0.1 cd/m²)
ΔE ColorChecker Calman: 0.55 | ∀{0.5-29.43 Ø4.71}
calibrated: 1.15
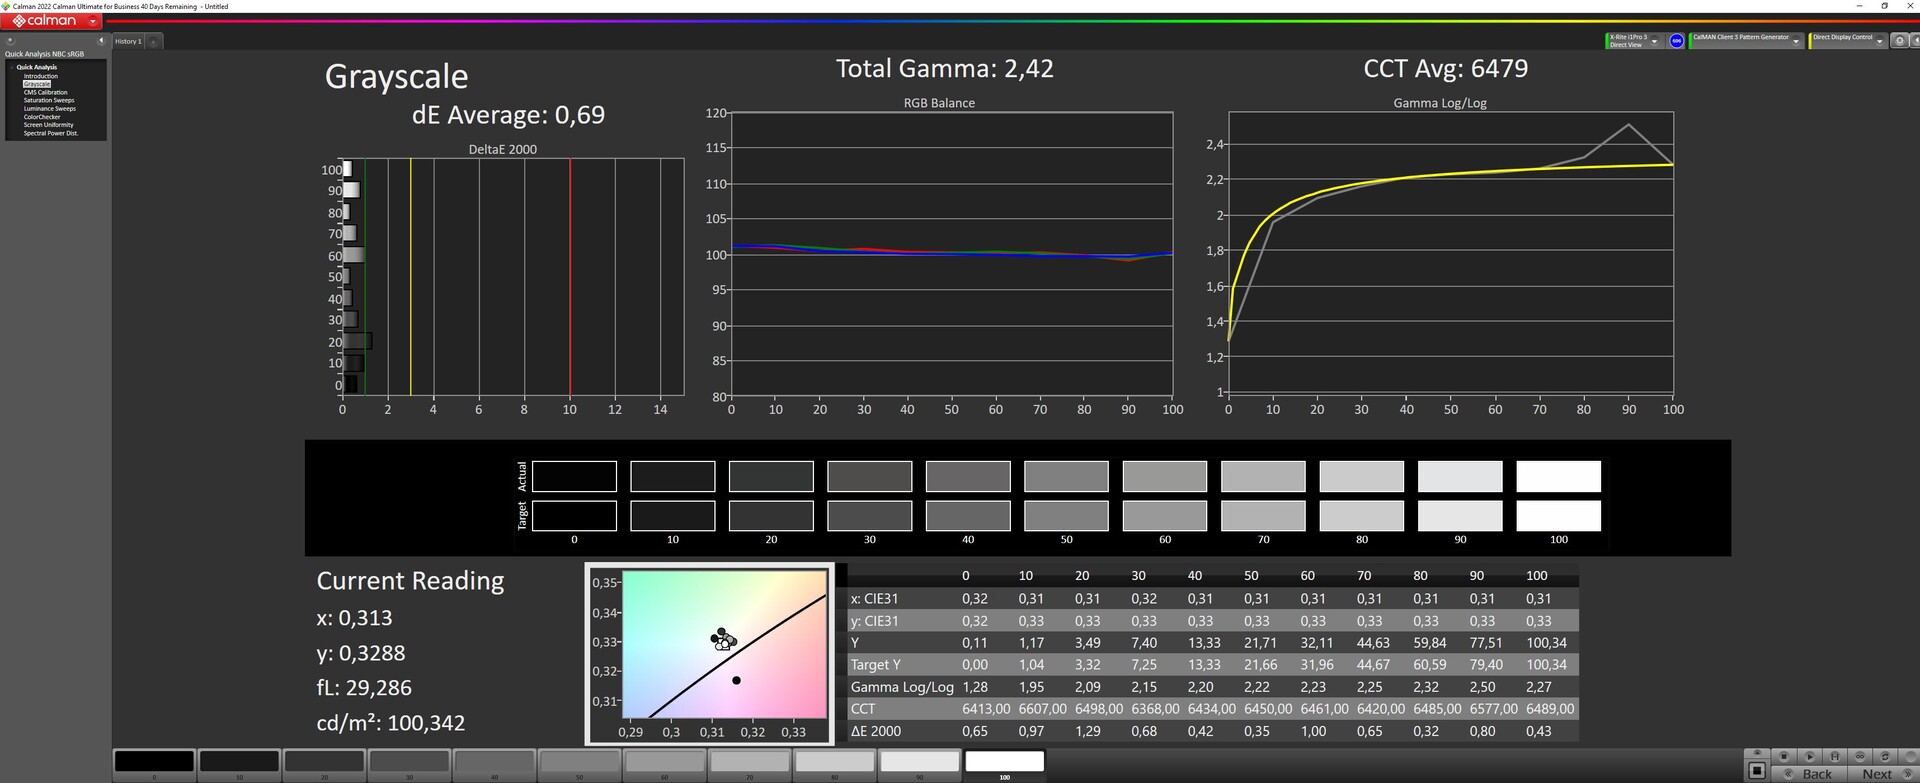
ΔE Greyscale Calman: 0.69 | ∀{0.09-98 Ø4.96}
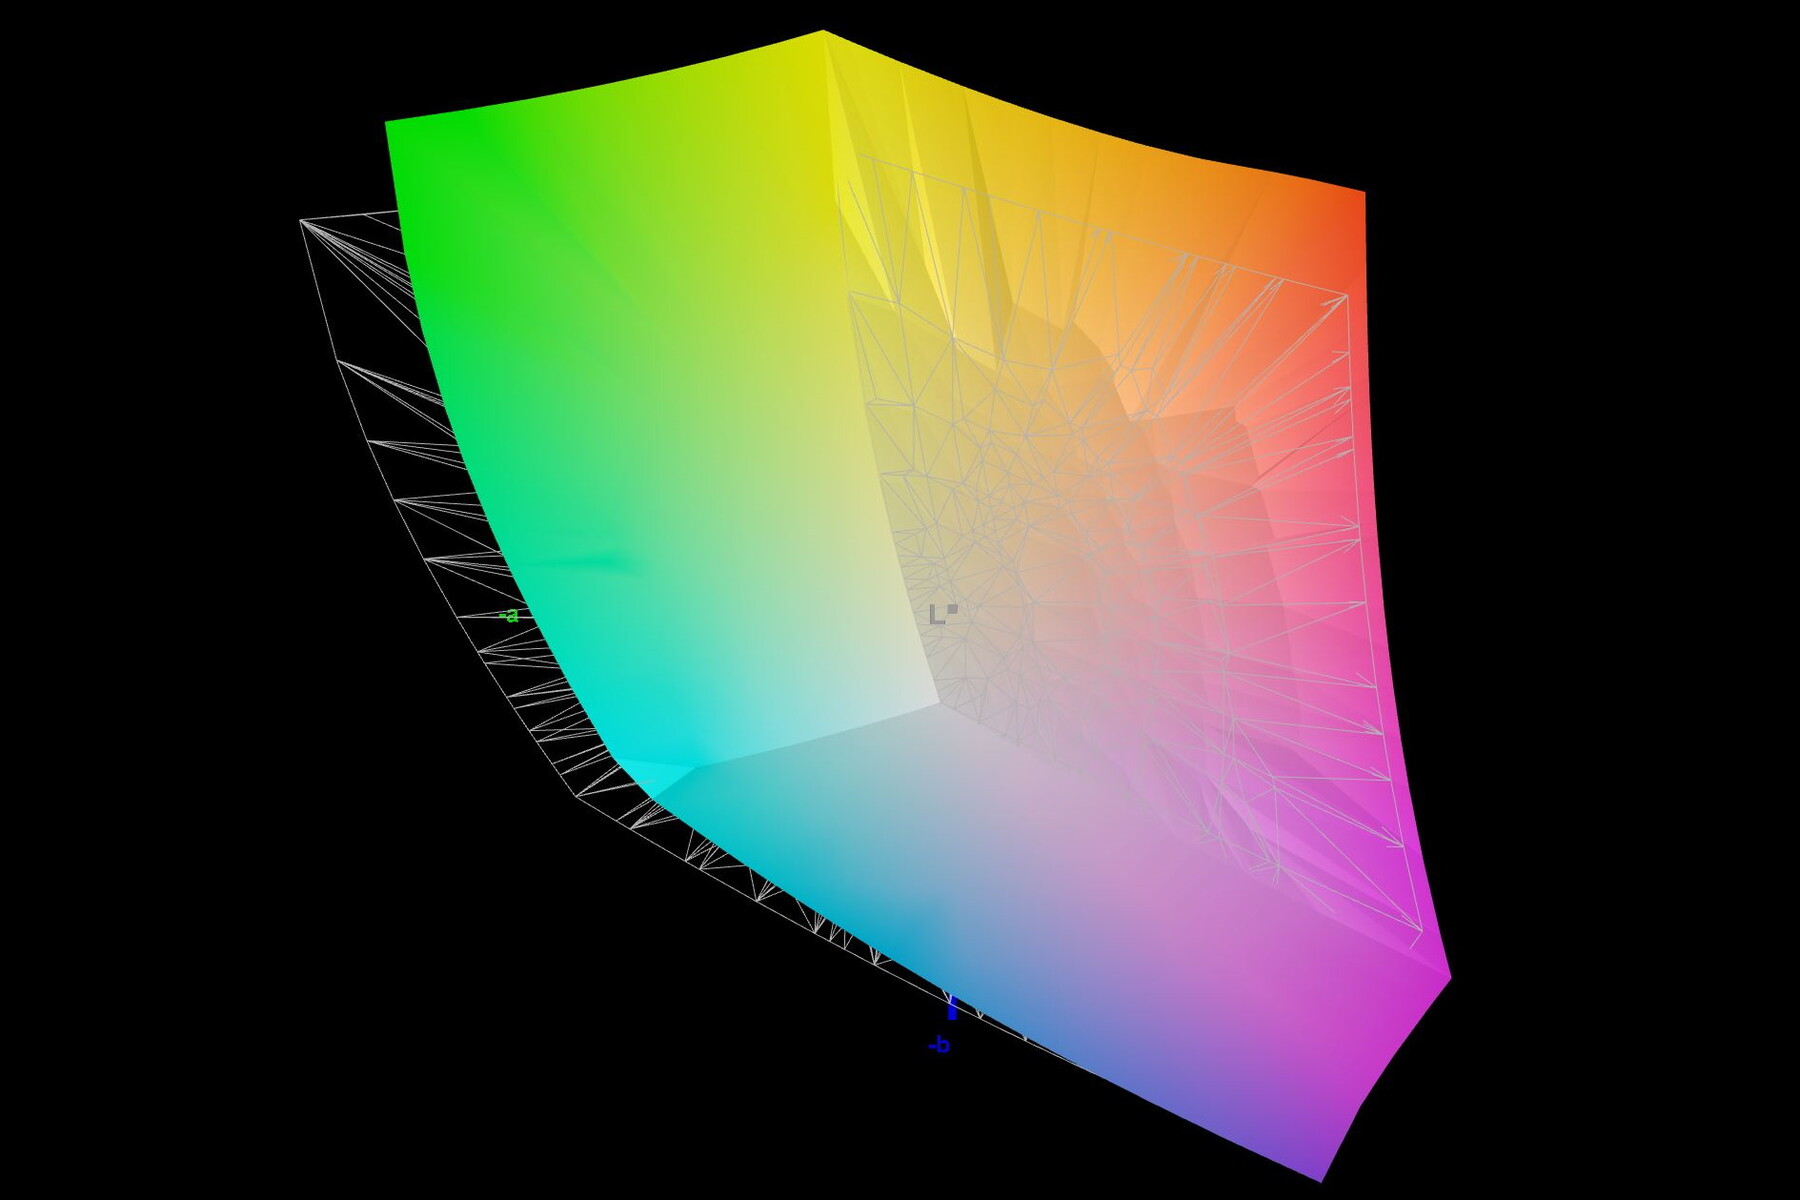
88.7% AdobeRGB 1998 (Argyll 3D)
100% sRGB (Argyll 3D)
99.8% Display P3 (Argyll 3D)
Gamma: 2.42
CCT: 6479 K
| Gigabyte Aero 14 OLED BMF Samsung SDC4192 (ATNA40YK14-0), OLED, 2880x1800, 14" | Schenker Vision 14 2022 RTX 3050 Ti MNE007ZA1-1, IPS, 2880x1800, 14" | MSI Stealth 14 Studio A13V B140QAN06.T, IPS, 2560x1600, 14" | Lenovo Yoga Pro 7 14IRH G8 LEN145-3K, IPS, 3072x1920, 14.5" | Asus Zephyrus G14 GA401QM LM140LF-1F02, IPS, 1920x1080, 14" | Acer Predator Triton 300 SE Samsung ATNA40YK07-0, OLED, 2880x1800, 14" | Acer Swift X SFX14-51G-5876 NV140DRM-N62, IPS-LED, 2240x1400, 14" | |
|---|---|---|---|---|---|---|---|
| Display | -15% | -3% | -1% | -21% | 4% | -16% | |
| Display P3 Coverage (%) | 99.8 | 74.1 -26% | 96.2 -4% | 98.7 -1% | 68.1 -32% | 99.9 0% | 70.21 -30% |
| sRGB Coverage (%) | 100 | 97.4 -3% | 99.6 0% | 100 0% | 92.4 -8% | 100 0% | 99.04 -1% |
| AdobeRGB 1998 Coverage (%) | 88.7 | 75.3 -15% | 85.3 -4% | 87.6 -1% | 67.7 -24% | 99 12% | 72.59 -18% |
| Response Times | -859% | -136% | -886% | -1192% | 43% | -1338% | |
| Response Time Grey 50% / Grey 80% * (ms) | 2.4 ? | 31.5 ? -1213% | 5.5 ? -129% | 31.5 ? -1213% | 34.4 ? -1333% | 1.36 ? 43% | 42 ? -1650% |
| Response Time Black / White * (ms) | 2.4 ? | 14.5 ? -504% | 5.8 ? -142% | 15.8 ? -558% | 27.6 ? -1050% | 1.36 ? 43% | 27 ? -1025% |
| PWM Frequency (Hz) | 300 | 367.6 ? | |||||
| Screen | -192% | -167% | -33% | -252% | -249% | -159% | |
| Brightness middle (cd/m²) | 423 | 421 0% | 419 -1% | 441 4% | 329.4 -22% | 414.3 -2% | 344 -19% |
| Brightness (cd/m²) | 427 | 416 -3% | 402 -6% | 453 6% | 311 -27% | 416 -3% | 330 -23% |
| Brightness Distribution (%) | 98 | 89 -9% | 89 -9% | 92 -6% | 90 -8% | 99 1% | 81 -17% |
| Black Level * (cd/m²) | 0.1 | 0.28 -180% | 0.43 -330% | 0.34 -240% | 0.39 -290% | 0.21 -110% | |
| Contrast (:1) | 4230 | 1504 -64% | 974 -77% | 1297 -69% | 845 -80% | 1638 -61% | |
| Colorchecker dE 2000 * | 0.55 | 3.2 -482% | 2.3 -318% | 0.6 -9% | 4.01 -629% | 4.68 -751% | 2.39 -335% |
| Colorchecker dE 2000 max. * | 1.15 | 5.5 -378% | 5.8 -404% | 1.3 -13% | 8.21 -614% | 7.78 -577% | 5.24 -356% |
| Colorchecker dE 2000 calibrated * | 1.15 | 2 -74% | 0.9 22% | 0.6 48% | 3.89 -238% | 0.99 14% | |
| Greyscale dE 2000 * | 0.69 | 4.4 -538% | 3.3 -378% | 0.8 -16% | 3.2 -364% | 1.8 -161% | 4.31 -525% |
| Gamma | 2.42 91% | 2.22 99% | 2.14 103% | 2.2 100% | 2.2 100% | 2.22 99% | 2.46 89% |
| CCT | 6479 100% | 6384 102% | 6550 99% | 6597 99% | 7070 92% | 6207 105% | 6573 99% |
| Media total (Programa/Opciones) | -355% /
-249% | -102% /
-127% | -307% /
-148% | -488% /
-337% | -67% /
-127% | -504% /
-297% |
* ... más pequeño es mejor
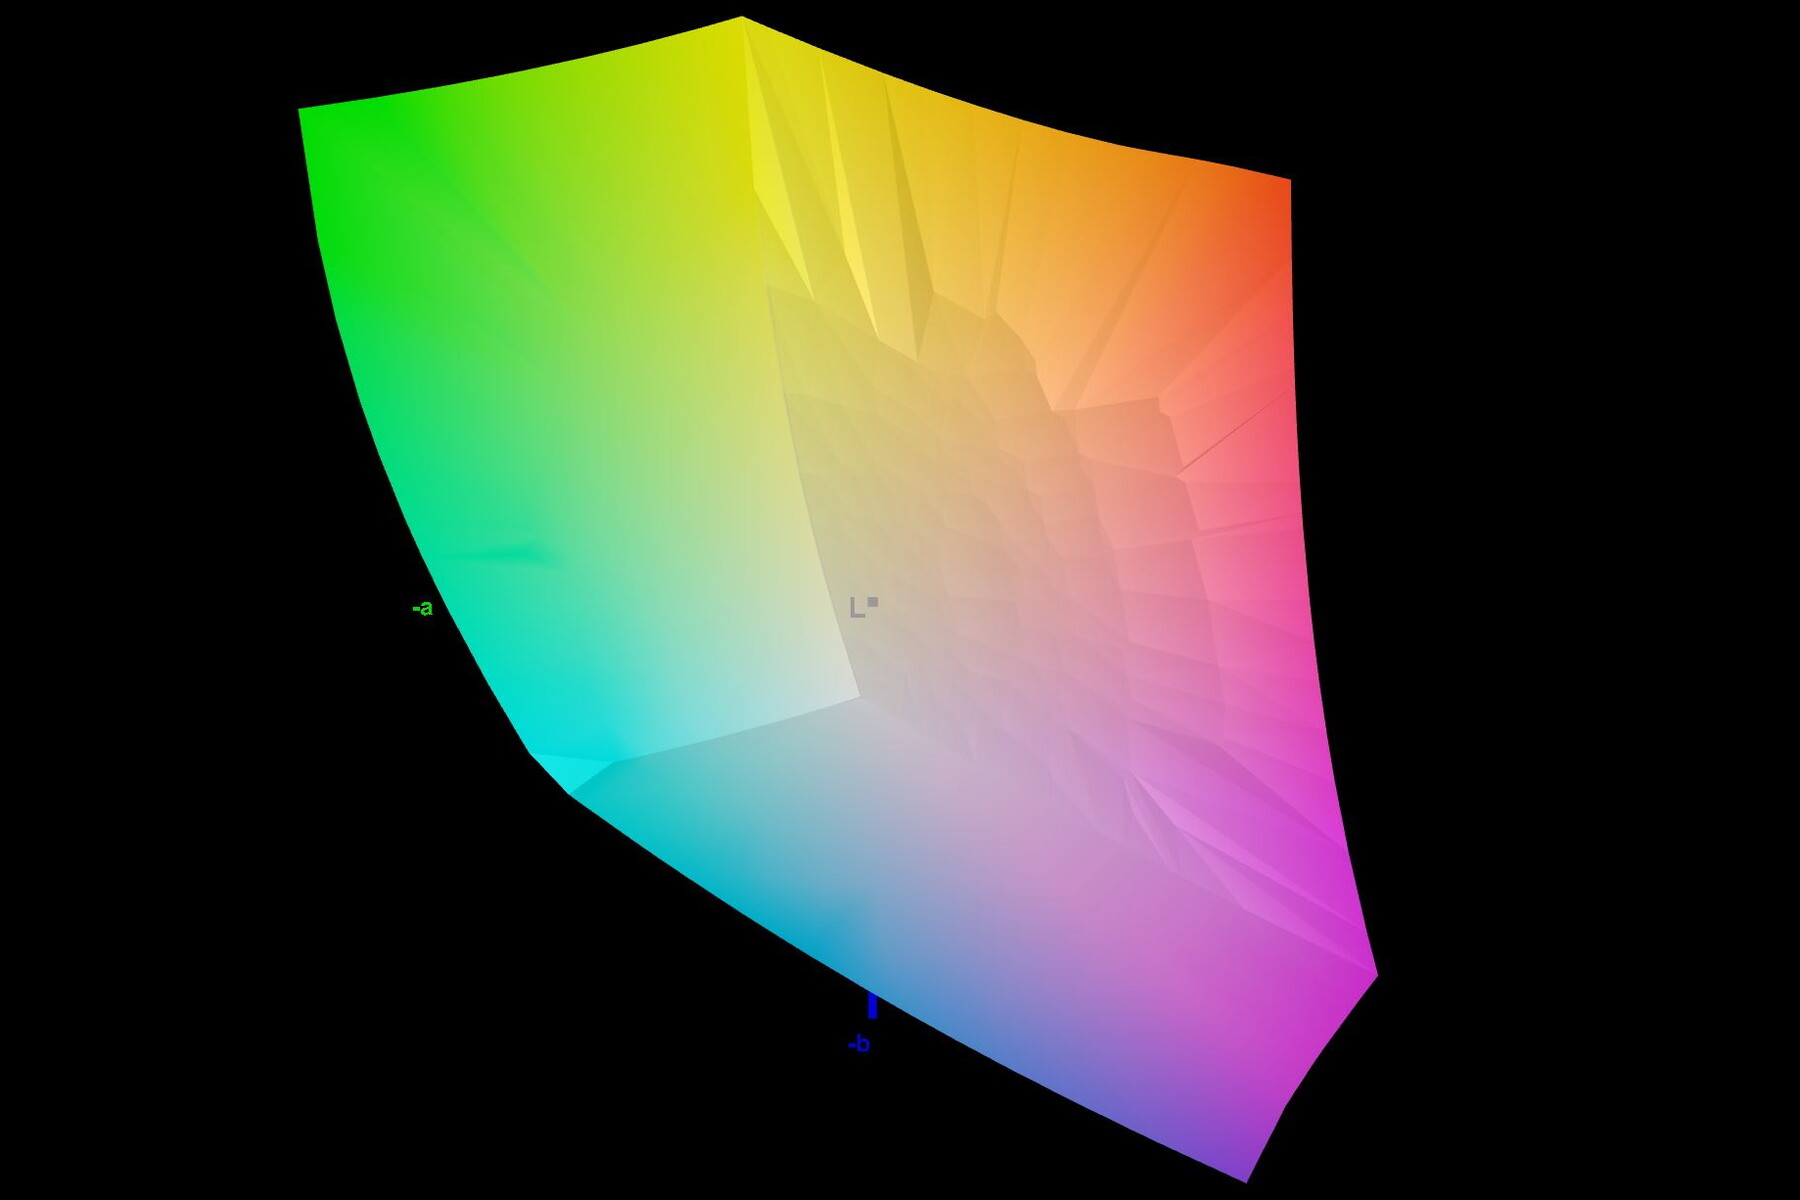
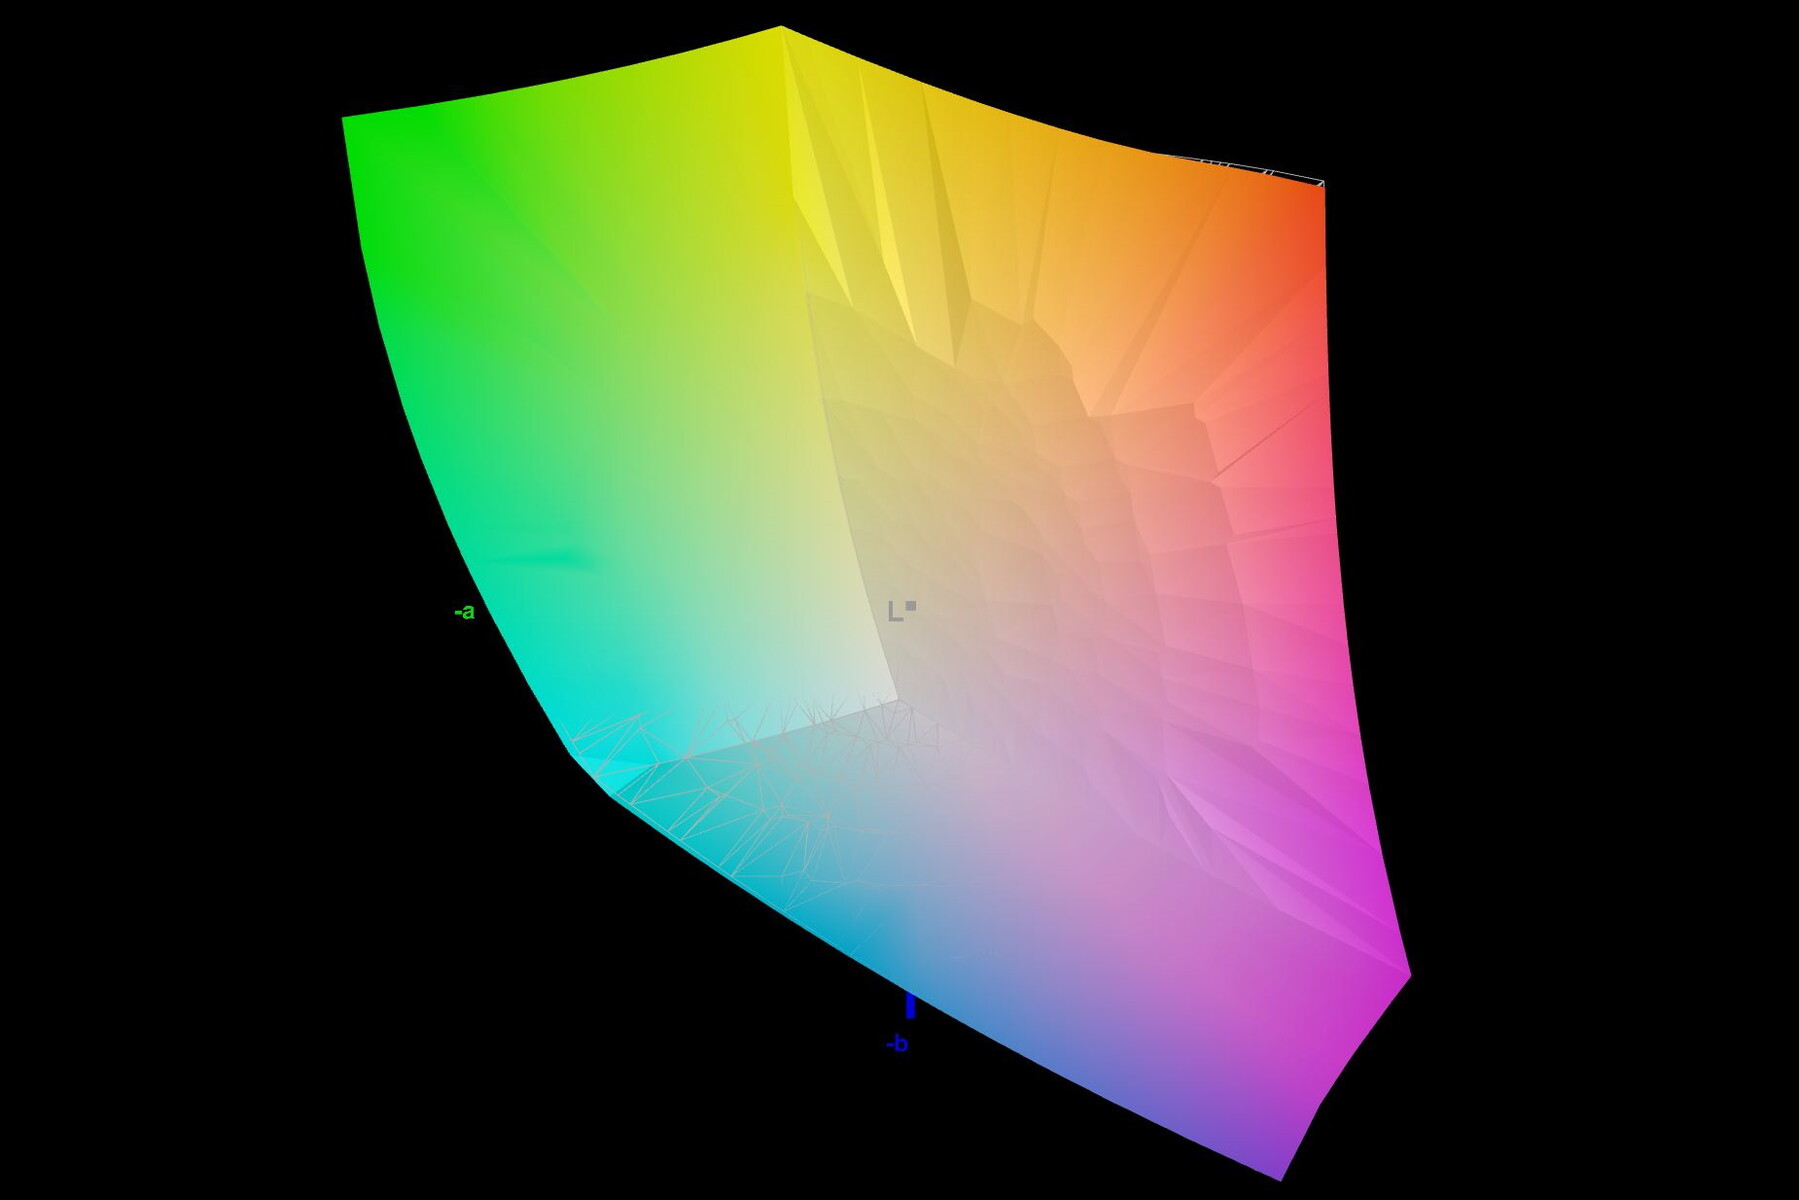
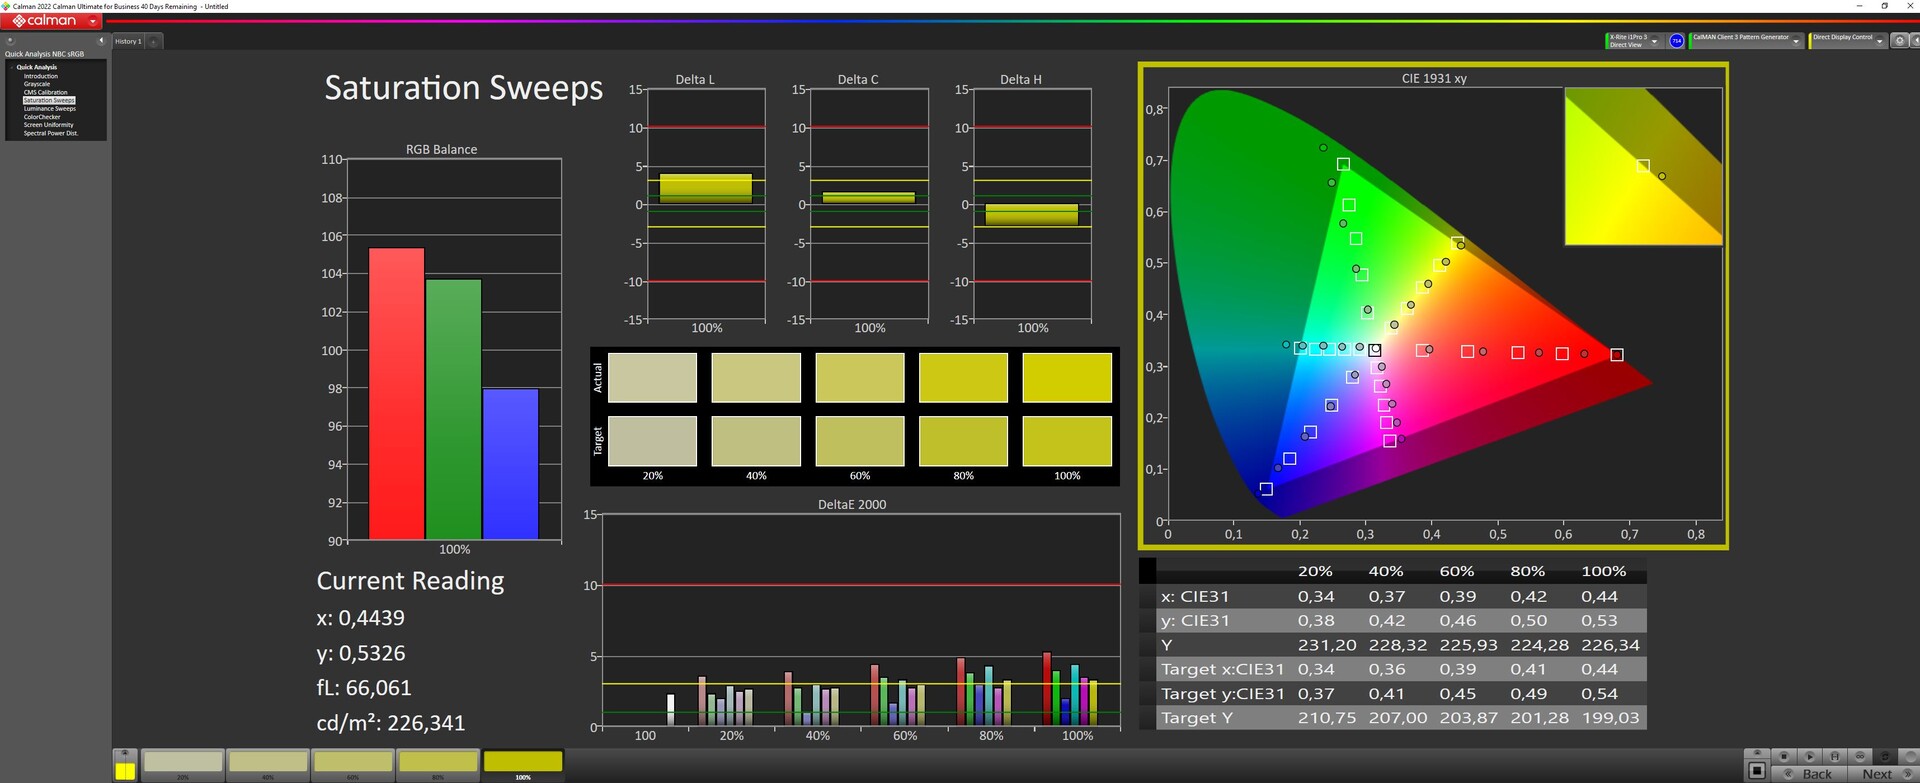
Display P3 y sRGB se reproducen casi al 100%. Para la reproducción AdobeRGB completa, la pantalla tiene carencias en los espectros de color verde y azul. Según nuestras mediciones, la pantalla sólo alcanza el 88% de AdobeRGB a pleno brillo.
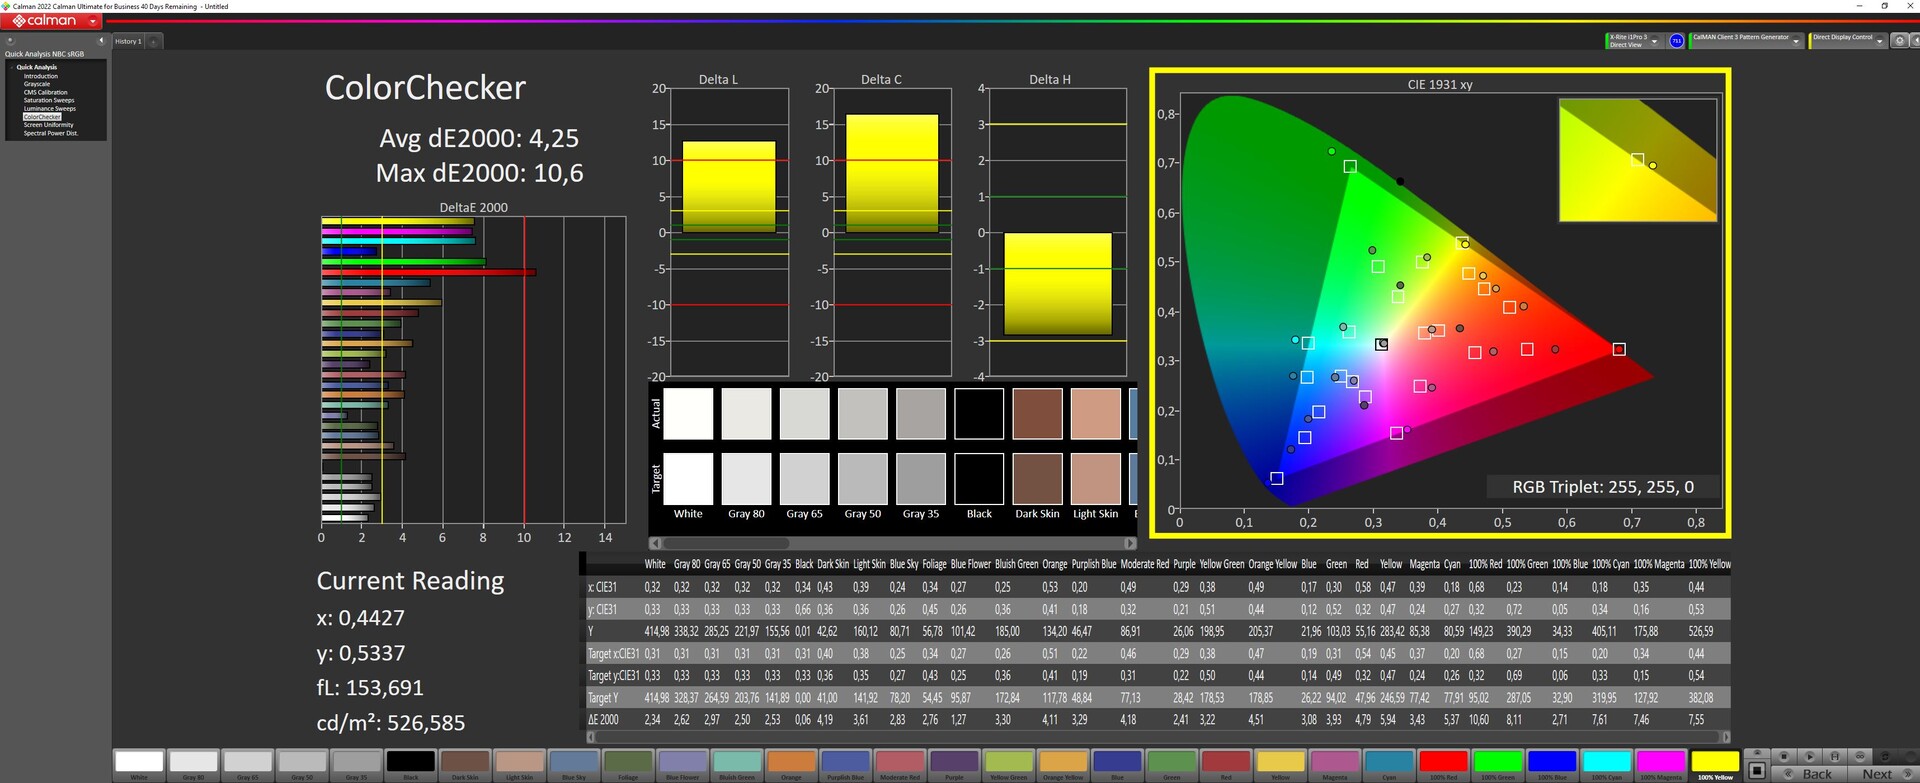
Aquí se estableció el perfil DisplayP3 y se midió con la app X-Rite. A brillo máximo, Gigabyte no puede mantener su promesa publicitaria para el Aero 14 OLED. Se echa claramente de menos DeltaE 1.15. La pantalla sólo alcanza la fidelidad de color anunciada con un 62% de brillo o menos. Nuestro perfil ICC, creado al 100% de brillo (disponible para descargar en la caja de información de arriba), sólo trae ligeras mejoras aquí. La pantalla mejora de una desviación de color media de DeltaE de 5,17 a 4,25. Incluso a pleno brillo, sería deseable una desviación de color de DeltaE de 3 e inferior.


Tiempos de respuesta del display
| ↔ Tiempo de respuesta de Negro a Blanco | ||
|---|---|---|
| 2.4 ms ... subida ↗ y bajada ↘ combinada | ↗ 1.4 ms subida | 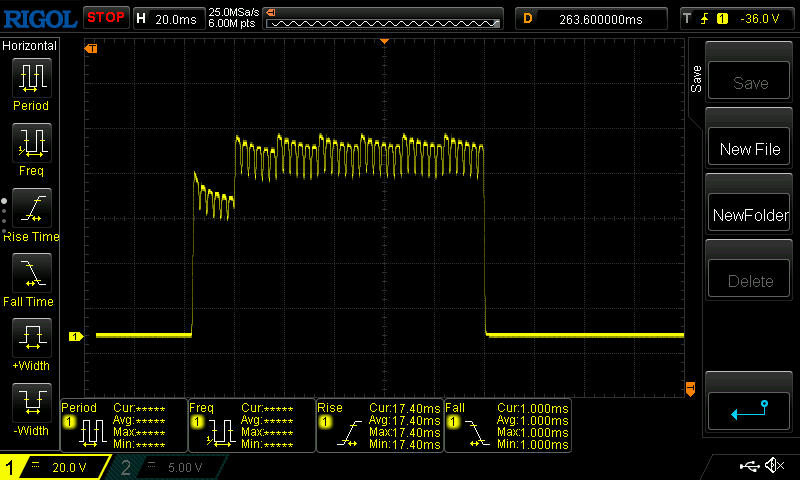 |
| ↘ 1 ms bajada | ||
| La pantalla mostró tiempos de respuesta muy rápidos en nuestros tests y debería ser adecuada para juegos frenéticos. En comparación, todos los dispositivos de prueba van de ##min### (mínimo) a 240 (máximo) ms. » 13 % de todos los dispositivos son mejores. Esto quiere decir que el tiempo de respuesta medido es mejor que la media (19.8 ms) de todos los dispositivos testados. | ||
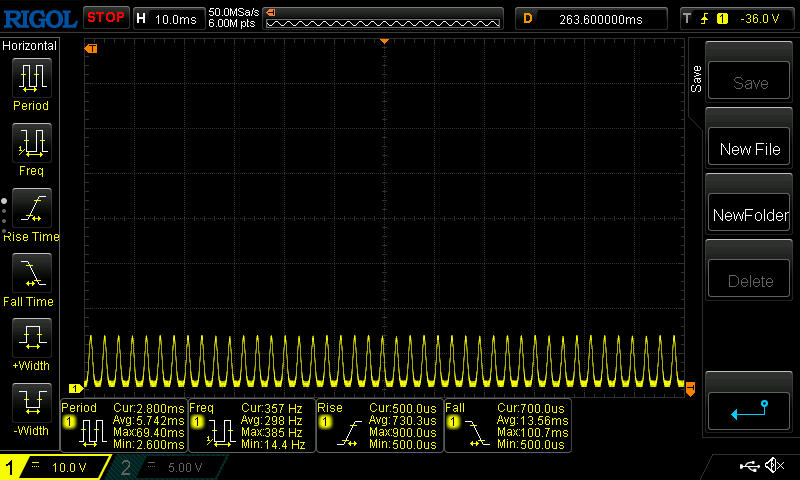
| ↔ Tiempo de respuesta 50% Gris a 80% Gris | ||
| 2.4 ms ... subida ↗ y bajada ↘ combinada | ↗ 1.4 ms subida | 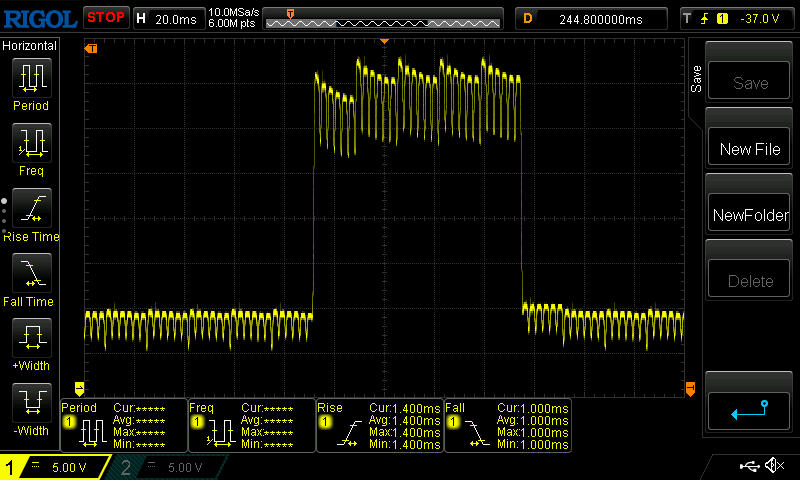 |
| ↘ 1 ms bajada | ||
| La pantalla mostró tiempos de respuesta muy rápidos en nuestros tests y debería ser adecuada para juegos frenéticos. En comparación, todos los dispositivos de prueba van de ##min### (mínimo) a 636 (máximo) ms. » 11 % de todos los dispositivos son mejores. Esto quiere decir que el tiempo de respuesta medido es mejor que la media (31 ms) de todos los dispositivos testados. | ||
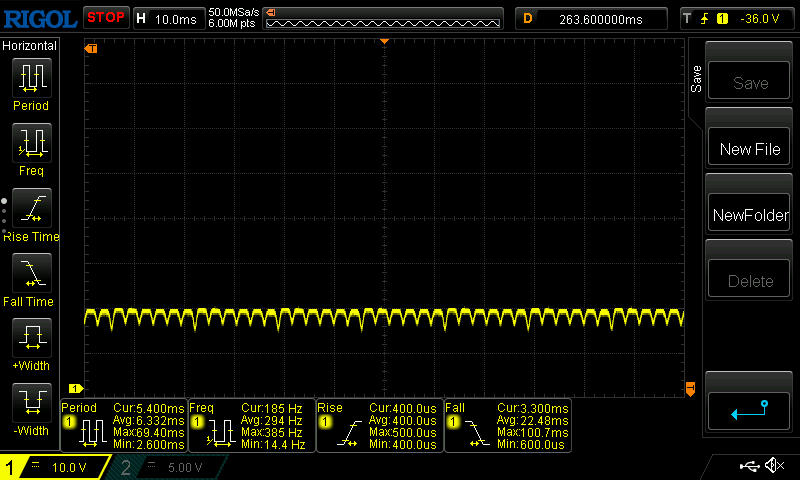
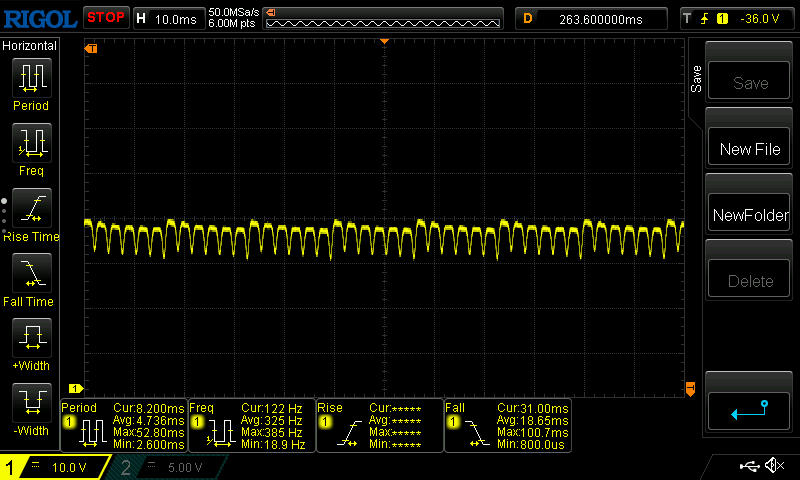
Parpadeo de Pantalla / PWM (Pulse-Width Modulation)
| Parpadeo de Pantalla / PWM detectado | 300 Hz | 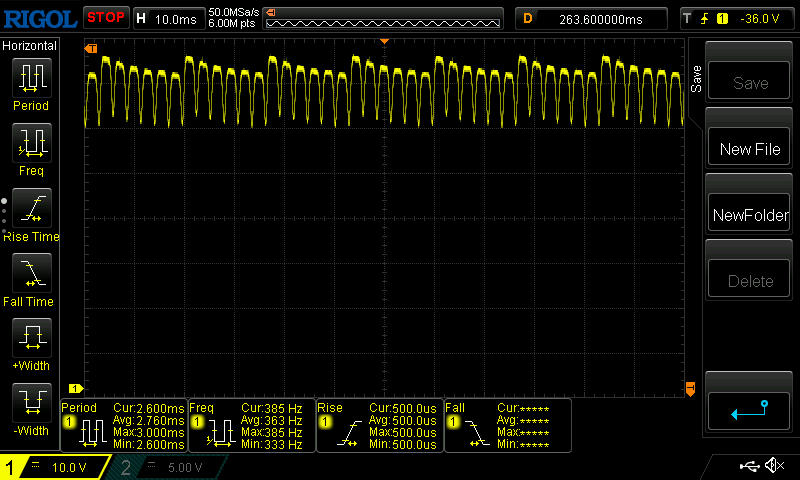 | |
La retroiluminación del display parpadea a 300 Hz (seguramente usa PWM - Pulse-Width Modulation) . La frecuencia de 300 Hz es relativamente alta, por lo que la mayoría de gente no debería ver parpadeo o tener fatiga visual. Sin embargo, hay informes de que algunas personas pueden seguir viendo parpadeos a 500 Hz y superior, por lo que cuidado. Comparación: 52 % de todos los dispositivos testados no usaron PWM para atenuar el display. Si se usó, medimos una media de 7754 (mínimo: 5 - máxmo: 343500) Hz. | |||

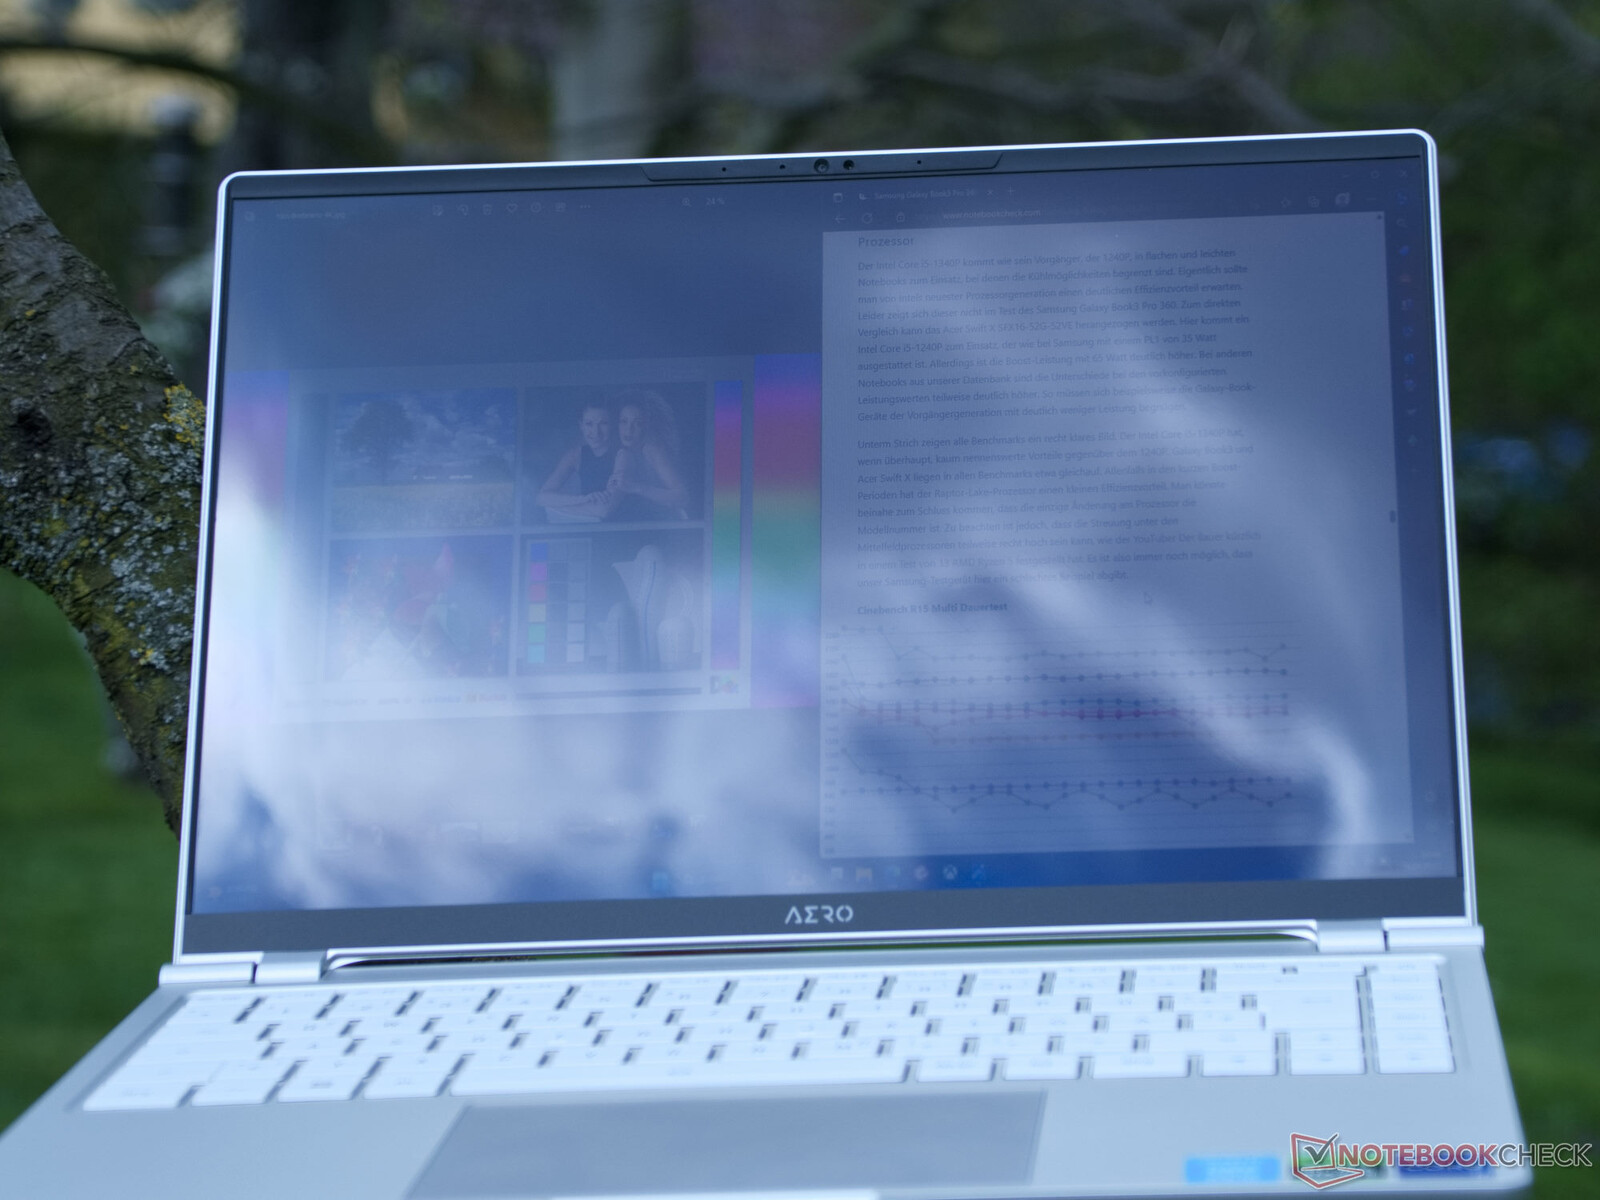
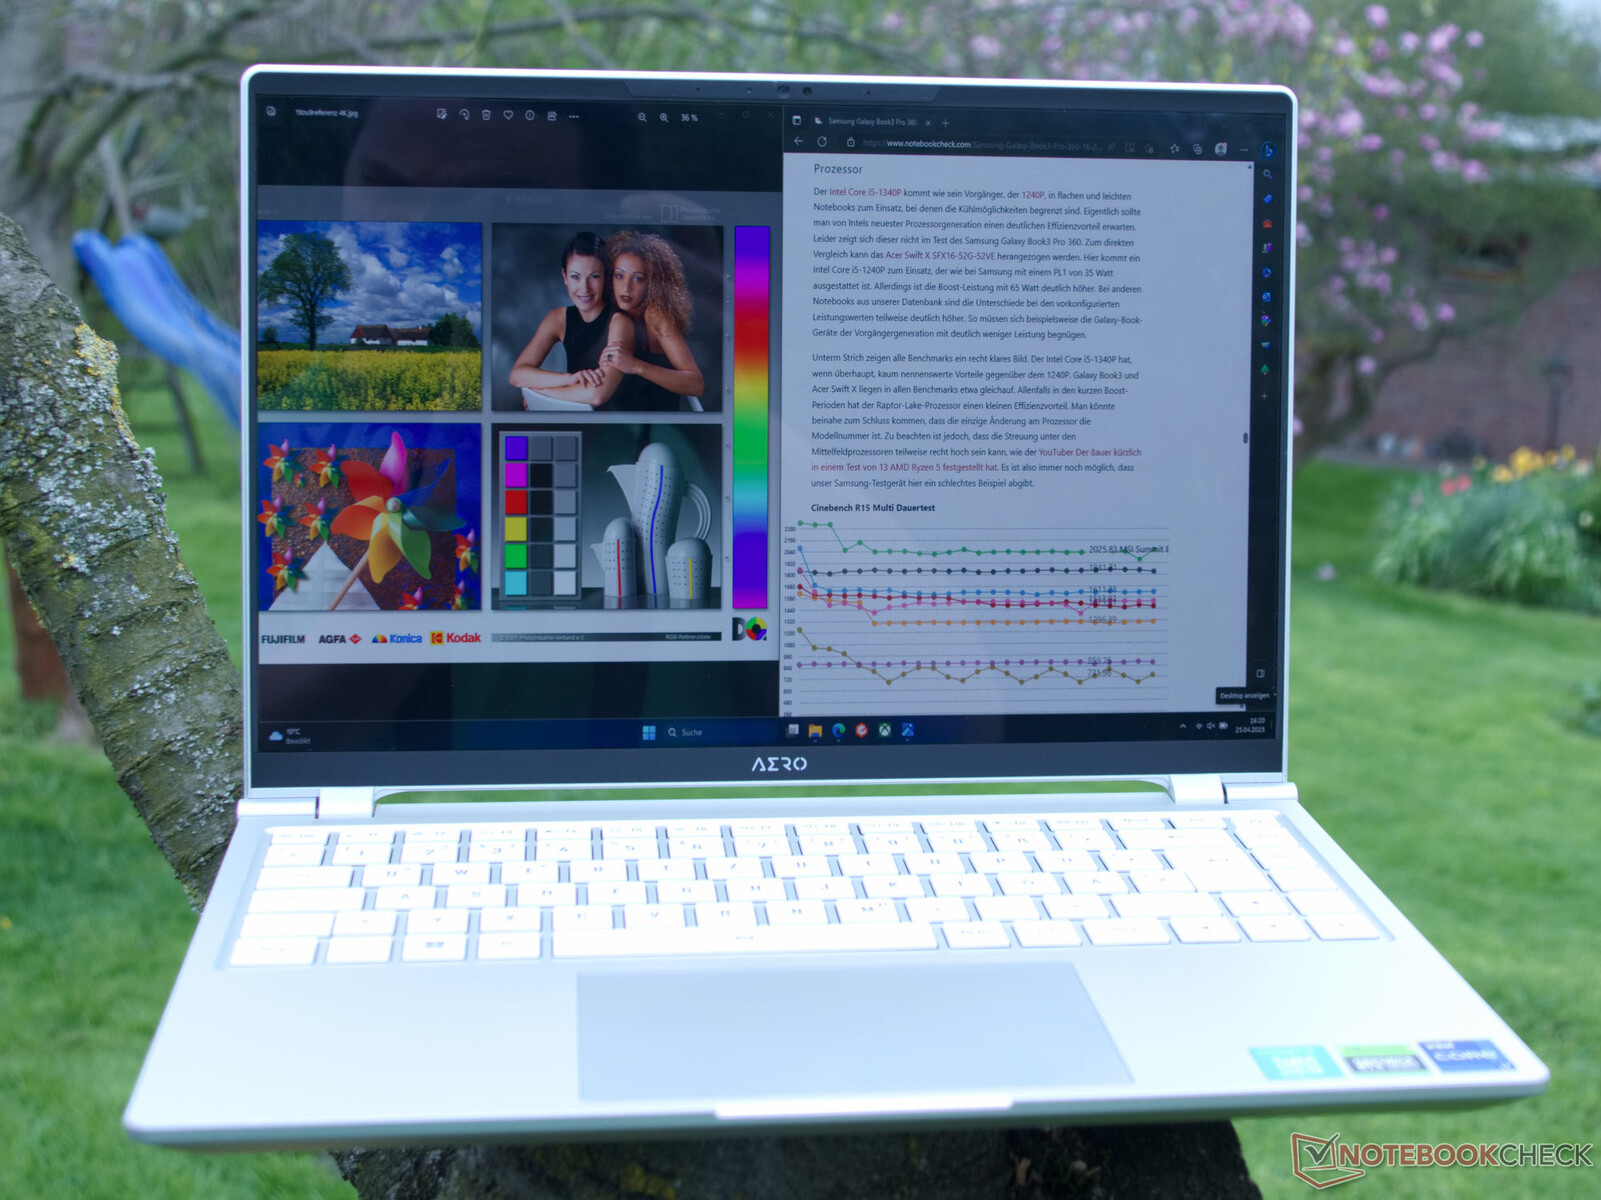
Con 430 cd/m², la pantalla debería ser realmente adecuada para su uso en exteriores. Sin embargo, esto cambia en un perfil de color preestablecido siempre que se quiera una reproducción exacta del color. 162 cd/m² es apenas suficiente para eclipsar interiores bien iluminados y sus reflejos en la pantalla brillante. Incluso a 430 cd/m², los reflejos pueden perjudicar gravemente la legibilidad en presencia de luz solar.
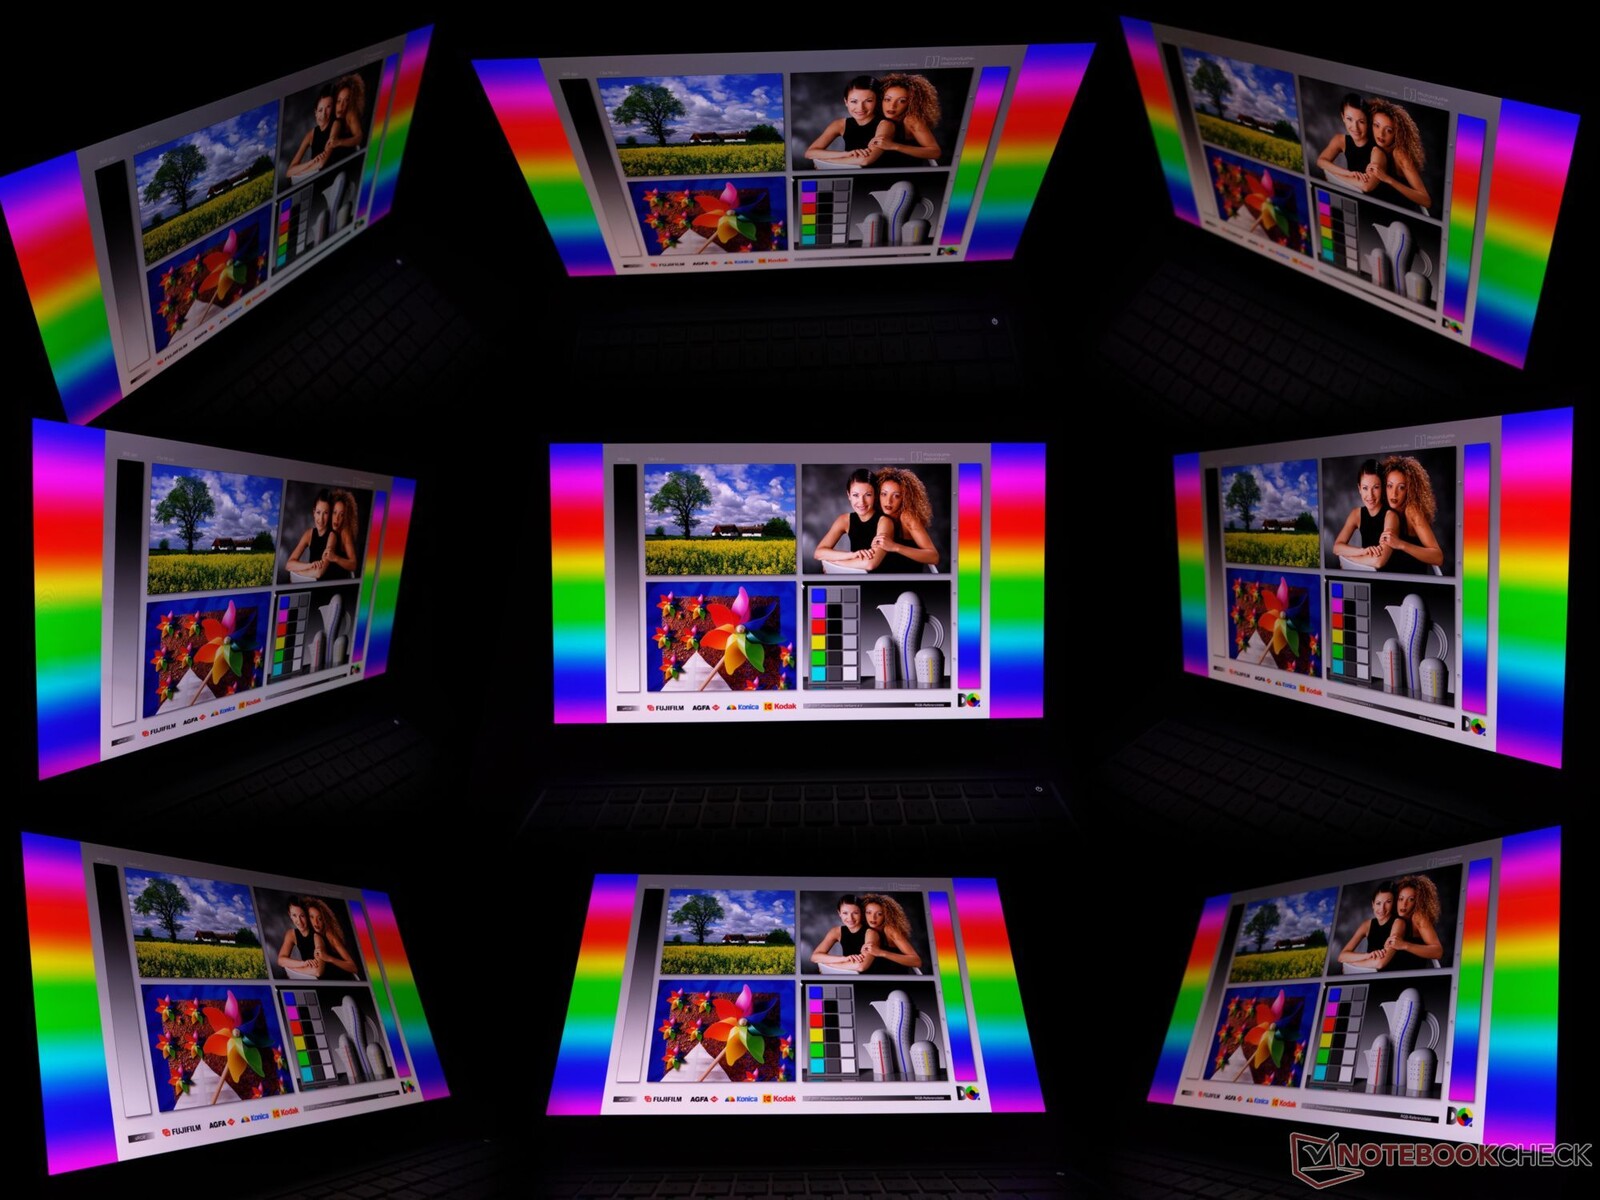
Como es habitual en las pantallas OLED, apenas hay desviaciones de color y contraste al cambiar el ángulo de visión. Visto desde todas las posiciones, el Aero 14 OLED ofrece una buena imagen.
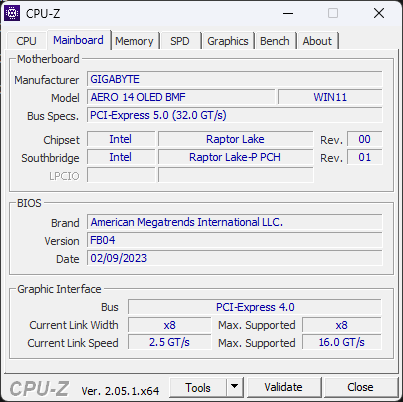
Rendimiento - Intel Core i7-13700H sin mejoras respecto al predecesor
El Aero 14 OLED está disponible en dos configuraciones, ambas con unaGeForce RTX 4050y 16 GB LPDDR5. Nuestro dispositivo de pruebas (BMF) usa el Intel Core i7-13700Hmientras que la otra variante de configuración (9MF) usa el i5-12500Hen el resto de características, el Aero 14 OLED BMF y el 9MF son casi idénticos.
Esto significa que ambos están bien equipados para los requisitos de un portátil de estudio. Puedes hacer renderizado 3D, edición de vídeo y fotos. Muchos juegos también deberían funcionar sin problemas en los dispositivos. Sin embargo, los títulos actuales suelen exigir más a la memoria gráfica. por tanto, 6 GB en el GeForce 4050 es bastante justo.
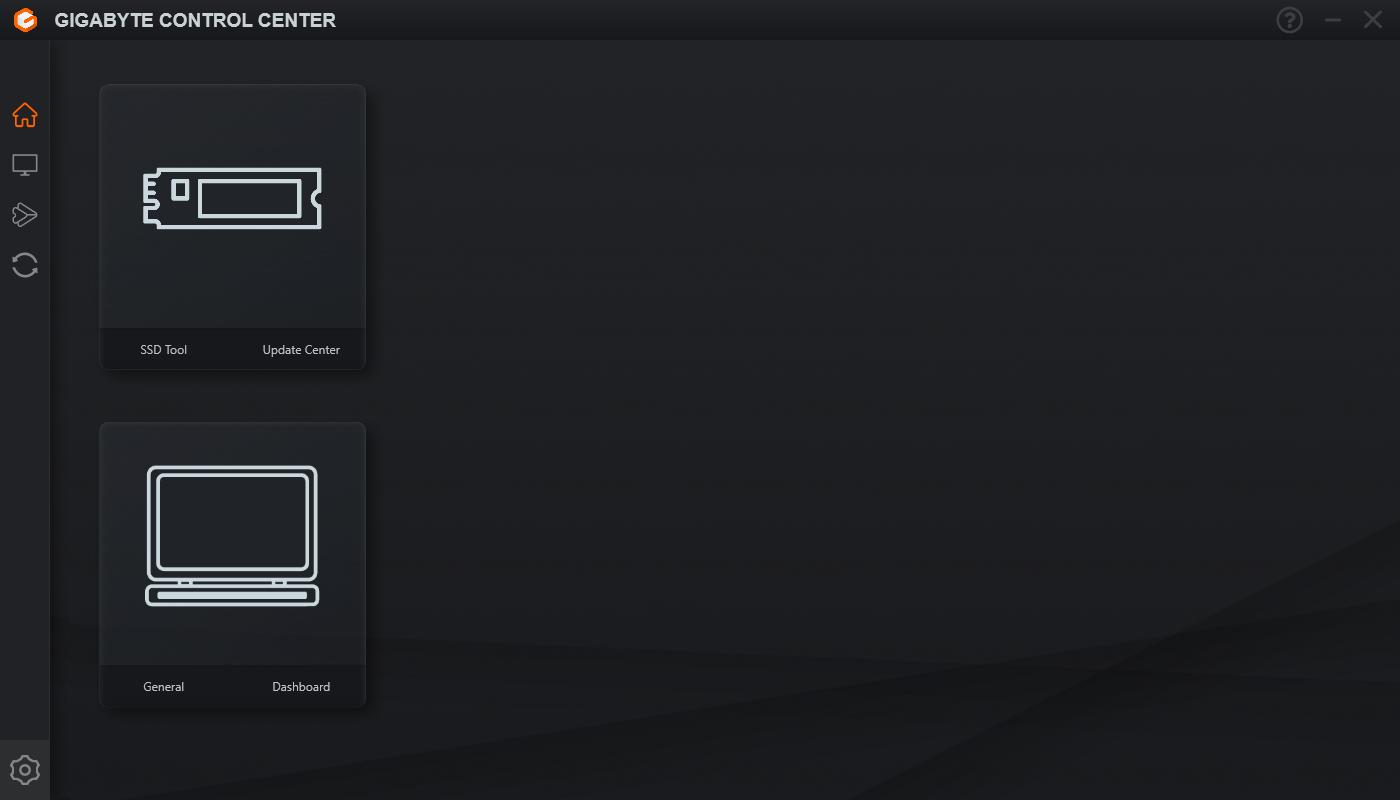
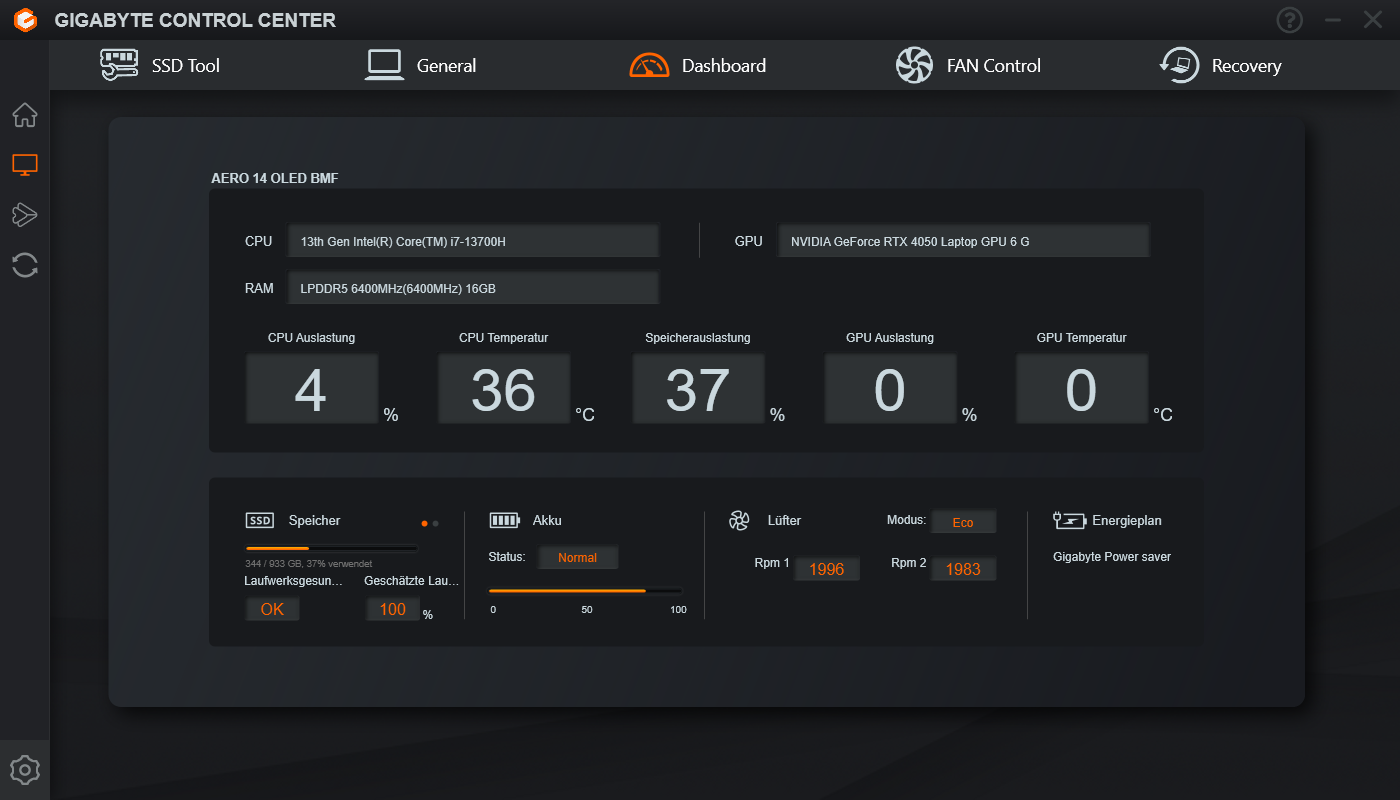
Gigabyte Control Center - ha perdido el control
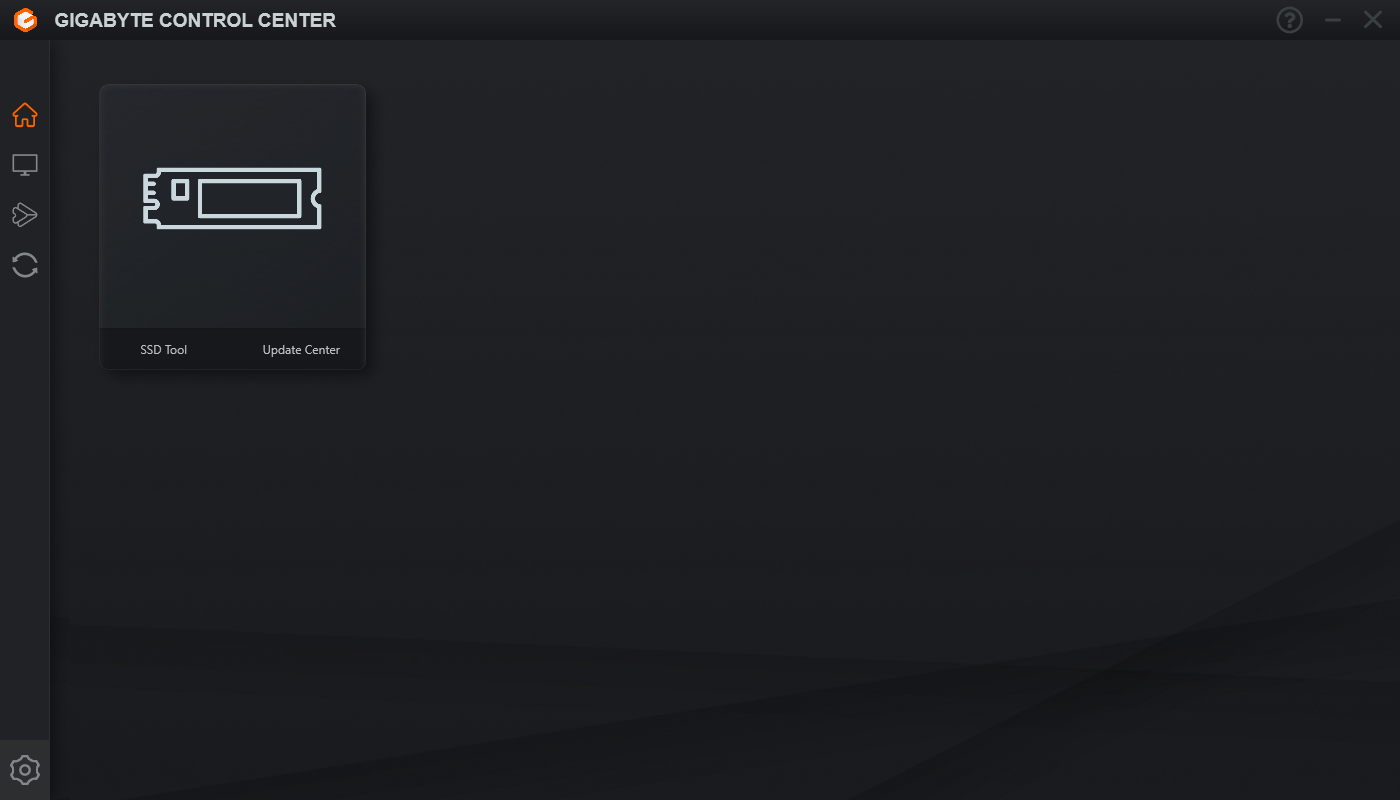
El Gigabyte Control Center causó problemas considerables, pantallas azules y mucha frustración en nuestras pruebas. En realidad, la aplicación puede usarse para ajustar un gran número de parámetros del portátil con unos pocos clics. El primer punto de crítica aparece al iniciar la aplicación: se activa el control de cuentas de usuario de Windows. Aparece la consabida pregunta: "¿Desea permitir que esta aplicación realice cambios en su dispositivo?"
Después, acabas en la absurda pantalla de inicio de la aplicación. Aquí tienes que hacer clic más para llegar a la configuración extendida.
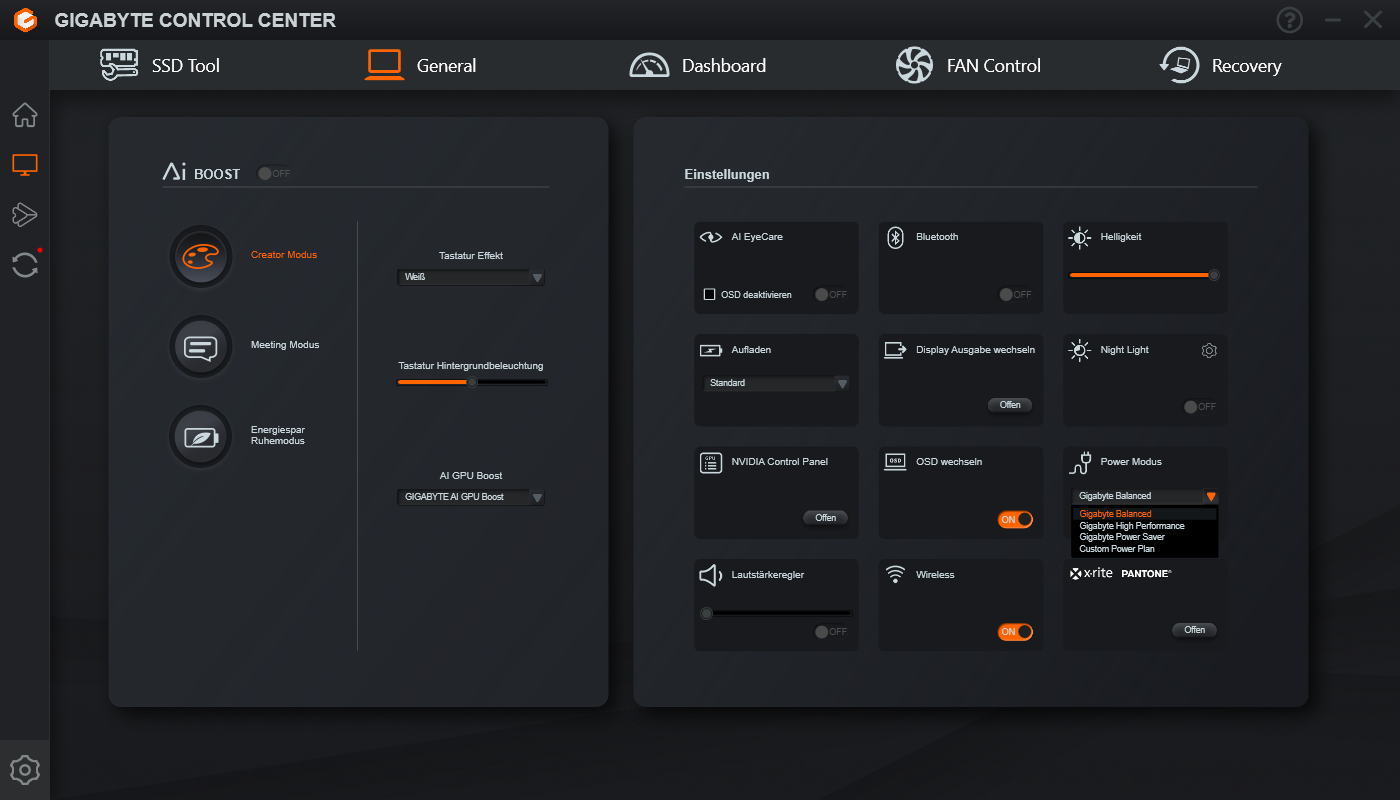
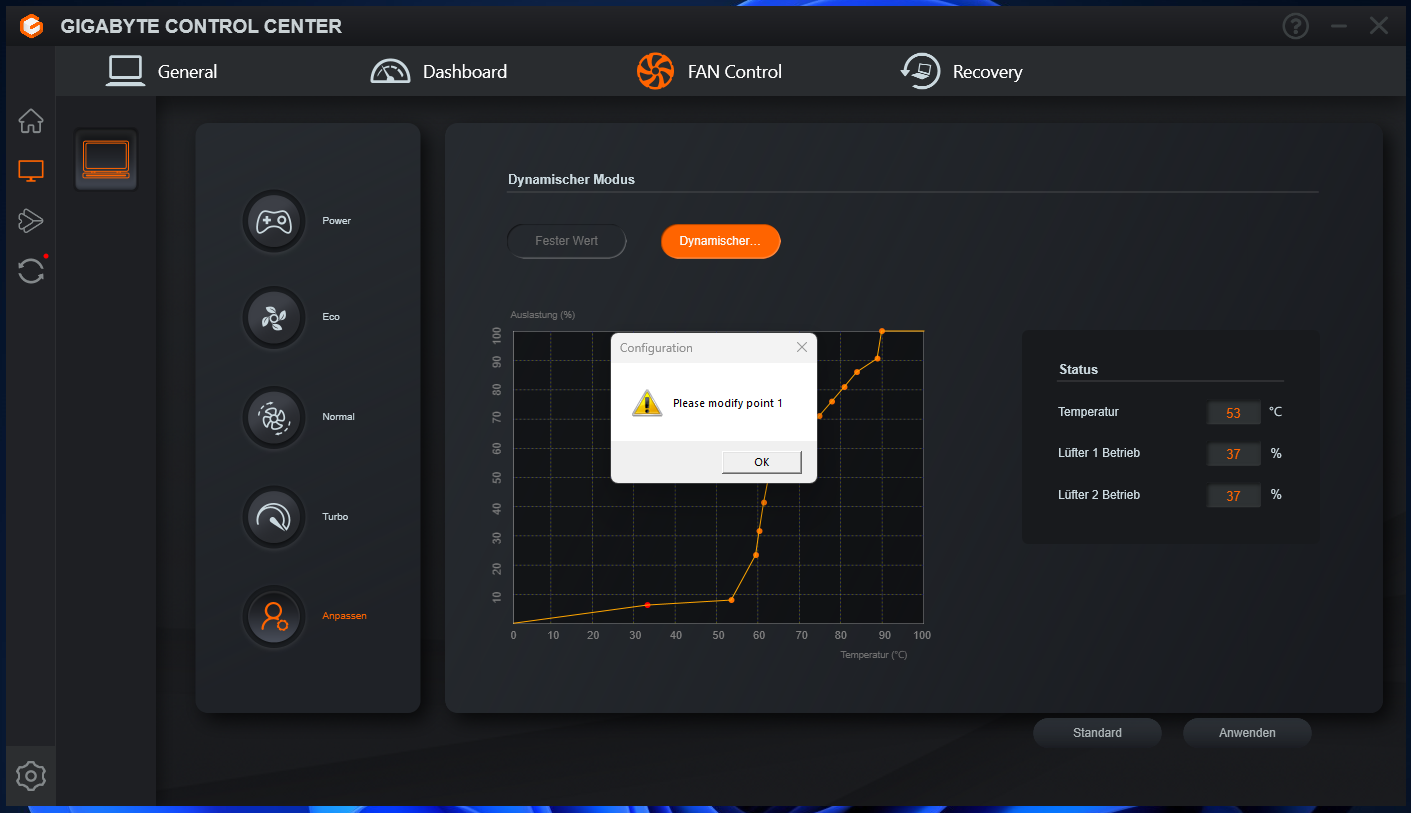
Las numerosas opciones de configuración de la pestaña "General" no se explican con detalle en ninguna parte. Aquí también se puede acceder a los cuatro perfiles de rendimiento diferentes para Aero 14. Sin embargo, hemos notado en nuestras pruebas que el portátil a veces cambia de un perfil de rendimiento a otro de forma errática
El mayor problema con la aplicación son las pantallas azules aleatorias mientras la aplicación está abierta. Al principio, no teníamos ni idea de la causa, pero después de algún tiempo, determinamos que esto estaba relacionado con la aplicación Gigabyte Control. Sólo cuando ésta no estaba minimizada, el portátil se bloqueaba en varios escenarios.
Después de una de estas caídas, la aplicación se negó a reconocer que se estaba ejecutando en un portátil Gigabyte. Había perdido casi todas las funciones. Esto significaba que los ventiladores del portátil funcionaban constantemente a toda velocidad. Una simple actualización o reinicio de la aplicación no supuso ninguna mejora. Sólo después de desinstalar el Gigabyte Control Center con todos sus componentes, limpiar el registro con CCleaner, y volver a instalar la última versión del Centro de Control de Gigabytedespués de descargar varias actualizaciones para nuestro dispositivo de prueba. A continuación, corrió mucho más estable que antes.
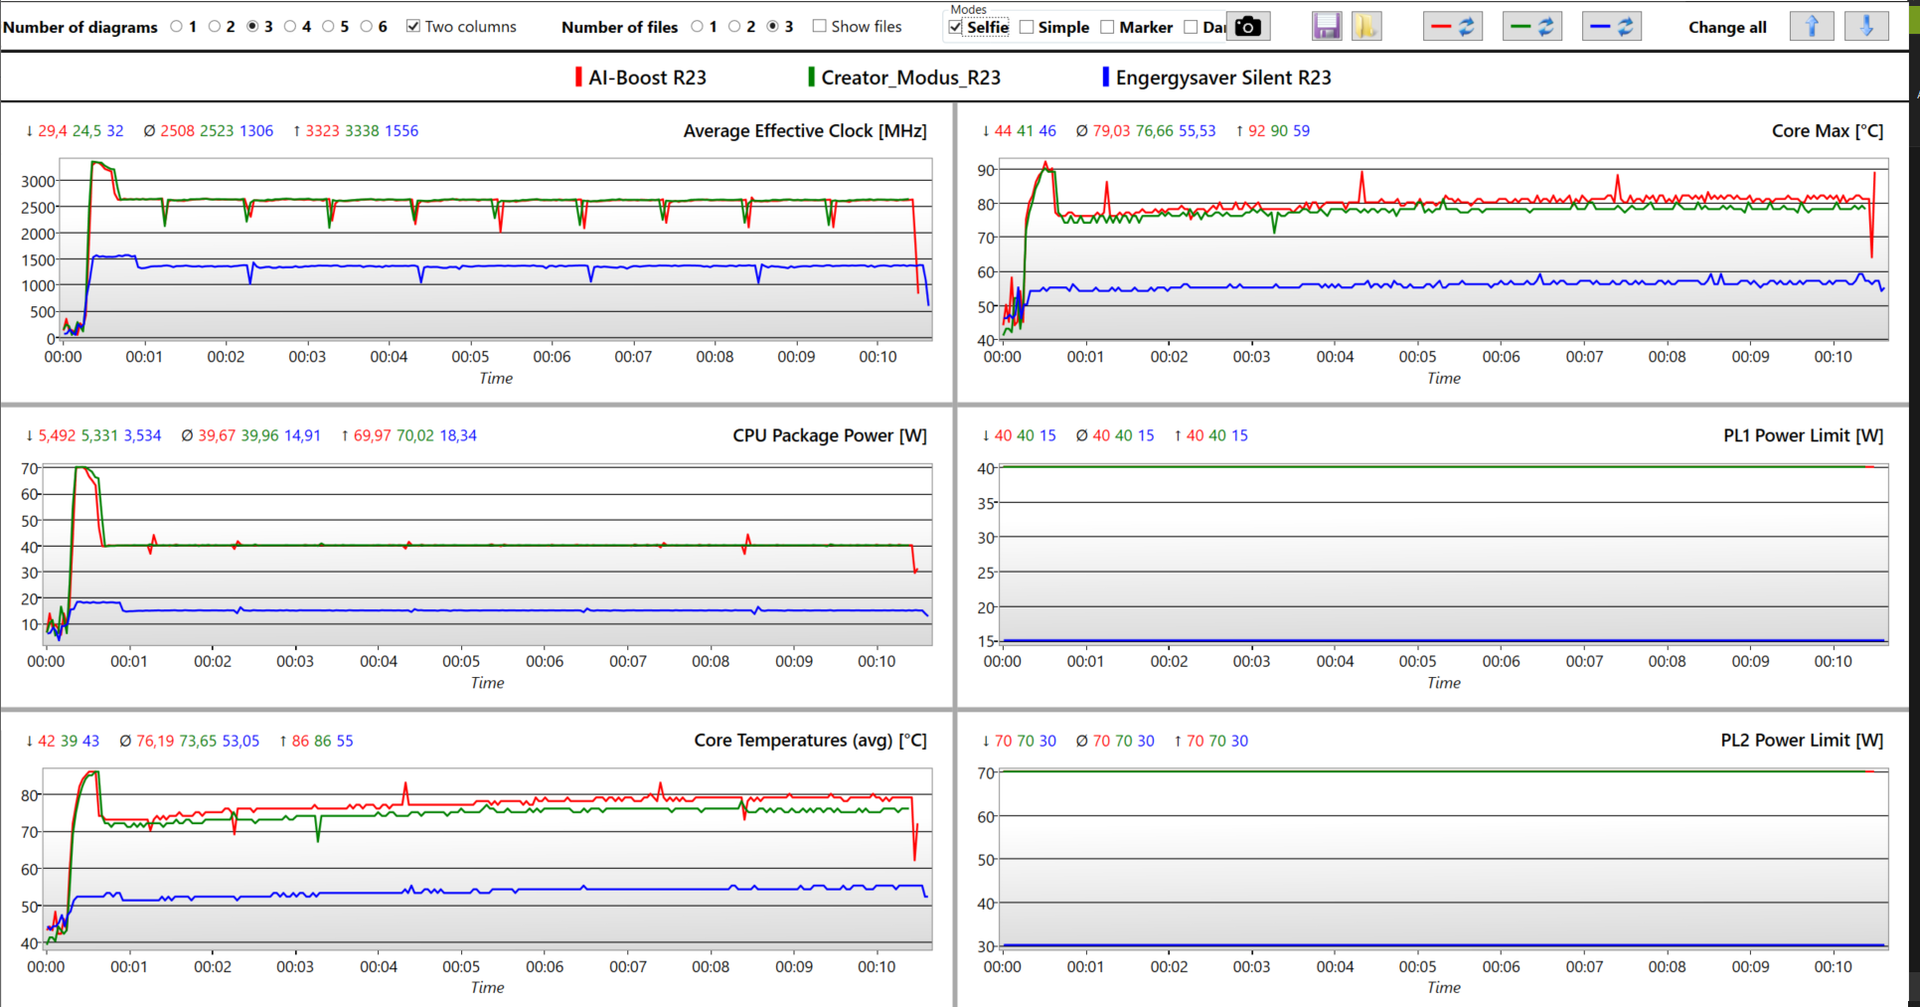
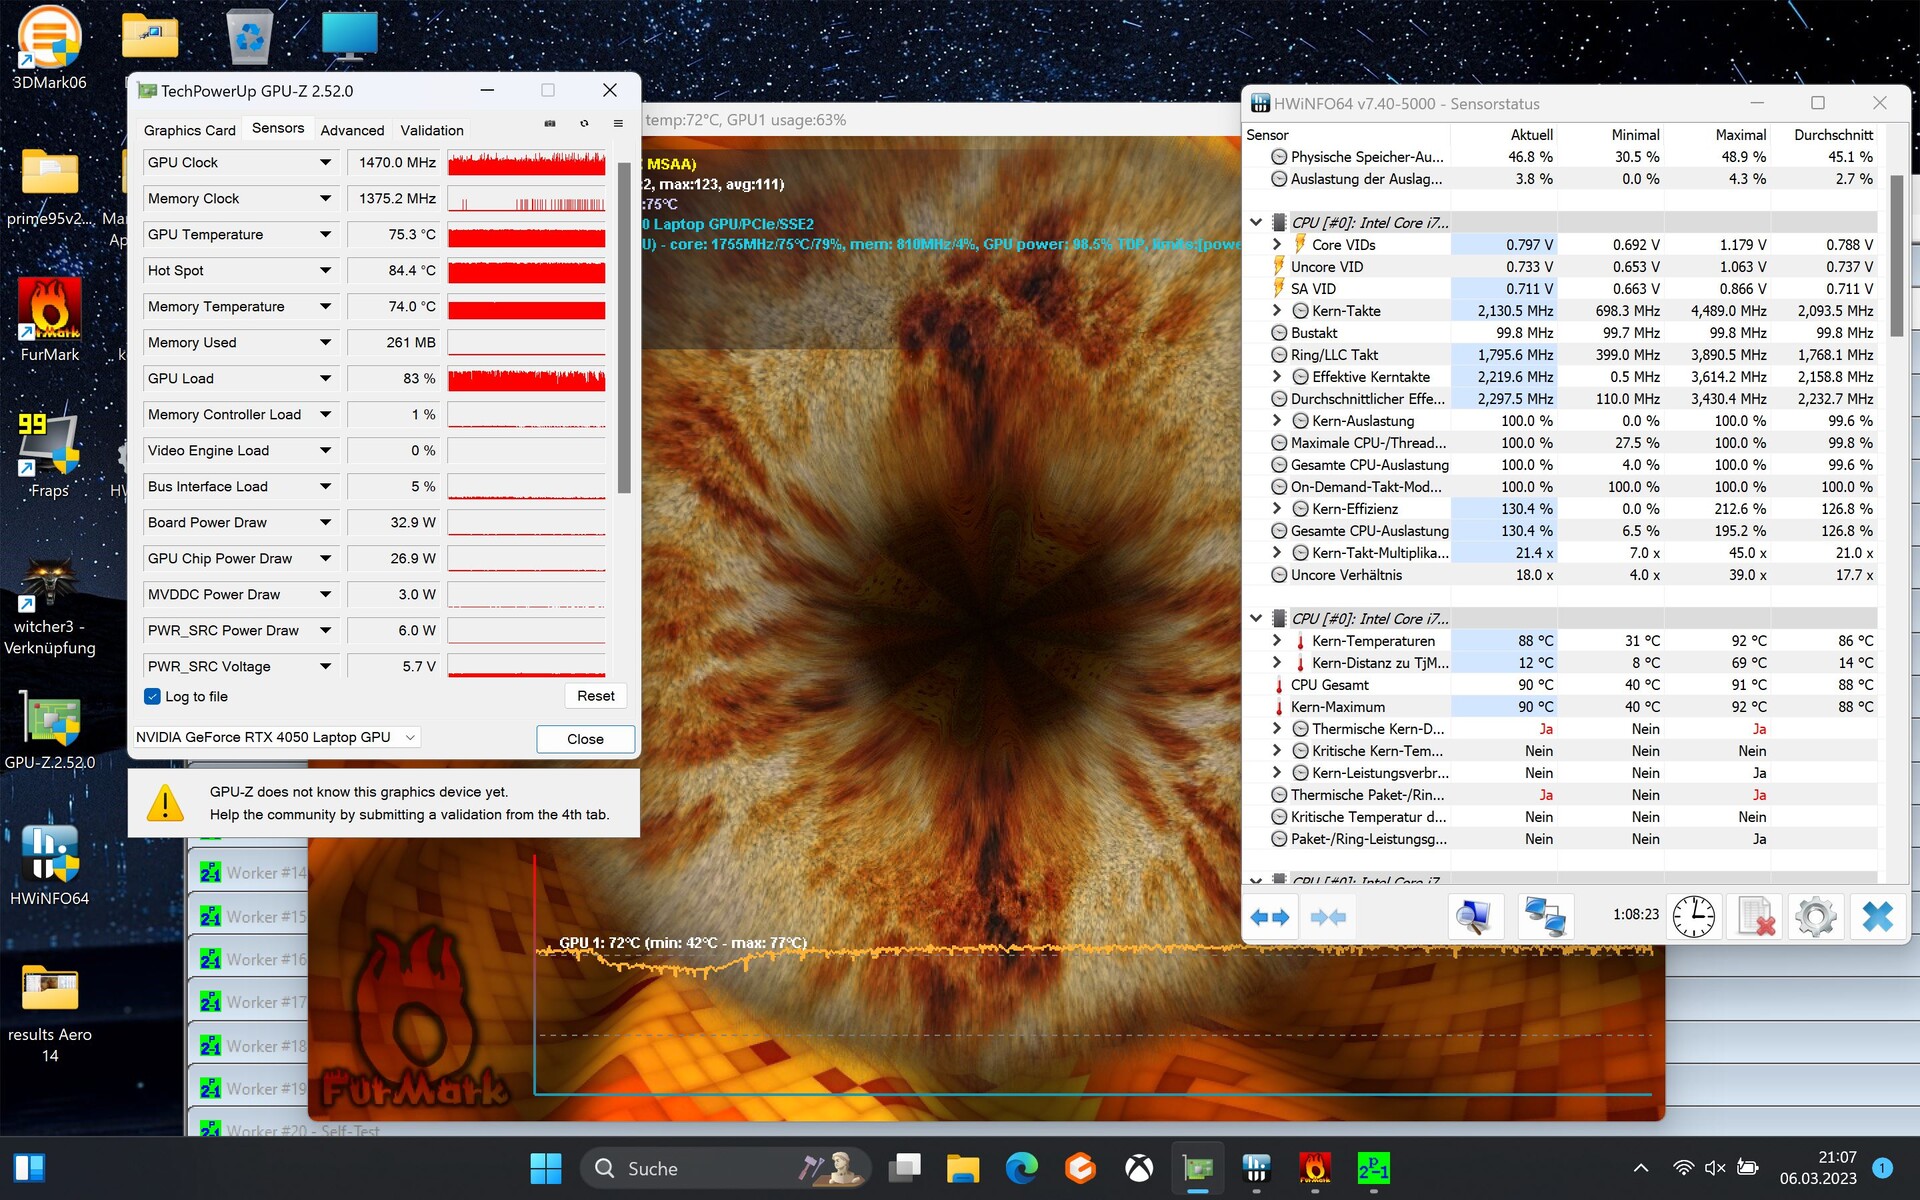
Condiciones de ensayo
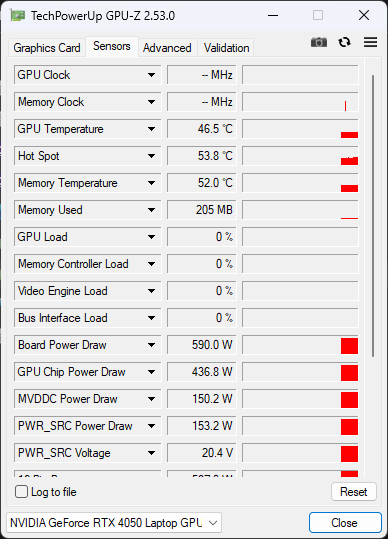
El Gigabyte Control Center tiene cuatro perfiles de rendimiento. Ejecutamos todas las pruebas en modo AI Boost con la curva de ventilador "Normal" activada. El procesador se alimenta entonces con 40 vatios, la Nvidia GeForce RTX 4050 con 35 vatios. Todos los registros grabados muestran que no se produce un trasvase de energía entre la GPU y la CPU. En todos los modos de rendimiento vemos que la potencia máxima de la GPU es de 35 vatios. En los modos AI y Creator, el rendimiento del Intel Core i7 se limita a 70 vatios en PL2 y 40 vatios en PL1. En el modo Reunión y en el modo Energysaver-Silent, PL1 está limitado a 15 vatios y PL2 a 30 vatios.

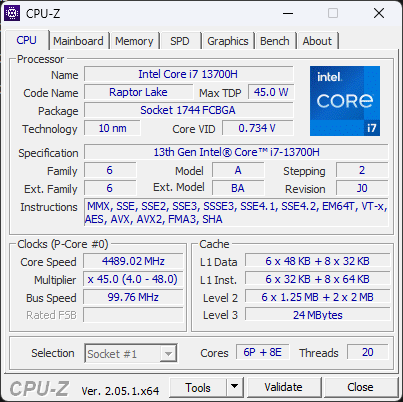
Procesador
Gigabyte instala una CPU Core i7 de gama alta de la actual serie Raptor Lake de Intel. Eli7-13700Hes muy potente para un portátil tan pequeño y suele instalarse en portátiles gaming. Con seis núcleos de rendimiento y ocho de eficiencia, el procesador tiene 20 hilos. Una vez más, la diferencia apenas perceptible con el predecesor se nota en los procesadores Raptor Lake. Aquí el i7-12700H en el Schenker Vision 14es una buena comparación. Allí, el procesador de 12ª generación también consume 40 vatios. Ambos procesadores sólo difieren ligeramente en las pruebas genéricas de procesador.
Si quieres ahorrar algo de dinero, deberías echar un vistazo a los benchmarks delAcer Swift 3 SF314-71-56U3 y el Honor MagicBook 14las CPU i5-12500H de ambos portátiles también están disponibles en el Aero 14 OLED 9MF, más barato. Aunque la diferencia de rendimiento es visible en los benchmarks, es del orden del 10 al 15% y, por tanto, bastante insignificante para la mayoría de las aplicaciones. Especialmente porque el Aero tiene una GPU dedicada, las desventajas del i5 quedan claramente mitigadas.
Cinebench R15 Multi Sustained Load
Cinebench R23: Multi Core | Single Core
Cinebench R20: CPU (Multi Core) | CPU (Single Core)
Cinebench R15: CPU Multi 64Bit | CPU Single 64Bit
Blender: v2.79 BMW27 CPU
7-Zip 18.03: 7z b 4 | 7z b 4 -mmt1
Geekbench 5.5: Multi-Core | Single-Core
HWBOT x265 Benchmark v2.2: 4k Preset
LibreOffice : 20 Documents To PDF
R Benchmark 2.5: Overall mean
| CPU Performance rating | |
| Lenovo Yoga Pro 7 14IRH G8 | |
| Acer Predator Triton 300 SE | |
| Media de la clase Multimedia | |
| MSI Stealth 14 Studio A13V | |
| Gigabyte Aero 14 OLED BMF | |
| Medio Intel Core i7-13700H | |
| Schenker Vision 14 2022 RTX 3050 Ti | |
| Honor MagicBook 14 2022 | |
| Acer Swift 3 SF314-71-56U3 | |
| Asus Zephyrus G14 GA401QM -2! | |
| Acer Swift X SFX14-51G-5876 | |
| Cinebench R23 / Multi Core | |
| Lenovo Yoga Pro 7 14IRH G8 | |
| MSI Stealth 14 Studio A13V | |
| Media de la clase Multimedia (4861 - 33362, n=74, últimos 2 años) | |
| Acer Predator Triton 300 SE | |
| Medio Intel Core i7-13700H (5890 - 20034, n=29) | |
| Schenker Vision 14 2022 RTX 3050 Ti | |
| Gigabyte Aero 14 OLED BMF | |
| Asus Zephyrus G14 GA401QM | |
| Honor MagicBook 14 2022 | |
| Acer Swift 3 SF314-71-56U3 | |
| Acer Swift X SFX14-51G-5876 | |
| Cinebench R23 / Single Core | |
| Media de la clase Multimedia (1128 - 2459, n=66, últimos 2 años) | |
| Acer Predator Triton 300 SE | |
| Lenovo Yoga Pro 7 14IRH G8 | |
| Gigabyte Aero 14 OLED BMF | |
| Medio Intel Core i7-13700H (1323 - 1914, n=29) | |
| Honor MagicBook 14 2022 | |
| Schenker Vision 14 2022 RTX 3050 Ti | |
| Acer Swift 3 SF314-71-56U3 | |
| MSI Stealth 14 Studio A13V | |
| Acer Swift X SFX14-51G-5876 | |
| Asus Zephyrus G14 GA401QM | |
| Cinebench R20 / CPU (Multi Core) | |
| MSI Stealth 14 Studio A13V | |
| Lenovo Yoga Pro 7 14IRH G8 | |
| Media de la clase Multimedia (1887 - 12912, n=57, últimos 2 años) | |
| Acer Predator Triton 300 SE | |
| Medio Intel Core i7-13700H (2322 - 7674, n=29) | |
| Schenker Vision 14 2022 RTX 3050 Ti | |
| Gigabyte Aero 14 OLED BMF | |
| Asus Zephyrus G14 GA401QM | |
| Honor MagicBook 14 2022 | |
| Acer Swift 3 SF314-71-56U3 | |
| Acer Swift X SFX14-51G-5876 | |
| Cinebench R20 / CPU (Single Core) | |
| Acer Predator Triton 300 SE | |
| Lenovo Yoga Pro 7 14IRH G8 | |
| Media de la clase Multimedia (425 - 853, n=57, últimos 2 años) | |
| Gigabyte Aero 14 OLED BMF | |
| Schenker Vision 14 2022 RTX 3050 Ti | |
| Medio Intel Core i7-13700H (508 - 741, n=29) | |
| Acer Swift 3 SF314-71-56U3 | |
| Honor MagicBook 14 2022 | |
| MSI Stealth 14 Studio A13V | |
| Acer Swift X SFX14-51G-5876 | |
| Asus Zephyrus G14 GA401QM | |
| Cinebench R15 / CPU Multi 64Bit | |
| MSI Stealth 14 Studio A13V | |
| Media de la clase Multimedia (856 - 5224, n=61, últimos 2 años) | |
| Lenovo Yoga Pro 7 14IRH G8 | |
| Gigabyte Aero 14 OLED BMF | |
| Medio Intel Core i7-13700H (905 - 2982, n=29) | |
| Acer Predator Triton 300 SE | |
| Schenker Vision 14 2022 RTX 3050 Ti | |
| Asus Zephyrus G14 GA401QM | |
| Honor MagicBook 14 2022 | |
| Honor MagicBook 14 2022 | |
| Acer Swift 3 SF314-71-56U3 | |
| Acer Swift X SFX14-51G-5876 | |
| Cinebench R15 / CPU Single 64Bit | |
| Media de la clase Multimedia (184.8 - 326, n=59, últimos 2 años) | |
| Lenovo Yoga Pro 7 14IRH G8 | |
| Acer Predator Triton 300 SE | |
| Gigabyte Aero 14 OLED BMF | |
| Schenker Vision 14 2022 RTX 3050 Ti | |
| Medio Intel Core i7-13700H (213 - 278, n=29) | |
| MSI Stealth 14 Studio A13V | |
| Honor MagicBook 14 2022 | |
| Acer Swift 3 SF314-71-56U3 | |
| Asus Zephyrus G14 GA401QM | |
| Acer Swift X SFX14-51G-5876 | |
| Blender / v2.79 BMW27 CPU | |
| Acer Swift X SFX14-51G-5876 | |
| Acer Swift 3 SF314-71-56U3 | |
| Honor MagicBook 14 2022 | |
| Schenker Vision 14 2022 RTX 3050 Ti | |
| Media de la clase Multimedia (100 - 557, n=58, últimos 2 años) | |
| Asus Zephyrus G14 GA401QM | |
| Gigabyte Aero 14 OLED BMF | |
| Medio Intel Core i7-13700H (169 - 555, n=29) | |
| Acer Predator Triton 300 SE | |
| Lenovo Yoga Pro 7 14IRH G8 | |
| MSI Stealth 14 Studio A13V | |
| 7-Zip 18.03 / 7z b 4 | |
| MSI Stealth 14 Studio A13V | |
| Lenovo Yoga Pro 7 14IRH G8 | |
| Acer Predator Triton 300 SE | |
| Medio Intel Core i7-13700H (27322 - 76344, n=29) | |
| Gigabyte Aero 14 OLED BMF | |
| Media de la clase Multimedia (26062 - 130368, n=55, últimos 2 años) | |
| Asus Zephyrus G14 GA401QM | |
| Honor MagicBook 14 2022 | |
| Schenker Vision 14 2022 RTX 3050 Ti | |
| Acer Swift 3 SF314-71-56U3 | |
| Acer Swift X SFX14-51G-5876 | |
| 7-Zip 18.03 / 7z b 4 -mmt1 | |
| Gigabyte Aero 14 OLED BMF | |
| Lenovo Yoga Pro 7 14IRH G8 | |
| Media de la clase Multimedia (3666 - 7545, n=56, últimos 2 años) | |
| Medio Intel Core i7-13700H (4825 - 6238, n=29) | |
| Schenker Vision 14 2022 RTX 3050 Ti | |
| Asus Zephyrus G14 GA401QM | |
| Acer Predator Triton 300 SE | |
| Acer Swift 3 SF314-71-56U3 | |
| MSI Stealth 14 Studio A13V | |
| Honor MagicBook 14 2022 | |
| Acer Swift X SFX14-51G-5876 | |
| Geekbench 5.5 / Multi-Core | |
| Lenovo Yoga Pro 7 14IRH G8 | |
| Media de la clase Multimedia (4652 - 20422, n=56, últimos 2 años) | |
| MSI Stealth 14 Studio A13V | |
| Acer Predator Triton 300 SE | |
| Medio Intel Core i7-13700H (6165 - 14215, n=29) | |
| Schenker Vision 14 2022 RTX 3050 Ti | |
| Gigabyte Aero 14 OLED BMF | |
| Honor MagicBook 14 2022 | |
| Acer Swift 3 SF314-71-56U3 | |
| Acer Swift X SFX14-51G-5876 | |
| Geekbench 5.5 / Single-Core | |
| Media de la clase Multimedia (805 - 2974, n=56, últimos 2 años) | |
| Lenovo Yoga Pro 7 14IRH G8 | |
| Gigabyte Aero 14 OLED BMF | |
| Acer Predator Triton 300 SE | |
| Medio Intel Core i7-13700H (1362 - 1919, n=29) | |
| Schenker Vision 14 2022 RTX 3050 Ti | |
| MSI Stealth 14 Studio A13V | |
| Acer Swift 3 SF314-71-56U3 | |
| Honor MagicBook 14 2022 | |
| Acer Swift X SFX14-51G-5876 | |
| HWBOT x265 Benchmark v2.2 / 4k Preset | |
| Lenovo Yoga Pro 7 14IRH G8 | |
| Acer Predator Triton 300 SE | |
| Media de la clase Multimedia (5.26 - 36.1, n=56, últimos 2 años) | |
| MSI Stealth 14 Studio A13V | |
| Medio Intel Core i7-13700H (6.72 - 21.2, n=29) | |
| Gigabyte Aero 14 OLED BMF | |
| Asus Zephyrus G14 GA401QM | |
| Honor MagicBook 14 2022 | |
| Schenker Vision 14 2022 RTX 3050 Ti | |
| Acer Swift 3 SF314-71-56U3 | |
| Acer Swift X SFX14-51G-5876 | |
| LibreOffice / 20 Documents To PDF | |
| Acer Swift X SFX14-51G-5876 | |
| MSI Stealth 14 Studio A13V | |
| Asus Zephyrus G14 GA401QM | |
| Media de la clase Multimedia (23.9 - 146.7, n=57, últimos 2 años) | |
| Medio Intel Core i7-13700H (31.3 - 62.4, n=29) | |
| Lenovo Yoga Pro 7 14IRH G8 | |
| Schenker Vision 14 2022 RTX 3050 Ti | |
| Honor MagicBook 14 2022 | |
| Acer Predator Triton 300 SE | |
| Gigabyte Aero 14 OLED BMF | |
| Acer Swift 3 SF314-71-56U3 | |
| R Benchmark 2.5 / Overall mean | |
| Acer Swift X SFX14-51G-5876 | |
| Acer Swift 3 SF314-71-56U3 | |
| Asus Zephyrus G14 GA401QM | |
| MSI Stealth 14 Studio A13V | |
| Honor MagicBook 14 2022 | |
| Medio Intel Core i7-13700H (0.4308 - 0.607, n=29) | |
| Media de la clase Multimedia (0.3604 - 0.947, n=56, últimos 2 años) | |
| Schenker Vision 14 2022 RTX 3050 Ti | |
| Gigabyte Aero 14 OLED BMF | |
| Lenovo Yoga Pro 7 14IRH G8 | |
| Acer Predator Triton 300 SE | |
* ... más pequeño es mejor
AIDA64: FP32 Ray-Trace | FPU Julia | CPU SHA3 | CPU Queen | FPU SinJulia | FPU Mandel | CPU AES | CPU ZLib | FP64 Ray-Trace | CPU PhotoWorxx
| Performance rating | |
| Acer Predator Triton 300 SE | |
| MSI Stealth 14 Studio A13V | |
| Asus Zephyrus G14 GA401QM | |
| Media de la clase Multimedia | |
| Lenovo Yoga Pro 7 14IRH G8 | |
| Gigabyte Aero 14 OLED BMF | |
| Medio Intel Core i7-13700H | |
| Schenker Vision 14 2022 RTX 3050 Ti | |
| Acer Swift X SFX14-51G-5876 | |
| AIDA64 / FP32 Ray-Trace | |
| Media de la clase Multimedia (2214 - 50388, n=53, últimos 2 años) | |
| MSI Stealth 14 Studio A13V | |
| Asus Zephyrus G14 GA401QM | |
| Acer Predator Triton 300 SE | |
| Lenovo Yoga Pro 7 14IRH G8 | |
| Medio Intel Core i7-13700H (4986 - 18908, n=29) | |
| Gigabyte Aero 14 OLED BMF | |
| Schenker Vision 14 2022 RTX 3050 Ti | |
| Acer Swift X SFX14-51G-5876 | |
| AIDA64 / FPU Julia | |
| Asus Zephyrus G14 GA401QM | |
| MSI Stealth 14 Studio A13V | |
| Media de la clase Multimedia (12867 - 201874, n=54, últimos 2 años) | |
| Acer Predator Triton 300 SE | |
| Lenovo Yoga Pro 7 14IRH G8 | |
| Medio Intel Core i7-13700H (25360 - 92359, n=29) | |
| Gigabyte Aero 14 OLED BMF | |
| Schenker Vision 14 2022 RTX 3050 Ti | |
| Acer Swift X SFX14-51G-5876 | |
| AIDA64 / CPU SHA3 | |
| Media de la clase Multimedia (626 - 8623, n=54, últimos 2 años) | |
| MSI Stealth 14 Studio A13V | |
| Acer Predator Triton 300 SE | |
| Lenovo Yoga Pro 7 14IRH G8 | |
| Asus Zephyrus G14 GA401QM | |
| Medio Intel Core i7-13700H (1339 - 4224, n=29) | |
| Gigabyte Aero 14 OLED BMF | |
| Schenker Vision 14 2022 RTX 3050 Ti | |
| Acer Swift X SFX14-51G-5876 | |
| AIDA64 / CPU Queen | |
| Acer Predator Triton 300 SE | |
| Gigabyte Aero 14 OLED BMF | |
| Lenovo Yoga Pro 7 14IRH G8 | |
| MSI Stealth 14 Studio A13V | |
| Asus Zephyrus G14 GA401QM | |
| Medio Intel Core i7-13700H (59324 - 107159, n=29) | |
| Schenker Vision 14 2022 RTX 3050 Ti | |
| Acer Swift X SFX14-51G-5876 | |
| Media de la clase Multimedia (13483 - 181505, n=41, últimos 2 años) | |
| AIDA64 / FPU SinJulia | |
| Asus Zephyrus G14 GA401QM | |
| MSI Stealth 14 Studio A13V | |
| Lenovo Yoga Pro 7 14IRH G8 | |
| Acer Predator Triton 300 SE | |
| Medio Intel Core i7-13700H (4800 - 11050, n=29) | |
| Media de la clase Multimedia (886 - 28794, n=54, últimos 2 años) | |
| Gigabyte Aero 14 OLED BMF | |
| Schenker Vision 14 2022 RTX 3050 Ti | |
| Acer Swift X SFX14-51G-5876 | |
| AIDA64 / FPU Mandel | |
| Asus Zephyrus G14 GA401QM | |
| Media de la clase Multimedia (6395 - 105740, n=53, últimos 2 años) | |
| MSI Stealth 14 Studio A13V | |
| Acer Predator Triton 300 SE | |
| Lenovo Yoga Pro 7 14IRH G8 | |
| Medio Intel Core i7-13700H (12321 - 45118, n=29) | |
| Gigabyte Aero 14 OLED BMF | |
| Schenker Vision 14 2022 RTX 3050 Ti | |
| Acer Swift X SFX14-51G-5876 | |
| AIDA64 / CPU AES | |
| Asus Zephyrus G14 GA401QM | |
| Acer Predator Triton 300 SE | |
| Gigabyte Aero 14 OLED BMF | |
| MSI Stealth 14 Studio A13V | |
| Medio Intel Core i7-13700H (28769 - 151254, n=29) | |
| Lenovo Yoga Pro 7 14IRH G8 | |
| Schenker Vision 14 2022 RTX 3050 Ti | |
| Media de la clase Multimedia (8171 - 126790, n=54, últimos 2 años) | |
| Acer Swift X SFX14-51G-5876 | |
| AIDA64 / CPU ZLib | |
| MSI Stealth 14 Studio A13V | |
| Lenovo Yoga Pro 7 14IRH G8 | |
| Acer Predator Triton 300 SE | |
| Media de la clase Multimedia (143.8 - 2022, n=54, últimos 2 años) | |
| Schenker Vision 14 2022 RTX 3050 Ti | |
| Medio Intel Core i7-13700H (389 - 1215, n=29) | |
| Asus Zephyrus G14 GA401QM | |
| Gigabyte Aero 14 OLED BMF | |
| Acer Swift X SFX14-51G-5876 | |
| AIDA64 / FP64 Ray-Trace | |
| Media de la clase Multimedia (1014 - 26875, n=54, últimos 2 años) | |
| MSI Stealth 14 Studio A13V | |
| Acer Predator Triton 300 SE | |
| Lenovo Yoga Pro 7 14IRH G8 | |
| Asus Zephyrus G14 GA401QM | |
| Medio Intel Core i7-13700H (2540 - 10135, n=29) | |
| Gigabyte Aero 14 OLED BMF | |
| Schenker Vision 14 2022 RTX 3050 Ti | |
| Acer Swift X SFX14-51G-5876 | |
| AIDA64 / CPU PhotoWorxx | |
| Gigabyte Aero 14 OLED BMF | |
| Media de la clase Multimedia (8187 - 88154, n=54, últimos 2 años) | |
| Acer Predator Triton 300 SE | |
| Lenovo Yoga Pro 7 14IRH G8 | |
| Medio Intel Core i7-13700H (12872 - 52727, n=29) | |
| Acer Swift X SFX14-51G-5876 | |
| MSI Stealth 14 Studio A13V | |
| Schenker Vision 14 2022 RTX 3050 Ti | |
| Asus Zephyrus G14 GA401QM | |
Rendimiento del sistema
El pequeño portátil rinde bien en las pruebas PCMark 10 y Crossmark. Sólo en la sección de Creación de Contenido Digital el portátil de estudio muestra alguna debilidad y queda ligeramente por debajo de la media con 9.627 puntos. Sin embargo, cualquier crítica en este sentido sería exagerada, por lo que el portátil de 14 pulgadas debería cumplir sin problemas su cometido. El Aero 14 OLED maneja con rapidez el renderizado 3D y de vídeo, así como la edición de imágenes y otras tareas.
CrossMark: Overall | Productivity | Creativity | Responsiveness
| PCMark 10 / Score | |
| Media de la clase Multimedia (4325 - 10386, n=52, últimos 2 años) | |
| Acer Predator Triton 300 SE | |
| Lenovo Yoga Pro 7 14IRH G8 | |
| Gigabyte Aero 14 OLED BMF | |
| Medio Intel Core i7-13700H, NVIDIA GeForce RTX 4050 Laptop GPU (6822 - 7556, n=7) | |
| MSI Stealth 14 Studio A13V | |
| Asus Zephyrus G14 GA401QM | |
| Schenker Vision 14 2022 RTX 3050 Ti | |
| Acer Swift X SFX14-51G-5876 | |
| PCMark 10 / Essentials | |
| Gigabyte Aero 14 OLED BMF | |
| Acer Predator Triton 300 SE | |
| Medio Intel Core i7-13700H, NVIDIA GeForce RTX 4050 Laptop GPU (10283 - 11549, n=7) | |
| Lenovo Yoga Pro 7 14IRH G8 | |
| Media de la clase Multimedia (8025 - 11664, n=51, últimos 2 años) | |
| Schenker Vision 14 2022 RTX 3050 Ti | |
| Asus Zephyrus G14 GA401QM | |
| MSI Stealth 14 Studio A13V | |
| Acer Swift X SFX14-51G-5876 | |
| PCMark 10 / Productivity | |
| Media de la clase Multimedia (7323 - 18233, n=51, últimos 2 años) | |
| Acer Predator Triton 300 SE | |
| Asus Zephyrus G14 GA401QM | |
| Gigabyte Aero 14 OLED BMF | |
| Lenovo Yoga Pro 7 14IRH G8 | |
| Medio Intel Core i7-13700H, NVIDIA GeForce RTX 4050 Laptop GPU (8368 - 9836, n=7) | |
| Schenker Vision 14 2022 RTX 3050 Ti | |
| Acer Swift X SFX14-51G-5876 | |
| MSI Stealth 14 Studio A13V | |
| PCMark 10 / Digital Content Creation | |
| Acer Predator Triton 300 SE | |
| Media de la clase Multimedia (3651 - 16240, n=51, últimos 2 años) | |
| MSI Stealth 14 Studio A13V | |
| Lenovo Yoga Pro 7 14IRH G8 | |
| Medio Intel Core i7-13700H, NVIDIA GeForce RTX 4050 Laptop GPU (9527 - 10643, n=7) | |
| Gigabyte Aero 14 OLED BMF | |
| Schenker Vision 14 2022 RTX 3050 Ti | |
| Asus Zephyrus G14 GA401QM | |
| Acer Swift X SFX14-51G-5876 | |
| CrossMark / Overall | |
| Acer Predator Triton 300 SE | |
| Media de la clase Multimedia (866 - 2728, n=60, últimos 2 años) | |
| Gigabyte Aero 14 OLED BMF | |
| Lenovo Yoga Pro 7 14IRH G8 | |
| MSI Stealth 14 Studio A13V | |
| Medio Intel Core i7-13700H, NVIDIA GeForce RTX 4050 Laptop GPU (1205 - 1937, n=9) | |
| Schenker Vision 14 2022 RTX 3050 Ti | |
| Acer Swift X SFX14-51G-5876 | |
| CrossMark / Productivity | |
| Acer Predator Triton 300 SE | |
| Gigabyte Aero 14 OLED BMF | |
| Media de la clase Multimedia (931 - 2489, n=60, últimos 2 años) | |
| Lenovo Yoga Pro 7 14IRH G8 | |
| Medio Intel Core i7-13700H, NVIDIA GeForce RTX 4050 Laptop GPU (1158 - 1877, n=9) | |
| MSI Stealth 14 Studio A13V | |
| Schenker Vision 14 2022 RTX 3050 Ti | |
| Acer Swift X SFX14-51G-5876 | |
| CrossMark / Creativity | |
| Media de la clase Multimedia (907 - 3465, n=60, últimos 2 años) | |
| Acer Predator Triton 300 SE | |
| Lenovo Yoga Pro 7 14IRH G8 | |
| Gigabyte Aero 14 OLED BMF | |
| MSI Stealth 14 Studio A13V | |
| Medio Intel Core i7-13700H, NVIDIA GeForce RTX 4050 Laptop GPU (1293 - 2044, n=9) | |
| Schenker Vision 14 2022 RTX 3050 Ti | |
| Acer Swift X SFX14-51G-5876 | |
| CrossMark / Responsiveness | |
| Acer Predator Triton 300 SE | |
| Gigabyte Aero 14 OLED BMF | |
| Medio Intel Core i7-13700H, NVIDIA GeForce RTX 4050 Laptop GPU (1097 - 1929, n=9) | |
| MSI Stealth 14 Studio A13V | |
| Acer Swift X SFX14-51G-5876 | |
| Schenker Vision 14 2022 RTX 3050 Ti | |
| Media de la clase Multimedia (605 - 2024, n=60, últimos 2 años) | |
| Lenovo Yoga Pro 7 14IRH G8 | |
| PCMark 10 Score | 7273 puntos | |
ayuda | ||
| AIDA64 / Memory Copy | |
| Media de la clase Multimedia (11299 - 132135, n=54, últimos 2 años) | |
| Gigabyte Aero 14 OLED BMF | |
| Acer Predator Triton 300 SE | |
| Lenovo Yoga Pro 7 14IRH G8 | |
| Medio Intel Core i7-13700H (24334 - 78081, n=29) | |
| MSI Stealth 14 Studio A13V | |
| Acer Swift X SFX14-51G-5876 | |
| Schenker Vision 14 2022 RTX 3050 Ti | |
| Asus Zephyrus G14 GA401QM | |
| AIDA64 / Memory Read | |
| Media de la clase Multimedia (11624 - 174586, n=54, últimos 2 años) | |
| Gigabyte Aero 14 OLED BMF | |
| Acer Predator Triton 300 SE | |
| MSI Stealth 14 Studio A13V | |
| Lenovo Yoga Pro 7 14IRH G8 | |
| Acer Swift X SFX14-51G-5876 | |
| Medio Intel Core i7-13700H (23681 - 79656, n=29) | |
| Asus Zephyrus G14 GA401QM | |
| Schenker Vision 14 2022 RTX 3050 Ti | |
| AIDA64 / Memory Write | |
| Gigabyte Aero 14 OLED BMF | |
| Media de la clase Multimedia (11755 - 134998, n=54, últimos 2 años) | |
| Lenovo Yoga Pro 7 14IRH G8 | |
| Medio Intel Core i7-13700H (22986 - 99898, n=29) | |
| Acer Predator Triton 300 SE | |
| Acer Swift X SFX14-51G-5876 | |
| MSI Stealth 14 Studio A13V | |
| Schenker Vision 14 2022 RTX 3050 Ti | |
| Asus Zephyrus G14 GA401QM | |
| AIDA64 / Memory Latency | |
| Media de la clase Multimedia (7 - 535, n=53, últimos 2 años) | |
| Acer Swift X SFX14-51G-5876 | |
| Lenovo Yoga Pro 7 14IRH G8 | |
| Acer Predator Triton 300 SE | |
| Medio Intel Core i7-13700H (82.4 - 136.8, n=29) | |
| Gigabyte Aero 14 OLED BMF | |
| Schenker Vision 14 2022 RTX 3050 Ti | |
| MSI Stealth 14 Studio A13V | |
| Asus Zephyrus G14 GA401QM | |
* ... más pequeño es mejor
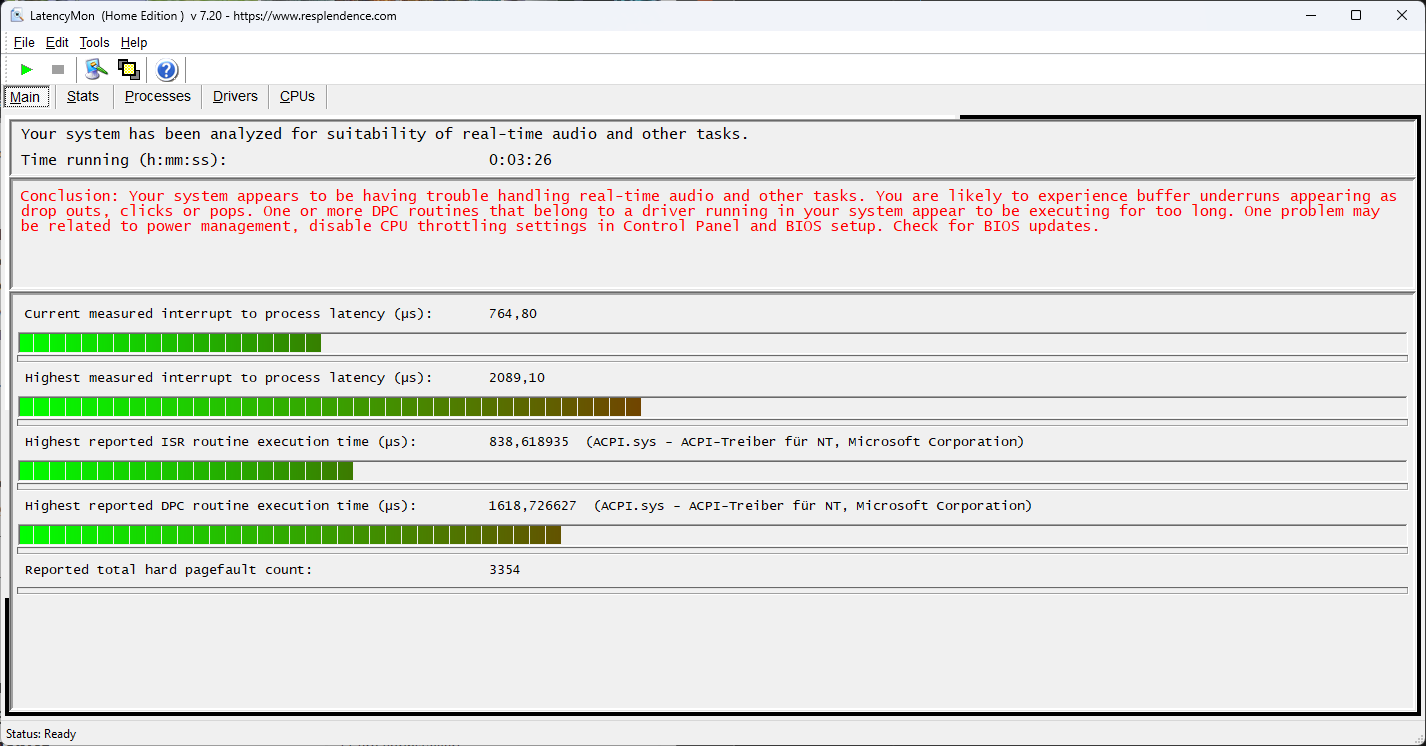
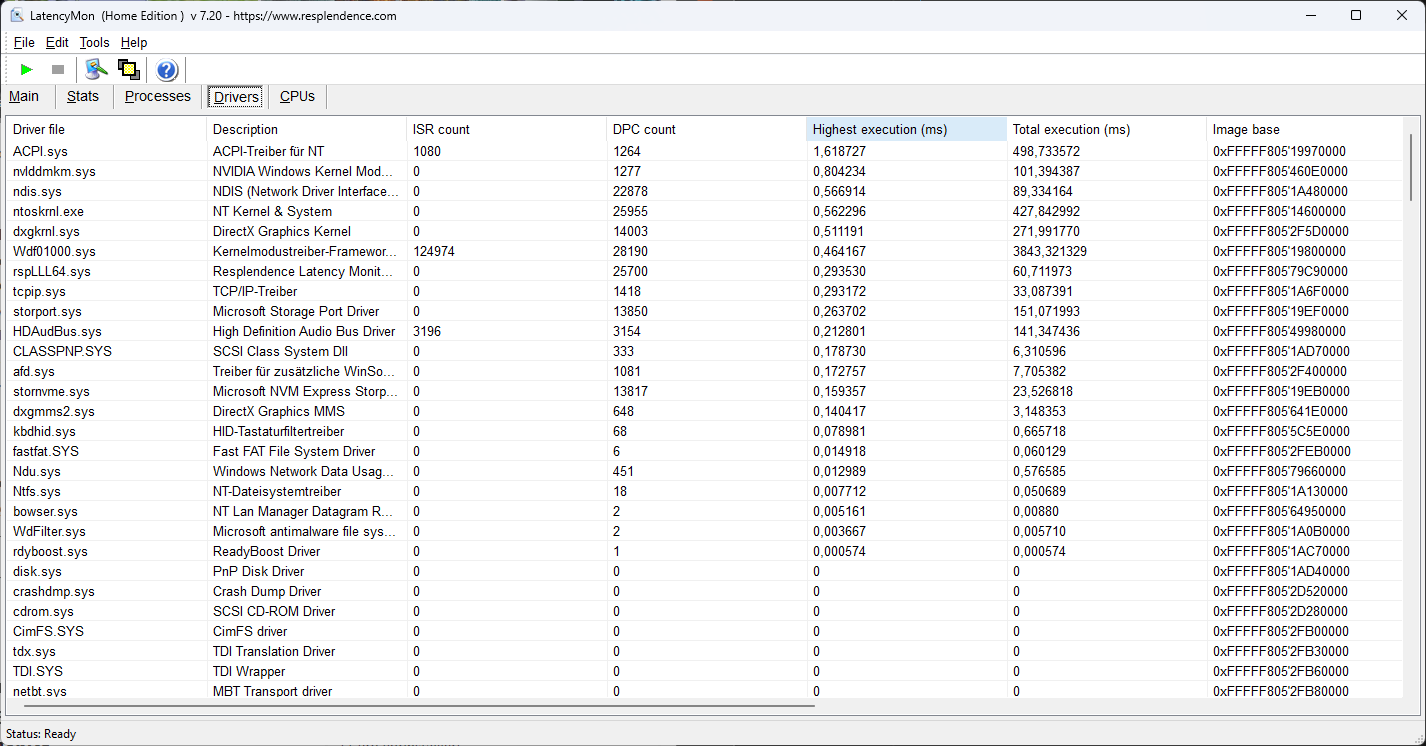
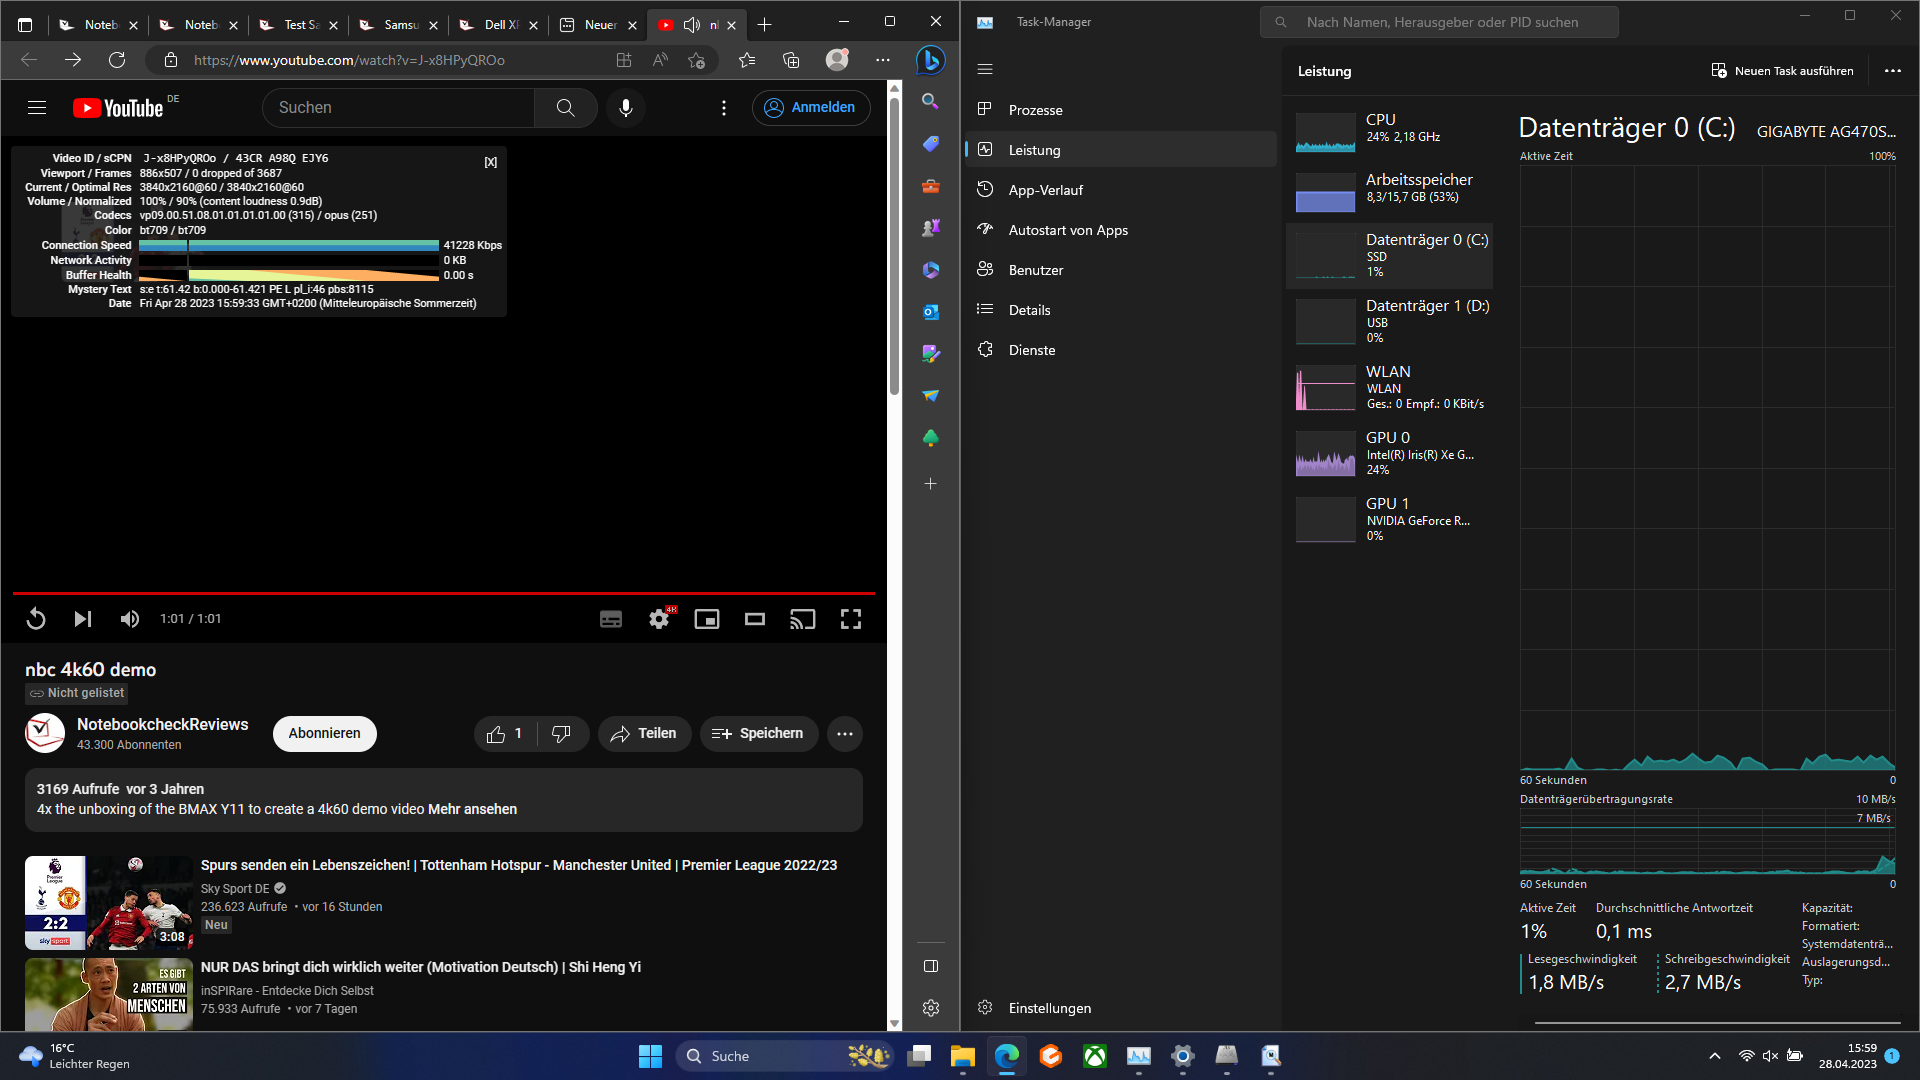
Latencia del CPD
Para los creadores de contenidos que realizan podcasts o transmisiones en directo, es probable que las latencias DPC relativamente altas medidas sean un gran punto de crítica. Con su configuración de controladores actual en el momento de la prueba, el Aero 14 OLED no es adecuado para la edición de audio o vídeo en tiempo real. Por otro lado, nuestro vídeo de prueba 4K 60Hz YouTube corrió sin ningún fotogramas caídos.
| DPC Latencies / LatencyMon - interrupt to process latency (max), Web, Youtube, Prime95 | |
| Asus Zephyrus G14 GA401QM | |
| Acer Predator Triton 300 SE | |
| Gigabyte Aero 14 OLED BMF | |
| MSI Stealth 14 Studio A13V | |
| Lenovo Yoga Pro 7 14IRH G8 | |
| Schenker Vision 14 2022 RTX 3050 Ti | |
| Acer Swift X SFX14-51G-5876 | |
* ... más pequeño es mejor
Dispositivos de almacenamiento
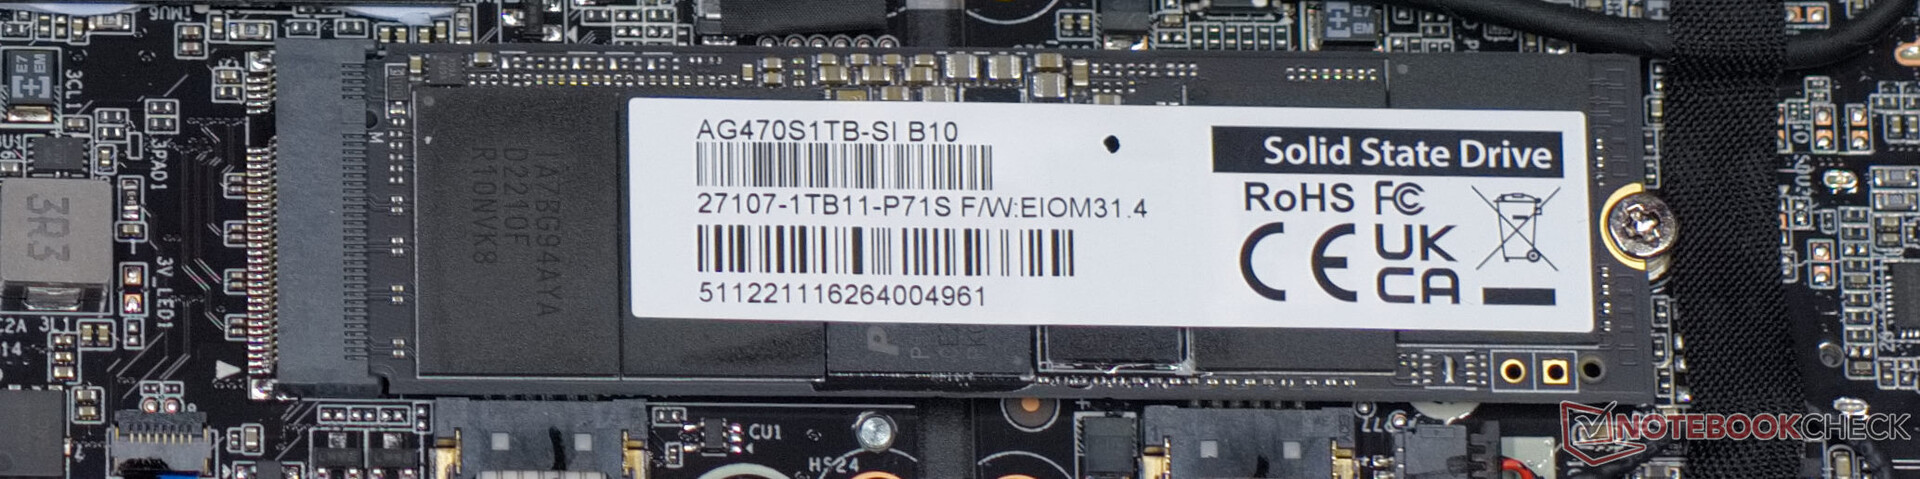
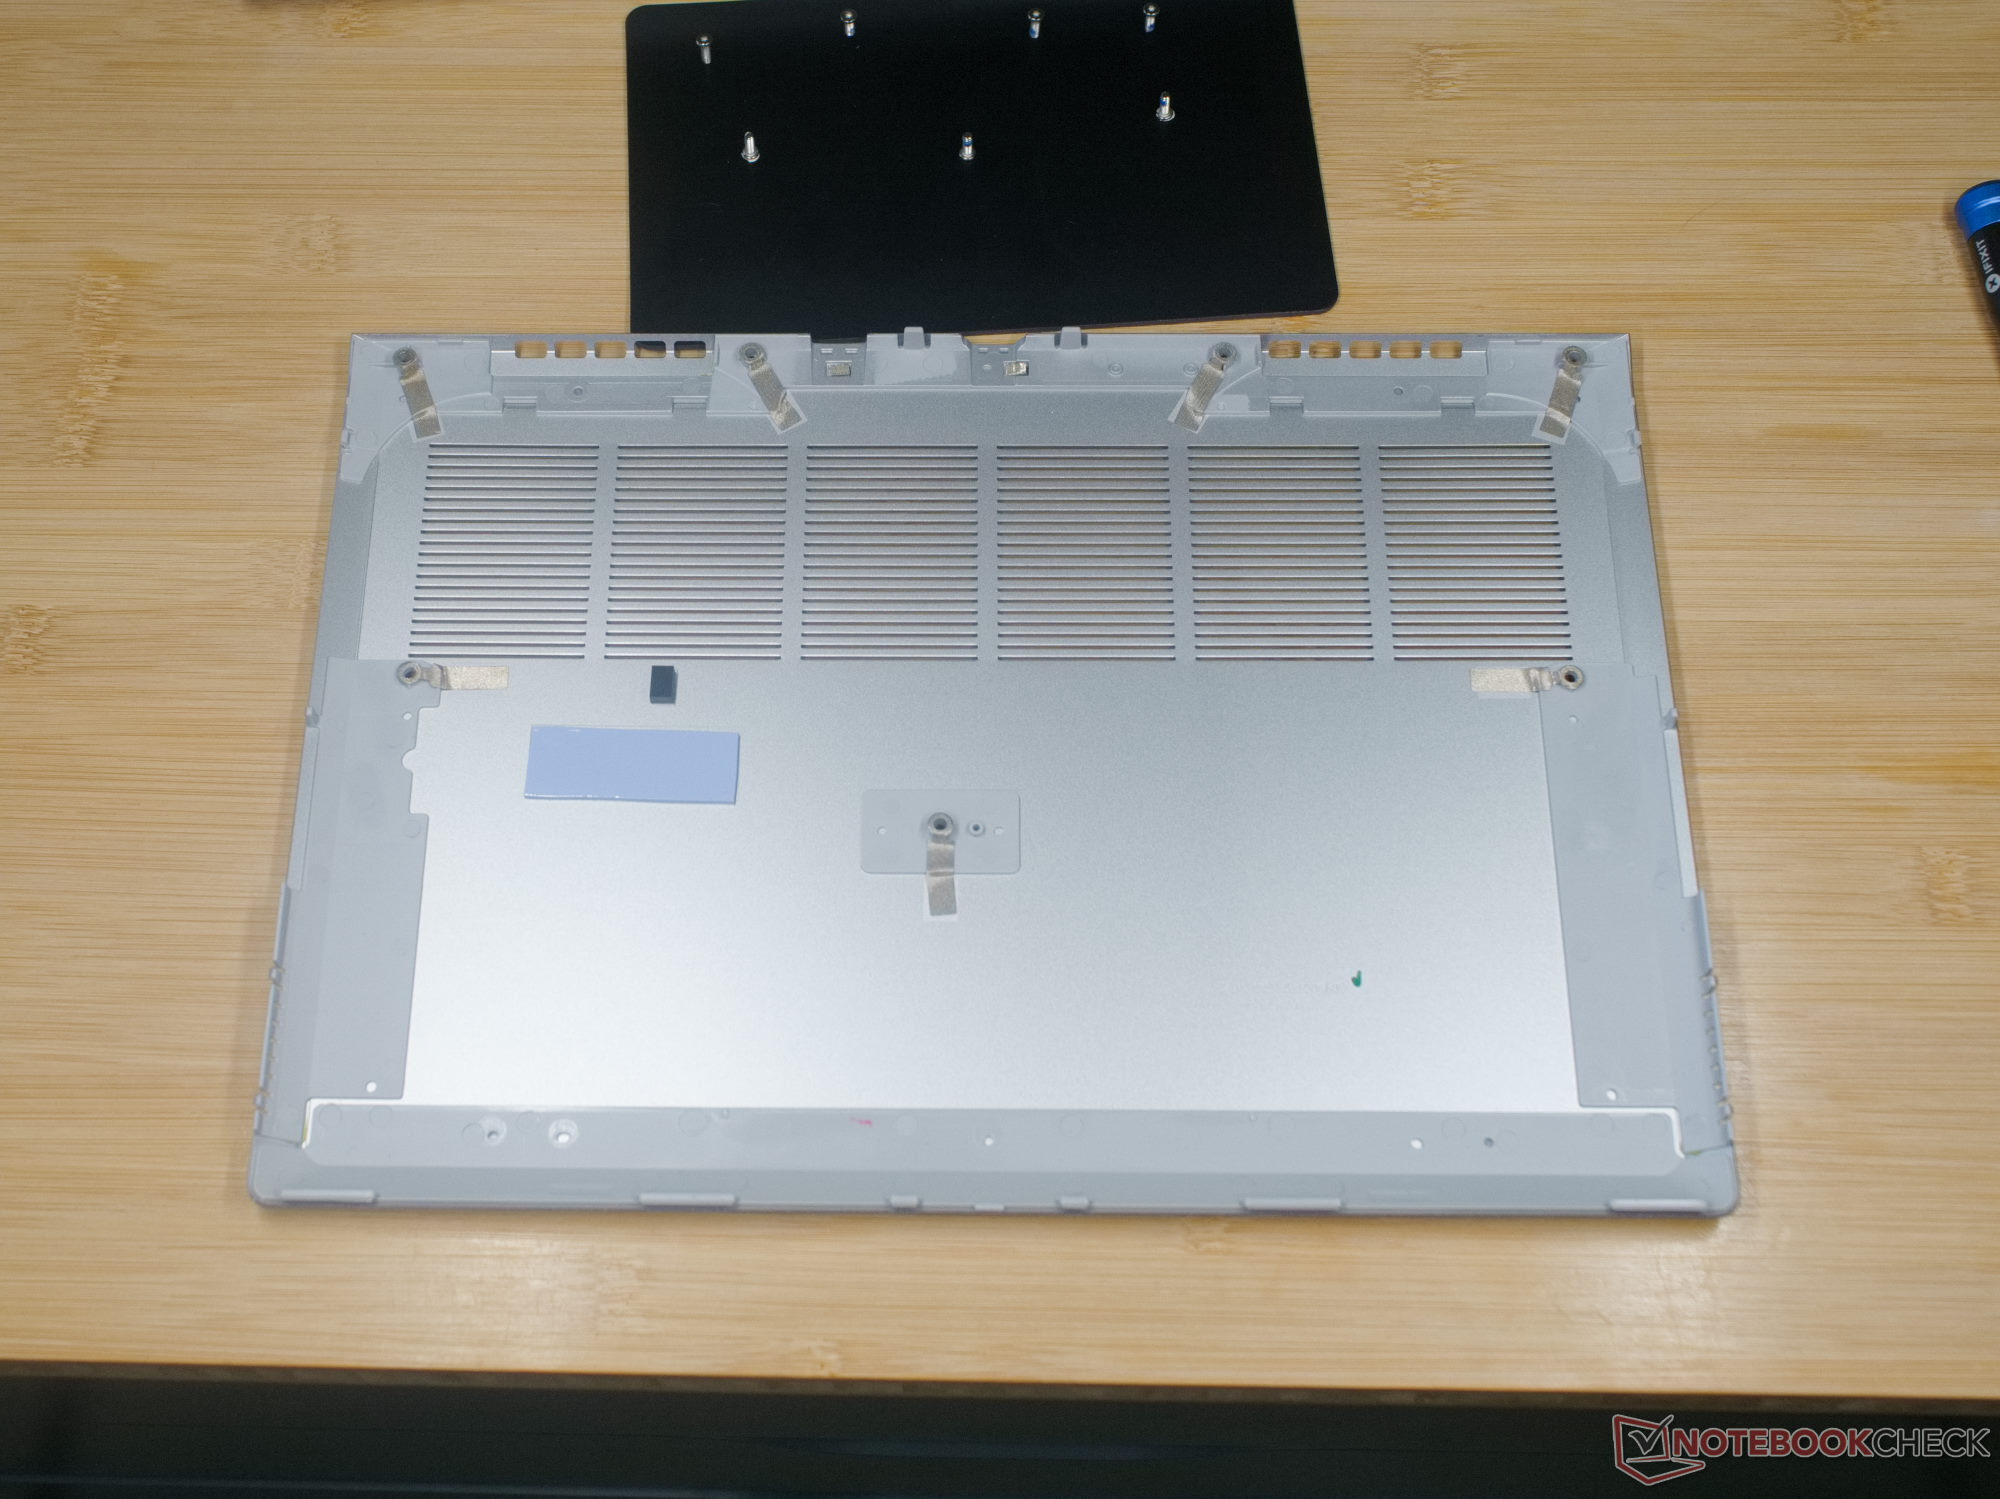
Gigabyte instala su propio SSD NVMe en el Aero 14 OLED. EnGigabyte AG470S1TB-SI B10muestra buenas tasas de transferencia y no tiene nada que envidiar a los alabados SSDs Samsung 980 Pro. Estos son más rápidos en lectura secuencial, pero el SSD Gigabyte tiene una clara ventaja en las tareas aleatorias que son más comunes en el uso diario. Sobre todo, el SSD del Aero 14 OLED es capaz de mantener un alto rendimiento durante periodos largos, como muestra el DiskSpd Loop. A ello contribuye, entre otras cosas, la almohadilla térmica de la parte inferior de la carcasa, que mantiene el disco duro a bajas temperaturas de funcionamiento.

* ... más pequeño es mejor
Sustained Read Performance: DiskSpd Read Loop, Queue Depth 8
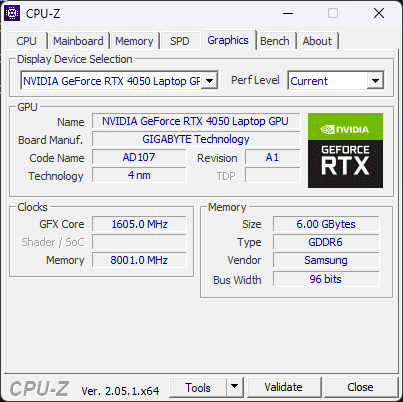
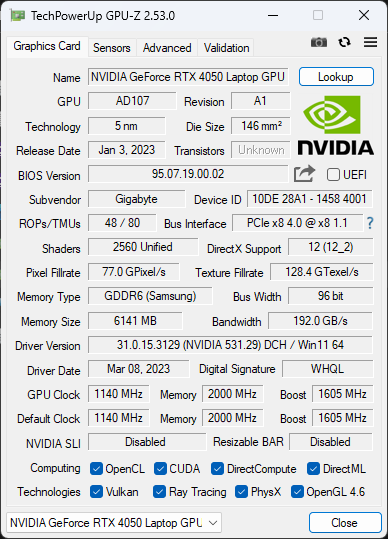
Tarjeta gráfica
El Nvidia GeForce RTX 4050 de nuestro dispositivo de pruebas se alimenta con 35 vatios. En teoría, la tarjeta gráfica de la última generación Ada Lovelace de Nvidia puede alimentarse con hasta 115 vatios. Así que la Aero 14 no produce realmente puntuaciones altas en los benchmarks con 3DMark, Blender y otros. Pero la tarjeta gráfica de nivel básico sigue siendo suficiente para un trabajo óptimo en el renderizado de vídeos o escenas 3D. Afortunadamente, el rendimiento de la GPU se mantiene bastante estable durante largos periodos.
En contraste con el Core i7, la gráfica Nvidia muestra un aumento de rendimiento significativo comparado con el predecesor cuando se tienen en cuenta las fases TGP. LaRTX 3050en el Schenker Vision 14 y el Acer Swift X también se suministran con 35 vatios. Los dos portátiles están al menos un 20% por detrás en todos los benchmarks del chip gráfico.
| 3DMark Ice Storm Standard Score | 211524 puntos | |
| 3DMark Cloud Gate Standard Score | 45695 puntos | |
| 3DMark Fire Strike Score | 15329 puntos | |
| 3DMark Time Spy Score | 6151 puntos | |
ayuda | ||
* ... más pequeño es mejor
Rendimiento en juegos
Para un gran número de juegos en resolución FullHD, la RTX 4050es perfectamente adecuada para alcanzar buenos fps, incluso con ajustes de alta calidad. Sólo los juegos más antiguos son realmente jugables en la resolución 3K completa de la pantalla. Sin embargo, el trazado de rayos como en F1 2022 o Hogwarts Legacy provocan una caída significativa de la tasa de fotogramas, también en FullHD. Los 6 GB de VRAM del 4050 podrían resultar un cuello de botella en los títulos más recientes. Recientemente, la versión para PC de The Last of Usnos causó frustración por su alta demanda de memoria gráfica. En definitiva, el pequeño portátil es utilizable para algo más que juegos ocasionales.
| The Witcher 3 - 1920x1080 Ultra Graphics & Postprocessing (HBAO+) | |
| MSI Stealth 14 Studio A13V | |
| Acer Predator Triton 300 SE | |
| Gigabyte Aero 14 OLED BMF | |
| Gigabyte Aero 14 OLED BMF | |
| Asus Zephyrus G14 GA401QM | |
| Lenovo Yoga Pro 7 14IRH G8 | |
| Media de la clase Multimedia (11 - 121, n=7, últimos 2 años) | |
| Schenker Vision 14 2022 RTX 3050 Ti | |
| Acer Swift X SFX14-51G-5876 | |
En la prueba de larga duración de Witcher 3, vimos velocidades de fotogramas bastante estables. Los típicos altibajos durante el transcurso día/noche en el juego apenas se notan aquí. Después de unos dos tercios de la prueba, se nota una pequeña caída de rendimiento de unos 3 fps.
Witcher 3 FPS chart
| bajo | medio | alto | ultra | QHD | 4K | |
|---|---|---|---|---|---|---|
| GTA V (2015) | 183.4 | 180.9 | 161.6 | 74.3 | ||
| The Witcher 3 (2015) | 87 | 67.7 | ||||
| Dota 2 Reborn (2015) | 147.6 | 139.4 | 135.1 | 129.1 | 69.7 | |
| Final Fantasy XV Benchmark (2018) | 142.6 | 77.5 | 58.5 | 41 | 22.5 | |
| X-Plane 11.11 (2018) | 146.6 | 122.9 | 98.2 | 83.2 | ||
| Strange Brigade (2018) | 396 | 150.5 | 117 | 100.2 | ||
| F1 22 (2022) | 157.9 | 149 | 100.8 | 33.3 | ||
| Hogwarts Legacy (2023) | 49.4 | 44.8 | 39 | |||
| The Last of Us (2023) | 53.4 | 44.6 | 0 |
Emisiones - Ventiladores silbantes
Ruido
Aunque los ventiladores del portátil rara vez alcanzan los 51 dB(A) medidos a una distancia de 15 cm, siguen produciendo un ruido desagradablemente alto en muchos casos. El silbido a unos 2.000 Hz casi siempre se oye en cuanto giran un poco más rápido. Y esto ocurre a menudo, por desgracia. Incluso cuando el portátil está inactivo, los ventiladores giran a intervalos regulares.
También hay un silbido de bobina ligeramente perceptible cuando el teclado está encendido en uno de los niveles de brillo mas bajos durante periodos largos de tiempo.
Ruido
| Ocioso |
| 24 / 24 / 35.71 dB(A) |
| Carga |
| / 51.93 dB(A) |
 | ||
30 dB silencioso 40 dB(A) audible 50 dB(A) ruidosamente alto |
||
min: | ||
| Gigabyte Aero 14 OLED BMF GeForce RTX 4050 Laptop GPU, i7-13700H, Gigabyte AG470S1TB-SI B10 | Schenker Vision 14 2022 RTX 3050 Ti GeForce RTX 3050 Ti Laptop GPU, i7-12700H, Samsung SSD 980 Pro 1TB MZ-V8P1T0BW | Asus Zephyrus G14 GA401QM GeForce RTX 3060 Laptop GPU, R9 5900HS, SK Hynix HFM001TD3JX013N | Acer Predator Triton 300 SE GeForce RTX 3060 Laptop GPU, i9-12900H, Micron 3400 1TB MTFDKBA1T0TFH | Acer Swift X SFX14-51G-5876 GeForce RTX 3050 4GB Laptop GPU, i5-1240P, Micron 3400 MTFDKBA512TFH 512GB | MSI Katana 15 B12VEK GeForce RTX 4050 Laptop GPU, i7-12650H, Micron 2400 MTFDKBA1T0QFM | |
|---|---|---|---|---|---|---|
| Noise | 0% | -14% | -8% | 0% | 2% | |
| apagado / medio ambiente * (dB) | 24 | 24.4 -2% | 24.8 -3% | 23.8 1% | 25 -4% | 24 -0% |
| Idle Minimum * (dB) | 24 | 24.4 -2% | 25.4 -6% | 23.8 1% | 26.6 -11% | 24 -0% |
| Idle Average * (dB) | 24 | 24.4 -2% | 34.5 -44% | 23.8 1% | 26.6 -11% | 24 -0% |
| Idle Maximum * (dB) | 35.71 | 27.8 22% | 34.5 3% | 30.6 14% | 27.5 23% | 24 33% |
| Witcher 3 ultra * (dB) | 40.22 | 48.2 -20% | 52.7 -31% | 60.1 -49% | 45.75 -14% | |
| Load Maximum * (dB) | 51.93 | 48.8 6% | 52.3 -1% | 60 -16% | 49.7 4% | 54.55 -5% |
| Load Average * (dB) | 43.3 | 35.4 | 44.2 | 49.7 | 37.71 |
* ... más pequeño es mejor
Temperatura
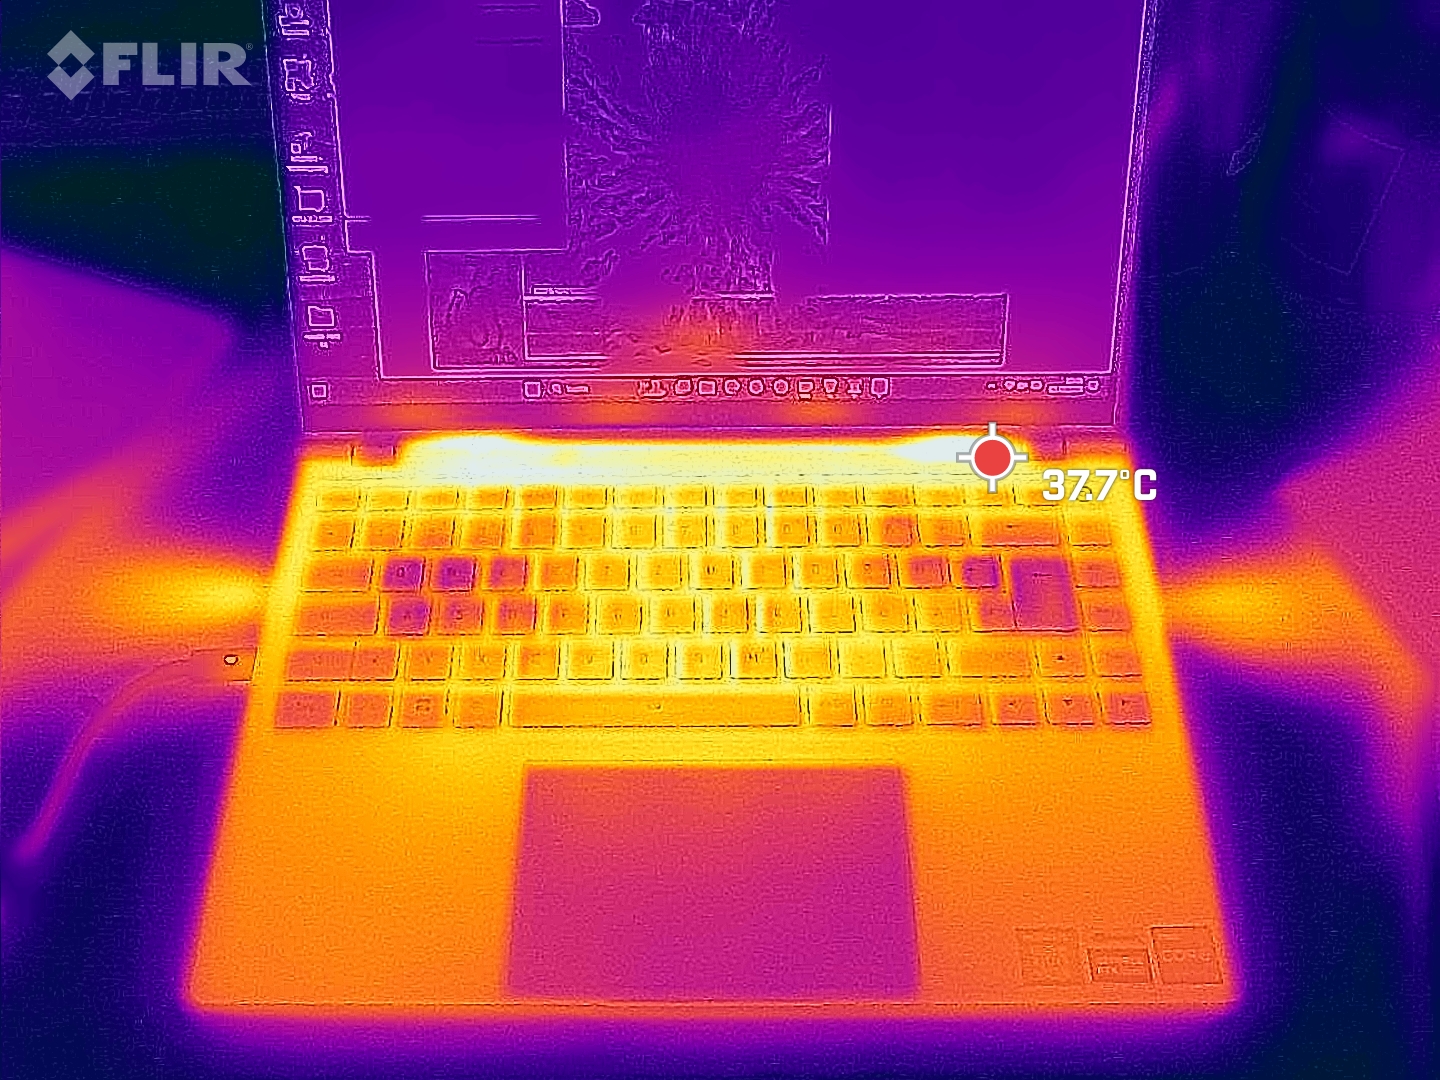
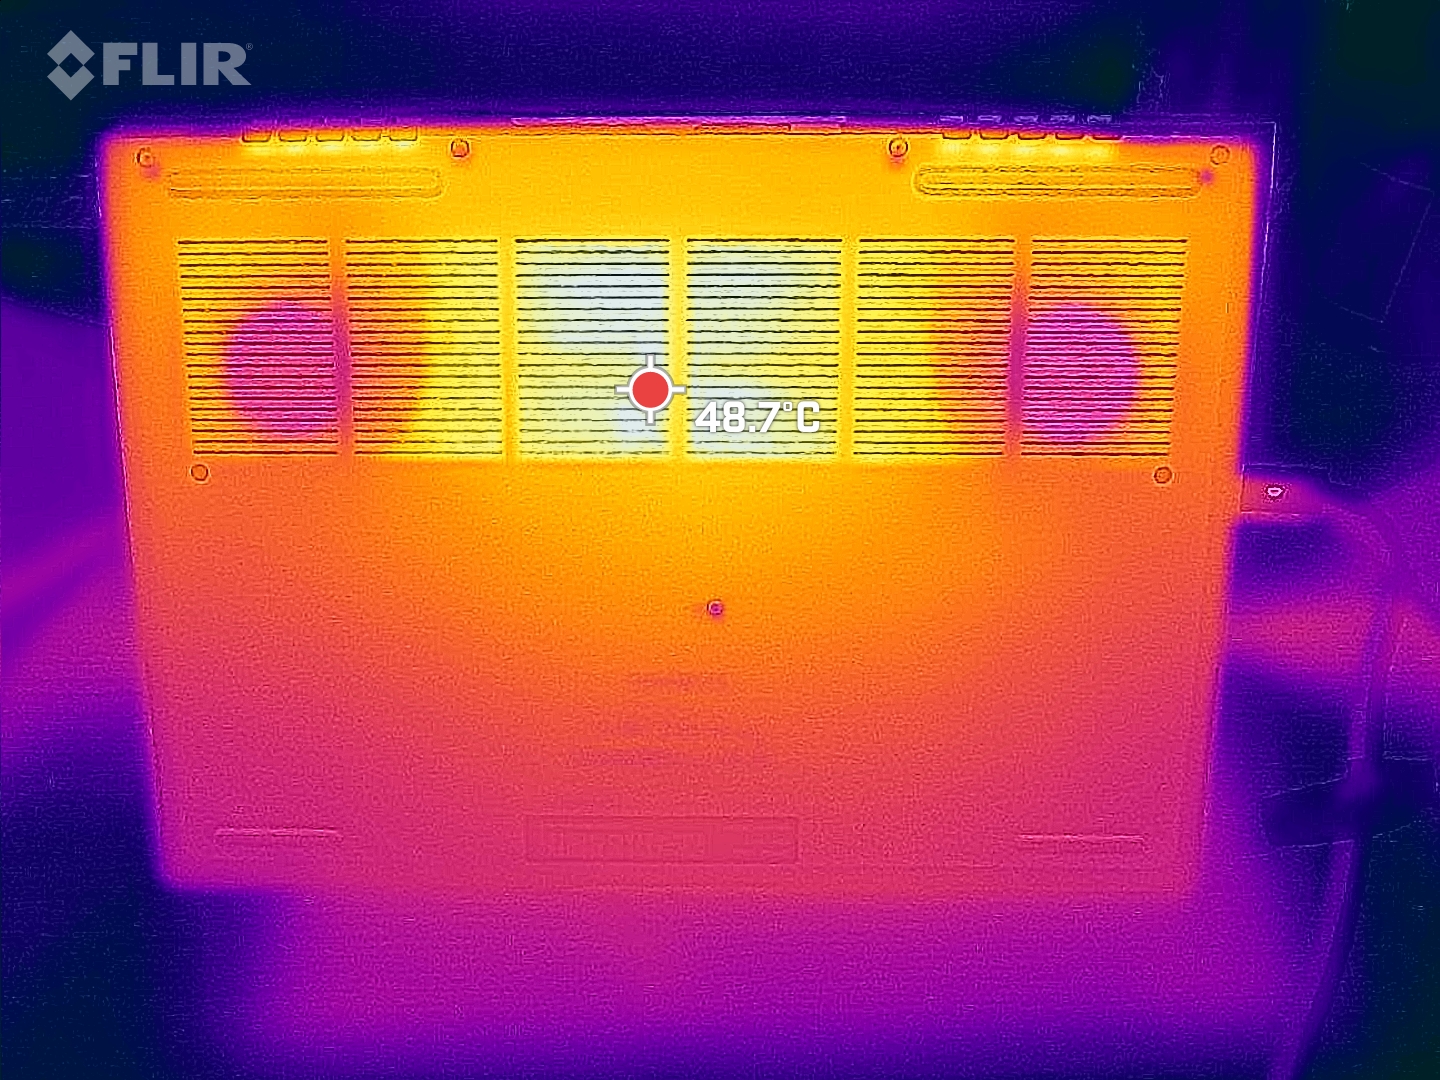
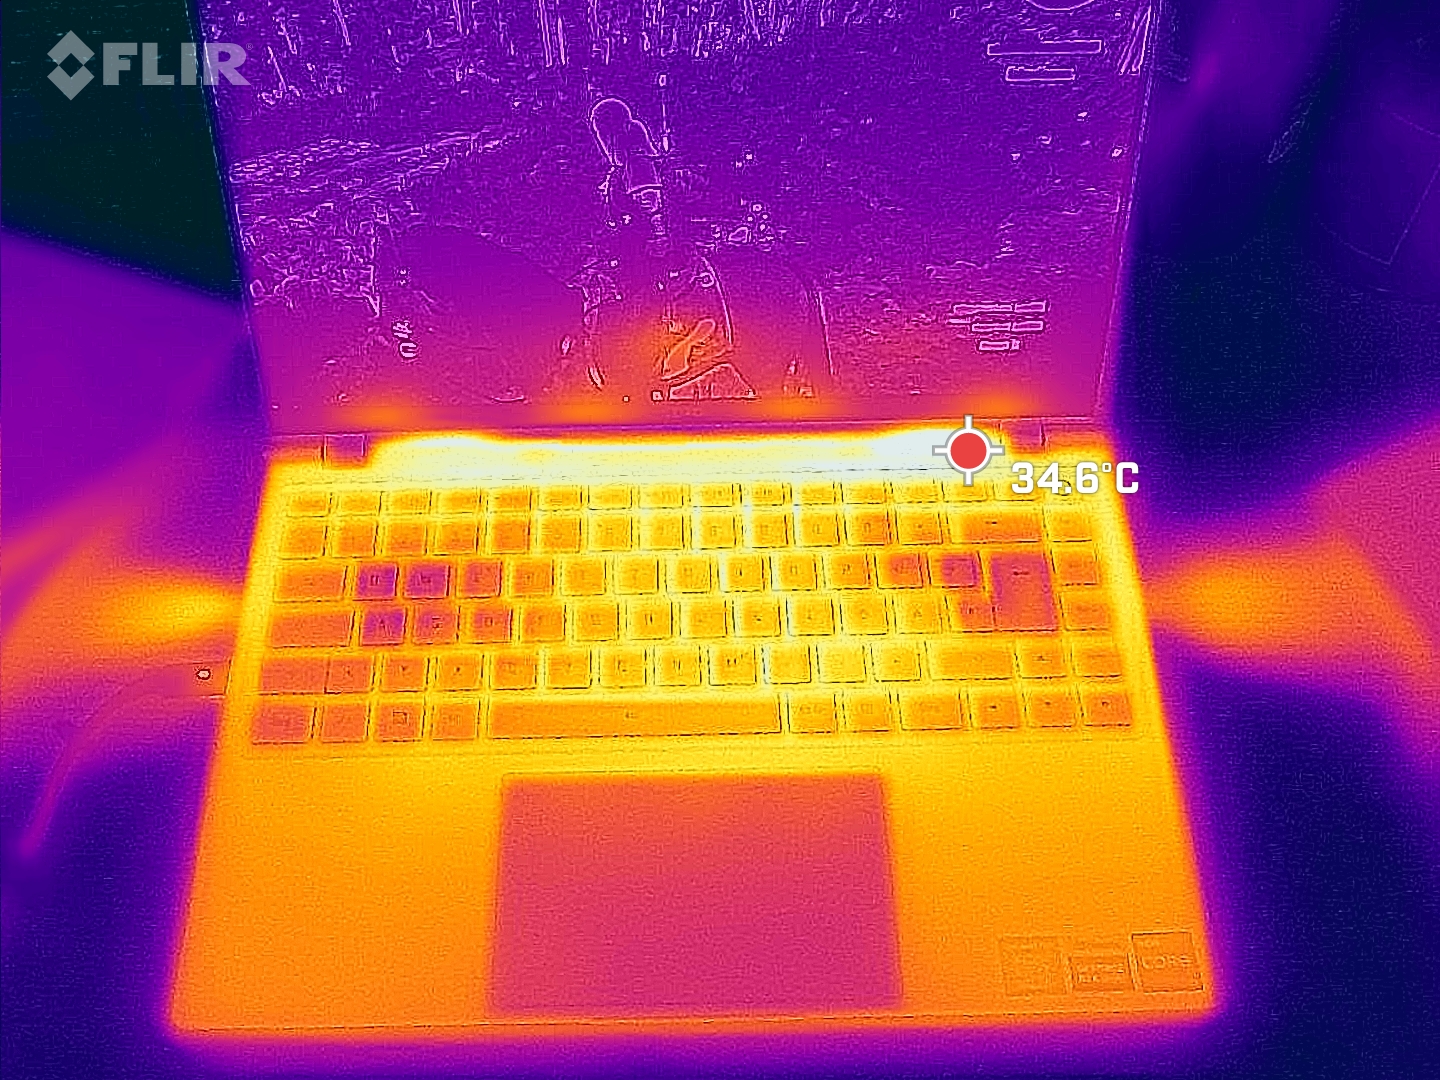
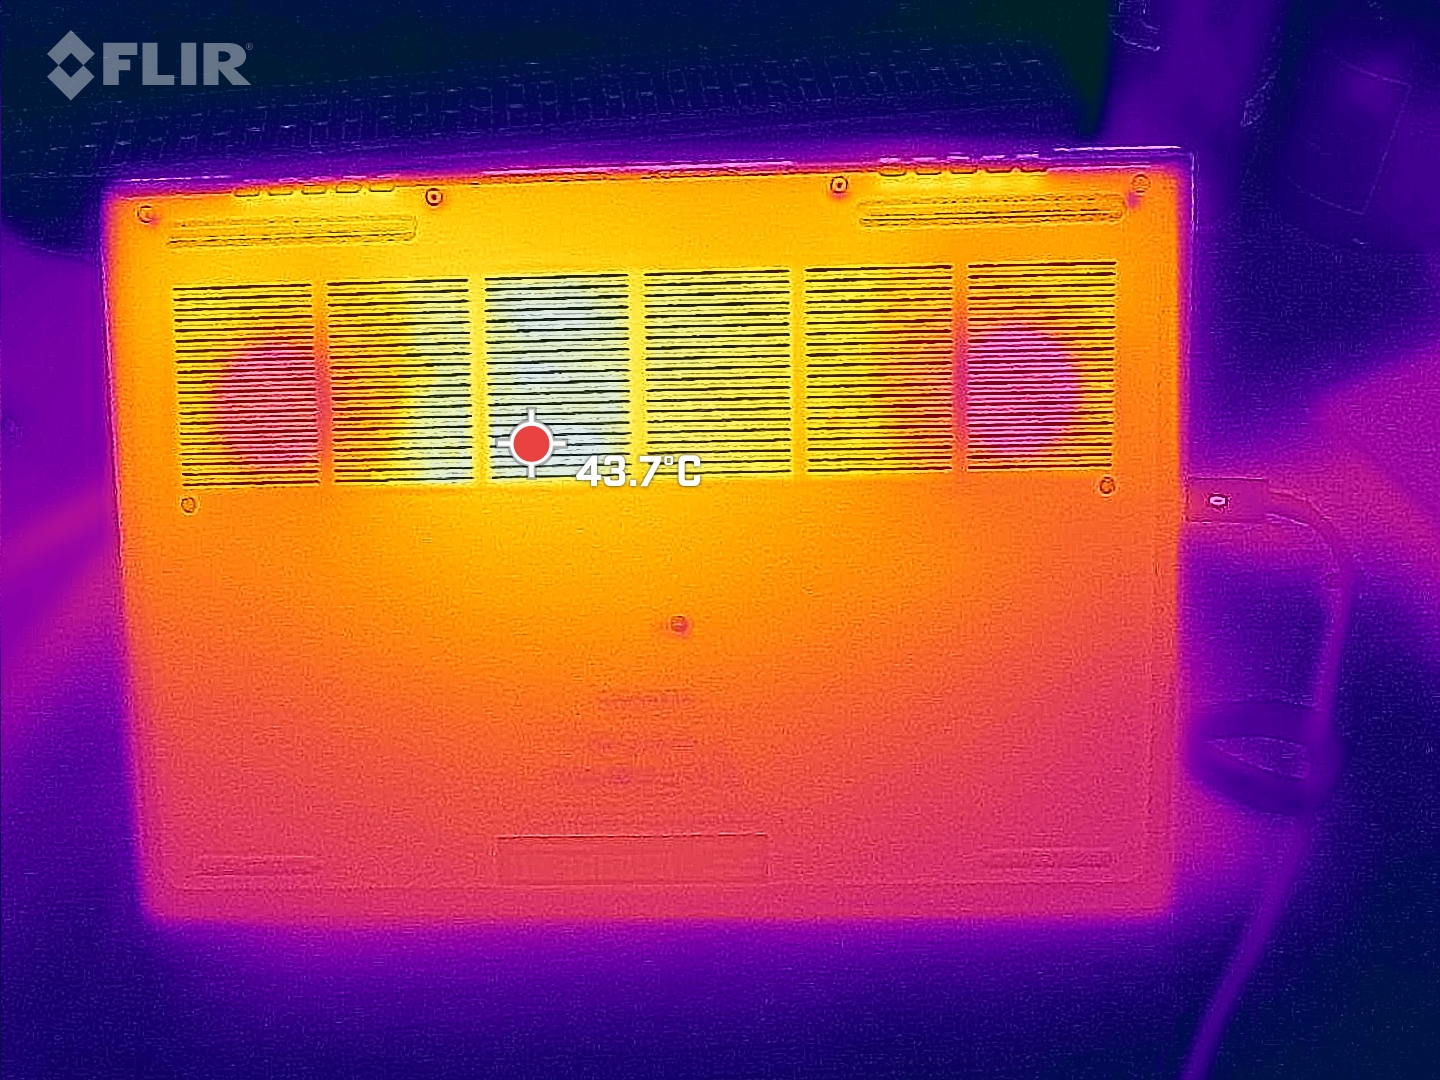
Con la CPU y la dGPU juntas produciendo hasta 75 vatios de calor residual, no sorprende que el pequeño Gigabyte Aero 14 OLED se caliente significativamente con el tiempo. Tras una hora de pruebas de estrés, sólo el touchpad se mantuvo por debajo de los 30 °C. La parte inferior del portátil se calienta hasta los 52 °C. Dado que la unidad base está hecha enteramente de aluminio, esta temperatura parece incómodamente alta. Por otro lado, el portátil casi siempre permanece a temperatura ambiente durante carga baja o inactivo.
Sin embargo, la comparación con la competencia lo demuestra: El Gigabyte Aero 14 se mantiene relativamente fresco. El Asus Zephyrus G14 es el líder aquí con hasta 62 °C.
(±) La temperatura máxima en la parte superior es de 42 °C / 108 F, frente a la media de 36.8 °C / 98 F, que oscila entre 21 y 71 °C para la clase Multimedia.
(-) El fondo se calienta hasta un máximo de 52 °C / 126 F, frente a la media de 39.1 °C / 102 F
(+) En reposo, la temperatura media de la parte superior es de 25 °C / 77# F, frente a la media del dispositivo de 31.3 °C / 88 F.
(±) Jugando a The Witcher 3, la temperatura media de la parte superior es de 35.2 °C / 95 F, frente a la media del dispositivo de 31.3 °C / 88 F.
(+) Los reposamanos y el panel táctil alcanzan como máximo la temperatura de la piel (35 °C / 95 F) y, por tanto, no están calientes.
(-) La temperatura media de la zona del reposamanos de dispositivos similares fue de 28.7 °C / 83.7 F (-6.3 °C / -11.3 F).
| Gigabyte Aero 14 OLED BMF Intel Core i7-13700H, NVIDIA GeForce RTX 4050 Laptop GPU | Schenker Vision 14 2022 RTX 3050 Ti Intel Core i7-12700H, NVIDIA GeForce RTX 3050 Ti Laptop GPU | Lenovo Yoga Pro 7 14IRH G8 Intel Core i7-13700H, NVIDIA GeForce RTX 4050 Laptop GPU | Asus Zephyrus G14 GA401QM AMD Ryzen 9 5900HS, NVIDIA GeForce RTX 3060 Laptop GPU | Acer Predator Triton 300 SE Intel Core i9-12900H, NVIDIA GeForce RTX 3060 Laptop GPU | Acer Swift X SFX14-51G-5876 Intel Core i5-1240P, NVIDIA GeForce RTX 3050 4GB Laptop GPU | |
|---|---|---|---|---|---|---|
| Heat | -10% | -3% | -23% | -1% | -23% | |
| Maximum Upper Side * (°C) | 42 | 48.4 -15% | 41.6 1% | 55.4 -32% | 43 -2% | 49.8 -19% |
| Maximum Bottom * (°C) | 52 | 57.1 -10% | 55.7 -7% | 62.2 -20% | 46.4 11% | 51 2% |
| Idle Upper Side * (°C) | 26 | 28.1 -8% | 25.9 -0% | 31 -19% | 28.2 -8% | 39.6 -52% |
| Idle Bottom * (°C) | 27 | 29 -7% | 28 -4% | 32.4 -20% | 28.4 -5% | 32.7 -21% |
* ... más pequeño es mejor
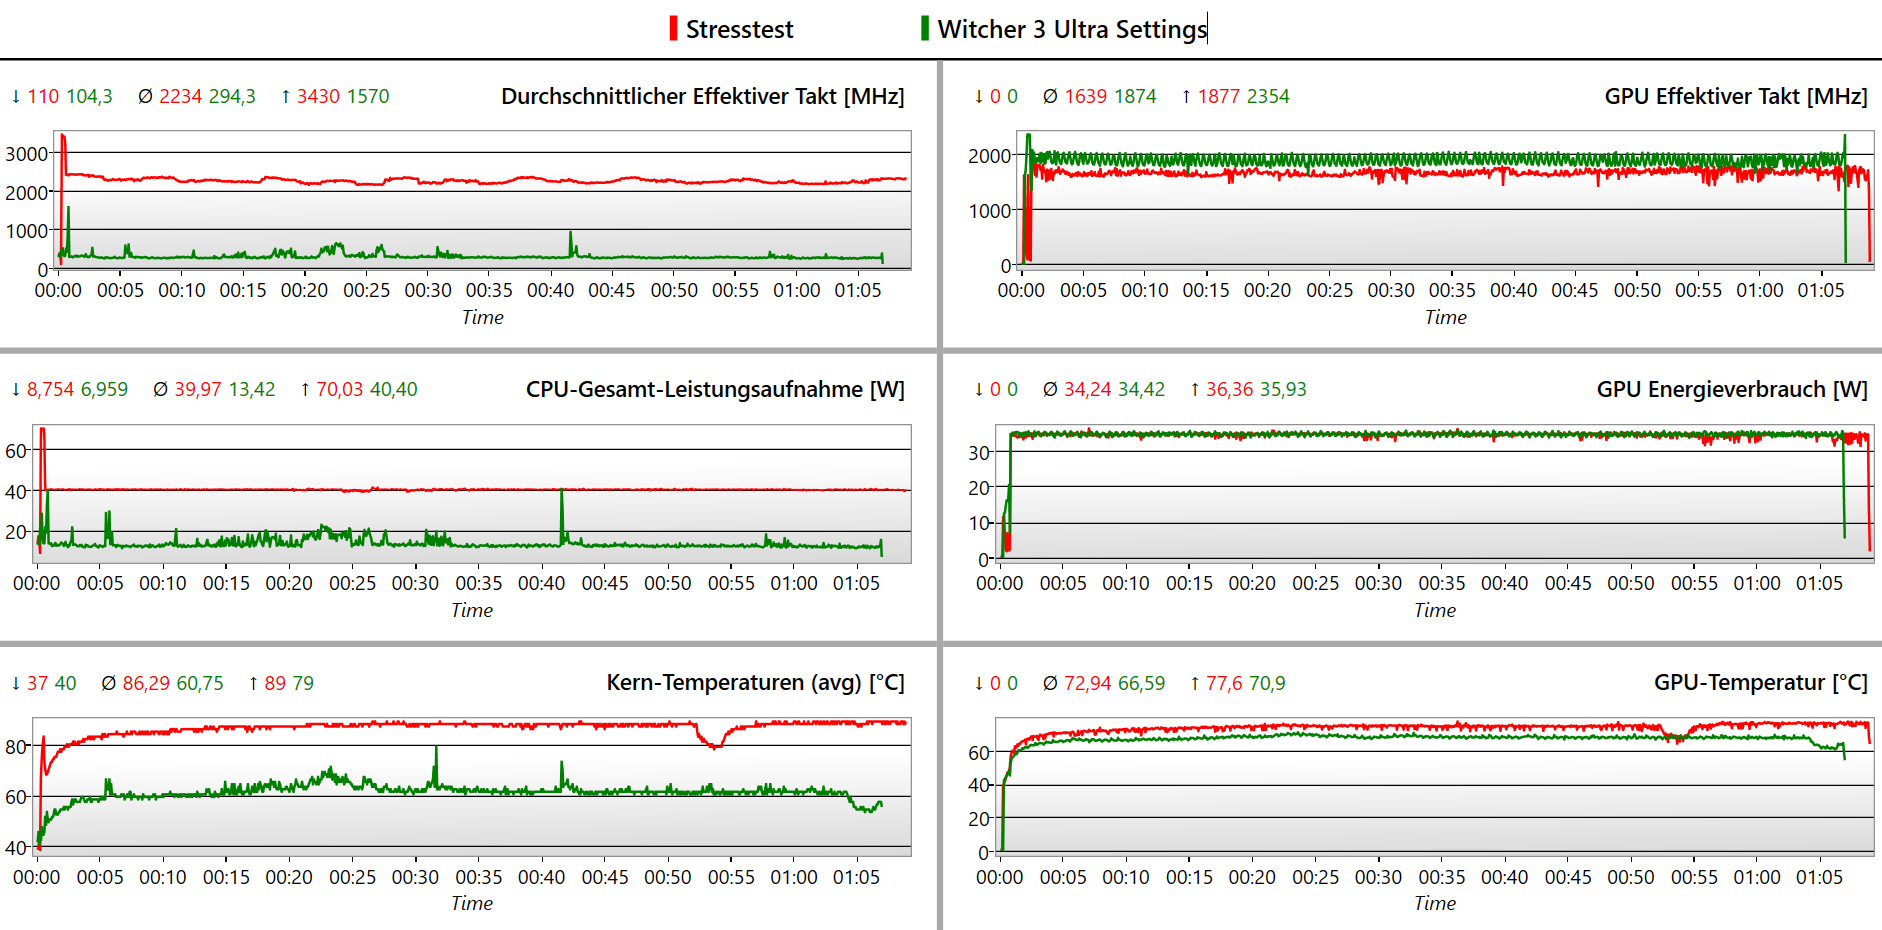
Prueba de resistencia
El Gigabyte Aero 14 OLED es capaz de mantener su rendimiento hasta cierto punto durante todo el test de estrés. Tras la breve fase de aceleración, la frecuencia efectiva del procesador fluctúa entre 2,400 y 2,100 Hz. Apenas hay pérdidas de rendimiento reales asociadas a esto. El Core i7 necesita unos 15 minutos aquí para alcanzar unos 89 °C. Esta temperatura se mantiene casi continuamente.
Altavoces
El pequeño portátil no alberga un gran sistema de sonido. Con 86 dB(A), los altavoces alcanzan un volumen razonable, pero carecen claramente de potencia, especialmente en las frecuencias bajas. Por desgracia, los medios y agudos tampoco están equilibrados en absoluto. Siempre hay ciertas frecuencias que están particularmente enfatizadas, mientras que otras están claramente infrarrepresentadas. Se pueden determinar desviaciones de más de 10 dB respecto a la mediana en las gamas media y alta.
Gigabyte Aero 14 OLED BMF análisis de audio
(+) | los altavoces pueden reproducir a un volumen relativamente alto (#82.72 dB)
Graves 100 - 315 Hz
(-) | casi sin bajos - de media 21.9% inferior a la mediana
(±) | la linealidad de los graves es media (10% delta a frecuencia anterior)
Medios 400 - 2000 Hz
(±) | medias más altas - de media 5.3% más altas que la mediana
(+) | los medios son lineales (6.7% delta a la frecuencia anterior)
Altos 2 - 16 kHz
(±) | máximos más altos - de media 5.6% más altos que la mediana
(±) | la linealidad de los máximos es media (11% delta a frecuencia anterior)
Total 100 - 16.000 Hz
(±) | la linealidad del sonido global es media (20% de diferencia con la mediana)
En comparación con la misma clase
» 66% de todos los dispositivos probados de esta clase eran mejores, 8% similares, 26% peores
» El mejor tuvo un delta de 5%, la media fue 17%, el peor fue ###max##%
En comparación con todos los dispositivos probados
» 51% de todos los dispositivos probados eran mejores, 8% similares, 41% peores
» El mejor tuvo un delta de 4%, la media fue 23%, el peor fue ###max##%
Schenker Vision 14 2022 RTX 3050 Ti análisis de audio
(±) | la sonoridad del altavoz es media pero buena (81.9 dB)
Graves 100 - 315 Hz
(-) | casi sin bajos - de media 20.6% inferior a la mediana
(±) | la linealidad de los graves es media (9% delta a frecuencia anterior)
Medios 400 - 2000 Hz
(±) | medias más altas - de media 6.7% más altas que la mediana
(+) | los medios son lineales (5.8% delta a la frecuencia anterior)
Altos 2 - 16 kHz
(+) | máximos equilibrados - a sólo 4.3% de la mediana
(+) | los máximos son lineales (4.9% delta a la frecuencia anterior)
Total 100 - 16.000 Hz
(±) | la linealidad del sonido global es media (20.4% de diferencia con la mediana)
En comparación con la misma clase
» 65% de todos los dispositivos probados de esta clase eran mejores, 8% similares, 26% peores
» El mejor tuvo un delta de 5%, la media fue 18%, el peor fue ###max##%
En comparación con todos los dispositivos probados
» 54% de todos los dispositivos probados eran mejores, 8% similares, 38% peores
» El mejor tuvo un delta de 4%, la media fue 23%, el peor fue ###max##%
Gestión de energía - Económica
Consumo de energía
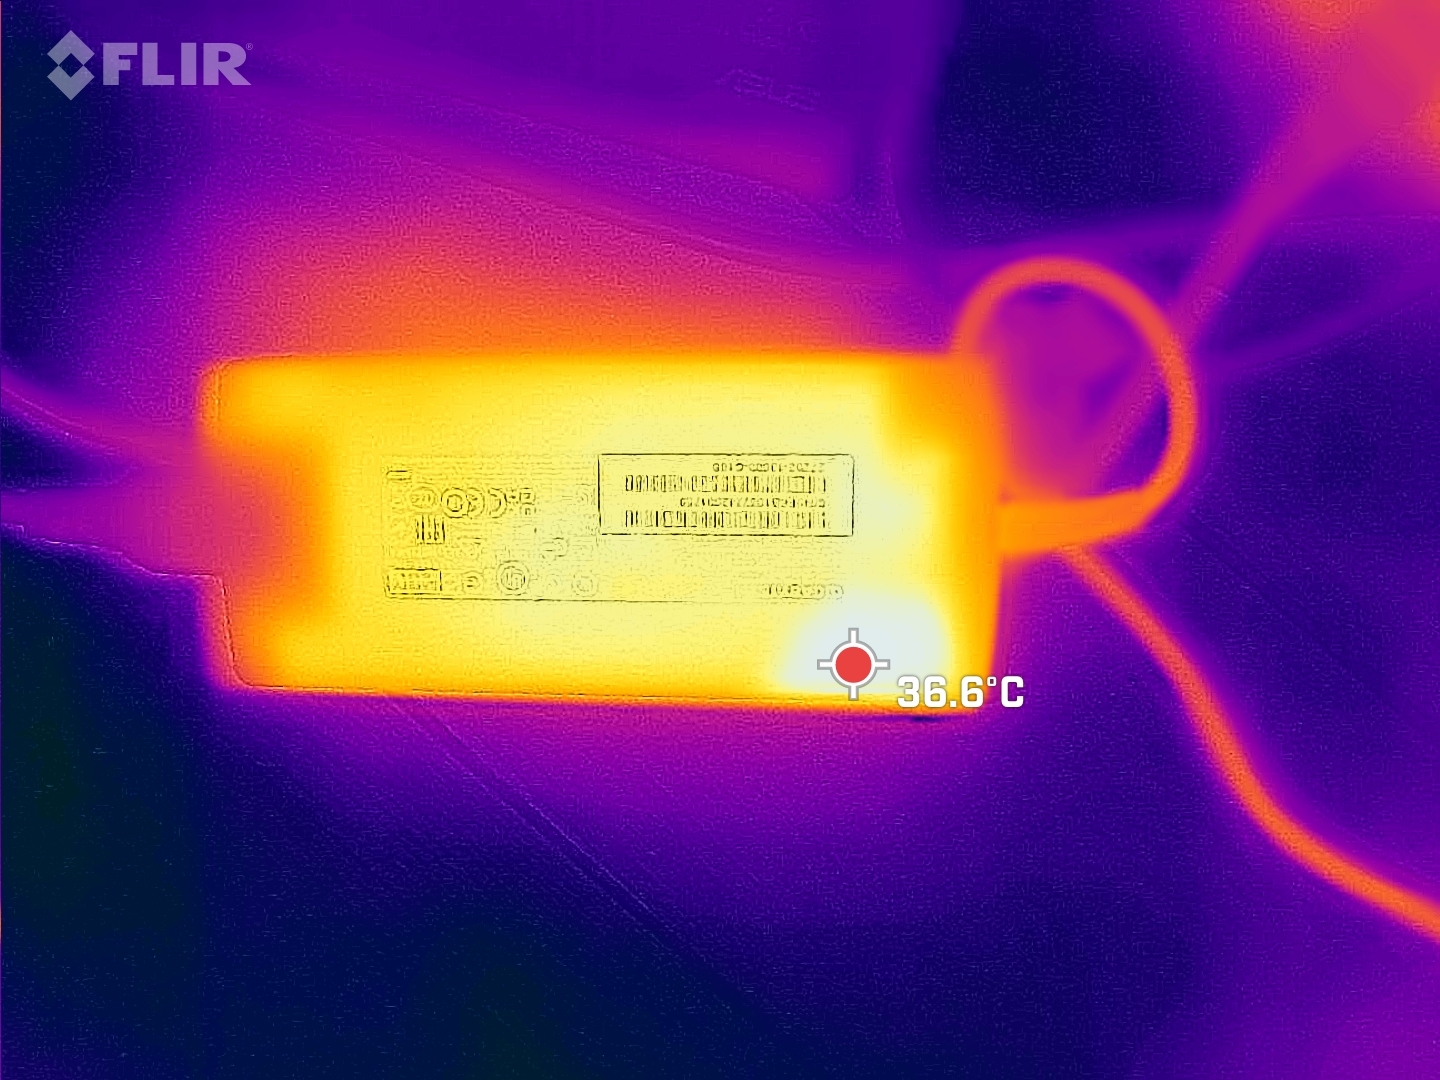
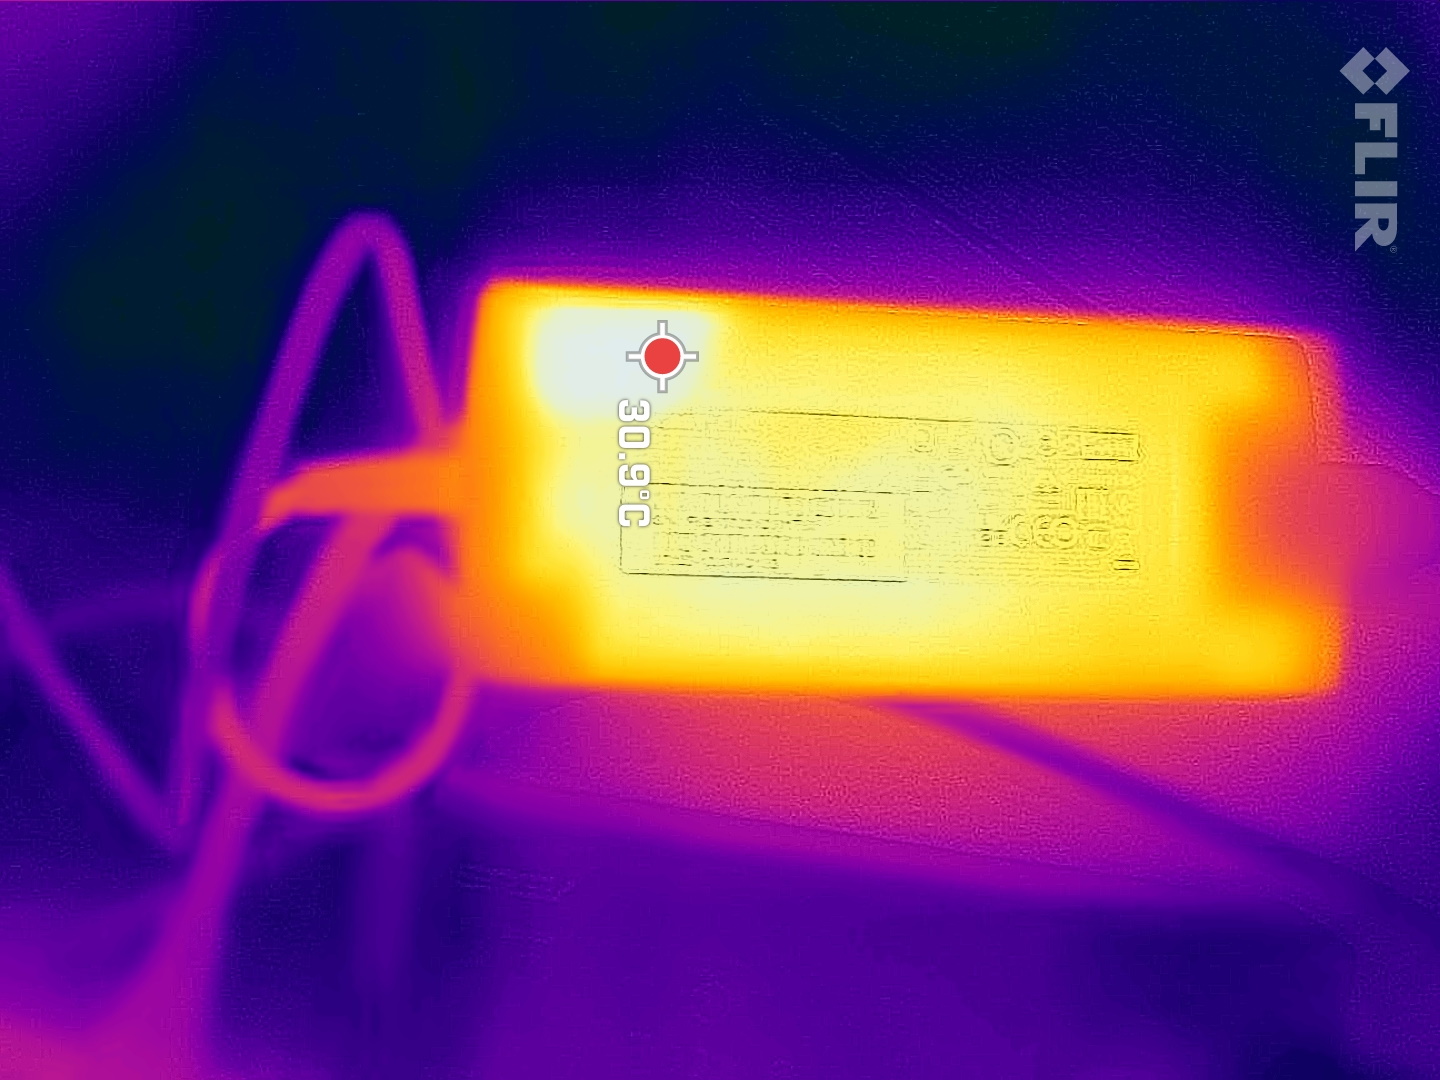
El consumo de energía del portátil Gigabyte es bueno. El Aero 14 es más eficiente que los dispositivos de la comparación en casi todas las mediciones. Gigabyte incluye una fuente de alimentación de 130w. El pequeño portátil sólo demanda esta potencia durante periodos muy cortos durante nuestras pruebas, por lo demás se queda en unos 120 vatios durante largos periodos en el test de estrés. En los resultados de esta medición, vemos claramente una caída repentina en el consumo de energía. Esto se debe posiblemente al cambio observado inicialmente entre los modos de rendimiento.
| Off / Standby | |
| Ocioso | |
| Carga |
|
Clave:
min: | |
| Gigabyte Aero 14 OLED BMF i7-13700H, GeForce RTX 4050 Laptop GPU, Gigabyte AG470S1TB-SI B10, OLED, 2880x1800, 14" | Schenker Vision 14 2022 RTX 3050 Ti i7-12700H, GeForce RTX 3050 Ti Laptop GPU, Samsung SSD 980 Pro 1TB MZ-V8P1T0BW, IPS, 2880x1800, 14" | Asus Zephyrus G14 GA401QM R9 5900HS, GeForce RTX 3060 Laptop GPU, SK Hynix HFM001TD3JX013N, IPS, 1920x1080, 14" | Acer Predator Triton 300 SE i9-12900H, GeForce RTX 3060 Laptop GPU, Micron 3400 1TB MTFDKBA1T0TFH, OLED, 2880x1800, 14" | Acer Swift X SFX14-51G-5876 i5-1240P, GeForce RTX 3050 4GB Laptop GPU, Micron 3400 MTFDKBA512TFH 512GB, IPS-LED, 2240x1400, 14" | MSI Katana 15 B12VEK i7-12650H, GeForce RTX 4050 Laptop GPU, Micron 2400 MTFDKBA1T0QFM, IPS, 1920x1080, 15.6" | Medio NVIDIA GeForce RTX 4050 Laptop GPU | Media de la clase Multimedia | |
|---|---|---|---|---|---|---|---|---|
| Power Consumption | -14% | -30% | -59% | -2% | -34% | -61% | -3% | |
| Idle Minimum * (Watt) | 7.4 | 7.5 -1% | 5.6 24% | 7.6 -3% | 7.3 1% | 8.5 -15% | 9.95 ? -34% | 5.66 ? 24% |
| Idle Average * (Watt) | 8.3 | 10.4 -25% | 10.4 -25% | 12.3 -48% | 8.3 -0% | 10.2 -23% | 15.8 ? -90% | 10.2 ? -23% |
| Idle Maximum * (Watt) | 8.7 | 11.4 -31% | 18 -107% | 17.6 -102% | 13.1 -51% | 11.3 -30% | 20.1 ? -131% | 12.5 ? -44% |
| Load Average * (Watt) | 76 | 83.3 -10% | 68 11% | 111 -46% | 70 8% | 84 -11% | 88 ? -16% | 65.2 ? 14% |
| Witcher 3 ultra * (Watt) | 70 | 92.7 -32% | 113 -61% | 117.1 -67% | 70.2 -0% | 128 -83% | ||
| Load Maximum * (Watt) | 132 | 110.3 16% | 158.2 -20% | 245.8 -86% | 95 28% | 189 -43% | 176.3 ? -34% | 113.5 ? 14% |
* ... más pequeño es mejor
Energieaufnahme Witcher 3 / Stresstest
Power consumption with an external monitor
Duración de la batería
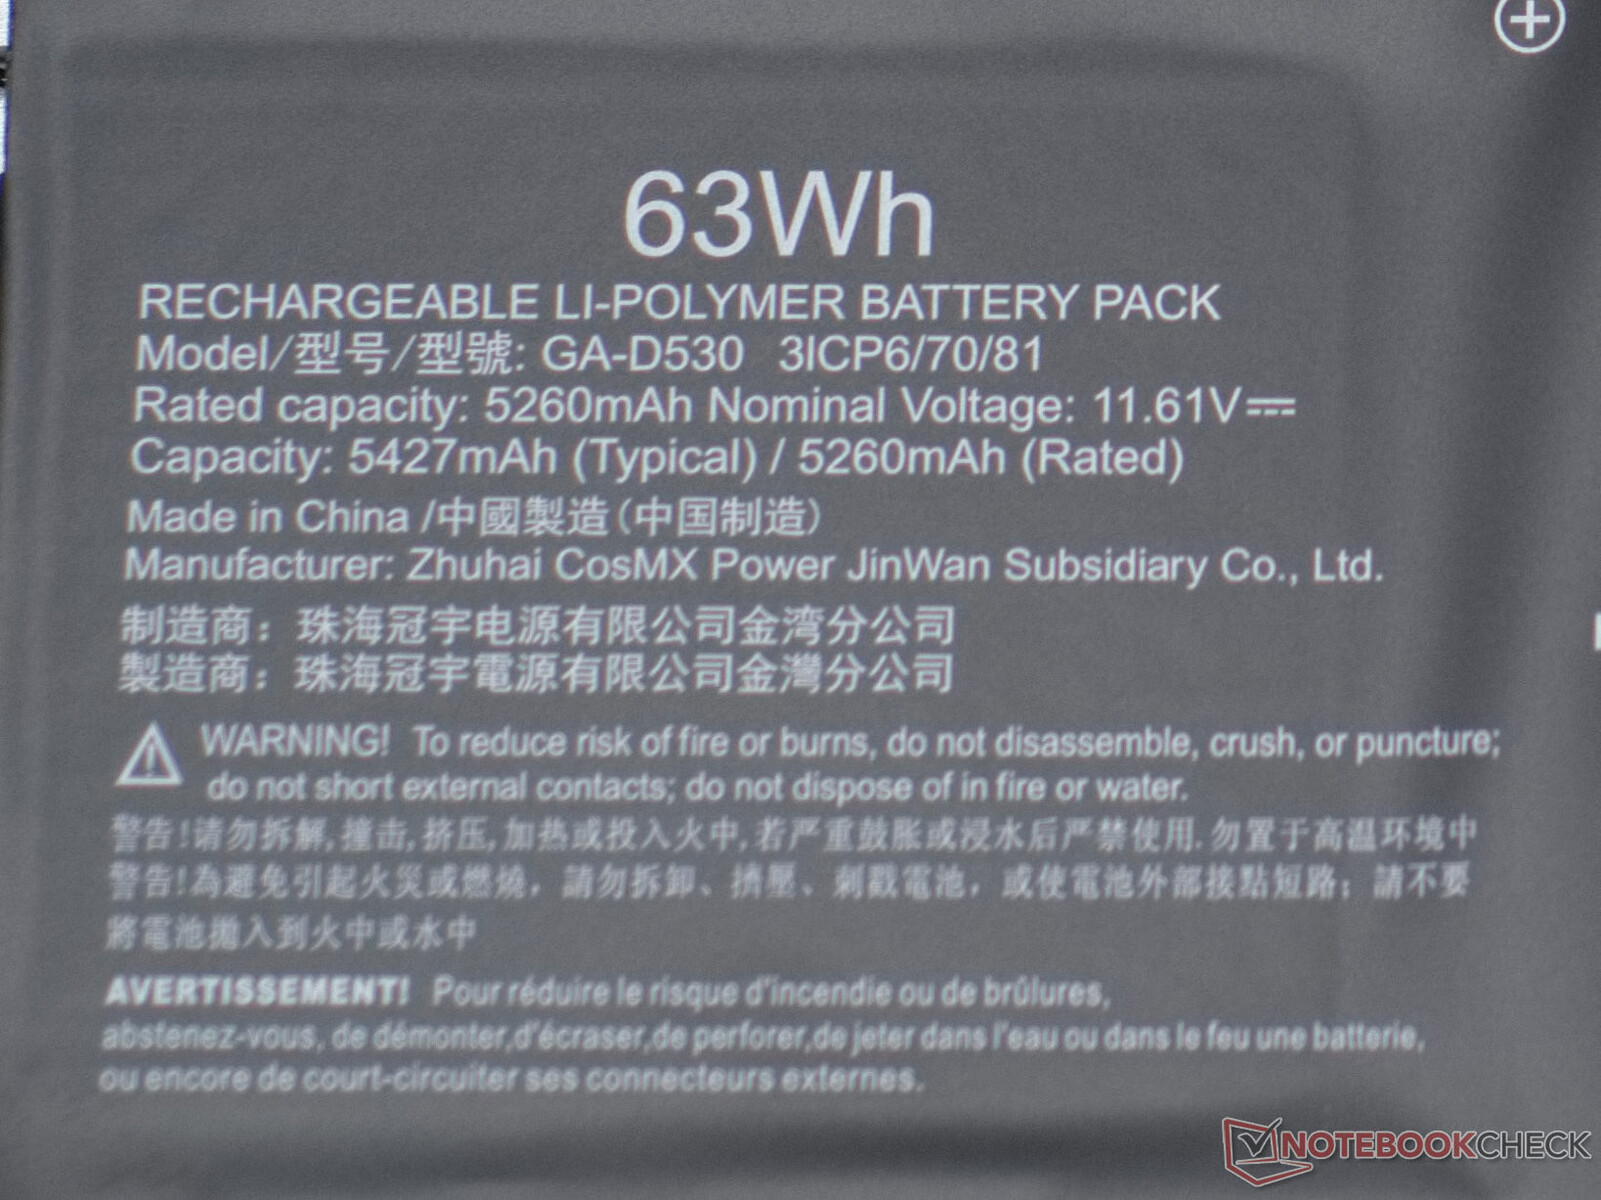
Como mucho, la batería de 63 Wh del Gigabyte Aero 14 OLED duró más de 7.5 horas en el test de navegación web Wi-Fi, pero sólo tras reinstalar por completo el Gigabyte Control Center. Antes de eso, sólo fueron posibles tres horas de duración con un brillo de pantalla de 150 cd/m². Aunque el Aero 14 casi tiene la batería más pequeña de la comparativa, funciona con bastante eficiencia.
| Gigabyte Aero 14 OLED BMF i7-13700H, GeForce RTX 4050 Laptop GPU, 63 Wh | Schenker Vision 14 2022 RTX 3050 Ti i7-12700H, GeForce RTX 3050 Ti Laptop GPU, 99.8 Wh | MSI Stealth 14 Studio A13V i7-13700H, GeForce RTX 4050 Laptop GPU, 72 Wh | Lenovo Yoga Pro 7 14IRH G8 i7-13700H, GeForce RTX 4050 Laptop GPU, 73 Wh | Asus Zephyrus G14 GA401QM R9 5900HS, GeForce RTX 3060 Laptop GPU, 76 Wh | Acer Predator Triton 300 SE i9-12900H, GeForce RTX 3060 Laptop GPU, 76 Wh | Acer Swift X SFX14-51G-5876 i5-1240P, GeForce RTX 3050 4GB Laptop GPU, 58.7 Wh | Media de la clase Multimedia | |
|---|---|---|---|---|---|---|---|---|
| Duración de Batería | 37% | -19% | -9% | 45% | -20% | 17% | 64% | |
| Reader / Idle (h) | 11.3 | 21 86% | 8.1 -28% | 24.9 ? 120% | ||||
| WiFi v1.3 (h) | 7.6 | 10.1 33% | 6.3 -17% | 9.9 30% | 11.8 55% | 6.2 -18% | 10.7 41% | 12.2 ? 61% |
| Load (h) | 1.5 | 2.1 40% | 1.2 -20% | 0.8 -47% | 1.4 -7% | 1.3 -13% | 1.4 -7% | 1.664 ? 11% |
| H.264 (h) | 11.1 | 6.6 | 12.4 | 12.3 | 17.1 ? |
Pro
Contra
Veredicto - Concepto sólido con demasiados inconvenientes
En cuanto al hardware del portátil, el Gigabyte Aero 14 OLED convence con un chasis estable que alberga un Core Core i7-13700H y una GeForce RTX 4050. Ambos no funcionan a su TDP máximo, pero nuestras pruebas muestran que 40 y 35 vatios para la CPU y la dGPU, respectivamente, son adecuados para ofrecer un rendimiento sólido. La pantalla OLED del Areo 14 ofrece una buena reproducción del color en determinadas circunstancias. Sin embargo, las limitaciones de brillo de 162 cd/m² en modo calibrado requieren un entorno oscuro para lograr una buena legibilidad. Por otro lado, el excelente teclado es un claro punto a favor. Un recorrido de tecla de 1,7 mm es una rareza, especialmente para portátiles pequeños.
El software de control de Gigabyte es otra historia: el Centro de Control es sencillamente decepcionante. Es tan desordenado como propenso a errores. Obviamente, esto merma nuestra impresión general del portátil. Lo mismo cabe decir de la conectividad en términos de USB-C y PowerDelivery. Otras fuentes de alimentación USB-PD simplemente no quieren cooperar con el portátil. Así, el factor de movilidad del portátil sufre aquí.
Con un Intel Core i7-13700H y Nvidia GeForce RTX 4050, el potente hardware está integrado en el portátil de 14". A pesar de un suministro de 75 vatios, sigue ofreciendo un rendimiento decente. En cambio, el Aero 14 OLED se ve ralentizado por el propio software de Gigabyte.
Básicamente, Gigabyte posiciona el Aero 14 OLED en un atractivo espectro de precio-rendimiento: tienes un potente dispositivo por 1.699,00 US$. Sin embargo, todos los dispositivos de referencia del año pasado están ahora disponibles a precios sensiblemente inferiores. El Acer Predator Triton 300 ofrece menos rendimiento que el Gigabyte Aero en términos de duración de la batería, pero cuesta sólo 1.179,99 US$. El Schenker Vision 14 también tiene un precio similar. Dada la falta de mejoras entre la 12ª y la 13ª generación de Intel, también merece la pena echar un vistazo a otros portátiles de 14 pulgadas del año pasado.
Precio y disponibilidad
El Gigabyte Aero 14 OLED BMF está listado actualmente en Amazon USA por US$1.699,00.
Se recomienda a los compradores interesados de otros países que consulten directamente la página oficial del producto de Gigabyte aquí. Haga clic en "Comprar" y seleccione su país en la lista desplegable que aparece, después de lo cual se le remitirá a una lista de tiendas en línea y minoristas aplicables en el país seleccionado.
Los precios son los vigentes a 05.05.2023 y están sujetos a cambios.
Gigabyte Aero 14 OLED BMF
- 05/02/2023 v7 (old)
Marc Herter
Transparencia
La selección de los dispositivos que se van a reseñar corre a cargo de nuestro equipo editorial. La muestra de prueba fue proporcionada al autor en calidad de préstamo por el fabricante o el minorista a los efectos de esta reseña. El prestamista no tuvo ninguna influencia en esta reseña, ni el fabricante recibió una copia de la misma antes de su publicación. No había ninguna obligación de publicar esta reseña. Como empresa de medios independiente, Notebookcheck no está sujeta a la autoridad de fabricantes, minoristas o editores.
Así es como prueba Notebookcheck
Cada año, Notebookcheck revisa de forma independiente cientos de portátiles y smartphones utilizando procedimientos estandarizados para asegurar que todos los resultados son comparables. Hemos desarrollado continuamente nuestros métodos de prueba durante unos 20 años y hemos establecido los estándares de la industria en el proceso. En nuestros laboratorios de pruebas, técnicos y editores experimentados utilizan equipos de medición de alta calidad. Estas pruebas implican un proceso de validación en varias fases. Nuestro complejo sistema de clasificación se basa en cientos de mediciones y puntos de referencia bien fundamentados, lo que mantiene la objetividad.Price comparison

