Análisis del MSI Stealth 14 Studio - Un portátil para juegos caro que ha hecho demasiados compromisos
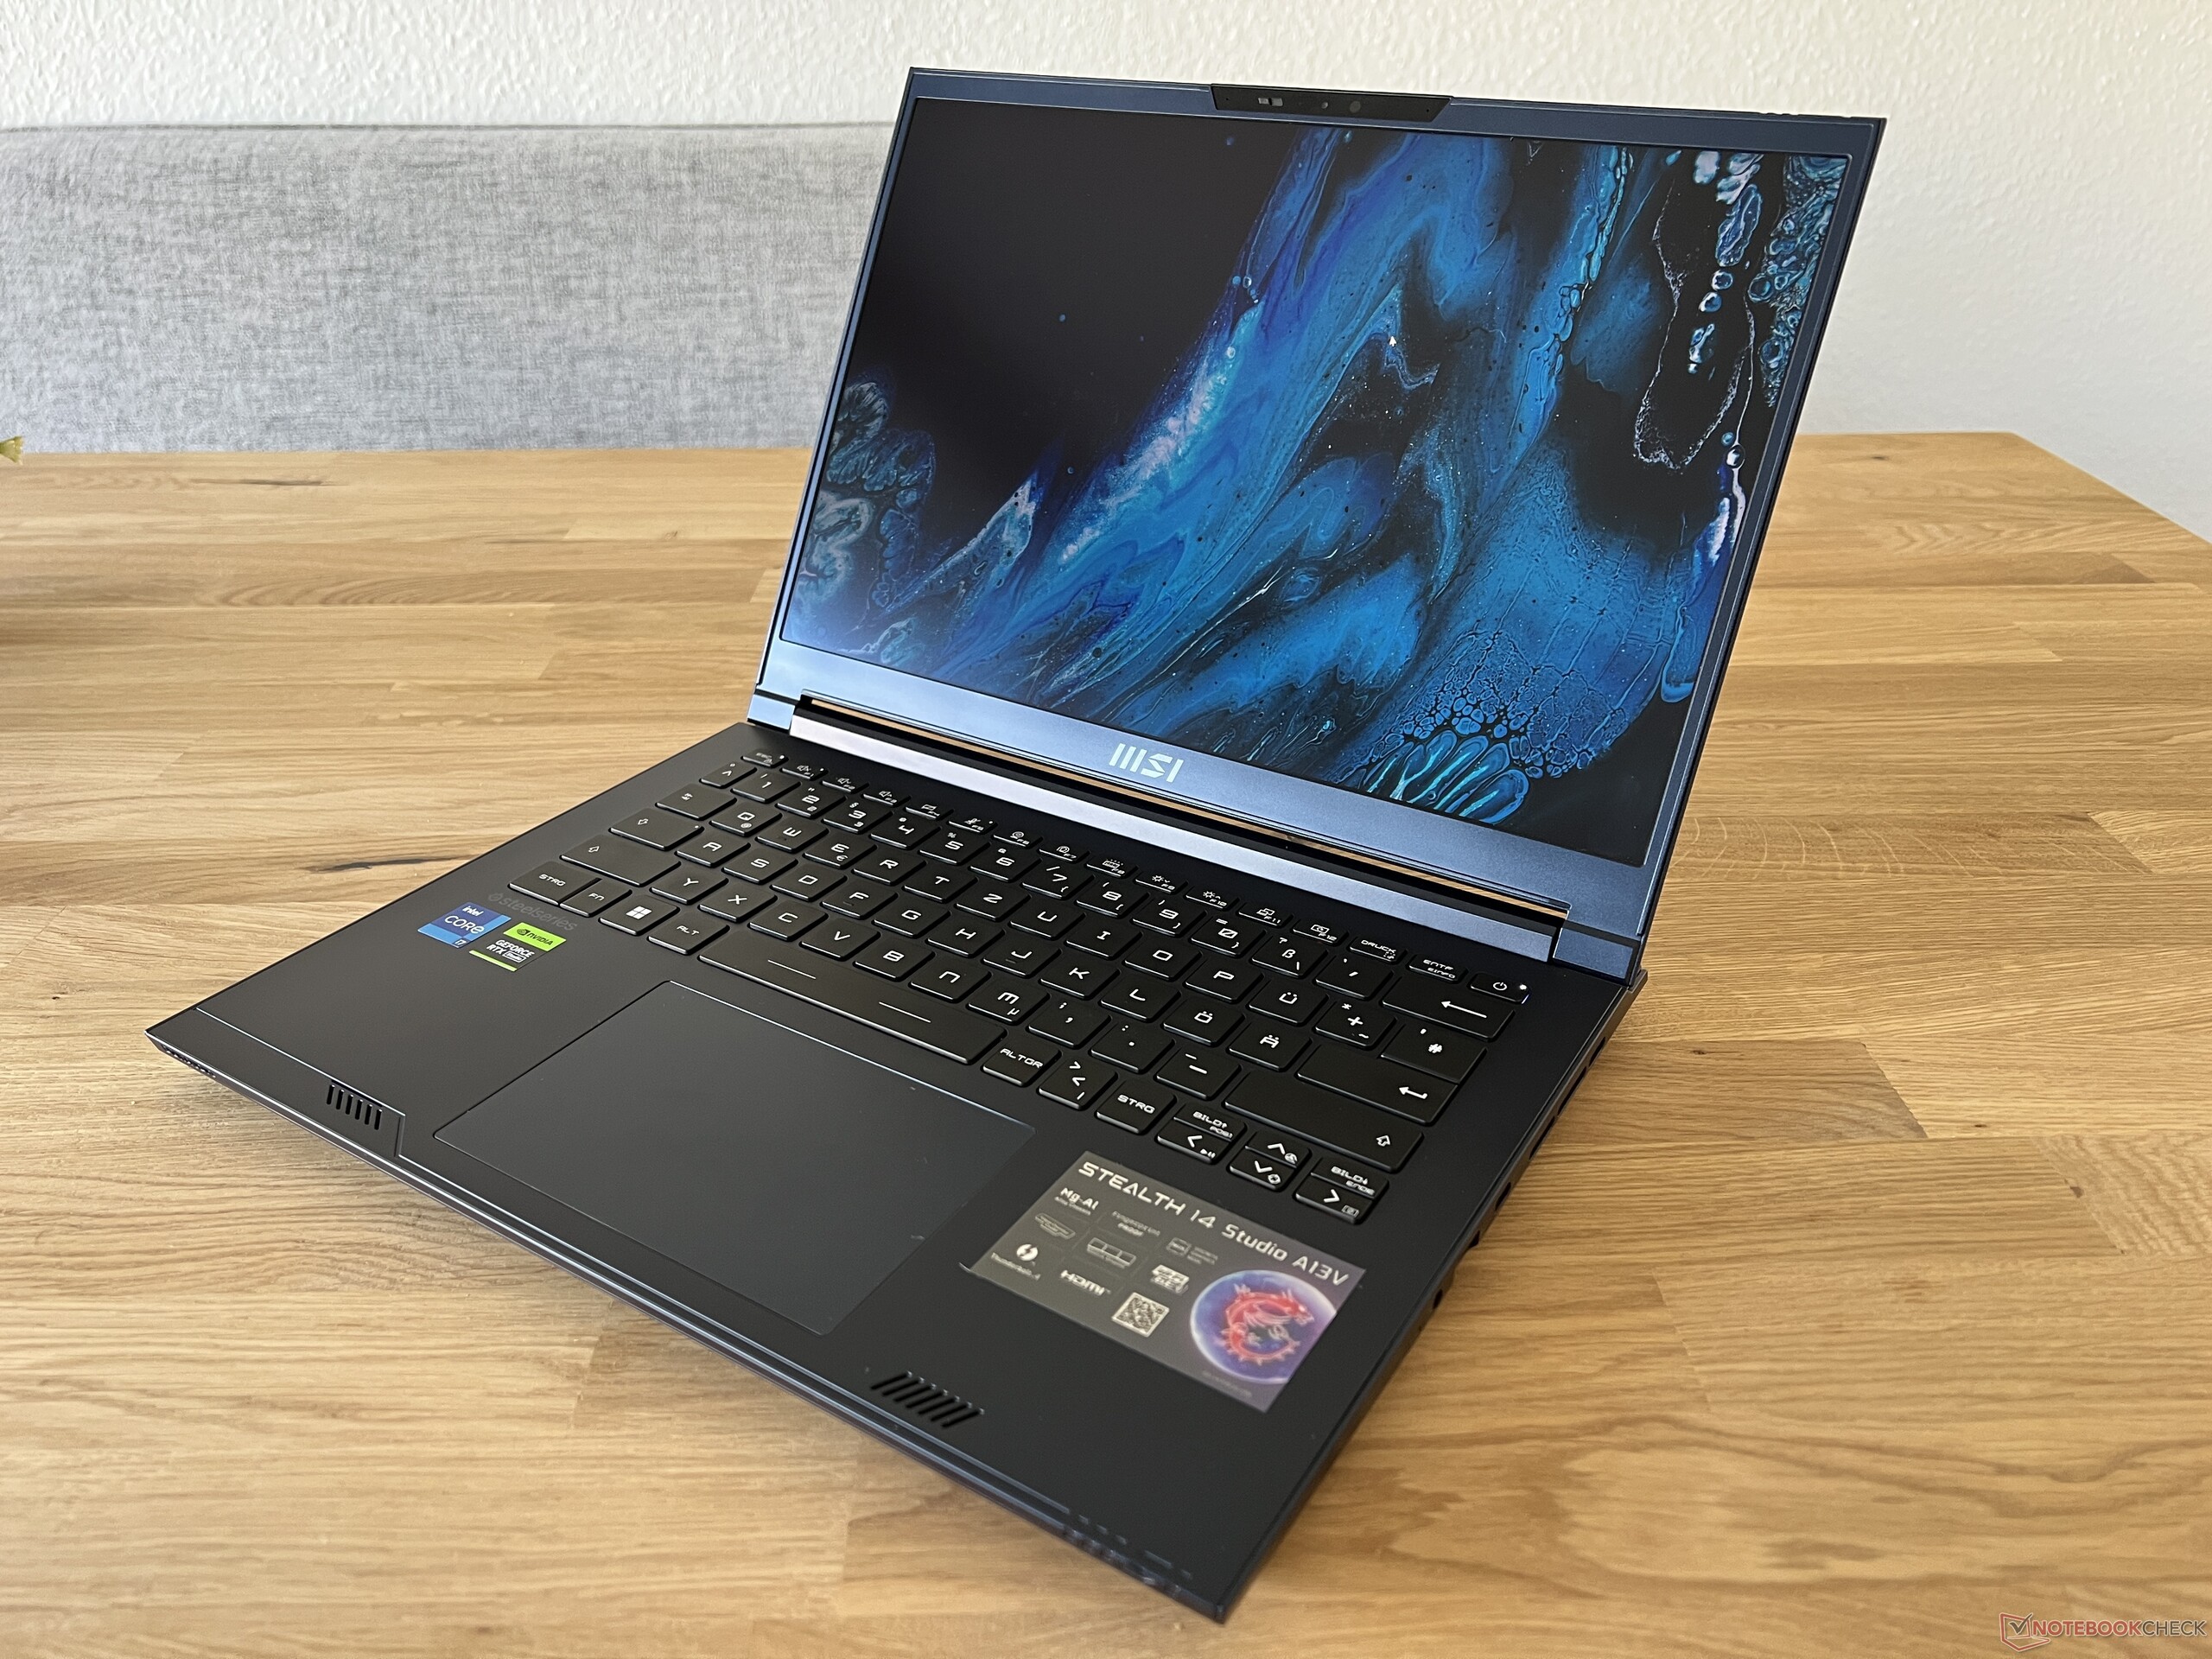
El MSI Stealth 14 Studio pretende ser un portátil gaming de 14 pulgadas compacto pero potente, que también pretende hablar a los creadores de contenido - o a cualquier usuario que busque buenos niveles de rendimiento dentro de una carcasa pequeña. El fabricante ha confiado en su receta de eficacia probada, combinando los chips Intel Raptor Lake de la serie de construcción H45 con los nuevos portátiles RTX 4000 de Nvidia. Nuestro dispositivo de pruebas es un Stealth 14 Studio A13VE-029, y por 1.699,99 dólares, ofrece unCore i7-13700HelGeForce RTX 4050 portátil, 16 GB de RAM, así como un SSD NVMe de 1 TB. Cuenta con un panel IPS mate (2.560 x 1.600 píxeles) con una frecuencia de actualización de 240 Hz. Opcionalmente, el Stealth 14 Studio puede adquirirse con elPortátil RTX 4070y 32 GB de RAM.
Posibles contendientes en la comparación
Valoración | Fecha | Modelo | Peso | Altura | Tamaño | Resolución | Precio |
|---|---|---|---|---|---|---|---|
| 85.4 % v7 (old) | 07/2023 | MSI Stealth 14 Studio A13V i7-13700H, GeForce RTX 4050 Laptop GPU | 1.7 kg | 19 mm | 14.00" | 2560x1600 | |
| 89.4 % v7 (old) | 05/2023 | Gigabyte Aero 14 OLED BMF i7-13700H, GeForce RTX 4050 Laptop GPU | 1.4 kg | 17 mm | 14.00" | 2880x1800 | |
| 88.8 % v7 (old) | 10/2022 | Schenker Vision 14 2022 RTX 3050 Ti i7-12700H, GeForce RTX 3050 Ti Laptop GPU | 1.3 kg | 16.6 mm | 14.00" | 2880x1800 | |
| 86.8 % v7 (old) | 03/2022 | Asus ROG Flow Z13 GZ301ZE i9-12900H, GeForce RTX 3050 Ti Laptop GPU | 1.2 kg | 12 mm | 13.40" | 1920x1200 | |
| 86.7 % v7 (old) | 03/2022 | Alienware x14 i7 RTX 3060 i7-12700H, GeForce RTX 3060 Laptop GPU | 1.8 kg | 14.5 mm | 14.00" | 1920x1080 | |
| 89.4 % v7 (old) | 05/2022 | Razer Blade 14 Ryzen 9 6900HX R9 6900HX, GeForce RTX 3070 Ti Laptop GPU | 1.8 kg | 16.8 mm | 14.00" | 2560x1440 | |
| 86 % v7 (old) | 11/2022 | Acer Predator Triton 300 SE i9-12900H, GeForce RTX 3060 Laptop GPU | 1.7 kg | 19.8 mm | 14.00" | 2880x1800 |
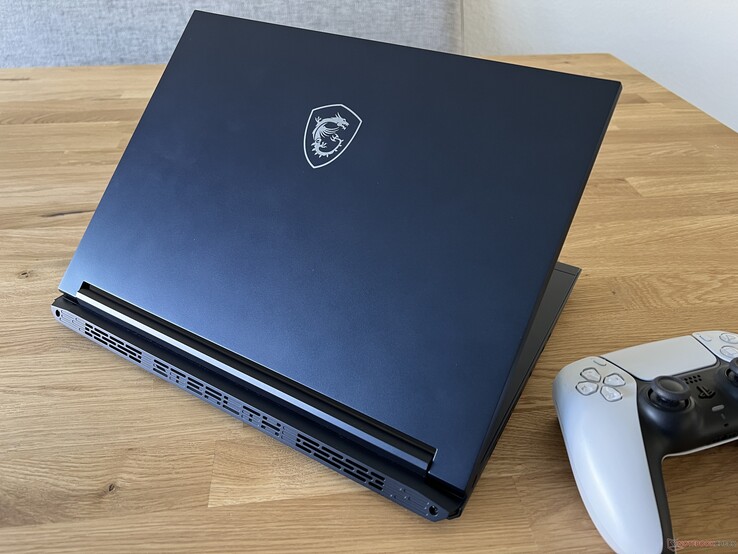
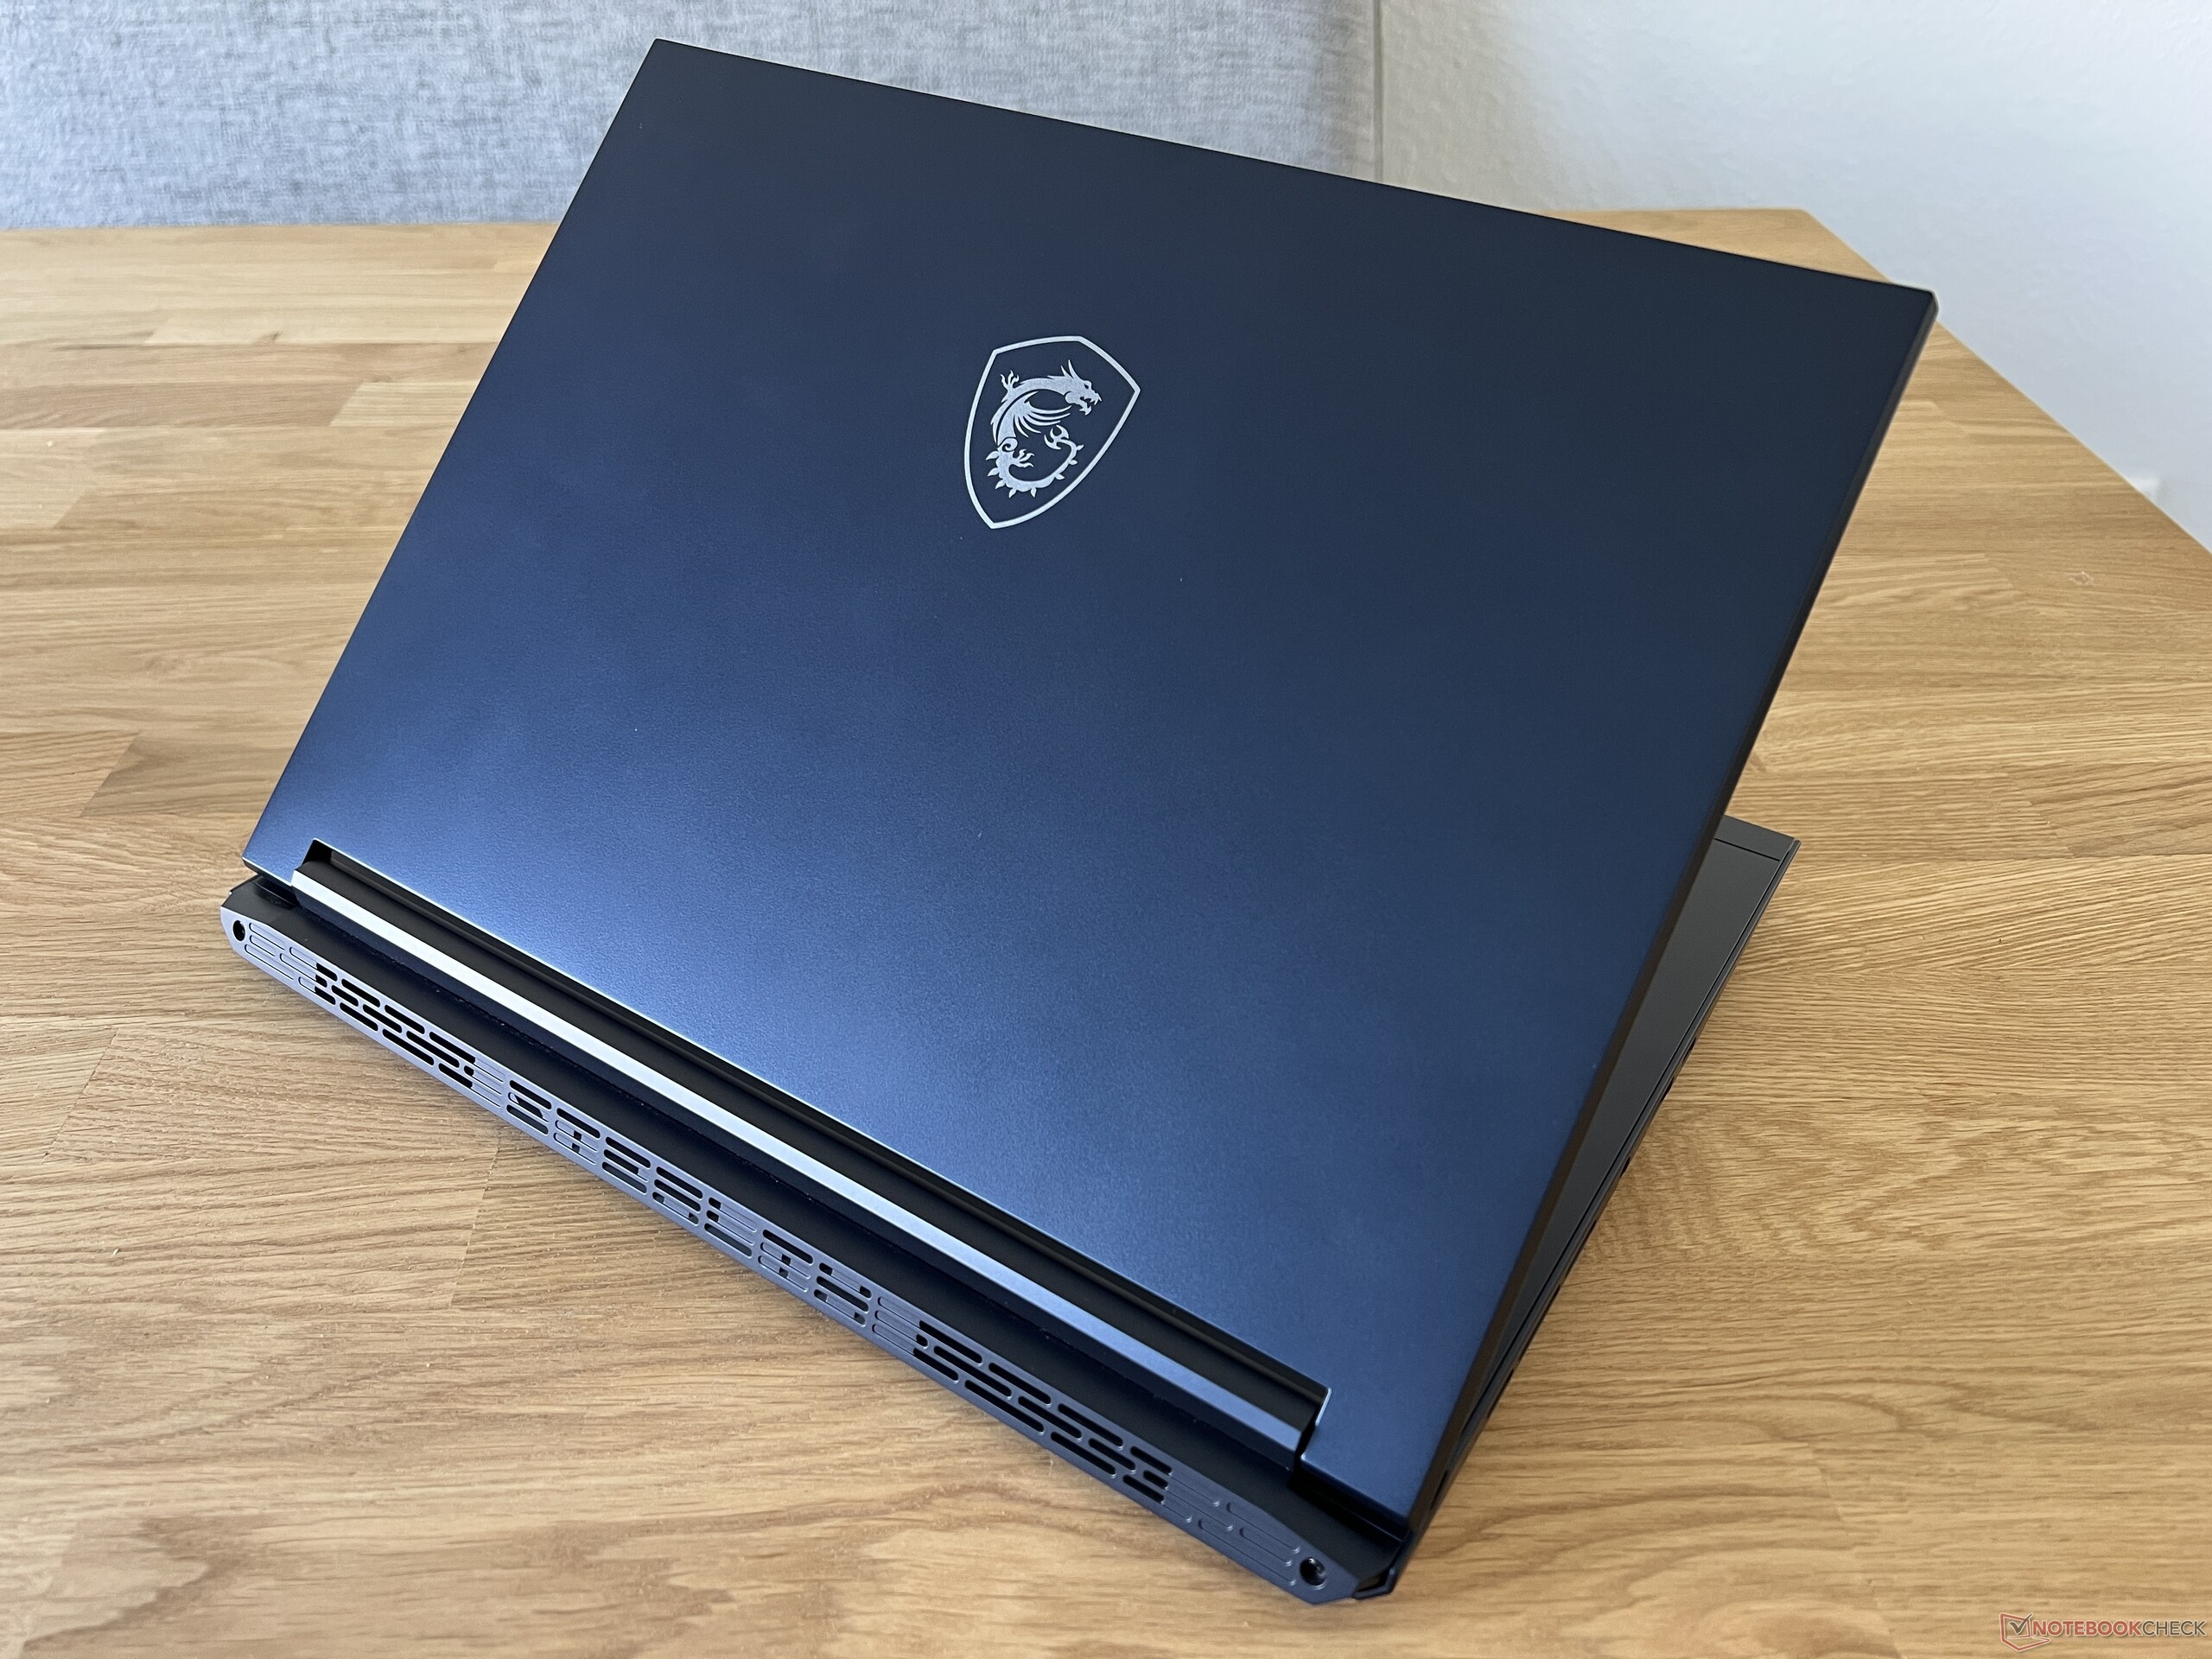
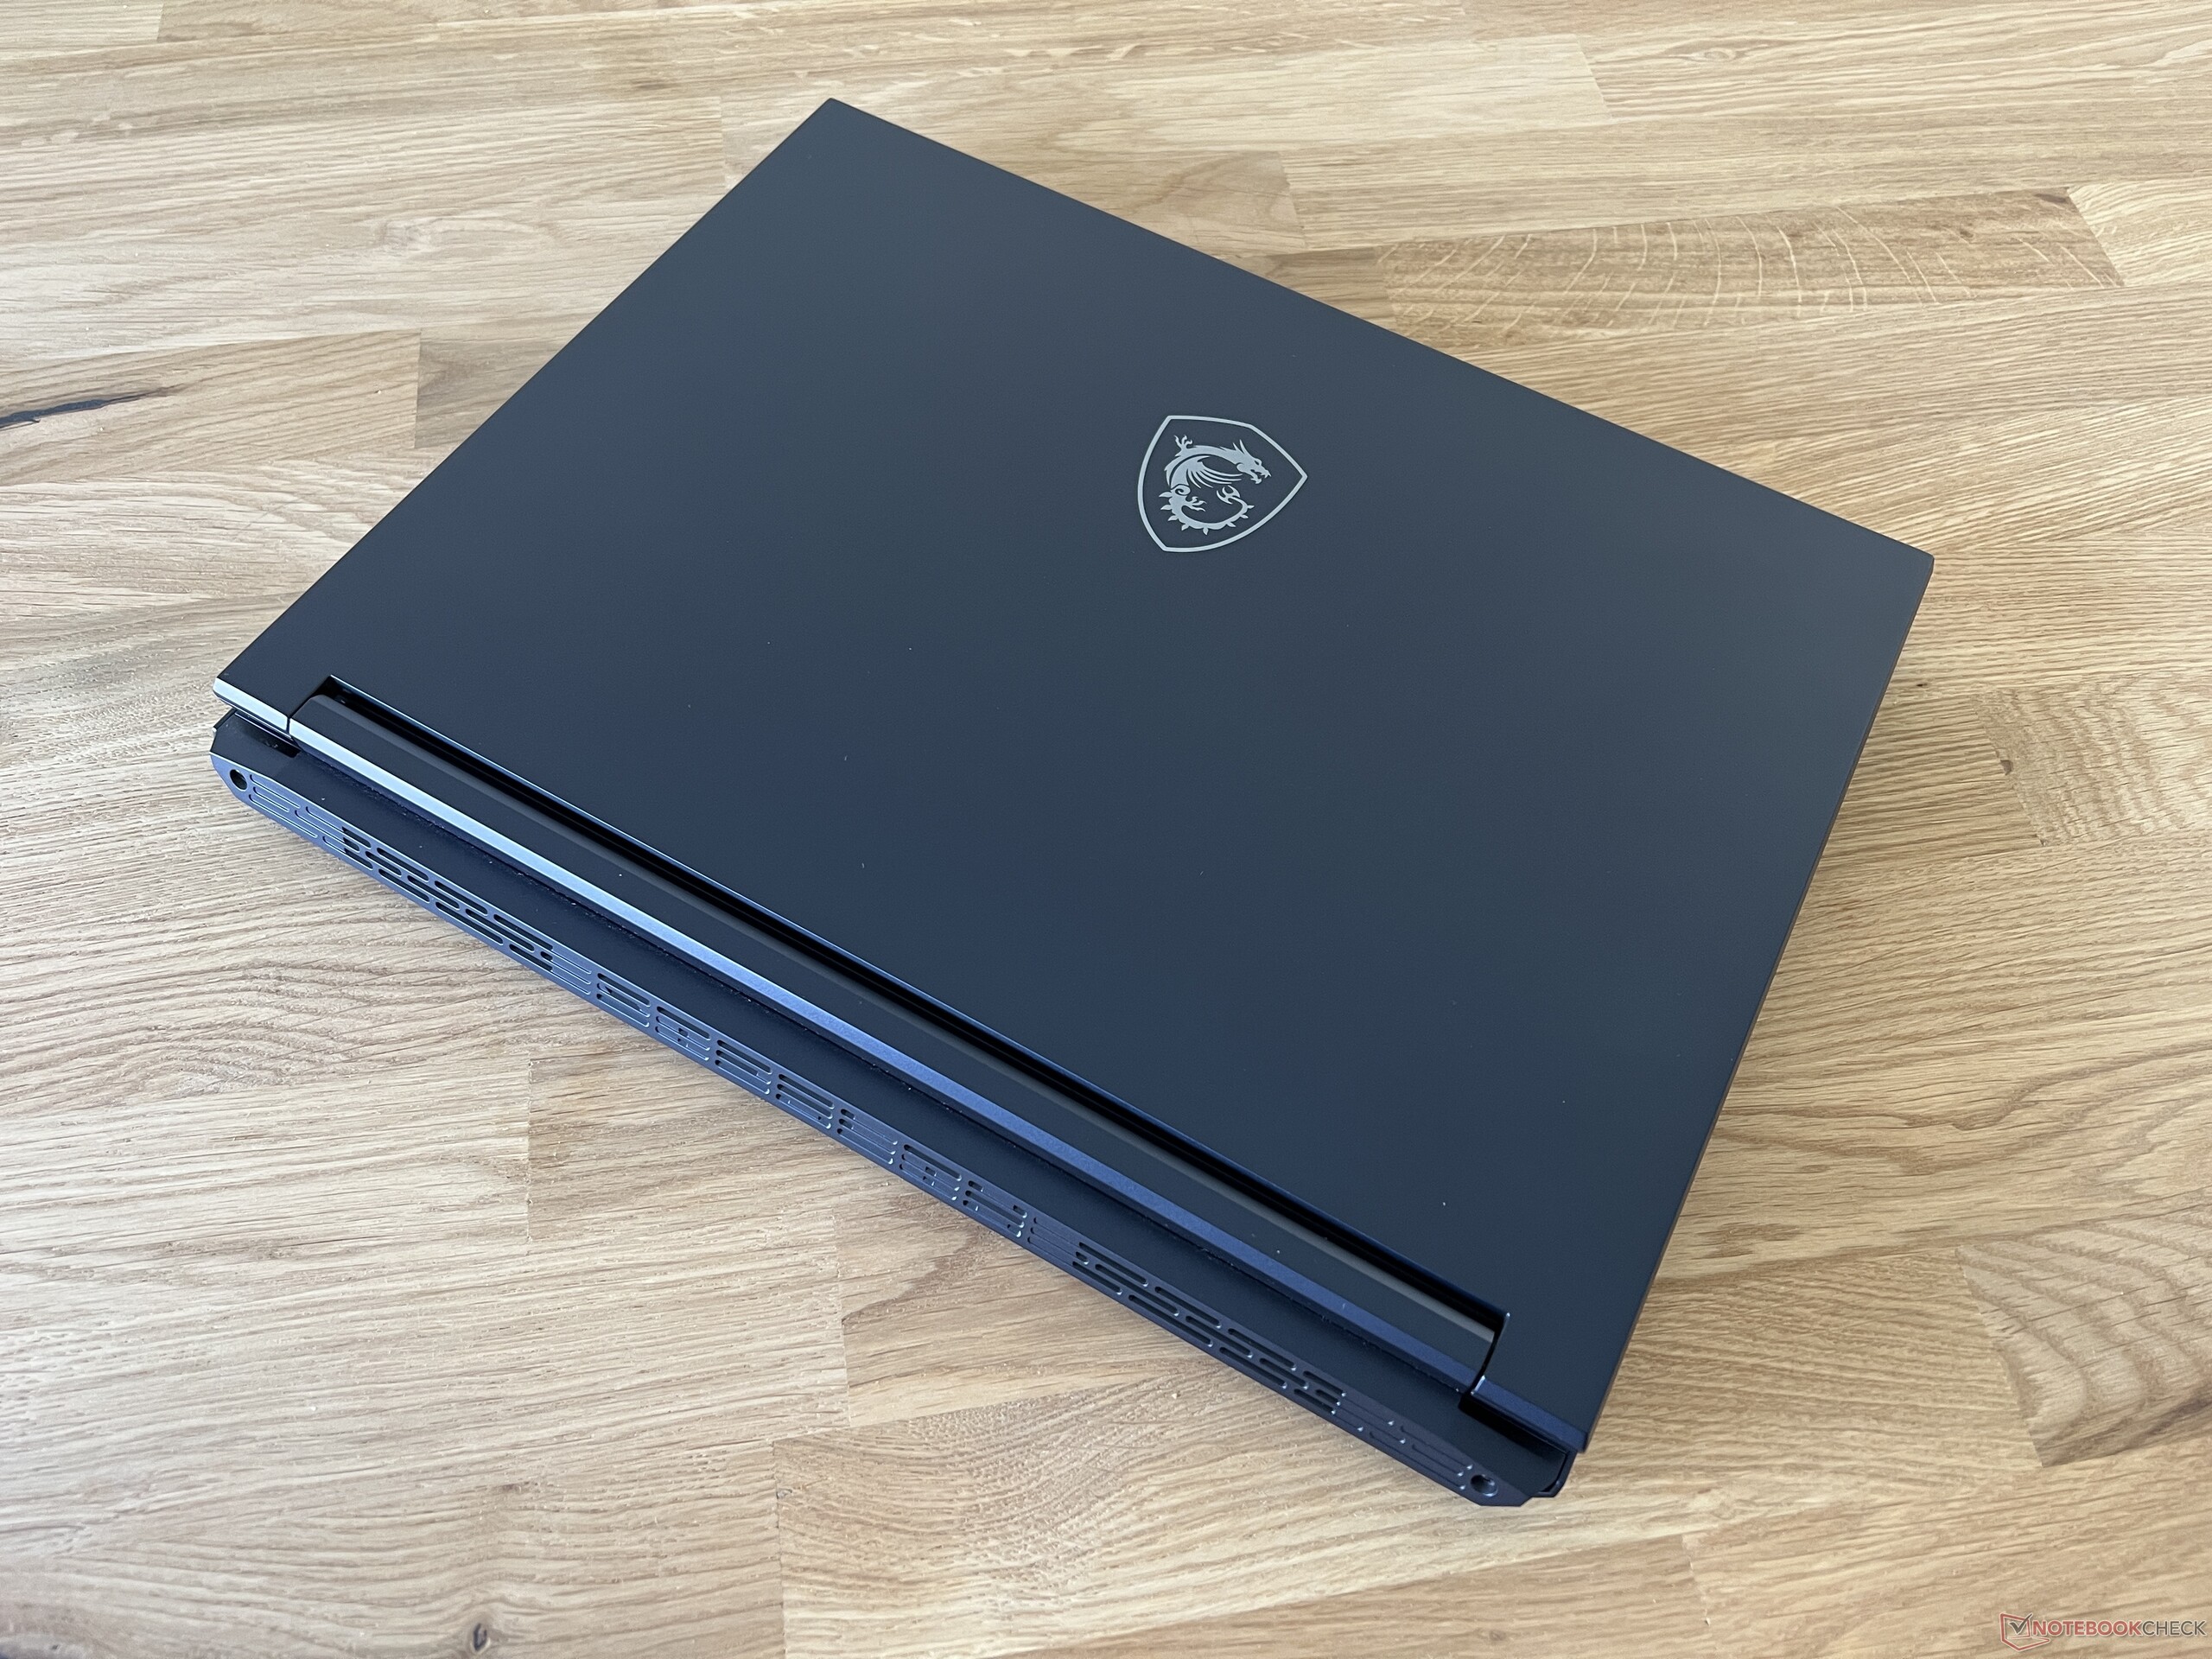
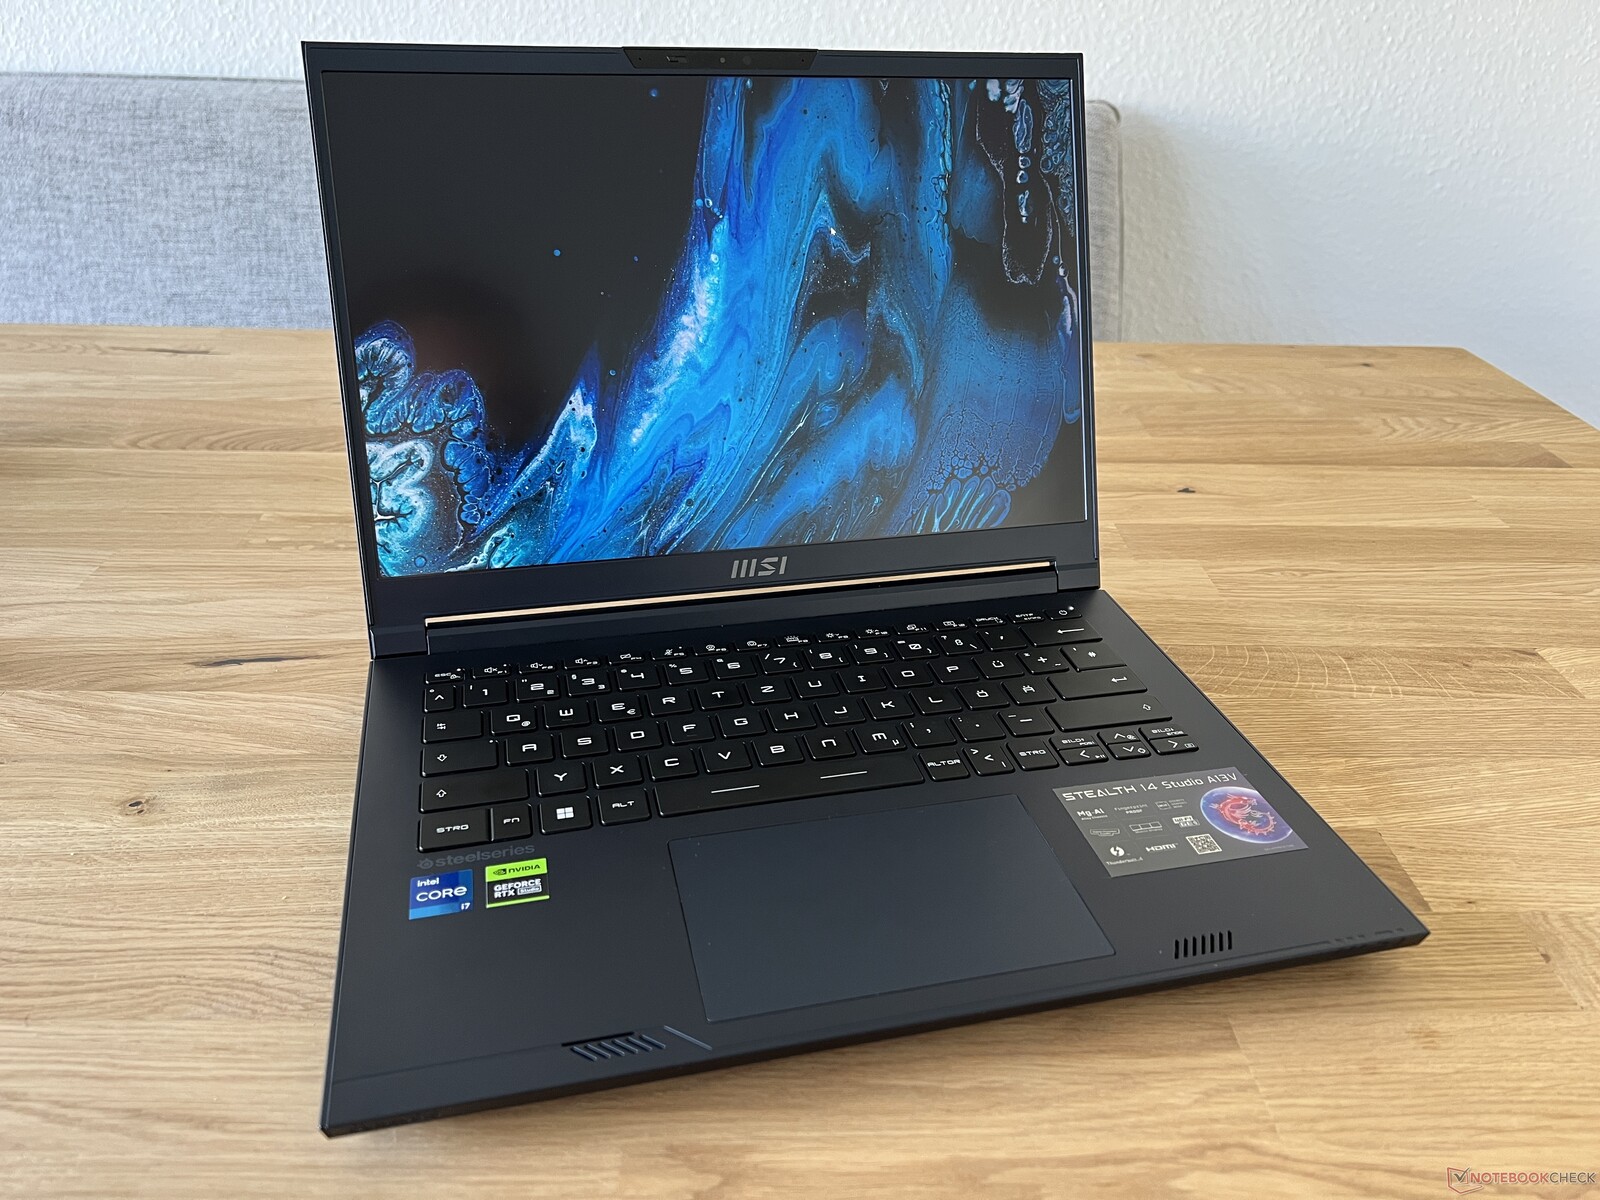
Caja - Metal azul o blanco
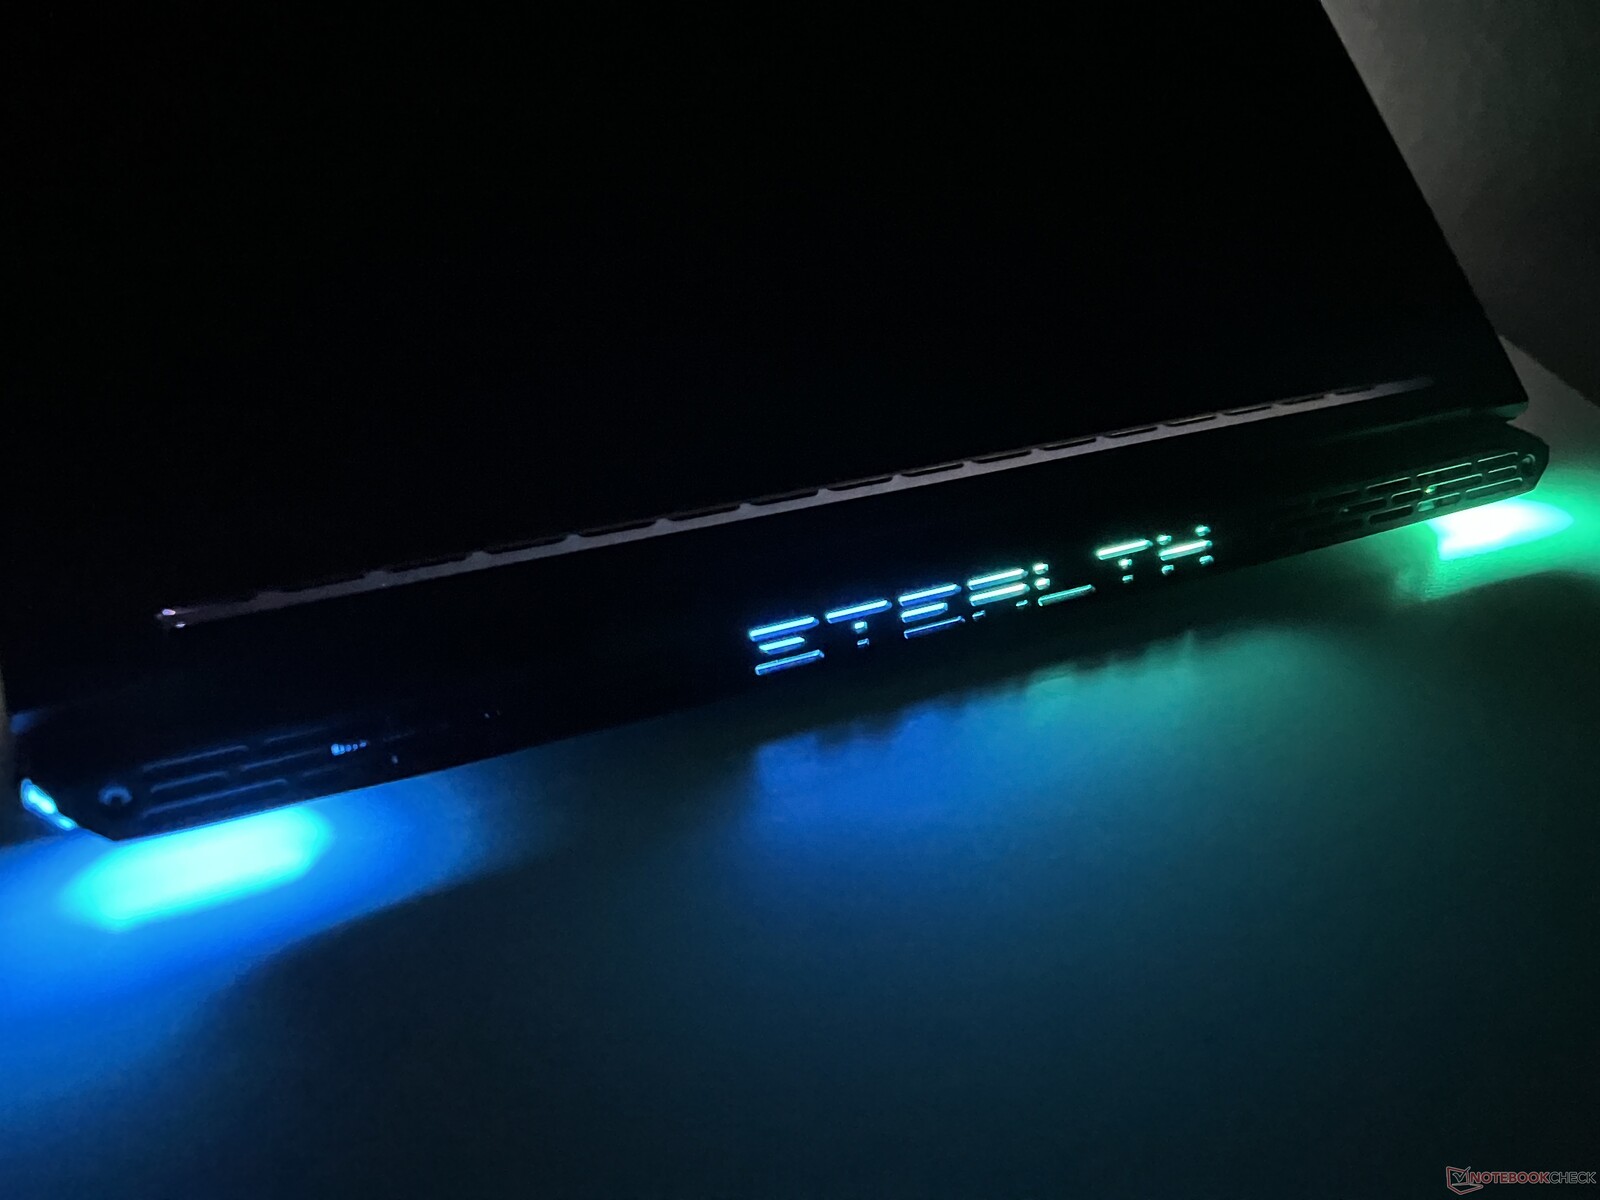
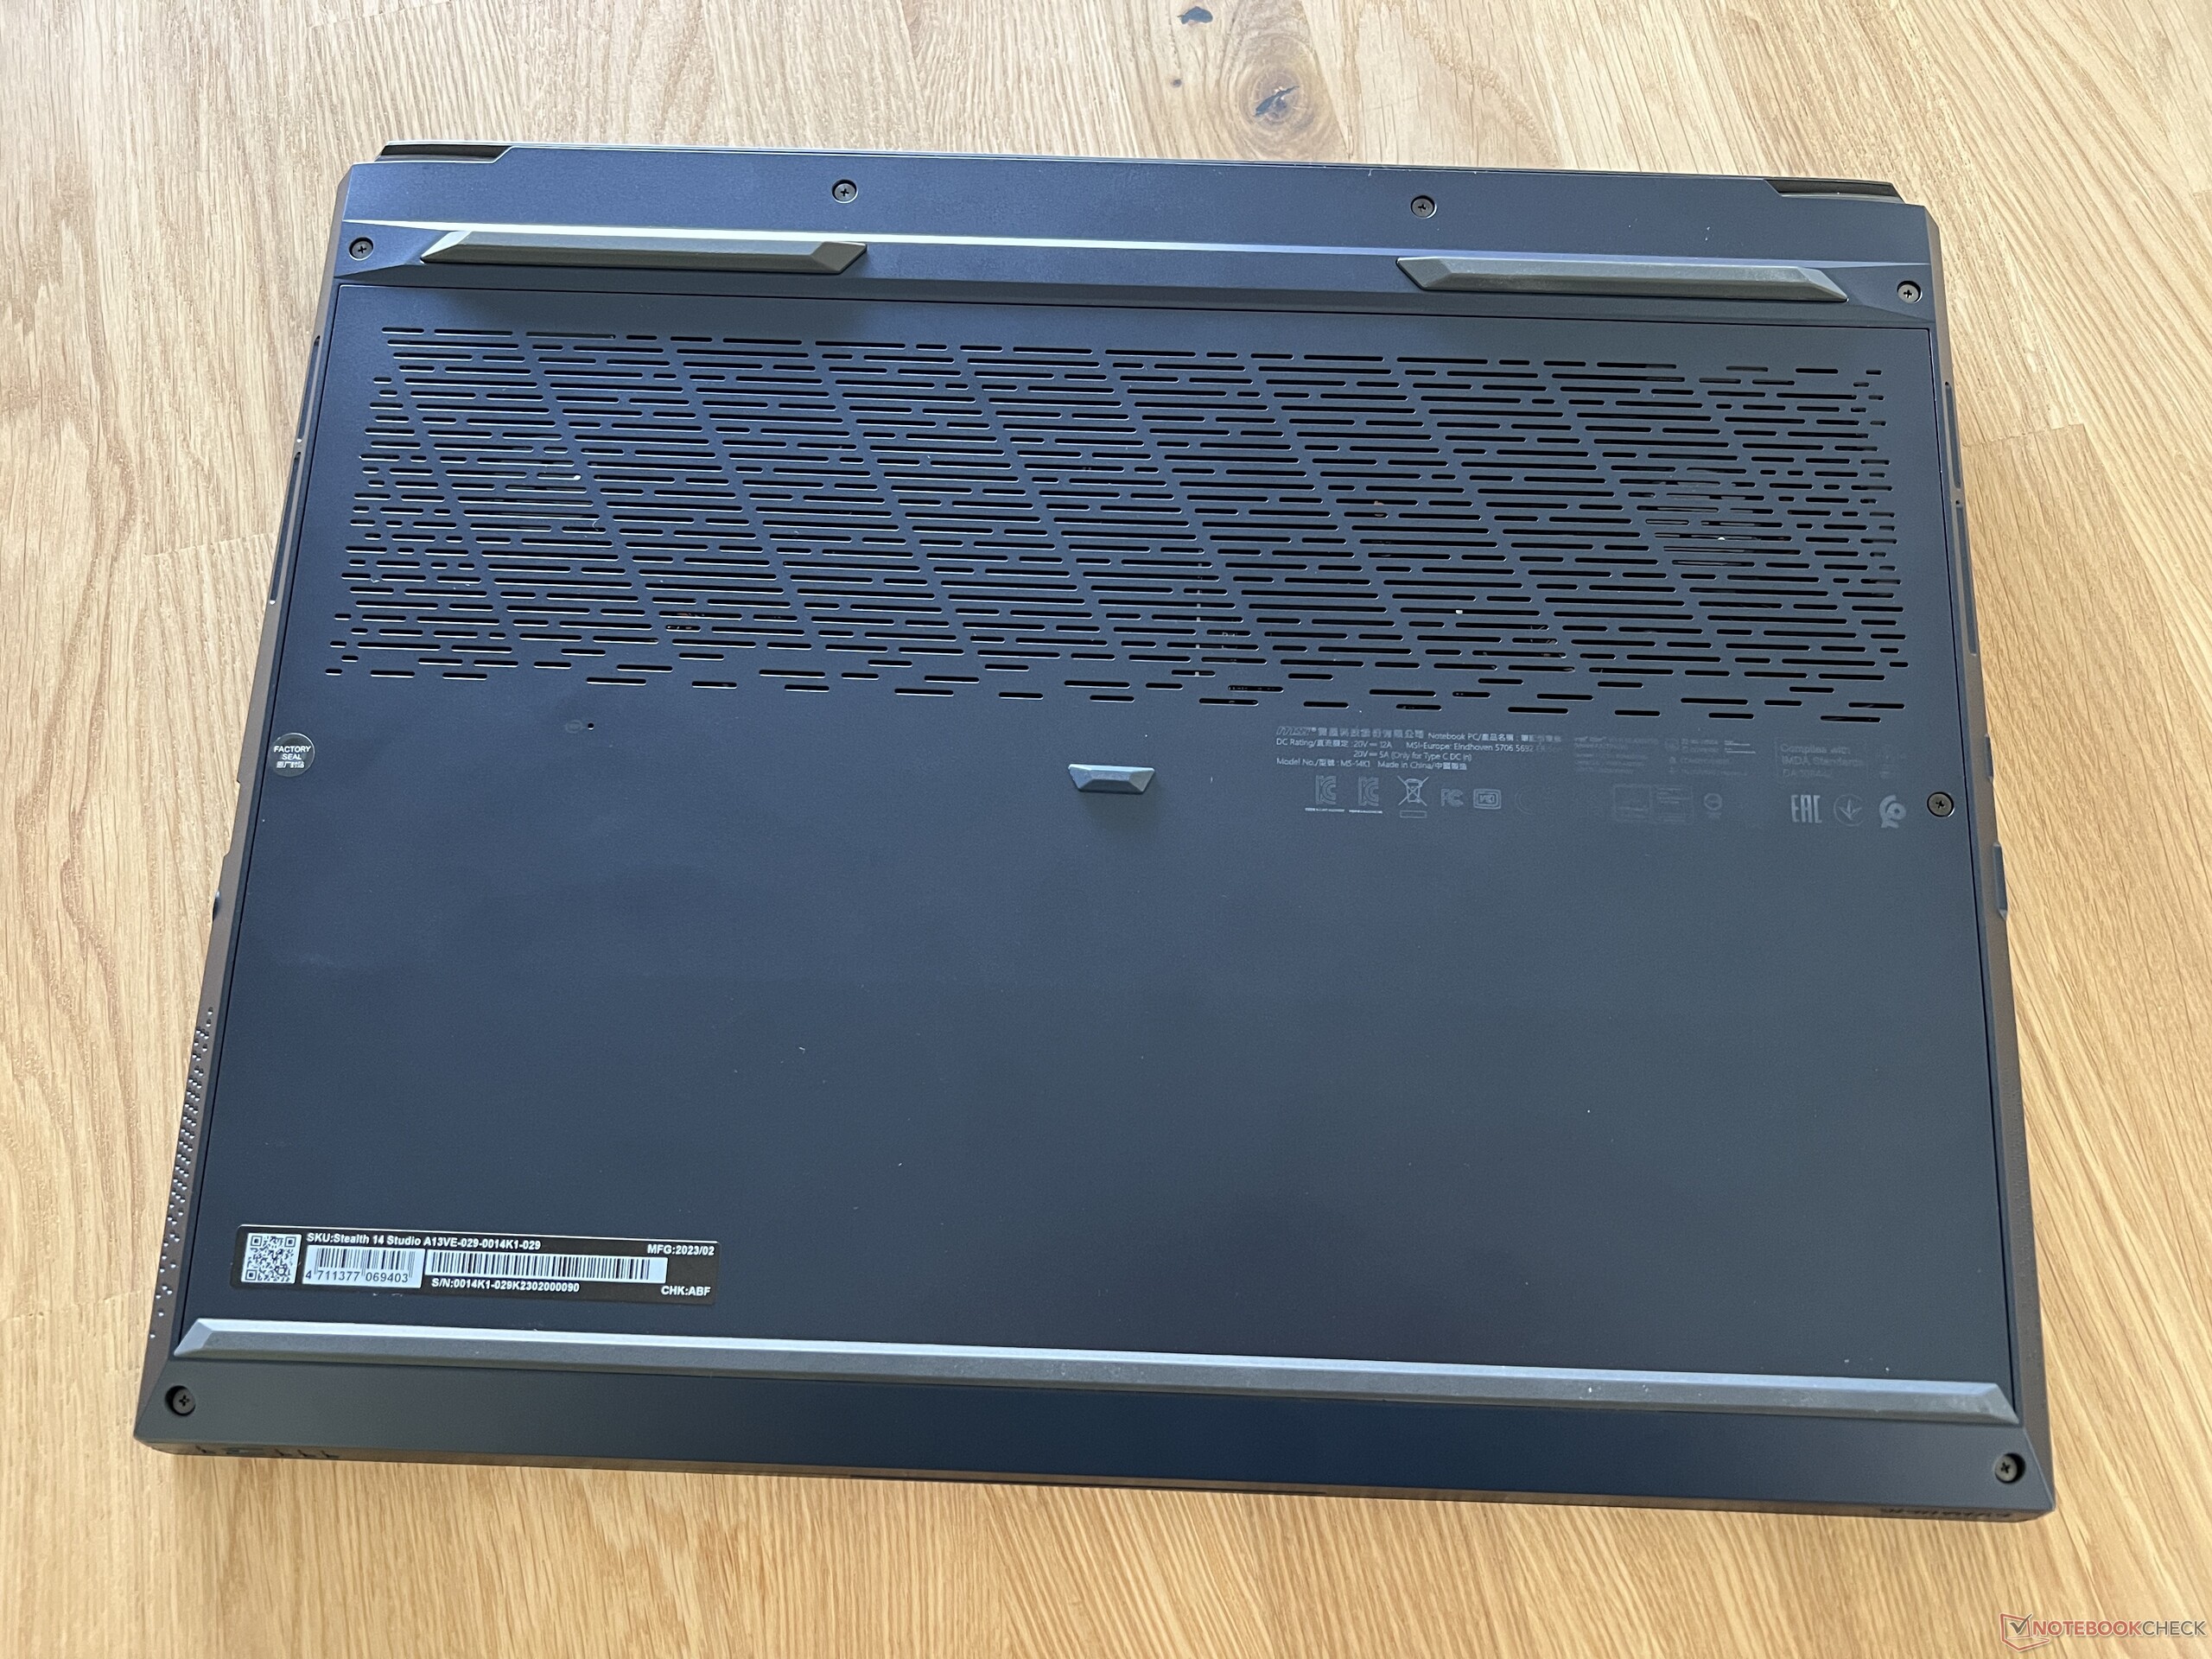
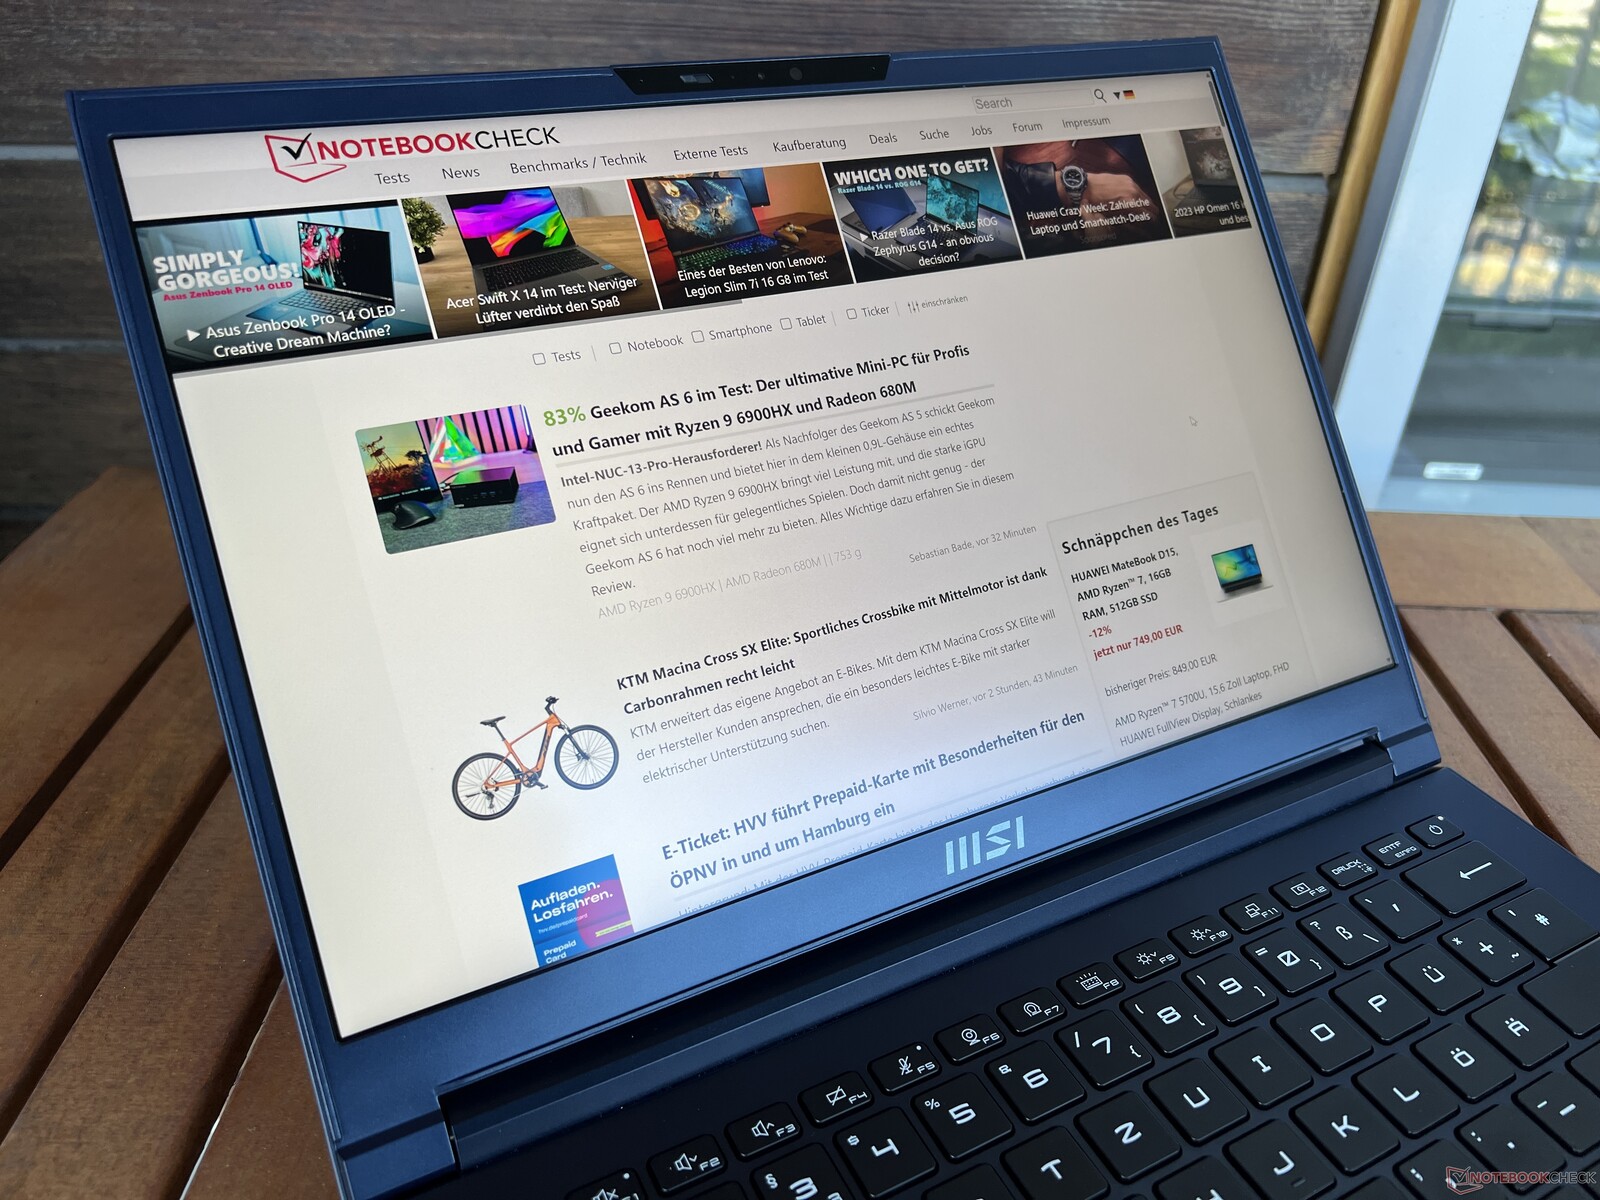
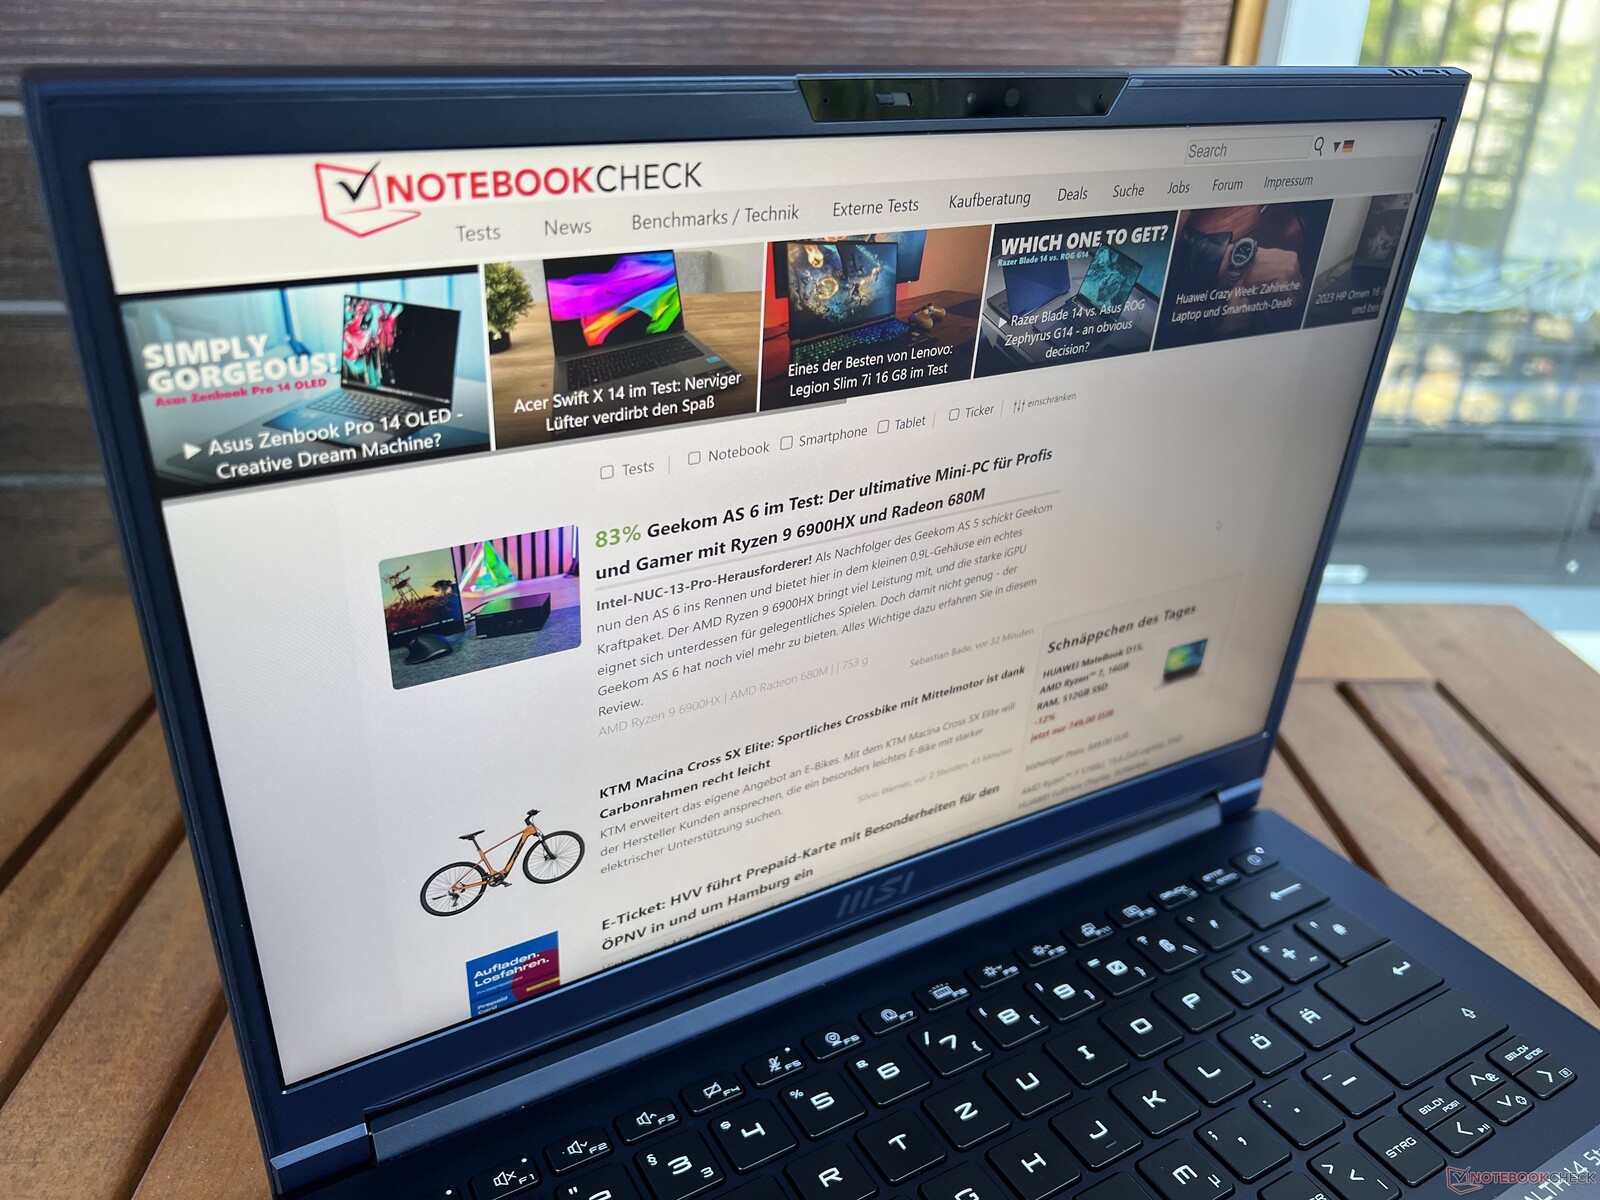
MSI ofrece el Stealth 14 Studio en azul oscuro o blanco. Estamos probando el modelo azul que parece bastante elegante pero tiene tendencia a mostrar bastantes marcas de huellas dactilares. Para un portátil de juegos, este diseño es en realidad bastante reservado - el logo del dragón en la tapa es lo único que llama la atención de la serie del dispositivo. En la parte trasera, hay algunos elementos de iluminación adicionales (que puedes activar a través del MSI Center) - ambas esquinas, así como el logo Stealth, pueden iluminarse. Por desgracia, no se puede cambiar el color o la intensidad de la iluminación.
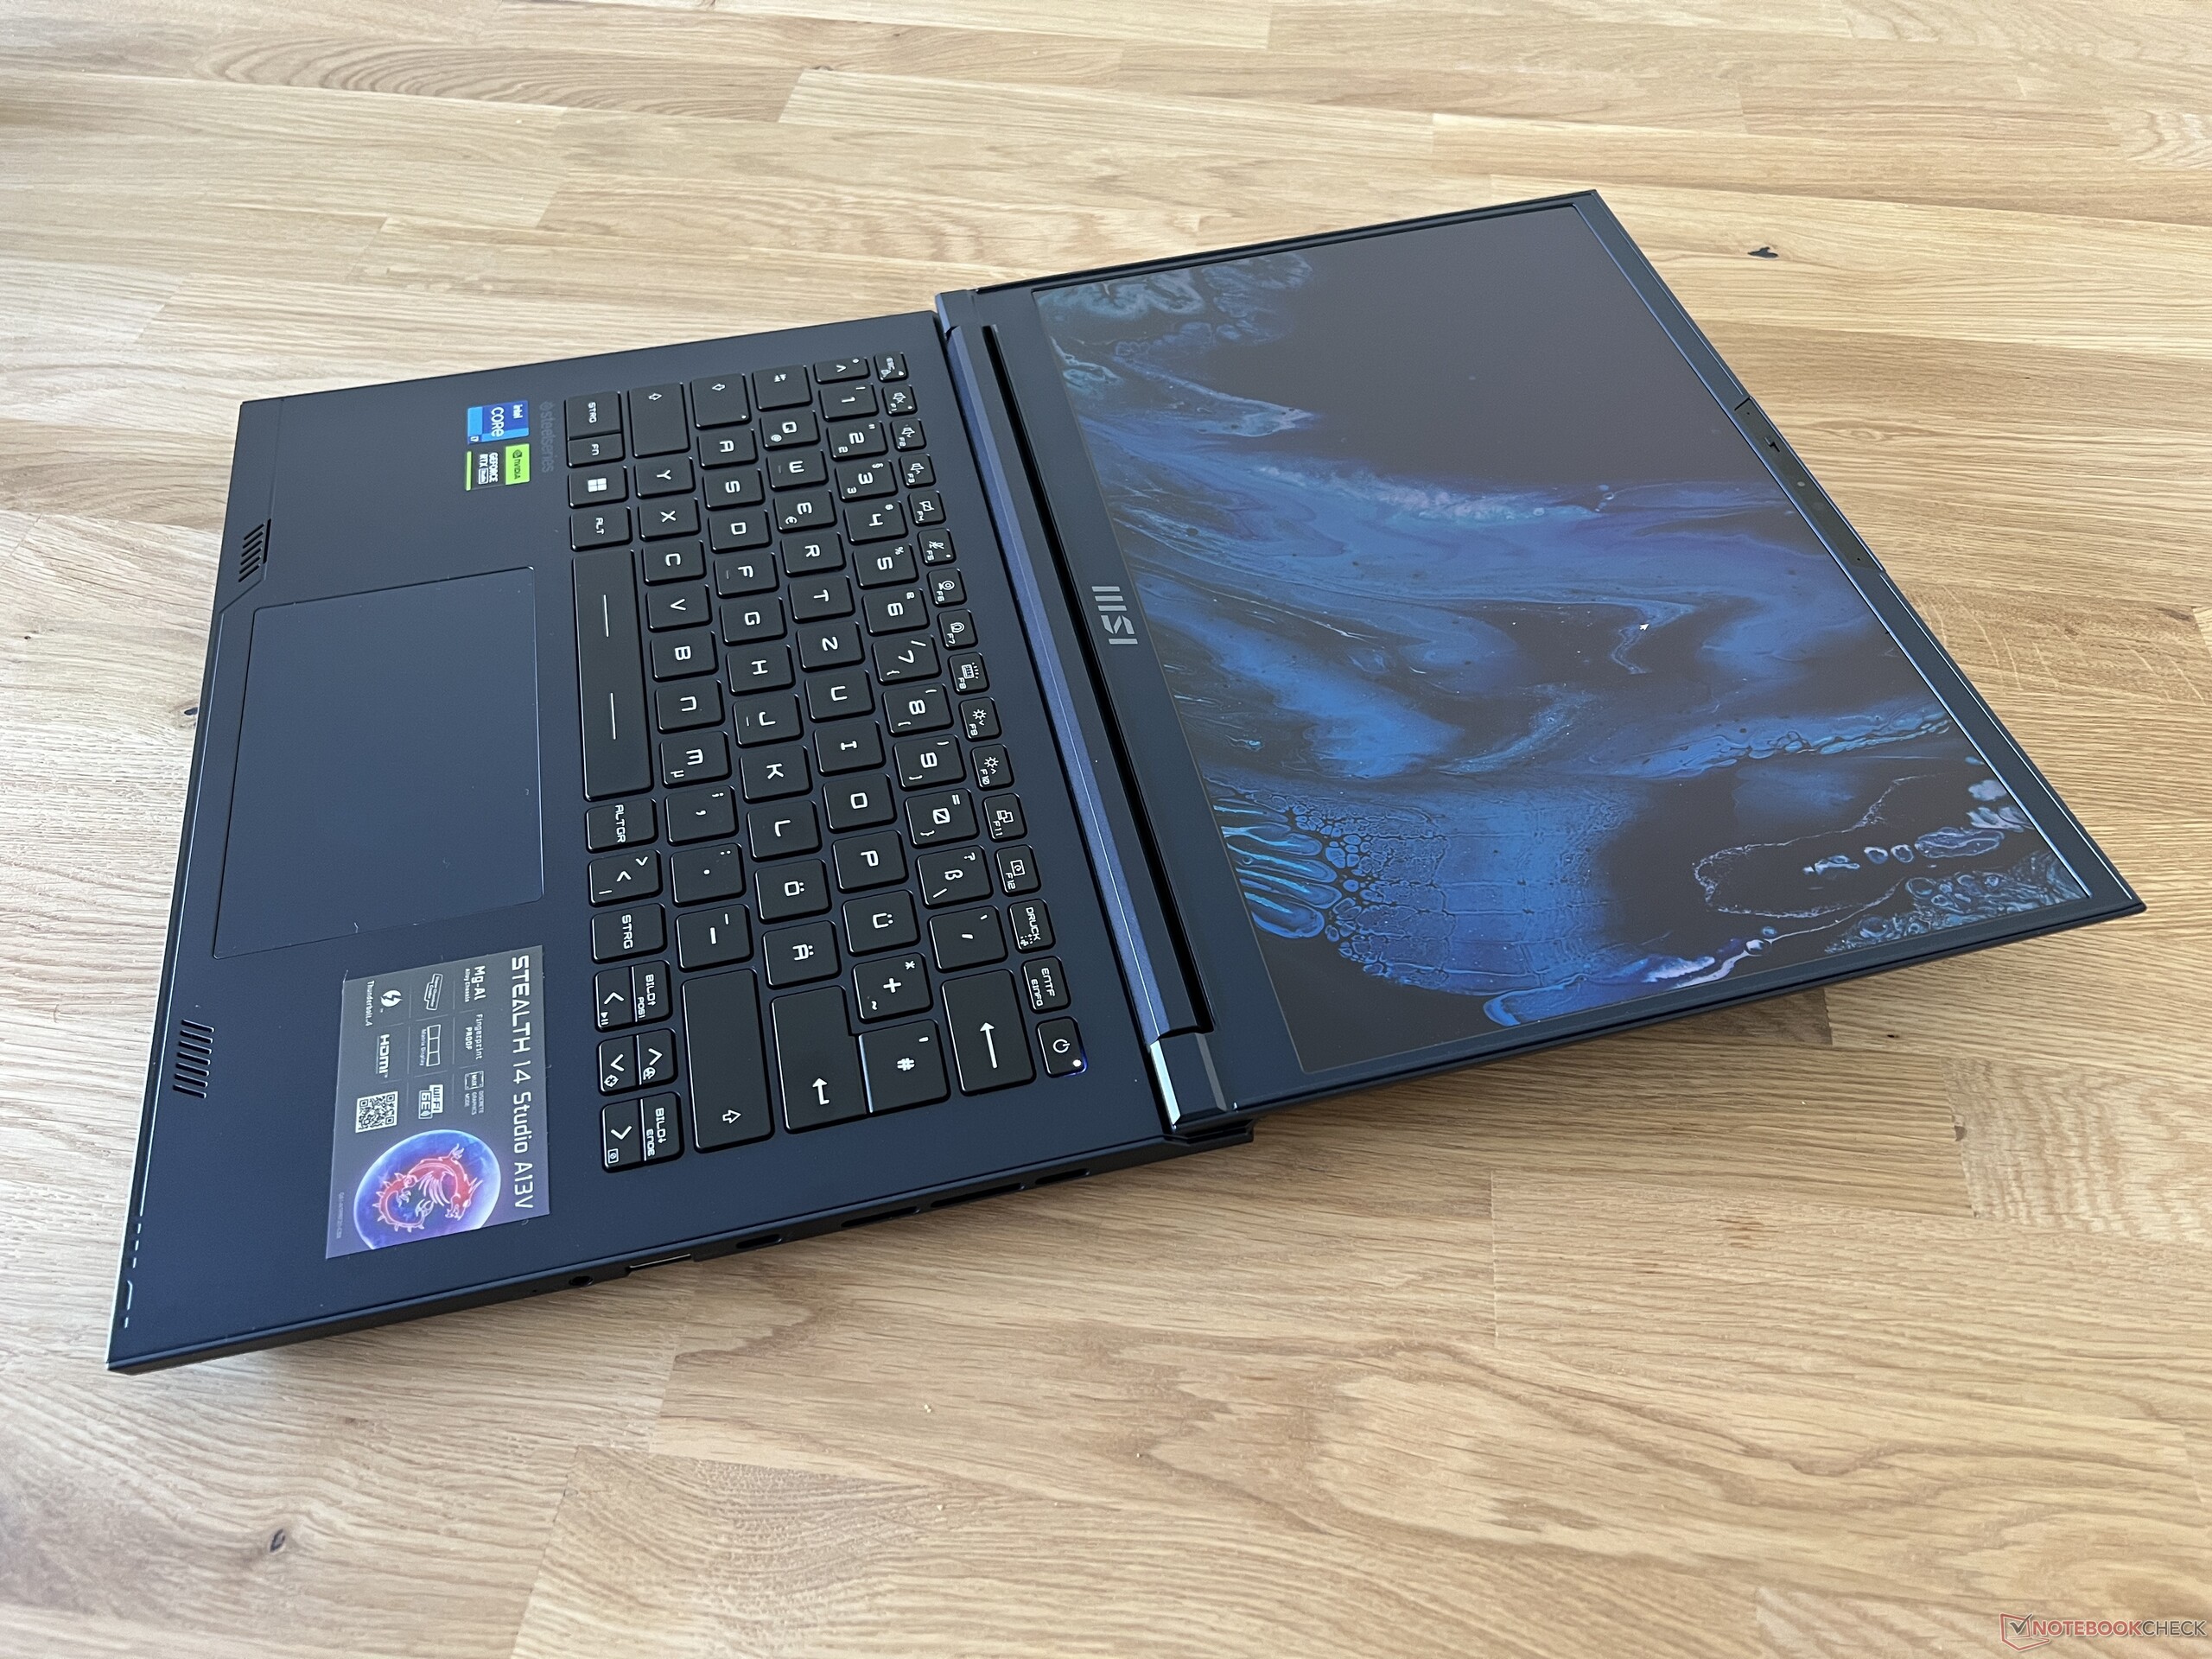
La carcasa está hecha de una aleación de magnesio y aluminio y la unidad base es extremadamente estable. No se puede doblar ni retorcer y no se oyen crujidos. Lamentablemente, no puede decirse lo mismo de la tapa del dispositivo, que es bastante más flexible y puede incluso doblarse ligeramente, lo que provoca crujidos audibles. Normalmente, estos problemas se olvidan hace tiempo en los dispositivos modernos, por lo que hay que tener cuidado de no coger el portátil por la pantalla para no causar daños permanentes. Ambas bisagras están bien ajustadas y permiten un ángulo máximo de apertura de 180 grados. Los biseles son bastante gruesos para un dispositivo moderno - su relación pantalla-cuerpo sólo llega al 73 %.
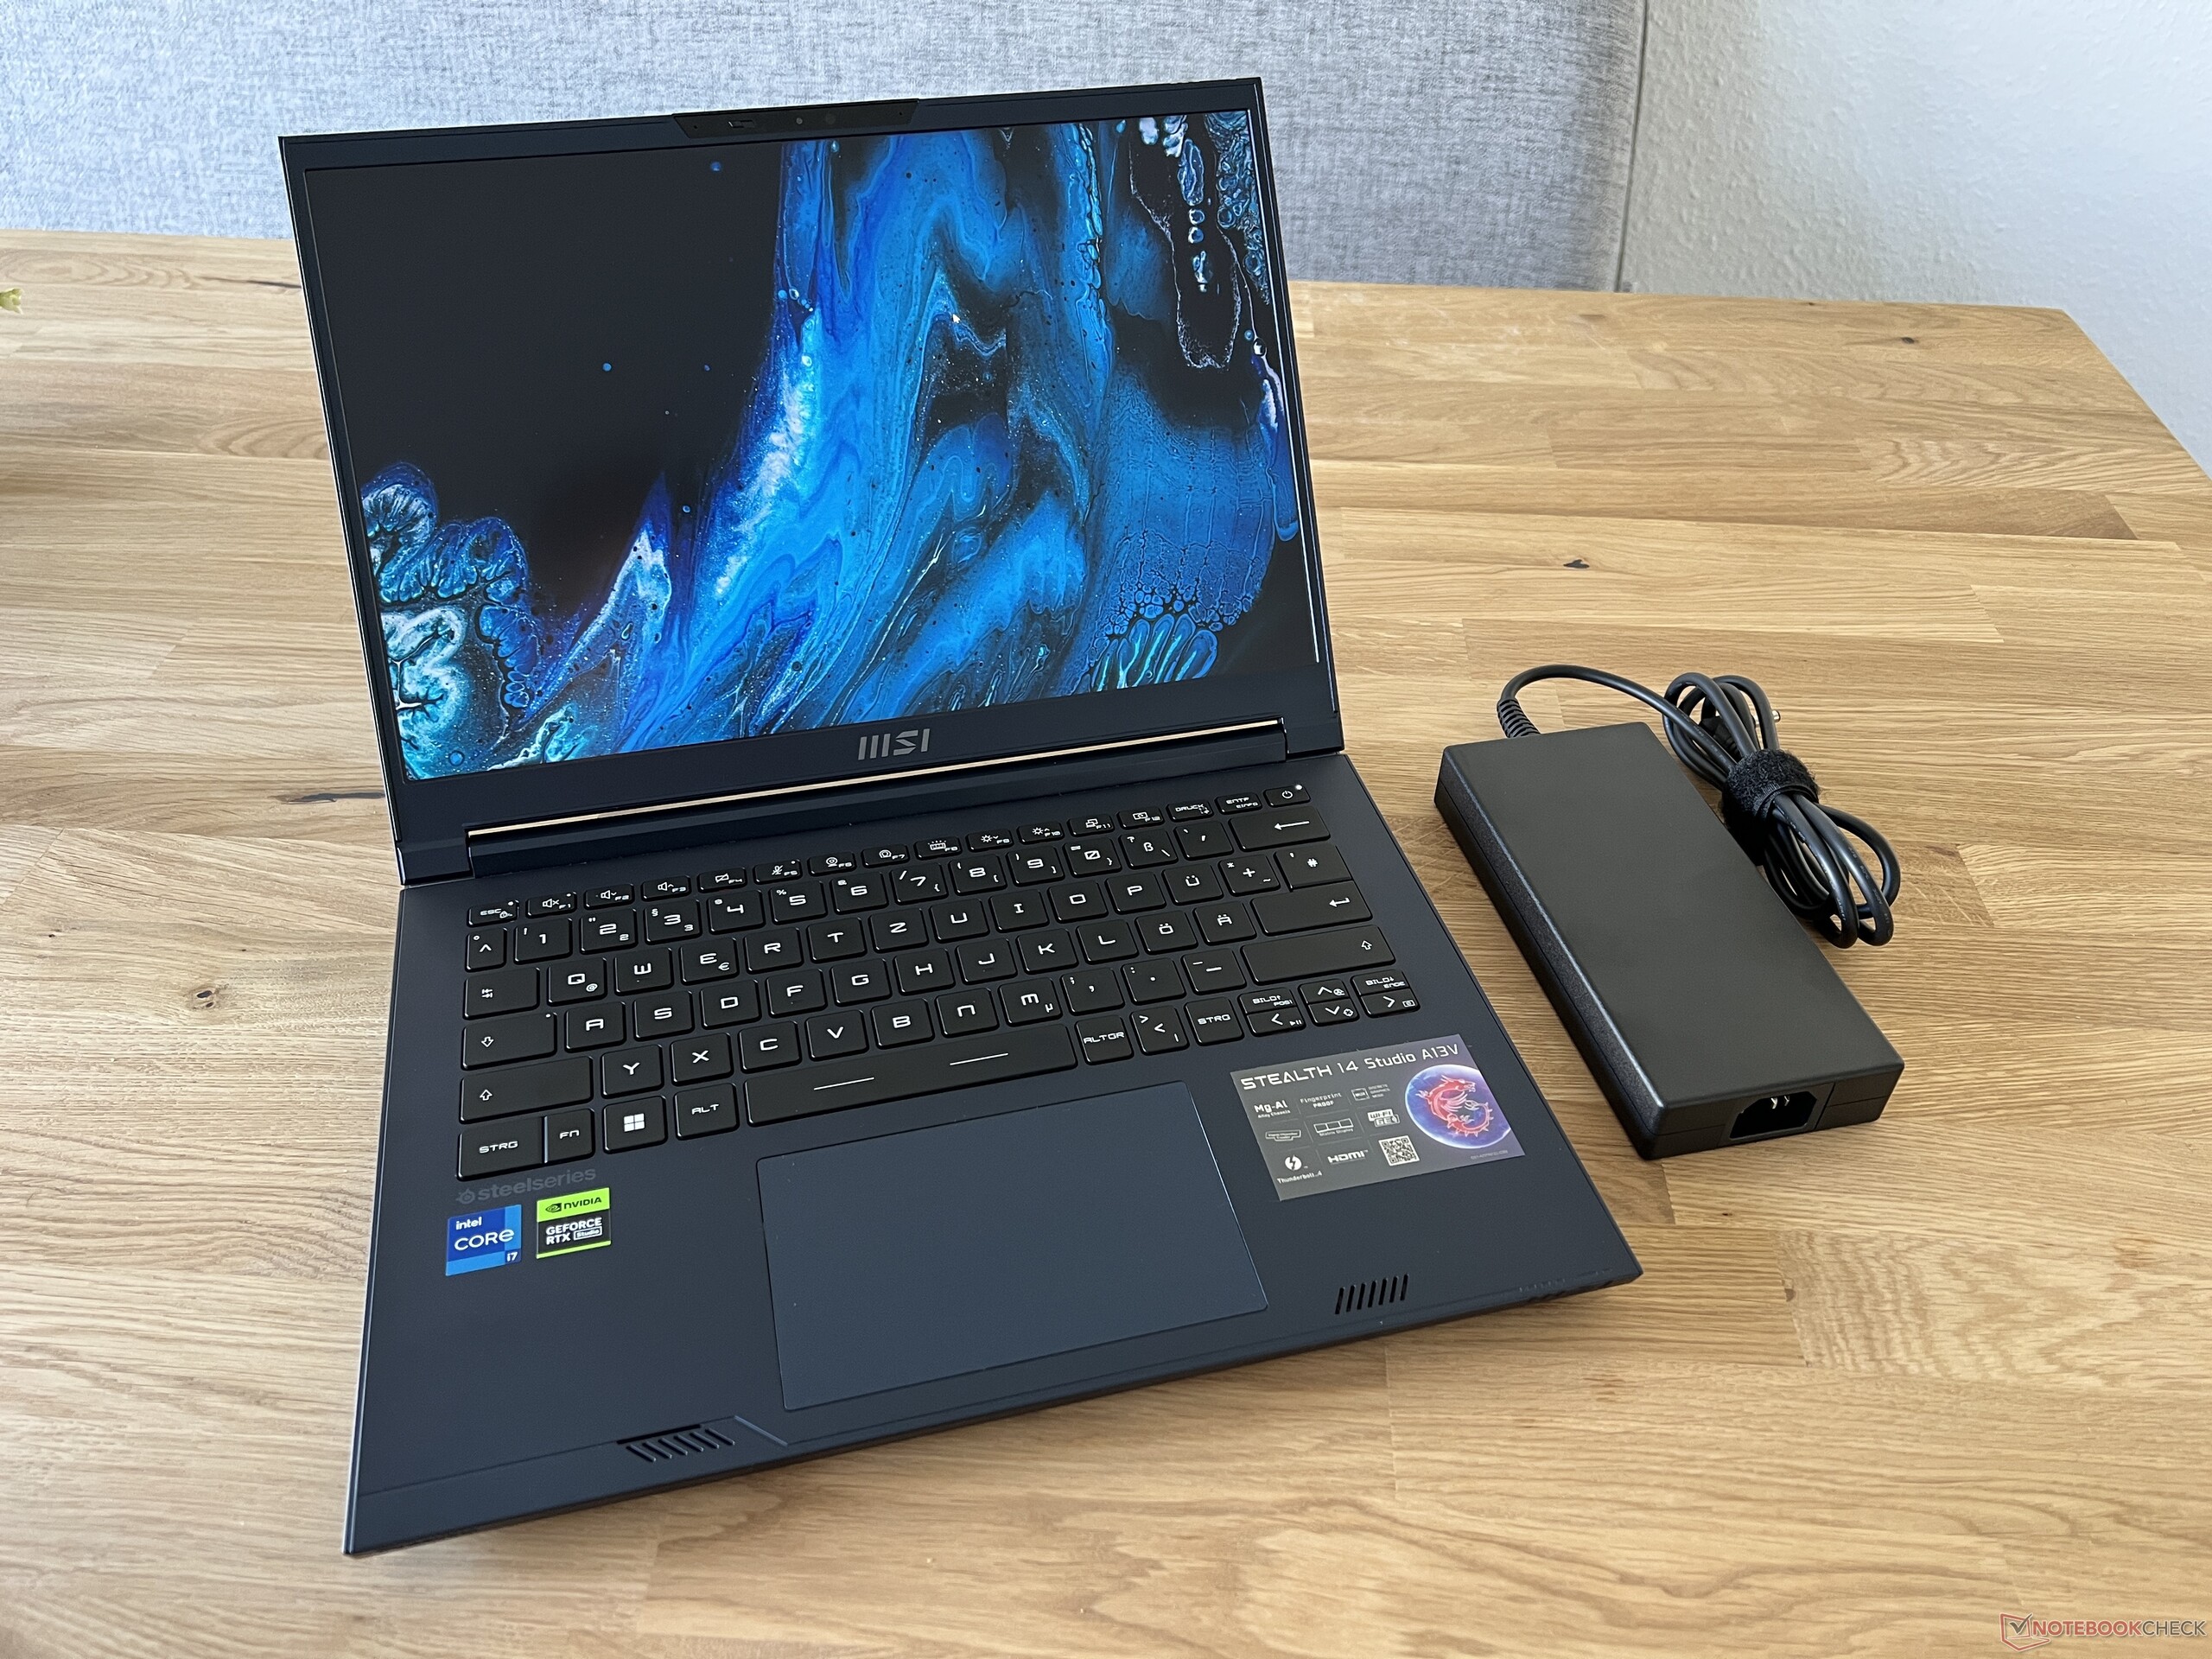
El Stealth 14 Studio es uno de los dispositivos más grandes de nuestro grupo de comparación - sólo elAlienware x14ocupa aún más espacio. Con poco más de 1,7 kg, su peso está en la media. La fuente de alimentación de 240 vatios añade otros 700 gramos a la balanza.
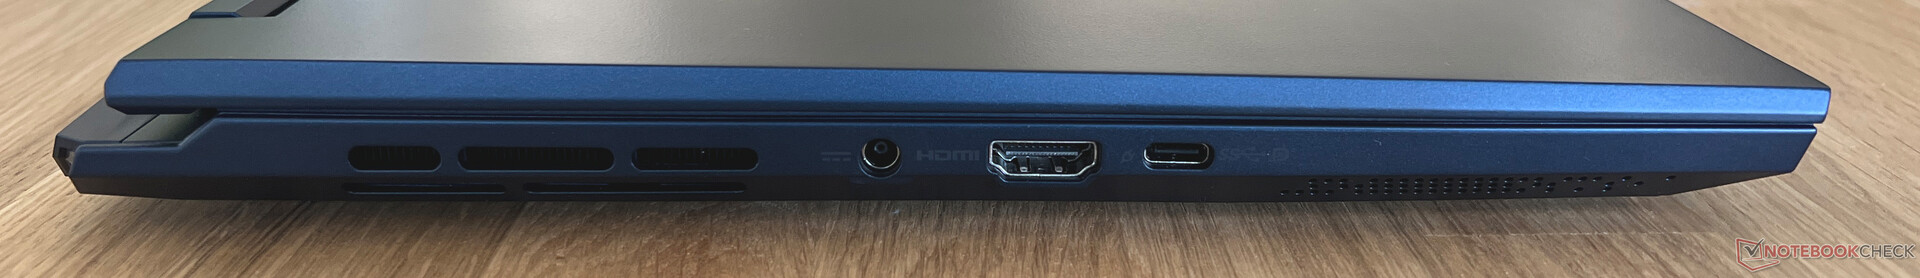
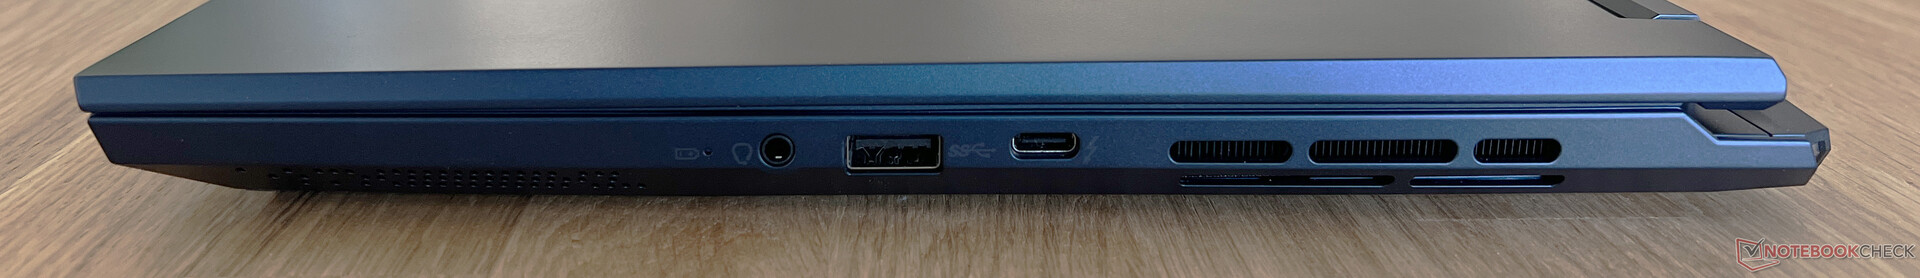
Conectividad - Thunderbolt 4, pero sin lector de tarjetas SD
Los puertos del Stealth 14 Studio están en el centro a ambos lados del dispositivo, aunque solo hay tres en cada lado. Solo podrás encontrar las conexiones más necesarias, pero los puertos del portátil están al menos al día, ya que incluyen Thunderbolt 4 y HDMI 2.1. Un lector de tarjetas SD y un puerto Ethernet desafortunadamente no están incluidos - en su lugar, tendrás que depender de un adaptador.
Comunicación
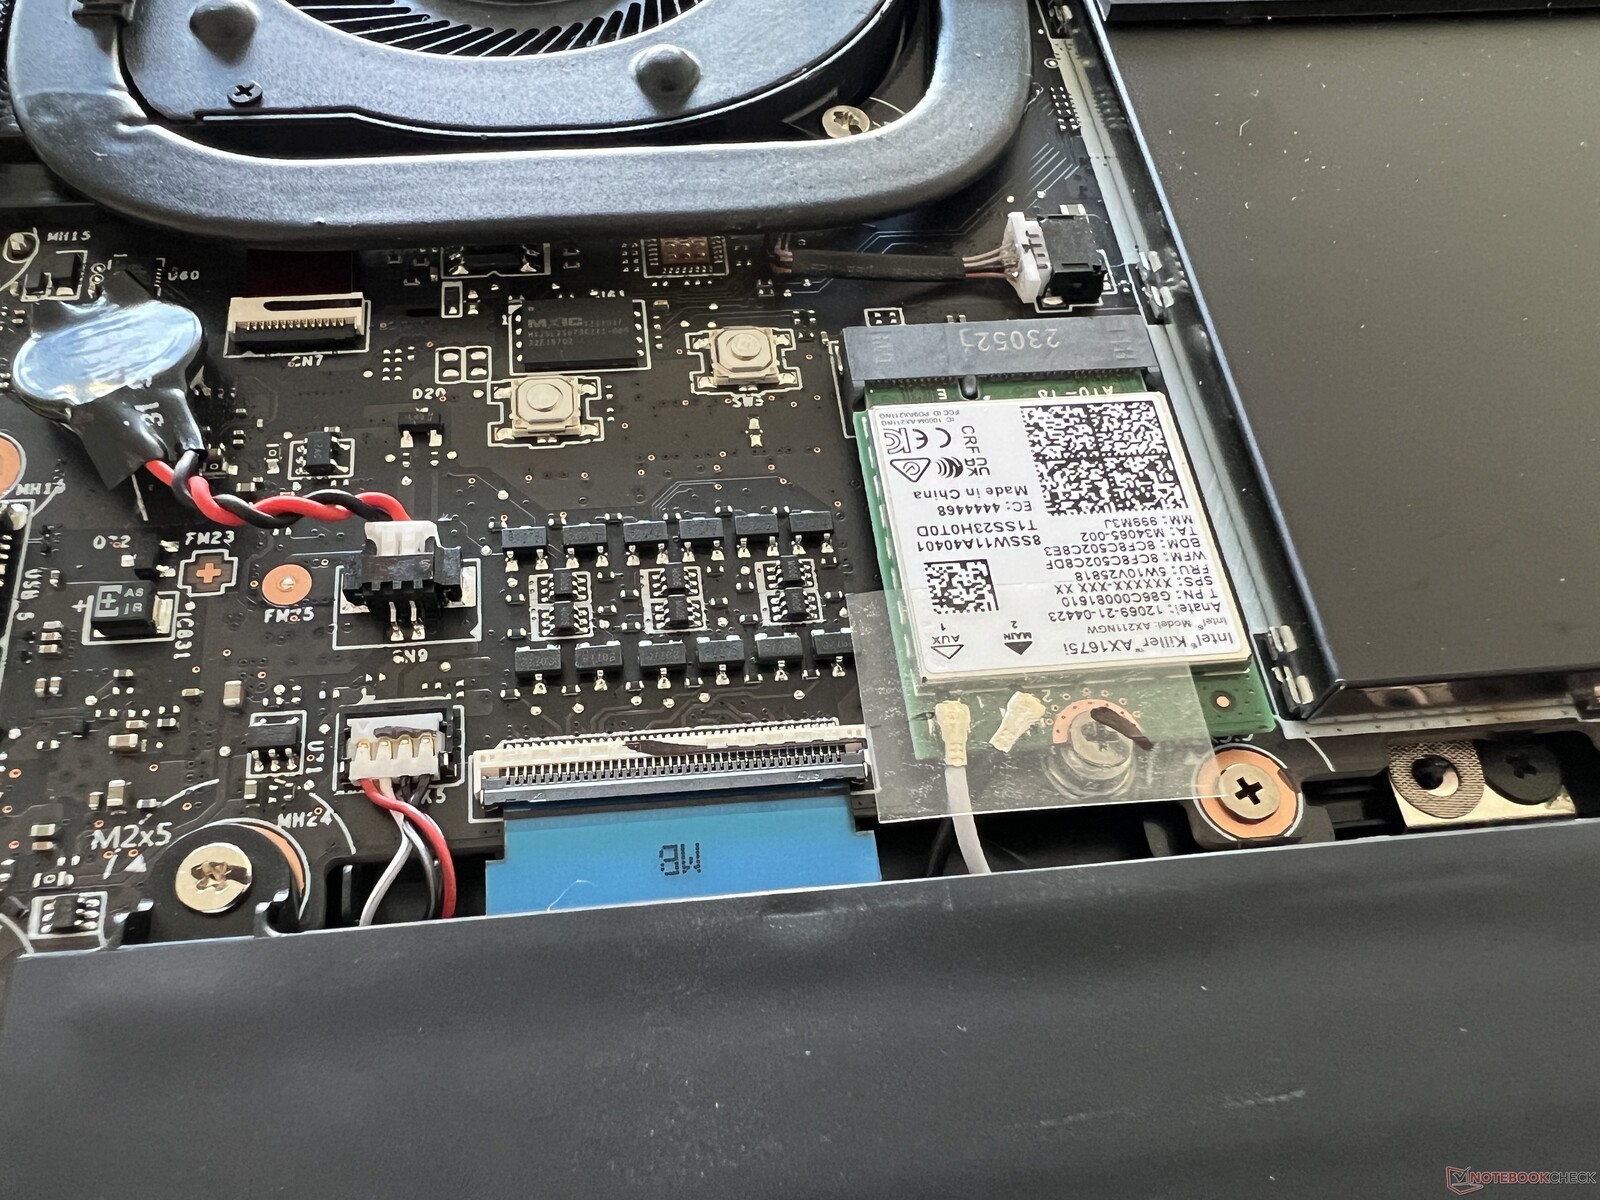
El portátil confía en un Killer AX1675i como módulo WLAN, que también soporta conexiones modernas de 6-GHz (Wi-Fi 6E). Usando nuestro router de referencia de Asus, medimos buenos (pero no geniales) resultados de transferencia. En el uso diario, esto no debería dar problemas y tampoco tuvimos problemas de estabilidad de señal en nuestro test.
| Networking | |
| MSI Stealth 14 Studio A13V | |
| iperf3 transmit AXE11000 | |
| iperf3 receive AXE11000 | |
| Gigabyte Aero 14 OLED BMF | |
| iperf3 transmit AXE11000 | |
| iperf3 receive AXE11000 | |
| iperf3 transmit AXE11000 6GHz | |
| iperf3 receive AXE11000 6GHz | |
| Schenker Vision 14 2022 RTX 3050 Ti | |
| iperf3 transmit AXE11000 | |
| iperf3 receive AXE11000 | |
| Asus ROG Flow Z13 GZ301ZE | |
| iperf3 transmit AX12 | |
| iperf3 receive AX12 | |
| Alienware x14 i7 RTX 3060 | |
| iperf3 transmit AX12 | |
| iperf3 receive AX12 | |
| Razer Blade 14 Ryzen 9 6900HX | |
| iperf3 transmit AX12 | |
| iperf3 receive AX12 | |
| Acer Predator Triton 300 SE | |
| iperf3 transmit AXE11000 6GHz | |
| iperf3 receive AXE11000 6GHz | |
Cámara web
Sorprende ligeramente la escasa webcam de 720p del Stealth 14 Studio, que se esfuerza por ofrecer una imagen decente incluso en condiciones de buena iluminación. Además, hay un módulo IR instalado - el reconocimiento facial es compatible con Windows Hello.


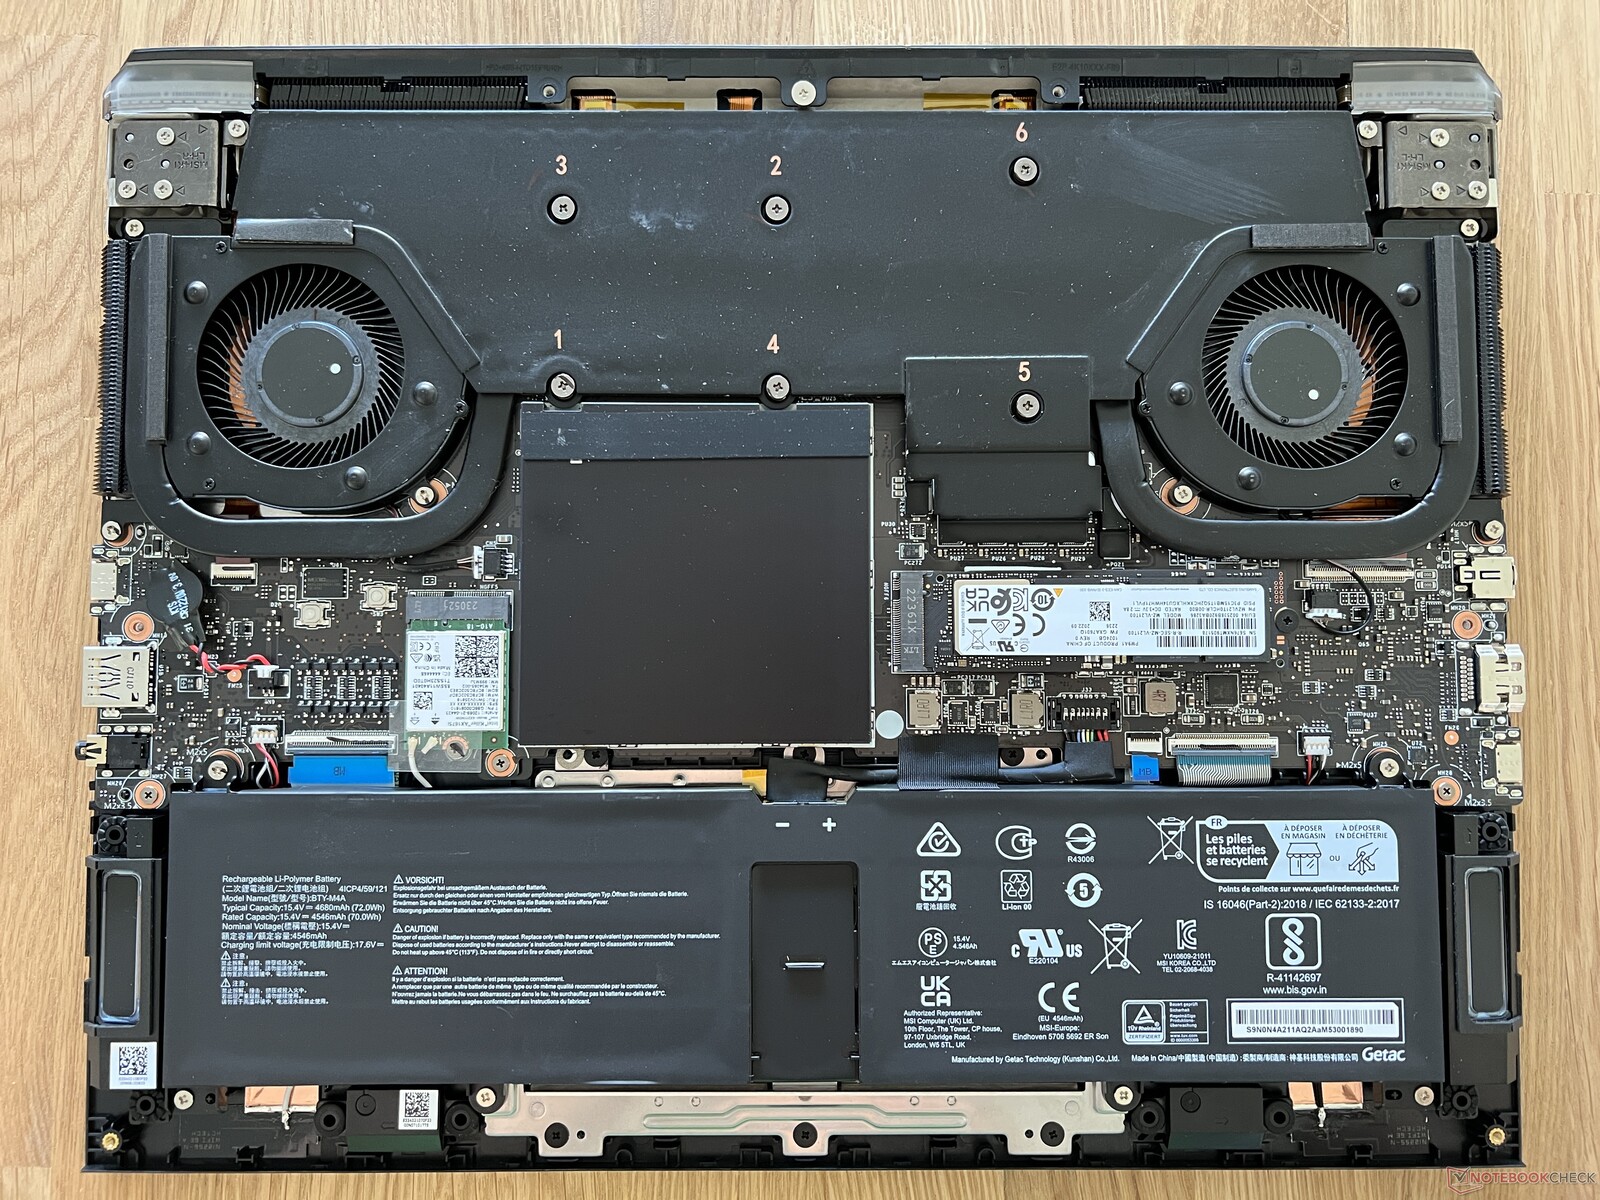
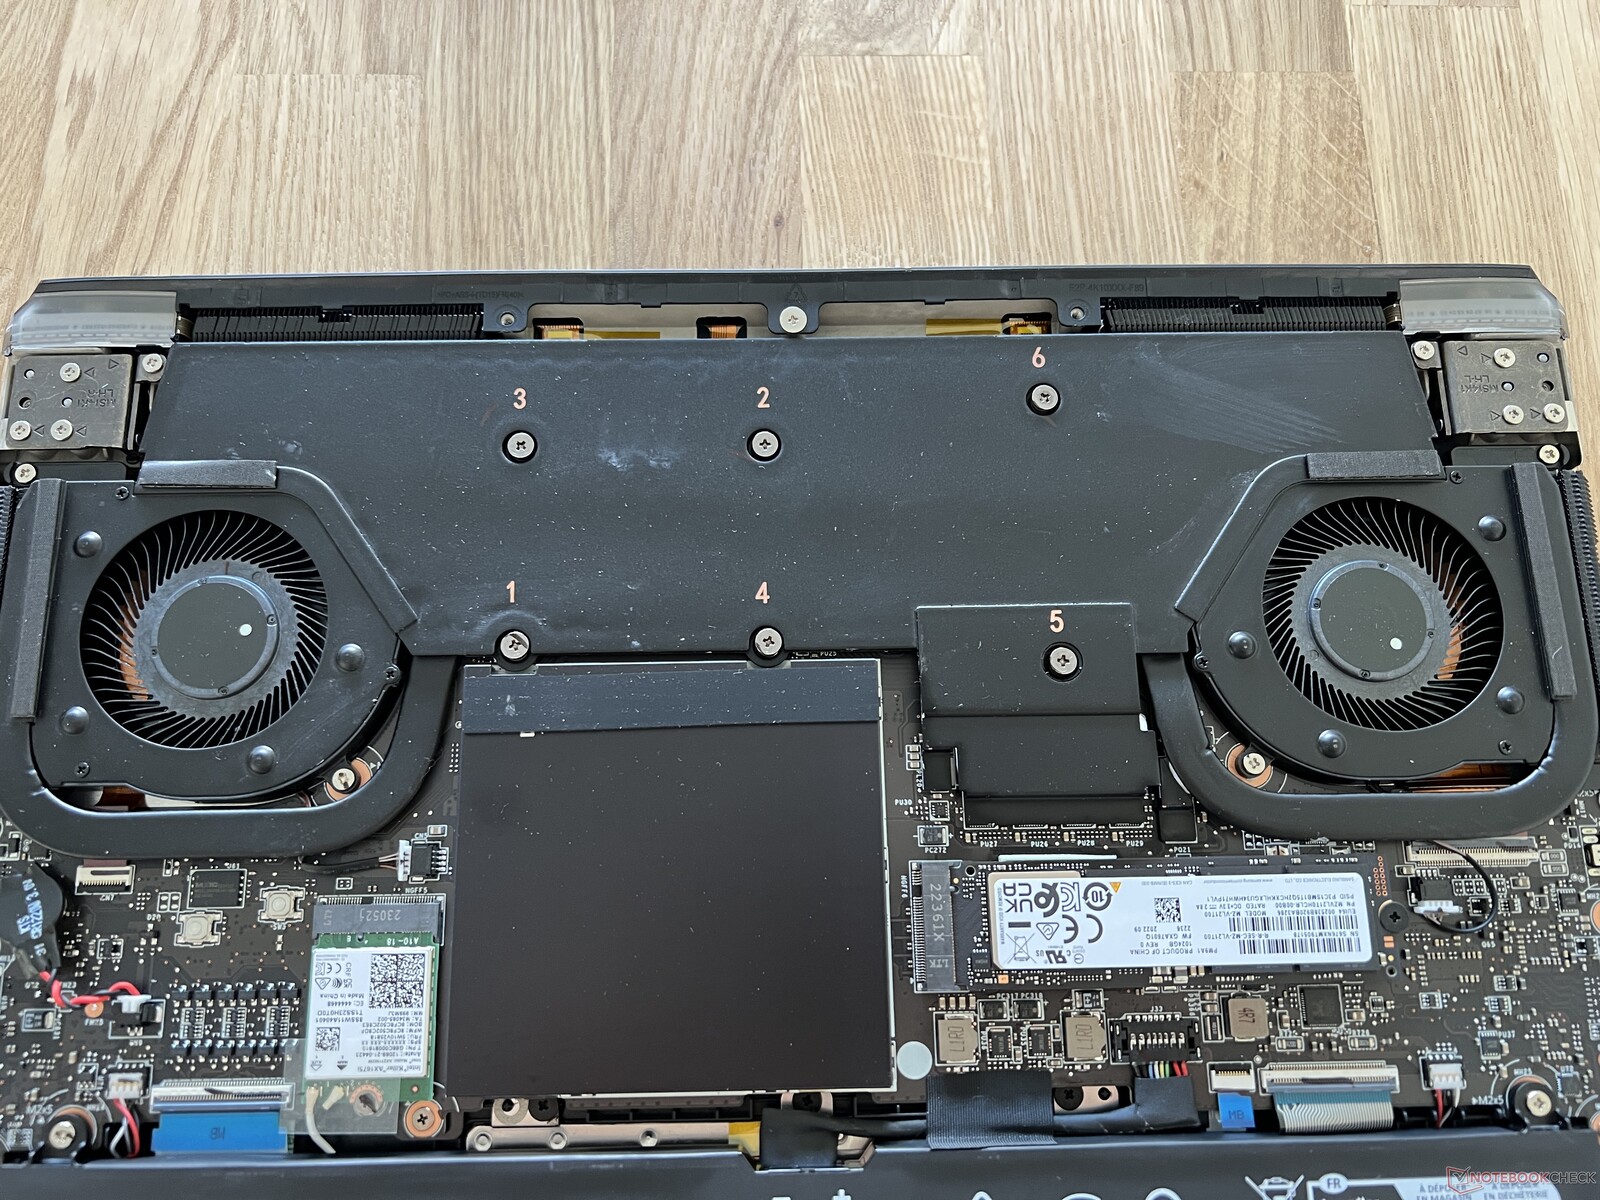
Mantenimiento
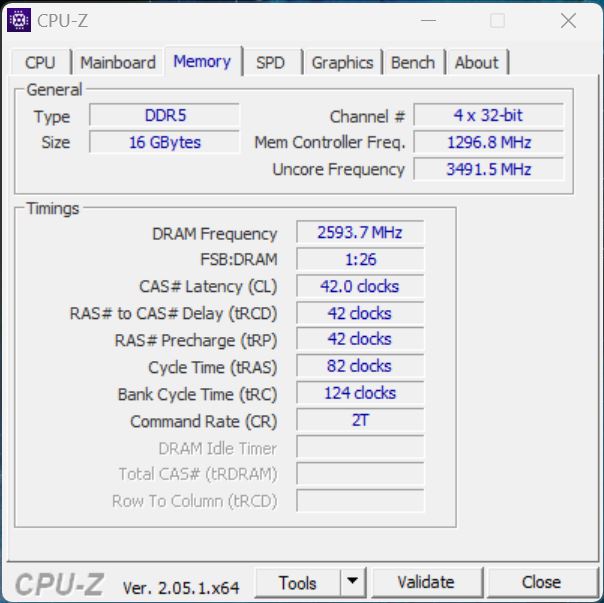
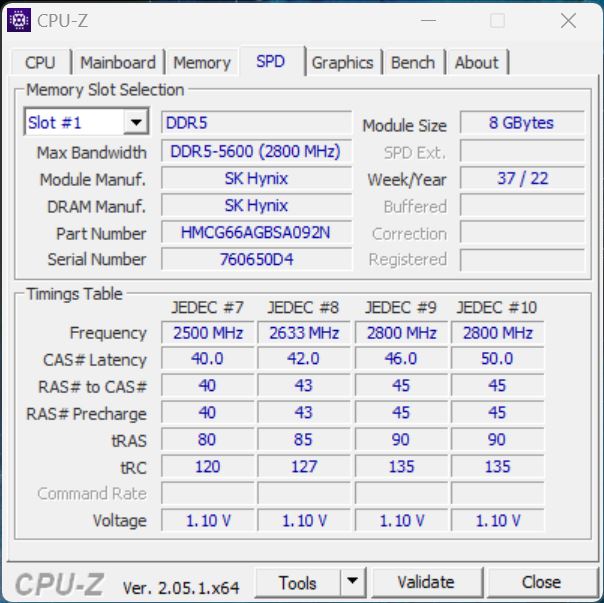
Para acceder a los componentes del portátil, hay que desmontar toda la parte inferior de la carcasa. Uno de los tornillos en cruz está cubierto por un precinto, al menos en Alemania (donde realizamos esta prueba), el uso apropiado de este no debería afectar a la garantía. Dentro, puedes limpiar los ventiladores e intercambiar el módulo WLAN y el SSD M.2 2280. Teóricamente, también se podría cambiar el módulo de memoria RAM, sin embargo, la cubierta adicional estaba unida con tanta fuerza que no pudimos quitarla (y no queríamos causar ningún daño a nuestra muestra de prueba). Probablemente hay una almohadilla de pegamento adicional que lo mantiene en su lugar, lo que hace que sea muy difícil para el usuario sacarlo.
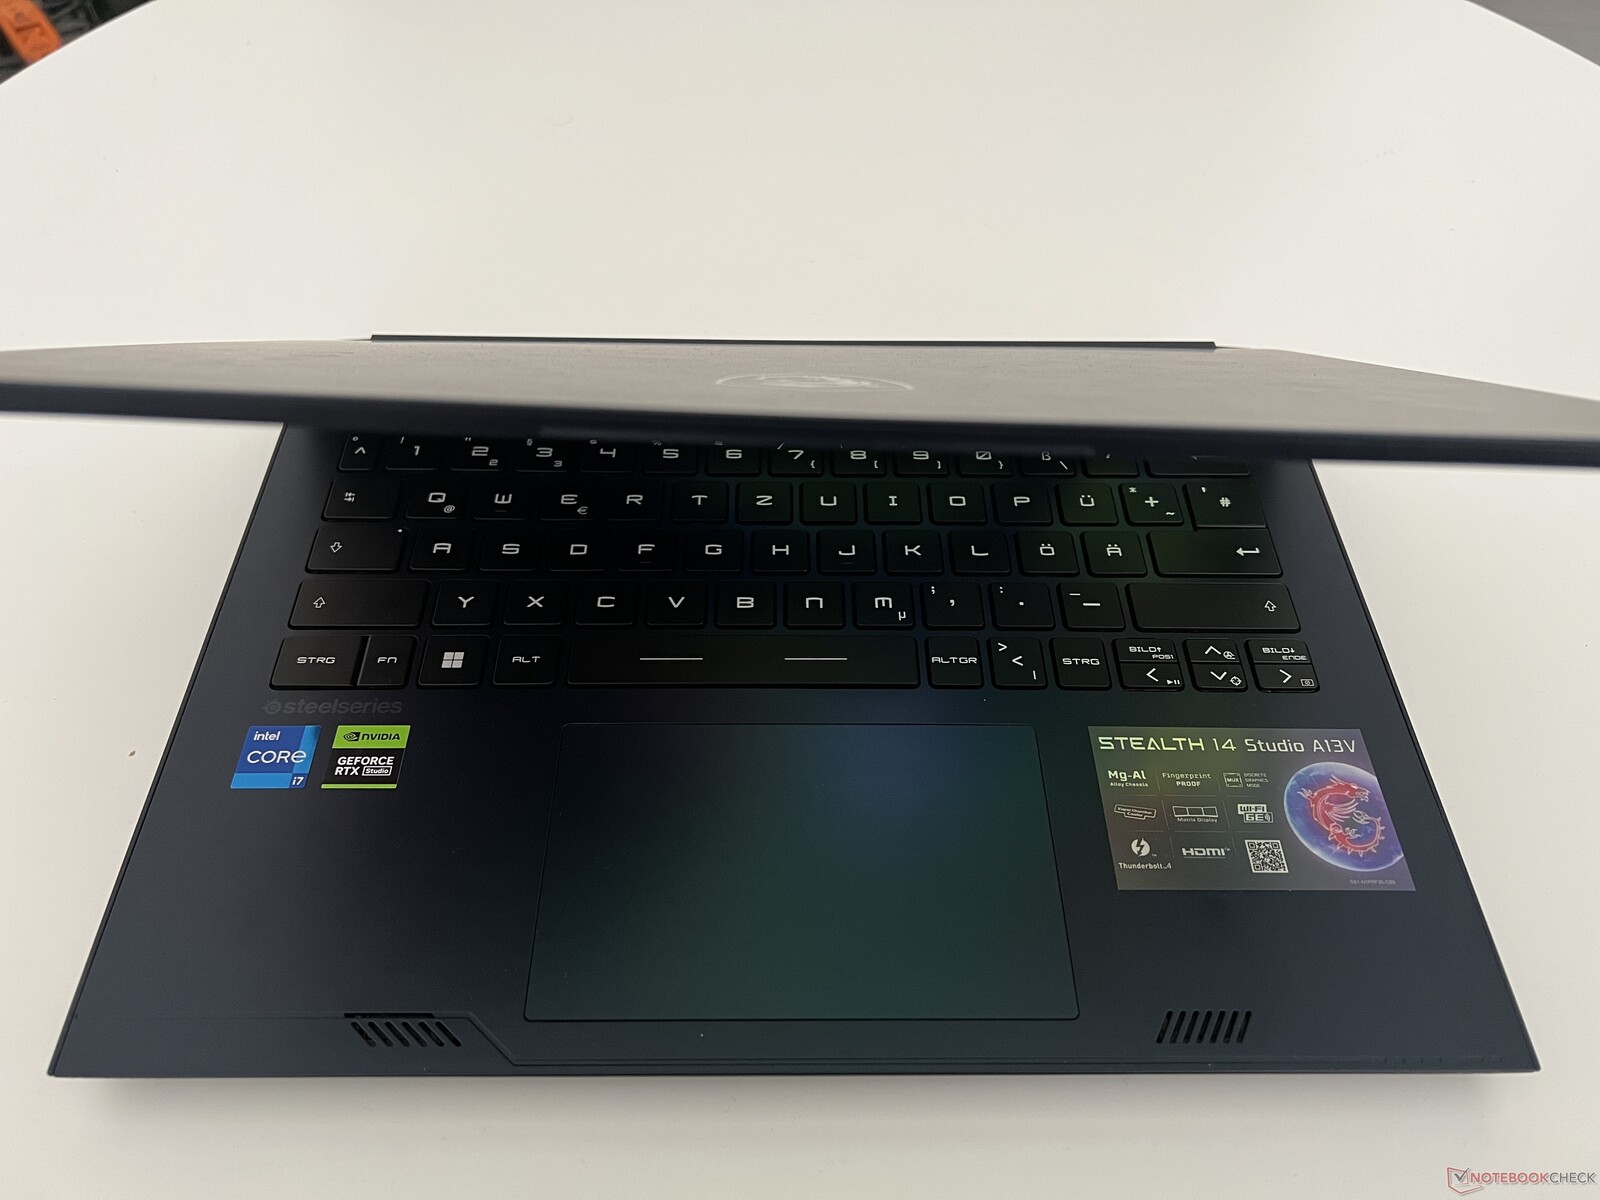
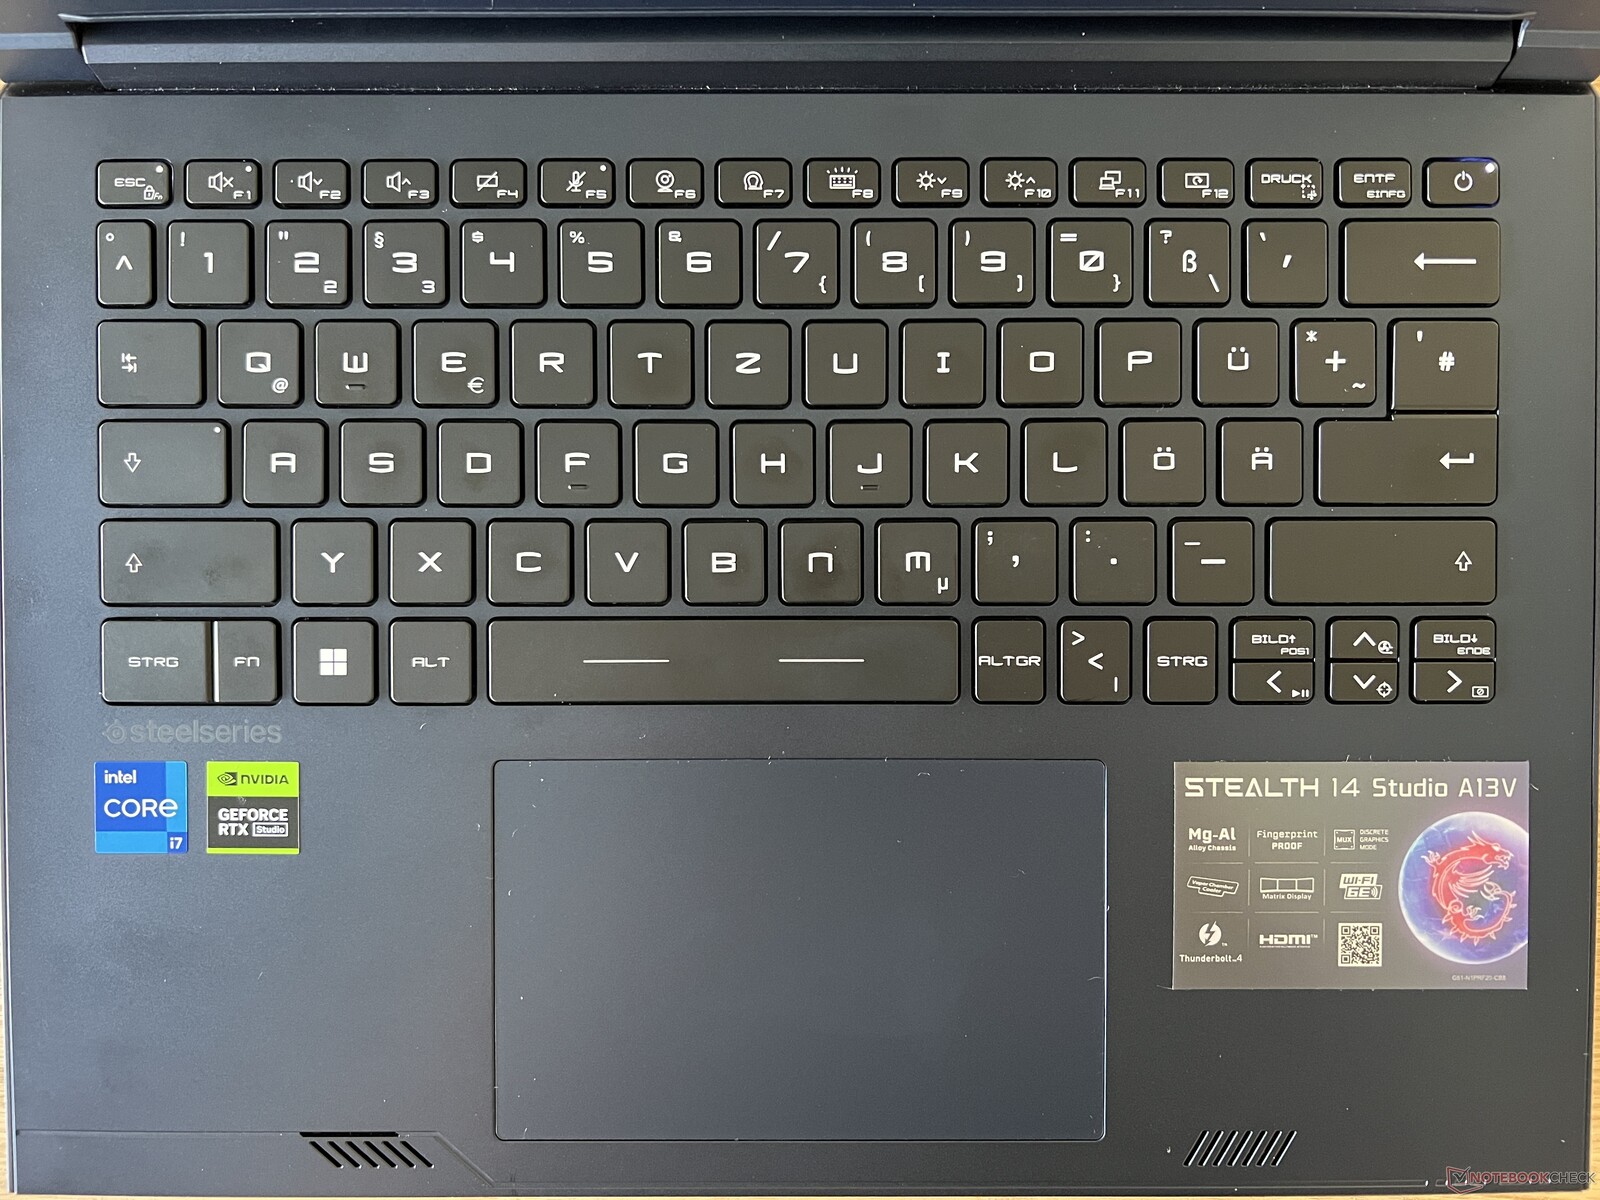
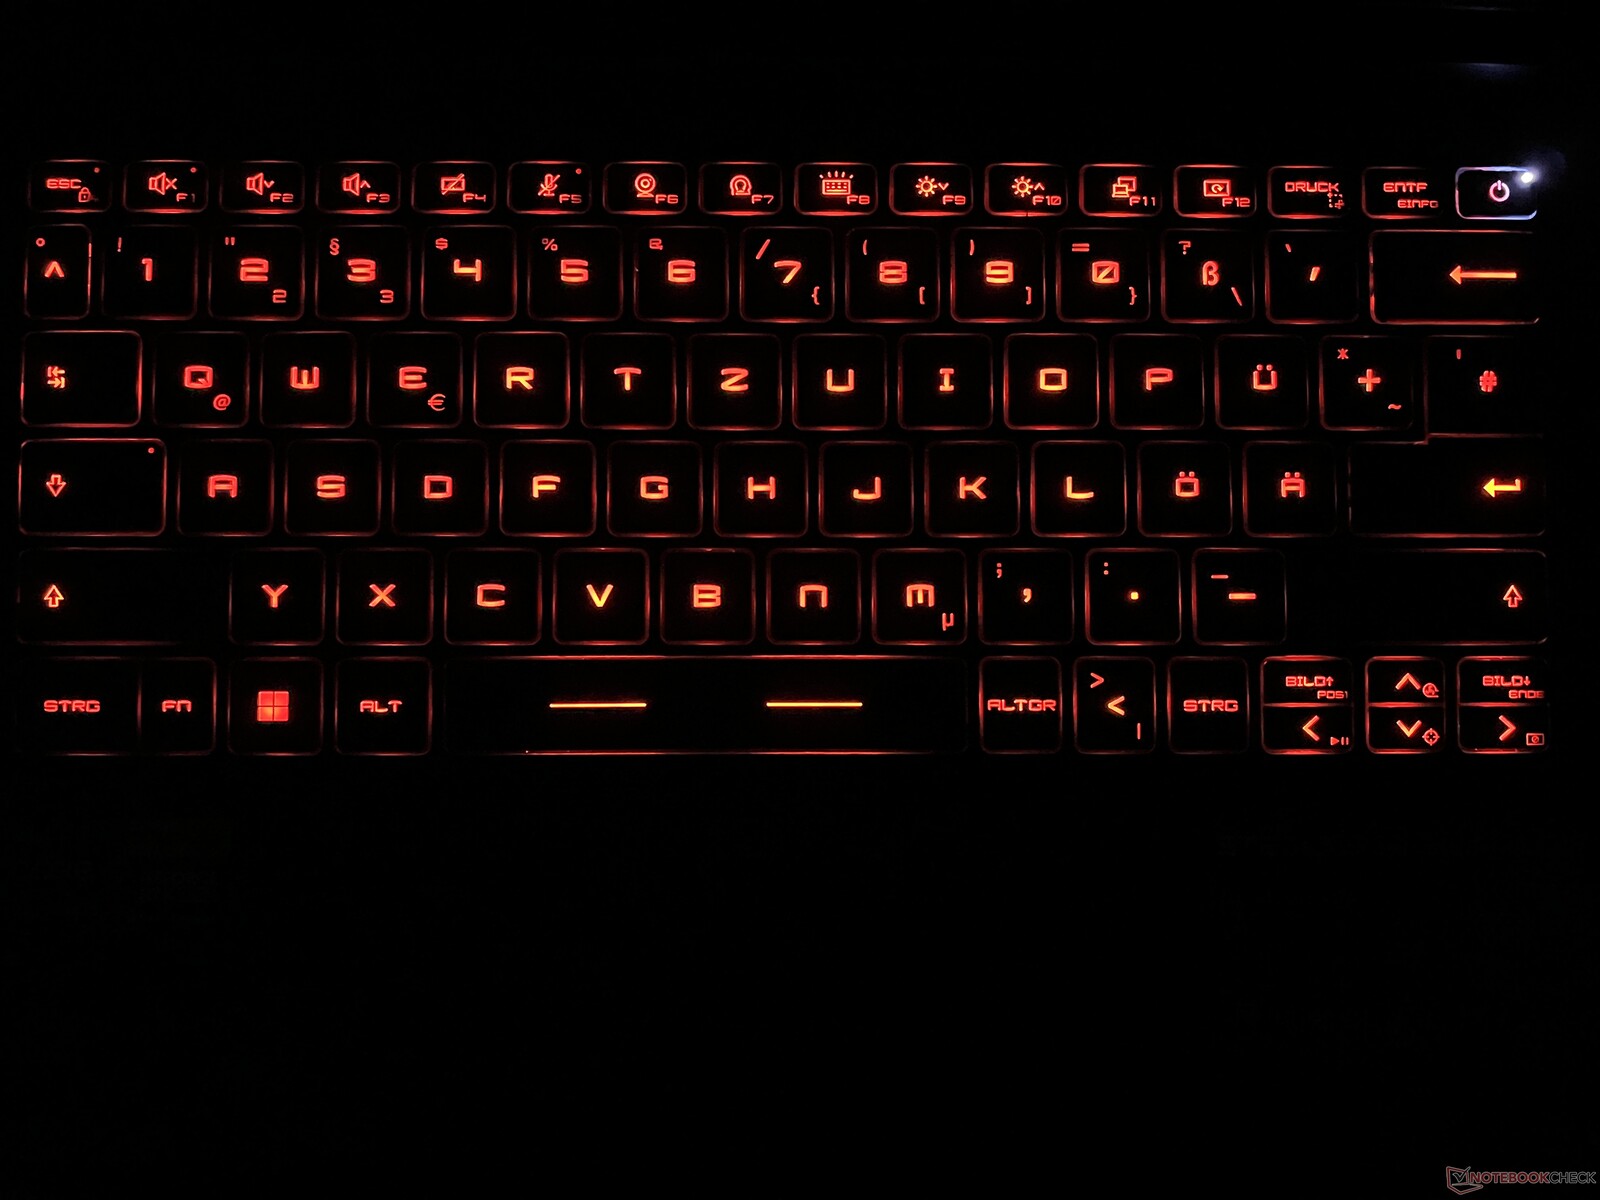
Dispositivos de entrada - Un teclado con teclas iluminadas individualmente
El teclado puede contarse como uno de los defectos del Stealth 14 Studio, ya que su elevación de tecla es muy superficial y las teclas tienen un tacto bastante raquítico. Aún así, pulsar las teclas resulta bastante preciso y no notamos ninguna entrada errónea. Sólo tienes que acostumbrarte a su disposición, ya que tiene una tecla de intro de una sola línea y la tecla "|<>" está en un lugar un poco inusual. Las cuatro teclas de flecha también son bastante pequeñas, pero al menos hay teclas designadas para "subir la imagen" y "bajar la imagen". La iluminación de cada tecla se puede ajustar con el software de Steelseries, pero no es nada intuitivo.
El suave click pad (12 x 7,5 cm) funciona bien en el uso diario, pero recomendaríamos simplemente pulsarlo para introducir comandos. Si se presiona la parte inferior del pad, se produce un ruido de clic muy fuerte y barato.
Pantalla - Un panel rápido de 240 Hz
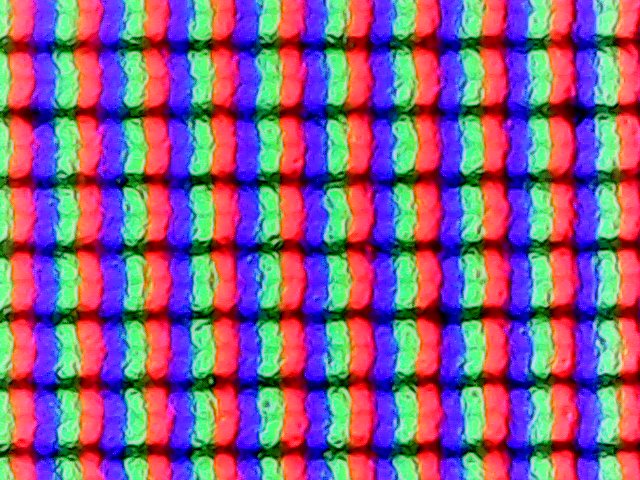
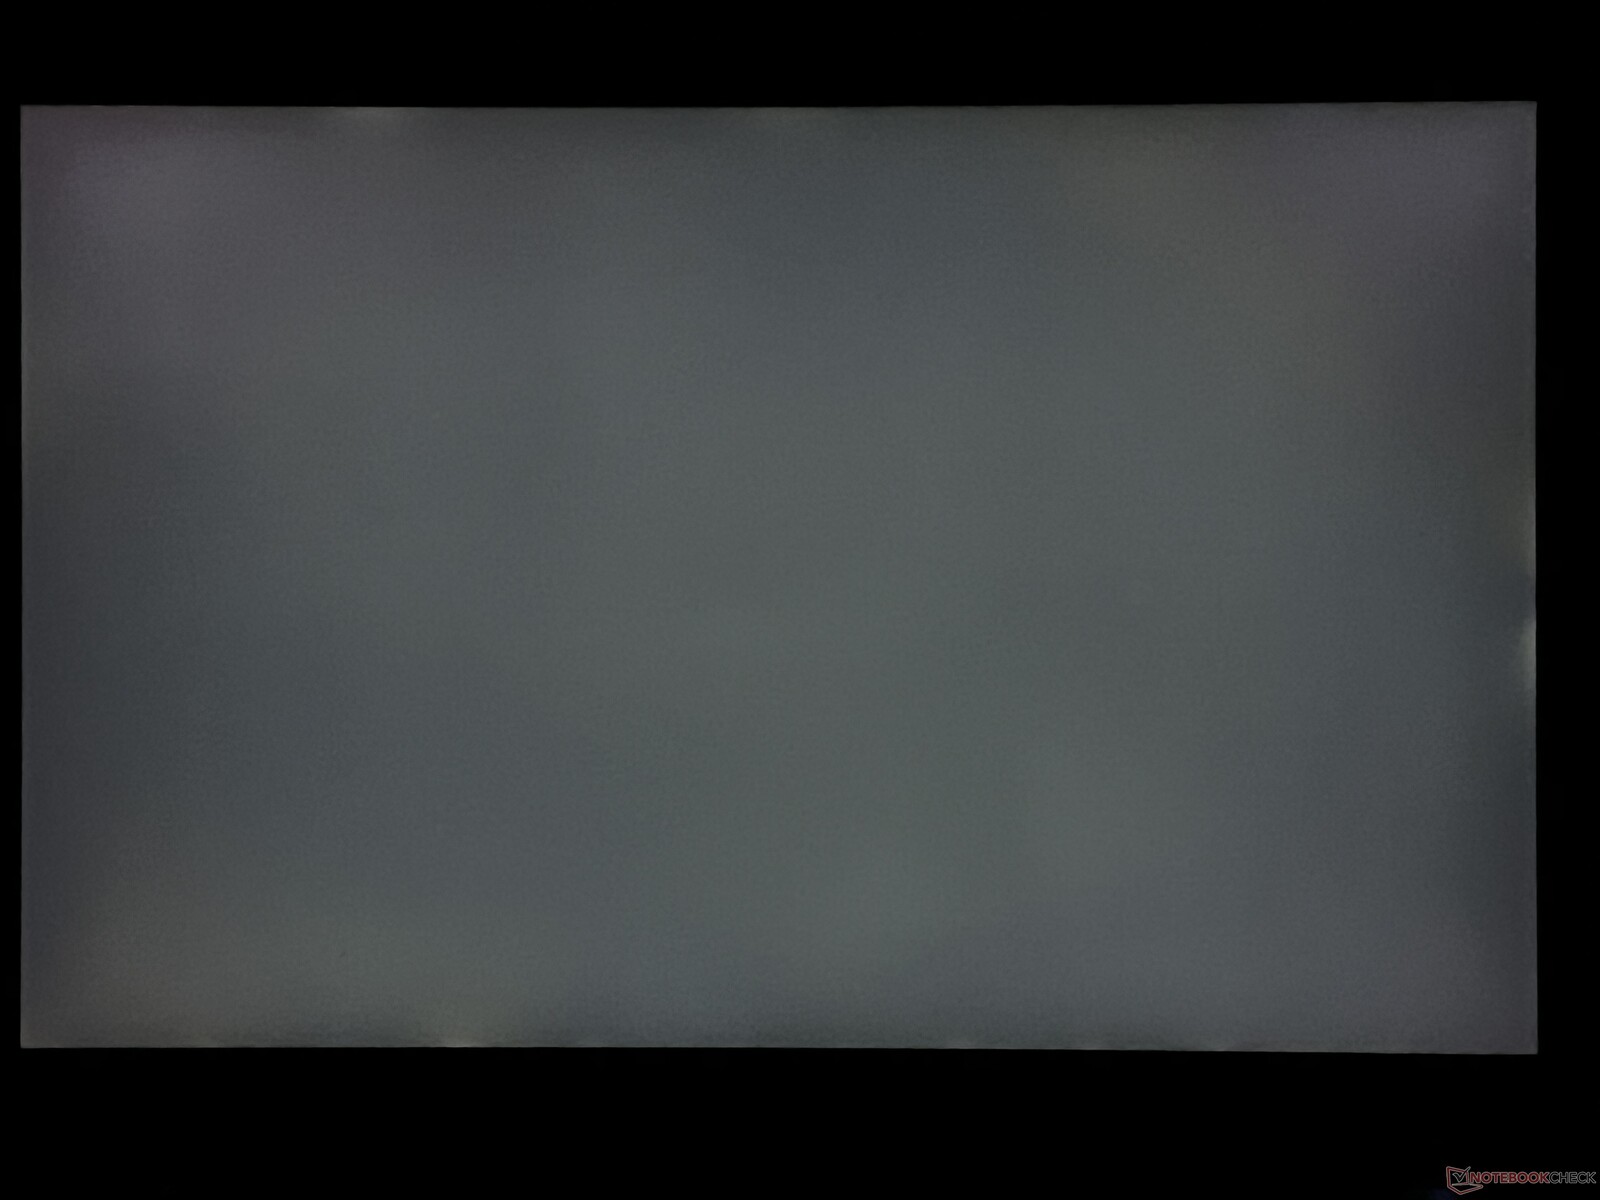
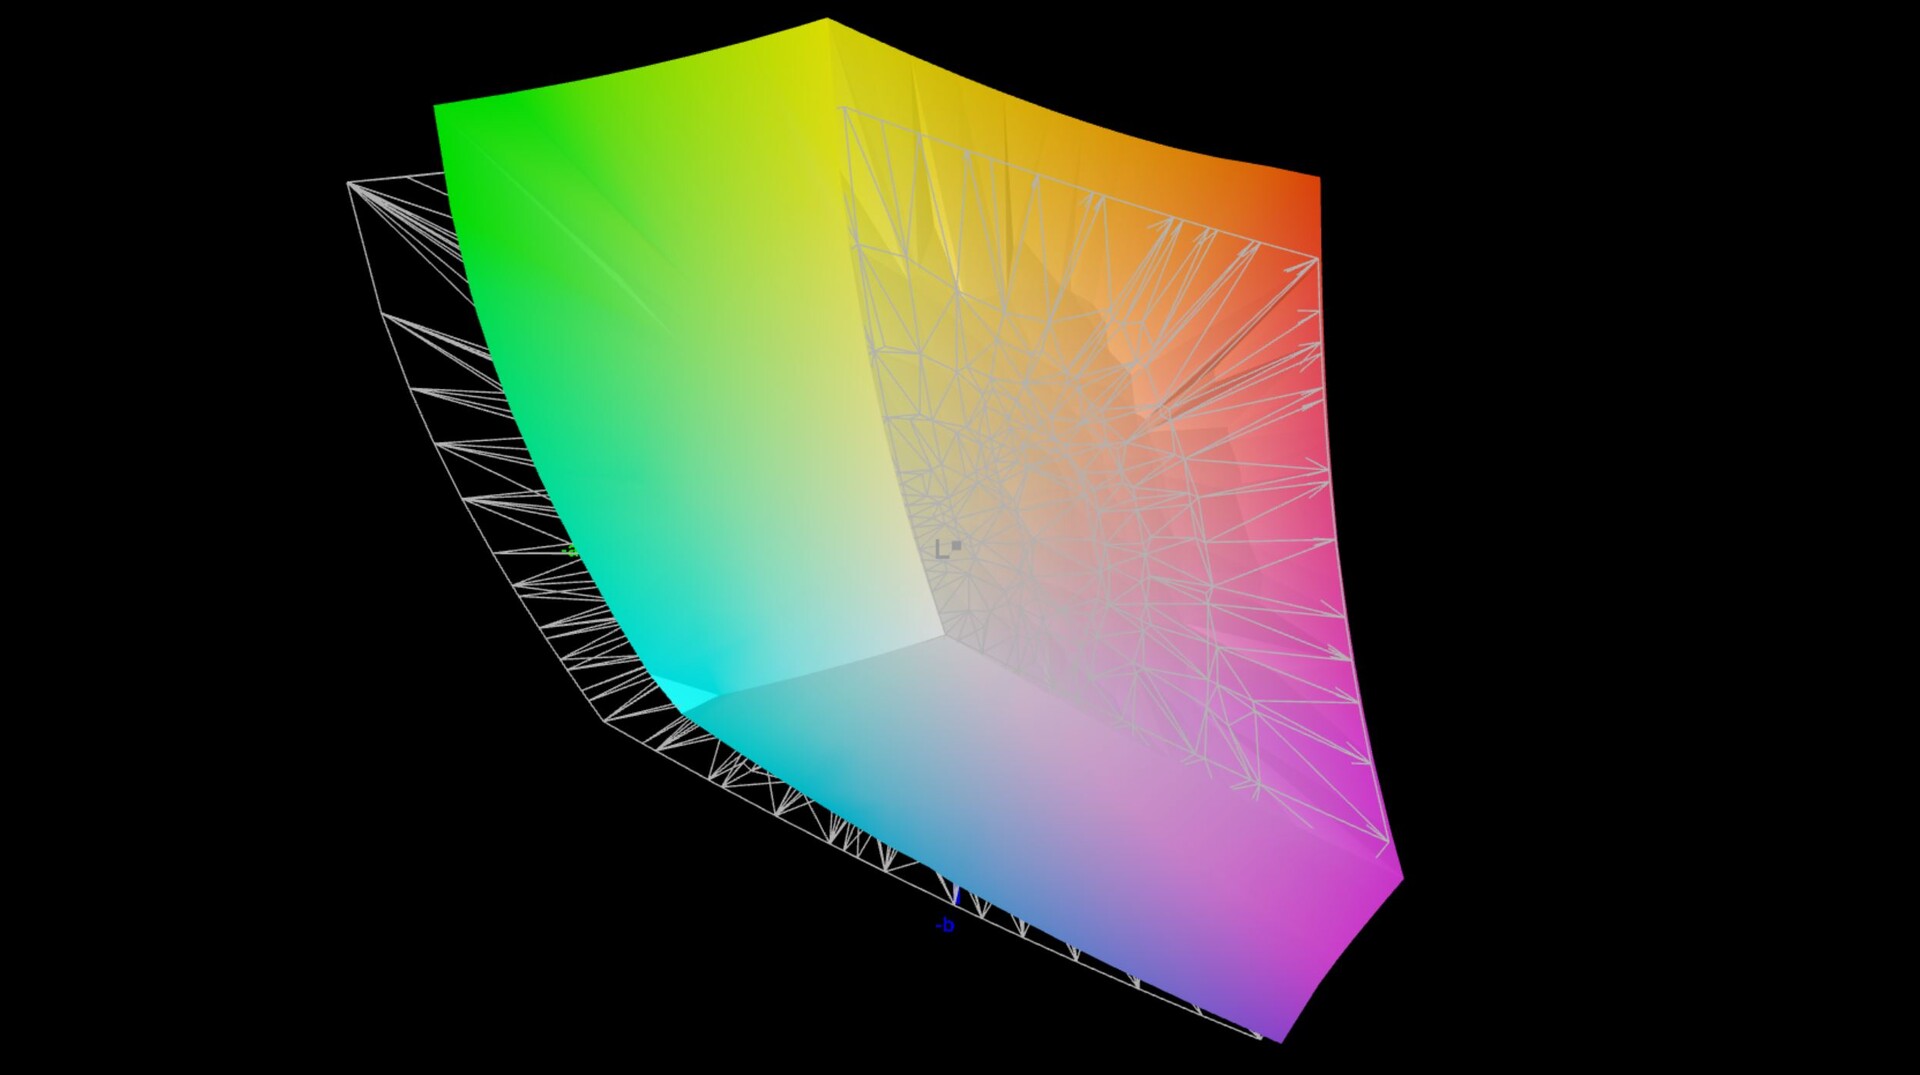
MSI ha optado por un panel IPS de 14 pulgadas con una resolución de 2.560 x 1.600 píxeles. Lo más destacado es su tasa de refresco de 240-Hz así como sus rápidos tiempos de reacción - aunque, subjetivamente, no nos impresionó del todo su calidad de imagen. Sus niveles de nitidez son buenos, pero las zonas oscuras siempre se ven un poco como si tuvieran un velo gris colgando sobre ellas.
El alto valor de negro de la pantalla de 0,43 cd/m² es responsable de ello, lo que -incluso en combinación con su decente brillo de unos 400 cd/m²- lleva a un mediocre ratio de contraste de menos de 1.000:1. La pantalla no es mala en absoluto, pero especialmente en tiempos de Mini LEDs y OLEDs, el panel instalado deja mucho que desear subjetivamente. El sangrado de la retroiluminación no parece ser un problema demasiado grande y no notamos ningún parpadeo PWM.
| |||||||||||||||||||||||||
iluminación: 89 %
Brillo con batería: 422 cd/m²
Contraste: 974:1 (Negro: 0.43 cd/m²)
ΔE ColorChecker Calman: 2.3 | ∀{0.5-29.43 Ø4.71}
calibrated: 0.9
ΔE Greyscale Calman: 3.3 | ∀{0.09-98 Ø4.96}
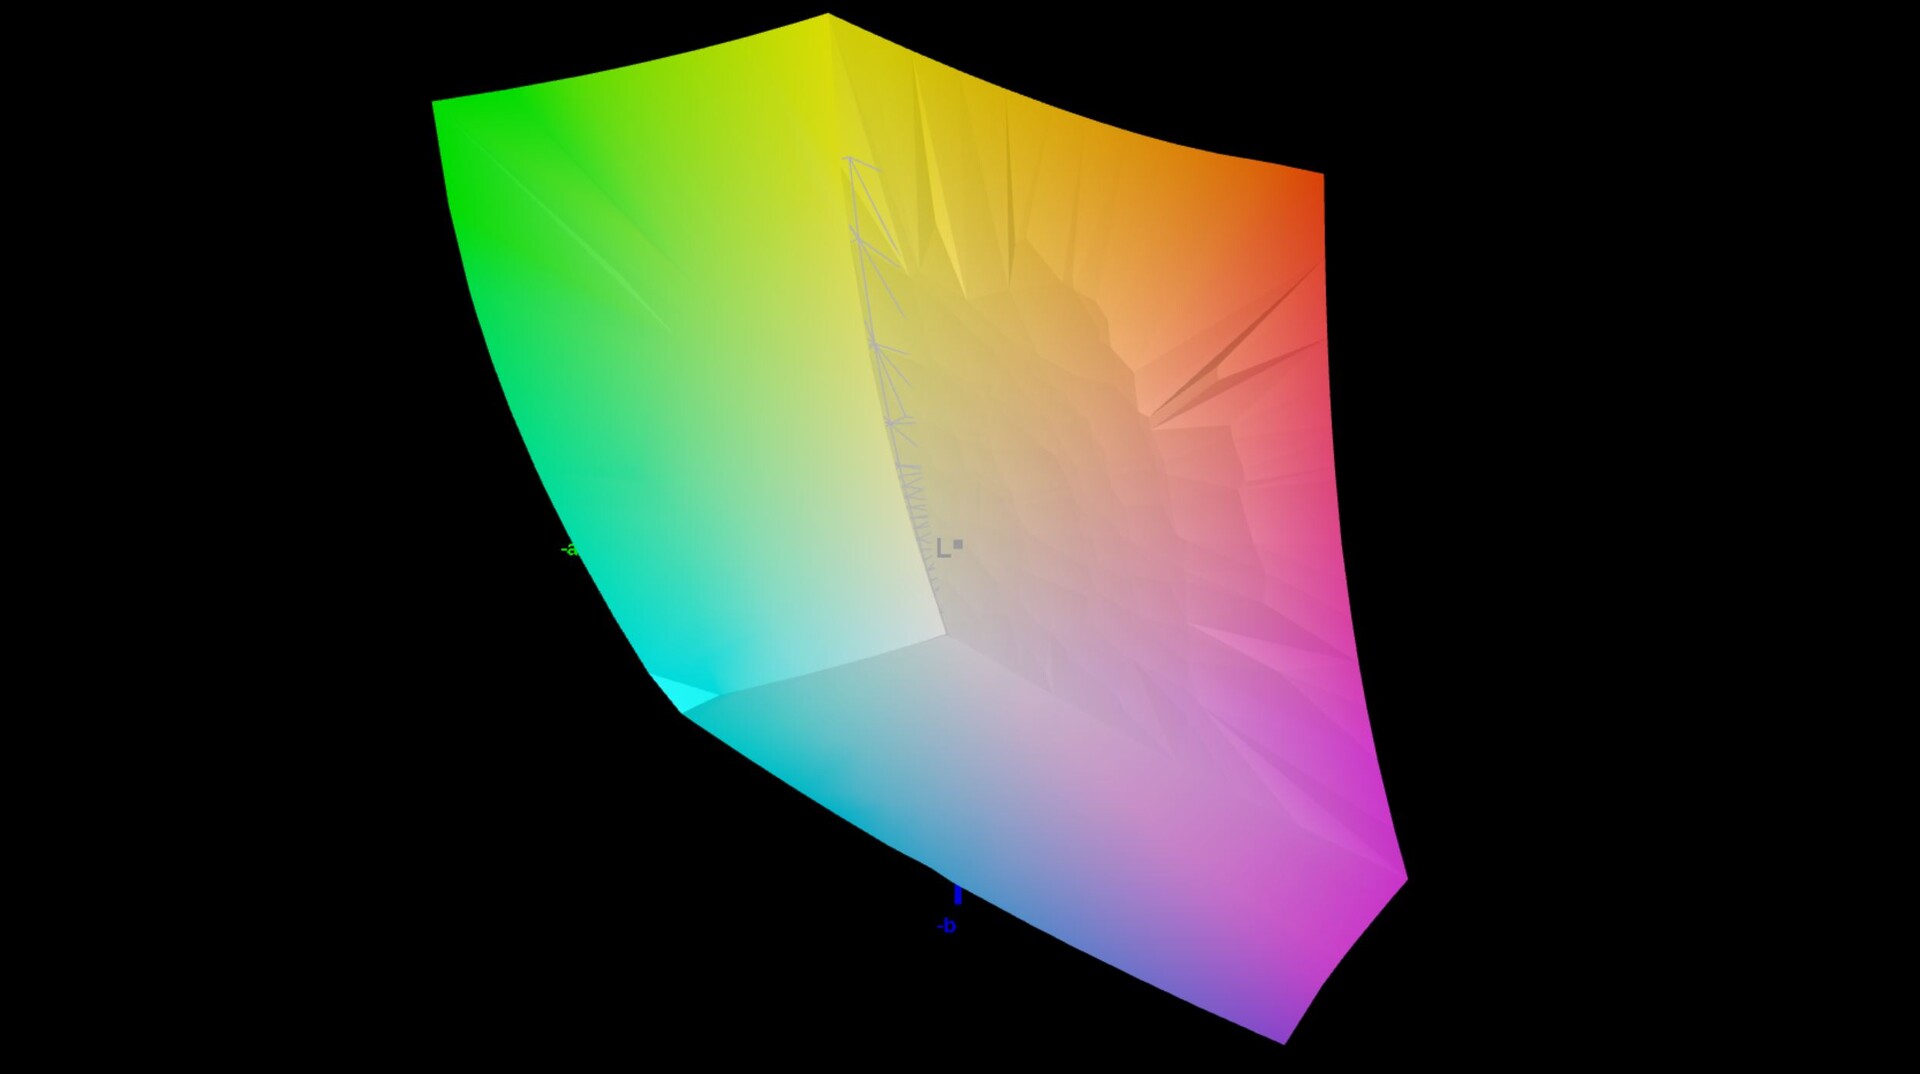
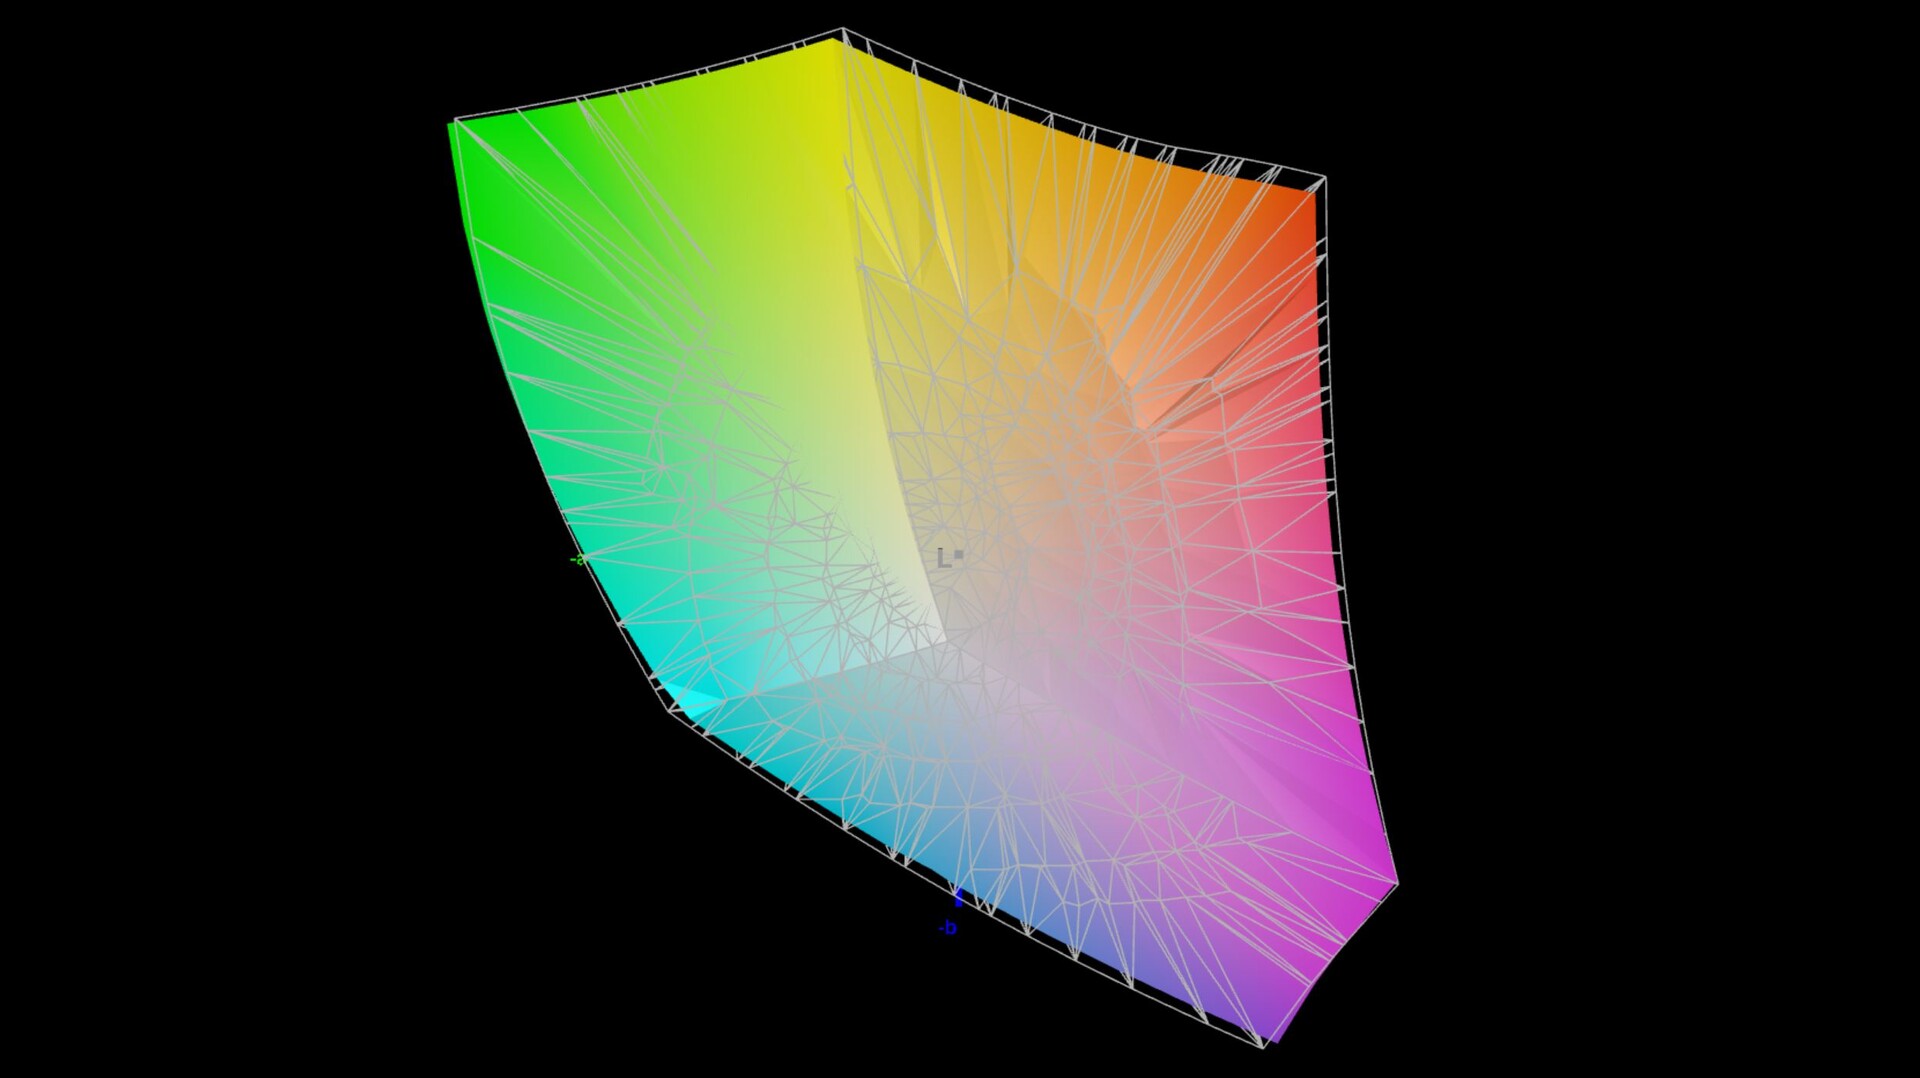
85.3% AdobeRGB 1998 (Argyll 3D)
99.6% sRGB (Argyll 3D)
96.2% Display P3 (Argyll 3D)
Gamma: 2.14
CCT: 6550 K
| MSI Stealth 14 Studio A13V B140QAN06.T, IPS, 2560x1600, 14" | Gigabyte Aero 14 OLED BMF Samsung SDC4192 (ATNA40YK14-0), OLED, 2880x1800, 14" | Schenker Vision 14 2022 RTX 3050 Ti MNE007ZA1-1, IPS, 2880x1800, 14" | Asus ROG Flow Z13 GZ301ZE LQ134N1JW54, IPS, 1920x1200, 13.4" | Alienware x14 i7 RTX 3060 SHP154D, IPS, 1920x1080, 14" | Razer Blade 14 Ryzen 9 6900HX TL140BDXP02-0, IPS, 2560x1440, 14" | Acer Predator Triton 300 SE Samsung ATNA40YK07-0, OLED, 2880x1800, 14" | |
|---|---|---|---|---|---|---|---|
| Display | 3% | -12% | -17% | 2% | 0% | 7% | |
| Display P3 Coverage (%) | 96.2 | 99.8 4% | 74.1 -23% | 67.5 -30% | 99.6 4% | 97.2 1% | 99.9 4% |
| sRGB Coverage (%) | 99.6 | 100 0% | 97.4 -2% | 97.1 -3% | 100 0% | 99.9 0% | 100 0% |
| AdobeRGB 1998 Coverage (%) | 85.3 | 88.7 4% | 75.3 -12% | 69.3 -19% | 87.6 3% | 85.7 0% | 99 16% |
| Response Times | 58% | -312% | -452% | -53% | -184% | 76% | |
| Response Time Grey 50% / Grey 80% * (ms) | 5.5 ? | 2.4 ? 56% | 31.5 ? -473% | 44 ? -700% | 9.6 ? -75% | 16.8 ? -205% | 1.36 ? 75% |
| Response Time Black / White * (ms) | 5.8 ? | 2.4 ? 59% | 14.5 ? -150% | 17.6 ? -203% | 7.6 ? -31% | 15.2 ? -162% | 1.36 ? 77% |
| PWM Frequency (Hz) | 300 | 367.6 ? | |||||
| Screen | 71% | -11% | 18% | 5% | 11% | -13% | |
| Brightness middle (cd/m²) | 419 | 423 1% | 421 0% | 515 23% | 434 4% | 354 -16% | 414.3 -1% |
| Brightness (cd/m²) | 402 | 427 6% | 416 3% | 476 18% | 411 2% | 328 -18% | 416 3% |
| Brightness Distribution (%) | 89 | 98 10% | 89 0% | 87 -2% | 89 0% | 86 -3% | 99 11% |
| Black Level * (cd/m²) | 0.43 | 0.1 77% | 0.28 35% | 0.35 19% | 0.25 42% | 0.37 14% | |
| Contrast (:1) | 974 | 4230 334% | 1504 54% | 1471 51% | 1736 78% | 957 -2% | |
| Colorchecker dE 2000 * | 2.3 | 0.55 76% | 3.2 -39% | 1.6 30% | 3 -30% | 1.66 28% | 4.68 -103% |
| Colorchecker dE 2000 max. * | 5.8 | 1.15 80% | 5.5 5% | 4 31% | 7.1 -22% | 3.83 34% | 7.78 -34% |
| Colorchecker dE 2000 calibrated * | 0.9 | 1.15 -28% | 2 -122% | 1.2 -33% | 0.7 22% | ||
| Greyscale dE 2000 * | 3.3 | 0.69 79% | 4.4 -33% | 2.5 24% | 5.1 -55% | 1.6 52% | 1.8 45% |
| Gamma | 2.14 103% | 2.42 91% | 2.22 99% | 2.2 100% | 2.19 100% | 2.23 99% | 2.22 99% |
| CCT | 6550 99% | 6479 100% | 6384 102% | 6939 94% | 6204 105% | 6542 99% | 6207 105% |
| Media total (Programa/Opciones) | 44% /
54% | -112% /
-54% | -150% /
-57% | -15% /
-4% | -58% /
-21% | 23% /
8% |
* ... más pequeño es mejor
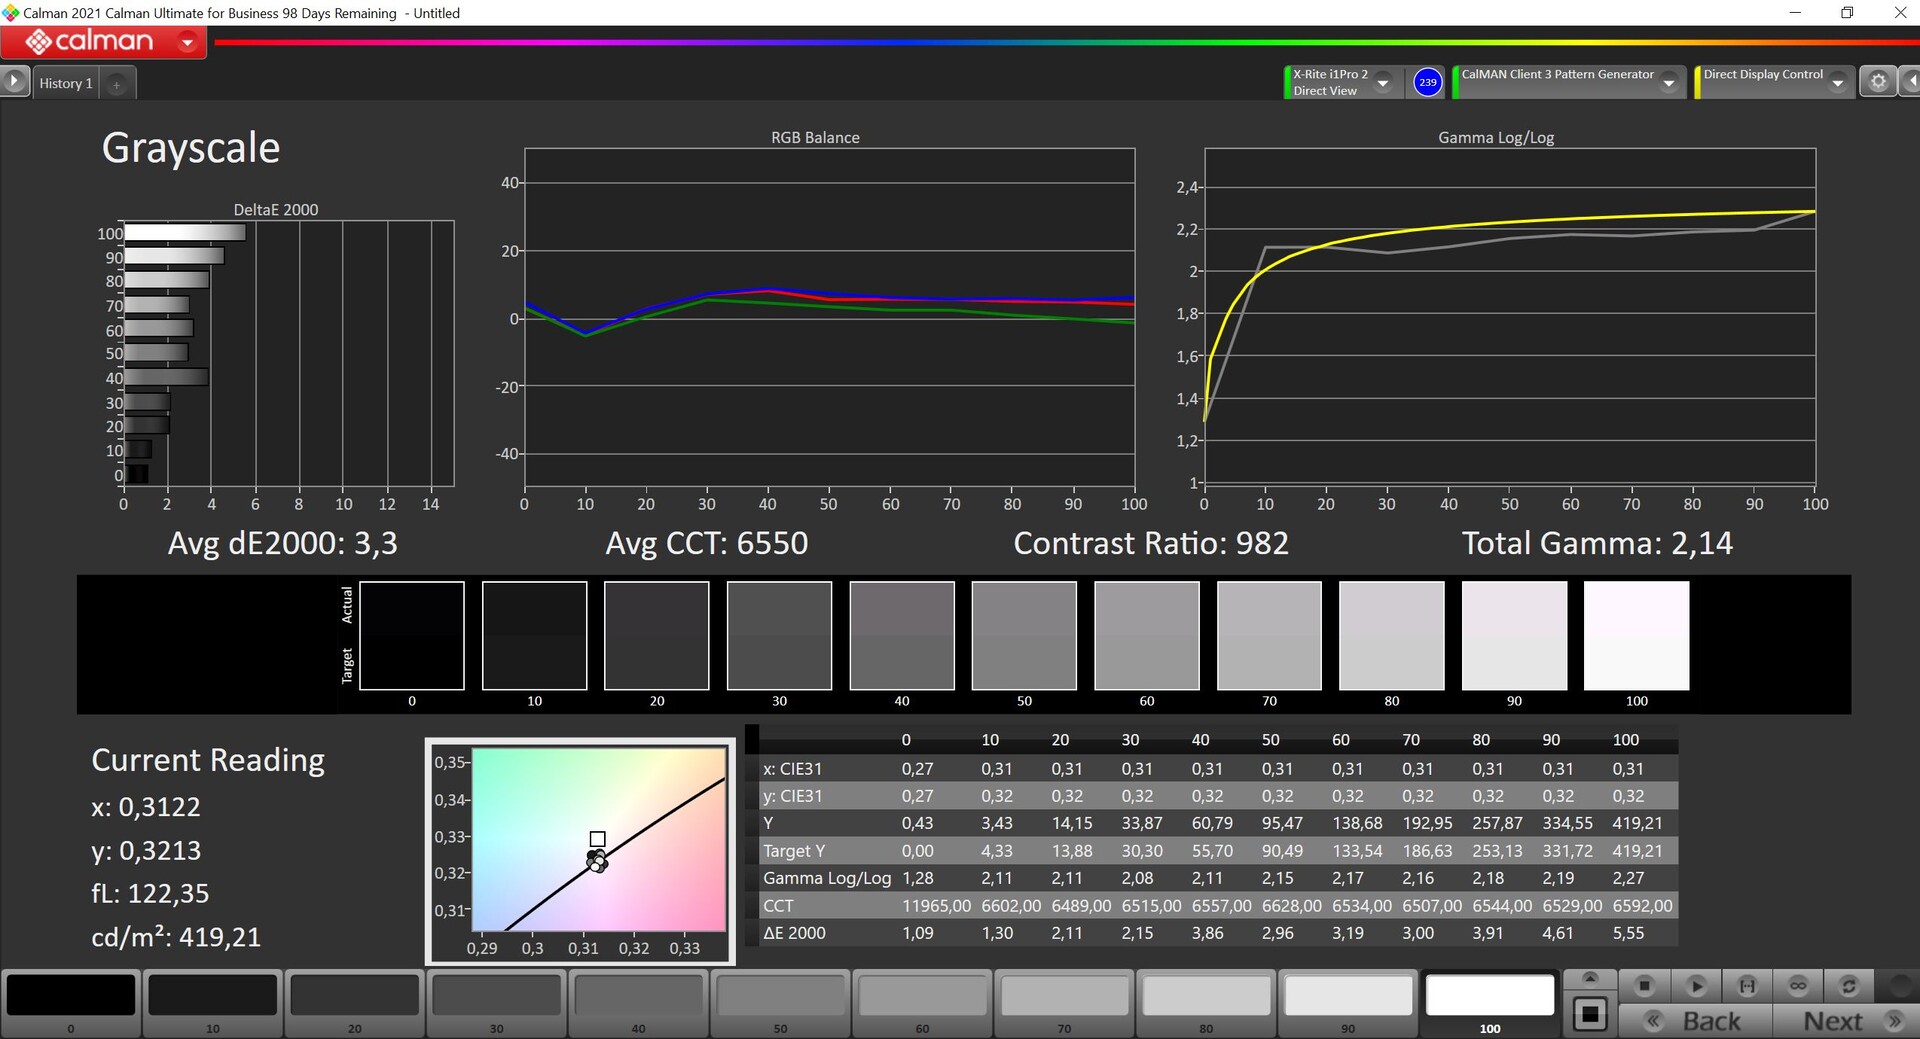
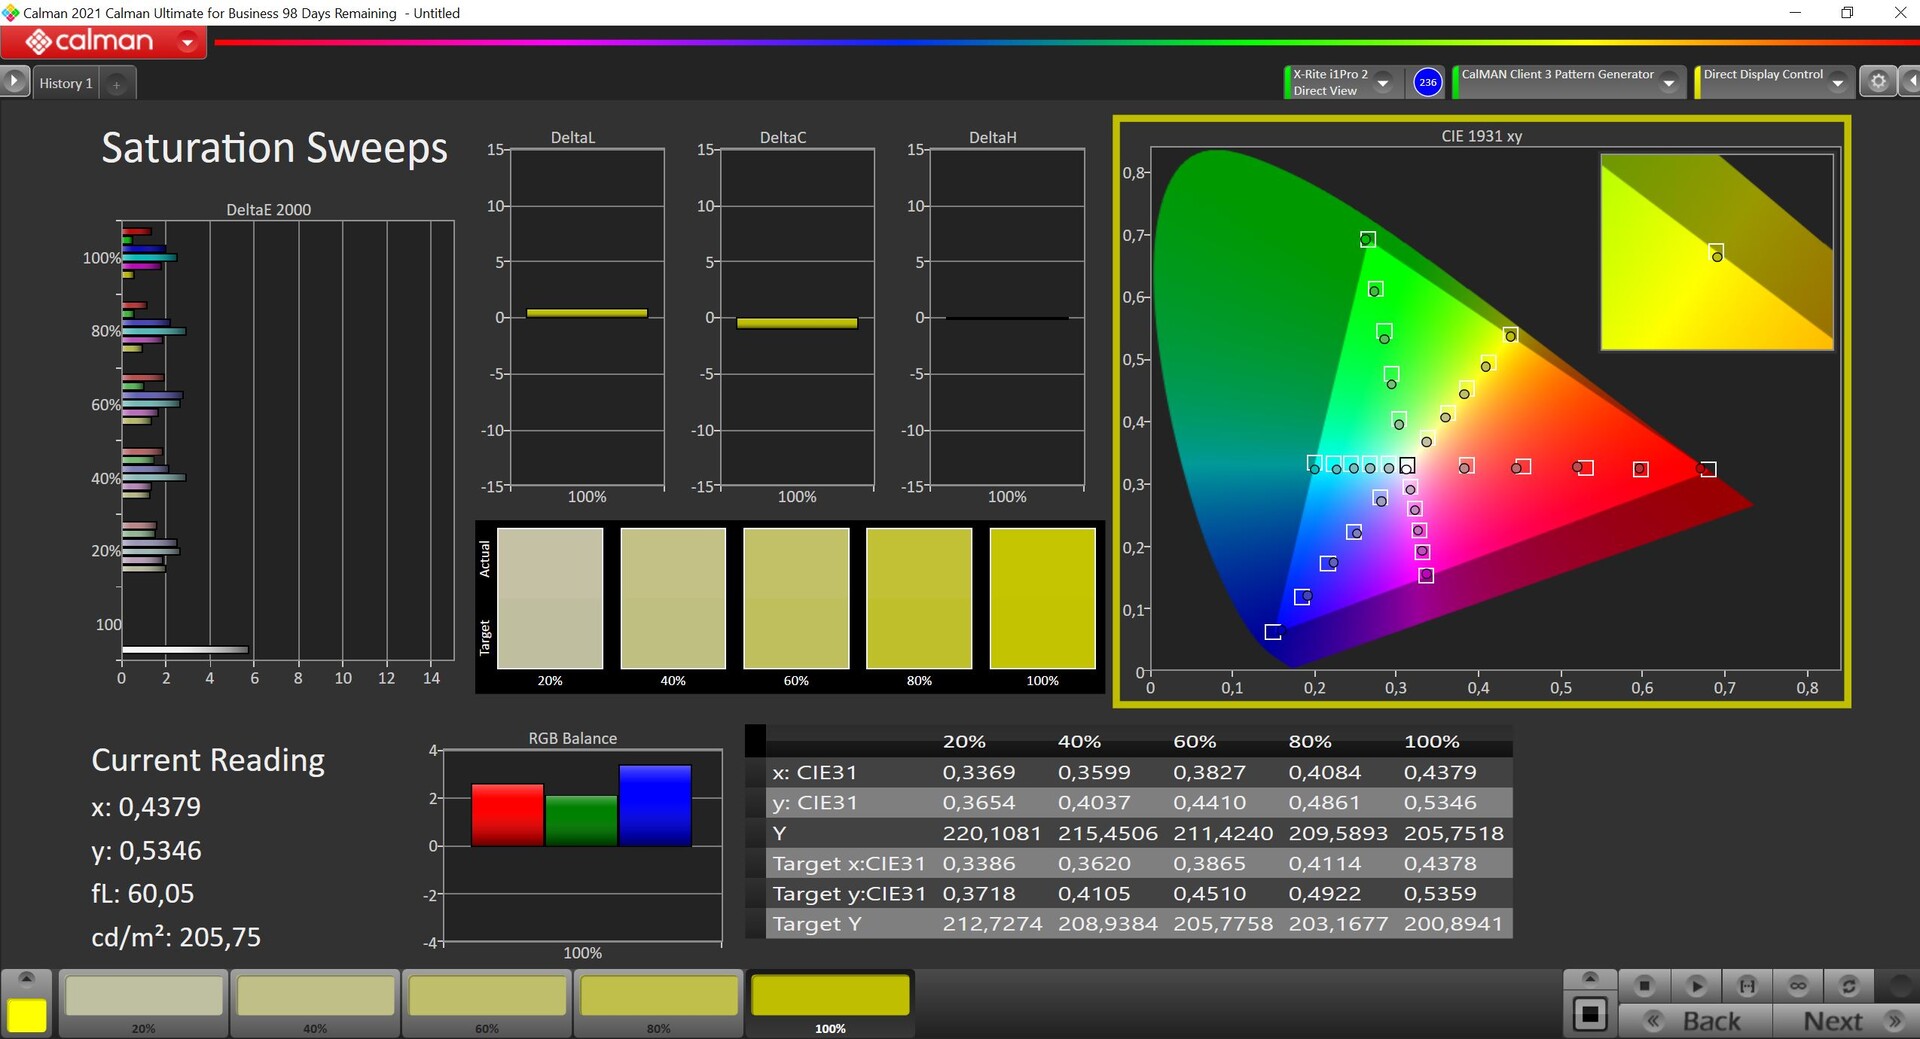
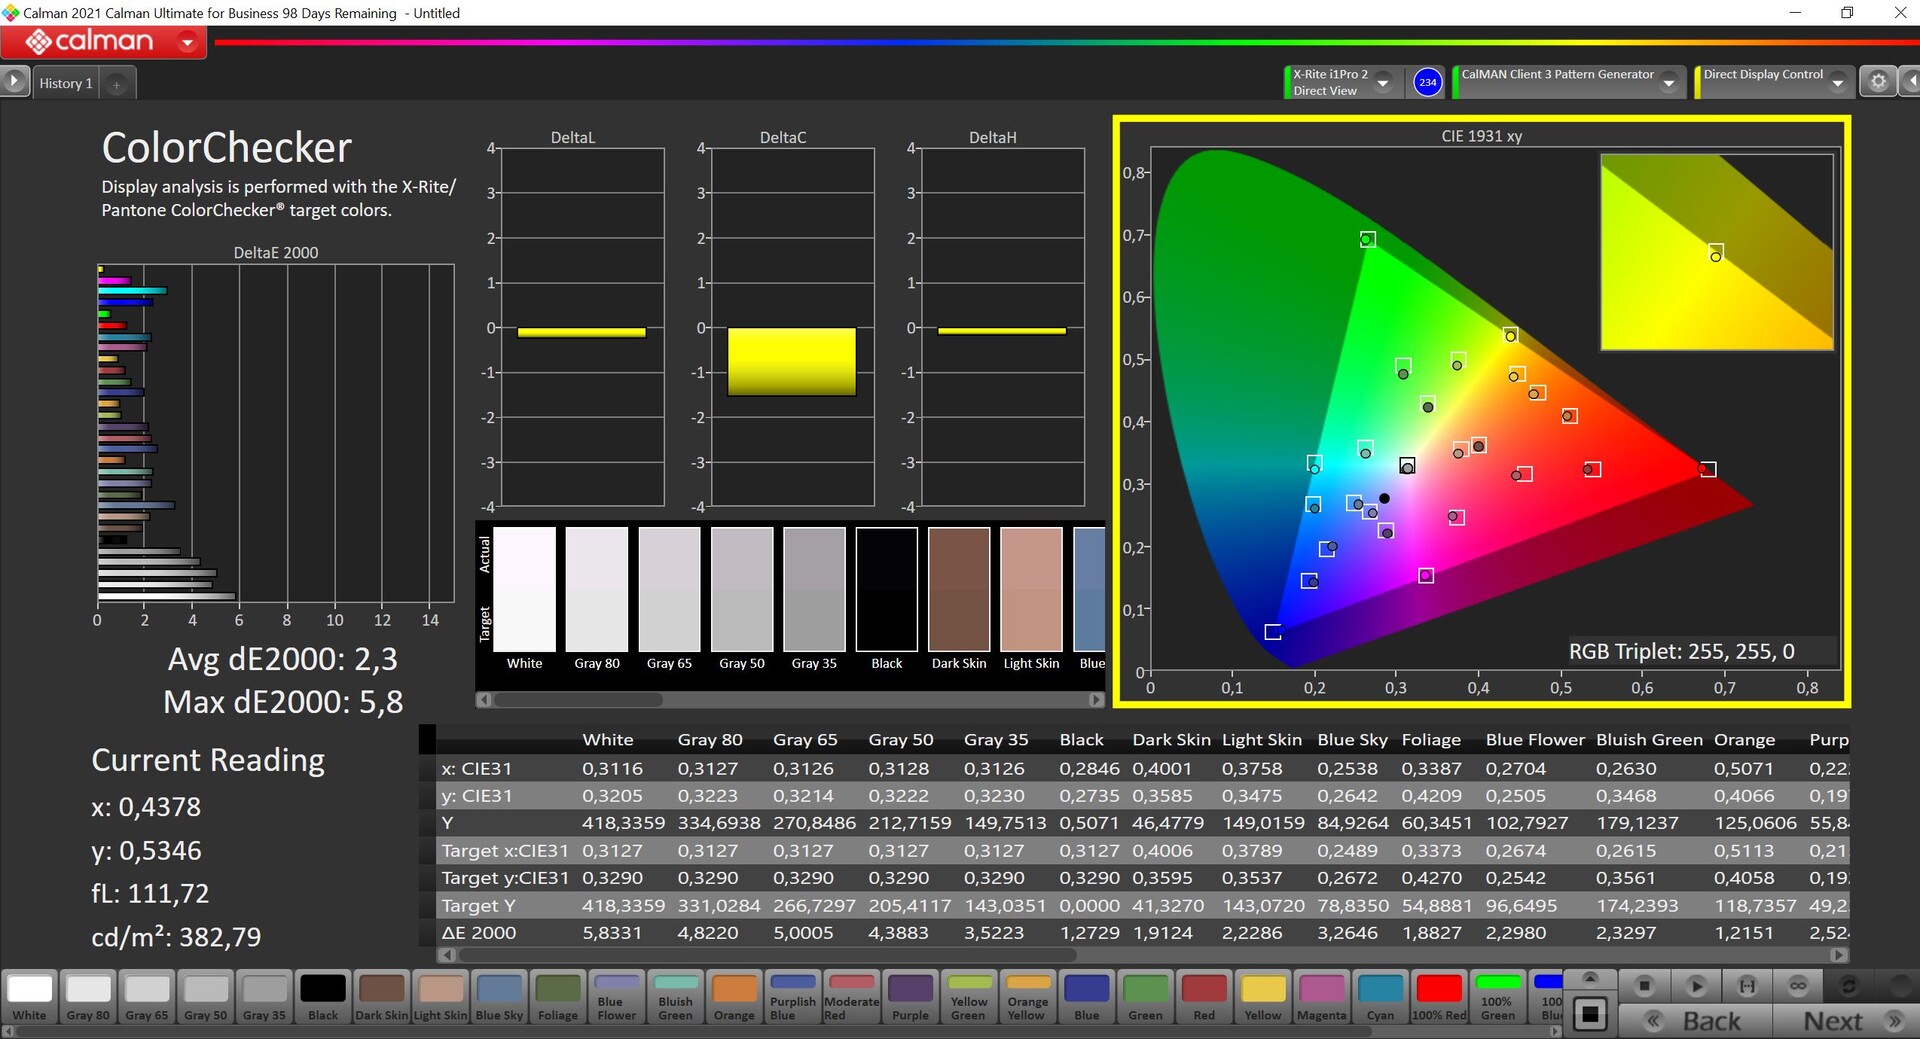
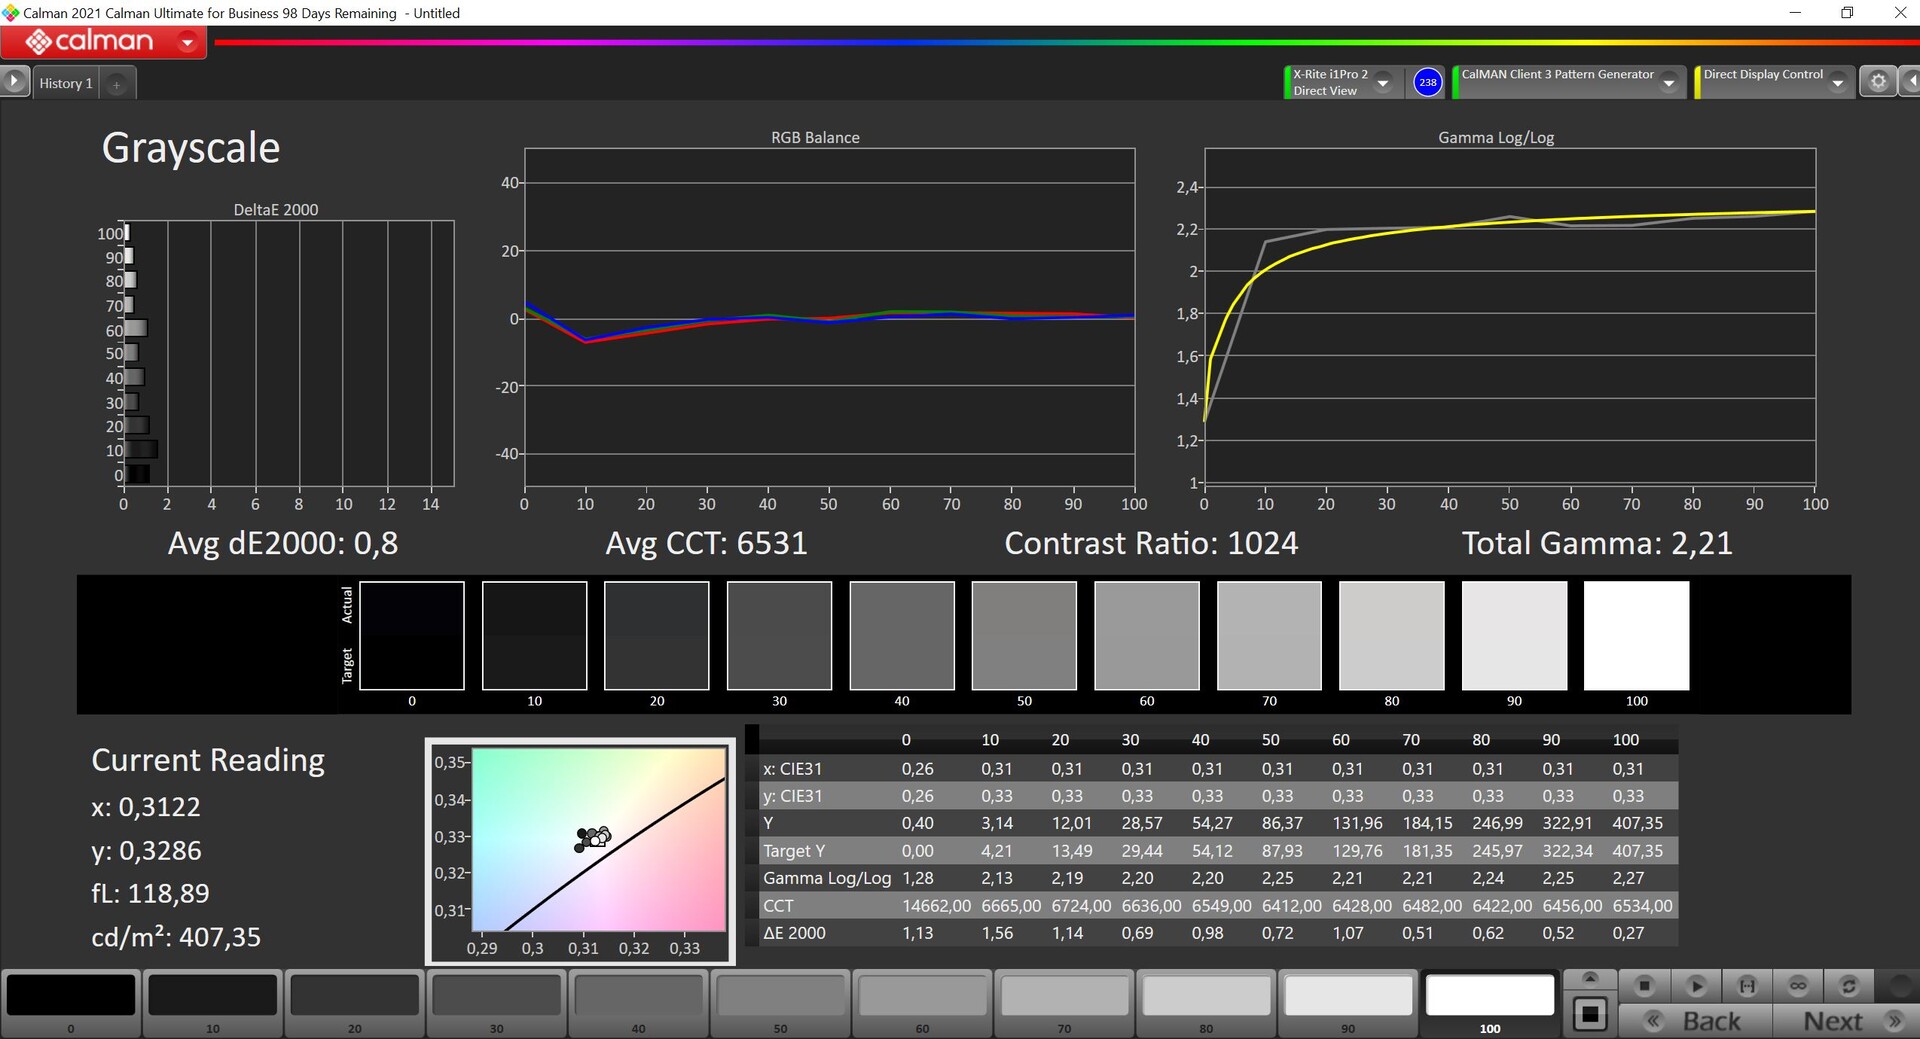
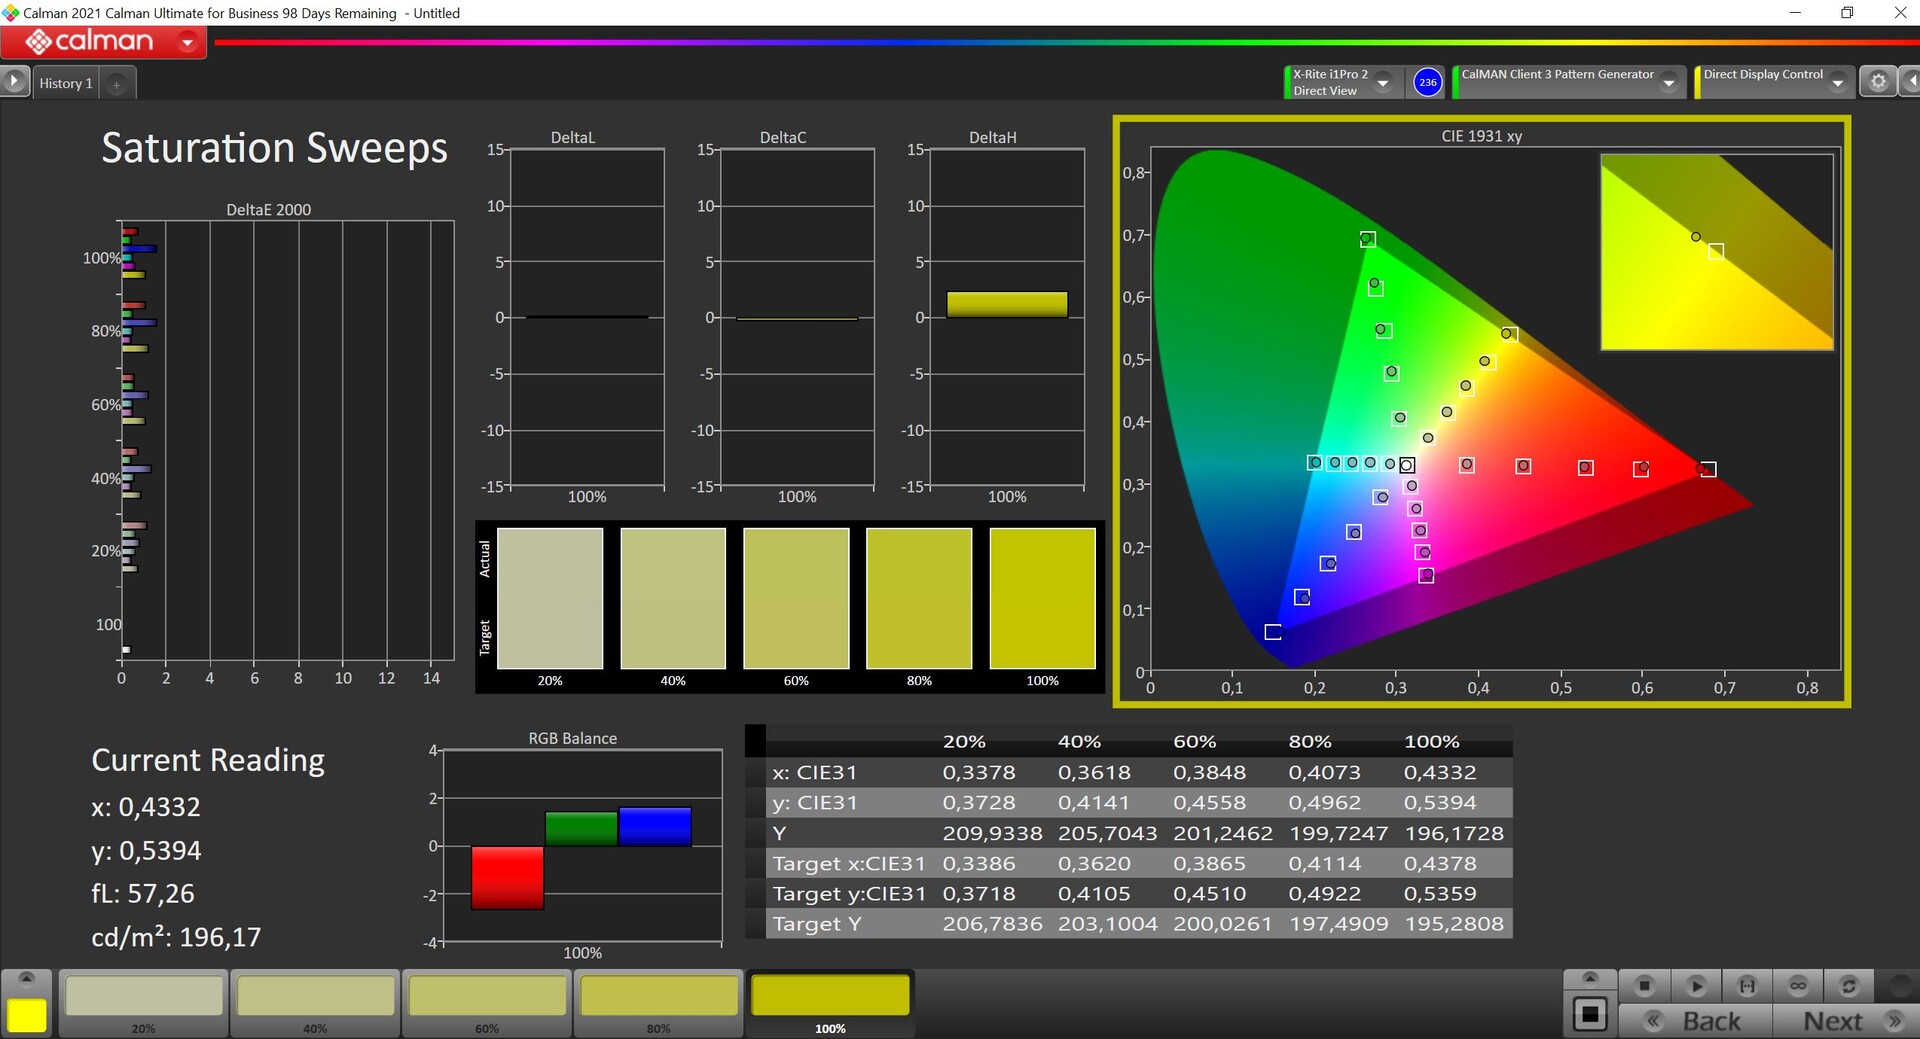

MSI ofrece varios perfiles de color diferentes a través de su software TrueColor y elegimos el modo Display P3 para nuestras mediciones usando el software profesional CalMAN (X-Rite i1 Pro2). Es el modo que viene activado de serie. Los colores que medimos estaban por debajo de la importante desviación DeltaE 2000 de 3 en comparación con la referencia P3, sin embargo, los tonos grises parecían mostrar un ligero tinte púrpura. Utilizando nuestra propia calibración (puede descargar nuestro perfil gratuitamente más arriba), conseguimos controlarlo fácilmente. El espacio de color P3 pudo representarse casi en su totalidad.
Tiempos de respuesta del display
| ↔ Tiempo de respuesta de Negro a Blanco | ||
|---|---|---|
| 5.8 ms ... subida ↗ y bajada ↘ combinada | ↗ 2.1 ms subida | 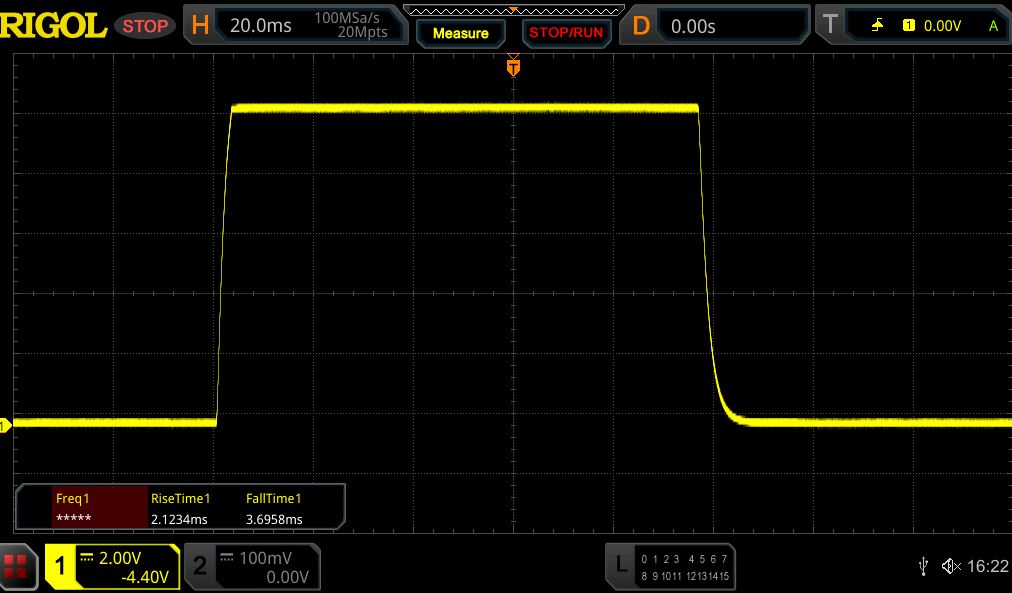 |
| ↘ 3.7 ms bajada | ||
| La pantalla mostró tiempos de respuesta muy rápidos en nuestros tests y debería ser adecuada para juegos frenéticos. En comparación, todos los dispositivos de prueba van de ##min### (mínimo) a 240 (máximo) ms. » 18 % de todos los dispositivos son mejores. Esto quiere decir que el tiempo de respuesta medido es mejor que la media (19.8 ms) de todos los dispositivos testados. | ||
| ↔ Tiempo de respuesta 50% Gris a 80% Gris | ||
| 5.5 ms ... subida ↗ y bajada ↘ combinada | ↗ 2.7 ms subida | 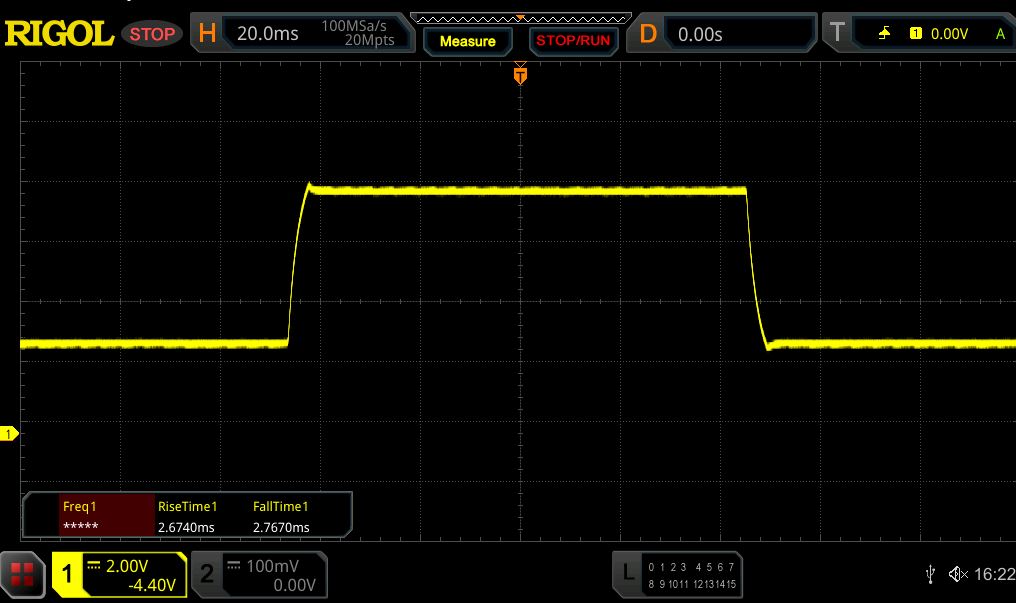 |
| ↘ 2.8 ms bajada | ||
| La pantalla mostró tiempos de respuesta muy rápidos en nuestros tests y debería ser adecuada para juegos frenéticos. En comparación, todos los dispositivos de prueba van de ##min### (mínimo) a 636 (máximo) ms. » 18 % de todos los dispositivos son mejores. Esto quiere decir que el tiempo de respuesta medido es mejor que la media (31 ms) de todos los dispositivos testados. | ||
Parpadeo de Pantalla / PWM (Pulse-Width Modulation)
| Parpadeo de Pantalla / PWM no detectado | 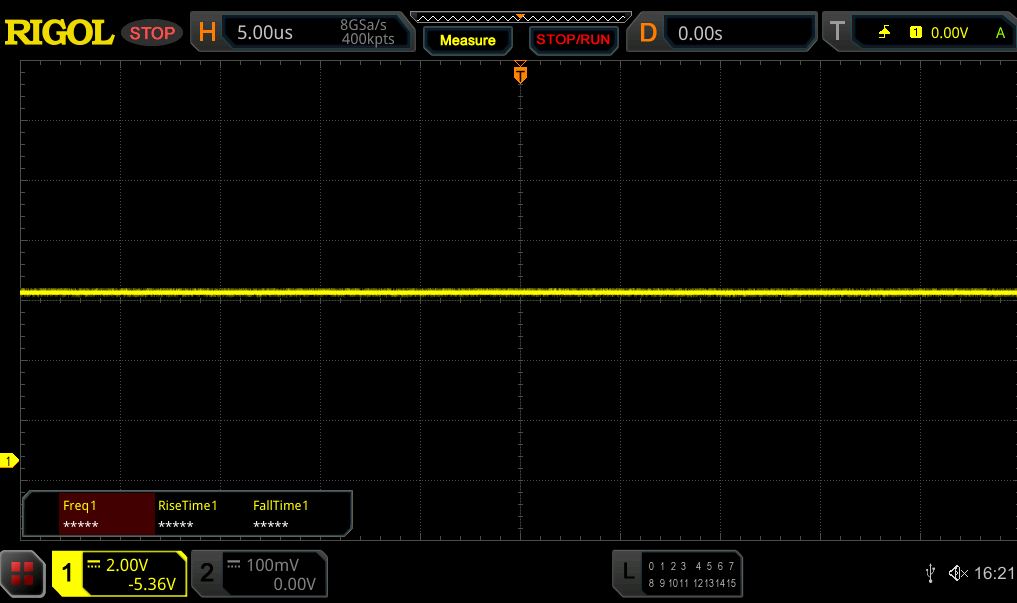 | ||
Comparación: 52 % de todos los dispositivos testados no usaron PWM para atenuar el display. Si se usó, medimos una media de 7754 (mínimo: 5 - máxmo: 343500) Hz. | |||
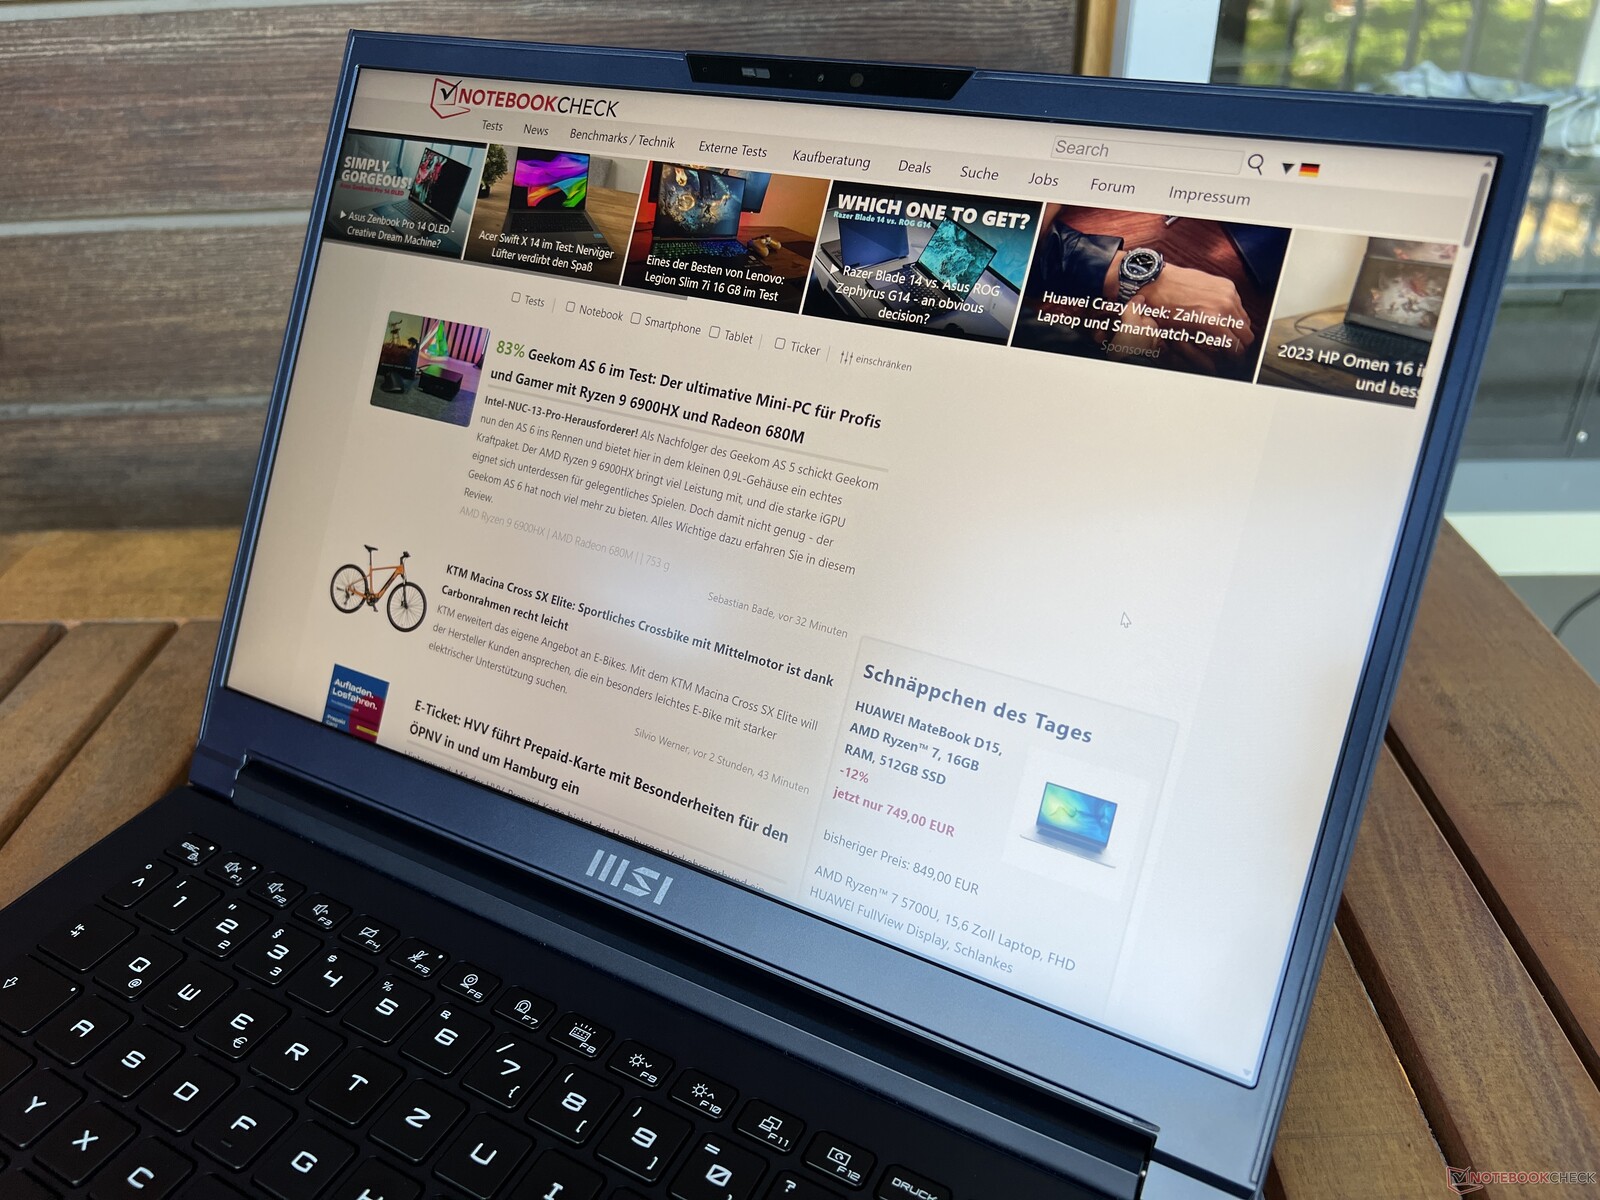
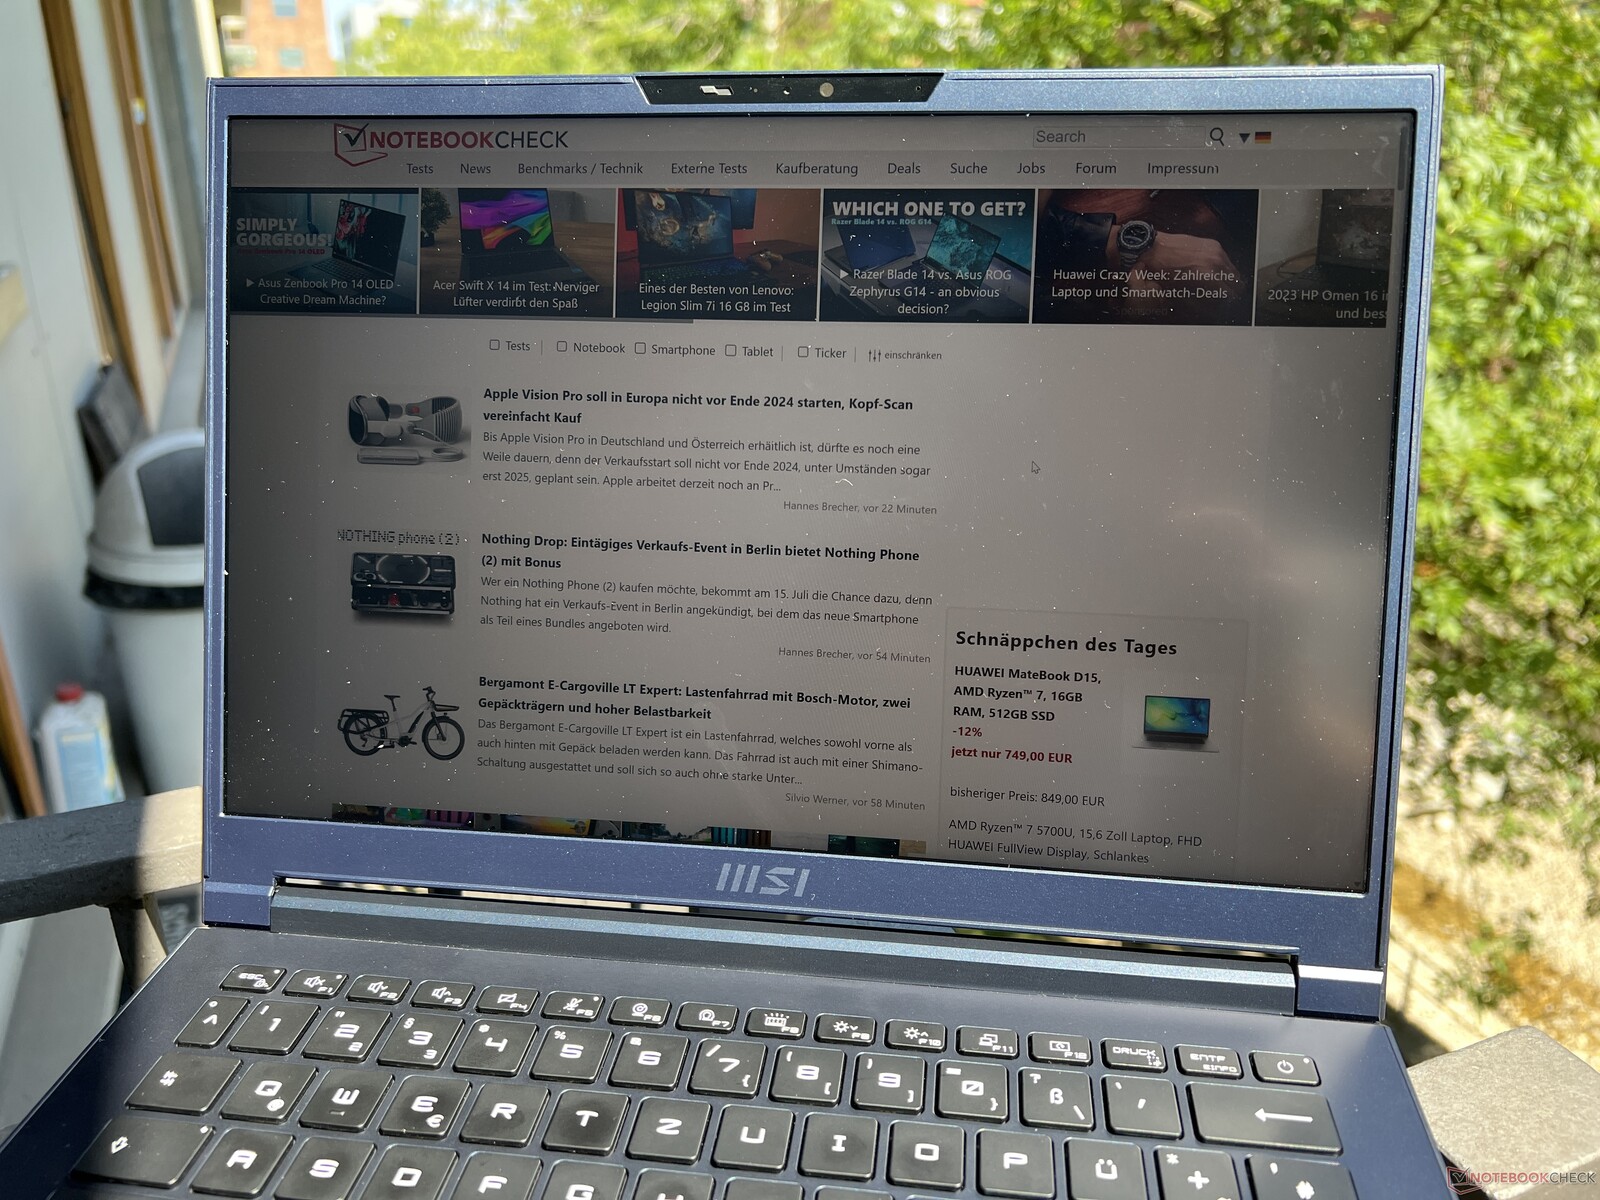
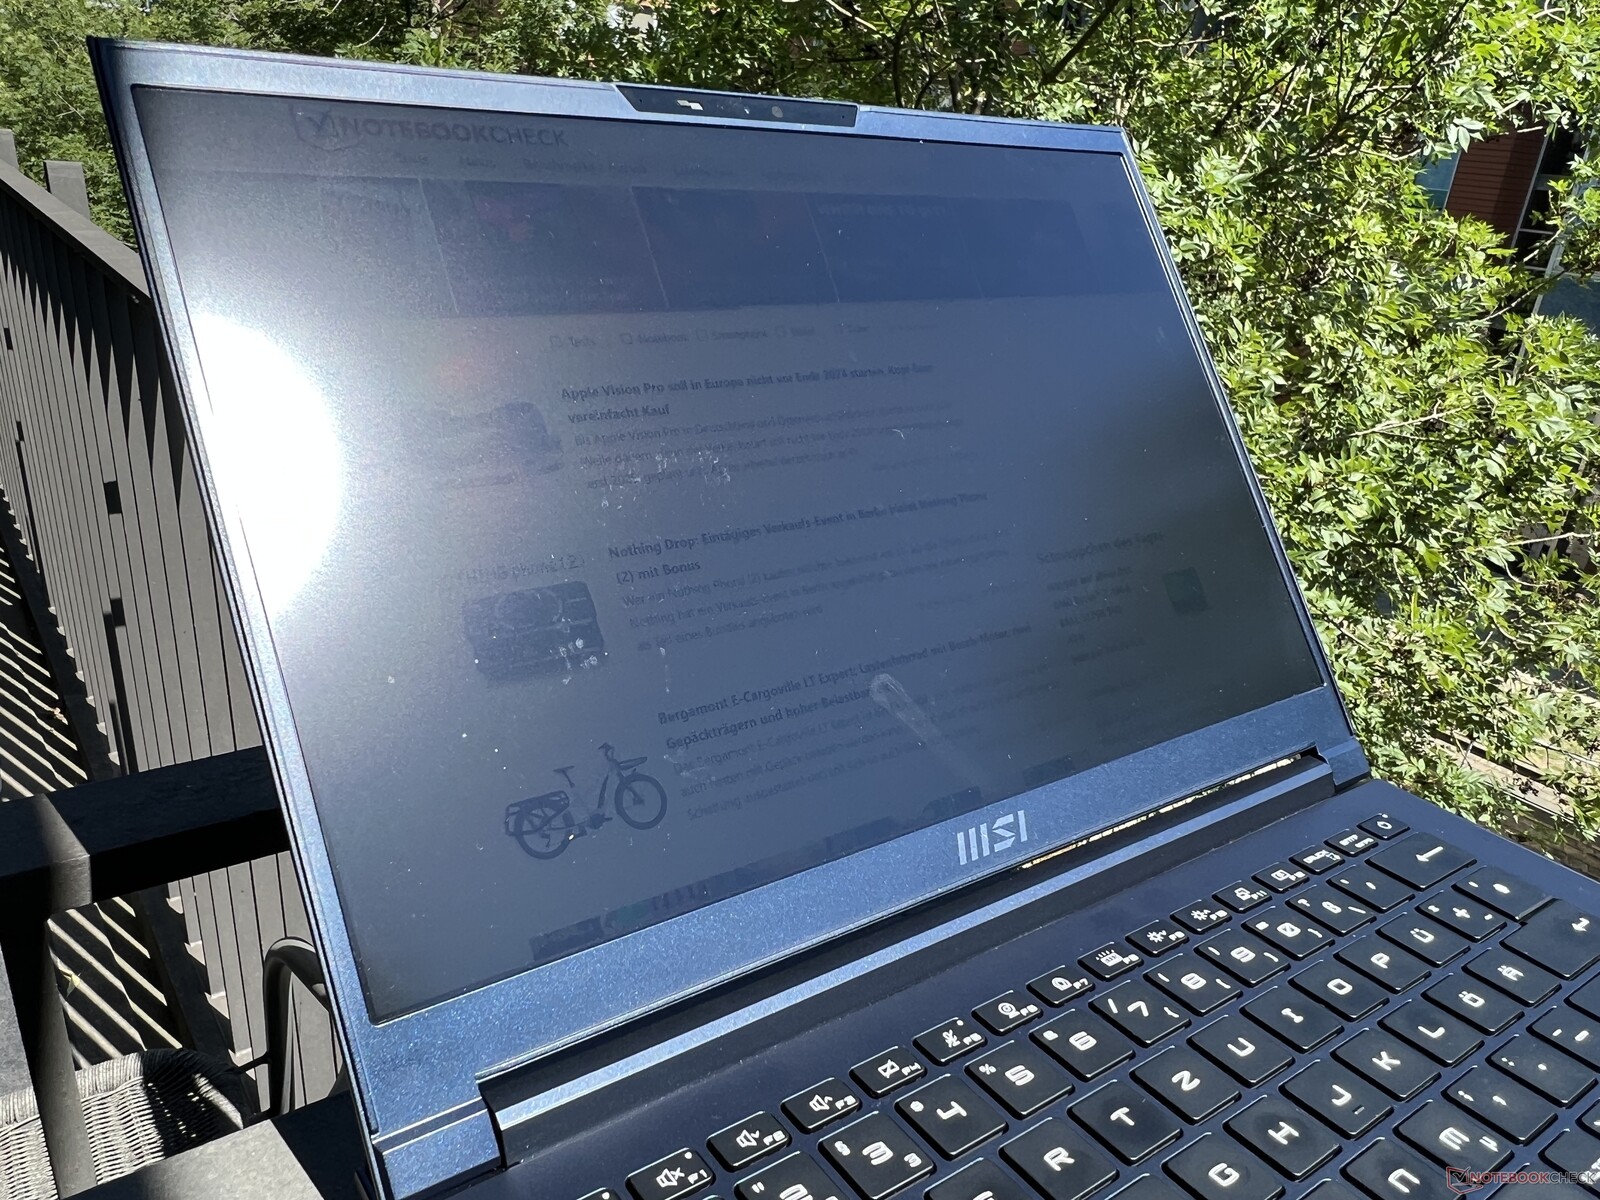

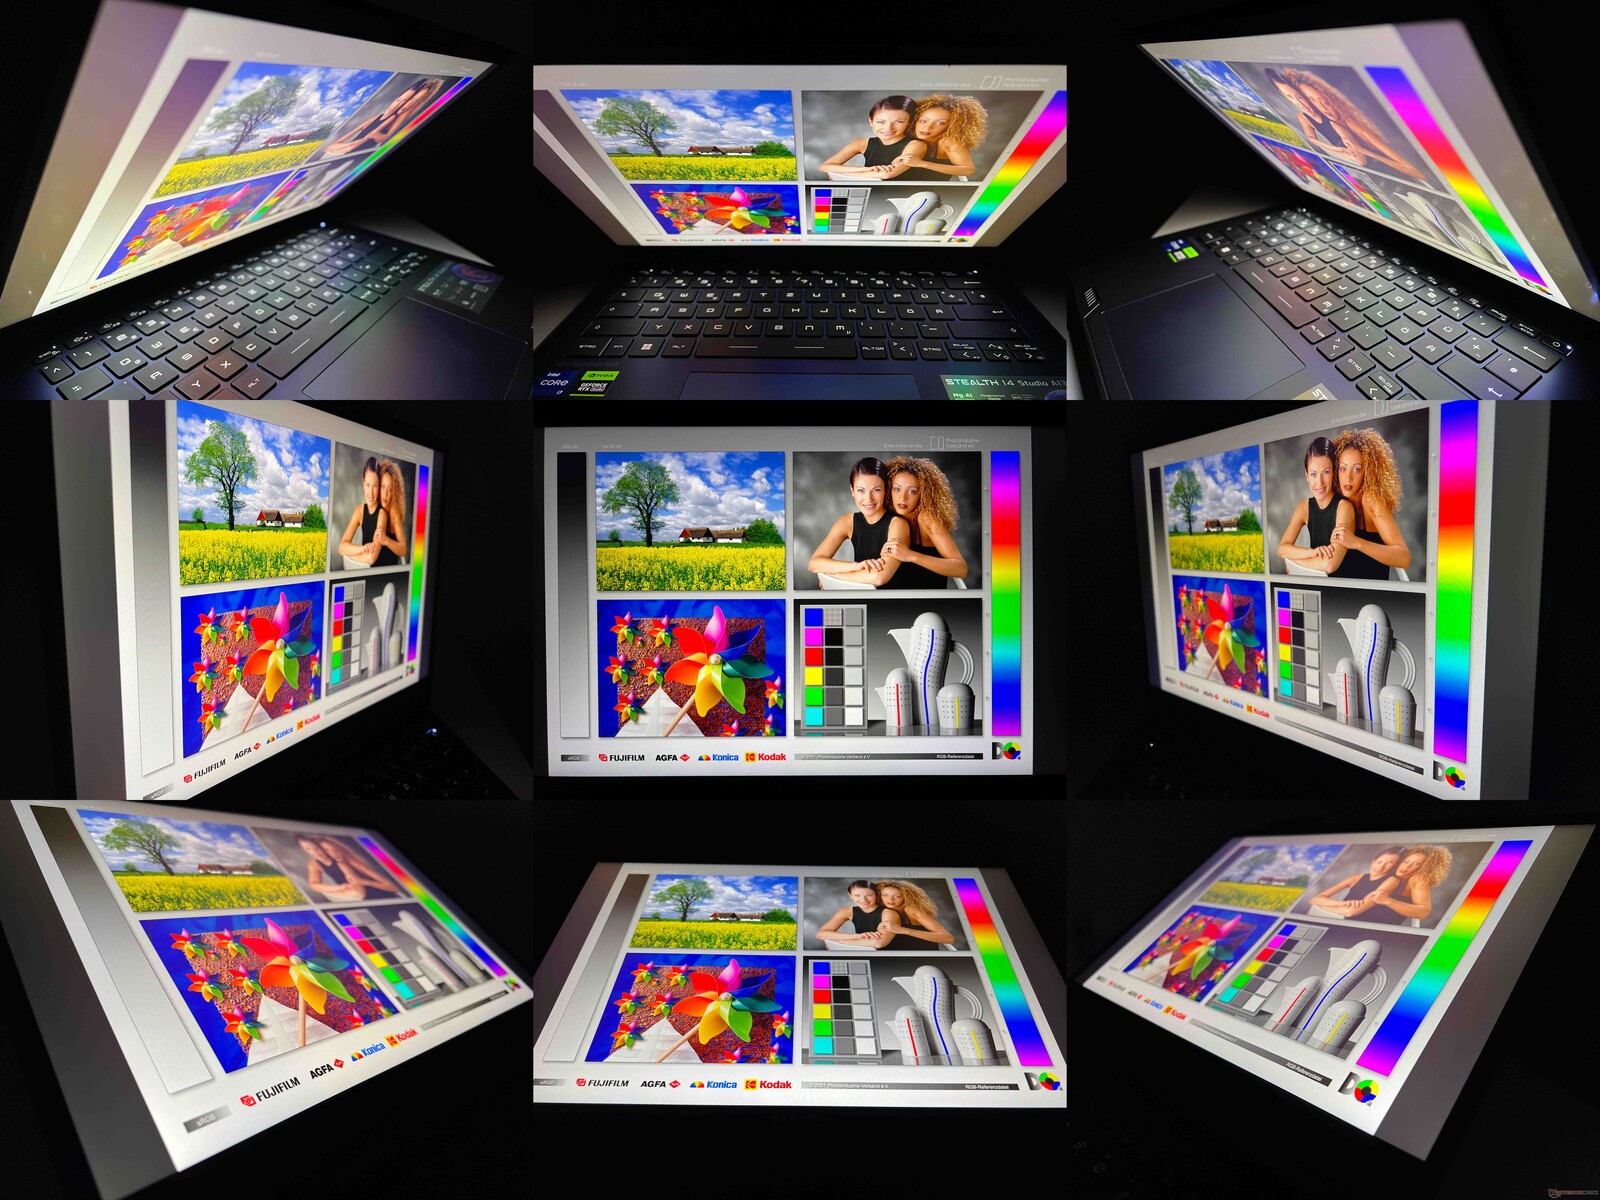
Siempre que no coloques el Stealth 14 Studio bajo la luz directa del sol, no deberías tener problemas para leer en la pantalla mate en exteriores, incluso en días bastante luminosos. La estabilidad del ángulo de visión es buena, pero podría ser mejor. Especialmente viendo desde arriba en diagonal, la imagen se vuelve rápidamente demasiado clara y pierde bastante contraste.
Rendimiento - Raptor Lake y un portátil RTX 4050
Condiciones de ensayo
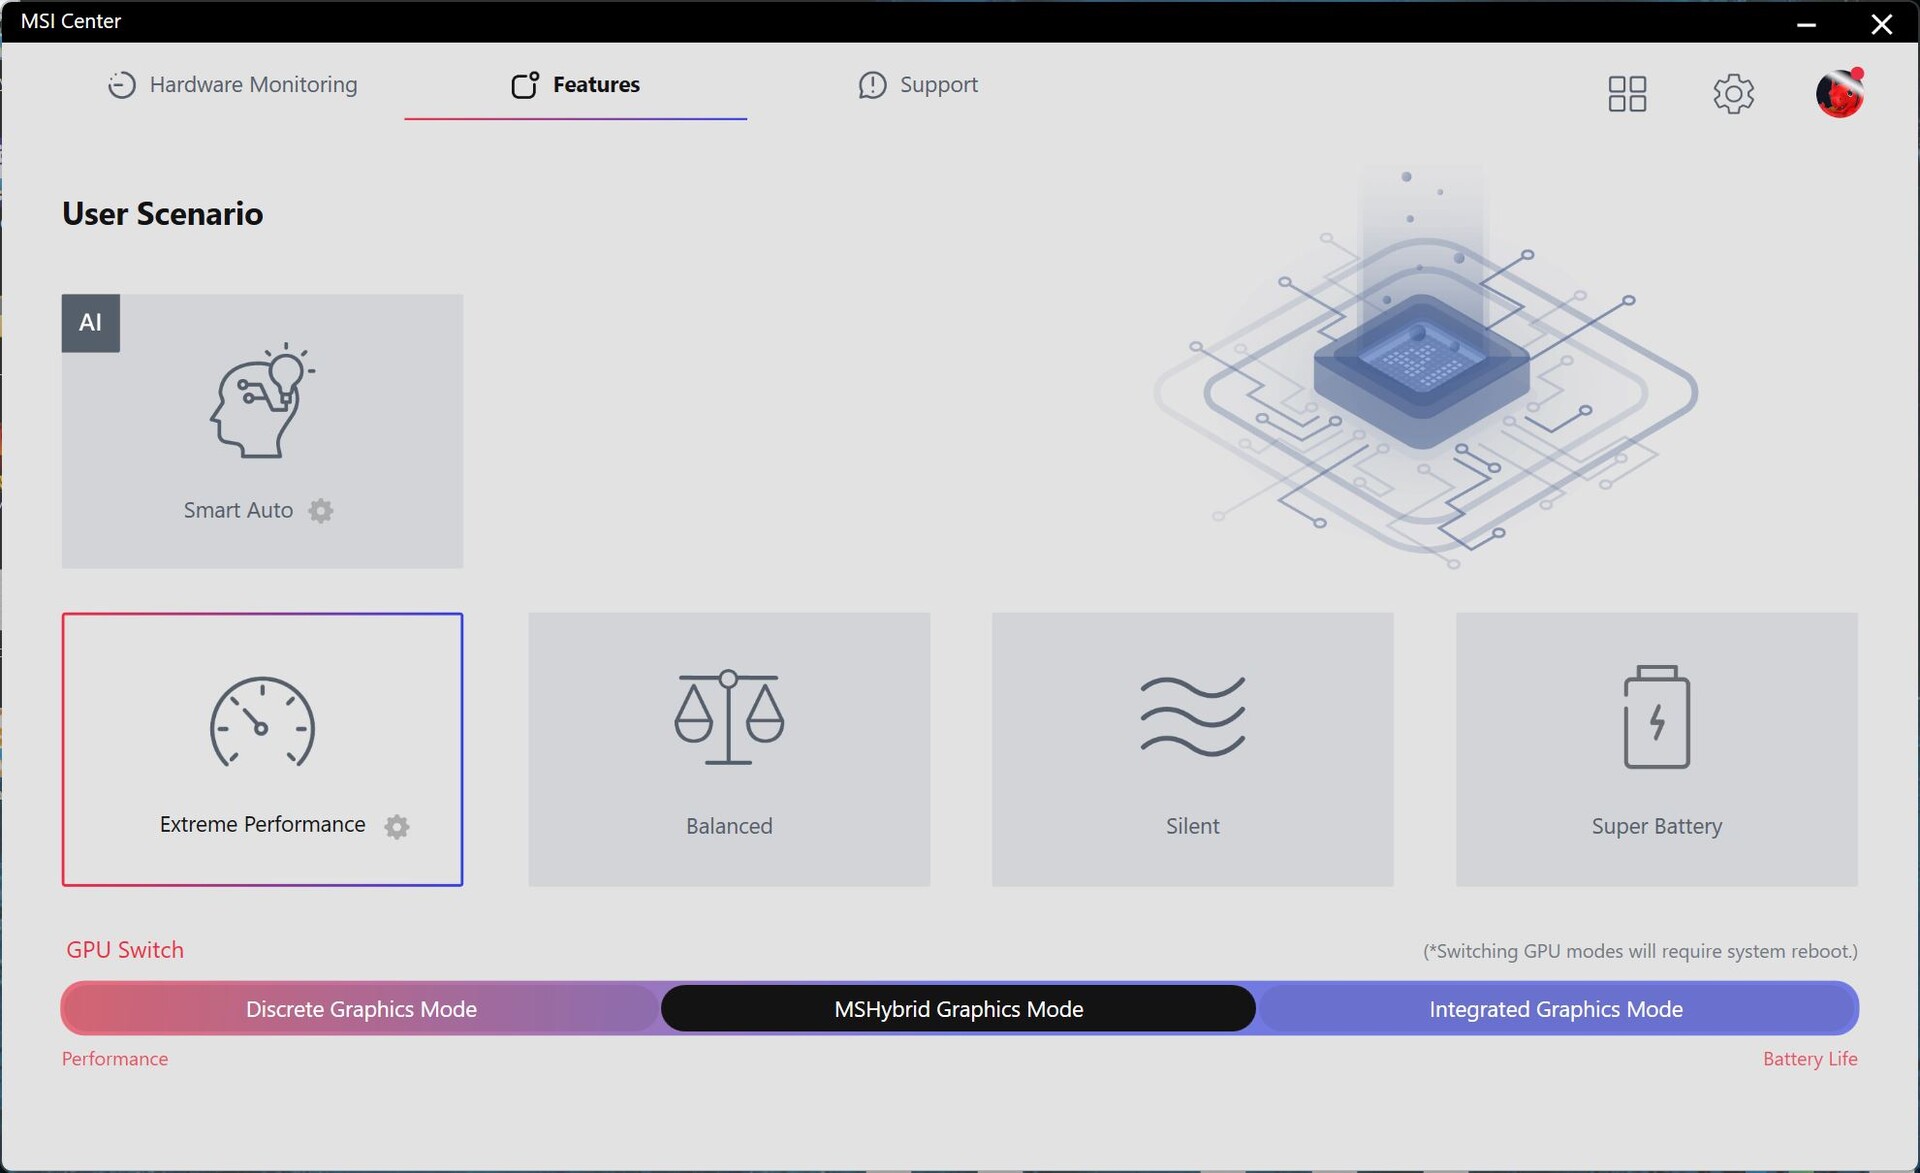
Hay diferentes perfiles de energía para elegir en el MSI Center preinstalado. El modo Smart Auto se supone que adapta dinámicamente los niveles de rendimiento según los requisitos del portátil con la ayuda de unos pocos parámetros diferentes - en nuestro test, los resultados no parecieron ser siempre consistentes. Como resultado, decidimos usar el modo de energía Rendimiento Extremo para nuestras pruebas y mediciones, para maximizar los niveles de rendimiento - especialmente durante periodos de carga combinada CPU/GPU. Usamos el perfil Equilibrado para nuestras pruebas de batería. Al mismo tiempo, siempre estaba activado el Modo Gráfico Híbrido de MSI, que cambia a la GPU Nvidia dedicada cuando es necesario. Hay disponible un control MUX, pero el cambio requiere un reinicio. Respecto al precio, nos habría encantado ver la tecnología Advanced Optimus utilizada aquí.
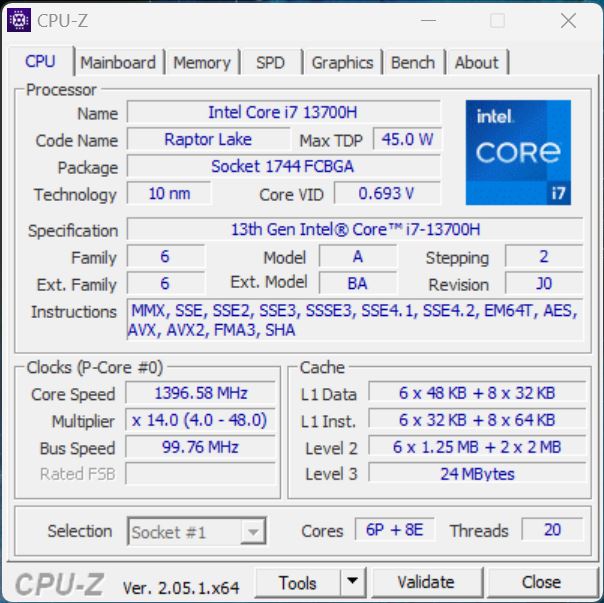
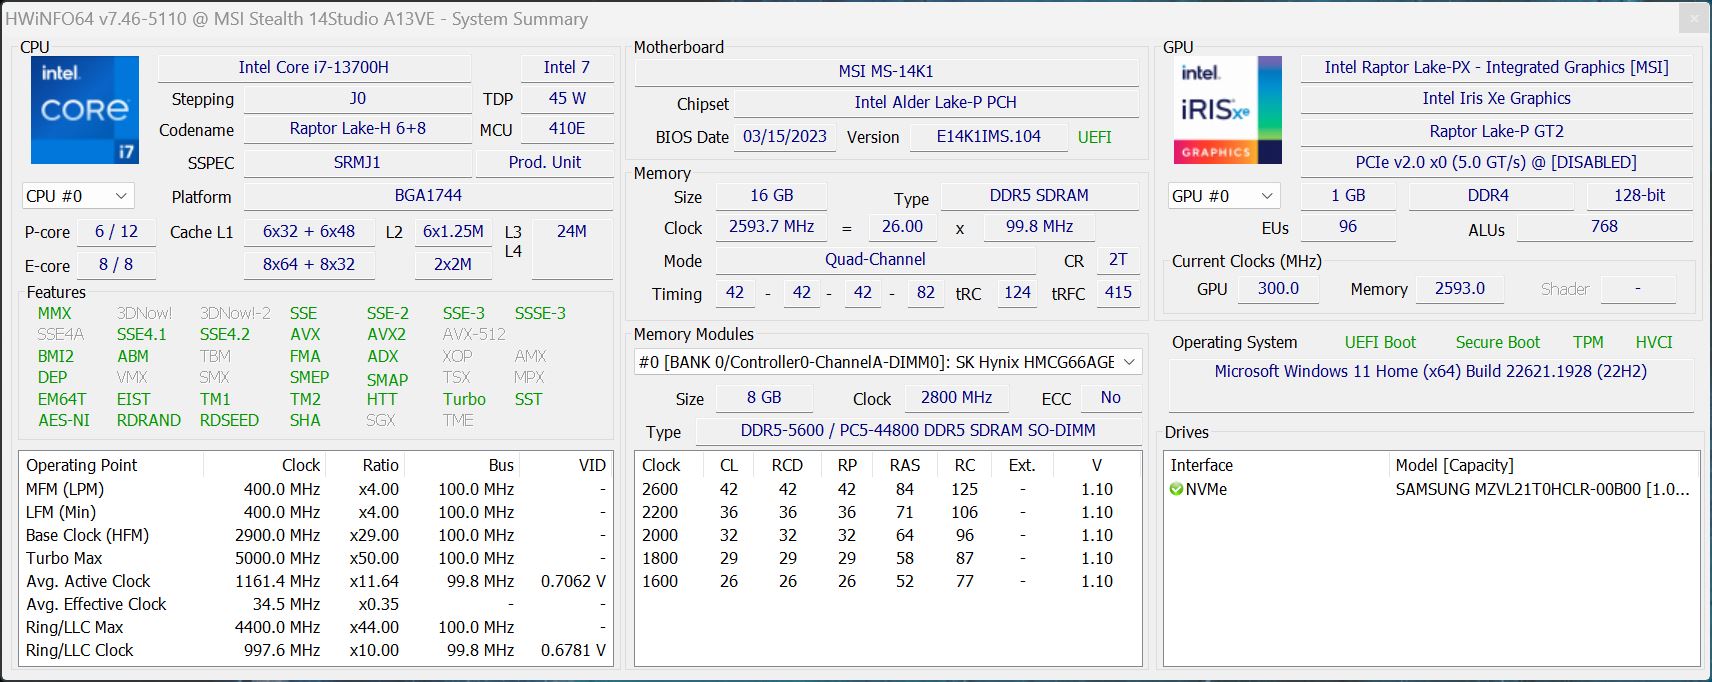
Prozessor - Core i7-13700H
El Stealth 14 Studio está equipado con el actual procesador de Intel, su Core i7-13700H- diseñado para portátiles multimedia y de juegos. Tiene 6 núcleos de rendimiento rápido y 8 núcleos de eficiencia, lo que significa que puede procesar un total de 20 hilos a la vez. En comparación con su predecesor, sólo presenta ligeras mejoras, como un reloj turbo ligeramente superior. Su rendimiento energético es muy bueno, ya que el procesador consume mucha energía. Medimos picos de 115 vatios y durante la carga continua, el portátil sigue consumiendo algo más de 80 vatios - aunque, medimos algunas fluctuaciones. En las pruebas mononúcleo, el rendimiento del portátil no cumplió nuestras expectativas.
Durante el uso en batería, su rendimiento multinúcleo se reduce considerablemente, ya que el procesador sólo consume un máximo de 35 vatios - lo que lleva a un déficit de alrededor del 33 %. Se pueden encontrar más pruebas de CPU en aquí.
Cinebench R15 Multi continuous test

Cinebench R23: Multi Core | Single Core
Cinebench R20: CPU (Multi Core) | CPU (Single Core)
Cinebench R15: CPU Multi 64Bit | CPU Single 64Bit
Blender: v2.79 BMW27 CPU
7-Zip 18.03: 7z b 4 | 7z b 4 -mmt1
Geekbench 5.5: Multi-Core | Single-Core
HWBOT x265 Benchmark v2.2: 4k Preset
LibreOffice : 20 Documents To PDF
R Benchmark 2.5: Overall mean
| CPU Performance rating | |
| Media de la clase Gaming | |
| Asus ROG Flow Z13 GZ301ZE | |
| Acer Predator Triton 300 SE | |
| Alienware x14 i7 RTX 3060 | |
| Gigabyte Aero 14 OLED BMF | |
| MSI Stealth 14 Studio A13V | |
| Medio Intel Core i7-13700H | |
| Schenker Vision 14 2022 RTX 3050 Ti | |
| Razer Blade 14 Ryzen 9 6900HX | |
| Cinebench R23 / Multi Core | |
| Media de la clase Gaming (10488 - 42661, n=107, últimos 2 años) | |
| MSI Stealth 14 Studio A13V | |
| Acer Predator Triton 300 SE | |
| Alienware x14 i7 RTX 3060 | |
| Asus ROG Flow Z13 GZ301ZE | |
| Medio Intel Core i7-13700H (5890 - 20034, n=29) | |
| Schenker Vision 14 2022 RTX 3050 Ti | |
| Gigabyte Aero 14 OLED BMF | |
| Razer Blade 14 Ryzen 9 6900HX | |
| Cinebench R23 / Single Core | |
| Media de la clase Gaming (1166 - 2415, n=107, últimos 2 años) | |
| Asus ROG Flow Z13 GZ301ZE | |
| Acer Predator Triton 300 SE | |
| Gigabyte Aero 14 OLED BMF | |
| Medio Intel Core i7-13700H (1323 - 1914, n=29) | |
| Alienware x14 i7 RTX 3060 | |
| Schenker Vision 14 2022 RTX 3050 Ti | |
| MSI Stealth 14 Studio A13V | |
| Razer Blade 14 Ryzen 9 6900HX | |
| Cinebench R20 / CPU (Multi Core) | |
| Media de la clase Gaming (4029 - 16433, n=106, últimos 2 años) | |
| MSI Stealth 14 Studio A13V | |
| Acer Predator Triton 300 SE | |
| Alienware x14 i7 RTX 3060 | |
| Medio Intel Core i7-13700H (2322 - 7674, n=29) | |
| Schenker Vision 14 2022 RTX 3050 Ti | |
| Asus ROG Flow Z13 GZ301ZE | |
| Razer Blade 14 Ryzen 9 6900HX | |
| Gigabyte Aero 14 OLED BMF | |
| Cinebench R20 / CPU (Single Core) | |
| Media de la clase Gaming (442 - 913, n=106, últimos 2 años) | |
| Asus ROG Flow Z13 GZ301ZE | |
| Acer Predator Triton 300 SE | |
| Gigabyte Aero 14 OLED BMF | |
| Schenker Vision 14 2022 RTX 3050 Ti | |
| Medio Intel Core i7-13700H (508 - 741, n=29) | |
| Alienware x14 i7 RTX 3060 | |
| MSI Stealth 14 Studio A13V | |
| Razer Blade 14 Ryzen 9 6900HX | |
| Cinebench R15 / CPU Multi 64Bit | |
| Media de la clase Gaming (1578 - 6330, n=105, últimos 2 años) | |
| Asus ROG Flow Z13 GZ301ZE | |
| MSI Stealth 14 Studio A13V | |
| Alienware x14 i7 RTX 3060 | |
| Gigabyte Aero 14 OLED BMF | |
| Medio Intel Core i7-13700H (905 - 2982, n=29) | |
| Acer Predator Triton 300 SE | |
| Razer Blade 14 Ryzen 9 6900HX | |
| Schenker Vision 14 2022 RTX 3050 Ti | |
| Cinebench R15 / CPU Single 64Bit | |
| Media de la clase Gaming (188.8 - 350, n=106, últimos 2 años) | |
| Asus ROG Flow Z13 GZ301ZE | |
| Acer Predator Triton 300 SE | |
| Gigabyte Aero 14 OLED BMF | |
| Schenker Vision 14 2022 RTX 3050 Ti | |
| Medio Intel Core i7-13700H (213 - 278, n=29) | |
| Alienware x14 i7 RTX 3060 | |
| Razer Blade 14 Ryzen 9 6900HX | |
| MSI Stealth 14 Studio A13V | |
| Blender / v2.79 BMW27 CPU | |
| Schenker Vision 14 2022 RTX 3050 Ti | |
| Gigabyte Aero 14 OLED BMF | |
| Medio Intel Core i7-13700H (169 - 555, n=29) | |
| Alienware x14 i7 RTX 3060 | |
| Razer Blade 14 Ryzen 9 6900HX | |
| Asus ROG Flow Z13 GZ301ZE | |
| Acer Predator Triton 300 SE | |
| MSI Stealth 14 Studio A13V | |
| Media de la clase Gaming (79 - 330, n=104, últimos 2 años) | |
| 7-Zip 18.03 / 7z b 4 | |
| Media de la clase Gaming (33491 - 148086, n=105, últimos 2 años) | |
| MSI Stealth 14 Studio A13V | |
| Alienware x14 i7 RTX 3060 | |
| Acer Predator Triton 300 SE | |
| Asus ROG Flow Z13 GZ301ZE | |
| Razer Blade 14 Ryzen 9 6900HX | |
| Medio Intel Core i7-13700H (27322 - 76344, n=29) | |
| Gigabyte Aero 14 OLED BMF | |
| Schenker Vision 14 2022 RTX 3050 Ti | |
| 7-Zip 18.03 / 7z b 4 -mmt1 | |
| Media de la clase Gaming (4199 - 7436, n=105, últimos 2 años) | |
| Asus ROG Flow Z13 GZ301ZE | |
| Gigabyte Aero 14 OLED BMF | |
| Medio Intel Core i7-13700H (4825 - 6238, n=29) | |
| Razer Blade 14 Ryzen 9 6900HX | |
| Schenker Vision 14 2022 RTX 3050 Ti | |
| Alienware x14 i7 RTX 3060 | |
| Acer Predator Triton 300 SE | |
| MSI Stealth 14 Studio A13V | |
| Geekbench 5.5 / Multi-Core | |
| Media de la clase Gaming (6460 - 28263, n=105, últimos 2 años) | |
| Asus ROG Flow Z13 GZ301ZE | |
| Alienware x14 i7 RTX 3060 | |
| MSI Stealth 14 Studio A13V | |
| Acer Predator Triton 300 SE | |
| Medio Intel Core i7-13700H (6165 - 14215, n=29) | |
| Schenker Vision 14 2022 RTX 3050 Ti | |
| Gigabyte Aero 14 OLED BMF | |
| Razer Blade 14 Ryzen 9 6900HX | |
| Geekbench 5.5 / Single-Core | |
| Media de la clase Gaming (986 - 2474, n=105, últimos 2 años) | |
| Asus ROG Flow Z13 GZ301ZE | |
| Gigabyte Aero 14 OLED BMF | |
| Acer Predator Triton 300 SE | |
| Alienware x14 i7 RTX 3060 | |
| Medio Intel Core i7-13700H (1362 - 1919, n=29) | |
| Schenker Vision 14 2022 RTX 3050 Ti | |
| MSI Stealth 14 Studio A13V | |
| Razer Blade 14 Ryzen 9 6900HX | |
| HWBOT x265 Benchmark v2.2 / 4k Preset | |
| Media de la clase Gaming (11.5 - 44.4, n=105, últimos 2 años) | |
| Acer Predator Triton 300 SE | |
| MSI Stealth 14 Studio A13V | |
| Razer Blade 14 Ryzen 9 6900HX | |
| Alienware x14 i7 RTX 3060 | |
| Asus ROG Flow Z13 GZ301ZE | |
| Medio Intel Core i7-13700H (6.72 - 21.2, n=29) | |
| Gigabyte Aero 14 OLED BMF | |
| Schenker Vision 14 2022 RTX 3050 Ti | |
| LibreOffice / 20 Documents To PDF | |
| MSI Stealth 14 Studio A13V | |
| Razer Blade 14 Ryzen 9 6900HX | |
| Media de la clase Gaming (33.2 - 88.8, n=105, últimos 2 años) | |
| Medio Intel Core i7-13700H (31.3 - 62.4, n=29) | |
| Schenker Vision 14 2022 RTX 3050 Ti | |
| Asus ROG Flow Z13 GZ301ZE | |
| Acer Predator Triton 300 SE | |
| Gigabyte Aero 14 OLED BMF | |
| Alienware x14 i7 RTX 3060 | |
| R Benchmark 2.5 / Overall mean | |
| MSI Stealth 14 Studio A13V | |
| Razer Blade 14 Ryzen 9 6900HX | |
| Medio Intel Core i7-13700H (0.4308 - 0.607, n=29) | |
| Schenker Vision 14 2022 RTX 3050 Ti | |
| Alienware x14 i7 RTX 3060 | |
| Gigabyte Aero 14 OLED BMF | |
| Acer Predator Triton 300 SE | |
| Media de la clase Gaming (0.3439 - 0.759, n=106, últimos 2 años) | |
| Asus ROG Flow Z13 GZ301ZE | |
* ... más pequeño es mejor
AIDA64: FP32 Ray-Trace | FPU Julia | CPU SHA3 | CPU Queen | FPU SinJulia | FPU Mandel | CPU AES | CPU ZLib | FP64 Ray-Trace | CPU PhotoWorxx
| Performance rating | |
| Media de la clase Gaming | |
| Razer Blade 14 Ryzen 9 6900HX | |
| Acer Predator Triton 300 SE | |
| MSI Stealth 14 Studio A13V | |
| Gigabyte Aero 14 OLED BMF | |
| Medio Intel Core i7-13700H | |
| Alienware x14 i7 RTX 3060 | |
| Schenker Vision 14 2022 RTX 3050 Ti | |
| Asus ROG Flow Z13 GZ301ZE | |
| AIDA64 / FP32 Ray-Trace | |
| Media de la clase Gaming (10227 - 85542, n=105, últimos 2 años) | |
| MSI Stealth 14 Studio A13V | |
| Razer Blade 14 Ryzen 9 6900HX | |
| Acer Predator Triton 300 SE | |
| Medio Intel Core i7-13700H (4986 - 18908, n=29) | |
| Gigabyte Aero 14 OLED BMF | |
| Schenker Vision 14 2022 RTX 3050 Ti | |
| Alienware x14 i7 RTX 3060 | |
| Asus ROG Flow Z13 GZ301ZE | |
| AIDA64 / FPU Julia | |
| Media de la clase Gaming (51376 - 238426, n=105, últimos 2 años) | |
| Razer Blade 14 Ryzen 9 6900HX | |
| MSI Stealth 14 Studio A13V | |
| Acer Predator Triton 300 SE | |
| Medio Intel Core i7-13700H (25360 - 92359, n=29) | |
| Gigabyte Aero 14 OLED BMF | |
| Schenker Vision 14 2022 RTX 3050 Ti | |
| Alienware x14 i7 RTX 3060 | |
| Asus ROG Flow Z13 GZ301ZE | |
| AIDA64 / CPU SHA3 | |
| Media de la clase Gaming (2180 - 10115, n=105, últimos 2 años) | |
| MSI Stealth 14 Studio A13V | |
| Acer Predator Triton 300 SE | |
| Razer Blade 14 Ryzen 9 6900HX | |
| Medio Intel Core i7-13700H (1339 - 4224, n=29) | |
| Gigabyte Aero 14 OLED BMF | |
| Alienware x14 i7 RTX 3060 | |
| Schenker Vision 14 2022 RTX 3050 Ti | |
| Asus ROG Flow Z13 GZ301ZE | |
| AIDA64 / CPU Queen | |
| Media de la clase Gaming (49785 - 173351, n=90, últimos 2 años) | |
| Acer Predator Triton 300 SE | |
| Gigabyte Aero 14 OLED BMF | |
| MSI Stealth 14 Studio A13V | |
| Asus ROG Flow Z13 GZ301ZE | |
| Razer Blade 14 Ryzen 9 6900HX | |
| Alienware x14 i7 RTX 3060 | |
| Medio Intel Core i7-13700H (59324 - 107159, n=29) | |
| Schenker Vision 14 2022 RTX 3050 Ti | |
| AIDA64 / FPU SinJulia | |
| Media de la clase Gaming (4424 - 33636, n=105, últimos 2 años) | |
| Razer Blade 14 Ryzen 9 6900HX | |
| MSI Stealth 14 Studio A13V | |
| Acer Predator Triton 300 SE | |
| Alienware x14 i7 RTX 3060 | |
| Asus ROG Flow Z13 GZ301ZE | |
| Medio Intel Core i7-13700H (4800 - 11050, n=29) | |
| Gigabyte Aero 14 OLED BMF | |
| Schenker Vision 14 2022 RTX 3050 Ti | |
| AIDA64 / FPU Mandel | |
| Media de la clase Gaming (25115 - 128721, n=105, últimos 2 años) | |
| Razer Blade 14 Ryzen 9 6900HX | |
| MSI Stealth 14 Studio A13V | |
| Acer Predator Triton 300 SE | |
| Medio Intel Core i7-13700H (12321 - 45118, n=29) | |
| Gigabyte Aero 14 OLED BMF | |
| Schenker Vision 14 2022 RTX 3050 Ti | |
| Alienware x14 i7 RTX 3060 | |
| Asus ROG Flow Z13 GZ301ZE | |
| AIDA64 / CPU AES | |
| Razer Blade 14 Ryzen 9 6900HX | |
| Acer Predator Triton 300 SE | |
| Gigabyte Aero 14 OLED BMF | |
| Media de la clase Gaming (39258 - 247074, n=105, últimos 2 años) | |
| Alienware x14 i7 RTX 3060 | |
| Asus ROG Flow Z13 GZ301ZE | |
| MSI Stealth 14 Studio A13V | |
| Medio Intel Core i7-13700H (28769 - 151254, n=29) | |
| Schenker Vision 14 2022 RTX 3050 Ti | |
| AIDA64 / CPU ZLib | |
| Media de la clase Gaming (574 - 2531, n=105, últimos 2 años) | |
| MSI Stealth 14 Studio A13V | |
| Acer Predator Triton 300 SE | |
| Alienware x14 i7 RTX 3060 | |
| Schenker Vision 14 2022 RTX 3050 Ti | |
| Medio Intel Core i7-13700H (389 - 1215, n=29) | |
| Asus ROG Flow Z13 GZ301ZE | |
| Razer Blade 14 Ryzen 9 6900HX | |
| Gigabyte Aero 14 OLED BMF | |
| AIDA64 / FP64 Ray-Trace | |
| Media de la clase Gaming (5509 - 45446, n=105, últimos 2 años) | |
| MSI Stealth 14 Studio A13V | |
| Razer Blade 14 Ryzen 9 6900HX | |
| Acer Predator Triton 300 SE | |
| Medio Intel Core i7-13700H (2540 - 10135, n=29) | |
| Gigabyte Aero 14 OLED BMF | |
| Schenker Vision 14 2022 RTX 3050 Ti | |
| Alienware x14 i7 RTX 3060 | |
| Asus ROG Flow Z13 GZ301ZE | |
| AIDA64 / CPU PhotoWorxx | |
| Gigabyte Aero 14 OLED BMF | |
| Acer Predator Triton 300 SE | |
| Alienware x14 i7 RTX 3060 | |
| Media de la clase Gaming (12271 - 89891, n=105, últimos 2 años) | |
| Asus ROG Flow Z13 GZ301ZE | |
| Medio Intel Core i7-13700H (12872 - 52727, n=29) | |
| MSI Stealth 14 Studio A13V | |
| Schenker Vision 14 2022 RTX 3050 Ti | |
| Razer Blade 14 Ryzen 9 6900HX | |
Rendimiento del sistema
Subjetivamente (y como era de esperar), este componente nos causó una gran impresión en términos de rendimiento, aunque nuestro dispositivo de prueba sólo obtuvo resultados medios durante las pruebas sintéticas. No notamos ningún problema durante la prueba.
CrossMark: Overall | Productivity | Creativity | Responsiveness
| PCMark 10 / Score | |
| Media de la clase Gaming (5828 - 12414, n=93, últimos 2 años) | |
| Acer Predator Triton 300 SE | |
| Razer Blade 14 Ryzen 9 6900HX | |
| Gigabyte Aero 14 OLED BMF | |
| Medio Intel Core i7-13700H, NVIDIA GeForce RTX 4050 Laptop GPU (6822 - 7556, n=7) | |
| Alienware x14 i7 RTX 3060 | |
| MSI Stealth 14 Studio A13V | |
| Schenker Vision 14 2022 RTX 3050 Ti | |
| Asus ROG Flow Z13 GZ301ZE | |
| PCMark 10 / Essentials | |
| Gigabyte Aero 14 OLED BMF | |
| Acer Predator Triton 300 SE | |
| Razer Blade 14 Ryzen 9 6900HX | |
| Medio Intel Core i7-13700H, NVIDIA GeForce RTX 4050 Laptop GPU (10283 - 11549, n=7) | |
| Asus ROG Flow Z13 GZ301ZE | |
| Media de la clase Gaming (8810 - 11935, n=97, últimos 2 años) | |
| Schenker Vision 14 2022 RTX 3050 Ti | |
| Alienware x14 i7 RTX 3060 | |
| MSI Stealth 14 Studio A13V | |
| PCMark 10 / Productivity | |
| Media de la clase Gaming (6845 - 25323, n=95, últimos 2 años) | |
| Acer Predator Triton 300 SE | |
| Asus ROG Flow Z13 GZ301ZE | |
| Alienware x14 i7 RTX 3060 | |
| Gigabyte Aero 14 OLED BMF | |
| Medio Intel Core i7-13700H, NVIDIA GeForce RTX 4050 Laptop GPU (8368 - 9836, n=7) | |
| Razer Blade 14 Ryzen 9 6900HX | |
| Schenker Vision 14 2022 RTX 3050 Ti | |
| MSI Stealth 14 Studio A13V | |
| PCMark 10 / Digital Content Creation | |
| Media de la clase Gaming (7602 - 19954, n=95, últimos 2 años) | |
| Razer Blade 14 Ryzen 9 6900HX | |
| Acer Predator Triton 300 SE | |
| MSI Stealth 14 Studio A13V | |
| Medio Intel Core i7-13700H, NVIDIA GeForce RTX 4050 Laptop GPU (9527 - 10643, n=7) | |
| Alienware x14 i7 RTX 3060 | |
| Gigabyte Aero 14 OLED BMF | |
| Schenker Vision 14 2022 RTX 3050 Ti | |
| Asus ROG Flow Z13 GZ301ZE | |
| CrossMark / Overall | |
| Asus ROG Flow Z13 GZ301ZE | |
| Media de la clase Gaming (1366 - 2409, n=94, últimos 2 años) | |
| Acer Predator Triton 300 SE | |
| Alienware x14 i7 RTX 3060 | |
| Gigabyte Aero 14 OLED BMF | |
| MSI Stealth 14 Studio A13V | |
| Medio Intel Core i7-13700H, NVIDIA GeForce RTX 4050 Laptop GPU (1205 - 1937, n=9) | |
| Schenker Vision 14 2022 RTX 3050 Ti | |
| CrossMark / Productivity | |
| Asus ROG Flow Z13 GZ301ZE | |
| Acer Predator Triton 300 SE | |
| Media de la clase Gaming (1386 - 2254, n=94, últimos 2 años) | |
| Alienware x14 i7 RTX 3060 | |
| Gigabyte Aero 14 OLED BMF | |
| Medio Intel Core i7-13700H, NVIDIA GeForce RTX 4050 Laptop GPU (1158 - 1877, n=9) | |
| MSI Stealth 14 Studio A13V | |
| Schenker Vision 14 2022 RTX 3050 Ti | |
| CrossMark / Creativity | |
| Media de la clase Gaming (1343 - 2786, n=94, últimos 2 años) | |
| Asus ROG Flow Z13 GZ301ZE | |
| Acer Predator Triton 300 SE | |
| Alienware x14 i7 RTX 3060 | |
| Gigabyte Aero 14 OLED BMF | |
| MSI Stealth 14 Studio A13V | |
| Medio Intel Core i7-13700H, NVIDIA GeForce RTX 4050 Laptop GPU (1293 - 2044, n=9) | |
| Schenker Vision 14 2022 RTX 3050 Ti | |
| CrossMark / Responsiveness | |
| Asus ROG Flow Z13 GZ301ZE | |
| Acer Predator Triton 300 SE | |
| Alienware x14 i7 RTX 3060 | |
| Gigabyte Aero 14 OLED BMF | |
| Media de la clase Gaming (1226 - 2334, n=94, últimos 2 años) | |
| Medio Intel Core i7-13700H, NVIDIA GeForce RTX 4050 Laptop GPU (1097 - 1929, n=9) | |
| MSI Stealth 14 Studio A13V | |
| Schenker Vision 14 2022 RTX 3050 Ti | |
| PCMark 10 Score | 6924 puntos | |
ayuda | ||
| AIDA64 / Memory Copy | |
| Gigabyte Aero 14 OLED BMF | |
| Alienware x14 i7 RTX 3060 | |
| Asus ROG Flow Z13 GZ301ZE | |
| Acer Predator Triton 300 SE | |
| Media de la clase Gaming (21750 - 129946, n=105, últimos 2 años) | |
| Medio Intel Core i7-13700H (24334 - 78081, n=29) | |
| MSI Stealth 14 Studio A13V | |
| Razer Blade 14 Ryzen 9 6900HX | |
| Schenker Vision 14 2022 RTX 3050 Ti | |
| AIDA64 / Memory Read | |
| Gigabyte Aero 14 OLED BMF | |
| Alienware x14 i7 RTX 3060 | |
| Acer Predator Triton 300 SE | |
| Media de la clase Gaming (22956 - 118858, n=105, últimos 2 años) | |
| Asus ROG Flow Z13 GZ301ZE | |
| MSI Stealth 14 Studio A13V | |
| Medio Intel Core i7-13700H (23681 - 79656, n=29) | |
| Razer Blade 14 Ryzen 9 6900HX | |
| Schenker Vision 14 2022 RTX 3050 Ti | |
| AIDA64 / Memory Write | |
| Gigabyte Aero 14 OLED BMF | |
| Media de la clase Gaming (22297 - 135096, n=105, últimos 2 años) | |
| Medio Intel Core i7-13700H (22986 - 99898, n=29) | |
| Alienware x14 i7 RTX 3060 | |
| Acer Predator Triton 300 SE | |
| Asus ROG Flow Z13 GZ301ZE | |
| Razer Blade 14 Ryzen 9 6900HX | |
| MSI Stealth 14 Studio A13V | |
| Schenker Vision 14 2022 RTX 3050 Ti | |
| AIDA64 / Memory Latency | |
| Alienware x14 i7 RTX 3060 | |
| Media de la clase Gaming (75.3 - 259, n=105, últimos 2 años) | |
| Asus ROG Flow Z13 GZ301ZE | |
| Acer Predator Triton 300 SE | |
| Medio Intel Core i7-13700H (82.4 - 136.8, n=29) | |
| Gigabyte Aero 14 OLED BMF | |
| Schenker Vision 14 2022 RTX 3050 Ti | |
| MSI Stealth 14 Studio A13V | |
| Razer Blade 14 Ryzen 9 6900HX | |
* ... más pequeño es mejor
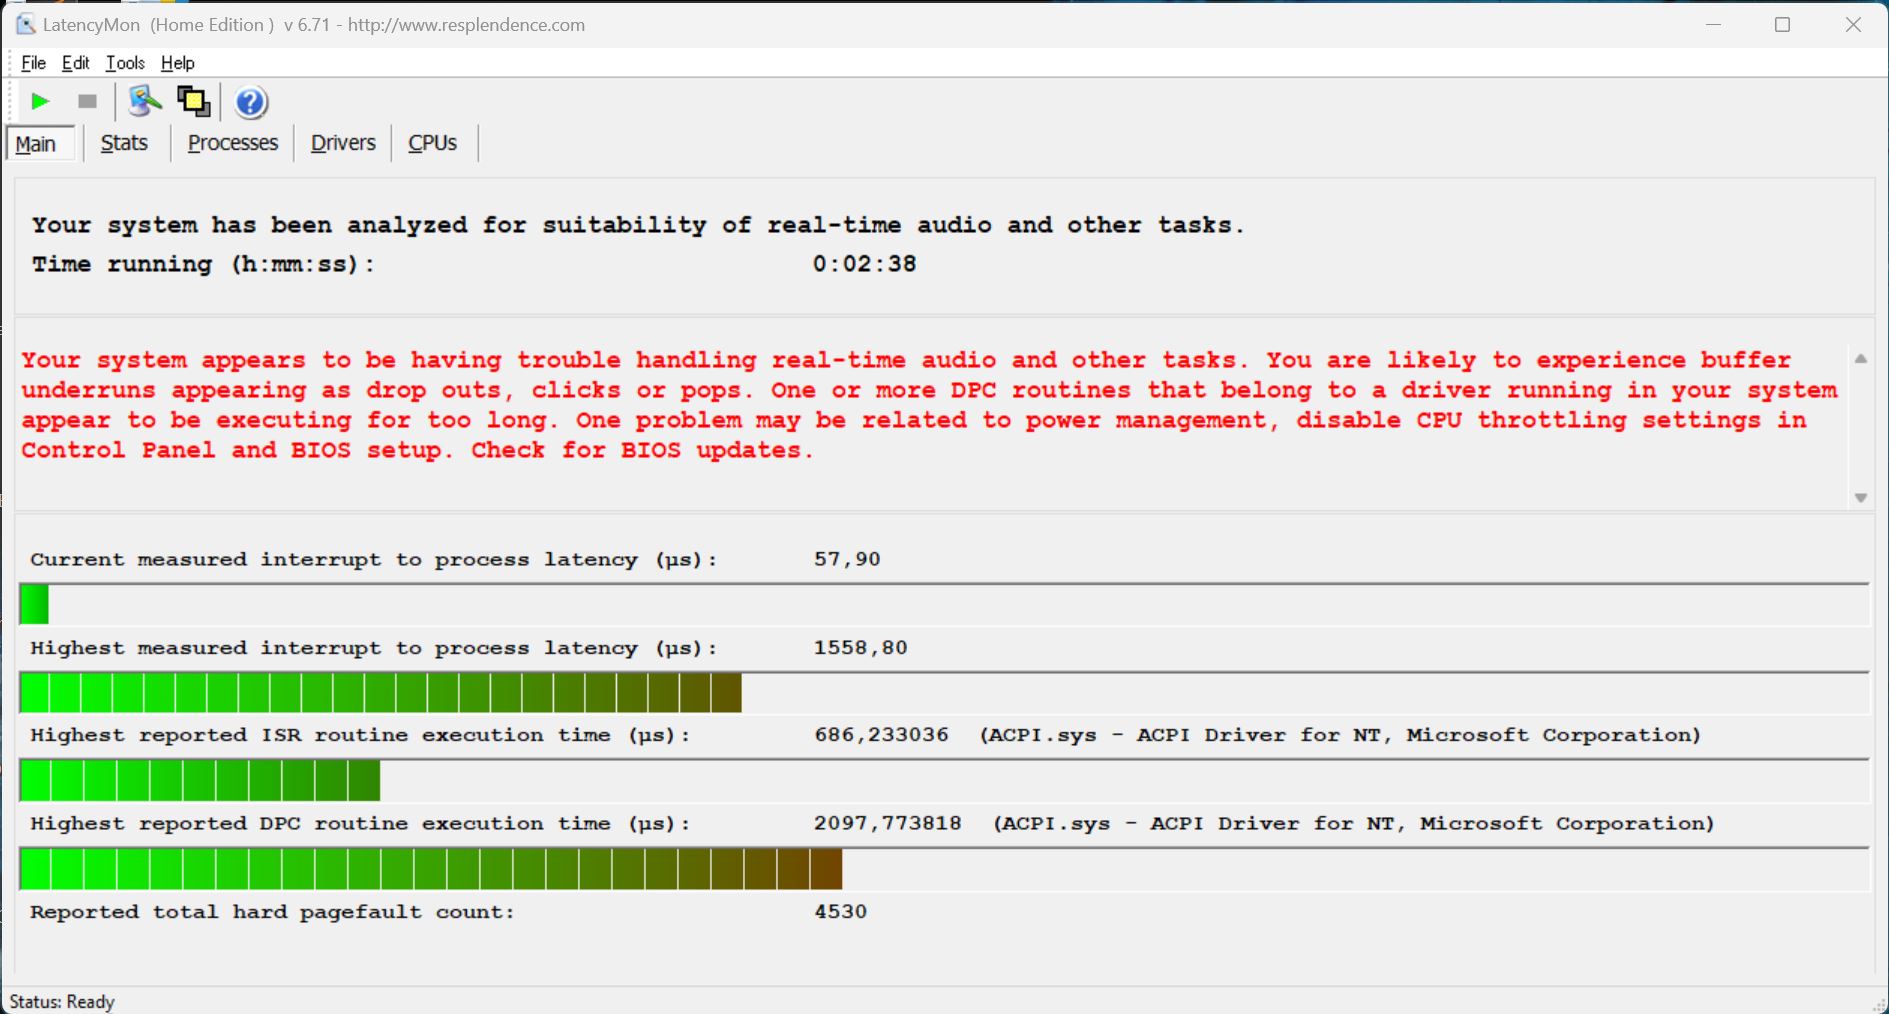
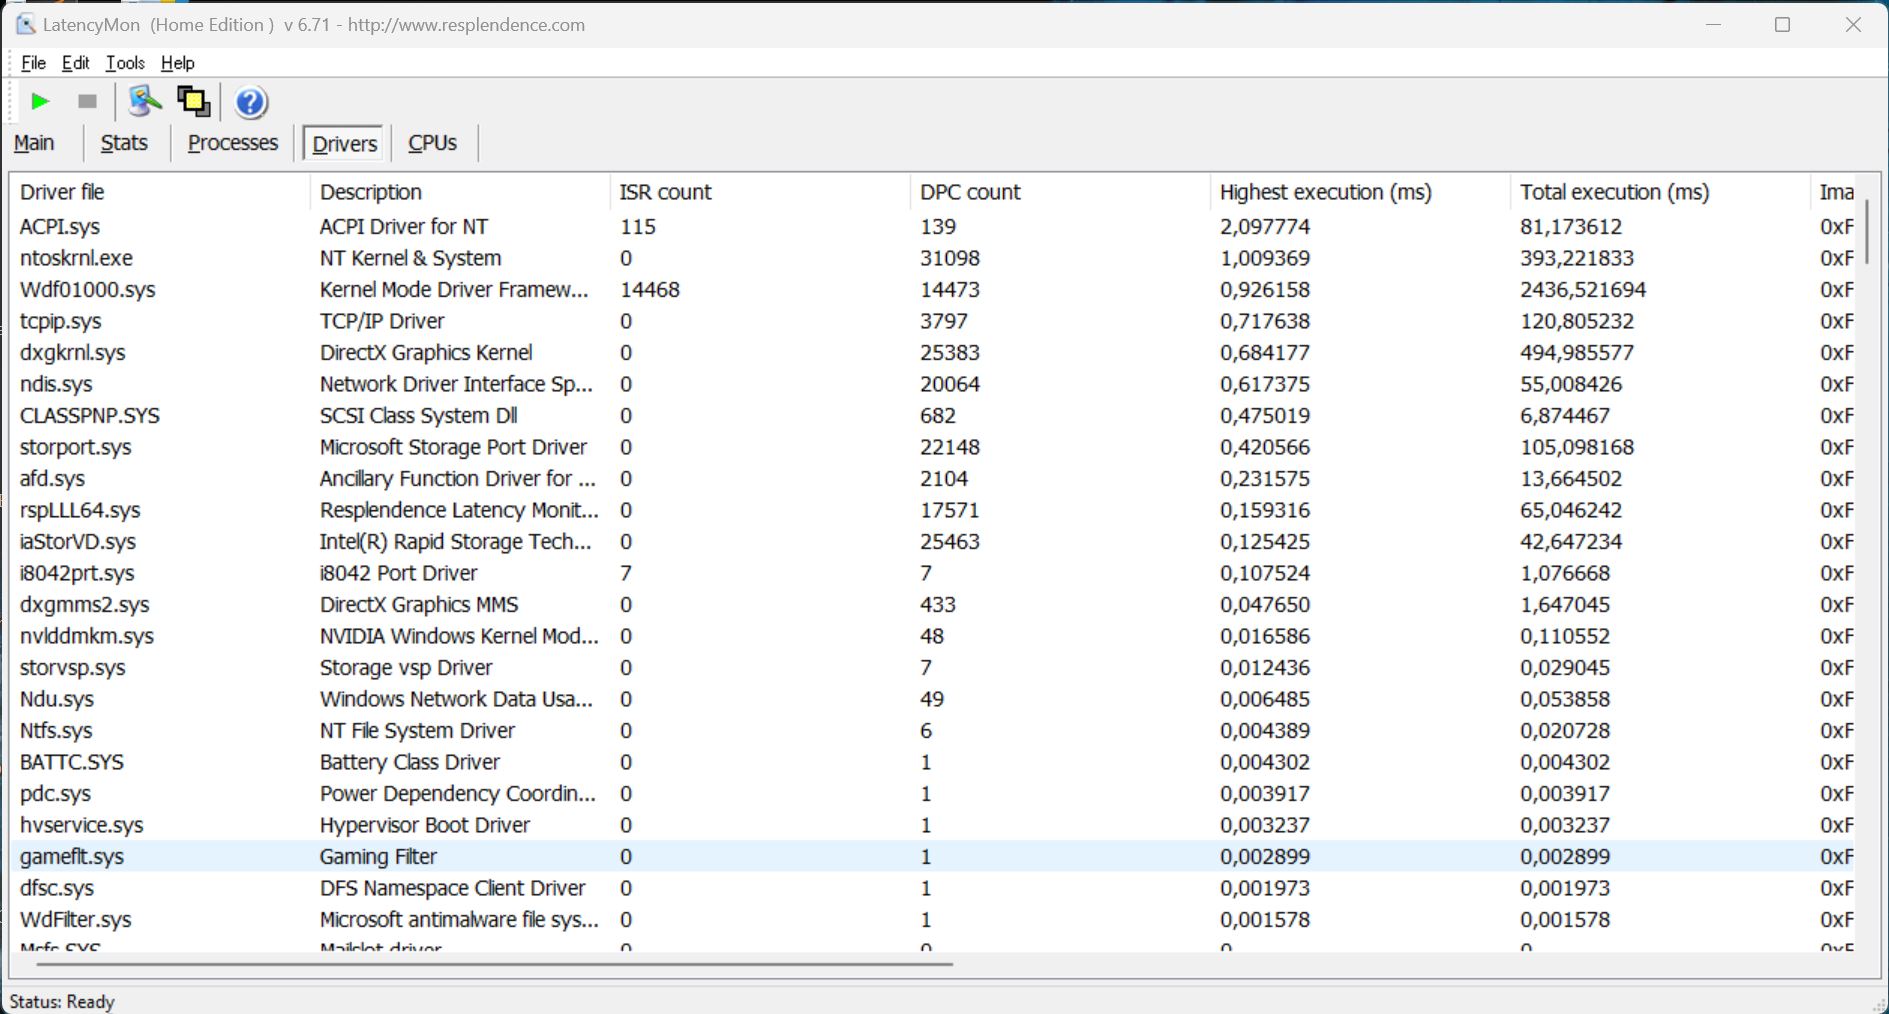
Latencia del CPD
Nuestro dispositivo de pruebas sólo es parcialmente apto para usos de audio en tiempo real con la versión actual de la BIOS, ya que nuestra prueba de latencia estandarizada (navegación por Internet, reproducción 4K de YouTube, carga de la CPU) detectó algunos problemas menores.
| DPC Latencies / LatencyMon - interrupt to process latency (max), Web, Youtube, Prime95 | |
| Acer Predator Triton 300 SE | |
| Gigabyte Aero 14 OLED BMF | |
| MSI Stealth 14 Studio A13V | |
| Asus ROG Flow Z13 GZ301ZE | |
| Razer Blade 14 Ryzen 9 6900HX | |
| Alienware x14 i7 RTX 3060 | |
| Schenker Vision 14 2022 RTX 3050 Ti | |
* ... más pequeño es mejor
Dispositivos de almacenamiento
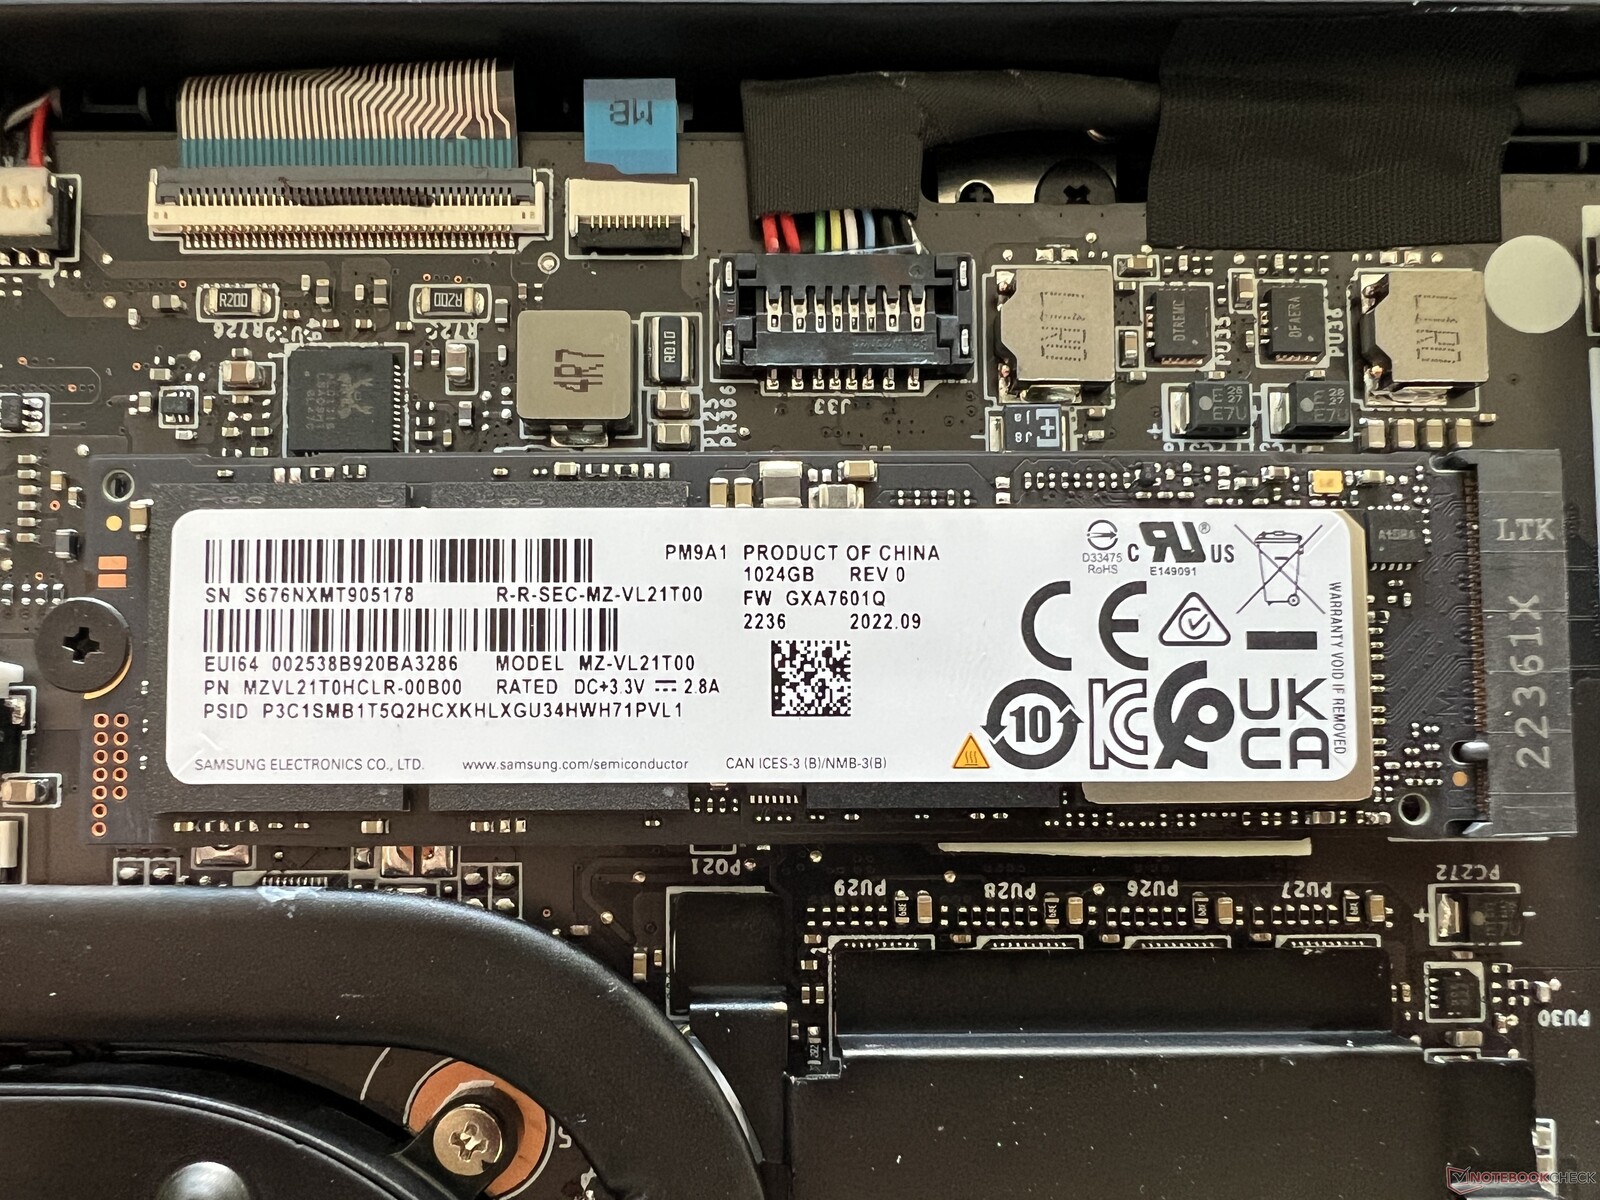
Nuestra muestra de prueba está equipada con la versión de 1 TB de la unidad Samsung PM9A1. Es una unidad PCIe 4.0 rápida y las tasas de transferencia en nuestras pruebas fueron bastante buenas, con resultados de hasta 7 GB/s - sin embargo, su rendimiento no permaneció estable. Después de unos minutos, el SSD tuvo que reducir su rendimiento en un 50%, lo que no debería ser tan notable en el uso diario. El hecho de que el SSD esté situado justo al lado del tubo de calor seguramente no puede ser bueno para las temperaturas del SSD. Se pueden encontrar más pruebas de SSDaquí.

* ... más pequeño es mejor
Reading continuous performance: DiskSpd Read Loop, Queue Depth 8
Tarjeta gráfica - GeForce RTX 4050 Portátil
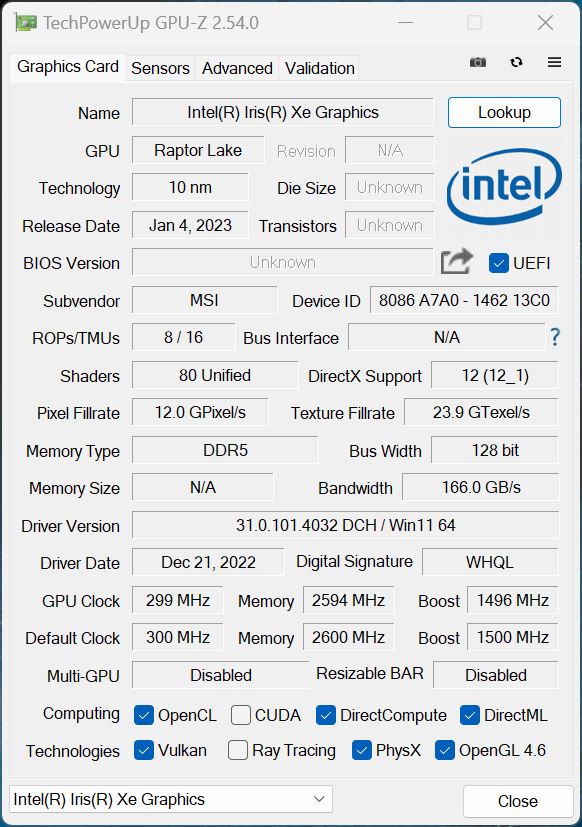
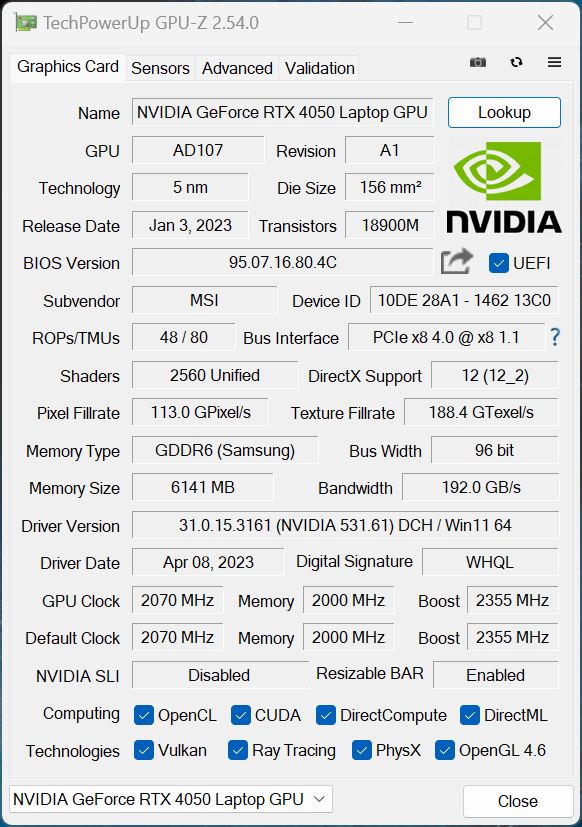
Como ya hemos mencionado, el Stealth 14 Studio puede tener un control MUX con el que puedes desactivar completamente la GPU integrada, sin embargo, esto requiere un reinicio que puede resultar molesto durante el uso diario en algún momento. Habríamos preferido ver la tecnología Advanced Optimus de Nvidia. Como resultado, confiamos en el método normal de conmutación de gráficos a través de Optimus. ElGeForce RTX 4050 Portátiles la nueva GPU de gama media de Nvidia y, a diferencia de muchos otros portátiles multimedia actuales (la mayoría con TGPs de entre 40 y 50 vatios), usa una de las variantes más rápidas, con un TGP de 90 vatios.
En consecuencia, los resultados del portátil en los bancos de pruebas fueron buenos y estuvieron más o menos al mismo nivel que laRTX 3060delAcer Predator Triton 300 SE. También incluimos modelos adicionales con laRTX 4060y laPortátil RTX 4070y que tienen valores TGP similares en nuestra comparación, para que pudiéramos hacernos una mejor idea de lo bien que podrían rendir los modelos más rápidos del Stealth 14 Studio. En general, puedes esperar entre un 20 y un 35 % más de rendimiento gráfico.
Bajo carga continua, el rendimiento gráfico se mantuvo estable, pero durante el uso de la batería, la GPU sólo consumió 35 vatios, lo que significa que el rendimiento de la GPU se hunde de media en torno a un 35 % si no estás conectado a una toma de corriente. Puedes encontrar más pruebas de rendimiento de la GPU en nuestra sección de tecnología.
| 3DMark 11 Performance | 26475 puntos | |
| 3DMark Cloud Gate Standard Score | 48584 puntos | |
| 3DMark Fire Strike Score | 19121 puntos | |
| 3DMark Time Spy Score | 7845 puntos | |
ayuda | ||
| Blender / v3.3 Classroom OPTIX/RTX | |
| Schenker Vision 14 2022 RTX 3050 Ti | |
| Acer Predator Triton 300 SE | |
| Gigabyte Aero 14 OLED BMF | |
| Medio NVIDIA GeForce RTX 4050 Laptop GPU (25 - 37, n=40) | |
| MSI Stealth 14 Studio A13V | |
| Media de la clase Gaming (9 - 32, n=106, últimos 2 años) | |
| Blender / v3.3 Classroom CUDA | |
| Schenker Vision 14 2022 RTX 3050 Ti | |
| Gigabyte Aero 14 OLED BMF | |
| Acer Predator Triton 300 SE | |
| Medio NVIDIA GeForce RTX 4050 Laptop GPU (47 - 68, n=39) | |
| Media de la clase Gaming (15 - 228, n=106, últimos 2 años) | |
| Blender / v3.3 Classroom CPU | |
| Schenker Vision 14 2022 RTX 3050 Ti | |
| Gigabyte Aero 14 OLED BMF | |
| Medio NVIDIA GeForce RTX 4050 Laptop GPU (243 - 907, n=40) | |
| Acer Predator Triton 300 SE | |
| MSI Stealth 14 Studio A13V | |
| Media de la clase Gaming (122 - 565, n=102, últimos 2 años) | |
* ... más pequeño es mejor
Rendimiento de juego
El rendimiento real en juegos del Stealth 14 Studio está por delante de su competidor, el Gigabyte Aero 14, que también está equipado con el portátil RTX 4050. Por su parte, el antiguoRTX 3060(por ejemploAlienware x14,Acer Triton 300 SE) tiene una clara ventaja a la hora de jugar. Lo mismo puede decirse, por supuesto, de las GPU más rápidasPortátil RTX 4060yRTX 4070 Portátil. En general, puedes jugar a la mayoría de juegos sin problemas en QHD con el portátil RTX 4050; solo algunos juegos más complejos pueden requerir que bajes los ajustes de detalle/resolución o que uses tecnología de muestreo ascendente como DLSS (si el juego lo admite). Lo mismo ocurre con el trazado de rayos, para el que el portátil RTX 4050 no sería lo bastante potente. Además, hay que tener en cuenta que, especialmente en las resoluciones más altas, la pequeña memoria gráfica de 6 GB del portátil no está totalmente preparada para el futuro. Al igual que en las pruebas de GPU pura, el rendimiento de juego del Stealth 14 Studio también se mantuvo completamente estable durante sesiones largas.
| F1 2021 - 1920x1080 Ultra High Preset + Raytracing AA:T AF:16x | |
| MSI Katana 17 B13VFK (874931) | |
| Asus Zenbook Pro 14 OLED UX6404VI (874931) | |
| MSI Stealth 14 Studio A13V (874931) | |
| Medio NVIDIA GeForce RTX 4050 Laptop GPU (70.7 - 119.5, n=7) | |
| Alienware x14 i7 RTX 3060 | |
| Schenker Vision 14 2022 RTX 3050 Ti (874931) | |
| Asus ROG Flow Z13 GZ301ZE (843175) | |
| F1 22 - 1920x1080 Ultra High Preset AA:T AF:16x | |
| Razer Blade 14 RTX 4070 (959964) | |
| Media de la clase Gaming (40.1 - 121.2, n=4, últimos 2 años) | |
| Asus Zenbook Pro 14 OLED UX6404VI (959964) | |
| MSI Katana 17 B13VFK (946728) | |
| MSI Stealth 14 Studio A13V (959964) | |
| Medio NVIDIA GeForce RTX 4050 Laptop GPU (10.9 - 56.4, n=24) | |
| Gigabyte Aero 14 OLED BMF (959964) | |
| Schenker Vision 14 2022 RTX 3050 Ti (923650) | |
| Call of Duty Modern Warfare 2 2022 - 1920x1080 Extreme Quality Preset AA:T2X Filmic SM | |
| Razer Blade 14 RTX 4070 | |
| MSI Katana 17 B13VFK | |
| MSI Stealth 14 Studio A13V | |
| Medio NVIDIA GeForce RTX 4050 Laptop GPU (54 - 77, n=3) | |
Witcher 3 FPS diagram
| bajo | medio | alto | ultra | QHD | 4K | |
|---|---|---|---|---|---|---|
| GTA V (2015) | 161.7 | 142.4 | 55.9 | 55.7 | ||
| The Witcher 3 (2015) | 168.5 | 121.7 | 76.7 | |||
| Dota 2 Reborn (2015) | 172.1 | 157.1 | 142.8 | 135.3 | 101.2 | |
| Final Fantasy XV Benchmark (2018) | 180.2 | 116.2 | 82 | 59.7 | ||
| X-Plane 11.11 (2018) | 141.6 | 124.7 | 97.8 | |||
| Strange Brigade (2018) | 277 | 191.9 | 145.3 | 123.1 | 79.8 | |
| Shadow of the Tomb Raider (2018) | 102 | 95 | 86 | 60 | ||
| F1 2021 (2021) | 323 | 245 | 194.5 | 105.4 | 74.3 | |
| Cyberpunk 2077 1.6 (2022) | 72.78 | 60.72 | 57.77 | 37.66 | ||
| F1 22 (2022) | 156.5 | 149.6 | 133.6 | 48.4 | 29.9 | |
| Call of Duty Modern Warfare 2 2022 (2022) | 101 | 75 | 70 | 47 |
Emisiones - Cámara de vapor con tasas de éxito moderadas
Emisiones sonoras
El sistema de refrigeración del portátil consiste en una gran cámara de vapor así como dos ventiladores que se vuelven particularmente molestos durante el uso diario. Bajo carga baja y a veces incluso en modo inactivo, notamos zumbidos de hasta casi 34 dB(A), que sin duda se oyen. A veces, incluso notamos picos cortos de más de 40 dB(A) cuando los ventiladores arrancaban, lo que es completamente innecesario. Bajo carga, el modo de Rendimiento Extremo fue el más ruidoso, midiendo 51 dB(A) - aunque los 47 dB(A) que medimos usando el modo Equilibrado no son precisamente mucho más silenciosos. Recomendamos usar auriculares mientras se juega. No notamos ningún otro ruido electrónico.
| Uso | Silencioso | Equilibrado | Rendimiento extremo |
|---|---|---|---|
| 3DMark 06 | 36,6 dB(A) | 42,2 dB(A) | 42,2 dB(A) |
| Witcher 3 | 42.2 dB(A) | 47,3 dB(A) | 51 dB(A) |
| Prueba de esfuerzo | 42,2 dB(A) | 47,3 dB(A) | 51 dB(A) |
Ruido
| Ocioso |
| 25.3 / 25 / 33.7 dB(A) |
| Carga |
| 42.2 / 51 dB(A) |
 | ||
30 dB silencioso 40 dB(A) audible 50 dB(A) ruidosamente alto |
||
min: | ||
| MSI Stealth 14 Studio A13V GeForce RTX 4050 Laptop GPU, i7-13700H, Samsung PM9A1 MZVL21T0HCLR | Gigabyte Aero 14 OLED BMF GeForce RTX 4050 Laptop GPU, i7-13700H, Gigabyte AG470S1TB-SI B10 | Schenker Vision 14 2022 RTX 3050 Ti GeForce RTX 3050 Ti Laptop GPU, i7-12700H, Samsung SSD 980 Pro 1TB MZ-V8P1T0BW | Asus ROG Flow Z13 GZ301ZE GeForce RTX 3050 Ti Laptop GPU, i9-12900H, Micron 2450 1TB MTFDKBK1T0TFK | Alienware x14 i7 RTX 3060 GeForce RTX 3060 Laptop GPU, i7-12700H, WDC PC SN810 1TB | Razer Blade 14 Ryzen 9 6900HX GeForce RTX 3070 Ti Laptop GPU, R9 6900HX, Samsung PM9A1 MZVL21T0HCLR | Acer Predator Triton 300 SE GeForce RTX 3060 Laptop GPU, i9-12900H, Micron 3400 1TB MTFDKBA1T0TFH | |
|---|---|---|---|---|---|---|---|
| Noise | 5% | 5% | 11% | 2% | 15% | -2% | |
| apagado / medio ambiente * (dB) | 25.3 | 24 5% | 24.4 4% | 24.5 3% | 24.7 2% | 23.3 8% | 23.8 6% |
| Idle Minimum * (dB) | 25.3 | 24 5% | 24.4 4% | 24.5 3% | 24.7 2% | 23.3 8% | 23.8 6% |
| Idle Average * (dB) | 25 | 24 4% | 24.4 2% | 24.5 2% | 24.7 1% | 23.3 7% | 23.8 5% |
| Idle Maximum * (dB) | 33.7 | 35.71 -6% | 27.8 18% | 24.5 27% | 30.9 8% | 23.3 31% | 30.6 9% |
| Load Average * (dB) | 42.2 | 43.3 -3% | 41 3% | 40 5% | 34.7 18% | 44.2 -5% | |
| Witcher 3 ultra * (dB) | 51 | 40.22 21% | 48.2 5% | 41 20% | 51.5 -1% | 42.1 17% | 60.1 -18% |
| Load Maximum * (dB) | 51 | 51.93 -2% | 48.8 4% | 41 20% | 51.5 -1% | 42.1 17% | 60 -18% |
* ... más pequeño es mejor
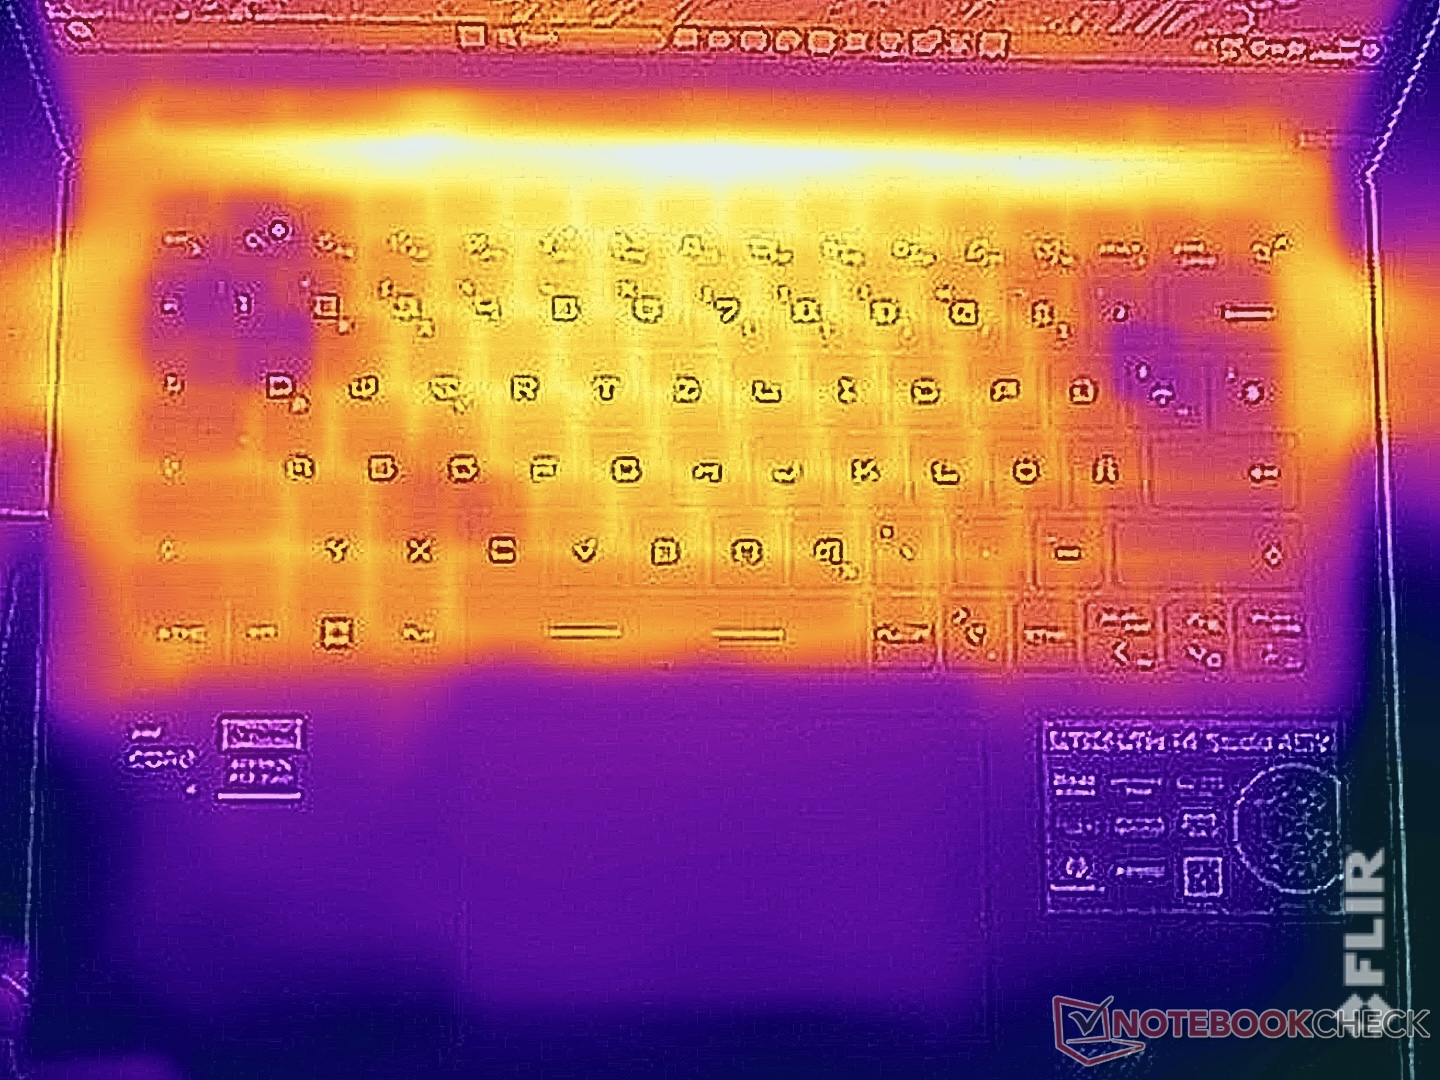
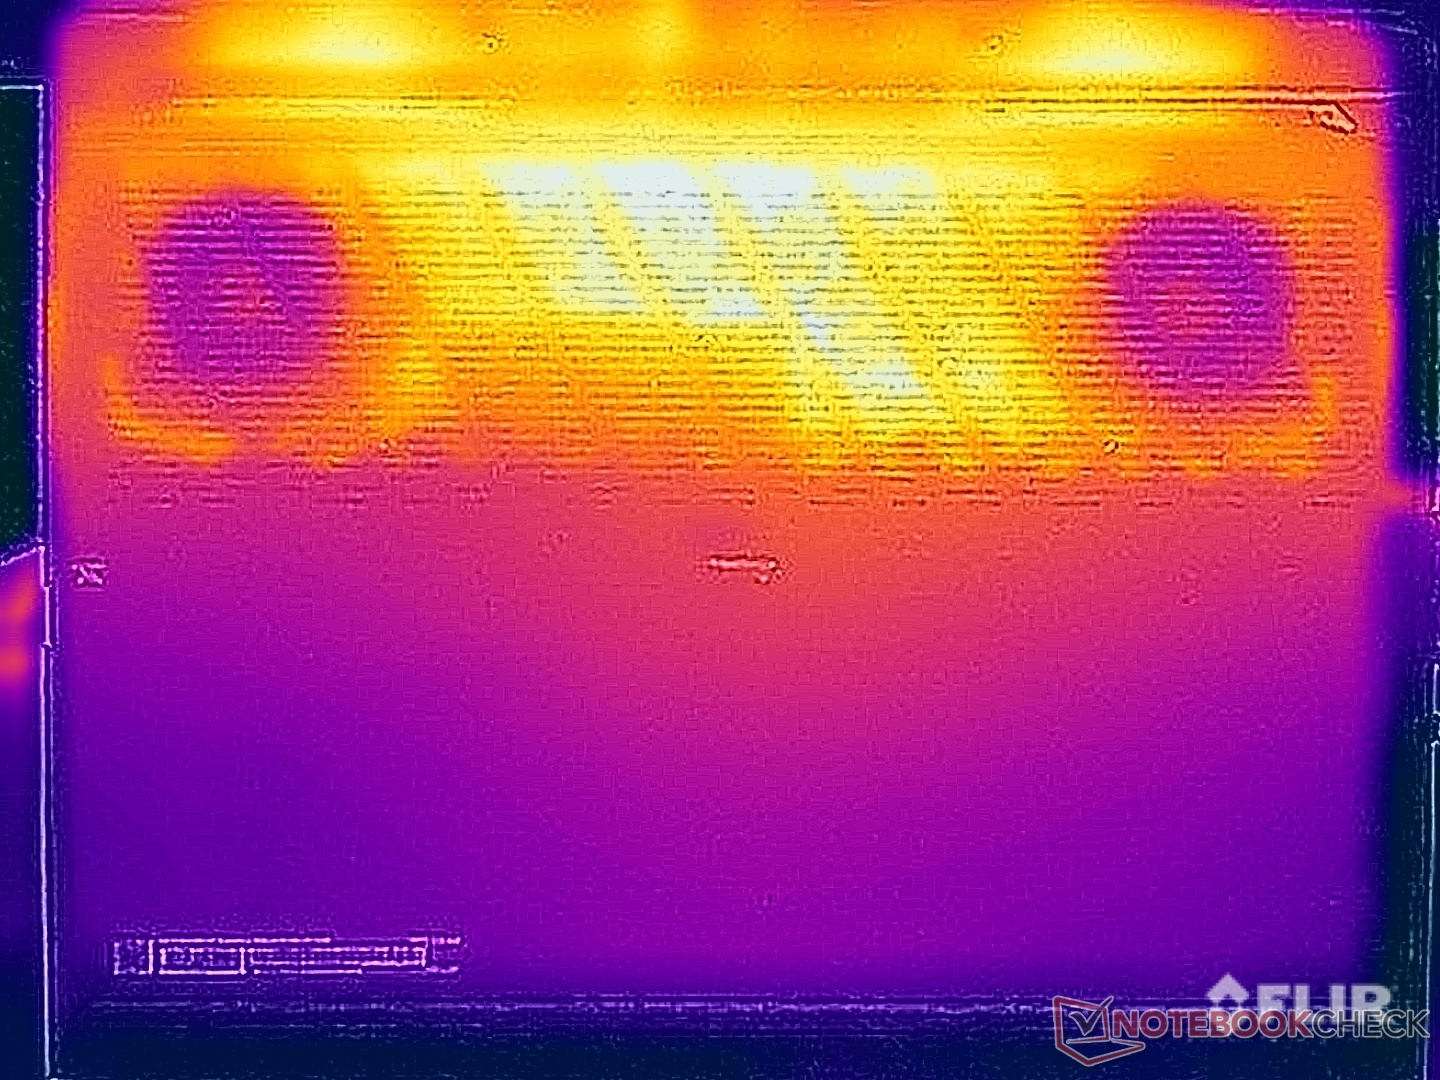
Temperatura
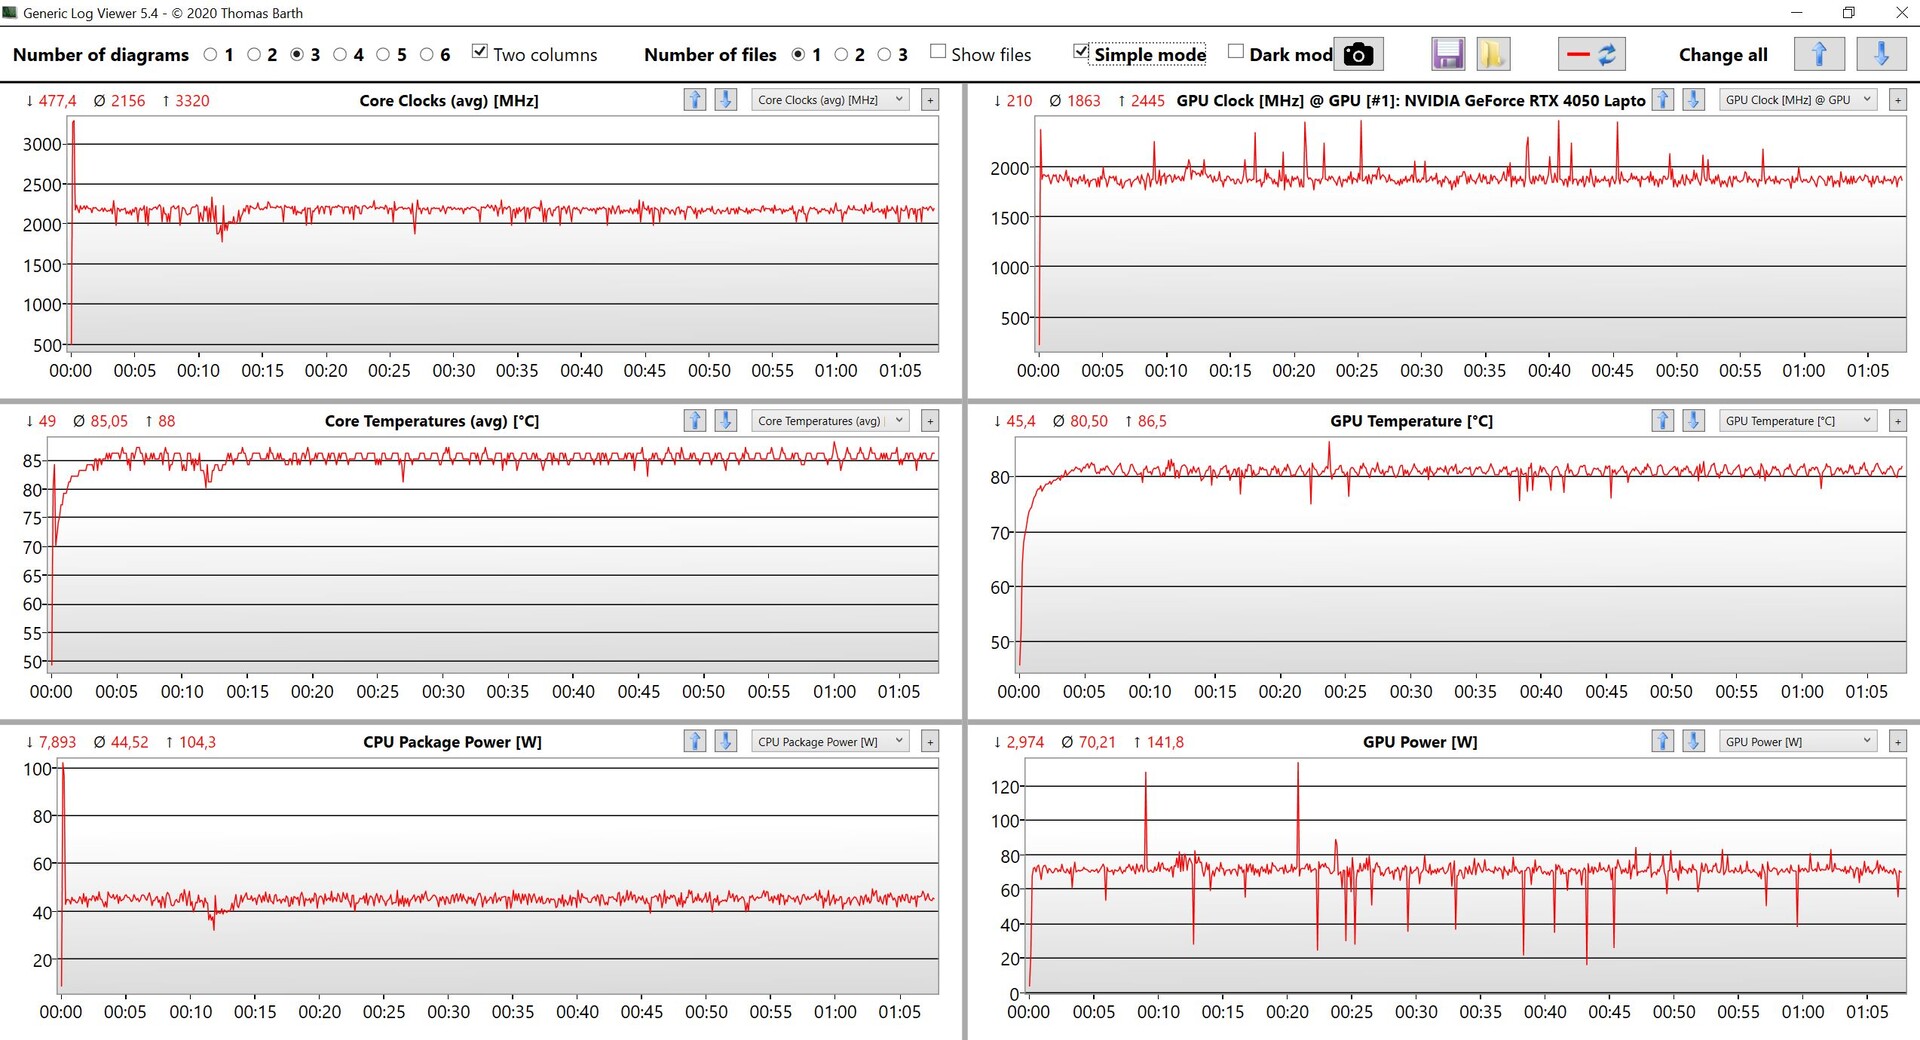
Ya hemos notado que el Stealth 14 Studio se calienta bastante en reposo, especialmente la parte inferior del dispositivo. Durante las tareas diarias simples, aún puedes cómodamente sentar el portátil sobre tus muslos. Tan pronto como el dispositivo se coloca bajo grandes cantidades de carga o cuando empiezas a jugar, entonces probablemente deberías evitar hacer esto, ya que rápidamente empezará a ser incómodo. Medimos más de 55 °C en la parte inferior del dispositivo. Incluso el teclado se calentó y alcanzó los 45 °C, lo que definitivamente se nota al jugar y tras un largo periodo de tiempo, empieza a ser un poco incómodo.
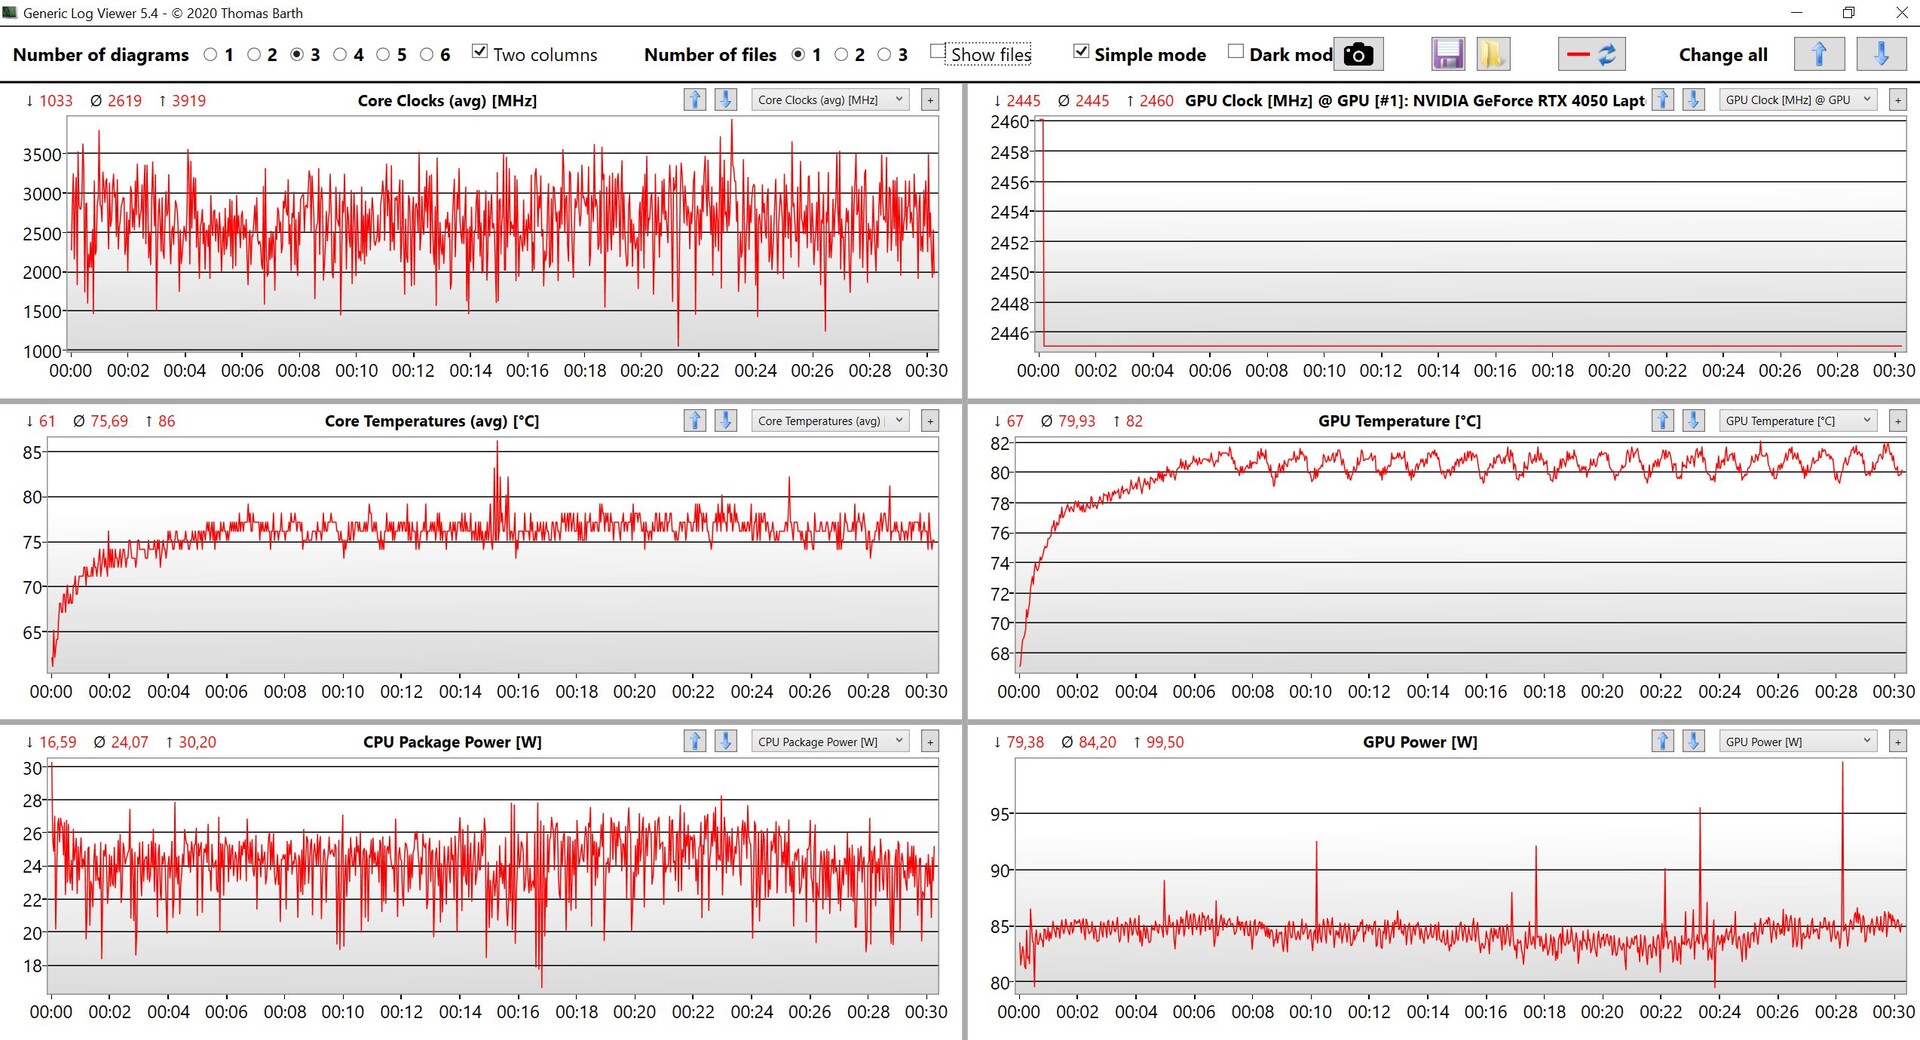
Durante la prueba de estrés, la CPU y la GPU se igualaron rápidamente a 45 y 70 vatios respectivamente, lo que significa que el portátil tiene que enfriar 115 vatios con el tiempo. Inmediatamente después de la prueba de estrés, no notamos ninguna reducción en el rendimiento.
(-) La temperatura máxima en la parte superior es de 46.9 °C / 116 F, frente a la media de 40.4 °C / 105 F, que oscila entre 21.2 y 68.8 °C para la clase Gaming.
(-) El fondo se calienta hasta un máximo de 56.1 °C / 133 F, frente a la media de 43.2 °C / 110 F
(+) En reposo, la temperatura media de la parte superior es de 29.7 °C / 85# F, frente a la media del dispositivo de 33.9 °C / 93 F.
(-) Jugando a The Witcher 3, la temperatura media de la parte superior es de 38.3 °C / 101 F, frente a la media del dispositivo de 33.9 °C / 93 F.
(+) El reposamanos y el panel táctil están a una temperatura inferior a la de la piel, con un máximo de 27.5 °C / 81.5 F y, por tanto, son fríos al tacto.
(±) La temperatura media de la zona del reposamanos de dispositivos similares fue de 28.8 °C / 83.8 F (+1.3 °C / 2.3 F).
| MSI Stealth 14 Studio A13V Intel Core i7-13700H, NVIDIA GeForce RTX 4050 Laptop GPU | Gigabyte Aero 14 OLED BMF Intel Core i7-13700H, NVIDIA GeForce RTX 4050 Laptop GPU | Schenker Vision 14 2022 RTX 3050 Ti Intel Core i7-12700H, NVIDIA GeForce RTX 3050 Ti Laptop GPU | Asus ROG Flow Z13 GZ301ZE Intel Core i9-12900H, NVIDIA GeForce RTX 3050 Ti Laptop GPU | Alienware x14 i7 RTX 3060 Intel Core i7-12700H, NVIDIA GeForce RTX 3060 Laptop GPU | Razer Blade 14 Ryzen 9 6900HX AMD Ryzen 9 6900HX, NVIDIA GeForce RTX 3070 Ti Laptop GPU | Acer Predator Triton 300 SE Intel Core i9-12900H, NVIDIA GeForce RTX 3060 Laptop GPU | |
|---|---|---|---|---|---|---|---|
| Heat | 17% | 9% | 13% | 16% | 7% | 17% | |
| Maximum Upper Side * (°C) | 46.9 | 42 10% | 48.4 -3% | 45.3 3% | 51.3 -9% | 40.6 13% | 43 8% |
| Maximum Bottom * (°C) | 56.1 | 52 7% | 57.1 -2% | 48.3 14% | 44.4 21% | 42.6 24% | 46.4 17% |
| Idle Upper Side * (°C) | 33.8 | 26 23% | 28.1 17% | 29.2 14% | 27.2 20% | 38 -12% | 28.2 17% |
| Idle Bottom * (°C) | 37.9 | 27 29% | 29 23% | 30 21% | 26.6 30% | 37 2% | 28.4 25% |
* ... más pequeño es mejor
Altavoces
MSI ha equipado el Stealth 14 Studio con cuatro altavoces incluyendo su software Nahimic Audio. Este software ofrece diferentes perfiles que pueden ser adaptados (por ejemplo con mas graves o voces mas pronunciadas) y definitivamente recomendariamos usar este software. En general, notamos buenos resultados y definitivamente mejores que los dispositivos de comparación - los únicos dispositivos a los que el portátil MSI no pudo acercarse fueron algunos de los portátiles multimedia con sistemas de sonido realmente buenos. Por desgracia, los altavoces no son los mejores para jugar, ya que los ruidosos ventiladores del portátil ahogan casi todo.
MSI Stealth 14 Studio A13V análisis de audio
(±) | la sonoridad del altavoz es media pero buena (81 dB)
Graves 100 - 315 Hz
(±) | lubina reducida - en promedio 11.2% inferior a la mediana
(+) | el bajo es lineal (6.7% delta a la frecuencia anterior)
Medios 400 - 2000 Hz
(+) | medios equilibrados - a sólo 1.6% de la mediana
(+) | los medios son lineales (2.9% delta a la frecuencia anterior)
Altos 2 - 16 kHz
(±) | máximos más altos - de media 5.3% más altos que la mediana
(±) | la linealidad de los máximos es media (7.5% delta a frecuencia anterior)
Total 100 - 16.000 Hz
(+) | el sonido global es lineal (11.9% de diferencia con la mediana)
En comparación con la misma clase
» 12% de todos los dispositivos probados de esta clase eran mejores, 4% similares, 84% peores
» El mejor tuvo un delta de 6%, la media fue 18%, el peor fue ###max##%
En comparación con todos los dispositivos probados
» 9% de todos los dispositivos probados eran mejores, 2% similares, 89% peores
» El mejor tuvo un delta de 4%, la media fue 23%, el peor fue ###max##%
Acer Predator Triton 300 SE análisis de audio
(±) | la sonoridad del altavoz es media pero buena (79.9 dB)
Graves 100 - 315 Hz
(±) | lubina reducida - en promedio 10.3% inferior a la mediana
(±) | la linealidad de los graves es media (9.7% delta a frecuencia anterior)
Medios 400 - 2000 Hz
(±) | medias más altas - de media 5% más altas que la mediana
(+) | los medios son lineales (4% delta a la frecuencia anterior)
Altos 2 - 16 kHz
(±) | máximos más altos - de media 5.5% más altos que la mediana
(±) | la linealidad de los máximos es media (7.6% delta a frecuencia anterior)
Total 100 - 16.000 Hz
(±) | la linealidad del sonido global es media (15.1% de diferencia con la mediana)
En comparación con la misma clase
» 32% de todos los dispositivos probados de esta clase eran mejores, 6% similares, 62% peores
» El mejor tuvo un delta de 6%, la media fue 18%, el peor fue ###max##%
En comparación con todos los dispositivos probados
» 21% de todos los dispositivos probados eran mejores, 4% similares, 75% peores
» El mejor tuvo un delta de 4%, la media fue 23%, el peor fue ###max##%
Gestión de la energía - Poca resistencia
Consumo de energía

Especialmente en modo inactivo, nos sorprendió la cantidad de energía que consume el dispositivo a pesar de su conmutación gráfica. Definitivamente notamos una gran desventaja sobre sus competidores en este aspecto. A brillo máximo, medimos unos 20 vatios en inactivo, lo que es mucho para un dispositivo compacto de 14 pulgadas con un brillo de 400 cd/m². El portátil MSI consume mucho también durante los juegos; el fabricante podría echarle un vistazo a esto. Durante nuestro test de estrés, medimos un máximo de 200 vatios - esto se estabilizó rápidamente en unos 150 vatios. Como resultado, la fuente de alimentación de 240 vatios suministrada es completamente suficiente - quizá incluso demasiado potente.
| Off / Standby | |
| Ocioso | |
| Carga |
|
Clave:
min: | |
| MSI Stealth 14 Studio A13V i7-13700H, GeForce RTX 4050 Laptop GPU, Samsung PM9A1 MZVL21T0HCLR, IPS, 2560x1600, 14" | Gigabyte Aero 14 OLED BMF i7-13700H, GeForce RTX 4050 Laptop GPU, Gigabyte AG470S1TB-SI B10, OLED, 2880x1800, 14" | Schenker Vision 14 2022 RTX 3050 Ti i7-12700H, GeForce RTX 3050 Ti Laptop GPU, Samsung SSD 980 Pro 1TB MZ-V8P1T0BW, IPS, 2880x1800, 14" | Asus ROG Flow Z13 GZ301ZE i9-12900H, GeForce RTX 3050 Ti Laptop GPU, Micron 2450 1TB MTFDKBK1T0TFK, IPS, 1920x1200, 13.4" | Alienware x14 i7 RTX 3060 i7-12700H, GeForce RTX 3060 Laptop GPU, WDC PC SN810 1TB, IPS, 1920x1080, 14" | Razer Blade 14 Ryzen 9 6900HX R9 6900HX, GeForce RTX 3070 Ti Laptop GPU, Samsung PM9A1 MZVL21T0HCLR, IPS, 2560x1440, 14" | Acer Predator Triton 300 SE i9-12900H, GeForce RTX 3060 Laptop GPU, Micron 3400 1TB MTFDKBA1T0TFH, OLED, 2880x1800, 14" | Medio NVIDIA GeForce RTX 4050 Laptop GPU | Media de la clase Gaming | |
|---|---|---|---|---|---|---|---|---|---|
| Power Consumption | 41% | 35% | 34% | 24% | -15% | 9% | 8% | -19% | |
| Idle Minimum * (Watt) | 10.4 | 7.4 29% | 7.5 28% | 8.8 15% | 7.9 24% | 10.2 2% | 7.6 27% | 9.95 ? 4% | 13 ? -25% |
| Idle Average * (Watt) | 19.1 | 8.3 57% | 10.4 46% | 12.1 37% | 11.1 42% | 26 -36% | 12.3 36% | 15.8 ? 17% | 19 ? 1% |
| Idle Maximum * (Watt) | 19.4 | 8.7 55% | 11.4 41% | 12.7 35% | 11.8 39% | 26.7 -38% | 17.6 9% | 20.1 ? -4% | 24.6 ? -27% |
| Load Average * (Watt) | 95.9 | 76 21% | 83.3 13% | 72.3 25% | 107.4 -12% | 89.3 7% | 111 -16% | 88 ? 8% | 110.7 ? -15% |
| Witcher 3 ultra * (Watt) | 141.6 | 70 51% | 92.7 35% | 77.3 45% | 111 22% | 158.7 -12% | 117.1 17% | ||
| Load Maximum * (Watt) | 203 | 132 35% | 110.3 46% | 103.1 49% | 140.4 31% | 227.5 -12% | 245.8 -21% | 176.3 ? 13% | 259 ? -28% |
* ... más pequeño es mejor
Power consumption Witcher 3 / stress test
Power consumption with external monitor
Tiempos de ejecución
A pesar de su batería de 72 Wh, la duración del portátil MSI no es especialmente buena, ni siquiera en modo 60-Hz. Con un brillo adaptado de 150 cd/m² (lo que significa alrededor del 36 % del brillo de nuestro modelo de pruebas), nuestro test WLAN acabó tras poco más de 6 horas. A 240 Hz, la prueba no duró ni 5 horas. Cuando repetimos el test usando el brillo máximo del portátil, sólo duró 5 horas a 60 Hz, y 4 horas a 240 Hz. Incluso el test de vídeo a 150 cd/m² y 60 Hz sólo duró algo más de 6.5 horas. Para un dispositivo compacto de 14 pulgadas con una batería relativamente grande y conmutación gráfica, es un resultado decepcionante. El dispositivo tarda unas 2 horas en cargarse por completo, y el 75 % de su capacidad se alcanza tras 45 minutos. El portátil también se puede cargar por USB-C sobre la marcha.
| MSI Stealth 14 Studio A13V i7-13700H, GeForce RTX 4050 Laptop GPU, 72 Wh | Gigabyte Aero 14 OLED BMF i7-13700H, GeForce RTX 4050 Laptop GPU, 63 Wh | Schenker Vision 14 2022 RTX 3050 Ti i7-12700H, GeForce RTX 3050 Ti Laptop GPU, 99.8 Wh | Asus ROG Flow Z13 GZ301ZE i9-12900H, GeForce RTX 3050 Ti Laptop GPU, 56 Wh | Alienware x14 i7 RTX 3060 i7-12700H, GeForce RTX 3060 Laptop GPU, 80 Wh | Razer Blade 14 Ryzen 9 6900HX R9 6900HX, GeForce RTX 3070 Ti Laptop GPU, 62 Wh | Acer Predator Triton 300 SE i9-12900H, GeForce RTX 3060 Laptop GPU, 76 Wh | Media de la clase Gaming | |
|---|---|---|---|---|---|---|---|---|
| Duración de Batería | 23% | 68% | -7% | 17% | 42% | 3% | 21% | |
| H.264 (h) | 6.6 | 11.1 68% | 6 -9% | 9.4 42% | 8.32 ? 26% | |||
| WiFi v1.3 (h) | 6.3 | 7.6 21% | 10.1 60% | 5.6 -11% | 8.9 41% | 9.5 51% | 6.2 -2% | 7.11 ? 13% |
| Load (h) | 1.2 | 1.5 25% | 2.1 75% | 1.2 0% | 0.8 -33% | 1.6 33% | 1.3 8% | 1.502 ? 25% |
| Reader / Idle (h) | 11.3 | 12.2 | 8.1 | 8.27 ? | ||||
| Witcher 3 ultra (h) | 0.8 | 0.8 |
Pro
Contra
Veredicto - El MSI Stealth 14 Studio deja impresiones encontradas

El MSI Stealth 14 Studio pretende ser un portátil potente pero compacto para jugadores y usuarios creativos. Durante nuestra prueba, tuvimos que señalar algunos puntos negativos que resultan ser un problema para un portátil que cuesta 1.699,99 dólares. Por un lado, el dispositivo "sólo" está equipado con la pequeñaPortátil RTX 4050sin Advanced Optimus - este rendimiento es simplemente insuficiente para el precio. Aunque su potencia de salida es buena en teoría, el sistema de refrigeración no nos impresionó en el uso diario. Se esperan ventiladores ruidosos bajo carga máxima, pero nos confunde por qué los ventiladores siempre parecen estar funcionando de forma audible - incluso notamos picos de emisión de ruido de más de 40 dB(A) al usar los modos de potencia más débiles. Esto simplemente estorba mientras usas el portátil. En general, su consumo de energía también es muy alto (a pesar de su conmutación gráfica), lo que a su vez también contribuye a tiempos de ejecución más cortos.
La carcasa del portátil también nos causó una impresión mixta - en comparación con su unidad base extremadamente estable, la tapa de la pantalla puede retorcerse bastante y hay que tener mucho cuidado para no causar daños permanentes. También tenemos algunos aspectos negativos que señalar sobre su teclado. Mientras que la iluminación individual de las teclas es agradable (a pesar de que el software para controlar esto es cualquier cosa menos intuitivo), la elevación de las teclas es muy superficial y, en general, tiene una sensación bastante raquítica.
El MSI Stealth 14 Studio quiere ser el todoterreno compacto perfecto que ofrezca un gran rendimiento para jugadores y usuarios creativos. Por desgracia, -aunque su rendimiento en juegos es bueno- el portátil presenta demasiados defectos como ventiladores molestos, un teclado mediocre y una tapa de pantalla flexible. Por 1.699,99 dólares, esto no es suficiente.
La pantalla del dispositivo también es un arma de doble filo, ya que presenta aspectos positivos como su rápida velocidad de reacción, una tasa de refresco de 240-Hz y una gran precisión del color. Por otro lado, su valor de negro es bastante alto. Esto hace que el contenido negro se represente más como un gris oscuro, y los niveles de contraste no siempre son demasiado buenos. Por supuesto, se trata de una queja en el más alto de los niveles, pero en total, subjetivamente no se ve tan bien como los OLED o incluso muy buenos paneles IPS / mini LED. En definitiva, el portátil MSI tiene demasiados puntos débiles (teniendo en cuenta su elevado precio) para que podamos recomendarlo con confianza.
Precio y disponibilidad
El MSI Stealth 14 Studio puede adquirirse en Best Buy por 1.699,99 dólares.
MSI Stealth 14 Studio A13V
- 07/12/2023 v7 (old)
Andreas Osthoff
Transparencia
La selección de los dispositivos que se van a reseñar corre a cargo de nuestro equipo editorial. La muestra de prueba fue proporcionada al autor en calidad de préstamo por el fabricante o el minorista a los efectos de esta reseña. El prestamista no tuvo ninguna influencia en esta reseña, ni el fabricante recibió una copia de la misma antes de su publicación. No había ninguna obligación de publicar esta reseña. Como empresa de medios independiente, Notebookcheck no está sujeta a la autoridad de fabricantes, minoristas o editores.
Así es como prueba Notebookcheck
Cada año, Notebookcheck revisa de forma independiente cientos de portátiles y smartphones utilizando procedimientos estandarizados para asegurar que todos los resultados son comparables. Hemos desarrollado continuamente nuestros métodos de prueba durante unos 20 años y hemos establecido los estándares de la industria en el proceso. En nuestros laboratorios de pruebas, técnicos y editores experimentados utilizan equipos de medición de alta calidad. Estas pruebas implican un proceso de validación en varias fases. Nuestro complejo sistema de clasificación se basa en cientos de mediciones y puntos de referencia bien fundamentados, lo que mantiene la objetividad.Price comparison

