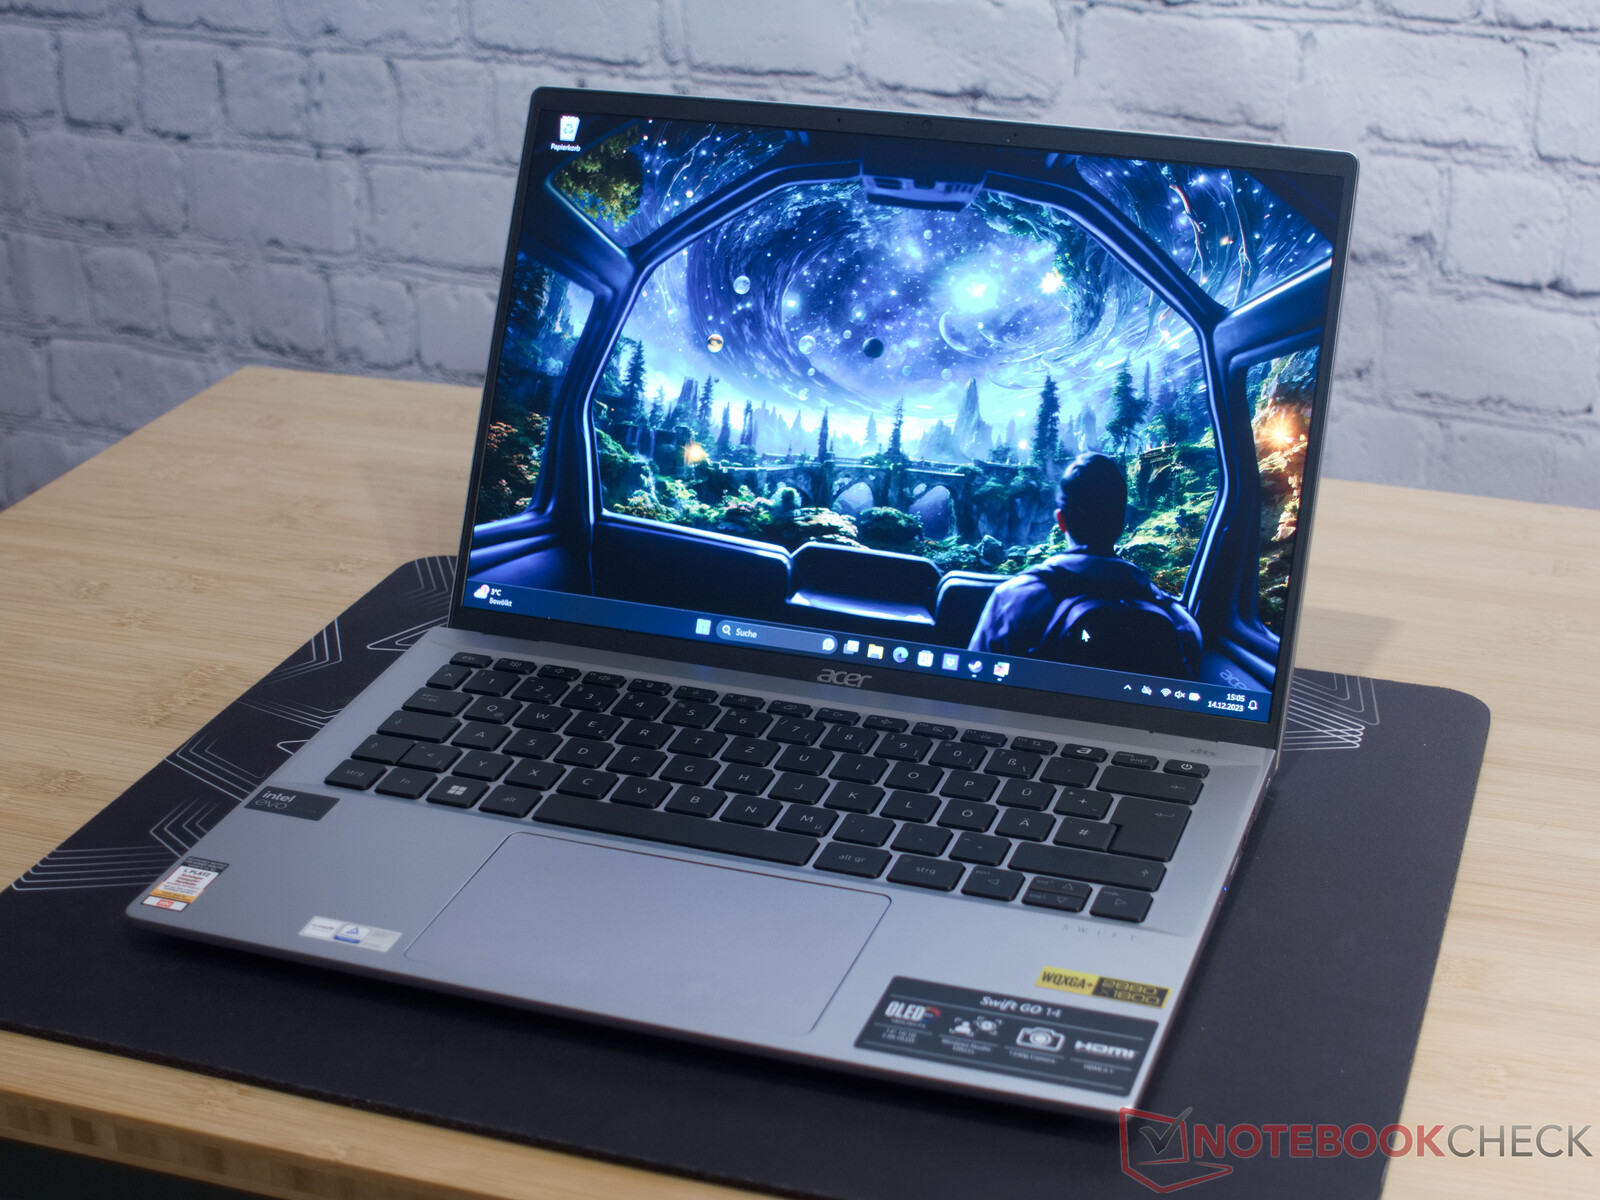
Analisis del Acer Swift Go 14 - El Meteor Lake Core Ultra 7 impresiona con su núcleo de IA
No han pasado ni dos meses desde que analizamos un Acer Swift Go 14. Aquel nos impresionó por su buen rendimiento a un precio asequible. Nuestro actual dispositivo de análisis viene con la última generación de procesadores de Intel. El Acer Swift Go 14 -que estará disponible la próxima primavera- alberga un procesador Intel Core Ultra 155H. Desde el punto de vista del hardware, Acer nos ha proporcionado un portátil basado en el dispositivo de especificaciones estándar. Sin embargo, para la primavera, todavía habrá pequeñas mejoras en el software de acompañamiento, la gestión del rendimiento y la BIOS. Por esta razón, nos detendremos en otorgar una calificación hasta que veamos qué mejoras futuras aporta la última generación de procesadores de Intel a este modelo premium con pantalla OLED.
En algunas pruebas comparativas, registramos más del doble de rendimiento en comparación con el predecesor, que incorporaba un Intel Core i5-1335U. Además, la nueva iGPU Arc de Intel complacerá sin duda a muchos jugadores, ya que los gráficos de Intel están ahora, como mínimo, a la altura de la Radeon RX 780M.
La propia Intel compara a menudo sus nuevos procesadores con el Ryzen R7 7840U de AMD y, por esta razón, echaremos un vistazo al HP Pavillon Plus 14 que viene con ambas variantes de procesador, Intel y AMD, como parte de nuestra comparación. Un representante bastante inusual podría ser el Ayaneo Air 1S, pero este dispositivo también viene con el potente chip competidor de AMD. Y, por último, el LG Gram 2en1 y el Acer Swift Go 14 SFG14-71 y su procesador de 13ª generación cierran nuestro ilustre grupo.
Posibles contendientes en la comparación
Valoración | Fecha | Modelo | Peso | Altura | Tamaño | Resolución | Precio |
|---|---|---|---|---|---|---|---|
v (old) | 12/2023 | Acer Swift Go 14 SFG14-72 Ultra 7 155H, Arc 8-Core | 1.3 kg | 14.9 mm | 14.00" | 2880x1800 | |
| 85.6 % v7 (old) | 11/2023 | Acer Swift Go 14 SFG14-71 i5-1335U, Iris Xe G7 80EUs | 1.3 kg | 14.9 mm | 14.00" | 2880x1800 | |
| 85.8 % v7 (old) | 11/2023 | LG Gram 2in1 16 16T90R - G.AA78G i7-1360P, Iris Xe G7 96EUs | 1.5 kg | 17.2 mm | 16.00" | 2560x1600 | |
| 87.5 % v7 (old) | 12/2023 | HP Pavilion Plus 14-ew0153TU i7-1355U, Iris Xe G7 96EUs | 1.4 kg | 17.5 mm | 14.00" | 2880x1800 | |
| 90.4 % v7 (old) | 12/2023 | Lenovo ThinkPad T14 G4 21K4S02000 R7 PRO 7840U, Radeon 780M | 1.5 kg | 17.9 mm | 14.00" | 1920x1200 | |
| 88.2 % v7 (old) | 10/2023 | Ayaneo Air 1S Retro Power R7 7840U, Radeon 780M | 443.8 g | 21 mm | 5.50" | 1920x1080 | |
| 87.8 % v7 (old) | 11/2023 | HP Pavilion Plus 14-ey0095cl R7 7840U, Radeon 780M | 1.4 kg | 18.8 mm | 14.00" | 2880x1800 |
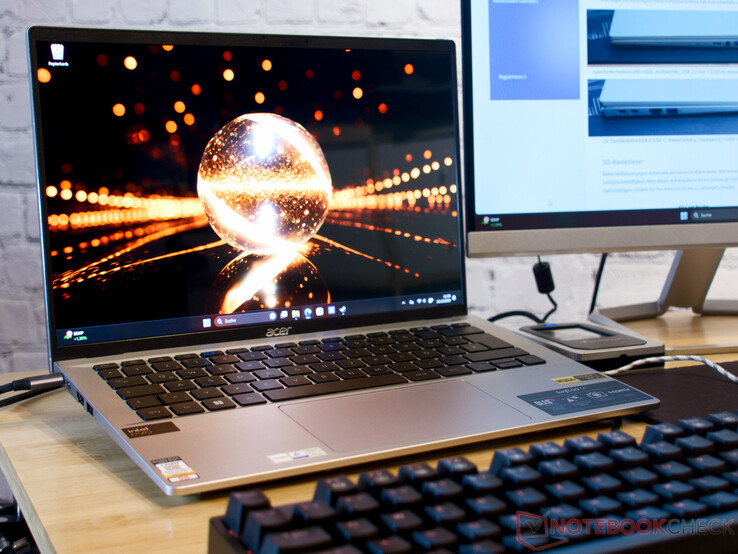
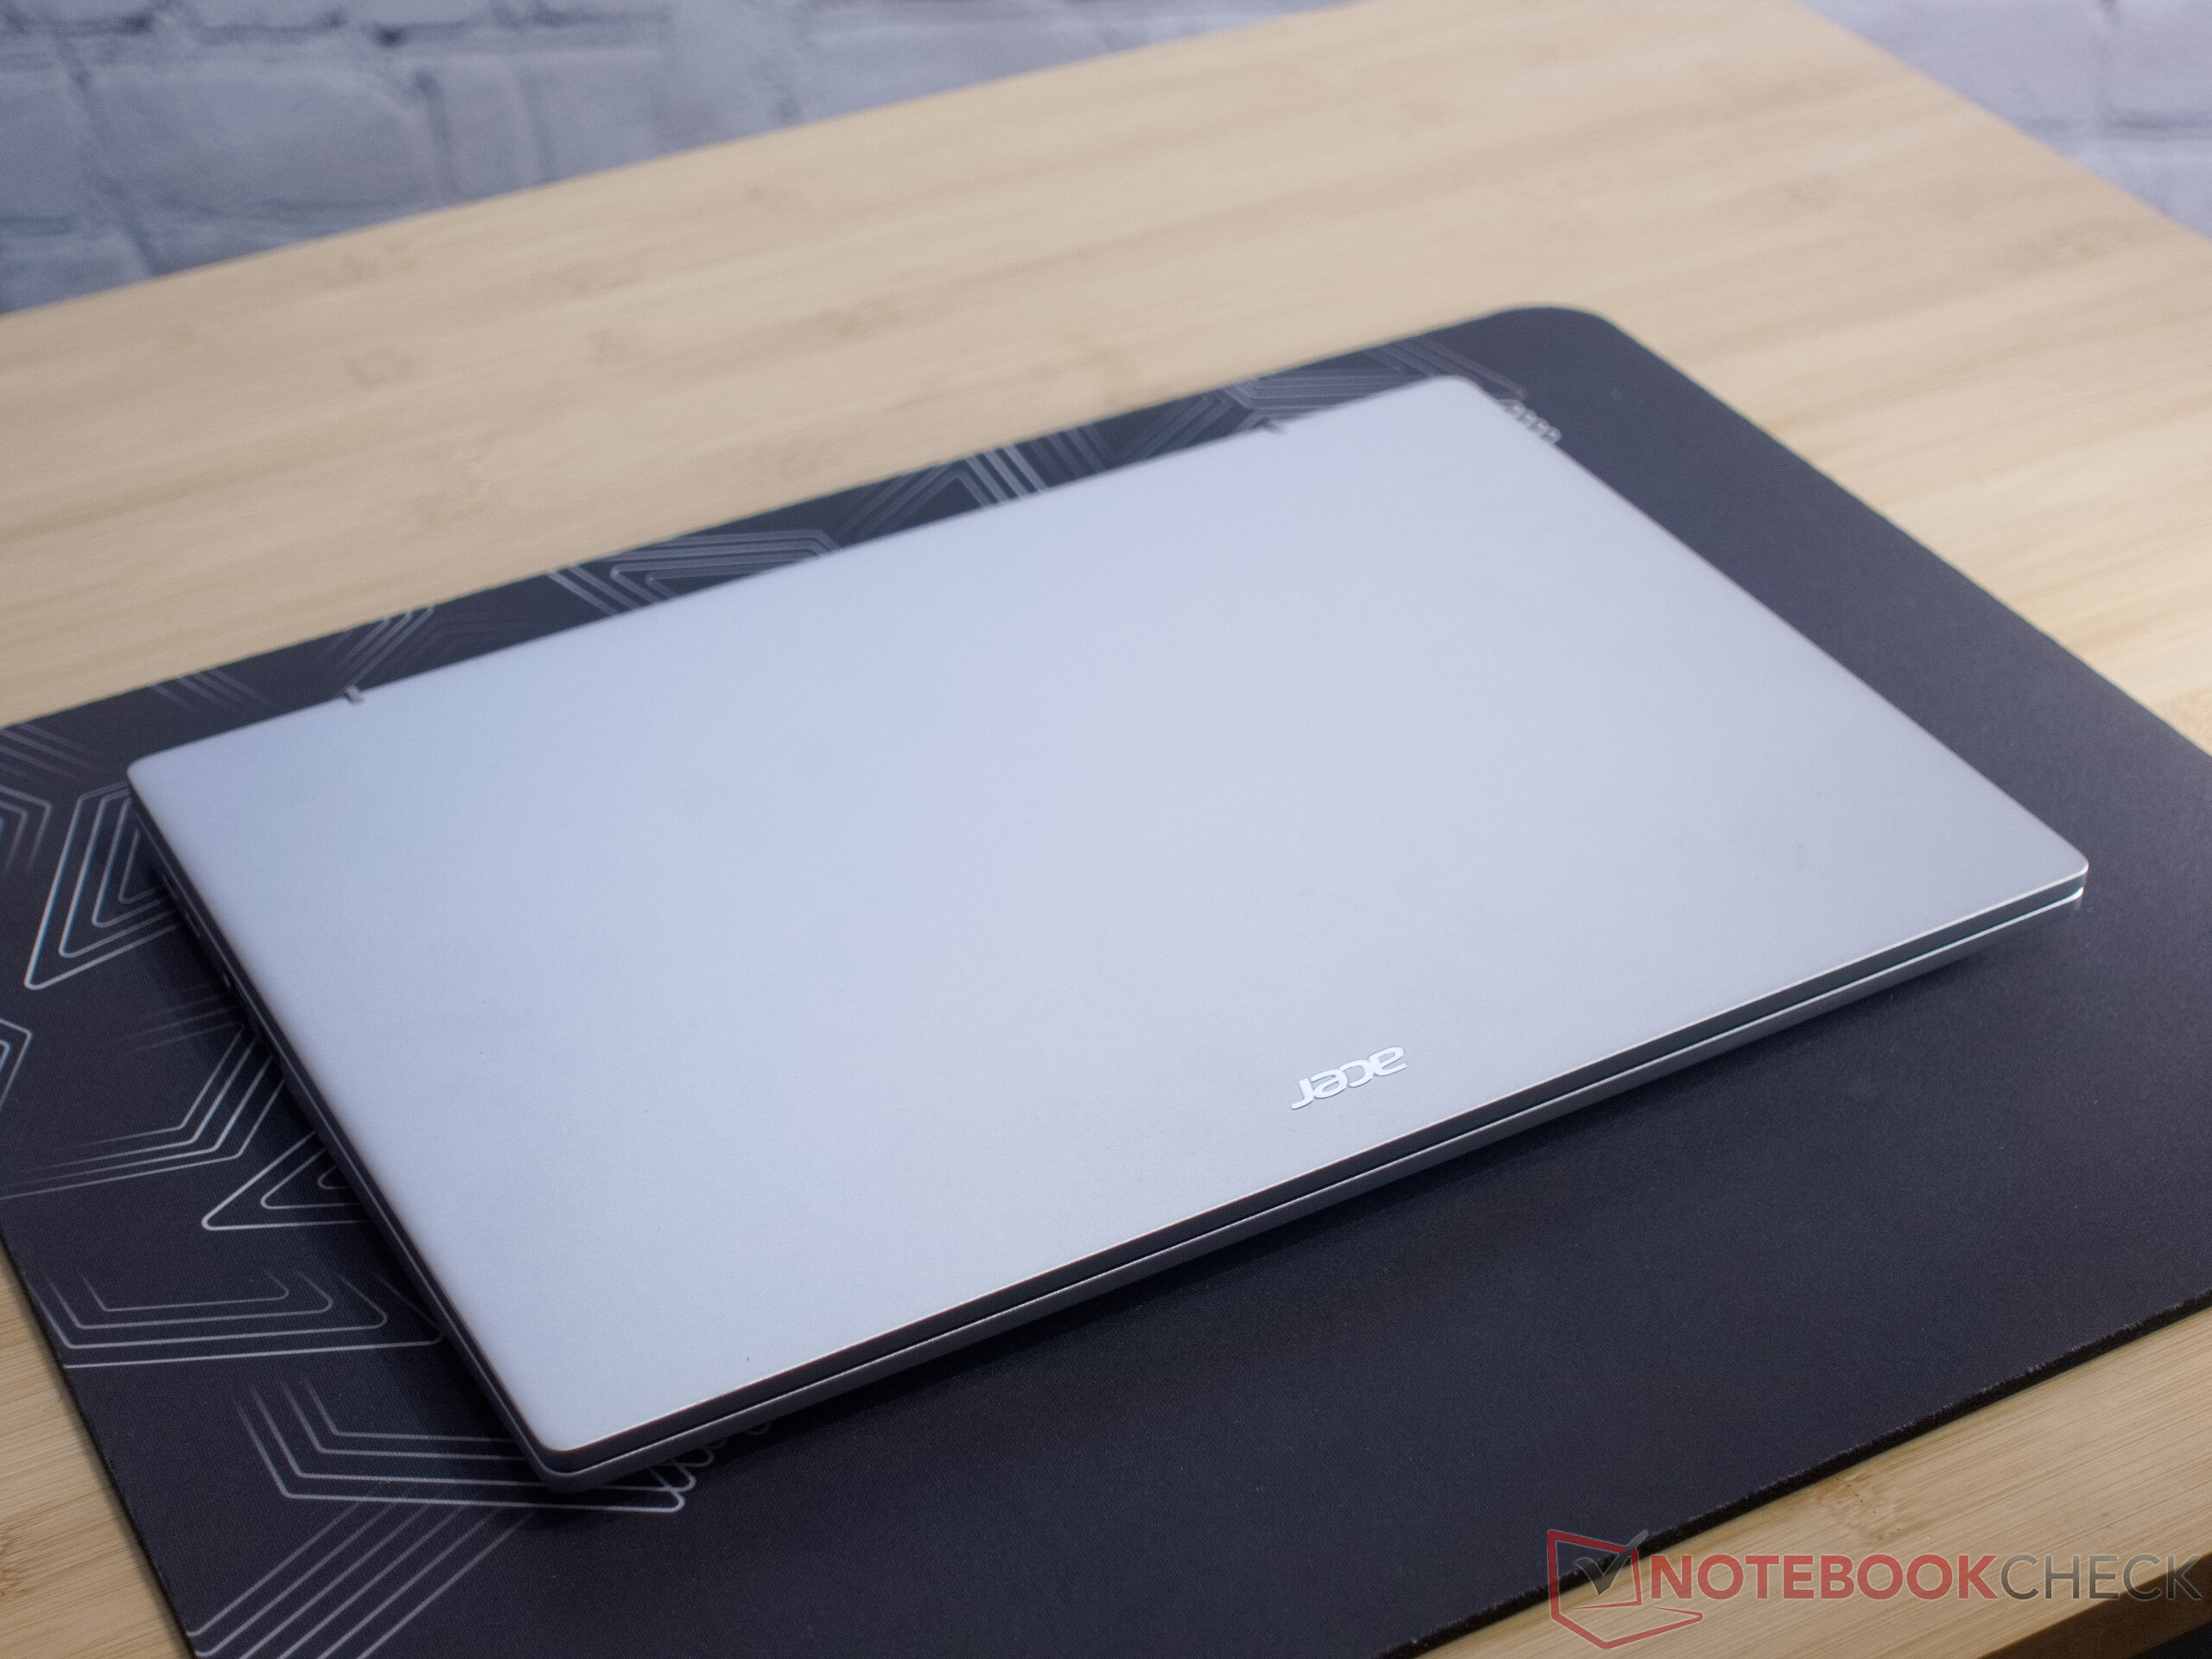
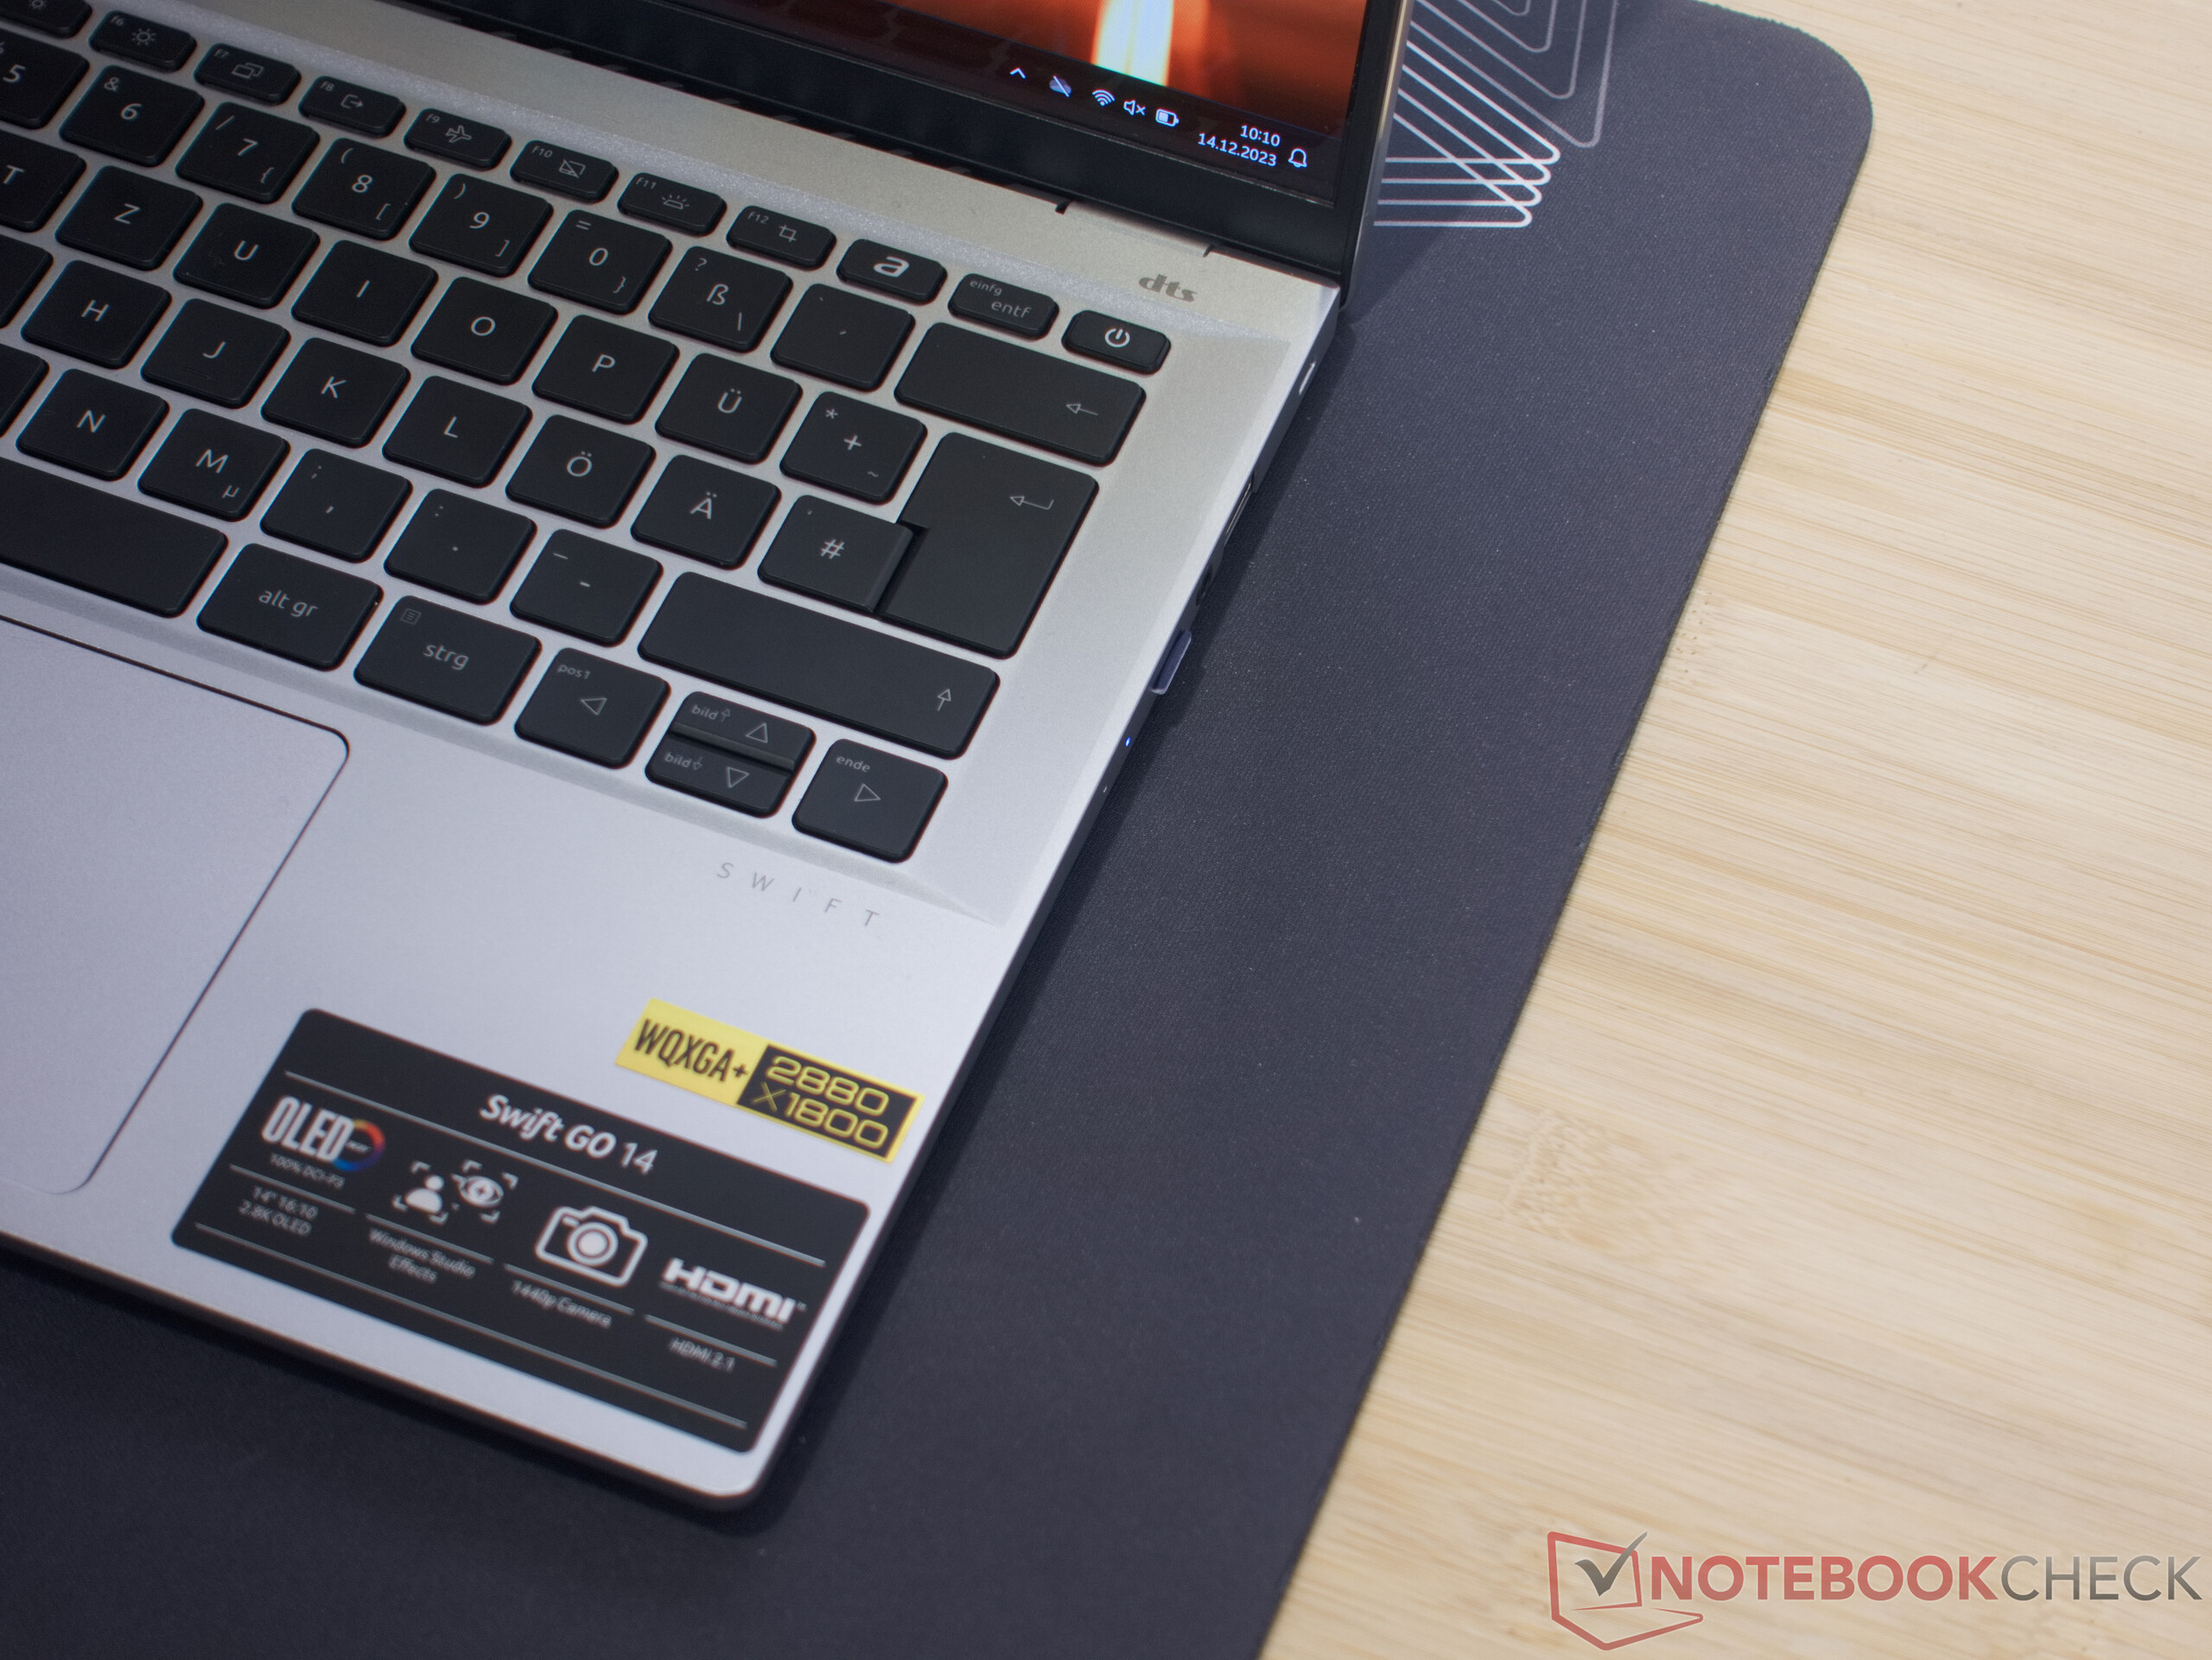
Caja - Aluminio angular
Aunque las primeras impresiones sugieren que el dispositivo no ha sufrido ningún cambio, nos hemos dado cuenta de que Acer ha realizado mejoras detalladas en la carcasa de aluminio. El diseño angular del marco no revela ningún defecto de fabricación y esto significa que casi podríamos copiar y pegar toda la descripción del predecesor. Sin embargo, Acer se las ha arreglado para instalar un panel táctil significativamente más grande que resulta en una mejora notable de la usabilidad del portátil.

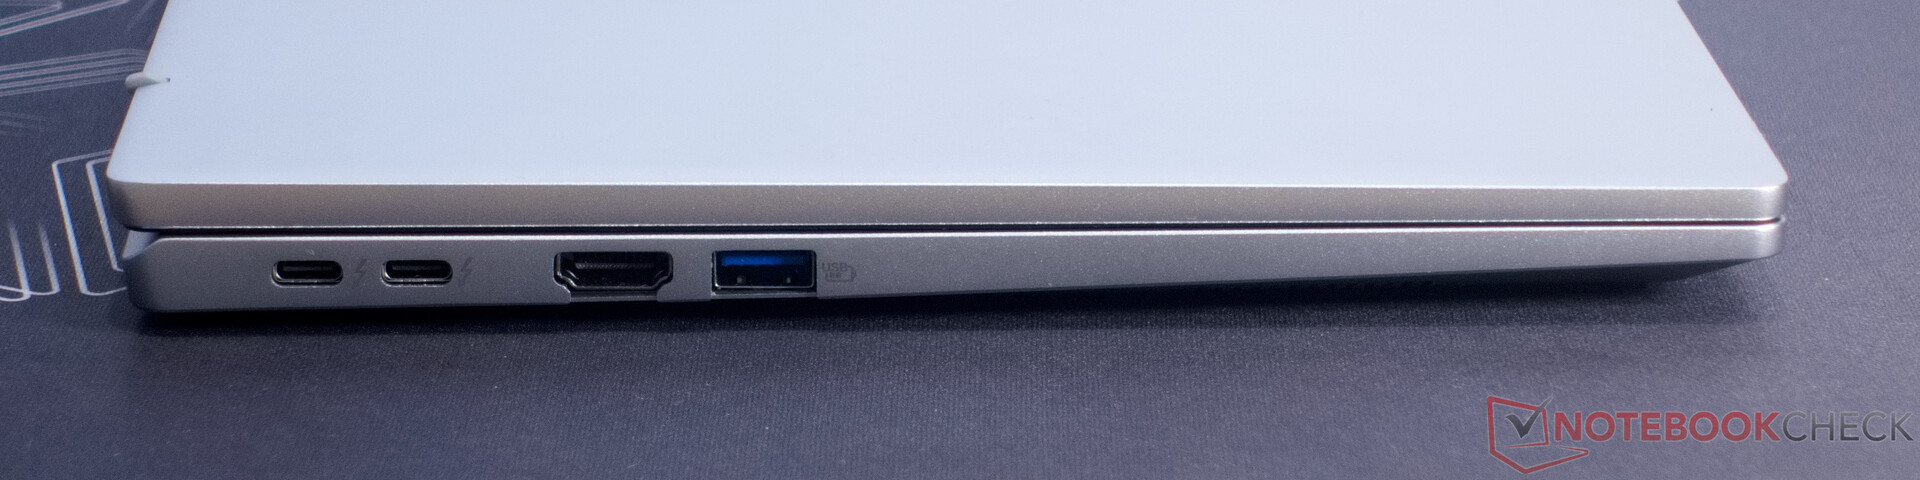
Características - Wi-Fi de primera y una cámara web excelente
Es posible conectar hasta tres monitores al pequeño portátil a través de HDMI 2.1 y ambos puertos Thunderbolt 4. El actual procesador Intel Meteor Lake admite la salida a hasta cuatro monitores simultáneamente. Asimismo, Acer se las ha arreglado para albergar un lector de tarjetas microSD e incluso una mini ranura de bloqueo Kensington.
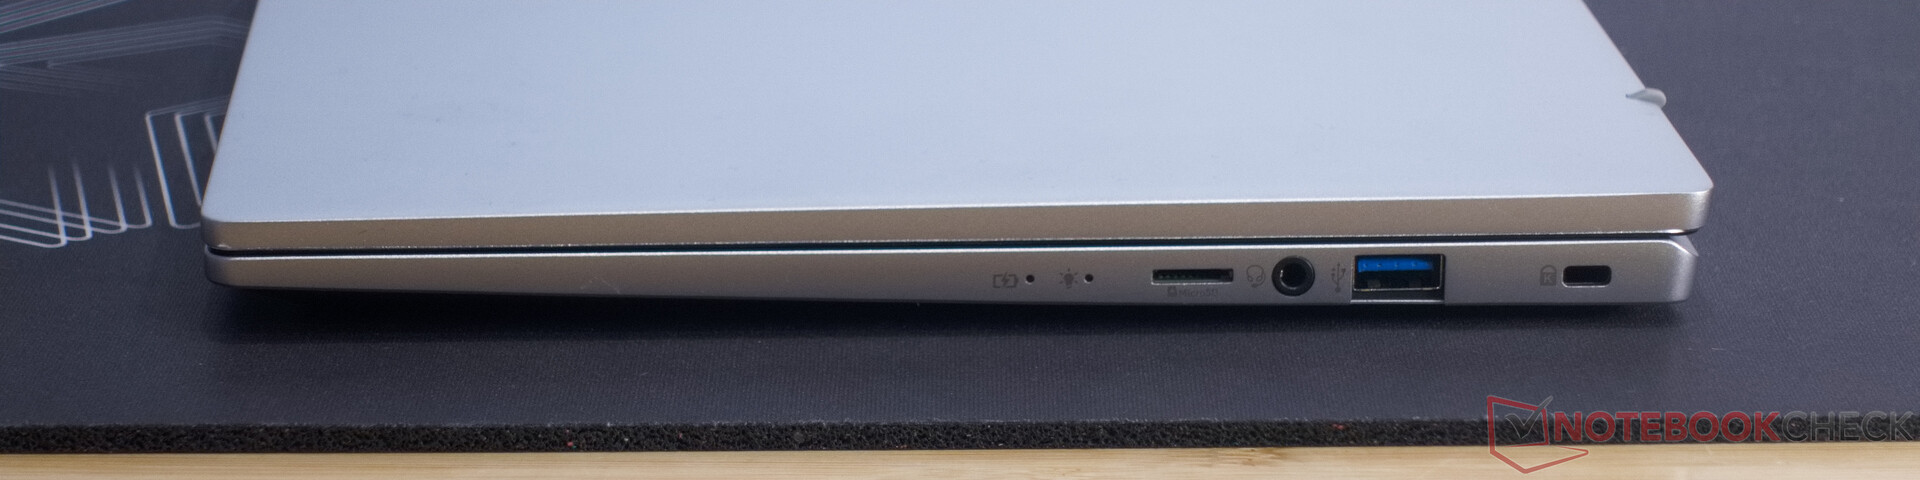
Lector de tarjetas SD
No se aprecian mejoras en el lector de tarjetas microSD. Con su lenta velocidad de lectura de 28 MB/s, es comparable al modelo del año pasado y sólo es adecuado para pequeñas cantidades de datos. Nuestro AV Pro microSD es hasta diez veces más rápido.
| SD Card Reader | |
| average JPG Copy Test (av. of 3 runs) | |
| Media de la clase Subnotebook (23.7 - 188, n=9, últimos 2 años) | |
| Acer Swift Go 14 SFG14-72 | |
| maximum AS SSD Seq Read Test (1GB) | |
| Media de la clase Subnotebook (24.9 - 195, n=8, últimos 2 años) | |
| Acer Swift Go 14 SFG14-72 | |
Comunicación
Utilizando iPerf3 y el Asus GT-AXE11000, en nuestra prueba Wi-Fi, el Acer Swift Go demostró velocidades de transferencia considerablemente superiores tanto en la red de 5 GHz como en la de 6 GHz. Con hasta 1,9 GBit/s, las cargas y descargas a una red doméstica avanzan a un ritmo enérgico.
Cámara web
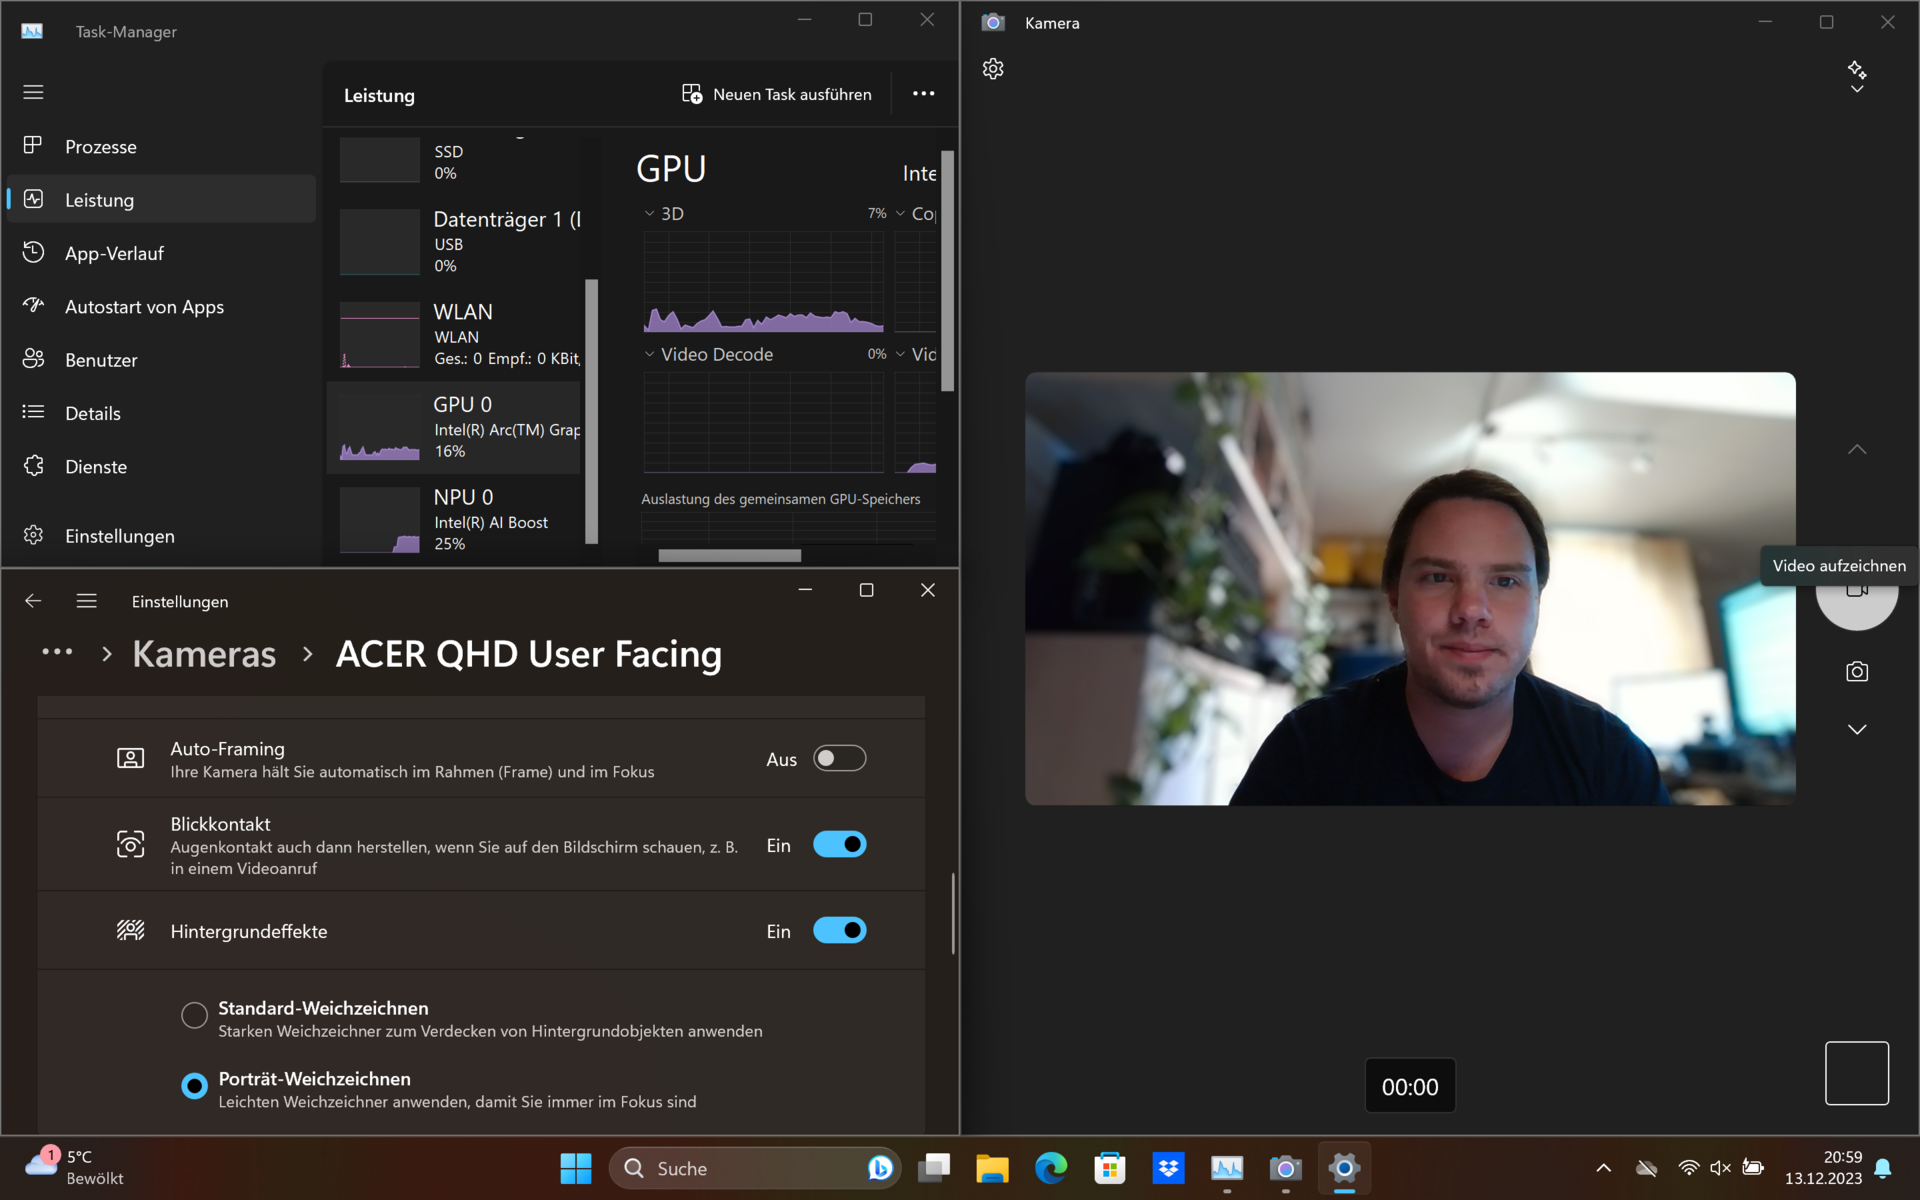
La cámara web QHD del Acer Swift Go ofreció unos resultados muy impresionantes. La calidad de imagen puede incluso mejorarse un poco más gracias a la NPU de Intel y a Windows Studio Effects. Sin embargo, esto grava la iGPU y, como era de esperar, los ventiladores del Acer Swift Go hacen sentir su presencia rápida y ruidosamente.


Seguridad
Incorpora un sensor de huellas dactilares, una ranura Kensington Lock y un TPM 2.0. Esto significa que se cumplen todos los requisitos básicos de seguridad relativos a la protección contra el robo físico y el acceso.
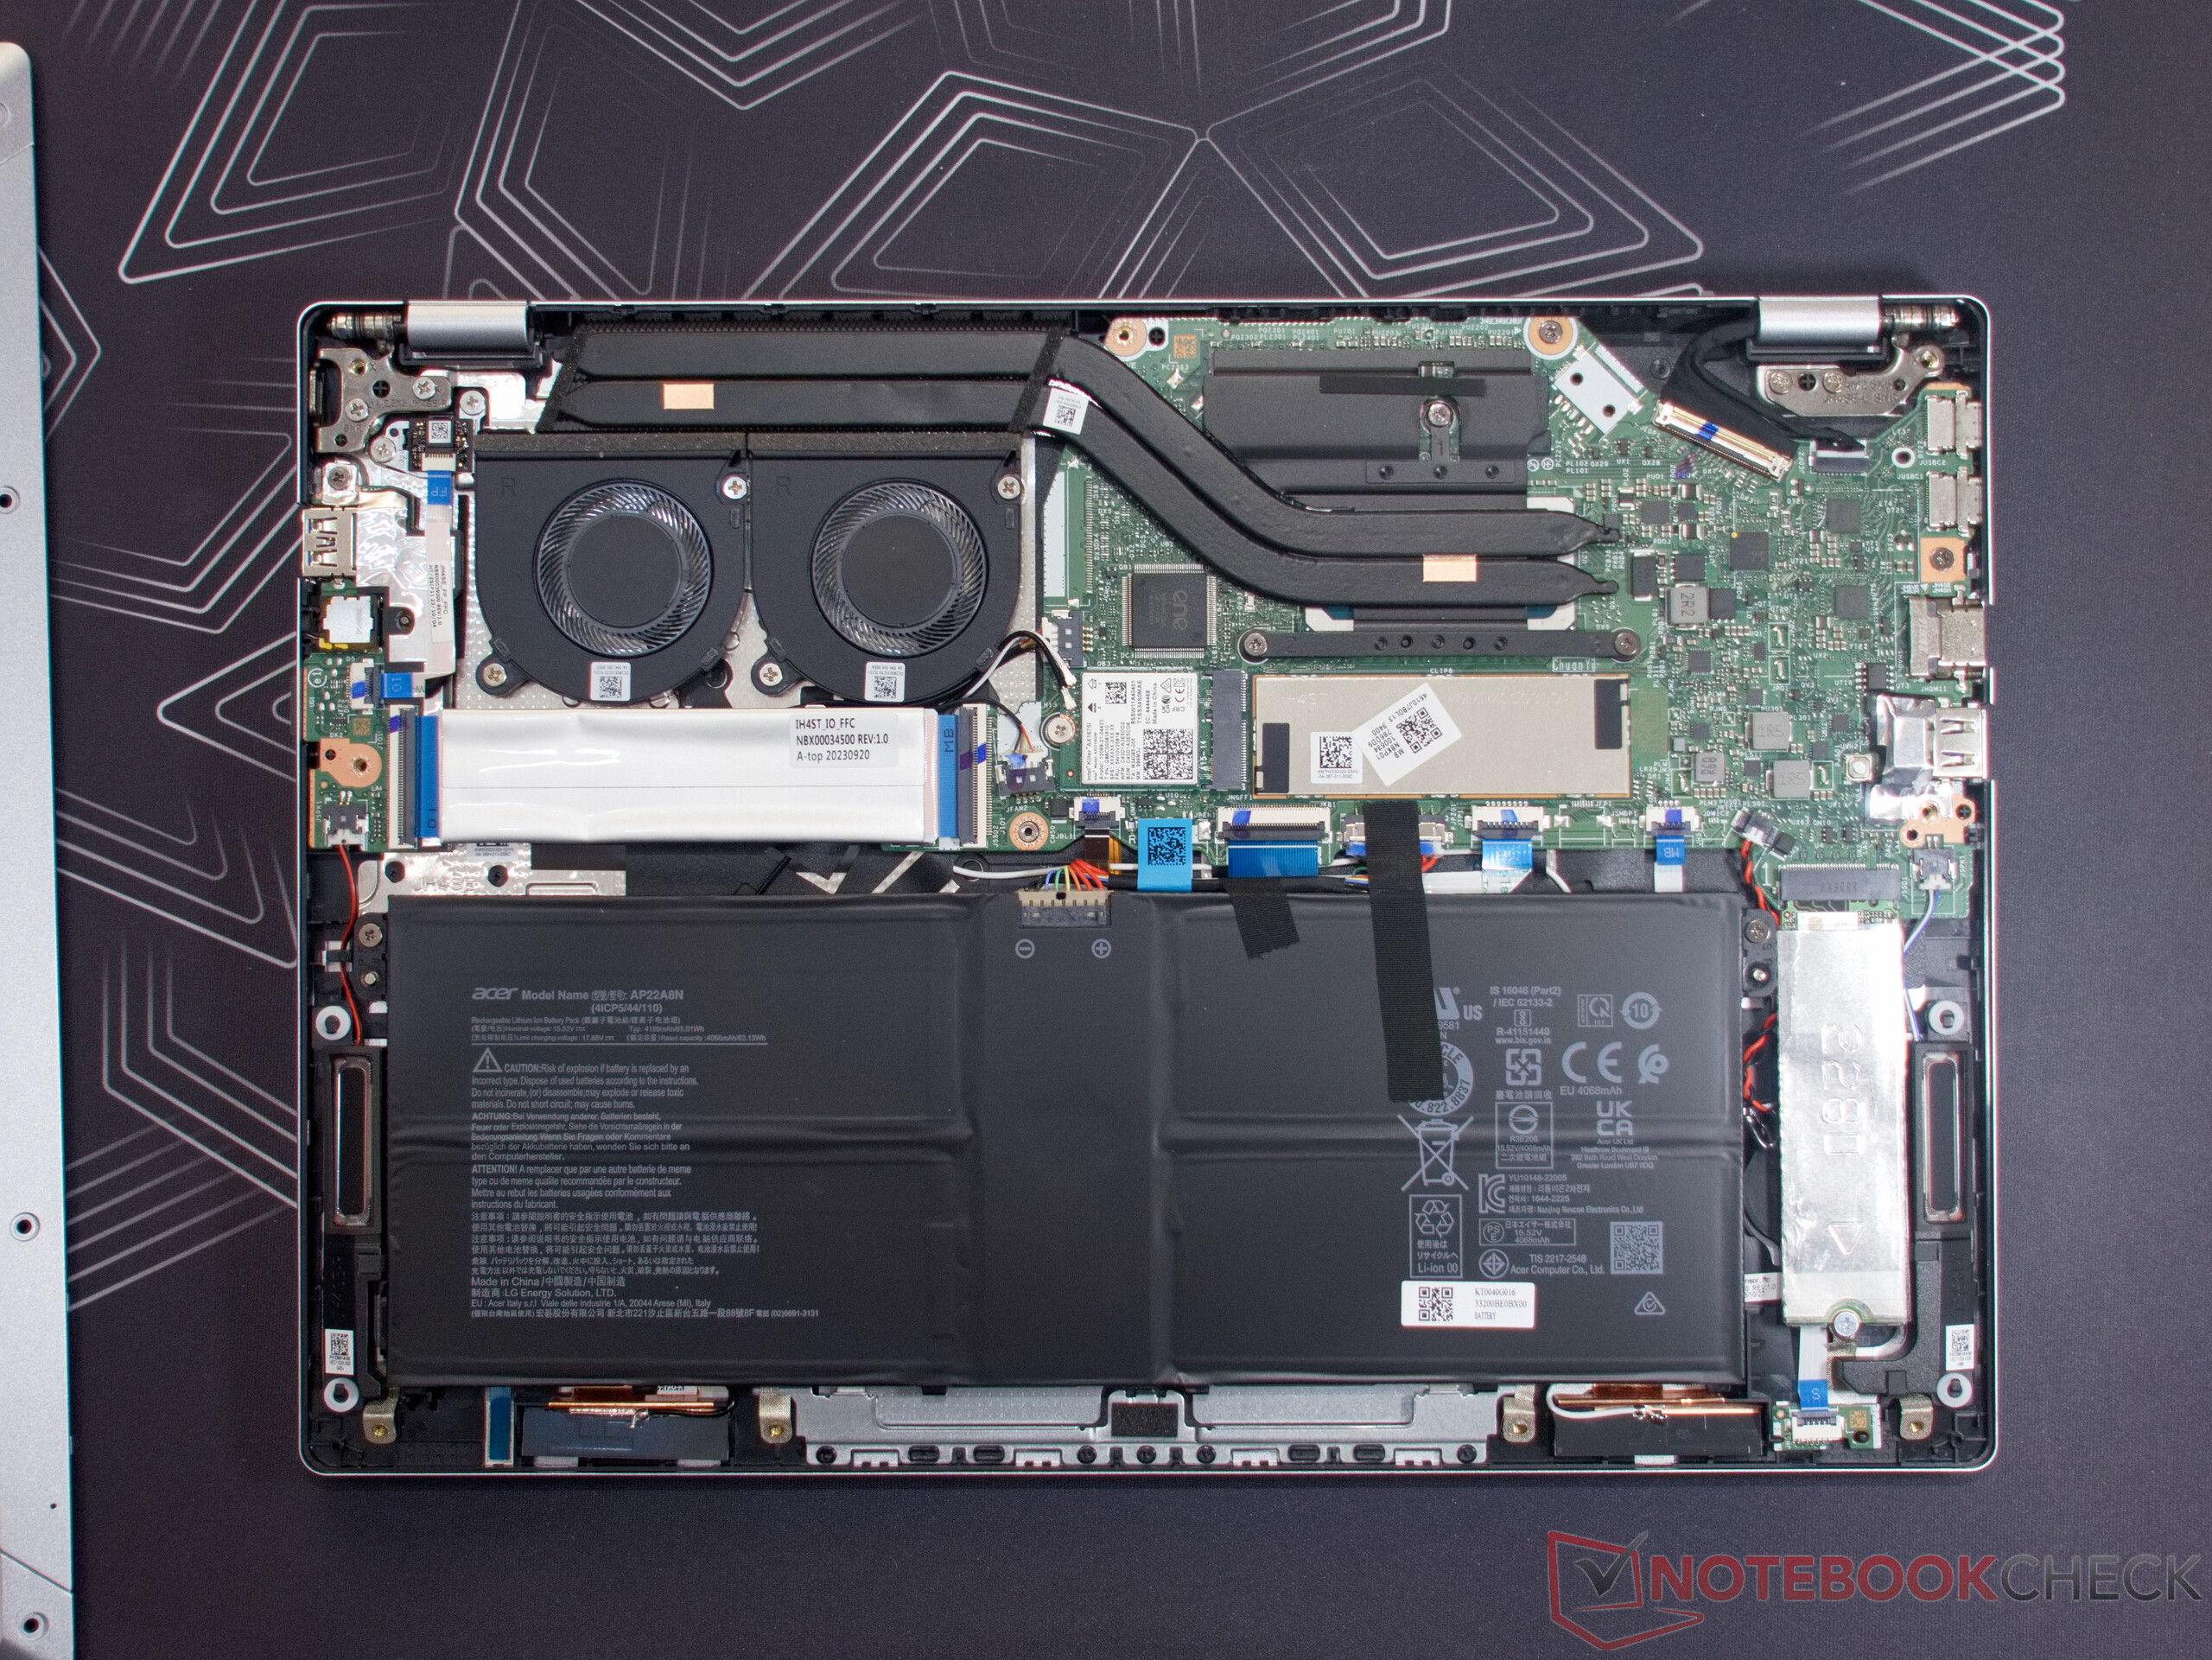
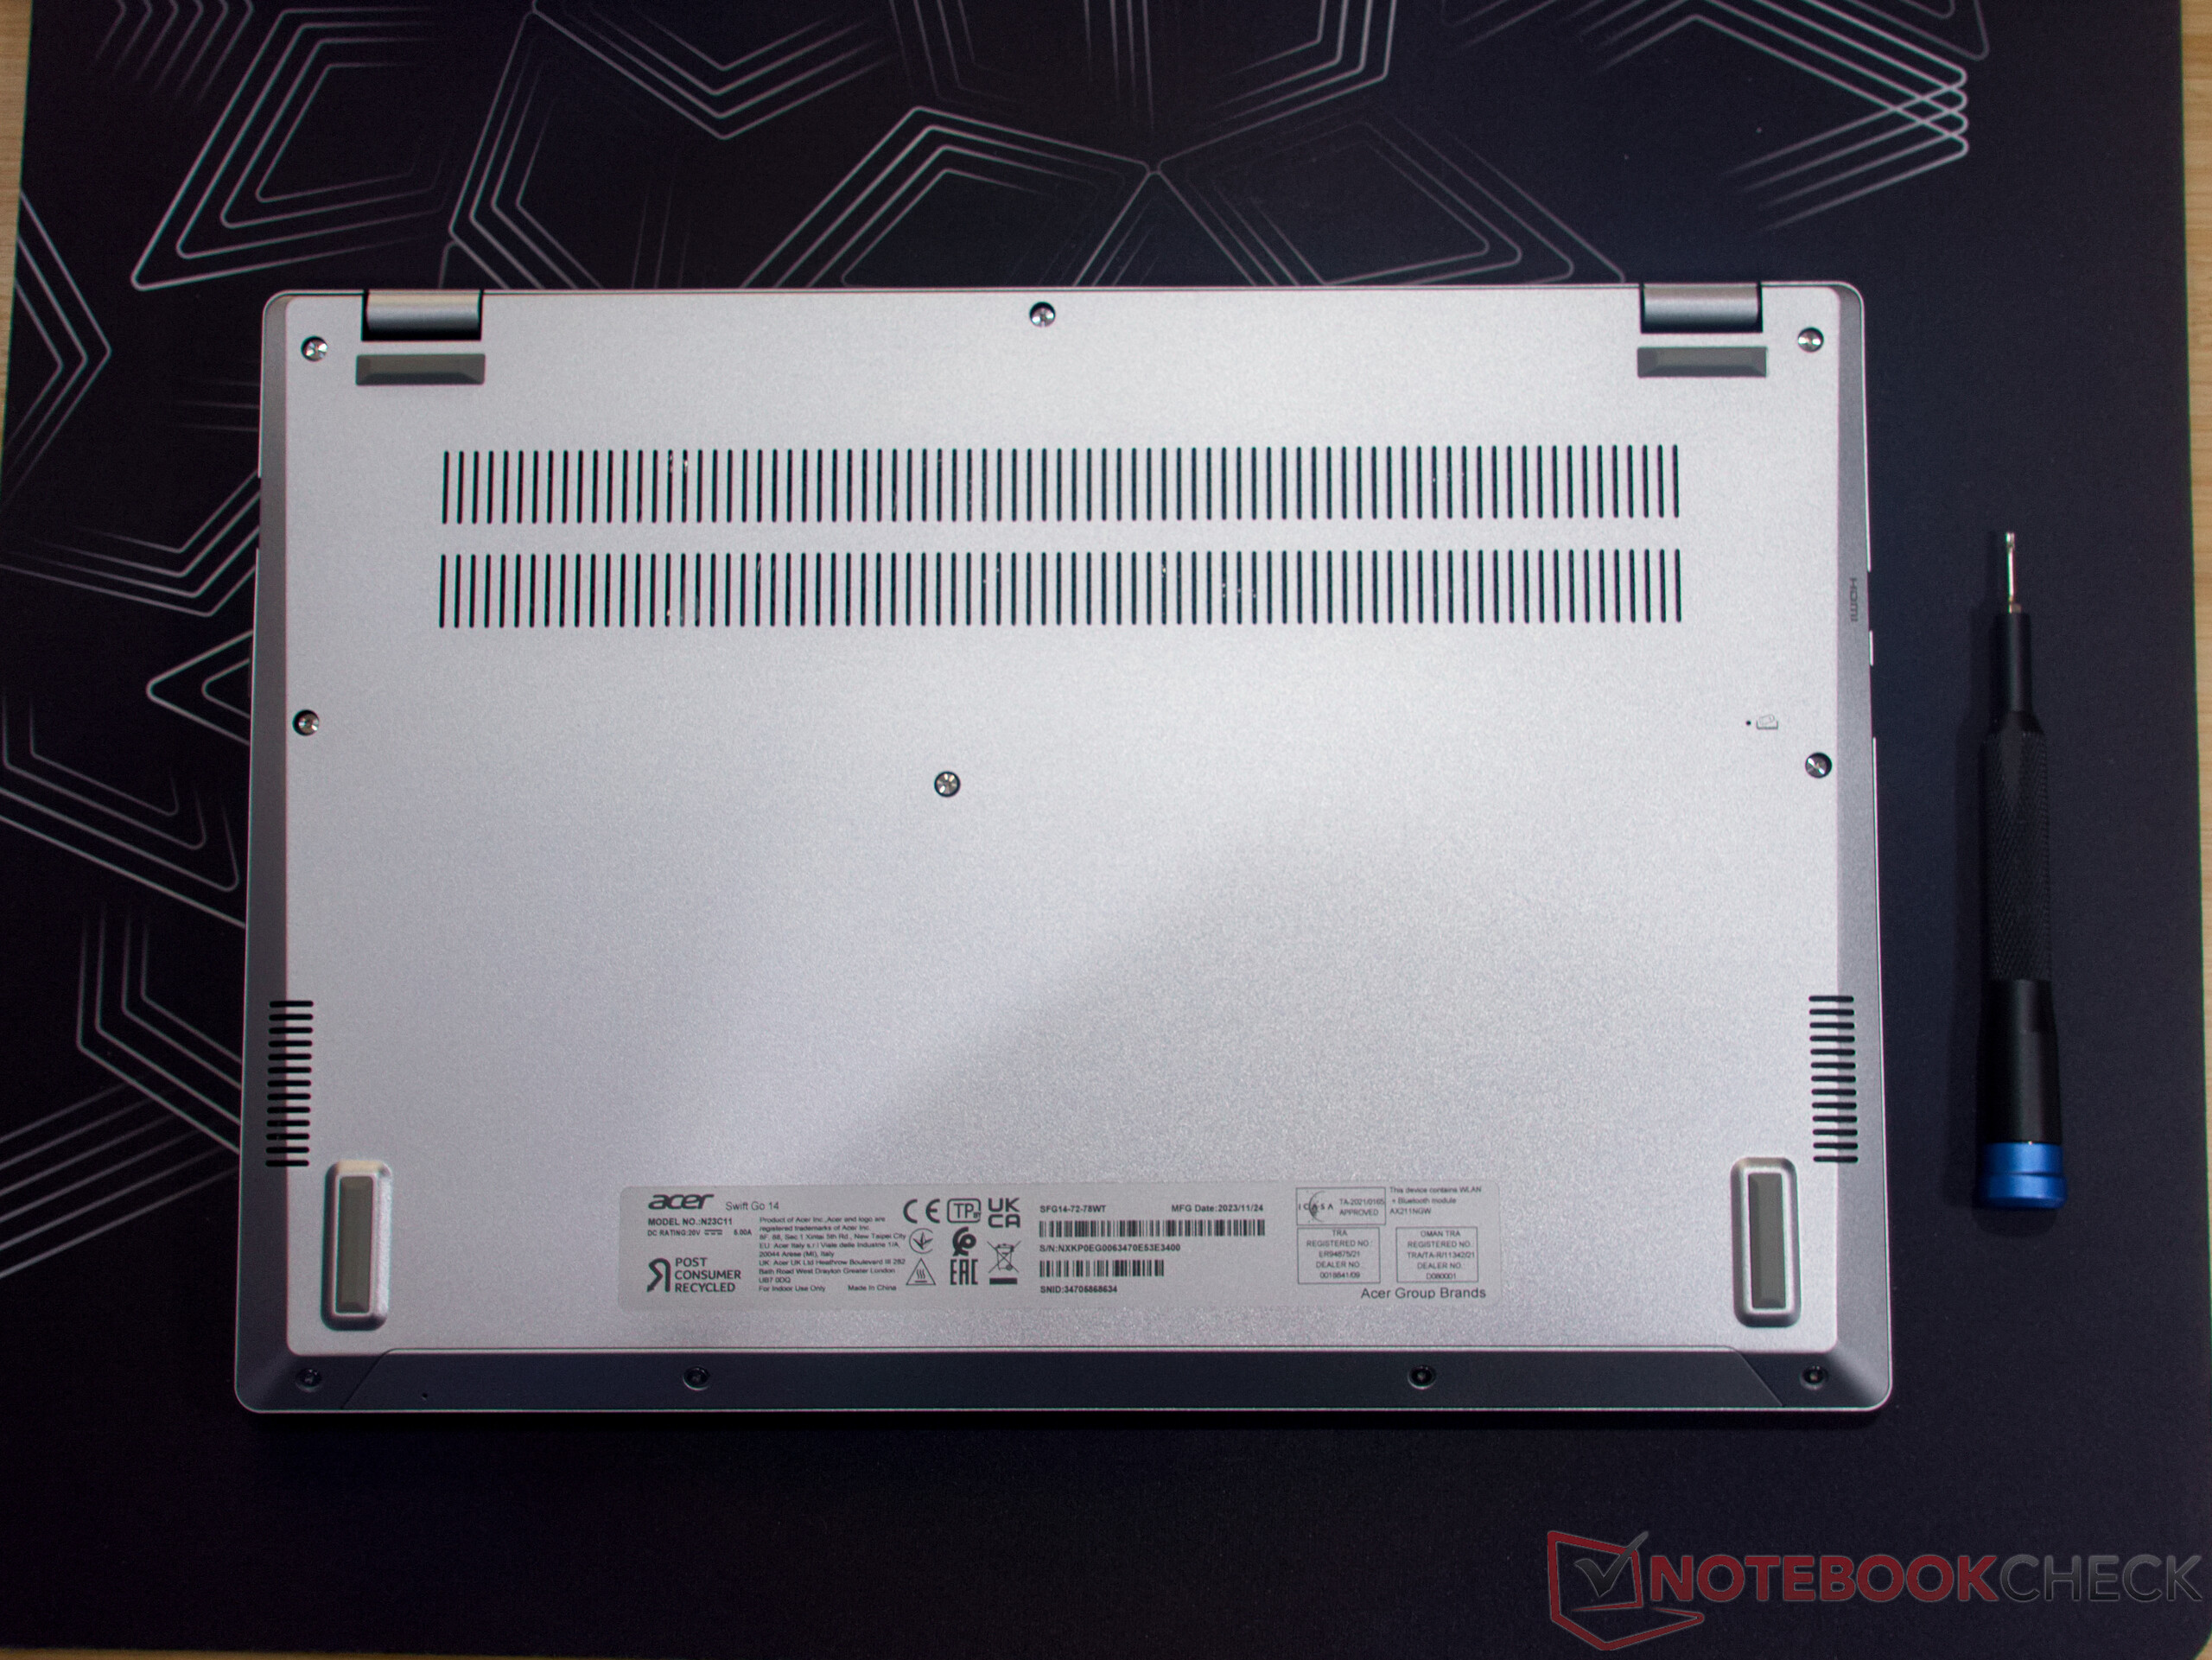
Mantenimiento
Hemos necesitado un destornillador TX5 y una ventosa para abrir el Acer Swift Go. Al igual que con su predecesorse encuentran muchas opciones de mantenimiento en el interior del portátil. Dispone de dos ranuras M.2, (una ocupada) así como de un módulo Wi-Fi instalado. Los ventiladores pueden extraerse fácilmente para su limpieza. Sólo la memoria RAM de 32 GB, de generosas dimensiones, está soldada. Por cierto, la ranura M.2 libre se encuentra bajo el cable plano junto a los ventiladores.
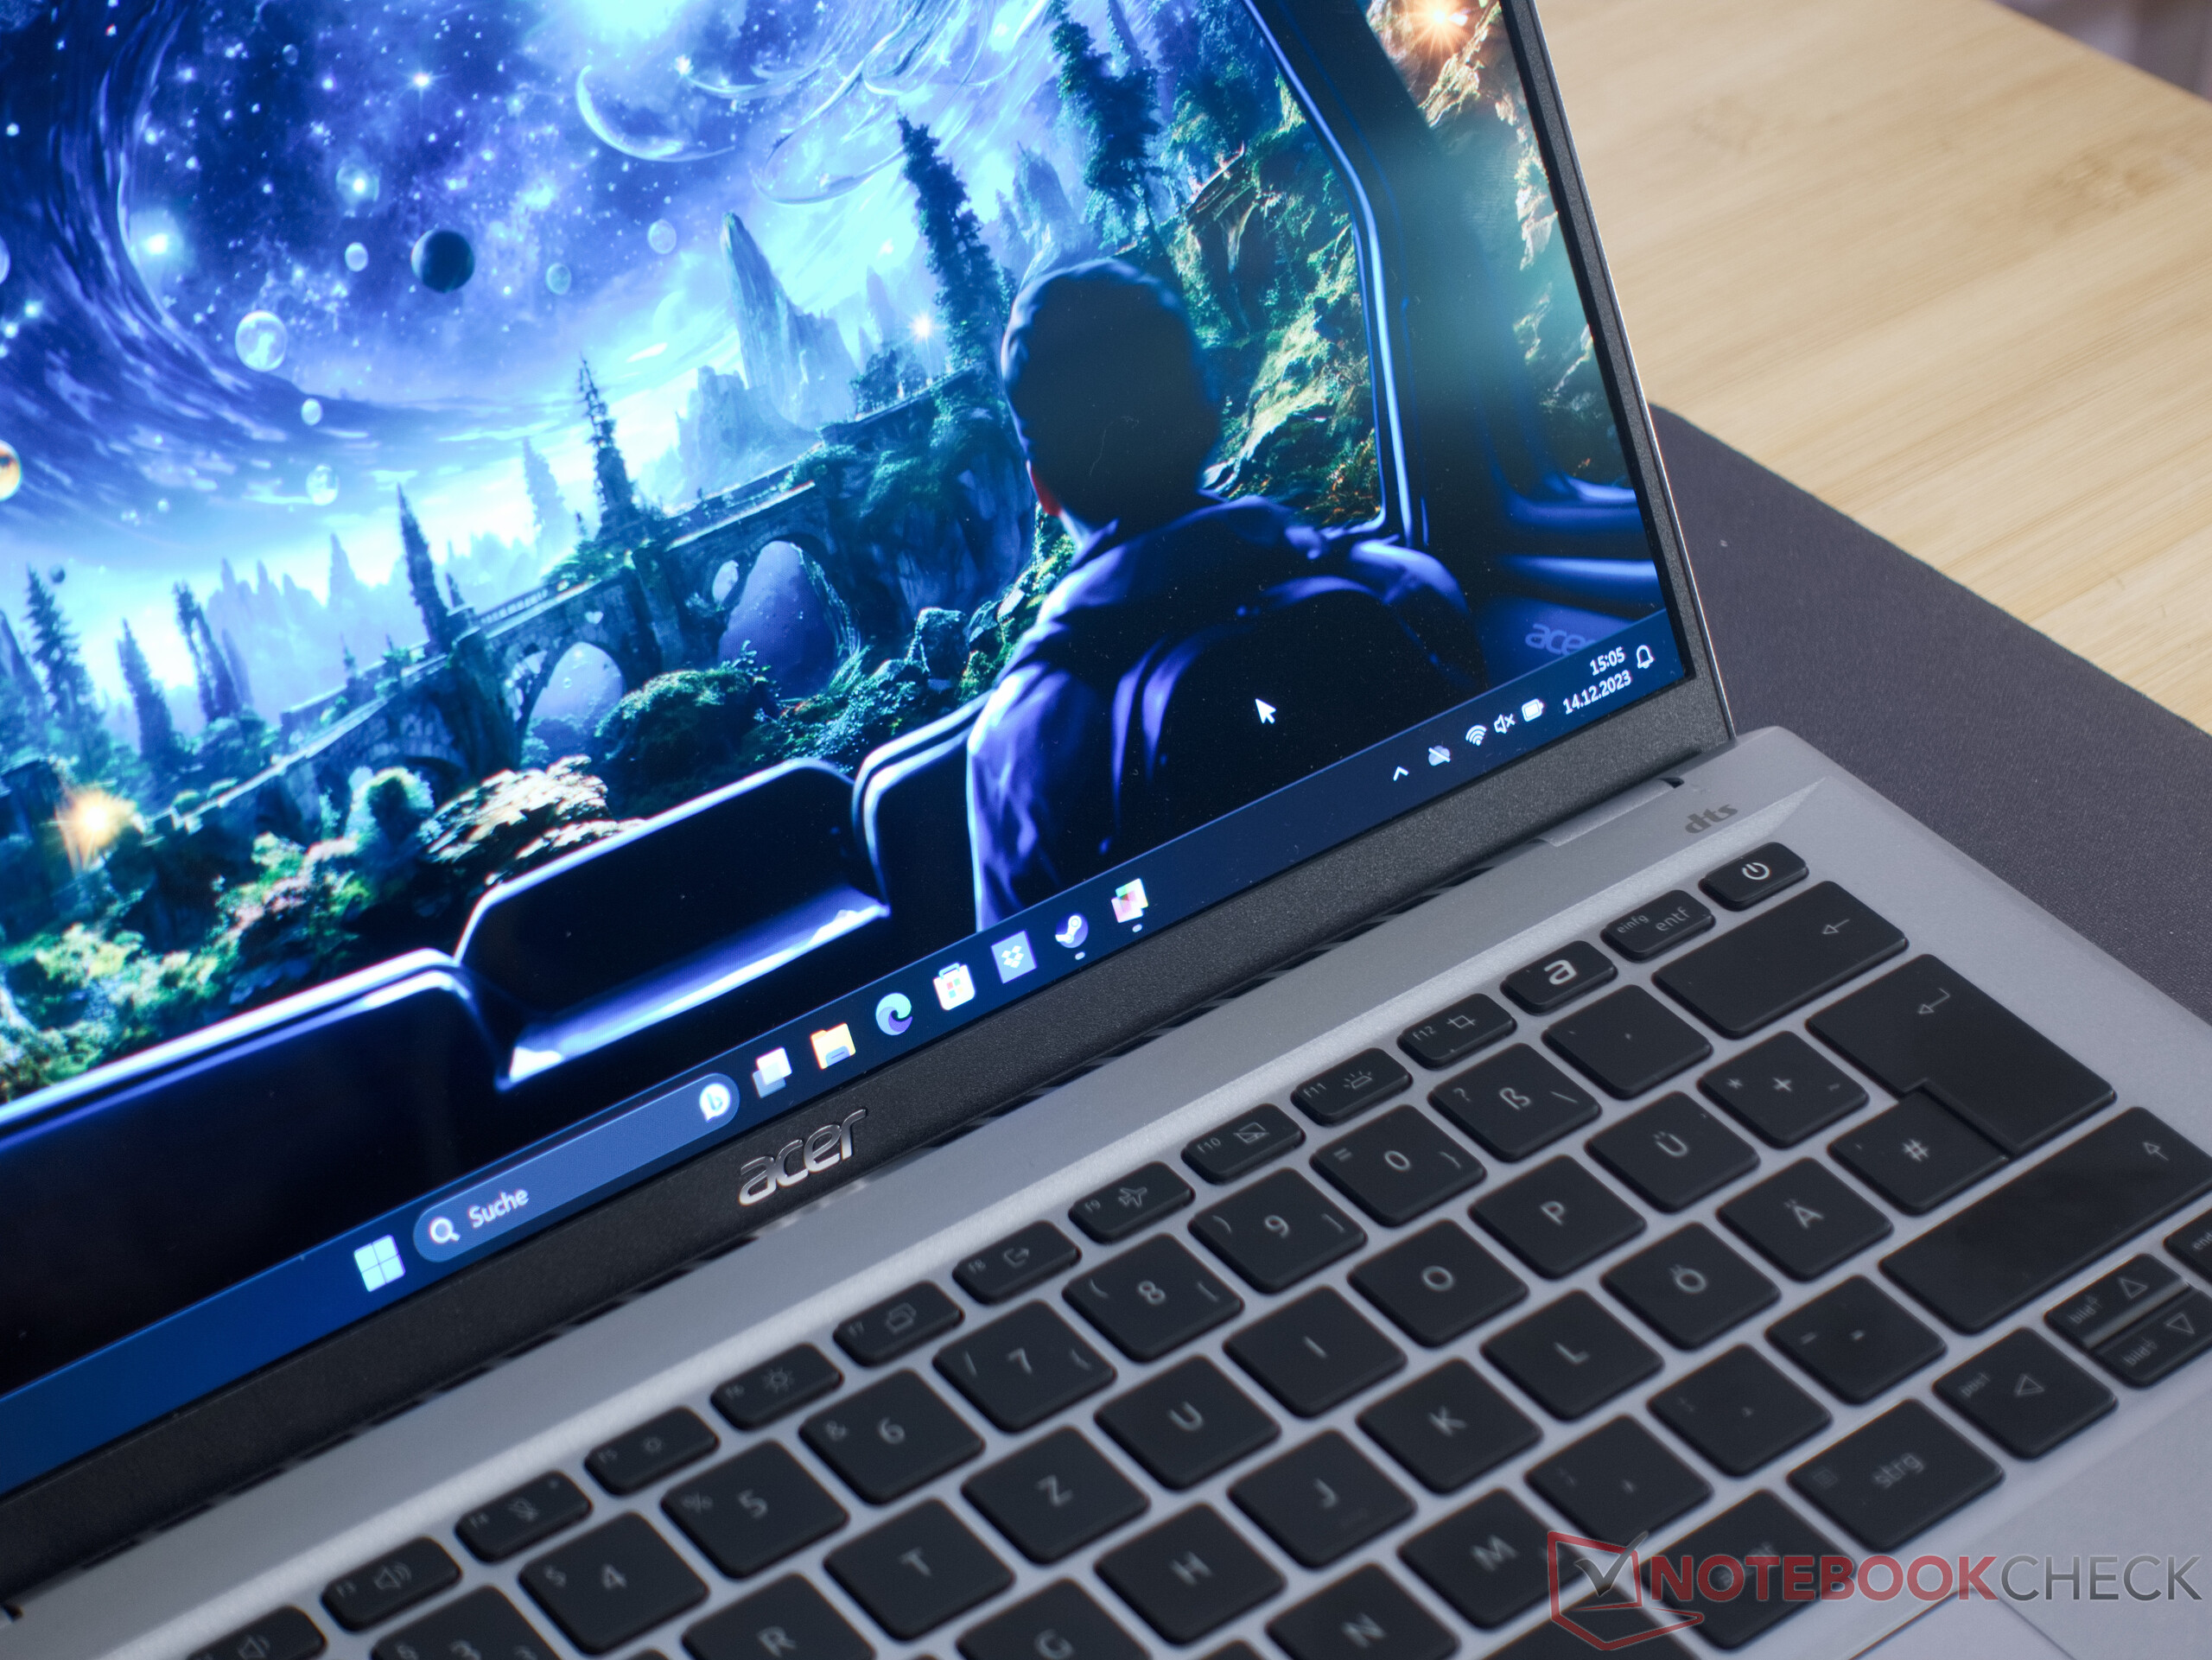
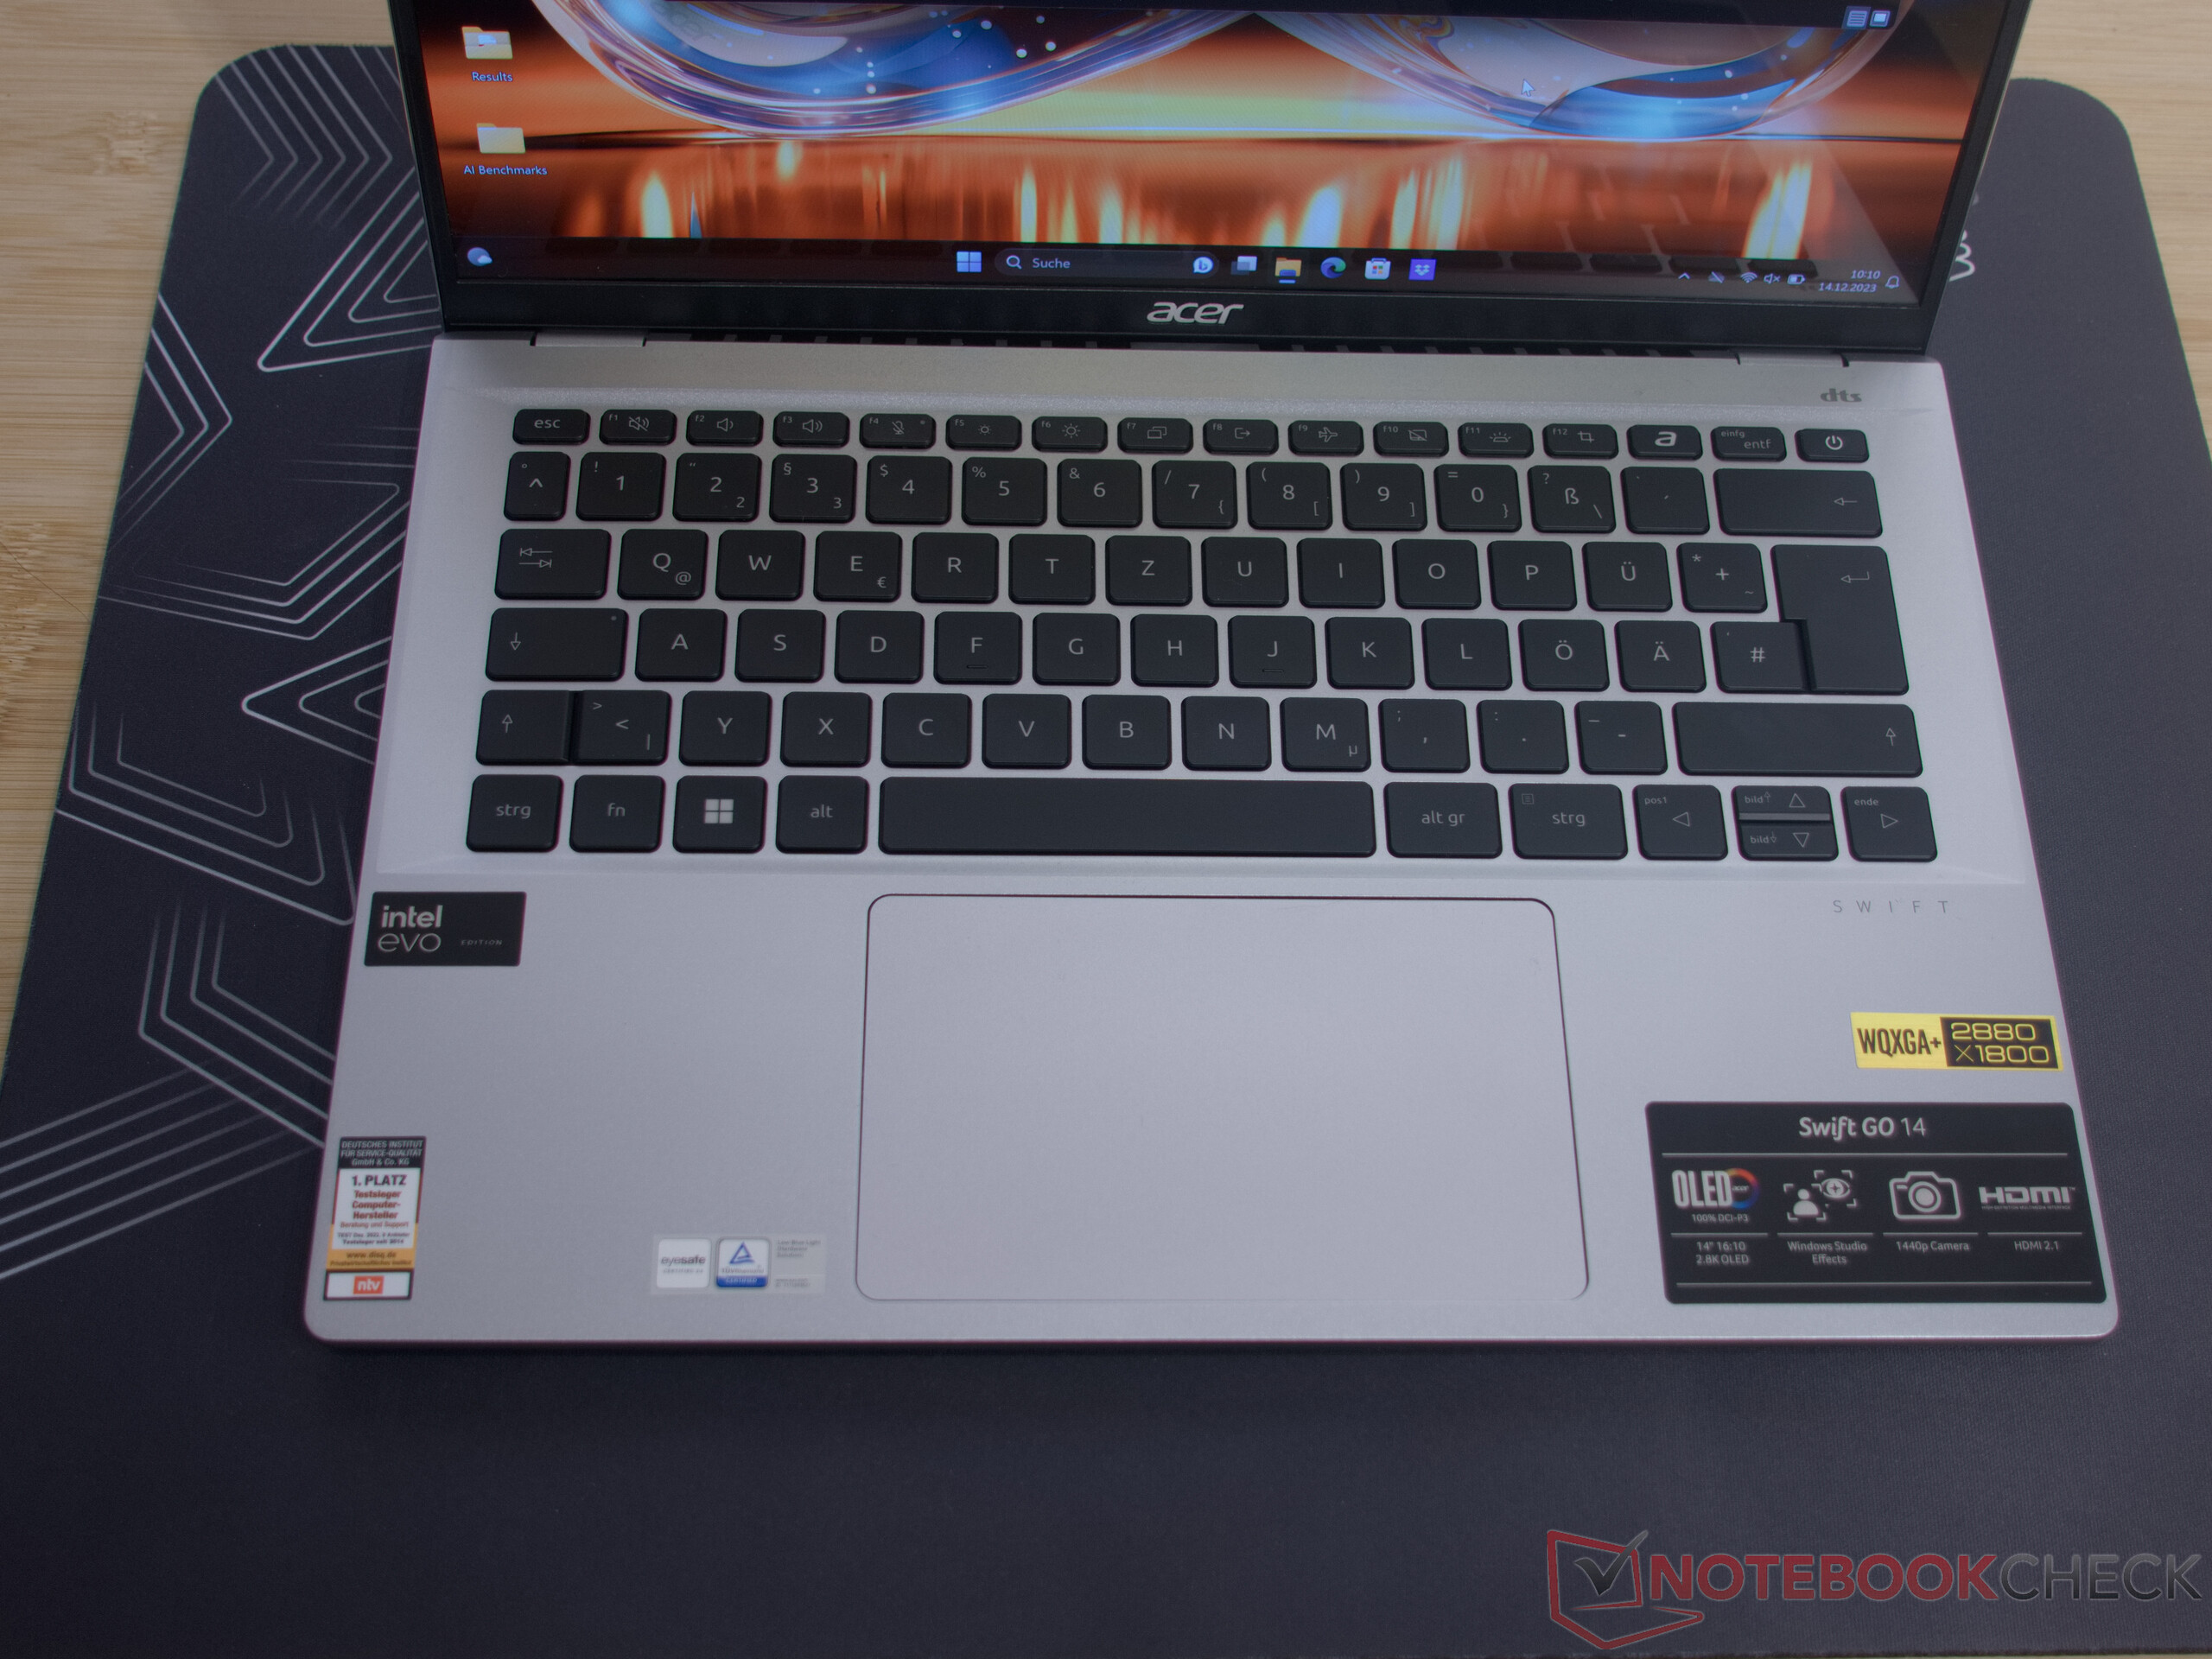
Dispositivos de entrada - Un gran panel táctil
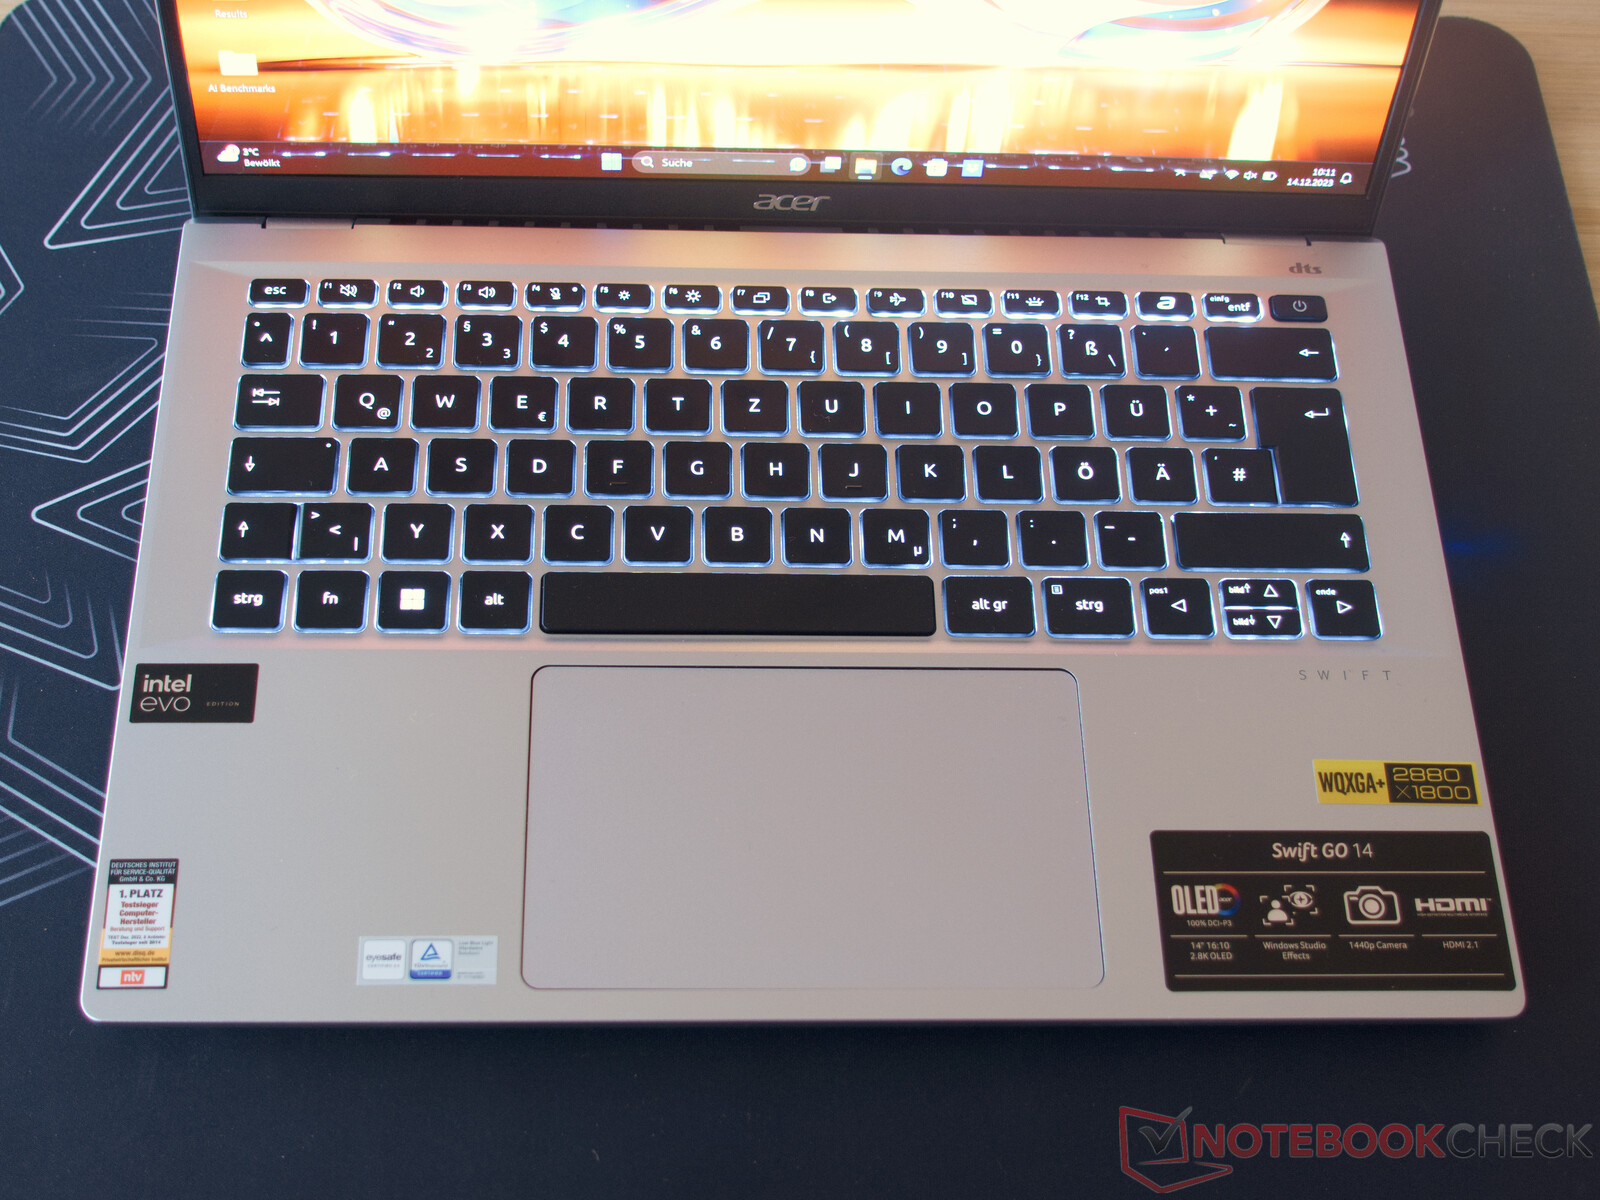
Teclado
Sobre todo, el punto de presión de la tecla retroiluminada podría ser un poco más nítido. Por lo demás, el teclado ofrece una experiencia de escritura agradable. En entornos oscuros, la retroiluminación de las teclas puede ajustarse en dos niveles. Al igual que el predecesor, la carcasa superior también puede doblarse ligeramente, lo que podría irritar a algunos usuarios al presionar las teclas con firmeza.
Panel táctil
En la nueva versión, Acer ha aumentado significativamente el tamaño del panel táctil del Swift Go 14, pero se mantienen los radios en las esquinas. Este cambio no sólo beneficia al aspecto. En la práctica, muchas cosas como arrastrar y soltar y copiar son más fáciles de realizar. Ahora de 12 x 8 cm, el clickpad ofrece considerablemente más espacio para las entradas y el control por gestos.
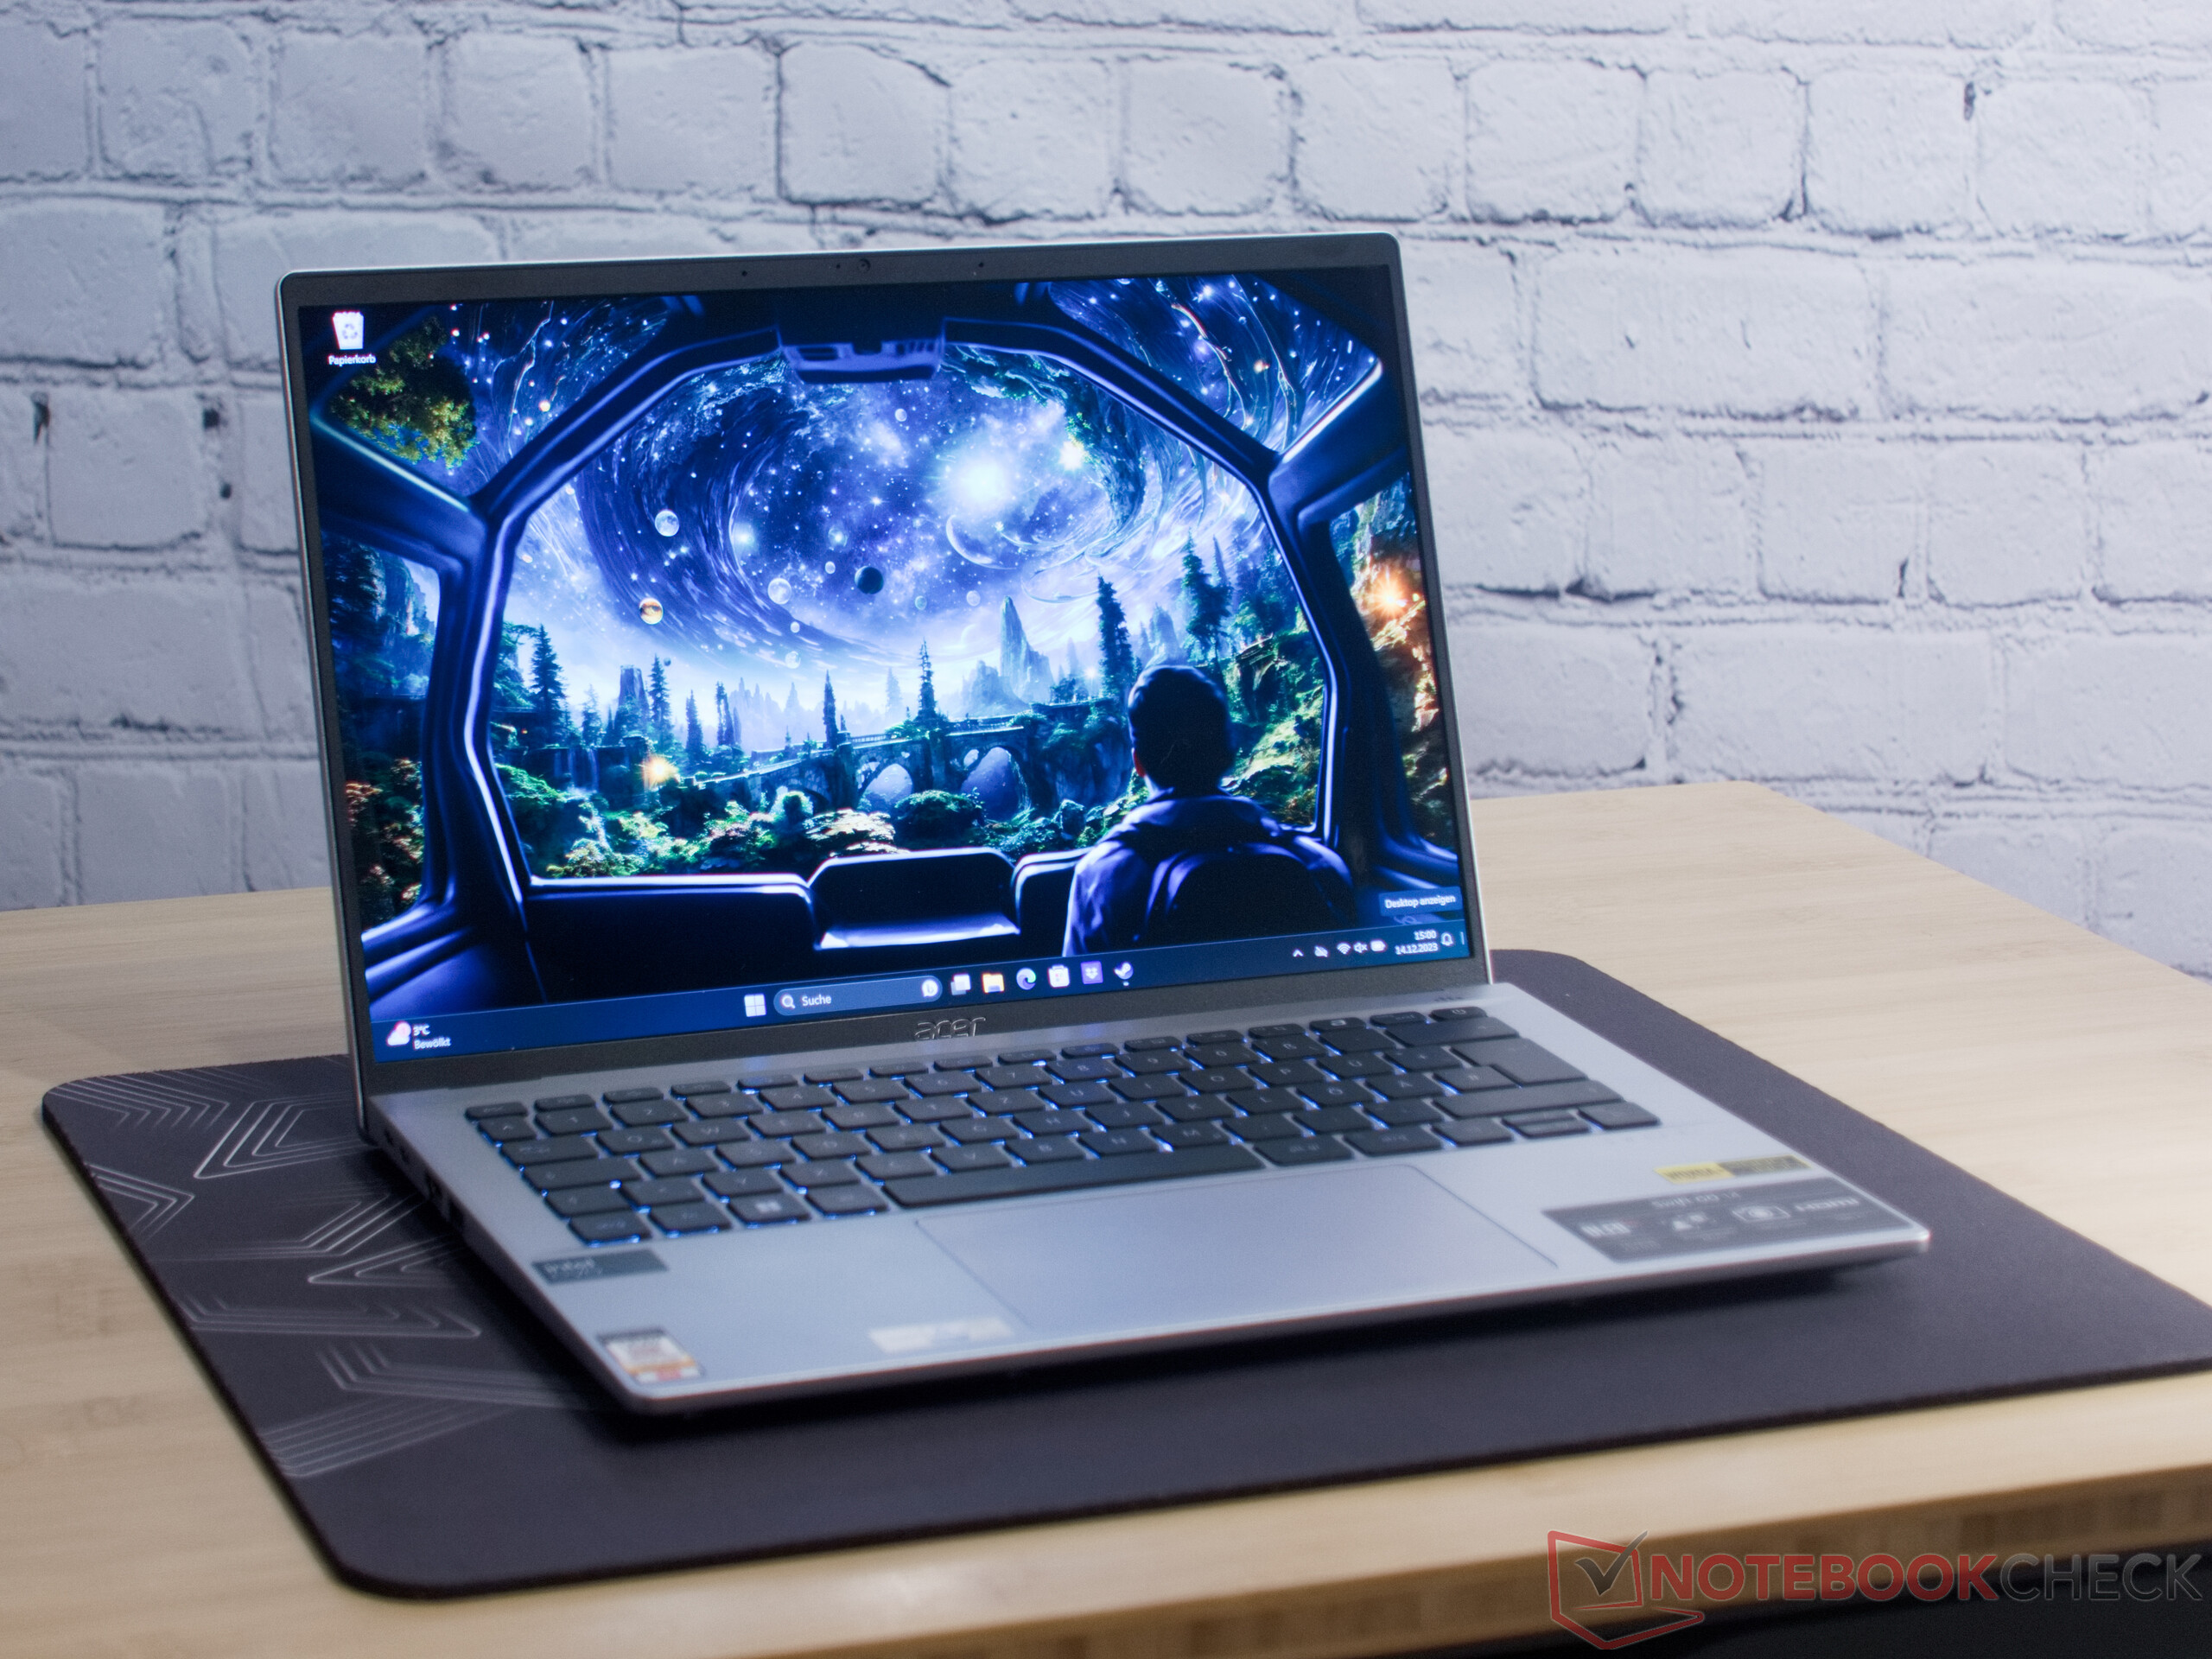
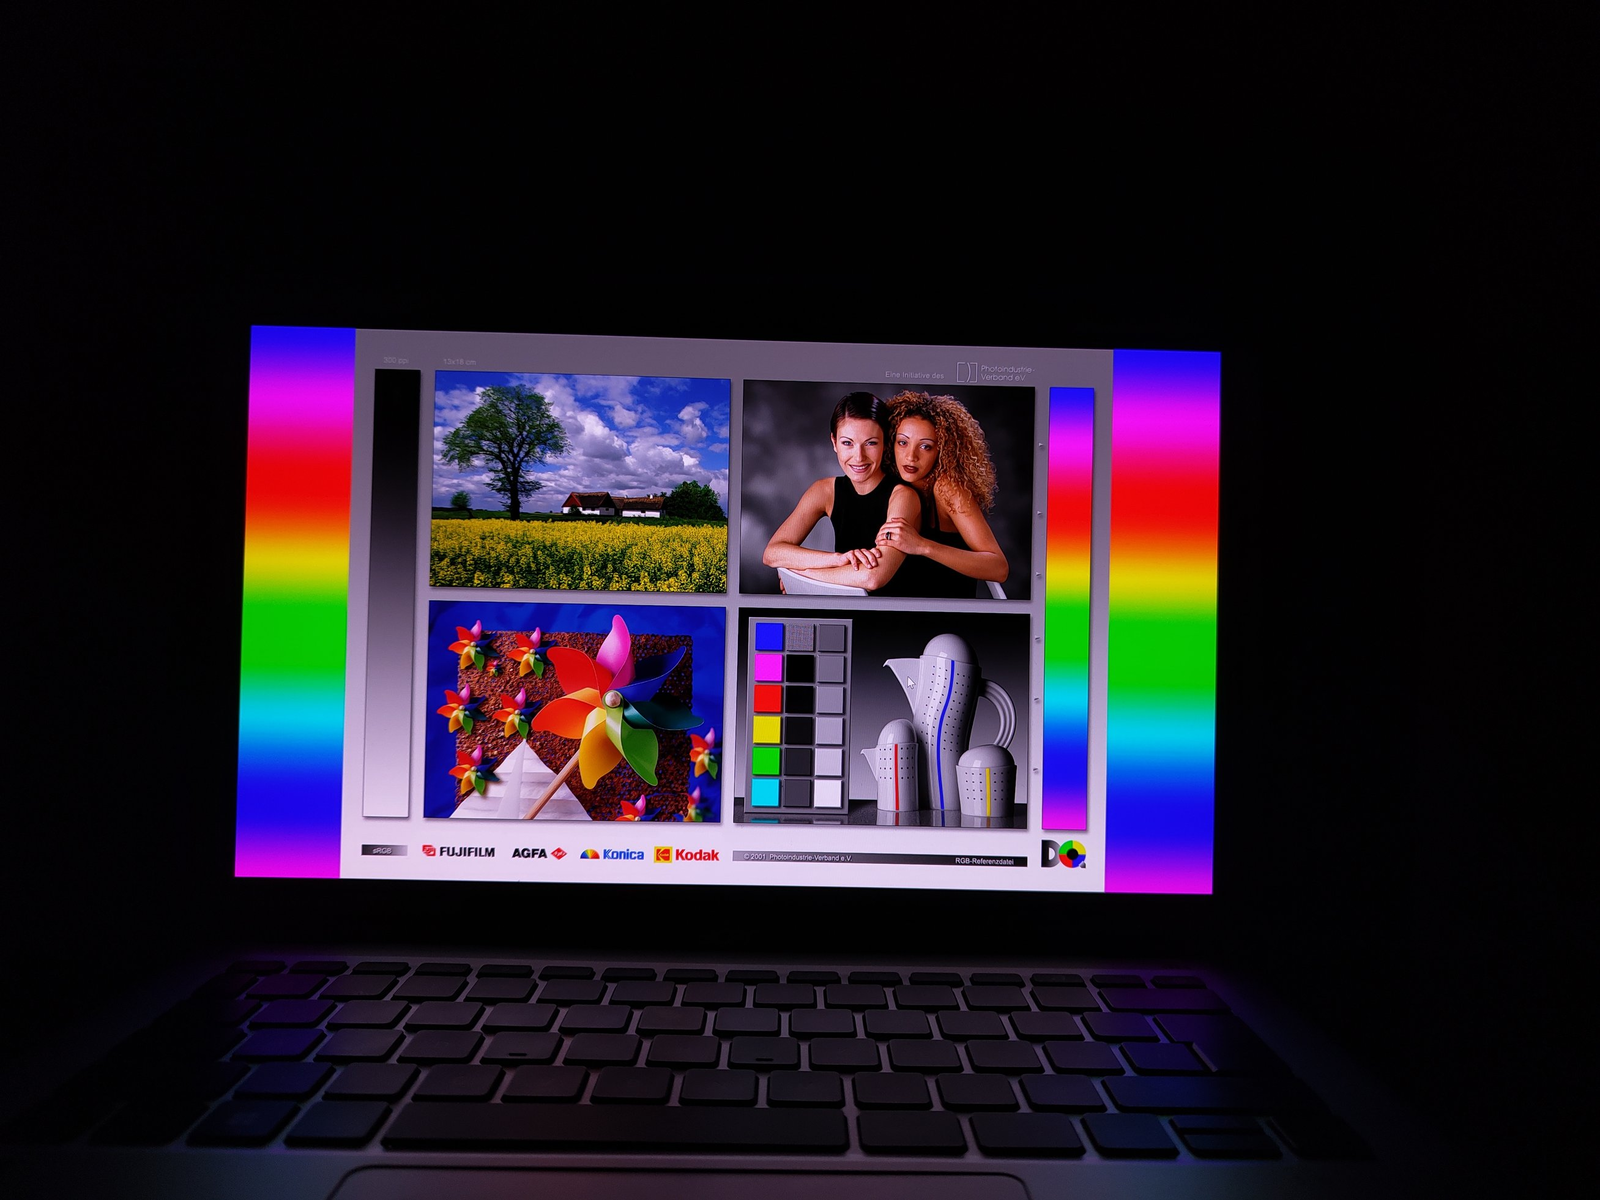
Pantalla - 2,8K, 90Hz OLED y HDR500
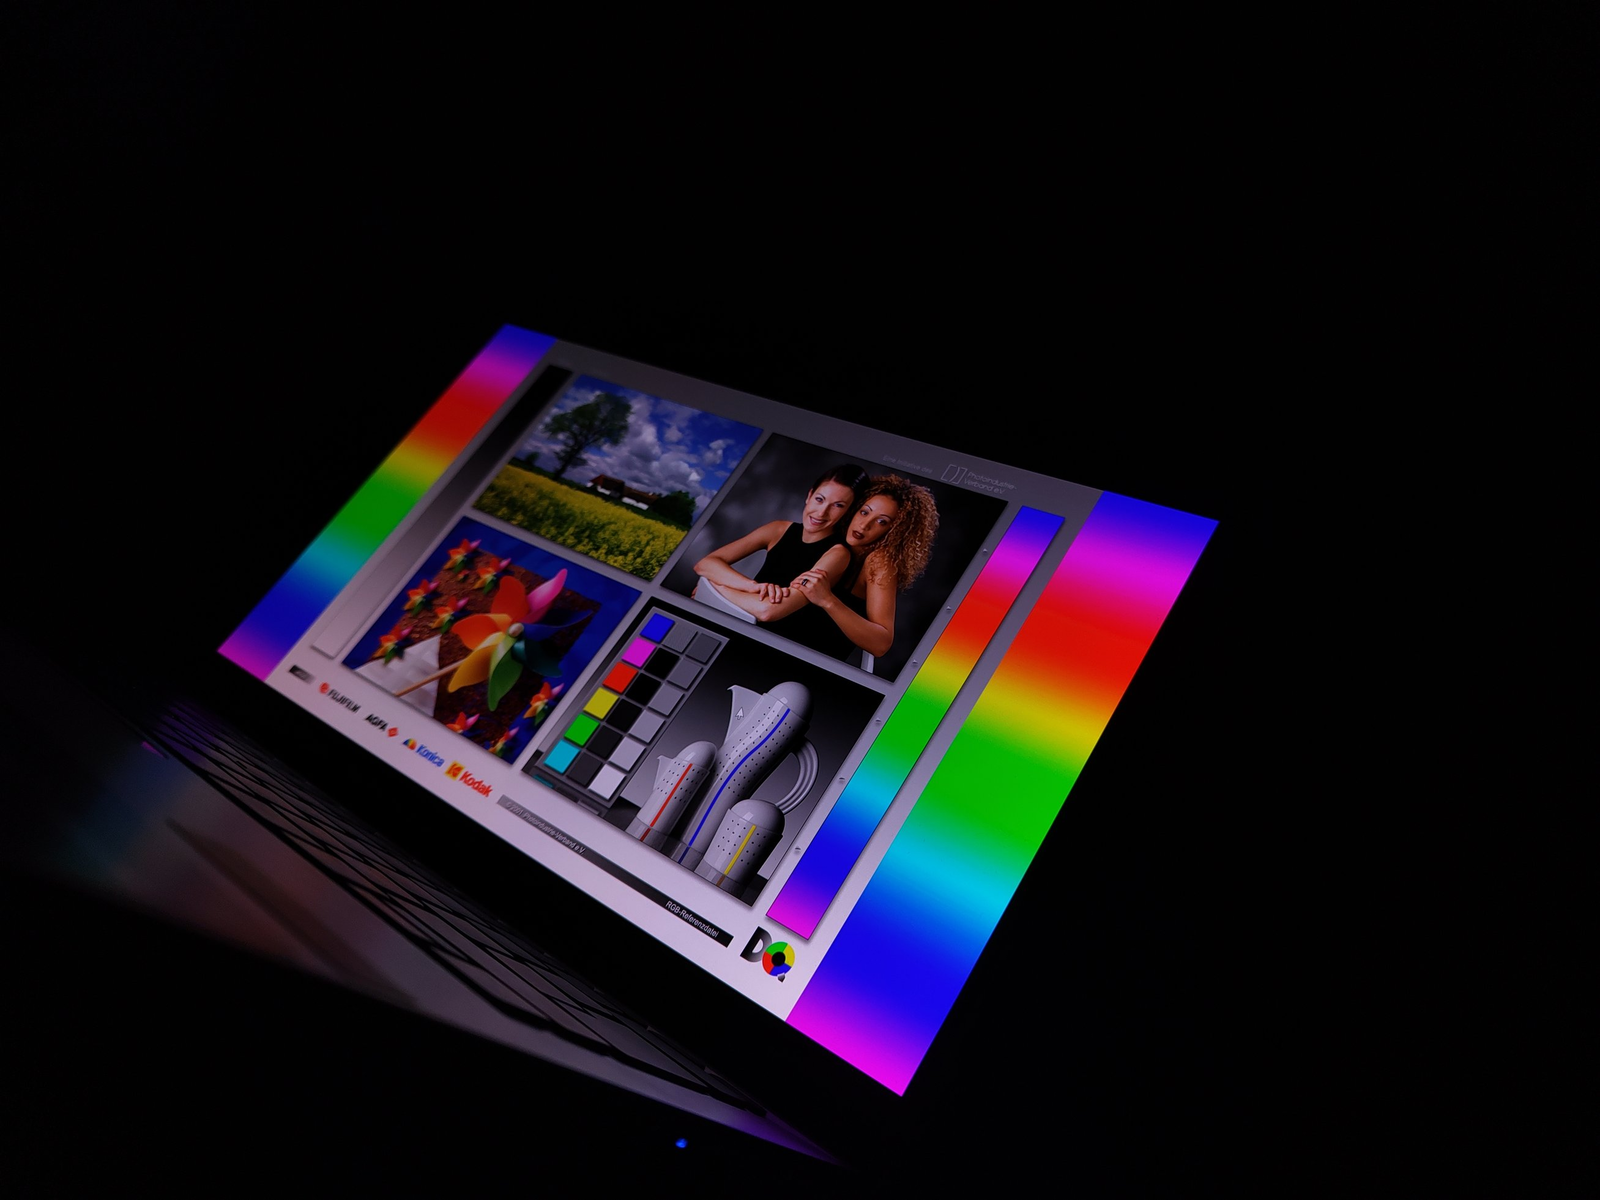
El modelo con procesador Acer Swift Go Meteor Lake alberga ahora un panel OLED mucho más brillante. Puede alcanzar los 400 cd/m², y algo más, al mostrar contenido HDR. Los negros profundos y los altos niveles de contraste son estándar para este tipo de tecnología de visualización. El brillo es uniforme y con una resolución de 2,8K, en una relación de aspecto 16:10 de 14 pulgadas (unos 36 cm) apenas se pueden ver píxeles individuales a simple vista. Todo ello garantiza que podamos disfrutar de una calidad de imagen maravillosa que puede brillar tanto en exteriores como bajo luces de estudio.
La nueva aplicación AcerSense del Swift Go ofrece más perfiles de pantalla. Sin embargo, aún no hemos observado ningún cambio en los valores medidos en los distintos perfiles. Como se mencionó al principio, Acer sigue trabajando en los detalles finales del portátil.
| |||||||||||||||||||||||||
iluminación: 98 %
Brillo con batería: 385 cd/m²
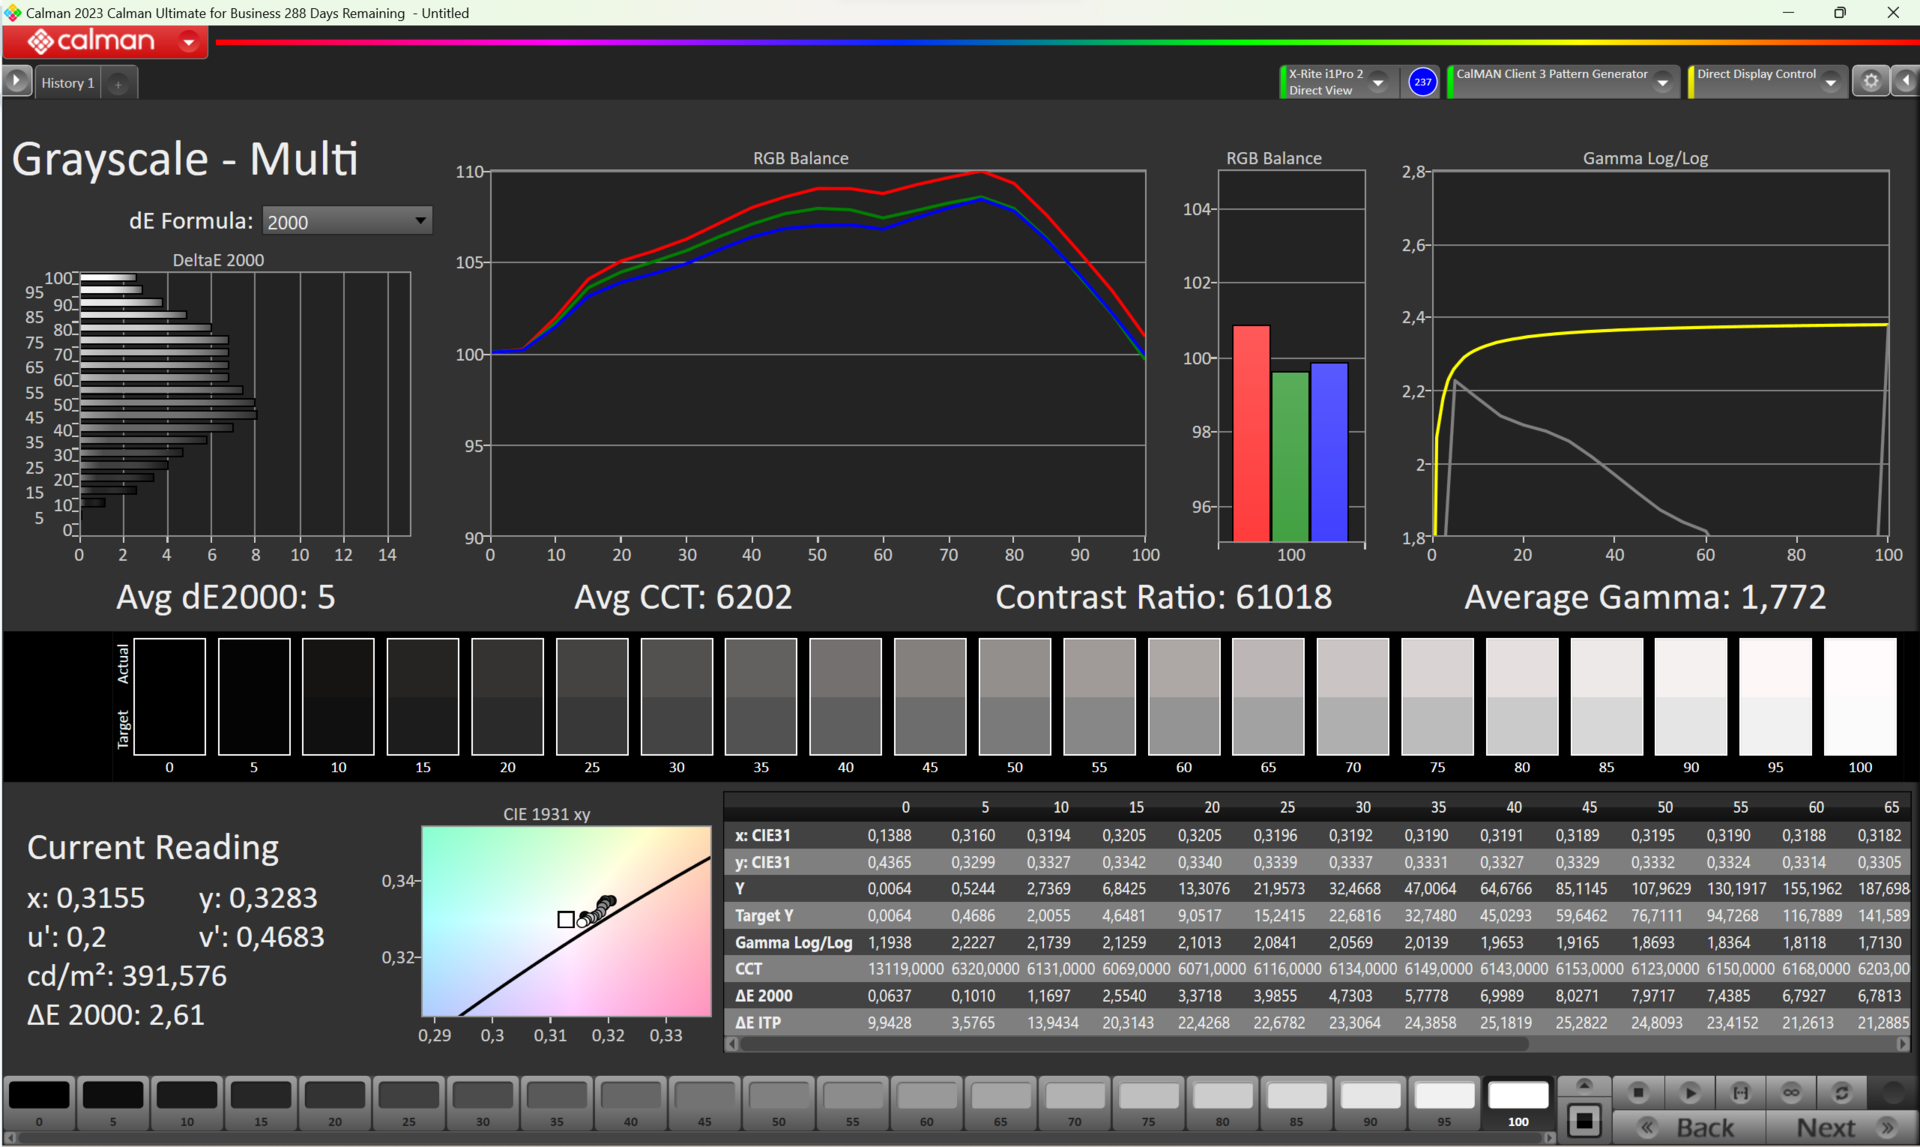
Contraste: 9440:1 (Negro: 0.0411 cd/m²)
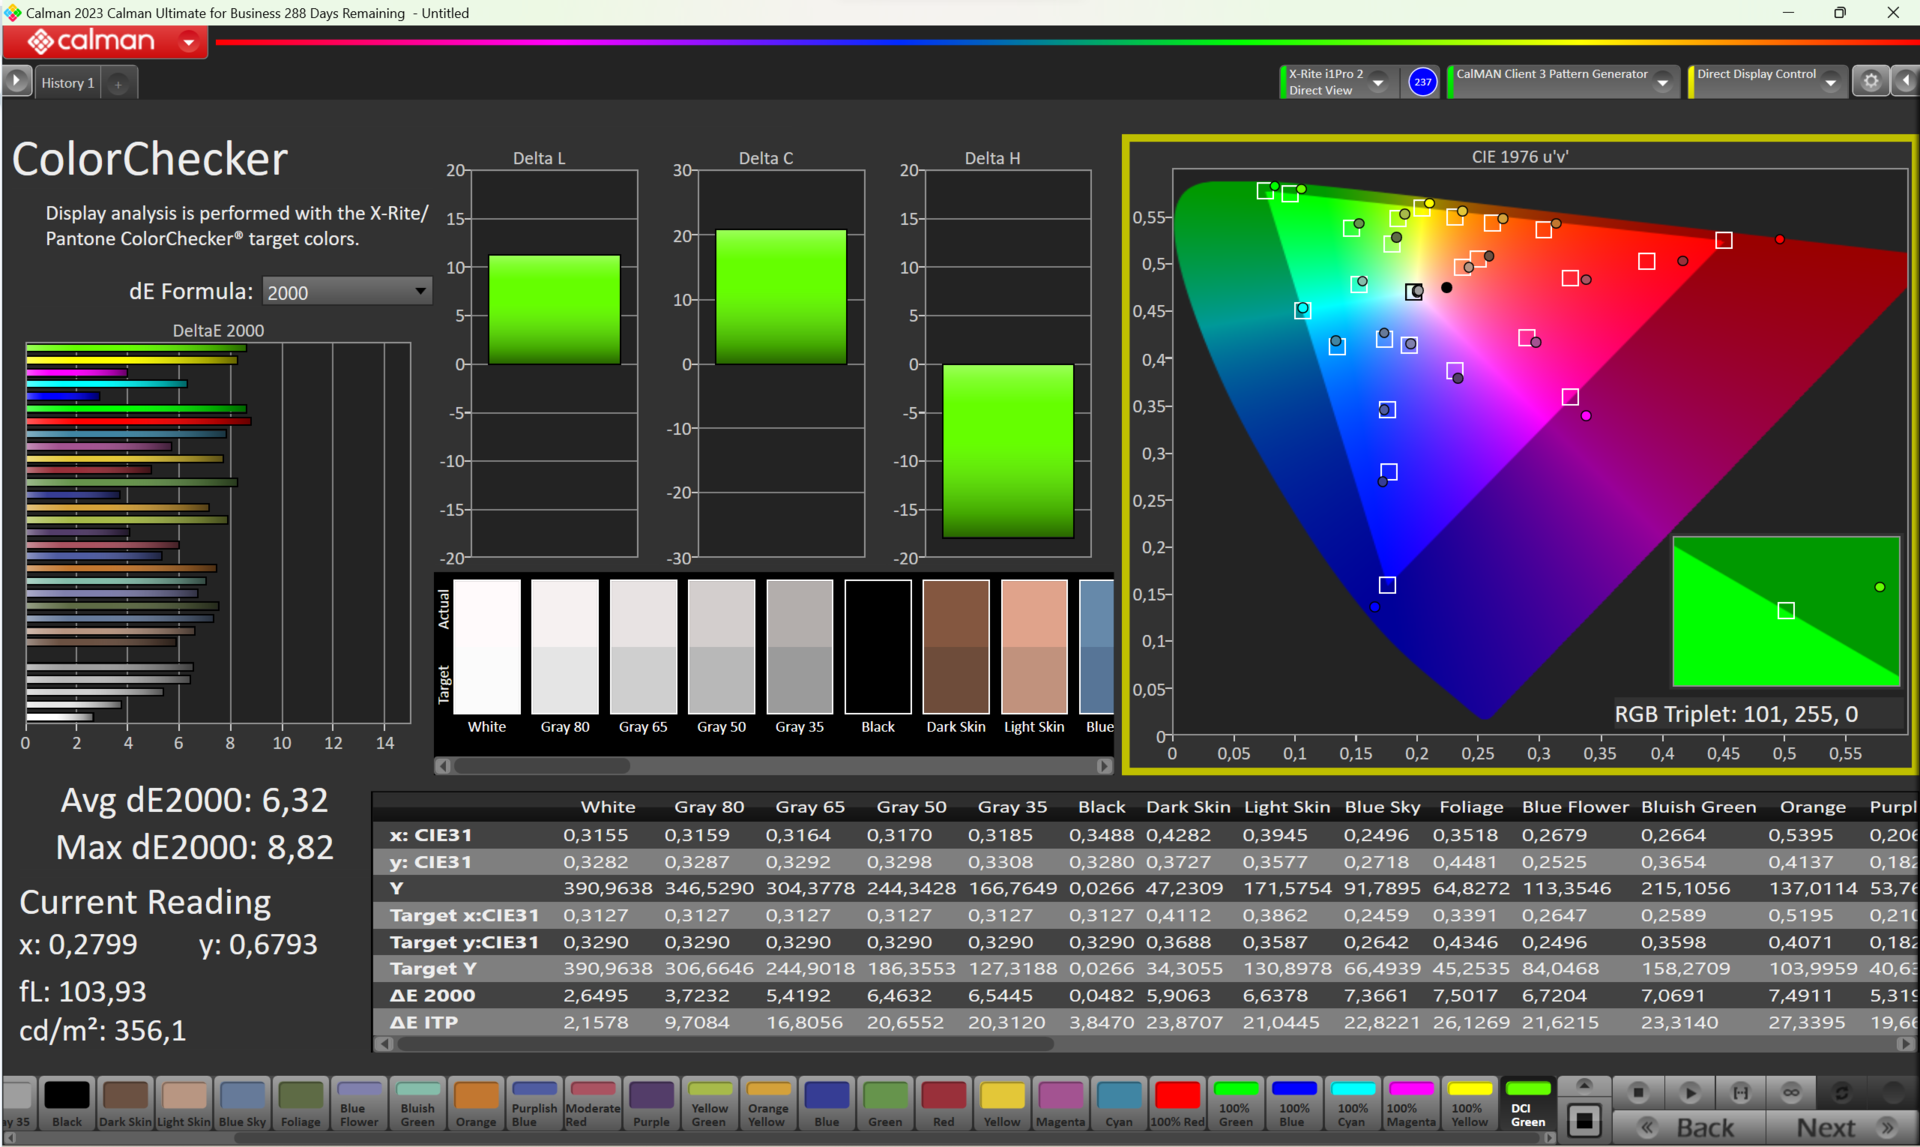
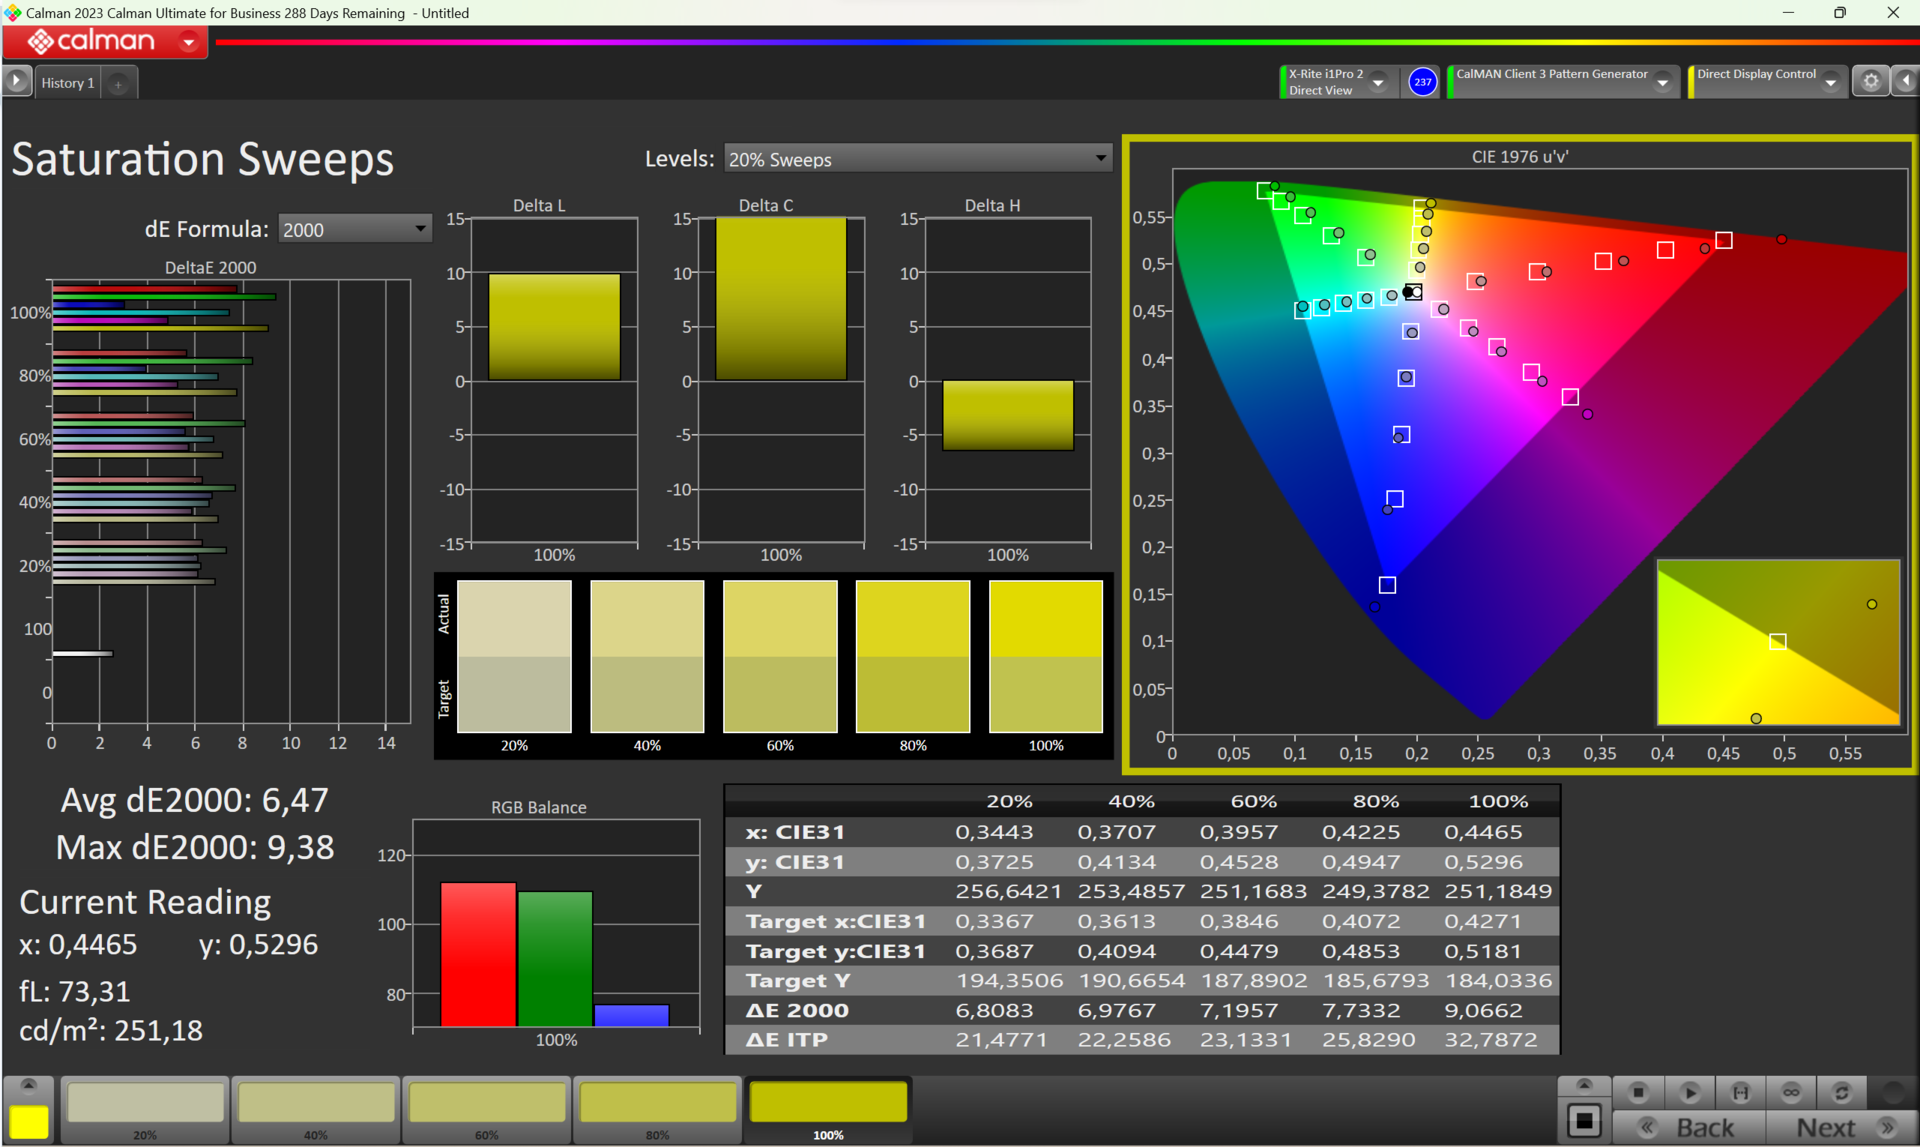
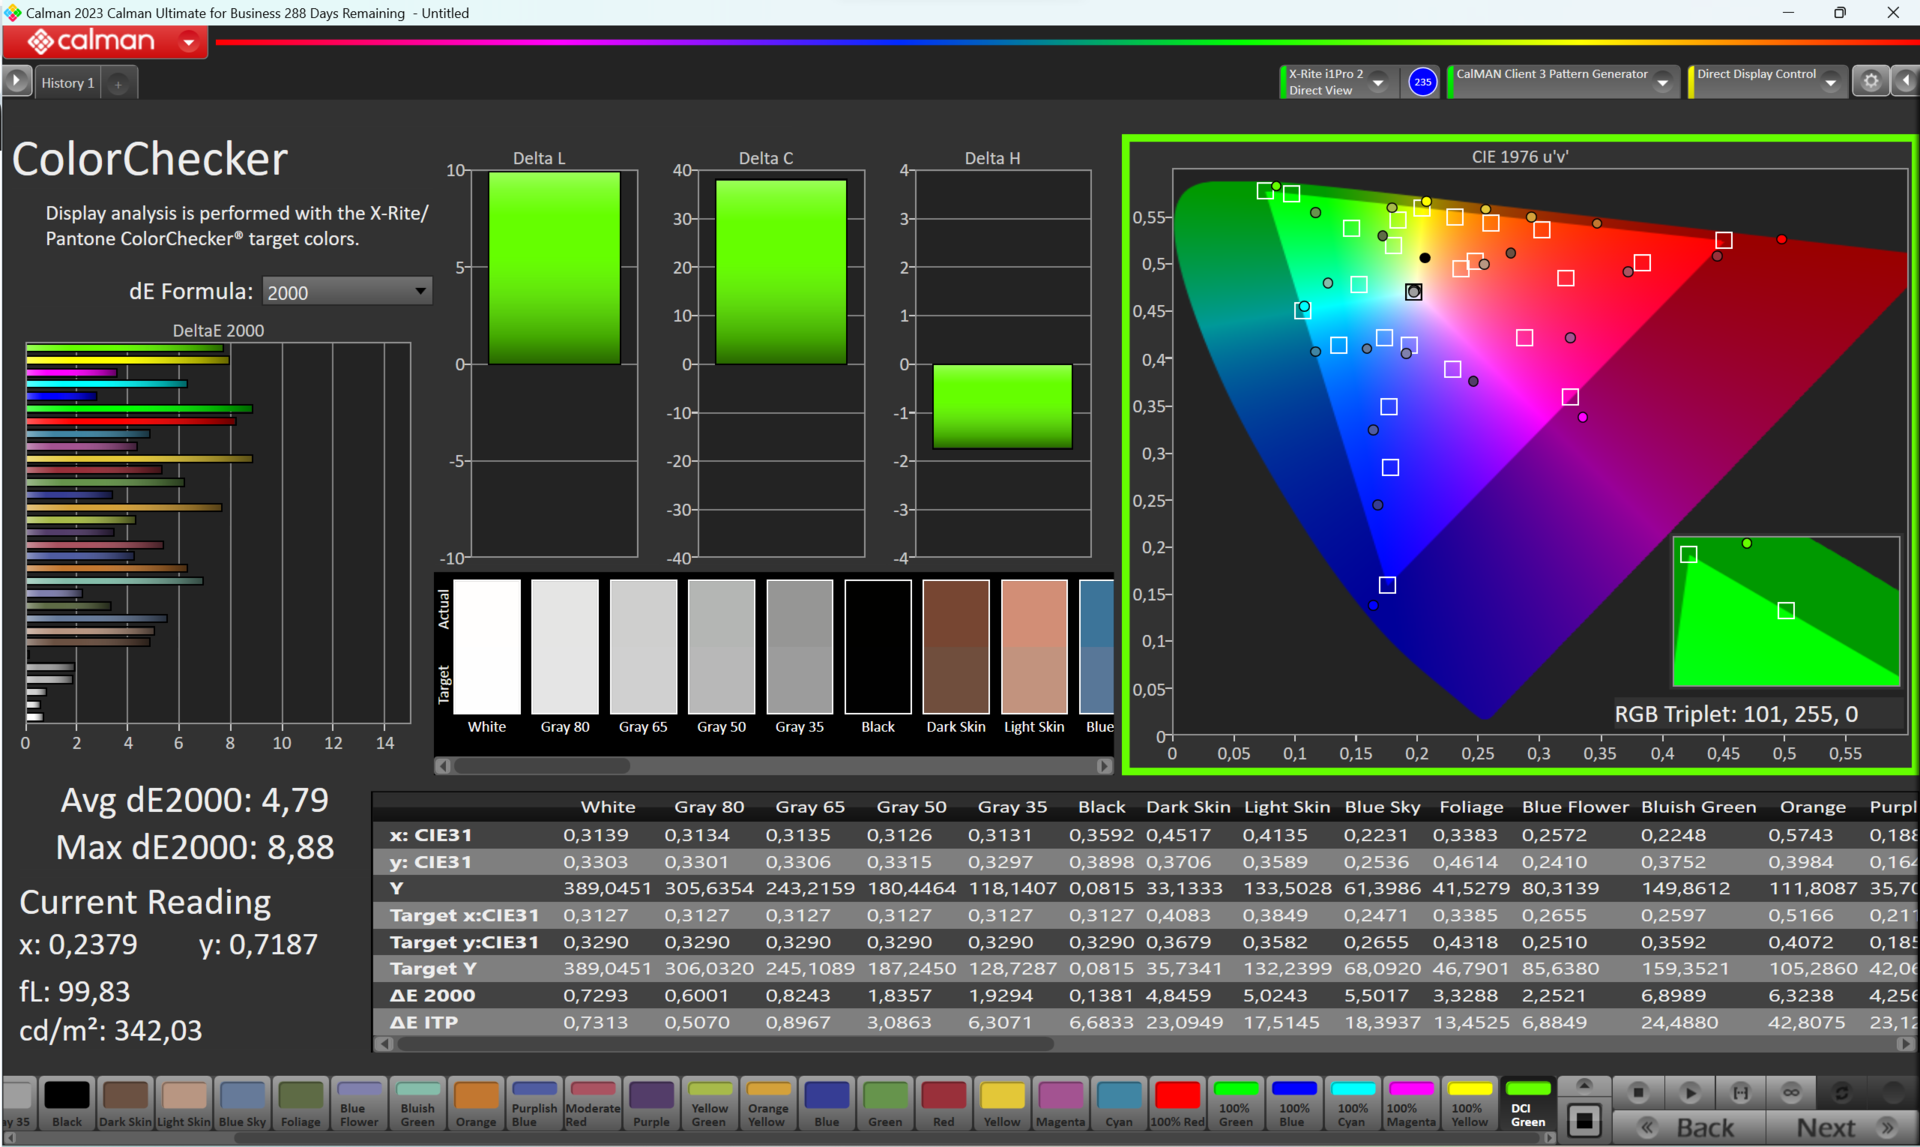
ΔE ColorChecker Calman: 6.32 | ∀{0.5-29.43 Ø4.71}
calibrated: 4.79
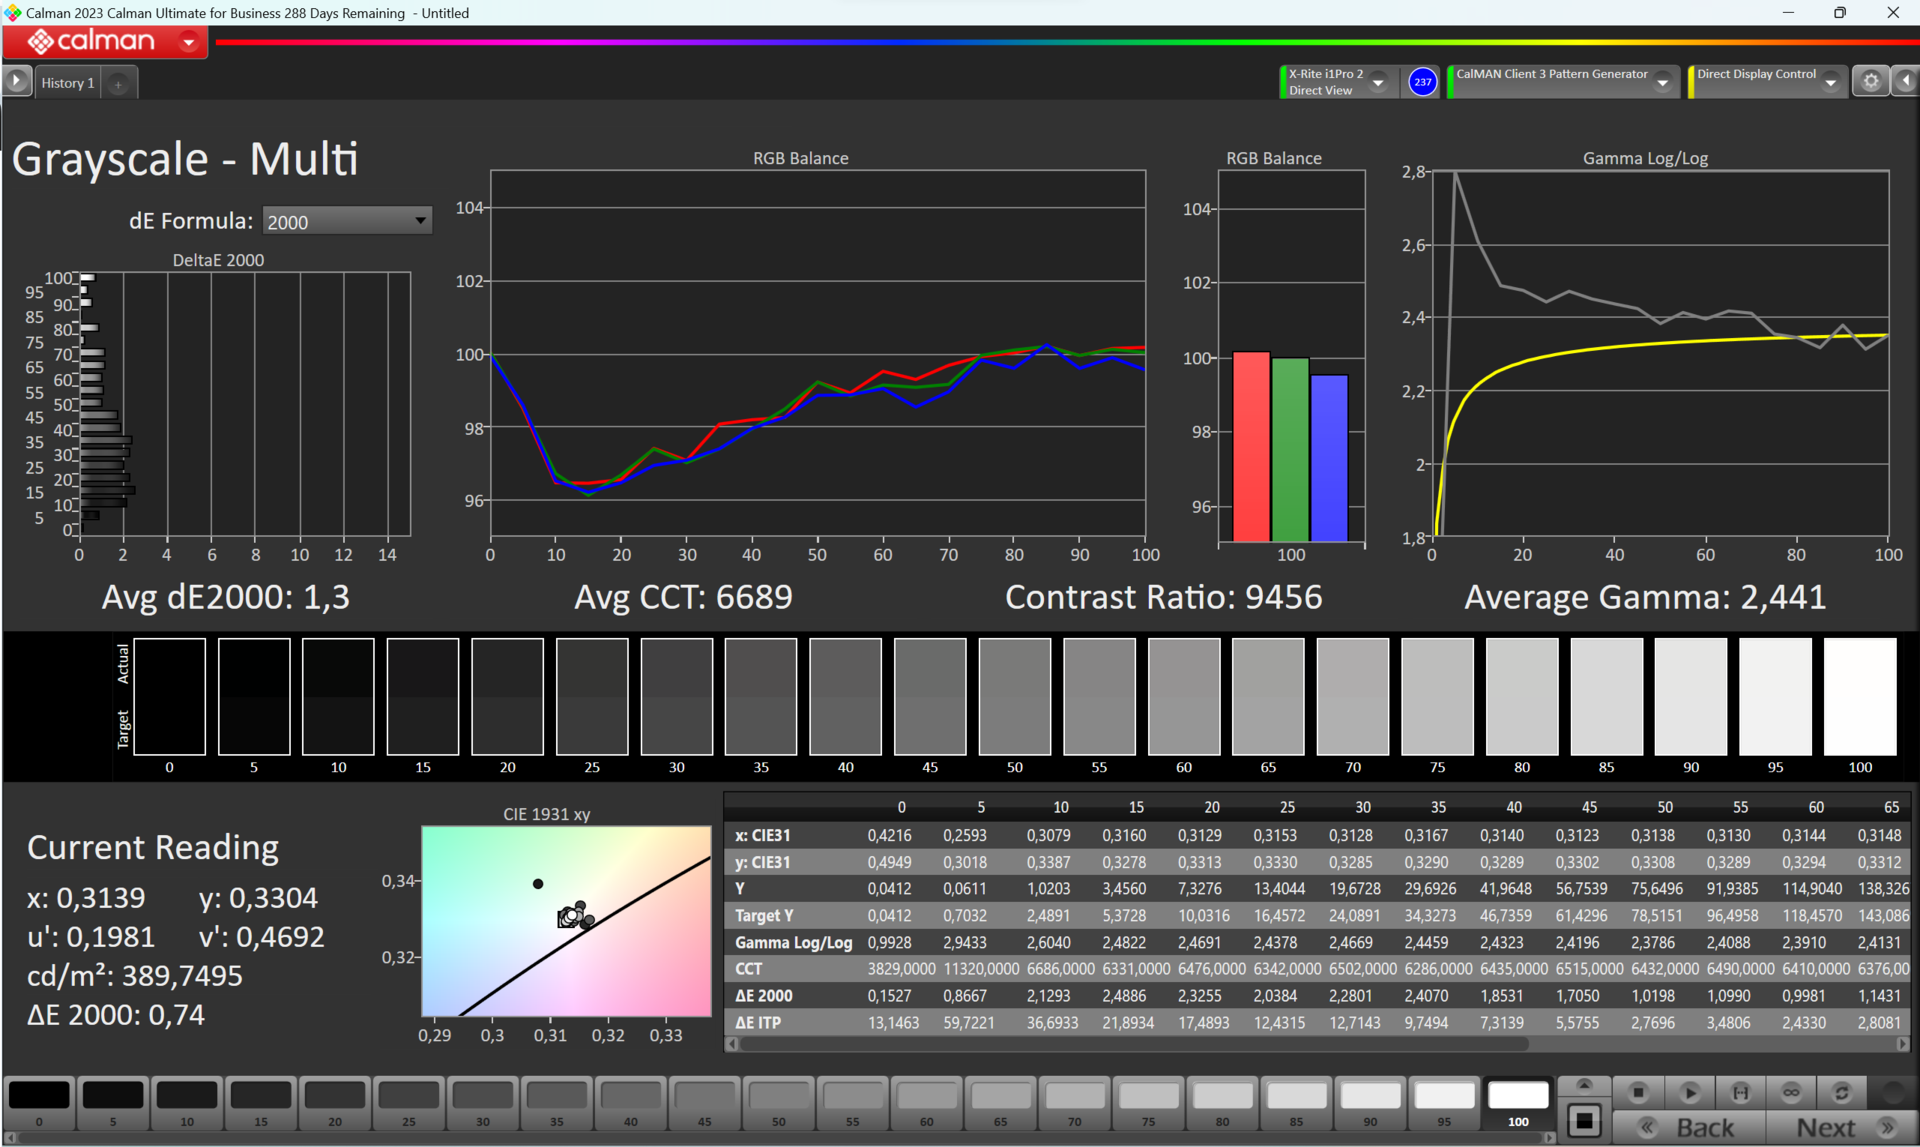
ΔE Greyscale Calman: 2.61 | ∀{0.09-98 Ø4.96}
98.56% AdobeRGB 1998 (Argyll 3D)
99.99% sRGB (Argyll 3D)
99.75% Display P3 (Argyll 3D)
Gamma: 1.772
CCT: 6202 K
| Acer Swift Go 14 SFG14-72 ATNA40YK11-0, OLED, 2880x1800, 14" | LG Gram 2in1 16 16T90R - G.AA78G LP160WQ1-SPB2, IPS, 2560x1600, 16" | HP Pavilion Plus 14-ew0153TU Samsung SDC4197, OLED, 2880x1800, 14" | Lenovo ThinkPad T14 G4 21K4S02000 MNE007JA1-1, IPS LED, 1920x1200, 14" | Ayaneo Air 1S Retro Power Ayaneo-OLED, OLED, 1920x1080, 5.5" | HP Pavilion Plus 14-ey0095cl Samsung SDC4197, OLED, 2880x1800, 14" | |
|---|---|---|---|---|---|---|
| Display | -6% | -3% | -22% | 0% | -1% | |
| Display P3 Coverage (%) | 99.75 | 96.5 -3% | 97.9 -2% | 67.1 -33% | 99.85 0% | 99.8 0% |
| sRGB Coverage (%) | 99.99 | 99.9 0% | 99.6 0% | 97.8 -2% | 100 0% | 100 0% |
| AdobeRGB 1998 Coverage (%) | 98.56 | 84.6 -14% | 92.1 -7% | 69.4 -30% | 99.71 1% | 95.8 -3% |
| Response Times | -856% | -182% | -871% | -20% | 78% | |
| Response Time Grey 50% / Grey 80% * (ms) | 2.2 ? | 38.4 ? -1645% | 10.8 ? -391% | 38.4 ? -1645% | 4.4 ? -100% | 0.82 ? 63% |
| Response Time Black / White * (ms) | 12.8 ? | 21.4 ? -67% | 9.29 ? 27% | 25.1 ? -96% | 5 ? 61% | 0.95 ? 93% |
| PWM Frequency (Hz) | 300 | 120 ? | 240 ? | 504.7 ? | ||
| Screen | -107% | 65% | -32% | -42% | 29% | |
| Brightness middle (cd/m²) | 388 | 329 -15% | 387 0% | 398 3% | 331 -15% | 384 -1% |
| Brightness (cd/m²) | 391 | 310 -21% | 387 -1% | 379 -3% | 339 -13% | 386 -1% |
| Brightness Distribution (%) | 98 | 88 -10% | 97 -1% | 90 -8% | 90 -8% | 98 0% |
| Black Level * (cd/m²) | 0.0411 | 0.39 -849% | 0.01 76% | 0.23 -460% | 0.07 -70% | |
| Contrast (:1) | 9440 | 844 -91% | 38700 310% | 1730 -82% | 4729 -50% | |
| Colorchecker dE 2000 * | 6.32 | 3.52 44% | 2.03 68% | 1.3 79% | 4.76 25% | 4.06 36% |
| Colorchecker dE 2000 max. * | 8.82 | 6.96 21% | 3.86 56% | 3.1 65% | 9.2 -4% | 6.73 24% |
| Colorchecker dE 2000 calibrated * | 4.79 | 1.15 76% | 1.6 67% | 1.2 75% | 5.04 -5% | 0.49 90% |
| Greyscale dE 2000 * | 2.61 | 5.75 -120% | 2.3 12% | 1.4 46% | 8.79 -237% | 1.1 58% |
| Gamma | 1.772 124% | 2.137 103% | 2.23 99% | 2.26 97% | 2.155 102% | 2.26 97% |
| CCT | 6202 105% | 7584 86% | 6523 100% | 6448 101% | 7571 86% | 6331 103% |
| Media total (Programa/Opciones) | -323% /
-192% | -40% /
15% | -308% /
-149% | -21% /
-30% | 35% /
30% |
* ... más pequeño es mejor


Los tres espacios de color están casi completamente cubiertos por el excelente OLED. Sólo el espacio de color Adobe RGB se queda a un 3 % de la perfección.
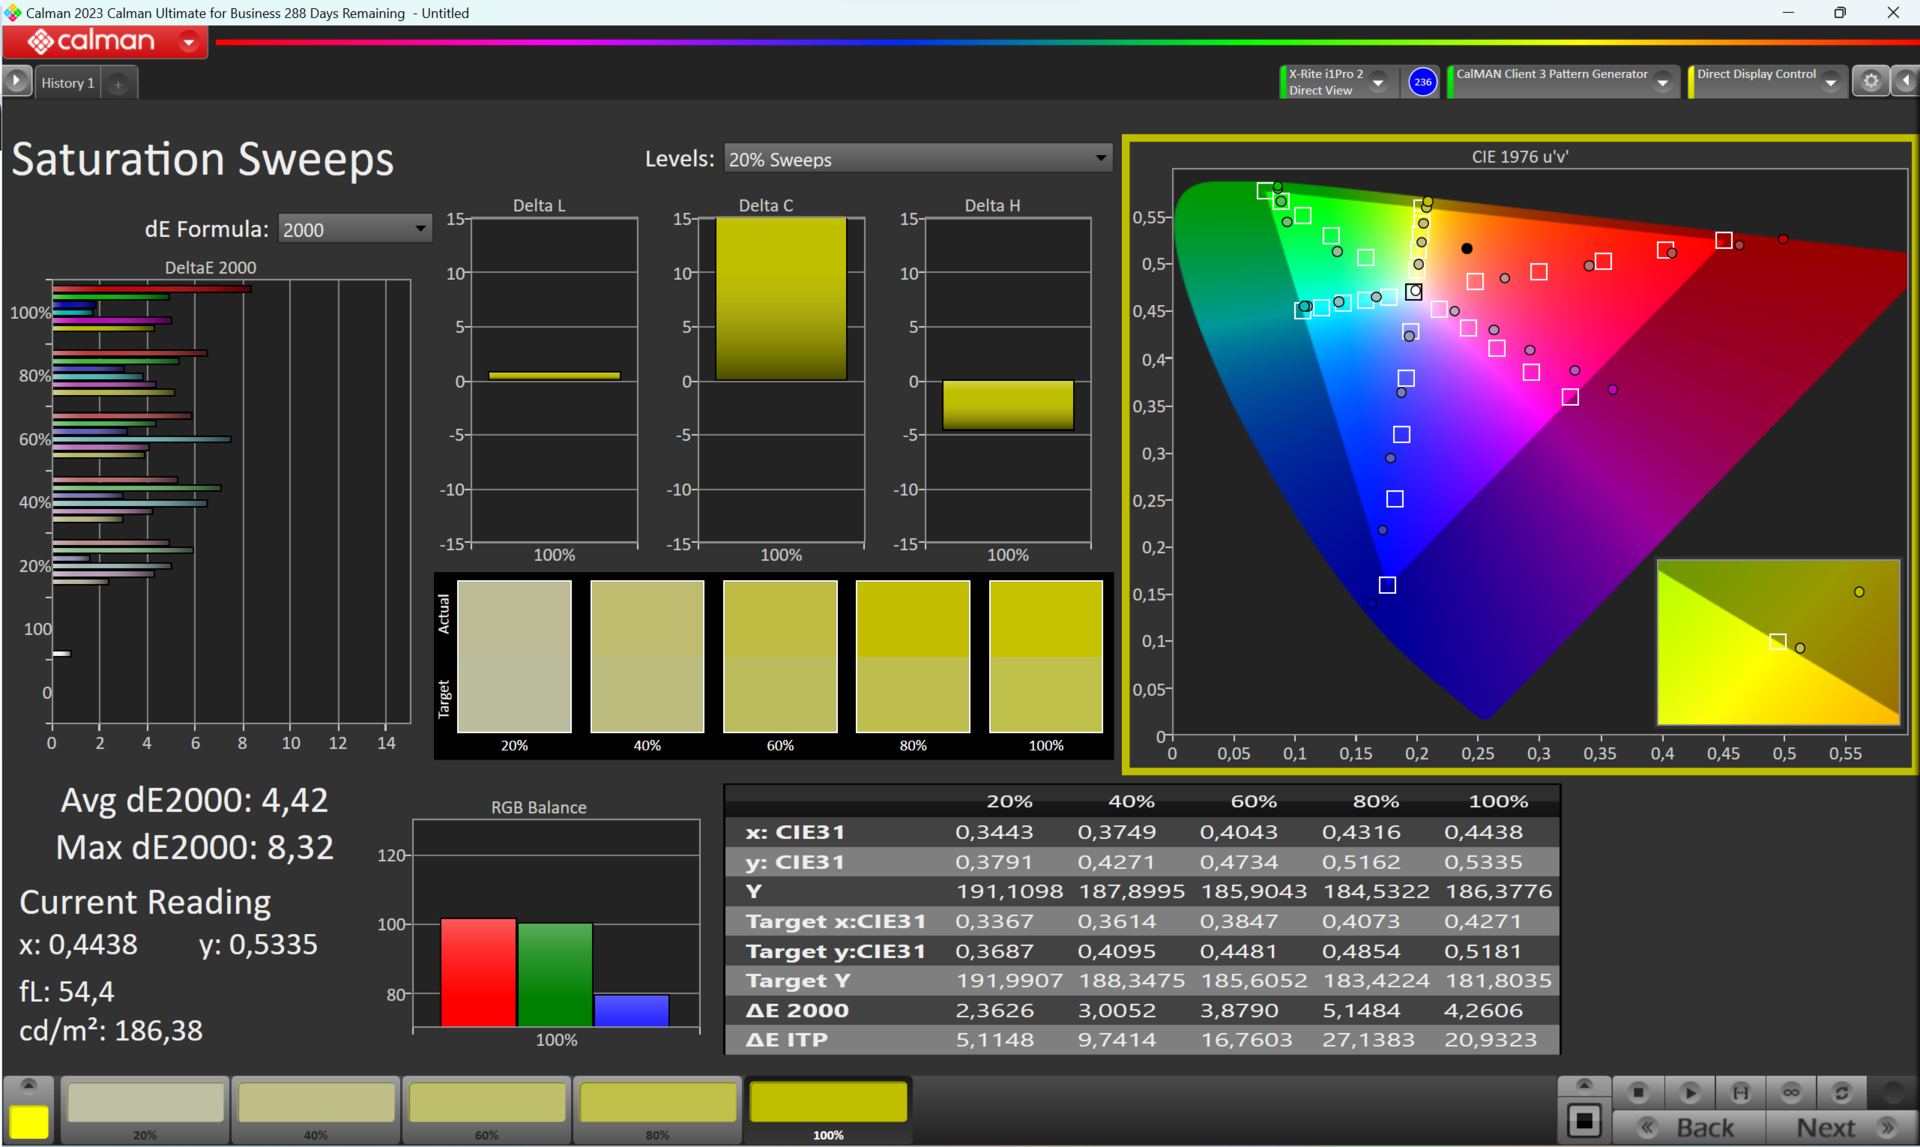
Hasta ahora, los distintos perfiles de pantalla no han mostrado mejoras en las desviaciones de color medidas que, en su estado actual, siguen siendo muy elevadas. Por ejemplo, en el espacio de color Adobe RGB, nuestro propio perfil ICC ofrece pequeñas mejoras en la reproducción del color. También podemos suponer que Acer introducirá mejoras en este ámbito en el software acabado.
Tiempos de respuesta del display
| ↔ Tiempo de respuesta de Negro a Blanco | ||
|---|---|---|
| 12.8 ms ... subida ↗ y bajada ↘ combinada | ↗ 11.8 ms subida |  |
| ↘ 1 ms bajada | ||
| La pantalla mostró buenos tiempos de respuesta en nuestros tests pero podría ser demasiado lenta para los jugones competitivos. En comparación, todos los dispositivos de prueba van de ##min### (mínimo) a 240 (máximo) ms. » 33 % de todos los dispositivos son mejores. Esto quiere decir que el tiempo de respuesta medido es mejor que la media (19.8 ms) de todos los dispositivos testados. | ||
| ↔ Tiempo de respuesta 50% Gris a 80% Gris | ||
| 2.2 ms ... subida ↗ y bajada ↘ combinada | ↗ 1 ms subida |  |
| ↘ 1.2 ms bajada | ||
| La pantalla mostró tiempos de respuesta muy rápidos en nuestros tests y debería ser adecuada para juegos frenéticos. En comparación, todos los dispositivos de prueba van de ##min### (mínimo) a 636 (máximo) ms. » 11 % de todos los dispositivos son mejores. Esto quiere decir que el tiempo de respuesta medido es mejor que la media (31 ms) de todos los dispositivos testados. | ||
Parpadeo de Pantalla / PWM (Pulse-Width Modulation)
| Parpadeo de Pantalla / PWM detectado | 300 Hz |  | |
La retroiluminación del display parpadea a 300 Hz (seguramente usa PWM - Pulse-Width Modulation) . La frecuencia de 300 Hz es relativamente alta, por lo que la mayoría de gente no debería ver parpadeo o tener fatiga visual. Sin embargo, hay informes de que algunas personas pueden seguir viendo parpadeos a 500 Hz y superior, por lo que cuidado. Comparación: 52 % de todos los dispositivos testados no usaron PWM para atenuar el display. Si se usó, medimos una media de 7754 (mínimo: 5 - máxmo: 343500) Hz. | |||
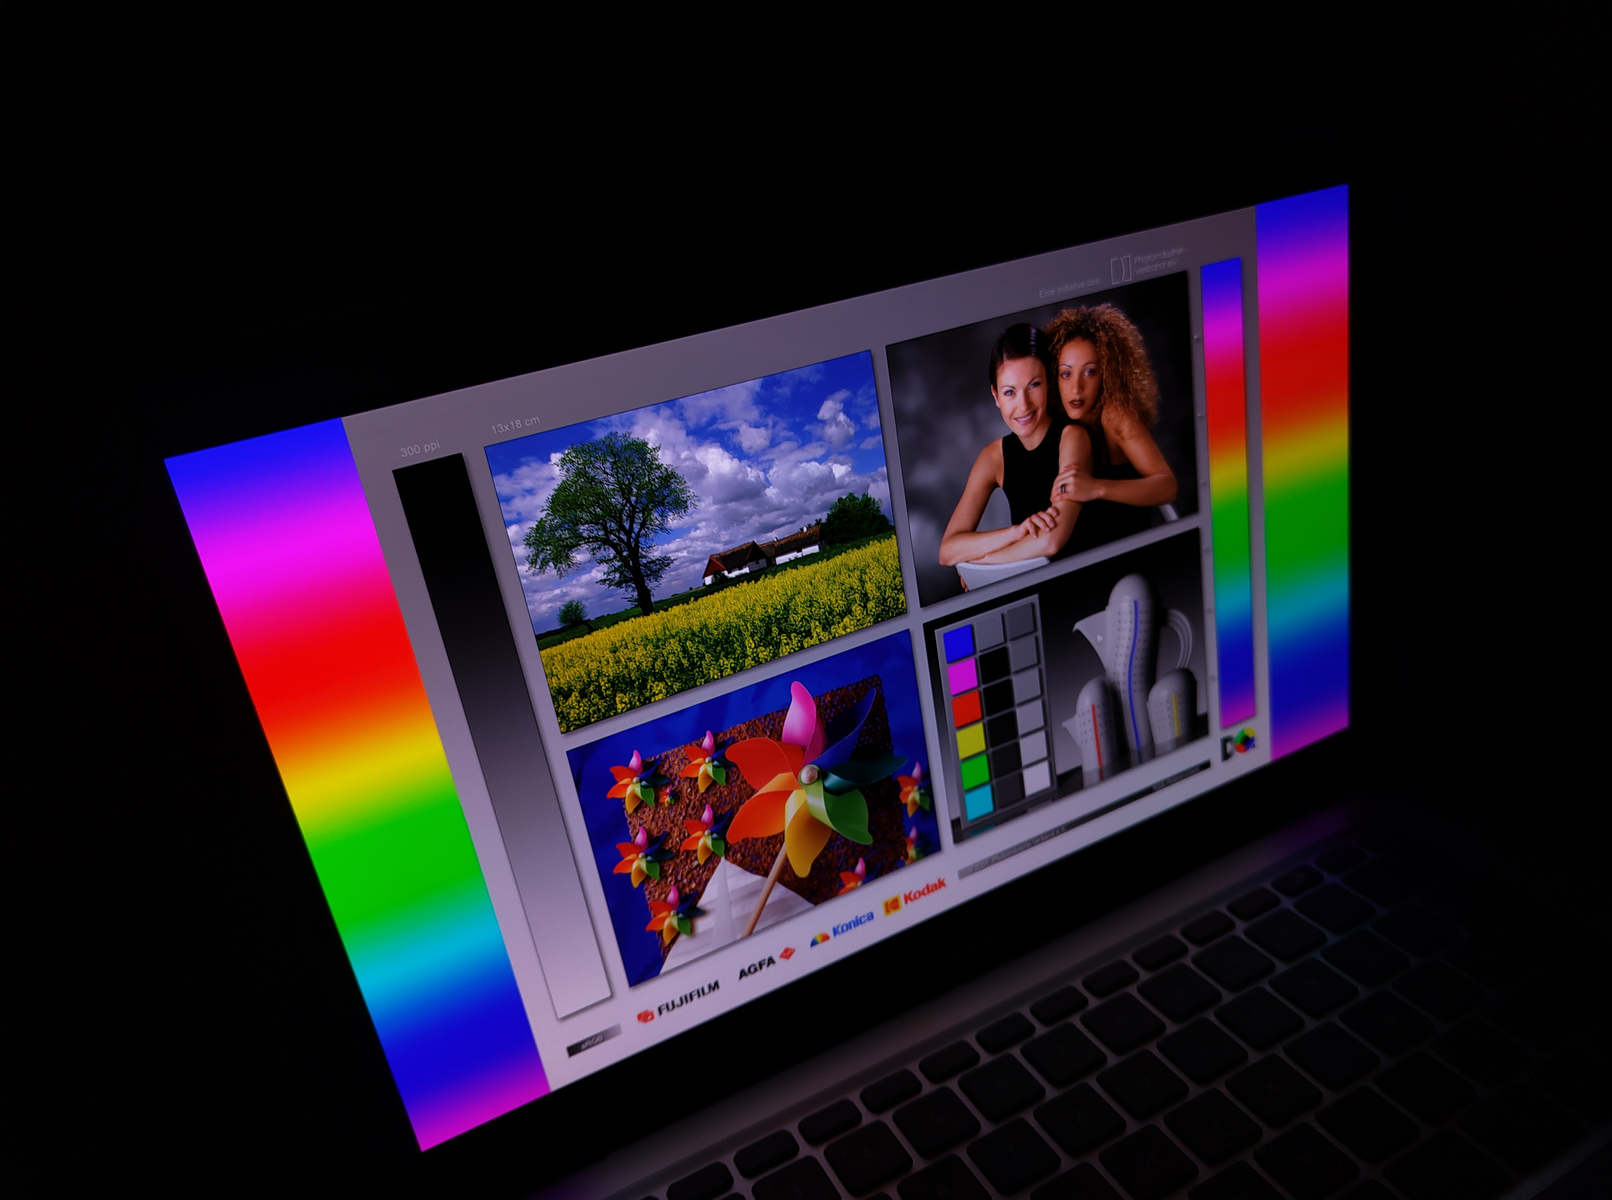
Gracias a su alto brillo, el Acer Swift Go se comporta bien en situaciones de exterior a pesar de poseer una pantalla brillante. El análisis del ángulo de visión tampoco reveló ninguna anomalía.
Rendimiento - Meteor Lake transforma el Swift Go en una pequeña máquina de juegos
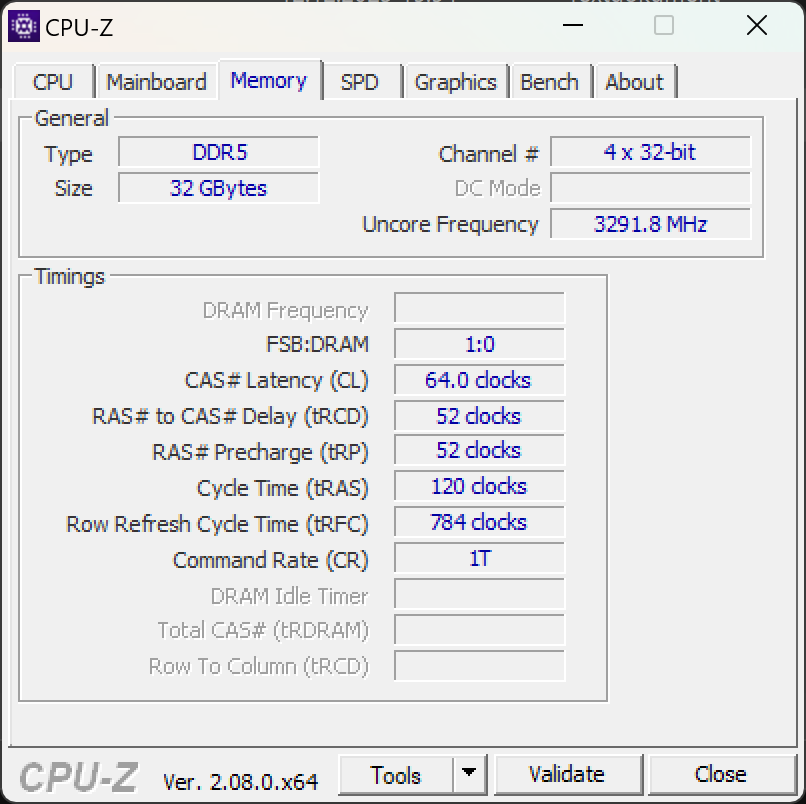
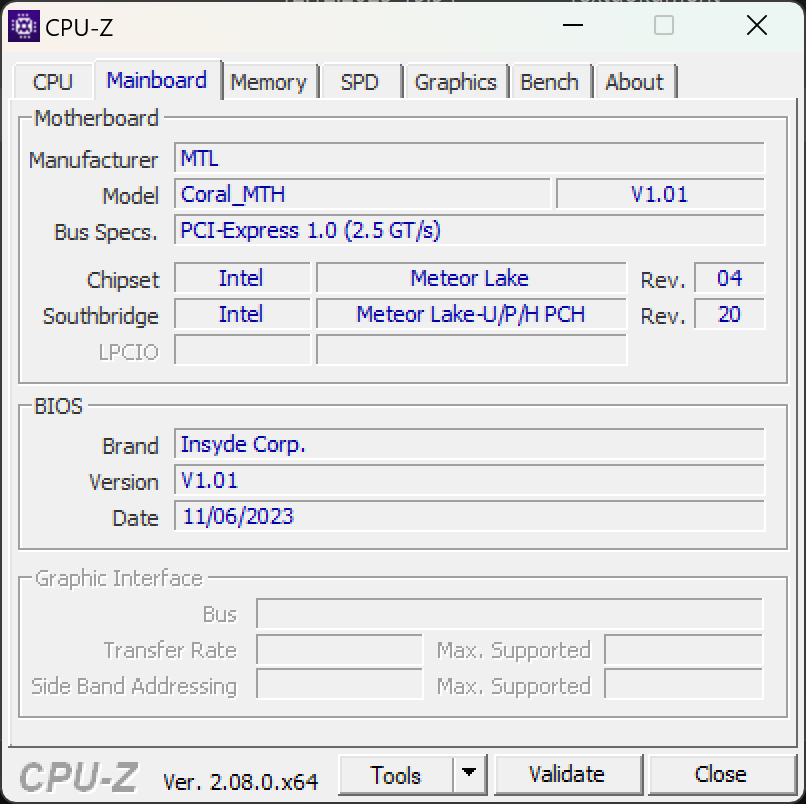
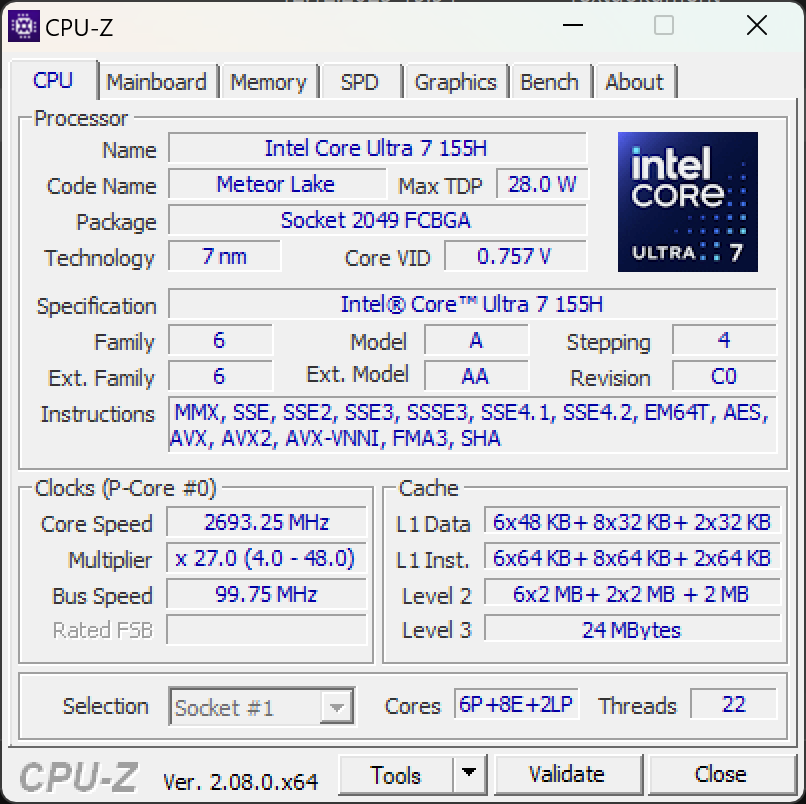
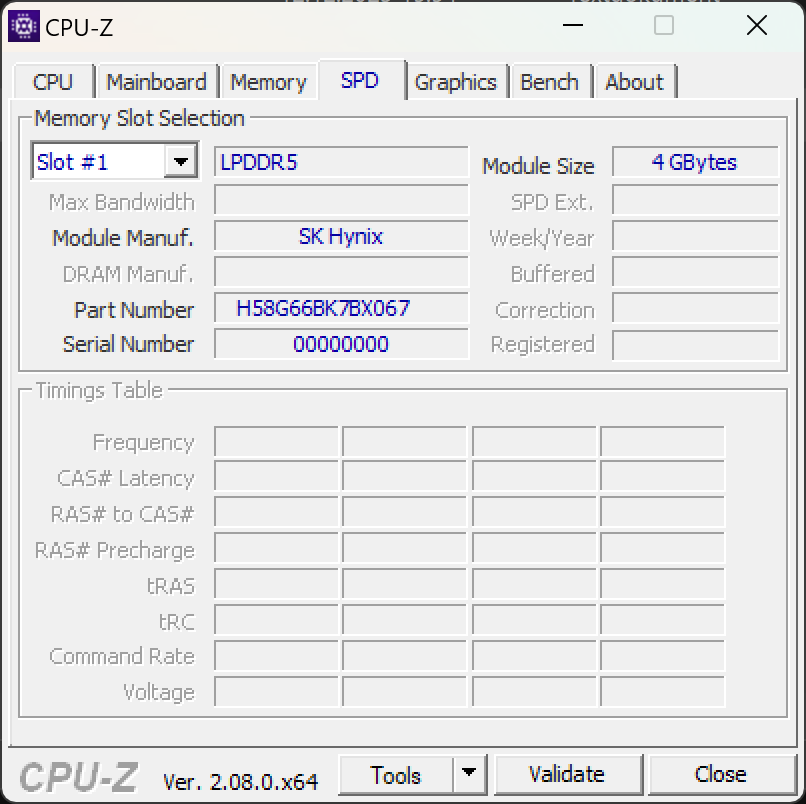
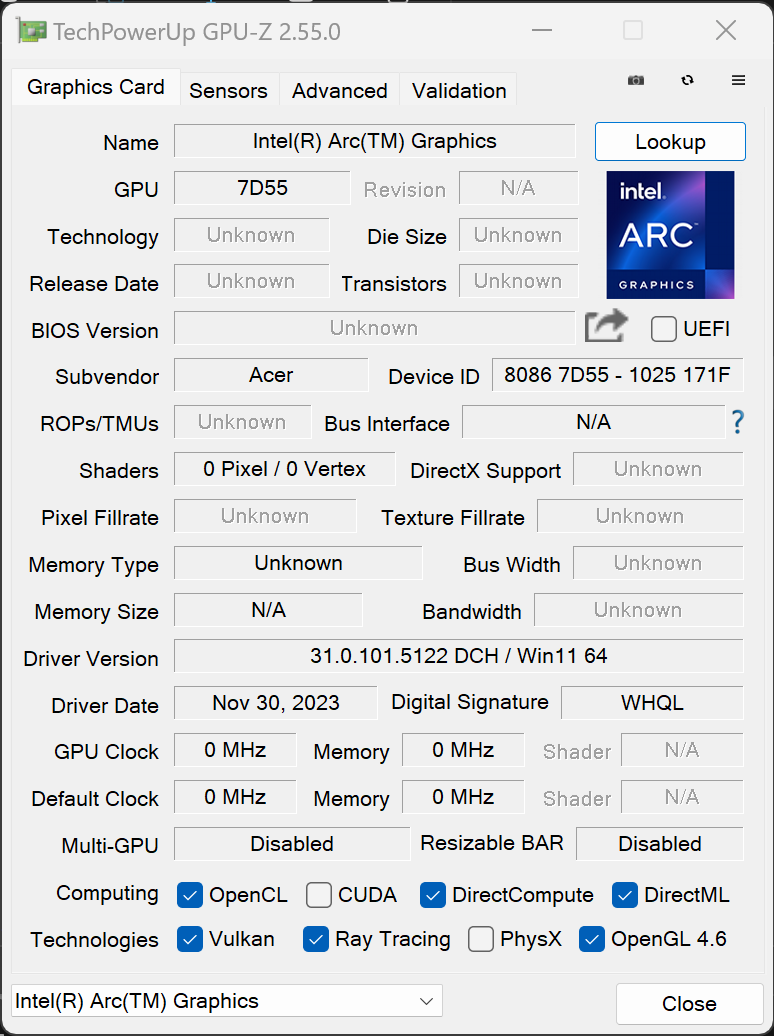
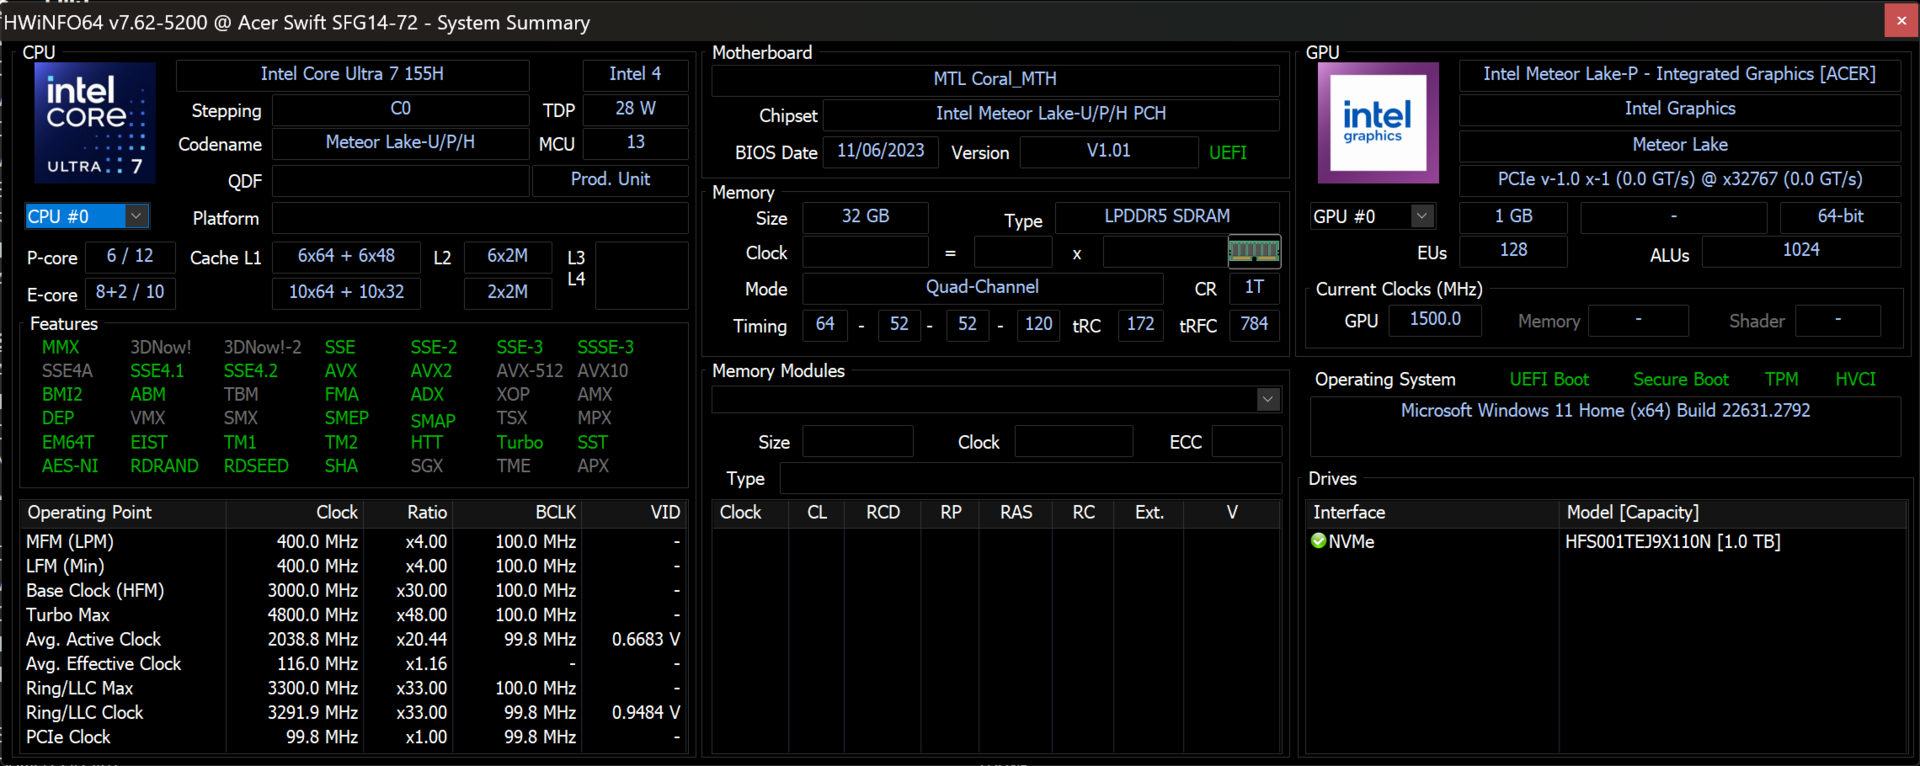
El nuevo Acer Swift Go 14 ofrece un procesador Intel Meteor Lake. Por primera vez, el Intel Core Ultra 7 155H también alberga una IGPU Arc con ocho núcleos y una NPU. El dispositivo se completa con 32 GB de RAM DDR5 y una SSD NVMe SK Hynix de 1 TB.

Condiciones de la prueba
Como se mencionó al principio, el Acer Swift Go 14 que nos ocupa es un dispositivo que corresponde al hardware de especificaciones estándar. El software y el firmware de nuestra máquina de revisión aún no están del todo perfeccionados. Por ejemplo, en nuestro Swift Go 14, los valores para el rendimiento boost se configuraron inicialmente algo demasiado altos. En el transcurso de la prueba, también tuvimos problemas con el AlterView preinstalado que crea fondos 3D visualmente atractivos. Tras un animado intercambio con Acer, decidimos eliminar el software. También pudimos bajar el PL2 a 55 vatios mientras dejábamos el PL1 a 45 vatios, todo ello con la ayuda del Throttle Stop de TechPowerUp. Esto ayudó a que el portátil funcionara considerablemente mejor y de forma más estable. Acer llevará a cabo algunos ajustes mucho más detallados cuando se trate de la gestión final del rendimiento. Esto debería dar lugar a que el portátil disfrute de un mejor rendimiento que el actual.
Procesador
El nuevo procesador de Intel trae consigo algunos cambios muy esperados. Por primera vez, el chip con un proceso de fabricación de 7 nm ofrece una NPU y la nueva iGPU Arc. El Core Ultra 7 155H alberga seis núcleos P, ocho núcleos E y dos núcleos E LP adicionales de los que se dice que son especialmente eficientes desde el punto de vista energético. Esto significa que dispone de un total de 22 hilos.
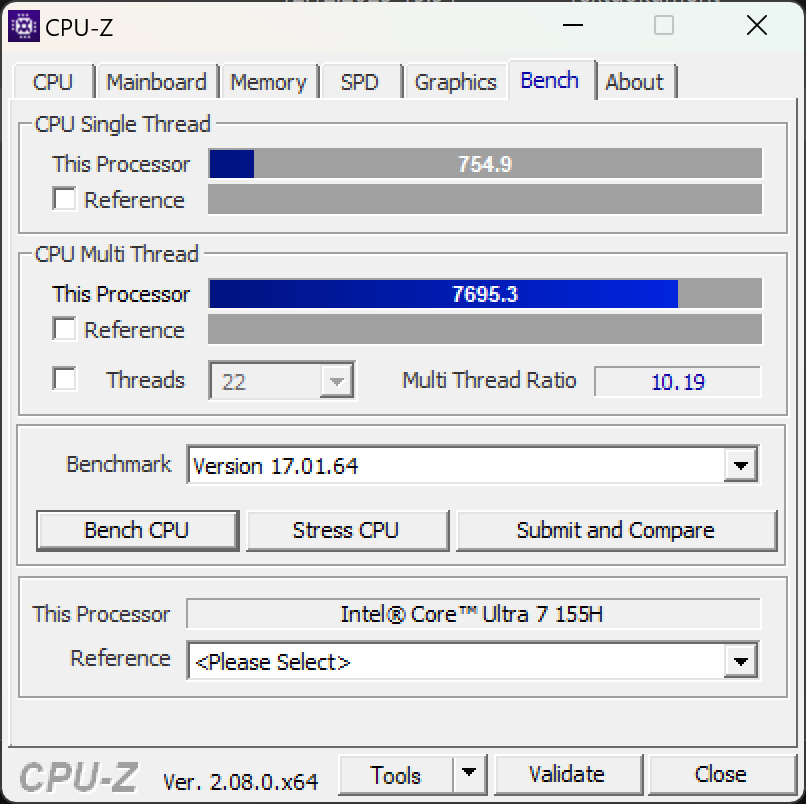
La última generación de procesadores Intel no disfruta de una clara ventaja de rendimiento sobre su predecesor de 13ª generación más similar. En este caso se trata de dos equipos con el Intel Core i7-13700H. Asimismo, ofrece seis núcleos P y ocho núcleos E. Sólo faltan los dos núcleos E de bajo consumo. El procesador más reciente de Intel suele salir bien parado en comparación con su competidor directo, el AMD Ryzen 7 7840U. En los últimos tiempos (y de forma sorprendente), el equipo rojo tiene ahora la sartén por el mango en lo que respecta al rendimiento de un solo núcleo en Cinebench R23. Ya hemos publicado un análisis detallado de la nueva generación de procesadores.
Cinebench R15 Multi Continuous Test
Cinebench R23: Multi Core | Single Core
Cinebench R20: CPU (Multi Core) | CPU (Single Core)
Cinebench R15: CPU Multi 64Bit | CPU Single 64Bit
Blender: v2.79 BMW27 CPU
7-Zip 18.03: 7z b 4 | 7z b 4 -mmt1
Geekbench 5.5: Multi-Core | Single-Core
HWBOT x265 Benchmark v2.2: 4k Preset
LibreOffice : 20 Documents To PDF
R Benchmark 2.5: Overall mean
| CPU Performance rating | |
| Medio Intel Core Ultra 7 155H | |
| Acer Swift Go 14 SFG14-72 | |
| Lenovo ThinkPad T14 G4 21K4S02000 | |
| HP Pavilion Plus 14-ey0095cl | |
| Ayaneo Air 1S Retro Power | |
| Media de la clase Subnotebook | |
| LG Gram 2in1 16 16T90R - G.AA78G | |
| HP Pavilion Plus 14-ew0153TU | |
| Acer Swift Go 14 SFG14-71 | |
| Cinebench R23 / Multi Core | |
| Acer Swift Go 14 SFG14-72 | |
| Medio Intel Core Ultra 7 155H (9769 - 19007, n=52) | |
| Lenovo ThinkPad T14 G4 21K4S02000 | |
| Media de la clase Subnotebook (1555 - 21812, n=59, últimos 2 años) | |
| Ayaneo Air 1S Retro Power | |
| HP Pavilion Plus 14-ey0095cl | |
| LG Gram 2in1 16 16T90R - G.AA78G | |
| Acer Swift Go 14 SFG14-71 | |
| HP Pavilion Plus 14-ew0153TU | |
| Cinebench R23 / Single Core | |
| Acer Swift Go 14 SFG14-72 | |
| Media de la clase Subnotebook (358 - 2213, n=60, últimos 2 años) | |
| Lenovo ThinkPad T14 G4 21K4S02000 | |
| HP Pavilion Plus 14-ew0153TU | |
| Medio Intel Core Ultra 7 155H (1496 - 1815, n=52) | |
| Ayaneo Air 1S Retro Power | |
| LG Gram 2in1 16 16T90R - G.AA78G | |
| HP Pavilion Plus 14-ey0095cl | |
| Acer Swift Go 14 SFG14-71 | |
| Cinebench R20 / CPU (Multi Core) | |
| Medio Intel Core Ultra 7 155H (3798 - 7409, n=50) | |
| Acer Swift Go 14 SFG14-72 | |
| Lenovo ThinkPad T14 G4 21K4S02000 | |
| Media de la clase Subnotebook (579 - 8541, n=56, últimos 2 años) | |
| Ayaneo Air 1S Retro Power | |
| LG Gram 2in1 16 16T90R - G.AA78G | |
| HP Pavilion Plus 14-ey0095cl | |
| HP Pavilion Plus 14-ew0153TU | |
| Acer Swift Go 14 SFG14-71 | |
| Cinebench R20 / CPU (Single Core) | |
| Lenovo ThinkPad T14 G4 21K4S02000 | |
| Acer Swift Go 14 SFG14-72 | |
| Ayaneo Air 1S Retro Power | |
| Medio Intel Core Ultra 7 155H (601 - 696, n=50) | |
| Media de la clase Subnotebook (128 - 832, n=56, últimos 2 años) | |
| HP Pavilion Plus 14-ew0153TU | |
| LG Gram 2in1 16 16T90R - G.AA78G | |
| HP Pavilion Plus 14-ey0095cl | |
| Acer Swift Go 14 SFG14-71 | |
| Cinebench R15 / CPU Multi 64Bit | |
| Acer Swift Go 14 SFG14-72 | |
| Medio Intel Core Ultra 7 155H (1932 - 2880, n=56) | |
| LG Gram 2in1 16 16T90R - G.AA78G | |
| Lenovo ThinkPad T14 G4 21K4S02000 | |
| Media de la clase Subnotebook (327 - 3345, n=56, últimos 2 años) | |
| HP Pavilion Plus 14-ey0095cl | |
| Ayaneo Air 1S Retro Power | |
| Acer Swift Go 14 SFG14-71 | |
| HP Pavilion Plus 14-ew0153TU | |
| Cinebench R15 / CPU Single 64Bit | |
| Lenovo ThinkPad T14 G4 21K4S02000 | |
| HP Pavilion Plus 14-ey0095cl | |
| Media de la clase Subnotebook (72.4 - 322, n=56, últimos 2 años) | |
| Ayaneo Air 1S Retro Power | |
| Acer Swift Go 14 SFG14-72 | |
| Medio Intel Core Ultra 7 155H (99.6 - 268, n=52) | |
| LG Gram 2in1 16 16T90R - G.AA78G | |
| HP Pavilion Plus 14-ew0153TU | |
| Acer Swift Go 14 SFG14-71 | |
| Blender / v2.79 BMW27 CPU | |
| HP Pavilion Plus 14-ew0153TU | |
| Acer Swift Go 14 SFG14-71 | |
| Media de la clase Subnotebook (159 - 2271, n=57, últimos 2 años) | |
| LG Gram 2in1 16 16T90R - G.AA78G | |
| HP Pavilion Plus 14-ey0095cl | |
| Ayaneo Air 1S Retro Power | |
| Lenovo ThinkPad T14 G4 21K4S02000 | |
| Medio Intel Core Ultra 7 155H (175 - 381, n=47) | |
| Acer Swift Go 14 SFG14-72 | |
| 7-Zip 18.03 / 7z b 4 | |
| Acer Swift Go 14 SFG14-72 | |
| Medio Intel Core Ultra 7 155H (41739 - 70254, n=50) | |
| Lenovo ThinkPad T14 G4 21K4S02000 | |
| Ayaneo Air 1S Retro Power | |
| HP Pavilion Plus 14-ey0095cl | |
| Media de la clase Subnotebook (11668 - 77867, n=56, últimos 2 años) | |
| LG Gram 2in1 16 16T90R - G.AA78G | |
| Acer Swift Go 14 SFG14-71 | |
| HP Pavilion Plus 14-ew0153TU | |
| 7-Zip 18.03 / 7z b 4 -mmt1 | |
| HP Pavilion Plus 14-ey0095cl | |
| Lenovo ThinkPad T14 G4 21K4S02000 | |
| Ayaneo Air 1S Retro Power | |
| Media de la clase Subnotebook (2643 - 6699, n=58, últimos 2 años) | |
| HP Pavilion Plus 14-ew0153TU | |
| Medio Intel Core Ultra 7 155H (4594 - 5621, n=50) | |
| Acer Swift Go 14 SFG14-72 | |
| Acer Swift Go 14 SFG14-71 | |
| LG Gram 2in1 16 16T90R - G.AA78G | |
| Geekbench 5.5 / Multi-Core | |
| Medio Intel Core Ultra 7 155H (10017 - 13556, n=52) | |
| Acer Swift Go 14 SFG14-72 | |
| Media de la clase Subnotebook (2557 - 17218, n=48, últimos 2 años) | |
| LG Gram 2in1 16 16T90R - G.AA78G | |
| Lenovo ThinkPad T14 G4 21K4S02000 | |
| HP Pavilion Plus 14-ey0095cl | |
| HP Pavilion Plus 14-ew0153TU | |
| Acer Swift Go 14 SFG14-71 | |
| Ayaneo Air 1S Retro Power | |
| Geekbench 5.5 / Single-Core | |
| Media de la clase Subnotebook (726 - 2224, n=48, últimos 2 años) | |
| Lenovo ThinkPad T14 G4 21K4S02000 | |
| HP Pavilion Plus 14-ey0095cl | |
| HP Pavilion Plus 14-ew0153TU | |
| Medio Intel Core Ultra 7 155H (1462 - 1824, n=52) | |
| Acer Swift Go 14 SFG14-72 | |
| Ayaneo Air 1S Retro Power | |
| LG Gram 2in1 16 16T90R - G.AA78G | |
| Acer Swift Go 14 SFG14-71 | |
| HWBOT x265 Benchmark v2.2 / 4k Preset | |
| Medio Intel Core Ultra 7 155H (9.93 - 21.2, n=50) | |
| Acer Swift Go 14 SFG14-72 | |
| Lenovo ThinkPad T14 G4 21K4S02000 | |
| HP Pavilion Plus 14-ey0095cl | |
| Ayaneo Air 1S Retro Power | |
| Media de la clase Subnotebook (0.97 - 25.1, n=56, últimos 2 años) | |
| LG Gram 2in1 16 16T90R - G.AA78G | |
| Acer Swift Go 14 SFG14-71 | |
| HP Pavilion Plus 14-ew0153TU | |
| LibreOffice / 20 Documents To PDF | |
| Acer Swift Go 14 SFG14-71 | |
| LG Gram 2in1 16 16T90R - G.AA78G | |
| Media de la clase Subnotebook (39.9 - 220, n=55, últimos 2 años) | |
| HP Pavilion Plus 14-ew0153TU | |
| Acer Swift Go 14 SFG14-72 | |
| HP Pavilion Plus 14-ey0095cl | |
| Medio Intel Core Ultra 7 155H (37.5 - 79.2, n=49) | |
| Ayaneo Air 1S Retro Power | |
| Lenovo ThinkPad T14 G4 21K4S02000 | |
| R Benchmark 2.5 / Overall mean | |
| LG Gram 2in1 16 16T90R - G.AA78G | |
| Acer Swift Go 14 SFG14-71 | |
| Media de la clase Subnotebook (0.4024 - 1.456, n=57, últimos 2 años) | |
| Acer Swift Go 14 SFG14-72 | |
| Medio Intel Core Ultra 7 155H (0.4457 - 0.53, n=49) | |
| HP Pavilion Plus 14-ew0153TU | |
| Lenovo ThinkPad T14 G4 21K4S02000 | |
| Ayaneo Air 1S Retro Power | |
| HP Pavilion Plus 14-ey0095cl | |
* ... más pequeño es mejor
AIDA64: FP32 Ray-Trace | FPU Julia | CPU SHA3 | CPU Queen | FPU SinJulia | FPU Mandel | CPU AES | CPU ZLib | FP64 Ray-Trace | CPU PhotoWorxx
| Performance rating | |
| Lenovo ThinkPad T14 G4 21K4S02000 | |
| HP Pavilion Plus 14-ey0095cl | |
| Ayaneo Air 1S Retro Power | |
| Acer Swift Go 14 SFG14-72 | |
| Medio Intel Core Ultra 7 155H | |
| Media de la clase Subnotebook | |
| LG Gram 2in1 16 16T90R - G.AA78G | |
| Acer Swift Go 14 SFG14-71 | |
| HP Pavilion Plus 14-ew0153TU | |
| AIDA64 / FP32 Ray-Trace | |
| Lenovo ThinkPad T14 G4 21K4S02000 | |
| Ayaneo Air 1S Retro Power | |
| HP Pavilion Plus 14-ey0095cl | |
| Media de la clase Subnotebook (1135 - 32888, n=57, últimos 2 años) | |
| Acer Swift Go 14 SFG14-72 | |
| Medio Intel Core Ultra 7 155H (6670 - 18470, n=50) | |
| LG Gram 2in1 16 16T90R - G.AA78G | |
| LG Gram 2in1 16 16T90R - G.AA78G | |
| Acer Swift Go 14 SFG14-71 | |
| HP Pavilion Plus 14-ew0153TU | |
| AIDA64 / FPU Julia | |
| Lenovo ThinkPad T14 G4 21K4S02000 | |
| HP Pavilion Plus 14-ey0095cl | |
| Ayaneo Air 1S Retro Power | |
| Acer Swift Go 14 SFG14-72 | |
| Medio Intel Core Ultra 7 155H (40905 - 93181, n=50) | |
| Media de la clase Subnotebook (5218 - 123315, n=57, últimos 2 años) | |
| LG Gram 2in1 16 16T90R - G.AA78G | |
| Acer Swift Go 14 SFG14-71 | |
| HP Pavilion Plus 14-ew0153TU | |
| AIDA64 / CPU SHA3 | |
| Lenovo ThinkPad T14 G4 21K4S02000 | |
| Ayaneo Air 1S Retro Power | |
| HP Pavilion Plus 14-ey0095cl | |
| Acer Swift Go 14 SFG14-72 | |
| Medio Intel Core Ultra 7 155H (1940 - 4436, n=50) | |
| Media de la clase Subnotebook (444 - 5287, n=57, últimos 2 años) | |
| LG Gram 2in1 16 16T90R - G.AA78G | |
| Acer Swift Go 14 SFG14-71 | |
| HP Pavilion Plus 14-ew0153TU | |
| AIDA64 / CPU Queen | |
| Lenovo ThinkPad T14 G4 21K4S02000 | |
| HP Pavilion Plus 14-ey0095cl | |
| Ayaneo Air 1S Retro Power | |
| Acer Swift Go 14 SFG14-72 | |
| Medio Intel Core Ultra 7 155H (64698 - 94181, n=50) | |
| LG Gram 2in1 16 16T90R - G.AA78G | |
| HP Pavilion Plus 14-ew0153TU | |
| Media de la clase Subnotebook (10579 - 95002, n=48, últimos 2 años) | |
| Acer Swift Go 14 SFG14-71 | |
| AIDA64 / FPU SinJulia | |
| Lenovo ThinkPad T14 G4 21K4S02000 | |
| Ayaneo Air 1S Retro Power | |
| HP Pavilion Plus 14-ey0095cl | |
| Acer Swift Go 14 SFG14-72 | |
| Medio Intel Core Ultra 7 155H (5639 - 10647, n=50) | |
| Media de la clase Subnotebook (744 - 18418, n=57, últimos 2 años) | |
| LG Gram 2in1 16 16T90R - G.AA78G | |
| HP Pavilion Plus 14-ew0153TU | |
| Acer Swift Go 14 SFG14-71 | |
| AIDA64 / FPU Mandel | |
| Lenovo ThinkPad T14 G4 21K4S02000 | |
| HP Pavilion Plus 14-ey0095cl | |
| Ayaneo Air 1S Retro Power | |
| Acer Swift Go 14 SFG14-72 | |
| Medio Intel Core Ultra 7 155H (18236 - 47685, n=50) | |
| Media de la clase Subnotebook (3341 - 65433, n=57, últimos 2 años) | |
| LG Gram 2in1 16 16T90R - G.AA78G | |
| Acer Swift Go 14 SFG14-71 | |
| HP Pavilion Plus 14-ew0153TU | |
| AIDA64 / CPU AES | |
| Lenovo ThinkPad T14 G4 21K4S02000 | |
| LG Gram 2in1 16 16T90R - G.AA78G | |
| Medio Intel Core Ultra 7 155H (45713 - 152179, n=50) | |
| Acer Swift Go 14 SFG14-72 | |
| Ayaneo Air 1S Retro Power | |
| HP Pavilion Plus 14-ey0095cl | |
| Media de la clase Subnotebook (638 - 96917, n=57, últimos 2 años) | |
| Acer Swift Go 14 SFG14-71 | |
| HP Pavilion Plus 14-ew0153TU | |
| AIDA64 / CPU ZLib | |
| Medio Intel Core Ultra 7 155H (557 - 1250, n=50) | |
| Acer Swift Go 14 SFG14-72 | |
| Lenovo ThinkPad T14 G4 21K4S02000 | |
| HP Pavilion Plus 14-ey0095cl | |
| Ayaneo Air 1S Retro Power | |
| LG Gram 2in1 16 16T90R - G.AA78G | |
| Media de la clase Subnotebook (164.9 - 1379, n=57, últimos 2 años) | |
| Acer Swift Go 14 SFG14-71 | |
| HP Pavilion Plus 14-ew0153TU | |
| AIDA64 / FP64 Ray-Trace | |
| Lenovo ThinkPad T14 G4 21K4S02000 | |
| HP Pavilion Plus 14-ey0095cl | |
| Ayaneo Air 1S Retro Power | |
| Media de la clase Subnotebook (610 - 17495, n=57, últimos 2 años) | |
| Acer Swift Go 14 SFG14-72 | |
| Medio Intel Core Ultra 7 155H (3569 - 9802, n=50) | |
| LG Gram 2in1 16 16T90R - G.AA78G | |
| Acer Swift Go 14 SFG14-71 | |
| HP Pavilion Plus 14-ew0153TU | |
| AIDA64 / CPU PhotoWorxx | |
| Media de la clase Subnotebook (6569 - 85600, n=57, últimos 2 años) | |
| Medio Intel Core Ultra 7 155H (32719 - 54223, n=50) | |
| Acer Swift Go 14 SFG14-72 | |
| LG Gram 2in1 16 16T90R - G.AA78G | |
| Lenovo ThinkPad T14 G4 21K4S02000 | |
| HP Pavilion Plus 14-ew0153TU | |
| Acer Swift Go 14 SFG14-71 | |
| HP Pavilion Plus 14-ey0095cl | |
| Ayaneo Air 1S Retro Power | |
Rendimiento del sistema
Según Intel, la nueva iGPU Arc es la principal responsable de las mejoras significativas en el rendimiento gráfico. Esto queda claro en cuanto echamos un vistazo a la sección de creación de contenidos digitales en PCMark 10. En esta área, el Swift Go 14 y su iGPU Arc son impresionantes. En general, el rendimiento del sistema del Acer Swift Go 14 es muy superior al de su predecesor y al de la mayoría de los dispositivos de la comparación. Esto significa que estamos ante un dispositivo potente que no tiene motivos para echarse atrás incluso cuando se enfrenta a aplicaciones 3D.
CrossMark: Overall | Productivity | Creativity | Responsiveness
WebXPRT 3: Overall
WebXPRT 4: Overall
Mozilla Kraken 1.1: Total
| PCMark 10 / Score | |
| Media de la clase Subnotebook (4920 - 9939, n=45, últimos 2 años) | |
| Lenovo ThinkPad T14 G4 21K4S02000 | |
| Medio Intel Core Ultra 7 155H, Intel Arc 8-Core iGPU (4809 - 7529, n=34) | |
| Acer Swift Go 14 SFG14-72 | |
| HP Pavilion Plus 14-ey0095cl | |
| Ayaneo Air 1S Retro Power | |
| LG Gram 2in1 16 16T90R - G.AA78G | |
| HP Pavilion Plus 14-ew0153TU | |
| Acer Swift Go 14 SFG14-71 | |
| PCMark 10 / Essentials | |
| LG Gram 2in1 16 16T90R - G.AA78G | |
| Lenovo ThinkPad T14 G4 21K4S02000 | |
| Medio Intel Core Ultra 7 155H, Intel Arc 8-Core iGPU (7605 - 11289, n=34) | |
| Media de la clase Subnotebook (8552 - 11646, n=45, últimos 2 años) | |
| Acer Swift Go 14 SFG14-72 | |
| HP Pavilion Plus 14-ew0153TU | |
| Acer Swift Go 14 SFG14-71 | |
| HP Pavilion Plus 14-ey0095cl | |
| Ayaneo Air 1S Retro Power | |
| PCMark 10 / Productivity | |
| Lenovo ThinkPad T14 G4 21K4S02000 | |
| Media de la clase Subnotebook (5435 - 16606, n=45, últimos 2 años) | |
| HP Pavilion Plus 14-ey0095cl | |
| Medio Intel Core Ultra 7 155H, Intel Arc 8-Core iGPU (6042 - 10591, n=34) | |
| Acer Swift Go 14 SFG14-72 | |
| Ayaneo Air 1S Retro Power | |
| Acer Swift Go 14 SFG14-71 | |
| HP Pavilion Plus 14-ew0153TU | |
| LG Gram 2in1 16 16T90R - G.AA78G | |
| PCMark 10 / Digital Content Creation | |
| Media de la clase Subnotebook (5722 - 13779, n=45, últimos 2 años) | |
| Acer Swift Go 14 SFG14-72 | |
| Medio Intel Core Ultra 7 155H, Intel Arc 8-Core iGPU (4985 - 10709, n=34) | |
| Lenovo ThinkPad T14 G4 21K4S02000 | |
| HP Pavilion Plus 14-ey0095cl | |
| Ayaneo Air 1S Retro Power | |
| LG Gram 2in1 16 16T90R - G.AA78G | |
| HP Pavilion Plus 14-ew0153TU | |
| Acer Swift Go 14 SFG14-71 | |
| CrossMark / Overall | |
| Lenovo ThinkPad T14 G4 21K4S02000 | |
| Media de la clase Subnotebook (365 - 2356, n=59, últimos 2 años) | |
| Medio Intel Core Ultra 7 155H, Intel Arc 8-Core iGPU (1366 - 1903, n=34) | |
| Acer Swift Go 14 SFG14-72 | |
| HP Pavilion Plus 14-ew0153TU | |
| LG Gram 2in1 16 16T90R - G.AA78G | |
| HP Pavilion Plus 14-ey0095cl | |
| Acer Swift Go 14 SFG14-71 | |
| Ayaneo Air 1S Retro Power | |
| CrossMark / Productivity | |
| Lenovo ThinkPad T14 G4 21K4S02000 | |
| Medio Intel Core Ultra 7 155H, Intel Arc 8-Core iGPU (1291 - 1798, n=33) | |
| Media de la clase Subnotebook (364 - 2277, n=59, últimos 2 años) | |
| HP Pavilion Plus 14-ew0153TU | |
| HP Pavilion Plus 14-ey0095cl | |
| Acer Swift Go 14 SFG14-72 | |
| LG Gram 2in1 16 16T90R - G.AA78G | |
| Acer Swift Go 14 SFG14-71 | |
| Ayaneo Air 1S Retro Power | |
| CrossMark / Creativity | |
| Media de la clase Subnotebook (372 - 2743, n=59, últimos 2 años) | |
| Lenovo ThinkPad T14 G4 21K4S02000 | |
| Medio Intel Core Ultra 7 155H, Intel Arc 8-Core iGPU (1519 - 1929, n=33) | |
| Acer Swift Go 14 SFG14-72 | |
| HP Pavilion Plus 14-ey0095cl | |
| HP Pavilion Plus 14-ew0153TU | |
| LG Gram 2in1 16 16T90R - G.AA78G | |
| Acer Swift Go 14 SFG14-71 | |
| Ayaneo Air 1S Retro Power | |
| CrossMark / Responsiveness | |
| LG Gram 2in1 16 16T90R - G.AA78G | |
| Acer Swift Go 14 SFG14-71 | |
| Medio Intel Core Ultra 7 155H, Intel Arc 8-Core iGPU (939 - 1802, n=33) | |
| Lenovo ThinkPad T14 G4 21K4S02000 | |
| Acer Swift Go 14 SFG14-72 | |
| Media de la clase Subnotebook (312 - 1854, n=59, últimos 2 años) | |
| HP Pavilion Plus 14-ew0153TU | |
| HP Pavilion Plus 14-ey0095cl | |
| Ayaneo Air 1S Retro Power | |
| WebXPRT 3 / Overall | |
| Media de la clase Subnotebook (156 - 530, n=55, últimos 2 años) | |
| Lenovo ThinkPad T14 G4 21K4S02000 | |
| HP Pavilion Plus 14-ey0095cl | |
| Acer Swift Go 14 SFG14-72 | |
| Medio Intel Core Ultra 7 155H, Intel Arc 8-Core iGPU (252 - 299, n=34) | |
| HP Pavilion Plus 14-ew0153TU | |
| LG Gram 2in1 16 16T90R - G.AA78G | |
| Acer Swift Go 14 SFG14-71 | |
| Ayaneo Air 1S Retro Power | |
| WebXPRT 4 / Overall | |
| Media de la clase Subnotebook (132 - 378, n=60, últimos 2 años) | |
| HP Pavilion Plus 14-ew0153TU | |
| Medio Intel Core Ultra 7 155H, Intel Arc 8-Core iGPU (166.4 - 309, n=29) | |
| HP Pavilion Plus 14-ey0095cl | |
| Ayaneo Air 1S Retro Power | |
| Mozilla Kraken 1.1 / Total | |
| LG Gram 2in1 16 16T90R - G.AA78G | |
| HP Pavilion Plus 14-ey0095cl | |
| Acer Swift Go 14 SFG14-71 | |
| Acer Swift Go 14 SFG14-71 | |
| Medio Intel Core Ultra 7 155H, Intel Arc 8-Core iGPU (517 - 614, n=35) | |
| Acer Swift Go 14 SFG14-72 | |
| Lenovo ThinkPad T14 G4 21K4S02000 | |
| Ayaneo Air 1S Retro Power | |
| HP Pavilion Plus 14-ew0153TU | |
| Media de la clase Subnotebook (234 - 1104, n=60, últimos 2 años) | |
* ... más pequeño es mejor
| PCMark 10 Score | 6625 puntos | |
ayuda | ||
| AIDA64 / Memory Copy | |
| Media de la clase Subnotebook (14554 - 131023, n=57, últimos 2 años) | |
| Medio Intel Core Ultra 7 155H (62397 - 96791, n=50) | |
| Acer Swift Go 14 SFG14-72 | |
| AIDA64 / Memory Read | |
| Media de la clase Subnotebook (15948 - 127174, n=57, últimos 2 años) | |
| Medio Intel Core Ultra 7 155H (60544 - 90647, n=50) | |
| Acer Swift Go 14 SFG14-72 | |
| AIDA64 / Memory Write | |
| Media de la clase Subnotebook (15709 - 135141, n=57, últimos 2 años) | |
| Acer Swift Go 14 SFG14-72 | |
| Medio Intel Core Ultra 7 155H (58692 - 93451, n=50) | |
| AIDA64 / Memory Latency | |
| Acer Swift Go 14 SFG14-72 | |
| Medio Intel Core Ultra 7 155H (116.2 - 233, n=50) | |
| Media de la clase Subnotebook (6.1 - 159.9, n=55, últimos 2 años) | |
* ... más pequeño es mejor
Almacenamiento masivo
En la Swift Go 14, una nueva SSD NVMe de SK Hynix hace su trabajo y consigue alcanzar velocidades de transferencia de medias a altas en todos los puntos de referencia. En el bucle DiskSpd, en el que se analiza el rendimiento del almacenamiento durante un periodo más largo, la velocidad de lectura desciende ligeramente.

* ... más pequeño es mejor
Continuous Performance Read: DiskSpd Read Loop, Queue Depth 8
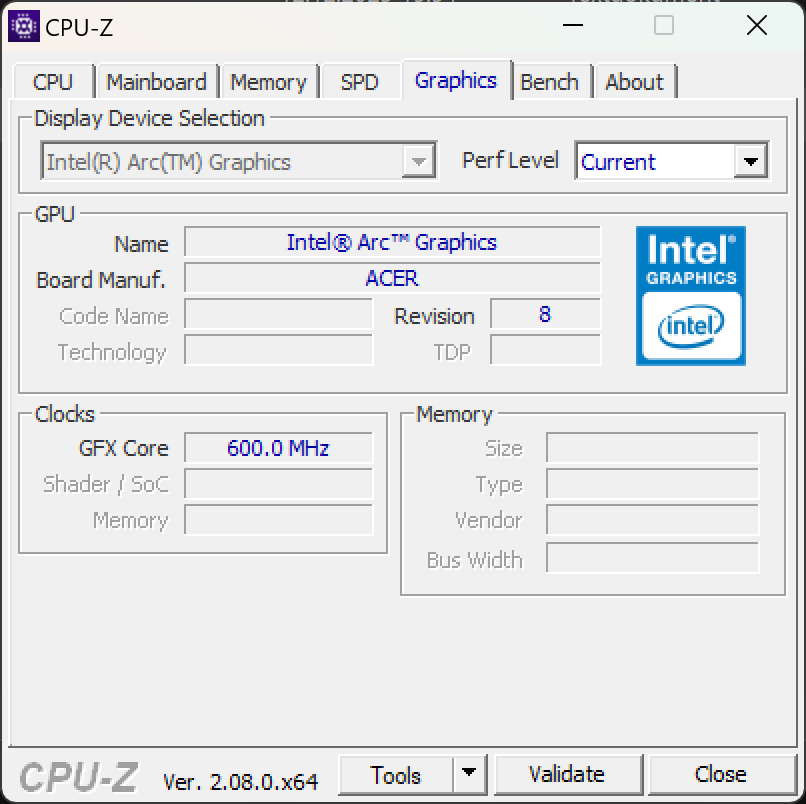
Tarjeta gráfica
Según Intel, se dice que el rendimiento gráfico del nuevo procesador para portátiles es el doble que el de la 13ª generación. En cualquier caso, nuestras primeras pruebas comparativas confirman un rendimiento muy elevado con la iGPU Arc de ocho núcleos consiguiendo incluso superar de forma convincente a la AMD Radeon 780M. Las GPU dedicadas de Intel para portátiles se quedan cortas en nuestro análisis. Incluso dejando a un lado el rendimiento 3D, el rendimiento de la iGPU del Acer Swift Go es asombrosamente alto.
| 3DMark 06 Standard Score | puntos | |
| 3DMark Vantage P Result | 43185 puntos | |
| 3DMark 11 Performance | 13075 puntos | |
| 3DMark Ice Storm Standard Score | 157591 puntos | |
| 3DMark Cloud Gate Standard Score | 29783 puntos | |
| 3DMark Fire Strike Score | 8314 puntos | |
| 3DMark Time Spy Score | 3471 puntos | |
ayuda | ||
* ... más pequeño es mejor
Rendimiento en juegos
Con sus gráficos muy mejorados, el Intel Core 7 Ultra 155H impresiona cuando se juega, siempre que no se exagere con los ajustes de calidad o la resolución. Los juegos Full HD a calidad media o alta se pueden jugar a más de 60 fps, en la mayoría de los juegos que probamos. Esto significa que podría prescindir del tipo de dGPU que se encuentra en muchos portátiles como la GeForce RTX 2050 o la Arc 530M.
| The Witcher 3 - 1920x1080 Ultra Graphics & Postprocessing (HBAO+) | |
| Ayaneo Air 1S Retro Power | |
| HP Pavilion Plus 14-ey0095cl | |
| Lenovo ThinkPad T14 G4 21K4S02000 | |
| Media de la clase Subnotebook (13.9 - 34.6, n=12, últimos 2 años) | |
| Acer Swift Go 14 SFG14-72 | |
| LG Gram 2in1 16 16T90R - G.AA78G | |
| HP Pavilion Plus 14-ew0153TU | |
| Acer Swift Go 14 SFG14-71 | |
La casi duplicación del rendimiento gráfico se hace evidente al echar un vistazo a las velocidades de fotogramas en The Witcher 3 en ajustes de ultra calidad. La Swift Go 14 ofrece casi el doble de fotogramas por segundo que la Schenker Vision 14.
Witcher 3 FPS diagram
| bajo | medio | alto | ultra | QHD | |
|---|---|---|---|---|---|
| GTA V (2015) | 124.1 | 120.8 | 34.8 | 13.1 | |
| The Witcher 3 (2015) | 23.3 | ||||
| Dota 2 Reborn (2015) | 99.4 | 90.4 | 76 | 73.4 | |
| Final Fantasy XV Benchmark (2018) | 42.8 | 32.1 | 18.2 | 14 | |
| X-Plane 11.11 (2018) | 54.5 | 42.5 | 36.1 | ||
| Far Cry 5 (2018) | 35 | 33 | |||
| Strange Brigade (2018) | 141.9 | 60.6 | 52 | 43.2 | |
| Horizon Zero Dawn (2020) | 33 | 28 () | 26 | ||
| Dying Light 2 (2022) | 31.1 | 29.9 | |||
| Hogwarts Legacy (2023) | 25.7 | 19.3 | 15.6 | ||
| F1 23 (2023) | 64.6 | 59 | 35.9 | 12.2 | |
| Ratchet & Clank Rift Apart (2023) | 28.4 | 29 | 25.9 | 21.1 | |
| Starfield (2023) | 11.5 | ||||
| Baldur's Gate 3 (2023) | 22.8 | 20.6 | 19.1 | ||
| Cyberpunk 2077 (2023) | 34.1 | 29.6 | 24 | 13.1 | |
| EA Sports WRC (2023) | 35.8 | 26.6 | 24.7 | 22.4 |
Rendimiento de la NPU
En el interior del Intel Core 7 155H se puede encontrar una unidad de procesamiento neuronal. Esta parte del procesador se encarga de procesar aplicaciones de IA de forma muy eficiente. Eso significa que modelos como la Difusión Estable o los modelos lingüísticos ya pueden ejecutarse en el dispositivo. Utilizando el banco de pruebas UL Procyon AI Interface, pusimos la GPU frente a frente con la NPU y comprobamos simultáneamente el consumo de energía. En ambos escenarios, rápidamente quedó claro que el rendimiento de la NPU era sólo ligeramente inferior al de la iGPU Arc cuando se trataba de procesar redes neuronales, pero los requisitos energéticos se reducían casi a la mitad. Esto definitivamente hace que el acelerador de IA sea más eficiente que el chip gráfico para las mismas aplicaciones.
Por tanto, es factible que muchas de las aplicaciones de IA que actualmente se ejecutan a través de la nube pronto puedan ejecutarse localmente en el propio portátil, de forma energéticamente eficiente, sin necesidad de conexión a Internet.
Power consumption UL Procyon Ai Inference benchmark on an external monitor
| UL Procyon for Windows | |
| Acer Swift Go 14 SFG14-72 | |
| Overall Score Integer NPU | |
| Overall Score Integer GPU | |
Intel nos proporcionó amablemente una versión de Gimp que ya incluye Stable Diffusion con OpenVINO y compatibilidad con NPU. Tras una larga configuración, el programa de conversión de texto en imagen funcionó sorprendentemente rápido. Hasta ahora, era posible ejecutar Stable Diffusion en tarjetas gráficas Arc.


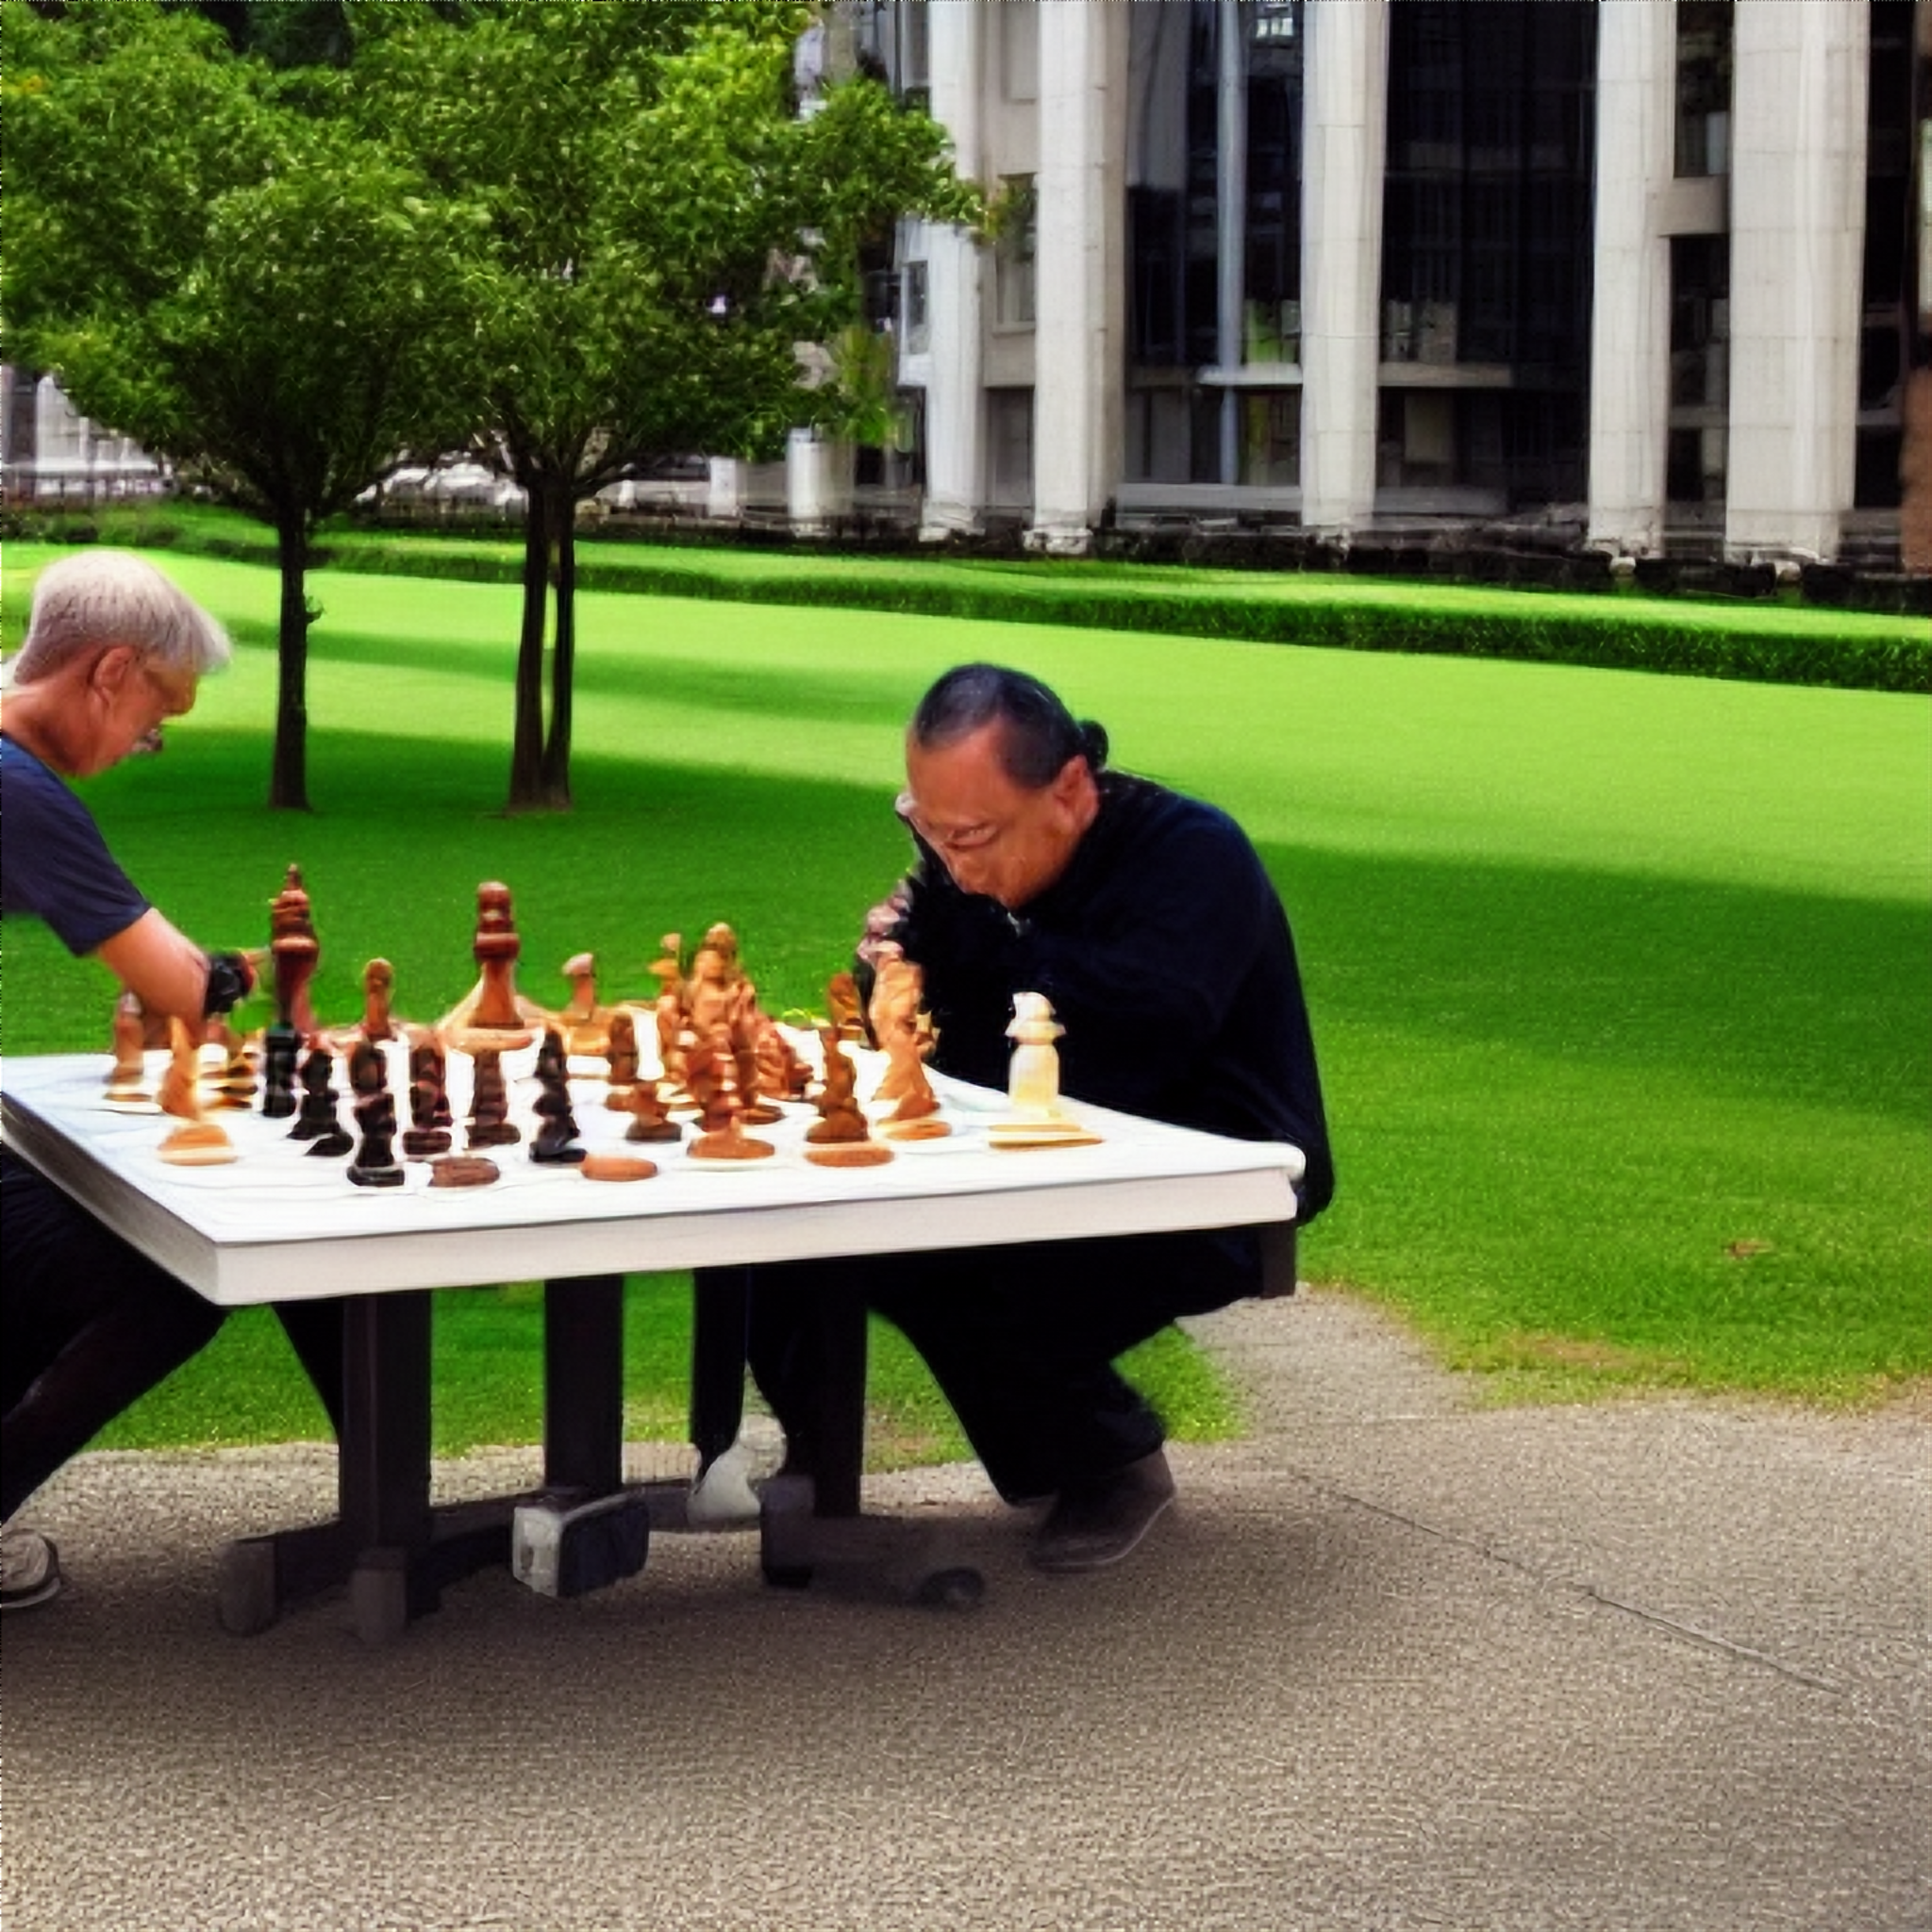

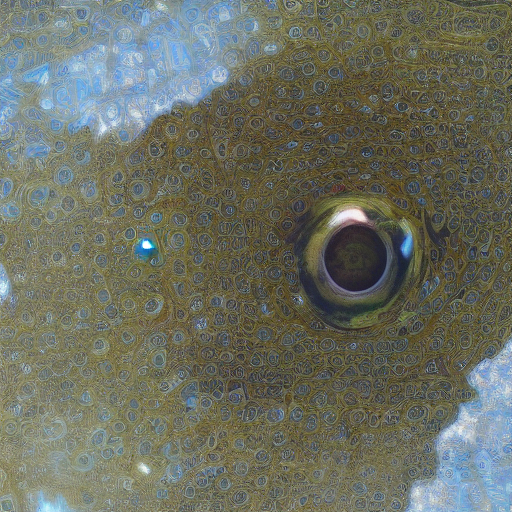
Hay que reconocer que no todas las imágenes creadas por la red neuronal son especialmente utilizables. La difusión estable sólo tiene una capacidad limitada para manejar rostros, pies y manos, vistos desde lejos. Sin embargo, las tareas que usted fije para el programa también deben definirse con la mayor claridad posible. Es necesaria cierta experiencia en este ámbito para asegurarse de obtener lo que ha pedido.
Emisiones - Se mantiene en silencio en su mayor parte
Emisiones sonoras
A pesar del rendimiento de alto nivel, el nuevo Acer Swift Go no se ha vuelto más ruidoso. Con casi 45 dB(A) a plena carga, no se puede decir que sea realmente silencioso, pero es tolerable. El Acer Swift Go maneja tareas pequeñas y medianas normalmente sin la presencia audible del ventilador.
Ruido
| Ocioso |
| 25 / 25 / 26.2 dB(A) |
| Carga |
| 35.7 / 45.5 dB(A) |
 | ||
30 dB silencioso 40 dB(A) audible 50 dB(A) ruidosamente alto |
||
min: | ||
| Acer Swift Go 14 SFG14-72 Arc 8-Core, Ultra 7 155H, SK hynix HFS001TEJ9X110NA | Acer Swift Go 14 SFG14-71 Iris Xe G7 80EUs, i5-1335U, WD PC SN740 SDDQNQD-512G-1014 | LG Gram 2in1 16 16T90R - G.AA78G Iris Xe G7 96EUs, i7-1360P, Samsung PM9A1 MZVL21T0HCLR | HP Pavilion Plus 14-ew0153TU Iris Xe G7 96EUs, i7-1355U, SK hynix PC801 HFS001TEJ9X101N | Lenovo ThinkPad T14 G4 21K4S02000 Radeon 780M, R7 PRO 7840U, Samsung PM9A1a MZVL21T0HDLU | Ayaneo Air 1S Retro Power Radeon 780M, R7 7840U, Ayaneo CyberThunder-2TB | HP Pavilion Plus 14-ey0095cl Radeon 780M, R7 7840U, WDC PC SN810 1TB | |
|---|---|---|---|---|---|---|---|
| Noise | 4% | 5% | 20% | 14% | 3% | 6% | |
| apagado / medio ambiente * (dB) | 25 | 24.9 -0% | 25.1 -0% | 19.35 23% | 23.1 8% | 23 8% | 23.4 6% |
| Idle Minimum * (dB) | 25 | 24.9 -0% | 25.1 -0% | 20.57 18% | 23.1 8% | 24.7 1% | 24.1 4% |
| Idle Average * (dB) | 25 | 24.9 -0% | 25.1 -0% | 20.57 18% | 23.1 8% | 25.2 -1% | 24.1 4% |
| Idle Maximum * (dB) | 26.2 | 24.9 5% | 26.1 -0% | 20.57 21% | 23.1 12% | 25.2 4% | 25.3 3% |
| Load Average * (dB) | 35.7 | 31.9 11% | 31.4 12% | 32.18 10% | 26.5 26% | 32.1 10% | 33.4 6% |
| Load Maximum * (dB) | 45.5 | 43.2 5% | 36.6 20% | 32.26 29% | 35.78 21% | 47.1 -4% | 39.4 13% |
| Witcher 3 ultra * (dB) | 43.2 | 41.1 | 29.44 | 35.7 | 39.4 |
* ... más pequeño es mejor
Temperatura
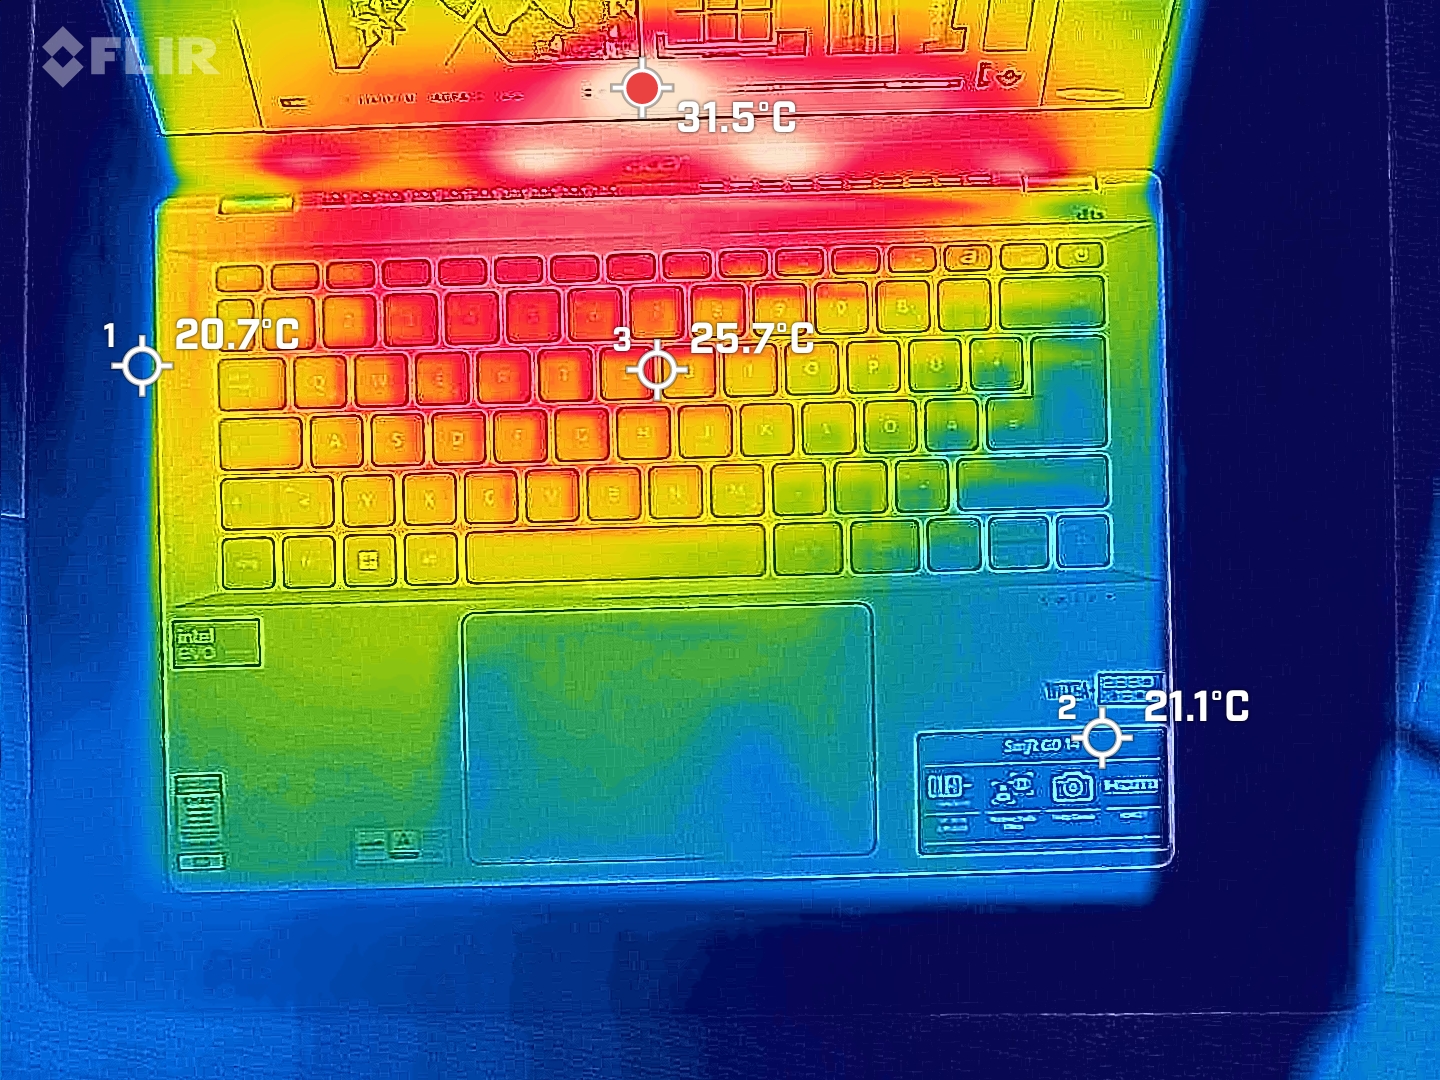
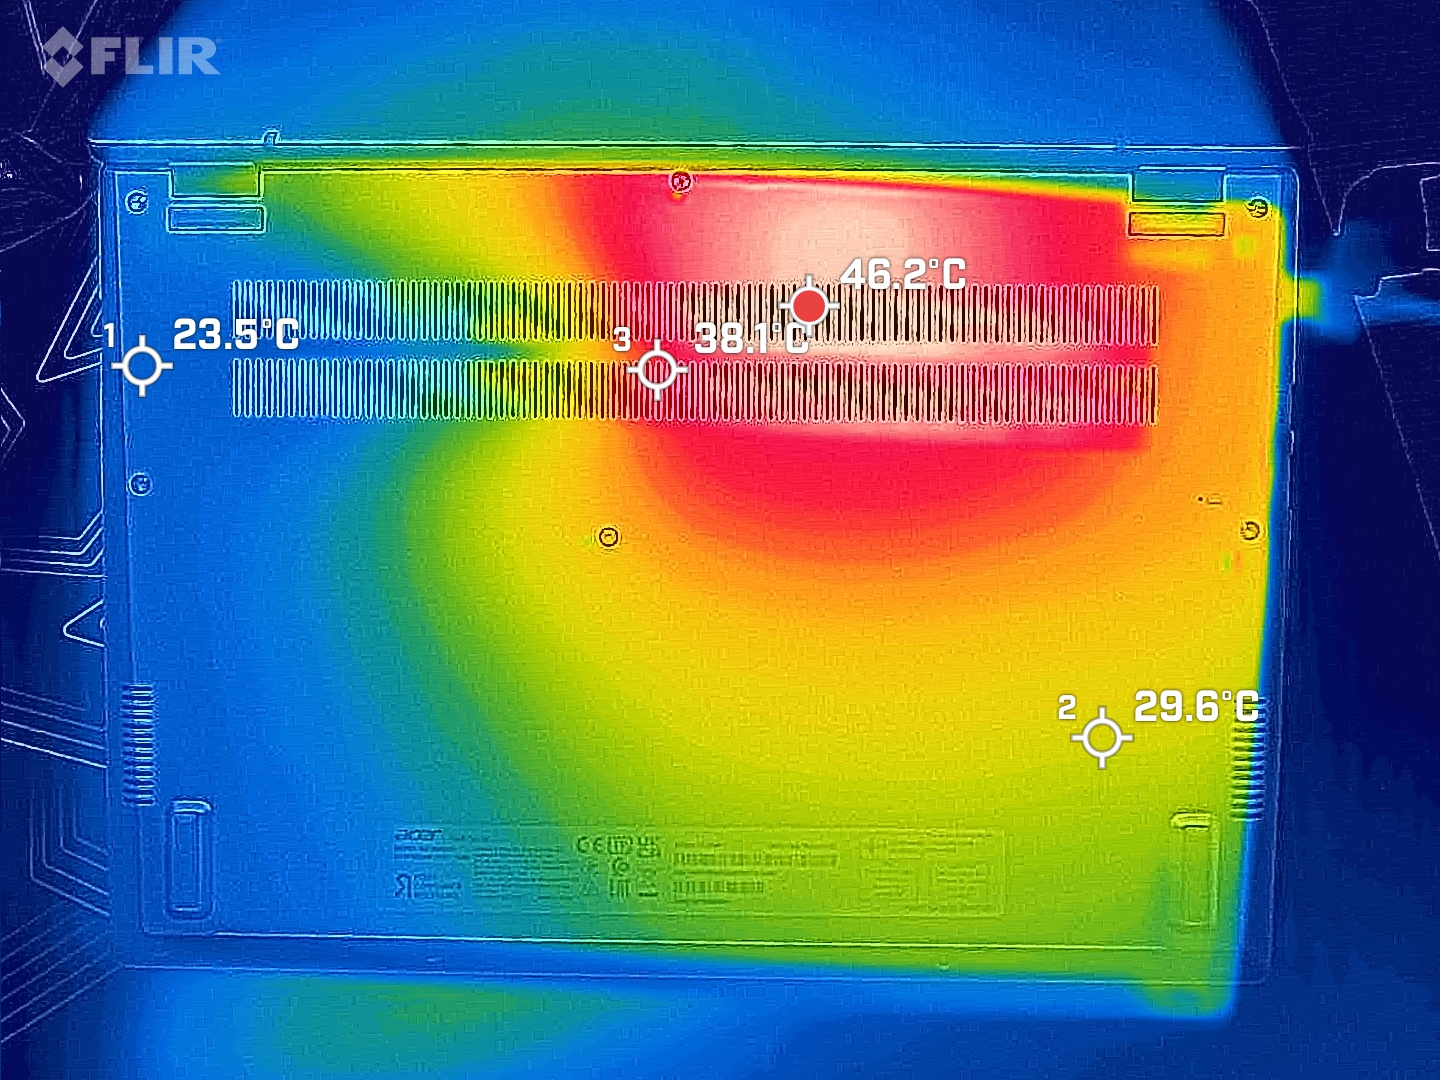
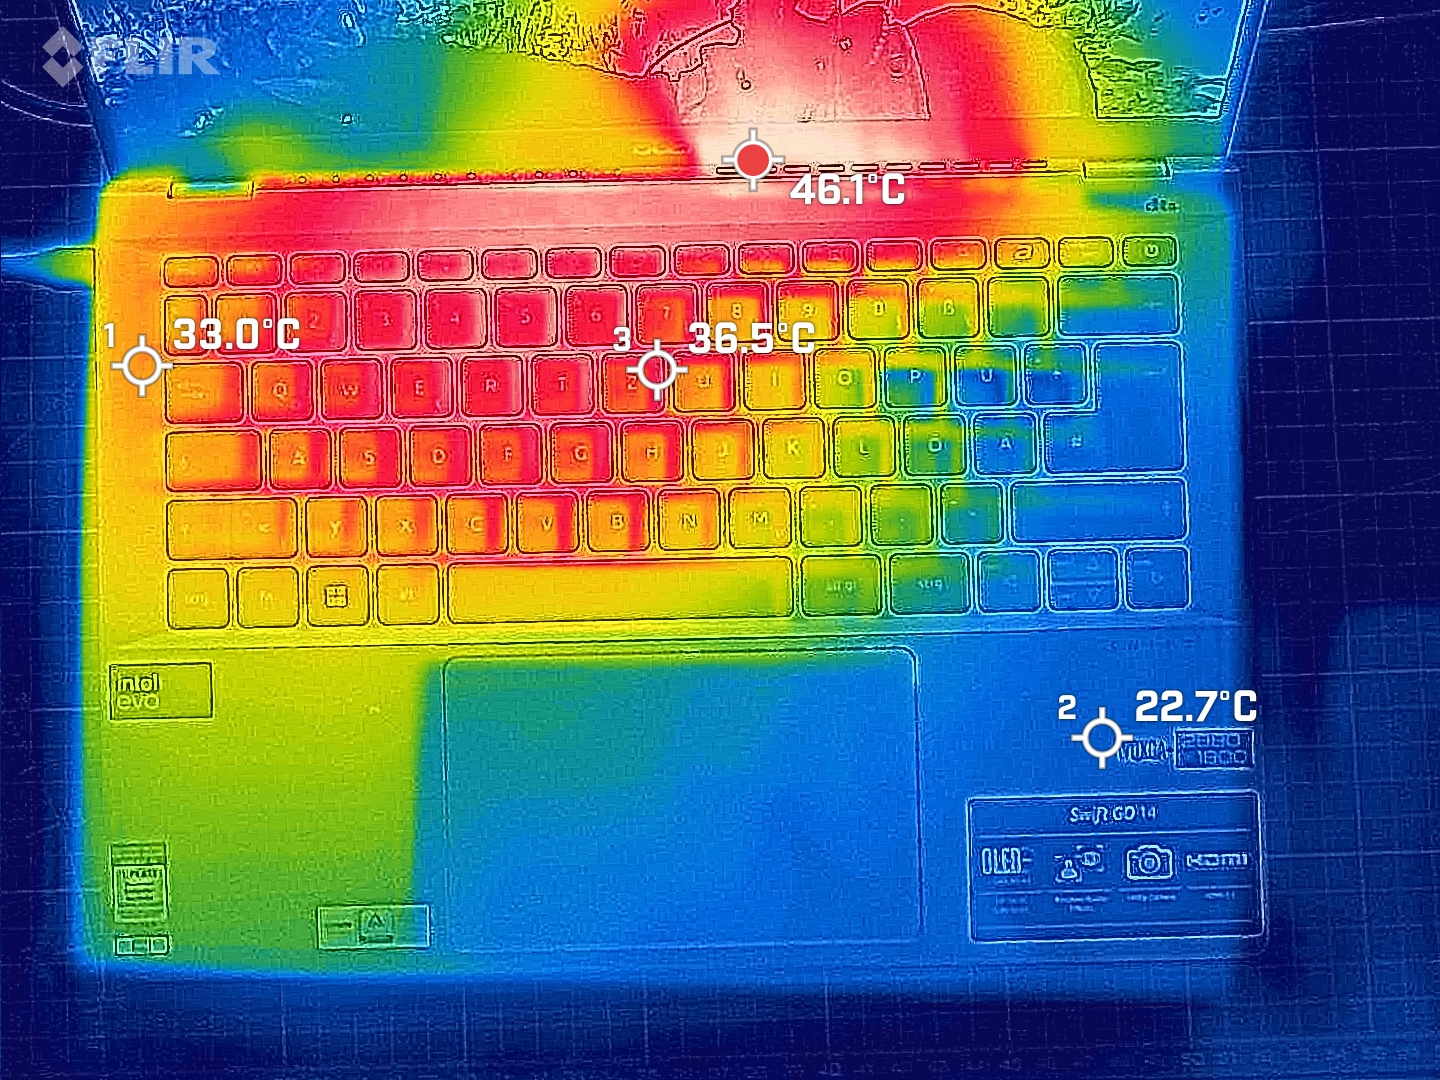
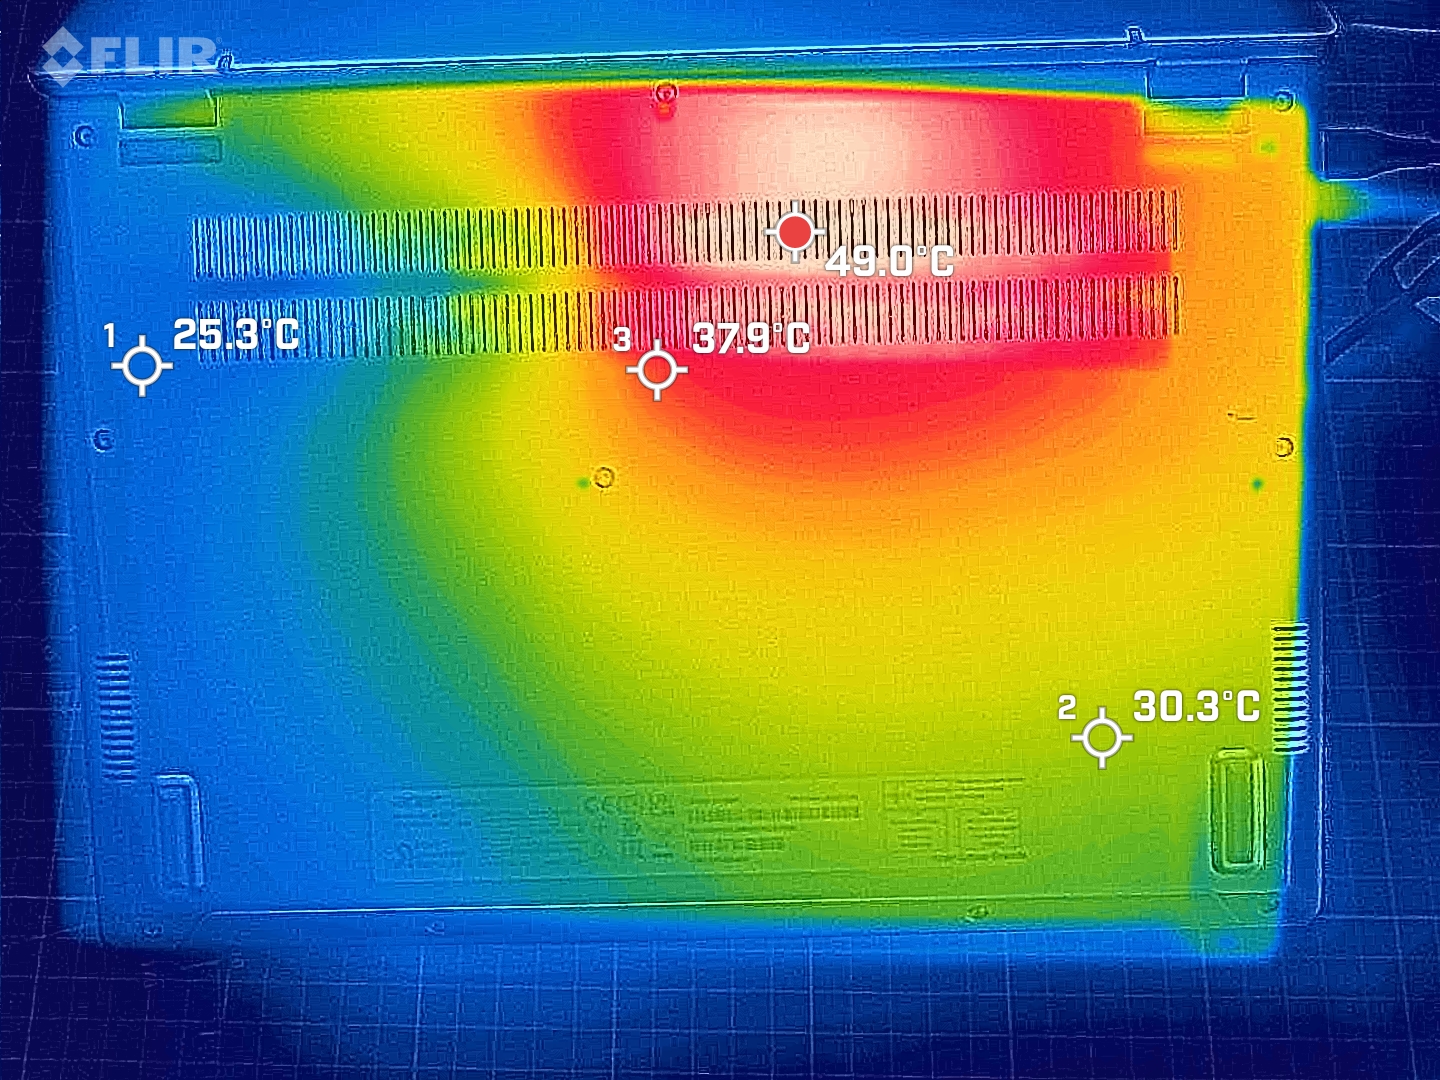
Por desgracia, lo que no ha cambiado son las elevadísimas temperaturas de la superficie del portátil que medimos durante las pruebas. La barra situada detrás del teclado llegó incluso a alcanzar los 40 °C. Sin embargo, la zona que más se calienta es la pantalla, sobre la que se dirige el aire expulsado por el ventilador. A pesar de ello, en condiciones normales de funcionamiento, cuando se navega por Internet o se utilizan aplicaciones ofimáticas, la superficie del portátil sólo se calienta hasta superar ligeramente la temperatura ambiente.
(+) La temperatura máxima en la parte superior es de 36.5 °C / 98 F, frente a la media de 35.9 °C / 97 F, que oscila entre 21.4 y 59 °C para la clase Subnotebook.
(-) El fondo se calienta hasta un máximo de 49.5 °C / 121 F, frente a la media de 39.2 °C / 103 F
(+) En reposo, la temperatura media de la parte superior es de 22.6 °C / 73# F, frente a la media del dispositivo de 30.8 °C / 87 F.
(+) El reposamanos y el panel táctil están a una temperatura inferior a la de la piel, con un máximo de 26.2 °C / 79.2 F y, por tanto, son fríos al tacto.
(±) La temperatura media de la zona del reposamanos de dispositivos similares fue de 28.2 °C / 82.8 F (+2 °C / 3.6 F).
| Acer Swift Go 14 SFG14-72 Intel Core Ultra 7 155H, Intel Arc 8-Core iGPU | Acer Swift Go 14 SFG14-71 Intel Core i5-1335U, Intel Iris Xe Graphics G7 80EUs | LG Gram 2in1 16 16T90R - G.AA78G Intel Core i7-1360P, Intel Iris Xe Graphics G7 96EUs | HP Pavilion Plus 14-ew0153TU Intel Core i7-1355U, Intel Iris Xe Graphics G7 96EUs | Lenovo ThinkPad T14 G4 21K4S02000 AMD Ryzen 7 PRO 7840U, AMD Radeon 780M | Ayaneo Air 1S Retro Power AMD Ryzen 7 7840U, AMD Radeon 780M | HP Pavilion Plus 14-ey0095cl AMD Ryzen 7 7840U, AMD Radeon 780M | |
|---|---|---|---|---|---|---|---|
| Heat | -2% | -22% | 4% | 3% | -30% | 12% | |
| Maximum Upper Side * (°C) | 36.5 | 44.8 -23% | 55 -51% | 36.6 -0% | 43.5 -19% | 55 -51% | 39 -7% |
| Maximum Bottom * (°C) | 49.5 | 34.8 30% | 55.4 -12% | 37.2 25% | 47.4 4% | 53.2 -7% | 35.8 28% |
| Idle Upper Side * (°C) | 25.5 | 30.7 -20% | 34.9 -37% | 31.6 -24% | 24.9 2% | 37.1 -45% | 25.2 1% |
| Idle Bottom * (°C) | 35 | 32.5 7% | 30 14% | 30 14% | 26 26% | 40.1 -15% | 25.6 27% |
* ... más pequeño es mejor
Prueba de esfuerzo
Como ya hemos mencionado, ajustamos el rendimiento boost del procesador a un nivel ligeramente inferior al valor establecido por Acer. Nuestra prueba de estrés reveló que el ajuste de rendimiento continuo (PL1) del Core Ultra 7 es algo demasiado alto. Al cabo de un rato, se asienta en torno a los 43 vatios en lugar de los 45, pero consigue mantener ahí su nivel de rendimiento a largo plazo.
Altavoces
En general, los altavoces del Acer Swift Go suenan bien. Sólo los graves podrían tener un poco más de pegada. Fuimos incapaces de discernir una diferencia con el predecesor.
Acer Swift Go 14 SFG14-72 análisis de audio
(+) | los altavoces pueden reproducir a un volumen relativamente alto (#86.7 dB)
Graves 100 - 315 Hz
(-) | casi sin bajos - de media 29.6% inferior a la mediana
(±) | la linealidad de los graves es media (13.8% delta a frecuencia anterior)
Medios 400 - 2000 Hz
(±) | medias más altas - de media 6.4% más altas que la mediana
(+) | los medios son lineales (5.4% delta a la frecuencia anterior)
Altos 2 - 16 kHz
(±) | máximos más altos - de media 5.7% más altos que la mediana
(±) | la linealidad de los máximos es media (7.4% delta a frecuencia anterior)
Total 100 - 16.000 Hz
(±) | la linealidad del sonido global es media (22.6% de diferencia con la mediana)
En comparación con la misma clase
» 77% de todos los dispositivos probados de esta clase eran mejores, 4% similares, 18% peores
» El mejor tuvo un delta de 5%, la media fue 18%, el peor fue ###max##%
En comparación con todos los dispositivos probados
» 67% de todos los dispositivos probados eran mejores, 6% similares, 28% peores
» El mejor tuvo un delta de 4%, la media fue 23%, el peor fue ###max##%
Acer Swift Go 14 SFG14-71 análisis de audio
(+) | los altavoces pueden reproducir a un volumen relativamente alto (#82.1 dB)
Graves 100 - 315 Hz
(-) | casi sin bajos - de media 29.2% inferior a la mediana
(±) | la linealidad de los graves es media (11.1% delta a frecuencia anterior)
Medios 400 - 2000 Hz
(+) | medios equilibrados - a sólo 3.9% de la mediana
(+) | los medios son lineales (6.5% delta a la frecuencia anterior)
Altos 2 - 16 kHz
(+) | máximos equilibrados - a sólo 2.1% de la mediana
(+) | los máximos son lineales (5% delta a la frecuencia anterior)
Total 100 - 16.000 Hz
(±) | la linealidad del sonido global es media (20.4% de diferencia con la mediana)
En comparación con la misma clase
» 45% de todos los dispositivos probados de esta clase eran mejores, 10% similares, 45% peores
» El mejor tuvo un delta de 7%, la media fue 21%, el peor fue ###max##%
En comparación con todos los dispositivos probados
» 54% de todos los dispositivos probados eran mejores, 8% similares, 38% peores
» El mejor tuvo un delta de 4%, la media fue 23%, el peor fue ###max##%
Gestión de la energía - Meteor Lake puede ser económico
Consumo de energía
Se dice que los nuevos procesadores Meteor Lake de Intel son significativamente más eficientes energéticamente que su predecesor. Esto no nos resultó del todo evidente en nuestras pruebas, pero, una vez más, esto pone de manifiesto el estado beta del software instalado. Se aprecian fuertes fluctuaciones en casi todas las mediciones de energía, lo que indica que los picos de carga son menores.
| Off / Standby | |
| Ocioso | |
| Carga |
|
Clave:
min: | |
| Acer Swift Go 14 SFG14-72 Ultra 7 155H, Arc 8-Core, SK hynix HFS001TEJ9X110NA, OLED, 2880x1800, 14" | LG Gram 2in1 16 16T90R - G.AA78G i7-1360P, Iris Xe G7 96EUs, Samsung PM9A1 MZVL21T0HCLR, IPS, 2560x1600, 16" | HP Pavilion Plus 14-ew0153TU i7-1355U, Iris Xe G7 96EUs, SK hynix PC801 HFS001TEJ9X101N, OLED, 2880x1800, 14" | Lenovo ThinkPad T14 G4 21K4S02000 R7 PRO 7840U, Radeon 780M, Samsung PM9A1a MZVL21T0HDLU, IPS LED, 1920x1200, 14" | Ayaneo Air 1S Retro Power R7 7840U, Radeon 780M, Ayaneo CyberThunder-2TB, OLED, 1920x1080, 5.5" | HP Pavilion Plus 14-ey0095cl R7 7840U, Radeon 780M, WDC PC SN810 1TB, OLED, 2880x1800, 14" | Medio Intel Arc 8-Core iGPU | Media de la clase Subnotebook | |
|---|---|---|---|---|---|---|---|---|
| Power Consumption | 9% | 14% | 38% | 22% | 15% | 3% | 29% | |
| Idle Minimum * (Watt) | 5.5 | 5.5 -0% | 6.7 -22% | 3.3 40% | 7.01 -27% | 6 -9% | 5.31 ? 3% | 3.73 ? 32% |
| Idle Average * (Watt) | 10.1 | 7.2 29% | 7.16 29% | 5.6 45% | 7.91 22% | 6.5 36% | 8.56 ? 15% | 6.51 ? 36% |
| Idle Maximum * (Watt) | 11.2 | 12.9 -15% | 11.17 -0% | 6.1 46% | 12.3 -10% | 13.9 -24% | 11.9 ? -6% | 7.88 ? 30% |
| Load Average * (Watt) | 45.9 | 55 -20% | 46.5 -1% | 40.1 13% | 19.66 57% | 41.9 9% | 53.6 ? -17% | 42.3 ? 8% |
| Witcher 3 ultra * (Watt) | 60.9 | 47 23% | 37.2 39% | 41.4 32% | 38.2 37% | 43.9 28% | ||
| Load Maximum * (Watt) | 104.1 | 63.6 39% | 64.36 38% | 51.8 50% | 50 52% | 50.8 51% | 84.2 ? 19% | 64.8 ? 38% |
* ... más pequeño es mejor
Power consumption Witcher 3 / stress test
Power consumption with an external monitor
Duración de las pilas
El Acer Swift Go 14, con su procesador Intel Meteor Lake y su batería de 65 Wh, se quedó justo por debajo de la marca de ocho horas en la prueba de navegación por Internet Wi-Fi. Según nuestras mediciones de energía, es el panel OLED el que consume más energía al navegar. Visitar páginas web y ejecutar aplicaciones en modo oscuro debería mejorar considerablemente los tiempos de ejecución. Con el predecesor, se podían conseguir casi 45 minutos de autonomía adicionales.
| Acer Swift Go 14 SFG14-72 Ultra 7 155H, Arc 8-Core, 65 Wh | Acer Swift Go 14 SFG14-71 i5-1335U, Iris Xe G7 80EUs, 54.6 Wh | LG Gram 2in1 16 16T90R - G.AA78G i7-1360P, Iris Xe G7 96EUs, 80 Wh | HP Pavilion Plus 14-ew0153TU i7-1355U, Iris Xe G7 96EUs, 68 Wh | Lenovo ThinkPad T14 G4 21K4S02000 R7 PRO 7840U, Radeon 780M, 52.5 Wh | Ayaneo Air 1S Retro Power R7 7840U, Radeon 780M, 37.5 Wh | HP Pavilion Plus 14-ey0095cl R7 7840U, Radeon 780M, 68 Wh | Media de la clase Subnotebook | |
|---|---|---|---|---|---|---|---|---|
| Duración de Batería | -5% | 58% | 20% | 48% | -17% | 37% | 71% | |
| WiFi v1.3 (h) | 8 | 7.6 -5% | 11.9 49% | 9.6 20% | 12.2 53% | 5.9 -26% | 8.5 6% | 14 ? 75% |
| Load (h) | 1.2 | 2 67% | 1.7 42% | 1.1 -8% | 2 67% | 1.998 ? 67% | ||
| H.264 (h) | 12 | 3.1 | 15.3 ? | |||||
| Gaming (h) | 1.2 | |||||||
| Reader / Idle (h) | 16.9 | 28.6 ? |
Pro
Contra
Veredicto - No sólo la oficina
Acer nos ha hecho llegar el Swift Go 14 bastante antes de que el dispositivo salga al mercado y eso significa que no todo funciona a la perfección. Pero ya hemos tenido la oportunidad de experimentar la última generación de procesadores de Intel y nos ha impresionado el rendimiento gráfico de alto nivel del chip Meteor Lake. Estaremos atentos a los cambios que se produzcan en el dispositivo hasta la primavera del año que viene y entonces emitiremos nuestro veredicto final sobre el Swift Go 14 (2024). No obstante, ya nos hemos dado cuenta de que la máquina compacta se beneficia del considerablemente más potente Core Ultra 7. El mayor rendimiento gráfico permite al portátil y a su excelente pantalla OLED disfrutar de un espectro de aplicaciones más amplio. Esto, al menos, hace que los juegos y la edición de vídeo sean una posibilidad. El núcleo NPU del Procesador Meteor Lake también fue capaz de demostrar su potencia en nuestras pruebas.
Con un peso de 1,3 kg, el Acer Swift Go 14 es una potencia ligera que ofrece una potencia considerable dentro de su elegante carcasa. El procesador Meteor Lake de Intel garantiza una gama significativamente más amplia de casos de uso de aplicaciones.
No hay duda, el Swift Go 14 es un dispositivo móvil. Gracias a Thunderbolt 4, HDMI 2.1 y algunos puertos adicionales, no le falta conectividad. En breve, habrá otras alternativas con procesadores Meteor Lake, y Asus ya ofrece un chipset de este tipo en su ZenBook 14. Cualquiera demasiado impaciente para esperar a portátiles con procesadores Intel debería echar un vistazo a máquinas de 14 pulgadas con el AMD Ryzen 7 7840U como el HP Pavilion Plus 14.
Precio y disponibilidad
Se espera que la Swift Go 14 esté disponible a partir de febrero de 2024. Hasta el momento, se ha anunciado un precio de compra previsto de algo menos de 1.000 euros para Alemania.
Transparencia
La selección de los dispositivos que se van a reseñar corre a cargo de nuestro equipo editorial. La muestra de prueba fue proporcionada al autor en calidad de préstamo por el fabricante o el minorista a los efectos de esta reseña. El prestamista no tuvo ninguna influencia en esta reseña, ni el fabricante recibió una copia de la misma antes de su publicación. No había ninguna obligación de publicar esta reseña. Como empresa de medios independiente, Notebookcheck no está sujeta a la autoridad de fabricantes, minoristas o editores.
Así es como prueba Notebookcheck
Cada año, Notebookcheck revisa de forma independiente cientos de portátiles y smartphones utilizando procedimientos estandarizados para asegurar que todos los resultados son comparables. Hemos desarrollado continuamente nuestros métodos de prueba durante unos 20 años y hemos establecido los estándares de la industria en el proceso. En nuestros laboratorios de pruebas, técnicos y editores experimentados utilizan equipos de medición de alta calidad. Estas pruebas implican un proceso de validación en varias fases. Nuestro complejo sistema de clasificación se basa en cientos de mediciones y puntos de referencia bien fundamentados, lo que mantiene la objetividad.Price comparison

