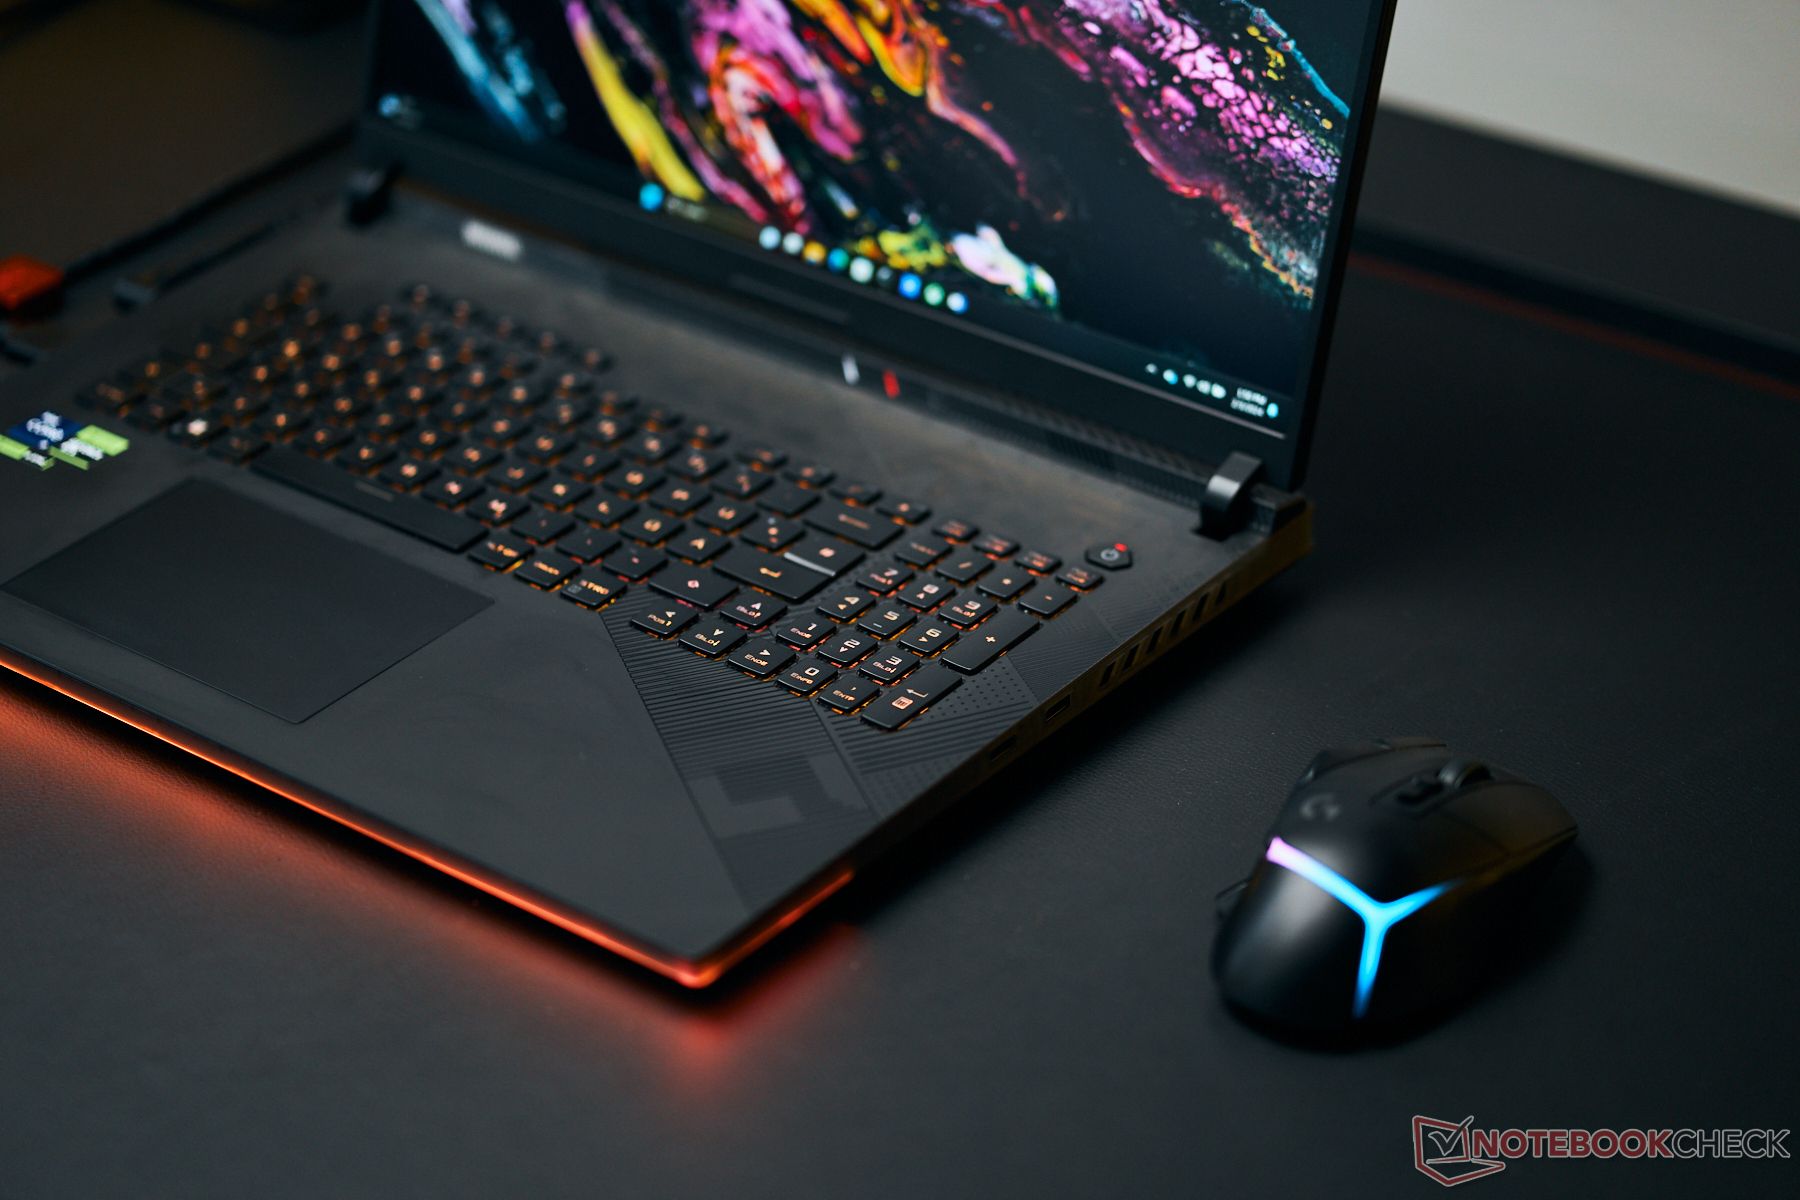
Análisis del Asus ROG Strix Scar 18 (2024): Portátil gaming con RTX 4090 y panel mini-LED
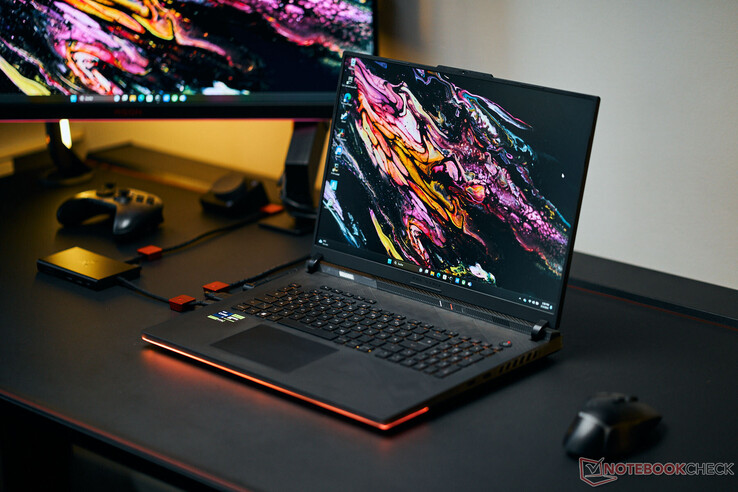
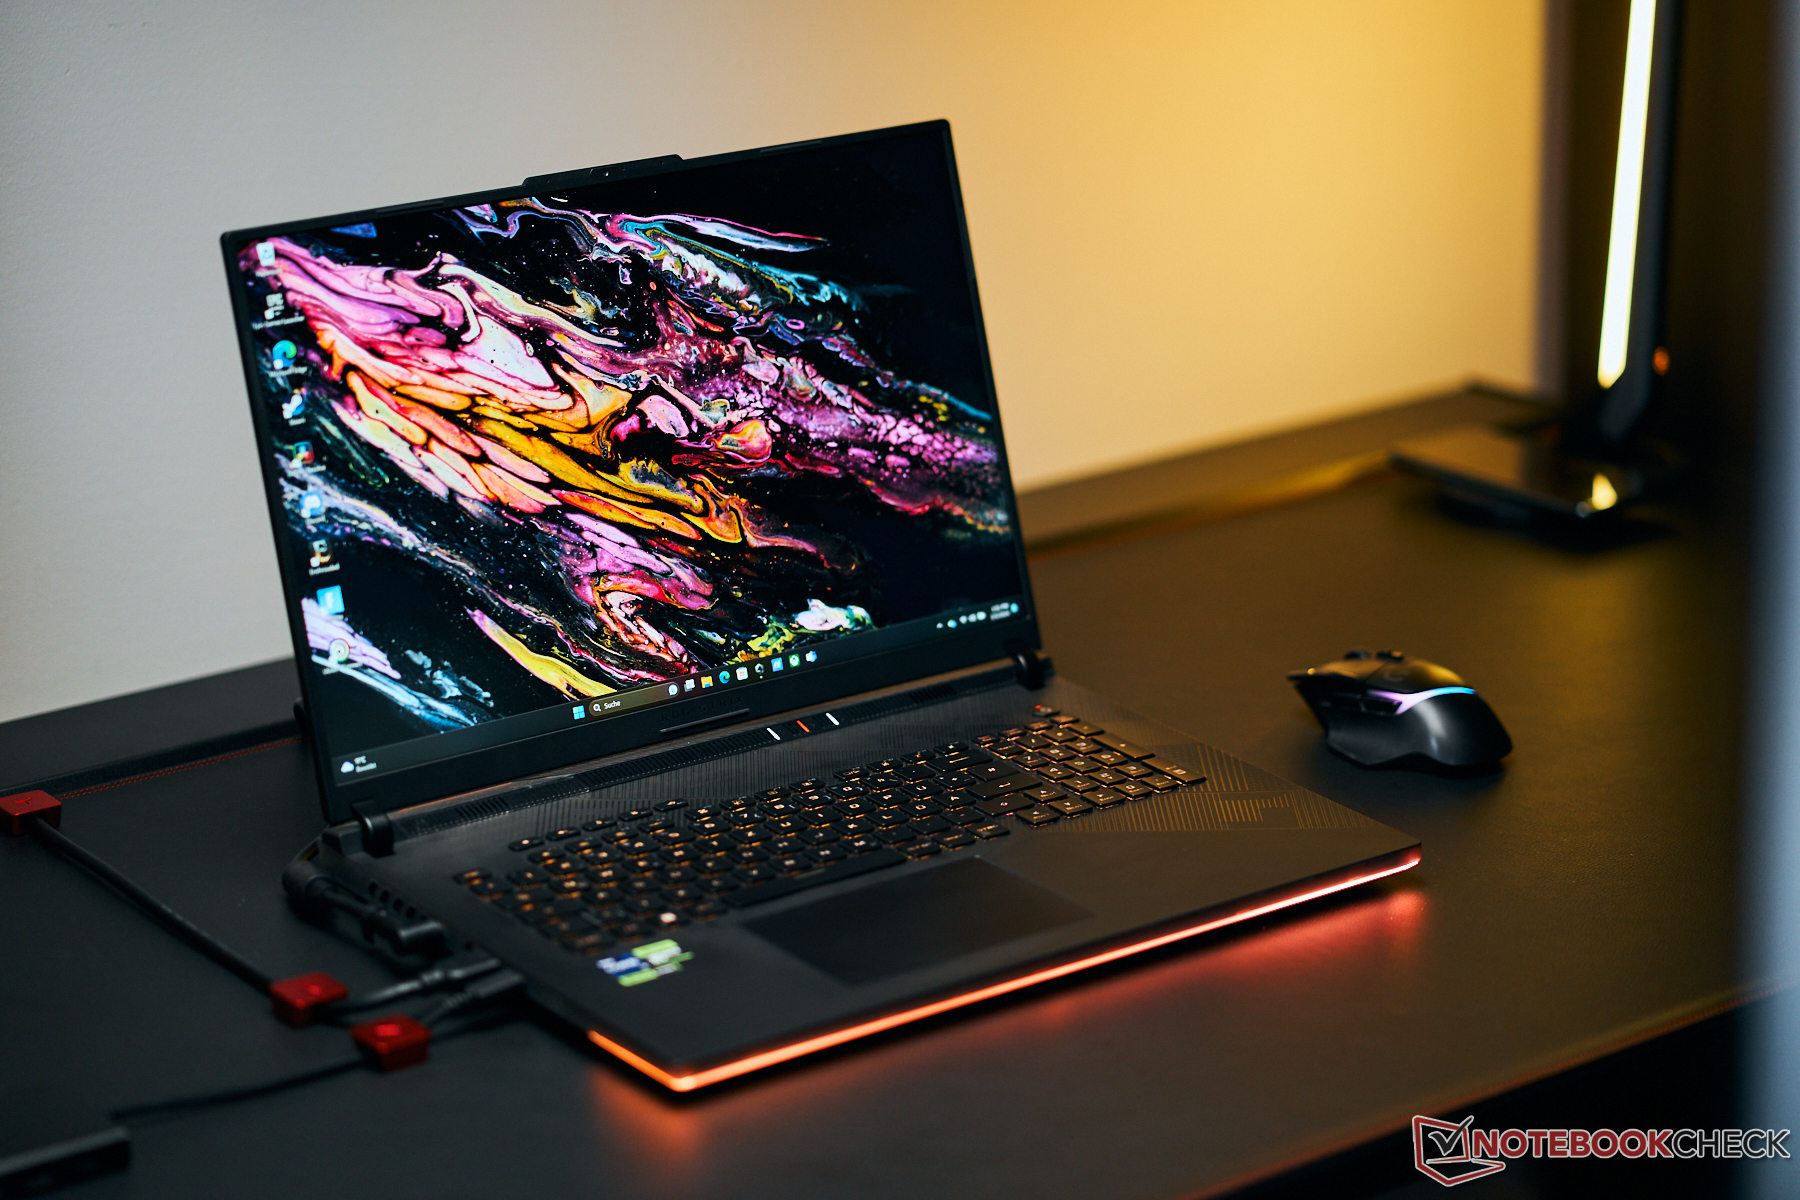
Con el ROG Strix Scar 18, ASUS se dirige a los jugadores y creadores que no carecen de los fondos necesarios: Nuestra configuración de prueba del campeón de gama alta está disponible a partir de unos 4.500 euros (~4.848 dólares). El precio se ve impulsado a tales alturas por el potente hardware y una pantalla mini-LED muy brillante en formato 16:10 con colores precisos y una diagonal de 18 pulgadas. Entre los competidores se encuentran dispositivos como el Alienware m18 R1el Acer Predator Helios 18el Razer Blade 18y el MSI Titan 18 HX A14VIG.
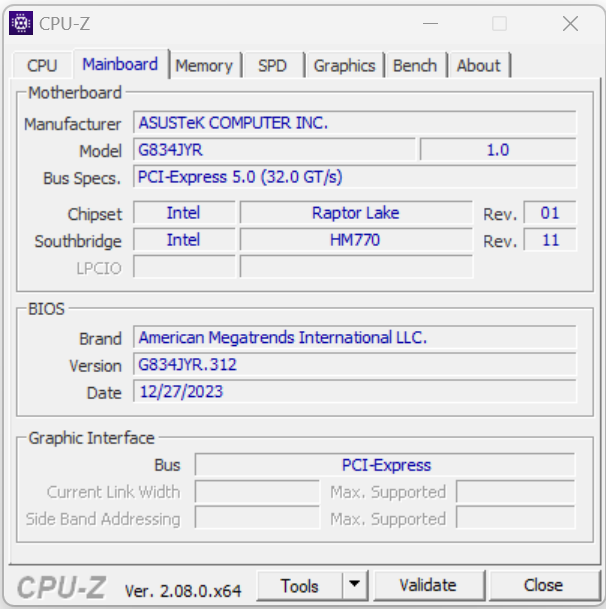
El portátil es el hermano del Scar 18 que probamos el año pasado y comparte una construcción idéntica. Además de la pantalla, la generación de CPU representa el único cambio, con Raptor Lake Refresh sustituyendo a Raptor Lake.
Posibles contendientes en la comparación
Valoración | Fecha | Modelo | Peso | Altura | Tamaño | Resolución | Precio |
|---|---|---|---|---|---|---|---|
| 88.3 % v7 (old) | 02/2024 | Asus ROG Strix Scar 18 G834JYR (2024) i9-14900HX, GeForce RTX 4090 Laptop GPU | 3.1 kg | 30.8 mm | 18.00" | 2560x1600 | |
| 89.2 % v7 (old) | 11/2023 | Alienware m18 R1 AMD R9 7945HX, Radeon RX 7900M | 3.9 kg | 26.7 mm | 18.00" | 1920x1200 | |
| 90.7 % v7 (old) | 04/2023 | Alienware m18 R1 i9-13980HX, GeForce RTX 4090 Laptop GPU | 3.9 kg | 26.7 mm | 18.00" | 1920x1200 | |
| 88.3 % v7 (old) | 10/2023 | Acer Predator Helios 18 N23Q2 i9-13900HX, GeForce RTX 4080 Laptop GPU | 3.2 kg | 29.15 mm | 18.00" | 2560x1600 | |
| 91.4 % v7 (old) | 02/2023 | Razer Blade 18 RTX 4070 i9-13950HX, GeForce RTX 4070 Laptop GPU | 3 kg | 21.9 mm | 18.00" | 2560x1600 | |
| 88.8 % v7 (old) | 01/2024 | MSI Titan 18 HX A14VIG i9-14900HX, GeForce RTX 4090 Laptop GPU | 3.6 kg | 32.1 mm | 18.00" | 3840x2400 |
Caja - Mucho plástico y poco aluminio
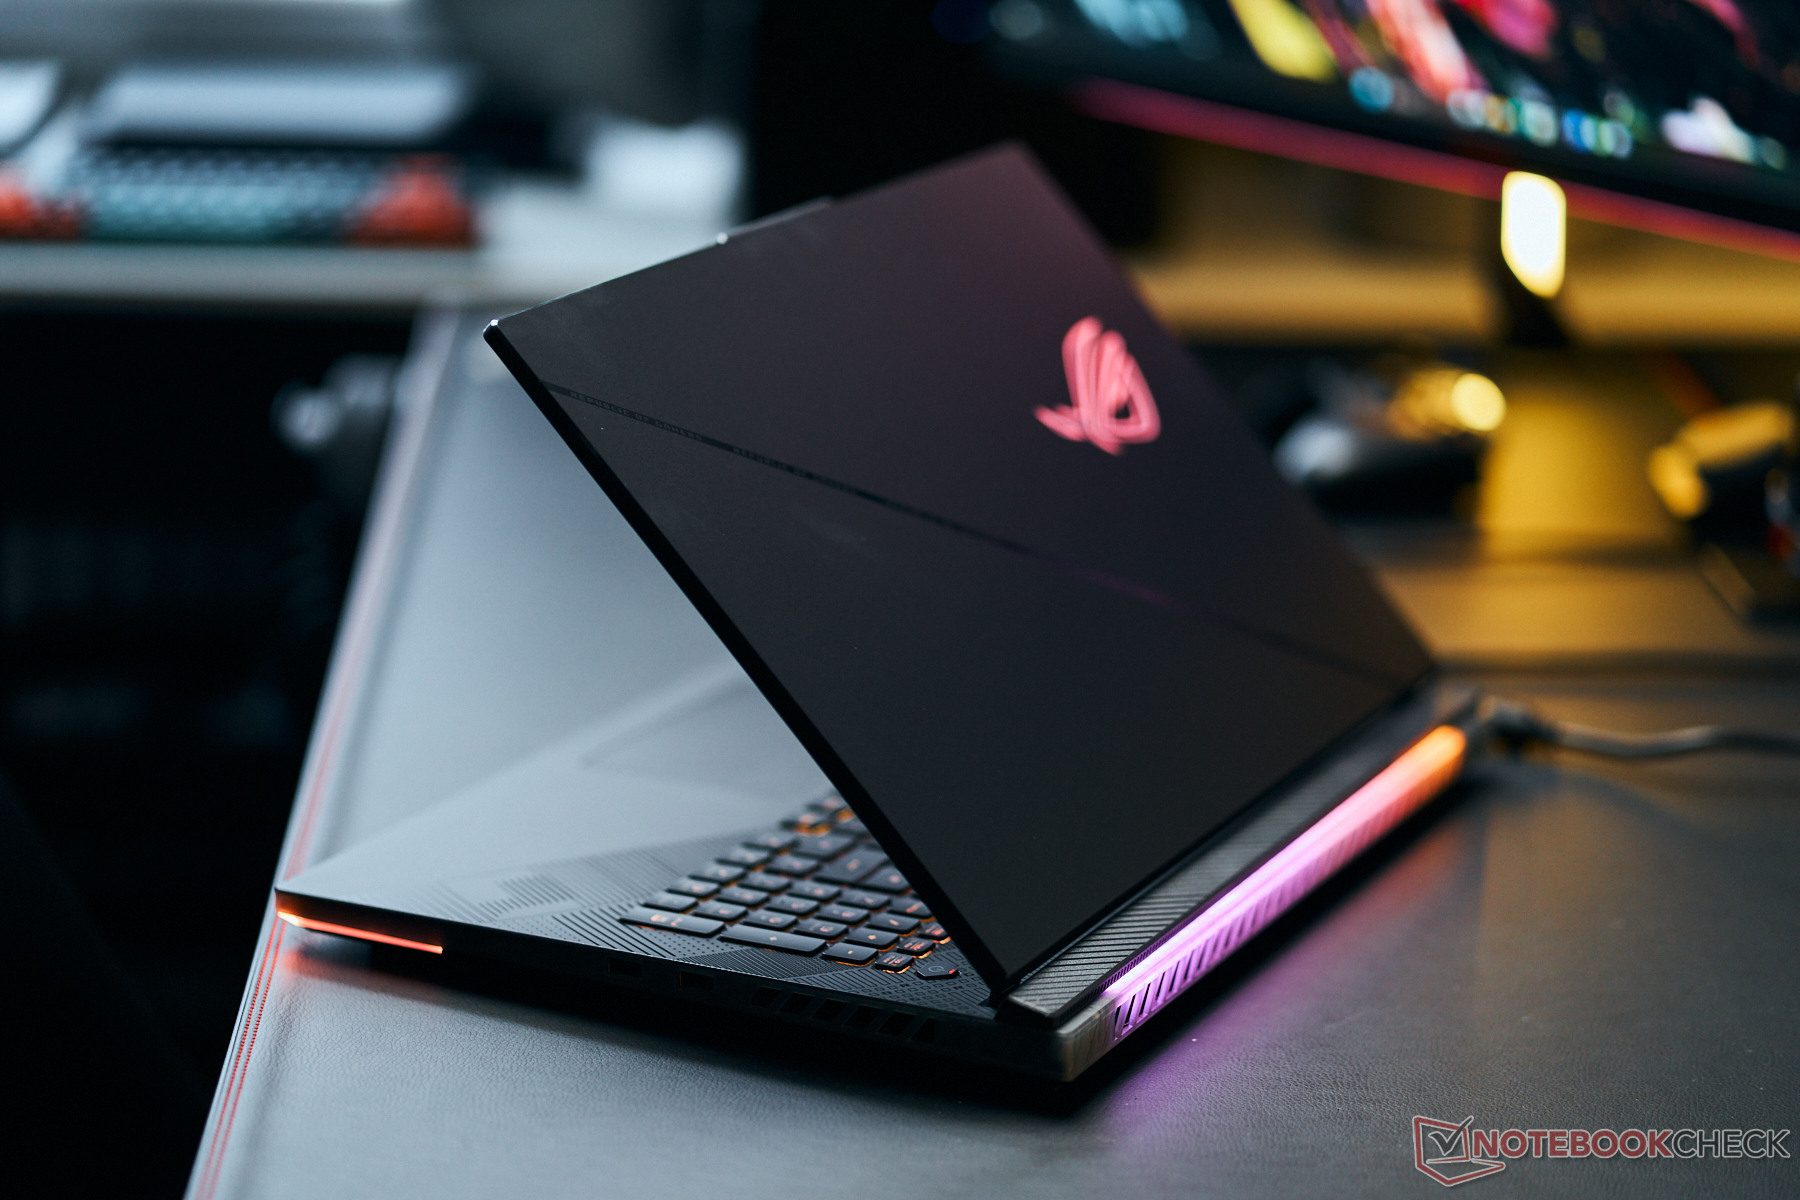
A pesar de su elevado nivel de precio, el uso de materiales de alta calidad sigue siendo limitado, ya que sólo la parte trasera de la tapa de la pantalla del Scar es de aluminio y el resto de los componentes son de plástico. Algunas partes del plástico (encima del teclado y en los laterales cortos) dejan pasar algo de luz. Unas bandas LED en la parte delantera y trasera y un logotipo iluminado en la tapa de la pantalla aportan algo de vida a la carcasa negra.
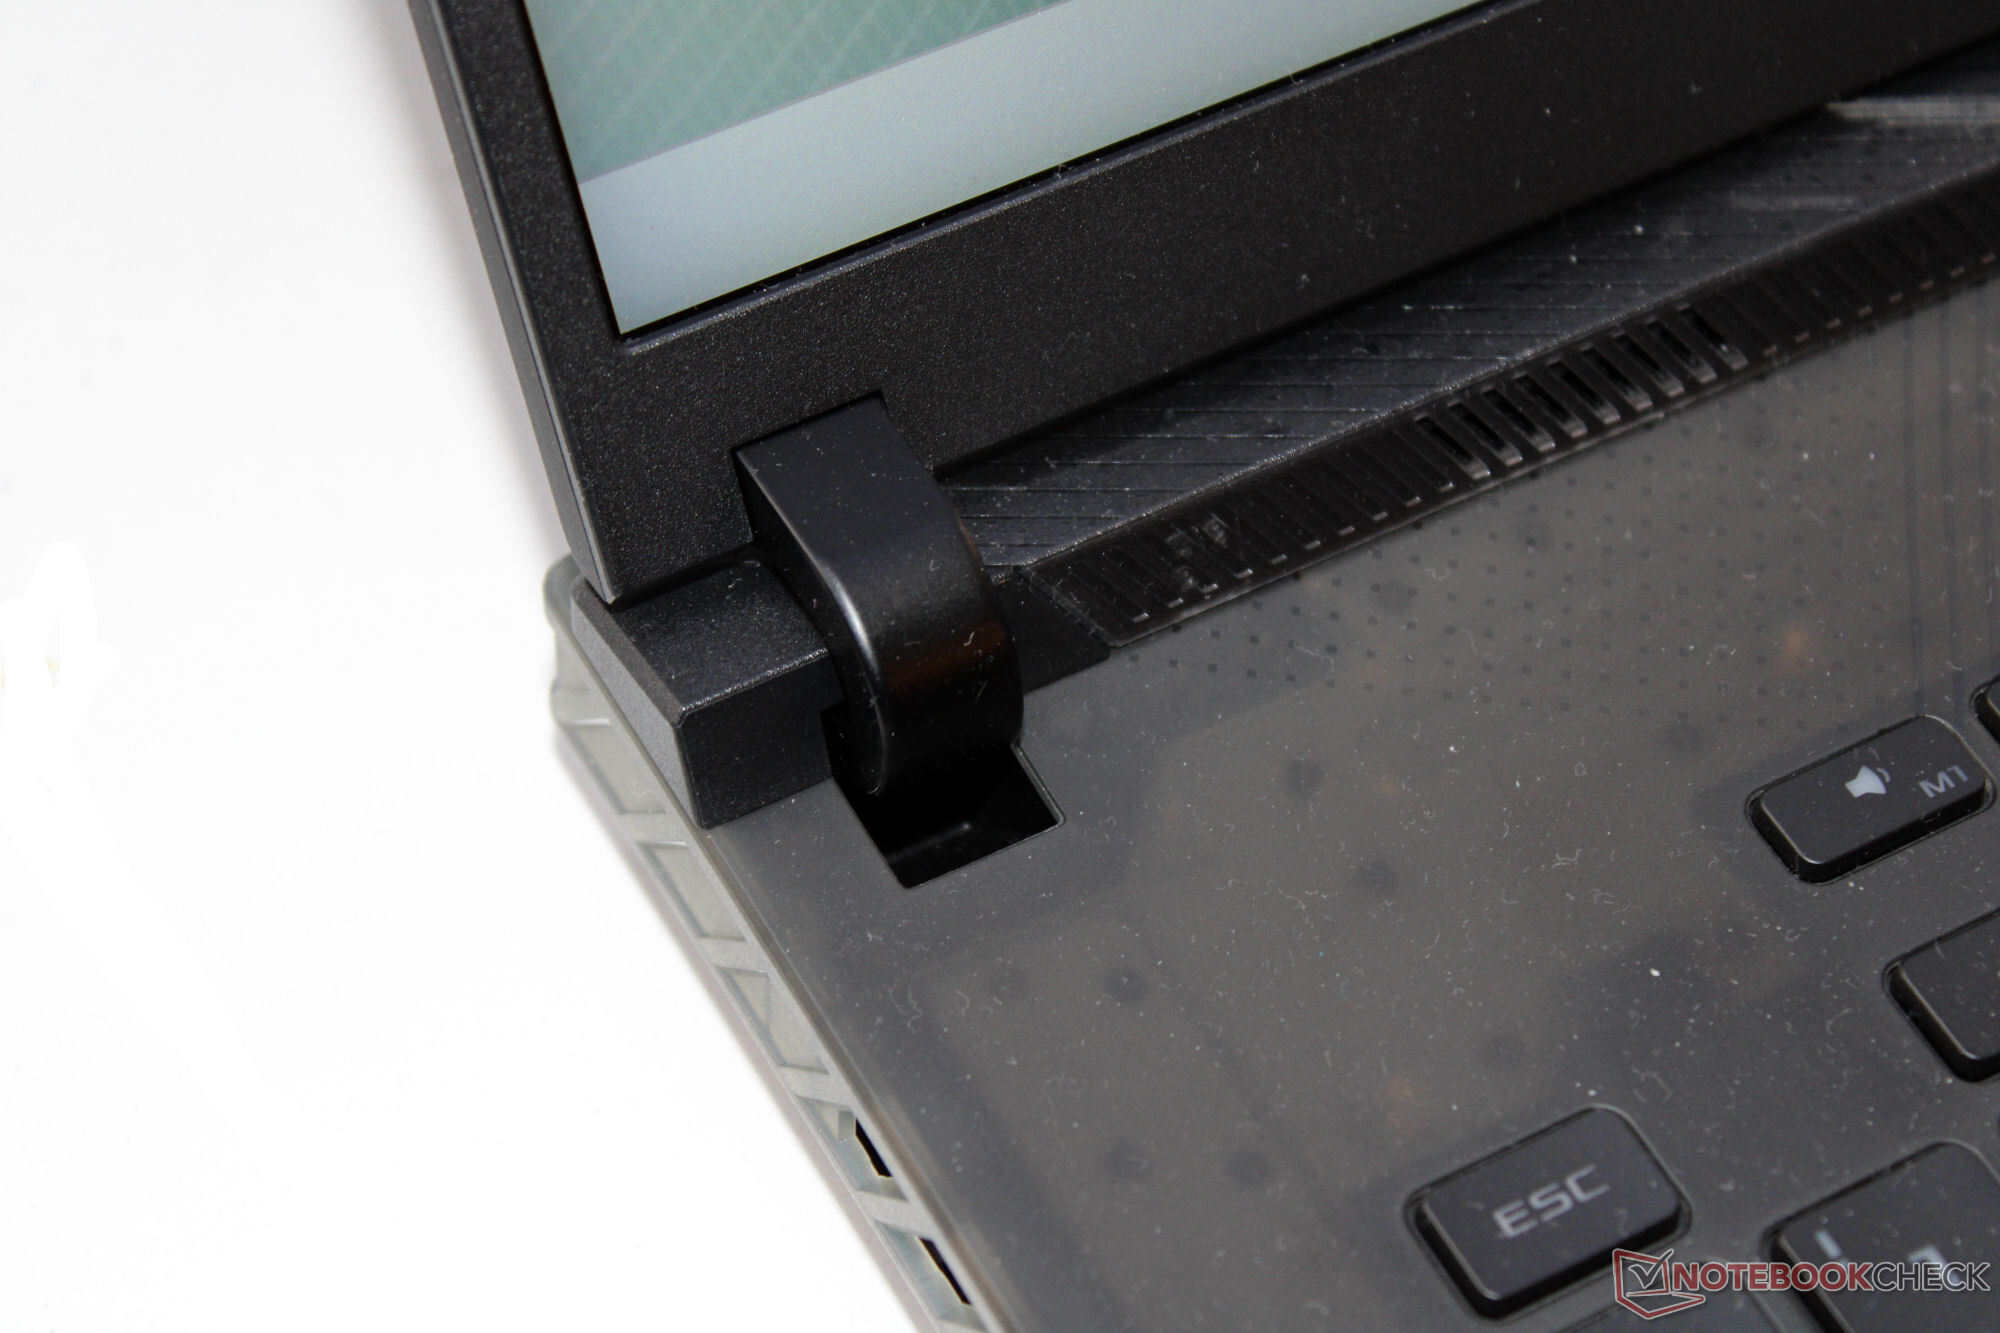
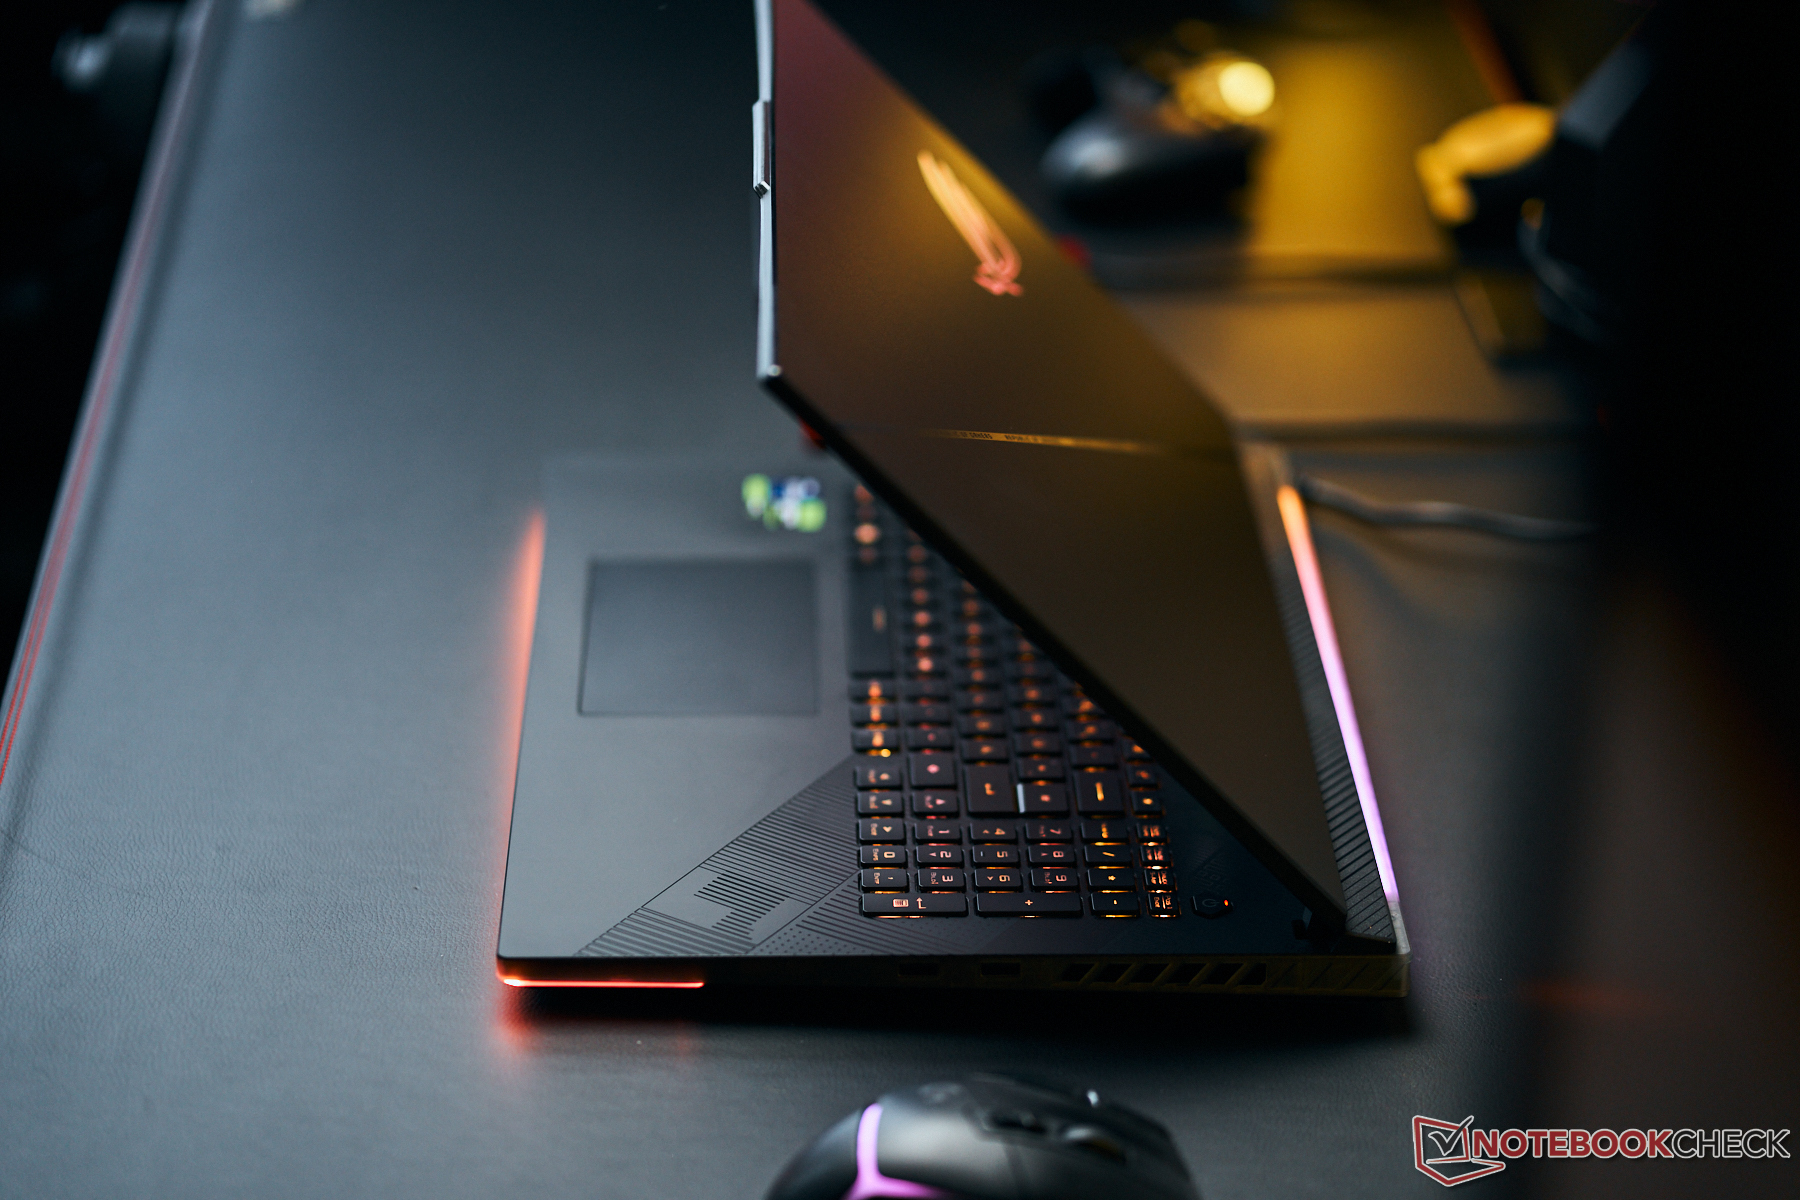
No vemos ningún fallo en la fabricación y las holguras del material son pequeñas y uniformes. Mientras que la tapa sólo se puede girar ligeramente, la respuesta de la unidad base es más pronunciada. Un portátil caro de varios miles de euros debería hacerlo mejor aquí. La presión sobre la tapa de la pantalla no causa ningún artefacto de imagen. Las bisagras mantienen la tapa en su sitio con firmeza, pero la pantalla aún se tambalea ligeramente al mover el portátil. El ángulo máximo de apertura es de 130 grados, y se puede abrir con una sola mano.
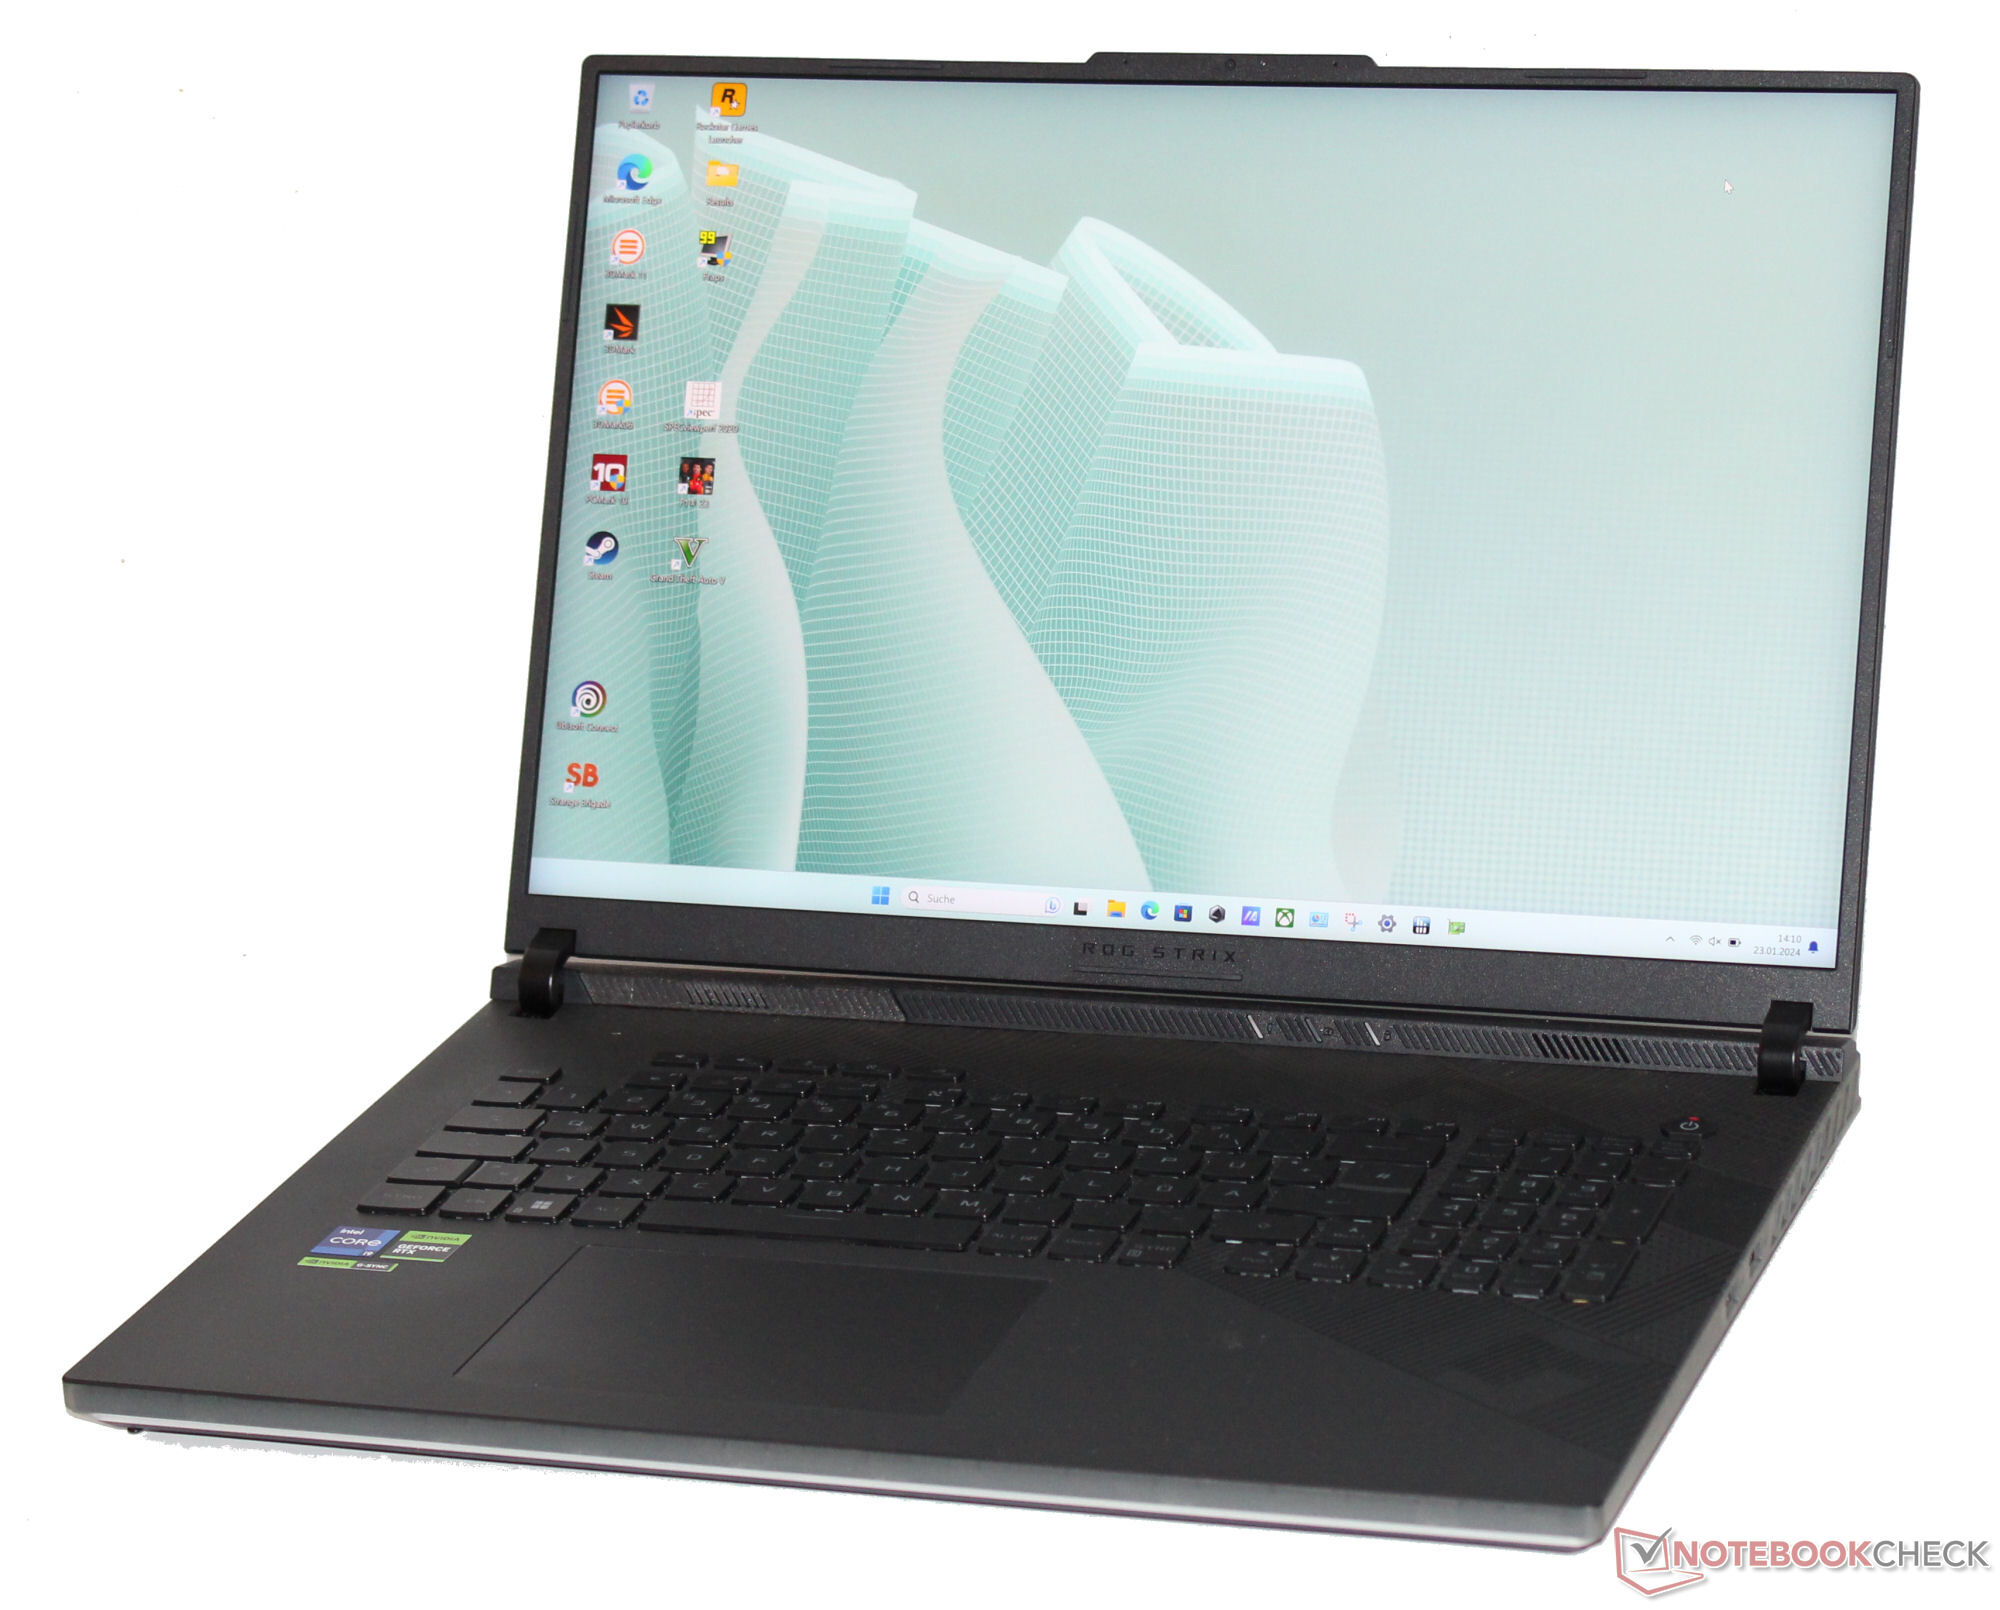
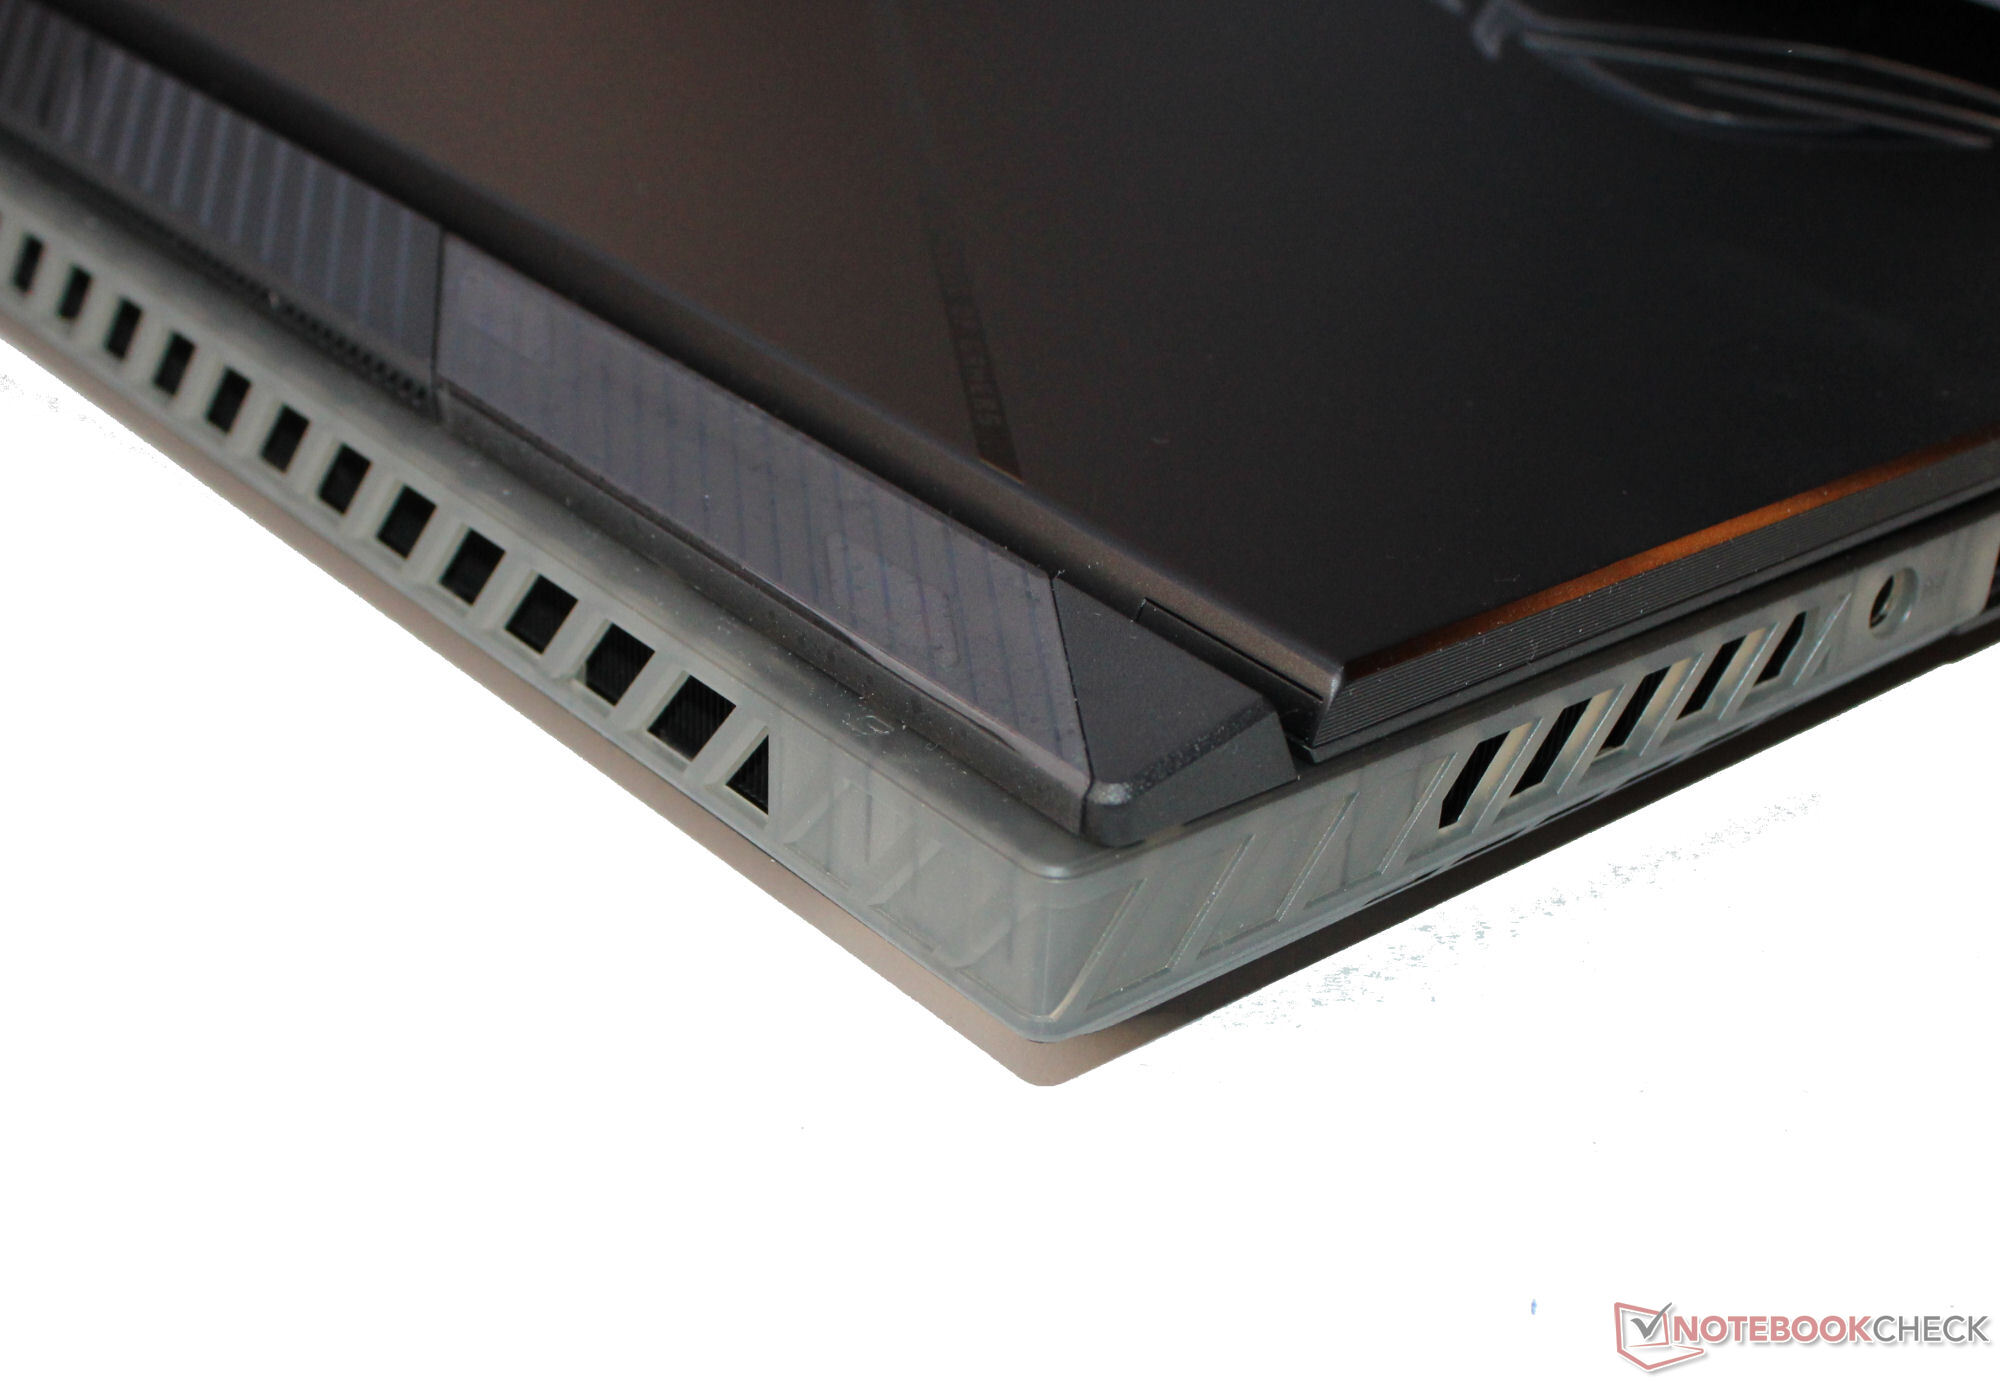
El Scar 18 es uno de los aparatos más compactos y ligeros de nuestra comparativa y sólo es superado por el Blade 18 en estos aspectos.
Equipamiento - Asus Strix ofrece Thunderbolt 4
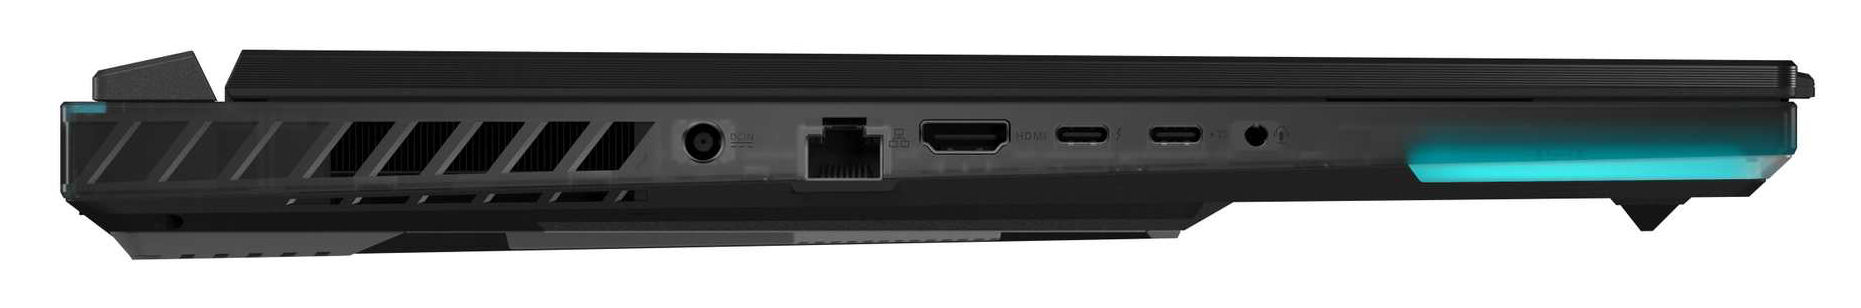
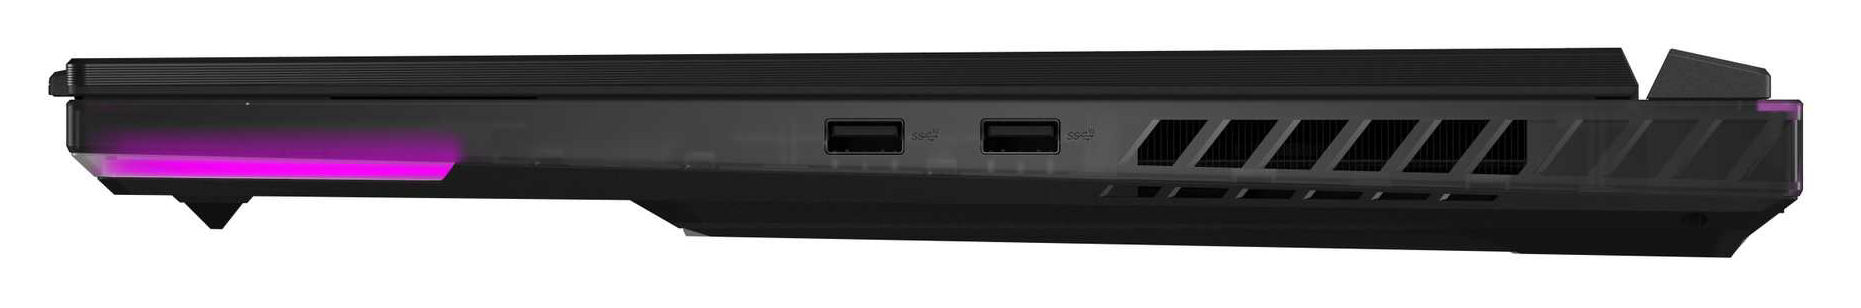
El portátil Asus ofrece dos puertos USB-A (USB 3.2 Gen 2) y dos puertos USB-C (1x Thunderbolt 4, 1x USB 3.2 Gen 2). Ambos puertos USB-C son capaces de emitir una señal DisplayPort, y el puerto USB 3.2 Gen 2 también es compatible con Power Delivery. Las conexiones se completan con un puerto HDMI, un puerto de audio y un puerto Gigabit Ethernet. El portátil no incluye un lector de tarjetas de almacenamiento.
No hay puertos en la parte trasera del portátil, y todos los puertos están situados en los laterales izquierdo y derecho de la carcasa. Los cables que van hacia la parte trasera bloquearían algunas de las aberturas de los ventiladores en los laterales del portátil. Este es el caso, por ejemplo, del cable de alimentación (enchufe de alimentación en ángulo). Los usuarios diestros sólo podrían sentirse molestos por los puertos USB-A que sólo están colocados en el lado derecho.
Comunicación
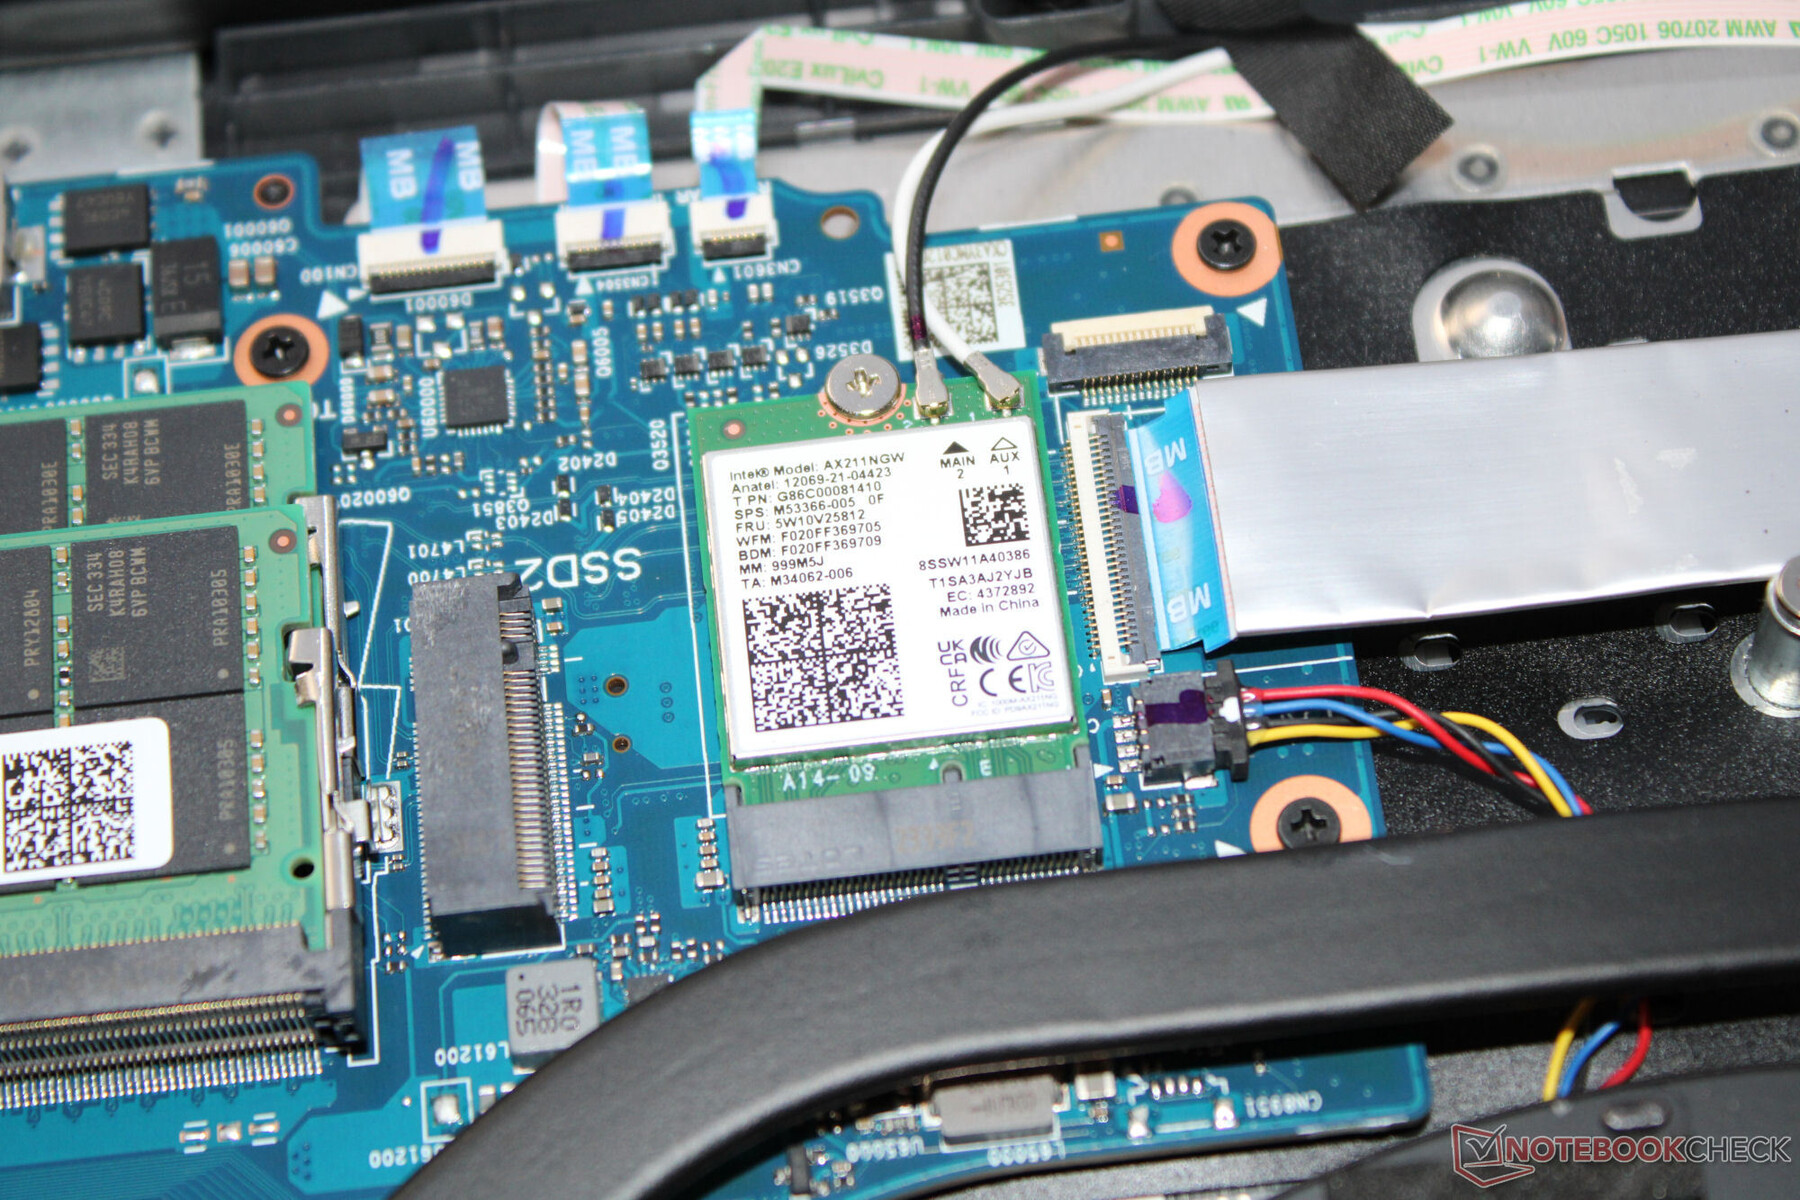
En condiciones óptimas (sin otros dispositivos Wi-Fi próximos, distancia corta entre el portátil y el PC servidor), el portátil alcanza velocidades de transferencia Wi-Fi de buenas a muy buenas. El Strix utiliza un chip Wi-Fi 6E (Intel AX211), y de las conexiones por cable se encarga un controlador Realtek (RTL8125; 2,5 Gbit/s).
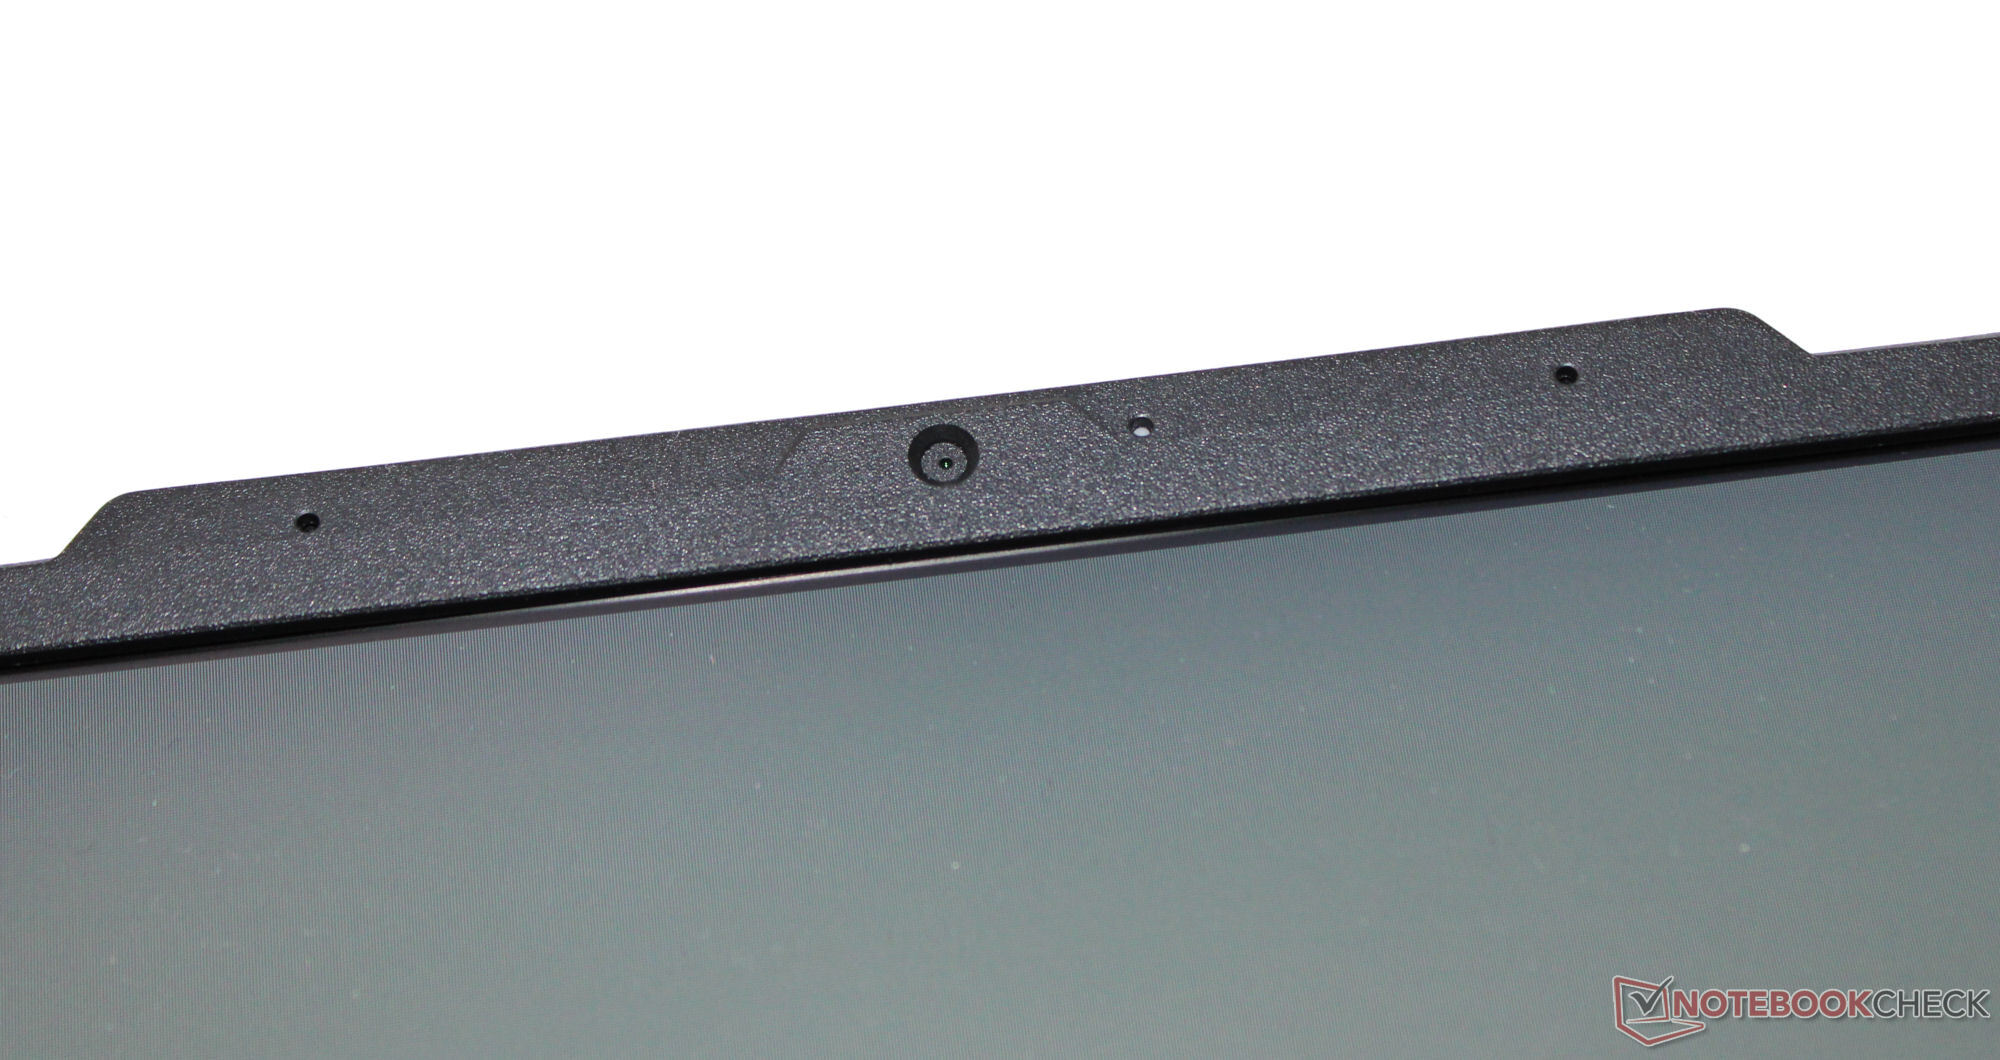
Cámara web
Aunque Asus utiliza en la mayoría de los casos hardware de primera calidad, la cámara web es una excepción, ya que aquí sólo se utiliza un escaso modelo de 0,9 MP (1280 x 720 píxeles como máximo). La calidad de imagen es poco convincente, pero una desviación de color de alrededor de 8 (objetivo DeltaE < 3) sigue estando bien. La cámara no incluye obturador manual.

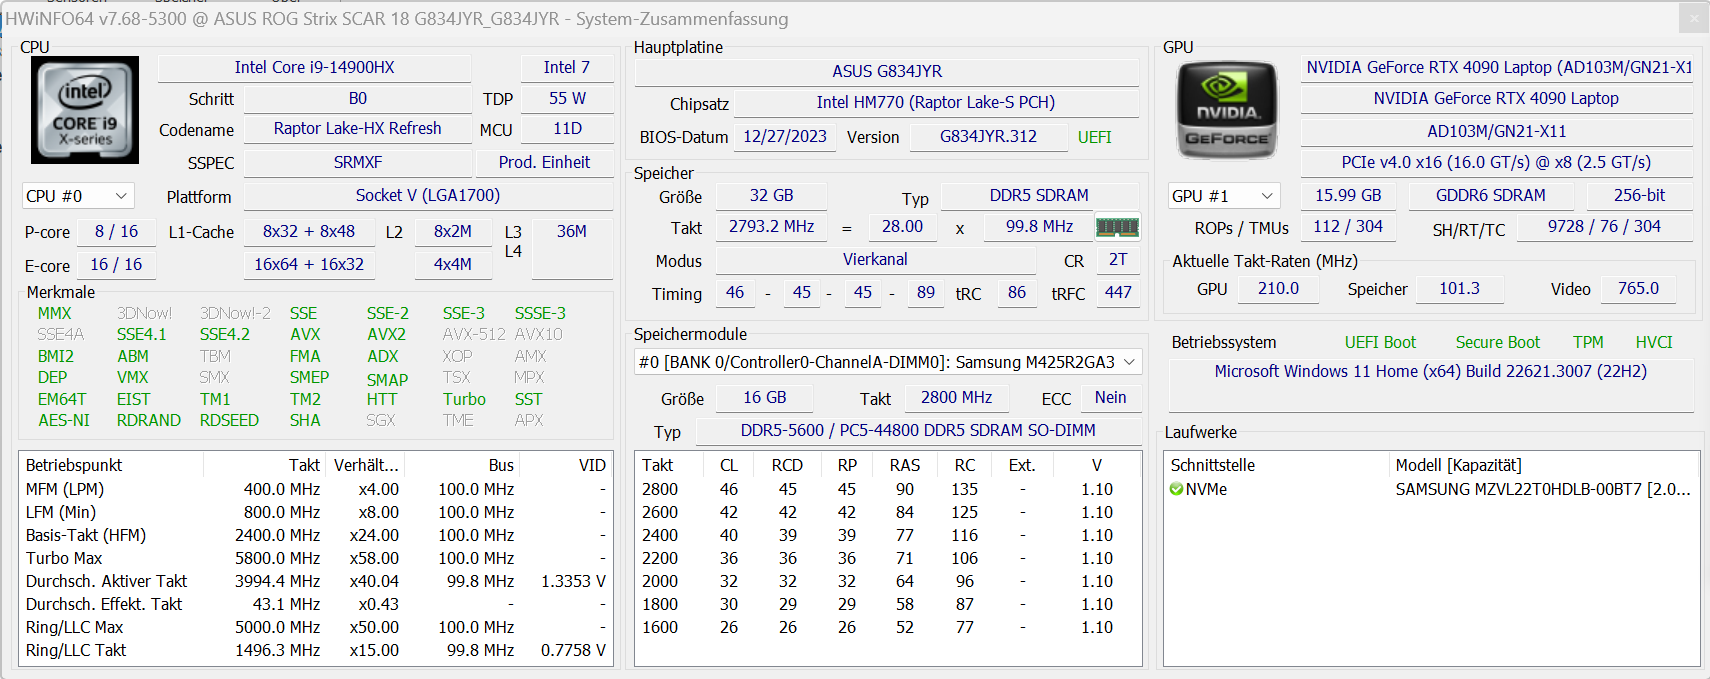
 GeForce RTX 4090 Laptop GPU, i9-14900HX, Samsung PM9A1a MZVL22T0HDLB")
 GeForce RTX 4090 Laptop GPU, i9-14900HX, Samsung PM9A1a MZVL22T0HDLB")
Accesorios
El portátil no incluye ningún accesorio adicional aparte de los documentos habituales.
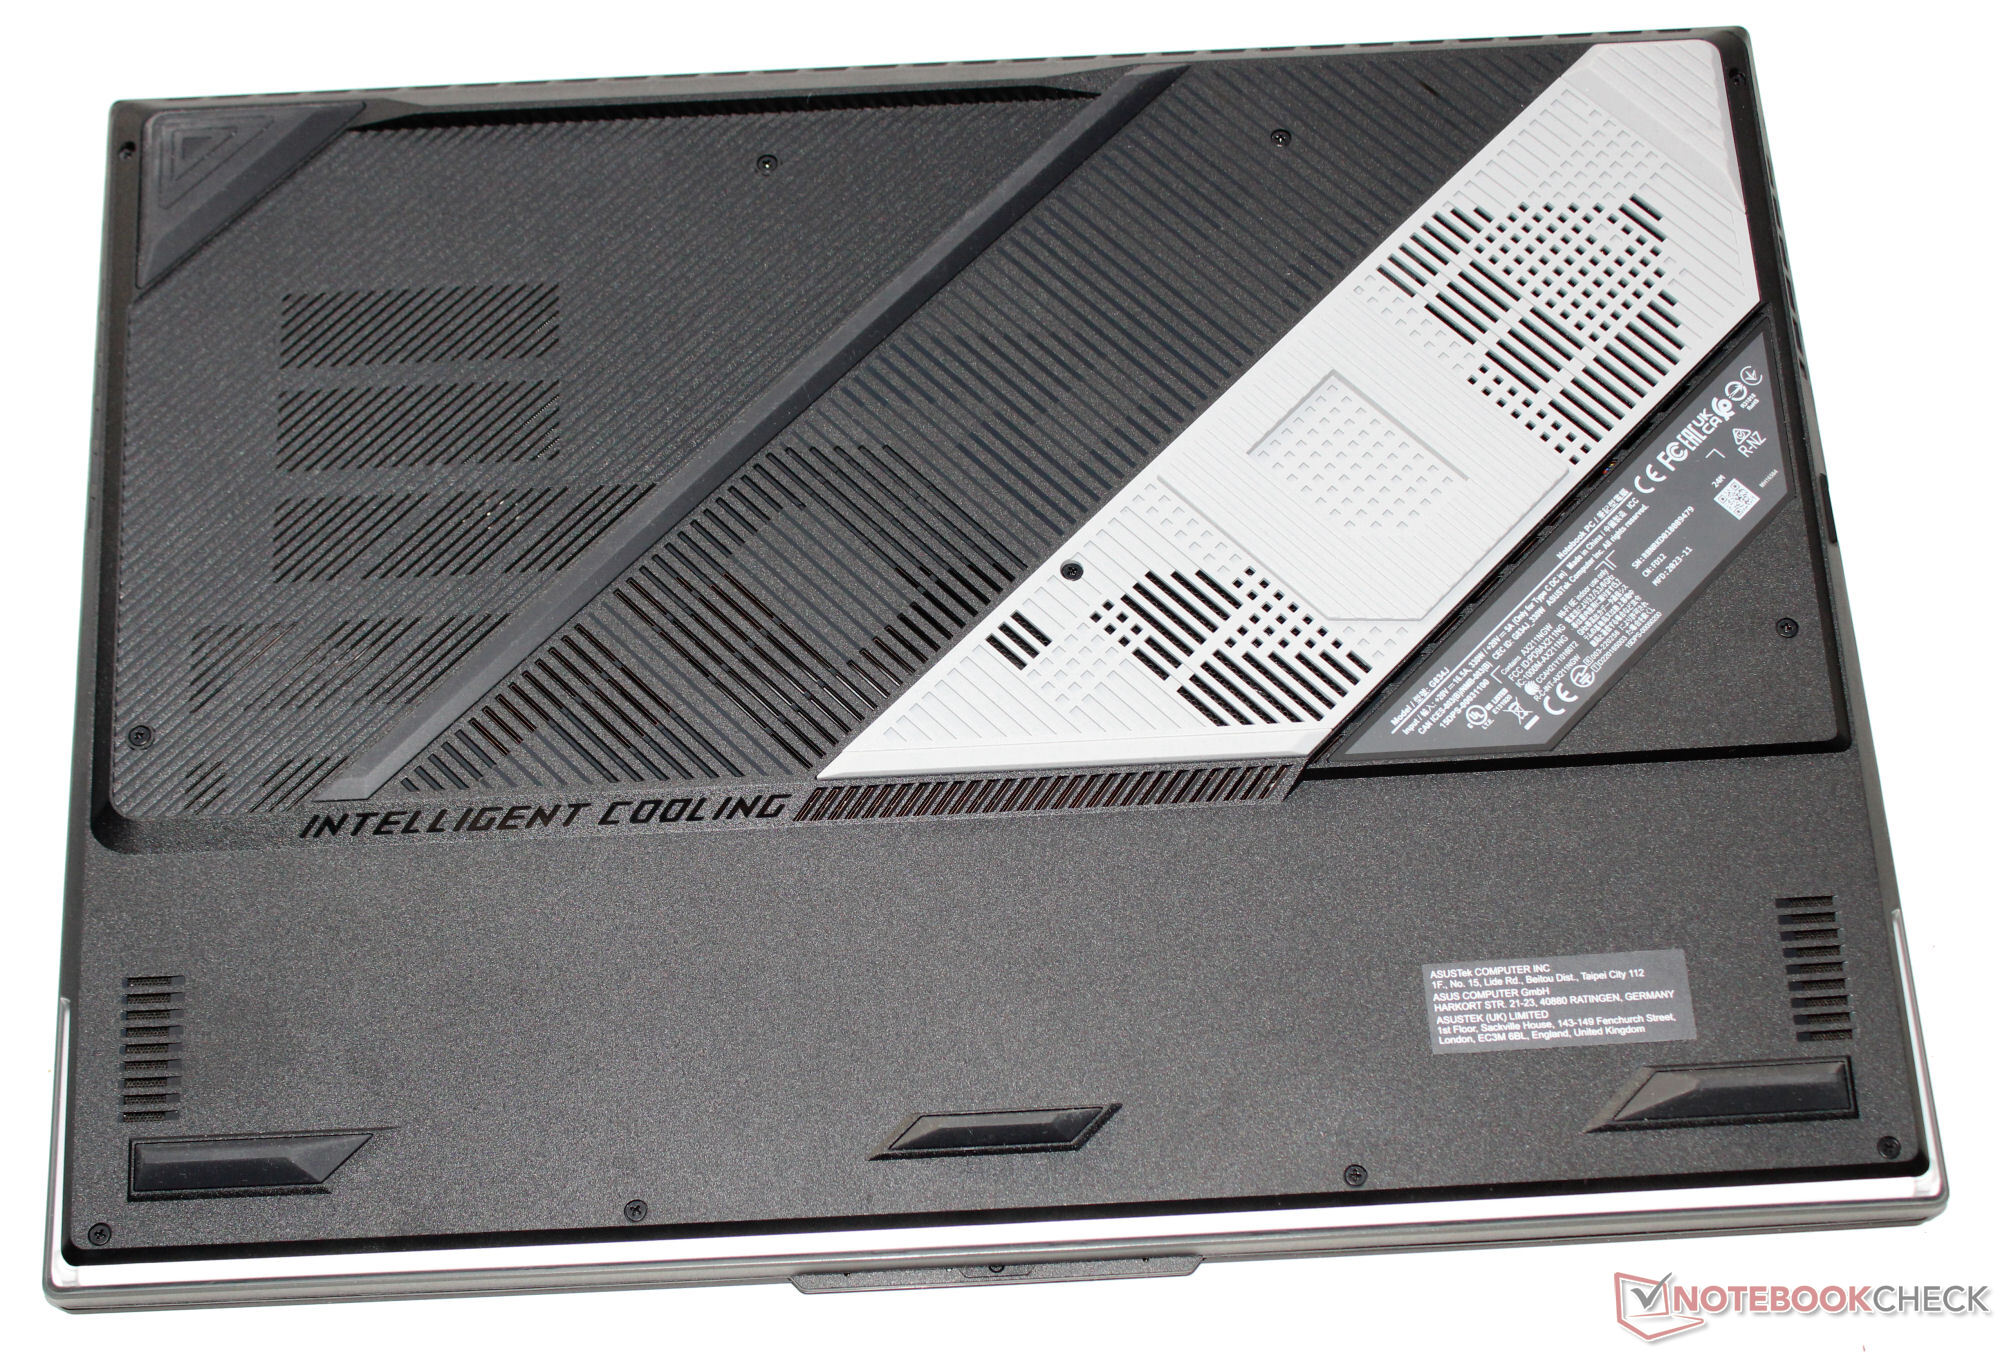
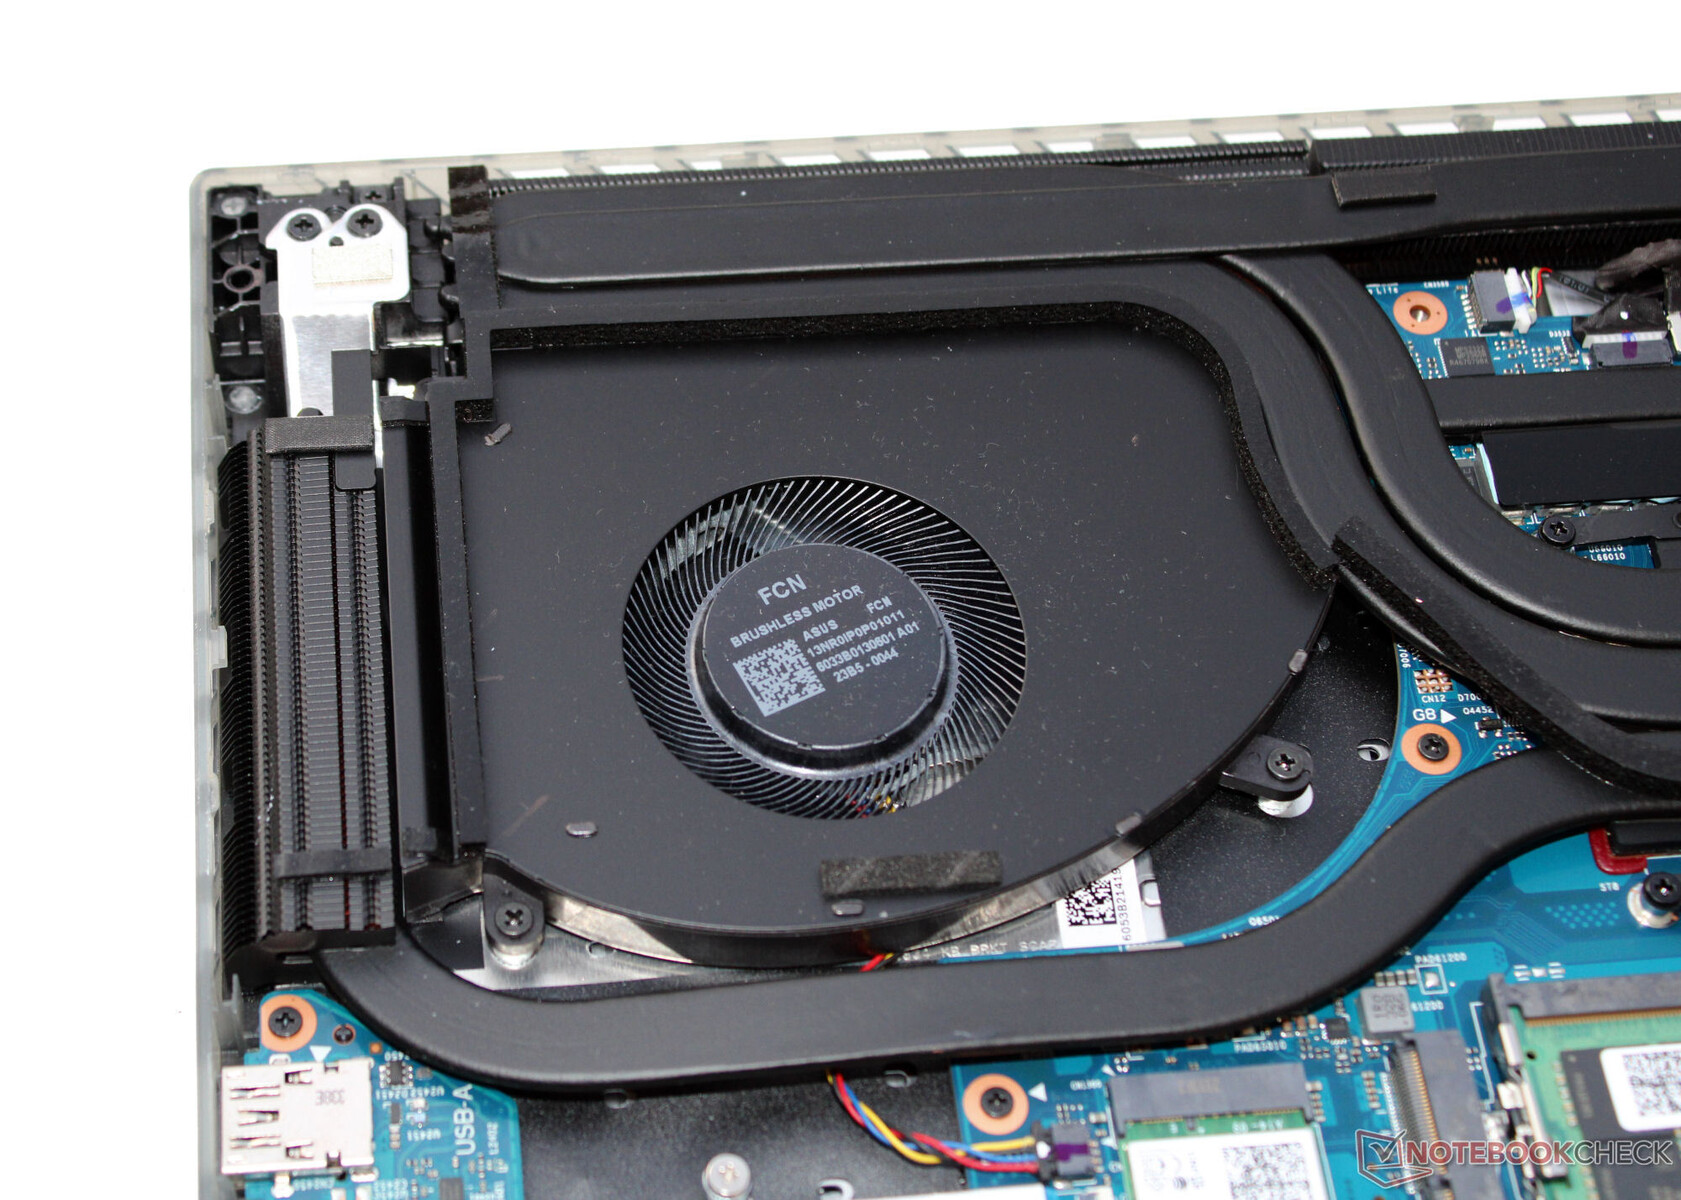
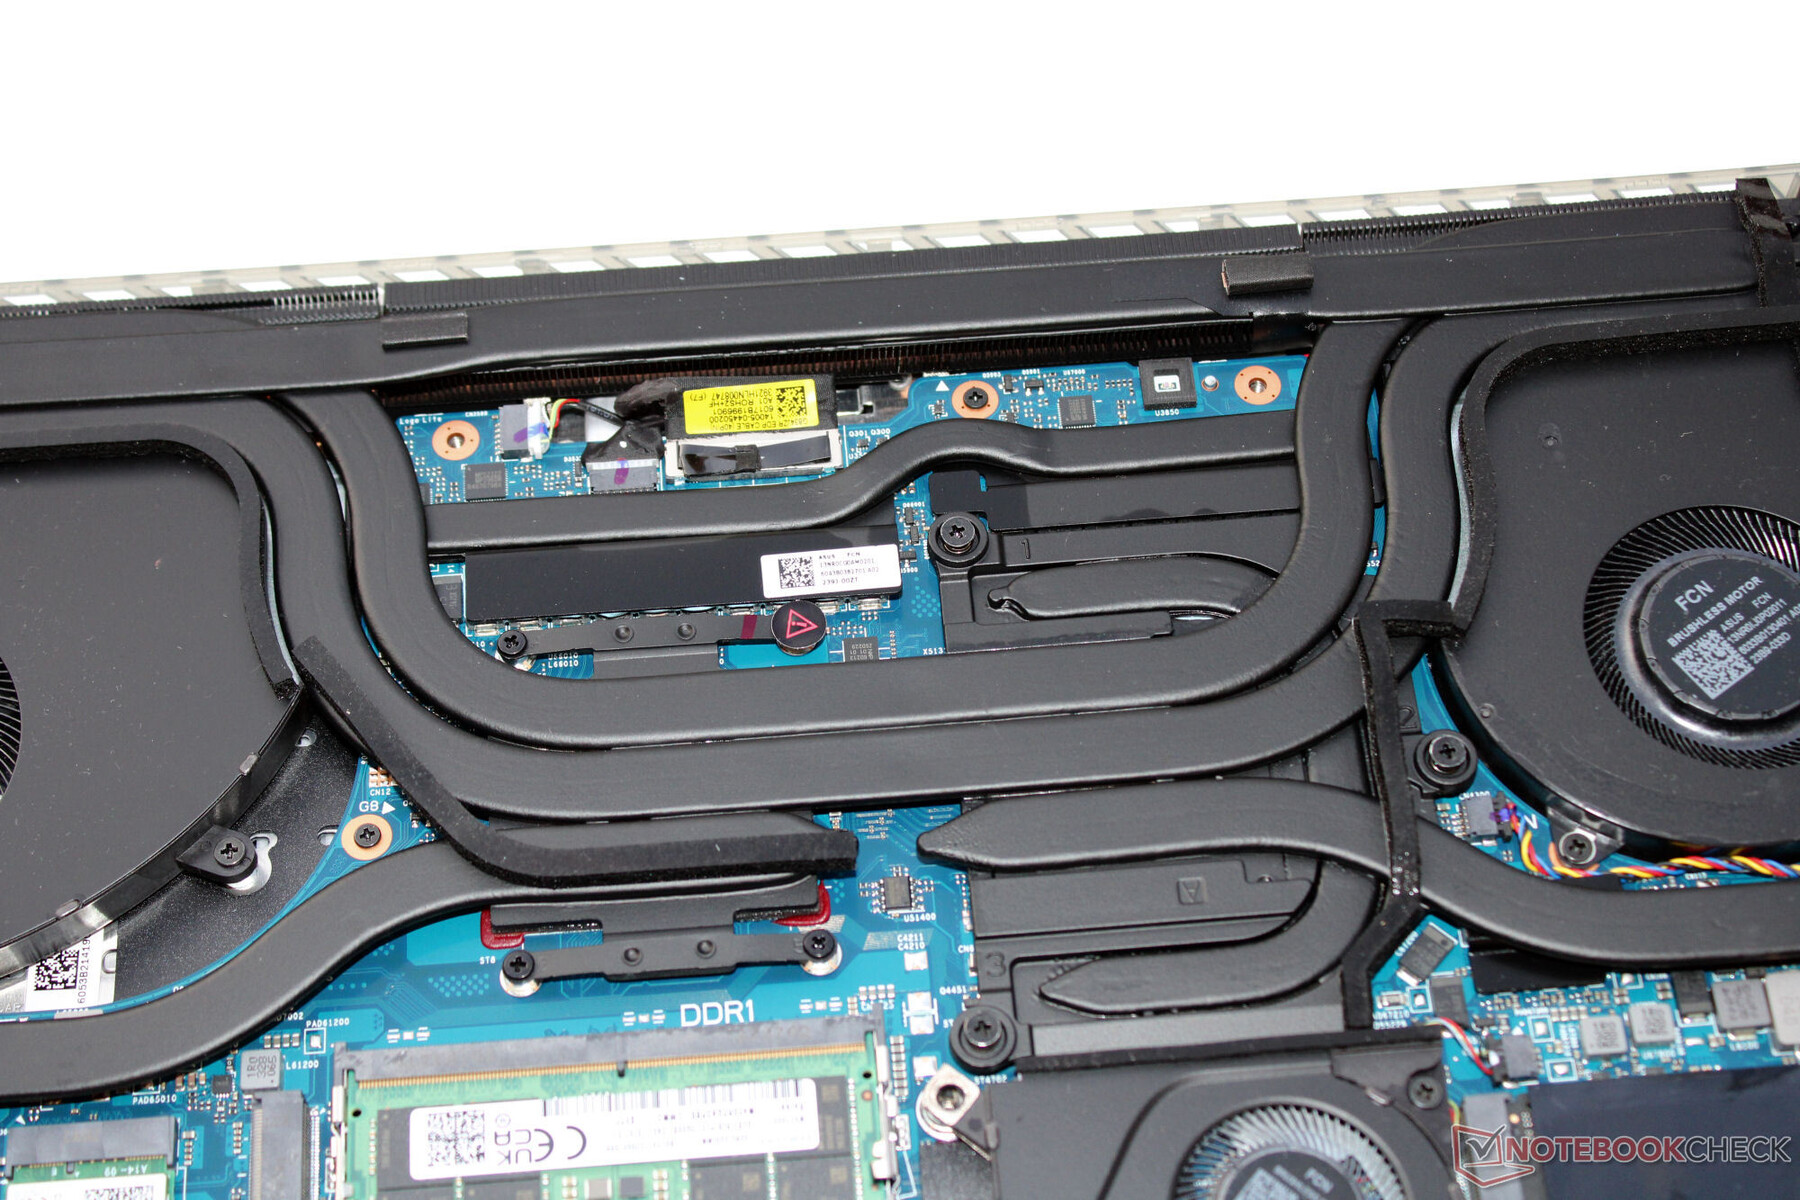
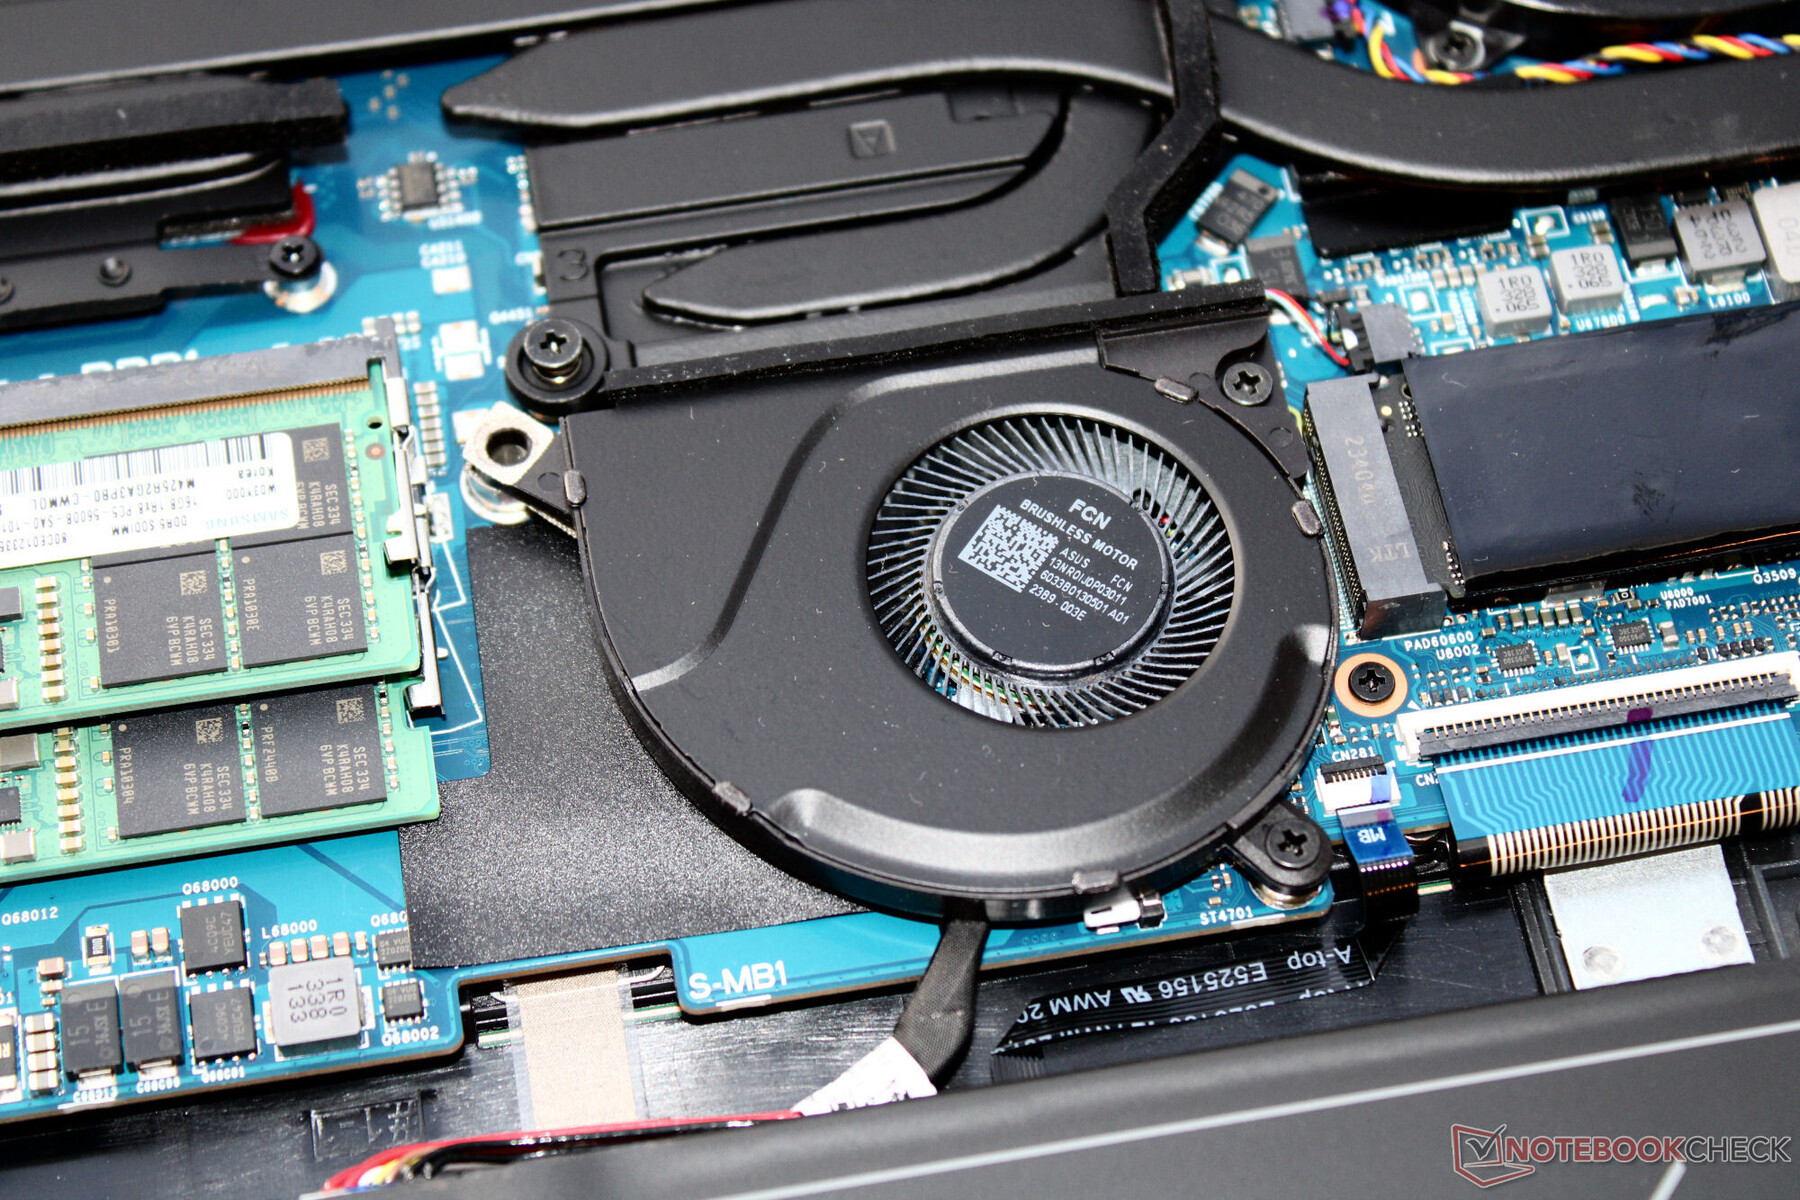
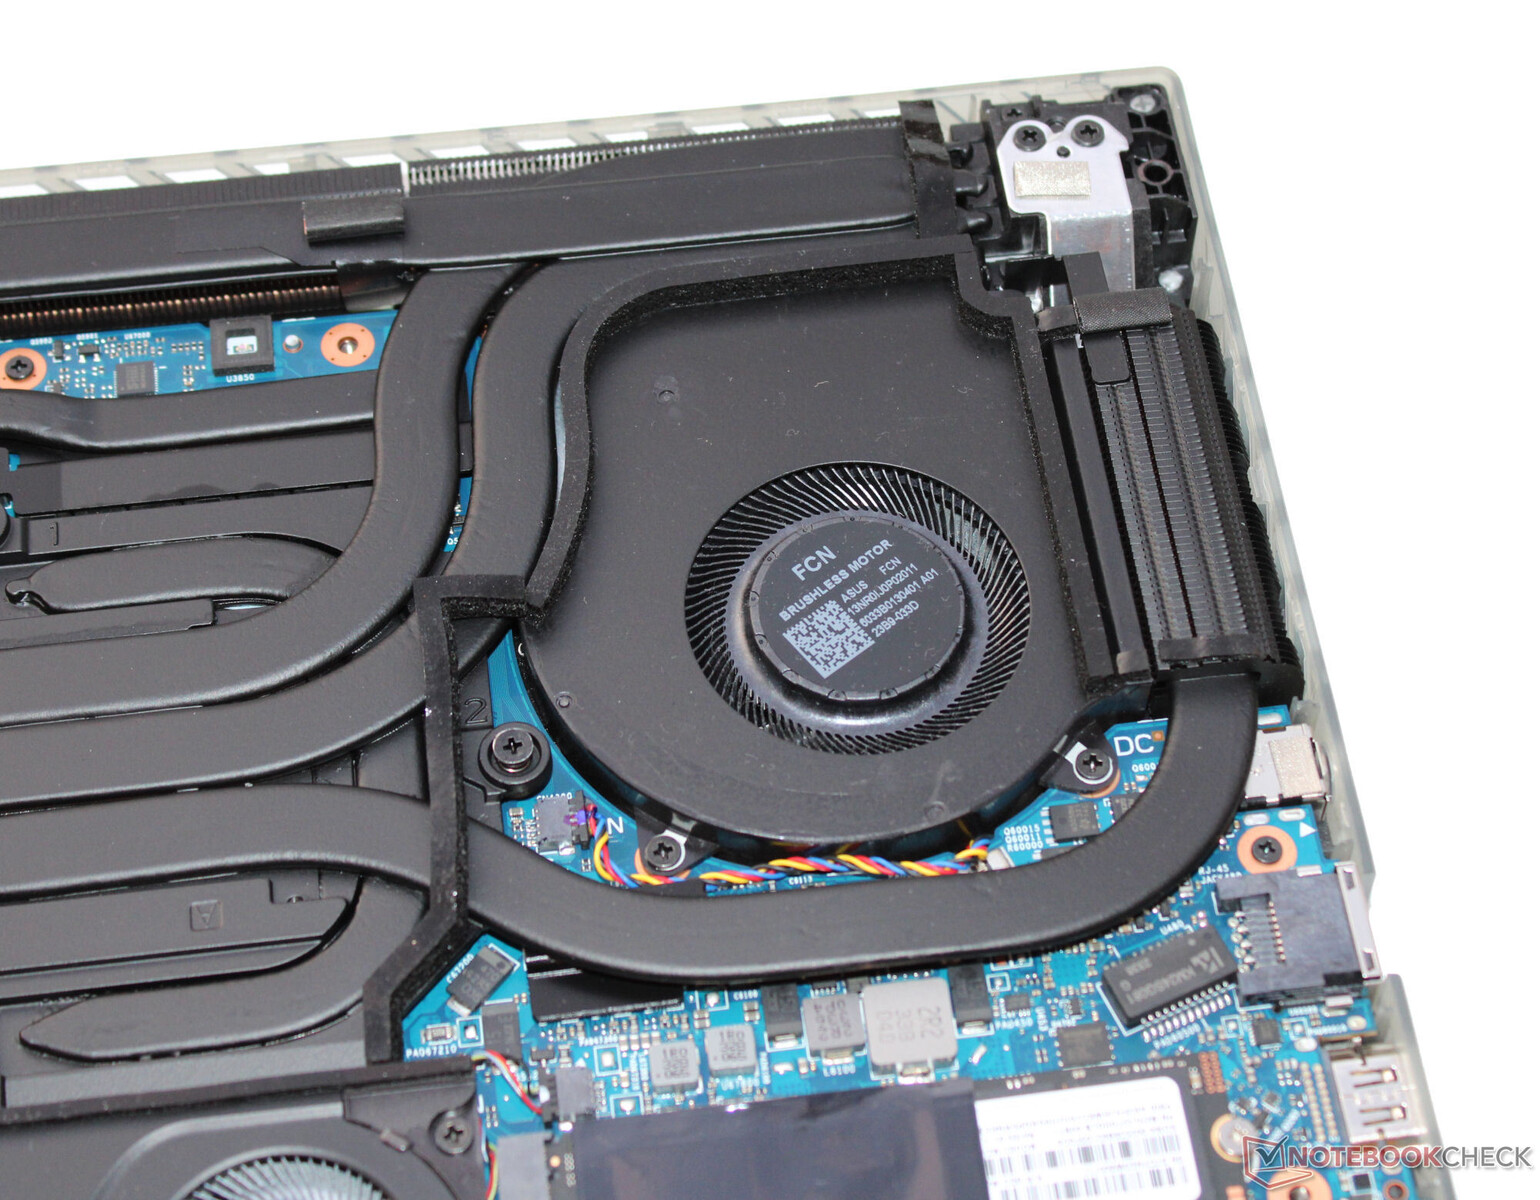
Mantenimiento
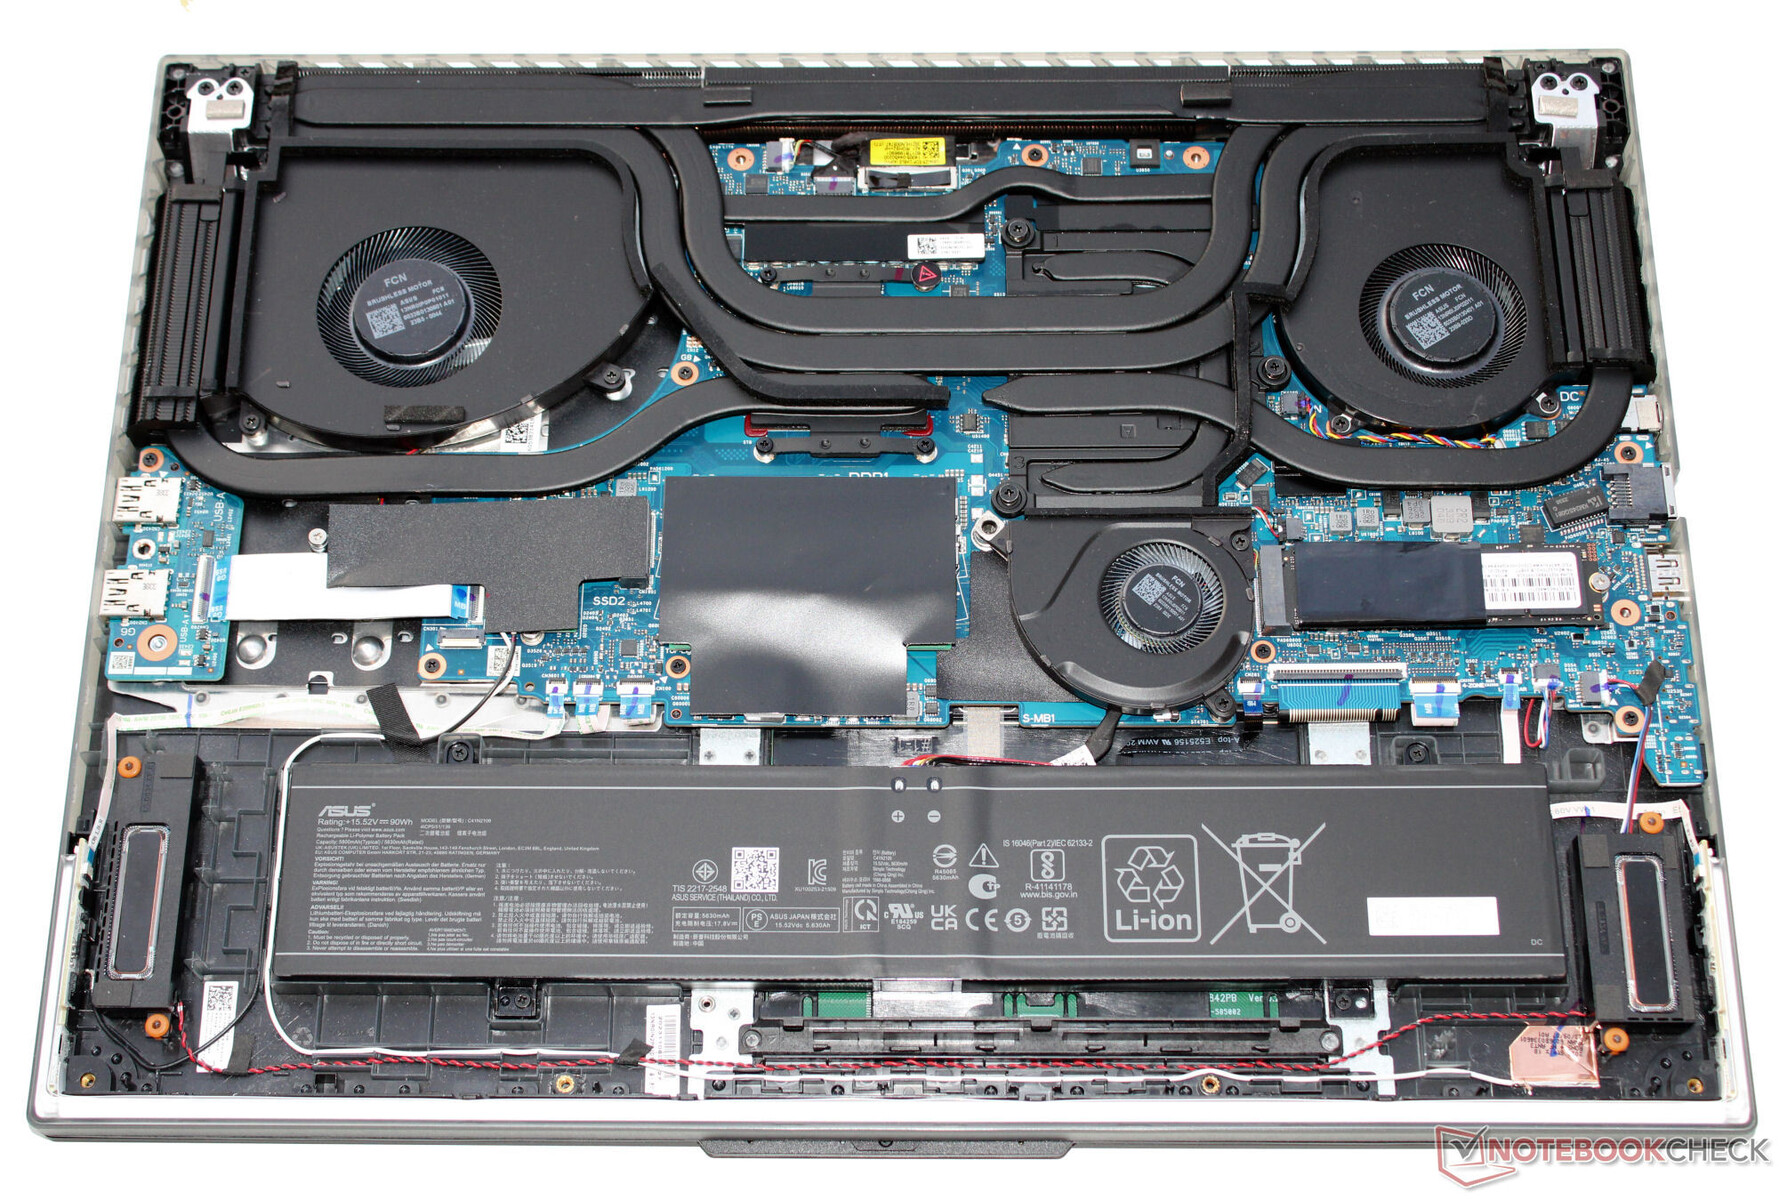
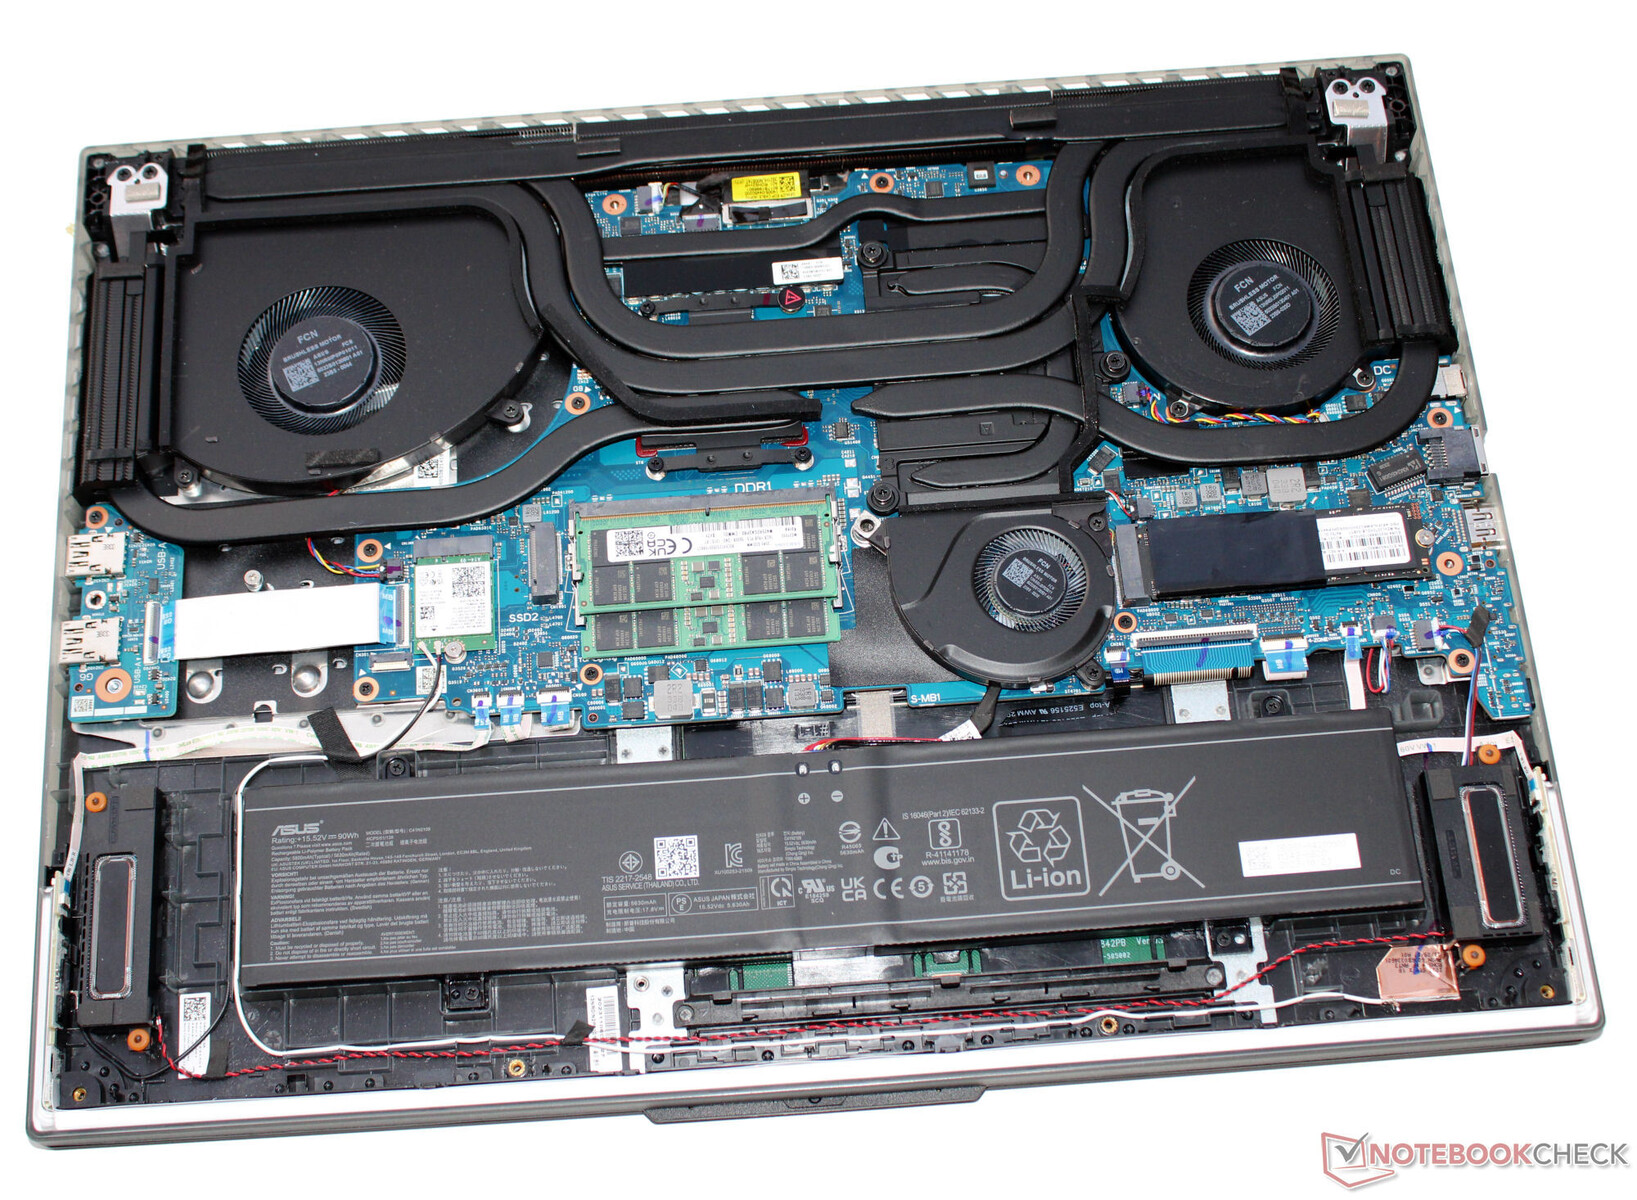
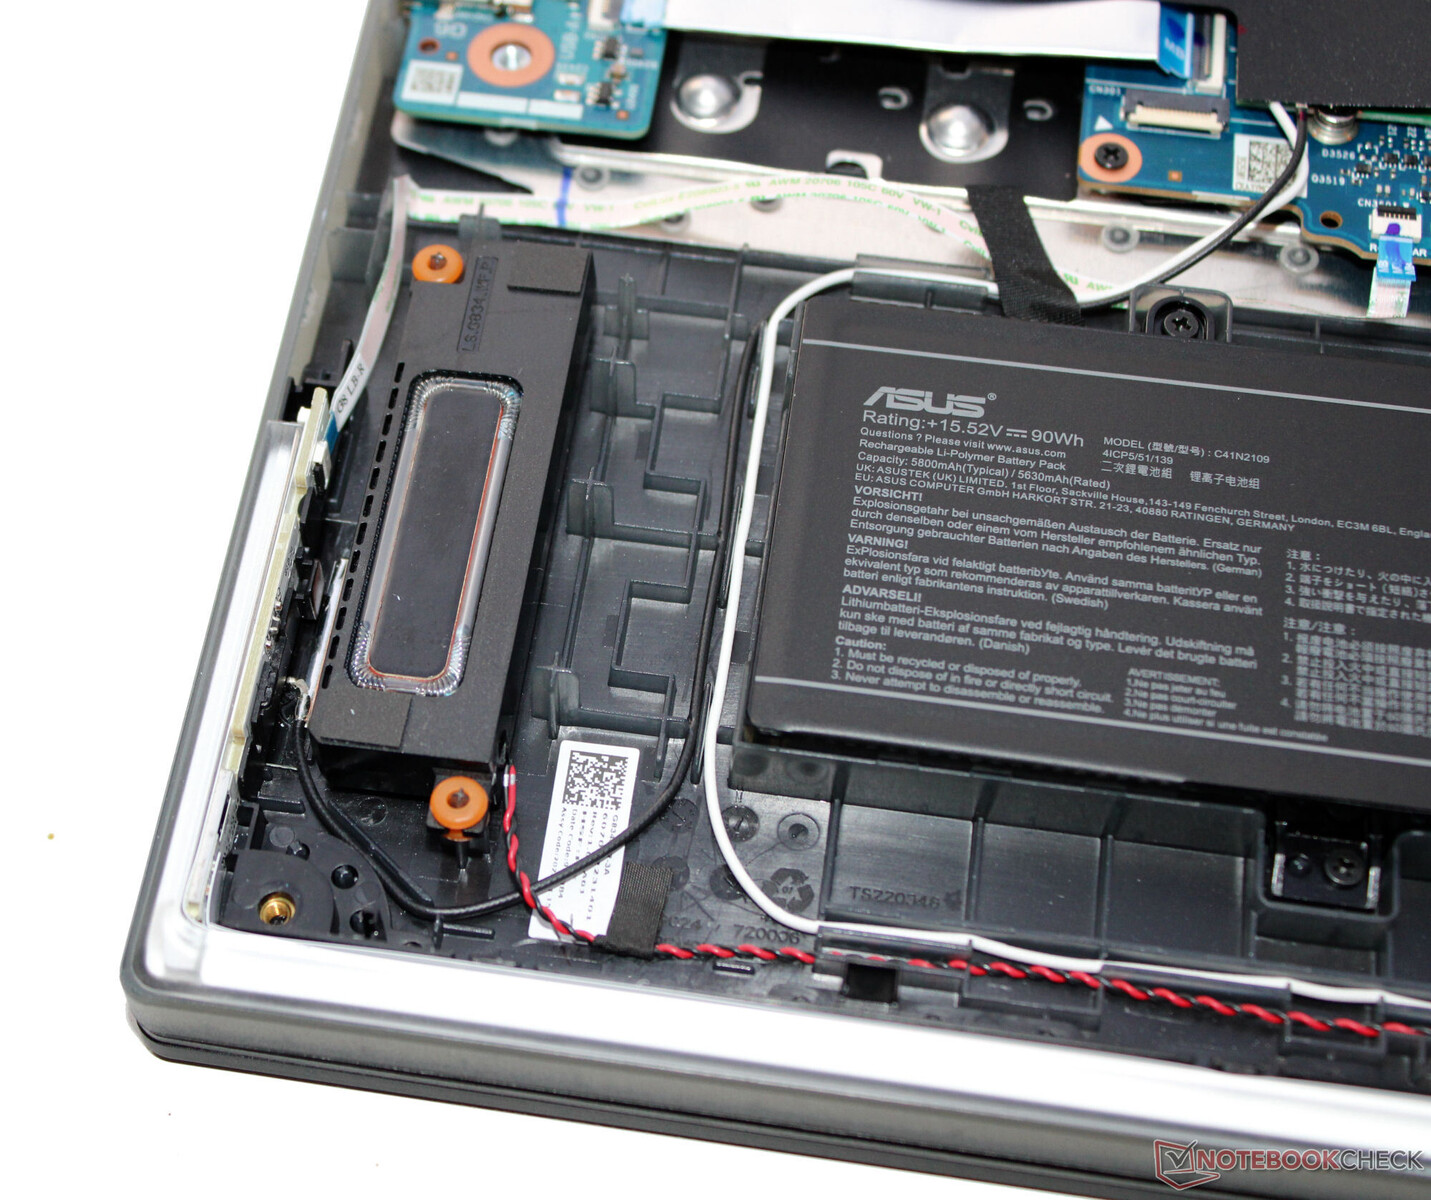
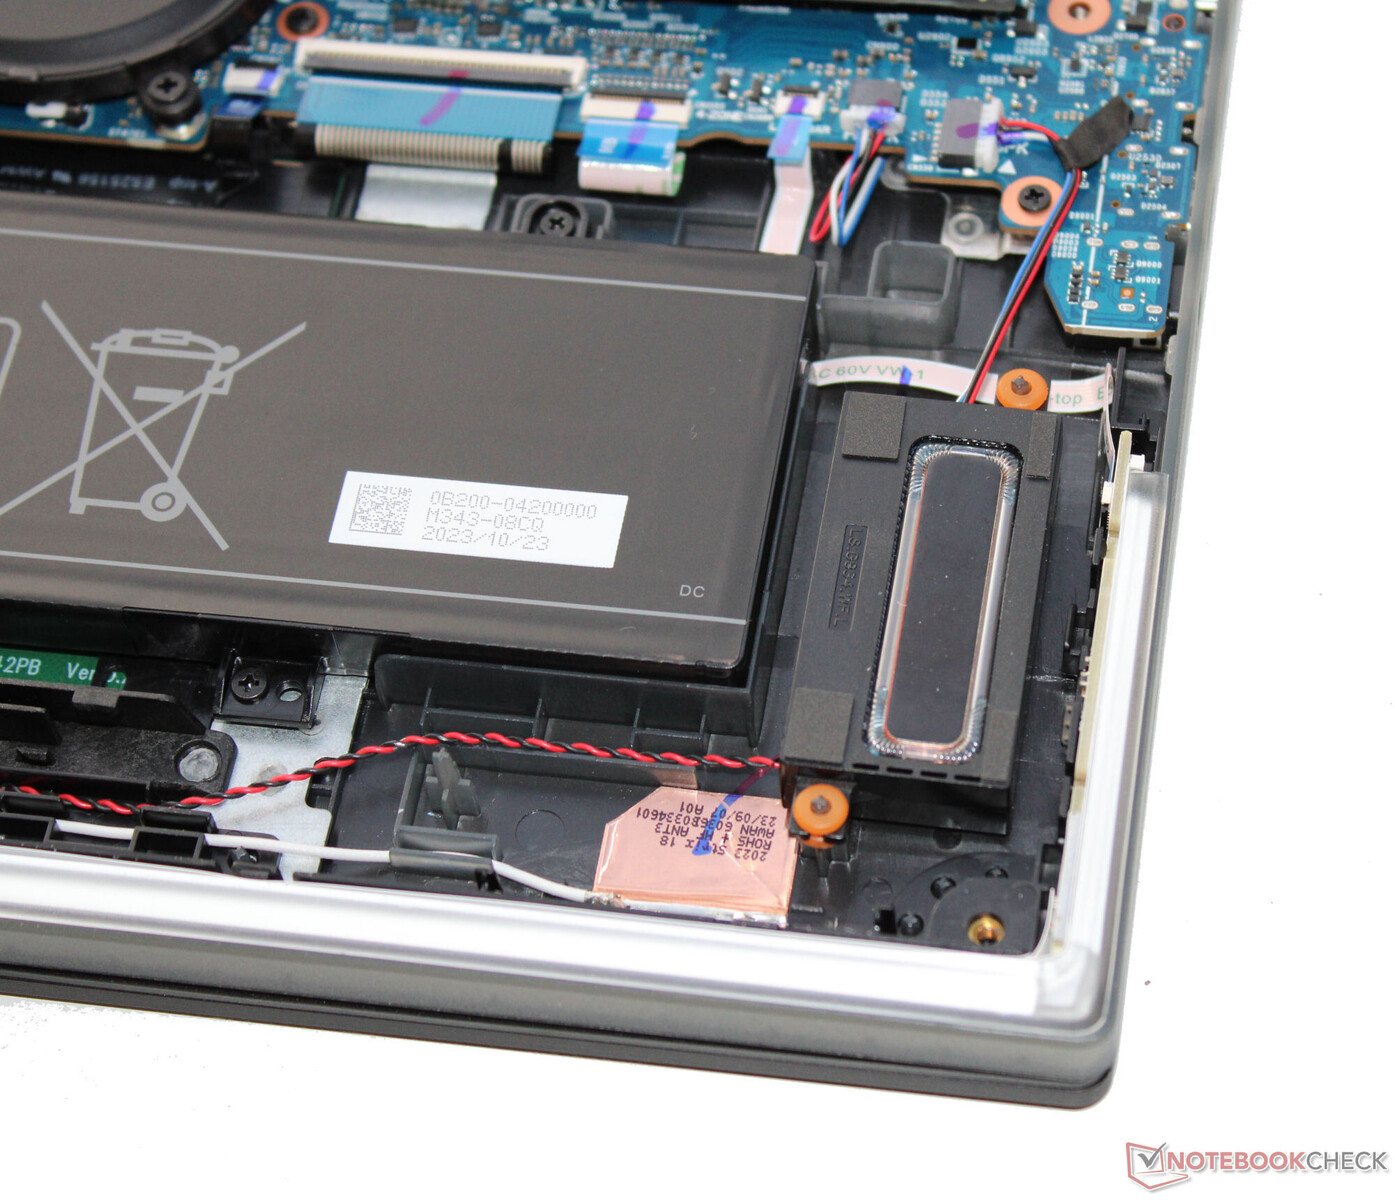
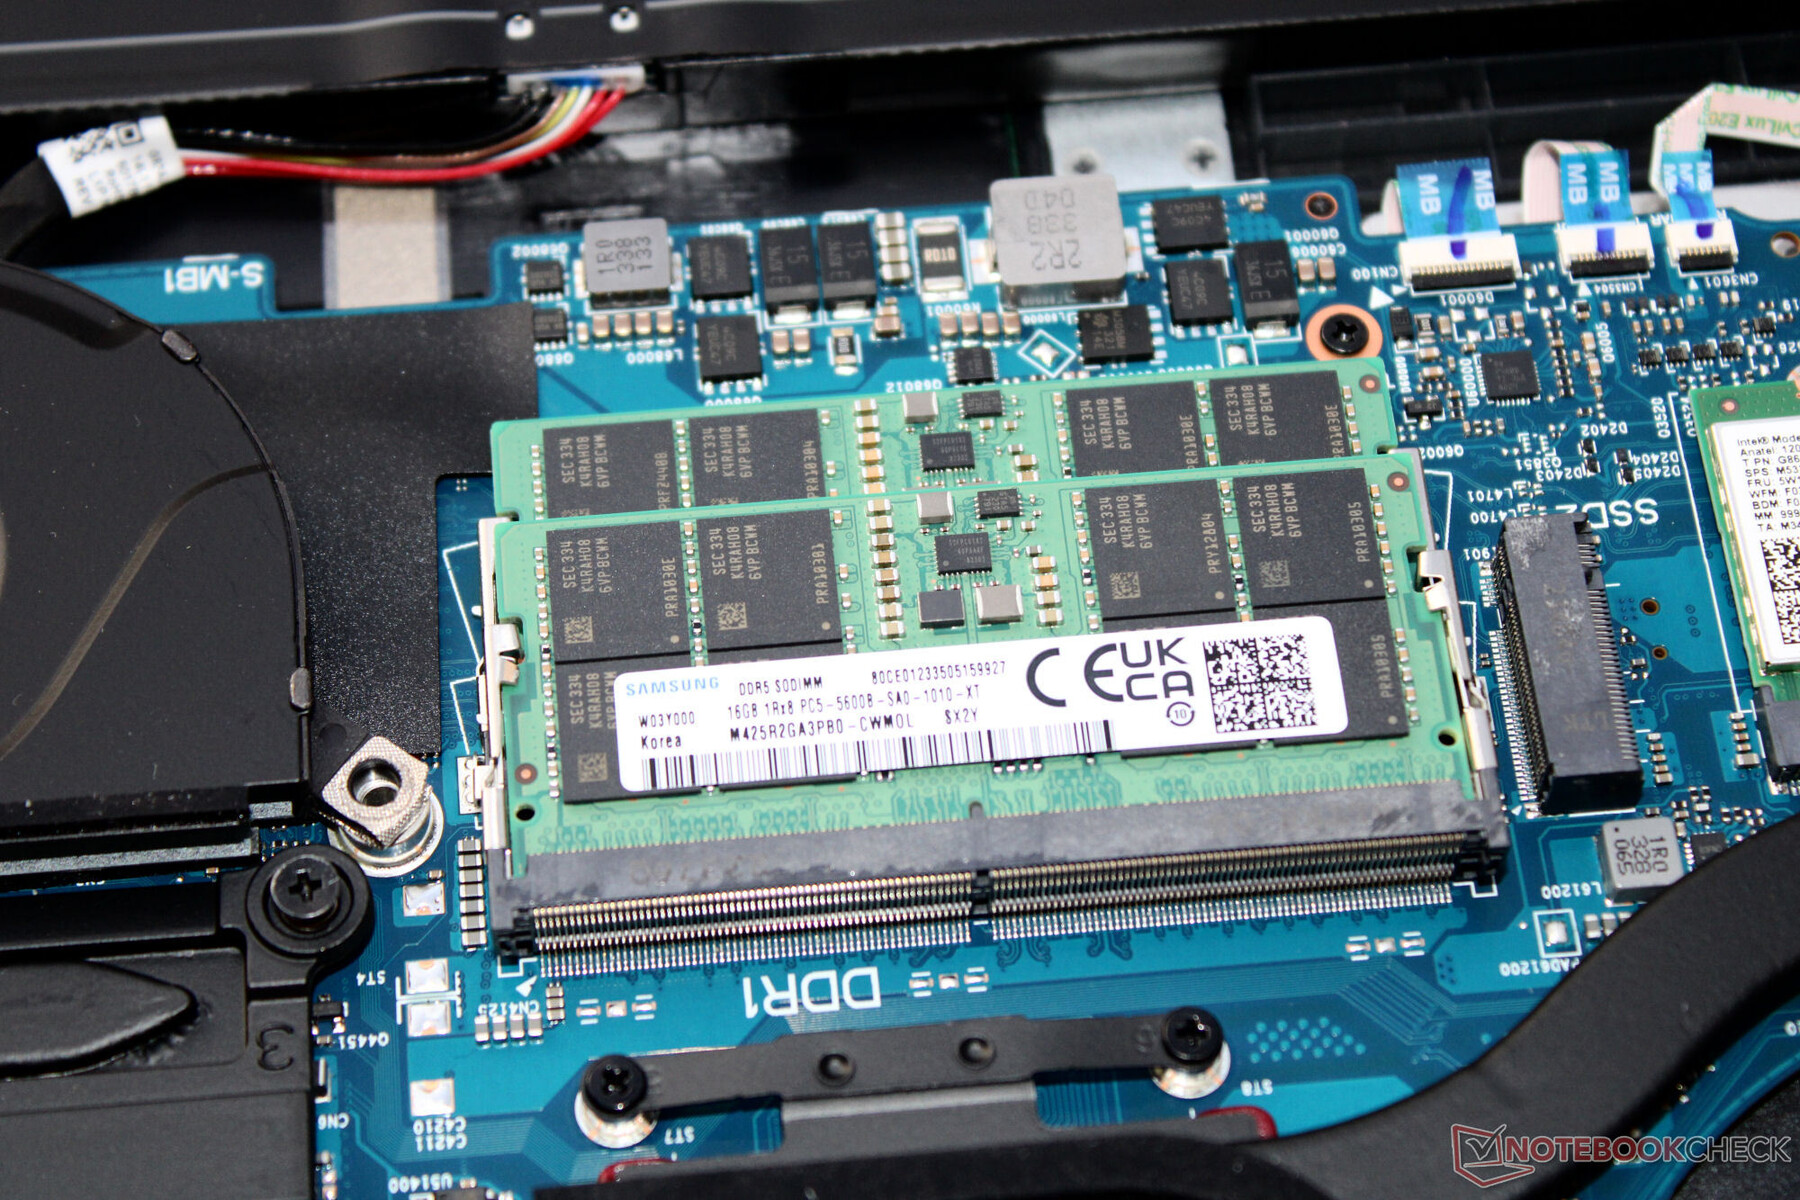
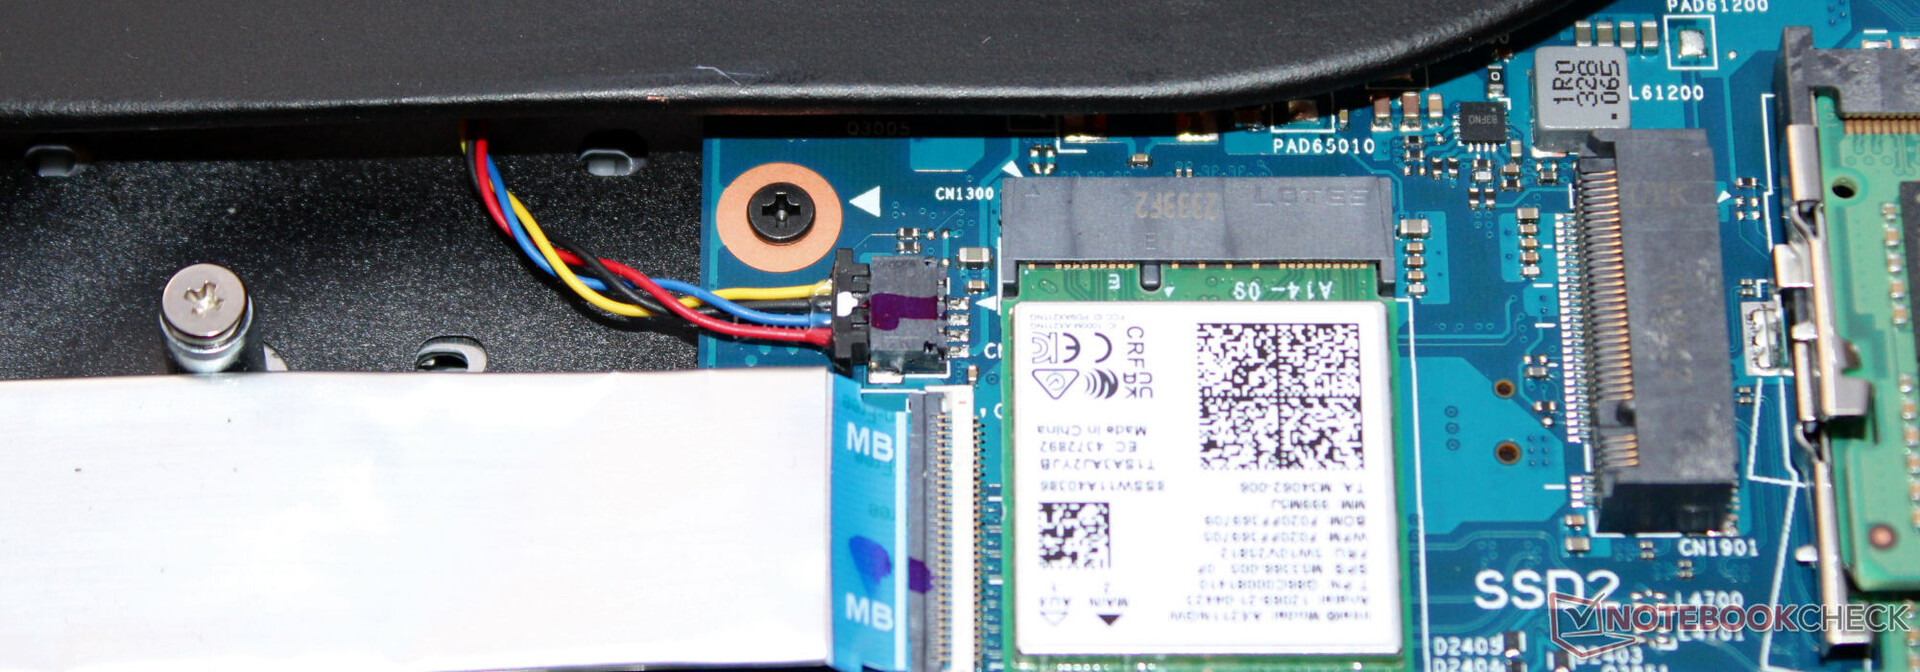
Para abrir el portátil, tiene que quitar todos los tornillos del fondo de la carcasa. A continuación, puede levantar la placa de la carcasa con una herramienta de palanca. Tras retirar la placa de la carcasa, tendrá acceso a los bancos de almacenamiento (ocupados), la unidad SSD (PCIe 4, M.2-2280), la segunda ranura SSD (PCIe 4, M.2-2280), el módulo WLAN, la batería de la BIOS, los ventiladores y la batería (atornillada, no pegada).
El teclado no se puede sustituir fácilmente. Para hacerlo, tendría que sustituir toda la parte superior de la base, lo que requeriría desmontar el portátil por completo.
Garantía
Asus ofrece una garantía de dos años para el portátil de 18 pulgadas en Alemania. Una ampliación de la garantía a tres años costaría unos 200 euros (~215 dólares).
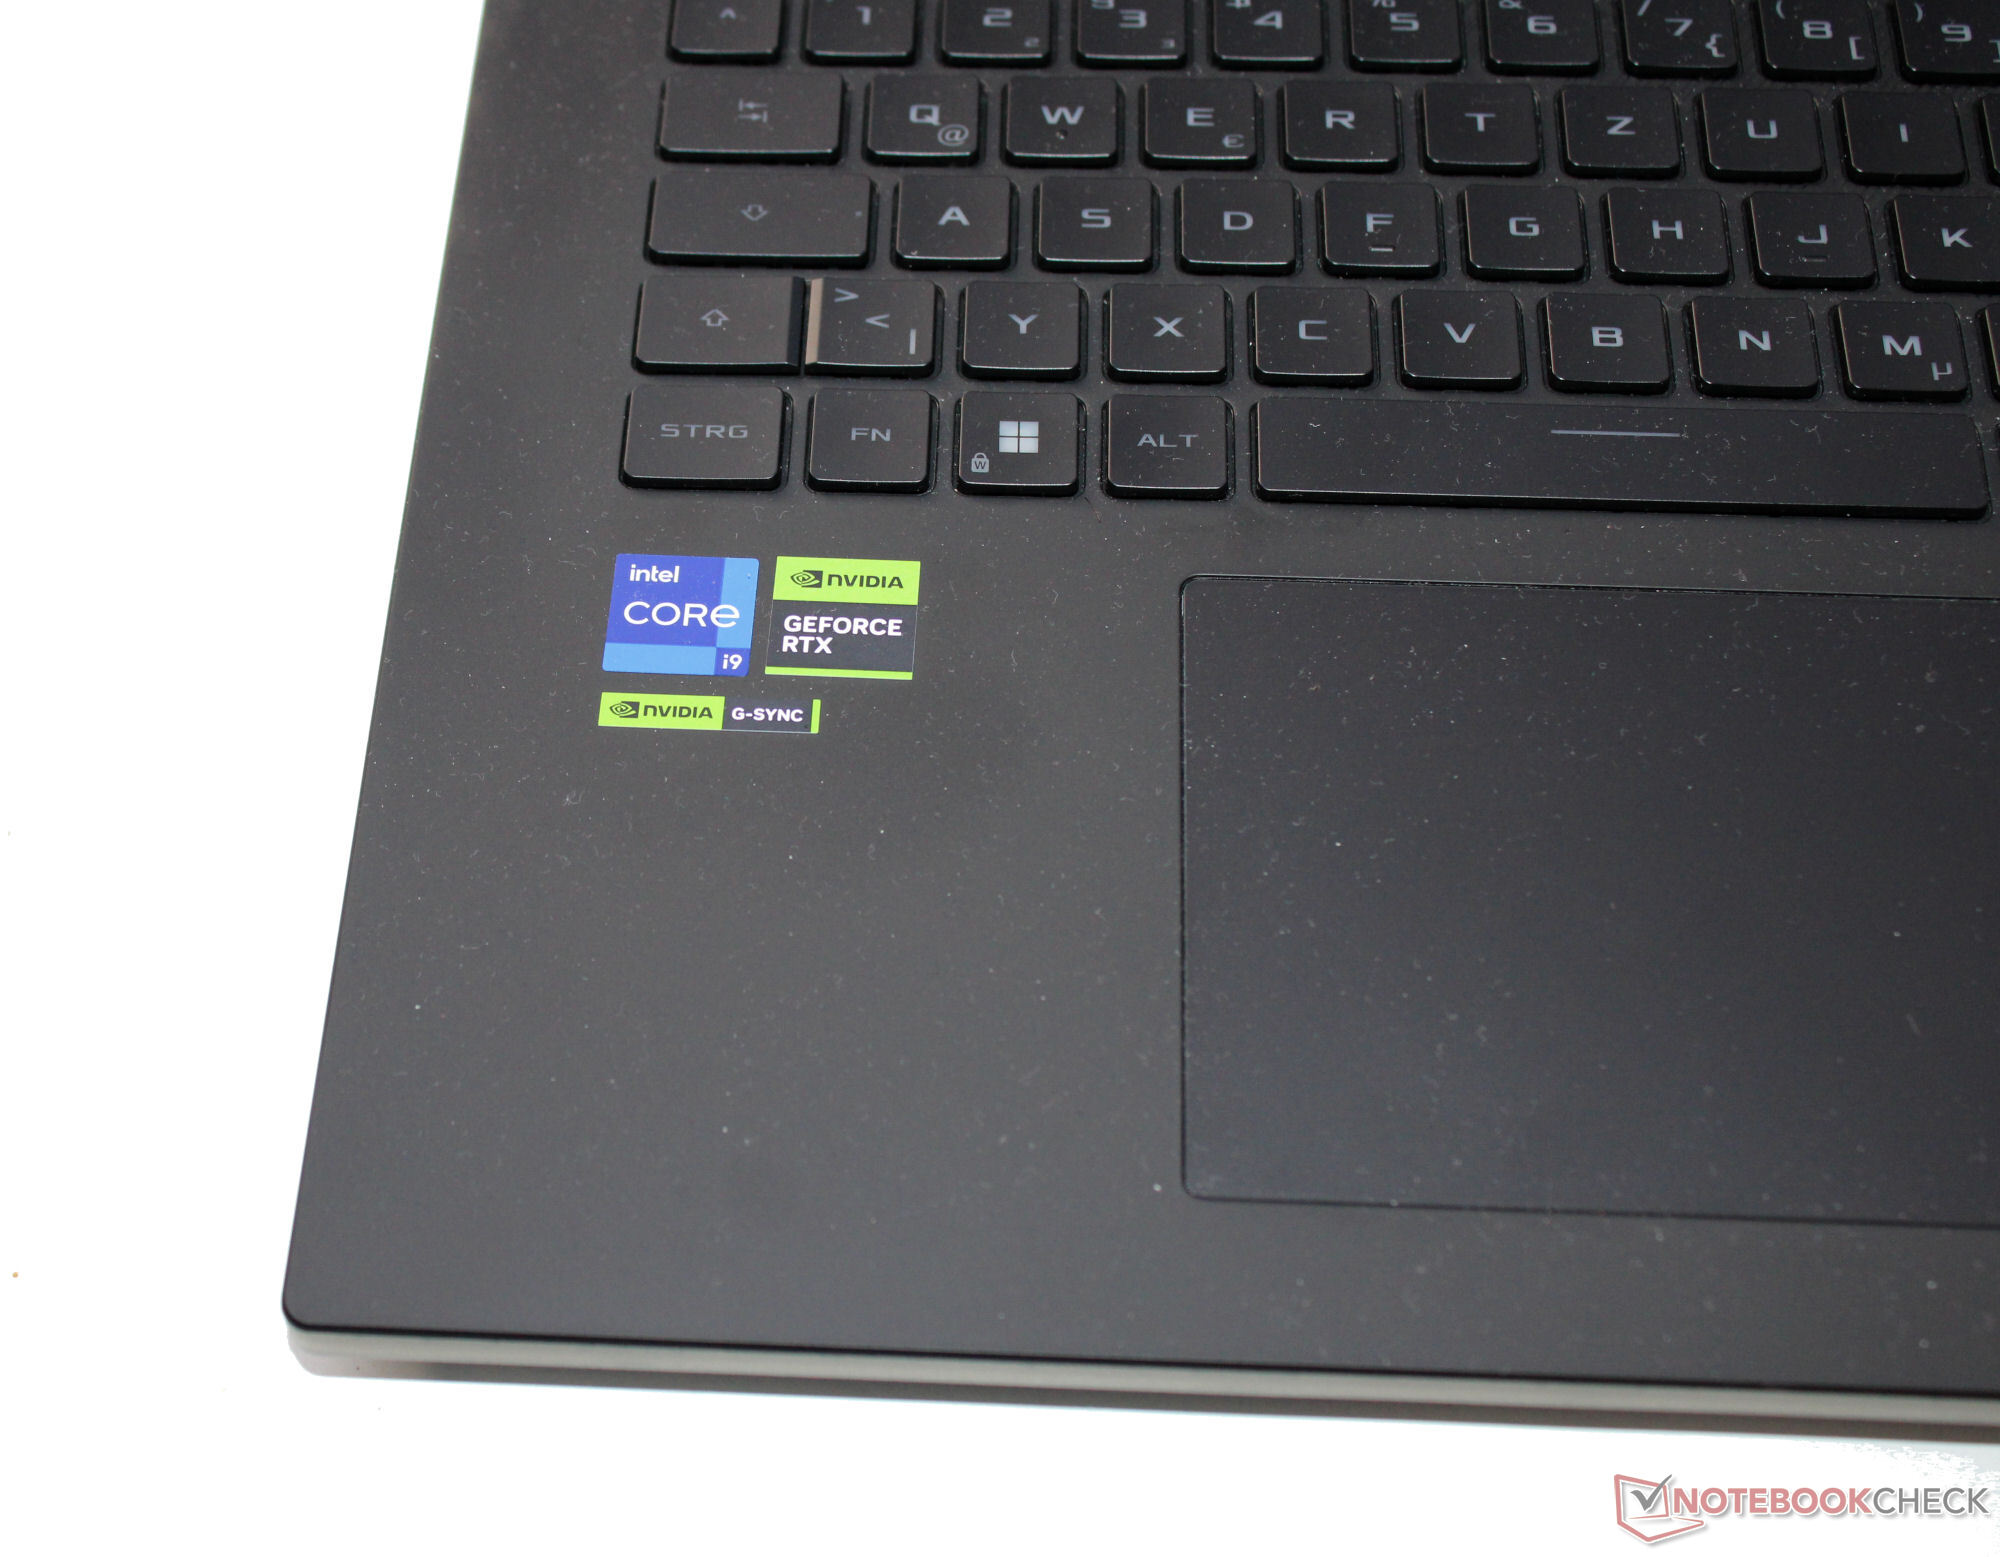
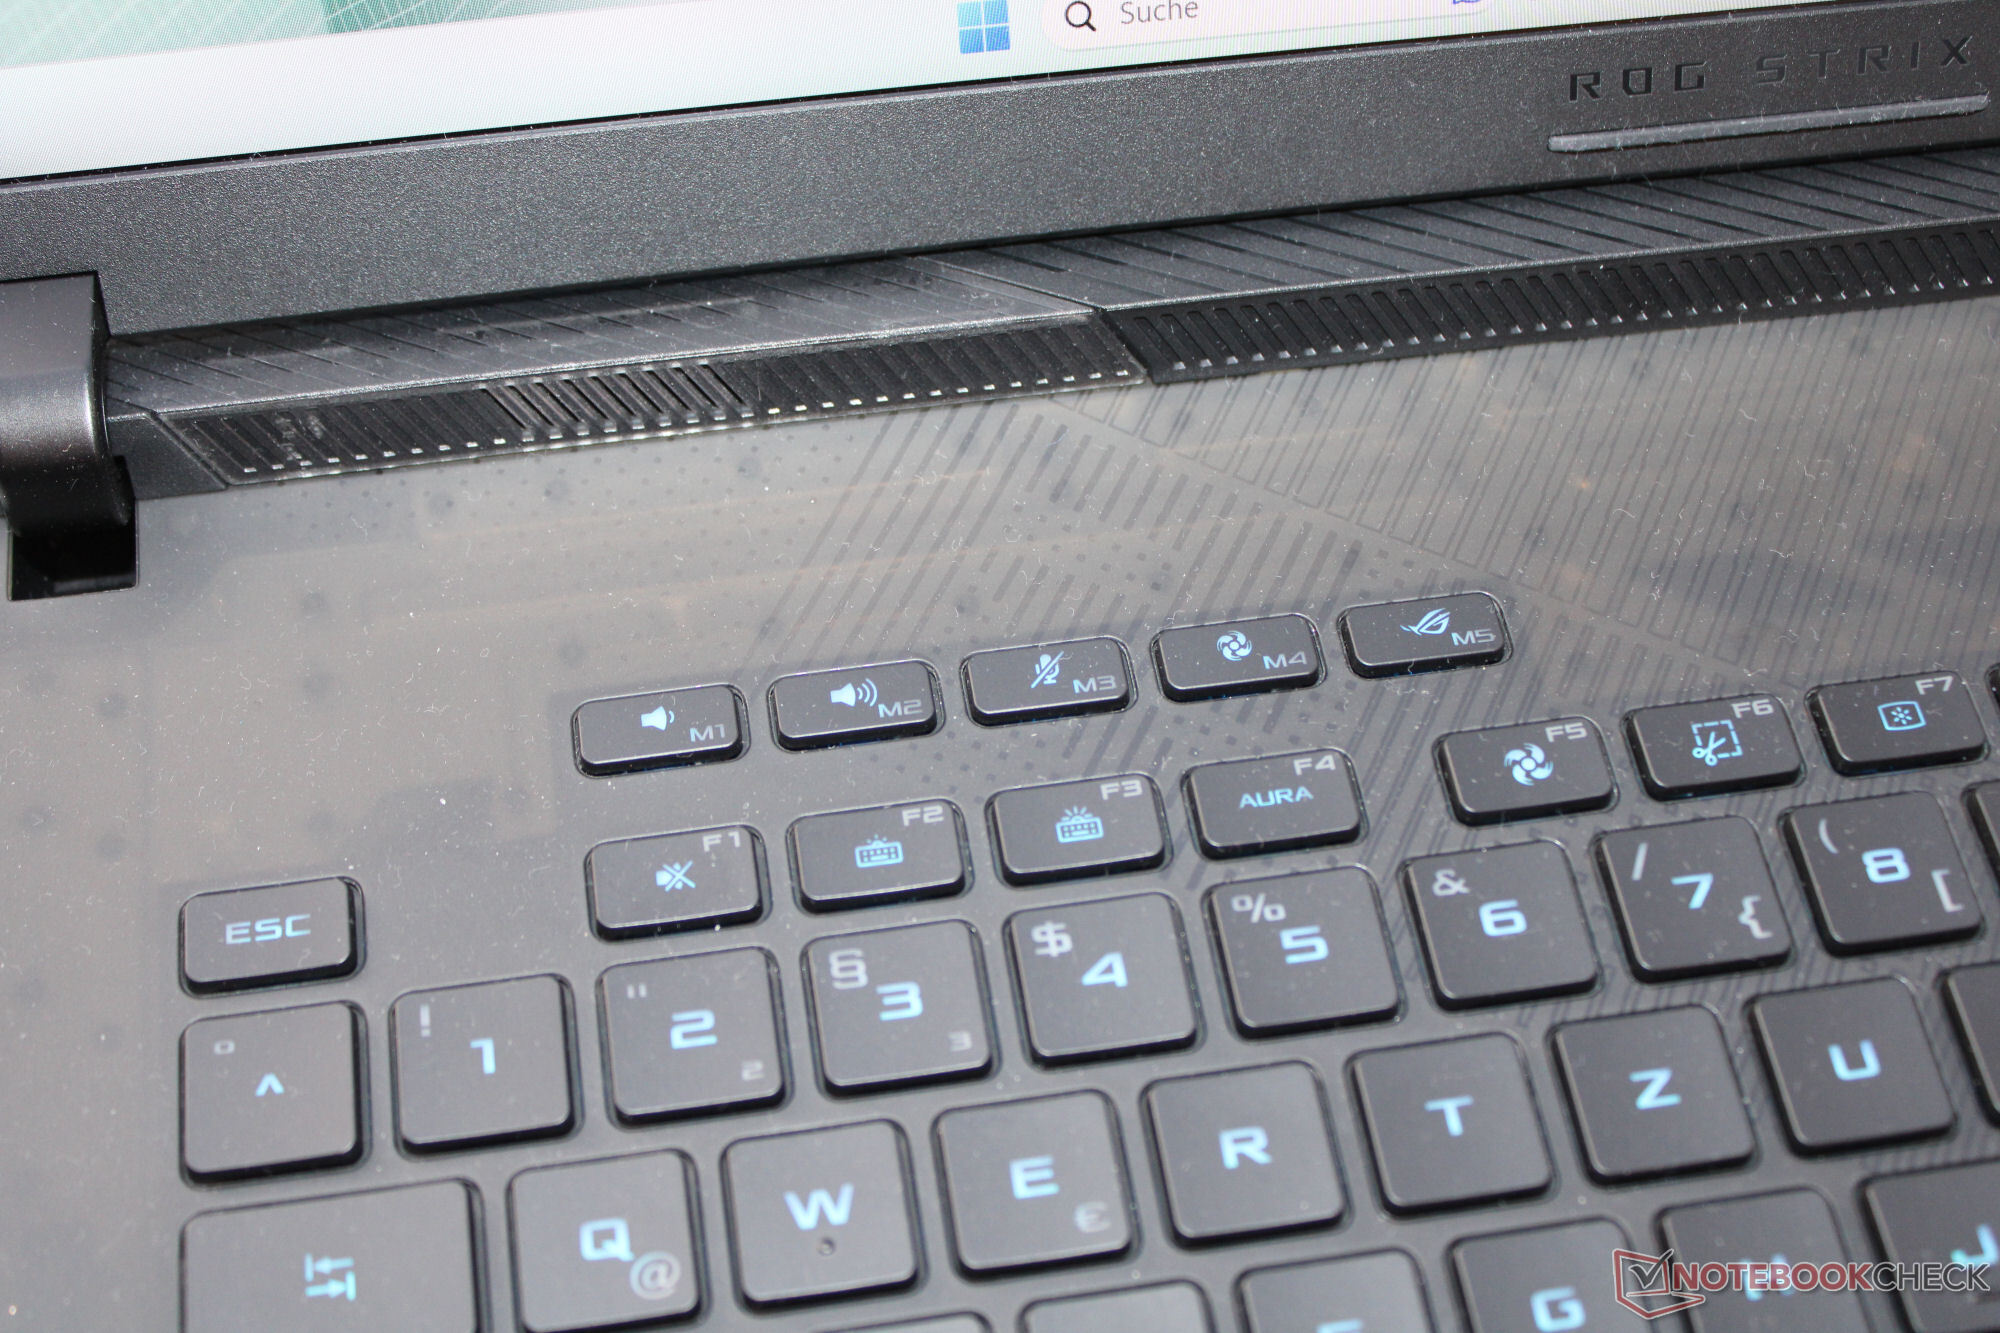
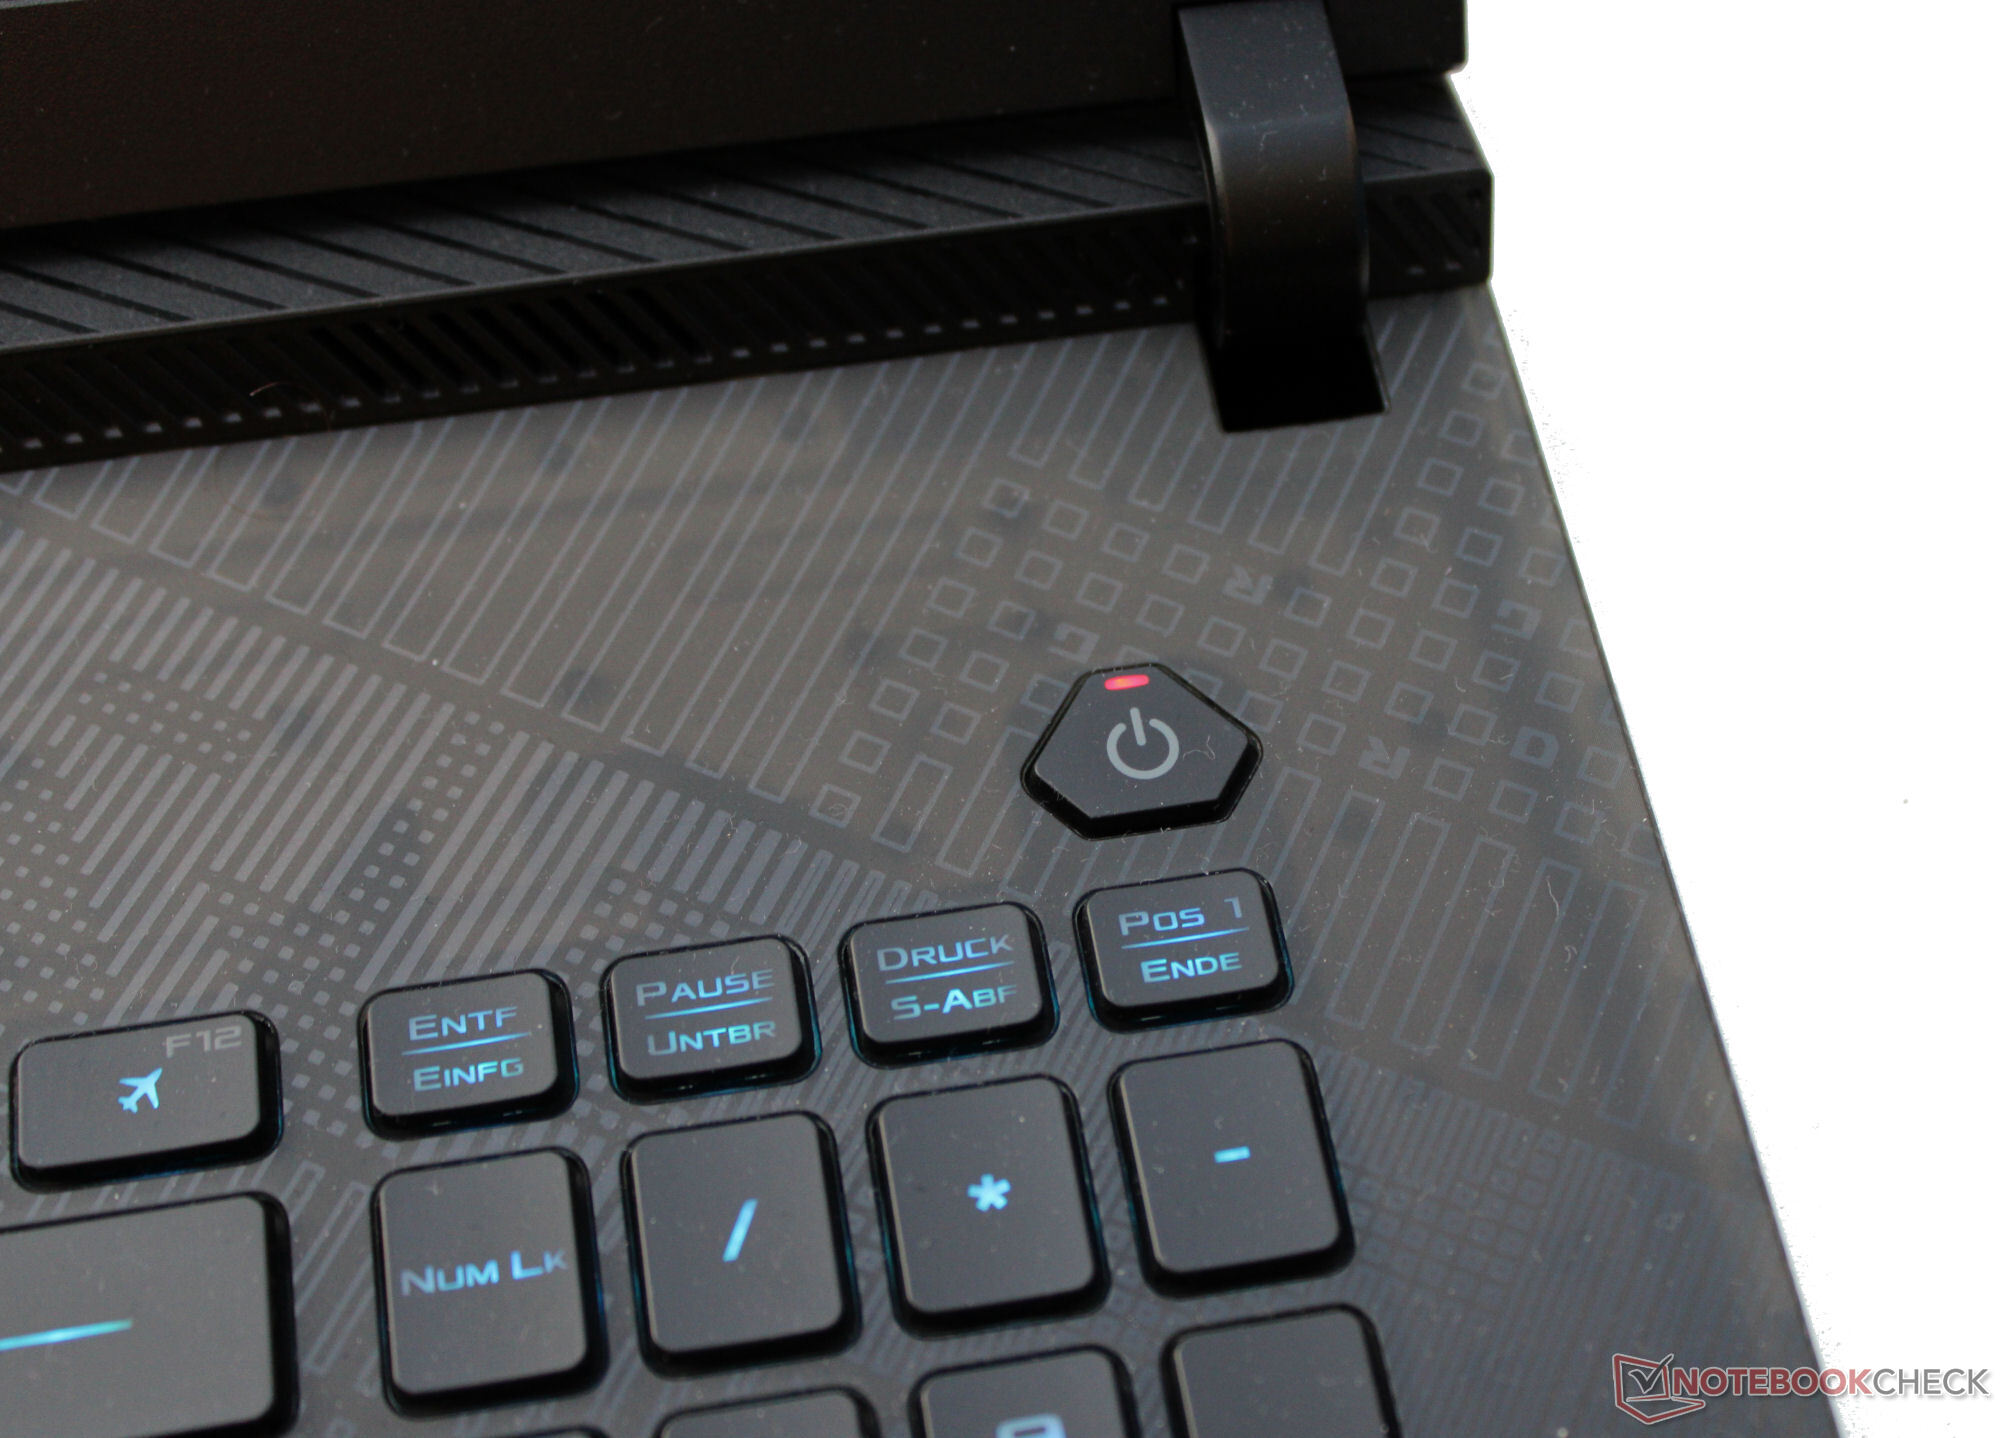
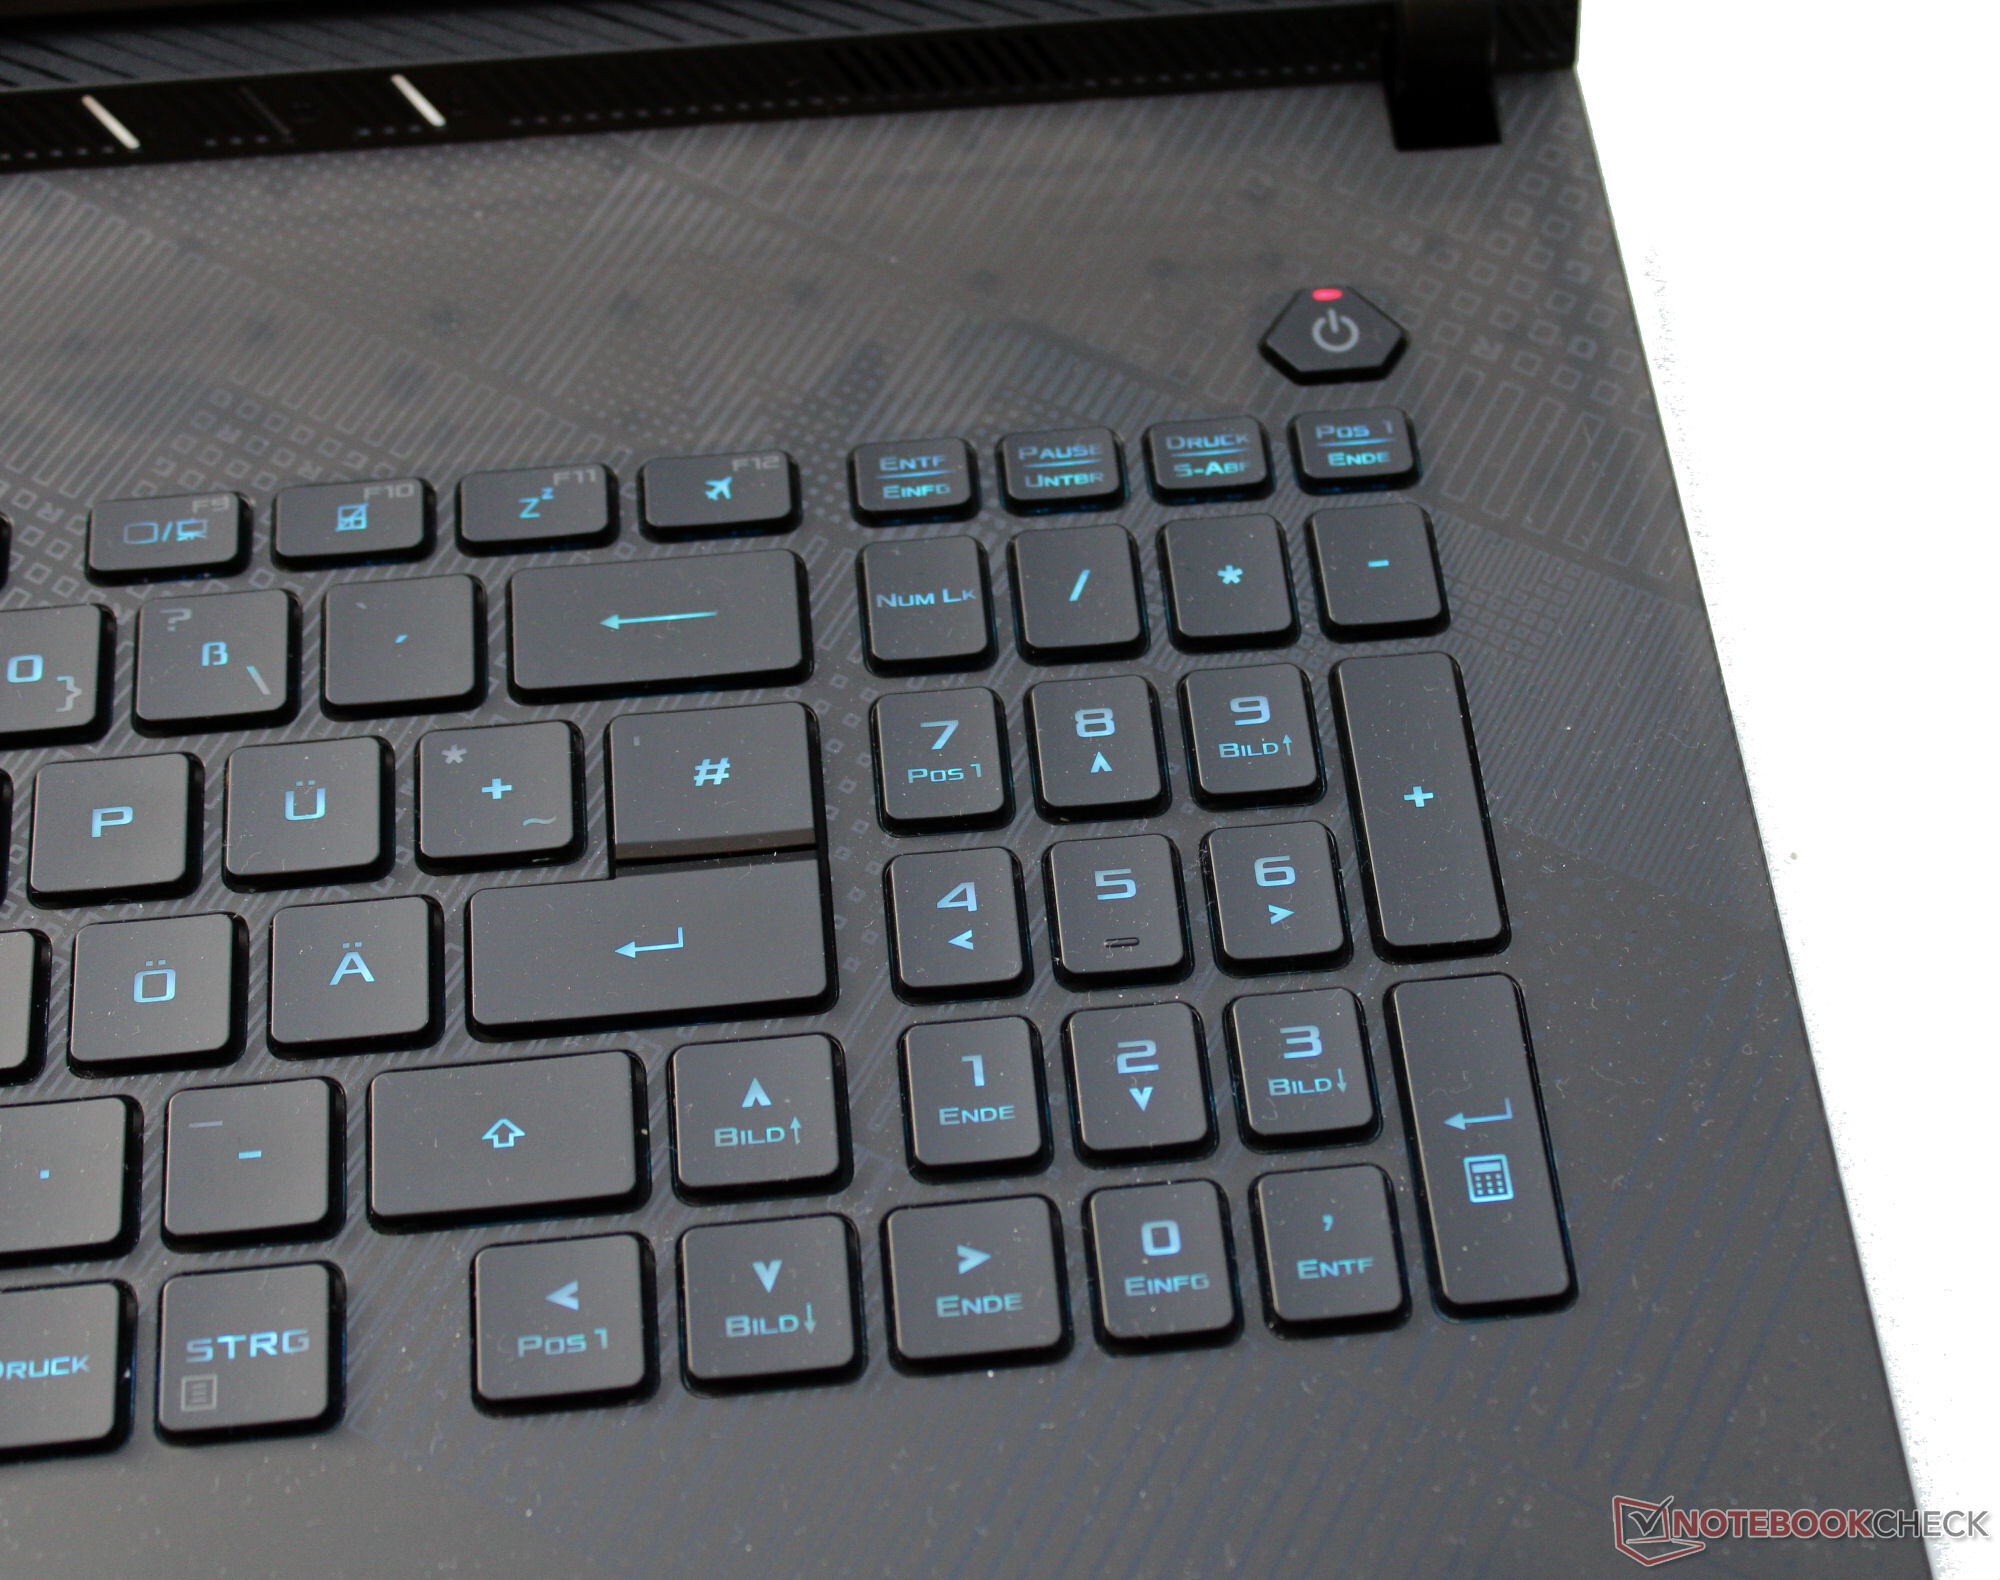
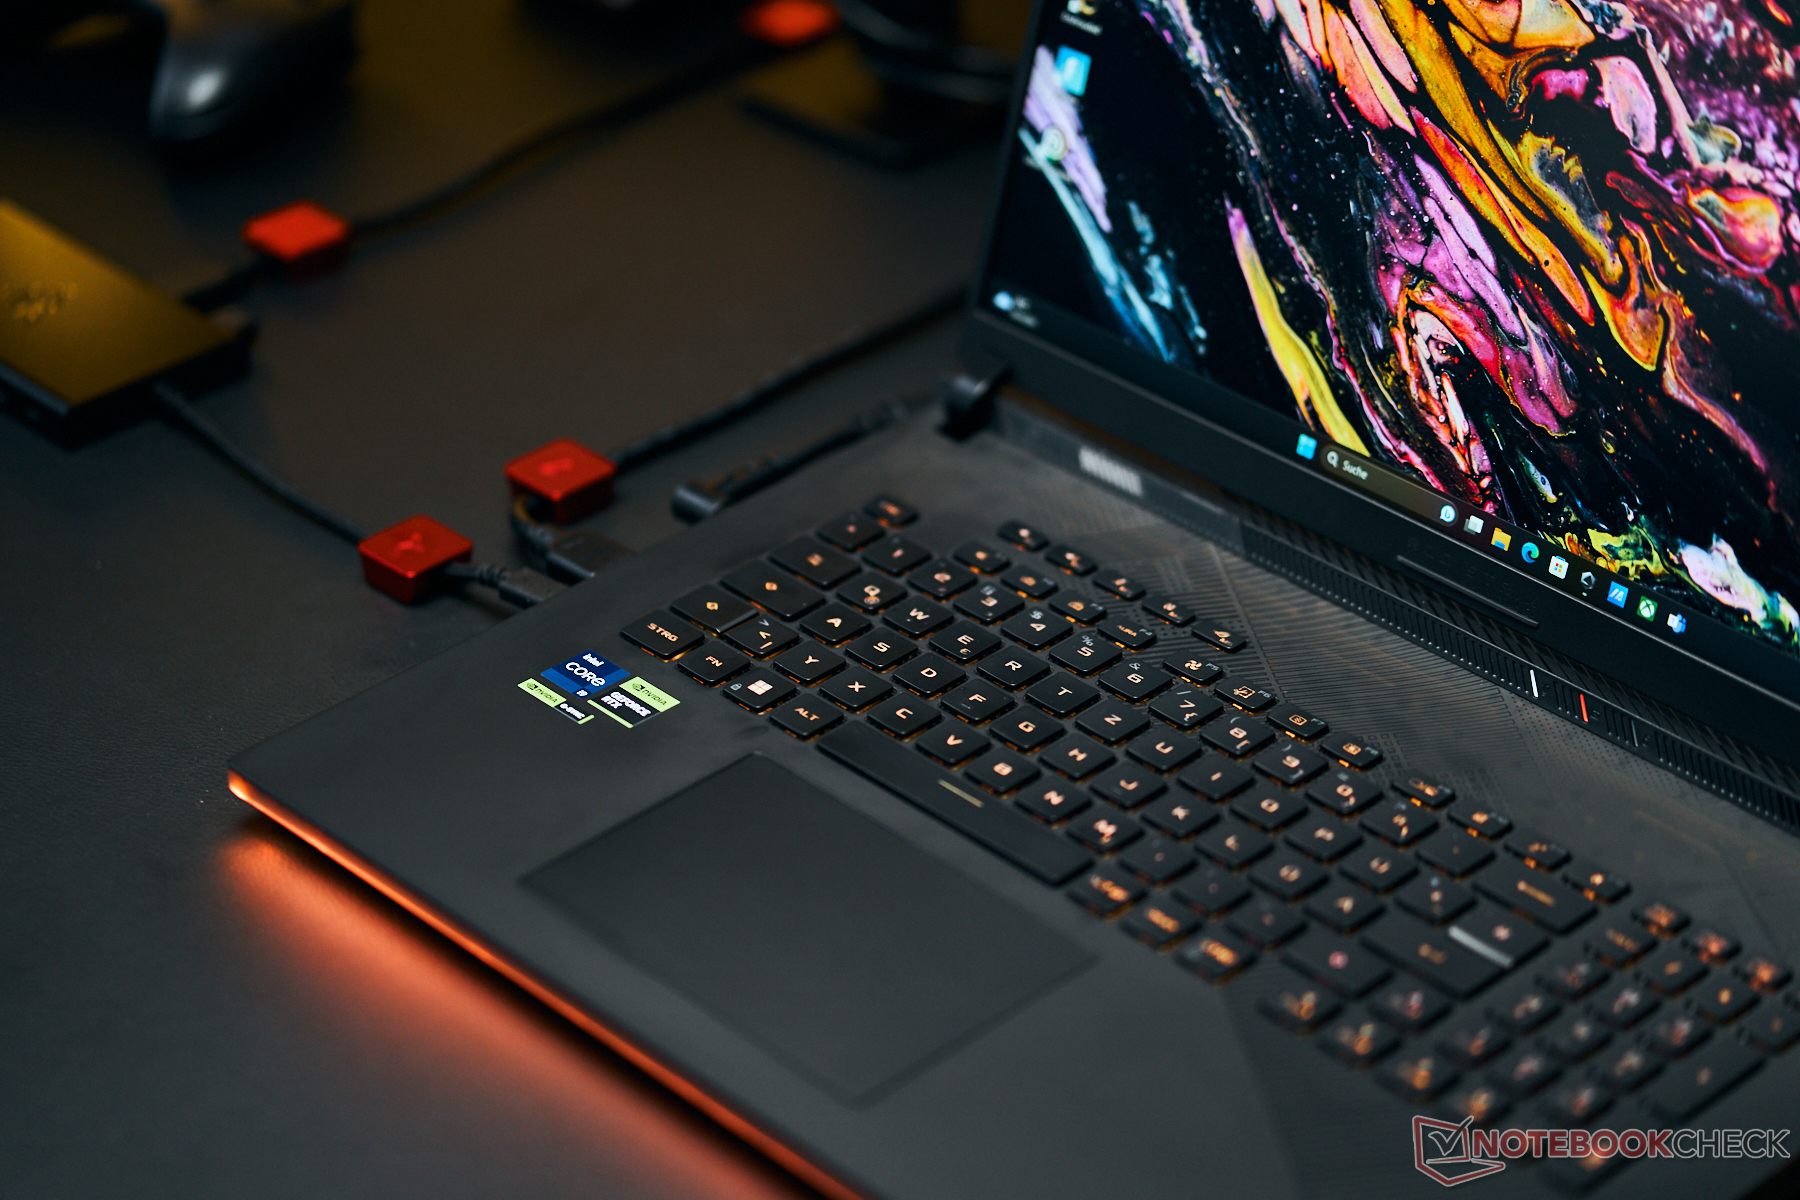
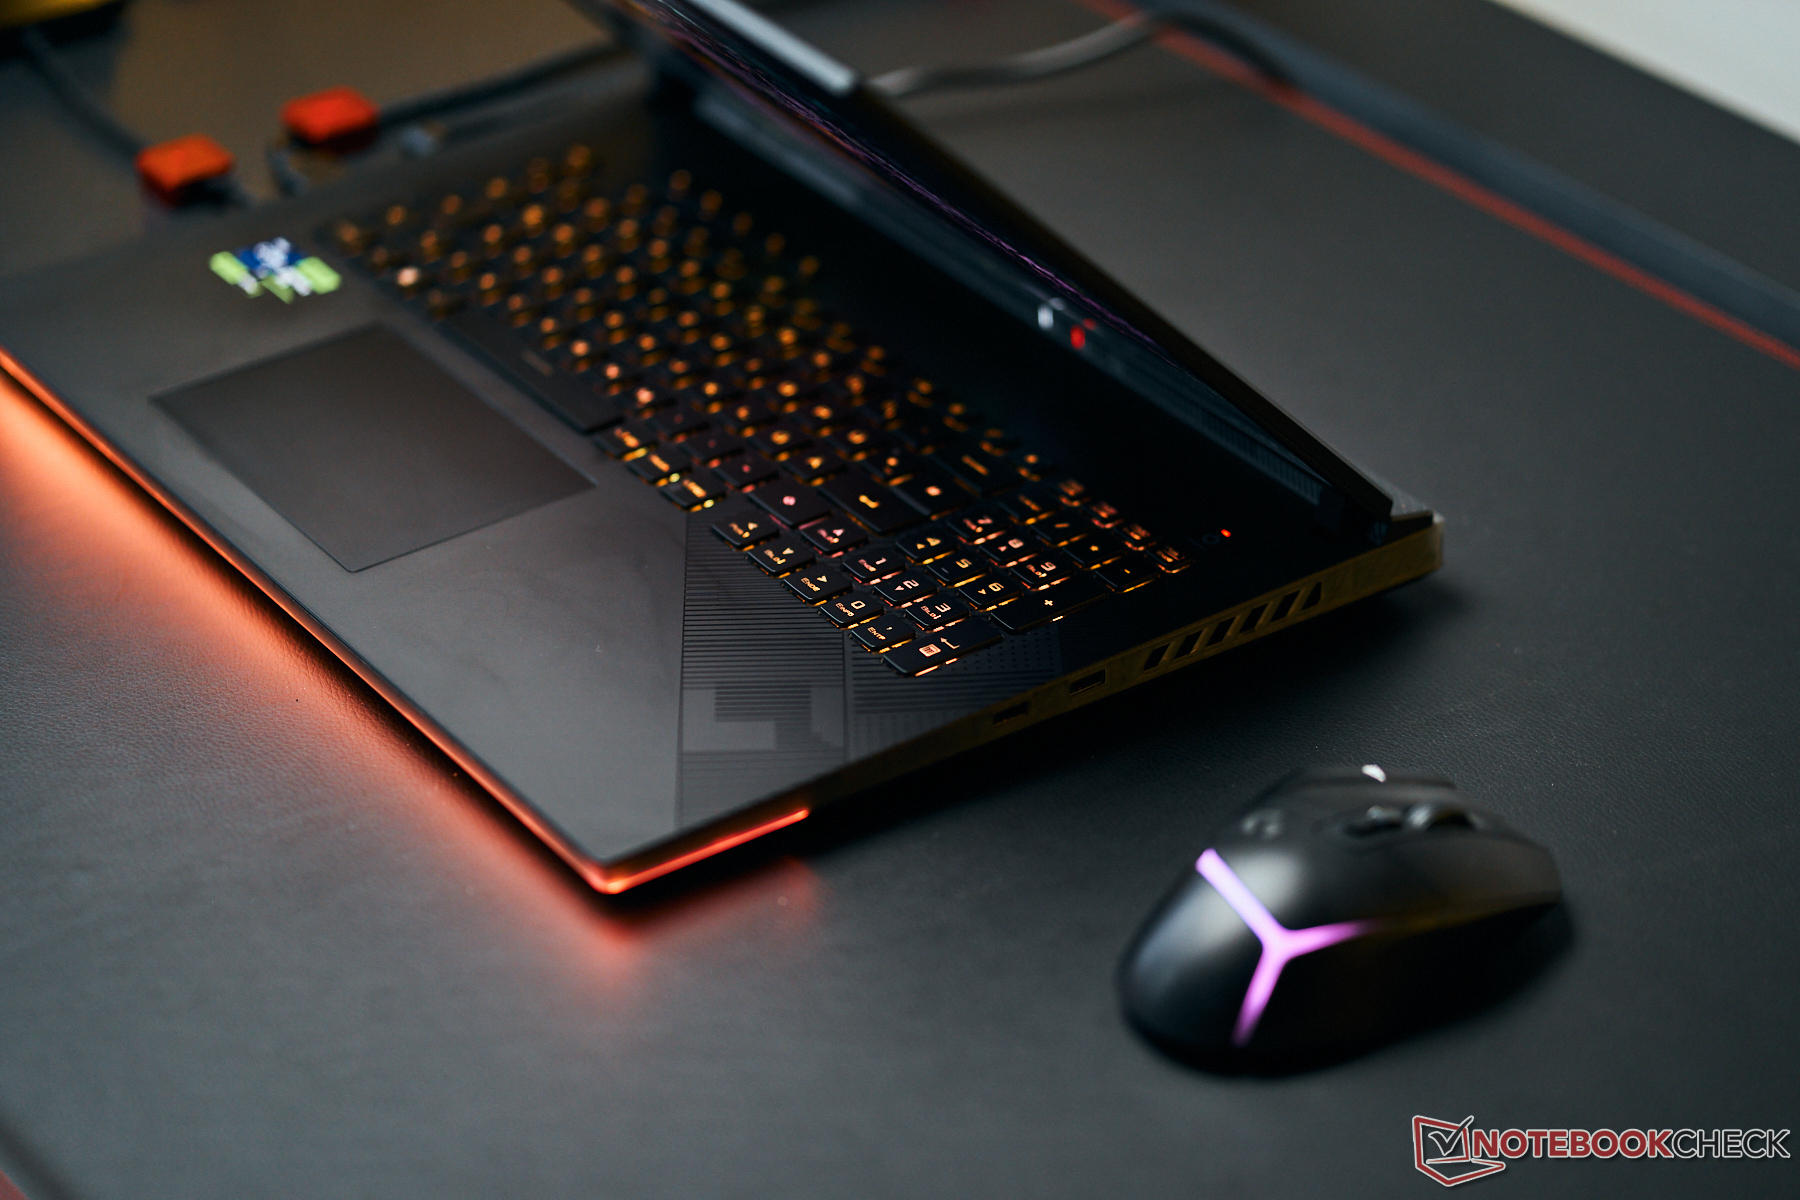
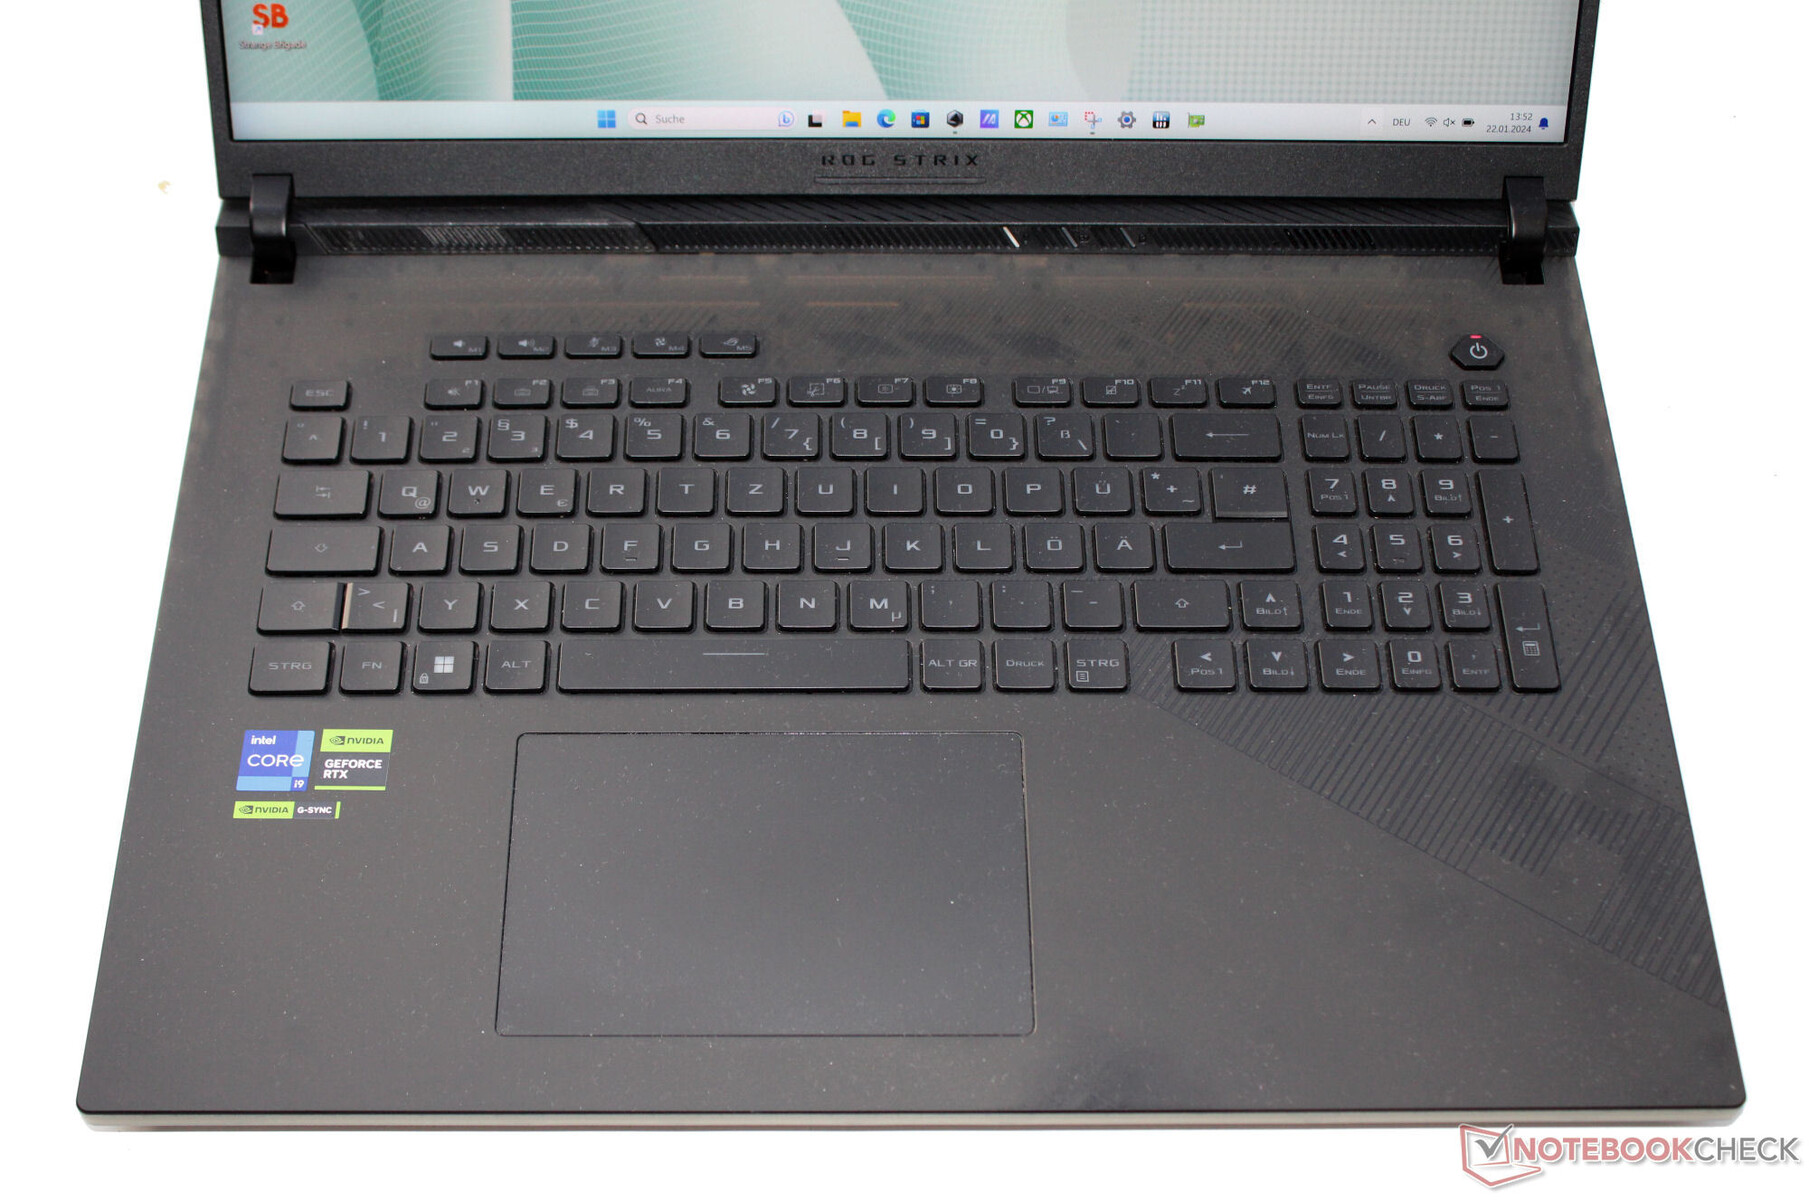
Dispositivos de entrada - Ordenador Asus con iluminación RGB de una sola tecla
Teclado
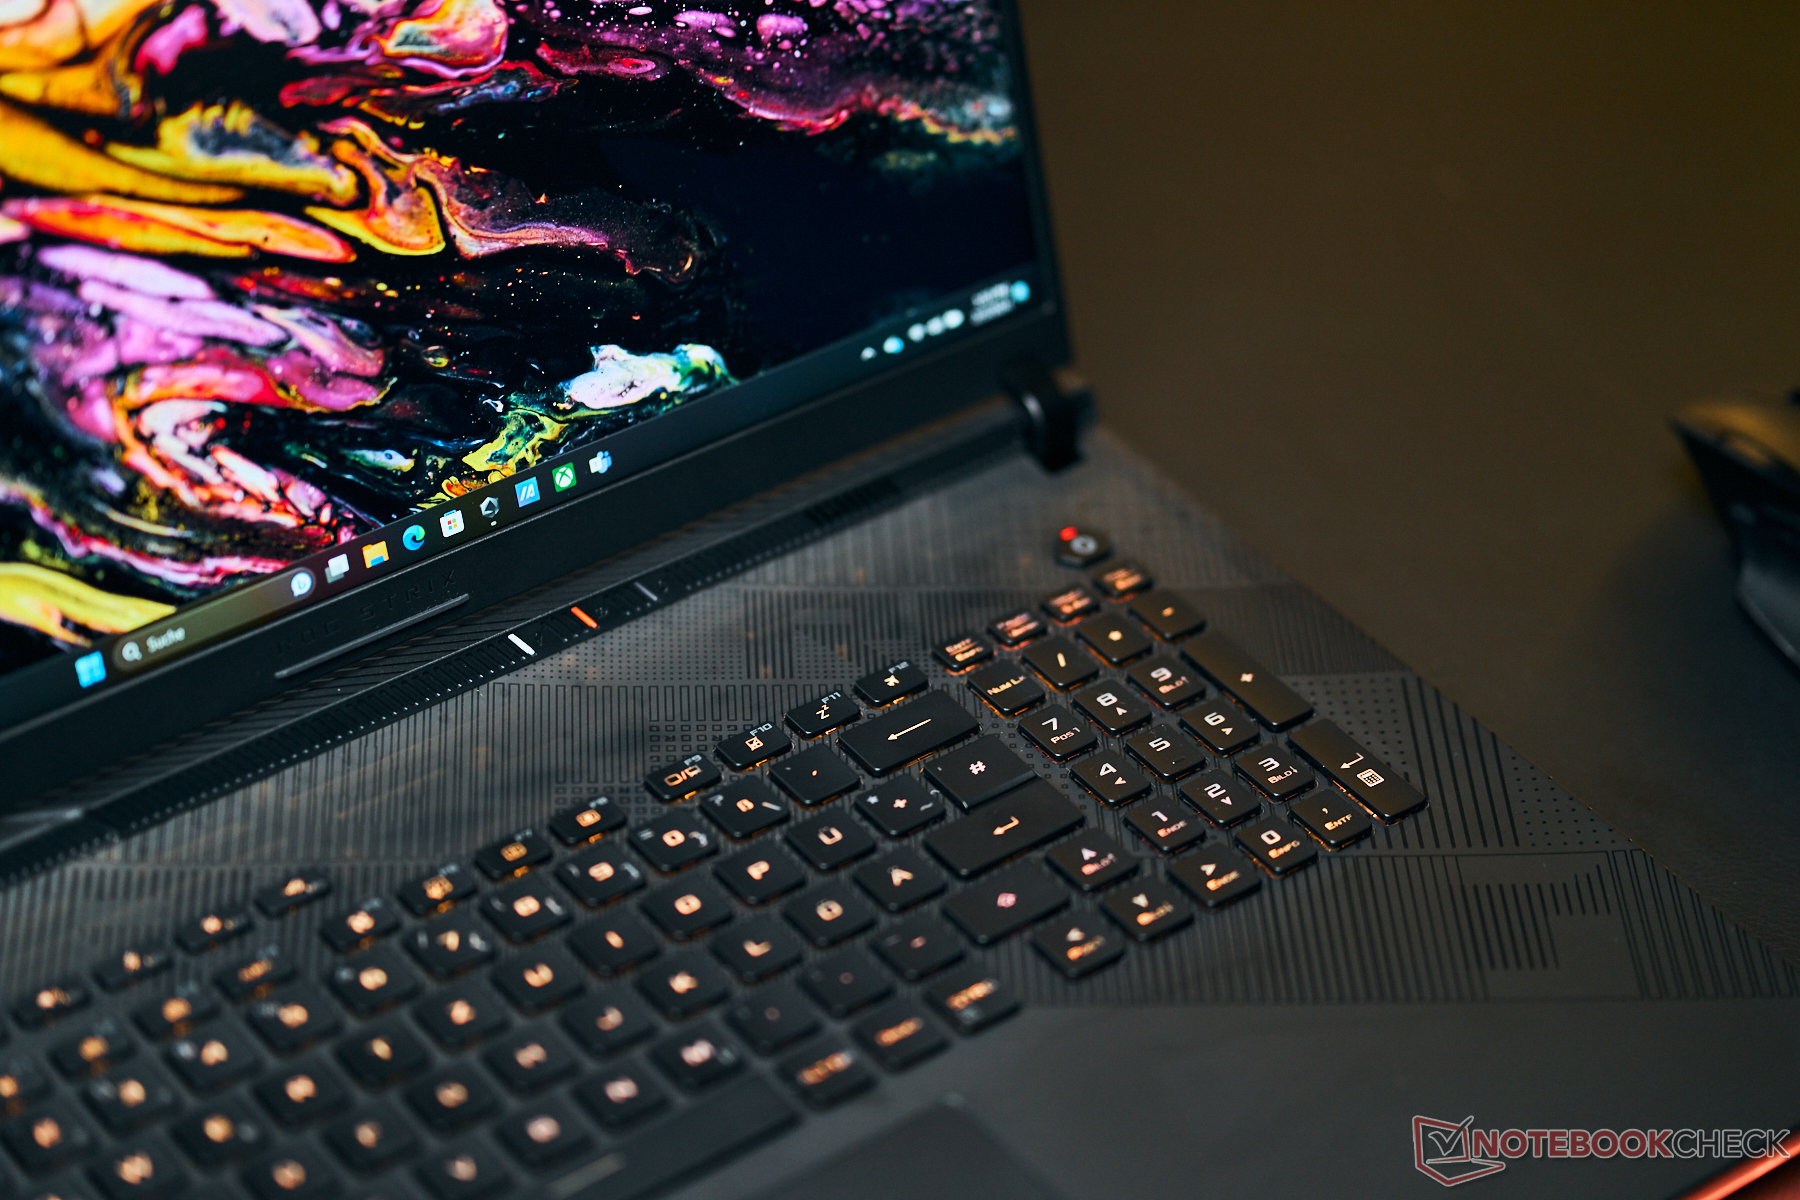
Las teclas cóncavas del teclado chiclet iluminado ofrecen un recorrido medio y un punto de presión claro. La resistencia de las teclas es básicamente buena, pero subjetivamente podría haber resultado algo más nítida. Al teclear, la mitad derecha del teclado tiene una cierta cesión que es mínima en el mejor de los casos. Sin embargo, esto no resultó ser ningún obstáculo. Un aspecto positivo es que las cuatro teclas de flecha tienen el tamaño normal. En general, Asus ofrece aquí un teclado adecuado para las tareas cotidianas.
Panel táctil
Un ClickPad (~13 x 8,5 cm, ~5,1 x 3,35 in) cuya superficie lisa facilita el deslizamiento de los dedos sirve como sustituto del ratón. Ofrece un recorrido corto y un punto de presión claro.
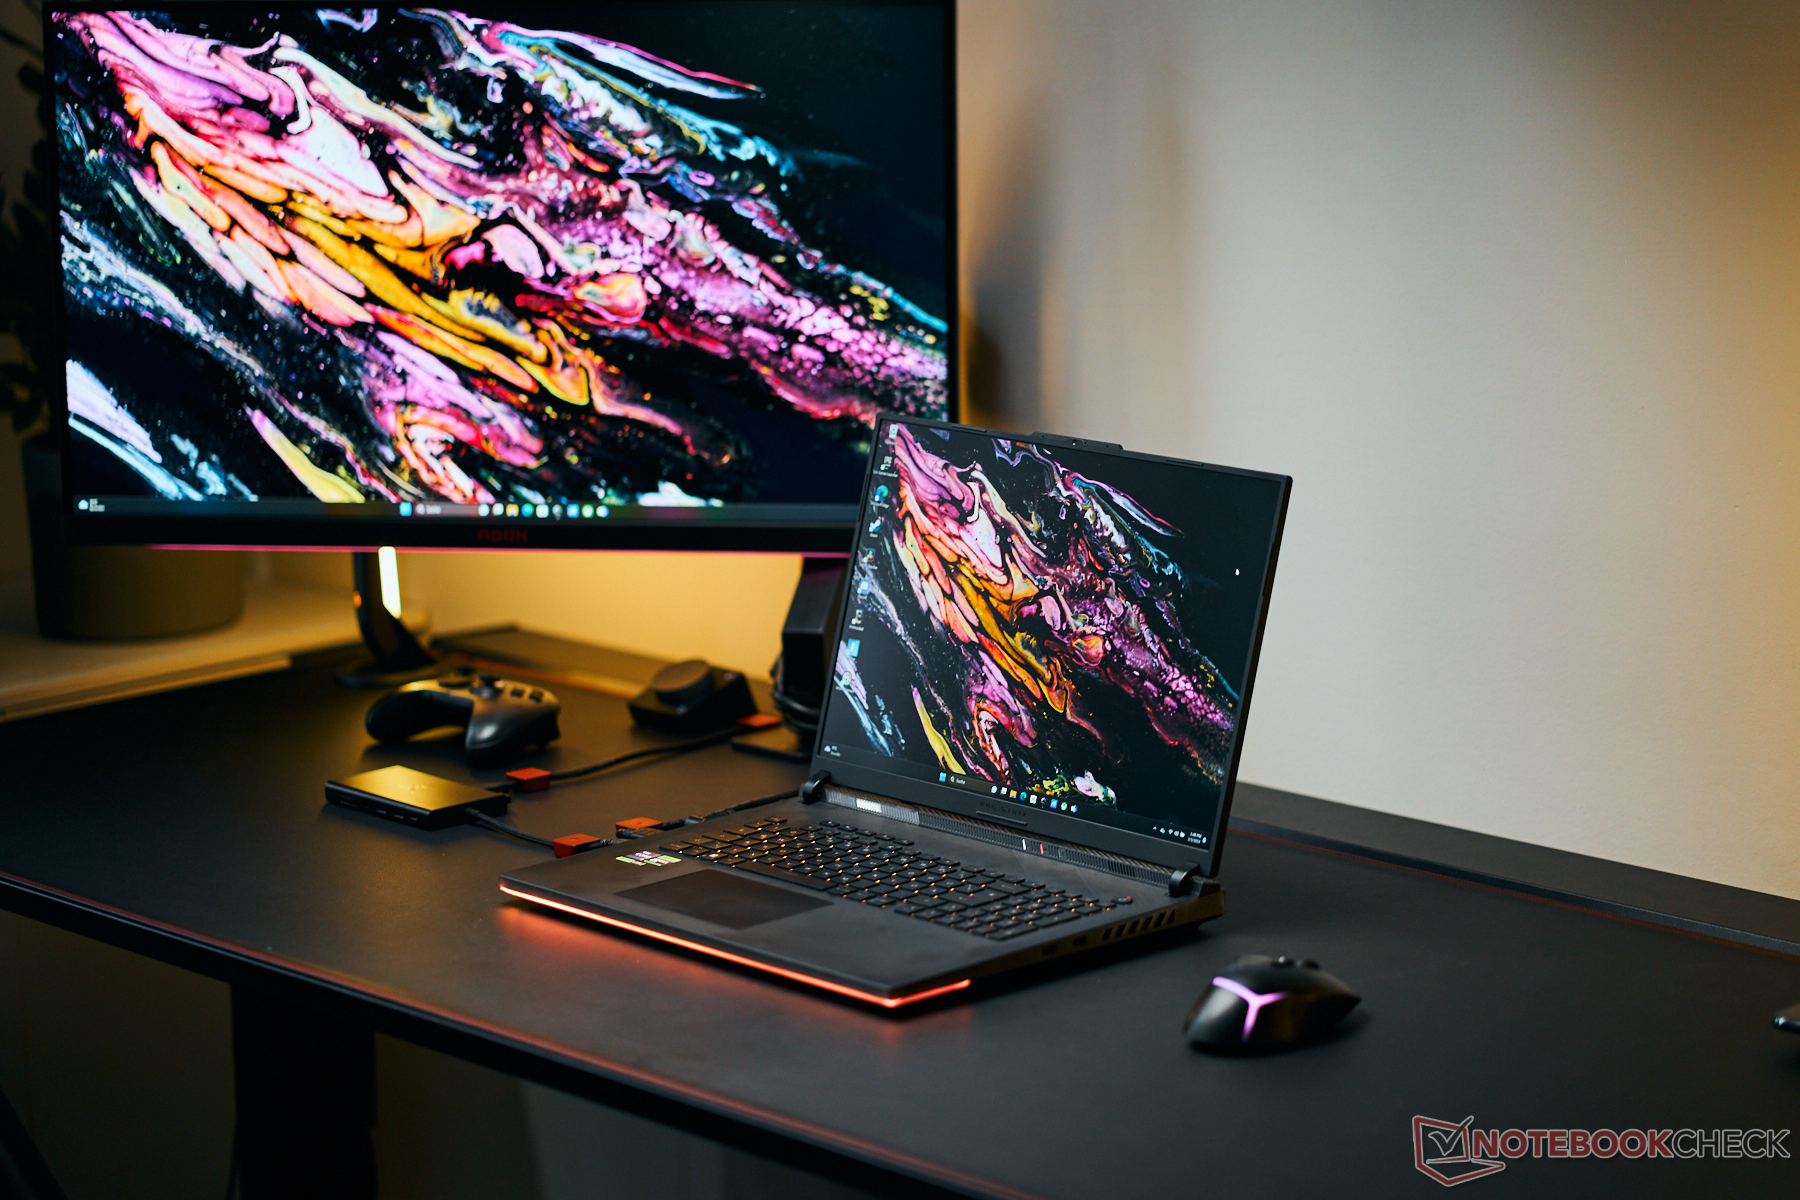
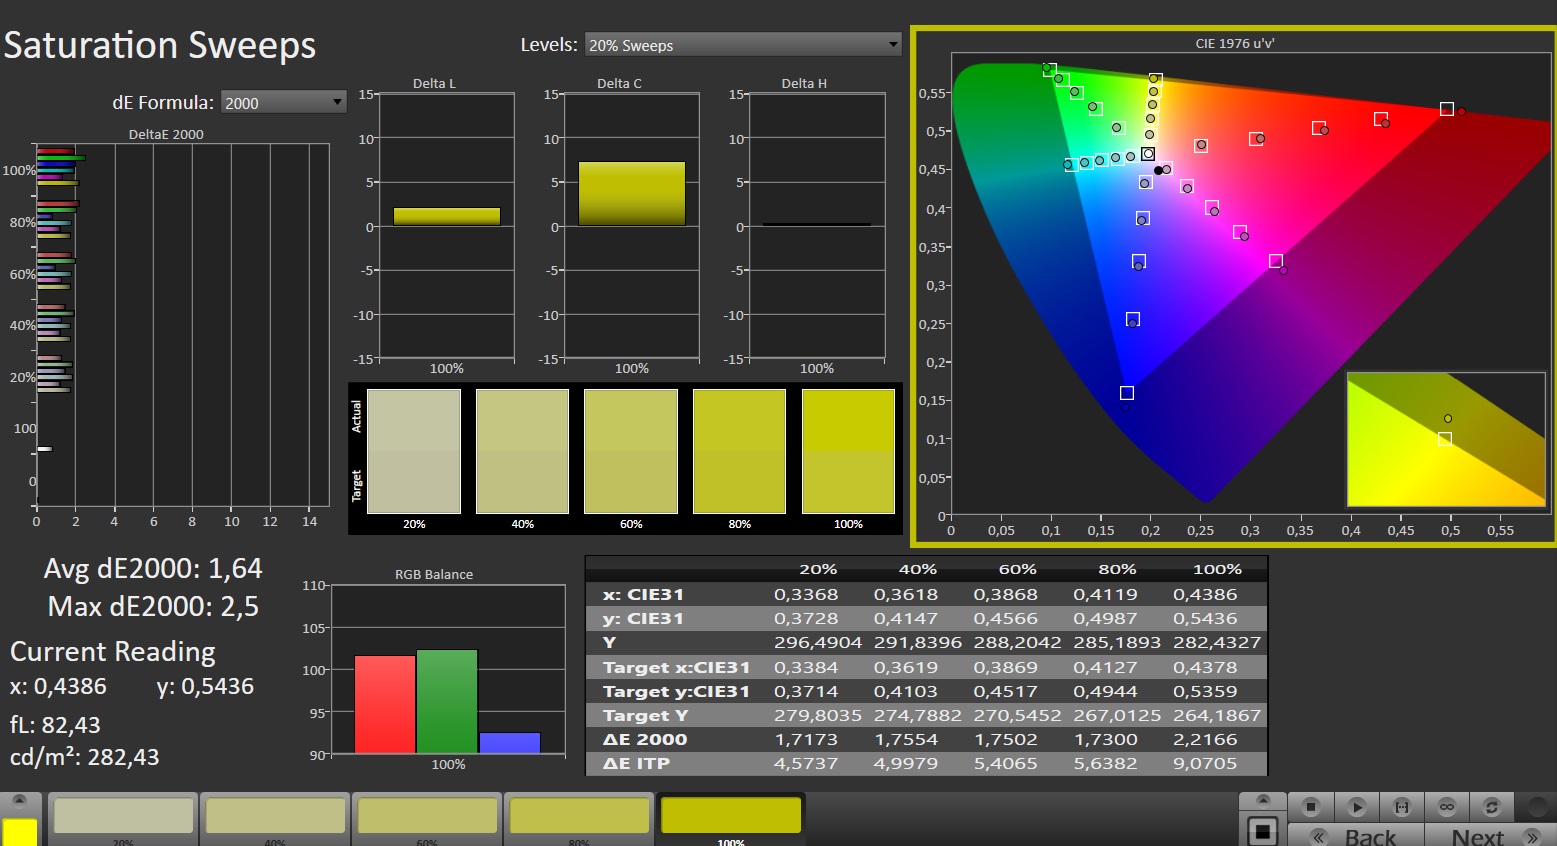
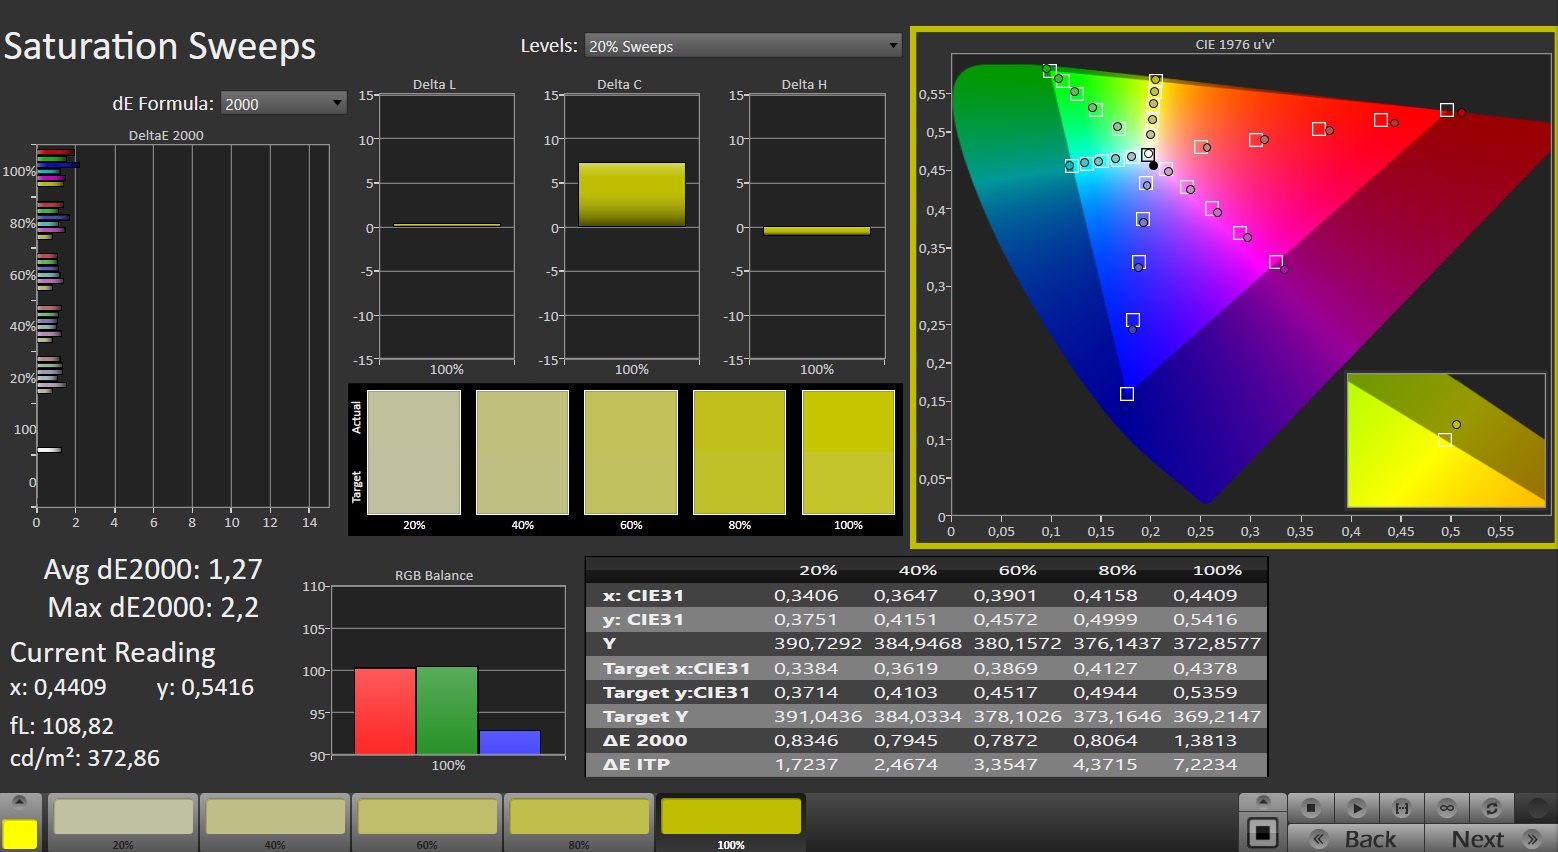
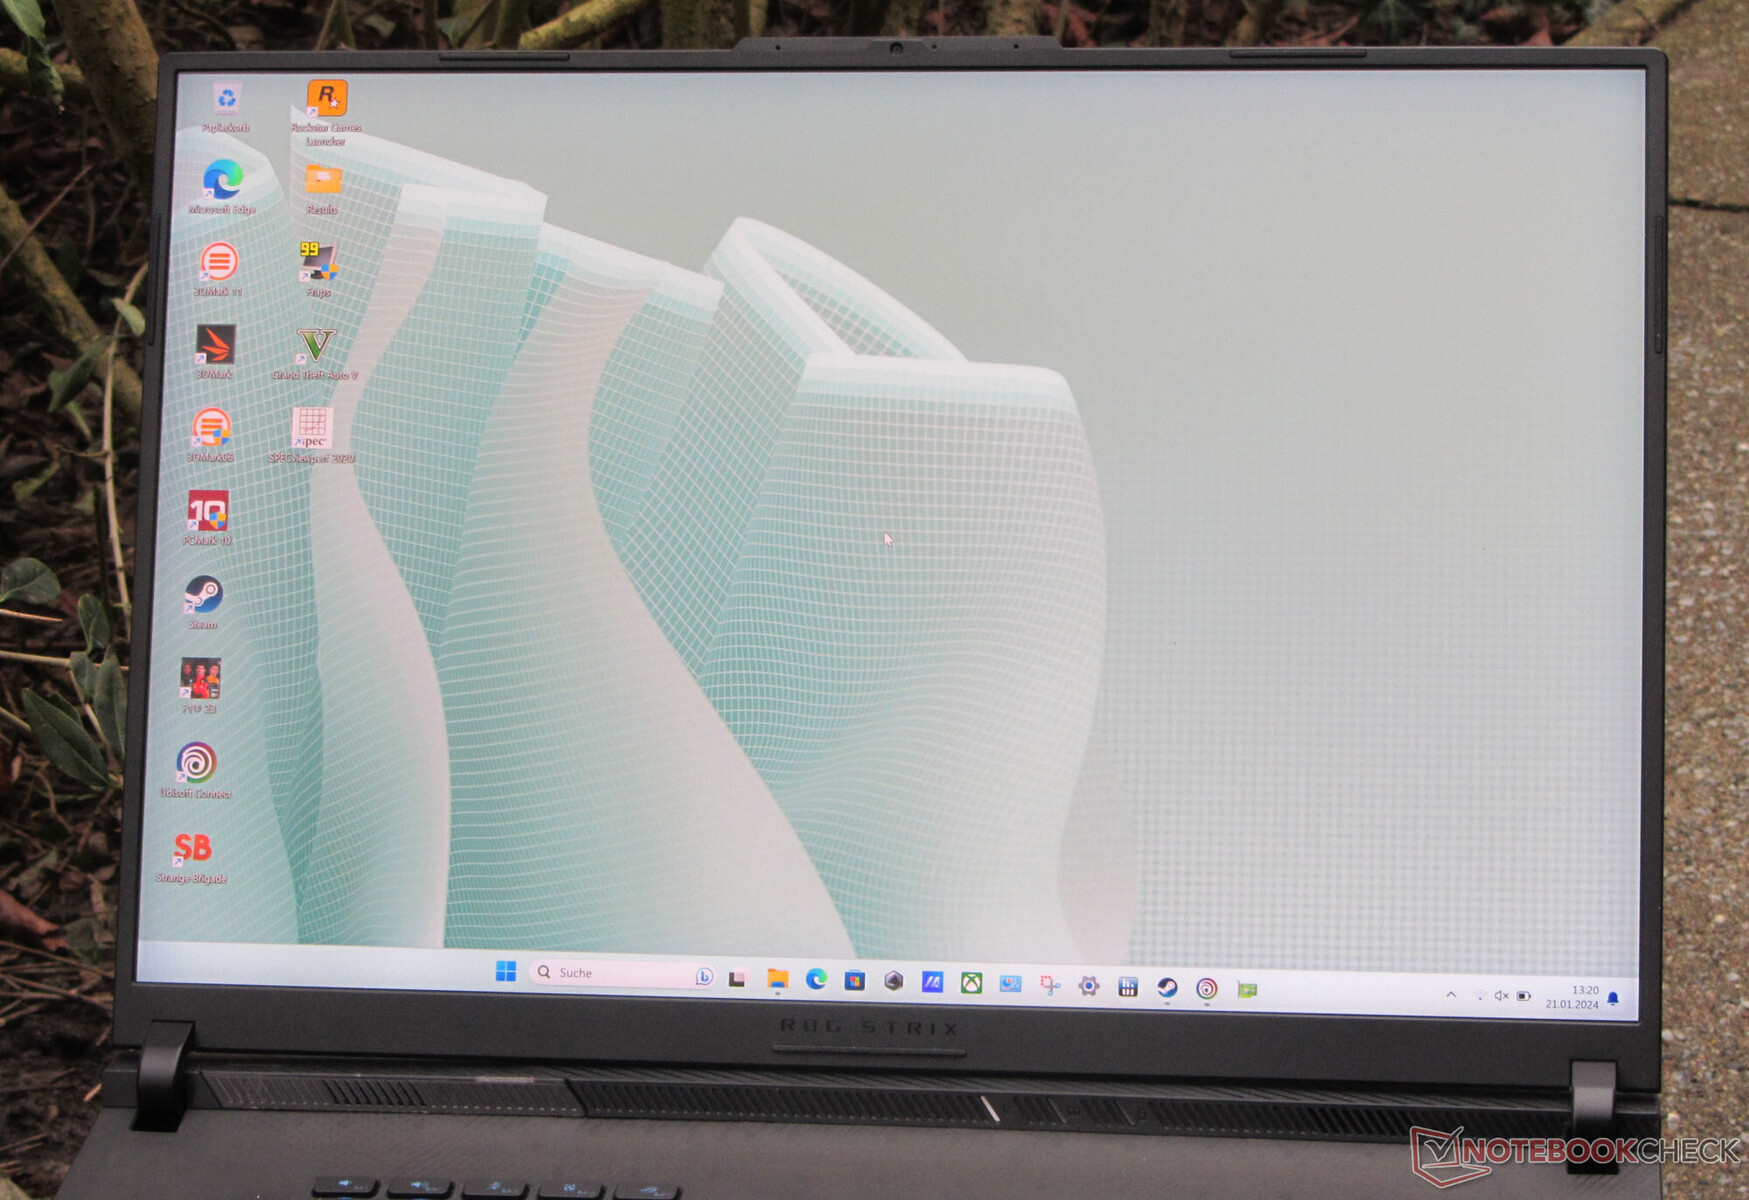
Pantalla - Mini-LED con cobertura del espacio de color DCI-P3
La Scar 18 ofrece una pantalla mini-LED de 18 pulgadas (2560x1600 píxeles) en formato 16:10. Entre sus aspectos positivos destacan el alto brillo, el excelente contraste y valor de negro, y la superficie mate. El rápido panel de 240 Hz también es compatible con HDR y G-Sync.
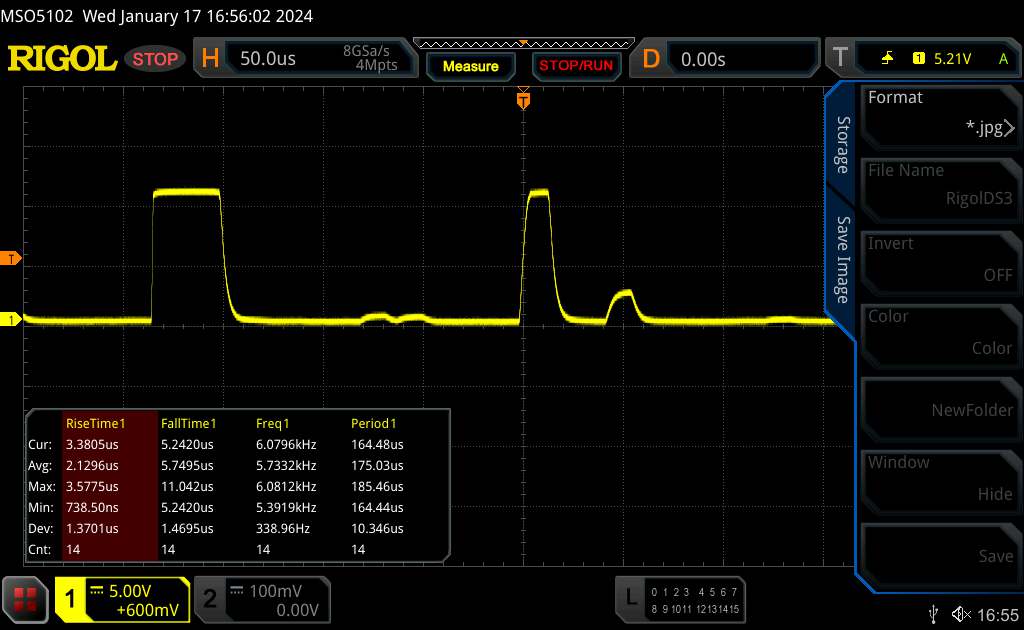
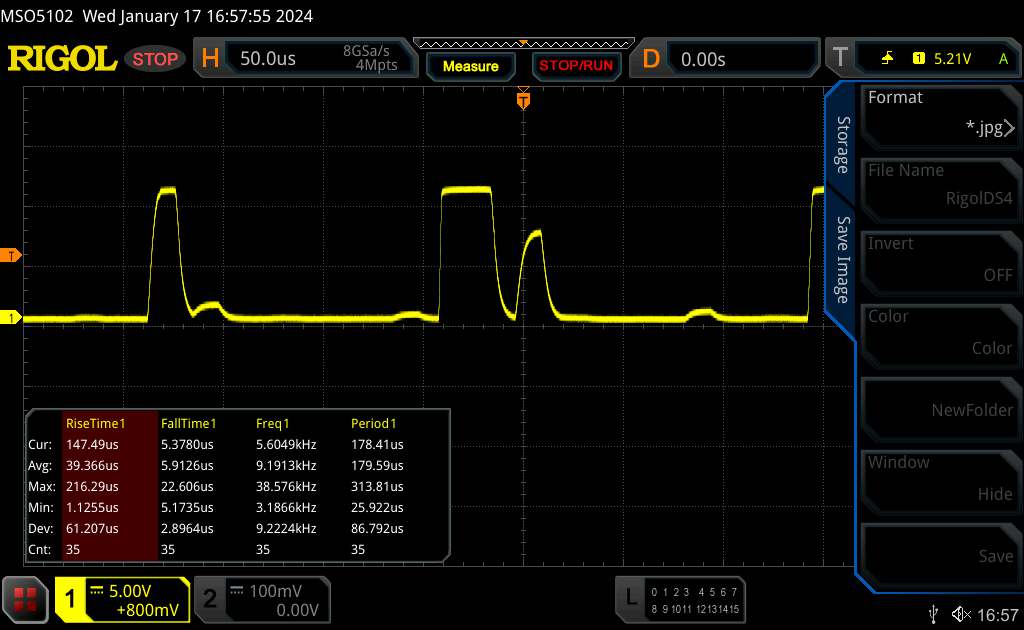
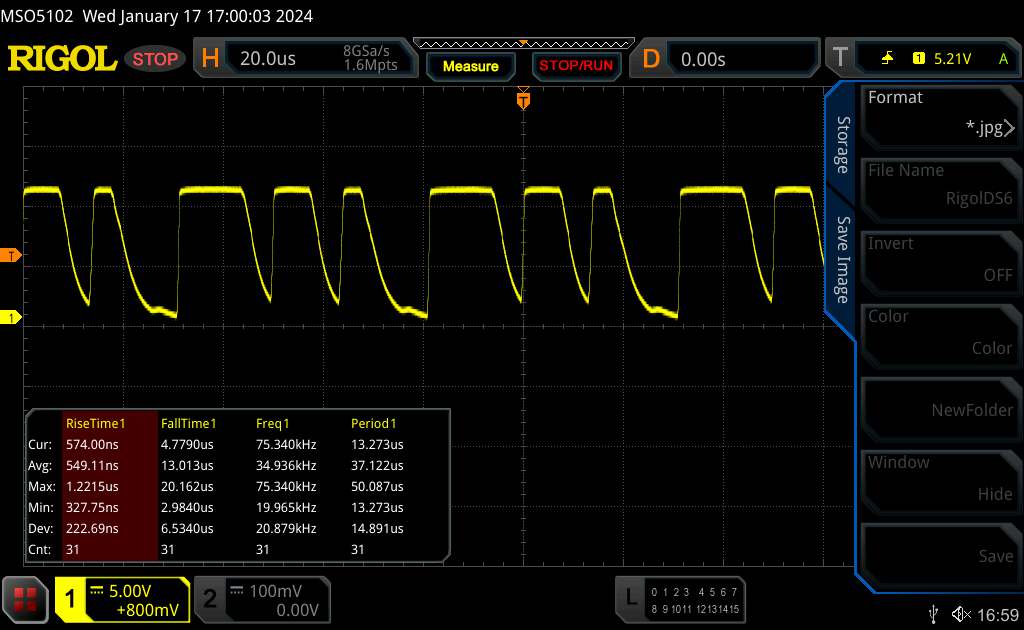
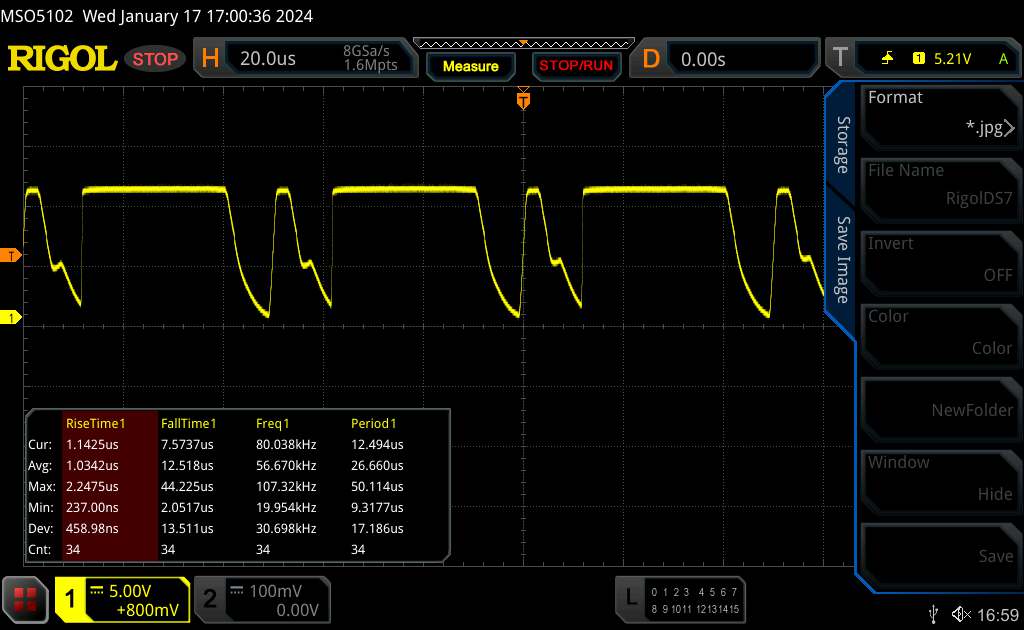
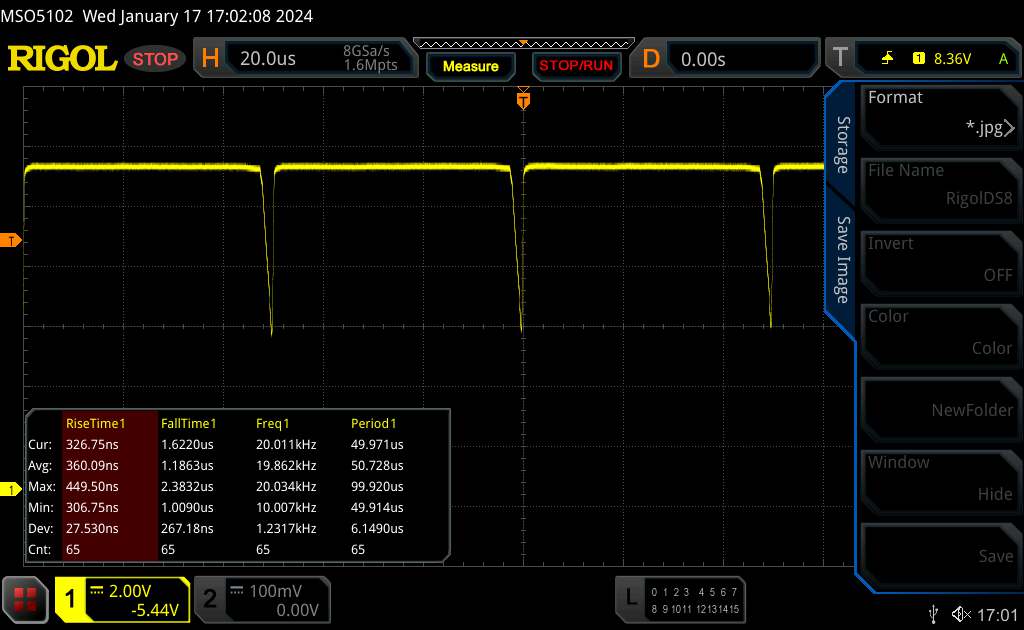
Por otro lado, la pantalla no está completamente libre de parpadeo PWM, aunque eso no debería jugar un papel importante en el funcionamiento diario: Medimos un parpadeo de alta frecuencia (5.733 Hz) con valores de brillo inferiores a 94 cd/m².
| |||||||||||||||||||||||||
iluminación: 89 %
Brillo con batería: 937 cd/m²
Contraste: 14197:1 (Negro: 0.066 cd/m²)
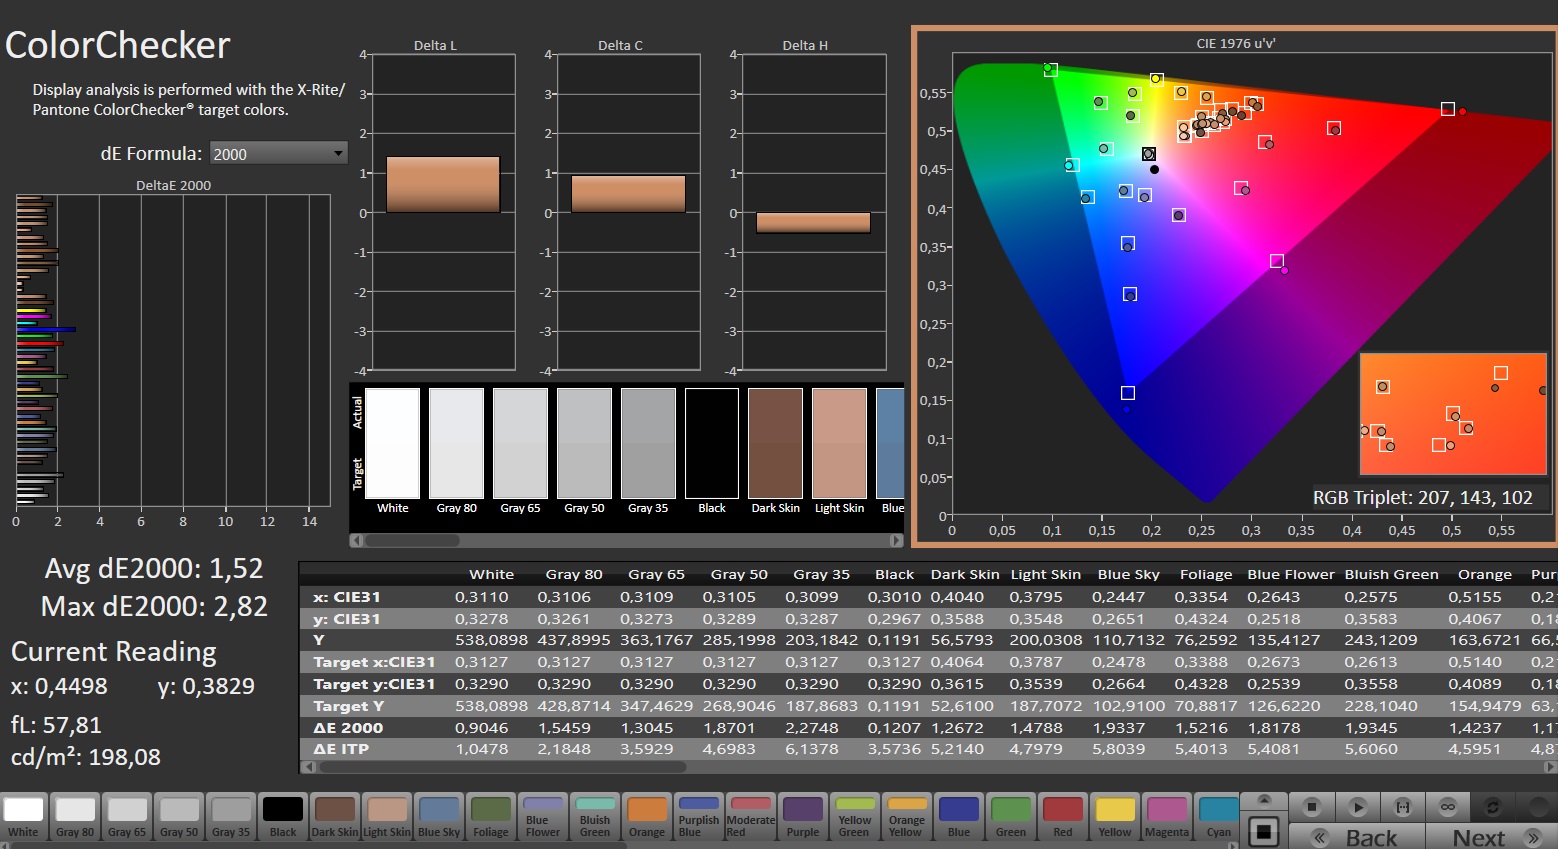
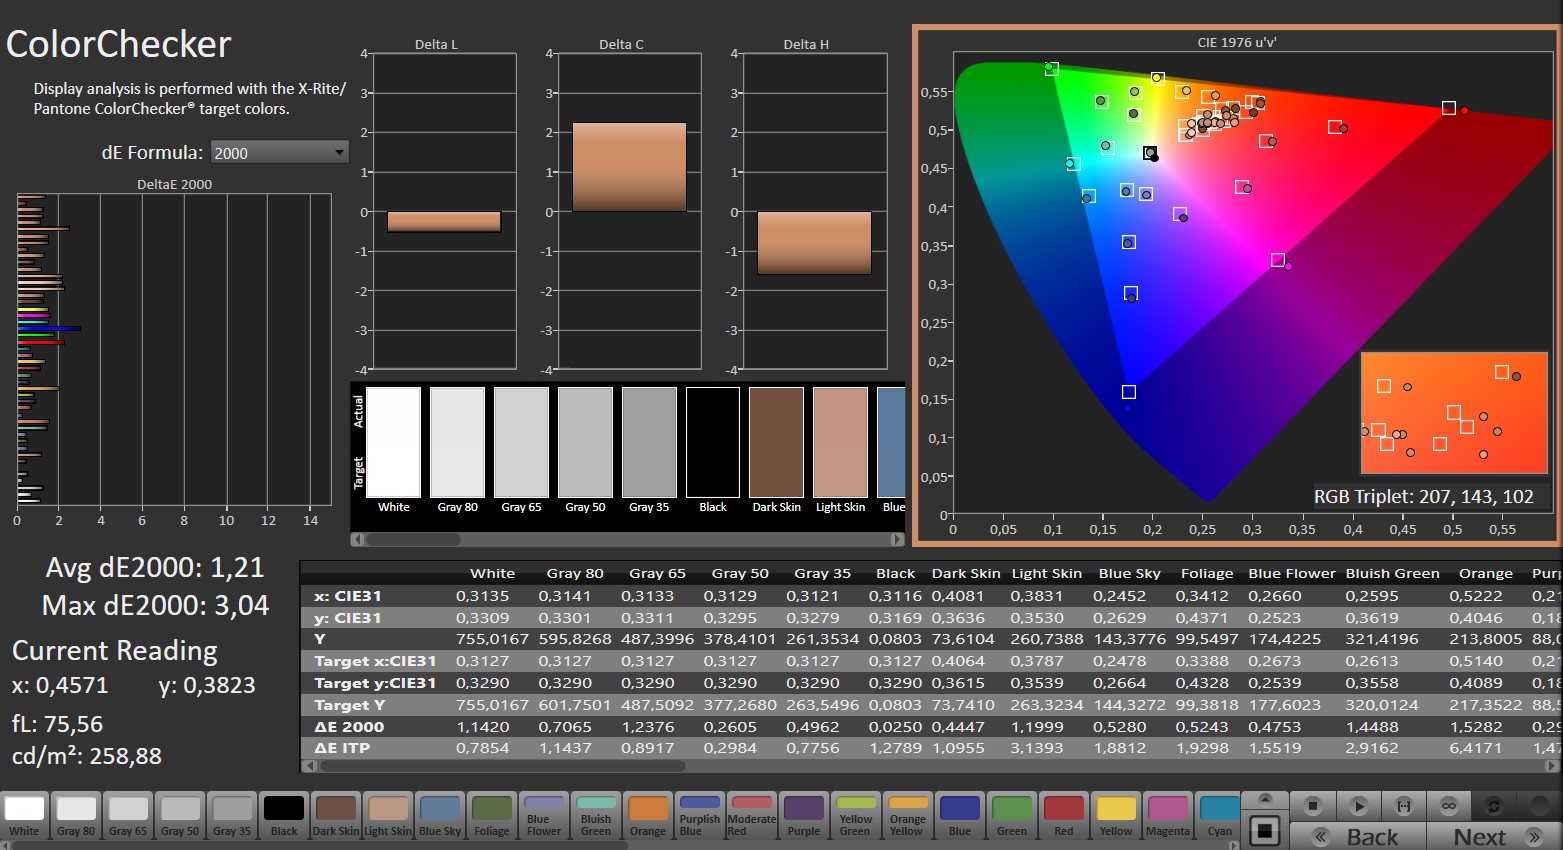
ΔE ColorChecker Calman: 1.52 | ∀{0.5-29.43 Ø4.71}
calibrated: 1.21
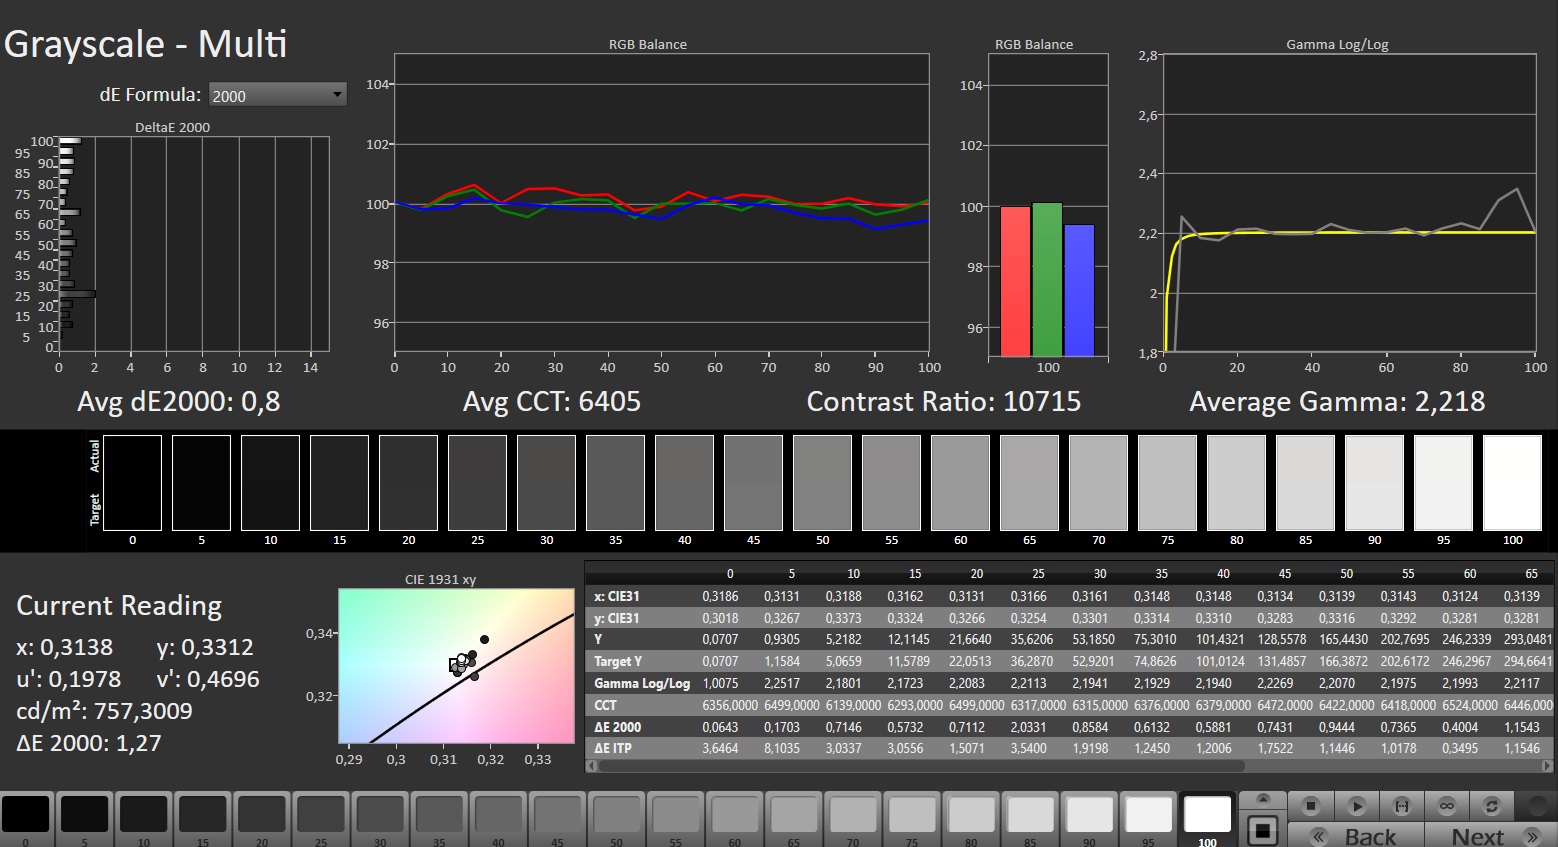
ΔE Greyscale Calman: 1.7 | ∀{0.09-98 Ø4.96}
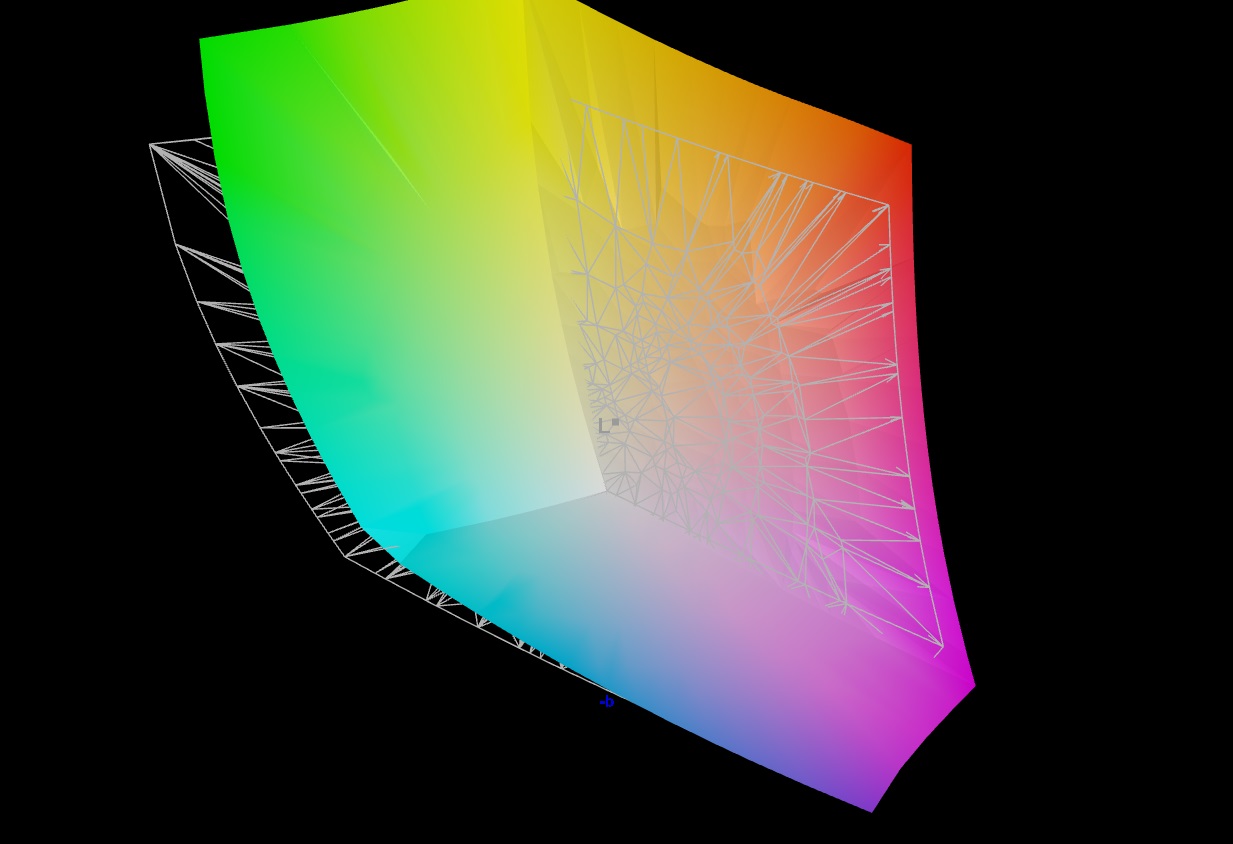
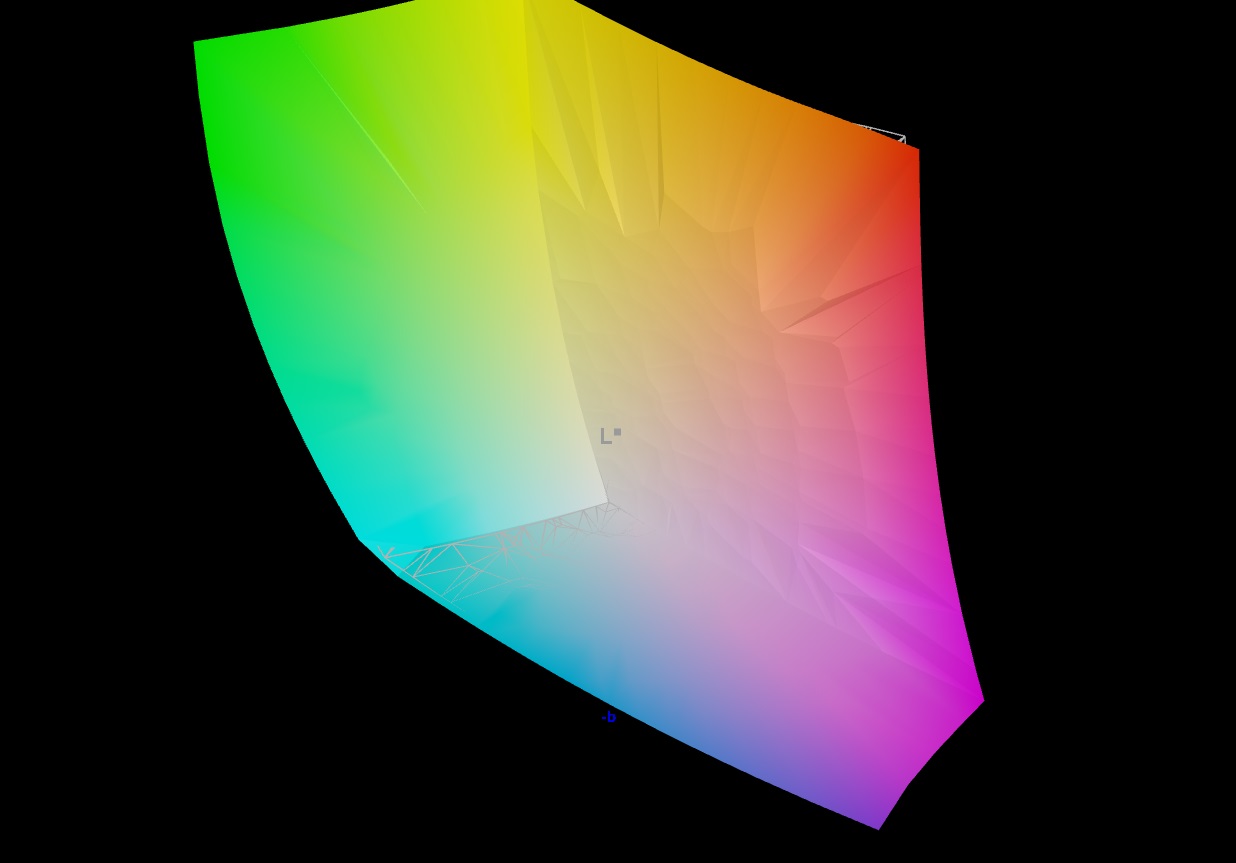
90% AdobeRGB 1998 (Argyll 3D)
100% sRGB (Argyll 3D)
99.9% Display P3 (Argyll 3D)
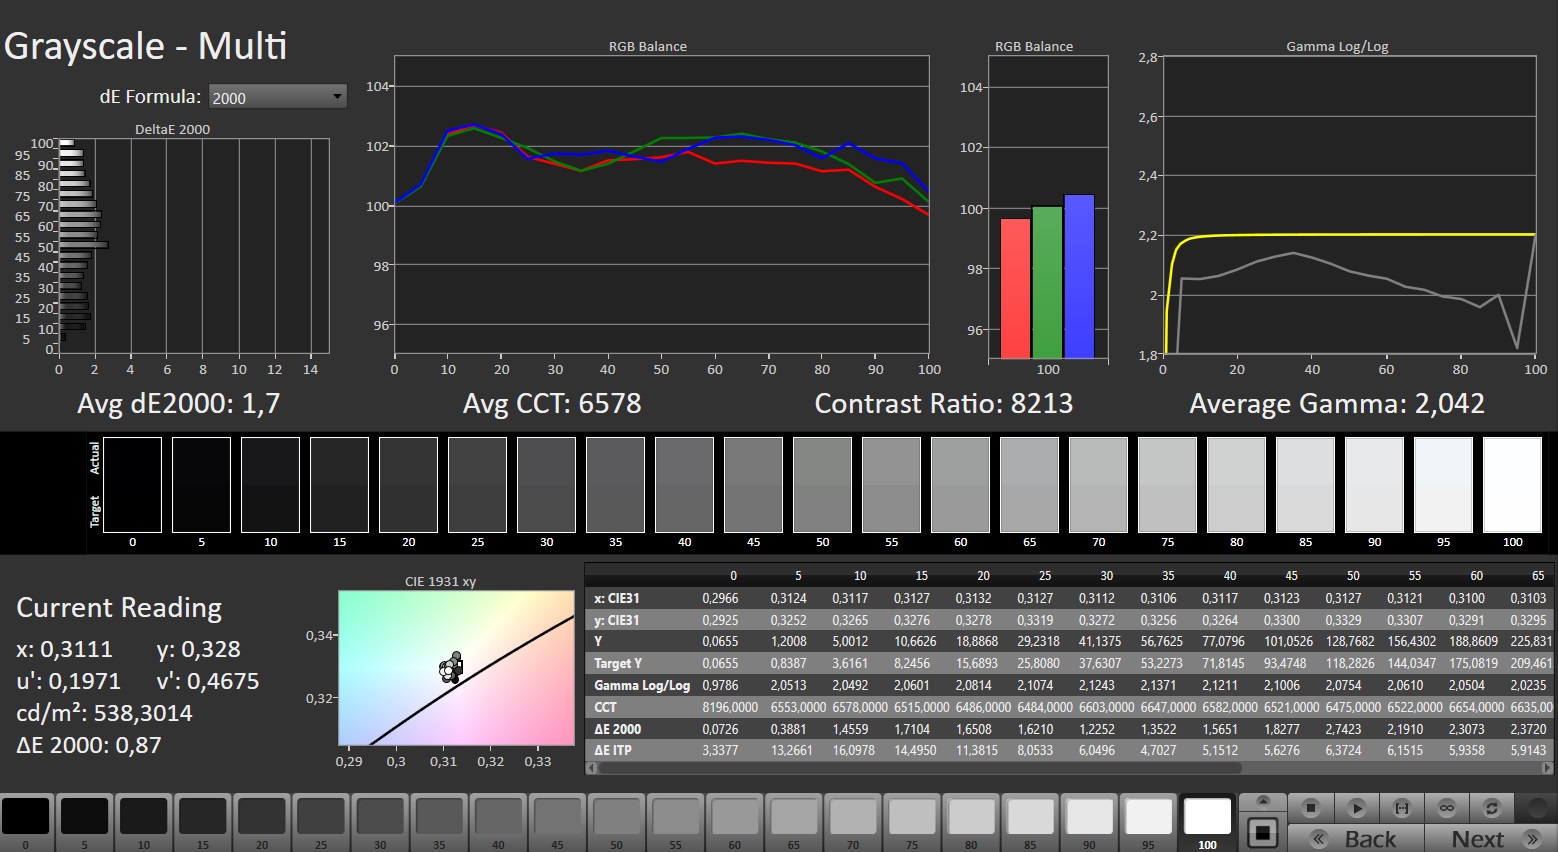
Gamma: 2.042
CCT: 6578 K
| Asus ROG Strix Scar 18 G834JYR (2024) BOE NE180QDM-NM1, Mini LED, 2560x1600, 18" | Alienware m18 R1 AMD BOE NE18NZ1, IPS, 1920x1200, 18" | Alienware m18 R1 Chi Mei 180JME, IPS, 1920x1200, 18" | Acer Predator Helios 18 N23Q2 AUO45A8 (B180QAN01.2), IPS, 2560x1600, 18" | Razer Blade 18 RTX 4070 AU Optronics B180QAN01.0, IPS, 2560x1600, 18" | MSI Titan 18 HX A14VIG AU Optronics B180ZAN01.0, Mini-LED, 3840x2400, 18" | Asus ROG Strix Scar 18 2023 G834JY-N6005W NE180QDM-NZ2, IPS, 2560x1600, 18" | |
|---|---|---|---|---|---|---|---|
| Display | -1% | -1% | 1% | -3% | -2% | -3% | |
| Display P3 Coverage (%) | 99.9 | 98.5 -1% | 97.7 -2% | 99.8 0% | 96.9 -3% | 98.1 -2% | 97.2 -3% |
| sRGB Coverage (%) | 100 | 99.7 0% | 100 0% | 100 0% | 99.8 0% | 99.8 0% | 99.9 0% |
| AdobeRGB 1998 Coverage (%) | 90 | 88.7 -1% | 89.8 0% | 91.8 2% | 85.3 -5% | 86.2 -4% | 84.9 -6% |
| Response Times | 44% | 41% | -15% | 45% | -318% | 37% | |
| Response Time Grey 50% / Grey 80% * (ms) | 12 ? | 2.8 ? 77% | 3 ? 75% | 7.6 ? 37% | 4.2 ? 65% | 8.6 ? 28% | 5.41 ? 55% |
| Response Time Black / White * (ms) | 10.7 ? | 9.6 ? 10% | 9.9 ? 7% | 17.8 ? -66% | 8 ? 25% | 81.8 ? -664% | 8.62 ? 19% |
| PWM Frequency (Hz) | 5733 ? | 2509 | 2592 ? | ||||
| Screen | -42% | -64% | -114% | -142% | -85% | -211% | |
| Brightness middle (cd/m²) | 937 | 319.6 -66% | 372.8 -60% | 360 -62% | 549.6 -41% | 467.5 -50% | 490 -48% |
| Brightness (cd/m²) | 934 | 304 -67% | 367 -61% | 355 -62% | 524 -44% | 459 -51% | 468 -50% |
| Brightness Distribution (%) | 89 | 87 -2% | 97 9% | 92 3% | 89 0% | 90 1% | 86 -3% |
| Black Level * (cd/m²) | 0.066 | 0.25 -279% | 0.32 -385% | 0.21 -218% | 0.53 -703% | 0.54 -718% | |
| Contrast (:1) | 14197 | 1278 -91% | 1165 -92% | 1714 -88% | 1037 -93% | 907 -94% | |
| Colorchecker dE 2000 * | 1.52 | 1.22 20% | 1.92 -26% | 3.82 -151% | 3.32 -118% | 3.77 -148% | 4.97 -227% |
| Colorchecker dE 2000 max. * | 2.82 | 3.1 -10% | 3.65 -29% | 7.38 -162% | 6.63 -135% | 6.12 -117% | 11.02 -291% |
| Colorchecker dE 2000 calibrated * | 1.21 | 0.47 61% | 0.51 58% | 2.24 -85% | 2.7 -123% | 2.94 -143% | 2.97 -145% |
| Greyscale dE 2000 * | 1.7 | 0.8 53% | 1.5 12% | 5.06 -198% | 2 -18% | 3.2 -88% | 7.2 -324% |
| Gamma | 2.042 108% | 2.23 99% | 2.34 94% | 2.52 87% | 2.29 96% | 2.43 91% | 2.161 102% |
| CCT | 6578 99% | 6471 100% | 6607 98% | 5657 115% | 6319 103% | 6478 100% | 6515 100% |
| Media total (Programa/Opciones) | 0% /
-21% | -8% /
-35% | -43% /
-75% | -33% /
-85% | -135% /
-103% | -59% /
-131% |
* ... más pequeño es mejor
La precisión del color es un hecho con los espacios de color sRGB y DCI-P3 cubiertos por completo y el espacio de color Adobe RGB al 90%. Gracias a la certificación Pantone, la reproducción del color ya es muy buena en el estado de entrega, y con una desviación de 1,52 se alcanza el objetivo de DeltaE < 3. Aunque con una calibración adicional aún se consigue una ligera mejora, ésta se refiere principalmente a una escala de grises más equilibrada.

Tiempos de respuesta del display
| ↔ Tiempo de respuesta de Negro a Blanco | ||
|---|---|---|
| 10.7 ms ... subida ↗ y bajada ↘ combinada | ↗ 7.6 ms subida | 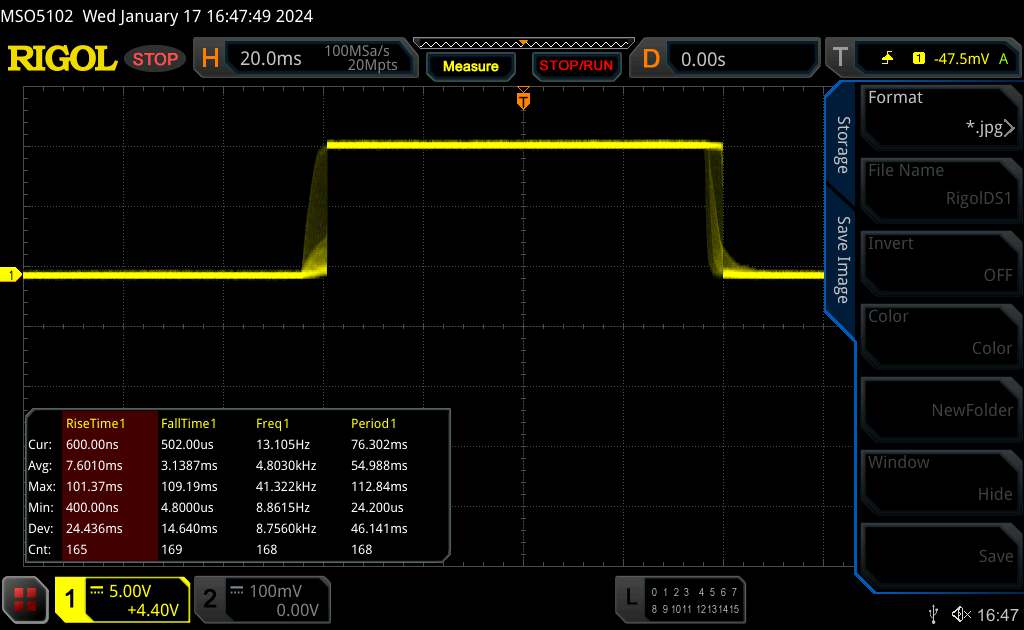 |
| ↘ 3.1 ms bajada | ||
| La pantalla mostró buenos tiempos de respuesta en nuestros tests pero podría ser demasiado lenta para los jugones competitivos. En comparación, todos los dispositivos de prueba van de ##min### (mínimo) a 240 (máximo) ms. » 29 % de todos los dispositivos son mejores. Esto quiere decir que el tiempo de respuesta medido es mejor que la media (19.8 ms) de todos los dispositivos testados. | ||
| ↔ Tiempo de respuesta 50% Gris a 80% Gris | ||
| 12 ms ... subida ↗ y bajada ↘ combinada | ↗ 8 ms subida | |
| ↘ 4 ms bajada | ||
| La pantalla mostró buenos tiempos de respuesta en nuestros tests pero podría ser demasiado lenta para los jugones competitivos. En comparación, todos los dispositivos de prueba van de ##min### (mínimo) a 636 (máximo) ms. » 25 % de todos los dispositivos son mejores. Esto quiere decir que el tiempo de respuesta medido es mejor que la media (31 ms) de todos los dispositivos testados. | ||
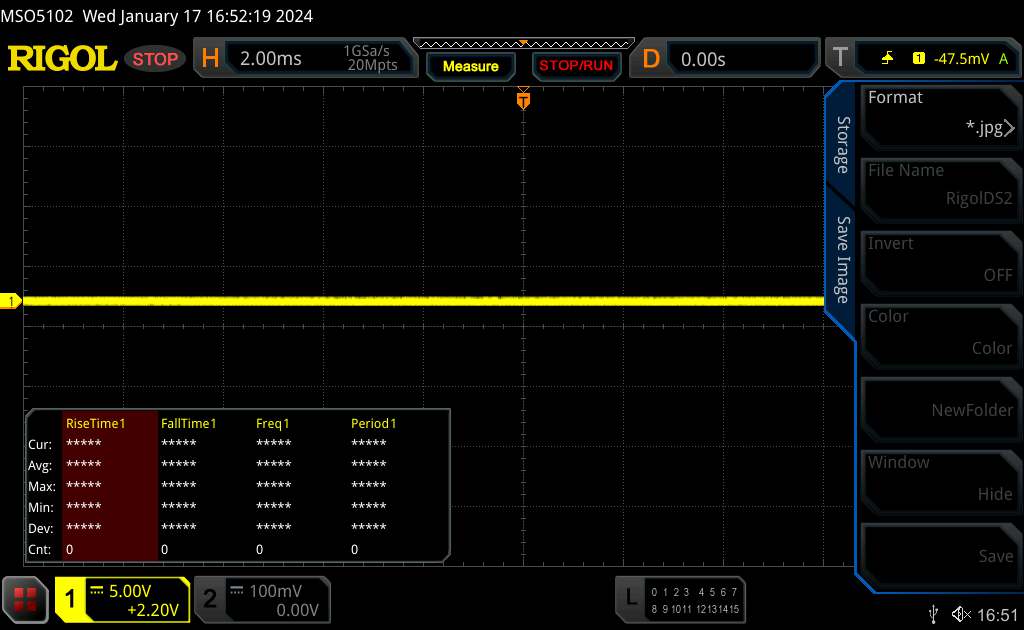
Parpadeo de Pantalla / PWM (Pulse-Width Modulation)
| Parpadeo de Pantalla / PWM detectado | 5733 Hz | |
| ≤ 94 cd/m² brillo | ||
La retroiluminación del display parpadea a 5733 Hz (seguramente usa PWM - Pulse-Width Modulation) a un brillo del 94 cd/m² e inferior. Sobre este nivel de brillo no debería darse parpadeo / PWM. La frecuencia de 5733 Hz es bastante alta, por lo que la mayoría de gente sensible al parpadeo no debería ver parpadeo o tener fatiga visual. El parpadeo se da a un brillo relativamente bajo, por lo que el uso prolongado en interiores con este nivel de brillo puede ser fatigoso. Comparación: 52 % de todos los dispositivos testados no usaron PWM para atenuar el display. Si se usó, medimos una media de 7747 (mínimo: 5 - máxmo: 343500) Hz. | ||
El panel IPS tiene ángulos de visión estables y se puede leer desde casi cualquier ángulo. El alto brillo máximo también permite leer los contenidos de la pantalla en exteriores.

Rendimiento - La Scar 18 ofrece un hardware de gama alta
El Asus ROG Strix Scar 18 es un portátil de gama alta en formato de 18 pulgadas. Ofrece el rendimiento informático necesario gracias al hardware Raptor Lake Refresh y Ada Lovelace. Los precios empiezan a partir de 3.600 euros (~3.878 dólares), y nuestra unidad de pruebas actual está disponible por unos 4.500 euros (~4.848 dólares).
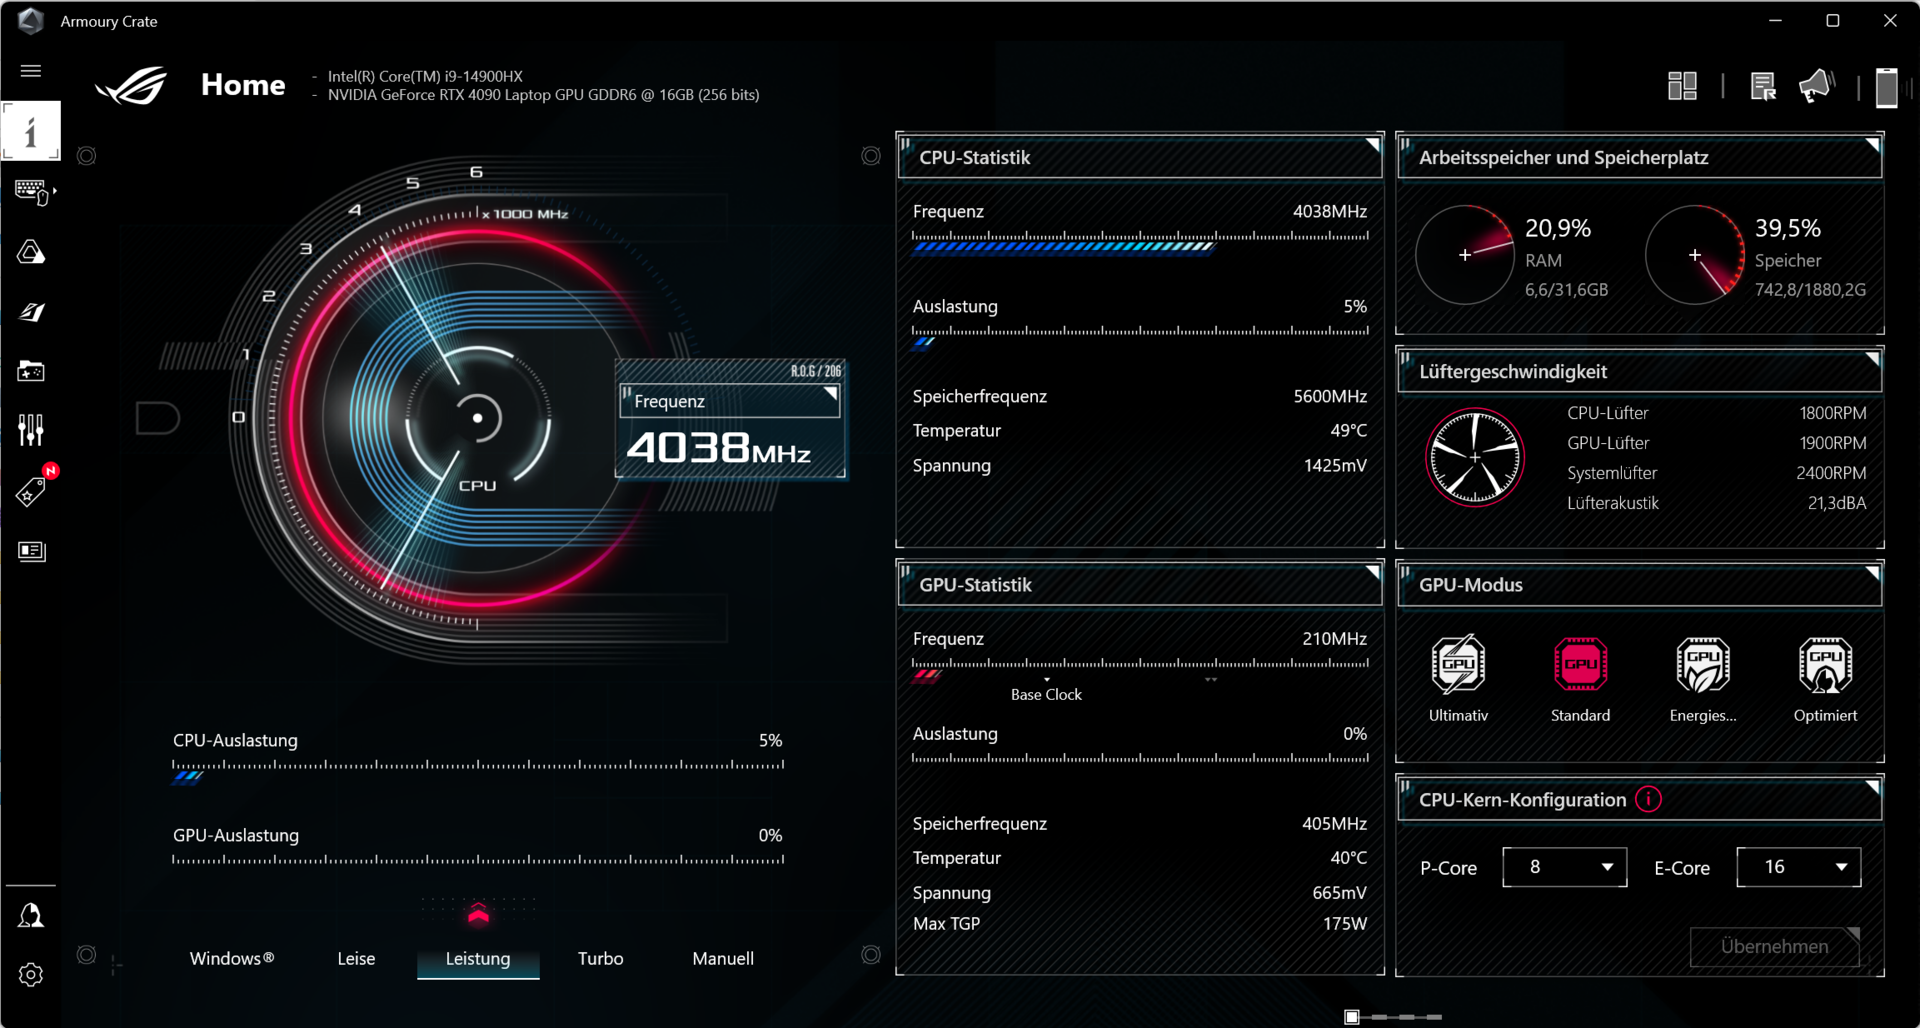
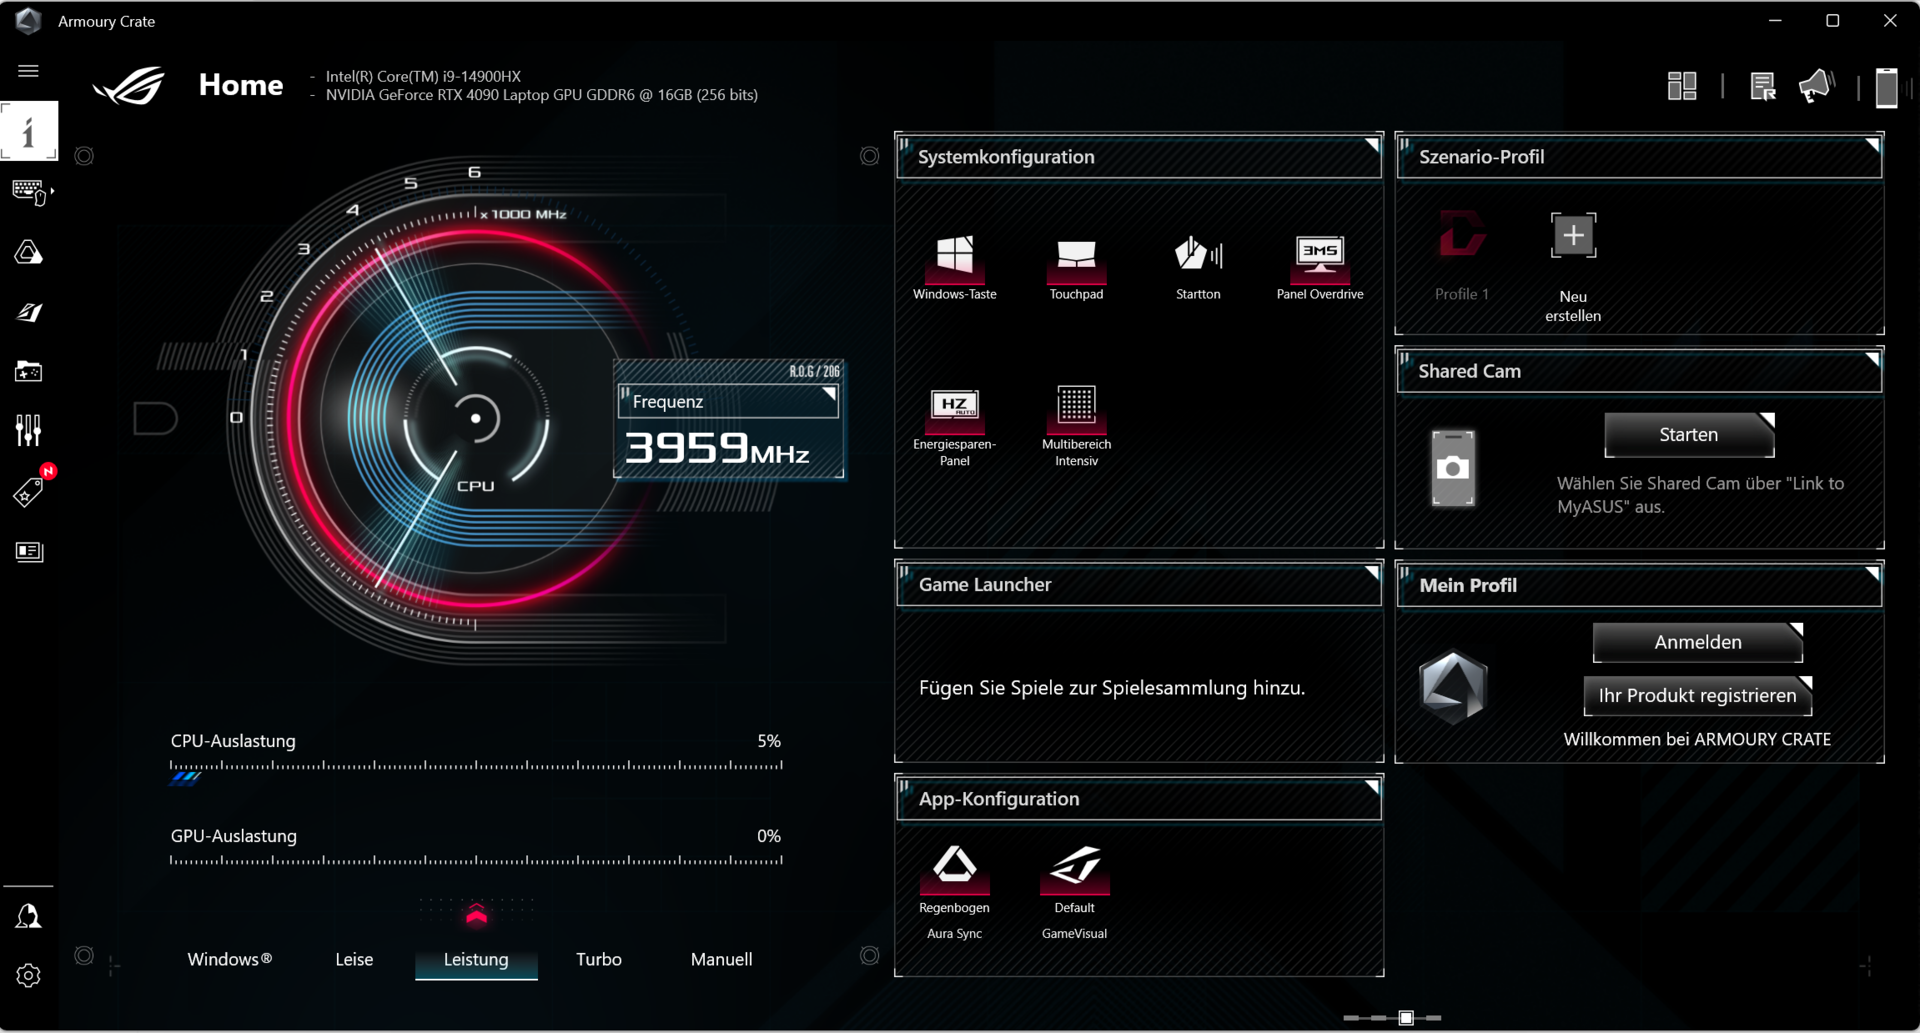
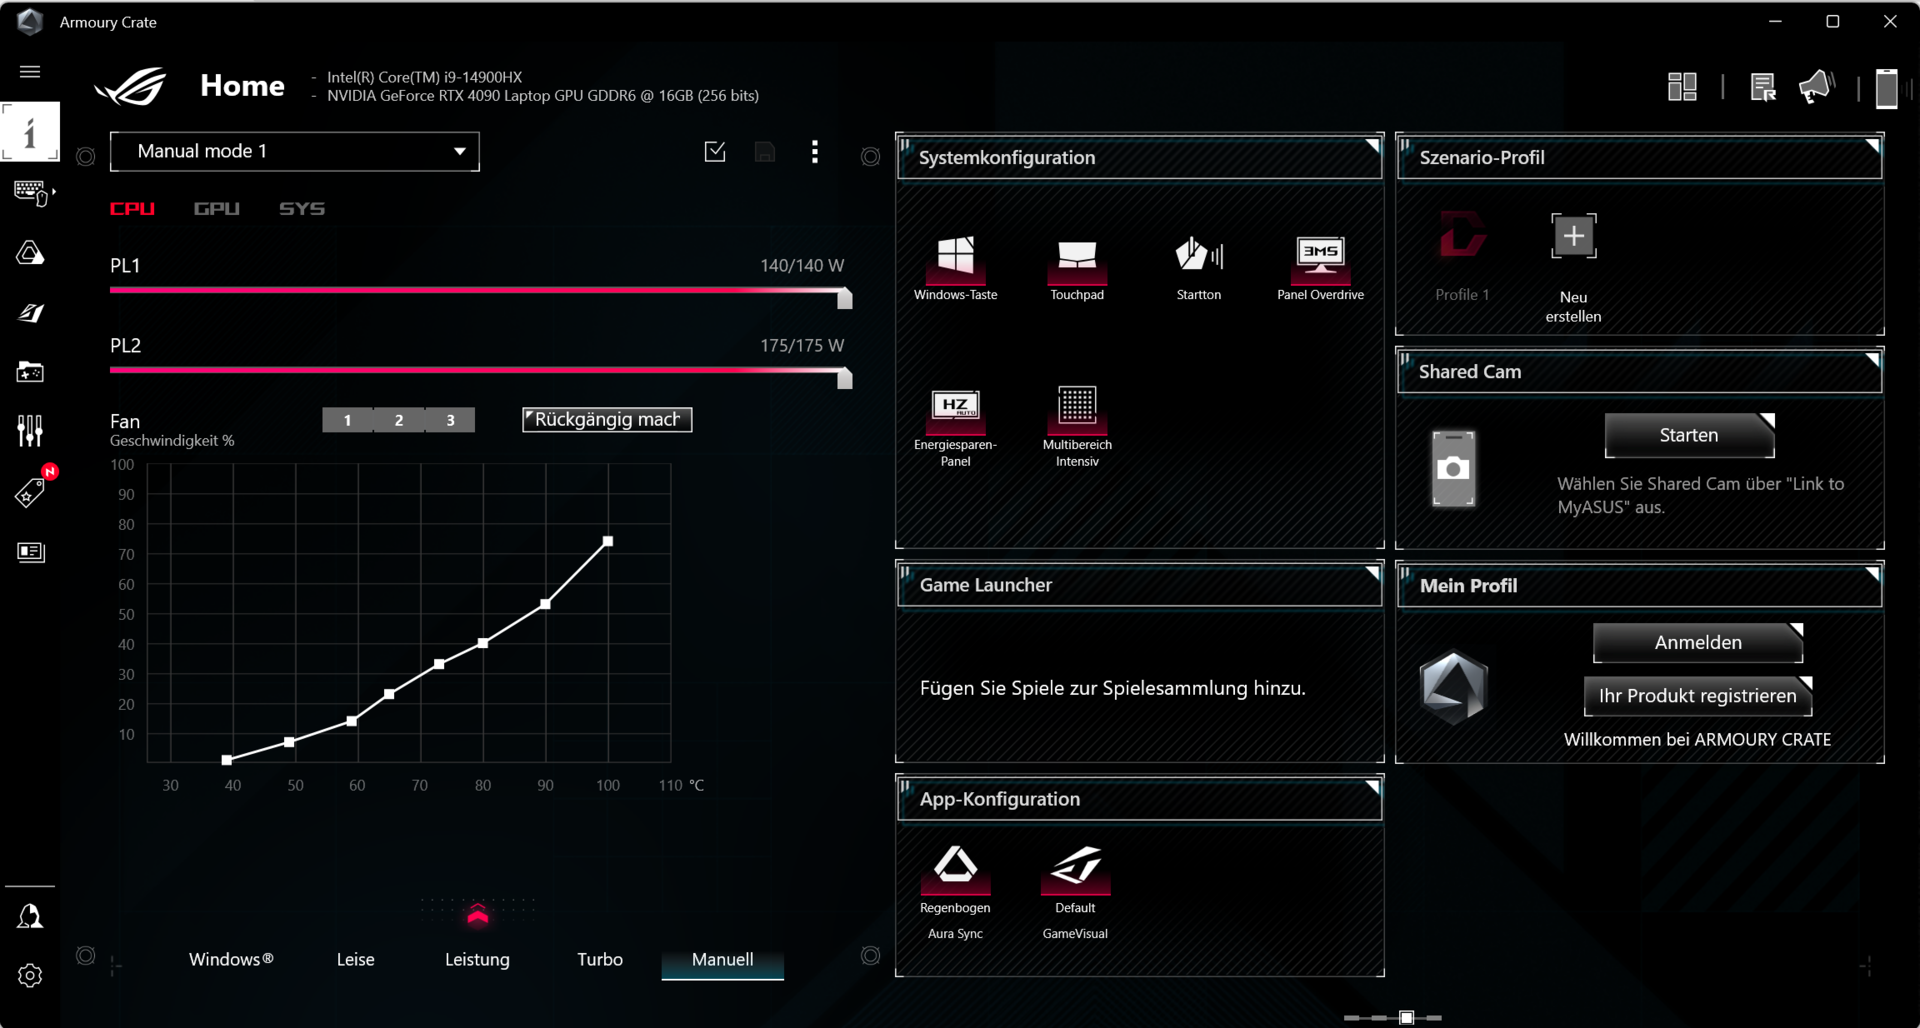
Condiciones de la prueba
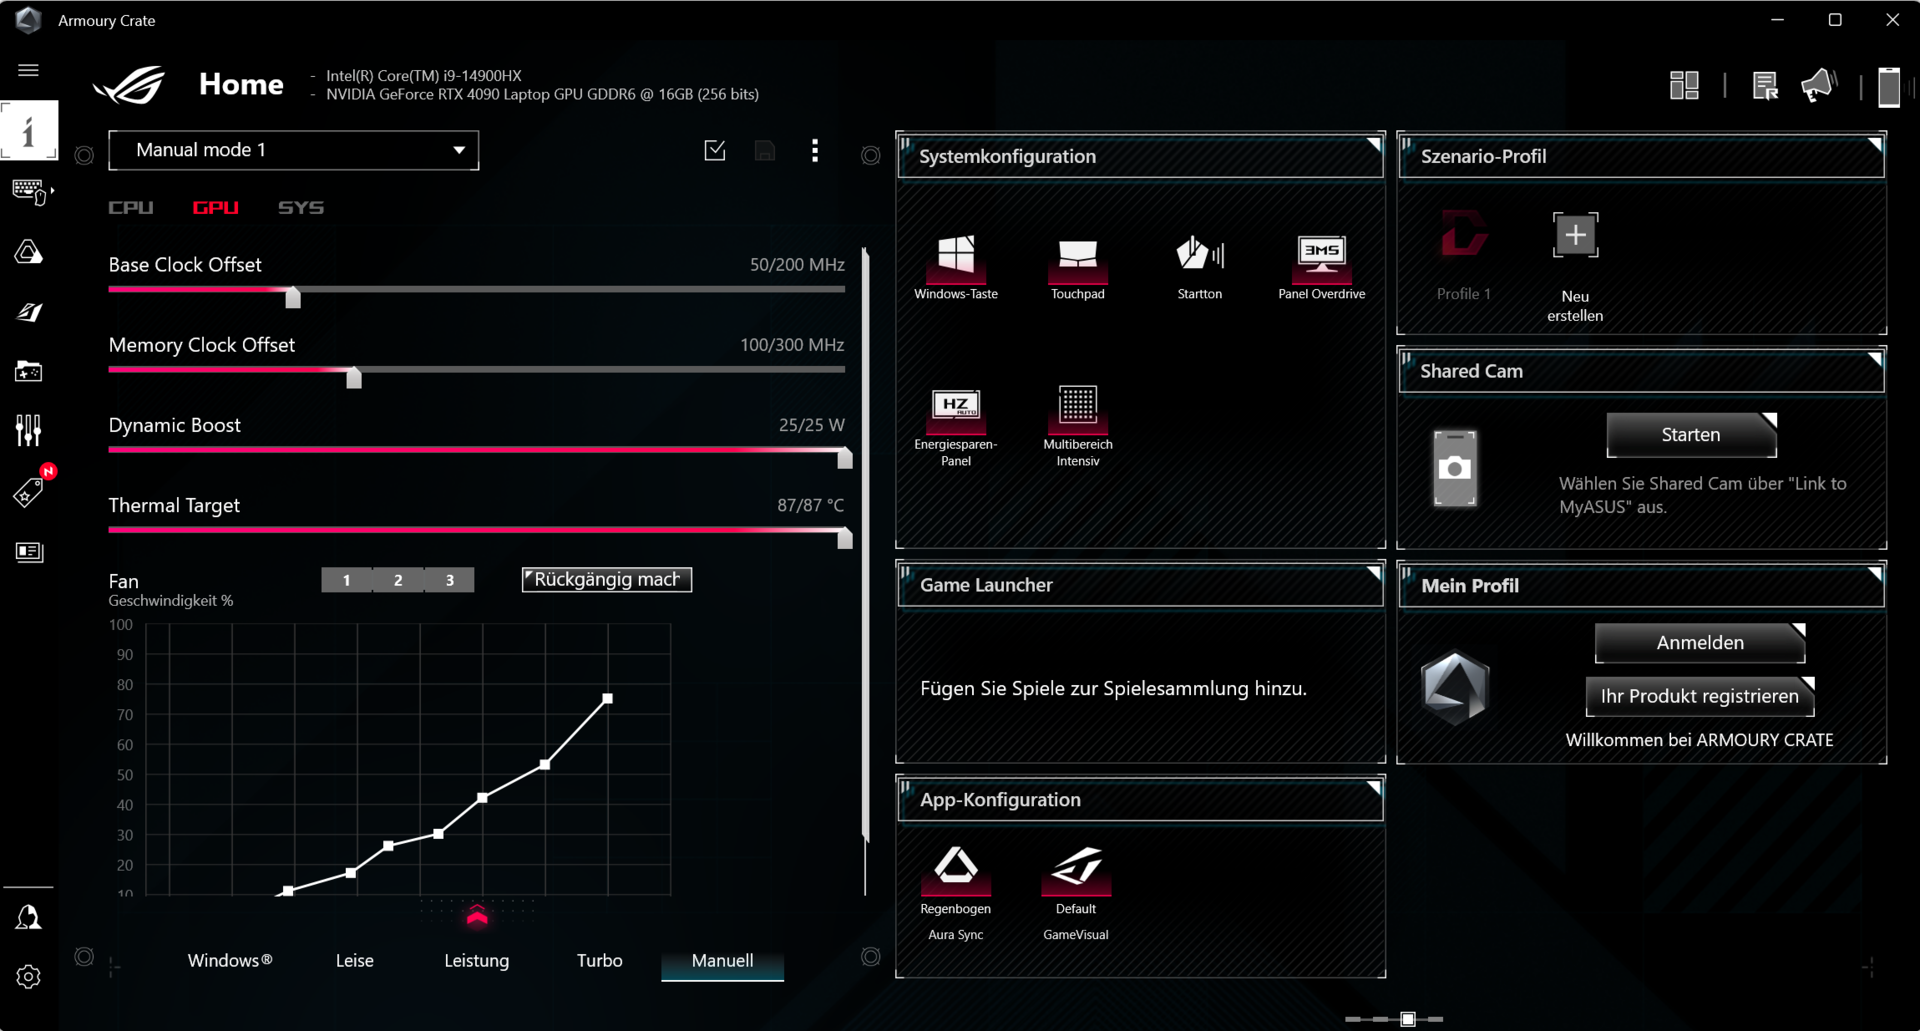
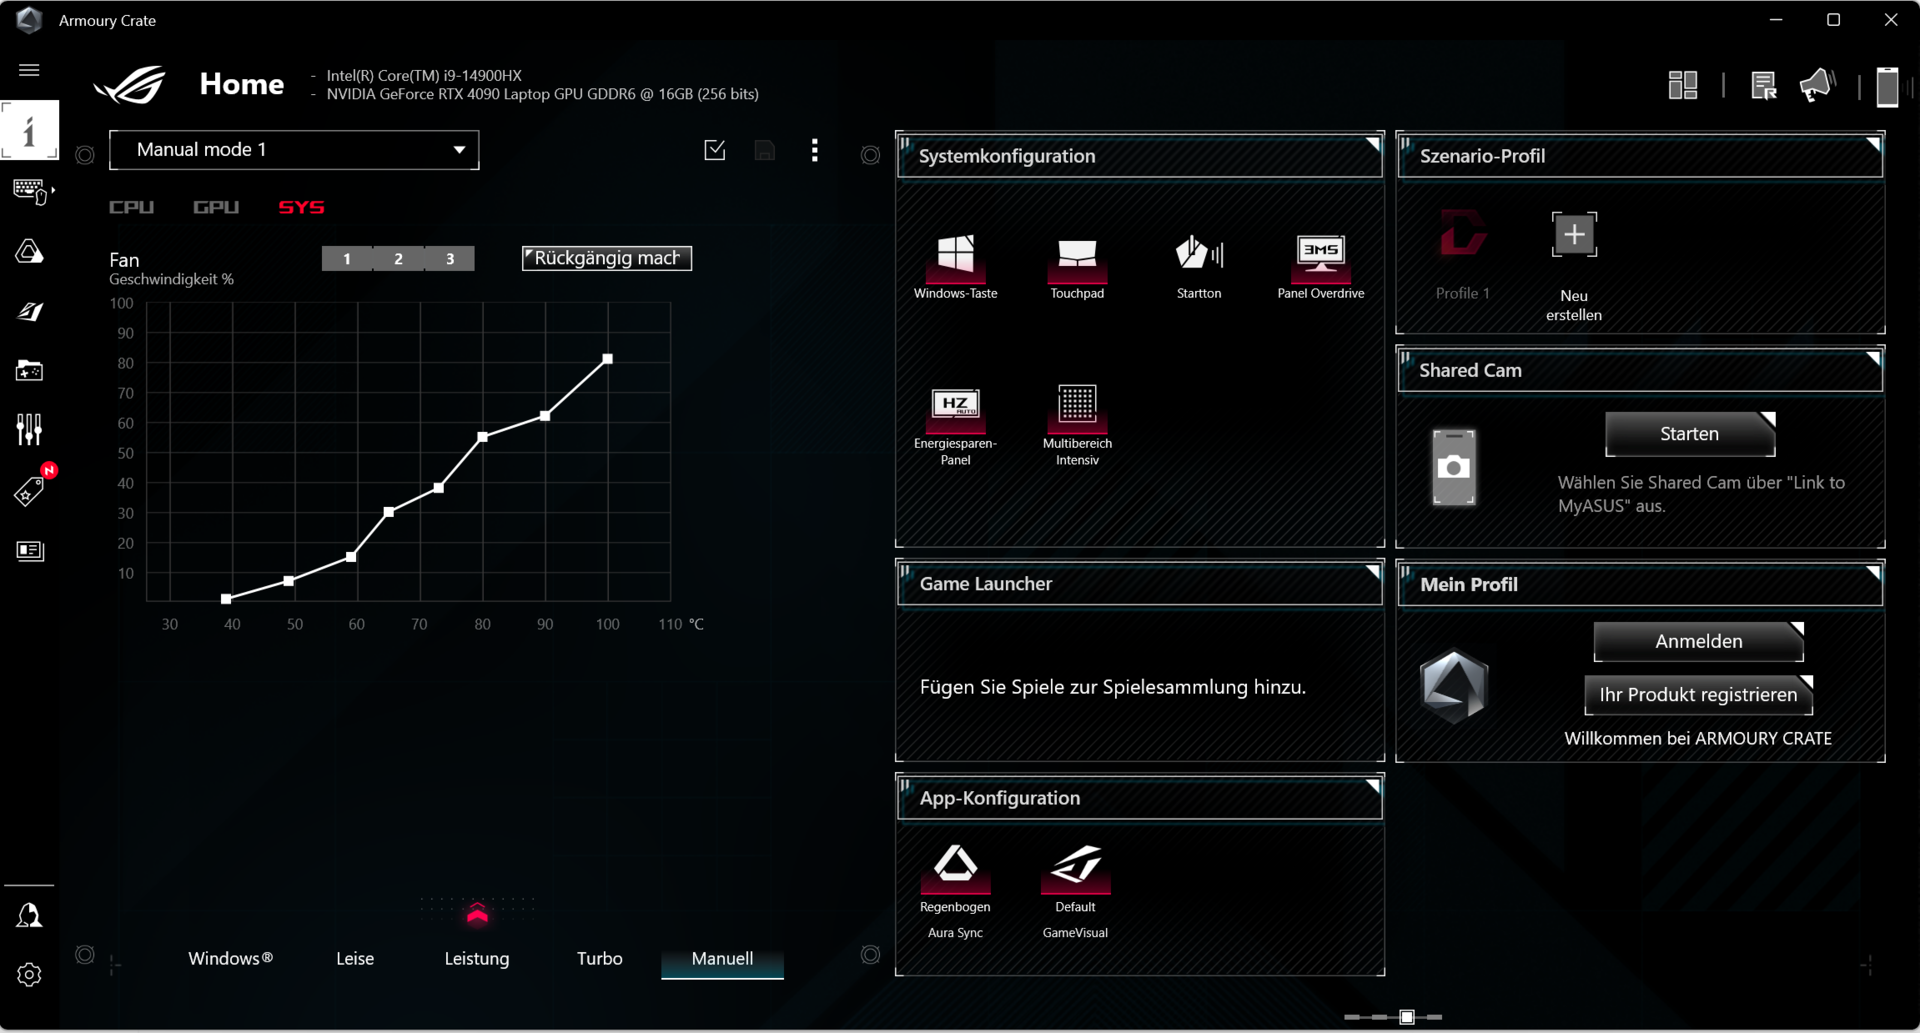
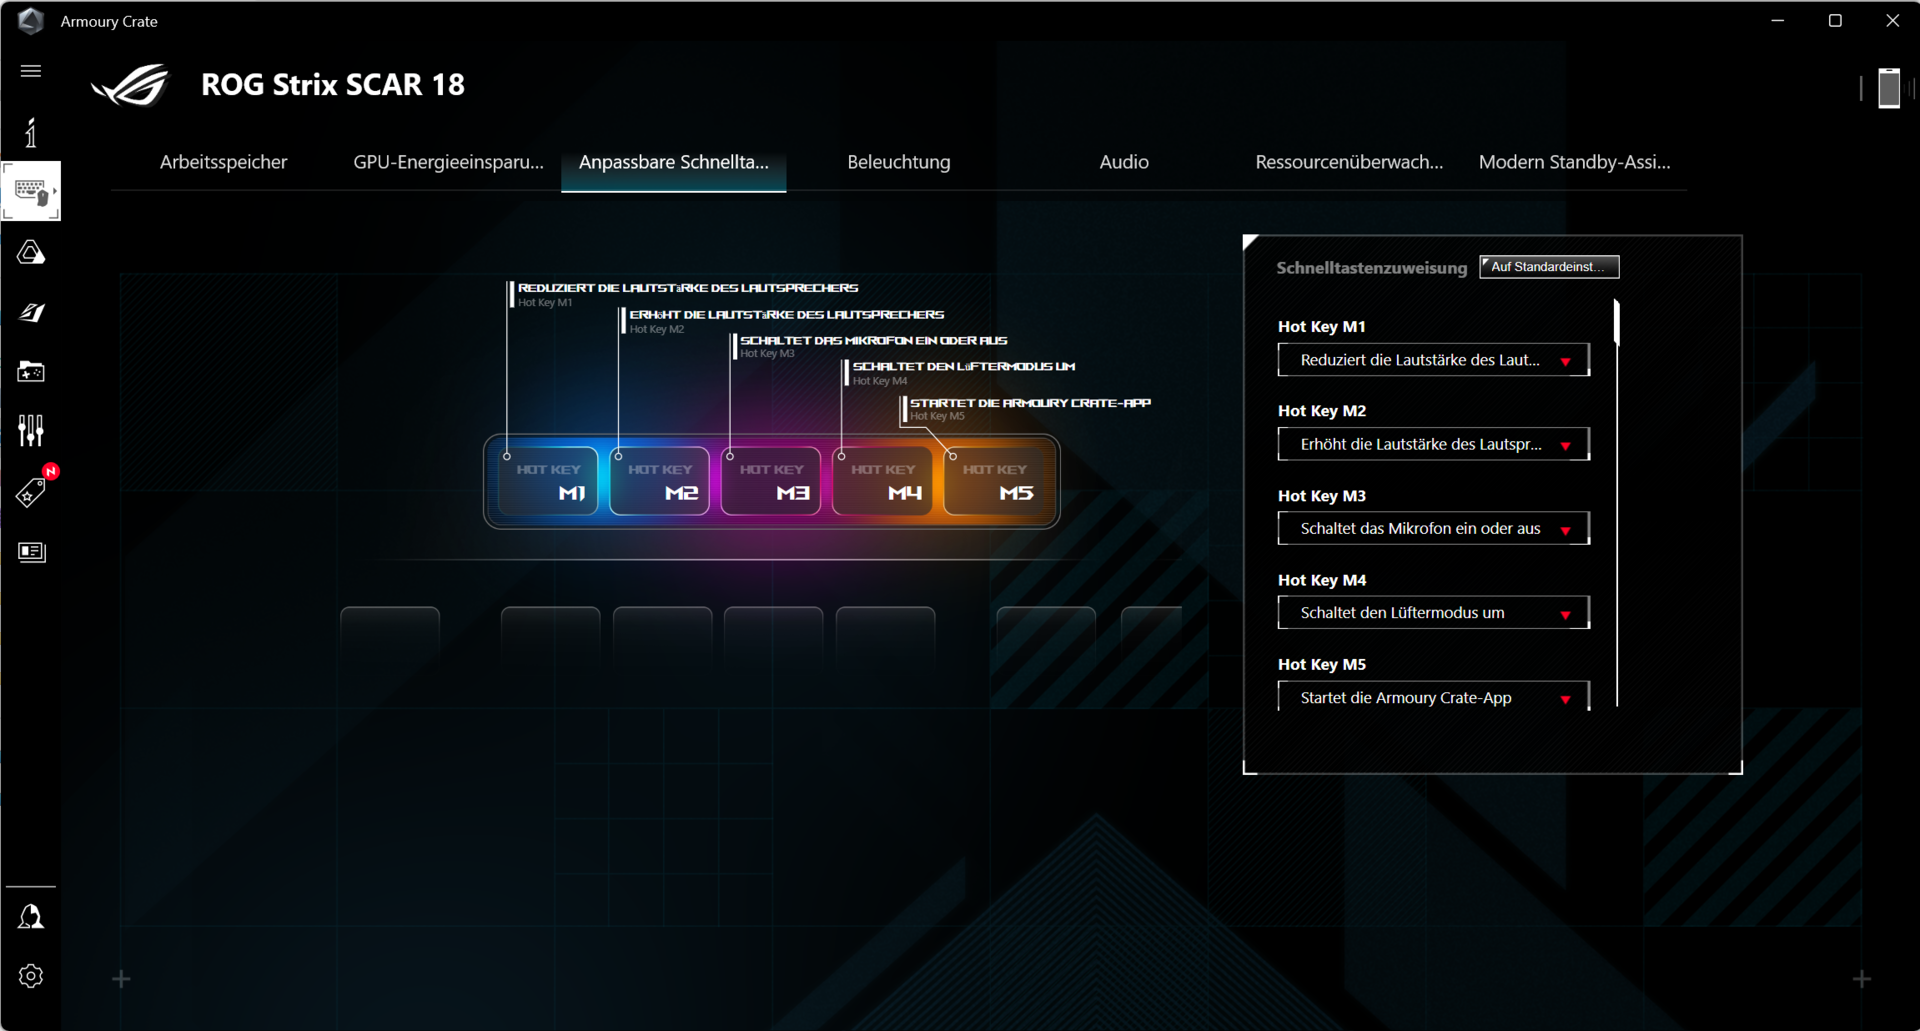
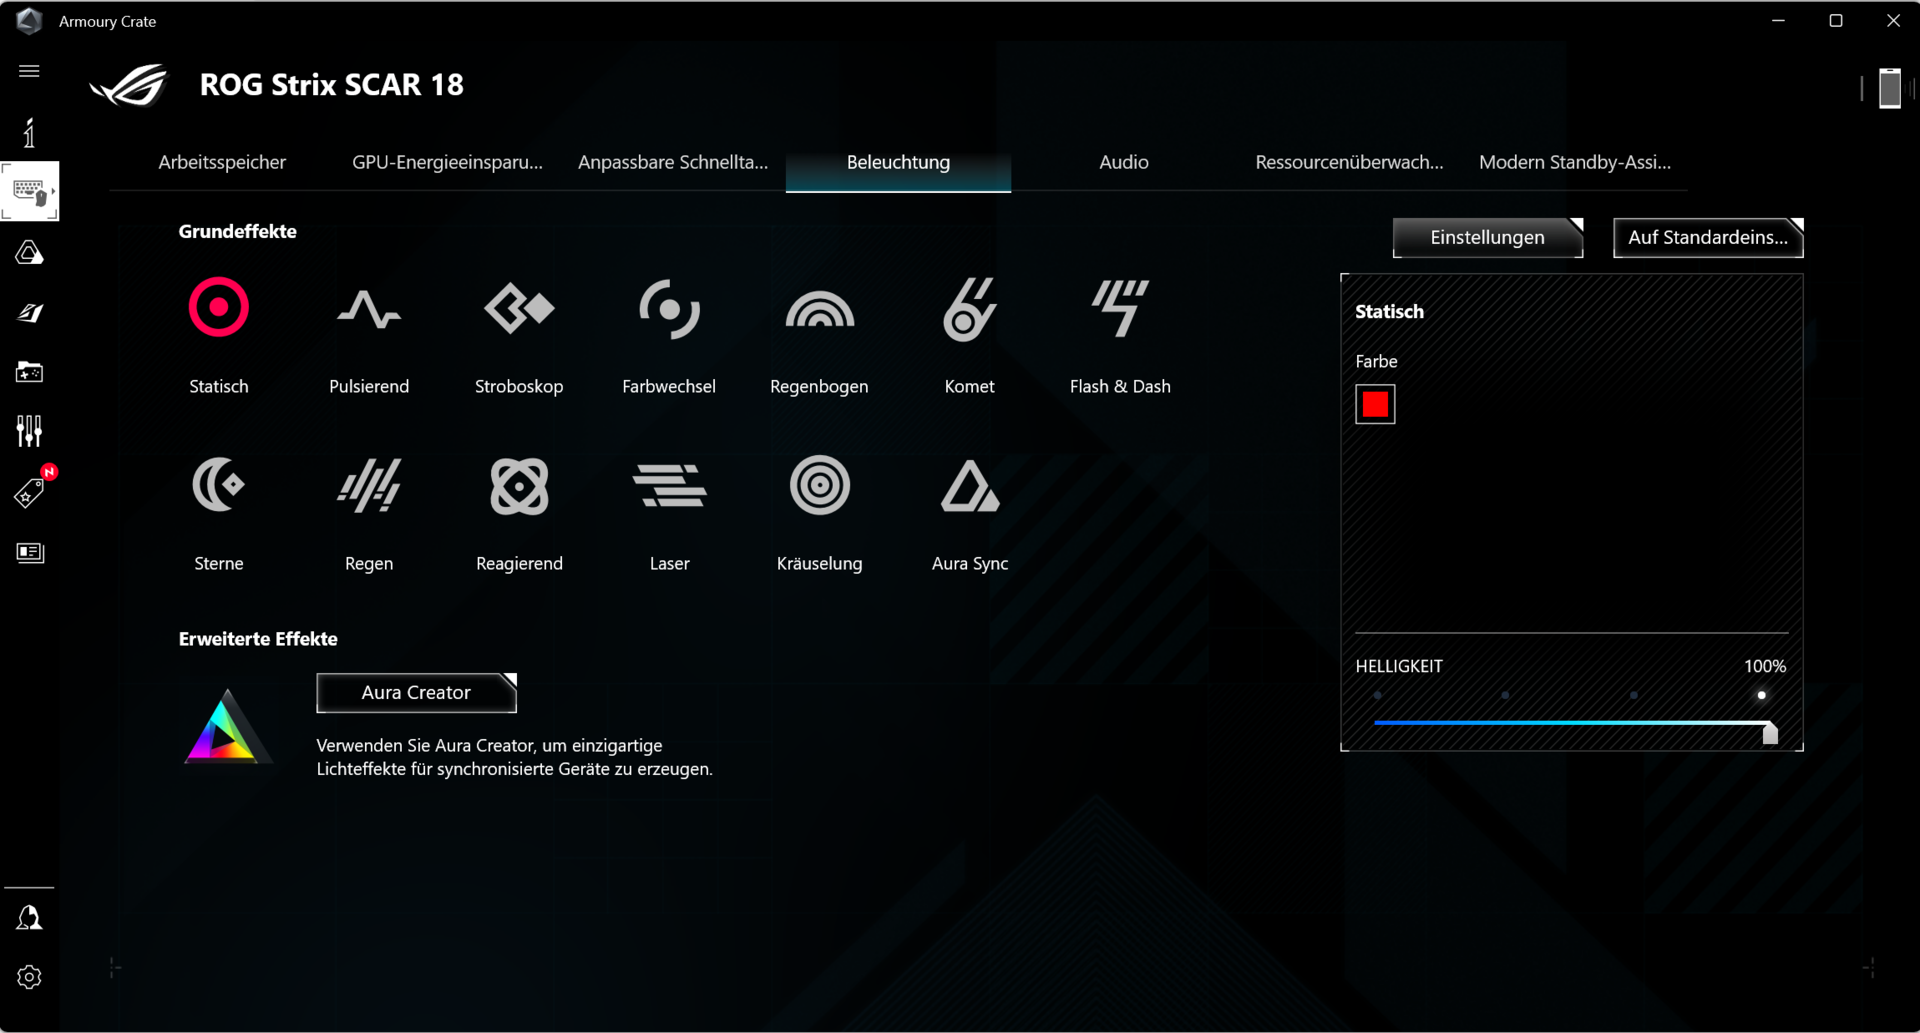
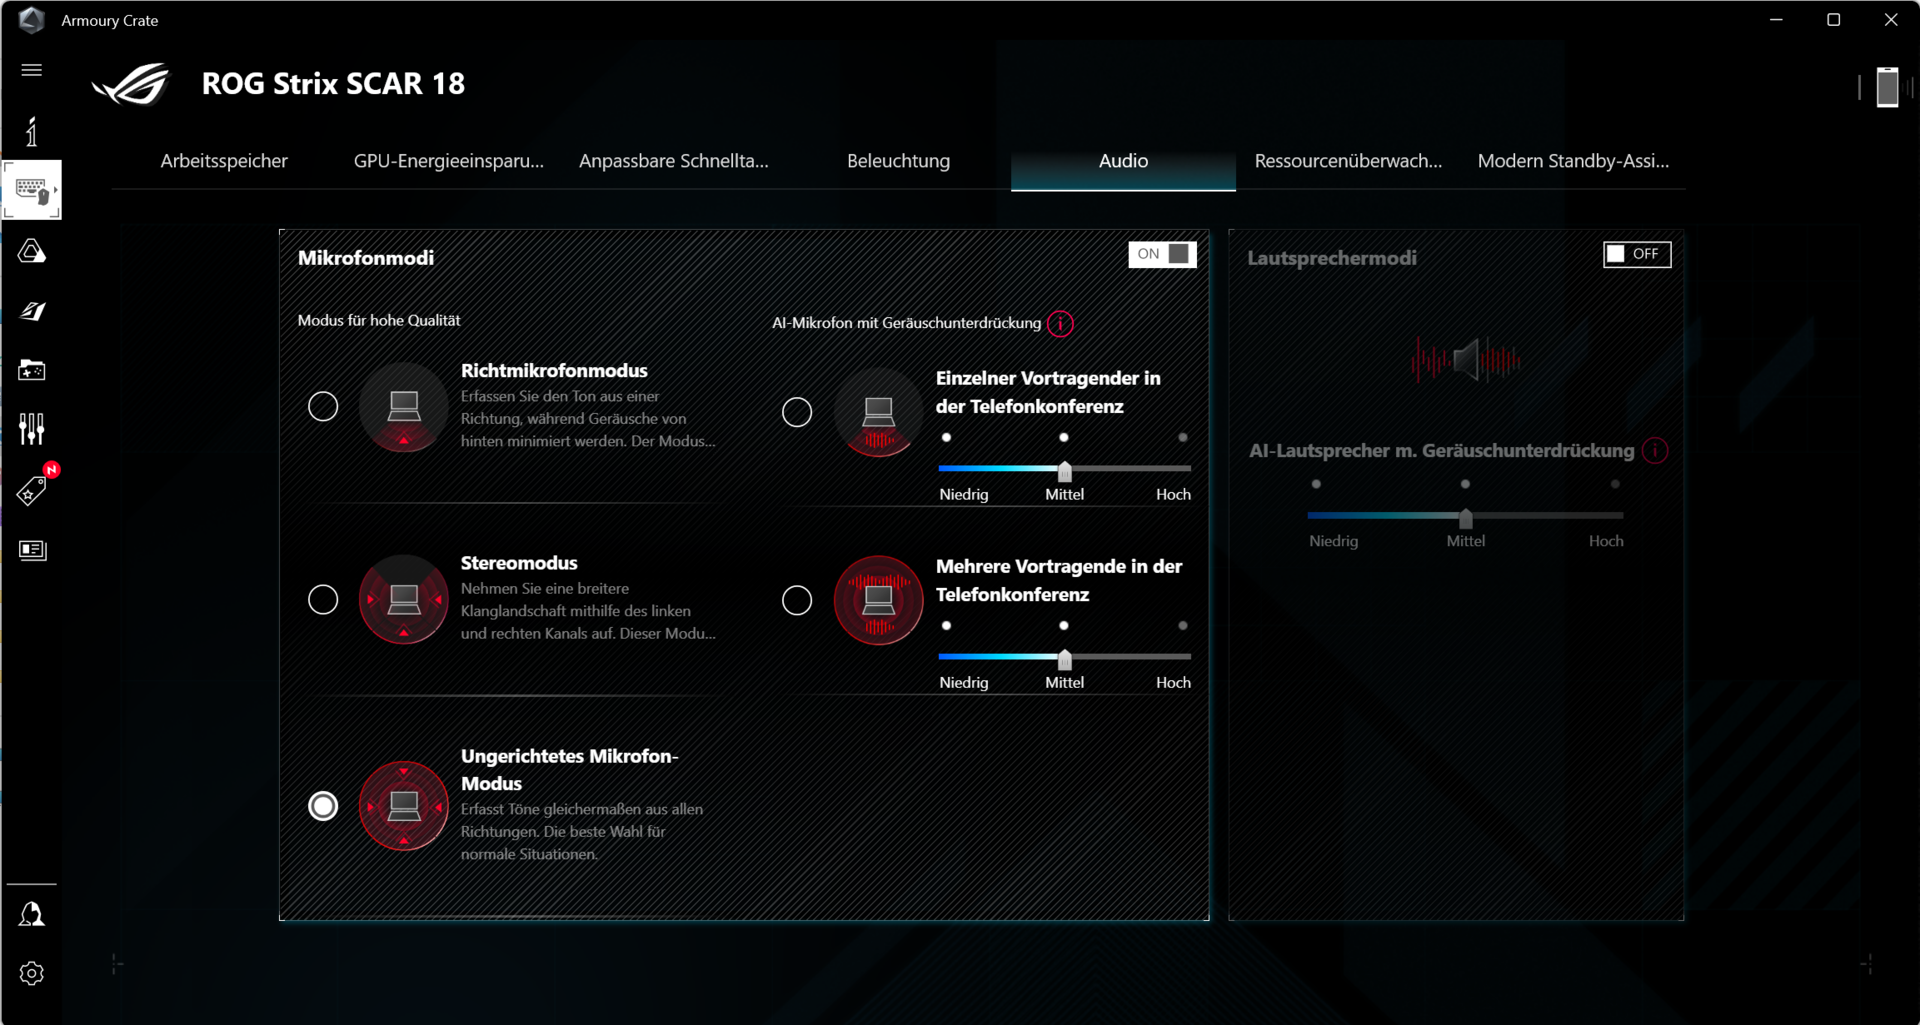
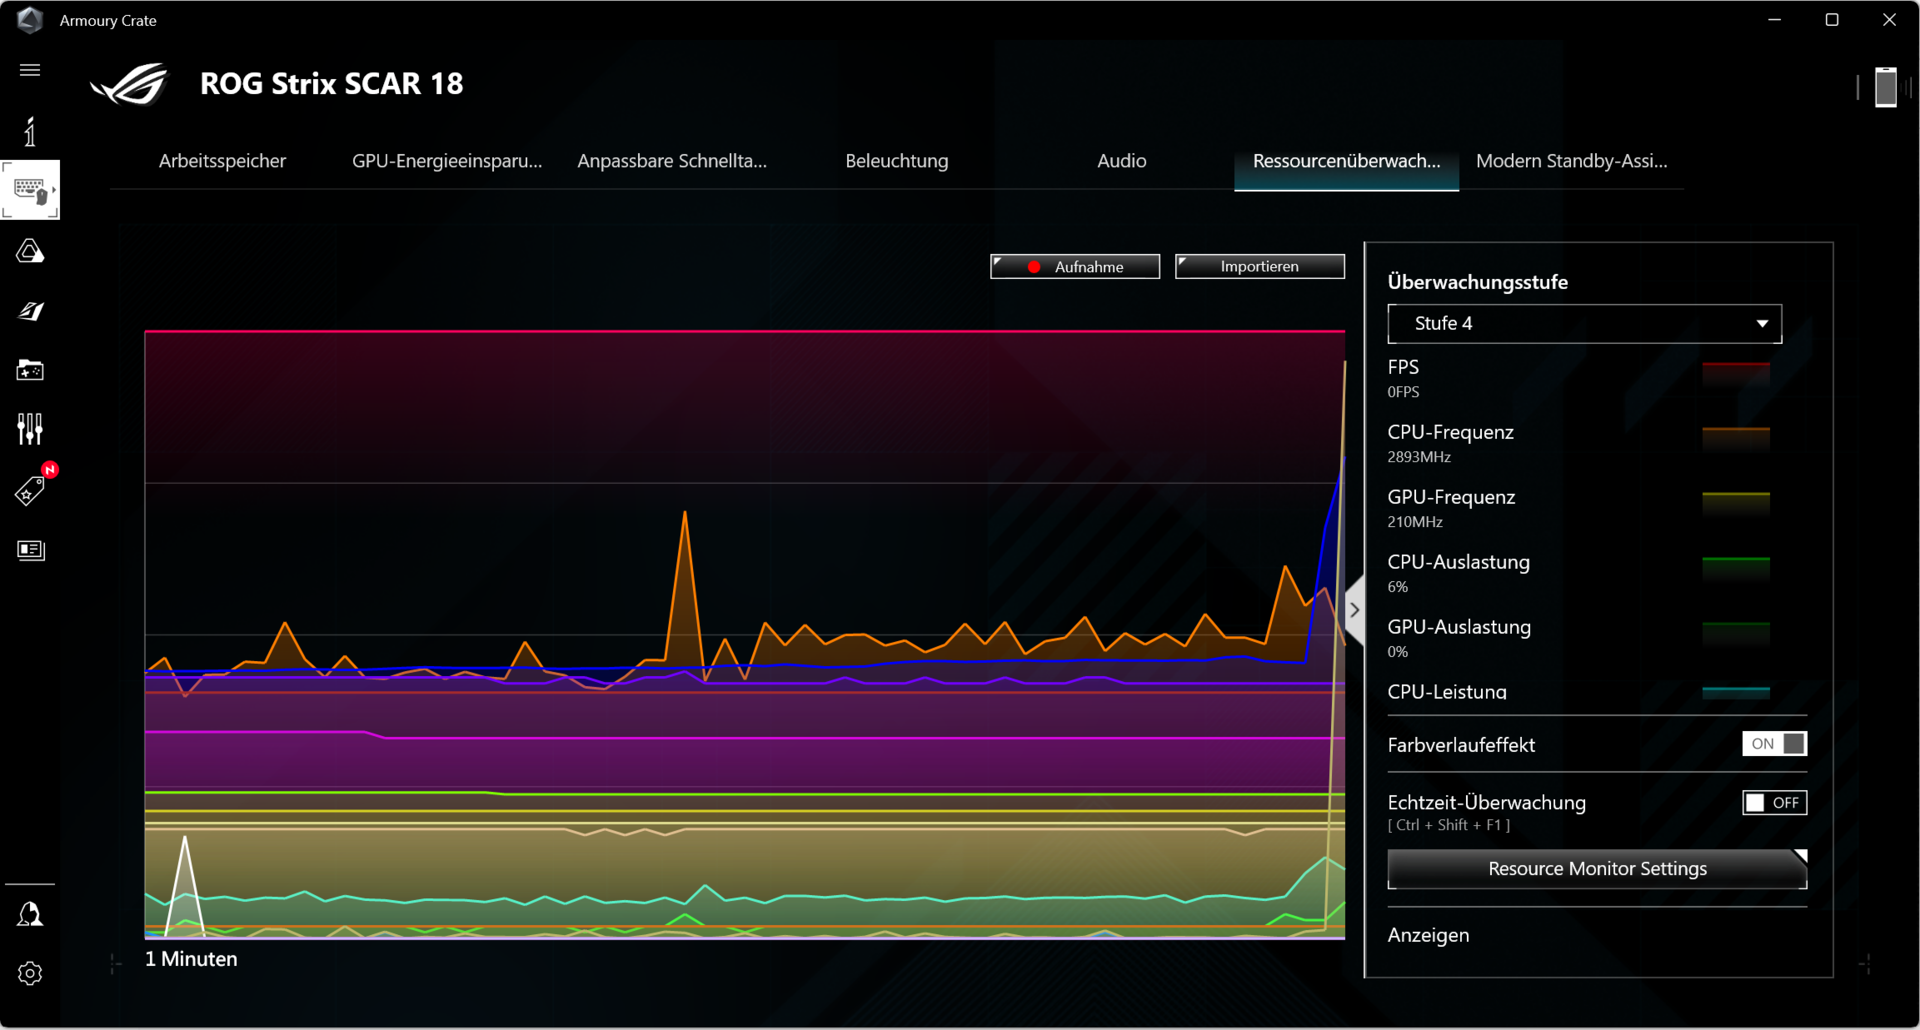
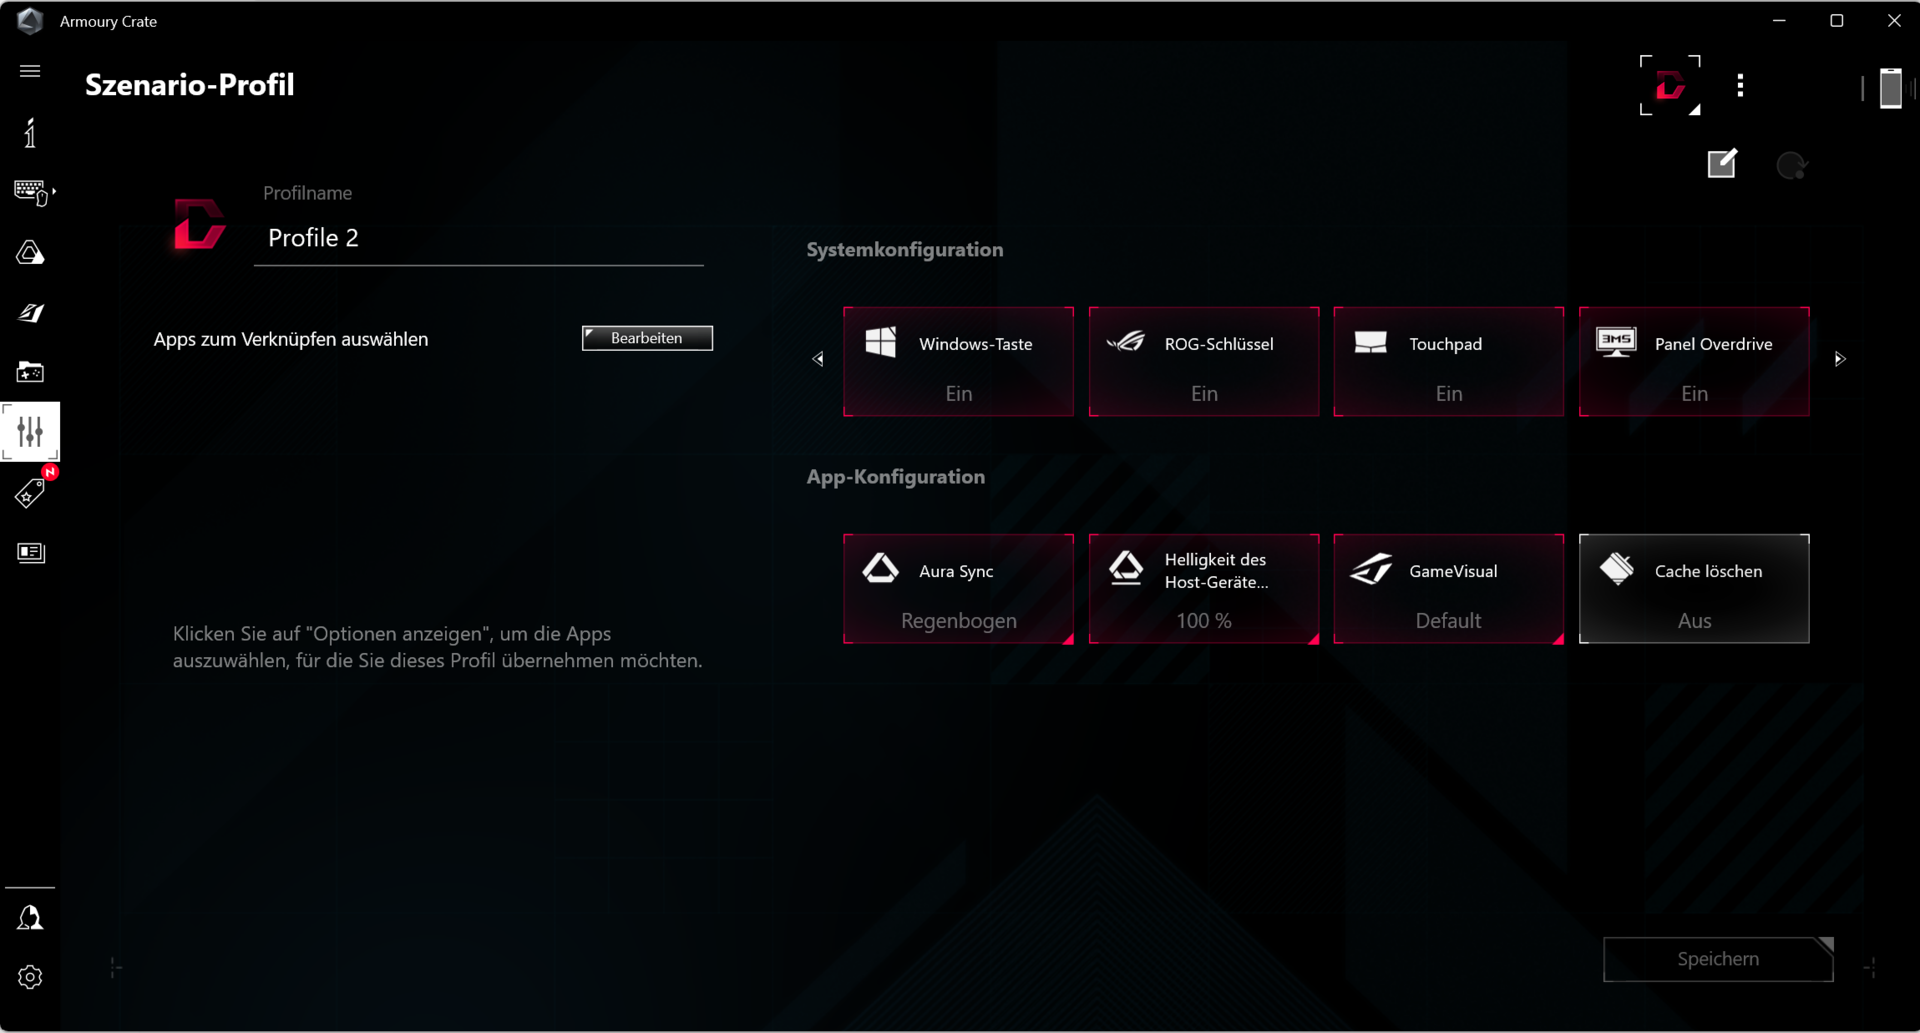
Dispone de tres modos de energía preconfigurados por Asus (véase la tabla), y puede cambiar entre ellos mediante la combinación de teclas Fn + F5. Utilizamos "Rendimiento" para nuestros benchmarks y "Silencioso" para nuestras pruebas de batería. El modo GPU está configurado en "Estándar". El centro de control ("Armory Crate") del portátil permite crear perfiles individuales ("Manual") que incluyen el ajuste de los límites de potencia, el refuerzo dinámico y las curvas de los ventiladores.
| Rendimiento | Turbo | Silencioso | |
|---|---|---|---|
| Límite de potencia 1 (HWInfo) | 110 vatios | 175 vatios | 65 vatios |
| Límite de potencia 2 (HWInfo) | 120 vatios | 175 vatios | 100 vatios |
| Ruido (El Witcher 3) | 50 dB(A) | 56 dB(A) | 35 dB(A) |
| Rendimiento (El Witcher 3) | ~188 fps | ~183 fps | ~68 fps |
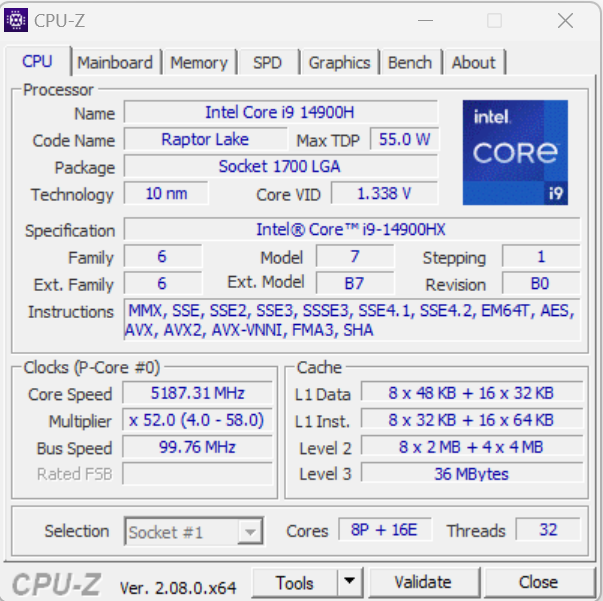
Procesador
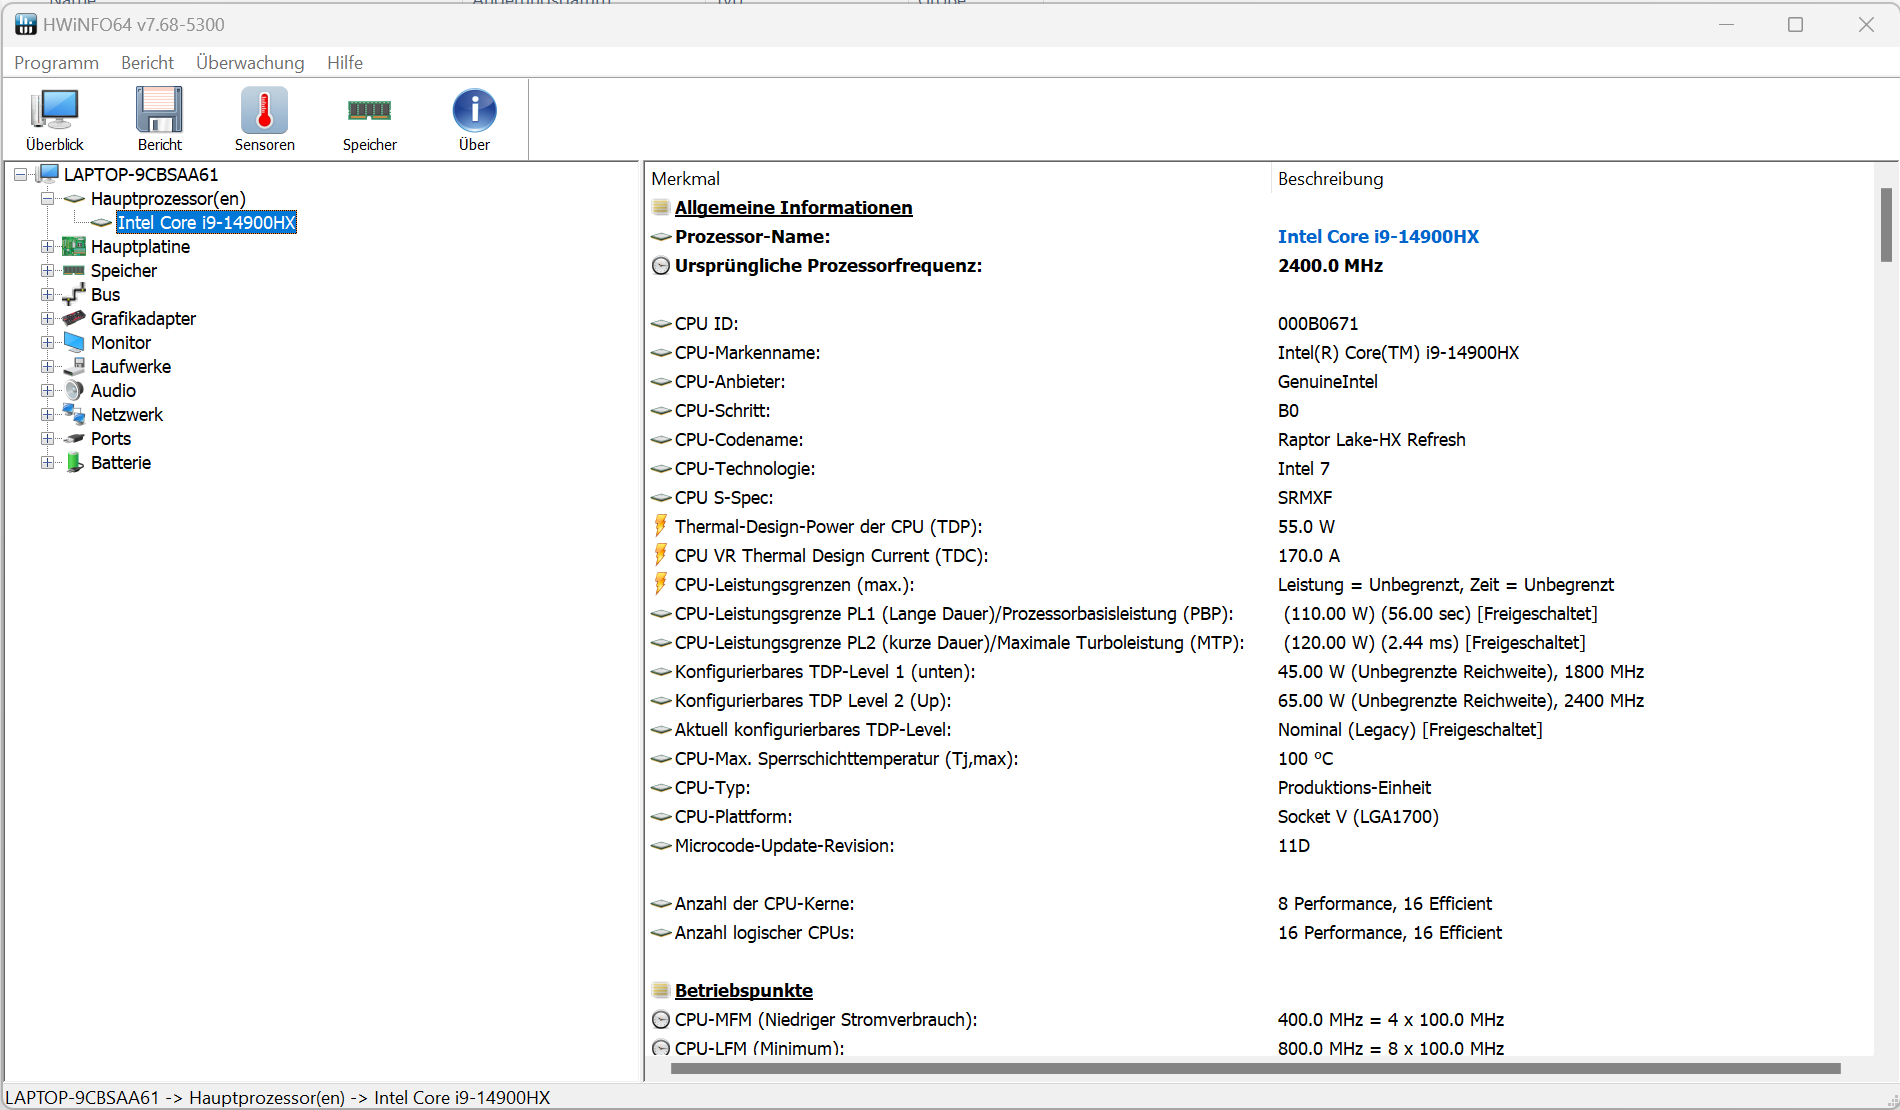
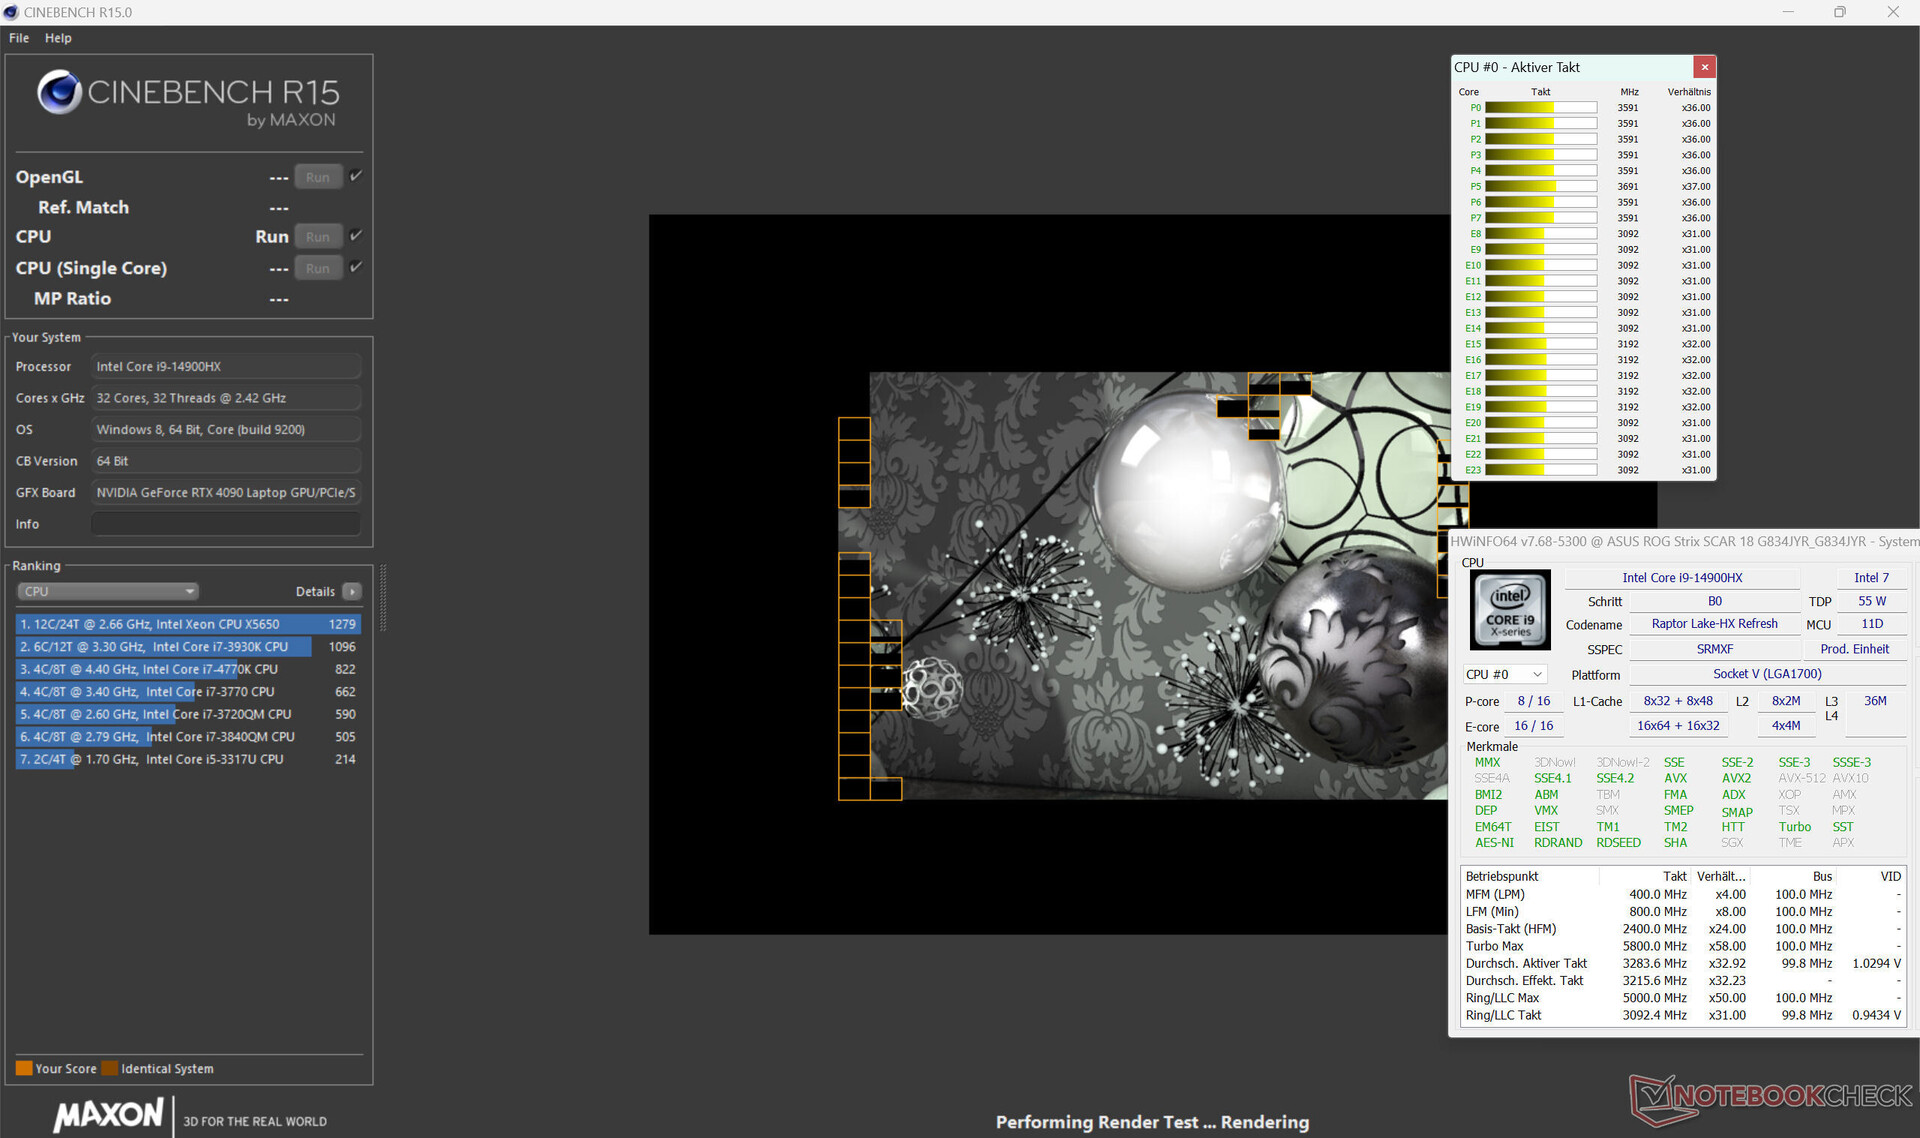
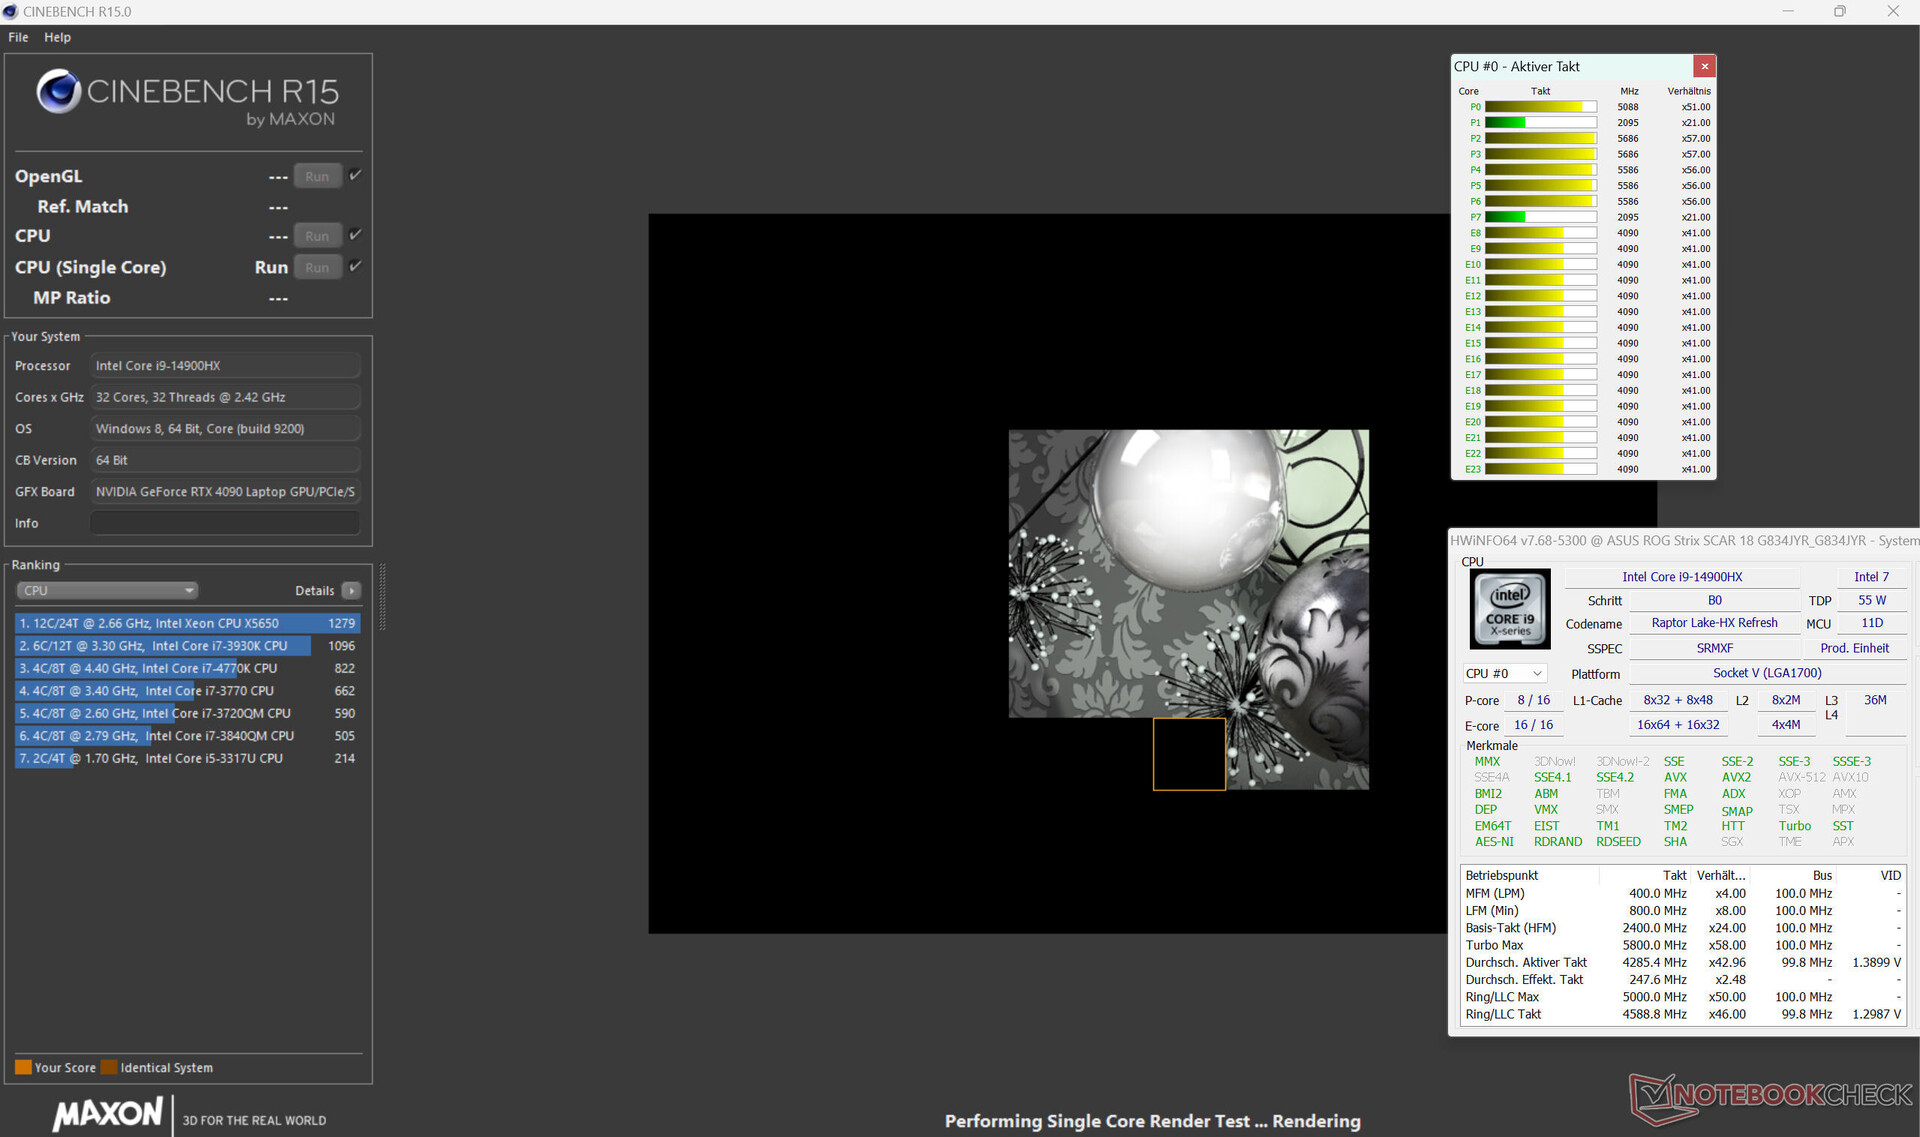
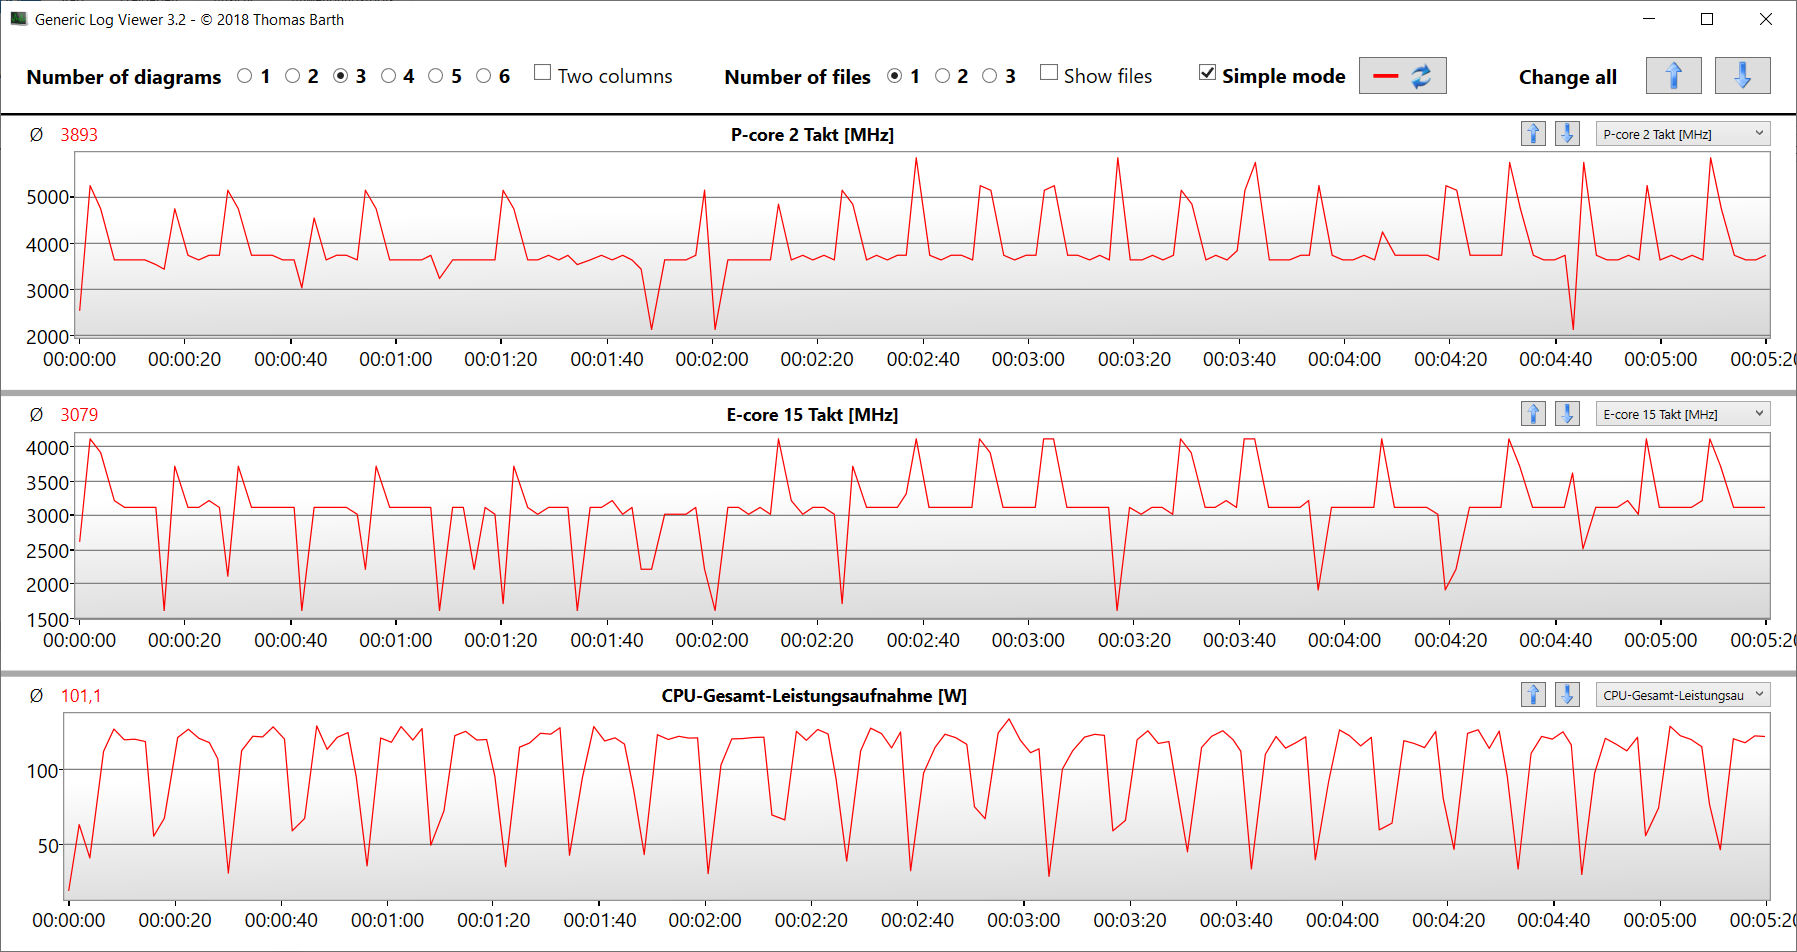
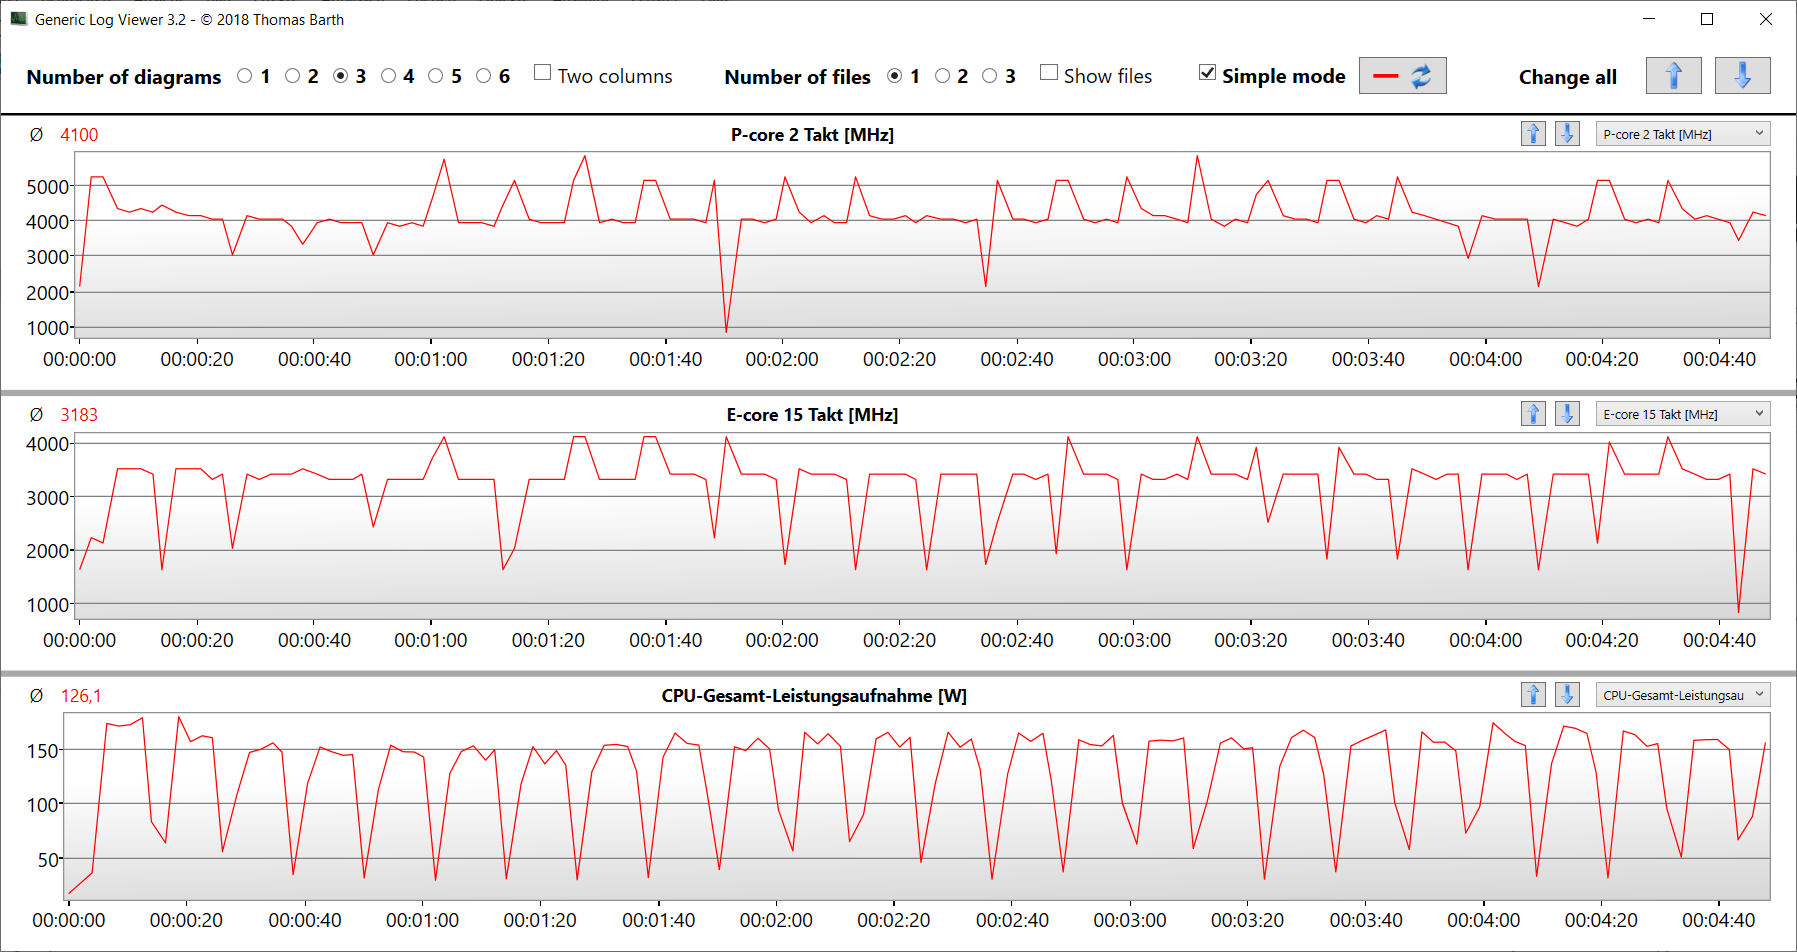
Los 24 núcleos de CPU (8P + 16E = 32 hilos) del Core i9-14900HX (Raptor Lake) alcanzan velocidades de reloj máximas de 5,8 GHz (núcleos P) y 4,1 GHz (núcleos E). La CPU responde a una carga multihilo constante (CB15 Loop) con una velocidad Turbo que se mantiene constantemente alta. Puede encontrar más información sobre el Core i9 en nuestro análisis.
La selección del perfil de potencia sólo influye de forma limitada en el rendimiento monohilo, pero tiene más influencia en el rendimiento multihilo. Al seleccionar "Rendimiento" se obtienen valores de referencia que están por debajo de la media de la CPU determinada hasta el momento, mientras que "Turbo" aumenta los resultados ligeramente por encima de la media. El rendimiento de un único subproceso, que es más relevante en el funcionamiento cotidiano, oscila al mismo nivel en funcionamiento con red y con batería, pero el rendimiento multihilo cae significativamente en funcionamiento con batería.
Cinebench R15 Multi Constant Load Test
| CPU Performance rating - Percent | |
| Alienware m18 R1 AMD | |
| Asus ROG Strix Scar 18 G834JYR (2024) | |
| Asus ROG Strix Scar 18 2023 G834JY-N6005W -2! | |
| Alienware m18 R1 -2! | |
| MSI Titan 18 HX A14VIG | |
| Acer Predator Helios 18 N23Q2 | |
| Asus ROG Strix Scar 18 G834JYR (2024) | |
| Medio Intel Core i9-14900HX | |
| Razer Blade 18 RTX 4070 -2! | |
| Media de la clase Gaming | |
| Cinebench R20 | |
| CPU (Multi Core) | |
| Alienware m18 R1 AMD | |
| Alienware m18 R1 | |
| Asus ROG Strix Scar 18 G834JYR (2024) (Turbo) | |
| MSI Titan 18 HX A14VIG | |
| Asus ROG Strix Scar 18 2023 G834JY-N6005W | |
| Acer Predator Helios 18 N23Q2 | |
| Medio Intel Core i9-14900HX (6579 - 13832, n=37) | |
| Razer Blade 18 RTX 4070 | |
| Asus ROG Strix Scar 18 G834JYR (2024) | |
| Media de la clase Gaming (4029 - 16433, n=106, últimos 2 años) | |
| CPU (Single Core) | |
| Asus ROG Strix Scar 18 G834JYR (2024) (Turbo) | |
| Asus ROG Strix Scar 18 G834JYR (2024) | |
| Asus ROG Strix Scar 18 2023 G834JY-N6005W | |
| Medio Intel Core i9-14900HX (657 - 859, n=37) | |
| MSI Titan 18 HX A14VIG | |
| Alienware m18 R1 | |
| Acer Predator Helios 18 N23Q2 | |
| Razer Blade 18 RTX 4070 | |
| Media de la clase Gaming (442 - 913, n=106, últimos 2 años) | |
| Alienware m18 R1 AMD | |
| Cinebench R15 | |
| CPU Multi 64Bit | |
| Alienware m18 R1 AMD | |
| Alienware m18 R1 | |
| MSI Titan 18 HX A14VIG | |
| Asus ROG Strix Scar 18 2023 G834JY-N6005W | |
| Asus ROG Strix Scar 18 G834JYR (2024) (Turbo) | |
| Acer Predator Helios 18 N23Q2 | |
| Razer Blade 18 RTX 4070 | |
| Medio Intel Core i9-14900HX (3263 - 5589, n=38) | |
| Asus ROG Strix Scar 18 G834JYR (2024) | |
| Media de la clase Gaming (1578 - 6330, n=105, últimos 2 años) | |
| CPU Single 64Bit | |
| Asus ROG Strix Scar 18 2023 G834JY-N6005W | |
| Alienware m18 R1 AMD | |
| Asus ROG Strix Scar 18 G834JYR (2024) (Turbo) | |
| Medio Intel Core i9-14900HX (247 - 323, n=37) | |
| Alienware m18 R1 | |
| Asus ROG Strix Scar 18 G834JYR (2024) | |
| MSI Titan 18 HX A14VIG | |
| Razer Blade 18 RTX 4070 | |
| Media de la clase Gaming (188.8 - 350, n=106, últimos 2 años) | |
| Acer Predator Helios 18 N23Q2 | |
| Blender - v2.79 BMW27 CPU | |
| Media de la clase Gaming (79 - 330, n=104, últimos 2 años) | |
| Medio Intel Core i9-14900HX (91 - 206, n=37) | |
| Asus ROG Strix Scar 18 G834JYR (2024) | |
| Razer Blade 18 RTX 4070 | |
| Asus ROG Strix Scar 18 G834JYR (2024) (Turbo) | |
| Acer Predator Helios 18 N23Q2 | |
| MSI Titan 18 HX A14VIG | |
| Asus ROG Strix Scar 18 2023 G834JY-N6005W | |
| Alienware m18 R1 | |
| Alienware m18 R1 AMD | |
| Geekbench 6.7 | |
| Multi-Core | |
| Asus ROG Strix Scar 18 G834JYR (2024) (6.2.1, Turbo) | |
| Acer Predator Helios 18 N23Q2 | |
| Asus ROG Strix Scar 18 G834JYR (2024) (6.2.1) | |
| Medio Intel Core i9-14900HX (13158 - 19665, n=37) | |
| MSI Titan 18 HX A14VIG (6.2.1) | |
| Alienware m18 R1 AMD | |
| Media de la clase Gaming (6625 - 22850, n=106, últimos 2 años) | |
| Single-Core | |
| Asus ROG Strix Scar 18 G834JYR (2024) (6.2.1, Turbo) | |
| Asus ROG Strix Scar 18 G834JYR (2024) (6.2.1) | |
| Medio Intel Core i9-14900HX (2419 - 3129, n=37) | |
| Acer Predator Helios 18 N23Q2 | |
| Alienware m18 R1 AMD | |
| Media de la clase Gaming (1490 - 3259, n=106, últimos 2 años) | |
| MSI Titan 18 HX A14VIG (6.2.1) | |
| HWBOT x265 Benchmark v2.2 - 4k Preset | |
| Alienware m18 R1 AMD | |
| Asus ROG Strix Scar 18 2023 G834JY-N6005W | |
| Alienware m18 R1 | |
| Asus ROG Strix Scar 18 G834JYR (2024) (Turbo) | |
| Razer Blade 18 RTX 4070 | |
| MSI Titan 18 HX A14VIG | |
| Acer Predator Helios 18 N23Q2 | |
| Medio Intel Core i9-14900HX (16.8 - 38.9, n=37) | |
| Asus ROG Strix Scar 18 G834JYR (2024) | |
| Media de la clase Gaming (11.5 - 44.4, n=105, últimos 2 años) | |
| LibreOffice - 20 Documents To PDF | |
| Media de la clase Gaming (33.2 - 88.8, n=105, últimos 2 años) | |
| Acer Predator Helios 18 N23Q2 | |
| Alienware m18 R1 | |
| MSI Titan 18 HX A14VIG (6.3.4.2) | |
| Asus ROG Strix Scar 18 G834JYR (2024) (6.3.4.2) | |
| Razer Blade 18 RTX 4070 | |
| Medio Intel Core i9-14900HX (19 - 85.1, n=37) | |
| Alienware m18 R1 AMD (6.3.4.2) | |
| Asus ROG Strix Scar 18 G834JYR (2024) (6.3.4.2, Turbo) | |
| Asus ROG Strix Scar 18 2023 G834JY-N6005W | |
| R Benchmark 2.5 - Overall mean | |
| Media de la clase Gaming (0.3439 - 0.759, n=106, últimos 2 años) | |
| Alienware m18 R1 AMD | |
| Acer Predator Helios 18 N23Q2 | |
| Razer Blade 18 RTX 4070 | |
| Asus ROG Strix Scar 18 G834JYR (2024) | |
| Alienware m18 R1 | |
| MSI Titan 18 HX A14VIG | |
| Medio Intel Core i9-14900HX (0.3604 - 0.4859, n=37) | |
| Asus ROG Strix Scar 18 2023 G834JY-N6005W | |
| Asus ROG Strix Scar 18 G834JYR (2024) (Turbo) | |
* ... más pequeño es mejor
AIDA64: FP32 Ray-Trace | FPU Julia | CPU SHA3 | CPU Queen | FPU SinJulia | FPU Mandel | CPU AES | CPU ZLib | FP64 Ray-Trace | CPU PhotoWorxx
| Performance rating | |
| Alienware m18 R1 AMD | |
| Acer Predator Helios 18 N23Q2 | |
| Alienware m18 R1 | |
| MSI Titan 18 HX A14VIG | |
| Asus ROG Strix Scar 18 2023 G834JY-N6005W | |
| Asus ROG Strix Scar 18 G834JYR (2024) | |
| Razer Blade 18 RTX 4070 | |
| Asus ROG Strix Scar 18 G834JYR (2024) | |
| Media de la clase Gaming | |
| Medio Intel Core i9-14900HX | |
| AIDA64 / FP32 Ray-Trace | |
| Alienware m18 R1 AMD (v6.85.6300) | |
| Media de la clase Gaming (10227 - 85542, n=105, últimos 2 años) | |
| Alienware m18 R1 (v6.85.6300) | |
| MSI Titan 18 HX A14VIG (v6.92.6600) | |
| Asus ROG Strix Scar 18 2023 G834JY-N6005W (v6.85.6300) | |
| Acer Predator Helios 18 N23Q2 (v6.85.6300) | |
| Asus ROG Strix Scar 18 G834JYR (2024) (v6.92.6600, Turbo) | |
| Razer Blade 18 RTX 4070 (v6.85.6300) | |
| Asus ROG Strix Scar 18 G834JYR (2024) (v6.92.6600) | |
| Medio Intel Core i9-14900HX (13098 - 33474, n=36) | |
| AIDA64 / FPU Julia | |
| Alienware m18 R1 AMD (v6.85.6300) | |
| MSI Titan 18 HX A14VIG (v6.92.6600) | |
| Alienware m18 R1 (v6.85.6300) | |
| Media de la clase Gaming (51376 - 238426, n=105, últimos 2 años) | |
| Asus ROG Strix Scar 18 2023 G834JY-N6005W (v6.85.6300) | |
| Asus ROG Strix Scar 18 G834JYR (2024) (v6.92.6600, Turbo) | |
| Acer Predator Helios 18 N23Q2 (v6.85.6300) | |
| Razer Blade 18 RTX 4070 (v6.85.6300) | |
| Asus ROG Strix Scar 18 G834JYR (2024) (v6.92.6600) | |
| Medio Intel Core i9-14900HX (67573 - 166040, n=36) | |
| AIDA64 / CPU SHA3 | |
| Alienware m18 R1 AMD (v6.85.6300) | |
| MSI Titan 18 HX A14VIG (v6.92.6600) | |
| Alienware m18 R1 (v6.85.6300) | |
| Asus ROG Strix Scar 18 2023 G834JY-N6005W (v6.85.6300) | |
| Acer Predator Helios 18 N23Q2 (v6.85.6300) | |
| Asus ROG Strix Scar 18 G834JYR (2024) (v6.92.6600, Turbo) | |
| Media de la clase Gaming (2180 - 10115, n=105, últimos 2 años) | |
| Razer Blade 18 RTX 4070 (v6.85.6300) | |
| Asus ROG Strix Scar 18 G834JYR (2024) (v6.92.6600) | |
| Medio Intel Core i9-14900HX (3589 - 7979, n=36) | |
| AIDA64 / CPU Queen | |
| Alienware m18 R1 AMD (v6.85.6300) | |
| MSI Titan 18 HX A14VIG (v6.92.6600) | |
| Alienware m18 R1 (v6.85.6300) | |
| Asus ROG Strix Scar 18 G834JYR (2024) (v6.92.6600) | |
| Asus ROG Strix Scar 18 G834JYR (2024) (v6.92.6600, Turbo) | |
| Asus ROG Strix Scar 18 2023 G834JY-N6005W (v6.85.6300) | |
| Medio Intel Core i9-14900HX (118405 - 148966, n=36) | |
| Razer Blade 18 RTX 4070 (v6.85.6300) | |
| Acer Predator Helios 18 N23Q2 (v6.85.6300) | |
| Media de la clase Gaming (49785 - 173351, n=90, últimos 2 años) | |
| AIDA64 / FPU SinJulia | |
| Alienware m18 R1 AMD (v6.85.6300) | |
| MSI Titan 18 HX A14VIG (v6.92.6600) | |
| Asus ROG Strix Scar 18 2023 G834JY-N6005W (v6.85.6300) | |
| Alienware m18 R1 (v6.85.6300) | |
| Asus ROG Strix Scar 18 G834JYR (2024) (v6.92.6600, Turbo) | |
| Asus ROG Strix Scar 18 G834JYR (2024) (v6.92.6600) | |
| Razer Blade 18 RTX 4070 (v6.85.6300) | |
| Acer Predator Helios 18 N23Q2 (v6.85.6300) | |
| Medio Intel Core i9-14900HX (10475 - 18517, n=36) | |
| Media de la clase Gaming (4424 - 33636, n=105, últimos 2 años) | |
| AIDA64 / FPU Mandel | |
| Alienware m18 R1 AMD (v6.85.6300) | |
| Alienware m18 R1 (v6.85.6300) | |
| Media de la clase Gaming (25115 - 128721, n=105, últimos 2 años) | |
| MSI Titan 18 HX A14VIG (v6.92.6600) | |
| Asus ROG Strix Scar 18 2023 G834JY-N6005W (v6.85.6300) | |
| Acer Predator Helios 18 N23Q2 (v6.85.6300) | |
| Asus ROG Strix Scar 18 G834JYR (2024) (v6.92.6600, Turbo) | |
| Razer Blade 18 RTX 4070 (v6.85.6300) | |
| Asus ROG Strix Scar 18 G834JYR (2024) (v6.92.6600) | |
| Medio Intel Core i9-14900HX (32543 - 83662, n=36) | |
| AIDA64 / CPU AES | |
| Acer Predator Helios 18 N23Q2 (v6.85.6300) | |
| Alienware m18 R1 AMD (v6.85.6300) | |
| Medio Intel Core i9-14900HX (86964 - 241777, n=36) | |
| MSI Titan 18 HX A14VIG (v6.92.6600) | |
| Alienware m18 R1 (v6.85.6300) | |
| Asus ROG Strix Scar 18 2023 G834JY-N6005W (v6.85.6300) | |
| Asus ROG Strix Scar 18 G834JYR (2024) (v6.92.6600, Turbo) | |
| Asus ROG Strix Scar 18 G834JYR (2024) (v6.92.6600) | |
| Razer Blade 18 RTX 4070 (v6.85.6300) | |
| Media de la clase Gaming (39258 - 247074, n=105, últimos 2 años) | |
| AIDA64 / CPU ZLib | |
| Alienware m18 R1 AMD (v6.85.6300) | |
| MSI Titan 18 HX A14VIG (v6.92.6600) | |
| Asus ROG Strix Scar 18 2023 G834JY-N6005W (v6.85.6300) | |
| Alienware m18 R1 (v6.85.6300) | |
| Acer Predator Helios 18 N23Q2 (v6.85.6300) | |
| Asus ROG Strix Scar 18 G834JYR (2024) (v6.92.6600, Turbo) | |
| Razer Blade 18 RTX 4070 (v6.85.6300) | |
| Medio Intel Core i9-14900HX (1054 - 2292, n=36) | |
| Asus ROG Strix Scar 18 G834JYR (2024) | |
| Media de la clase Gaming (574 - 2531, n=105, últimos 2 años) | |
| AIDA64 / FP64 Ray-Trace | |
| Alienware m18 R1 AMD (v6.85.6300) | |
| Media de la clase Gaming (5509 - 45446, n=105, últimos 2 años) | |
| Alienware m18 R1 (v6.85.6300) | |
| MSI Titan 18 HX A14VIG (v6.92.6600) | |
| Asus ROG Strix Scar 18 2023 G834JY-N6005W (v6.85.6300) | |
| Acer Predator Helios 18 N23Q2 (v6.85.6300) | |
| Asus ROG Strix Scar 18 G834JYR (2024) (v6.92.6600, Turbo) | |
| Razer Blade 18 RTX 4070 (v6.85.6300) | |
| Asus ROG Strix Scar 18 G834JYR (2024) (v6.92.6600) | |
| Medio Intel Core i9-14900HX (6809 - 18349, n=36) | |
| AIDA64 / CPU PhotoWorxx | |
| Alienware m18 R1 (v6.85.6300) | |
| Acer Predator Helios 18 N23Q2 (v6.85.6300) | |
| Asus ROG Strix Scar 18 G834JYR (2024) (v6.92.6600) | |
| Asus ROG Strix Scar 18 G834JYR (2024) (v6.92.6600, Turbo) | |
| Razer Blade 18 RTX 4070 (v6.85.6300) | |
| Medio Intel Core i9-14900HX (23903 - 54702, n=36) | |
| Media de la clase Gaming (12271 - 89891, n=105, últimos 2 años) | |
| Asus ROG Strix Scar 18 2023 G834JY-N6005W (v6.85.6300) | |
| Alienware m18 R1 AMD (v6.85.6300) | |
| MSI Titan 18 HX A14VIG (v6.92.6600) | |
Rendimiento del sistema
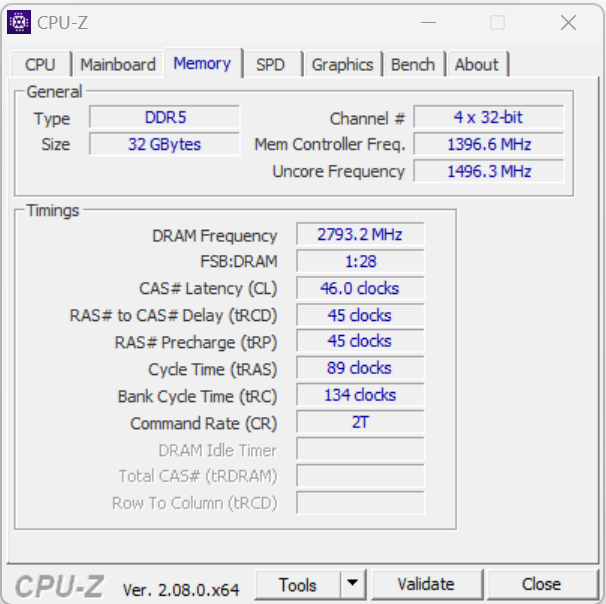
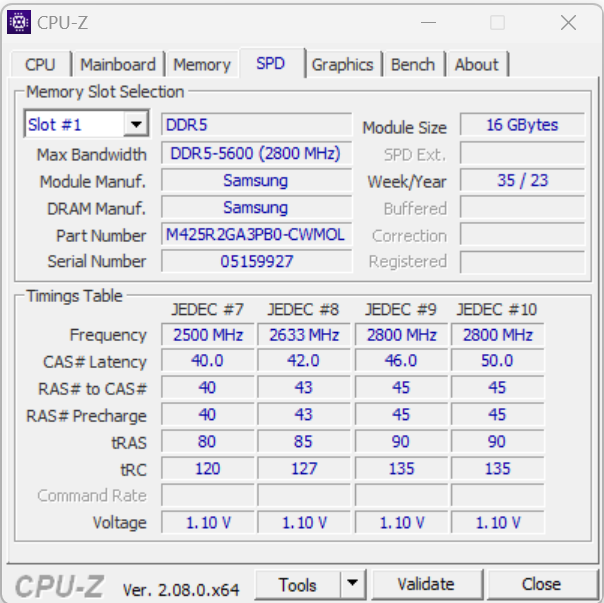
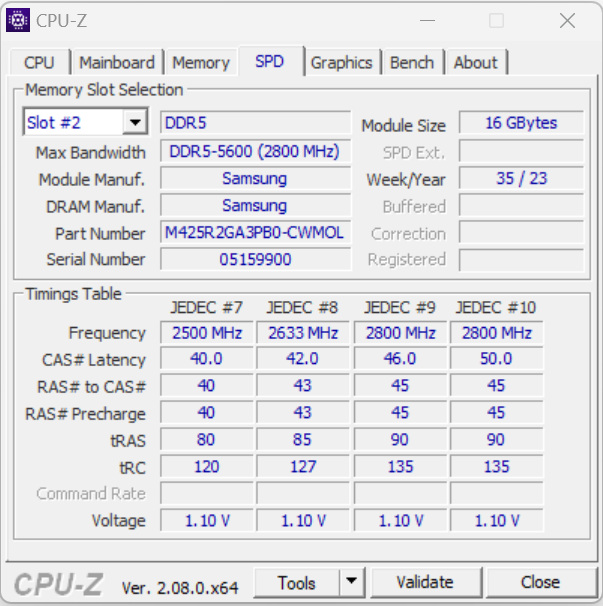
El buen funcionamiento del sistema no muestra ninguna carencia en el rendimiento informático, y el portátil maneja los juegos, el renderizado y otras tareas de forma impecable. Las tasas de transferencia de la memoria de trabajo se sitúan en un nivel normal para una RAM DDR5-5600.
CrossMark: Overall | Productivity | Creativity | Responsiveness
WebXPRT 3: Overall
WebXPRT 4: Overall
Mozilla Kraken 1.1: Total
| PCMark 10 / Score | |
| Alienware m18 R1 AMD | |
| MSI Titan 18 HX A14VIG | |
| Asus ROG Strix Scar 18 G834JYR (2024) | |
| Asus ROG Strix Scar 18 2023 G834JY-N6005W | |
| Alienware m18 R1 | |
| Medio Intel Core i9-14900HX, NVIDIA GeForce RTX 4090 Laptop GPU (8230 - 9234, n=13) | |
| Acer Predator Helios 18 N23Q2 | |
| Media de la clase Gaming (5828 - 12414, n=93, últimos 2 años) | |
| Razer Blade 18 RTX 4070 | |
| PCMark 10 / Essentials | |
| Alienware m18 R1 AMD | |
| Razer Blade 18 RTX 4070 | |
| MSI Titan 18 HX A14VIG | |
| Asus ROG Strix Scar 18 G834JYR (2024) | |
| Alienware m18 R1 | |
| Medio Intel Core i9-14900HX, NVIDIA GeForce RTX 4090 Laptop GPU (10778 - 11628, n=13) | |
| Acer Predator Helios 18 N23Q2 | |
| Media de la clase Gaming (8810 - 11935, n=97, últimos 2 años) | |
| PCMark 10 / Productivity | |
| Alienware m18 R1 AMD | |
| Media de la clase Gaming (6845 - 25323, n=95, últimos 2 años) | |
| Medio Intel Core i9-14900HX, NVIDIA GeForce RTX 4090 Laptop GPU (9458 - 11759, n=13) | |
| Asus ROG Strix Scar 18 G834JYR (2024) | |
| Acer Predator Helios 18 N23Q2 | |
| MSI Titan 18 HX A14VIG | |
| Alienware m18 R1 | |
| Razer Blade 18 RTX 4070 | |
| PCMark 10 / Digital Content Creation | |
| Alienware m18 R1 AMD | |
| MSI Titan 18 HX A14VIG | |
| Alienware m18 R1 | |
| Asus ROG Strix Scar 18 G834JYR (2024) | |
| Medio Intel Core i9-14900HX, NVIDIA GeForce RTX 4090 Laptop GPU (13219 - 16462, n=13) | |
| Acer Predator Helios 18 N23Q2 | |
| Media de la clase Gaming (7602 - 19954, n=95, últimos 2 años) | |
| Razer Blade 18 RTX 4070 | |
| CrossMark / Overall | |
| Asus ROG Strix Scar 18 G834JYR (2024) | |
| Acer Predator Helios 18 N23Q2 | |
| Alienware m18 R1 | |
| Razer Blade 18 RTX 4070 | |
| Medio Intel Core i9-14900HX, NVIDIA GeForce RTX 4090 Laptop GPU (1877 - 2344, n=10) | |
| Asus ROG Strix Scar 18 2023 G834JY-N6005W | |
| Media de la clase Gaming (1366 - 2409, n=94, últimos 2 años) | |
| Alienware m18 R1 AMD | |
| MSI Titan 18 HX A14VIG | |
| CrossMark / Productivity | |
| Acer Predator Helios 18 N23Q2 | |
| Asus ROG Strix Scar 18 G834JYR (2024) | |
| Alienware m18 R1 | |
| Razer Blade 18 RTX 4070 | |
| Medio Intel Core i9-14900HX, NVIDIA GeForce RTX 4090 Laptop GPU (1738 - 2162, n=10) | |
| Asus ROG Strix Scar 18 2023 G834JY-N6005W | |
| Media de la clase Gaming (1386 - 2254, n=94, últimos 2 años) | |
| Alienware m18 R1 AMD | |
| MSI Titan 18 HX A14VIG | |
| CrossMark / Creativity | |
| Asus ROG Strix Scar 18 G834JYR (2024) | |
| Alienware m18 R1 | |
| Asus ROG Strix Scar 18 2023 G834JY-N6005W | |
| Acer Predator Helios 18 N23Q2 | |
| Razer Blade 18 RTX 4070 | |
| Medio Intel Core i9-14900HX, NVIDIA GeForce RTX 4090 Laptop GPU (2195 - 2660, n=10) | |
| Media de la clase Gaming (1343 - 2786, n=94, últimos 2 años) | |
| Alienware m18 R1 AMD | |
| MSI Titan 18 HX A14VIG | |
| CrossMark / Responsiveness | |
| Acer Predator Helios 18 N23Q2 | |
| Asus ROG Strix Scar 18 G834JYR (2024) | |
| Alienware m18 R1 | |
| Razer Blade 18 RTX 4070 | |
| Medio Intel Core i9-14900HX, NVIDIA GeForce RTX 4090 Laptop GPU (1478 - 2327, n=10) | |
| Media de la clase Gaming (1226 - 2334, n=94, últimos 2 años) | |
| Asus ROG Strix Scar 18 2023 G834JY-N6005W | |
| Alienware m18 R1 AMD | |
| MSI Titan 18 HX A14VIG | |
| WebXPRT 3 / Overall | |
| Alienware m18 R1 AMD | |
| Razer Blade 18 RTX 4070 | |
| Alienware m18 R1 | |
| Asus ROG Strix Scar 18 2023 G834JY-N6005W | |
| MSI Titan 18 HX A14VIG | |
| Medio Intel Core i9-14900HX, NVIDIA GeForce RTX 4090 Laptop GPU (279 - 339, n=10) | |
| Asus ROG Strix Scar 18 G834JYR (2024) | |
| Acer Predator Helios 18 N23Q2 | |
| Media de la clase Gaming (220 - 532, n=98, últimos 2 años) | |
| WebXPRT 4 / Overall | |
| Asus ROG Strix Scar 18 2023 G834JY-N6005W | |
| Alienware m18 R1 | |
| Asus ROG Strix Scar 18 G834JYR (2024) | |
| Razer Blade 18 RTX 4070 | |
| Alienware m18 R1 AMD | |
| Medio Intel Core i9-14900HX, NVIDIA GeForce RTX 4090 Laptop GPU (246 - 309, n=8) | |
| MSI Titan 18 HX A14VIG | |
| Media de la clase Gaming (165 - 354, n=98, últimos 2 años) | |
| Mozilla Kraken 1.1 / Total | |
| Razer Blade 18 RTX 4070 | |
| Alienware m18 R1 AMD | |
| Media de la clase Gaming (391 - 590, n=100, últimos 2 años) | |
| Alienware m18 R1 | |
| Acer Predator Helios 18 N23Q2 | |
| Medio Intel Core i9-14900HX, NVIDIA GeForce RTX 4090 Laptop GPU (428 - 535, n=11) | |
| MSI Titan 18 HX A14VIG | |
| Asus ROG Strix Scar 18 G834JYR (2024) | |
| Asus ROG Strix Scar 18 2023 G834JY-N6005W | |
* ... más pequeño es mejor
| PCMark 10 Score | 8801 puntos | |
ayuda | ||
| AIDA64 / Memory Copy | |
| Asus ROG Strix Scar 18 G834JYR (2024) | |
| Alienware m18 R1 | |
| Acer Predator Helios 18 N23Q2 | |
| Razer Blade 18 RTX 4070 | |
| Medio Intel Core i9-14900HX (38028 - 83392, n=36) | |
| Media de la clase Gaming (21750 - 129946, n=105, últimos 2 años) | |
| Asus ROG Strix Scar 18 2023 G834JY-N6005W | |
| MSI Titan 18 HX A14VIG | |
| Alienware m18 R1 AMD | |
| AIDA64 / Memory Read | |
| Alienware m18 R1 | |
| Asus ROG Strix Scar 18 G834JYR (2024) | |
| Acer Predator Helios 18 N23Q2 | |
| Razer Blade 18 RTX 4070 | |
| Medio Intel Core i9-14900HX (43306 - 87568, n=36) | |
| Asus ROG Strix Scar 18 2023 G834JY-N6005W | |
| Media de la clase Gaming (22956 - 118858, n=105, últimos 2 años) | |
| Alienware m18 R1 AMD | |
| MSI Titan 18 HX A14VIG | |
| AIDA64 / Memory Write | |
| Alienware m18 R1 | |
| Asus ROG Strix Scar 18 G834JYR (2024) | |
| Media de la clase Gaming (22297 - 135096, n=105, últimos 2 años) | |
| Razer Blade 18 RTX 4070 | |
| Acer Predator Helios 18 N23Q2 | |
| Medio Intel Core i9-14900HX (37146 - 80589, n=36) | |
| Asus ROG Strix Scar 18 2023 G834JY-N6005W | |
| Alienware m18 R1 AMD | |
| MSI Titan 18 HX A14VIG | |
| AIDA64 / Memory Latency | |
| Media de la clase Gaming (75.3 - 259, n=105, últimos 2 años) | |
| MSI Titan 18 HX A14VIG | |
| Alienware m18 R1 AMD | |
| Asus ROG Strix Scar 18 2023 G834JY-N6005W | |
| Medio Intel Core i9-14900HX (76.1 - 105, n=36) | |
| Razer Blade 18 RTX 4070 | |
| Acer Predator Helios 18 N23Q2 | |
| Asus ROG Strix Scar 18 G834JYR (2024) | |
| Alienware m18 R1 | |
* ... más pequeño es mejor
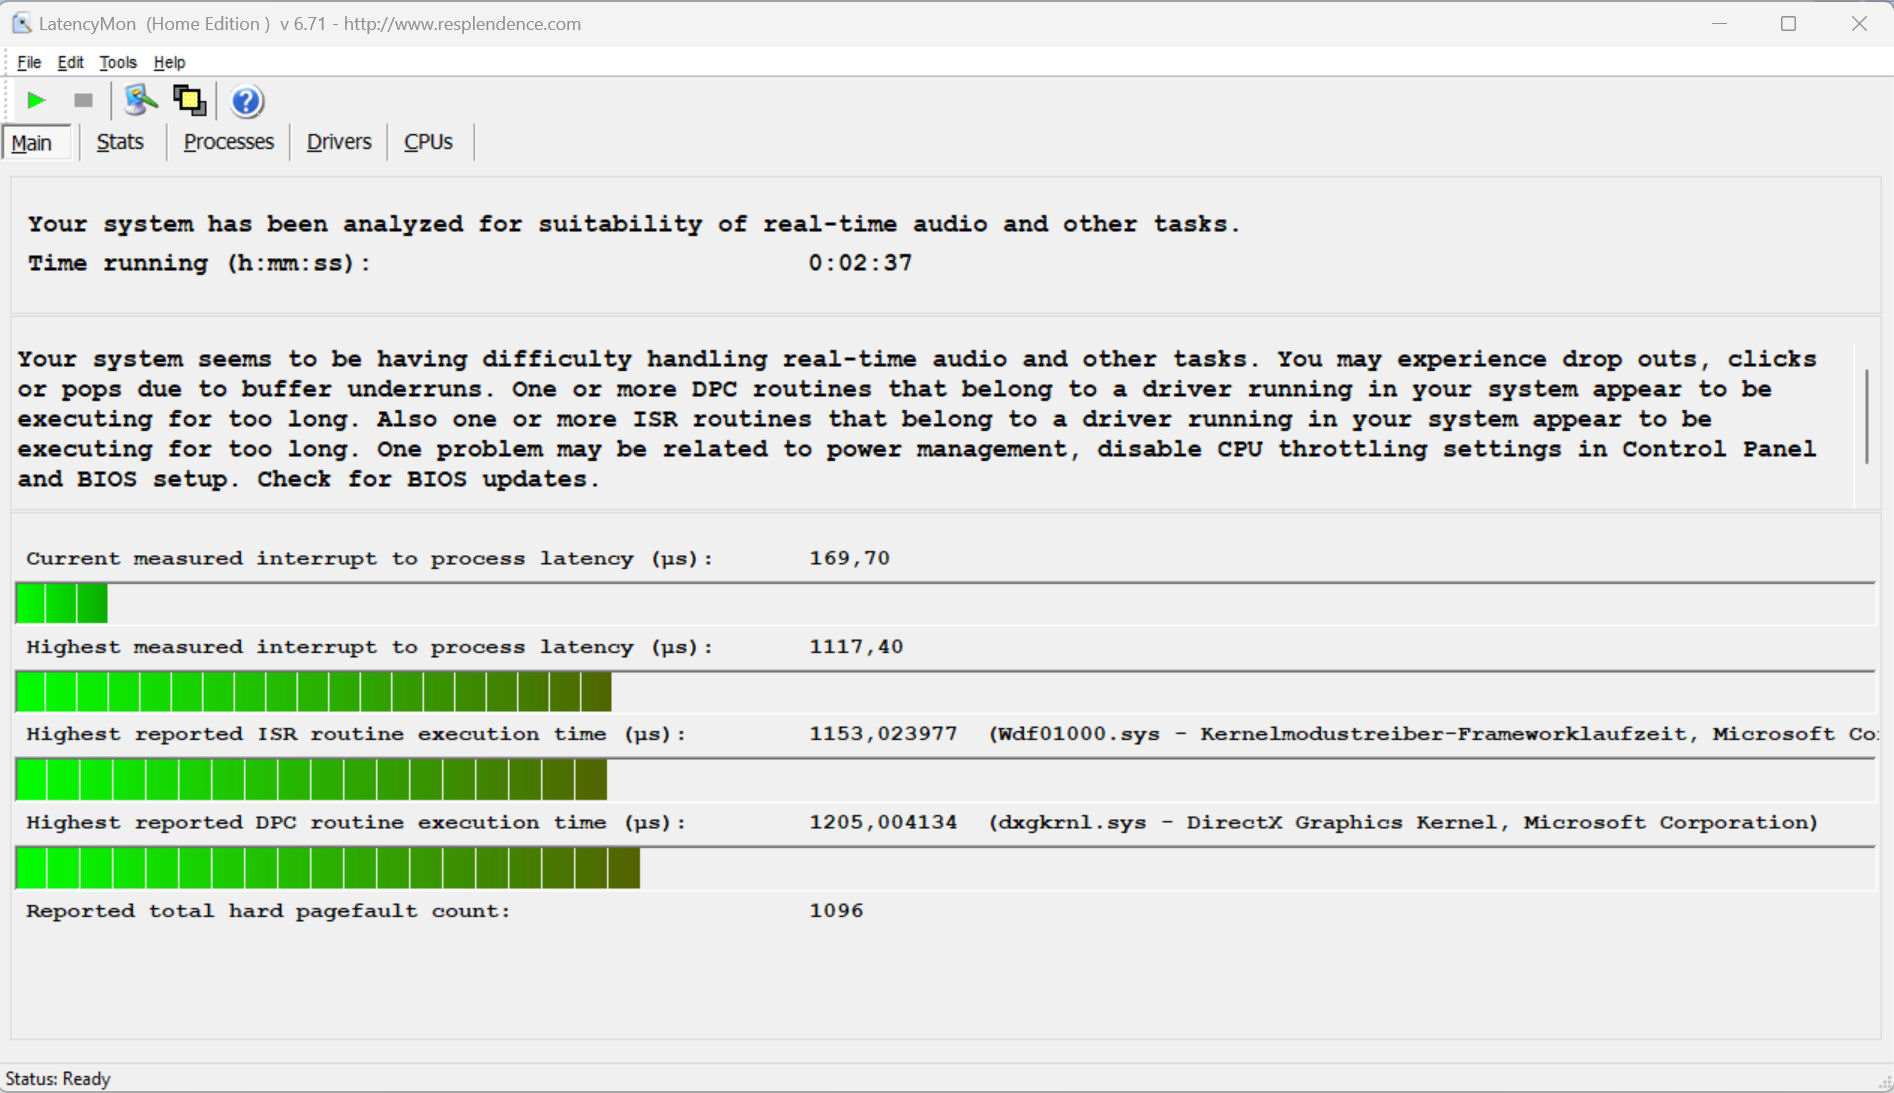
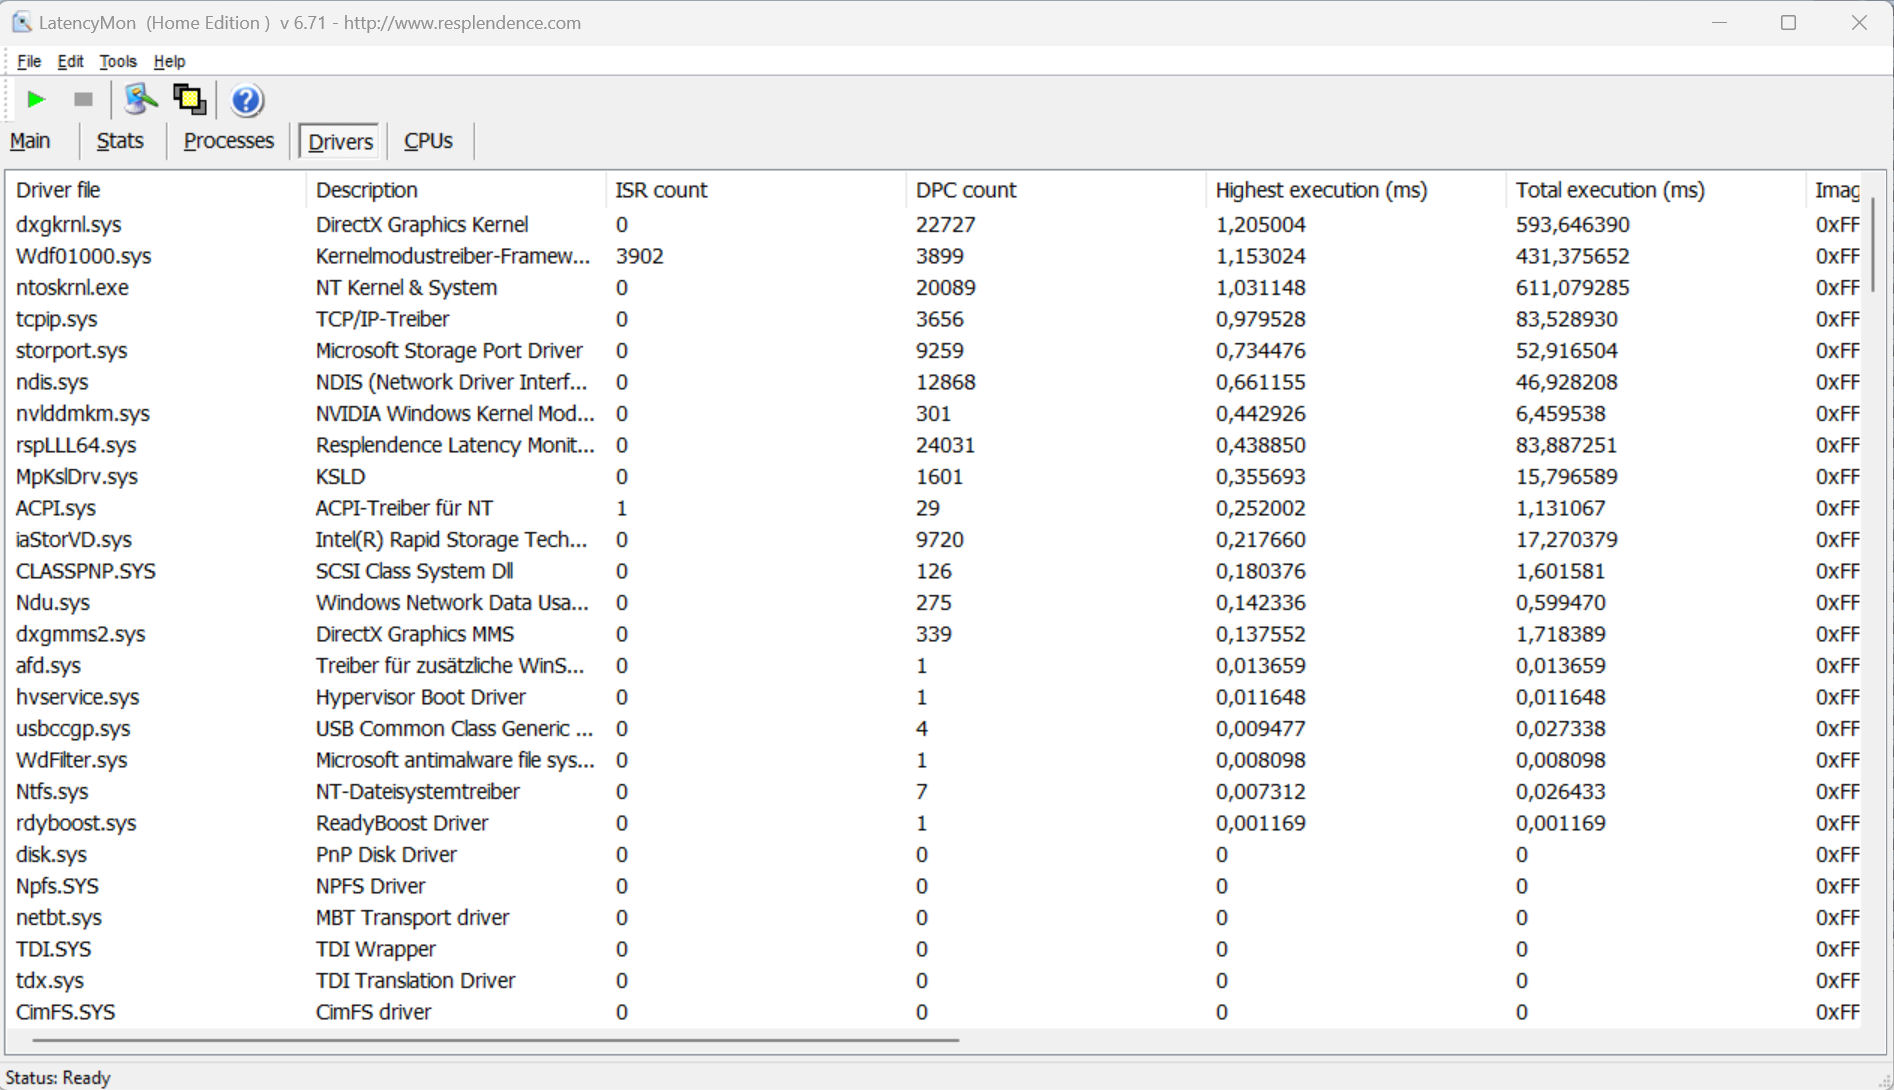
Latencias del CPD
La prueba estandarizada Latency Monitor (con navegación web, reproducción de vídeo 4k y carga alta de Prime95) revela algunos comportamientos llamativos, y el sistema no parece adecuado para el procesamiento de vídeo y audio en tiempo real. Las futuras actualizaciones de software podrían aportar algunas mejoras o incluso empeorar las cosas.
| DPC Latencies / LatencyMon - interrupt to process latency (max), Web, Youtube, Prime95 | |
| Acer Predator Helios 18 N23Q2 | |
| Alienware m18 R1 | |
| MSI Titan 18 HX A14VIG | |
| Razer Blade 18 RTX 4070 | |
| Alienware m18 R1 AMD | |
| Asus ROG Strix Scar 18 G834JYR (2024) | |
| Asus ROG Strix Scar 18 2023 G834JY-N6005W | |
* ... más pequeño es mejor
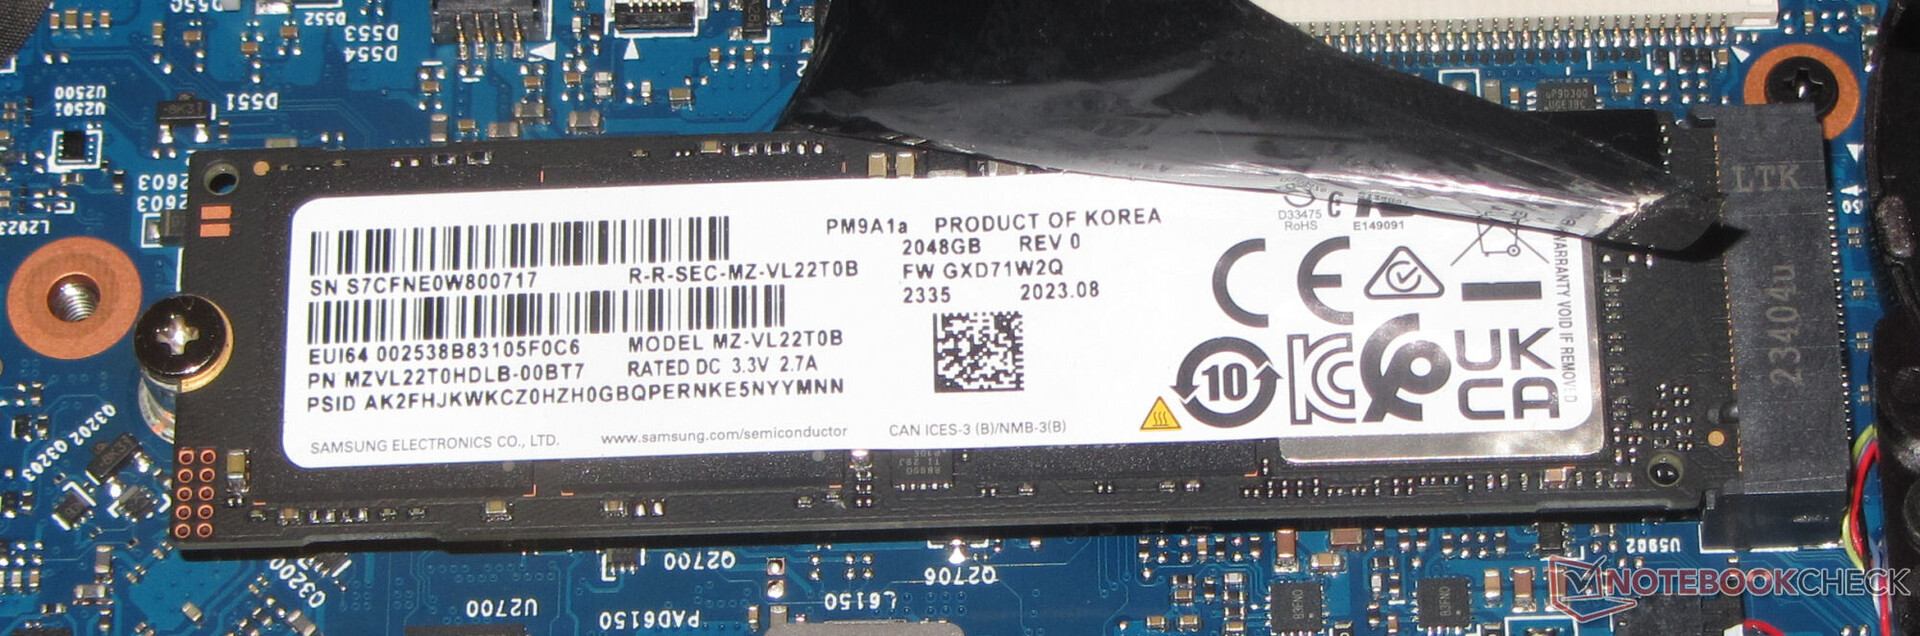
Solución de almacenamiento
El Scar 18 puede aceptar un total de dos SSD PCIe 4 en formato M.2-2280, siendo también compatible con RAID-0. La unidad SSD Samsung de 2 TB de nuestra unidad de pruebas ofrece unas velocidades de datos excelentes. Otro aspecto positivo es la ausencia de cualquier estrangulamiento causado térmicamente.

* ... más pequeño es mejor
Disk Throttling: DiskSpd Read Loop, Queue Depth 8
Tarjeta gráfica
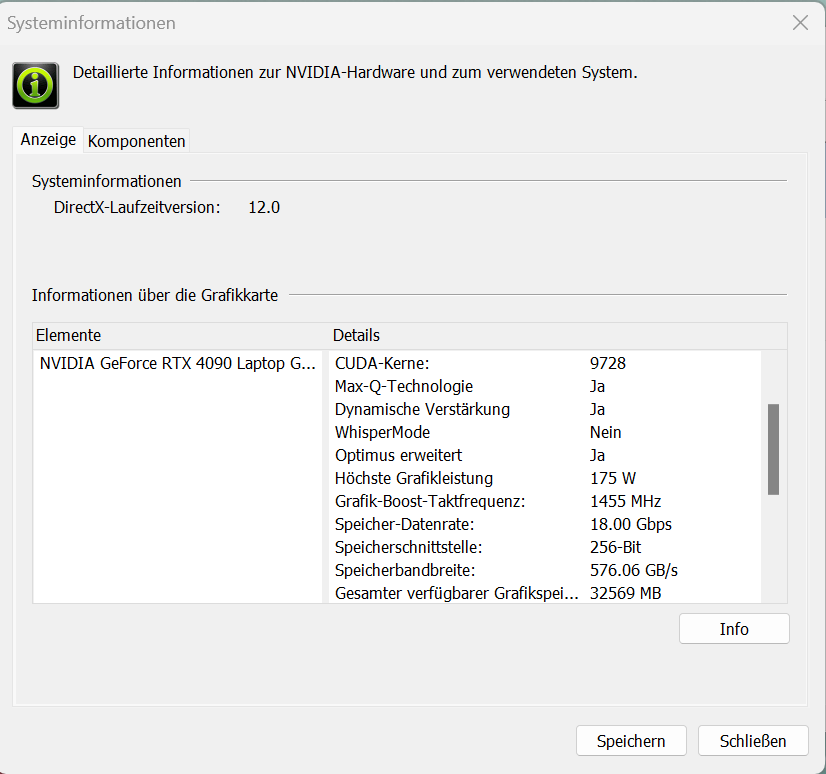
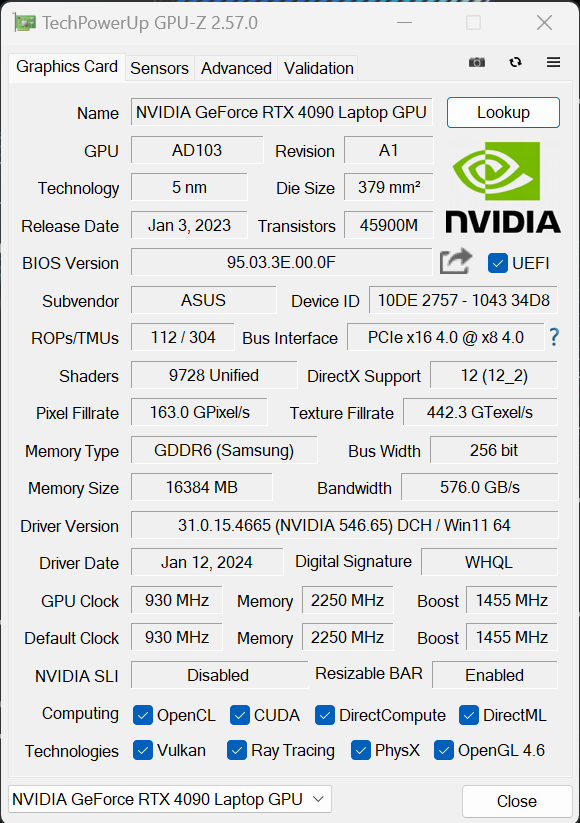
Con la GeForce RTX 4090asus utiliza el modelo superior actual de Nvidia entre las GPU móviles. Ofrece 9.728 unidades de sombreado, un bus de almacenamiento de 256 bits y también puede utilizar el rápido almacenamiento GDDR6 (16.384 MB). A la RTX 4090 se le concede un TGP máximo de 175 vatios (150 W + 25 W de Dynamic Boost); más no es posible.
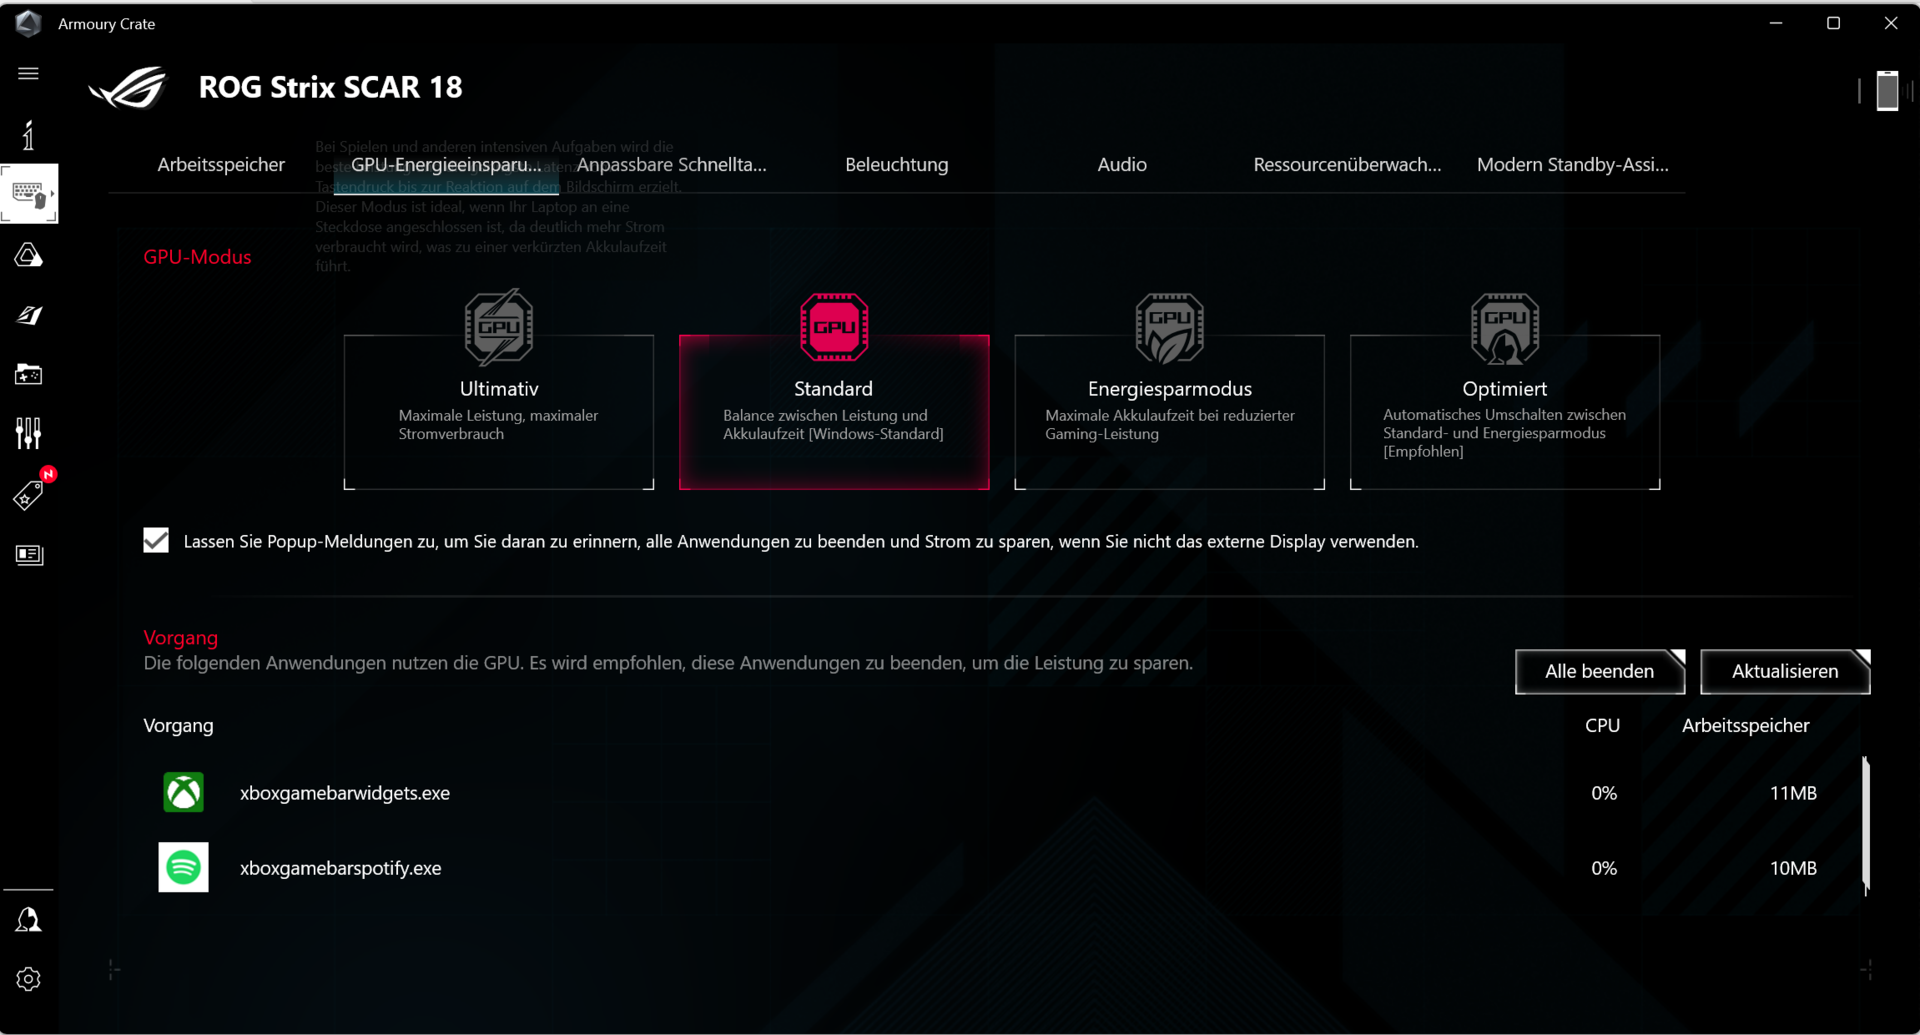
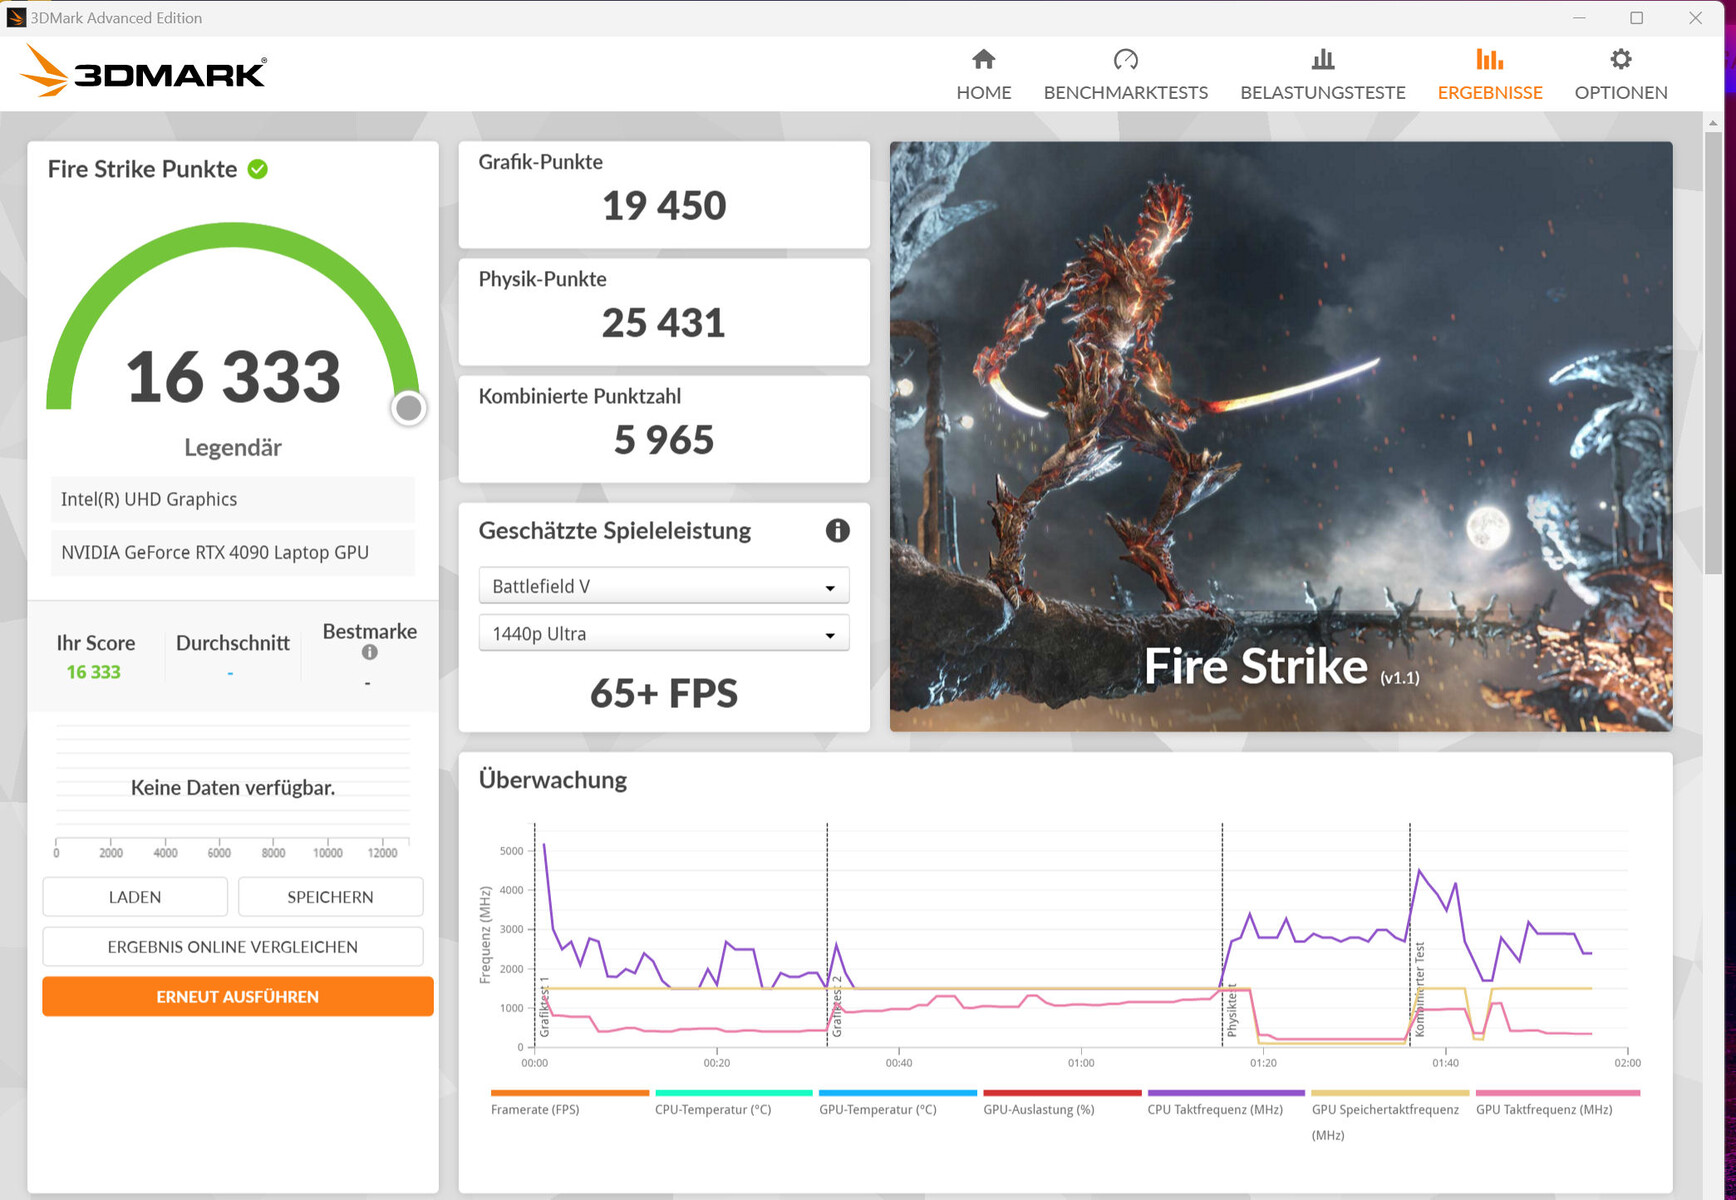
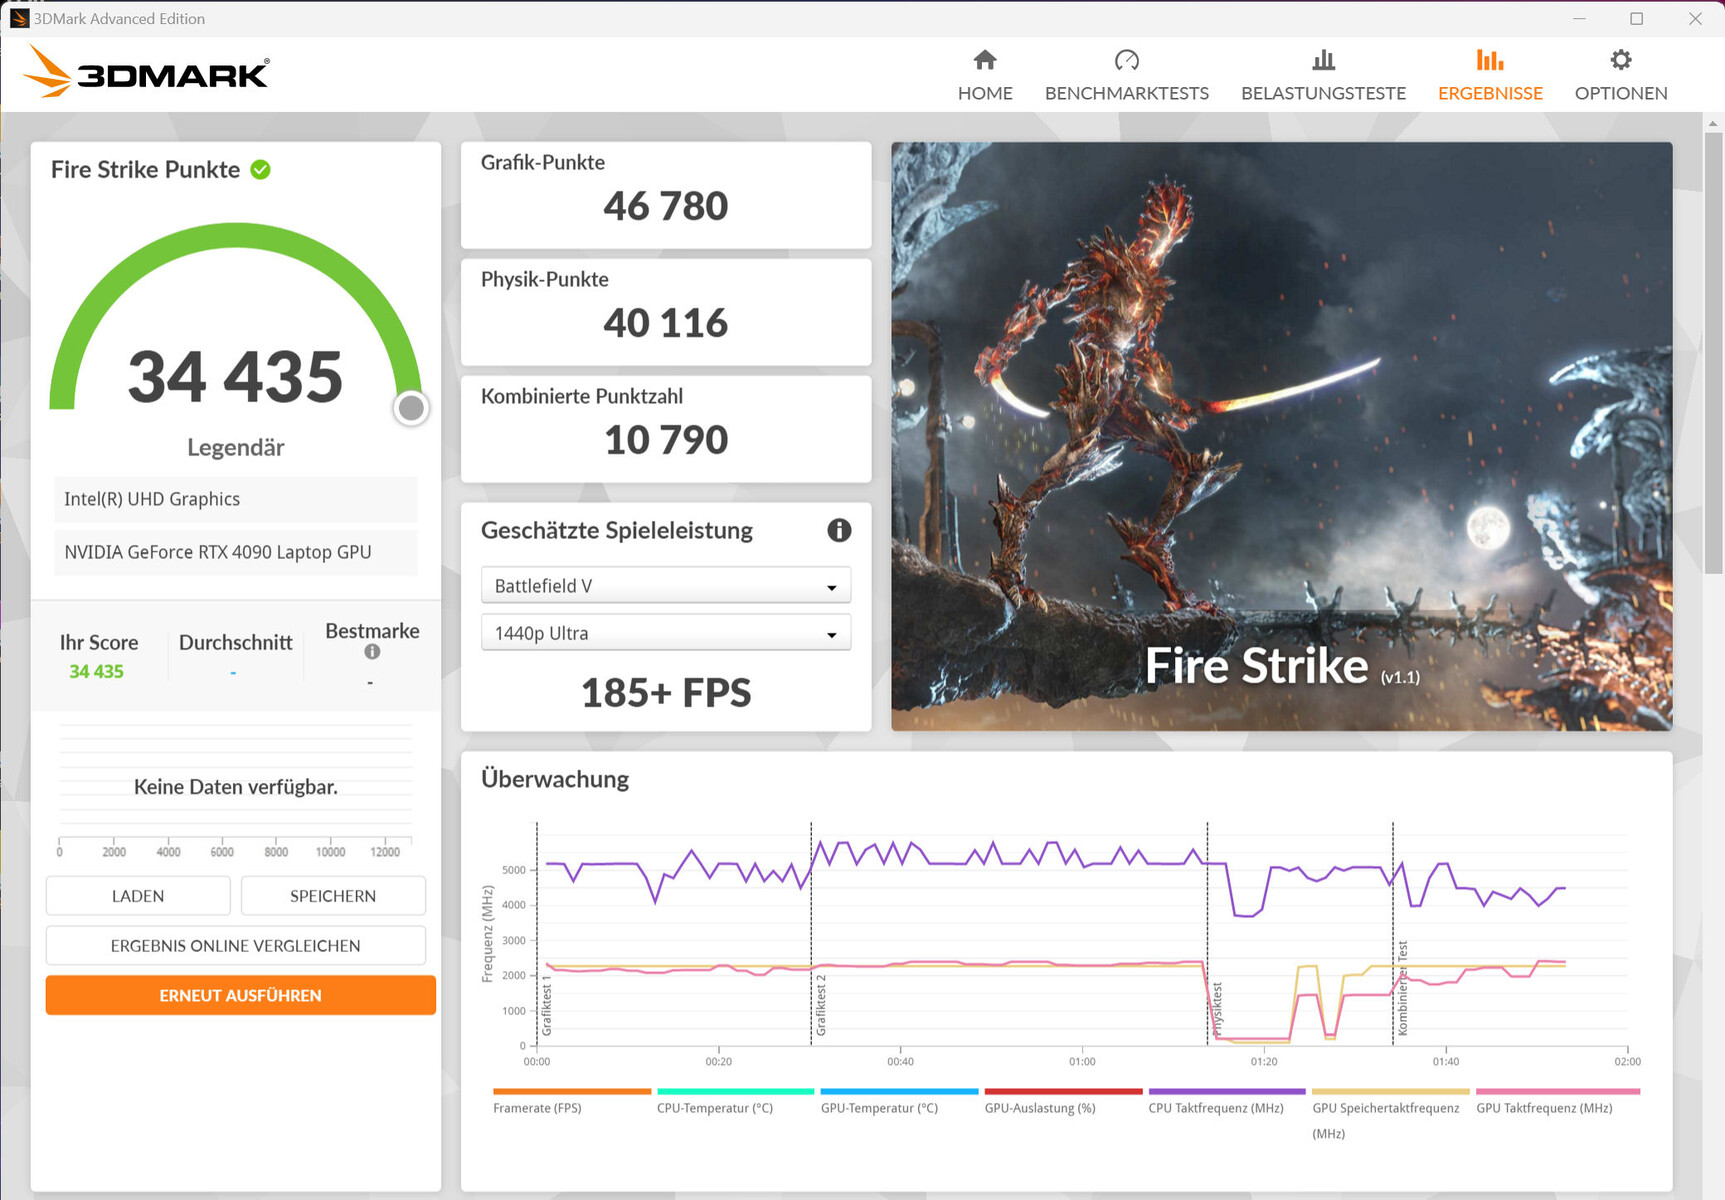
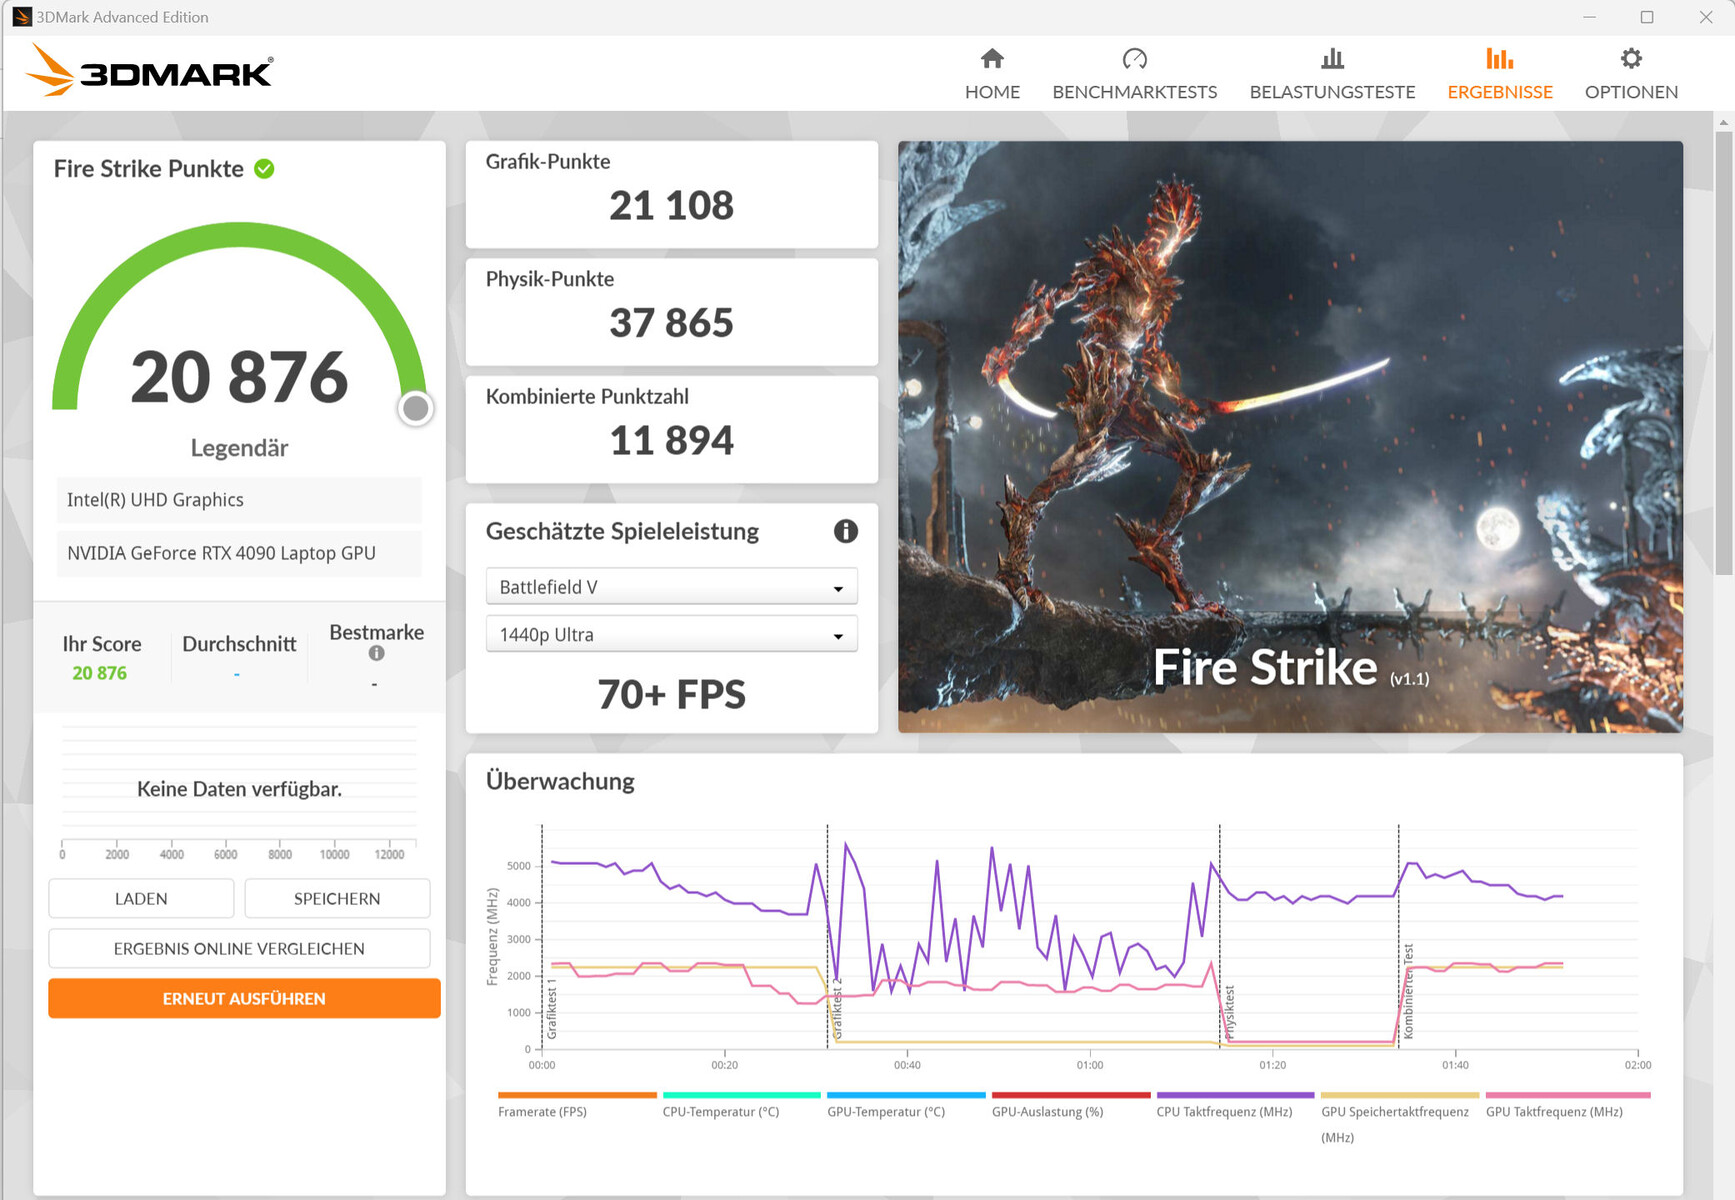
En el modo "Rendimiento", los resultados del benchmark se sitúan por debajo de la media determinada para la RTX 4090 hasta ahora, mientras que en "Turbo" se obtienen valores al mismo nivel que la media. El modo "Advanced Optimus" es compatible, y el cambio entre la dGPU y el modo "Optimus" no requiere un reinicio.

| 3DMark 11 Performance | 42985 puntos | |
| 3DMark Cloud Gate Standard Score | 65110 puntos | |
| 3DMark Fire Strike Score | 33620 puntos | |
| 3DMark Time Spy Score | 19507 puntos | |
ayuda | ||
| V-Ray Benchmark Next 4.10 | |
| GPU | |
| Asus ROG Strix Scar 18 2023 G834JY-N6005W (v4.10.07 ) | |
| Medio NVIDIA GeForce RTX 4090 Laptop GPU (873 - 1334, n=30) | |
| Asus ROG Strix Scar 18 G834JYR (2024) (v4.10.07 ) | |
| Acer Predator Helios 18 N23Q2 (v4.10.07 ) | |
| Media de la clase Gaming (427 - 1627, n=99, últimos 2 años) | |
| CPU | |
| Asus ROG Strix Scar 18 2023 G834JY-N6005W (v4.10.07 ) | |
| Acer Predator Helios 18 N23Q2 (v4.10.07 ) | |
| Medio NVIDIA GeForce RTX 4090 Laptop GPU (18206 - 37629, n=30) | |
| Asus ROG Strix Scar 18 G834JYR (2024) (v4.10.07 ) | |
| Media de la clase Gaming (10048 - 45327, n=97, últimos 2 años) | |
* ... más pequeño es mejor
Rendimiento en juegos
La Scar 18 permite jugar en QHD+ con los ajustes máximos. Se pueden utilizar resoluciones superiores si conecta el monitor correspondiente. Los juegos compatibles con DLSS 3 y Frame Generation permiten ajustes máximos y efectos de raytracing adicionales en resolución 4k.
En el modo "Rendimiento", las frecuencias de cuadro de nuestros juegos probados se sitúan por debajo de la media de la RTX 4090 que se ha determinado hasta ahora. Seleccionando "Turbo" puede producirse un ligero aumento, y lo mismo ocurre con el modo GPU "Ultimate".
| The Witcher 3 - 1920x1080 Ultra Graphics & Postprocessing (HBAO+) | |
| Alienware m18 R1 | |
| MSI Titan 18 HX A14VIG | |
| Medio NVIDIA GeForce RTX 4090 Laptop GPU (139.2 - 216, n=35) | |
| Media de la clase Gaming (104.7 - 240, n=6, últimos 2 años) | |
| Asus ROG Strix Scar 18 G834JYR (2024) | |
| Acer Predator Helios 18 N23Q2 | |
| Alienware m18 R1 AMD | |
| Razer Blade 18 RTX 4070 | |
| Call of Duty Modern Warfare 3 2023 | |
| 1920x1080 Extreme Preset | |
| Medio NVIDIA GeForce RTX 4090 Laptop GPU (148 - 205, n=7) | |
| Asus ROG Strix Scar 18 G834JYR (2024) | |
| Media de la clase Gaming (27 - 95, n=2, últimos 2 años) | |
| 2560x1440 Extreme Preset | |
| Asus ROG Strix Scar 18 G834JYR (2024) | |
| Medio NVIDIA GeForce RTX 4090 Laptop GPU (113 - 162, n=7) | |
| Media de la clase Gaming (n=1últimos 2 años) | |
| The Finals | |
| 1920x1080 Epic Preset | |
| Asus ROG Strix Scar 18 G834JYR (2024) | |
| Medio NVIDIA GeForce RTX 4090 Laptop GPU (174.1 - 211, n=2) | |
| Media de la clase Gaming (n=1últimos 2 años) | |
| 2560x1440 Epic Preset | |
| Asus ROG Strix Scar 18 G834JYR (2024) | |
| Medio NVIDIA GeForce RTX 4090 Laptop GPU (137.2 - 147.4, n=2) | |
| Media de la clase Gaming (n=1últimos 2 años) | |
| 1920x1080 Epic Preset + Epic RTX Global Illumination | |
| Asus ROG Strix Scar 18 G834JYR (2024) | |
| Medio NVIDIA GeForce RTX 4090 Laptop GPU (159.8 - 190.8, n=2) | |
| Palworld | |
| 1920x1080 Epic Preset AA:TSR | |
| Asus ROG Strix Scar 18 G834JYR (2024) | |
| Medio NVIDIA GeForce RTX 4090 Laptop GPU (138.8 - 150.9, n=2) | |
| Media de la clase Gaming (n=1últimos 2 años) | |
| 2560x1440 Epic Preset AA:TSR | |
| Asus ROG Strix Scar 18 G834JYR (2024) | |
| Medio NVIDIA GeForce RTX 4090 Laptop GPU (110.5 - 119.8, n=2) | |
| Enshrouded | |
| 1920x1080 Max. Quality AA:FX | |
| Medio NVIDIA GeForce RTX 4090 Laptop GPU (79 - 101.5, n=3) | |
| Asus ROG Strix Scar 18 G834JYR (2024) | |
| Media de la clase Gaming (n=1últimos 2 años) | |
| 2560x1440 Max. Quality AA:FX | |
| Asus ROG Strix Scar 18 G834JYR (2024) | |
| Medio NVIDIA GeForce RTX 4090 Laptop GPU (61.8 - 76, n=3) | |
Para evaluar si las frecuencias de cuadro se mantienen bastante constantes durante un periodo de tiempo más largo, ejecutamos el juego "The Witcher 3" durante unos 60 minutos en resolución Full-HD con los ajustes de máxima calidad. El personaje del juego no se mueve. No observamos ninguna caída en las frecuencias de cuadro.
The Witcher 3 FPS Chart
| bajo | medio | alto | ultra | QHD | |
|---|---|---|---|---|---|
| GTA V (2015) | 187.5 | 187.1 | 181.2 | 136 | 129.6 |
| The Witcher 3 (2015) | 579.6 | 501.7 | 342.8 | 189.4 | 151.5 |
| Dota 2 Reborn (2015) | 219 | 194.5 | 173.9 | 161.3 | |
| Final Fantasy XV Benchmark (2018) | 221 | 198.1 | 166.1 | 143.6 | |
| X-Plane 11.11 (2018) | 197.9 | 172.4 | 136.8 | ||
| Far Cry 5 (2018) | 176 | 163 | 156 | 145 | 145 |
| Strange Brigade (2018) | 429 | 350 | 341 | 331 | 279 |
| Starfield (2023) | 112.7 | 100 | 84.2 | 78.4 | 66 |
| Cyberpunk 2077 (2023) | 134.8 | 121.5 | 117.7 | 112.1 | 83.8 |
| Call of Duty Modern Warfare 3 2023 (2023) | 229 | 210 | 169 | 162 | 162 |
| The Finals (2023) | 228 | 216 | 214 | 211 | 147.4 |
| Palworld (2024) | 211 | 180.9 | 151.3 | 150.9 | 119.8 |
| Enshrouded (2024) | 135.2 | 120.1 | 100.8 | 87.6 | 68.9 |
Emisiones - El G834JYR puede funcionar silenciosamente
Emisiones acústicas
A plena carga, el nivel de ruido aumenta hasta 52 dB(A) en el modo "Rendimiento". Con "Turbo", el valor aumenta incluso ligeramente más, y una comparación con la Scar 18 de 2023 muestra lo mismo. Su funcionamiento también puede ser más silencioso en general: si renuncia al rendimiento seleccionando el modo "Silencioso", el nivel de ruido disminuye a 35 dB(A). En reposo o en funcionamiento cotidiano (Oficina, Internet), a menudo sólo funciona uno de los dos ventiladores y, en ocasiones, ambos permanecen en silencio, sobre todo si se utiliza el perfil "Silencioso".
Ruido
| Ocioso |
| 27 / 28 / 32 dB(A) |
| Carga |
| 50 / 52 dB(A) |
 | ||
30 dB silencioso 40 dB(A) audible 50 dB(A) ruidosamente alto |
||
min: | ||
| Asus ROG Strix Scar 18 G834JYR (2024) i9-14900HX, GeForce RTX 4090 Laptop GPU | Alienware m18 R1 AMD R9 7945HX, Radeon RX 7900M | Alienware m18 R1 i9-13980HX, GeForce RTX 4090 Laptop GPU | Acer Predator Helios 18 N23Q2 i9-13900HX, GeForce RTX 4080 Laptop GPU | Razer Blade 18 RTX 4070 i9-13950HX, GeForce RTX 4070 Laptop GPU | MSI Titan 18 HX A14VIG i9-14900HX, GeForce RTX 4090 Laptop GPU | Asus ROG Strix Scar 18 2023 G834JY-N6005W i9-13980HX, GeForce RTX 4090 Laptop GPU | |
|---|---|---|---|---|---|---|---|
| Noise | 8% | 12% | 6% | 10% | 5% | 2% | |
| apagado / medio ambiente * (dB) | 24 | 22.4 7% | 22.8 5% | 23 4% | 23.5 2% | 22.8 5% | 23.9 -0% |
| Idle Minimum * (dB) | 27 | 23 15% | 23 15% | 23 15% | 23.8 12% | 23.8 12% | 23.9 11% |
| Idle Average * (dB) | 28 | 23.4 16% | 23 18% | 23 18% | 23.8 15% | 23.8 15% | 32.6 -16% |
| Idle Maximum * (dB) | 32 | 33.5 -5% | 23 28% | 23 28% | 26.8 16% | 28 12% | 32.6 -2% |
| Load Average * (dB) | 50 | 33.5 33% | 35.6 29% | 45.26 9% | 37.3 25% | 38 24% | 35.9 28% |
| Witcher 3 ultra * (dB) | 50 | 53.6 -7% | 51.3 -3% | 59.82 -20% | 48 4% | 57.3 -15% | |
| Load Maximum * (dB) | 52 | 53.6 -3% | 56.7 -9% | 59.94 -15% | 53.5 -3% | 62.8 -21% | 55.8 -7% |
* ... más pequeño es mejor
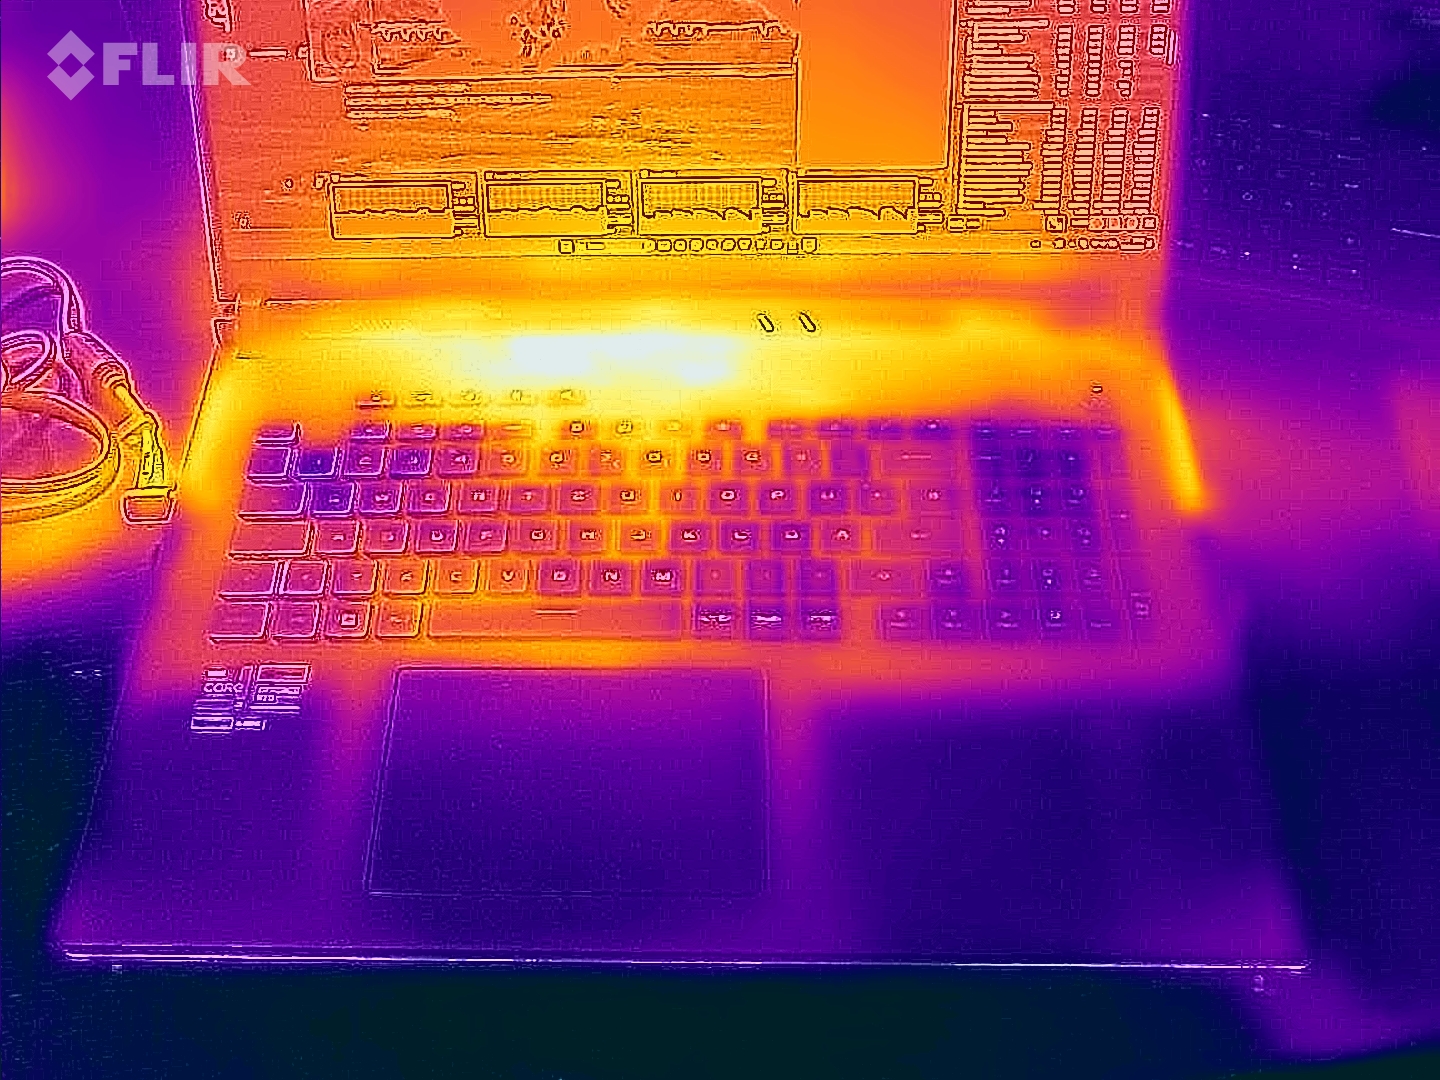
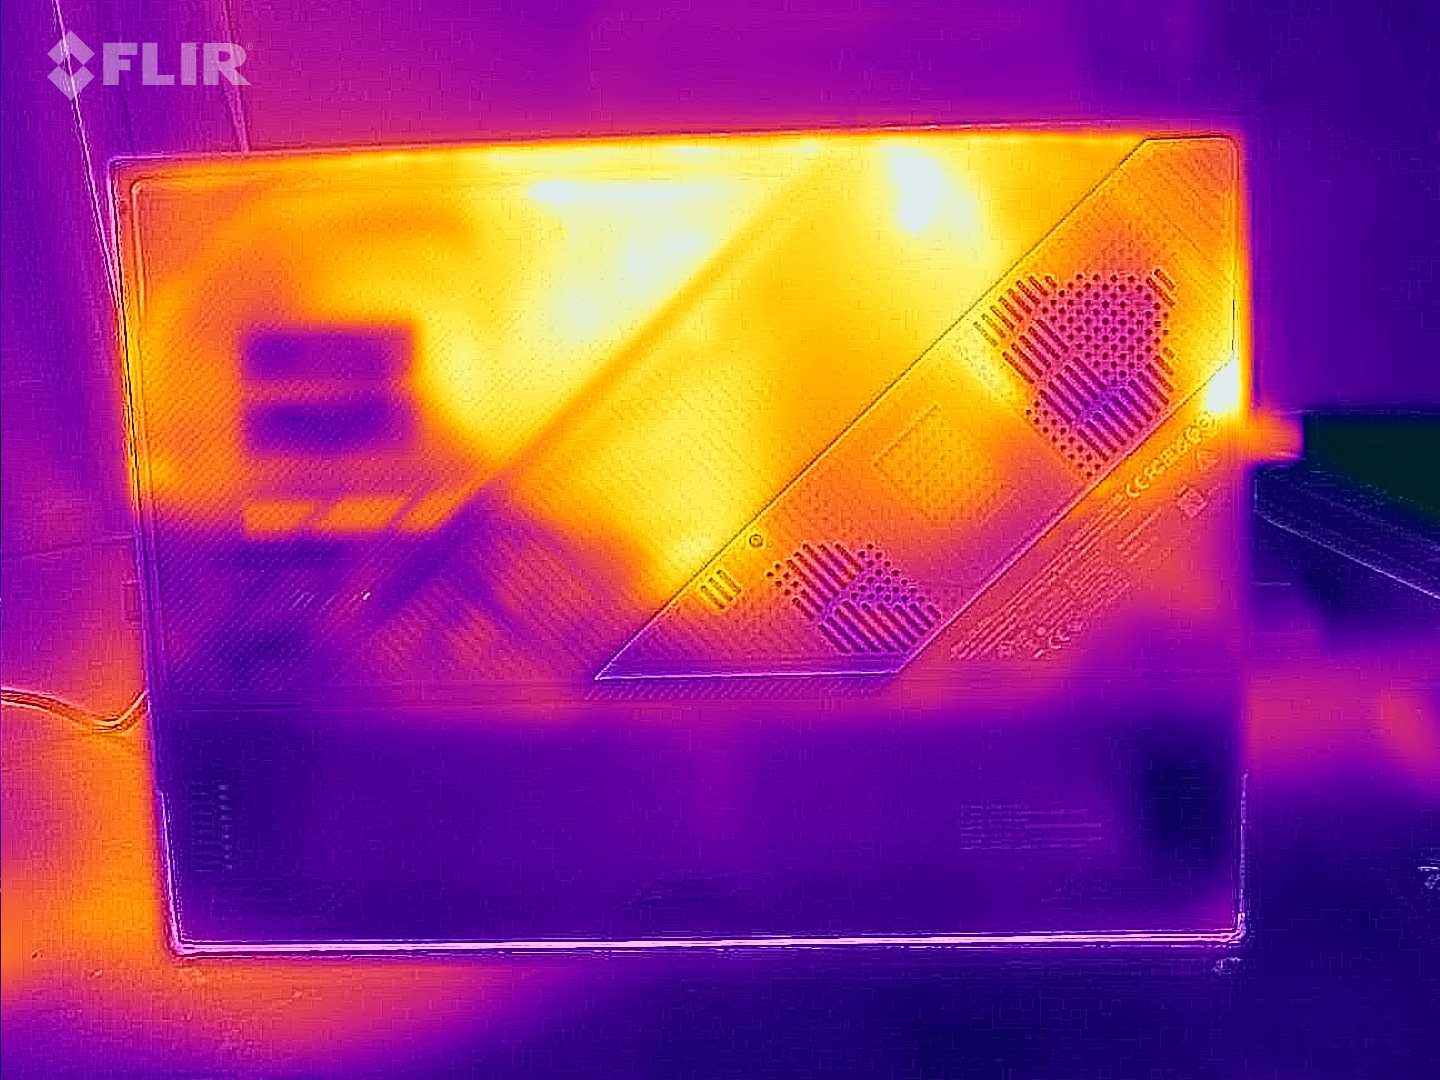
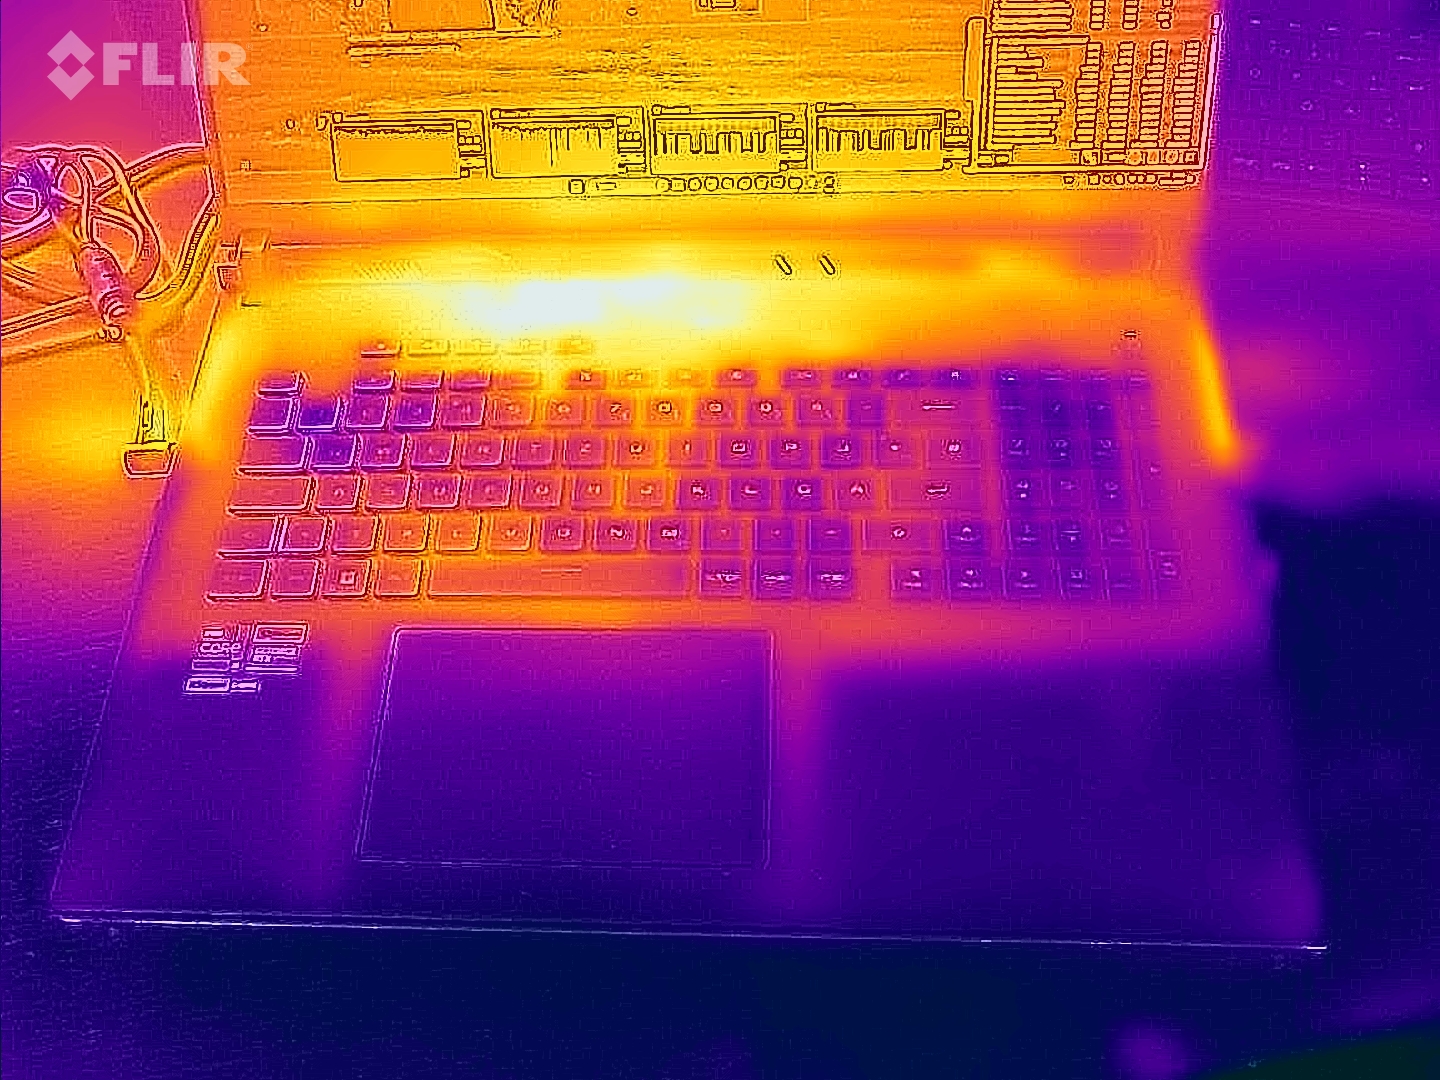
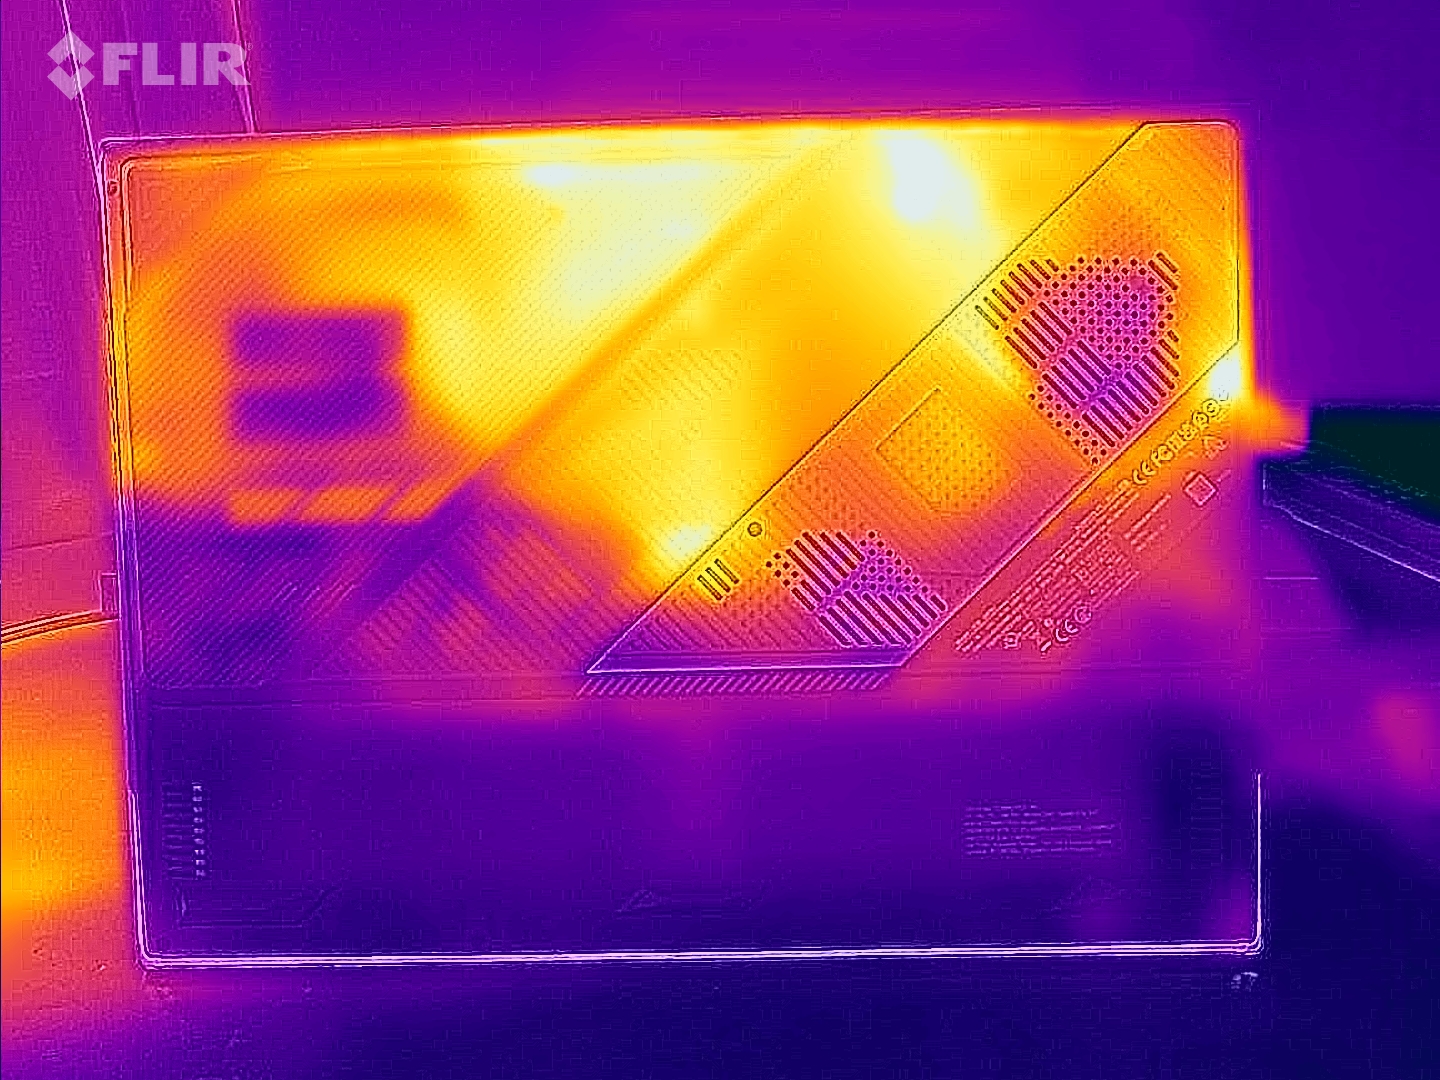
Temperaturas
Las pruebas de estrés y Witcher 3 provocan un calentamiento notable pero no excesivo del portátil. En algunos puntos se alcanzan valores superiores a 50 ºC (122 ºF). Sin embargo, durante el funcionamiento diario (Office, Internet), las temperaturas se mantienen dentro del rango verde.
(-) La temperatura máxima en la parte superior es de 49 °C / 120 F, frente a la media de 40.4 °C / 105 F, que oscila entre 21.2 y 68.8 °C para la clase Gaming.
(-) El fondo se calienta hasta un máximo de 47 °C / 117 F, frente a la media de 43.2 °C / 110 F
(+) En reposo, la temperatura media de la parte superior es de 27.3 °C / 81# F, frente a la media del dispositivo de 33.9 °C / 93 F.
(-) Jugando a The Witcher 3, la temperatura media de la parte superior es de 39.1 °C / 102 F, frente a la media del dispositivo de 33.9 °C / 93 F.
(+) Los reposamanos y el panel táctil alcanzan como máximo la temperatura de la piel (35 °C / 95 F) y, por tanto, no están calientes.
(-) La temperatura media de la zona del reposamanos de dispositivos similares fue de 28.8 °C / 83.8 F (-6.2 °C / -11.2 F).
| Asus ROG Strix Scar 18 G834JYR (2024) Intel Core i9-14900HX, NVIDIA GeForce RTX 4090 Laptop GPU | Alienware m18 R1 AMD AMD Ryzen 9 7945HX, AMD Radeon RX 7900M | Alienware m18 R1 Intel Core i9-13980HX, NVIDIA GeForce RTX 4090 Laptop GPU | Acer Predator Helios 18 N23Q2 Intel Core i9-13900HX, NVIDIA GeForce RTX 4080 Laptop GPU | Razer Blade 18 RTX 4070 Intel Core i9-13950HX, NVIDIA GeForce RTX 4070 Laptop GPU | MSI Titan 18 HX A14VIG Intel Core i9-14900HX, NVIDIA GeForce RTX 4090 Laptop GPU | Asus ROG Strix Scar 18 2023 G834JY-N6005W Intel Core i9-13980HX, NVIDIA GeForce RTX 4090 Laptop GPU | |
|---|---|---|---|---|---|---|---|
| Heat | 8% | 13% | -8% | 7% | 2% | -3% | |
| Maximum Upper Side * (°C) | 49 | 40.2 18% | 39 20% | 35 29% | 39.2 20% | 37.8 23% | 54 -10% |
| Maximum Bottom * (°C) | 47 | 37.4 20% | 36.4 23% | 56 -19% | 35.6 24% | 37.6 20% | 46 2% |
| Idle Upper Side * (°C) | 29 | 31.6 -9% | 29.2 -1% | 34 -17% | 31.8 -10% | 34.8 -20% | 30 -3% |
| Idle Bottom * (°C) | 31 | 30.6 1% | 27.8 10% | 39 -26% | 33.2 -7% | 36 -16% | 31 -0% |
* ... más pequeño es mejor
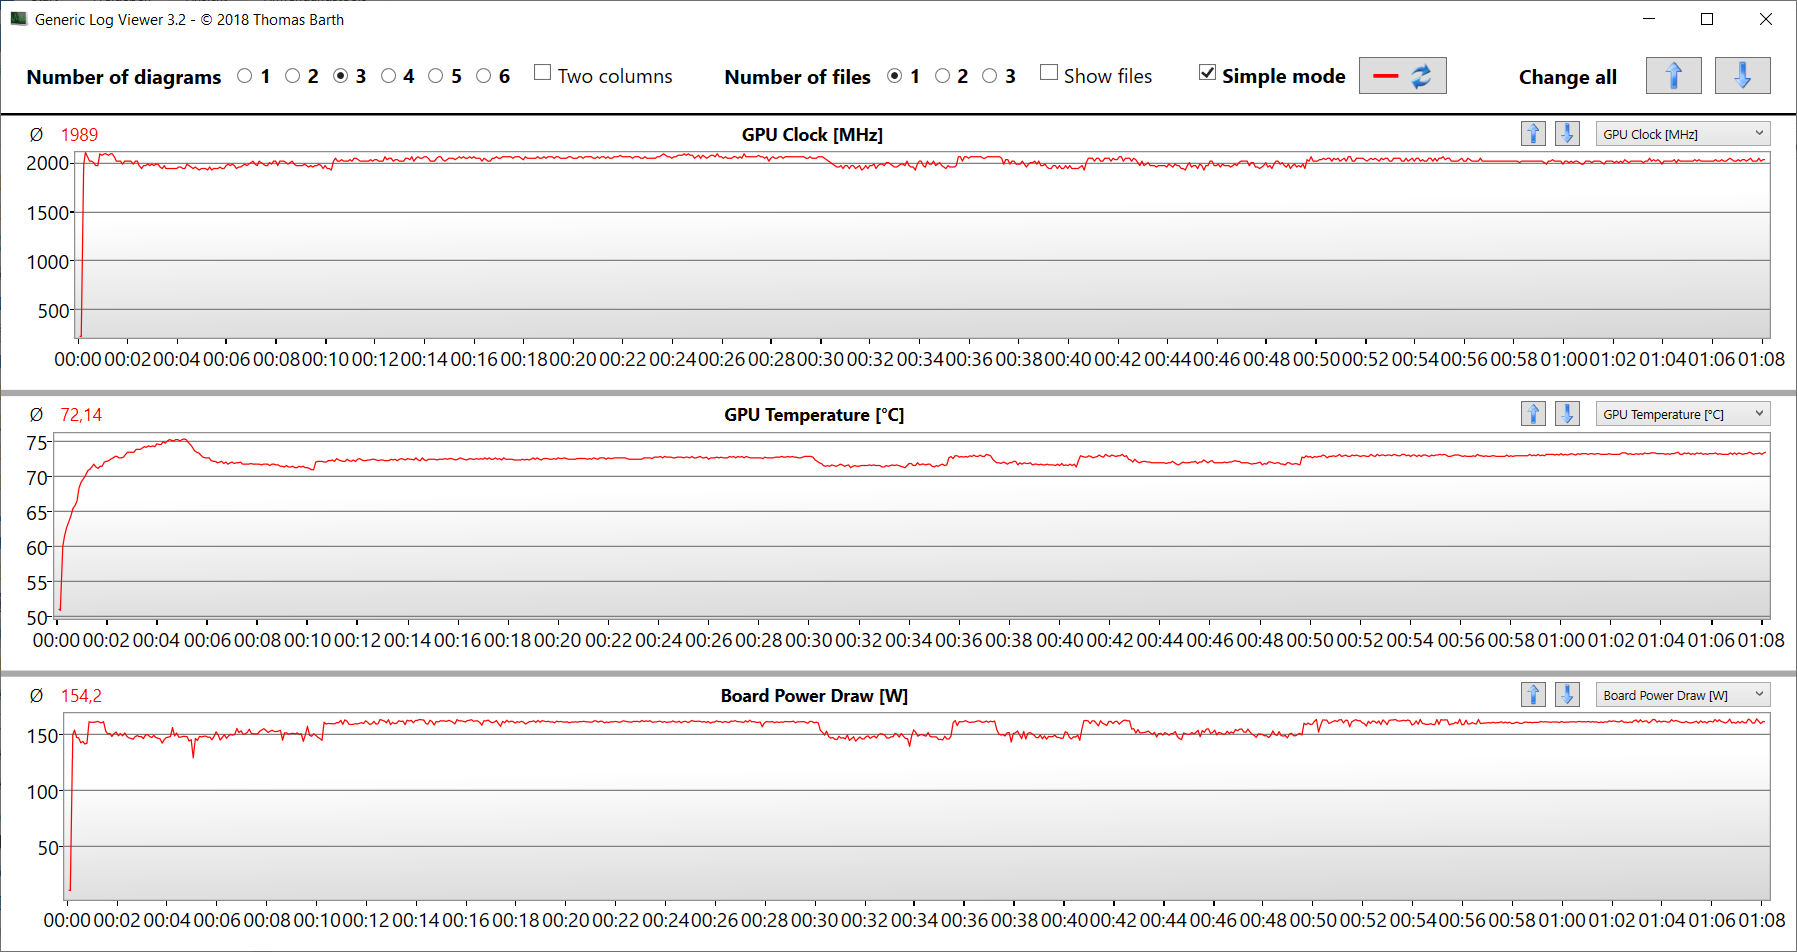
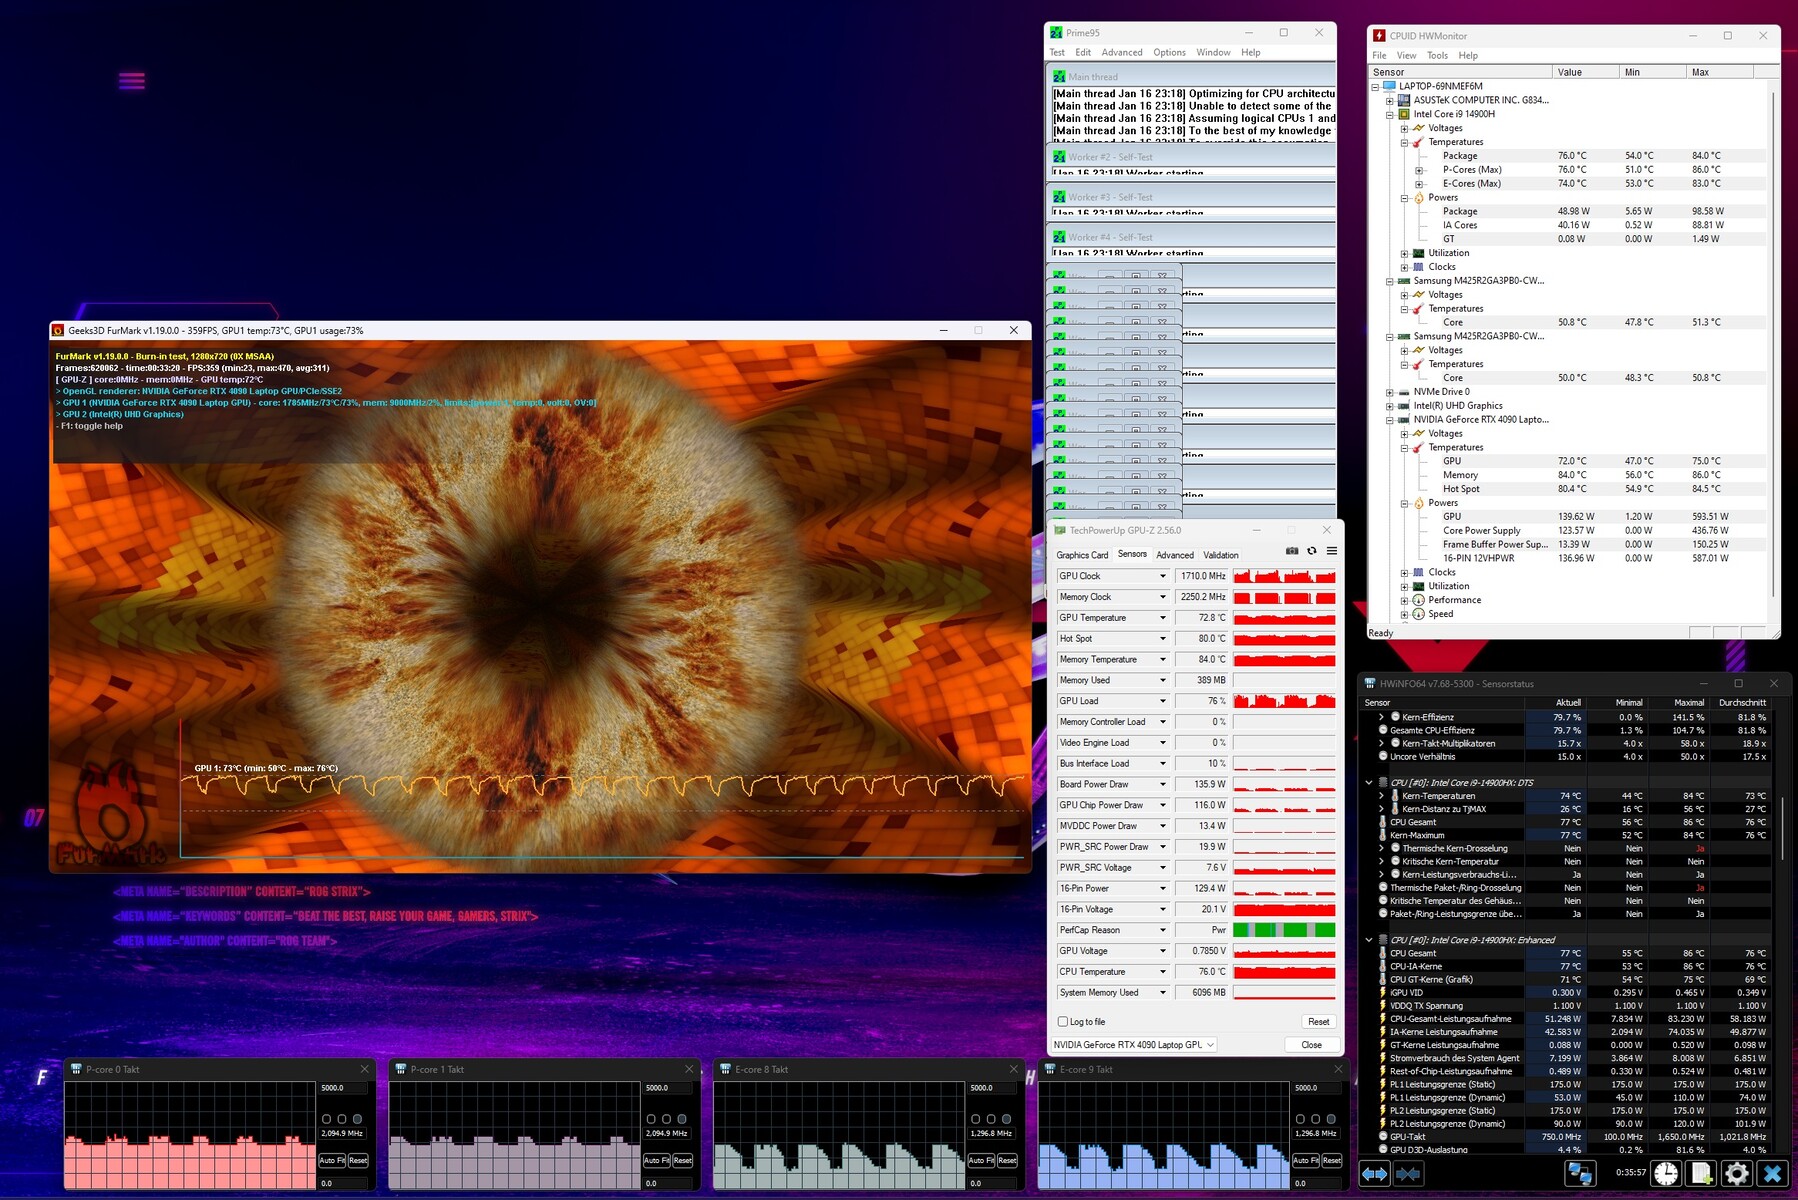
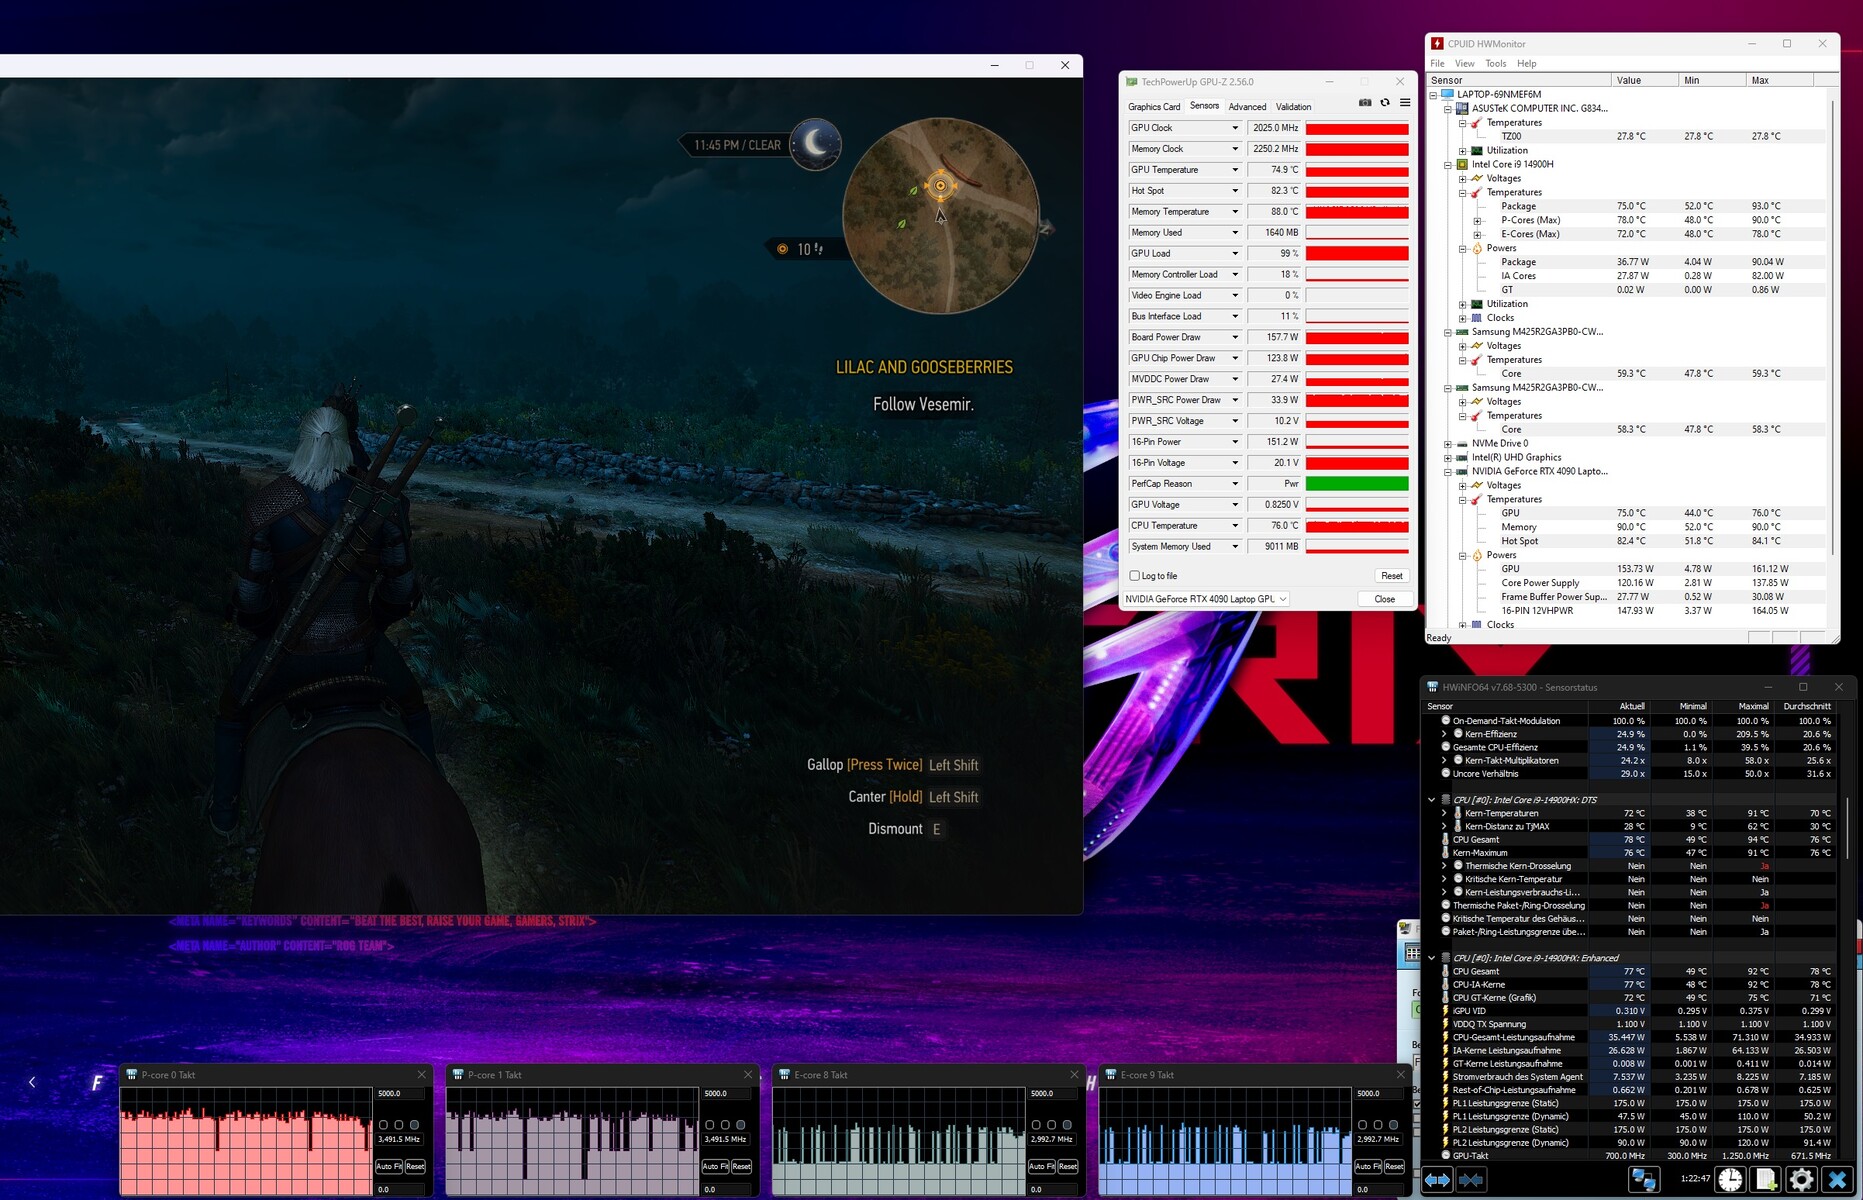
Prueba de estrés
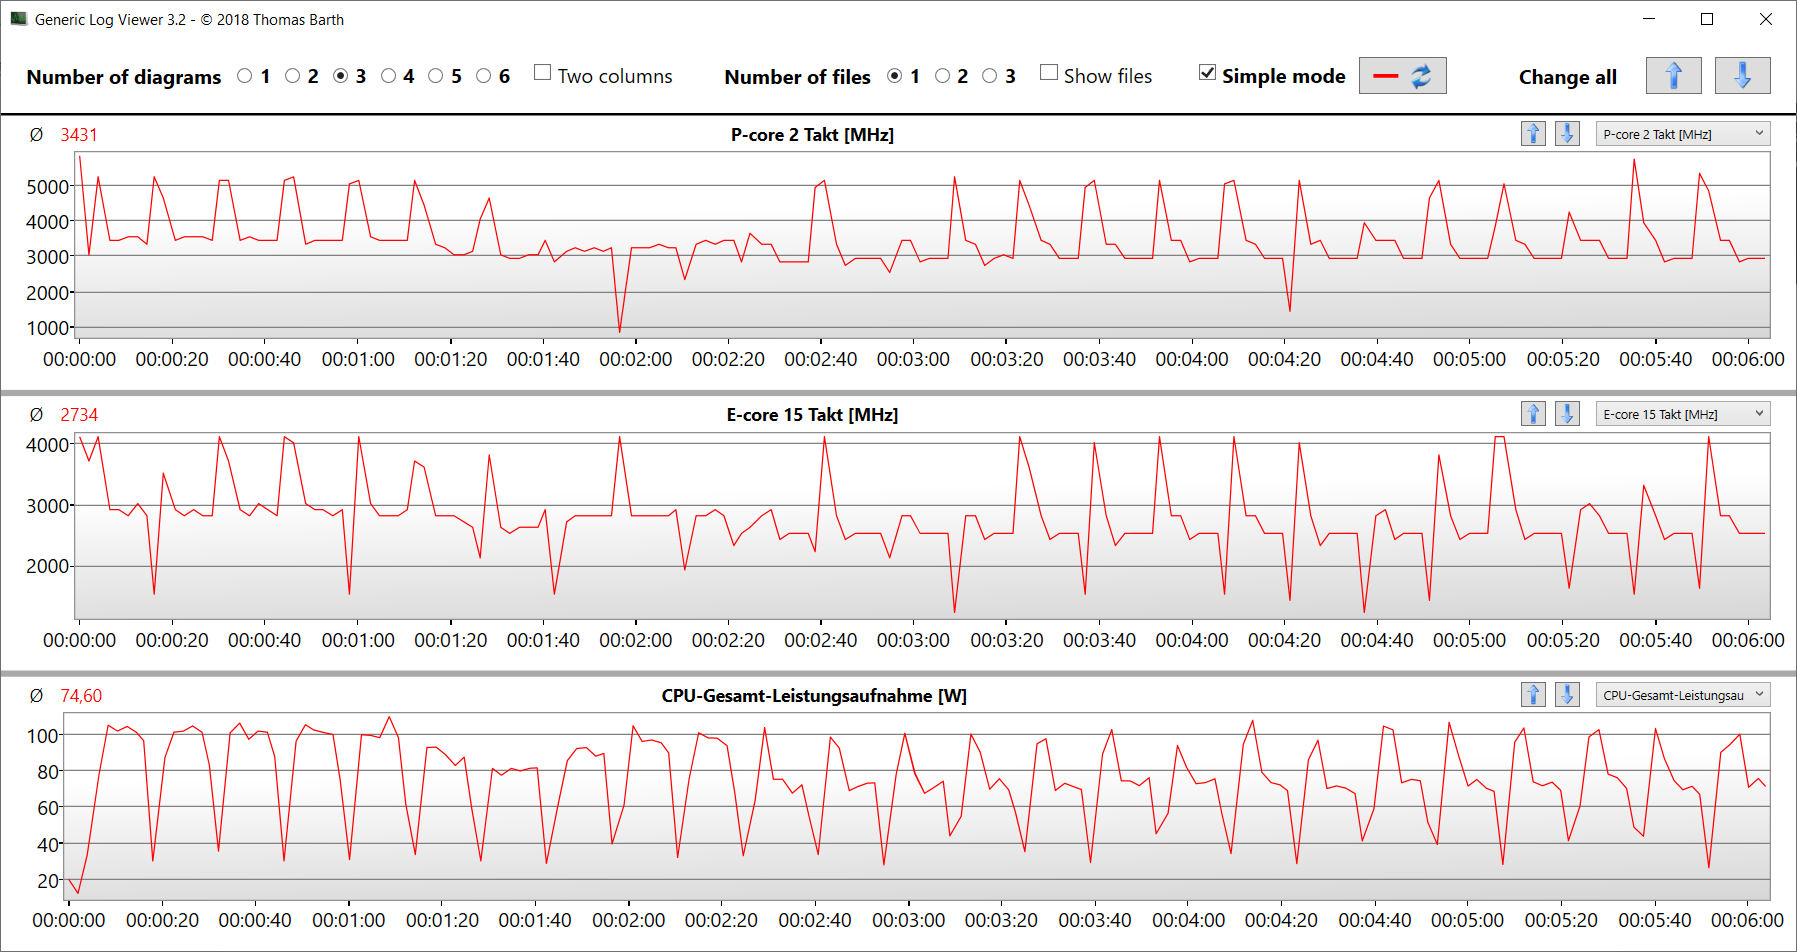
La prueba de estrés (con Prime95 y Furmark funcionando constantemente) representa un escenario extremo para evaluar la estabilidad del sistema a plena carga. La CPU alcanza velocidades máximas de 2,5 a 2,6 GHz (núcleos P) y de 2,2 a 2,3 GHz (núcleos E). La GPU (de 1,9 a 2 GHz) comienza la prueba casi a plena velocidad y ésta desciende ligeramente a medida que la prueba continúa. Además, la GPU se ralentiza regularmente de forma significativa.
Altavoces
Los cuatro altavoces producen un sonido muy decente en conjunto. Para una experiencia de sonido aún mejor, puede utilizar unos auriculares o unos altavoces externos.
Asus ROG Strix Scar 18 G834JYR (2024) análisis de audio
(+) | los altavoces pueden reproducir a un volumen relativamente alto (#82 dB)
Graves 100 - 315 Hz
(±) | lubina reducida - en promedio 5.6% inferior a la mediana
(+) | el bajo es lineal (6.8% delta a la frecuencia anterior)
Medios 400 - 2000 Hz
(±) | medias más altas - de media 5.7% más altas que la mediana
(+) | los medios son lineales (2.8% delta a la frecuencia anterior)
Altos 2 - 16 kHz
(±) | máximos reducidos - de media 7.2% inferior a la mediana
(±) | la linealidad de los máximos es media (7.2% delta a frecuencia anterior)
Total 100 - 16.000 Hz
(+) | el sonido global es lineal (13% de diferencia con la mediana)
En comparación con la misma clase
» 18% de todos los dispositivos probados de esta clase eran mejores, 3% similares, 79% peores
» El mejor tuvo un delta de 6%, la media fue 18%, el peor fue ###max##%
En comparación con todos los dispositivos probados
» 13% de todos los dispositivos probados eran mejores, 3% similares, 85% peores
» El mejor tuvo un delta de 4%, la media fue 23%, el peor fue ###max##%
MSI Titan 18 HX A14VIG análisis de audio
(+) | los altavoces pueden reproducir a un volumen relativamente alto (#89.2 dB)
Graves 100 - 315 Hz
(-) | casi sin bajos - de media 17.6% inferior a la mediana
(±) | la linealidad de los graves es media (8% delta a frecuencia anterior)
Medios 400 - 2000 Hz
(+) | medios equilibrados - a sólo 1.8% de la mediana
(+) | los medios son lineales (3.7% delta a la frecuencia anterior)
Altos 2 - 16 kHz
(+) | máximos equilibrados - a sólo 1.2% de la mediana
(+) | los máximos son lineales (2% delta a la frecuencia anterior)
Total 100 - 16.000 Hz
(+) | el sonido global es lineal (9.9% de diferencia con la mediana)
En comparación con la misma clase
» 5% de todos los dispositivos probados de esta clase eran mejores, 2% similares, 94% peores
» El mejor tuvo un delta de 6%, la media fue 18%, el peor fue ###max##%
En comparación con todos los dispositivos probados
» 4% de todos los dispositivos probados eran mejores, 1% similares, 95% peores
» El mejor tuvo un delta de 4%, la media fue 23%, el peor fue ###max##%
Gestión de energía - El Asus ROG alcanza una duración de batería bastante buena
Consumo de energía
Durante la prueba Witcher 3, el consumo de energía se mantiene constante en un nivel esperado, y durante la prueba de estrés el consumo varía. Esta variación se debe a una reducción significativa de la velocidad de la GPU que se produce con regularidad. El cargador de 330 vatios proporciona una cantidad de energía suficiente.
| Off / Standby | |
| Ocioso | |
| Carga |
|
Clave:
min: | |
| Asus ROG Strix Scar 18 G834JYR (2024) i9-14900HX, GeForce RTX 4090 Laptop GPU | Alienware m18 R1 AMD R9 7945HX, Radeon RX 7900M | Alienware m18 R1 i9-13980HX, GeForce RTX 4090 Laptop GPU | Acer Predator Helios 18 N23Q2 i9-13900HX, GeForce RTX 4080 Laptop GPU | Razer Blade 18 RTX 4070 i9-13950HX, GeForce RTX 4070 Laptop GPU | MSI Titan 18 HX A14VIG i9-14900HX, GeForce RTX 4090 Laptop GPU | Asus ROG Strix Scar 18 2023 G834JY-N6005W i9-13980HX, GeForce RTX 4090 Laptop GPU | Media de la clase Gaming | |
|---|---|---|---|---|---|---|---|---|
| Power Consumption | -112% | -48% | -4% | -40% | -40% | -35% | 7% | |
| Idle Minimum * (Watt) | 14 | 30.3 -116% | 21.6 -54% | 16 -14% | 24.5 -75% | 13.2 6% | 17.3 -24% | 13 ? 7% |
| Idle Average * (Watt) | 17 | 55.6 -227% | 25.2 -48% | 19 -12% | 34.1 -101% | 25.4 -49% | 27 -59% | 18.7 ? -10% |
| Idle Maximum * (Watt) | 24 | 101.1 -321% | 56.7 -136% | 21.3 11% | 47.7 -99% | 53.5 -123% | 46 -92% | 24.3 ? -1% |
| Load Average * (Watt) | 143 | 160.3 -12% | 164.1 -15% | 124 13% | 140 2% | 151.4 -6% | 133 7% | 110.2 ? 23% |
| Witcher 3 ultra * (Watt) | 251 | 216 14% | 311 -24% | 289 -15% | 202 20% | 336 -34% | ||
| Load Maximum * (Watt) | 302 | 332.1 -10% | 338.9 -12% | 319 -6% | 261 14% | 395.2 -31% | 329 -9% | 258 ? 15% |
* ... más pequeño es mejor
Power Consumption The Witcher 3 / Stress Test
Power Consumption With External Monitor
Duración de las pilas
En nuestra prueba WLAN de carga de sitios web mediante script y o la prueba de vídeo reproduciendo el cortometraje Big Buck Bunny (codificación H.264, FHD) en un bucle constante, el portátil de 18 pulgadas alcanza tiempos de ejecución de 7:41 h y 7:27 h respectivamente. Así que el Scar 18 ofrece muy buenos valores en general y es capaz de superar a sus competidores por márgenes significativos, a pesar de que la capacidad de sus baterías es mayor en parte.
| Asus ROG Strix Scar 18 G834JYR (2024) i9-14900HX, GeForce RTX 4090 Laptop GPU, 90 Wh | Alienware m18 R1 AMD R9 7945HX, Radeon RX 7900M, 97 Wh | Alienware m18 R1 i9-13980HX, GeForce RTX 4090 Laptop GPU, 97 Wh | Acer Predator Helios 18 N23Q2 i9-13900HX, GeForce RTX 4080 Laptop GPU, 90 Wh | Razer Blade 18 RTX 4070 i9-13950HX, GeForce RTX 4070 Laptop GPU, 91.7 Wh | MSI Titan 18 HX A14VIG i9-14900HX, GeForce RTX 4090 Laptop GPU, 99.9 Wh | Asus ROG Strix Scar 18 2023 G834JY-N6005W i9-13980HX, GeForce RTX 4090 Laptop GPU, 90 Wh | Media de la clase Gaming | |
|---|---|---|---|---|---|---|---|---|
| Duración de Batería | -61% | -45% | -16% | -26% | -32% | -15% | 2% | |
| Reader / Idle (h) | 10.2 | 4.5 -56% | 5.6 -45% | 7 -31% | 5.9 -42% | 8.71 ? -15% | ||
| H.264 (h) | 7.5 | 4.8 -36% | 7 -7% | 8.64 ? 15% | ||||
| WiFi v1.3 (h) | 7.7 | 1.4 -82% | 4.3 -44% | 4.4 -43% | 4 -48% | 4.2 -45% | 7.1 -8% | 7.11 ? -8% |
| Load (h) | 1.3 | 0.7 -46% | 0.7 -46% | 1.7 31% | 1.3 0% | 1.2 -8% | 0.9 -31% | 1.502 ? 16% |
| Witcher 3 ultra (h) | 0.9 |
Pro
Contra
Veredicto - Espacio para la mejora
El procesamiento de vídeo e imágenes, el streaming, el renderizado y los juegos se incluyen entre los principales escenarios de uso del portátil. Mientras que la GeForce RTX 4090 y Core i9-14900HX ofrecen el rendimiento necesario, no alcanzan nuevos récords. Las emisiones se sitúan en los altos niveles habituales para esta clase de dispositivos.
Con el ROG Strix Scar 18 (2024), Asus ofrece un potente portátil de gama alta a un precio elevado.
Lo más destacado del portátil es su pantalla mini-LED (2560x1600 píxeles, DCI-P3, Dolby Vision, 240 Hz) con una diagonal de 18 pulgadas en formato 16:10. Sus aspectos positivos incluyen un brillo máximo de casi 1.000 cd/m², un valor de negro muy bueno y una gran precisión del color.
Los puertos USB-C (1x USB 3.2 Gen 2, 1x Thunderbolt 4) facilitan su integración en las configuraciones existentes en el lugar de trabajo y abren algunas opciones de expansión, como una GPU externa o una estación de acoplamiento. Ambos puertos USB-C pueden utilizarse para la salida de señal DisplayPort, y el puerto USB 3.2 Gen 2 también es compatible con Power Delivery. Todo ello acompañado de una muy buena duración de la batería.
Una alternativa podría ser el MSI Titan 18 HX A14VIGque es capaz de obtener un rendimiento ligeramente superior de la misma combinación CPU/GPU, ofrece una pantalla 4k mini-LED y cuenta con dos puertos TB4. Sin embargo, el portátil de MSI no se acerca a la duración de la batería del Strix.
Precio y disponibilidad
El Asus ROG Strix Scar 18 (2024) está disponible por unos 3.000 dólares en la tienda de Asus y por el mismo precio también desde Amazon, por ejemplo. Una configuración similar a nuestra unidad de prueba está disponible por ~3.900 dólares en Amazon.
Asus ROG Strix Scar 18 G834JYR (2024)
- 02/07/2024 v7 (old)
Sascha Mölck
Transparencia
La selección de los dispositivos que se van a reseñar corre a cargo de nuestro equipo editorial. La muestra de prueba fue proporcionada al autor en calidad de préstamo por el fabricante o el minorista a los efectos de esta reseña. El prestamista no tuvo ninguna influencia en esta reseña, ni el fabricante recibió una copia de la misma antes de su publicación. No había ninguna obligación de publicar esta reseña. Como empresa de medios independiente, Notebookcheck no está sujeta a la autoridad de fabricantes, minoristas o editores.
Así es como prueba Notebookcheck
Cada año, Notebookcheck revisa de forma independiente cientos de portátiles y smartphones utilizando procedimientos estandarizados para asegurar que todos los resultados son comparables. Hemos desarrollado continuamente nuestros métodos de prueba durante unos 20 años y hemos establecido los estándares de la industria en el proceso. En nuestros laboratorios de pruebas, técnicos y editores experimentados utilizan equipos de medición de alta calidad. Estas pruebas implican un proceso de validación en varias fases. Nuestro complejo sistema de clasificación se basa en cientos de mediciones y puntos de referencia bien fundamentados, lo que mantiene la objetividad.Price comparison

