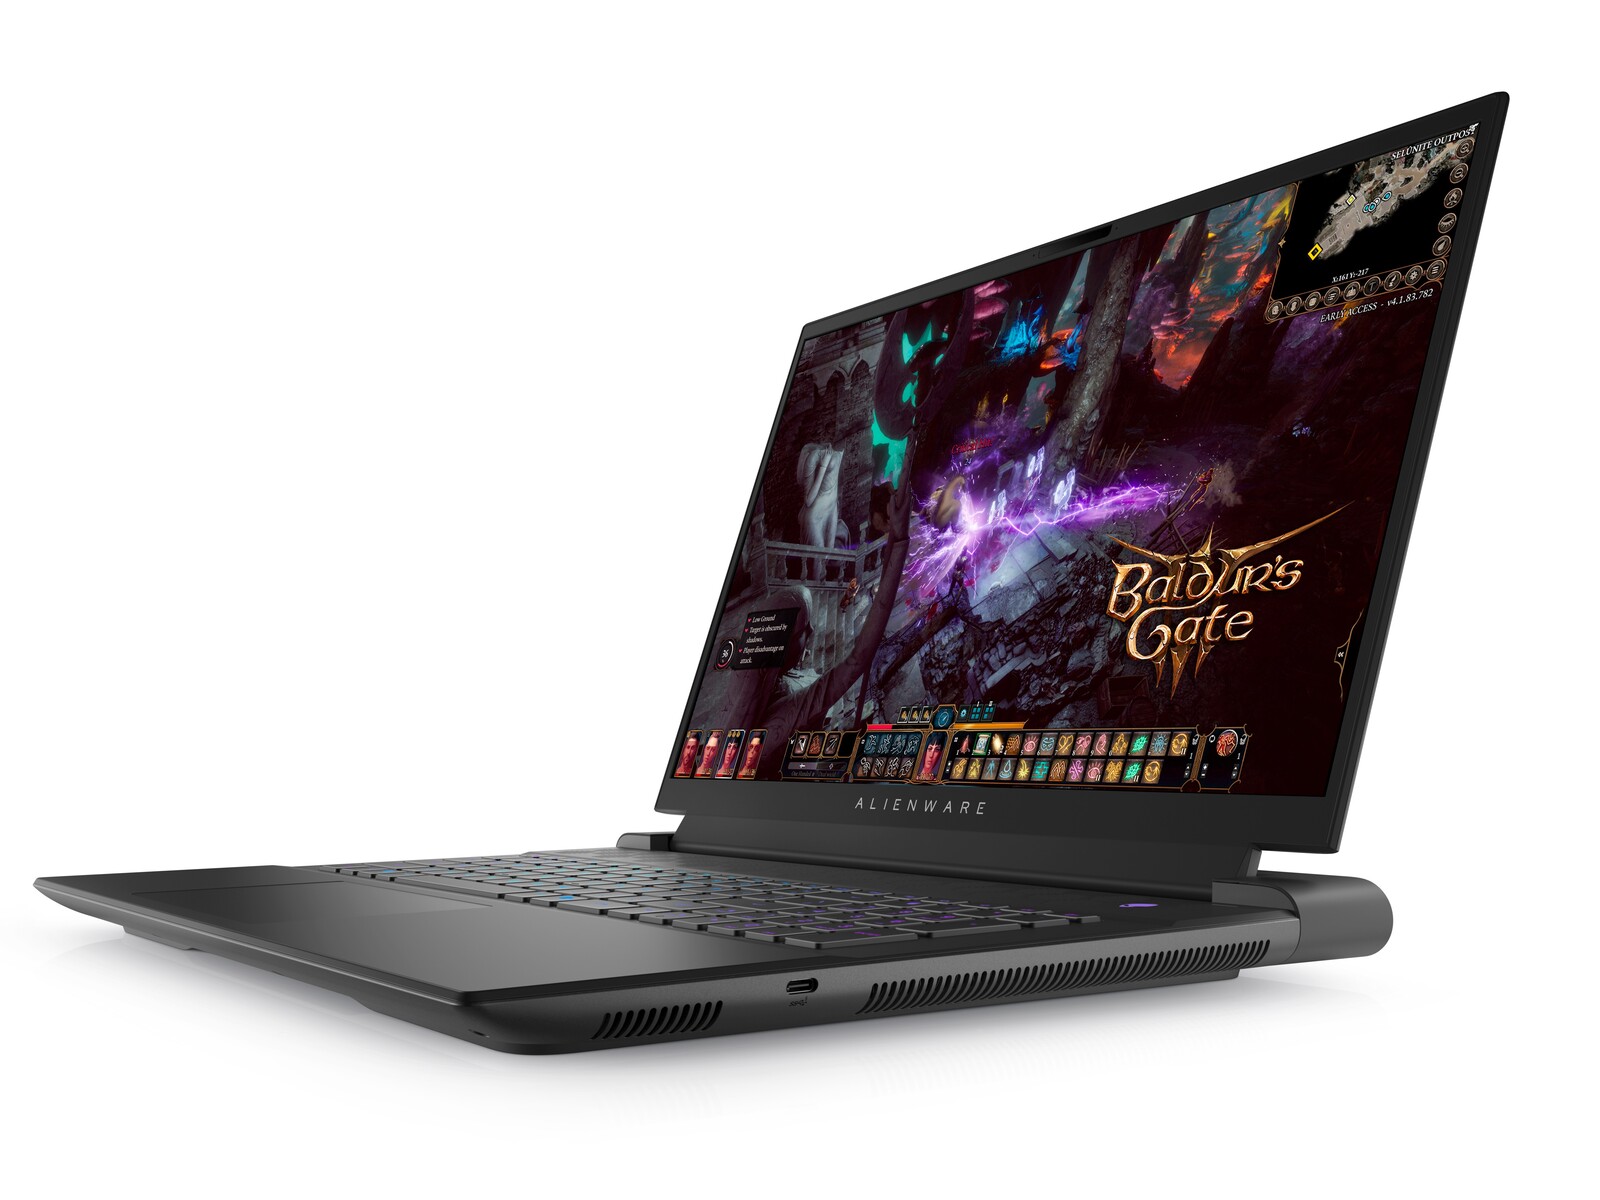
Análisis del portátil Alienware m18 R1: Más grande y pesado que el MSI Titan GT77
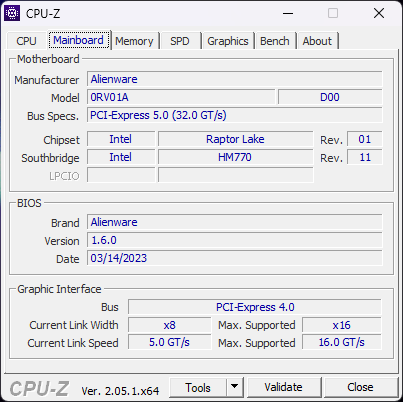
Presentado a principios de este año junto con la serie móvil Intel Raptor Lake-H y la serie móvil Ada Lovelace GeForce RTX 40, el buque insignia Alienware m18 R1 es el primer modelo de 18 pulgadas de su familia desde 2013. Mucho ha cambiado desde entonces, por supuesto, pero los cazadores de rendimiento que quieran algo más grande que la solución habitual de 17 pulgadas pueden encontrar mucho que gustar de un factor de forma de 18 pulgadas donde se pueden maximizar las características y las térmicas.
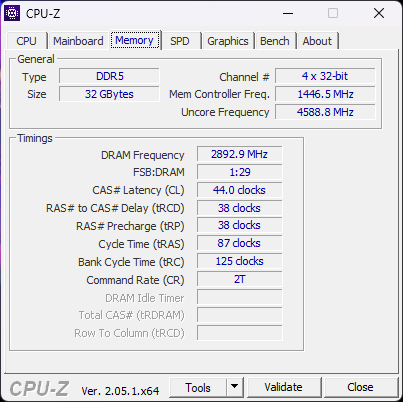
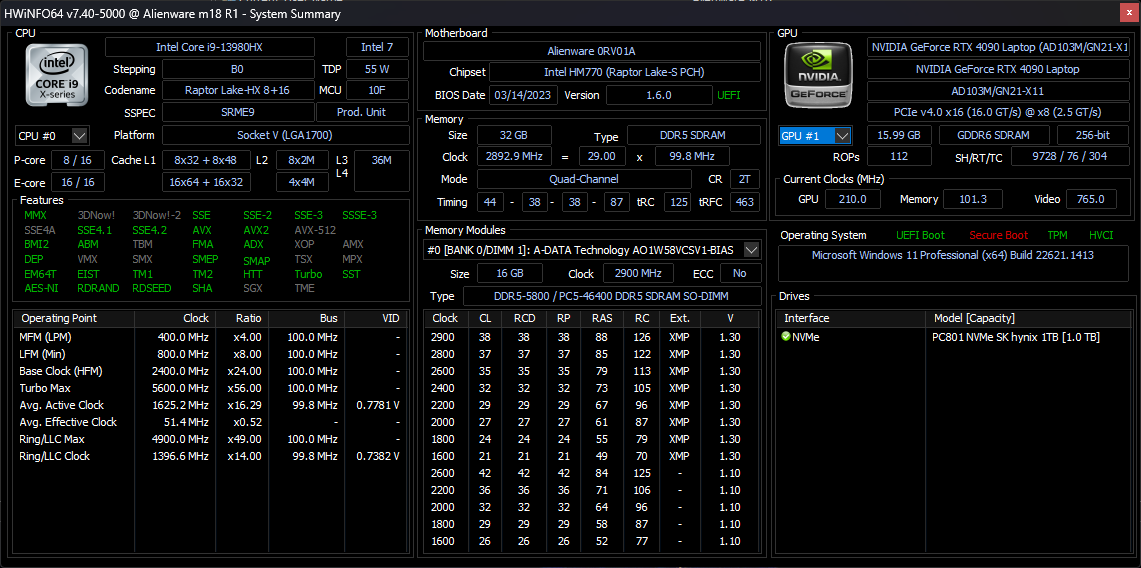
Nuestra configuración de prueba es una especificación de gama alta con la CPU Core i9-13980HX de 13ª generación, GeForce RTX 4090 de 175 W, teclado RGB de membrana y pantalla IPS 1200p 480 Hz por unos 2900 dólares. Otras SKU disponibles son RTX 4060, Core i7-13700HX y pantalla 1600p 165 Hz con teclado mecánico CherryMX de perfil ultrabajo. Por lo demás, todas las configuraciones admiten G-Sync y colores DCI-P3 completos.
Entre los competidores directos se incluyen otros portátiles para juegos de 18 pulgadas como el Razer Blade 18 oAsus ROG Strix Scar 18. MSI aún no ha anunciado un nuevo modelo de 18 pulgadas en el momento de redactar este artículo.
Más análisis de Dell:
Posibles contendientes en la comparación
Valoración | Fecha | Modelo | Peso | Altura | Tamaño | Resolución | Precio |
|---|---|---|---|---|---|---|---|
| 90.7 % v7 (old) | 04/2023 | Alienware m18 R1 i9-13980HX, GeForce RTX 4090 Laptop GPU | 3.9 kg | 26.7 mm | 18.00" | 1920x1200 | |
| 91.4 % v7 (old) | 02/2023 | Razer Blade 18 RTX 4070 i9-13950HX, GeForce RTX 4070 Laptop GPU | 3 kg | 21.9 mm | 18.00" | 2560x1600 | |
| 86.6 % v7 (old) | 02/2023 | Asus ROG Strix Scar 18 2023 G834JY-N6005W i9-13980HX, GeForce RTX 4090 Laptop GPU | 3.1 kg | 30.8 mm | 18.00" | 2560x1600 | |
| 88.3 % v7 (old) | 03/2023 | MSI GE78HX 13VH-070US i9-13950HX, GeForce RTX 4080 Laptop GPU | 3 kg | 23 mm | 17.00" | 2560x1600 | |
| 89.9 % v7 (old) | 03/2023 | Eluktronics Mech-17 GP2 i9-13900HX, GeForce RTX 4090 Laptop GPU | 2.9 kg | 27 mm | 17.00" | 2560x1600 | |
| 89 % v7 (old) | 02/2023 | MSI Titan GT77 HX 13VI i9-13950HX, GeForce RTX 4090 Laptop GPU | 3.5 kg | 23 mm | 17.30" | 3840x2160 |
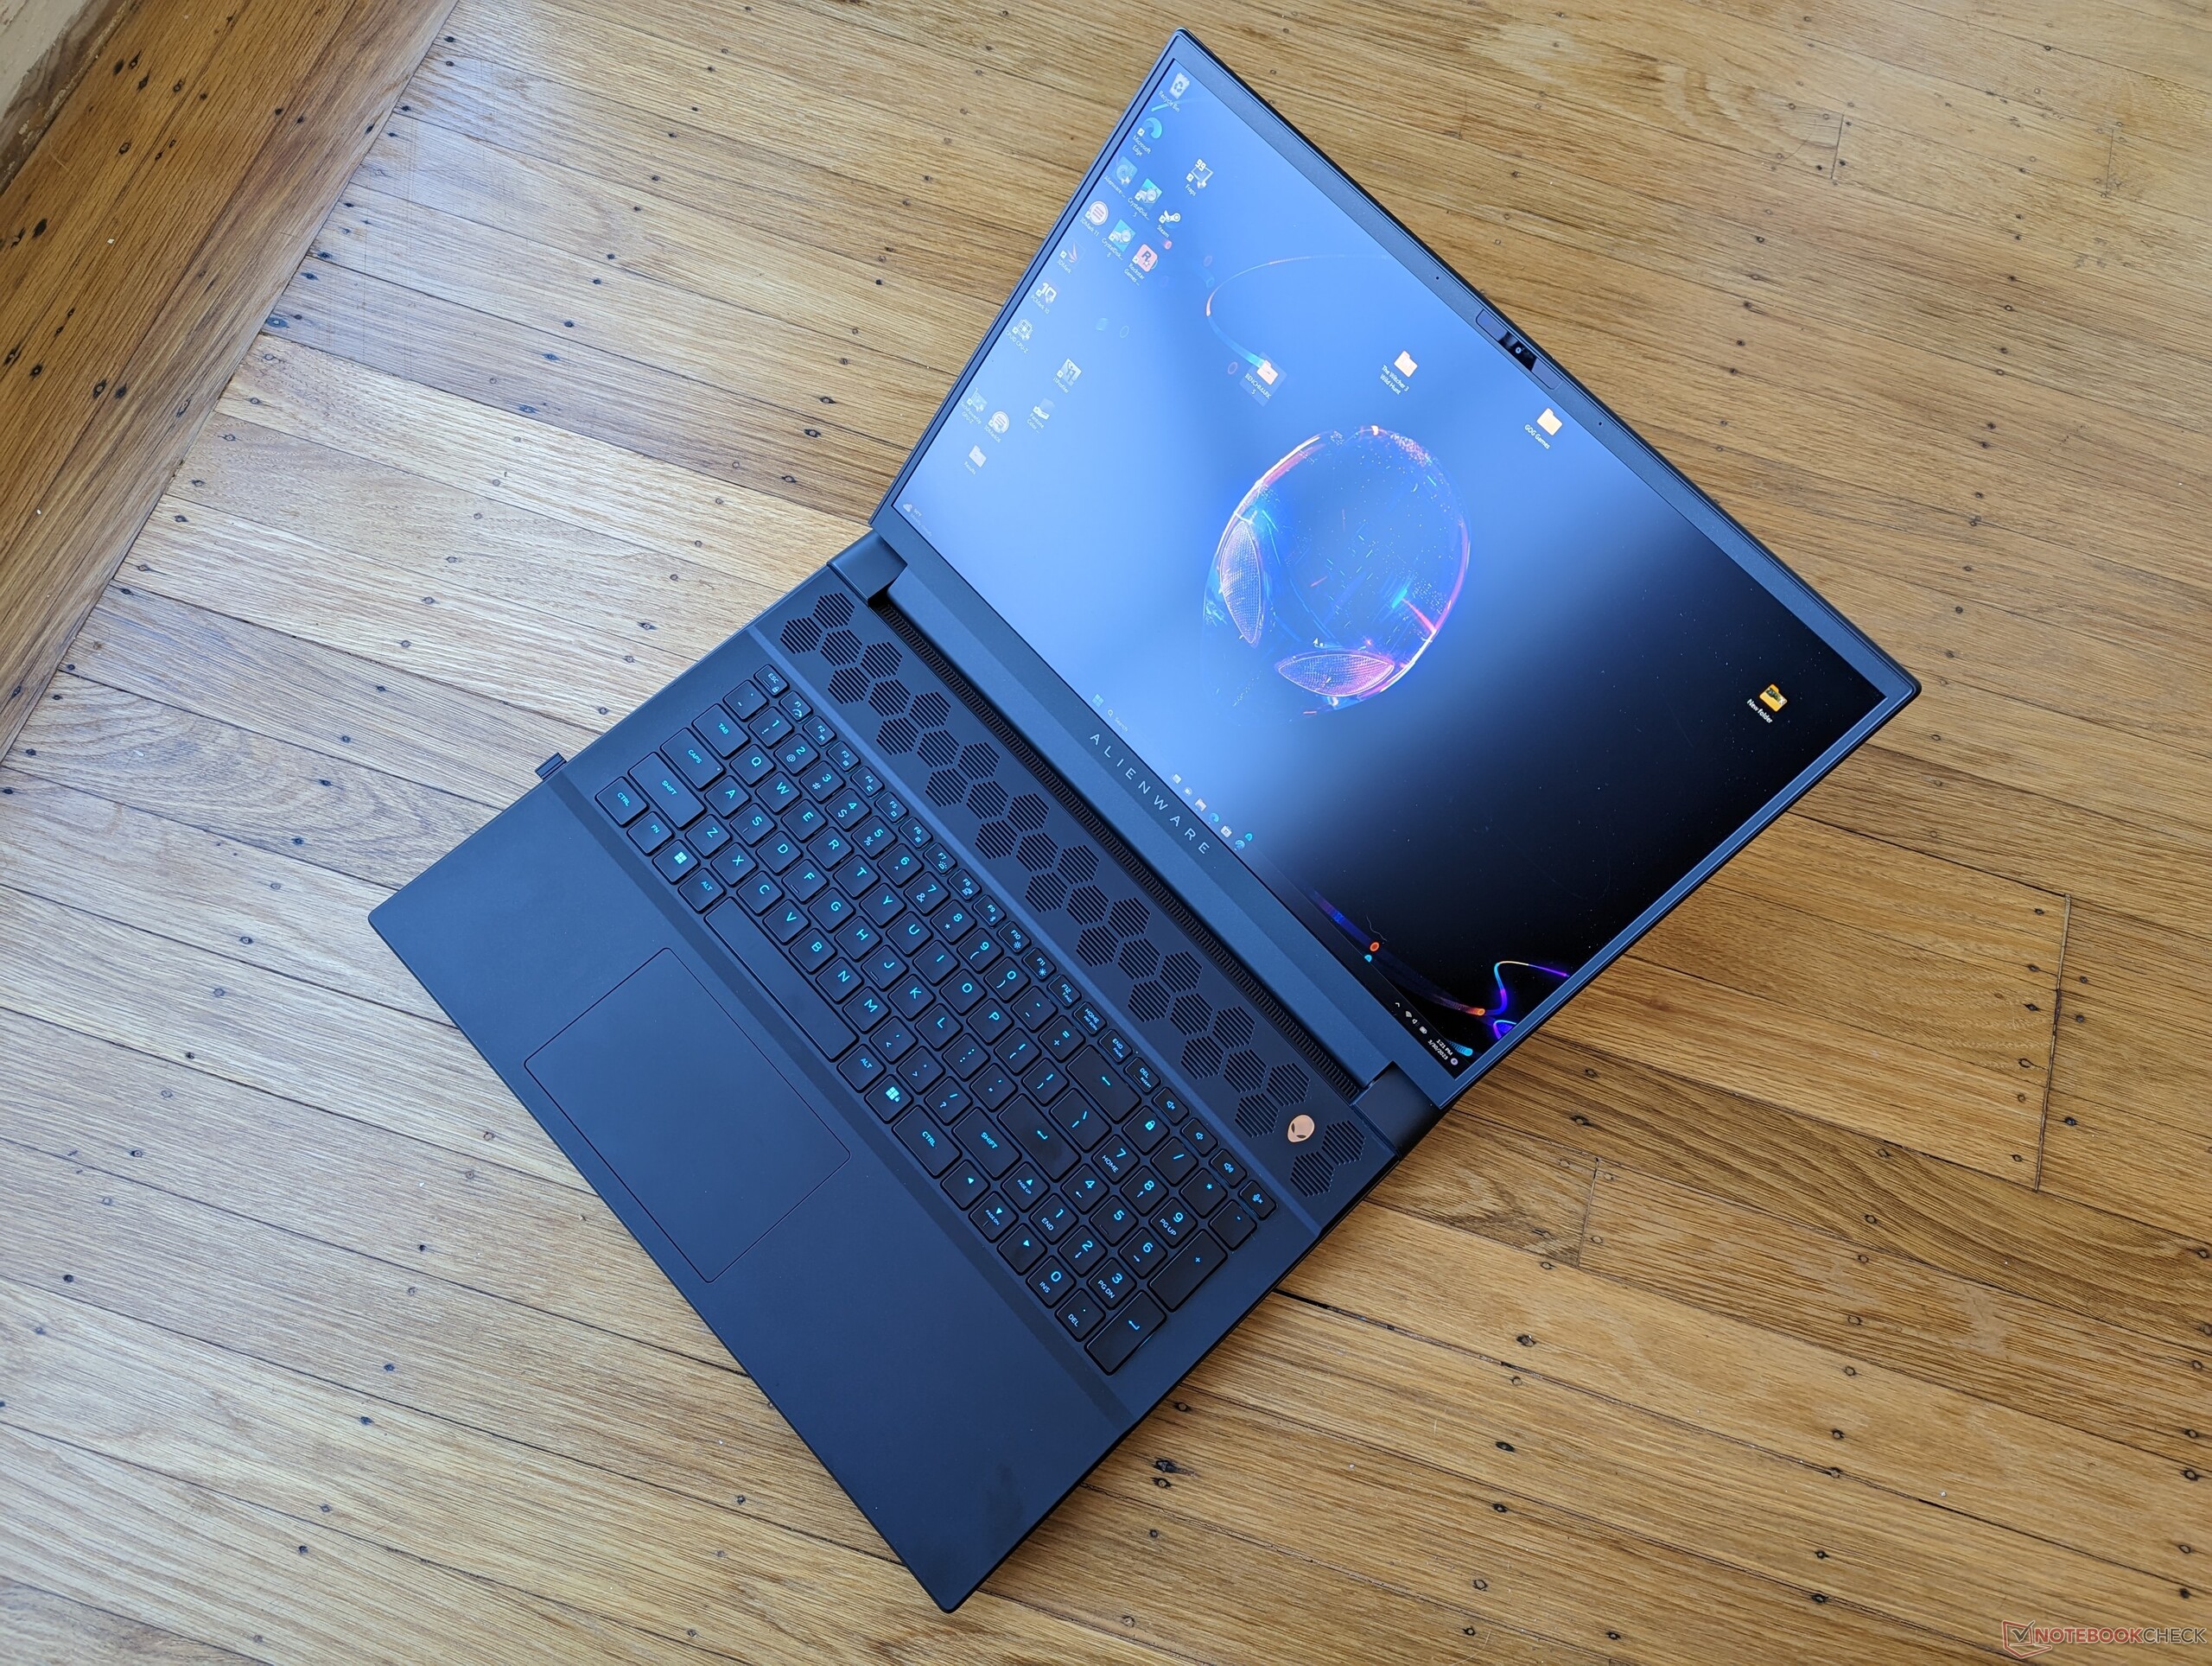
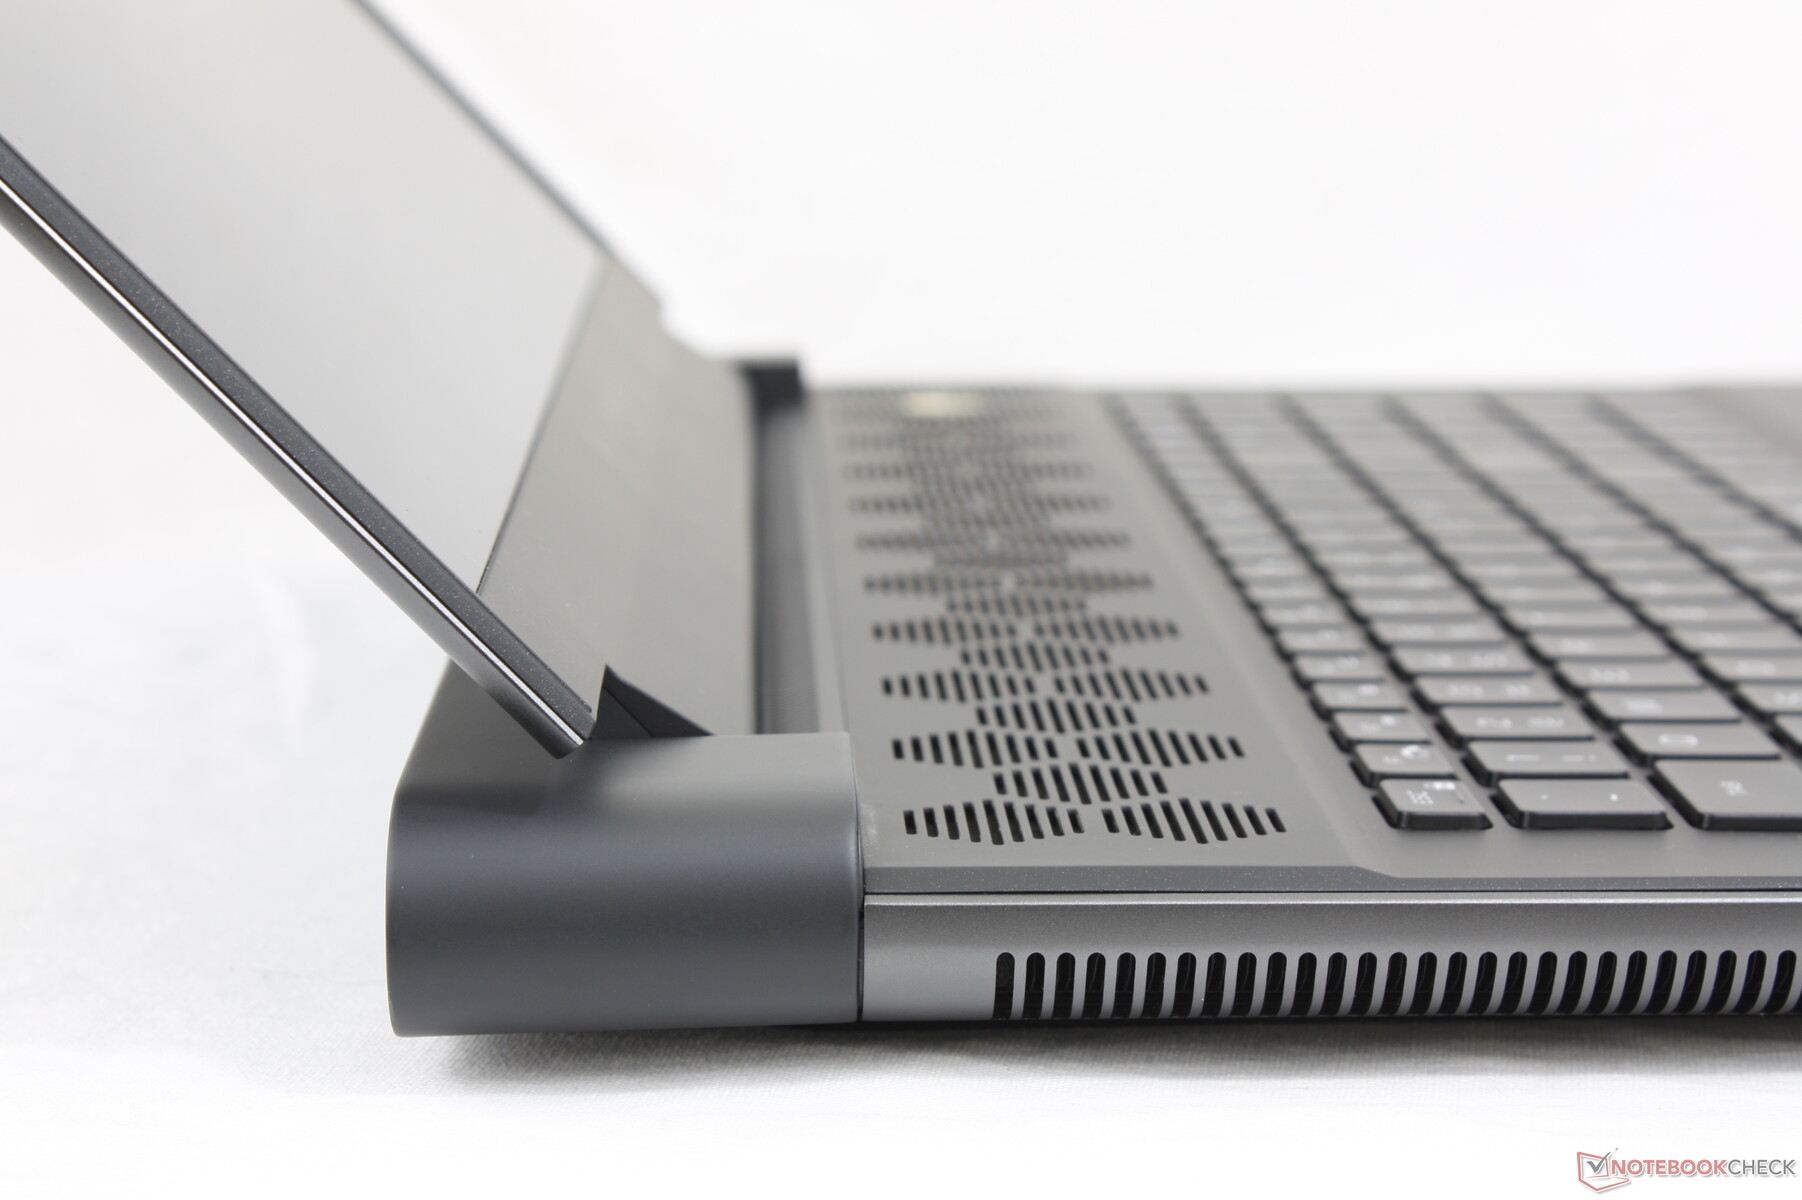
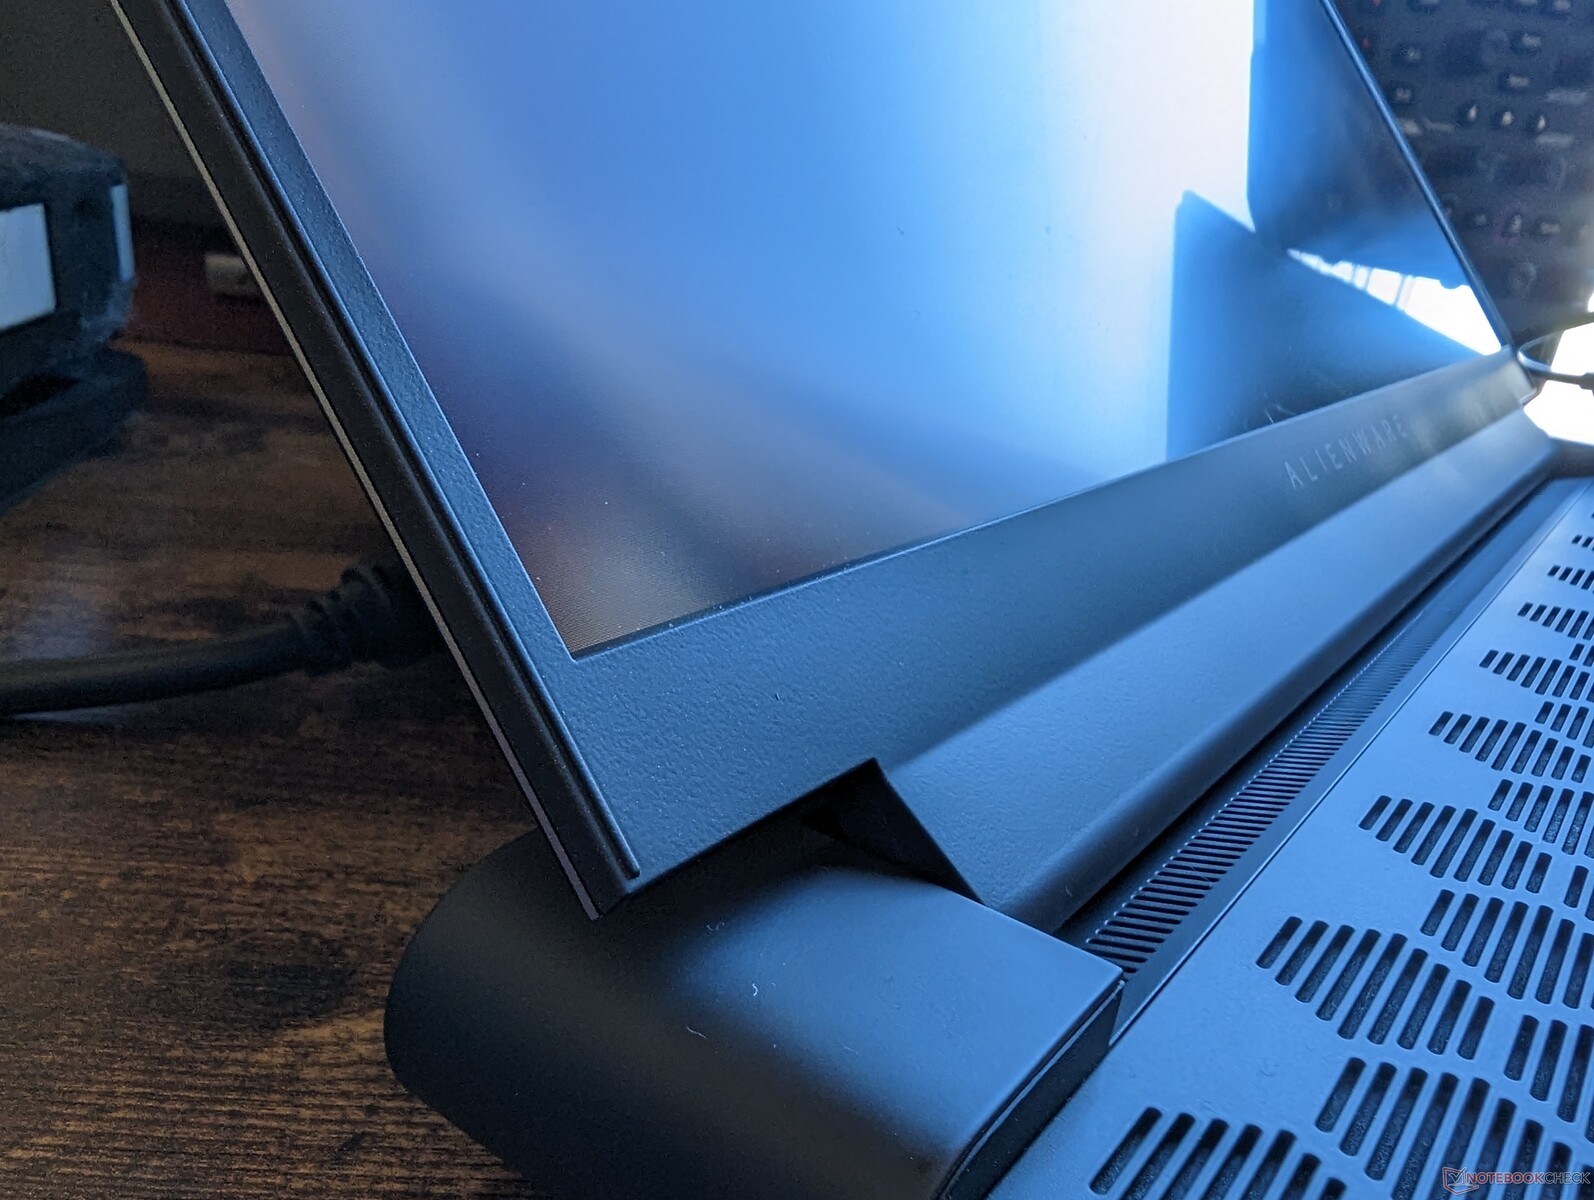
Maletín - Diseño Legend 3
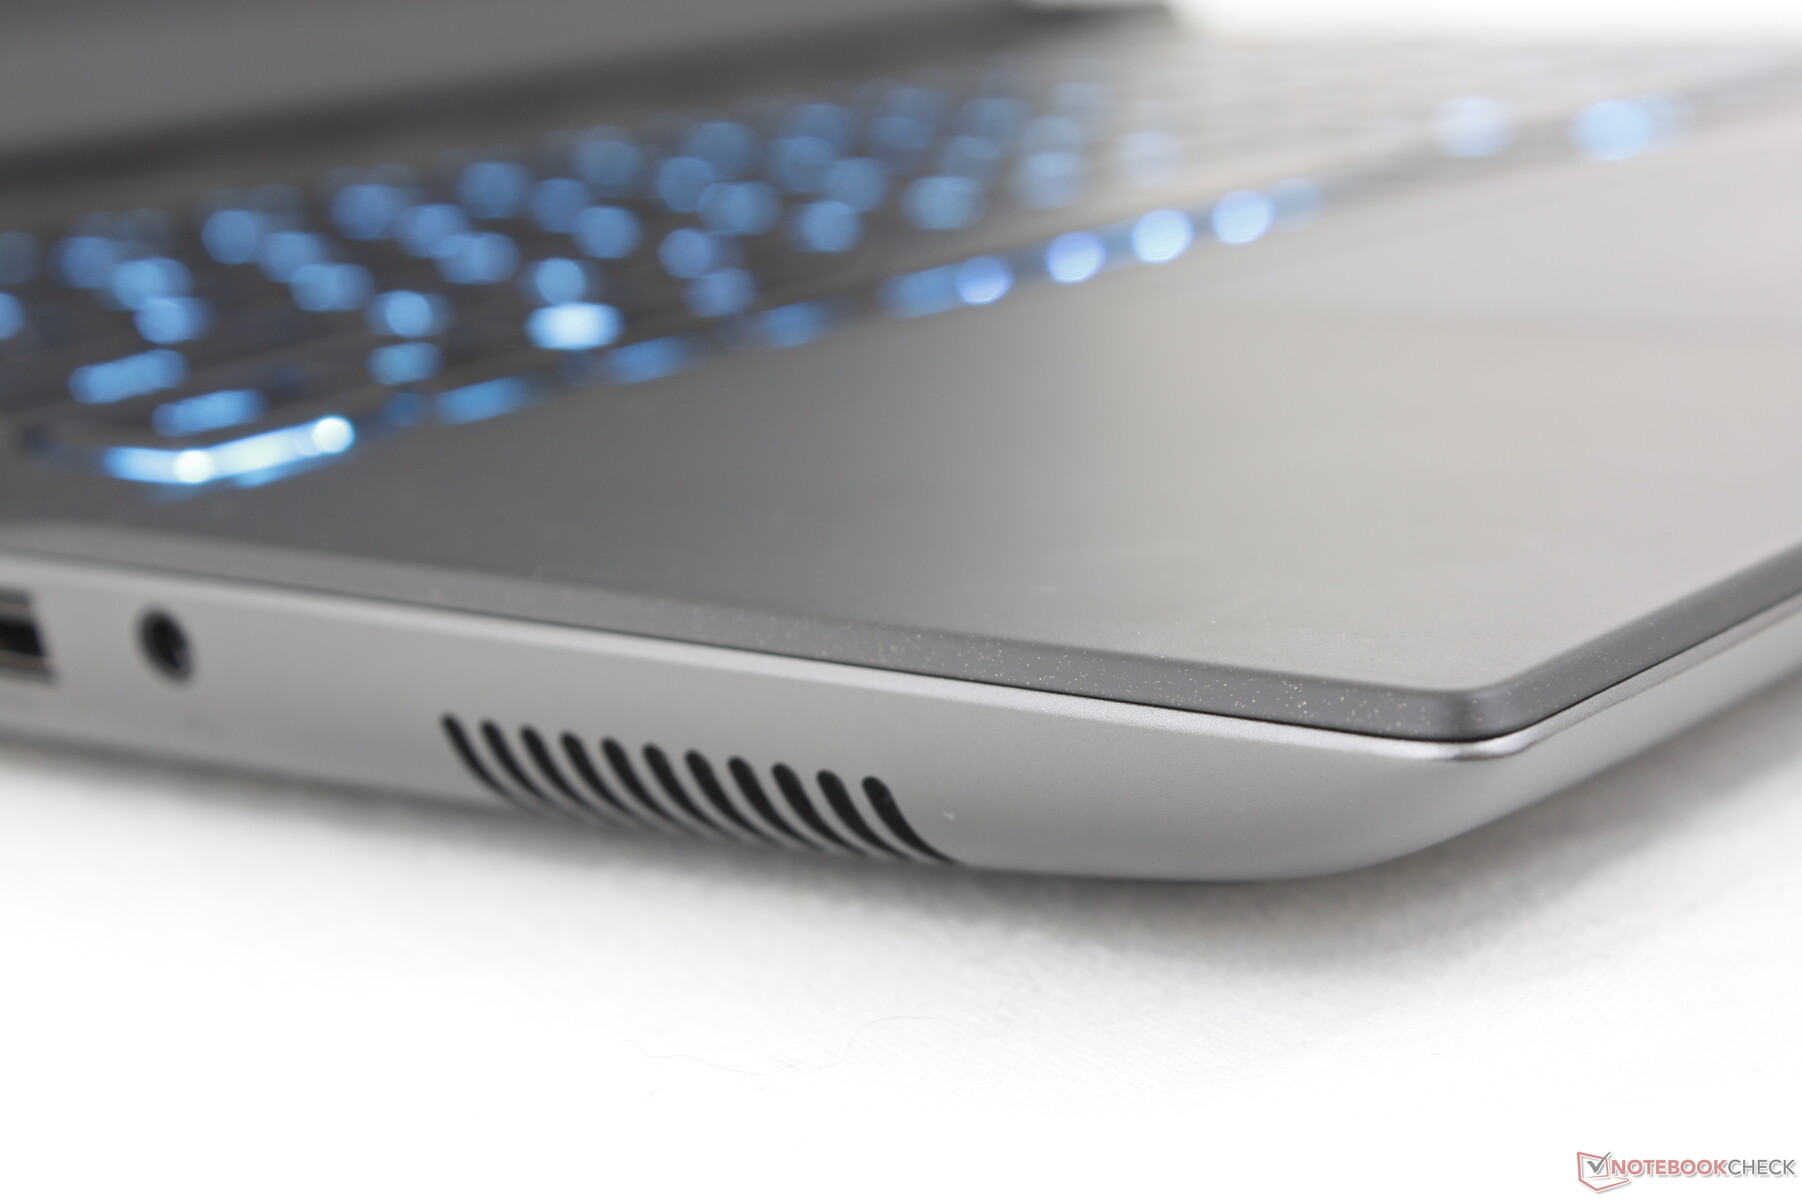
Las impresiones del chasis son similares a las del reciente Alienware x17 R2 ya que el Alienware m18 R1 utiliza materiales similares. Su construcción densa y la estrecha alineación entre materiales demuestran que no hace falta un diseño unibody como el Razer Blade 18 para una sensación de alta calidad. Todo, desde el centro del teclado hasta la tapa exterior, es más firme y resistente a cualquier torsión o depresión que en muchos otros portátiles para juegos, incluido el MSI GE78.
La cubierta de goma mate del teclado puede ser una bolsa de mezcla, ya que recoge fácilmente la grasa antiestética y las huellas dactilares con el tiempo.
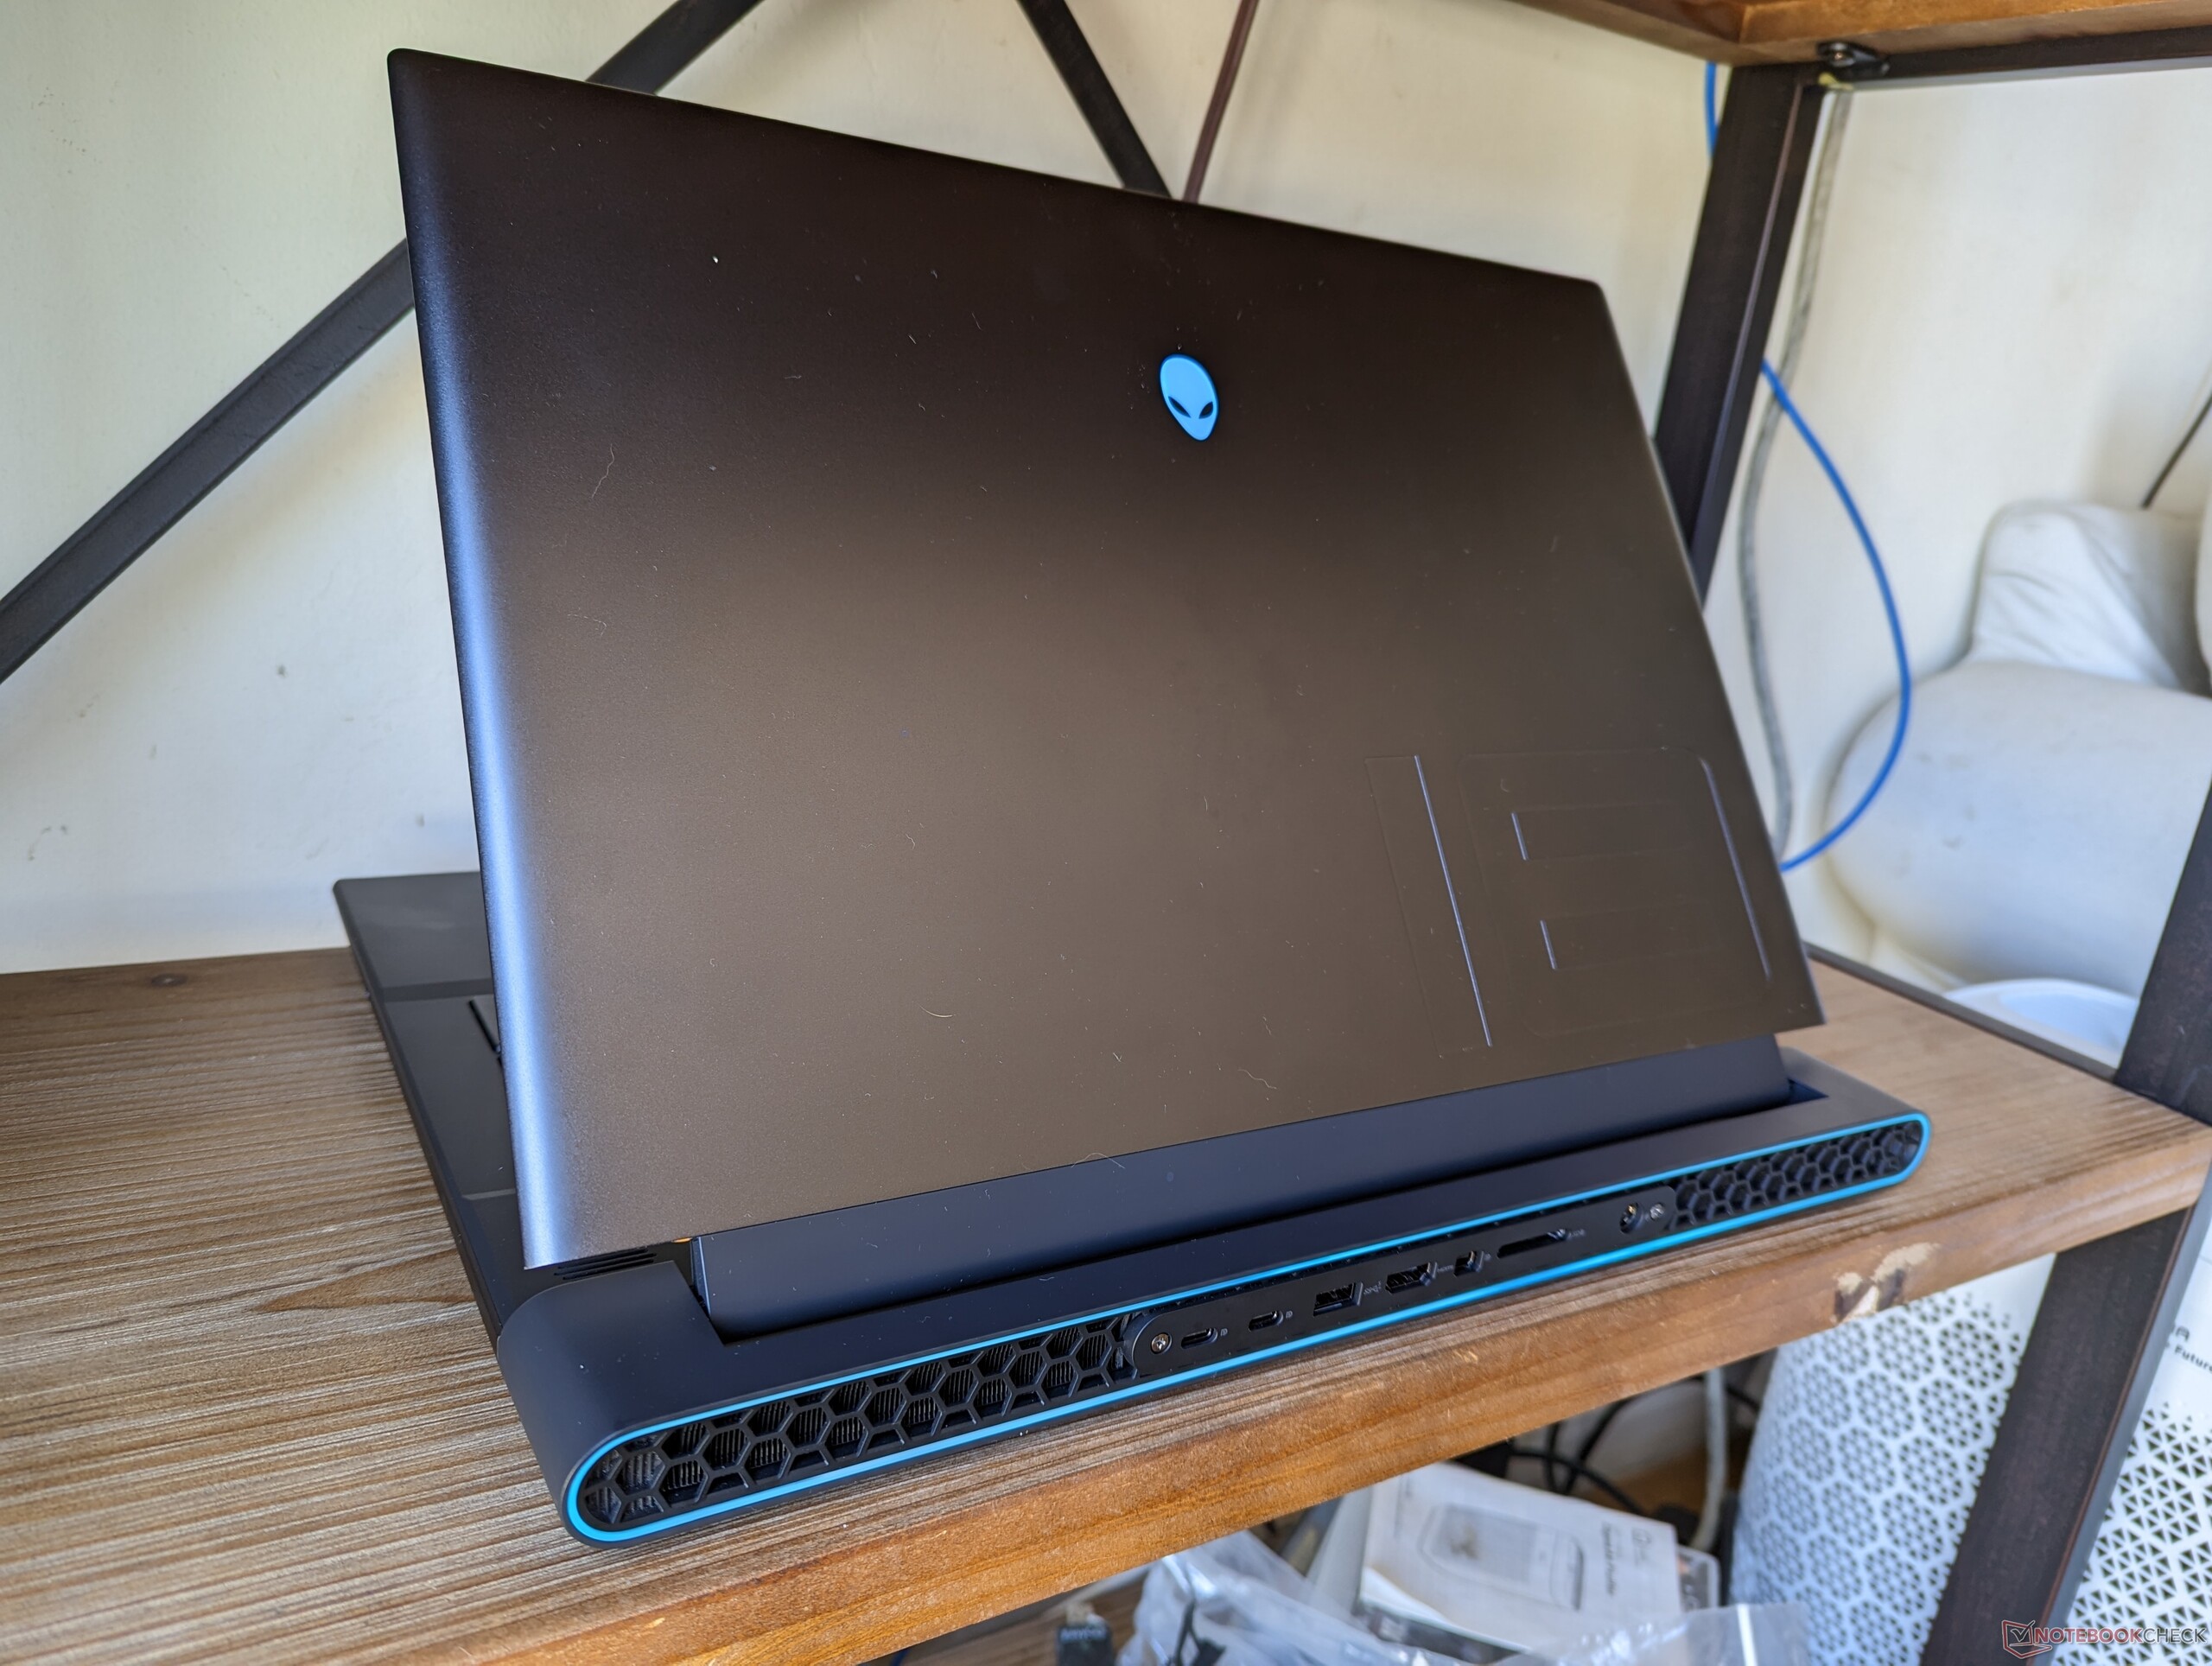
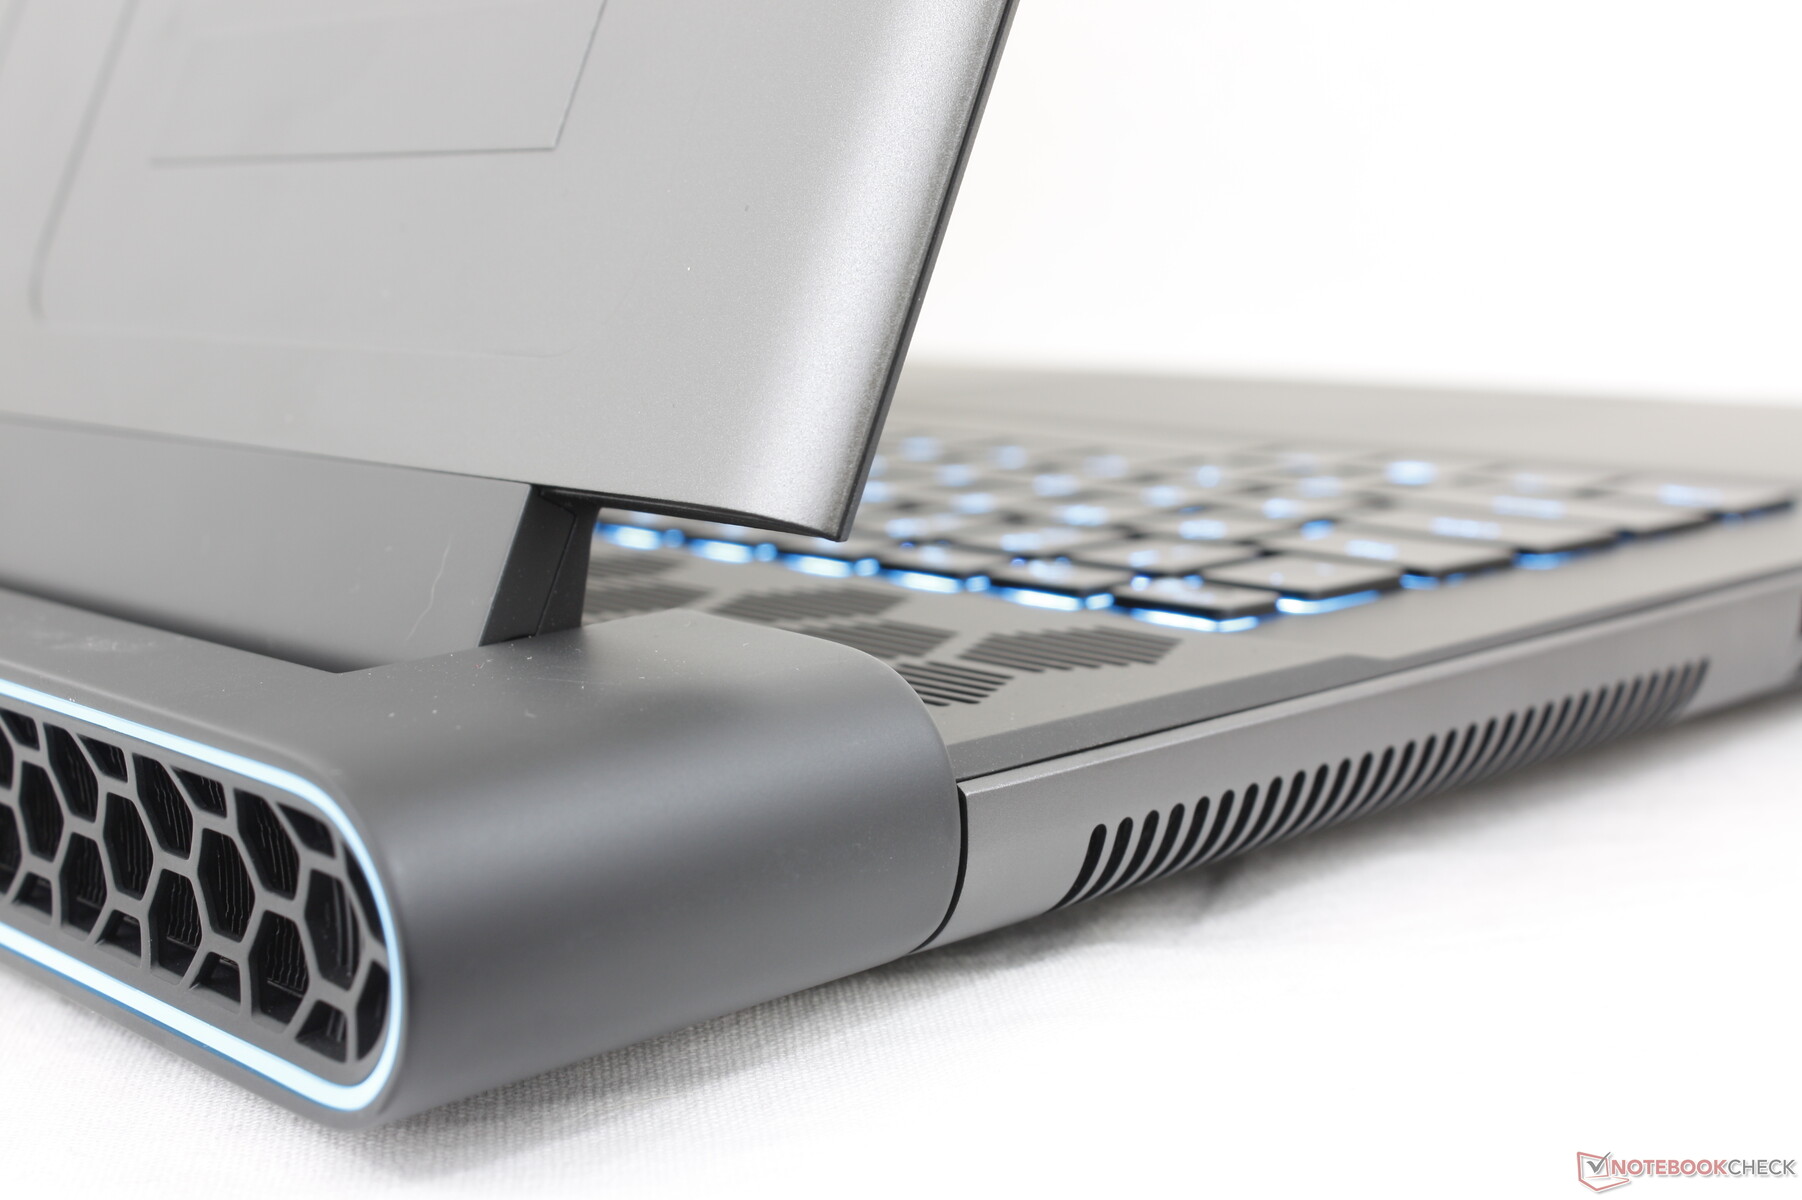
El modelo de Alienware es significativamente más pesado que el Blade 18 de 18 pulgadas o elROG Strix Scar 18 con casi un kilo de peso cada uno para ser uno de los portátiles más pesados del año. De hecho, nuestro mensajero incluso comentó lo pesada que era la caja de envío en relación con su pequeño tamaño. Gran parte del peso puede atribuirse a la parte trasera alargada, el perfil más grueso y el refrigerador con cámara de vapor, todo ello destinado a mejorar la refrigeración. Si te preocupa el peso en los viajes, quizá quieras considerar el MSI Titan GT77 que es más ligero y delgado que nuestro Alienware.
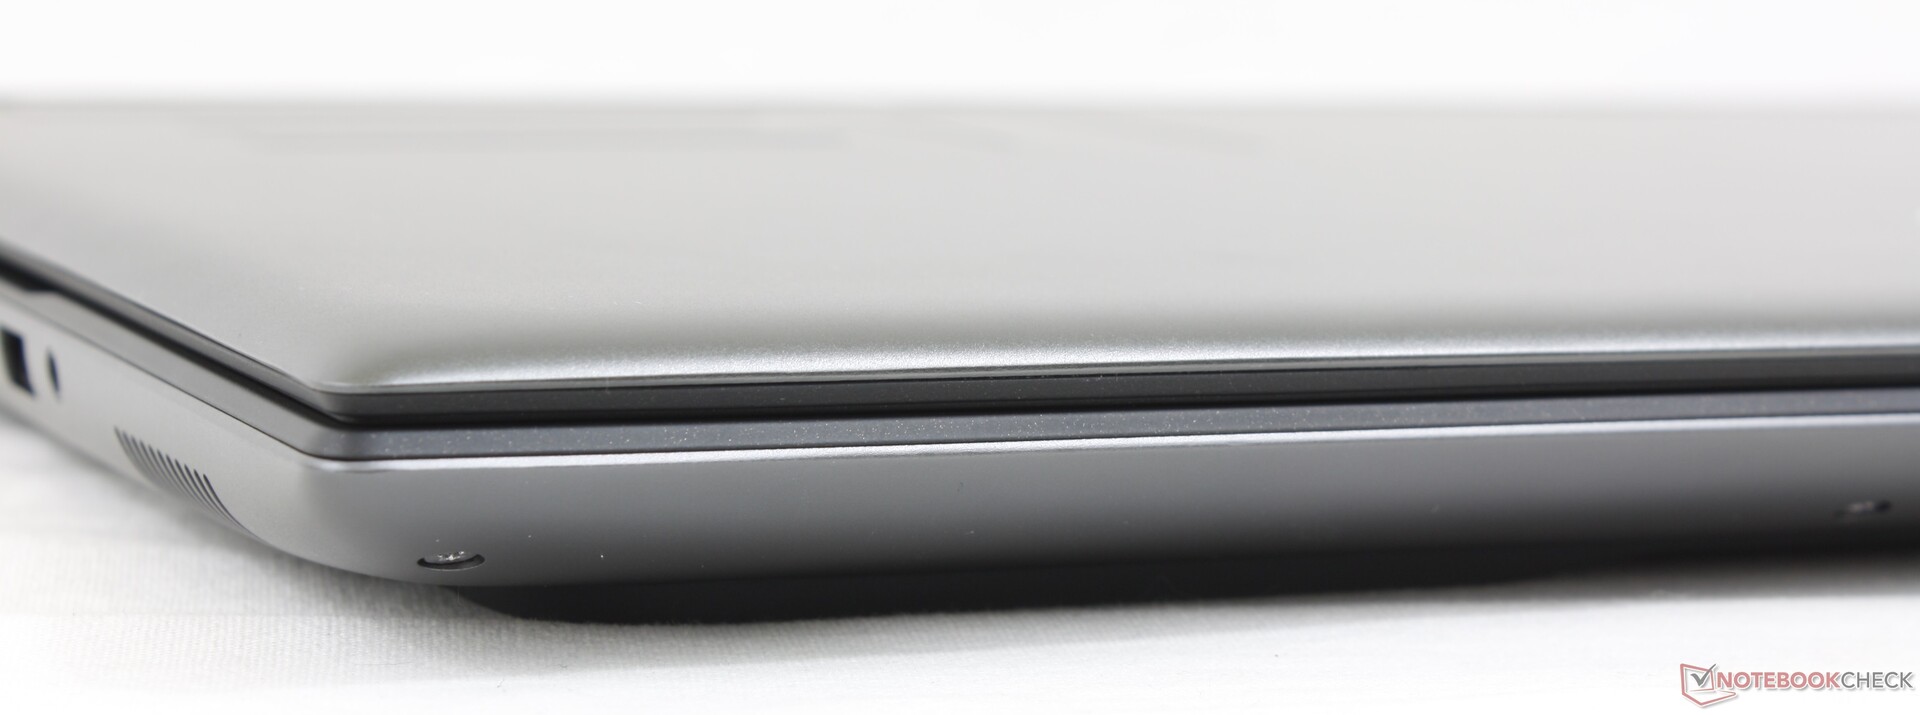
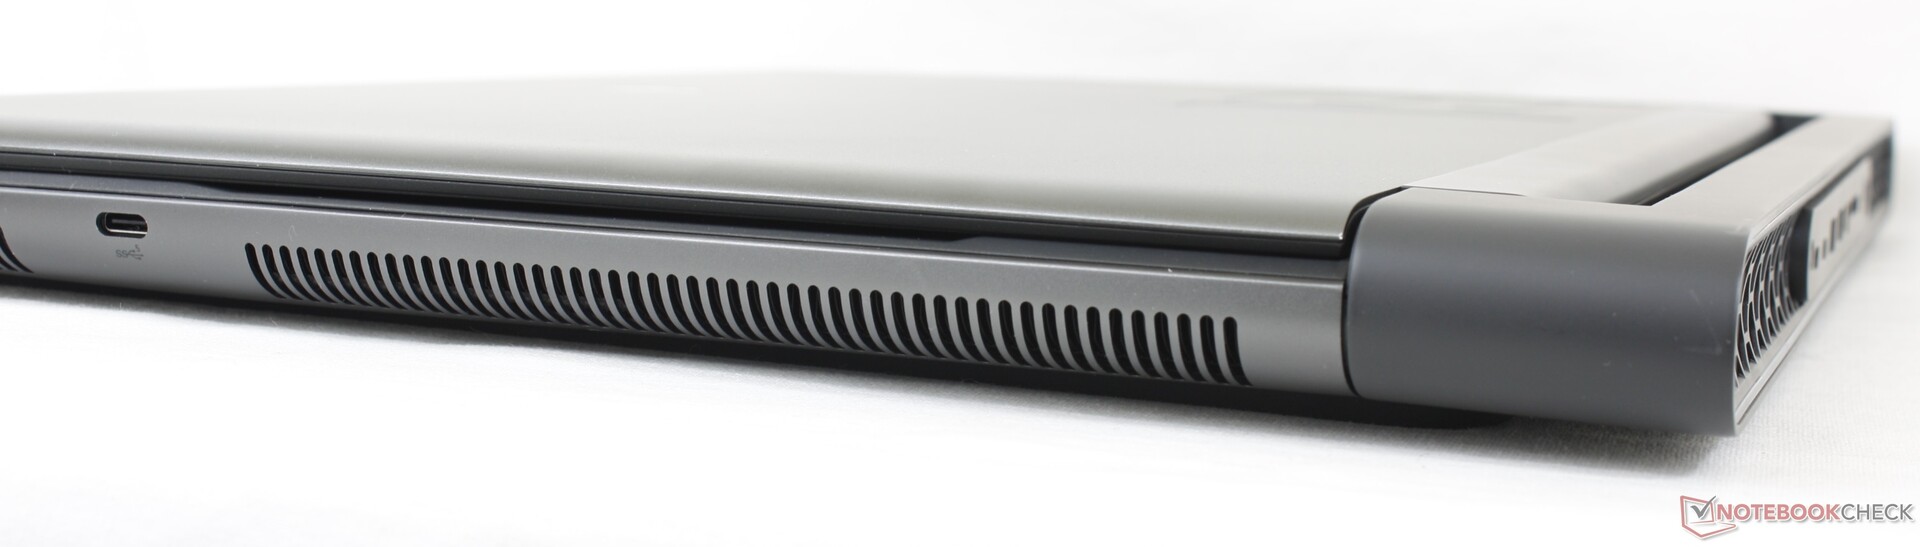
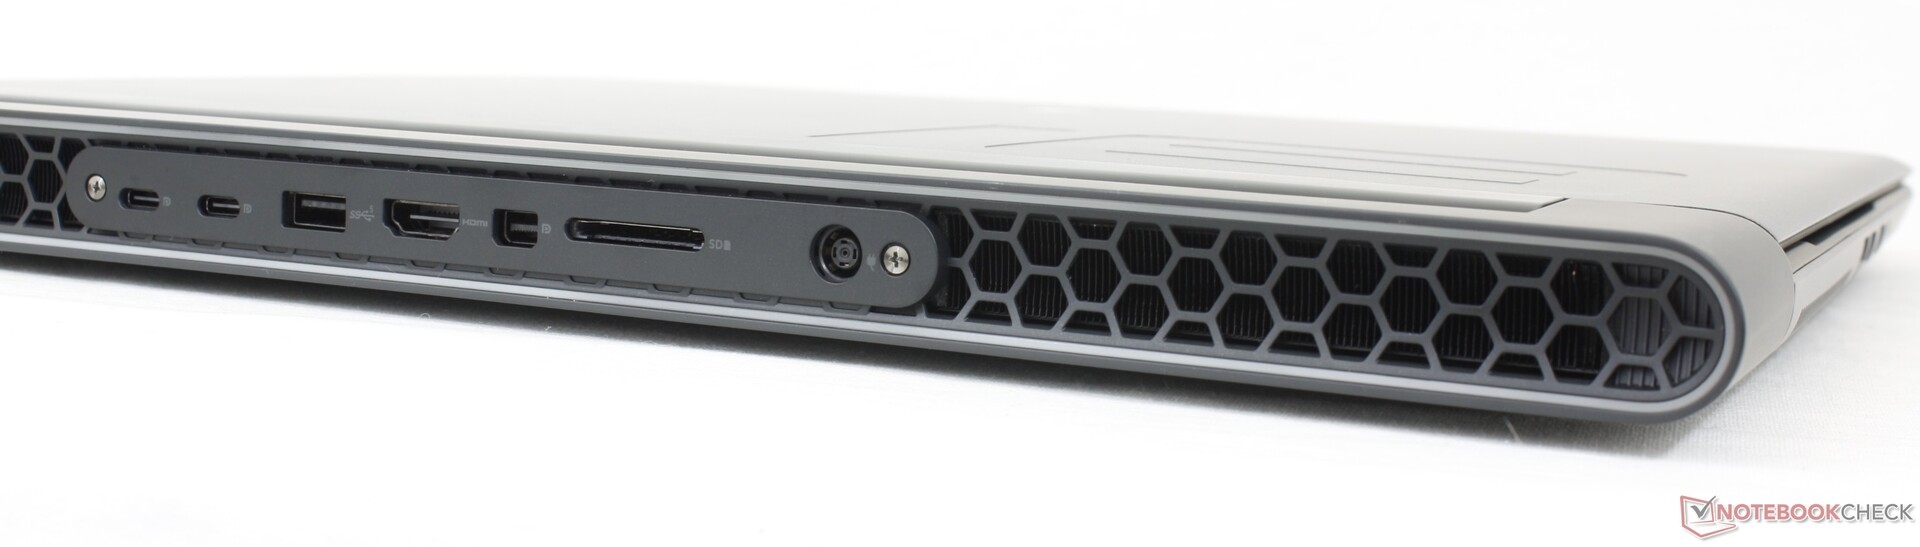
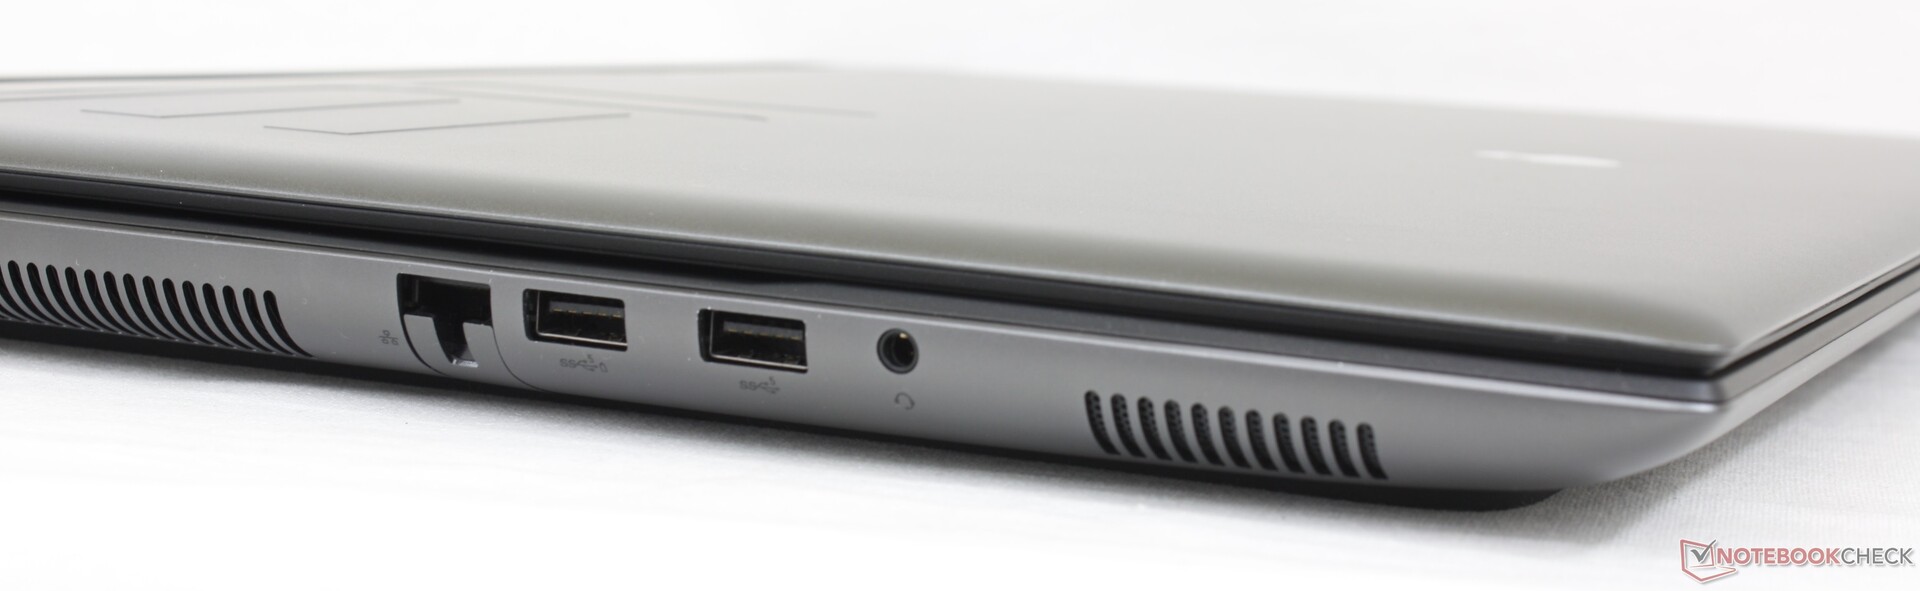
Conectividad - Más de lo habitual
Hay más puertos integrados en el Alienware que en el Razer Blade 18 o el Asus ROG Strix Scar 18 de la competencia. La pega, sin embargo, es que la mayoría de los puertos están apretados en el borde trasero, lo que dificulta un poco el acceso.
Los monitores USB-C sólo son compatibles con los dos puertos USB-C traseros, ya que el tercer puerto USB-C del borde derecho no admite salida de vídeo.
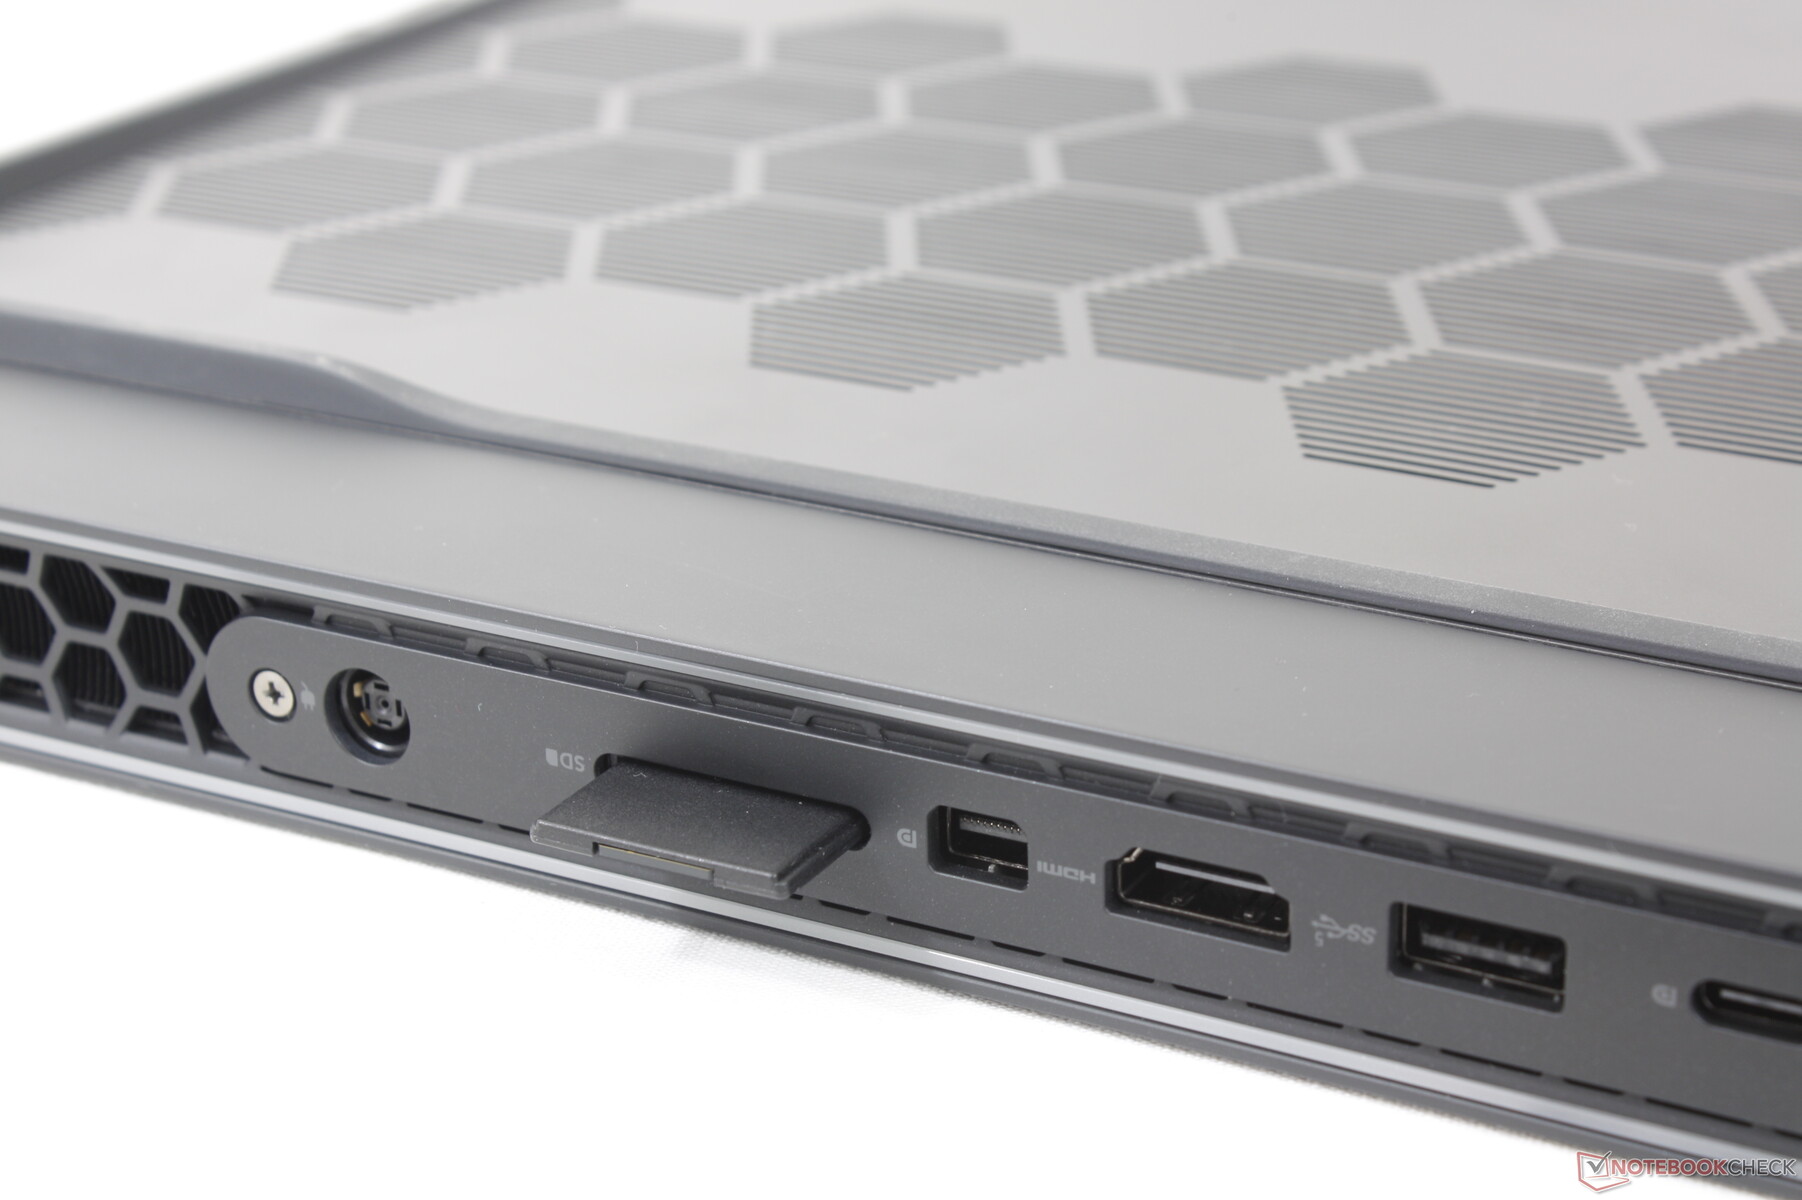
Lector de tarjetas SD
El lector de tarjetas SD integrado se encuentra en la parte trasera de la unidad, a diferencia de lo que ocurre en la mayoría de portátiles. No obstante, las velocidades de transferencia son muy rápidas, más del doble que en el MSI Titan GT77.
| SD Card Reader | |
| average JPG Copy Test (av. of 3 runs) | |
| Razer Blade 18 RTX 4070 (Angelibird AV Pro V60) | |
| Alienware m18 R1 (Angelibird AV Pro V60) | |
| Alienware x17 R2 P48E (AV Pro V60) | |
| MSI Titan GT77 HX 13VI (Angelibird AV Pro V60) | |
| Eluktronics Mech-17 GP2 (Angelibird AV Pro V60) | |
| maximum AS SSD Seq Read Test (1GB) | |
| Alienware x17 R2 P48E (AV Pro V60) | |
| Alienware m18 R1 (Angelibird AV Pro V60) | |
| Razer Blade 18 RTX 4070 (Angelibird AV Pro V60) | |
| Eluktronics Mech-17 GP2 (Angelibird AV Pro V60) | |
| MSI Titan GT77 HX 13VI (Angelibird AV Pro V60) | |
Comunicación
El Intel Killer 1675i viene de serie con compatibilidad Wi-Fi 6E y Bluetooth 5.2. Killer es una submarca de Intel optimizada para portátiles de juegos, por lo que el Killer 1675i es básicamente un Intel AX211. El rendimiento es excelente y fiable cuando se combina con nuestro router de pruebas Asus AXE11000.
| Networking | |
| iperf3 transmit AX12 | |
| Alienware x17 R2 P48E | |
| iperf3 receive AX12 | |
| Alienware x17 R2 P48E | |
| iperf3 transmit AXE11000 | |
| MSI Titan GT77 HX 13VI | |
| Asus ROG Strix Scar 18 2023 G834JY-N6005W | |
| Eluktronics Mech-17 GP2 | |
| Alienware m18 R1 | |
| Razer Blade 18 RTX 4070 | |
| iperf3 receive AXE11000 | |
| Asus ROG Strix Scar 18 2023 G834JY-N6005W | |
| MSI Titan GT77 HX 13VI | |
| Razer Blade 18 RTX 4070 | |
| Eluktronics Mech-17 GP2 | |
| Alienware m18 R1 | |
| iperf3 transmit AXE11000 6GHz | |
| Alienware m18 R1 | |
| Razer Blade 18 RTX 4070 | |
| iperf3 receive AXE11000 6GHz | |
| Razer Blade 18 RTX 4070 | |
| Alienware m18 R1 | |
Cámara web
La webcam de 2 MP es típica en la mayoría de portátiles de hoy en día, pero nos decepciona un poco no ver un sensor de 5 MP dado lo grande que es el chasis. Los infrarrojos vienen de serie, mientras que el obturador de la webcam está ausente, a diferencia del Razer Blade 18.


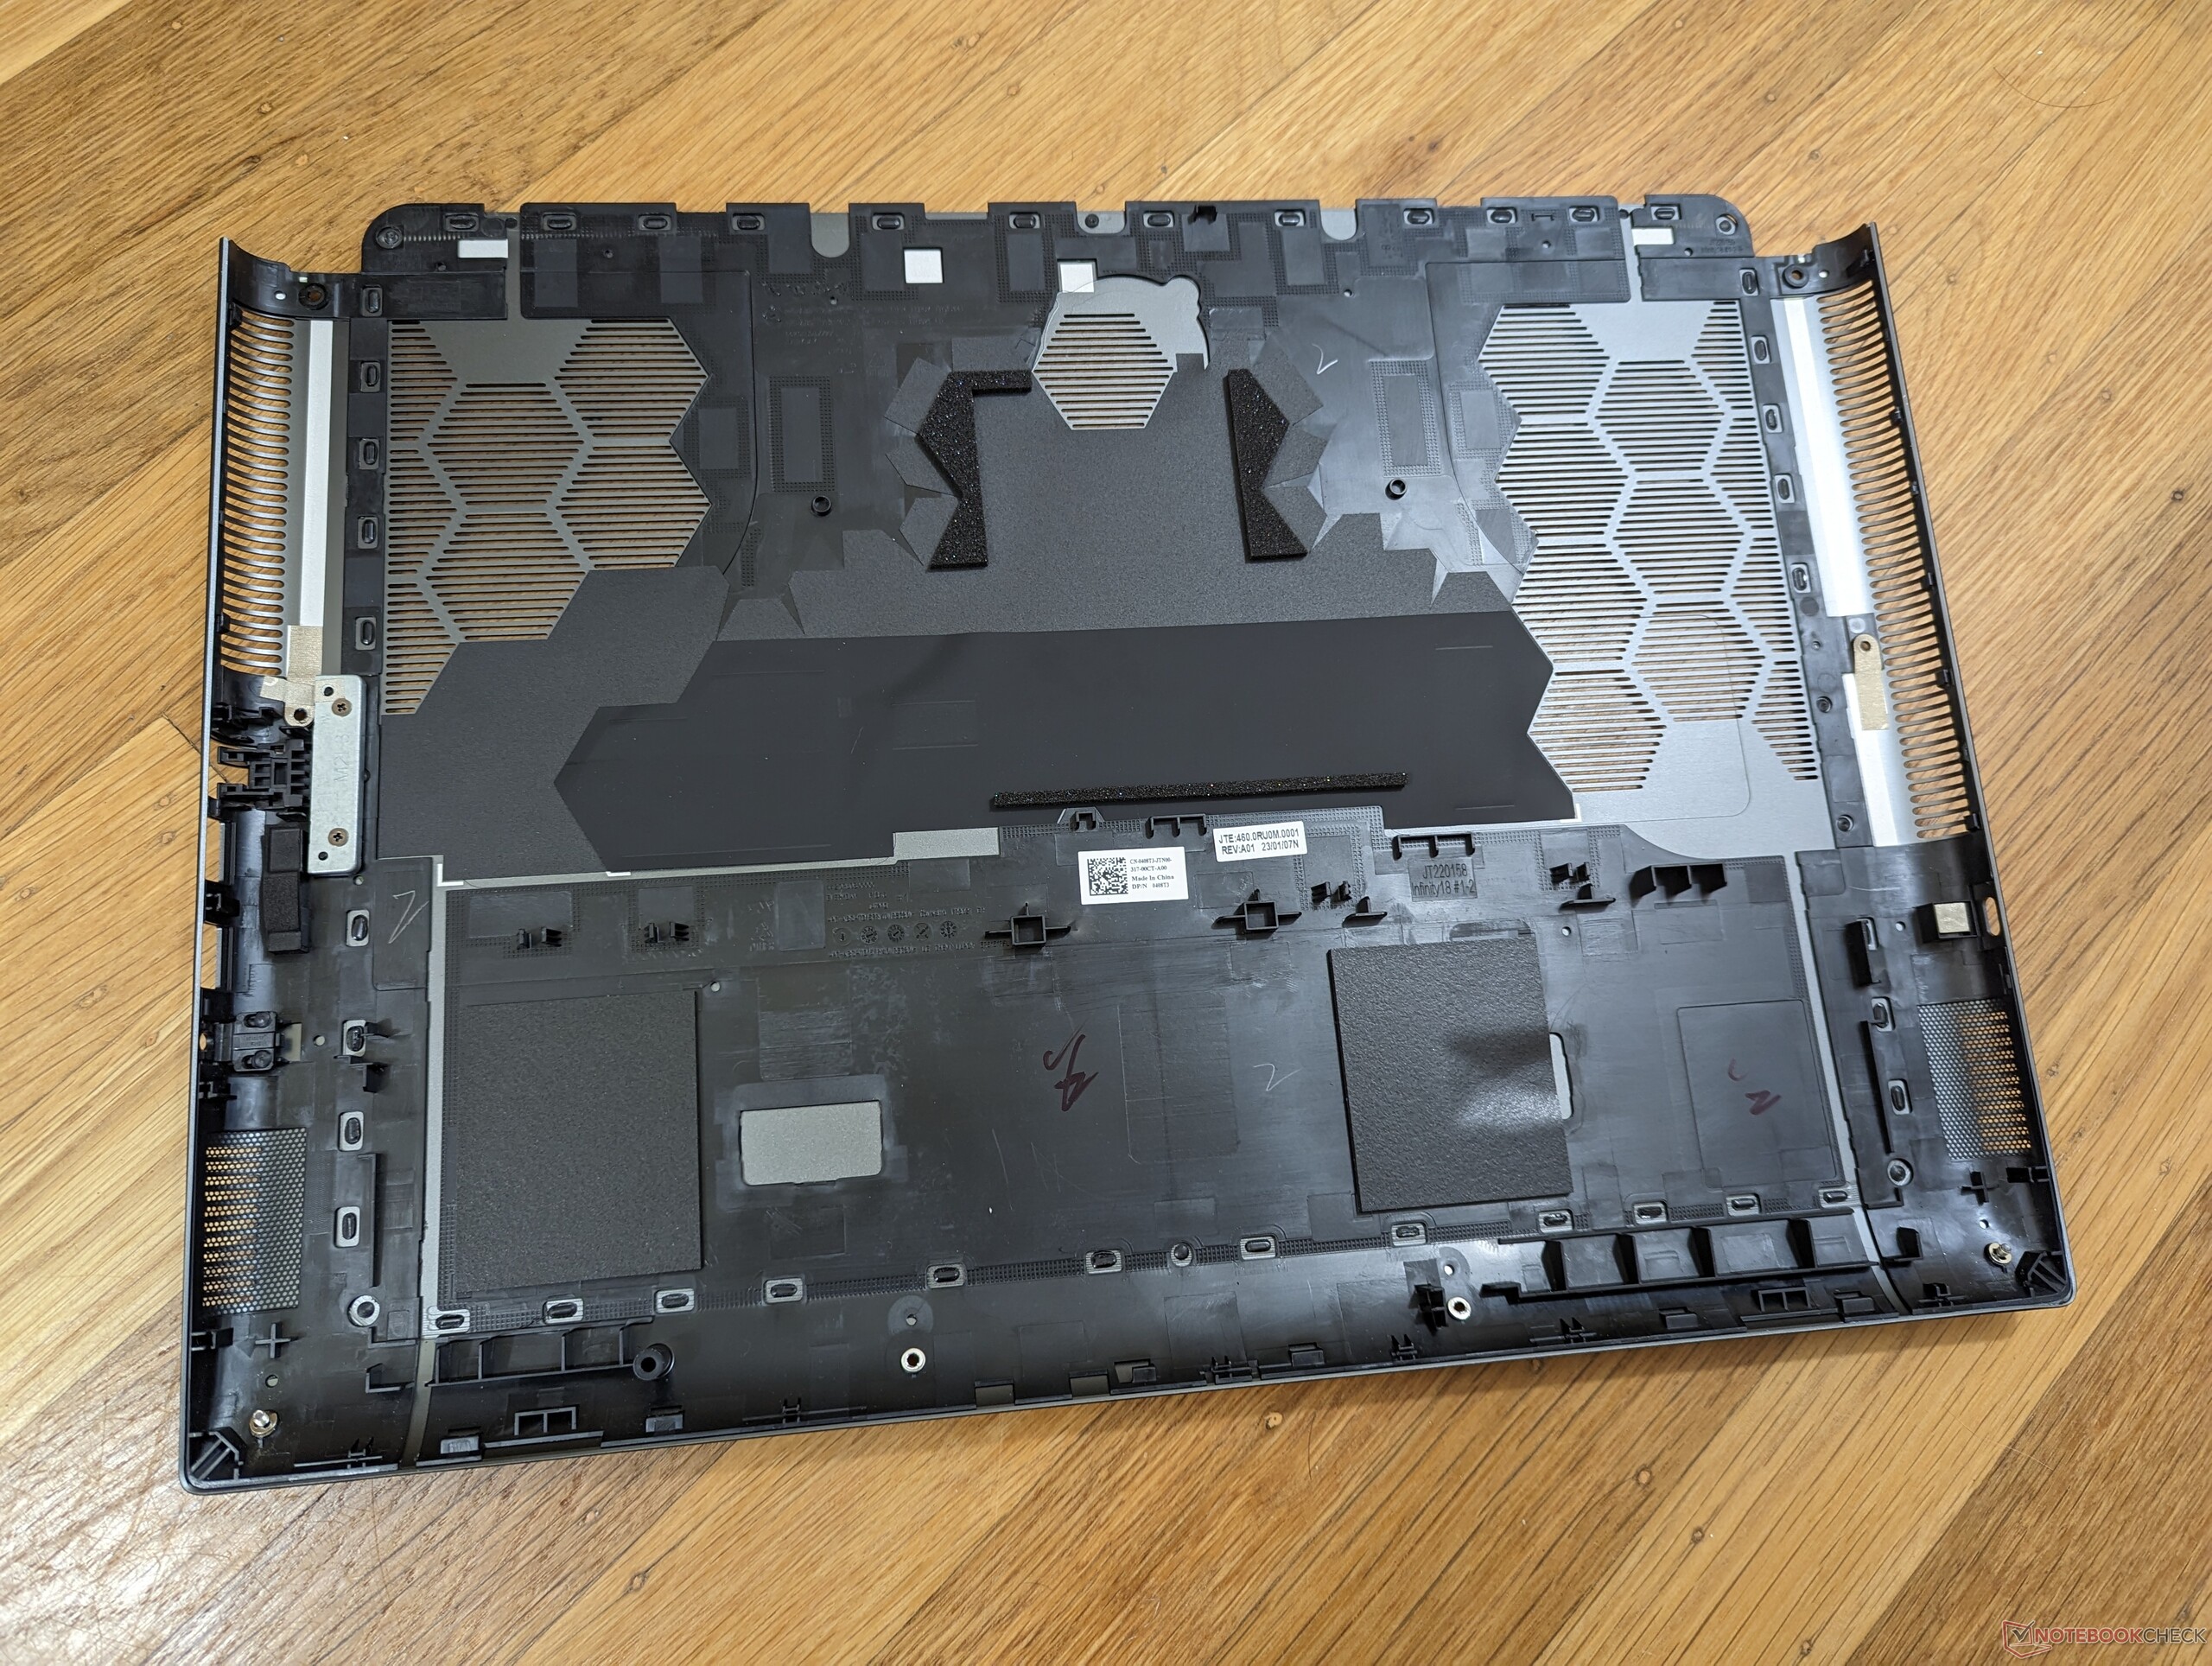
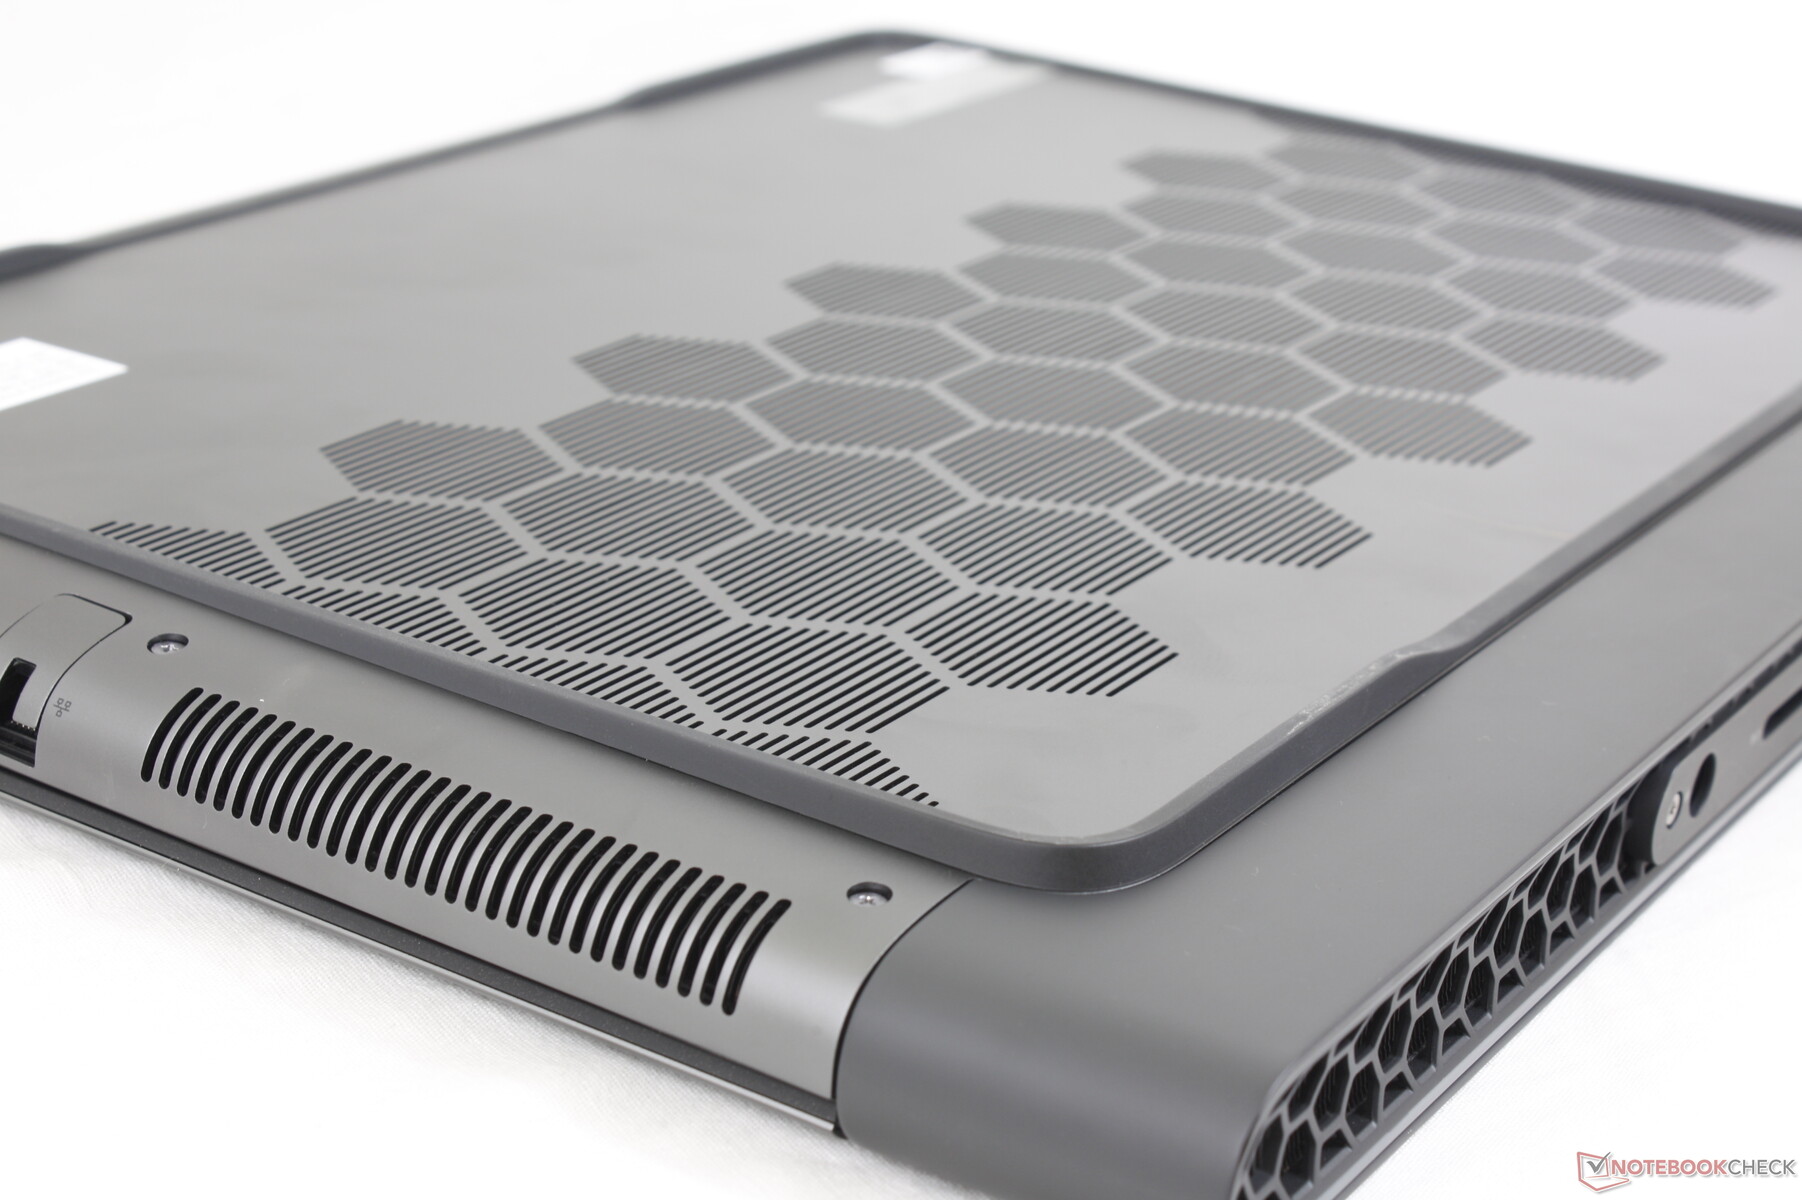
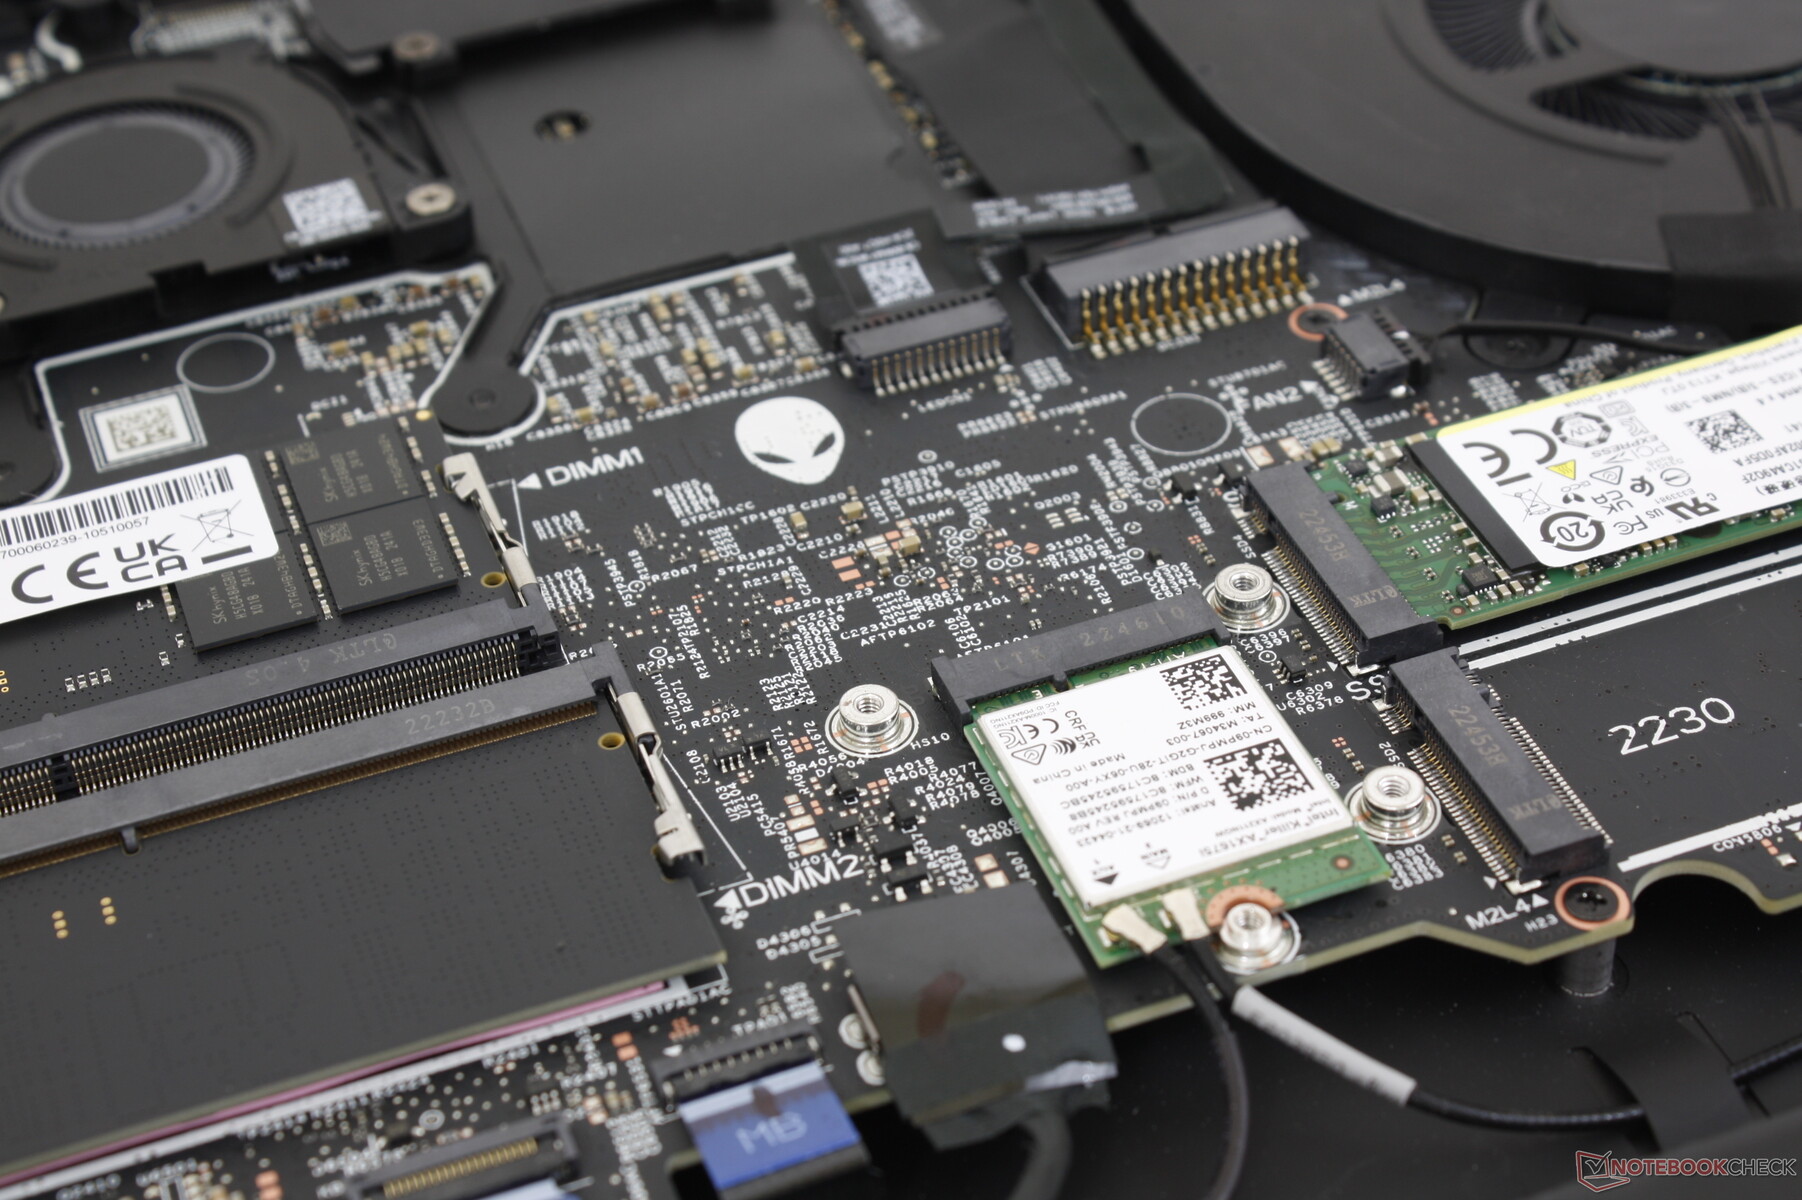
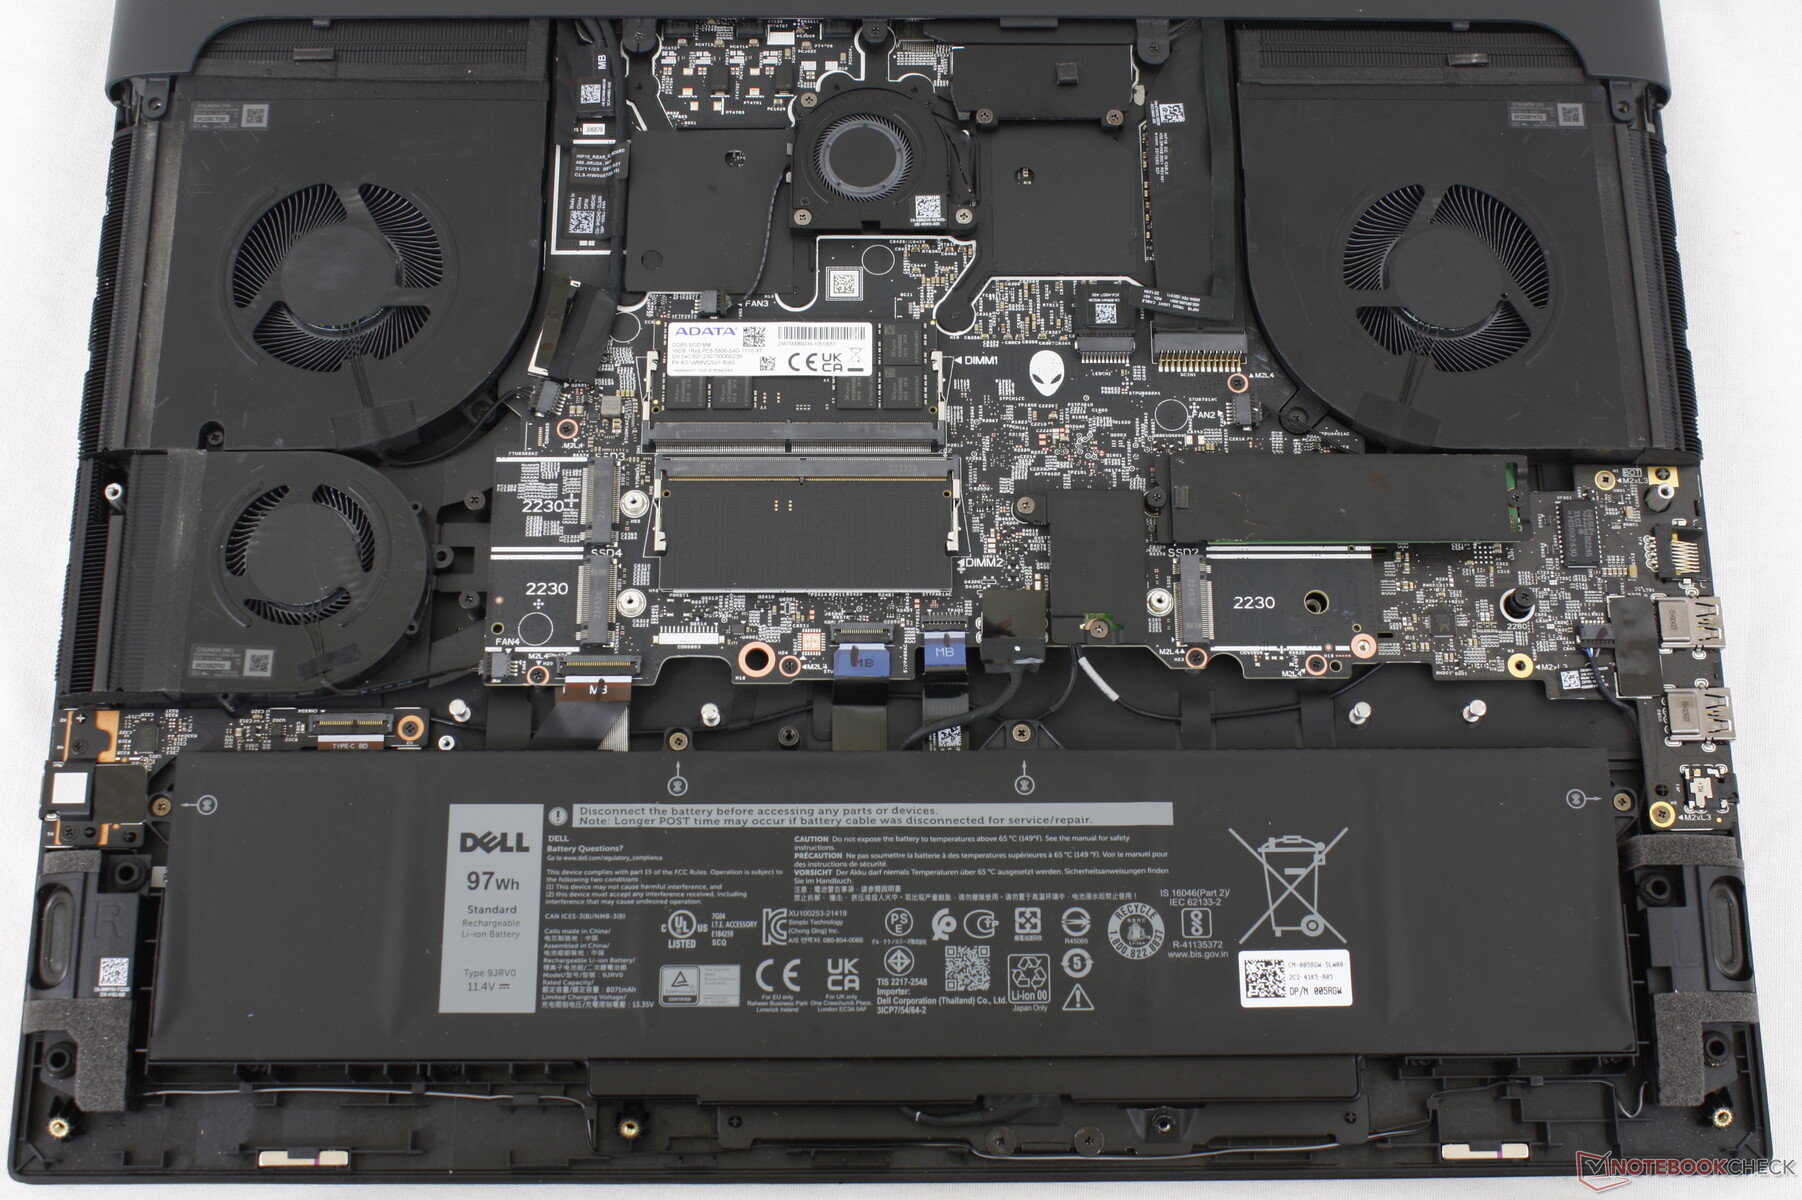
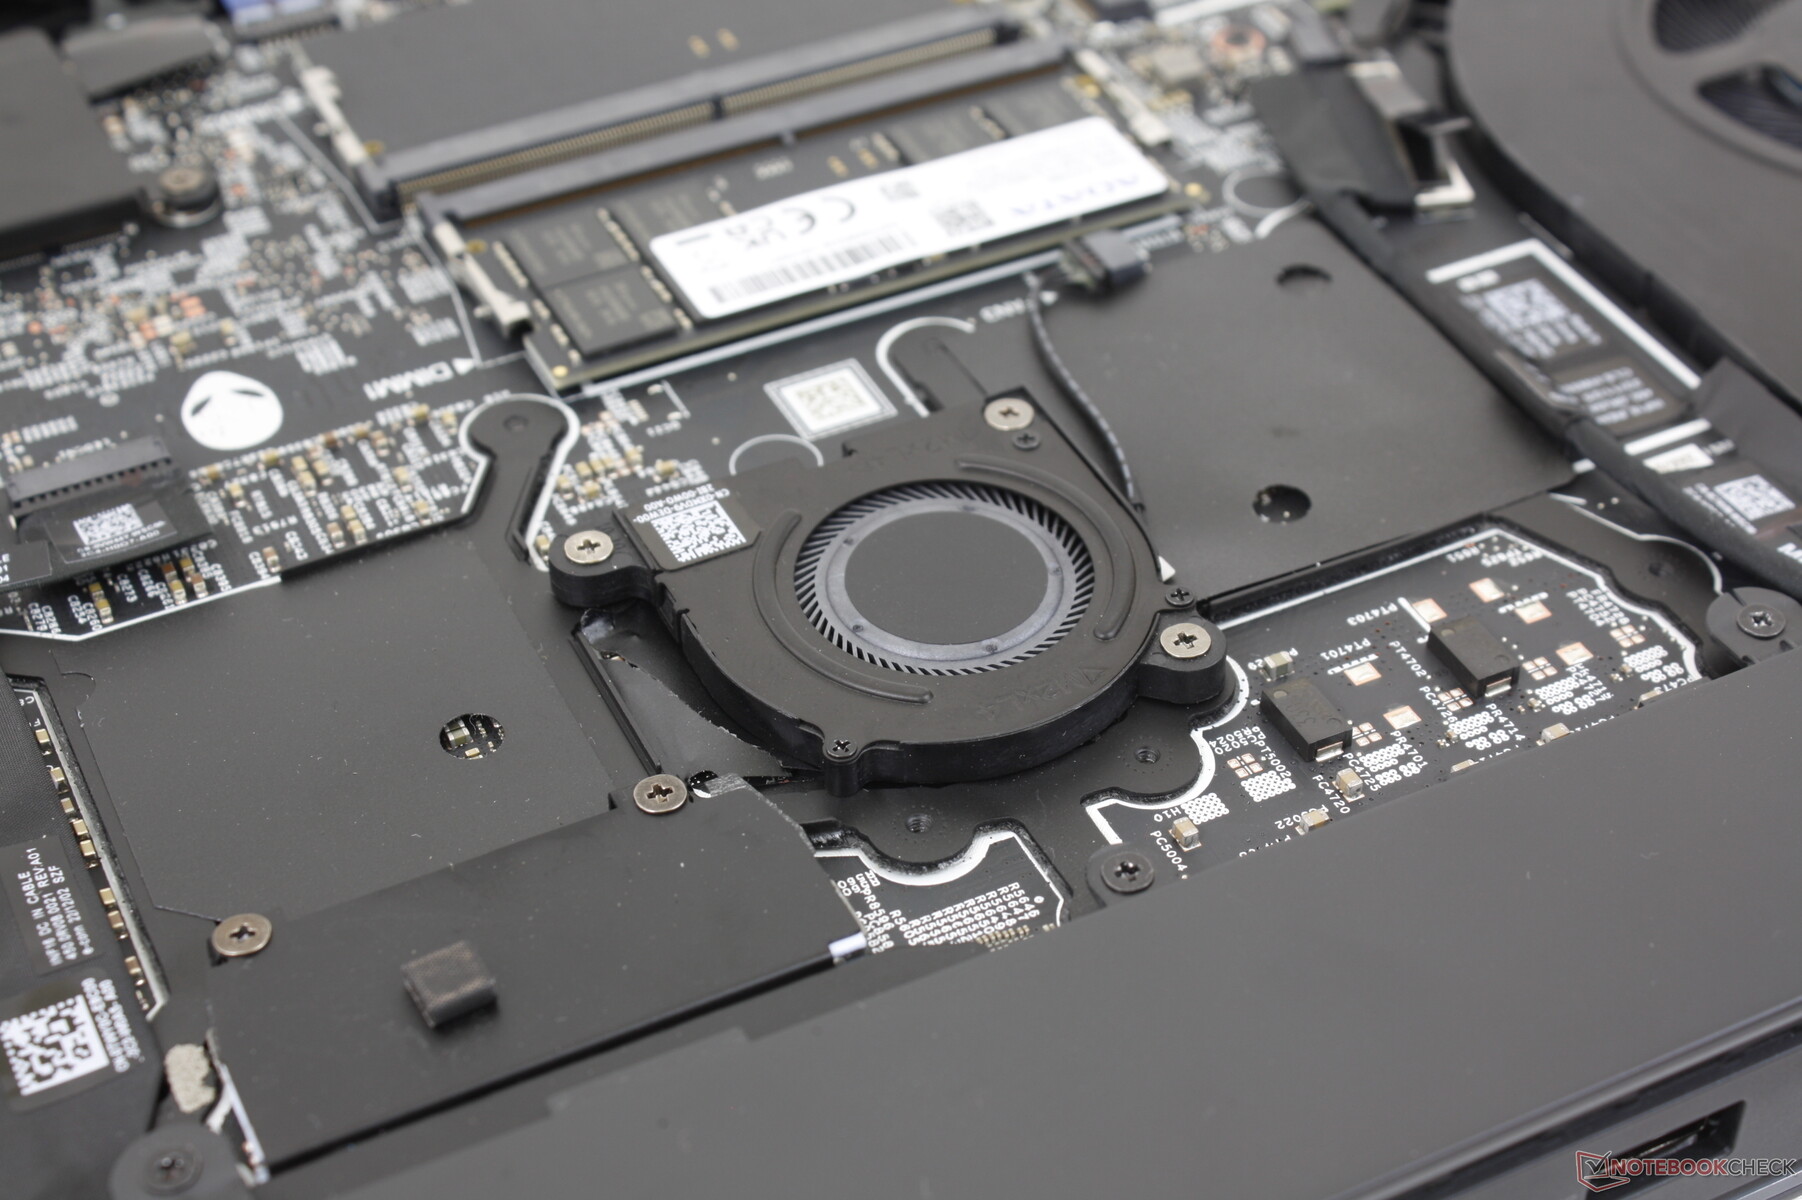
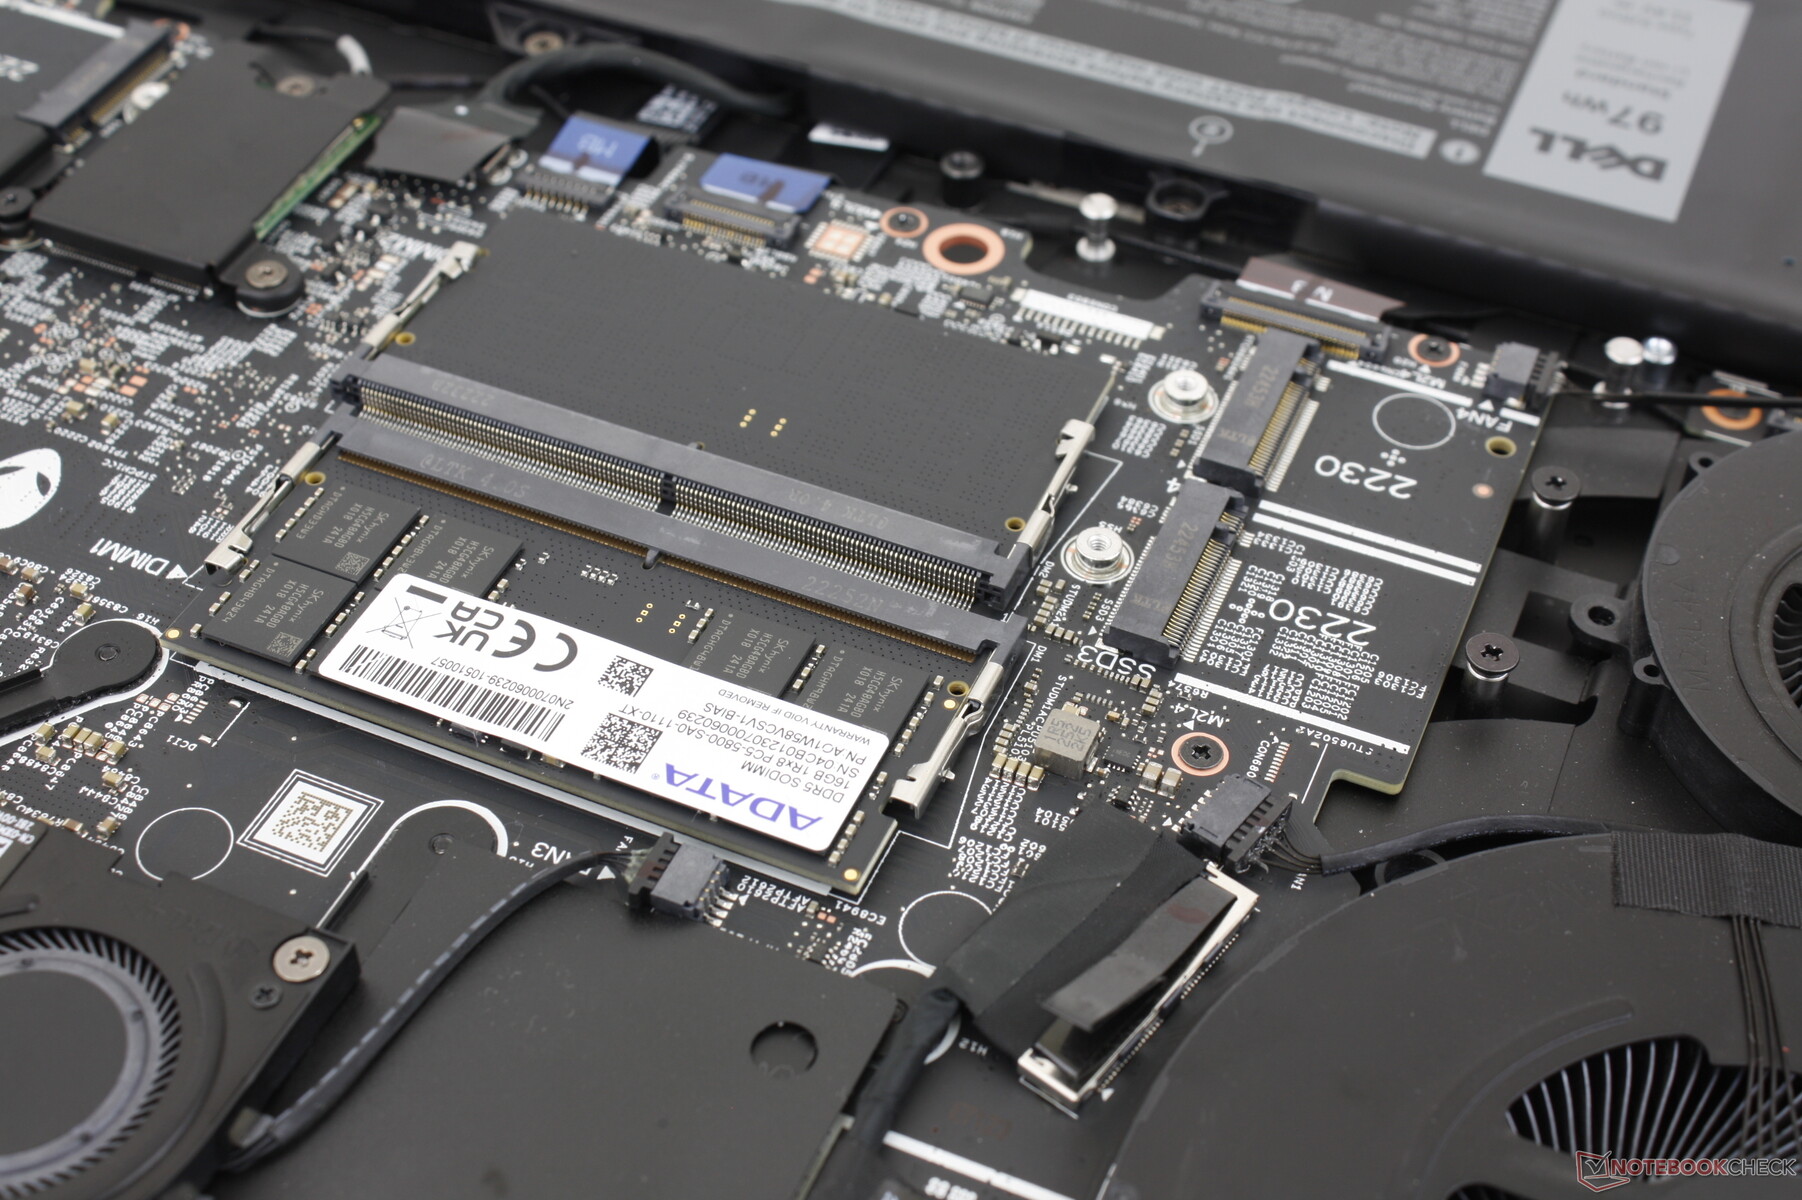
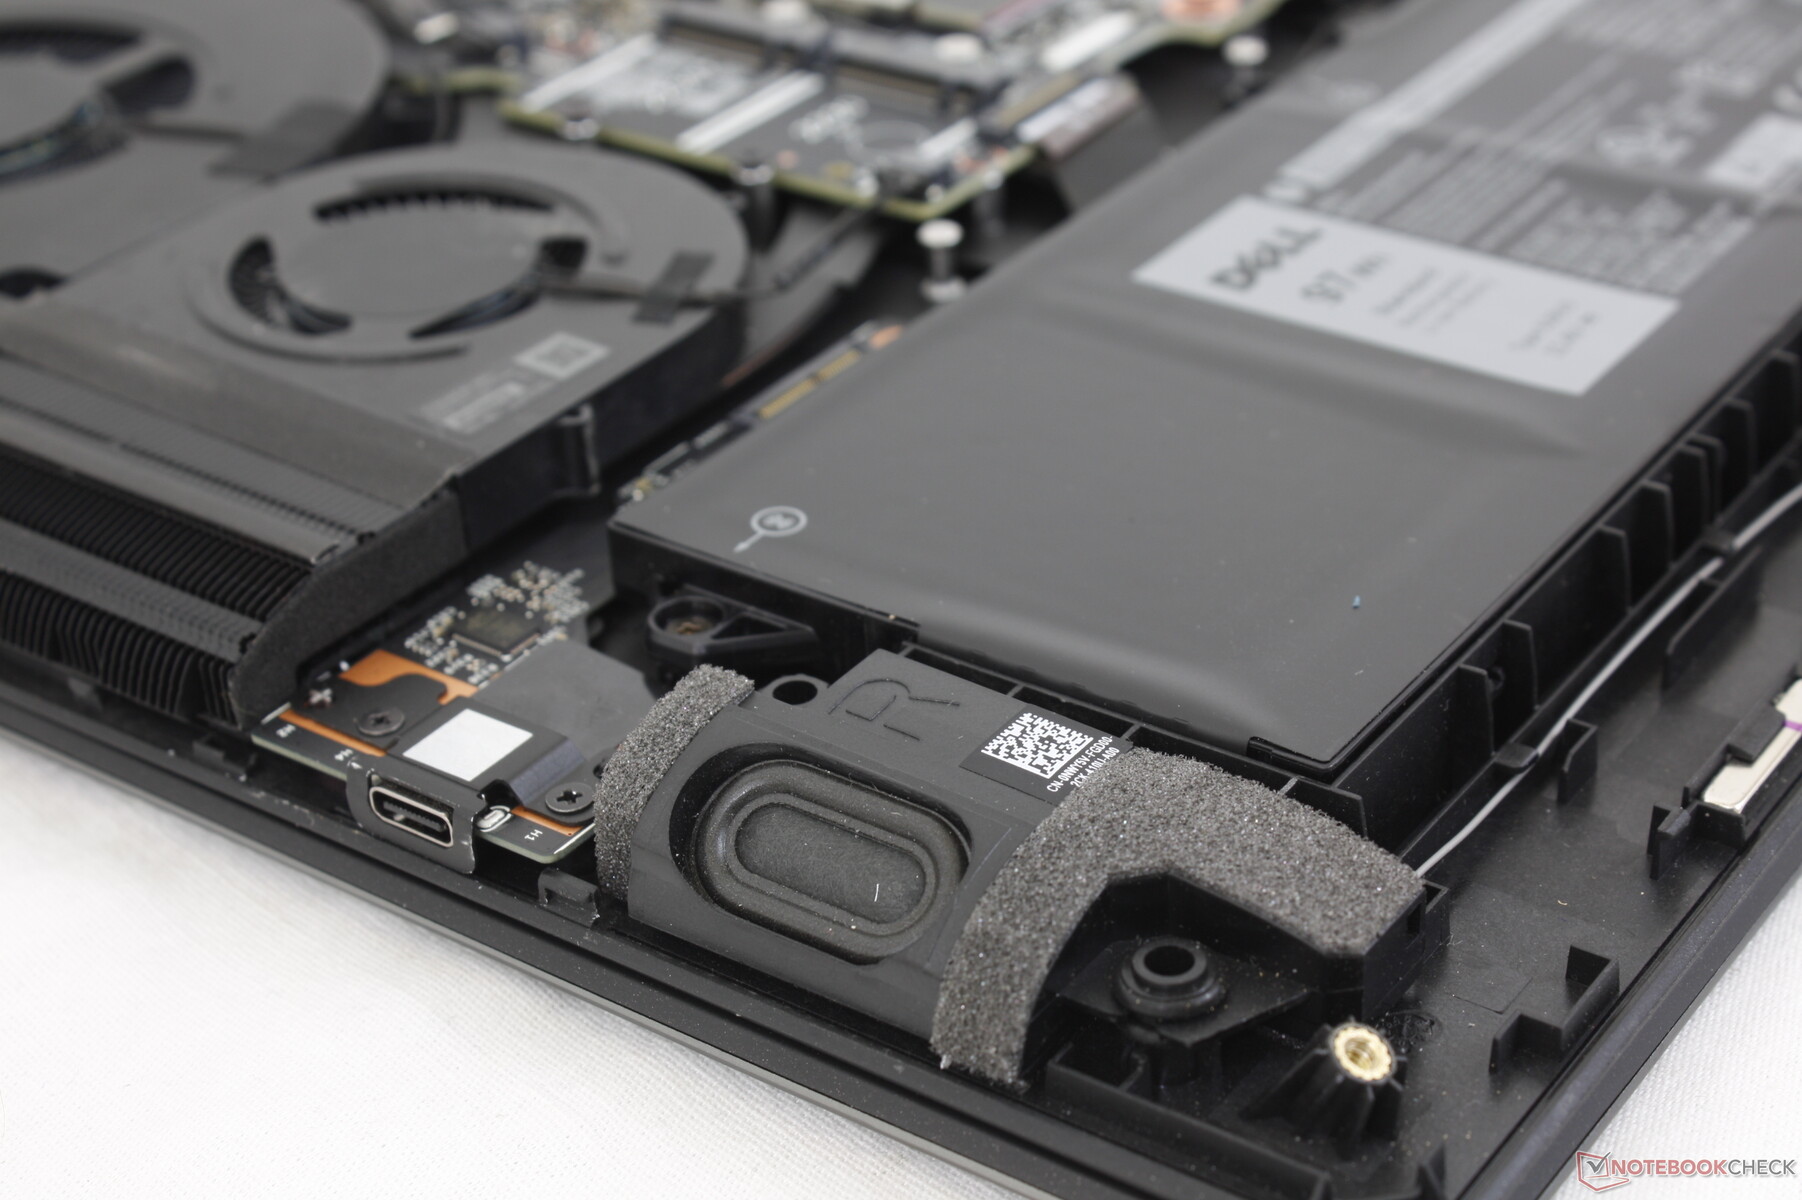
Mantenimiento
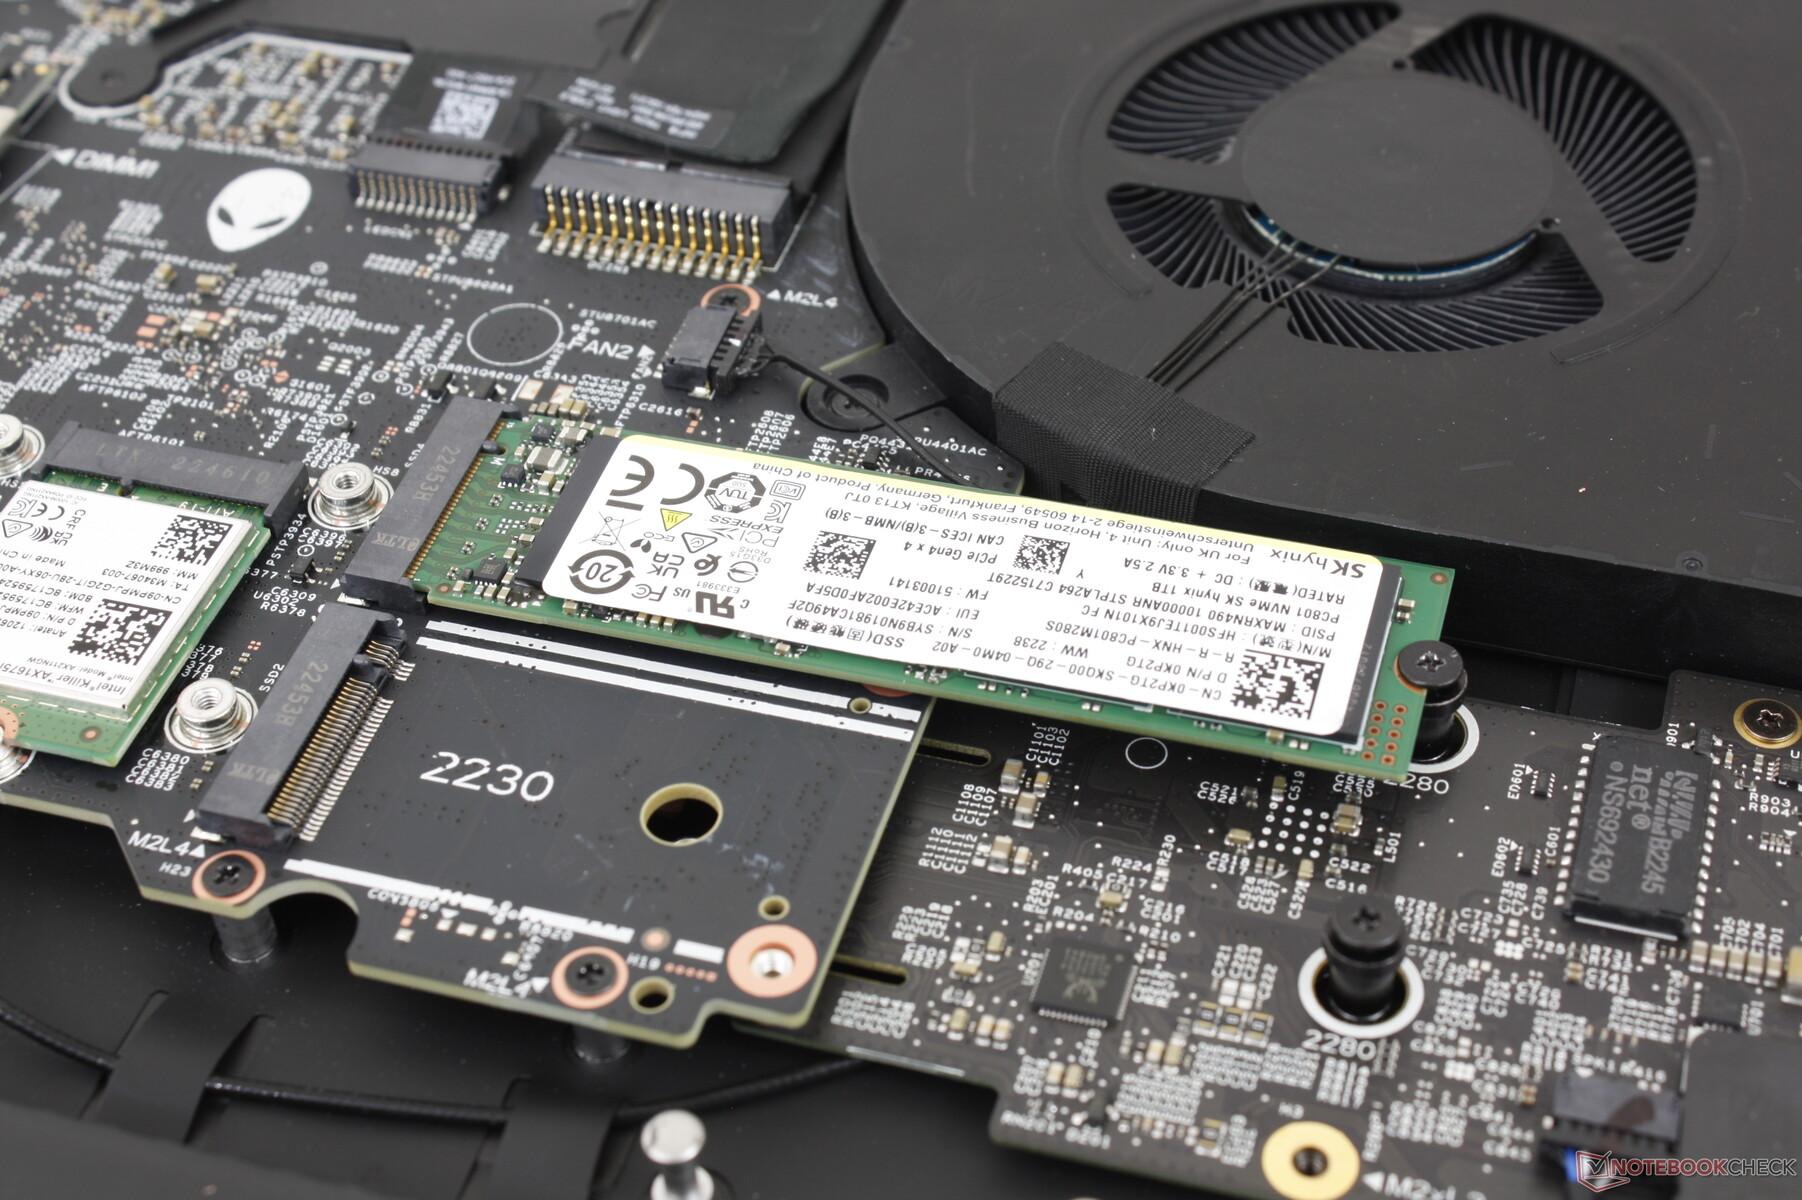
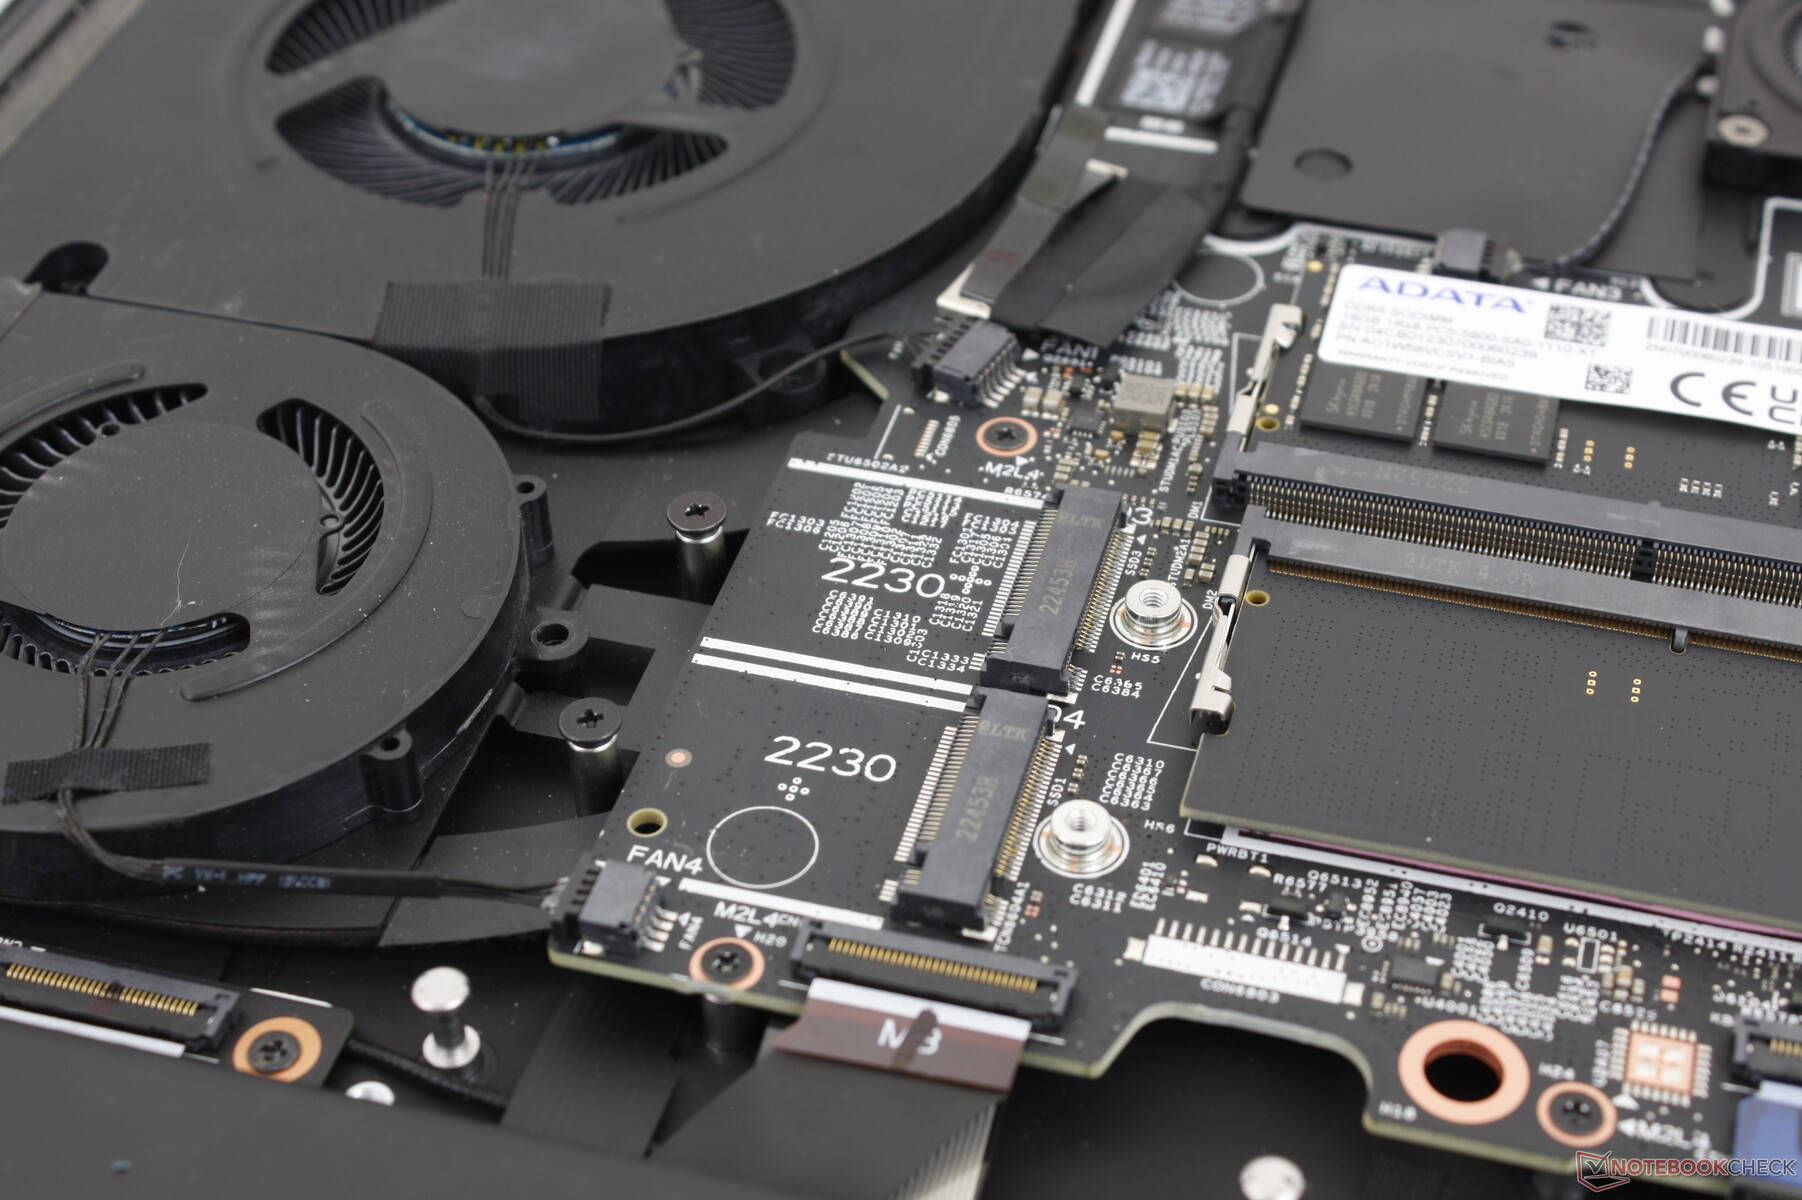
El panel inferior se quita muy fácilmente con un destornillador Philips. En comparación, el panel inferior del nuevo MSI GE78 requiere más manipulación y arrancar una pegatina antimanipulación.
Los usuarios tienen acceso directo a la batería, el módulo WLAN extraíble, 4 ranuras SSD M.2 y 2 ranuras SODIMM DDR5. Es uno de los pocos portátiles con soporte para cuatro SSD NVMe internas (2x M.2 2230 + 2x M.2 2280). Habría sido interesante ver CAMM en vez de SODIMM, especialmente dado que Dell ha defendido la tecnología RAM más rápida.
Accesorios y garantía
No hay más extras en la caja que el adaptador de CA y la documentación. Tenga en cuenta que Dell ha abandonado su puerto de acoplamiento propietario Alienware y por lo tanto la antigua estación de acoplamiento Alienware eGPU ya no es compatible.
La garantía limitada estándar de un año se aplica si se compra en los EE.UU..
Dispositivos de entrada: teclado cómodo, touchpad esponjoso
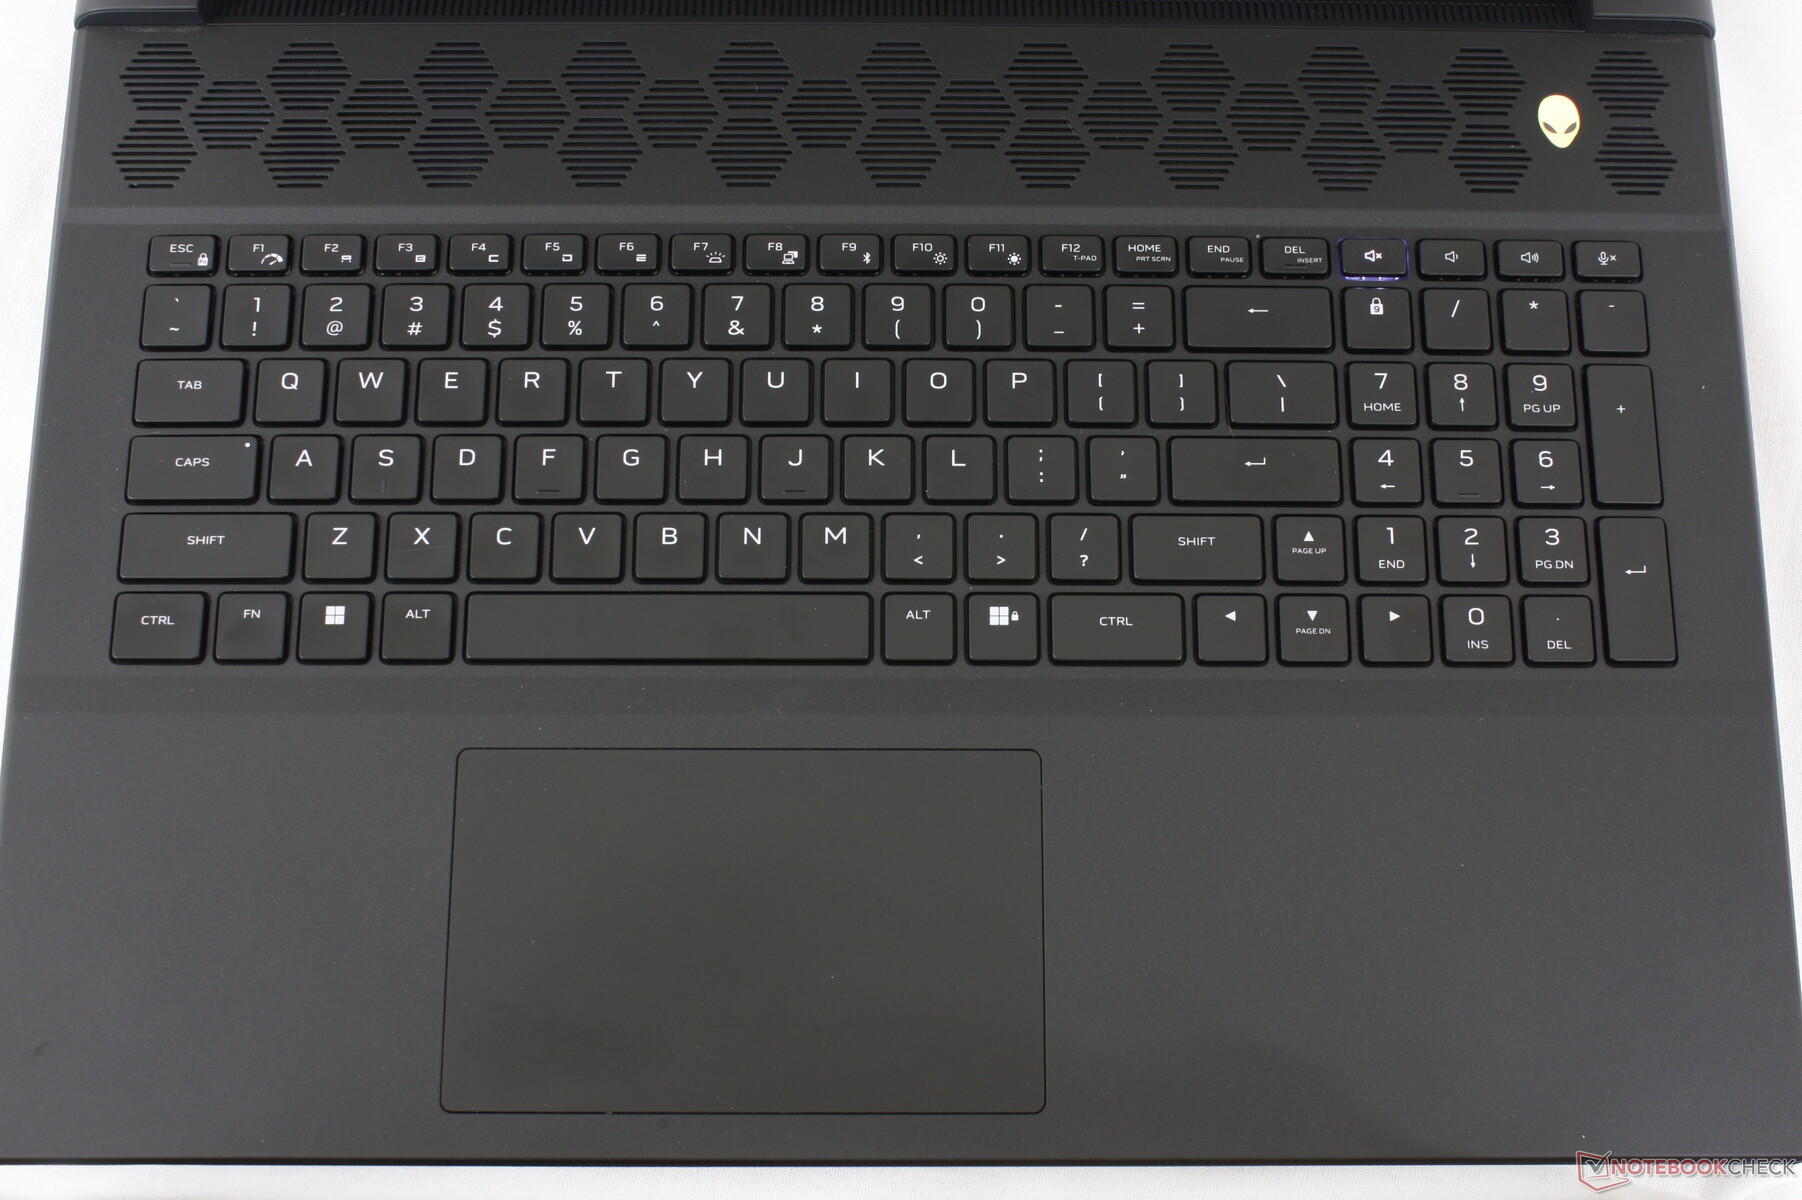
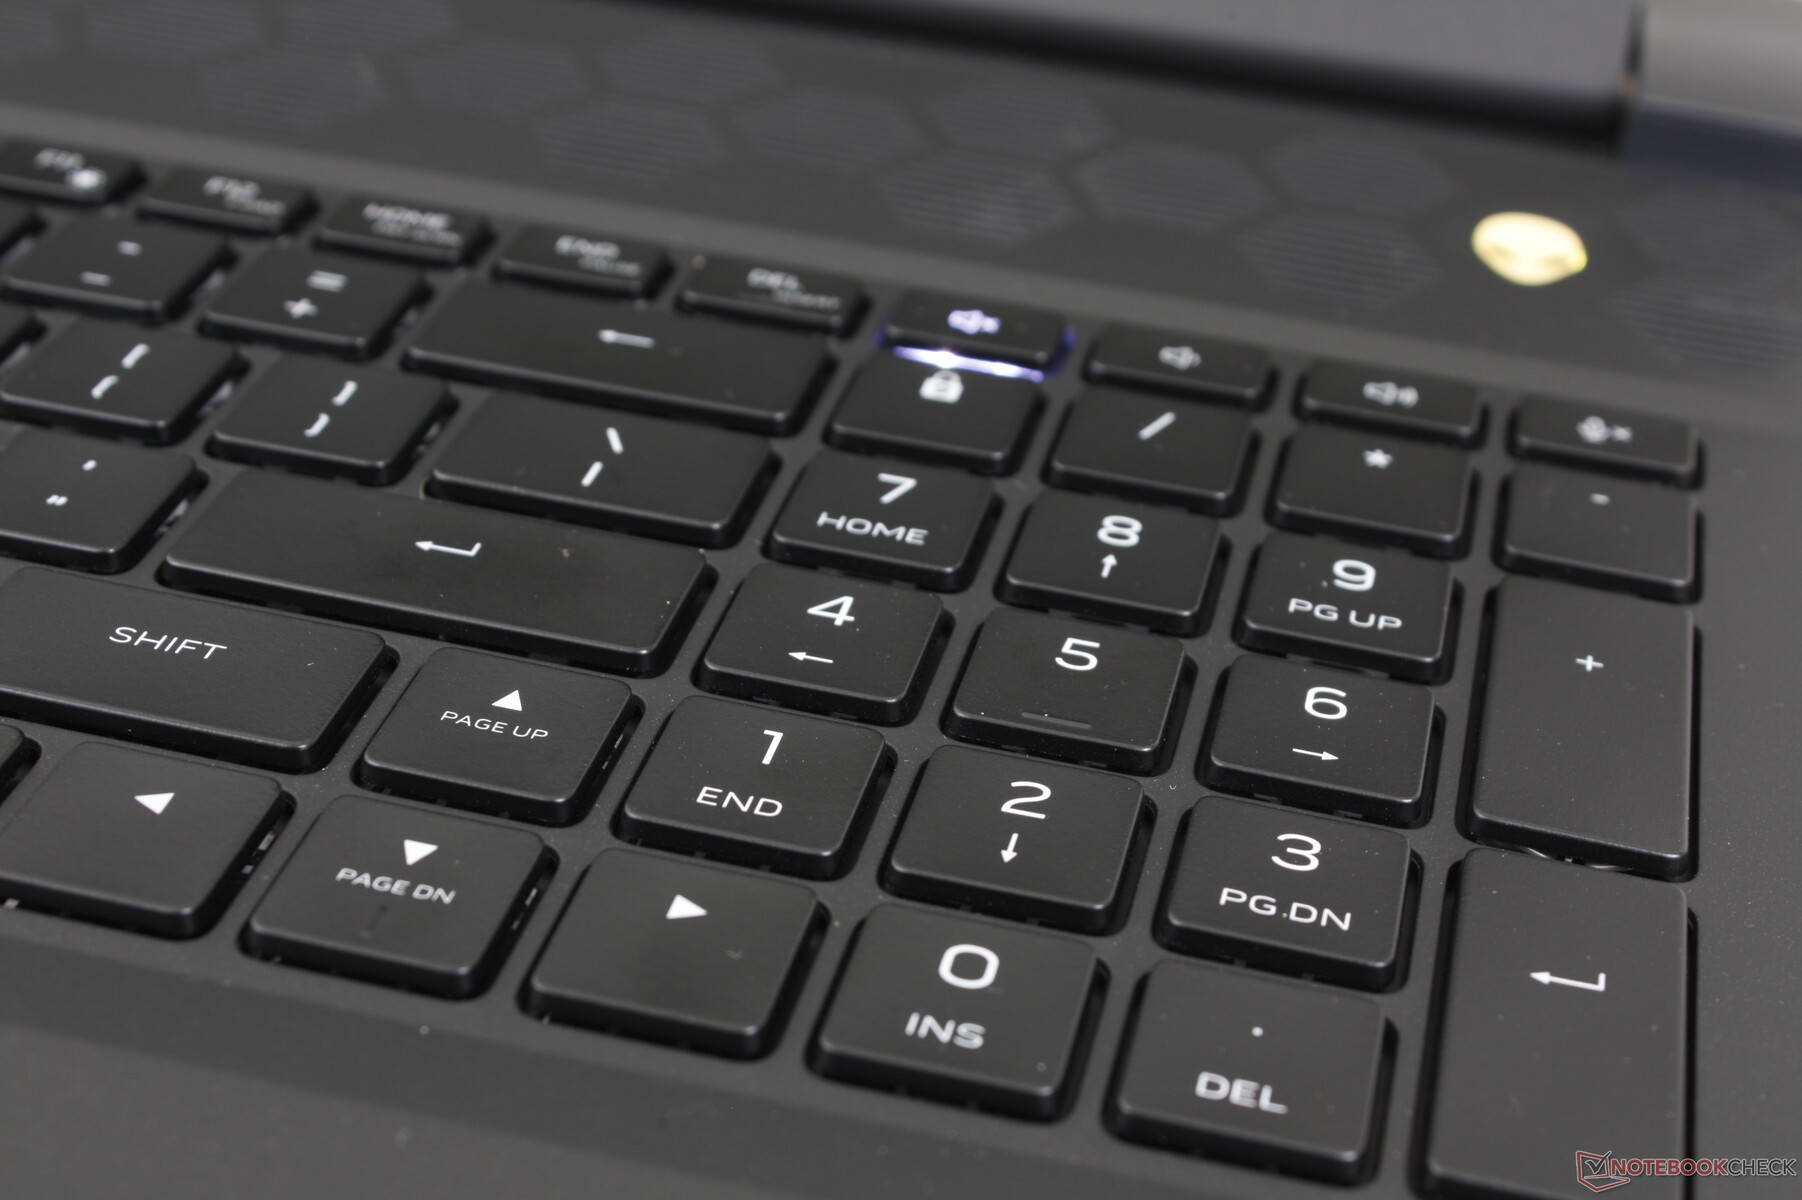
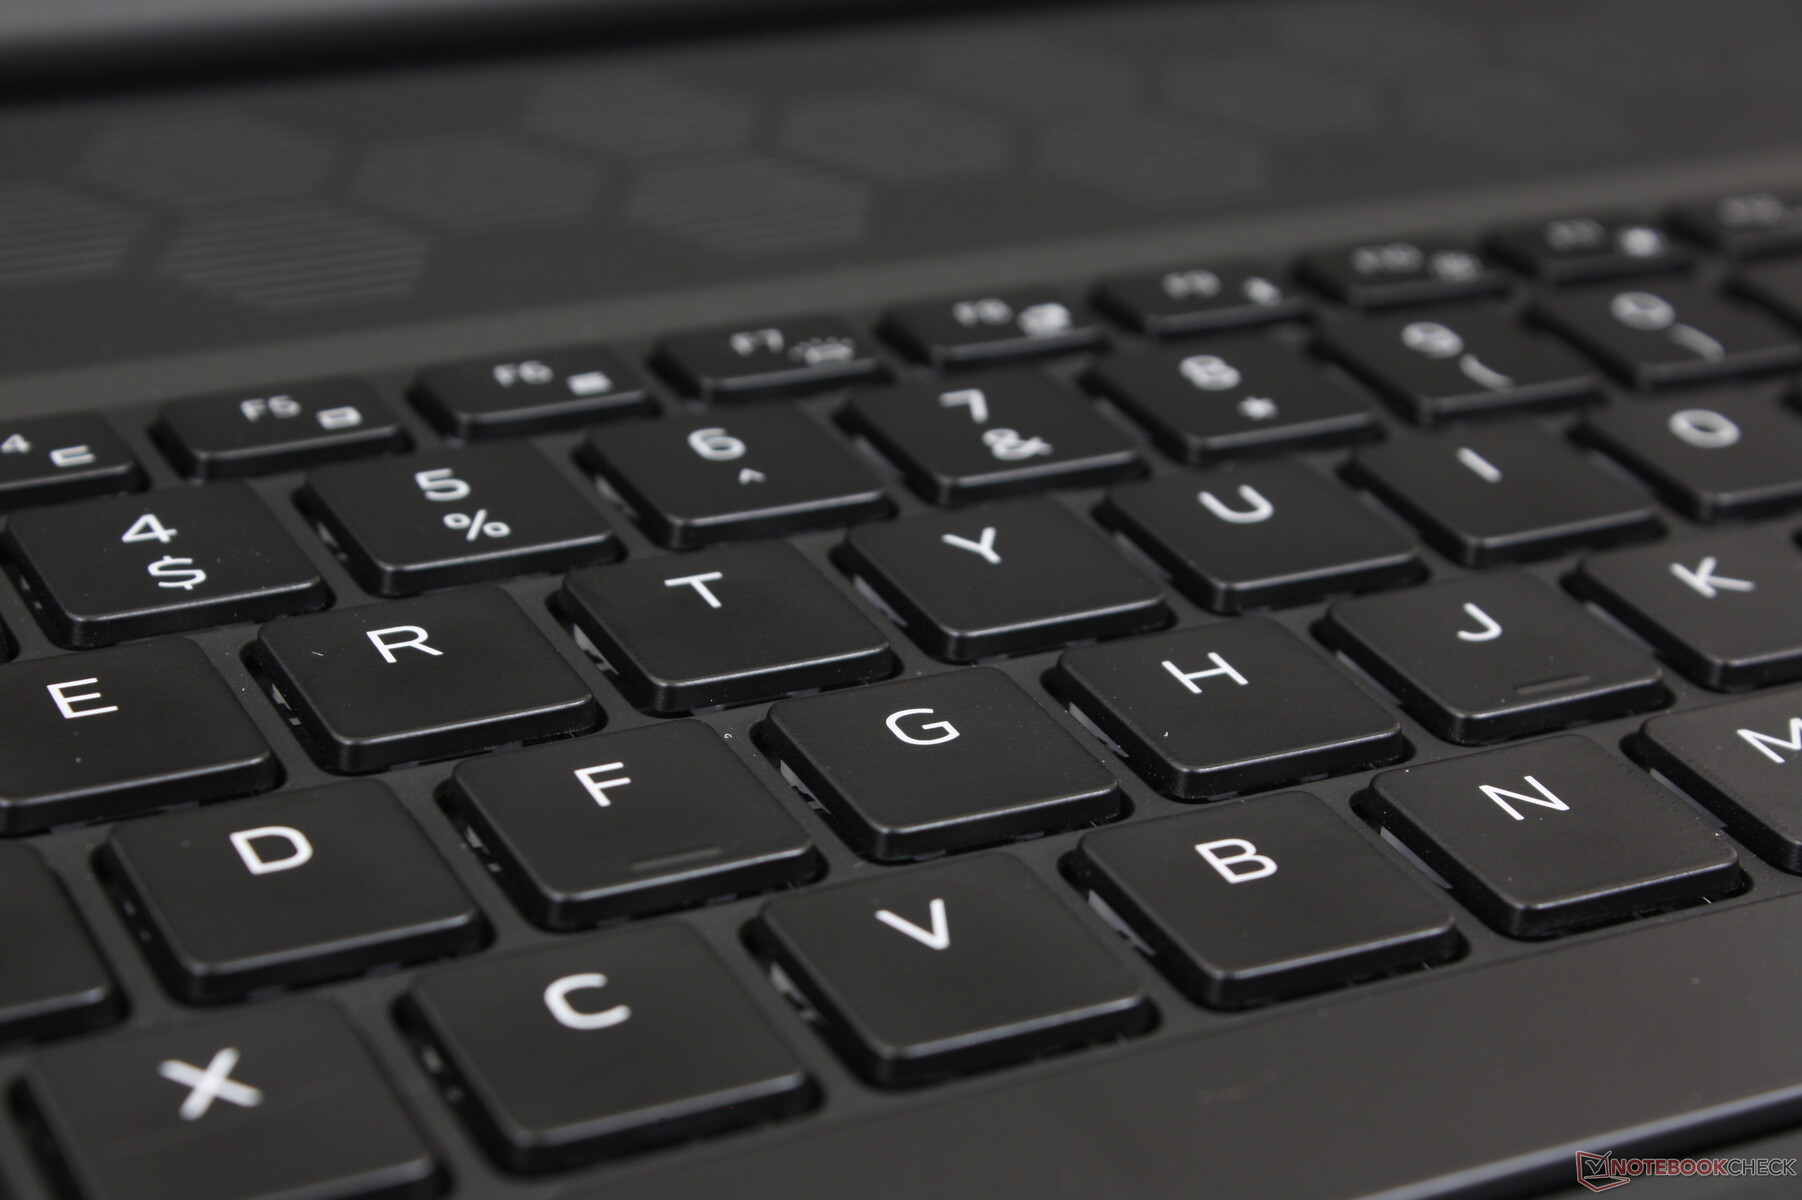
Teclado
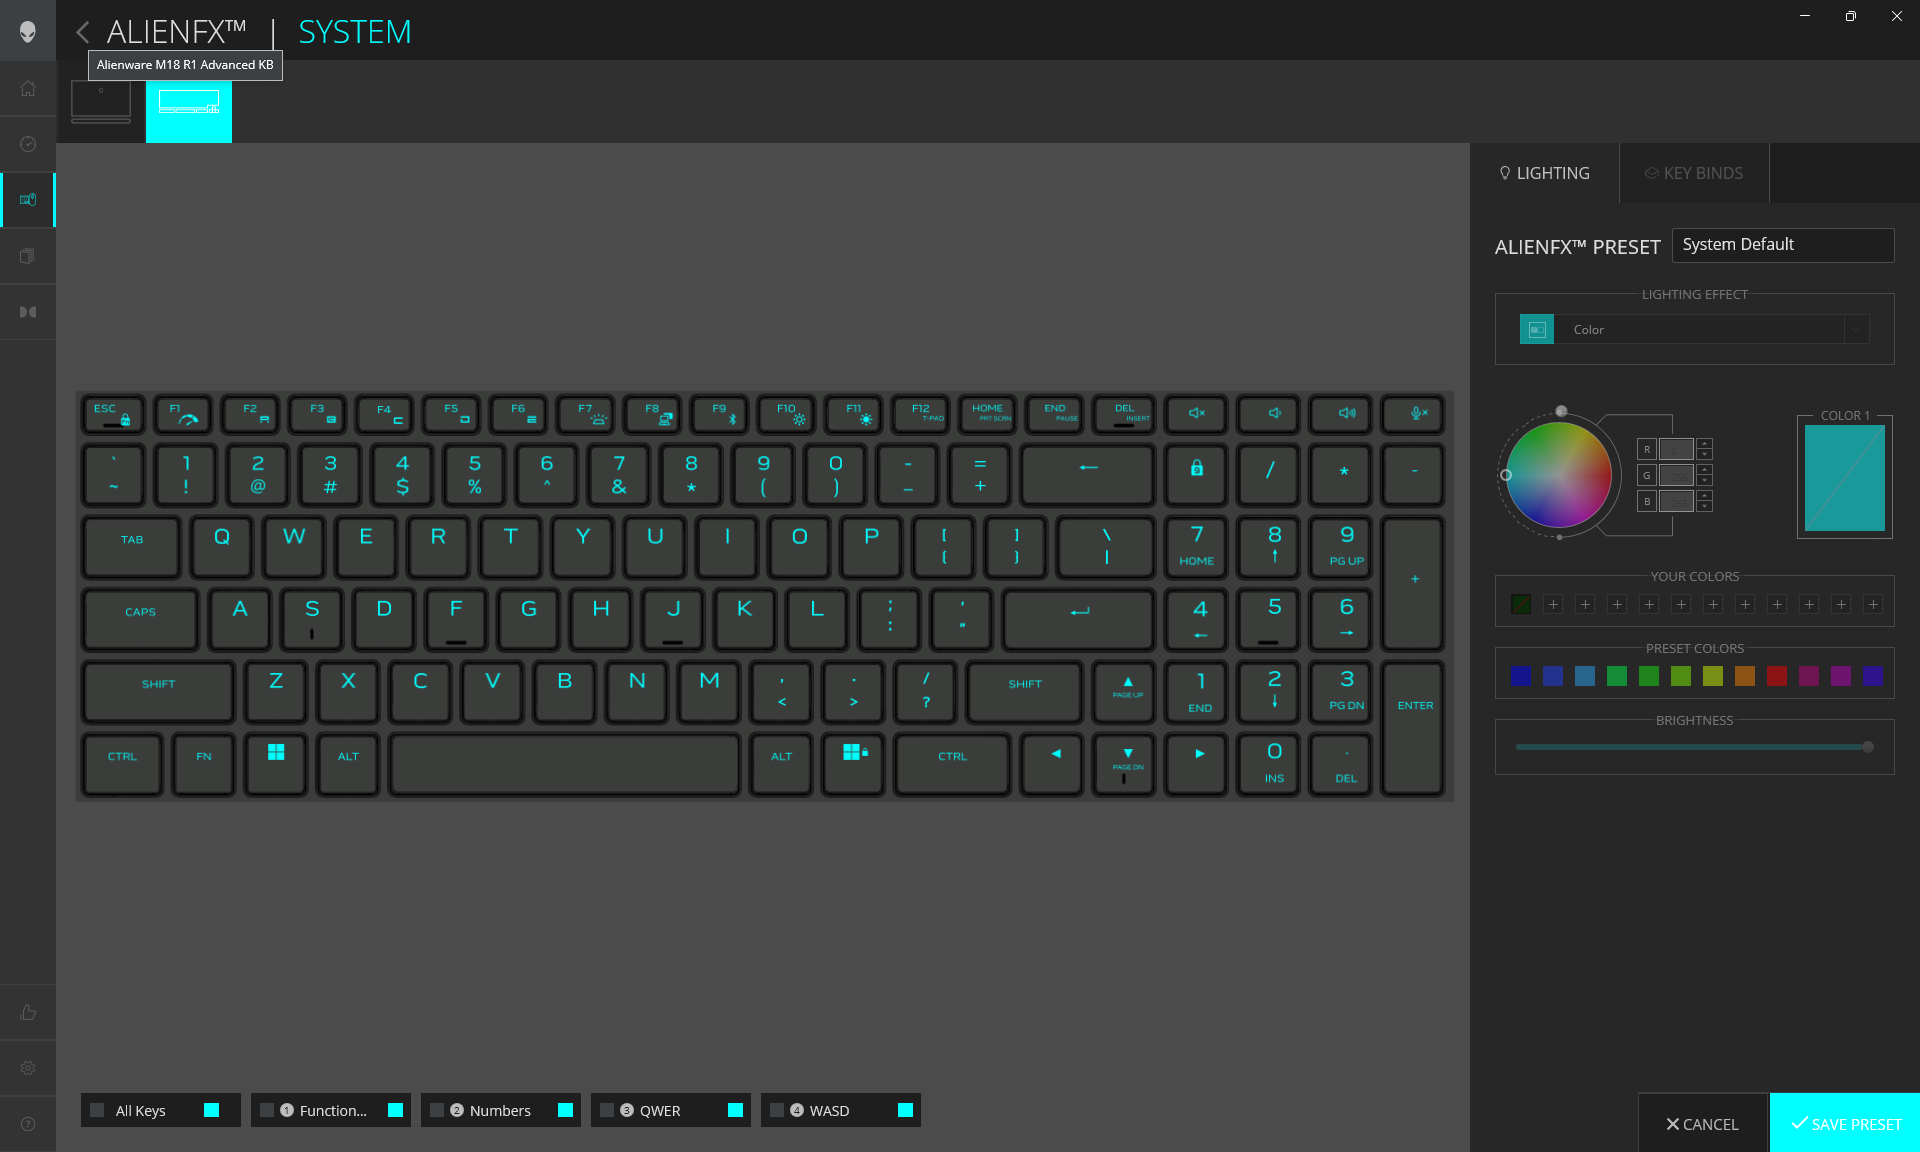
Las teclas de membrana de nuestra unidad son probablemente las mejores que hemos usado en un portátil de juegos. El desplazamiento se siente más profundo y con una respuesta más firme que las teclas del MSI GE78 o el Razer Blade 18. No hay mucho de lo que quejarse en términos de comodidad.
Los interruptores mecánicos CherryMX opcionales son probablemente más cliqueantes pero mucho más ruidosos. Estos interruptores son probablemente los mismos que Dell ofrece para las series existentes Alienware M15 y M17.
Todos los símbolos de las teclas se iluminan cuando la retroiluminación está activa a diferencia de los modelos antiguos Alienware x15/x17 donde los símbolos secundarios no se iluminan.
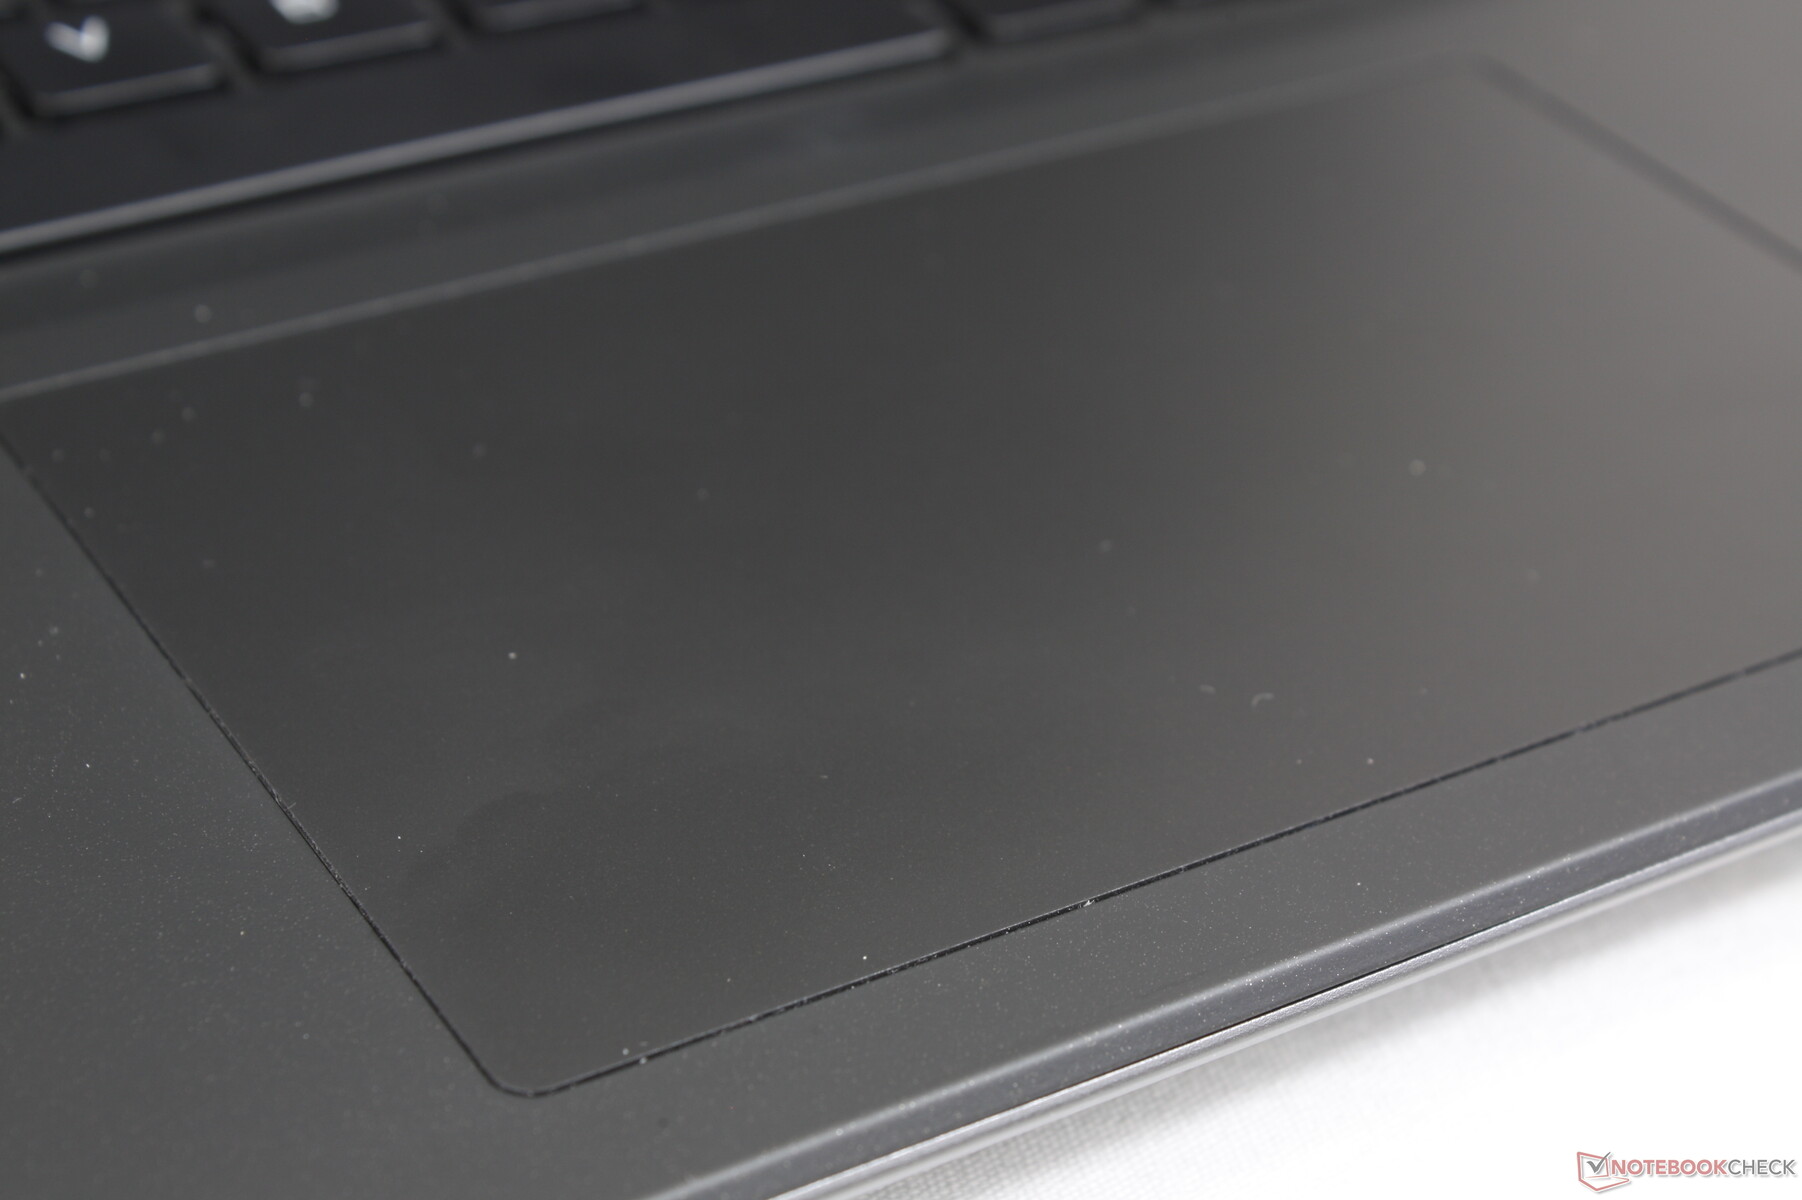
Panel táctil
La superficie es casi idéntica a la del clickpad del MSI GE78 (13.2 x 8 cm vs. 13 x 8.2 cm) a pesar del mayor factor de forma de 18 pulgadas del Alienware. Aunque la tracción es suave con una adherencia mínima al deslizarse, la respuesta al hacer clic es suave, lo que hace que la experiencia no sea satisfactoria. Hacer doble clic también puede resultar cansado ya que cada clic requiere un poco más de fuerza del dedo que en la mayoría de portátiles.
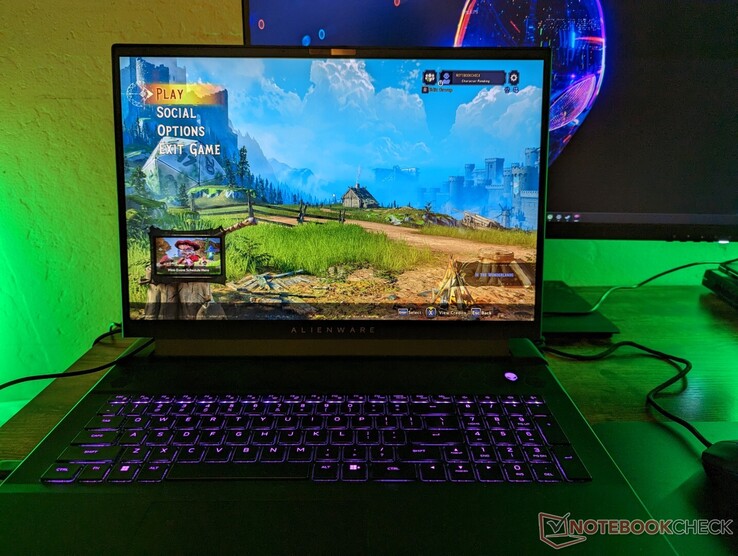
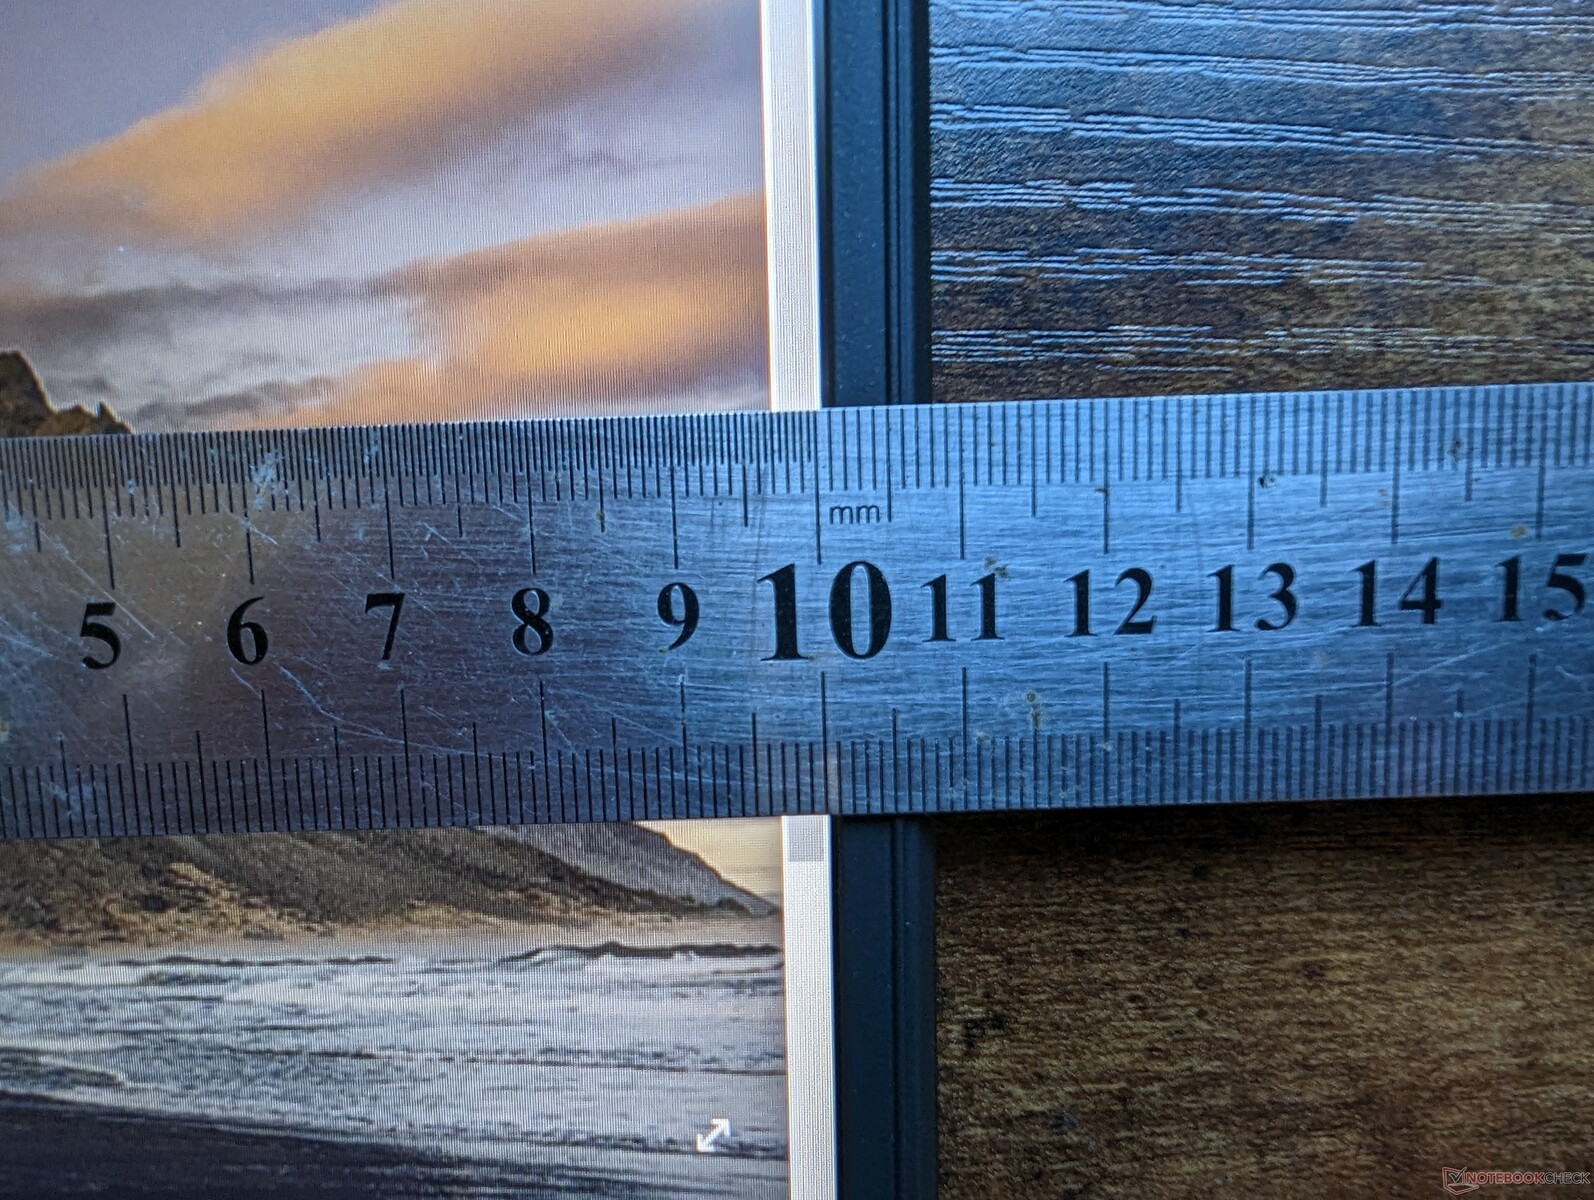
Pantalla: frecuencia de actualización extremadamente rápida de 480 Hz
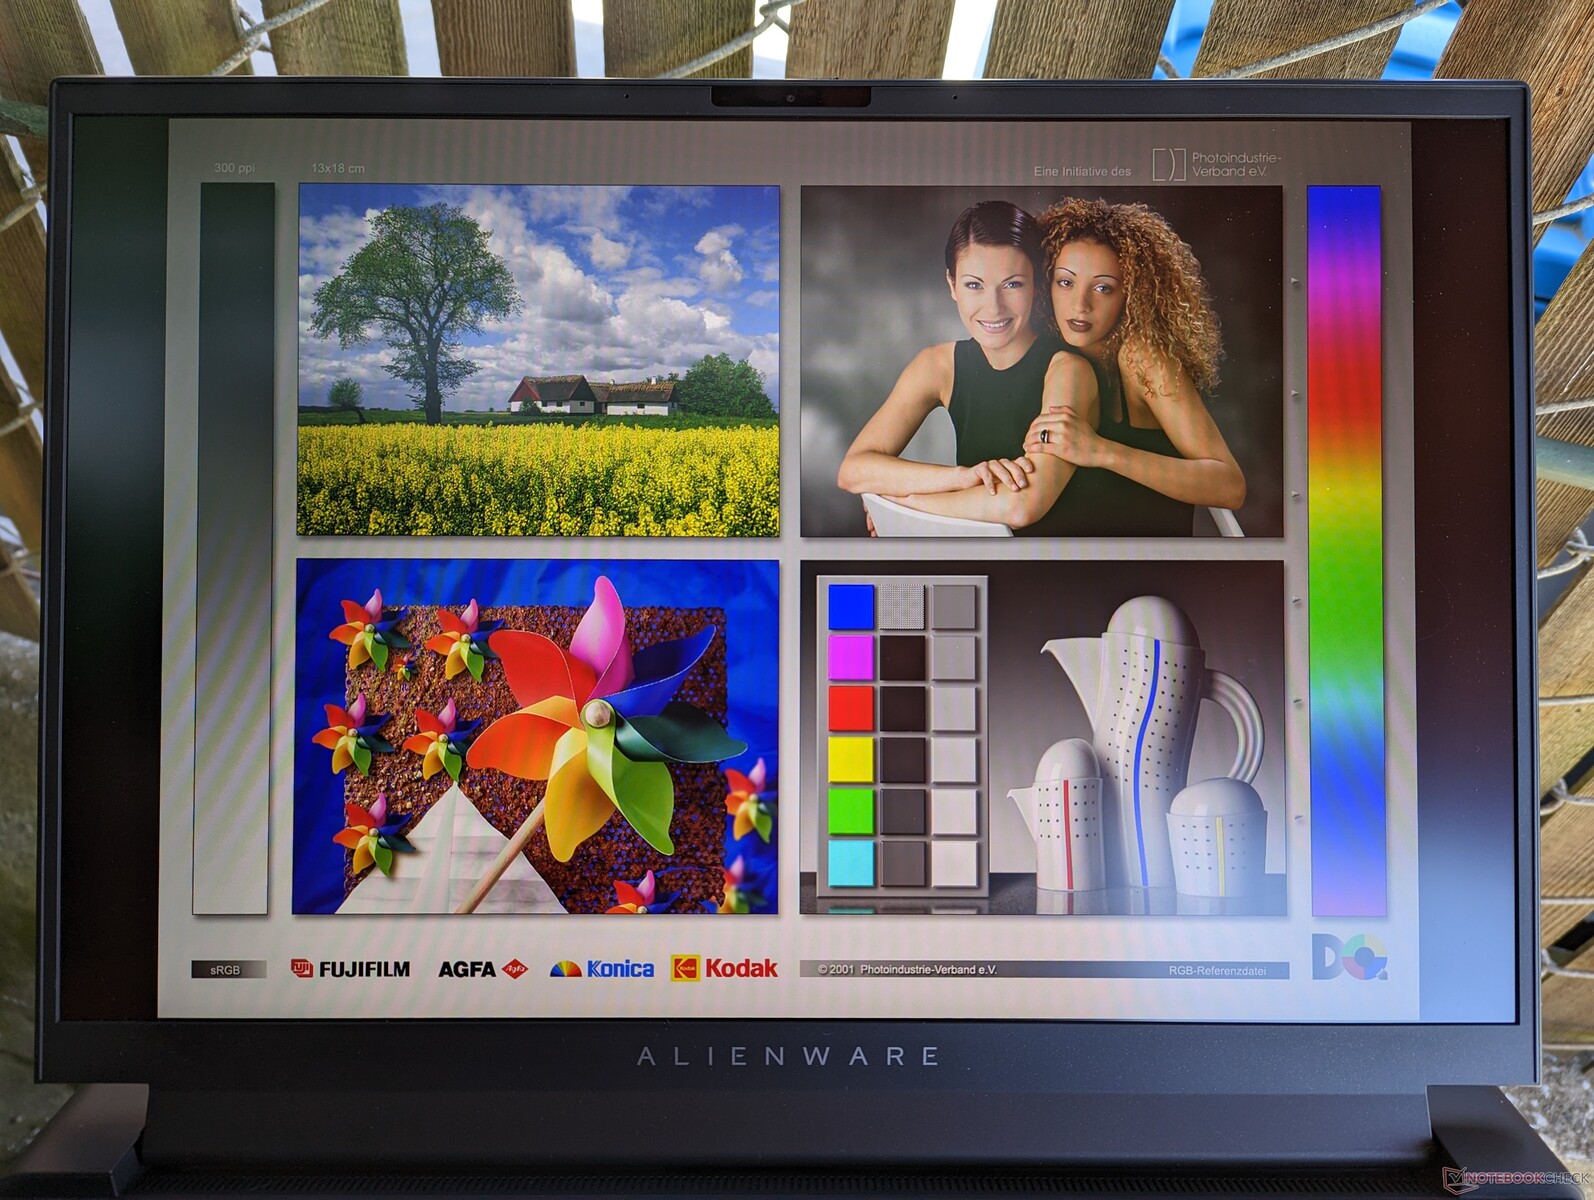
El Alienware viene con un panel Chi Mei 180JME de 1200p en contraste con los paneles AU Optronics B180QAN01.0 de 1600p o BOE NE180QDM delRazer Blade 18 y Asus ROG Strix Scar 18, respectivamente. La única característica que diferencia a este panel Chi Mei de los otros dos es su frecuencia de actualización nativa dos veces más rápida, de 480 Hz en lugar de 240 Hz. Por lo demás, los tres paneles comparten coberturas de color, tiempos de respuesta de píxel y ratios de contraste similares. Los colores P3 completos y la rápida tasa de refresco hacen que este modelo Alienware en particular sea adecuado tanto para juegos como para edición de gráficos.
Hay disponible una segunda opción de pantalla con una resolución nativa superior de 1600p pero una frecuencia de actualización inferior de 165 Hz.
| |||||||||||||||||||||||||
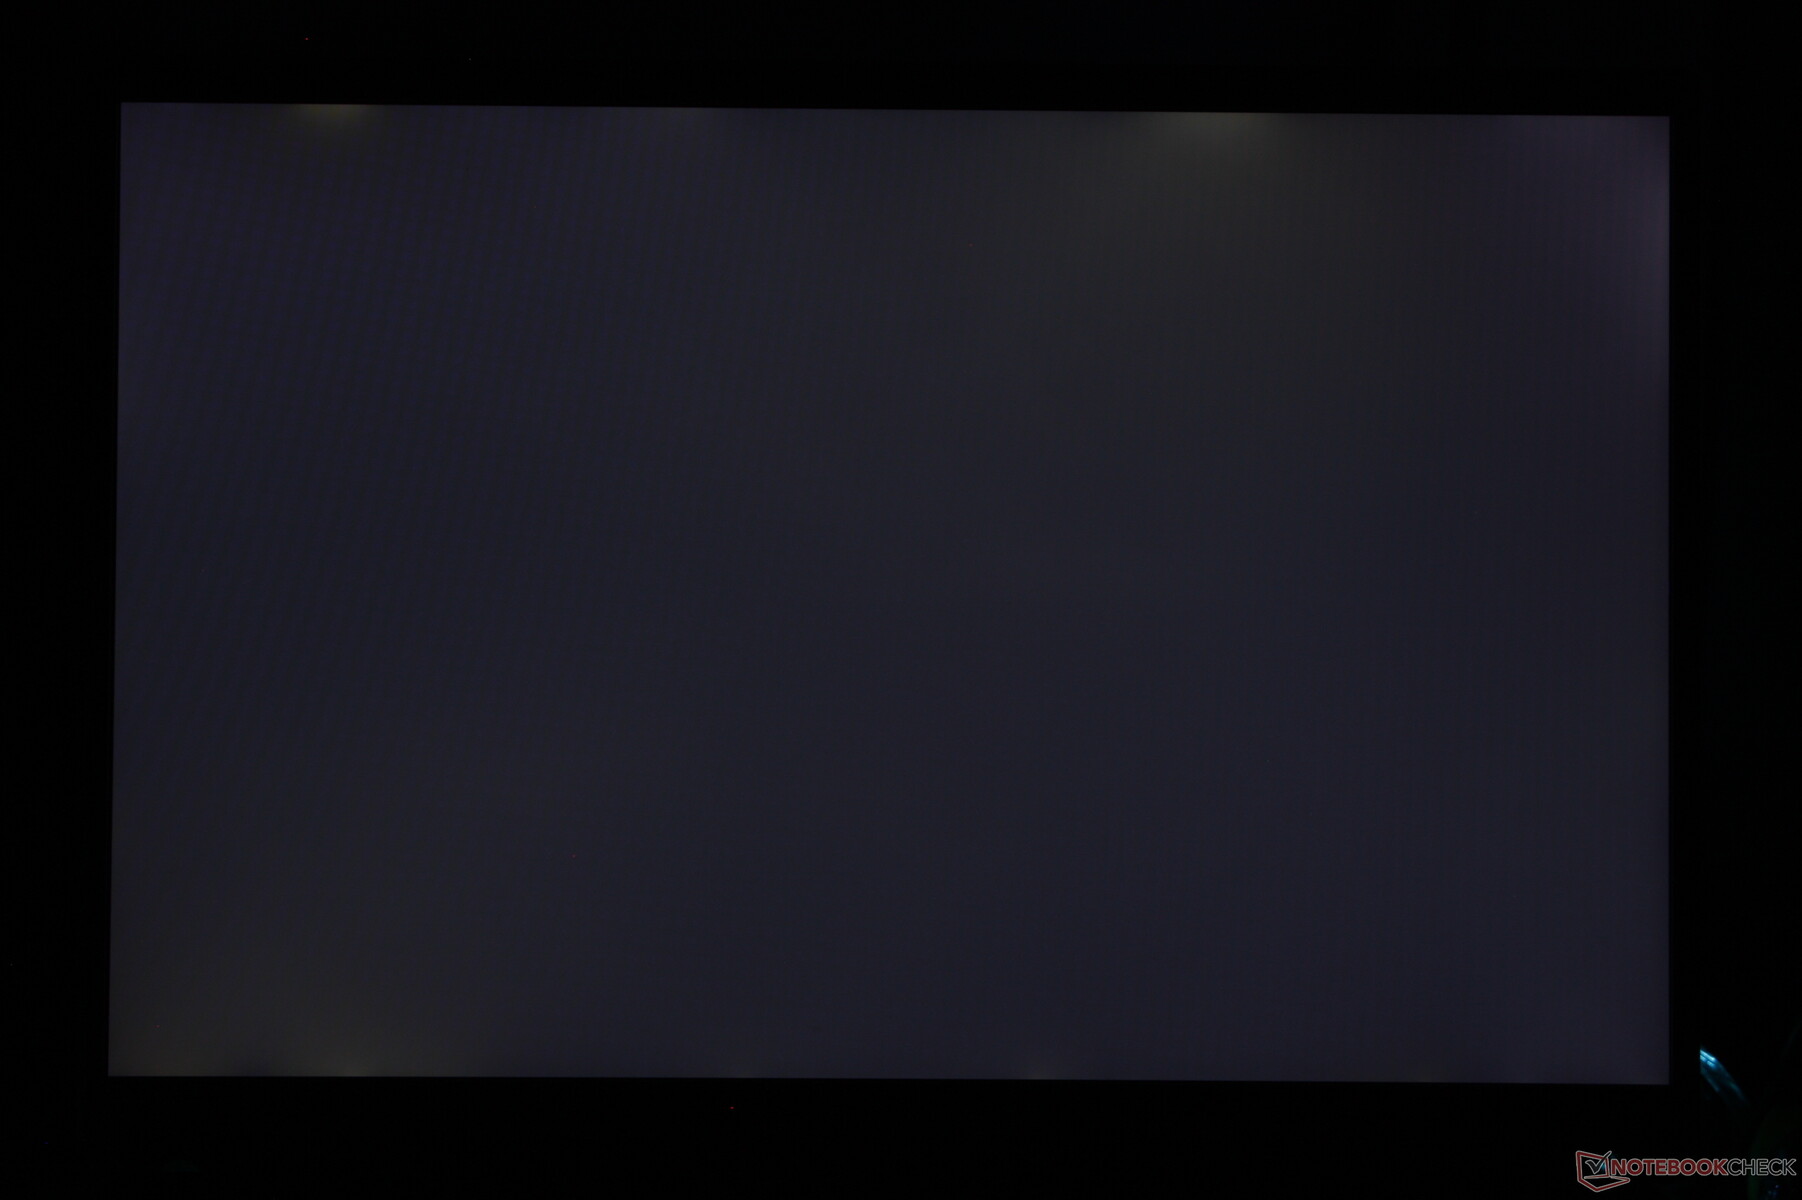
iluminación: 97 %
Brillo con batería: 372.8 cd/m²
Contraste: 1165:1 (Negro: 0.32 cd/m²)
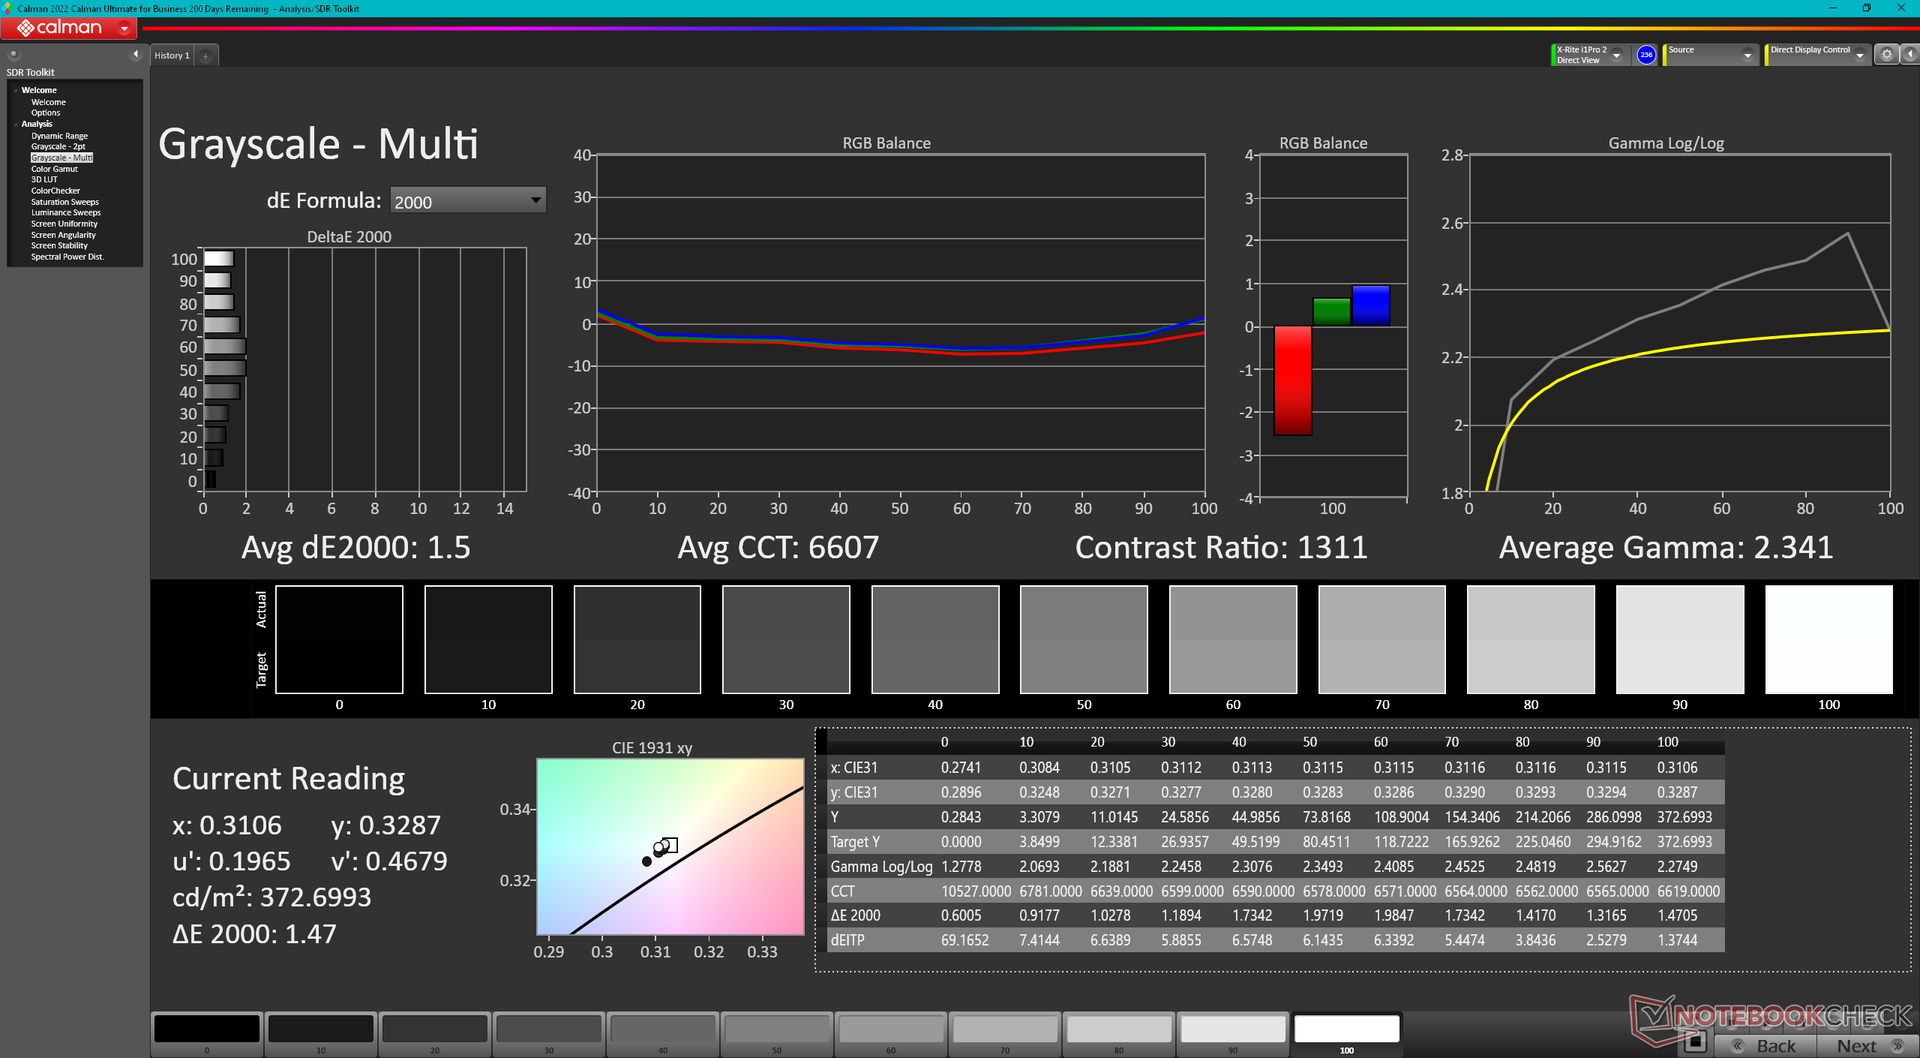
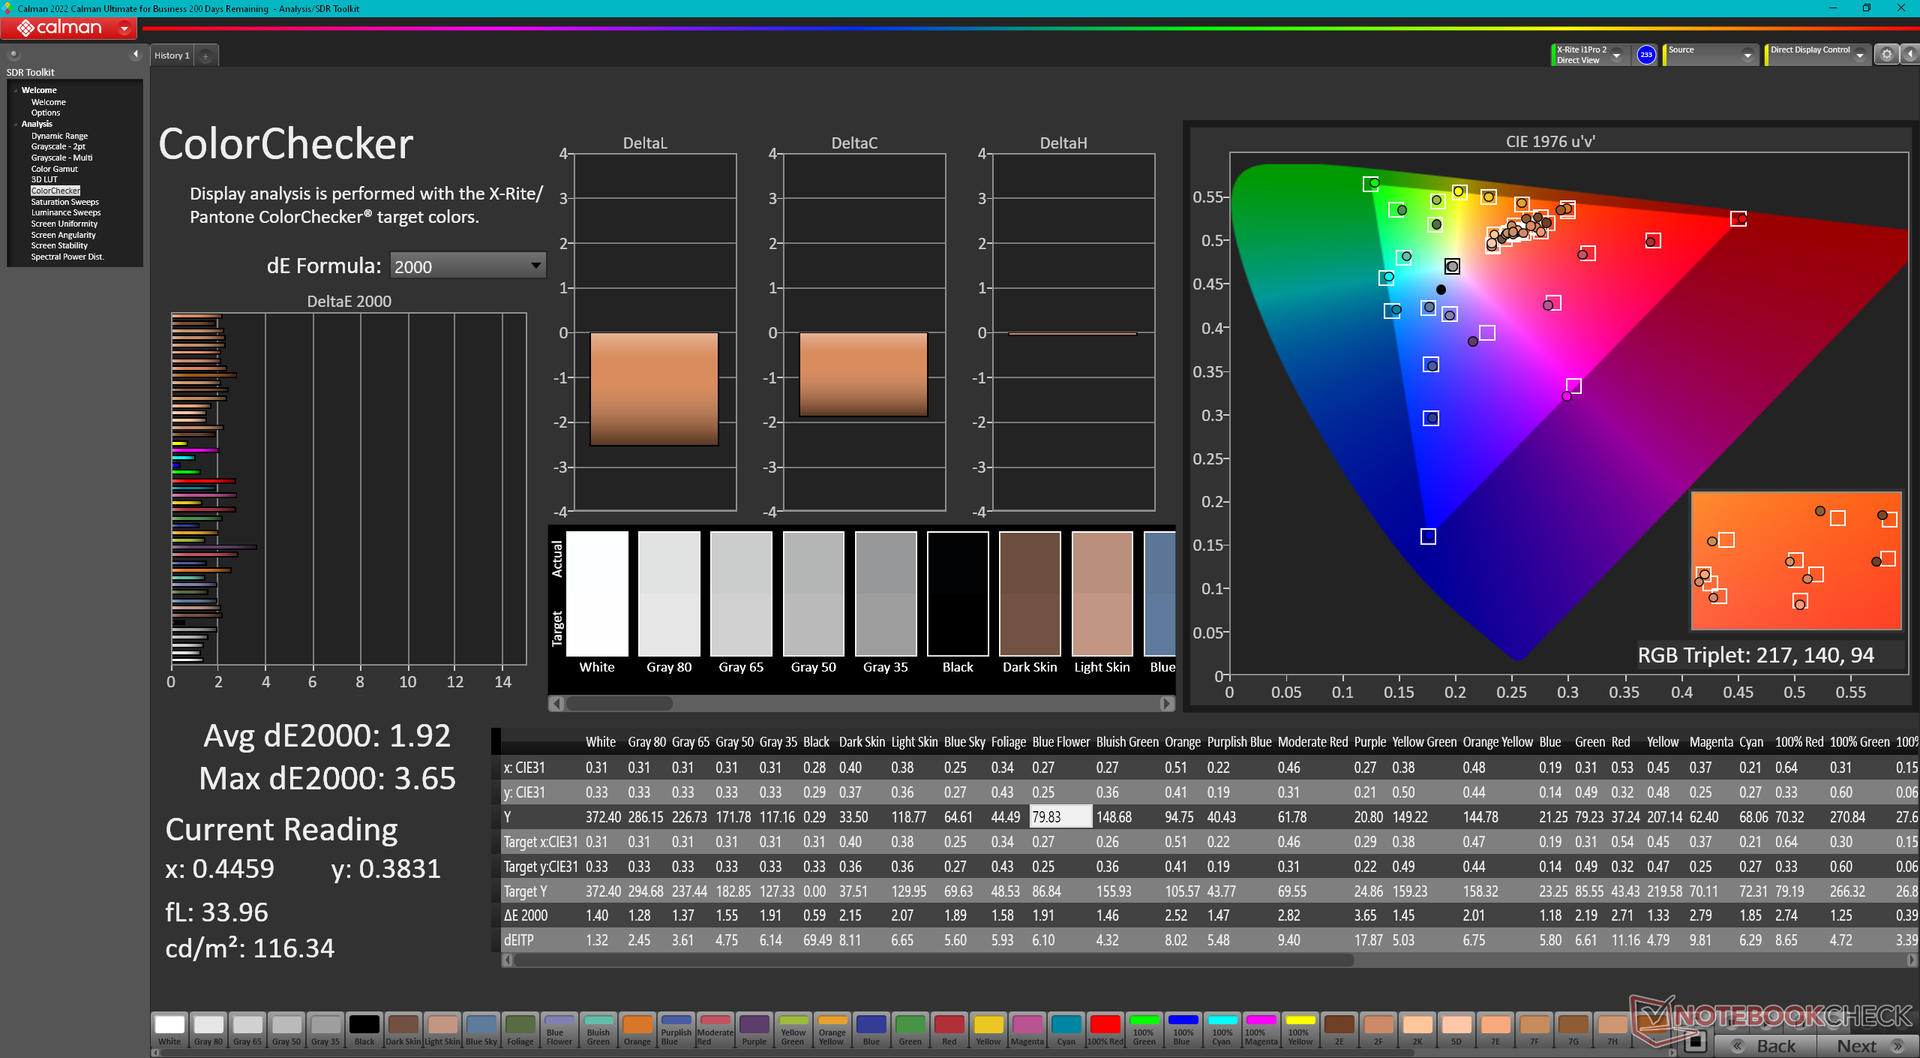
ΔE ColorChecker Calman: 1.92 | ∀{0.5-29.43 Ø4.72}
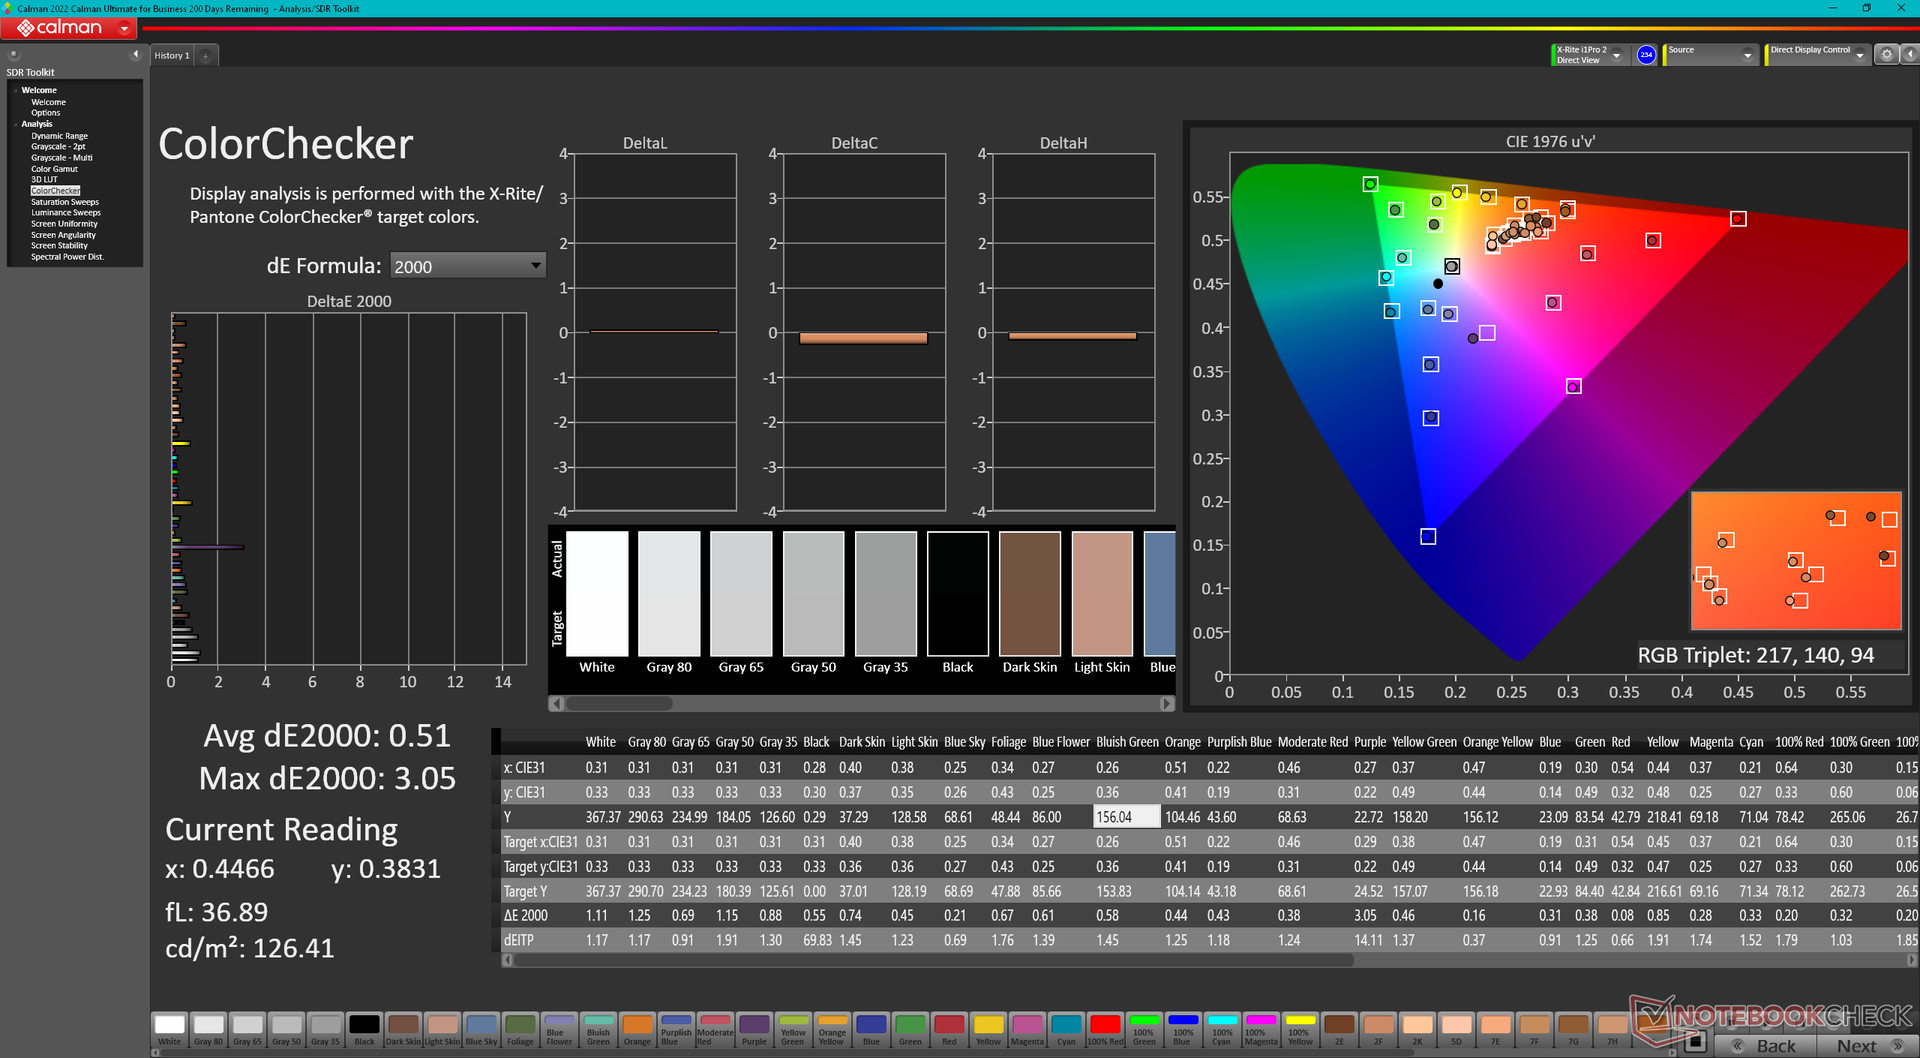
calibrated: 0.51
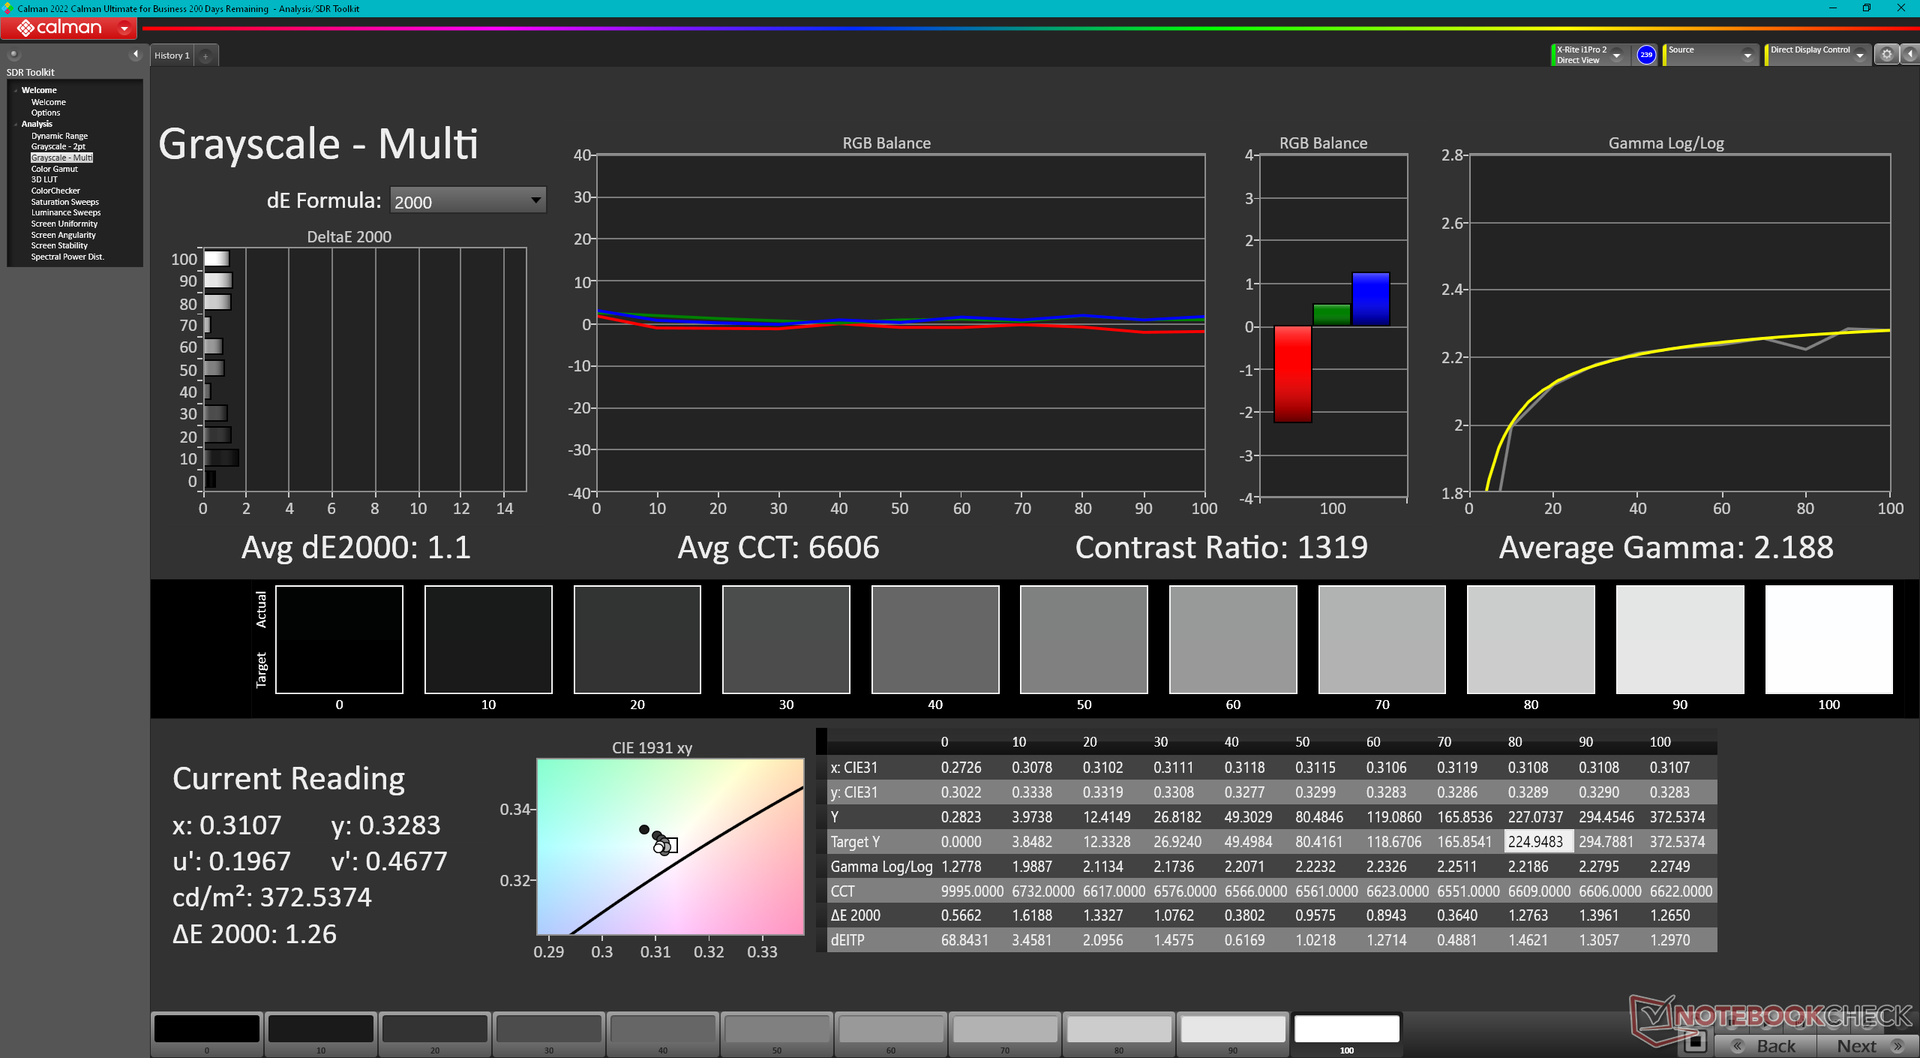
ΔE Greyscale Calman: 1.5 | ∀{0.09-98 Ø4.97}
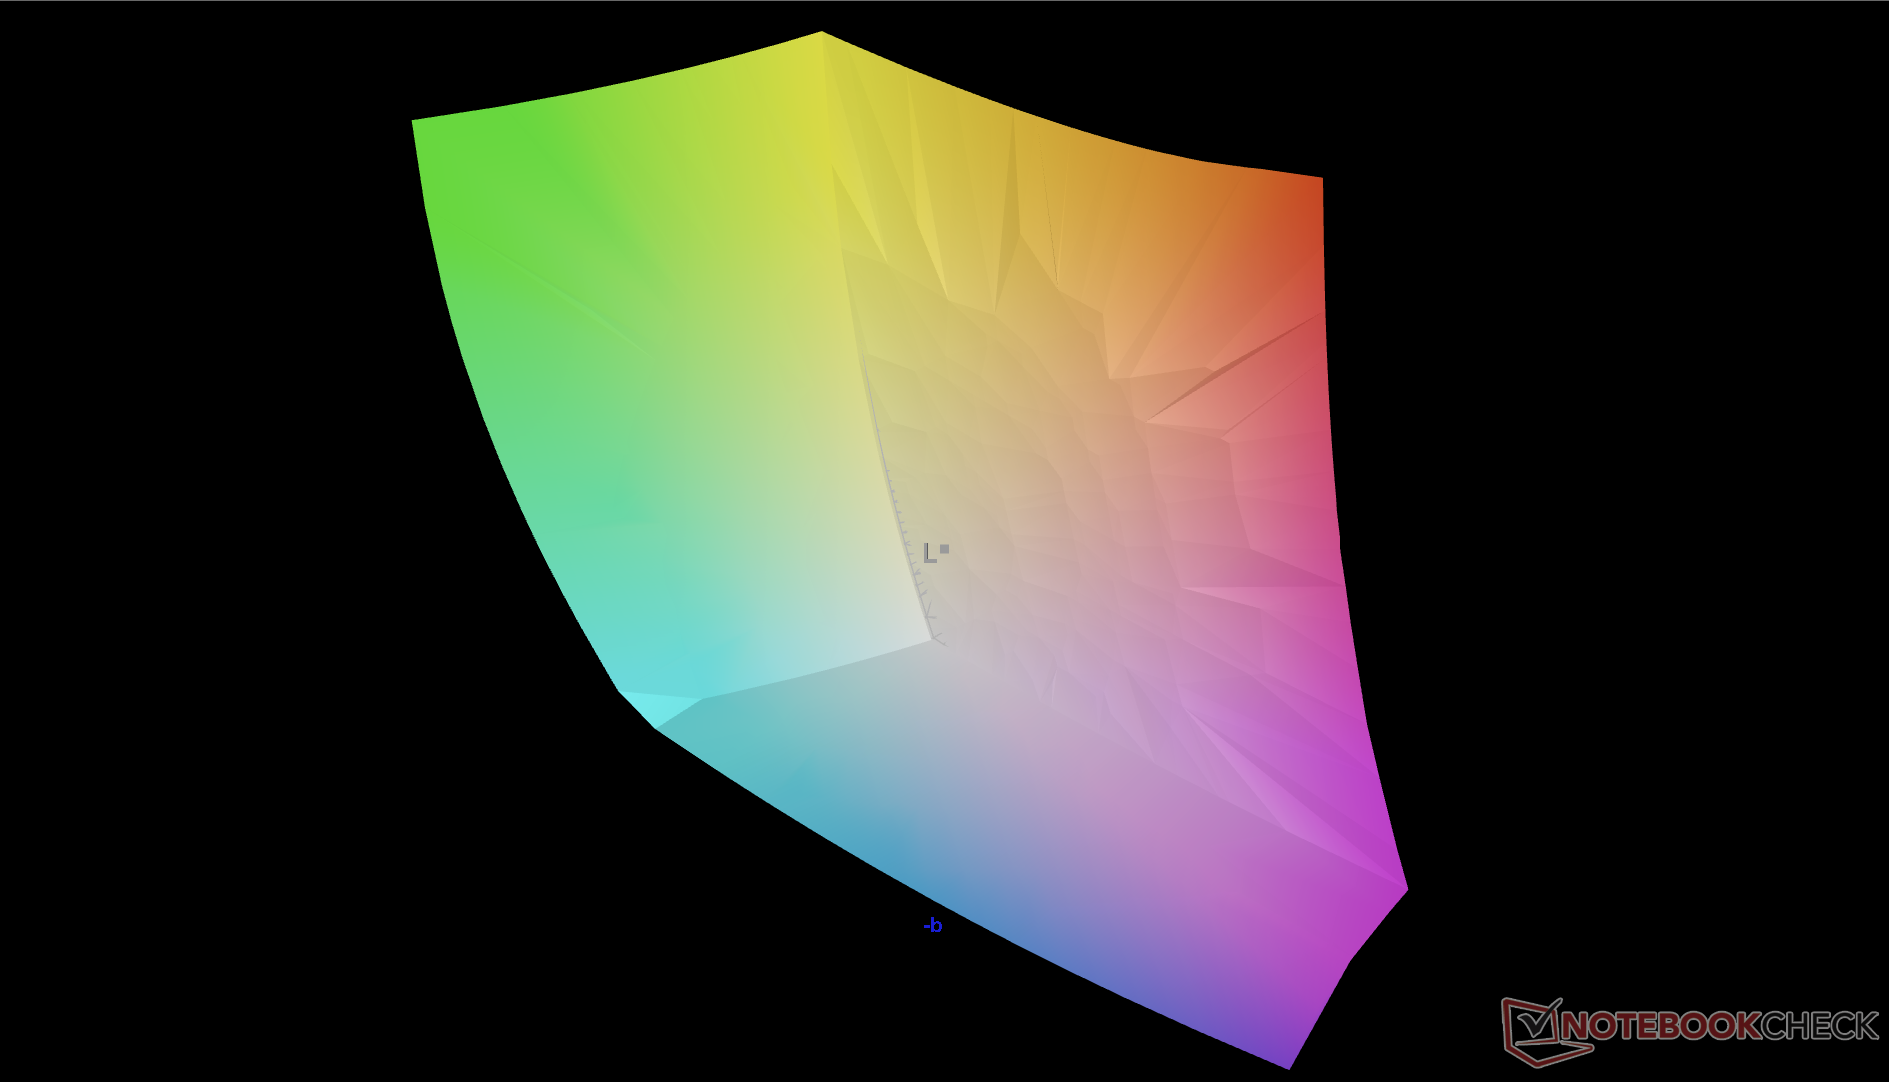
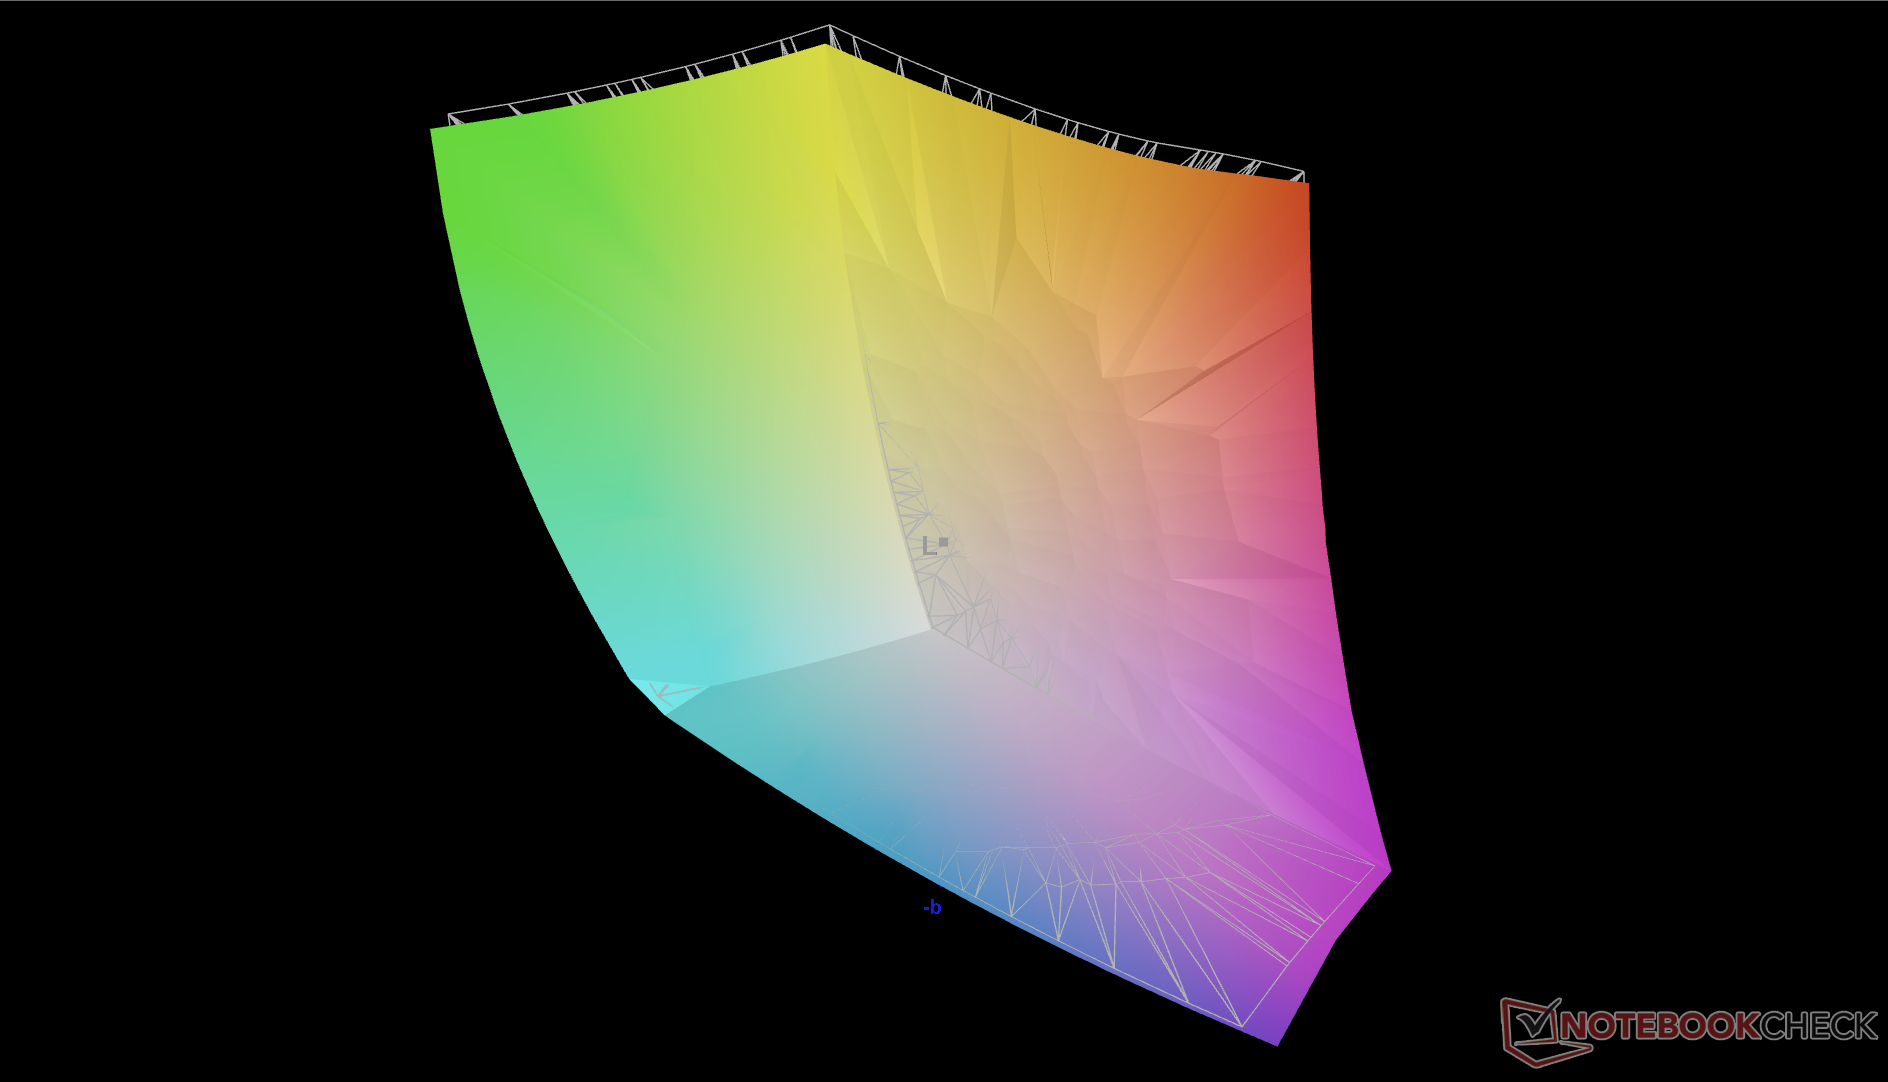
89.8% AdobeRGB 1998 (Argyll 3D)
100% sRGB (Argyll 3D)
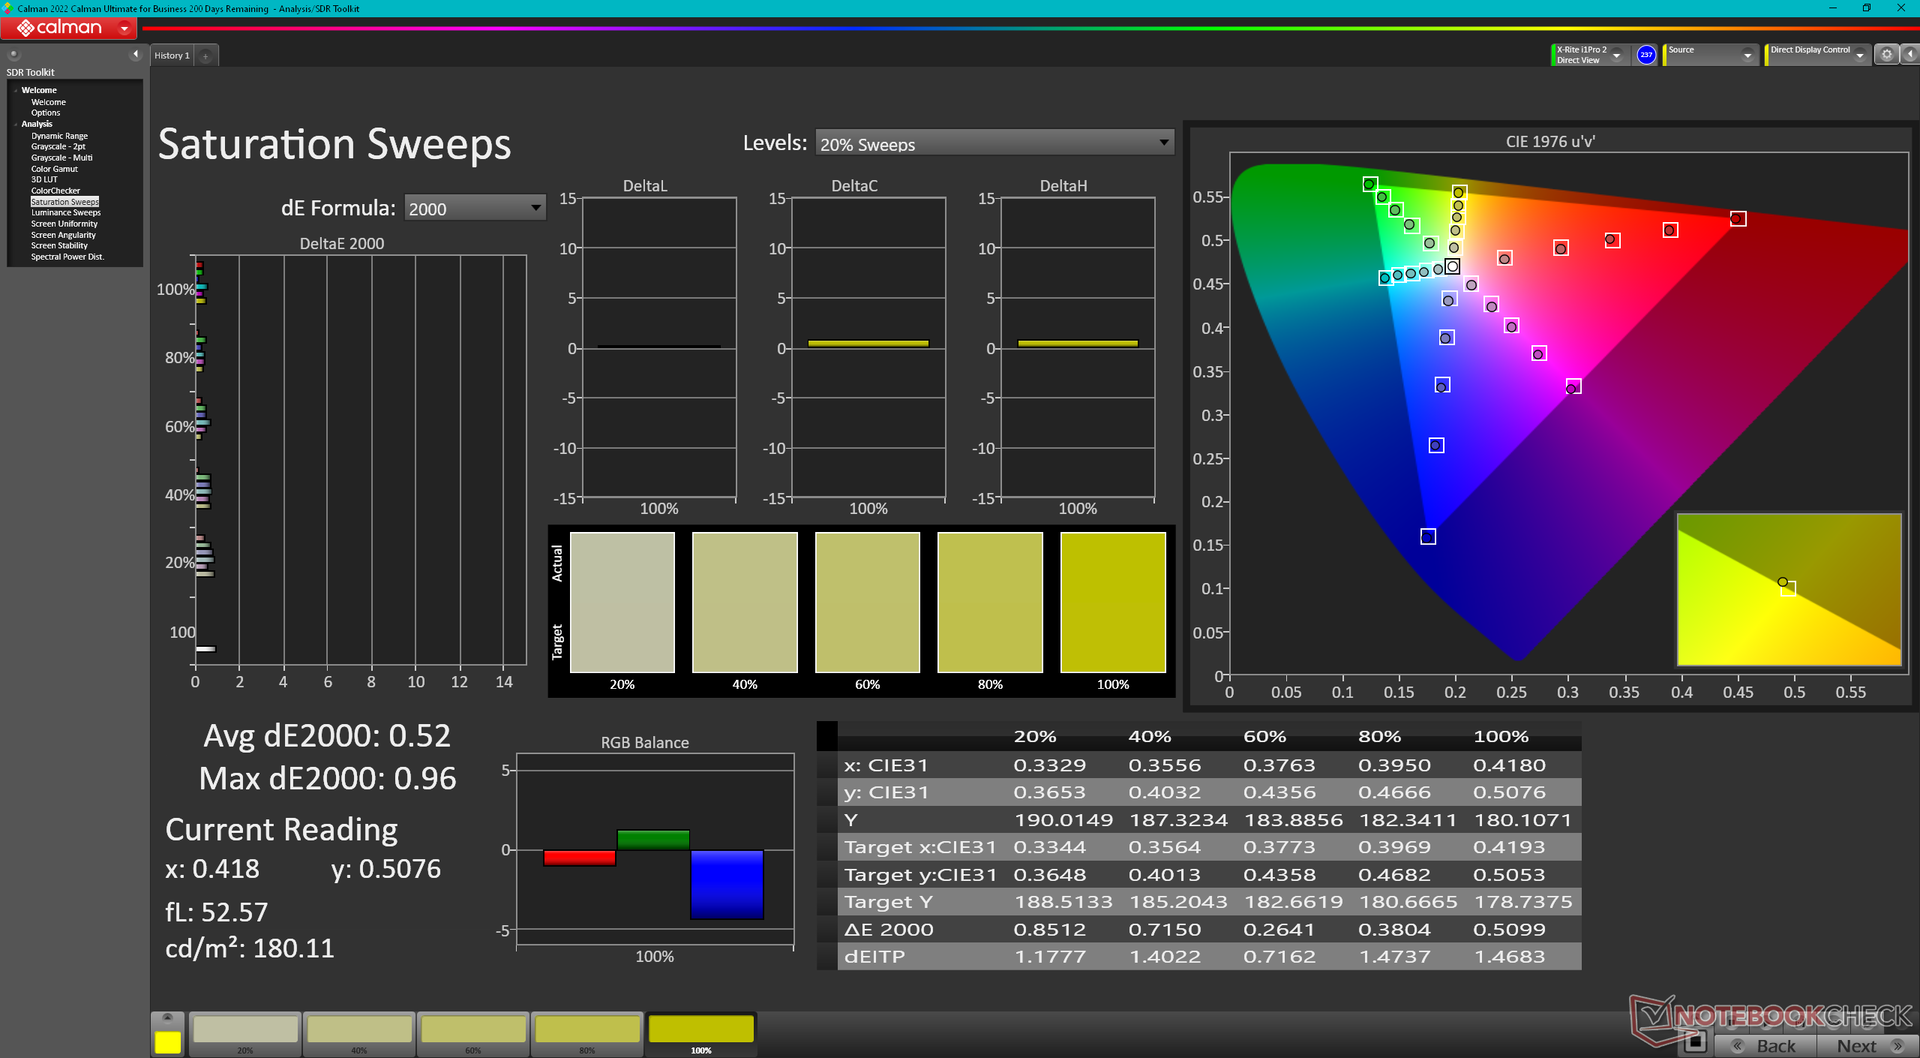
97.7% Display P3 (Argyll 3D)
Gamma: 2.34
CCT: 6607 K
| Alienware m18 R1 Chi Mei 180JME, IPS, 1920x1200, 18" | Razer Blade 18 RTX 4070 AU Optronics B180QAN01.0, IPS, 2560x1600, 18" | Asus ROG Strix Scar 18 2023 G834JY-N6005W NE180QDM-NZ2, IPS, 2560x1600, 18" | Eluktronics Mech-17 GP2 BOE NE170QDM-NZ1, IPS, 2560x1600, 17" | MSI Titan GT77 HX 13VI B173ZAN06.C, Mini-LED, 3840x2160, 17.3" | Alienware x17 R2 P48E AU Optronics B173HAN, IPS, 1920x1080, 17.3" | |
|---|---|---|---|---|---|---|
| Display | -2% | -2% | -17% | 0% | -10% | |
| Display P3 Coverage (%) | 97.7 | 96.9 -1% | 97.2 -1% | 69.1 -29% | 94.9 -3% | 79.2 -19% |
| sRGB Coverage (%) | 100 | 99.8 0% | 99.9 0% | 99.7 0% | 99.9 0% | 99.8 0% |
| AdobeRGB 1998 Coverage (%) | 89.8 | 85.3 -5% | 84.9 -5% | 69.8 -22% | 92.4 3% | 79.6 -11% |
| Response Times | -11% | -34% | -148% | -675% | -153% | |
| Response Time Grey 50% / Grey 80% * (ms) | 3 ? | 4.2 ? -40% | 5.41 ? -80% | 12 ? -300% | 38.4 ? -1180% | 12.4 ? -313% |
| Response Time Black / White * (ms) | 9.9 ? | 8 ? 19% | 8.62 ? 13% | 9.4 ? 5% | 26.6 ? -169% | 9.2 ? 7% |
| PWM Frequency (Hz) | 2380 ? | |||||
| Screen | -68% | -141% | -17% | 57715% | -48% | |
| Brightness middle (cd/m²) | 372.8 | 549.6 47% | 490 31% | 417.3 12% | 606 63% | 365.4 -2% |
| Brightness (cd/m²) | 367 | 524 43% | 468 28% | 387 5% | 602 64% | 344 -6% |
| Brightness Distribution (%) | 97 | 89 -8% | 86 -11% | 87 -10% | 93 -4% | 85 -12% |
| Black Level * (cd/m²) | 0.32 | 0.53 -66% | 0.54 -69% | 0.42 -31% | 0.0001 100% | 0.29 9% |
| Contrast (:1) | 1165 | 1037 -11% | 907 -22% | 994 -15% | 6060000 520072% | 1260 8% |
| Colorchecker dE 2000 * | 1.92 | 3.32 -73% | 4.97 -159% | 2.14 -11% | 4.8 -150% | 3.17 -65% |
| Colorchecker dE 2000 max. * | 3.65 | 6.63 -82% | 11.02 -202% | 4.09 -12% | 8.2 -125% | 7.69 -111% |
| Colorchecker dE 2000 calibrated * | 0.51 | 2.7 -429% | 2.97 -482% | 0.42 18% | 1.8 -253% | 0.51 -0% |
| Greyscale dE 2000 * | 1.5 | 2 -33% | 7.2 -380% | 3.1 -107% | 6.5 -333% | 5.3 -253% |
| Gamma | 2.34 94% | 2.29 96% | 2.161 102% | 2.19 100% | 2.63 84% | 2.18 101% |
| CCT | 6607 98% | 6319 103% | 6515 100% | 6040 108% | 6596 99% | 5879 111% |
| Media total (Programa/Opciones) | -27% /
-46% | -59% /
-96% | -61% /
-36% | 19013% /
37006% | -70% /
-55% |
* ... más pequeño es mejor
La pantalla viene precalibrada de fábrica para ofrecer colores y escala de grises precisos. Calibrar el panel nosotros mismos no mejoraría significativamente los valores medios de deltaE, por lo que no es necesaria una calibración por parte del usuario final.

Tiempos de respuesta del display
| ↔ Tiempo de respuesta de Negro a Blanco | ||
|---|---|---|
| 9.9 ms ... subida ↗ y bajada ↘ combinada | ↗ 5.4 ms subida | 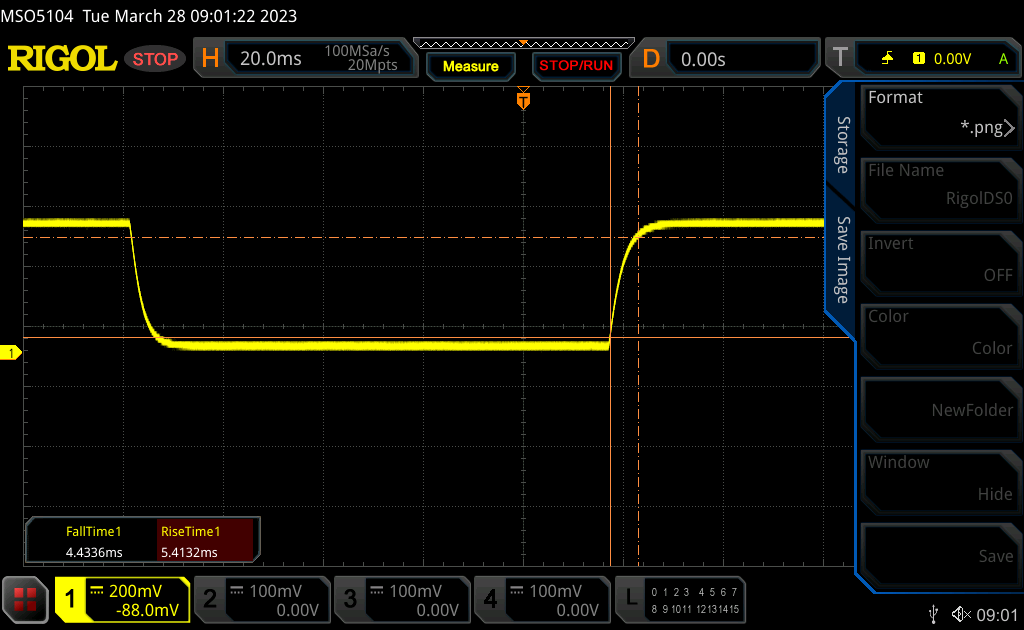 |
| ↘ 4.5 ms bajada | ||
| La pantalla mostró tiempos de respuesta rápidos en nuestros tests y debería ser adecuada para juegos. En comparación, todos los dispositivos de prueba van de ##min### (mínimo) a 240 (máximo) ms. » 27 % de todos los dispositivos son mejores. Esto quiere decir que el tiempo de respuesta medido es mejor que la media (19.8 ms) de todos los dispositivos testados. | ||
| ↔ Tiempo de respuesta 50% Gris a 80% Gris | ||
| 3 ms ... subida ↗ y bajada ↘ combinada | ↗ 1.5 ms subida | 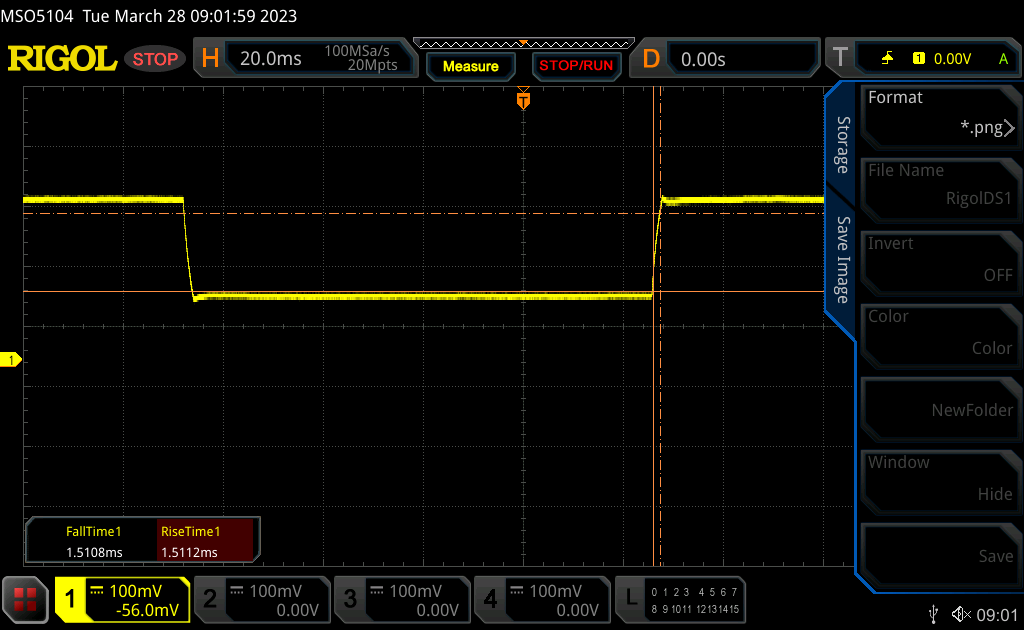 |
| ↘ 1.5 ms bajada | ||
| La pantalla mostró tiempos de respuesta muy rápidos en nuestros tests y debería ser adecuada para juegos frenéticos. En comparación, todos los dispositivos de prueba van de ##min### (mínimo) a 636 (máximo) ms. » 13 % de todos los dispositivos son mejores. Esto quiere decir que el tiempo de respuesta medido es mejor que la media (31 ms) de todos los dispositivos testados. | ||
Parpadeo de Pantalla / PWM (Pulse-Width Modulation)
| Parpadeo de Pantalla / PWM no detectado | 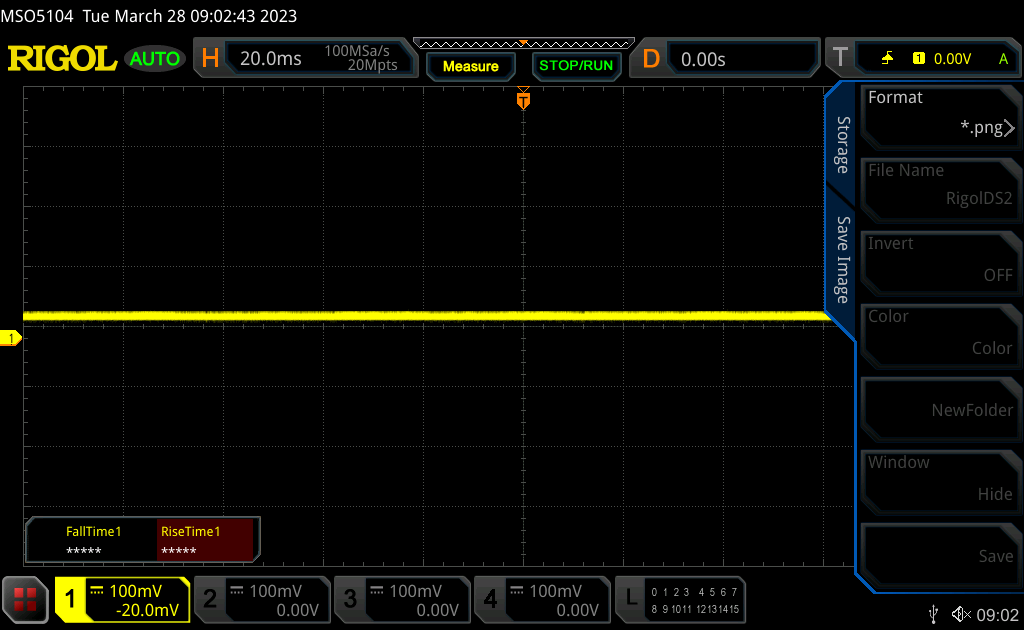 | ||
Comparación: 52 % de todos los dispositivos testados no usaron PWM para atenuar el display. Si se usó, medimos una media de 7769 (mínimo: 5 - máxmo: 343500) Hz. | |||
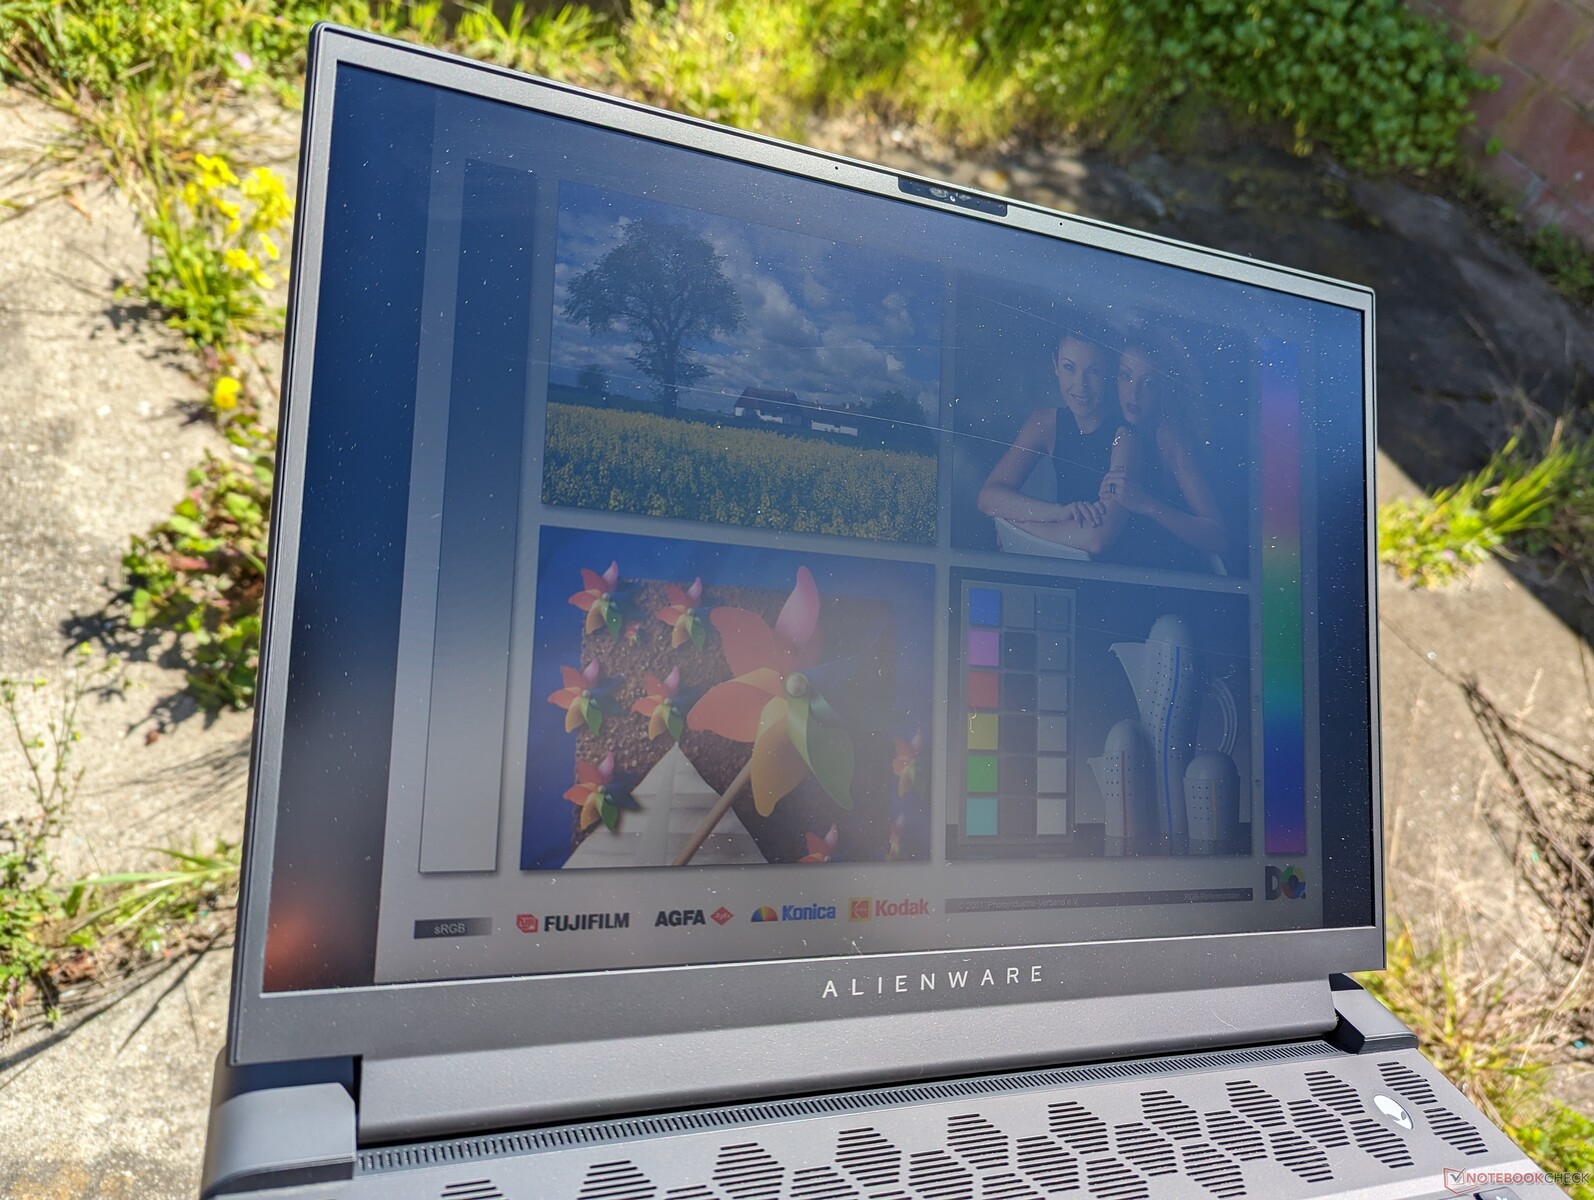
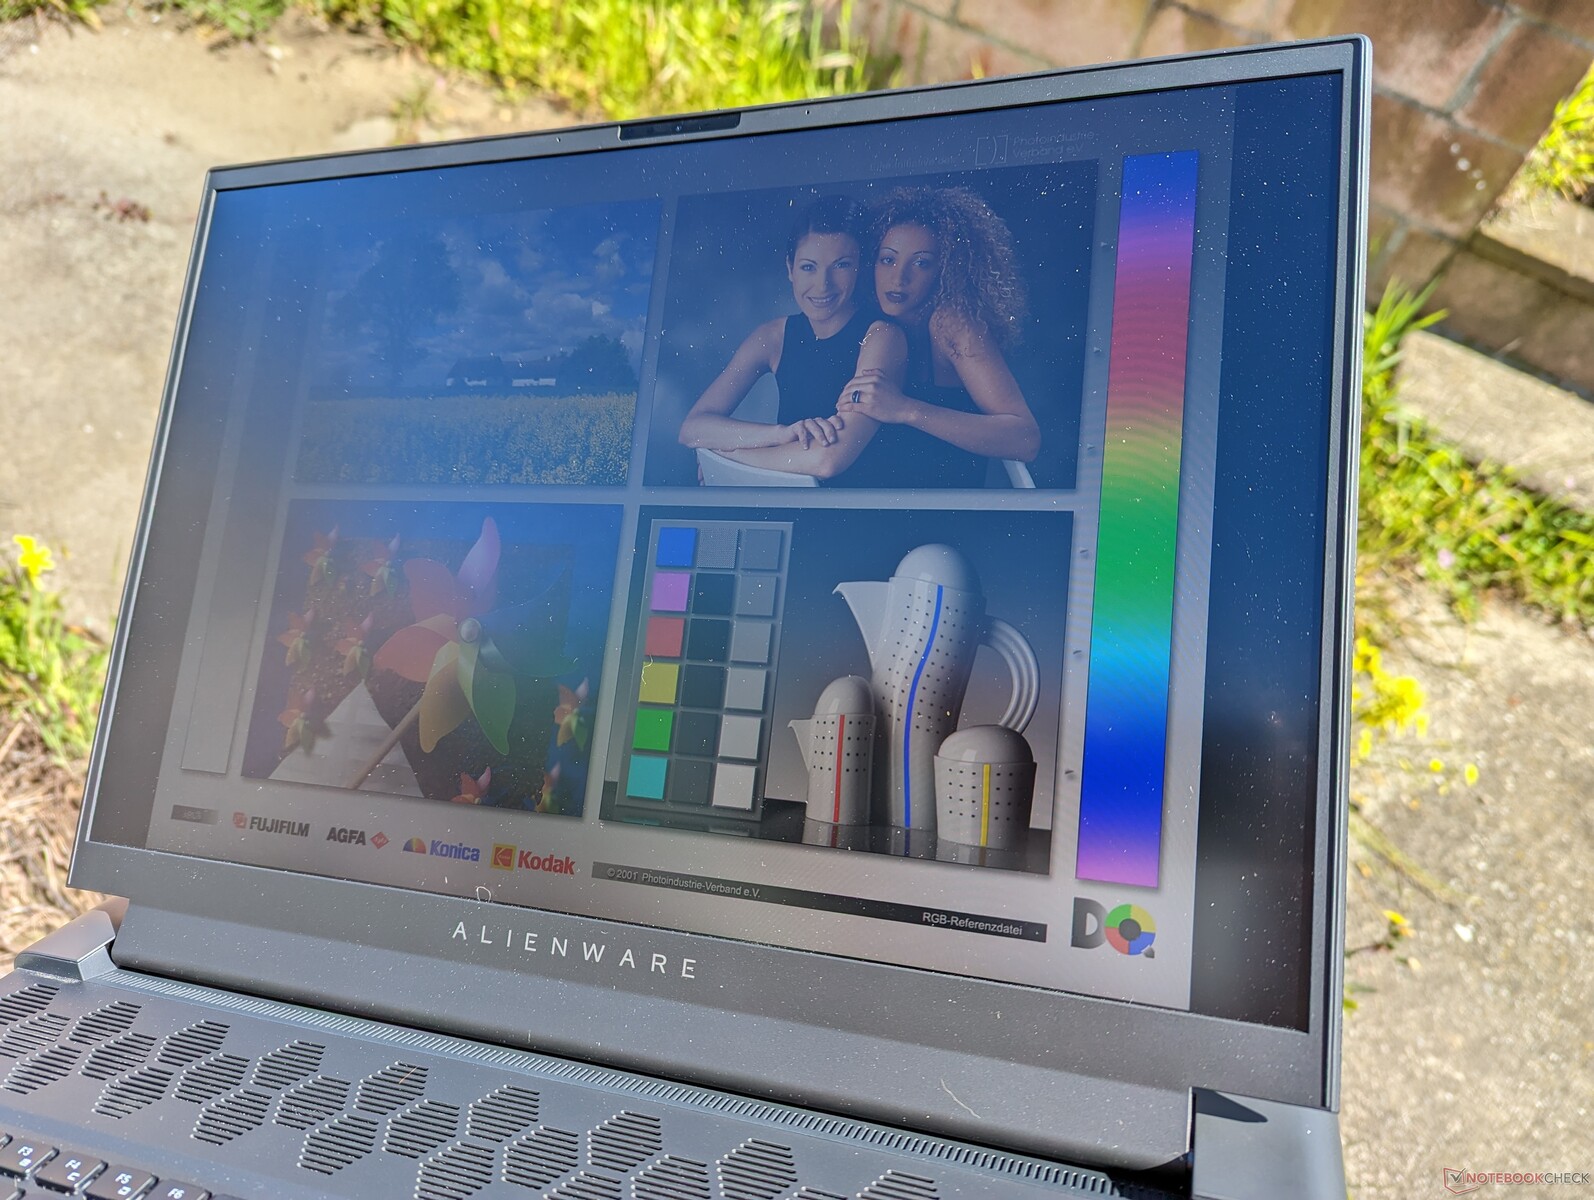
La visibilidad en exteriores es media para la categoría, ya que las pantallas de la mayoría de portátiles para juegos suelen oscilar entre 300 y 400 nits. Aun así, el inmenso peso del Alienware desaconseja su uso en exteriores. El Blade 18 y el Titan GT77 son más brillantes para una mejor visibilidad en exteriores.
Rendimiento - Intel 13ª generación + Nvidia Ada Lovelace
Condiciones de ensayo
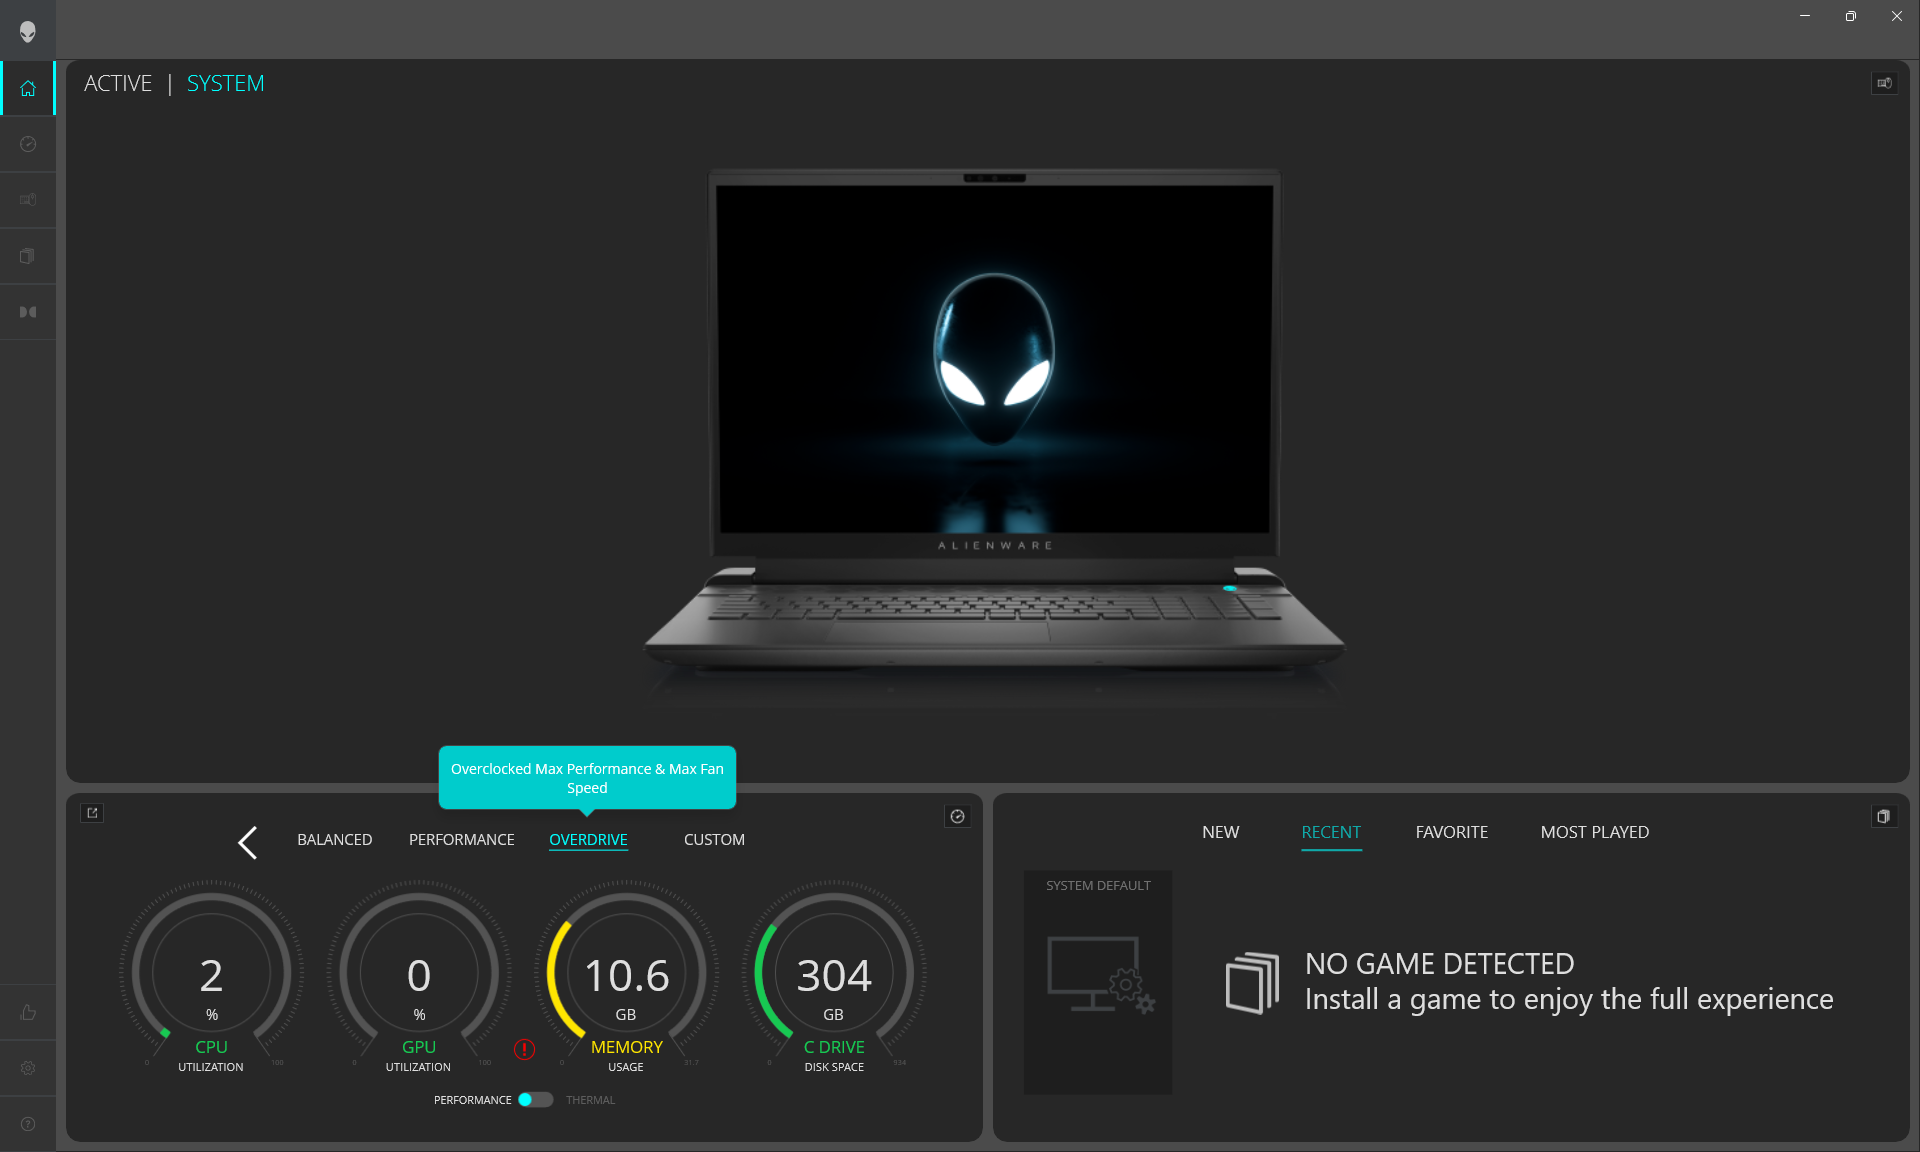
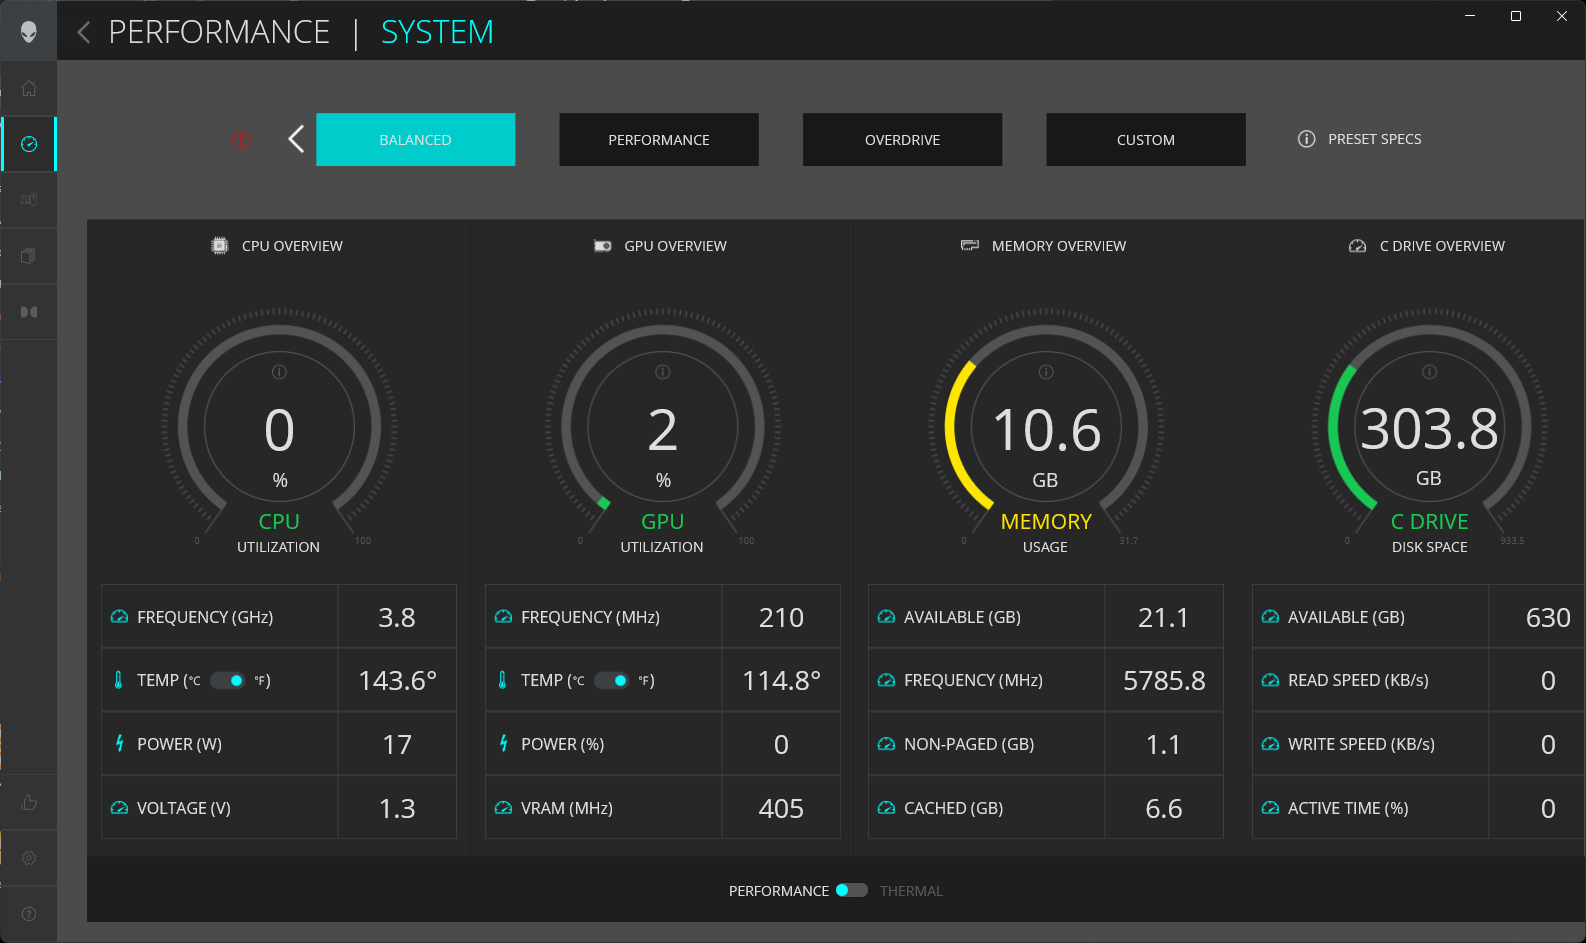
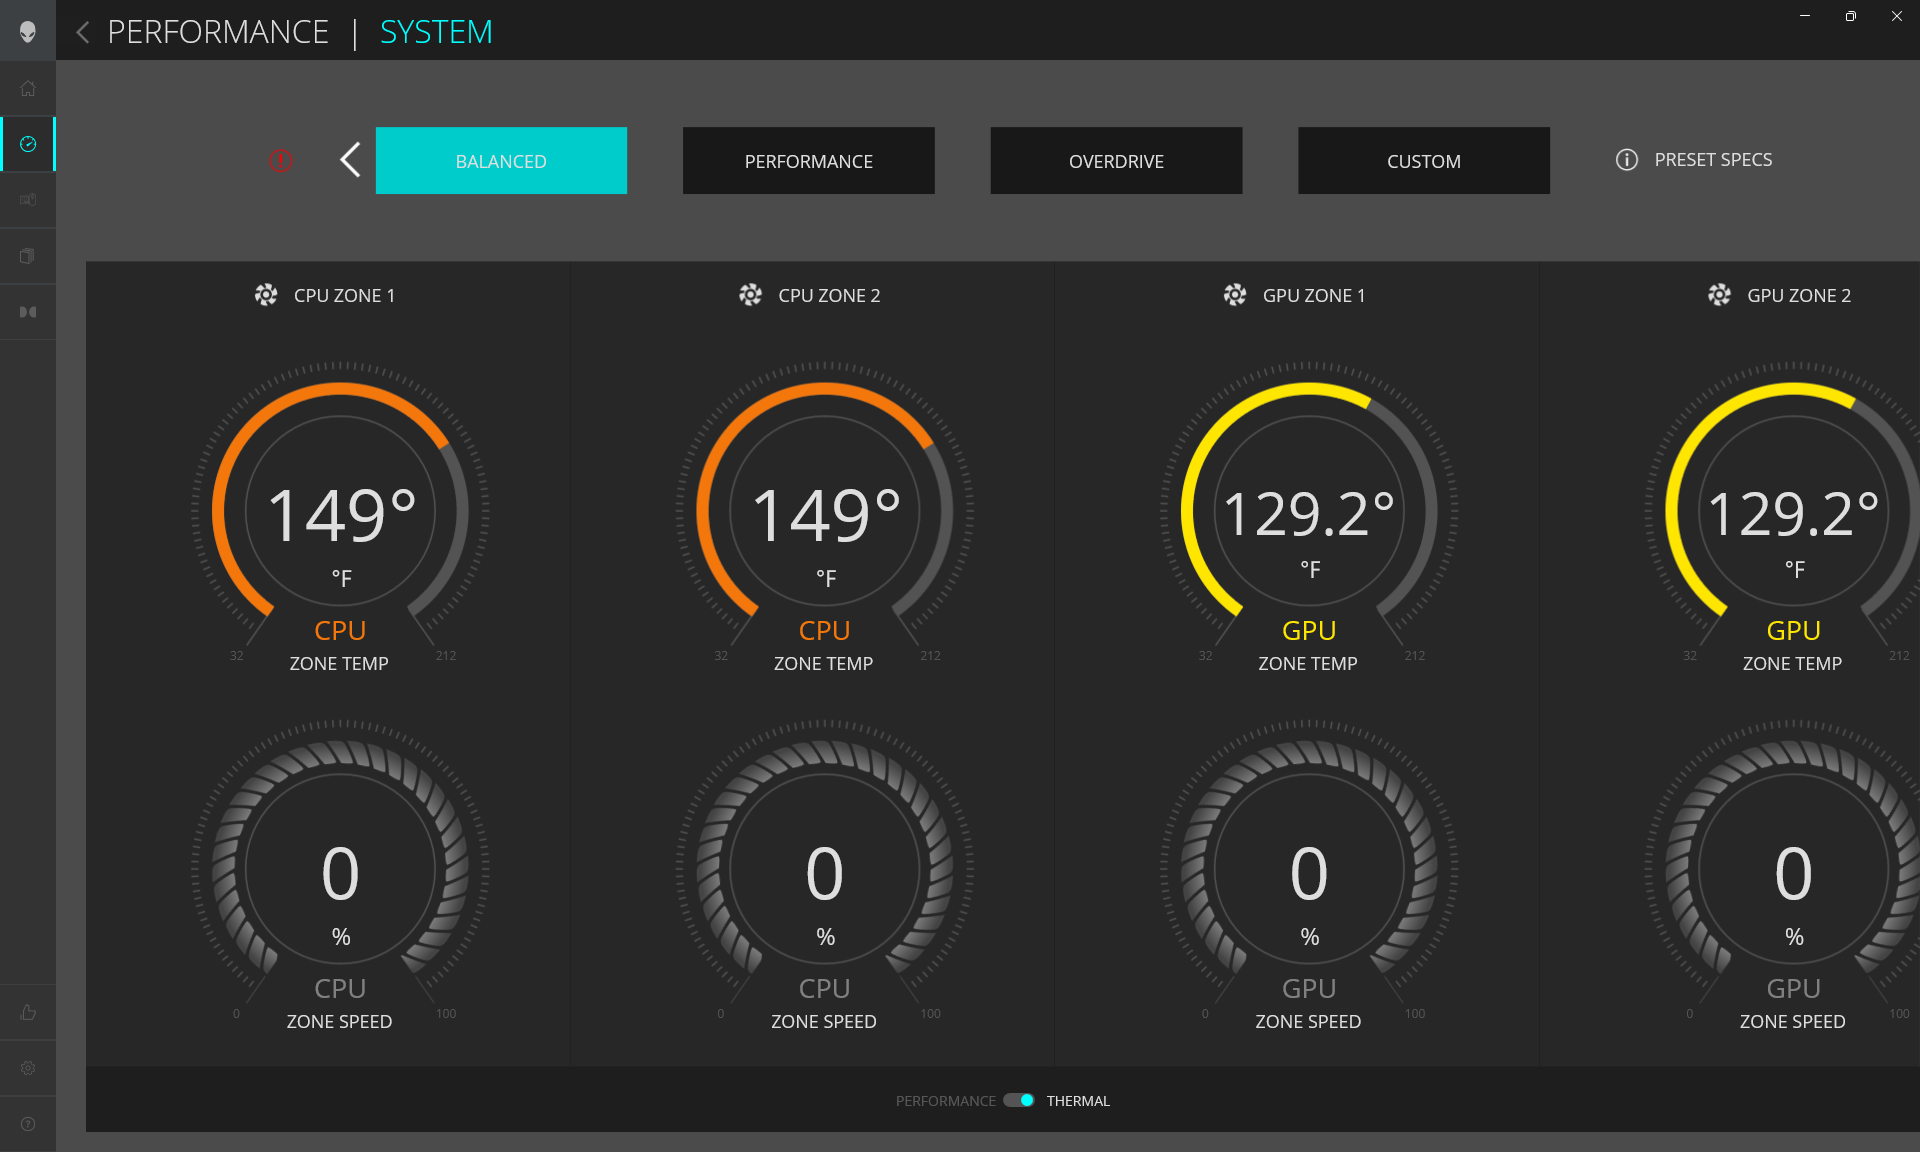
Pusimos nuestra unidad en modo Rendimiento a través de Windows, en modo GPU discreta a través del Panel de Control Nvidia, y en modo Overdrive a través del Centro de Comandos Alienware antes de ejecutar los benchmarks a continuación. Dell ha renovado completamente el software del Centro de Comandos este año para que sea más fácil de usar y con tamaños de fuente más grandes que antes. Sigue cargando muy lentamente, sin embargo, especialmente cuando se compara con el más rápido MSI Center o los equivalentes Schenker Control Center.
Hemos experimentado un par de errores con Alienware Command Center que vale la pena mencionar incluso después de actualizar a la última versión en el momento de escribir. Primero, el software falla al cargar si se conecta un monitor externo. Segundo, los ventiladores internos a veces continuaban funcionando muy fuerte incluso cuando el sistema está durmiendo o hibernando en los modos Rendimiento u Overdrive.
Optimus Avanzado está soportado, lo que significa que los usuarios pueden cambiar entre los modos GPU discreta y Optimus a través del Panel de Control de Nvidia sin necesidad de reiniciar. G-Sync sólo está disponible en el modo dGPU, mientras que Optimus se activa automáticamente si se conecta un monitor externo.
Procesador
El rendimiento del procesador es uno de los más rápidos de cualquier CPU móvil actualmente en el mercado. Los usuarios pueden esperar aumentos de rendimiento en un solo subproceso y en varios subprocesos de aproximadamente un 10 y un 75 por ciento, respectivamente, con respecto al procesador de 12ª generaciónCore i9-12900HK en el antiguo Alienware x17 R2. El principal competidor Zen 4 de AMD, elRyzen 9 7945HX se queda corto en cargas de un solo subproceso entre un 10 y un 15 por ciento.
A pesar del enorme salto de rendimiento respecto a Alder Lake-H, las diferencias de rendimiento entre elCore i9-13900HX,Core i9-13950HXy elCore i9-13980HX son muy pequeñas, por debajo del 5 por ciento. Por tanto, si te dan a elegir entre las tres CPU, puede que quieras ahorrar algo de pasta optando por la "más lenta" i9-13900HX.
La opción de CPU más baja disponible es el Core i7-13700HX que es un 33% más lento que nuestro i9-13980HX.
Cinebench R15 Multi Loop
Cinebench R23: Multi Core | Single Core
Cinebench R20: CPU (Multi Core) | CPU (Single Core)
Cinebench R15: CPU Multi 64Bit | CPU Single 64Bit
Blender: v2.79 BMW27 CPU
7-Zip 18.03: 7z b 4 | 7z b 4 -mmt1
Geekbench 5.5: Multi-Core | Single-Core
HWBOT x265 Benchmark v2.2: 4k Preset
LibreOffice : 20 Documents To PDF
R Benchmark 2.5: Overall mean
* ... más pequeño es mejor
AIDA64: FP32 Ray-Trace | FPU Julia | CPU SHA3 | CPU Queen | FPU SinJulia | FPU Mandel | CPU AES | CPU ZLib | FP64 Ray-Trace | CPU PhotoWorxx
| Performance rating | |
| Alienware m18 R1 | |
| Eluktronics Mech-17 GP2 | |
| MSI Titan GT77 HX 13VI | |
| Asus ROG Strix Scar 18 2023 G834JY-N6005W | |
| Medio Intel Core i9-13980HX | |
| Razer Blade 18 RTX 4070 | |
| Alienware x17 R2 P48E | |
| AIDA64 / FP32 Ray-Trace | |
| Alienware m18 R1 | |
| MSI Titan GT77 HX 13VI | |
| Asus ROG Strix Scar 18 2023 G834JY-N6005W | |
| Eluktronics Mech-17 GP2 | |
| Medio Intel Core i9-13980HX (21332 - 29553, n=9) | |
| Razer Blade 18 RTX 4070 | |
| Alienware x17 R2 P48E | |
| AIDA64 / FPU Julia | |
| Alienware m18 R1 | |
| MSI Titan GT77 HX 13VI | |
| Asus ROG Strix Scar 18 2023 G834JY-N6005W | |
| Medio Intel Core i9-13980HX (108001 - 148168, n=9) | |
| Eluktronics Mech-17 GP2 | |
| Razer Blade 18 RTX 4070 | |
| Alienware x17 R2 P48E | |
| AIDA64 / CPU SHA3 | |
| Alienware m18 R1 | |
| MSI Titan GT77 HX 13VI | |
| Eluktronics Mech-17 GP2 | |
| Asus ROG Strix Scar 18 2023 G834JY-N6005W | |
| Medio Intel Core i9-13980HX (5264 - 7142, n=9) | |
| Razer Blade 18 RTX 4070 | |
| Alienware x17 R2 P48E | |
| AIDA64 / CPU Queen | |
| Alienware m18 R1 | |
| Asus ROG Strix Scar 18 2023 G834JY-N6005W | |
| Eluktronics Mech-17 GP2 | |
| MSI Titan GT77 HX 13VI | |
| Medio Intel Core i9-13980HX (126758 - 143409, n=9) | |
| Razer Blade 18 RTX 4070 | |
| Alienware x17 R2 P48E | |
| AIDA64 / FPU SinJulia | |
| Eluktronics Mech-17 GP2 | |
| Asus ROG Strix Scar 18 2023 G834JY-N6005W | |
| MSI Titan GT77 HX 13VI | |
| Alienware m18 R1 | |
| Medio Intel Core i9-13980HX (13785 - 17117, n=9) | |
| Razer Blade 18 RTX 4070 | |
| Alienware x17 R2 P48E | |
| AIDA64 / FPU Mandel | |
| Alienware m18 R1 | |
| MSI Titan GT77 HX 13VI | |
| Asus ROG Strix Scar 18 2023 G834JY-N6005W | |
| Eluktronics Mech-17 GP2 | |
| Medio Intel Core i9-13980HX (53398 - 73758, n=9) | |
| Razer Blade 18 RTX 4070 | |
| Alienware x17 R2 P48E | |
| AIDA64 / CPU AES | |
| Eluktronics Mech-17 GP2 | |
| MSI Titan GT77 HX 13VI | |
| Alienware m18 R1 | |
| Asus ROG Strix Scar 18 2023 G834JY-N6005W | |
| Medio Intel Core i9-13980HX (105169 - 136520, n=9) | |
| Razer Blade 18 RTX 4070 | |
| Alienware x17 R2 P48E | |
| AIDA64 / CPU ZLib | |
| MSI Titan GT77 HX 13VI | |
| Asus ROG Strix Scar 18 2023 G834JY-N6005W | |
| Alienware m18 R1 | |
| Eluktronics Mech-17 GP2 | |
| Medio Intel Core i9-13980HX (1513 - 2039, n=9) | |
| Razer Blade 18 RTX 4070 | |
| Alienware x17 R2 P48E | |
| AIDA64 / FP64 Ray-Trace | |
| Alienware m18 R1 | |
| MSI Titan GT77 HX 13VI | |
| Asus ROG Strix Scar 18 2023 G834JY-N6005W | |
| Eluktronics Mech-17 GP2 | |
| Medio Intel Core i9-13980HX (11431 - 16325, n=9) | |
| Razer Blade 18 RTX 4070 | |
| Alienware x17 R2 P48E | |
| AIDA64 / CPU PhotoWorxx | |
| Alienware m18 R1 | |
| Razer Blade 18 RTX 4070 | |
| Medio Intel Core i9-13980HX (37069 - 52949, n=9) | |
| Eluktronics Mech-17 GP2 | |
| Asus ROG Strix Scar 18 2023 G834JY-N6005W | |
| MSI Titan GT77 HX 13VI | |
| Alienware x17 R2 P48E | |
Rendimiento del sistema
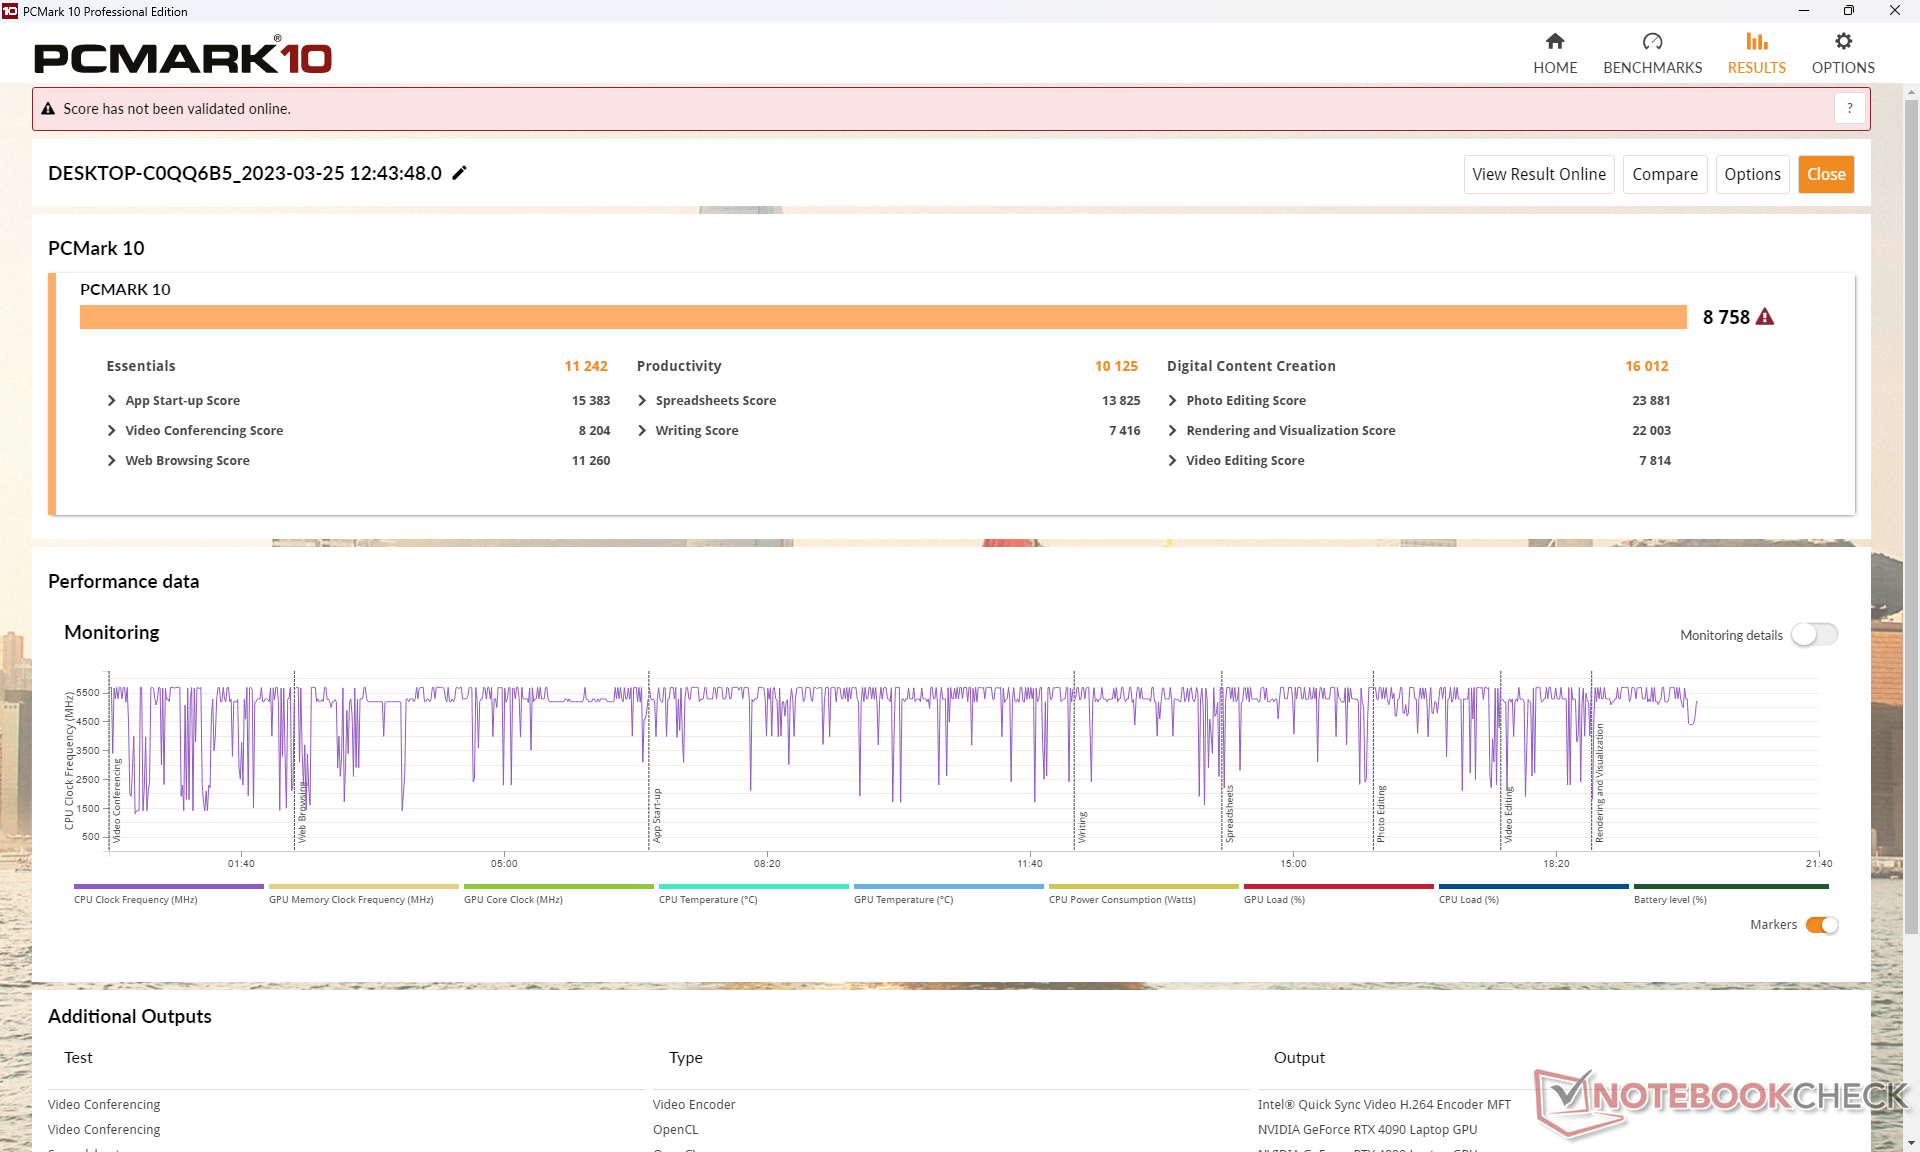
Las puntuaciones en PCMark 10 son comparables a las de otros portátiles para juegos con CPU Intel de 13ª generación y GPU GeForce 40 similares, como elAsus ROG Strix Scar 18 o la MSI Titan GT77 HX. Nuestro Alienware también logra superar al antiguo Alienware x17 R2 con dos SSD Samsung PM9A1 en RAID 0.
CrossMark: Overall | Productivity | Creativity | Responsiveness
| PCMark 10 / Score | |
| Eluktronics Mech-17 GP2 | |
| MSI Titan GT77 HX 13VI | |
| Medio Intel Core i9-13980HX, NVIDIA GeForce RTX 4090 Laptop GPU (8650 - 9068, n=4) | |
| Asus ROG Strix Scar 18 2023 G834JY-N6005W | |
| Alienware m18 R1 | |
| Alienware x17 R2 P48E | |
| Razer Blade 18 RTX 4070 | |
| PCMark 10 / Essentials | |
| Eluktronics Mech-17 GP2 | |
| MSI Titan GT77 HX 13VI | |
| Razer Blade 18 RTX 4070 | |
| Medio Intel Core i9-13980HX, NVIDIA GeForce RTX 4090 Laptop GPU (11215 - 11644, n=3) | |
| Alienware m18 R1 | |
| Alienware x17 R2 P48E | |
| PCMark 10 / Productivity | |
| Eluktronics Mech-17 GP2 | |
| Medio Intel Core i9-13980HX, NVIDIA GeForce RTX 4090 Laptop GPU (10125 - 11067, n=3) | |
| Alienware x17 R2 P48E | |
| Alienware m18 R1 | |
| MSI Titan GT77 HX 13VI | |
| Razer Blade 18 RTX 4070 | |
| PCMark 10 / Digital Content Creation | |
| MSI Titan GT77 HX 13VI | |
| Alienware m18 R1 | |
| Medio Intel Core i9-13980HX, NVIDIA GeForce RTX 4090 Laptop GPU (15052 - 16012, n=3) | |
| Eluktronics Mech-17 GP2 | |
| Alienware x17 R2 P48E | |
| Razer Blade 18 RTX 4070 | |
| CrossMark / Overall | |
| Eluktronics Mech-17 GP2 | |
| Alienware m18 R1 | |
| MSI Titan GT77 HX 13VI | |
| Razer Blade 18 RTX 4070 | |
| Asus ROG Strix Scar 18 2023 G834JY-N6005W | |
| Medio Intel Core i9-13980HX, NVIDIA GeForce RTX 4090 Laptop GPU (1935 - 2176, n=4) | |
| Alienware x17 R2 P48E | |
| CrossMark / Productivity | |
| Eluktronics Mech-17 GP2 | |
| Alienware m18 R1 | |
| MSI Titan GT77 HX 13VI | |
| Razer Blade 18 RTX 4070 | |
| Asus ROG Strix Scar 18 2023 G834JY-N6005W | |
| Medio Intel Core i9-13980HX, NVIDIA GeForce RTX 4090 Laptop GPU (1764 - 2005, n=4) | |
| Alienware x17 R2 P48E | |
| CrossMark / Creativity | |
| Eluktronics Mech-17 GP2 | |
| Alienware m18 R1 | |
| Asus ROG Strix Scar 18 2023 G834JY-N6005W | |
| MSI Titan GT77 HX 13VI | |
| Medio Intel Core i9-13980HX, NVIDIA GeForce RTX 4090 Laptop GPU (2267 - 2469, n=4) | |
| Razer Blade 18 RTX 4070 | |
| Alienware x17 R2 P48E | |
| CrossMark / Responsiveness | |
| Alienware m18 R1 | |
| Razer Blade 18 RTX 4070 | |
| MSI Titan GT77 HX 13VI | |
| Eluktronics Mech-17 GP2 | |
| Medio Intel Core i9-13980HX, NVIDIA GeForce RTX 4090 Laptop GPU (1556 - 1904, n=4) | |
| Alienware x17 R2 P48E | |
| Asus ROG Strix Scar 18 2023 G834JY-N6005W | |
| PCMark 10 Score | 8758 puntos | |
ayuda | ||
| AIDA64 / Memory Copy | |
| Alienware m18 R1 | |
| Razer Blade 18 RTX 4070 | |
| Medio Intel Core i9-13980HX (62189 - 80776, n=9) | |
| Eluktronics Mech-17 GP2 | |
| Asus ROG Strix Scar 18 2023 G834JY-N6005W | |
| MSI Titan GT77 HX 13VI | |
| Alienware x17 R2 P48E | |
| AIDA64 / Memory Read | |
| Alienware m18 R1 | |
| Razer Blade 18 RTX 4070 | |
| Medio Intel Core i9-13980HX (62624 - 89096, n=9) | |
| Eluktronics Mech-17 GP2 | |
| Asus ROG Strix Scar 18 2023 G834JY-N6005W | |
| MSI Titan GT77 HX 13VI | |
| Alienware x17 R2 P48E | |
| AIDA64 / Memory Write | |
| Alienware m18 R1 | |
| Razer Blade 18 RTX 4070 | |
| Medio Intel Core i9-13980HX (59912 - 79917, n=9) | |
| Eluktronics Mech-17 GP2 | |
| Asus ROG Strix Scar 18 2023 G834JY-N6005W | |
| MSI Titan GT77 HX 13VI | |
| Alienware x17 R2 P48E | |
| AIDA64 / Memory Latency | |
| Alienware x17 R2 P48E | |
| MSI Titan GT77 HX 13VI | |
| Asus ROG Strix Scar 18 2023 G834JY-N6005W | |
| Eluktronics Mech-17 GP2 | |
| Medio Intel Core i9-13980HX (79.4 - 93.2, n=9) | |
| Razer Blade 18 RTX 4070 | |
| Alienware m18 R1 | |
* ... más pequeño es mejor
Latencia del CPD
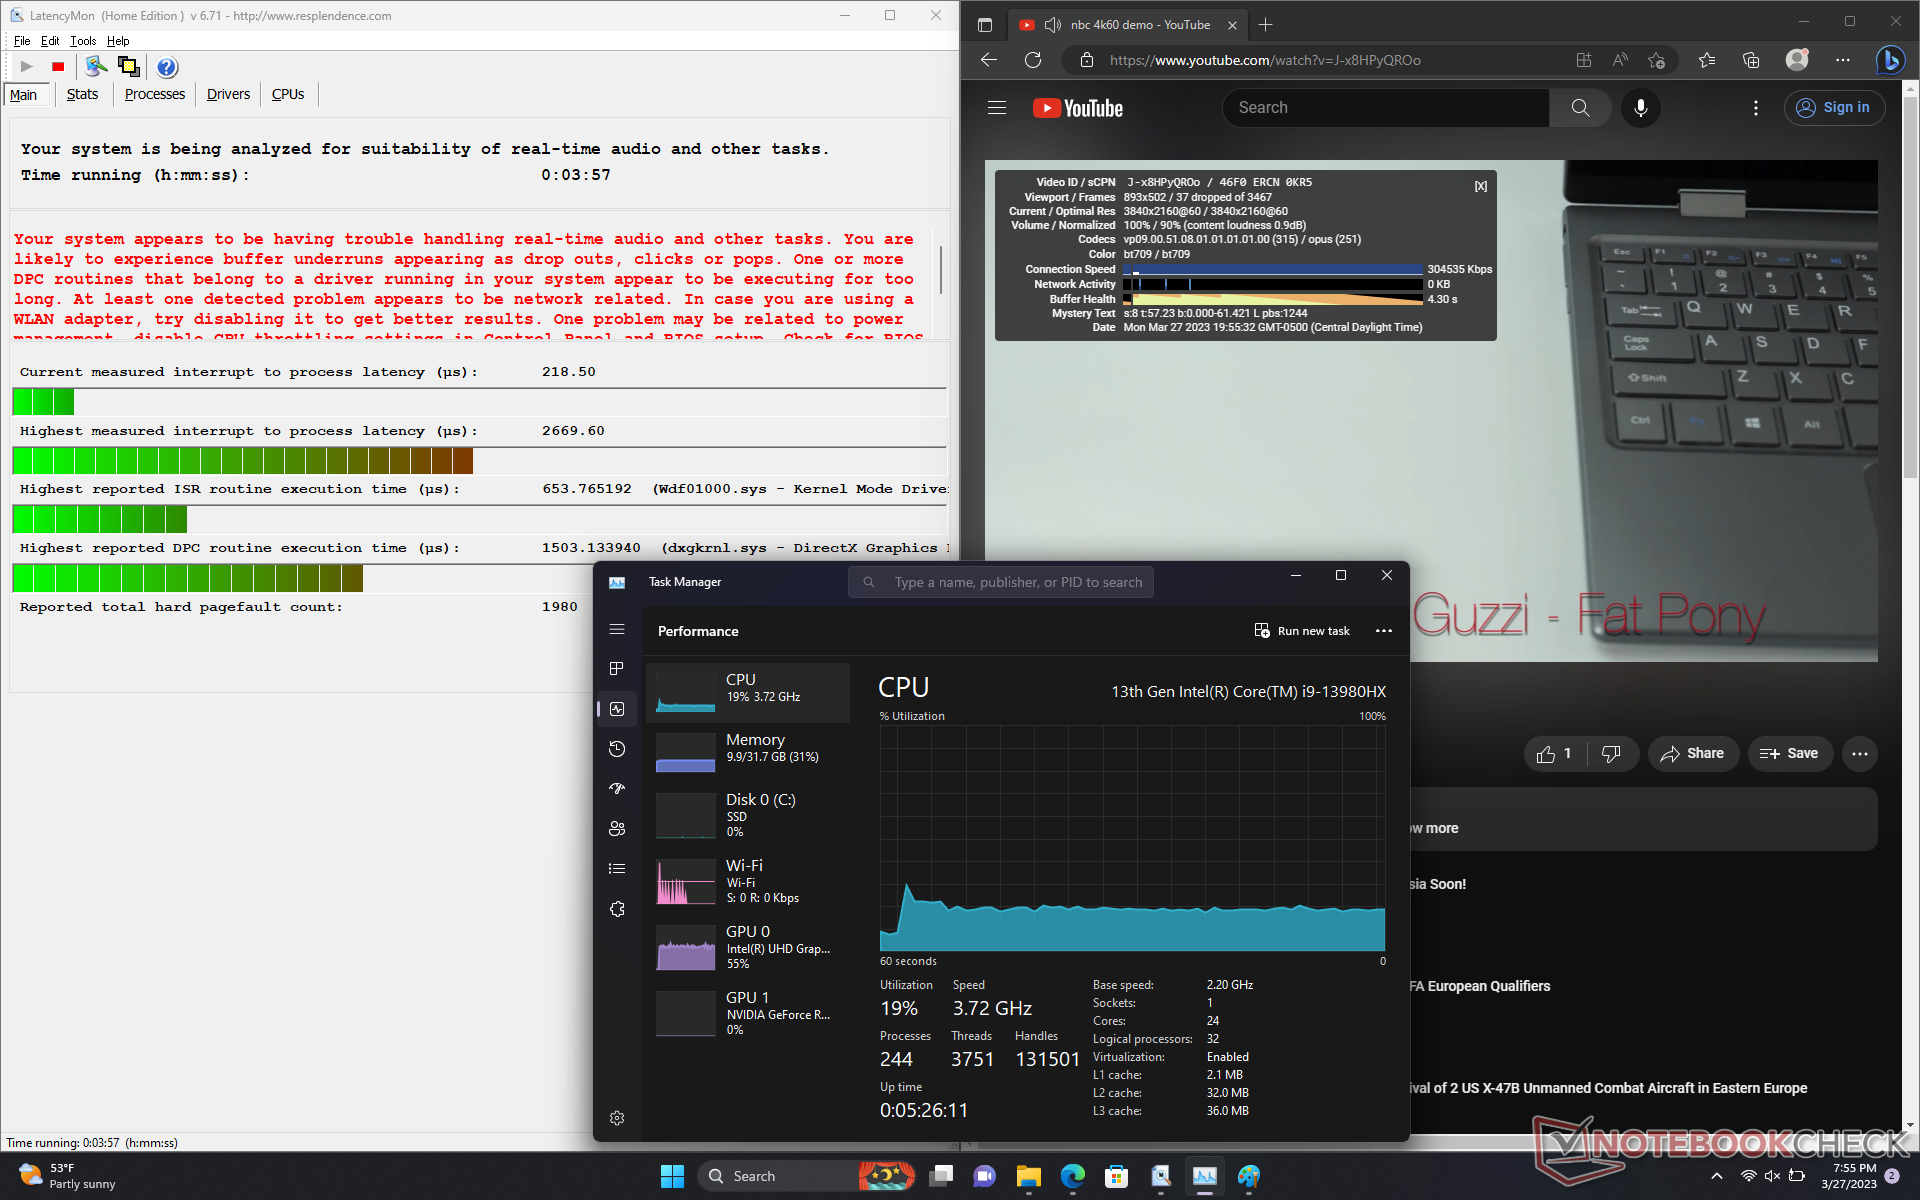
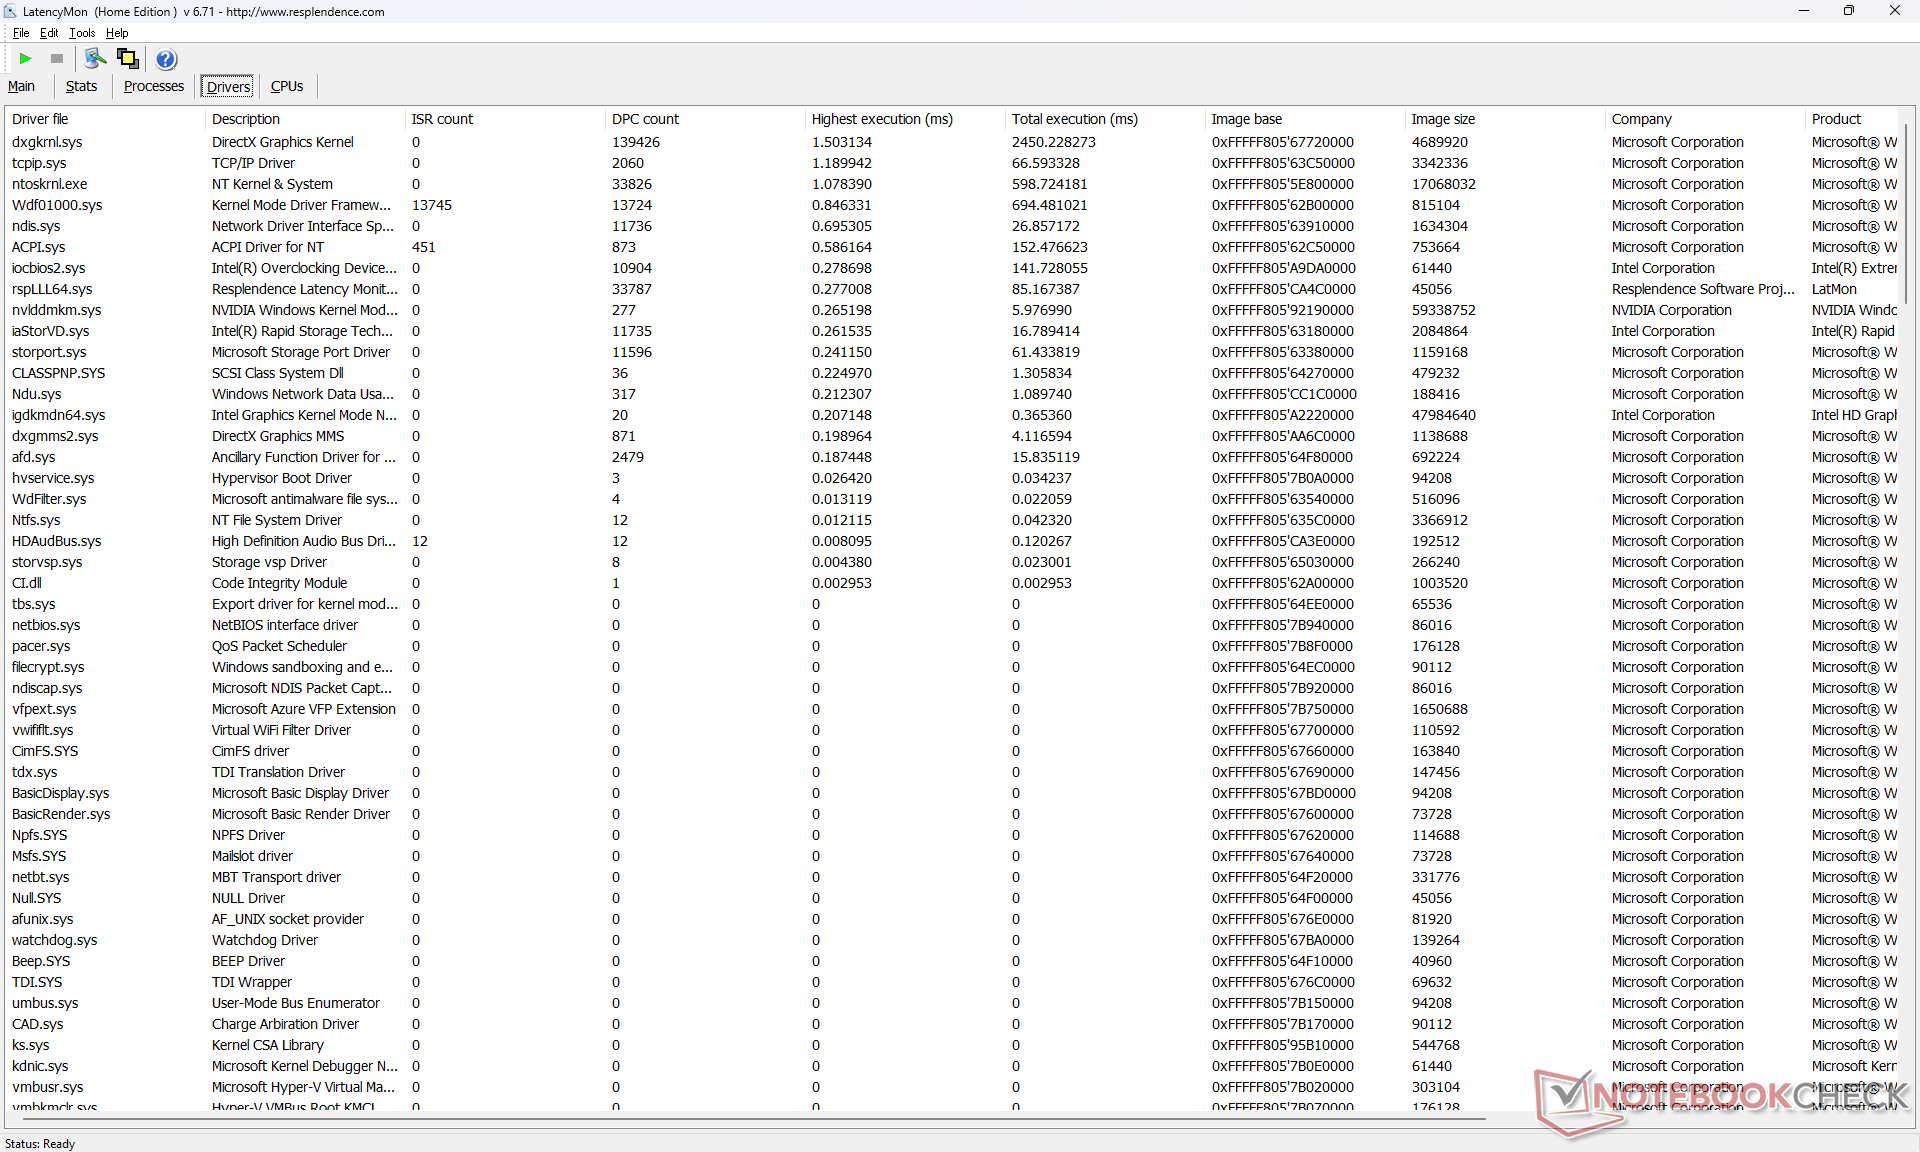
LatencyMon revela problemas de CPD al abrir varias pestañas de nuestra página de inicio. Además, el sistema tiene problemas al reproducir contenido de vídeo 4K, ya que pudimos registrar 37 fotogramas perdidos durante nuestro vídeo de prueba de un minuto incluso tras repetir la prueba. La utilización de la CPU y la iGPU son inusualmente altas, con un 19% y un 55% respectivamente. Estas observaciones sugieren una mala gestión de los procesos en segundo plano que pueden afectar a la actividad enfocada.
Por si sirve de algo, Nvidia ha reconocido un error relacionado con un aumento de la latencia DPC con el controlador gráfico 531.29. Esperemos que una solución pueda llegar pronto de cualquier manera.
| DPC Latencies / LatencyMon - interrupt to process latency (max), Web, Youtube, Prime95 | |
| MSI Titan GT77 HX 13VI | |
| Alienware m18 R1 | |
| Razer Blade 18 RTX 4070 | |
| Alienware x17 R2 P48E | |
| Asus ROG Strix Scar 18 2023 G834JY-N6005W | |
| Eluktronics Mech-17 GP2 | |
* ... más pequeño es mejor
Dispositivos de almacenamiento: cuatro unidades M.2 en total
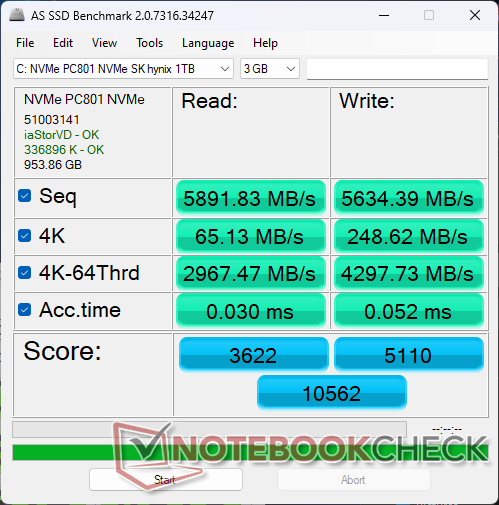
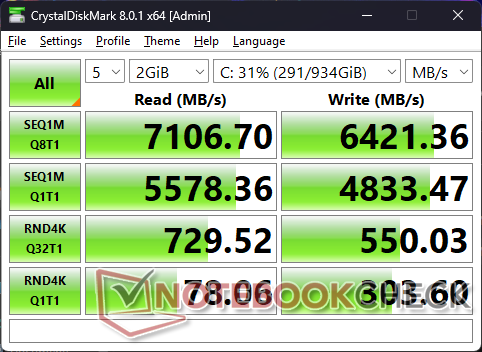
Nuestra unidad viene configurada con un SK Hynix PC801 PCIe4 x4 NVMe SSD para velocidades de lectura y escritura secuenciales de hasta 7000 MB/s y 6500 MB/s, respectivamente. El rendimiento es competitivo frente a la serie Samsung PMA1 y nuestra unidad no muestra problemas para mantener las velocidades máximas sin ralentización.
El Alienware no soporta SSDs PCIe5 NVMe como las series MSI GE78 o GT77. No obstante, soporta más SSDs internos que la mayoría de portátiles.

| Drive Performance rating - Percent | |
| Alienware m18 R1 | |
| MSI Titan GT77 HX 13VI | |
| Razer Blade 18 RTX 4070 | |
| Alienware x17 R2 P48E | |
| Asus ROG Strix Scar 18 2023 G834JY-N6005W | |
| Eluktronics Mech-17 GP2 | |
* ... más pequeño es mejor
Disk Throttling: DiskSpd Read Loop, Queue Depth 8
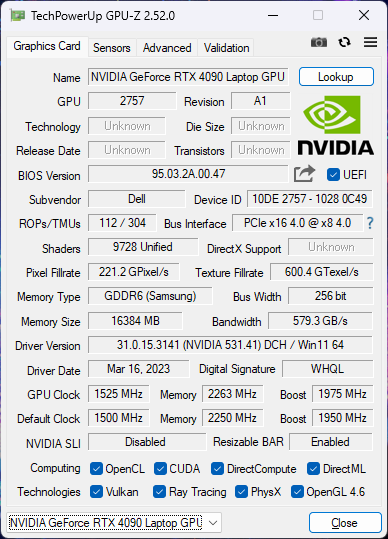
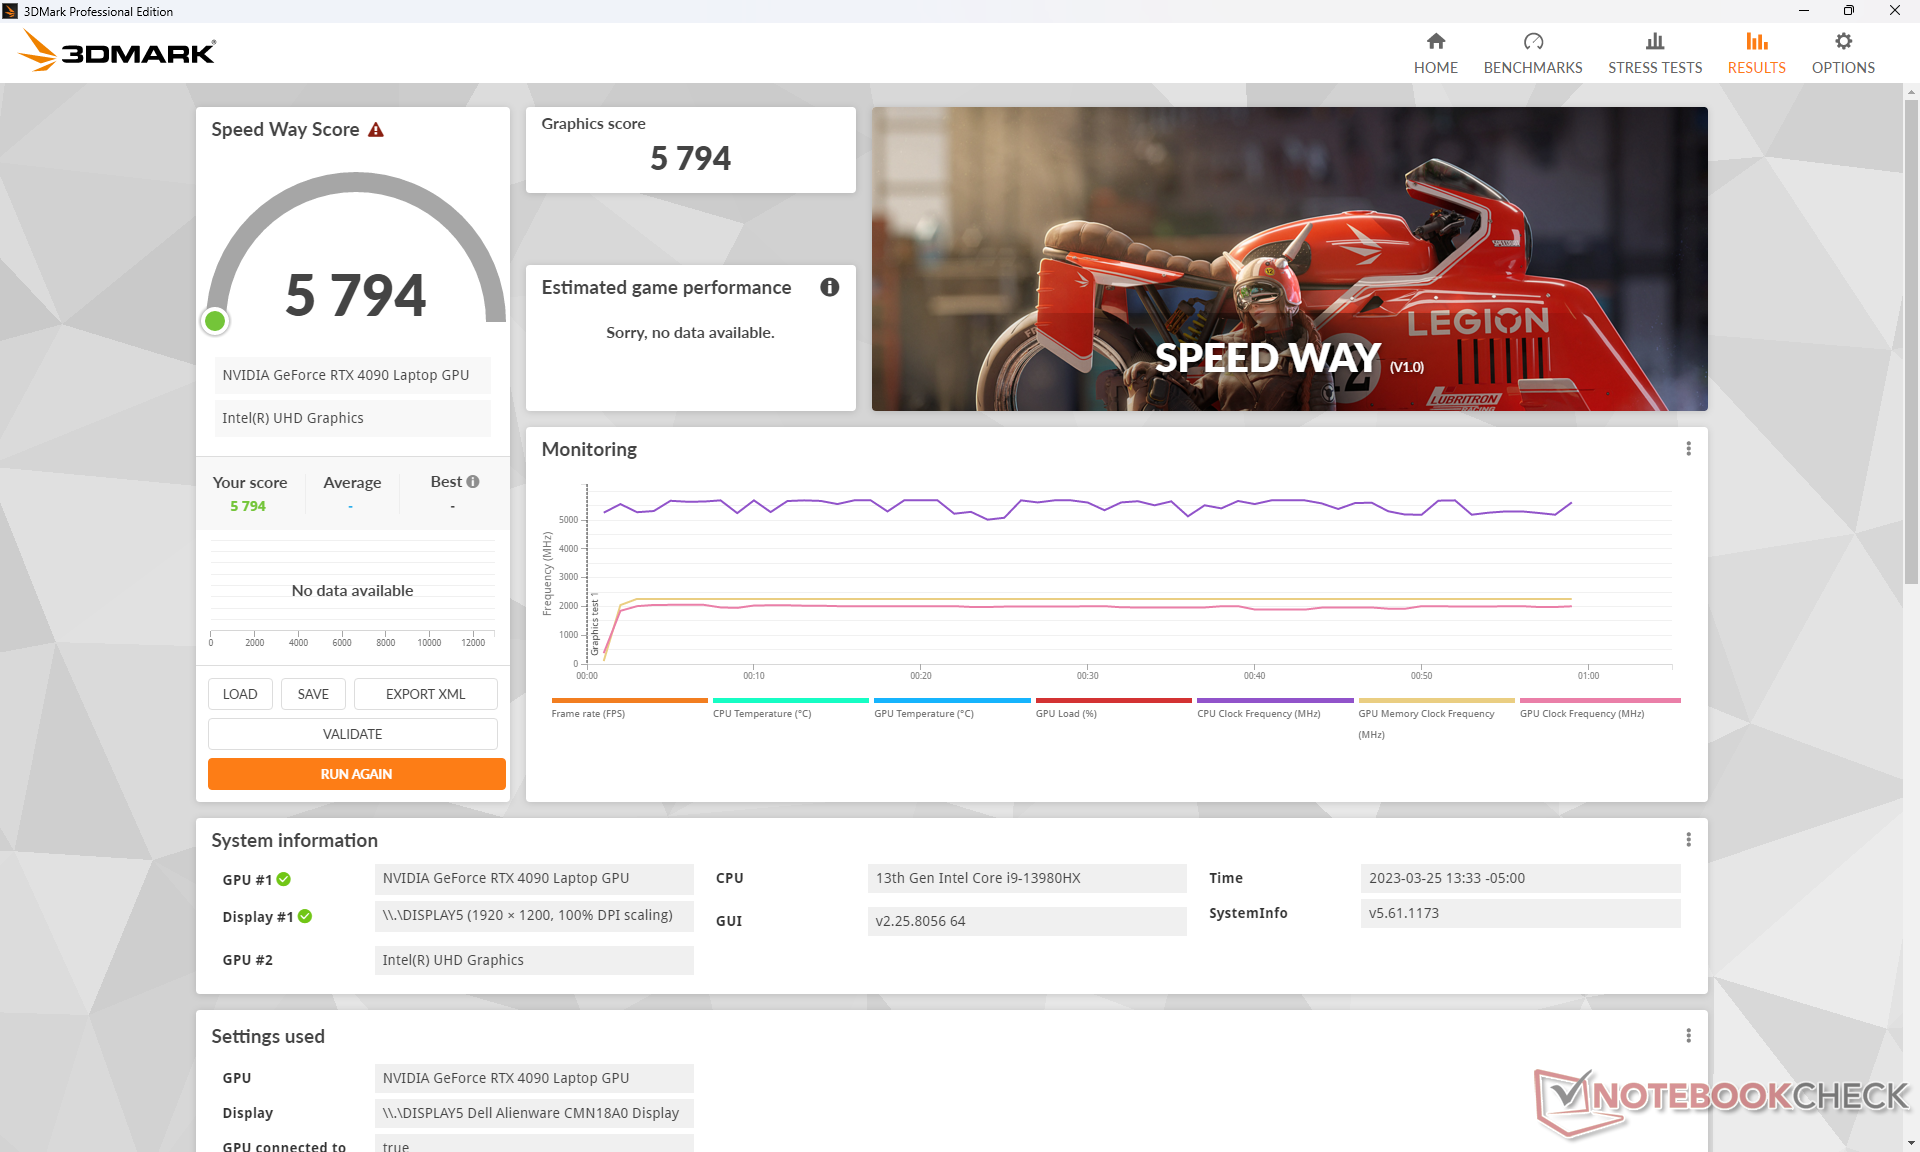
Rendimiento de la GPU - 175 W GeForce RTX 4090
Rendimiento gráfico general de la móvil GeForce RTX 4090 es muy similar al de la sobremesa GeForce RTX 4070. Ofrece rendimiento suficiente para jugar a cualquier juego actual con ajustes 4K Ultra, incluido F1 22. Sin embargo, si se activa el trazado de rayos, se recomienda activar DLSS o la generación de fotogramas cuando sea compatible para mantener a flote la velocidad de fotogramas.
En comparación con la última generación rTX 3080 Ti para portátilesla RTX 4090 para portátiles ofrece entre un 40 y un 70 por ciento más de rendimiento con un consumo similar de 175 W.
La ejecución de Fire Strike en modo Overdrive no muestra grandes ventajas en comparación con el modo Performance, más silencioso, ya que sus puntuaciones finales serían casi idénticas. Sin embargo, si se repite la prueba en modo Equilibrado, el rendimiento de la GPU y la CPU caen un 5% y un 9% respectivamente.
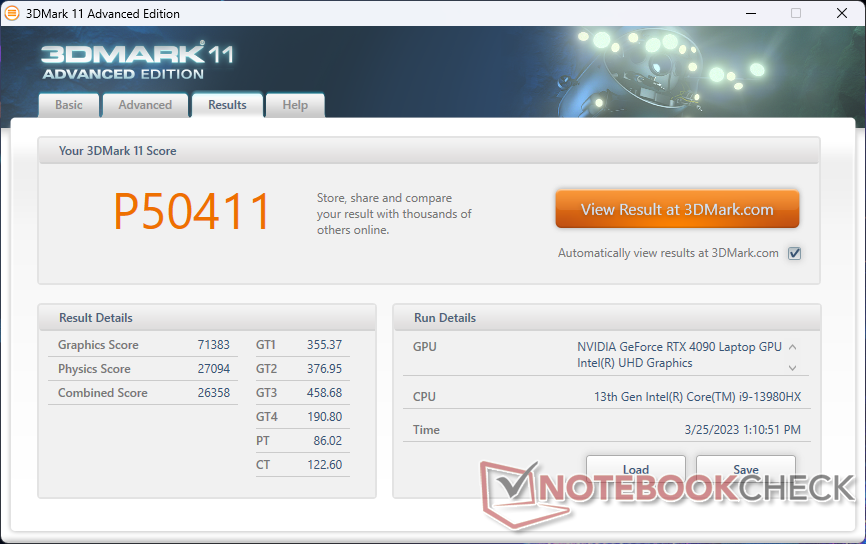
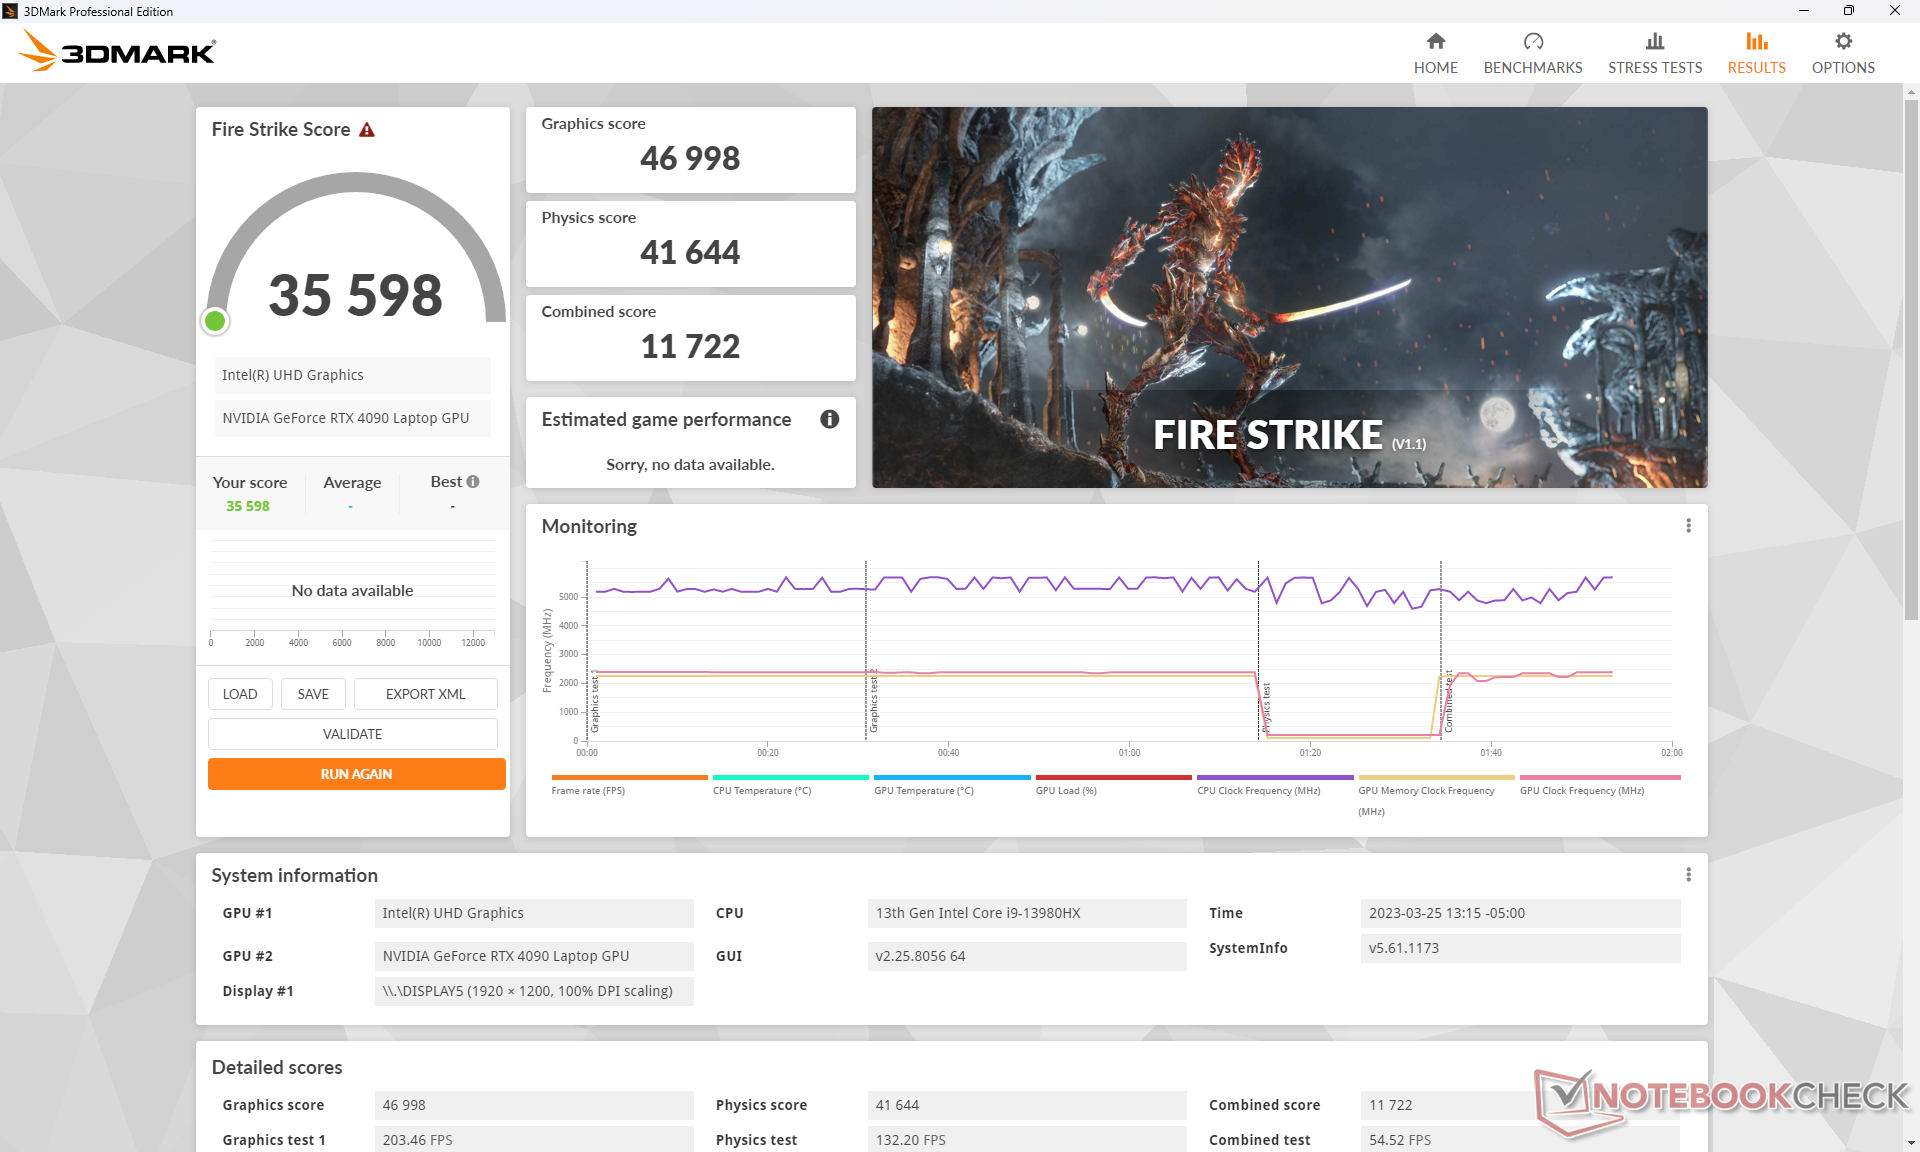
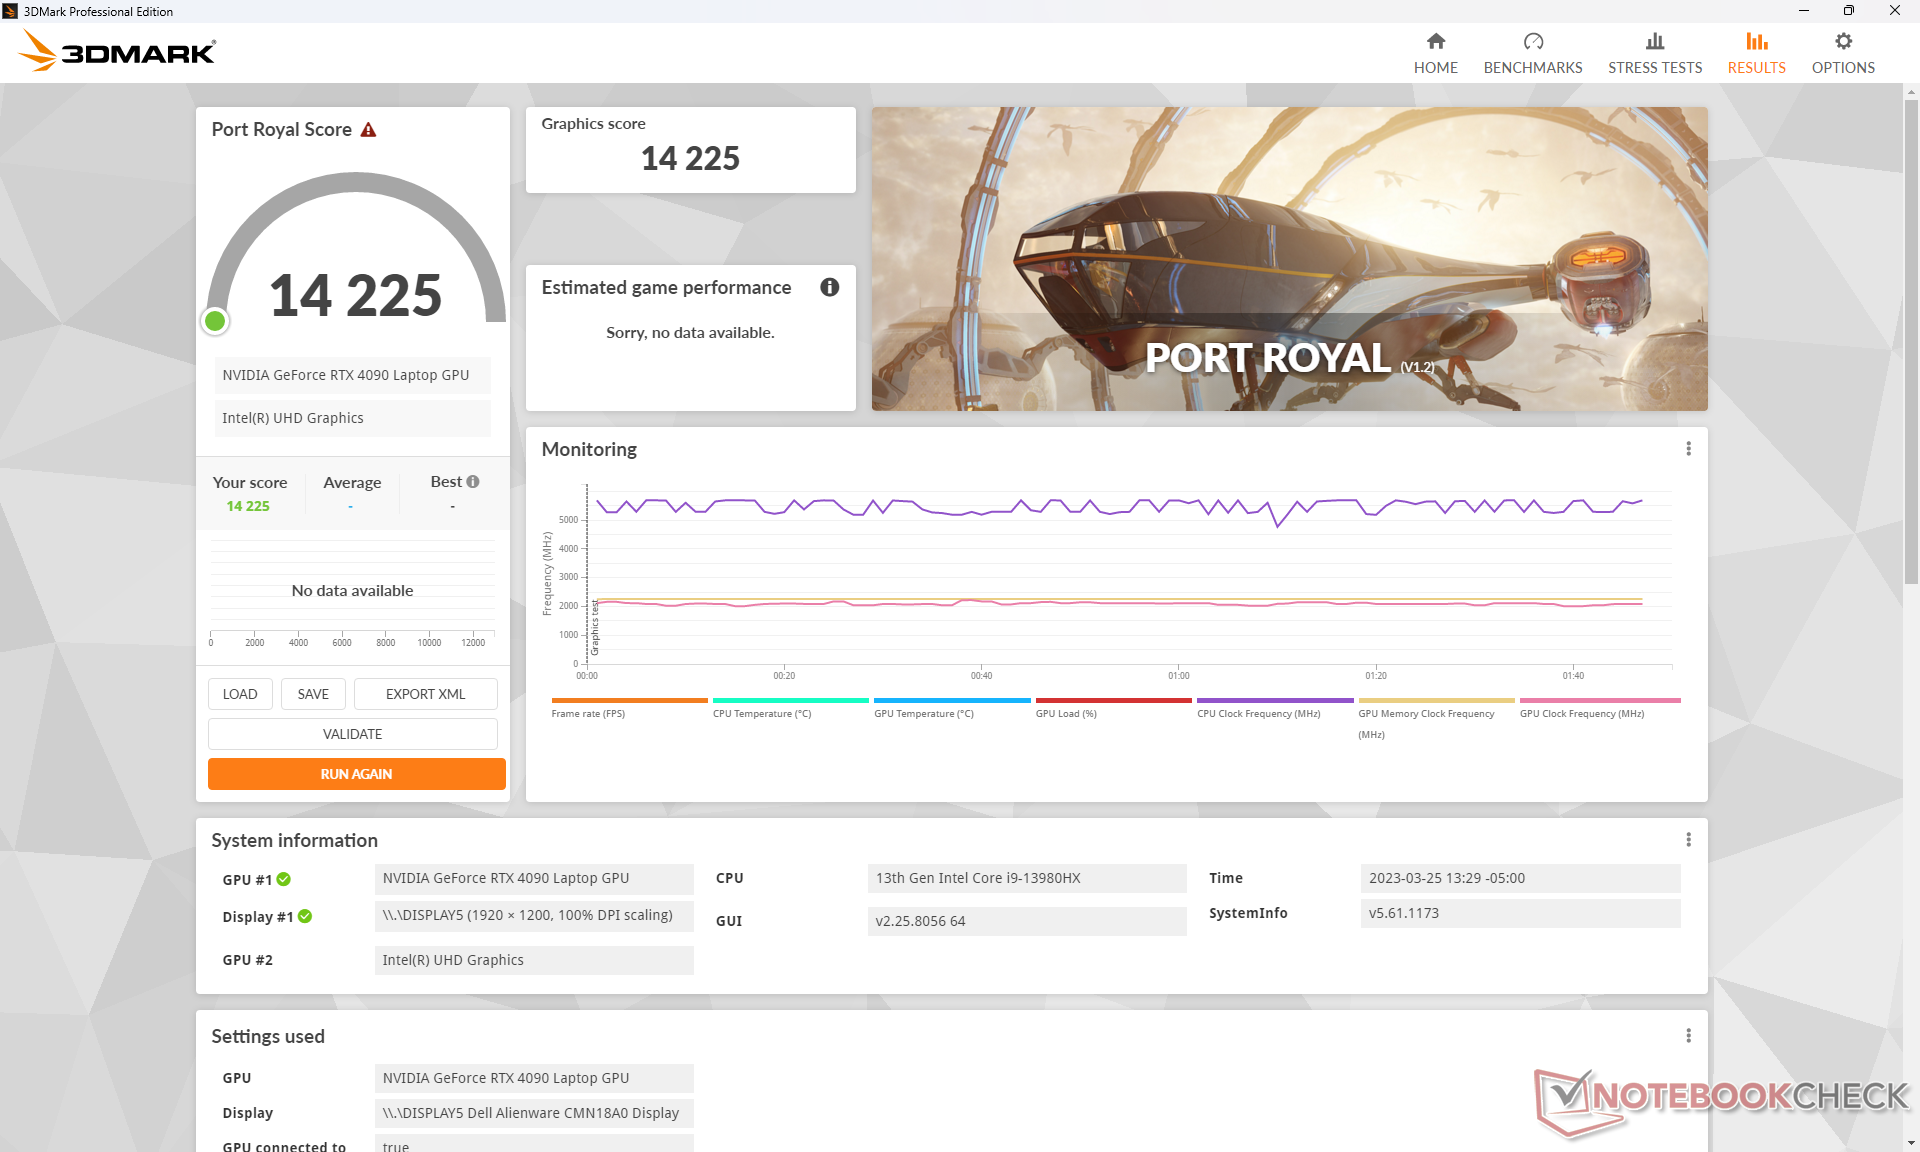
| 3DMark 11 Performance | 50411 puntos | |
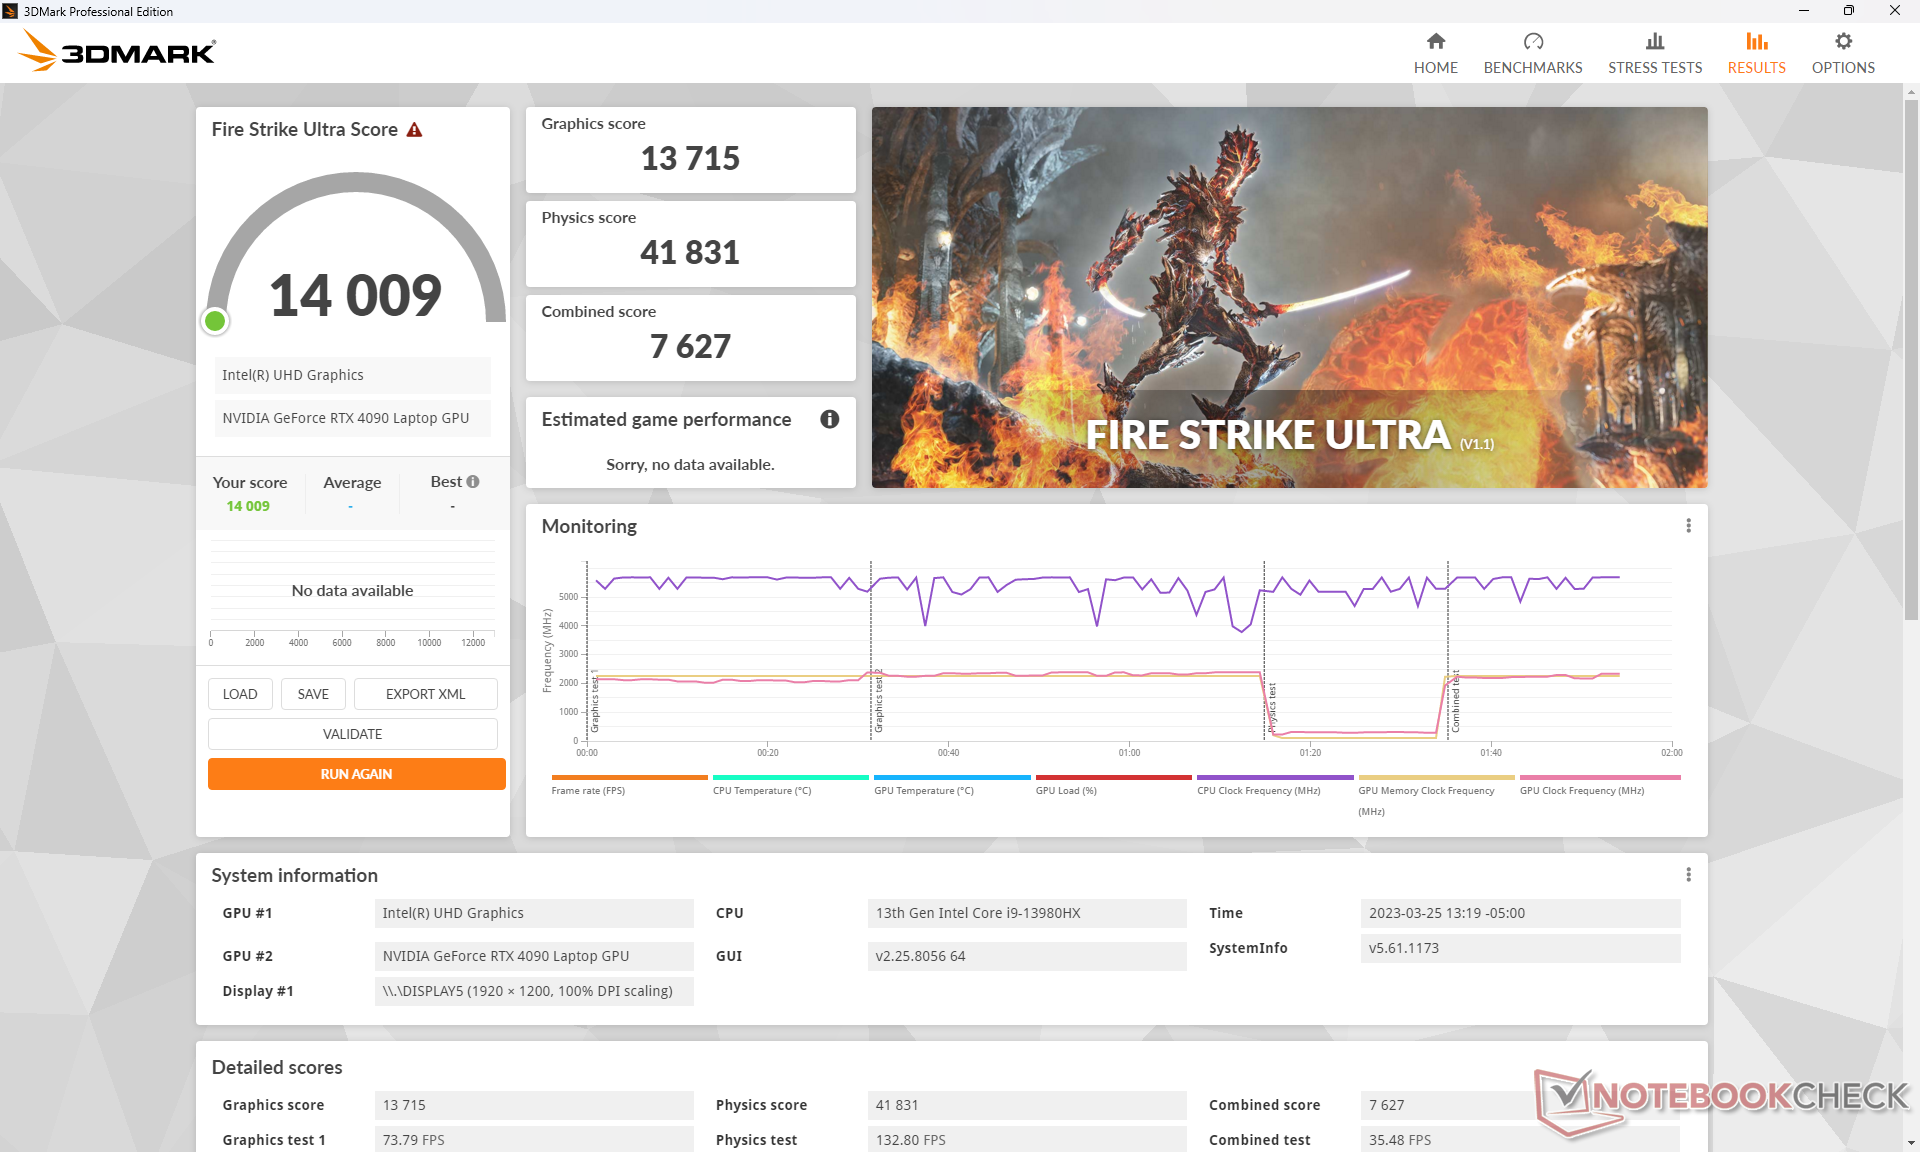
| 3DMark Fire Strike Score | 35598 puntos | |
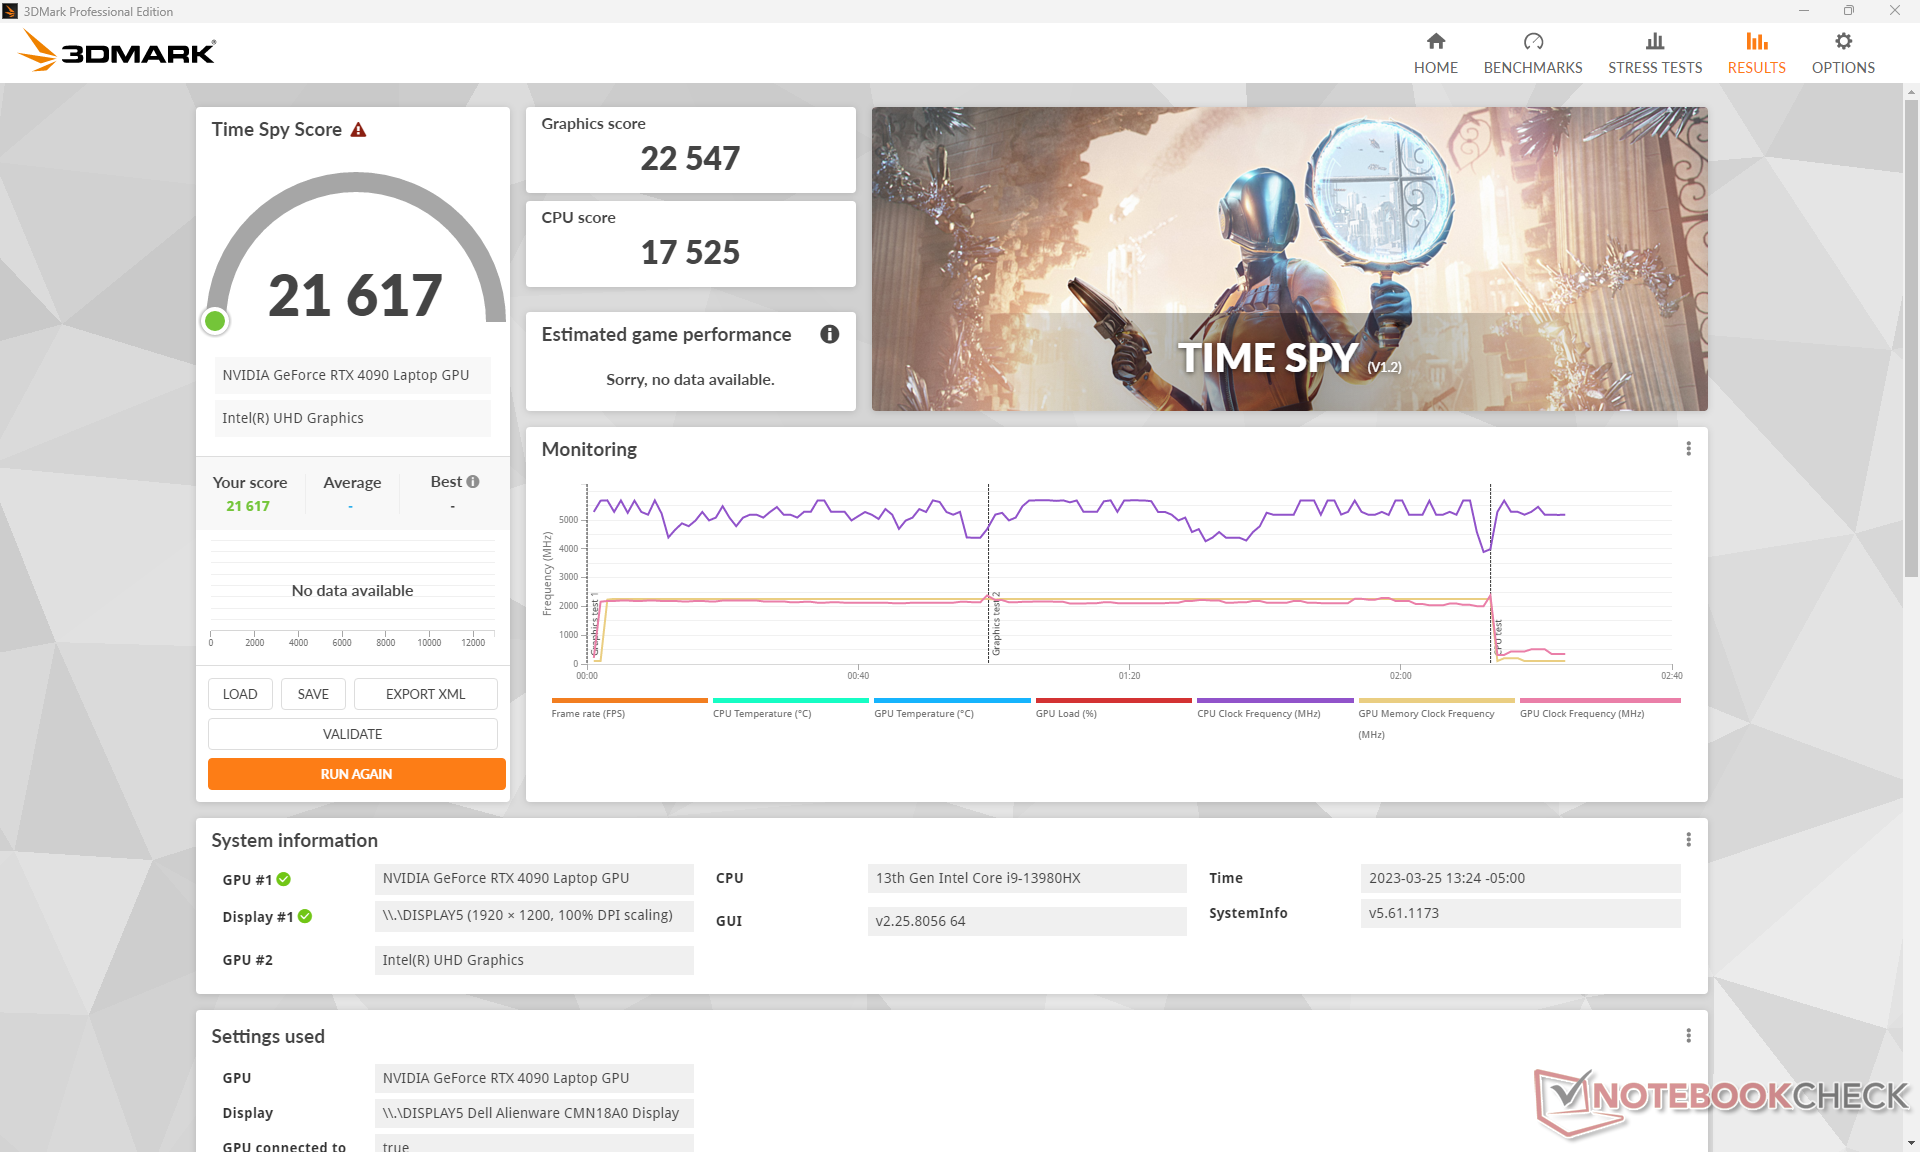
| 3DMark Time Spy Score | 21617 puntos | |
ayuda | ||
* ... más pequeño es mejor
Witcher 3 FPS Chart
| bajo | medio | alto | ultra | QHD | 4K | |
|---|---|---|---|---|---|---|
| GTA V (2015) | 186.7 | 185.3 | 184.5 | 149 | 145.5 | 176.4 |
| The Witcher 3 (2015) | 649.2 | 563.8 | 441.6 | 213.9 | 165.6 | |
| Dota 2 Reborn (2015) | 251 | 220 | 210 | 194.2 | 190.2 | |
| Final Fantasy XV Benchmark (2018) | 231 | 227 | 194.8 | 159.5 | 92.6 | |
| X-Plane 11.11 (2018) | 210 | 187.1 | 143.5 | 124 | ||
| Strange Brigade (2018) | 475 | 388 | 388 | 373 | 308 | 159.8 |
| Cyberpunk 2077 1.6 (2022) | 157.2 | 151.8 | 148.2 | 127.92 | 102.16 | 49.99 |
| Tiny Tina's Wonderlands (2022) | 359.1 | 301.8 | 232.5 | 187.7 | 133.8 | 71.3 |
| F1 22 (2022) | 336 | 320 | 318 | 144.7 | 92.2 | 45.5 |
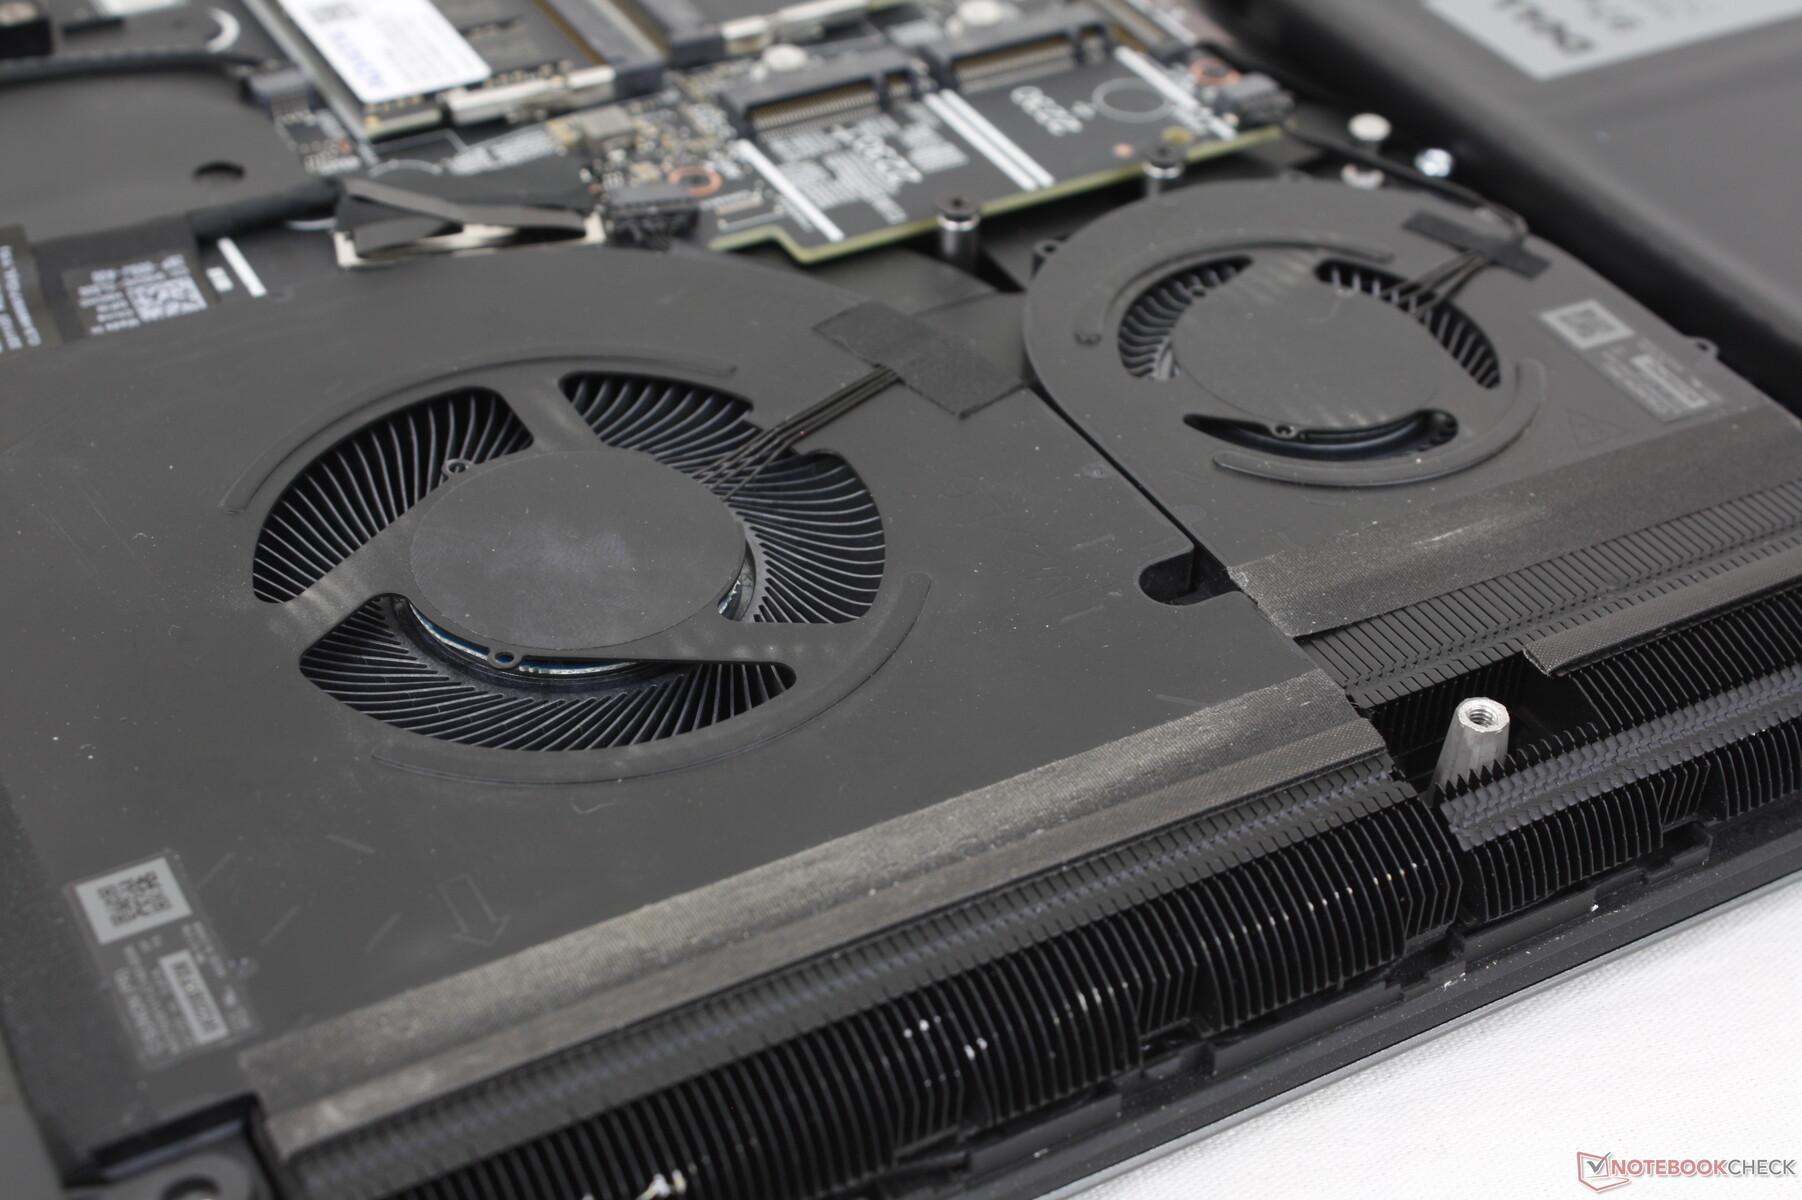
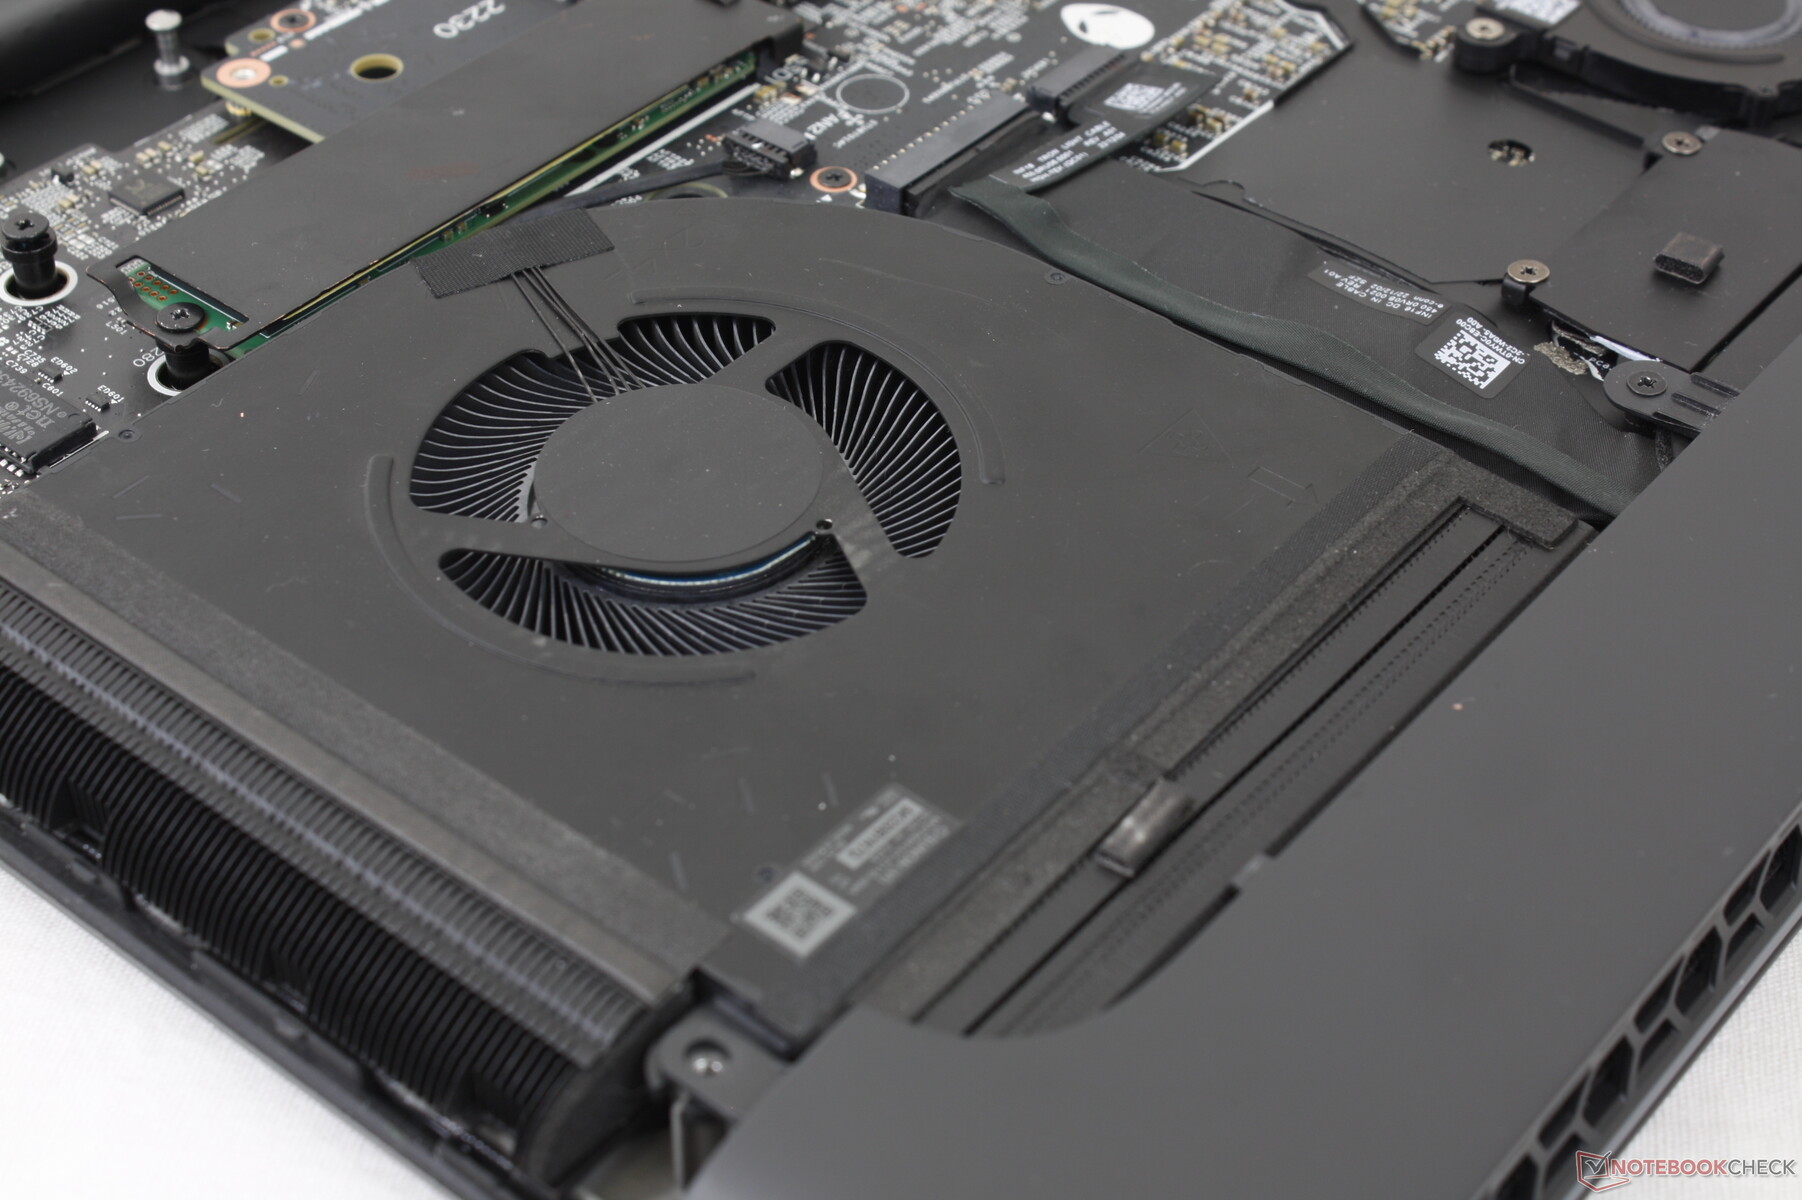
Emisiones - Cuatro fans de Fast & Furious
Ruido del sistema
Si pensabas que un portátil con cuatro ventiladores sería ruidoso, entonces estarías... bueno, totalmente en lo cierto. Jugar en modo Rendimiento produce un ruido de ventilador de 51 dB(A), similar al del Eluktronics Mech-17 GP2.Eluktronics Mech-17 GP2 pero más alto que el Razer Blade 18. Si se juega en modo Overdrive, el ruido del ventilador será aún mayor, casi 57 dB(A). Todo lo que supere los 50 dB(A) requiere un par de buenos auriculares para ahogar el zumbido de los ventiladores. Hay que tener en cuenta que el modo Overdrive no es necesario para la mayoría de los juegos, como muestra nuestra sección de pruebas de estrés.
Afortunadamente, el sistema es mejor en permanecer en silencio durante las cargas más bajas como los ventiladores no pulso cuando en la configuración de perfil inferior. Por lo tanto, todavía se puede navegar por la web o transmitir contenido de vídeo en los niveles de ruido del ventilador cómodo.
Ruido
| Ocioso |
| 23 / 23 / 23 dB(A) |
| Carga |
| 35.6 / 56.7 dB(A) |
 | ||
30 dB silencioso 40 dB(A) audible 50 dB(A) ruidosamente alto |
||
min: | ||
| Alienware m18 R1 GeForce RTX 4090 Laptop GPU, i9-13980HX, SK hynix PC801 HFS001TEJ9X101N | Razer Blade 18 RTX 4070 GeForce RTX 4070 Laptop GPU, i9-13950HX, SSSTC CA6-8D1024 | Asus ROG Strix Scar 18 2023 G834JY-N6005W GeForce RTX 4090 Laptop GPU, i9-13980HX, 2x Samsung PM9A1 MZVL21T0HCLR (RAID 0) | Eluktronics Mech-17 GP2 GeForce RTX 4090 Laptop GPU, i9-13900HX, Samsung PM9A1 MZVL21T0HCLR | MSI Titan GT77 HX 13VI GeForce RTX 4090 Laptop GPU, i9-13950HX, Samsung PM9A1 MZVL22T0HBLB | Alienware x17 R2 P48E GeForce RTX 3080 Ti Laptop GPU, i9-12900HK, 2x Samsung PM9A1 1TB (RAID 0) | |
|---|---|---|---|---|---|---|
| Noise | -3% | -15% | -13% | -20% | 2% | |
| apagado / medio ambiente * (dB) | 22.8 | 23.5 -3% | 23.9 -5% | 25.2 -11% | 24.6 -8% | 22.7 -0% |
| Idle Minimum * (dB) | 23 | 23.8 -3% | 23.9 -4% | 28 -22% | 29.2 -27% | 23.1 -0% |
| Idle Average * (dB) | 23 | 23.8 -3% | 32.6 -42% | 28 -22% | 29.2 -27% | 23.1 -0% |
| Idle Maximum * (dB) | 23 | 26.8 -17% | 32.6 -42% | 30.4 -32% | 29.2 -27% | 23.1 -0% |
| Load Average * (dB) | 35.6 | 37.3 -5% | 35.9 -1% | 41 -15% | 50.7 -42% | 31.9 10% |
| Witcher 3 ultra * (dB) | 51.3 | 48 6% | 50.7 1% | 53.3 -4% | 52.5 -2% | |
| Load Maximum * (dB) | 56.7 | 53.5 6% | 55.8 2% | 52.6 7% | 61 -8% | 52.5 7% |
* ... más pequeño es mejor
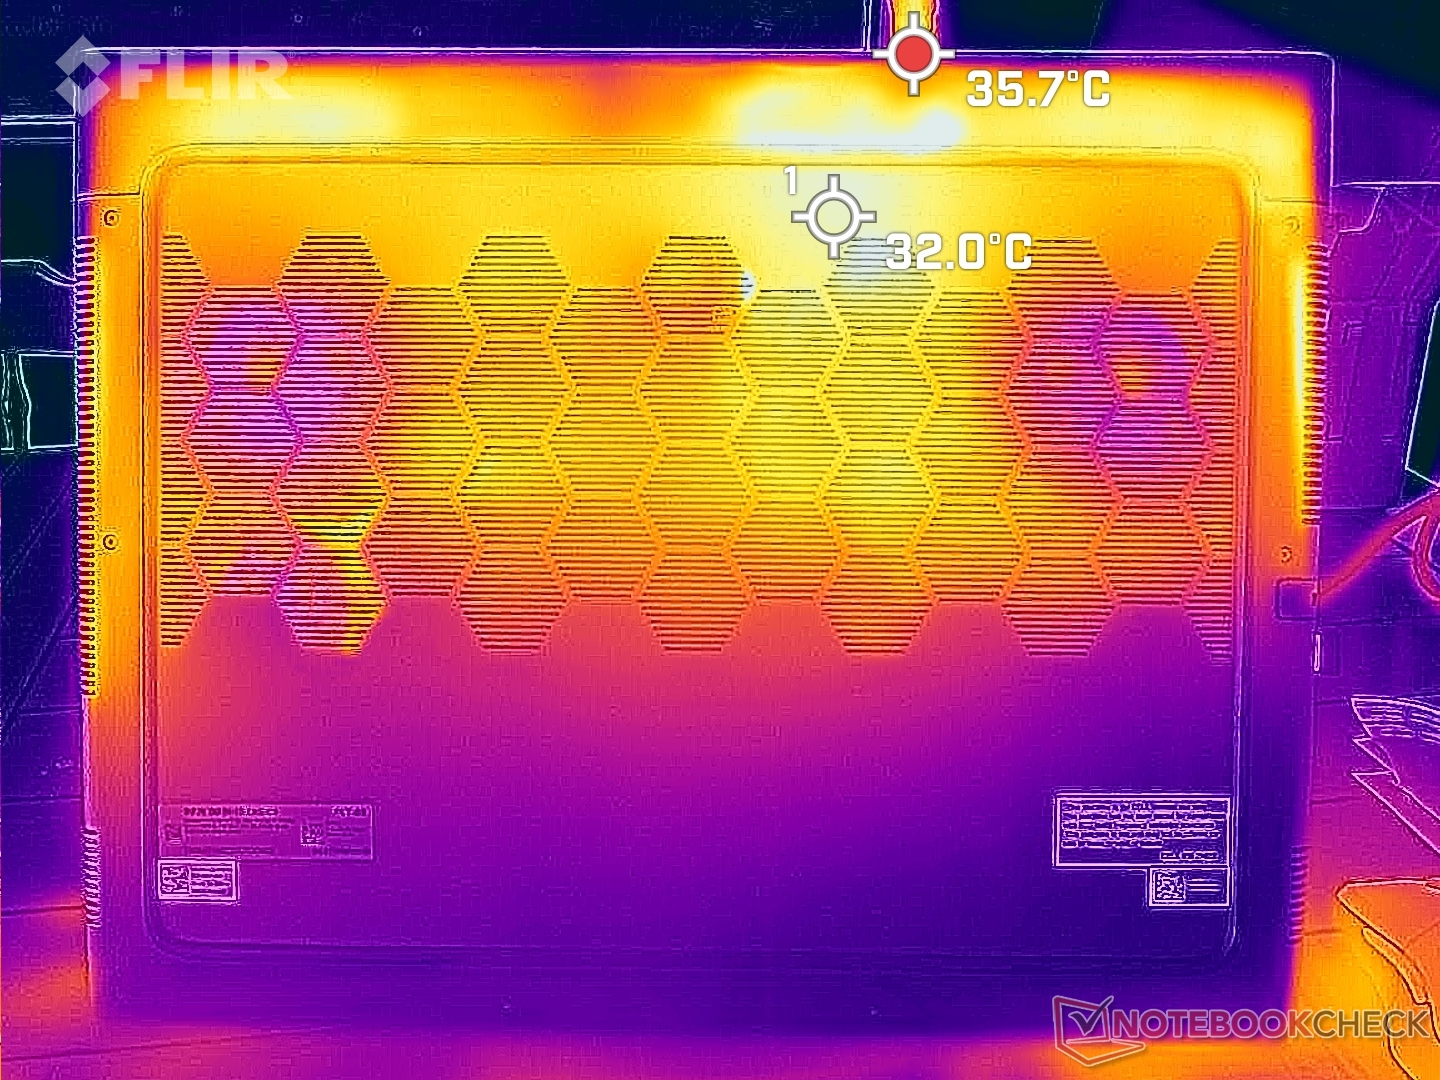
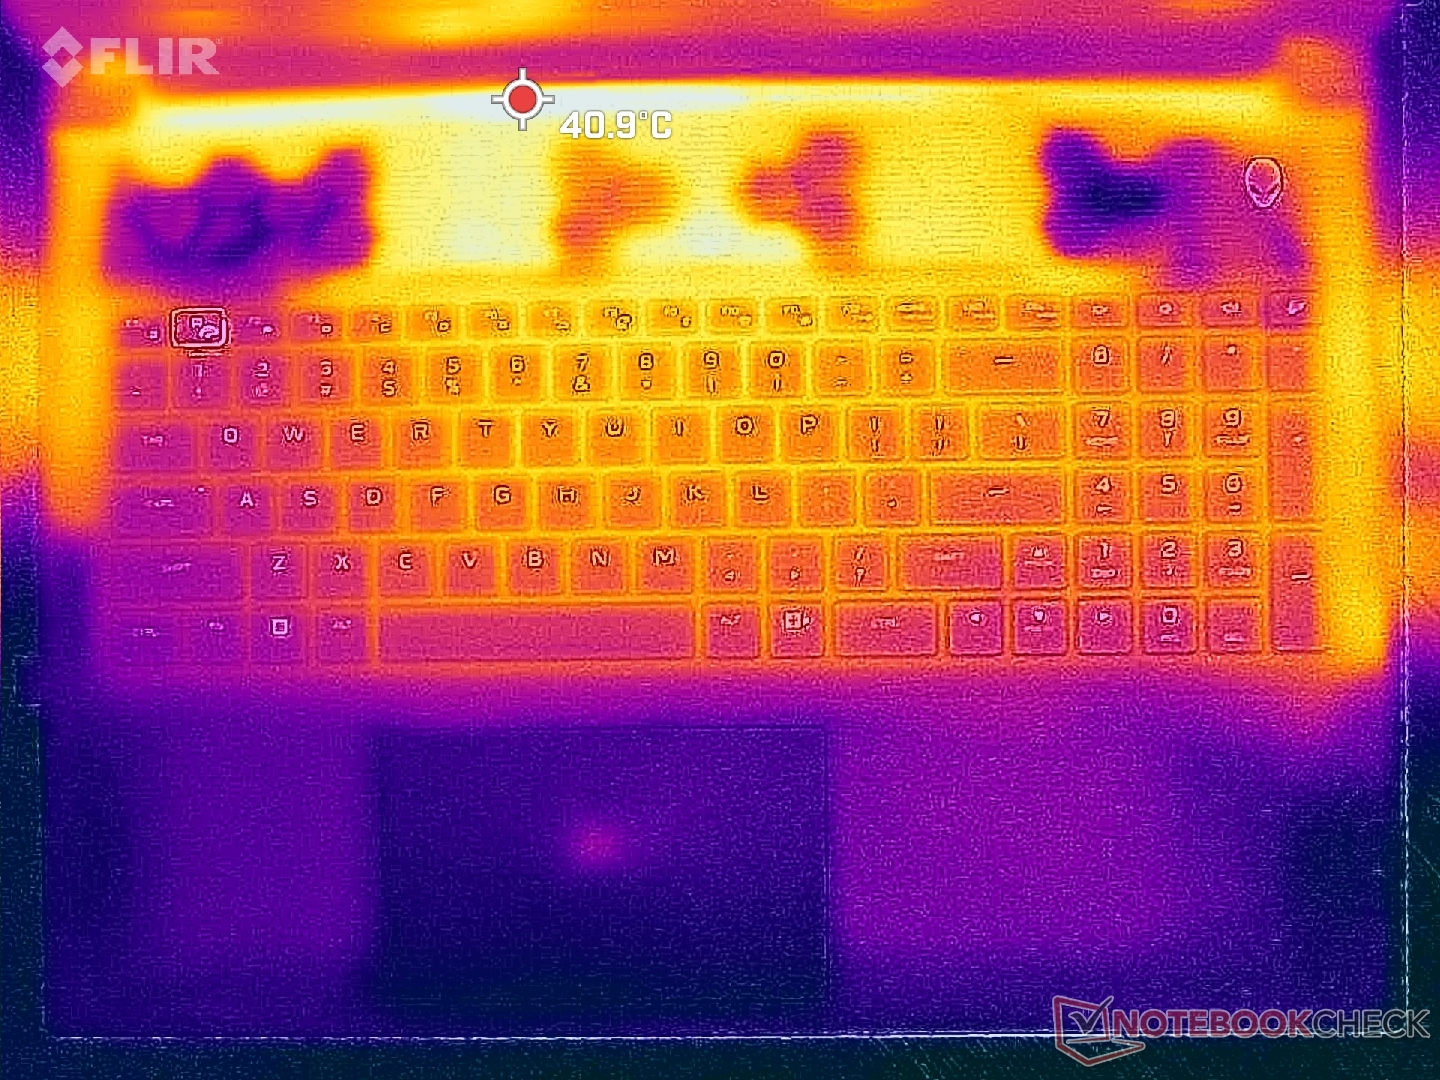
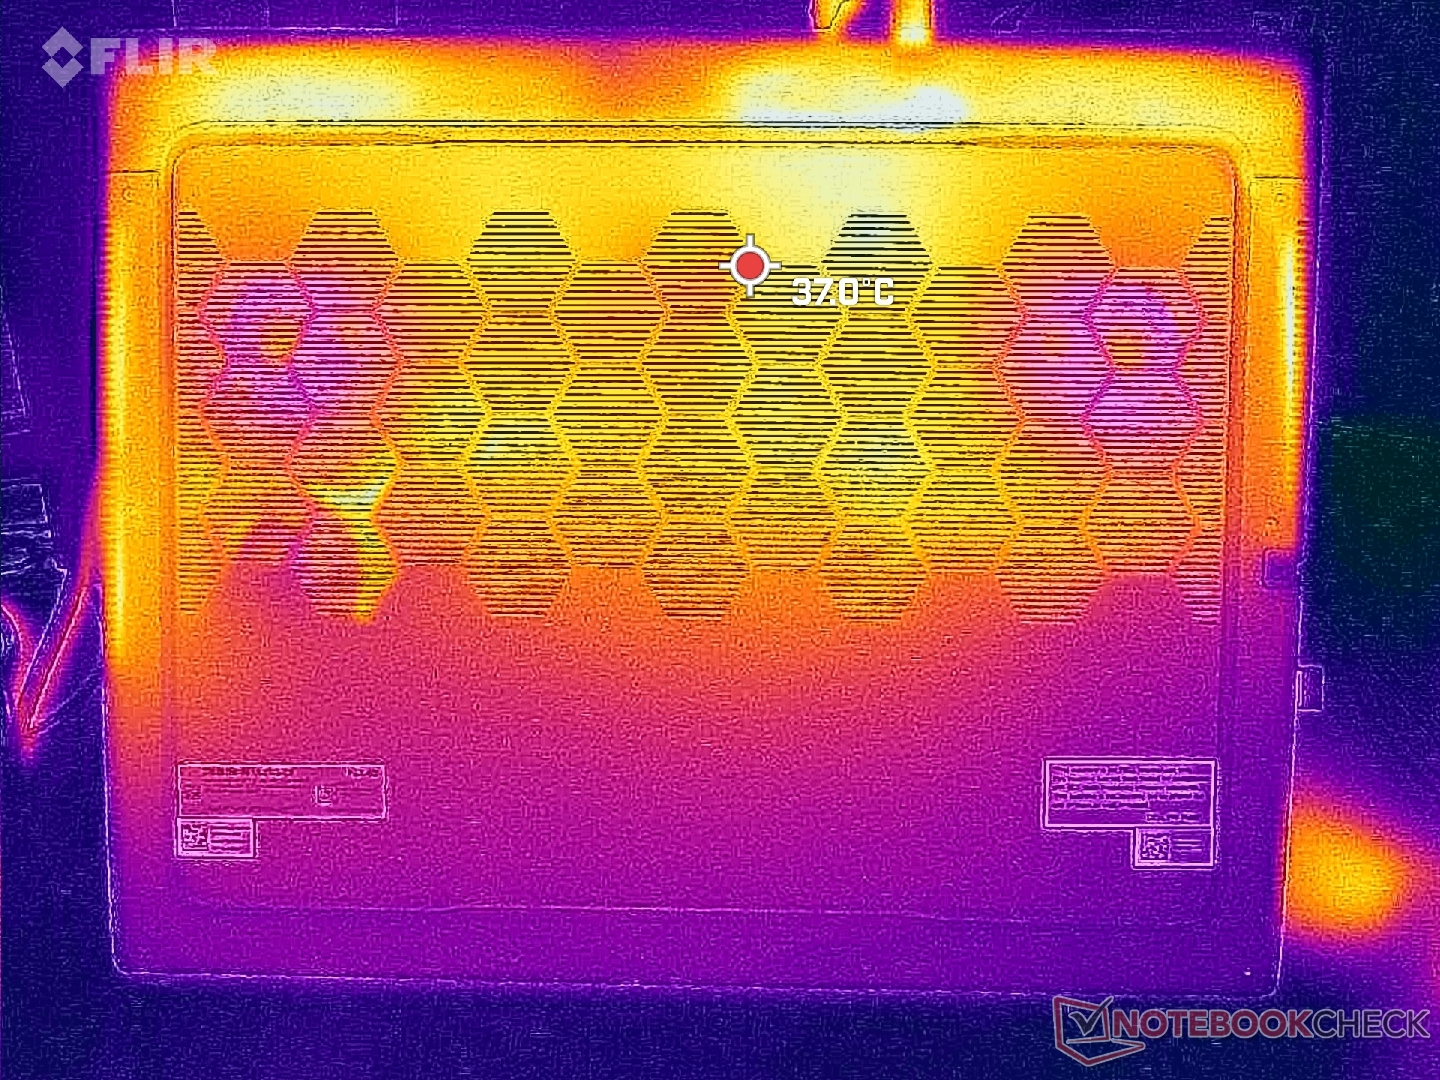
Temperatura
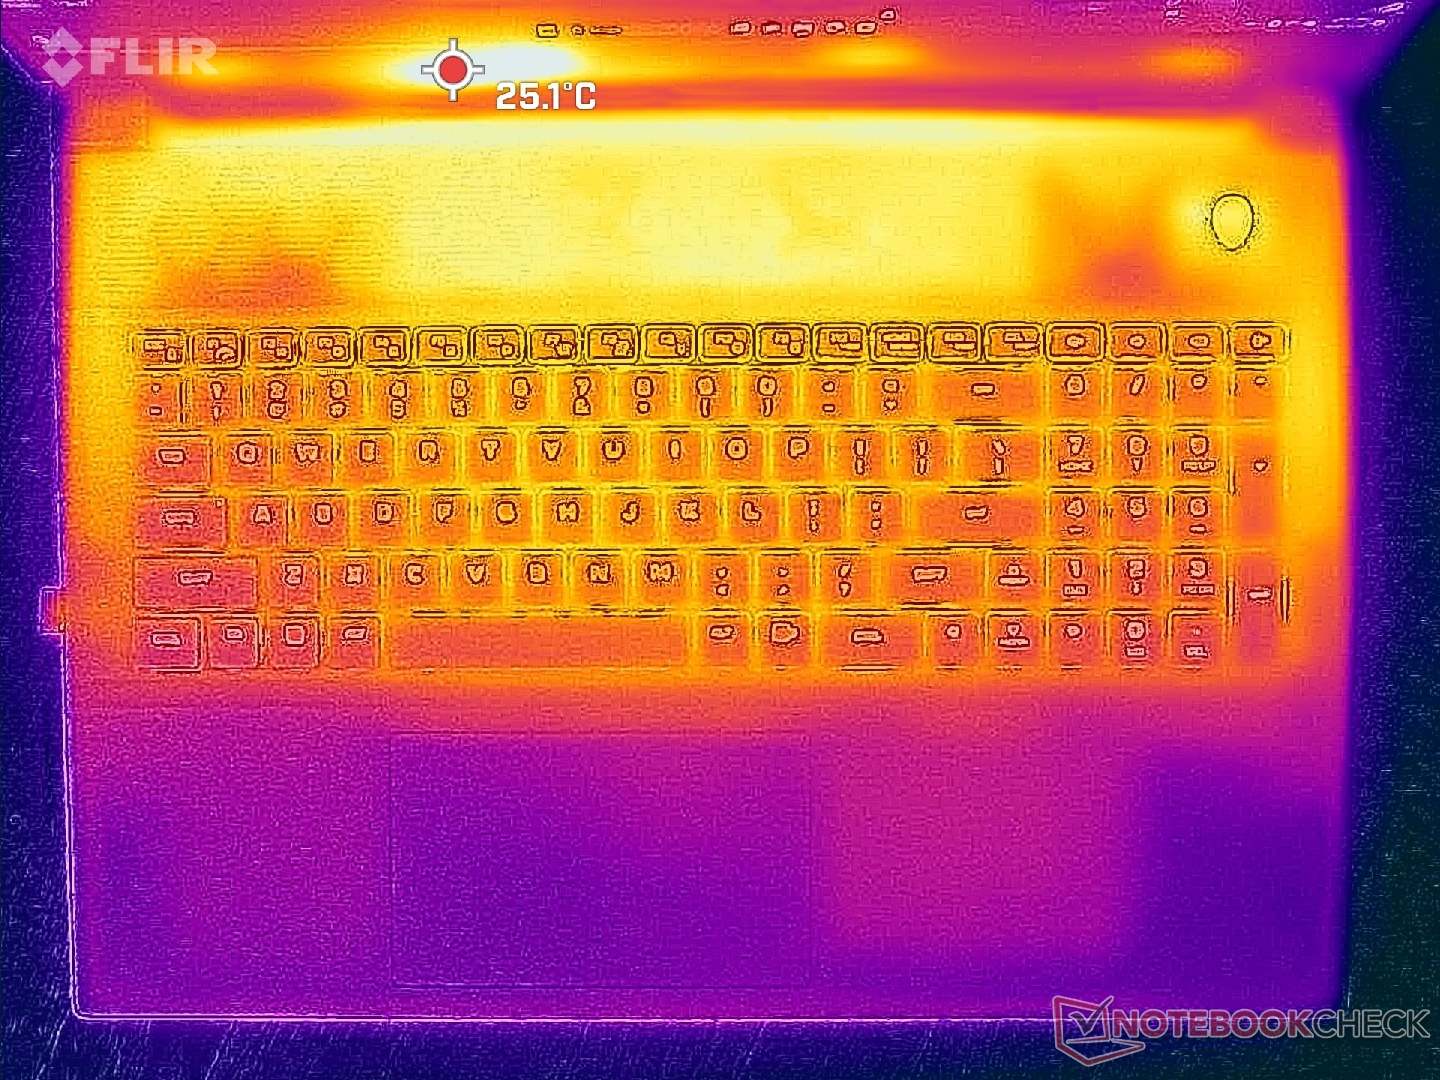
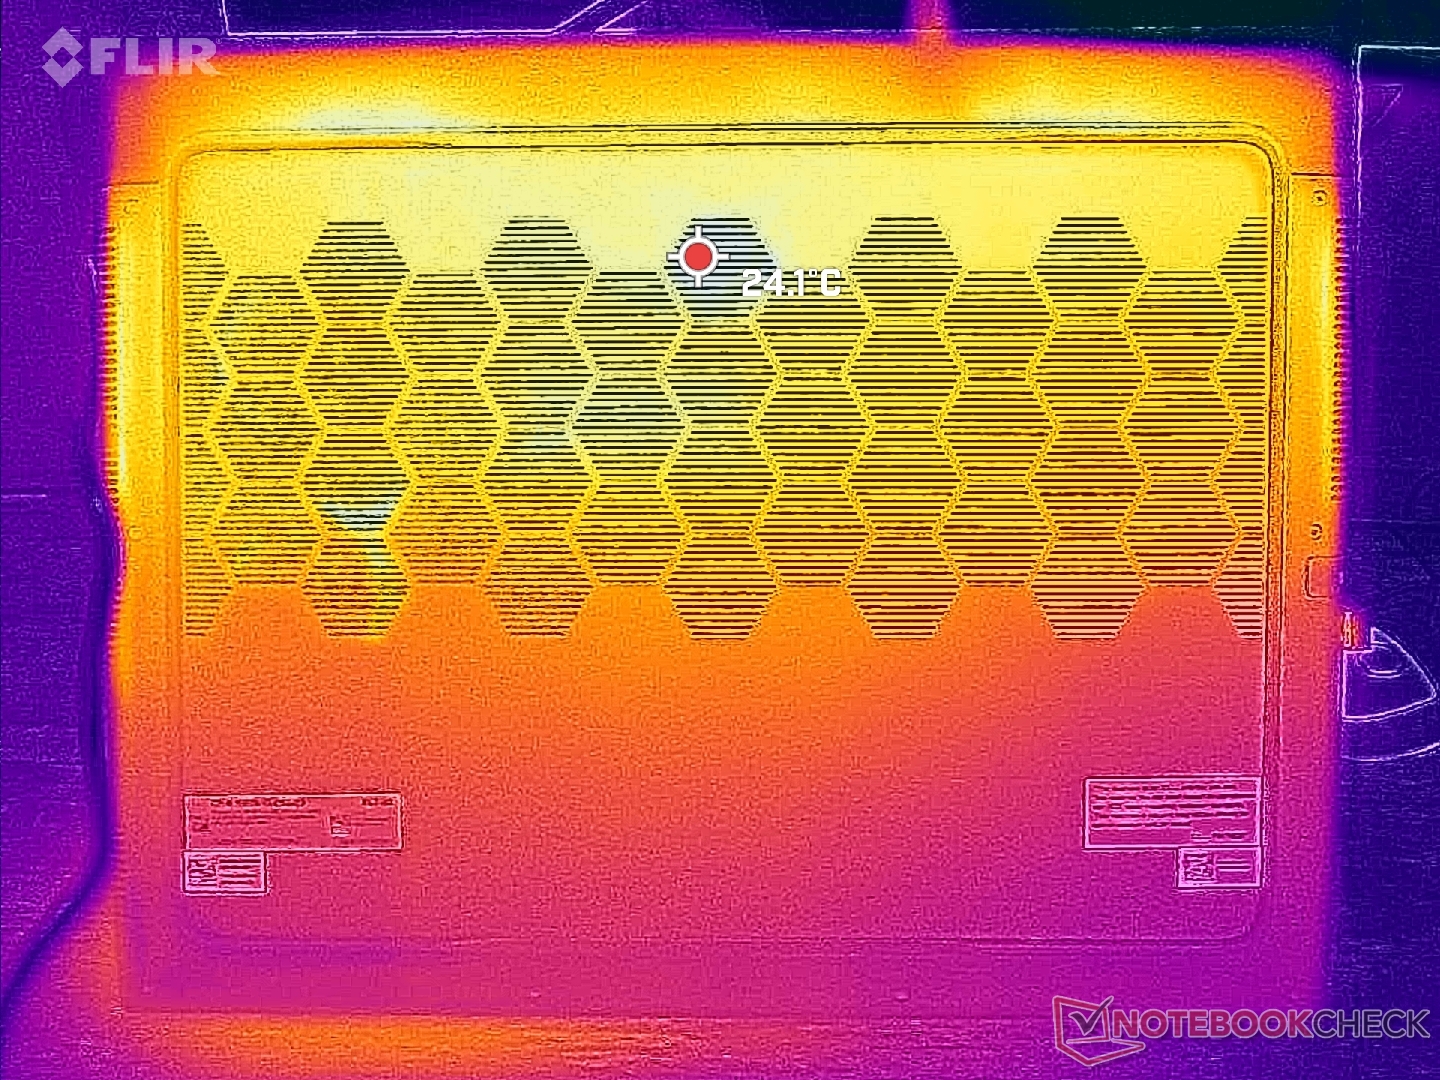
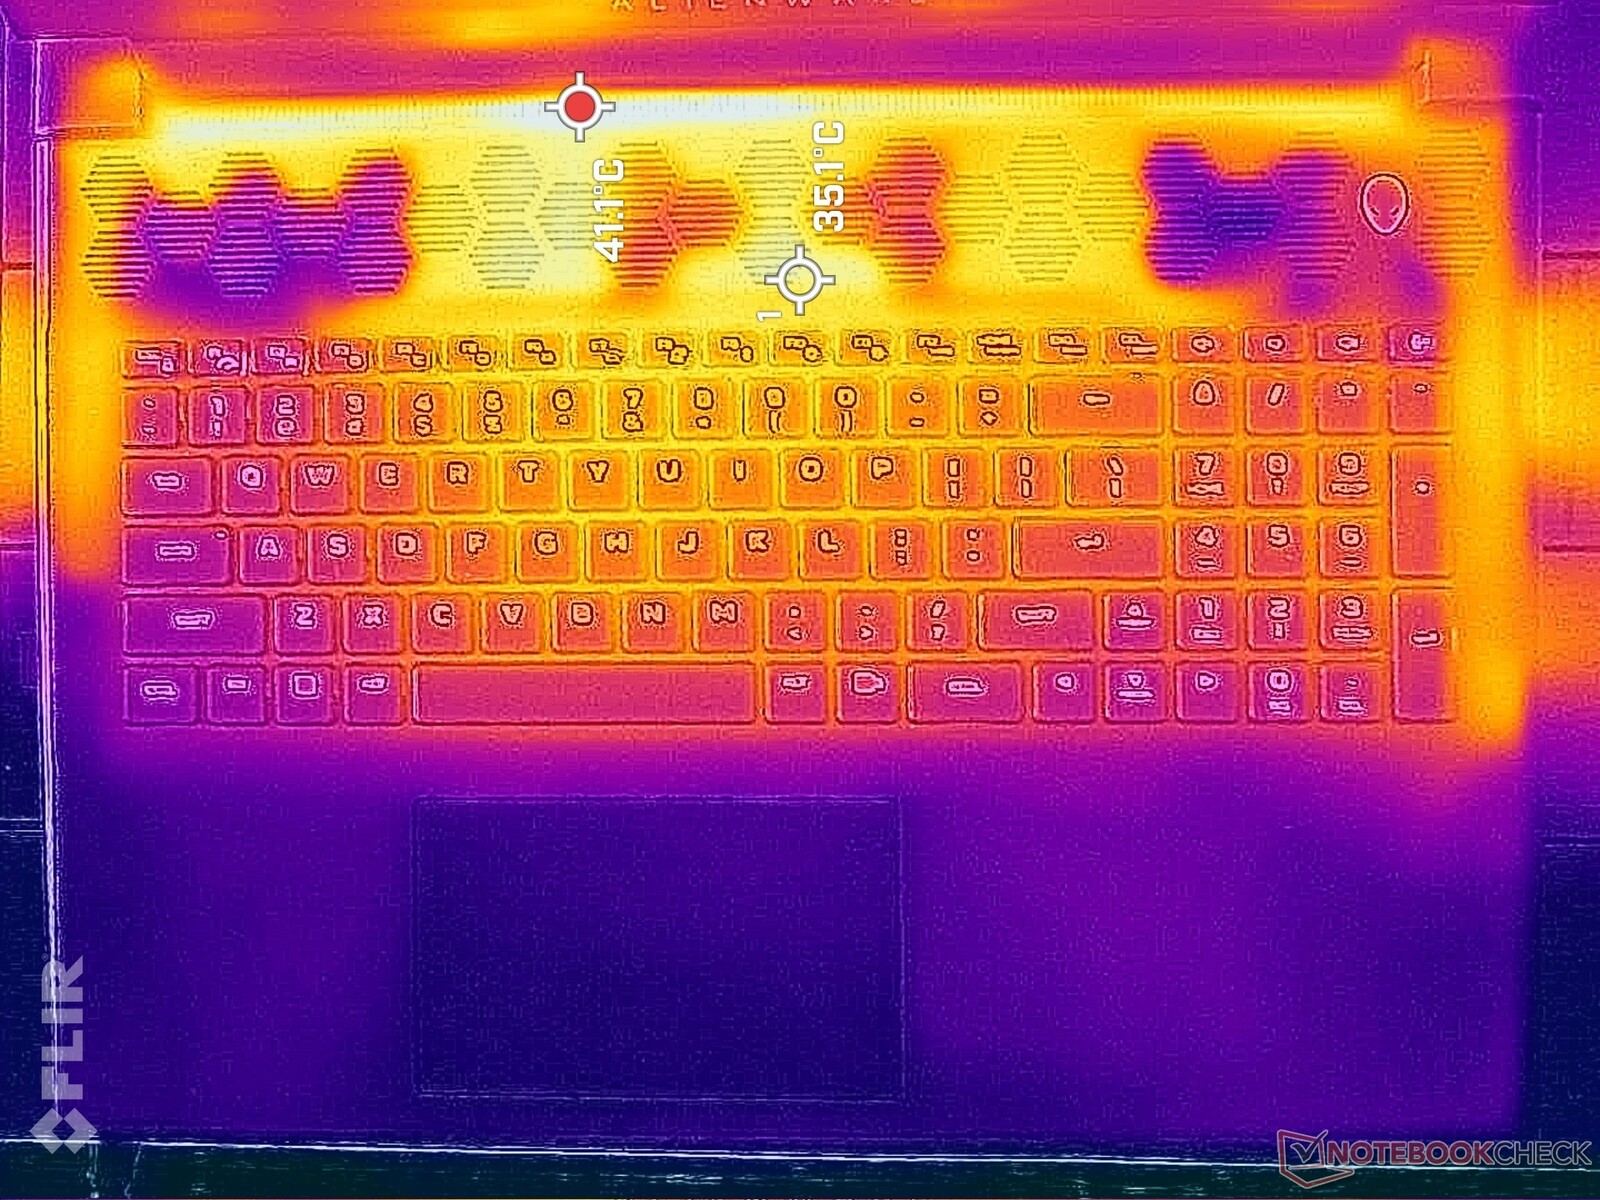
Las temperaturas superficiales no son un problema debido en parte a las amplias rejillas de ventilación en casi todos los lados del gran chasis. Los puntos más cálidos están en la parte trasera, lejos de las teclas del teclado y los reposamanos para mantener las manos cómodas.
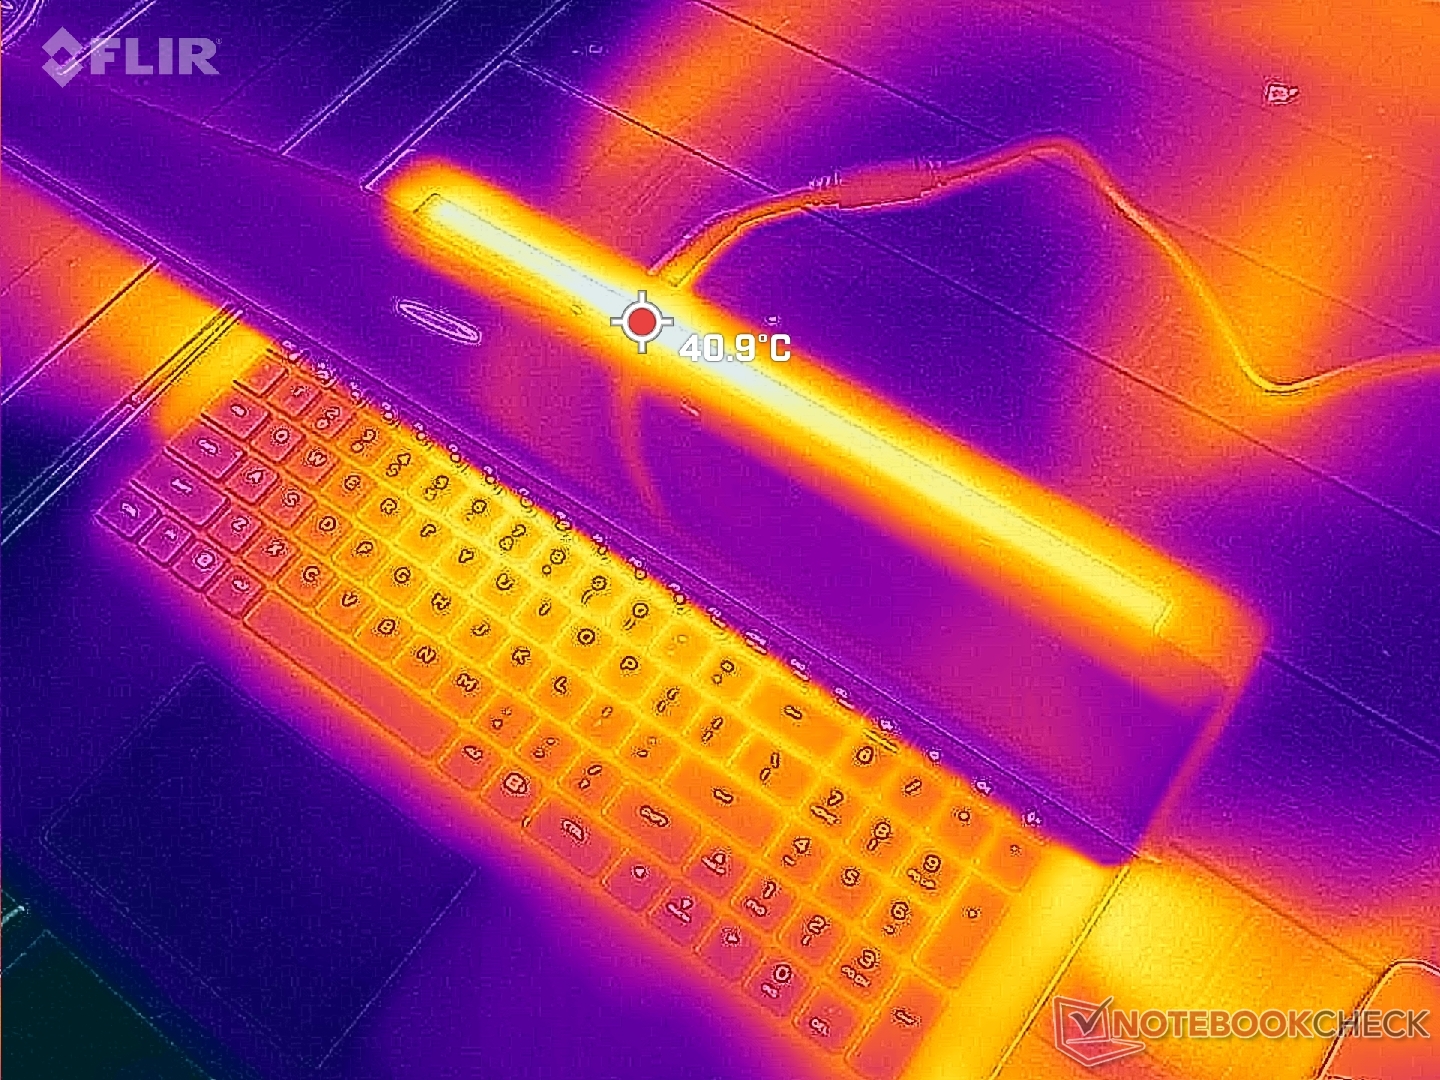
(+) La temperatura máxima en la parte superior es de 39 °C / 102 F, frente a la media de 40.4 °C / 105 F, que oscila entre 21.2 y 68.8 °C para la clase Gaming.
(+) El fondo se calienta hasta un máximo de 36.4 °C / 98 F, frente a la media de 43.2 °C / 110 F
(+) En reposo, la temperatura media de la parte superior es de 25.2 °C / 77# F, frente a la media del dispositivo de 33.9 °C / 93 F.
(+) Jugando a The Witcher 3, la temperatura media de la parte superior es de 29.8 °C / 86 F, frente a la media del dispositivo de 33.9 °C / 93 F.
(+) El reposamanos y el panel táctil están a una temperatura inferior a la de la piel, con un máximo de 23.8 °C / 74.8 F y, por tanto, son fríos al tacto.
(+) La temperatura media de la zona del reposamanos de dispositivos similares fue de 28.8 °C / 83.8 F (+5 °C / 9 F).
| Alienware m18 R1 Intel Core i9-13980HX, NVIDIA GeForce RTX 4090 Laptop GPU | Razer Blade 18 RTX 4070 Intel Core i9-13950HX, NVIDIA GeForce RTX 4070 Laptop GPU | Asus ROG Strix Scar 18 2023 G834JY-N6005W Intel Core i9-13980HX, NVIDIA GeForce RTX 4090 Laptop GPU | Eluktronics Mech-17 GP2 Intel Core i9-13900HX, NVIDIA GeForce RTX 4090 Laptop GPU | MSI Titan GT77 HX 13VI Intel Core i9-13950HX, NVIDIA GeForce RTX 4090 Laptop GPU | Alienware x17 R2 P48E Intel Core i9-12900HK, NVIDIA GeForce RTX 3080 Ti Laptop GPU | |
|---|---|---|---|---|---|---|
| Heat | -7% | -20% | -9% | -4% | -15% | |
| Maximum Upper Side * (°C) | 39 | 39.2 -1% | 54 -38% | 39 -0% | 40.6 -4% | 49.6 -27% |
| Maximum Bottom * (°C) | 36.4 | 35.6 2% | 46 -26% | 44 -21% | 41.1 -13% | 42.4 -16% |
| Idle Upper Side * (°C) | 29.2 | 31.8 -9% | 30 -3% | 31 -6% | 26.2 10% | 29.2 -0% |
| Idle Bottom * (°C) | 27.8 | 33.2 -19% | 31 -12% | 29.8 -7% | 30.3 -9% | 32 -15% |
* ... más pequeño es mejor
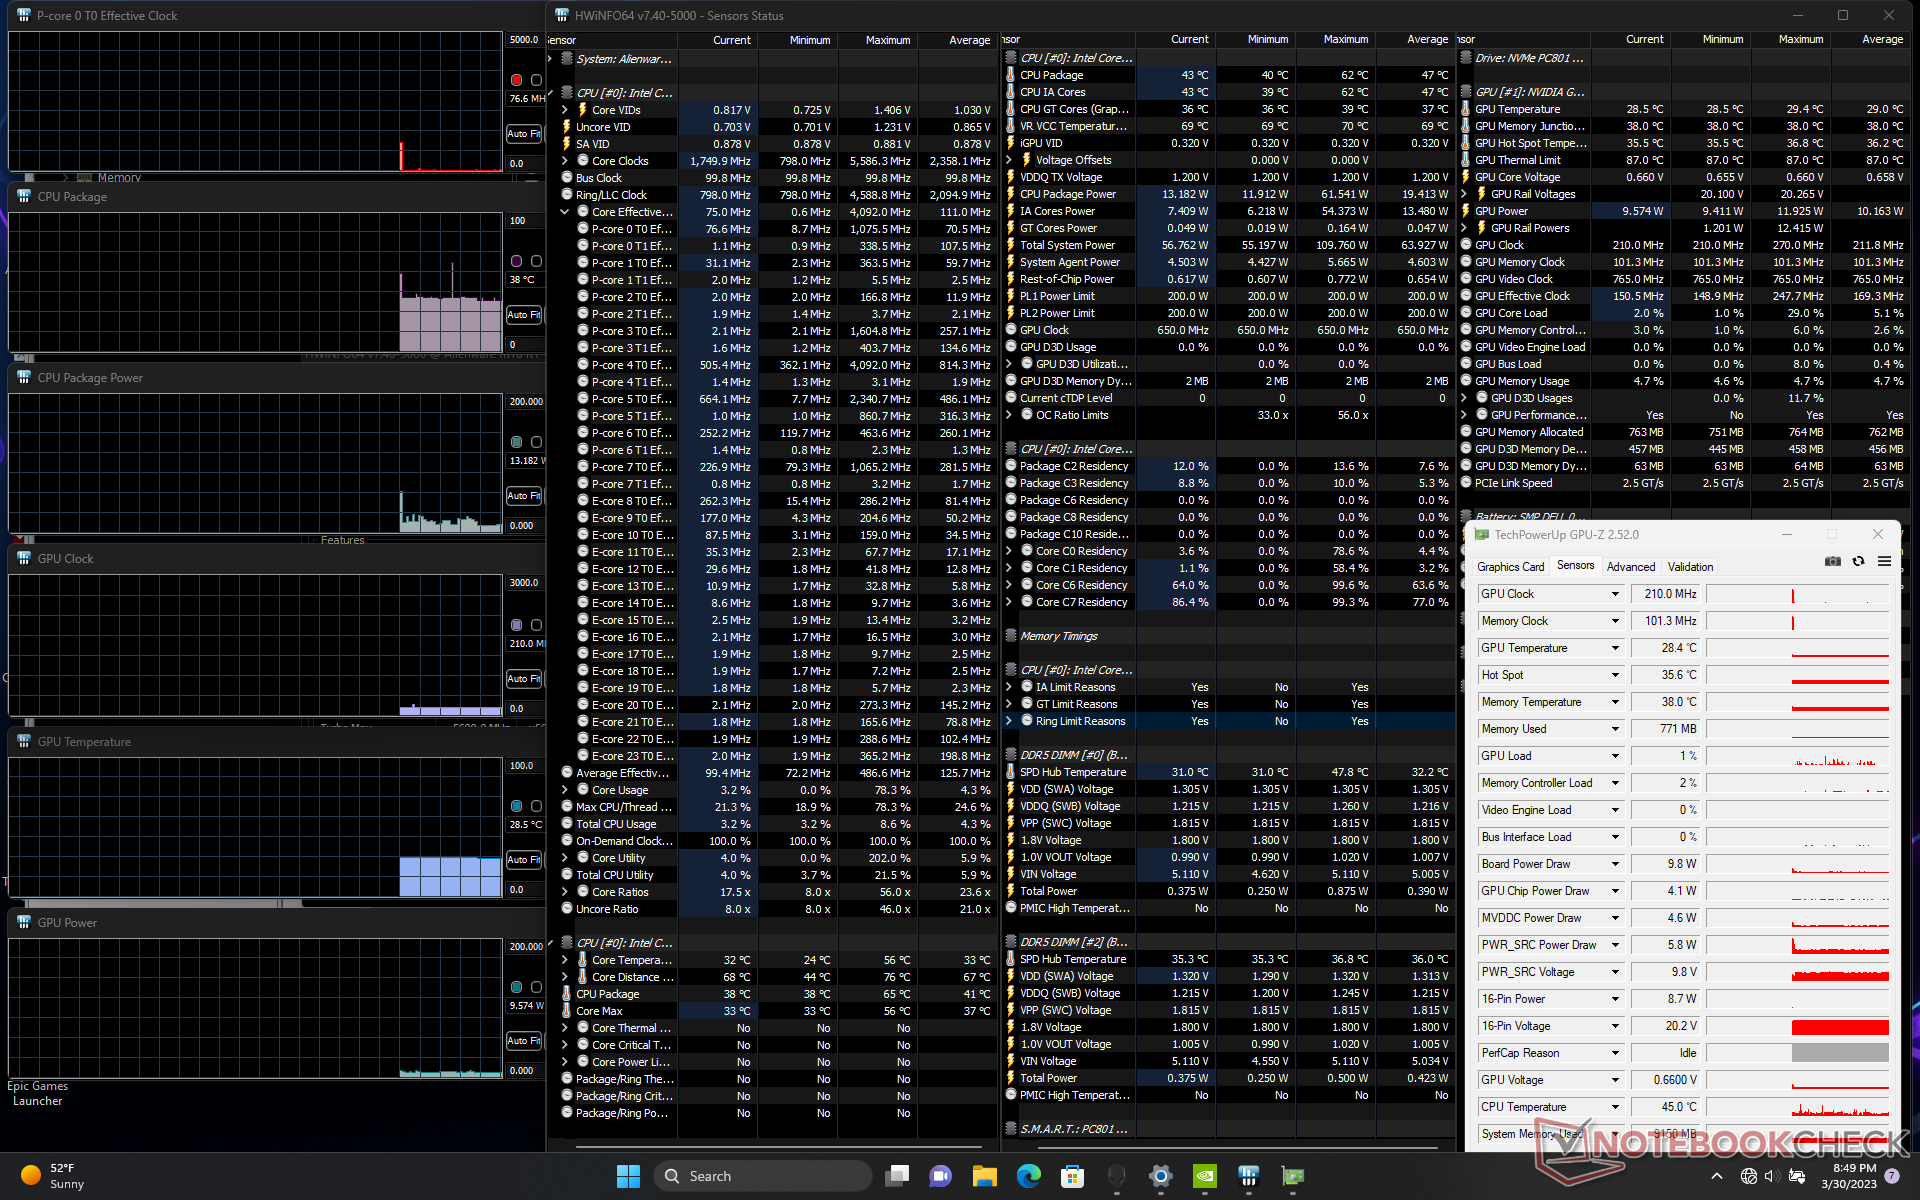
Prueba de resistencia
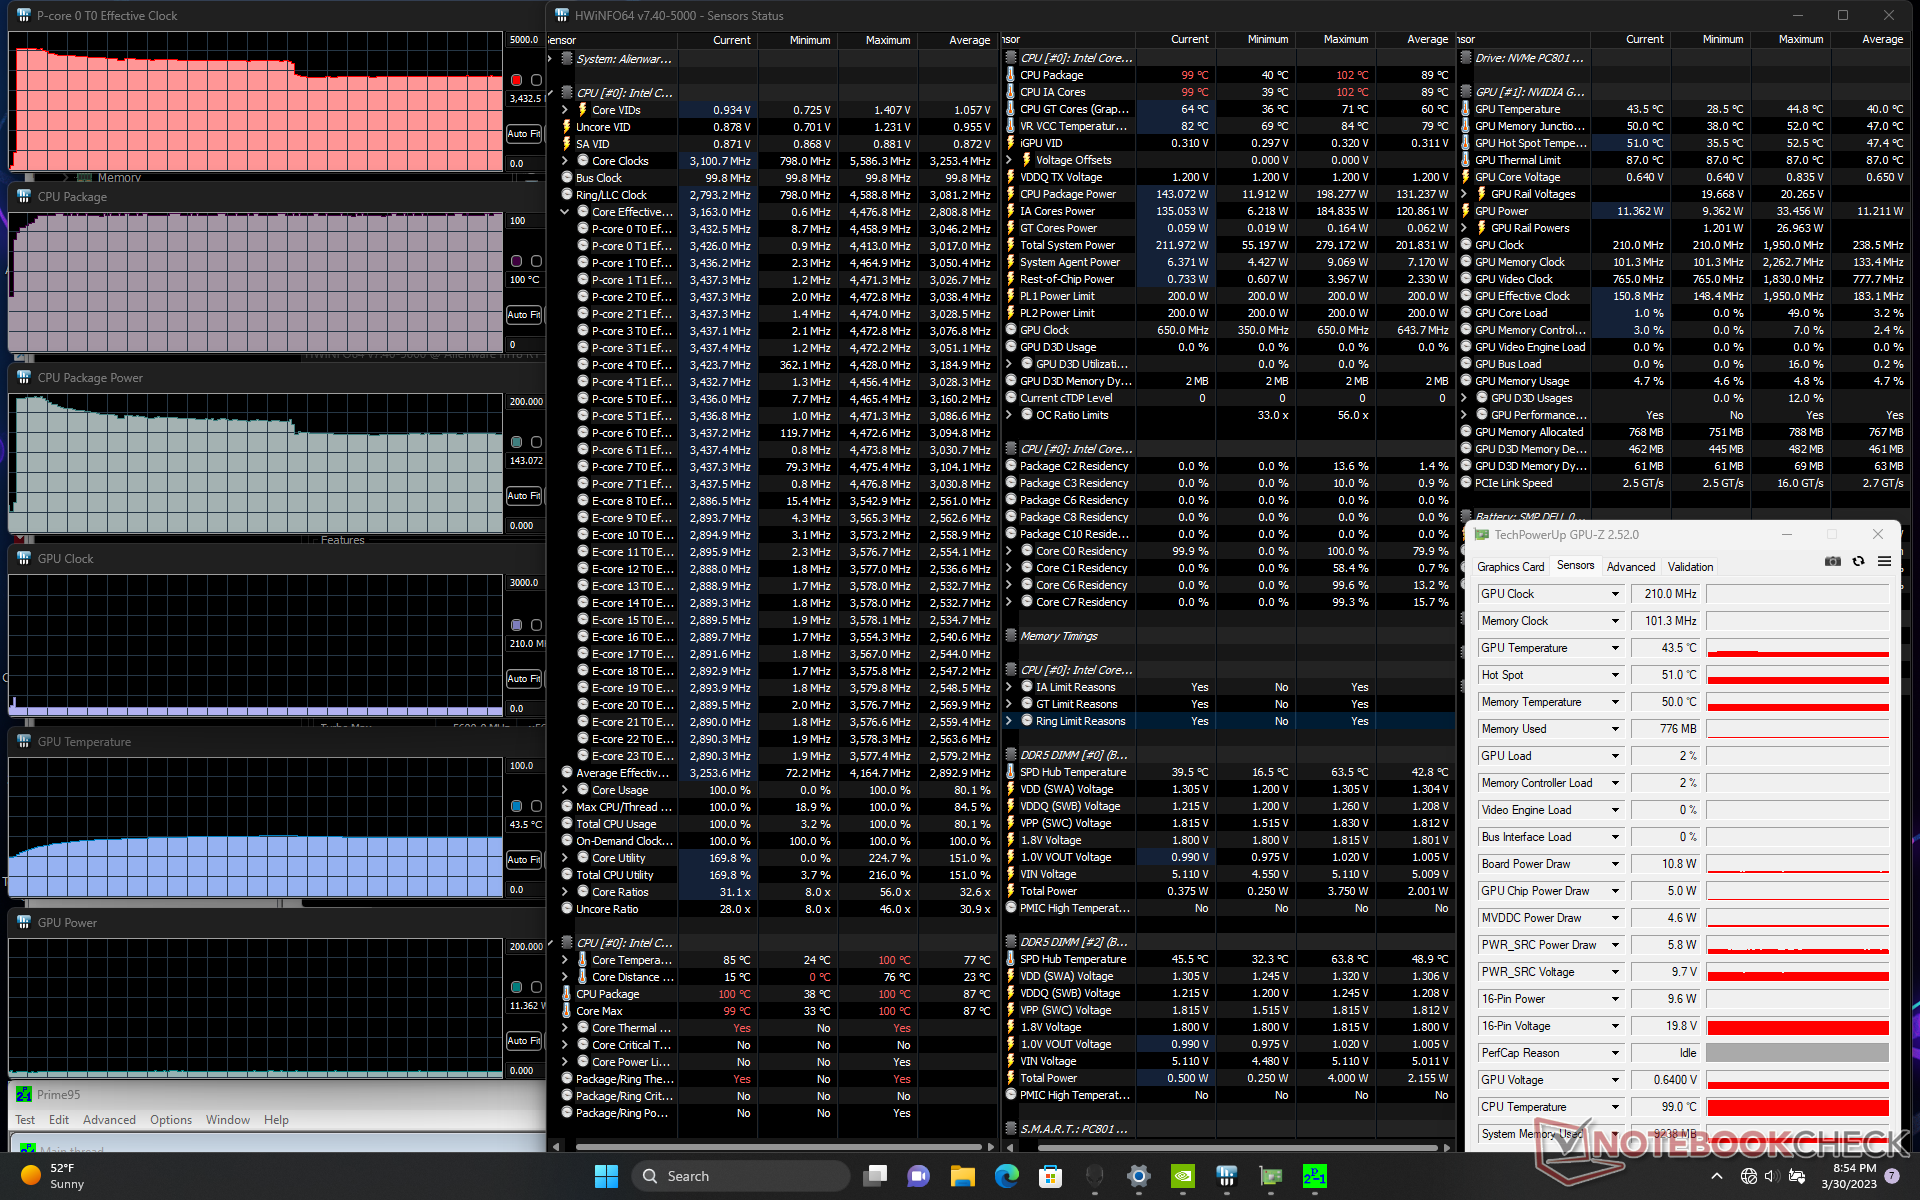
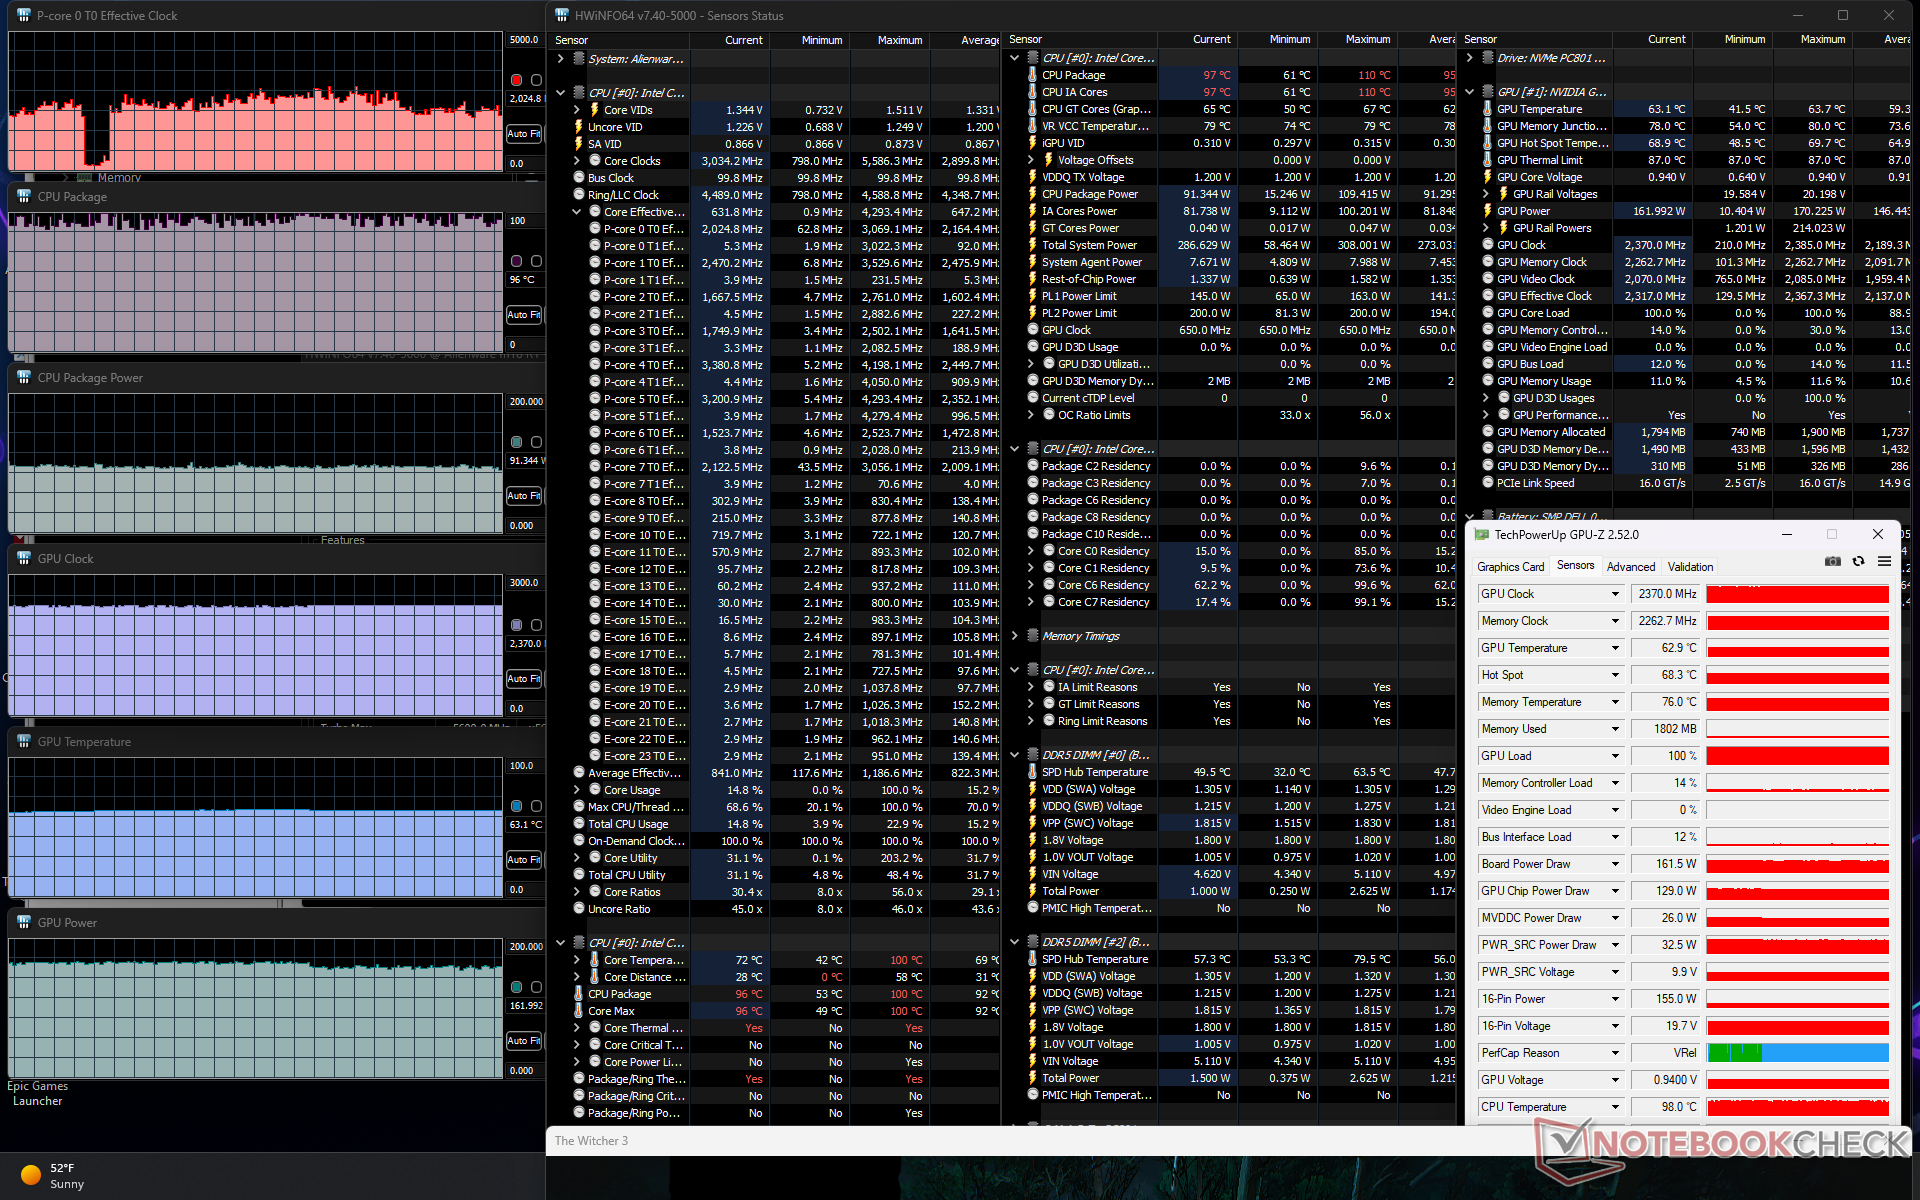
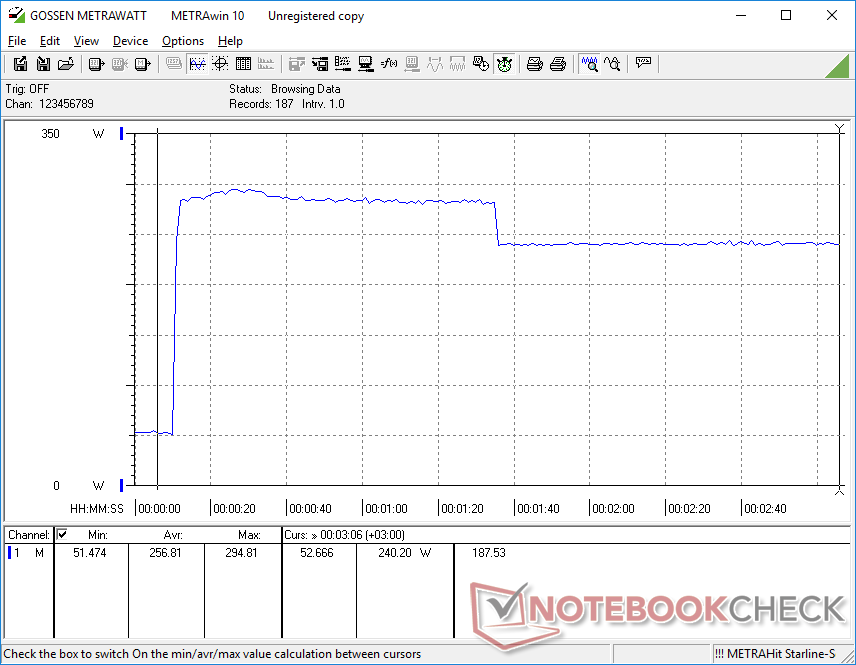
Al ejecutar Prime95 para estresar la CPU, las frecuencias de reloj y el consumo de la placa se disparan a 4.5 GHz y 198 W, respectivamente, durando sólo unos segundos o hasta que la temperatura del núcleo alcanza los 99 C. A partir de entonces, la CPU cae a 4.2 GHz y 175 W durante los siguientes minutos antes de estabilizarse finalmente en 3.4 GHz, 143 W, y 99 C. El Turbo Boost máximo no es, por tanto, sostenible sin importar el modo de energía. Las temperaturas de la CPU también son extremas incluso para un portátil de juegos.
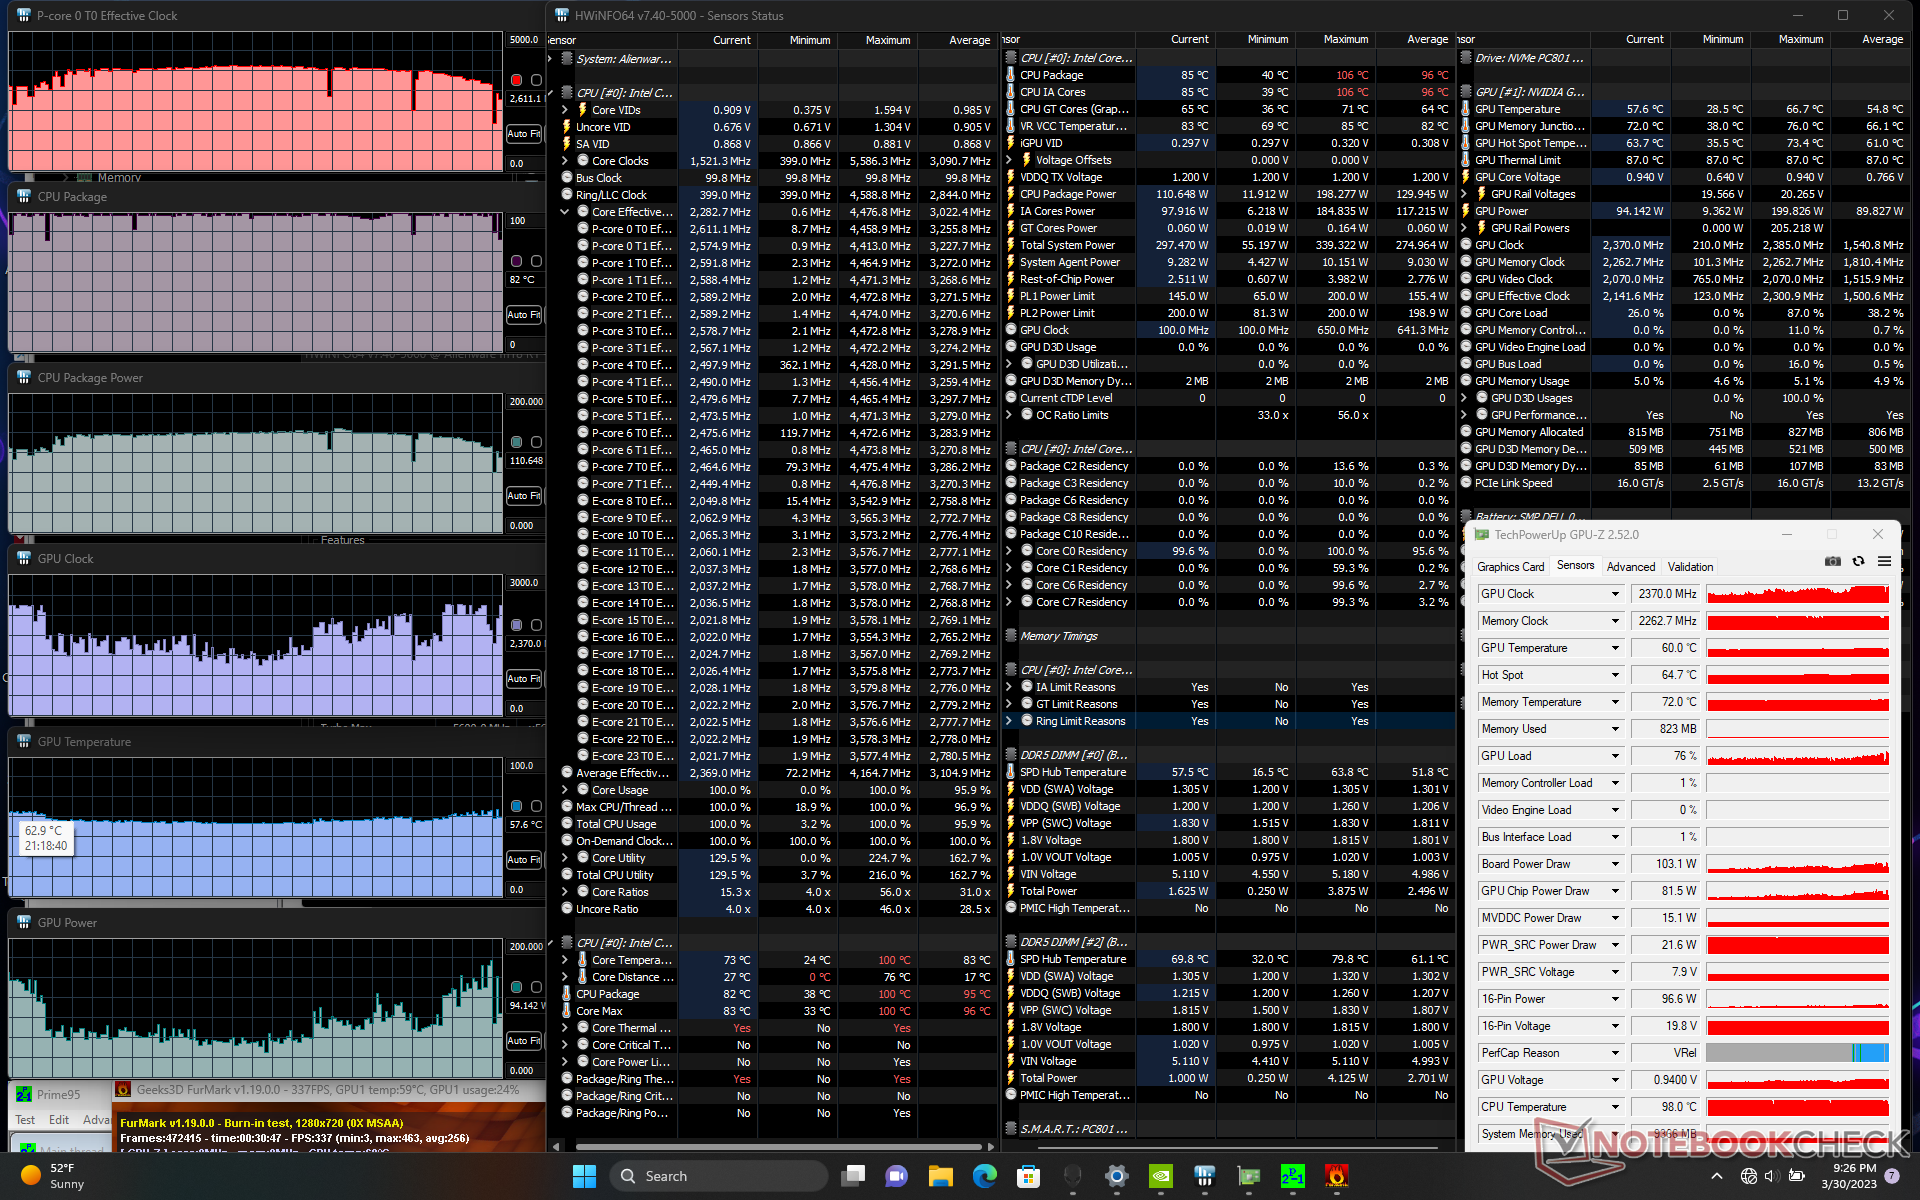
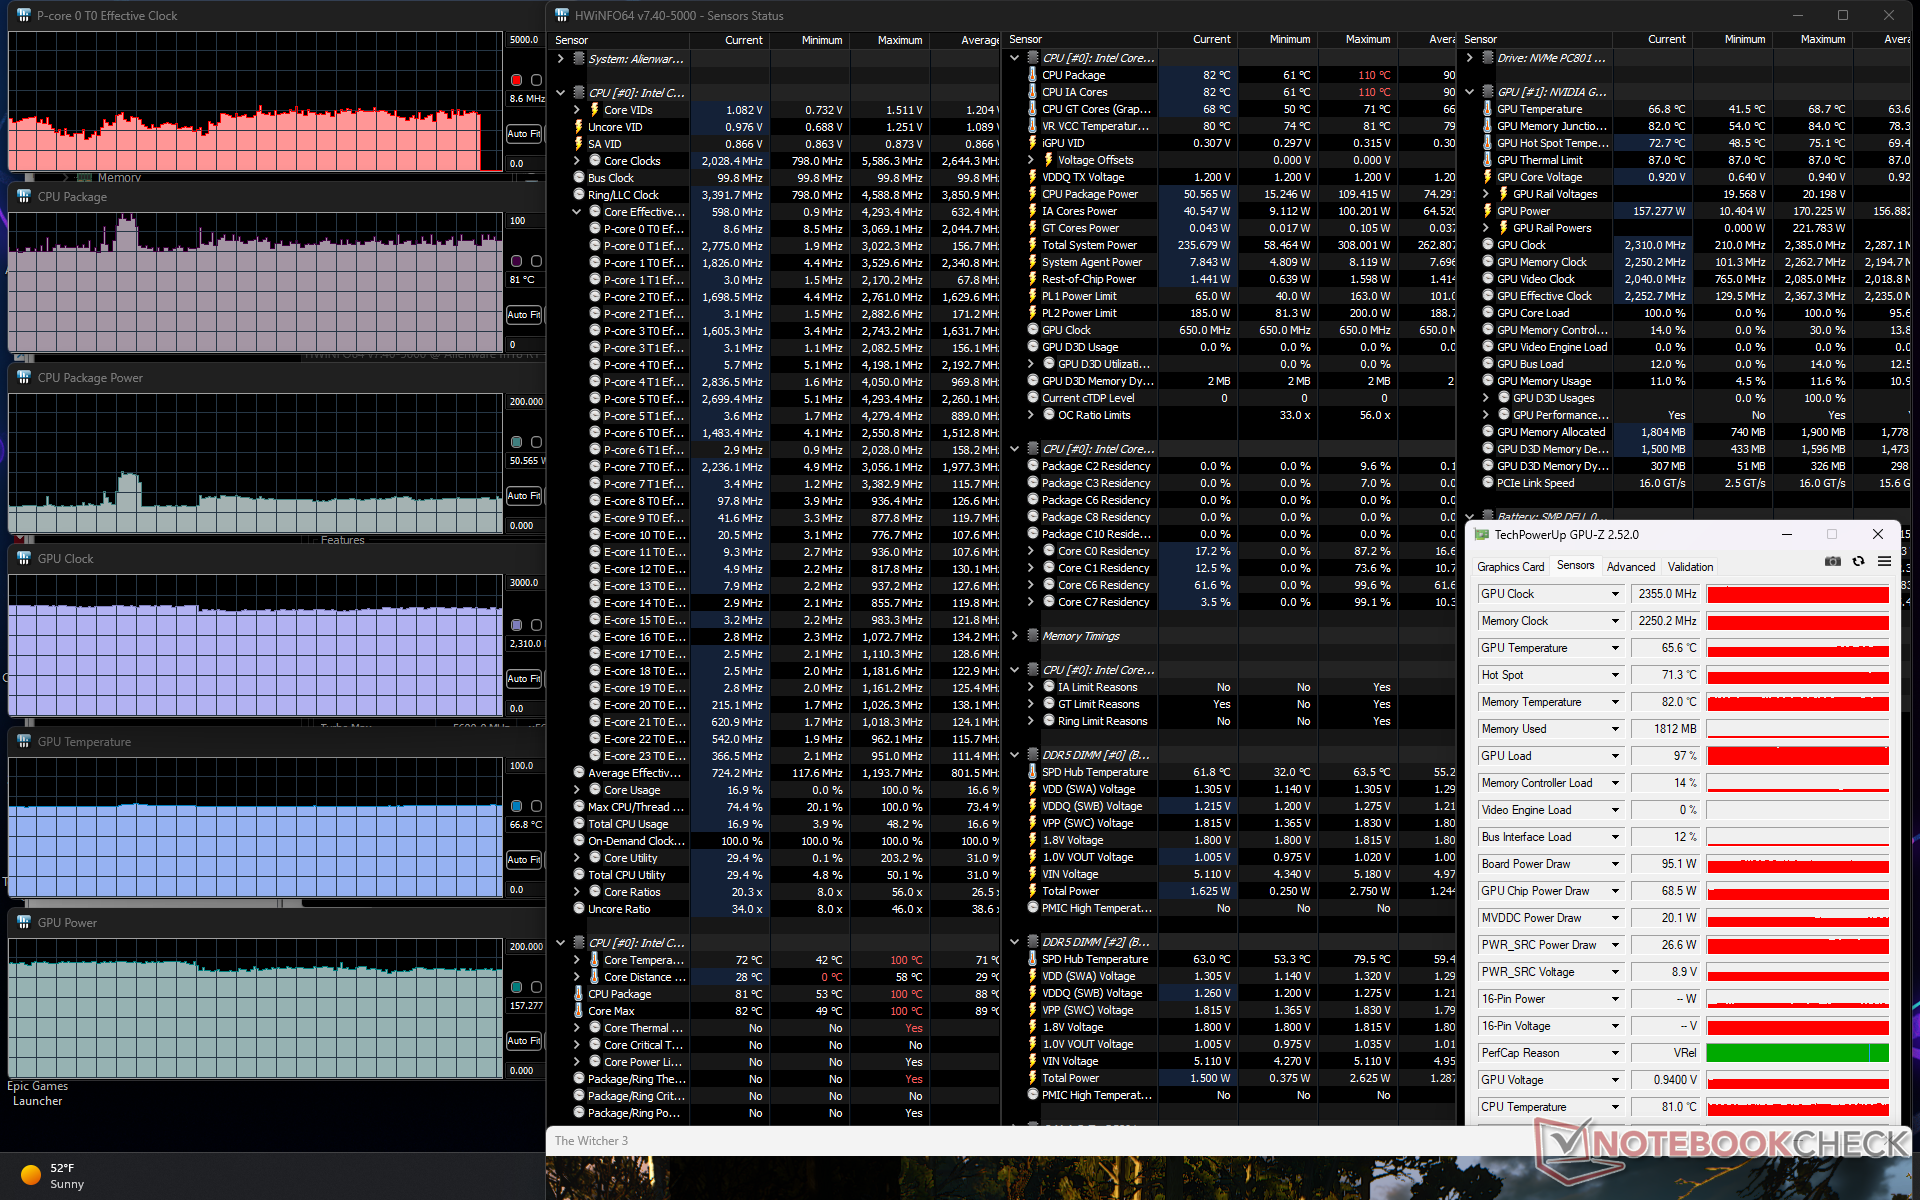
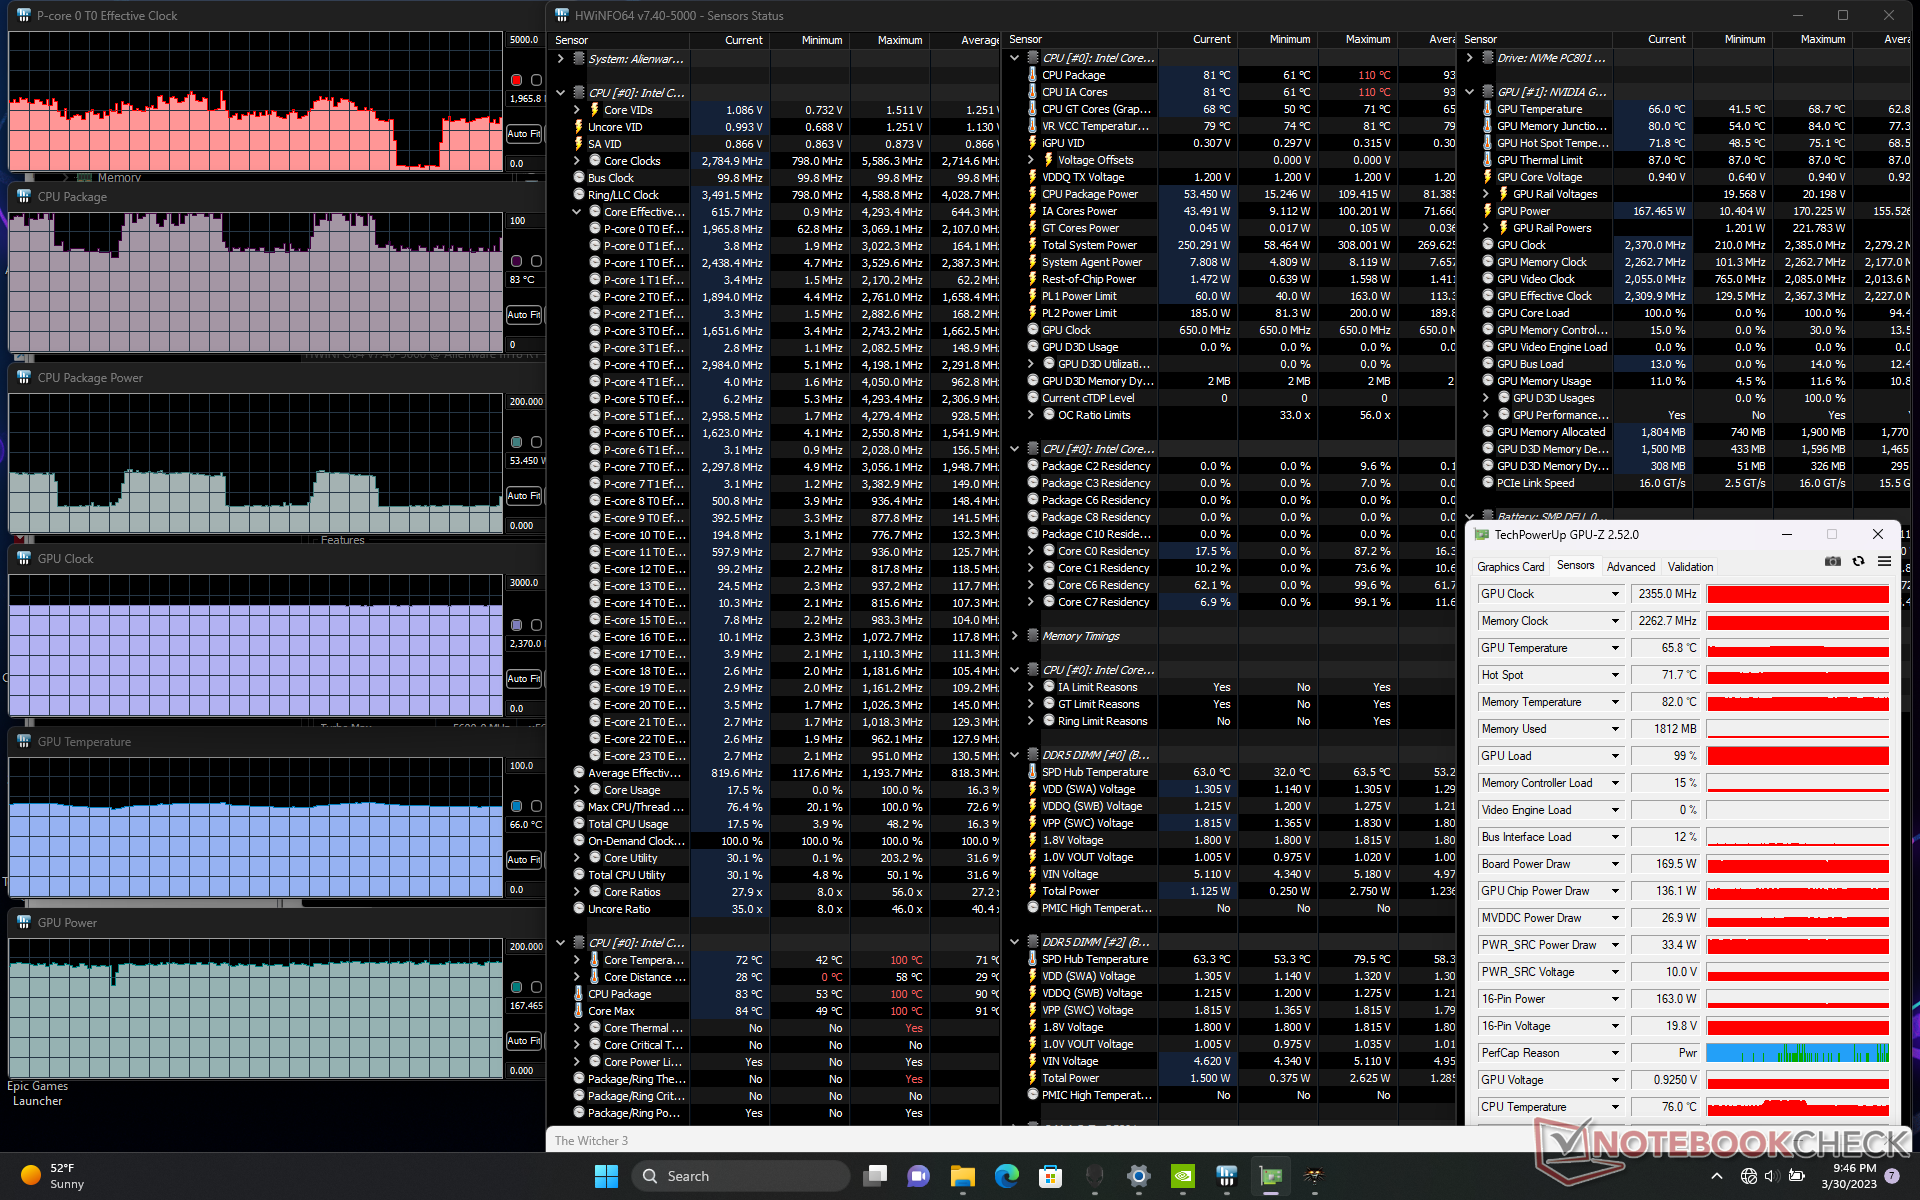
Las frecuencias de reloj de la GPU, la temperatura, y el consumo de energía de la placa se estabilizarían en 2370 MHz, 63 C, y 162 W, respectivamente, cuando se ejecuta en modo Overdrive Witcher 3 en modo Overdrive. Nótese que el rendimiento de la GPU no se ve afectado cuando funciona en el modo Performance, más silencioso, lo que concuerda con nuestras observaciones anteriores de Fire Strike. En cambio, es la CPU la que se ve ligeramente afectada. Dado que la mayoría de los juegos están vinculados a la GPU, recomendamos jugar en el modo Rendimiento en lugar del modo Overdrive más ruidoso si el ruido del ventilador es una preocupación.
Funcionar con batería limita el rendimiento como era de esperar. Un test de Fire Strike con batería arrojaría unas puntuaciones de Física y Gráficos de 25319 y 18778 puntos, respectivamente, frente a los 41644 y 46998 puntos de la red eléctrica.
| RelojCPU (GHz) | Reloj GPU (MHz) | Temperatura mediaCPU (°C) | Temperatura media GPU (°C) | |
| Sistema en reposo | -- | -- | 38 | 29 |
| Prime95 Stress | 3.4 | -- | 100 | 44 |
| Prime95+ FurMark Stress | 2.6+ | 1070 - 2370 | 82 - 100 | 57 |
| Witcher 3 Estrés (modoOverdrive) | ~2.0+ | 2370 | 96 | 63 |
| Witcher 3 Tensión (modoPerformance) | ~1,8+ | 2370 | 81 | 66 |
| Witcher 3 Tensión (modoequilibrado) | ~1,8 | 2310 | 81 | 67 |
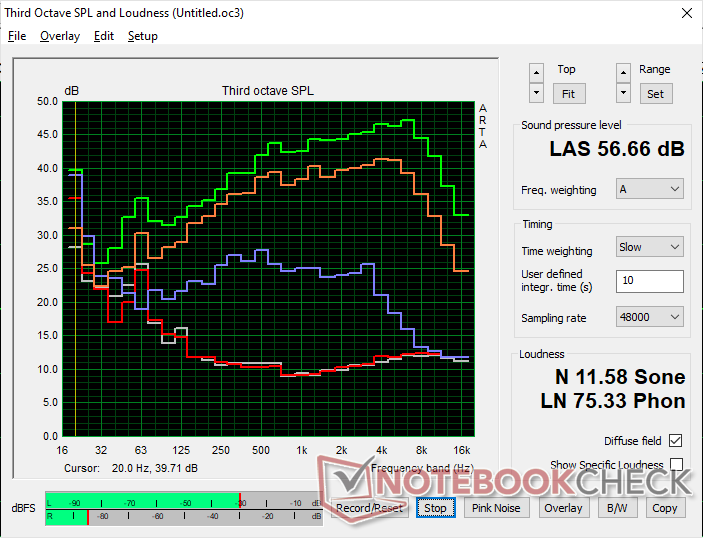
Altavoces
Alienware m18 R1 análisis de audio
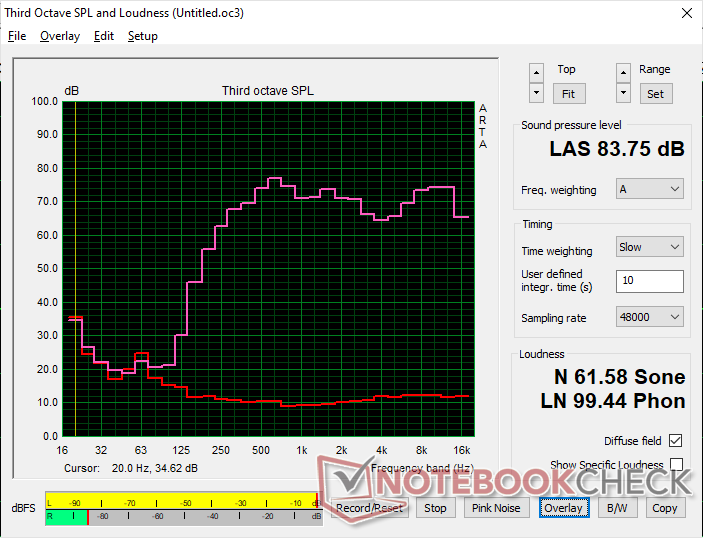
(+) | los altavoces pueden reproducir a un volumen relativamente alto (#83.8 dB)
Graves 100 - 315 Hz
(-) | casi sin bajos - de media 22.4% inferior a la mediana
(±) | la linealidad de los graves es media (13.4% delta a frecuencia anterior)
Medios 400 - 2000 Hz
(+) | medios equilibrados - a sólo 3.2% de la mediana
(+) | los medios son lineales (4.4% delta a la frecuencia anterior)
Altos 2 - 16 kHz
(+) | máximos equilibrados - a sólo 3.2% de la mediana
(+) | los máximos son lineales (4% delta a la frecuencia anterior)
Total 100 - 16.000 Hz
(+) | el sonido global es lineal (14.6% de diferencia con la mediana)
En comparación con la misma clase
» 28% de todos los dispositivos probados de esta clase eran mejores, 7% similares, 65% peores
» El mejor tuvo un delta de 6%, la media fue 18%, el peor fue ###max##%
En comparación con todos los dispositivos probados
» 19% de todos los dispositivos probados eran mejores, 4% similares, 77% peores
» El mejor tuvo un delta de 4%, la media fue 24%, el peor fue ###max##%
Apple MacBook Pro 16 2021 M1 Pro análisis de audio
(+) | los altavoces pueden reproducir a un volumen relativamente alto (#84.7 dB)
Graves 100 - 315 Hz
(+) | buen bajo - sólo 3.8% lejos de la mediana
(+) | el bajo es lineal (5.2% delta a la frecuencia anterior)
Medios 400 - 2000 Hz
(+) | medios equilibrados - a sólo 1.3% de la mediana
(+) | los medios son lineales (2.1% delta a la frecuencia anterior)
Altos 2 - 16 kHz
(+) | máximos equilibrados - a sólo 1.9% de la mediana
(+) | los máximos son lineales (2.7% delta a la frecuencia anterior)
Total 100 - 16.000 Hz
(+) | el sonido global es lineal (4.6% de diferencia con la mediana)
En comparación con la misma clase
» 0% de todos los dispositivos probados de esta clase eran mejores, 0% similares, 100% peores
» El mejor tuvo un delta de 5%, la media fue 17%, el peor fue ###max##%
En comparación con todos los dispositivos probados
» 0% de todos los dispositivos probados eran mejores, 0% similares, 100% peores
» El mejor tuvo un delta de 4%, la media fue 24%, el peor fue ###max##%
Gestión de la energía: más de 300 W en juegos
Consumo de energía
No sorprende que el sistema sea muy exigente incluso cuando no ejecuta ninguna aplicación. Podemos registrar un mínimo de 21 W en inactivo en modo Ahorro de Energía, modo Optimus y el brillo más bajo. El ralentí en modo Rendimiento o Turbo aumentaría el consumo en ralentí más del doble, por lo que se recomienda encarecidamente evitar los ajustes de perfil más alto si no se necesita la potencia extra.
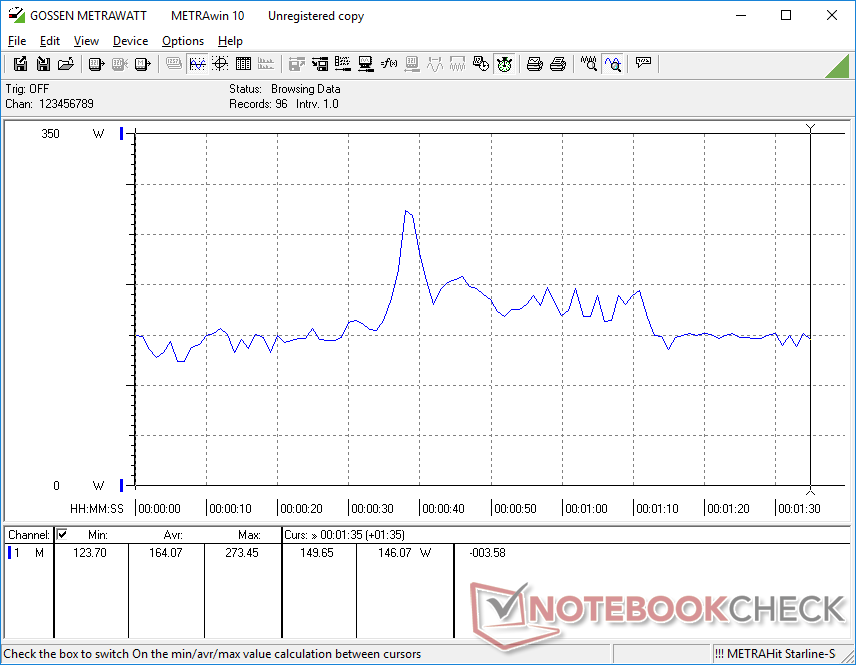
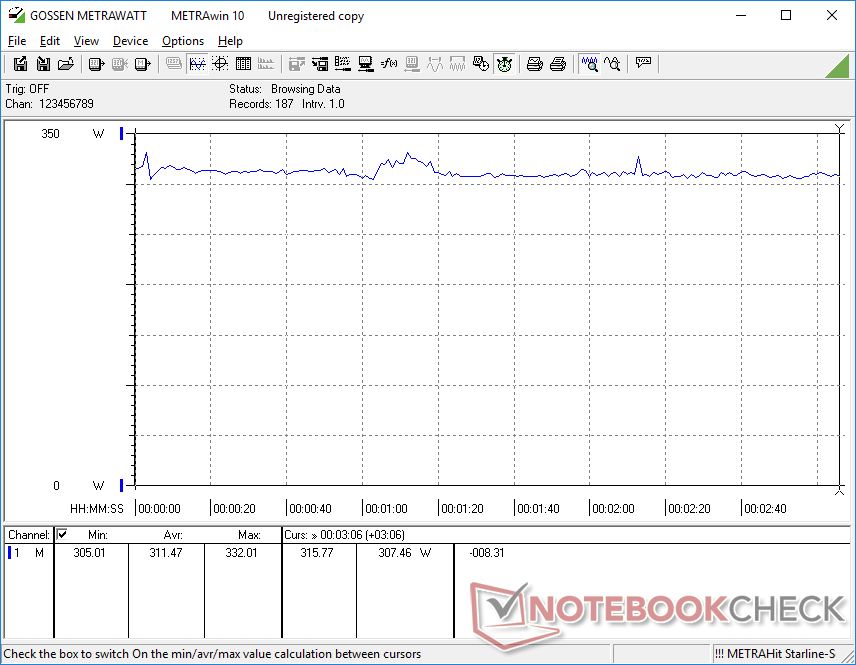
Ejecutando Witcher 3 para representar cargas de juego típicas consumiría 311 W o más de 50 W más que en el Alienware x17 R2. Así, si bien el rendimiento es más rápido de generación en generación, los usuarios tendrán que pagar por ello con facturas de energía más altas debido a la CPU más exigente.
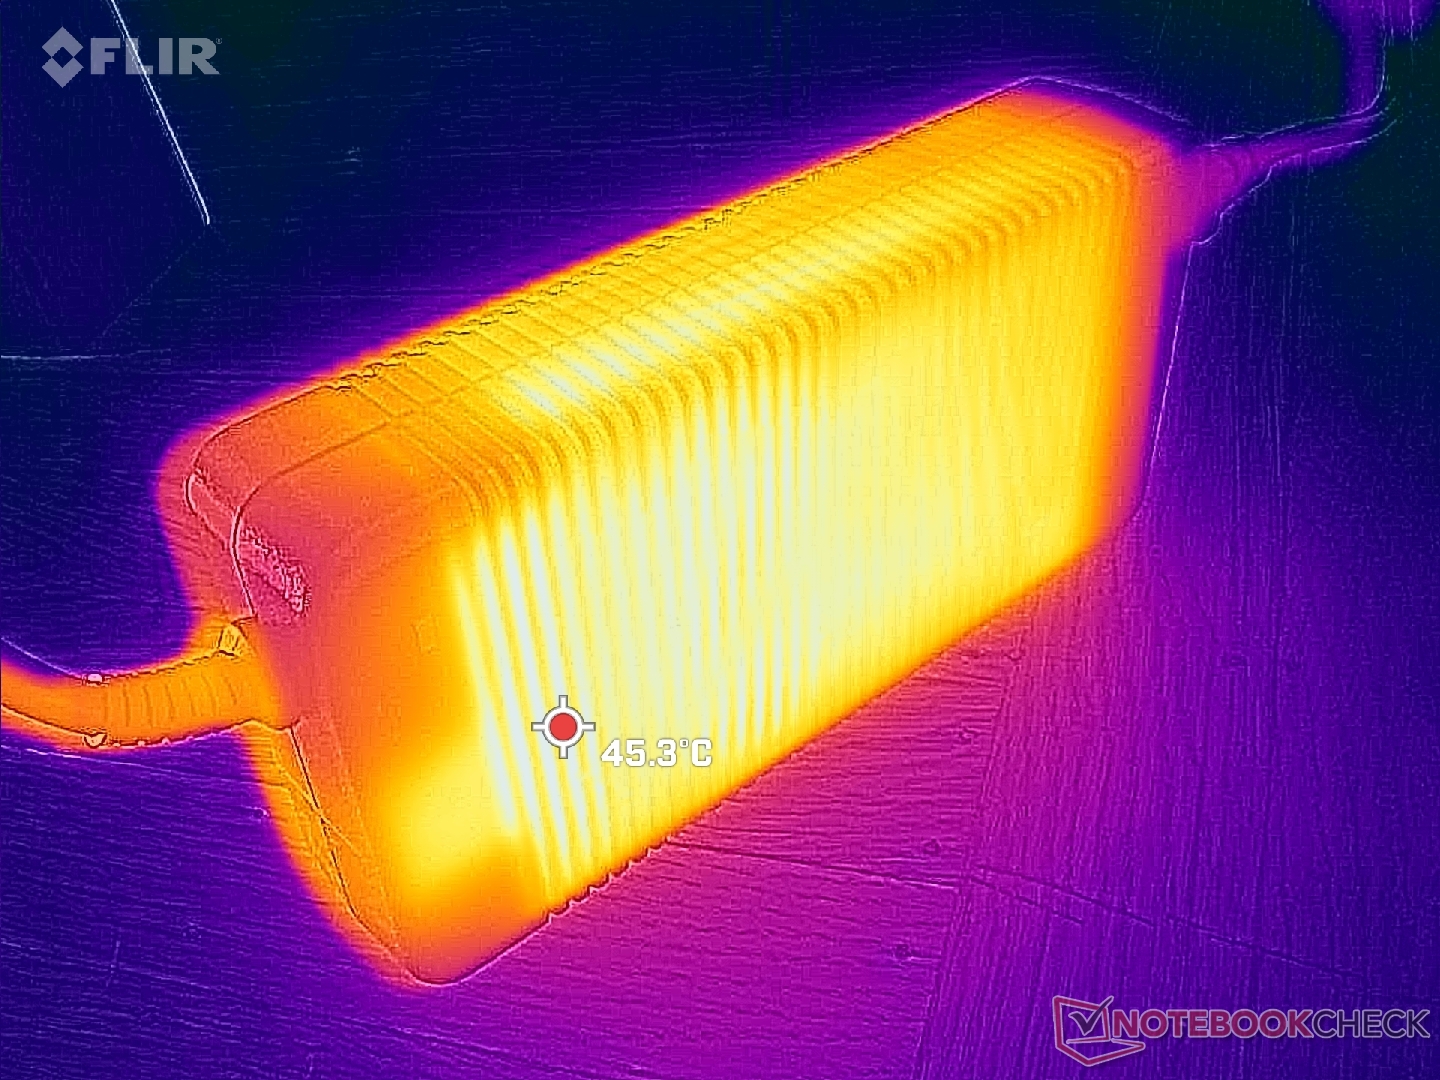
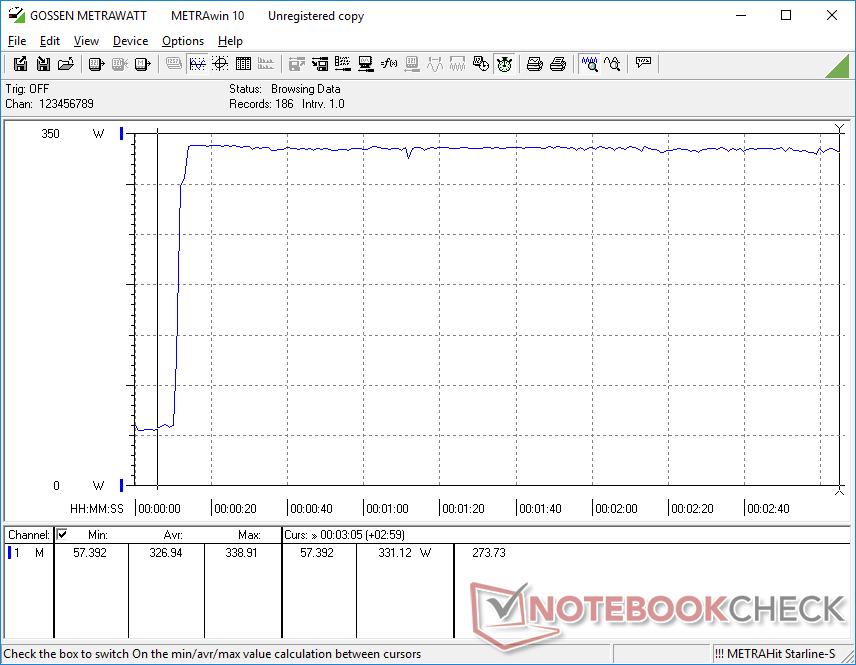
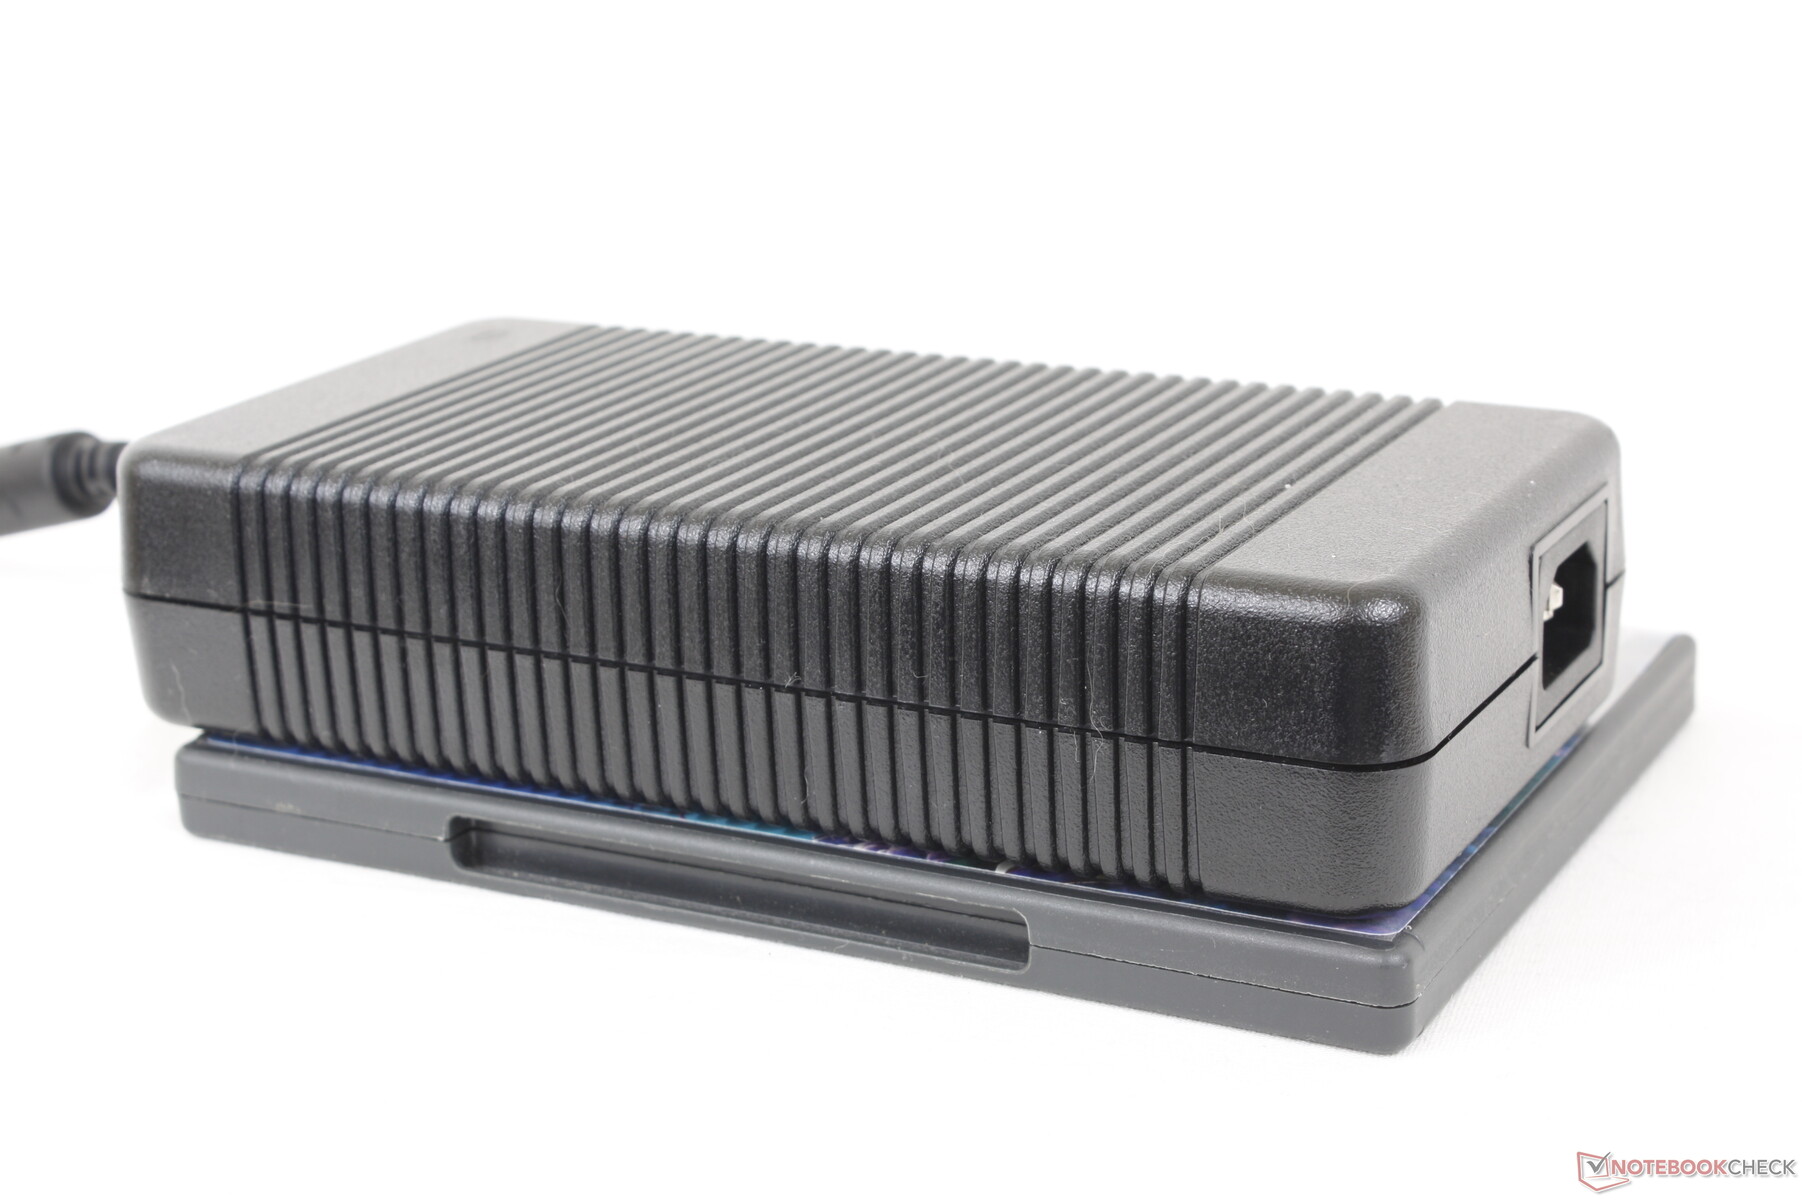
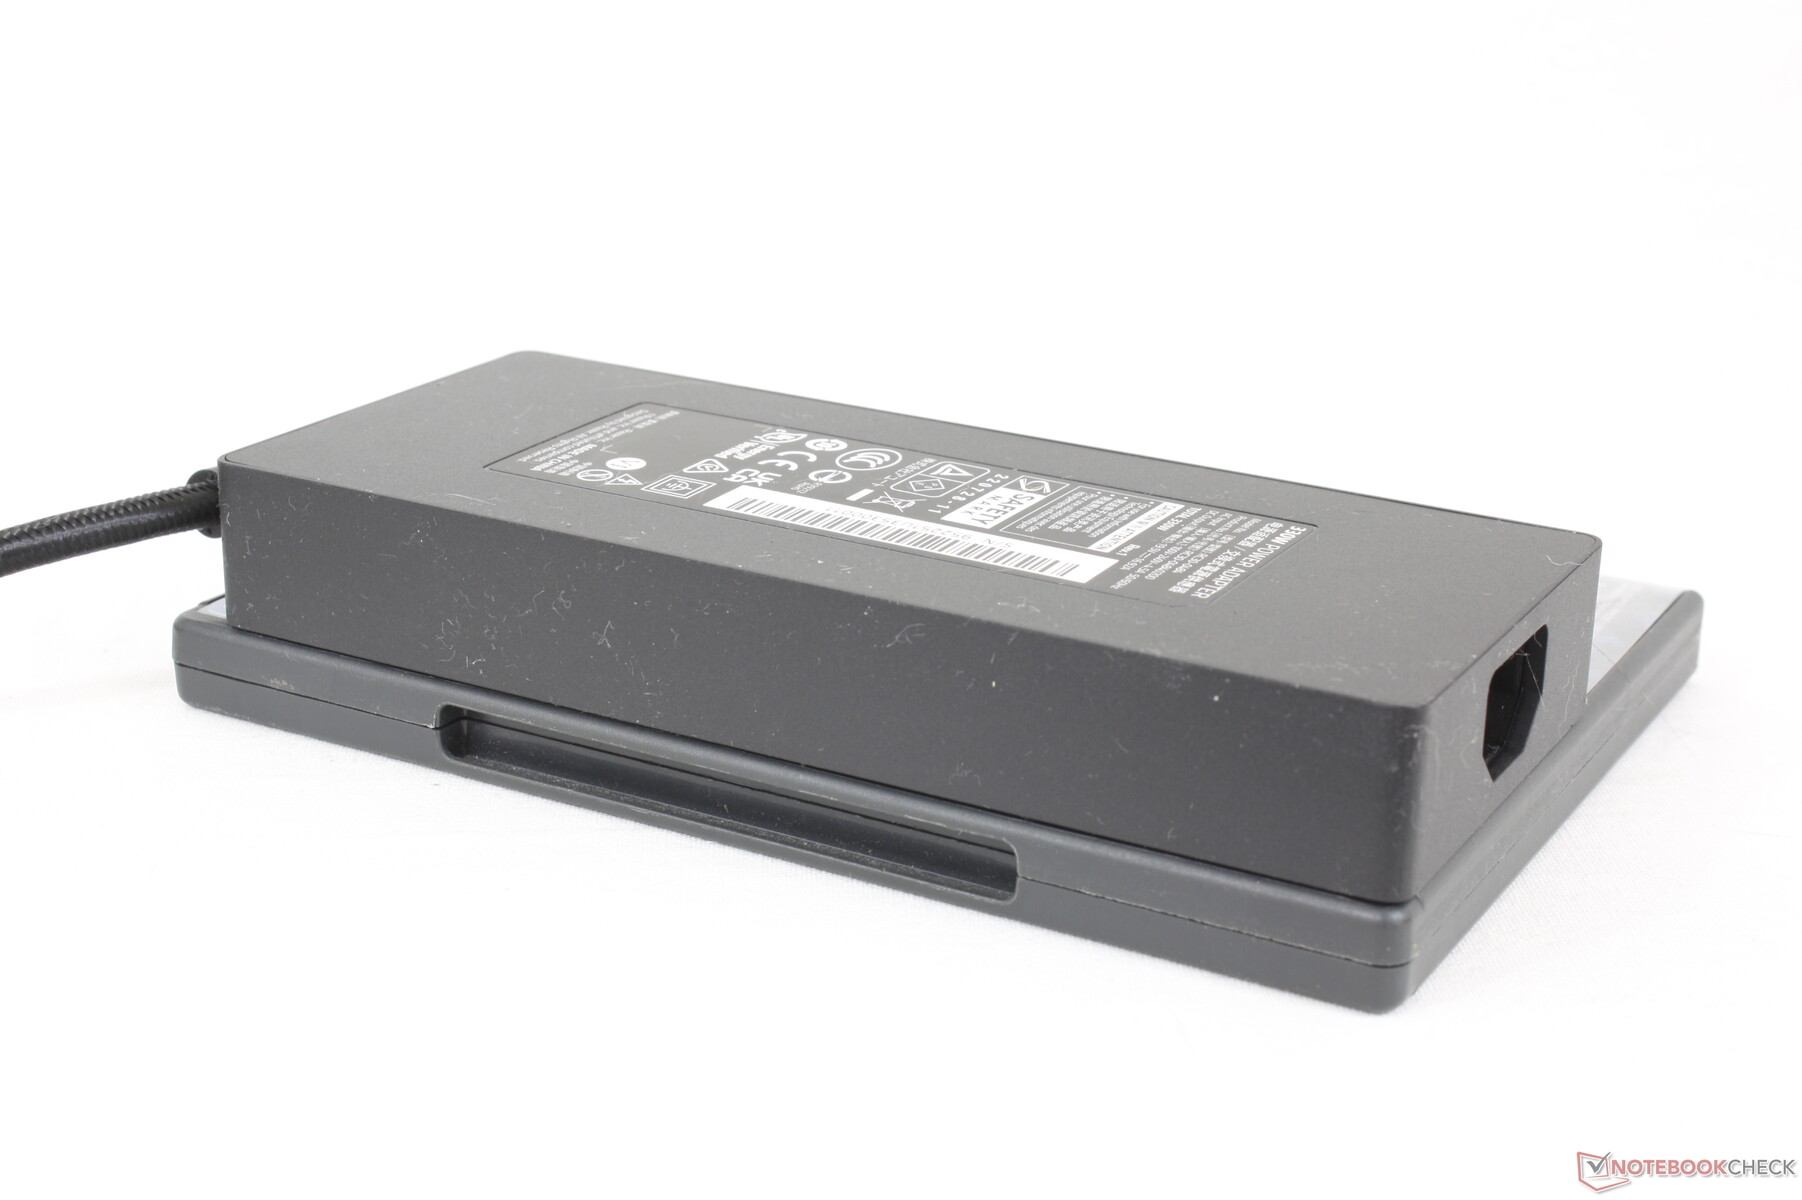
Registramos un consumo máximo de 339 W cuando CPU y GPU están al 100%. El voluminoso adaptador de CA (~19,5 x 9,8 x 4 cm) tiene una potencia nominal de 330 W, por lo que nuestra unidad totalmente configurada está aprovechando al máximo la energía disponible. Hay que tener en cuenta que la velocidad de carga de la batería del portátil se ralentiza cuando se juega. De hecho, podemos observar cómo nuestra batería cae del 100% al 91% cuando ejecutamos cargas extremadamente exigentes como Prime95 y FurMark simultáneamente.
| Off / Standby | |
| Ocioso | |
| Carga |
|
Clave:
min: | |
| Alienware m18 R1 i9-13980HX, GeForce RTX 4090 Laptop GPU, SK hynix PC801 HFS001TEJ9X101N, IPS, 1920x1200, 18" | Razer Blade 18 RTX 4070 i9-13950HX, GeForce RTX 4070 Laptop GPU, SSSTC CA6-8D1024, IPS, 2560x1600, 18" | Asus ROG Strix Scar 18 2023 G834JY-N6005W i9-13980HX, GeForce RTX 4090 Laptop GPU, 2x Samsung PM9A1 MZVL21T0HCLR (RAID 0), IPS, 2560x1600, 18" | MSI GE78HX 13VH-070US i9-13950HX, GeForce RTX 4080 Laptop GPU, Samsung PM9A1 MZVL22T0HBLB, IPS, 2560x1600, 17" | Eluktronics Mech-17 GP2 i9-13900HX, GeForce RTX 4090 Laptop GPU, Samsung PM9A1 MZVL21T0HCLR, IPS, 2560x1600, 17" | MSI Titan GT77 HX 13VI i9-13950HX, GeForce RTX 4090 Laptop GPU, Samsung PM9A1 MZVL22T0HBLB, Mini-LED, 3840x2160, 17.3" | |
|---|---|---|---|---|---|---|
| Power Consumption | 7% | 11% | 20% | 21% | 20% | |
| Idle Minimum * (Watt) | 21.6 | 24.5 -13% | 17.3 20% | 16.1 25% | 14 35% | 14 35% |
| Idle Average * (Watt) | 25.2 | 34.1 -35% | 27 -7% | 24 5% | 19.3 23% | 21.6 14% |
| Idle Maximum * (Watt) | 56.7 | 47.7 16% | 46 19% | 34 40% | 36.8 35% | 24.8 56% |
| Load Average * (Watt) | 164.1 | 140 15% | 133 19% | 123.6 25% | 117.2 29% | 122.5 25% |
| Witcher 3 ultra * (Watt) | 311 | 202 35% | 286 8% | 304 2% | 265 15% | |
| Load Maximum * (Watt) | 338.9 | 261 23% | 329 3% | 285.7 16% | 342.5 -1% | 418 -23% |
* ... más pequeño es mejor
Power Consumption Witcher 3 / Stresstest
Power Consumption external Monitor
Duración de la batería - No es terrible para el tamaño
La duración de la batería nunca ha sido un punto fuerte de la serie Alienware. El Alienware x17 R2 del año pasado, por ejemplo, sólo duraba un par de horas incluso navegando por Internet. El Alienware m18 incluye una batería de mayor capacidad (97 Wh frente a 87 Wh) con una mejor gestión de la energía para una autonomía de navegación notablemente superior, de unas 4 horas. Ciertamente no es tan larga como la de un Ultrabook típico, pero no está mal para un portátil de juegos tan grande.
La carga de vacío a lleno tarda unas 2 horas con el adaptador de barril incluido. No soporta cargadores USB-C, lo que es una pena porque significa que estás atado al enorme adaptador de CA de 330 W allá donde vayas.
| Alienware m18 R1 i9-13980HX, GeForce RTX 4090 Laptop GPU, 97 Wh | Razer Blade 18 RTX 4070 i9-13950HX, GeForce RTX 4070 Laptop GPU, 91.7 Wh | Asus ROG Strix Scar 18 2023 G834JY-N6005W i9-13980HX, GeForce RTX 4090 Laptop GPU, 90 Wh | Eluktronics Mech-17 GP2 i9-13900HX, GeForce RTX 4090 Laptop GPU, 99 Wh | MSI Titan GT77 HX 13VI i9-13950HX, GeForce RTX 4090 Laptop GPU, 99.9 Wh | Alienware x17 R2 P48E i9-12900HK, GeForce RTX 3080 Ti Laptop GPU, 87 Wh | |
|---|---|---|---|---|---|---|
| Duración de Batería | 35% | 47% | 19% | 62% | -23% | |
| Reader / Idle (h) | 5.6 | 7 25% | 3.9 -30% | |||
| WiFi v1.3 (h) | 4.3 | 4 -7% | 7.1 65% | 5.1 19% | 5.3 23% | 2 -53% |
| Load (h) | 0.7 | 1.3 86% | 0.9 29% | 1.4 100% | 0.8 14% | |
| H.264 (h) | 7 | 6 | ||||
| Witcher 3 ultra (h) | 0.9 |
Pro
Contra
Veredicto - Nueve libras de pura potencia
Los portátiles Alienware siempre han tenido esa mentalidad de "rendimiento a toda costa" y el Alienware m18 R1 no es una excepción. Esta máquina no teme ser uno de los portátiles más grandes, pesados o incluso ruidosos del mercado si con ello puede exprimir un poco más el rendimiento de la CPU y la GPU o incorporar más funciones que los jugadores más entusiastas puedan apreciar. Los usuarios que quieran aprovechar las 4 unidades SSD M.2, las amplias opciones de puertos, el teclado numérico integrado y la rápida frecuencia de actualización de 480 Hz y no les importe el peso voluminoso o el enorme adaptador de CA tendrán mucho más que disfrutar del Alienware m18 R1.
Si quieres maximizar el rendimiento y las características aunque eso signifique un portátil mucho más pesado y grande, entonces el Alienware m18 R1 es para ti.
Si las características auxiliares anteriores no te entusiasman, entonces puedes obtener casi el mismo rendimiento básico del notablemente más ligero Razer Blade 18 o Asus ROG Strix 18. También nos gustaría ver mejoras en el nuevo software Alienware Command Center, ya que a veces se carga con una lentitud inusual.
Precio y disponibilidad
El Alienware m18 R1 ya está a la venta directamente desde Dell a partir de $2100 USD para la configuración Core i7/RTX 4060 hasta más de $5000 USD si está totalmente configurado. Nuestra unidad analizada cuesta unos 3.700 dólares. En el momento de escribir estas líneas, el modelo aún no estaba disponible en otros grandes distribuidores.
Alienware m18 R1
- 04/01/2023 v7 (old)
Allen Ngo
Transparencia
La selección de los dispositivos que se van a reseñar corre a cargo de nuestro equipo editorial. La muestra de prueba fue proporcionada al autor en calidad de préstamo por el fabricante o el minorista a los efectos de esta reseña. El prestamista no tuvo ninguna influencia en esta reseña, ni el fabricante recibió una copia de la misma antes de su publicación. No había ninguna obligación de publicar esta reseña. Como empresa de medios independiente, Notebookcheck no está sujeta a la autoridad de fabricantes, minoristas o editores.
Así es como prueba Notebookcheck
Cada año, Notebookcheck revisa de forma independiente cientos de portátiles y smartphones utilizando procedimientos estandarizados para asegurar que todos los resultados son comparables. Hemos desarrollado continuamente nuestros métodos de prueba durante unos 20 años y hemos establecido los estándares de la industria en el proceso. En nuestros laboratorios de pruebas, técnicos y editores experimentados utilizan equipos de medición de alta calidad. Estas pruebas implican un proceso de validación en varias fases. Nuestro complejo sistema de clasificación se basa en cientos de mediciones y puntos de referencia bien fundamentados, lo que mantiene la objetividad.Price comparison

