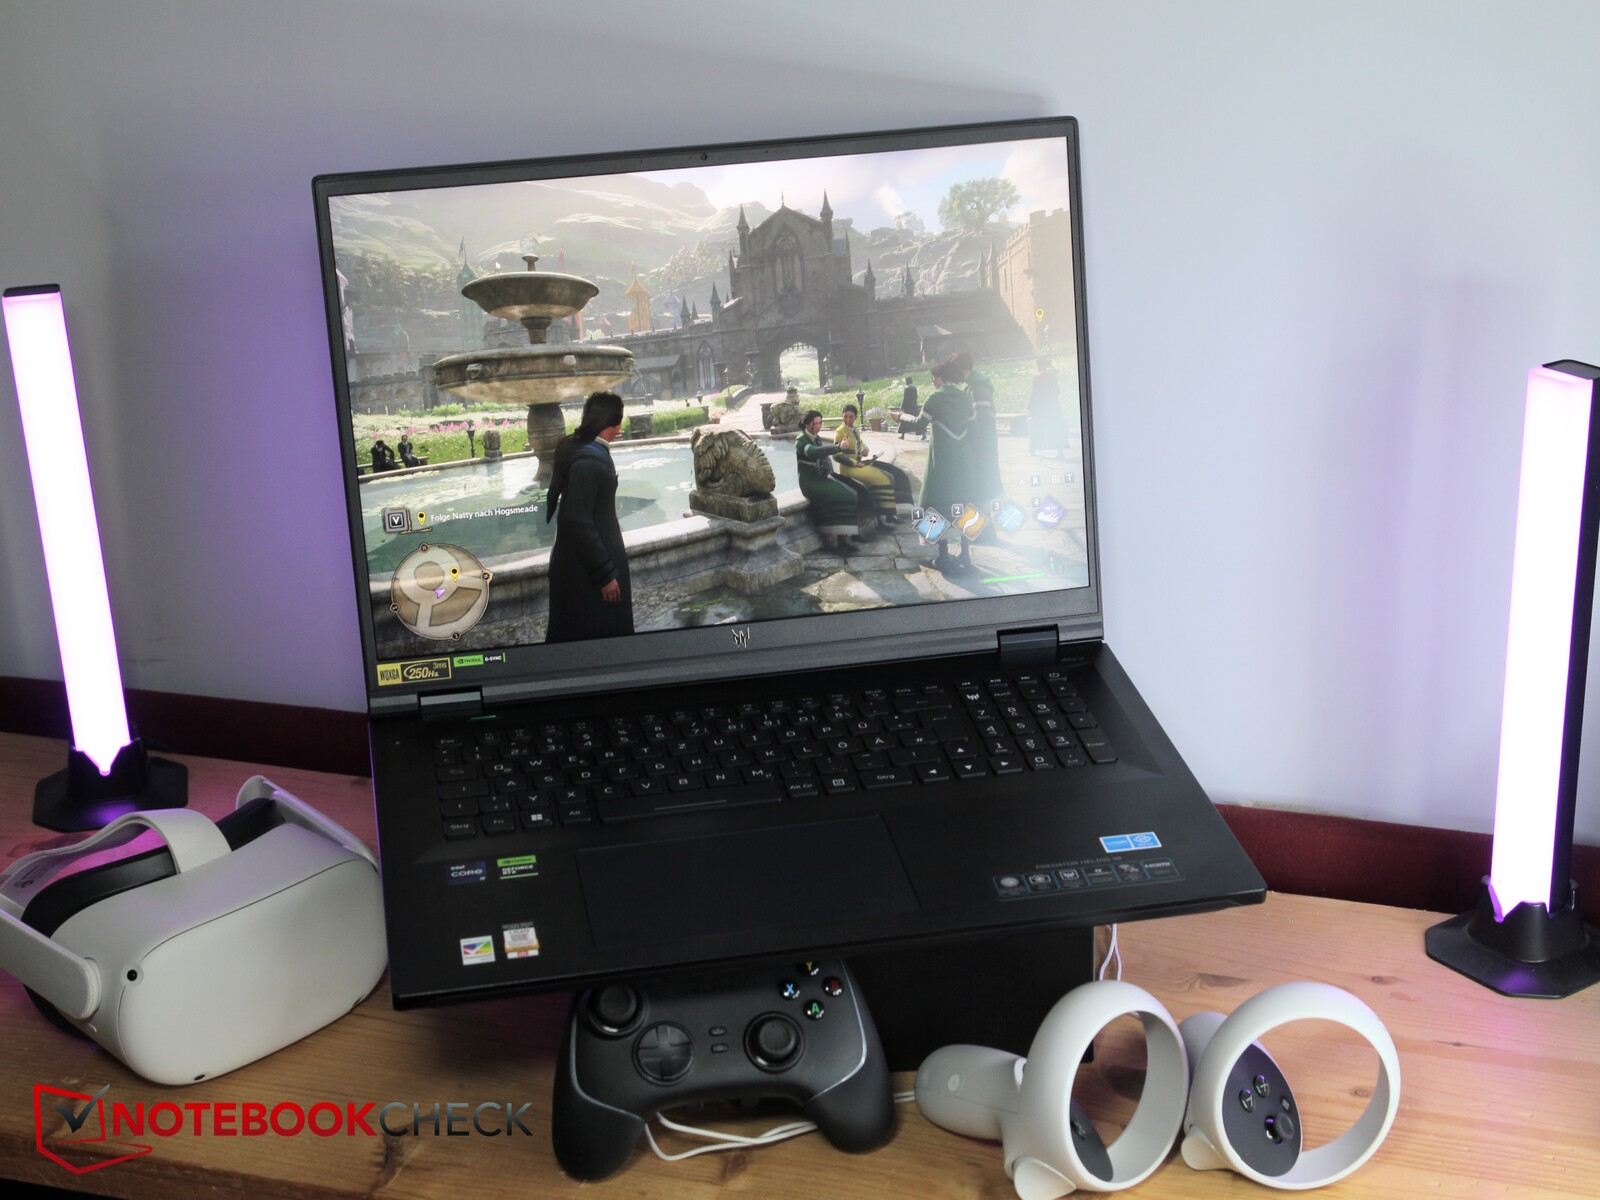
Análisis del portátil Acer Predator Helios 18: RTX 4080 gamer con pantalla MiniLED a más de 1.000 nits

La RTX 4060 equipado Acer Predator Helios 16 obtuvo una puntuación total del 90% en nuestro análisis de julio. Ahora, echamos un vistazo al modelo de gama alta de 18 pulgadas con un procesador Intel HX, un procesador RTX 4080 y una pantalla MiniLED.
Para la comparación, utilizamos otros portátiles de 18 pulgadas, así como otros de 17 pulgadas con especificaciones similares, ya que el Predator Helios 18 es el primero con una RTX 4080 entre nuestros análisis de portátiles de 18 pulgadas. Entre los competidores se incluyen elMSI Raider GE78 HX 13VHel HP Omen 17el Alienware m18 R1, el Asus ROG Strix G18 G814JI y el Razer Blade 18.
Posibles contendientes en la comparación
Valoración | Fecha | Modelo | Peso | Altura | Tamaño | Resolución | Precio |
|---|---|---|---|---|---|---|---|
| 88.3 % v7 (old) | 10/2023 | Acer Predator Helios 18 N23Q2 i9-13900HX, GeForce RTX 4080 Laptop GPU | 3.2 kg | 29.15 mm | 18.00" | 2560x1600 | |
| 88.3 % v7 (old) | 03/2023 | MSI GE78HX 13VH-070US i9-13950HX, GeForce RTX 4080 Laptop GPU | 3 kg | 23 mm | 17.00" | 2560x1600 | |
| 85.4 % v7 (old) | 03/2023 | HP Omen 17-ck2097ng i9-13900HX, GeForce RTX 4080 Laptop GPU | 2.8 kg | 27 mm | 17.30" | 2560x1440 | |
| 90.7 % v7 (old) | 04/2023 | Alienware m18 R1 i9-13980HX, GeForce RTX 4090 Laptop GPU | 3.9 kg | 26.7 mm | 18.00" | 1920x1200 | |
| 87.4 % v7 (old) | 03/2023 | Asus ROG Strix G18 G814JI i7-13650HX, GeForce RTX 4070 Laptop GPU | 3 kg | 31 mm | 18.00" | 2560x1600 | |
| 91.4 % v7 (old) | 02/2023 | Razer Blade 18 RTX 4070 i9-13950HX, GeForce RTX 4070 Laptop GPU | 3 kg | 21.9 mm | 18.00" | 2560x1600 |
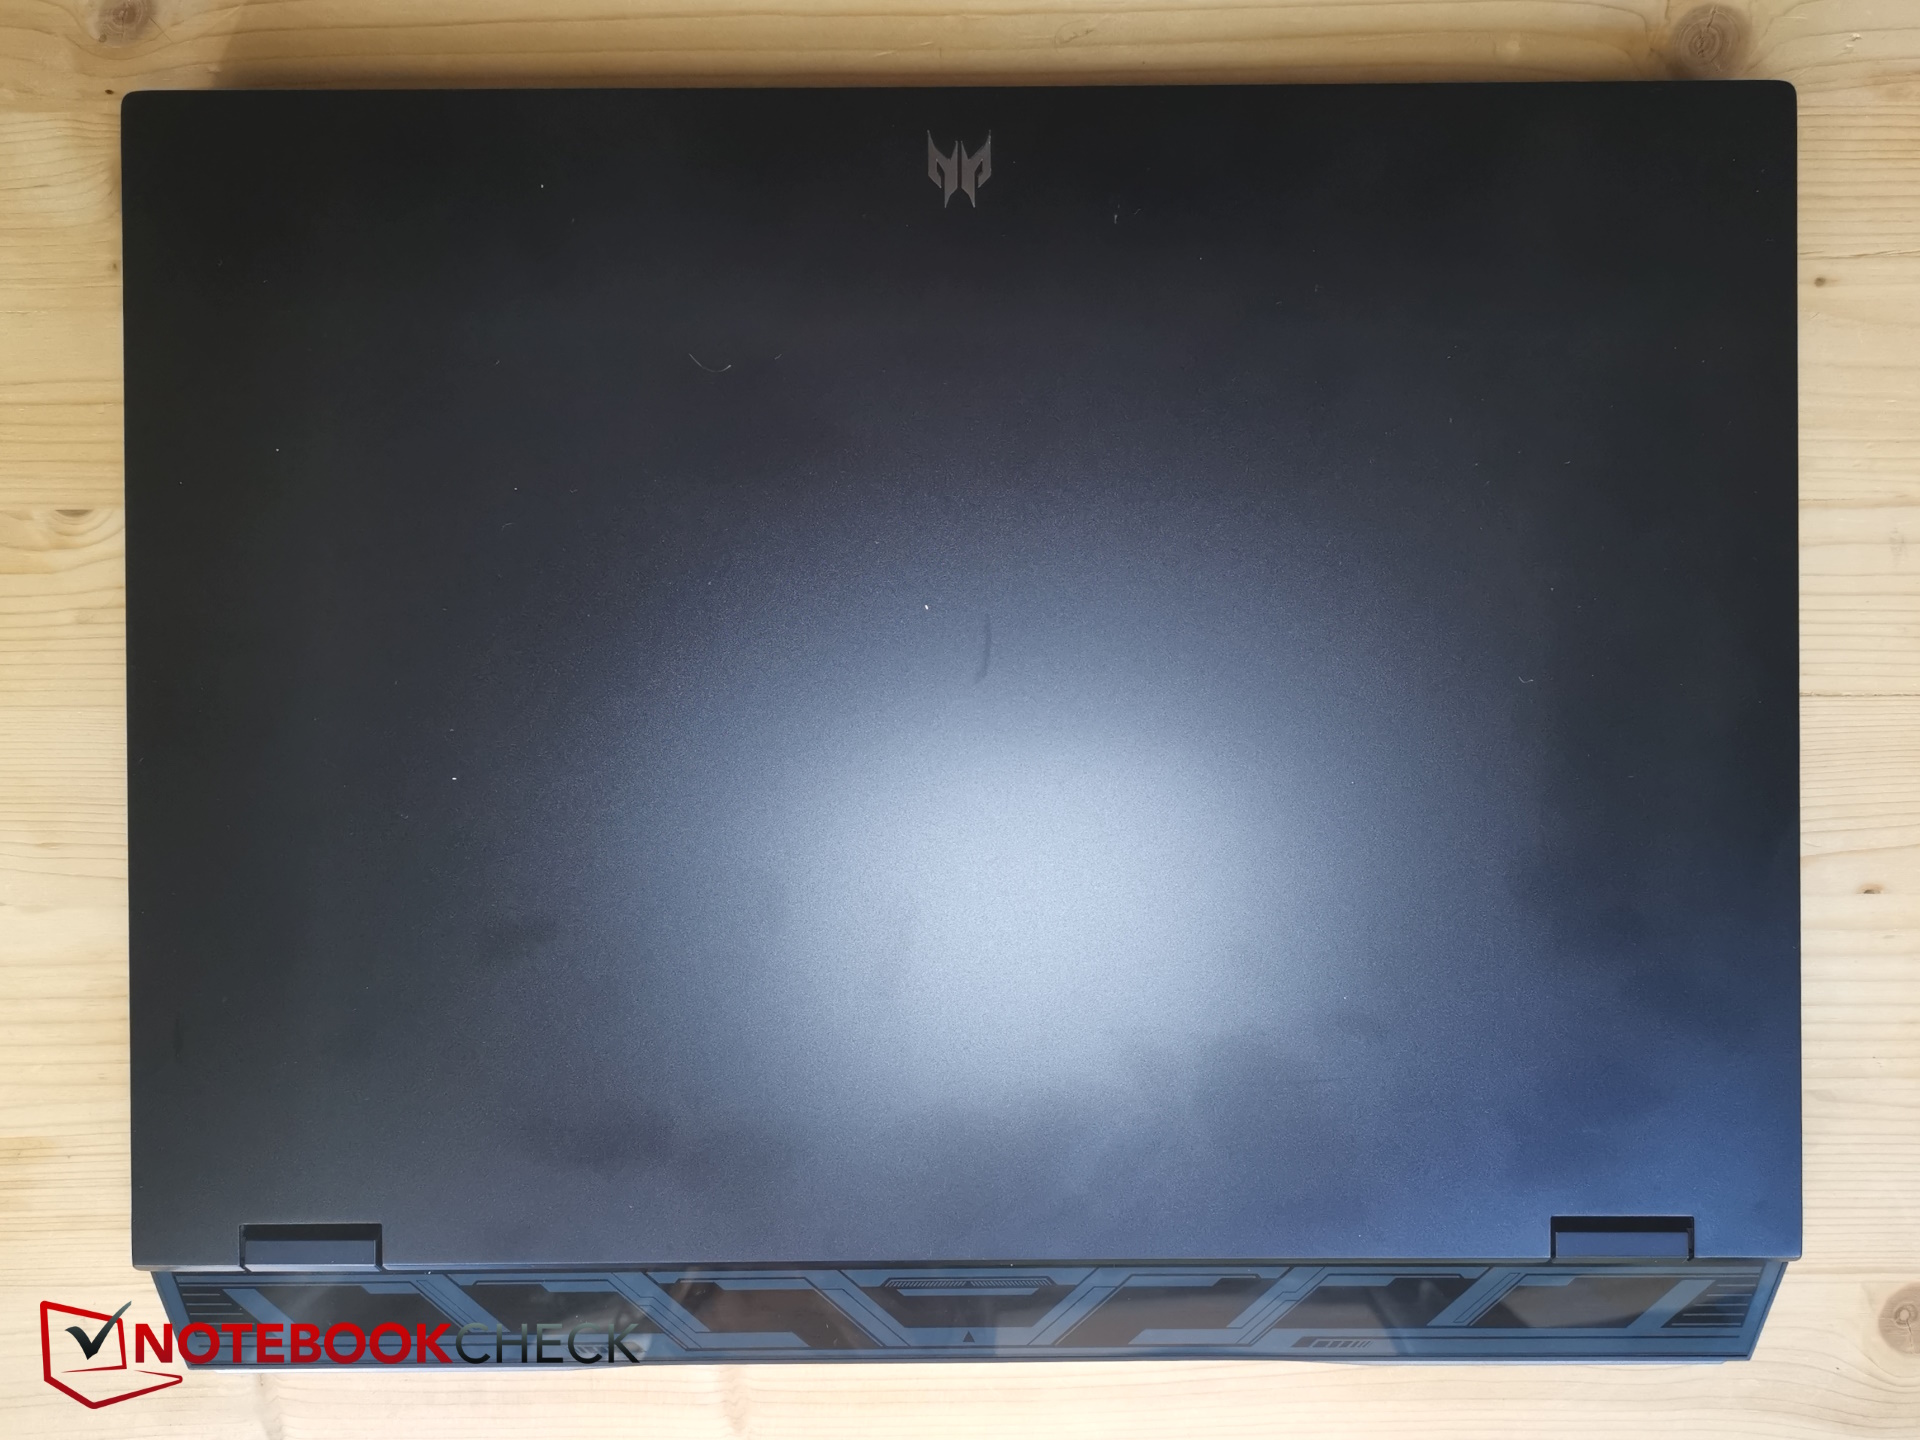
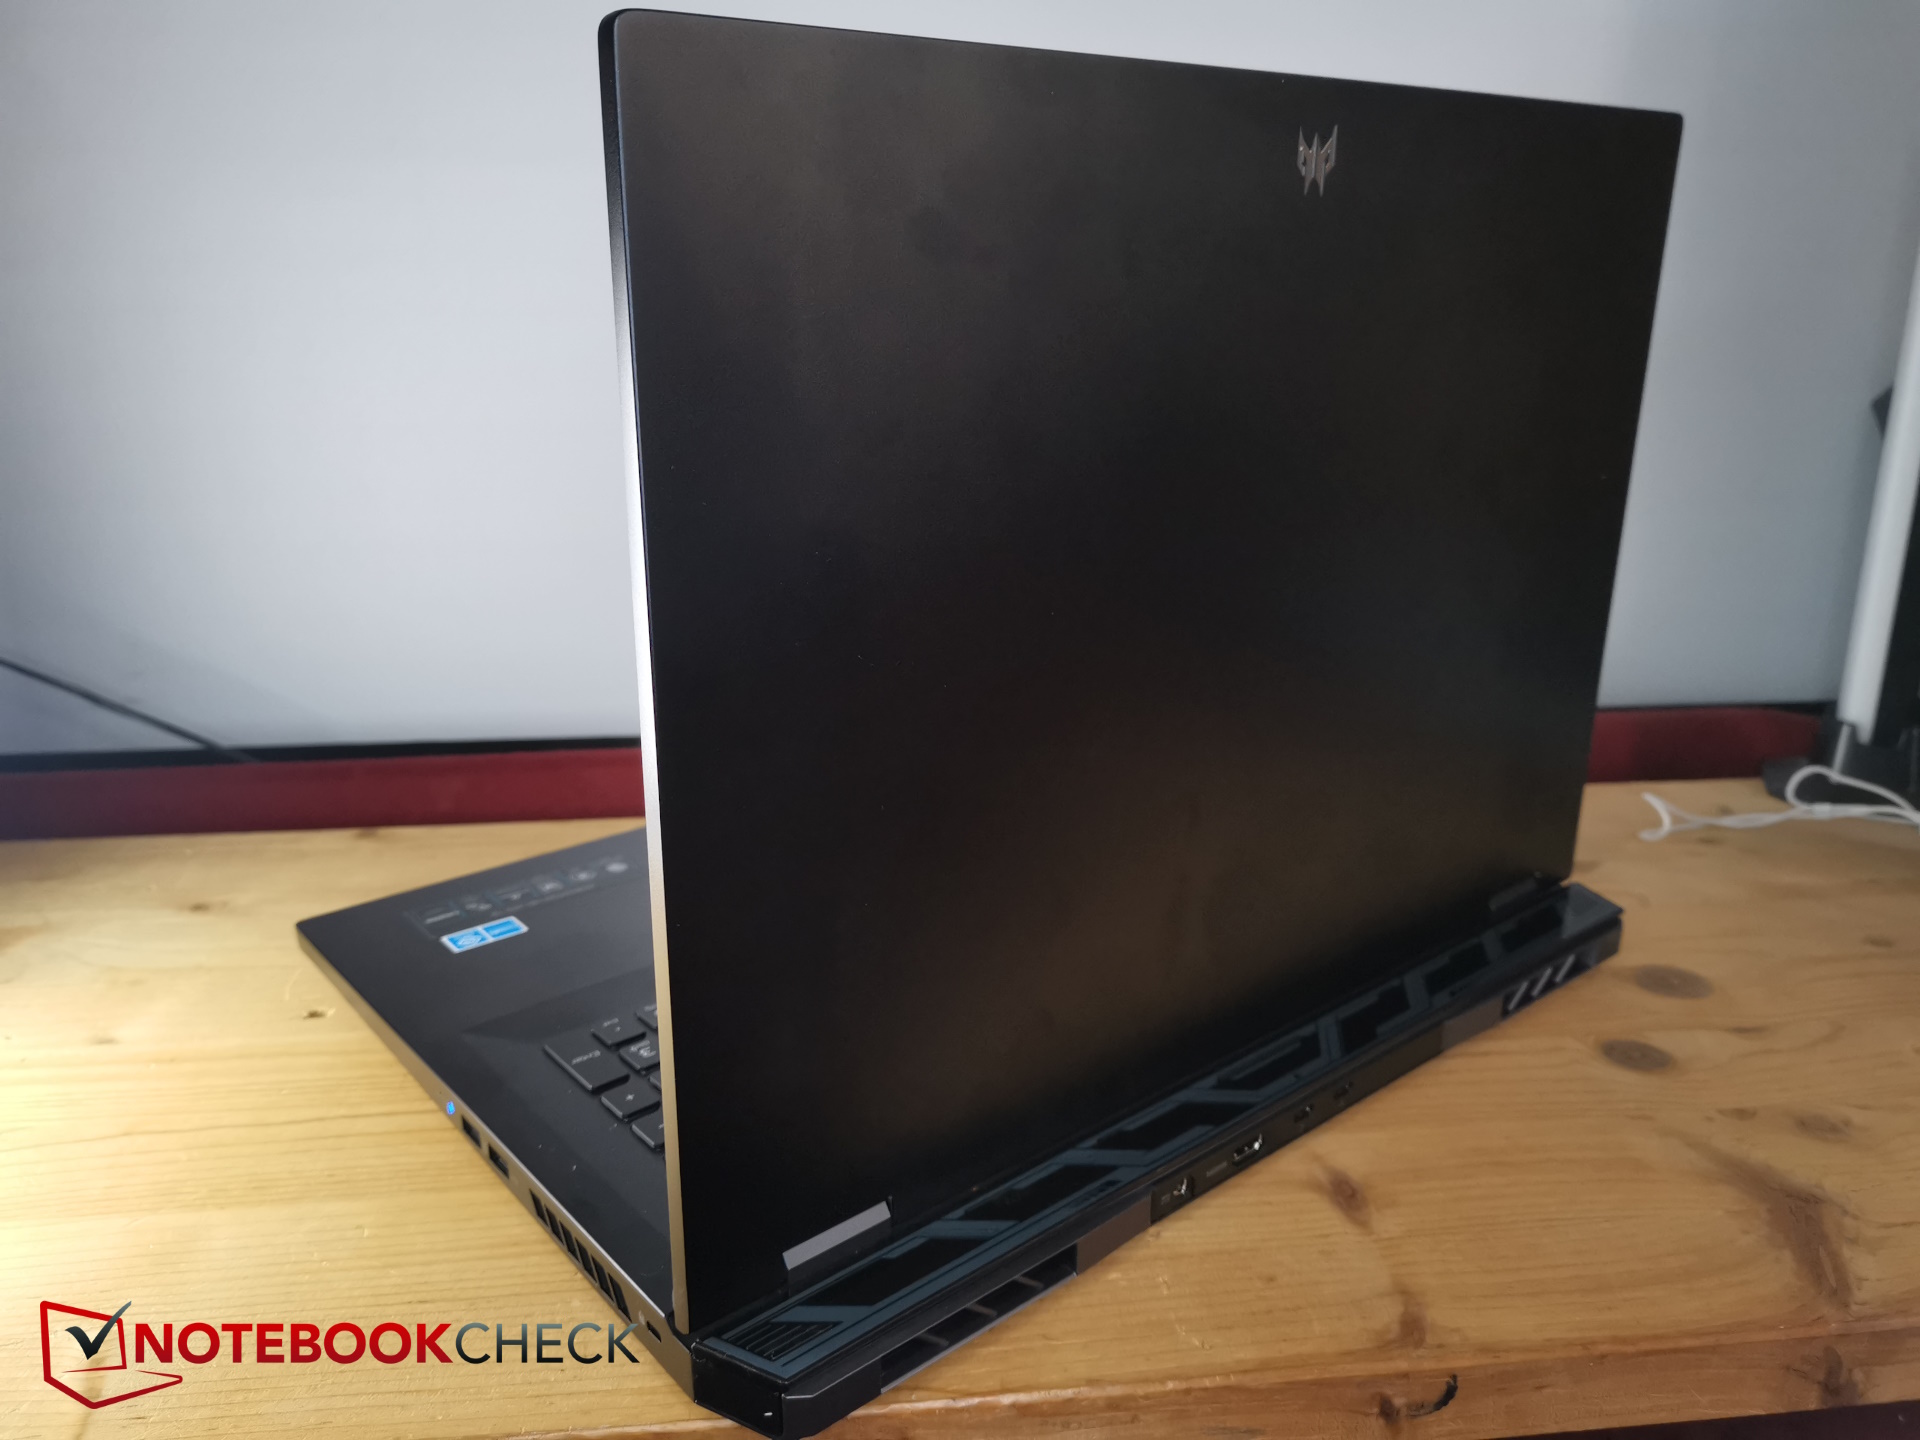
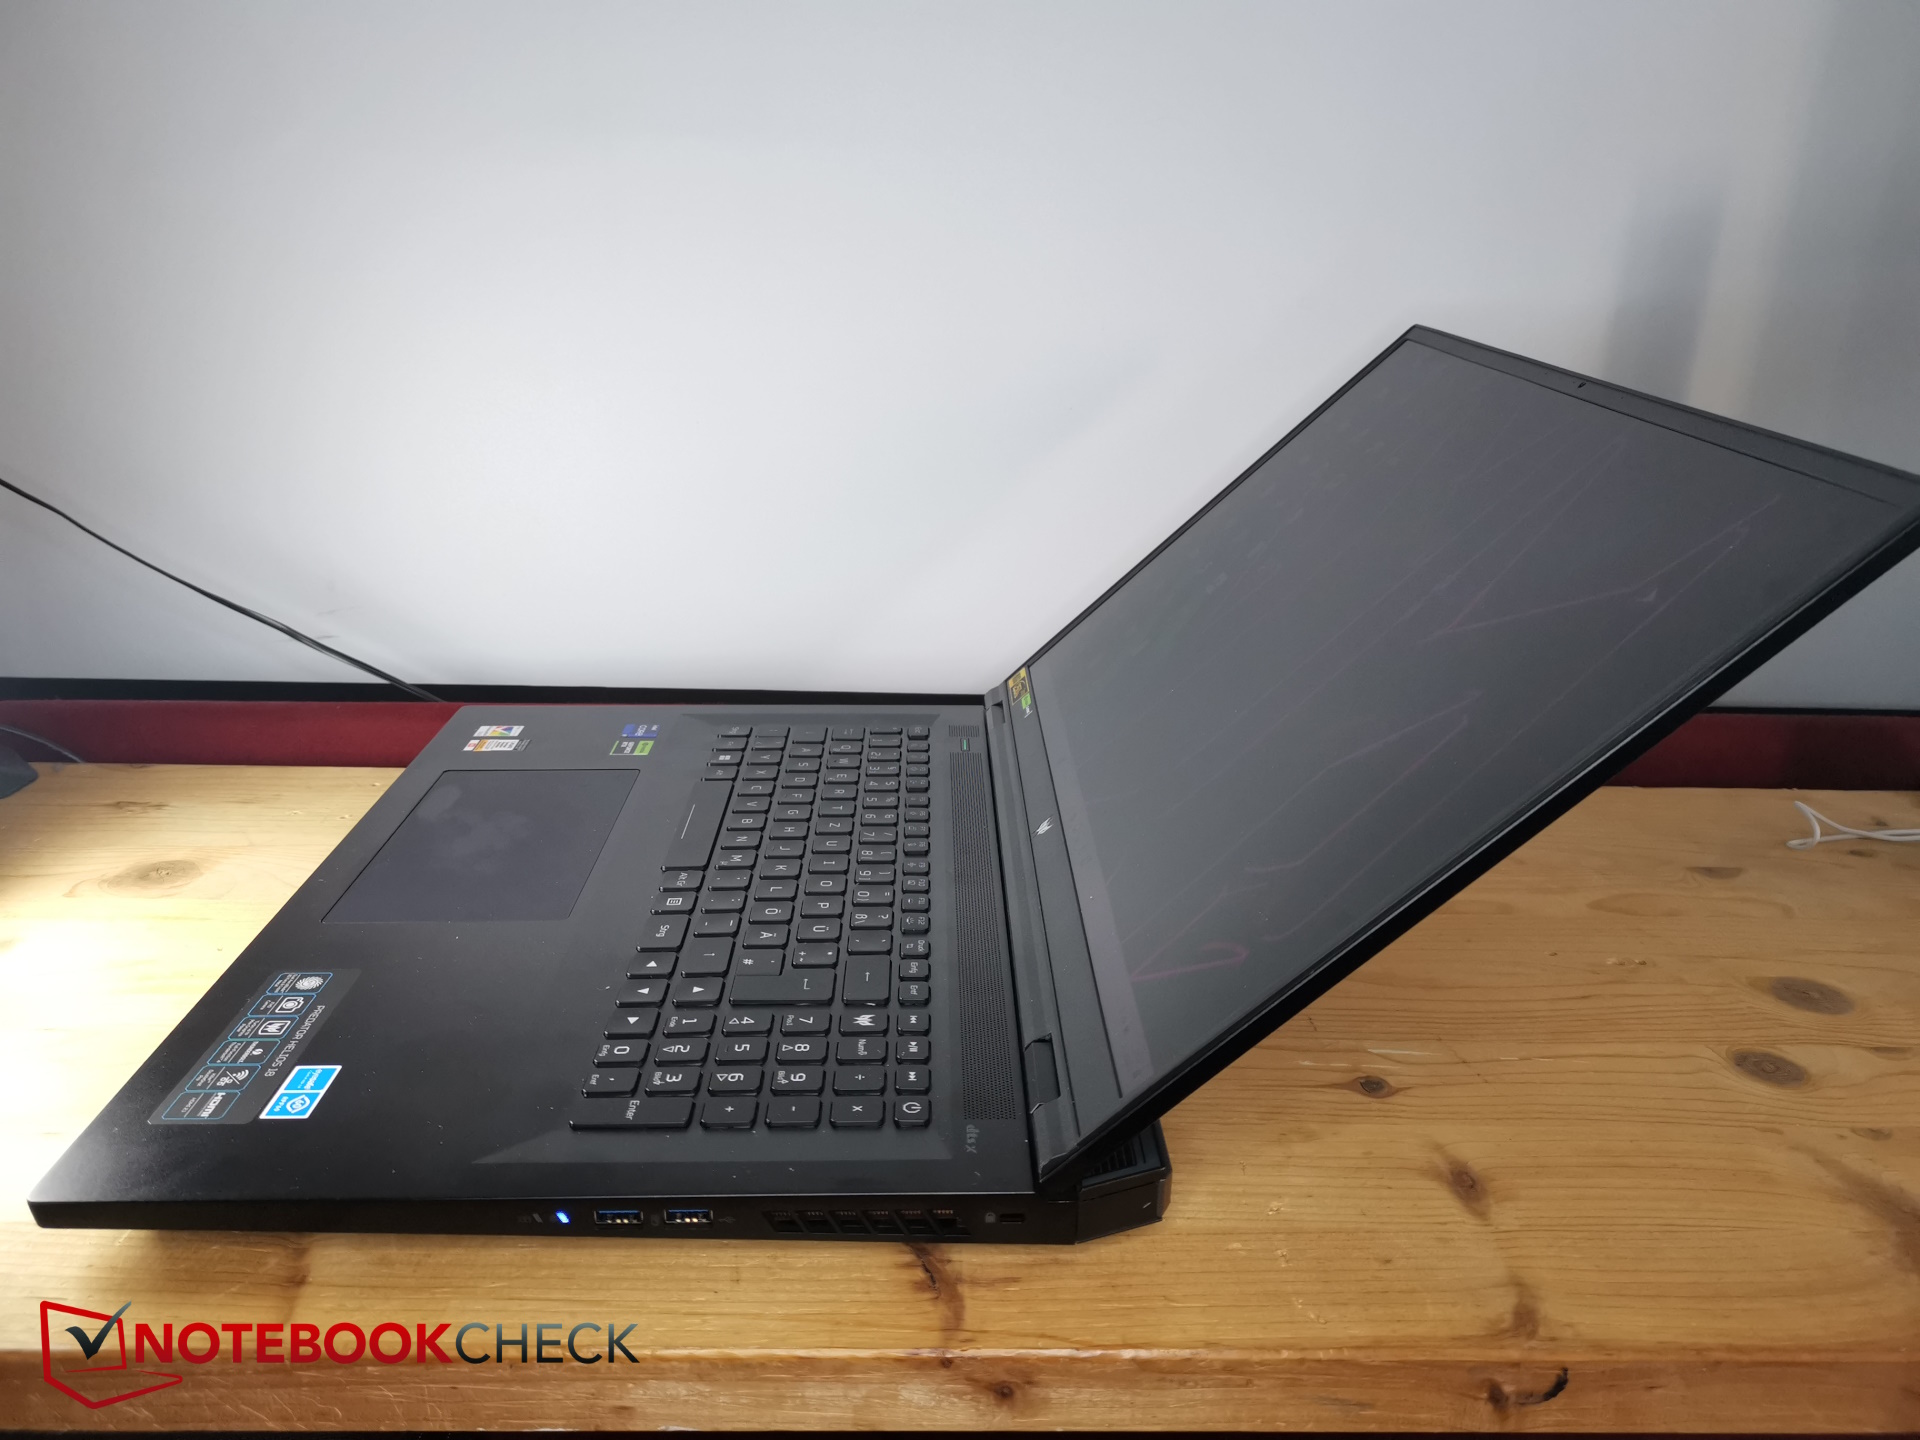
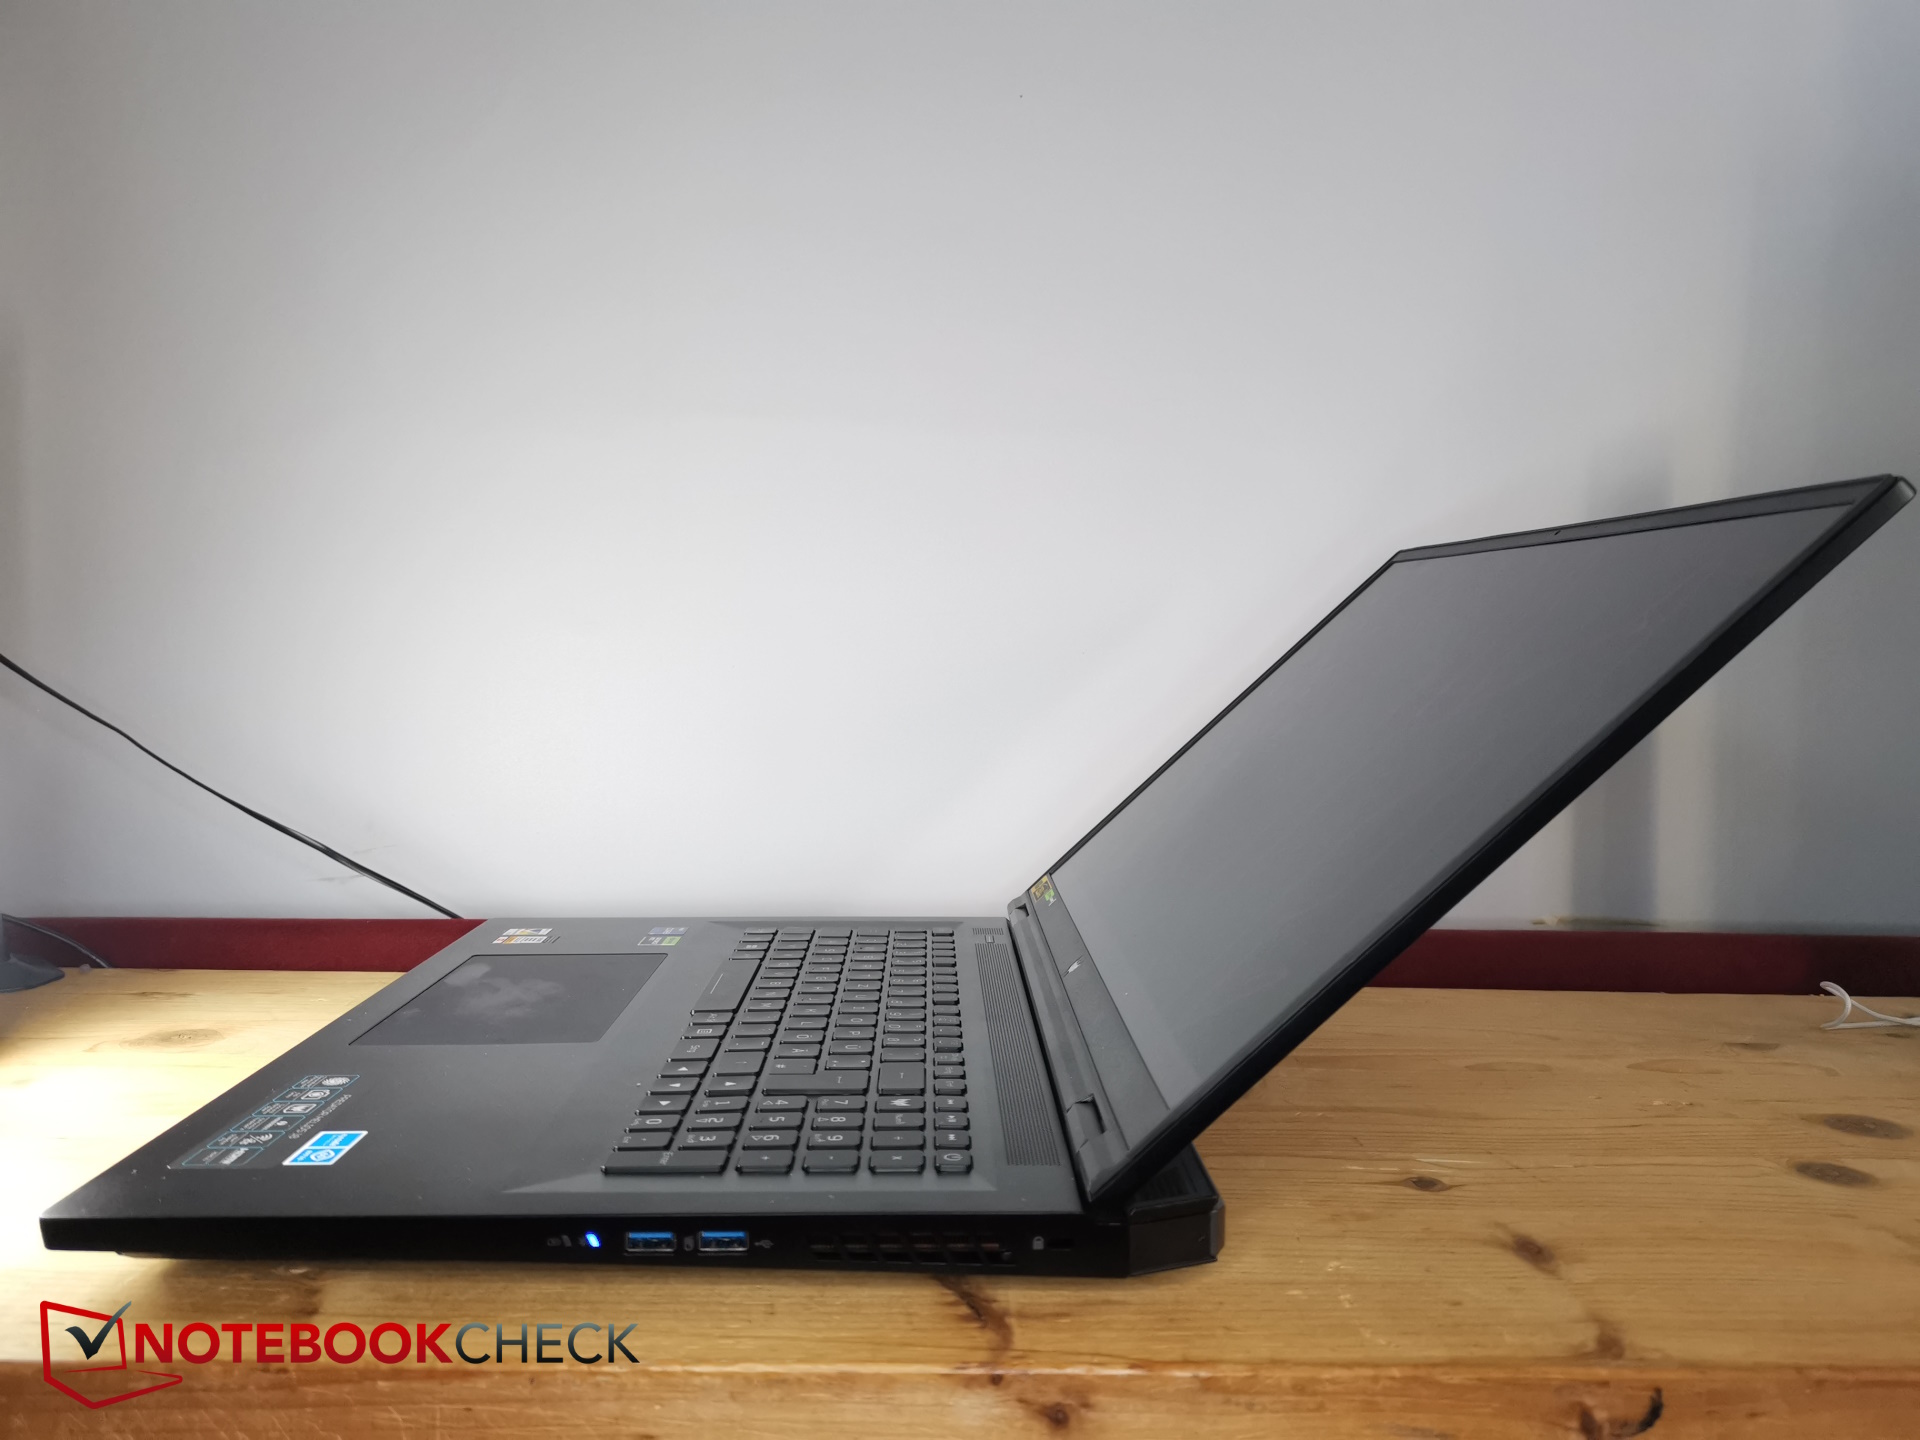
Funda - Aluminio negro para el Acer Predator
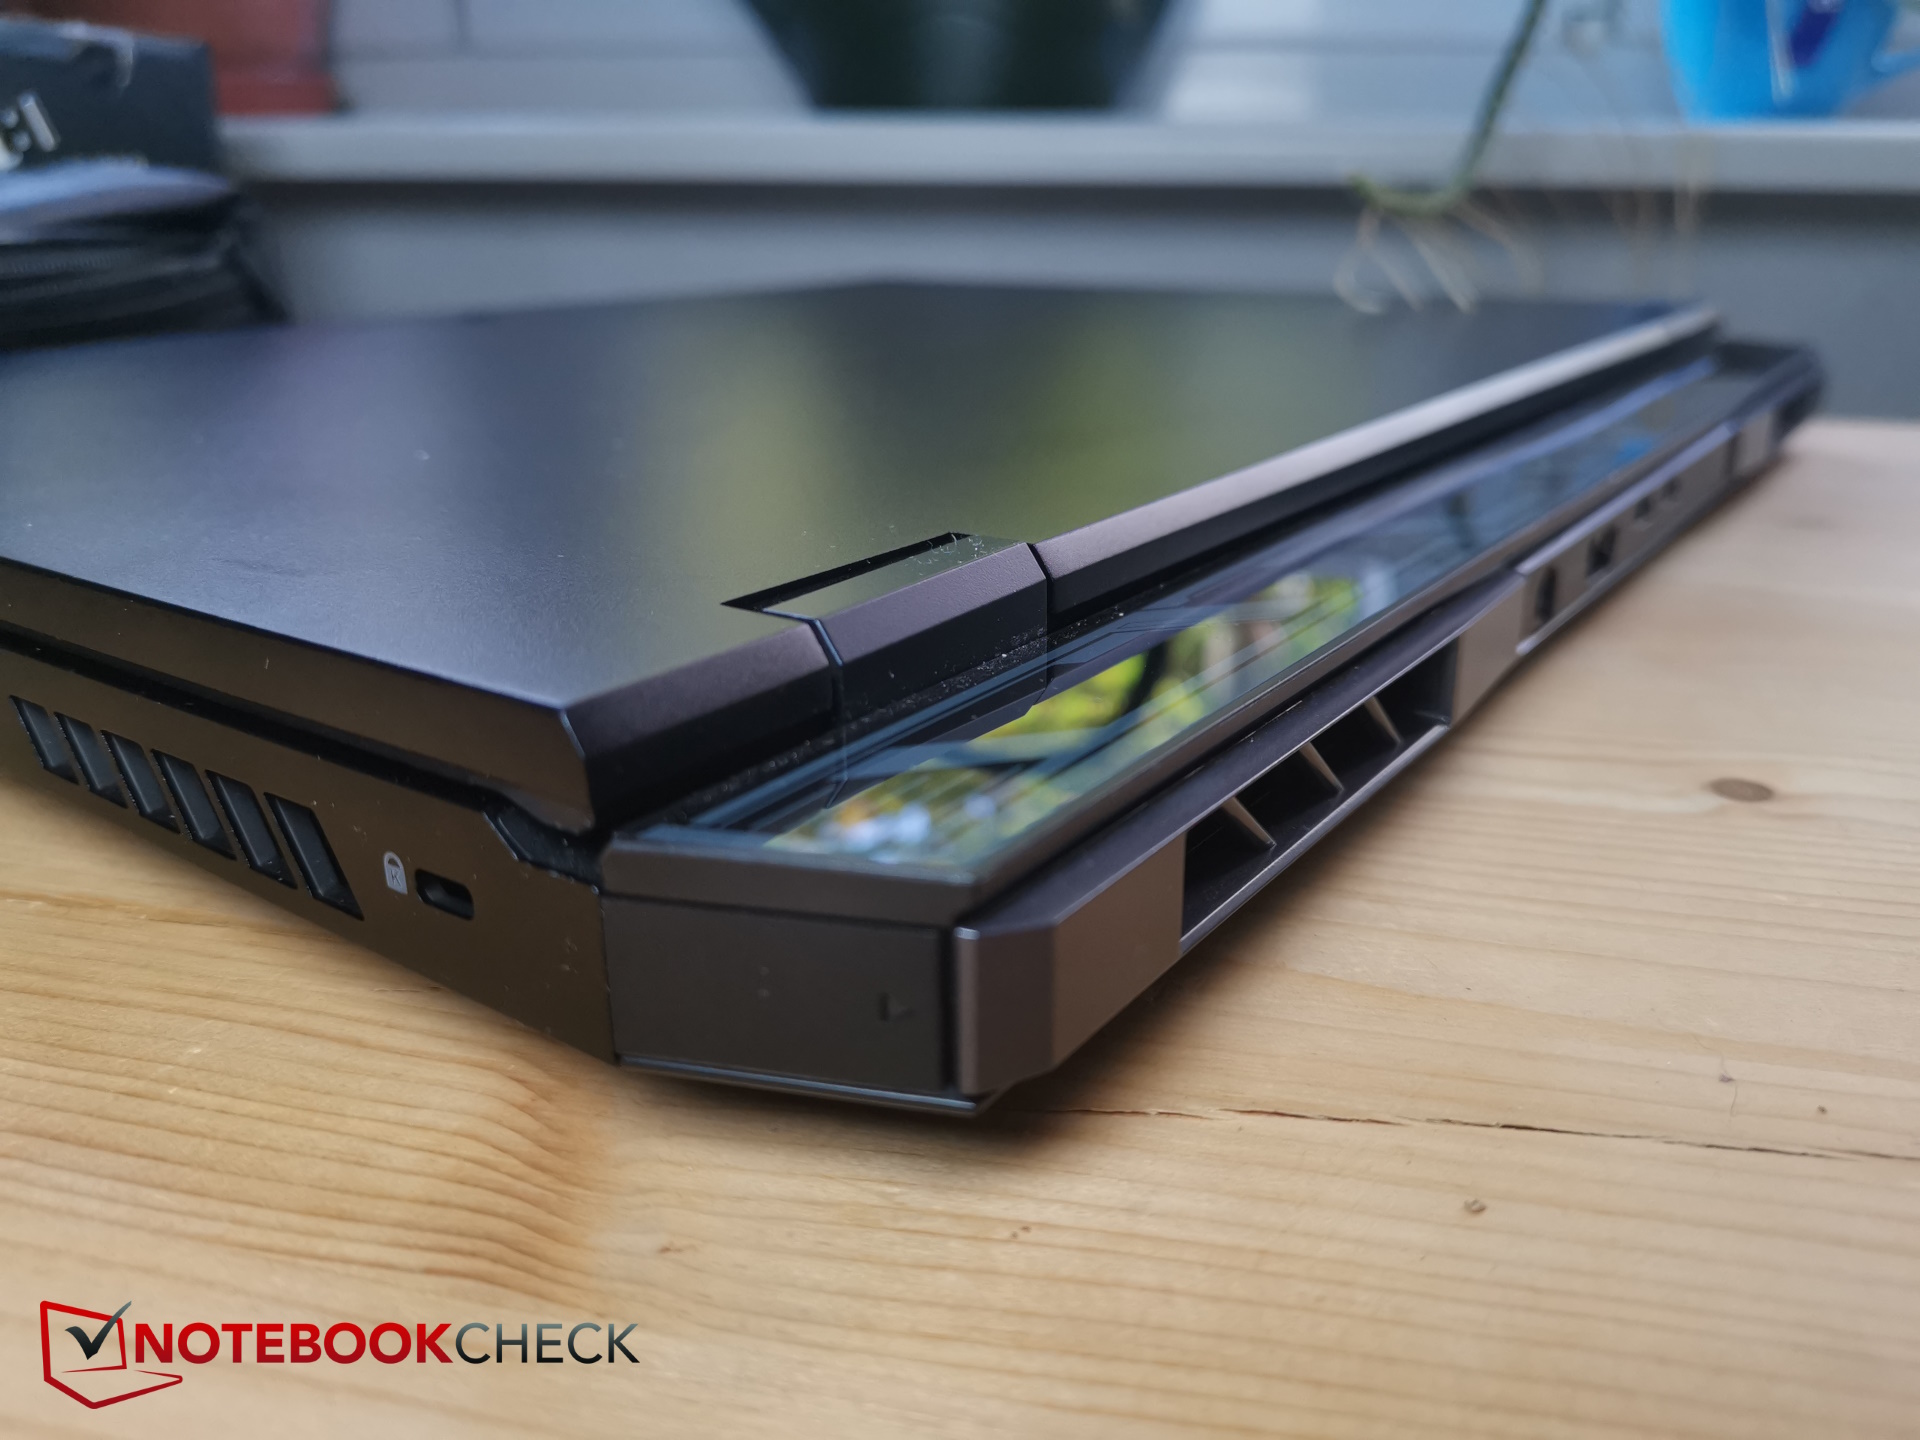
Acer diseña el Helios 18 en un negro oscuro, casi discreto. Pero el dispositivo no intenta ocultar su naturaleza de juego, caracterizada por el pequeño logotipo Predator en la tapa de la pantalla y el sistema de refrigeración que sobresale en la parte trasera.
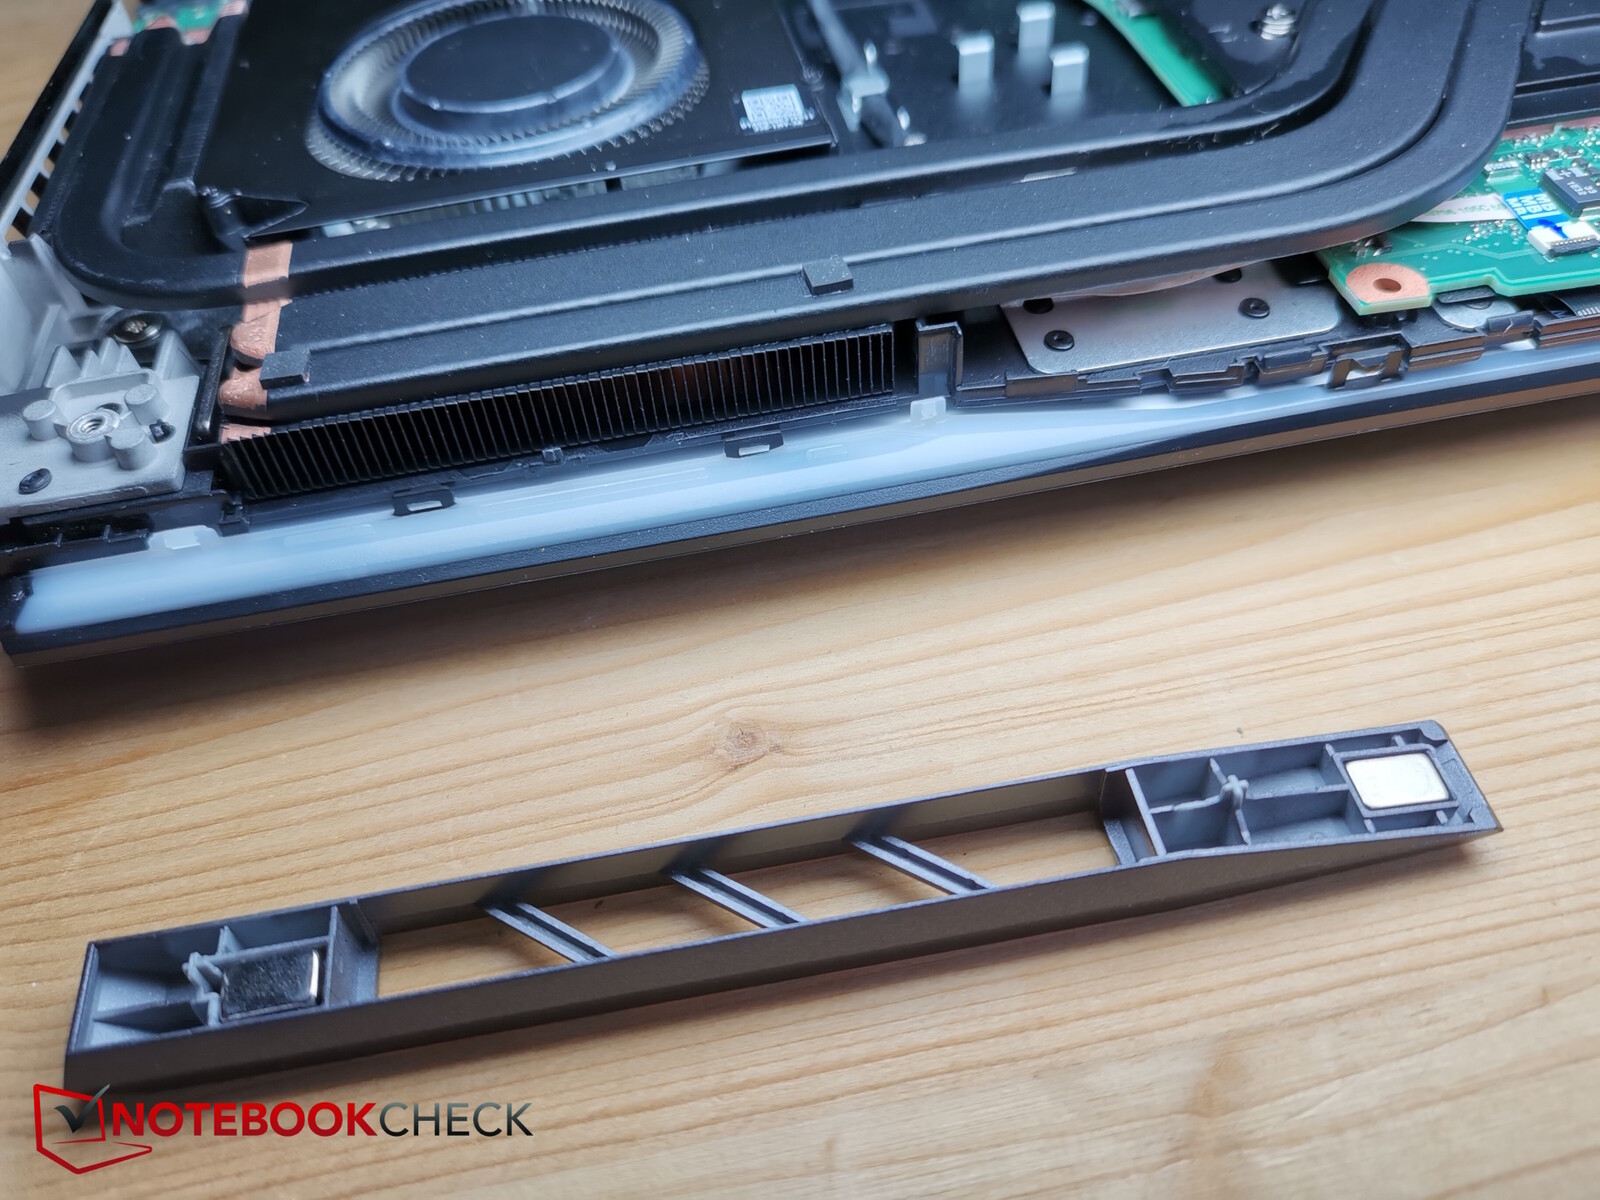
La mano de obra no deja lugar a críticas: los huecos son imperceptibles. Las salidas de aire traseras pueden incluso personalizarse: Acer incluye otro par de rejillas de ventilación, que pueden personalizarse aún más con una impresora 3D.
La tapa de la pantalla y la base son de aluminio, mientras que los bordes de la pantalla, la unidad de refrigeración trasera y la parte inferior del portátil son de plástico. El metal proporciona al Helios 18 una buena rigidez y nada cruje ni se agrieta cuando se somete a esfuerzos de torsión. Sin embargo, las huellas dactilares se acumulan fácilmente aquí, y la parte superior de la base puede presionarse un poco a pesar del metal, incluso al teclear. Pero esto se mantiene dentro de unos límites y se debe a la gran superficie.
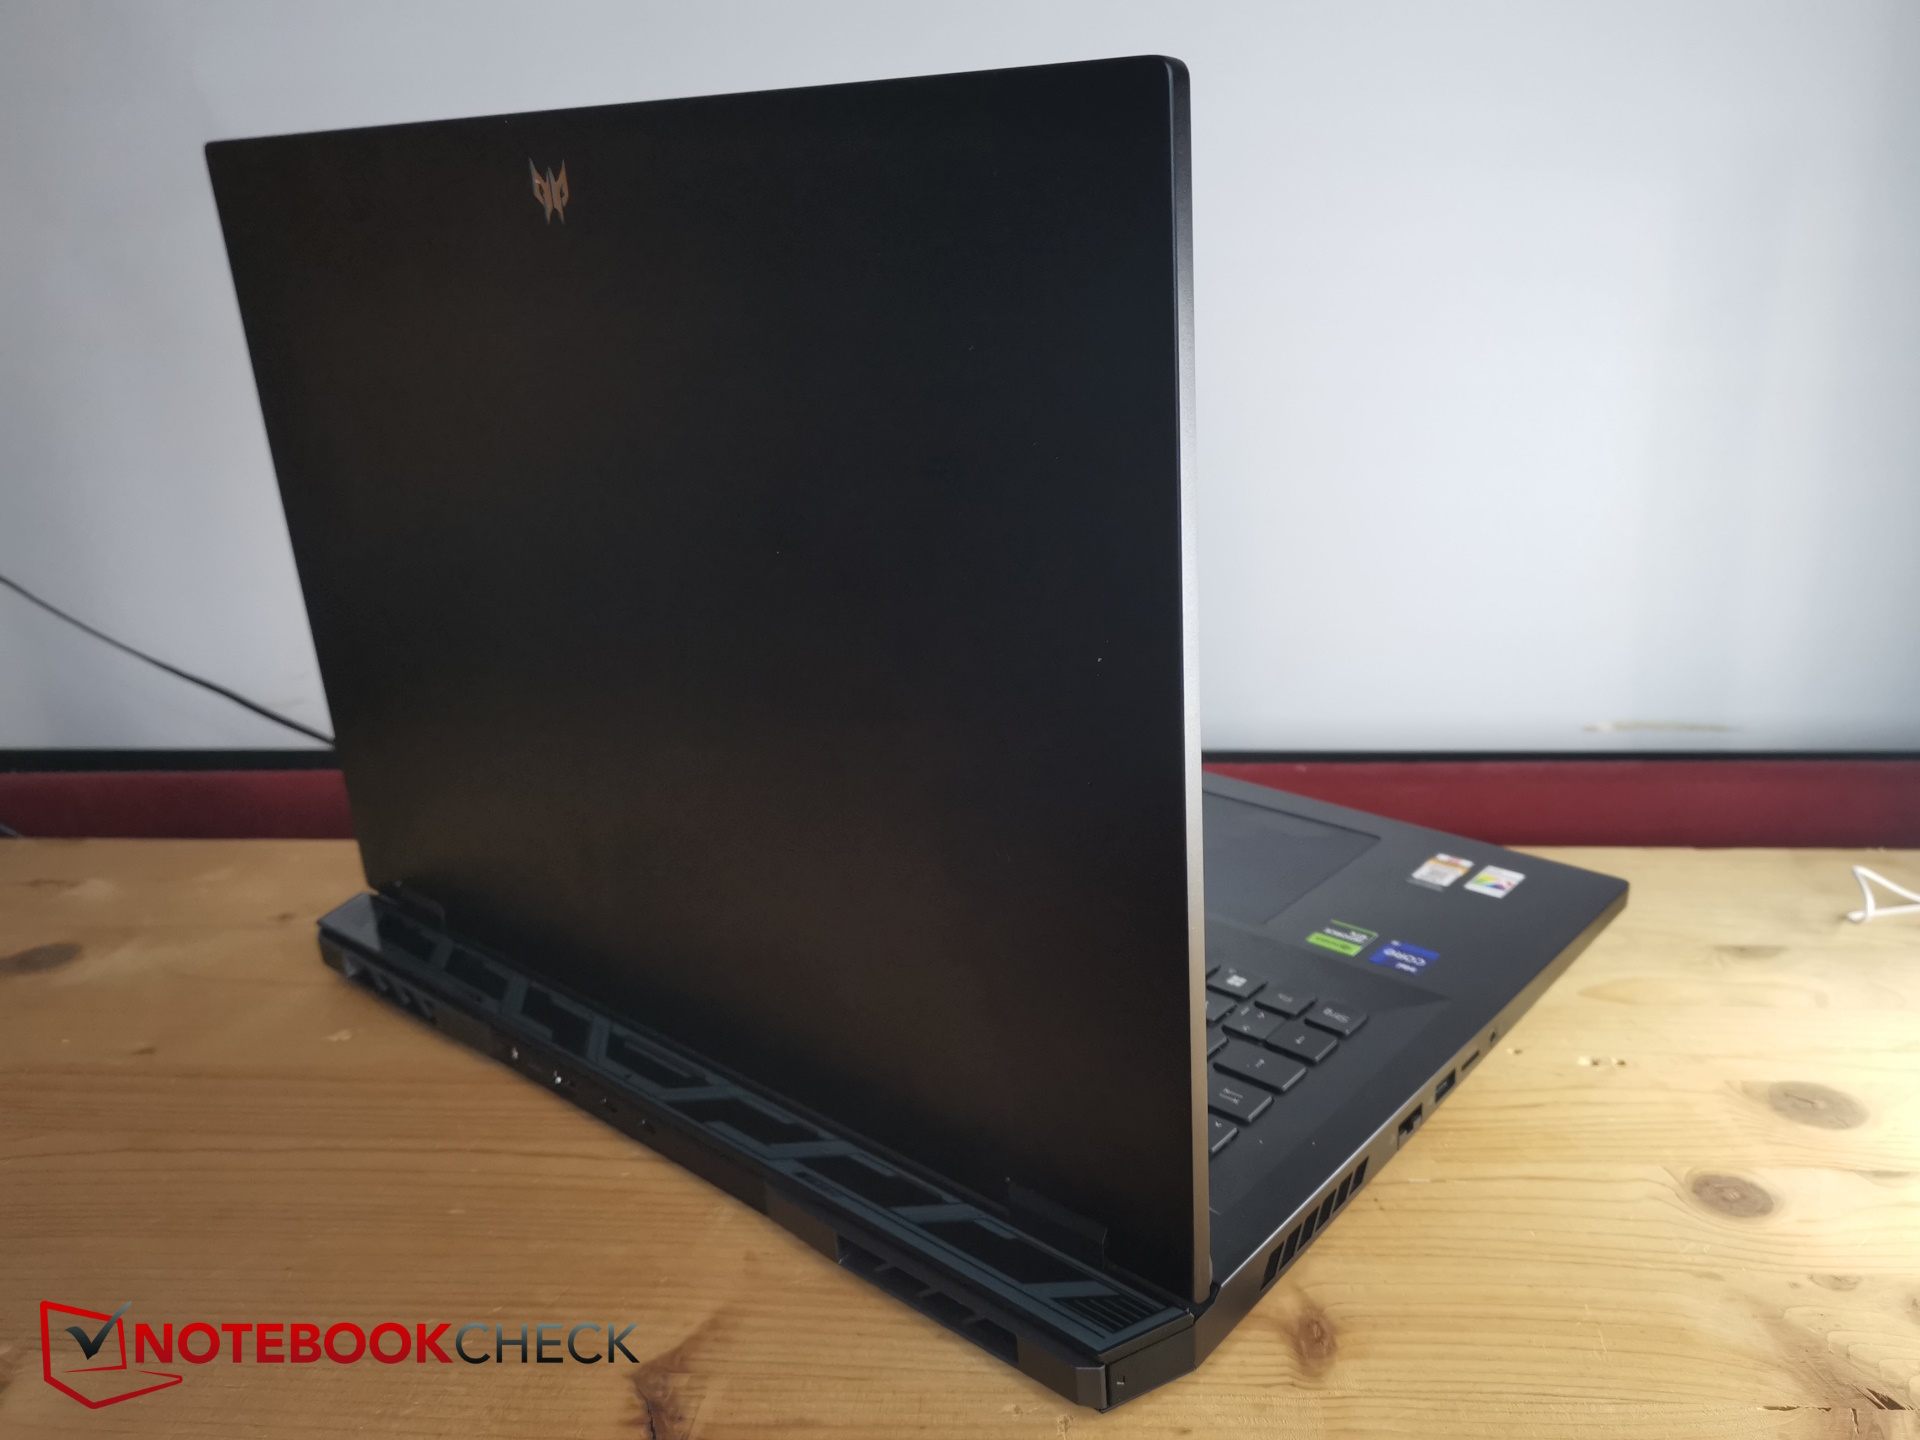
Comparado con la competencia de 18 pulgadas, el Helios 18 cae en el medio en términos de tamaño. El Alienware m18 es ligeramente más grande, el Asus ROG Strix G18 es más pequeño. Este último es un poco más grueso, mientras que el Alienware m18 es más delgado. En cuanto al peso, el Alien es claramente más pesado, el G18 ligeramente más ligero.
Los de 17 pulgadas son en parte mucho más pequeños y también más delgados.
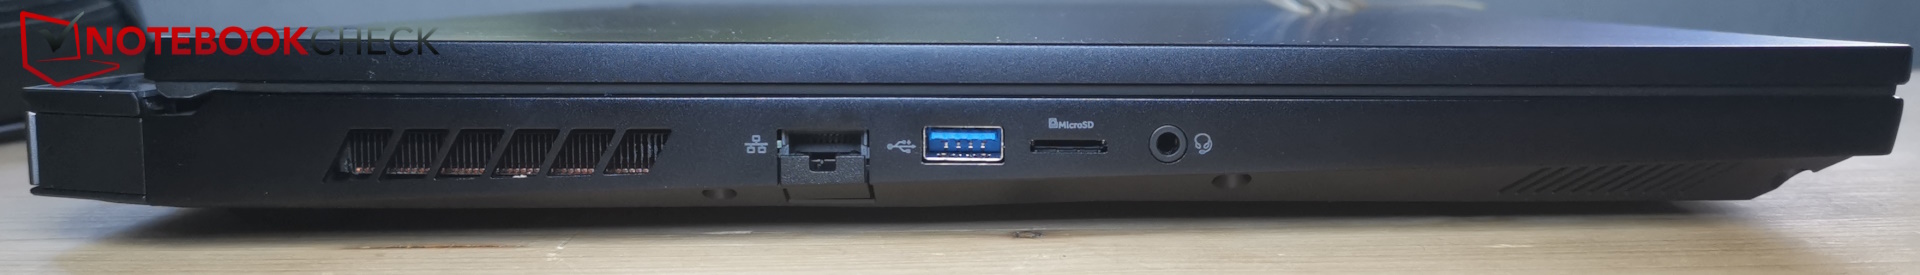
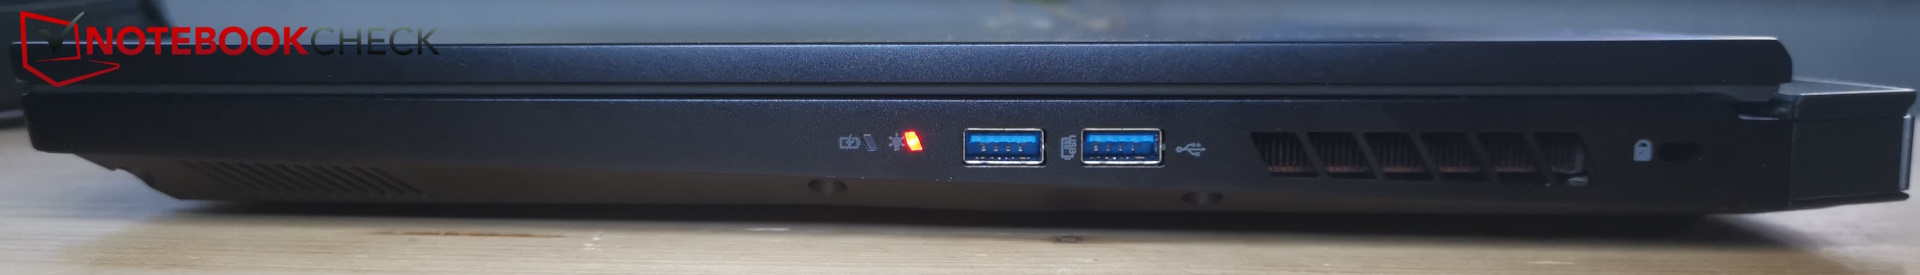
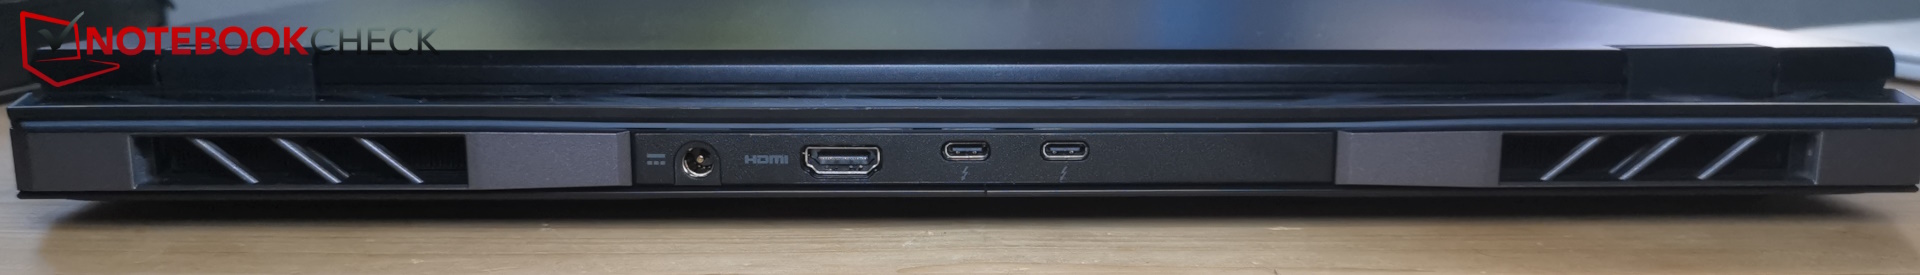
Equipamiento - 2x Thunderbolt 4 en el Predator Helios
El Helios 18 dispone de todos los puertos necesarios. Dos puertos Thunderbolt 4 en forma de USB-C están a bordo. Sólo PowerDelivery no está disponible. El lector de tarjetas SD "sólo" acepta tarjetas MicroSD.
Los puertos están repartidos en tres lados, aunque la parte trasera aún tiene espacio y podría haber alojado fácilmente uno de los muchos puertos de la izquierda. Habríamos preferido el puerto LAN en la parte trasera y uno de los cada vez más importantes puertos USB-C en el lateral.
Lector de tarjetas SD
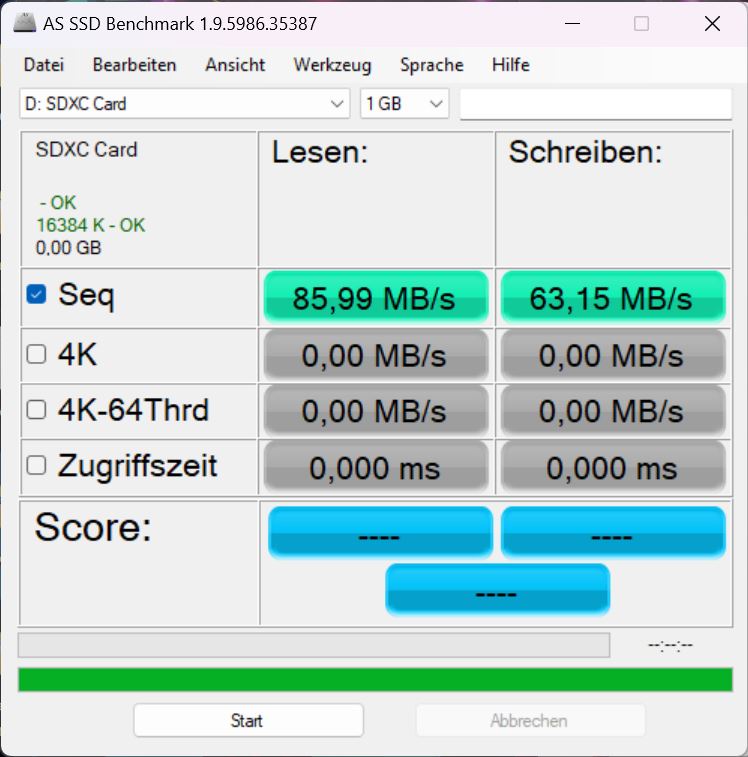
Las tarjetas microSD insertadas se deslizan en su sitio y no sobresalen. La inserción de nuestra AV PRO microSD 128 GB V60 resultó un poco enrevesada, ya que hubo que empujarla hacia dentro un poco más de lo debido para fijarla y desengancharla.
La velocidad está en un nivel medio, poco destacable; los lectores de tarjetas de la Blade 18 o el Alienware m18son significativamente más rápidos.
| SD Card Reader | |
| average JPG Copy Test (av. of 3 runs) | |
| Razer Blade 18 RTX 4070 (Angelibird AV Pro V60) | |
| Alienware m18 R1 (Angelibird AV Pro V60) | |
| Media de la clase Gaming (20.9 - 210, n=54, últimos 2 años) | |
| HP Omen 17-ck2097ng (AV PRO microSD 128 GB V60) | |
| Acer Predator Helios 18 N23Q2 | |
| MSI GE78HX 13VH-070US (Angelibird AV Pro V60) | |
| maximum AS SSD Seq Read Test (1GB) | |
| Alienware m18 R1 (Angelibird AV Pro V60) | |
| Razer Blade 18 RTX 4070 (Angelibird AV Pro V60) | |
| Media de la clase Gaming (25.5 - 261, n=51, últimos 2 años) | |
| MSI GE78HX 13VH-070US (Angelibird AV Pro V60) | |
| Acer Predator Helios 18 N23Q2 | |
| HP Omen 17-ck2097ng (AV PRO microSD 128 GB V60) | |
Comunicación
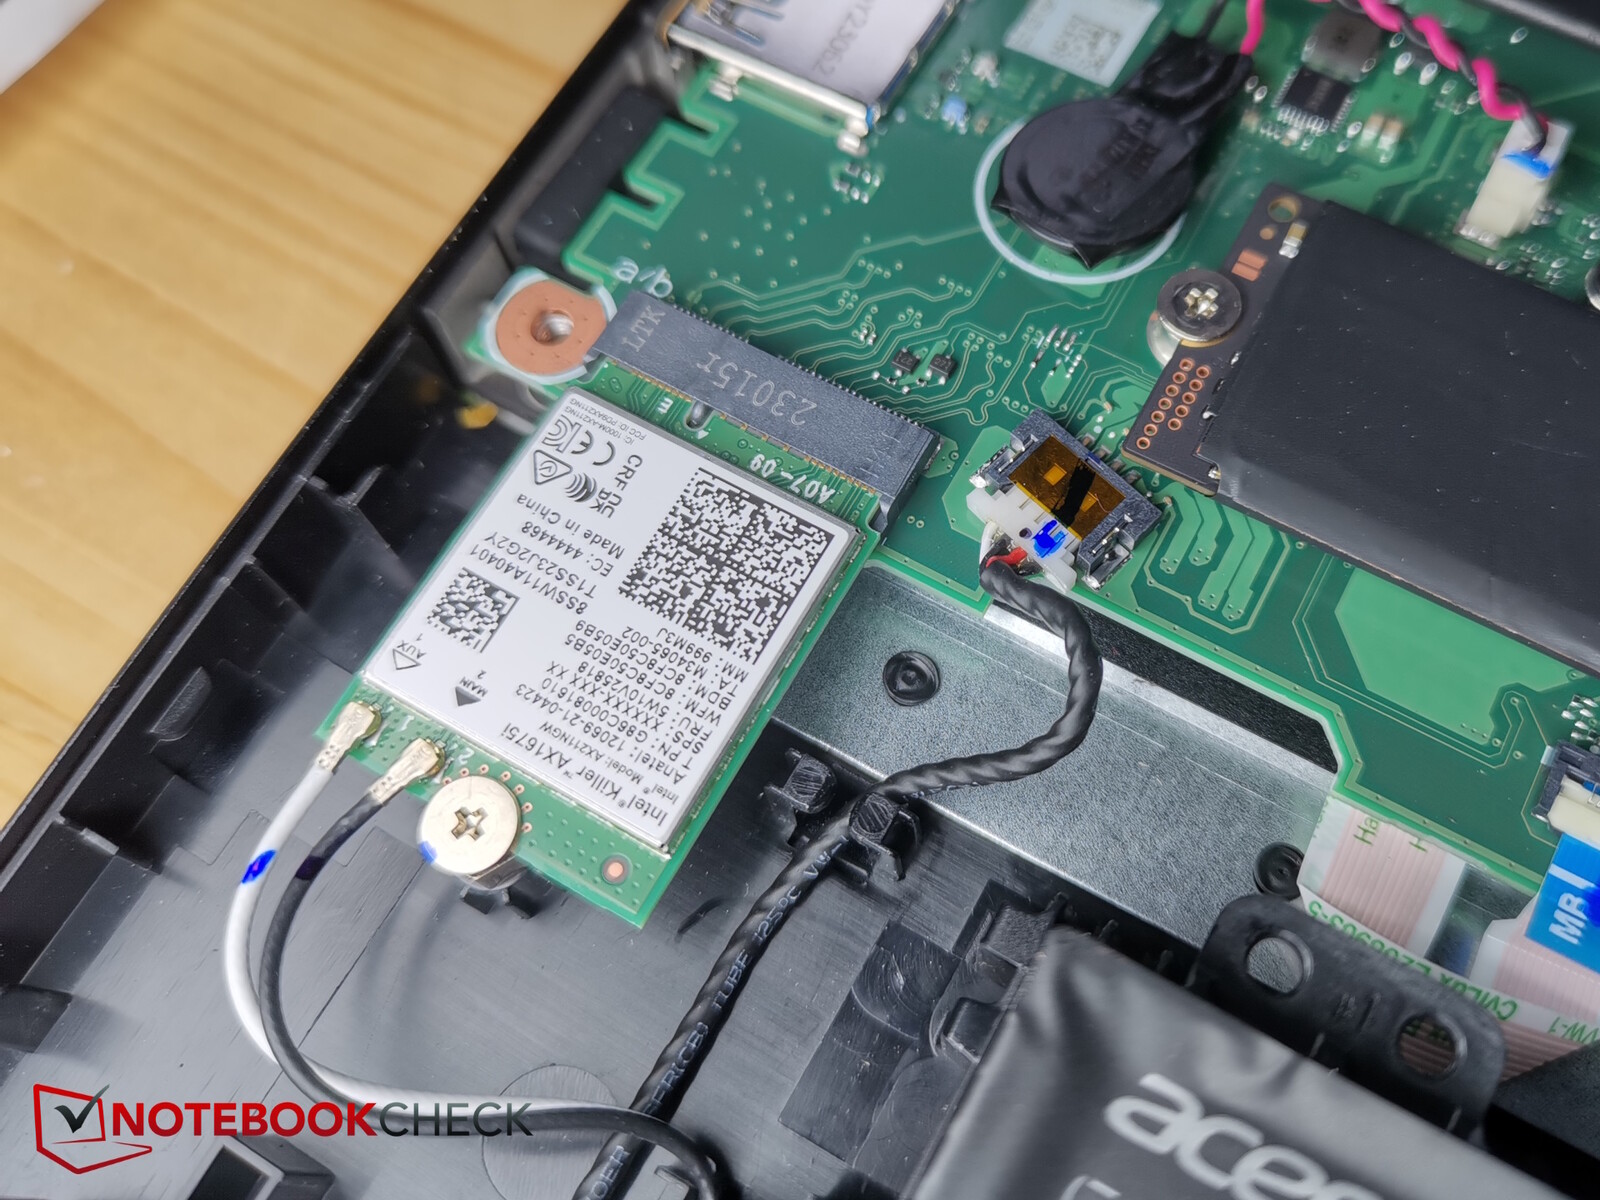
Acer utiliza el módulo WiFi Killer WiFi 6E AX1675i, que es compatible con 6E en el modo de 6 GHz y garantiza buenas velocidades de transferencia de alrededor de 1,5 Mbps. En la red de 5 GHz es considerablemente más lento, alcanzando alrededor de 900 Mbit/s.
Las tasas de transferencia resultan muy estables.
Cámara web
La cámara hace fotos y vídeos en FullHD. La calidad es aceptable: las desviaciones de color se mantienen dentro de los límites. Los tonos azules presentan las mayores desviaciones.


Seguridad
TPM está a bordo, al igual que una conexión para una cerradura de acero. Sin embargo, no hay sensor de huellas dactilares.
Accesorios y garantía
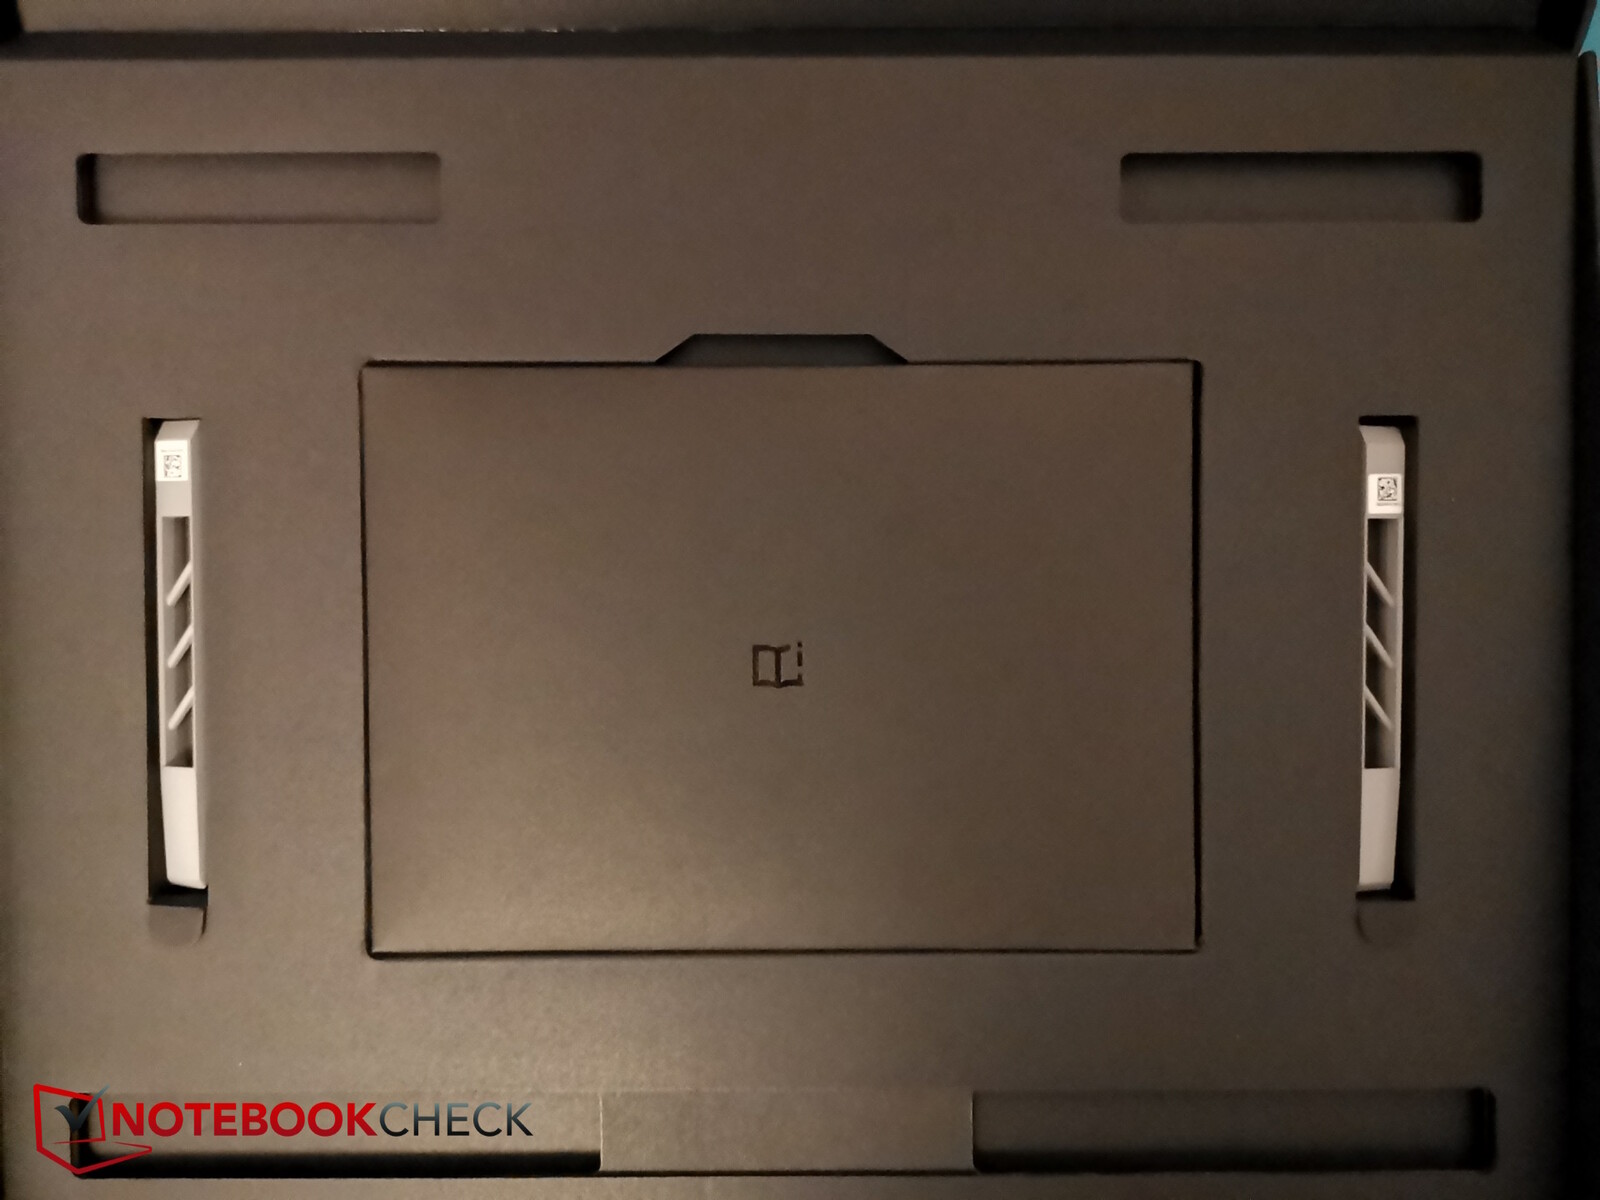
Además del portátil, la fuente de alimentación y la documentación habitual, se incluyen en el volumen de suministro un par de cubiertas de ventilador alternativas para la parte posterior del Helios 18.
Acer ofrece una garantía estándar de 24 meses en Alemania. Esto puede diferir en otros países, por lo que los compradores potenciales deben comprobarlo antes de comprar.
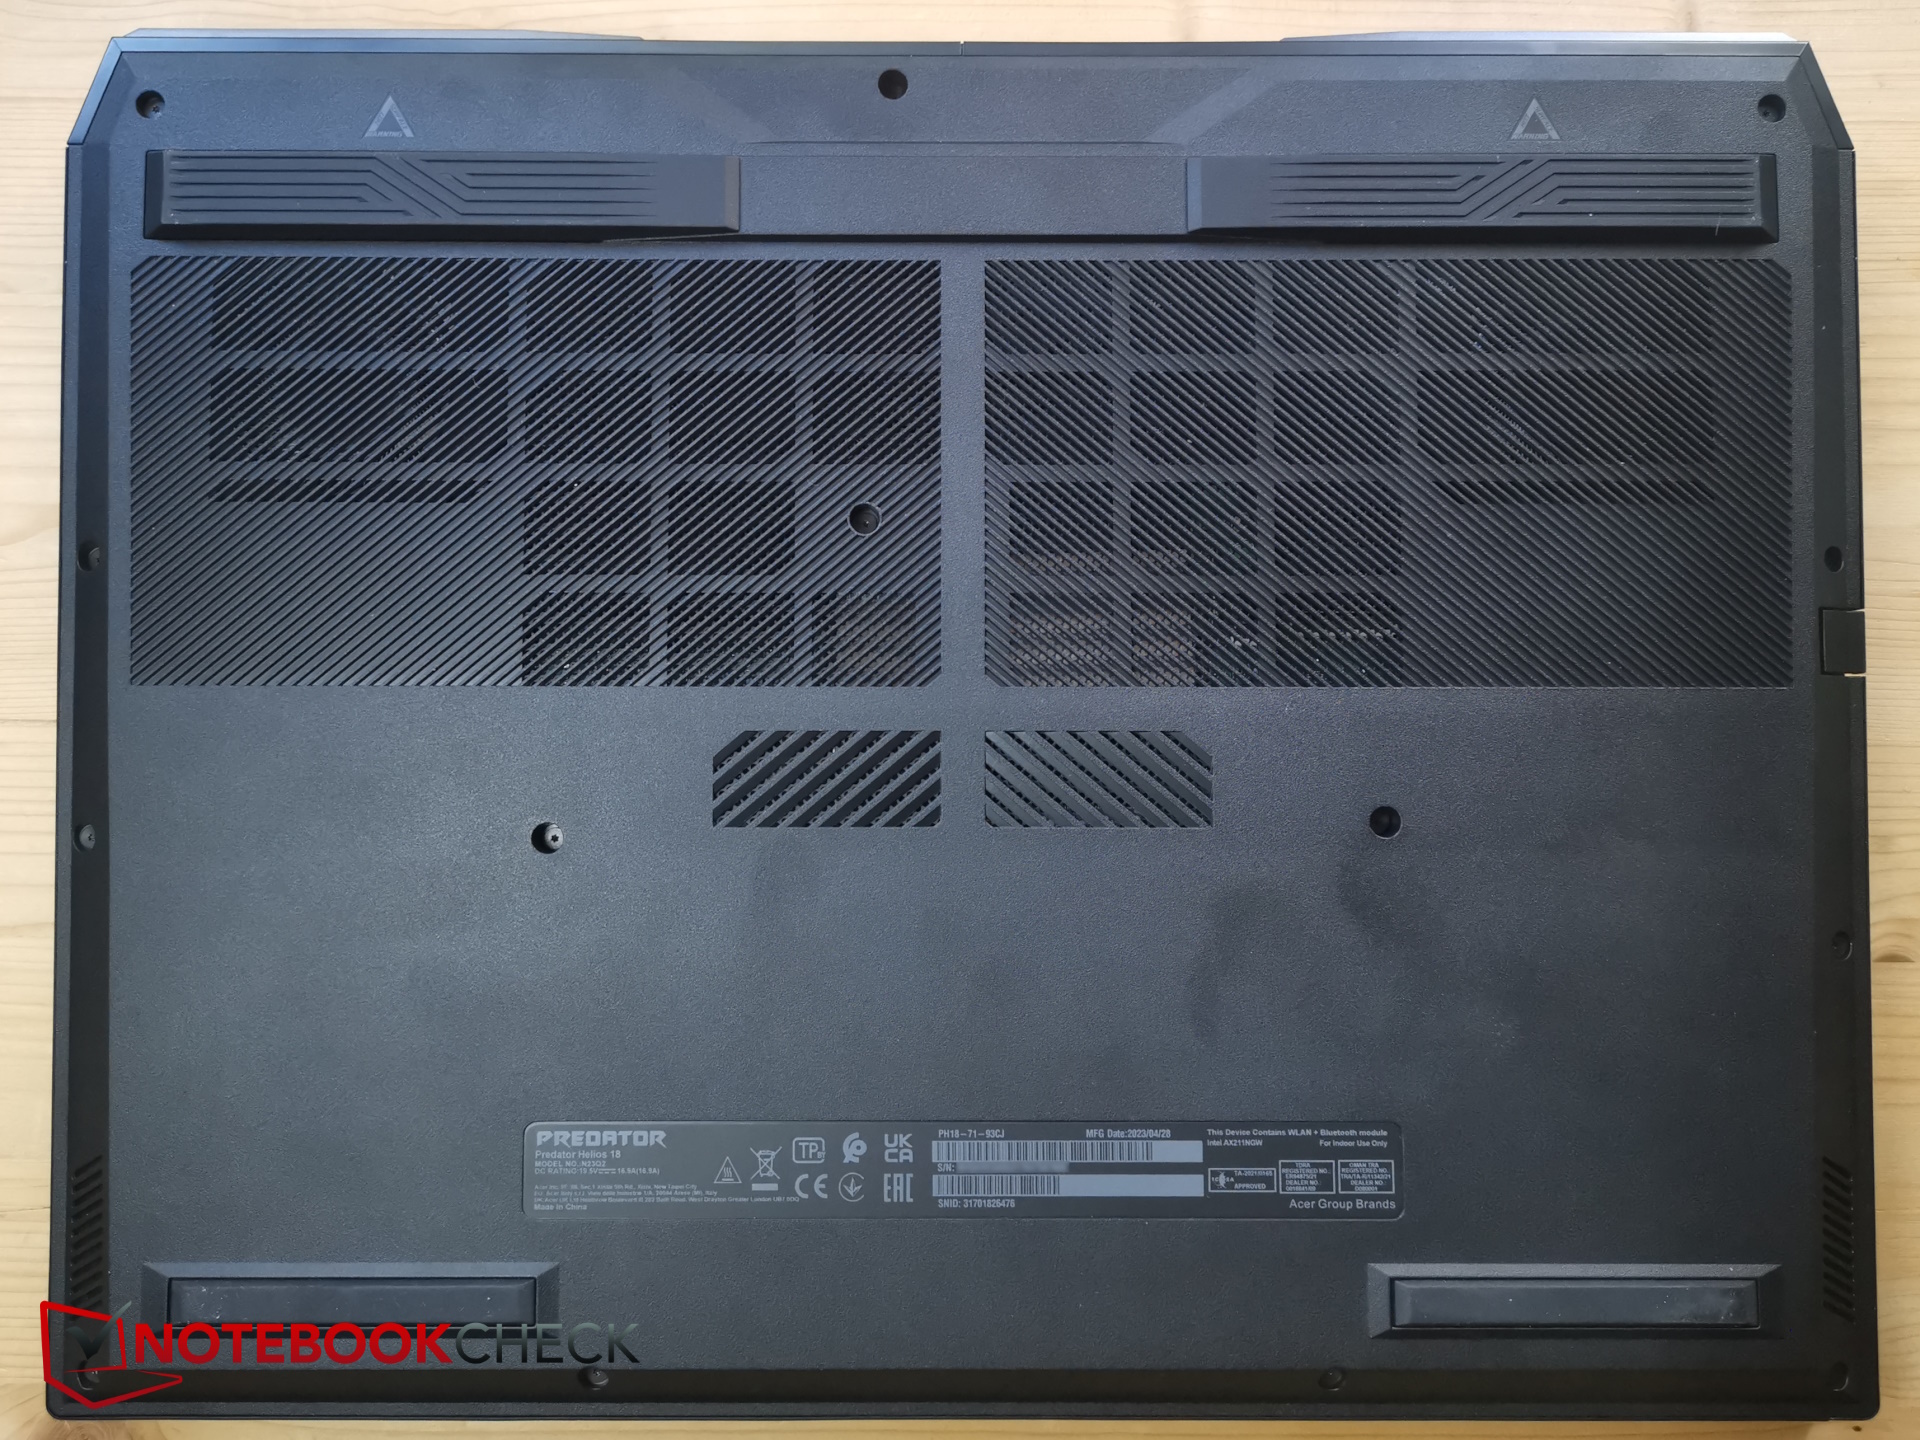
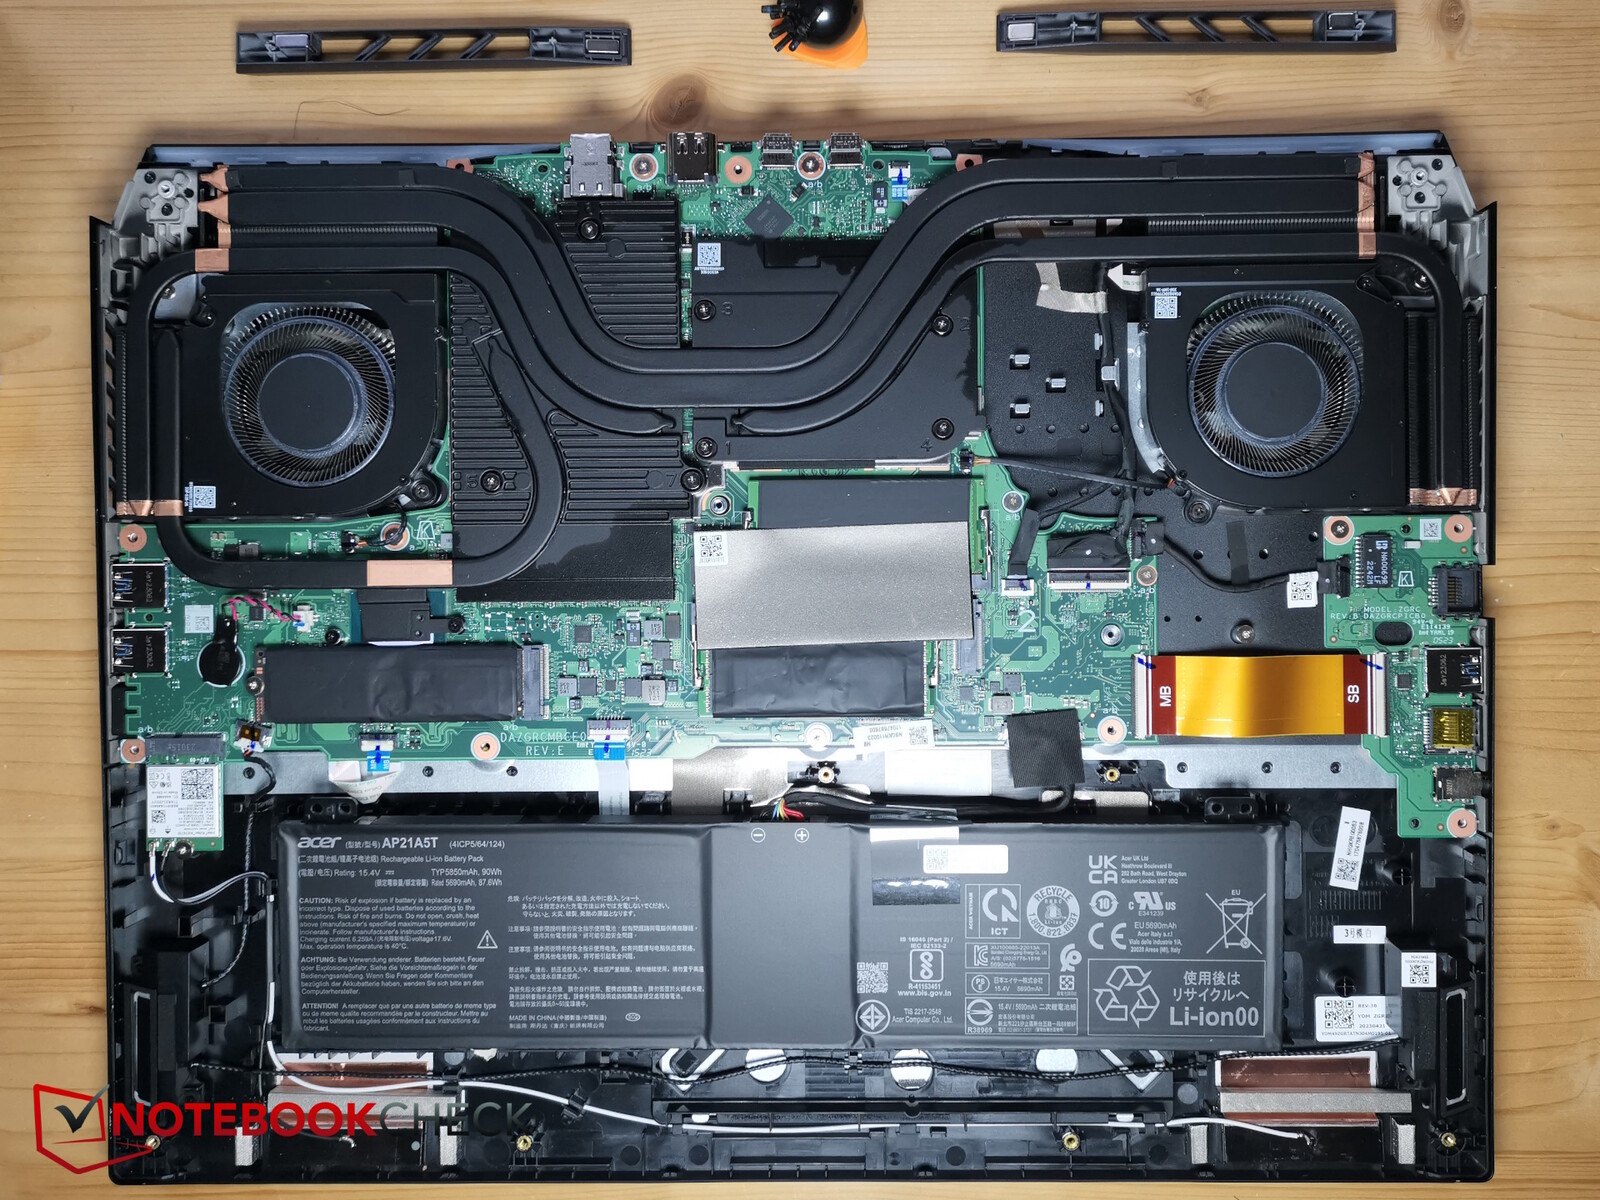
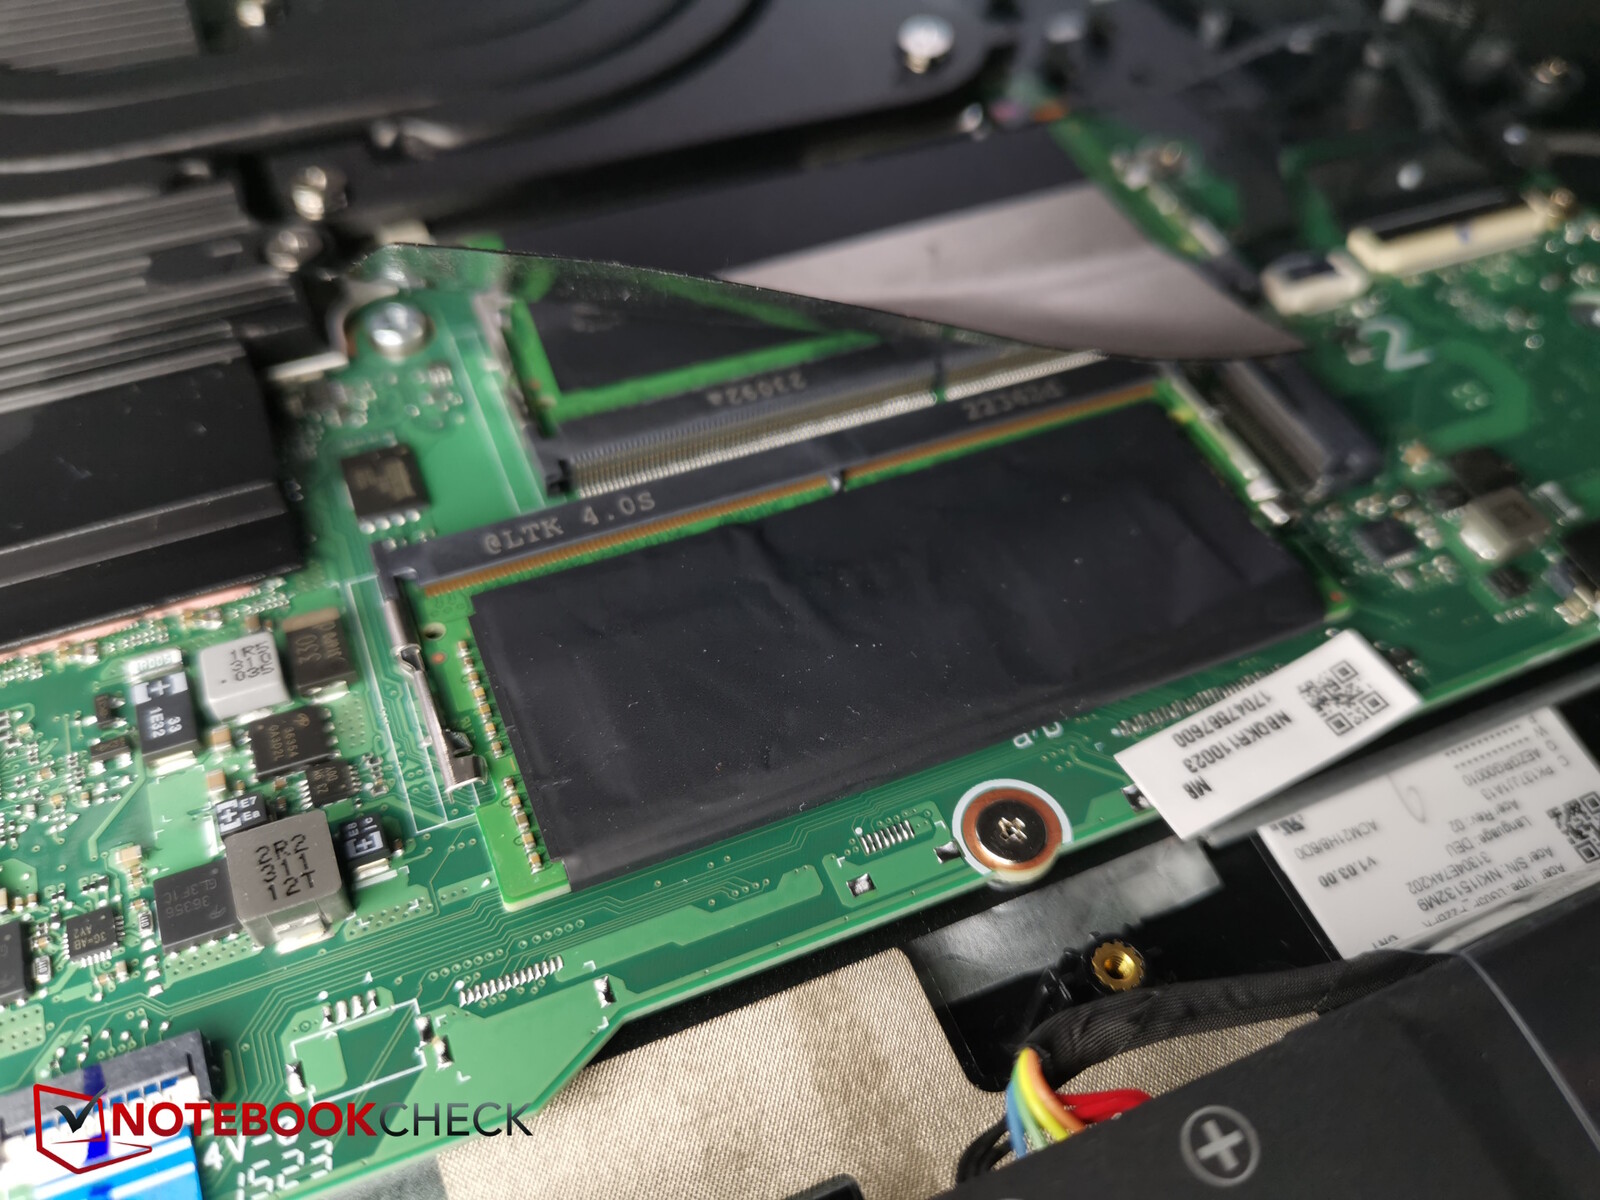
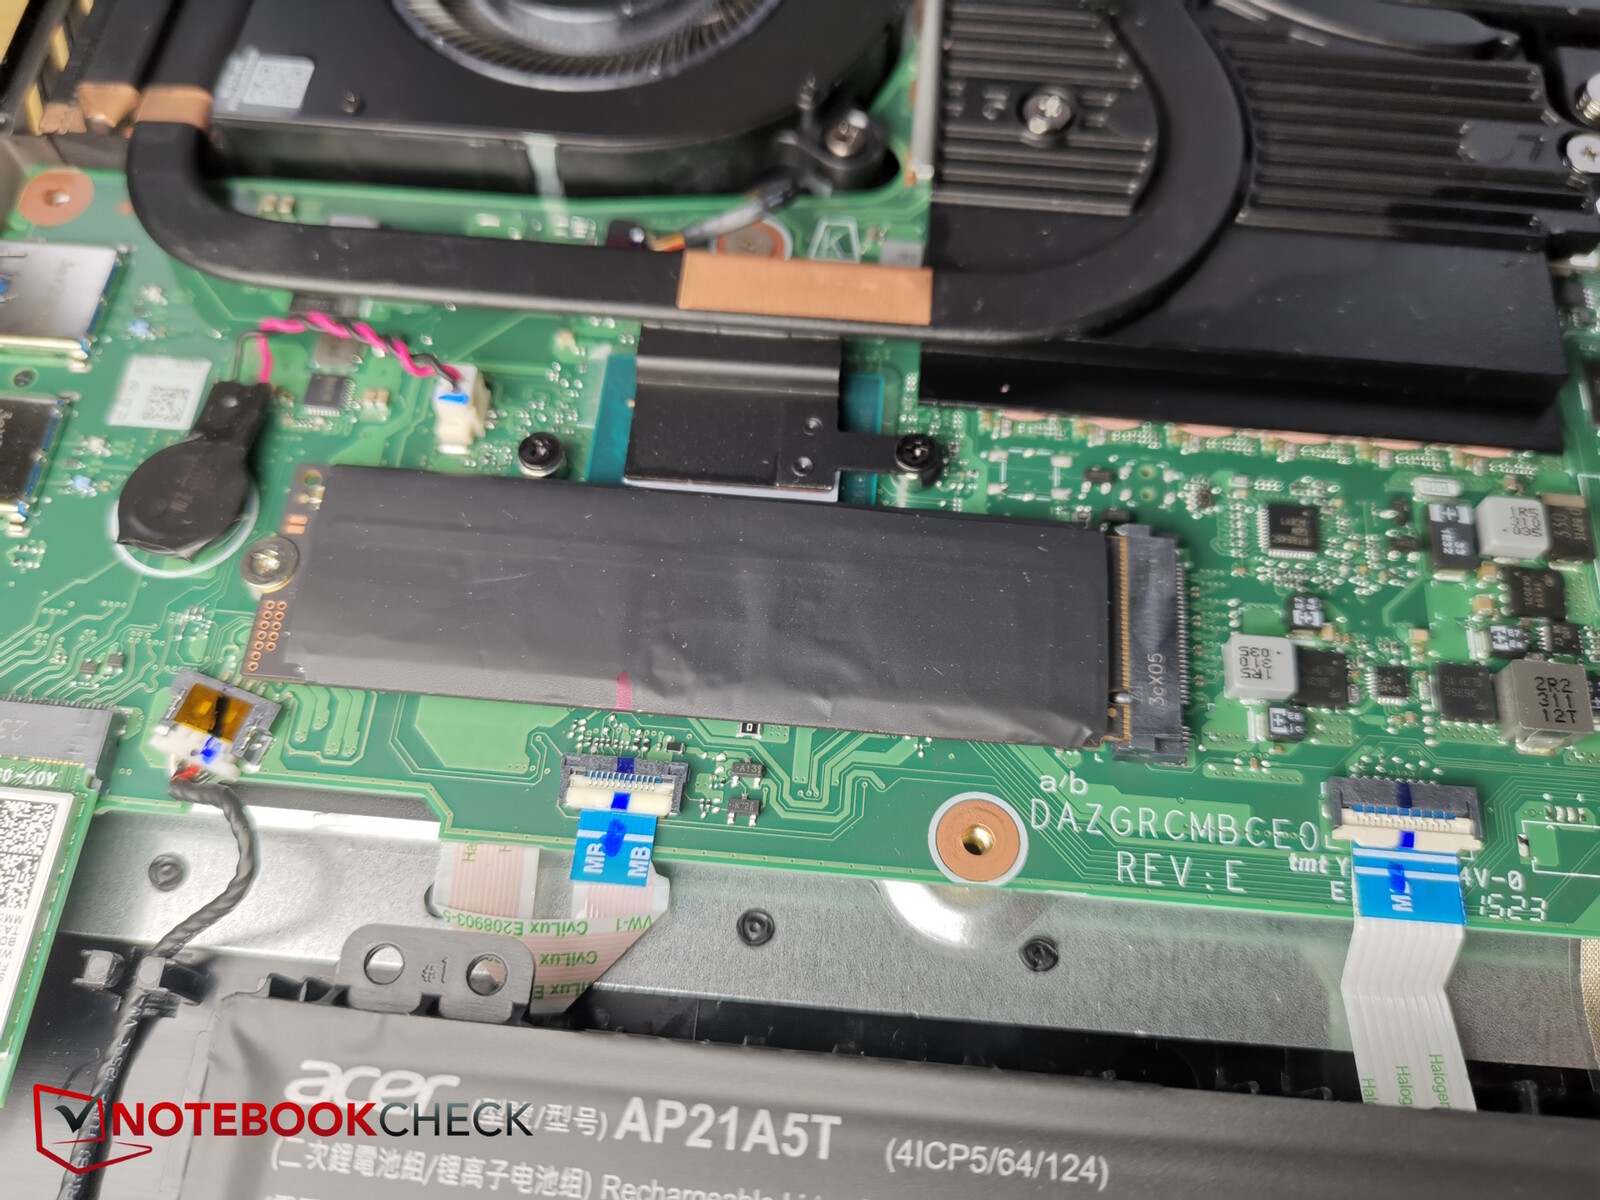
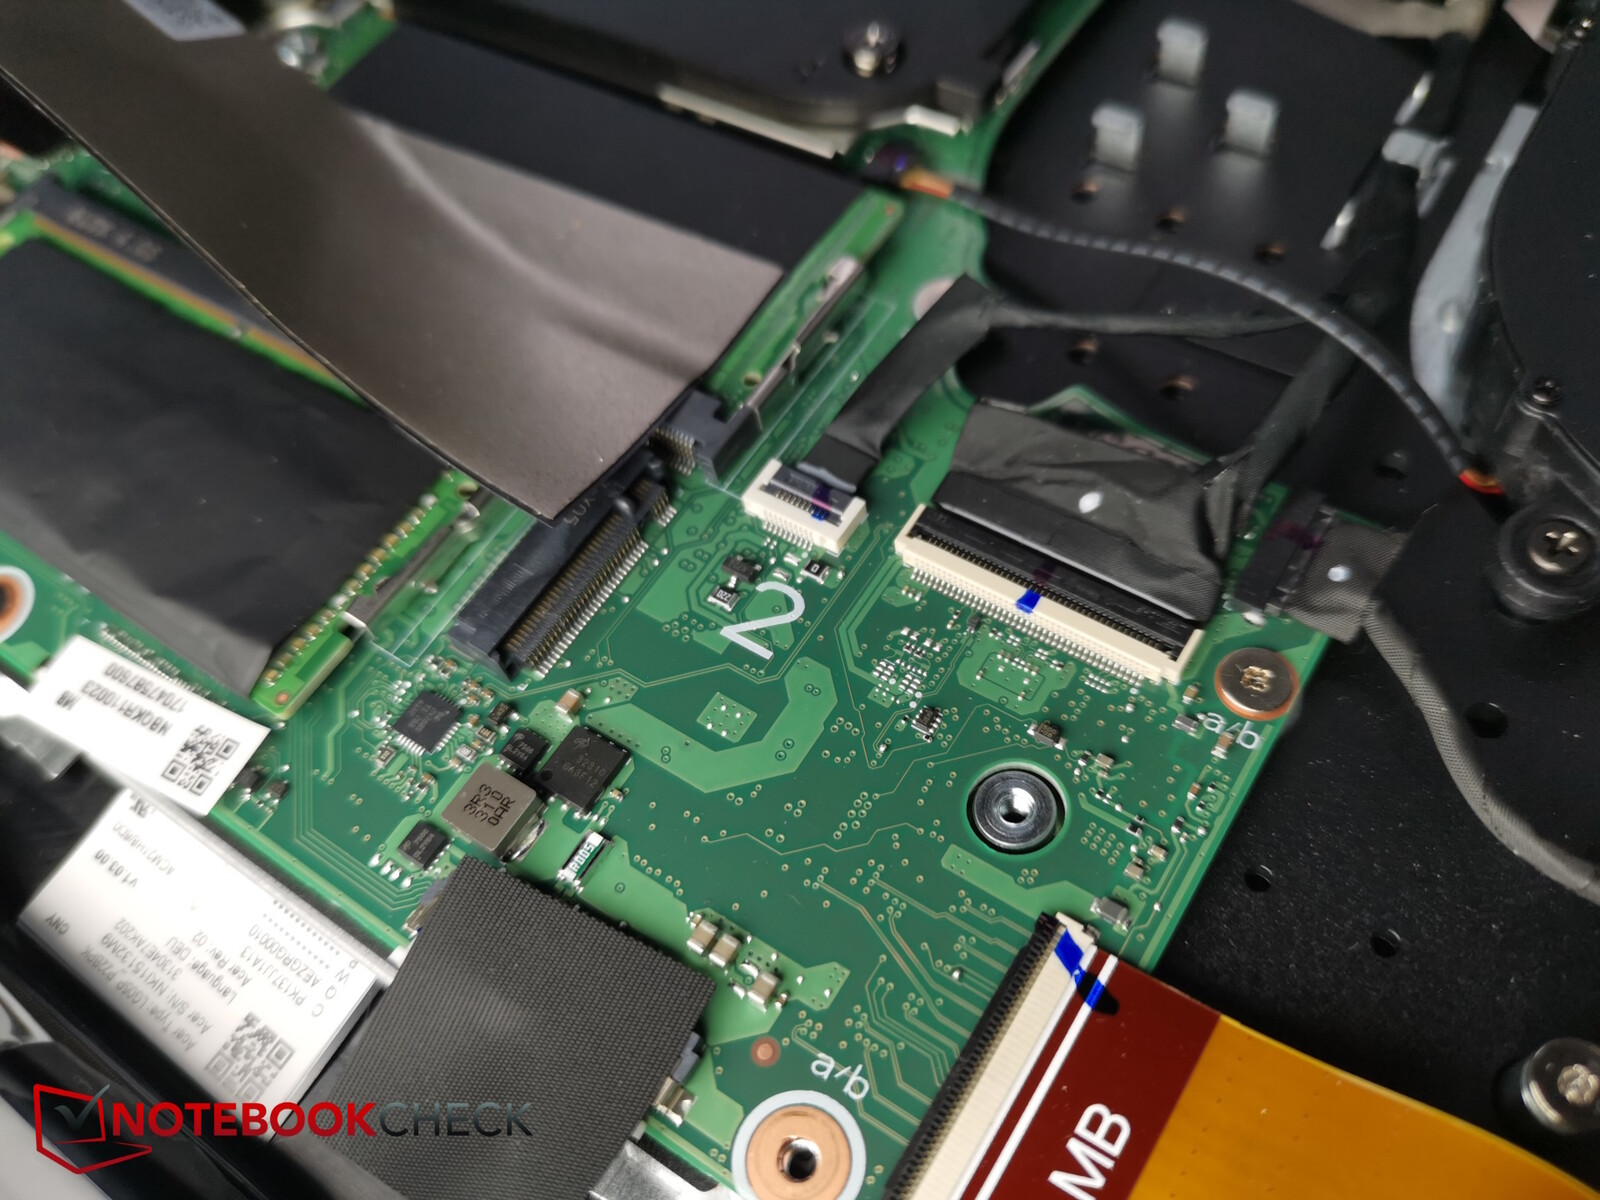
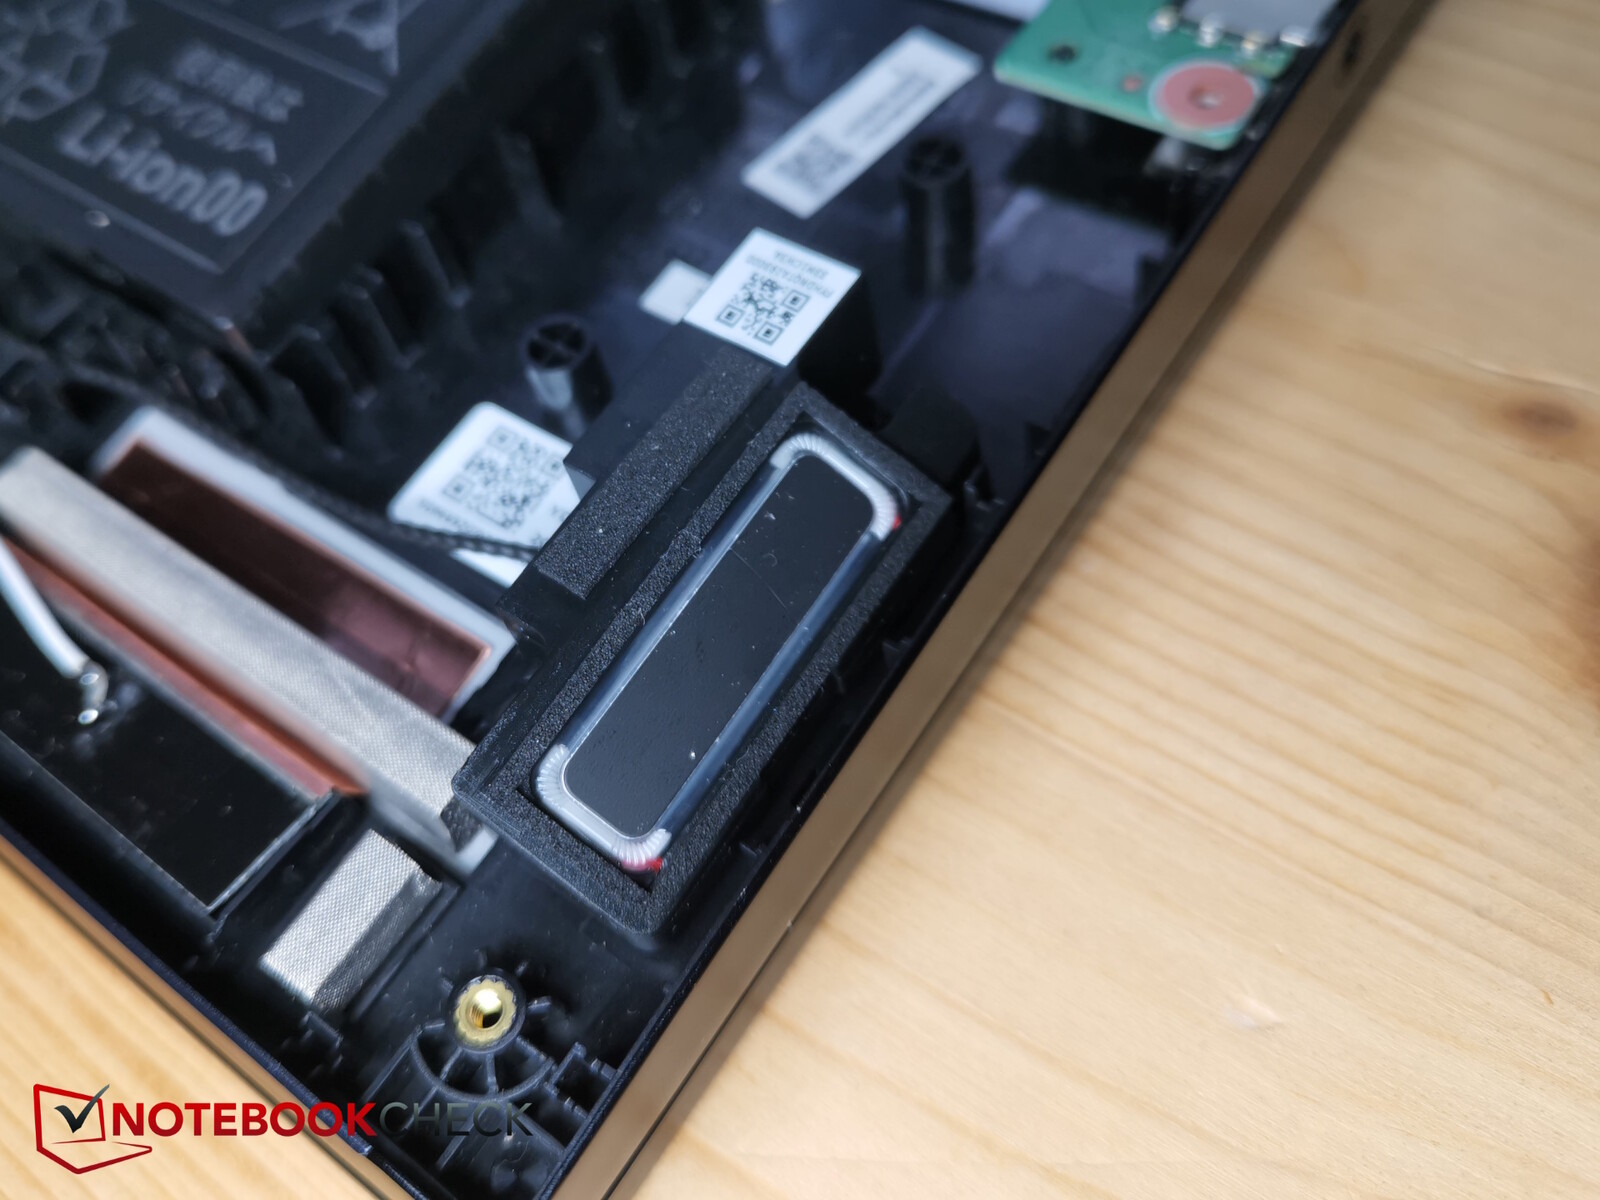
Mantenimiento
Abrir el Helios 18 no es tan fácil debido a las apretadas abrazaderas y a la rígida base de aluminio, pero aún así es manejable. En primer lugar, hay que aflojar 14 tornillos Torx del mismo tamaño. Después, lo mejor es hacer palanca para abrir la parte trasera desde las esquinas delanteras, preferiblemente con una herramienta de plástico de filo estrecho
Una vez dentro del Acer Predator, los usuarios tienen acceso a los ventiladores, la batería, la unidad SSD (más una segunda ranura), las ranuras de RAM y el módulo WiFi.
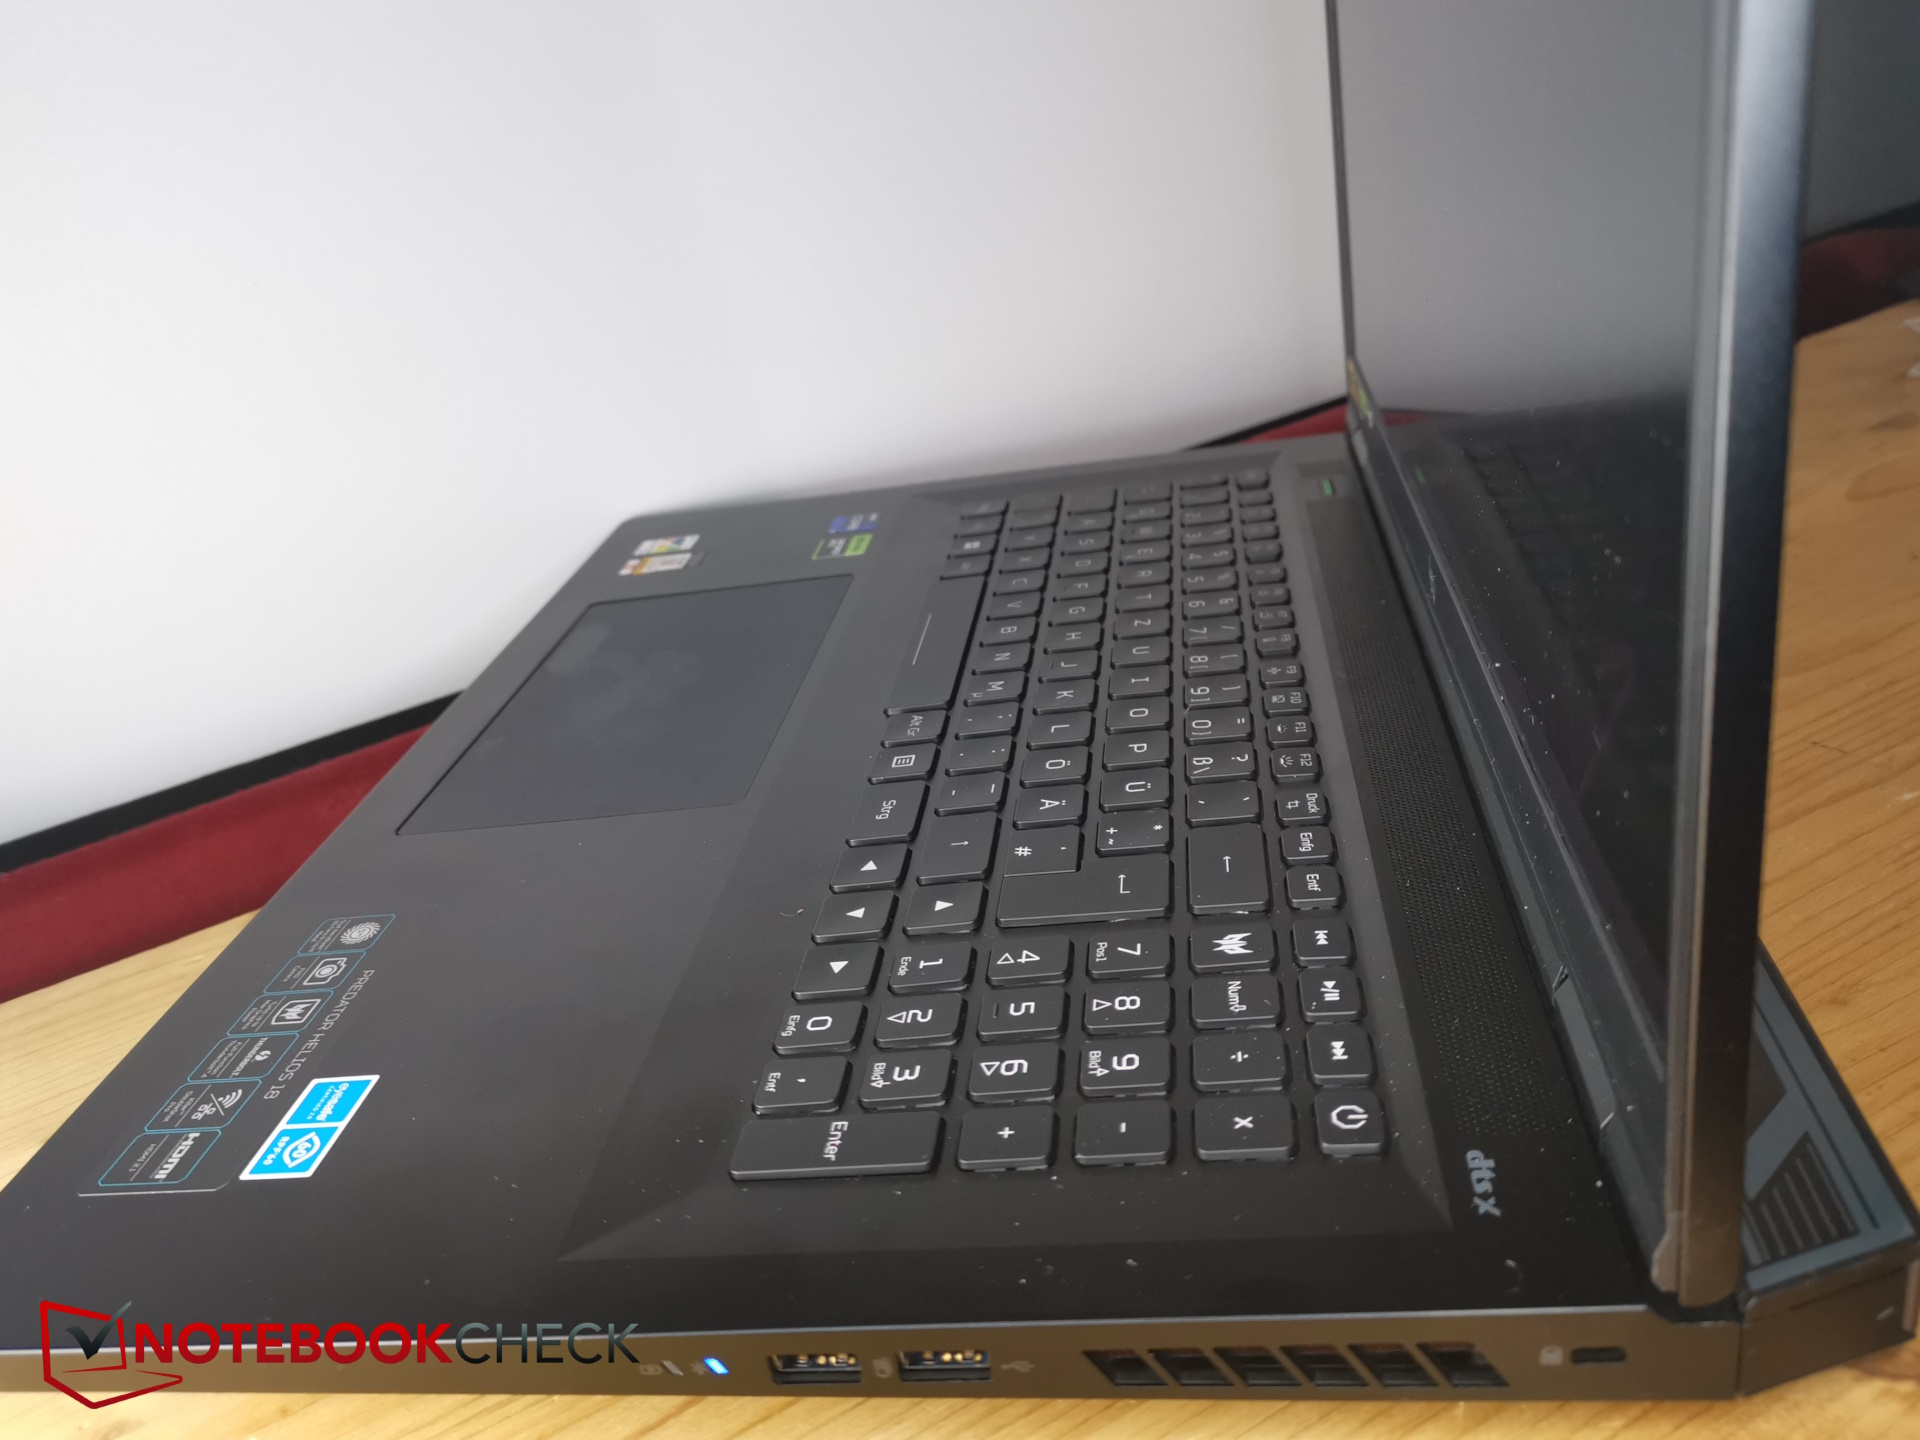
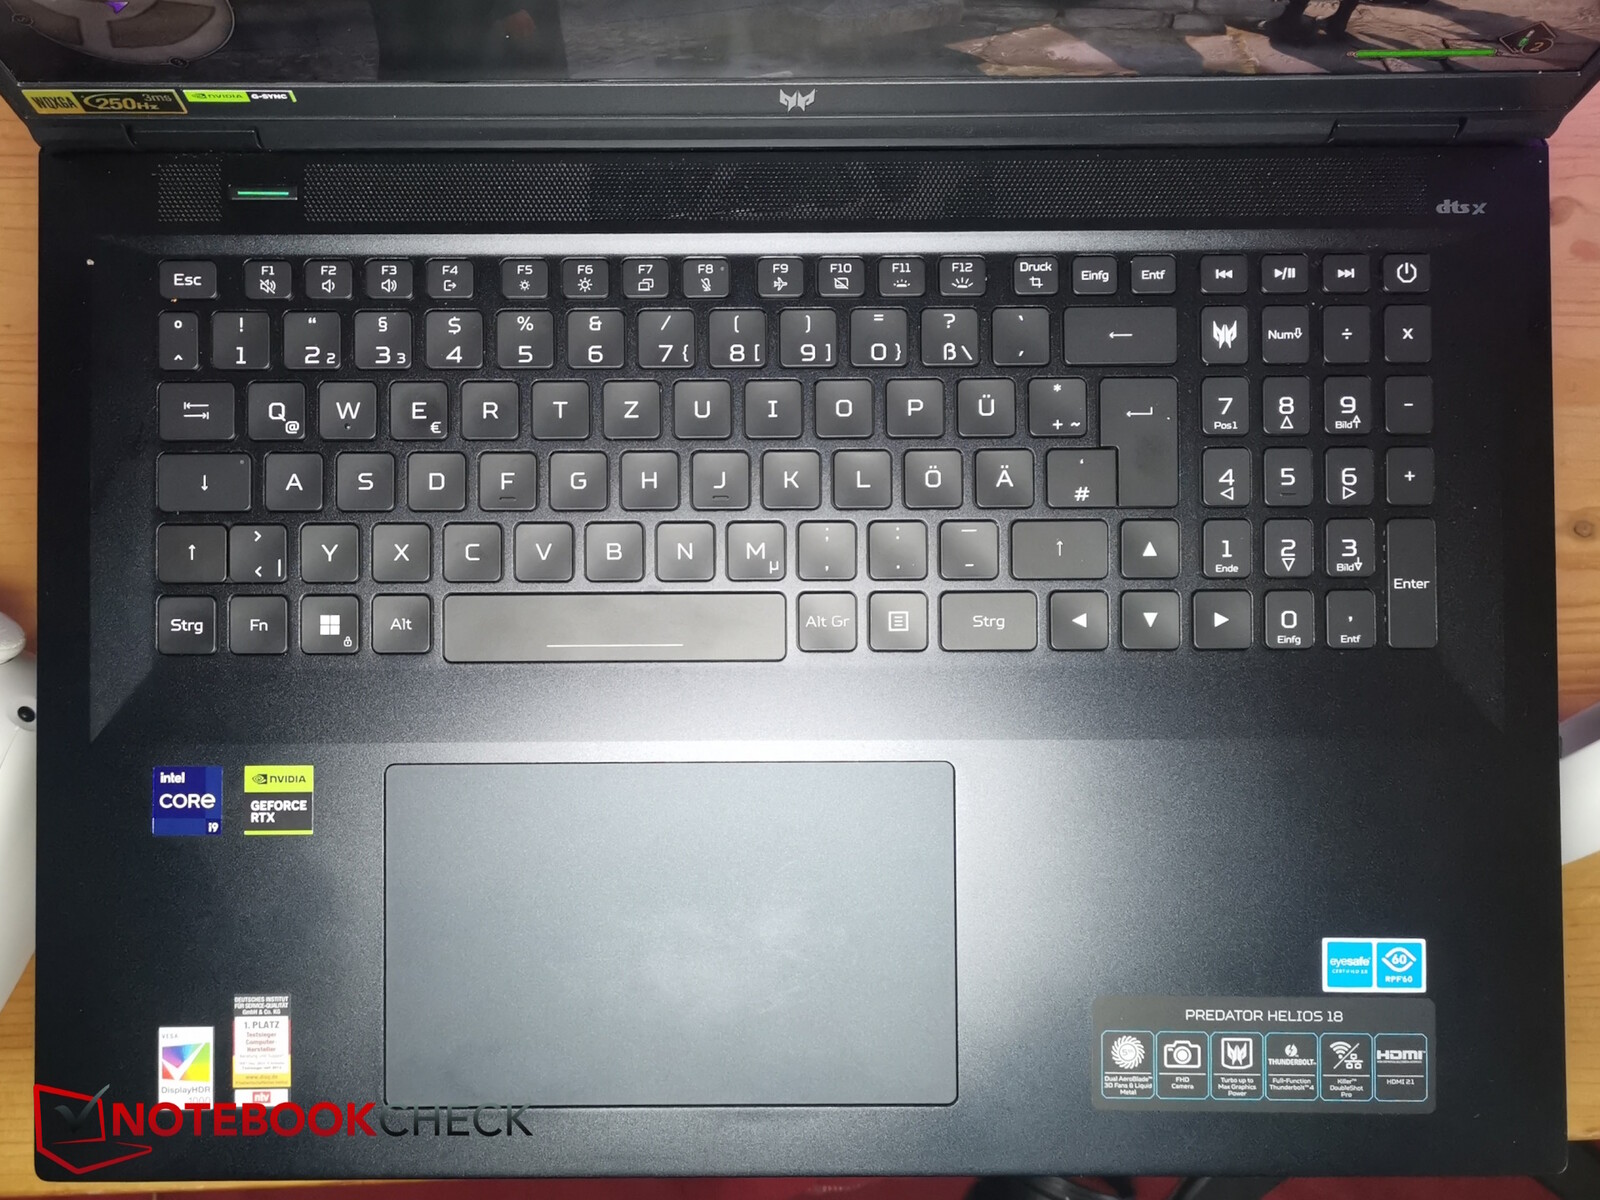
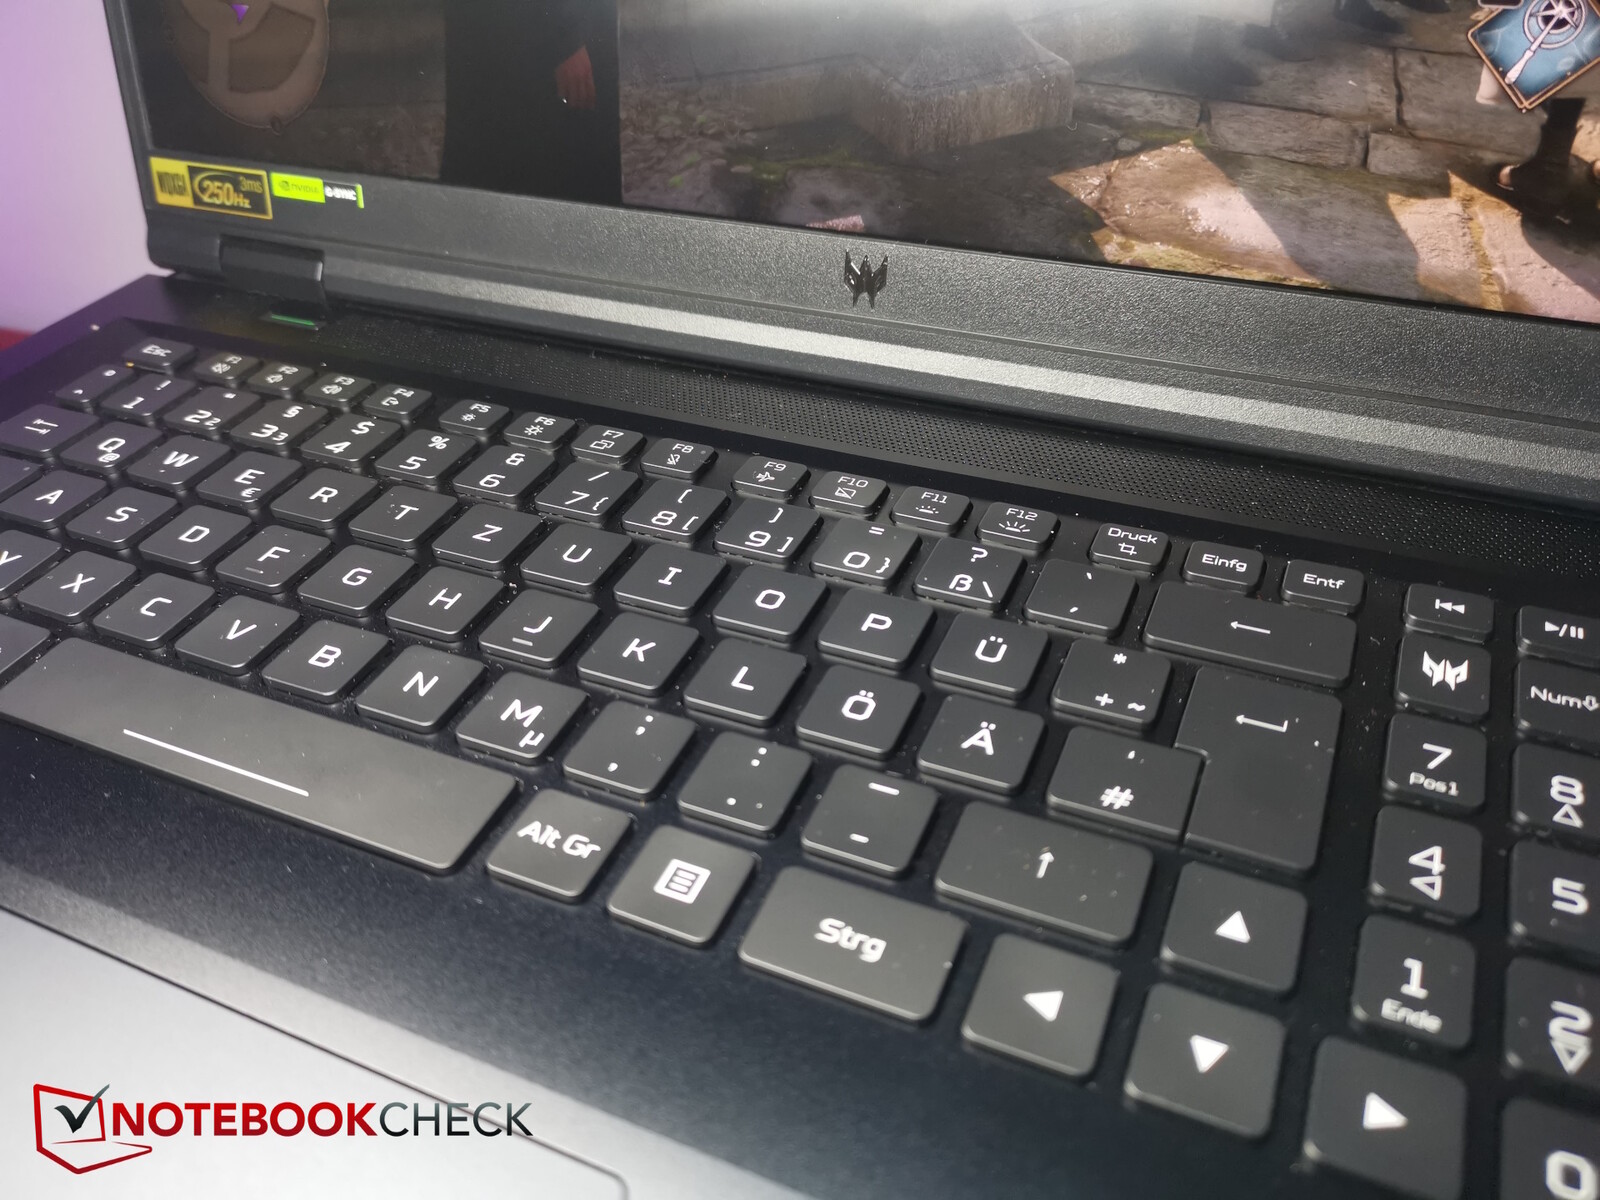
Dispositivos de entrada - MiniLED también para las teclas
Teclado
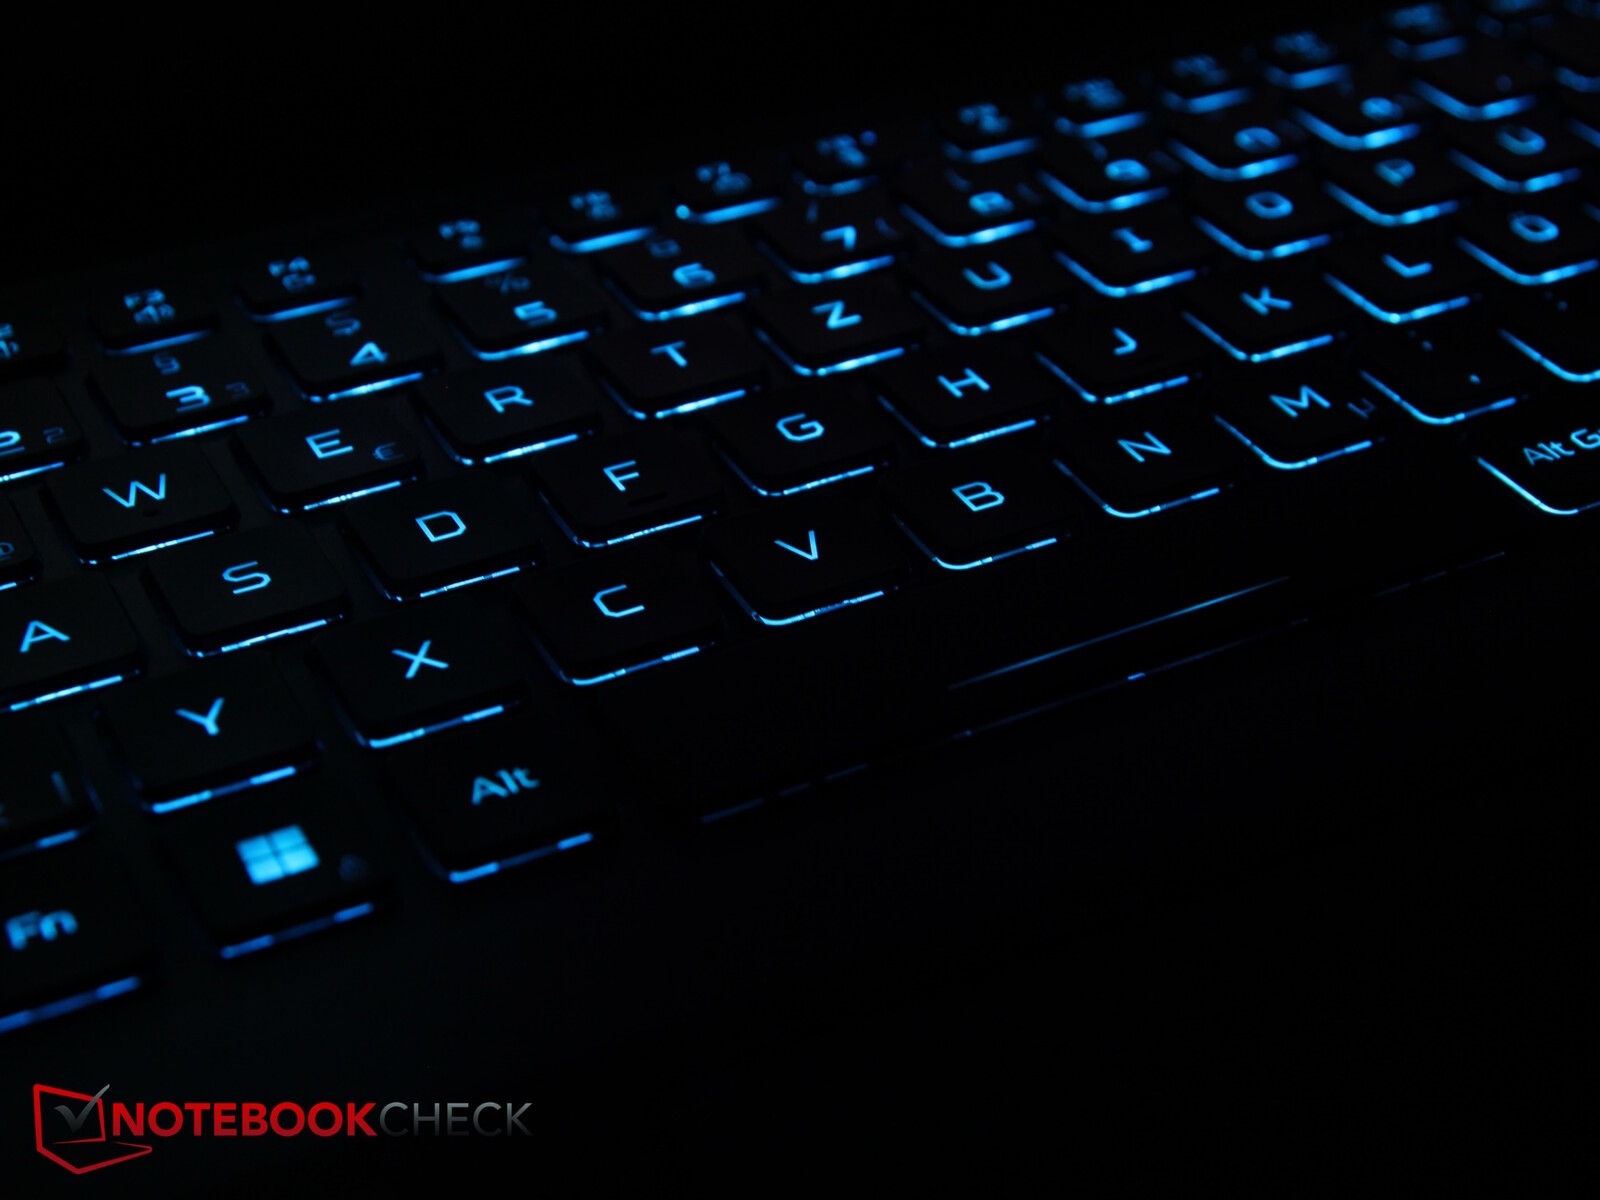
El Predator tiene una disposición muy ordenada que incluye teclas de flecha de tamaño completo, un teclado numérico a la derecha y teclas adicionales para llamar al software Predator Sense y cambiar los modos de rendimiento
Las teclas son de 1,5 x 1,5 mm, tienen un recorrido medio y una respuesta perceptible, que podría ser un poco más firme. El ruido de tecleo es moderado y la velocidad de tecleo es rápida.
Según Acer, la retroiluminación RGB por tecla funciona mediante MiniLED, al igual que la pantalla, y puede ajustarse en cuatro niveles.
Panel táctil
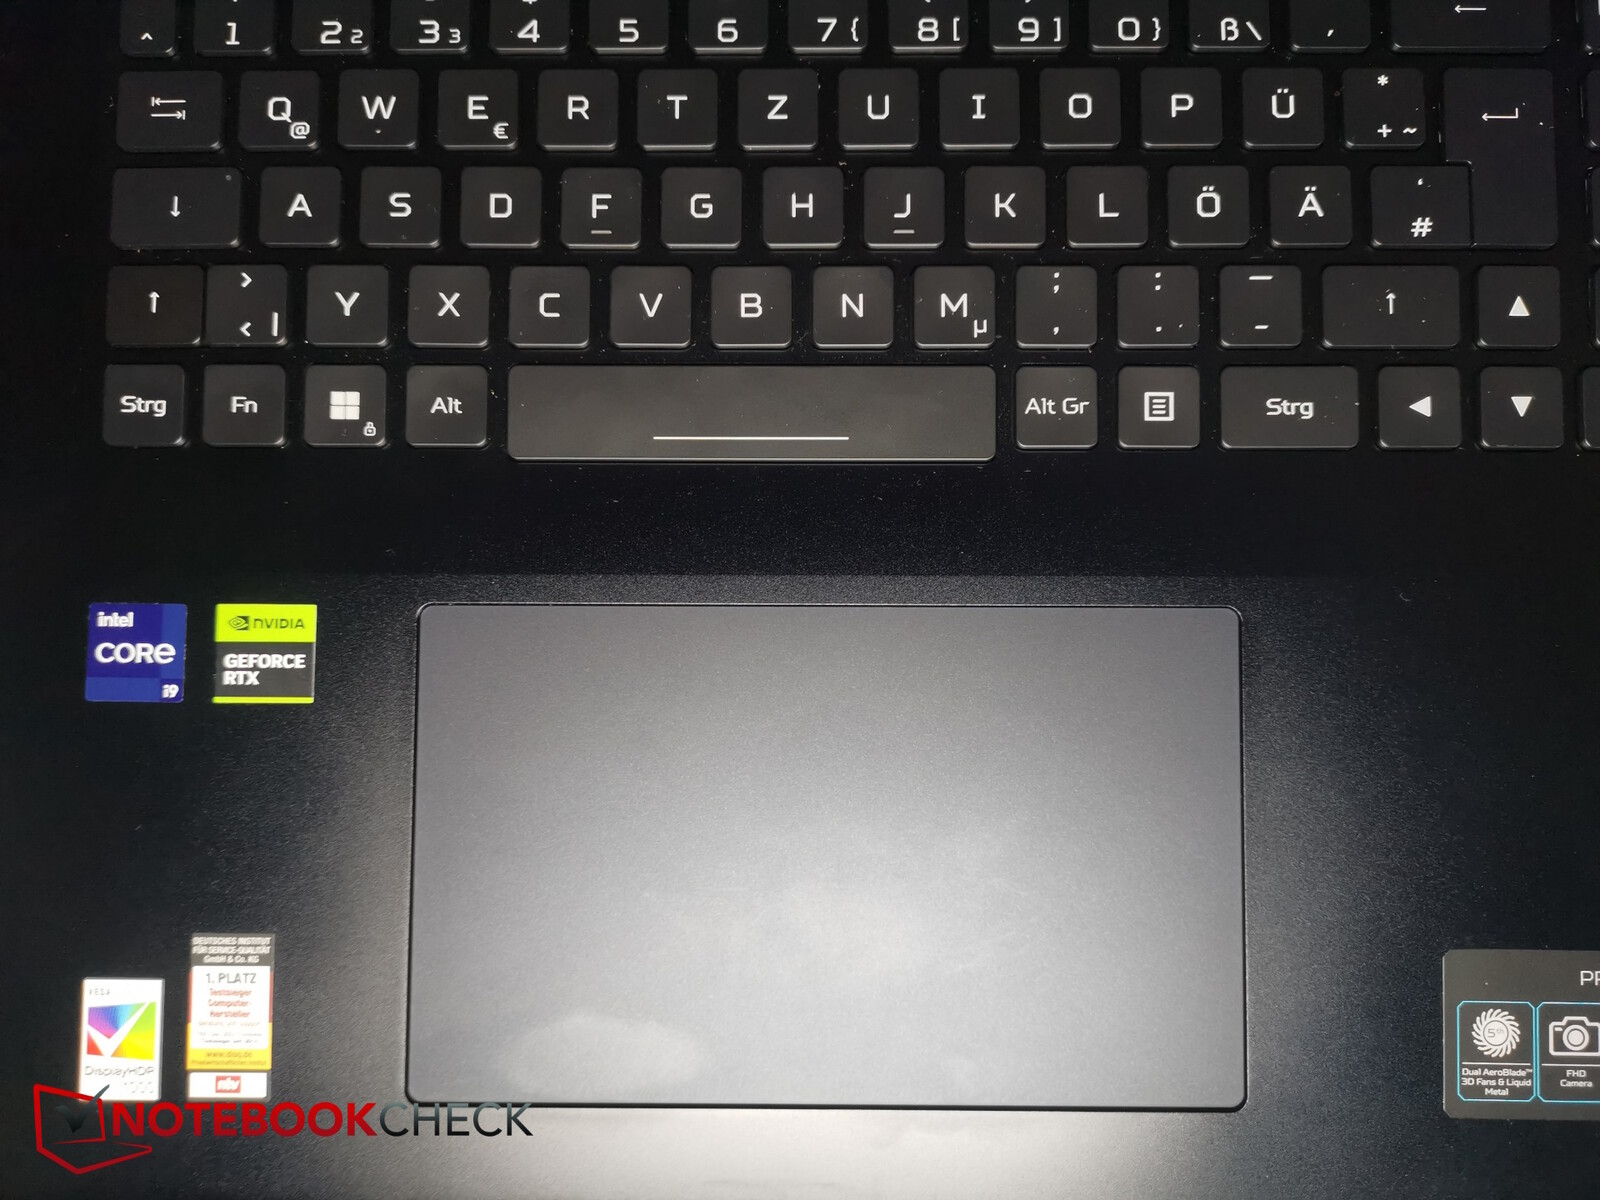
El touchpad de 18 pulgadas es francamente enorme (aprox. 15,2 x 9,1 cm) y ofrece muy buenas propiedades de deslizamiento que casi nunca provocan tartamudeos.
Los botones de clic integrados son muy silenciosos y tienen un recorrido extremadamente corto, pero se disparan con fiabilidad y ofrecen una buena respuesta.
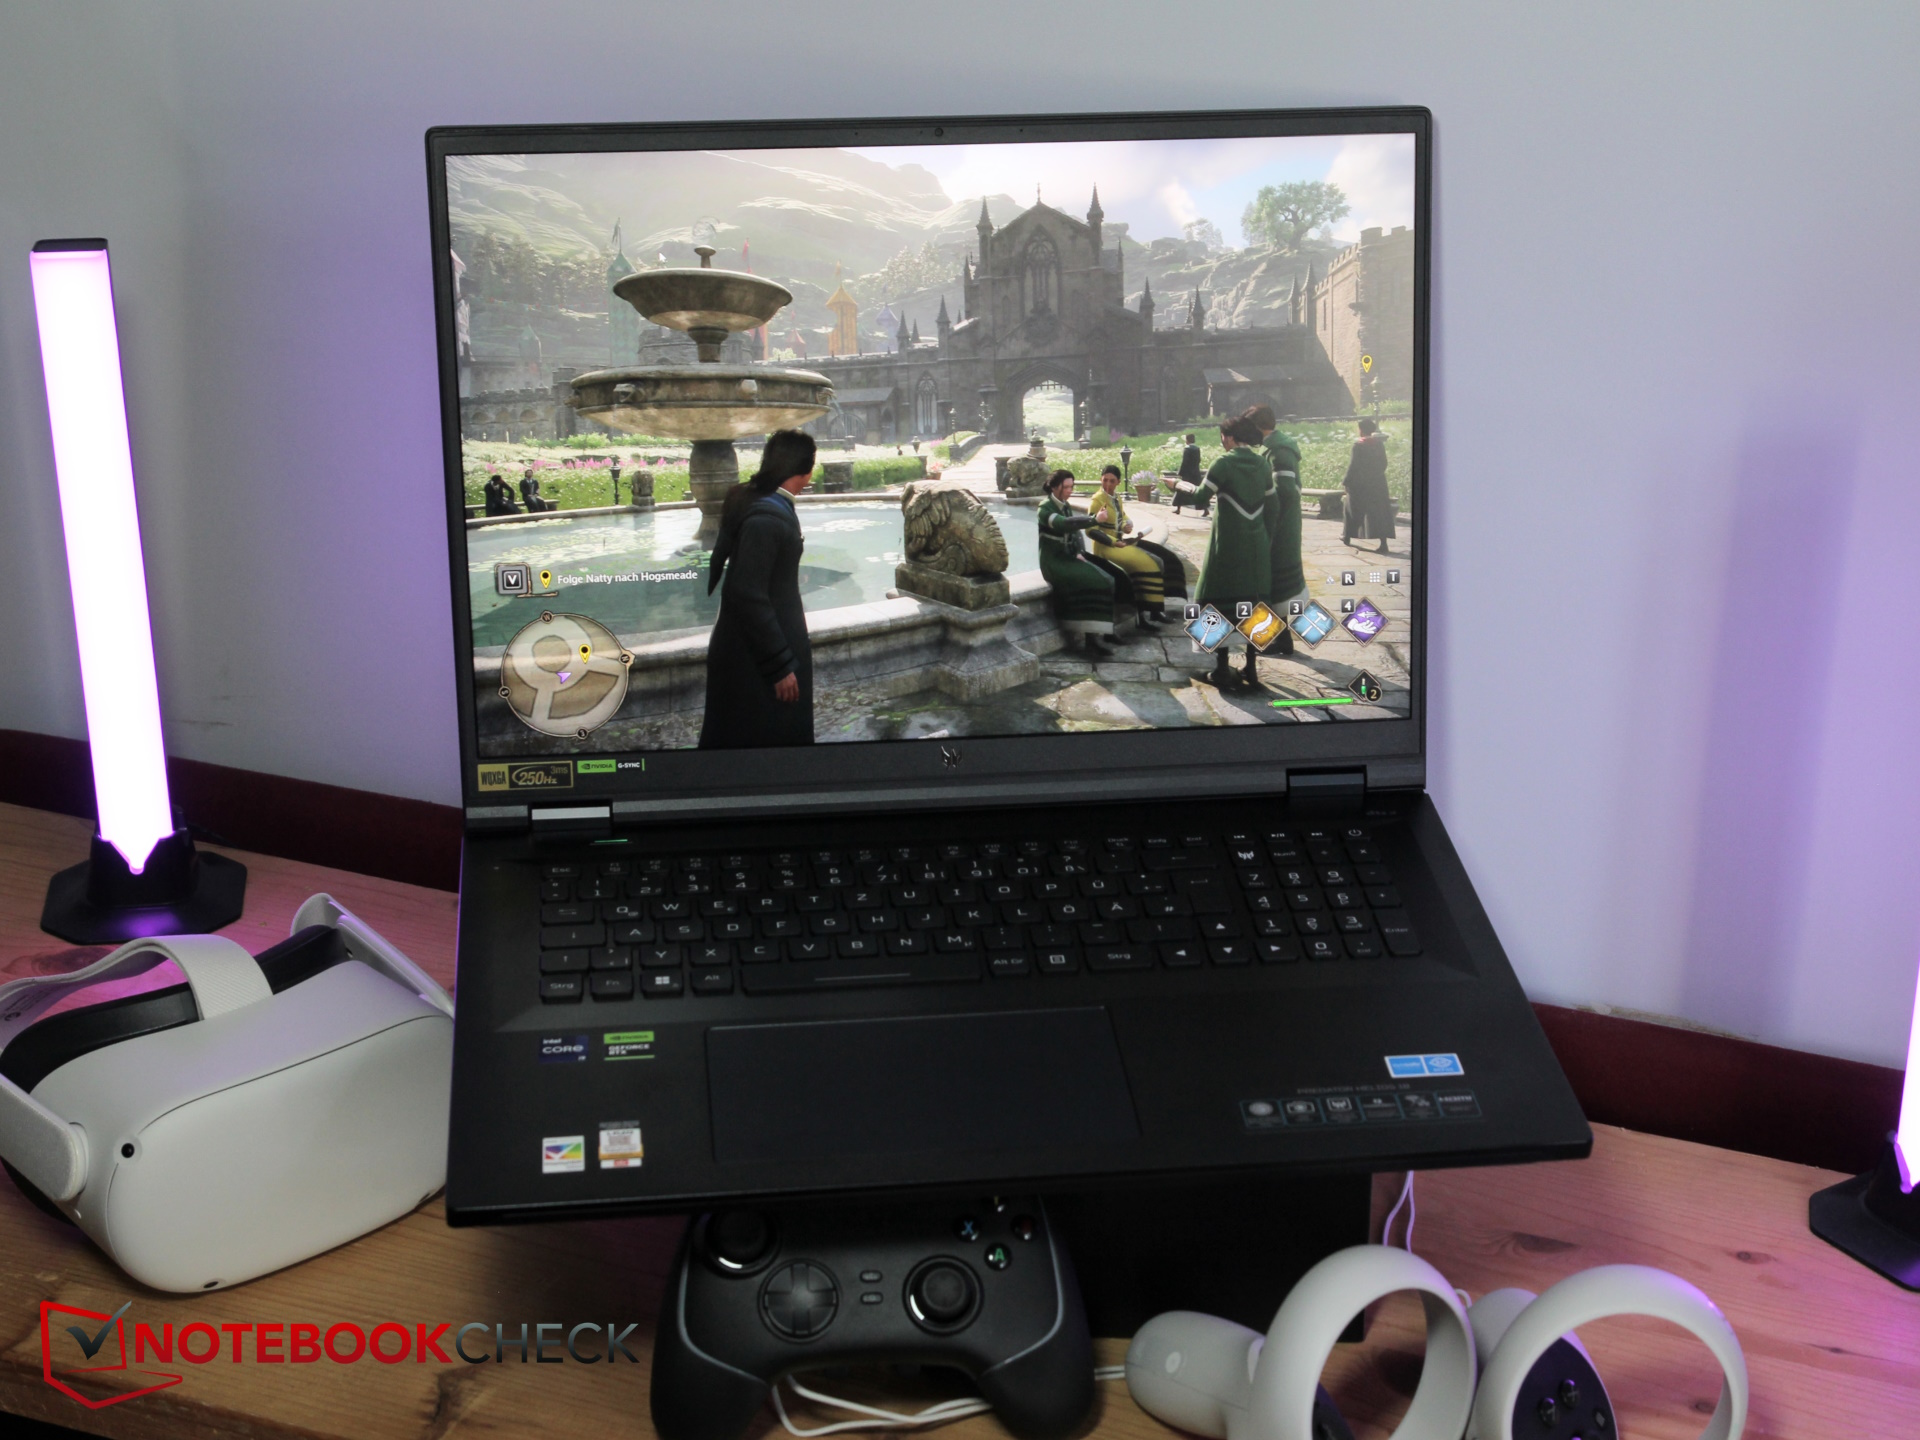
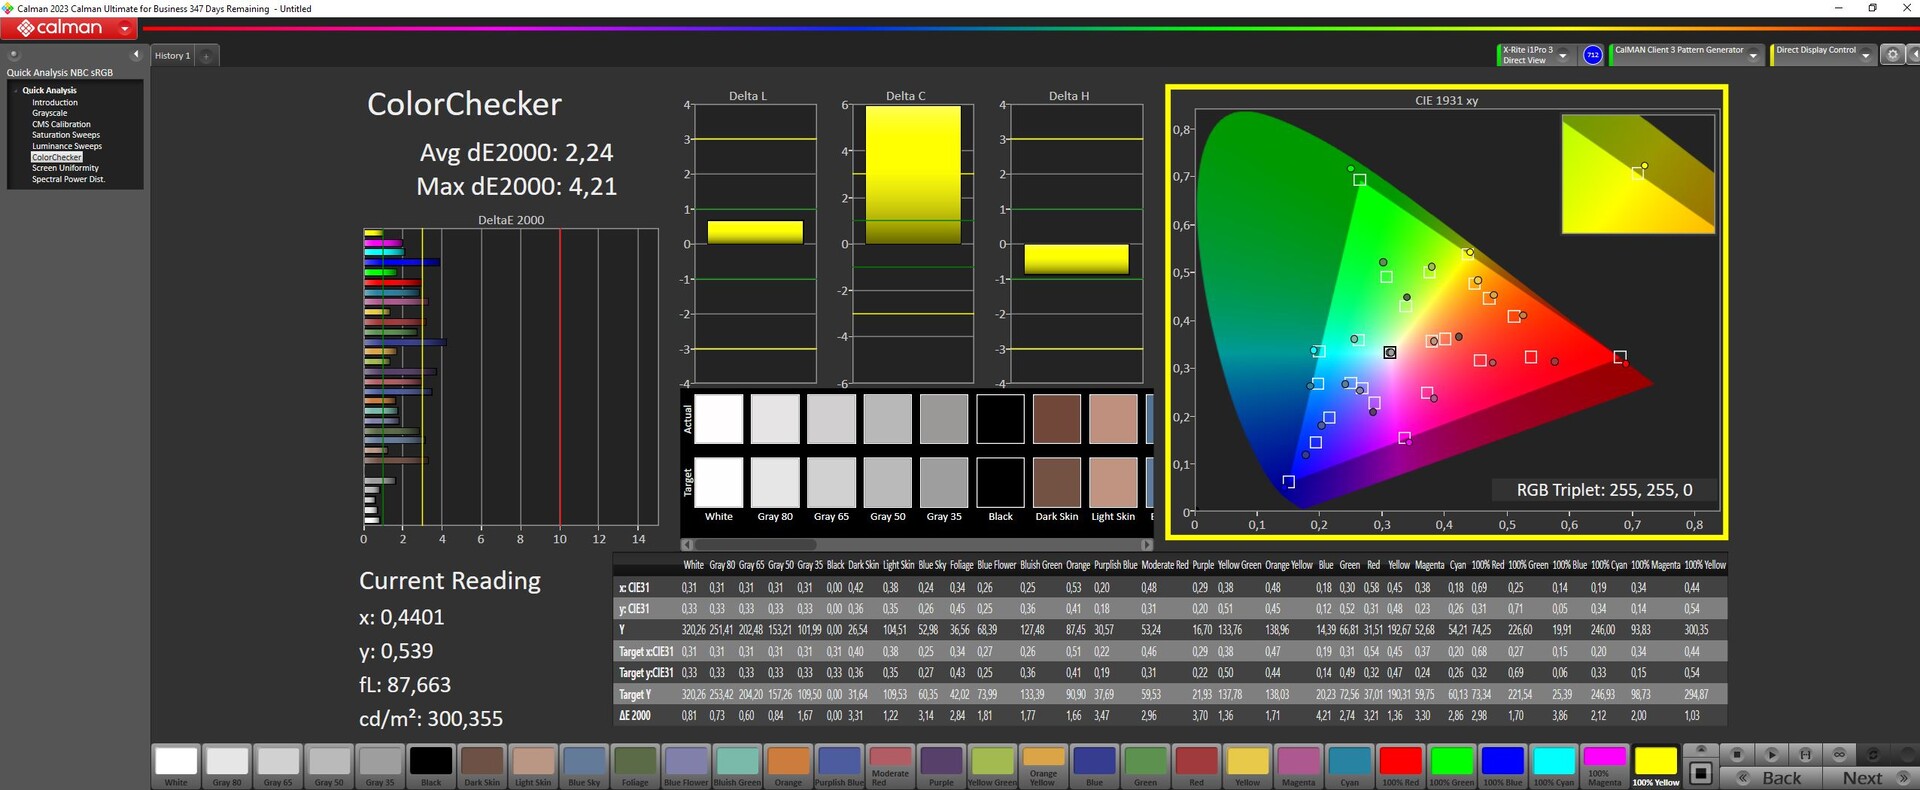
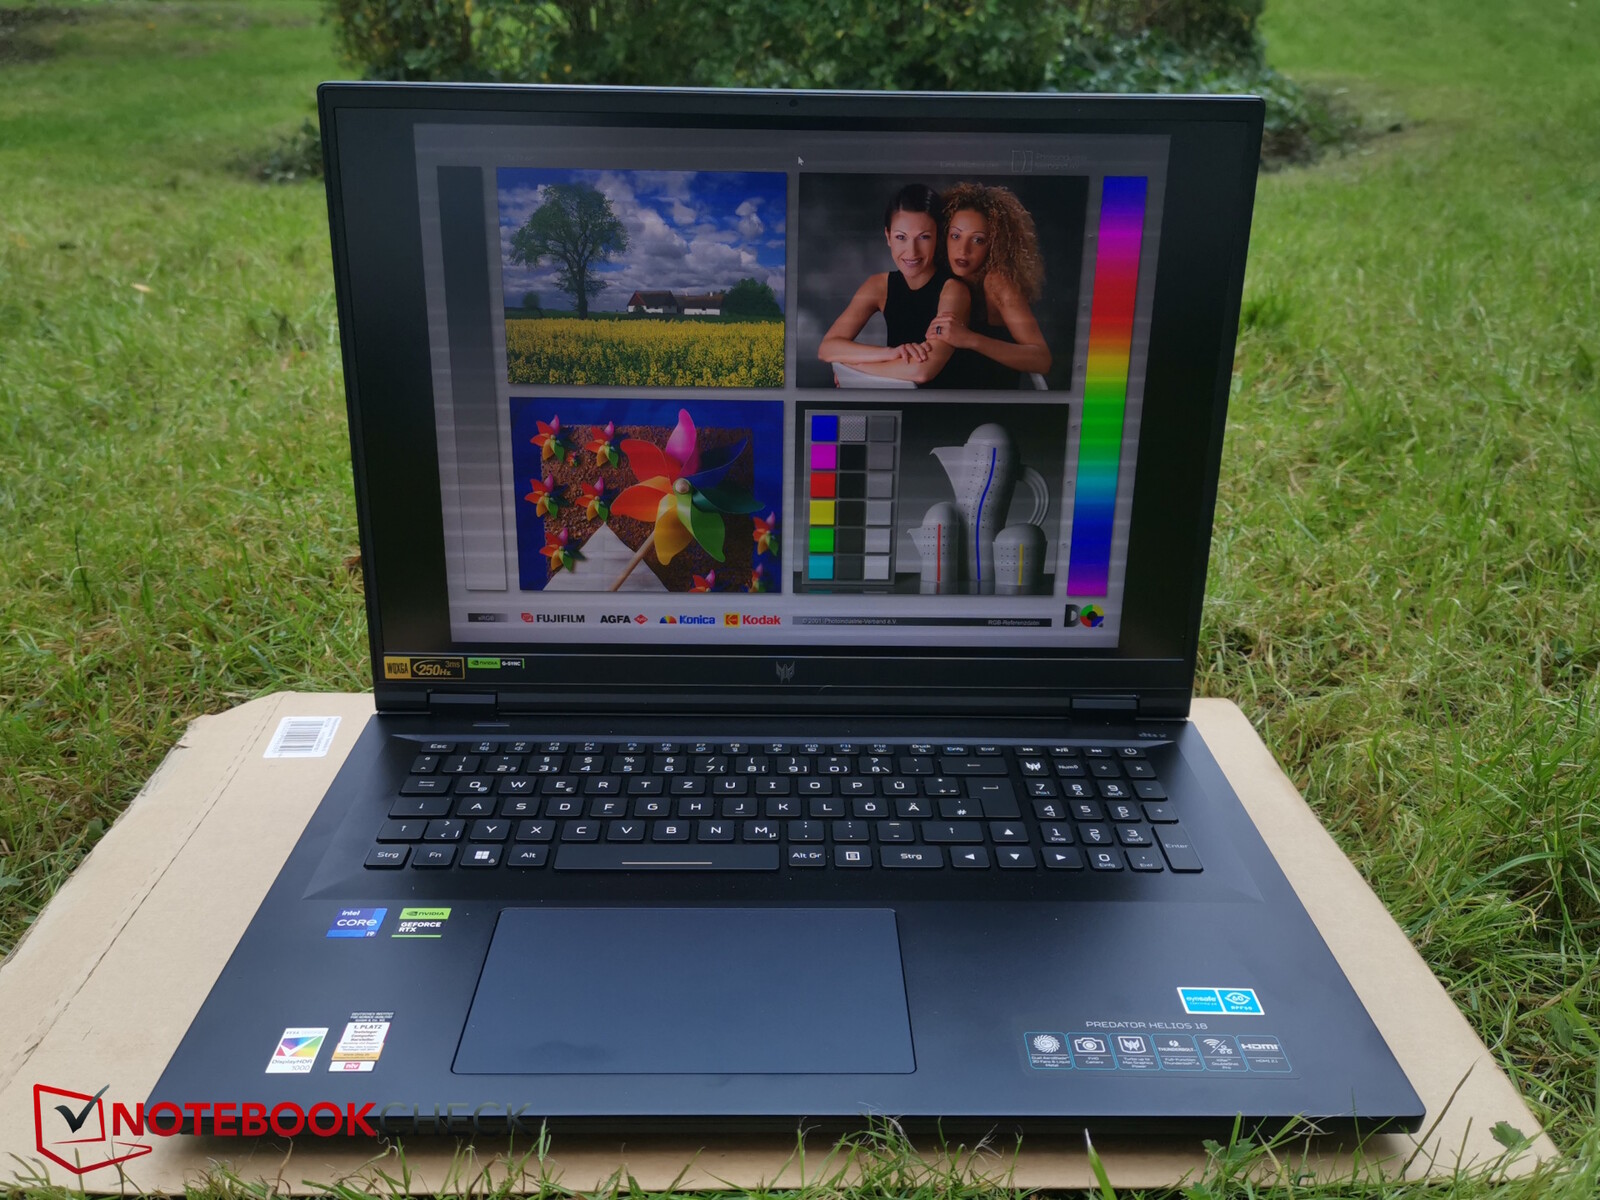
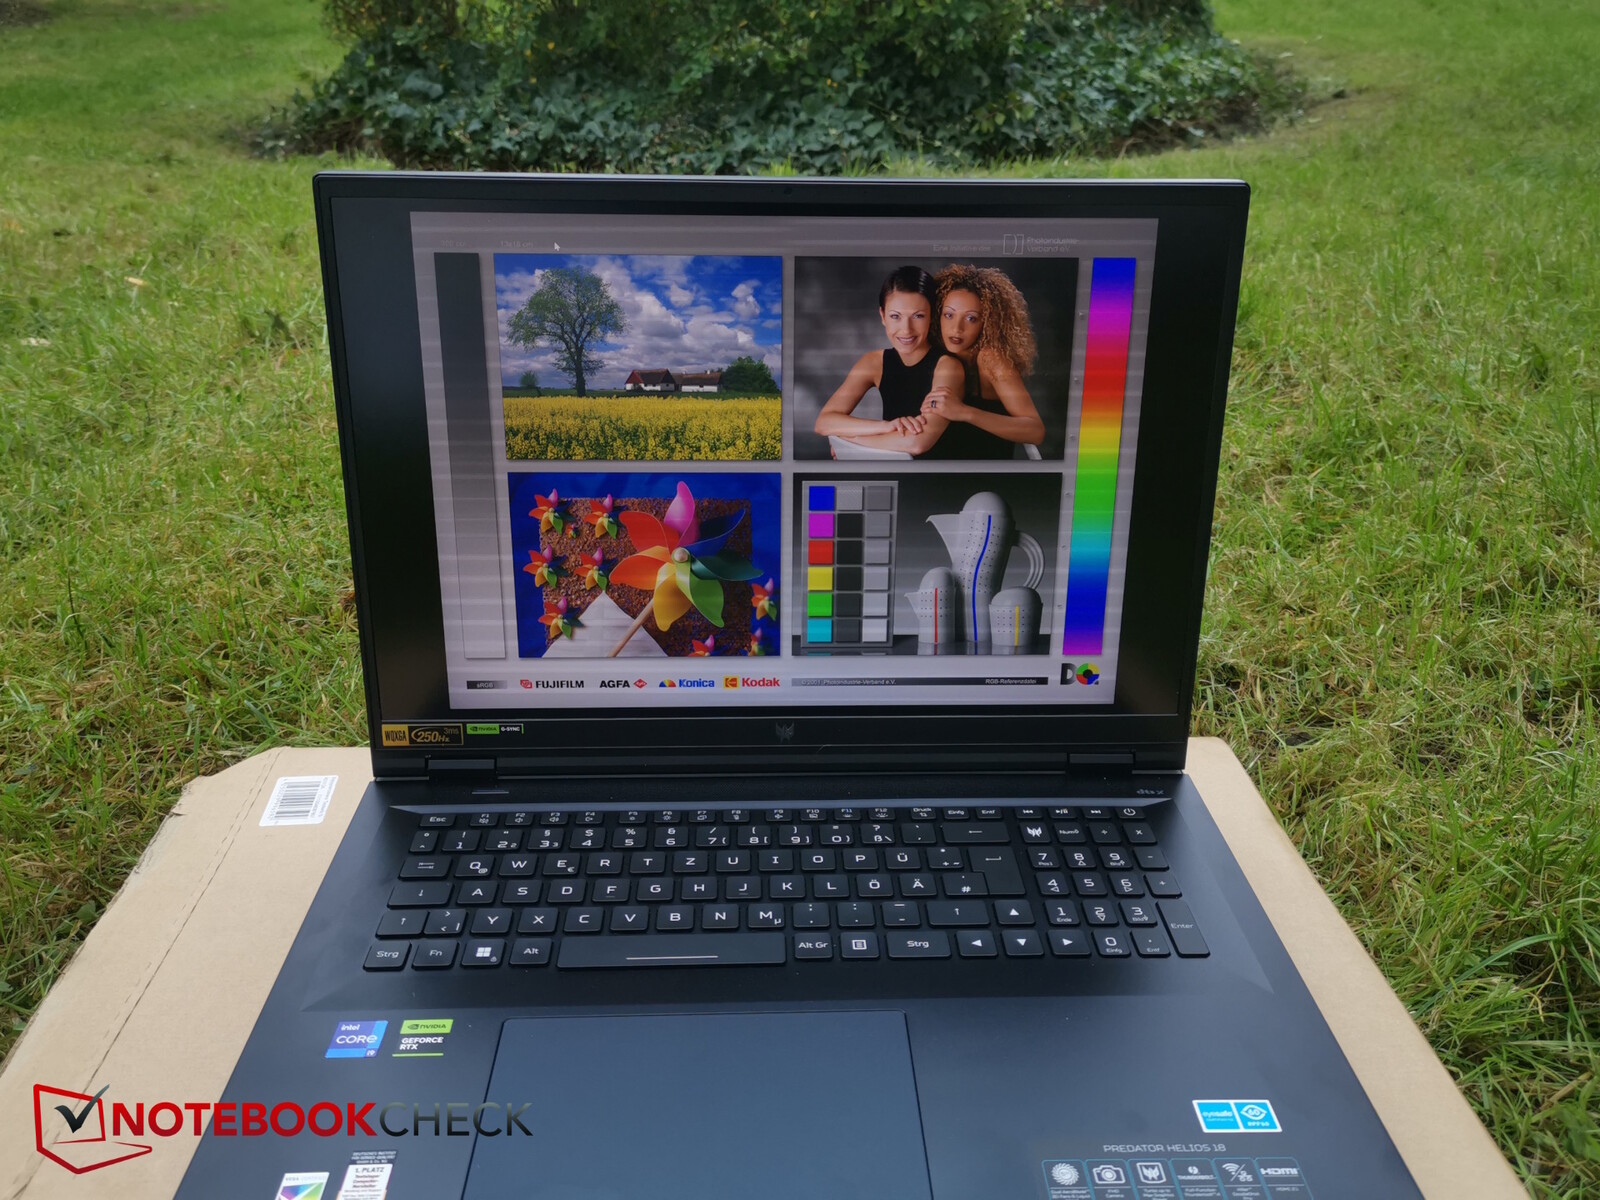
Pantalla - MiniLEDs a más de 1.000 nits
El Helios 18 está disponible opcionalmente con la fantástica pantalla MiniLED a 250 Hz, que también está instalada en nuestro aparato de pruebas. Aquí no se aprecian halos, el negro es rico sin molestos artefactos luminosos y el contraste es correspondientemente bueno.
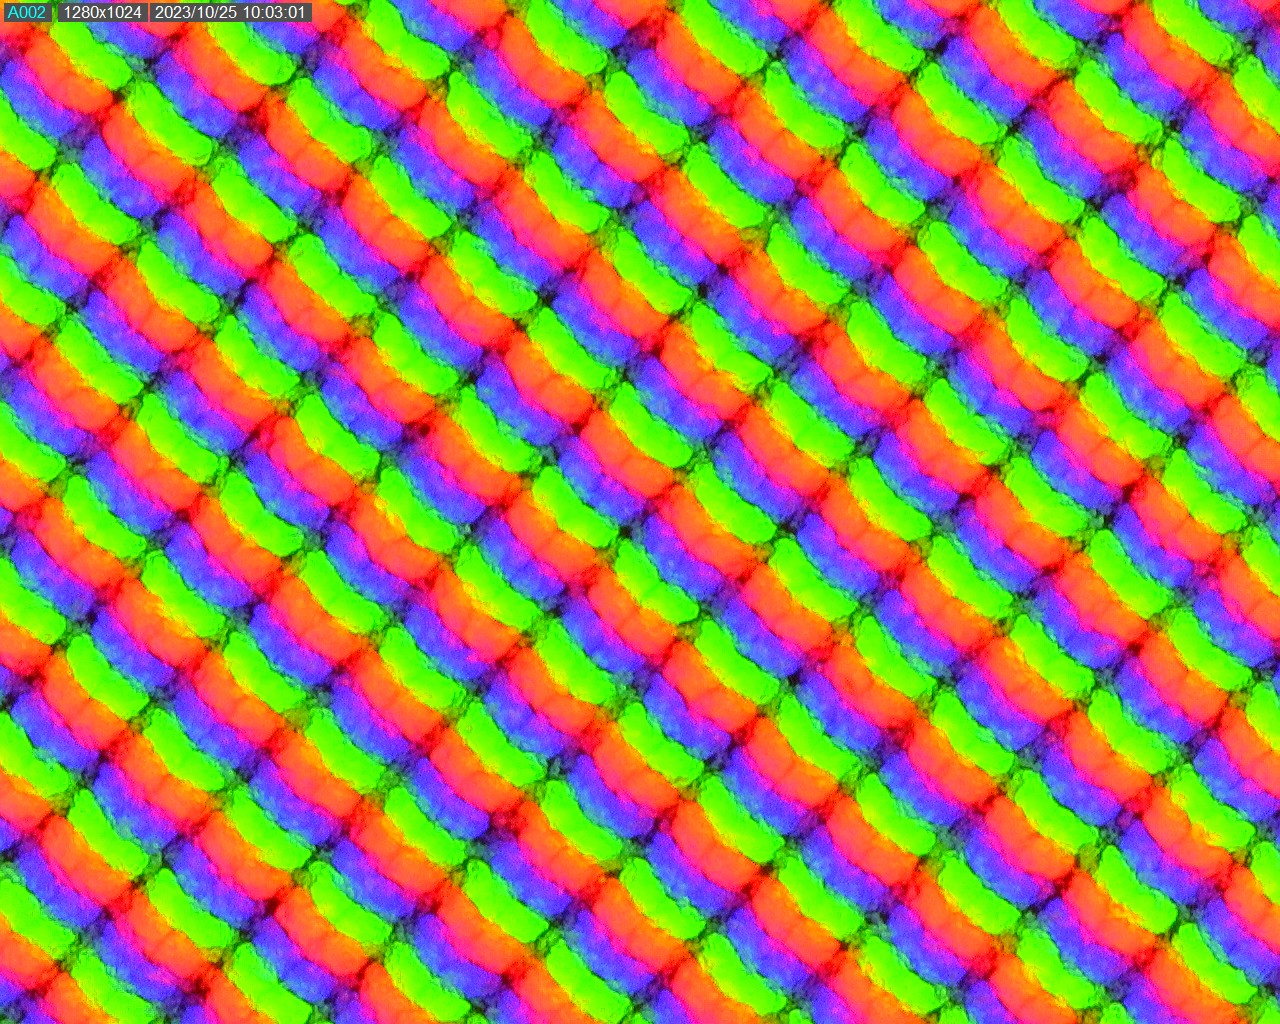
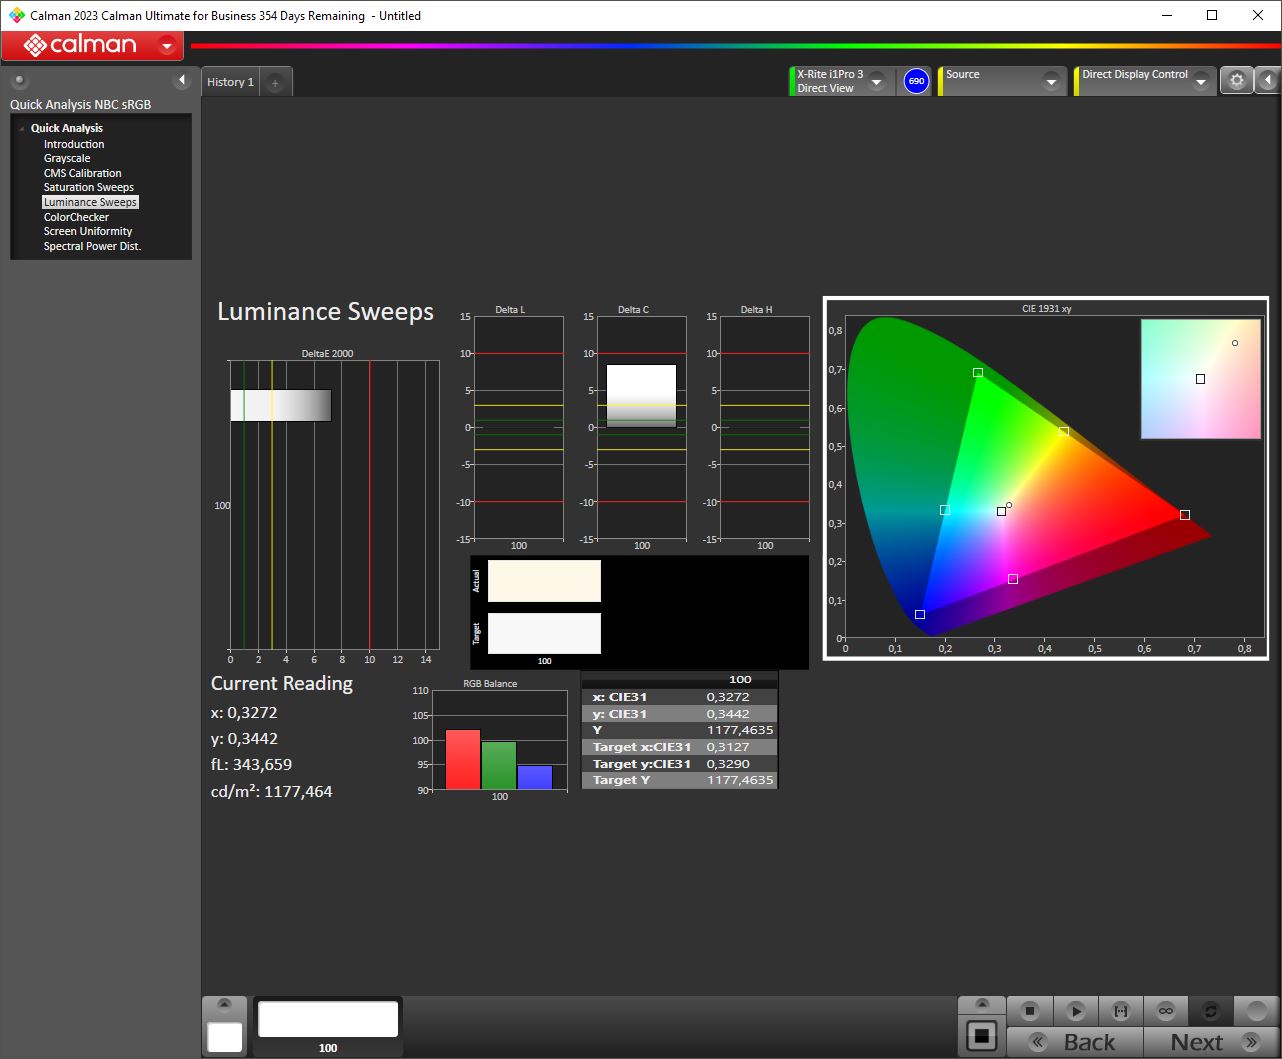
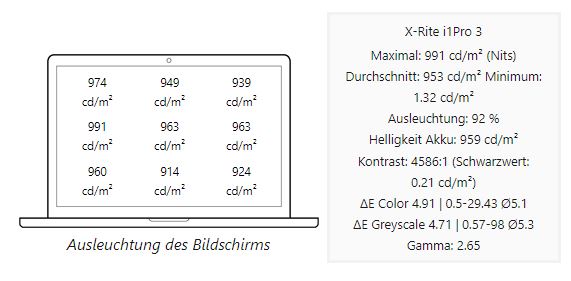
En el modo SDR normal, el panel de AU Optronics alcanza unos 350 nits. Sin embargo, la pantalla produce aún más brillo en el modo HDR. Aquí, medimos un brillo máximo de ¡más de 1.100 nits! La iluminación es de un muy buen 92% en ambos casos.
Iluminación en modo HDR
Illumination in SDR mode
| |||||||||||||||||||||||||
iluminación: 92 %
Brillo con batería: 359 cd/m²
Contraste: 1714:1 (Negro: 0.21 cd/m²)
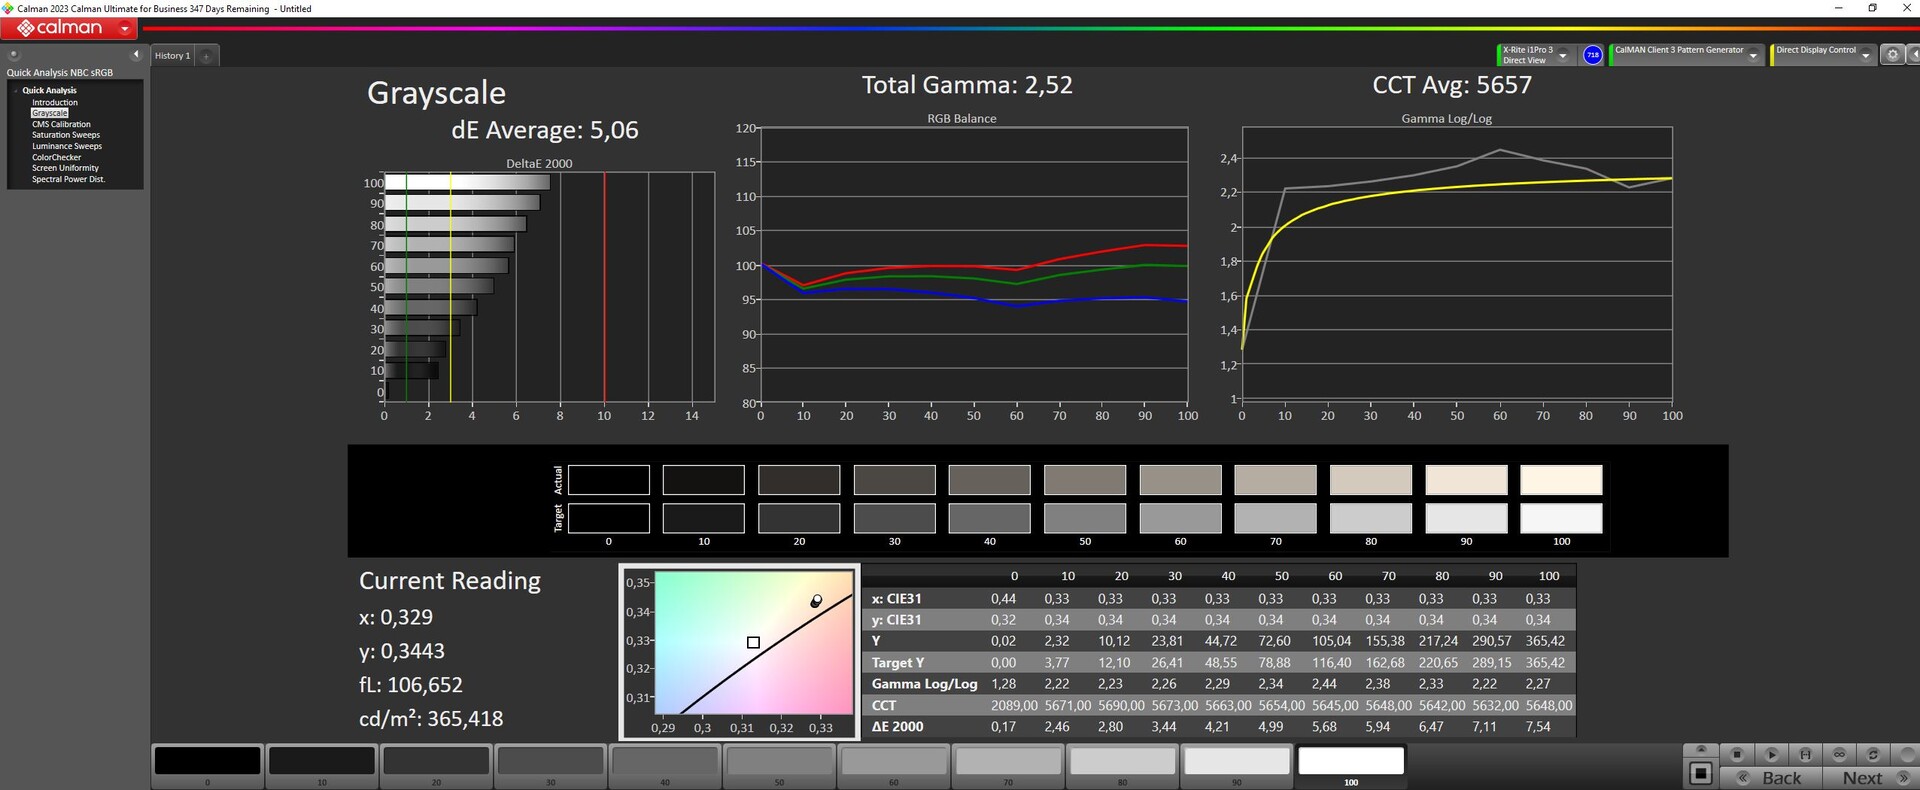
ΔE ColorChecker Calman: 3.82 | ∀{0.5-29.43 Ø4.71}
calibrated: 2.24
ΔE Greyscale Calman: 5.06 | ∀{0.09-98 Ø4.96}
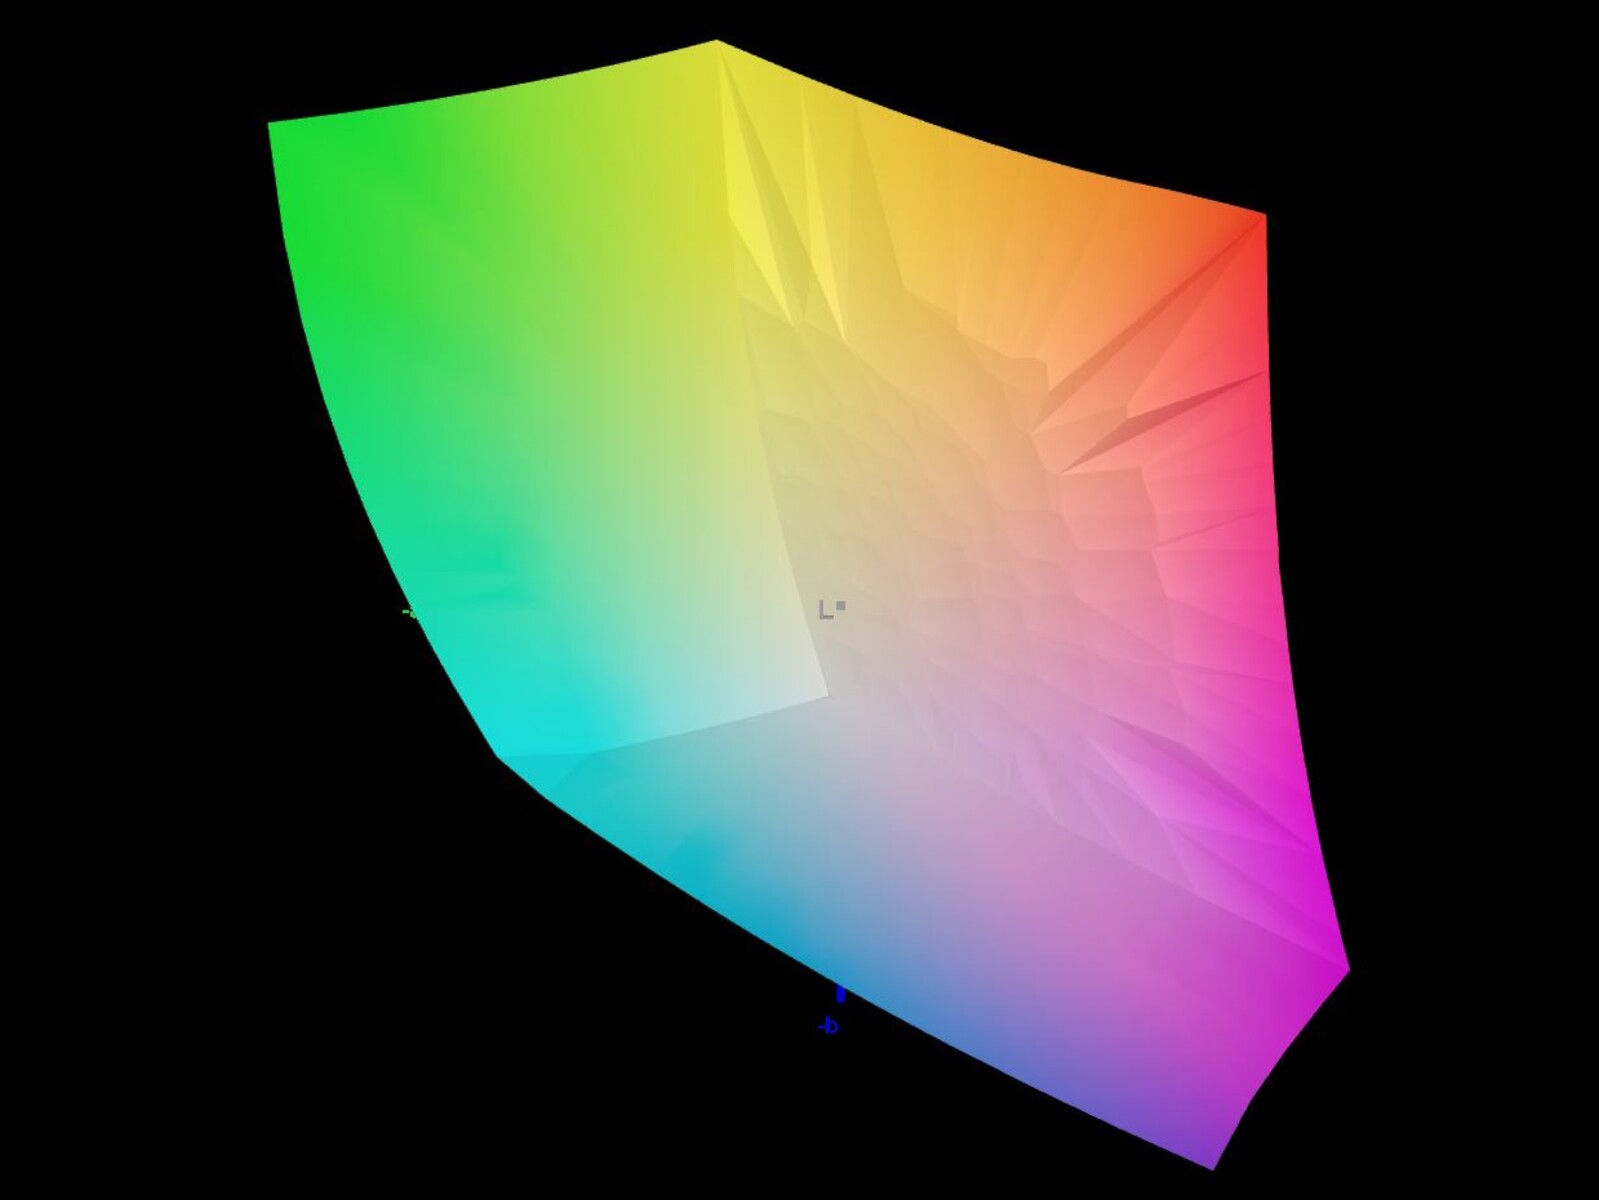
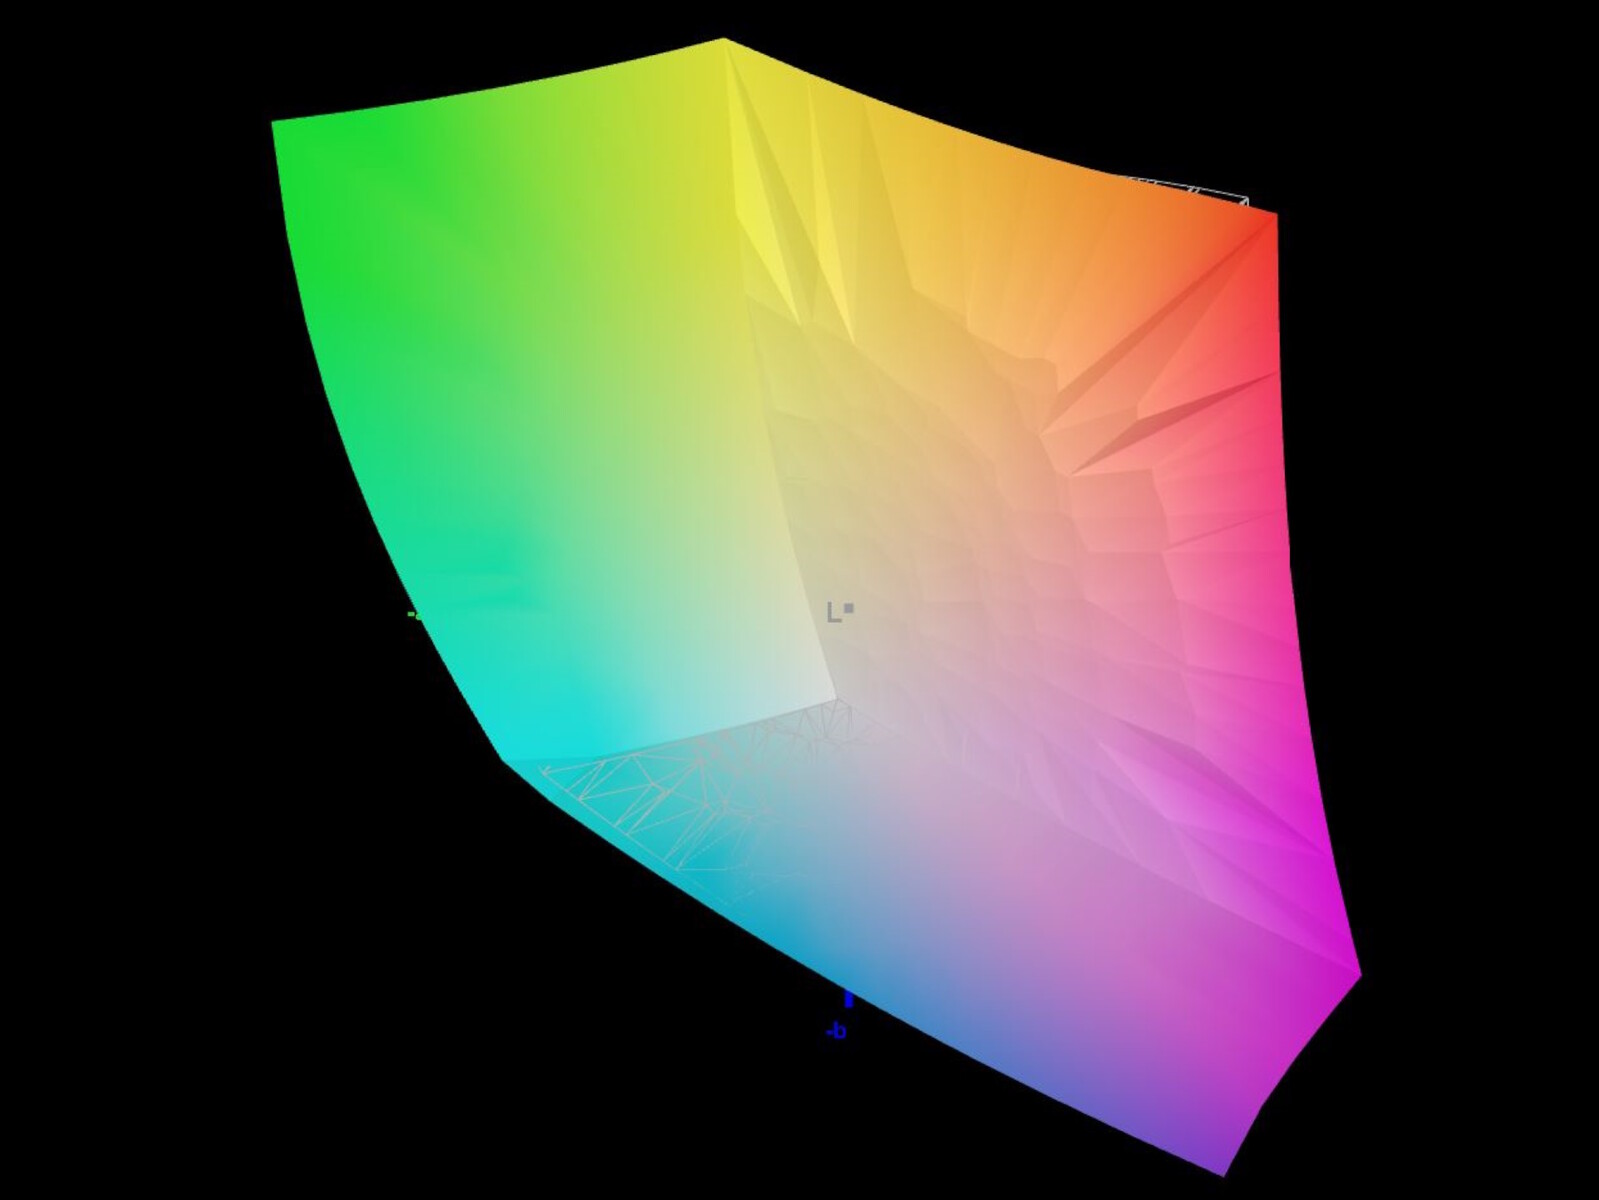
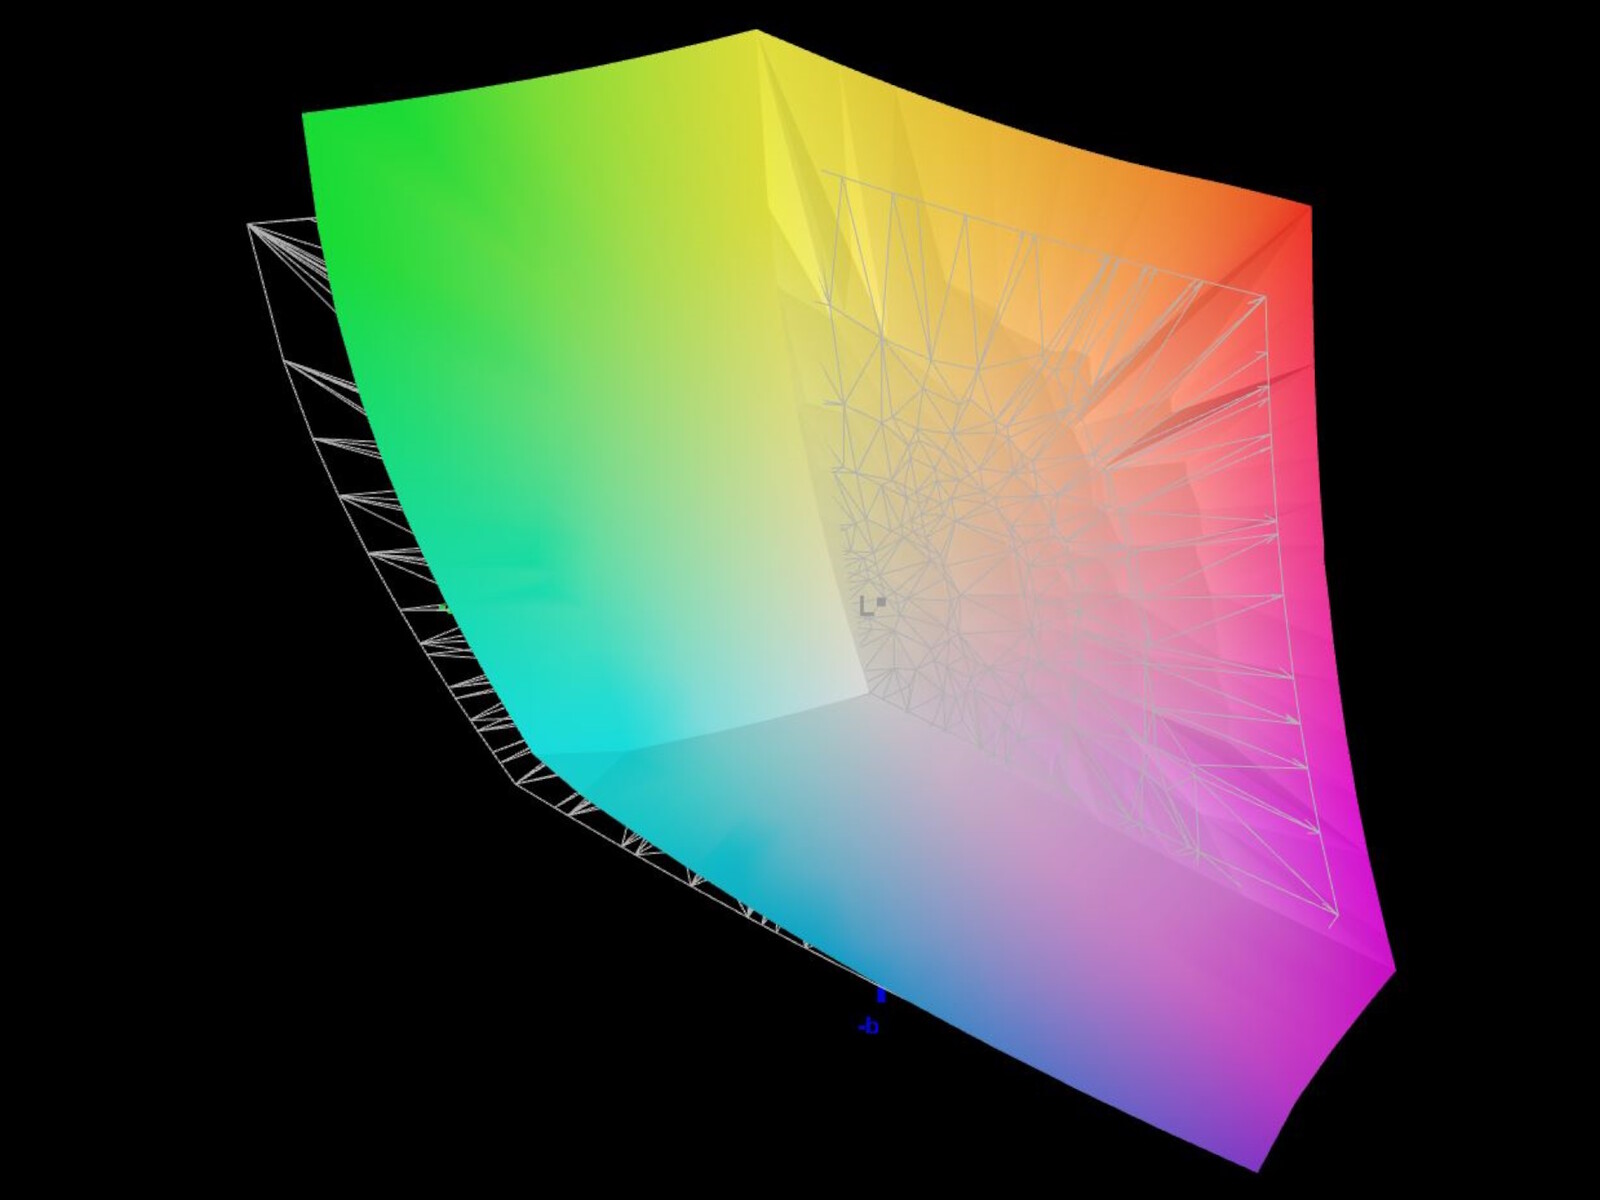
91.8% AdobeRGB 1998 (Argyll 3D)
100% sRGB (Argyll 3D)
99.8% Display P3 (Argyll 3D)
Gamma: 2.52
CCT: 5657 K
| Acer Predator Helios 18 N23Q2 AUO45A8 (B180QAN01.2), IPS, 2560x1600, 18" | MSI GE78HX 13VH-070US AU Optronics B170QAN01.2, IPS, 2560x1600, 17" | HP Omen 17-ck2097ng BOE BOE09BF, IPS, 2560x1440, 17.3" | Alienware m18 R1 Chi Mei 180JME, IPS, 1920x1200, 18" | Asus ROG Strix G18 G814JI NE180QDM-NZ2 (BOE0B35), IPS, 2560x1600, 18" | Razer Blade 18 RTX 4070 AU Optronics B180QAN01.0, IPS, 2560x1600, 18" | |
|---|---|---|---|---|---|---|
| Display | -3% | -19% | -1% | -3% | -3% | |
| Display P3 Coverage (%) | 99.8 | 97.6 -2% | 67.4 -32% | 97.7 -2% | 98.1 -2% | 96.9 -3% |
| sRGB Coverage (%) | 100 | 99.9 0% | 97.6 -2% | 100 0% | 99.9 0% | 99.8 0% |
| AdobeRGB 1998 Coverage (%) | 91.8 | 86.5 -6% | 69.6 -24% | 89.8 -2% | 85.6 -7% | 85.3 -7% |
| Response Times | 55% | -28% | 53% | 38% | 50% | |
| Response Time Grey 50% / Grey 80% * (ms) | 7.6 ? | 4.2 ? 45% | 15.6 ? -105% | 3 ? 61% | 5.6 ? 26% | 4.2 ? 45% |
| Response Time Black / White * (ms) | 17.8 ? | 6.4 ? 64% | 8.9 ? 50% | 9.9 ? 44% | 9 ? 49% | 8 ? 55% |
| PWM Frequency (Hz) | 2509 | |||||
| Screen | -17% | 13% | 20% | 8% | -3% | |
| Brightness middle (cd/m²) | 360 | 398.6 11% | 371 3% | 372.8 4% | 471 31% | 549.6 53% |
| Brightness (cd/m²) | 355 | 384 8% | 350 -1% | 367 3% | 422 19% | 524 48% |
| Brightness Distribution (%) | 92 | 89 -3% | 90 -2% | 97 5% | 83 -10% | 89 -3% |
| Black Level * (cd/m²) | 0.21 | 0.46 -119% | 0.32 -52% | 0.32 -52% | 0.47 -124% | 0.53 -152% |
| Contrast (:1) | 1714 | 867 -49% | 1159 -32% | 1165 -32% | 1002 -42% | 1037 -39% |
| Colorchecker dE 2000 * | 3.82 | 4.05 -6% | 1.74 54% | 1.92 50% | 2.05 46% | 3.32 13% |
| Colorchecker dE 2000 max. * | 7.38 | 8.68 -18% | 3.59 51% | 3.65 51% | 4.15 44% | 6.63 10% |
| Colorchecker dE 2000 calibrated * | 2.24 | 1.02 54% | 1.01 55% | 0.51 77% | 0.8 64% | 2.7 -21% |
| Greyscale dE 2000 * | 5.06 | 6.5 -28% | 2.8 45% | 1.5 70% | 2.8 45% | 2 60% |
| Gamma | 2.52 87% | 2.11 104% | 2.19 100% | 2.34 94% | 2.204 100% | 2.29 96% |
| CCT | 5657 115% | 7518 86% | 6474 100% | 6607 98% | 7122 91% | 6319 103% |
| Media total (Programa/Opciones) | 12% /
-4% | -11% /
1% | 24% /
20% | 14% /
10% | 15% /
4% |
* ... más pequeño es mejor
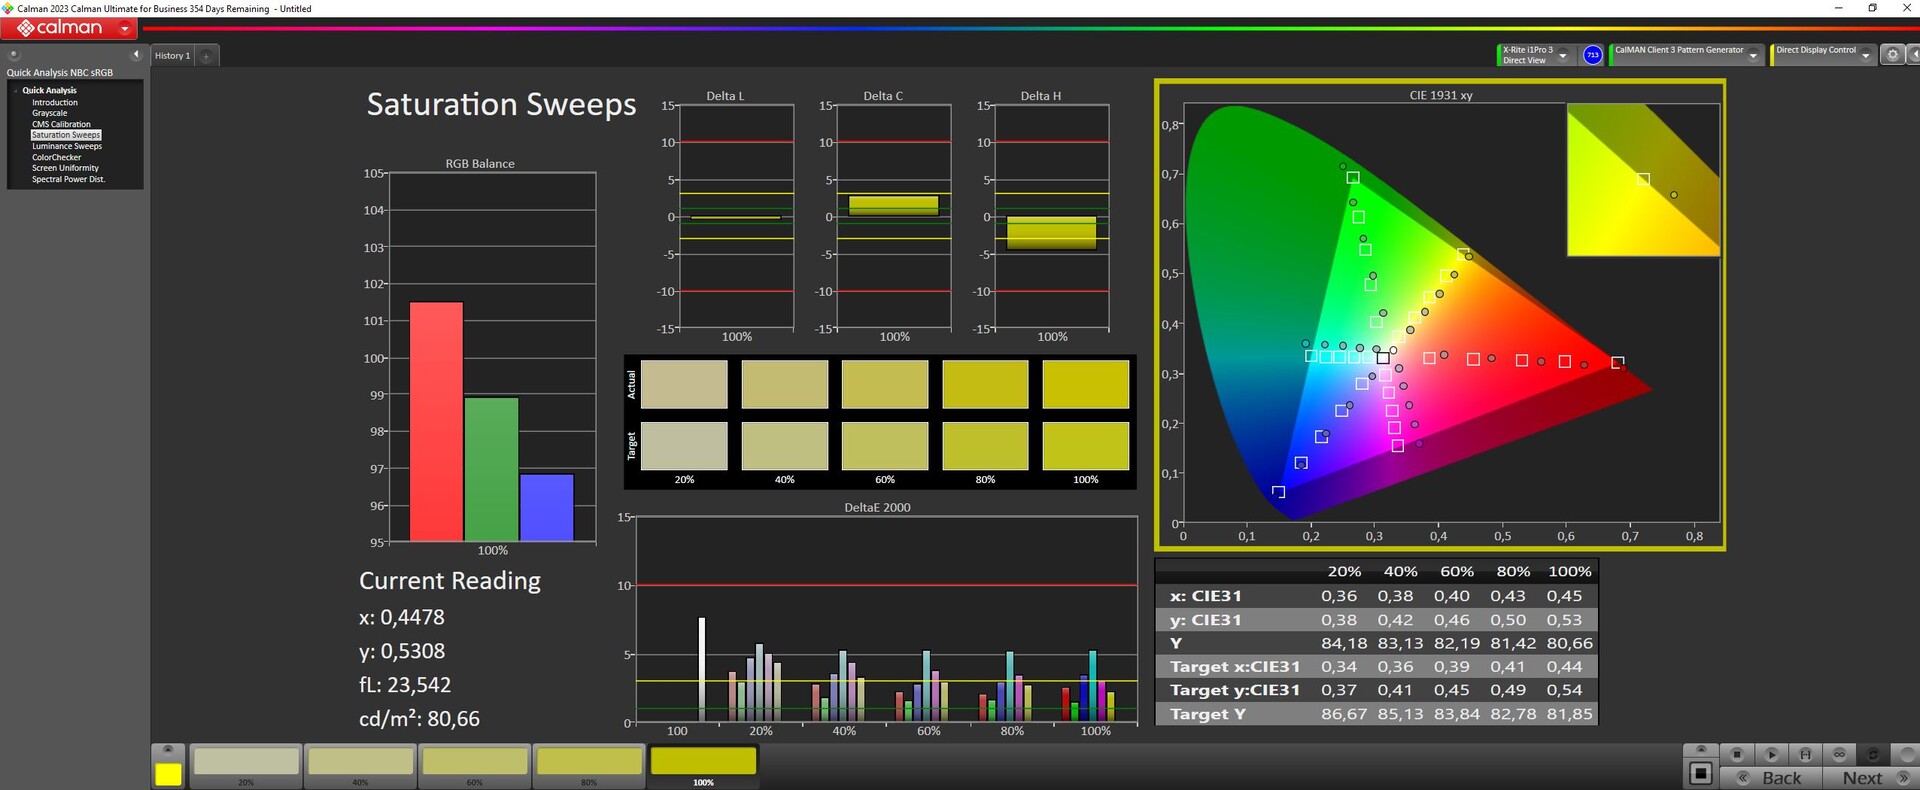
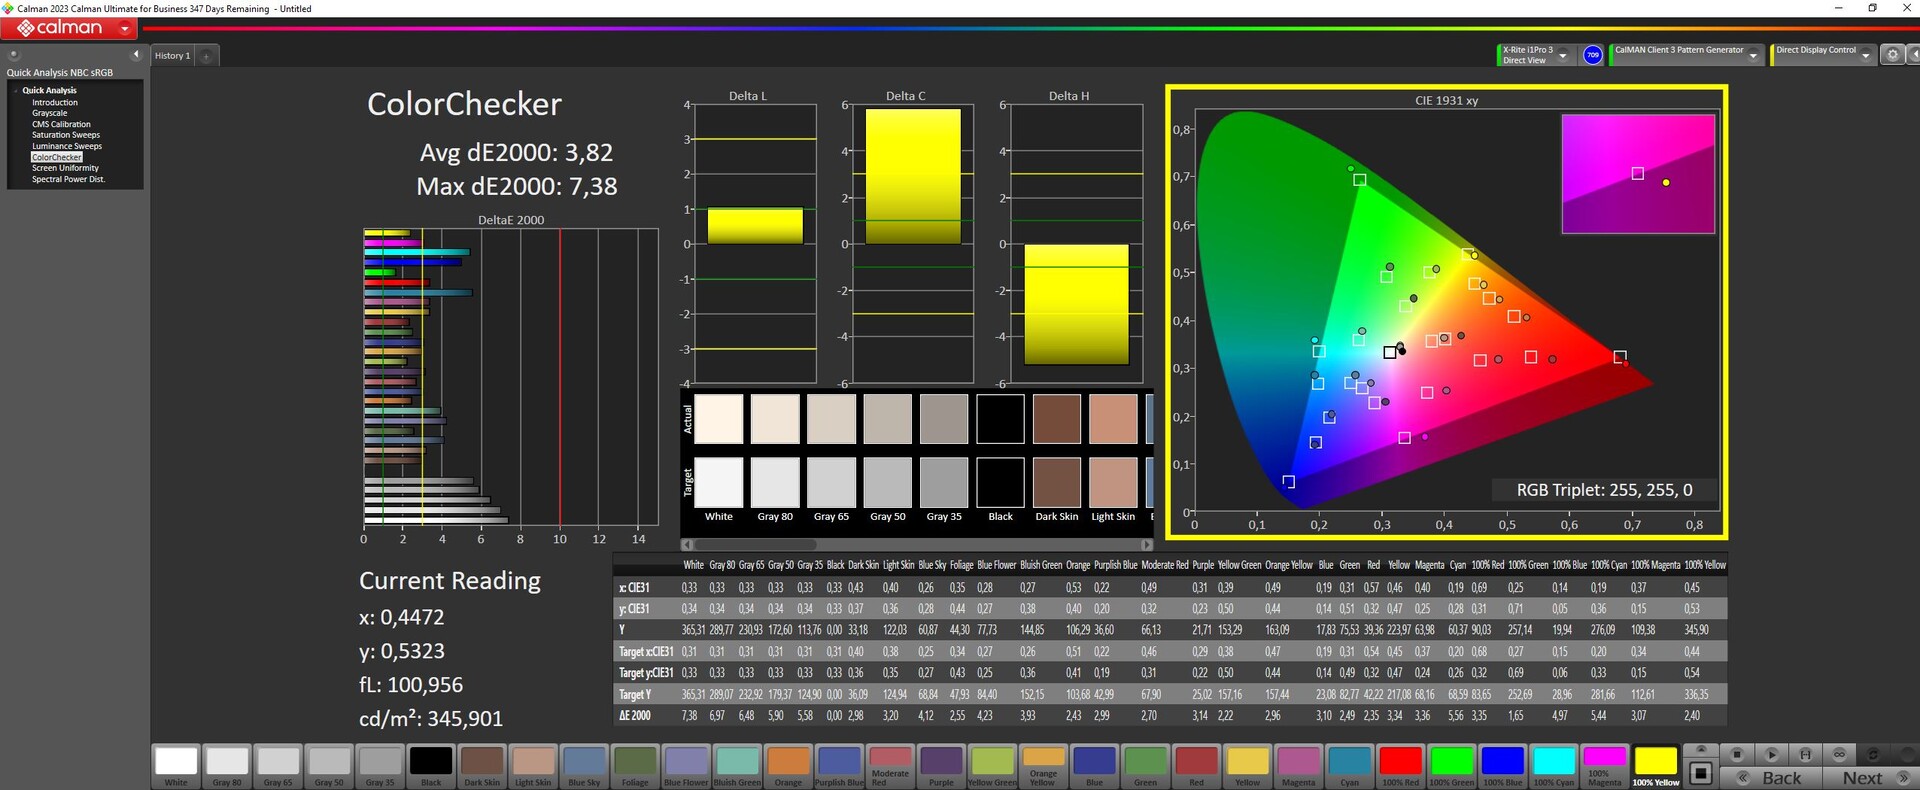
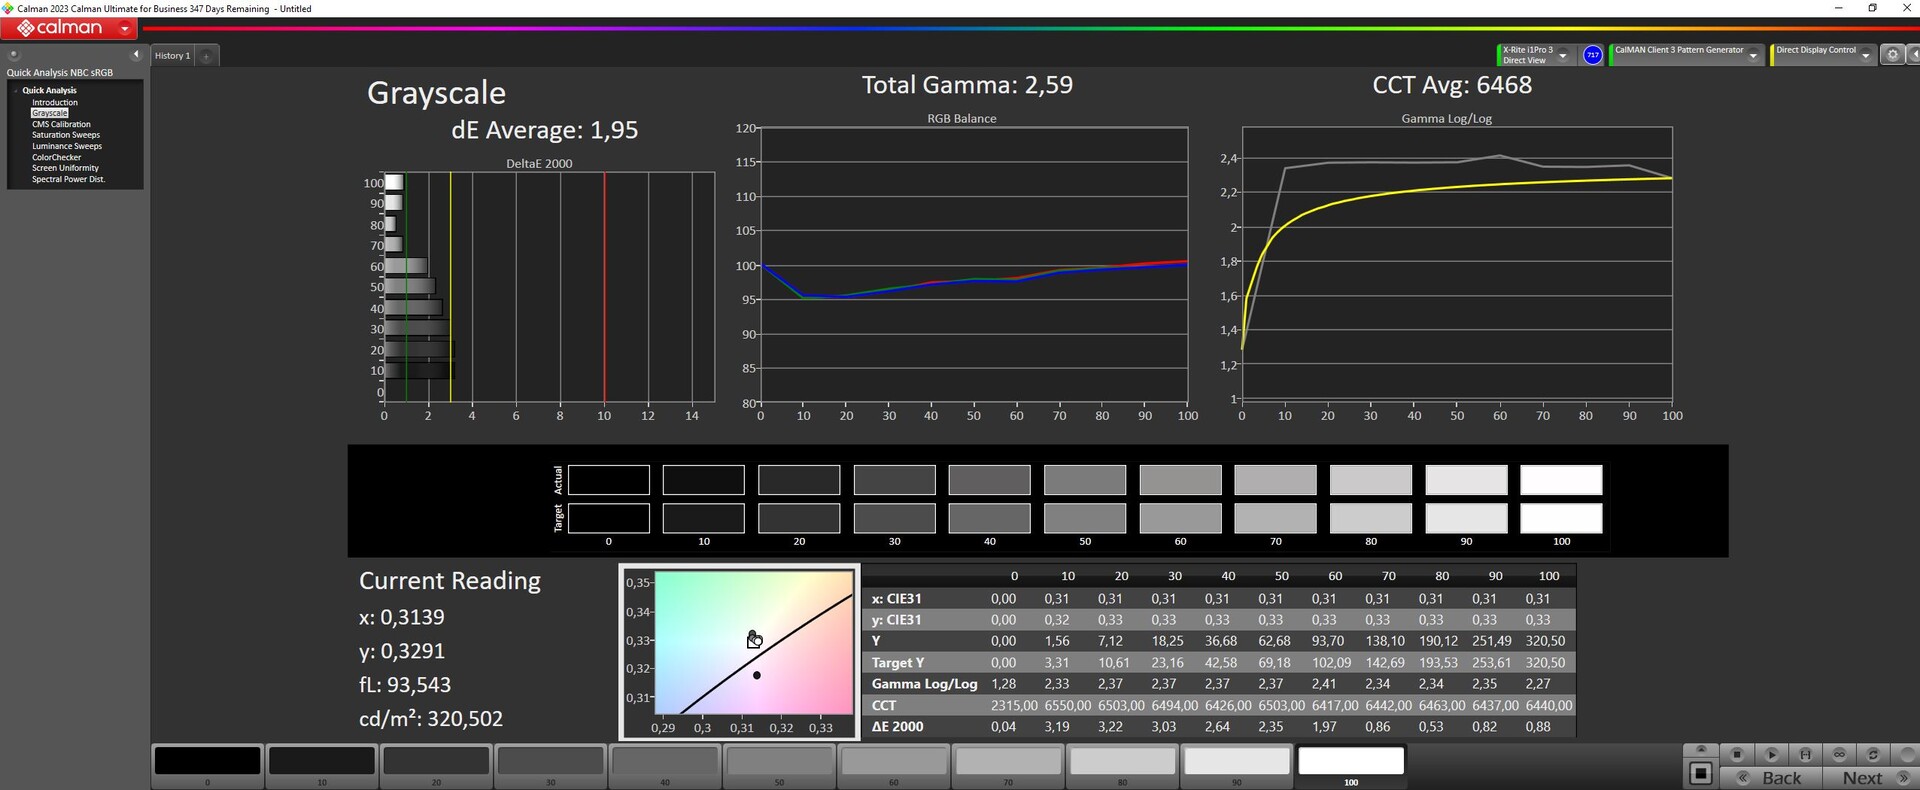
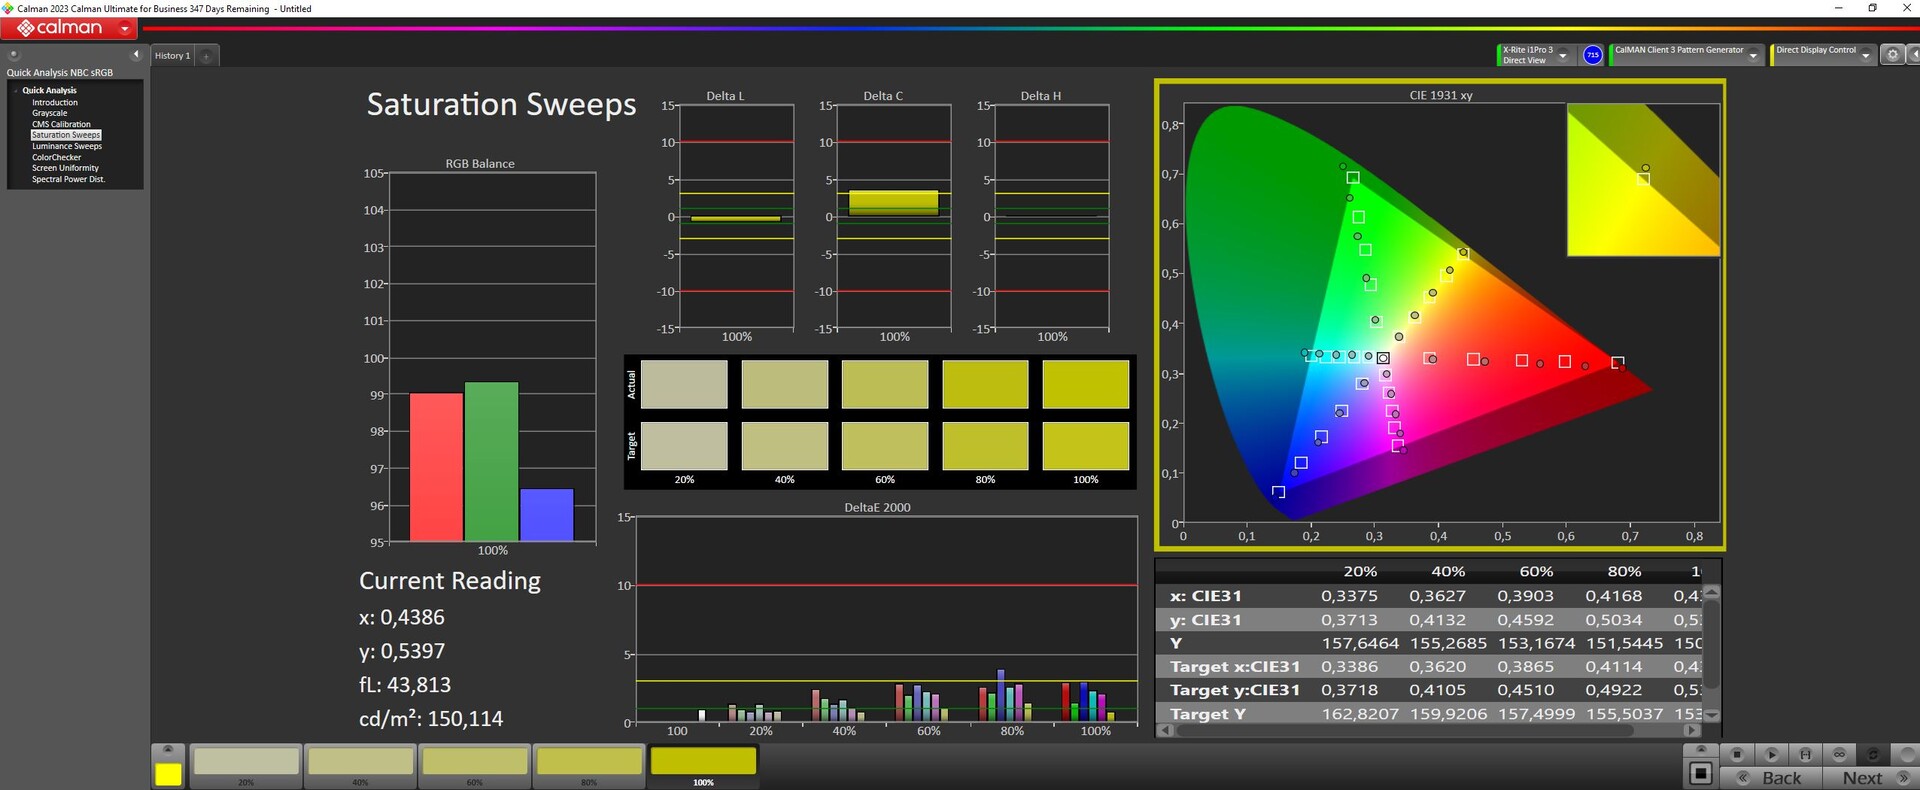
Realizamos la medición con el espacio de color P3. La pantalla cubre sRGB y DisplayP3 casi por completo. AdobeRGB tiene una cobertura del 92%. Gracias a P3 en particular, la pantalla brillante y de alto contraste también es adecuada para la edición de imagen y vídeo.
Sin embargo, nada más sacarla de la caja, la pantalla se dispara por encima del importante valor DeltaE de 3 para los colores y la escala de grises. Nuestra calibración manual mejora las desviaciones de color y empuja los valores DeltaE por debajo del umbral. Bajar el brillo a 160 nits también puede aportar más mejoras. Nuestro archivo icc calibrado puede descargarse gratuitamente más arriba.
Tiempos de respuesta del display
| ↔ Tiempo de respuesta de Negro a Blanco | ||
|---|---|---|
| 17.8 ms ... subida ↗ y bajada ↘ combinada | ↗ 15.6 ms subida | 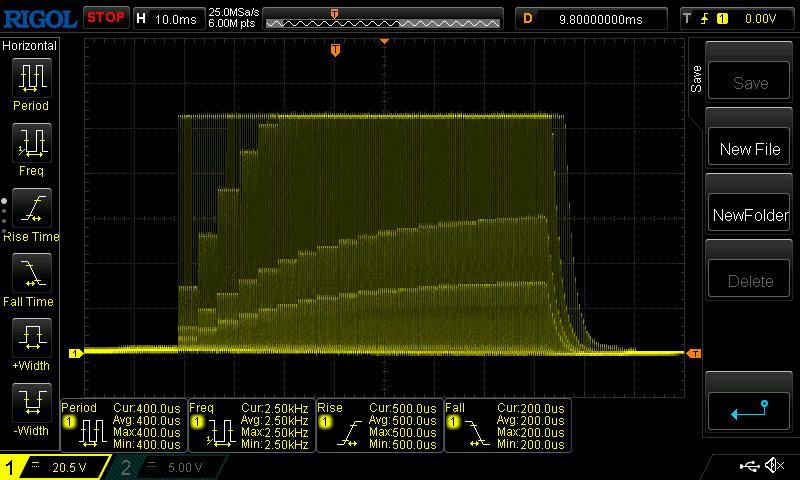 |
| ↘ 2.2 ms bajada | ||
| La pantalla mostró buenos tiempos de respuesta en nuestros tests pero podría ser demasiado lenta para los jugones competitivos. En comparación, todos los dispositivos de prueba van de ##min### (mínimo) a 240 (máximo) ms. » 40 % de todos los dispositivos son mejores. Esto quiere decir que el tiempo de respuesta medido es mejor que la media (19.8 ms) de todos los dispositivos testados. | ||
| ↔ Tiempo de respuesta 50% Gris a 80% Gris | ||
| 7.6 ms ... subida ↗ y bajada ↘ combinada | ↗ 4.4 ms subida | 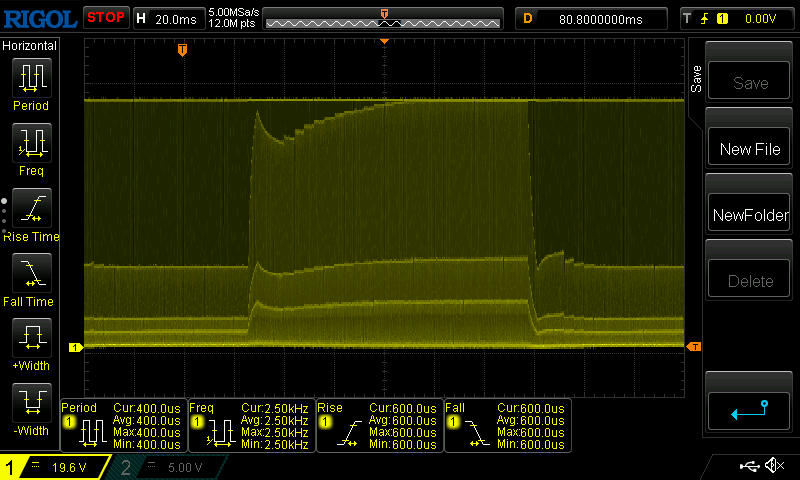 |
| ↘ 3.2 ms bajada | ||
| La pantalla mostró tiempos de respuesta muy rápidos en nuestros tests y debería ser adecuada para juegos frenéticos. En comparación, todos los dispositivos de prueba van de ##min### (mínimo) a 636 (máximo) ms. » 20 % de todos los dispositivos son mejores. Esto quiere decir que el tiempo de respuesta medido es mejor que la media (31 ms) de todos los dispositivos testados. | ||
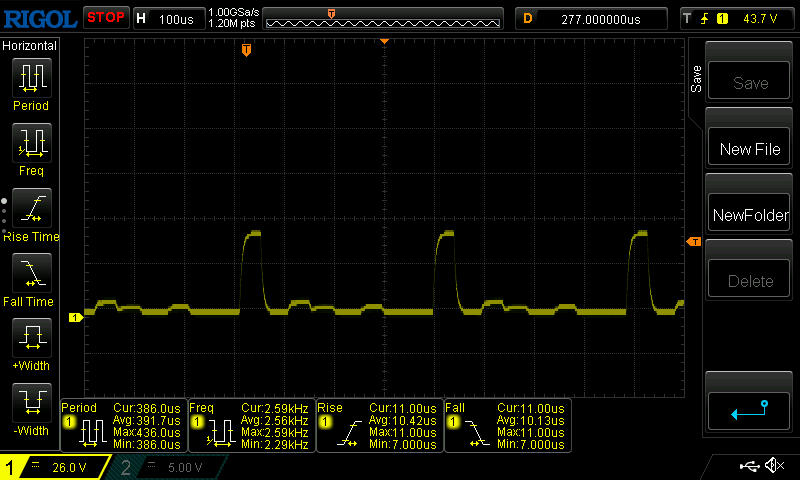
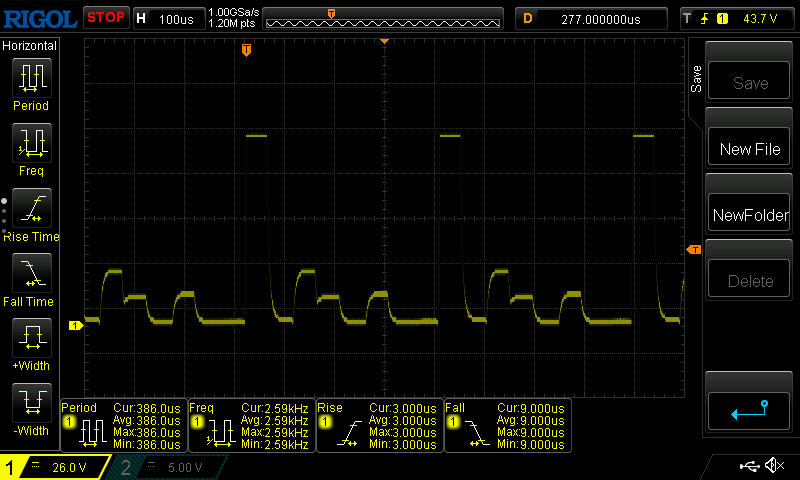
Parpadeo de Pantalla / PWM (Pulse-Width Modulation)
| Parpadeo de Pantalla / PWM detectado | 2509 Hz | 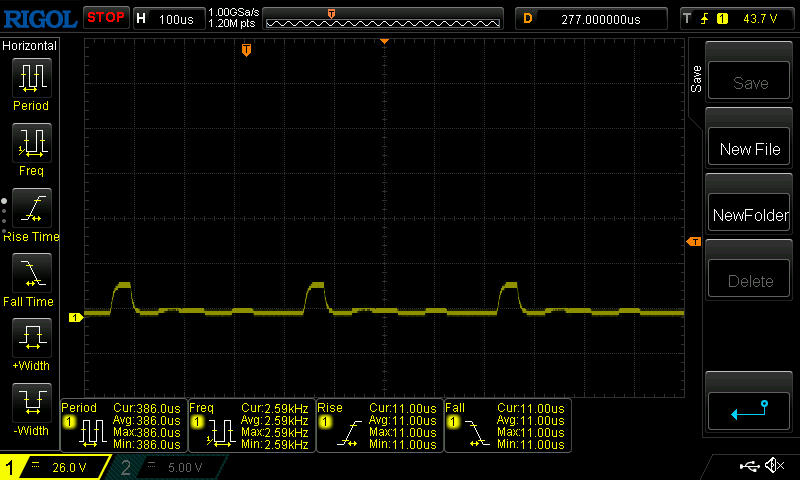 | |
La retroiluminación del display parpadea a 2509 Hz (seguramente usa PWM - Pulse-Width Modulation) . La frecuencia de 2509 Hz es bastante alta, por lo que la mayoría de gente sensible al parpadeo no debería ver parpadeo o tener fatiga visual. Comparación: 52 % de todos los dispositivos testados no usaron PWM para atenuar el display. Si se usó, medimos una media de 7757 (mínimo: 5 - máxmo: 343500) Hz. | |||
El PWM se utiliza para controlar el brillo de la pantalla. Con el brillo al mínimo, la frecuencia es más baja, en torno a los 2,5 kHz, pero lo suficientemente alta como para no causar problemas a las personas sensibles.
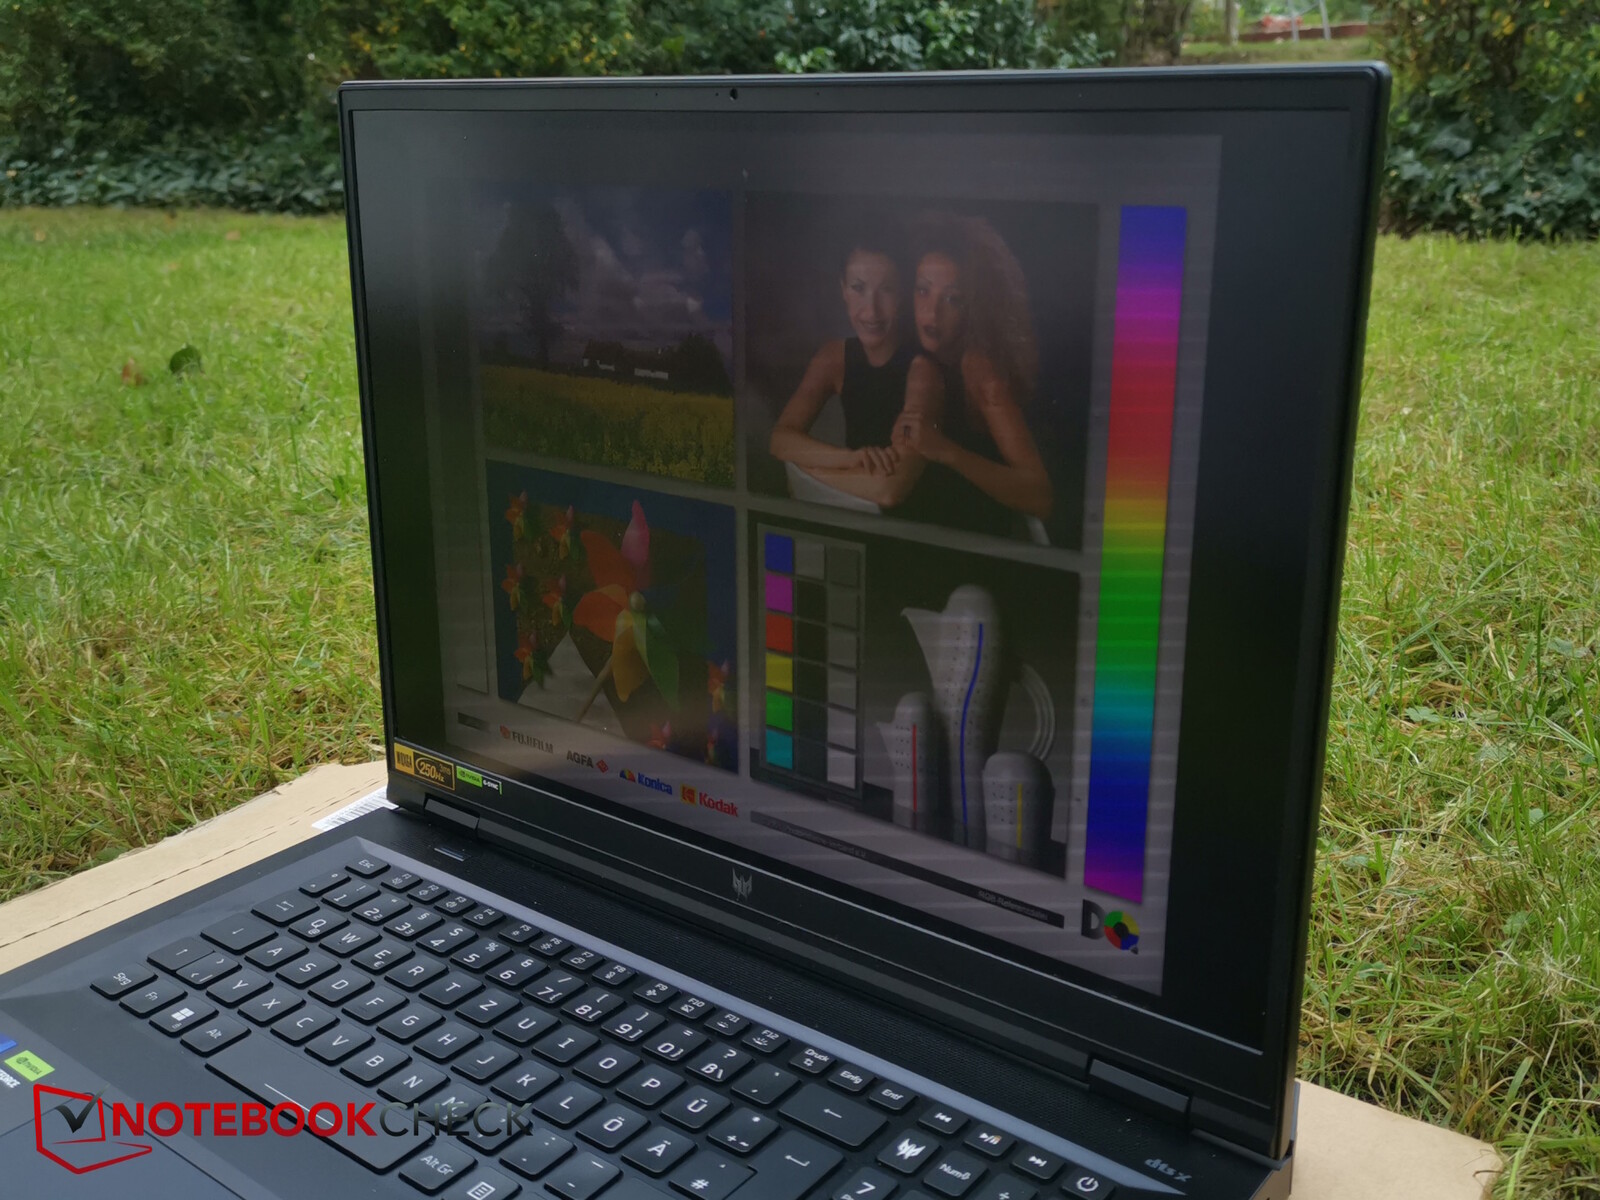
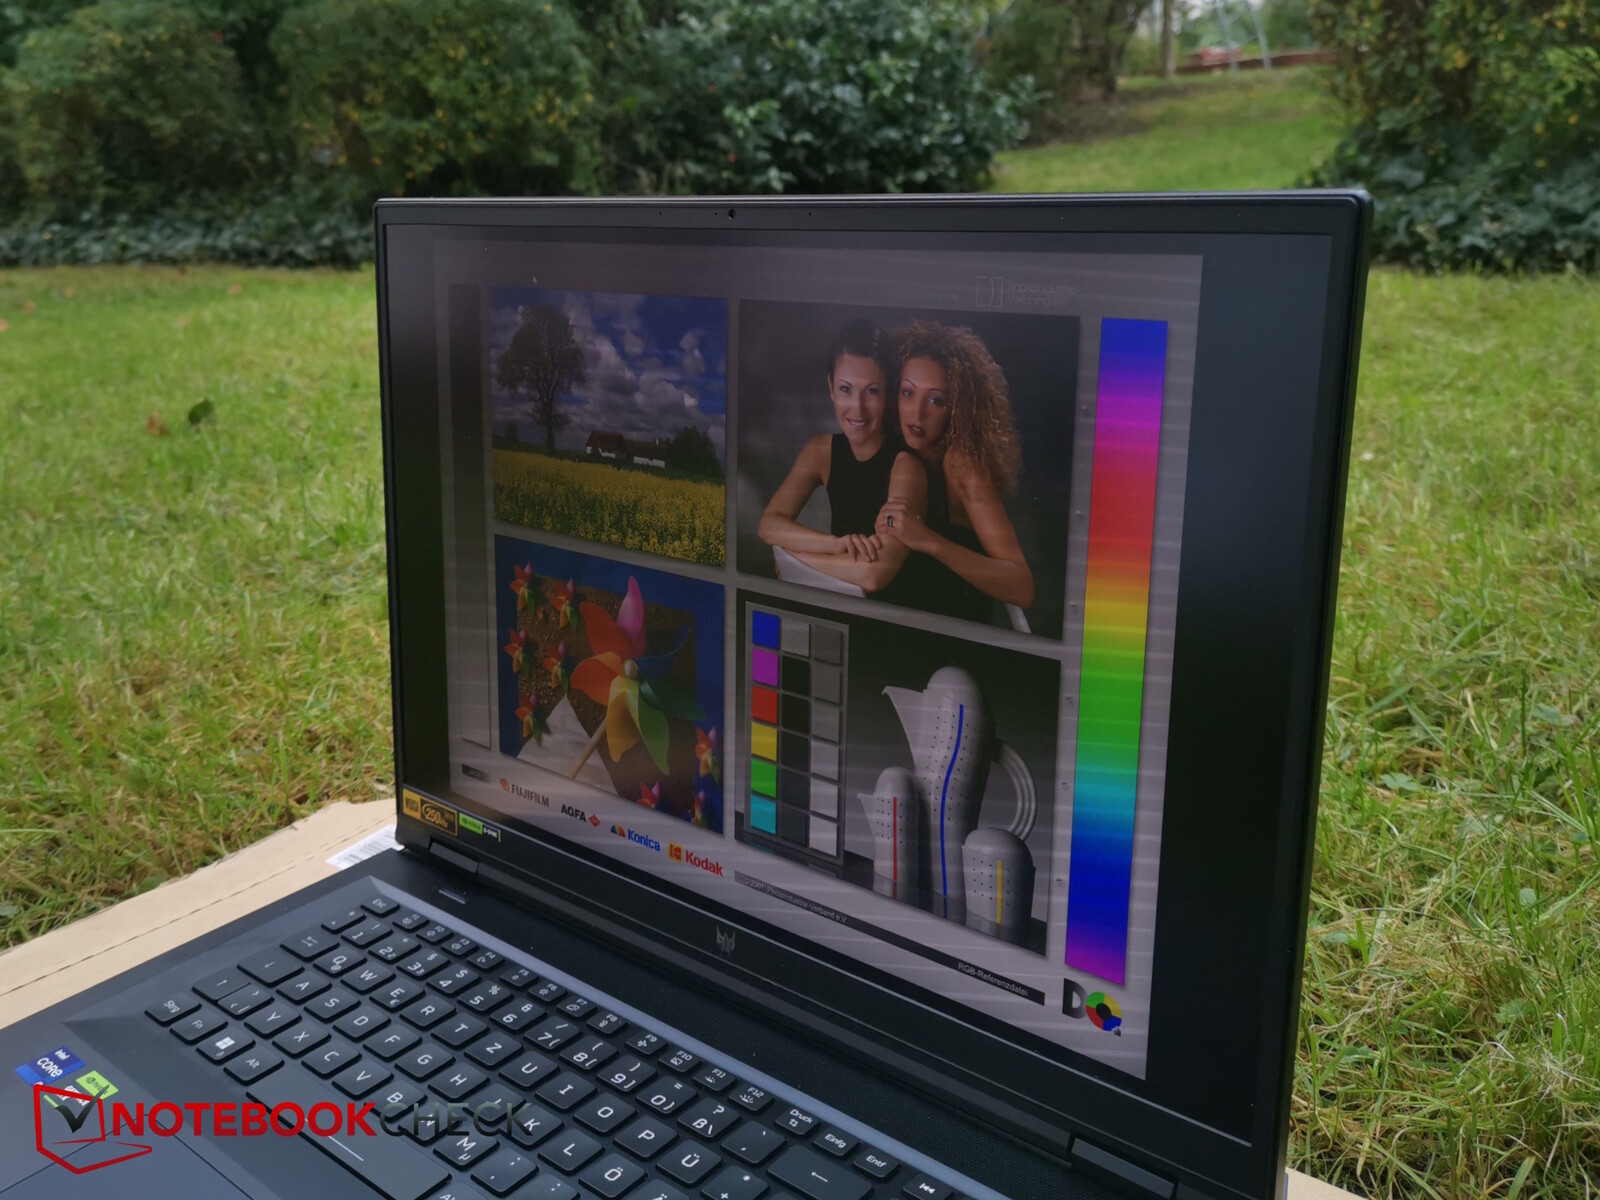
En exteriores, puede merecer la pena ajustar la pantalla a HDR para hacerla aún más brillante. En la sombra, los contenidos se siguen viendo muy bien.

Rendimiento - CPU HX y RTX 4080
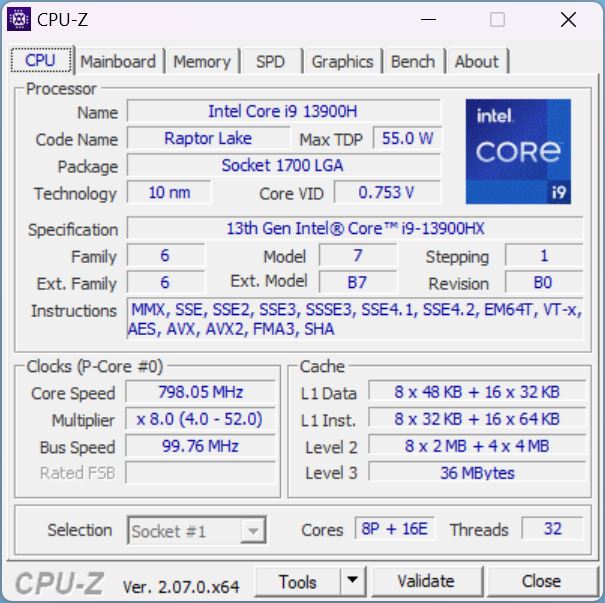
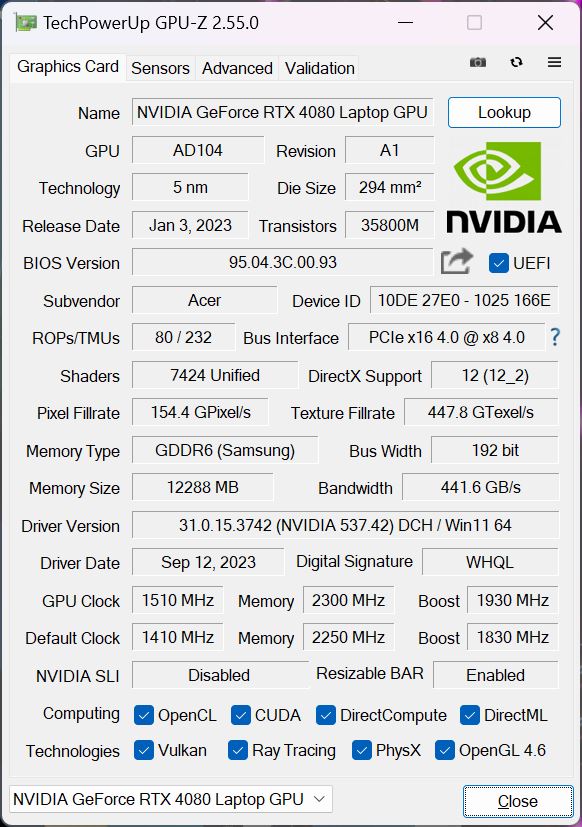
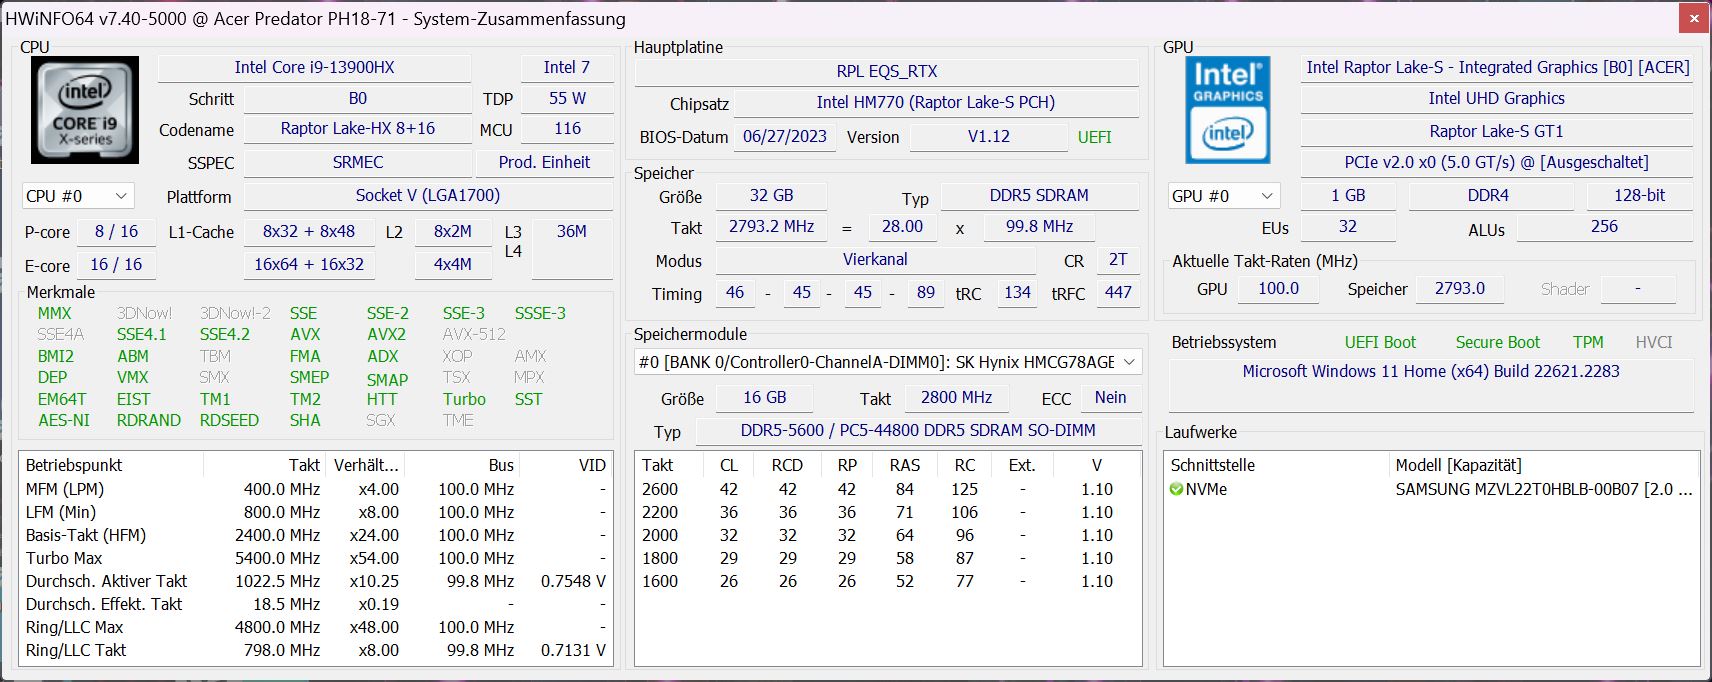
Equipado con un Intel Core i9-13900HX y una GeForce GPU RTX 4080 para portátiles, más 32 GB de RAM y una pantalla MiniLED de 18 pulgadas, tenemos un sustituto de sobremesa extremadamente potente y un gamer de gama alta que debería renderizar todos los juegos actuales con fluidez, incluso en la resolución nativa WQXGA.
Gracias a la buena pantalla, el portátil también puede servir como estación de trabajo para creativos.
Condiciones de prueba
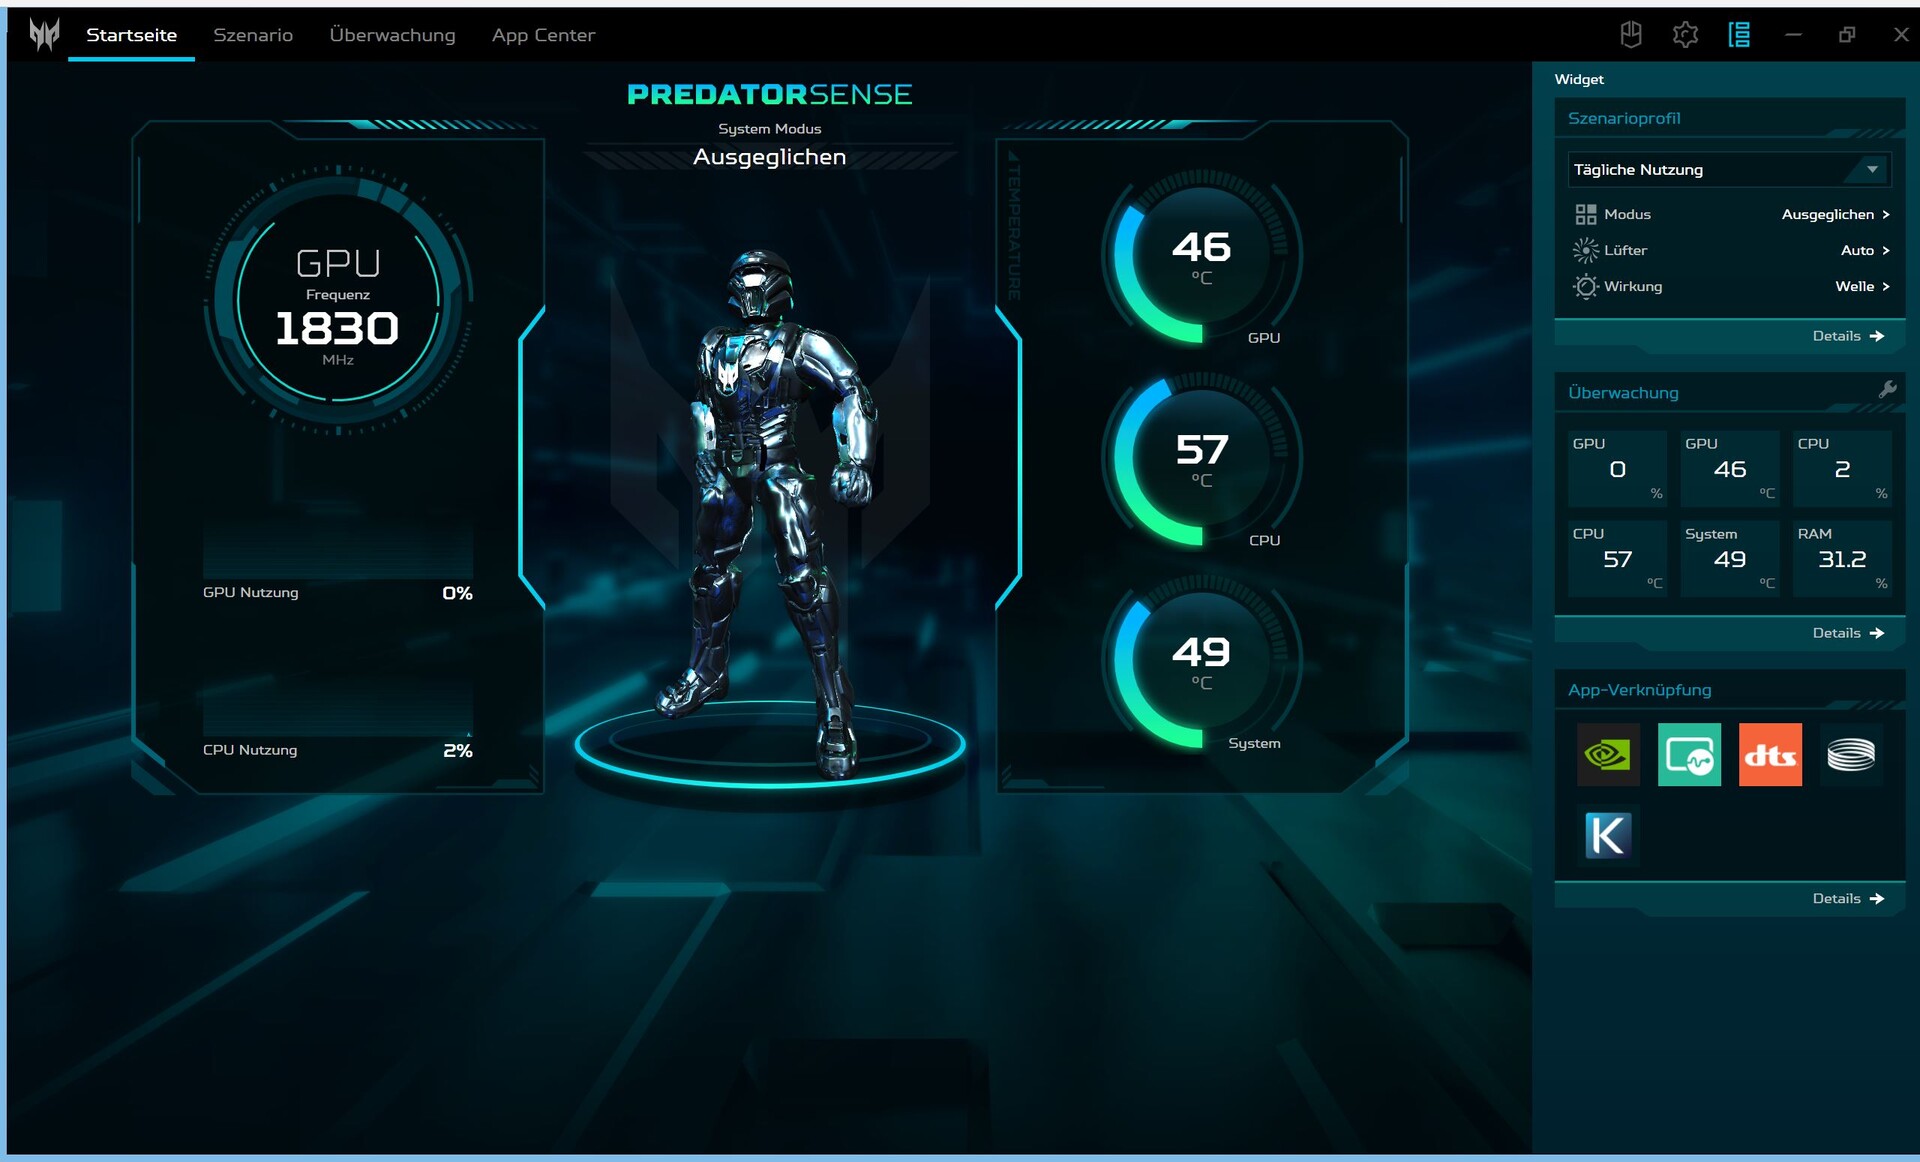
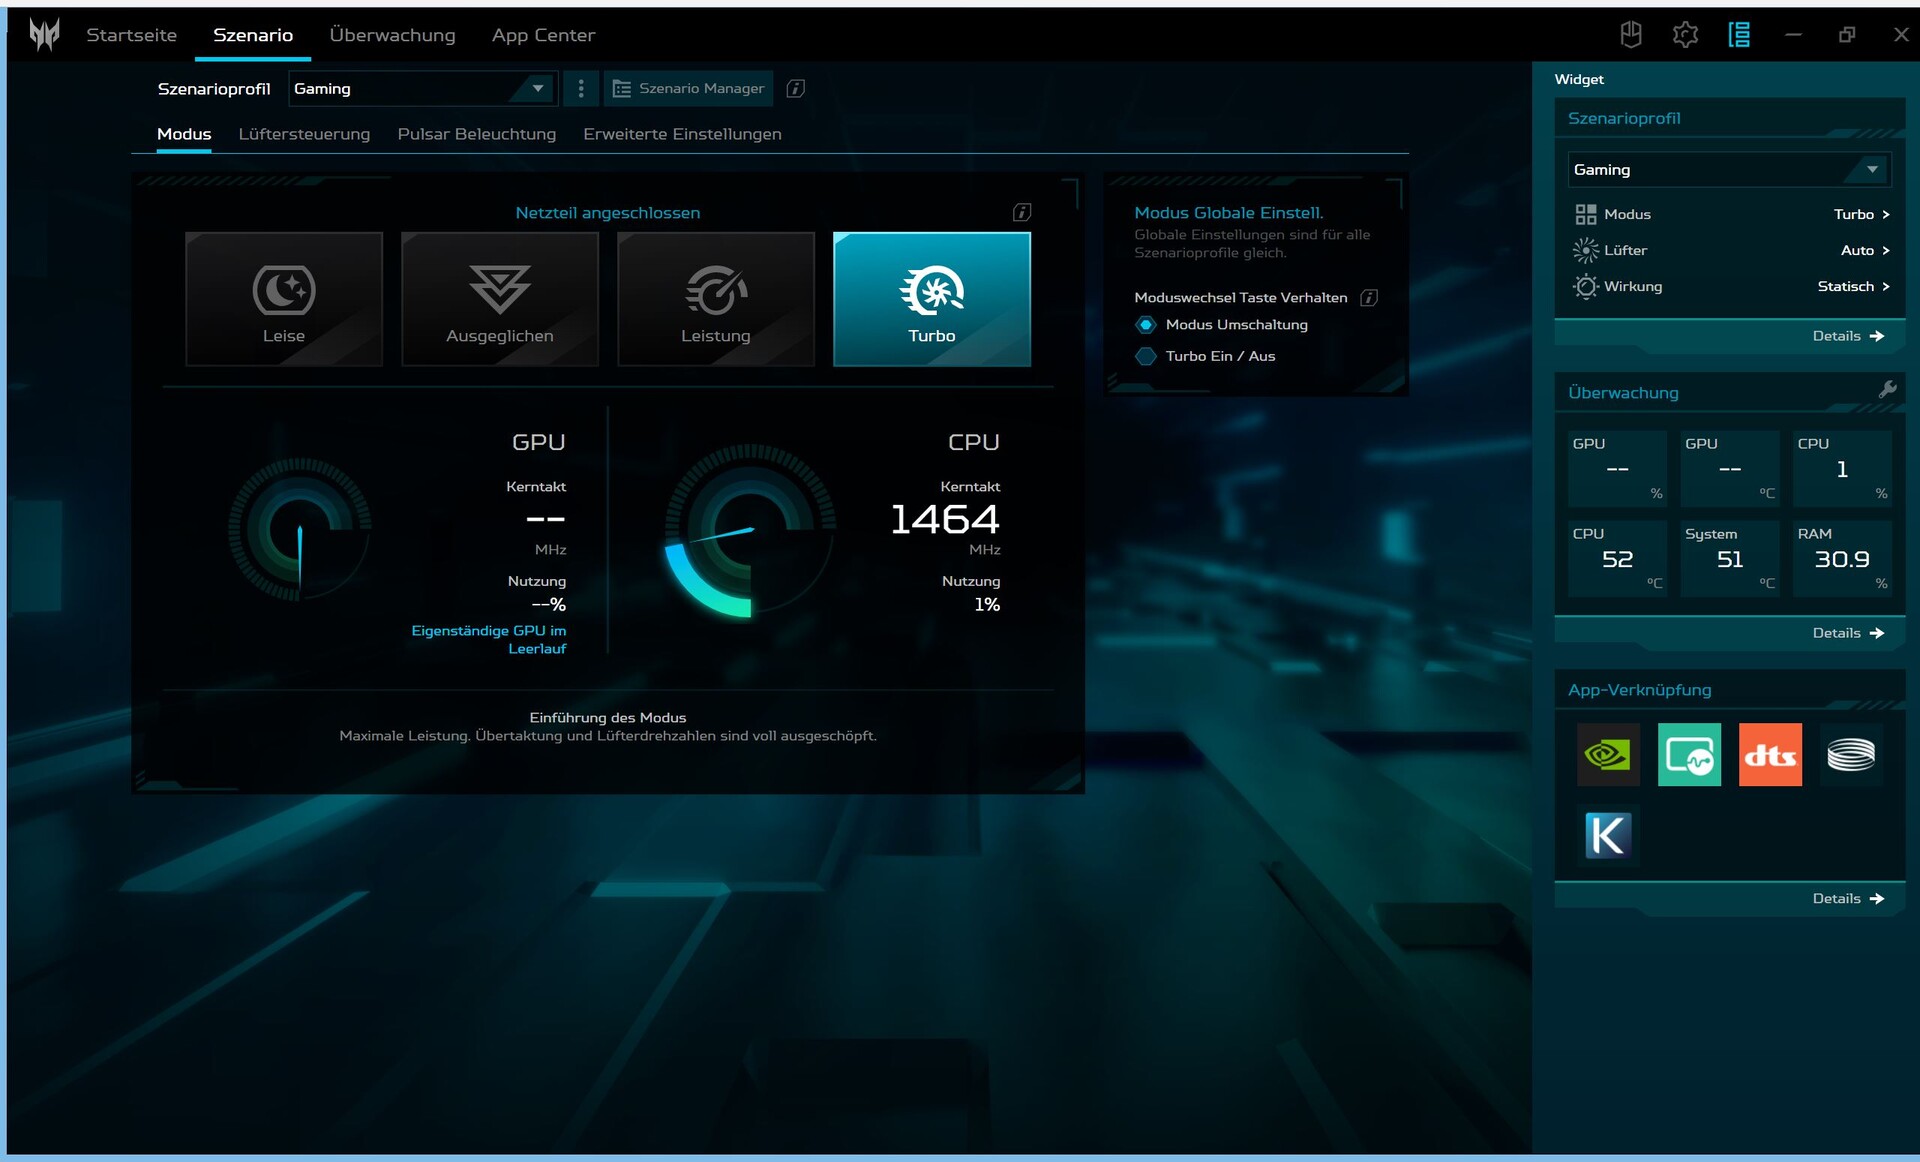
Acer instala, entre otras cosas, el software Predator Sense en su portátil para juegos. Aquí se pueden personalizar cuatro modos de rendimiento(Eco, Equilibrado, Rendimiento, Turbo), así como otras opciones (por ejemplo, para la iluminación del teclado). El software es bastante claro, pero no ofrece tantos ajustes (manuales) como los dispositivos de la competencia. Por ejemplo, echamos en falta una opción para la conmutación de la GPU, así como configuraciones para ajustar manualmente los parámetros de rendimiento.
Lamentablemente, Acer también instala otro software como McAfee o Acer Care, que es más bien de asistencia. Además, recibimos publicidad no solicitada de Acer. Una vez incluso recibimos una solicitud no solicitada para instalar el navegador Opera. Este tipo de publicidad forzada a través del software obligatorio del fabricante es una verdadera molestia y, por desgracia, es cada vez más frecuente, por ejemplo por parte de Lenovo en el LOQ 16al hacer clic en el centro de juegos "Planet9" en Sense se desencadena una solicitud de cookies que incluye molestos y diversos botones de "interés legítimo", que deben deseleccionarse individualmente si el usuario desea excluirse.
Hemos utilizado principalmente el modo Turbo para obtener los mejores resultados en los benchmarks, pero también ofrecemos información sobre los demás modos.

Procesador
El Intel Core i9-13900HXes una auténtica CPU de gama alta de la serie Raptor-Lake. Puede ejecutar 32 hilos con 8 núcleos P (incluyendo hyperthreading) y 16 núcleos E. Sus núcleos tienen un reloj base de 1,6 (núcleos E) y 2,2 GHz (núcleos P) y alcanzan un turbo de un solo núcleo de 3,9 - 5,4 GHz.
En el bucle Cinebench R15 (bucle CB15), el Helios ofrece un rendimiento sólido y, sobre todo, consistente que, sin embargo, se ve mínimamente superado por elMSI GE78HX y el Alienware m18 R1 con una CPU ligeramente más potente (i9-13950HX y i9-13980HX). El HP Omen con la misma CPU supera fácilmente al Helios, al igual que los dispositivos de la competencia con CPU H en lugar de HX.
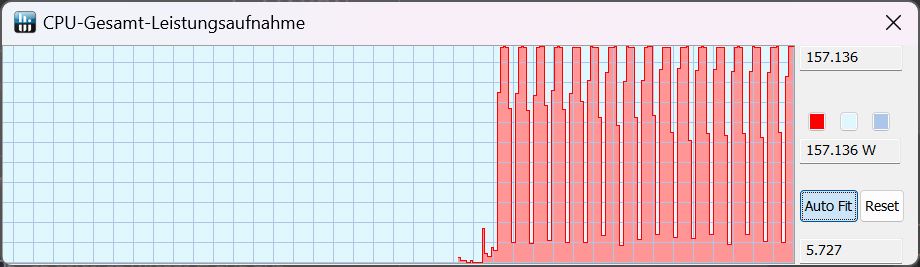
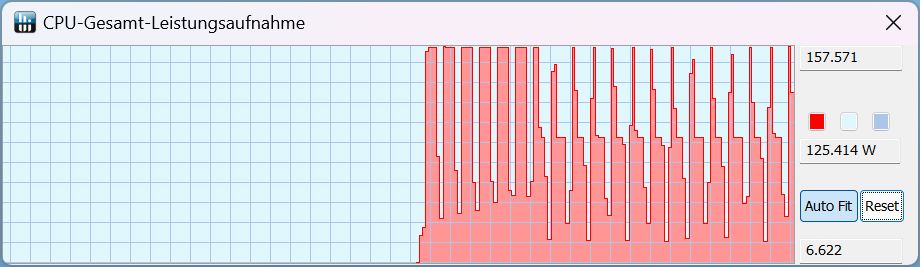
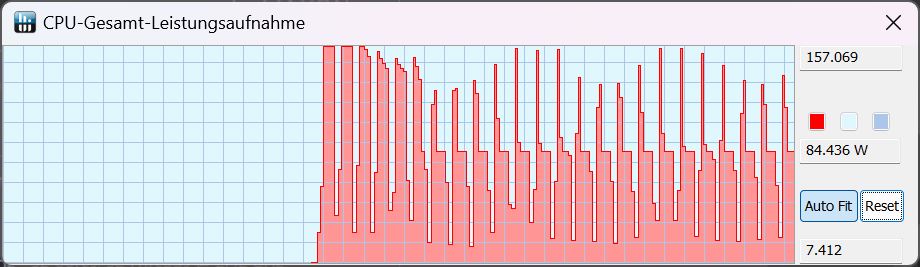
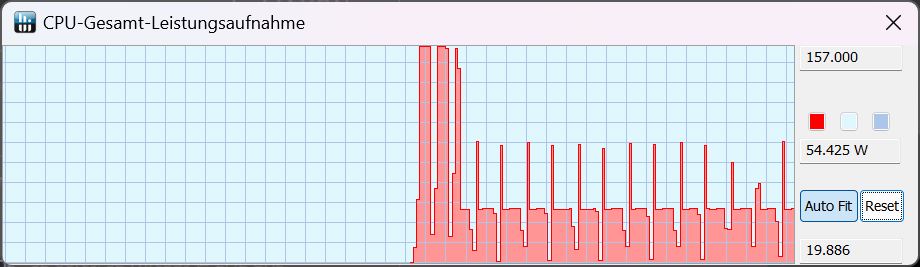
Hemos enumerado todos los valores de TDP alcanzados para cada modo de rendimiento durante los bucles de la CB15 en una tabla a continuación. En el modo de batería, aún puede elegir entre los modos Equilibrado y Eco . En ambos modos, el TDP sigue siendo de 25 W y la CB15 obtiene alrededor de 1.300 puntos, ¡un descenso de más del 70%! Por tanto, no existe una diferencia real de rendimiento entre ambos modos.
| TDP/Modo de rendimiento | Turbo | Rendimiento | Equilibrado | Silencioso | Batería Equilibrado | Batería Silencioso |
|---|---|---|---|---|---|---|
| Inicio del CB15 | 157 | 157 | 157 | 157 | 25 | 25 |
| Historia posterior del CB15 | 157 | 125 | 85 | 25 | 55 | 25 |
Cinebench R15 Multi Sustained Load
Cinebench R23: Multi Core | Single Core
Cinebench R20: CPU (Multi Core) | CPU (Single Core)
Cinebench R15: CPU Multi 64Bit | CPU Single 64Bit
Blender: v2.79 BMW27 CPU
7-Zip 18.03: 7z b 4 | 7z b 4 -mmt1
Geekbench 5.5: Multi-Core | Single-Core
HWBOT x265 Benchmark v2.2: 4k Preset
LibreOffice : 20 Documents To PDF
R Benchmark 2.5: Overall mean
| CPU Performance rating | |
| MSI GE78HX 13VH-070US | |
| Alienware m18 R1 | |
| Acer Predator Helios 18 N23Q2 | |
| Razer Blade 18 RTX 4070 | |
| Medio Intel Core i9-13900HX | |
| HP Omen 17-ck2097ng | |
| Media de la clase Gaming | |
| Asus ROG Strix G18 G814JI | |
| Cinebench R23 / Multi Core | |
| MSI GE78HX 13VH-070US | |
| Alienware m18 R1 | |
| Acer Predator Helios 18 N23Q2 | |
| Razer Blade 18 RTX 4070 | |
| Medio Intel Core i9-13900HX (24270 - 32623, n=23) | |
| HP Omen 17-ck2097ng | |
| Media de la clase Gaming (10488 - 42661, n=107, últimos 2 años) | |
| Asus ROG Strix G18 G814JI | |
| Cinebench R23 / Single Core | |
| MSI GE78HX 13VH-070US | |
| Alienware m18 R1 | |
| HP Omen 17-ck2097ng | |
| Acer Predator Helios 18 N23Q2 | |
| Razer Blade 18 RTX 4070 | |
| Medio Intel Core i9-13900HX (1867 - 2105, n=20) | |
| Media de la clase Gaming (1166 - 2415, n=107, últimos 2 años) | |
| Asus ROG Strix G18 G814JI | |
| Cinebench R20 / CPU (Multi Core) | |
| MSI GE78HX 13VH-070US | |
| Alienware m18 R1 | |
| Acer Predator Helios 18 N23Q2 | |
| Razer Blade 18 RTX 4070 | |
| Medio Intel Core i9-13900HX (9152 - 12541, n=21) | |
| Media de la clase Gaming (4029 - 16433, n=106, últimos 2 años) | |
| HP Omen 17-ck2097ng | |
| Asus ROG Strix G18 G814JI | |
| Cinebench R20 / CPU (Single Core) | |
| Alienware m18 R1 | |
| HP Omen 17-ck2097ng | |
| Acer Predator Helios 18 N23Q2 | |
| MSI GE78HX 13VH-070US | |
| Razer Blade 18 RTX 4070 | |
| Medio Intel Core i9-13900HX (722 - 810, n=21) | |
| Media de la clase Gaming (442 - 913, n=106, últimos 2 años) | |
| Asus ROG Strix G18 G814JI | |
| Cinebench R15 / CPU Multi 64Bit | |
| MSI GE78HX 13VH-070US | |
| Alienware m18 R1 | |
| Acer Predator Helios 18 N23Q2 | |
| Medio Intel Core i9-13900HX (3913 - 4970, n=22) | |
| Razer Blade 18 RTX 4070 | |
| HP Omen 17-ck2097ng | |
| Media de la clase Gaming (1578 - 6330, n=105, últimos 2 años) | |
| Asus ROG Strix G18 G814JI | |
| Cinebench R15 / CPU Single 64Bit | |
| MSI GE78HX 13VH-070US | |
| Alienware m18 R1 | |
| HP Omen 17-ck2097ng | |
| Razer Blade 18 RTX 4070 | |
| Media de la clase Gaming (188.8 - 350, n=106, últimos 2 años) | |
| Acer Predator Helios 18 N23Q2 | |
| Medio Intel Core i9-13900HX (247 - 304, n=22) | |
| Asus ROG Strix G18 G814JI | |
| Blender / v2.79 BMW27 CPU | |
| Asus ROG Strix G18 G814JI | |
| HP Omen 17-ck2097ng | |
| Media de la clase Gaming (79 - 330, n=104, últimos 2 años) | |
| Medio Intel Core i9-13900HX (101 - 153, n=22) | |
| Razer Blade 18 RTX 4070 | |
| Acer Predator Helios 18 N23Q2 | |
| MSI GE78HX 13VH-070US | |
| Alienware m18 R1 | |
| 7-Zip 18.03 / 7z b 4 | |
| Alienware m18 R1 | |
| MSI GE78HX 13VH-070US | |
| Acer Predator Helios 18 N23Q2 | |
| Razer Blade 18 RTX 4070 | |
| Medio Intel Core i9-13900HX (90675 - 127283, n=21) | |
| HP Omen 17-ck2097ng | |
| Media de la clase Gaming (33491 - 148086, n=105, últimos 2 años) | |
| Asus ROG Strix G18 G814JI | |
| 7-Zip 18.03 / 7z b 4 -mmt1 | |
| MSI GE78HX 13VH-070US | |
| Acer Predator Helios 18 N23Q2 | |
| HP Omen 17-ck2097ng | |
| Alienware m18 R1 | |
| Razer Blade 18 RTX 4070 | |
| Medio Intel Core i9-13900HX (6340 - 7177, n=21) | |
| Media de la clase Gaming (4199 - 7436, n=105, últimos 2 años) | |
| Asus ROG Strix G18 G814JI | |
| Geekbench 5.5 / Multi-Core | |
| Alienware m18 R1 | |
| MSI GE78HX 13VH-070US | |
| Acer Predator Helios 18 N23Q2 | |
| HP Omen 17-ck2097ng | |
| Razer Blade 18 RTX 4070 | |
| Medio Intel Core i9-13900HX (17614 - 21075, n=22) | |
| Media de la clase Gaming (6460 - 28263, n=105, últimos 2 años) | |
| Asus ROG Strix G18 G814JI | |
| Geekbench 5.5 / Single-Core | |
| MSI GE78HX 13VH-070US | |
| HP Omen 17-ck2097ng | |
| Alienware m18 R1 | |
| Media de la clase Gaming (986 - 2474, n=105, últimos 2 años) | |
| Acer Predator Helios 18 N23Q2 | |
| Razer Blade 18 RTX 4070 | |
| Medio Intel Core i9-13900HX (1345 - 2093, n=22) | |
| Asus ROG Strix G18 G814JI | |
| HWBOT x265 Benchmark v2.2 / 4k Preset | |
| MSI GE78HX 13VH-070US | |
| Alienware m18 R1 | |
| Razer Blade 18 RTX 4070 | |
| Acer Predator Helios 18 N23Q2 | |
| Medio Intel Core i9-13900HX (23.5 - 34.4, n=22) | |
| Media de la clase Gaming (11.5 - 44.4, n=105, últimos 2 años) | |
| HP Omen 17-ck2097ng | |
| Asus ROG Strix G18 G814JI | |
| LibreOffice / 20 Documents To PDF | |
| Asus ROG Strix G18 G814JI | |
| Media de la clase Gaming (33.2 - 88.8, n=105, últimos 2 años) | |
| Acer Predator Helios 18 N23Q2 | |
| MSI GE78HX 13VH-070US | |
| Alienware m18 R1 | |
| HP Omen 17-ck2097ng | |
| Razer Blade 18 RTX 4070 | |
| Medio Intel Core i9-13900HX (32.8 - 51.1, n=21) | |
| R Benchmark 2.5 / Overall mean | |
| Asus ROG Strix G18 G814JI | |
| Media de la clase Gaming (0.3439 - 0.759, n=106, últimos 2 años) | |
| Medio Intel Core i9-13900HX (0.375 - 0.4564, n=22) | |
| Acer Predator Helios 18 N23Q2 | |
| Razer Blade 18 RTX 4070 | |
| Alienware m18 R1 | |
| HP Omen 17-ck2097ng | |
| MSI GE78HX 13VH-070US | |
* ... más pequeño es mejor
AIDA64: FP32 Ray-Trace | FPU Julia | CPU SHA3 | CPU Queen | FPU SinJulia | FPU Mandel | CPU AES | CPU ZLib | FP64 Ray-Trace | CPU PhotoWorxx
| Performance rating | |
| Alienware m18 R1 | |
| Acer Predator Helios 18 N23Q2 | |
| MSI GE78HX 13VH-070US | |
| Media de la clase Gaming | |
| Razer Blade 18 RTX 4070 | |
| Medio Intel Core i9-13900HX | |
| HP Omen 17-ck2097ng | |
| Asus ROG Strix G18 G814JI | |
| AIDA64 / FP32 Ray-Trace | |
| Media de la clase Gaming (10227 - 85542, n=105, últimos 2 años) | |
| Alienware m18 R1 | |
| MSI GE78HX 13VH-070US | |
| Acer Predator Helios 18 N23Q2 | |
| Razer Blade 18 RTX 4070 | |
| Medio Intel Core i9-13900HX (17589 - 27615, n=22) | |
| Asus ROG Strix G18 G814JI | |
| HP Omen 17-ck2097ng | |
| AIDA64 / FPU Julia | |
| Alienware m18 R1 | |
| MSI GE78HX 13VH-070US | |
| Media de la clase Gaming (51376 - 238426, n=105, últimos 2 años) | |
| Acer Predator Helios 18 N23Q2 | |
| Razer Blade 18 RTX 4070 | |
| Medio Intel Core i9-13900HX (88686 - 137015, n=22) | |
| Asus ROG Strix G18 G814JI | |
| HP Omen 17-ck2097ng | |
| AIDA64 / CPU SHA3 | |
| Alienware m18 R1 | |
| MSI GE78HX 13VH-070US | |
| Acer Predator Helios 18 N23Q2 | |
| Media de la clase Gaming (2180 - 10115, n=105, últimos 2 años) | |
| Razer Blade 18 RTX 4070 | |
| Medio Intel Core i9-13900HX (4362 - 7029, n=22) | |
| Asus ROG Strix G18 G814JI | |
| HP Omen 17-ck2097ng | |
| AIDA64 / CPU Queen | |
| Alienware m18 R1 | |
| MSI GE78HX 13VH-070US | |
| Razer Blade 18 RTX 4070 | |
| Acer Predator Helios 18 N23Q2 | |
| HP Omen 17-ck2097ng | |
| Medio Intel Core i9-13900HX (125644 - 141385, n=22) | |
| Media de la clase Gaming (49785 - 173351, n=90, últimos 2 años) | |
| Asus ROG Strix G18 G814JI | |
| AIDA64 / FPU SinJulia | |
| MSI GE78HX 13VH-070US | |
| Alienware m18 R1 | |
| Razer Blade 18 RTX 4070 | |
| Acer Predator Helios 18 N23Q2 | |
| Medio Intel Core i9-13900HX (12334 - 17179, n=22) | |
| Media de la clase Gaming (4424 - 33636, n=105, últimos 2 años) | |
| HP Omen 17-ck2097ng | |
| Asus ROG Strix G18 G814JI | |
| AIDA64 / FPU Mandel | |
| Alienware m18 R1 | |
| Media de la clase Gaming (25115 - 128721, n=105, últimos 2 años) | |
| MSI GE78HX 13VH-070US | |
| Acer Predator Helios 18 N23Q2 | |
| Razer Blade 18 RTX 4070 | |
| Medio Intel Core i9-13900HX (43850 - 69202, n=22) | |
| Asus ROG Strix G18 G814JI | |
| HP Omen 17-ck2097ng | |
| AIDA64 / CPU AES | |
| Acer Predator Helios 18 N23Q2 | |
| Medio Intel Core i9-13900HX (89413 - 237881, n=22) | |
| Alienware m18 R1 | |
| MSI GE78HX 13VH-070US | |
| Razer Blade 18 RTX 4070 | |
| Media de la clase Gaming (39258 - 247074, n=105, últimos 2 años) | |
| HP Omen 17-ck2097ng | |
| Asus ROG Strix G18 G814JI | |
| AIDA64 / CPU ZLib | |
| MSI GE78HX 13VH-070US | |
| Alienware m18 R1 | |
| Acer Predator Helios 18 N23Q2 | |
| Razer Blade 18 RTX 4070 | |
| Medio Intel Core i9-13900HX (1284 - 1958, n=22) | |
| Media de la clase Gaming (574 - 2531, n=105, últimos 2 años) | |
| HP Omen 17-ck2097ng | |
| Asus ROG Strix G18 G814JI | |
| AIDA64 / FP64 Ray-Trace | |
| Media de la clase Gaming (5509 - 45446, n=105, últimos 2 años) | |
| Alienware m18 R1 | |
| MSI GE78HX 13VH-070US | |
| Acer Predator Helios 18 N23Q2 | |
| Razer Blade 18 RTX 4070 | |
| Medio Intel Core i9-13900HX (9481 - 15279, n=22) | |
| Asus ROG Strix G18 G814JI | |
| HP Omen 17-ck2097ng | |
| AIDA64 / CPU PhotoWorxx | |
| Alienware m18 R1 | |
| HP Omen 17-ck2097ng | |
| Acer Predator Helios 18 N23Q2 | |
| MSI GE78HX 13VH-070US | |
| Razer Blade 18 RTX 4070 | |
| Medio Intel Core i9-13900HX (42994 - 51994, n=22) | |
| Media de la clase Gaming (12271 - 89891, n=105, últimos 2 años) | |
| Asus ROG Strix G18 G814JI | |
Rendimiento del sistema
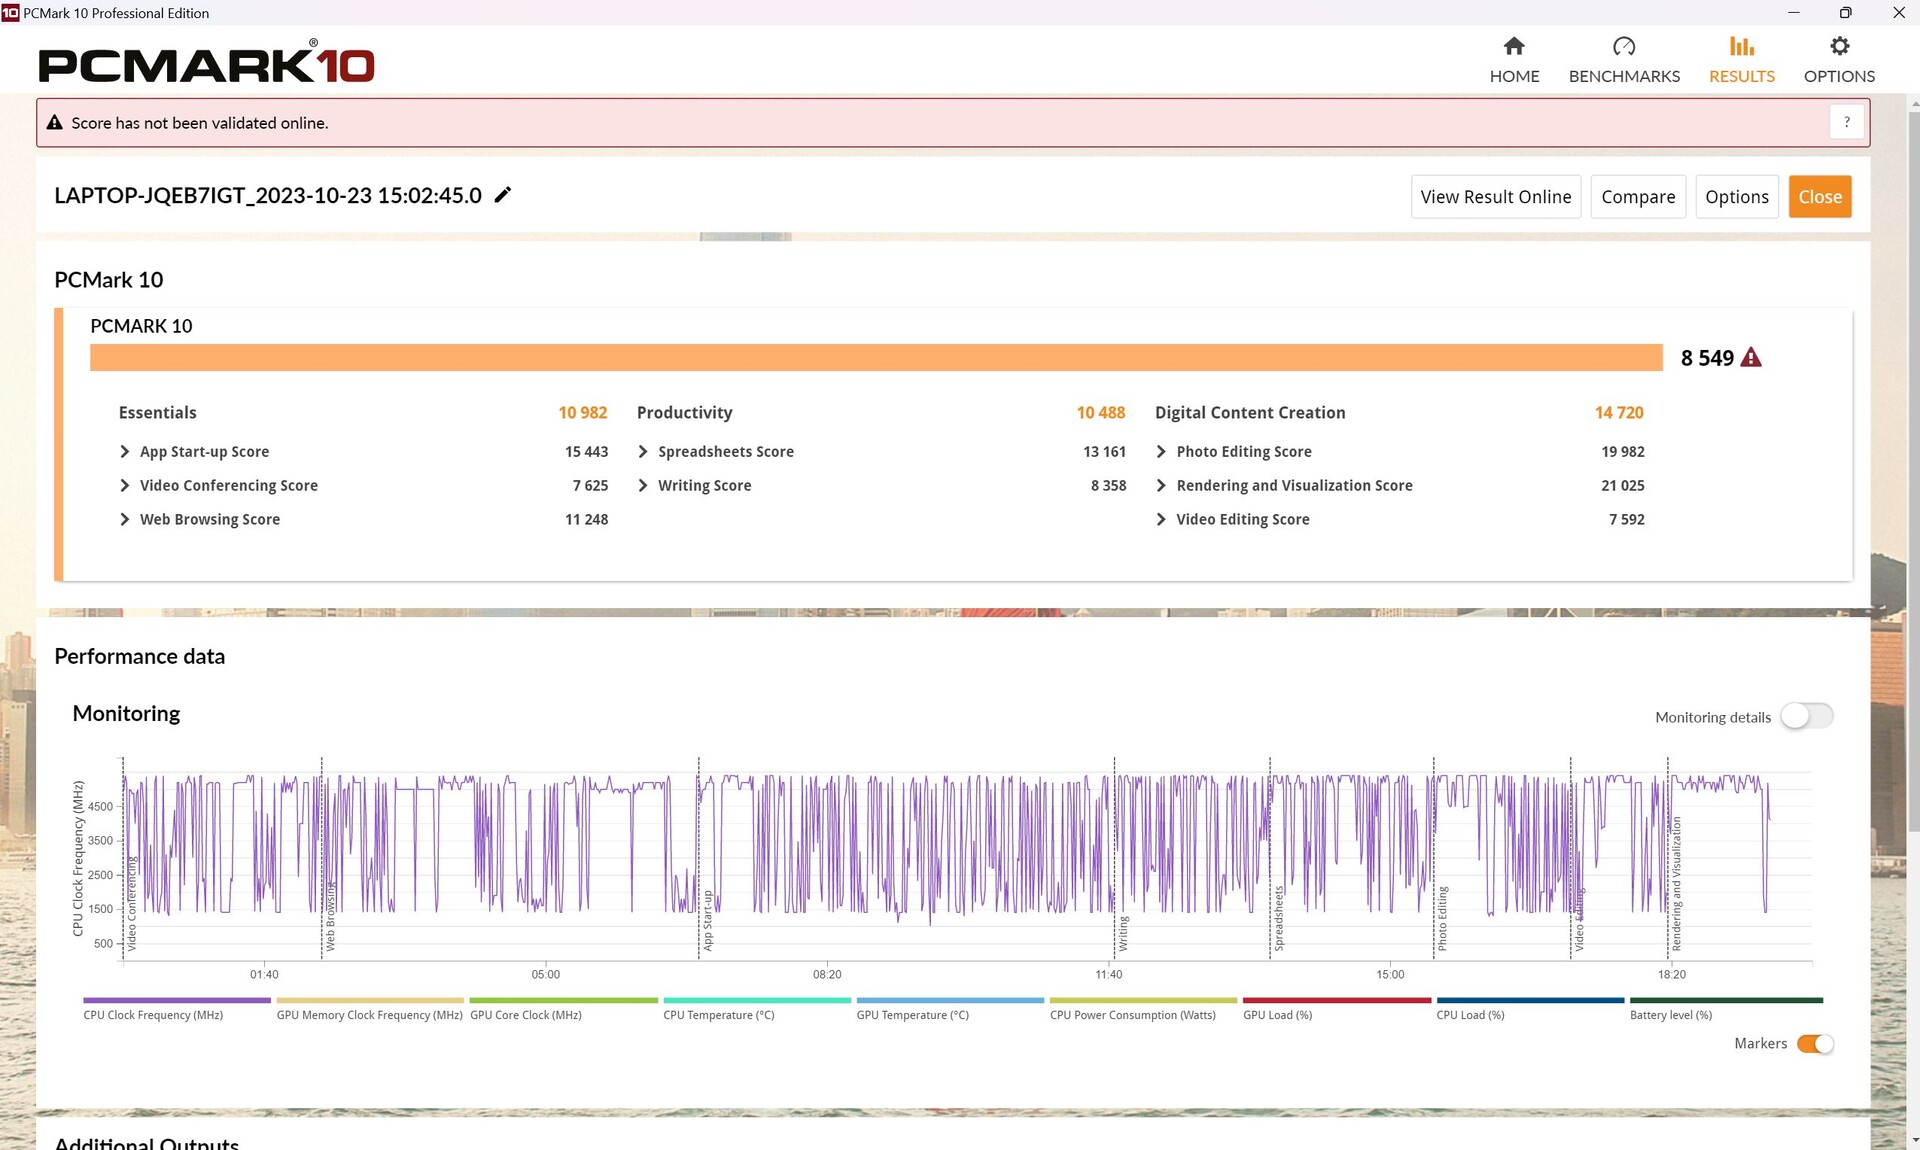
Al igual que el rendimiento de la CPU, el Helios está sólo marginalmente por detrás delMSI GE78HX y el Alienware m18 R1.
La mayoría de las aplicaciones se sienten subjetivamente suaves. Sólo la conmutación de gráficos (Advanced Optimus) es un problema constante para el portátil. Más sobre esto y los problemas de latencia en las siguientes secciones.
CrossMark: Overall | Productivity | Creativity | Responsiveness
| PCMark 10 / Score | |
| MSI GE78HX 13VH-070US | |
| Alienware m18 R1 | |
| Acer Predator Helios 18 N23Q2 | |
| Media de la clase Gaming (5828 - 12414, n=93, últimos 2 años) | |
| Medio Intel Core i9-13900HX, NVIDIA GeForce RTX 4080 Laptop GPU (7609 - 8549, n=3) | |
| Razer Blade 18 RTX 4070 | |
| HP Omen 17-ck2097ng | |
| Asus ROG Strix G18 G814JI | |
| PCMark 10 / Essentials | |
| HP Omen 17-ck2097ng | |
| Razer Blade 18 RTX 4070 | |
| Medio Intel Core i9-13900HX, NVIDIA GeForce RTX 4080 Laptop GPU (10982 - 11824, n=3) | |
| MSI GE78HX 13VH-070US | |
| Alienware m18 R1 | |
| Acer Predator Helios 18 N23Q2 | |
| Media de la clase Gaming (8810 - 11935, n=97, últimos 2 años) | |
| Asus ROG Strix G18 G814JI | |
| PCMark 10 / Productivity | |
| Media de la clase Gaming (6845 - 25323, n=95, últimos 2 años) | |
| Acer Predator Helios 18 N23Q2 | |
| MSI GE78HX 13VH-070US | |
| Medio Intel Core i9-13900HX, NVIDIA GeForce RTX 4080 Laptop GPU (9976 - 10788, n=3) | |
| Alienware m18 R1 | |
| HP Omen 17-ck2097ng | |
| Razer Blade 18 RTX 4070 | |
| Asus ROG Strix G18 G814JI | |
| PCMark 10 / Digital Content Creation | |
| Alienware m18 R1 | |
| MSI GE78HX 13VH-070US | |
| Acer Predator Helios 18 N23Q2 | |
| Media de la clase Gaming (7602 - 19954, n=95, últimos 2 años) | |
| Medio Intel Core i9-13900HX, NVIDIA GeForce RTX 4080 Laptop GPU (10135 - 14720, n=3) | |
| Razer Blade 18 RTX 4070 | |
| HP Omen 17-ck2097ng | |
| Asus ROG Strix G18 G814JI | |
| CrossMark / Overall | |
| Acer Predator Helios 18 N23Q2 | |
| Alienware m18 R1 | |
| Razer Blade 18 RTX 4070 | |
| Medio Intel Core i9-13900HX, NVIDIA GeForce RTX 4080 Laptop GPU (1991 - 2194, n=2) | |
| HP Omen 17-ck2097ng | |
| Media de la clase Gaming (1366 - 2409, n=94, últimos 2 años) | |
| MSI GE78HX 13VH-070US | |
| CrossMark / Productivity | |
| Acer Predator Helios 18 N23Q2 | |
| Alienware m18 R1 | |
| Razer Blade 18 RTX 4070 | |
| Medio Intel Core i9-13900HX, NVIDIA GeForce RTX 4080 Laptop GPU (1828 - 2059, n=2) | |
| Media de la clase Gaming (1386 - 2254, n=94, últimos 2 años) | |
| MSI GE78HX 13VH-070US | |
| HP Omen 17-ck2097ng | |
| CrossMark / Creativity | |
| Alienware m18 R1 | |
| Acer Predator Helios 18 N23Q2 | |
| Razer Blade 18 RTX 4070 | |
| Medio Intel Core i9-13900HX, NVIDIA GeForce RTX 4080 Laptop GPU (2239 - 2411, n=2) | |
| Media de la clase Gaming (1343 - 2786, n=94, últimos 2 años) | |
| HP Omen 17-ck2097ng | |
| MSI GE78HX 13VH-070US | |
| CrossMark / Responsiveness | |
| Acer Predator Helios 18 N23Q2 | |
| Alienware m18 R1 | |
| Medio Intel Core i9-13900HX, NVIDIA GeForce RTX 4080 Laptop GPU (1808 - 1998, n=2) | |
| Razer Blade 18 RTX 4070 | |
| HP Omen 17-ck2097ng | |
| Media de la clase Gaming (1226 - 2334, n=94, últimos 2 años) | |
| MSI GE78HX 13VH-070US | |
| PCMark 10 Score | 8549 puntos | |
ayuda | ||
| AIDA64 / Memory Copy | |
| Alienware m18 R1 | |
| Acer Predator Helios 18 N23Q2 | |
| HP Omen 17-ck2097ng | |
| MSI GE78HX 13VH-070US | |
| Razer Blade 18 RTX 4070 | |
| Medio Intel Core i9-13900HX (67716 - 79193, n=22) | |
| Media de la clase Gaming (21750 - 129946, n=105, últimos 2 años) | |
| Asus ROG Strix G18 G814JI | |
| AIDA64 / Memory Read | |
| Alienware m18 R1 | |
| Acer Predator Helios 18 N23Q2 | |
| HP Omen 17-ck2097ng | |
| Razer Blade 18 RTX 4070 | |
| MSI GE78HX 13VH-070US | |
| Medio Intel Core i9-13900HX (73998 - 88462, n=22) | |
| Media de la clase Gaming (22956 - 118858, n=105, últimos 2 años) | |
| Asus ROG Strix G18 G814JI | |
| AIDA64 / Memory Write | |
| Alienware m18 R1 | |
| HP Omen 17-ck2097ng | |
| MSI GE78HX 13VH-070US | |
| Media de la clase Gaming (22297 - 135096, n=105, últimos 2 años) | |
| Razer Blade 18 RTX 4070 | |
| Acer Predator Helios 18 N23Q2 | |
| Medio Intel Core i9-13900HX (65472 - 77045, n=22) | |
| Asus ROG Strix G18 G814JI | |
| AIDA64 / Memory Latency | |
| Media de la clase Gaming (75.3 - 259, n=105, últimos 2 años) | |
| Medio Intel Core i9-13900HX (75.3 - 91.1, n=22) | |
| HP Omen 17-ck2097ng | |
| Razer Blade 18 RTX 4070 | |
| MSI GE78HX 13VH-070US | |
| Asus ROG Strix G18 G814JI | |
| Acer Predator Helios 18 N23Q2 | |
| Alienware m18 R1 | |
* ... más pequeño es mejor
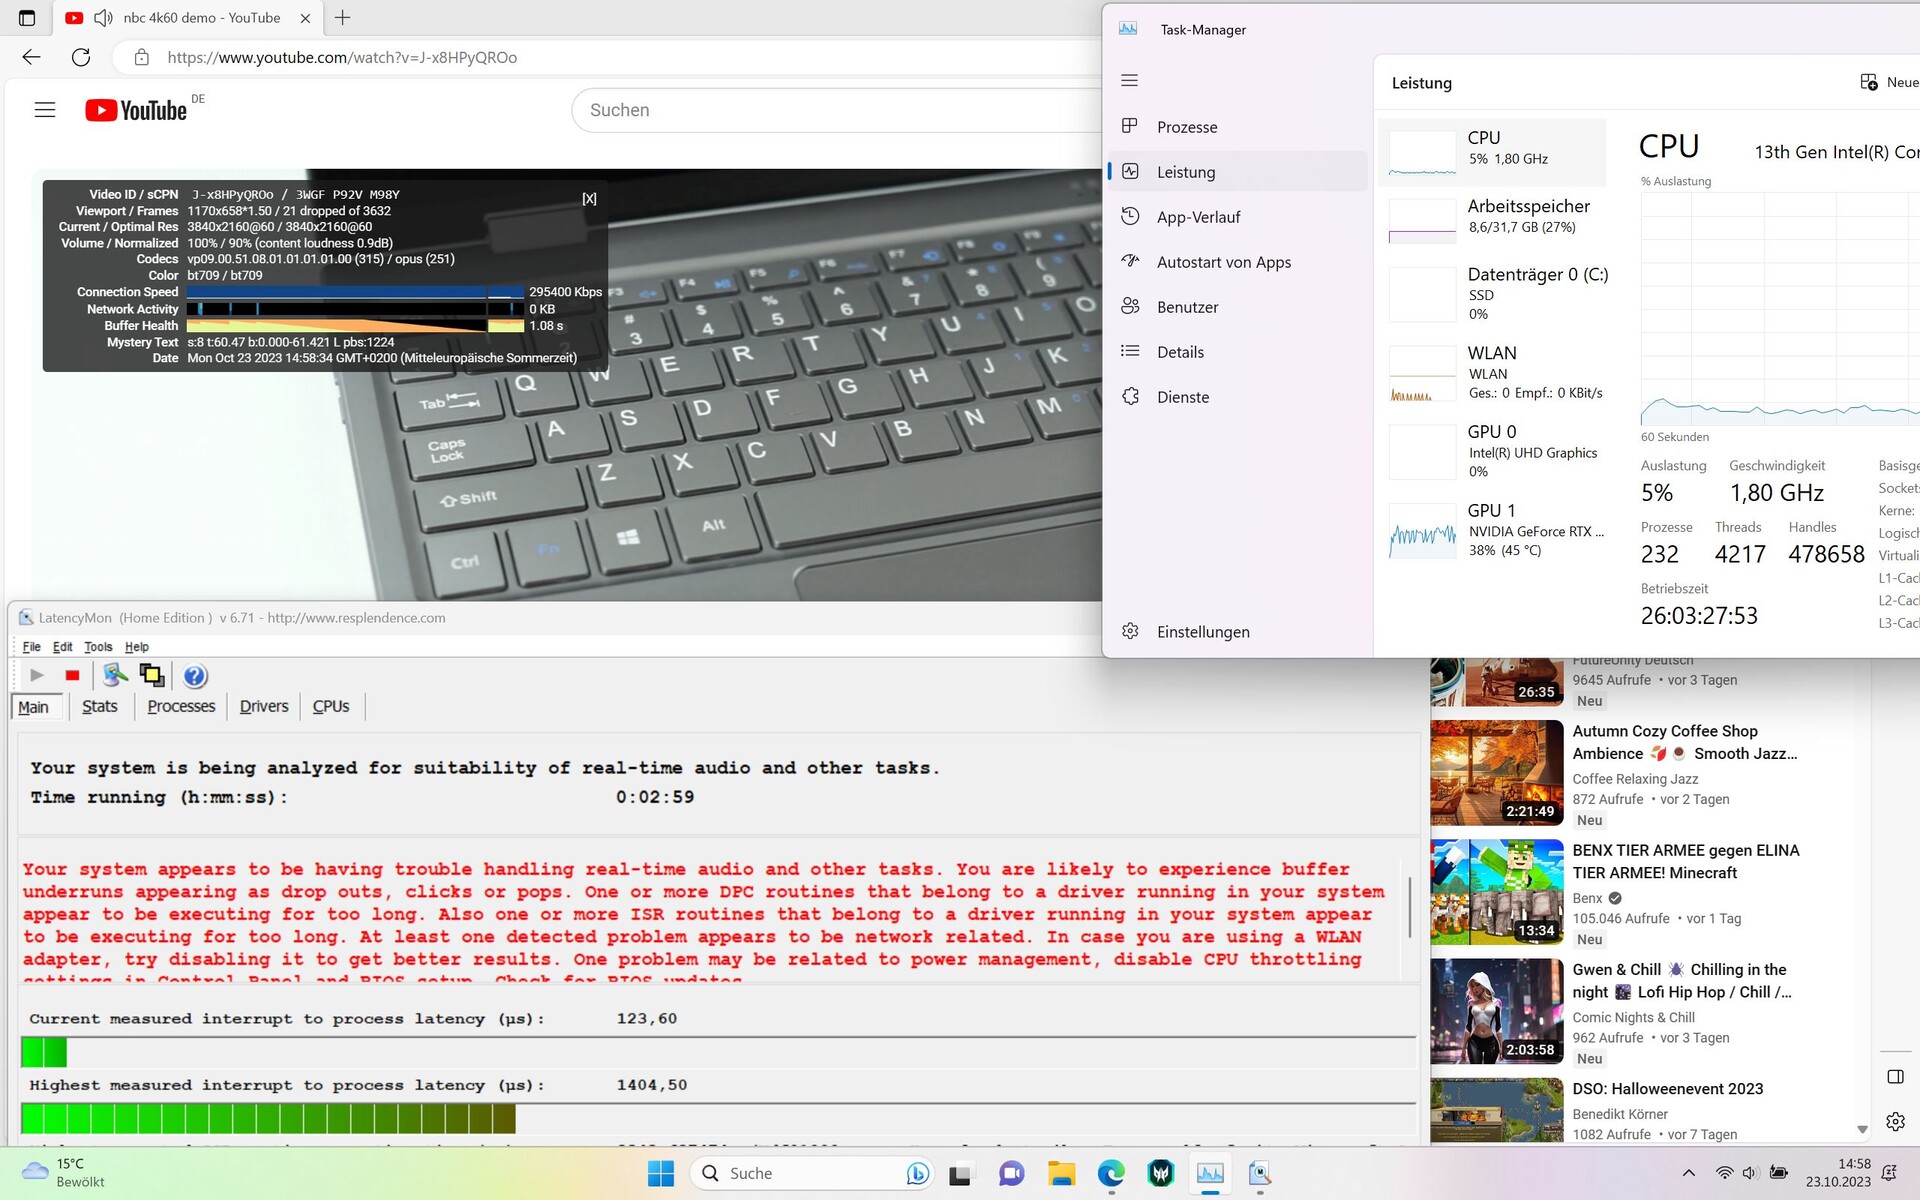
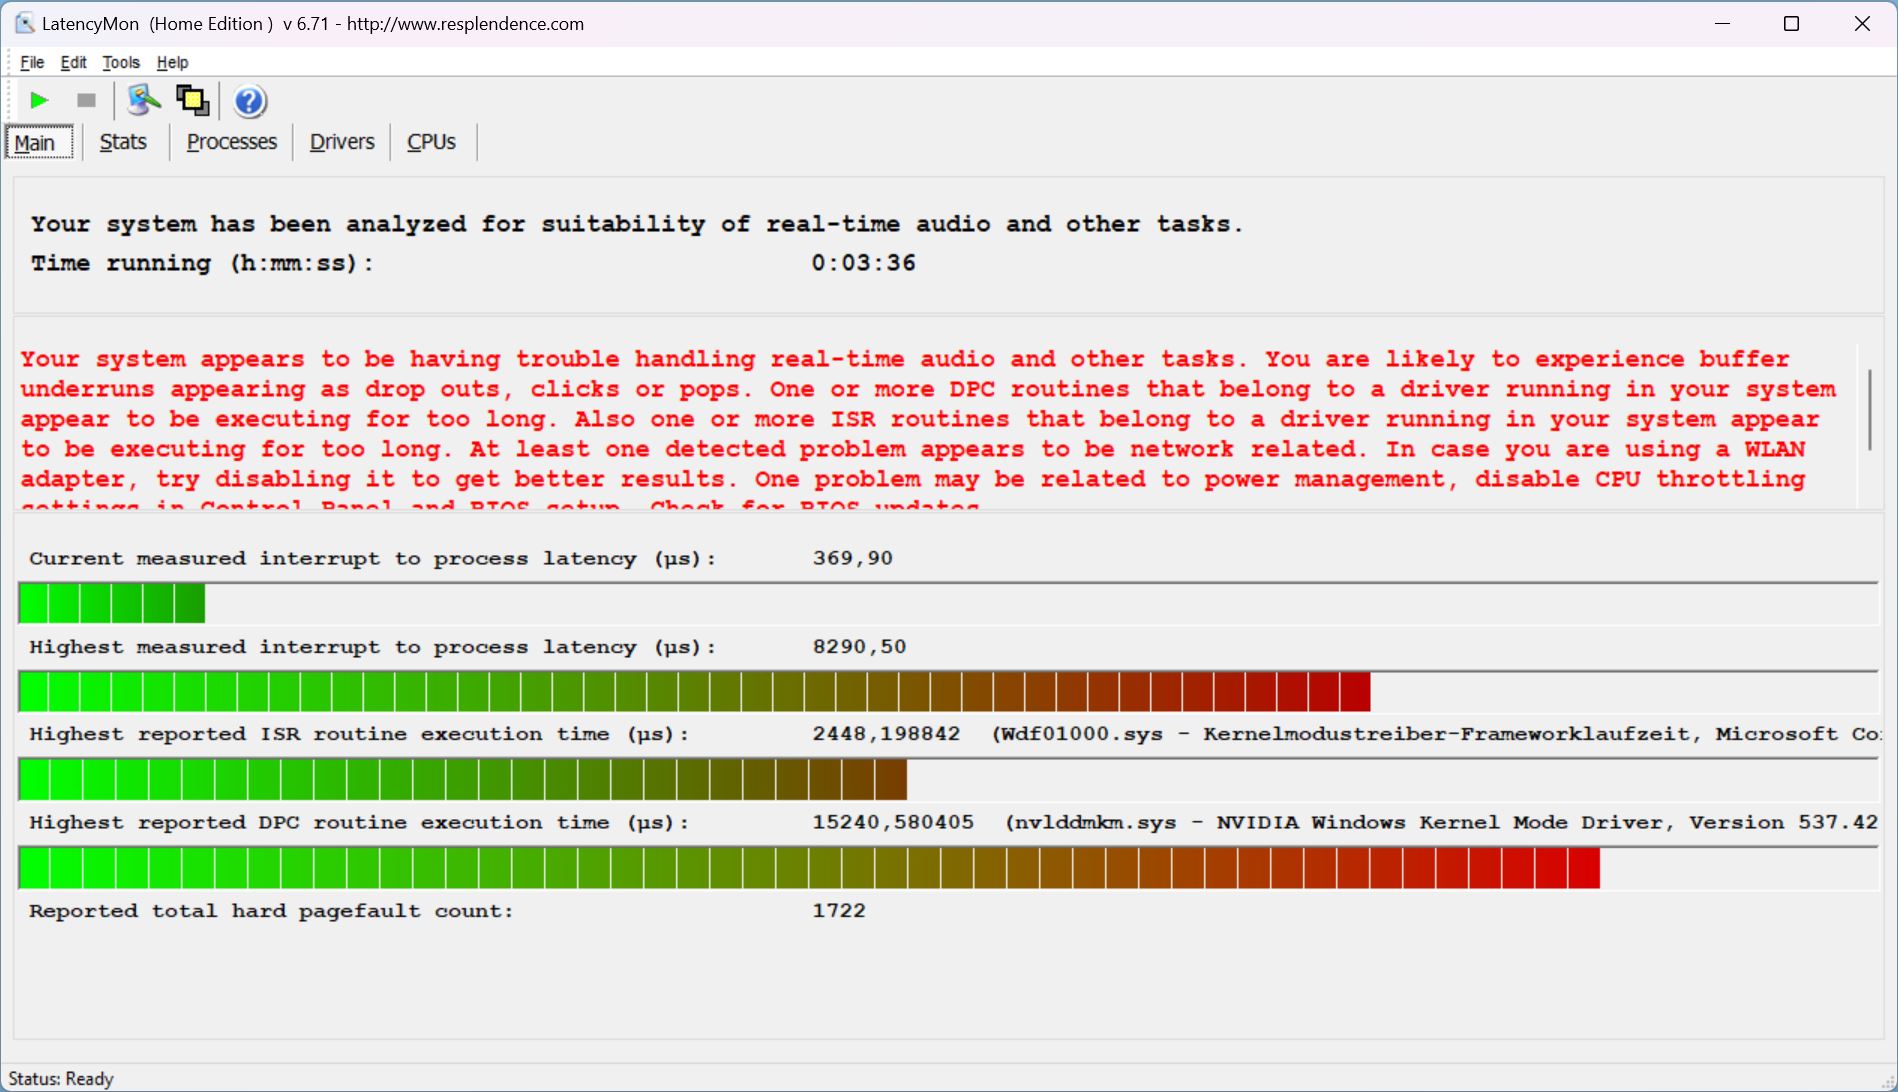
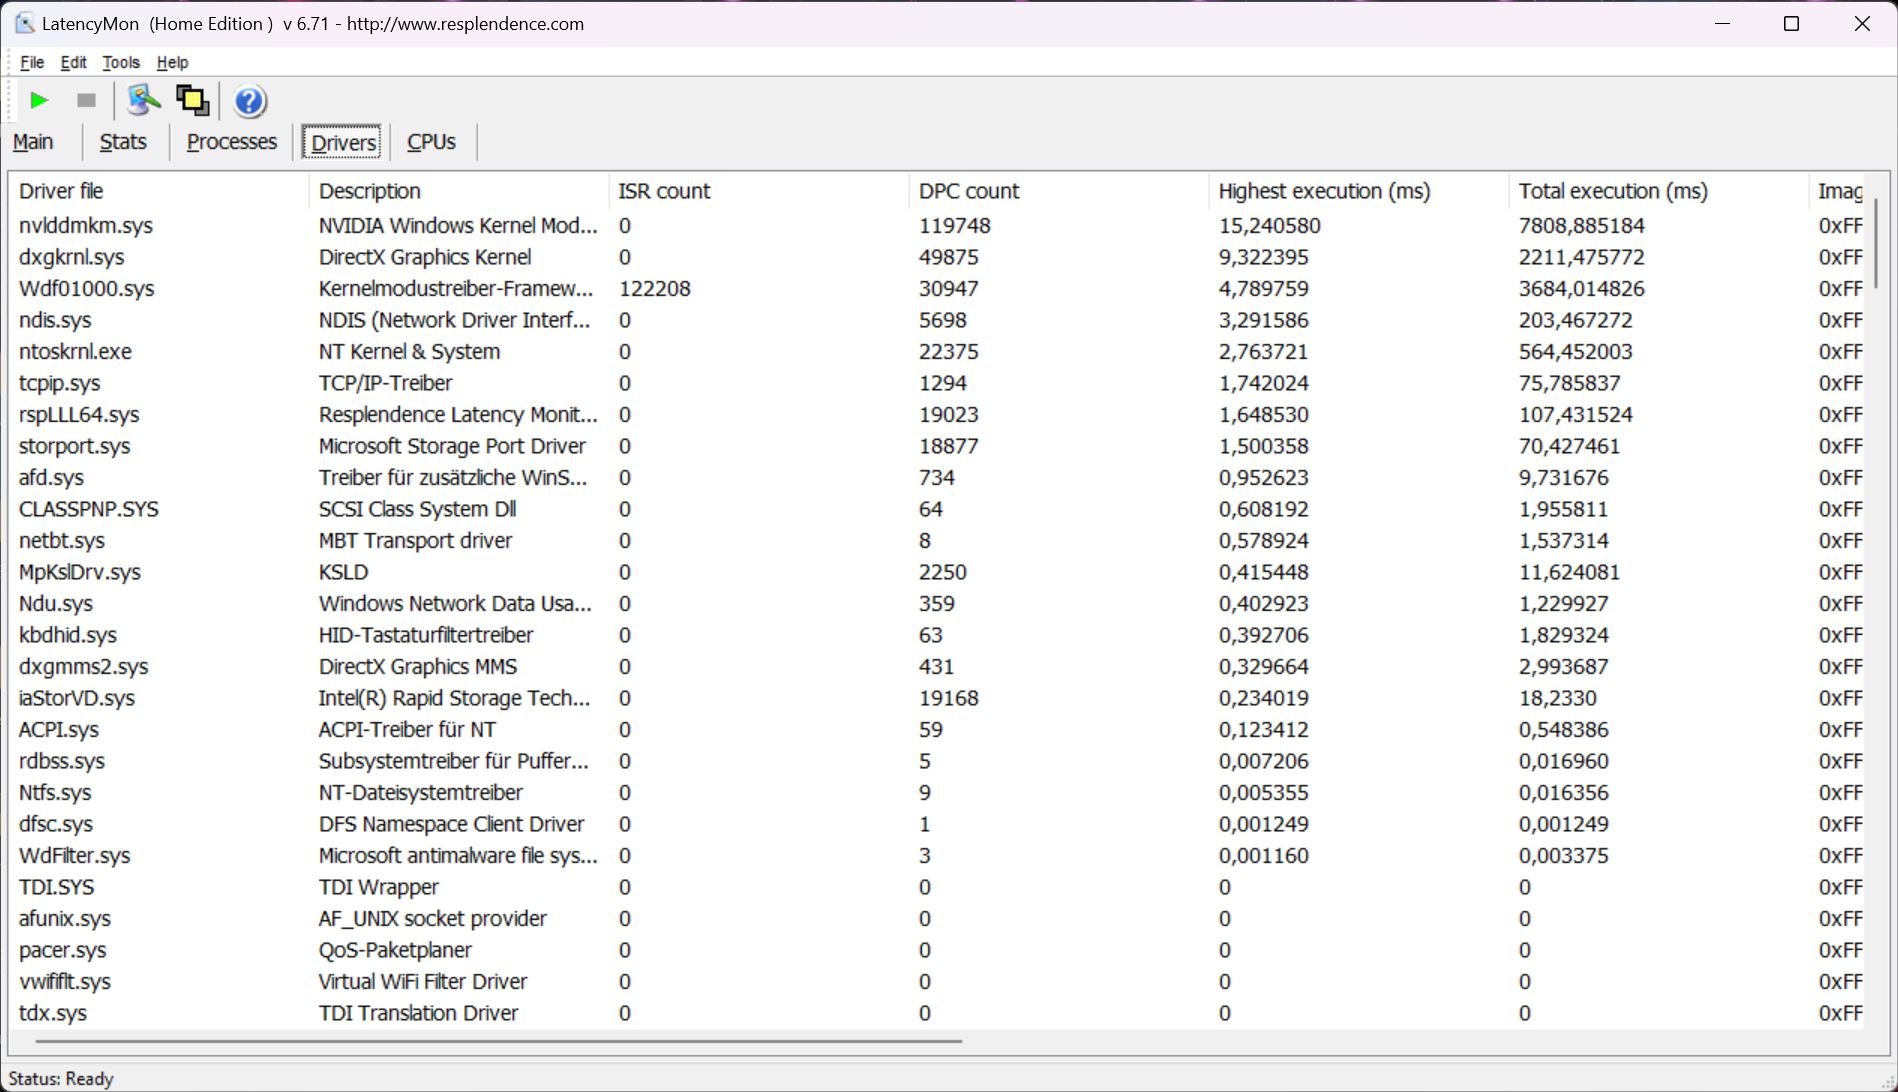
Latencia del CPD
En el estado actual del controlador, el portátil tiene graves problemas de latencia, como revela LatencyMon. En el modo equilibrado , se producen retrasos al abrir el navegador o al mover una ventana del escritorio. Estos aumentan al abrir varias pestañas del navegador en nuestro sitio web, e incluso al reproducir un vídeo 4K/60 fps de YouTube se saltan 18 fotogramas. Acer necesita mejorar el controlador aquí. Sin embargo, los portátiles rivales también tienen problemas similares.
| DPC Latencies / LatencyMon - interrupt to process latency (max), Web, Youtube, Prime95 | |
| Acer Predator Helios 18 N23Q2 | |
| MSI GE78HX 13VH-070US | |
| Alienware m18 R1 | |
| HP Omen 17-ck2097ng | |
| Razer Blade 18 RTX 4070 | |
| Asus ROG Strix G18 G814JI | |
* ... más pequeño es mejor
Dispositivos de almacenamiento
El Helios 18 está equipado con el Samsung PM9A1, uno de los SSD más rápidos de nuestraLista de mejores SSDdesgraciadamente, este no rinde bien en el Predator y su rendimiento se ralentiza muy rápidamente, como muestra nuestro gráfico siguiente. Repetimos la misma prueba más tarde y obtuvimos el mismo resultado, ya que nos sorprendió la rápida y fuerte caída. También se observó un comportamiento similar de estrangulamiento de la SSD en el anteriormente revisado Predator Helios 16.

* ... más pequeño es mejor
Sustained Read Performance: DiskSpd Read Loop, Queue Depth 8
Grafikkarte
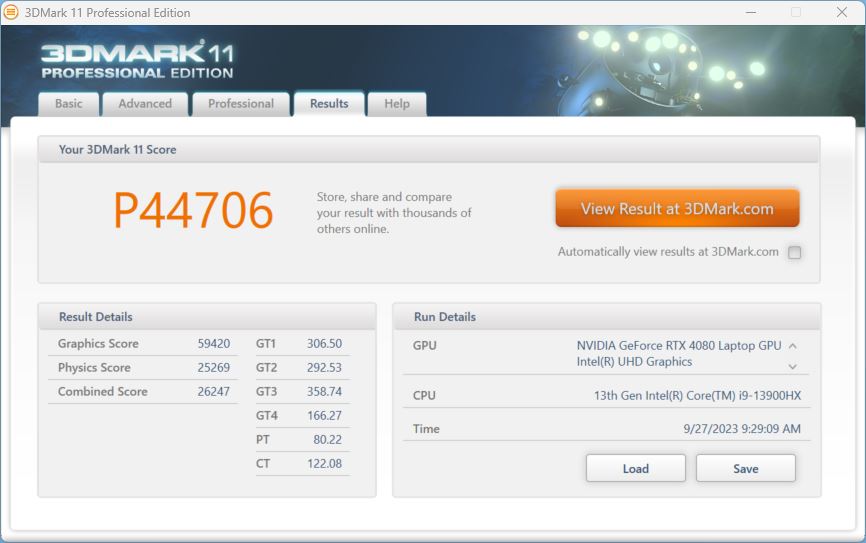
La RTX 4080es una GPU de gama alta que se presentó a principios de 2023. En el Helios 18, puede consumir un máximo de 175 W, incluido Dynamic Boost.
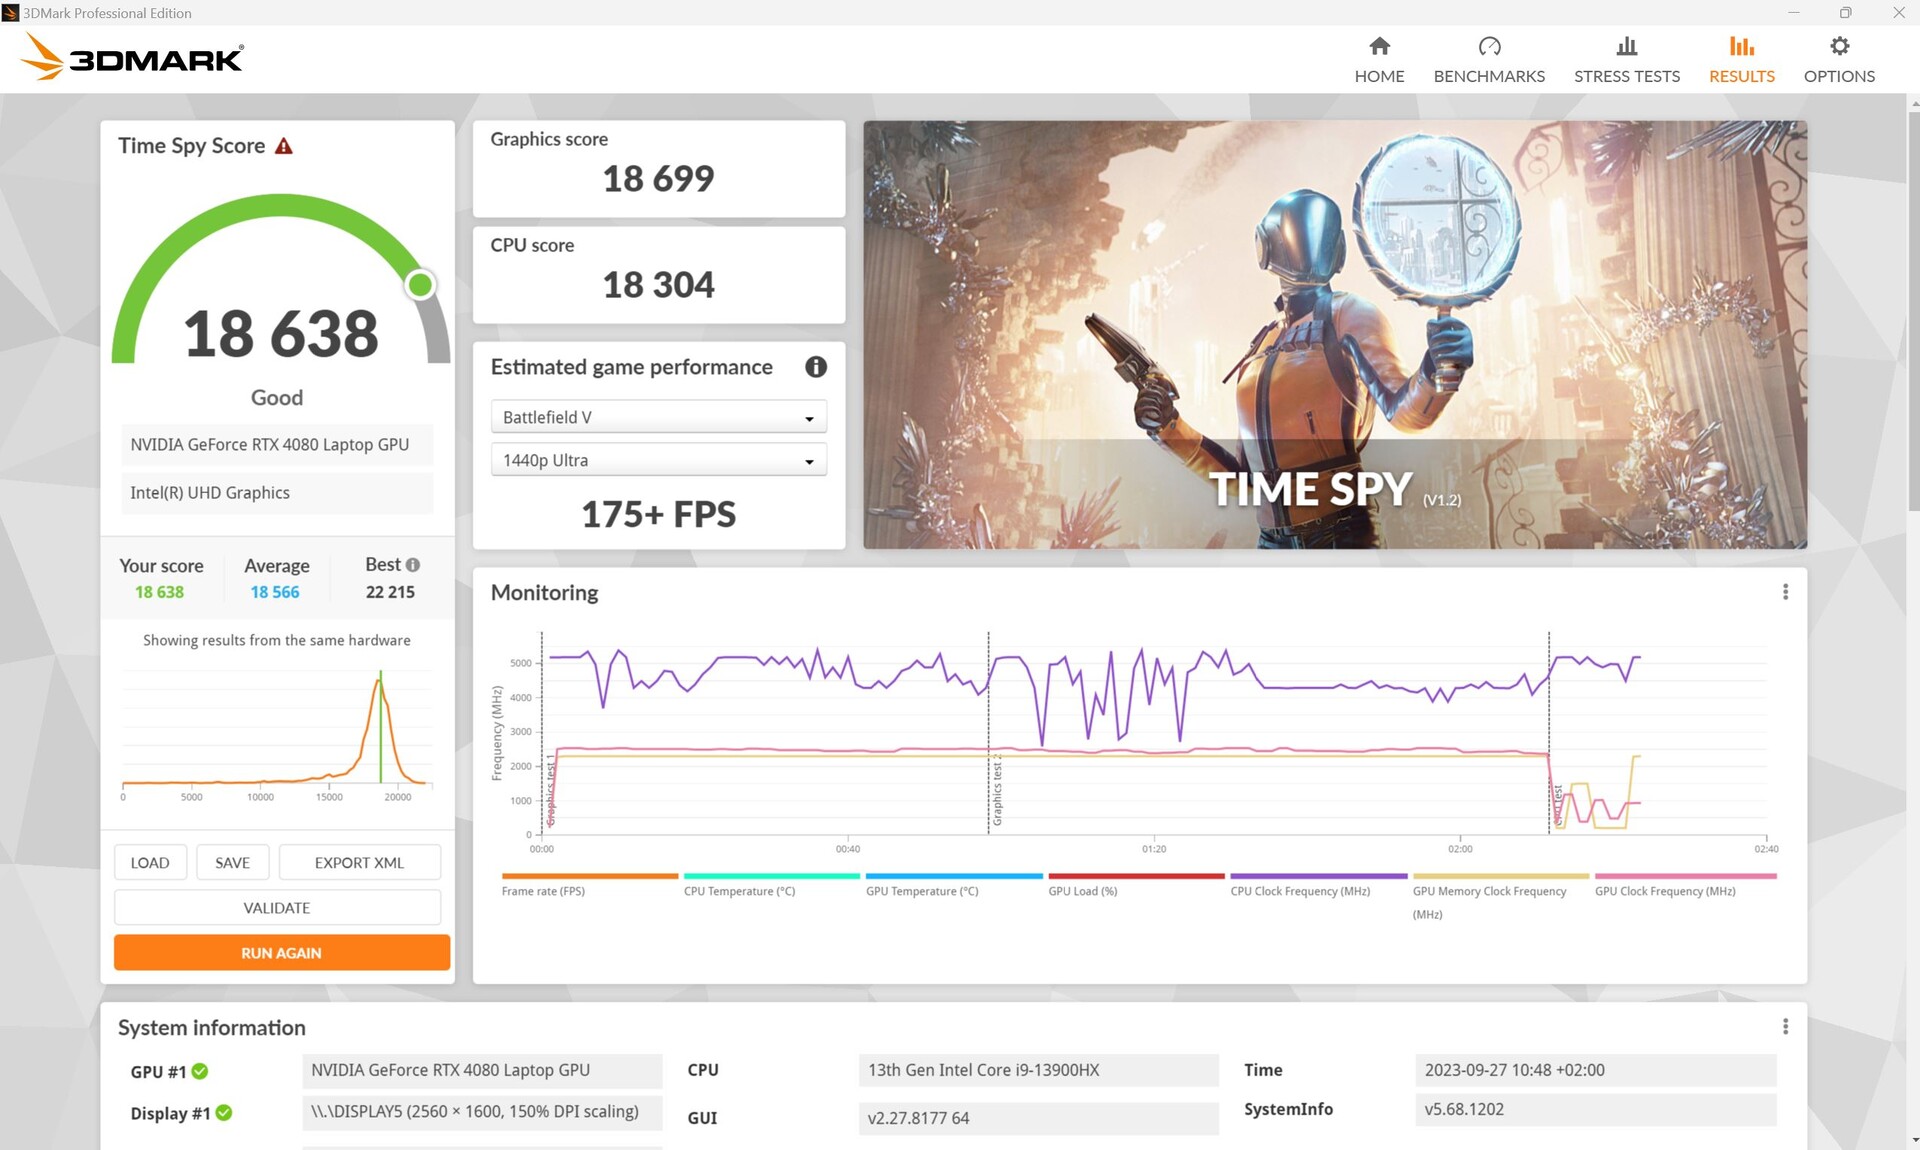
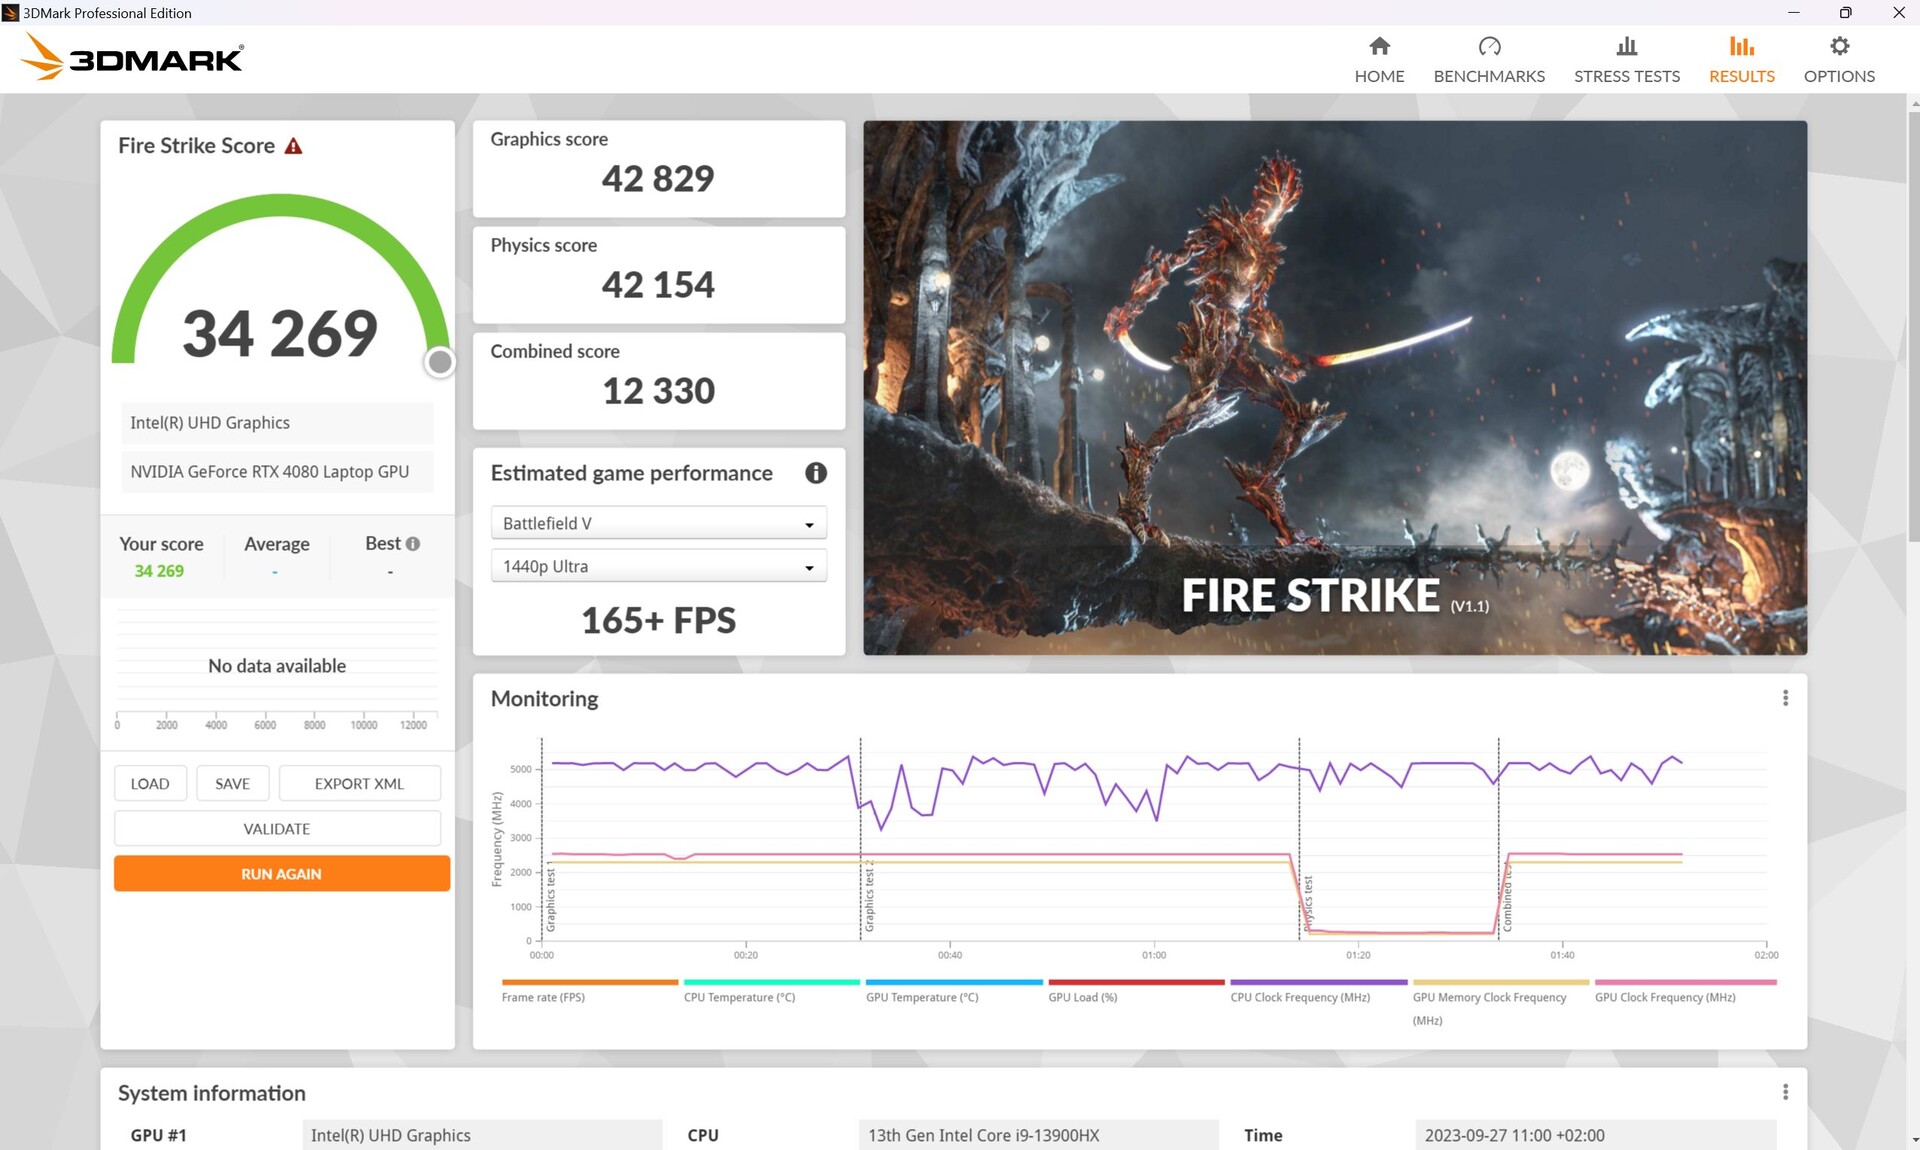
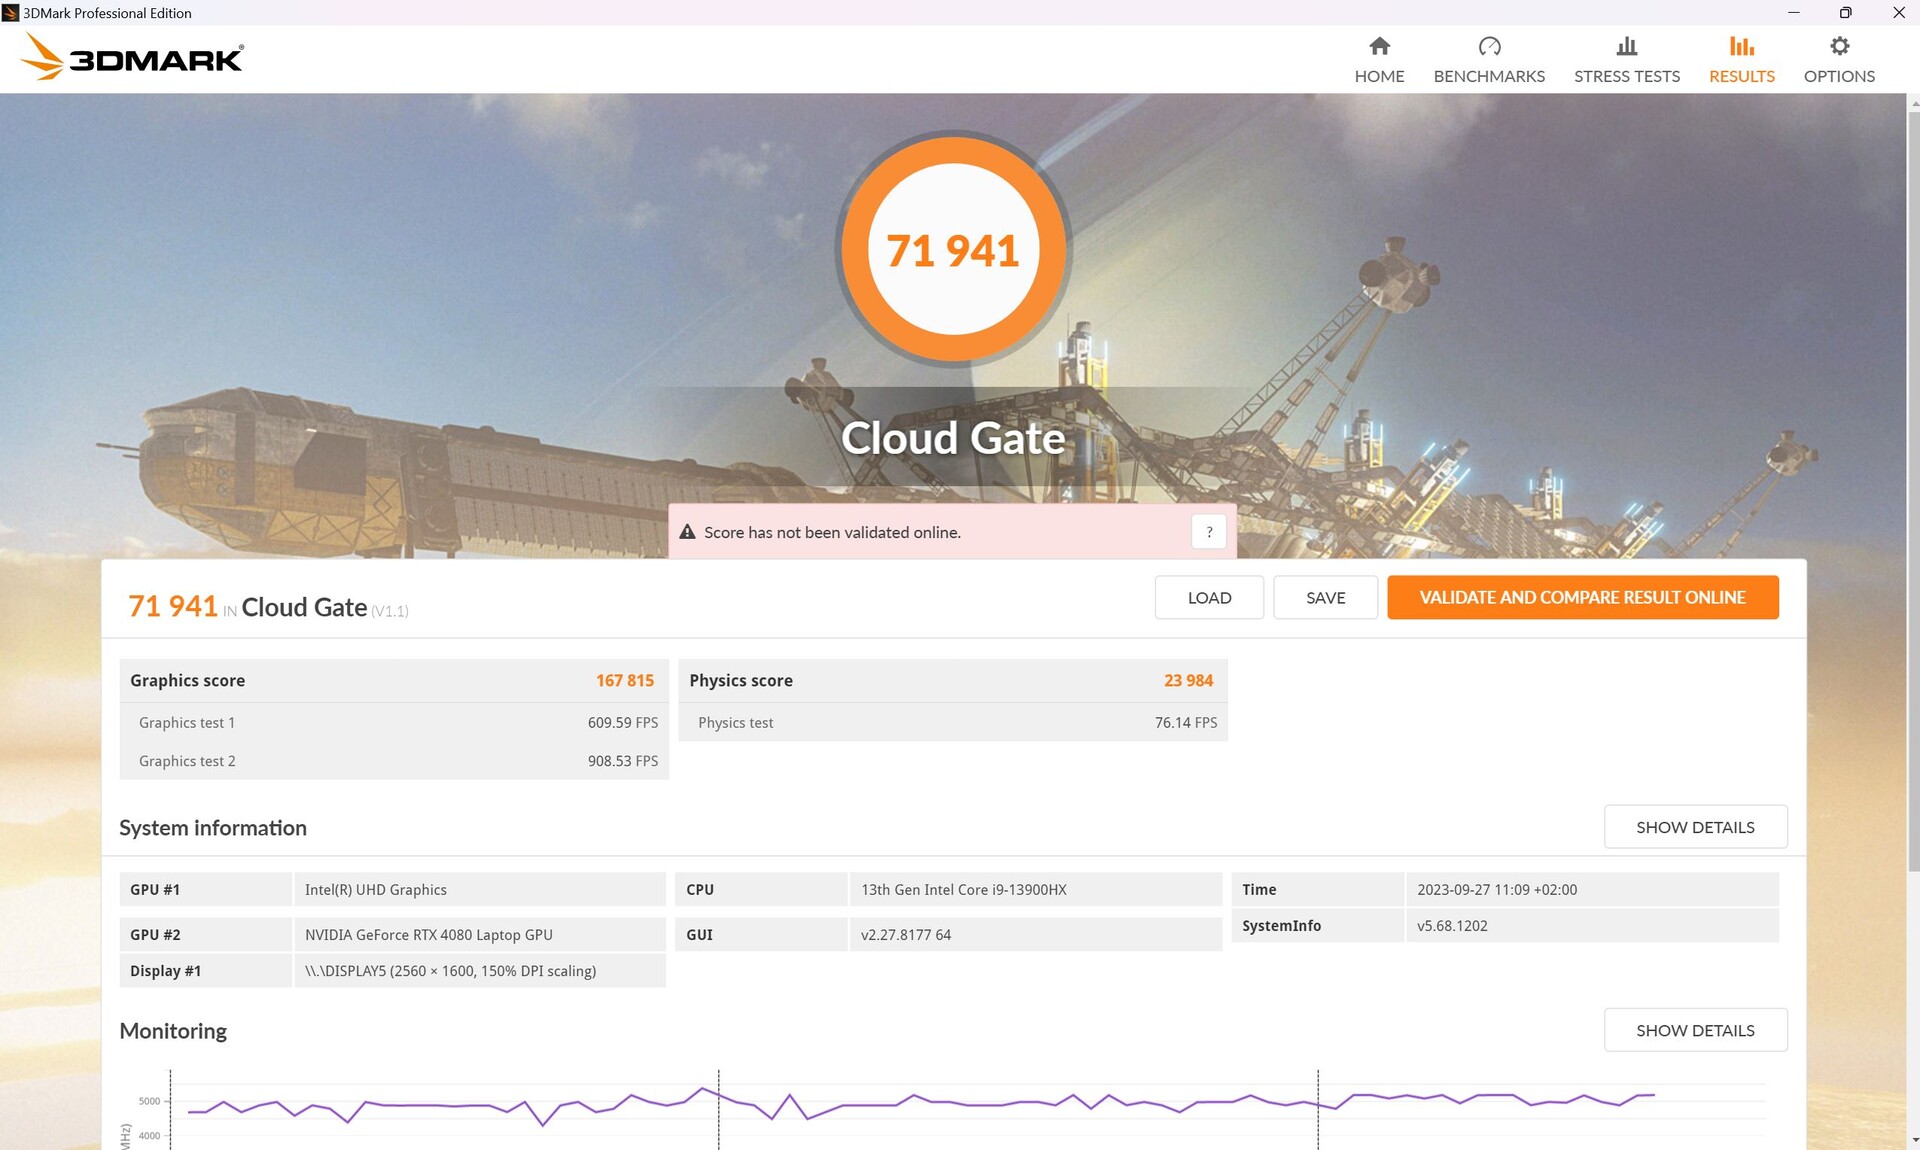
En las pruebas sintéticas 3DMark, el Helios supera por poco al MSI GE78HXcon la misma GPU por primera vez. El rendimiento de la RTX 4080 es aproximadamente un 10% superior a la media de todos los portátiles con la misma GPU de nuestra base de datos.
Lejos del zócalo, el Predator aún consigue 6.897 puntos gráficos en Fire Strike, ¡un descenso del 84%!
| 3DMark Performance rating - Percent | |
| Alienware m18 R1 -1! | |
| Acer Predator Helios 18 N23Q2 | |
| MSI GE78HX 13VH-070US -1! | |
| Medio NVIDIA GeForce RTX 4080 Laptop GPU | |
| Media de la clase Gaming | |
| HP Omen 17-ck2097ng | |
| Asus ROG Strix G18 G814JI | |
| Razer Blade 18 RTX 4070 -1! | |
| 3DMark 11 Performance | 44706 puntos | |
| 3DMark Cloud Gate Standard Score | 71941 puntos | |
| 3DMark Fire Strike Score | 34269 puntos | |
| 3DMark Time Spy Score | 18638 puntos | |
ayuda | ||
* ... más pequeño es mejor
Rendimiento en juegos
El Helios 18 también supera por poco alMSI GE78HX en juegos, pero ambos están a la par en última instancia. El Alienware m18 R1 con su RTX 4090 es alrededor de un 7% más rápido; la diferencia es mayor en Witcher 3 con un +22%, y nuestro Predator incluso lidera en GTA V.
| Performance rating - Percent | |
| Alienware m18 R1 | |
| Acer Predator Helios 18 N23Q2 | |
| Media de la clase Gaming | |
| HP Omen 17-ck2097ng | |
| MSI GE78HX 13VH-070US | |
| Razer Blade 18 RTX 4070 | |
| Asus ROG Strix G18 G814JI | |
| The Witcher 3 - 1920x1080 Ultra Graphics & Postprocessing (HBAO+) | |
| Alienware m18 R1 | |
| Media de la clase Gaming (104.7 - 240, n=7, últimos 2 años) | |
| MSI GE78HX 13VH-070US | |
| Acer Predator Helios 18 N23Q2 | |
| HP Omen 17-ck2097ng | |
| Asus ROG Strix G18 G814JI | |
| Razer Blade 18 RTX 4070 | |
| GTA V - 1920x1080 Highest AA:4xMSAA + FX AF:16x | |
| Acer Predator Helios 18 N23Q2 | |
| Alienware m18 R1 | |
| Media de la clase Gaming (48.3 - 186.9, n=94, últimos 2 años) | |
| Razer Blade 18 RTX 4070 | |
| HP Omen 17-ck2097ng | |
| Asus ROG Strix G18 G814JI | |
| MSI GE78HX 13VH-070US | |
| Final Fantasy XV Benchmark - 1920x1080 High Quality | |
| Alienware m18 R1 | |
| Acer Predator Helios 18 N23Q2 | |
| Media de la clase Gaming (41 - 215, n=95, últimos 2 años) | |
| MSI GE78HX 13VH-070US | |
| HP Omen 17-ck2097ng | |
| Asus ROG Strix G18 G814JI | |
| Razer Blade 18 RTX 4070 | |
| Strange Brigade - 1920x1080 ultra AA:ultra AF:16 | |
| Alienware m18 R1 | |
| Acer Predator Helios 18 N23Q2 | |
| Media de la clase Gaming (76.3 - 458, n=87, últimos 2 años) | |
| HP Omen 17-ck2097ng | |
| MSI GE78HX 13VH-070US | |
| Asus ROG Strix G18 G814JI | |
| Razer Blade 18 RTX 4070 | |
| Dota 2 Reborn - 1920x1080 ultra (3/3) best looking | |
| Alienware m18 R1 | |
| Acer Predator Helios 18 N23Q2 | |
| Razer Blade 18 RTX 4070 | |
| HP Omen 17-ck2097ng | |
| Asus ROG Strix G18 G814JI | |
| Media de la clase Gaming (84.8 - 248, n=107, últimos 2 años) | |
| MSI GE78HX 13VH-070US | |
| The Witcher 3 | |
| 1920x1080 High Graphics & Postprocessing (Nvidia HairWorks Off) | |
| Alienware m18 R1 | |
| MSI GE78HX 13VH-070US | |
| Media de la clase Gaming (341 - 404, n=2, últimos 2 años) | |
| Acer Predator Helios 18 N23Q2 | |
| Medio NVIDIA GeForce RTX 4080 Laptop GPU (246 - 385, n=14) | |
| HP Omen 17-ck2097ng | |
| Razer Blade 18 RTX 4070 | |
| Asus ROG Strix G18 G814JI | |
| 1920x1080 Ultra Graphics & Postprocessing (HBAO+) | |
| Alienware m18 R1 | |
| Media de la clase Gaming (104.7 - 240, n=7, últimos 2 años) | |
| MSI GE78HX 13VH-070US | |
| Acer Predator Helios 18 N23Q2 | |
| Medio NVIDIA GeForce RTX 4080 Laptop GPU (130.4 - 186.1, n=20) | |
| HP Omen 17-ck2097ng | |
| Asus ROG Strix G18 G814JI | |
| Razer Blade 18 RTX 4070 | |
| Hogwarts Legacy | |
| 1920x1080 Ultra Preset AA:High T | |
| Medio NVIDIA GeForce RTX 4080 Laptop GPU (108 - 131, n=3) | |
| Media de la clase Gaming (n=1últimos 2 años) | |
| Acer Predator Helios 18 N23Q2 | |
| Asus ROG Strix G18 G814JI | |
| 2560x1440 Ultra Preset AA:High T | |
| Media de la clase Gaming (n=1últimos 2 años) | |
| Medio NVIDIA GeForce RTX 4080 Laptop GPU (76 - 102, n=3) | |
| Acer Predator Helios 18 N23Q2 | |
| Asus ROG Strix G18 G814JI | |
| 1920x1080 Ultra Preset + Full Ray Tracing AA:High T | |
| Acer Predator Helios 18 N23Q2 | |
| Medio NVIDIA GeForce RTX 4080 Laptop GPU (53 - 66, n=2) | |
| Asus ROG Strix G18 G814JI | |
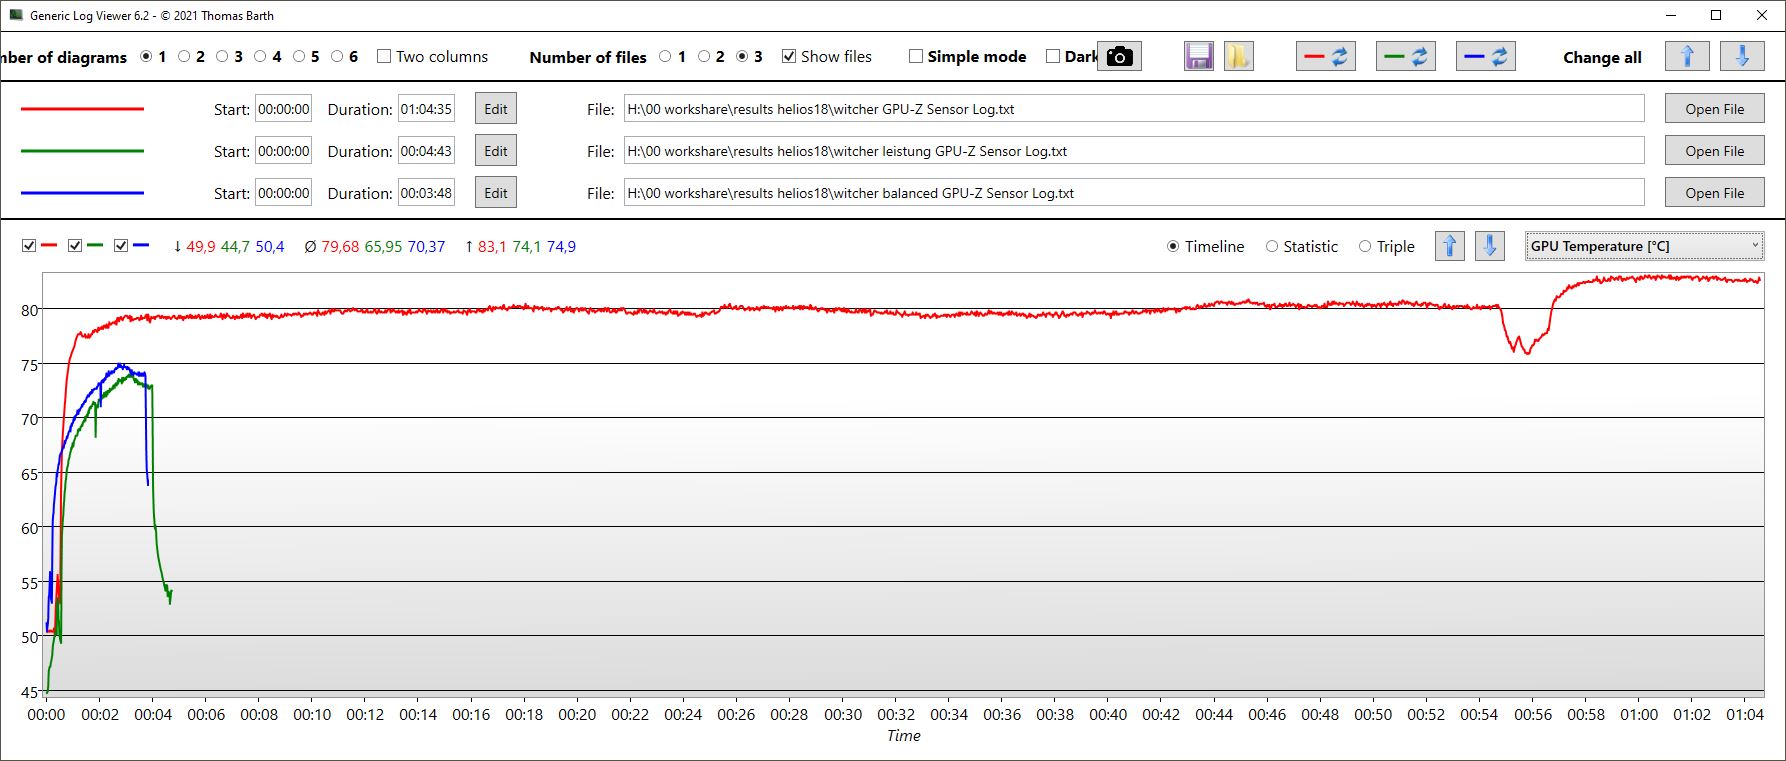
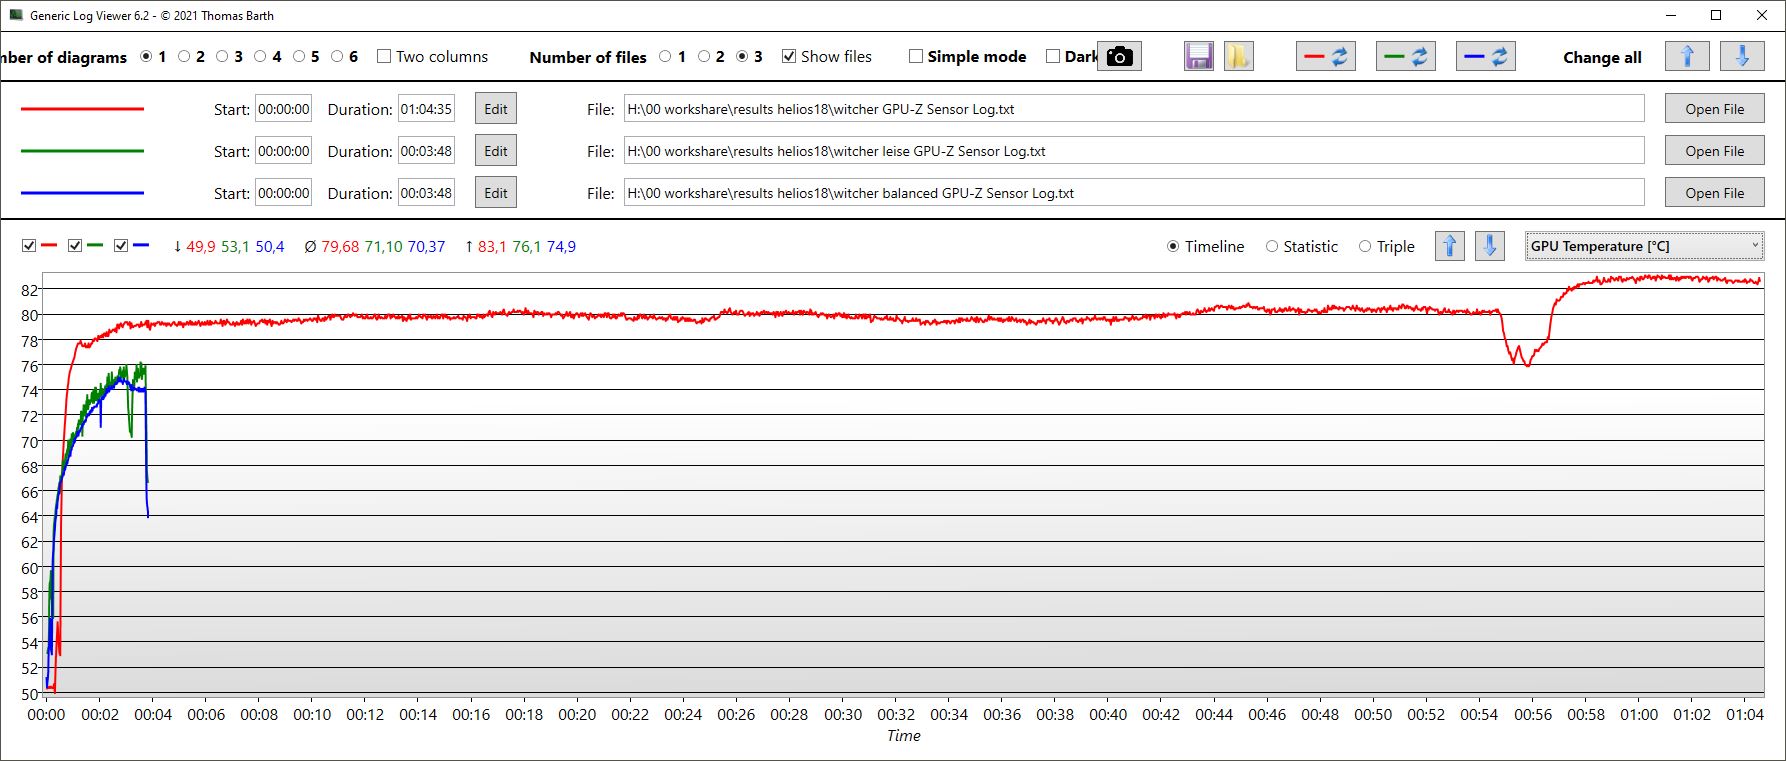
A lo largo de una hora, la tasa de imágenes por segundo en Witcher 3 se mantiene bastante estable; las ligeras fluctuaciones se deben al típico ciclo día/noche del juego.
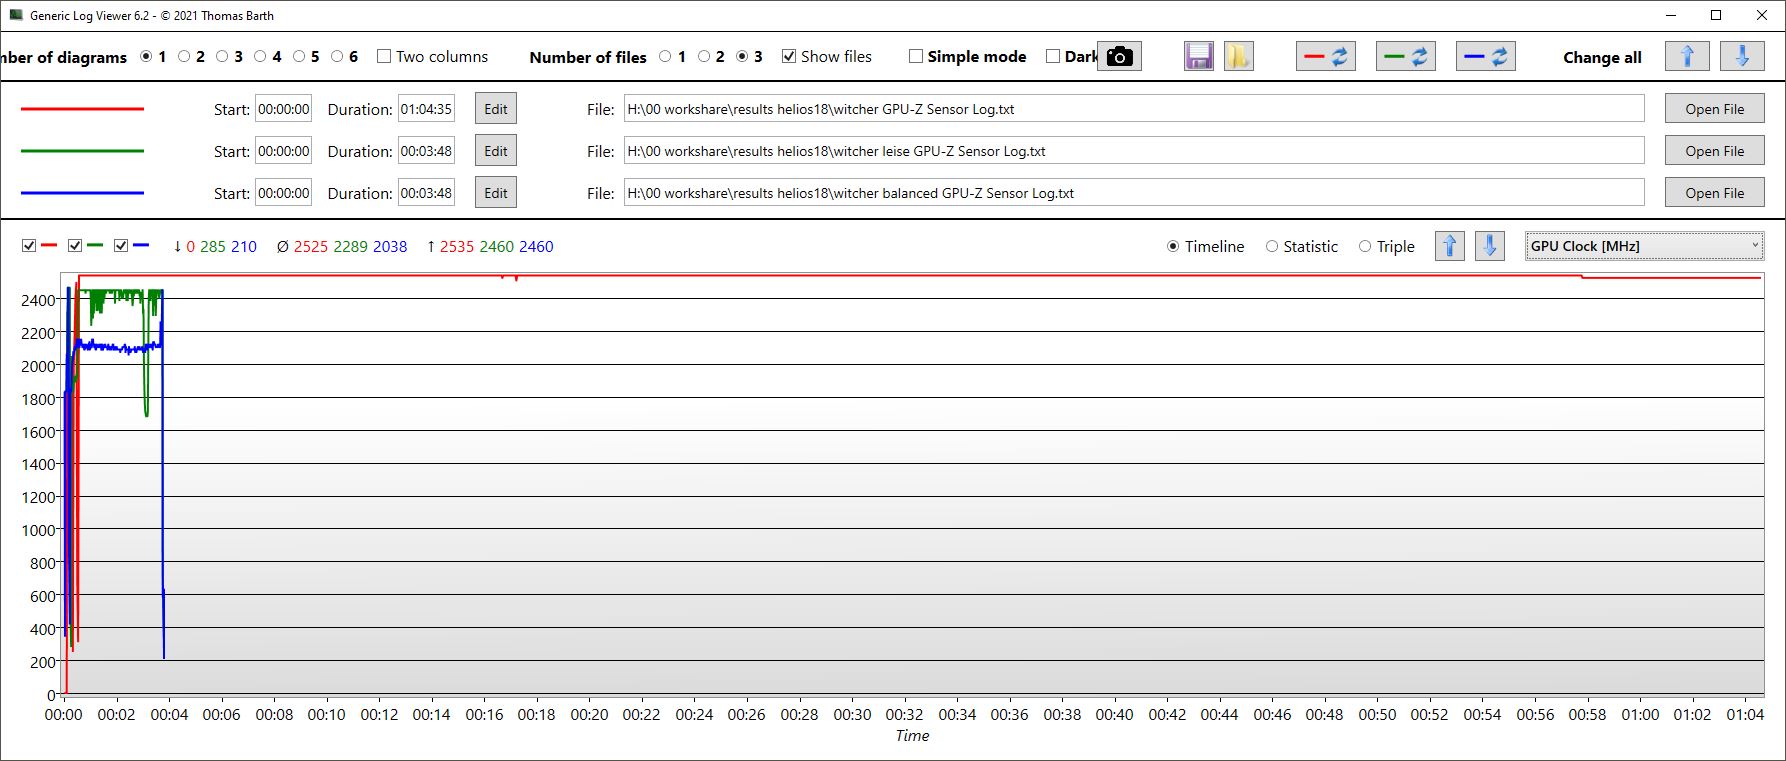
Al contrario que en el benchmark de la CPU, ahora hay una clara diferencia entre los modos Equilibrado y Silencioso a la hora de jugar. Este último es, fiel a su homónimo, muy silencioso y también consume menos energía. Las tablas de fps, consumo y volumen de cada uno de los modos de rendimiento de Witcher 3 Ultra pueden consultarse en las siguientes secciones Emisiones/Temperatura.
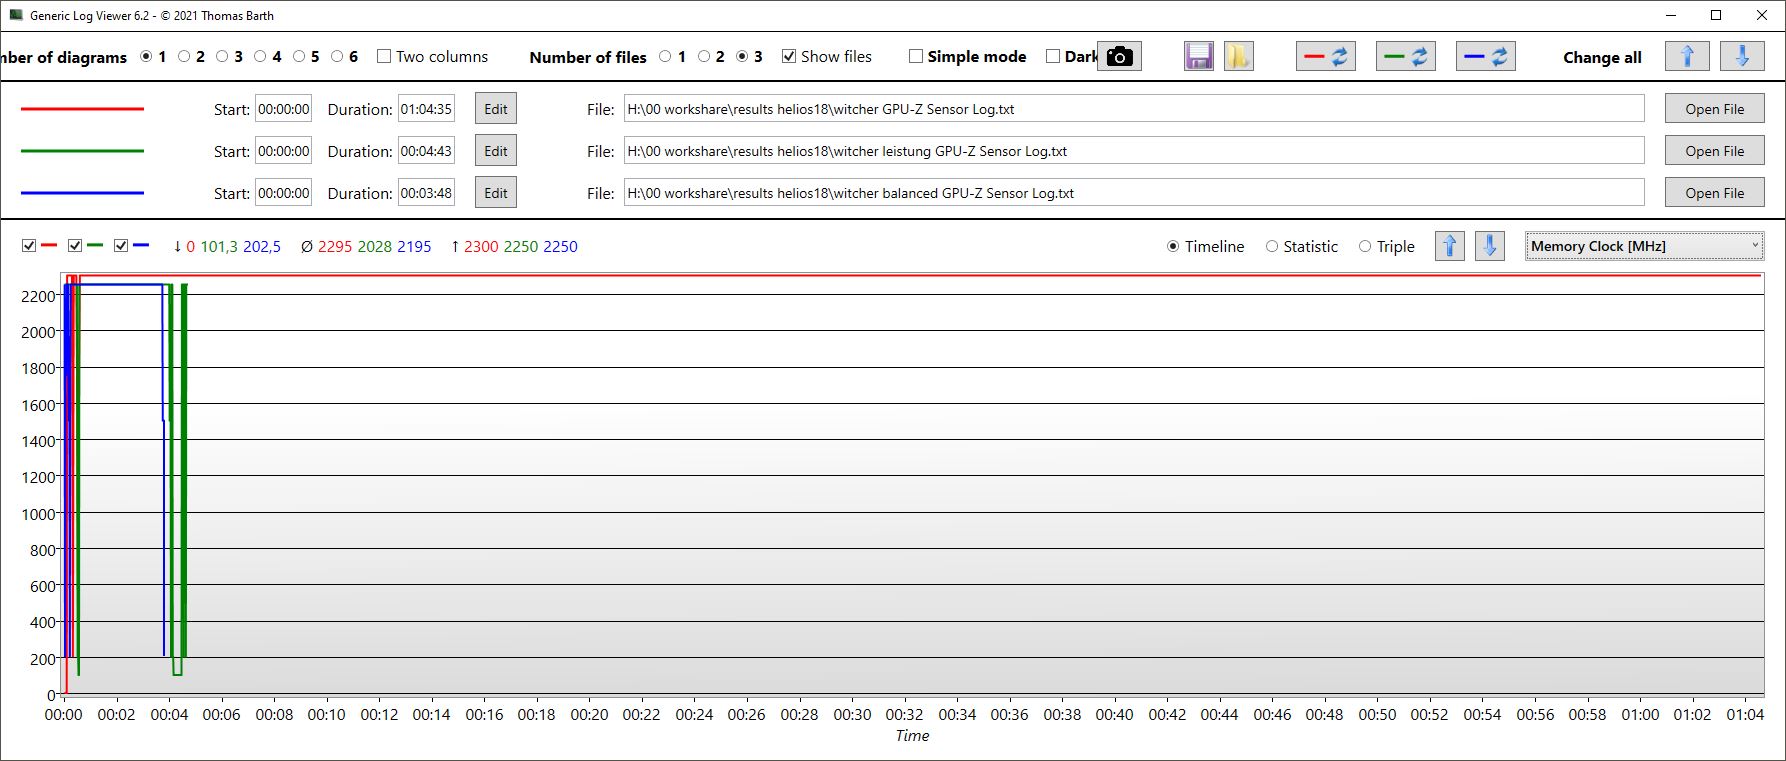
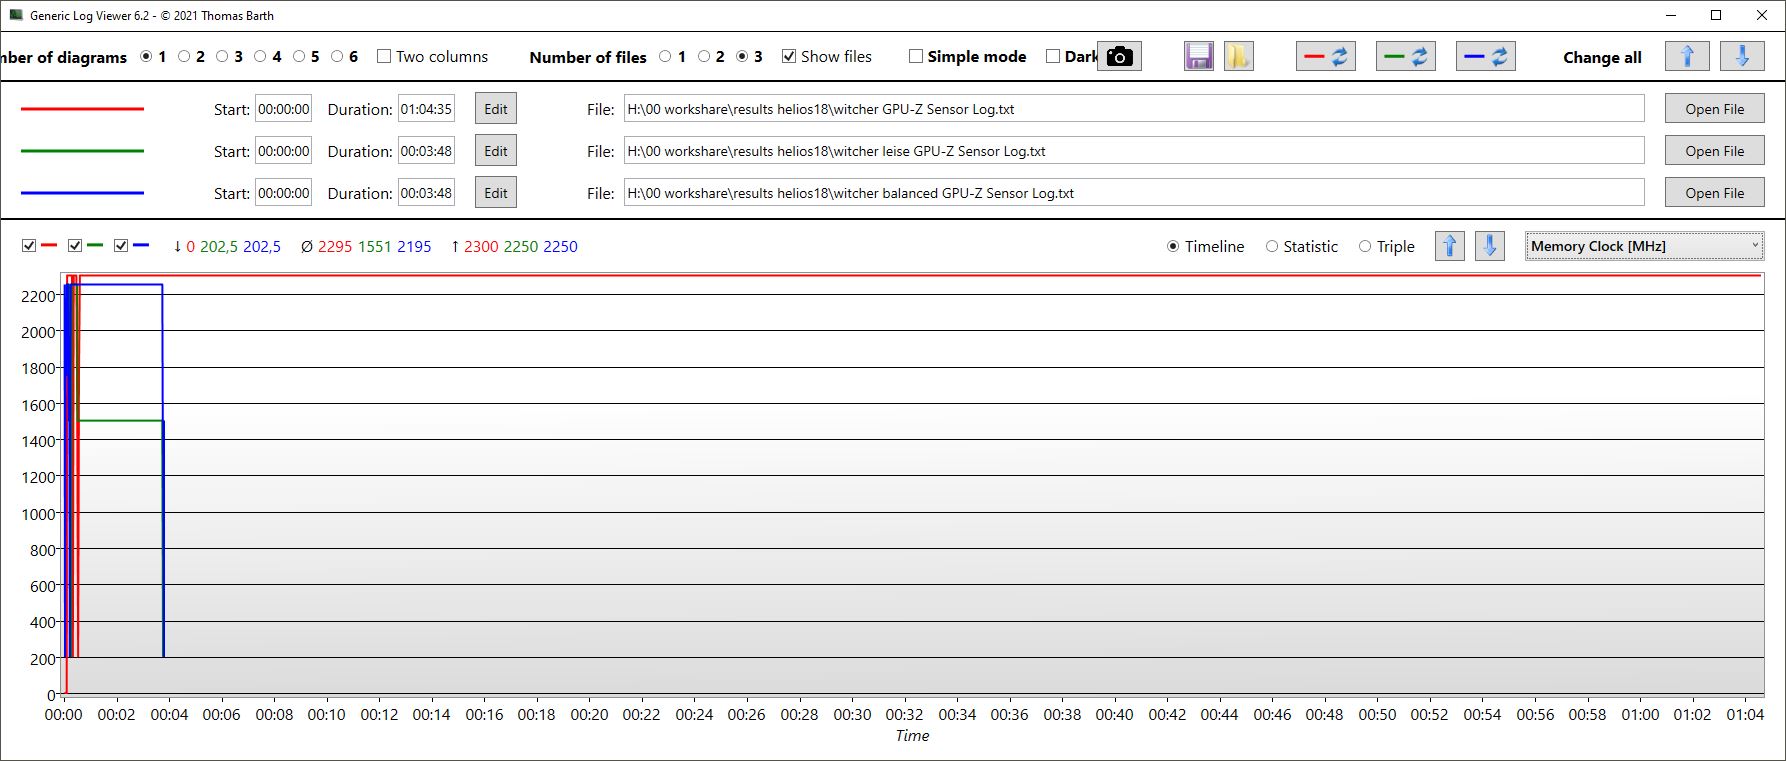
Curiosamente, la GPU funciona a frecuencias ligeramente superiores en el modo Silencioso que en el Equilibrado, pero el reloj de la memoria es significativamente inferior y el consumo de energía también es menor.
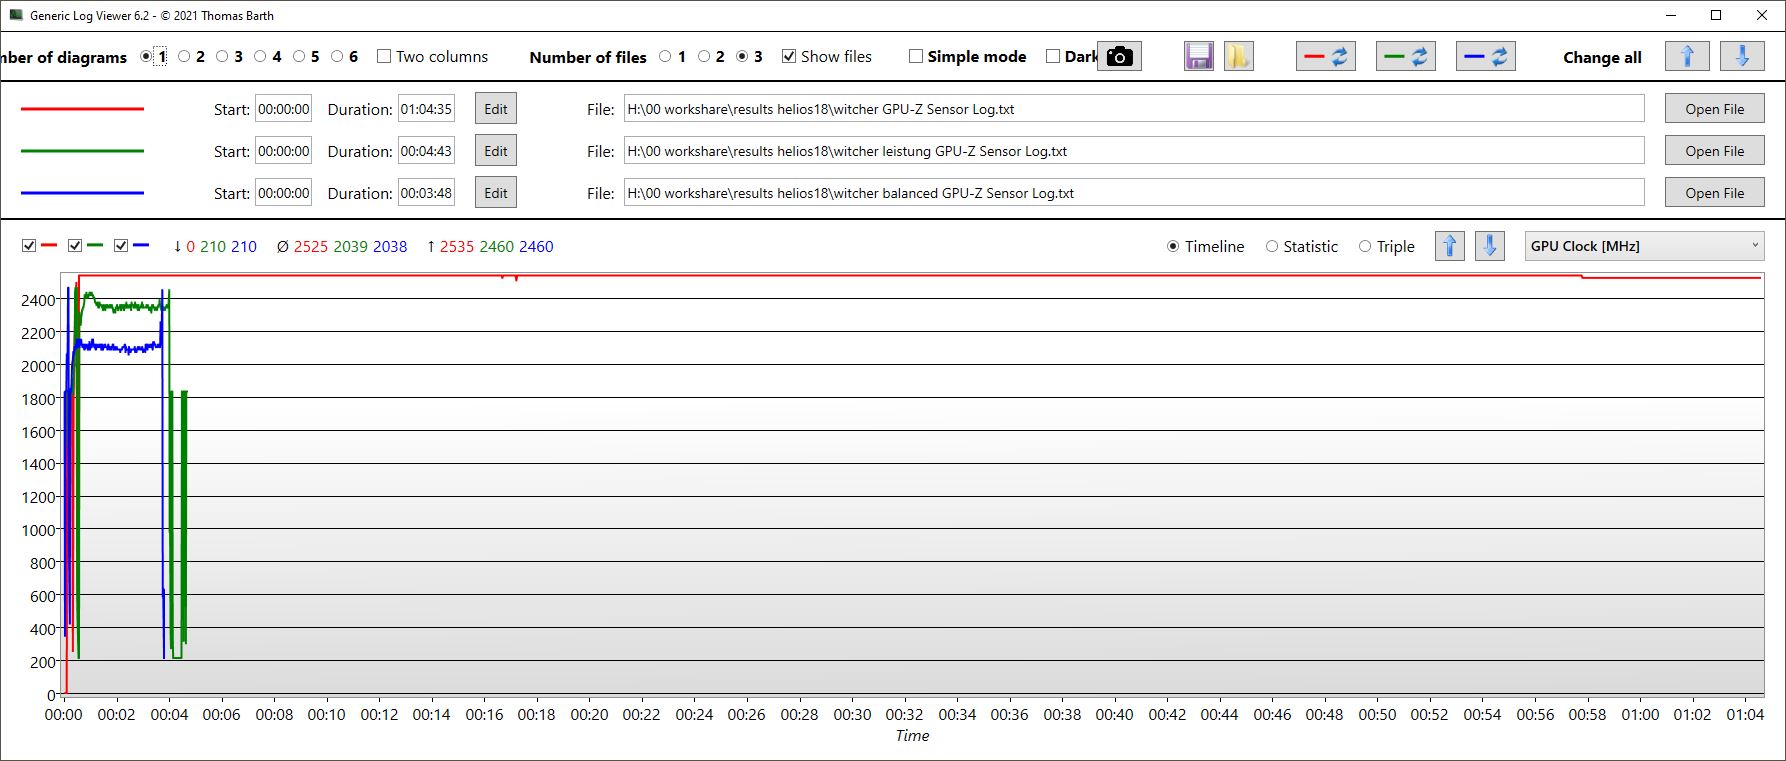
Witcher 3 FPS chart
| bajo | medio | alto | ultra | QHD | 4K | |
|---|---|---|---|---|---|---|
| GTA V (2015) | 187.3 | 187.6 | 186.7 | 152.7 | 140.7 | |
| The Witcher 3 (2015) | 642 | 568 | 368 | 175 | 153 | |
| Dota 2 Reborn (2015) | 234 | 211 | 202 | 186.4 | 131 | |
| Final Fantasy XV Benchmark (2018) | 234 | 225 | 182.1 | 136.6 | 79.4 | |
| X-Plane 11.11 (2018) | 199 | 183.5 | 139.5 | 143.7 | ||
| Far Cry 5 (2018) | 199 | 175 | 168 | 158 | 155 | |
| Strange Brigade (2018) | 562 | 448 | 382 | 339 | 238 | |
| Call of Duty Modern Warfare 2 2022 (2022) | 167 | 124 | ||||
| Hogwarts Legacy (2023) | 173 | 157 | 134 | 108 | 81 | |
| F1 23 (2023) | 329 | 329 | 304 | 111 | 73 | |
| Cyberpunk 2077 (2023) | 127.13 | 77.03 | ||||
| Alan Wake 2 (2023) | 100.7 | 71 |
Emisiones - Helios 18 muy ruidoso en turbo
Ruido
Naturalmente, el ruido del ventilador depende en gran medida del modo de rendimiento elegido. En el modo Turbo , el ruido de fondo es muy elevado bajo carga; medimos un máximo de algo menos de 60 dB, lo que lo convierte en el aparato más ruidoso del campo de comparación. ElAlienware con su RTX 4090 sigue siendo más silencioso; sólo el MSI es similarmente ruidoso. Al volumen máximo, el chasis incluso empieza a vibrar ligeramente. Por tanto, recomendamos el modo Rendimiento o inferior. En el primero, sólo se renuncia a entre un 3 y un 5 por ciento de rendimiento en Witcher 3, ¡pero el volumen baja casi 10 dB!
Al menos, el Helios 18 regula bien sus ventiladores en función de la carga y no desata inmediatamente el volumen máximo sobre los usuarios con cargas medias. Sin embargo, el giro del ventilador no permanece constante mientras se juega, sino que fluctúa cíclicamente, a veces más y a veces menos fuerte (Witcher 3).
Los otros modos de rendimiento pueden reducir considerablemente el nivel de ruido, véase la tabla siguiente.
| Parámetros/Modo de funcionamiento | Turbo | Rendimiento | Equilibrado | Silencioso |
|---|---|---|---|---|
| fps | 176 | 171 | 157 | 100 |
| Volumen en dB | 59,82 | 50,74 | 40,77 | 32,36 |
| Consumo en W | 289 | 227 | 182 | 153 |
Ruido
| Ocioso |
| 23 / 23 / 23 dB(A) |
| Carga |
| 45.26 / 59.94 dB(A) |
 | ||
30 dB silencioso 40 dB(A) audible 50 dB(A) ruidosamente alto |
||
min: | ||
| Acer Predator Helios 18 N23Q2 GeForce RTX 4080 Laptop GPU, i9-13900HX, Samsung PM9A1 MZVL22T0HBLB | MSI GE78HX 13VH-070US GeForce RTX 4080 Laptop GPU, i9-13950HX, Samsung PM9A1 MZVL22T0HBLB | HP Omen 17-ck2097ng GeForce RTX 4080 Laptop GPU, i9-13900HX, SK hynix PC801 HFS001TEJ9X101N | Alienware m18 R1 GeForce RTX 4090 Laptop GPU, i9-13980HX, SK hynix PC801 HFS001TEJ9X101N | Asus ROG Strix G18 G814JI GeForce RTX 4070 Laptop GPU, i7-13650HX, Micron 2400 MTFDKBA1T0QFM | Razer Blade 18 RTX 4070 GeForce RTX 4070 Laptop GPU, i9-13950HX, SSSTC CA6-8D1024 | |
|---|---|---|---|---|---|---|
| Noise | -6% | -11% | 6% | -2% | 3% | |
| apagado / medio ambiente * (dB) | 23 | 23.4 -2% | 24 -4% | 22.8 1% | 25 -9% | 23.5 -2% |
| Idle Minimum * (dB) | 23 | 24.2 -5% | 31 -35% | 23 -0% | 26 -13% | 23.8 -3% |
| Idle Average * (dB) | 23 | 25.6 -11% | 32 -39% | 23 -0% | 28 -22% | 23.8 -3% |
| Idle Maximum * (dB) | 23 | 31 -35% | 33 -43% | 23 -0% | 29 -26% | 26.8 -17% |
| Load Average * (dB) | 45.26 | 43.3 4% | 45 1% | 35.6 21% | 41 9% | 37.3 18% |
| Witcher 3 ultra * (dB) | 59.82 | 56.3 6% | 45 25% | 51.3 14% | 44 26% | 48 20% |
| Load Maximum * (dB) | 59.94 | 59.1 1% | 50 17% | 56.7 5% | 46 23% | 53.5 11% |
* ... más pequeño es mejor
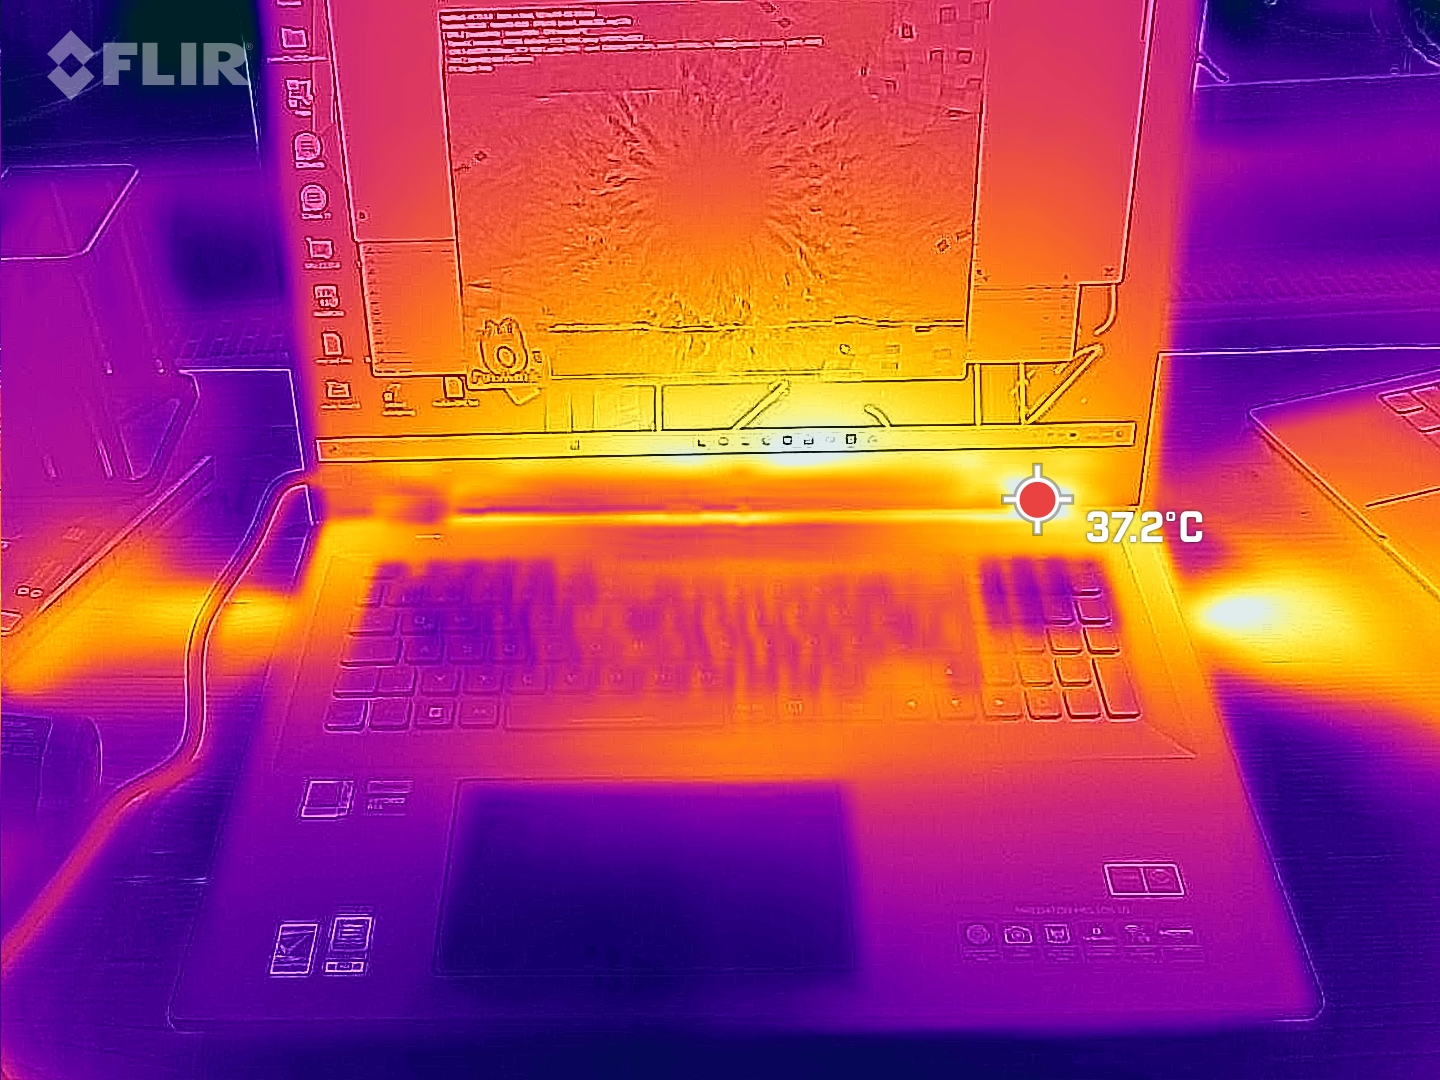
Temperatura
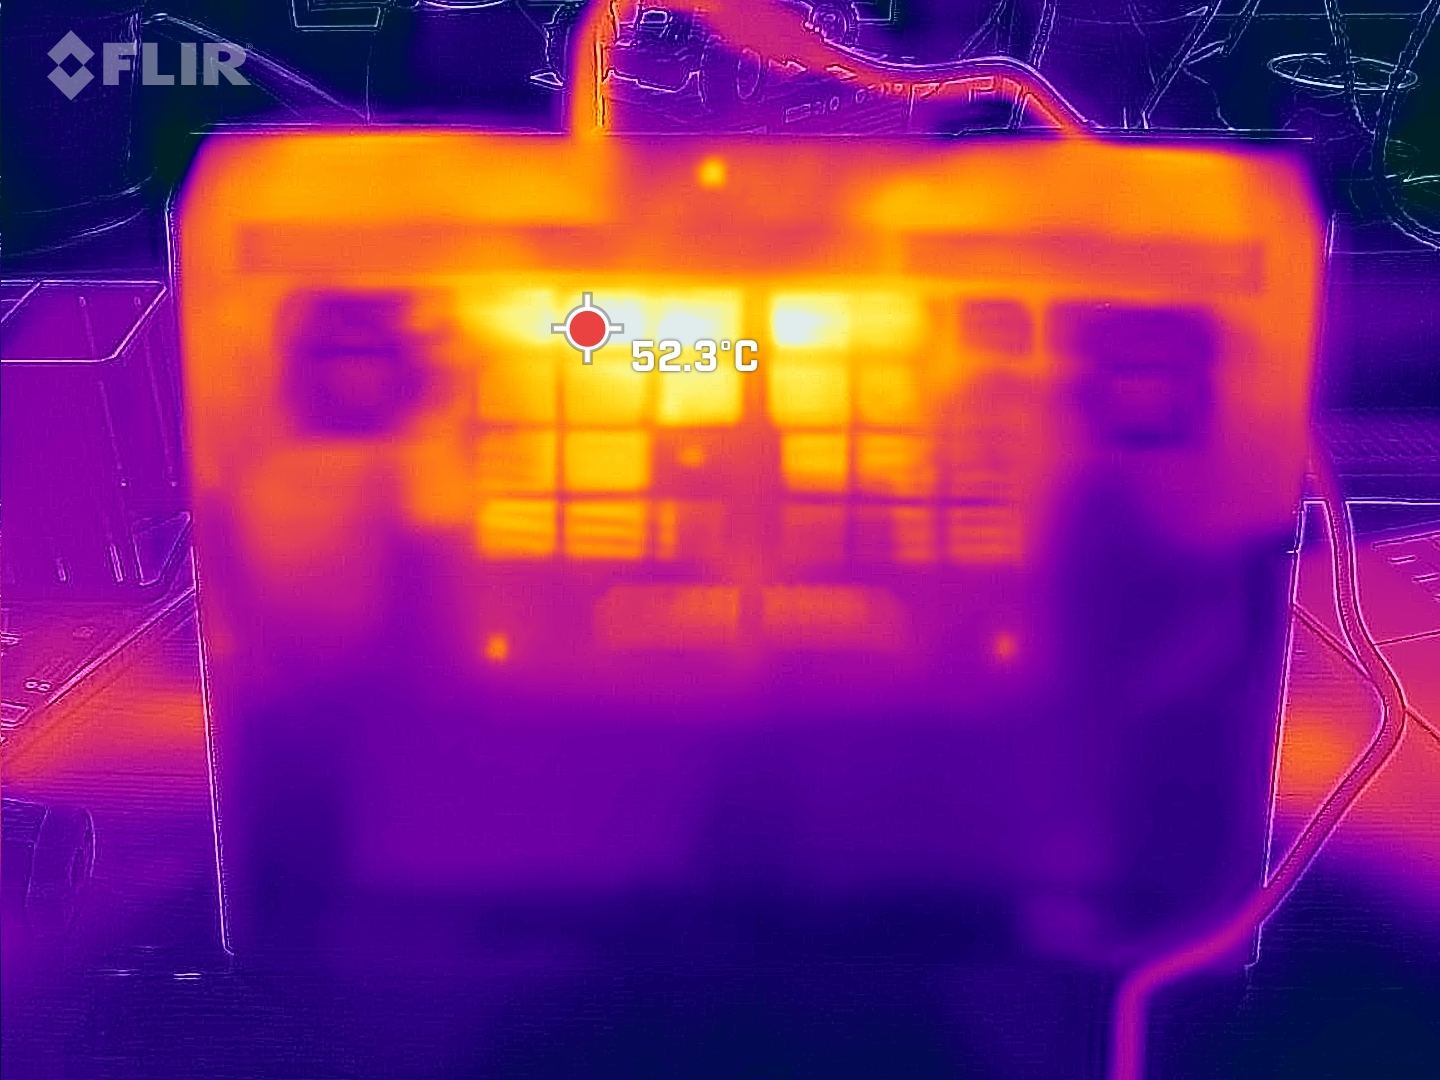
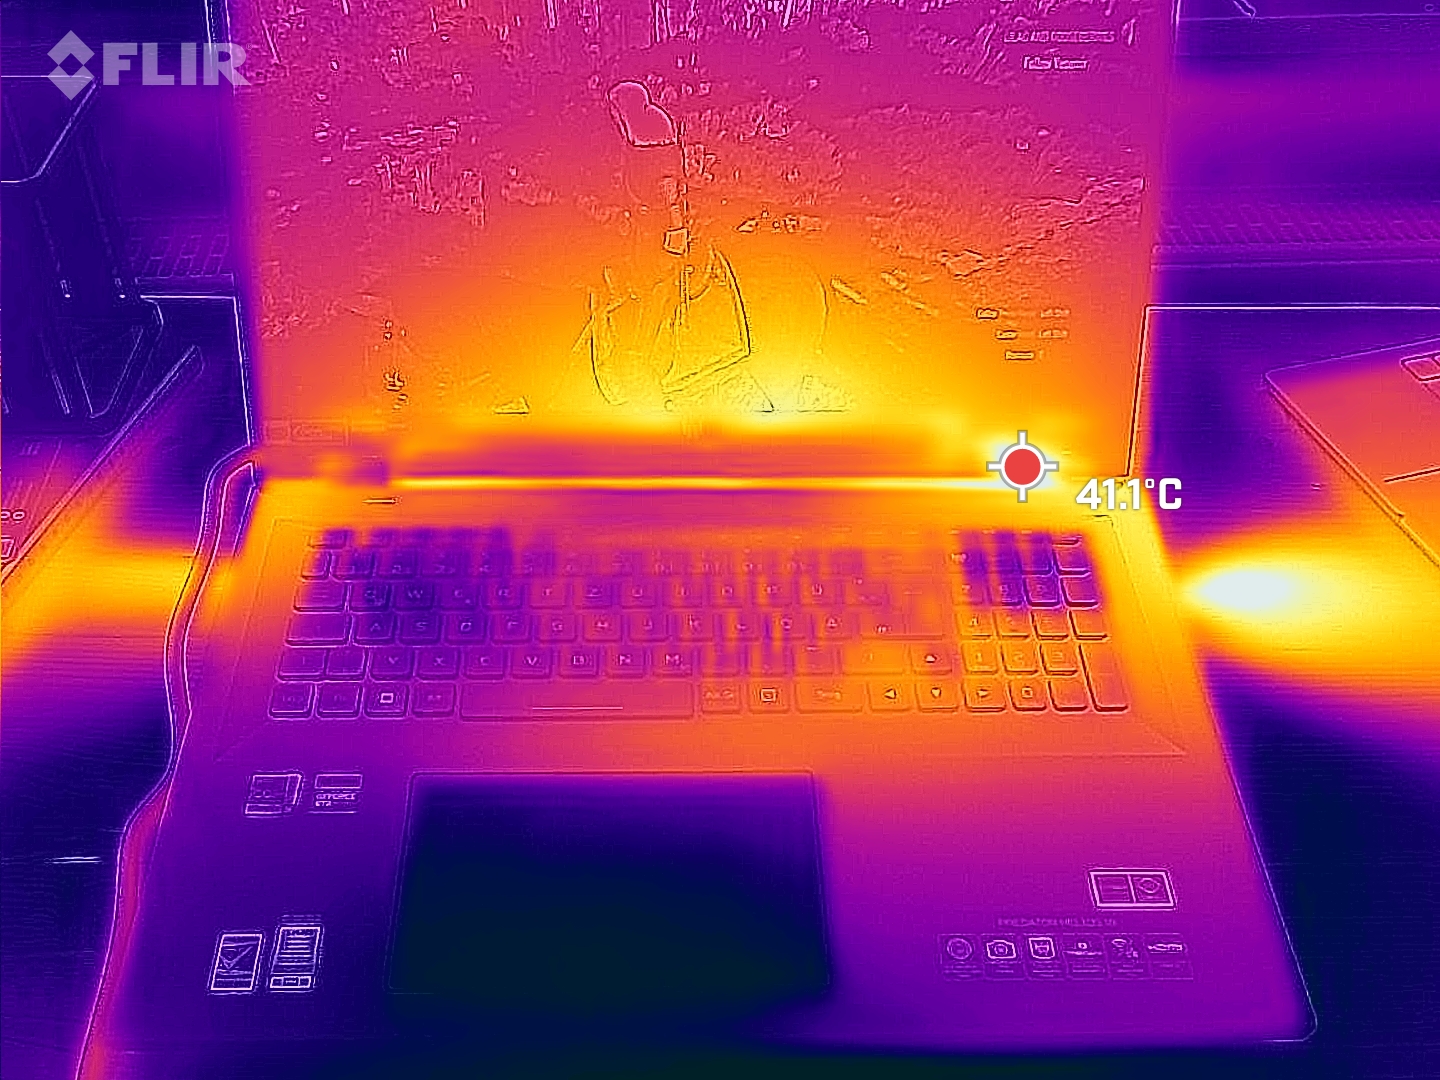
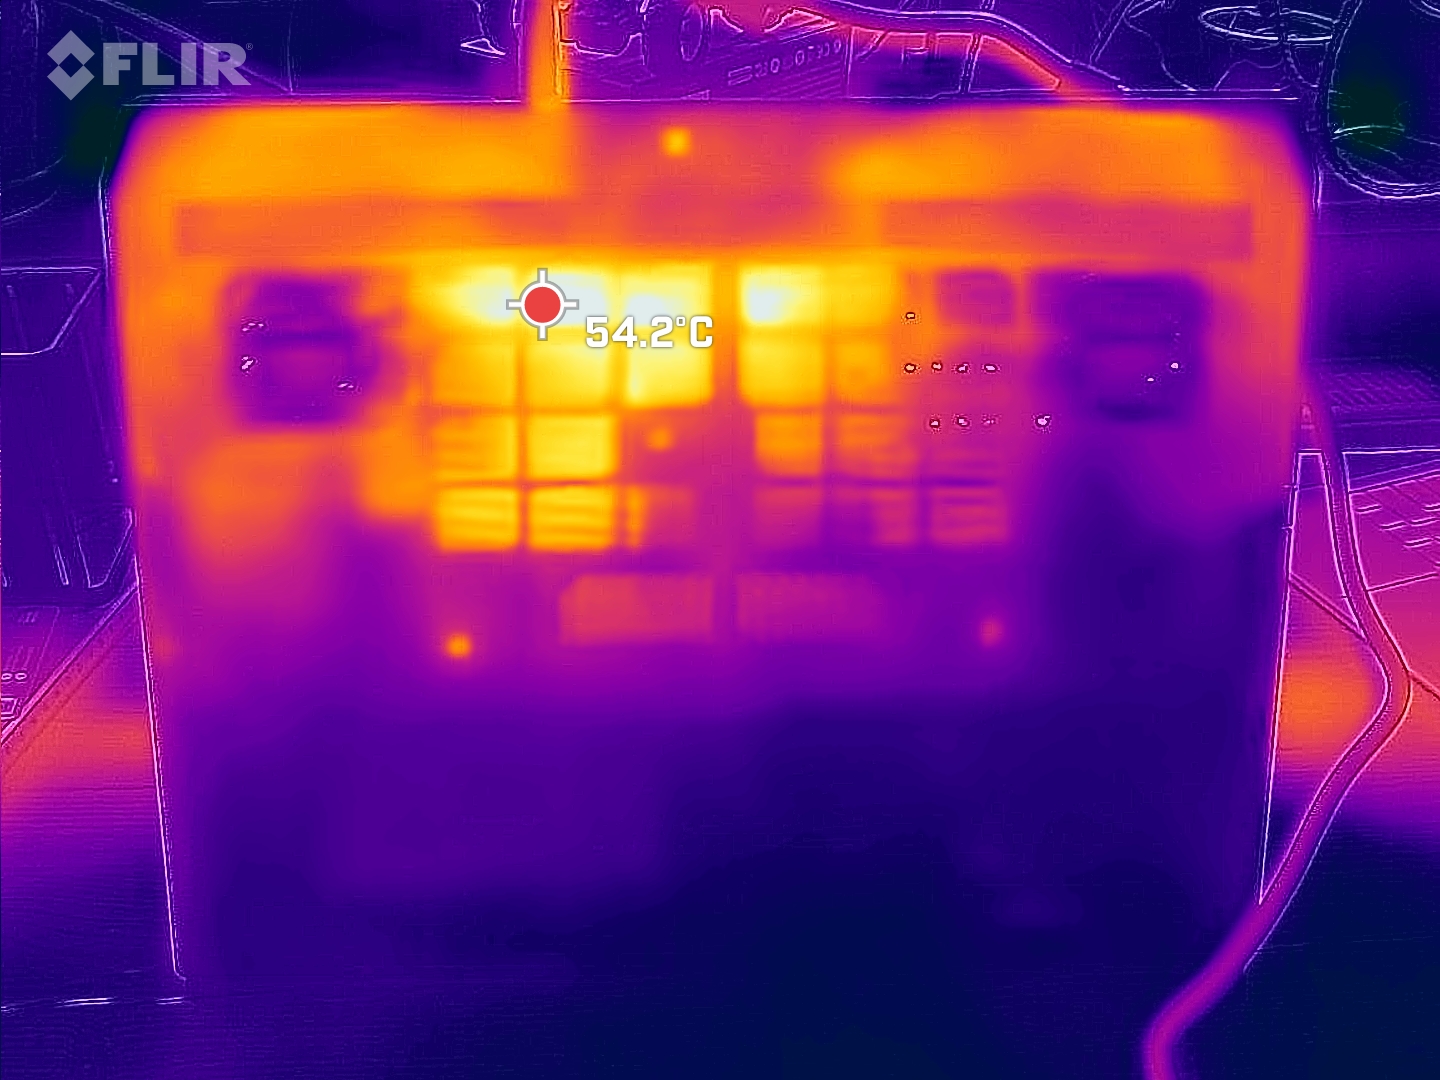
Las temperaturas superficiales muestran que los ventiladores ruidosos también tienen un aspecto positivo. El Helios 18 sólo se calienta de forma muy selectiva (parte inferior central y a la izquierda de la pantalla), pero por lo demás se mantiene casi inusualmente frío. Por ejemplo, el reposamanos izquierdo se siente francamente frío después de una hora de juego. Esto demuestra que, por un lado, los ruidosos ventiladores están configurados de forma demasiado agresiva y, por otro, el calor no se distribuye muy bien.
(+) La temperatura máxima en la parte superior es de 35 °C / 95 F, frente a la media de 40.4 °C / 105 F, que oscila entre 21.2 y 68.8 °C para la clase Gaming.
(-) El fondo se calienta hasta un máximo de 56 °C / 133 F, frente a la media de 43.2 °C / 110 F
(+) En reposo, la temperatura media de la parte superior es de 31.1 °C / 88# F, frente a la media del dispositivo de 33.9 °C / 93 F.
(+) Jugando a The Witcher 3, la temperatura media de la parte superior es de 30.7 °C / 87 F, frente a la media del dispositivo de 33.9 °C / 93 F.
(+) El reposamanos y el panel táctil están a una temperatura inferior a la de la piel, con un máximo de 29 °C / 84.2 F y, por tanto, son fríos al tacto.
(±) La temperatura media de la zona del reposamanos de dispositivos similares fue de 28.8 °C / 83.8 F (-0.2 °C / -0.4 F).
| Acer Predator Helios 18 N23Q2 Intel Core i9-13900HX, NVIDIA GeForce RTX 4080 Laptop GPU | MSI GE78HX 13VH-070US Intel Core i9-13950HX, NVIDIA GeForce RTX 4080 Laptop GPU | HP Omen 17-ck2097ng Intel Core i9-13900HX, NVIDIA GeForce RTX 4080 Laptop GPU | Alienware m18 R1 Intel Core i9-13980HX, NVIDIA GeForce RTX 4090 Laptop GPU | Asus ROG Strix G18 G814JI Intel Core i7-13650HX, NVIDIA GeForce RTX 4070 Laptop GPU | Razer Blade 18 RTX 4070 Intel Core i9-13950HX, NVIDIA GeForce RTX 4070 Laptop GPU | |
|---|---|---|---|---|---|---|
| Heat | 11% | 14% | 17% | 7% | 11% | |
| Maximum Upper Side * (°C) | 35 | 37.4 -7% | 41 -17% | 39 -11% | 45 -29% | 39.2 -12% |
| Maximum Bottom * (°C) | 56 | 45 20% | 51 9% | 36.4 35% | 47 16% | 35.6 36% |
| Idle Upper Side * (°C) | 34 | 29.8 12% | 24 29% | 29.2 14% | 28 18% | 31.8 6% |
| Idle Bottom * (°C) | 39 | 32.4 17% | 25 36% | 27.8 29% | 31 21% | 33.2 15% |
* ... más pequeño es mejor
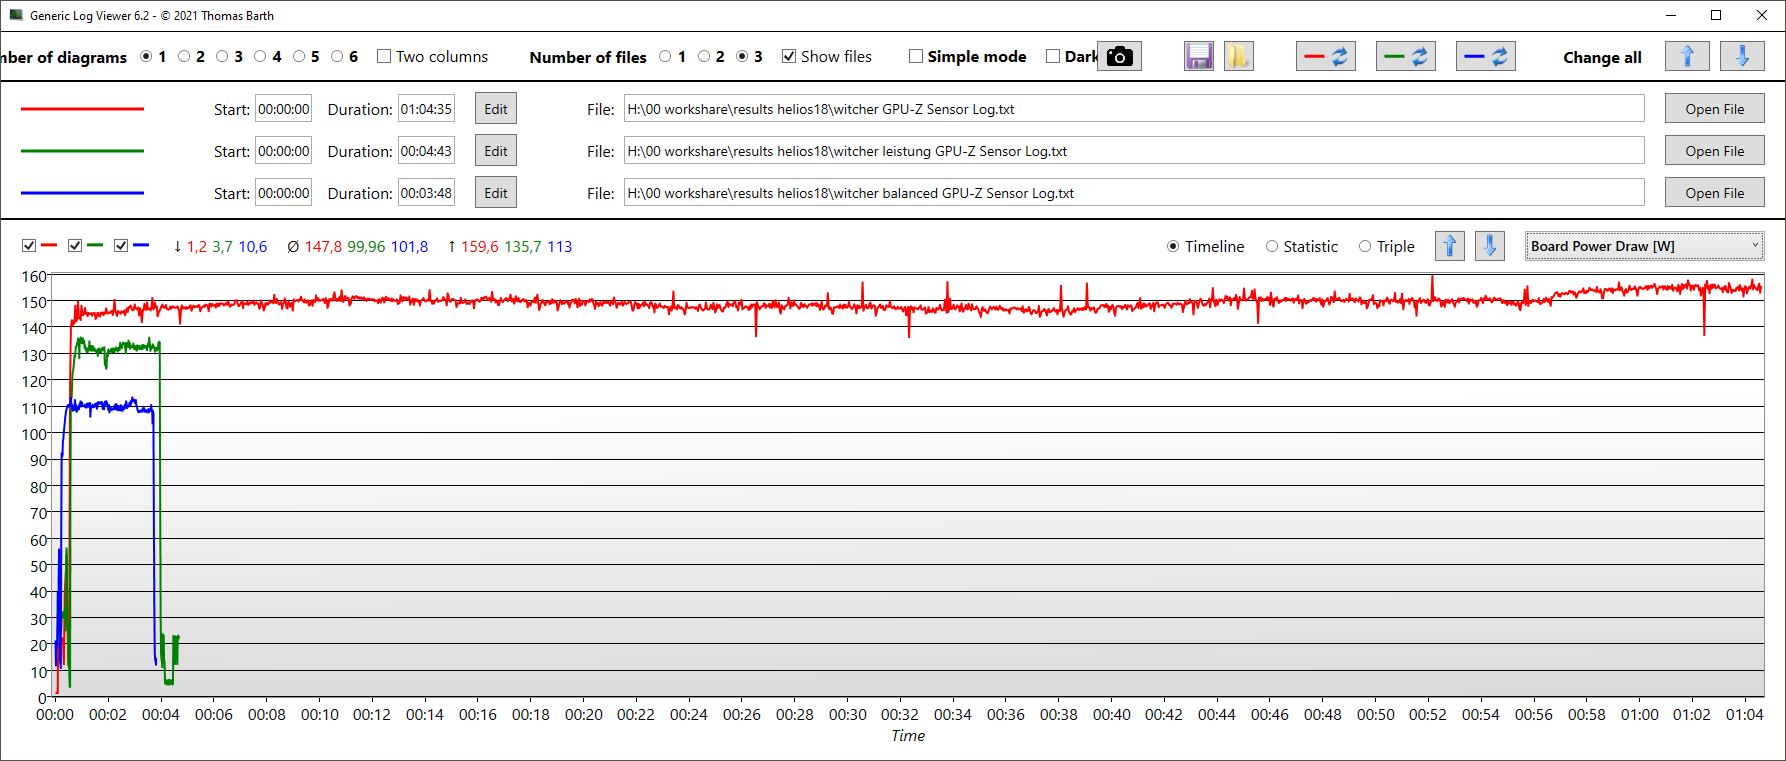
Pruebas de estrés
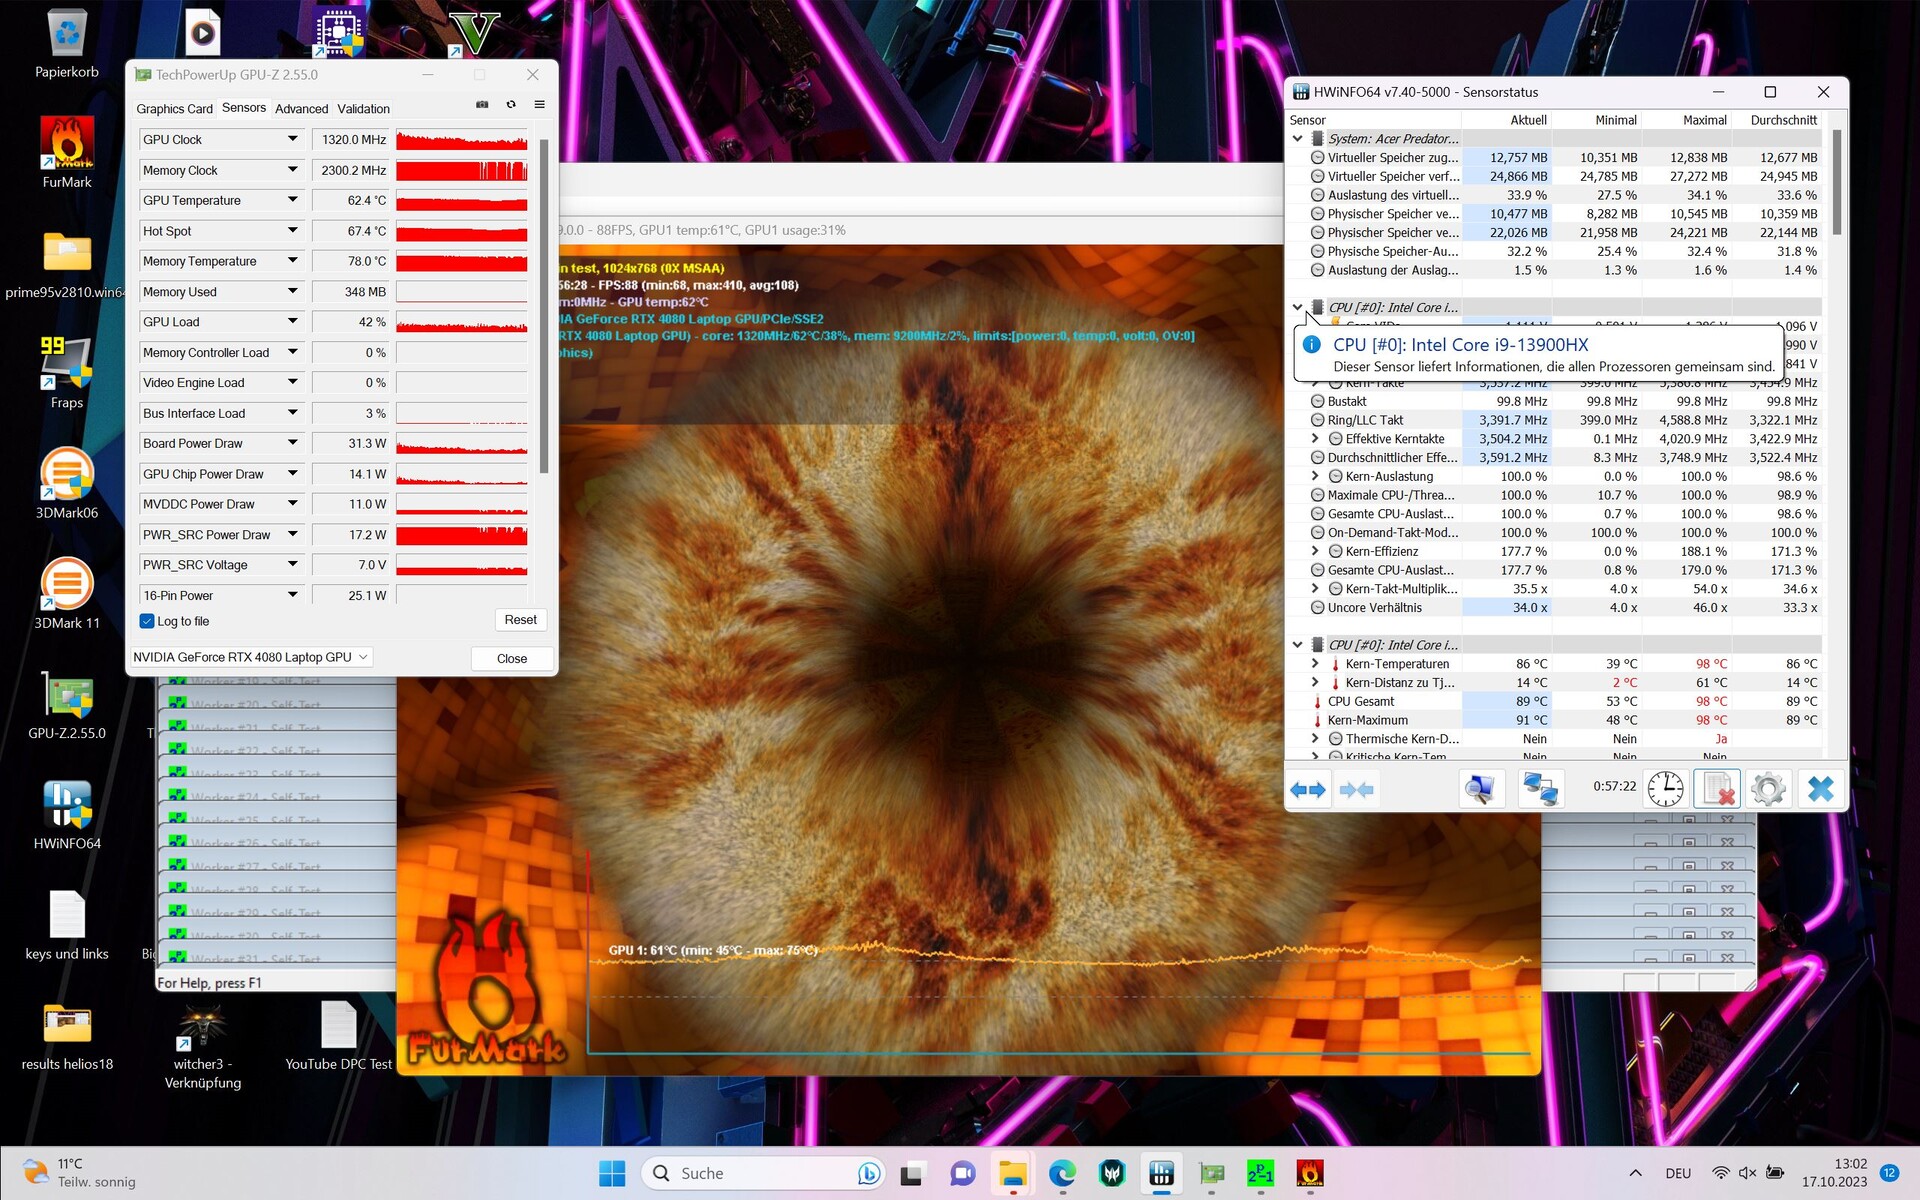
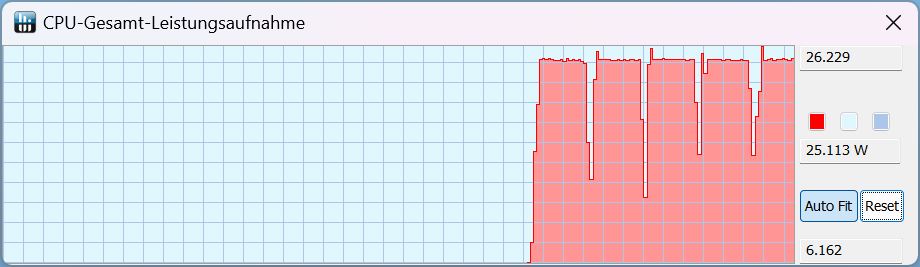
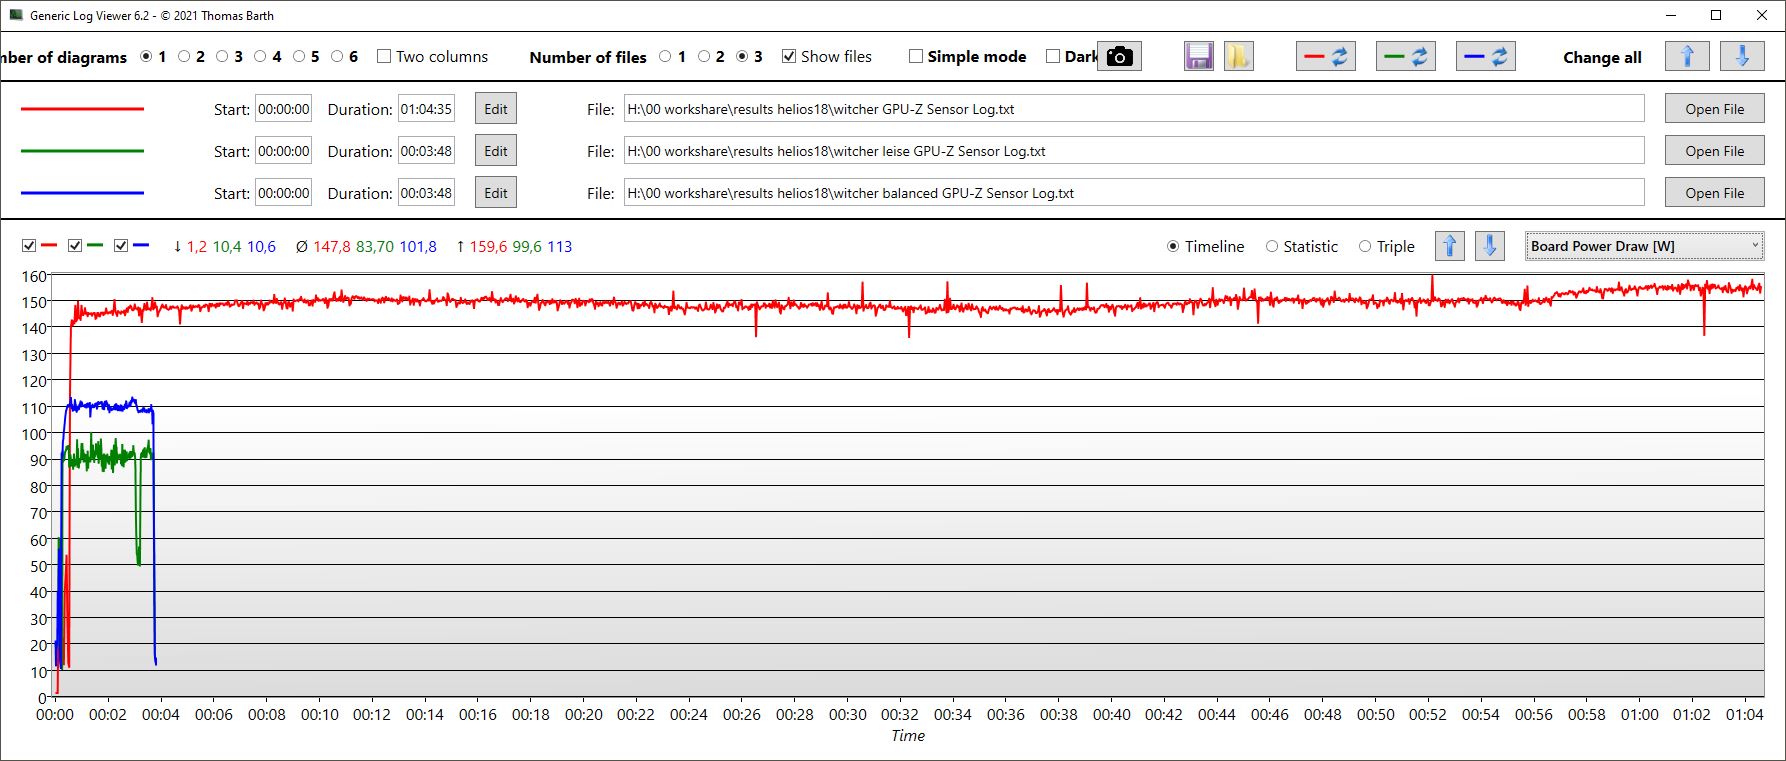
Después de lanzar nuestra prueba de estrés, el rendimiento de la CPU del Predator se mantiene relativamente constante, con los núcleos marcando constantemente entre 3,4 y 3,6 GHz. Siempre hay pequeñas fluctuaciones que se reflejan en el consumo de energía y también en la temperatura del núcleo. Las temperaturas del núcleo de la CPU suben hasta los 98 °C, pero la media es de 89 °C. El consumo de energía de la CPU alcanza un máximo de 156 W y una media de 137 W.
La GPU es mucho menos consistente y muestra una curva ondulada de rendimiento. La velocidad de reloj alcanza un máximo cíclicamente recurrente de 2,5 GHz y los valles de la curva se sitúan en torno a 1,2 GHz. Al mismo tiempo, medimos caídas muy espontáneas hasta sólo 200 MHz durante fracciones de segundo en el reloj de memoria, por lo demás constante, de 2,3 GHz. La temperatura de la GPU también fluctúa, pero sólo es de 64 °C de media, con un máximo de 76 °C. El consumo de energía fluctúa entre 25 W y 90 a 100 W.
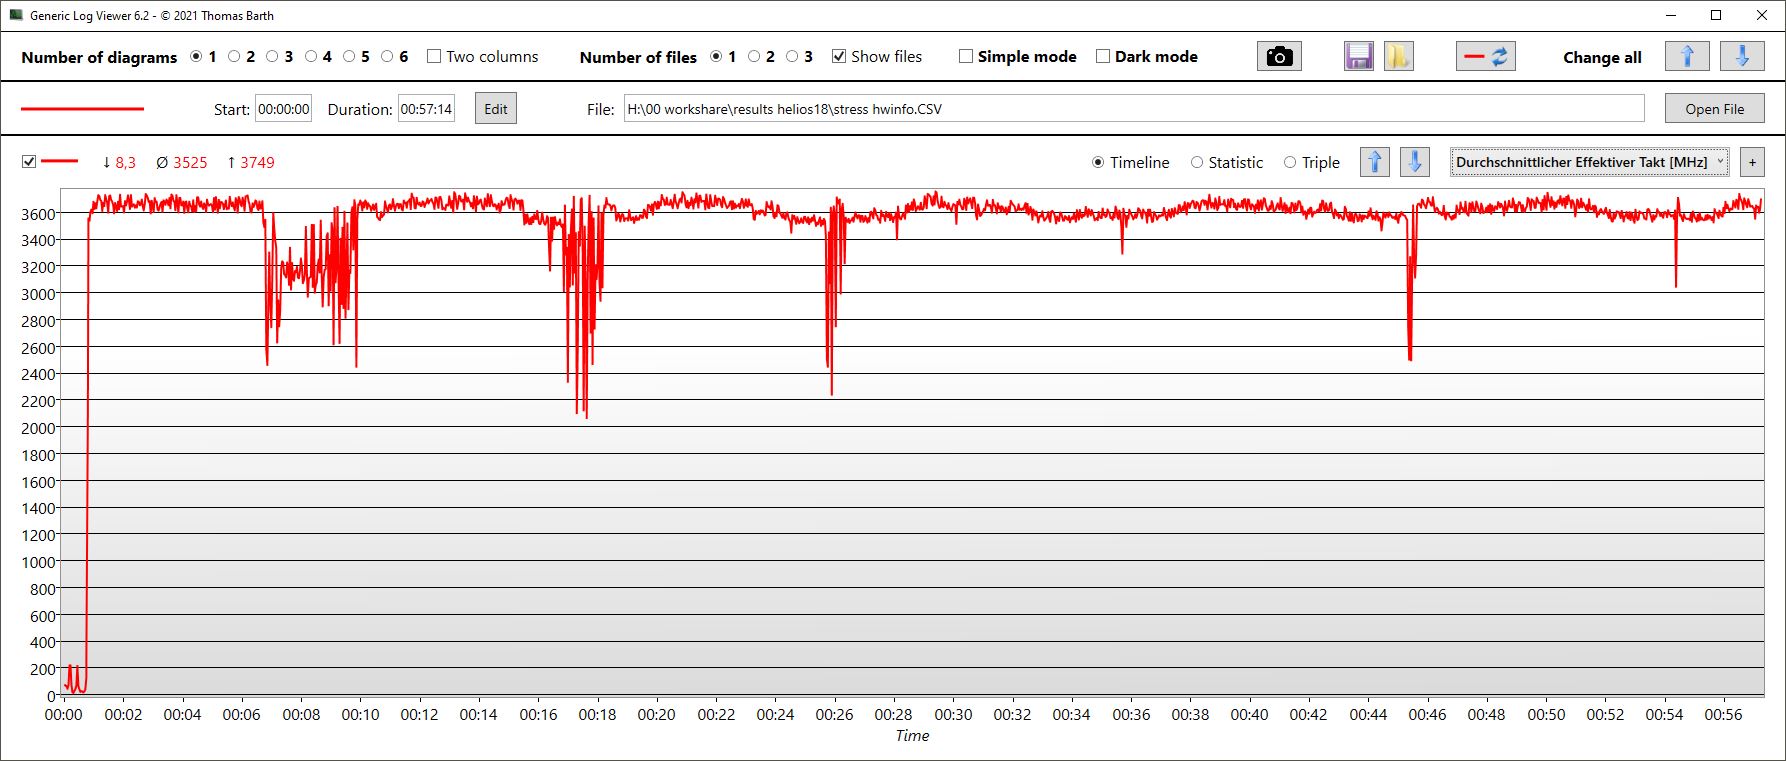
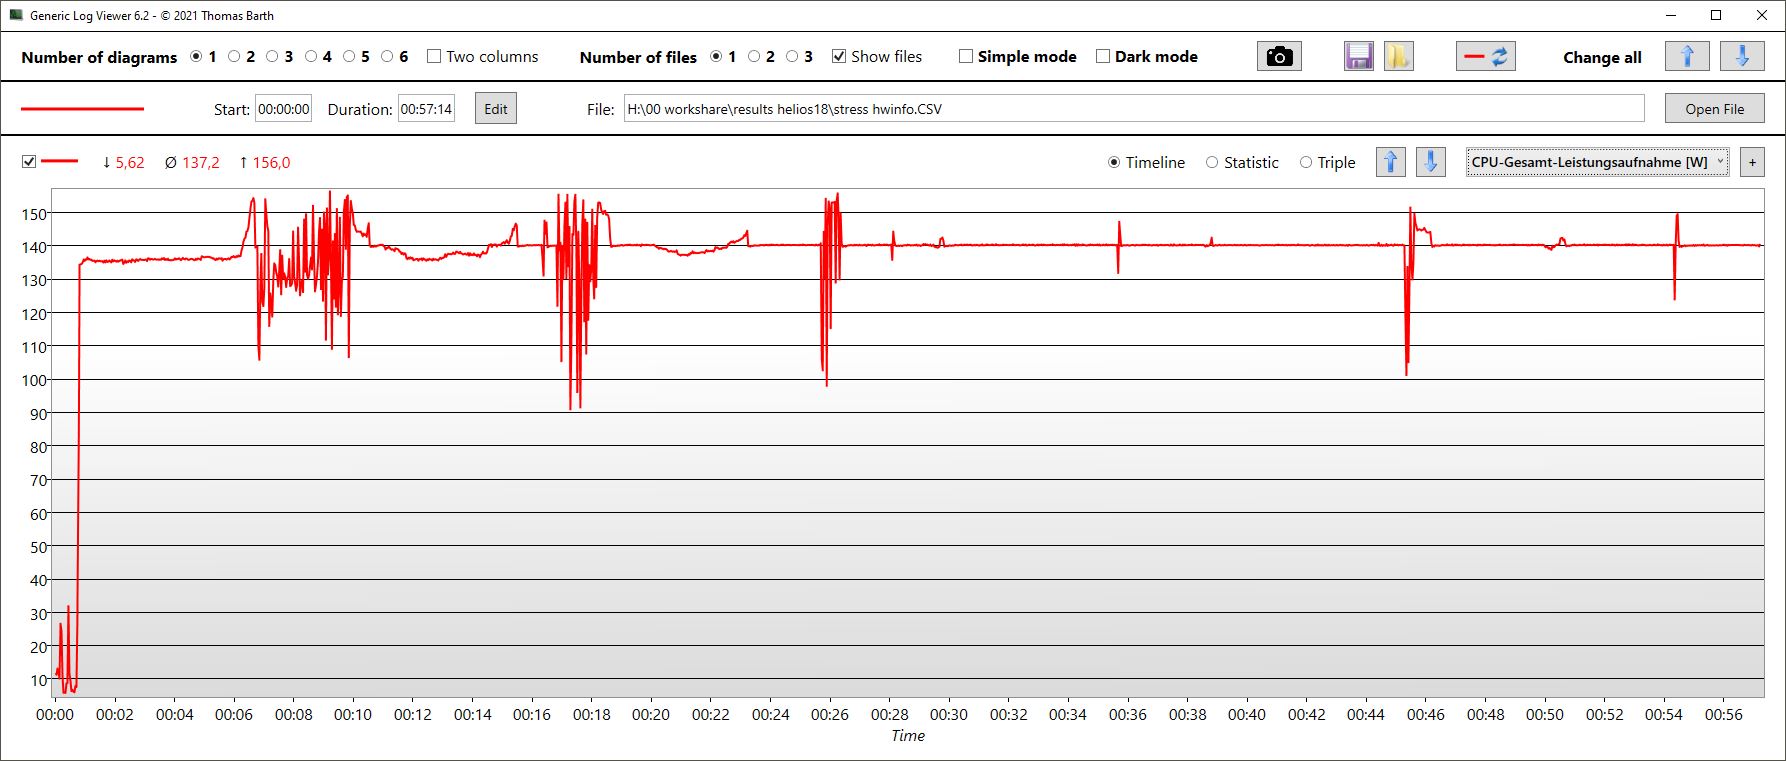
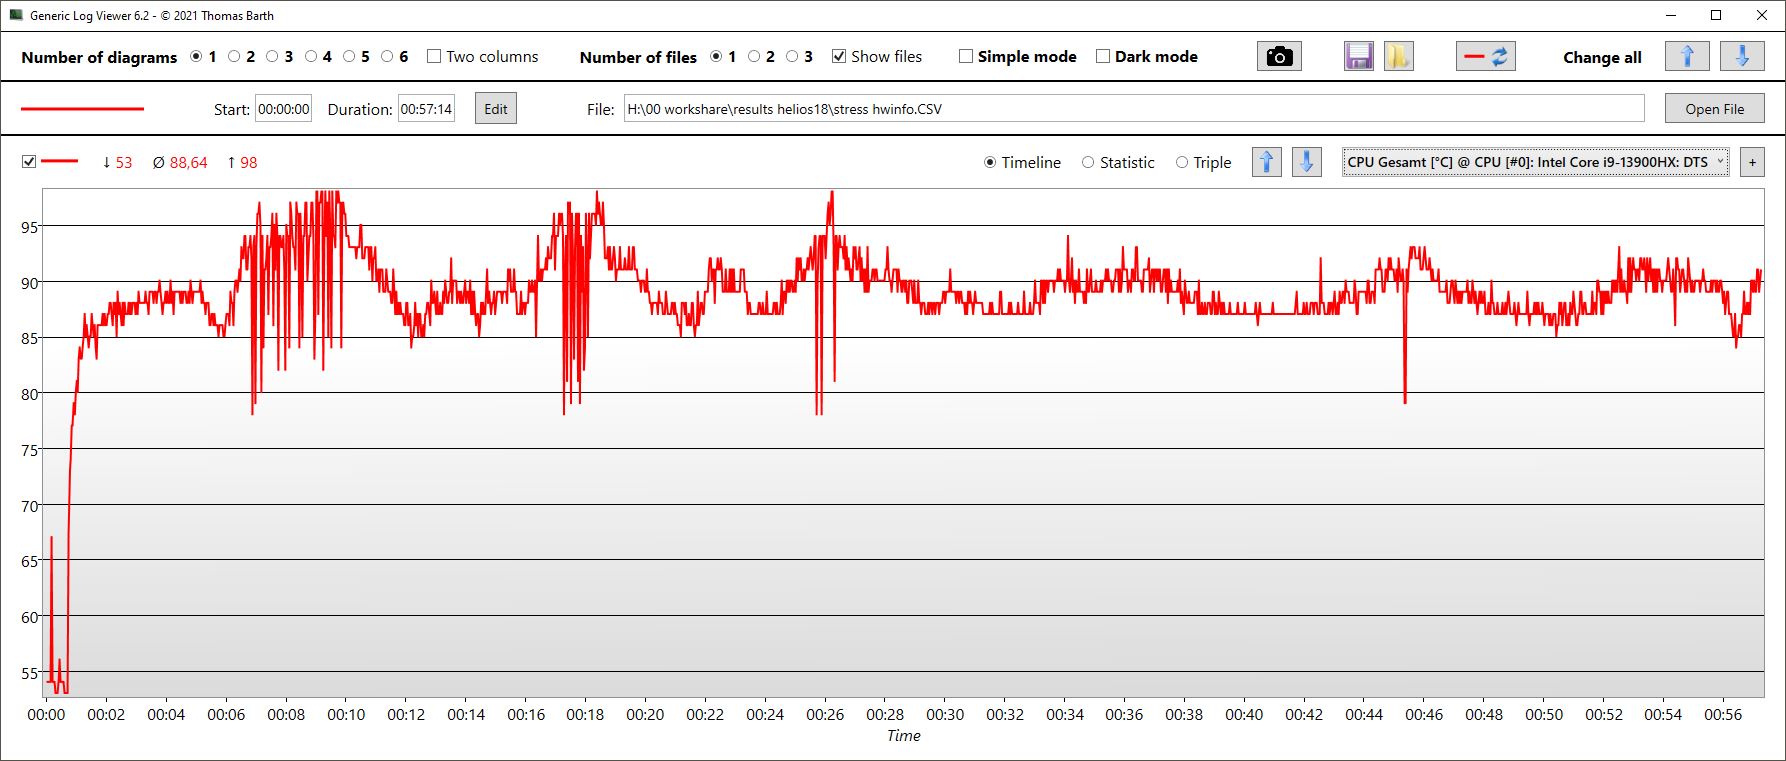
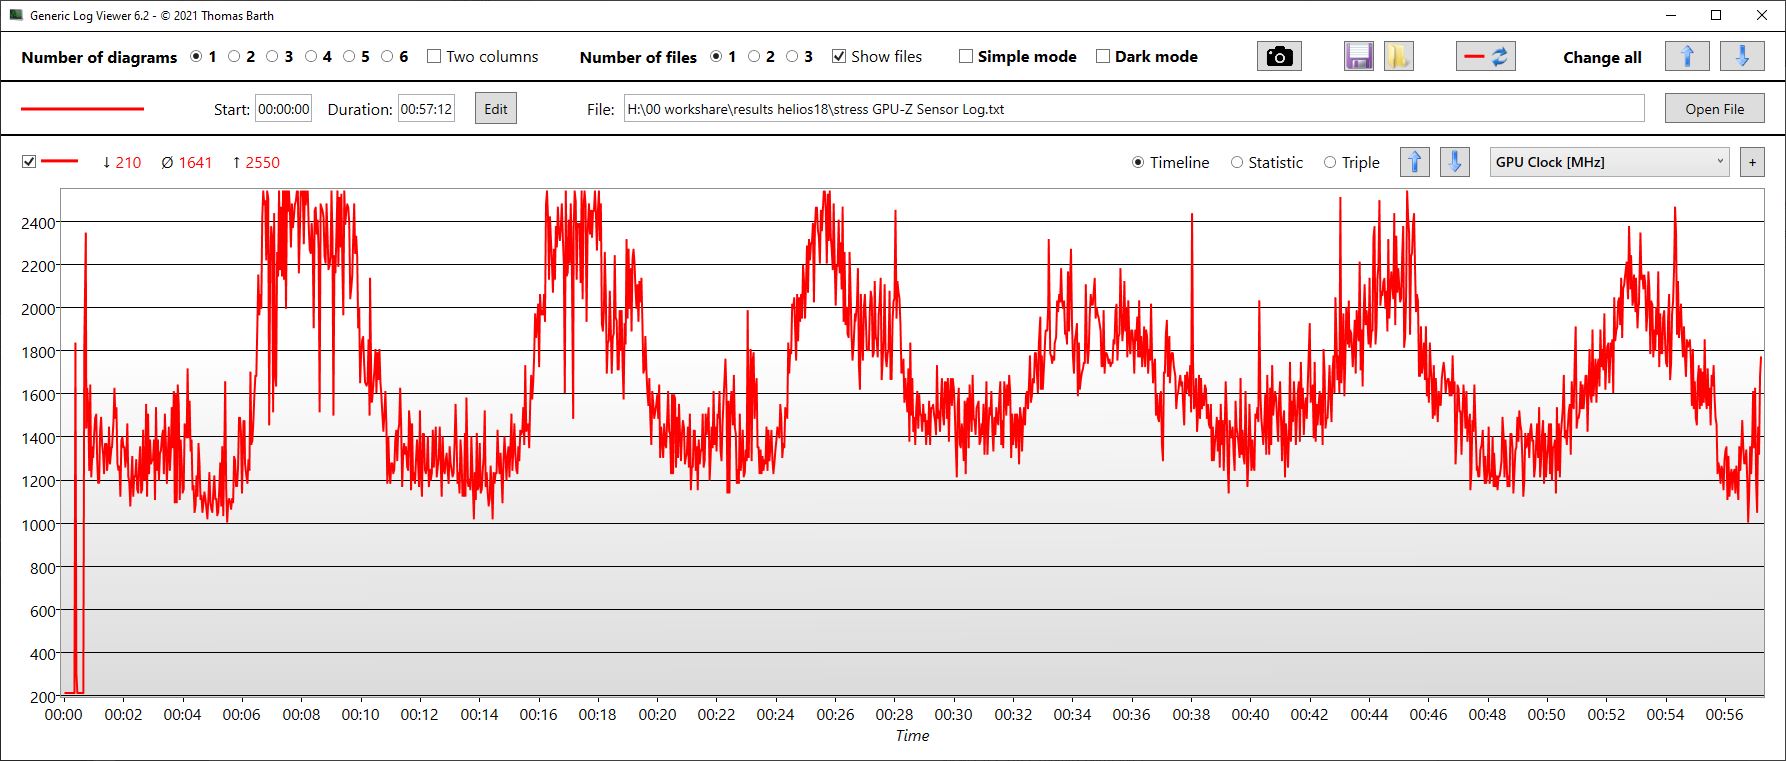
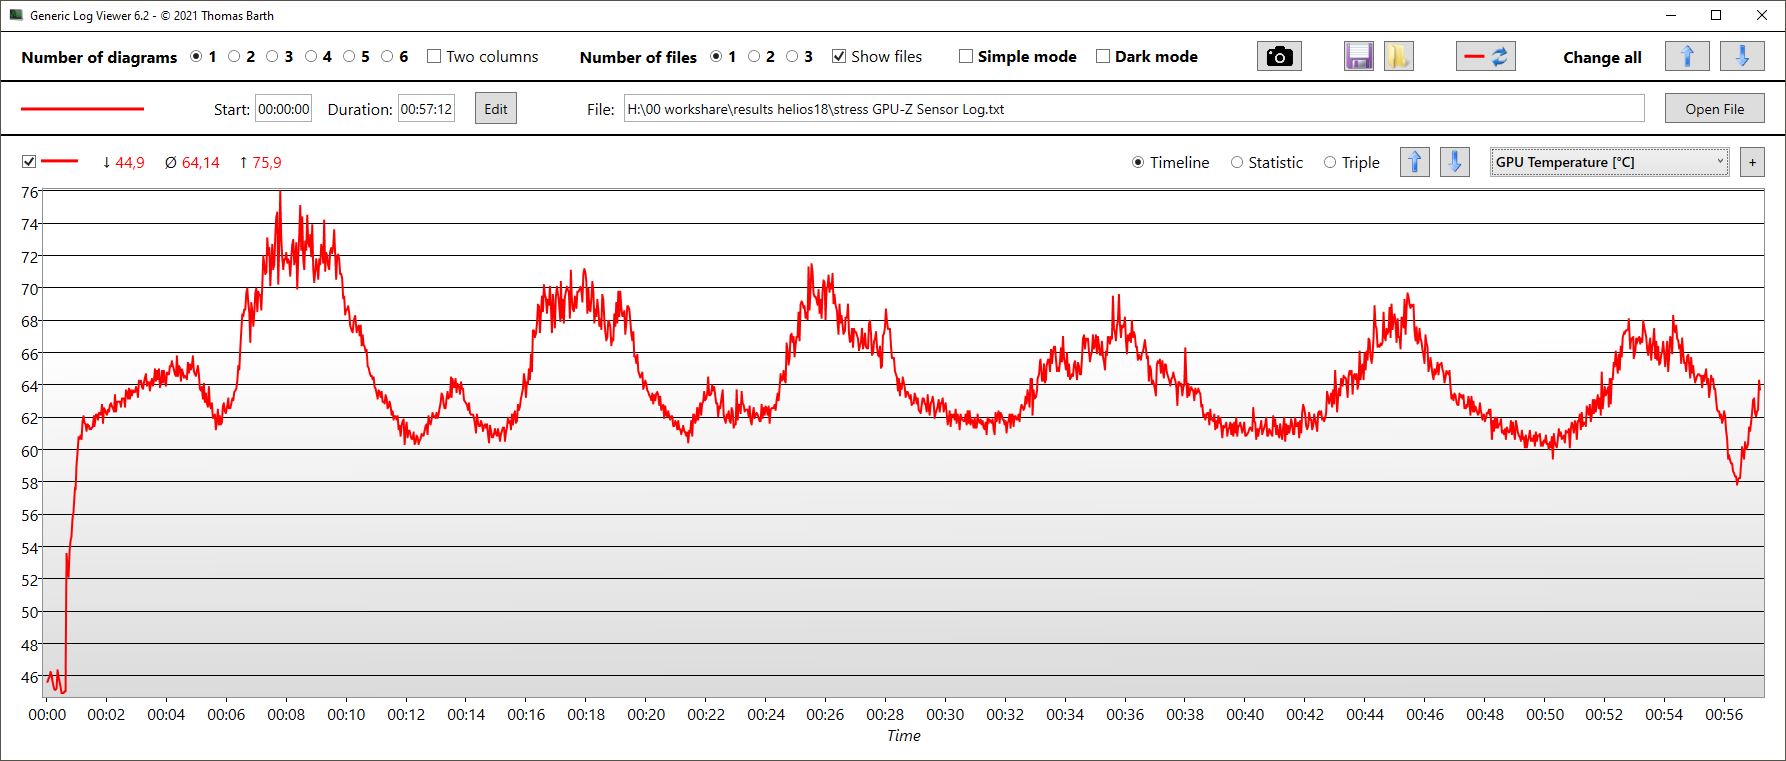
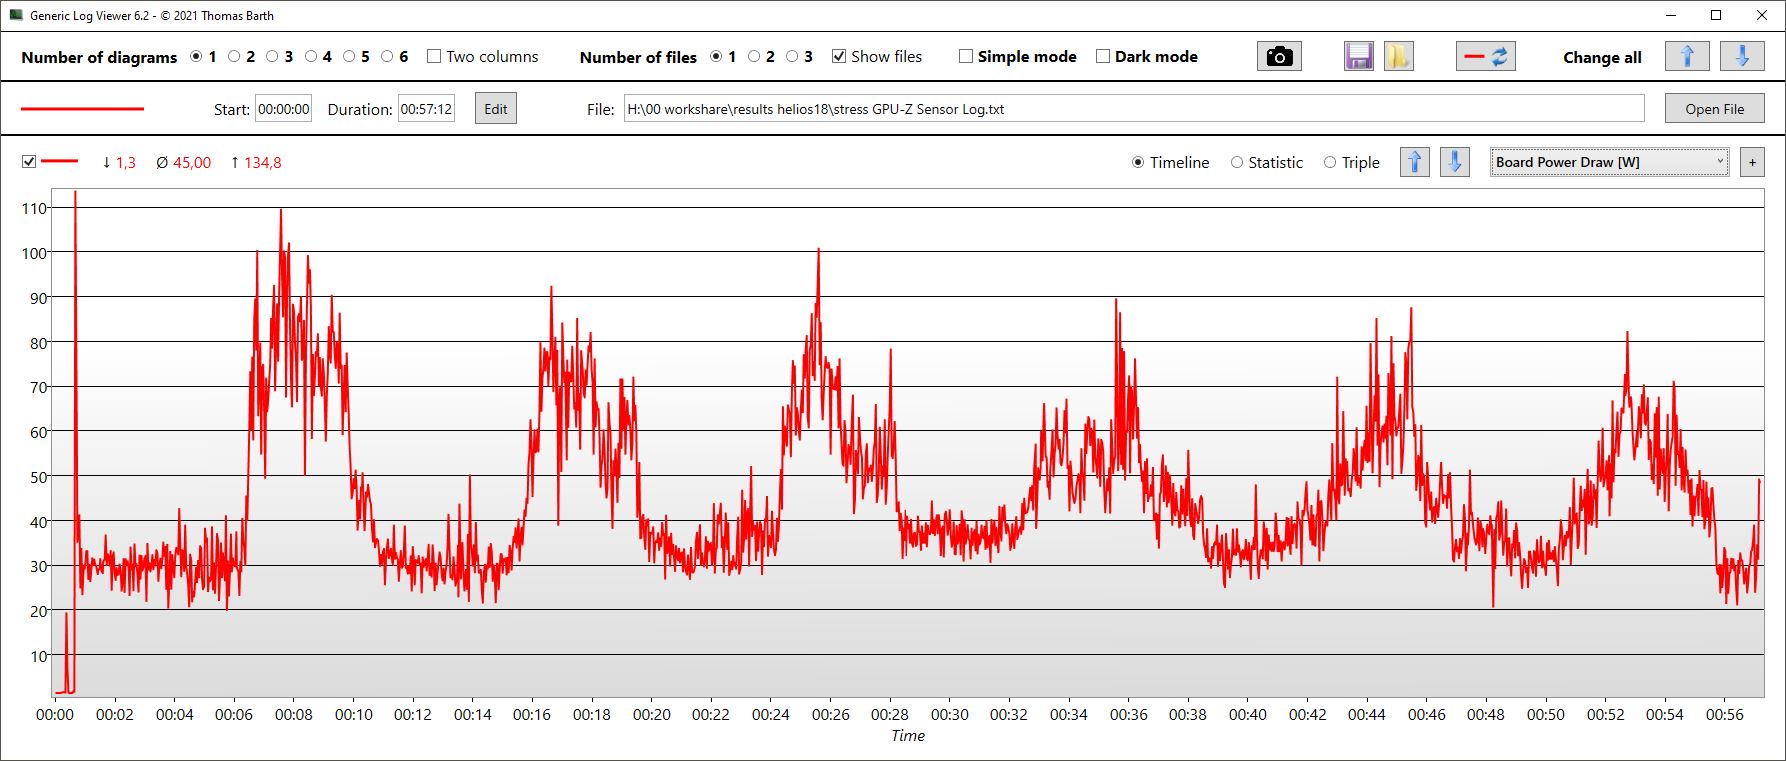
| Reloj dela CPU (GHz) | Reloj de la GPU (MHz) | Temperatura media dela CPU (°C) | Temperatura media de la GPU (°C) | |
| Prime95 + FurMark Estrés | 3,5 | 1.640 | 89 | 64 |
| Witcher 3 Estrés | 527 | 2.525 | 88,5 | 80 |
Altavoces
Los altavoces pueden ser bastante ruidosos, pero eso es todo en cuanto a noticias positivas. El sonido es metálico, los graves son prácticamente inexistentes e incluso los medios y agudos no están especialmente equilibrados. Esperábamos una mejor calidad de sonido, especialmente de un portátil tan grande.
Se pueden conectar dispositivos de audio externos a través de la toma combinada para auriculares, entre otras cosas. De todos modos, los auriculares son imprescindibles cuando se juega en modo Turbo a todo volumen.
Acer Predator Helios 18 N23Q2 análisis de audio
(+) | los altavoces pueden reproducir a un volumen relativamente alto (#82.74 dB)
Graves 100 - 315 Hz
(-) | casi sin bajos - de media 17.6% inferior a la mediana
(±) | la linealidad de los graves es media (9.8% delta a frecuencia anterior)
Medios 400 - 2000 Hz
(±) | medias más altas - de media 9.1% más altas que la mediana
(±) | la linealidad de los medios es media (8.8% delta respecto a la frecuencia anterior)
Altos 2 - 16 kHz
(±) | máximos más altos - de media 5.3% más altos que la mediana
(+) | los máximos son lineales (6.4% delta a la frecuencia anterior)
Total 100 - 16.000 Hz
(±) | la linealidad del sonido global es media (20.3% de diferencia con la mediana)
En comparación con la misma clase
» 72% de todos los dispositivos probados de esta clase eran mejores, 6% similares, 23% peores
» El mejor tuvo un delta de 6%, la media fue 18%, el peor fue ###max##%
En comparación con todos los dispositivos probados
» 53% de todos los dispositivos probados eran mejores, 8% similares, 39% peores
» El mejor tuvo un delta de 4%, la media fue 23%, el peor fue ###max##%
Apple MacBook Pro 16 2021 M1 Pro análisis de audio
(+) | los altavoces pueden reproducir a un volumen relativamente alto (#84.7 dB)
Graves 100 - 315 Hz
(+) | buen bajo - sólo 3.8% lejos de la mediana
(+) | el bajo es lineal (5.2% delta a la frecuencia anterior)
Medios 400 - 2000 Hz
(+) | medios equilibrados - a sólo 1.3% de la mediana
(+) | los medios son lineales (2.1% delta a la frecuencia anterior)
Altos 2 - 16 kHz
(+) | máximos equilibrados - a sólo 1.9% de la mediana
(+) | los máximos son lineales (2.7% delta a la frecuencia anterior)
Total 100 - 16.000 Hz
(+) | el sonido global es lineal (4.6% de diferencia con la mediana)
En comparación con la misma clase
» 0% de todos los dispositivos probados de esta clase eran mejores, 0% similares, 100% peores
» El mejor tuvo un delta de 5%, la media fue 17%, el peor fue ###max##%
En comparación con todos los dispositivos probados
» 0% de todos los dispositivos probados eran mejores, 0% similares, 100% peores
» El mejor tuvo un delta de 4%, la media fue 23%, el peor fue ###max##%
Gestión de la energía - Consumo y tiempo de funcionamiento acordes con las expectativas
Consumo de energía
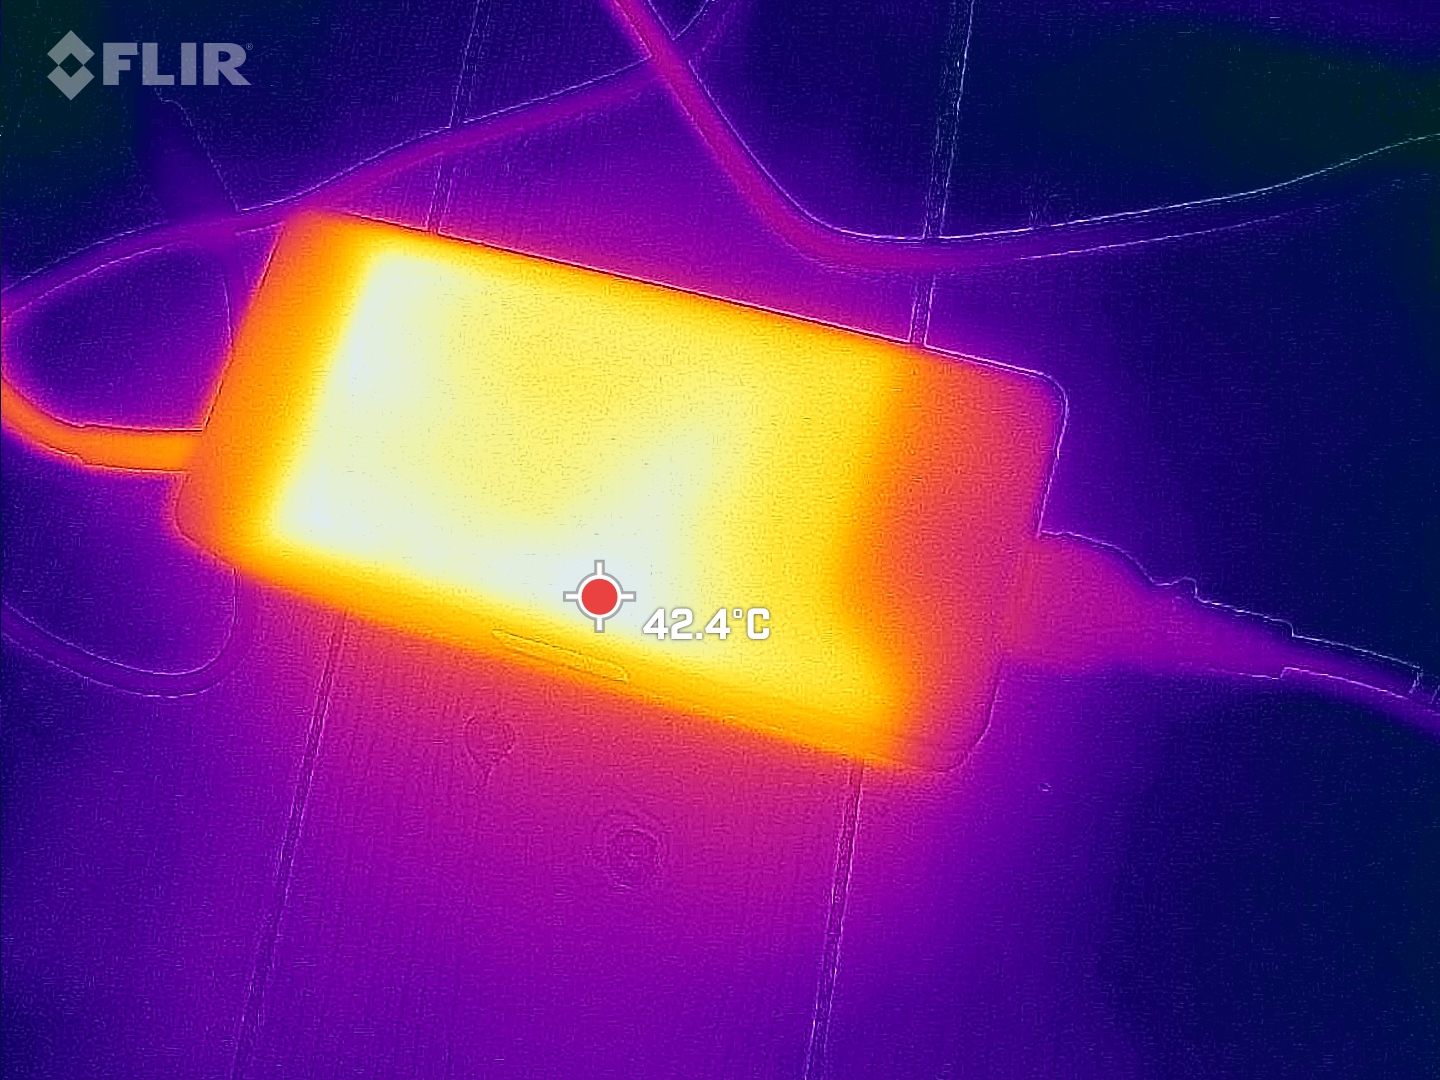
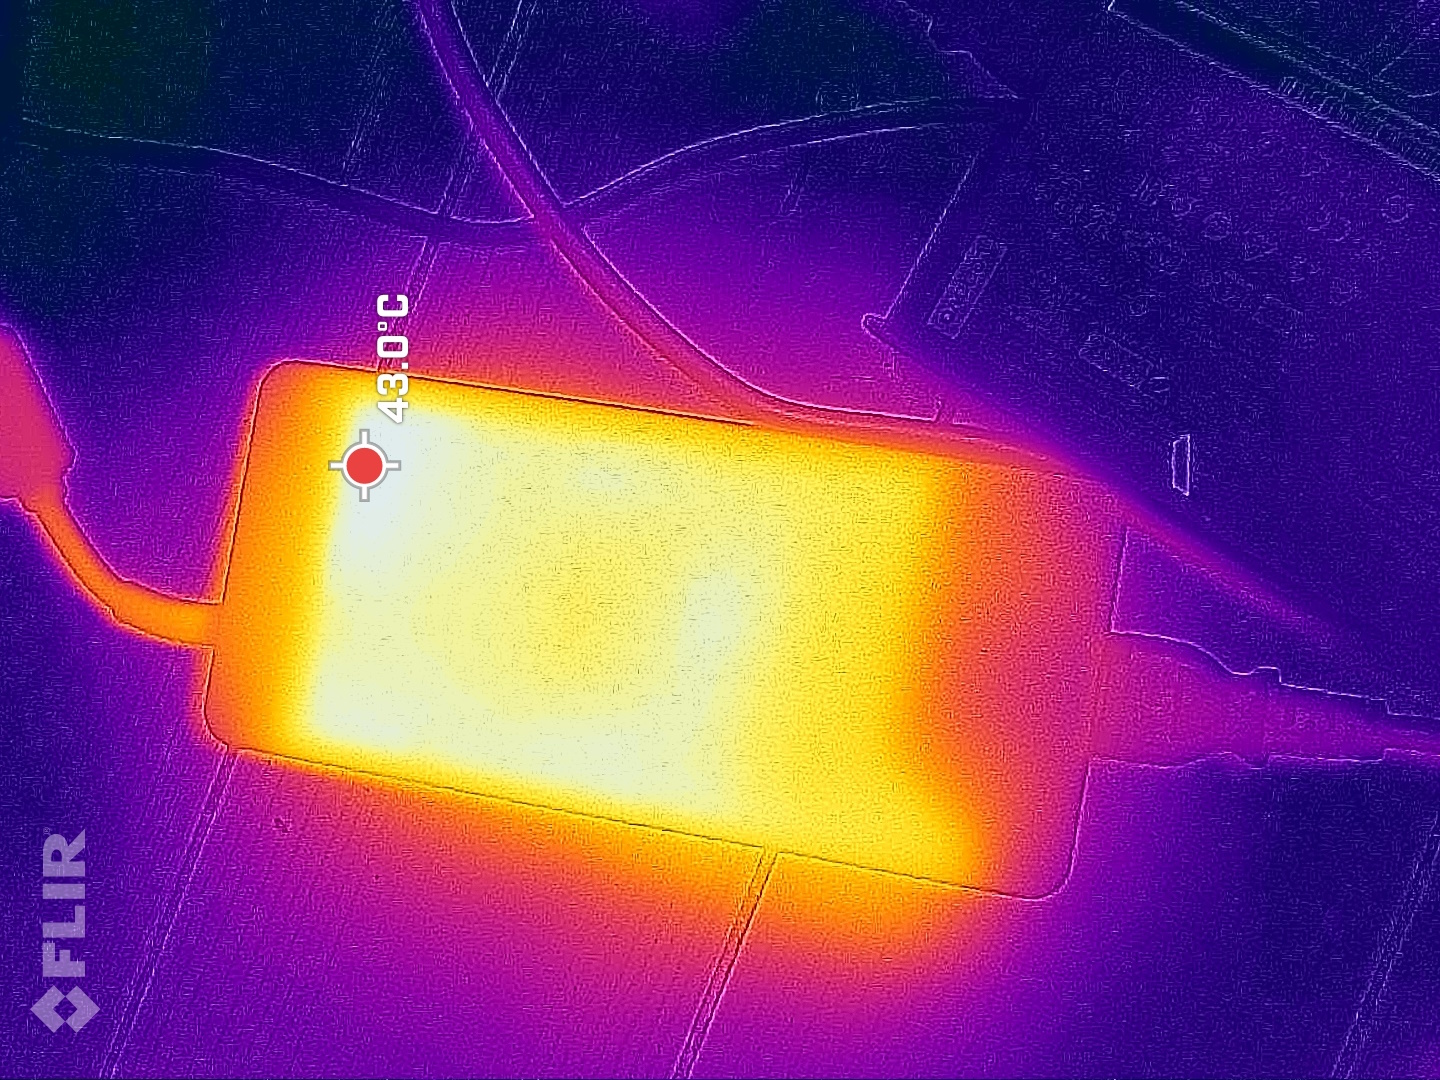
Nadie espera frugalidad de una CPU HX y una RTX 4080, por lo que el Helios 18 no es ninguna sorpresa. Es bastante frugal en reposo, pero cuando juega necesita casi tanto como el aproximadamente igual de potenteMSI GE78HXsólo el consumo máximo a corto plazo de 319 W es superior al del MSI. La gran y pesada fuente de alimentación Chicony tiene una potencia nominal de 330 W y debería ser capaz de suministrar a la Predator suficiente potencia en todo momento, incluso en escenarios exigentes.
| Off / Standby | |
| Ocioso | |
| Carga |
|
Clave:
min: | |
| Acer Predator Helios 18 N23Q2 i9-13900HX, GeForce RTX 4080 Laptop GPU, Samsung PM9A1 MZVL22T0HBLB, IPS, 2560x1600, 18" | MSI GE78HX 13VH-070US i9-13950HX, GeForce RTX 4080 Laptop GPU, Samsung PM9A1 MZVL22T0HBLB, IPS, 2560x1600, 17" | HP Omen 17-ck2097ng i9-13900HX, GeForce RTX 4080 Laptop GPU, SK hynix PC801 HFS001TEJ9X101N, IPS, 2560x1440, 17.3" | Alienware m18 R1 i9-13980HX, GeForce RTX 4090 Laptop GPU, SK hynix PC801 HFS001TEJ9X101N, IPS, 1920x1200, 18" | Asus ROG Strix G18 G814JI i7-13650HX, GeForce RTX 4070 Laptop GPU, Micron 2400 MTFDKBA1T0QFM, IPS, 2560x1600, 18" | Razer Blade 18 RTX 4070 i9-13950HX, GeForce RTX 4070 Laptop GPU, SSSTC CA6-8D1024, IPS, 2560x1600, 18" | Medio NVIDIA GeForce RTX 4080 Laptop GPU | Media de la clase Gaming | |
|---|---|---|---|---|---|---|---|---|
| Power Consumption | -13% | -1% | -47% | 20% | -37% | -14% | 7% | |
| Idle Minimum * (Watt) | 16 | 16.1 -1% | 16 -0% | 21.6 -35% | 8 50% | 24.5 -53% | 16.9 ? -6% | 13 ? 19% |
| Idle Average * (Watt) | 19 | 24 -26% | 20 -5% | 25.2 -33% | 15 21% | 34.1 -79% | 22 ? -16% | 19 ? -0% |
| Idle Maximum * (Watt) | 21.3 | 34 -60% | 26 -22% | 56.7 -166% | 26 -22% | 47.7 -124% | 34.1 ? -60% | 24.6 ? -15% |
| Load Average * (Watt) | 124 | 123.6 -0% | 135 -9% | 164.1 -32% | 102 18% | 140 -13% | 117.9 ? 5% | 110.7 ? 11% |
| Witcher 3 ultra * (Watt) | 289 | 286 1% | 215 26% | 311 -8% | 178.6 38% | 202 30% | ||
| Load Maximum * (Watt) | 319 | 285.7 10% | 299 6% | 338.9 -6% | 267 16% | 261 18% | 297 ? 7% | 259 ? 19% |
* ... más pequeño es mejor
Power consumption Witcher 3 / Stress test
Power consumption with an external monitor
Duración de las pilas
Acer instala una batería de 90 Wh, mientras que MSI y Alienware tienen 99 y 97 Wh, respectivamente. Los usuarios deben utilizar definitivamente el modo SDR para la pantalla en modo batería, de lo contrario los 1000 nits HDR agotarán la batería mucho más rápido.
El Helios 18 dura de 4,5 a casi 5 horas en la prueba de WiFi y vídeo con un brillo reducido de 150 nits. El MSI es ligeramente más duradero, y el Alienware tiene una duración similar en la prueba WiFi.
| Acer Predator Helios 18 N23Q2 i9-13900HX, GeForce RTX 4080 Laptop GPU, 90 Wh | MSI GE78HX 13VH-070US i9-13950HX, GeForce RTX 4080 Laptop GPU, 99 Wh | HP Omen 17-ck2097ng i9-13900HX, GeForce RTX 4080 Laptop GPU, 83 Wh | Alienware m18 R1 i9-13980HX, GeForce RTX 4090 Laptop GPU, 97 Wh | Asus ROG Strix G18 G814JI i7-13650HX, GeForce RTX 4070 Laptop GPU, 90 Wh | Razer Blade 18 RTX 4070 i9-13950HX, GeForce RTX 4070 Laptop GPU, 91.7 Wh | Media de la clase Gaming | |
|---|---|---|---|---|---|---|---|
| Duración de Batería | 14% | -20% | -31% | 28% | -17% | 41% | |
| H.264 (h) | 4.8 | 3.7 -23% | 8.32 ? 73% | ||||
| WiFi v1.3 (h) | 4.4 | 6.1 39% | 3.6 -18% | 4.3 -2% | 8.1 84% | 4 -9% | 7.11 ? 62% |
| Load (h) | 1.7 | 1.5 -12% | 1.4 -18% | 0.7 -59% | 1.2 -29% | 1.3 -24% | 1.502 ? -12% |
| Reader / Idle (h) | 7.3 | 4.2 | 5.6 | 11.7 | 7 | 8.27 ? |
Pro
Contra
Veredicto - Jugador fuerte con potencial de optimización en refrigeración
El gamer revela cero debilidades en términos de rendimiento. Tanto la CPU como la GPU rinden ligeramente mejor que la media de portátiles con la misma configuración de nuestra base de datos. También destaca la pantalla MiniLED brillante y de alto contraste, mientras que la mano de obra y las características también son impresionantes.
En contraste con el bien ajustado Helios 16 con su RTX 4060, las debilidades del Helios 18 con una RTX 4080 más exigente se hacen evidentes: el sistema de refrigeración es muy ruidoso en modo Turbo y no parece estar optimizado en otras áreas. Aunque la mayoría de las zonas del portátil permanecen inusualmente frías, el punto caliente sigue siendo uno de los más calientes de la clase. Al mismo tiempo, el teóricamente potente modelo SSD se ralentiza muy rápidamente. Recomendamos hacer funcionar el portátil en el modo Rendimiento , más silencioso.
El Acer Predator Helios 18 es un behemoth con un fuerte rendimiento, pero el ruidoso sistema de refrigeración necesita optimización.
Hasta la fecha sólo hemos analizado competidores de 18 pulgadas con GPU más débiles, por lo que recomendar alternativas no es tan fácil. En términos de rendimiento, el 17 pulgadas MSI Raider GE78HX puede seguirle el ritmo, pero tiene una pantalla más débil.
Precio y disponibilidad
En EE.UU., la configuración RTX 4080 del Acer Predator Helios 18 parece escasear. Best Buy tiene en oferta las configuraciones RTX 4070 y 4060 por 1.999,99 y 1.699,99 dólares, respectivamente.
Los precios son a fecha de 27.10.2023 y están sujetos a cambios.
Acer Predator Helios 18 N23Q2
- 10/25/2023 v7 (old)
Christian Hintze
Transparencia
La selección de los dispositivos que se van a reseñar corre a cargo de nuestro equipo editorial. La muestra de prueba fue proporcionada al autor en calidad de préstamo por el fabricante o el minorista a los efectos de esta reseña. El prestamista no tuvo ninguna influencia en esta reseña, ni el fabricante recibió una copia de la misma antes de su publicación. No había ninguna obligación de publicar esta reseña. Como empresa de medios independiente, Notebookcheck no está sujeta a la autoridad de fabricantes, minoristas o editores.
Así es como prueba Notebookcheck
Cada año, Notebookcheck revisa de forma independiente cientos de portátiles y smartphones utilizando procedimientos estandarizados para asegurar que todos los resultados son comparables. Hemos desarrollado continuamente nuestros métodos de prueba durante unos 20 años y hemos establecido los estándares de la industria en el proceso. En nuestros laboratorios de pruebas, técnicos y editores experimentados utilizan equipos de medición de alta calidad. Estas pruebas implican un proceso de validación en varias fases. Nuestro complejo sistema de clasificación se basa en cientos de mediciones y puntos de referencia bien fundamentados, lo que mantiene la objetividad.Price comparison

