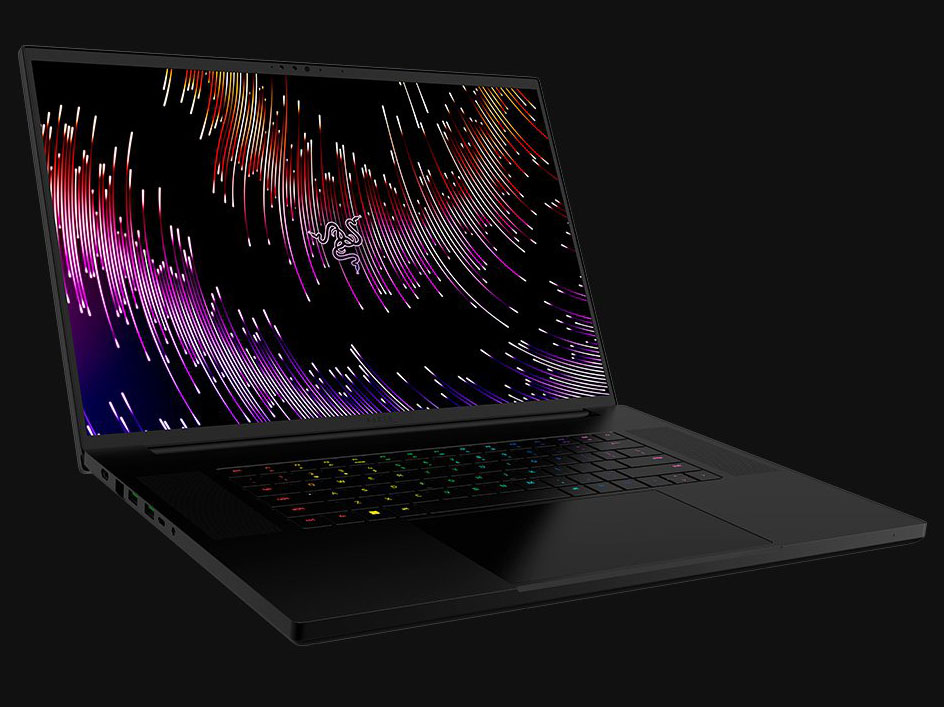
Análisis del portátil Razer Blade 18: Más pequeño que muchos portátiles para juegos de 17 pulgadas
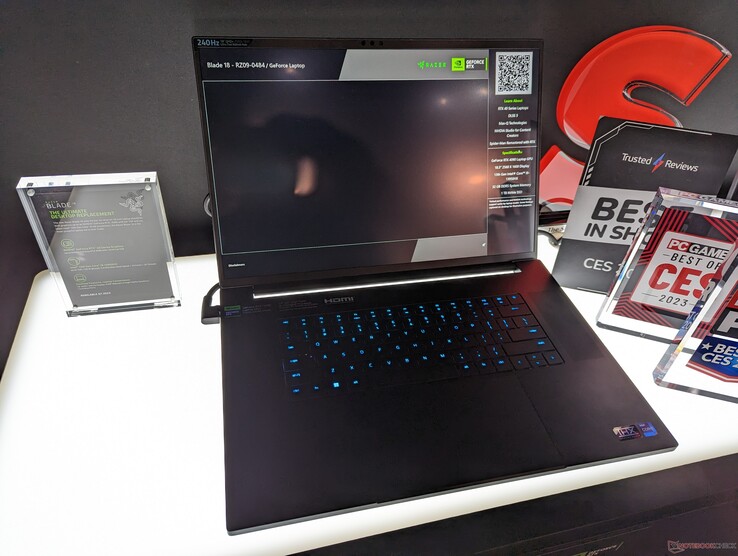
Presentado en el CES 2023, el Blade 18 ofrece el mayor tamaño de pantalla hasta la fecha para un portátil Blade a la vez que luce el familiar diseño de chasis de Razer. El lanzamiento de este modelo coincide con el de la serie Intel Core de 13ª generación y la serie Nvidia GeForce 40 Ada Lovelace, al igual que el reciente Blade 16.
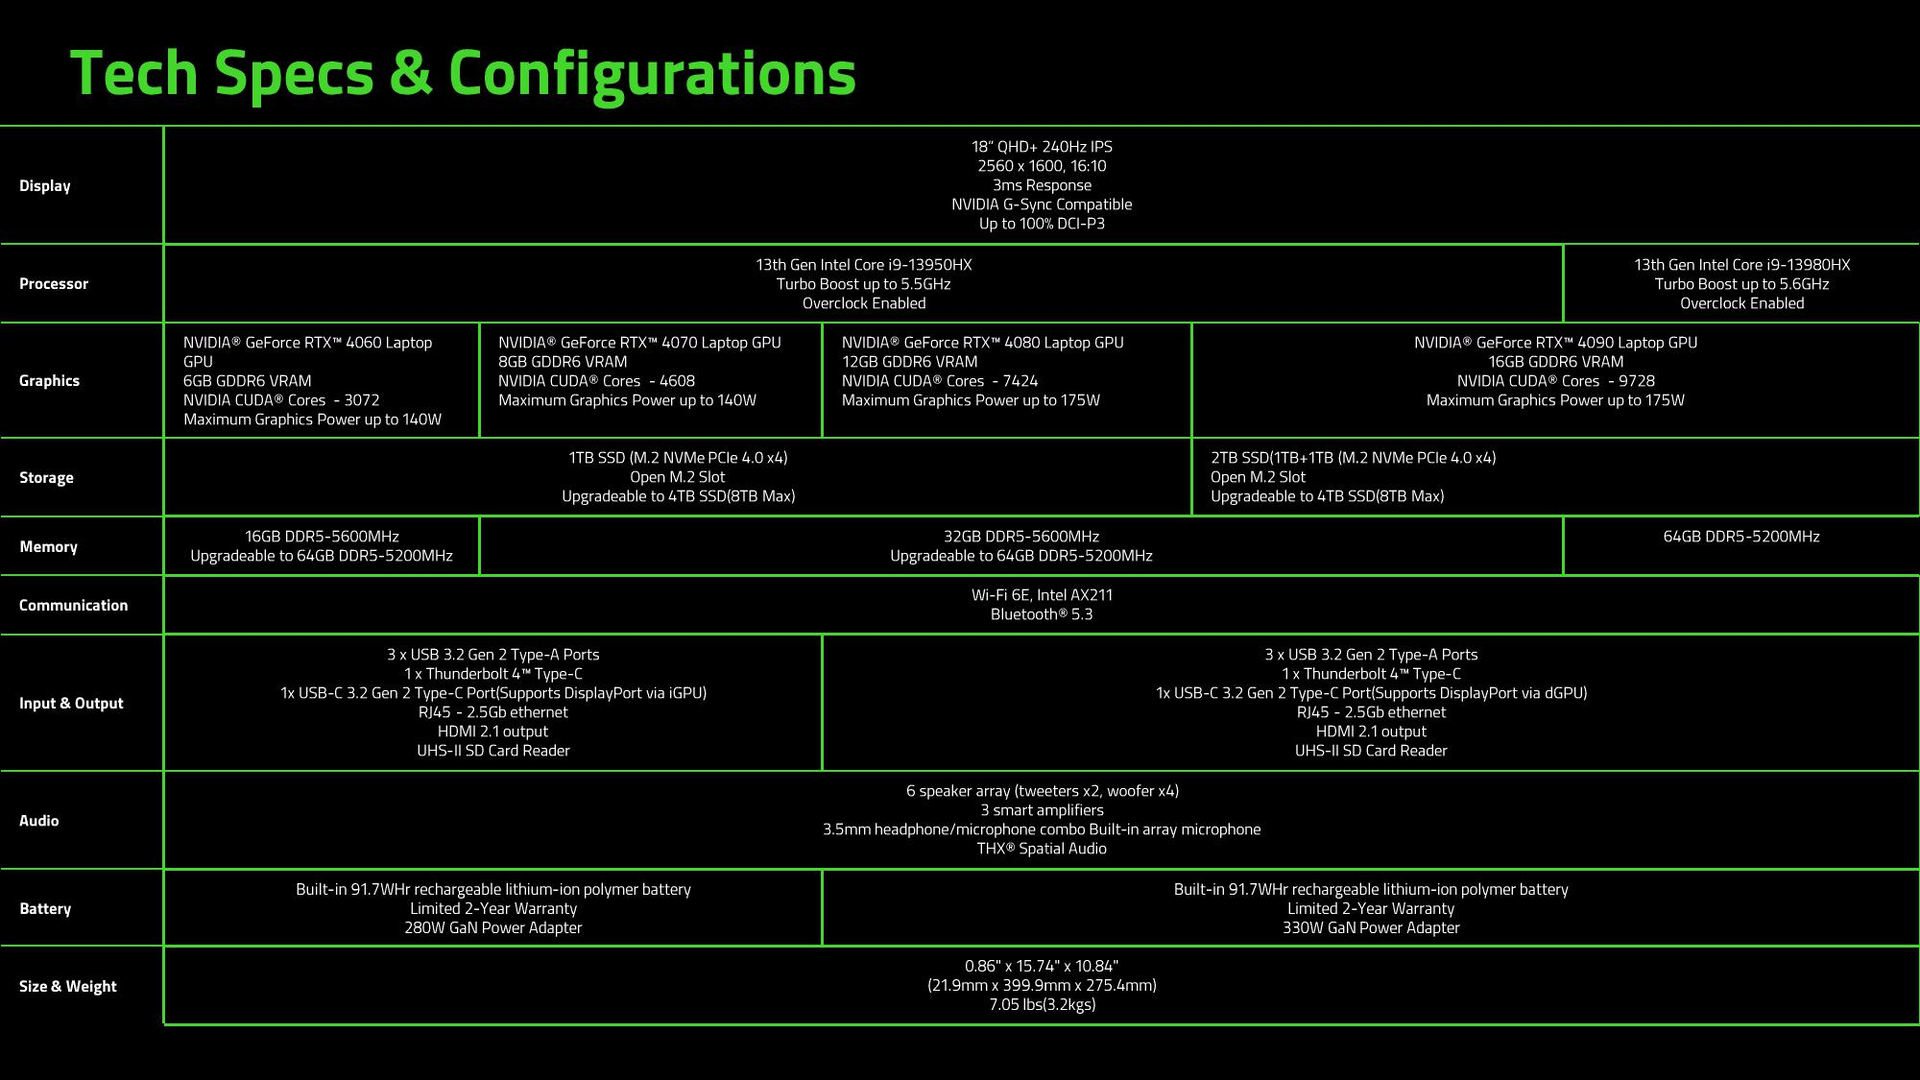
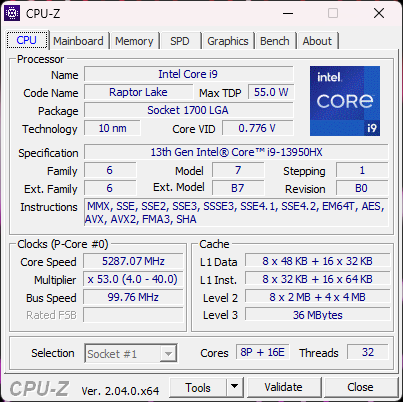
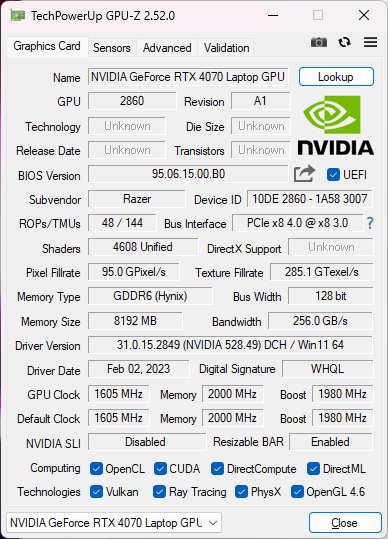
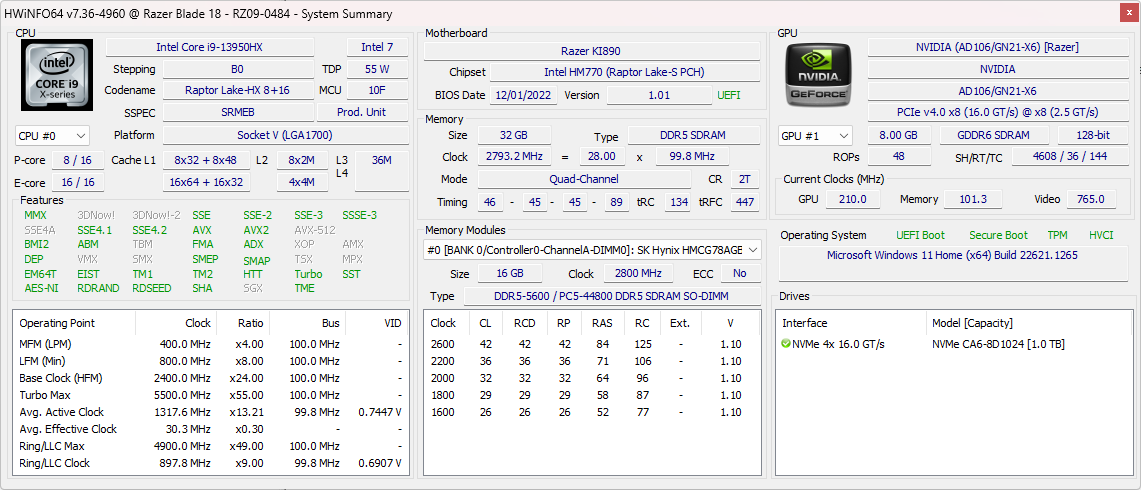
Las configuraciones van desde la CPU Core i9-13950HX y la GPU GeForce RTX 4060 de 140 W hasta la Core i9-13980HX y RTX 4090 de 175 W. Por lo demás, todas las configuraciones vienen con el mismo panel IPS 16:10 QHD+ 240 Hz. Nuestra unidad de pruebas específica es una configuración intermedia con la RTX 4070 de 140 W que se vende por unos 3200 $.
los portátiles de 18 pulgadas son poco comunes, con el MSI GT83 Titan de 6 años de antigüedad como ejemplo notable. Se espera que Asus y Dell lancen el ROG Strix Scar 18 y Alienware m18, respectivamente, para competir directamente con el Razer Blade 18.
Más análisis de Razer:
Posibles contendientes en la comparación
Valoración | Fecha | Modelo | Peso | Altura | Tamaño | Resolución | Precio |
|---|---|---|---|---|---|---|---|
| 91.4 % v7 (old) | 02/2023 | Razer Blade 18 RTX 4070 i9-13950HX, GeForce RTX 4070 Laptop GPU | 3 kg | 21.9 mm | 18.00" | 2560x1600 | |
| 89.9 % v7 (old) | 07/2022 | Razer Blade 17 Early 2022 i9-12900H, GeForce RTX 3080 Ti Laptop GPU | 2.8 kg | 19.9 mm | 17.30" | 3840x2160 | |
| 89 % v7 (old) | 02/2023 | MSI Titan GT77 HX 13VI i9-13950HX, GeForce RTX 4090 Laptop GPU | 3.5 kg | 23 mm | 17.30" | 3840x2160 | |
| 83.3 % v7 (old) | 01/2023 | Gigabyte G7 KE i5-12500H, GeForce RTX 3060 Laptop GPU | 2.6 kg | 25 mm | 17.30" | 1920x1080 | |
| 86.1 % v7 (old) | 01/2023 | Alienware m17 R5 (R9 6900HX, RX 6850M XT) R9 6900HX, Radeon RX 6850M XT | 3.4 kg | 26.7 mm | 17.00" | 3840x2160 | |
| 86.9 % v7 (old) | 11/2022 | Asus ROG Strix Scar 17 SE G733CX-LL014W i9-12950HX, GeForce RTX 3080 Ti Laptop GPU | 2.9 kg | 28.3 mm | 17.30" | 2560x1440 |
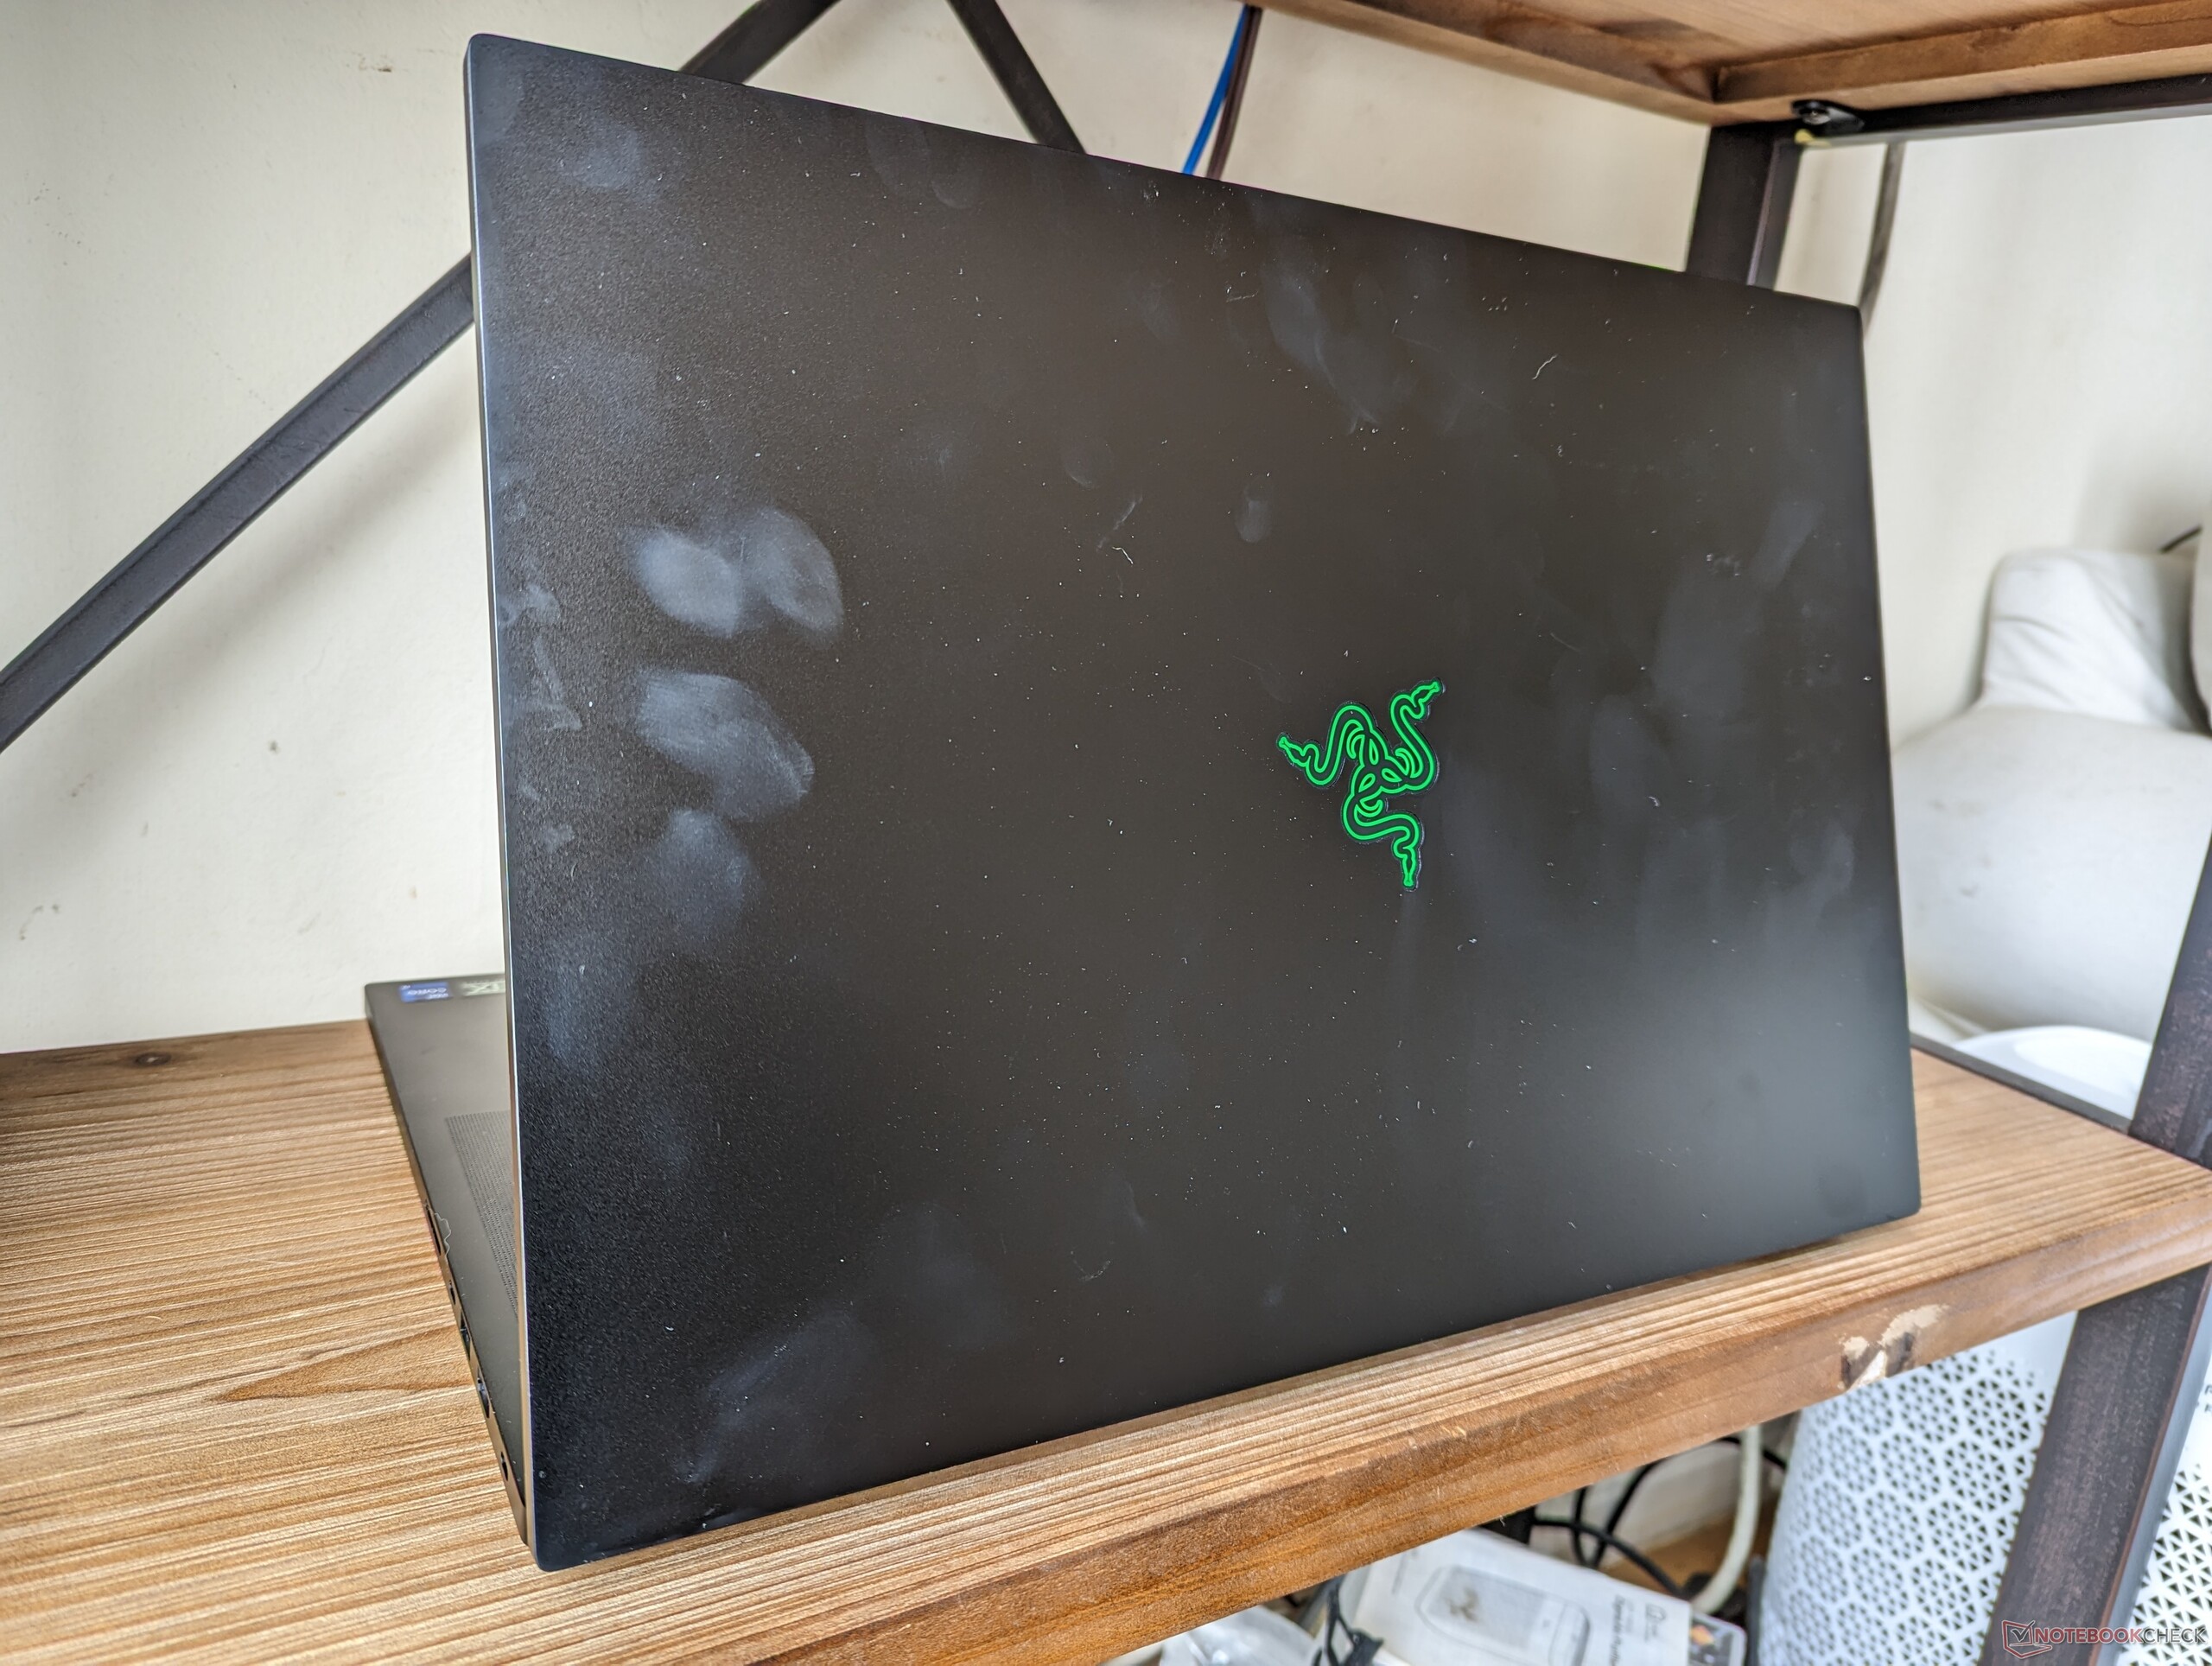
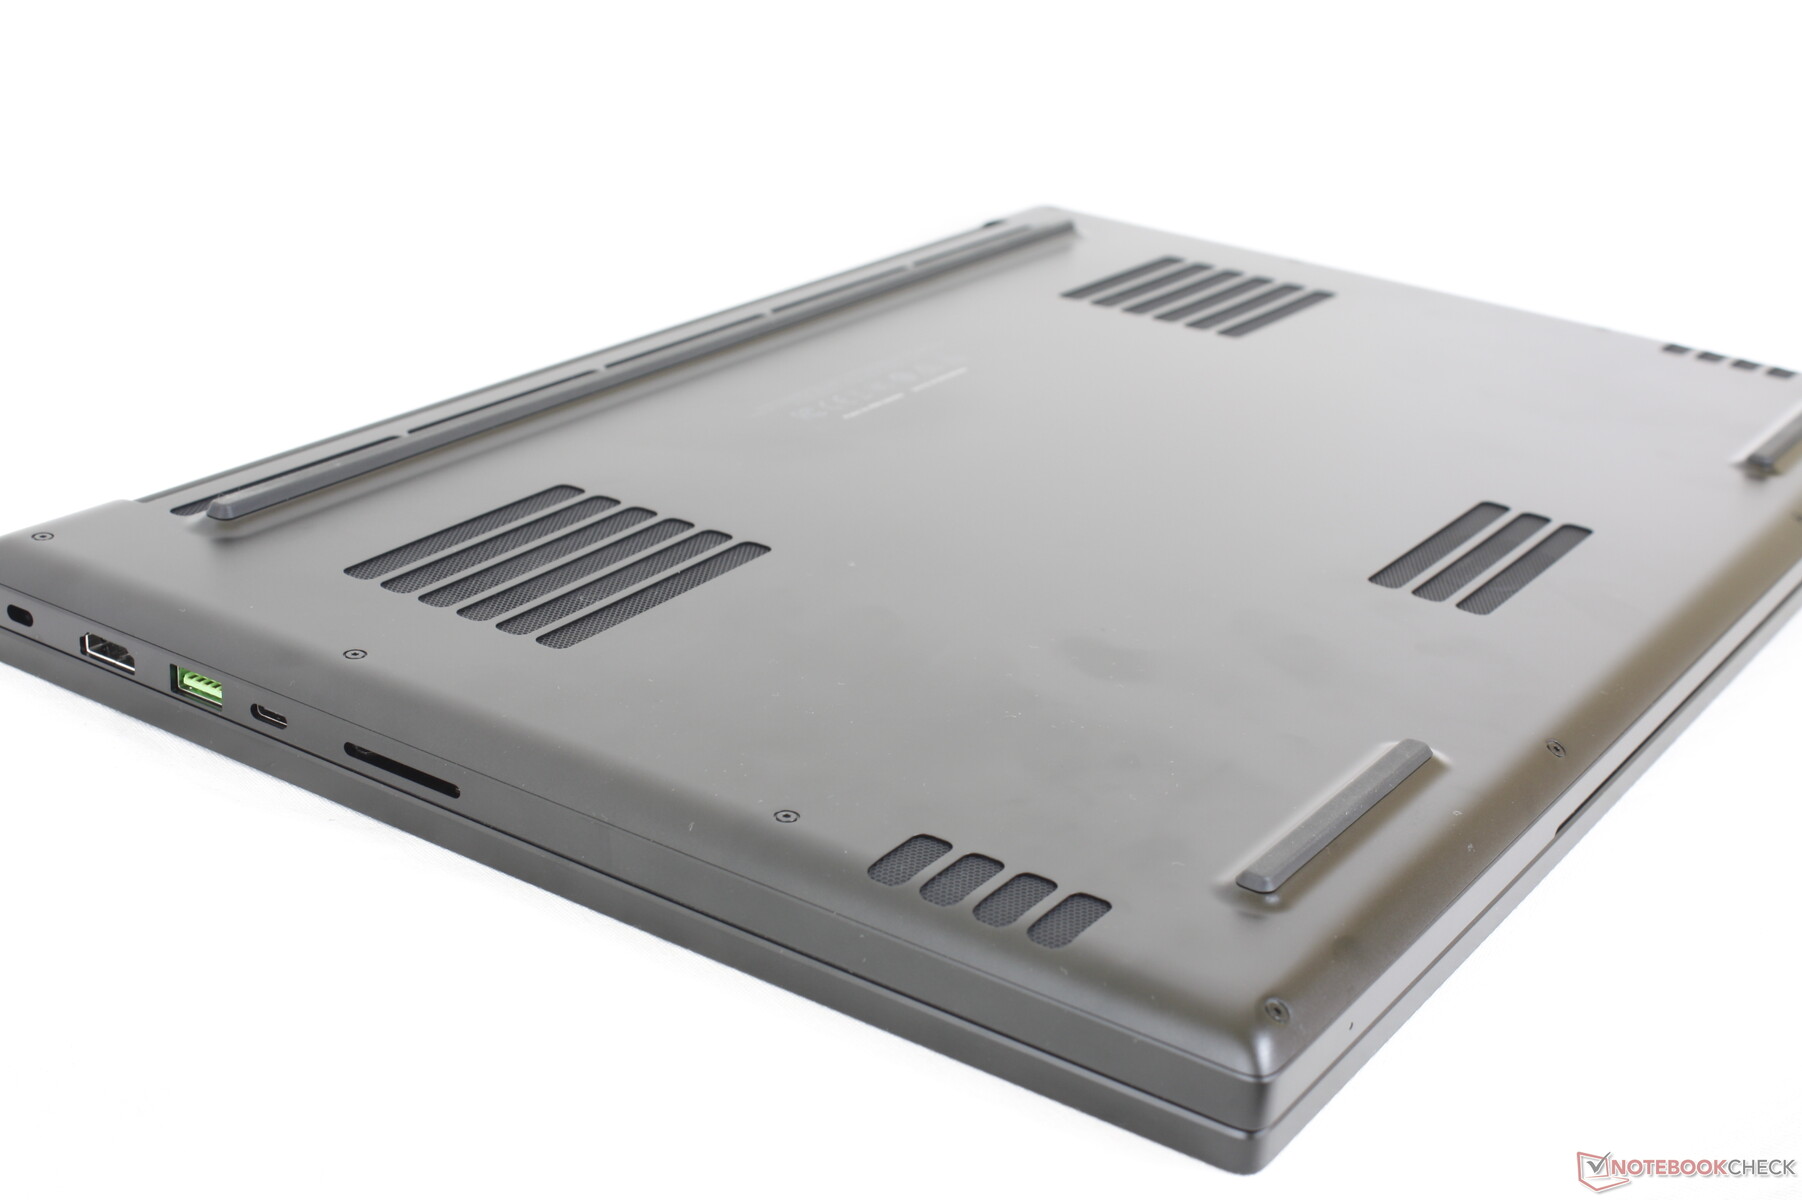
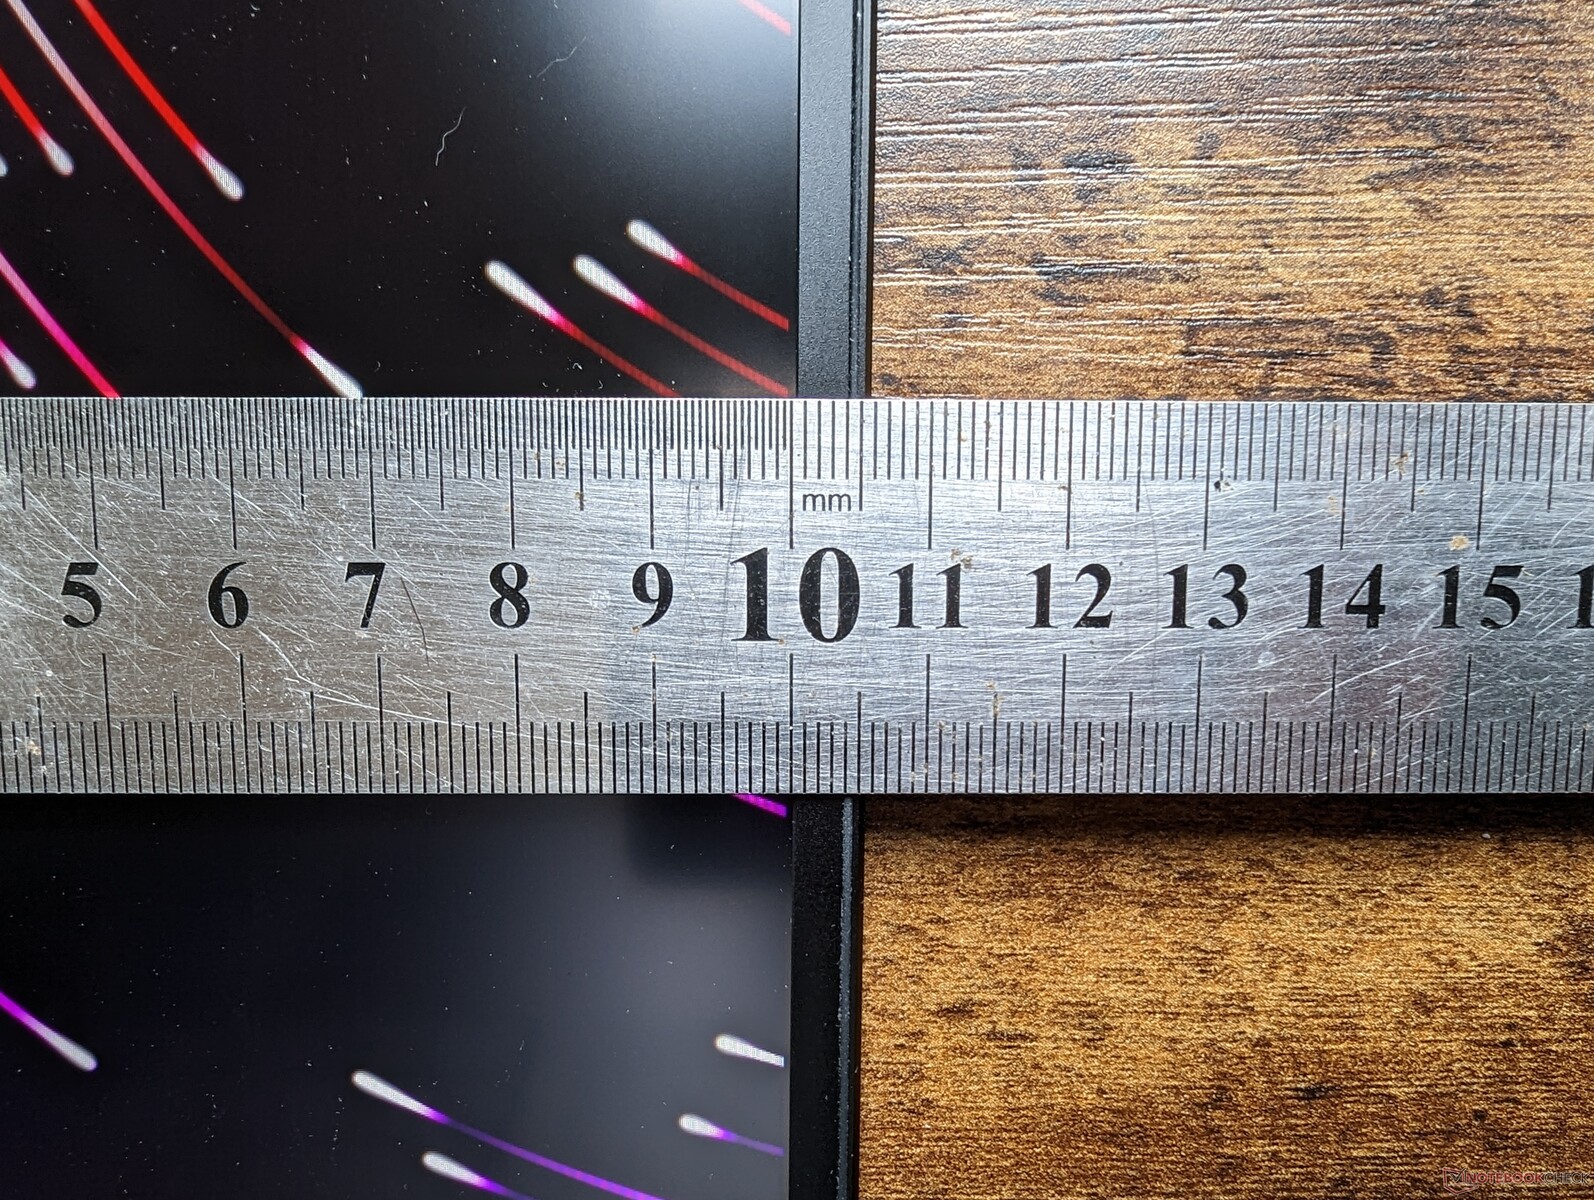
Maletín - Apenas más grande que el Blade 17
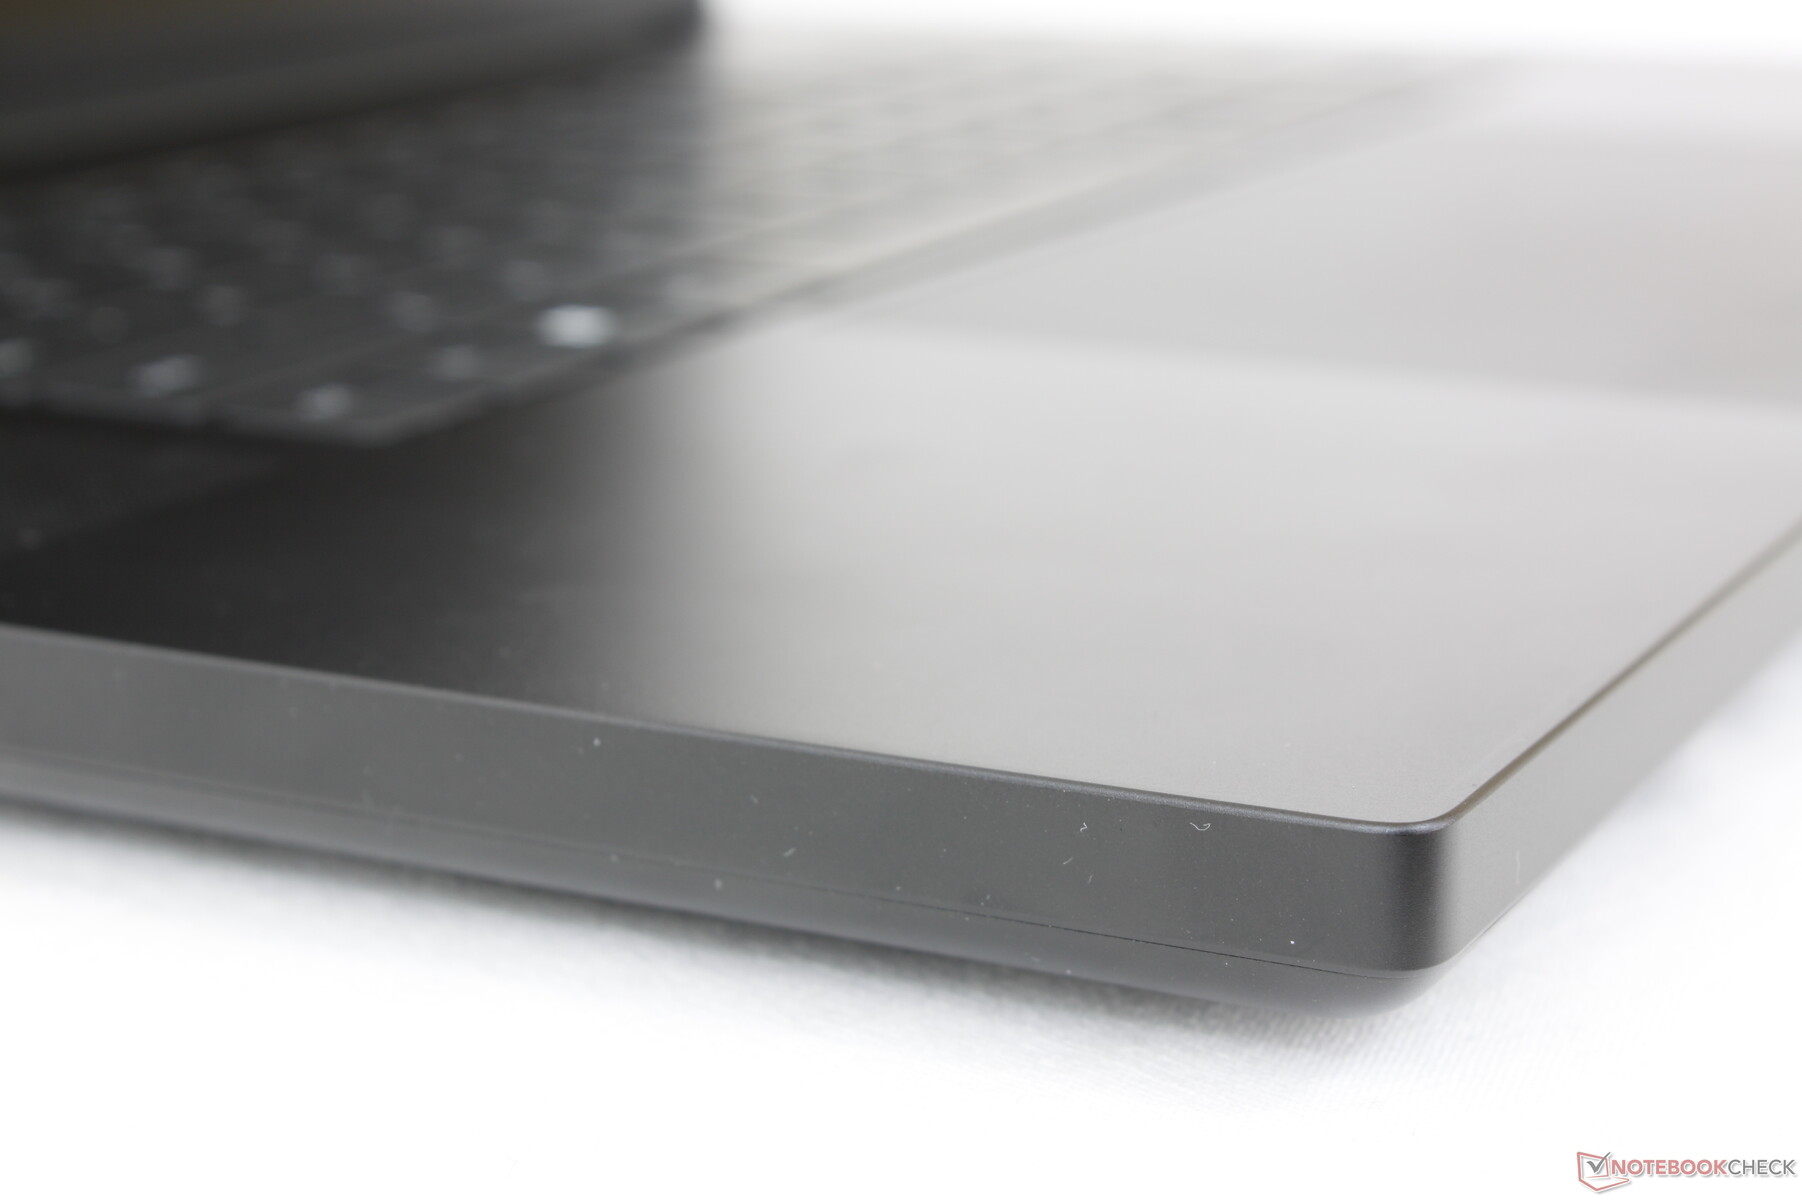
Puede que el Blade 18 tenga un nuevo tamaño de pantalla, pero no depara nuevas sorpresas en cuanto al diseño del chasis. El modelo parece y se siente como un Blade 17 de arriba a abajo. La mayor diferencia visual tiene que ver con el bisel de la barbilla mucho más pequeño en el Blade 18 en comparación con el Blade 17 para una mayor relación pantalla-cuerpo.
Afortunadamente, el mayor tamaño de 18 pulgadas no afecta a la rigidez del chasis. Tanto la base como la tapa son tan sólidas como en el Blade 17 para dar una fuerte impresión de MacBook Pro. Las bisagras en particular aguantan bien a pesar de la gran pantalla, pero su ángulo máximo sigue estando muy por debajo de los 180 grados. El punto más débil del portátil está quizá en el centro de la tapa exterior, donde la superficie se deforma más fácilmente con la presión aplicada.
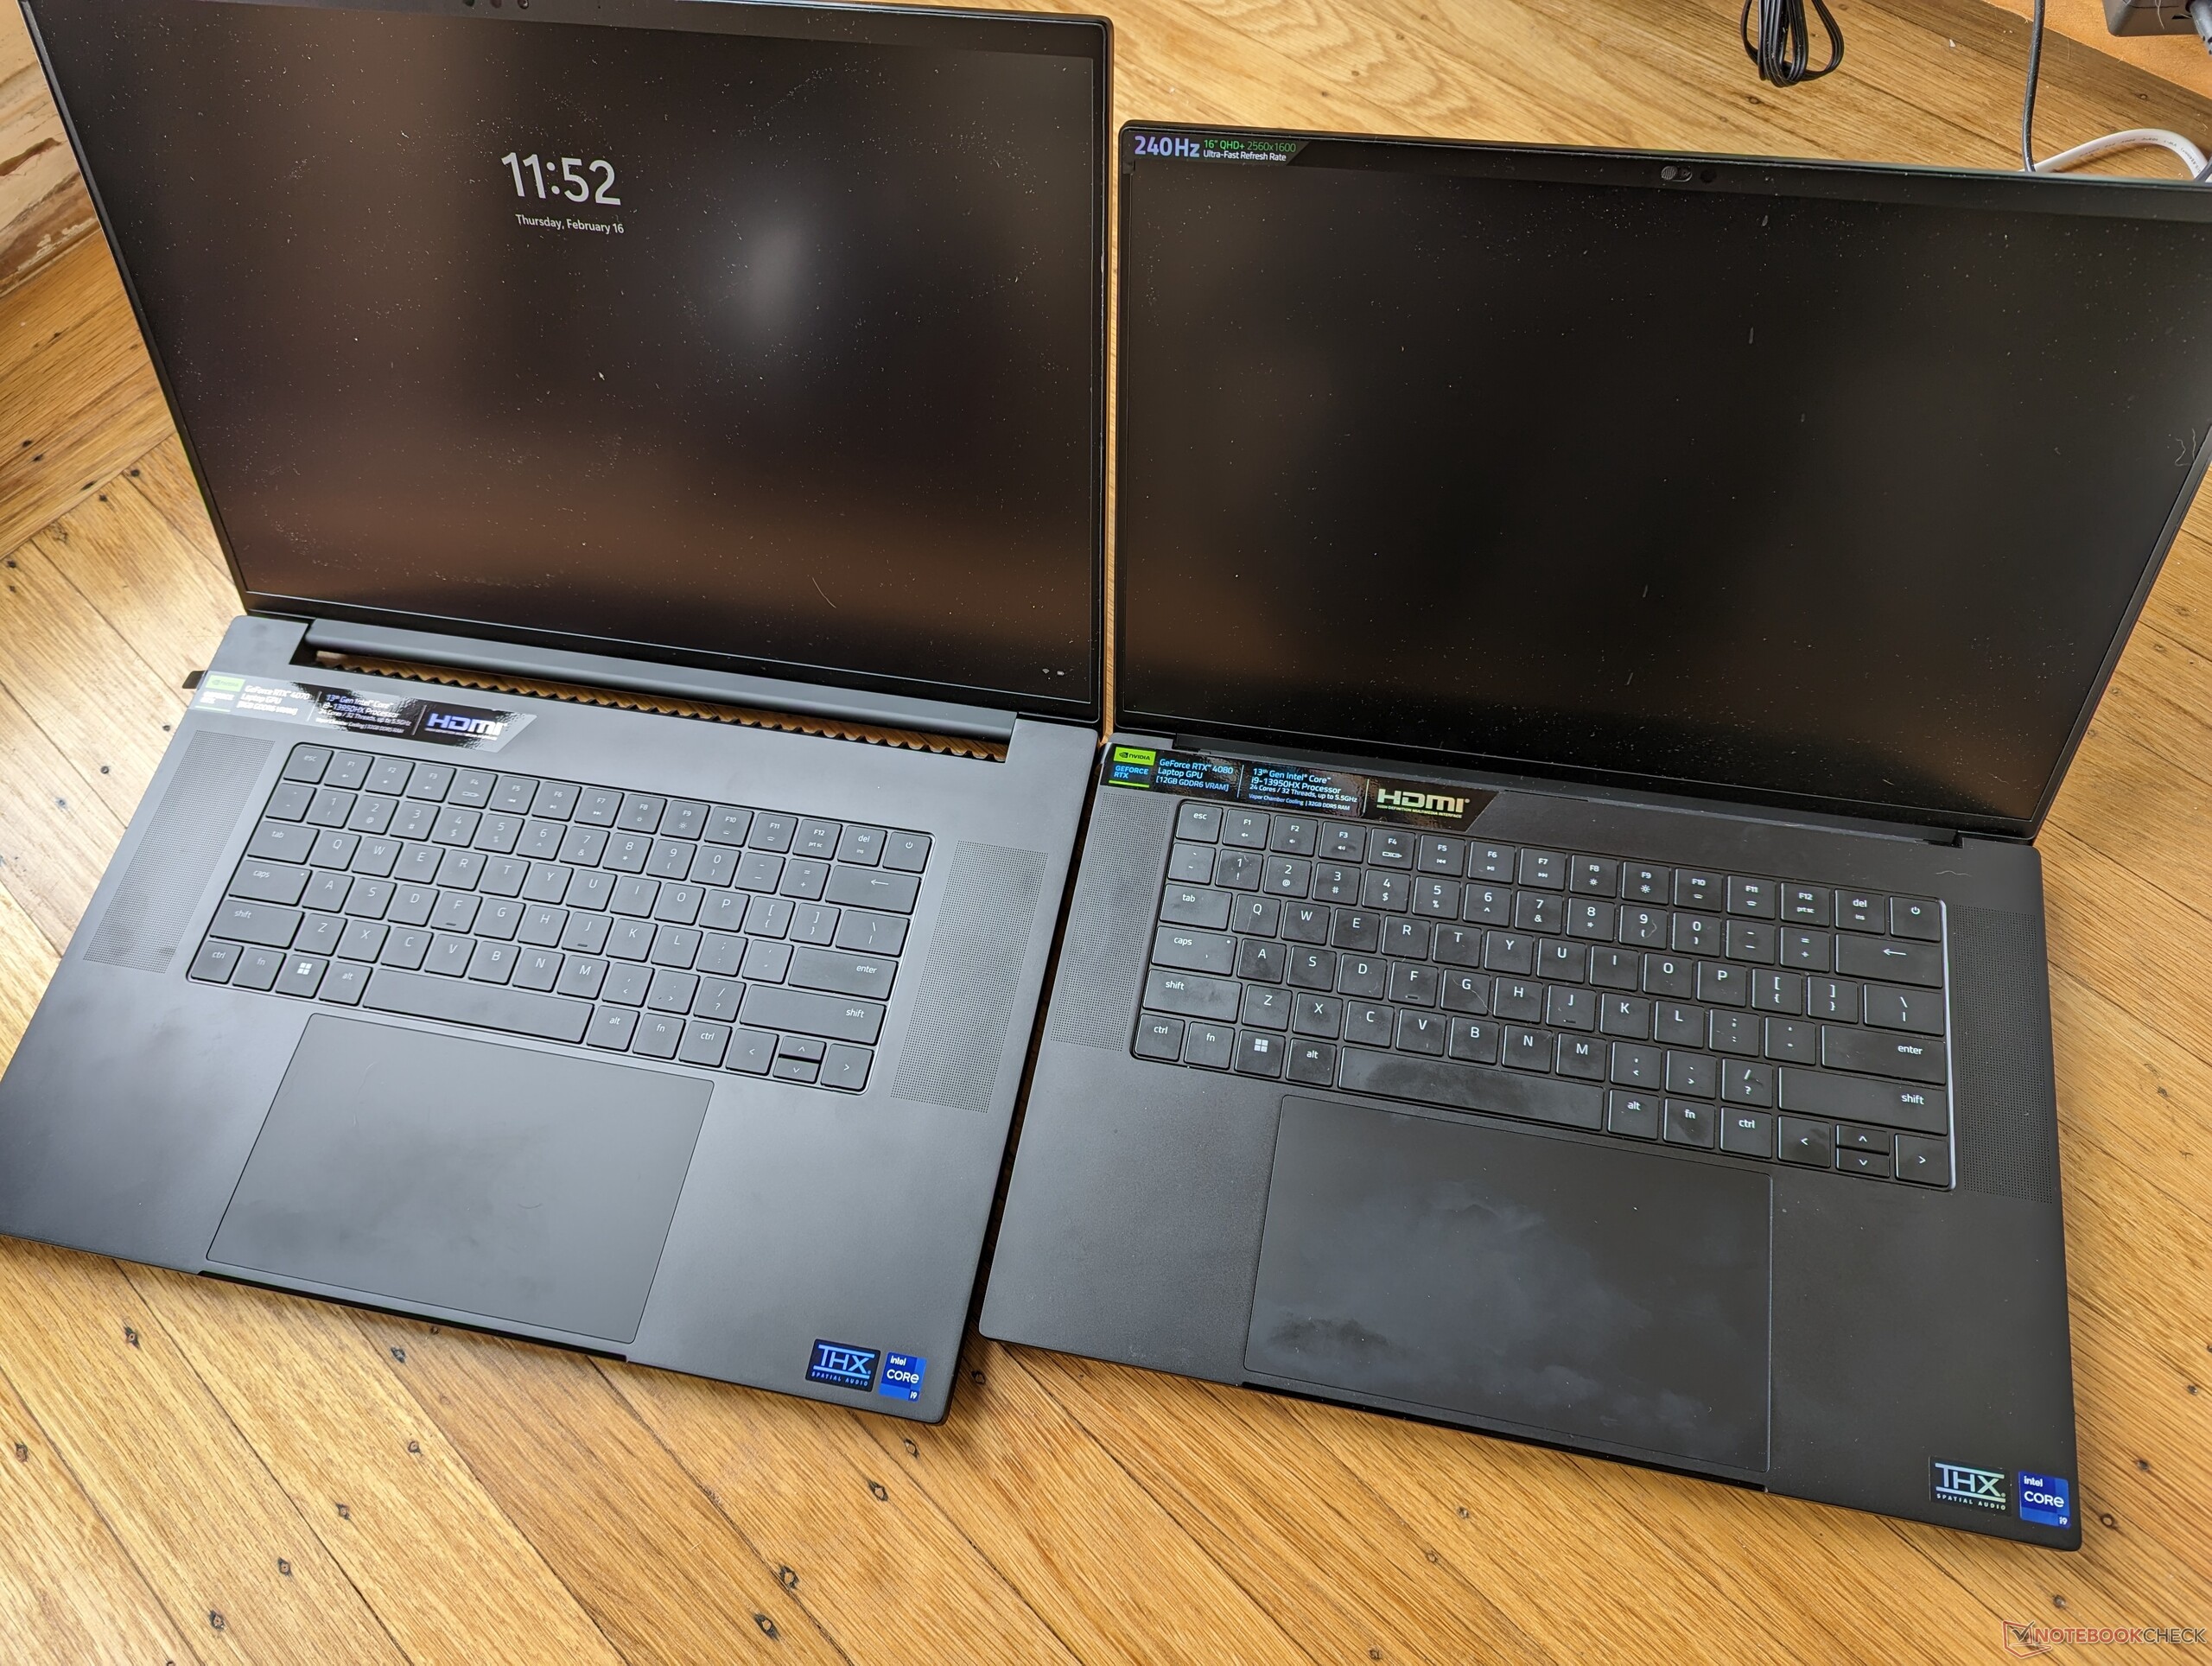
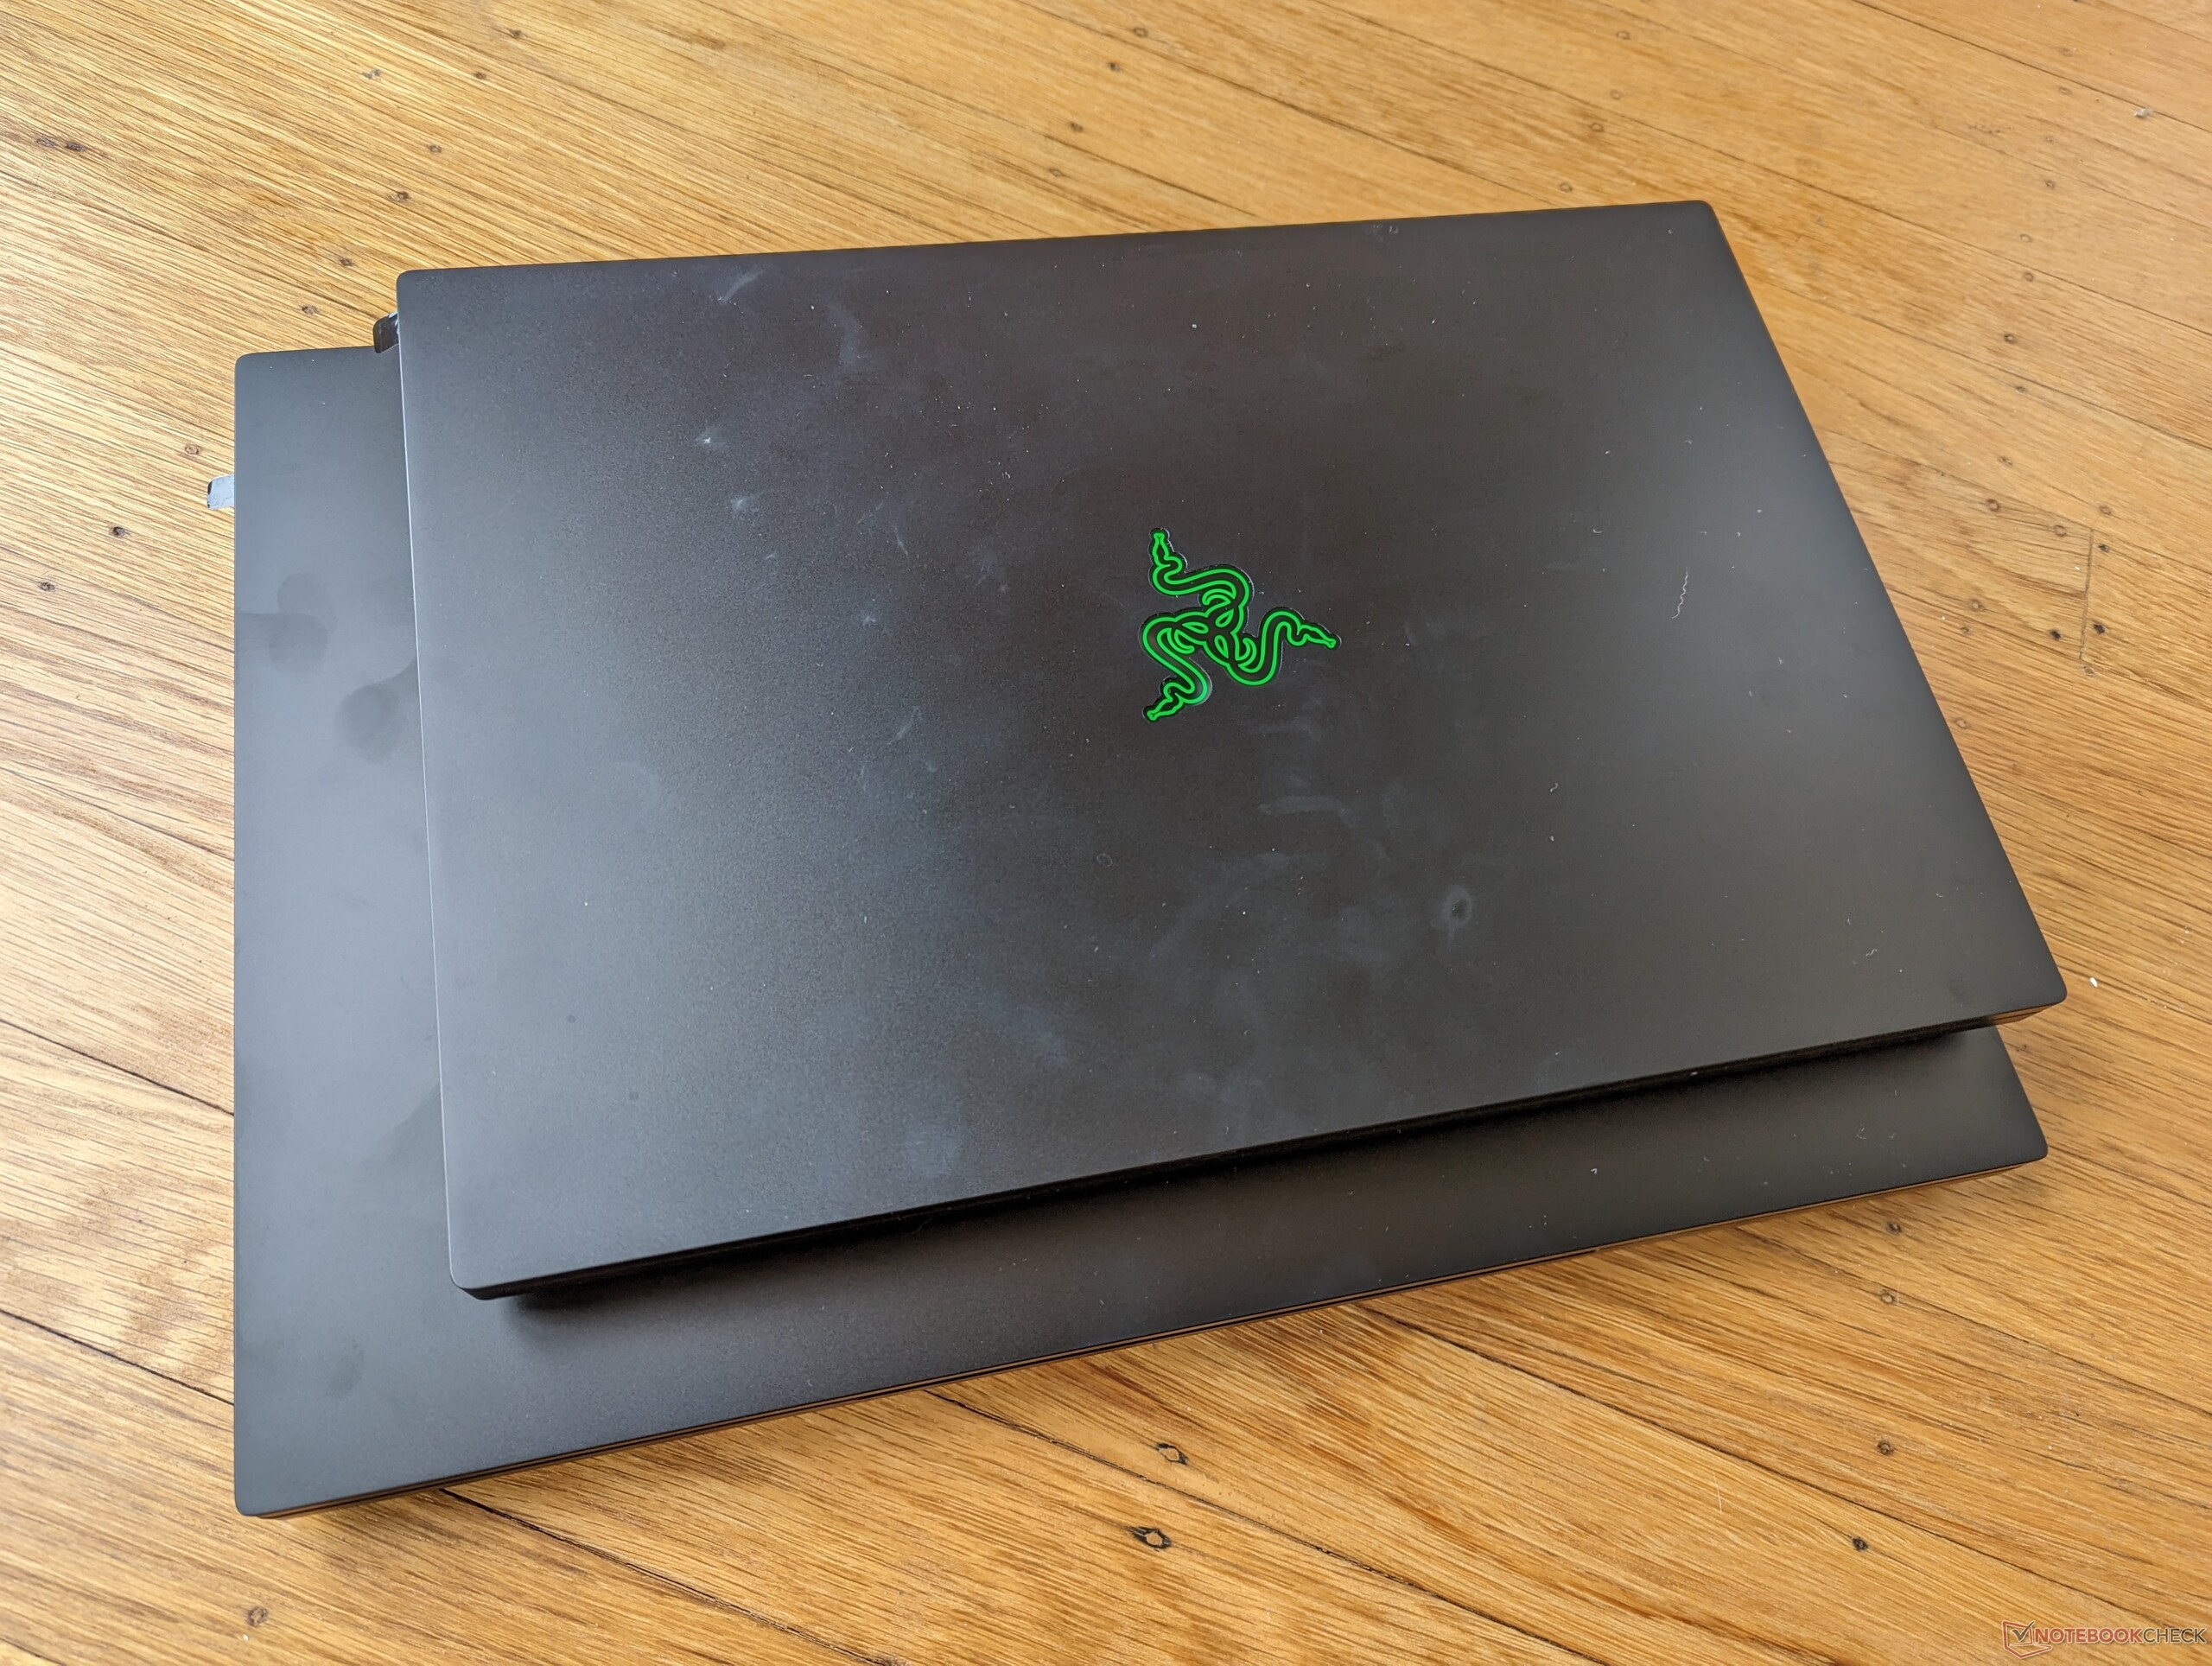
Razer se enorgullece de señalar que el Blade 18 es sólo un 18 por ciento más grande en volumen y un 7 por ciento más pesado que el Blade 17 de 2022, a pesar de sus diferencias de tamaño de pantalla. Así, el nuevo modelo de 18 pulgadas no resulta tan voluminoso como cabría esperar en un principio. De hecho, algunos portátiles para juegos de 17,3 pulgadas son más grandes o incluso más pesados que el Blade 18, incluido elAsus ROG Strix Scar 17 SE o el Alienware m17 R5.
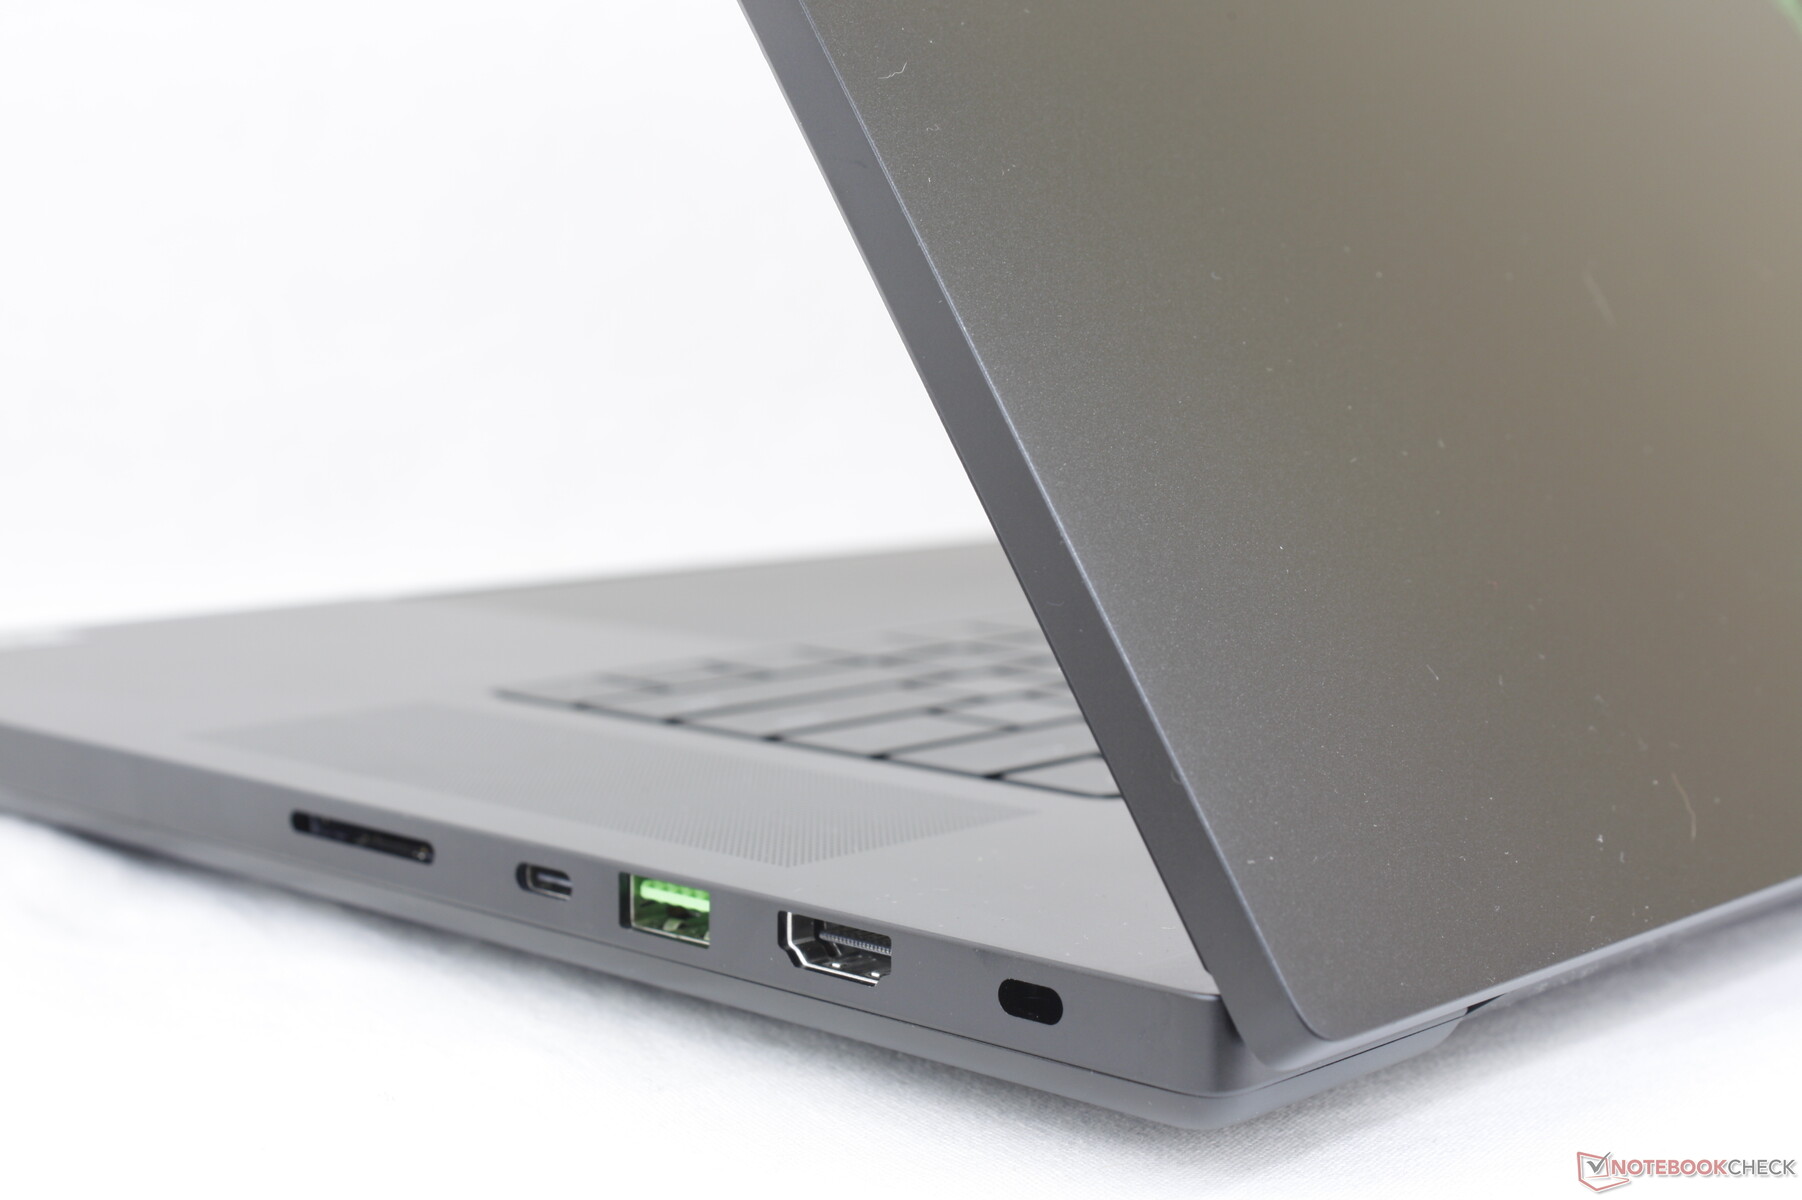
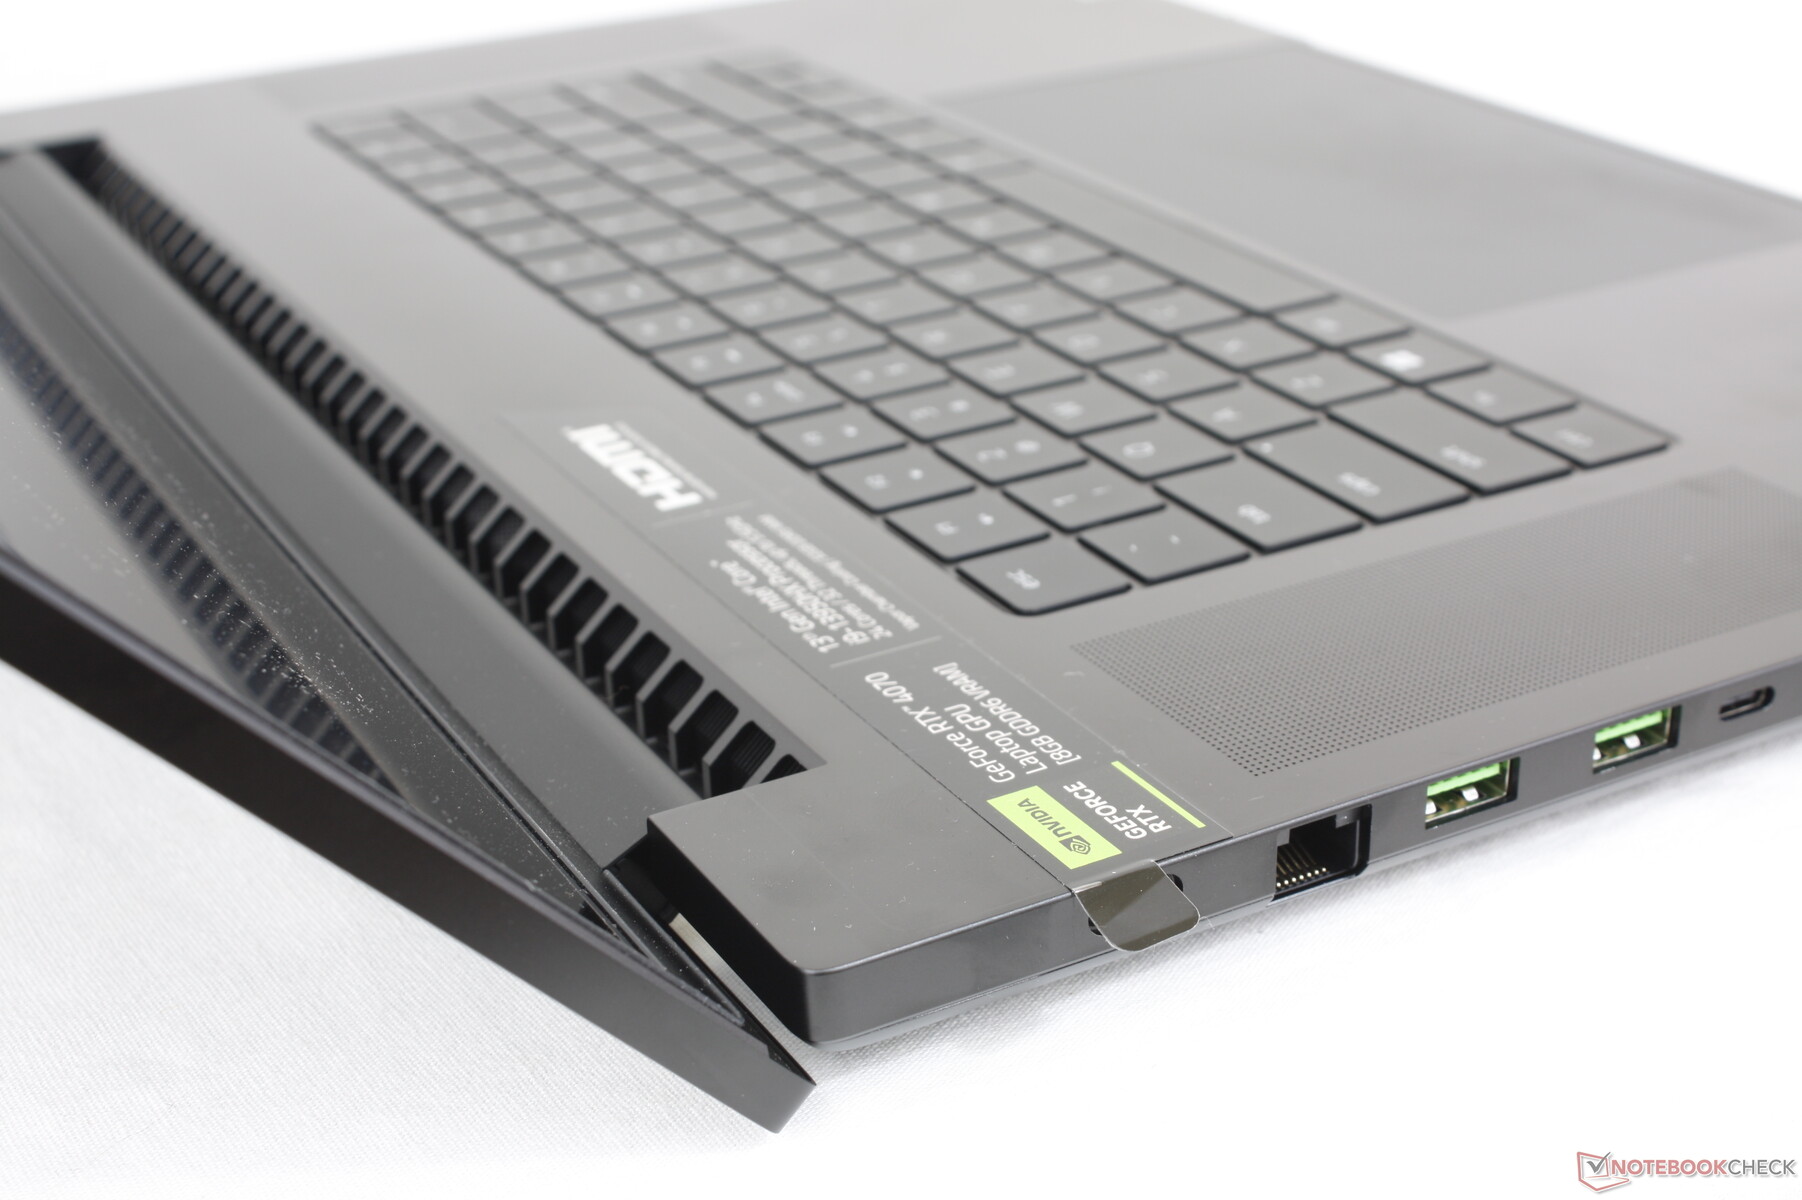
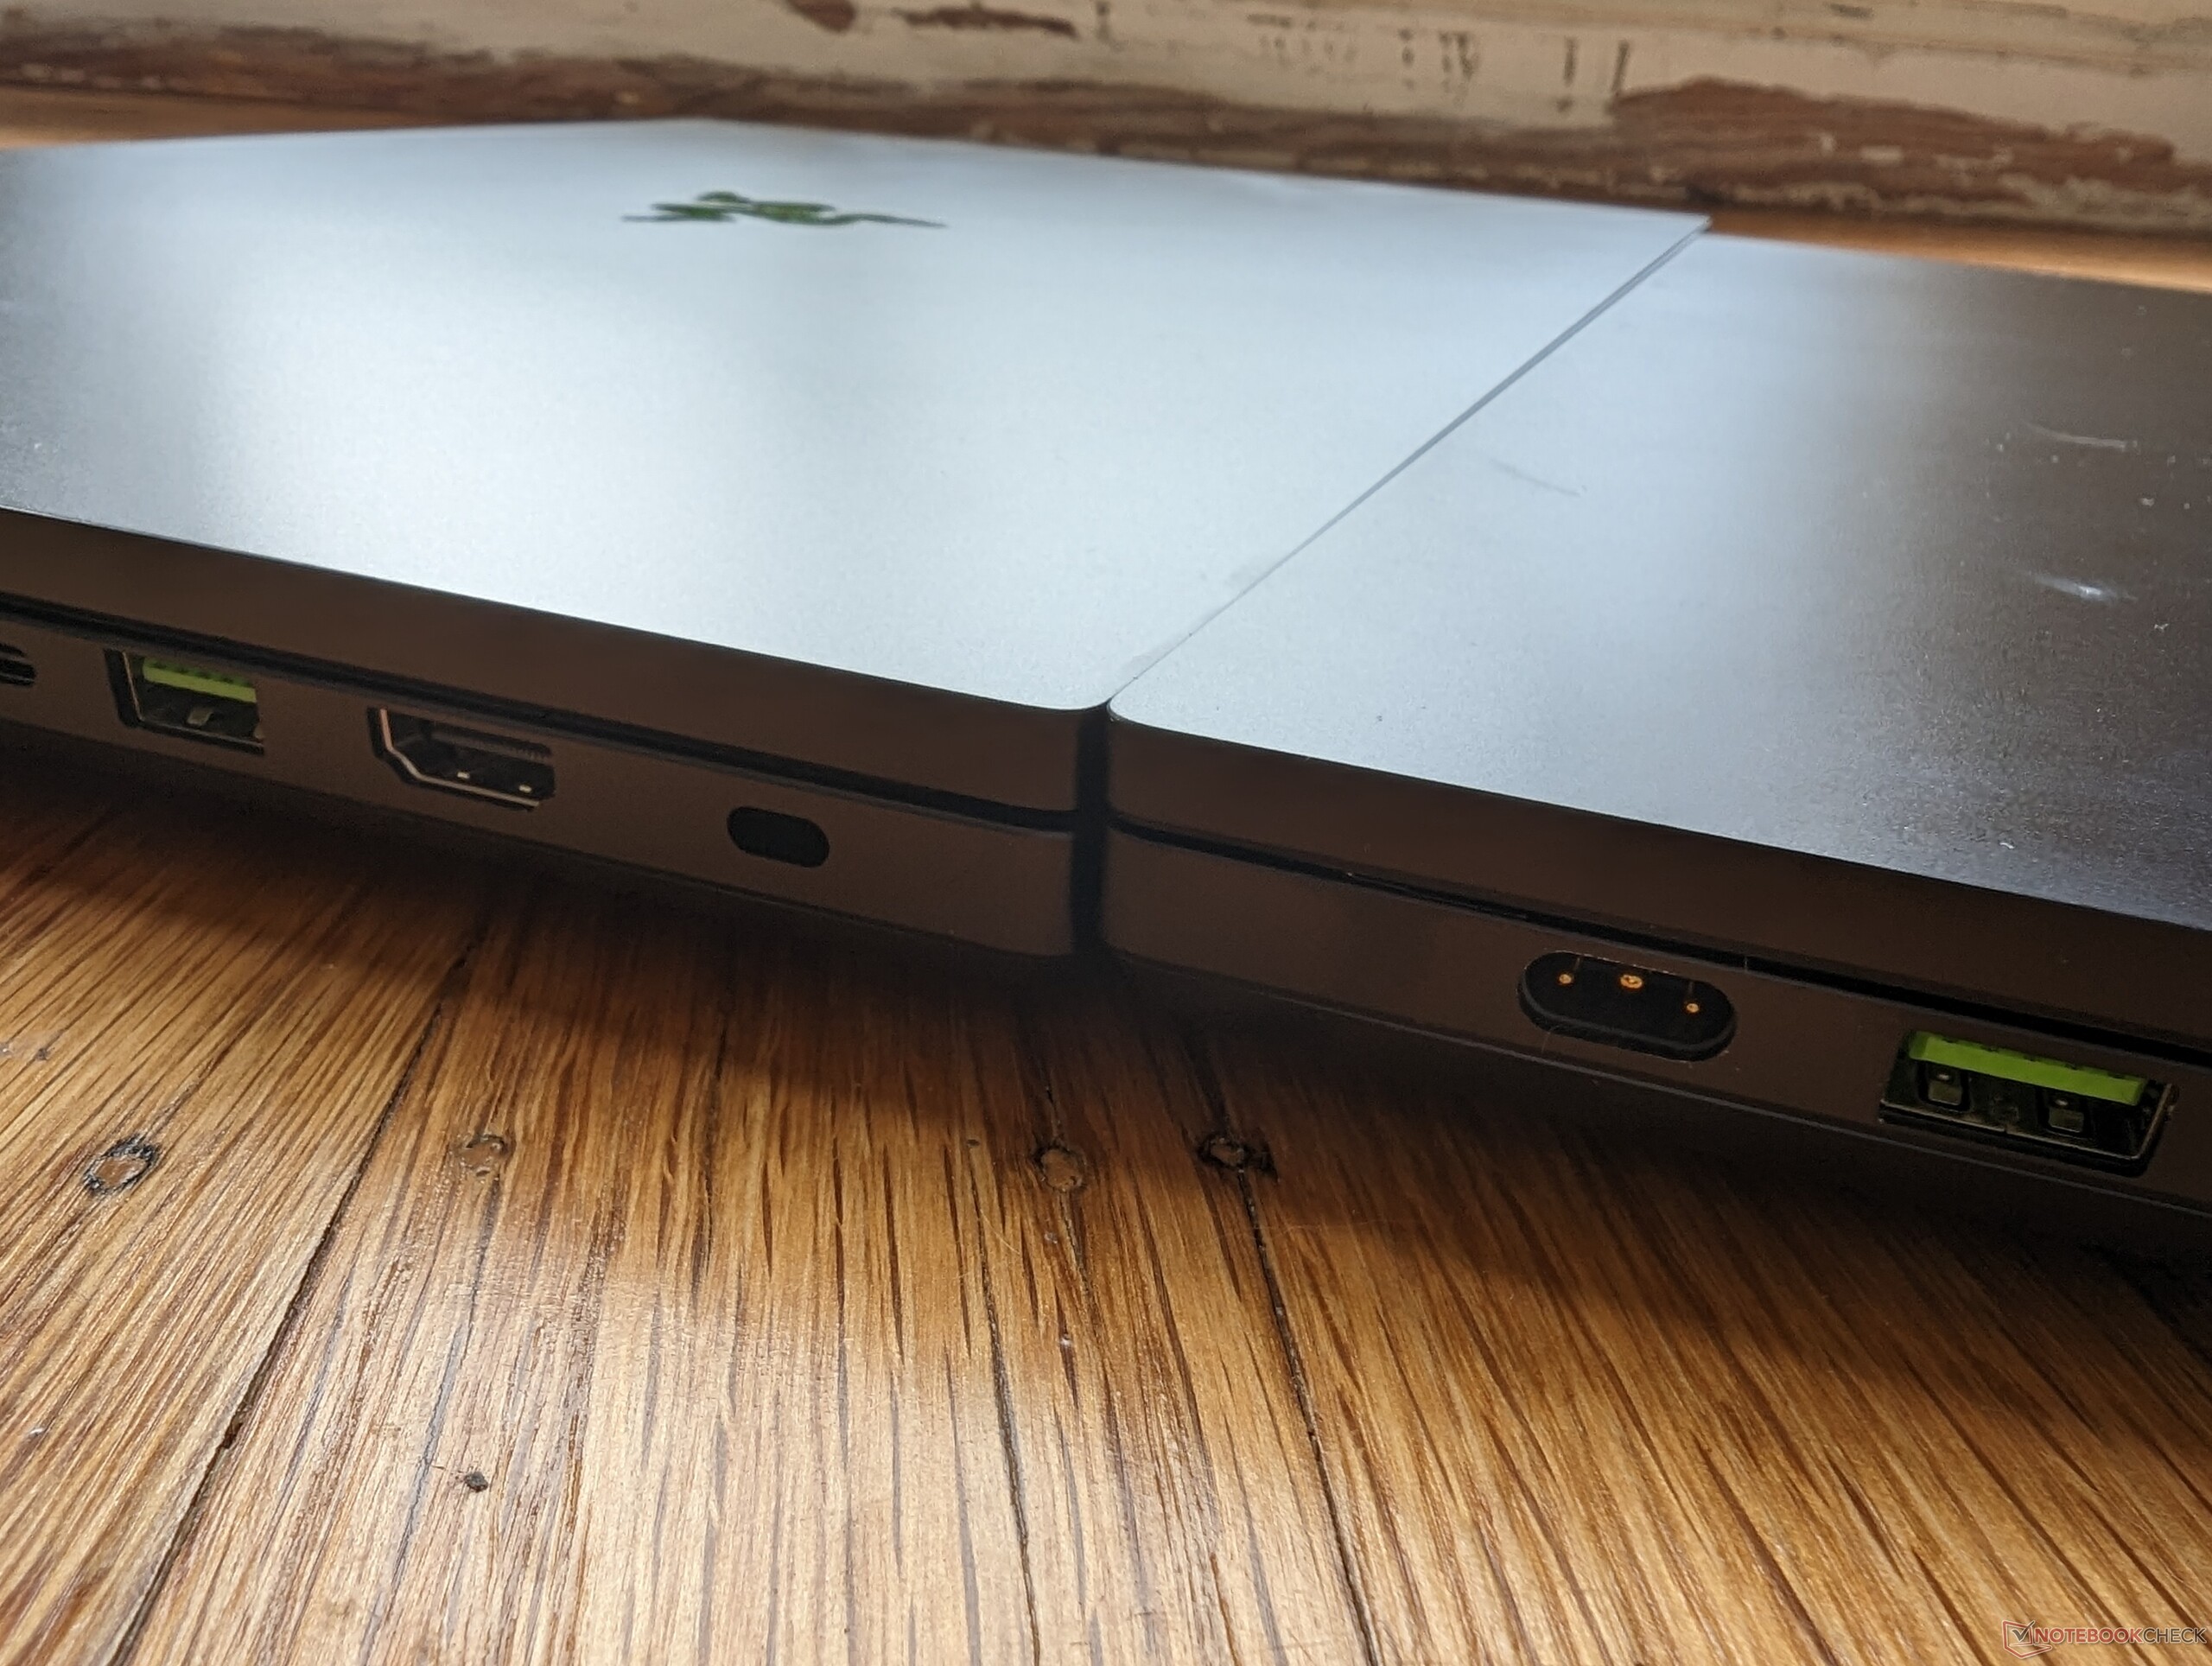
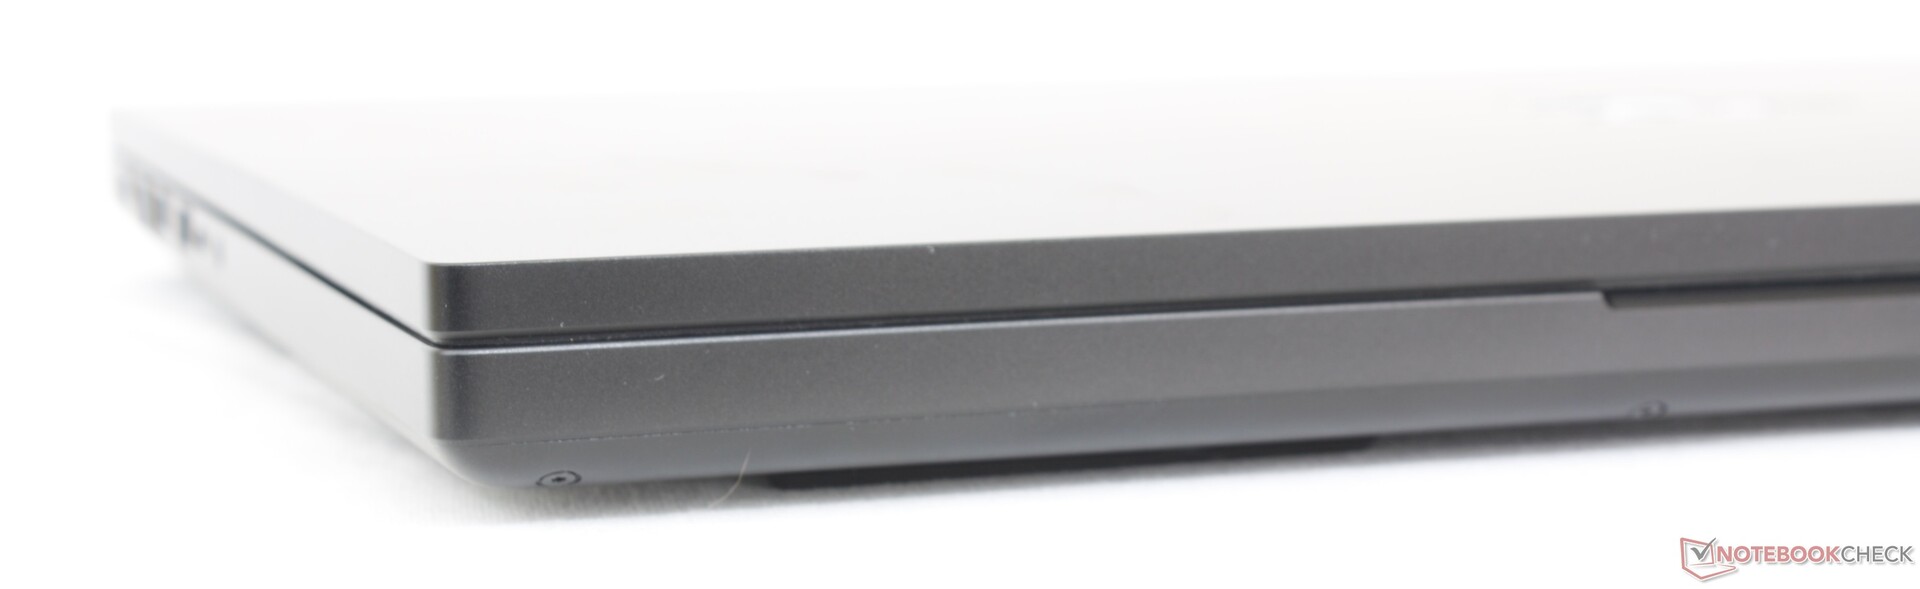
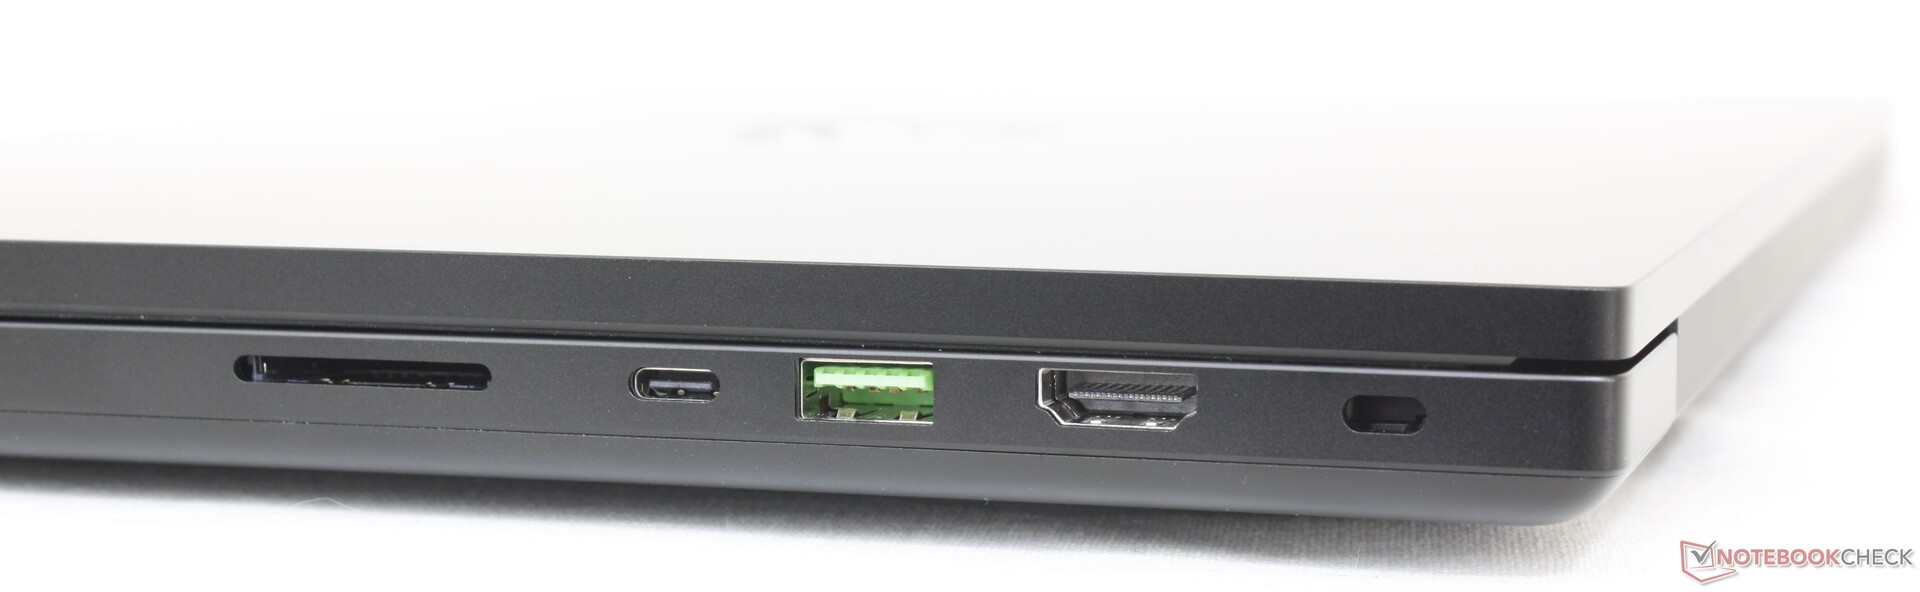
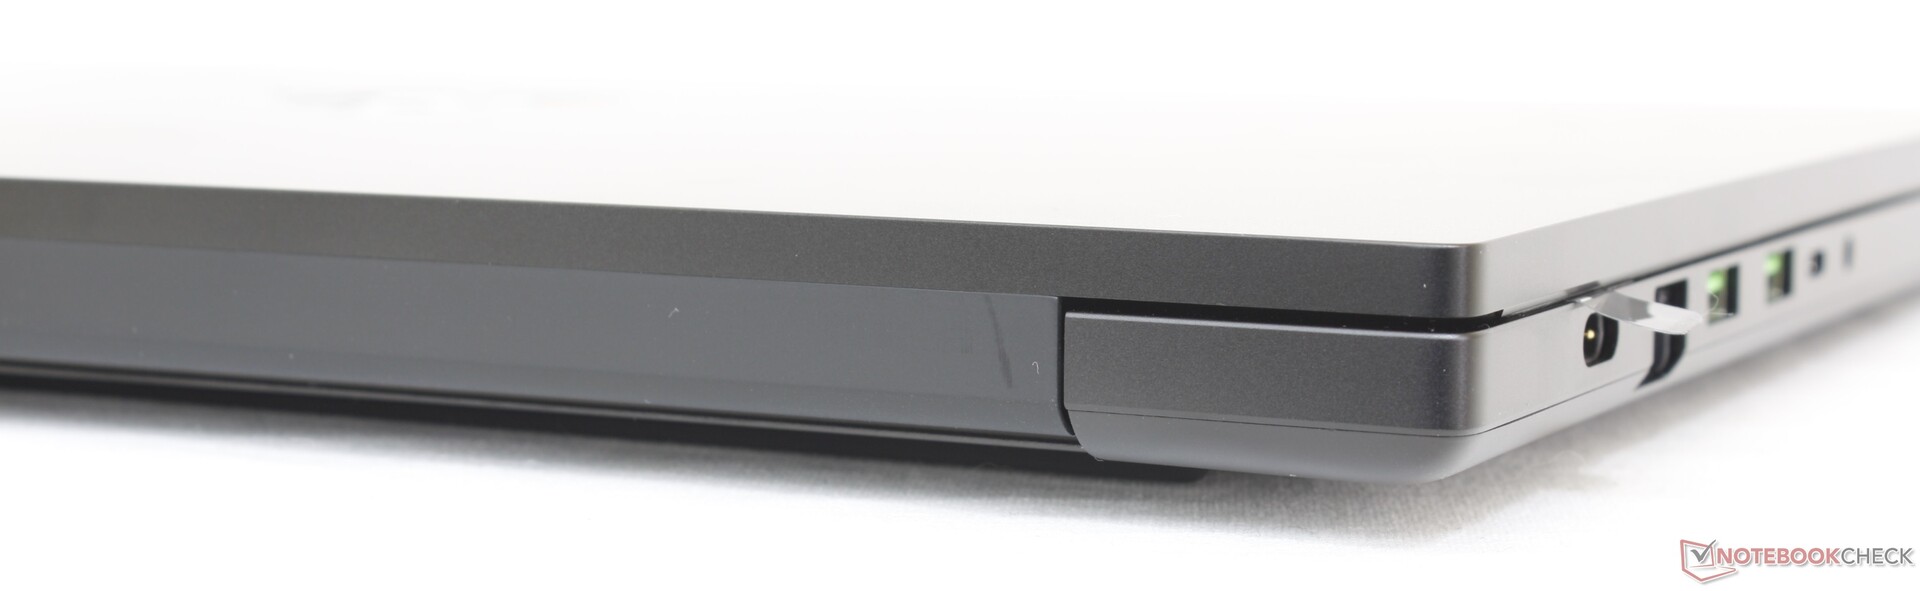
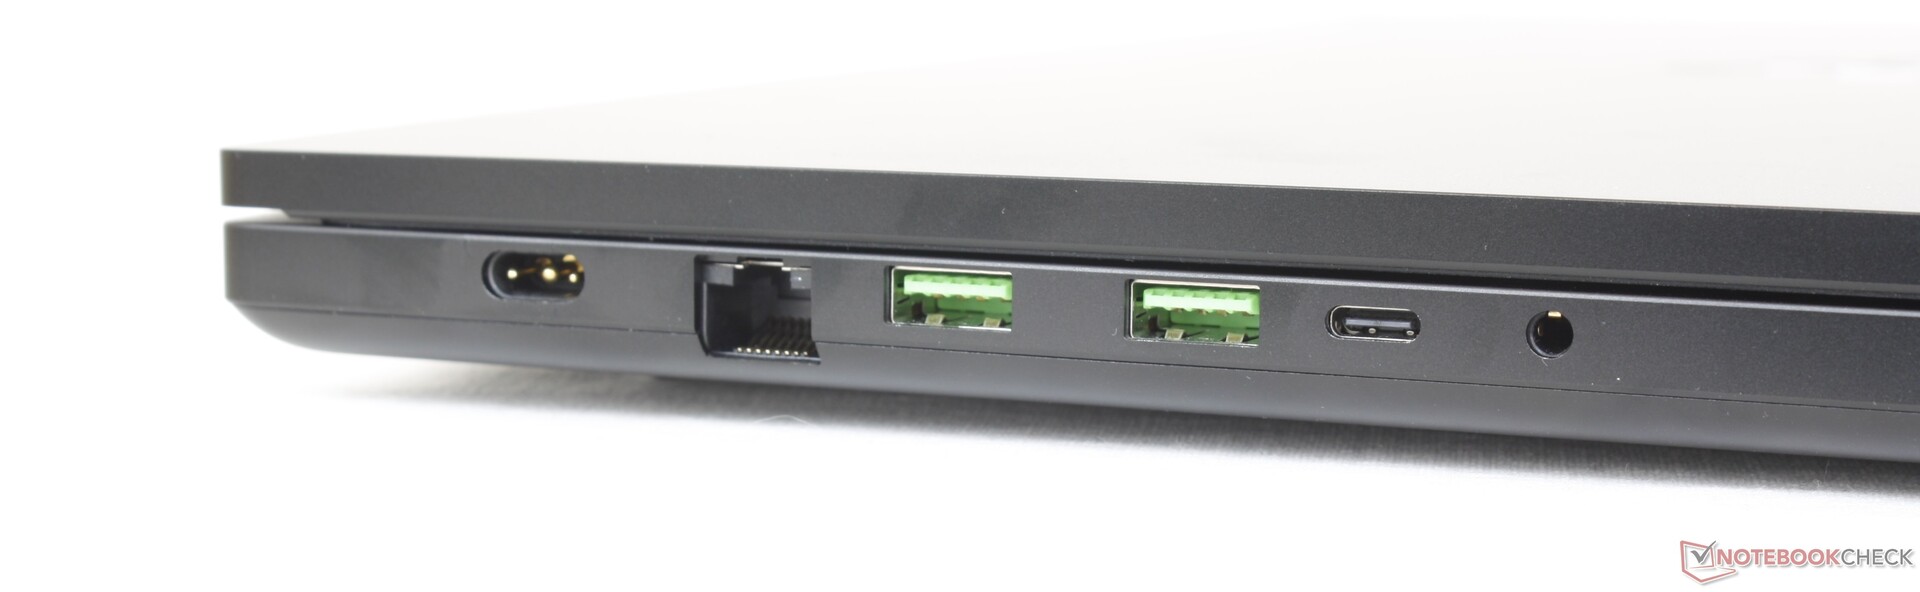
Conectividad: lo de siempre
El nuevo modelo hereda todos los puertos del Blade 17 para una saludable selección de opciones de conectividad. Aun así, nos gustaría ver algo más para distinguir mejor el Blade 18 de sus hermanos pequeños. Por ejemplo, un puerto HDMI habría añadido más versatilidad a la espaciosa pantalla de 18 pulgadas.
Hay que tener en cuenta que solo uno de los dos puertos USB-C es compatible con dispositivos Thunderbolt.
Lector de tarjetas SD
Somos capaces de mover 1 GB de imágenes desde nuestra tarjeta de prueba UHS-II al escritorio en tan sólo 5 segundos en comparación con los ~13 segundos de laMSI Titan GT77.
| SD Card Reader | |
| average JPG Copy Test (av. of 3 runs) | |
| Razer Blade 18 RTX 4070 (Angelibird AV Pro V60) | |
| Razer Blade 17 Early 2022 (AV PRO microSD 128 GB V60) | |
| Razer Blade 16 Early 2023 (AV PRO microSD 128 GB V60) | |
| MSI Titan GT77 HX 13VI (Angelibird AV Pro V60) | |
| maximum AS SSD Seq Read Test (1GB) | |
| Razer Blade 18 RTX 4070 (Angelibird AV Pro V60) | |
| Razer Blade 16 Early 2023 (AV PRO microSD 128 GB V60) | |
| Gigabyte G7 KE (AV PRO microSD 128 GB V60) | |
| MSI Titan GT77 HX 13VI (Angelibird AV Pro V60) | |
Comunicación
El Intel AX211 viene de serie con Wi-Fi 6E y Bluetooth 5.3, mientras que el Blade 17 viene con el Killer AX1690i. El Killer AX1690i es el derivado específico para juegos del Intel AX211, por lo que los usuarios no deberían ver diferencias de rendimiento significativas entre ambos.
| Networking | |
| iperf3 transmit AXE11000 6GHz | |
| Asus ROG Strix Scar 17 SE G733CX-LL014W | |
| Razer Blade 18 RTX 4070 | |
| iperf3 receive AXE11000 6GHz | |
| Asus ROG Strix Scar 17 SE G733CX-LL014W | |
| Razer Blade 18 RTX 4070 | |
| iperf3 receive AXE11000 | |
| Razer Blade 17 Early 2022 | |
| Gigabyte G7 KE | |
| MSI Titan GT77 HX 13VI | |
| Razer Blade 18 RTX 4070 | |
| Alienware m17 R5 (R9 6900HX, RX 6850M XT) | |
| iperf3 transmit AXE11000 | |
| Gigabyte G7 KE | |
| MSI Titan GT77 HX 13VI | |
| Razer Blade 18 RTX 4070 | |
| Alienware m17 R5 (R9 6900HX, RX 6850M XT) | |
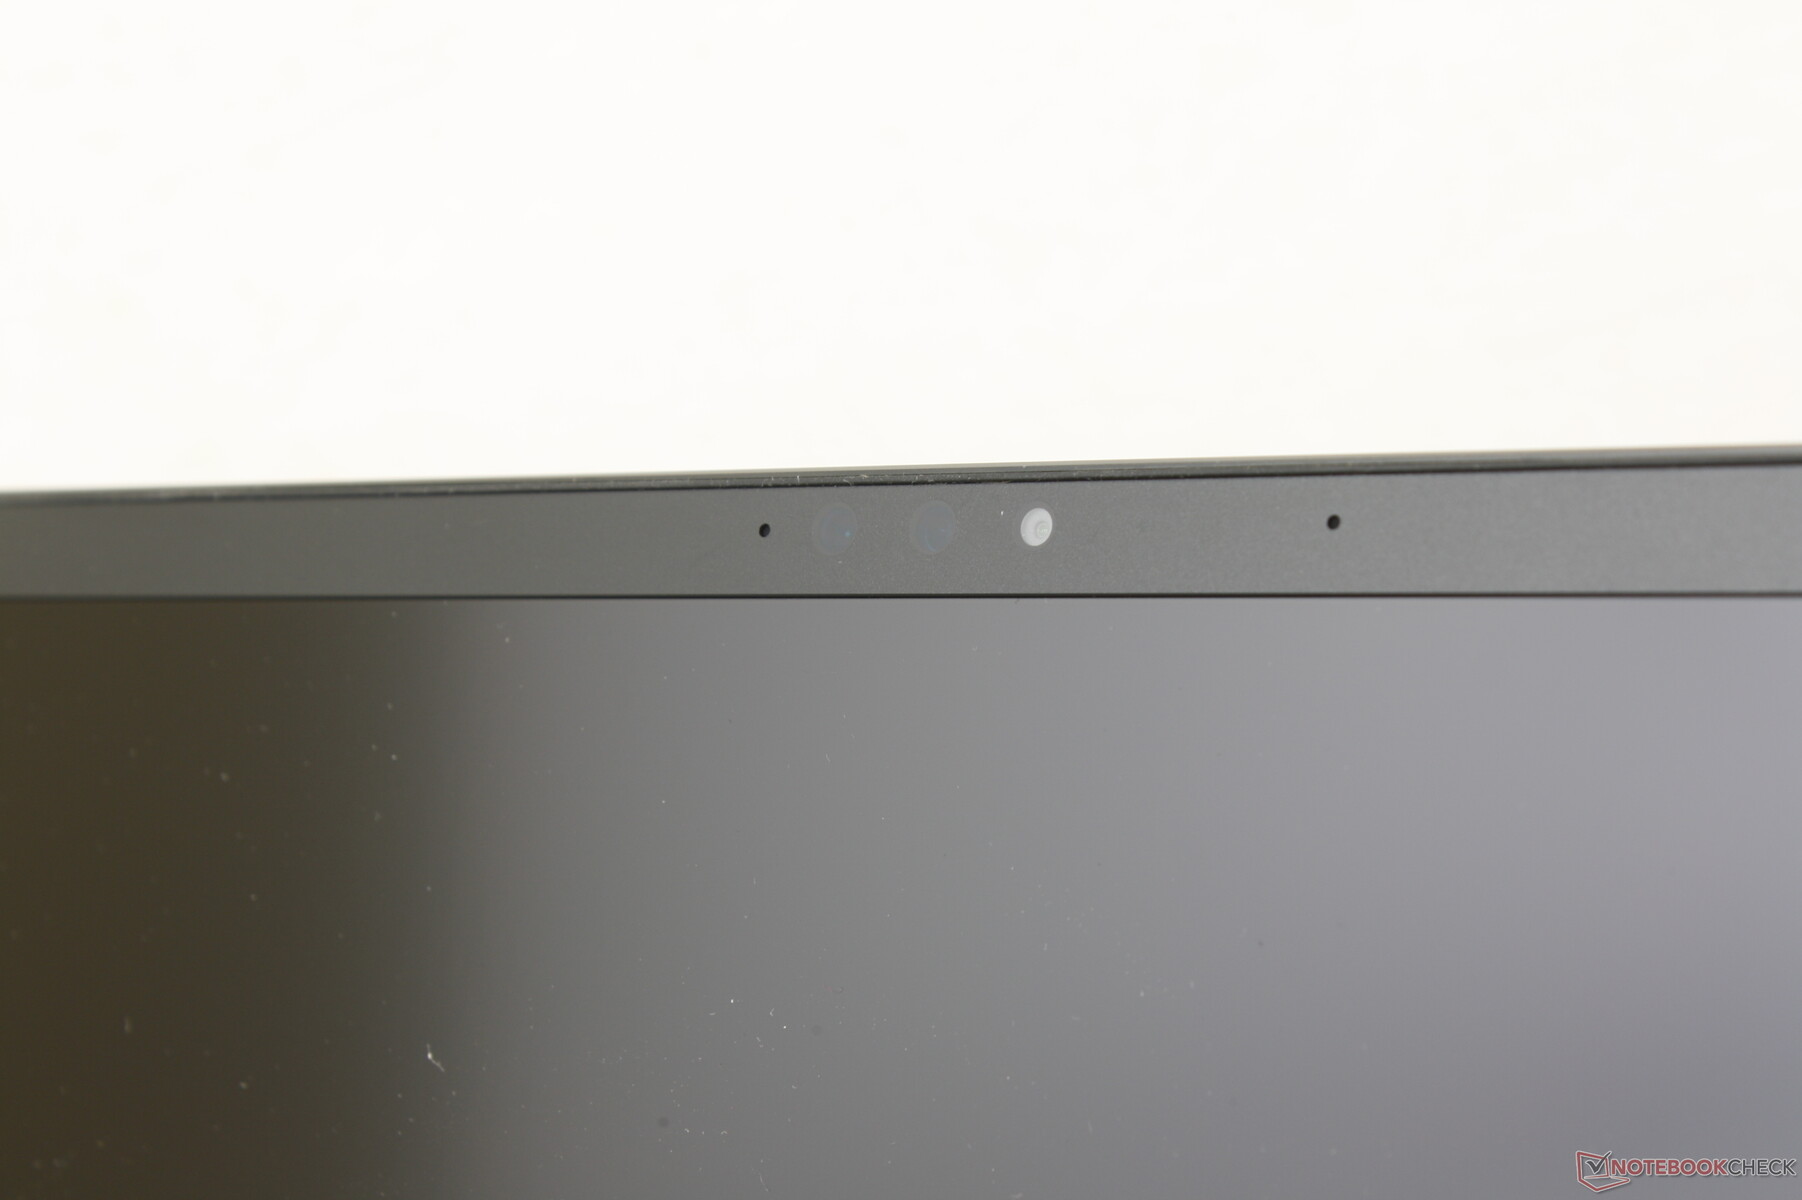
Webcam - Ahora con 5 MP
Razer ha actualizado la webcam de 2 MP en el Blade 17 a 5 MP en el Blade 18. Esperamos que el fabricante empiece a actualizar sus modelos Blade más pequeños con el mismo sensor de 5 MP en algún momento cercano. Esperamos que el fabricante empiece a actualizar sus modelos Blade más pequeños con el mismo sensor de 5 MP en un futuro próximo. Las imágenes son más nítidas con el sensor de 5 MP, mientras que los colores no han cambiado mucho. IR viene de serie para Windows Hello.
Extrañamente, no hay obturador físico de privacidad de la webcam aunque el Blade 16 incorpora uno. Ni siquiera hay un interruptor digital o tecla de acceso rápido.


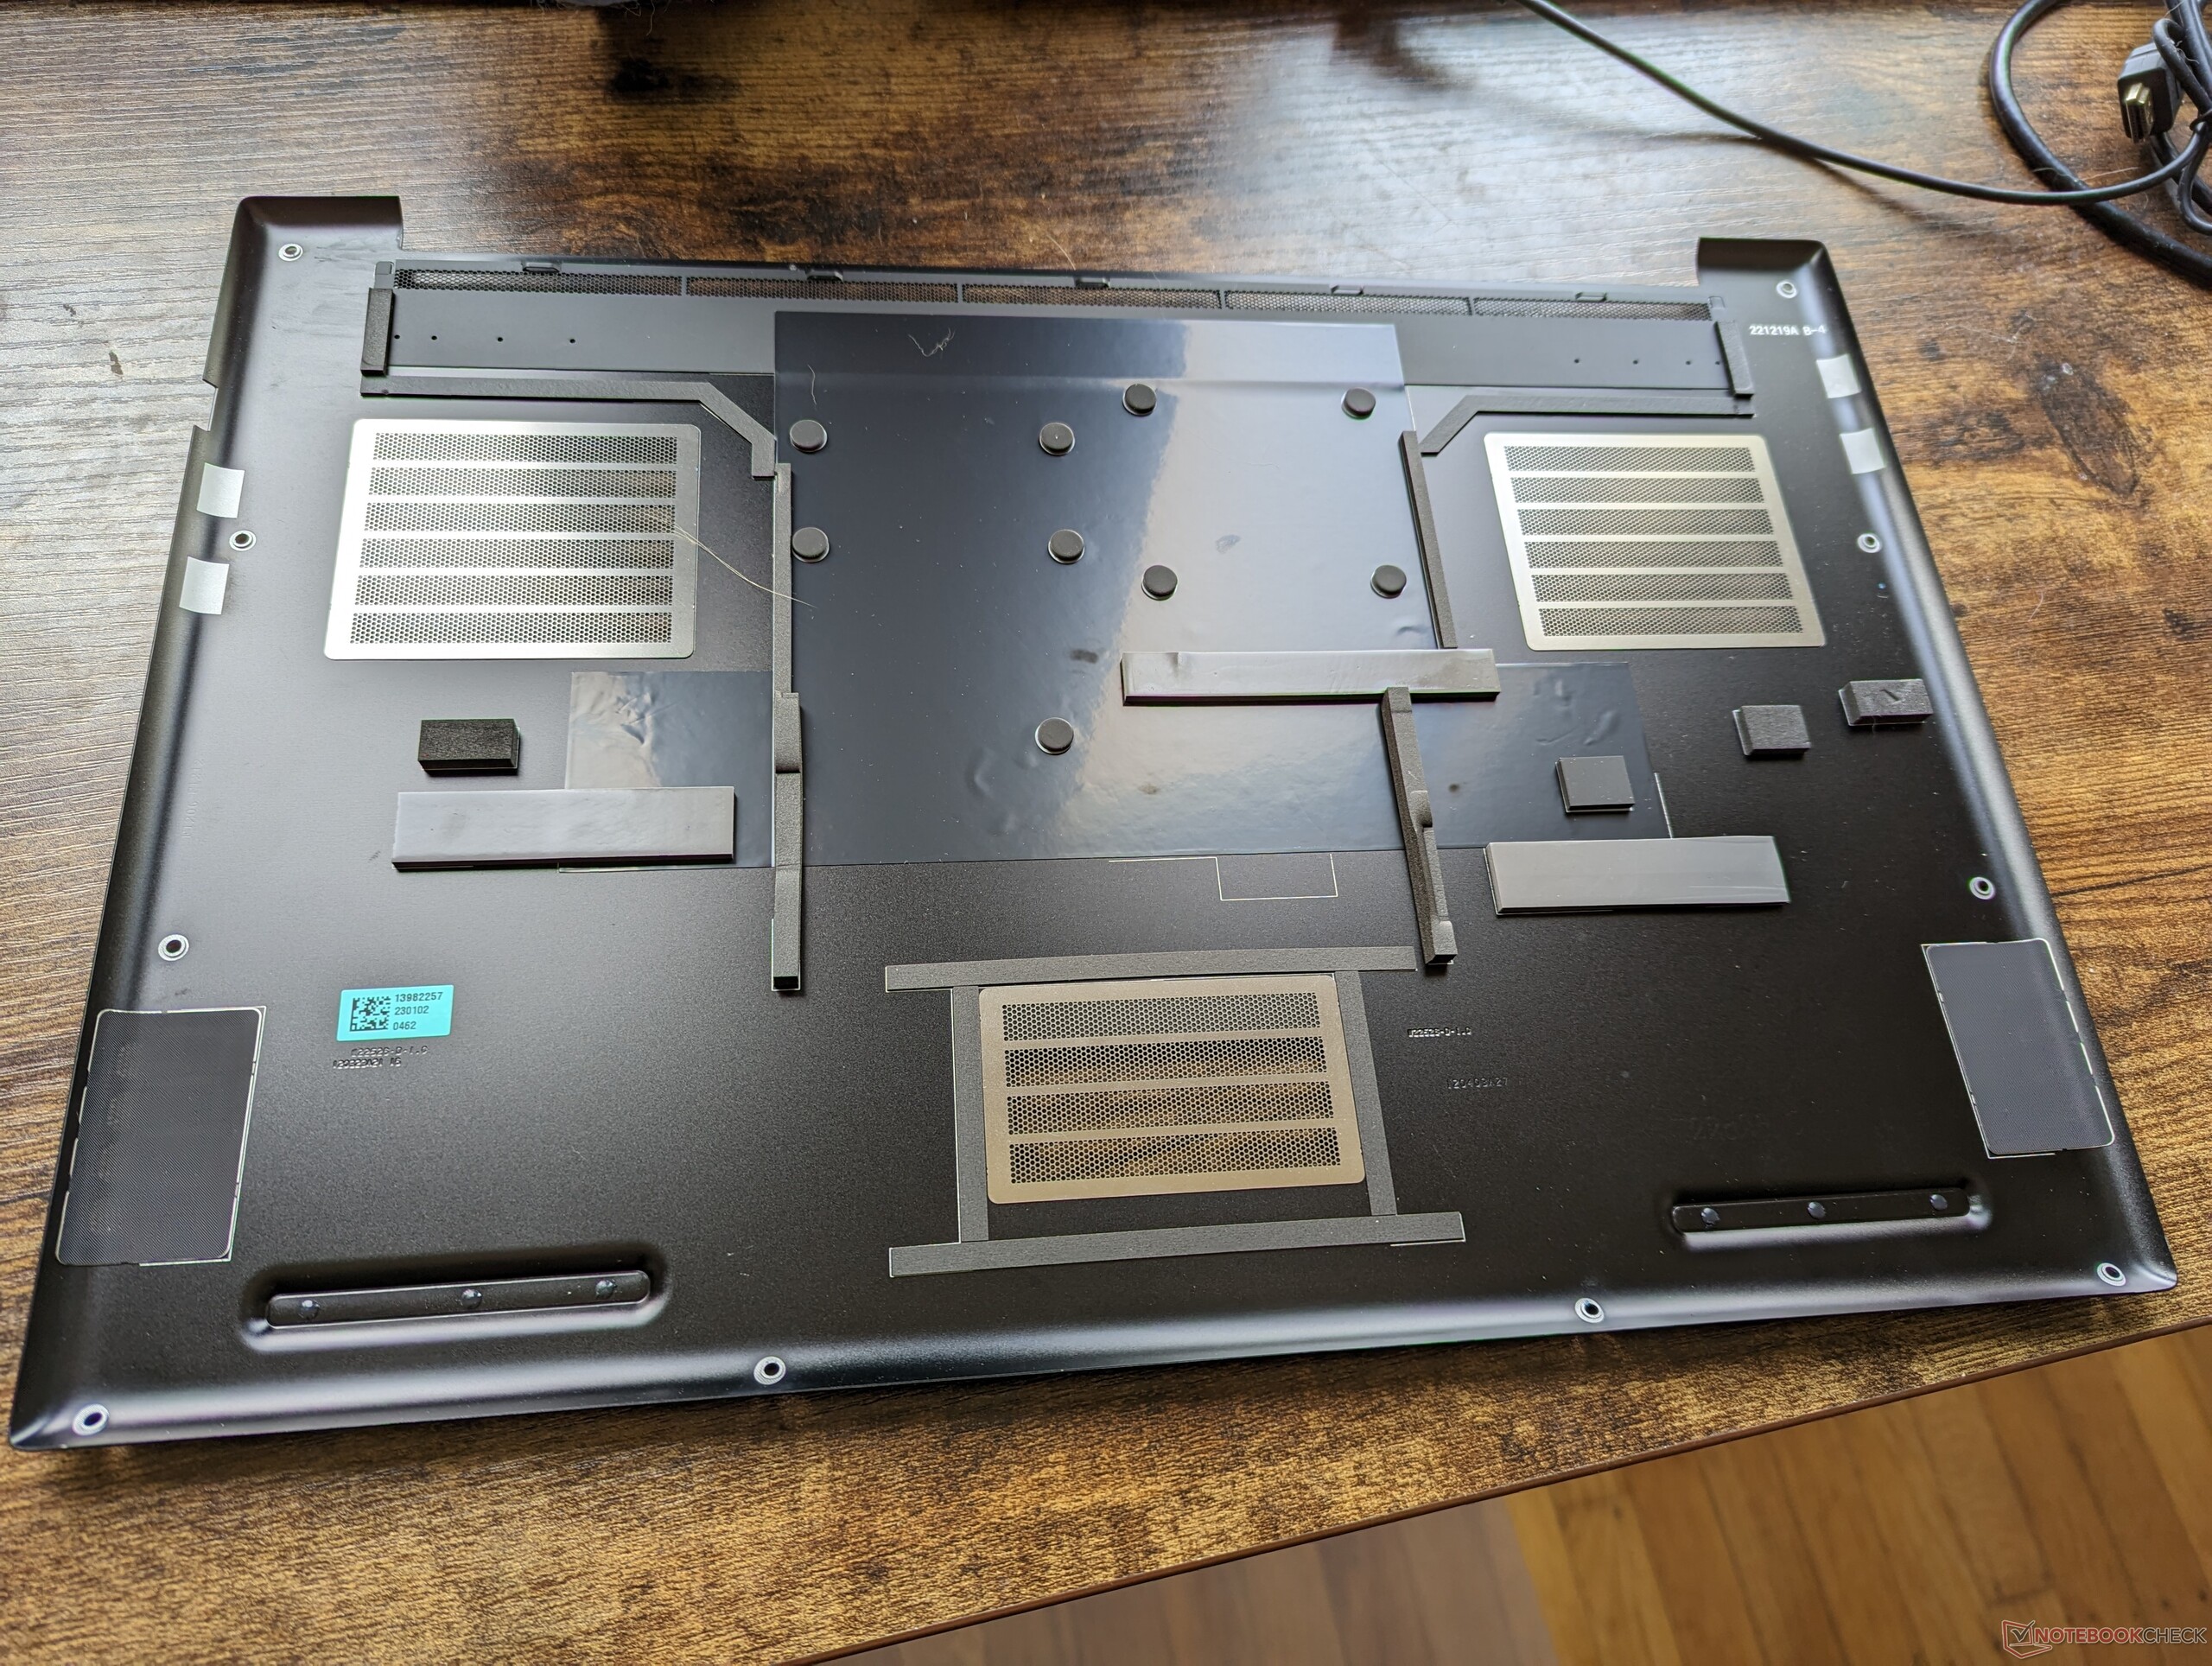
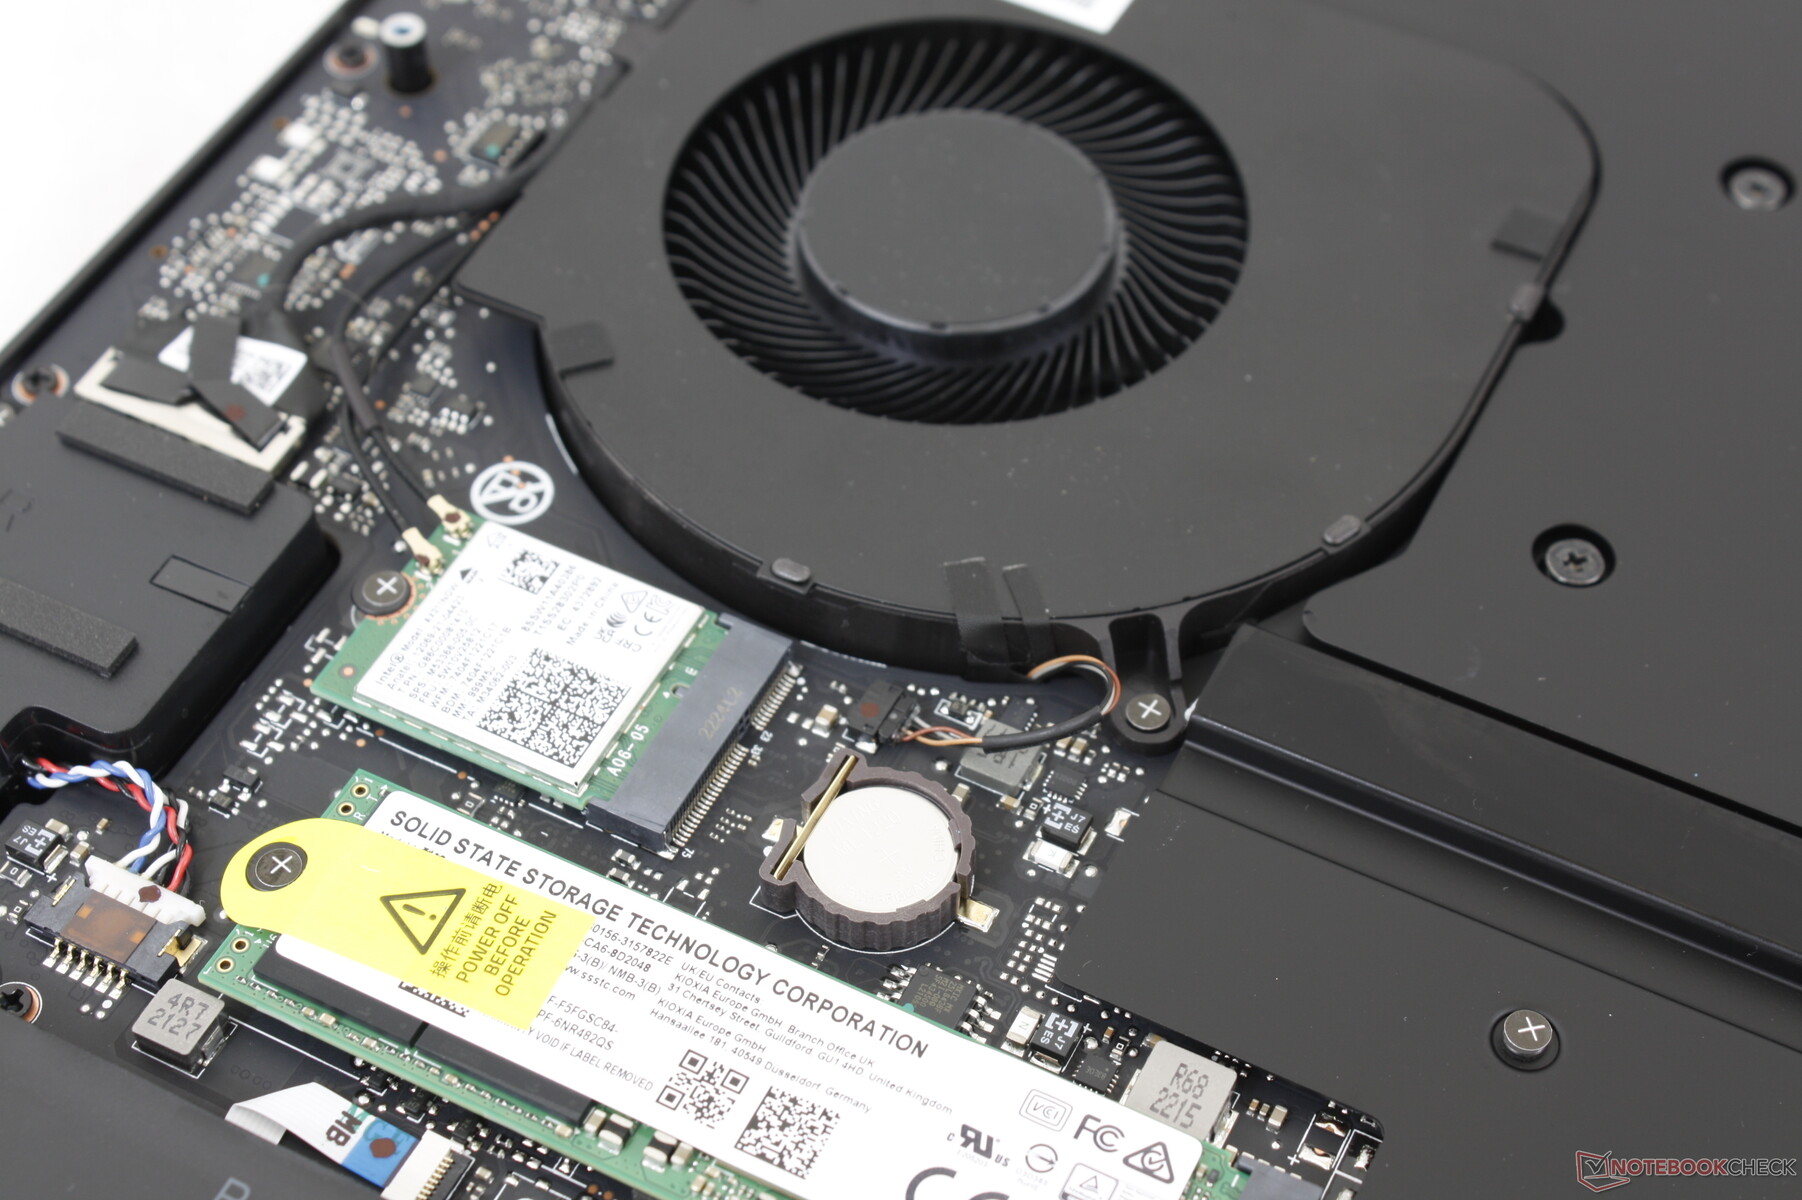
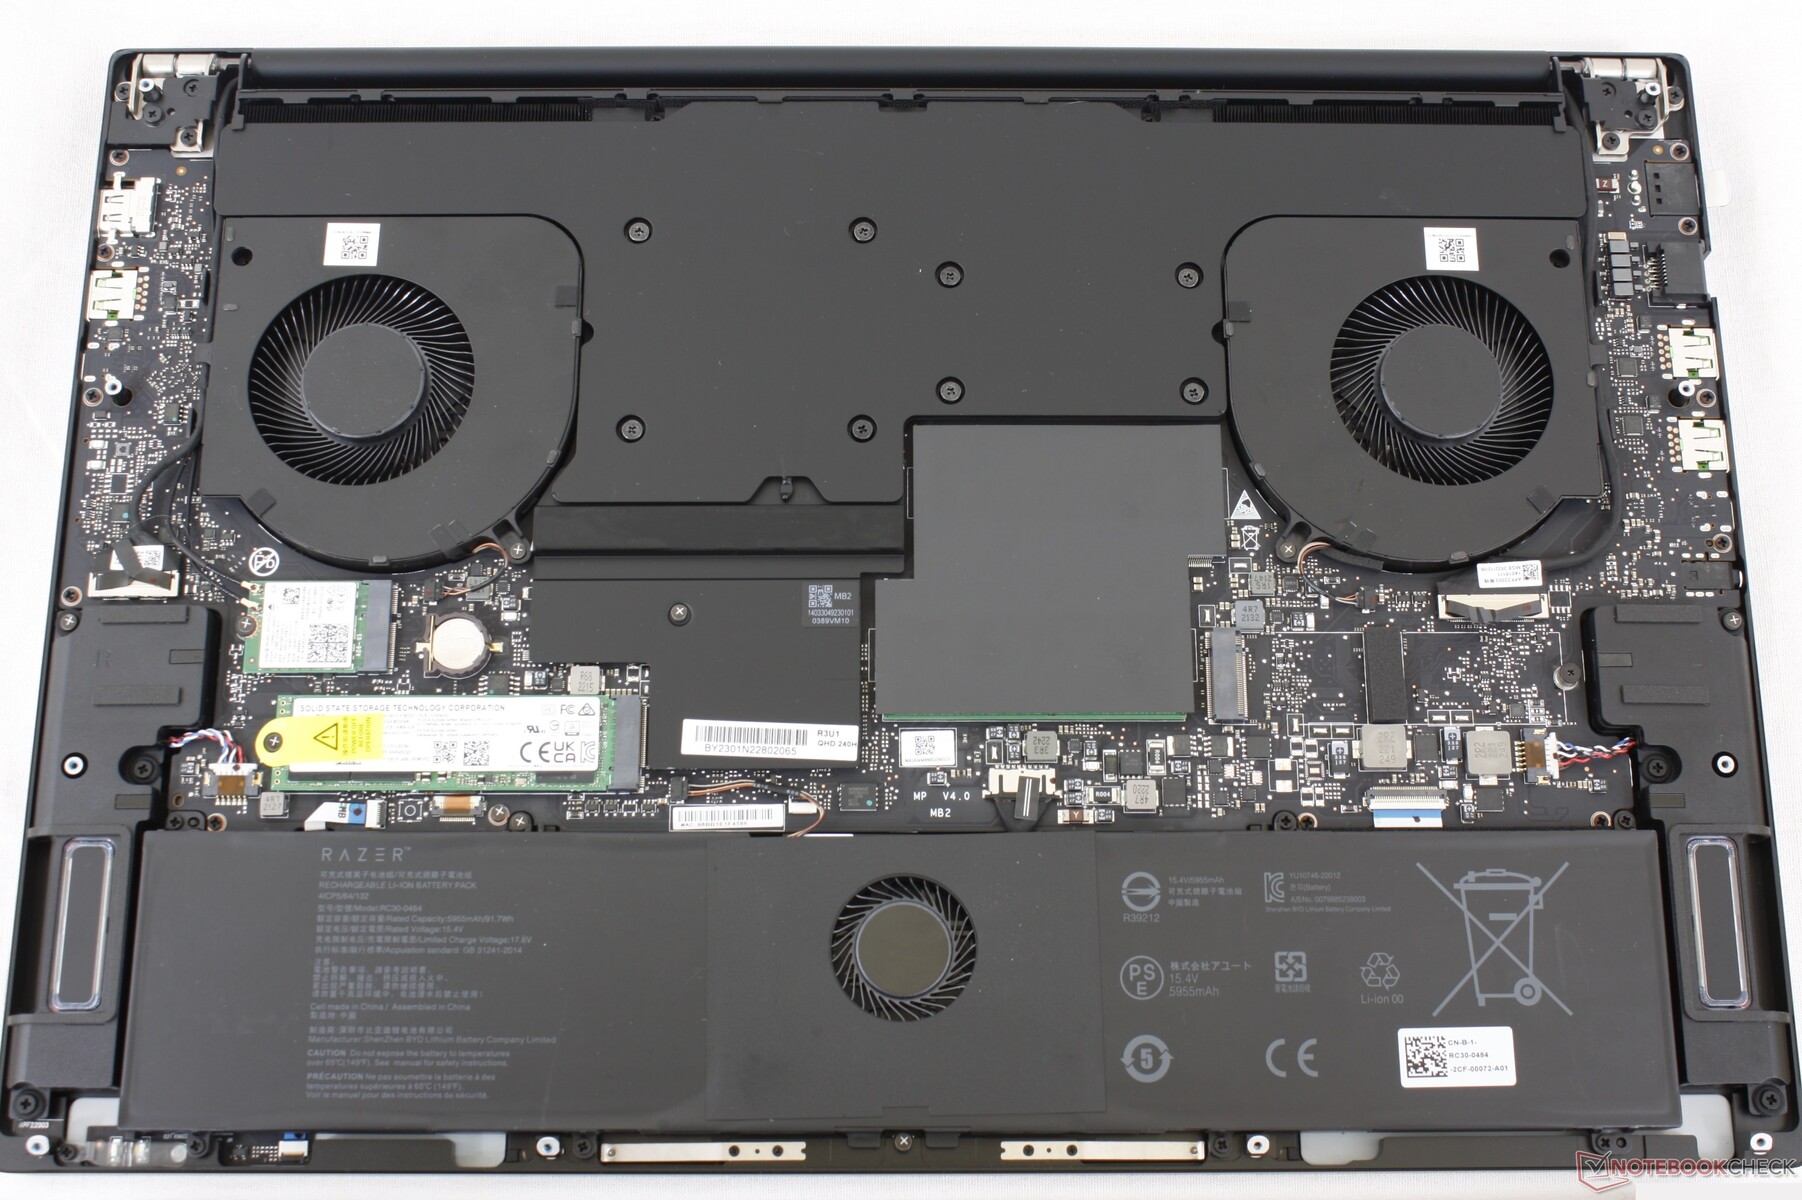
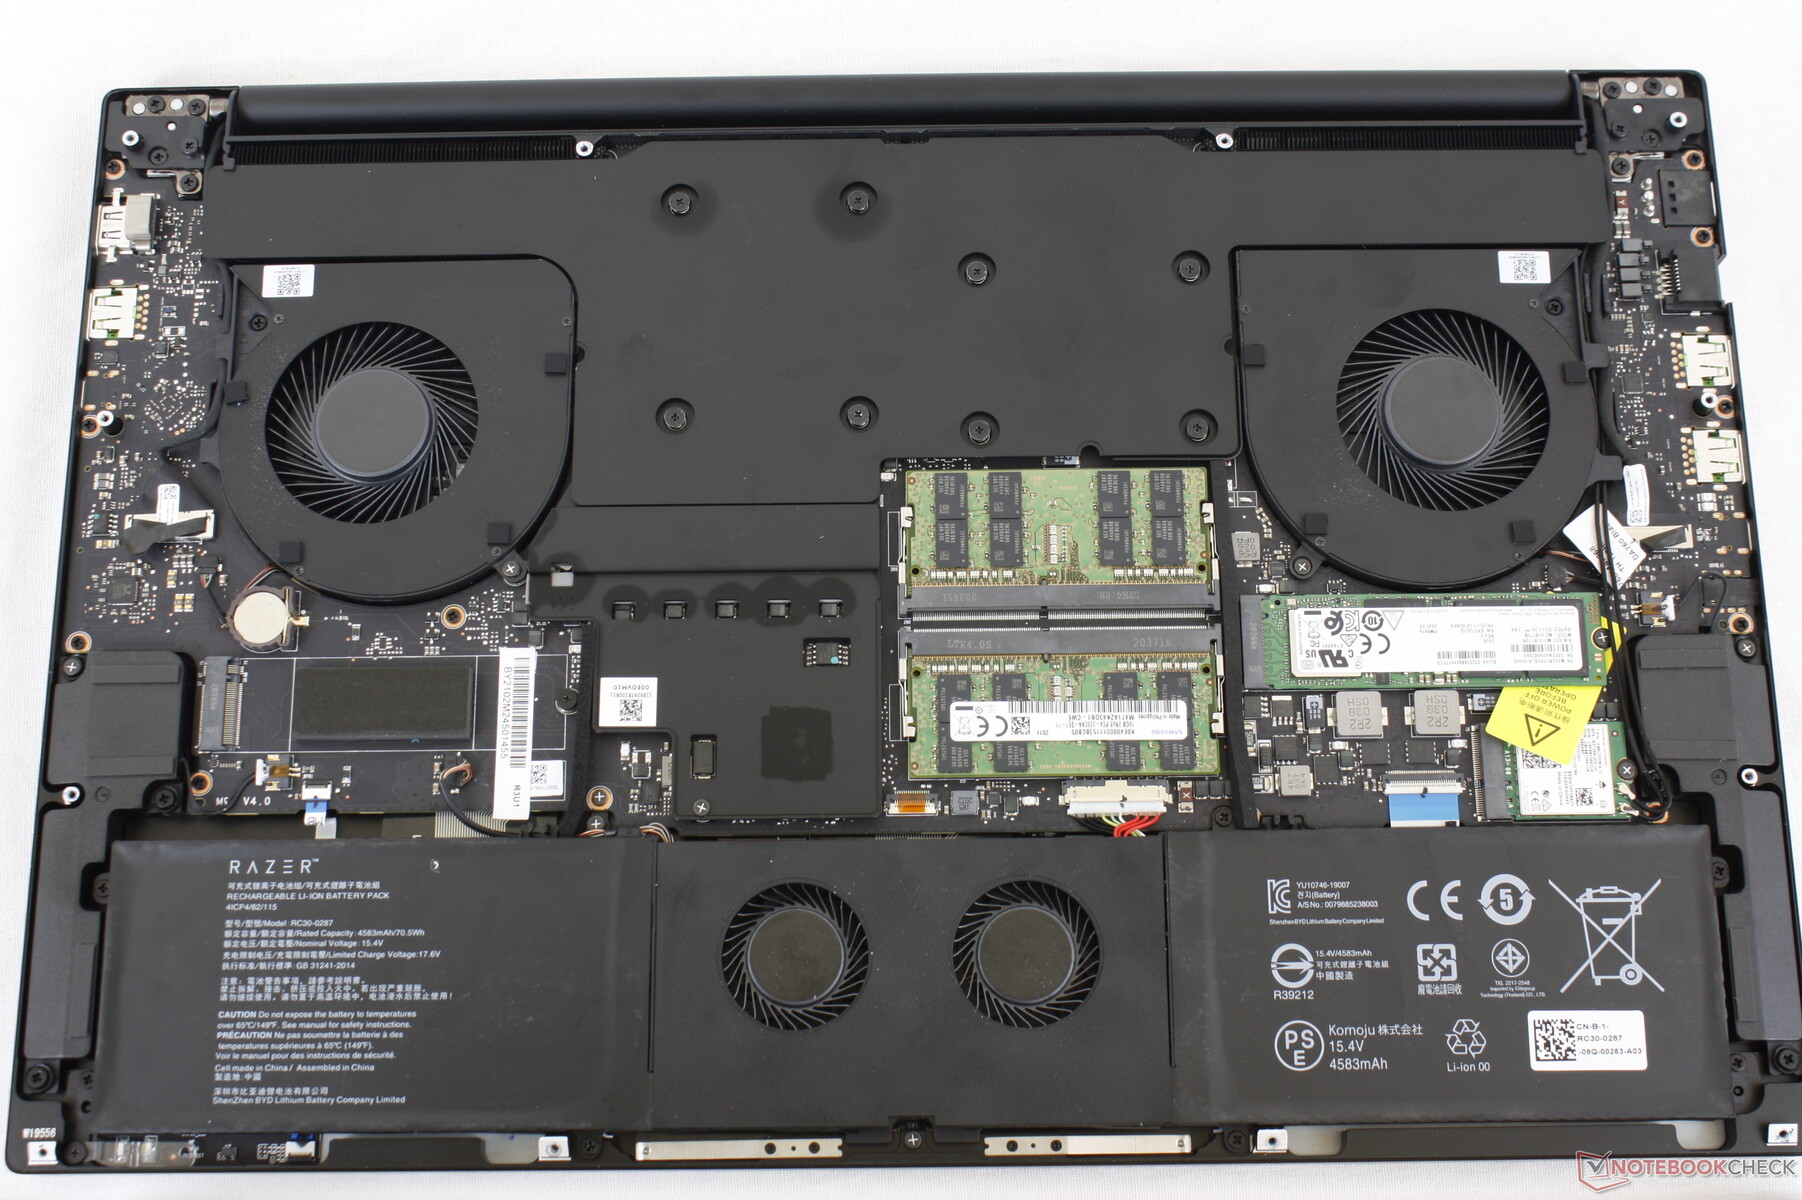
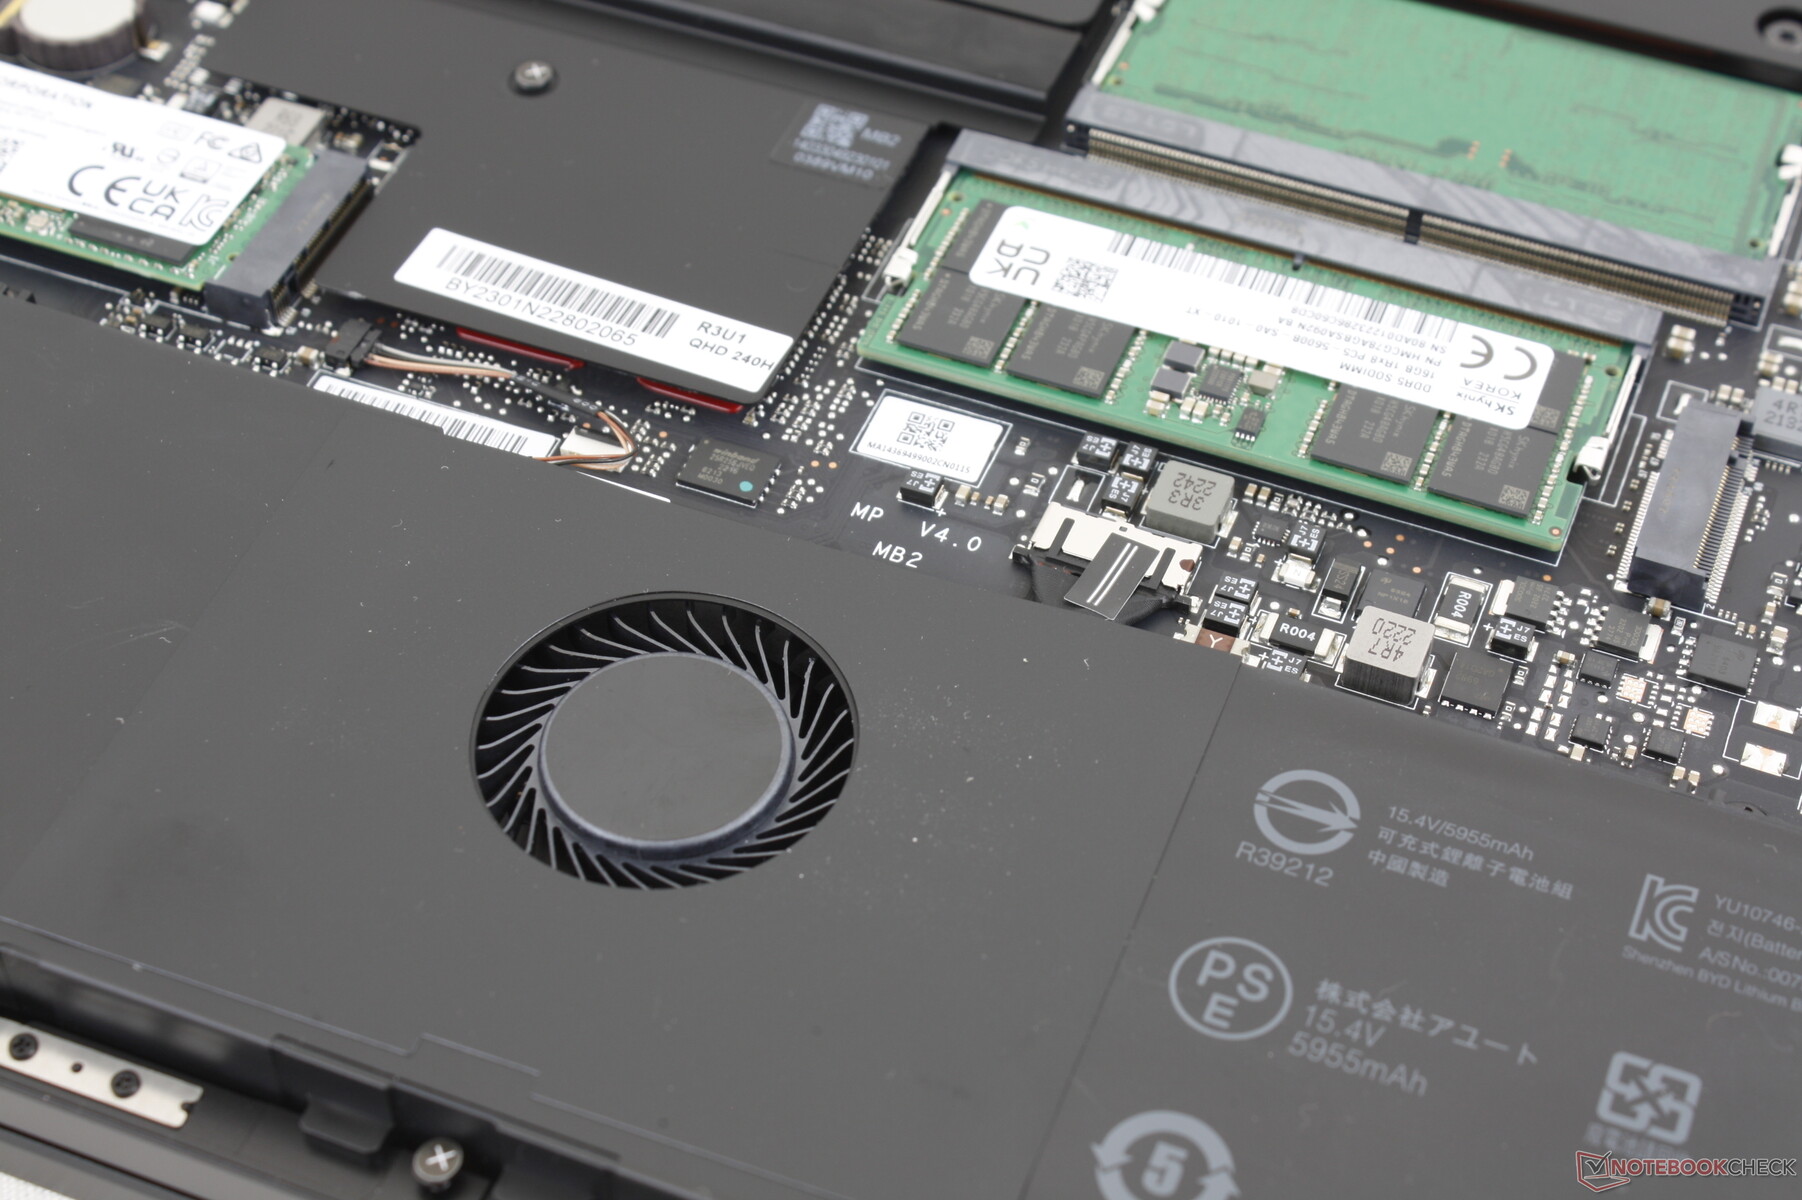
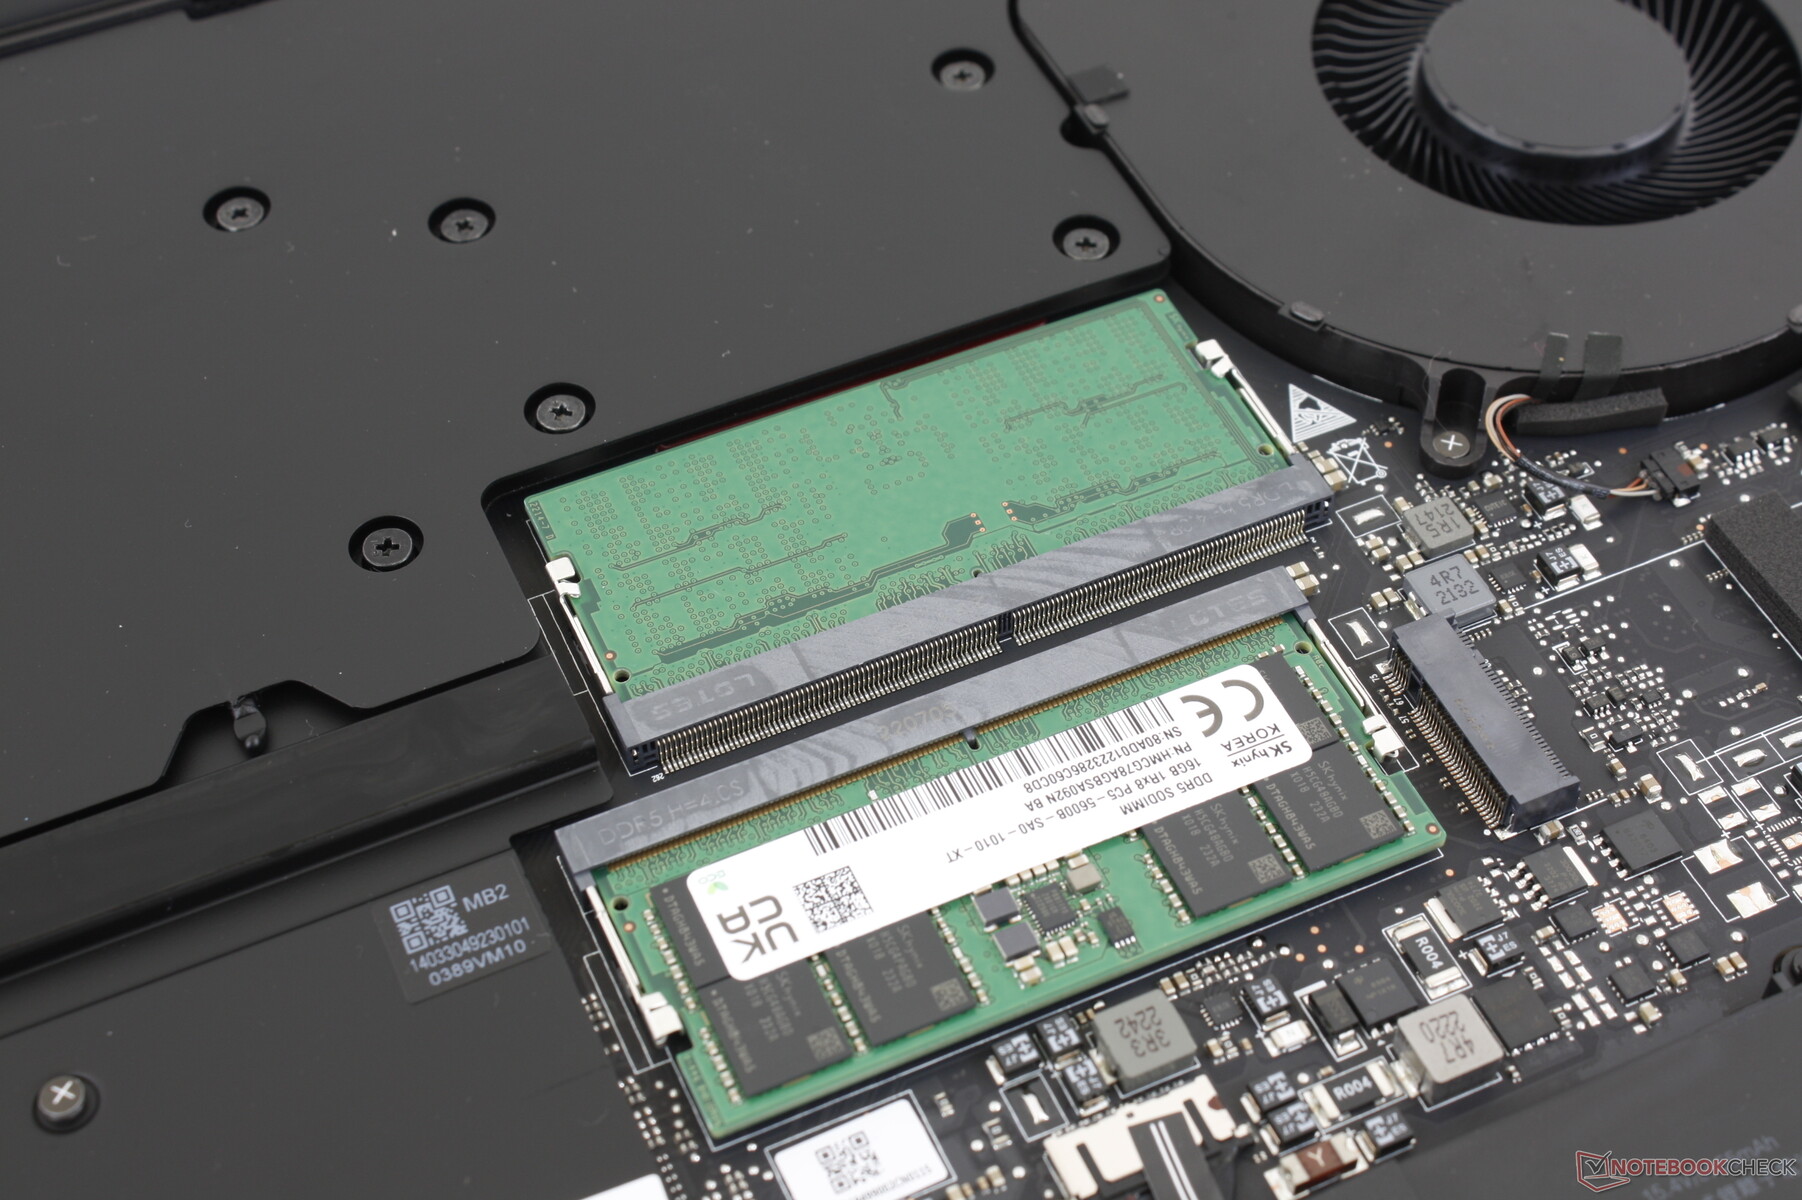
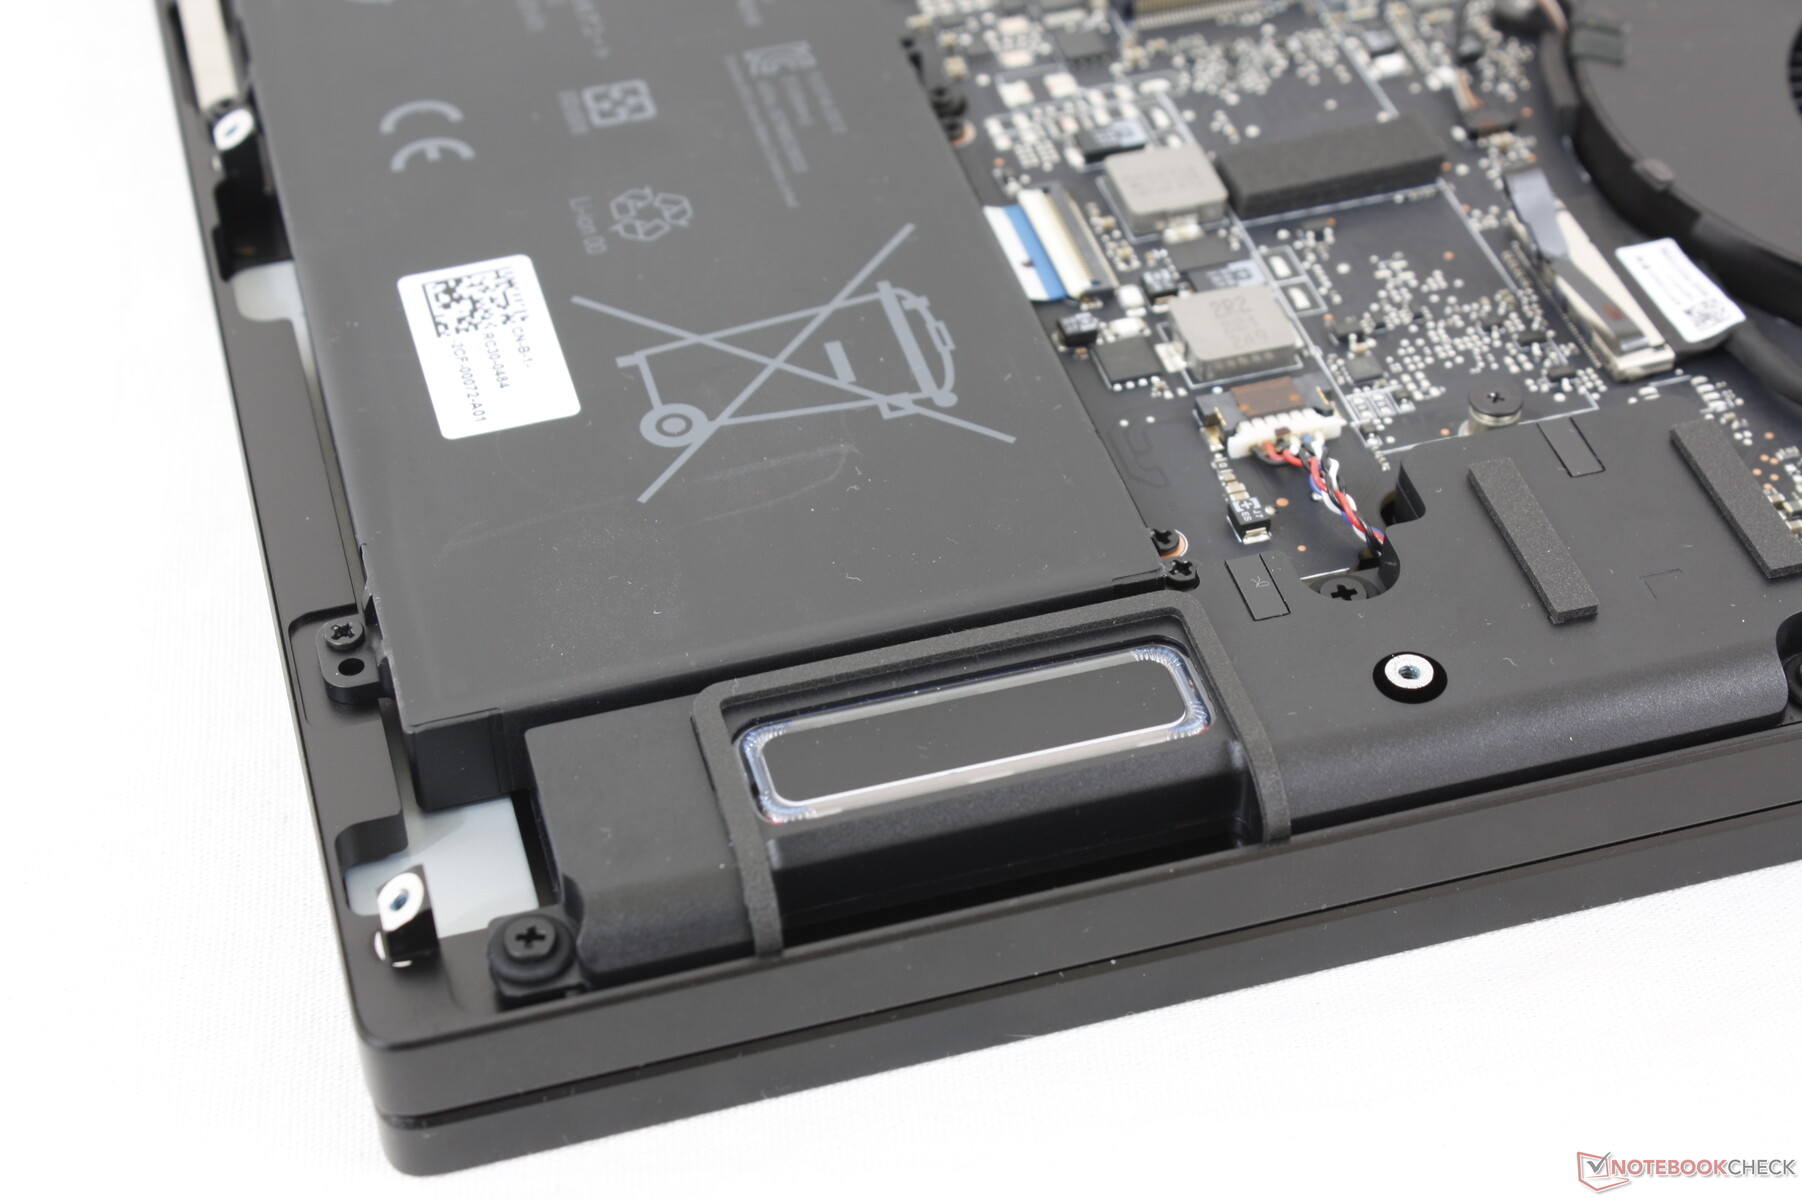
Mantenimiento
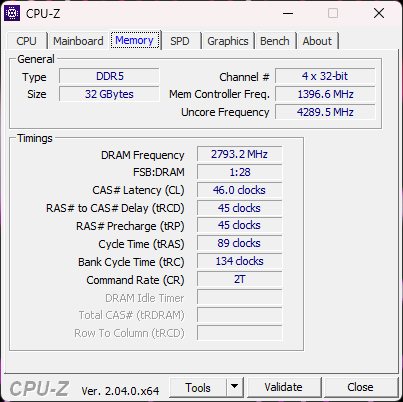
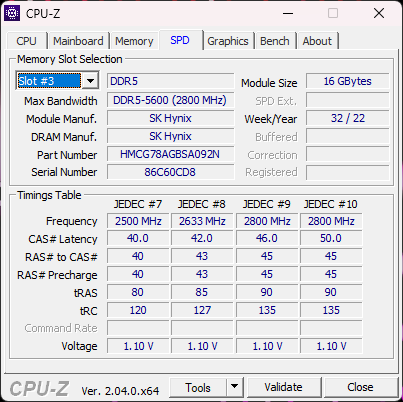
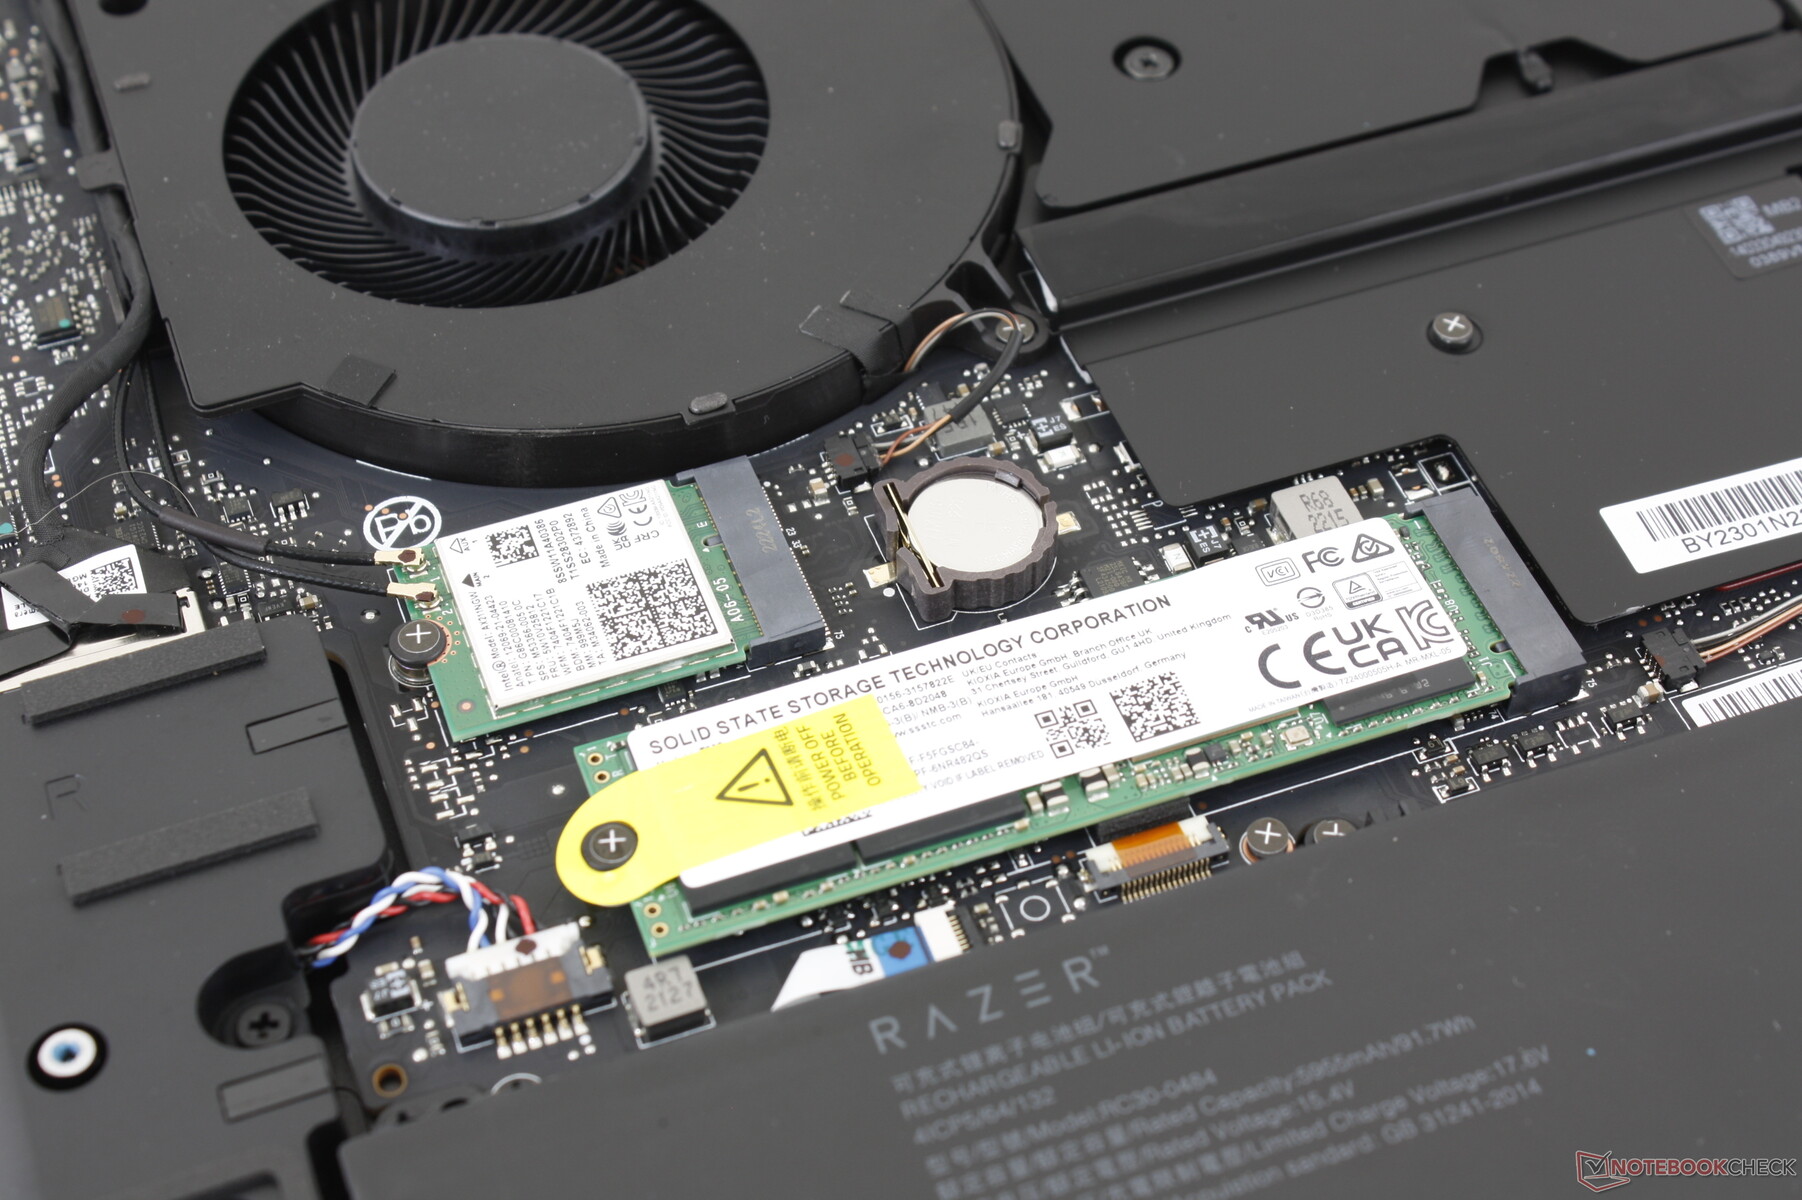
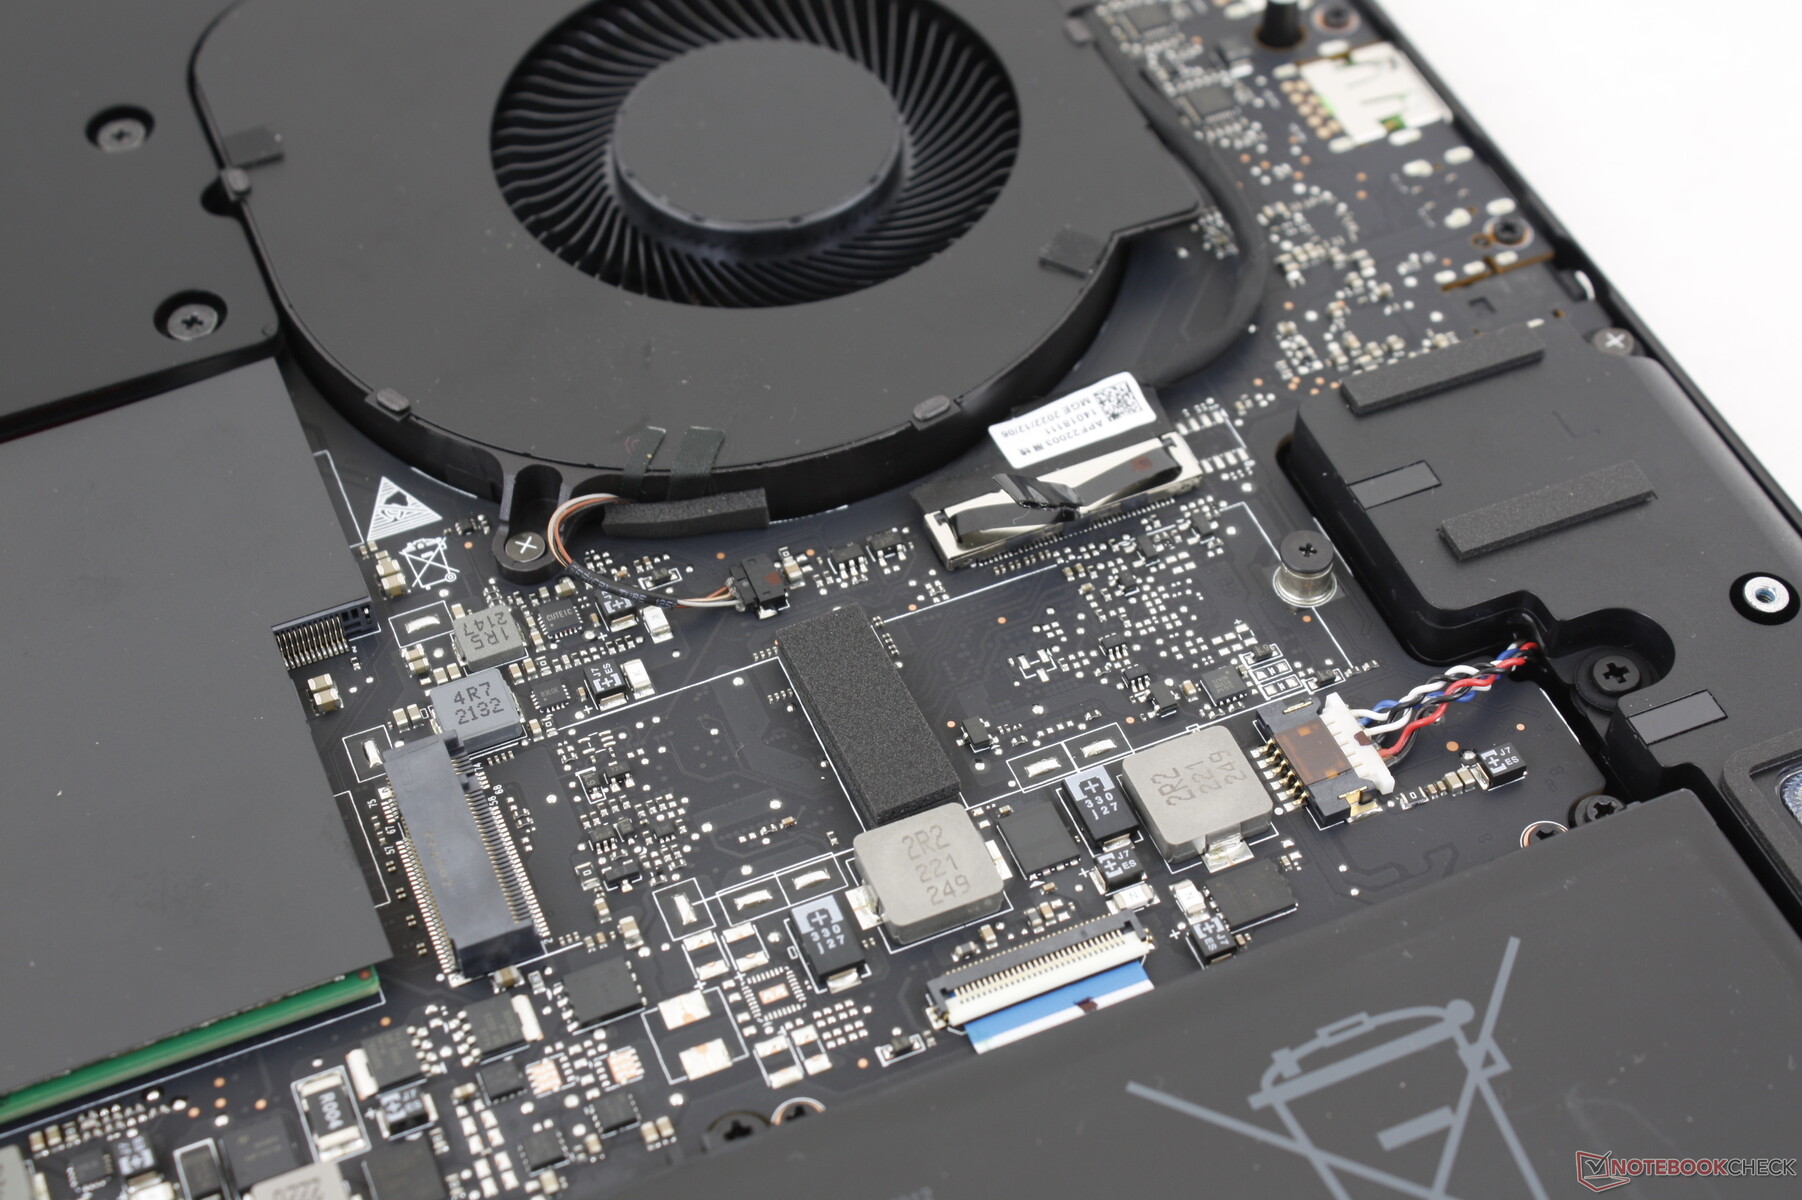
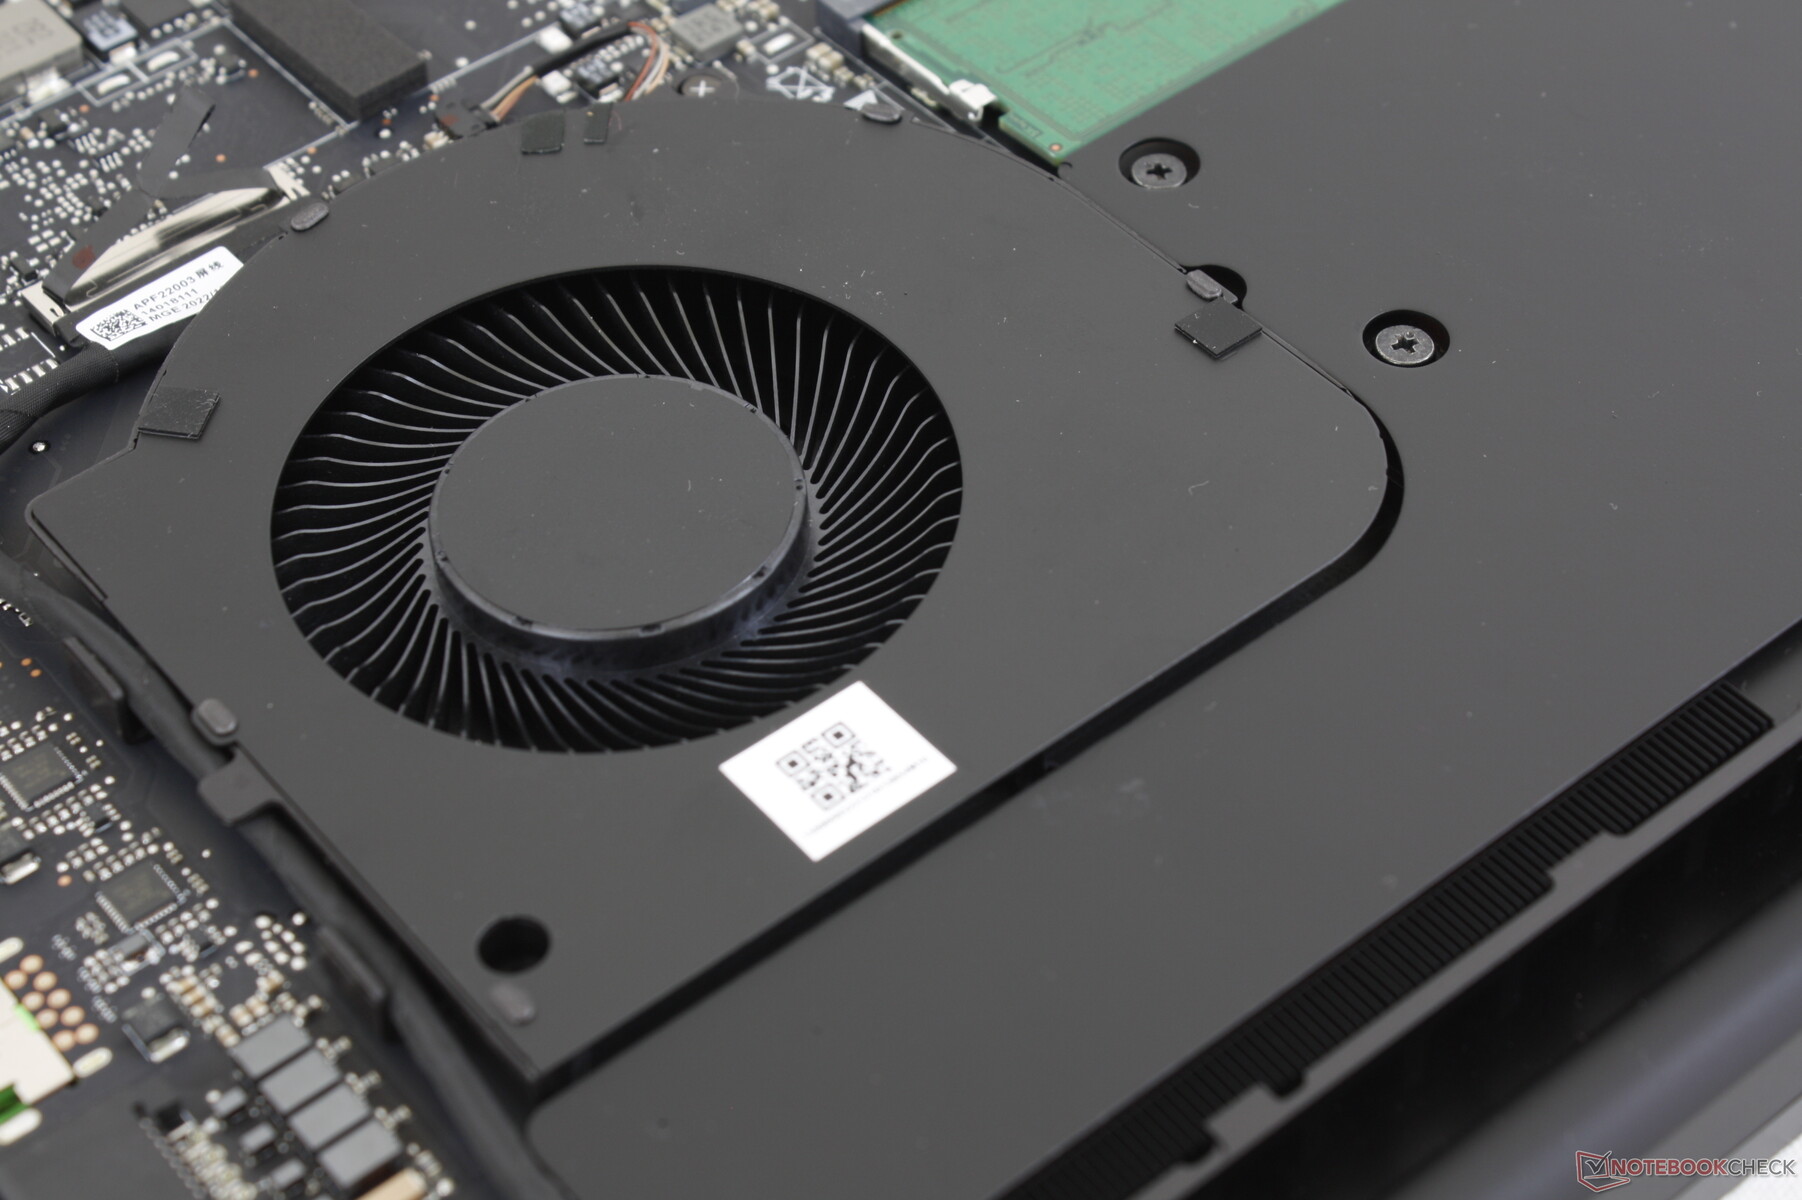
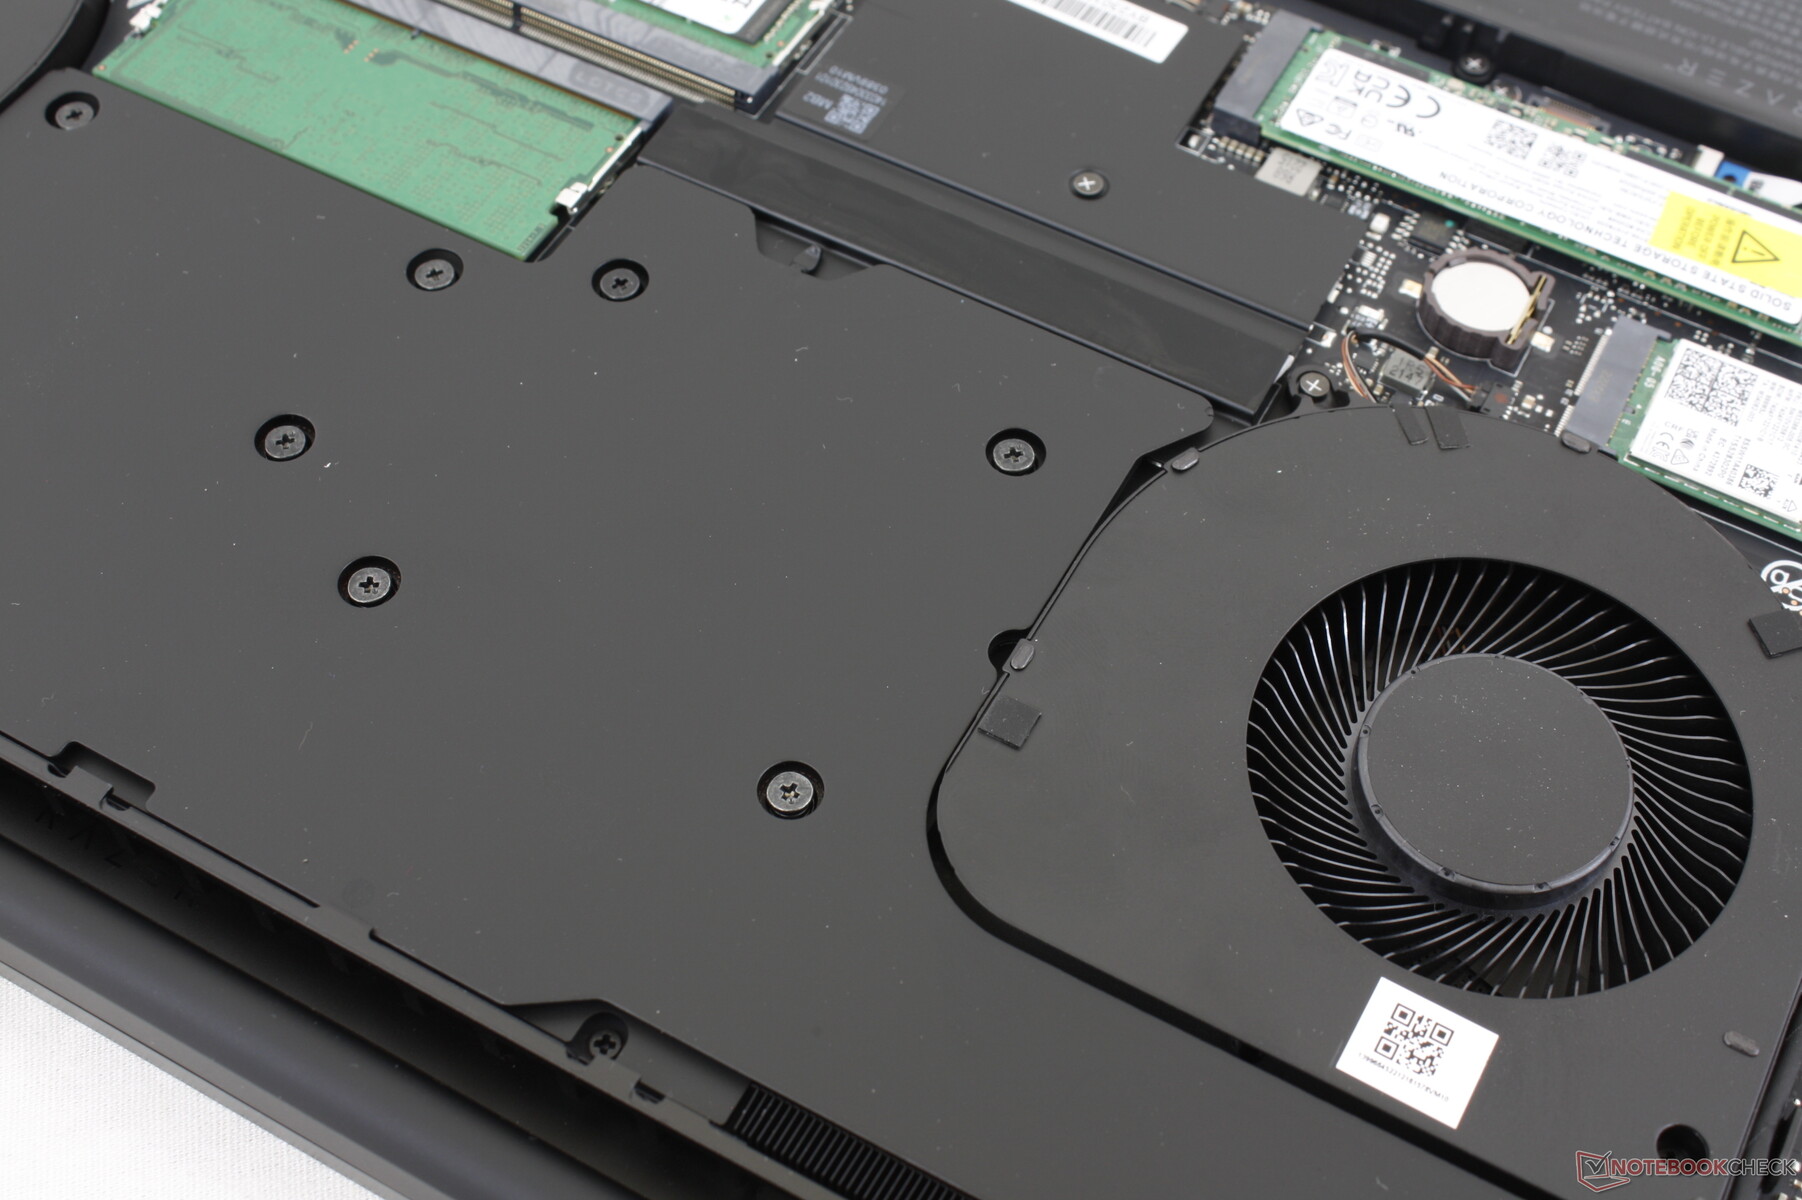
El panel inferior se fija con diez tornillos Torx T5 para facilitar el mantenimiento. Los usuarios tienen acceso directo a dos ranuras M.2 2280 SSD, dos ranuras SODIMM para hasta 32 GB DDR5-5600 o 64 GB DDR5-5200, y el módulo WLAN extraíble. Lo más destacable es que el actual diseño Blade 18 incorpora un ventilador adicional directamente debajo del clickpad, similar a los antiguos diseños Blade 17.
Accesorios y garantía
No hay extras en la caja. Se aplica una garantía limitada del fabricante de un año, mientras que la batería interna tiene una garantía independiente de dos años si se adquiere en Estados Unidos.
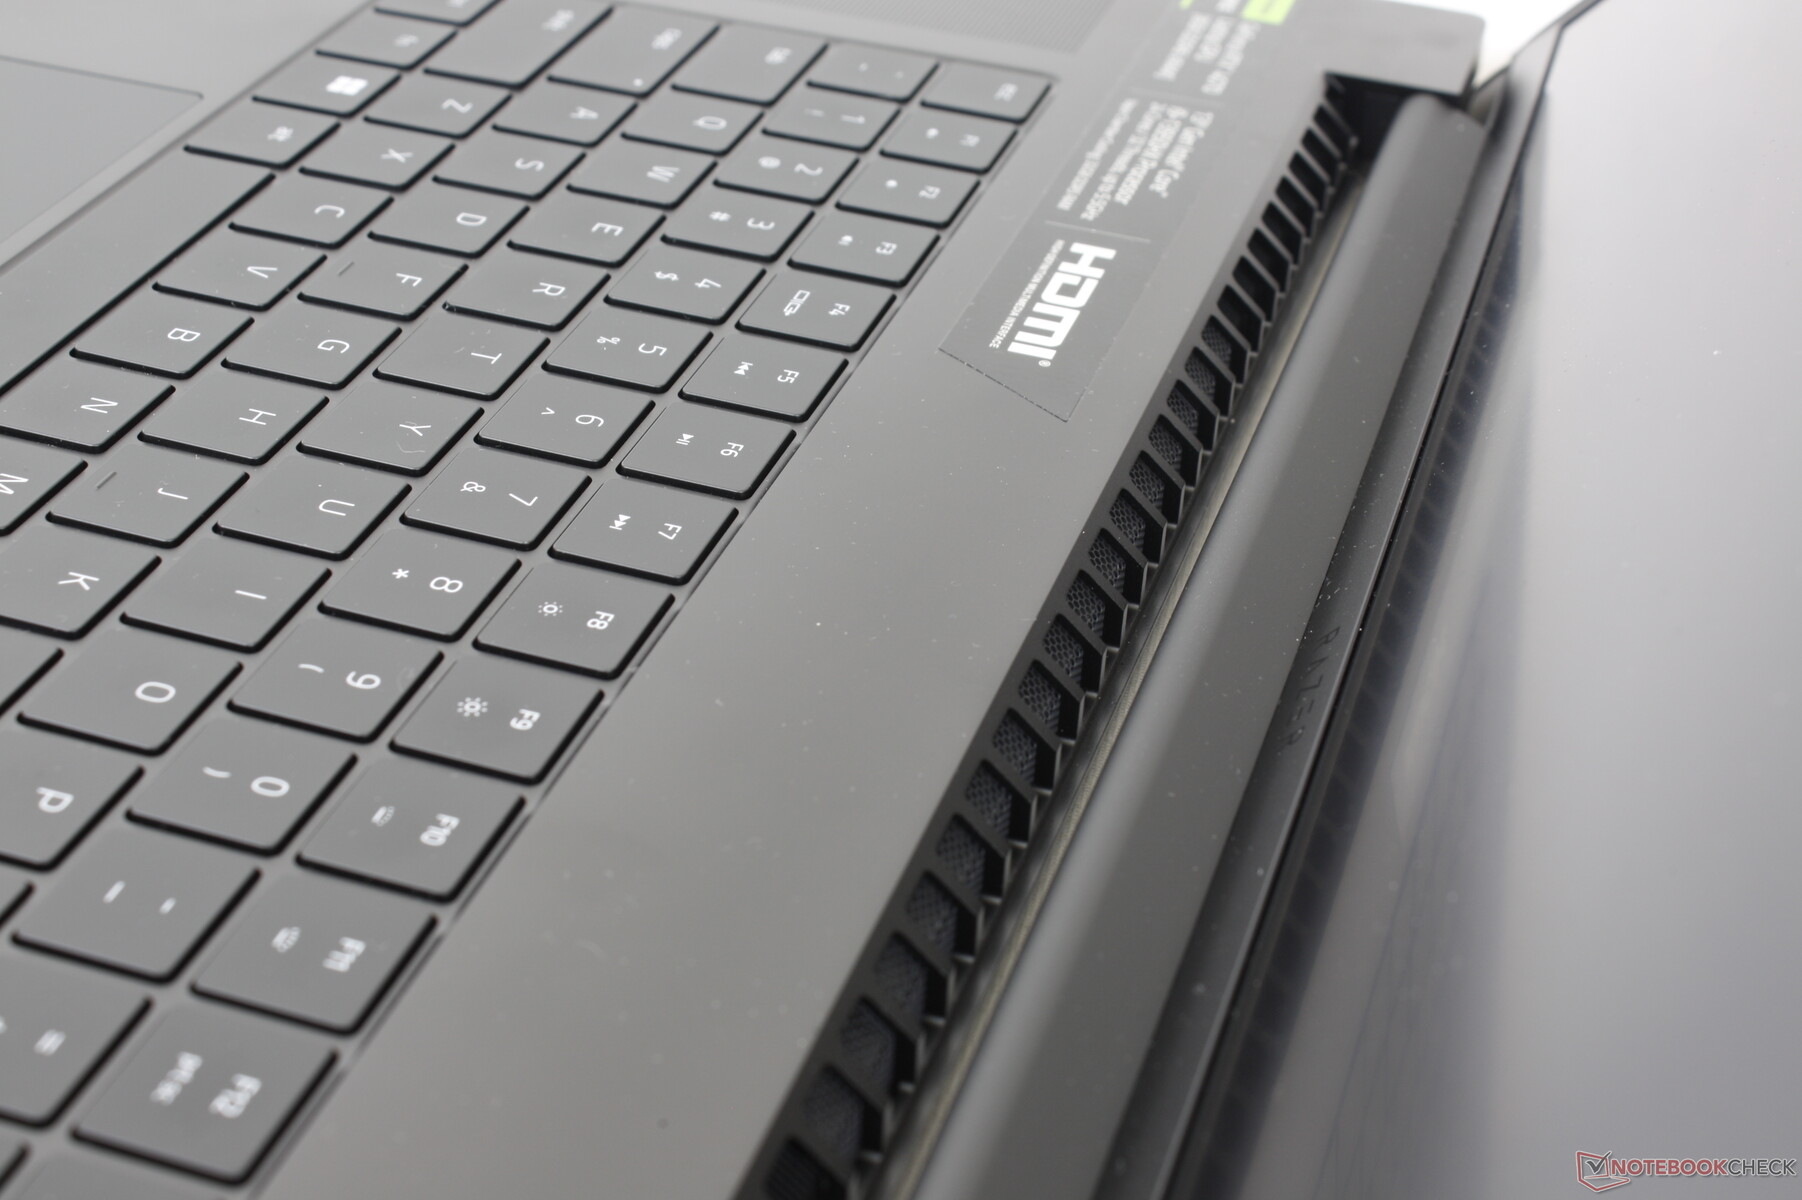
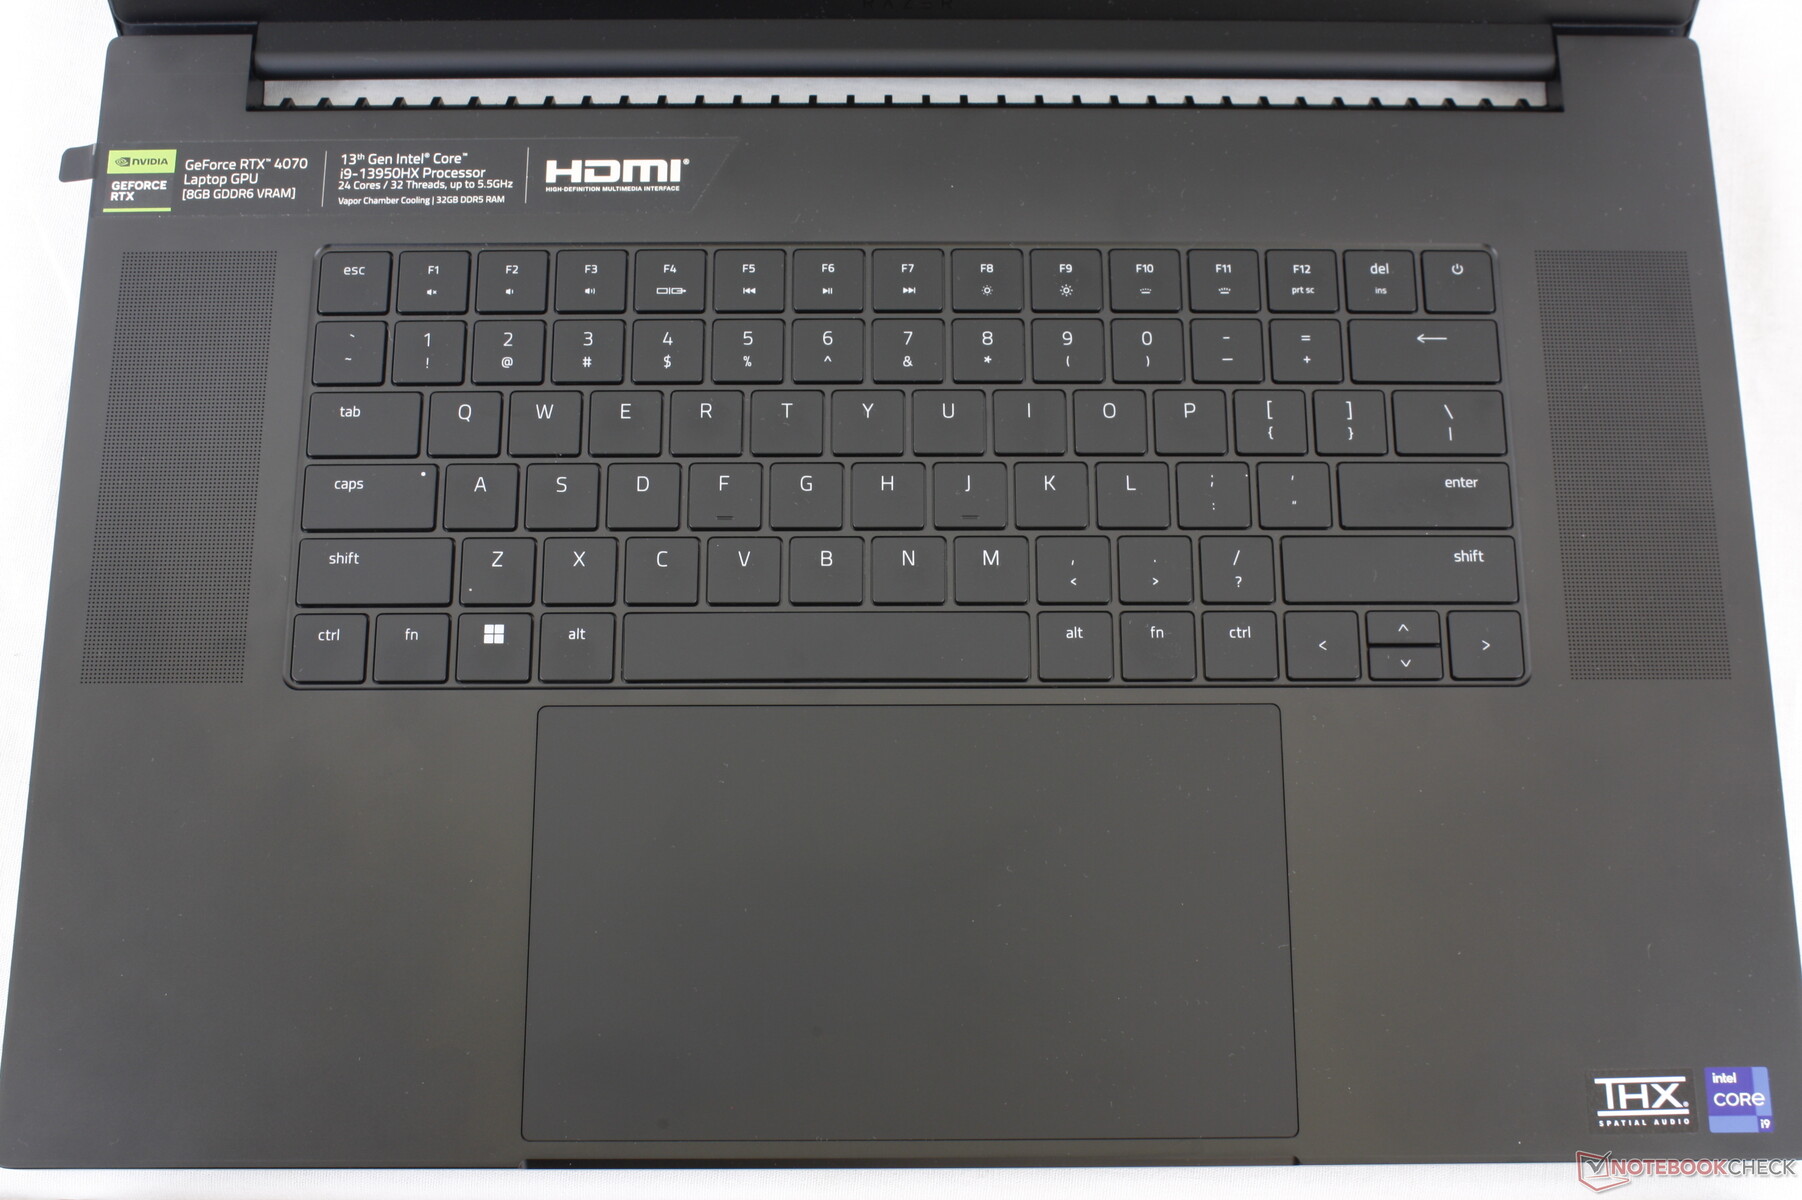
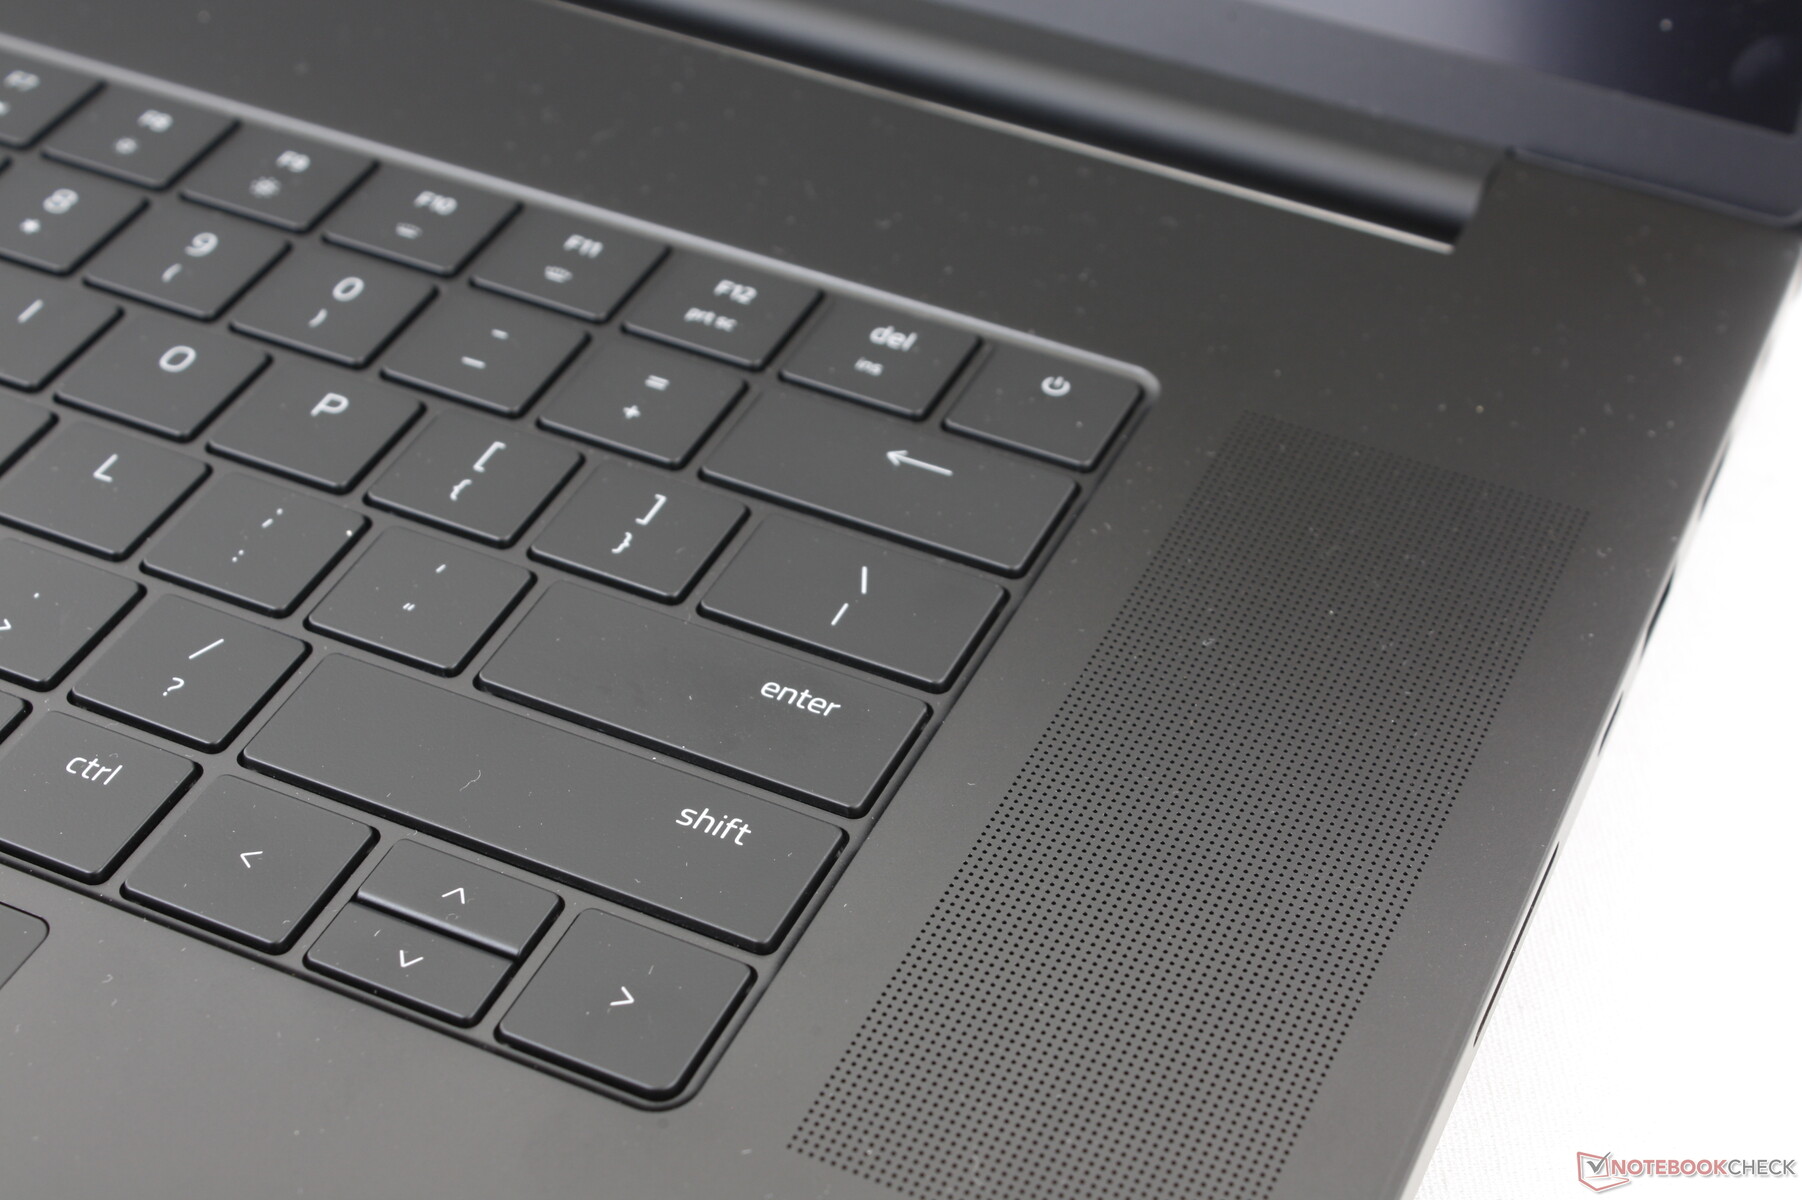
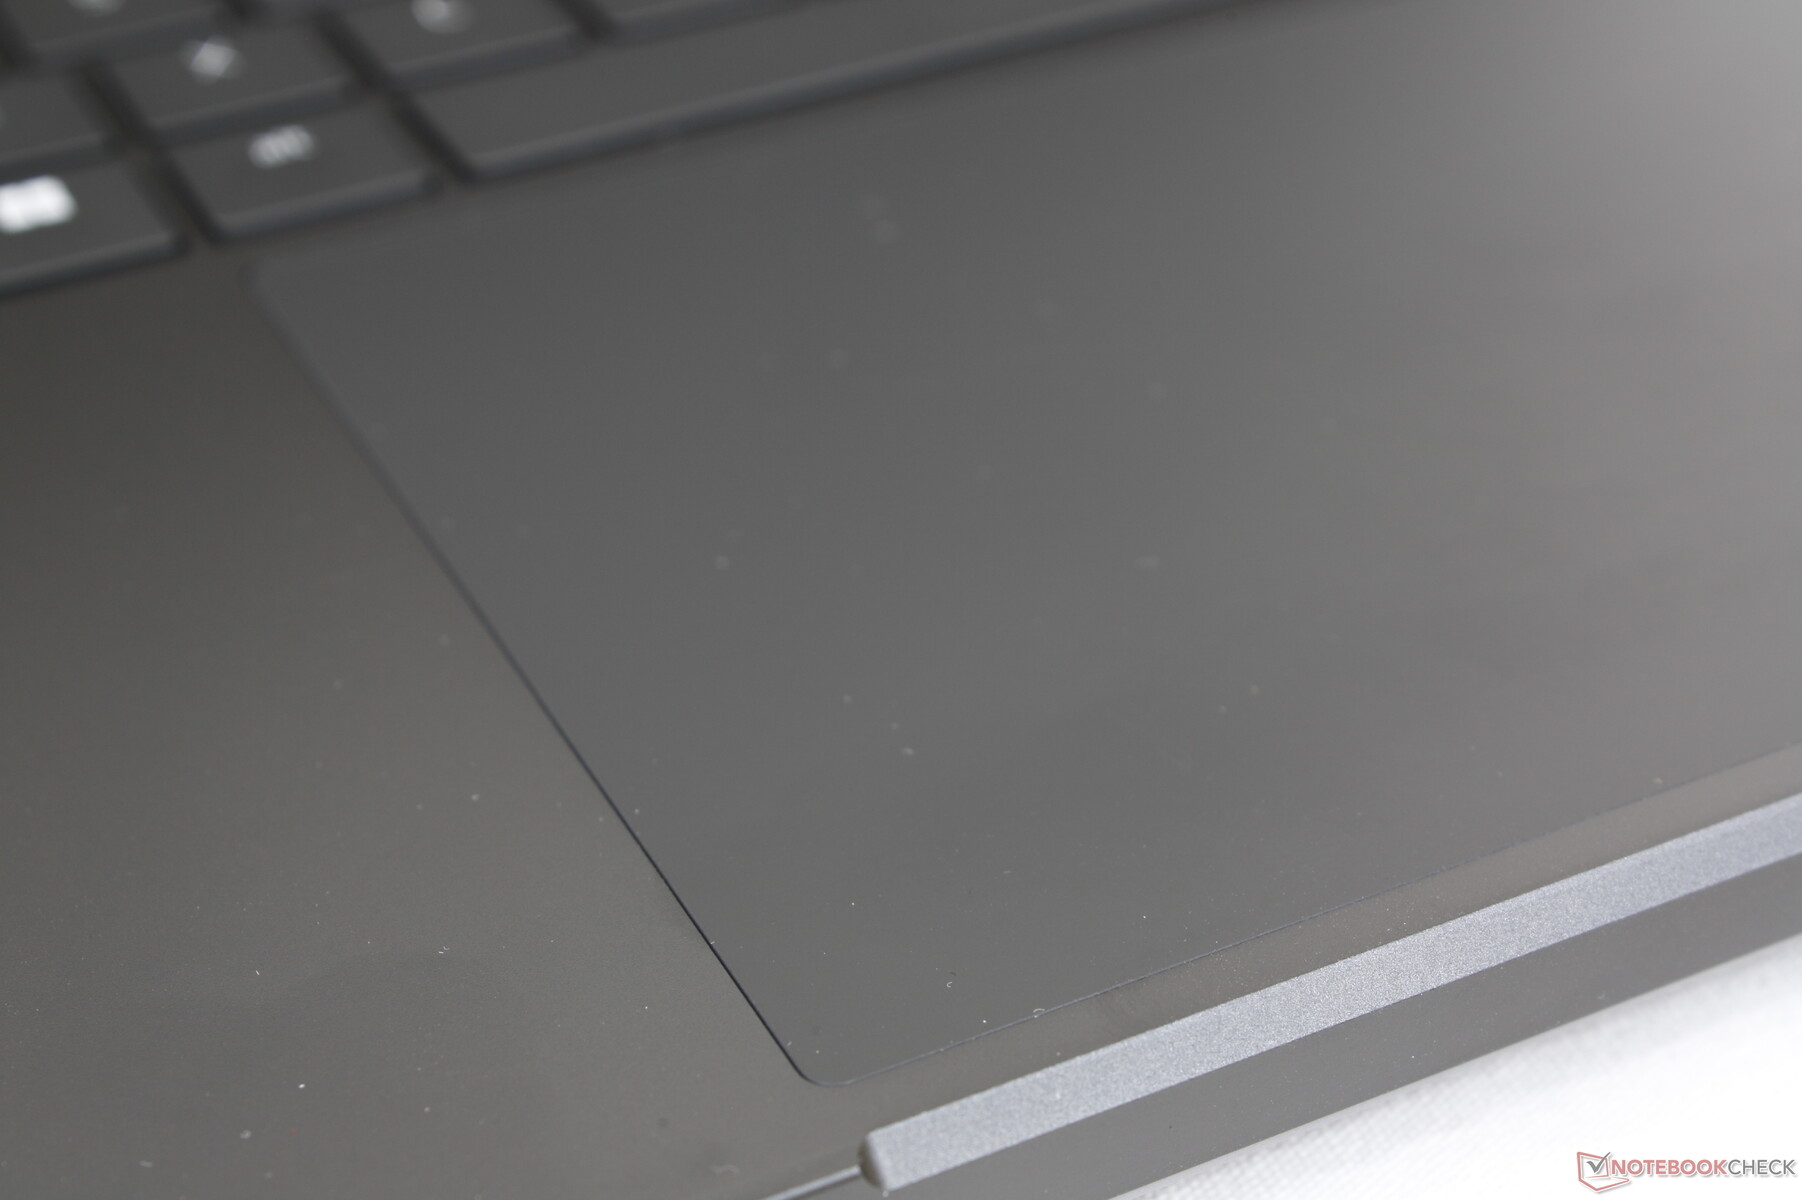
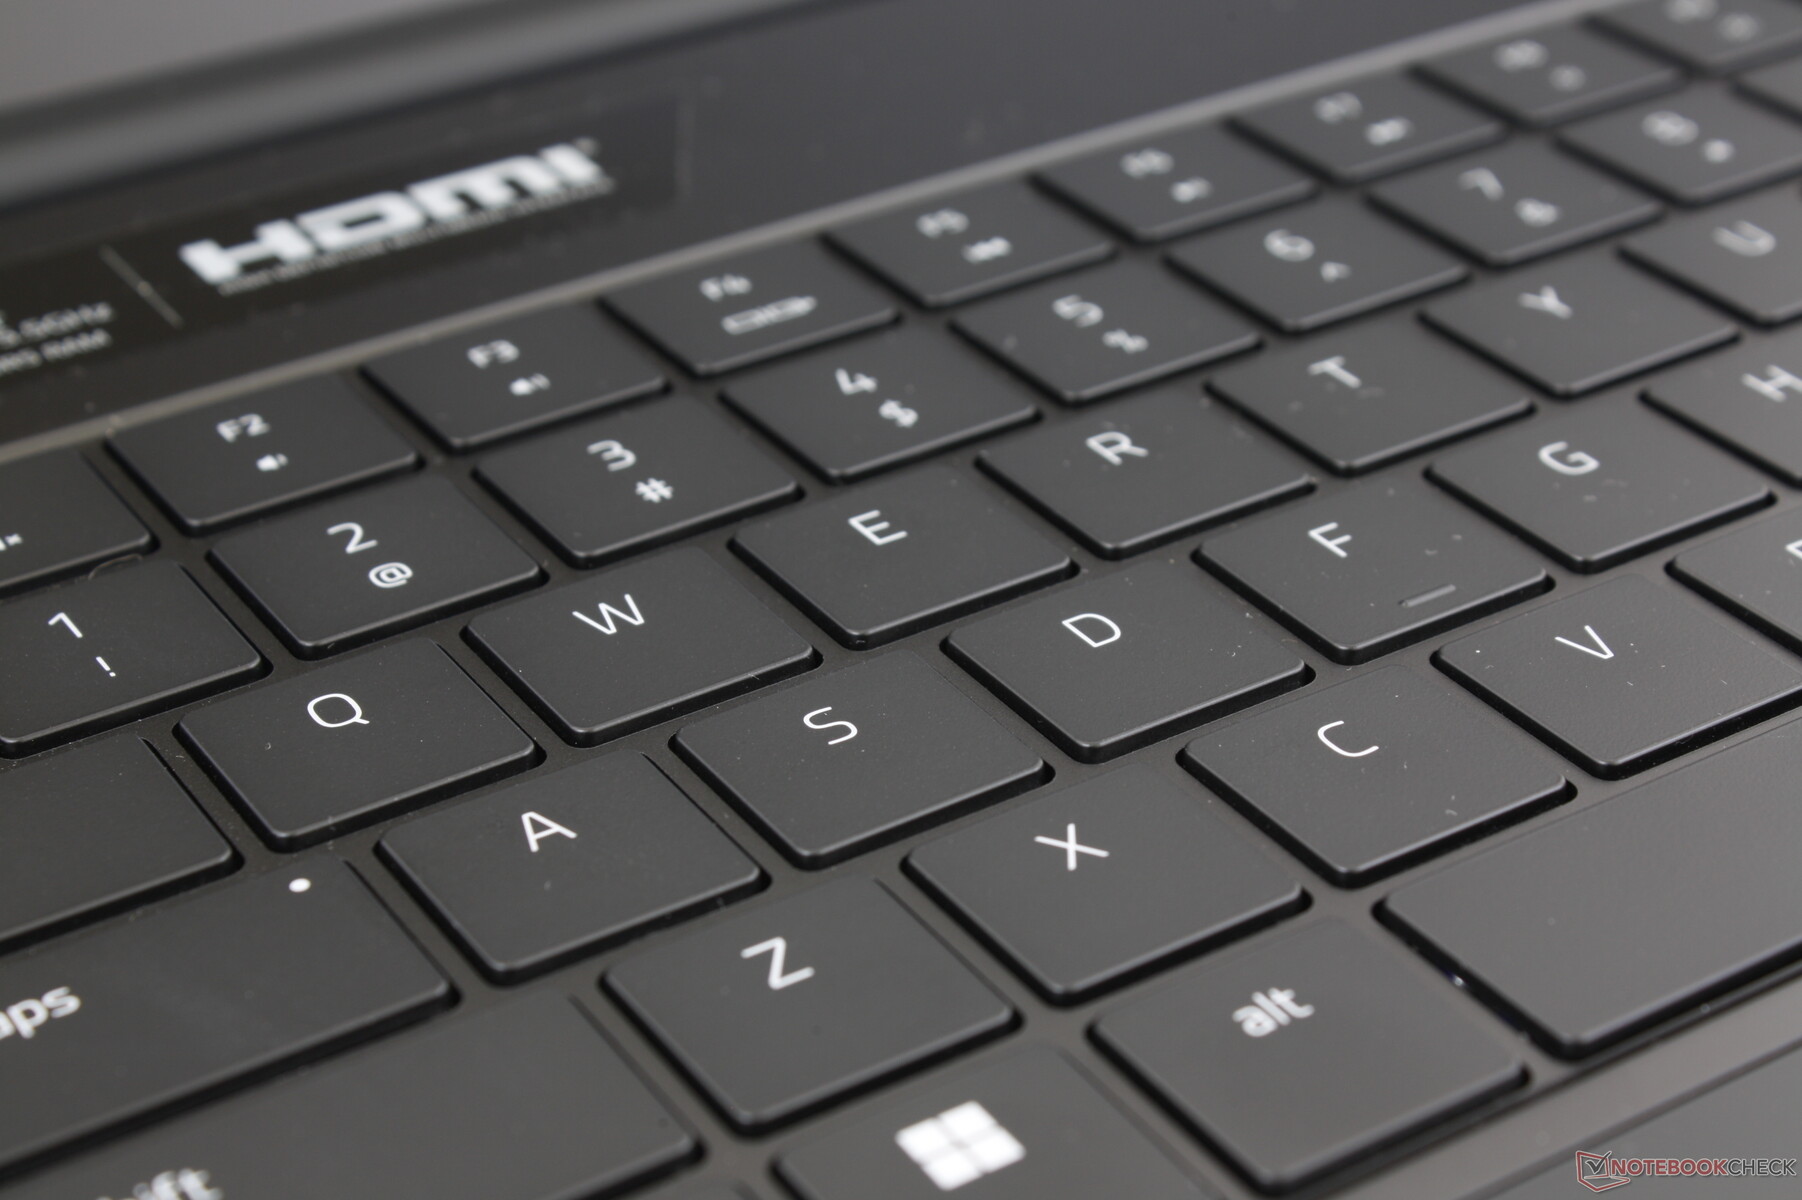
Dispositivos de entrada - Idénticos a los de Blade 16
Teclado y panel táctil
Tanto el teclado como el clickpad son los mismos que en el Blade 16 a pesar de las diferencias de tamaño de pantalla entre ambos modelos. Incluso las dimensiones del clickpad (17 x 9,7 cm) y el teclado no han cambiado, por lo que nuestros comentarios existentes sobre la experiencia de mecanografiado del Blade 16 se aplican aquí en el Blade 18. Es una pena que Razer no haya aprovechado la superficie extra para teclas de flecha más grandes o un posible numpad.
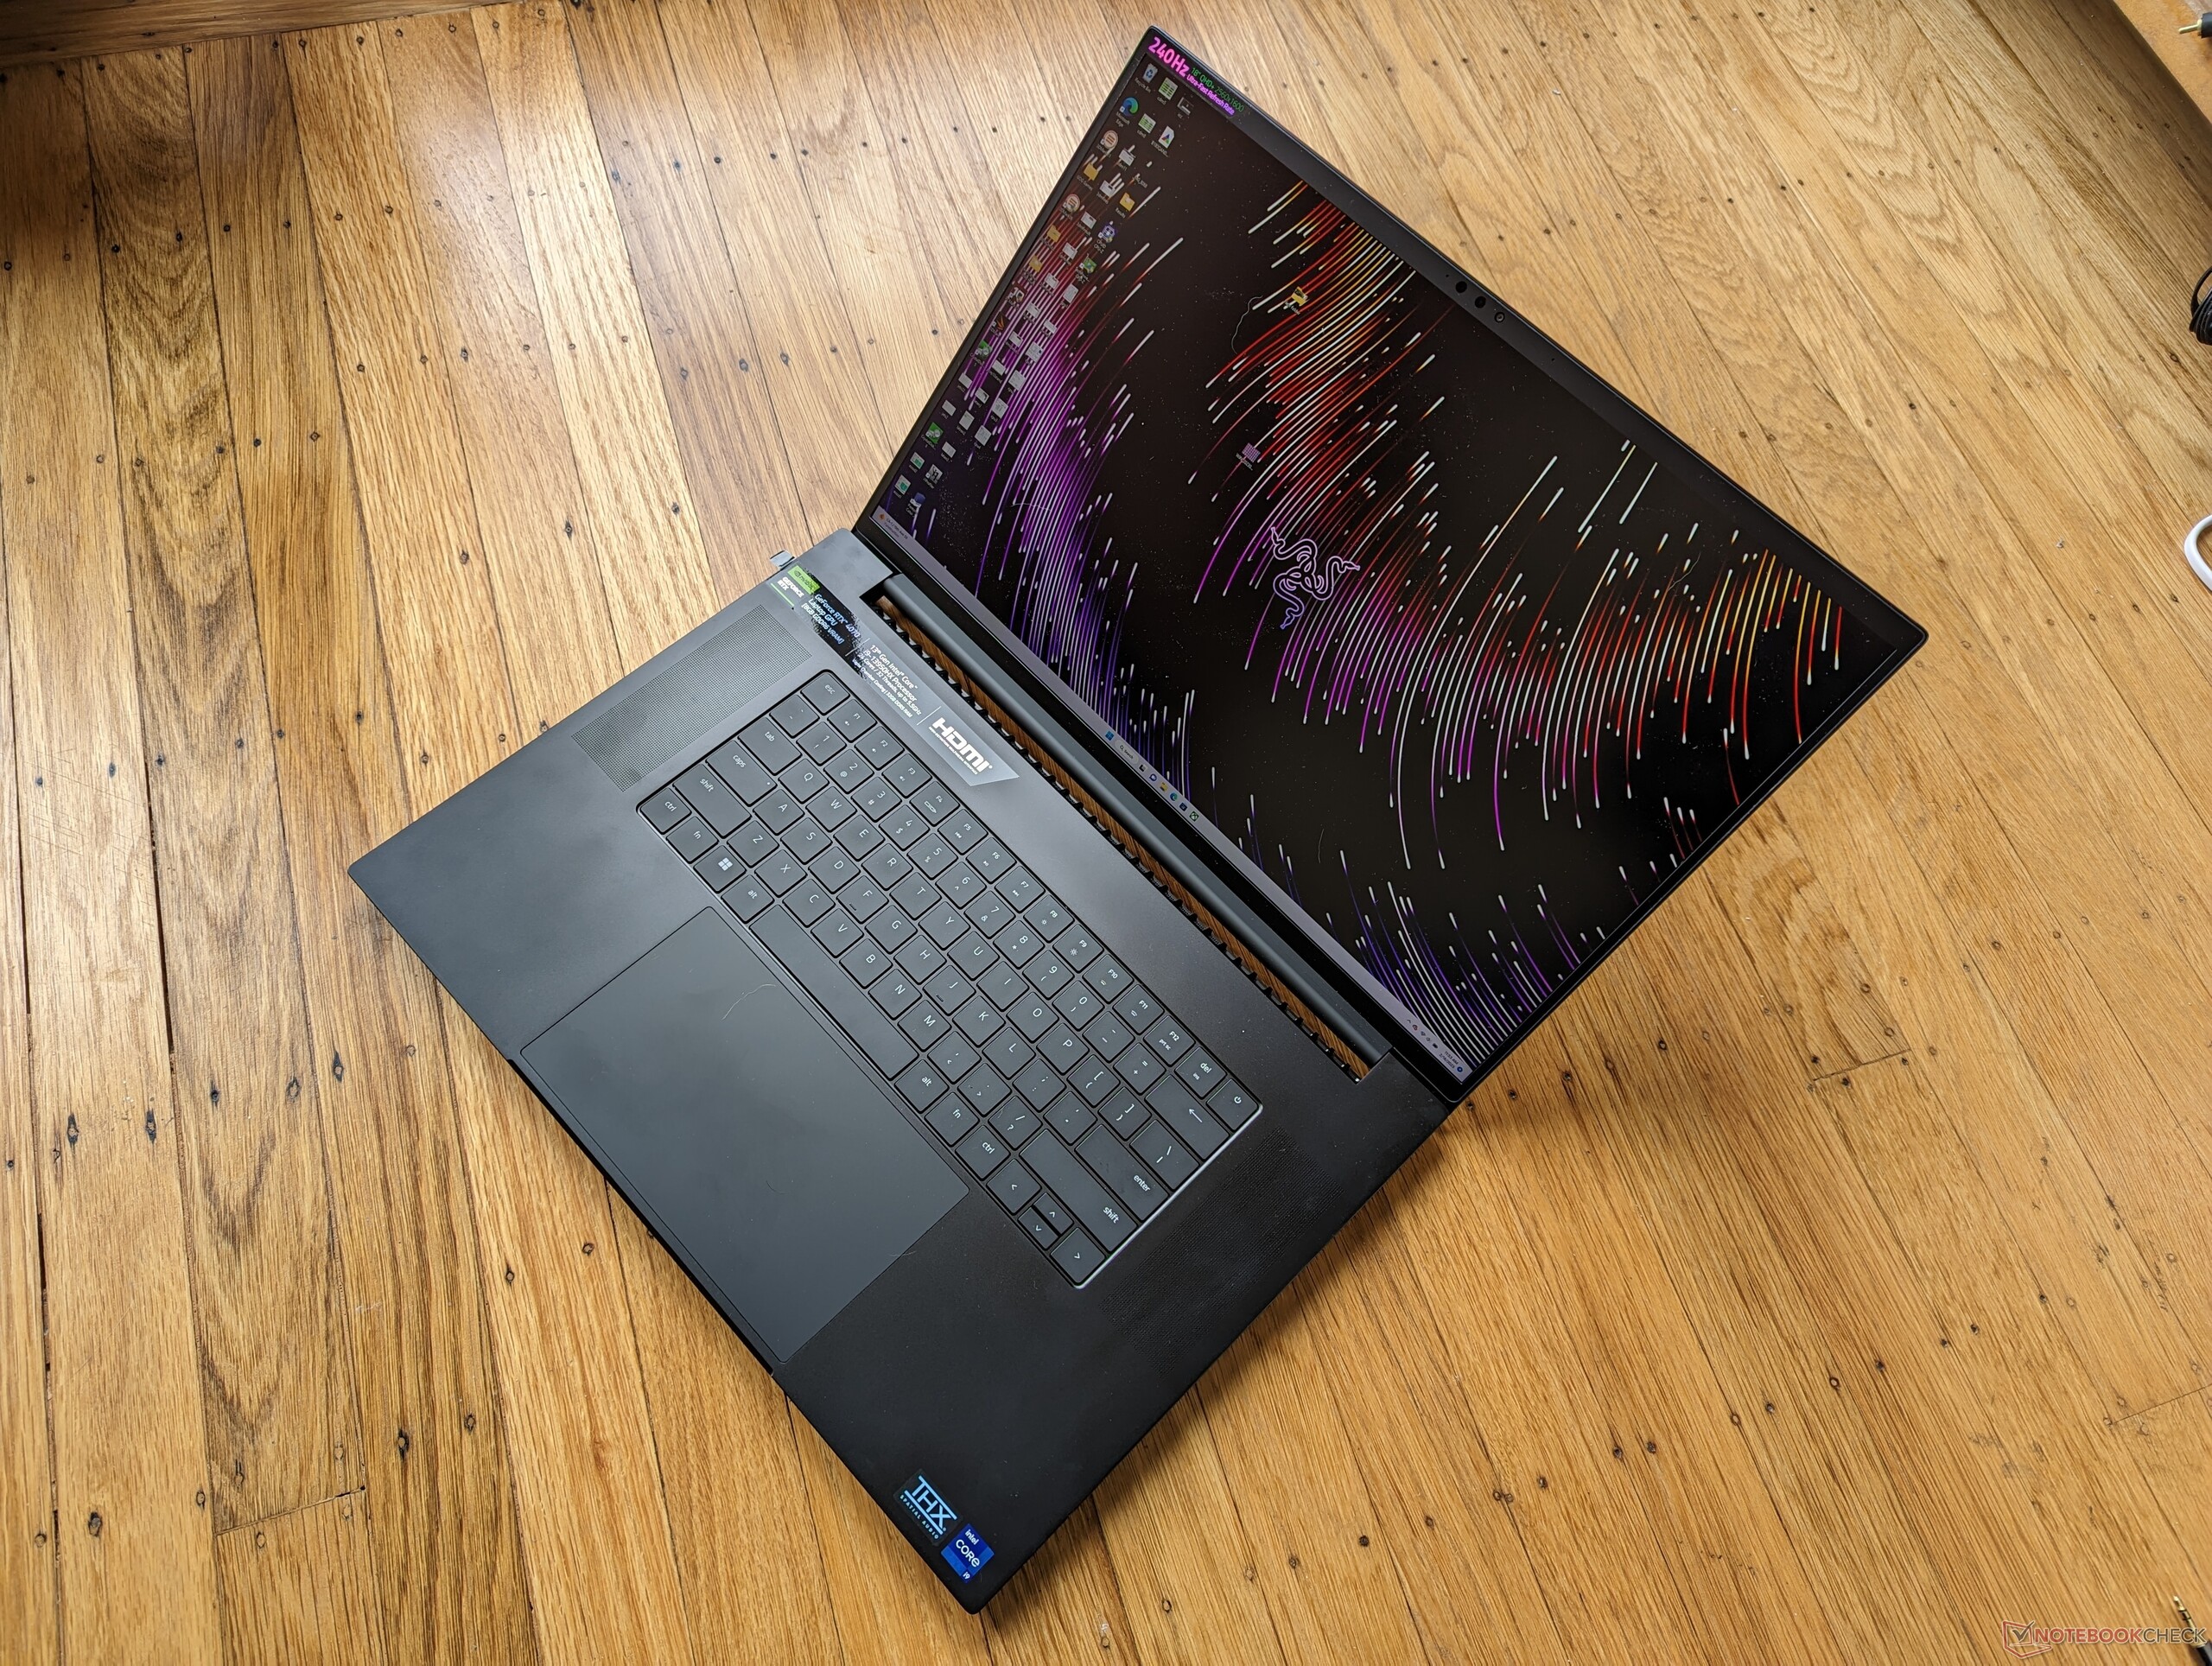
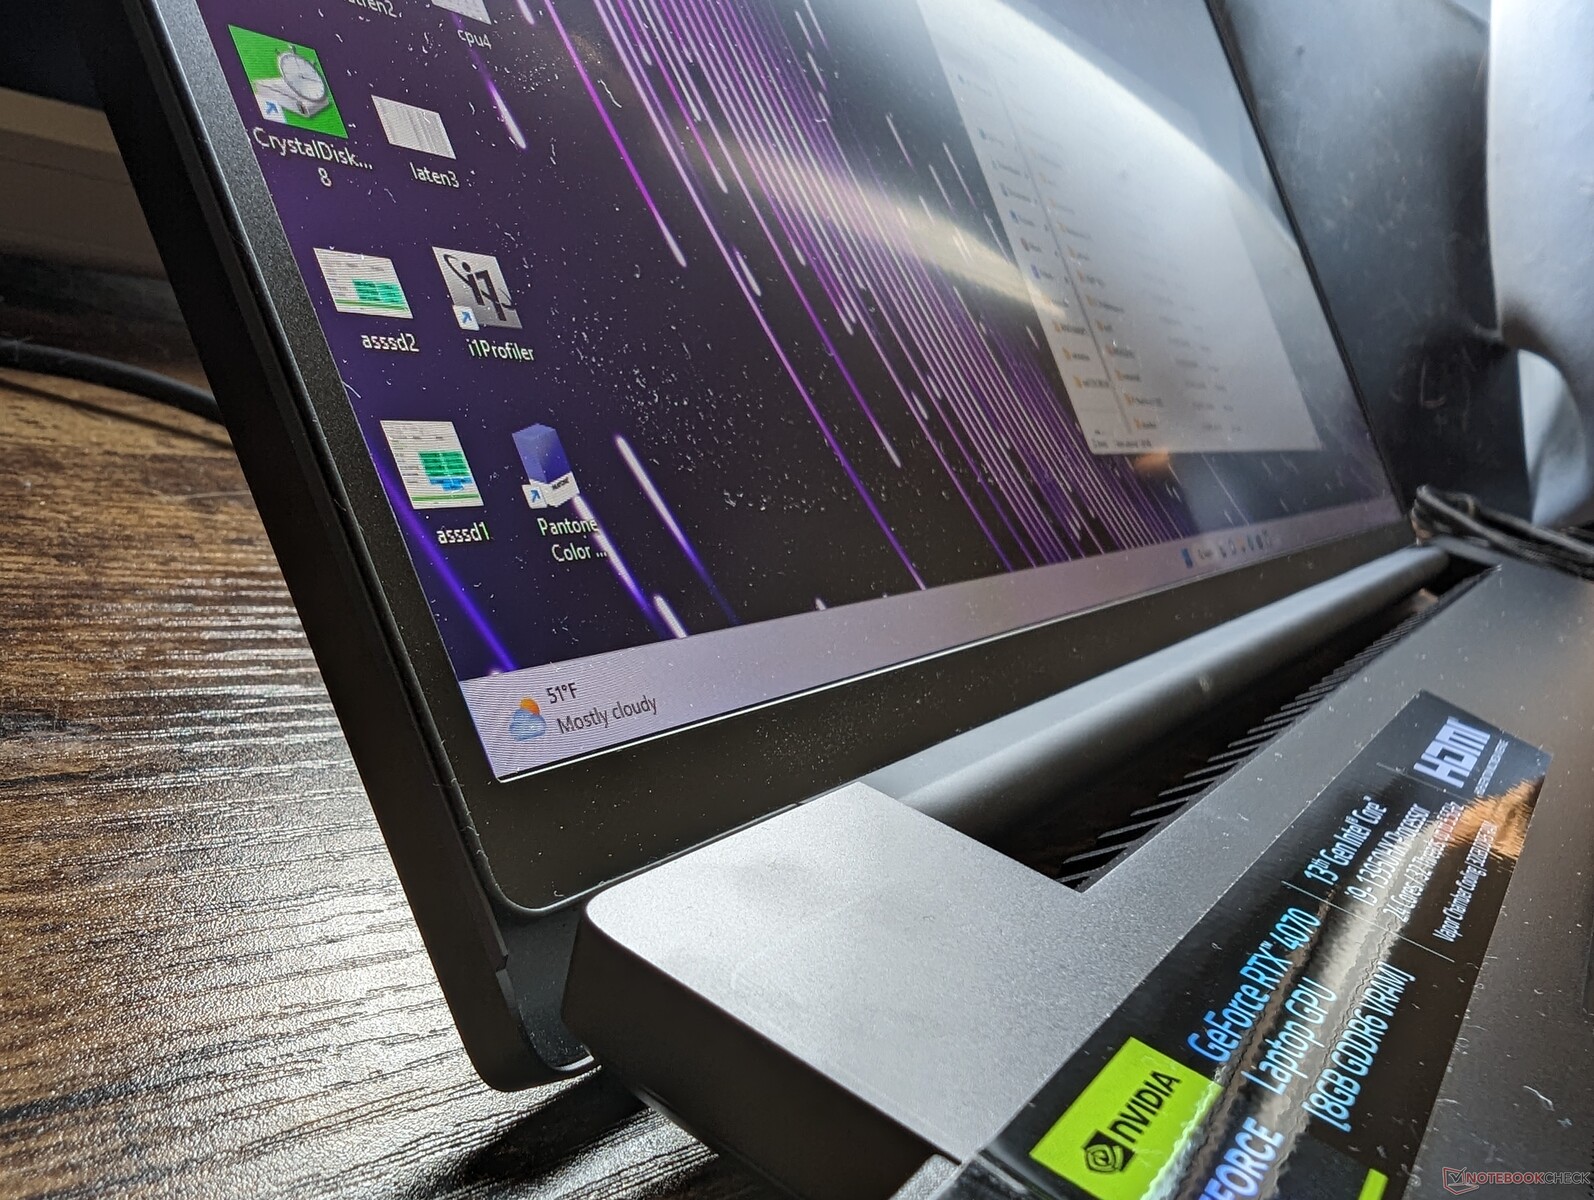
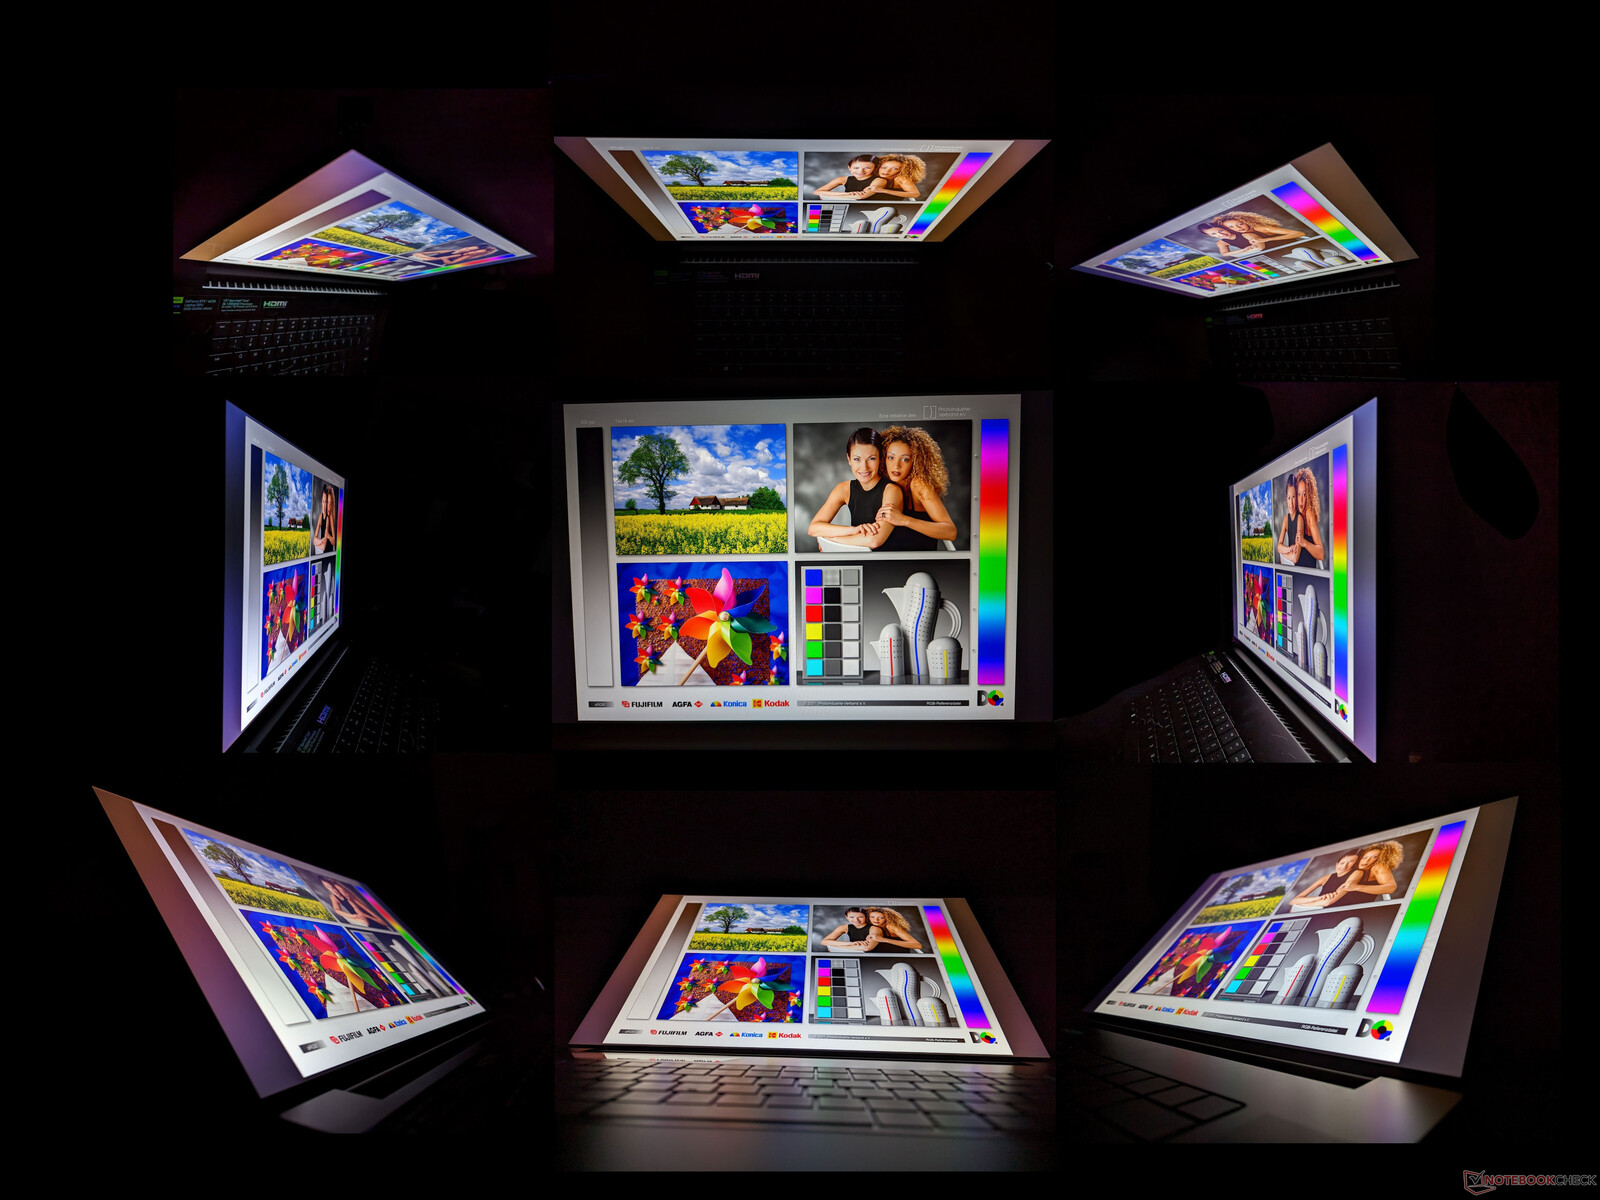
Pantalla - Muy espaciosa
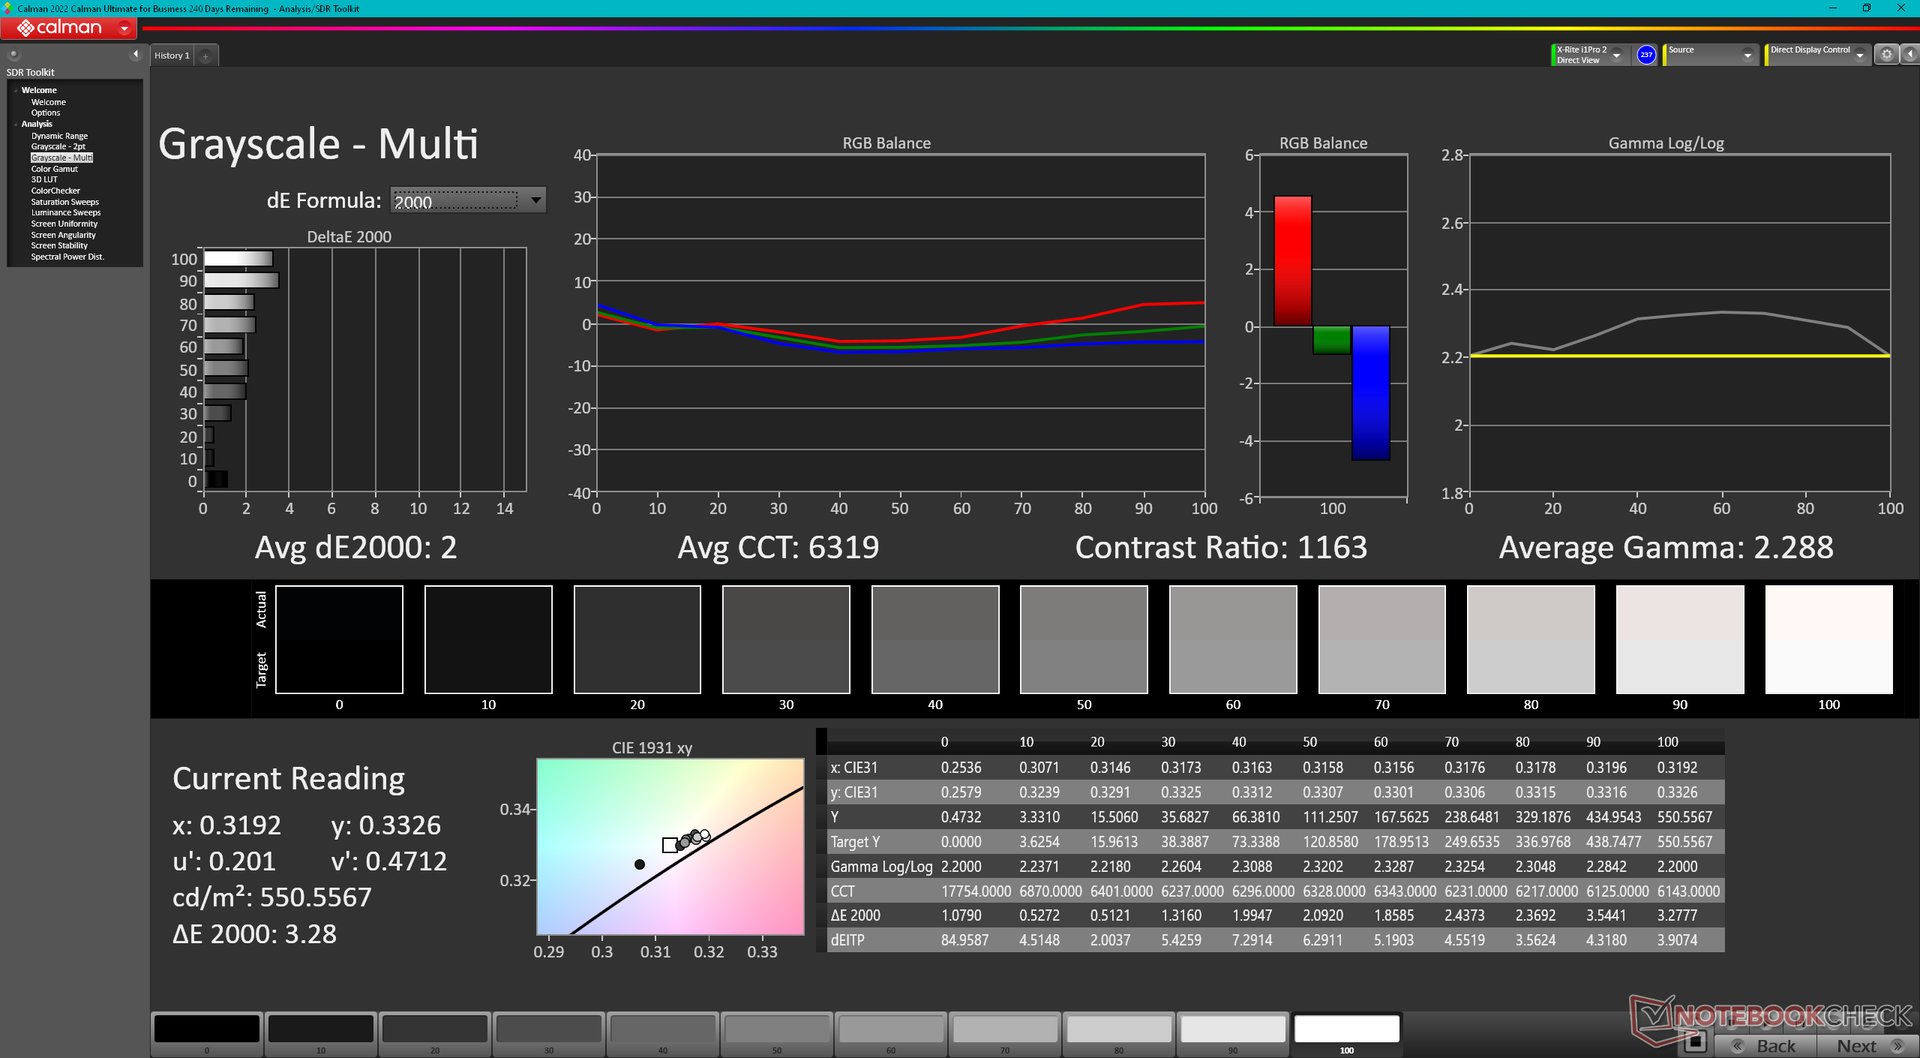
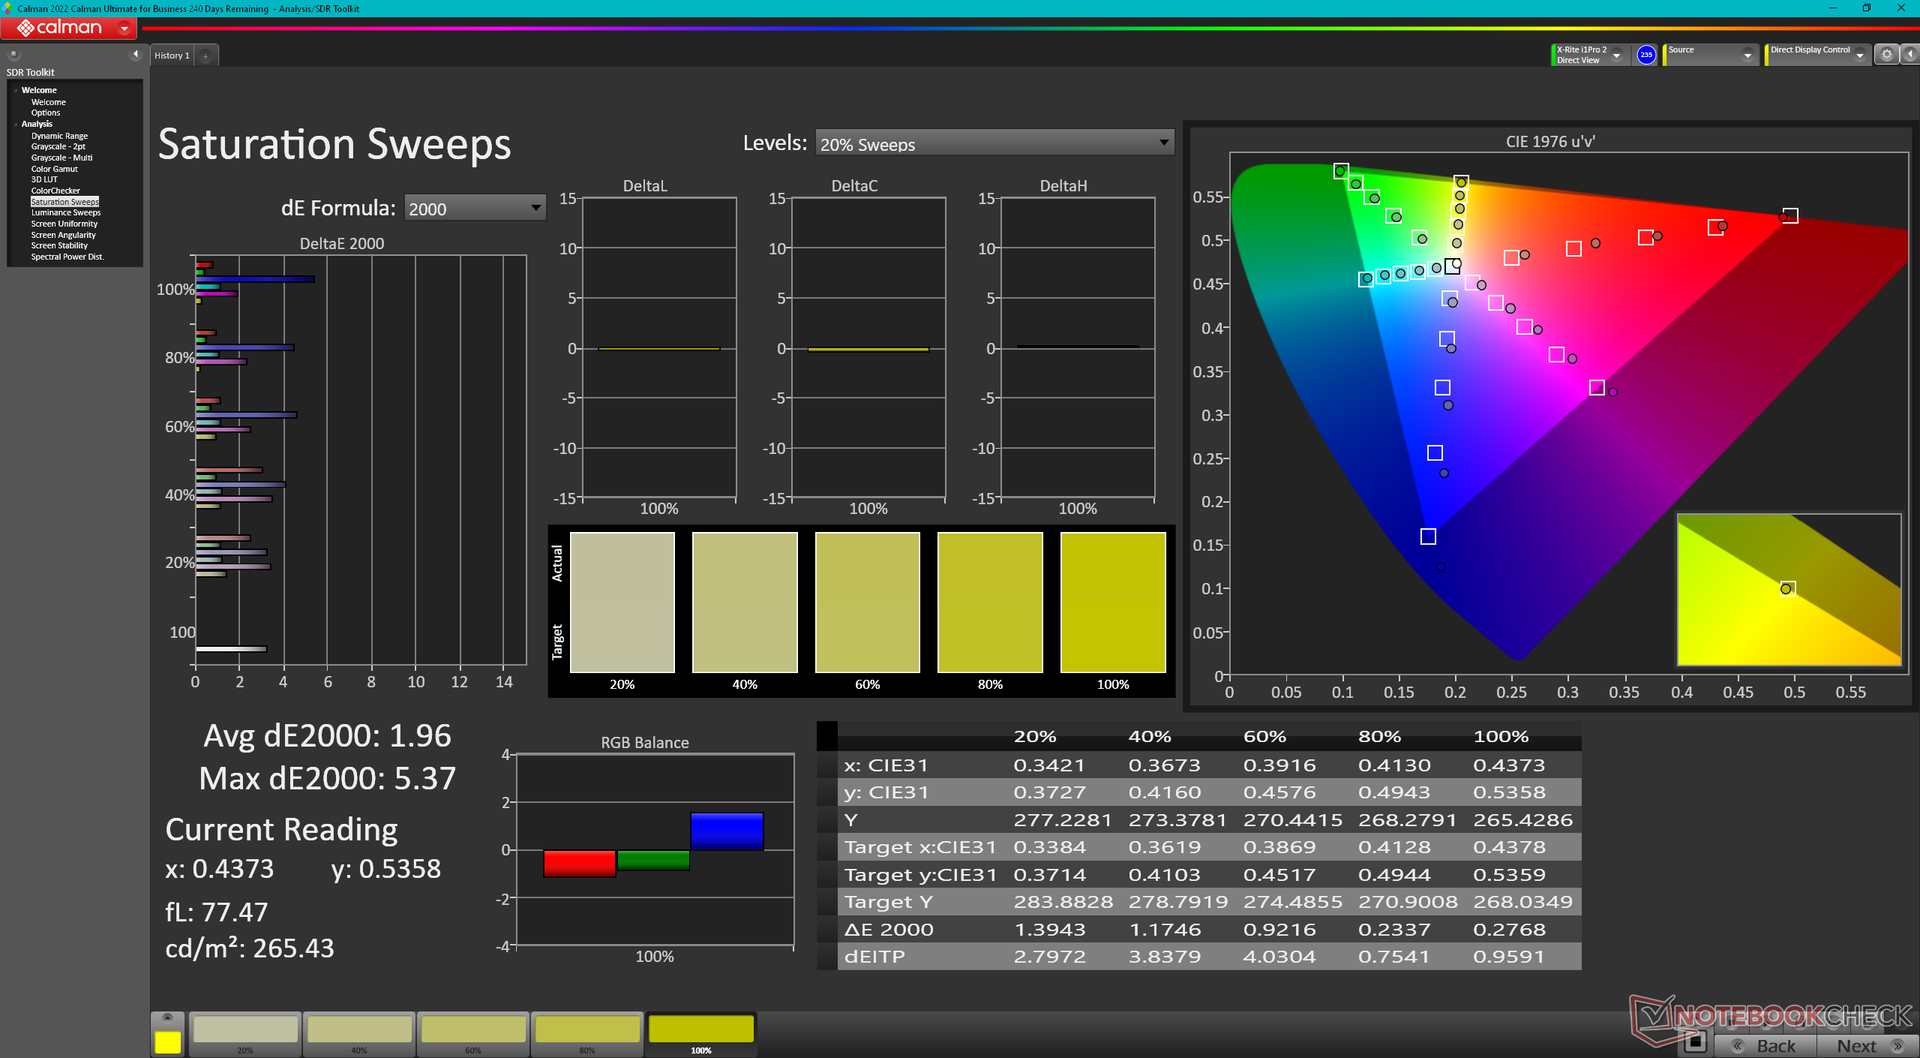
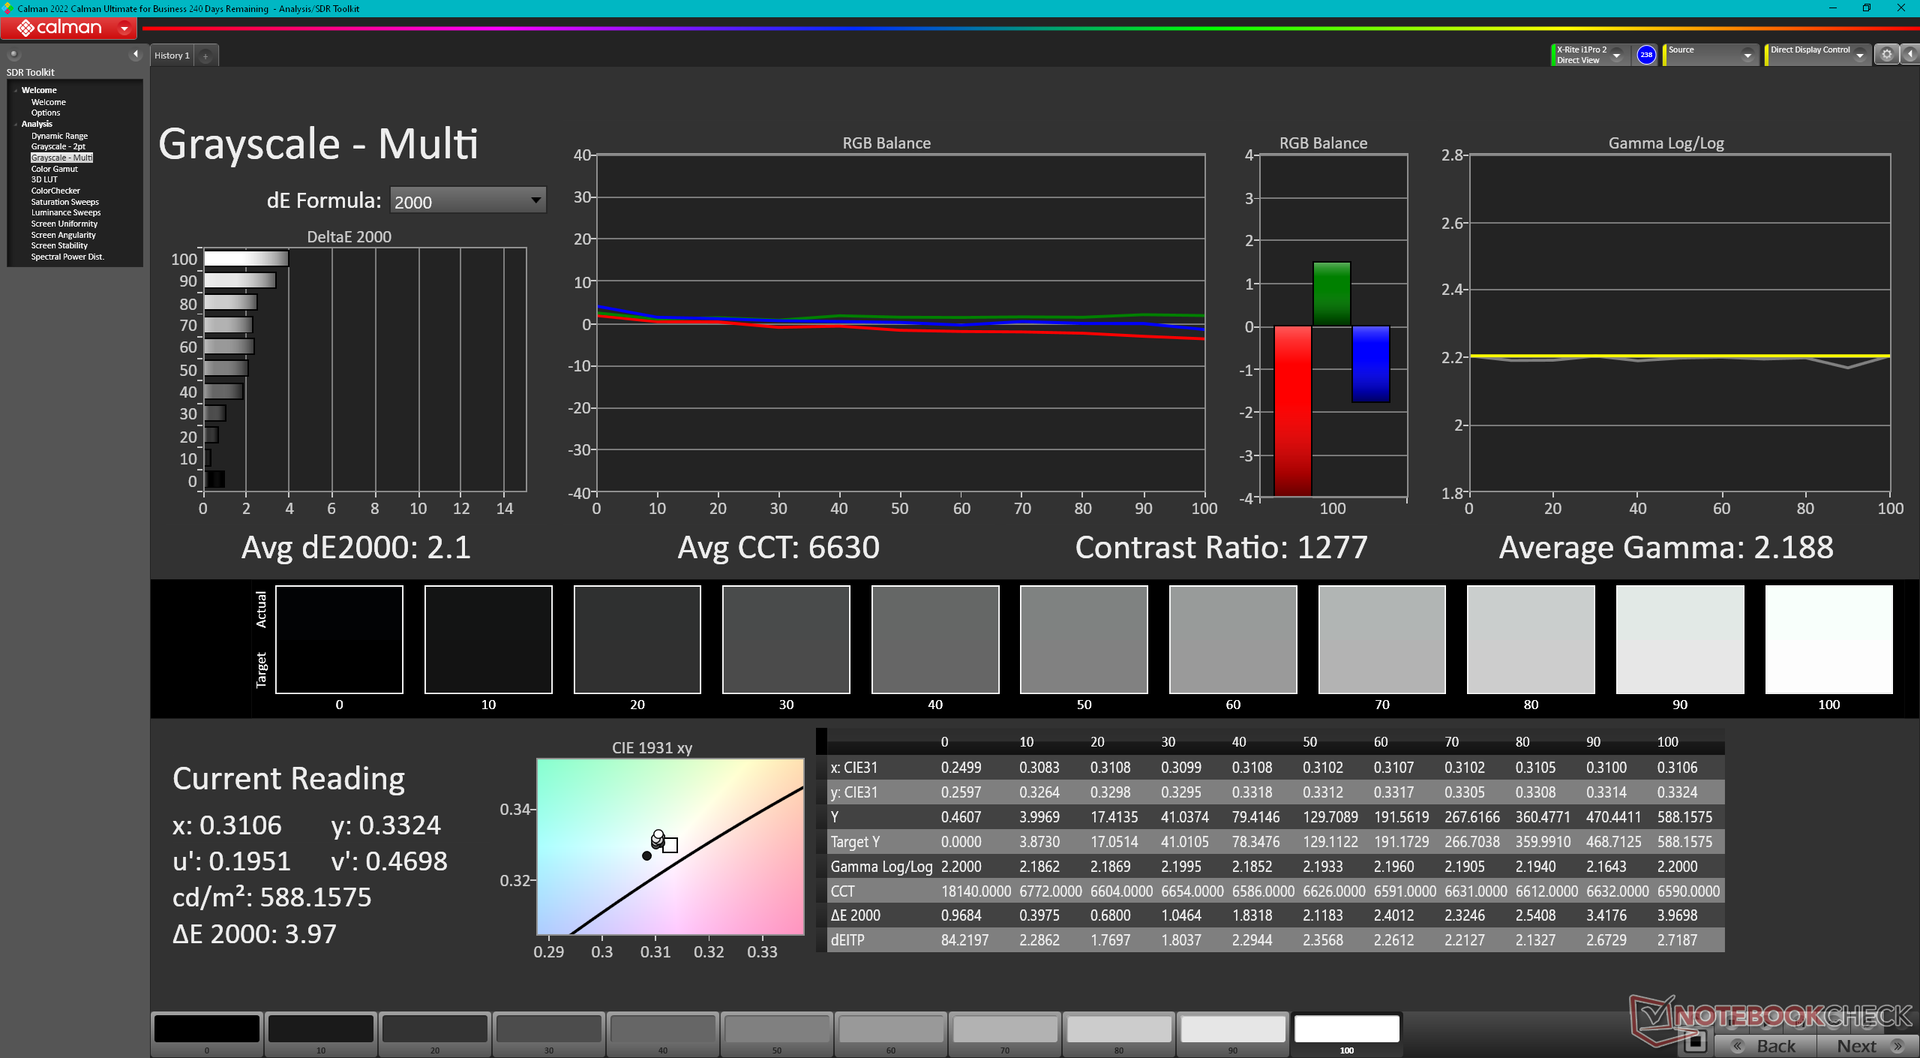
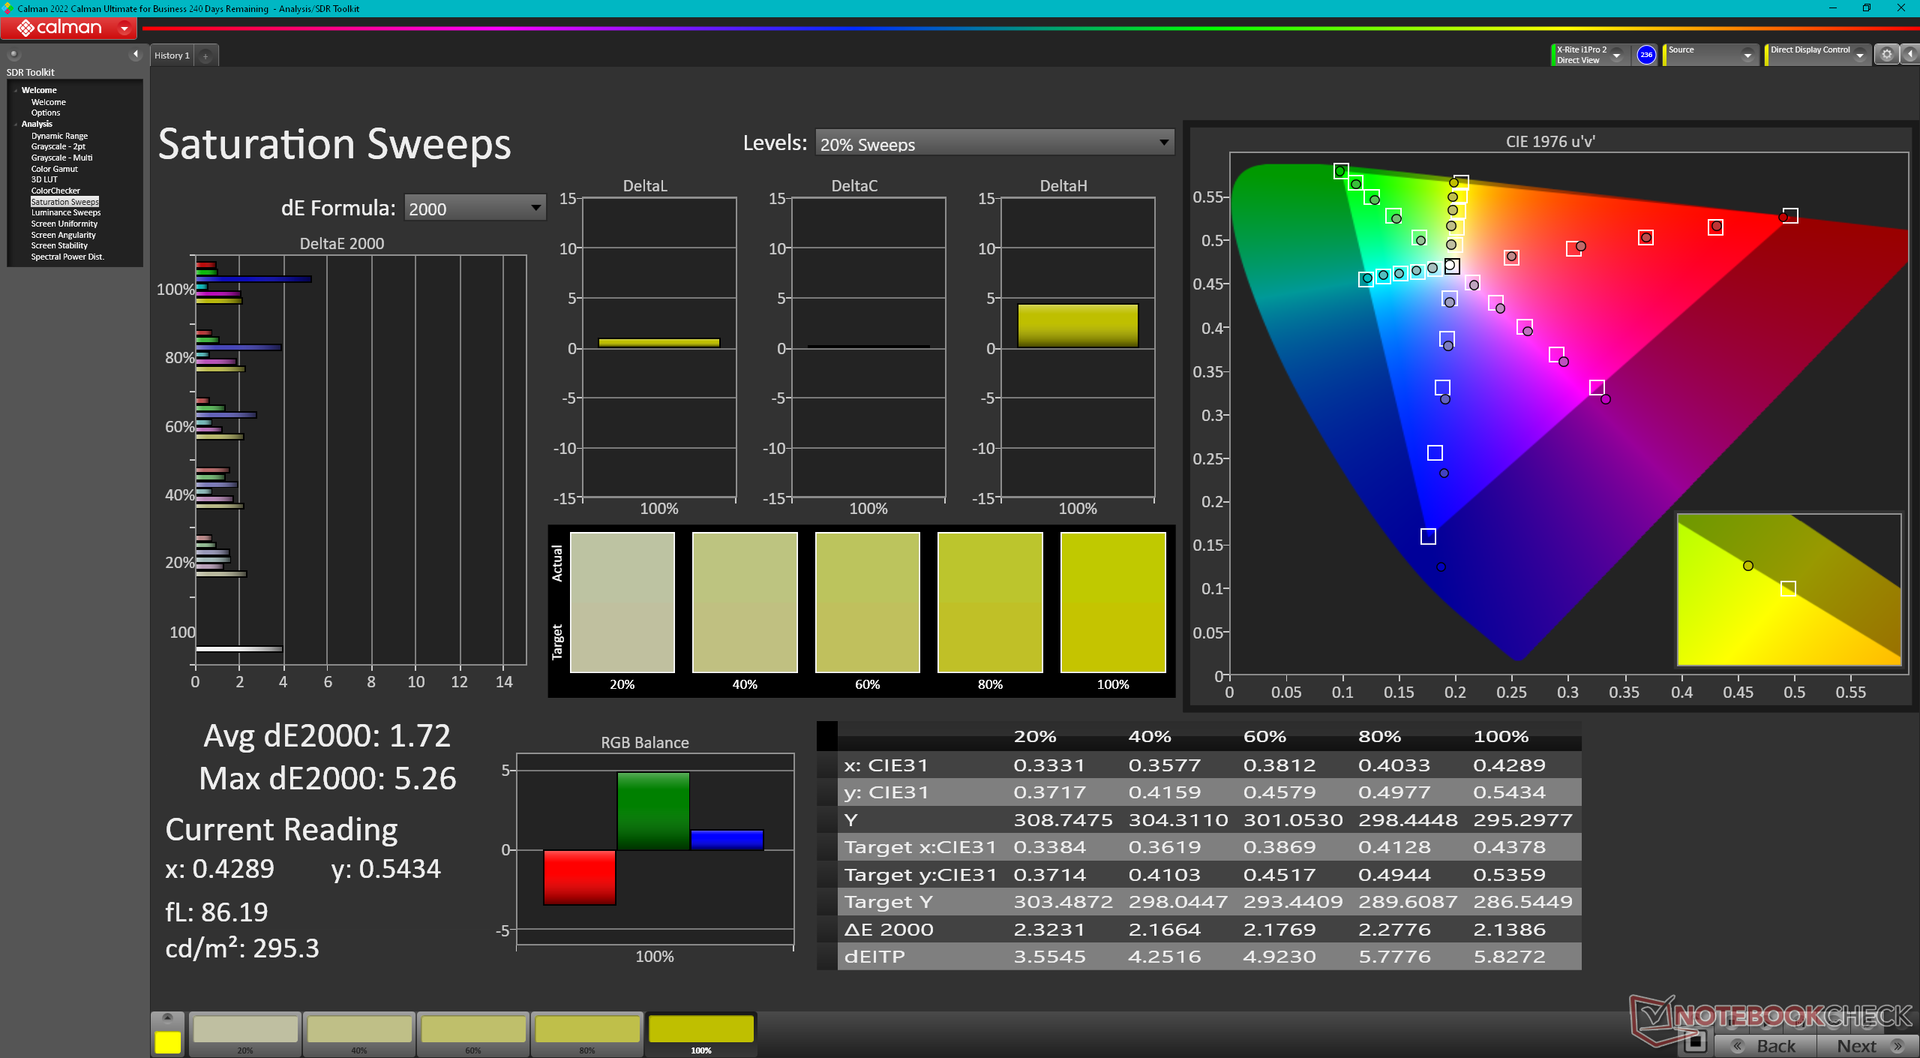
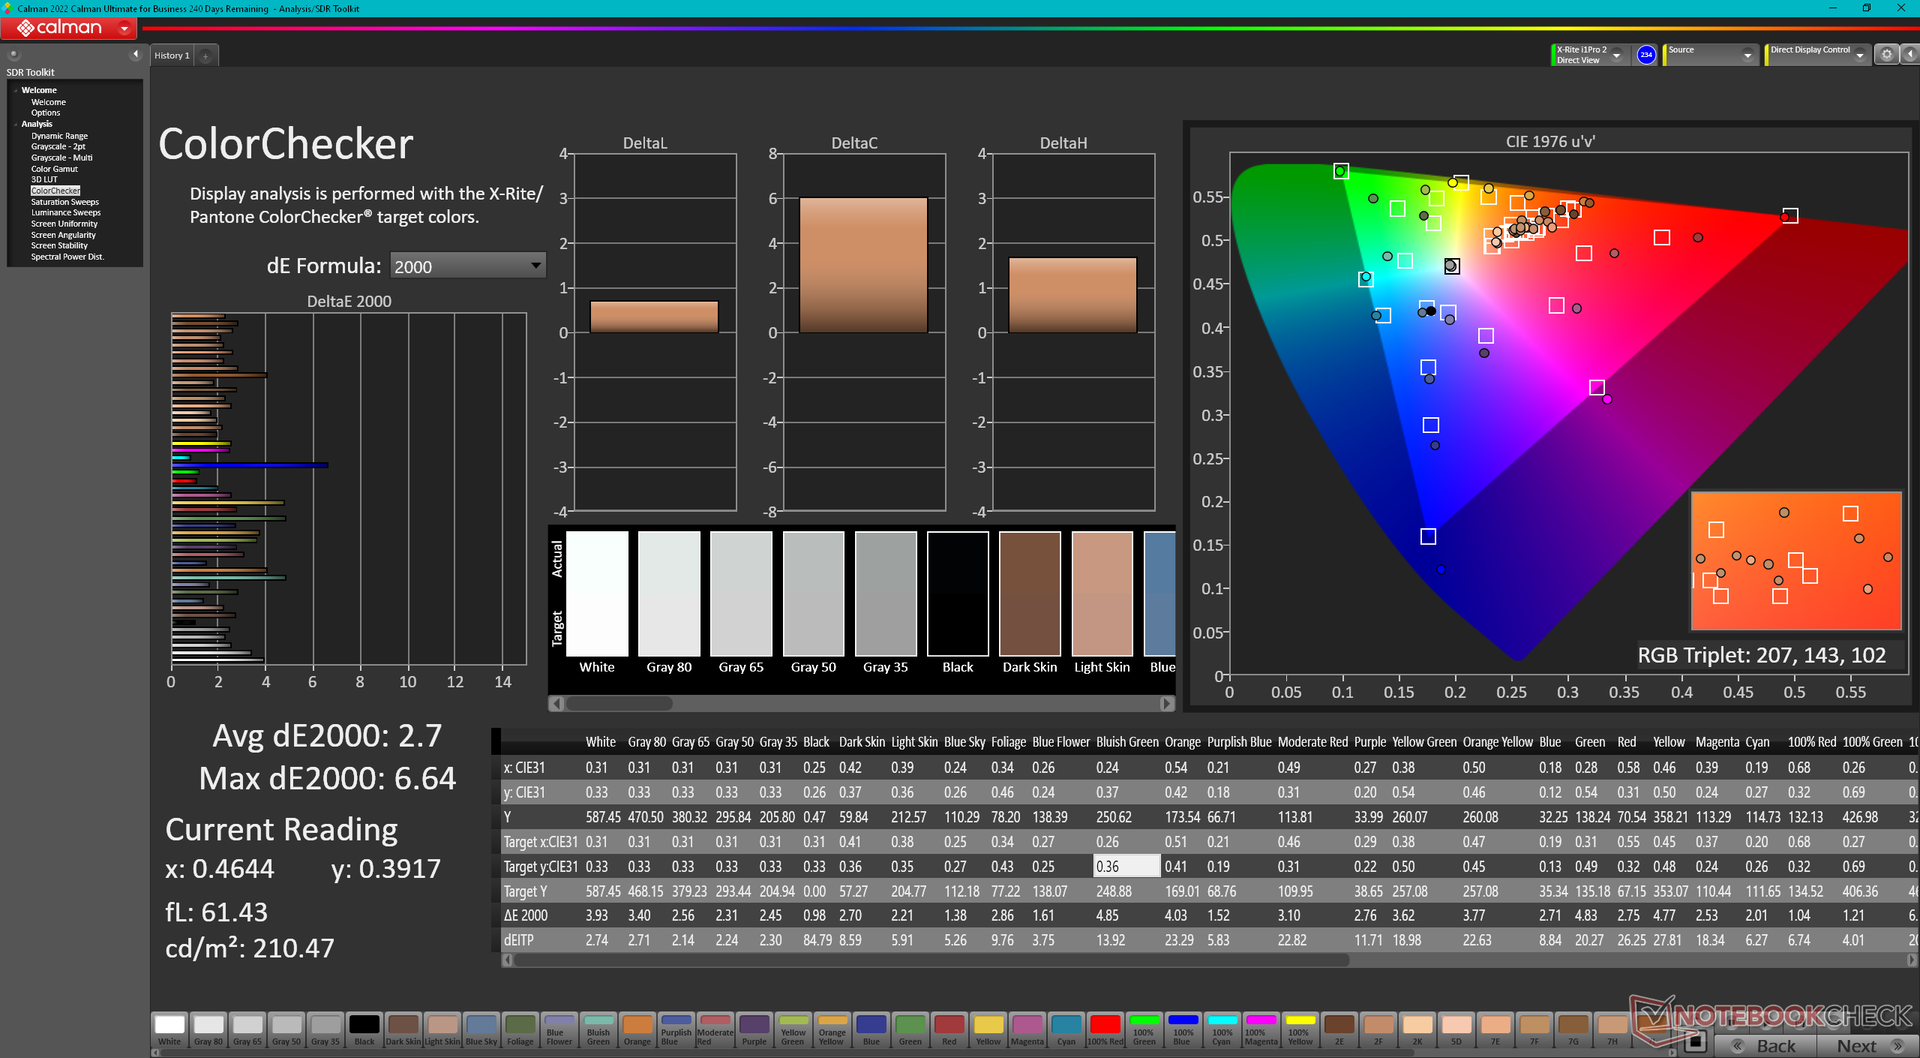
El Blade 18 no viene con una segunda opción de panel en el lanzamiento, probablemente debido a la oferta limitada. De hecho, el Asus ROG Strix Scar 18 de 18,0 pulgadas probablemente utilice el mismo panel IPS AU Optronics B180QAN01.0 que el Blade 18. Dicho esto, sigue siendo un panel de gran calidad con las características habituales de los portátiles de juego de gama alta, incluyendo la rápida tasa de refresco nativa de 240 Hz, tiempos de respuesta rápidos de 3 ms, cobertura completa de color DCI-P3, brillo de 500 nits y calibración de fábrica. Nuestras mediciones independientes con un colorímetro y un osciloscopio X-Rite han confirmado estas afirmaciones.
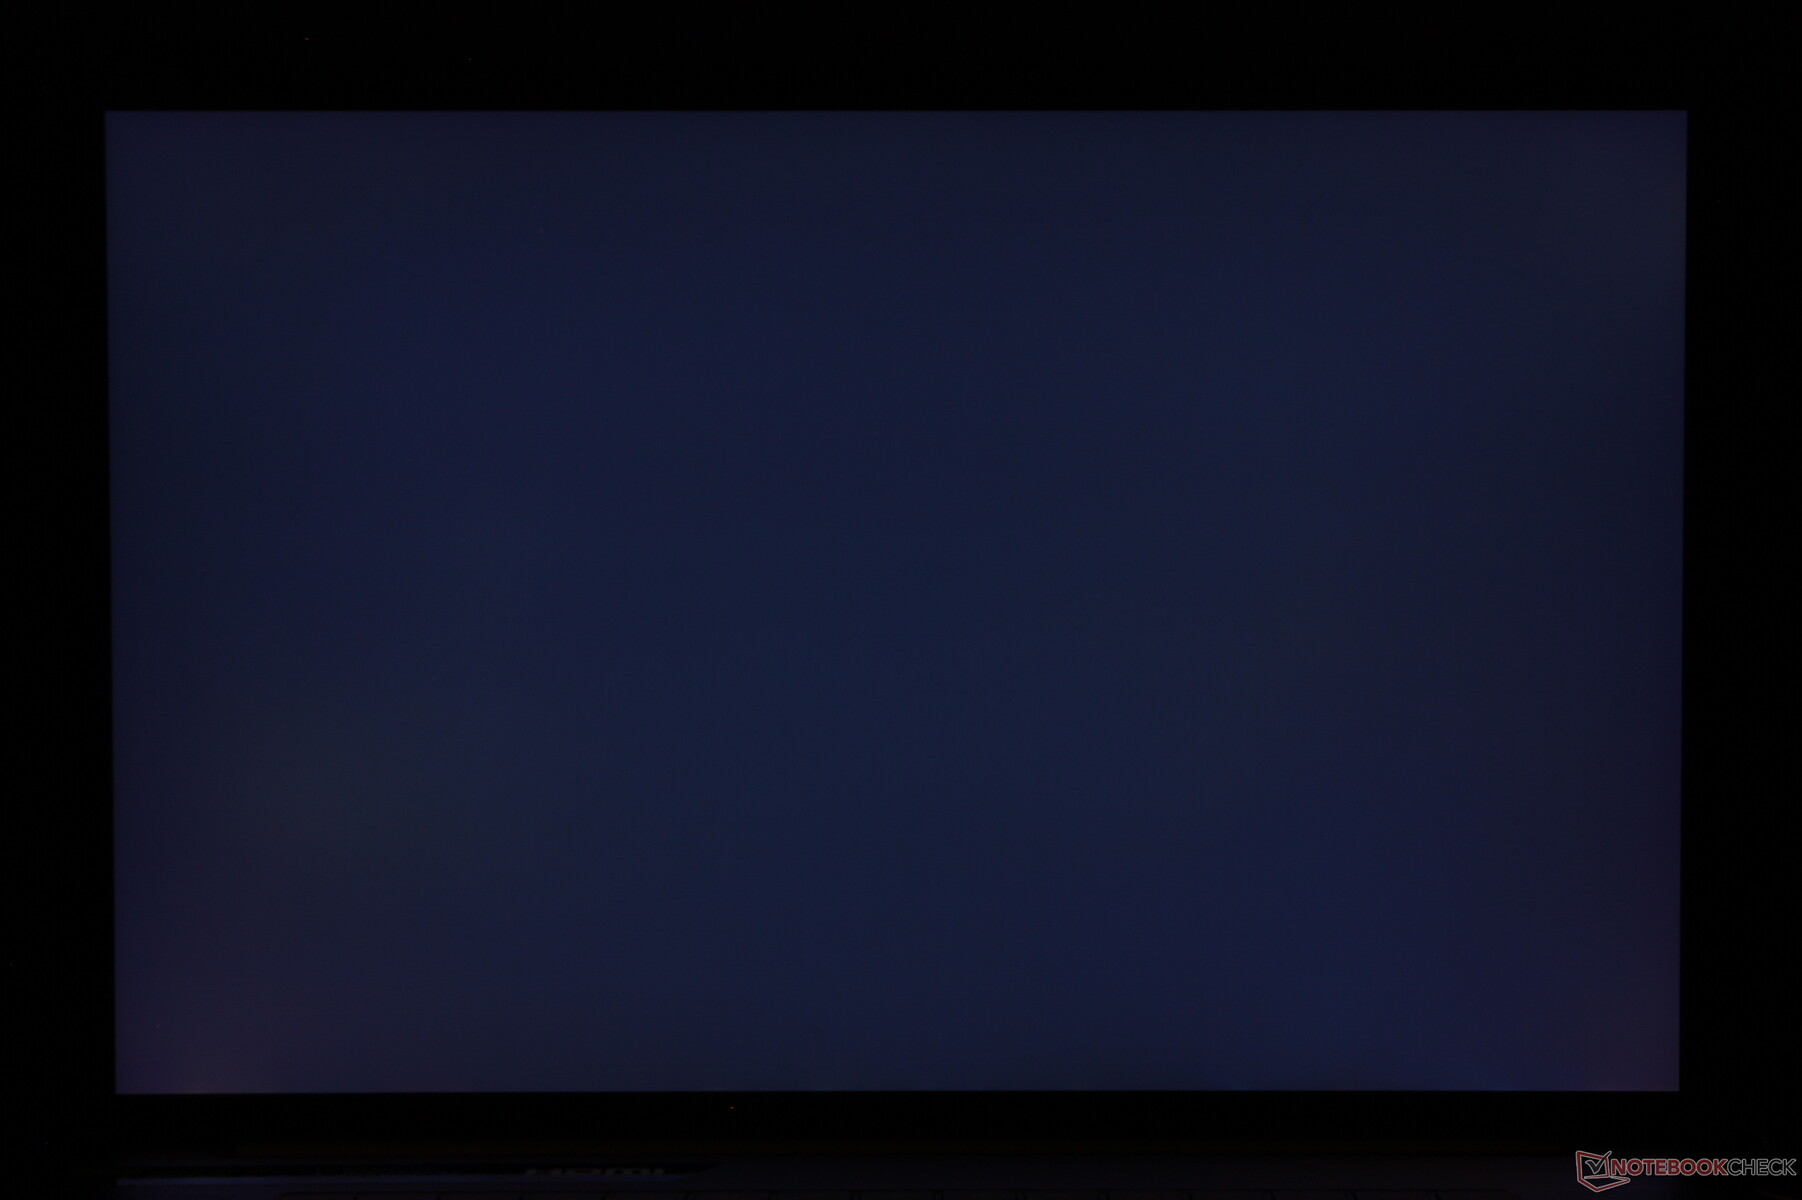
Por desgracia, la pantalla de nuestra unidad de prueba parpadeaba ocasionalmente entre diferentes niveles de brillo sin motivo aparente. El parpadeo no está relacionado con la modulación por ancho de pulsos, ya que el panel no utiliza PWM para controlar el brillo. Es probable que se trate de un fallo de la pantalla, pero aún no podemos confirmar si es un problema de software o de hardware. Supuestamente, algunos consumidores que ya han comprado el Blade 18 también han experimentado problemas similares de parpadeo. Esta sección se actualizará cuando Razer nos informe oficialmente.
| |||||||||||||||||||||||||
iluminación: 89 %
Brillo con batería: 549.6 cd/m²
Contraste: 1037:1 (Negro: 0.53 cd/m²)
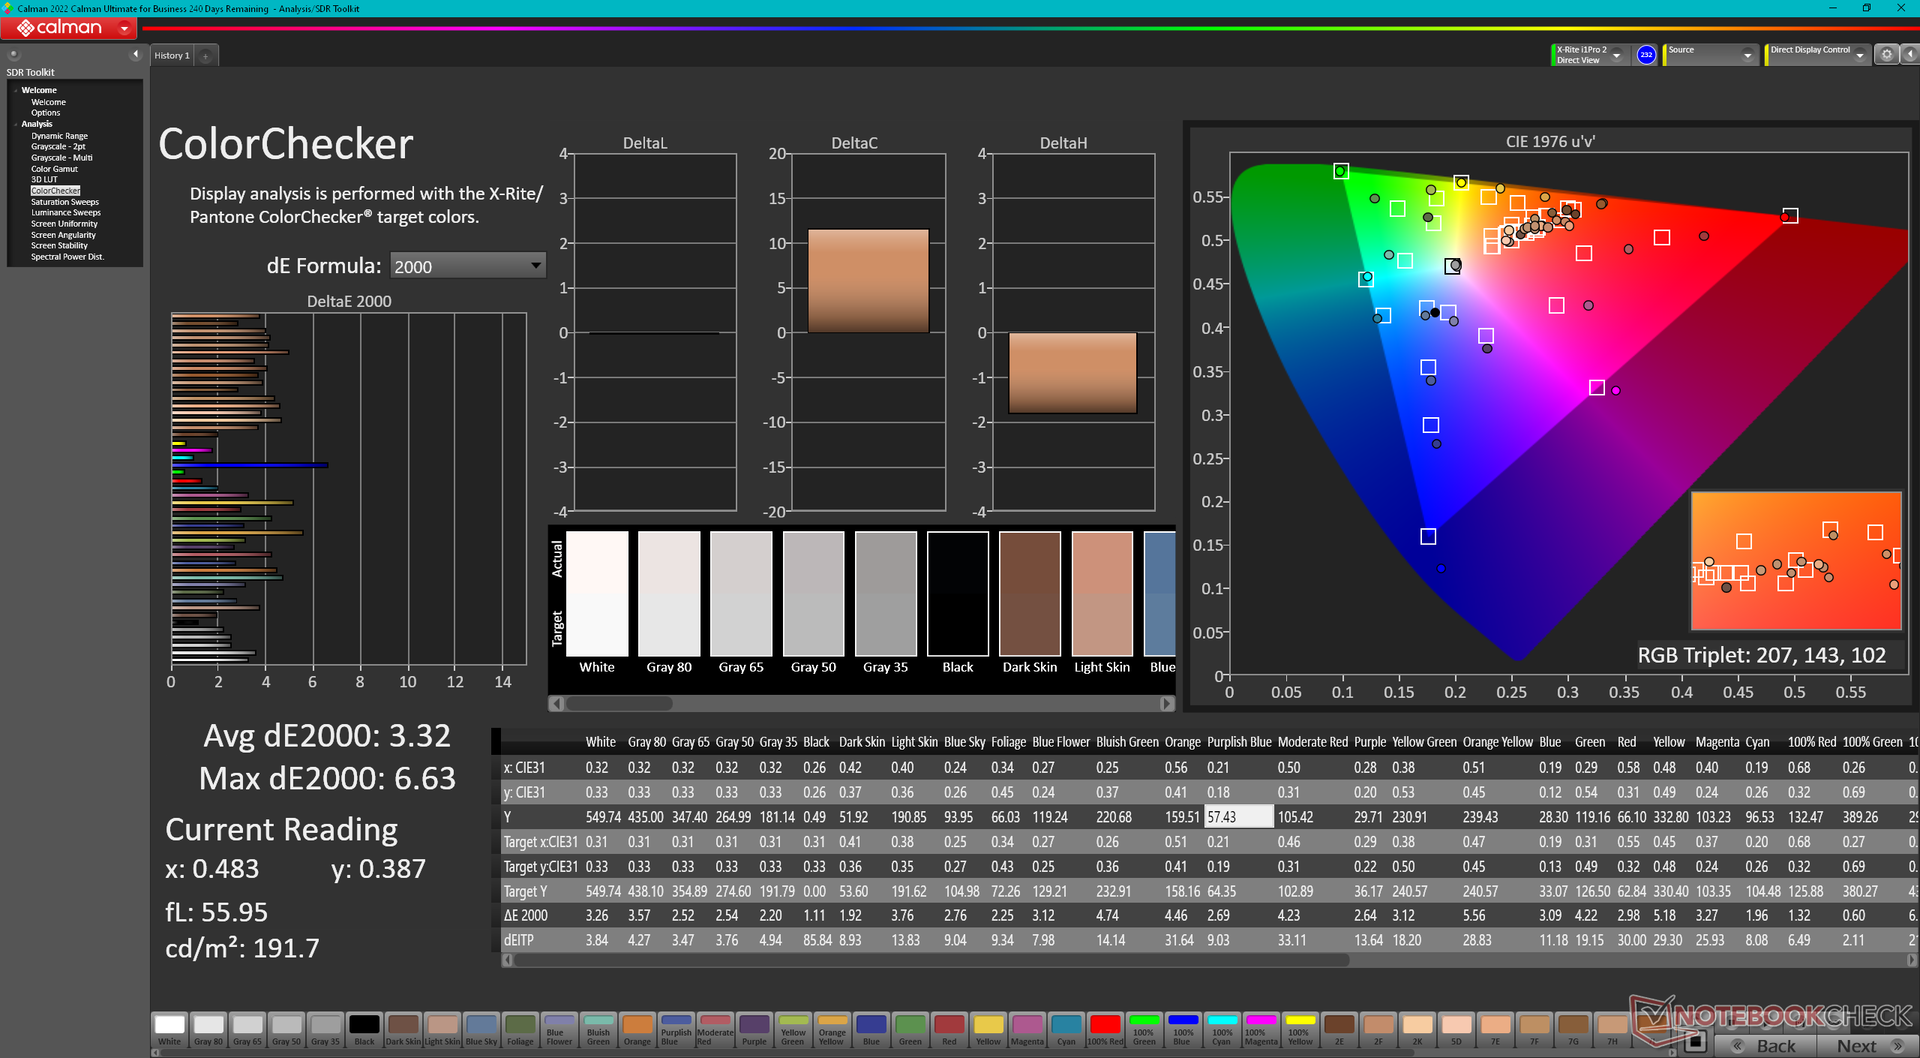
ΔE ColorChecker Calman: 3.32 | ∀{0.5-29.43 Ø4.71}
calibrated: 2.7
ΔE Greyscale Calman: 2 | ∀{0.09-98 Ø4.96}
85.3% AdobeRGB 1998 (Argyll 3D)
99.8% sRGB (Argyll 3D)
96.9% Display P3 (Argyll 3D)
Gamma: 2.29
CCT: 6319 K
| Razer Blade 18 RTX 4070 AU Optronics B180QAN01.0, IPS, 2560x1600, 18" | Razer Blade 17 Early 2022 AU Optronics B173ZAN06.9, IPS, 3840x2160, 17.3" | MSI Titan GT77 HX 13VI B173ZAN06.C, Mini-LED, 3840x2160, 17.3" | Gigabyte G7 KE AU Optronics B173HAN05.1, IPS, 1920x1080, 17.3" | Alienware m17 R5 (R9 6900HX, RX 6850M XT) AU Optronics AUODBA3, IPS, 3840x2160, 17" | Asus ROG Strix Scar 17 SE G733CX-LL014W NE173QHM-NZ2, IPS, 2560x1440, 17.3" | |
|---|---|---|---|---|---|---|
| Display | 2% | 2% | -14% | 1% | -0% | |
| Display P3 Coverage (%) | 96.9 | 99.4 3% | 94.9 -2% | 70.4 -27% | 97.2 0% | 97.1 0% |
| sRGB Coverage (%) | 99.8 | 100 0% | 99.9 0% | 99.8 0% | 99.6 0% | 99.9 0% |
| AdobeRGB 1998 Coverage (%) | 85.3 | 87.3 2% | 92.4 8% | 71.7 -16% | 88.4 4% | 84.8 -1% |
| Response Times | -25% | -524% | -12% | -168% | -31% | |
| Response Time Grey 50% / Grey 80% * (ms) | 4.2 ? | 7.5 ? -79% | 38.4 ? -814% | 5 ? -19% | 16.4 ? -290% | 5.7 ? -36% |
| Response Time Black / White * (ms) | 8 ? | 5.6 ? 30% | 26.6 ? -233% | 8.3 ? -4% | 11.6 ? -45% | 10.1 ? -26% |
| PWM Frequency (Hz) | 2380 ? | |||||
| Screen | 24% | 64905% | 19% | -40% | 16% | |
| Brightness middle (cd/m²) | 549.6 | 503 -8% | 606 10% | 307 -44% | 484 -12% | 320 -42% |
| Brightness (cd/m²) | 524 | 486 -7% | 602 15% | 301 -43% | 449 -14% | 303 -42% |
| Brightness Distribution (%) | 89 | 84 -6% | 93 4% | 93 4% | 87 -2% | 87 -2% |
| Black Level * (cd/m²) | 0.53 | 0.44 17% | 0.0001 100% | 0.2 62% | 0.55 -4% | 0.3 43% |
| Contrast (:1) | 1037 | 1143 10% | 6060000 584278% | 1535 48% | 880 -15% | 1067 3% |
| Colorchecker dE 2000 * | 3.32 | 1.08 67% | 4.8 -45% | 1.32 60% | 4.8 -45% | 1.1 67% |
| Colorchecker dE 2000 max. * | 6.63 | 4.54 32% | 8.2 -24% | 4.6 31% | 7.48 -13% | 2.7 59% |
| Colorchecker dE 2000 calibrated * | 2.7 | 0.6 78% | 1.8 33% | 1.03 62% | 4.74 -76% | |
| Greyscale dE 2000 * | 2 | 1.3 35% | 6.5 -225% | 2.1 -5% | 5.5 -175% | 1.1 45% |
| Gamma | 2.29 96% | 2.151 102% | 2.63 84% | 2.247 98% | 2.42 91% | 2.13 103% |
| CCT | 6319 103% | 6541 99% | 6596 99% | 6815 95% | 6148 106% | 6599 98% |
| Media total (Programa/Opciones) | 0% /
12% | 21461% /
41650% | -2% /
8% | -69% /
-49% | -5% /
5% |
* ... más pequeño es mejor
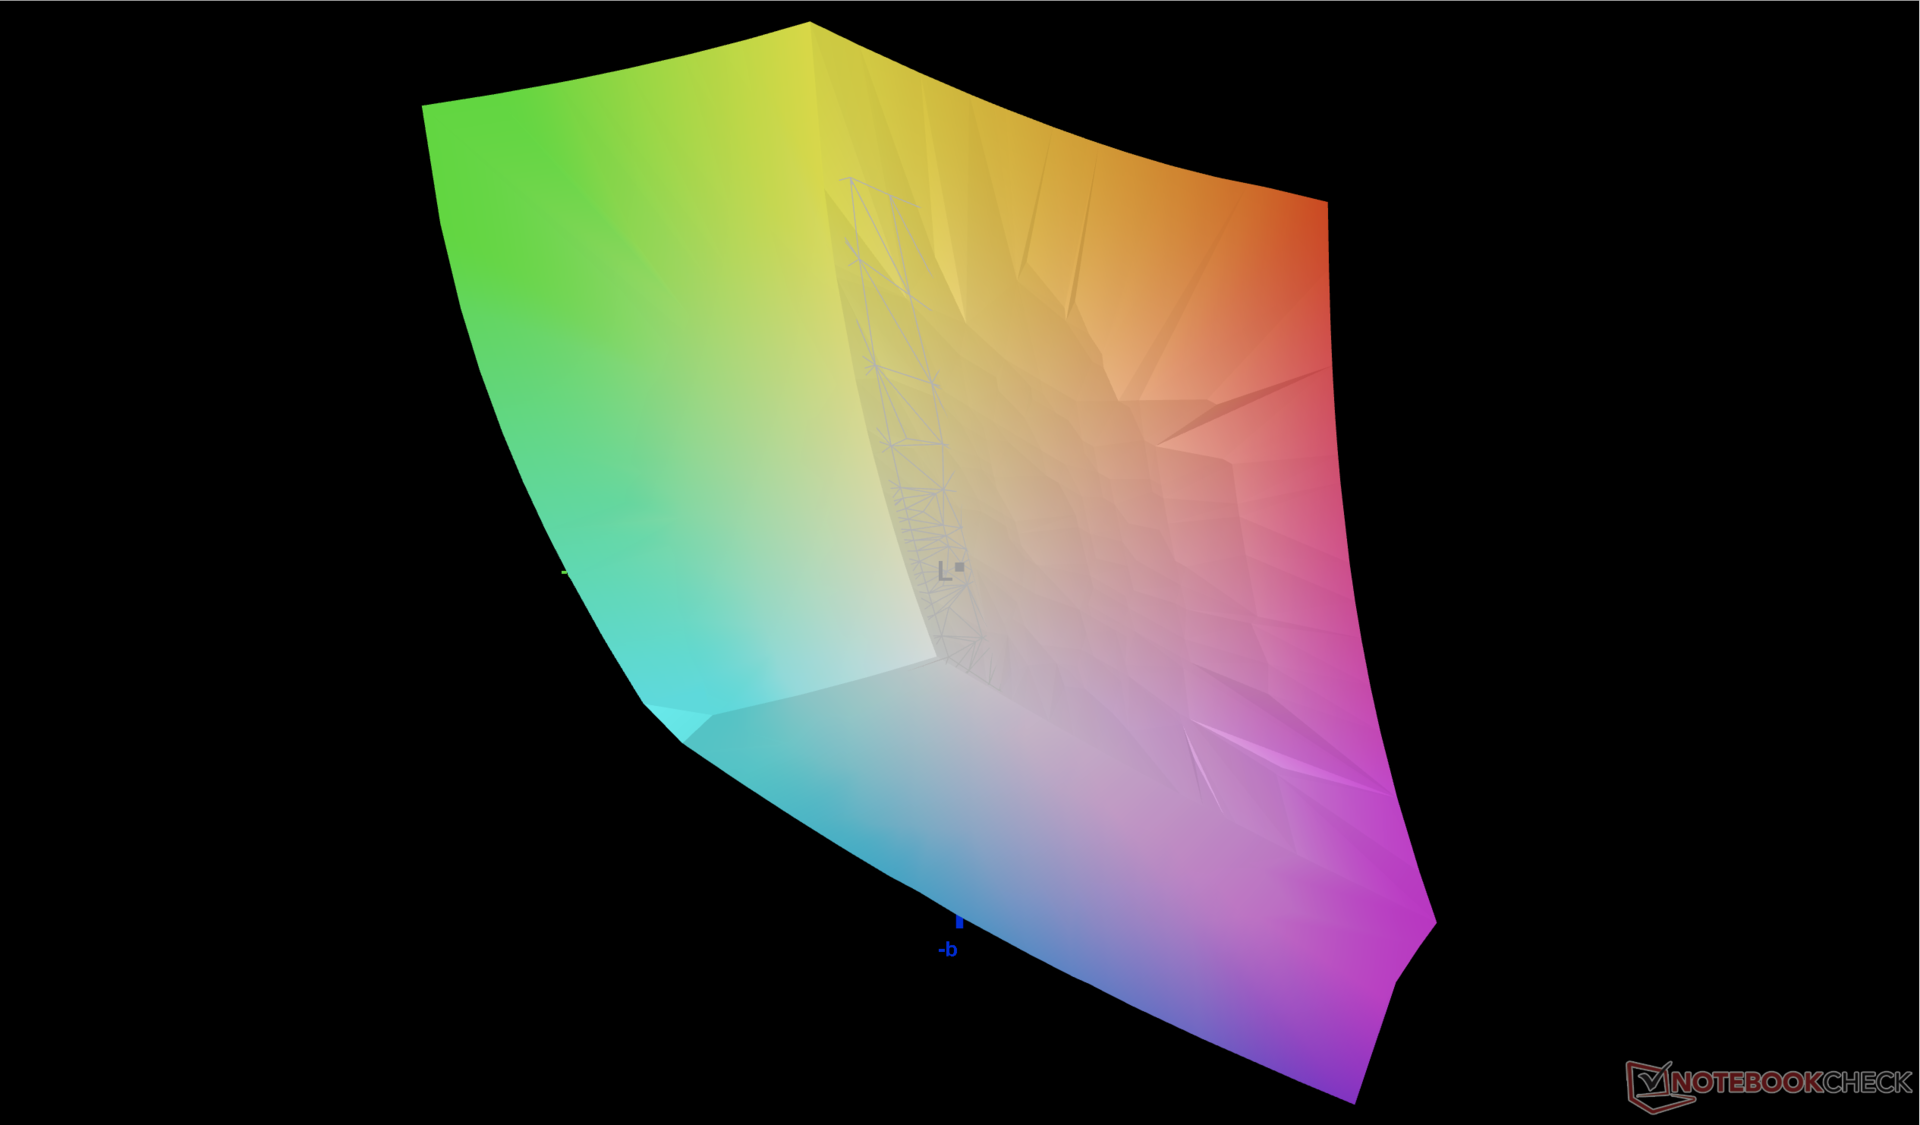
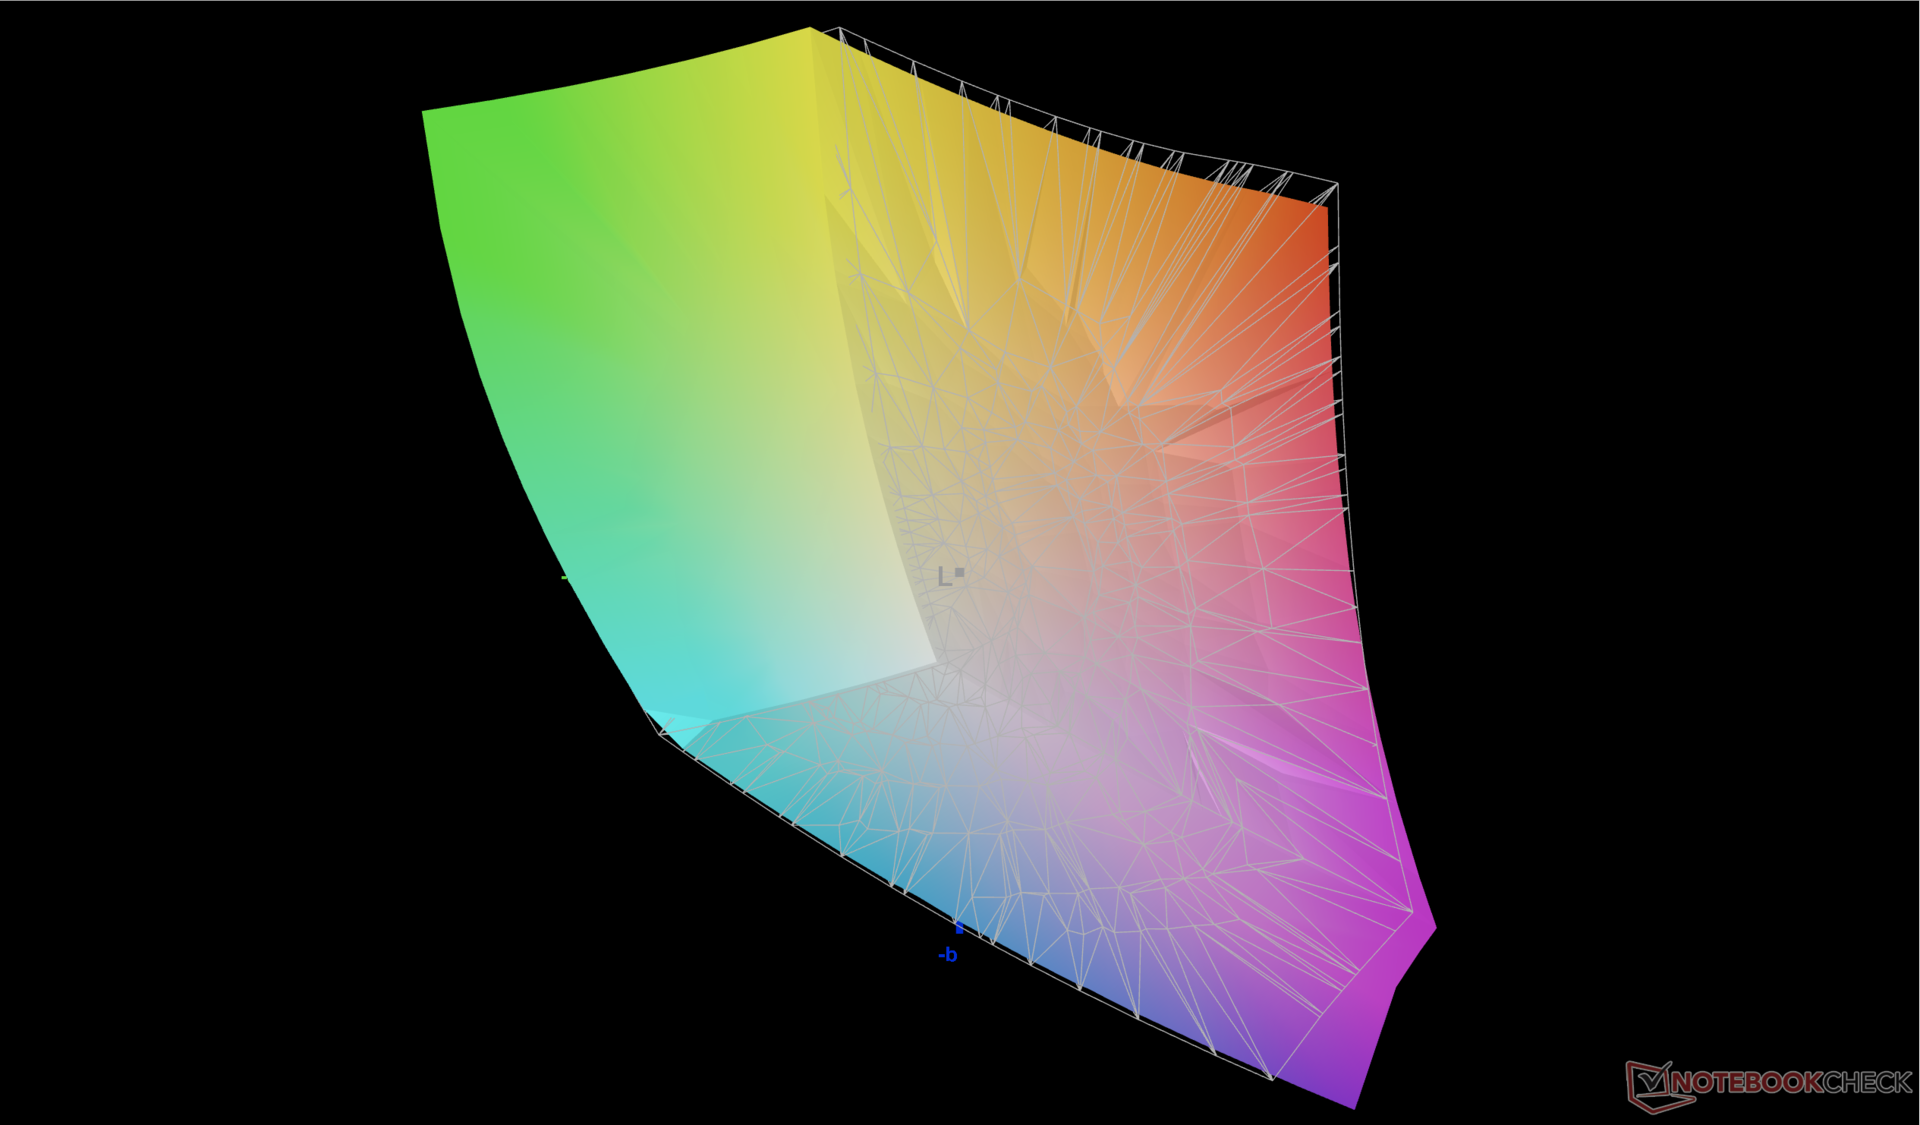
Los valores medios de escala de grises y deltaE de color son de sólo 2,0 y 3,32, respectivamente, ya que el panel viene precalibrado con el estándar P3. Intentar calibrar el panel nosotros mismos no mejoraría los colores de forma significativa. El azul, sin embargo, parece estar representado de forma más imprecisa que cualquier otro color primario o secundario.
Tiempos de respuesta del display
| ↔ Tiempo de respuesta de Negro a Blanco | ||
|---|---|---|
| 8 ms ... subida ↗ y bajada ↘ combinada | ↗ 3.8 ms subida | 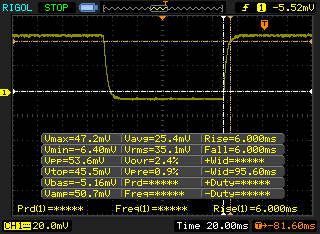 |
| ↘ 4.2 ms bajada | ||
| La pantalla mostró tiempos de respuesta rápidos en nuestros tests y debería ser adecuada para juegos. En comparación, todos los dispositivos de prueba van de ##min### (mínimo) a 240 (máximo) ms. » 22 % de todos los dispositivos son mejores. Esto quiere decir que el tiempo de respuesta medido es mejor que la media (19.8 ms) de todos los dispositivos testados. | ||
| ↔ Tiempo de respuesta 50% Gris a 80% Gris | ||
| 4.2 ms ... subida ↗ y bajada ↘ combinada | ↗ 2.1 ms subida | 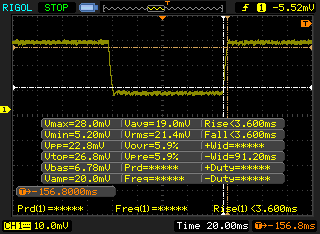 |
| ↘ 2.1 ms bajada | ||
| La pantalla mostró tiempos de respuesta muy rápidos en nuestros tests y debería ser adecuada para juegos frenéticos. En comparación, todos los dispositivos de prueba van de ##min### (mínimo) a 636 (máximo) ms. » 16 % de todos los dispositivos son mejores. Esto quiere decir que el tiempo de respuesta medido es mejor que la media (31 ms) de todos los dispositivos testados. | ||
Parpadeo de Pantalla / PWM (Pulse-Width Modulation)
| Parpadeo de Pantalla / PWM no detectado | 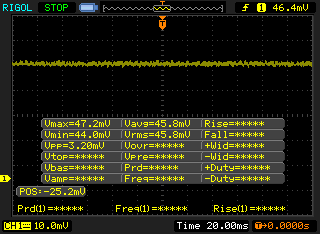 | ||
Comparación: 52 % de todos los dispositivos testados no usaron PWM para atenuar el display. Si se usó, medimos una media de 7754 (mínimo: 5 - máxmo: 343500) Hz. | |||
La visibilidad en exteriores es similar a la del Blade 17, ya que sus pantallas apuntan cada una a un máximo de 500 nits. Siempre se recomienda utilizar sombra para obtener colores óptimos y reducir el deslumbramiento en la medida de lo posible.
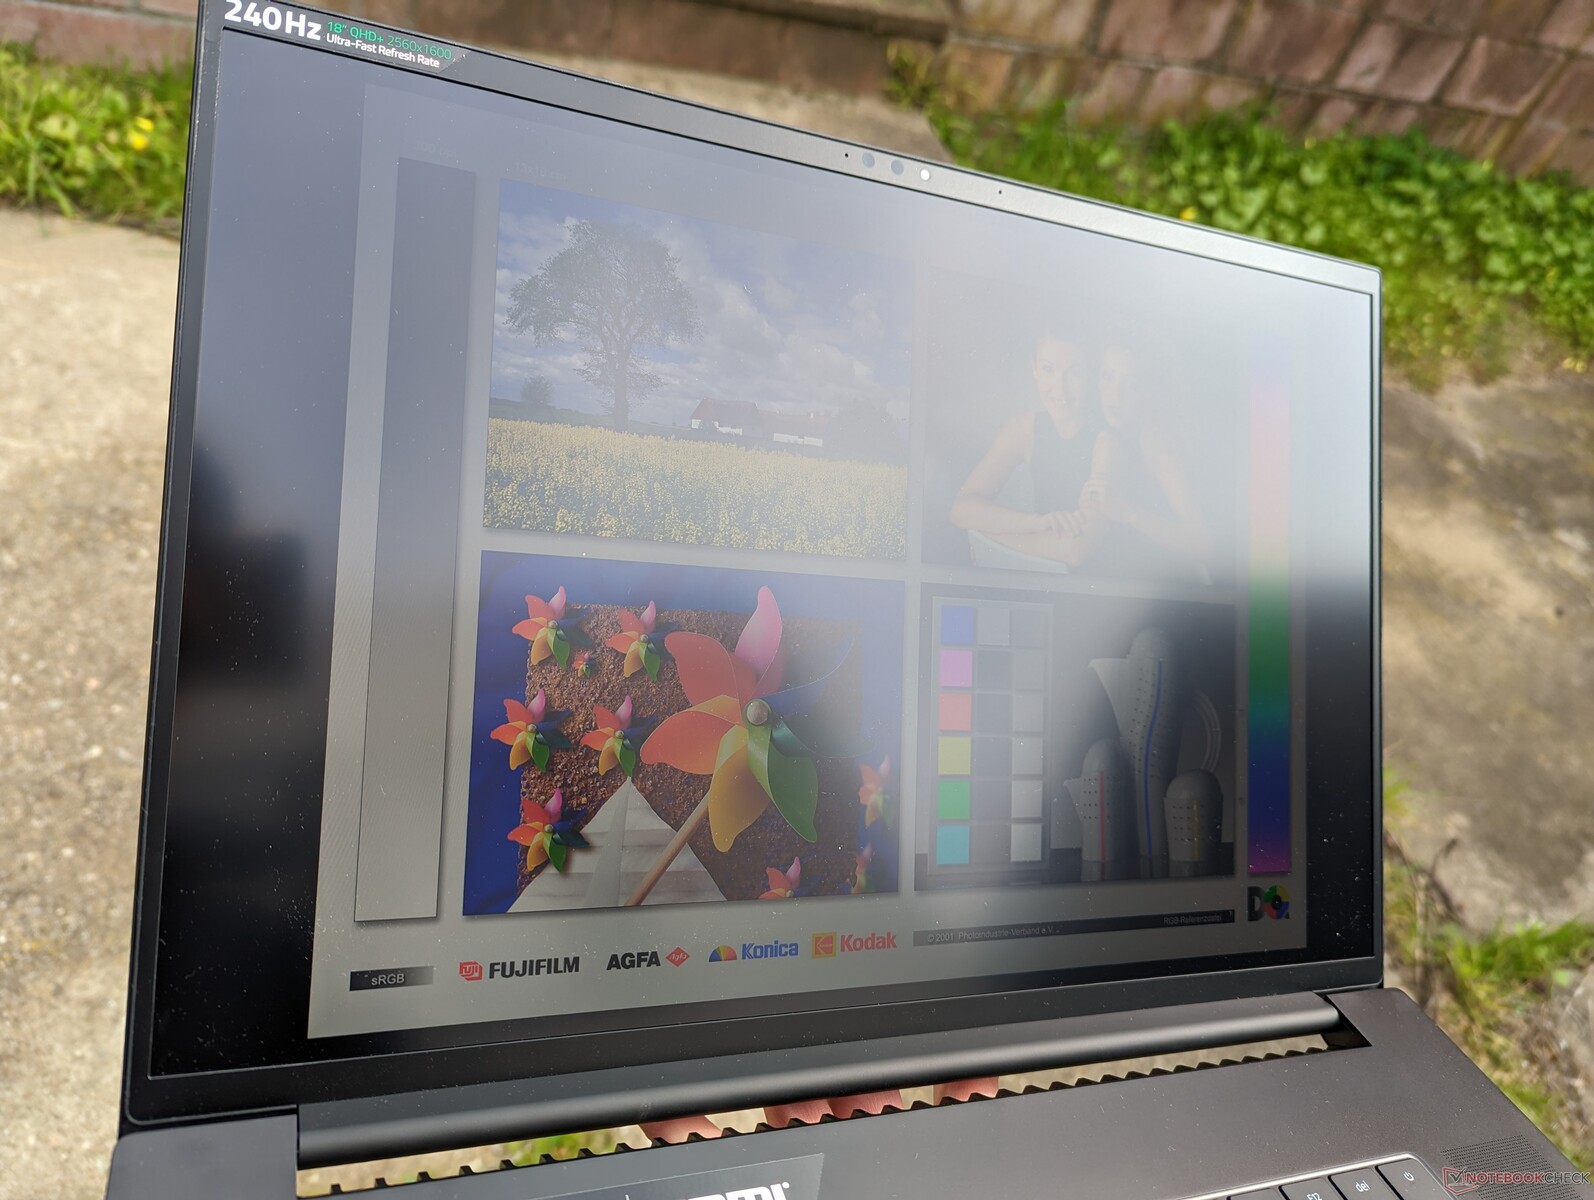
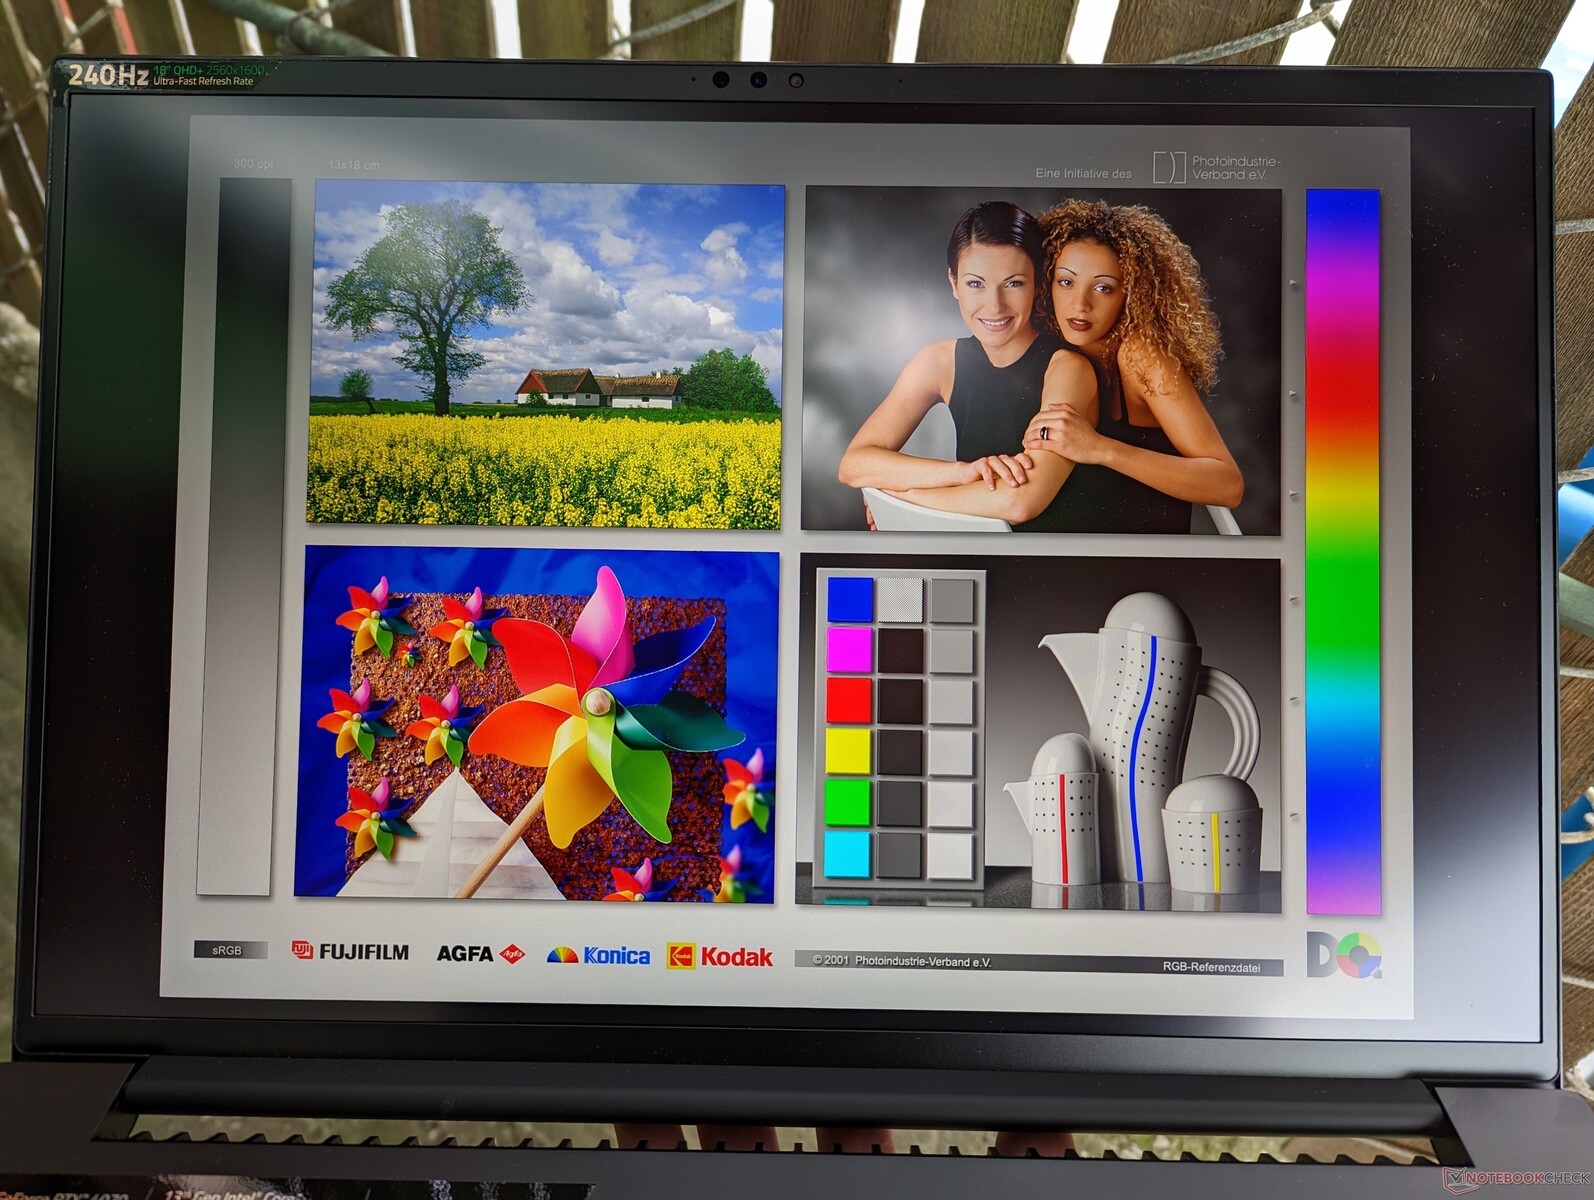
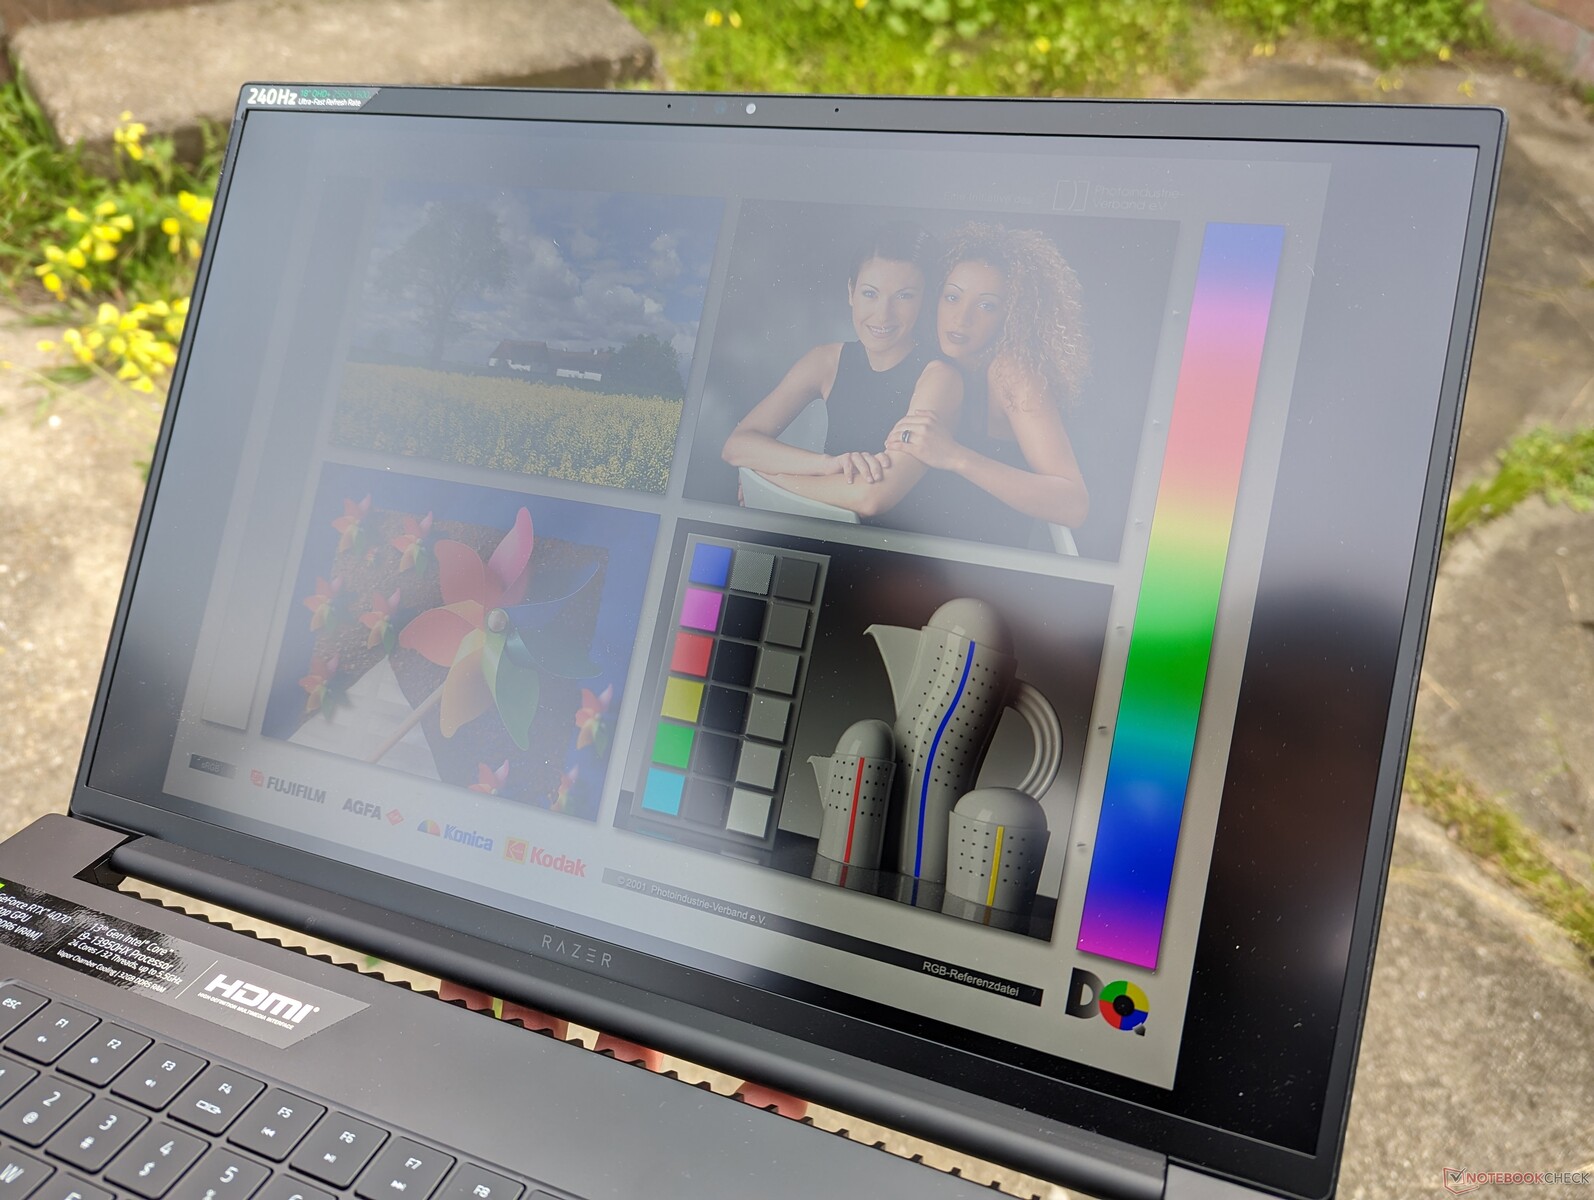
Los ángulos de visión son amplios, como cabe esperar de un panel IPS. Los colores y el contraste cambian solo si se mira desde ángulos extremos.
Rendimiento - Intel Raptor Lake + Nvidia Ada Lovelace
Condiciones de ensayo
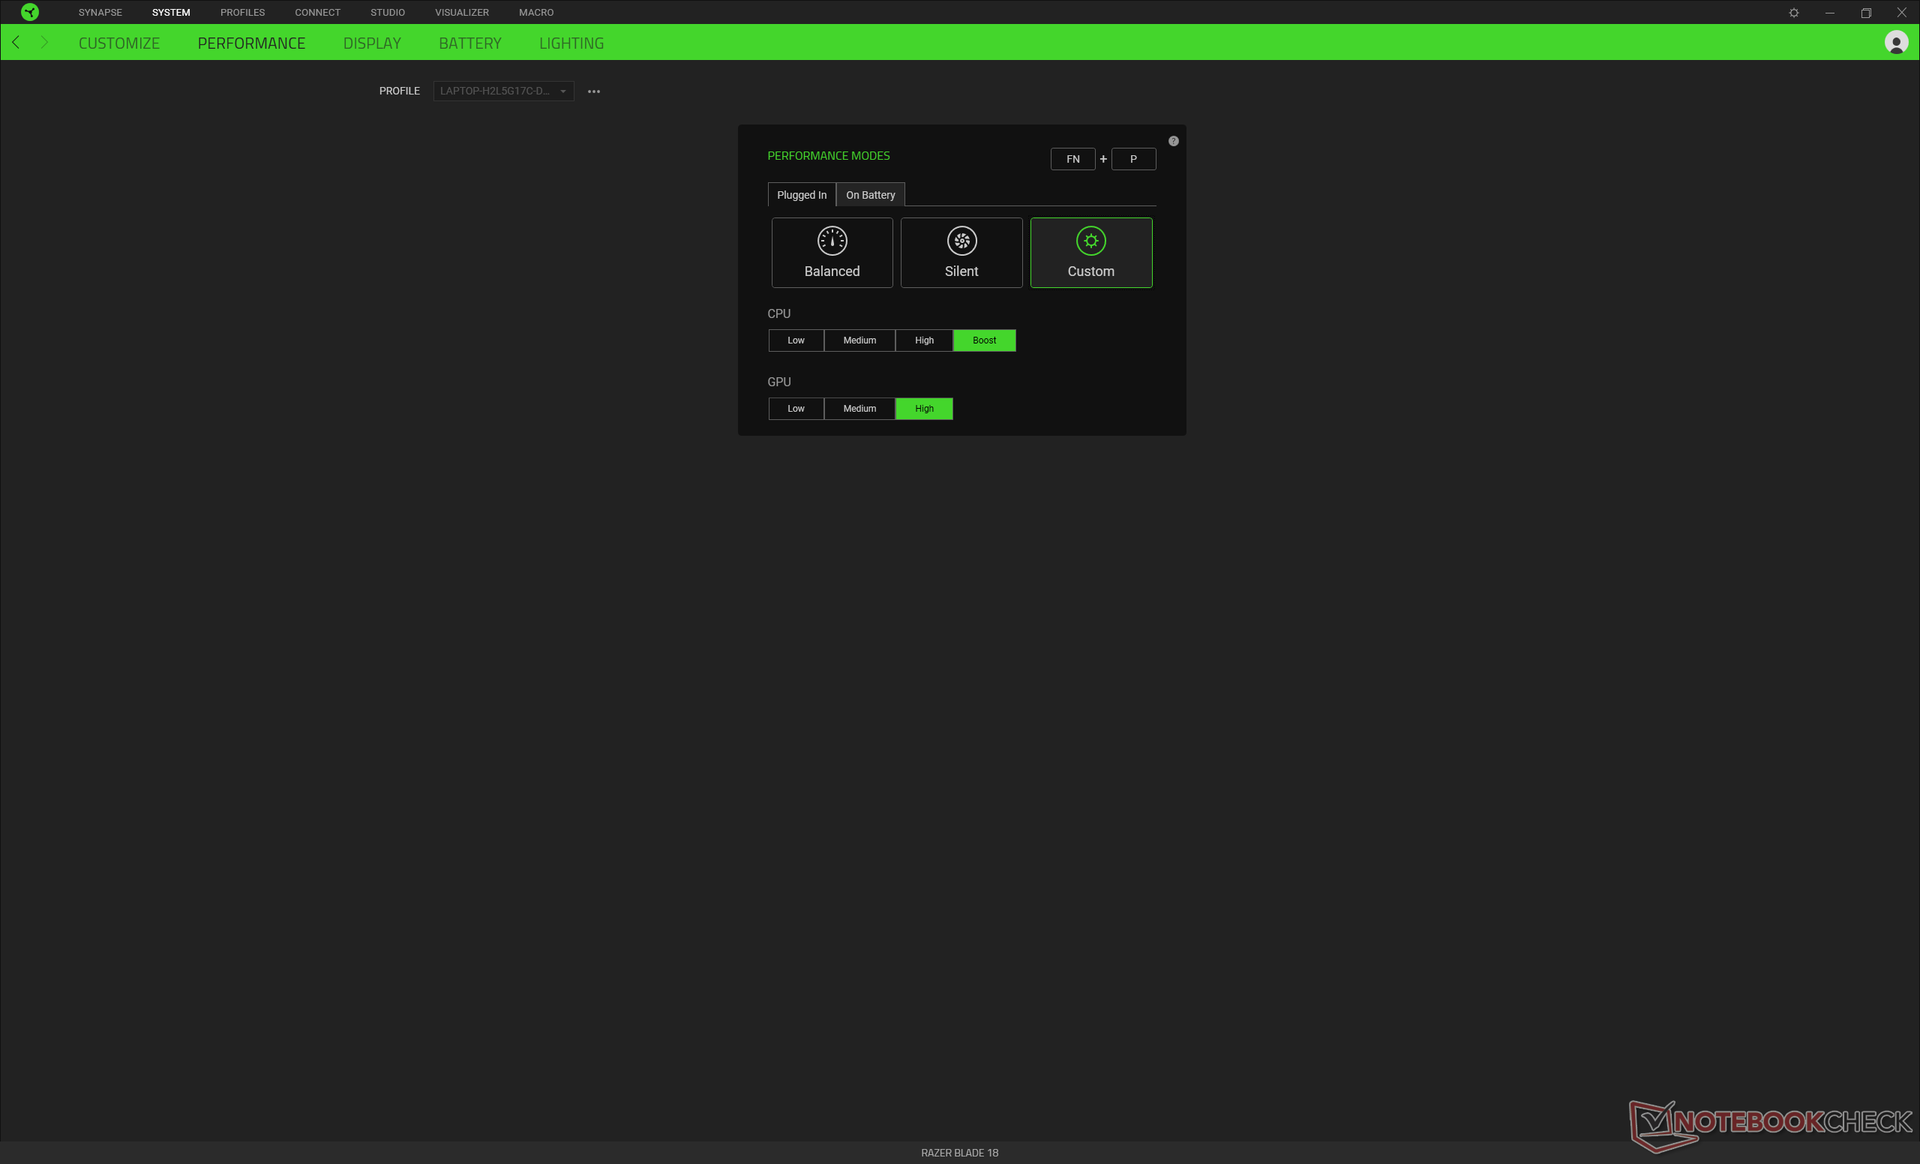
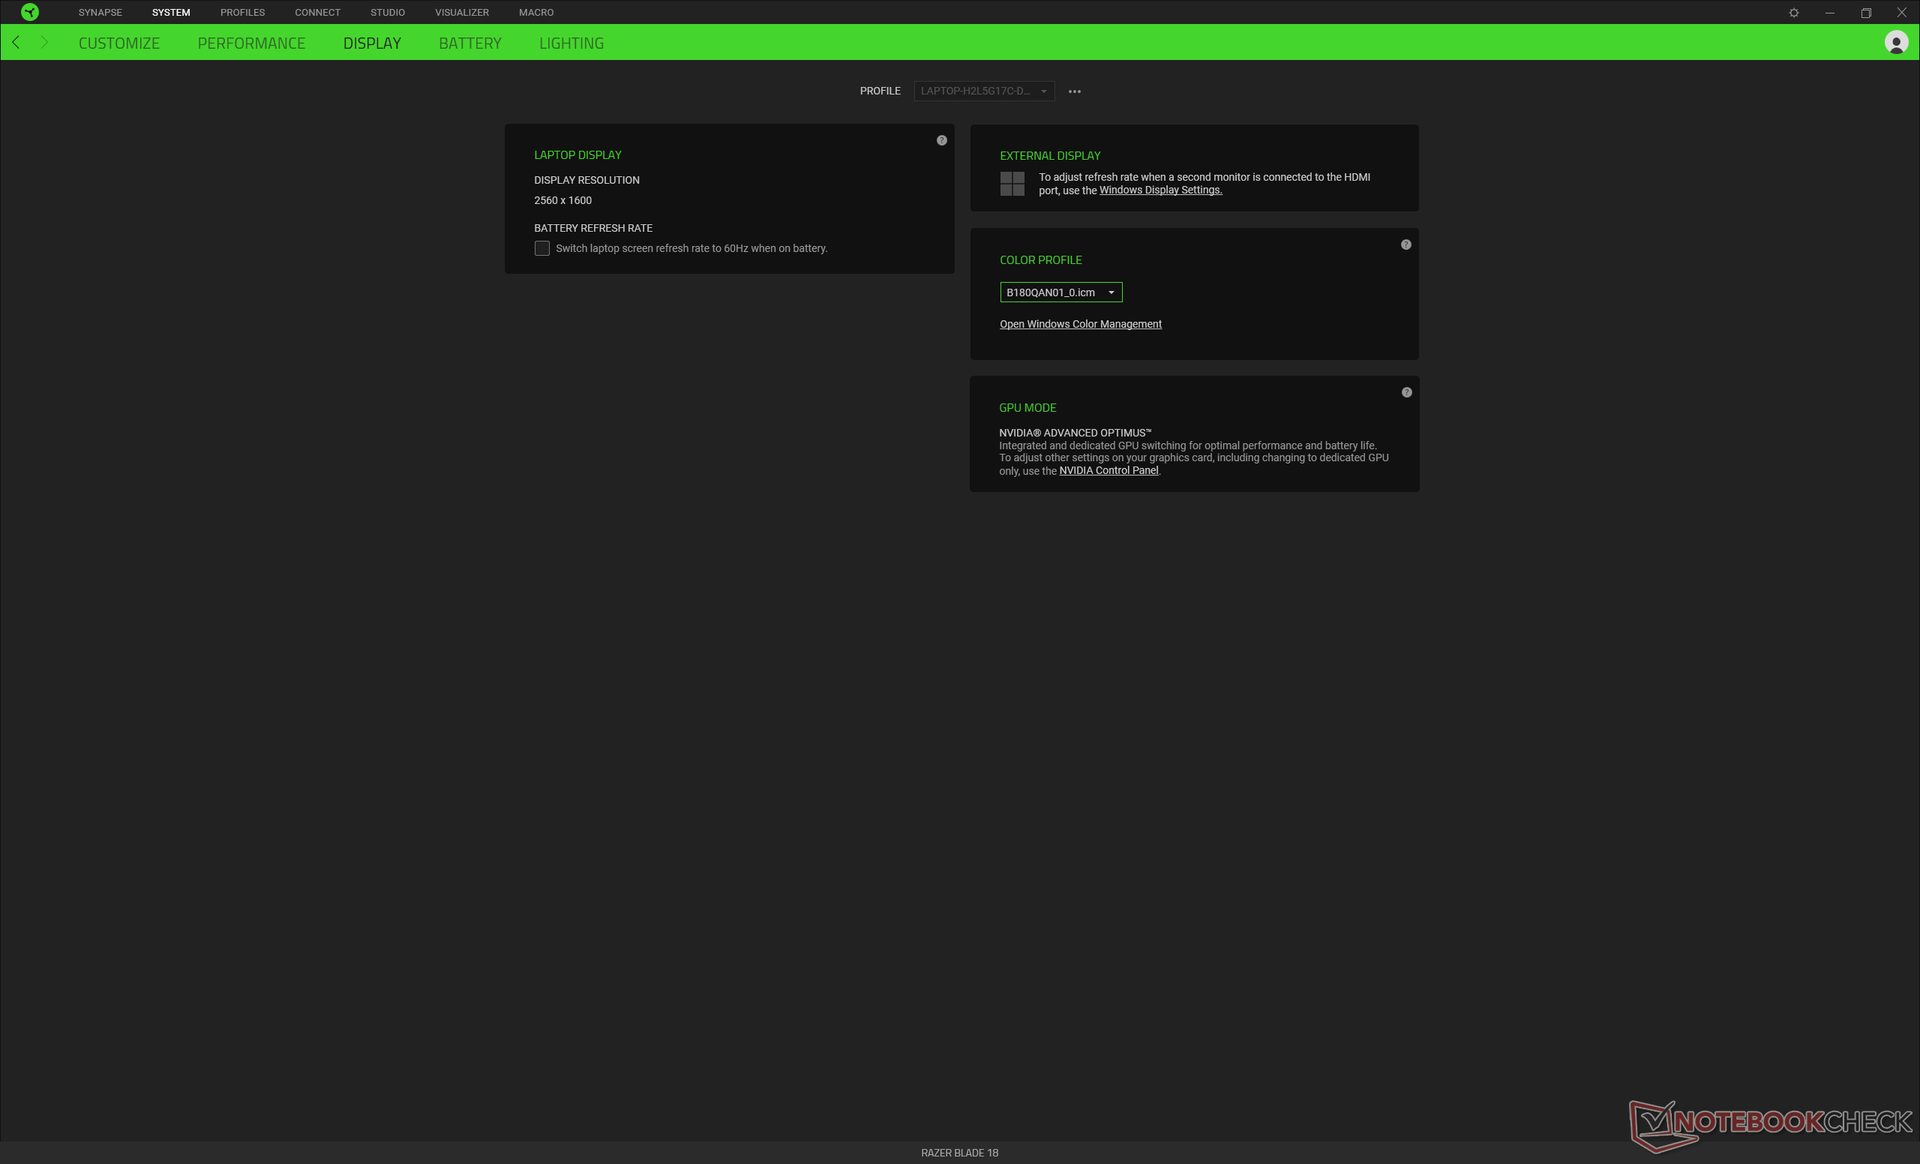
Configuramos nuestra unidad en modo Rendimiento a través de Windows y la CPU y la GPU en Boost y High, respectivamente, a través del software Razer Synapse, como se muestra a continuación. Se recomienda que los usuarios se familiaricen con Synapse, ya que es el centro para ajustar cualquier efecto de iluminación RGB, perfiles de rendimiento, macros y otras características auxiliares. El software no siempre es fiable, por desgracia, ya que a veces no responde o no se inicia en absoluto si no hay conectividad a Internet.
La Blade 18 no es compatible con MUX ni con Advanced Optimus, a diferencia de la Blade 16. Nuestra unidad tampoco soporta G-Sync a pesar de lo que Razer anuncia. Nos hemos puesto en contacto con Razer sobre la falta de G-Sync y actualizaremos esta sección cuando sea apropiado.
Procesador
El rendimiento de la CPU está a sólo unos puntos porcentuales del Blade 16 o GT77, cada uno equipado con el mismo Procesador Core i9-13950HX core i9-13950HX. Por tanto, la CPU no parece sufrir ningún problema importante de ralentización. El rendimiento multihilo es aproximadamente un 45% más rápido que la generación anterior de procesadoresCore i9-12950HX para estar a la par con un Core i9-12900K. El salto de rendimiento entre generaciones es significativo en este sentido.
Nuestros resultados habituales de la prueba CineBench R15 xT no se incluyen a continuación ya que las puntuaciones son inusualmente bajas y poco representativas del rendimiento del procesador. La ejecución de CineBench R15 activa tanto la CPU como la dGPU, por lo que el rendimiento de la CPU puede verse limitado en ocasiones por la dGPU. Este problema también puede observarse en otros portátiles. CineBench R23 es un benchmark de CPU puro que no activa la dGPU, por lo que estos resultados se proporcionan a continuación.
Cinebench R23 Multi Loop
Cinebench R23: Multi Core | Single Core
Cinebench R20: CPU (Multi Core) | CPU (Single Core)
Cinebench R15: CPU Multi 64Bit | CPU Single 64Bit
Blender: v2.79 BMW27 CPU
7-Zip 18.03: 7z b 4 | 7z b 4 -mmt1
Geekbench 5.5: Multi-Core | Single-Core
HWBOT x265 Benchmark v2.2: 4k Preset
LibreOffice : 20 Documents To PDF
R Benchmark 2.5: Overall mean
* ... más pequeño es mejor
AIDA64: FP32 Ray-Trace | FPU Julia | CPU SHA3 | CPU Queen | FPU SinJulia | FPU Mandel | CPU AES | CPU ZLib | FP64 Ray-Trace | CPU PhotoWorxx
| Performance rating | |
| MSI Titan GT77 HX 13VI | |
| Razer Blade 18 RTX 4070 | |
| Medio Intel Core i9-13950HX | |
| Asus ROG Strix Scar 17 SE G733CX-LL014W | |
| Alienware m17 R5 (R9 6900HX, RX 6850M XT) | |
| Gigabyte G7 KE | |
| Razer Blade 17 Early 2022 | |
| AIDA64 / FP32 Ray-Trace | |
| MSI Titan GT77 HX 13VI | |
| Razer Blade 18 RTX 4070 | |
| Medio Intel Core i9-13950HX (17993 - 28957, n=9) | |
| Asus ROG Strix Scar 17 SE G733CX-LL014W | |
| Alienware m17 R5 (R9 6900HX, RX 6850M XT) | |
| Gigabyte G7 KE | |
| Razer Blade 17 Early 2022 | |
| AIDA64 / FPU Julia | |
| MSI Titan GT77 HX 13VI | |
| Razer Blade 18 RTX 4070 | |
| Medio Intel Core i9-13950HX (89362 - 144303, n=9) | |
| Alienware m17 R5 (R9 6900HX, RX 6850M XT) | |
| Asus ROG Strix Scar 17 SE G733CX-LL014W | |
| Gigabyte G7 KE | |
| Razer Blade 17 Early 2022 | |
| AIDA64 / CPU SHA3 | |
| MSI Titan GT77 HX 13VI | |
| Razer Blade 18 RTX 4070 | |
| Medio Intel Core i9-13950HX (4518 - 7093, n=9) | |
| Asus ROG Strix Scar 17 SE G733CX-LL014W | |
| Alienware m17 R5 (R9 6900HX, RX 6850M XT) | |
| Gigabyte G7 KE | |
| Razer Blade 17 Early 2022 | |
| AIDA64 / CPU Queen | |
| MSI Titan GT77 HX 13VI | |
| Razer Blade 18 RTX 4070 | |
| Medio Intel Core i9-13950HX (131931 - 140103, n=8) | |
| Alienware m17 R5 (R9 6900HX, RX 6850M XT) | |
| Asus ROG Strix Scar 17 SE G733CX-LL014W | |
| Razer Blade 17 Early 2022 | |
| Gigabyte G7 KE | |
| AIDA64 / FPU SinJulia | |
| MSI Titan GT77 HX 13VI | |
| Razer Blade 18 RTX 4070 | |
| Medio Intel Core i9-13950HX (12318 - 17057, n=9) | |
| Alienware m17 R5 (R9 6900HX, RX 6850M XT) | |
| Asus ROG Strix Scar 17 SE G733CX-LL014W | |
| Gigabyte G7 KE | |
| Razer Blade 17 Early 2022 | |
| AIDA64 / FPU Mandel | |
| MSI Titan GT77 HX 13VI | |
| Razer Blade 18 RTX 4070 | |
| Medio Intel Core i9-13950HX (44372 - 71038, n=9) | |
| Alienware m17 R5 (R9 6900HX, RX 6850M XT) | |
| Asus ROG Strix Scar 17 SE G733CX-LL014W | |
| Gigabyte G7 KE | |
| Razer Blade 17 Early 2022 | |
| AIDA64 / CPU AES | |
| Asus ROG Strix Scar 17 SE G733CX-LL014W | |
| Medio Intel Core i9-13950HX (99981 - 204491, n=9) | |
| MSI Titan GT77 HX 13VI | |
| Razer Blade 18 RTX 4070 | |
| Gigabyte G7 KE | |
| Alienware m17 R5 (R9 6900HX, RX 6850M XT) | |
| Razer Blade 17 Early 2022 | |
| AIDA64 / CPU ZLib | |
| MSI Titan GT77 HX 13VI | |
| Razer Blade 18 RTX 4070 | |
| Medio Intel Core i9-13950HX (1263 - 2069, n=9) | |
| Asus ROG Strix Scar 17 SE G733CX-LL014W | |
| Gigabyte G7 KE | |
| Alienware m17 R5 (R9 6900HX, RX 6850M XT) | |
| Razer Blade 17 Early 2022 | |
| AIDA64 / FP64 Ray-Trace | |
| MSI Titan GT77 HX 13VI | |
| Razer Blade 18 RTX 4070 | |
| Medio Intel Core i9-13950HX (9649 - 15573, n=9) | |
| Asus ROG Strix Scar 17 SE G733CX-LL014W | |
| Alienware m17 R5 (R9 6900HX, RX 6850M XT) | |
| Gigabyte G7 KE | |
| Razer Blade 17 Early 2022 | |
| AIDA64 / CPU PhotoWorxx | |
| Razer Blade 18 RTX 4070 | |
| Medio Intel Core i9-13950HX (40233 - 50864, n=9) | |
| Asus ROG Strix Scar 17 SE G733CX-LL014W | |
| MSI Titan GT77 HX 13VI | |
| Razer Blade 17 Early 2022 | |
| Alienware m17 R5 (R9 6900HX, RX 6850M XT) | |
| Gigabyte G7 KE | |
Rendimiento del sistema
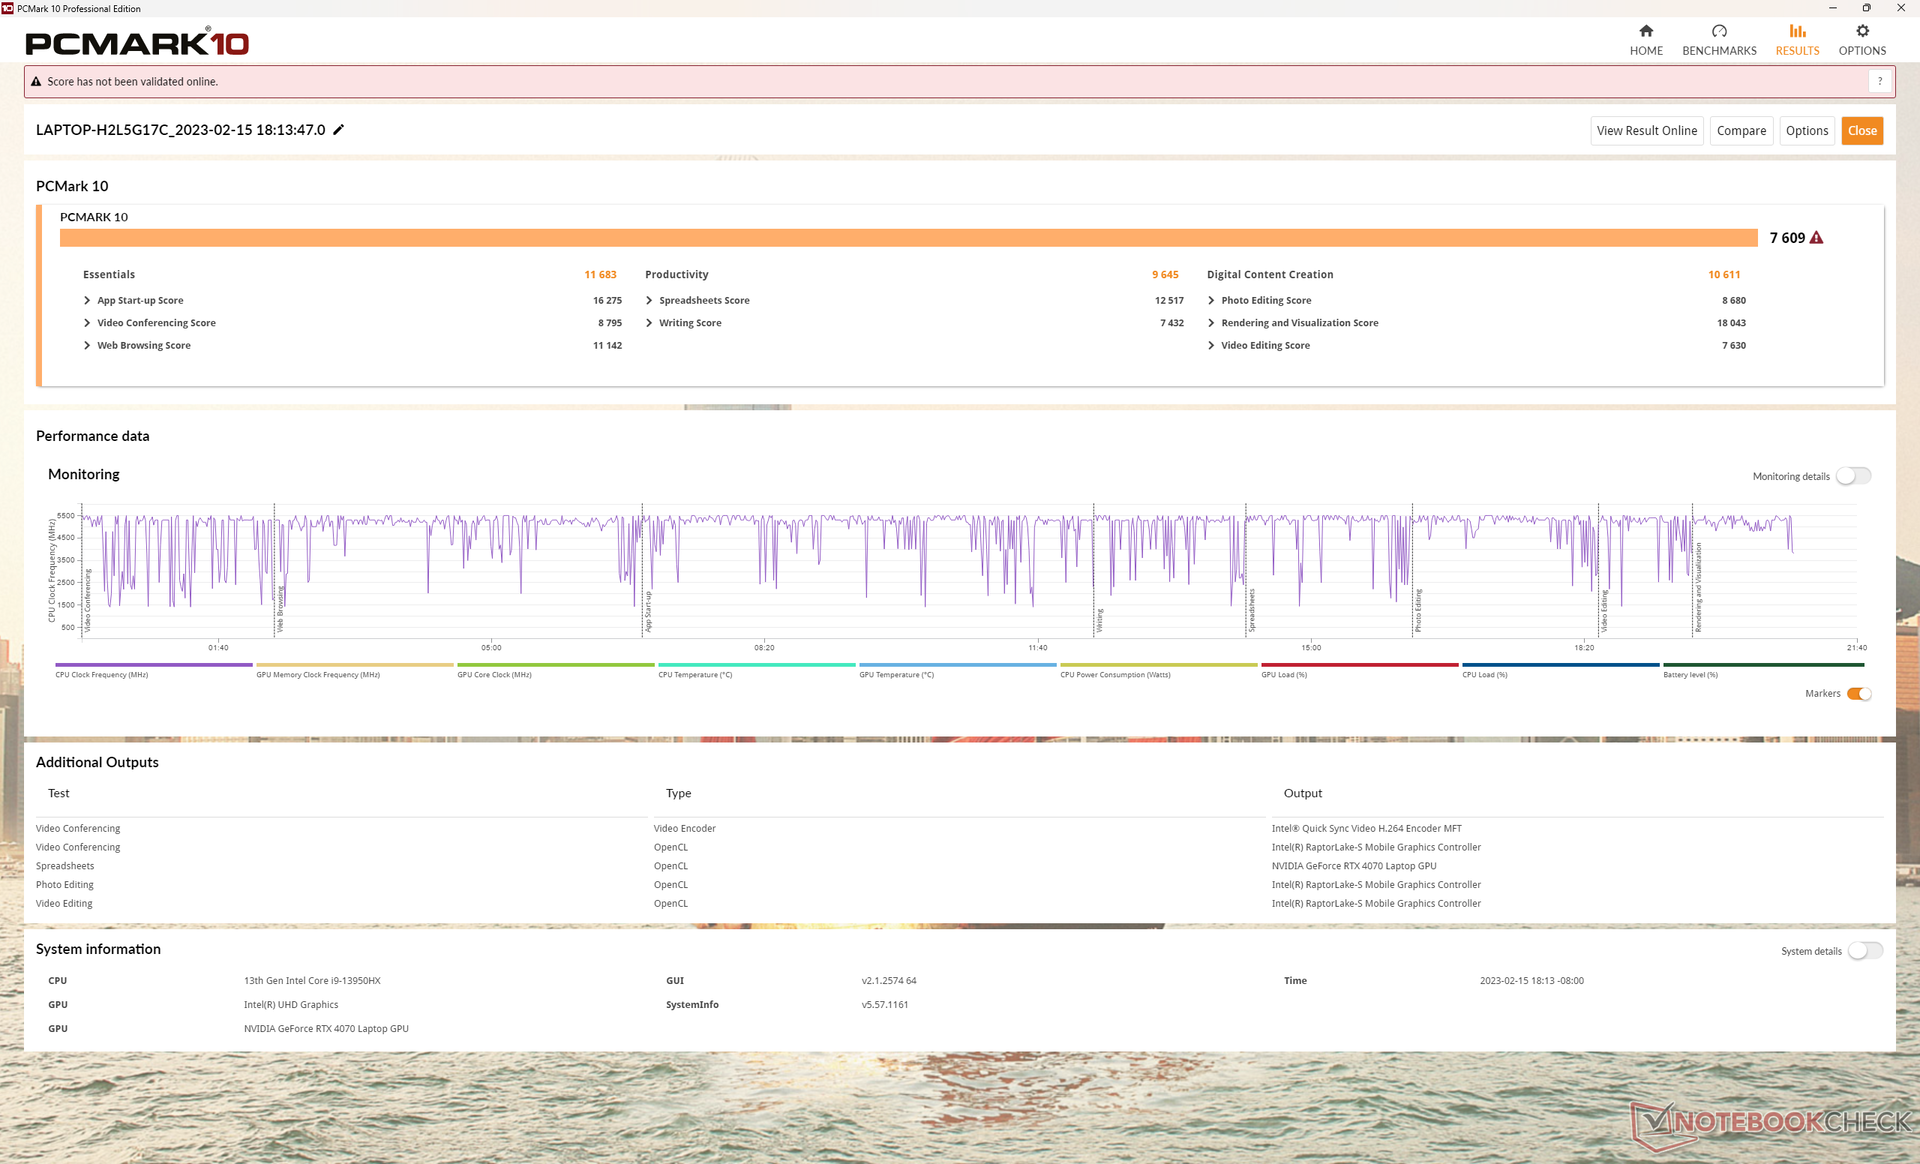
Las puntuaciones en PCMark 10 son sistemáticamente superiores a las del 2022 Blade 17 aunque los márgenes sean menores. El Blade 16 y el MSI GT77 puntúan mejor ya que cada uno lleva GPUs RTX 4080 y 4090 más rápidas, respectivamente.
CrossMark: Overall | Productivity | Creativity | Responsiveness
| PCMark 10 / Score | |
| MSI Titan GT77 HX 13VI | |
| Razer Blade 18 RTX 4070 | |
| Medio Intel Core i9-13950HX, NVIDIA GeForce RTX 4070 Laptop GPU (n=1) | |
| Alienware m17 R5 (R9 6900HX, RX 6850M XT) | |
| Asus ROG Strix Scar 17 SE G733CX-LL014W | |
| Razer Blade 17 Early 2022 | |
| Gigabyte G7 KE | |
| PCMark 10 / Essentials | |
| MSI Titan GT77 HX 13VI | |
| Razer Blade 18 RTX 4070 | |
| Medio Intel Core i9-13950HX, NVIDIA GeForce RTX 4070 Laptop GPU (n=1) | |
| Asus ROG Strix Scar 17 SE G733CX-LL014W | |
| Gigabyte G7 KE | |
| Razer Blade 17 Early 2022 | |
| Alienware m17 R5 (R9 6900HX, RX 6850M XT) | |
| PCMark 10 / Productivity | |
| Asus ROG Strix Scar 17 SE G733CX-LL014W | |
| MSI Titan GT77 HX 13VI | |
| Razer Blade 18 RTX 4070 | |
| Medio Intel Core i9-13950HX, NVIDIA GeForce RTX 4070 Laptop GPU (n=1) | |
| Razer Blade 17 Early 2022 | |
| Alienware m17 R5 (R9 6900HX, RX 6850M XT) | |
| Gigabyte G7 KE | |
| PCMark 10 / Digital Content Creation | |
| MSI Titan GT77 HX 13VI | |
| Alienware m17 R5 (R9 6900HX, RX 6850M XT) | |
| Razer Blade 18 RTX 4070 | |
| Medio Intel Core i9-13950HX, NVIDIA GeForce RTX 4070 Laptop GPU (n=1) | |
| Razer Blade 17 Early 2022 | |
| Asus ROG Strix Scar 17 SE G733CX-LL014W | |
| Gigabyte G7 KE | |
| CrossMark / Overall | |
| MSI Titan GT77 HX 13VI | |
| Razer Blade 18 RTX 4070 | |
| Medio Intel Core i9-13950HX, NVIDIA GeForce RTX 4070 Laptop GPU (n=1) | |
| Asus ROG Strix Scar 17 SE G733CX-LL014W | |
| Gigabyte G7 KE | |
| Razer Blade 17 Early 2022 | |
| Alienware m17 R5 (R9 6900HX, RX 6850M XT) | |
| CrossMark / Productivity | |
| MSI Titan GT77 HX 13VI | |
| Razer Blade 18 RTX 4070 | |
| Medio Intel Core i9-13950HX, NVIDIA GeForce RTX 4070 Laptop GPU (n=1) | |
| Asus ROG Strix Scar 17 SE G733CX-LL014W | |
| Gigabyte G7 KE | |
| Razer Blade 17 Early 2022 | |
| Alienware m17 R5 (R9 6900HX, RX 6850M XT) | |
| CrossMark / Creativity | |
| MSI Titan GT77 HX 13VI | |
| Razer Blade 18 RTX 4070 | |
| Medio Intel Core i9-13950HX, NVIDIA GeForce RTX 4070 Laptop GPU (n=1) | |
| Asus ROG Strix Scar 17 SE G733CX-LL014W | |
| Razer Blade 17 Early 2022 | |
| Gigabyte G7 KE | |
| Alienware m17 R5 (R9 6900HX, RX 6850M XT) | |
| CrossMark / Responsiveness | |
| Gigabyte G7 KE | |
| Asus ROG Strix Scar 17 SE G733CX-LL014W | |
| Razer Blade 18 RTX 4070 | |
| Medio Intel Core i9-13950HX, NVIDIA GeForce RTX 4070 Laptop GPU (n=1) | |
| MSI Titan GT77 HX 13VI | |
| Razer Blade 17 Early 2022 | |
| Alienware m17 R5 (R9 6900HX, RX 6850M XT) | |
| PCMark 10 Score | 7609 puntos | |
ayuda | ||
| AIDA64 / Memory Copy | |
| Razer Blade 18 RTX 4070 | |
| Medio Intel Core i9-13950HX (61938 - 78813, n=9) | |
| MSI Titan GT77 HX 13VI | |
| Asus ROG Strix Scar 17 SE G733CX-LL014W | |
| Razer Blade 17 Early 2022 | |
| Alienware m17 R5 (R9 6900HX, RX 6850M XT) | |
| Gigabyte G7 KE | |
| AIDA64 / Memory Read | |
| Razer Blade 18 RTX 4070 | |
| Medio Intel Core i9-13950HX (62368 - 86831, n=9) | |
| Asus ROG Strix Scar 17 SE G733CX-LL014W | |
| MSI Titan GT77 HX 13VI | |
| Razer Blade 17 Early 2022 | |
| Alienware m17 R5 (R9 6900HX, RX 6850M XT) | |
| Gigabyte G7 KE | |
| AIDA64 / Memory Write | |
| Razer Blade 18 RTX 4070 | |
| Medio Intel Core i9-13950HX (59501 - 80441, n=9) | |
| Asus ROG Strix Scar 17 SE G733CX-LL014W | |
| MSI Titan GT77 HX 13VI | |
| Razer Blade 17 Early 2022 | |
| Alienware m17 R5 (R9 6900HX, RX 6850M XT) | |
| Gigabyte G7 KE | |
| AIDA64 / Memory Latency | |
| Alienware m17 R5 (R9 6900HX, RX 6850M XT) | |
| MSI Titan GT77 HX 13VI | |
| Gigabyte G7 KE | |
| Medio Intel Core i9-13950HX (84.4 - 99.5, n=9) | |
| Asus ROG Strix Scar 17 SE G733CX-LL014W | |
| Razer Blade 18 RTX 4070 | |
* ... más pequeño es mejor
Latencia del CPD
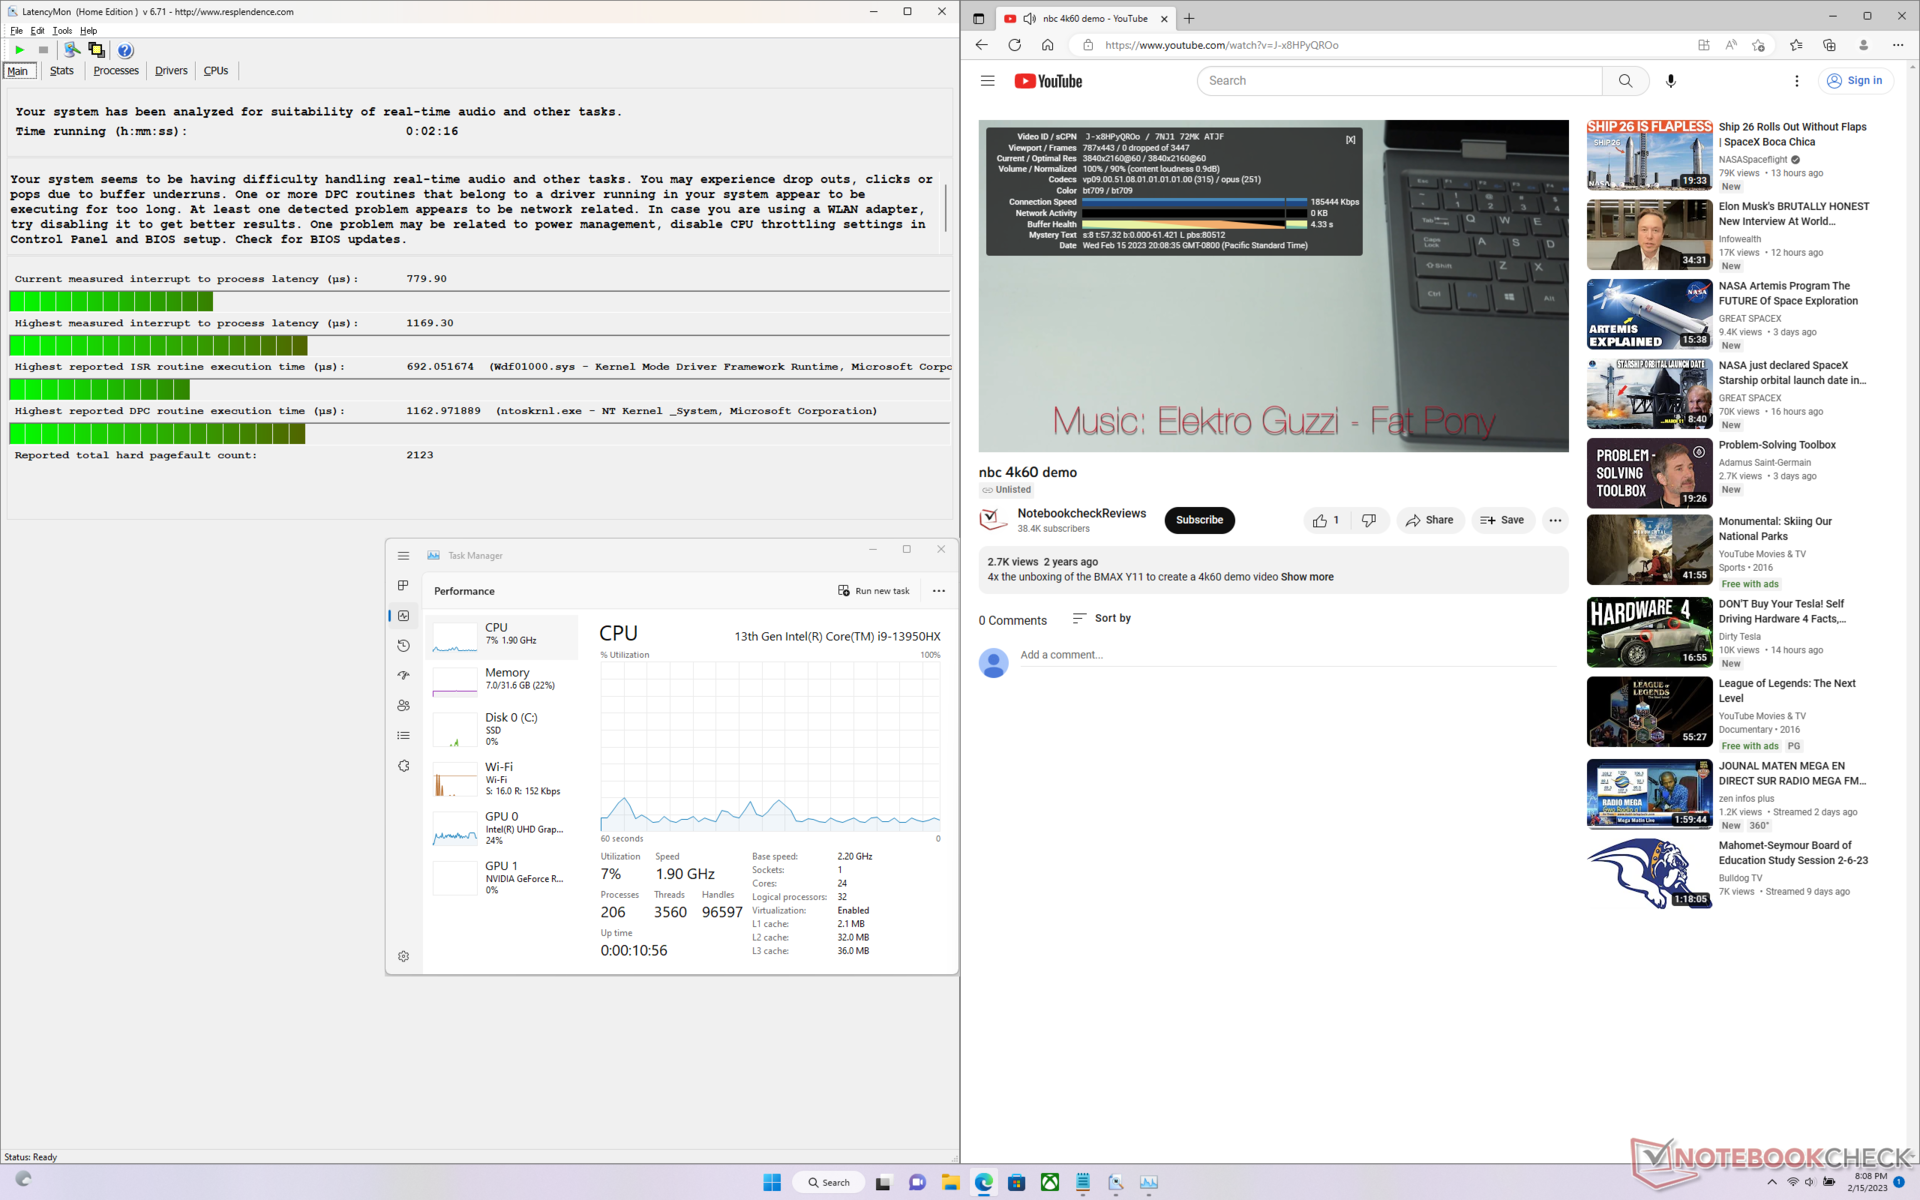
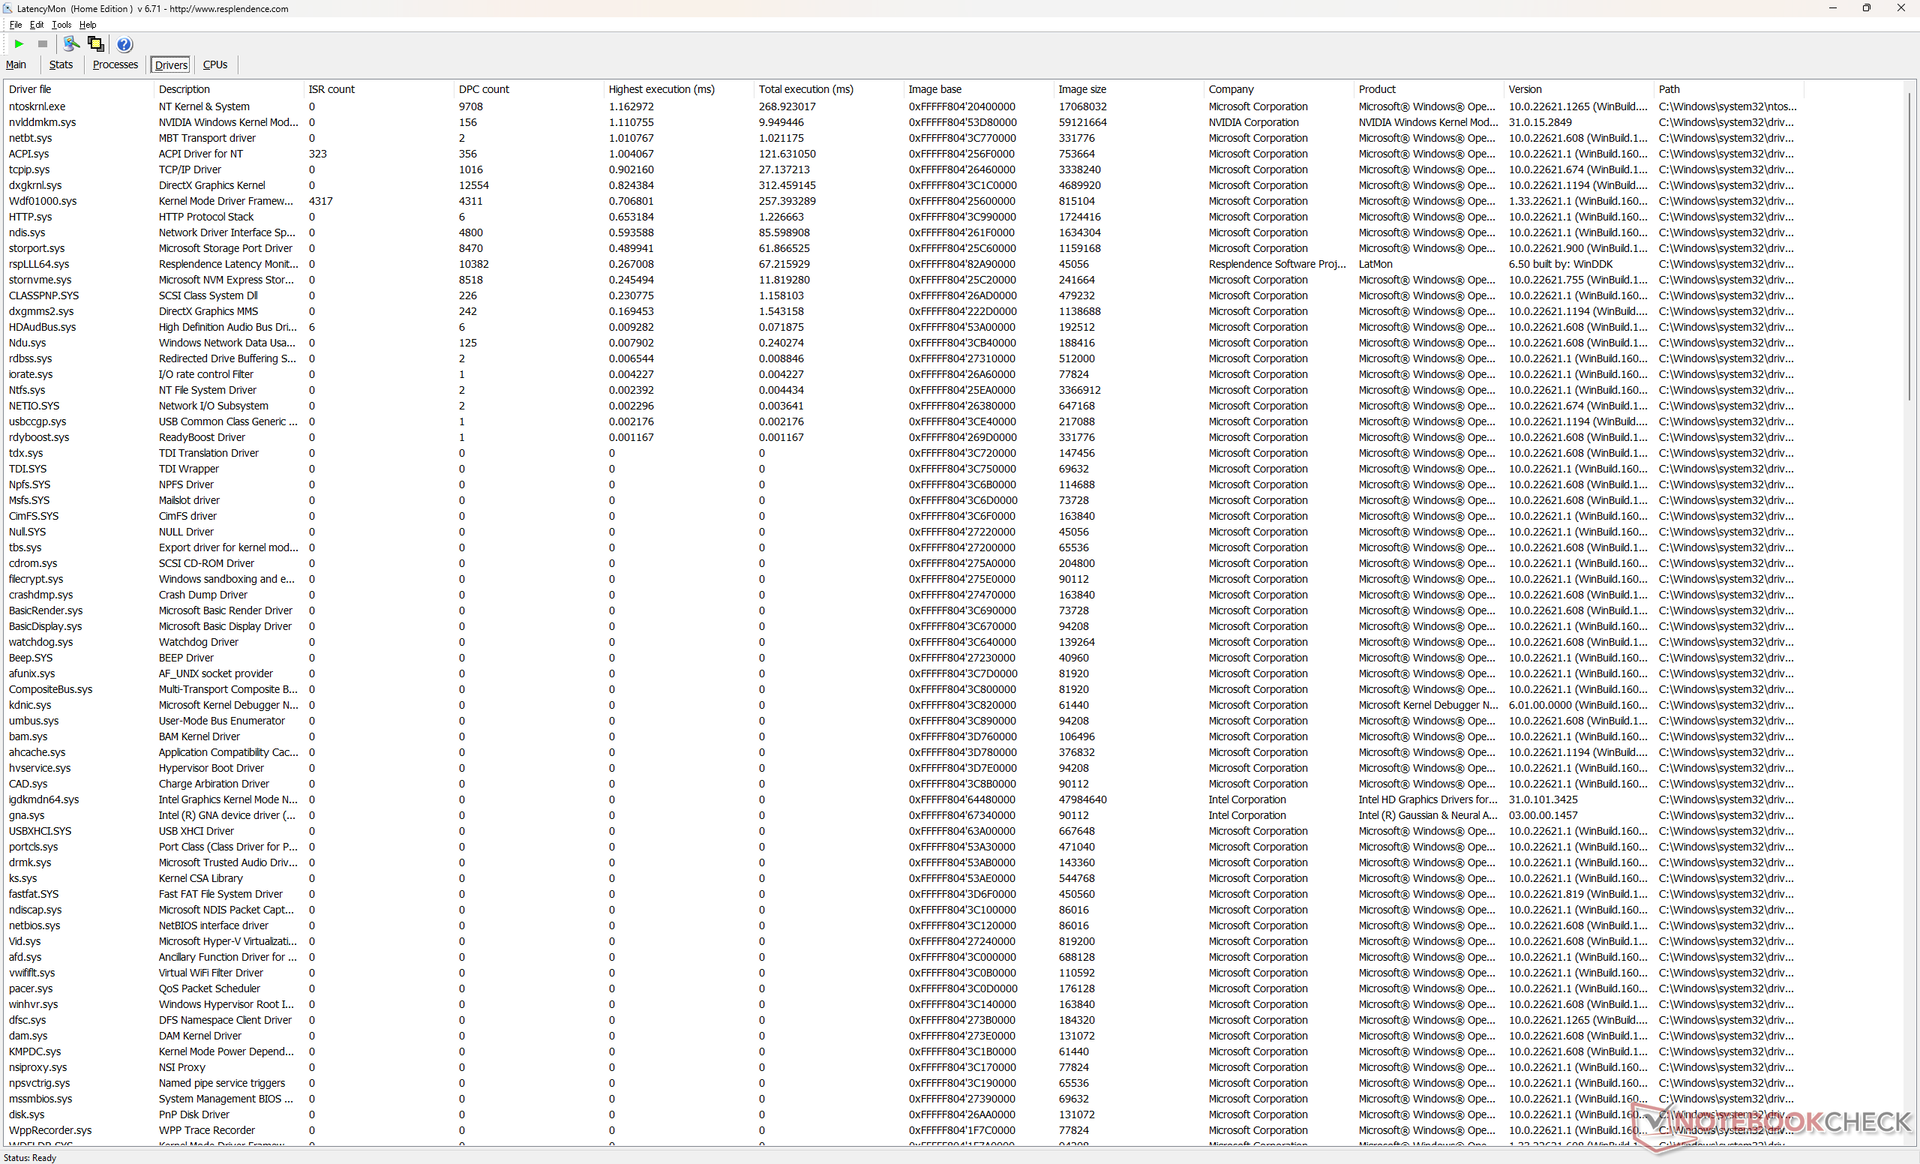
LatencyMon revela ligeros problemas de CPD al abrir varias pestañas de nuestra página de inicio. por lo demás, la reproducción de vídeo 4K a 60 FPS es impecable con bajo uso de CPU y GPU.
| DPC Latencies / LatencyMon - interrupt to process latency (max), Web, Youtube, Prime95 | |
| MSI Titan GT77 HX 13VI | |
| Asus ROG Strix Scar 17 SE G733CX-LL014W | |
| Gigabyte G7 KE | |
| Alienware m17 R5 (R9 6900HX, RX 6850M XT) | |
| Razer Blade 18 RTX 4070 | |
| Razer Blade 17 Early 2022 | |
* ... más pequeño es mejor
Dispositivos de almacenamiento: hasta dos SSD
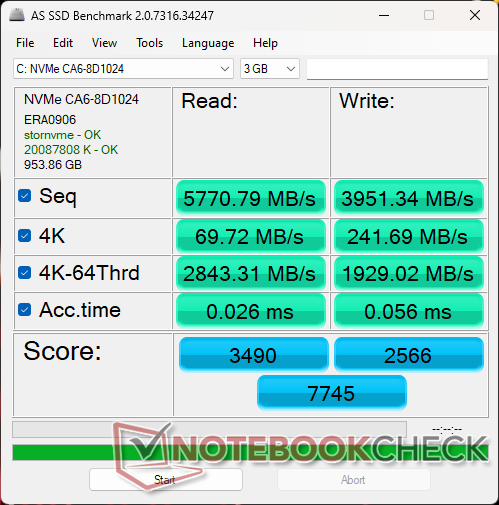
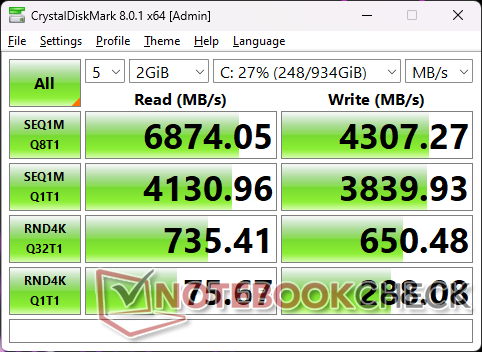
Nuestra unidad de prueba se envía con el mismo 1 TB SSSTC CA6-8D1024 PCIe4 x4 NVMe SSD que se encuentra en el Alienware m17 R5. Las velocidades de transferencia son comparables a las del popular Samsung PM9A1, con velocidades de lectura y escritura secuenciales estables que se acercan a 6900 MB/s y 4300 MB/s, respectivamente. Razer incluye una almohadilla térmica para cada una de las dos ranuras SSD para disipar el calor en el panel inferior metálico.

| Drive Performance rating - Percent | |
| Asus ROG Strix Scar 17 SE G733CX-LL014W | |
| Gigabyte G7 KE | |
| Razer Blade 17 Early 2022 | |
| MSI Titan GT77 HX 13VI | |
| Razer Blade 18 RTX 4070 | |
| Alienware m17 R5 (R9 6900HX, RX 6850M XT) | |
* ... más pequeño es mejor
Disk Throttling: DiskSpd Read Loop, Queue Depth 8
Rendimiento de la GPU - Rendimiento similar al de una GeForce RTX 3070 de sobremesa
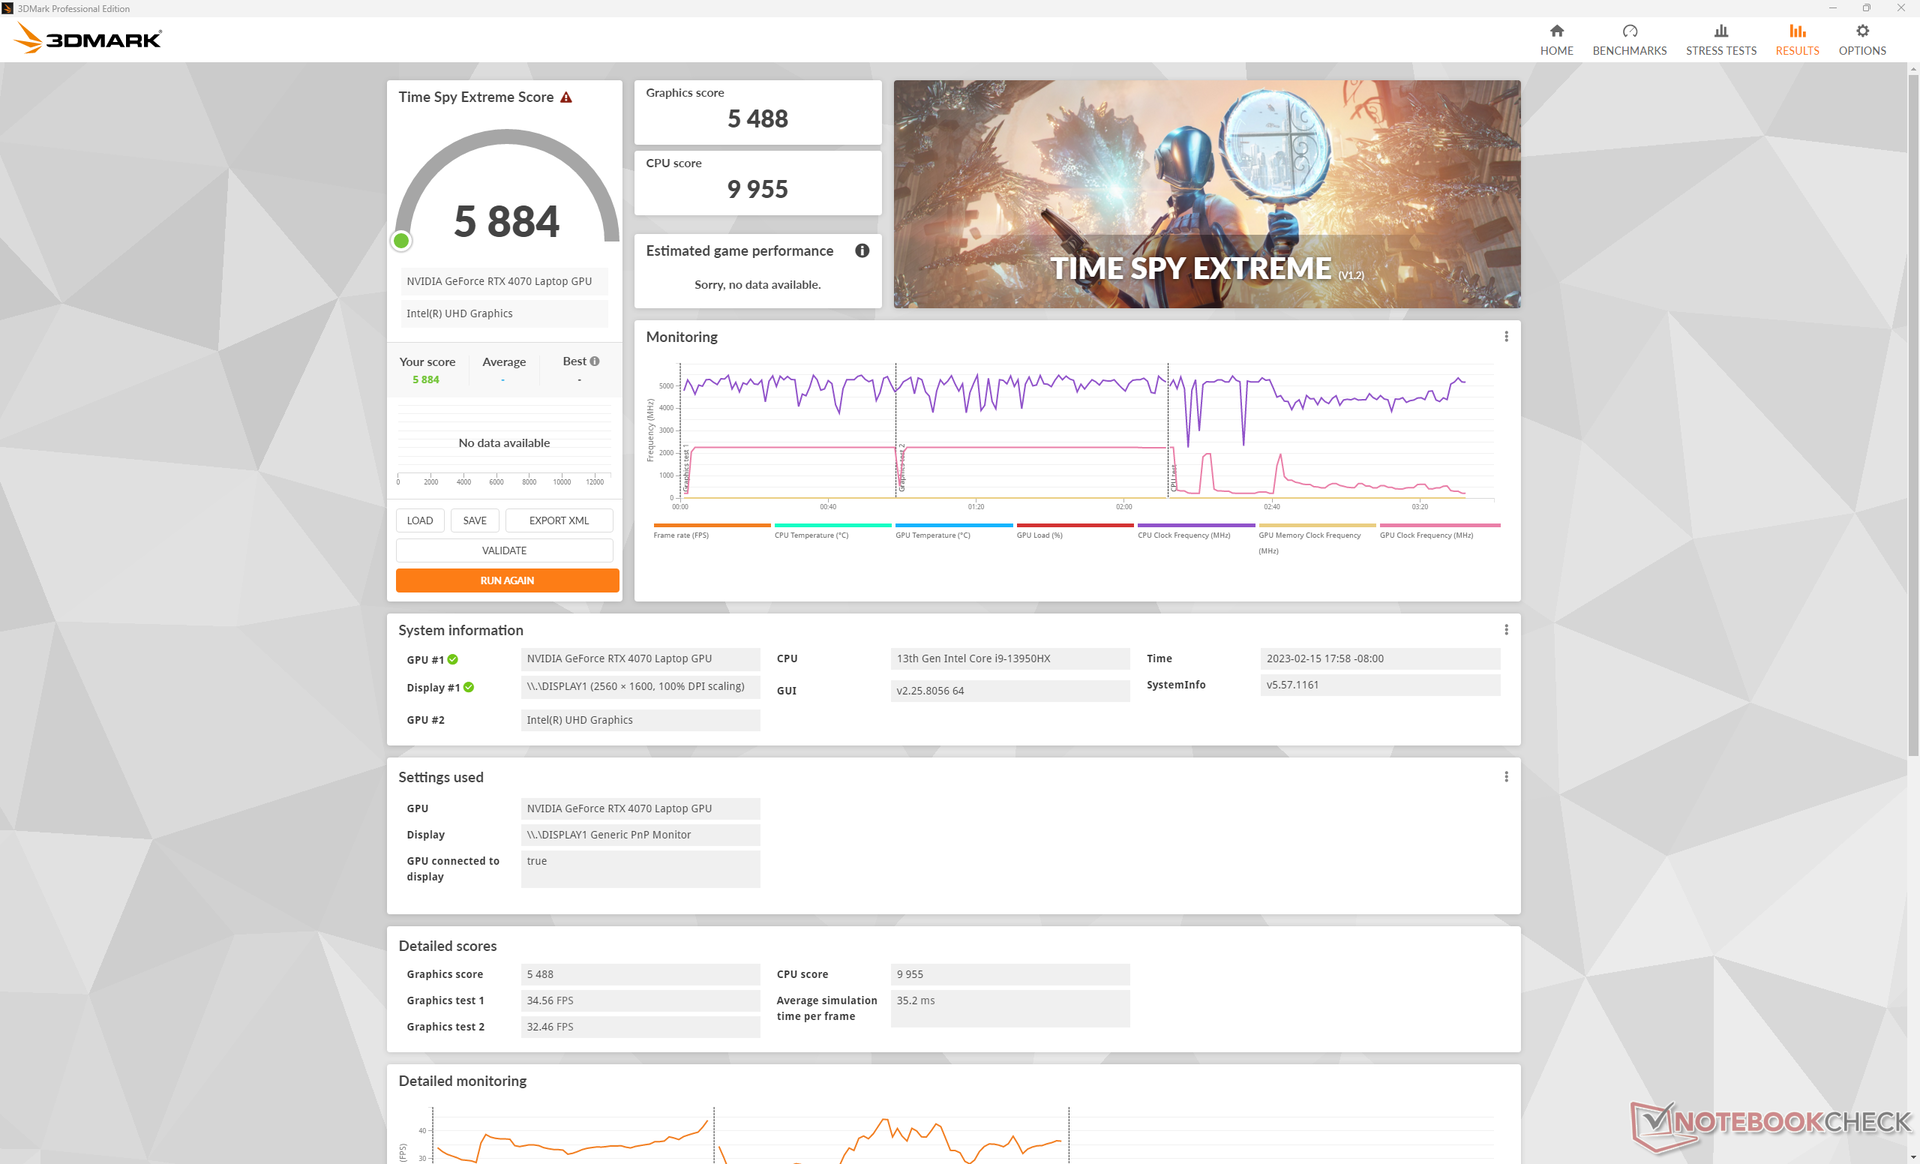
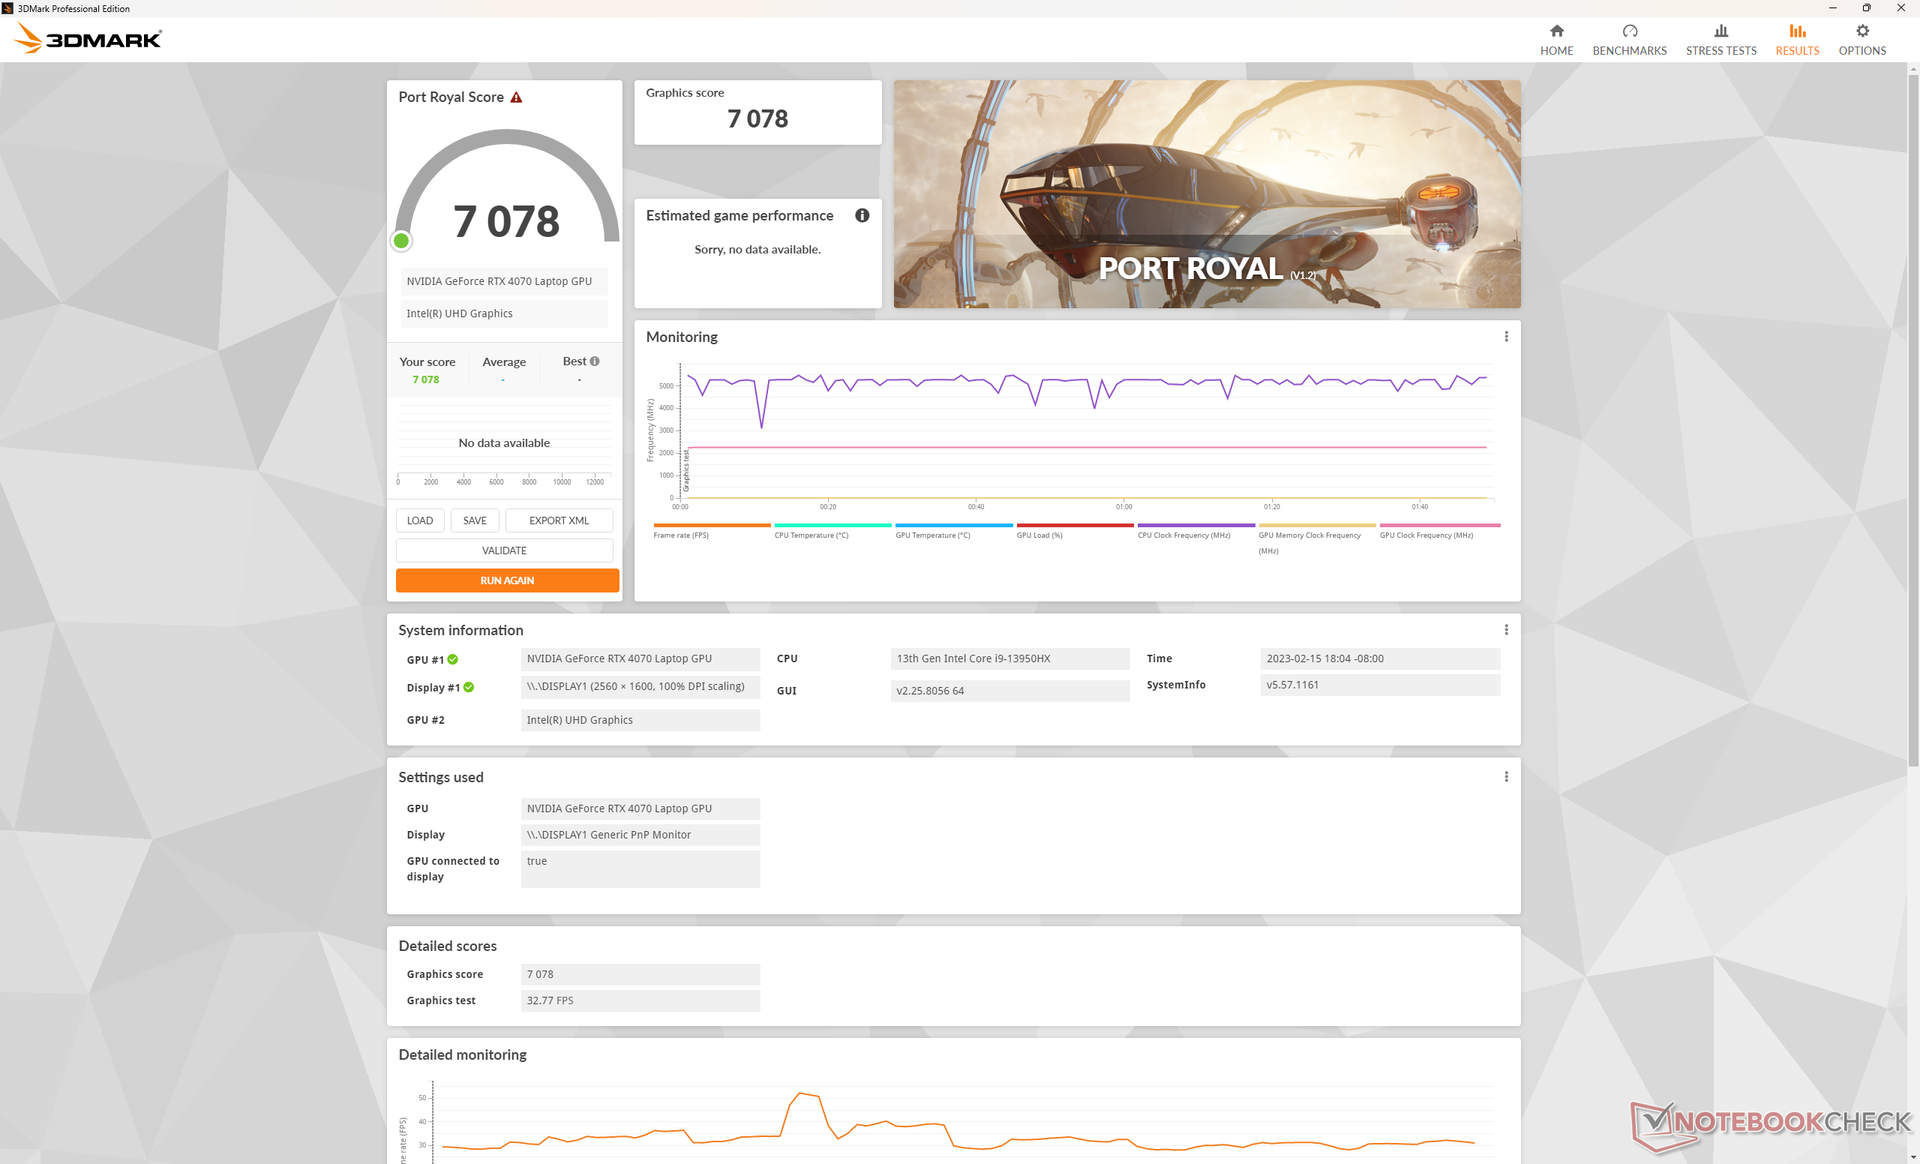
Los 140 Wmóvil GeForce RTX 4070 se sitúa cómodamente entre la rTX 3080 portátil yrTX 3080 Ti para portátiles en términos de rendimiento bruto. Sólo es entre un 10 y un 20 por ciento más rápida que la rTX 3070 para portátileslo que resulta un poco decepcionante si se tiene en cuenta que la rTX 4080 para portátiles es entre un 40 % y un 50 % más rápida que la rTX 3080 móvil. Esto significa que la brecha de rendimiento entre la RTX 4070 móvil y la RTX 4080 móvil es más significativa en un 40 a 60 por ciento.
En comparación con las GPU de sobremesa, la RTX 4070 para portátiles es entre un 5 y un 10 por ciento más lenta que la rTX 3070 de sobremesa que se lanzó hace tres años.
Uno de los grandes argumentos de venta de las GPU GeForce 40 es su compatibilidad con la generación de fotogramas o DLSS 3. Por desgracia, nuestra unidad de pruebas Blade 18 RTX 4070 mostraba problemas al ejecutar juegos compatibles con DLSS 3 activado en un monitor externo HDMI o USB-C 4K. Las frecuencias de cuadro se reducían a <30 FPS en todos los títulos probados sin motivo aparente, mientras que la Blade 16 RTX 4080 no tenía esos problemas. Curiosamente, DLSS 3 funcionaba perfectamente en la pantalla interna del Blade 18. Nos hemos puesto en contacto con Razer para encontrar una posible solución y actualizaremos esta sección cuando sea oportuno. Por ahora, sin embargo, querrás jugar en la pantalla interna si DLSS 3 está activado.
En los próximos días analizaremos otros juegos.
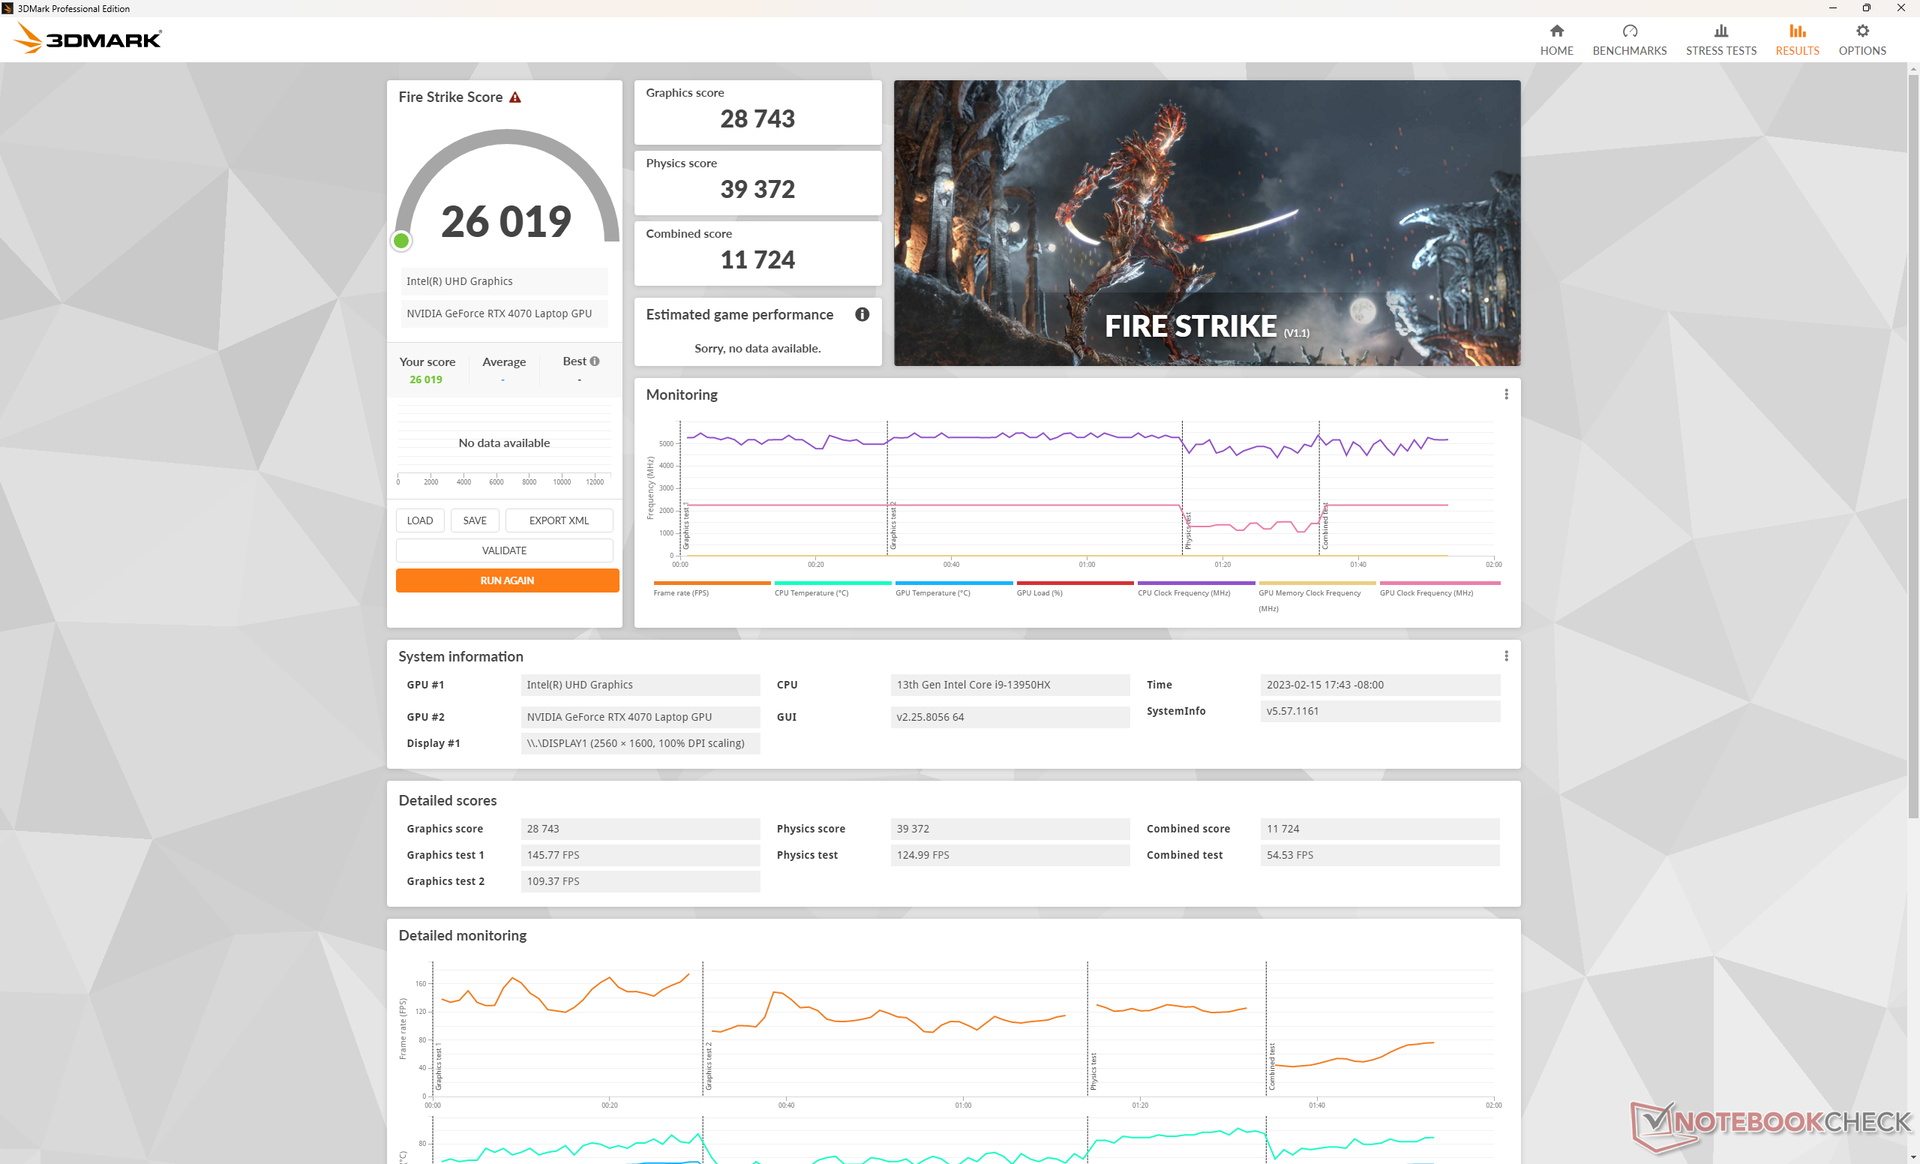
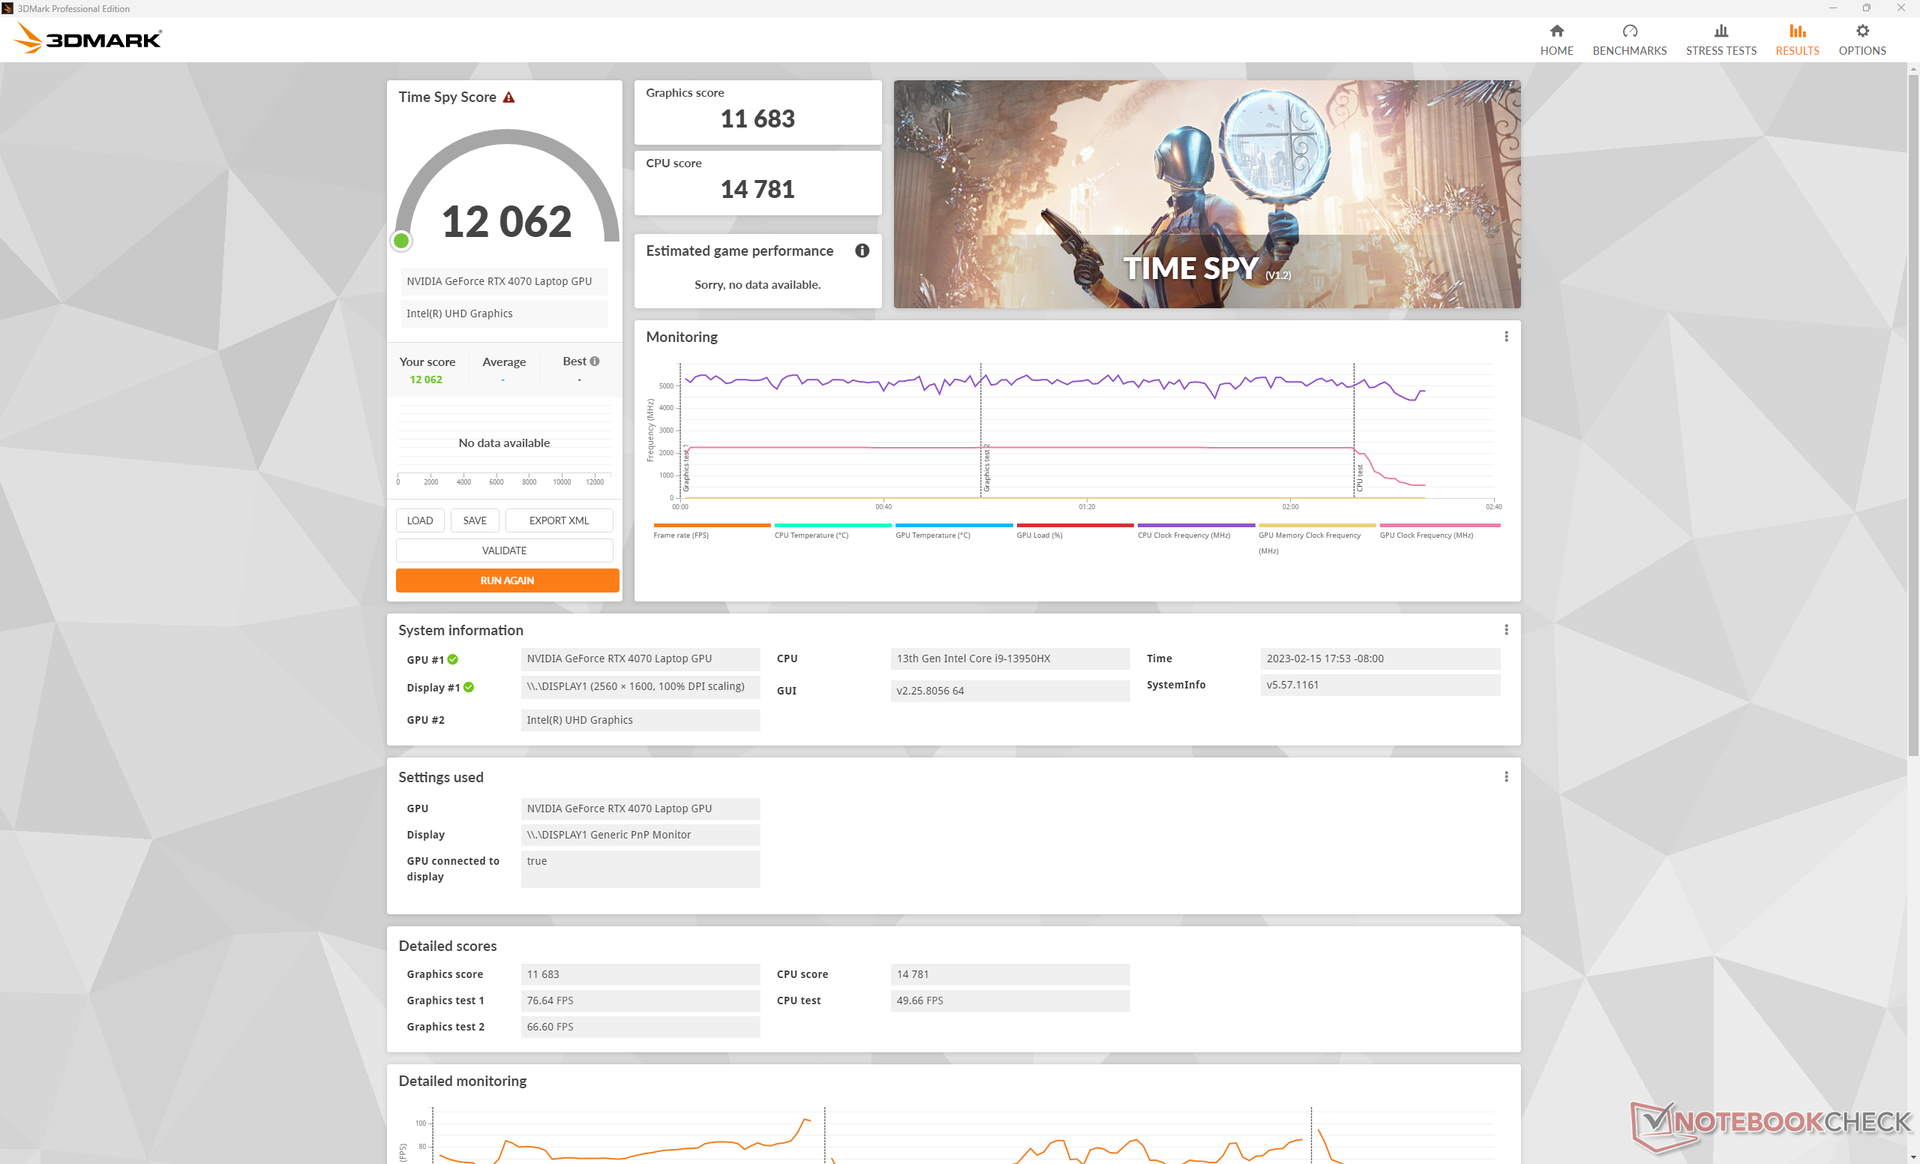
| 3DMark 11 Performance | 34754 puntos | |
| 3DMark Fire Strike Score | 26019 puntos | |
| 3DMark Time Spy Score | 12062 puntos | |
ayuda | ||
* ... más pequeño es mejor
En reposo durante Witcher 3 durante una hora devolvería velocidades de fotogramas estables sin caídas recurrentes en el rendimiento, lo que sugiere que no hay interrupción de aplicaciones en segundo plano ni ralentización importante.
Witcher 3 FPS Chart
| bajo | medio | alto | ultra | QHD | 4K | |
|---|---|---|---|---|---|---|
| GTA V (2015) | 186.1 | 184.7 | 181.6 | 121.4 | 87.6 | 88.5 |
| The Witcher 3 (2015) | 617 | 405.9 | 240.9 | 113.9 | 72.5 | |
| Dota 2 Reborn (2015) | 225 | 200 | 191 | 178.6 | 145.5 | |
| Final Fantasy XV Benchmark (2018) | 231 | 166.9 | 115.2 | 82 | 46.6 | |
| X-Plane 11.11 (2018) | 203 | 178.9 | 137.9 | 117.7 | ||
| Strange Brigade (2018) | 464 | 315 | 243 | 208 | 136.7 | 71.9 |
| Metro Exodus (2019) | 208.9 | 139.8 | 109.7 | 86.8 | 69 | 44 |
| Borderlands 3 (2019) | 258.5 | 200.1 | 131.8 | 100.3 | 68.7 | 35.7 |
| Hitman 3 (2021) | 294.3 | 234 | 208.4 | 197.4 | 129.9 | 68.5 |
| Cyberpunk 2077 1.6 (2022) | 147.8 | 125.7 | 111.5 | 92.1 | 54 | 23.3 |
Emisiones
Ruido del sistema: silencioso cuando no se juega
Los ventiladores internos son silenciosos cuando se ejecutan cargas poco exigentes como streaming de vídeo o navegación web. El ruido del ventilador suele rondar justo por debajo de los 27 dB(A) contra un fondo silencioso de 23,5 dB(A) para ser esencialmente inaudible en la mayoría de las condiciones. Esto es más silencioso de lo esperado dado el gran tamaño y potencia bajo la madera.
El funcionamiento con cargas más altas, como juegos, aumentará las RPM del ventilador de forma lenta pero constante antes de estabilizarse en 48 dB(A). Si se estresa al 100% de utilización, el ruido del ventilador puede incluso alcanzar los 54 dB(A). El rango bajo de 50 dB(A) es típico de la mayoría de portátiles para juegos, incluido el GT77 o el propio Blade 17 de Razer. El Blade 18 es casi tan ruidoso como sus hermanos pequeños al jugar a pesar de sus diferencias de tamaño.
Ruido
| Ocioso |
| 23.8 / 23.8 / 26.8 dB(A) |
| Carga |
| 37.3 / 53.5 dB(A) |
 | ||
30 dB silencioso 40 dB(A) audible 50 dB(A) ruidosamente alto |
||
min: | ||
| Razer Blade 18 RTX 4070 GeForce RTX 4070 Laptop GPU, i9-13950HX, SSSTC CA6-8D1024 | Razer Blade 17 Early 2022 GeForce RTX 3080 Ti Laptop GPU, i9-12900H, Samsung PM9A1 MZVL21T0HCLR | MSI Titan GT77 HX 13VI GeForce RTX 4090 Laptop GPU, i9-13950HX, Samsung PM9A1 MZVL22T0HBLB | Gigabyte G7 KE GeForce RTX 3060 Laptop GPU, i5-12500H, Gigabyte AG470S1TB-SI B10 | Alienware m17 R5 (R9 6900HX, RX 6850M XT) Radeon RX 6850M XT, R9 6900HX, SSSTC CA6-8D1024 | Asus ROG Strix Scar 17 SE G733CX-LL014W GeForce RTX 3080 Ti Laptop GPU, i9-12950HX, Samsung PM9A1 MZVL22T0HBLB | |
|---|---|---|---|---|---|---|
| Noise | -12% | -17% | -26% | 0% | 5% | |
| apagado / medio ambiente * (dB) | 23.5 | 26 -11% | 24.6 -5% | 27 -15% | 23 2% | 23.9 -2% |
| Idle Minimum * (dB) | 23.8 | 26 -9% | 29.2 -23% | 27 -13% | 23 3% | 23.9 -0% |
| Idle Average * (dB) | 23.8 | 27 -13% | 29.2 -23% | 35 -47% | 28.11 -18% | 23.9 -0% |
| Idle Maximum * (dB) | 26.8 | 32 -19% | 29.2 -9% | 38 -42% | 28.11 -5% | 23.9 11% |
| Load Average * (dB) | 37.3 | 50 -34% | 50.7 -36% | 52 -39% | 30.62 18% | 34.3 8% |
| Witcher 3 ultra * (dB) | 48 | 51 -6% | 53.3 -11% | 56 -17% | 49.75 -4% | |
| Load Maximum * (dB) | 53.5 | 51 5% | 61 -14% | 59 -10% | 50.17 6% | 45.9 14% |
* ... más pequeño es mejor
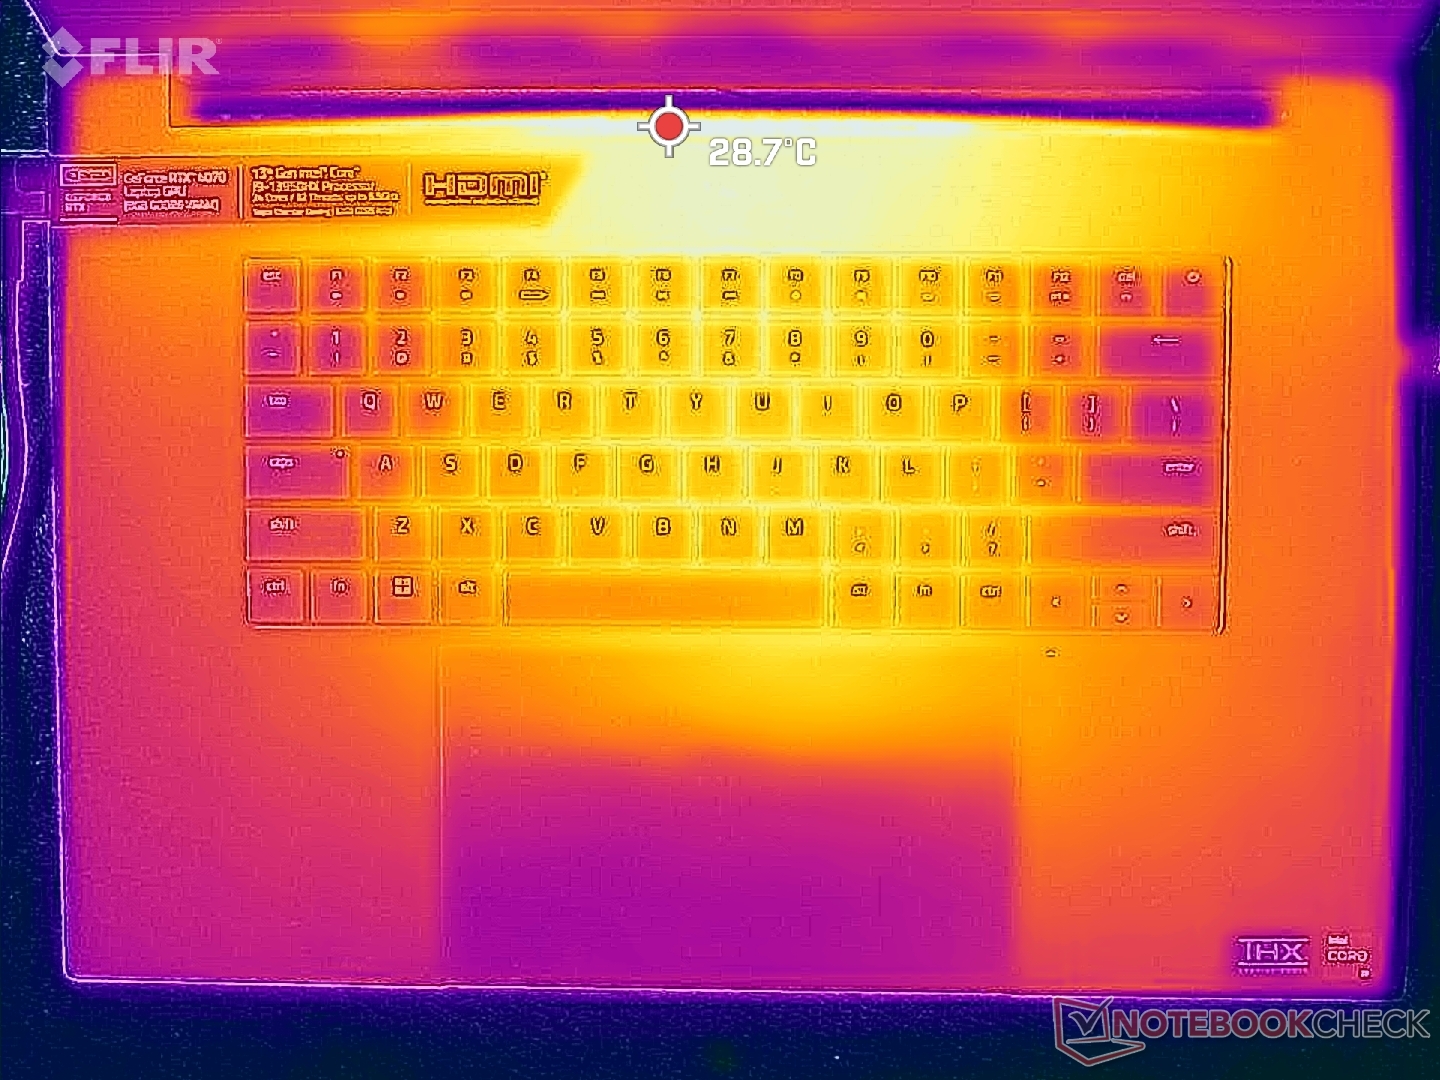
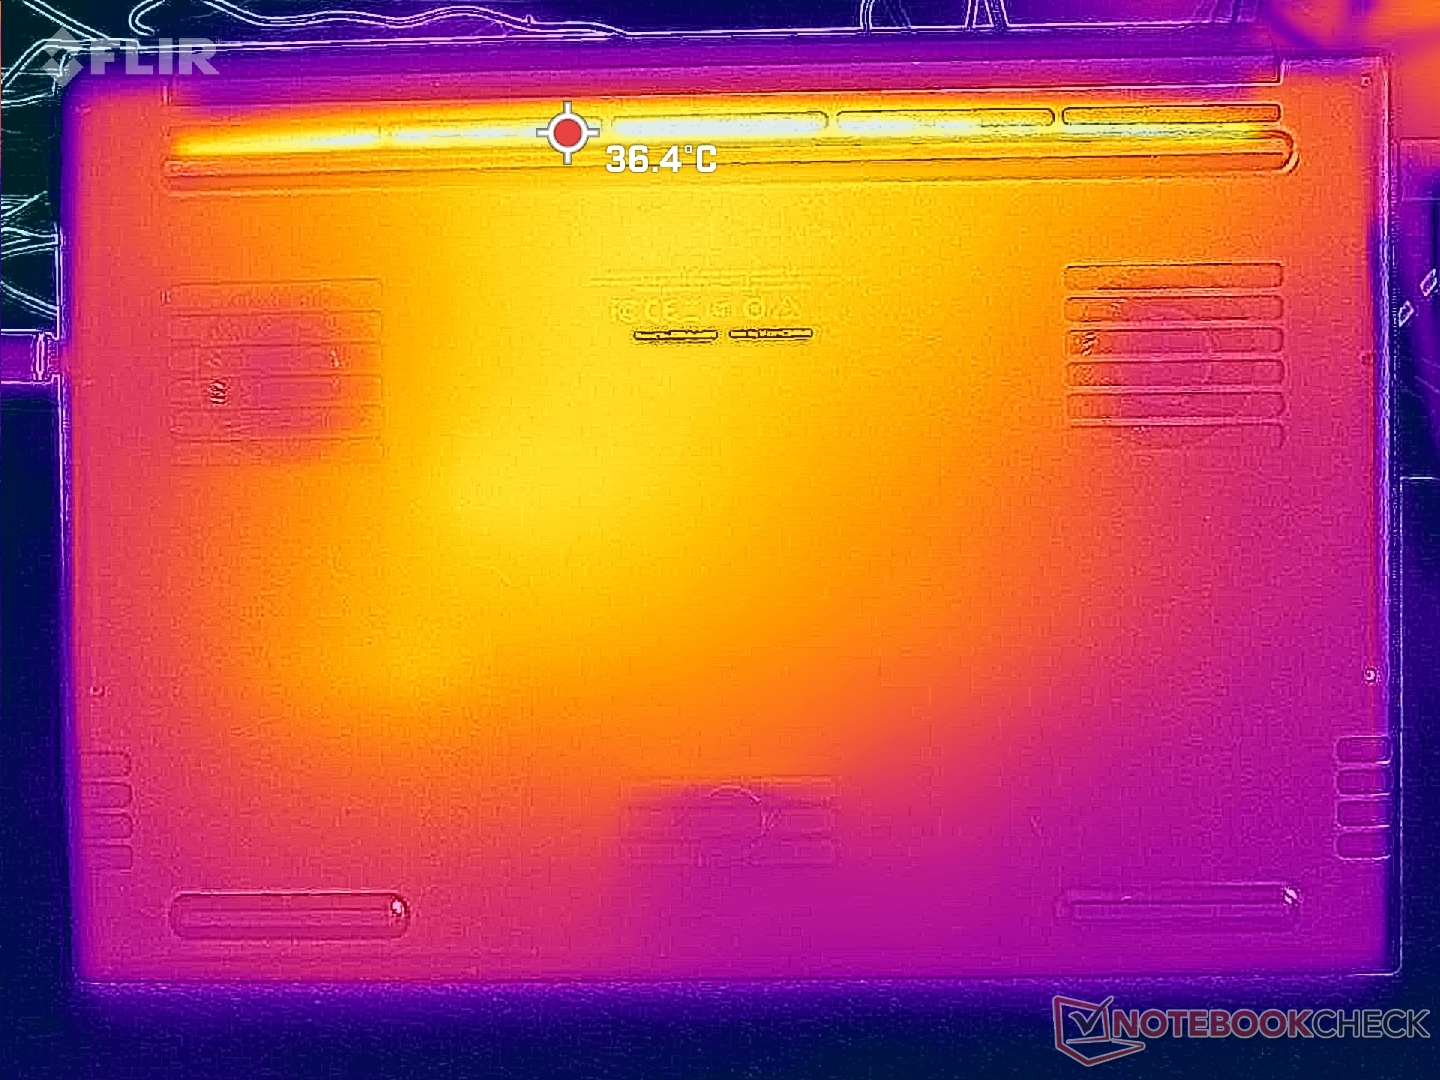
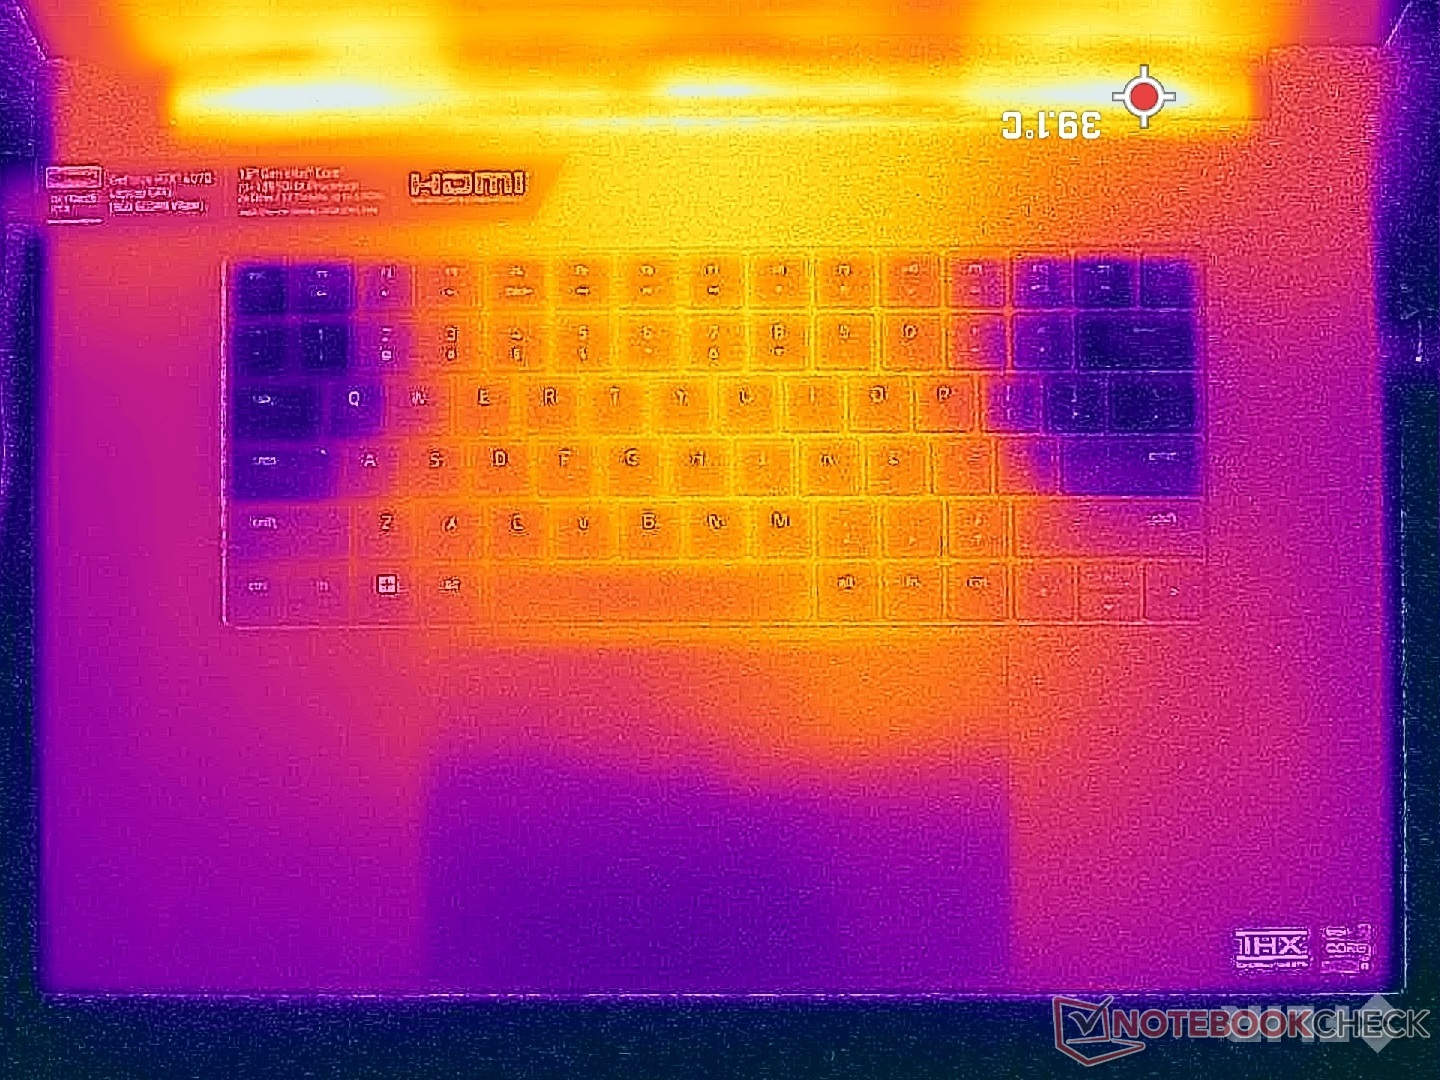
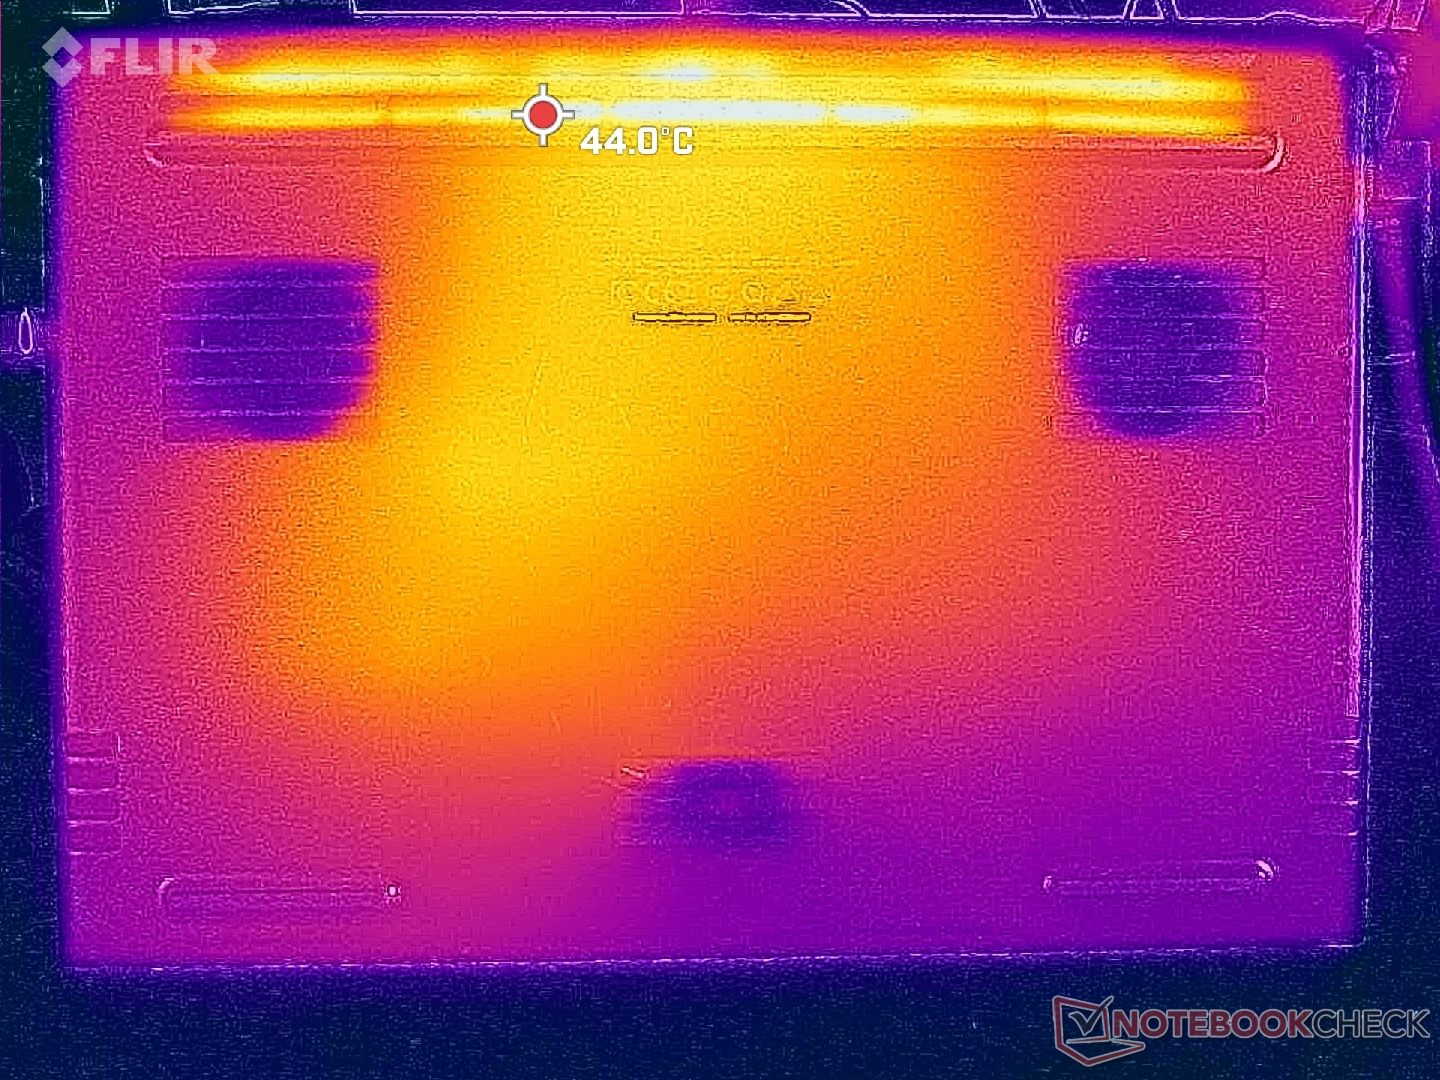
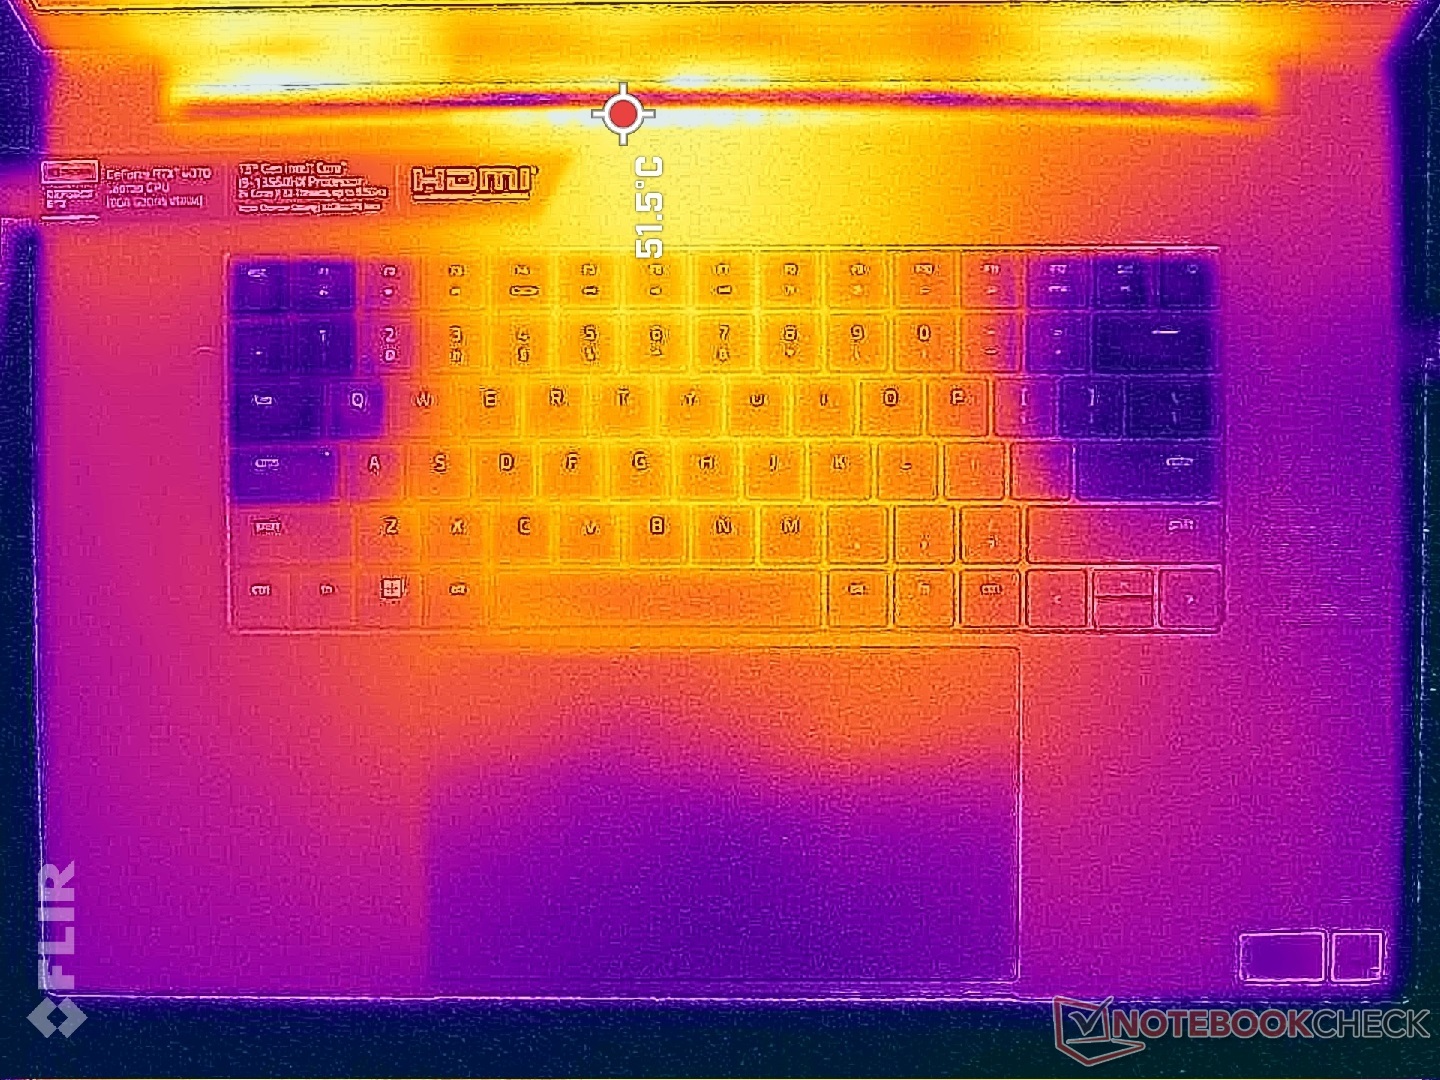
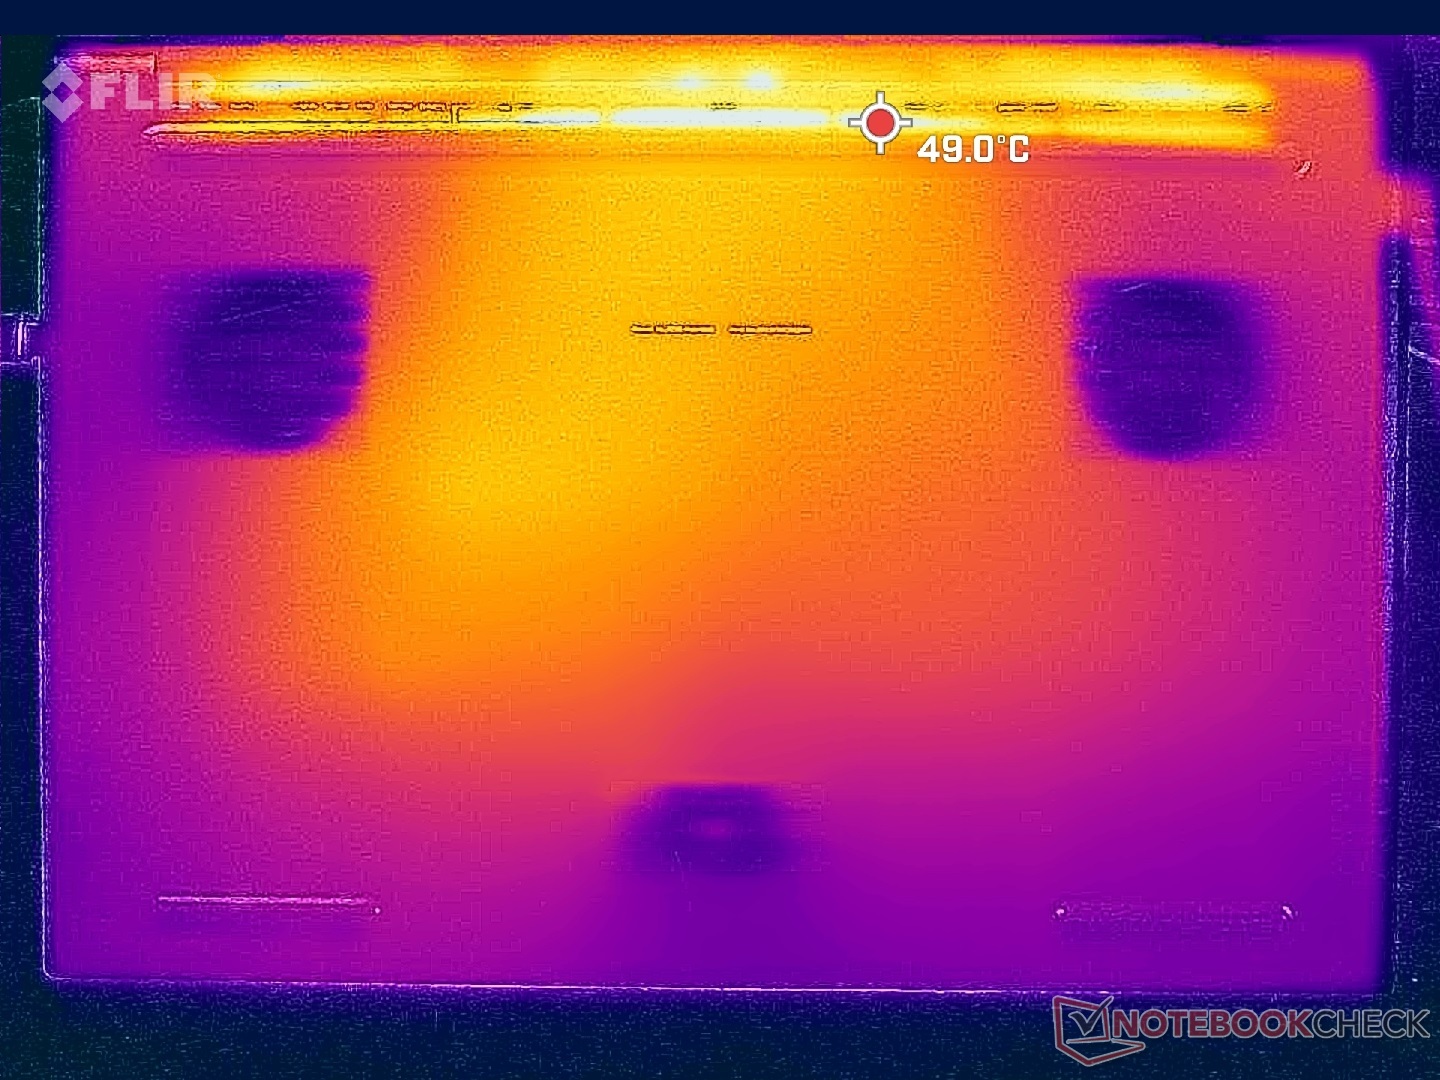
Temperatura
Las temperaturas superficiales son relativamente bajas para un portátil de juego, probablemente debido al gran factor de forma de 18", el disipador de cámara de vapor con ventiladores triples y la GPU TGP de 140W. Las configuraciones RTX 4080 o 4090 más rápidas probablemente se calienten más de lo que hemos registrado aquí, ya que cada una tiene un techo más alto de 175 W.
Los puntos calientes en funcionamiento Witcher 3 alcanzan los 36 C en la parte superior y los 33 C en la inferior comparado con los 50 C a 57 C del Alienware m17 R5. El Blade 18 con RTX 4070 es uno de los portátiles de juego más frescos que hemos probado hasta ahora y está claro que el chasis se construyó para manejar opciones más potentes que nuestra configuración RTX 4070.
Las temperaturas superficiales en inactivo son ligeramente más cálidas de lo esperado ya que los ventiladores tienden a ralentí durante cargas bajas. El Blade 18 nunca resulta incómodo a la piel siempre que el borde trasero esté bien ventilado.

(+) La temperatura máxima en la parte superior es de 39.2 °C / 103 F, frente a la media de 40.4 °C / 105 F, que oscila entre 21.2 y 68.8 °C para la clase Gaming.
(+) El fondo se calienta hasta un máximo de 35.6 °C / 96 F, frente a la media de 43.2 °C / 110 F
(+) En reposo, la temperatura media de la parte superior es de 28.1 °C / 83# F, frente a la media del dispositivo de 33.9 °C / 93 F.
(+) Jugando a The Witcher 3, la temperatura media de la parte superior es de 28.9 °C / 84 F, frente a la media del dispositivo de 33.9 °C / 93 F.
(+) El reposamanos y el panel táctil están a una temperatura inferior a la de la piel, con un máximo de 26 °C / 78.8 F y, por tanto, son fríos al tacto.
(+) La temperatura media de la zona del reposamanos de dispositivos similares fue de 28.8 °C / 83.8 F (+2.8 °C / 5 F).
| Razer Blade 18 RTX 4070 Intel Core i9-13950HX, NVIDIA GeForce RTX 4070 Laptop GPU | Razer Blade 17 Early 2022 Intel Core i9-12900H, NVIDIA GeForce RTX 3080 Ti Laptop GPU | MSI Titan GT77 HX 13VI Intel Core i9-13950HX, NVIDIA GeForce RTX 4090 Laptop GPU | Gigabyte G7 KE Intel Core i5-12500H, NVIDIA GeForce RTX 3060 Laptop GPU | Alienware m17 R5 (R9 6900HX, RX 6850M XT) AMD Ryzen 9 6900HX, AMD Radeon RX 6850M XT | Asus ROG Strix Scar 17 SE G733CX-LL014W Intel Core i9-12950HX, NVIDIA GeForce RTX 3080 Ti Laptop GPU | |
|---|---|---|---|---|---|---|
| Heat | -28% | 2% | -17% | -18% | -18% | |
| Maximum Upper Side * (°C) | 39.2 | 50 -28% | 40.6 -4% | 52 -33% | 53 -35% | 48.8 -24% |
| Maximum Bottom * (°C) | 35.6 | 56 -57% | 41.1 -15% | 54 -52% | 56 -57% | 52.4 -47% |
| Idle Upper Side * (°C) | 31.8 | 36 -13% | 26.2 18% | 28 12% | 30 6% | 30.4 4% |
| Idle Bottom * (°C) | 33.2 | 38 -14% | 30.3 9% | 32 4% | 29 13% | 34.1 -3% |
* ... más pequeño es mejor
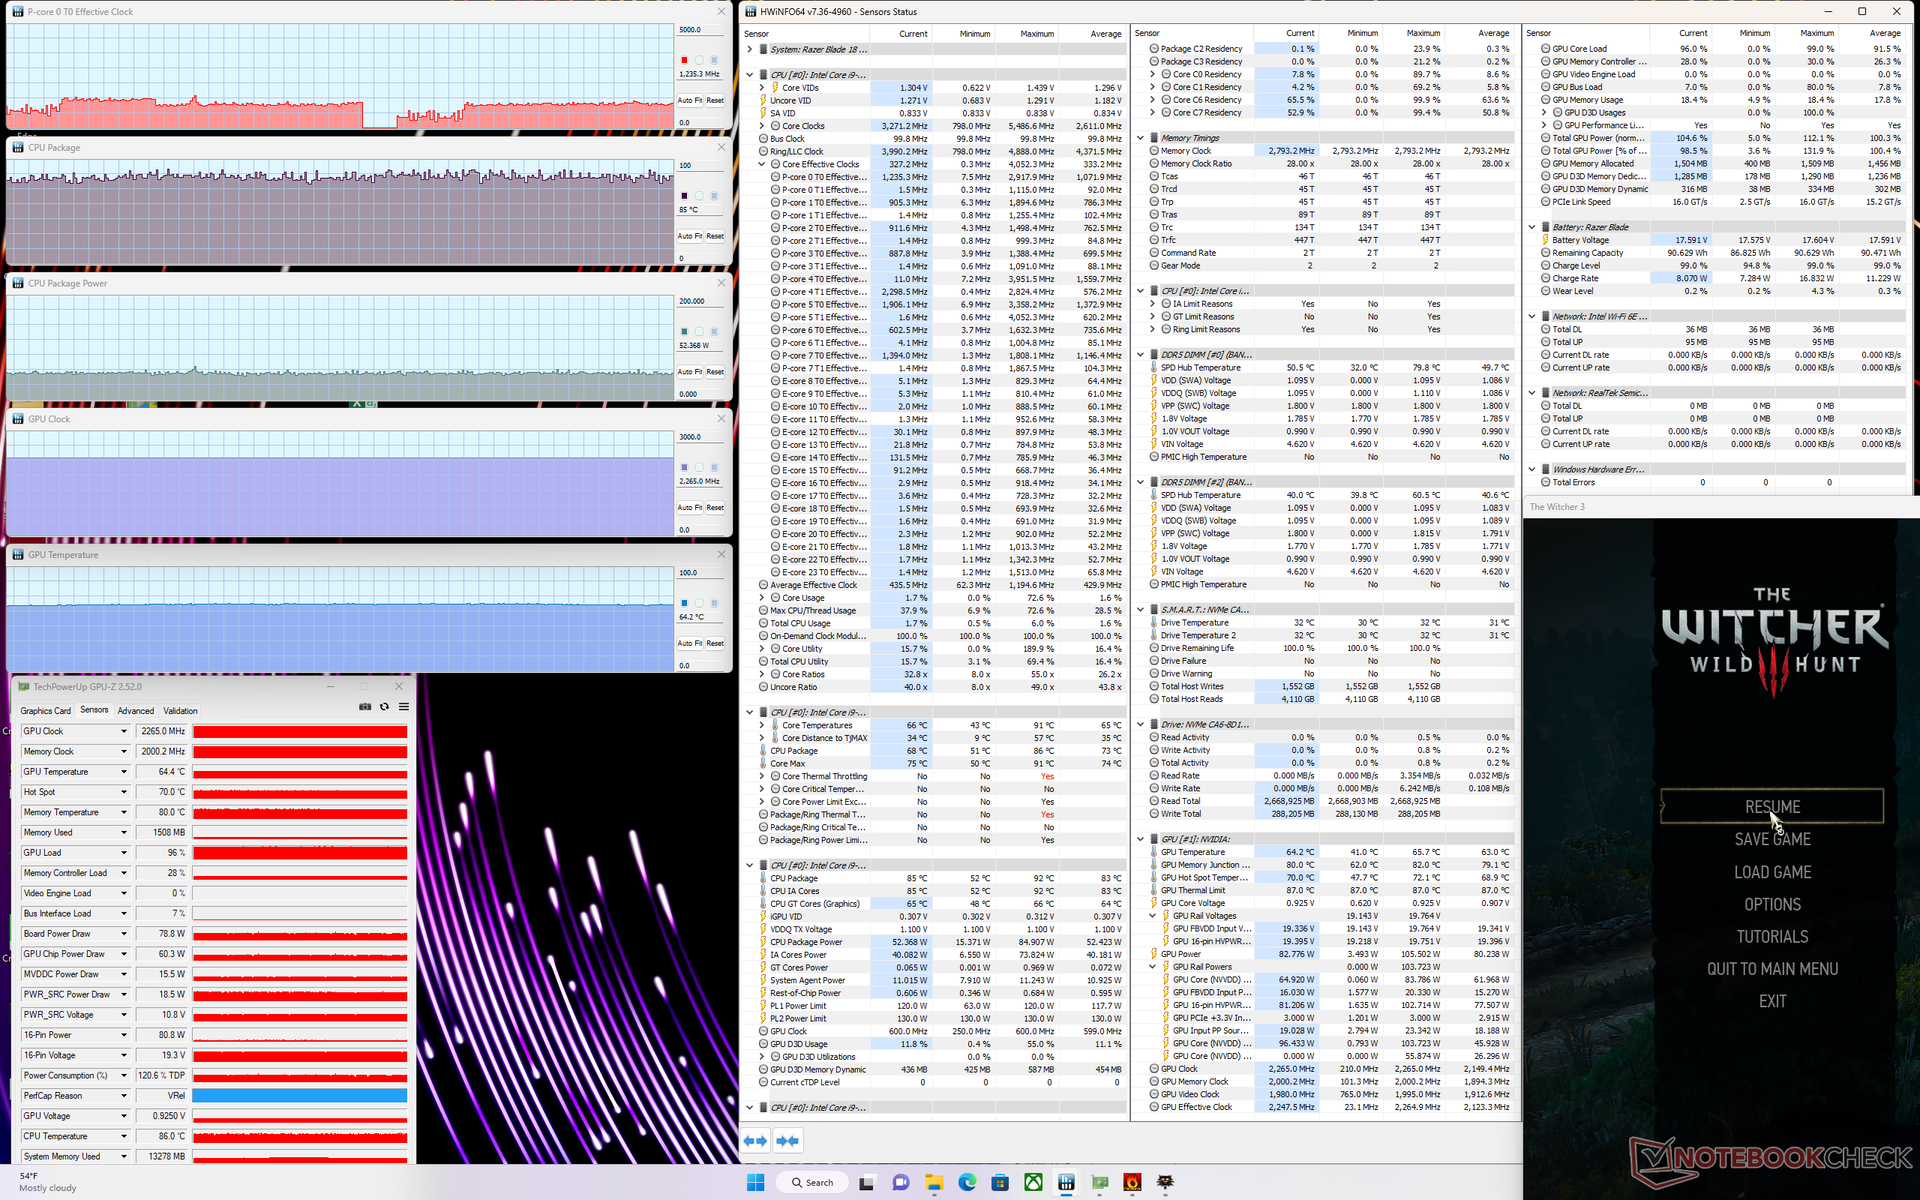
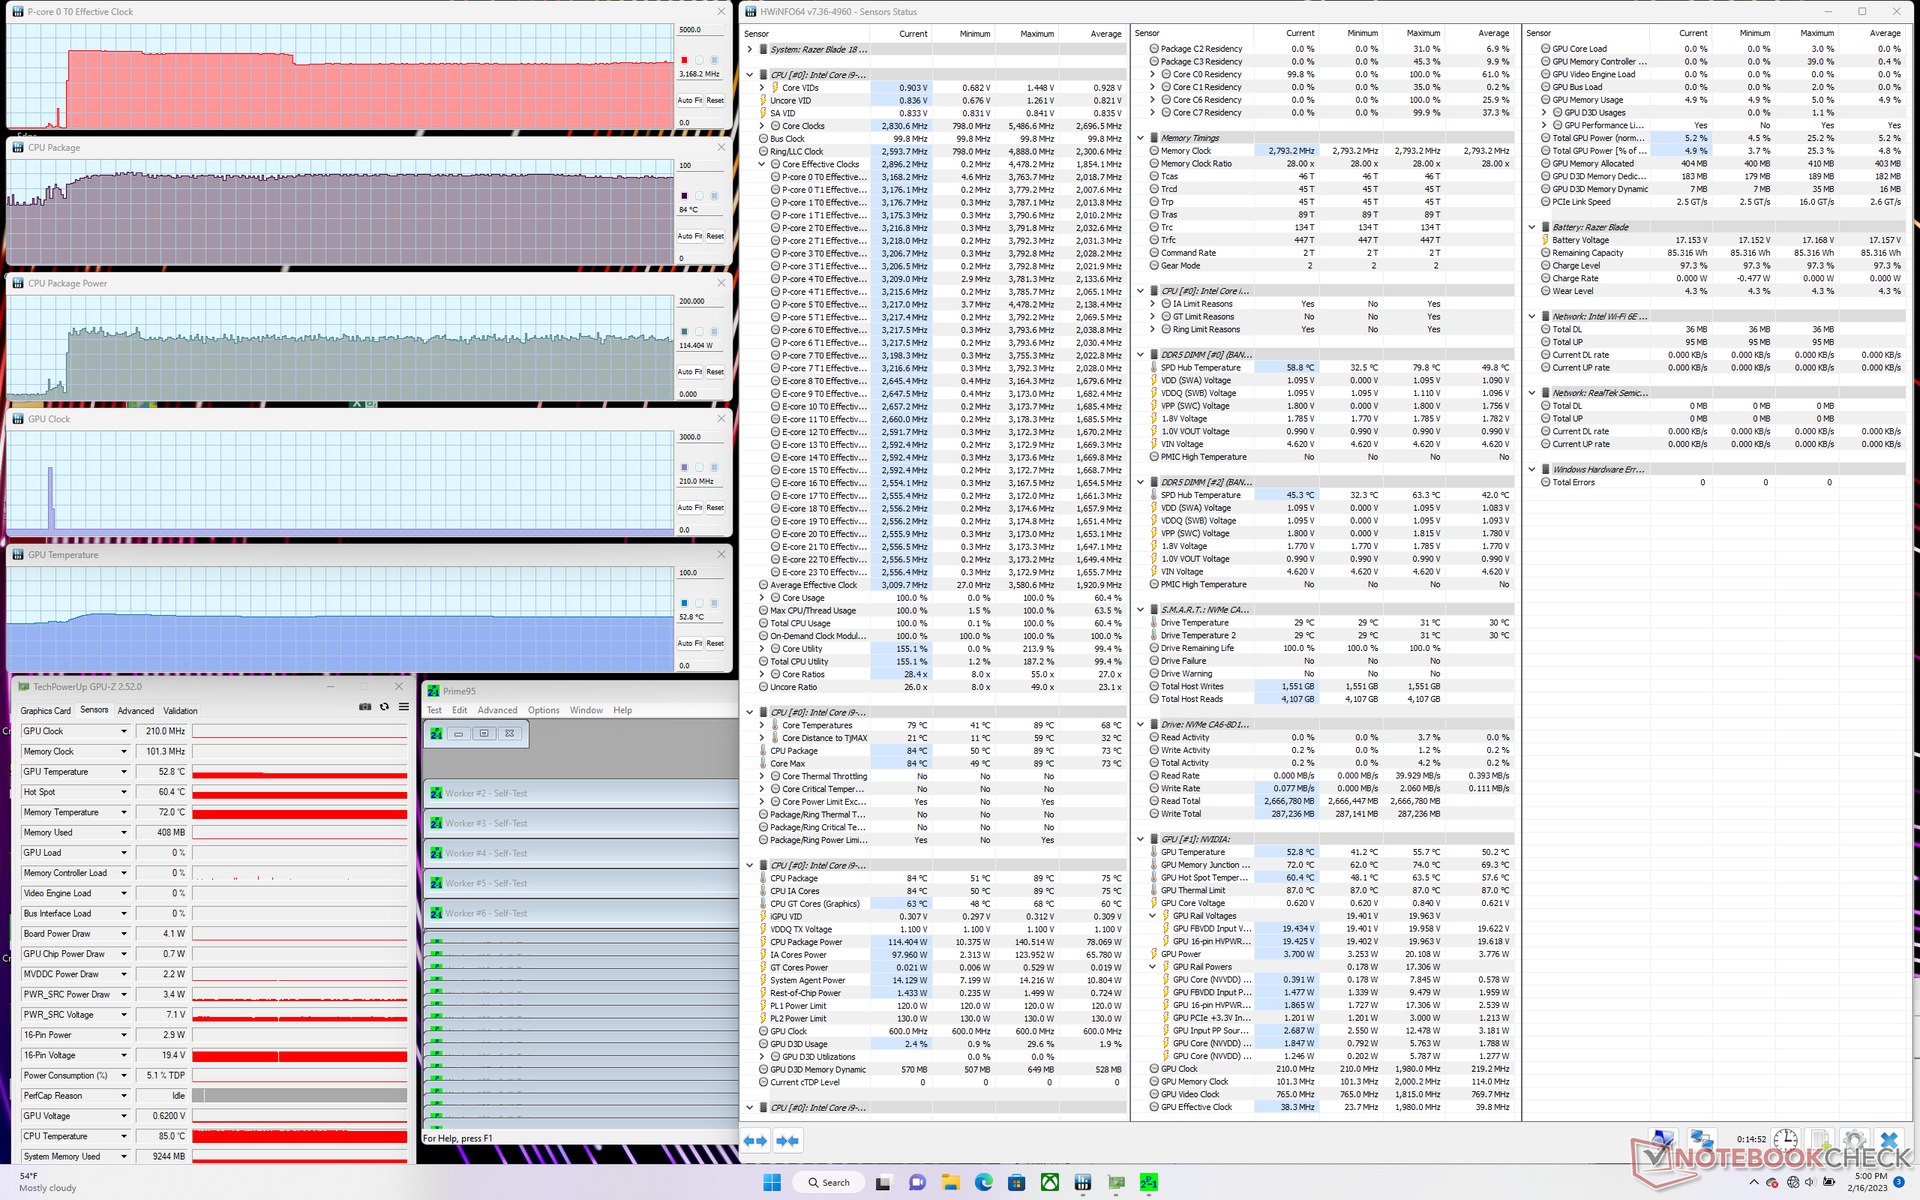
Prueba de resistencia
Al ejecutar Prime95 para estresar la CPU, las frecuencias de reloj y el consumo de la placa se disparaban hasta los 3,8 GHz y los 140 W, respectivamente, antes de caer hasta los 3,1 GHz y los 110 a 120 W unos 70 segundos después. La temperatura del núcleo se estabilizó en 87 C, frente a los 82 C del Blade 16 equipado con la misma CPU.
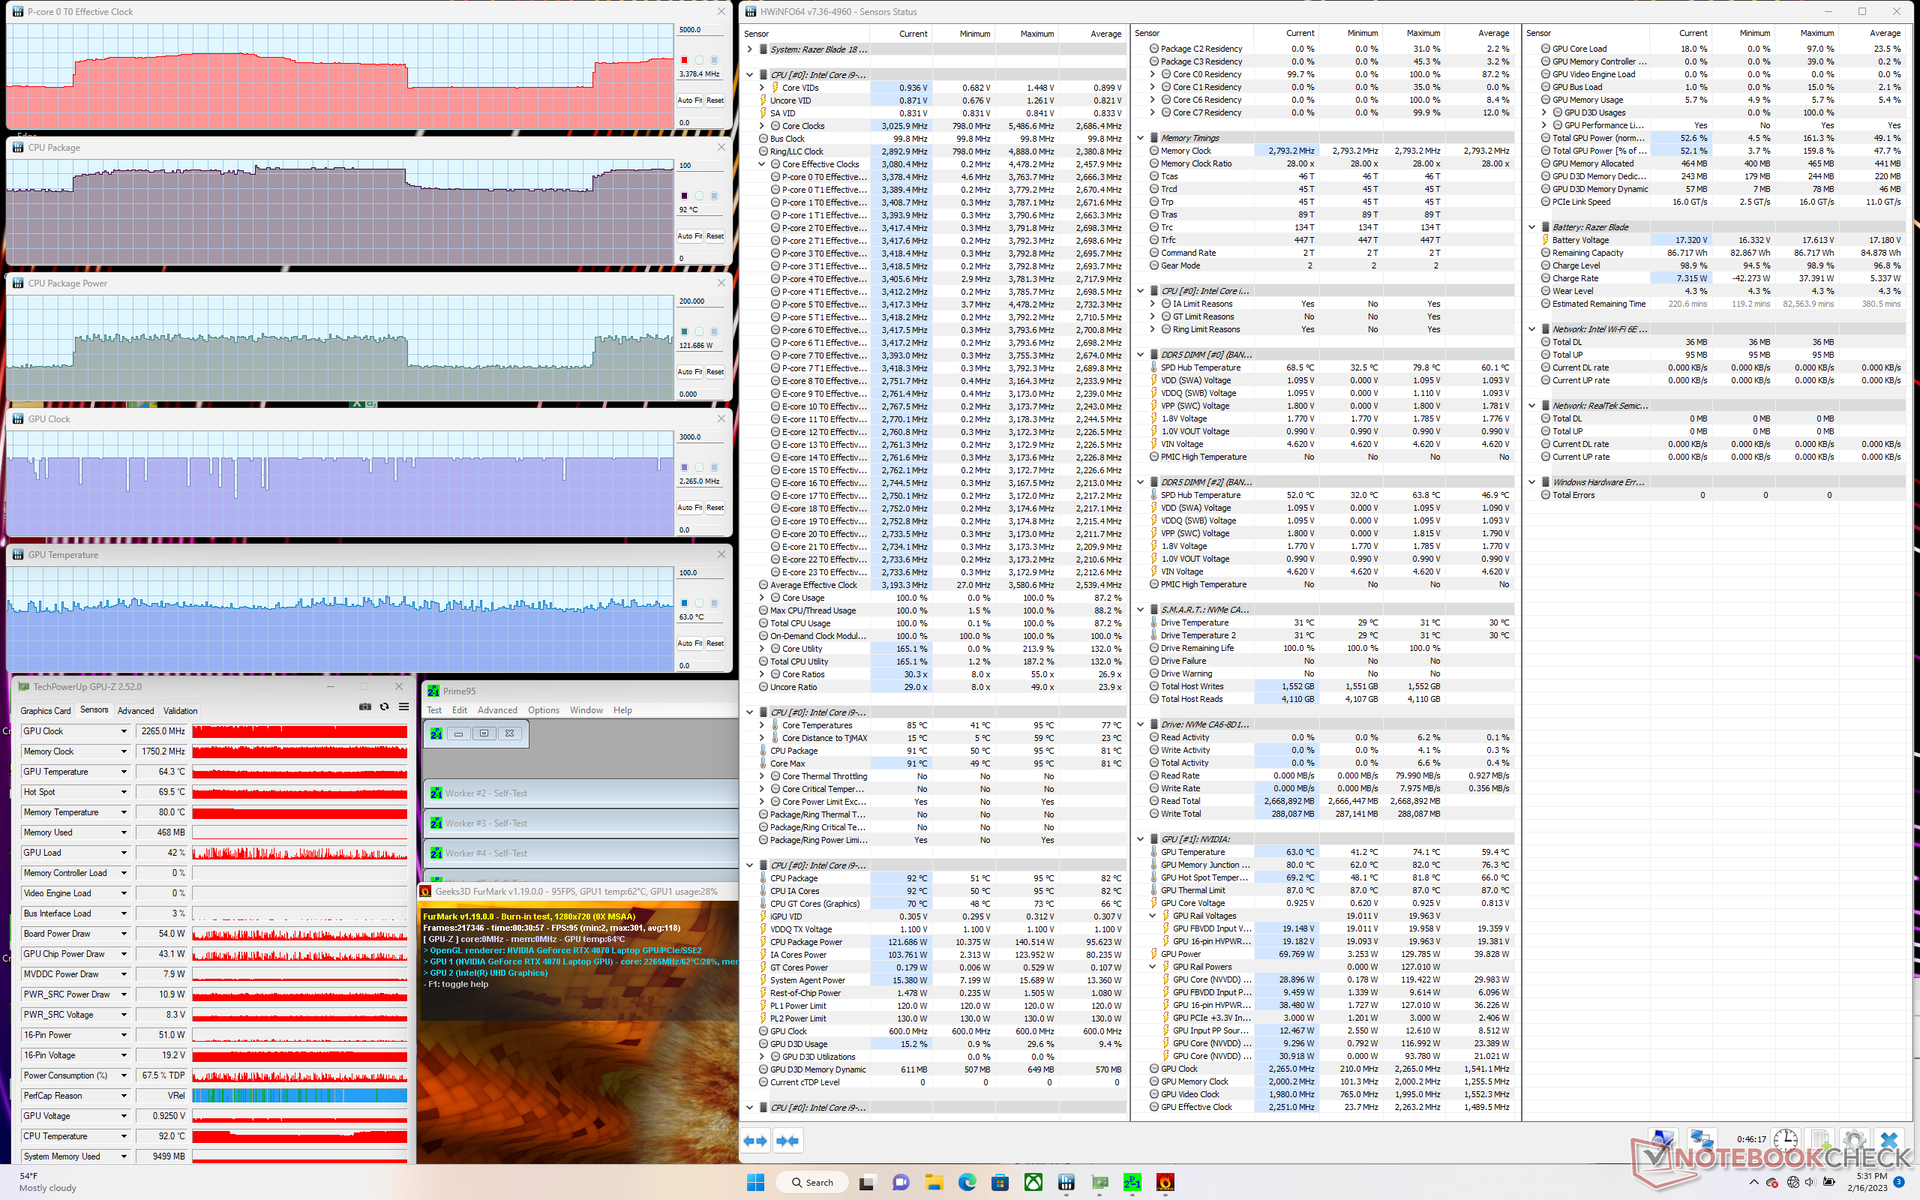
La velocidad de reloj de la GPU, la temperatura y el consumo de energía de la placa se estabilizarían en 2265 MHz, 64 C y 80 a 90 W, respectivamente, al ejecutar Witcher 3. La GPU en sí está preparada para un TGP de 140 W, por lo que el rango de ~80 W es mucho más bajo de lo esperado incluso cuando se configura en modo Rendimiento. Sólo alcanzamos un pico de 100 W para la GPU cuando ejecutamos un juego más exigente como Cyberpunk 2077. En comparación, la GPU RTX 4080 del Blade 16 se estabilizaría en ~160 W frente a su objetivo de 175 W TGP al ejecutar la misma Witcher 3 prueba.
Funcionar con batería limita el rendimiento. Un test 3DMark 11 en batería devolvería puntuaciones de Física y Gráficos de 10336 y 18043 puntos, respectivamente, comparados con los 25874 y 39733 puntos en red.
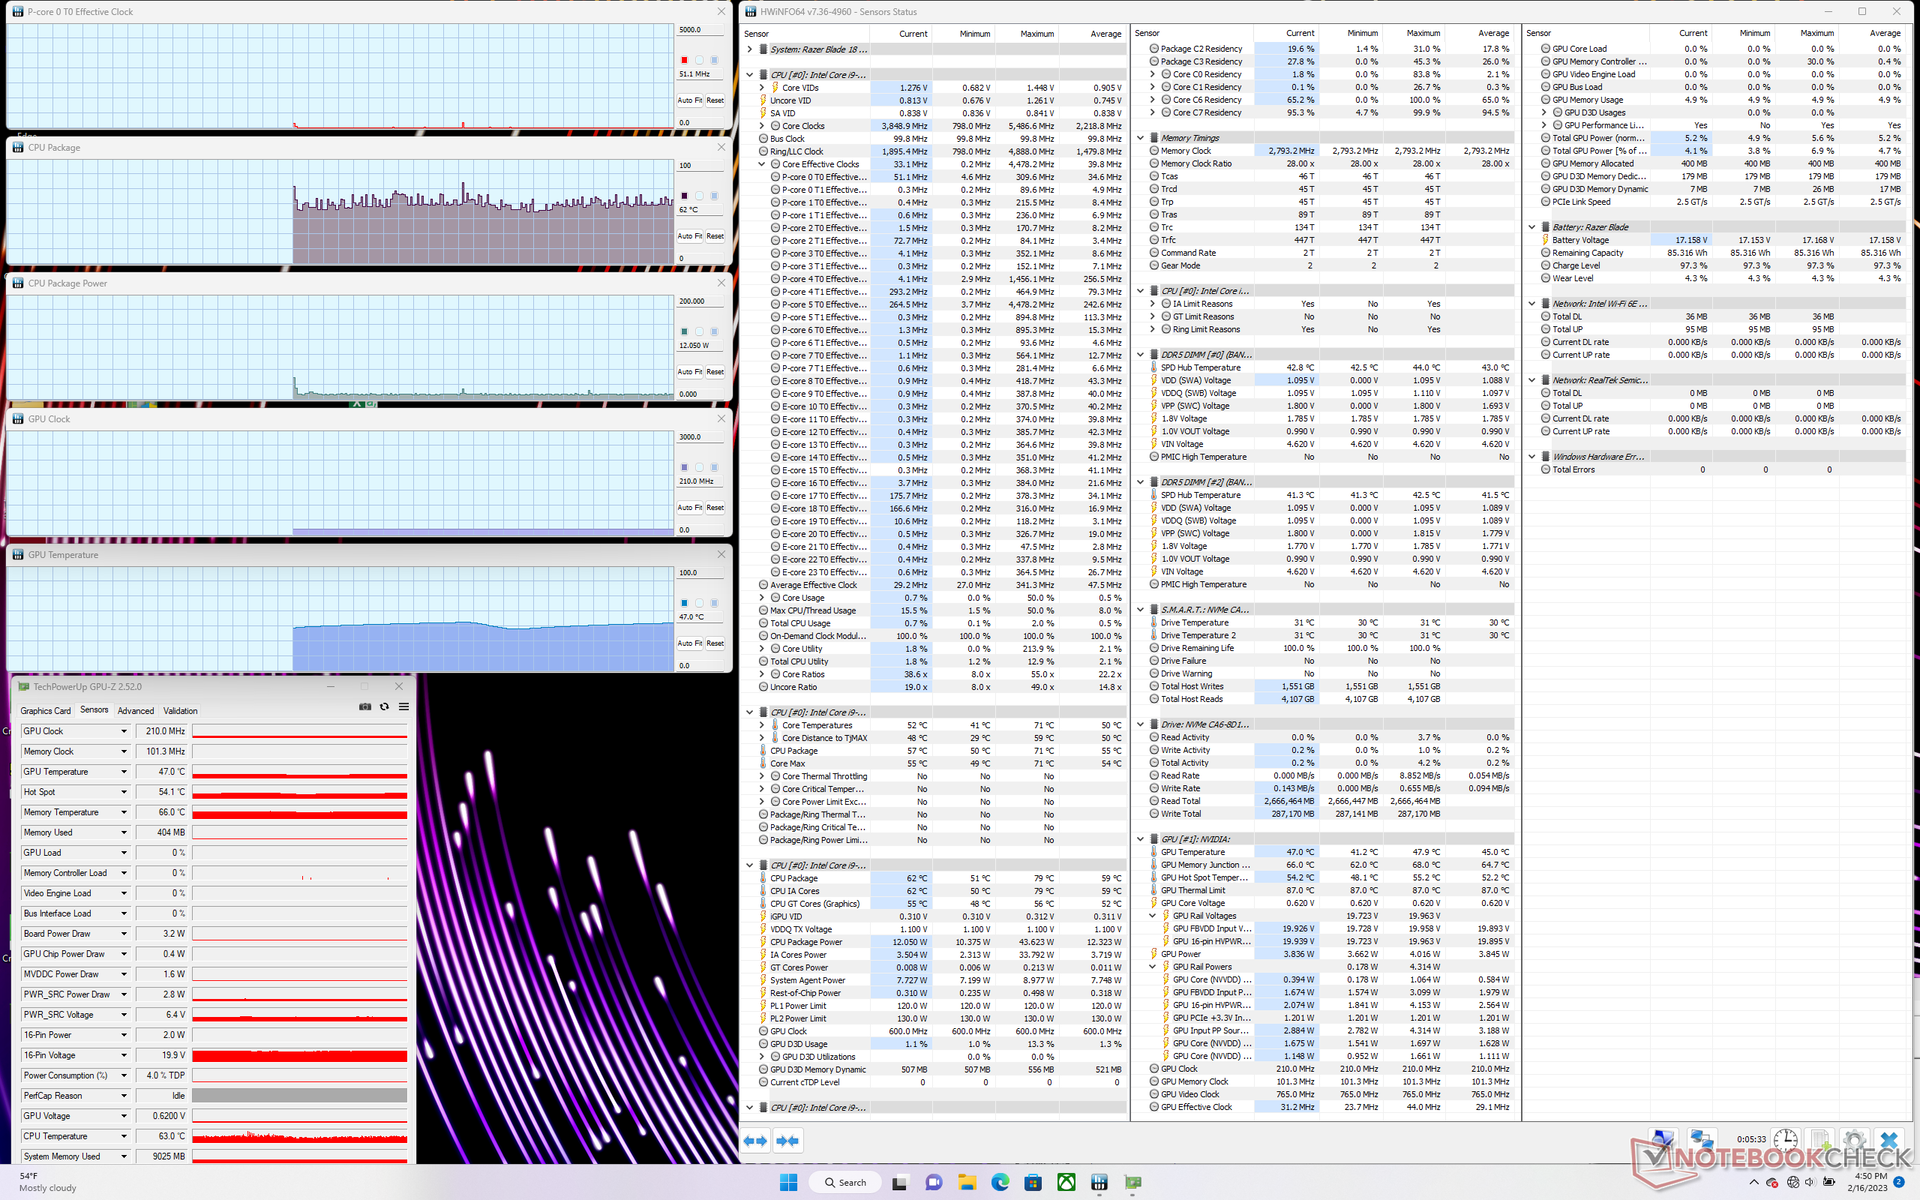
| RelojCPU (GHz) | Reloj GPU (MHz) | Temperatura mediaCPU (°C) | Temperatura media GPU (°C) | |
| Sistema en reposo | -- | -- | 62 | 47 |
| Prime95Stress | 3.2 | -- | 84 | 53 |
| Prime95+ FurMark Estrés | 2,0 - 3,7 | 2265 | 70 - 91 | 63 |
| Witcher 3 Tensión | ~1,2 | 2265 | 85 | 64 |
Altavoces
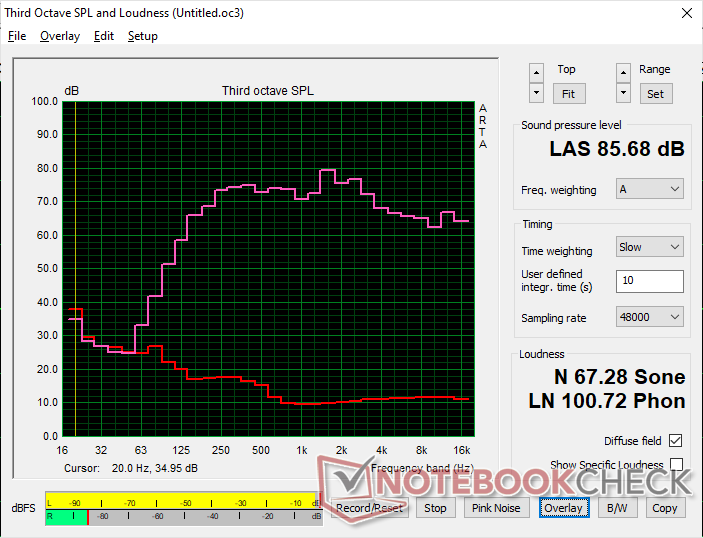
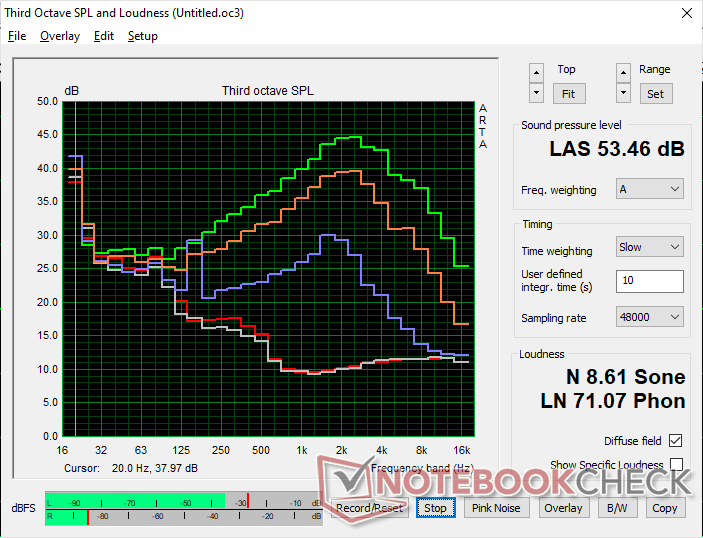
Razer Blade 18 RTX 4070 análisis de audio
(+) | los altavoces pueden reproducir a un volumen relativamente alto (#85.7 dB)
Graves 100 - 315 Hz
(±) | lubina reducida - en promedio 7.5% inferior a la mediana
(±) | la linealidad de los graves es media (9.2% delta a frecuencia anterior)
Medios 400 - 2000 Hz
(+) | medios equilibrados - a sólo 3.5% de la mediana
(+) | los medios son lineales (4.1% delta a la frecuencia anterior)
Altos 2 - 16 kHz
(+) | máximos equilibrados - a sólo 4.8% de la mediana
(+) | los máximos son lineales (3.8% delta a la frecuencia anterior)
Total 100 - 16.000 Hz
(+) | el sonido global es lineal (9.2% de diferencia con la mediana)
En comparación con la misma clase
» 3% de todos los dispositivos probados de esta clase eran mejores, 1% similares, 96% peores
» El mejor tuvo un delta de 6%, la media fue 18%, el peor fue ###max##%
En comparación con todos los dispositivos probados
» 3% de todos los dispositivos probados eran mejores, 1% similares, 96% peores
» El mejor tuvo un delta de 4%, la media fue 23%, el peor fue ###max##%
Apple MacBook Pro 16 2021 M1 Pro análisis de audio
(+) | los altavoces pueden reproducir a un volumen relativamente alto (#84.7 dB)
Graves 100 - 315 Hz
(+) | buen bajo - sólo 3.8% lejos de la mediana
(+) | el bajo es lineal (5.2% delta a la frecuencia anterior)
Medios 400 - 2000 Hz
(+) | medios equilibrados - a sólo 1.3% de la mediana
(+) | los medios son lineales (2.1% delta a la frecuencia anterior)
Altos 2 - 16 kHz
(+) | máximos equilibrados - a sólo 1.9% de la mediana
(+) | los máximos son lineales (2.7% delta a la frecuencia anterior)
Total 100 - 16.000 Hz
(+) | el sonido global es lineal (4.6% de diferencia con la mediana)
En comparación con la misma clase
» 0% de todos los dispositivos probados de esta clase eran mejores, 0% similares, 100% peores
» El mejor tuvo un delta de 5%, la media fue 17%, el peor fue ###max##%
En comparación con todos los dispositivos probados
» 0% de todos los dispositivos probados eran mejores, 0% similares, 100% peores
» El mejor tuvo un delta de 4%, la media fue 23%, el peor fue ###max##%
Gestión de la energía - Gran pantalla, gran demanda de energía
Consumo de energía
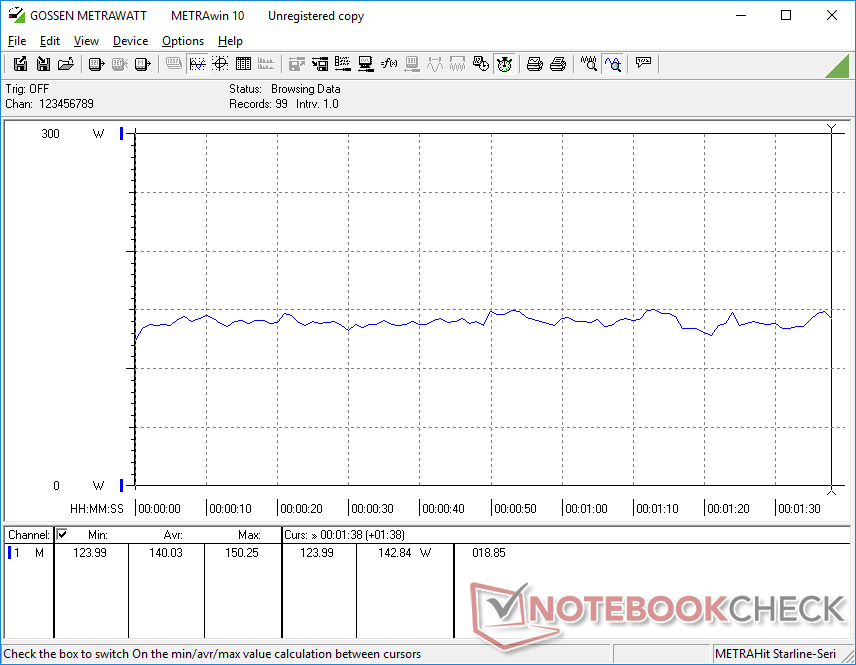
El consumo de energía en reposo en el escritorio oscila entre 24 W y 48 W dependiendo del ajuste de brillo y el perfil de energía. De hecho, la diferencia entre los ajustes de brillo mínimo y máximo llega a los 10 W. Este rango es notablemente superior al de la mayoría de portátiles más pequeños, lo que puede explicar los resultados poco excepcionales de duración de la batería de la siguiente sección.
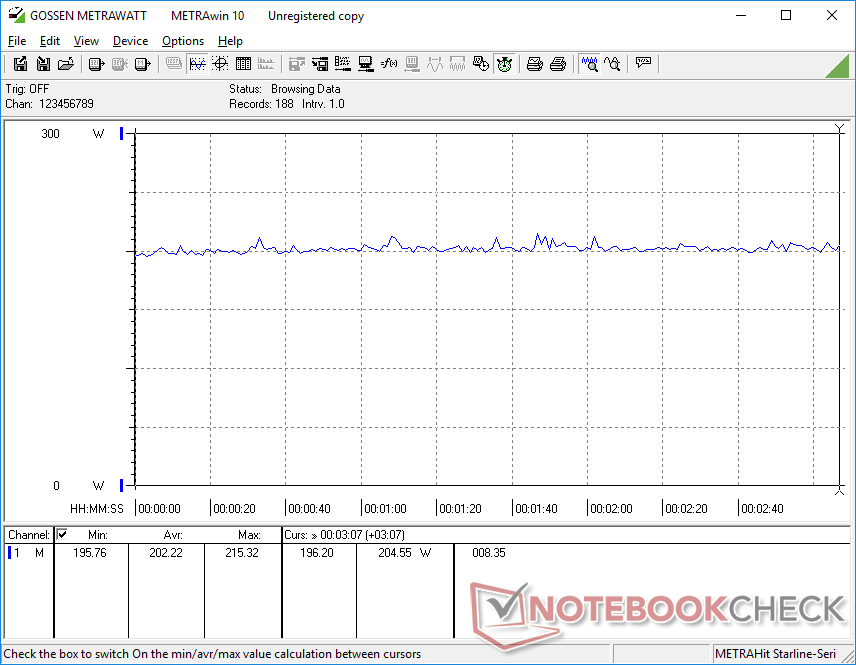
Cuando se ejecuta Witcher 3 para representar cargas de juego típicas, el sistema demandaría una media de 202 W comparado con los 229 W o 225 W del Blade 17 con RTX 3080 Ti o elAsus ROG Strix Scar 17 SErespectivamente. Por tanto, nuestro sistema de 18 pulgadas con RTX 4070 consume un 10% menos de energía y ofrece casi el mismo rendimiento gráfico que la RTX 3080 Ti móvil de última generación. La actualización a la configuración RTX 4080 o RTX 4090 probablemente consumirá entre 40 W y 50 W más de energía, similar a lo que observamos en el Blade 16.
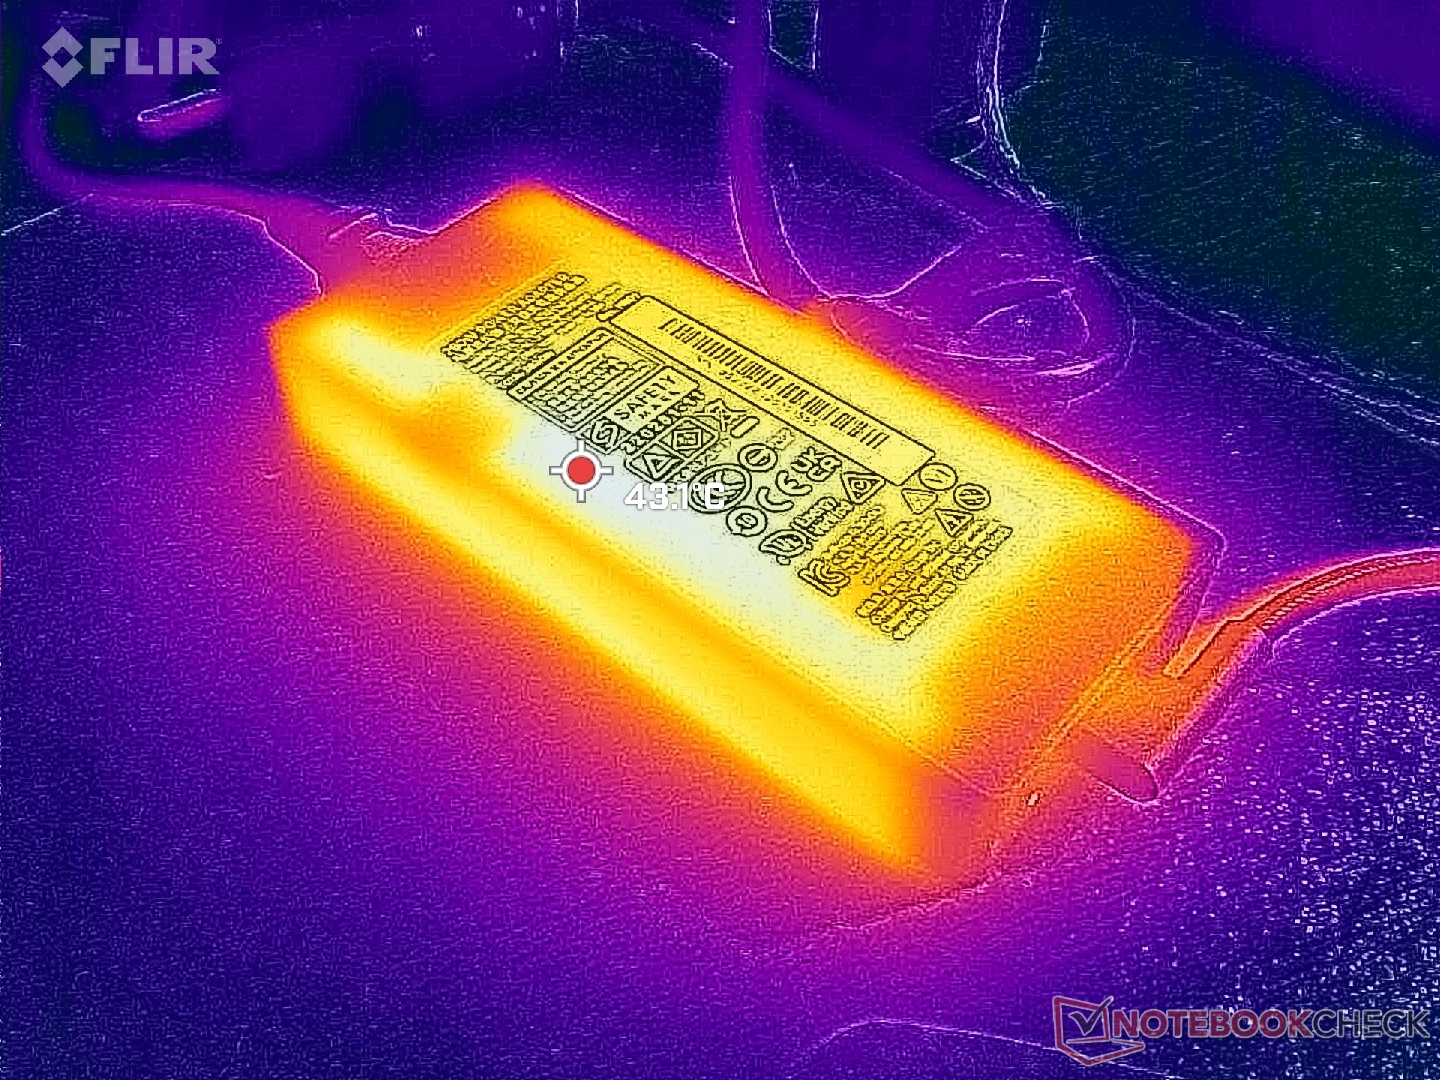
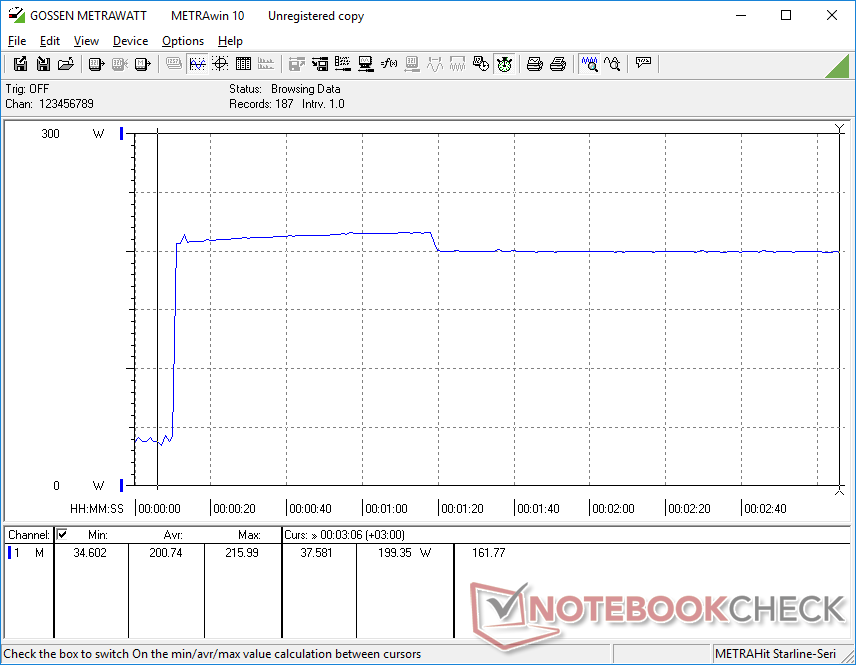
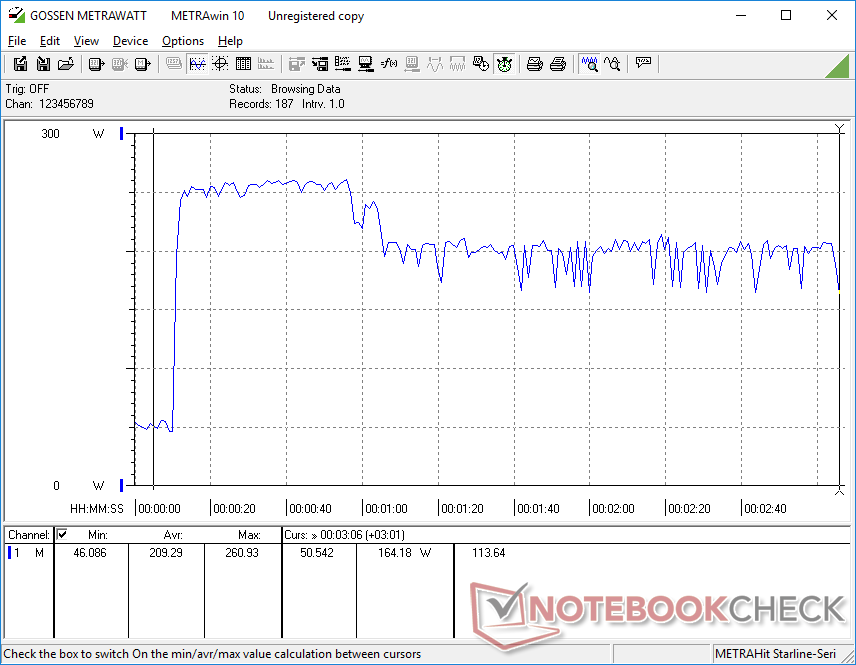
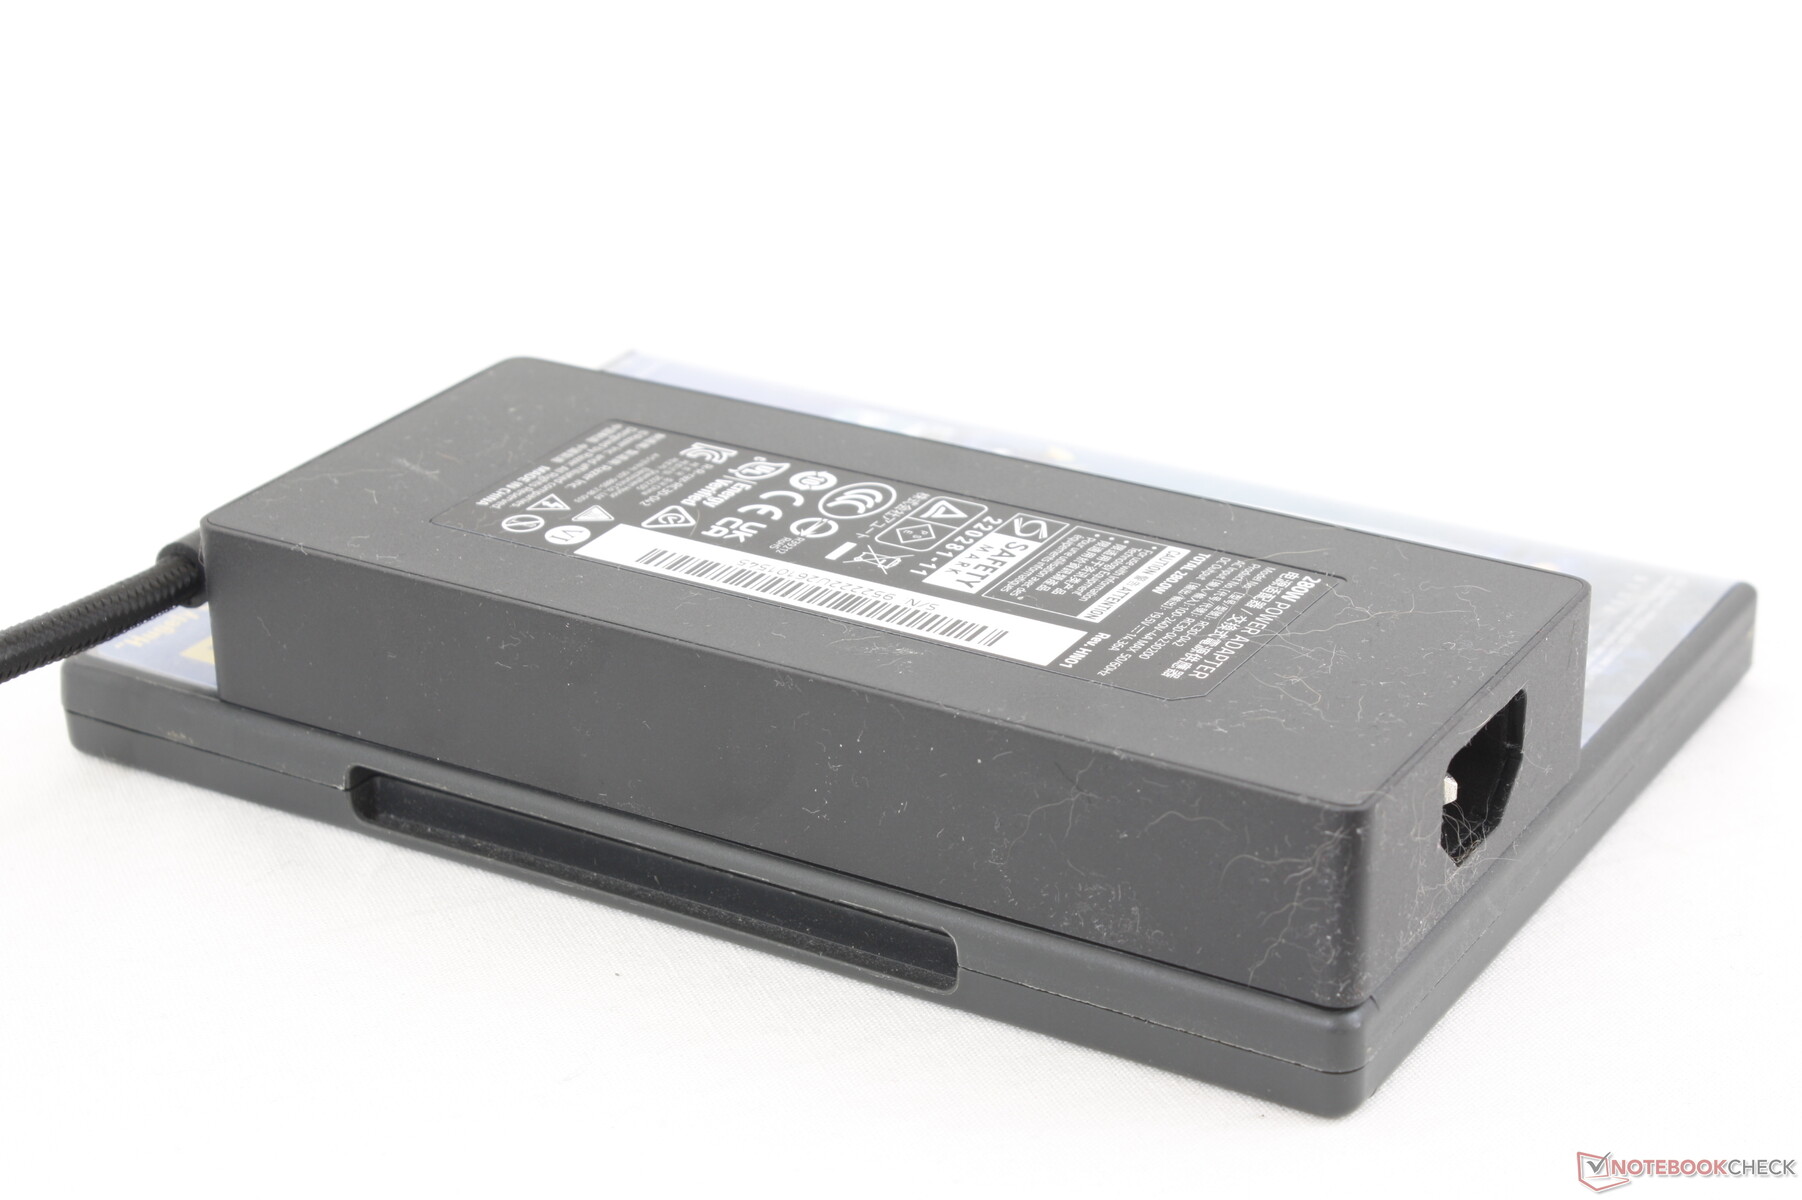
Hemos podido registrar un consumo máximo temporal de 261 W del adaptador GaN AC de 280 W pequeño-mediano (~16.3 x 7 x 2.5 cm) al ejecutar Prime95 y FurMark simultáneamente. Hay que tener en cuenta que existen dos adaptadores de CA diferentes en función de la configuración: uno más pequeño de 280 W para las RTX 4060 y 4070 y otro más grande de 330 W para las RTX 4080 y 4090.
| Off / Standby | |
| Ocioso | |
| Carga |
|
Clave:
min: | |
| Razer Blade 18 RTX 4070 i9-13950HX, GeForce RTX 4070 Laptop GPU, SSSTC CA6-8D1024, IPS, 2560x1600, 18" | Razer Blade 17 Early 2022 i9-12900H, GeForce RTX 3080 Ti Laptop GPU, Samsung PM9A1 MZVL21T0HCLR, IPS, 3840x2160, 17.3" | MSI Titan GT77 HX 13VI i9-13950HX, GeForce RTX 4090 Laptop GPU, Samsung PM9A1 MZVL22T0HBLB, Mini-LED, 3840x2160, 17.3" | Gigabyte G7 KE i5-12500H, GeForce RTX 3060 Laptop GPU, Gigabyte AG470S1TB-SI B10, IPS, 1920x1080, 17.3" | Alienware m17 R5 (R9 6900HX, RX 6850M XT) R9 6900HX, Radeon RX 6850M XT, SSSTC CA6-8D1024, IPS, 3840x2160, 17" | Asus ROG Strix Scar 17 SE G733CX-LL014W i9-12950HX, GeForce RTX 3080 Ti Laptop GPU, Samsung PM9A1 MZVL22T0HBLB, IPS, 2560x1440, 17.3" | |
|---|---|---|---|---|---|---|
| Power Consumption | 17% | 8% | 32% | 31% | 9% | |
| Idle Minimum * (Watt) | 24.5 | 17 31% | 14 43% | 15 39% | 13 47% | 19.3 21% |
| Idle Average * (Watt) | 34.1 | 23 33% | 21.6 37% | 17 50% | 16.5 52% | 26.5 22% |
| Idle Maximum * (Watt) | 47.7 | 34 29% | 24.8 48% | 24 50% | 17 64% | 27.1 43% |
| Load Average * (Watt) | 140 | 120 14% | 122.5 12% | 111 21% | 93 34% | 141 -1% |
| Witcher 3 ultra * (Watt) | 202 | 229 -13% | 265 -31% | 174.1 14% | 239 -18% | 225 -11% |
| Load Maximum * (Watt) | 261 | 243 7% | 418 -60% | 208 20% | 251 4% | 307.9 -18% |
* ... más pequeño es mejor
Power Consumption Witcher 3 / Stresstest
Power Consumption external Monitor
Duración de la batería
No es casualidad que el modelo Blade más grande también lleve la batería de mayor capacidad de la familia, con 91,7 Wh. Sin embargo, la duración de la batería no es necesariamente mayor, e incluso puede ser menor en muchos escenarios. Podemos navegar por internet con el perfil de energía equilibrado durante 4 horas antes de tener que recargar, casi una hora menos que en el Blade 15 del año pasado. Bajar la frecuencia de refresco de la pantalla a 60 Hz en vez de 240 Hz puede aumentar la duración de la batería sólo marginalmente.
La carga de vacío a lleno tarda unos 90 minutos. Los usuarios también pueden cargar el sistema por USB-C aunque a menor velocidad.
| Razer Blade 18 RTX 4070 i9-13950HX, GeForce RTX 4070 Laptop GPU, 91.7 Wh | Razer Blade 17 Early 2022 i9-12900H, GeForce RTX 3080 Ti Laptop GPU, 82 Wh | MSI Titan GT77 HX 13VI i9-13950HX, GeForce RTX 4090 Laptop GPU, 99.9 Wh | Gigabyte G7 KE i5-12500H, GeForce RTX 3060 Laptop GPU, 54 Wh | Alienware m17 R5 (R9 6900HX, RX 6850M XT) R9 6900HX, Radeon RX 6850M XT, 97 Wh | Asus ROG Strix Scar 17 SE G733CX-LL014W i9-12950HX, GeForce RTX 3080 Ti Laptop GPU, 90 Wh | |
|---|---|---|---|---|---|---|
| Duración de Batería | 9% | 21% | 11% | 29% | 5% | |
| Reader / Idle (h) | 7 | 7.1 1% | 7.1 1% | |||
| WiFi v1.3 (h) | 4 | 3.8 -5% | 5.3 33% | 5.3 33% | 4.8 20% | 4.2 5% |
| Load (h) | 1.3 | 1.7 31% | 1.4 8% | 1.3 0% | 1.8 38% | |
| H.264 (h) | 4.8 | 6 | 2.2 | 4.9 |
Pro
Contra
Veredicto - Me encanta el hardware, odio los fallos
Nos fuimos impresionados por el Blade 16pero no podemos decir lo mismo del Blade 18. Nuestra unidad presentaba problemas importantes, como un rendimiento DLSS 3 deficiente en un monitor externo, falta de compatibilidad con G-Sync cuando se supone que G-Sync está incluido, y una pantalla parpadeante potencialmente defectuosa. Hemos considerado la posibilidad de no publicar este análisis hasta que se solucionen estos problemas, pero el Blade 18 ya se está enviando a los clientes, por lo que nos ha parecido oportuno informar a nuestros lectores que puedan estar interesados en adquirir uno. Esta página se actualizará con la puntuación final una vez que el fabricante nos dé una solución adecuada.
El Blade 18 muestra potencial para ser otra excelente adición a la familia Blade cuando se mira más allá de los problemas anteriores. La pantalla de 18 pulgadas es magnífica y enorme en relación con su tamaño y peso. El hecho de que el sistema no sea mucho más grande o pesado que el Blade 17 debería hacerlo muy atractivo para los usuarios que ya estén considerando un Blade 17 u otro portátil de juego de 17 pulgadas. Su adaptador de CA GaN relativamente pequeño contribuye aún más a la naturaleza híbrida portátil-DTR del Blade 18.
El Blade 18 puede sonar enorme al principio, pero en realidad no es mucho más grande que el Blade 17 existente. Su gran pantalla y su elevada relación pantalla/cuerpo son impresionantes.
En cuanto a la RTX 4070 móvil, su rendimiento puede ser decepcionante dependiendo del juego. Los títulos compatibles con DLSS 3 funcionan como la mantequilla en la RTX 4070 para móviles. De lo contrario, el rendimiento será similar al de la RTX 3080 para móviles del año pasado o al de una RTX 3070 de sobremesa. Afortunadamente, la lista de títulos compatibles con DLSS 3 no ha dejado de crecer.
En general, es un buen comienzo para la serie Blade de 18 pulgadas, empañado por algunos problemas de lanzamiento notables. Los próximos Asus ROG Strix Scar 18 y Dell Alienware m18 podrían suponer un problema para el Blade 18 si no se solucionan algunos problemas clave.
Precio y disponibilidad
Transparencia
La selección de los dispositivos que se van a reseñar corre a cargo de nuestro equipo editorial. La muestra de prueba fue proporcionada al autor en calidad de préstamo por el fabricante o el minorista a los efectos de esta reseña. El prestamista no tuvo ninguna influencia en esta reseña, ni el fabricante recibió una copia de la misma antes de su publicación. No había ninguna obligación de publicar esta reseña. Como empresa de medios independiente, Notebookcheck no está sujeta a la autoridad de fabricantes, minoristas o editores.
Así es como prueba Notebookcheck
Cada año, Notebookcheck revisa de forma independiente cientos de portátiles y smartphones utilizando procedimientos estandarizados para asegurar que todos los resultados son comparables. Hemos desarrollado continuamente nuestros métodos de prueba durante unos 20 años y hemos establecido los estándares de la industria en el proceso. En nuestros laboratorios de pruebas, técnicos y editores experimentados utilizan equipos de medición de alta calidad. Estas pruebas implican un proceso de validación en varias fases. Nuestro complejo sistema de clasificación se basa en cientos de mediciones y puntos de referencia bien fundamentados, lo que mantiene la objetividad.Price comparison

