Análisis del portátil MSI Titan 18 HX A14VIG: El año del dragón

En el CES 2023, preguntamos a MSI por qué no tenía ningún portátil para juegos de 18 pulgadas en preparación cuando Asus, Alienware y Razer estaban lanzando sus respectivas ofertas de 18 pulgadas. No fue hasta el CES 2024 cuando por fin vimos un modelo MSI de 18 pulgadas propiamente dicho en forma de la Titan 18 HX. Puede que llegue un poco tarde a la fiesta, pero sus especificaciones y hardware son igual de competitivos.
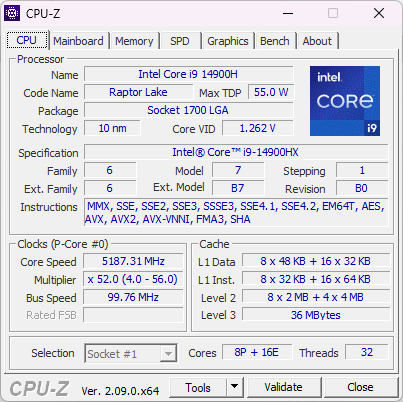
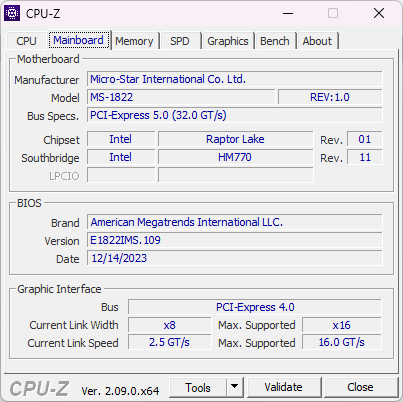
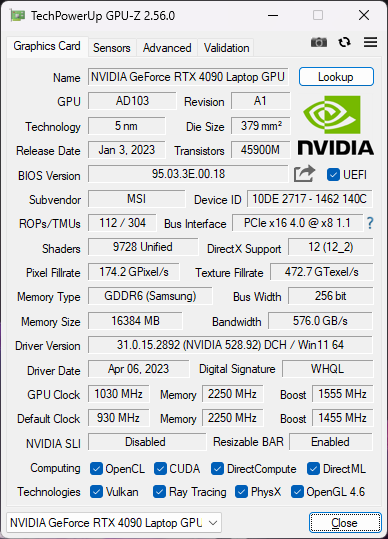
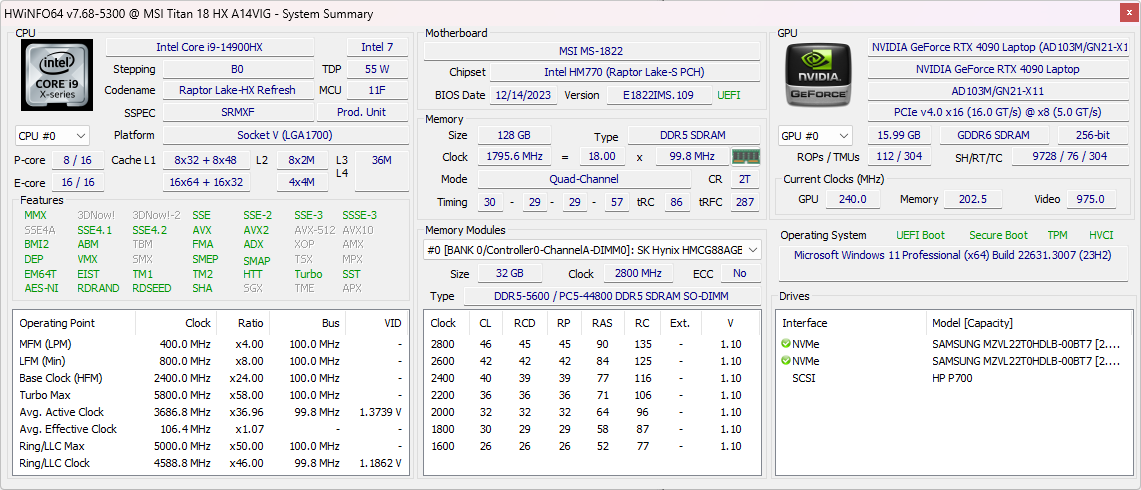
Nuestra configuración de revisión viene equipada con la nueva CPU Intel Raptor Lake Core i9-14900HX de 14ª generación, GPU GeForce RTX 4090 de 175 W y pantalla Mini-LED 4K (2400p) de 120 Hz por aproximadamente 4999 USD. No hay configuraciones inferiores disponibles con diferentes CPU, GPU o pantallas en el momento de escribir el significado.
Las alternativas a la Titan 18 HX incluyen otras portátiles para juegos de 18 pulgadas como la Asus ROG Strix G18, Alienware m18, Razer Blade 18, o el Acer Predator Helios 18.
Más opiniones sobre MSI:
Posibles contendientes en la comparación
Valoración | Fecha | Modelo | Peso | Altura | Tamaño | Resolución | Precio |
|---|---|---|---|---|---|---|---|
| 88.8 % v7 (old) | 01/2024 | MSI Titan 18 HX A14VIG i9-14900HX, GeForce RTX 4090 Laptop GPU | 3.6 kg | 32.1 mm | 18.00" | 3840x2400 | |
| 89 % v7 (old) | 02/2023 | MSI Titan GT77 HX 13VI i9-13950HX, GeForce RTX 4090 Laptop GPU | 3.5 kg | 23 mm | 17.30" | 3840x2160 | |
| 90.7 % v7 (old) | 04/2023 | Alienware m18 R1 i9-13980HX, GeForce RTX 4090 Laptop GPU | 3.9 kg | 26.7 mm | 18.00" | 1920x1200 | |
| 87.4 % v7 (old) | 03/2023 | Asus ROG Strix G18 G814JI i7-13650HX, GeForce RTX 4070 Laptop GPU | 3 kg | 31 mm | 18.00" | 2560x1600 | |
| 88.3 % v7 (old) | 10/2023 | Acer Predator Helios 18 N23Q2 i9-13900HX, GeForce RTX 4080 Laptop GPU | 3.2 kg | 29.15 mm | 18.00" | 2560x1600 | |
| 91.4 % v7 (old) | 02/2023 | Razer Blade 18 RTX 4070 i9-13950HX, GeForce RTX 4070 Laptop GPU | 3 kg | 21.9 mm | 18.00" | 2560x1600 |
Caja - Menos LEDs RGB
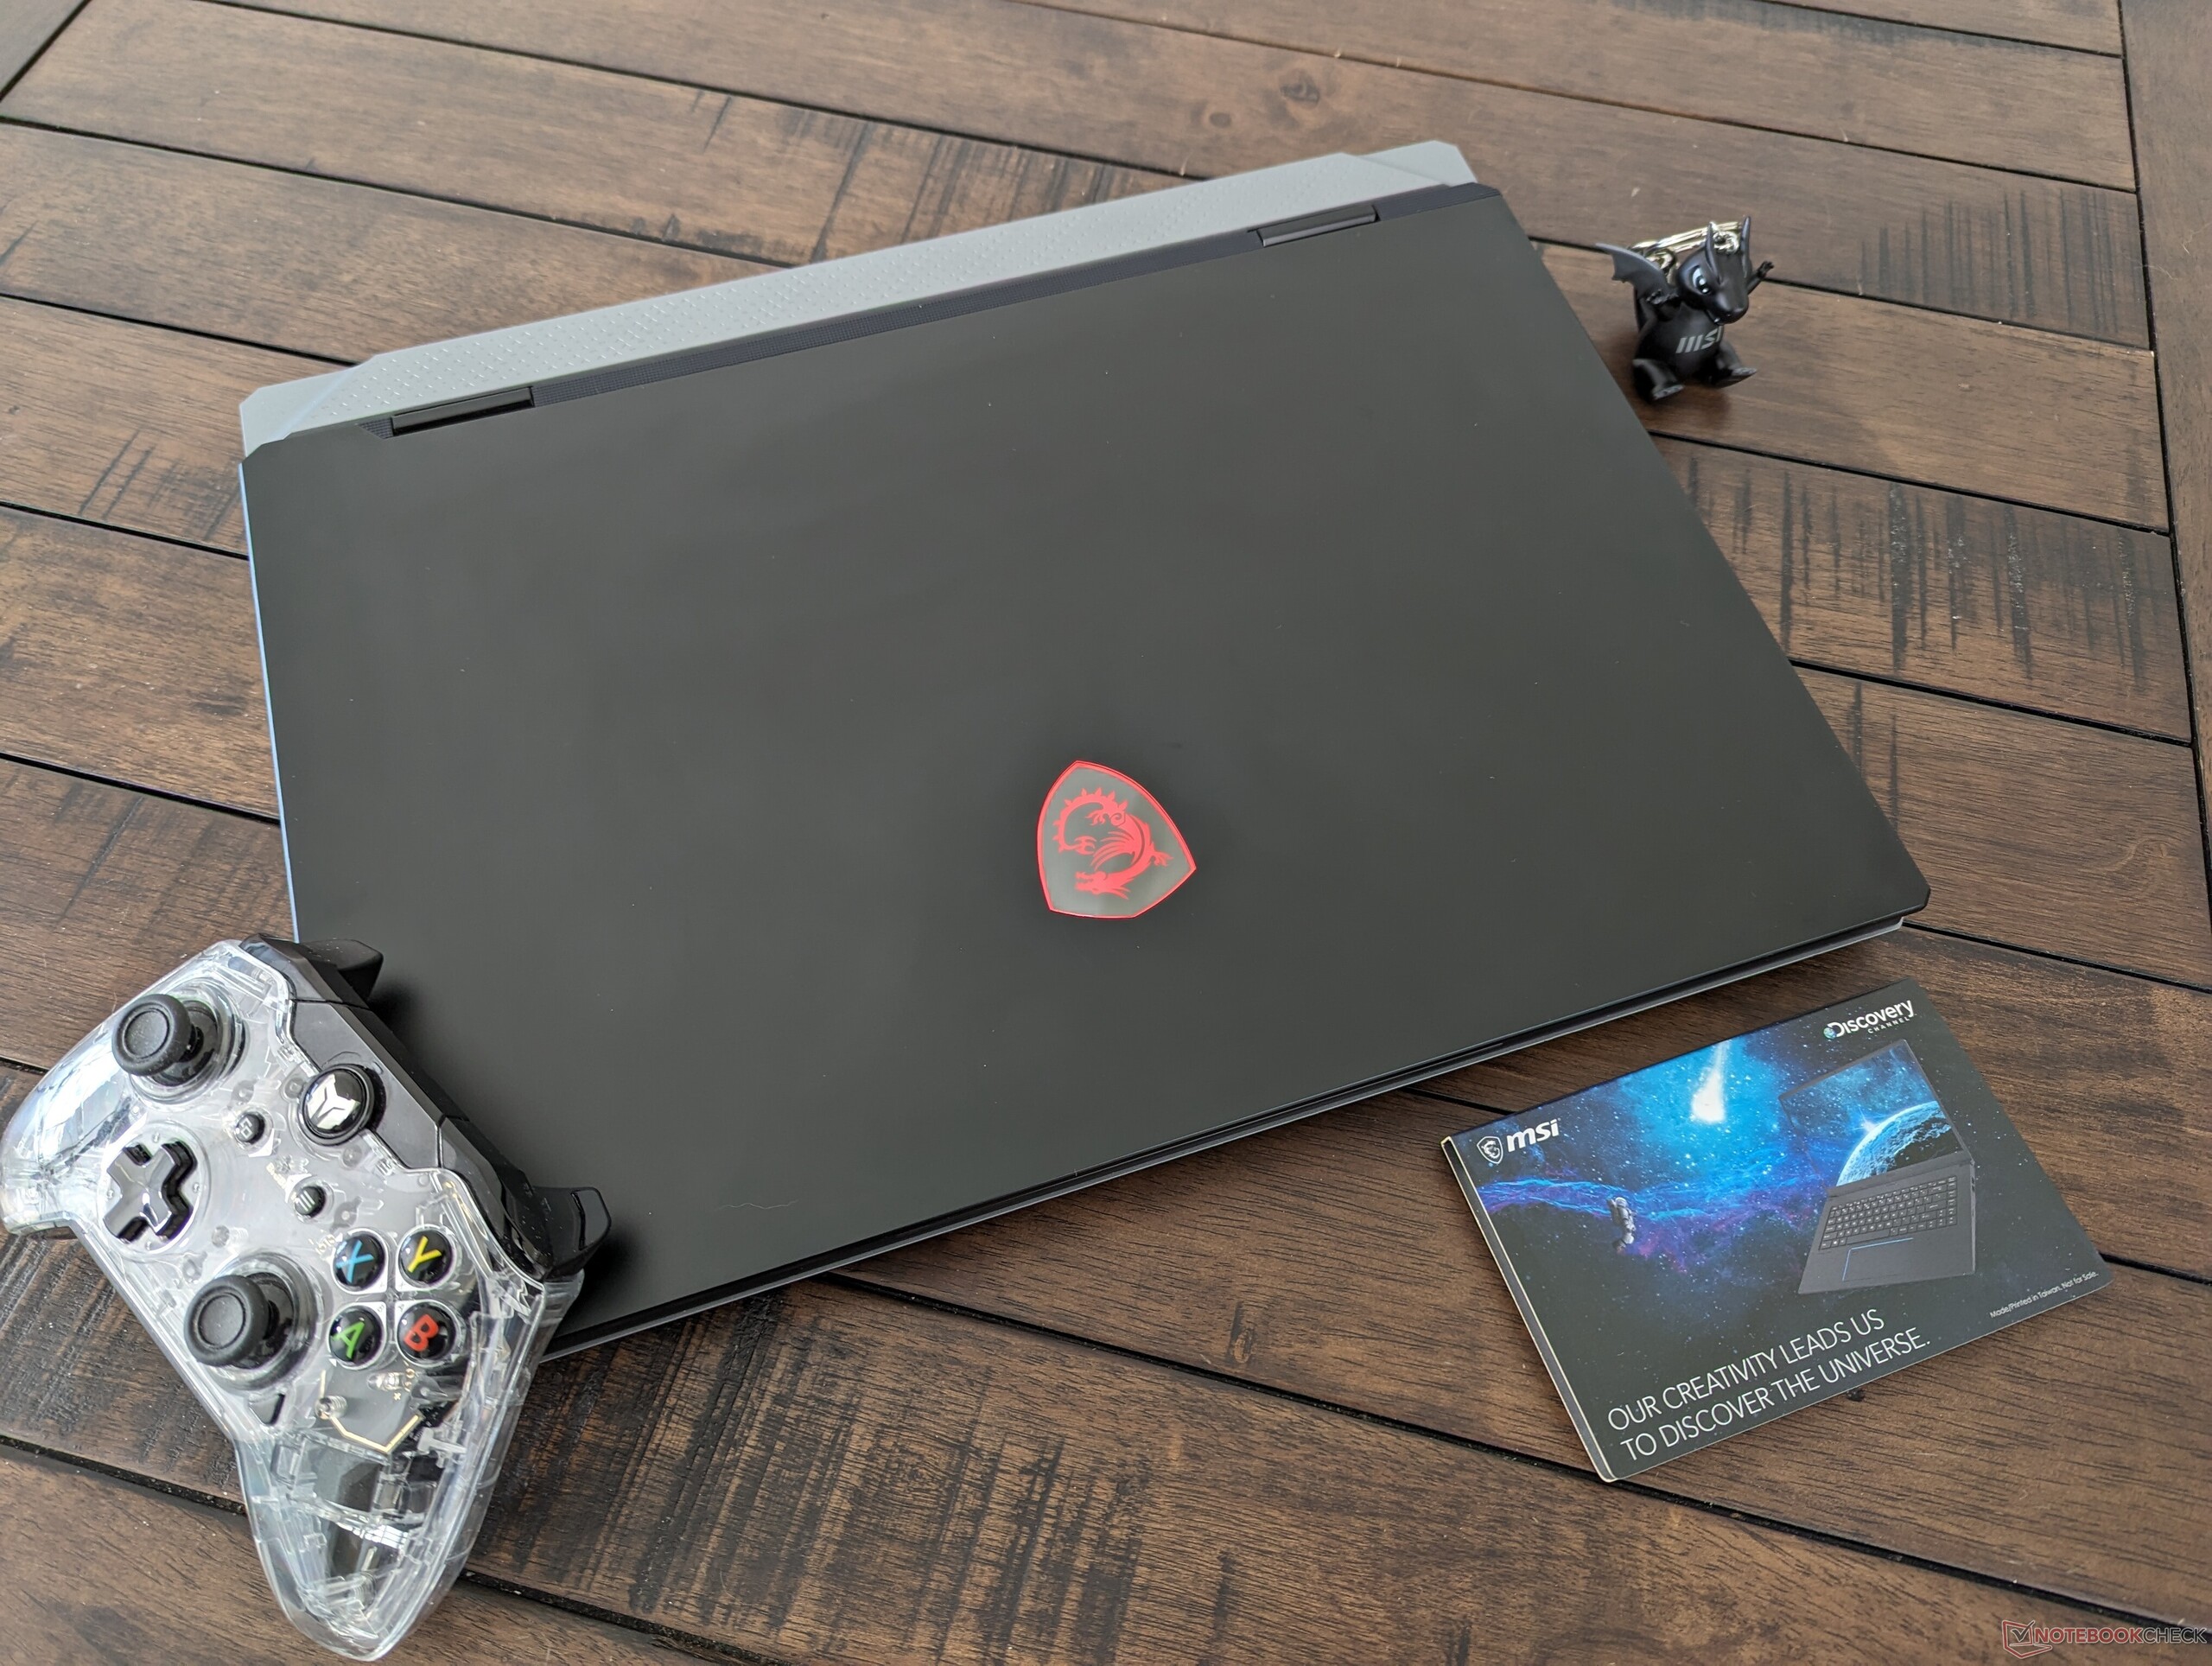
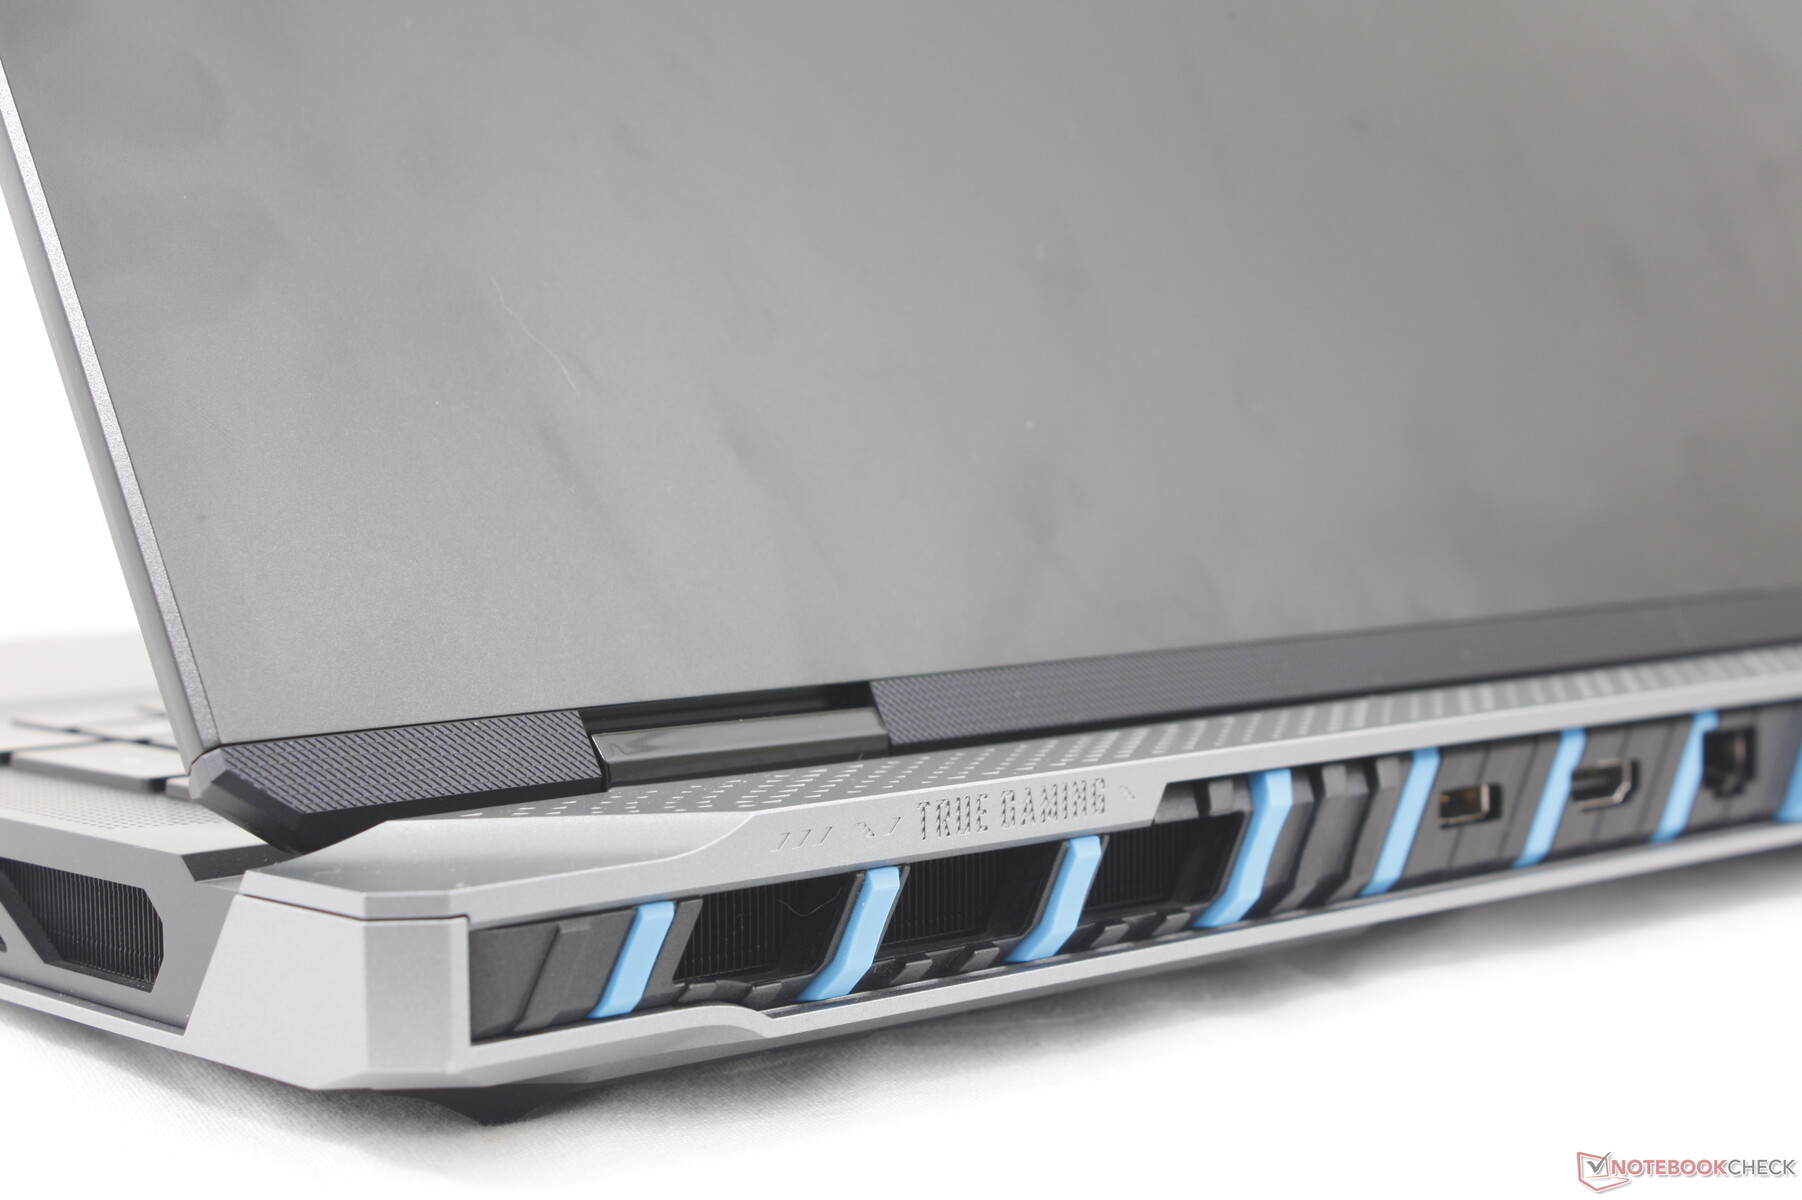
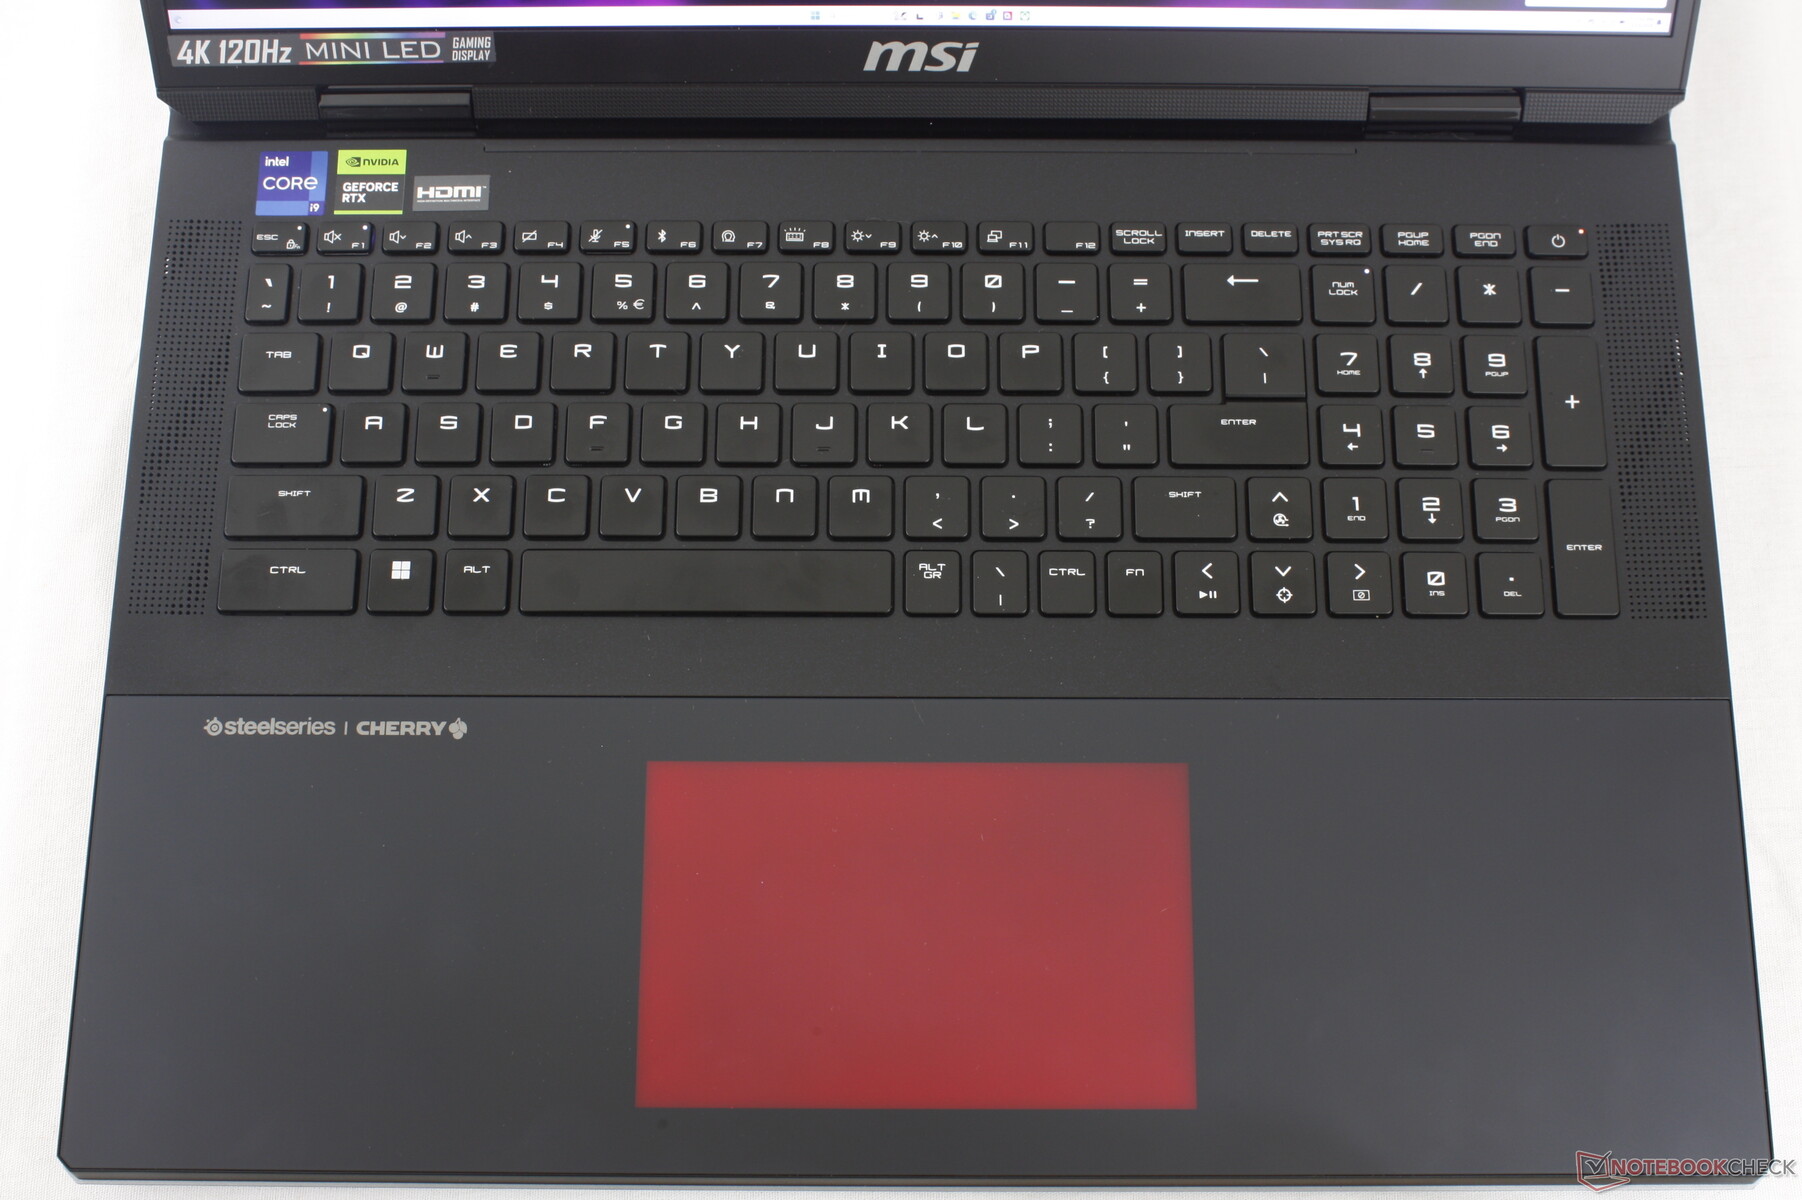
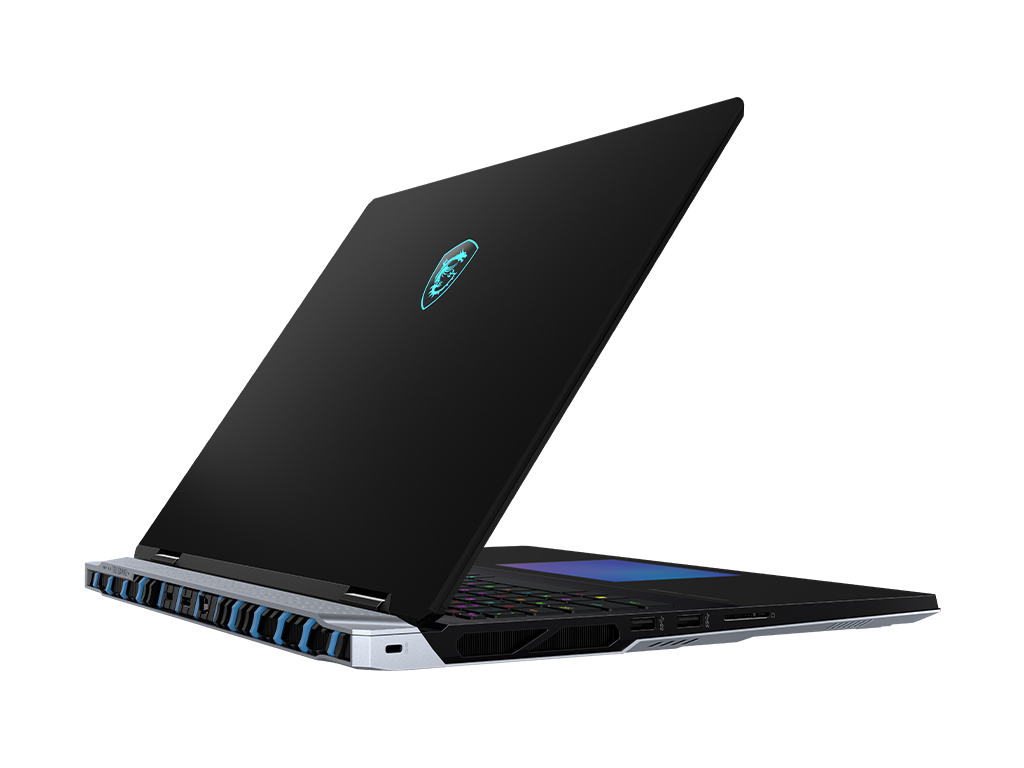
El nuevo chasis es una evolución de la Titan GT77 en lugar de la GE78, más llamativa y de inspiración retro. En comparación con el GT77, el Titan 18 añade colores plata y azul en dos tonos para complementar el exterior, que por lo demás es negro azabache. MSI también huye de la iluminación RGB "innecesaria" al eliminar la barra de LED de la parte trasera.
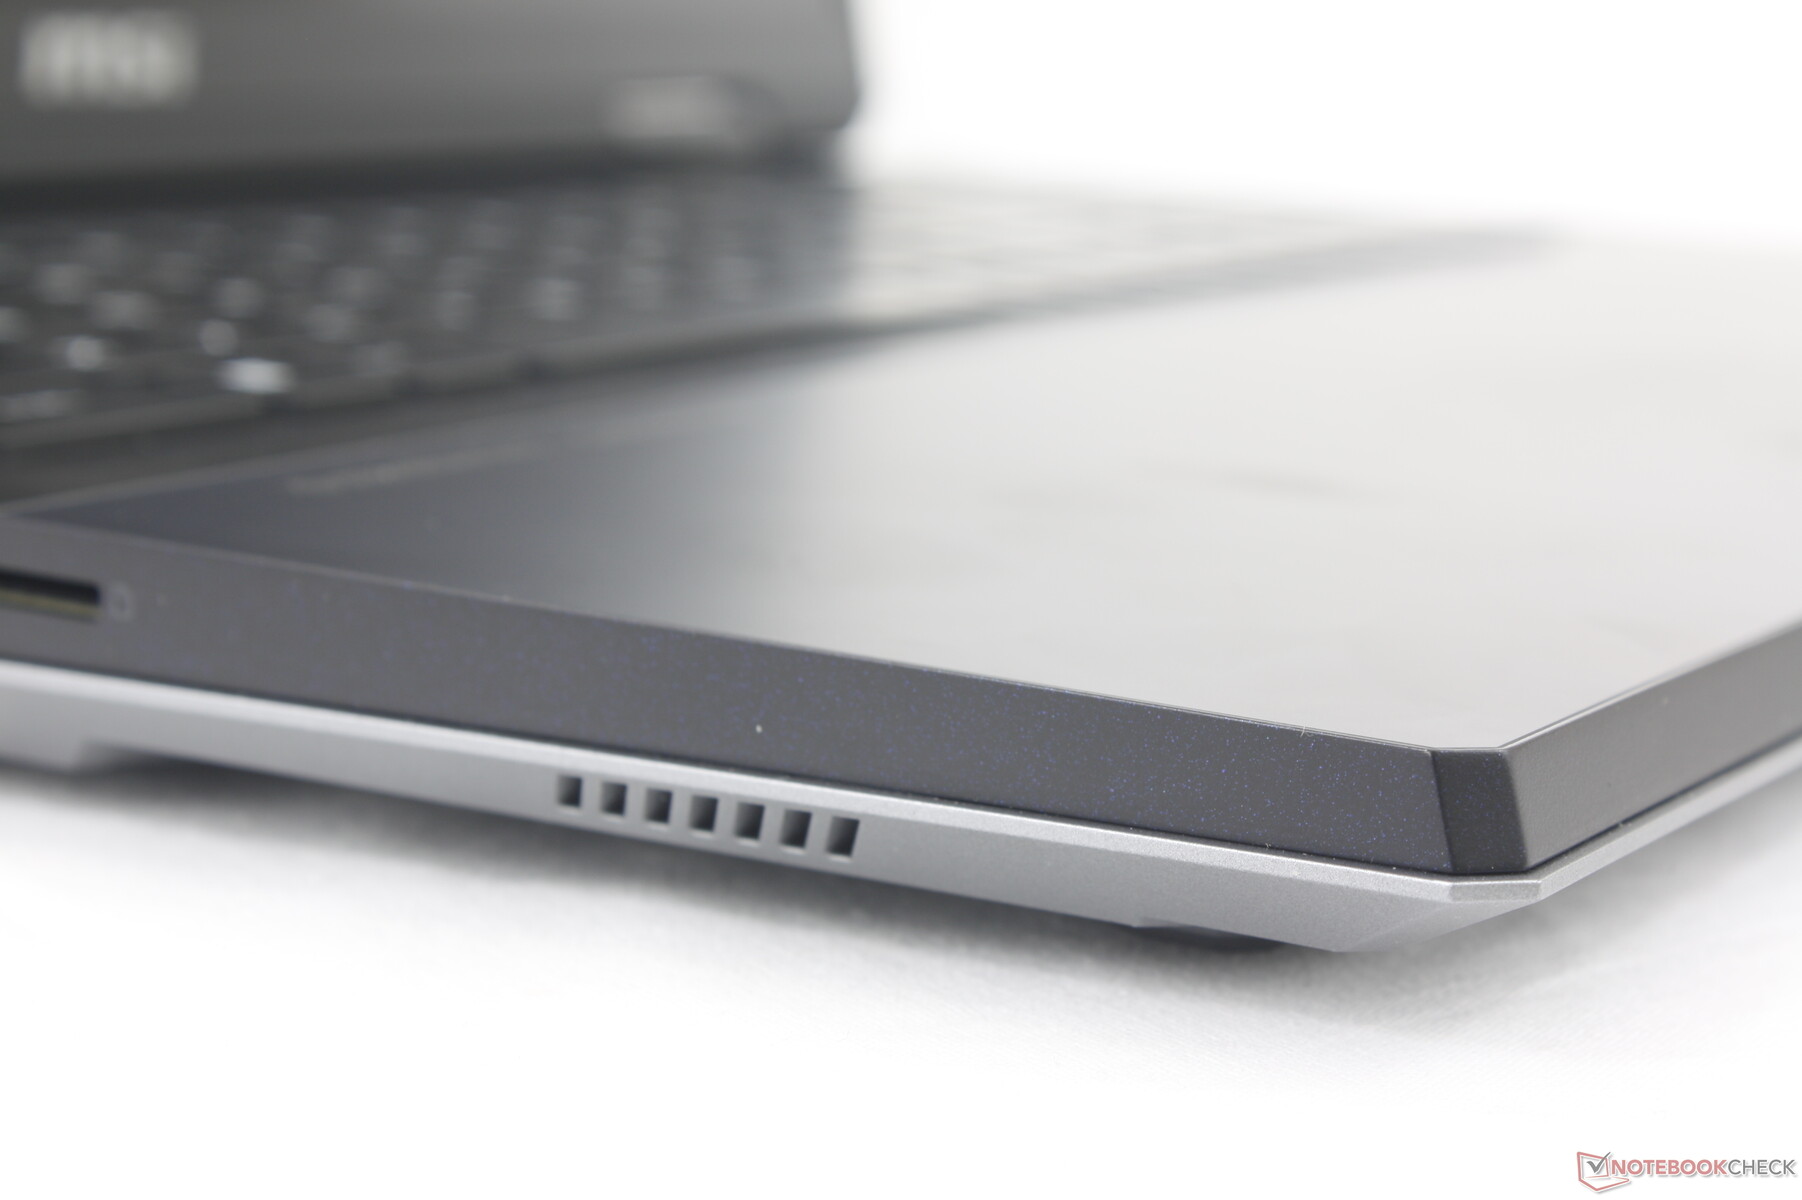
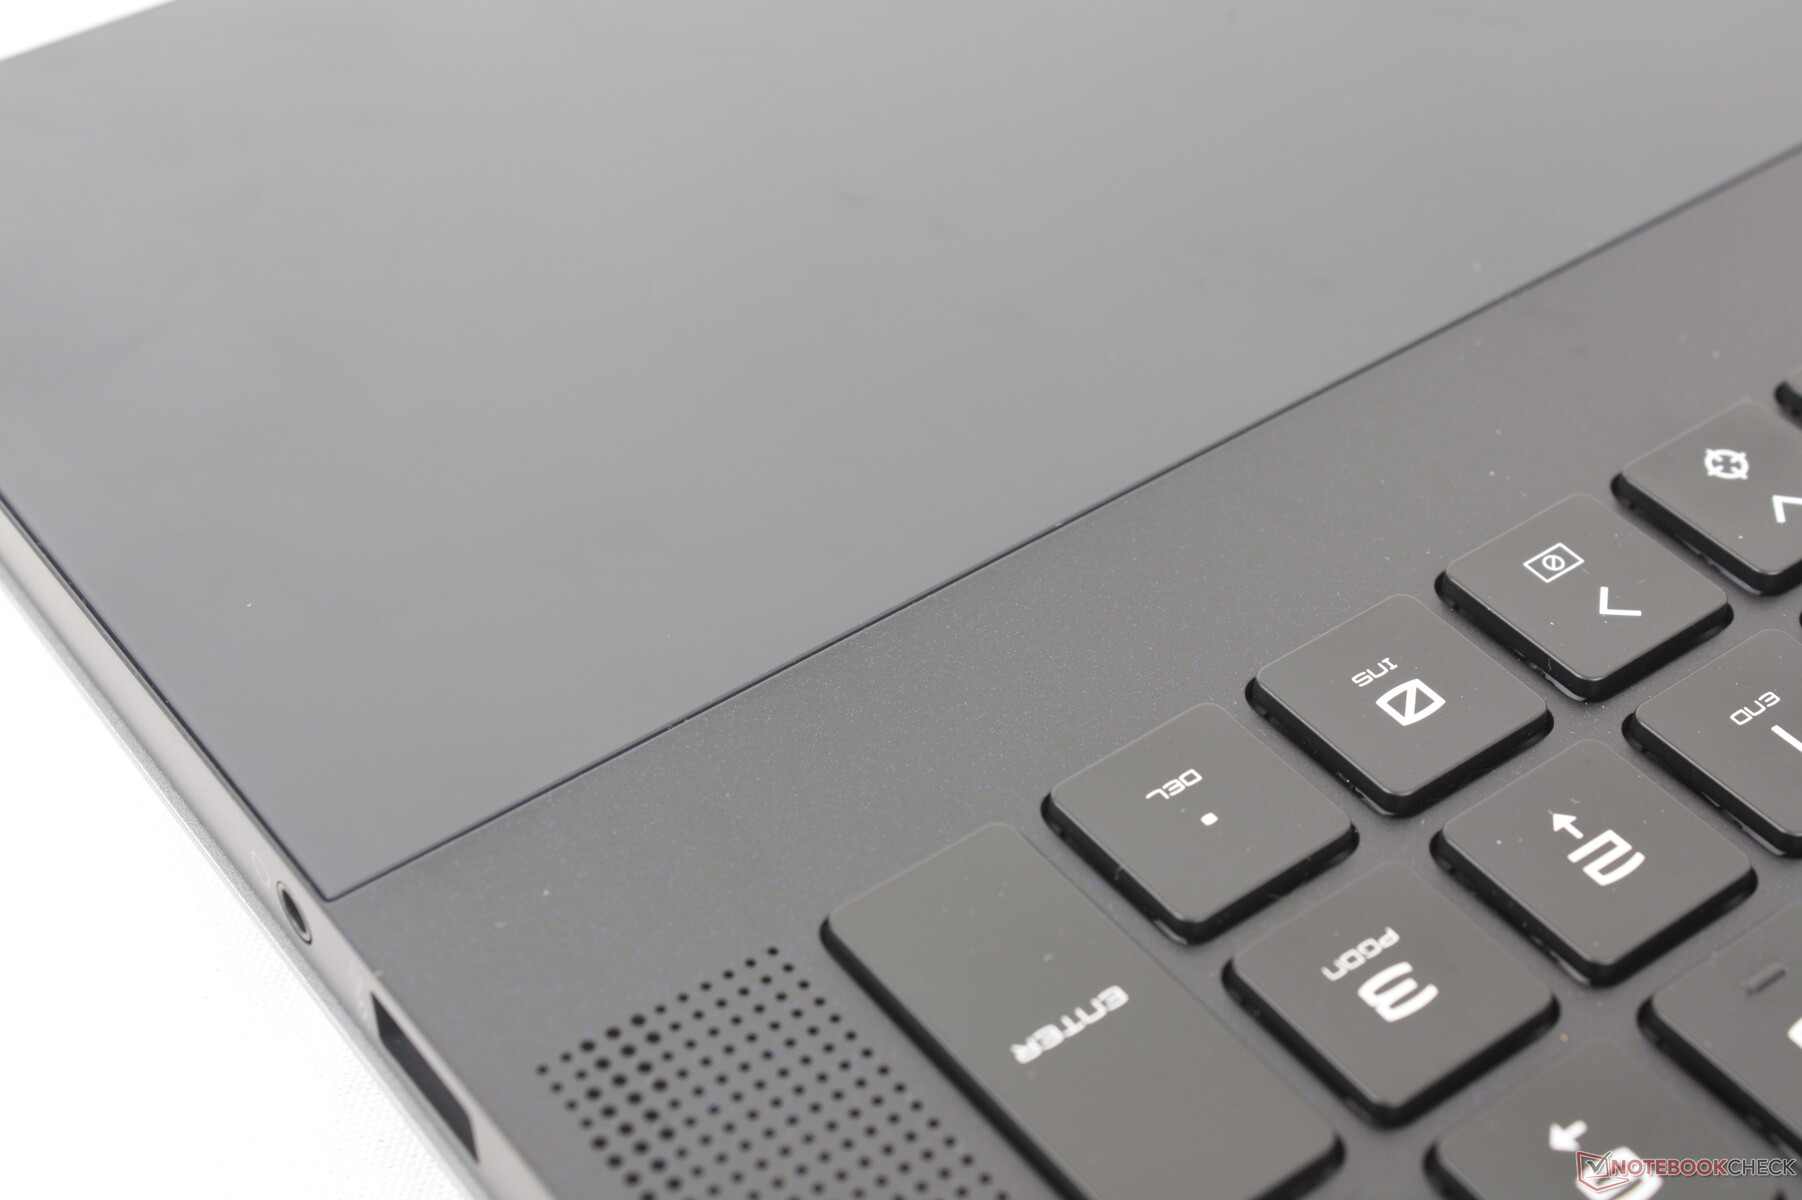
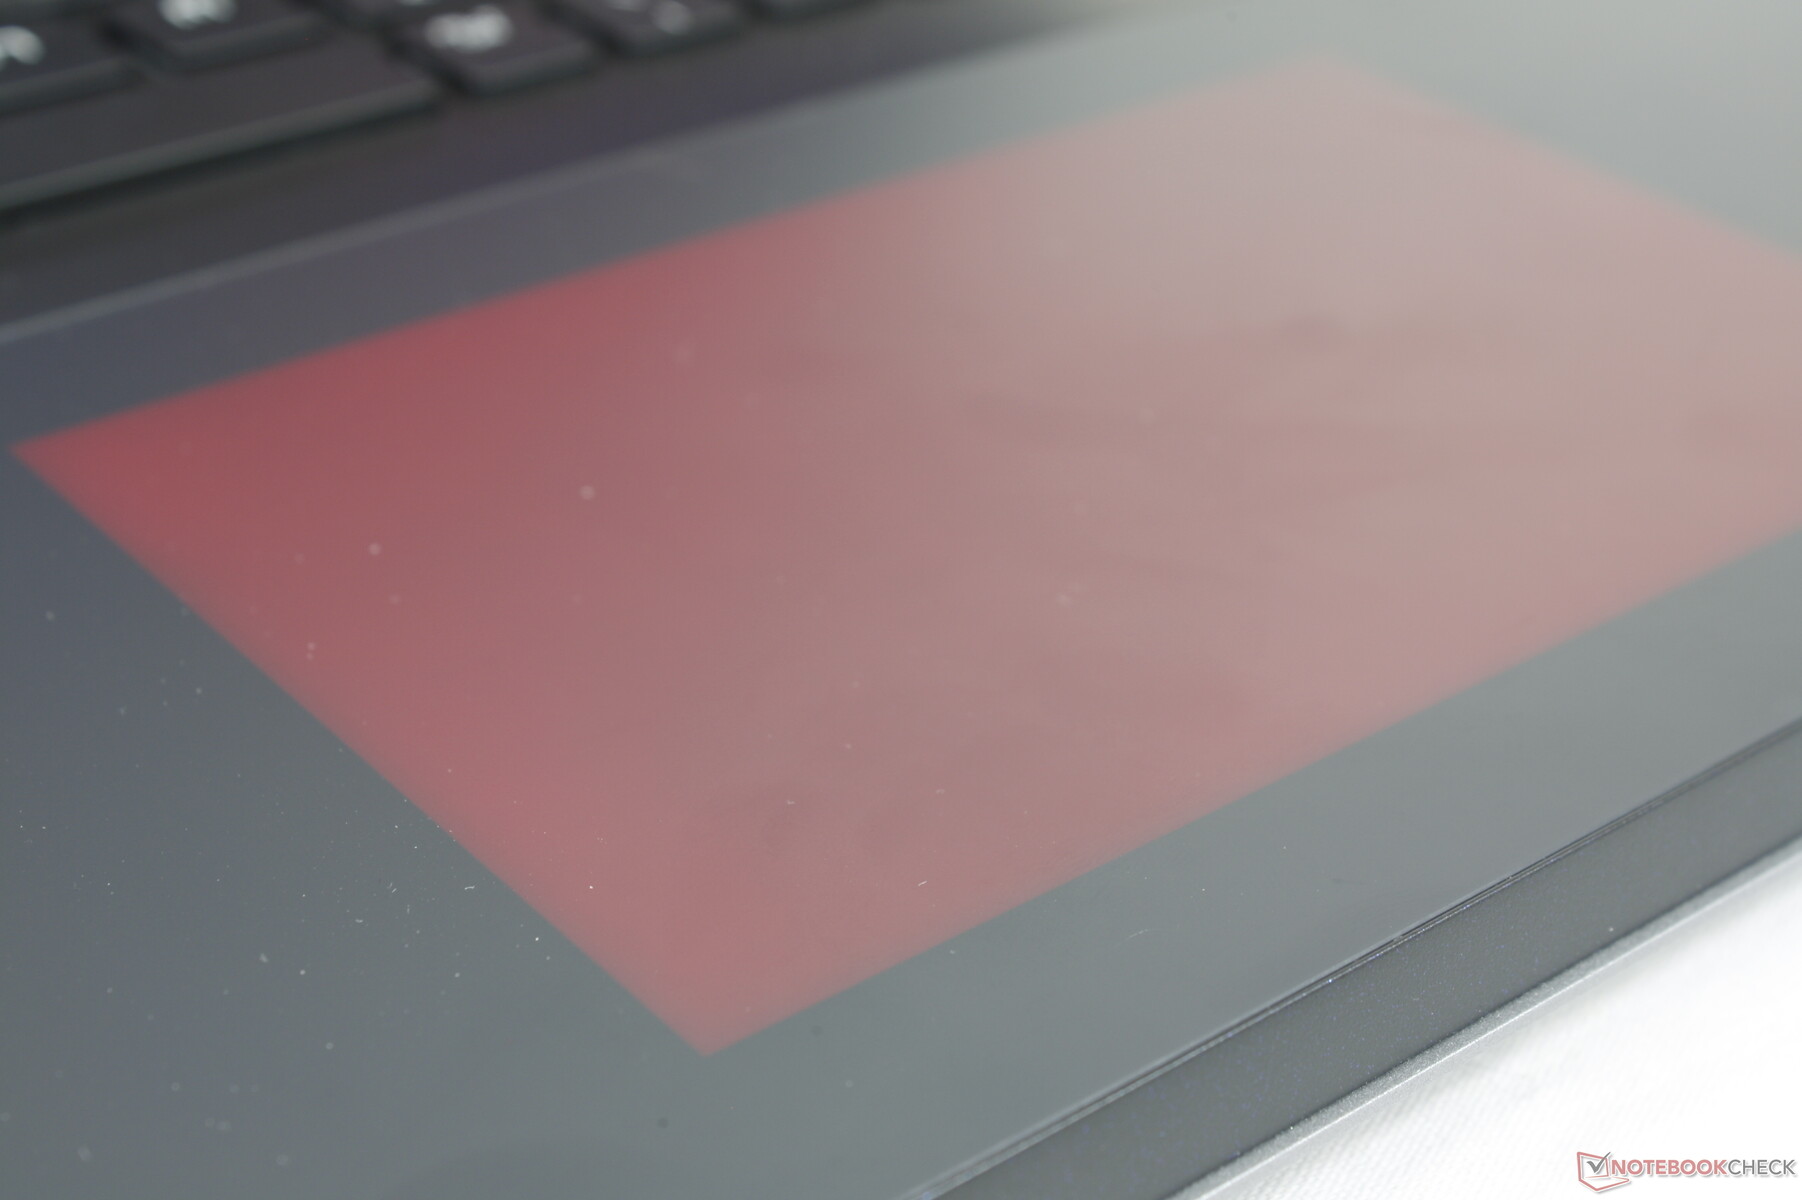
Quizá el aspecto más reconocible de la Titan 18 sea el cristal plano que se extiende por los reposamuñecas y el clickpad. El clickpad queda así enrasado con los reposamuñecas y se ilumina con efectos RGB. El resultado final es un diseño más elegante y suave que conserva la estética gamer de gama alta.
La rigidez del chasis de aleación de magnesio y aluminio es excelente y sólo se deforma ligeramente al presionar el centro del teclado. Ciertamente se siente más lujoso que las superficies de plástico habituales de los modelos MSI más baratos como el Cyborg o el Katana. Sin embargo, las bisagras podrían haber sido más firmes para una mayor sensación de longevidad y todo el sistema es un enorme imán de huellas dactilares.
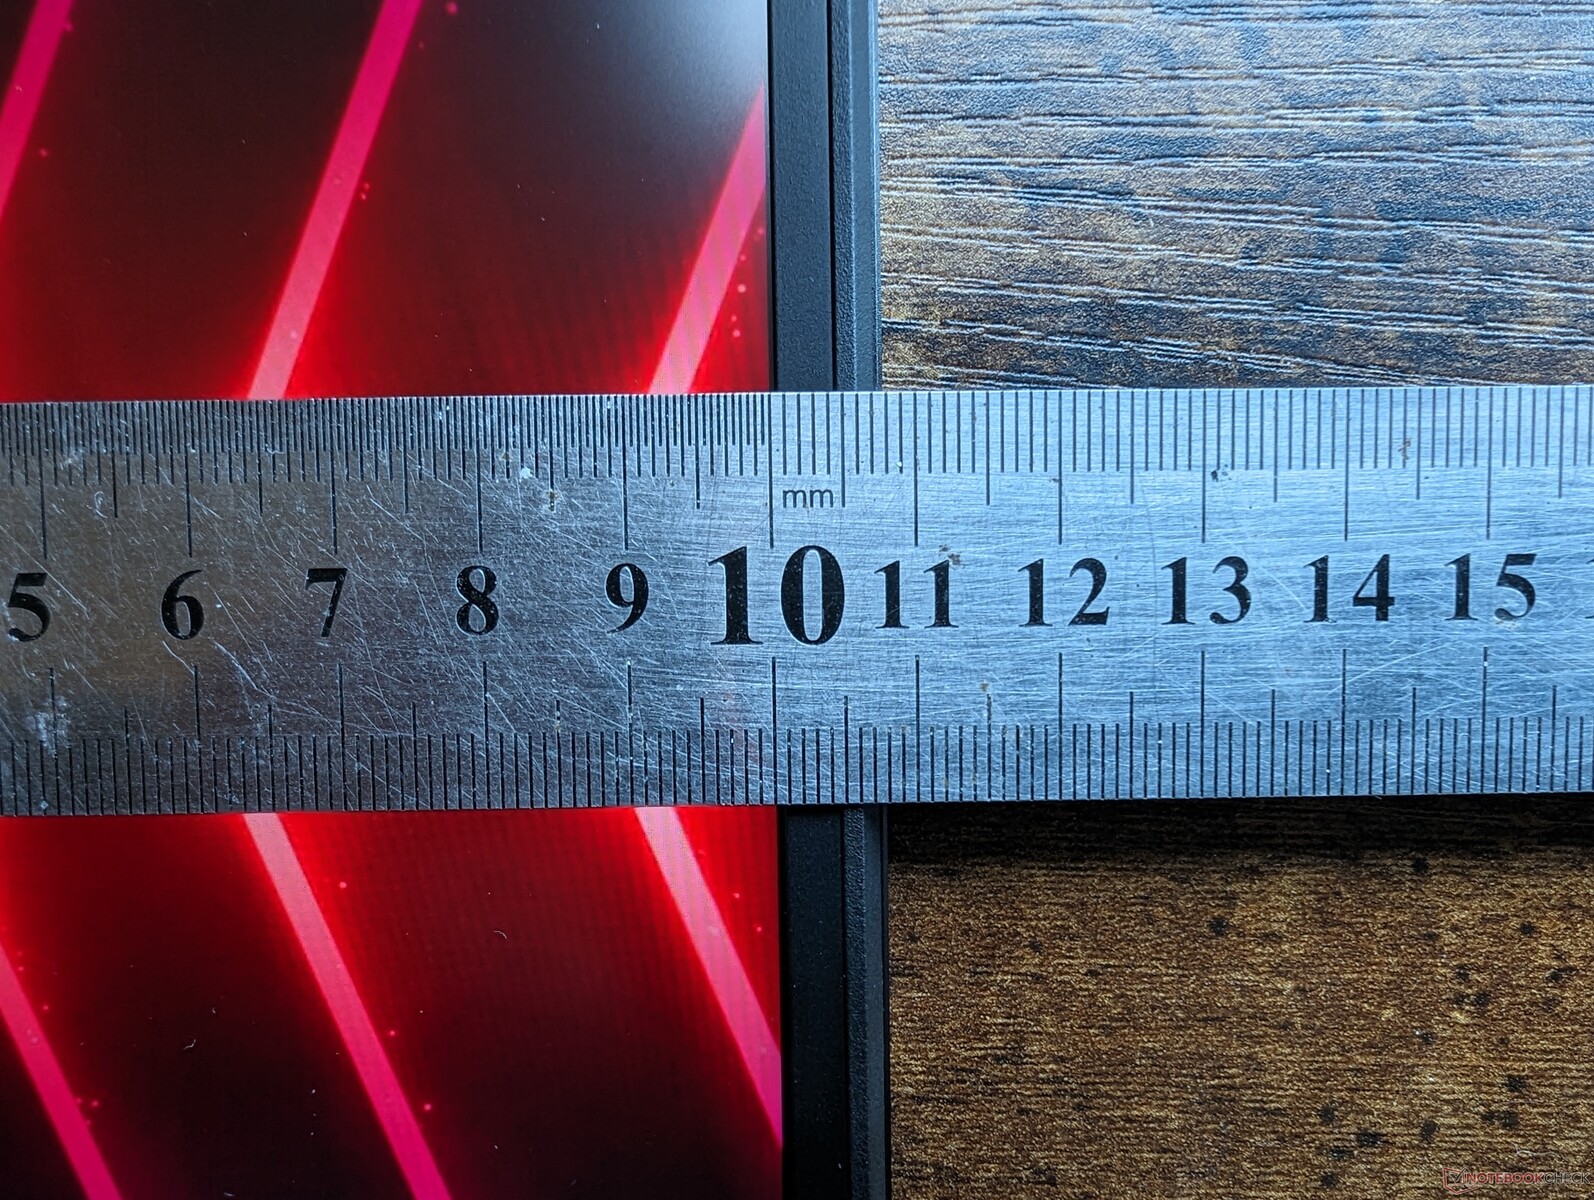
En particular, la Titan 18 HX 16:10 de 18 pulgadas ocupa menos espacio que la 16:9 de 17,3 pulgadas Titan GT77 debido a su parte trasera más corta. A su vez, sin embargo, el modelo más nuevo es notablemente más grueso en casi 10 mm para ser uno de los portátiles para juegos de 18 pulgadas más gruesos disponibles. No es necesariamente el más pesado, ya que esa corona se la lleva el Alienware m18 R1, pero sigue siendo notablemente más pesado que el Asus ROG Strix G18 o el Razer Blade 18 en más de 500 g cada uno.
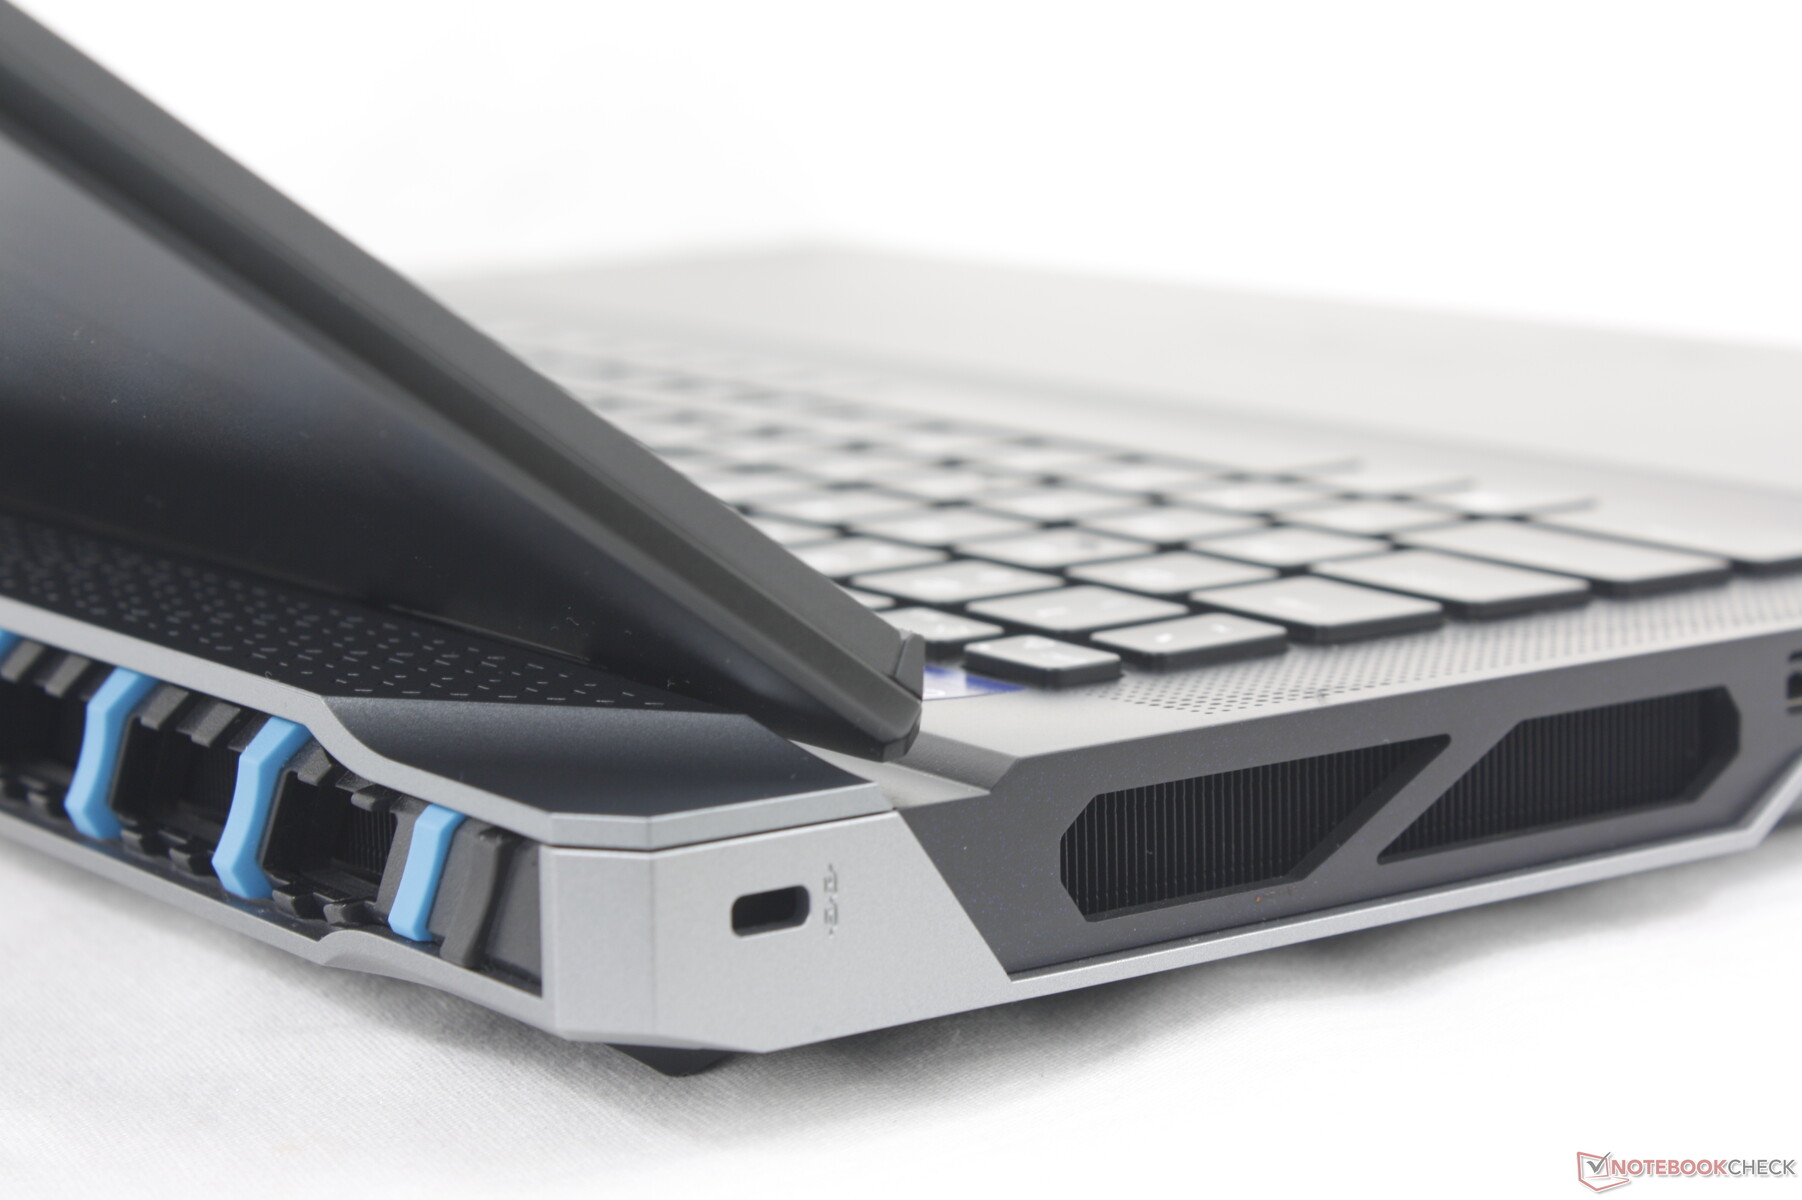
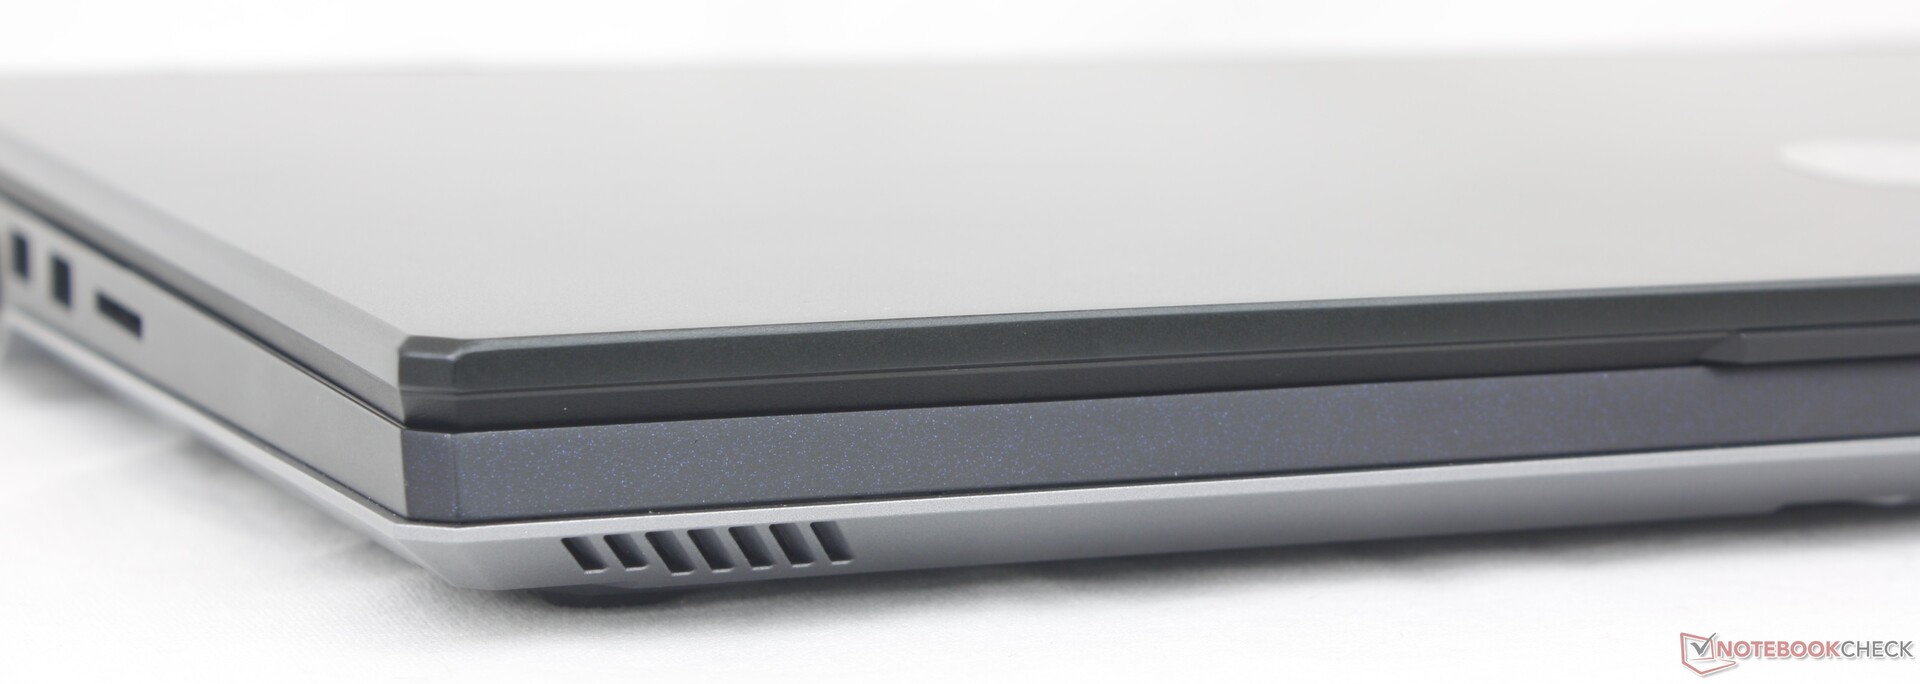
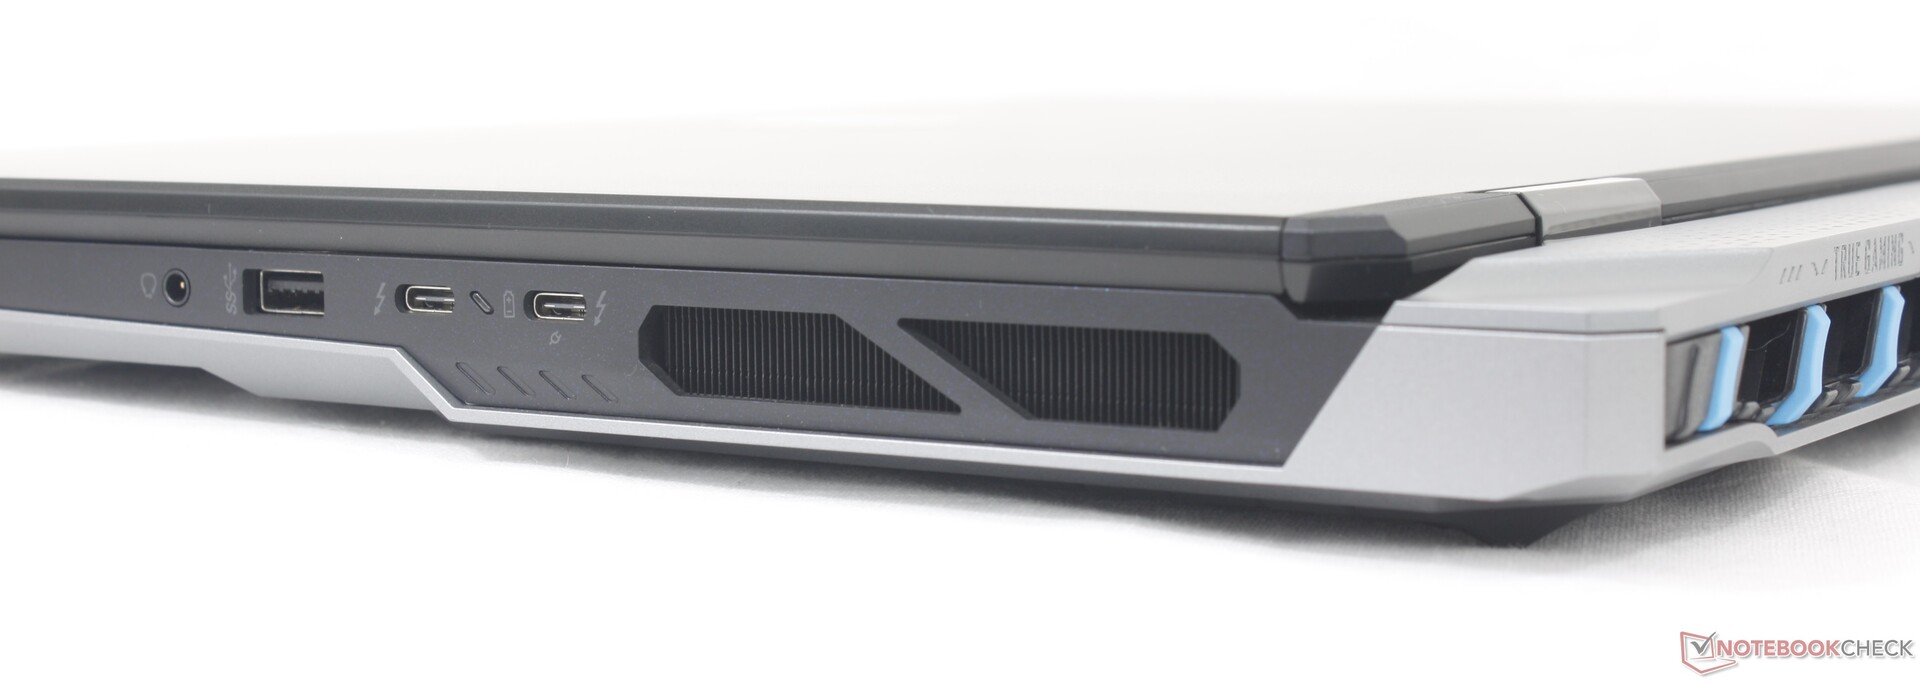
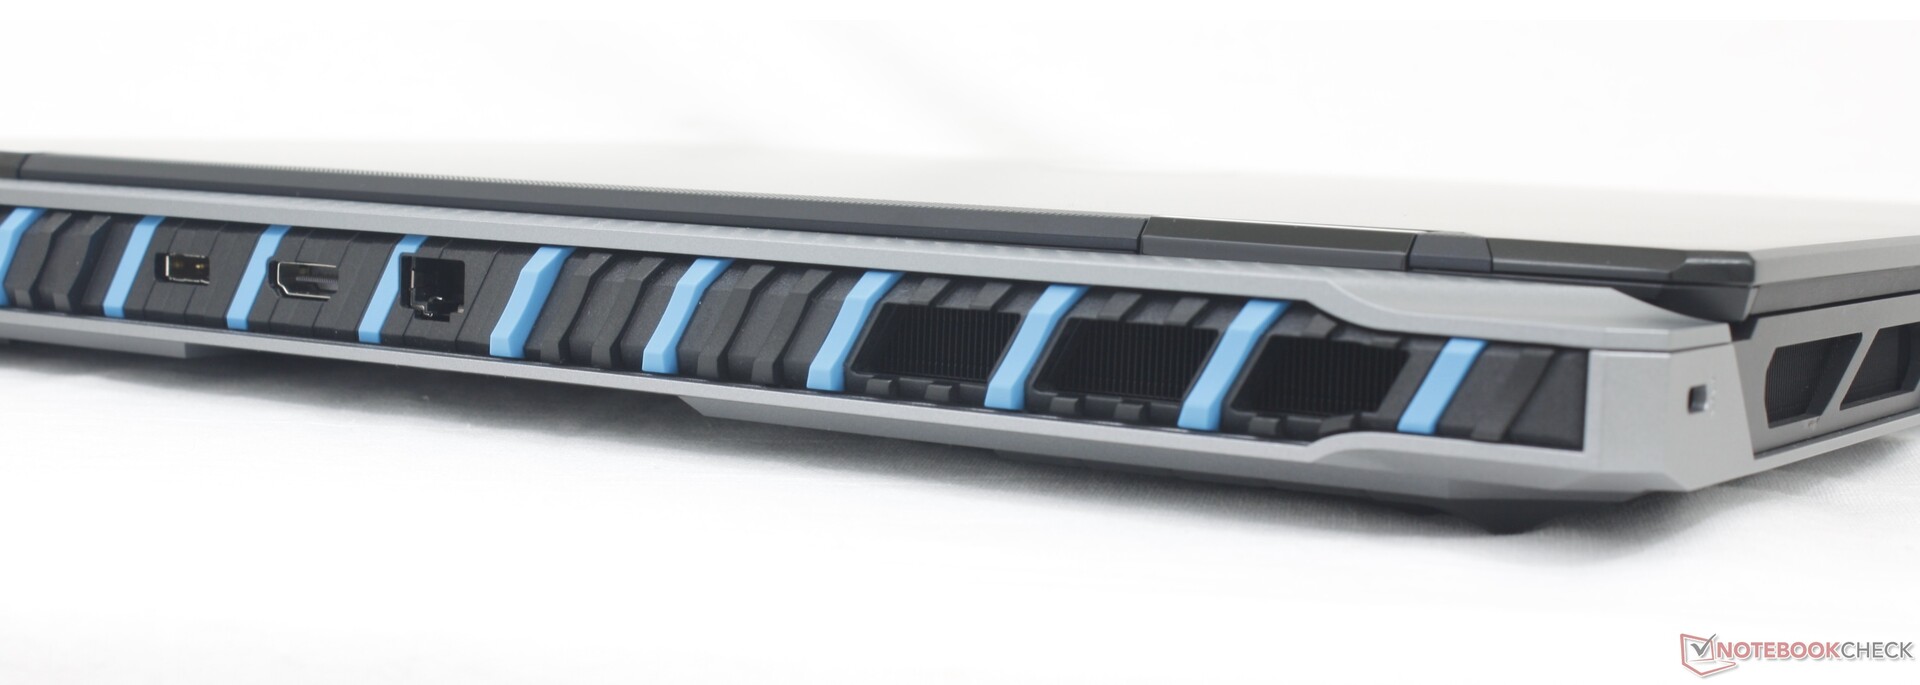
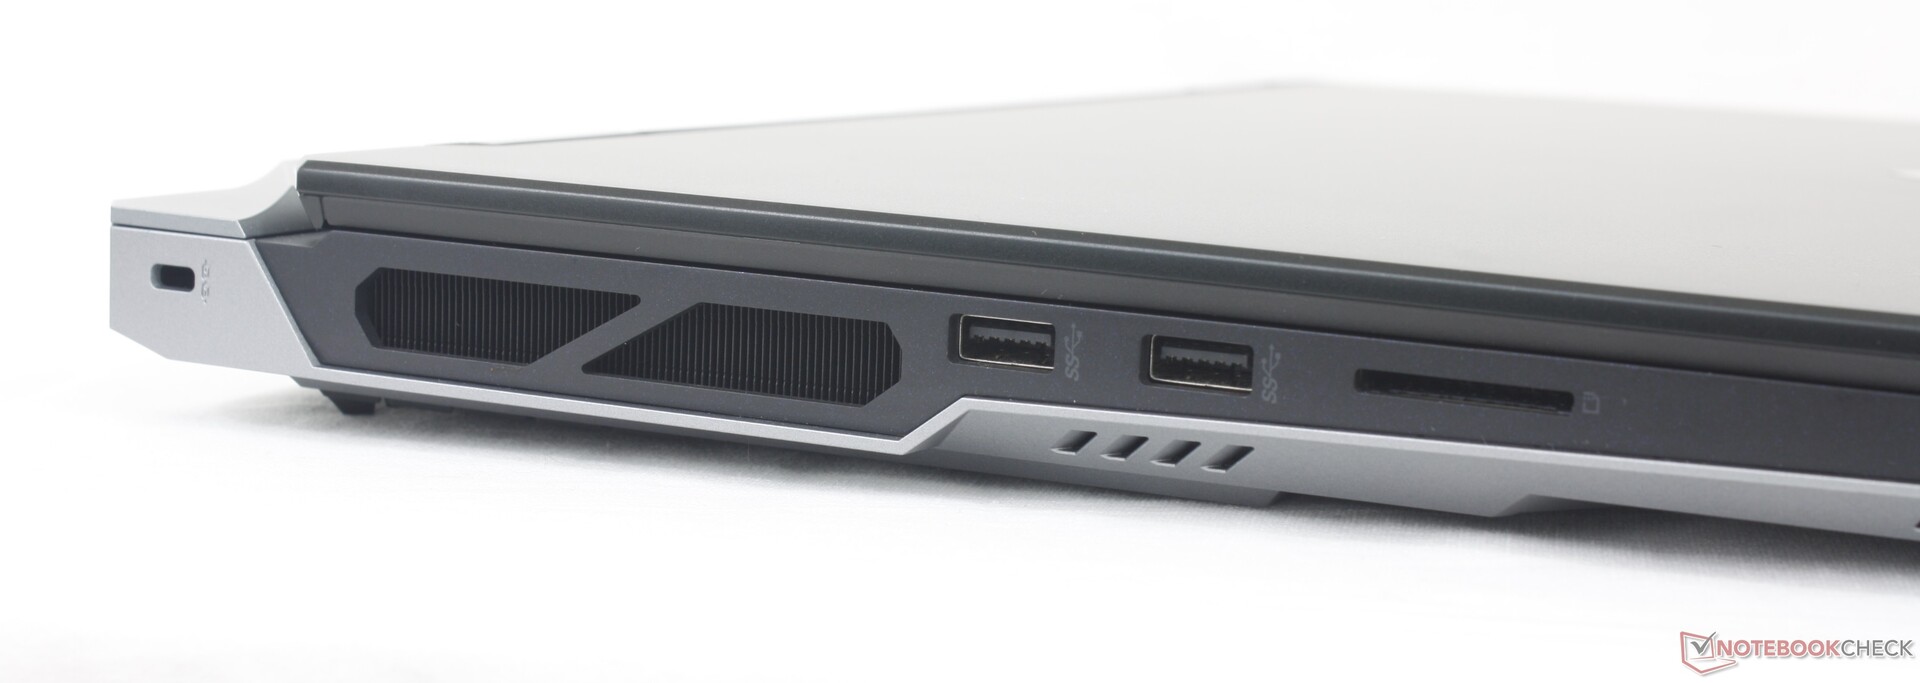
Conectividad
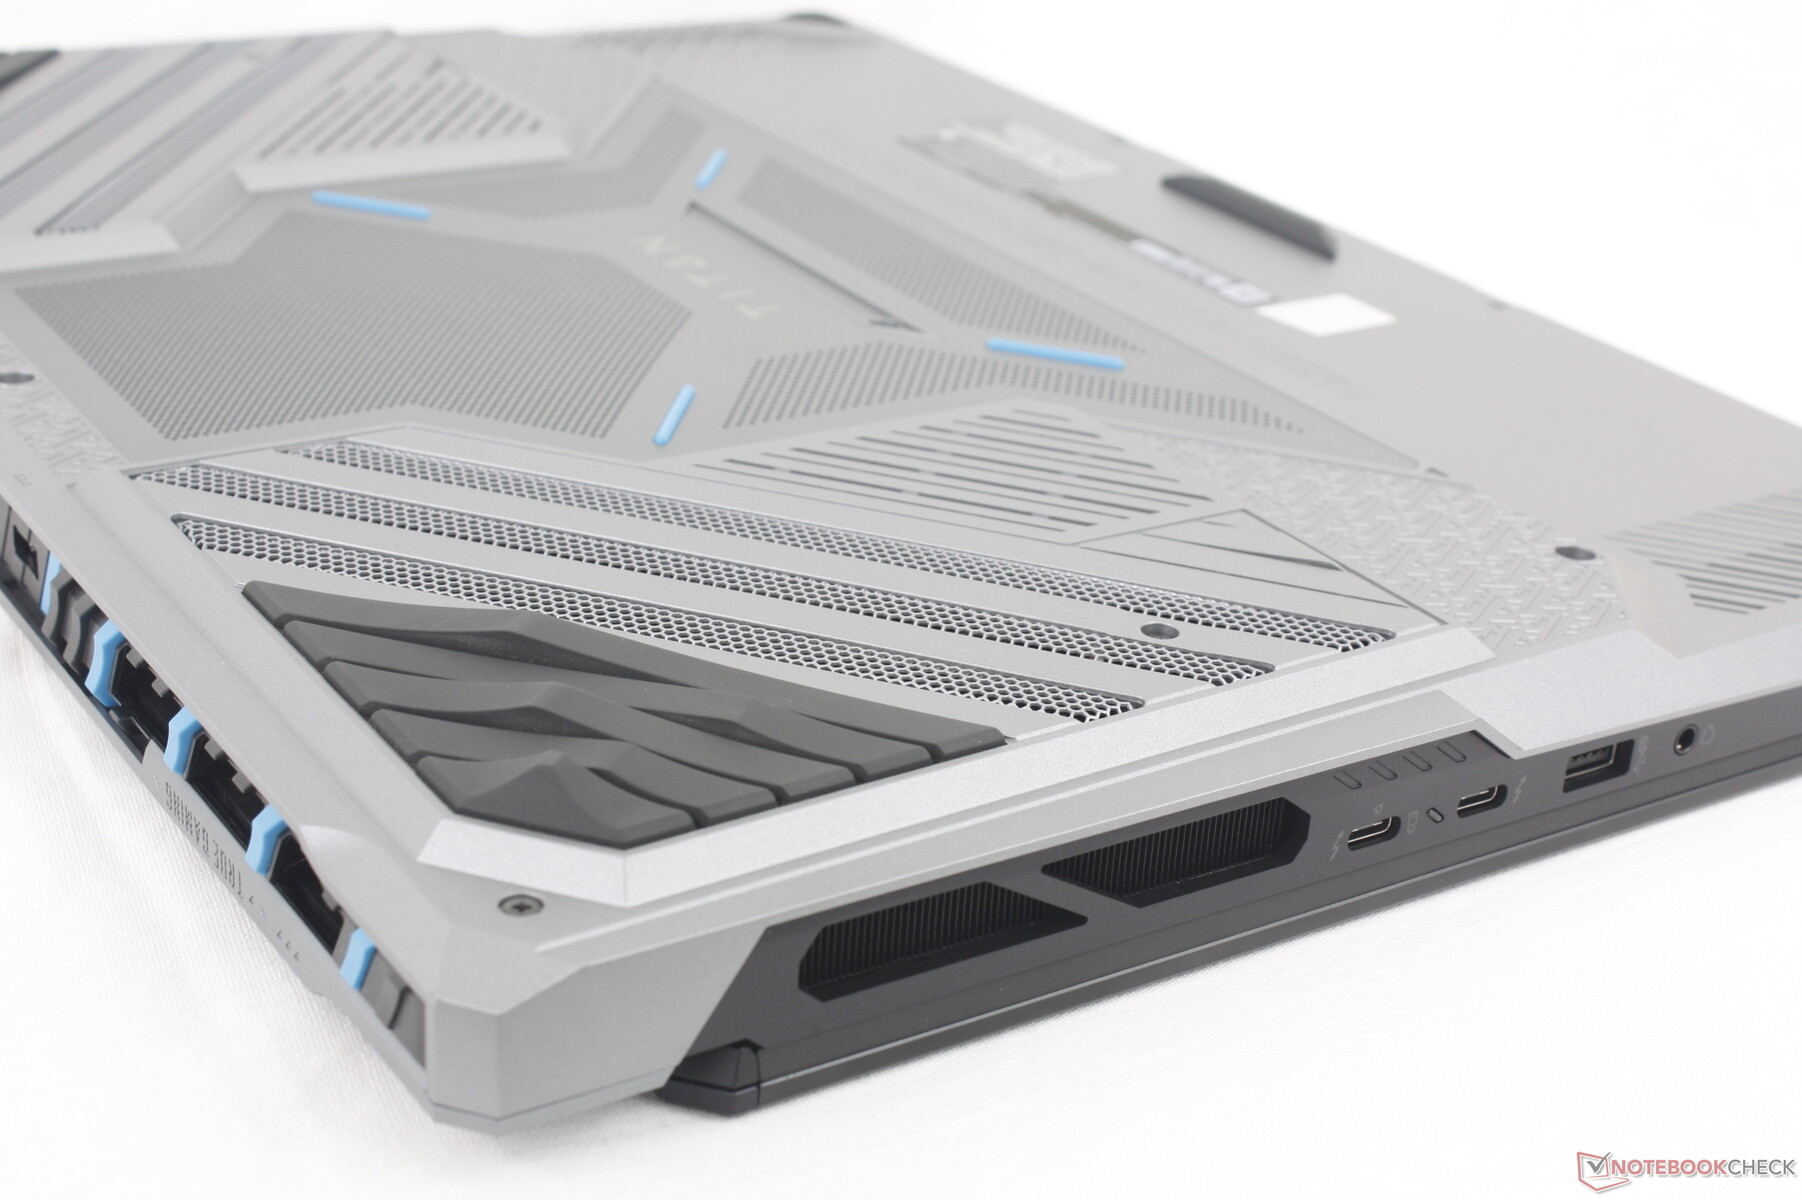
MSI ha recuperado todos los puertos del GT77 del año pasado excepto el mini-DisplayPort dedicado. Los puertos también se han reorganizado de forma más notable a lo largo de la parte trasera para reducir el desorden. En comparación, los puertos del GT77 estaban apretados a lo largo de los bordes izquierdo y derecho.
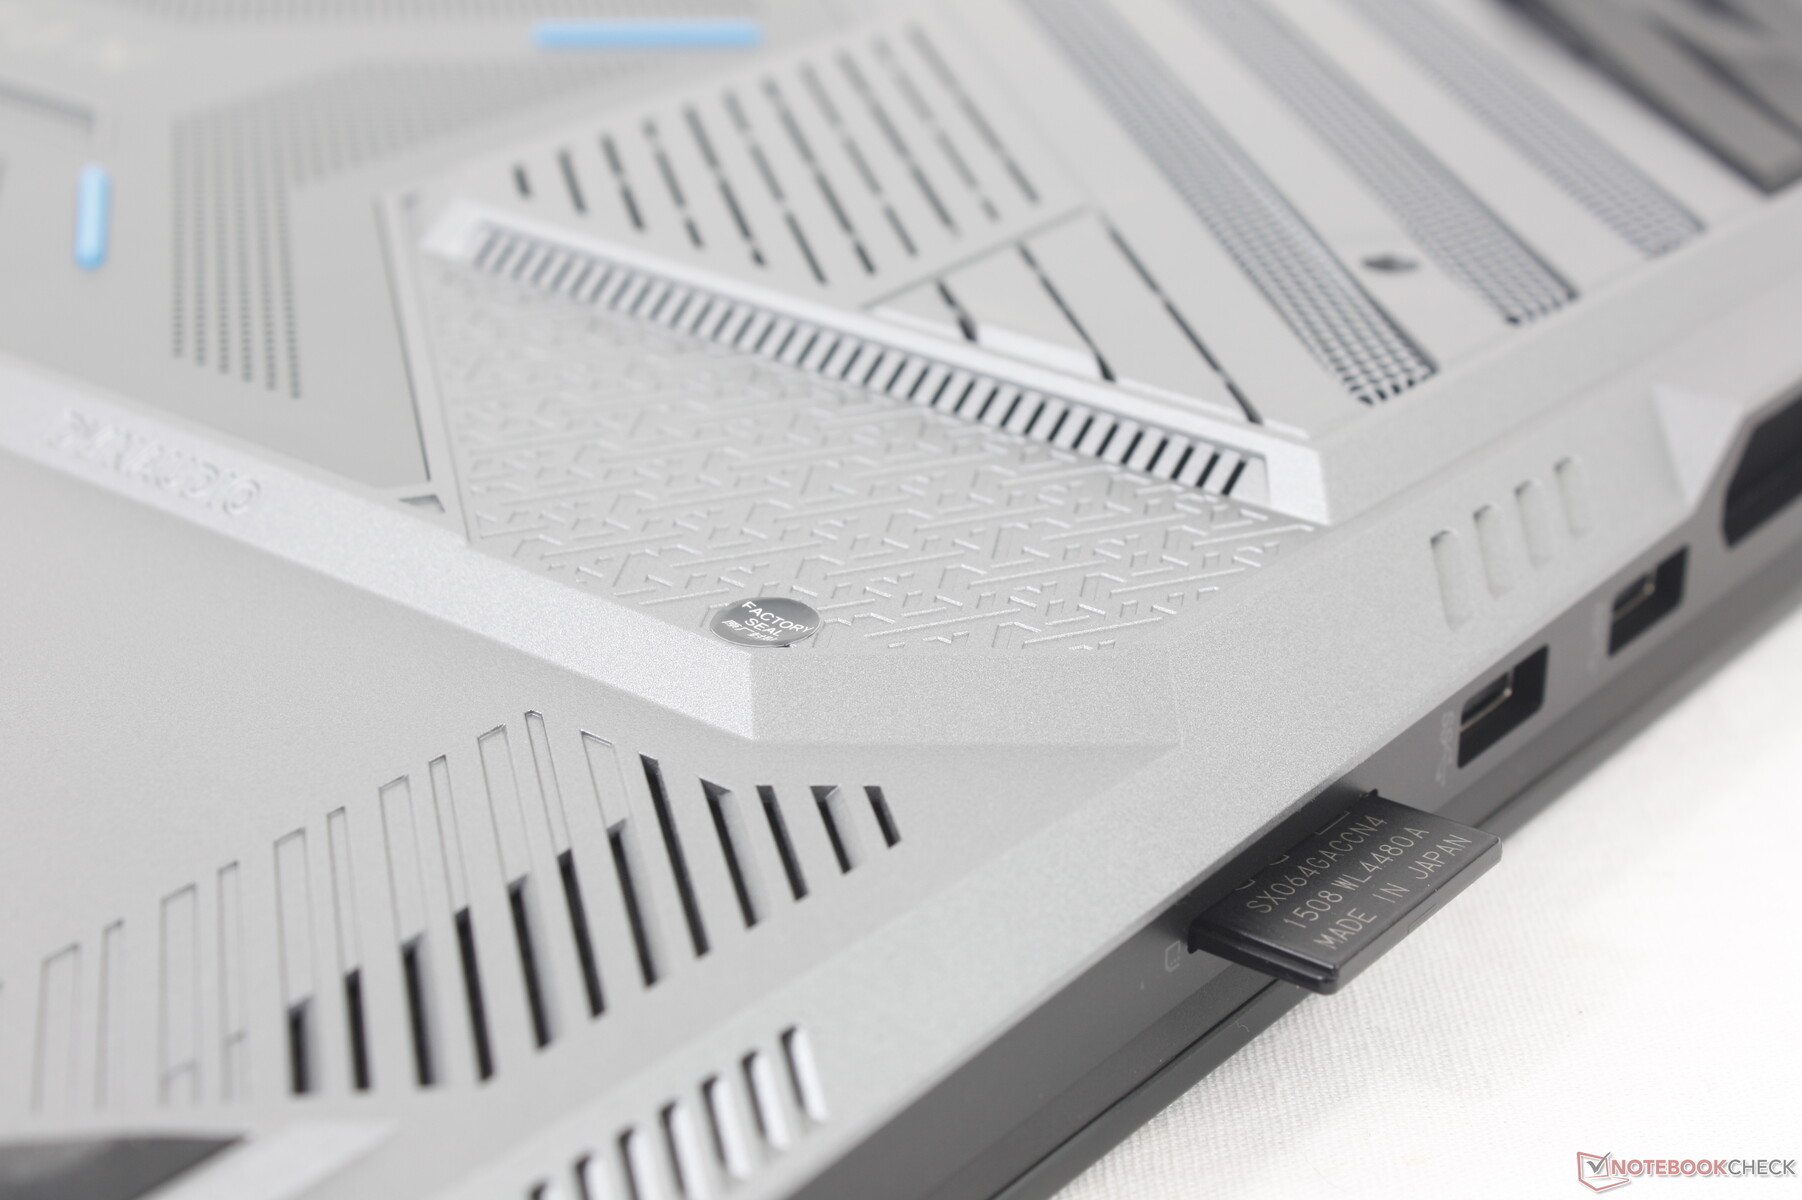
Lector de tarjetas SD
Mientras que el chasis ha sido renovado, el lento lector de tarjetas no lo ha sido. Mover 1 GB de imágenes desde nuestra tarjeta de prueba UHS-II al escritorio tarda unos 12 segundos, siendo 2 veces más lento que los lectores de tarjetas del Razer Blade 18 o el Alienware m18 R1.
| SD Card Reader | |
| average JPG Copy Test (av. of 3 runs) | |
| Razer Blade 18 RTX 4070 (Angelibird AV Pro V60) | |
| Alienware m18 R1 (Angelibird AV Pro V60) | |
| MSI Titan 18 HX A14VIG (Toshiba Exceria Pro SDXC 64 GB UHS-II) | |
| MSI Titan GT77 HX 13VI (Angelibird AV Pro V60) | |
| Acer Predator Helios 18 N23Q2 | |
| maximum AS SSD Seq Read Test (1GB) | |
| Alienware m18 R1 (Angelibird AV Pro V60) | |
| Razer Blade 18 RTX 4070 (Angelibird AV Pro V60) | |
| MSI Titan 18 HX A14VIG (Toshiba Exceria Pro SDXC 64 GB UHS-II) | |
| MSI Titan GT77 HX 13VI (Angelibird AV Pro V60) | |
| Acer Predator Helios 18 N23Q2 | |
Comunicación
La WLAN la proporciona el Killer BE1750x que es la variante para juegos del BE1750W. El módulo es compatible con Wi-Fi 7 a pesar de que los routers Wi-Fi 7 aún no son la corriente principal. No experimentamos ningún problema de conectividad cuando lo emparejamos con nuestro router de prueba Wi-Fi 6E.
| Networking | |
| iperf3 transmit AXE11000 | |
| Asus ROG Strix G18 G814JI | |
| MSI Titan GT77 HX 13VI | |
| Alienware m18 R1 | |
| Razer Blade 18 RTX 4070 | |
| MSI Titan 18 HX A14VIG | |
| Acer Predator Helios 18 N23Q2 | |
| iperf3 receive AXE11000 | |
| Asus ROG Strix G18 G814JI | |
| MSI Titan GT77 HX 13VI | |
| Razer Blade 18 RTX 4070 | |
| Alienware m18 R1 | |
| MSI Titan 18 HX A14VIG | |
| Acer Predator Helios 18 N23Q2 | |
| iperf3 transmit AXE11000 6GHz | |
| Acer Predator Helios 18 N23Q2 | |
| Alienware m18 R1 | |
| Razer Blade 18 RTX 4070 | |
| MSI Titan 18 HX A14VIG | |
| iperf3 receive AXE11000 6GHz | |
| Razer Blade 18 RTX 4070 | |
| Acer Predator Helios 18 N23Q2 | |
| MSI Titan 18 HX A14VIG | |
| Alienware m18 R1 | |
Cámara web
Una webcam de 2 MP con obturador físico de privacidad y sensor IR vienen de serie. La cámara puede tener problemas de brillo como muestra nuestra captura de abajo.

")
")
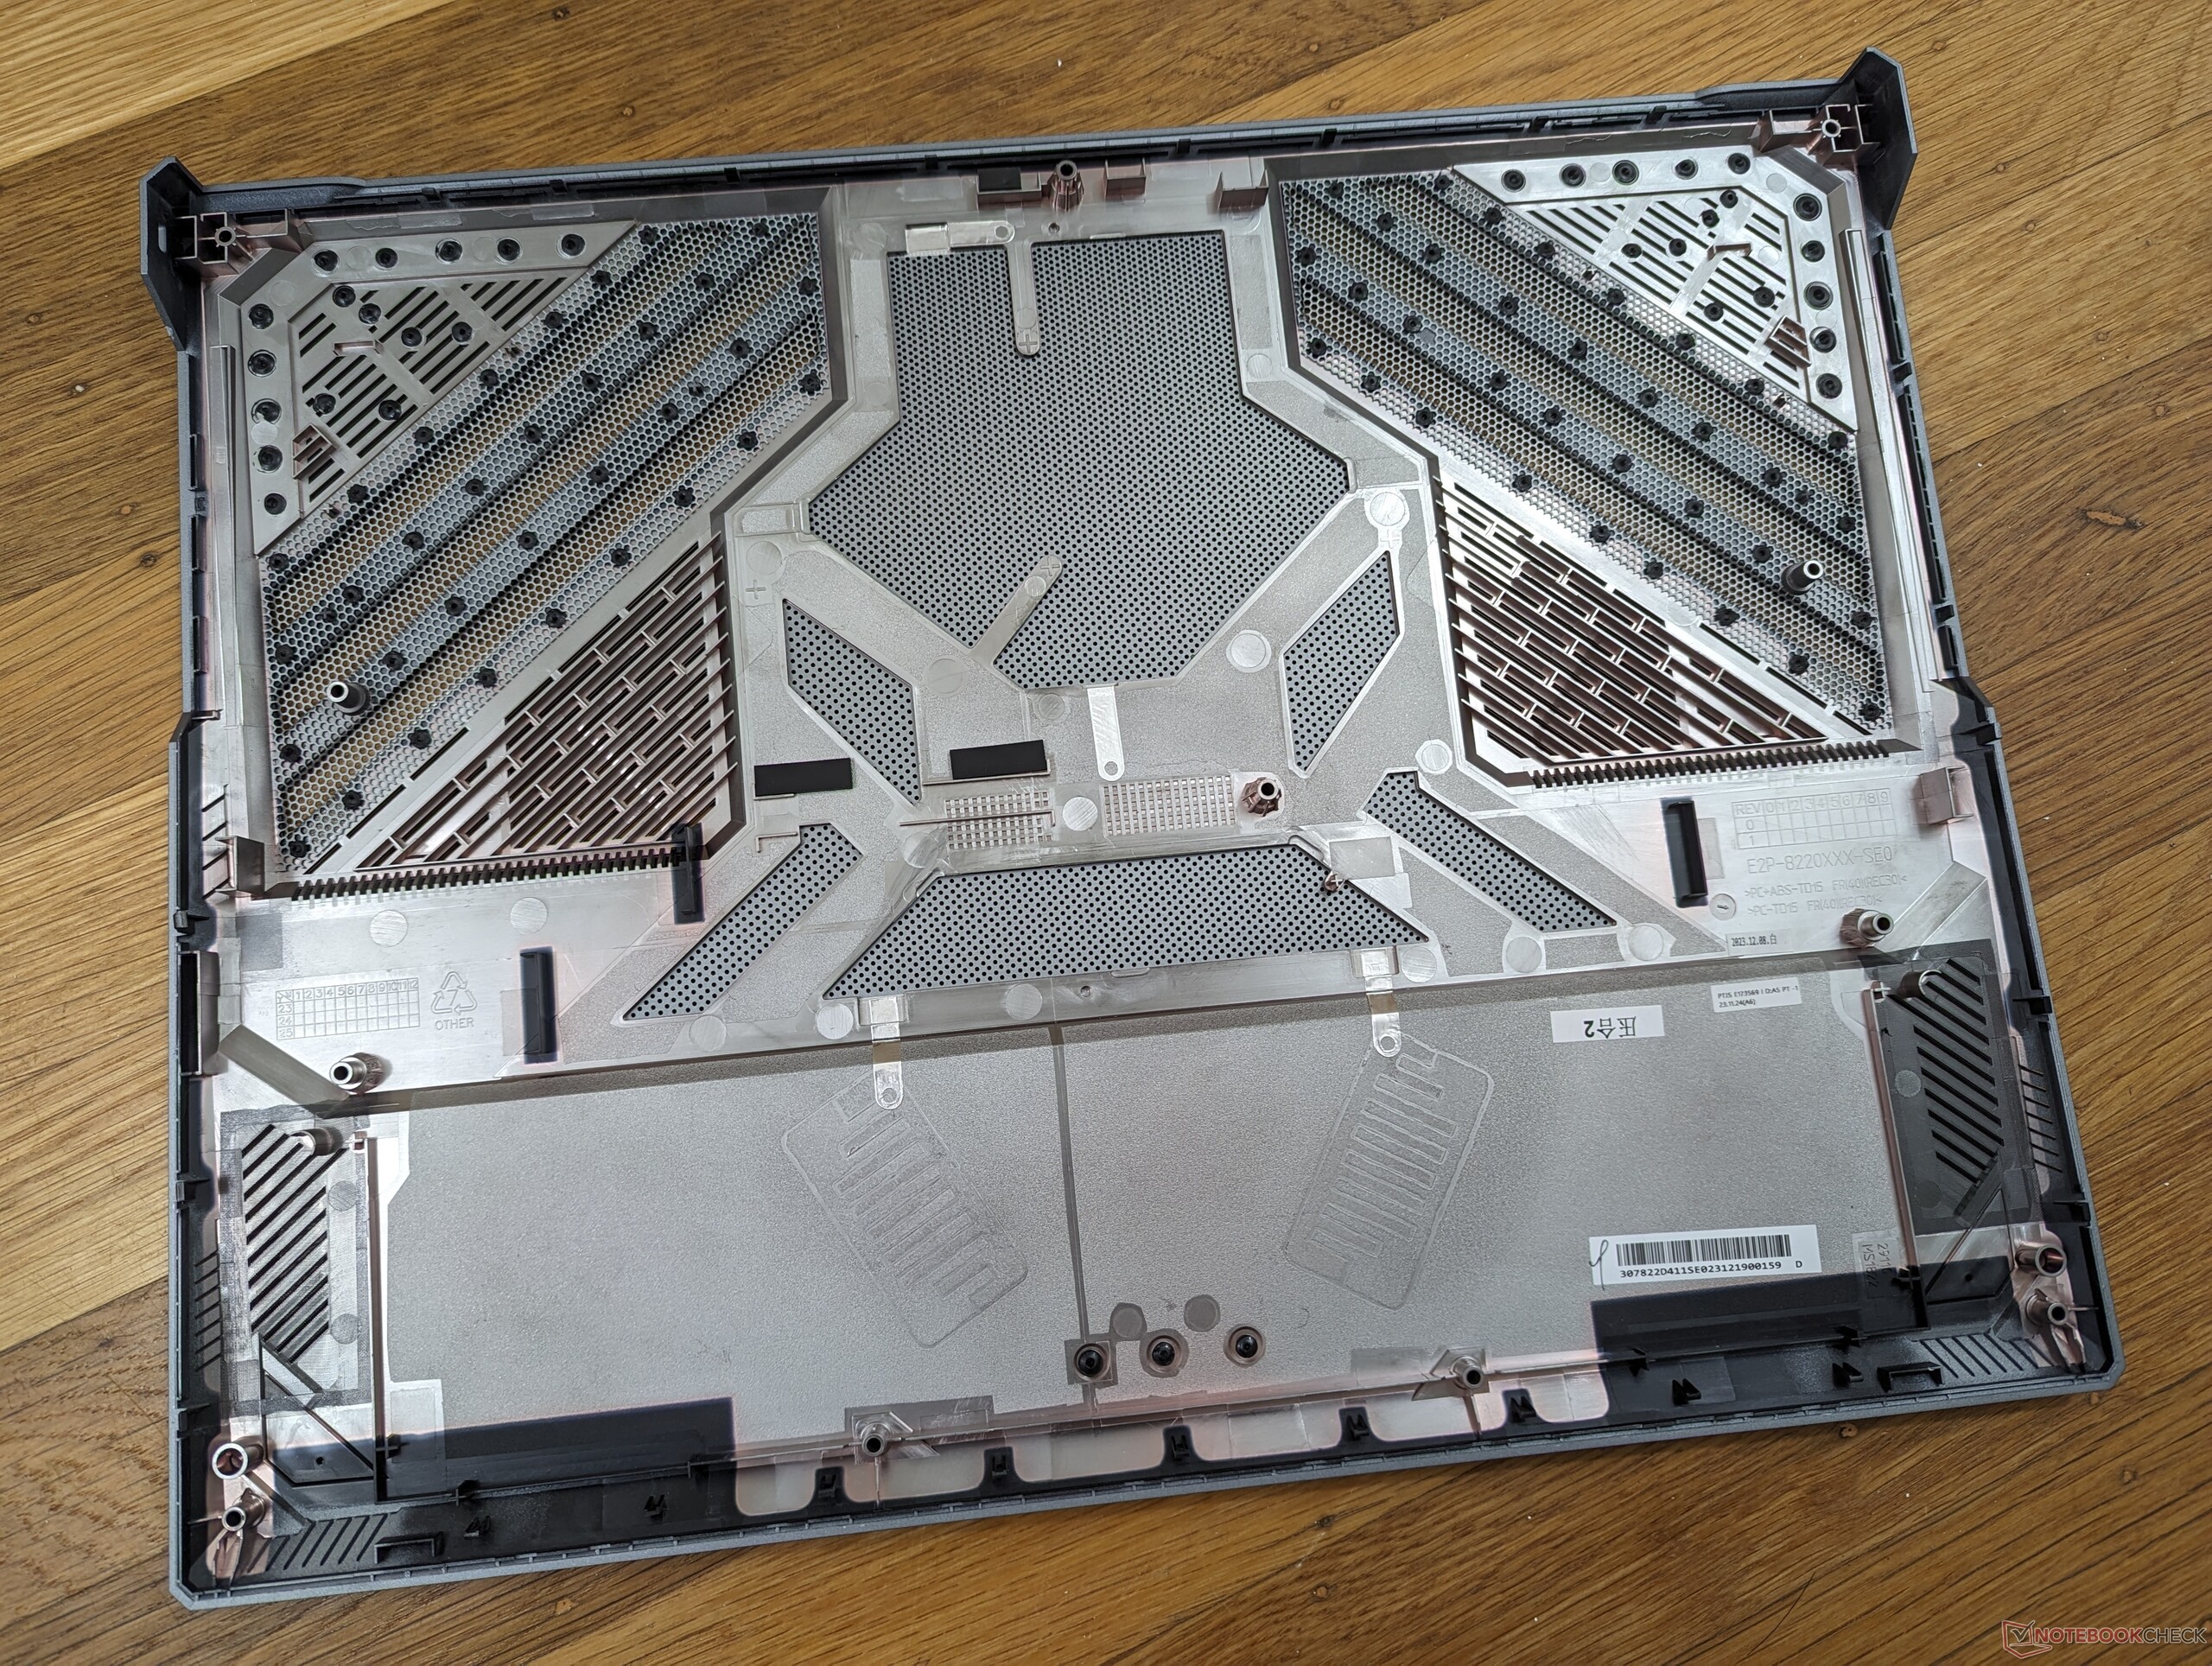
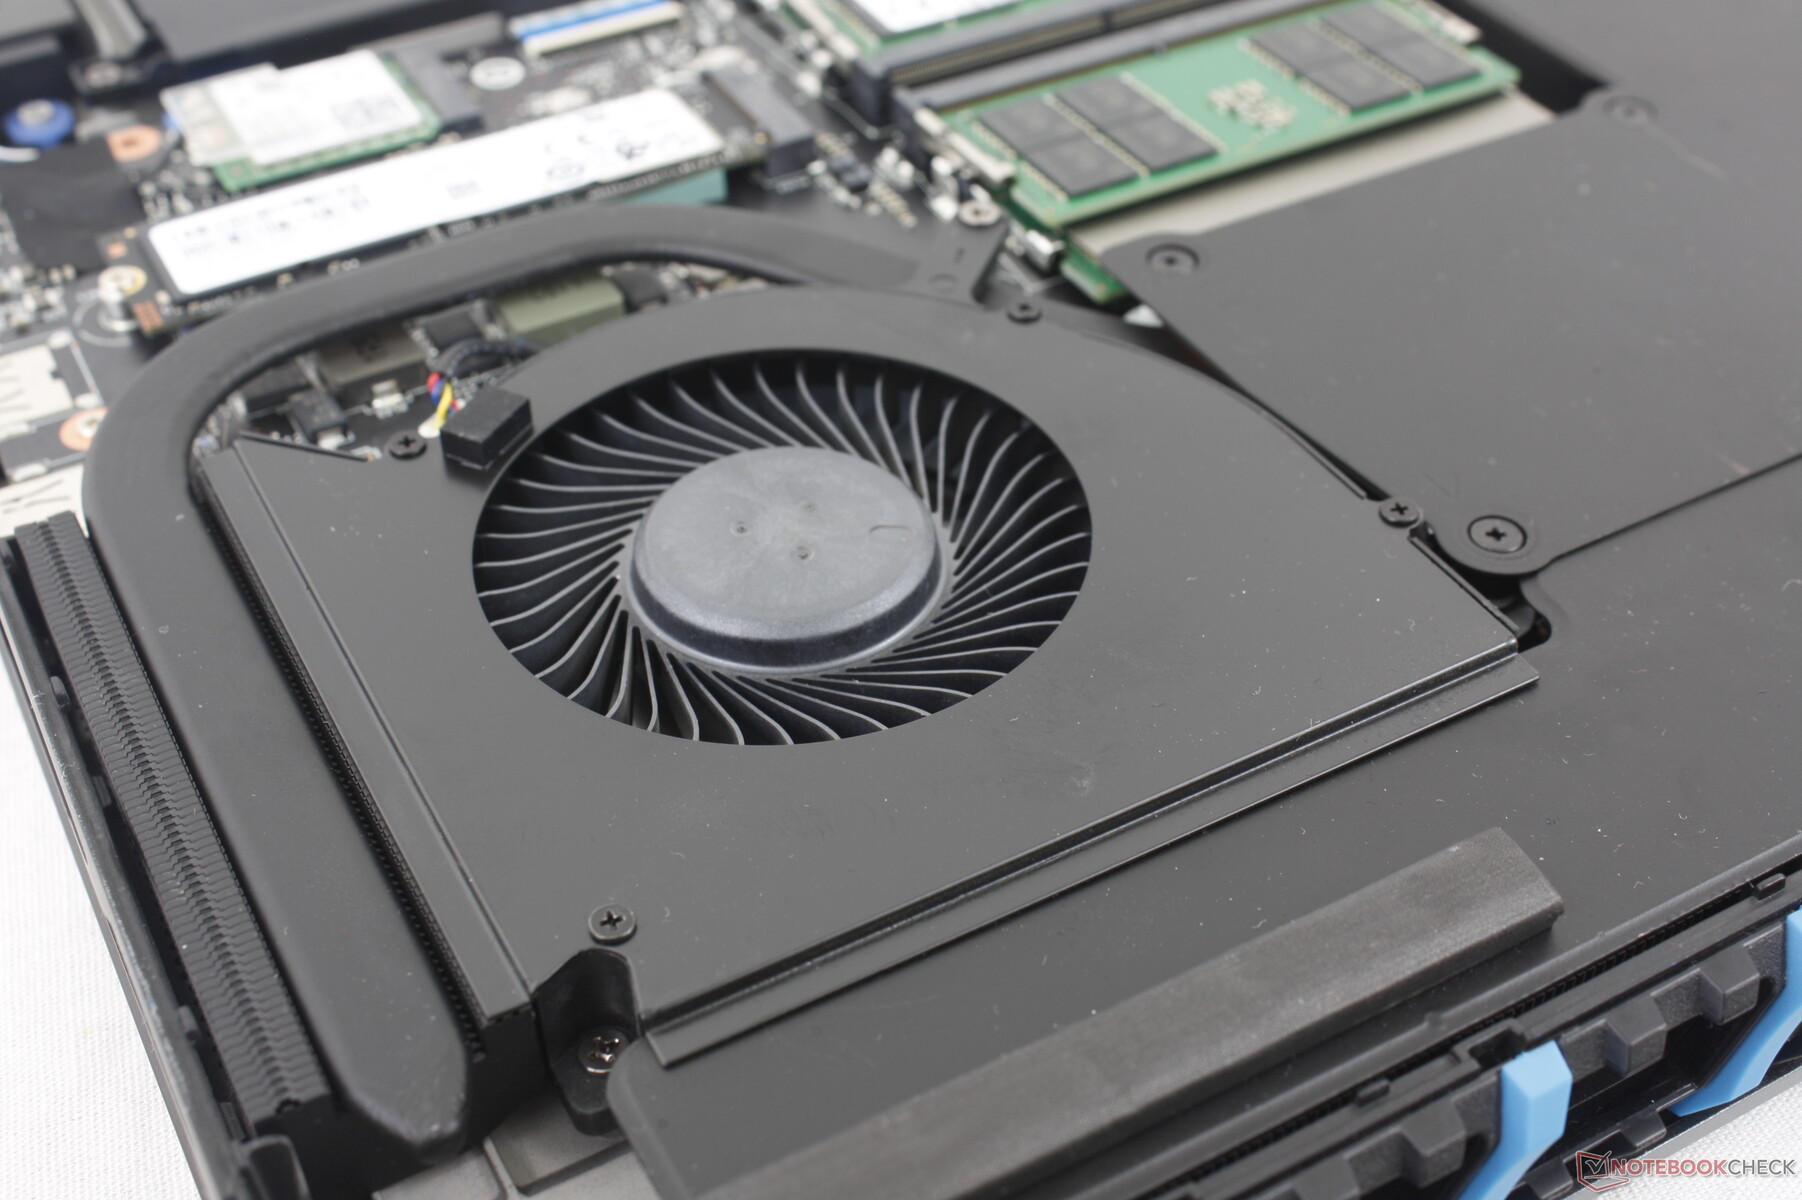
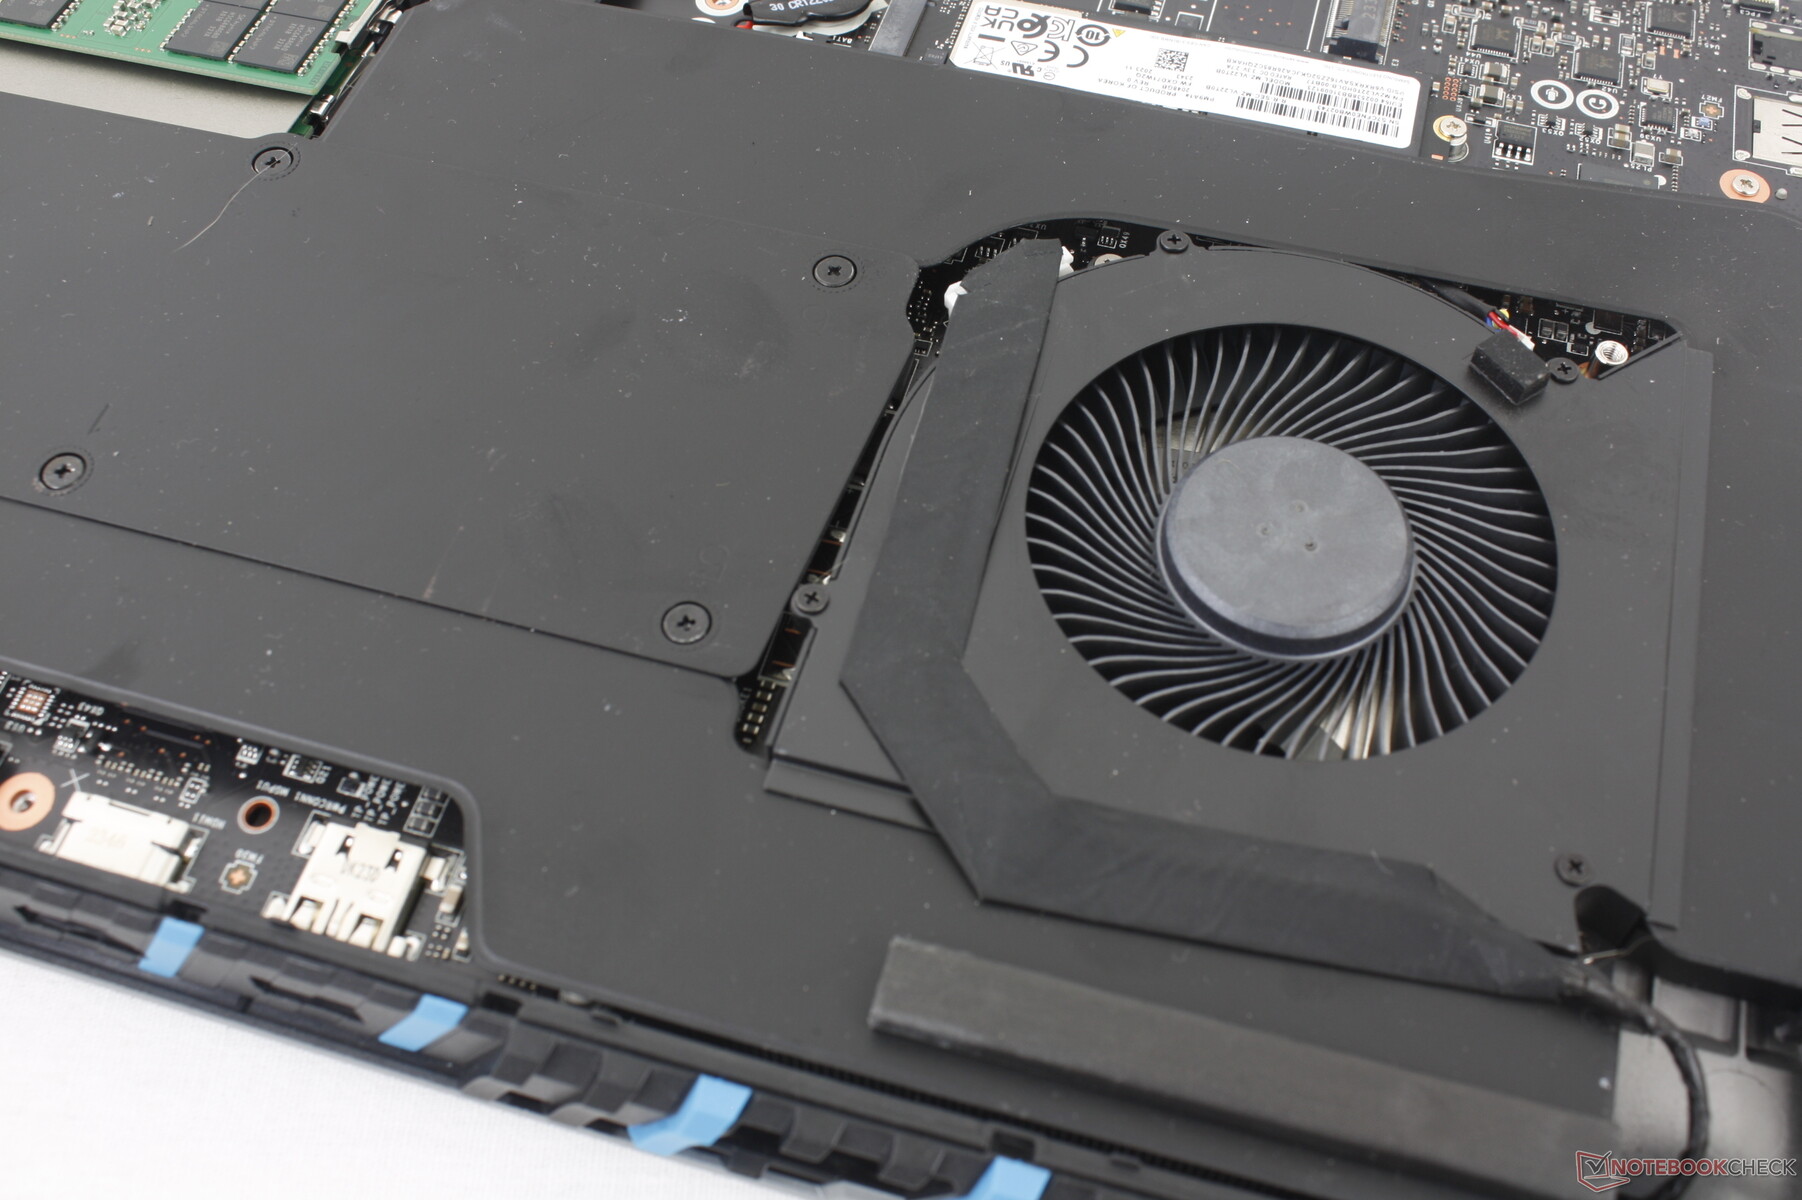
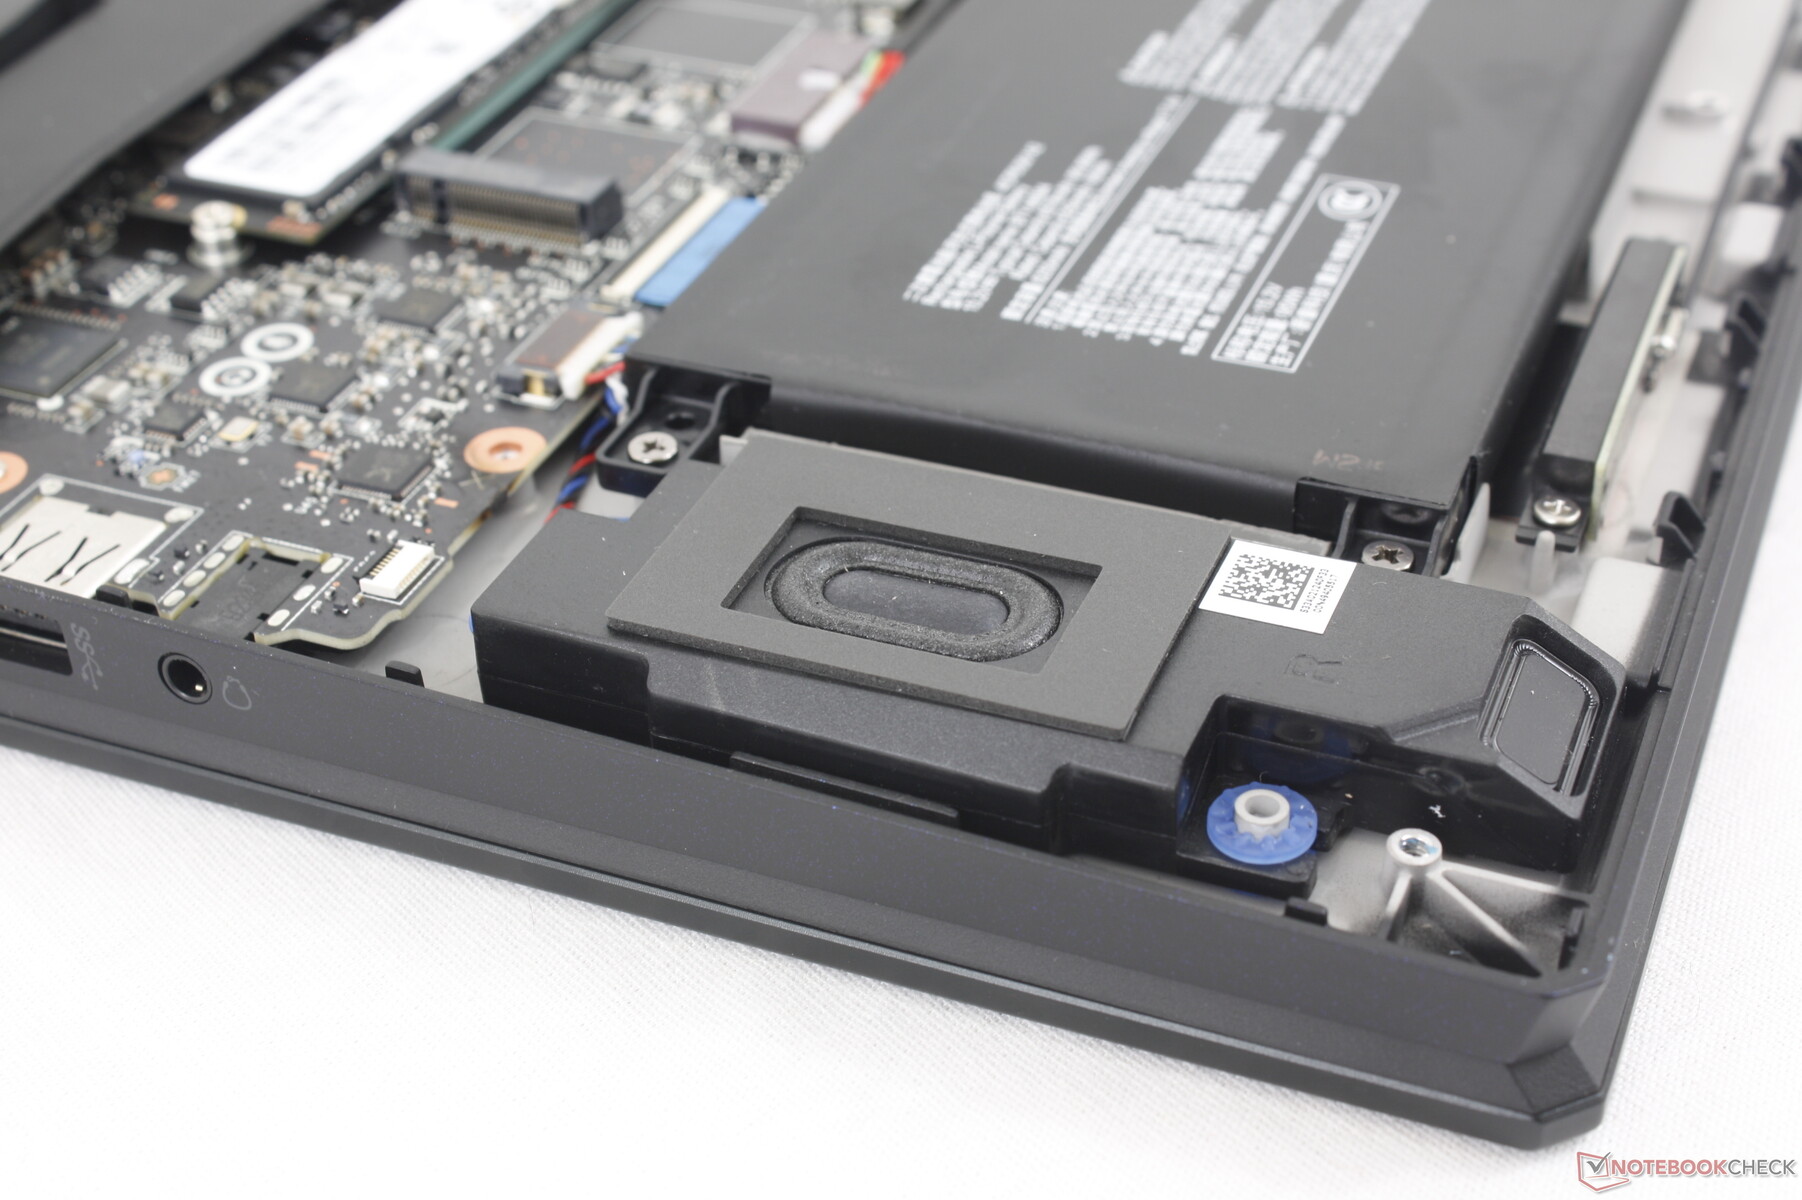
Mantenimiento
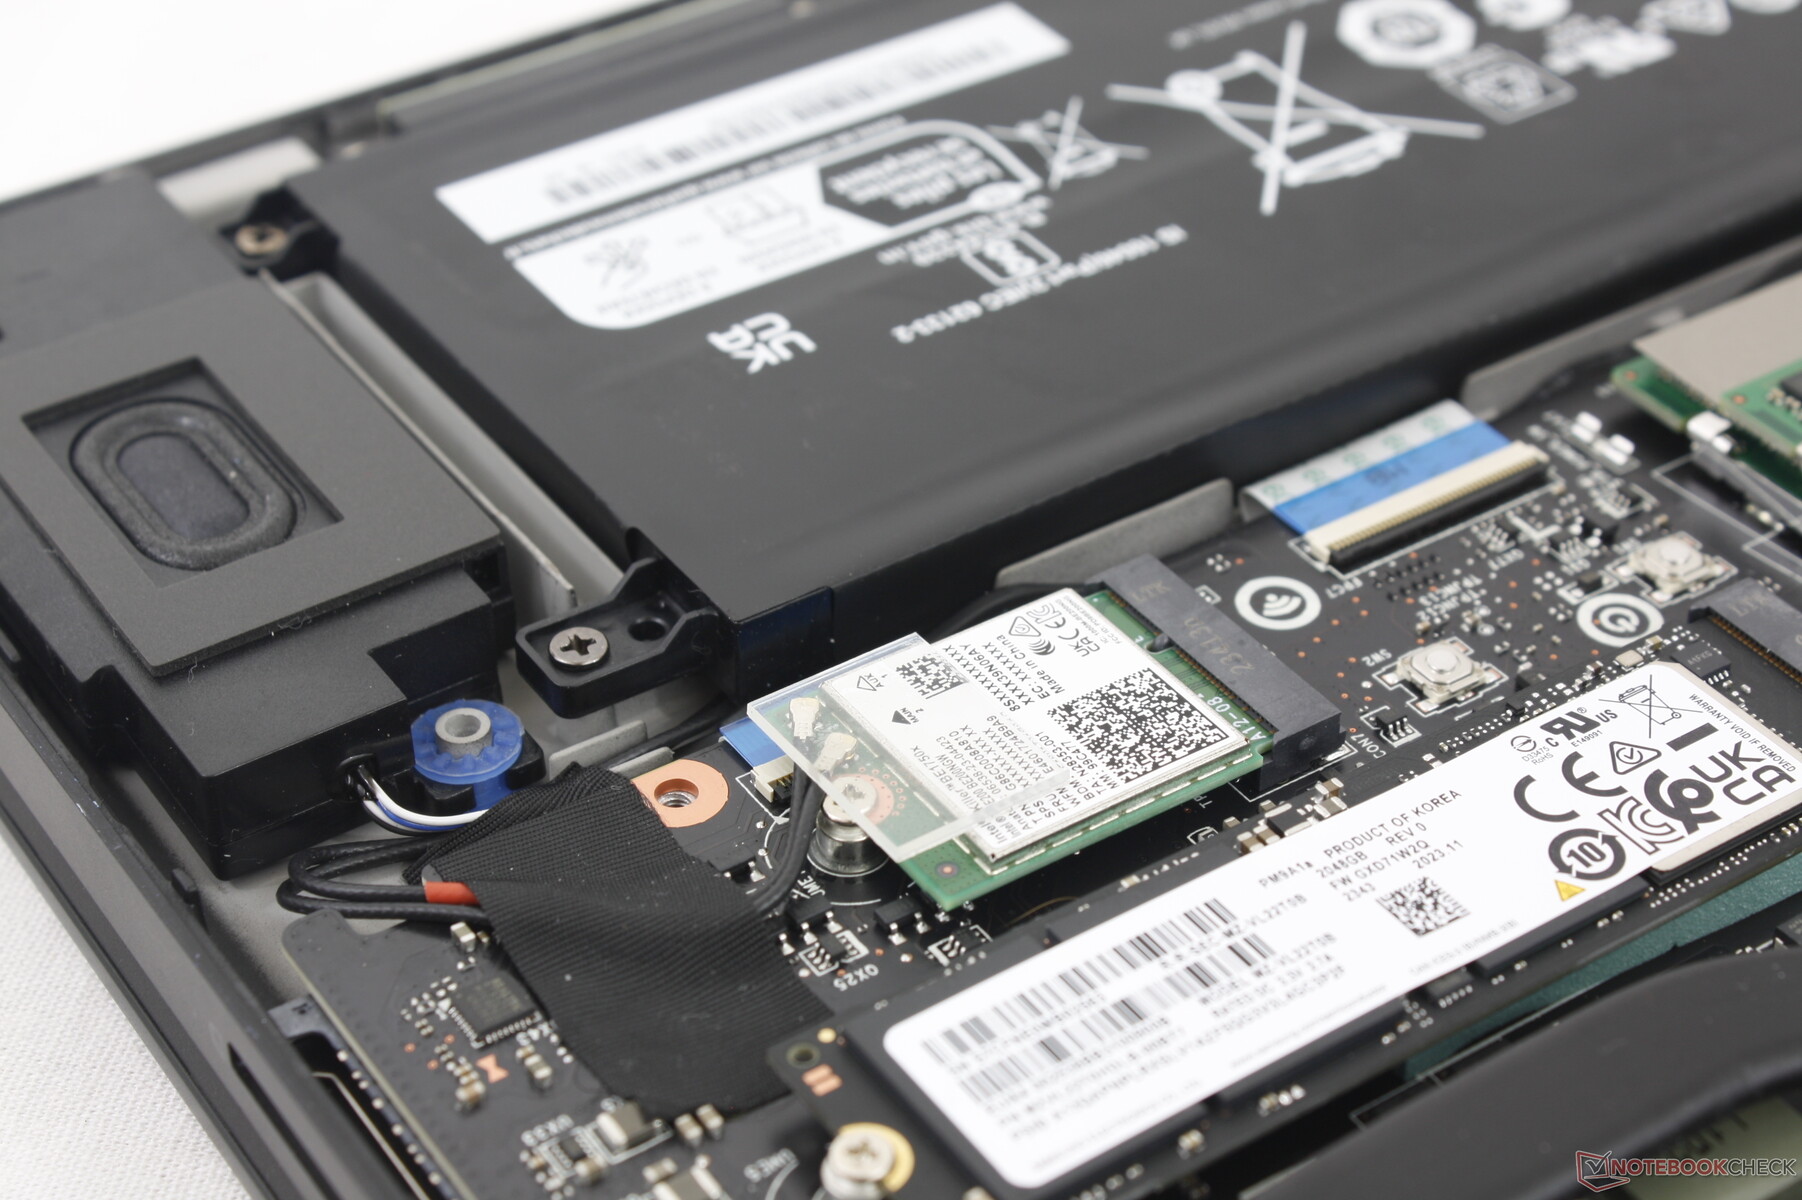
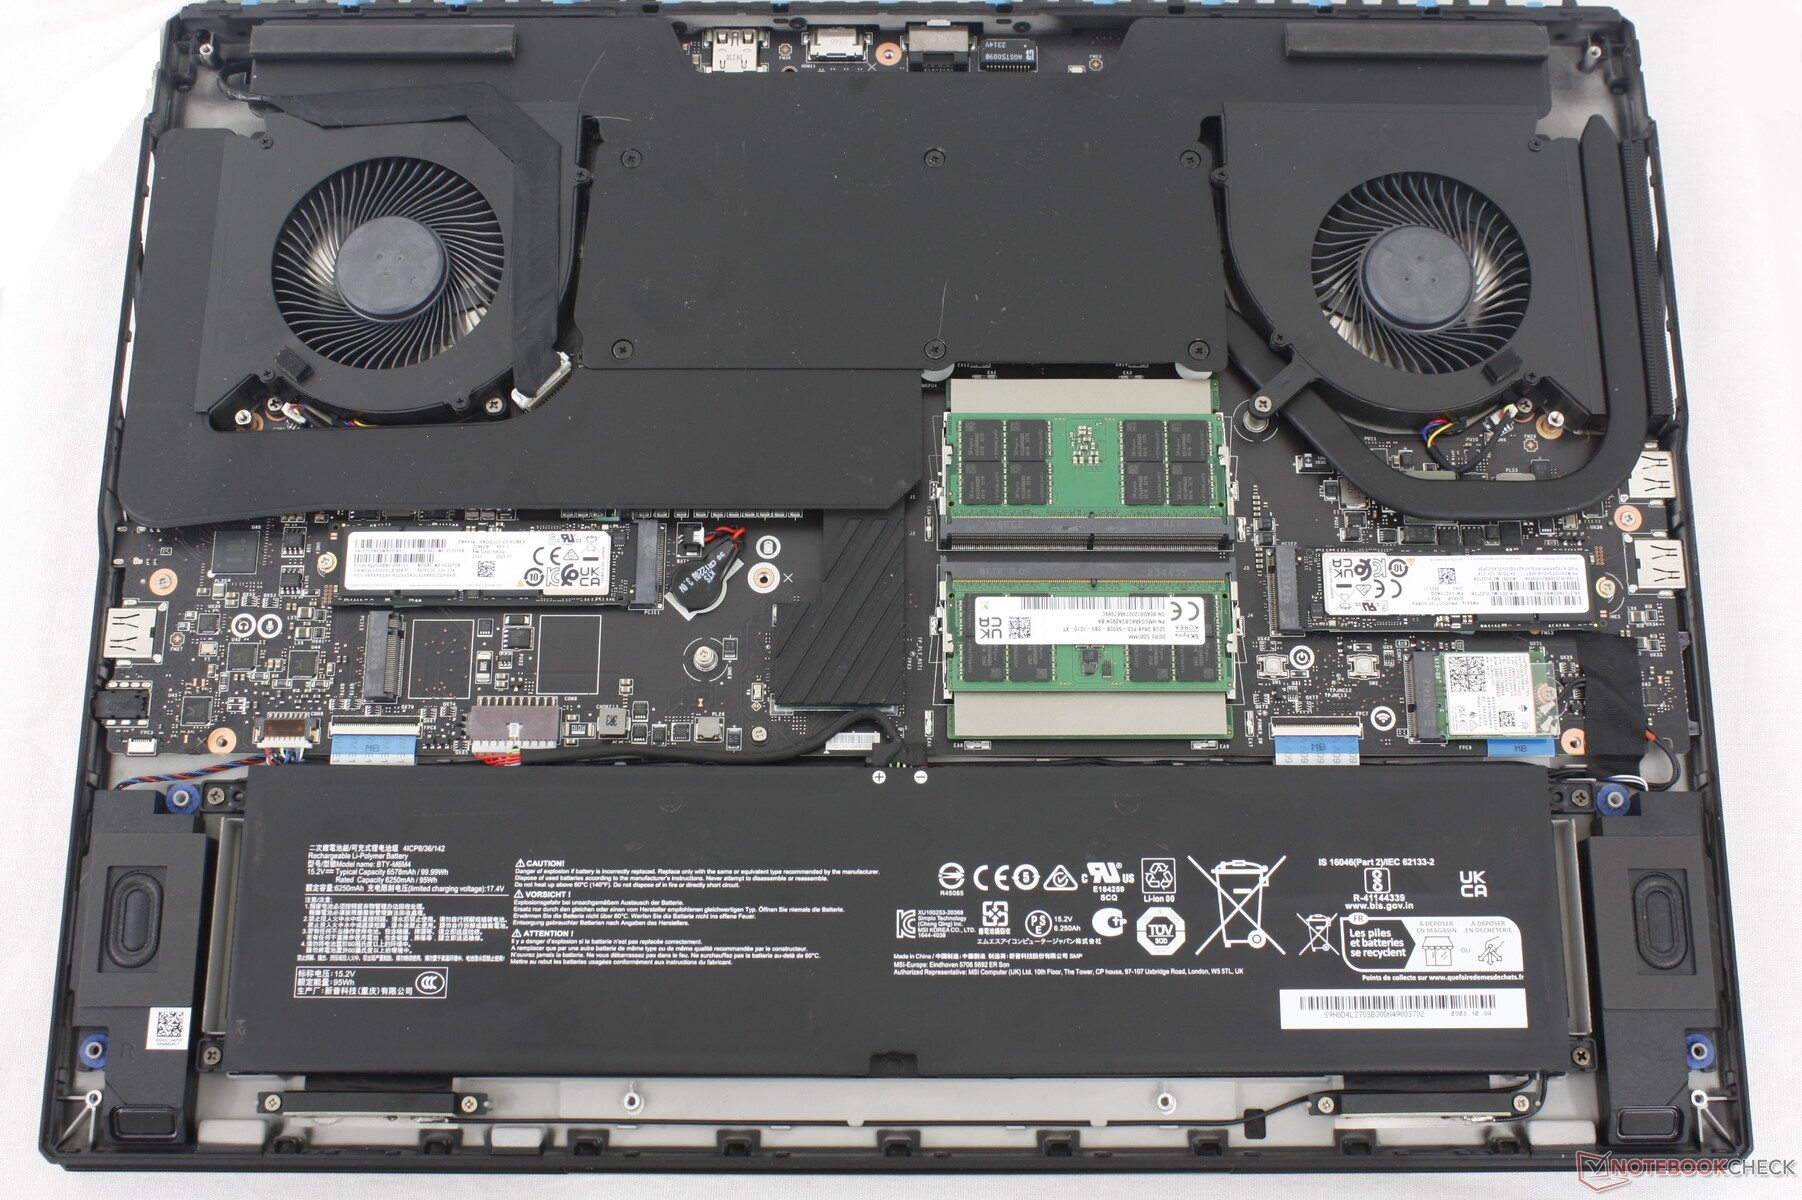
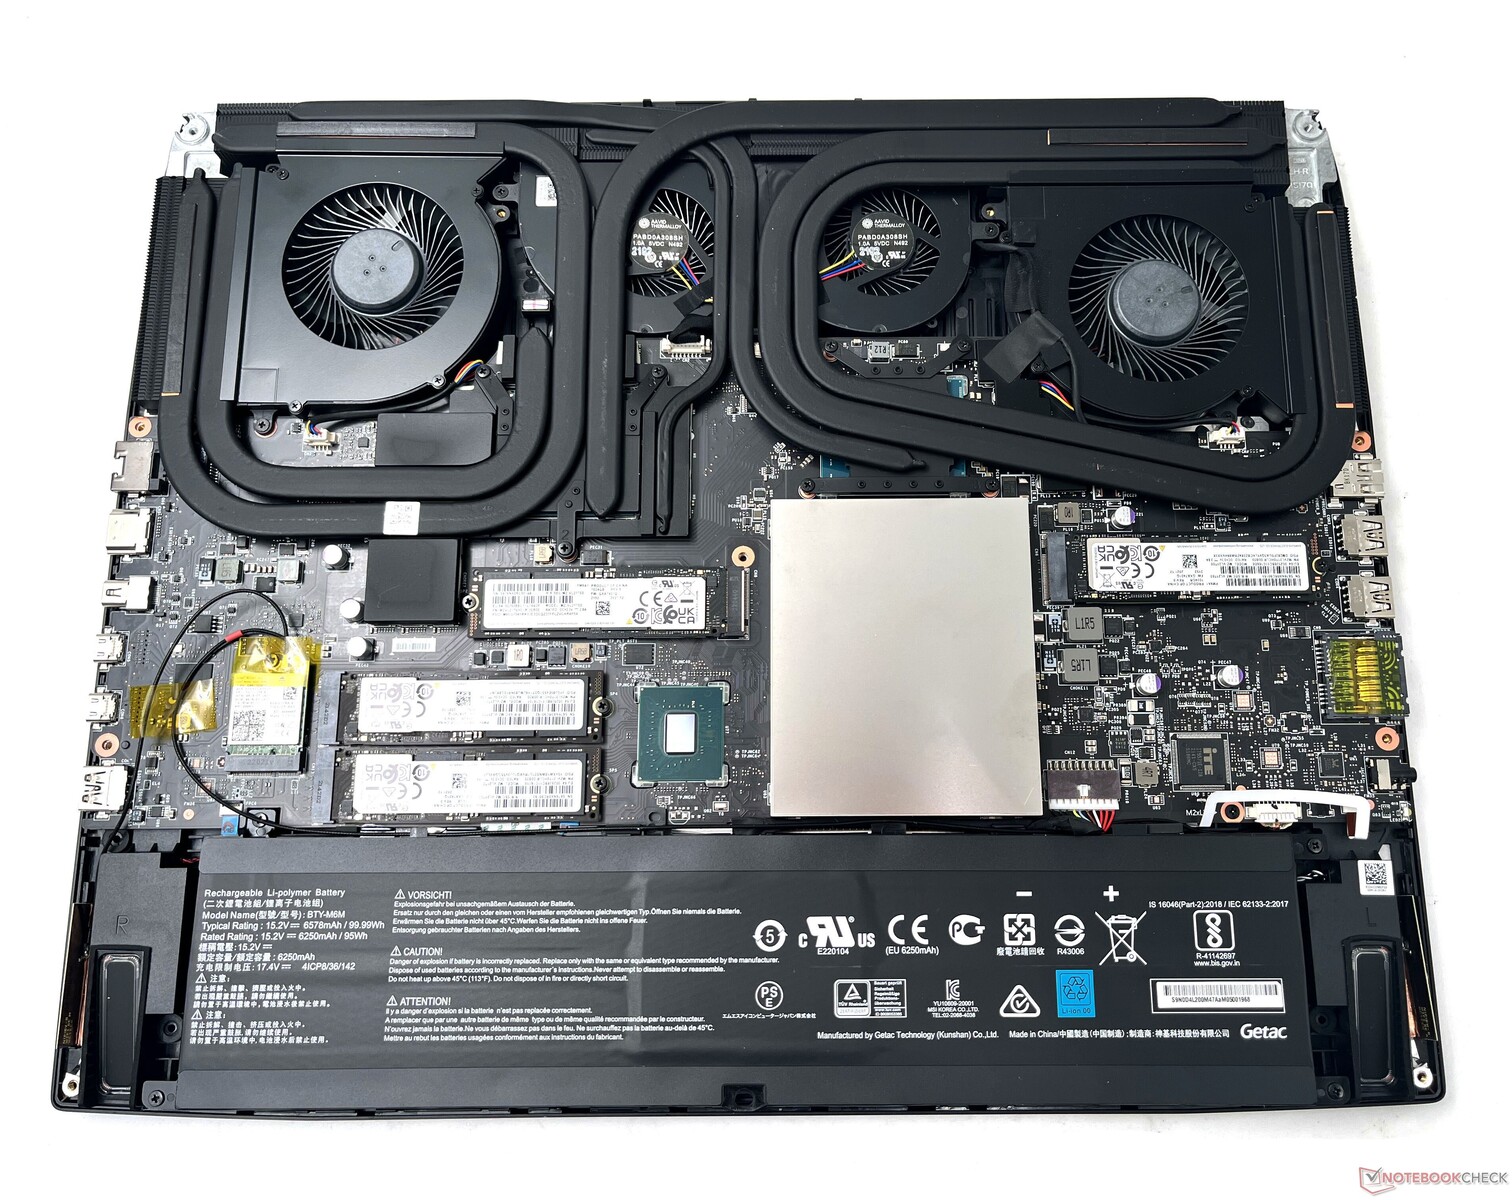
El panel inferior está asegurado por 12 tornillos Phillips para un mantenimiento relativamente fácil. Sin embargo, tenga en cuenta que para ello es necesario romper una pegatina de precinto de fábrica.
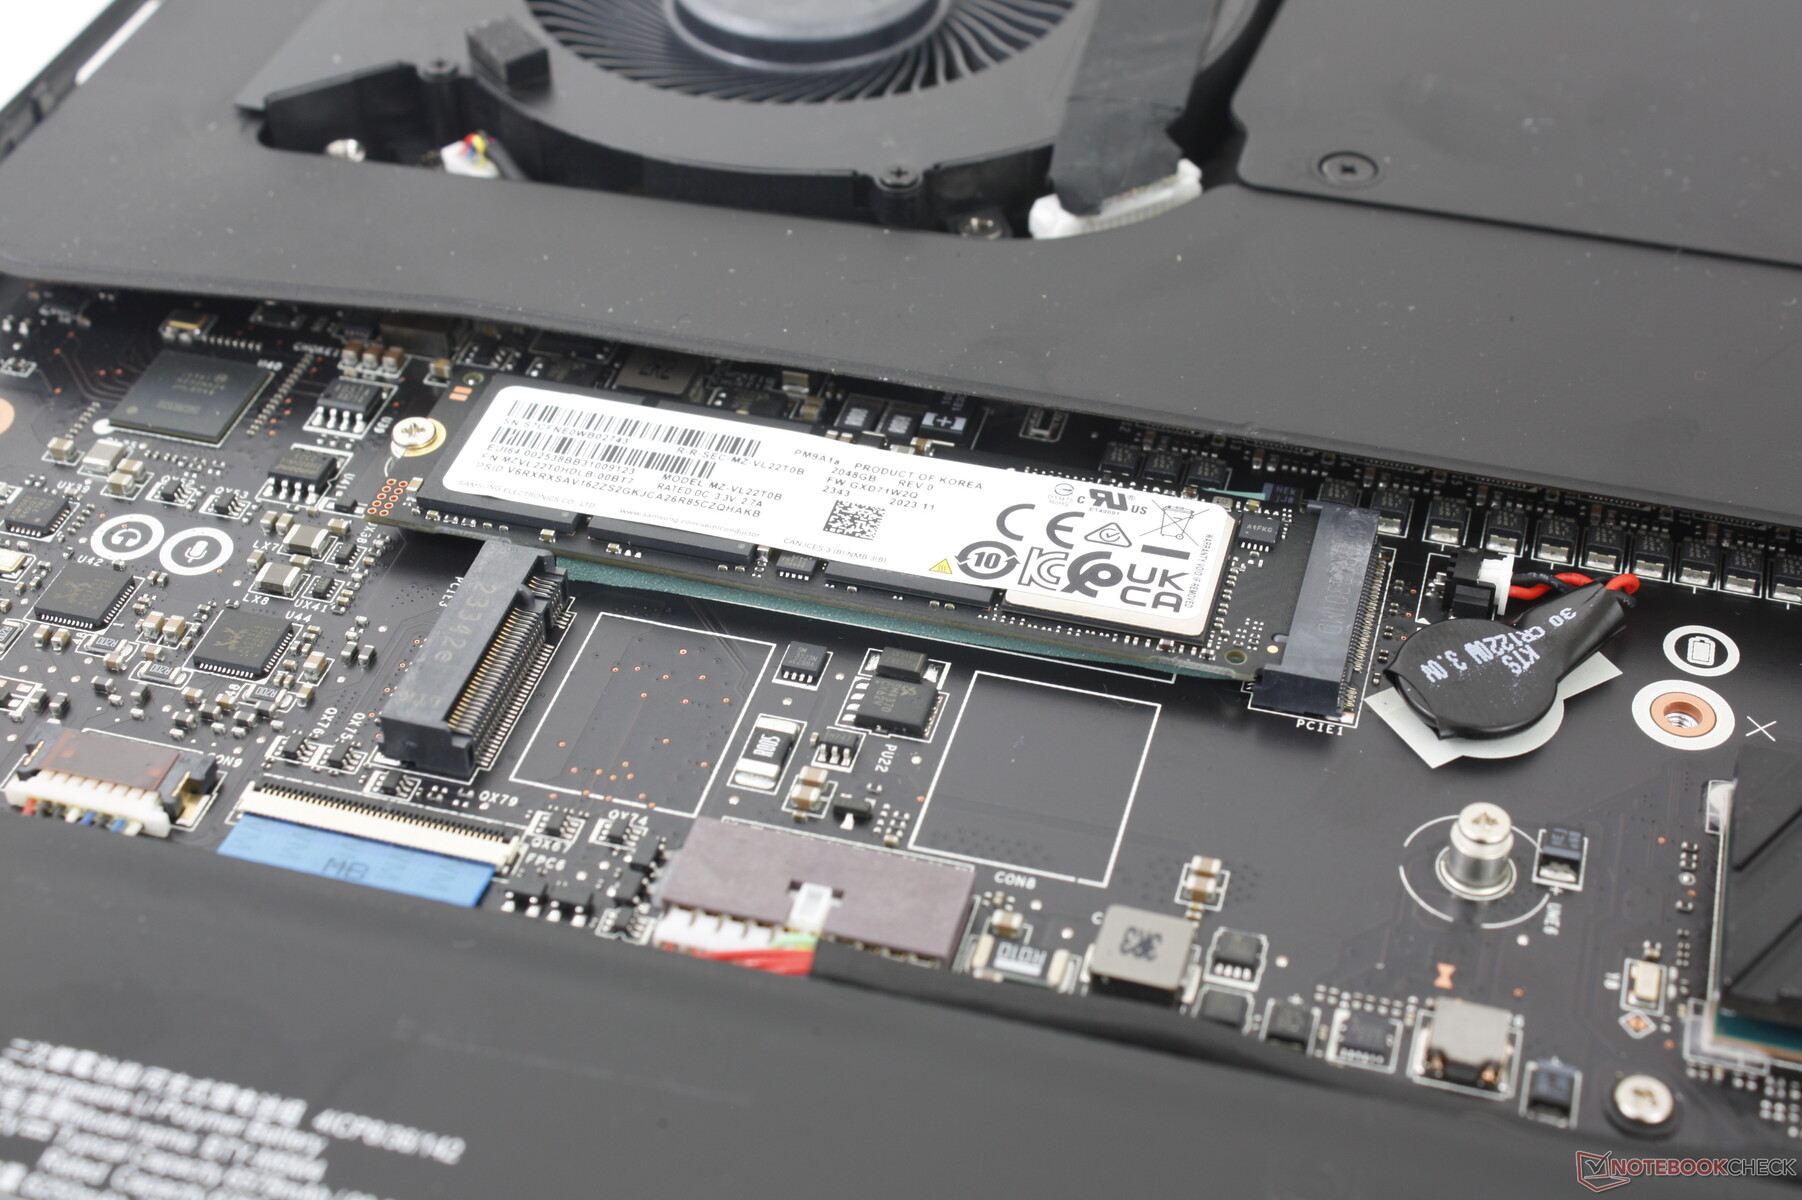
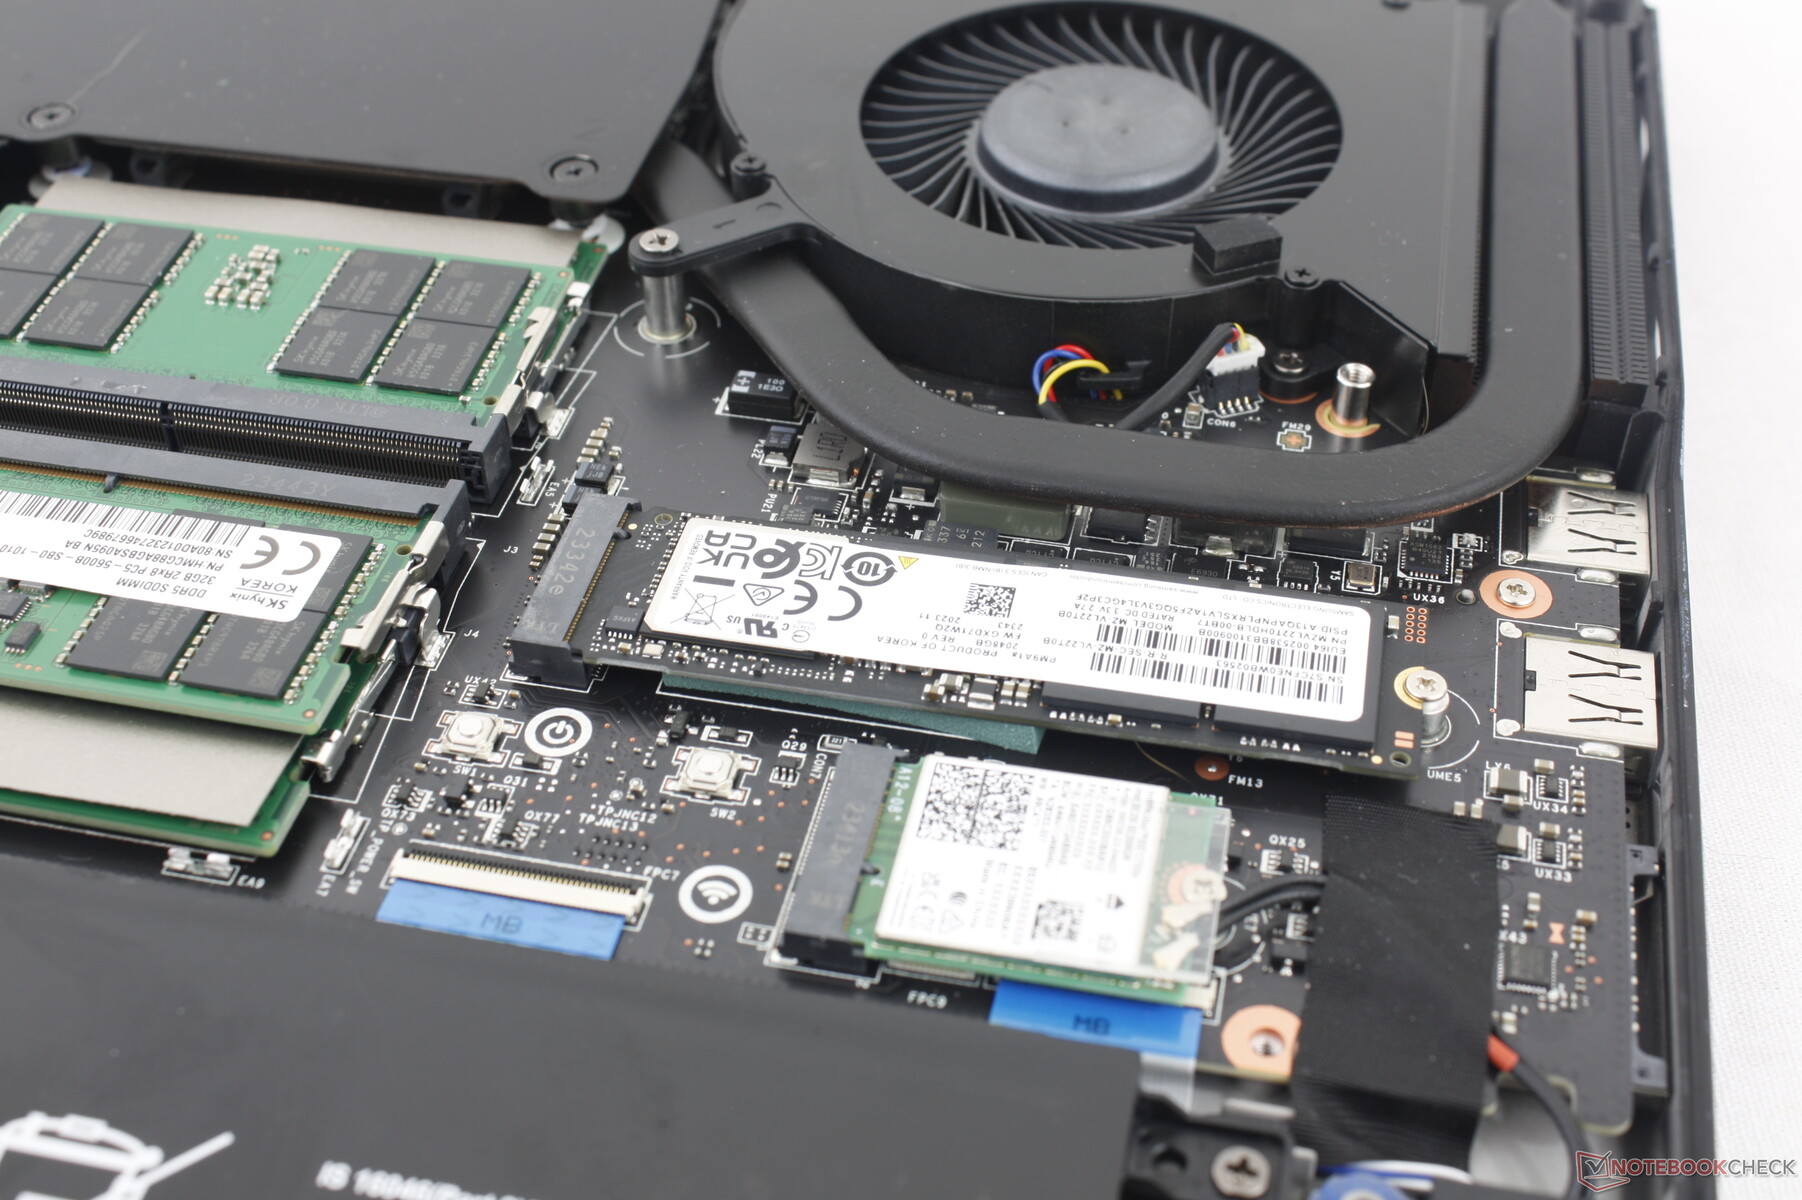
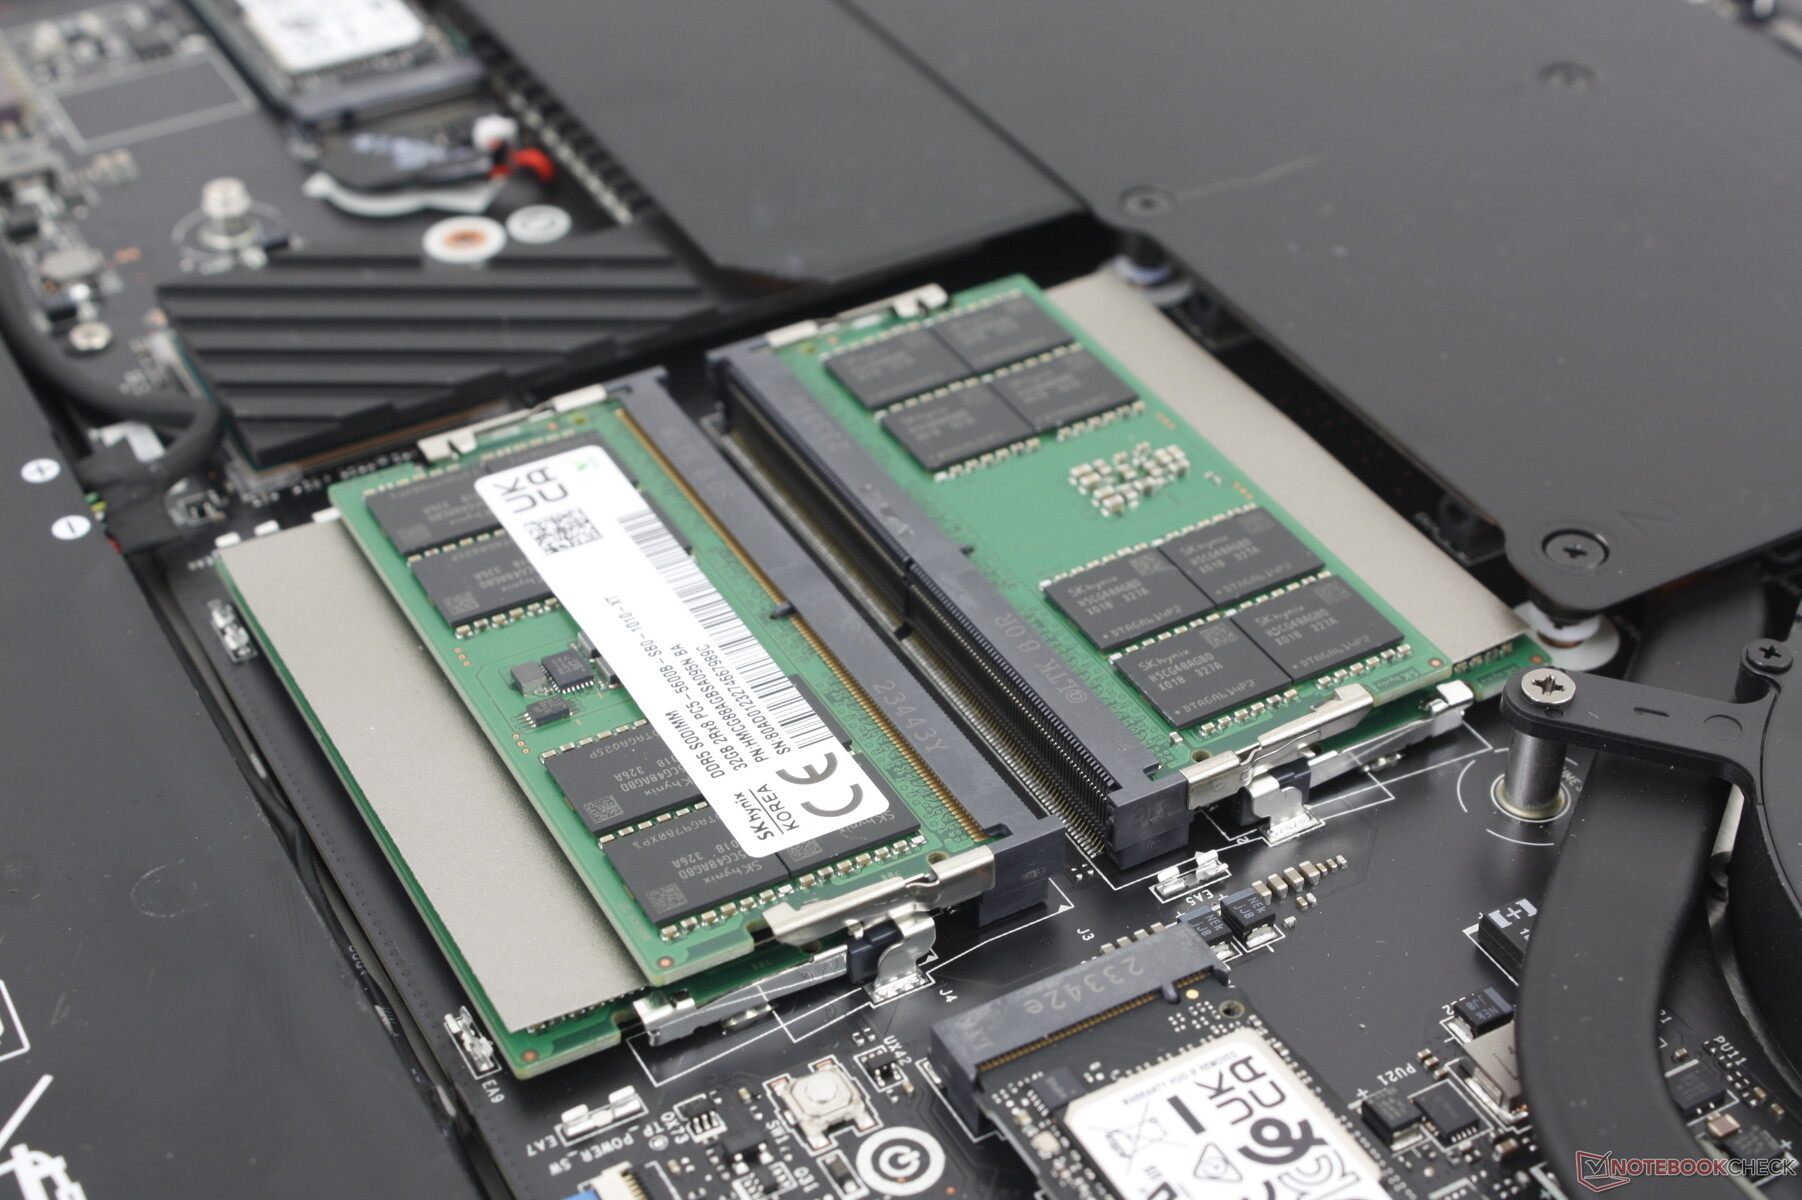
Una vez dentro, los usuarios tienen acceso directo a 4x ranuras SODIMM, 3x ranuras SSD M.2 2280 (2x PCIe4 x4, 1x PCIe5 x4) y el módulo WLAN extraíble. En comparación, el GT77 del año pasado podía admitir hasta cuatro SSD, por lo que las opciones de almacenamiento son algo más limitadas en esta ocasión.
Accesorios y garantía
La caja de venta incluye un ratón USB (M99 Pro), un paño de limpieza de terciopelo, una unidad flash USB de 256 GB y un llavero de Lucky el Dragón. Curiosamente, el llavero es negro en lugar de rojo, que es como se suele representar a la mascota.
La garantía limitada del fabricante de un año viene de serie si se adquiere en EE.UU.
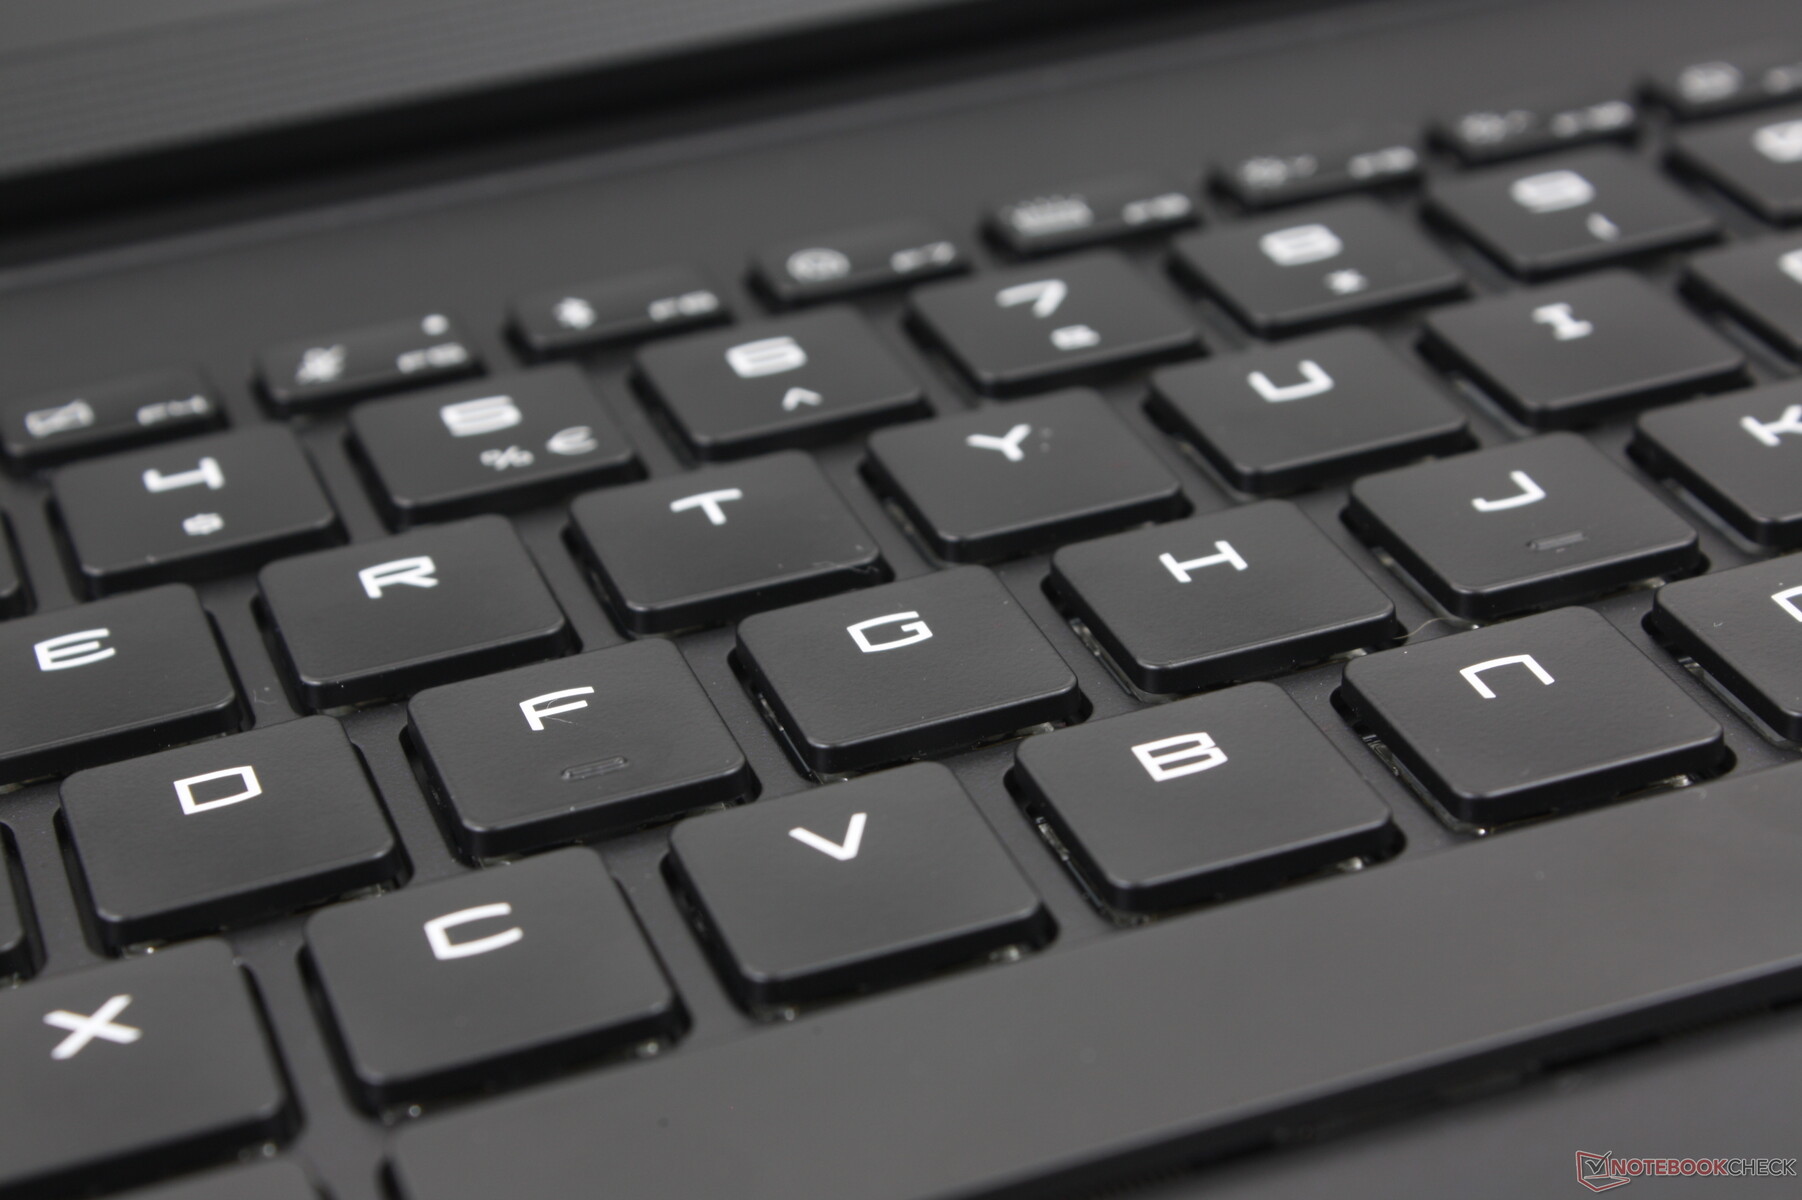
Dispositivos de entrada: teclas cómodas y fáciles de pulsar
Teclado
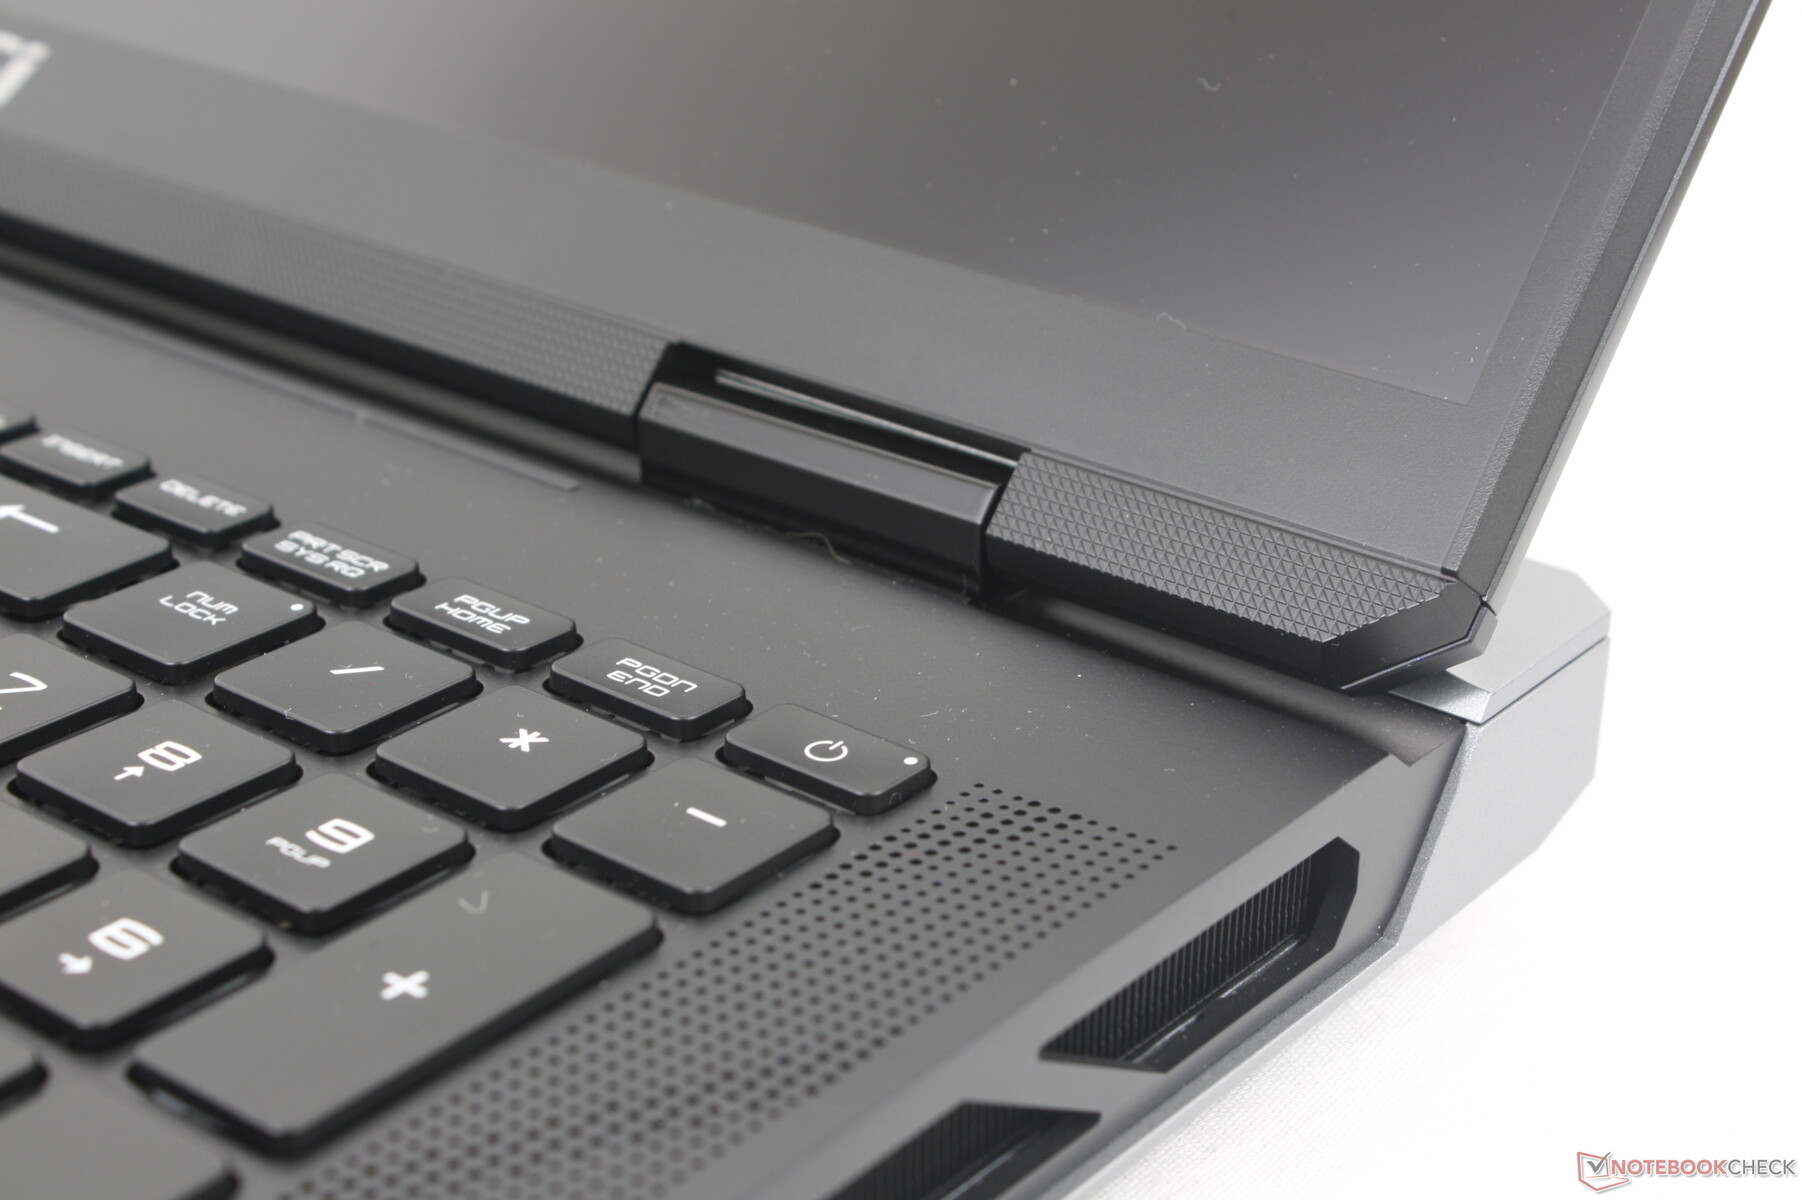
El teclado mecánico RGB Cherry de perfil ultrabajo por tecla viene de serie en todas las configuraciones, similar al disponible en ciertos modelos Alienware. La experiencia de tecleo es una de las mejores que hemos tenido en cualquier portátil en términos de recorrido y retroalimentación, ya que las diferencias son inmediatamente perceptibles en comparación con las teclas estándar basadas en membrana. El principal inconveniente, por supuesto, es el traqueteo más fuerte y agudo, especialmente al pulsar las teclas Intro y Espacio. Definitivamente, no es un teclado que desee utilizar en aulas o bibliotecas.
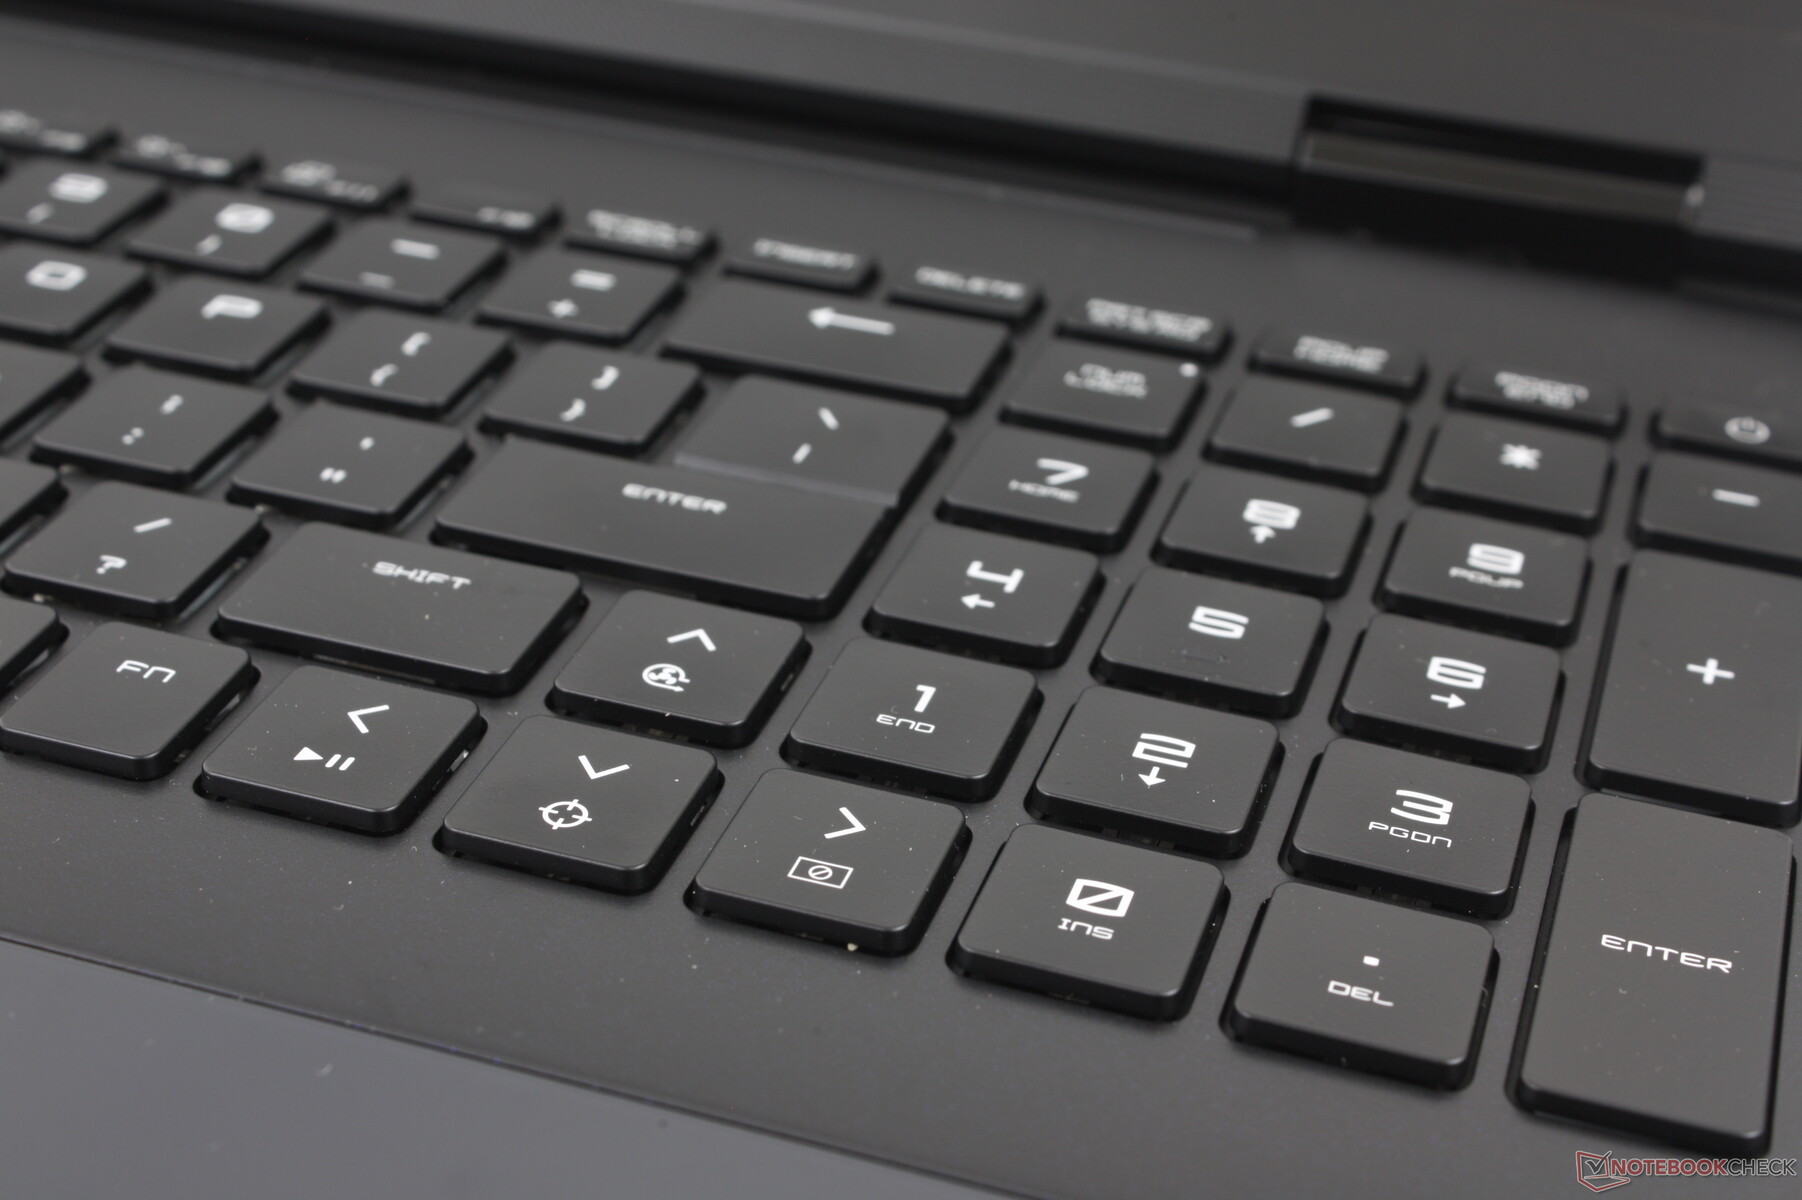
Por desgracia, no todas las teclas son mecánicas en el Titan 18 HX. En su lugar, el teclado numérico y las teclas de flecha son de membrana, por lo que se sienten más suaves y silenciosas al pulsarlas.
Panel táctil
El clickpad de 13 x 8,2 cm está iluminado RGB como en algunos modelos Alienware. La diferencia aquí, sin embargo, es que el clickpad de MSI está completamente enrasado con los reposamuñecas circundantes para conseguir una superficie suave y sin transiciones de borde a borde. Este enfoque es elegante y sexy, pero es menos práctico que un clickpad tradicional con bordes y esquinas táctiles. Presionar hacia abajo para introducir los clics del ratón también se hace más difícil y poco fiable, especialmente para las entradas multitáctiles como arrastrar y soltar. El embalaje estándar incluye un ratón USB gratuito, por lo que está claro que MSI se inclinó más por la forma que por la función a la hora de diseñar el clickpad.
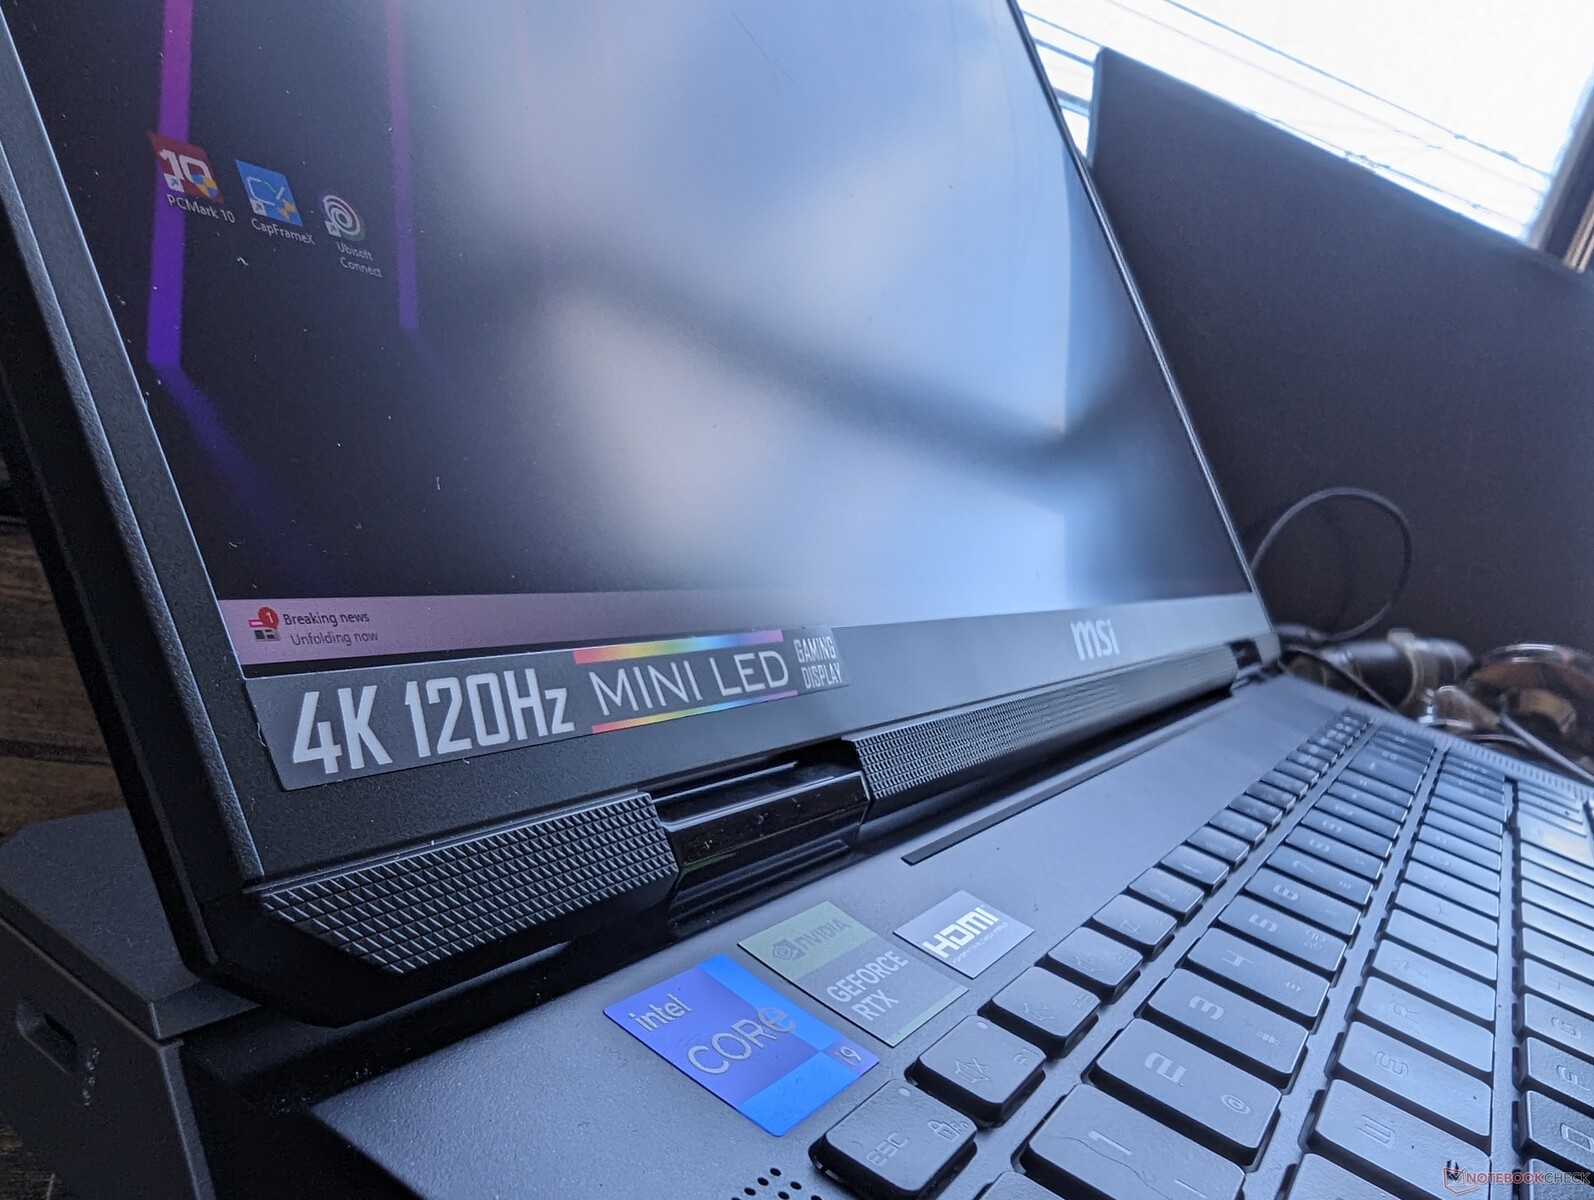
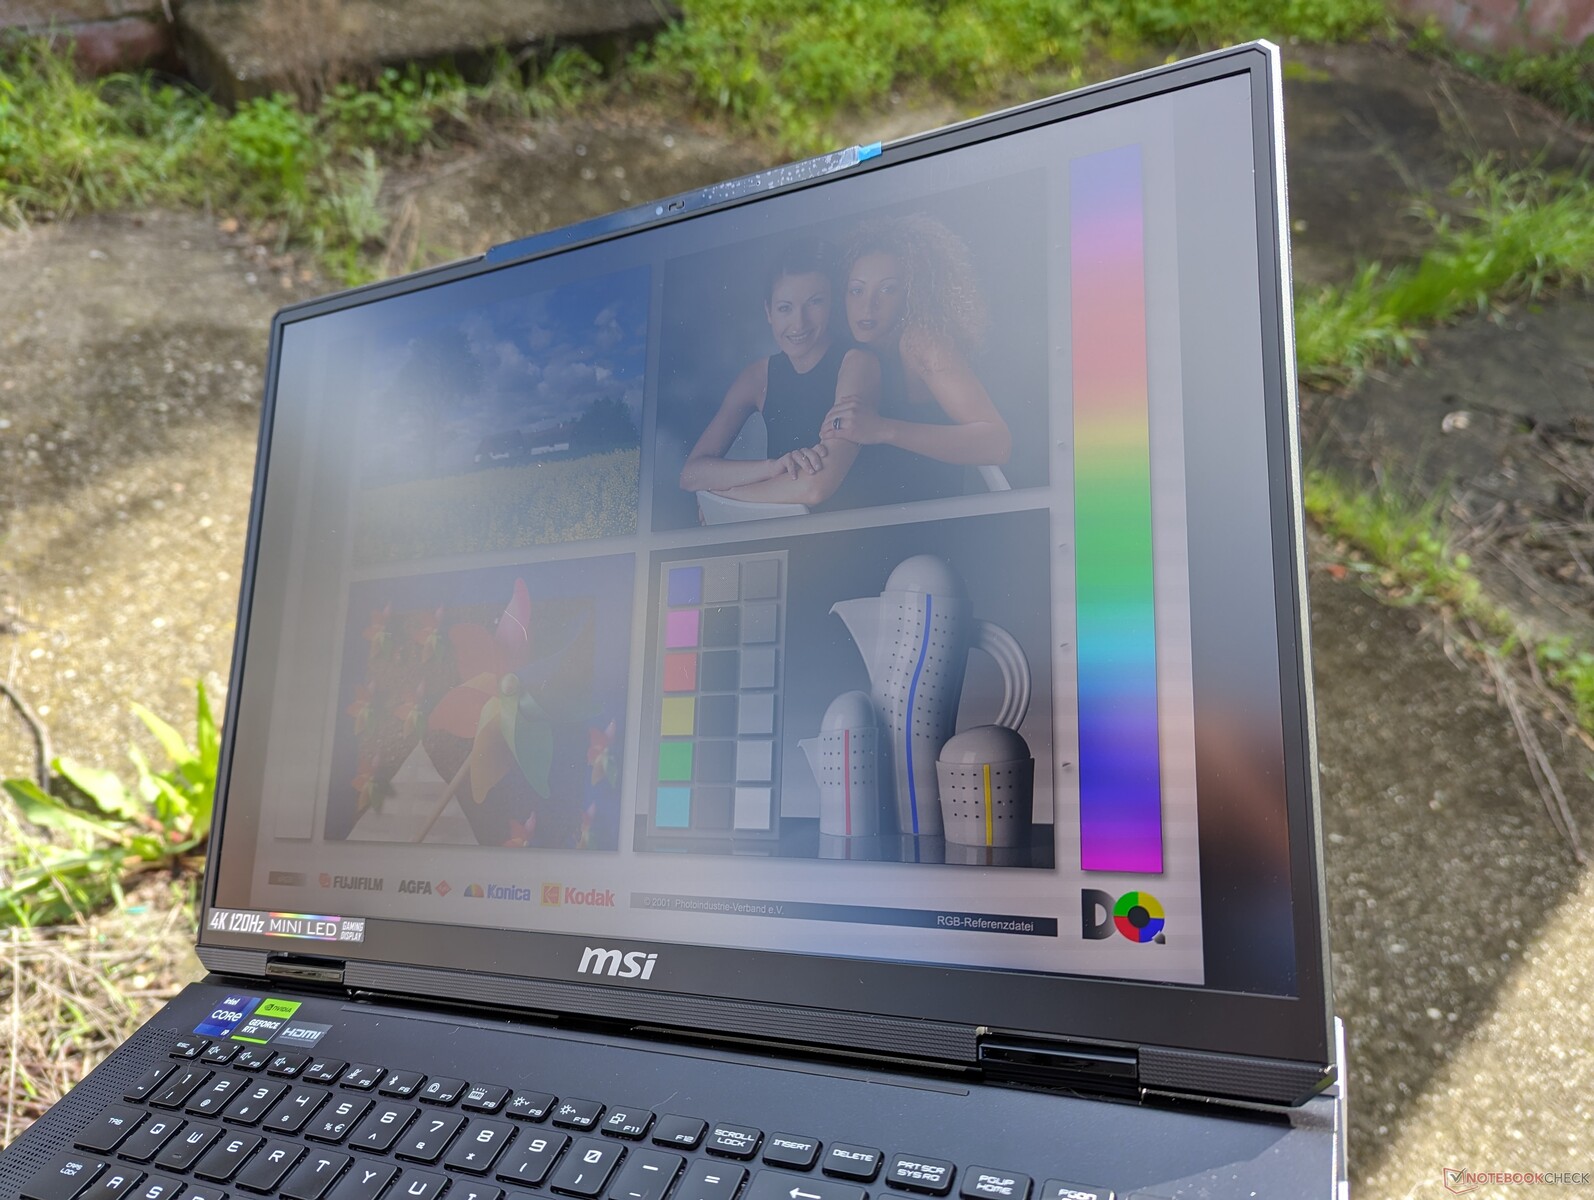
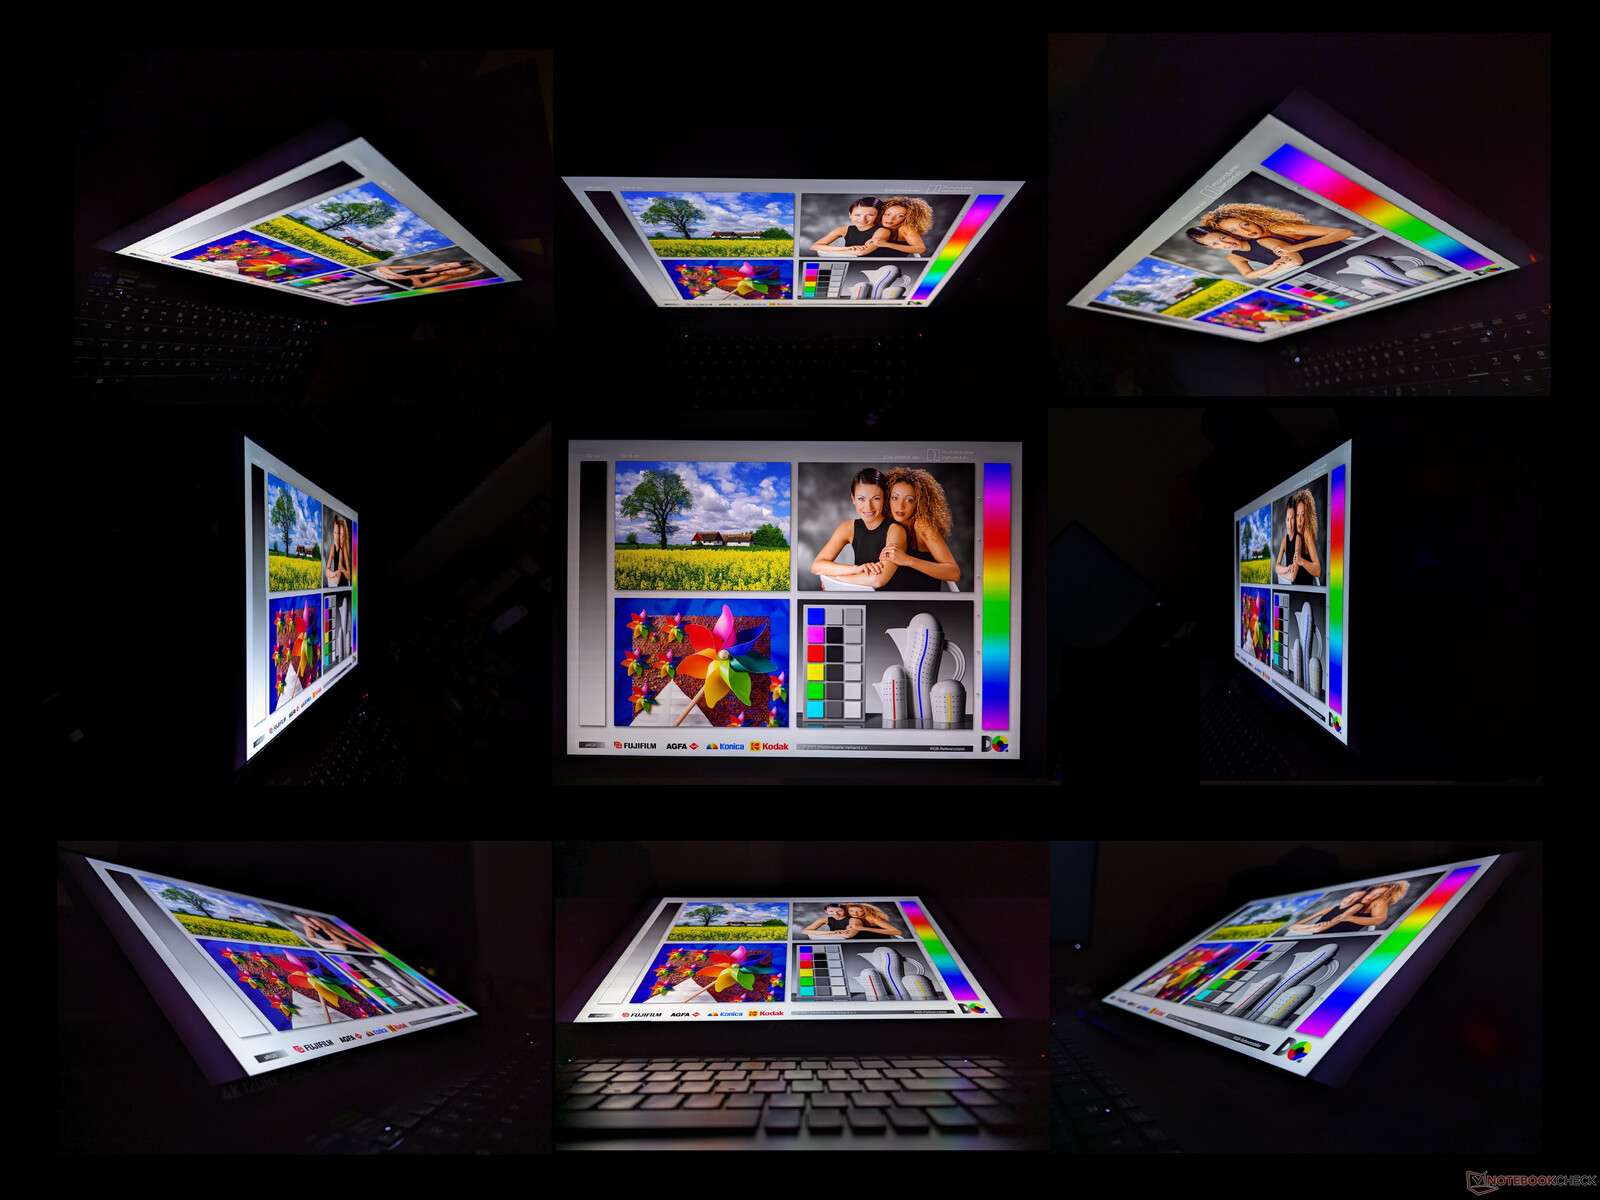
Pantalla - Fácilmente la característica más definitoria de la Titan 18 HX
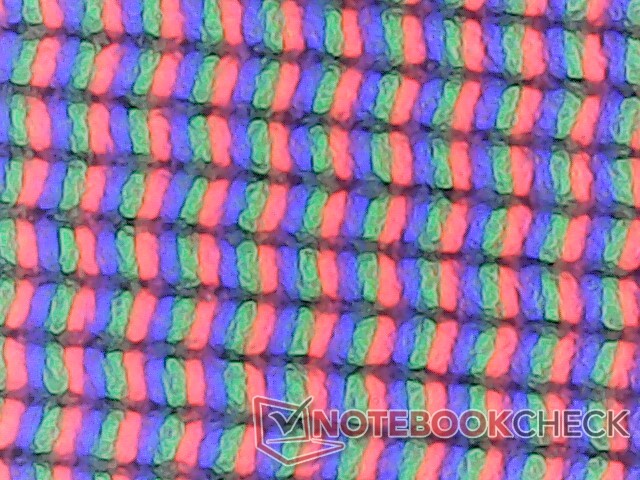
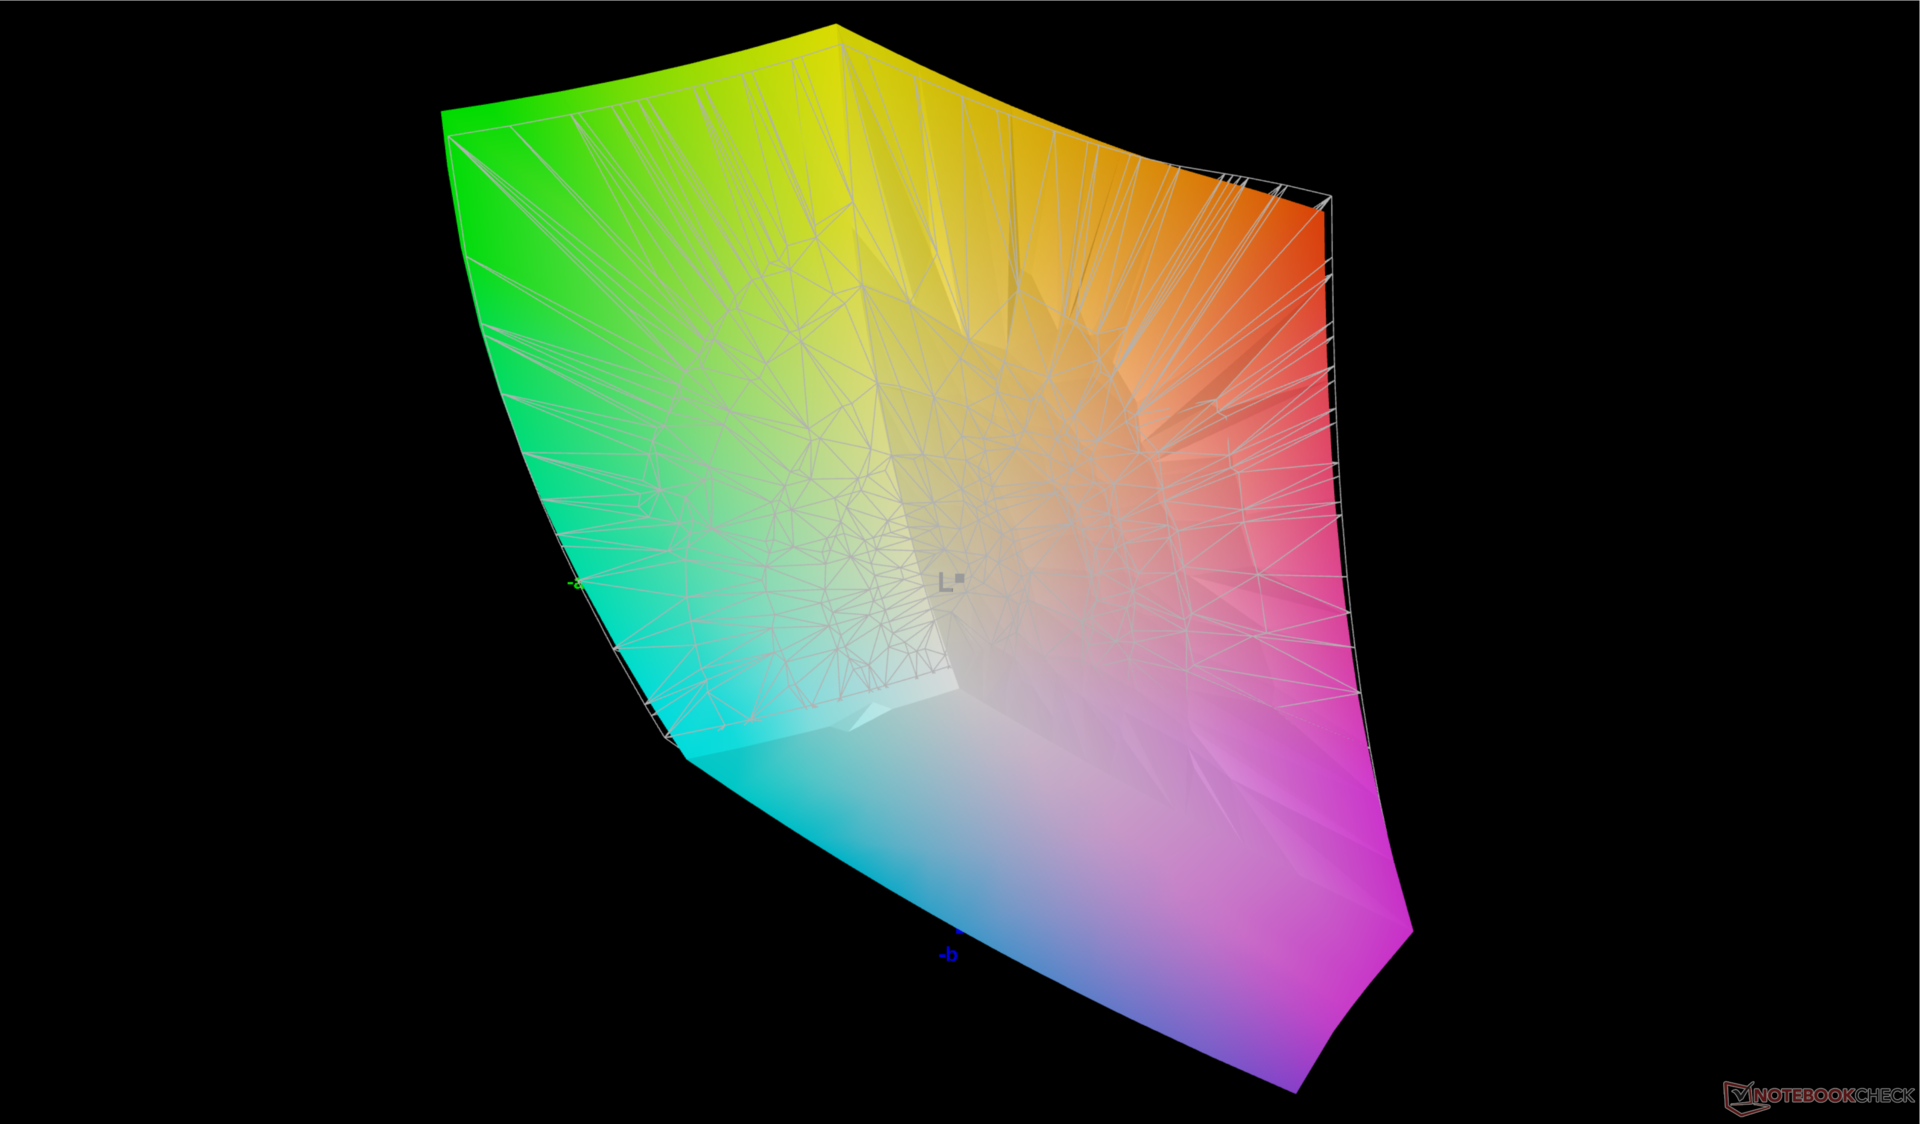
El Titan 18 HX es uno de los primeros portátiles de 18 pulgadas en salir al mercado este año con una pantalla mini-LED 4K de 120 Hz. En comparación con IPS y OLED, los paneles mini-LED pueden ser mucho más brillantes sin dejar de ofrecer colores DCI-P3 y niveles de negro similares a los de OLED para una mejor compatibilidad con HDR. En este caso, la pantalla Titan 18 HX puede alcanzar hasta 1155 nits en modo HDR según nuestro colorímetro para soportar la reproducción HDR1000. Si está en modo SDR, la pantalla está limitada a unos 470 nits que es similar a muchos paneles IPS.
Tenga en cuenta que el modo HDR no está disponible si funciona con batería. El brillo máximo cae a sólo 323 nits cuando funciona con baterías, incluso si la función de ahorro de energía de la pantalla está desactivada. No estamos seguros de si esto último es un error, pero la caída de brillo es ciertamente notable entre la batería y la red eléctrica.
Por desgracia, el mayor inconveniente de la pantalla es que no es compatible con G-Sync ni con la frecuencia de actualización variable (VRR). También puede ser muy exigente con la energía debido a su alto techo de brillo, como se demuestra en nuestra sección de consumo de energía a continuación. No obstante, la pantalla sigue siendo una de las mejores que hemos visto en cualquier portátil tanto para juegos como para multimedia.
| |||||||||||||||||||||||||
iluminación: 90 %
Brillo con batería: 323 cd/m²
Contraste: ∞:1 (Negro: 0 cd/m²)
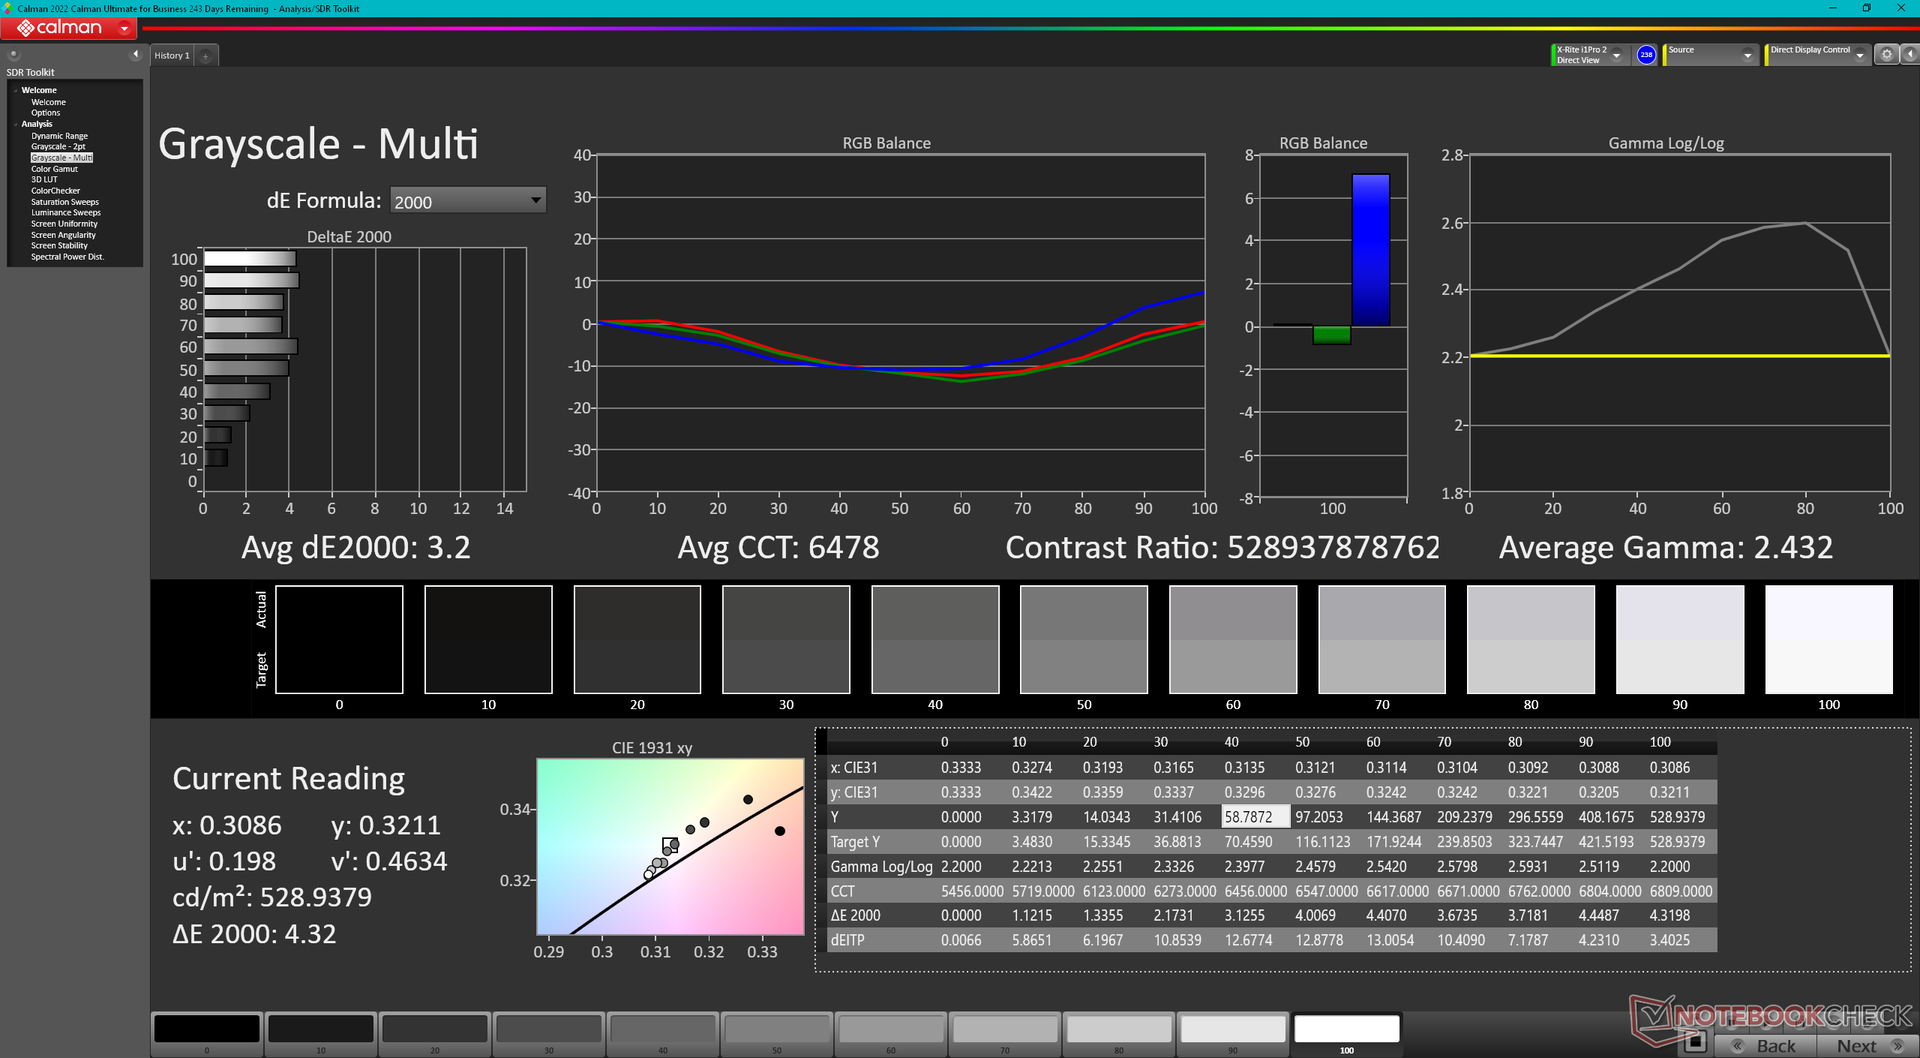
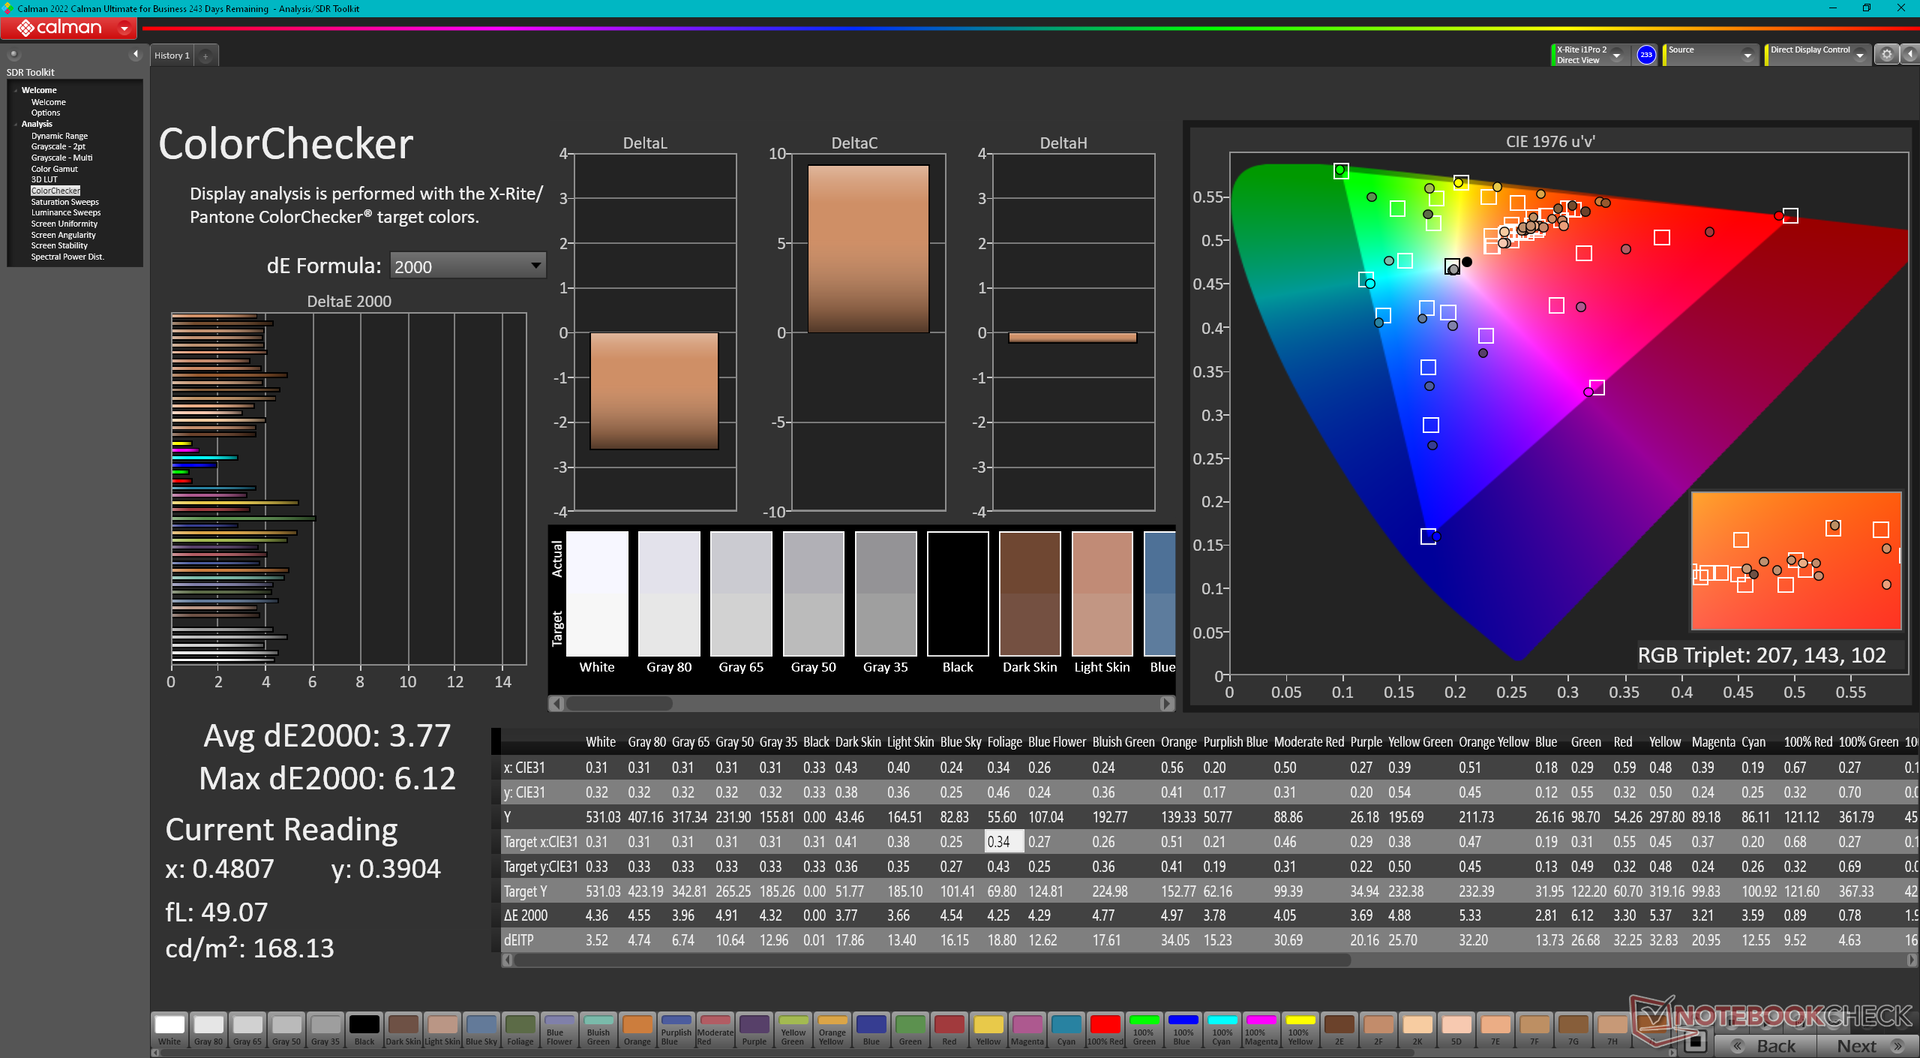
ΔE ColorChecker Calman: 3.77 | ∀{0.5-29.43 Ø4.72}
calibrated: 2.94
ΔE Greyscale Calman: 3.2 | ∀{0.09-98 Ø4.97}
86.2% AdobeRGB 1998 (Argyll 3D)
99.8% sRGB (Argyll 3D)
98.1% Display P3 (Argyll 3D)
Gamma: 2.43
CCT: 6478 K
| MSI Titan 18 HX A14VIG AU Optronics B180ZAN01.0, Mini-LED, 3840x2400, 18" | MSI Titan GT77 HX 13VI B173ZAN06.C, Mini-LED, 3840x2160, 17.3" | Alienware m18 R1 Chi Mei 180JME, IPS, 1920x1200, 18" | Asus ROG Strix G18 G814JI NE180QDM-NZ2 (BOE0B35), IPS, 2560x1600, 18" | Acer Predator Helios 18 N23Q2 AUO45A8 (B180QAN01.2), IPS, 2560x1600, 18" | Razer Blade 18 RTX 4070 AU Optronics B180QAN01.0, IPS, 2560x1600, 18" | |
|---|---|---|---|---|---|---|
| Display | 1% | 1% | -0% | 3% | -1% | |
| Display P3 Coverage (%) | 98.1 | 94.9 -3% | 97.7 0% | 98.1 0% | 99.8 2% | 96.9 -1% |
| sRGB Coverage (%) | 99.8 | 99.9 0% | 100 0% | 99.9 0% | 100 0% | 99.8 0% |
| AdobeRGB 1998 Coverage (%) | 86.2 | 92.4 7% | 89.8 4% | 85.6 -1% | 91.8 6% | 85.3 -1% |
| Response Times | -140% | 77% | 62% | 45% | 71% | |
| Response Time Grey 50% / Grey 80% * (ms) | 8.6 ? | 38.4 ? -347% | 3 ? 65% | 5.6 ? 35% | 7.6 ? 12% | 4.2 ? 51% |
| Response Time Black / White * (ms) | 81.8 ? | 26.6 ? 67% | 9.9 ? 88% | 9 ? 89% | 17.8 ? 78% | 8 ? 90% |
| PWM Frequency (Hz) | 2592 ? | 2380 ? | 2509 | |||
| Screen | -9% | 28% | 21% | -14% | 11% | |
| Brightness middle (cd/m²) | 467.5 | 606 30% | 372.8 -20% | 471 1% | 360 -23% | 549.6 18% |
| Brightness (cd/m²) | 459 | 602 31% | 367 -20% | 422 -8% | 355 -23% | 524 14% |
| Brightness Distribution (%) | 90 | 93 3% | 97 8% | 83 -8% | 92 2% | 89 -1% |
| Black Level * (cd/m²) | 0.0001 | 0.32 | 0.47 | 0.21 | 0.53 | |
| Colorchecker dE 2000 * | 3.77 | 4.8 -27% | 1.92 49% | 2.05 46% | 3.82 -1% | 3.32 12% |
| Colorchecker dE 2000 max. * | 6.12 | 8.2 -34% | 3.65 40% | 4.15 32% | 7.38 -21% | 6.63 -8% |
| Colorchecker dE 2000 calibrated * | 2.94 | 1.8 39% | 0.51 83% | 0.8 73% | 2.24 24% | 2.7 8% |
| Greyscale dE 2000 * | 3.2 | 6.5 -103% | 1.5 53% | 2.8 13% | 5.06 -58% | 2 37% |
| Gamma | 2.43 91% | 2.63 84% | 2.34 94% | 2.204 100% | 2.52 87% | 2.29 96% |
| CCT | 6478 100% | 6596 99% | 6607 98% | 7122 91% | 5657 115% | 6319 103% |
| Contrast (:1) | 6060000 | 1165 | 1002 | 1714 | 1037 | |
| Media total (Programa/Opciones) | -49% /
-28% | 35% /
29% | 28% /
23% | 11% /
-0% | 27% /
18% |
* ... más pequeño es mejor
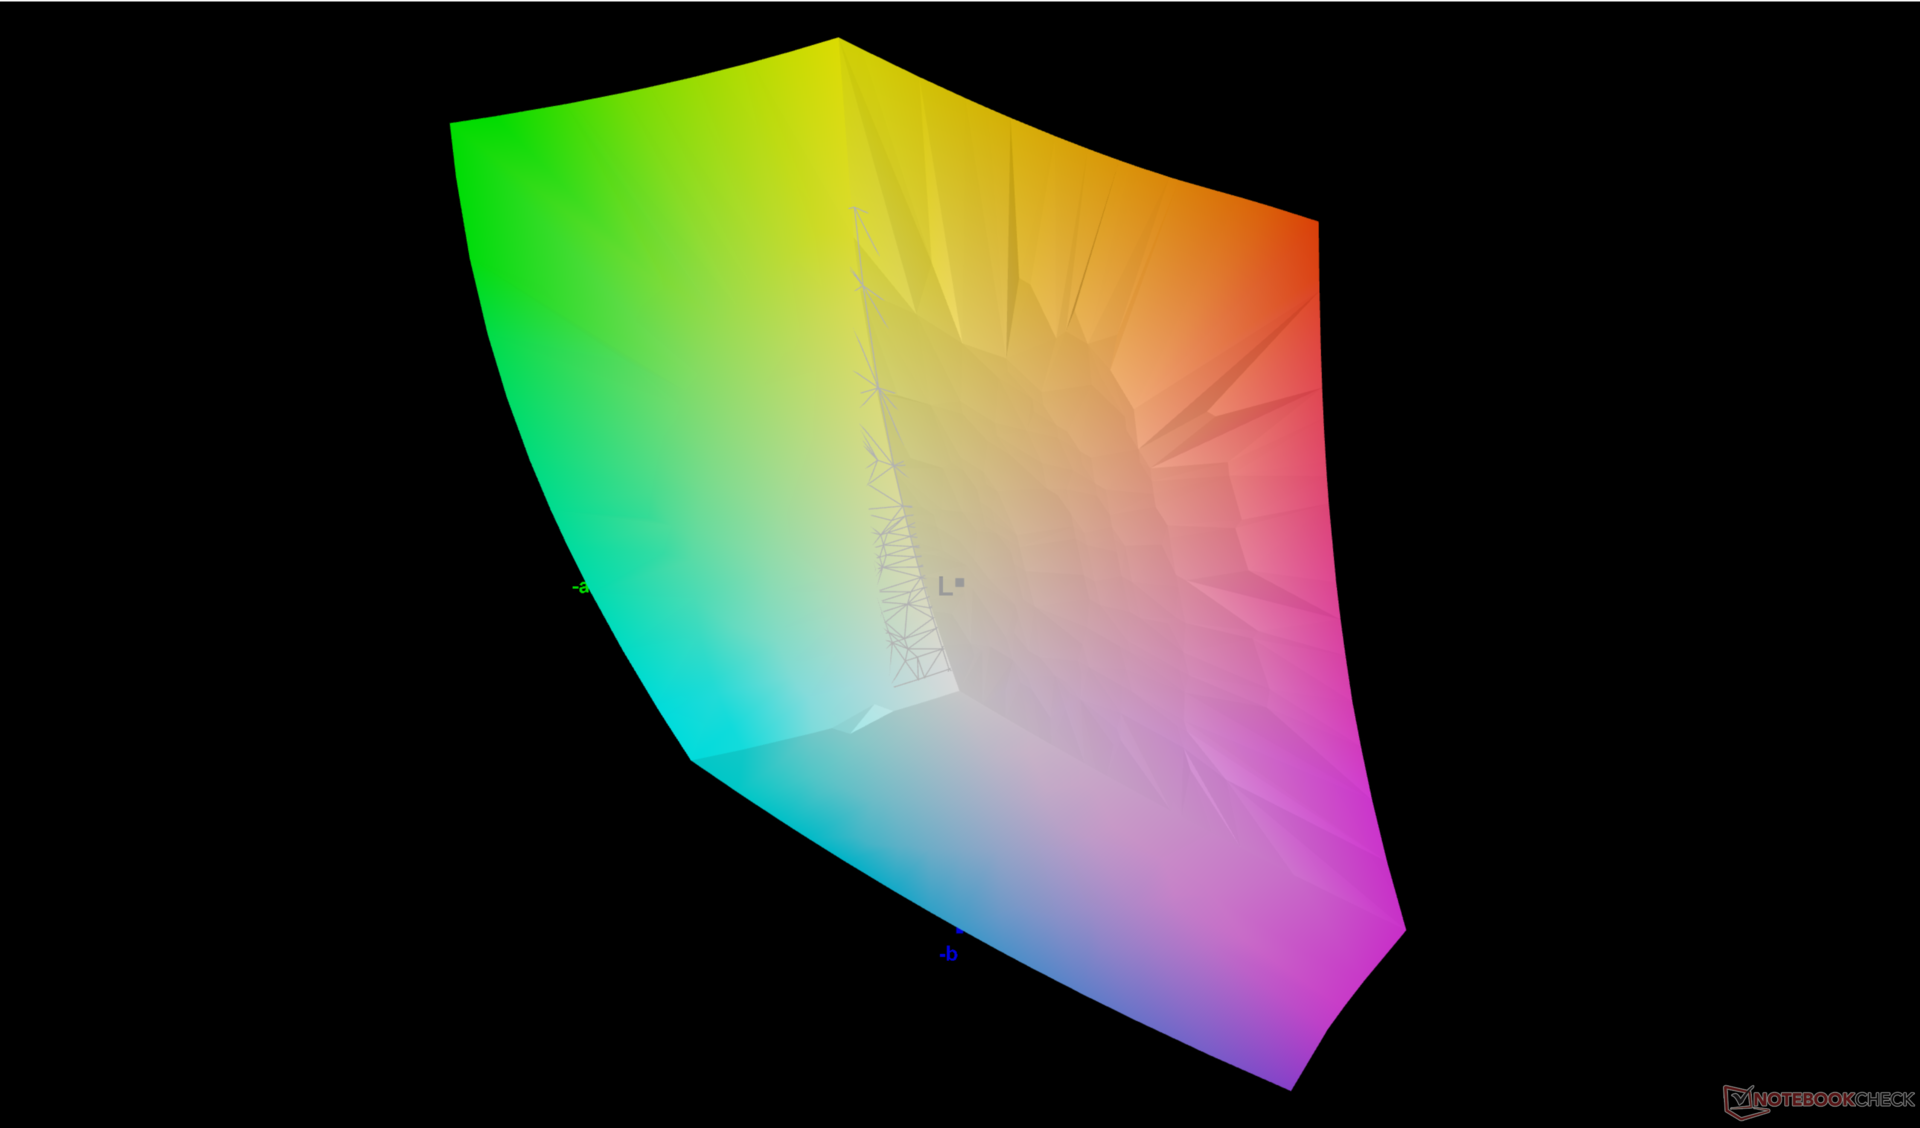
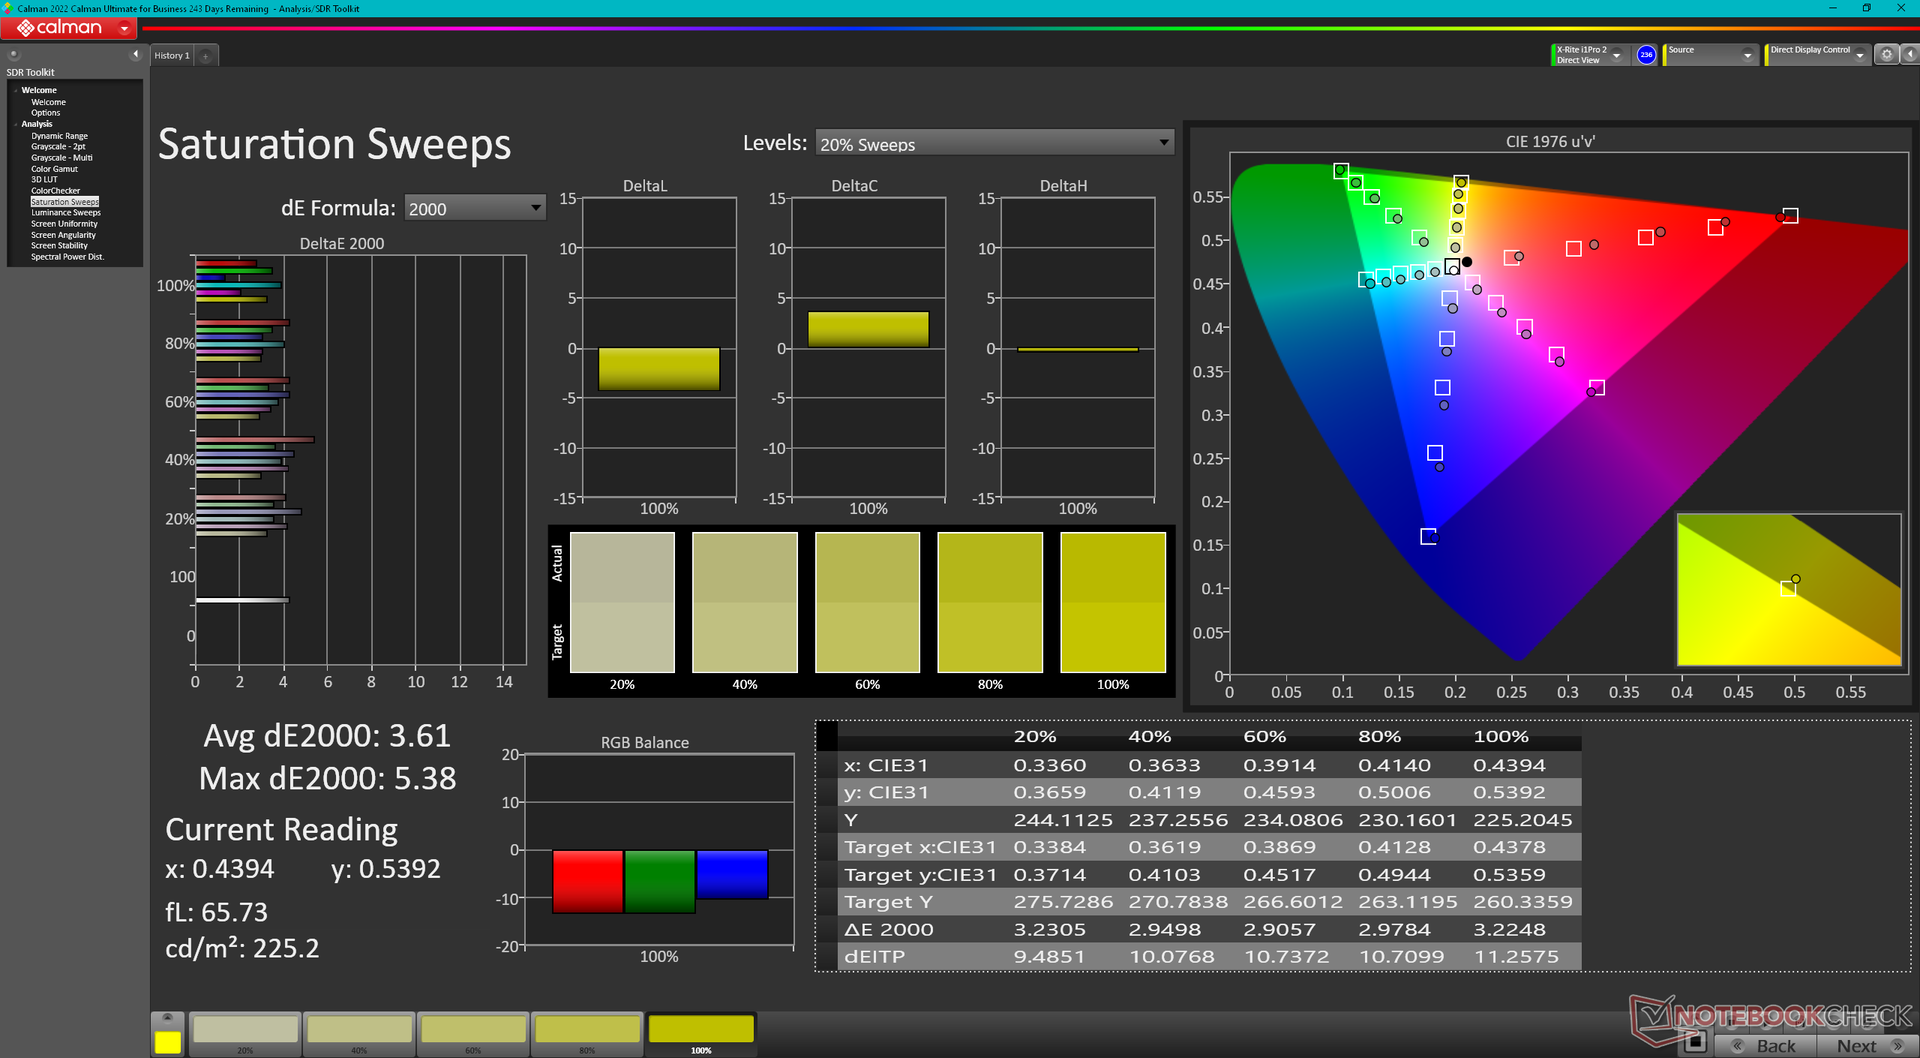
MSI no anuncia ningún esfuerzo de calibración Pantone a pesar del elevado precio de venta de la Titan. Los valores medios de escala de grises y deltaE de color son, no obstante, muy buenos nada más sacarlo de la caja, con 3,2 y 3,77, respectivamente.
Tiempos de respuesta del display
| ↔ Tiempo de respuesta de Negro a Blanco | ||
|---|---|---|
| 81.8 ms ... subida ↗ y bajada ↘ combinada | ↗ 76 ms subida | 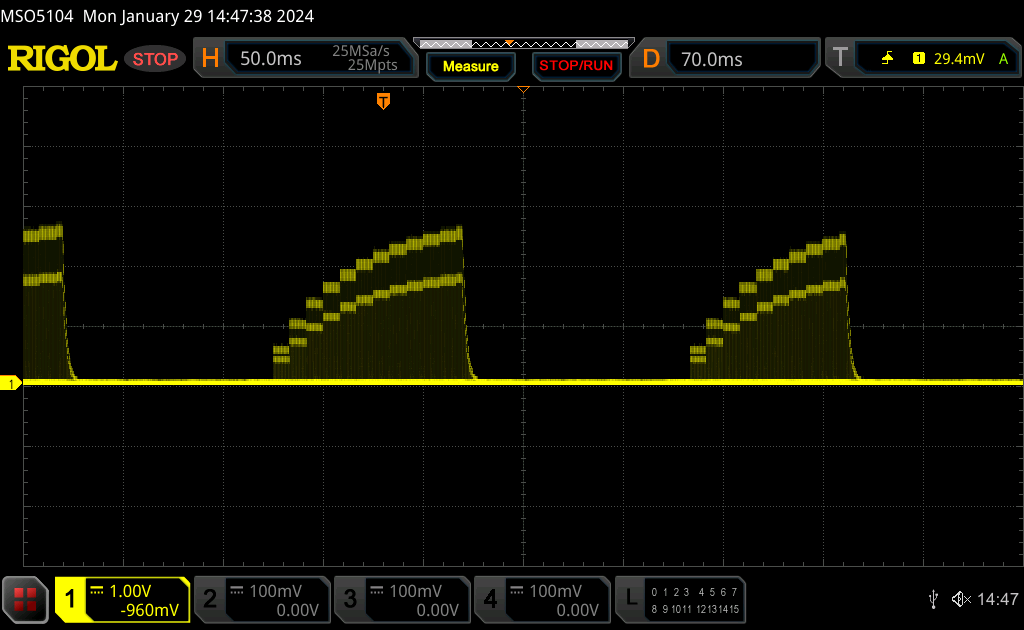 |
| ↘ 5.8 ms bajada | ||
| La pantalla mostró tiempos de respuesta lentos en nuestros tests y podría ser demasiado lenta para los jugones. En comparación, todos los dispositivos de prueba van de ##min### (mínimo) a 240 (máximo) ms. » 100 % de todos los dispositivos son mejores. Eso quiere decir que el tiempo de respuesta es peor que la media (19.8 ms) de todos los dispositivos testados. | ||
| ↔ Tiempo de respuesta 50% Gris a 80% Gris | ||
| 8.6 ms ... subida ↗ y bajada ↘ combinada | ↗ 4.2 ms subida | 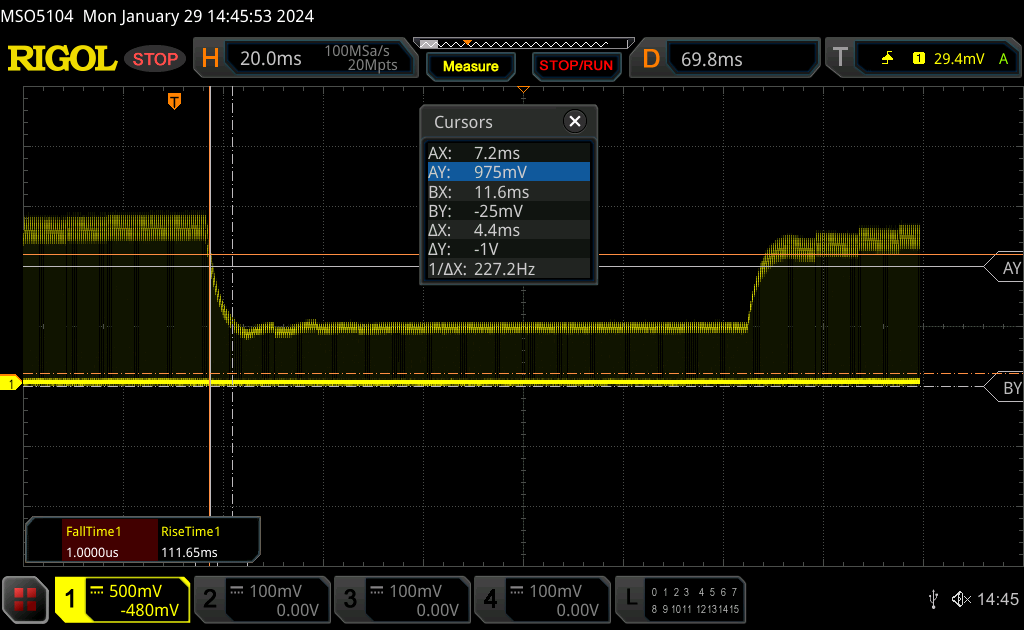 |
| ↘ 4.4 ms bajada | ||
| La pantalla mostró tiempos de respuesta rápidos en nuestros tests y debería ser adecuada para juegos. En comparación, todos los dispositivos de prueba van de ##min### (mínimo) a 636 (máximo) ms. » 22 % de todos los dispositivos son mejores. Esto quiere decir que el tiempo de respuesta medido es mejor que la media (31 ms) de todos los dispositivos testados. | ||
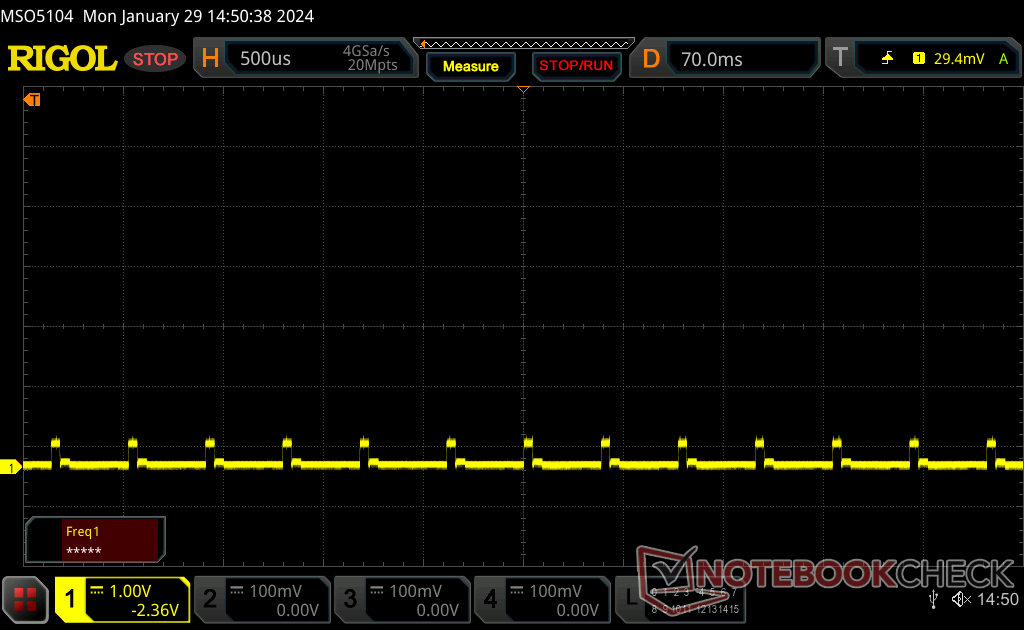
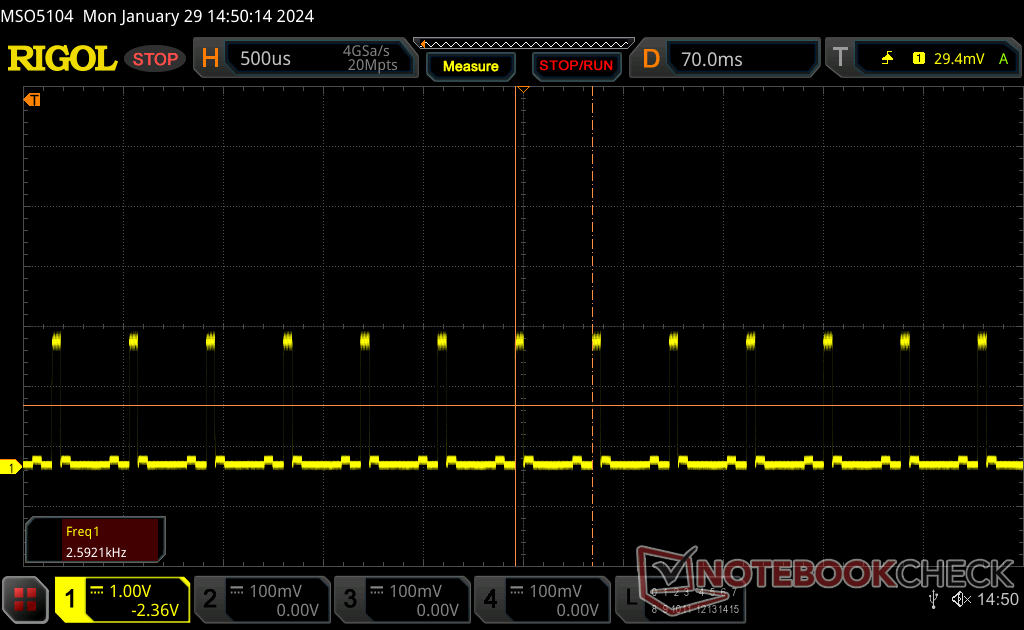
Parpadeo de Pantalla / PWM (Pulse-Width Modulation)
| Parpadeo de Pantalla / PWM detectado | 2592 Hz | ≤ 100 % de brillo | 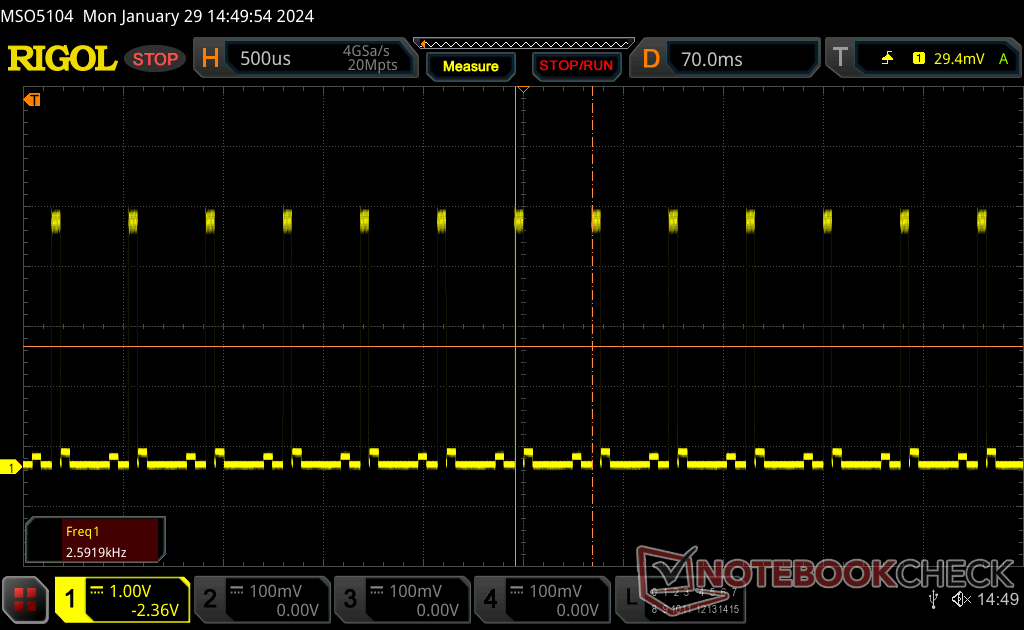 |
La retroiluminación del display parpadea a 2592 Hz (seguramente usa PWM - Pulse-Width Modulation) a un brillo del 100 % e inferior. Sobre este nivel de brillo no debería darse parpadeo / PWM. La frecuencia de 2592 Hz es bastante alta, por lo que la mayoría de gente sensible al parpadeo no debería ver parpadeo o tener fatiga visual. Comparación: 52 % de todos los dispositivos testados no usaron PWM para atenuar el display. Si se usó, medimos una media de 7763 (mínimo: 5 - máxmo: 343500) Hz. | |||
Los tiempos de respuesta blanco-negro y gris-gris del mini-LED son difíciles de medir por medios tradicionales. Sin embargo, podemos decir subjetivamente que el efecto fantasma no es un problema cuando se juega. Los movimientos rápidos aparecen suaves y sin emborronamiento para una experiencia que está más cerca de OLED o una pantalla IPS con tiempos de respuesta muy rápidos.
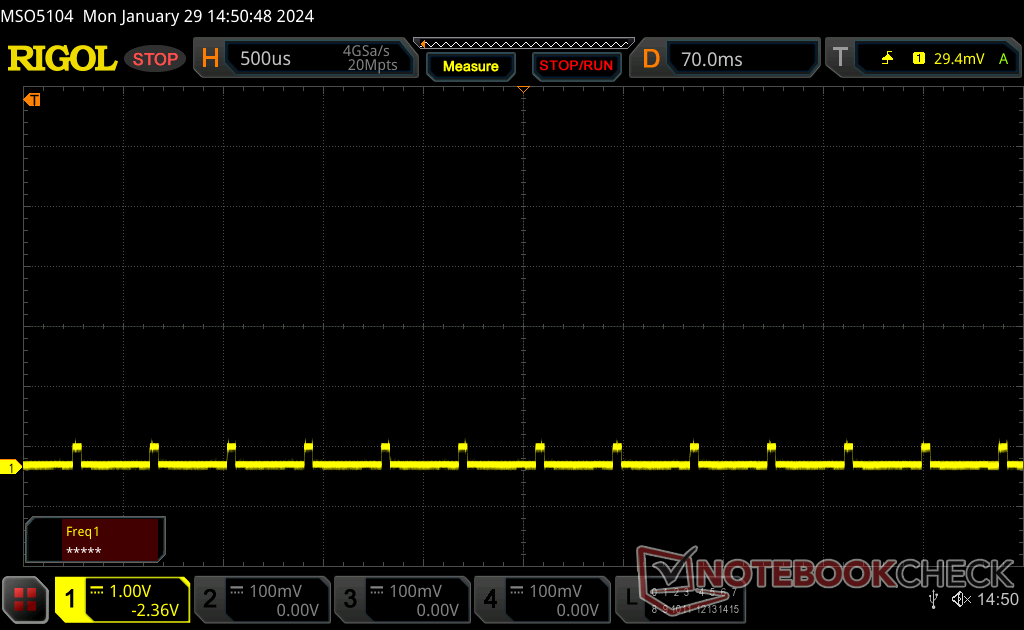
El parpadeo está presente con una frecuencia constante en todos los niveles de brillo, incluido el máximo.

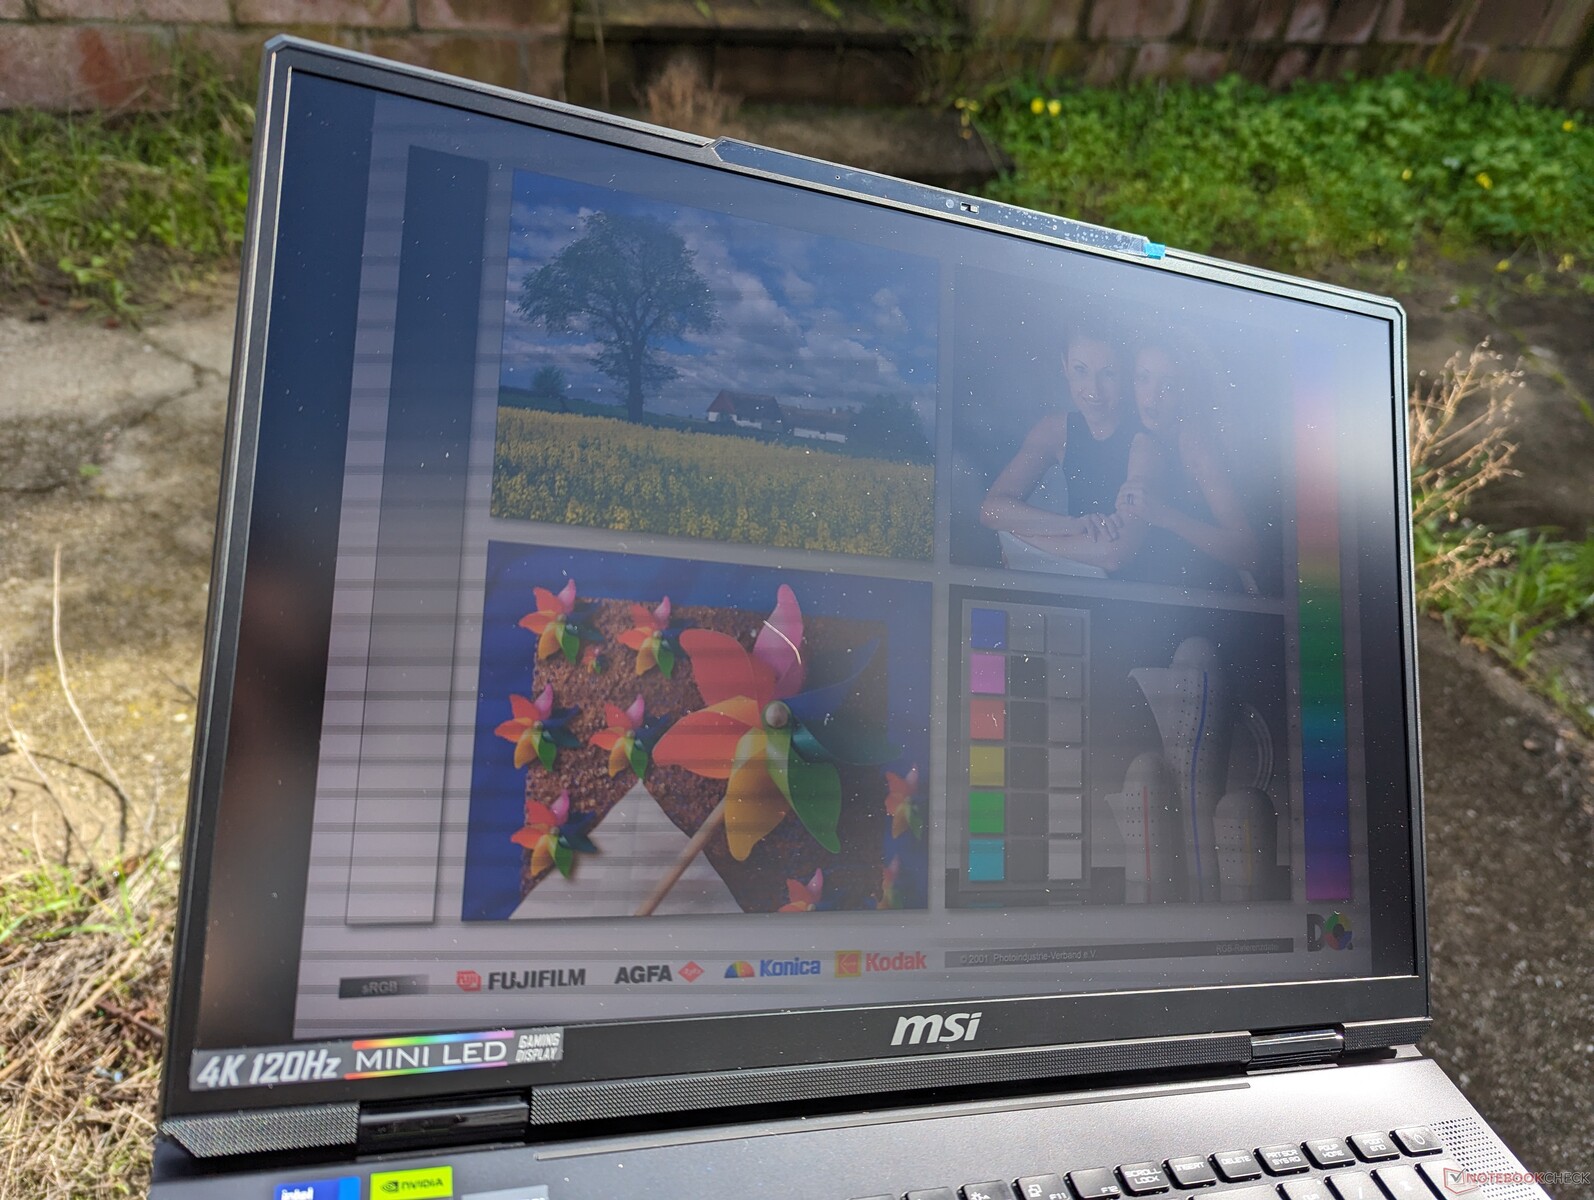
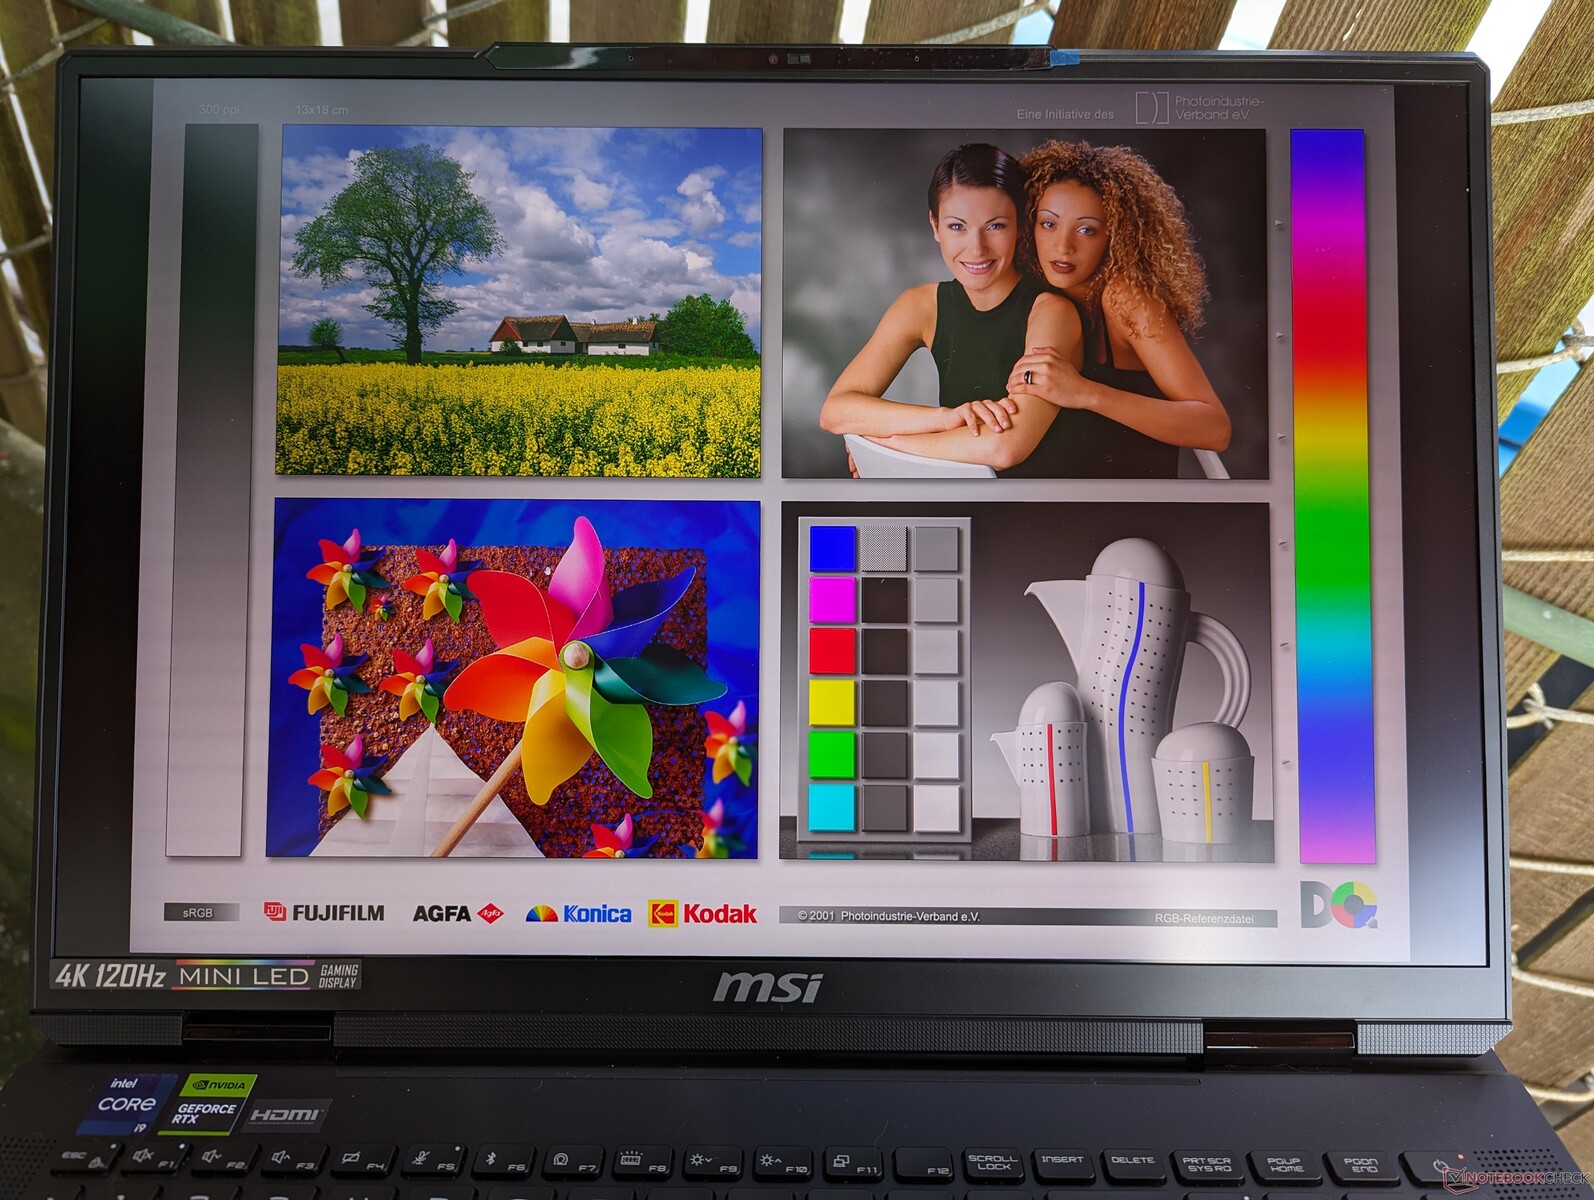
La visibilidad en exteriores es aceptable si está a la sombra, pero cualquier cosa más brillante y la pantalla se vuelve lavada. La retroiluminación ultrabrillante es inalcanzable si funciona con batería, como ya se ha mencionado.
Rendimiento - Raptor Lake-HX de 14ª generación
Condiciones de prueba
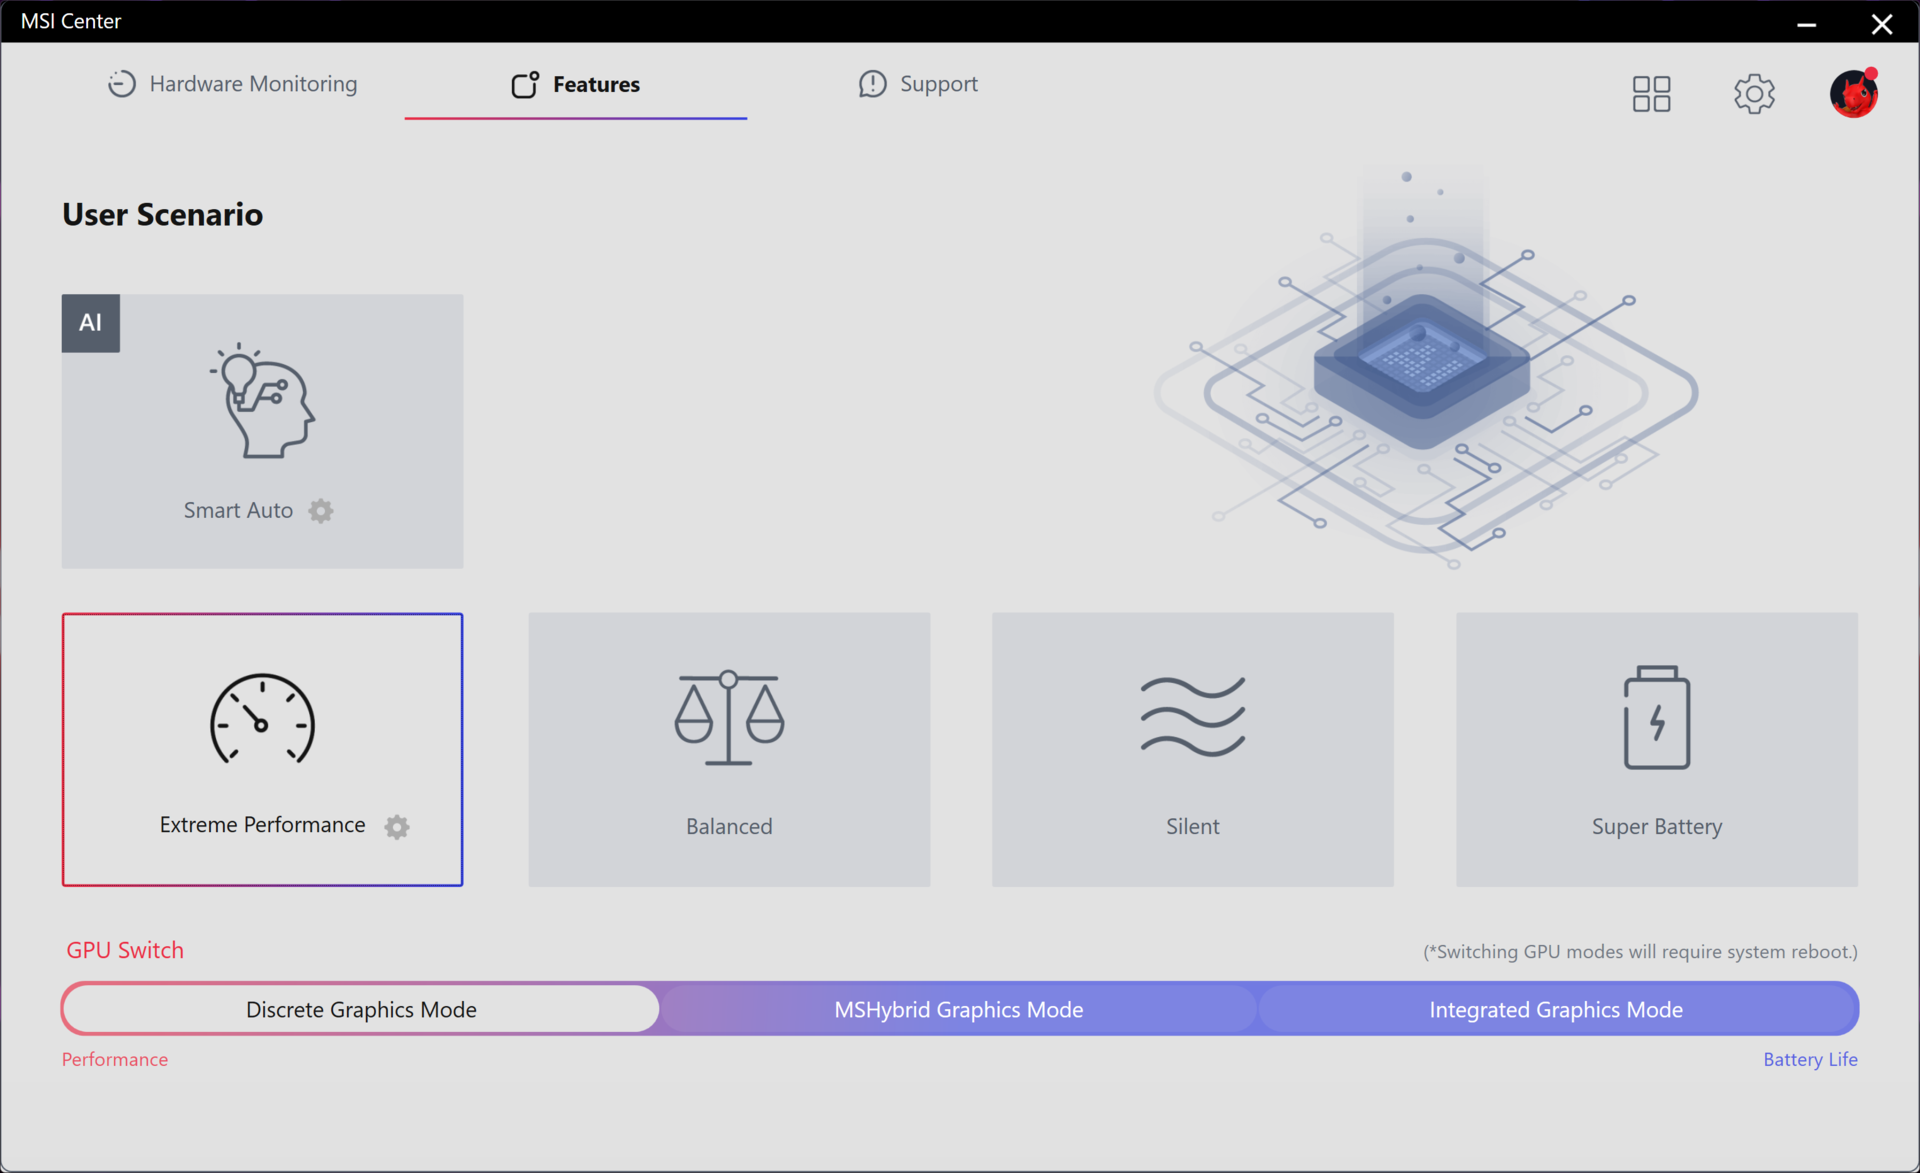
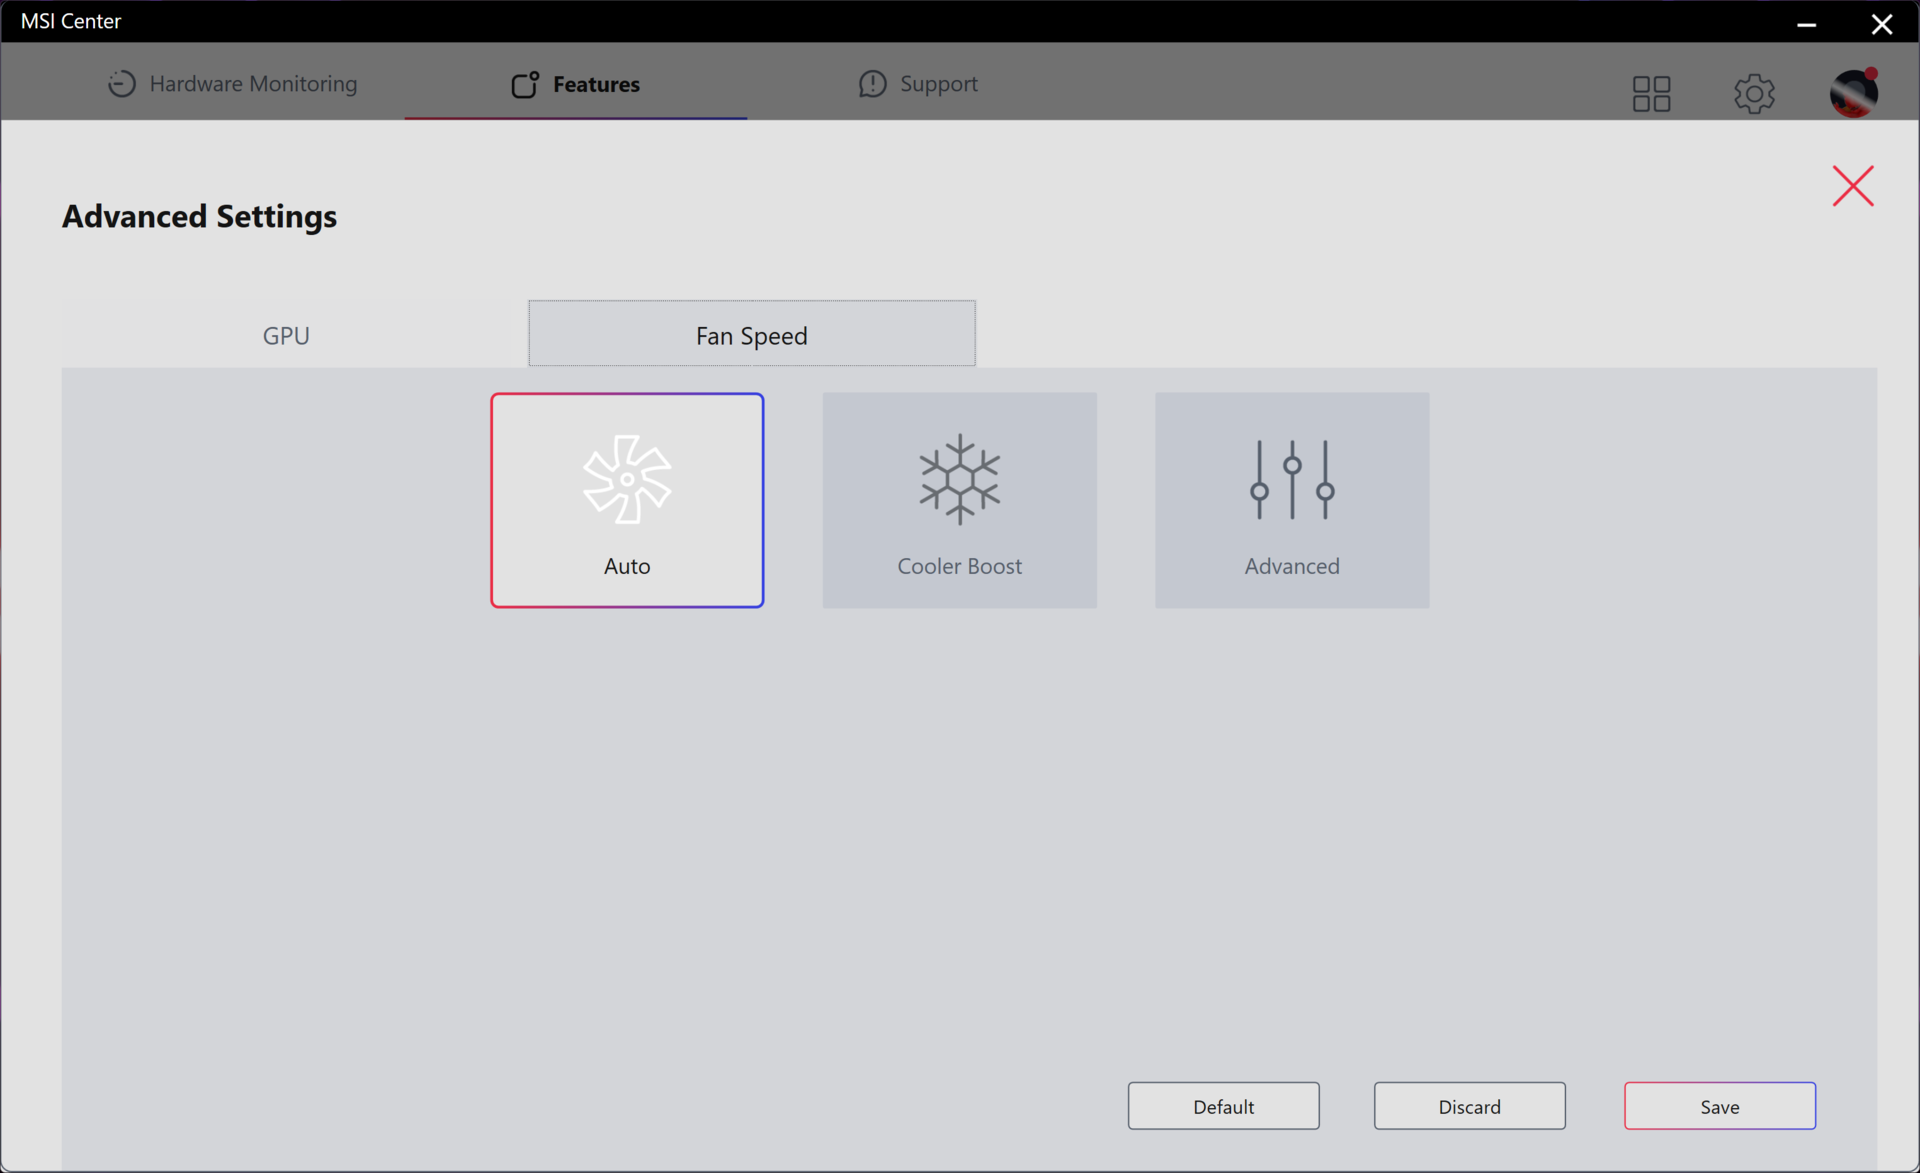
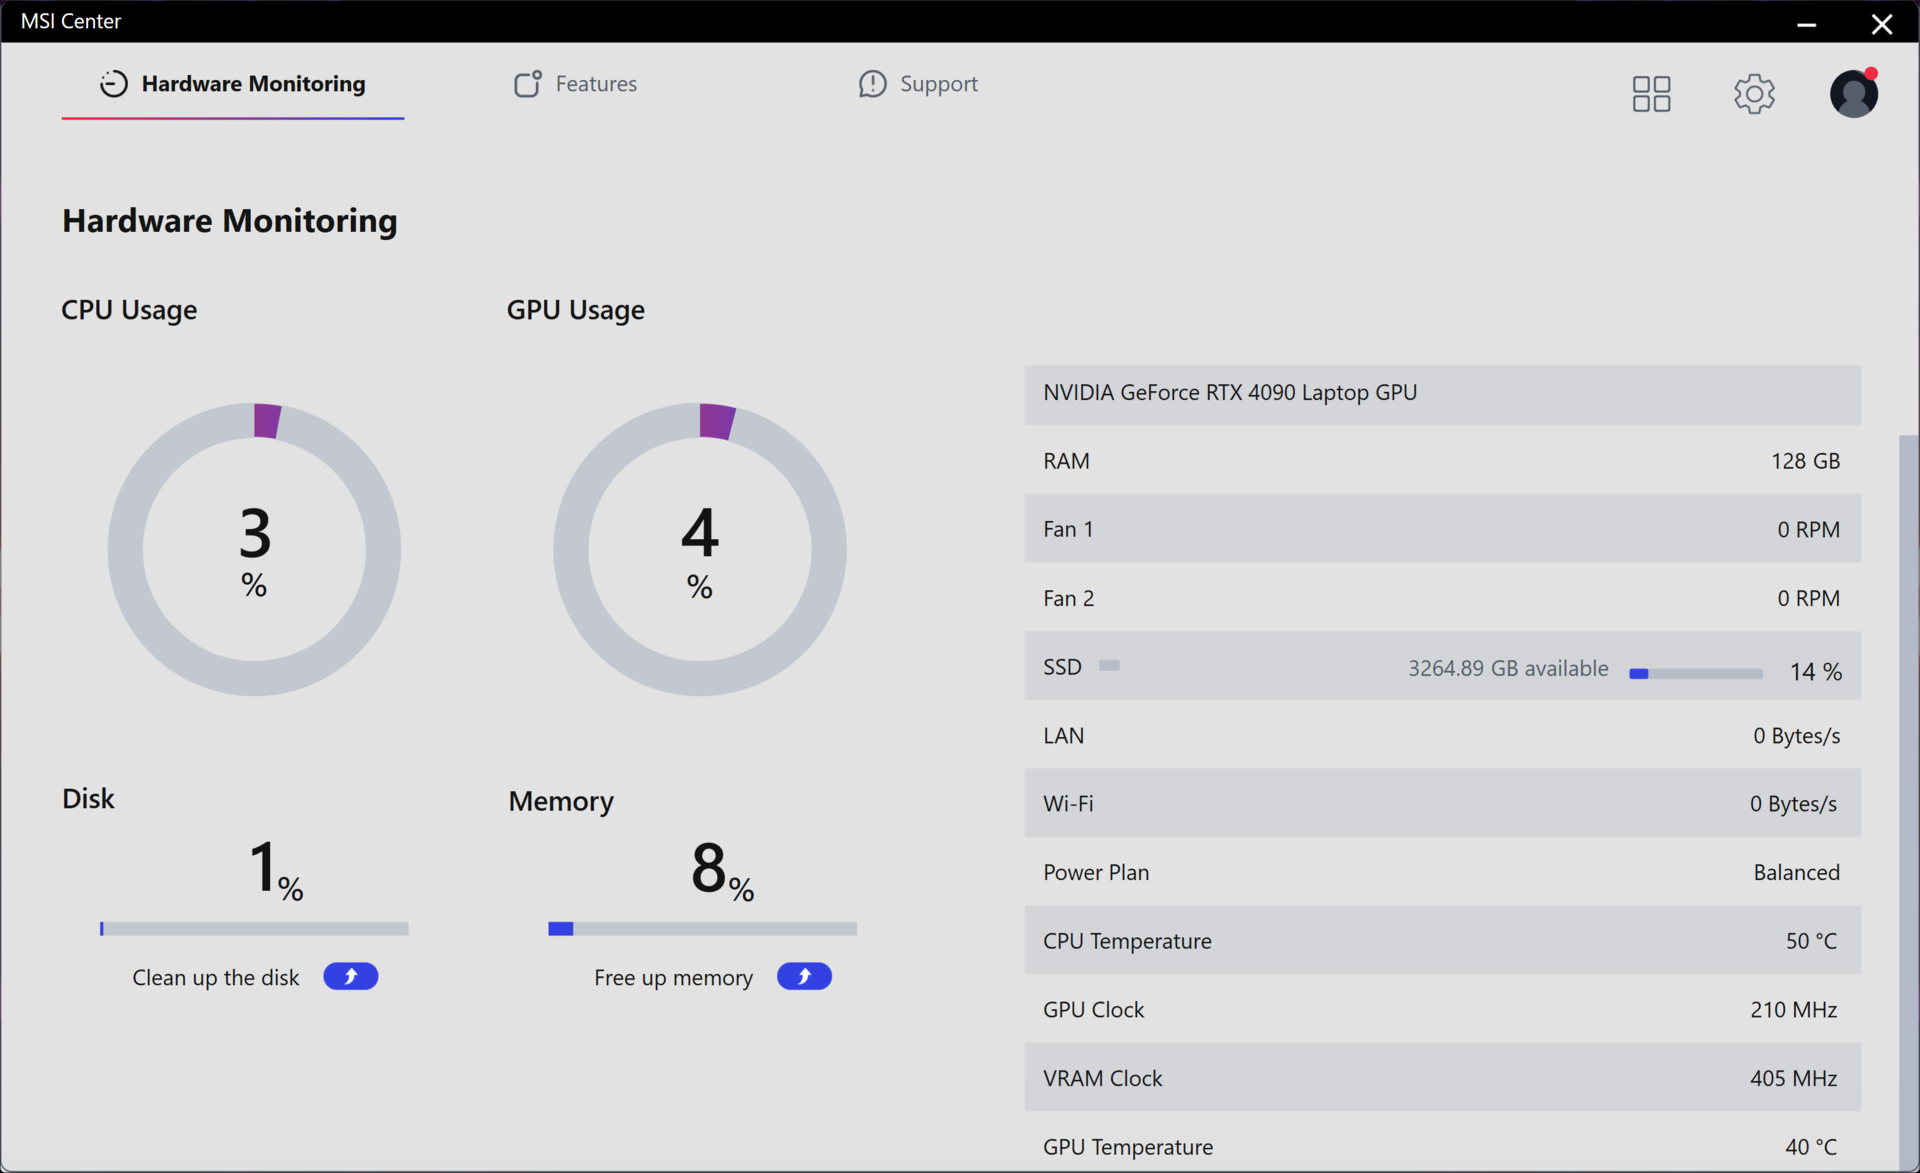
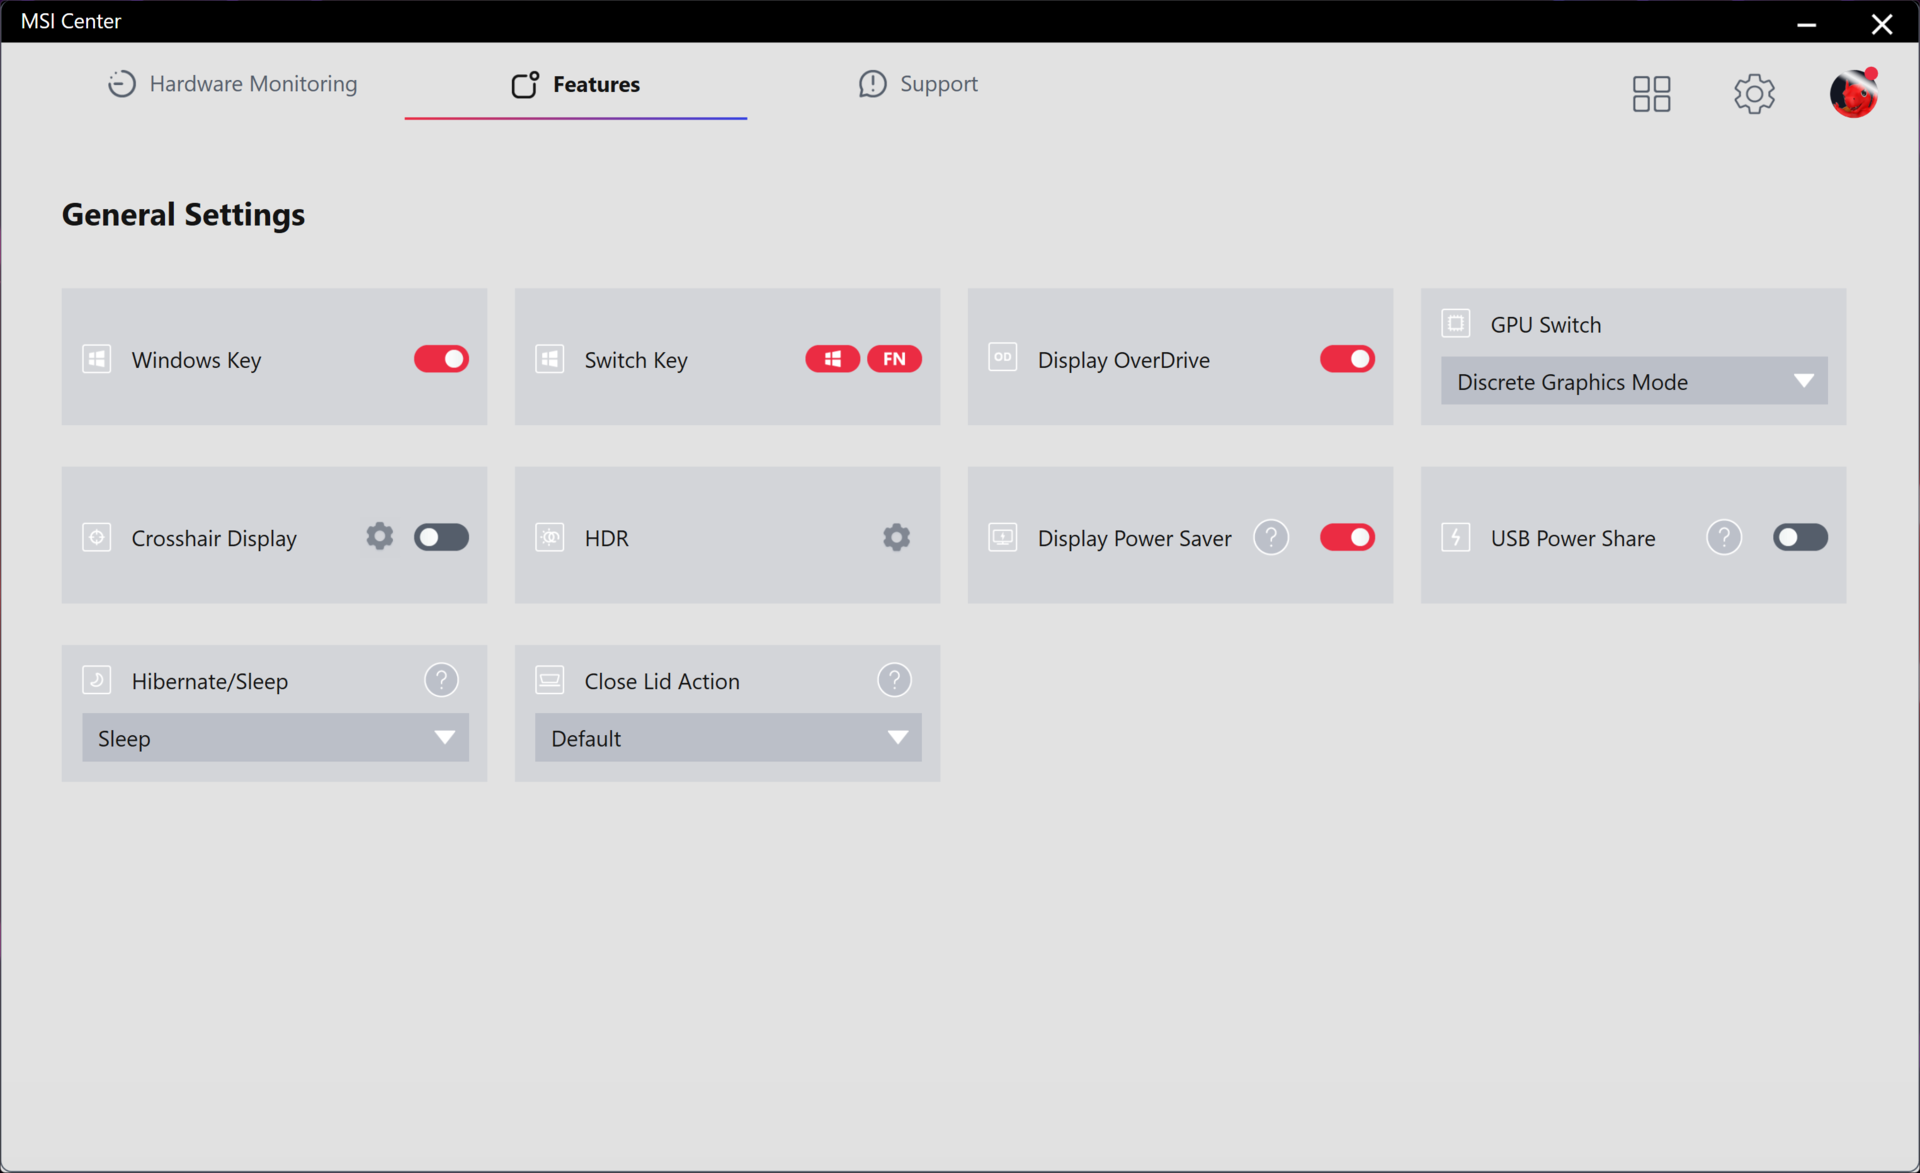
Pusimos el MSI Center en modo GPU discreta y en modo Rendimiento Extremo con Cooler Boost activo antes de ejecutar los benchmarks que se muestran a continuación. Cooler Boost es el nombre de marca de MSI para el modo de máxima velocidad del ventilador. Los propietarios deben familiarizarse con el Centro MSI, ya que es el centro de control para supervisar los signos vitales del sistema, instalar actualizaciones específicas de MSI, y alternar la mayoría de las características.
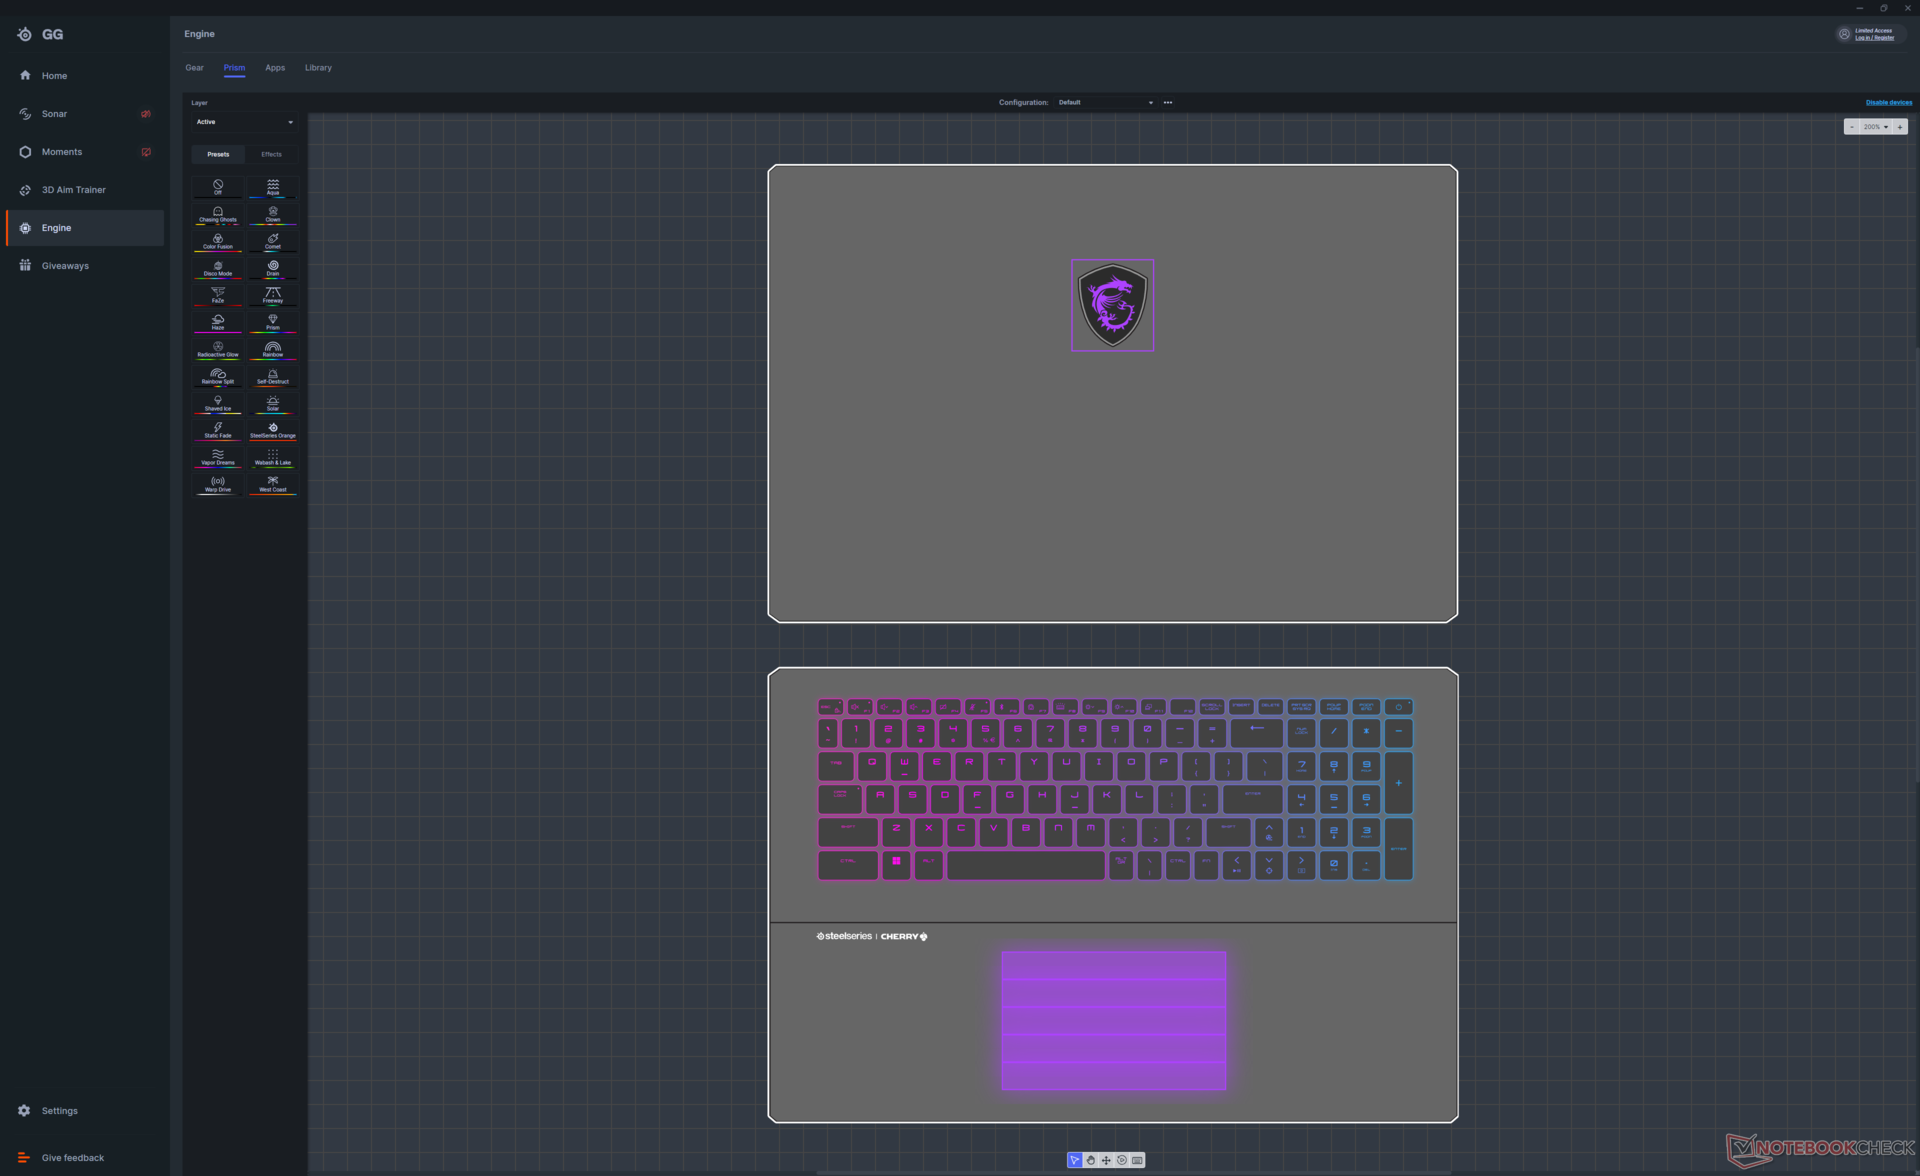
La iluminación del teclado se controla mediante una aplicación independiente preinstalada llamada SteelSeries GG.
Procesador
Rendimiento bruto de nuestro Core i9-14900HX está esencialmente codo con codo con el Core i9-13950HX del GT77 del año pasado. Por lo tanto, no espere ninguna ganancia de rendimiento notable cuando ejecute aplicaciones tradicionales de uso intensivo de la CPU. La CPU Raptor Lake-HX de 14ª generación tampoco cuenta con nuevas capacidades de IA, a diferencia de la serie Meteor Lake, que integra una NPU.
MSI está preparando el lanzamiento de su aplicación AI Artist en febrero para portátiles equipados con CPU Intel de 14ª generación. El programa aprovecha la aceleración de IA de Intel para generar arte basado en indicaciones a nivel local en lugar de depender de servicios en la nube para una experiencia de usuario más rápida. Si no le interesan las aplicaciones mejoradas con IA, una CPU Intel de 13ª generación más antigua puede servirle igual de bien.
Cinebench R15 Multi Loop
Cinebench R23: Multi Core | Single Core
Cinebench R20: CPU (Multi Core) | CPU (Single Core)
Cinebench R15: CPU Multi 64Bit | CPU Single 64Bit
Blender: v2.79 BMW27 CPU
7-Zip 18.03: 7z b 4 | 7z b 4 -mmt1
Geekbench 6.7: Multi-Core | Single-Core
Geekbench 5.5: Multi-Core | Single-Core
HWBOT x265 Benchmark v2.2: 4k Preset
LibreOffice : 20 Documents To PDF
R Benchmark 2.5: Overall mean
| CPU Performance rating | |
| Asus ROG Strix Scar 17 G733PYV-LL053X | |
| Asus ROG Strix Scar 17 G733PY-XS96 -2! | |
| Alienware m18 R1 -2! | |
| MSI Titan GT77 HX 13VI -2! | |
| MSI Titan 18 HX A14VIG | |
| Acer Predator Helios 18 N23Q2 | |
| Medio Intel Core i9-14900HX | |
| Razer Blade 18 RTX 4070 -2! | |
| Alienware m16 R1 AMD | |
| MSI Raider GE68 HX 13VG, i7-13700HX | |
| NVIDIA GeForce RTX 4070 Super Founders Edition -15! | |
| Asus TUF Gaming A17 FA707XI-NS94 | |
| Asus ROG Strix G18 G814JI -2! | |
| MSI Stealth 16 Studio A13VG -2! | |
| Dell G16 7620 -2! | |
| Alienware m17 R5 (R9 6900HX, RX 6850M XT) -2! | |
| Cinebench R23 / Multi Core | |
| Asus ROG Strix Scar 17 G733PY-XS96 | |
| MSI Titan GT77 HX 13VI | |
| Asus ROG Strix Scar 17 G733PYV-LL053X | |
| Alienware m18 R1 | |
| MSI Titan 18 HX A14VIG | |
| Acer Predator Helios 18 N23Q2 | |
| Medio Intel Core i9-14900HX (17078 - 36249, n=37) | |
| Razer Blade 18 RTX 4070 | |
| Alienware m16 R1 AMD | |
| MSI Raider GE68 HX 13VG, i7-13700HX | |
| Asus ROG Strix G18 G814JI | |
| MSI Stealth 16 Studio A13VG | |
| Asus TUF Gaming A17 FA707XI-NS94 | |
| Dell G16 7620 | |
| Alienware m17 R5 (R9 6900HX, RX 6850M XT) | |
| Cinebench R23 / Single Core | |
| Medio Intel Core i9-14900HX (1720 - 2245, n=37) | |
| MSI Titan 18 HX A14VIG | |
| Alienware m18 R1 | |
| MSI Titan GT77 HX 13VI | |
| Acer Predator Helios 18 N23Q2 | |
| Razer Blade 18 RTX 4070 | |
| Asus ROG Strix Scar 17 G733PYV-LL053X | |
| Asus ROG Strix G18 G814JI | |
| MSI Raider GE68 HX 13VG, i7-13700HX | |
| Asus ROG Strix Scar 17 G733PY-XS96 | |
| MSI Stealth 16 Studio A13VG | |
| Alienware m16 R1 AMD | |
| Asus TUF Gaming A17 FA707XI-NS94 | |
| Dell G16 7620 | |
| Alienware m17 R5 (R9 6900HX, RX 6850M XT) | |
| Cinebench R20 / CPU (Multi Core) | |
| Asus ROG Strix Scar 17 G733PY-XS96 | |
| Asus ROG Strix Scar 17 G733PYV-LL053X | |
| MSI Titan GT77 HX 13VI | |
| Alienware m18 R1 | |
| MSI Titan 18 HX A14VIG | |
| Acer Predator Helios 18 N23Q2 | |
| Medio Intel Core i9-14900HX (6579 - 13832, n=37) | |
| Razer Blade 18 RTX 4070 | |
| Alienware m16 R1 AMD | |
| MSI Raider GE68 HX 13VG, i7-13700HX | |
| Asus ROG Strix G18 G814JI | |
| MSI Stealth 16 Studio A13VG | |
| Asus TUF Gaming A17 FA707XI-NS94 | |
| Dell G16 7620 | |
| Alienware m17 R5 (R9 6900HX, RX 6850M XT) | |
| Cinebench R20 / CPU (Single Core) | |
| Medio Intel Core i9-14900HX (657 - 859, n=37) | |
| MSI Titan 18 HX A14VIG | |
| Alienware m18 R1 | |
| Acer Predator Helios 18 N23Q2 | |
| MSI Titan GT77 HX 13VI | |
| Razer Blade 18 RTX 4070 | |
| Asus ROG Strix Scar 17 G733PYV-LL053X | |
| Asus ROG Strix G18 G814JI | |
| MSI Raider GE68 HX 13VG, i7-13700HX | |
| Asus ROG Strix Scar 17 G733PY-XS96 | |
| MSI Stealth 16 Studio A13VG | |
| Alienware m16 R1 AMD | |
| Asus TUF Gaming A17 FA707XI-NS94 | |
| Dell G16 7620 | |
| Alienware m17 R5 (R9 6900HX, RX 6850M XT) | |
| Cinebench R15 / CPU Multi 64Bit | |
| Asus ROG Strix Scar 17 G733PYV-LL053X | |
| Asus ROG Strix Scar 17 G733PY-XS96 | |
| MSI Titan GT77 HX 13VI | |
| Alienware m18 R1 | |
| MSI Titan 18 HX A14VIG | |
| Acer Predator Helios 18 N23Q2 | |
| Razer Blade 18 RTX 4070 | |
| Medio Intel Core i9-14900HX (3263 - 5589, n=38) | |
| Alienware m16 R1 AMD | |
| MSI Raider GE68 HX 13VG, i7-13700HX | |
| Asus ROG Strix G18 G814JI | |
| MSI Stealth 16 Studio A13VG | |
| Asus TUF Gaming A17 FA707XI-NS94 | |
| Dell G16 7620 | |
| Alienware m17 R5 (R9 6900HX, RX 6850M XT) | |
| Cinebench R15 / CPU Single 64Bit | |
| Asus ROG Strix Scar 17 G733PYV-LL053X | |
| Asus ROG Strix Scar 17 G733PY-XS96 | |
| Medio Intel Core i9-14900HX (247 - 323, n=37) | |
| Alienware m18 R1 | |
| MSI Titan GT77 HX 13VI | |
| MSI Titan 18 HX A14VIG | |
| Razer Blade 18 RTX 4070 | |
| Alienware m16 R1 AMD | |
| Acer Predator Helios 18 N23Q2 | |
| Asus TUF Gaming A17 FA707XI-NS94 | |
| Asus ROG Strix G18 G814JI | |
| MSI Stealth 16 Studio A13VG | |
| MSI Raider GE68 HX 13VG, i7-13700HX | |
| Alienware m17 R5 (R9 6900HX, RX 6850M XT) | |
| Dell G16 7620 | |
| 7-Zip 18.03 / 7z b 4 -mmt1 | |
| Asus ROG Strix Scar 17 G733PY-XS96 | |
| Asus ROG Strix Scar 17 G733PYV-LL053X | |
| Medio Intel Core i9-14900HX (5452 - 7545, n=37) | |
| Alienware m16 R1 AMD | |
| Acer Predator Helios 18 N23Q2 | |
| MSI Titan GT77 HX 13VI | |
| Alienware m18 R1 | |
| Razer Blade 18 RTX 4070 | |
| Asus TUF Gaming A17 FA707XI-NS94 | |
| MSI Titan 18 HX A14VIG | |
| MSI Raider GE68 HX 13VG, i7-13700HX | |
| Asus ROG Strix G18 G814JI | |
| MSI Stealth 16 Studio A13VG | |
| Alienware m17 R5 (R9 6900HX, RX 6850M XT) | |
| Dell G16 7620 | |
| Geekbench 6.7 / Multi-Core | |
| Acer Predator Helios 18 N23Q2 | |
| Medio Intel Core i9-14900HX (13158 - 19665, n=37) | |
| Asus ROG Strix Scar 17 G733PYV-LL053X | |
| MSI Titan 18 HX A14VIG | |
| MSI Raider GE68 HX 13VG, i7-13700HX | |
| Alienware m16 R1 AMD | |
| Asus TUF Gaming A17 FA707XI-NS94 | |
| Geekbench 6.7 / Single-Core | |
| Medio Intel Core i9-14900HX (2419 - 3129, n=37) | |
| Asus ROG Strix Scar 17 G733PYV-LL053X | |
| Acer Predator Helios 18 N23Q2 | |
| MSI Titan 18 HX A14VIG | |
| Asus TUF Gaming A17 FA707XI-NS94 | |
| Alienware m16 R1 AMD | |
| MSI Raider GE68 HX 13VG, i7-13700HX | |
| Geekbench 5.5 / Multi-Core | |
| Alienware m18 R1 | |
| MSI Titan GT77 HX 13VI | |
| Acer Predator Helios 18 N23Q2 | |
| Razer Blade 18 RTX 4070 | |
| Asus ROG Strix Scar 17 G733PYV-LL053X | |
| Medio Intel Core i9-14900HX (8618 - 23194, n=37) | |
| Asus ROG Strix Scar 17 G733PY-XS96 | |
| MSI Titan 18 HX A14VIG | |
| MSI Raider GE68 HX 13VG, i7-13700HX | |
| Alienware m16 R1 AMD | |
| Asus ROG Strix G18 G814JI | |
| MSI Stealth 16 Studio A13VG | |
| Dell G16 7620 | |
| Asus TUF Gaming A17 FA707XI-NS94 | |
| Alienware m17 R5 (R9 6900HX, RX 6850M XT) | |
| Geekbench 5.5 / Single-Core | |
| Asus ROG Strix Scar 17 G733PYV-LL053X | |
| MSI Titan 18 HX A14VIG | |
| Medio Intel Core i9-14900HX (1669 - 2210, n=37) | |
| Alienware m18 R1 | |
| Acer Predator Helios 18 N23Q2 | |
| Asus ROG Strix Scar 17 G733PY-XS96 | |
| MSI Titan GT77 HX 13VI | |
| Razer Blade 18 RTX 4070 | |
| Asus TUF Gaming A17 FA707XI-NS94 | |
| Alienware m16 R1 AMD | |
| MSI Raider GE68 HX 13VG, i7-13700HX | |
| Asus ROG Strix G18 G814JI | |
| MSI Stealth 16 Studio A13VG | |
| Dell G16 7620 | |
| Alienware m17 R5 (R9 6900HX, RX 6850M XT) | |
| HWBOT x265 Benchmark v2.2 / 4k Preset | |
| Asus ROG Strix Scar 17 G733PY-XS96 | |
| Asus ROG Strix Scar 17 G733PYV-LL053X | |
| Alienware m18 R1 | |
| MSI Titan GT77 HX 13VI | |
| Razer Blade 18 RTX 4070 | |
| MSI Titan 18 HX A14VIG | |
| Acer Predator Helios 18 N23Q2 | |
| Alienware m16 R1 AMD | |
| Medio Intel Core i9-14900HX (16.8 - 38.9, n=37) | |
| MSI Raider GE68 HX 13VG, i7-13700HX | |
| Asus ROG Strix G18 G814JI | |
| Asus TUF Gaming A17 FA707XI-NS94 | |
| MSI Stealth 16 Studio A13VG | |
| Dell G16 7620 | |
| Alienware m17 R5 (R9 6900HX, RX 6850M XT) | |
| LibreOffice / 20 Documents To PDF | |
| Asus ROG Strix G18 G814JI | |
| Alienware m17 R5 (R9 6900HX, RX 6850M XT) | |
| MSI Stealth 16 Studio A13VG | |
| Dell G16 7620 | |
| MSI Raider GE68 HX 13VG, i7-13700HX | |
| Acer Predator Helios 18 N23Q2 | |
| Asus TUF Gaming A17 FA707XI-NS94 | |
| Alienware m18 R1 | |
| MSI Titan GT77 HX 13VI | |
| MSI Titan 18 HX A14VIG | |
| Razer Blade 18 RTX 4070 | |
| Medio Intel Core i9-14900HX (19 - 85.1, n=37) | |
| Alienware m16 R1 AMD | |
| Asus ROG Strix Scar 17 G733PYV-LL053X | |
| Asus ROG Strix Scar 17 G733PY-XS96 | |
| R Benchmark 2.5 / Overall mean | |
| Dell G16 7620 | |
| Alienware m17 R5 (R9 6900HX, RX 6850M XT) | |
| MSI Stealth 16 Studio A13VG | |
| Asus ROG Strix G18 G814JI | |
| MSI Raider GE68 HX 13VG, i7-13700HX | |
| Asus TUF Gaming A17 FA707XI-NS94 | |
| Alienware m16 R1 AMD | |
| Asus ROG Strix Scar 17 G733PYV-LL053X | |
| Asus ROG Strix Scar 17 G733PY-XS96 | |
| MSI Titan GT77 HX 13VI | |
| Acer Predator Helios 18 N23Q2 | |
| Razer Blade 18 RTX 4070 | |
| Alienware m18 R1 | |
| MSI Titan 18 HX A14VIG | |
| Medio Intel Core i9-14900HX (0.3604 - 0.4859, n=37) | |
Cinebench R23: Multi Core | Single Core
Cinebench R20: CPU (Multi Core) | CPU (Single Core)
Cinebench R15: CPU Multi 64Bit | CPU Single 64Bit
Blender: v2.79 BMW27 CPU
7-Zip 18.03: 7z b 4 | 7z b 4 -mmt1
Geekbench 6.7: Multi-Core | Single-Core
Geekbench 5.5: Multi-Core | Single-Core
HWBOT x265 Benchmark v2.2: 4k Preset
LibreOffice : 20 Documents To PDF
R Benchmark 2.5: Overall mean
* ... más pequeño es mejor
AIDA64: FP32 Ray-Trace | FPU Julia | CPU SHA3 | CPU Queen | FPU SinJulia | FPU Mandel | CPU AES | CPU ZLib | FP64 Ray-Trace | CPU PhotoWorxx
| Performance rating | |
| Alienware m18 R1 | |
| Acer Predator Helios 18 N23Q2 | |
| MSI Titan 18 HX A14VIG | |
| MSI Titan GT77 HX 13VI | |
| Razer Blade 18 RTX 4070 | |
| Medio Intel Core i9-14900HX | |
| Asus ROG Strix G18 G814JI | |
| AIDA64 / FP32 Ray-Trace | |
| Alienware m18 R1 | |
| MSI Titan 18 HX A14VIG | |
| MSI Titan GT77 HX 13VI | |
| Acer Predator Helios 18 N23Q2 | |
| Razer Blade 18 RTX 4070 | |
| Medio Intel Core i9-14900HX (13098 - 33474, n=36) | |
| Asus ROG Strix G18 G814JI | |
| AIDA64 / FPU Julia | |
| MSI Titan 18 HX A14VIG | |
| Alienware m18 R1 | |
| MSI Titan GT77 HX 13VI | |
| Acer Predator Helios 18 N23Q2 | |
| Razer Blade 18 RTX 4070 | |
| Medio Intel Core i9-14900HX (67573 - 166040, n=36) | |
| Asus ROG Strix G18 G814JI | |
| AIDA64 / CPU SHA3 | |
| MSI Titan 18 HX A14VIG | |
| Alienware m18 R1 | |
| MSI Titan GT77 HX 13VI | |
| Acer Predator Helios 18 N23Q2 | |
| Razer Blade 18 RTX 4070 | |
| Medio Intel Core i9-14900HX (3589 - 7979, n=36) | |
| Asus ROG Strix G18 G814JI | |
| AIDA64 / CPU Queen | |
| MSI Titan 18 HX A14VIG | |
| Alienware m18 R1 | |
| MSI Titan GT77 HX 13VI | |
| Medio Intel Core i9-14900HX (118405 - 148966, n=36) | |
| Razer Blade 18 RTX 4070 | |
| Acer Predator Helios 18 N23Q2 | |
| Asus ROG Strix G18 G814JI | |
| AIDA64 / FPU SinJulia | |
| MSI Titan 18 HX A14VIG | |
| MSI Titan GT77 HX 13VI | |
| Alienware m18 R1 | |
| Razer Blade 18 RTX 4070 | |
| Acer Predator Helios 18 N23Q2 | |
| Medio Intel Core i9-14900HX (10475 - 18517, n=36) | |
| Asus ROG Strix G18 G814JI | |
| AIDA64 / FPU Mandel | |
| Alienware m18 R1 | |
| MSI Titan 18 HX A14VIG | |
| MSI Titan GT77 HX 13VI | |
| Acer Predator Helios 18 N23Q2 | |
| Razer Blade 18 RTX 4070 | |
| Medio Intel Core i9-14900HX (32543 - 83662, n=36) | |
| Asus ROG Strix G18 G814JI | |
| AIDA64 / CPU AES | |
| Acer Predator Helios 18 N23Q2 | |
| Medio Intel Core i9-14900HX (86964 - 241777, n=36) | |
| MSI Titan 18 HX A14VIG | |
| MSI Titan GT77 HX 13VI | |
| Alienware m18 R1 | |
| Razer Blade 18 RTX 4070 | |
| Asus ROG Strix G18 G814JI | |
| AIDA64 / CPU ZLib | |
| MSI Titan 18 HX A14VIG | |
| MSI Titan GT77 HX 13VI | |
| Alienware m18 R1 | |
| Acer Predator Helios 18 N23Q2 | |
| Razer Blade 18 RTX 4070 | |
| Medio Intel Core i9-14900HX (1054 - 2292, n=36) | |
| Asus ROG Strix G18 G814JI | |
| AIDA64 / FP64 Ray-Trace | |
| Alienware m18 R1 | |
| MSI Titan 18 HX A14VIG | |
| MSI Titan GT77 HX 13VI | |
| Acer Predator Helios 18 N23Q2 | |
| Razer Blade 18 RTX 4070 | |
| Medio Intel Core i9-14900HX (6809 - 18349, n=36) | |
| Asus ROG Strix G18 G814JI | |
| AIDA64 / CPU PhotoWorxx | |
| Alienware m18 R1 | |
| Acer Predator Helios 18 N23Q2 | |
| Razer Blade 18 RTX 4070 | |
| Medio Intel Core i9-14900HX (23903 - 54702, n=36) | |
| Asus ROG Strix G18 G814JI | |
| MSI Titan GT77 HX 13VI | |
| MSI Titan 18 HX A14VIG | |
Rendimiento del sistema
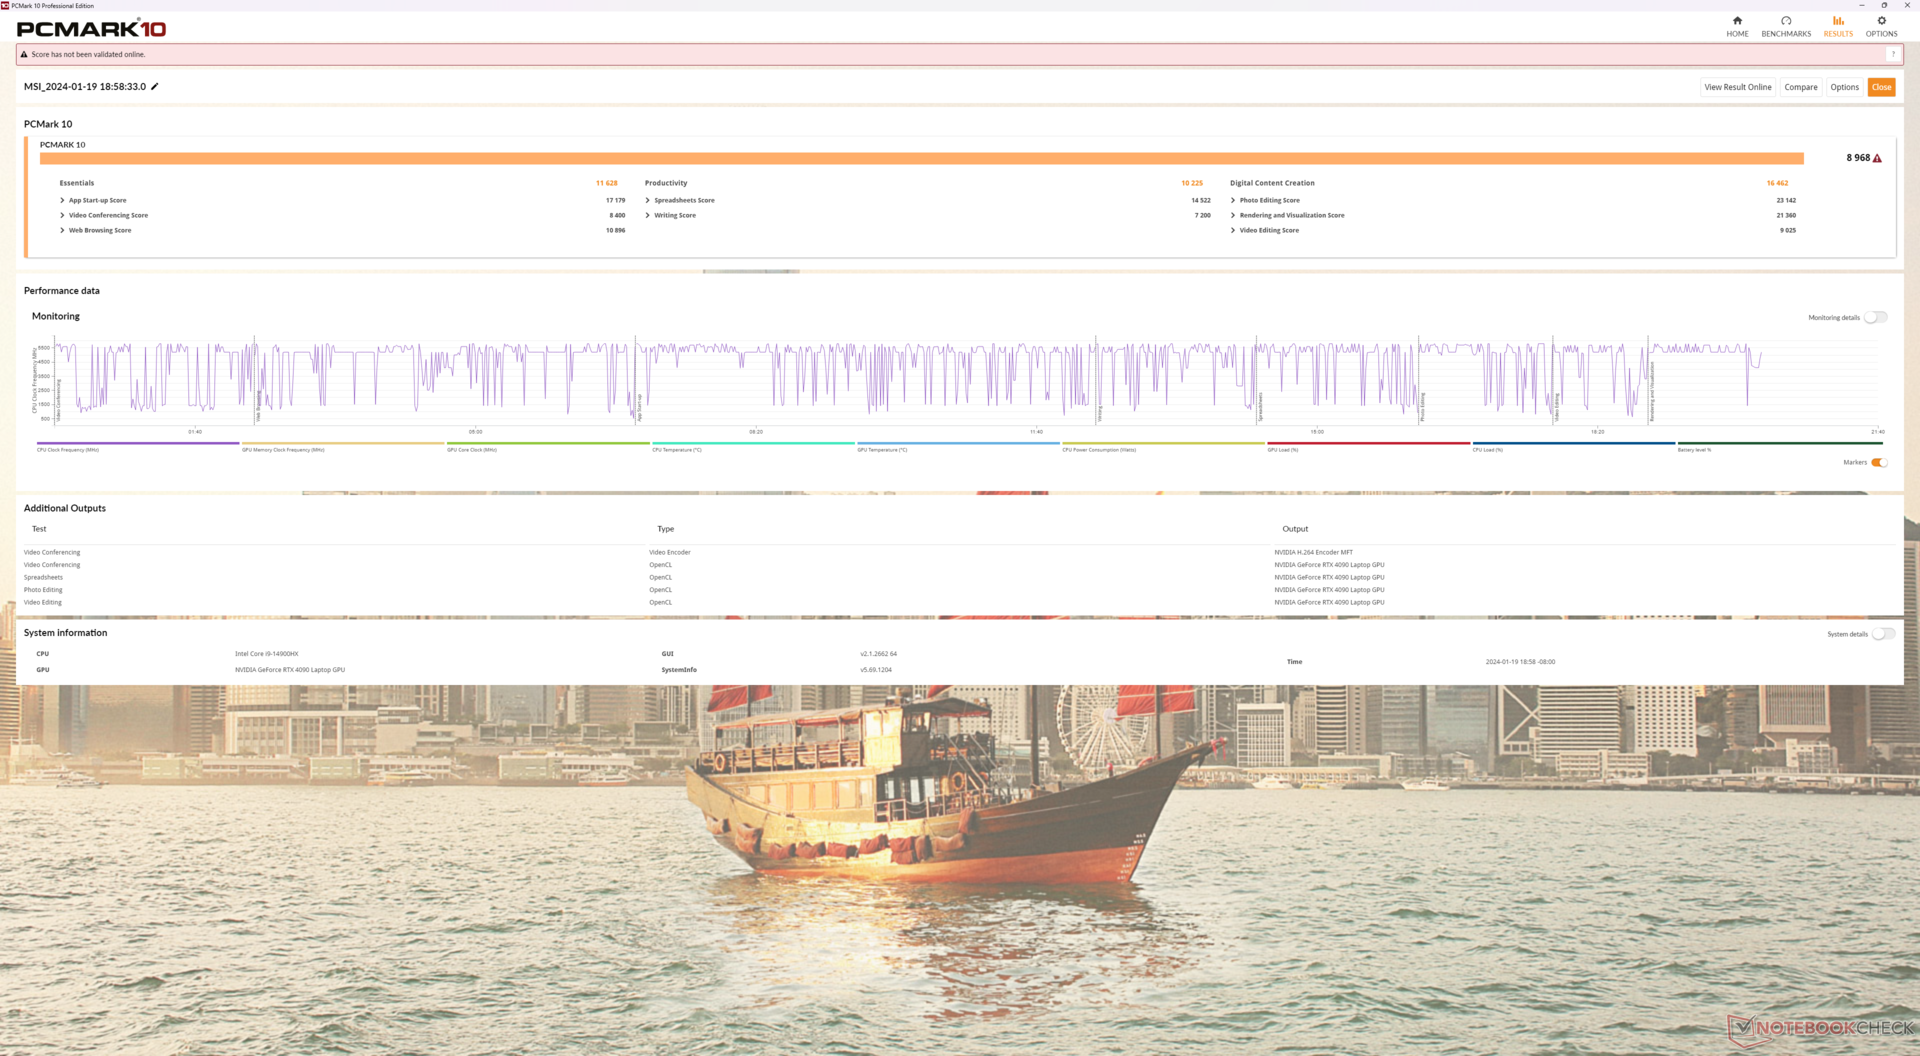
Los resultados de PCMark se sitúan a unos pocos puntos porcentuales de los de la GT77 del año pasado, lo que sugiere que no existen grandes diferencias de rendimiento entre sus CPU y GPU al ejecutar las tareas cotidianas.
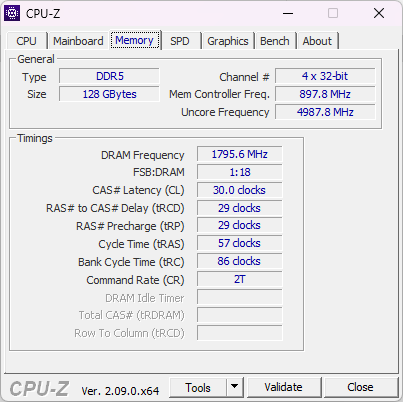
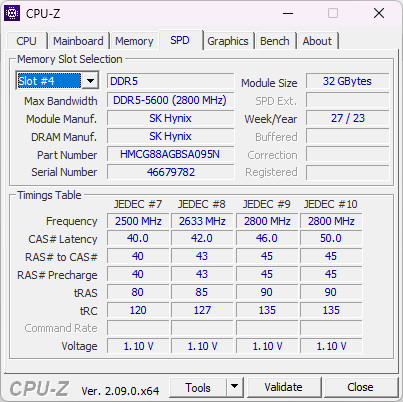
Tenga en cuenta que el rendimiento de la RAM es más lento en nuestra configuración de 128 GB en hasta un 30 o 40 por ciento en comparación con la configuración de 32 GB del Alienware m18 R1. Esto es de esperar, ya que el rendimiento de la RAM en capacidades más altas está limitado por el envejecimiento de la interfaz SODIMM.
CrossMark: Overall | Productivity | Creativity | Responsiveness
WebXPRT 3: Overall
WebXPRT 4: Overall
Mozilla Kraken 1.1: Total
| PCMark 10 / Score | |
| MSI Titan 18 HX A14VIG | |
| MSI Titan GT77 HX 13VI | |
| Alienware m18 R1 | |
| Medio Intel Core i9-14900HX, NVIDIA GeForce RTX 4090 Laptop GPU (8230 - 9234, n=13) | |
| Acer Predator Helios 18 N23Q2 | |
| Razer Blade 18 RTX 4070 | |
| Asus ROG Strix G18 G814JI | |
| PCMark 10 / Essentials | |
| MSI Titan GT77 HX 13VI | |
| Razer Blade 18 RTX 4070 | |
| MSI Titan 18 HX A14VIG | |
| Alienware m18 R1 | |
| Medio Intel Core i9-14900HX, NVIDIA GeForce RTX 4090 Laptop GPU (10778 - 11628, n=13) | |
| Acer Predator Helios 18 N23Q2 | |
| Asus ROG Strix G18 G814JI | |
| PCMark 10 / Productivity | |
| Medio Intel Core i9-14900HX, NVIDIA GeForce RTX 4090 Laptop GPU (9458 - 11759, n=13) | |
| Acer Predator Helios 18 N23Q2 | |
| MSI Titan 18 HX A14VIG | |
| Alienware m18 R1 | |
| MSI Titan GT77 HX 13VI | |
| Razer Blade 18 RTX 4070 | |
| Asus ROG Strix G18 G814JI | |
| PCMark 10 / Digital Content Creation | |
| MSI Titan 18 HX A14VIG | |
| MSI Titan GT77 HX 13VI | |
| Alienware m18 R1 | |
| Medio Intel Core i9-14900HX, NVIDIA GeForce RTX 4090 Laptop GPU (13219 - 16462, n=13) | |
| Acer Predator Helios 18 N23Q2 | |
| Razer Blade 18 RTX 4070 | |
| Asus ROG Strix G18 G814JI | |
| CrossMark / Overall | |
| Acer Predator Helios 18 N23Q2 | |
| Alienware m18 R1 | |
| MSI Titan GT77 HX 13VI | |
| Razer Blade 18 RTX 4070 | |
| Medio Intel Core i9-14900HX, NVIDIA GeForce RTX 4090 Laptop GPU (1877 - 2344, n=10) | |
| MSI Titan 18 HX A14VIG | |
| CrossMark / Productivity | |
| Acer Predator Helios 18 N23Q2 | |
| Alienware m18 R1 | |
| MSI Titan GT77 HX 13VI | |
| Razer Blade 18 RTX 4070 | |
| Medio Intel Core i9-14900HX, NVIDIA GeForce RTX 4090 Laptop GPU (1738 - 2162, n=10) | |
| MSI Titan 18 HX A14VIG | |
| CrossMark / Creativity | |
| Alienware m18 R1 | |
| MSI Titan GT77 HX 13VI | |
| Acer Predator Helios 18 N23Q2 | |
| Razer Blade 18 RTX 4070 | |
| Medio Intel Core i9-14900HX, NVIDIA GeForce RTX 4090 Laptop GPU (2195 - 2660, n=10) | |
| MSI Titan 18 HX A14VIG | |
| CrossMark / Responsiveness | |
| Acer Predator Helios 18 N23Q2 | |
| Alienware m18 R1 | |
| Razer Blade 18 RTX 4070 | |
| Medio Intel Core i9-14900HX, NVIDIA GeForce RTX 4090 Laptop GPU (1478 - 2327, n=10) | |
| MSI Titan GT77 HX 13VI | |
| MSI Titan 18 HX A14VIG | |
| WebXPRT 3 / Overall | |
| Razer Blade 18 RTX 4070 | |
| Alienware m18 R1 | |
| MSI Titan 18 HX A14VIG | |
| Medio Intel Core i9-14900HX, NVIDIA GeForce RTX 4090 Laptop GPU (279 - 339, n=10) | |
| MSI Titan GT77 HX 13VI | |
| Acer Predator Helios 18 N23Q2 | |
| Asus ROG Strix G18 G814JI | |
| Asus ROG Strix G18 G814JI | |
| WebXPRT 4 / Overall | |
| Alienware m18 R1 | |
| Razer Blade 18 RTX 4070 | |
| MSI Titan GT77 HX 13VI | |
| Medio Intel Core i9-14900HX, NVIDIA GeForce RTX 4090 Laptop GPU (246 - 309, n=8) | |
| MSI Titan 18 HX A14VIG | |
| Asus ROG Strix G18 G814JI | |
| Asus ROG Strix G18 G814JI | |
| Mozilla Kraken 1.1 / Total | |
| Asus ROG Strix G18 G814JI | |
| Asus ROG Strix G18 G814JI | |
| MSI Titan GT77 HX 13VI | |
| Razer Blade 18 RTX 4070 | |
| Alienware m18 R1 | |
| Acer Predator Helios 18 N23Q2 | |
| Medio Intel Core i9-14900HX, NVIDIA GeForce RTX 4090 Laptop GPU (428 - 535, n=11) | |
| MSI Titan 18 HX A14VIG | |
* ... más pequeño es mejor
| PCMark 10 Score | 8968 puntos | |
ayuda | ||
| AIDA64 / Memory Copy | |
| Alienware m18 R1 | |
| Acer Predator Helios 18 N23Q2 | |
| Razer Blade 18 RTX 4070 | |
| Medio Intel Core i9-14900HX (38028 - 83392, n=36) | |
| Asus ROG Strix G18 G814JI | |
| MSI Titan GT77 HX 13VI | |
| MSI Titan 18 HX A14VIG | |
| AIDA64 / Memory Read | |
| Alienware m18 R1 | |
| Acer Predator Helios 18 N23Q2 | |
| Razer Blade 18 RTX 4070 | |
| Medio Intel Core i9-14900HX (43306 - 87568, n=36) | |
| Asus ROG Strix G18 G814JI | |
| MSI Titan GT77 HX 13VI | |
| MSI Titan 18 HX A14VIG | |
| AIDA64 / Memory Write | |
| Alienware m18 R1 | |
| Razer Blade 18 RTX 4070 | |
| Acer Predator Helios 18 N23Q2 | |
| Medio Intel Core i9-14900HX (37146 - 80589, n=36) | |
| MSI Titan GT77 HX 13VI | |
| Asus ROG Strix G18 G814JI | |
| MSI Titan 18 HX A14VIG | |
| AIDA64 / Memory Latency | |
| MSI Titan 18 HX A14VIG | |
| MSI Titan GT77 HX 13VI | |
| Medio Intel Core i9-14900HX (76.1 - 105, n=36) | |
| Razer Blade 18 RTX 4070 | |
| Asus ROG Strix G18 G814JI | |
| Acer Predator Helios 18 N23Q2 | |
| Alienware m18 R1 | |
* ... más pequeño es mejor
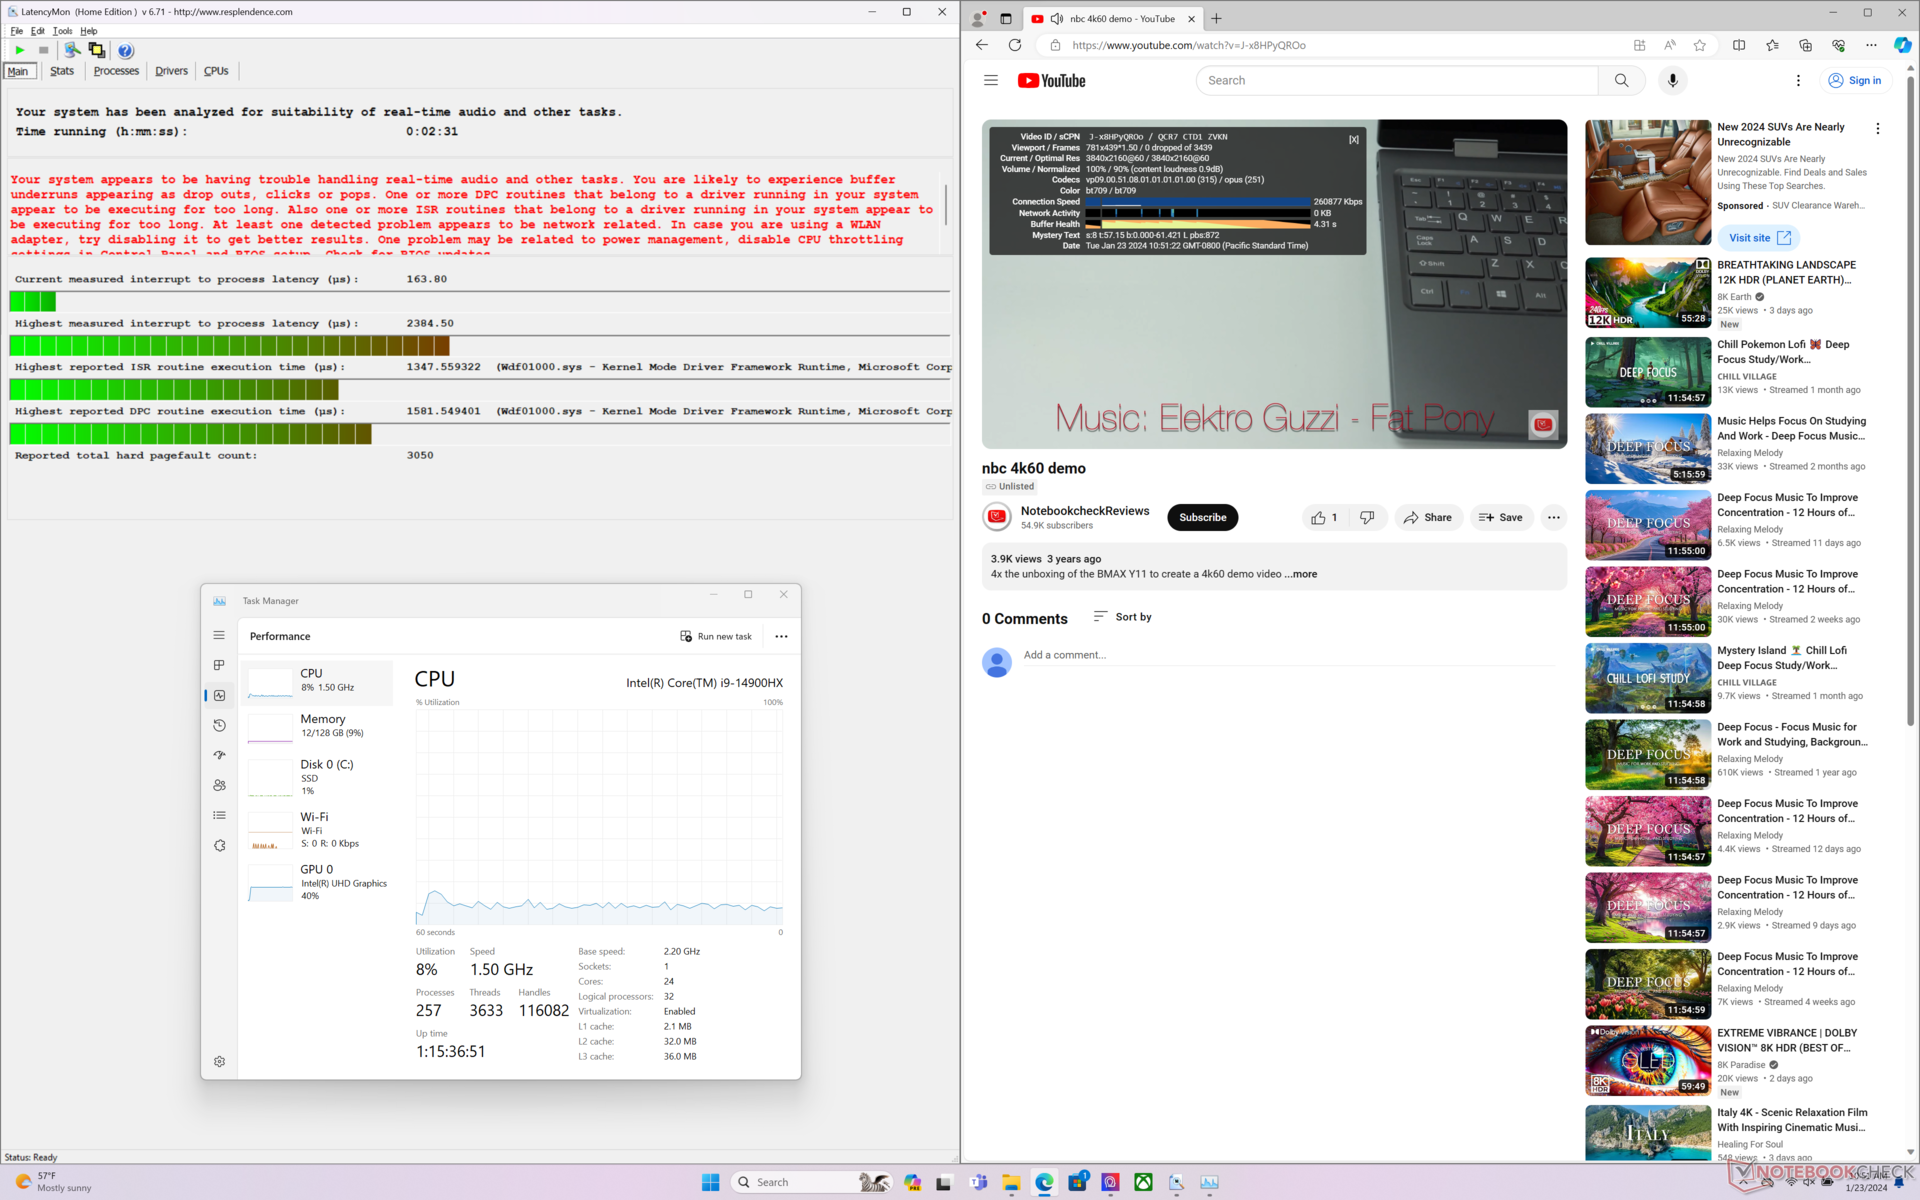
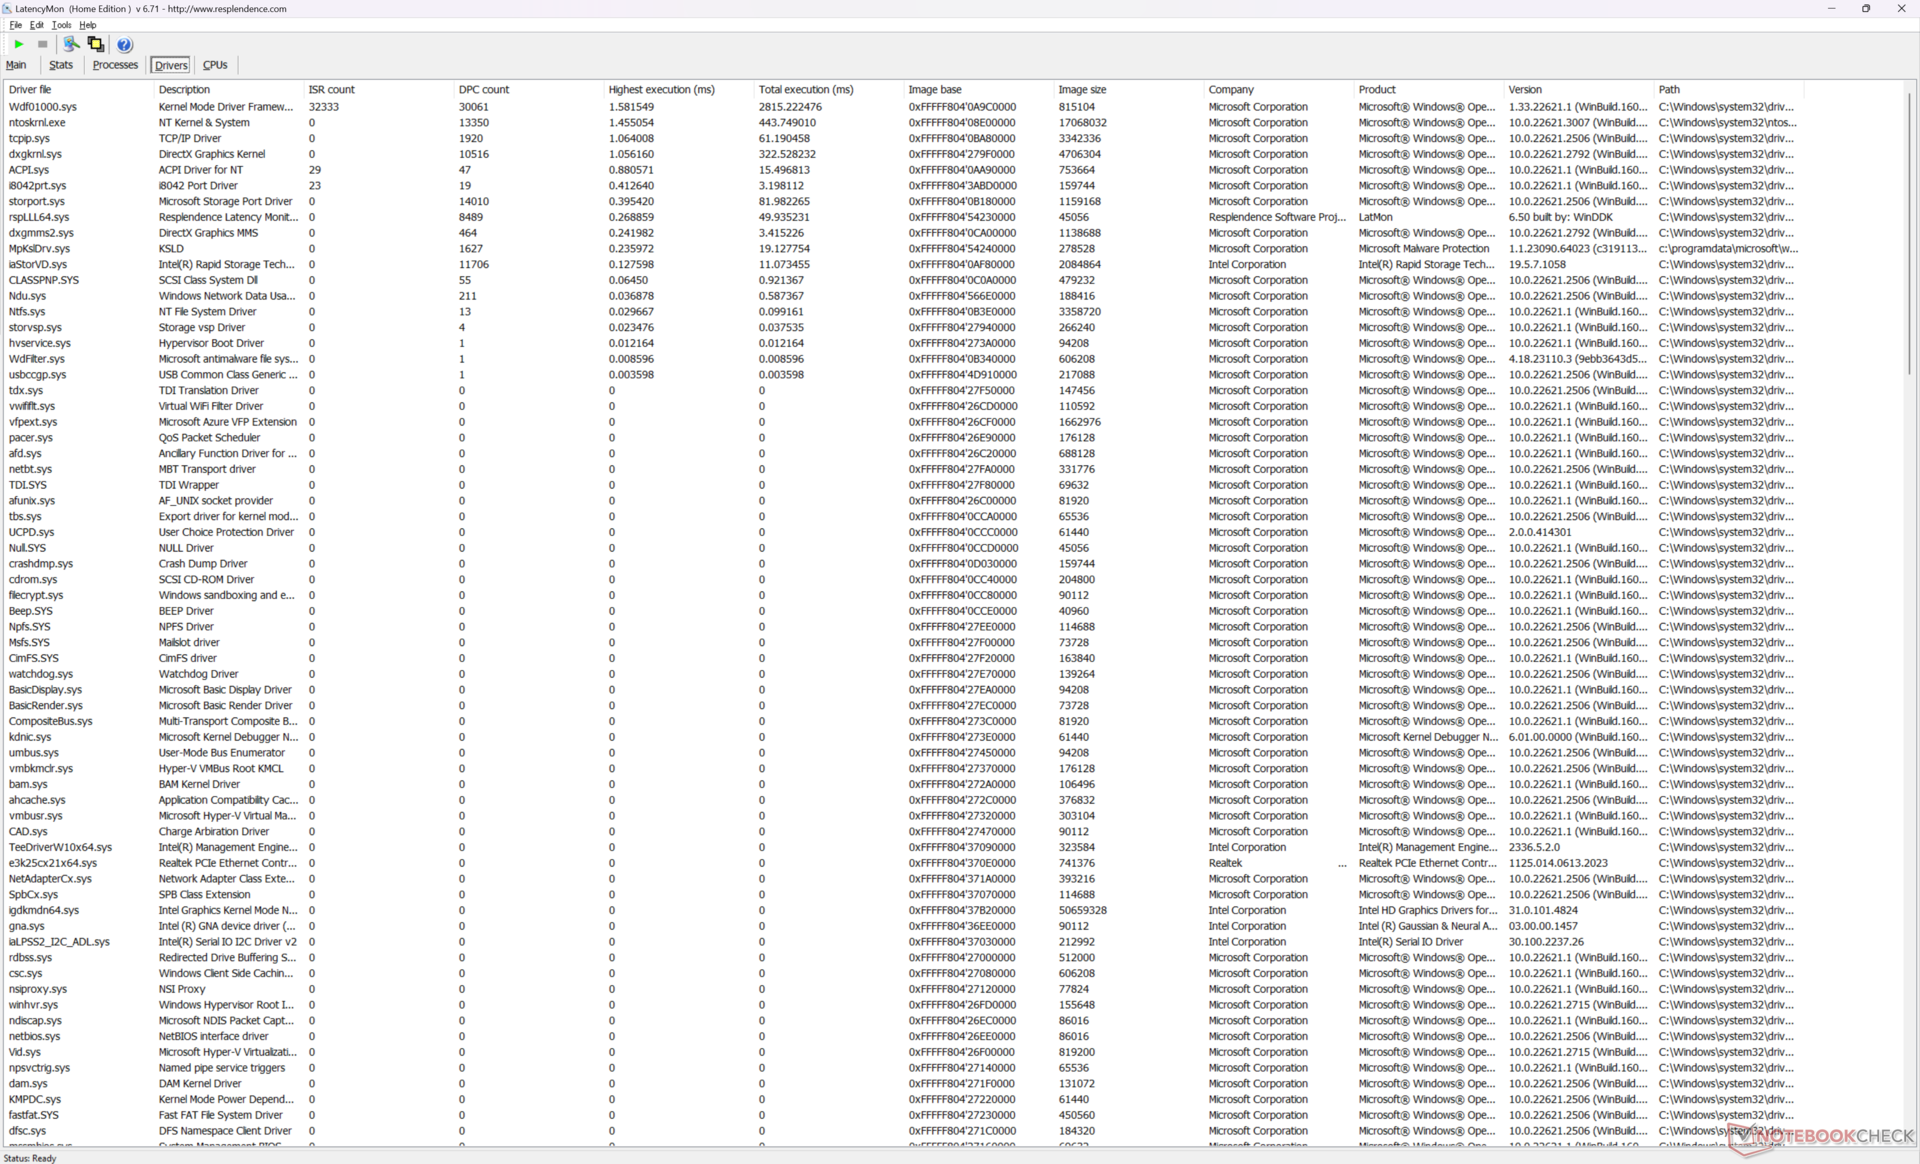
Latencia del CPD
LatencyMon muestra problemas de CPD al abrir varias pestañas del navegador de nuestra página principal. la reproducción de vídeo 4K a 60 FPS en modo iGPU es, por lo demás, perfecta, sin que se registren caídas de fotogramas.
| DPC Latencies / LatencyMon - interrupt to process latency (max), Web, Youtube, Prime95 | |
| Acer Predator Helios 18 N23Q2 | |
| MSI Titan GT77 HX 13VI | |
| Alienware m18 R1 | |
| MSI Titan 18 HX A14VIG | |
| Razer Blade 18 RTX 4070 | |
| Asus ROG Strix G18 G814JI | |
* ... más pequeño es mejor
Dispositivos de almacenamiento
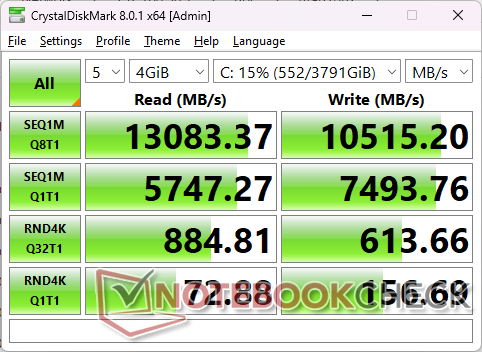
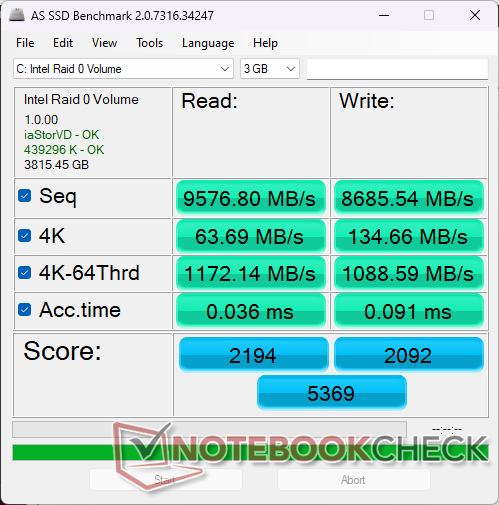
Nuestra unidad viene con dos Samsung MZVL22T0HDLB PM9A1a PCIe4 x4 NVMe SSD en configuración RAID 0 para velocidades de transferencia cercanas a los 13000 MB/s en lugar de los ~7000 MB/s habituales de la mayoría de SSD PCIe4 x4 individuales. Las unidades no mostraron problemas de ralentización cuando se sometieron a estrés bajo DiskSpd durante varios minutos.
La Titan 18 HX también admite una única unidad SSD M.2 PCIe5, pero las existencias de este tipo de unidades siguen siendo limitadas, por lo que la mayoría de las configuraciones actuales se entregan con unidades PCIe4 x4.

| Drive Performance rating - Percent | |
| Alienware m18 R1 | |
| Acer Predator Helios 18 N23Q2 | |
| Razer Blade 18 RTX 4070 | |
| MSI Titan GT77 HX 13VI | |
| MSI Titan 18 HX A14VIG | |
| Asus ROG Strix G18 G814JI | |
* ... más pequeño es mejor
Disk Throttling: DiskSpd Read Loop, Queue Depth 8
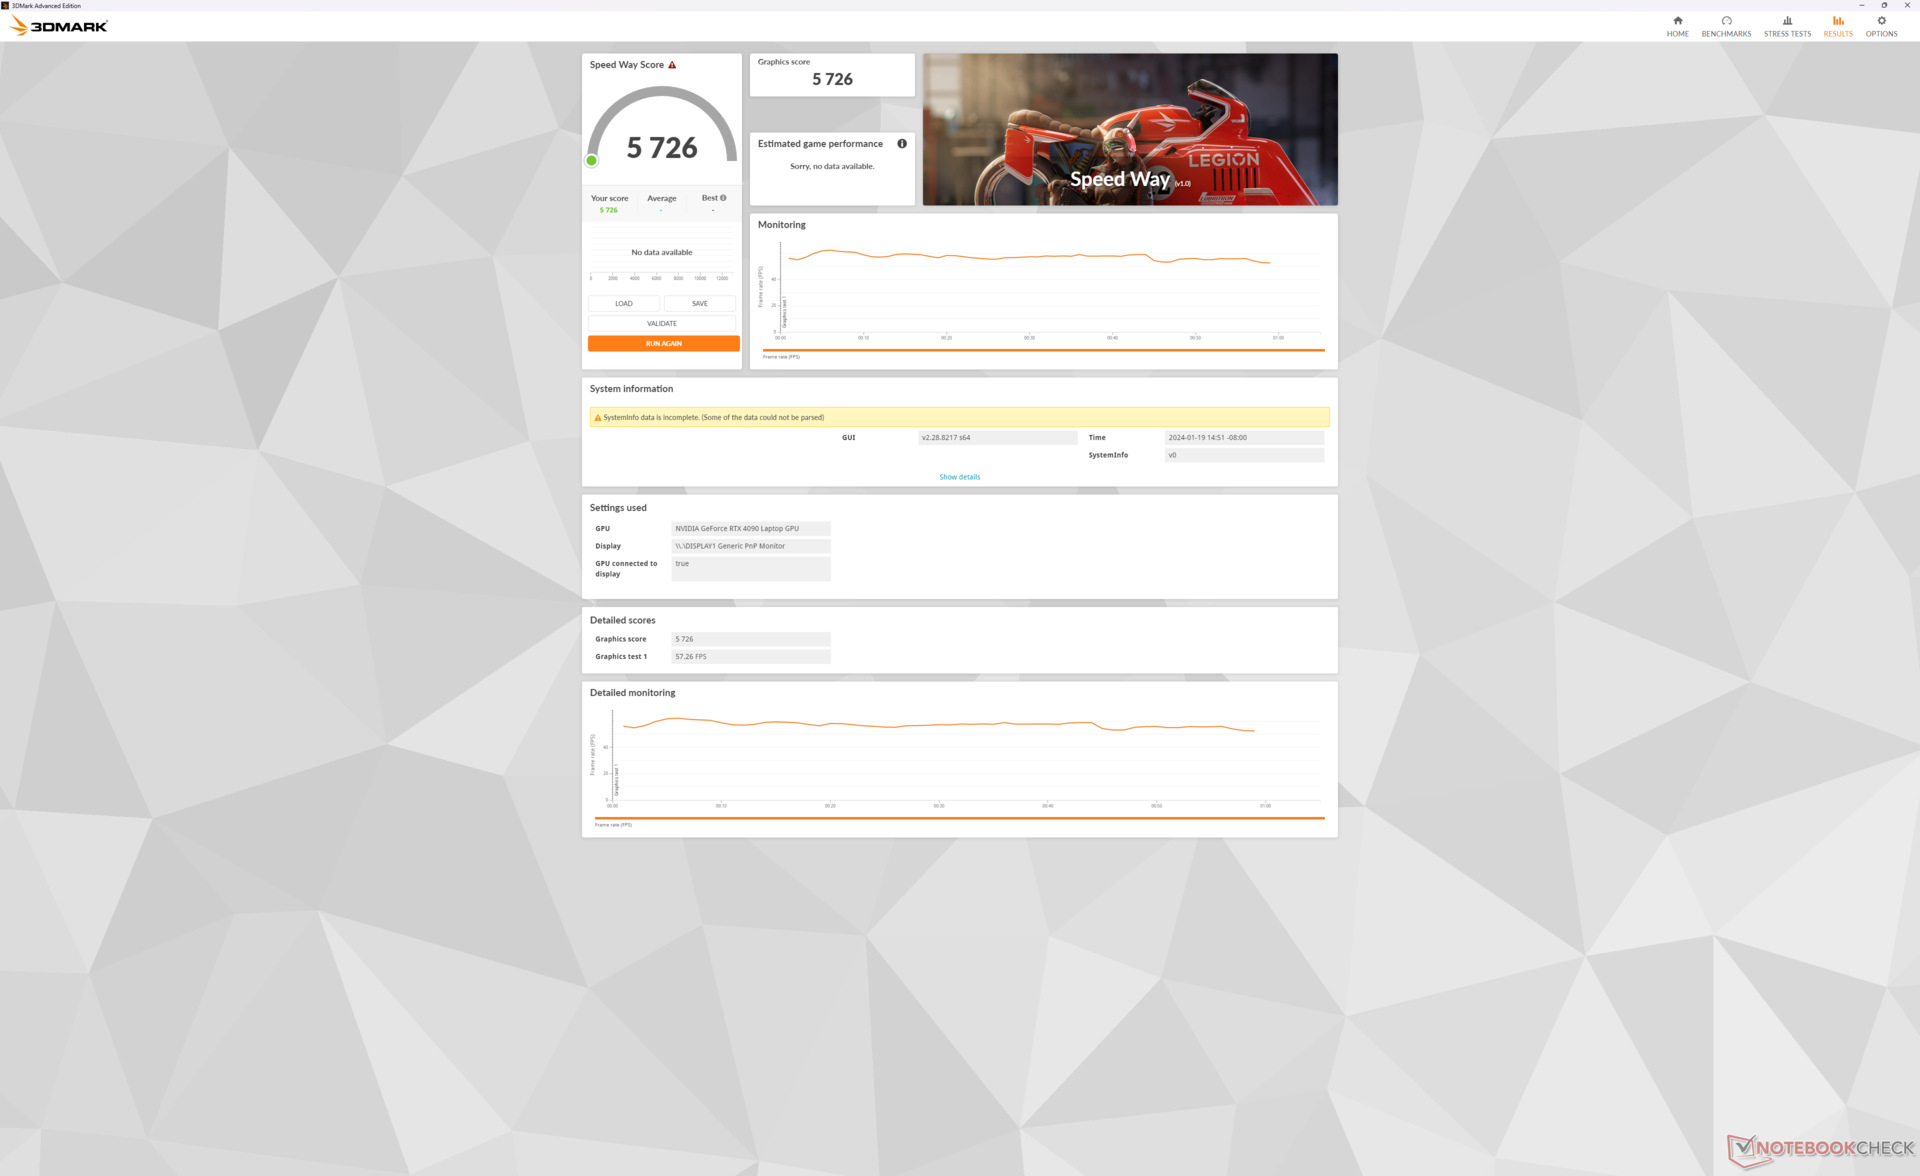
Rendimiento de la GPU: gráficos de 175 W + procesador de 95 W
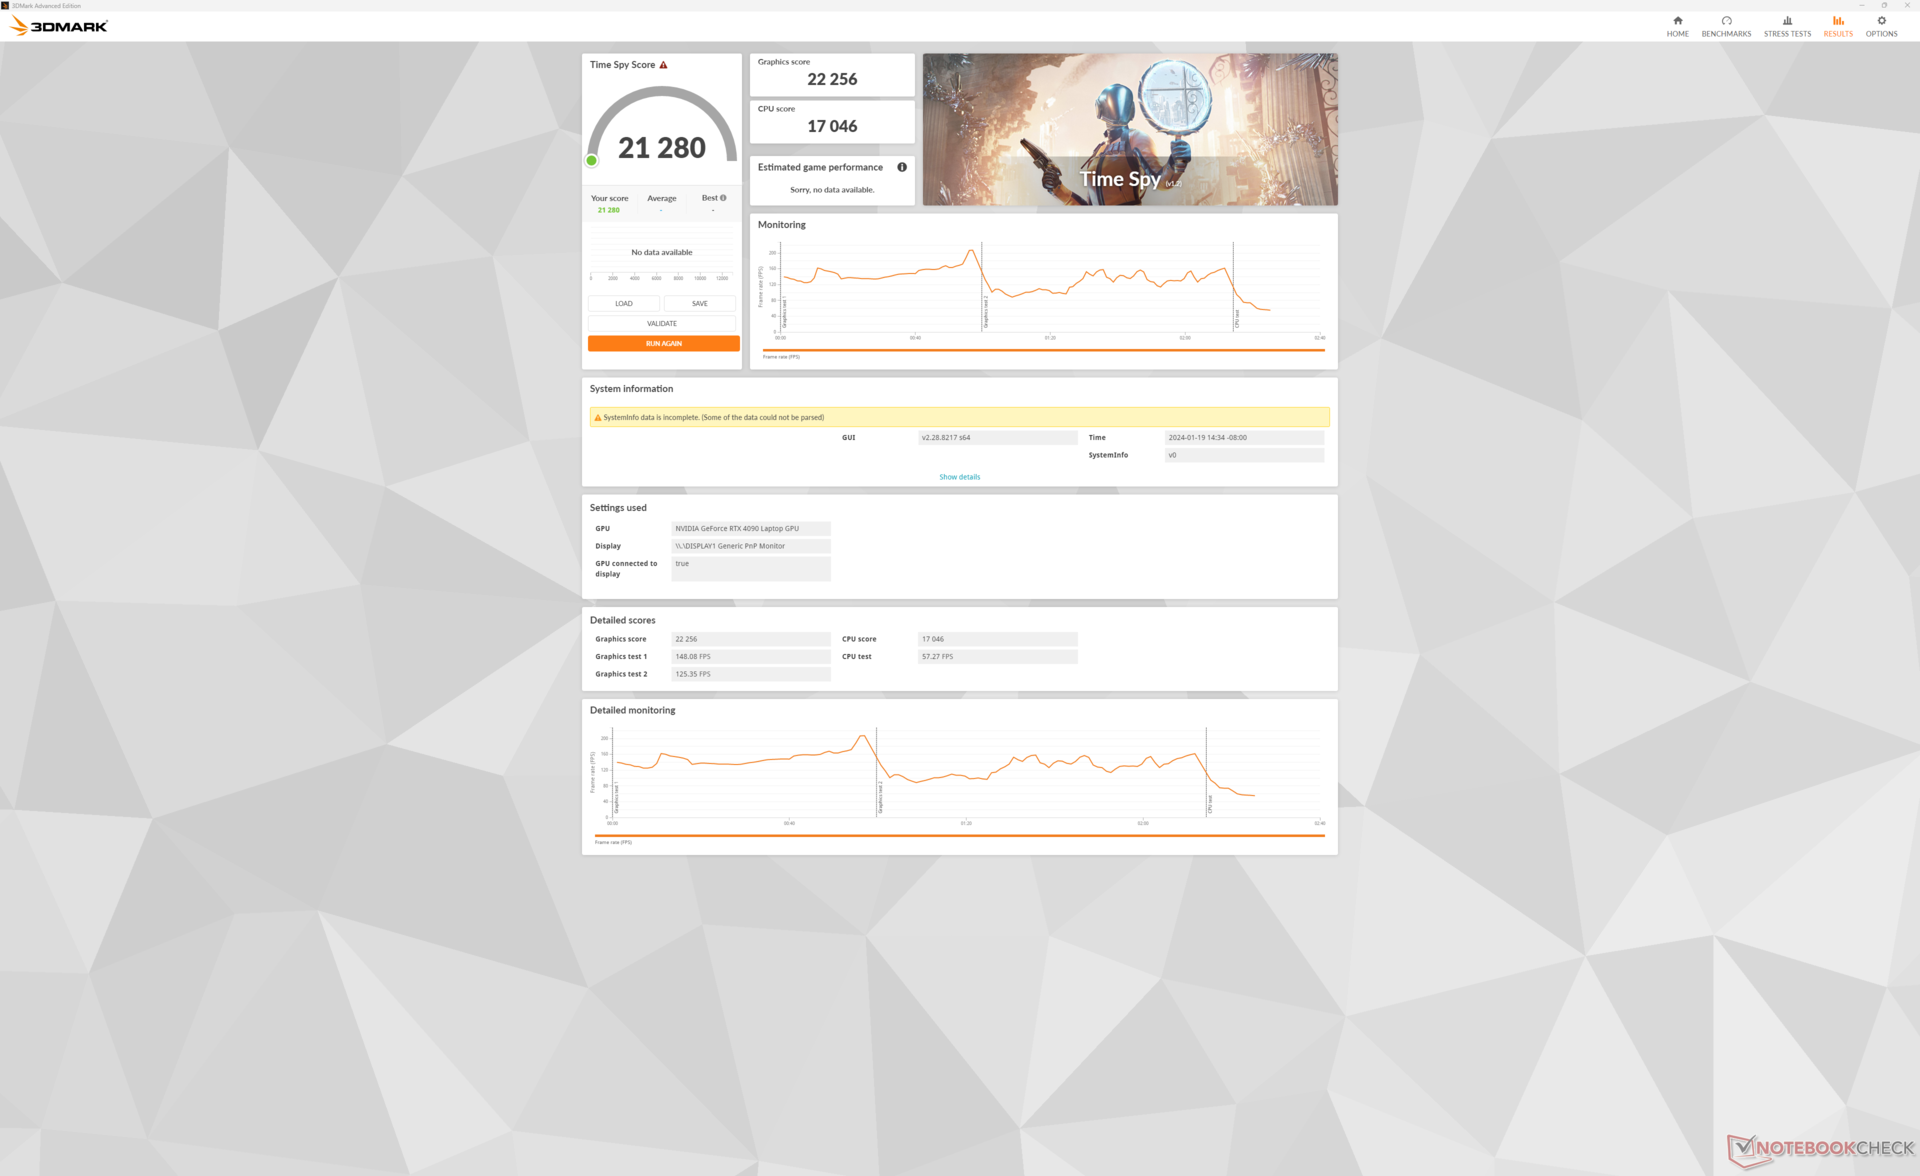
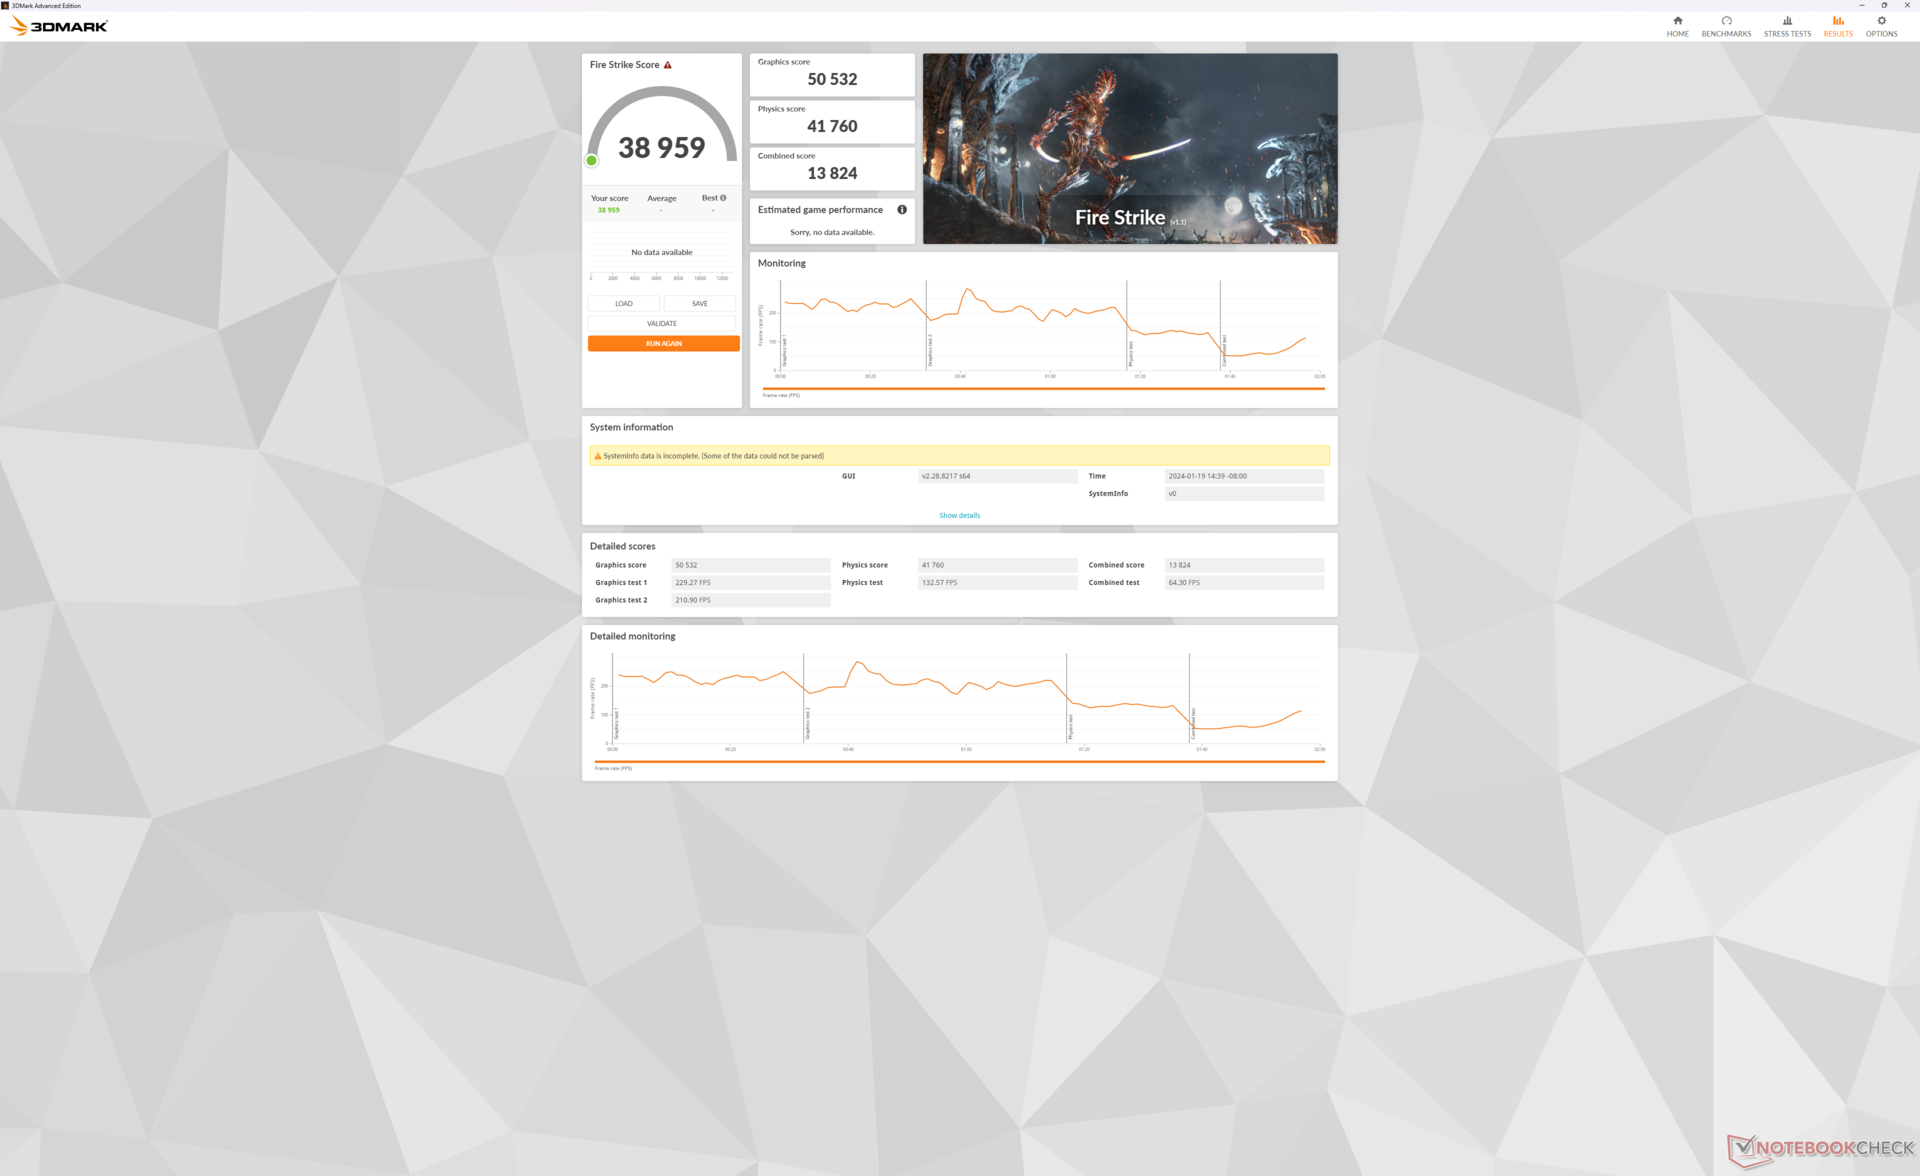
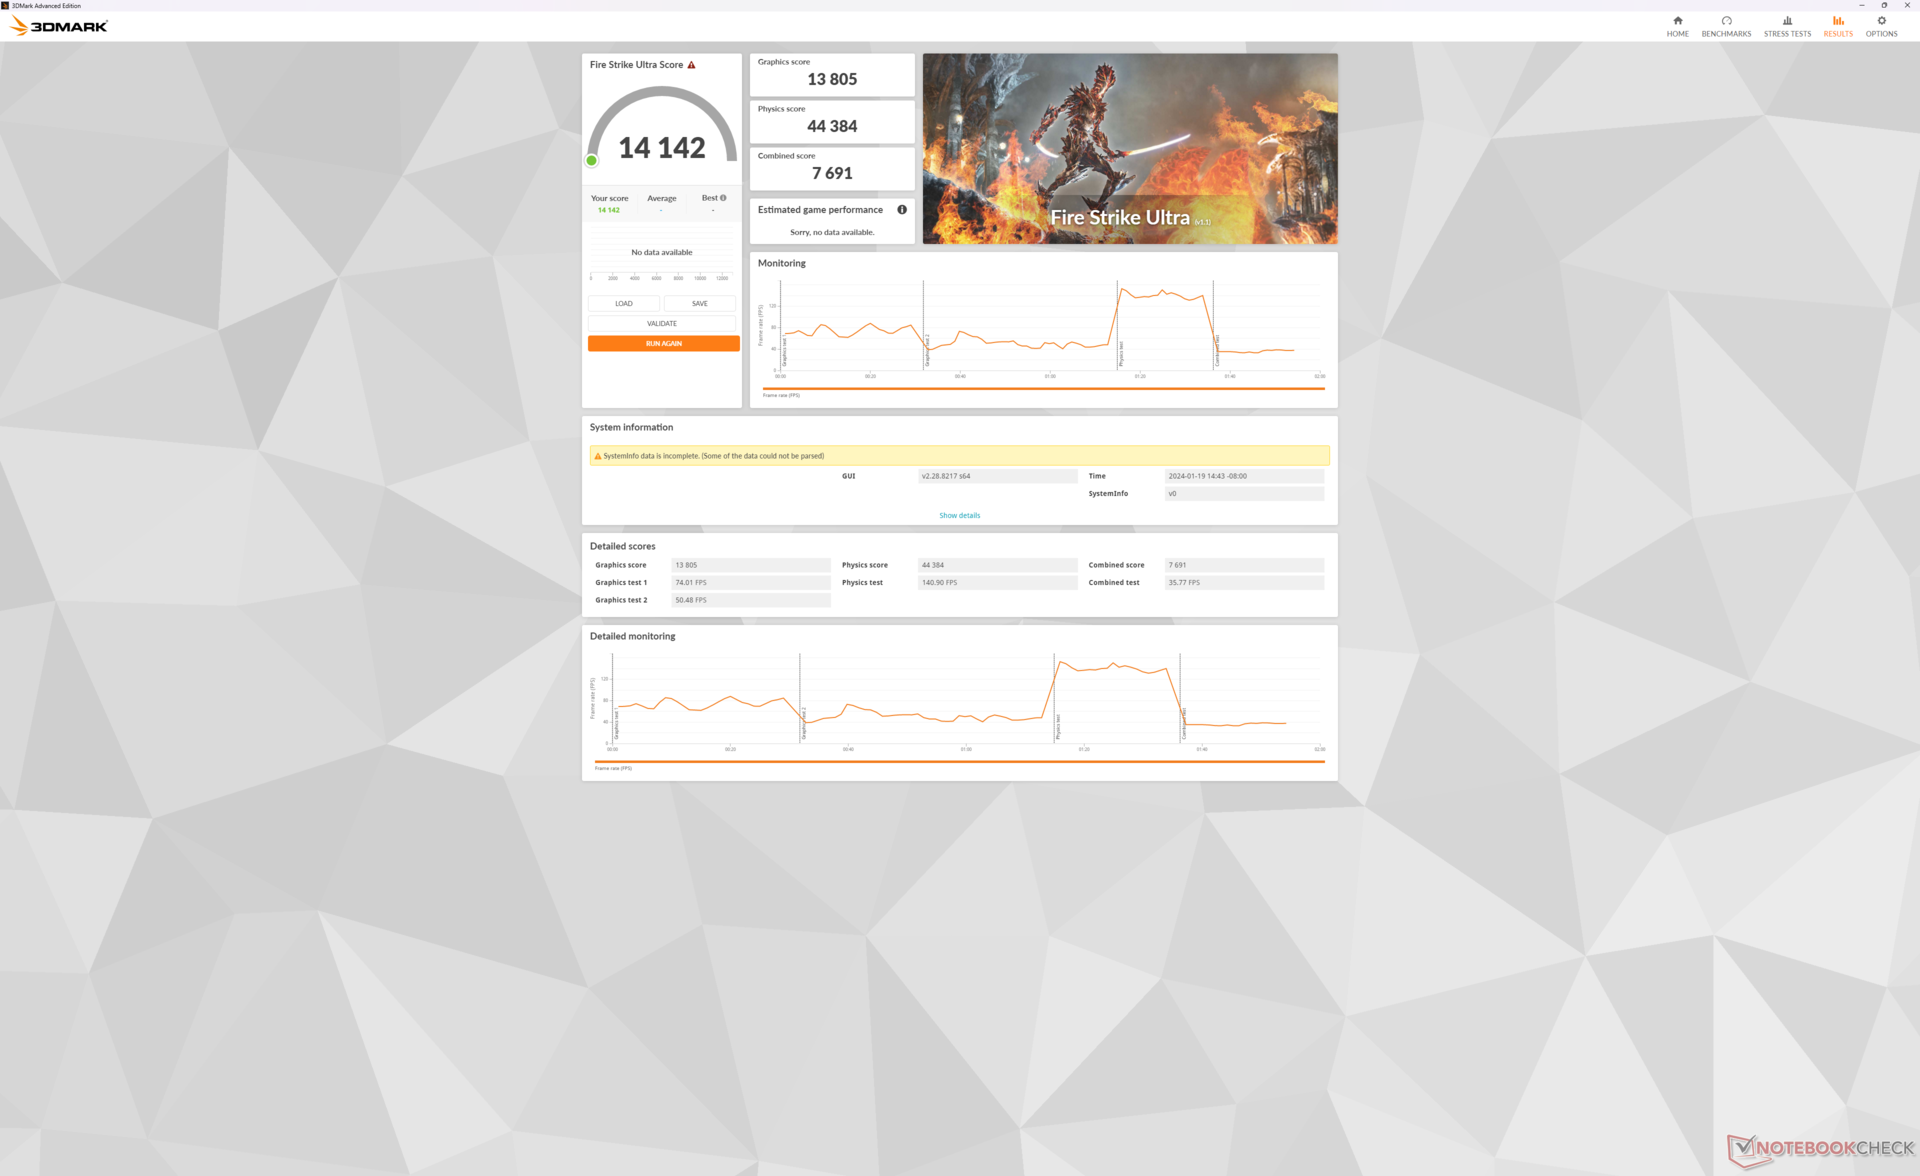
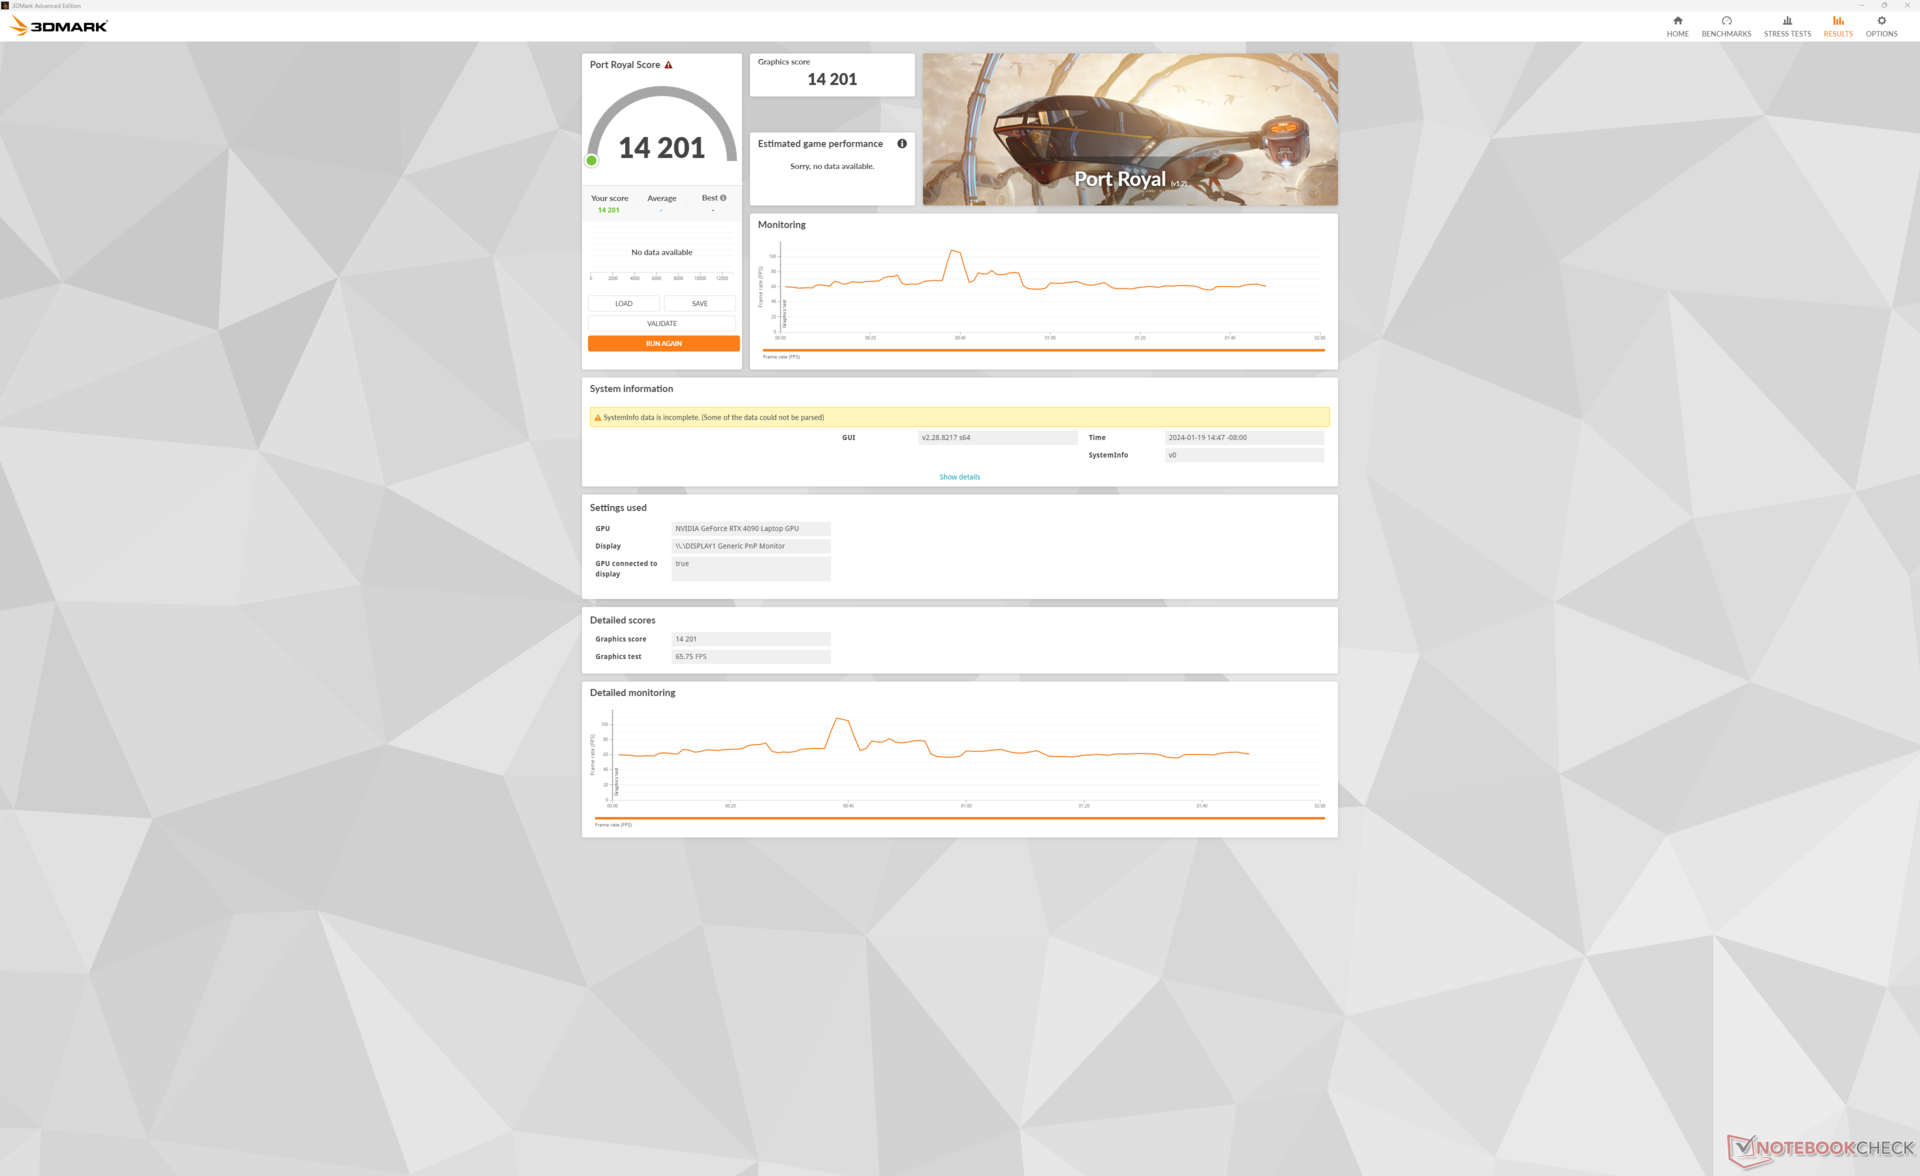
El móvil de 175 W GeForce RTX 4090 De nuestra Titan 18 HX arrojaría puntuaciones en 3DMark casi idénticas a las de la GT77 del año pasado equipada con la misma GPU. En otras palabras, no espere que el nuevo sistema de MSI rinda más rápido que antes a pesar del nuevo y elegante diseño externo. No obstante, es uno de los portátiles para juegos más rápidos del mercado, con unos niveles de rendimiento muy similares a los del sobremesa GeForce RTX 4070 Super.
Activar o desactivar Cooler Boost no parece tener un impacto significativo en el rendimiento, como muestra nuestra tabla de resultados Time Spy a continuación, a pesar de que hay diferencias significativas en el ruido del ventilador entre los dos modos. Por lo tanto, Cooler Boost sólo se recomienda si las temperaturas del núcleo son una preocupación o cuando se realiza overclocking. Sin embargo, utilizar el modo Equilibrado en lugar del modo Rendimiento extremo reduciría el rendimiento gráfico en aproximadamente un 10 por ciento.
| Perfil de potencia | Puntuación de gráficos | Puntuación CPU | Puntuación total |
| Rendimiento extremo (Cooler Boost activado) | 22256 | 17046 | 21280 |
| Rendimiento extremo (Cooler Boost desactivado) | 22097 (-1%) | 16608 (-3%) | 21053 (-1%) |
| Modo equilibrado | 20121 (-10%) | 16532 (-3%) | 19486 (-8%) |
| Batería | 6480 (-71%) | 6999 (-59%) | 6552 (-69%) |
| 3DMark Performance rating - Percent | |
| AMD Ryzen 9 7900 -2! | |
| MSI Titan GT77 HX 13VI | |
| MSI Titan 18 HX A14VIG | |
| NVIDIA GeForce RTX 4070 Super Founders Edition | |
| Medio NVIDIA GeForce RTX 4090 Laptop GPU | |
| Alienware m18 R1 AMD -1! | |
| Acer Predator Helios 18 N23Q2 -1! | |
| Asus ROG Strix Scar 17 SE G733CX-LL014W | |
| Alienware m17 R5 (R9 6900HX, RX 6850M XT) -1! | |
| Razer Blade 18 RTX 4070 | |
| MSI Raider GE68 HX 13VG, i7-13700HX -1! | |
| Asus ROG Strix G18 G814JI -1! | |
| Asus ROG Zephyrus M16 GU603Z -1! | |
| Dell G16 7620 -1! | |
| Lenovo ThinkPad Z16 Gen 2 -1! | |
| 3DMark 11 Performance | 46238 puntos | |
| 3DMark Fire Strike Score | 38959 puntos | |
| 3DMark Time Spy Score | 21280 puntos | |
ayuda | ||
* ... más pequeño es mejor
Rendimiento en juegos
Todos los títulos actuales se ejecutan sin problemas en la RTX 4090 móvil incluso con la mayoría de los ajustes al máximo. Sin embargo, la GPU comienza a luchar un poco en 4K con F1 22 y Cyberpunk 2077 con un promedio de sólo 44 FPS cada uno. En estos escenarios, se recomienda activar DLSS sobre todo porque la pantalla no es compatible con G-Sync. Por ejemplo, ejecutando Cyberpunk 2077 a 4K nativo y ajustes Ultra RT promediaría sólo 21,6 FPS mientras que habilitando DLSS Auto y Frame Generation aumentaría el promedio a 89 FPS.
| Performance rating - Percent | |
| Alienware m18 R1 | |
| MSI Titan GT77 HX 13VI | |
| MSI Titan 18 HX A14VIG | |
| Acer Predator Helios 18 N23Q2 | |
| Razer Blade 18 RTX 4070 | |
| Asus ROG Strix G18 G814JI | |
| The Witcher 3 - 1920x1080 Ultra Graphics & Postprocessing (HBAO+) | |
| Alienware m18 R1 | |
| MSI Titan 18 HX A14VIG | |
| MSI Titan GT77 HX 13VI | |
| Acer Predator Helios 18 N23Q2 | |
| Asus ROG Strix G18 G814JI | |
| Razer Blade 18 RTX 4070 | |
| GTA V - 1920x1080 Highest AA:4xMSAA + FX AF:16x | |
| Acer Predator Helios 18 N23Q2 | |
| Alienware m18 R1 | |
| MSI Titan GT77 HX 13VI | |
| MSI Titan 18 HX A14VIG | |
| Razer Blade 18 RTX 4070 | |
| Asus ROG Strix G18 G814JI | |
| Final Fantasy XV Benchmark - 1920x1080 High Quality | |
| Alienware m18 R1 | |
| MSI Titan GT77 HX 13VI | |
| MSI Titan 18 HX A14VIG | |
| Acer Predator Helios 18 N23Q2 | |
| Asus ROG Strix G18 G814JI | |
| Razer Blade 18 RTX 4070 | |
| Strange Brigade - 1920x1080 ultra AA:ultra AF:16 | |
| MSI Titan 18 HX A14VIG | |
| MSI Titan GT77 HX 13VI | |
| Alienware m18 R1 | |
| Acer Predator Helios 18 N23Q2 | |
| Asus ROG Strix G18 G814JI | |
| Razer Blade 18 RTX 4070 | |
| Dota 2 Reborn - 1920x1080 ultra (3/3) best looking | |
| Alienware m18 R1 | |
| Acer Predator Helios 18 N23Q2 | |
| MSI Titan GT77 HX 13VI | |
| Razer Blade 18 RTX 4070 | |
| MSI Titan 18 HX A14VIG | |
| Asus ROG Strix G18 G814JI | |
| X-Plane 11.11 - 1920x1080 high (fps_test=3) | |
| Alienware m18 R1 | |
| Acer Predator Helios 18 N23Q2 | |
| Razer Blade 18 RTX 4070 | |
| MSI Titan GT77 HX 13VI | |
| MSI Titan GT77 HX 13VI | |
| MSI Titan 18 HX A14VIG | |
| Asus ROG Strix G18 G814JI | |
| The Witcher 3 | |
| 1920x1080 Ultra Graphics & Postprocessing (HBAO+) | |
| AMD Ryzen 9 7900 | |
| MSI Titan 18 HX A14VIG | |
| MSI Titan GT77 HX 13VI | |
| Medio NVIDIA GeForce RTX 4090 Laptop GPU (139.2 - 216, n=35) | |
| NVIDIA GeForce RTX 4070 Super Founders Edition | |
| Acer Predator Helios 18 N23Q2 | |
| Alienware m18 R1 AMD | |
| Alienware m17 R5 (R9 6900HX, RX 6850M XT) | |
| MSI Raider GE68 HX 13VG, i7-13700HX | |
| Asus ROG Strix G18 G814JI | |
| Asus ROG Strix Scar 17 SE G733CX-LL014W | |
| Razer Blade 18 RTX 4070 | |
| Asus ROG Zephyrus M16 GU603Z | |
| Dell G16 7620 | |
| Lenovo ThinkPad Z16 Gen 2 | |
| 3840x2160 High Graphics & Postprocessing (Nvidia HairWorks Off) | |
| AMD Ryzen 9 7900 | |
| MSI Titan 18 HX A14VIG | |
| MSI Titan GT77 HX 13VI | |
| Medio NVIDIA GeForce RTX 4090 Laptop GPU (96.3 - 167.6, n=19) | |
| NVIDIA GeForce RTX 4070 Super Founders Edition | |
| Alienware m18 R1 AMD | |
| Razer Blade 18 RTX 4070 | |
| Alienware m17 R5 (R9 6900HX, RX 6850M XT) | |
| Tiny Tina's Wonderlands | |
| 1920x1080 Badass Preset (DX12) | |
| MSI Titan GT77 HX 13VI | |
| MSI Titan 18 HX A14VIG | |
| Medio NVIDIA GeForce RTX 4090 Laptop GPU (141.1 - 189.4, n=14) | |
| Alienware m18 R1 AMD | |
| Lenovo ThinkPad Z16 Gen 2 | |
| 2560x1440 Badass Preset (DX12) | |
| MSI Titan GT77 HX 13VI | |
| MSI Titan 18 HX A14VIG | |
| Medio NVIDIA GeForce RTX 4090 Laptop GPU (103.4 - 137.8, n=14) | |
| Alienware m18 R1 AMD | |
| Lenovo ThinkPad Z16 Gen 2 | |
| 3840x2160 Badass Preset (DX12) | |
| MSI Titan 18 HX A14VIG | |
| MSI Titan GT77 HX 13VI | |
| Medio NVIDIA GeForce RTX 4090 Laptop GPU (53.3 - 73.7, n=12) | |
| Alienware m18 R1 AMD | |
| Cyberpunk 2077 | |
| 1920x1080 Ultra Preset (FSR off) | |
| NVIDIA GeForce RTX 4070 Super Founders Edition | |
| MSI Titan 18 HX A14VIG | |
| Alienware m18 R1 AMD | |
| Acer Predator Helios 18 N23Q2 | |
| Medio NVIDIA GeForce RTX 4090 Laptop GPU (93.1 - 158, n=21) | |
| Lenovo ThinkPad Z16 Gen 2 | |
| 2560x1440 Ultra Preset (FSR off) | |
| MSI Titan 18 HX A14VIG | |
| Medio NVIDIA GeForce RTX 4090 Laptop GPU (68.1 - 103.9, n=21) | |
| Alienware m18 R1 AMD | |
| NVIDIA GeForce RTX 4070 Super Founders Edition | |
| Acer Predator Helios 18 N23Q2 | |
| Lenovo ThinkPad Z16 Gen 2 | |
| 3840x2160 Ultra Preset (FSR off) | |
| MSI Titan 18 HX A14VIG | |
| Medio NVIDIA GeForce RTX 4090 Laptop GPU (31.6 - 50.6, n=11) | |
| NVIDIA GeForce RTX 4070 Super Founders Edition | |
| Alienware m18 R1 AMD | |
| 3840x2160 Ray Tracing Ultra Preset (DLSS off, no Path Tracing) | |
| Medio NVIDIA GeForce RTX 4090 Laptop GPU (20.2 - 22.3, n=4) | |
| NVIDIA GeForce RTX 4070 Super Founders Edition | |
| F1 22 | |
| 1920x1080 Ultra High Preset AA:T AF:16x | |
| AMD Ryzen 9 7900 | |
| MSI Titan GT77 HX 13VI | |
| MSI Titan 18 HX A14VIG | |
| NVIDIA GeForce RTX 4070 Super Founders Edition | |
| Medio NVIDIA GeForce RTX 4090 Laptop GPU (70.3 - 144.7, n=25) | |
| Alienware m18 R1 AMD | |
| MSI Raider GE68 HX 13VG, i7-13700HX | |
| Asus ROG Strix Scar 17 SE G733CX-LL014W | |
| Lenovo ThinkPad Z16 Gen 2 | |
| 2560x1440 Ultra High Preset AA:T AF:16x | |
| AMD Ryzen 9 7900 | |
| MSI Titan 18 HX A14VIG | |
| MSI Titan GT77 HX 13VI | |
| Medio NVIDIA GeForce RTX 4090 Laptop GPU (65.9 - 92.2, n=25) | |
| NVIDIA GeForce RTX 4070 Super Founders Edition | |
| Alienware m18 R1 AMD | |
| Asus ROG Strix Scar 17 SE G733CX-LL014W | |
| MSI Raider GE68 HX 13VG, i7-13700HX | |
| Lenovo ThinkPad Z16 Gen 2 | |
| 3840x2160 Ultra High Preset AA:T AF:16x | |
| AMD Ryzen 9 7900 | |
| MSI Titan GT77 HX 13VI | |
| MSI Titan 18 HX A14VIG | |
| Medio NVIDIA GeForce RTX 4090 Laptop GPU (36.8 - 46.1, n=18) | |
| NVIDIA GeForce RTX 4070 Super Founders Edition | |
| Alienware m18 R1 AMD | |
| MSI Raider GE68 HX 13VG, i7-13700HX | |
Witcher 3 FPS Chart
| bajo | medio | alto | ultra | QHD | 4K | |
|---|---|---|---|---|---|---|
| GTA V (2015) | 139.2 | |||||
| The Witcher 3 (2015) | 595.3 | 506.6 | 412.2 | 211.2 | 160.7 | |
| Dota 2 Reborn (2015) | 218 | 196.3 | 186.5 | 174.5 | 168.3 | |
| Final Fantasy XV Benchmark (2018) | 229 | 216 | 184 | 158 | 93.6 | |
| X-Plane 11.11 (2018) | 184.9 | 161.8 | 126.1 | 106.5 | ||
| Far Cry 5 (2018) | 191 | 164 | 158 | 155 | 152 | 112 |
| Strange Brigade (2018) | 511 | 423 | 406 | 385 | 307 | 156.1 |
| Tiny Tina's Wonderlands (2022) | 324.7 | 279.8 | 223.7 | 182 | 130.8 | 71 |
| F1 22 (2022) | 307 | 297 | 280 | 132.7 | 90.5 | 44.6 |
| Baldur's Gate 3 (2023) | 246.7 | 226.9 | 208.6 | 207.7 | 155.2 | 80.8 |
| Cyberpunk 2077 (2023) | 155.7 | 145.4 | 135.9 | 129.8 | 94.5 | 43.9 |
| Avatar Frontiers of Pandora (2023) | 103 | 69 | 35 |
Emisiones
Ruido del sistema
El ruido y el comportamiento del ventilador están directamente ligados a los perfiles de potencia del Centro MSI: Rendimiento extremo con Cooler Boost activado, Rendimiento extremo con Cooler Boost desactivado, Equilibrado y Silencioso. Los juegos con Cooler Boost activado pueden ser tan ruidosos como 63 dB(A) frente a 57,3 dB(A) si Cooler Boost está desactivado. Sin embargo, dado que las diferencias de rendimiento entre ambos modos son muy pequeñas, como ya se ha indicado, se recomienda jugar con Cooler Boost desactivado para evitar que el portátil suene como un secador de pelo.
El ruido del ventilador al jugar en el modo Equilibrado alcanza un máximo de 53 dB(A) para ser notablemente más silencioso que cualquiera de los dos modos de Rendimiento Extremo. Sin embargo, tenga en cuenta que el déficit de rendimiento es mayor si se ejecuta en modo Equilibrado como se ha mencionado anteriormente. Prepárese para un sistema muy ruidoso a pesar de todo cuando juegue.
Ruido
| Ocioso |
| 23.8 / 23.8 / 28 dB(A) |
| Carga |
| 38 / 62.8 dB(A) |
 | ||
30 dB silencioso 40 dB(A) audible 50 dB(A) ruidosamente alto |
||
min: | ||
| MSI Titan 18 HX A14VIG GeForce RTX 4090 Laptop GPU, i9-14900HX, 2x Samsung PM9A1a MZVL22T0HDLB (RAID 0) | MSI Titan GT77 HX 13VI GeForce RTX 4090 Laptop GPU, i9-13950HX, Samsung PM9A1 MZVL22T0HBLB | Alienware m18 R1 GeForce RTX 4090 Laptop GPU, i9-13980HX, SK hynix PC801 HFS001TEJ9X101N | Asus ROG Strix G18 G814JI GeForce RTX 4070 Laptop GPU, i7-13650HX, Micron 2400 MTFDKBA1T0QFM | Acer Predator Helios 18 N23Q2 GeForce RTX 4080 Laptop GPU, i9-13900HX, Samsung PM9A1 MZVL22T0HBLB | Razer Blade 18 RTX 4070 GeForce RTX 4070 Laptop GPU, i9-13950HX, SSSTC CA6-8D1024 | |
|---|---|---|---|---|---|---|
| Noise | -12% | 7% | 0% | 1% | 5% | |
| apagado / medio ambiente * (dB) | 22.8 | 24.6 -8% | 22.8 -0% | 25 -10% | 23 -1% | 23.5 -3% |
| Idle Minimum * (dB) | 23.8 | 29.2 -23% | 23 3% | 26 -9% | 23 3% | 23.8 -0% |
| Idle Average * (dB) | 23.8 | 29.2 -23% | 23 3% | 28 -18% | 23 3% | 23.8 -0% |
| Idle Maximum * (dB) | 28 | 29.2 -4% | 23 18% | 29 -4% | 23 18% | 26.8 4% |
| Load Average * (dB) | 38 | 50.7 -33% | 35.6 6% | 41 -8% | 45.26 -19% | 37.3 2% |
| Witcher 3 ultra * (dB) | 57.3 | 53.3 7% | 51.3 10% | 44 23% | 59.82 -4% | 48 16% |
| Load Maximum * (dB) | 62.8 | 61 3% | 56.7 10% | 46 27% | 59.94 5% | 53.5 15% |
* ... más pequeño es mejor
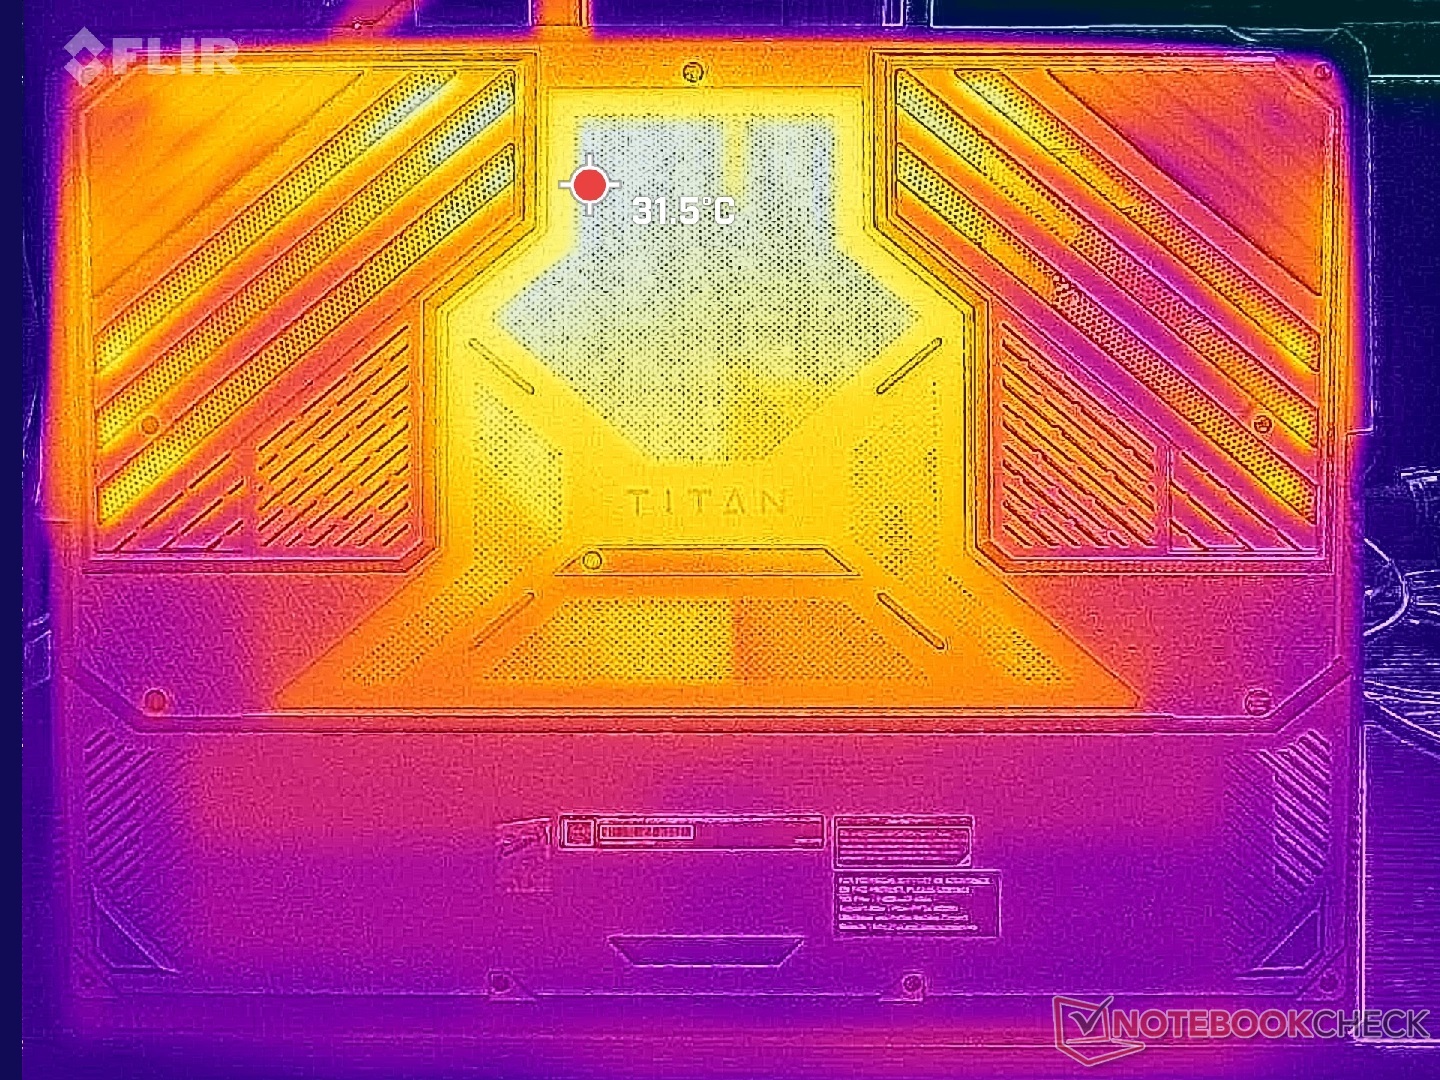
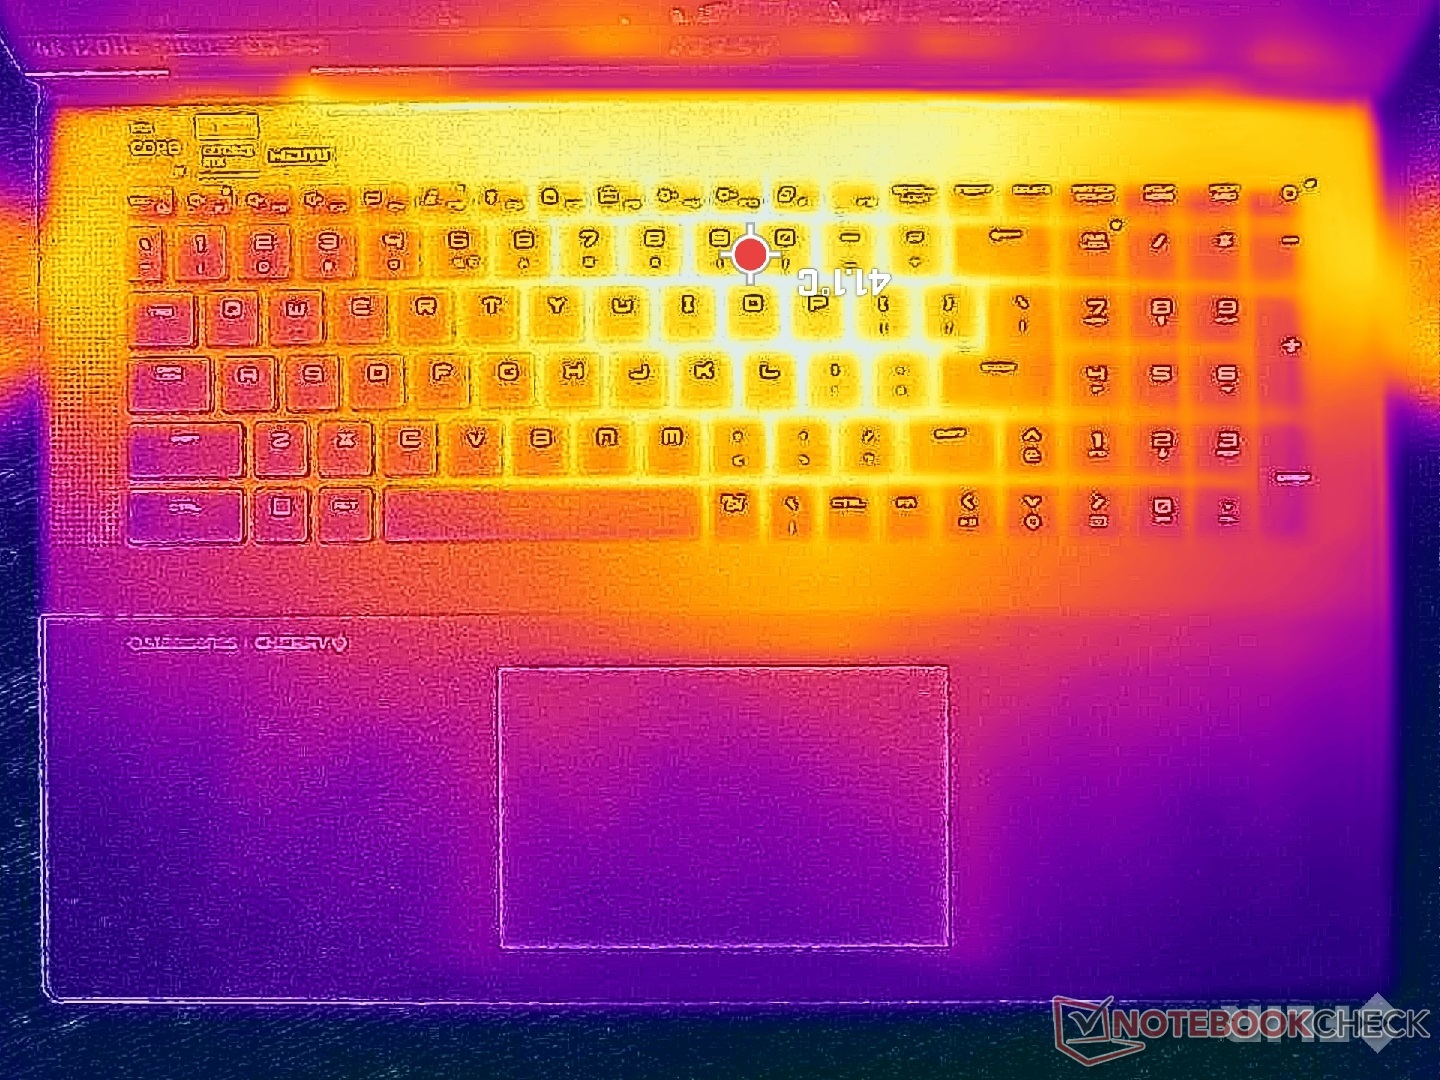
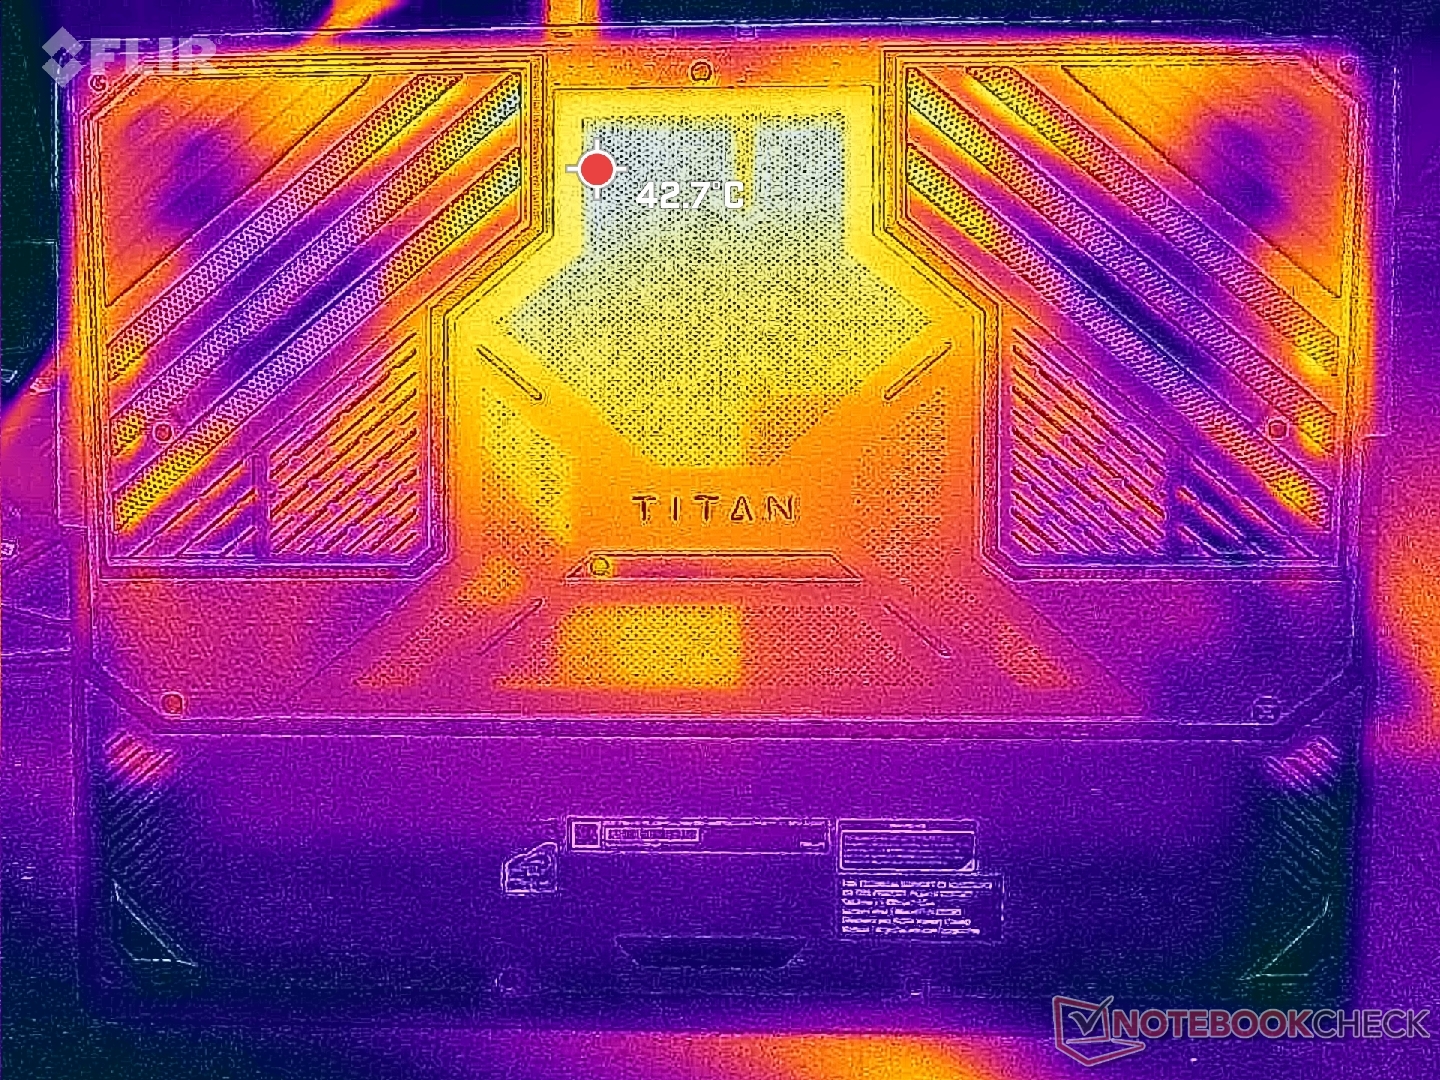
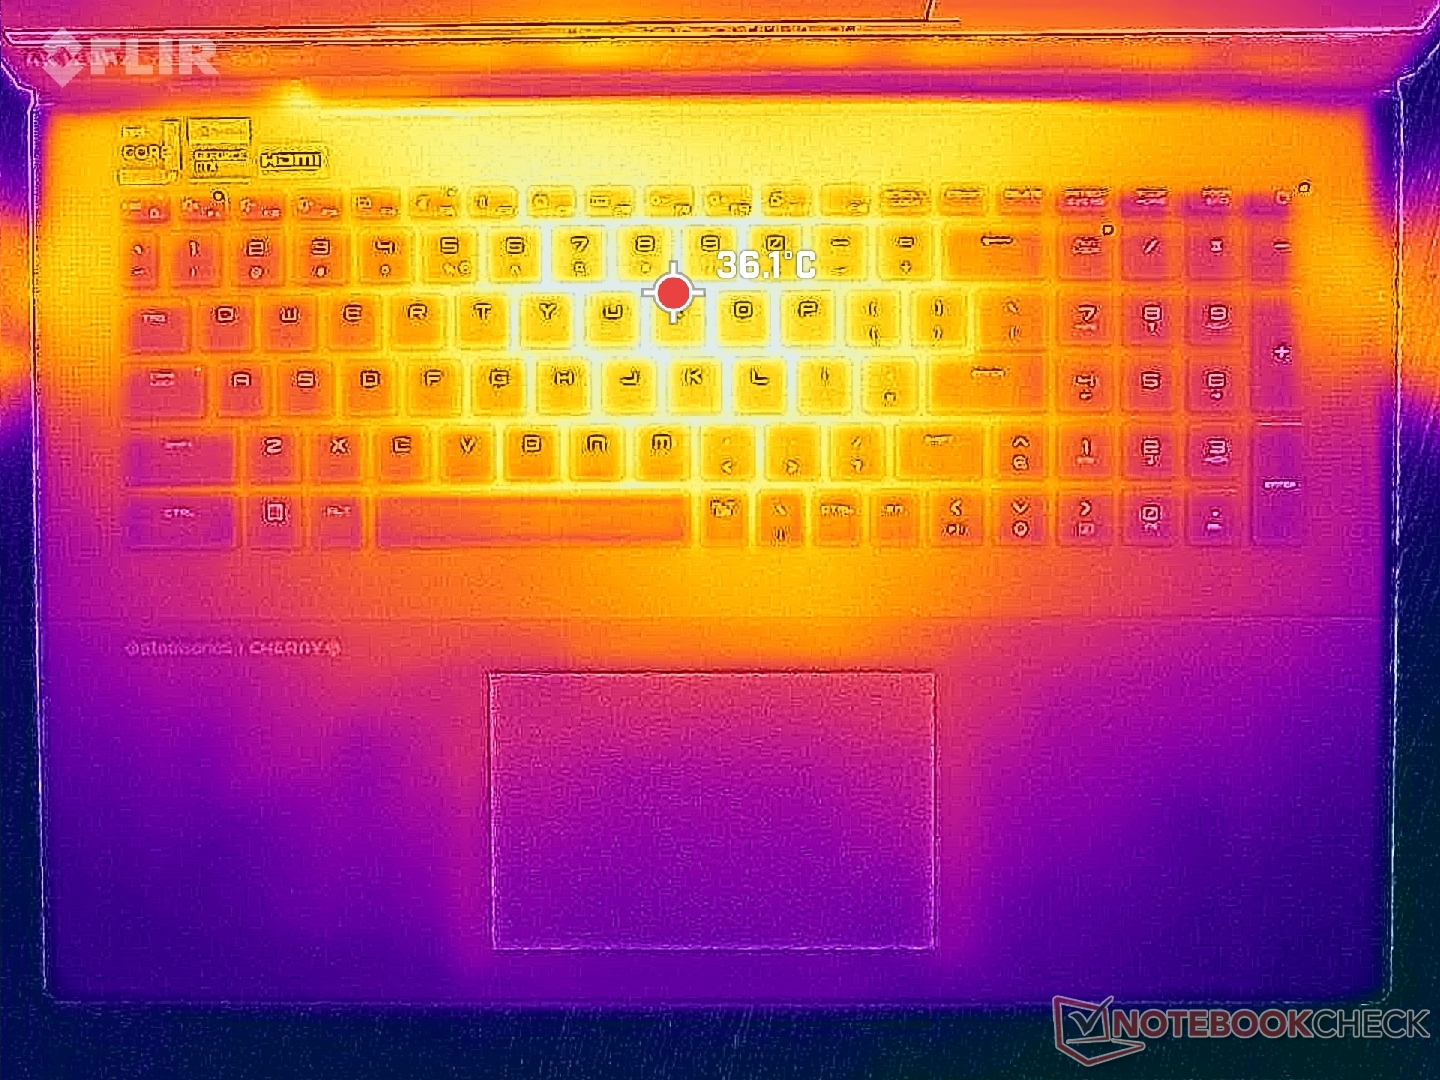
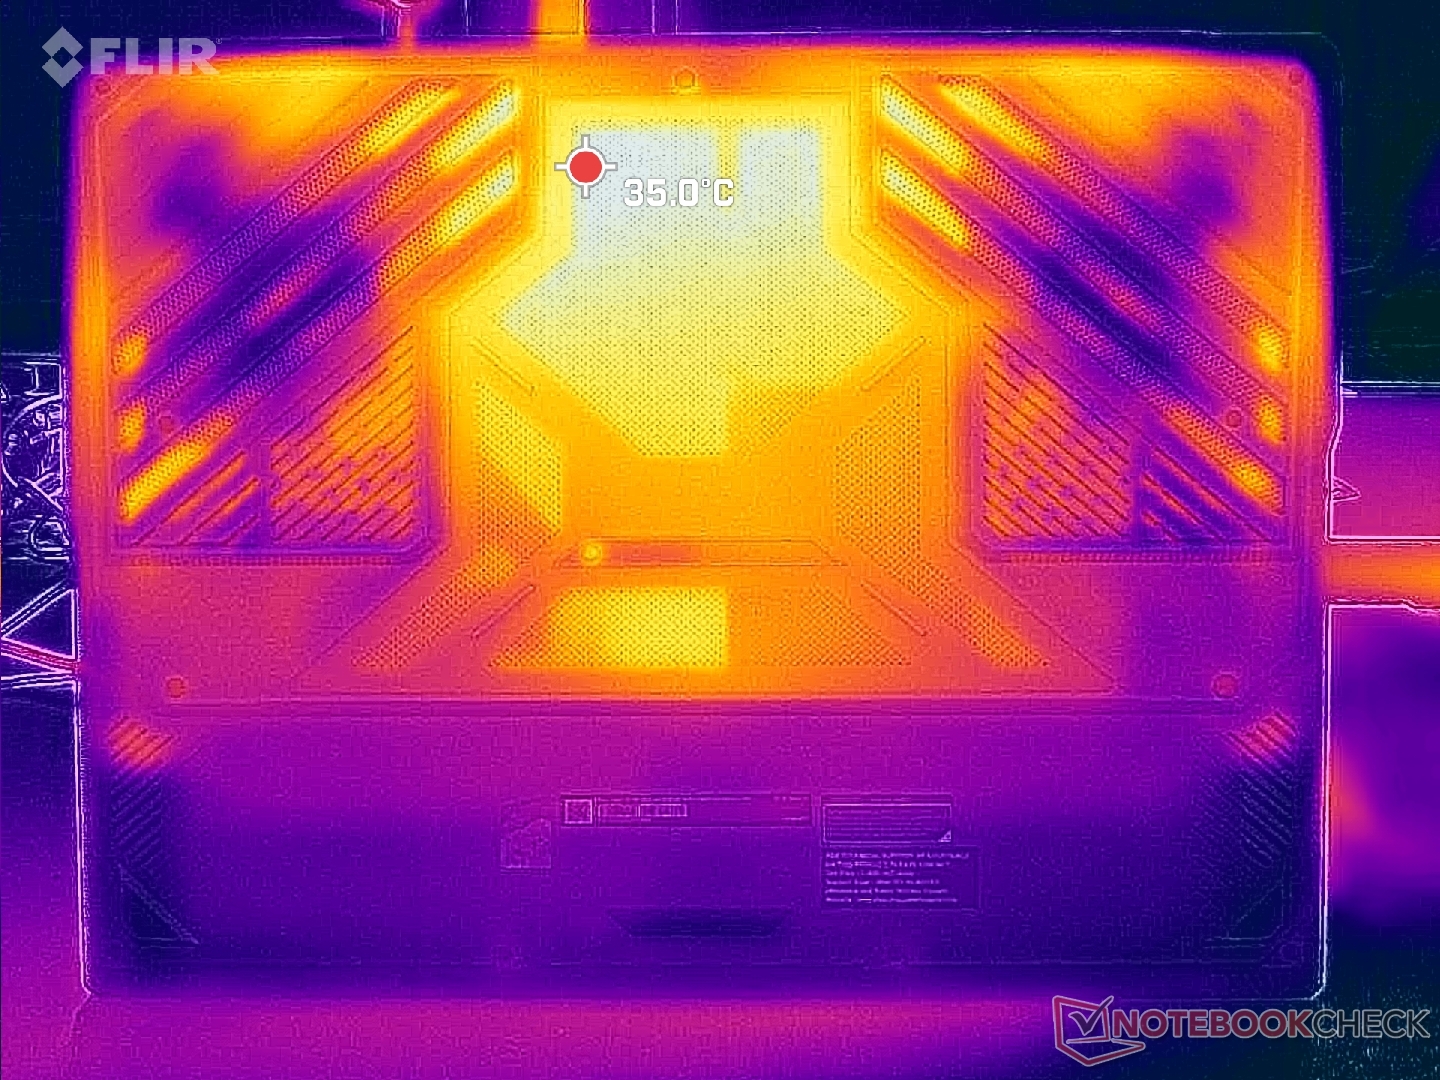
Temperatura
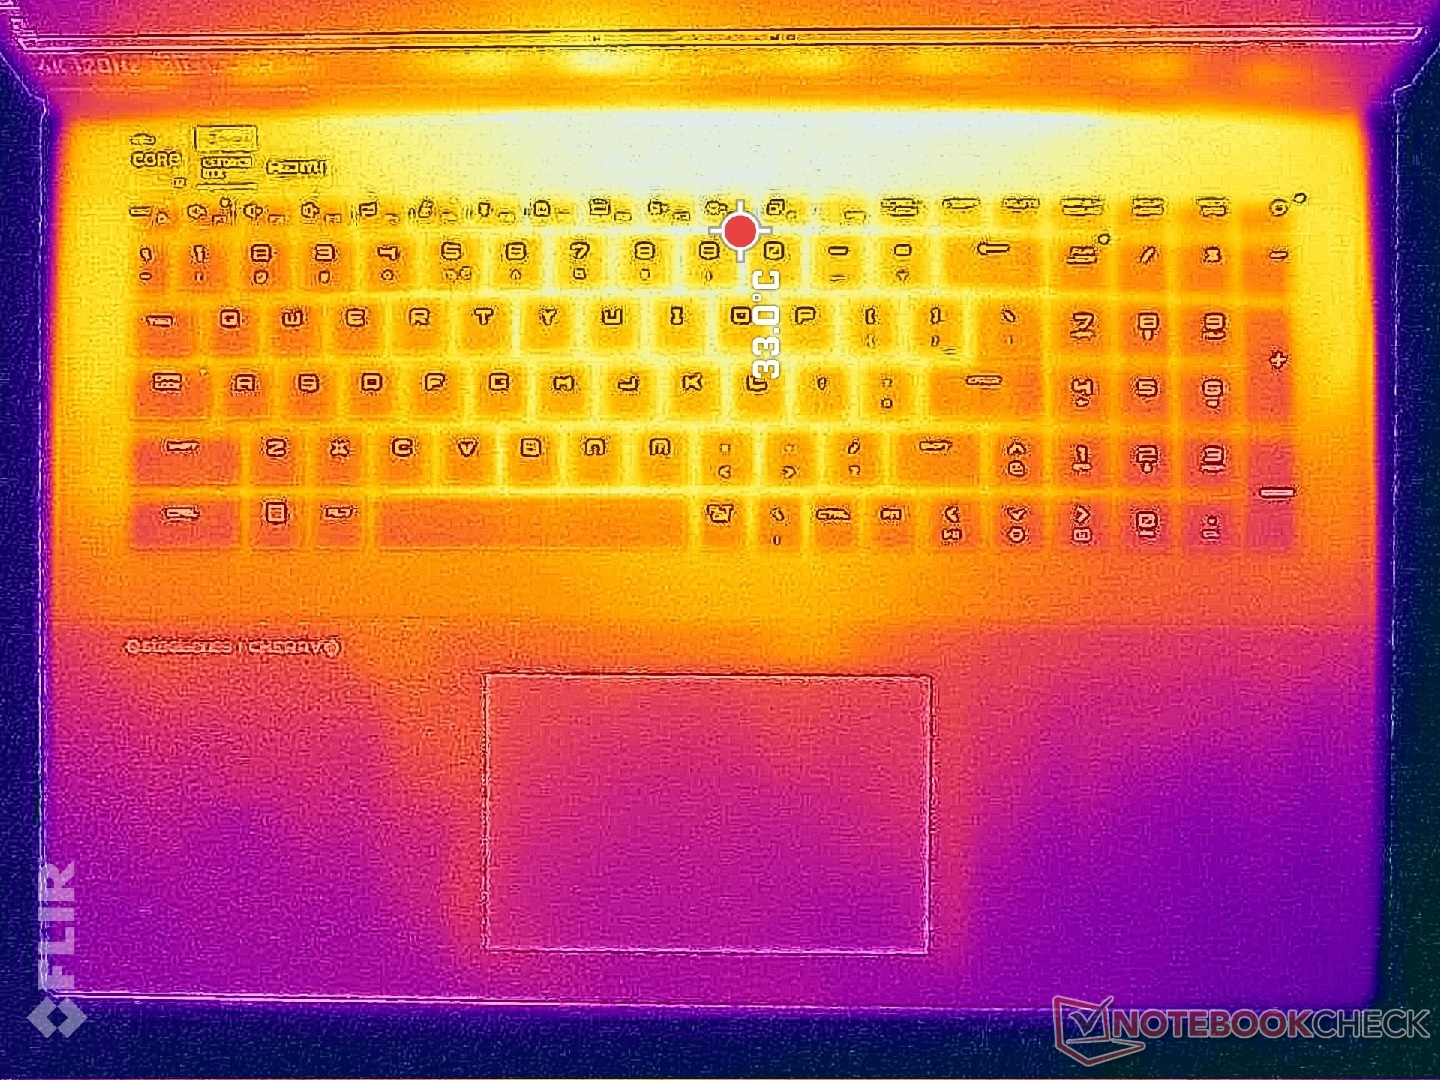
Sorprendentemente, las temperaturas de la superficie aquí son ligeramente más cálidas que las que registramos en el unibody Razer Blade 18 a pesar del diseño más grueso del MSI. Los puntos calientes alcanzarían algo más de 41 C y 37 C con Cooler Boost activo e inactivo, respectivamente, frente a los 35 C a 40 C del Razer. Los puntos calientes están, afortunadamente, hacia la parte trasera del sistema, donde es poco probable que toquen las manos y los dedos. Nunca encontramos que los reposamanos o las teclas estuvieran incómodamente calientes al jugar.
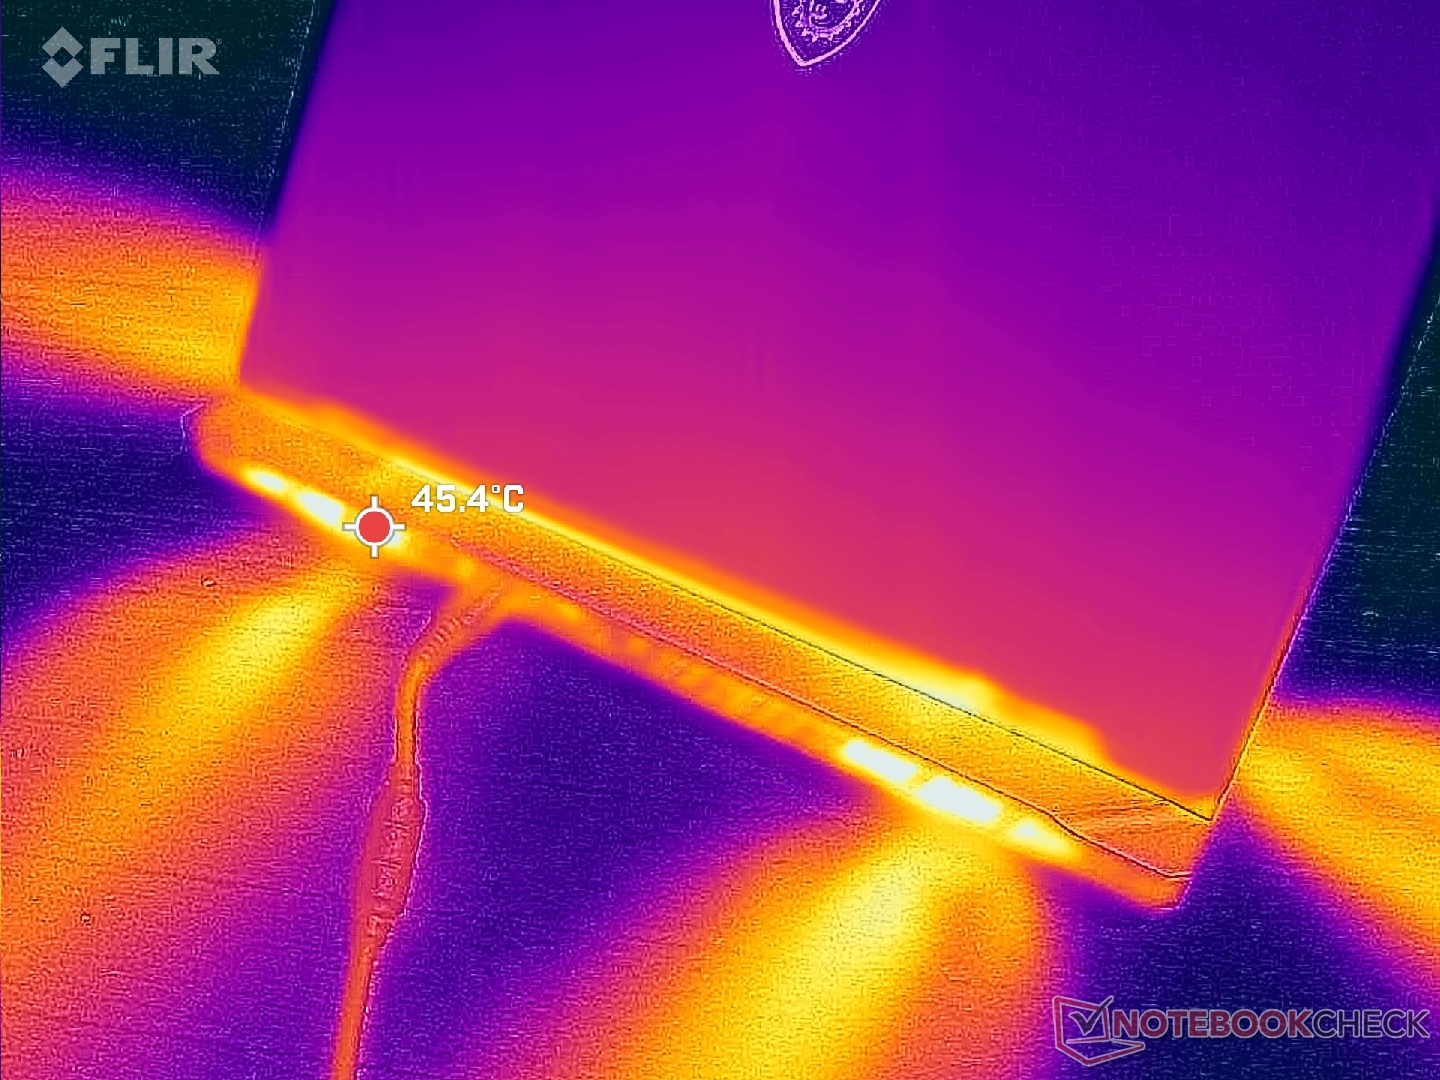
(+) La temperatura máxima en la parte superior es de 37.8 °C / 100 F, frente a la media de 40.4 °C / 105 F, que oscila entre 21.2 y 68.8 °C para la clase Gaming.
(+) El fondo se calienta hasta un máximo de 37.6 °C / 100 F, frente a la media de 43.2 °C / 110 F
(+) En reposo, la temperatura media de la parte superior es de 29.8 °C / 86# F, frente a la media del dispositivo de 33.9 °C / 93 F.
(±) Jugando a The Witcher 3, la temperatura media de la parte superior es de 32.3 °C / 90 F, frente a la media del dispositivo de 33.9 °C / 93 F.
(+) El reposamanos y el panel táctil están a una temperatura inferior a la de la piel, con un máximo de 25.6 °C / 78.1 F y, por tanto, son fríos al tacto.
(+) La temperatura media de la zona del reposamanos de dispositivos similares fue de 28.8 °C / 83.8 F (+3.2 °C / 5.7 F).
| MSI Titan 18 HX A14VIG Intel Core i9-14900HX, NVIDIA GeForce RTX 4090 Laptop GPU | MSI Titan GT77 HX 13VI Intel Core i9-13950HX, NVIDIA GeForce RTX 4090 Laptop GPU | Alienware m18 R1 Intel Core i9-13980HX, NVIDIA GeForce RTX 4090 Laptop GPU | Asus ROG Strix G18 G814JI Intel Core i7-13650HX, NVIDIA GeForce RTX 4070 Laptop GPU | Acer Predator Helios 18 N23Q2 Intel Core i9-13900HX, NVIDIA GeForce RTX 4080 Laptop GPU | Razer Blade 18 RTX 4070 Intel Core i9-13950HX, NVIDIA GeForce RTX 4070 Laptop GPU | |
|---|---|---|---|---|---|---|
| Heat | 6% | 10% | -3% | -12% | 5% | |
| Maximum Upper Side * (°C) | 37.8 | 40.6 -7% | 39 -3% | 45 -19% | 35 7% | 39.2 -4% |
| Maximum Bottom * (°C) | 37.6 | 41.1 -9% | 36.4 3% | 47 -25% | 56 -49% | 35.6 5% |
| Idle Upper Side * (°C) | 34.8 | 26.2 25% | 29.2 16% | 28 20% | 34 2% | 31.8 9% |
| Idle Bottom * (°C) | 36 | 30.3 16% | 27.8 23% | 31 14% | 39 -8% | 33.2 8% |
* ... más pequeño es mejor
Prueba de estrés
La temperatura de la CPU bajo carga puede calentarse más de lo esperado incluso si Cooler Boost está activado. Ejecutando Witcher 3 para representar cargas típicas de juego, por ejemplo, haría que la CPU se estabilizara en 97 C y 90 C con Cooler Boost desactivado y activado, respectivamente. Mientras tanto, la GPU se estabilizaría en el rango más razonable de 60 C. Repitiendo esta prueba en el Razer Blade 18 o el Alienware m18 R1 se obtendrían temperaturas similares de la GPU pero más frías de la CPU, en cambio, en el rango bajo de los 80 C.
Tenga en cuenta que no hay grandes diferencias de rendimiento entre Cooler Boost activado y Cooler Boost desactivado, similar a lo que observamos en nuestra sección de Rendimiento de la GPU más arriba. Tanto la velocidad de reloj de la GPU como el consumo de energía de la placa al ejecutar Witcher 3 se mantendrían relativamente constantes en 2370 MHz y 169 W, respectivamente.
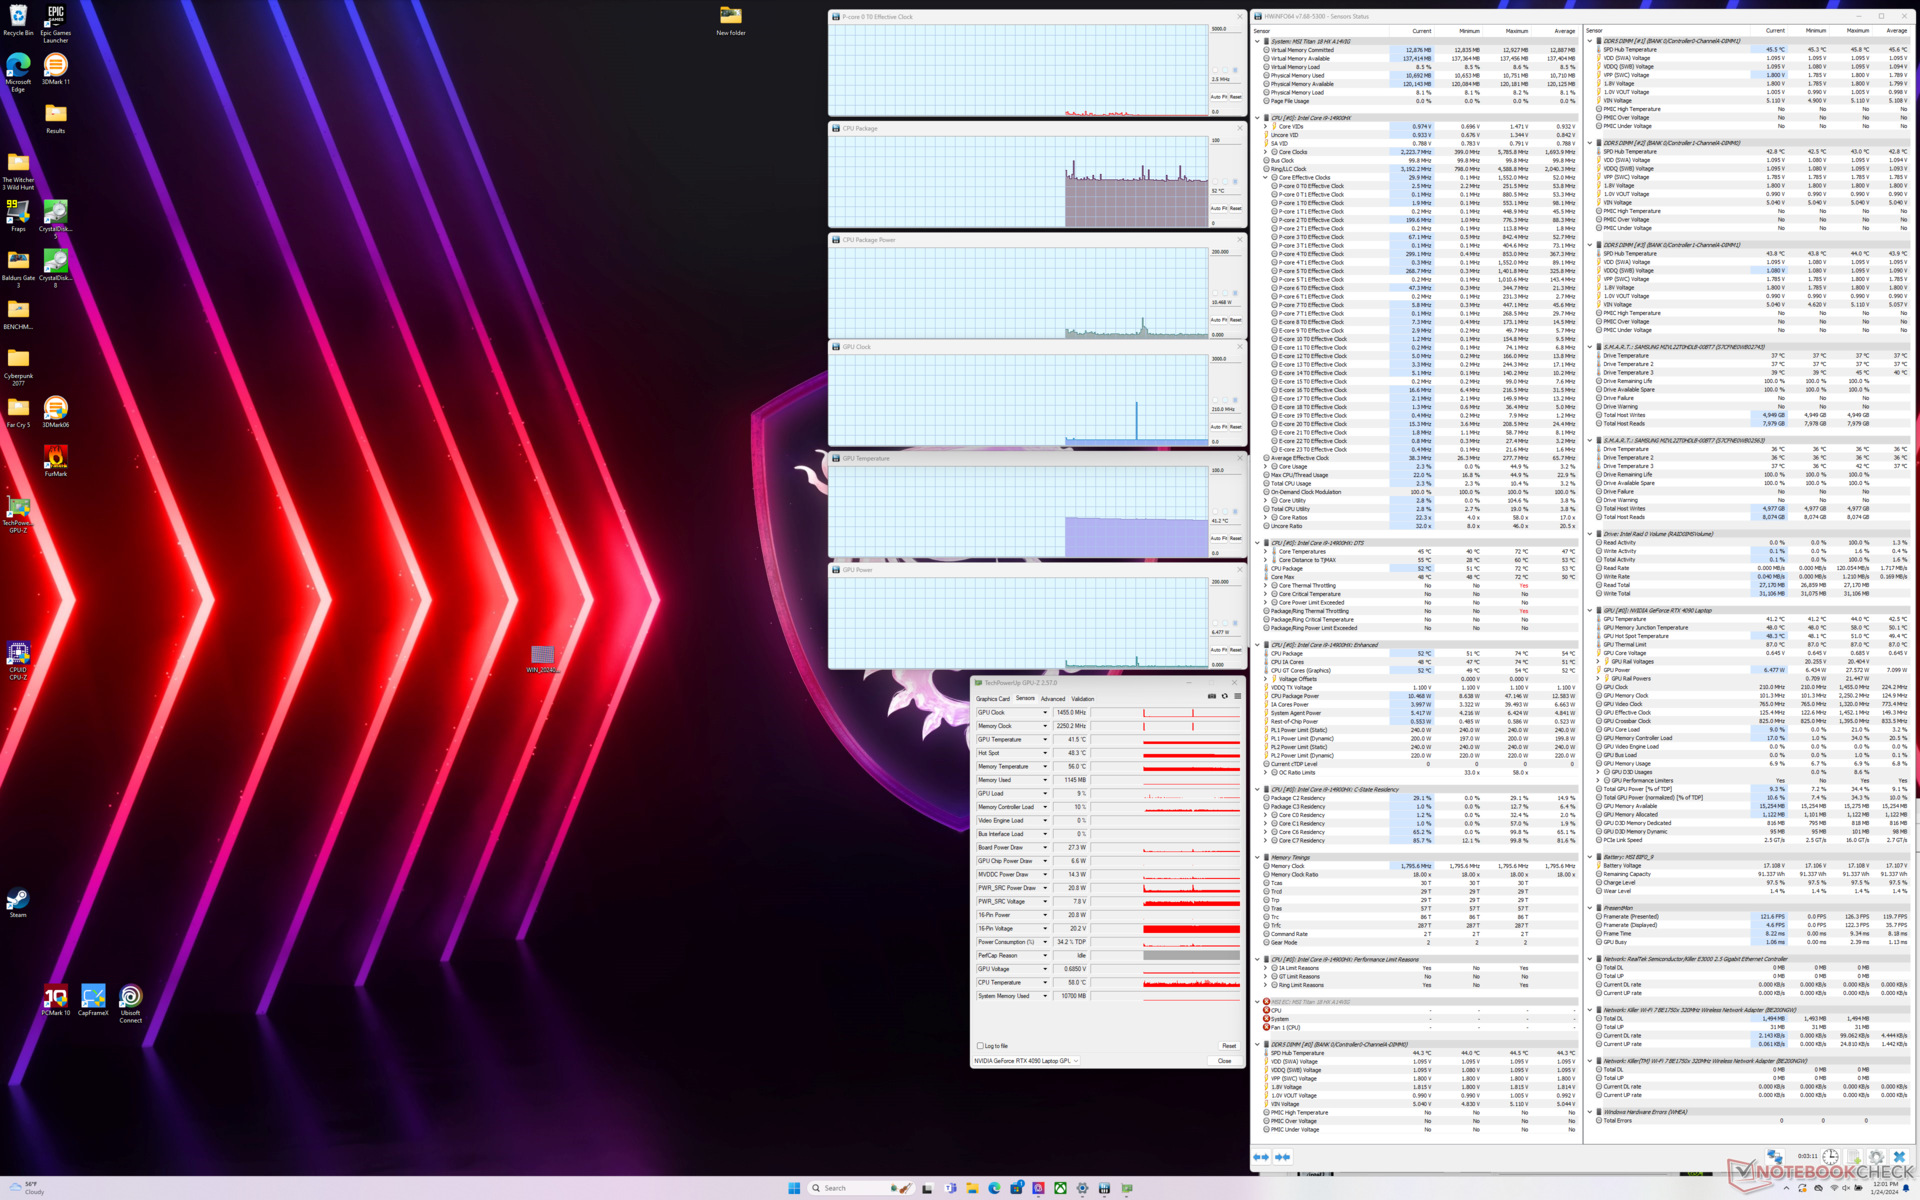
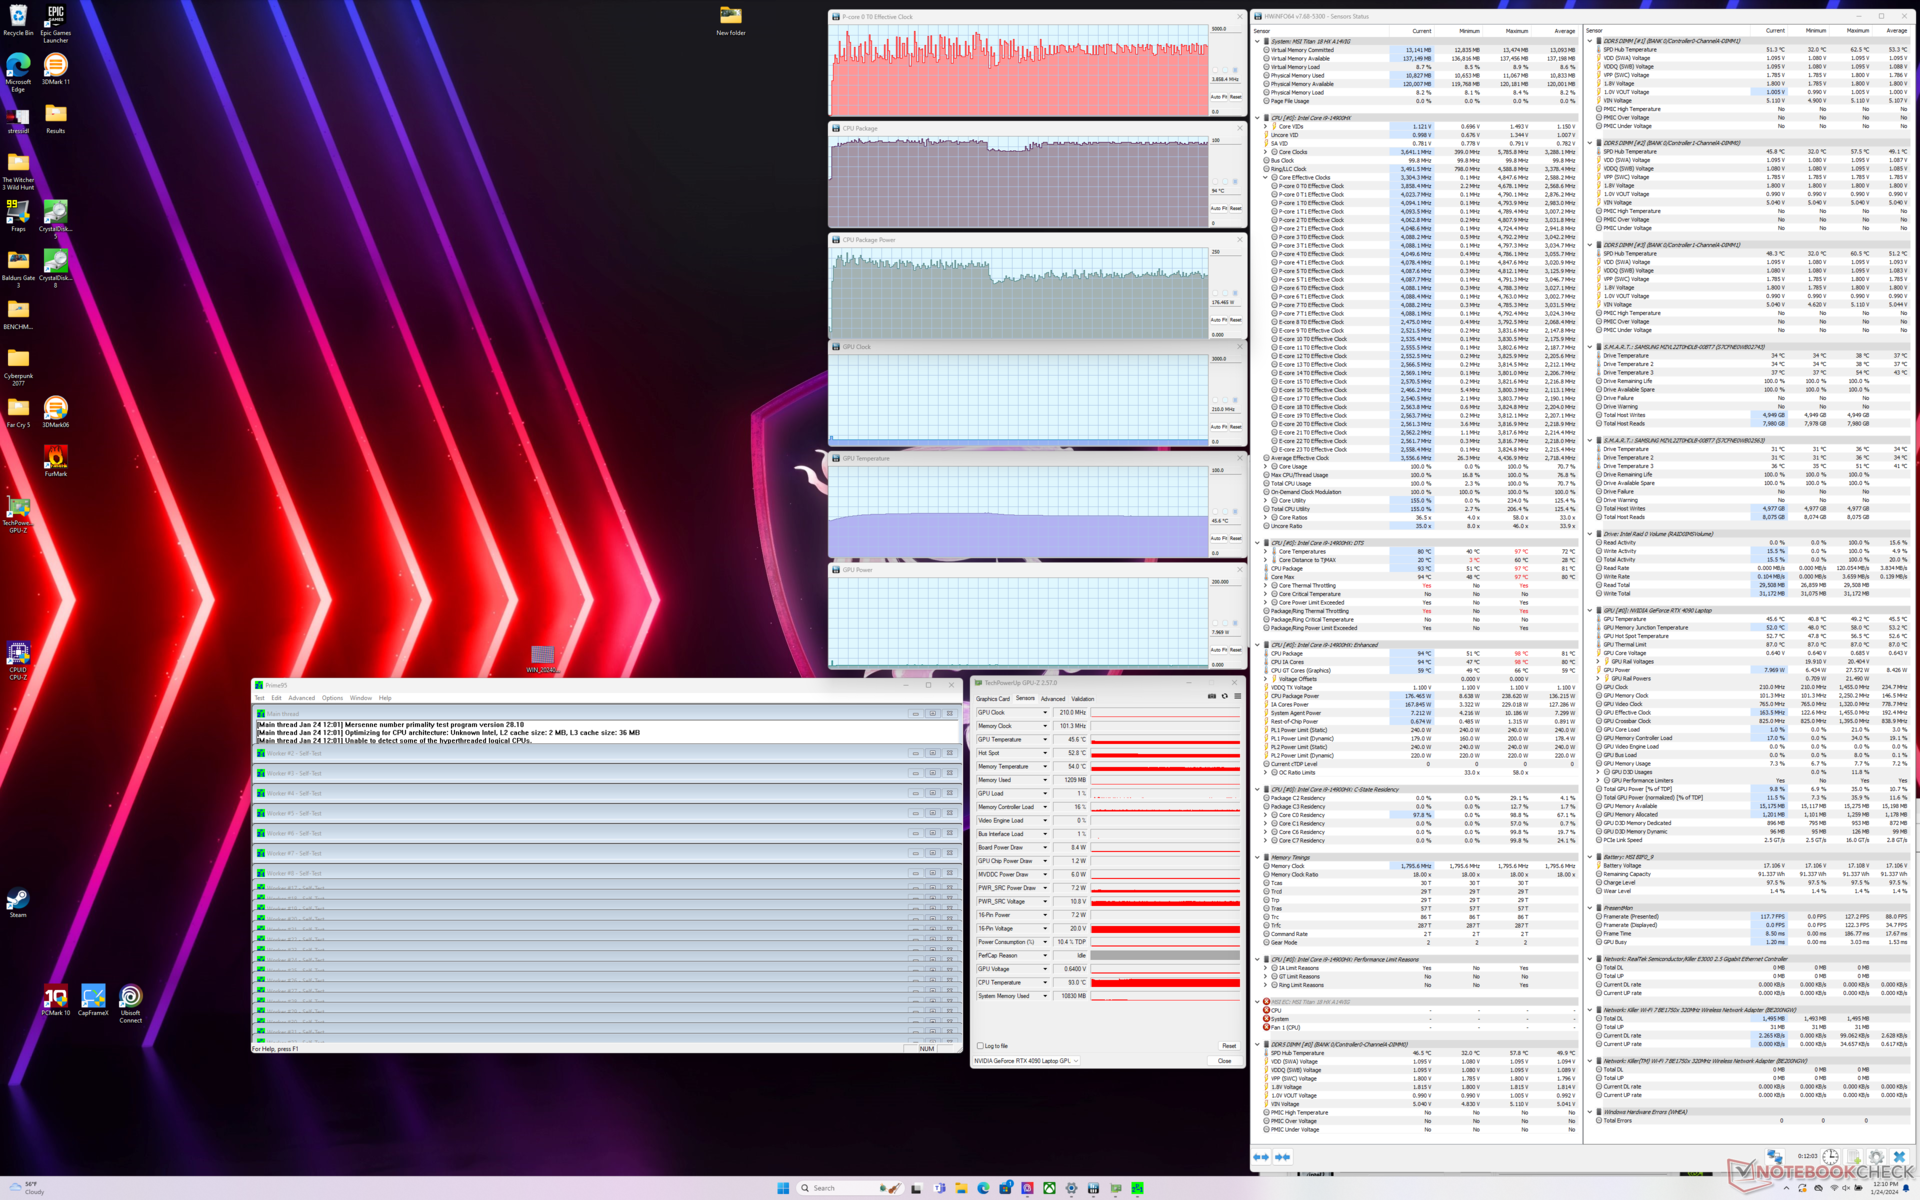
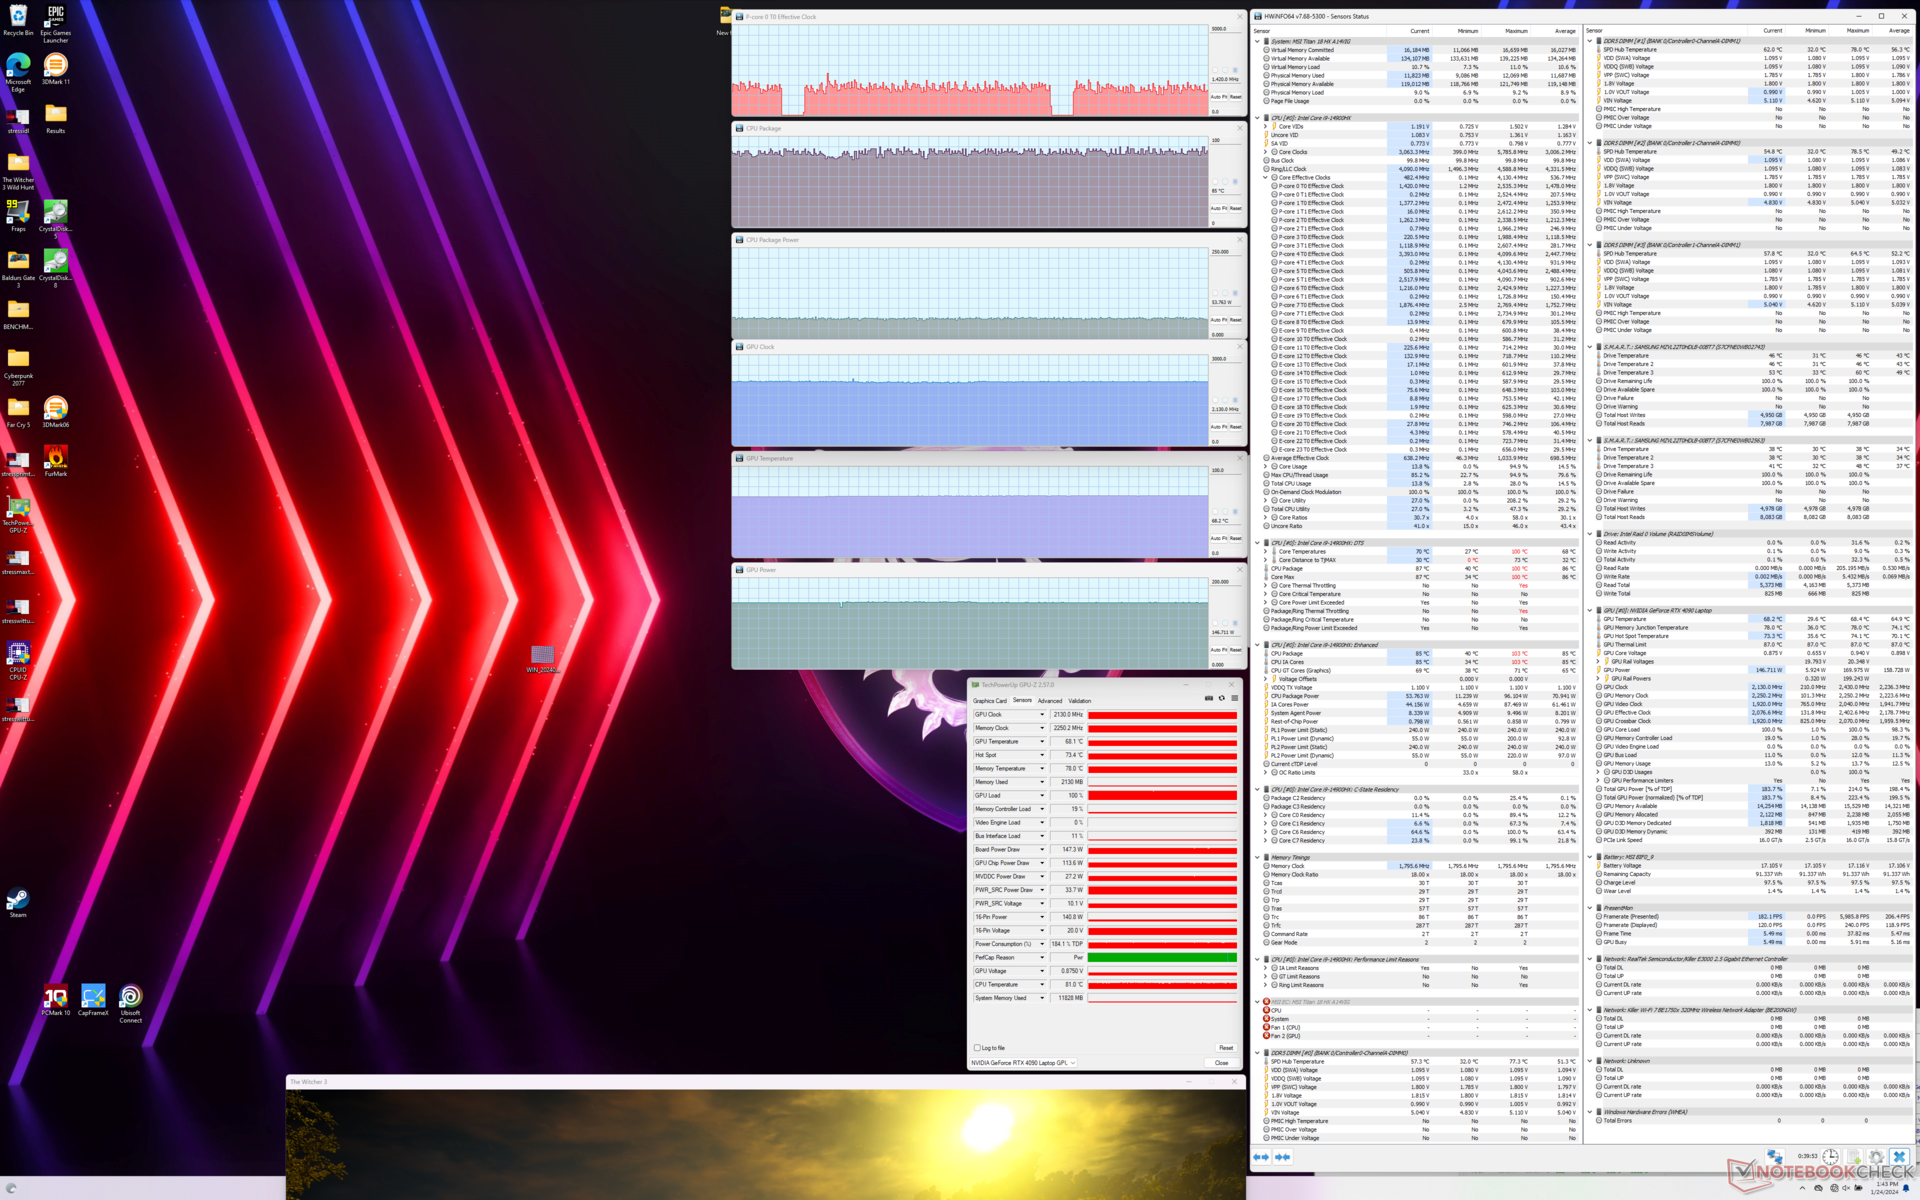
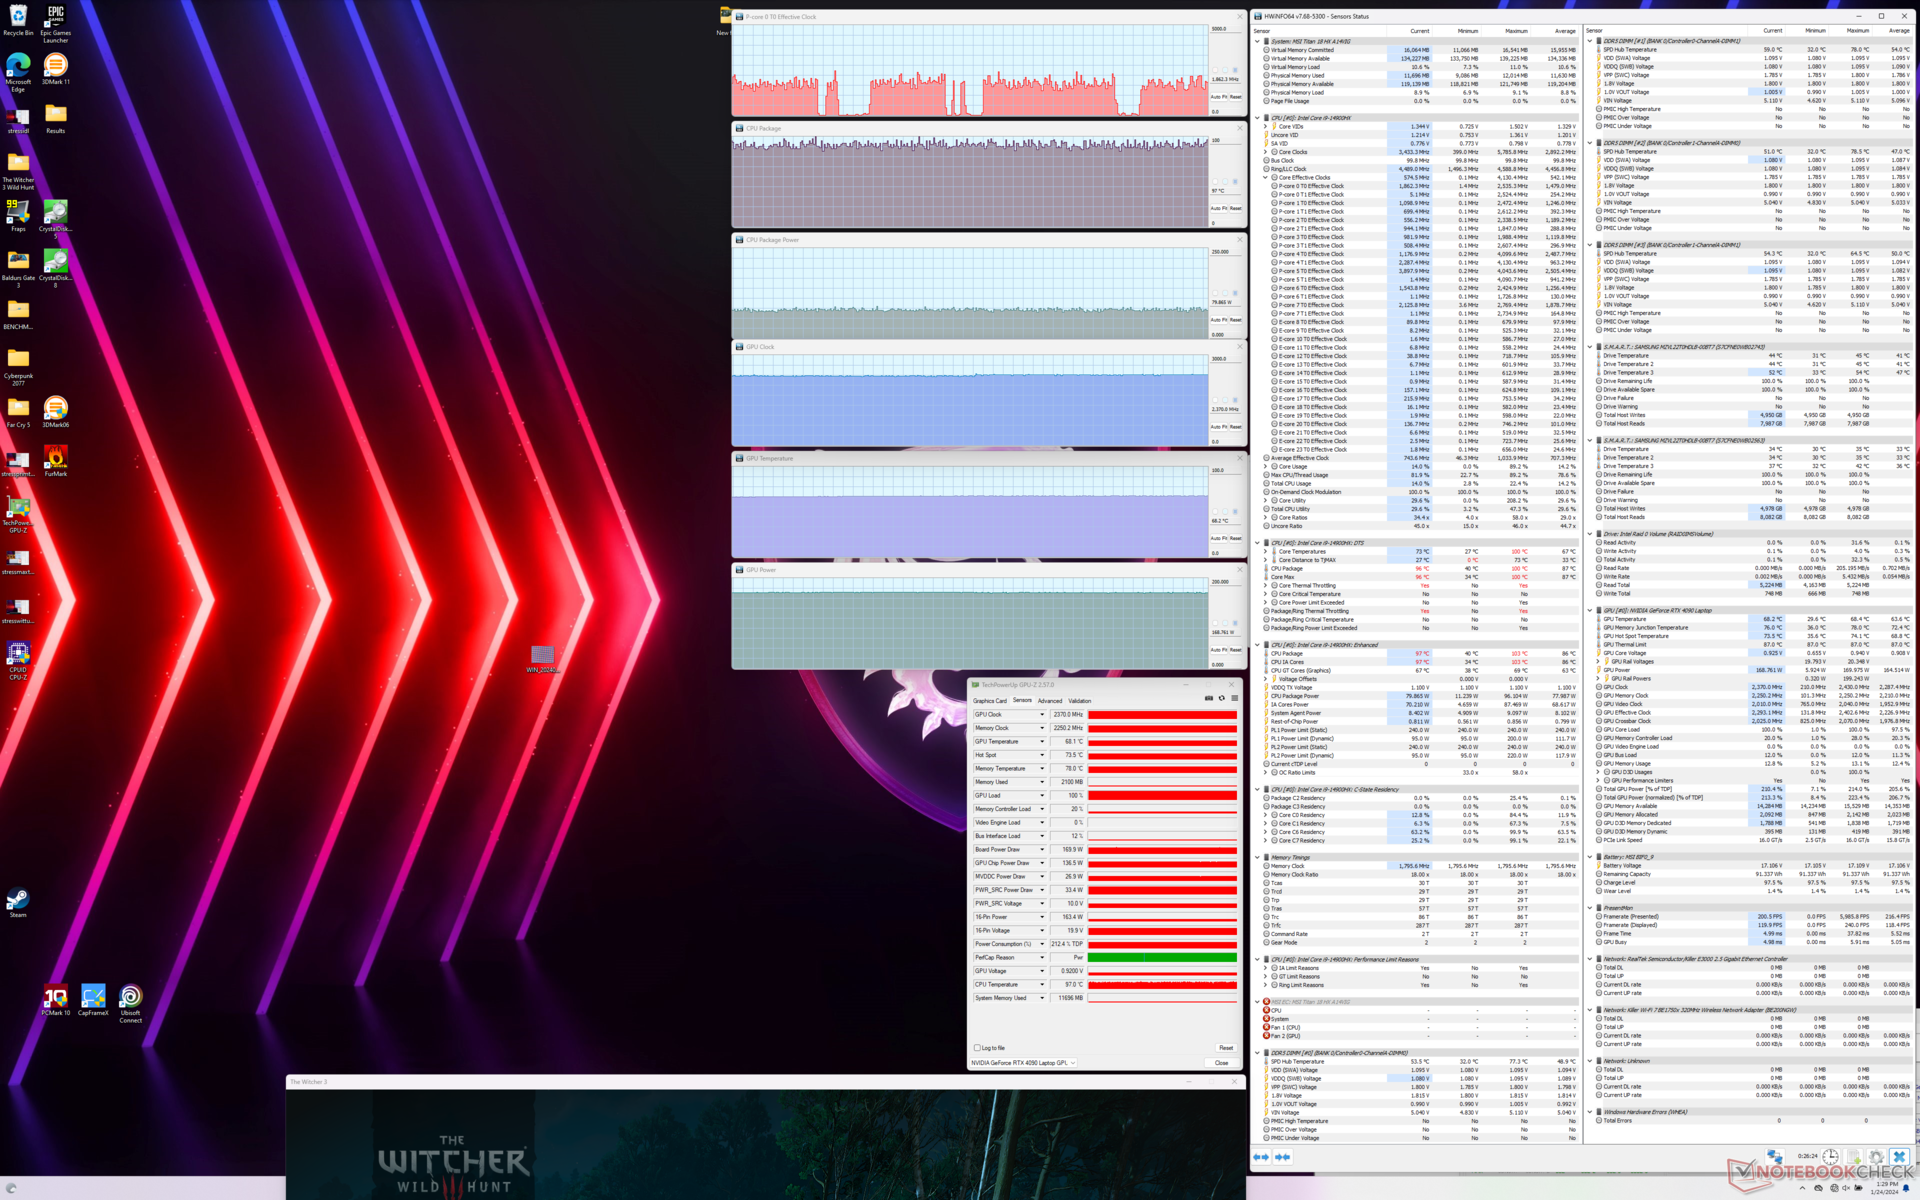
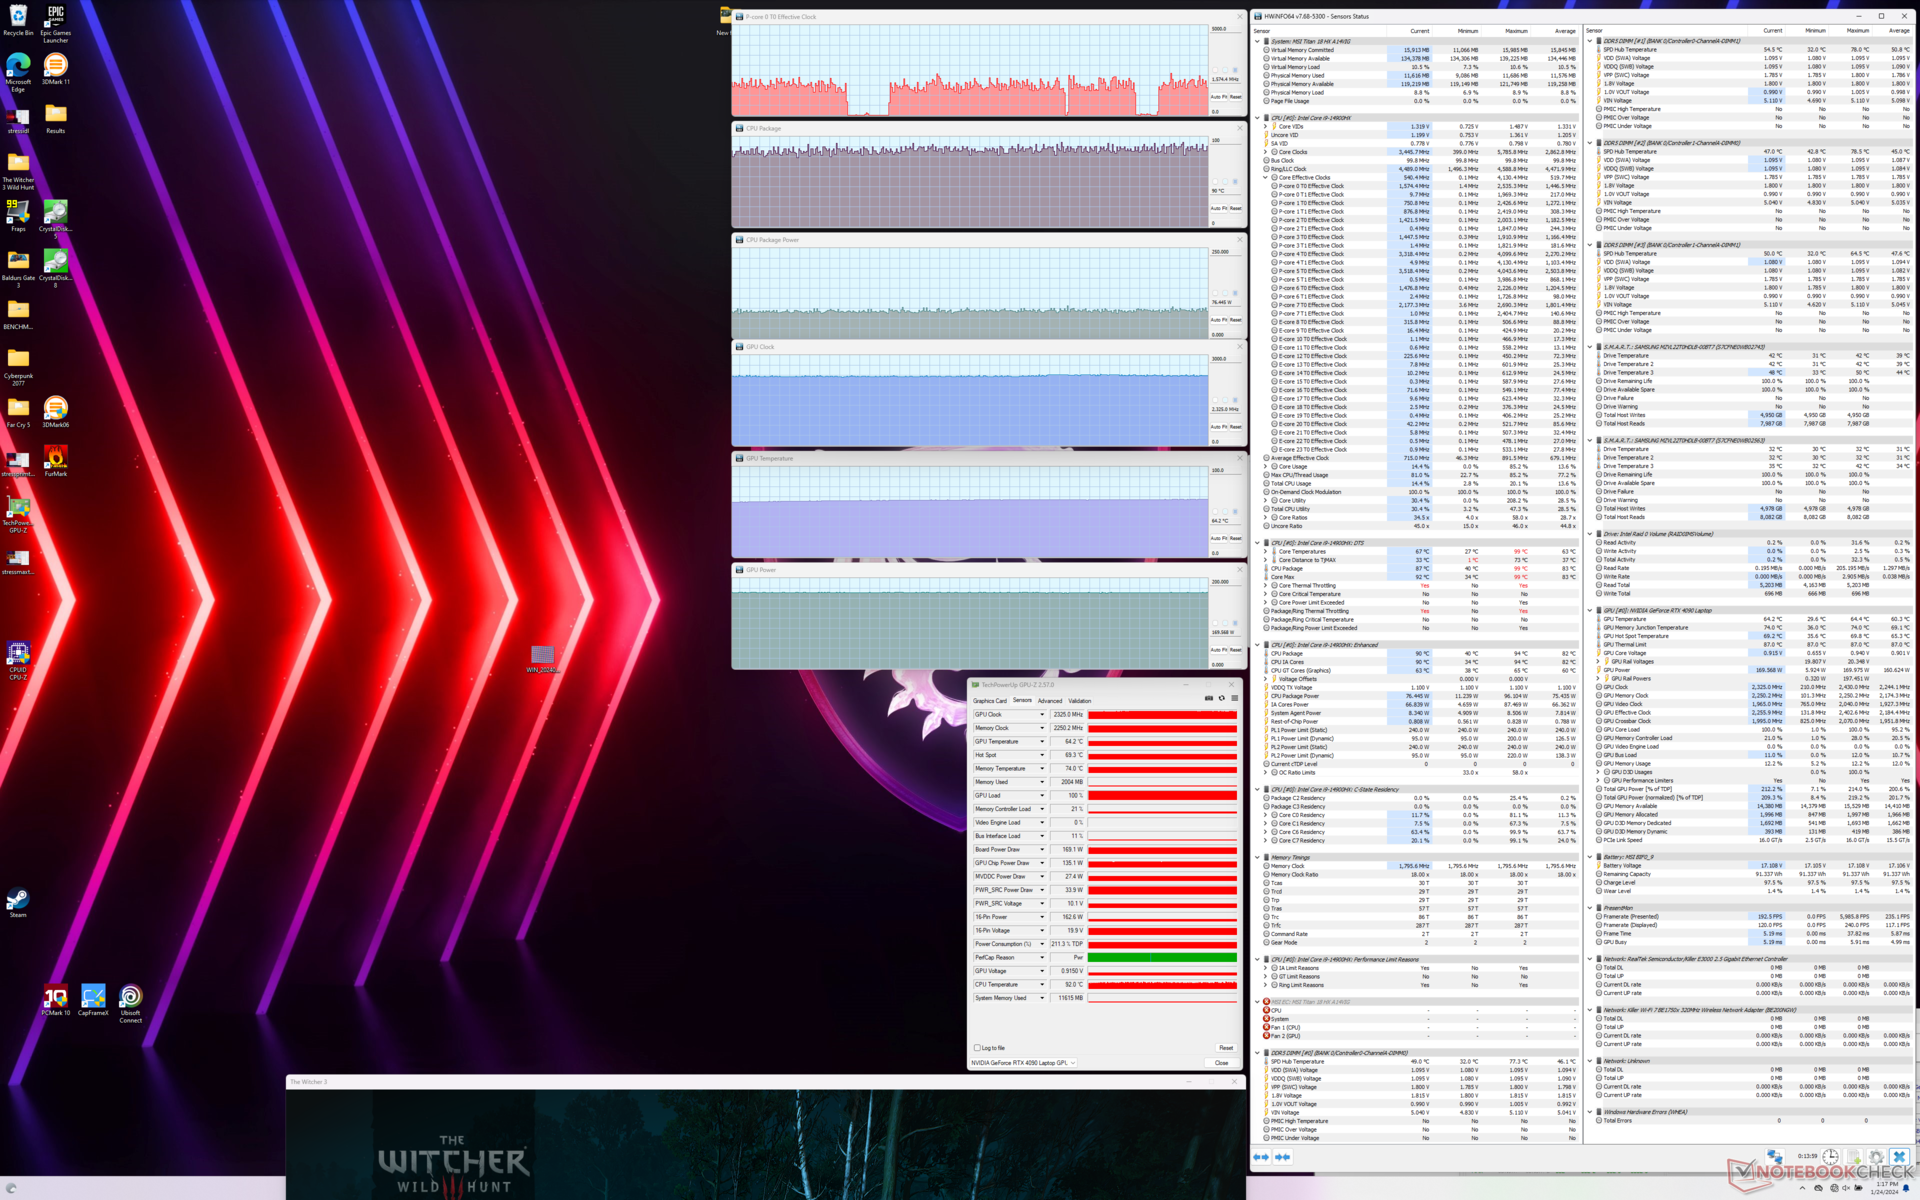
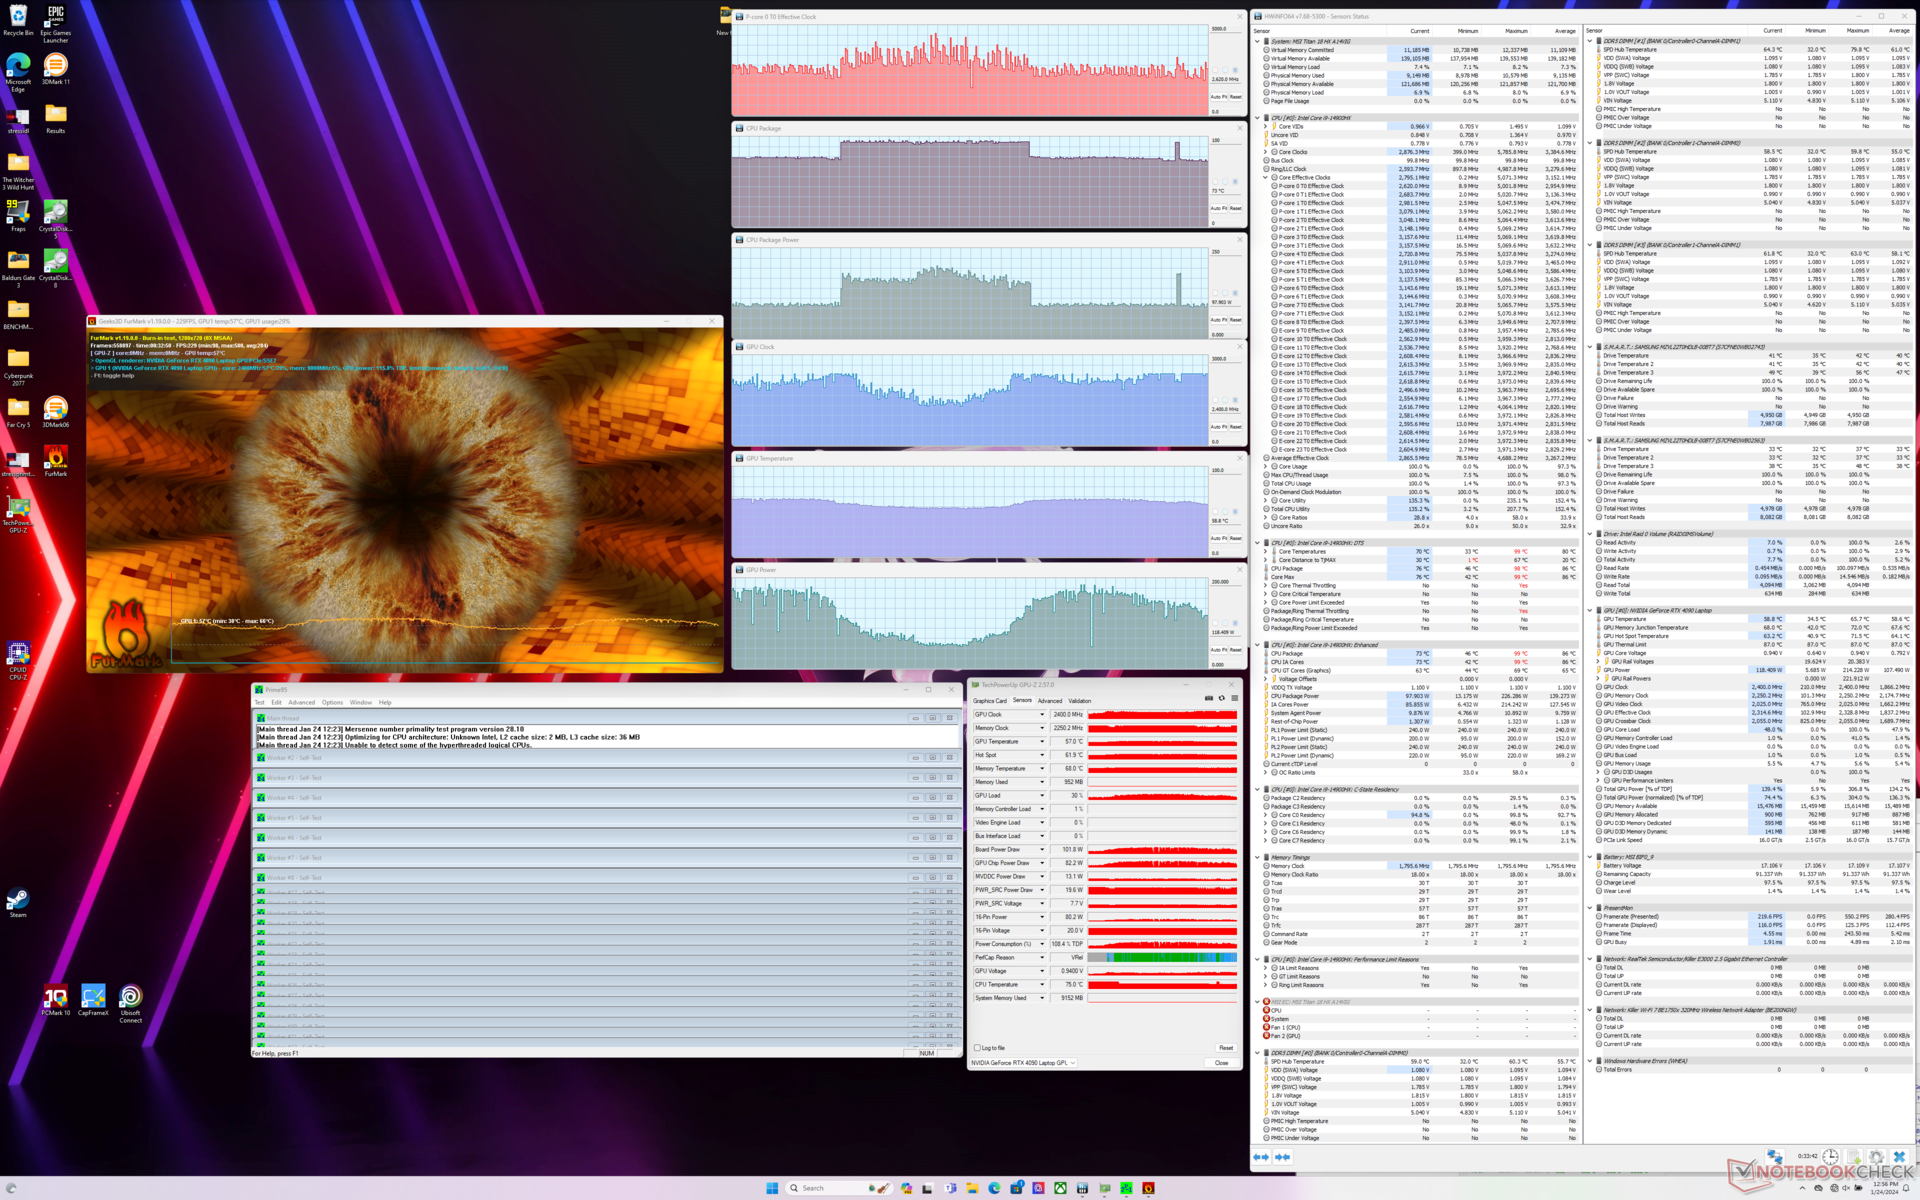
| Reloj dela CPU (GHz) | Reloj de la GPU (MHz) | Temperatura media dela CPU (°C) | Temperatura media de la GPU (°C) | |
| Sistema en reposo | -- | -- | 52 | 41 |
| EstrésPrime95 | ~3,8 | -- | 94 | 46 |
| Estrés Prime95+ FurMark | ~2,6 - ~4,3 | 1300 - 2400 | 73 - 95 | 55 - 65 |
| Witcher 3 Estrés(modo equilibrado) | ~1,4 | 2130 | 85 | 68 |
| Witcher 3 Estrés (Extreme PerformanceCooler Boost off) | ~1.8 | 2370 | 97 | 68 |
| Witcher 3 Tensión (Extreme PerformanceCooler Boost activado) | ~1,8 | 2325 | 90 | 64 |
Altavoces
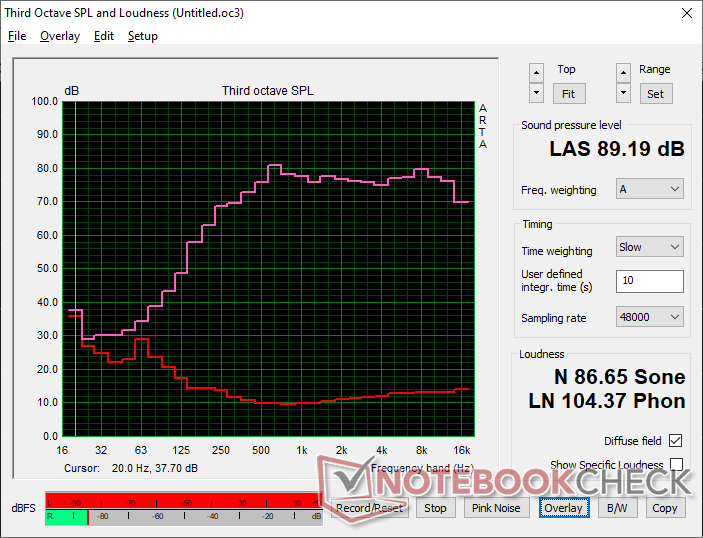
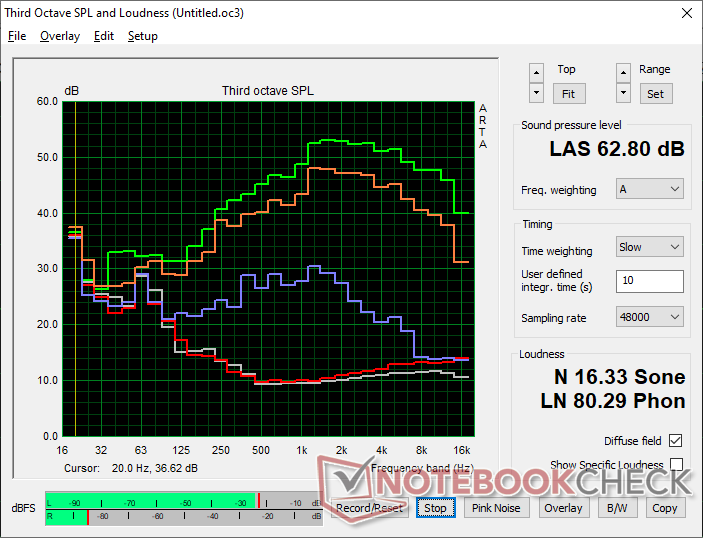
MSI Titan 18 HX A14VIG análisis de audio
(+) | los altavoces pueden reproducir a un volumen relativamente alto (#89.2 dB)
Graves 100 - 315 Hz
(-) | casi sin bajos - de media 17.6% inferior a la mediana
(±) | la linealidad de los graves es media (8% delta a frecuencia anterior)
Medios 400 - 2000 Hz
(+) | medios equilibrados - a sólo 1.8% de la mediana
(+) | los medios son lineales (3.7% delta a la frecuencia anterior)
Altos 2 - 16 kHz
(+) | máximos equilibrados - a sólo 1.2% de la mediana
(+) | los máximos son lineales (2% delta a la frecuencia anterior)
Total 100 - 16.000 Hz
(+) | el sonido global es lineal (9.9% de diferencia con la mediana)
En comparación con la misma clase
» 5% de todos los dispositivos probados de esta clase eran mejores, 2% similares, 94% peores
» El mejor tuvo un delta de 6%, la media fue 18%, el peor fue ###max##%
En comparación con todos los dispositivos probados
» 4% de todos los dispositivos probados eran mejores, 1% similares, 95% peores
» El mejor tuvo un delta de 4%, la media fue 24%, el peor fue ###max##%
Apple MacBook Pro 16 2021 M1 Pro análisis de audio
(+) | los altavoces pueden reproducir a un volumen relativamente alto (#84.7 dB)
Graves 100 - 315 Hz
(+) | buen bajo - sólo 3.8% lejos de la mediana
(+) | el bajo es lineal (5.2% delta a la frecuencia anterior)
Medios 400 - 2000 Hz
(+) | medios equilibrados - a sólo 1.3% de la mediana
(+) | los medios son lineales (2.1% delta a la frecuencia anterior)
Altos 2 - 16 kHz
(+) | máximos equilibrados - a sólo 1.9% de la mediana
(+) | los máximos son lineales (2.7% delta a la frecuencia anterior)
Total 100 - 16.000 Hz
(+) | el sonido global es lineal (4.6% de diferencia con la mediana)
En comparación con la misma clase
» 0% de todos los dispositivos probados de esta clase eran mejores, 0% similares, 100% peores
» El mejor tuvo un delta de 5%, la media fue 17%, el peor fue ###max##%
En comparación con todos los dispositivos probados
» 0% de todos los dispositivos probados eran mejores, 0% similares, 100% peores
» El mejor tuvo un delta de 4%, la media fue 24%, el peor fue ###max##%
Gestión de la energía
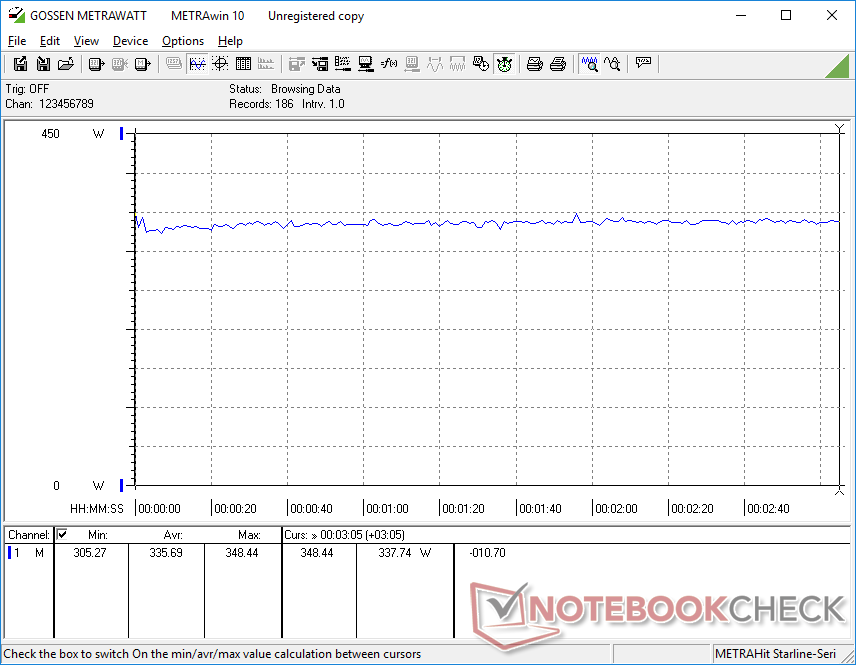
Consumo de energía
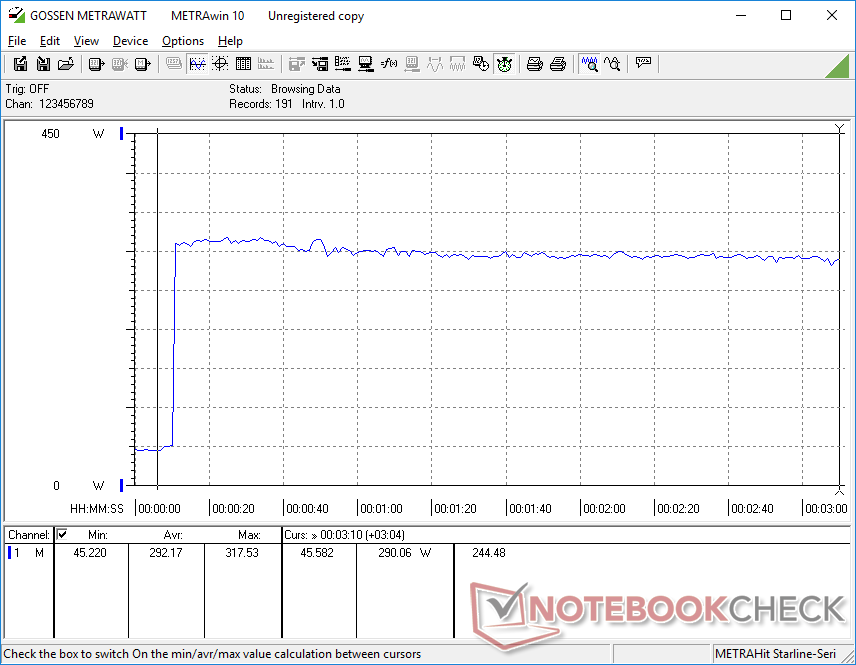
En general, el consumo de energía es superior al de otros portátiles para juegos de 18 pulgadas debido a la exigente CPU de 95 W, la GPU de 175 W y la pantalla mini-LED 4K ultrabrillante de 120 Hz. Simplemente en reposo sobre el escritorio consumiría entre 13 W y 54 W dependiendo del ajuste de brillo y de la configuración dGPU/iGPU, lo que supone un rango mucho más amplio que en el Asus ROG Strix G18 o el Acer Predator Helios 18, ambos con paneles IPS estándar.
Si se trata de juegos, el sistema de MSI sigue siendo uno de los portátiles más exigentes. Ejecutando Witcher 3 consumiría casi 340 W en comparación con los 265 W y 311 W de los GT77 o Alienware m18 R1respectivamente, todos ellos con la misma GPU RTX 4090.
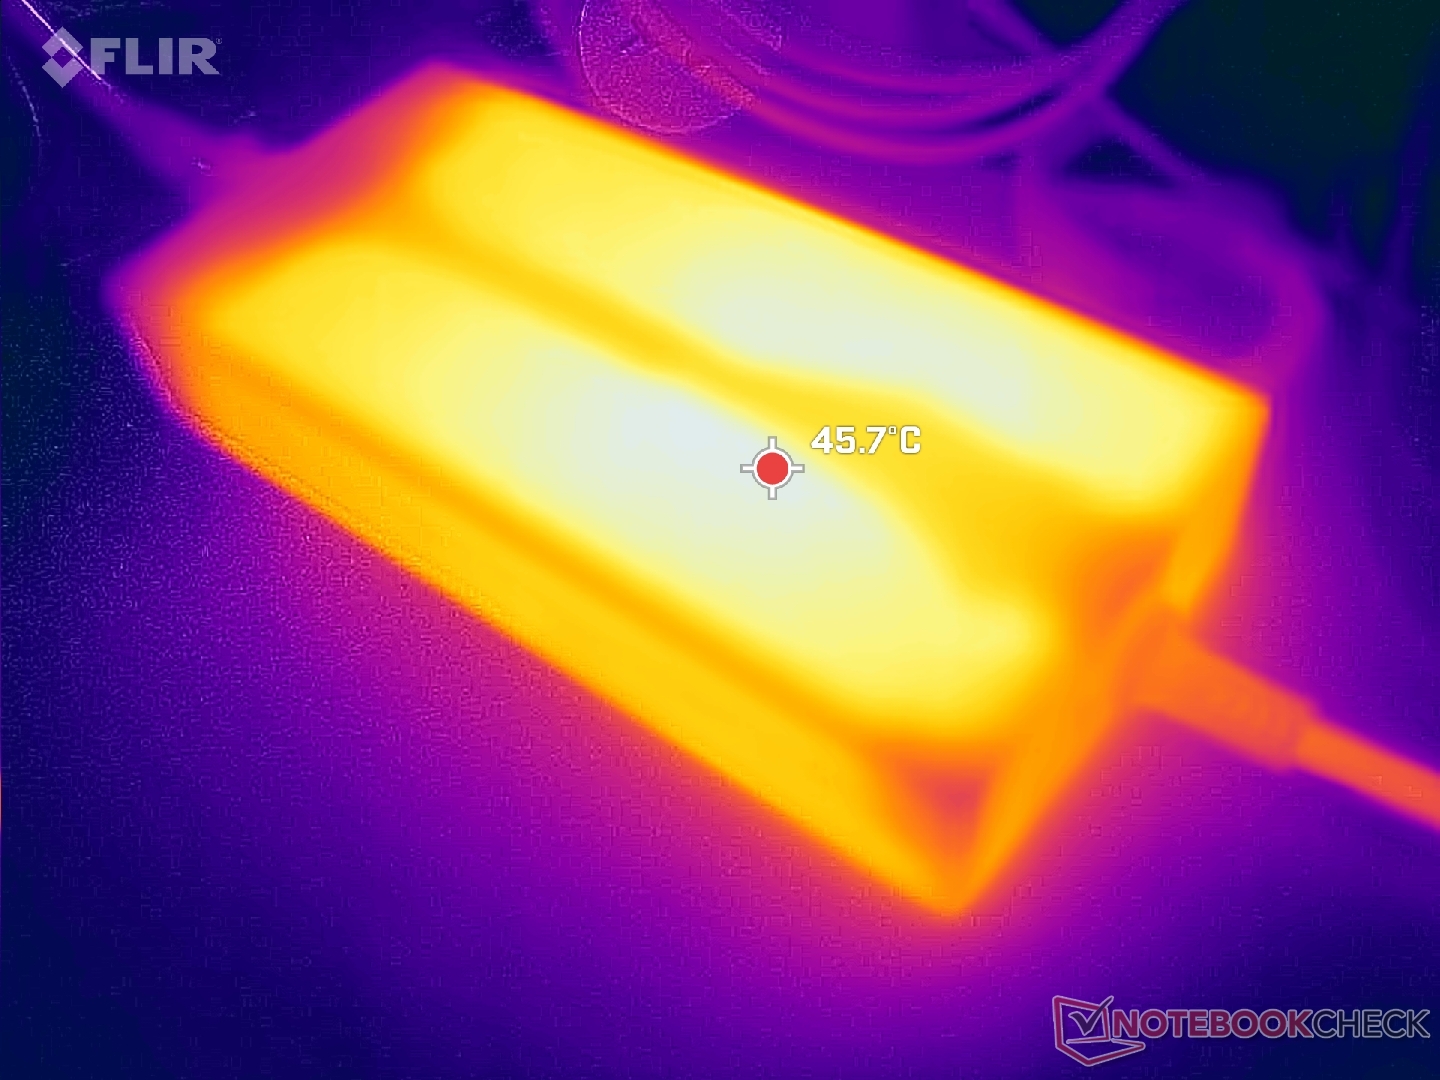
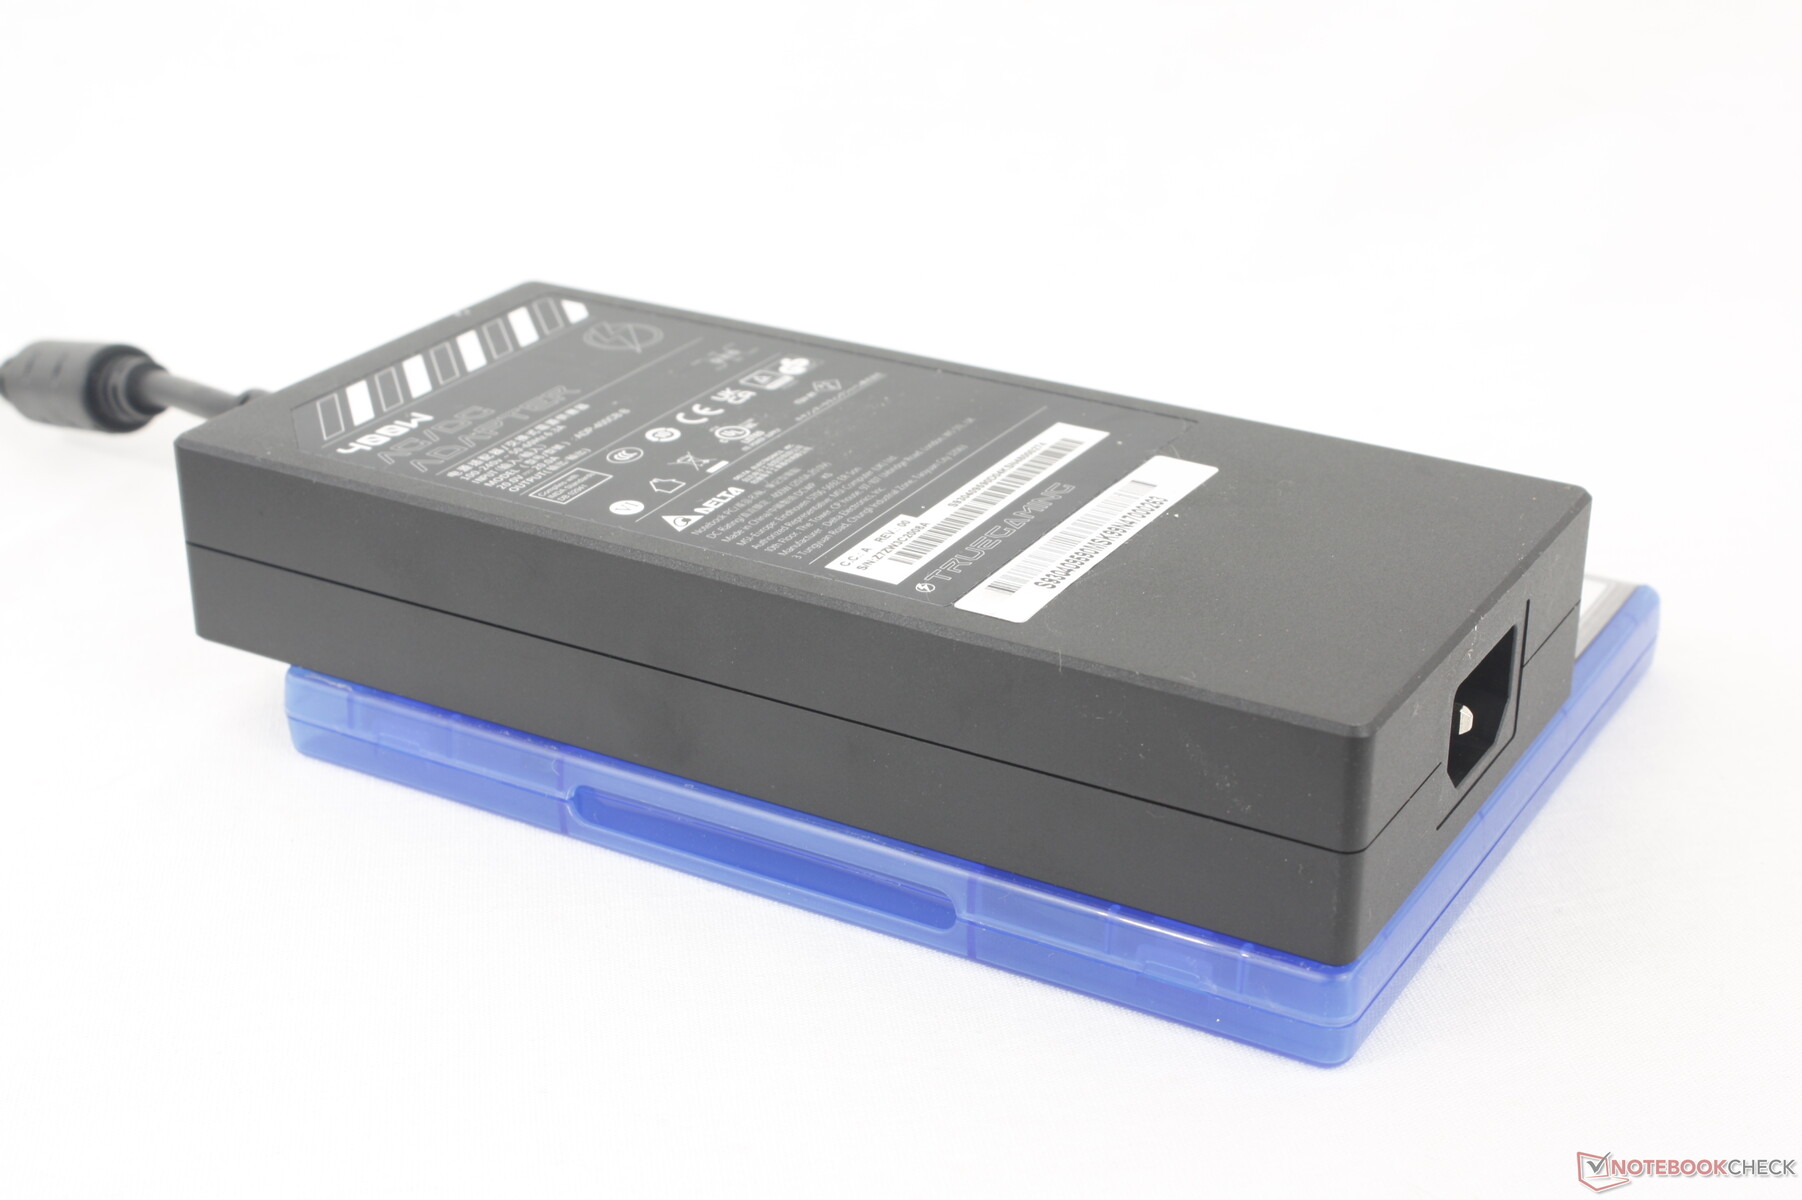
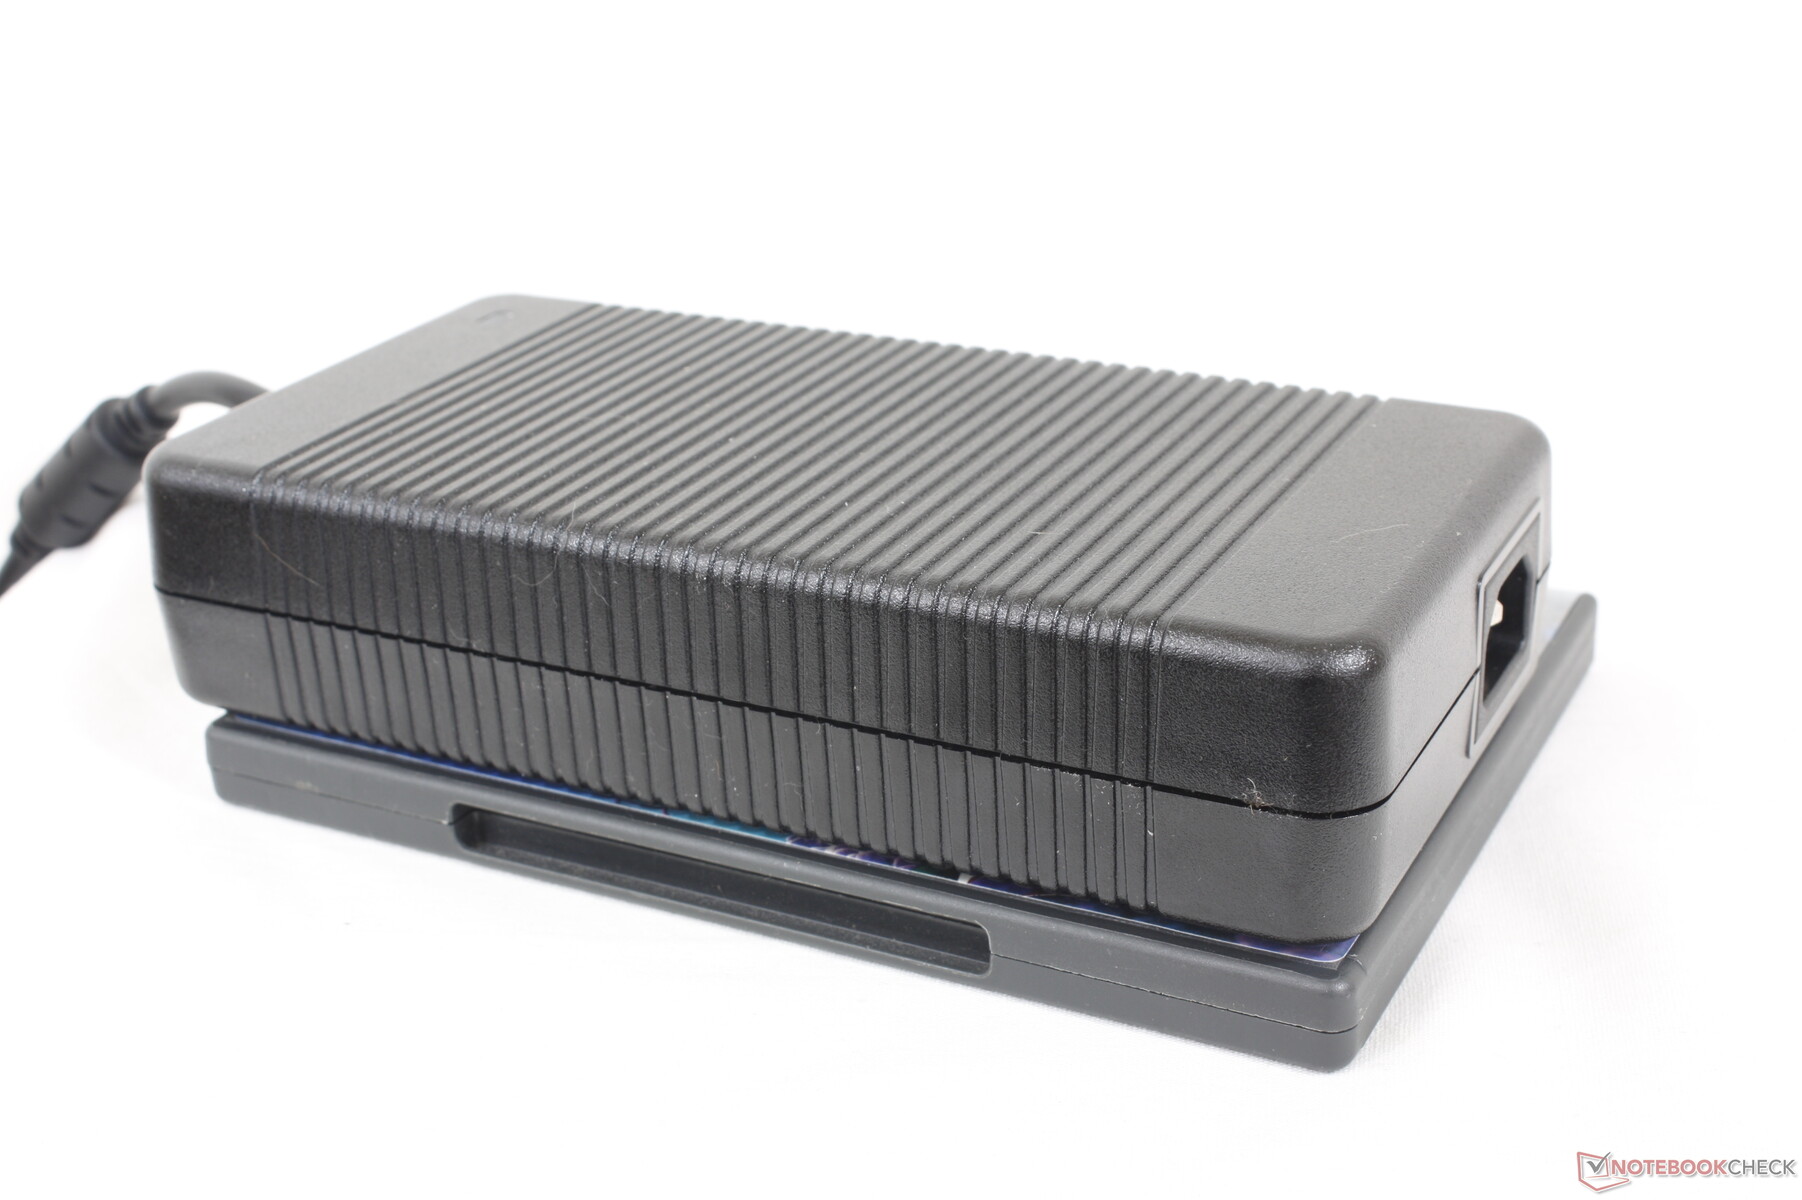
Una novedad en los portátiles MSI de este año es el adaptador de CA rediseñado, que ahora es más delgado y más potente que antes. Los adaptadores de CA anteriores eran bastante grandes, especialmente la versión de 330 W que se entregaba con portátiles potentes como el Raider GE78. La Titan 16 HX utiliza un adaptador de CA de 400 W (~18,8 x 8,8 x 3,2 cm) que es aproximadamente un 35% más pequeño para una mayor potencia por volumen. El adaptador de mayor capacidad permite un rendimiento y una velocidad de carga más constantes cuando se ejecutan cargas exigentes. En comparación, la mayoría de los demás portátiles para juegos de alto rendimiento siguen enviándose con adaptadores de CA de sólo 330 W o más pequeños.
| Off / Standby | |
| Ocioso | |
| Carga |
|
Clave:
min: | |
| MSI Titan 18 HX A14VIG i9-14900HX, GeForce RTX 4090 Laptop GPU, 2x Samsung PM9A1a MZVL22T0HDLB (RAID 0), Mini-LED, 3840x2400, 18" | MSI Titan GT77 HX 13VI i9-13950HX, GeForce RTX 4090 Laptop GPU, Samsung PM9A1 MZVL22T0HBLB, Mini-LED, 3840x2160, 17.3" | Alienware m18 R1 i9-13980HX, GeForce RTX 4090 Laptop GPU, SK hynix PC801 HFS001TEJ9X101N, IPS, 1920x1200, 18" | Asus ROG Strix G18 G814JI i7-13650HX, GeForce RTX 4070 Laptop GPU, Micron 2400 MTFDKBA1T0QFM, IPS, 2560x1600, 18" | Acer Predator Helios 18 N23Q2 i9-13900HX, GeForce RTX 4080 Laptop GPU, Samsung PM9A1 MZVL22T0HBLB, IPS, 2560x1600, 18" | Razer Blade 18 RTX 4070 i9-13950HX, GeForce RTX 4070 Laptop GPU, SSSTC CA6-8D1024, IPS, 2560x1600, 18" | |
|---|---|---|---|---|---|---|
| Power Consumption | 16% | -9% | 41% | 19% | -5% | |
| Idle Minimum * (Watt) | 13.2 | 14 -6% | 21.6 -64% | 8 39% | 16 -21% | 24.5 -86% |
| Idle Average * (Watt) | 25.4 | 21.6 15% | 25.2 1% | 15 41% | 19 25% | 34.1 -34% |
| Idle Maximum * (Watt) | 53.5 | 24.8 54% | 56.7 -6% | 26 51% | 21.3 60% | 47.7 11% |
| Load Average * (Watt) | 151.4 | 122.5 19% | 164.1 -8% | 102 33% | 124 18% | 140 8% |
| Witcher 3 ultra * (Watt) | 336 | 265 21% | 311 7% | 178.6 47% | 289 14% | 202 40% |
| Load Maximum * (Watt) | 395.2 | 418 -6% | 338.9 14% | 267 32% | 319 19% | 261 34% |
* ... más pequeño es mejor
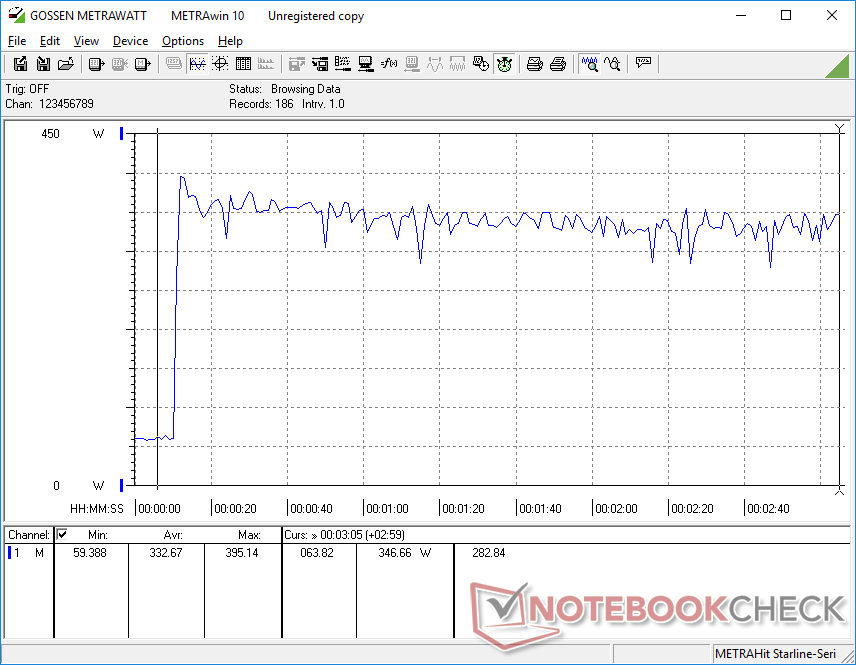
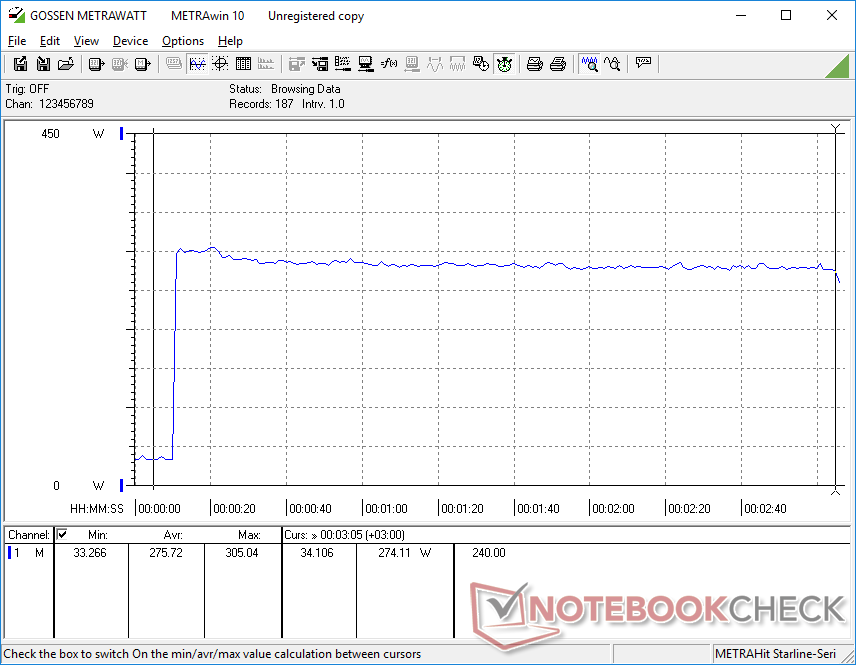
Power Consumption Witcher 3 / Stresstest
Power Consumption external Monitor
Duración de las pilas
Somos capaces de registrar algo más de 4 horas de uso de navegación en el mundo real cuando se configura en modo equilibrado con la dGPU inactiva. No es mucho tiempo, pero eso es de esperar de una potencia de 18 pulgadas con una pantalla mini-LED de 120 Hz. Incluso en ralentí en el modo de ahorro de batería de MSI en el ajuste de brillo más bajo para un mejor escenario duraría poco menos de 6 horas. Los resultados del Alienware m18 R1 o el Razer Blade 18 son similares.
La carga desde vacío a plena capacidad con el adaptador de CA incluido tarda entre 2 y 2,5 horas. El sistema también se puede recargar con adaptadores USB-C de terceros, aunque mucho más lentamente. Tenga en cuenta que solo uno de los dos puertos USB-C es compatible con USB-C Power Delivery.
| MSI Titan 18 HX A14VIG i9-14900HX, GeForce RTX 4090 Laptop GPU, 99.9 Wh | MSI Titan GT77 HX 13VI i9-13950HX, GeForce RTX 4090 Laptop GPU, 99.9 Wh | Alienware m18 R1 i9-13980HX, GeForce RTX 4090 Laptop GPU, 97 Wh | Asus ROG Strix G18 G814JI i7-13650HX, GeForce RTX 4070 Laptop GPU, 90 Wh | Acer Predator Helios 18 N23Q2 i9-13900HX, GeForce RTX 4080 Laptop GPU, 90 Wh | Razer Blade 18 RTX 4070 i9-13950HX, GeForce RTX 4070 Laptop GPU, 91.7 Wh | |
|---|---|---|---|---|---|---|
| Duración de Batería | 22% | -15% | 64% | 24% | 7% | |
| Reader / Idle (h) | 5.9 | 5.6 -5% | 11.7 98% | 7 19% | ||
| WiFi v1.3 (h) | 4.2 | 5.3 26% | 4.3 2% | 8.1 93% | 4.4 5% | 4 -5% |
| Load (h) | 1.2 | 1.4 17% | 0.7 -42% | 1.2 0% | 1.7 42% | 1.3 8% |
| H.264 (h) | 6 | 4.8 |
Pro
Contra
Veredicto - Nuevo diseño exterior, mismo rendimiento interior
Sin una nueva GPU Nvidia este año para portátiles, MSI ha tenido que refrescar todo lo que rodea a la tarjeta gráfica para compensarlo. Los usuarios obtienen un nuevo diseño de chasis de 18 pulgadas, una nueva CPU Intel HX de 14ª generación, un nuevo adaptador de CA, teclas más grandes y una nueva pantalla mini-LED 4K HDR1000 de 120 Hz que acompaña al elevado precio. La mayoría de estos cambios suponen un paso adelante con respecto a la GT77del año pasado, pero en última instancia los usuarios obtienen el mismo rendimiento en juegos de ambos modelos.
Los aspectos más destacados de la Titan 18 incluyen su pantalla mini-LED y la CPU Core i9-14900HX. La primera es indudablemente impresionante y una de las mejores formas de ver contenidos HDR en cualquier portátil, pero la falta de compatibilidad con G-Sync es difícil de ignorar, especialmente en un modelo insignia para juegos. Mientras tanto, la nueva CPU tiene un rendimiento casi idéntico al Core i9-13950HX de 13ª generación que se encuentra en la GT77, lo que hace que no parezca más que un rebrand. Por tanto, la Titan 18 puede considerarse un gran salto adelante frente a la GT77 debido a todos los cambios externos, pero los internos de Intel y Nvidia se sienten estancados en comparación.
El MSI Titan 18 HX es uno de los portátiles para juegos más rápidos del año, con una pantalla mini-LED 4K igualmente impresionante. Sin embargo, su rendimiento es casi idéntico al del GT77 del año pasado.
Si le atrae la gran y ultrabrillante pantalla mini-LED de 18 pulgadas, la Titan 18 HX es uno de los únicos lugares donde puede encontrar una en el momento de escribir estas líneas. Si no, entonces alternativas como el Alienware m18 R1, Asus ROG Strix G18o el Razer Blade 18 todos ofrecen G-Sync, frecuencias de actualización más rápidas y la misma opción GeForce RTX 4090 en diseños de chasis más delgados y a menudo más ligeros.
Precio y disponibilidad
La Titan 18 HX revisada ya está a la venta en Amazon por 5800 dólares. MSI también está ofreciendo el modelo directamente a través de su sitio web oficial a precios de salida más bajos.
MSI Titan 18 HX A14VIG
- 01/30/2024 v7 (old)
Allen Ngo
Transparencia
La selección de los dispositivos que se van a reseñar corre a cargo de nuestro equipo editorial. La muestra de prueba fue proporcionada al autor en calidad de préstamo por el fabricante o el minorista a los efectos de esta reseña. El prestamista no tuvo ninguna influencia en esta reseña, ni el fabricante recibió una copia de la misma antes de su publicación. No había ninguna obligación de publicar esta reseña. Como empresa de medios independiente, Notebookcheck no está sujeta a la autoridad de fabricantes, minoristas o editores.
Así es como prueba Notebookcheck
Cada año, Notebookcheck revisa de forma independiente cientos de portátiles y smartphones utilizando procedimientos estandarizados para asegurar que todos los resultados son comparables. Hemos desarrollado continuamente nuestros métodos de prueba durante unos 20 años y hemos establecido los estándares de la industria en el proceso. En nuestros laboratorios de pruebas, técnicos y editores experimentados utilizan equipos de medición de alta calidad. Estas pruebas implican un proceso de validación en varias fases. Nuestro complejo sistema de clasificación se basa en cientos de mediciones y puntos de referencia bien fundamentados, lo que mantiene la objetividad.Price comparison

