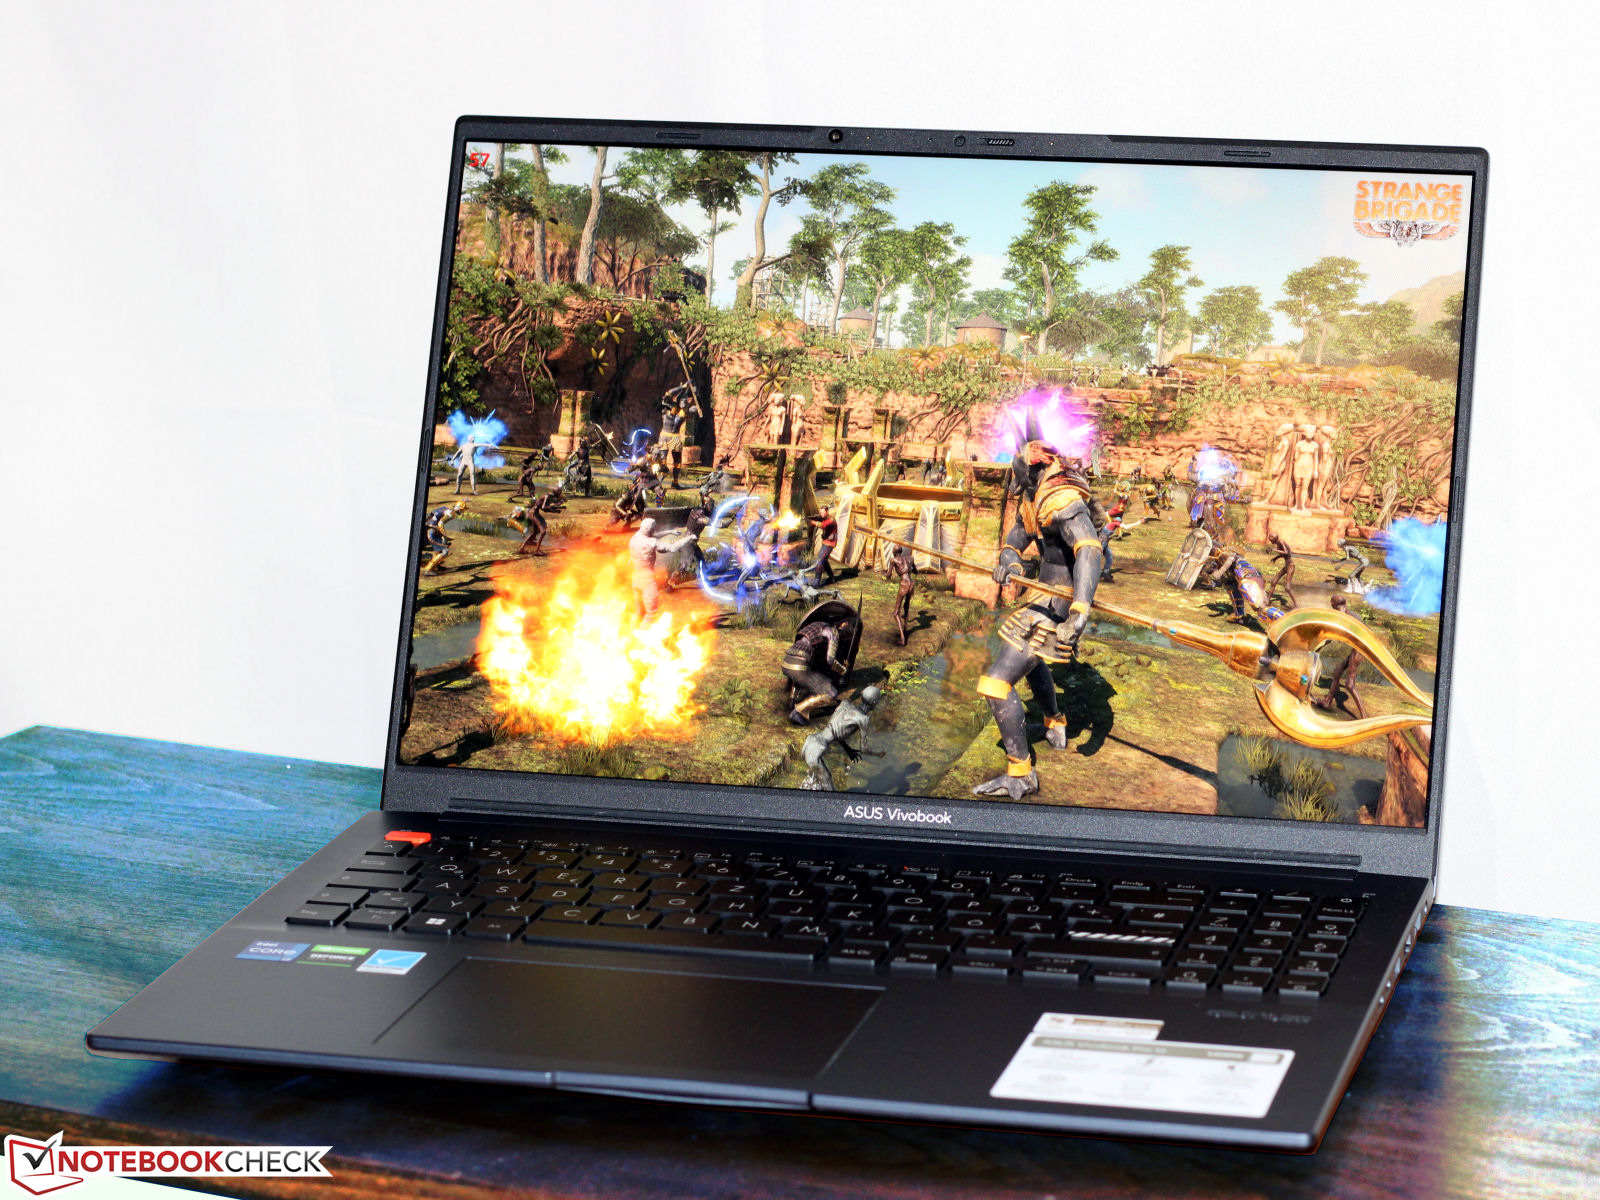
Análisis del Asus VivoBook Pro 16: Un portátil multimedia con Core i7, RTX 3050 Ti y DCI-P3
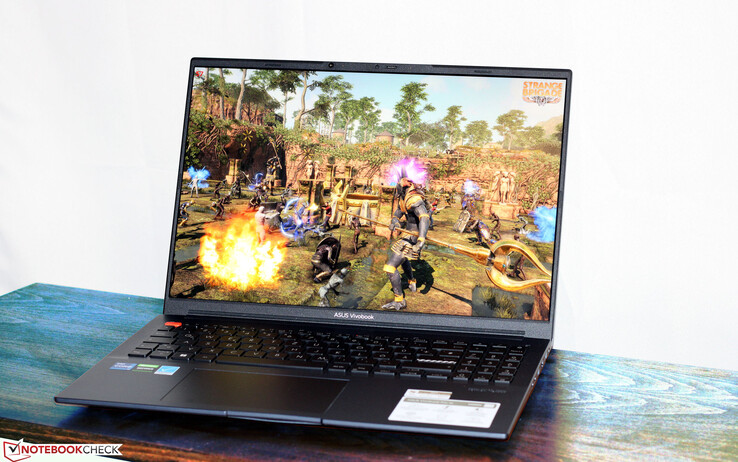
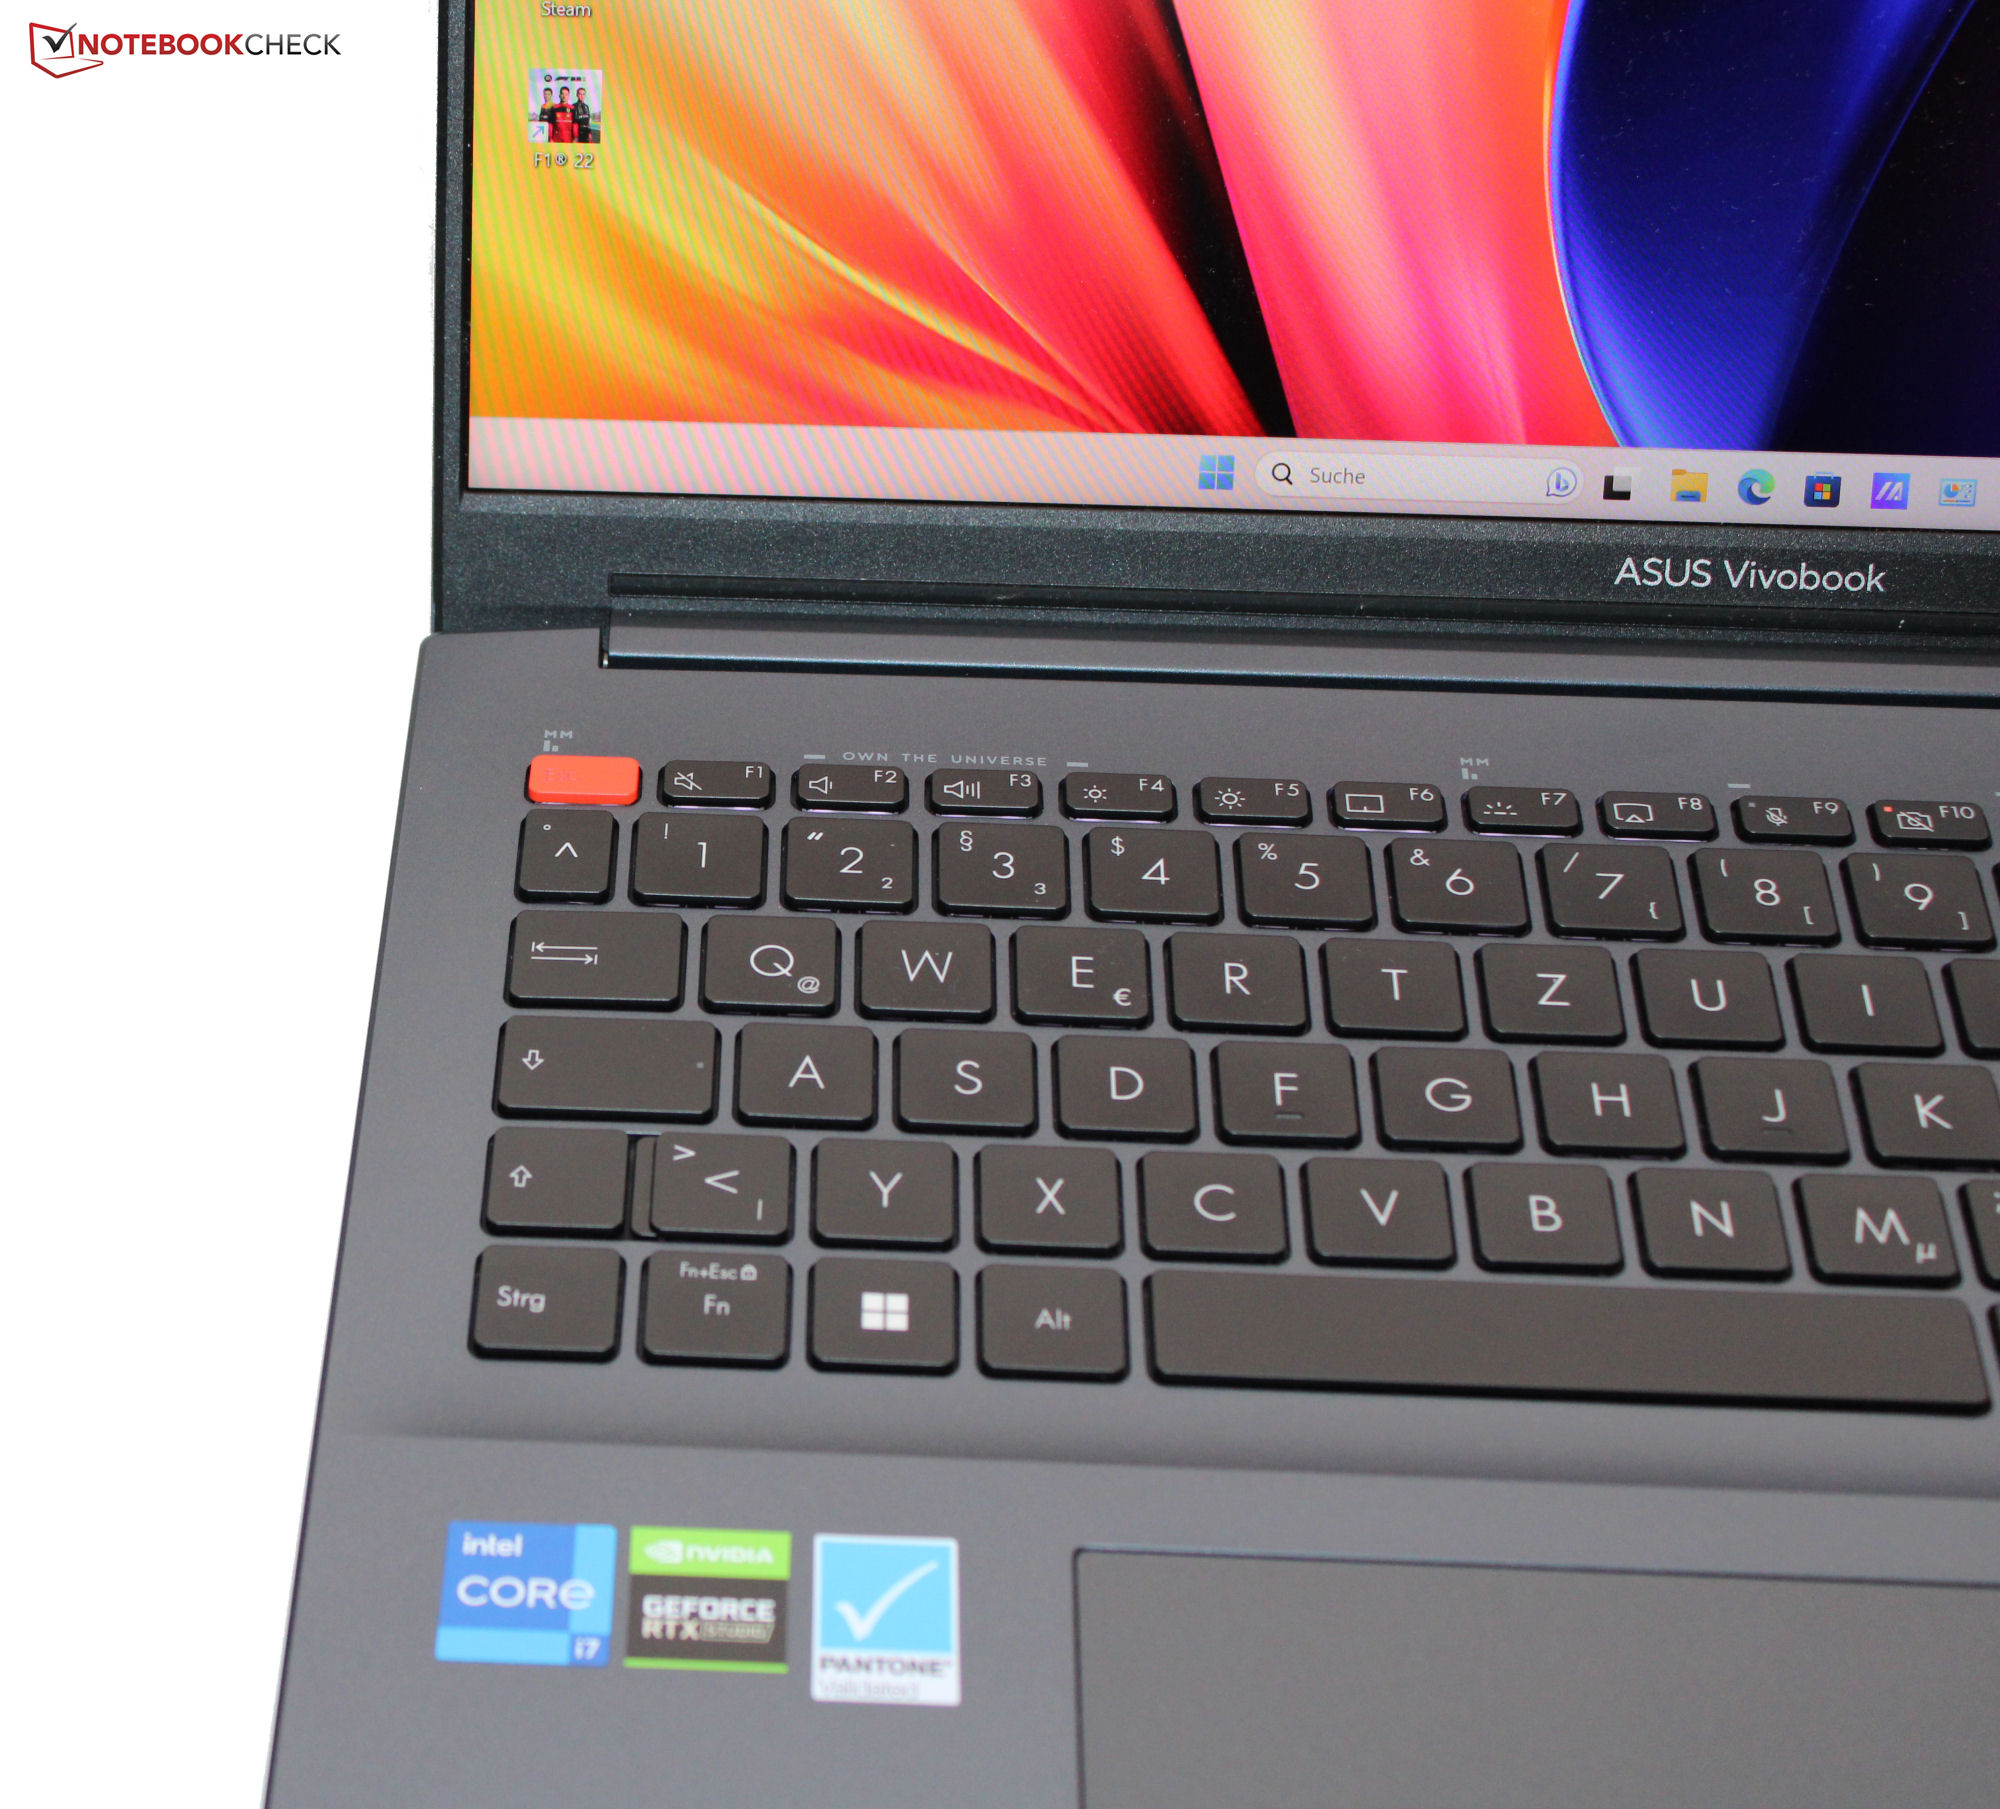
El Asus VivoBook es un portátil de 16 pulgadas para jugadores y creativos. El portátil viene con hardware adecuado: ACore i7-12700H,GeForce RTX 3050 Tiy una brillante pantalla IPS en formato 16:10 que tiene una gran precisión de color. Este portátil es similar alVivoBook Pro 16X que probamos anteriormente - pero no están construidos de forma idéntica. Los competidores de este portátil incluyen el Dell Inspiron 16 Plus 7620elXMG Fusion 15 (mediados de 22)y elAcer Swift X 16.
Posibles contendientes en la comparación
Valoración | Fecha | Modelo | Peso | Altura | Tamaño | Resolución | Precio |
|---|---|---|---|---|---|---|---|
| 86.3 % v7 (old) | 05/2023 | Asus VivoBook Pro 16 i7-12700H, GeForce RTX 3050 Ti Laptop GPU | 1.9 kg | 20 mm | 16.00" | 2560x1600 | |
| 86.4 % v7 (old) | 11/2022 | Acer Swift X SFX16-52G-77RX i7-1260P, A370M | 1.8 kg | 21.2 mm | 16.00" | 2560x1600 | |
| 87.4 % v7 (old) | 08/2022 | Dell Inspiron 16 Plus 7620 i7-12700H, GeForce RTX 3050 Ti Laptop GPU | 2.1 kg | 18.99 mm | 16.00" | 3072x1920 | |
| 87.4 % v7 (old) | 08/2022 | Schenker XMG Fusion 15 (Mid 22) i7-11800H, GeForce RTX 3070 Laptop GPU | 1.9 kg | 21.65 mm | 15.60" | 2560x1440 |
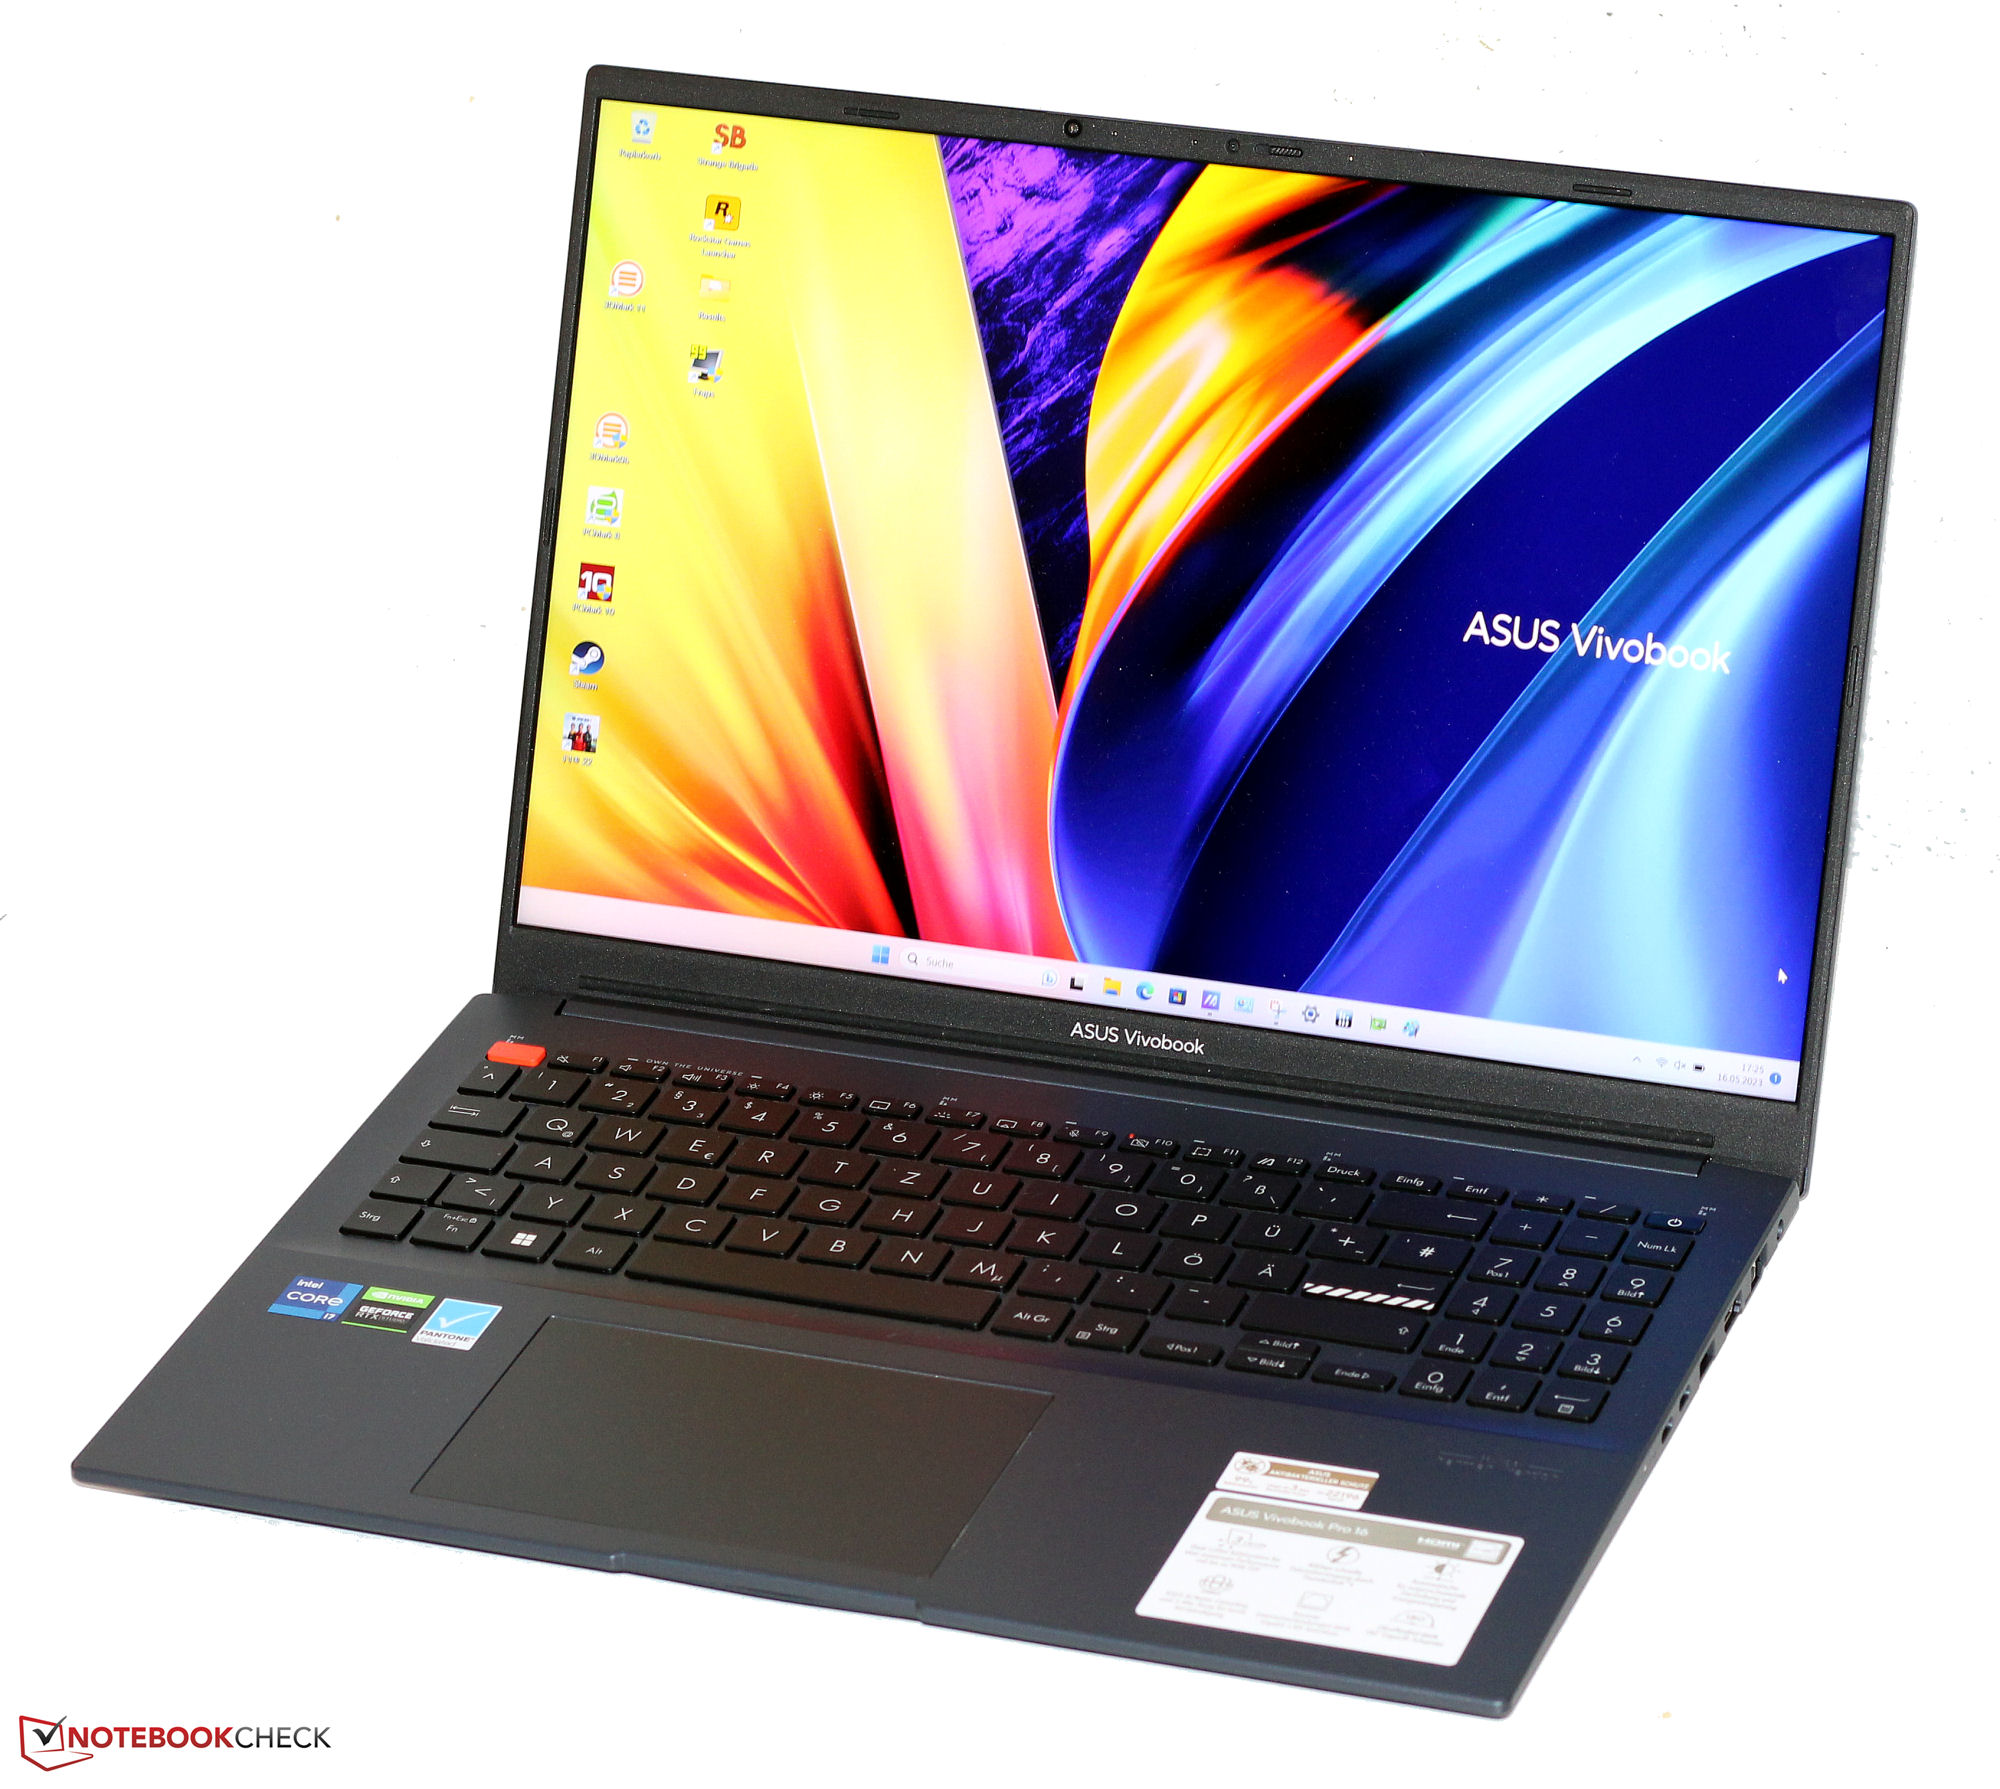
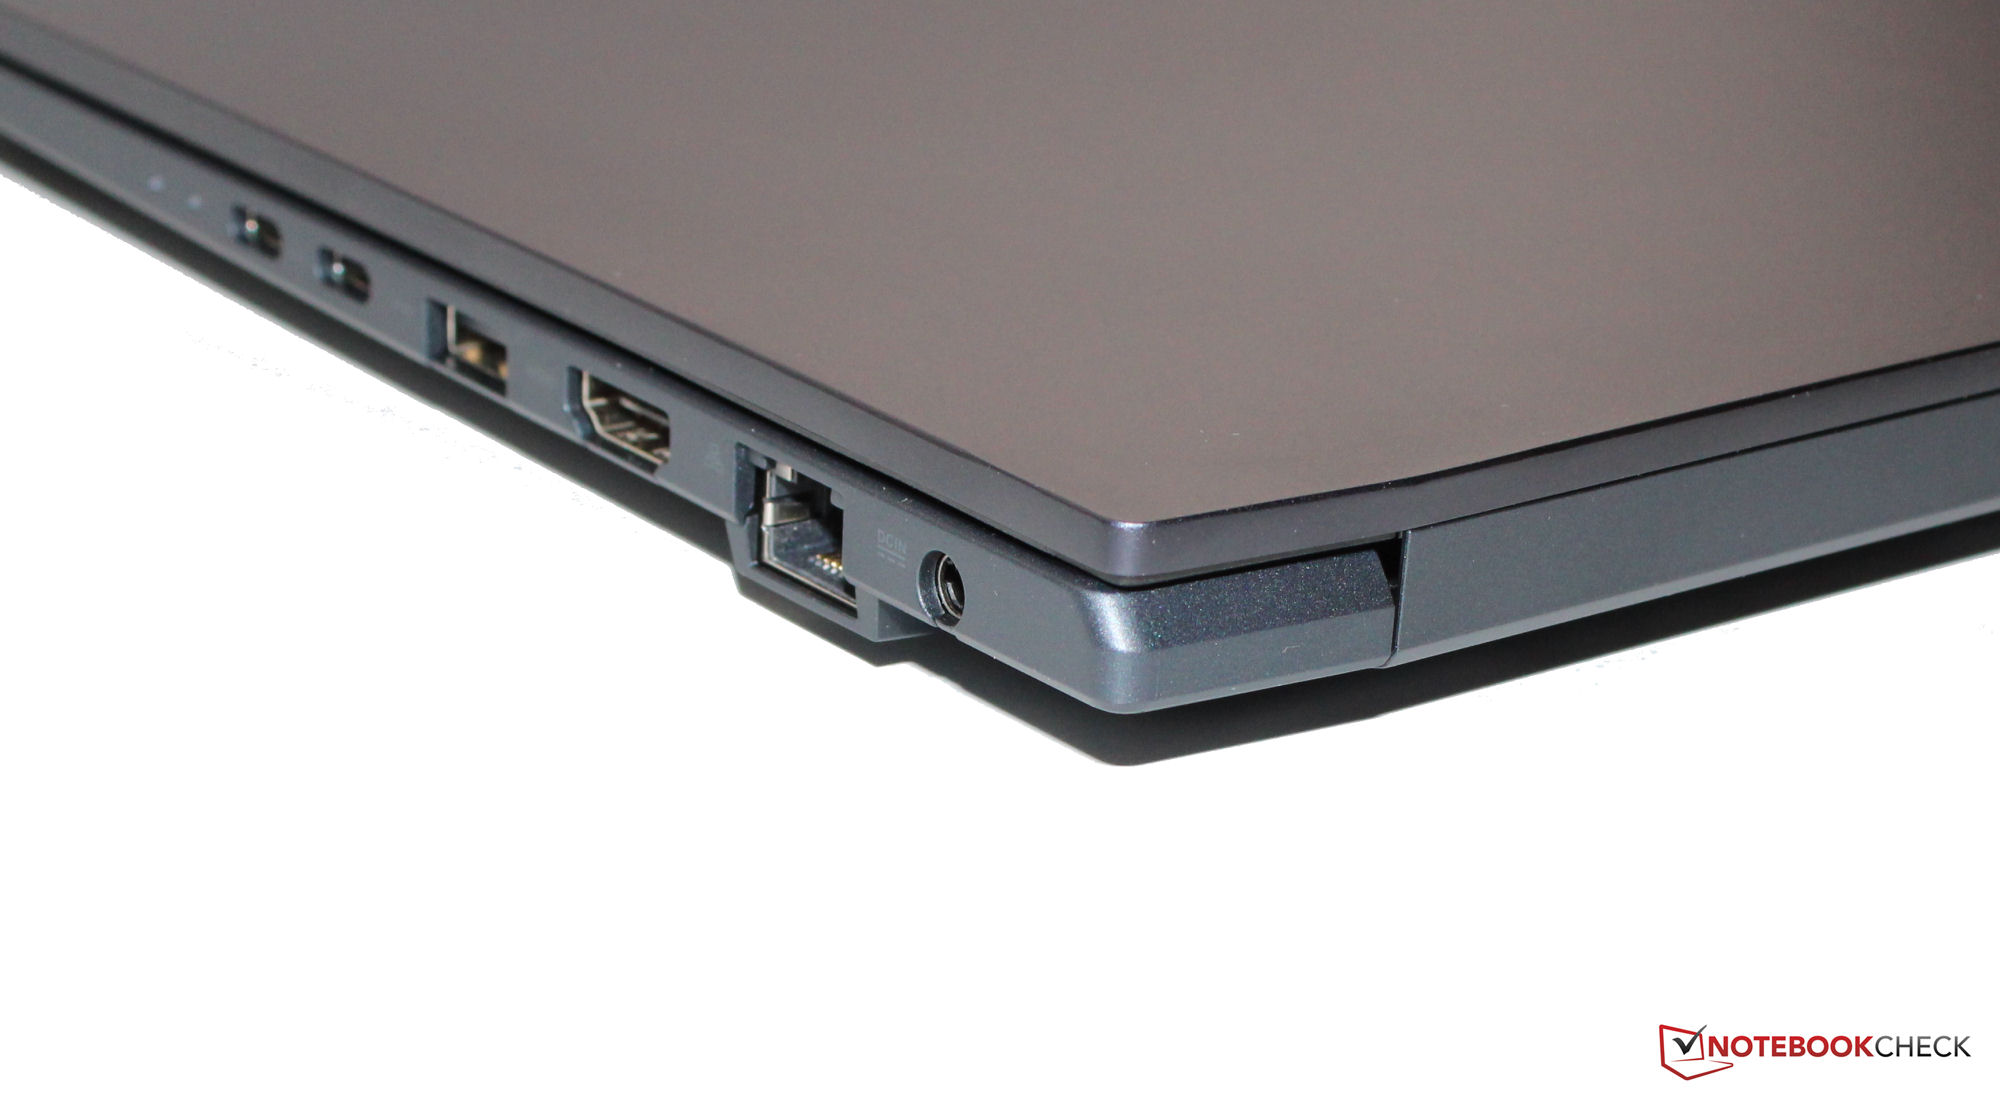
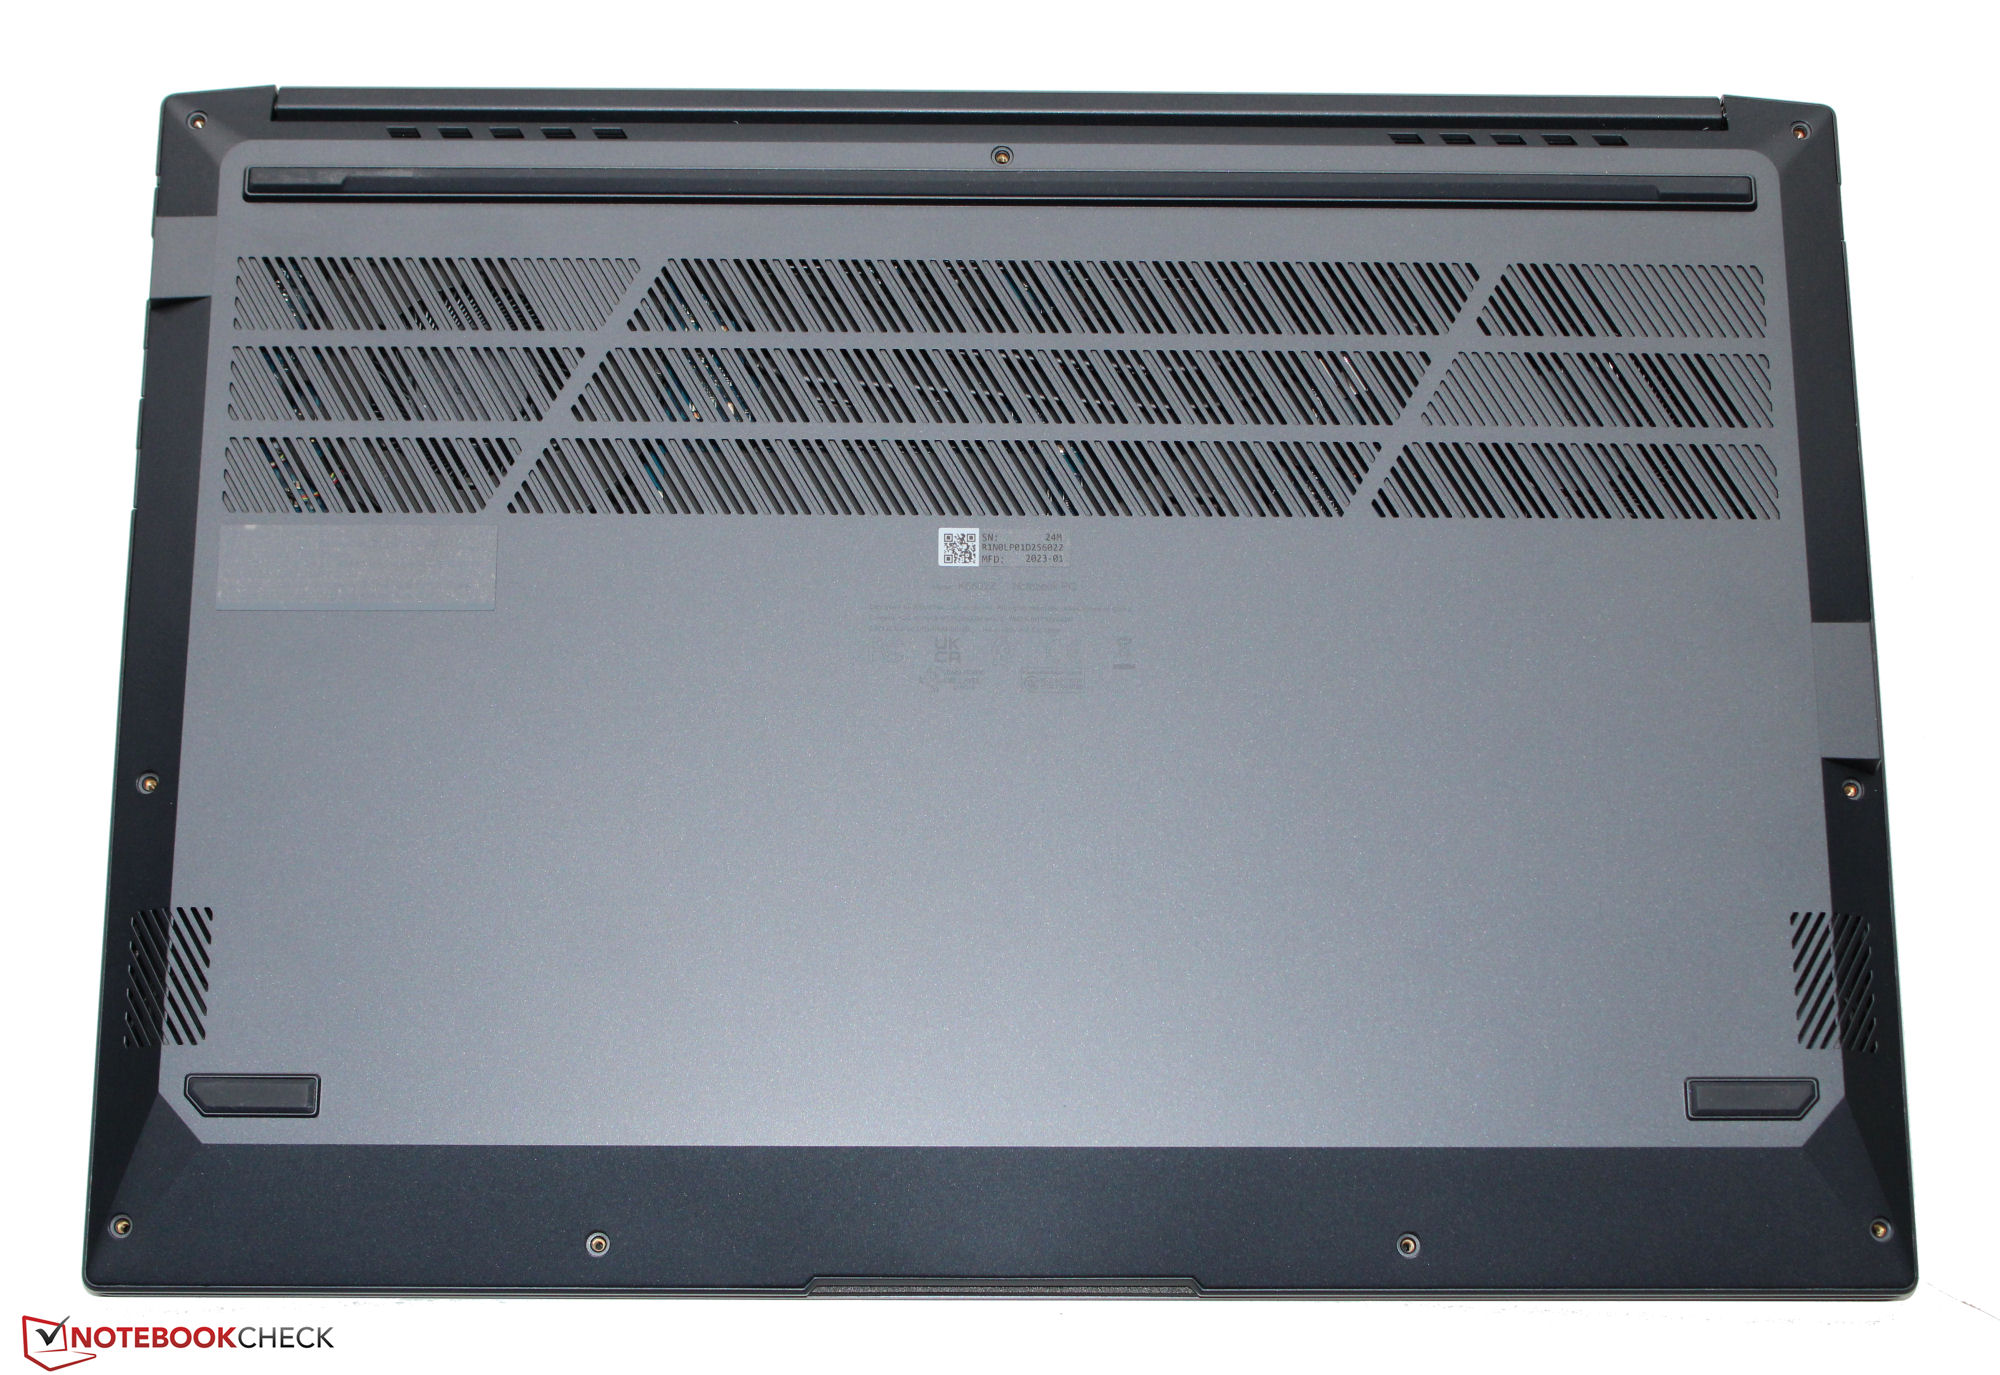
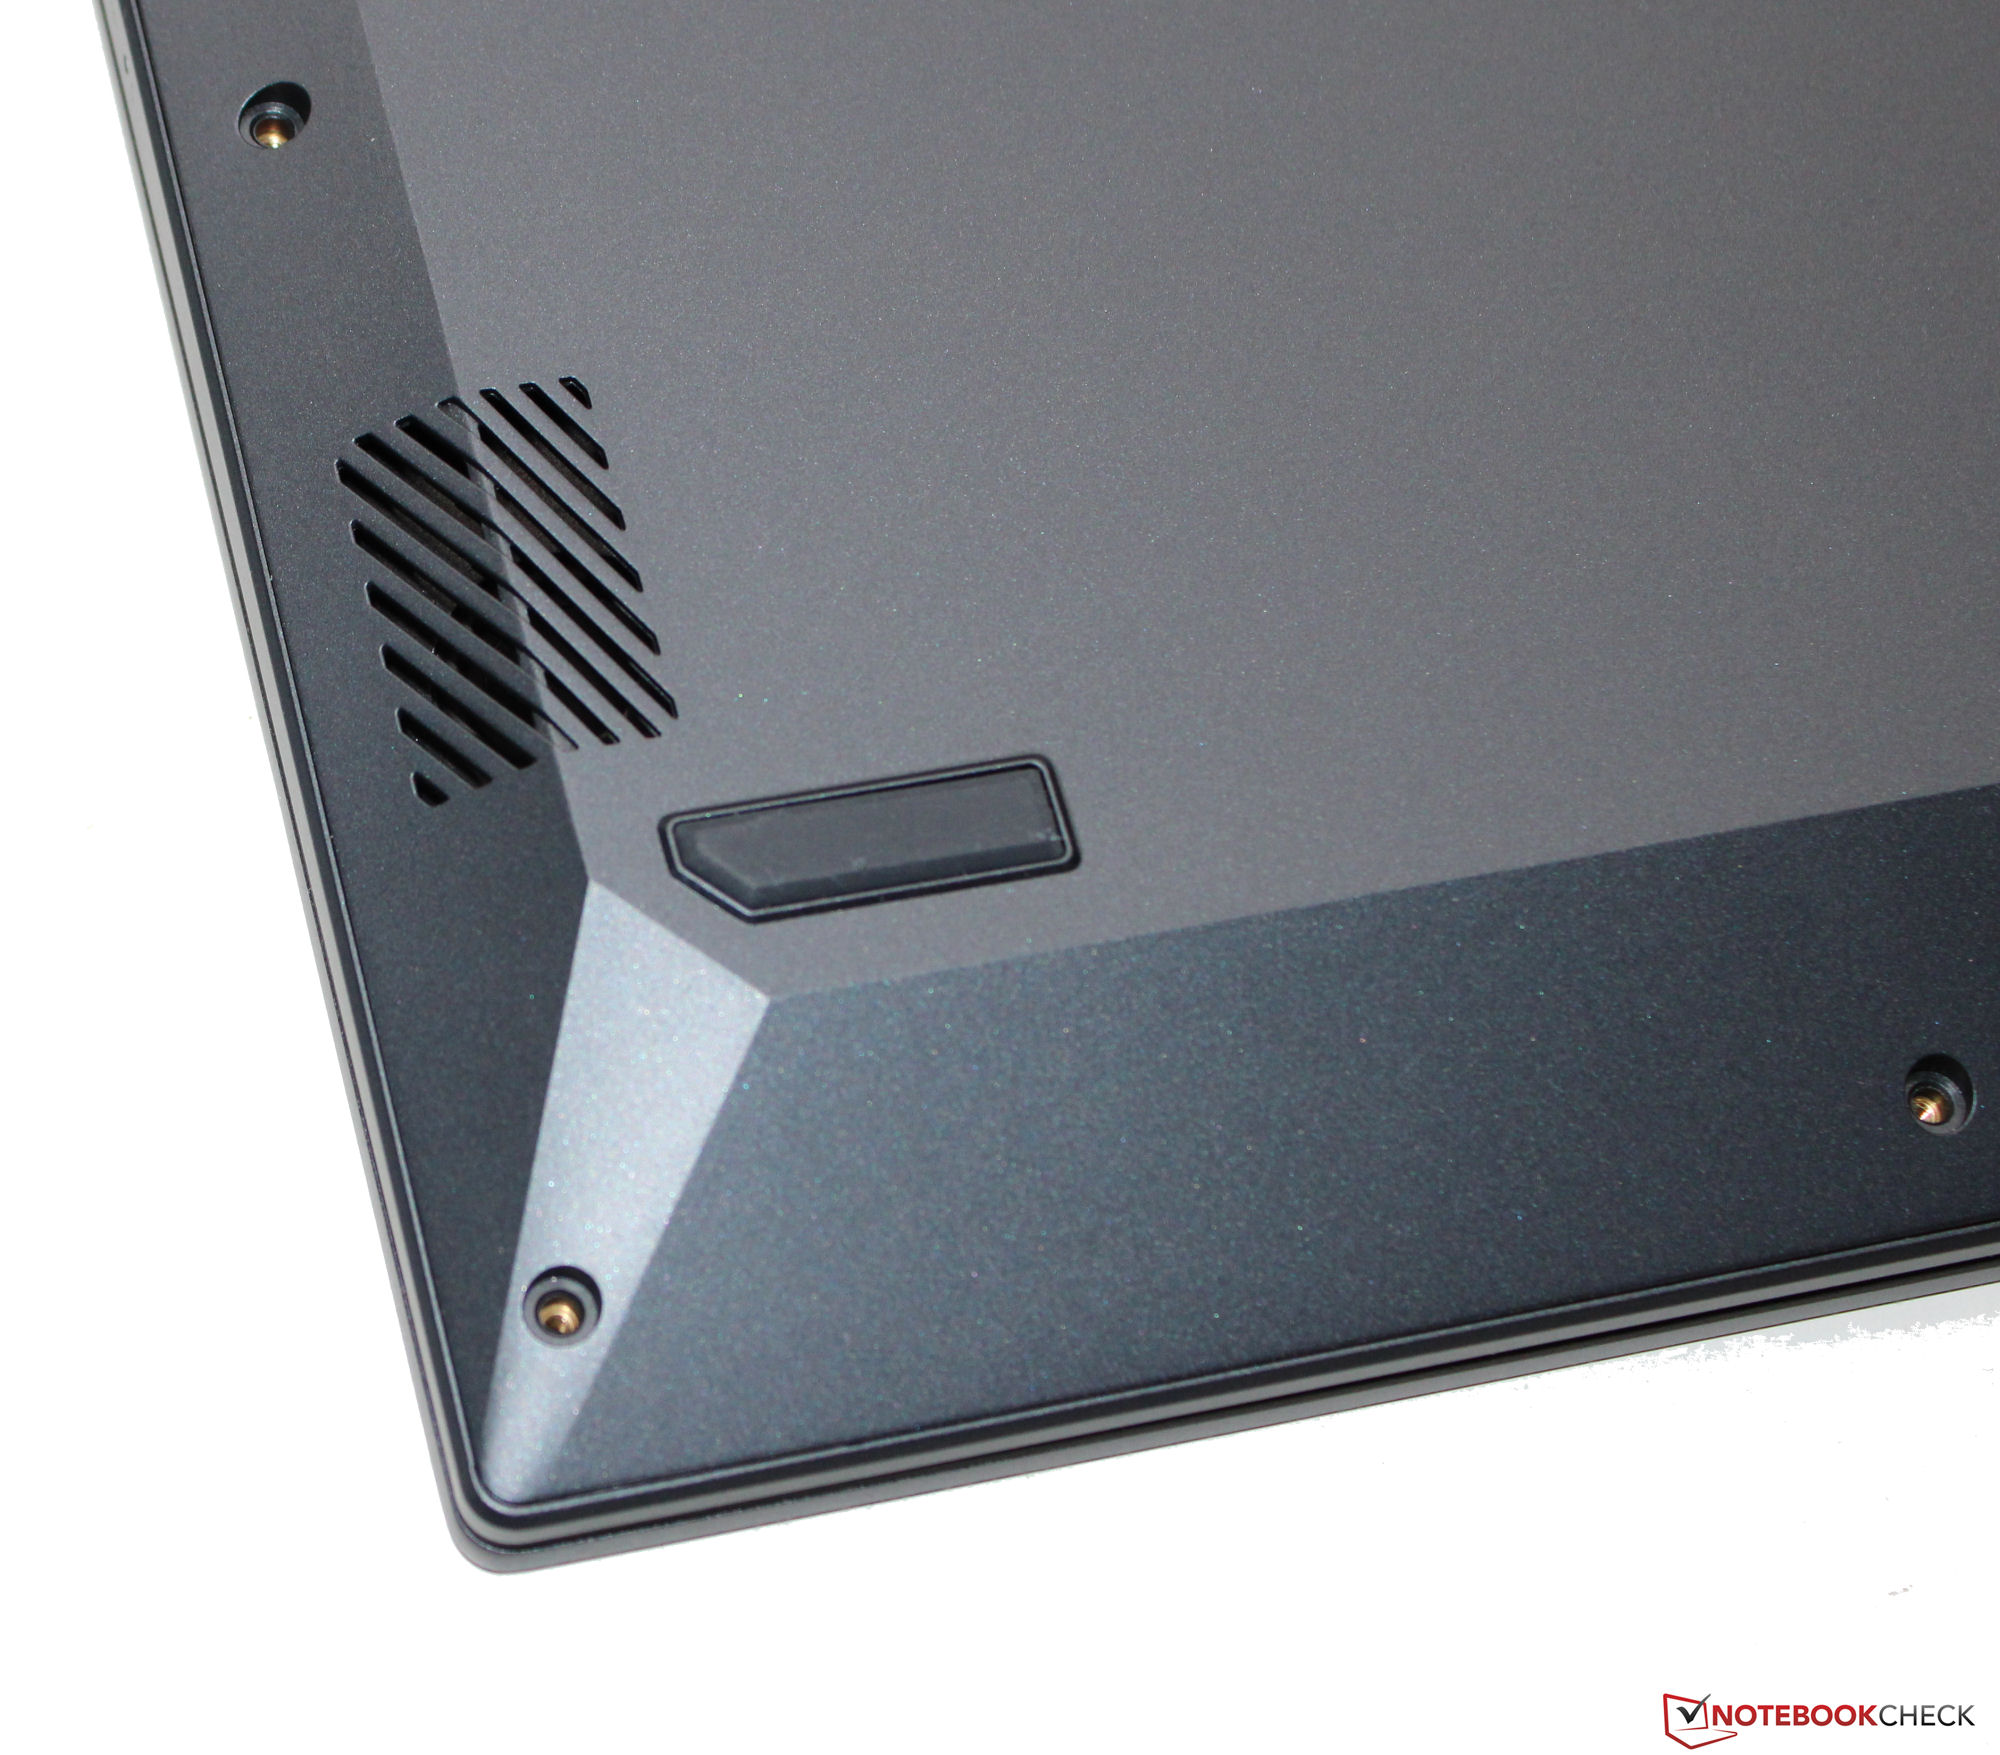
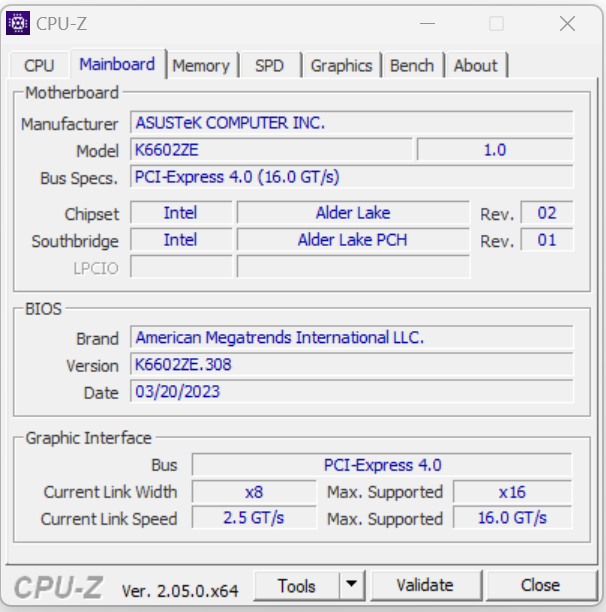
Carcasa y características - El VivoBook con Thunderbolt 4
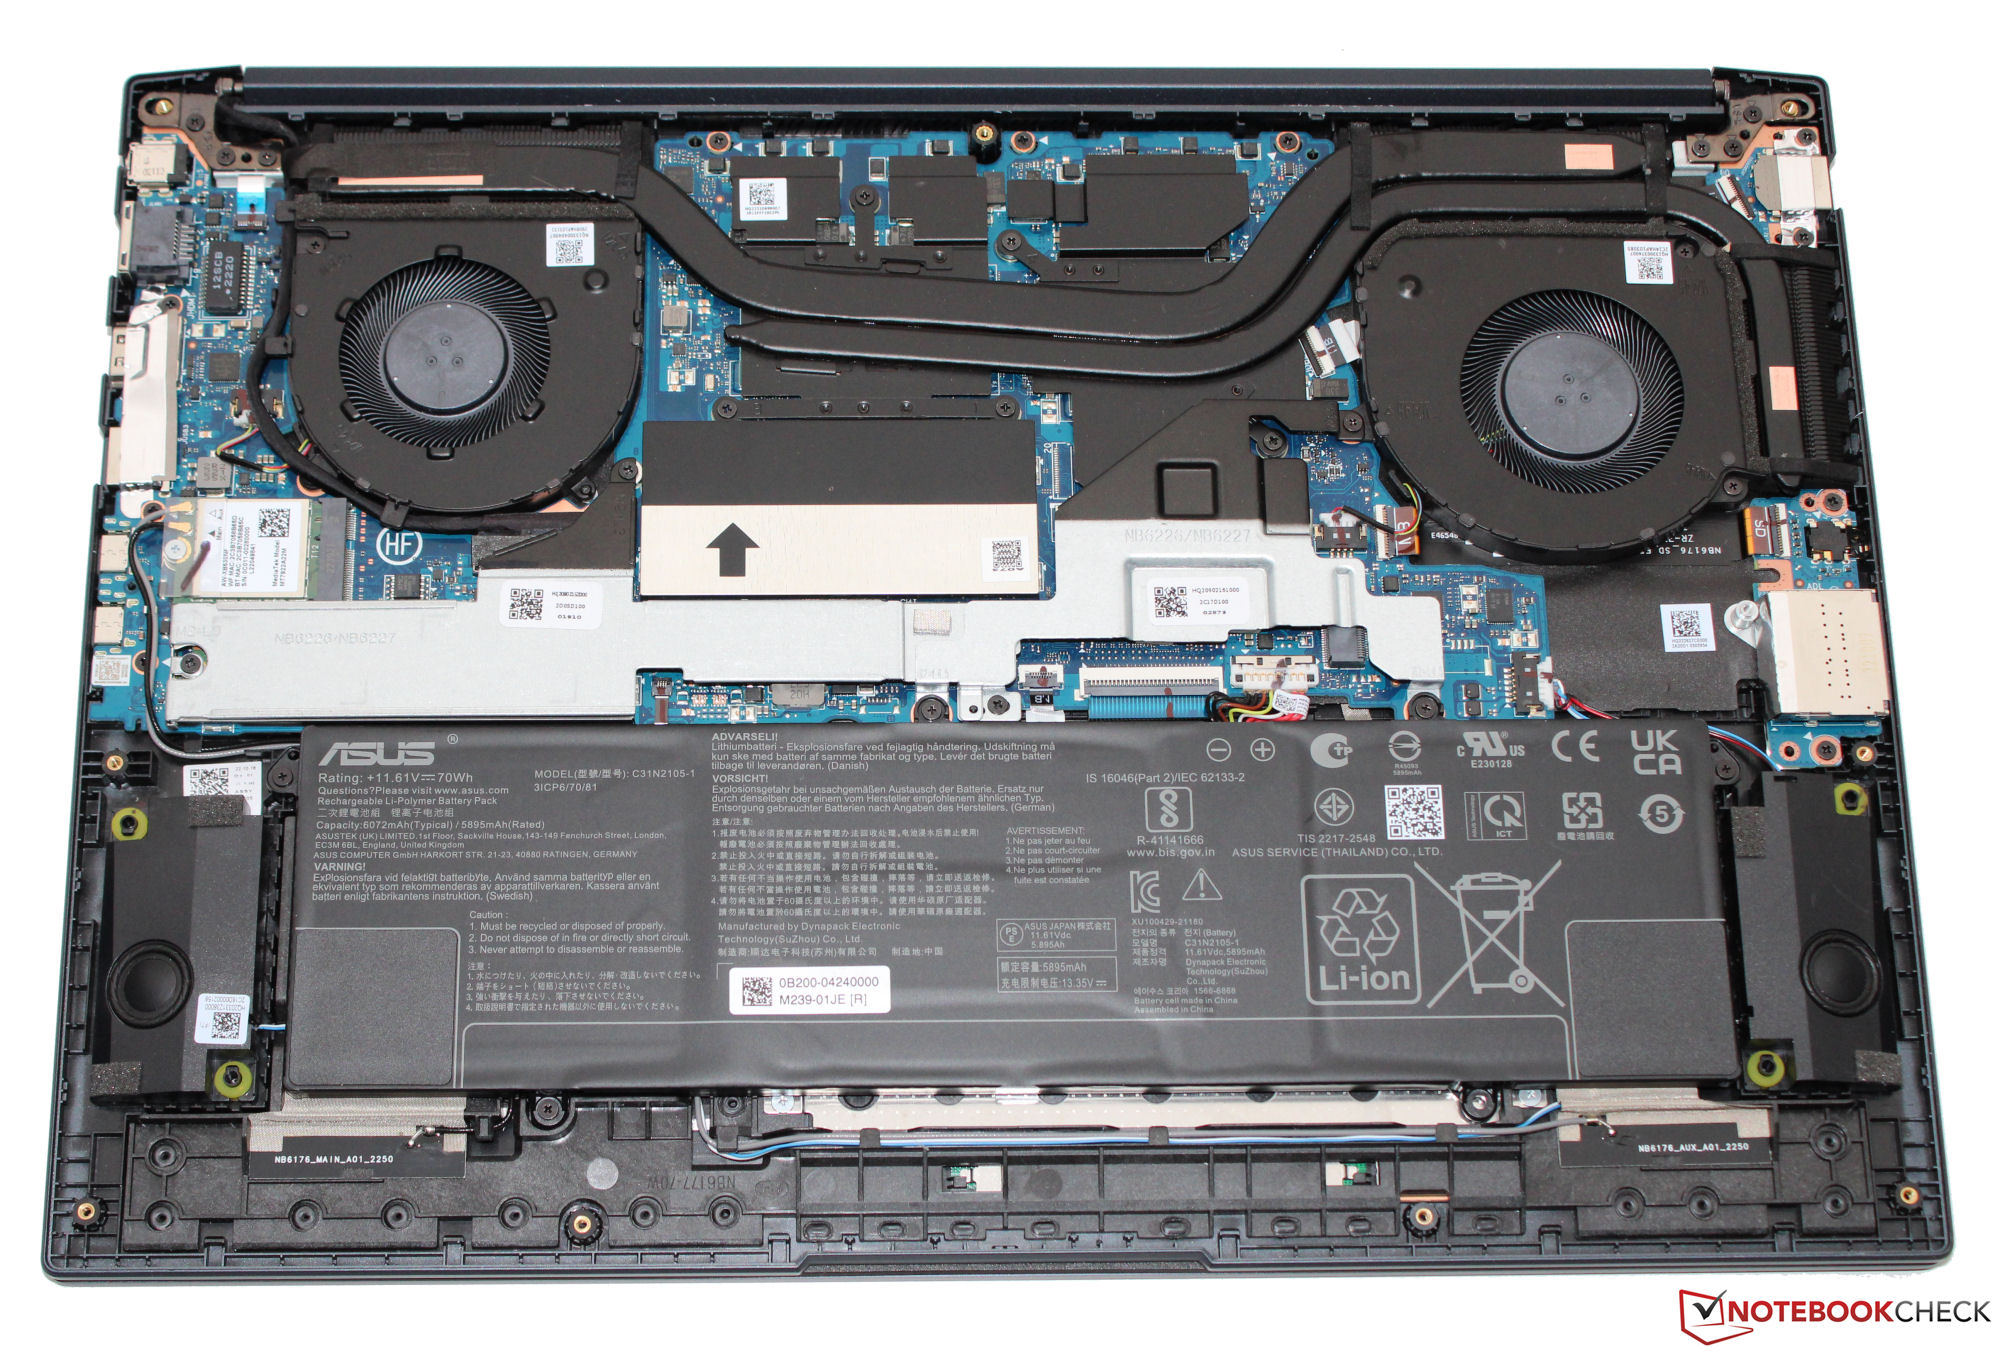
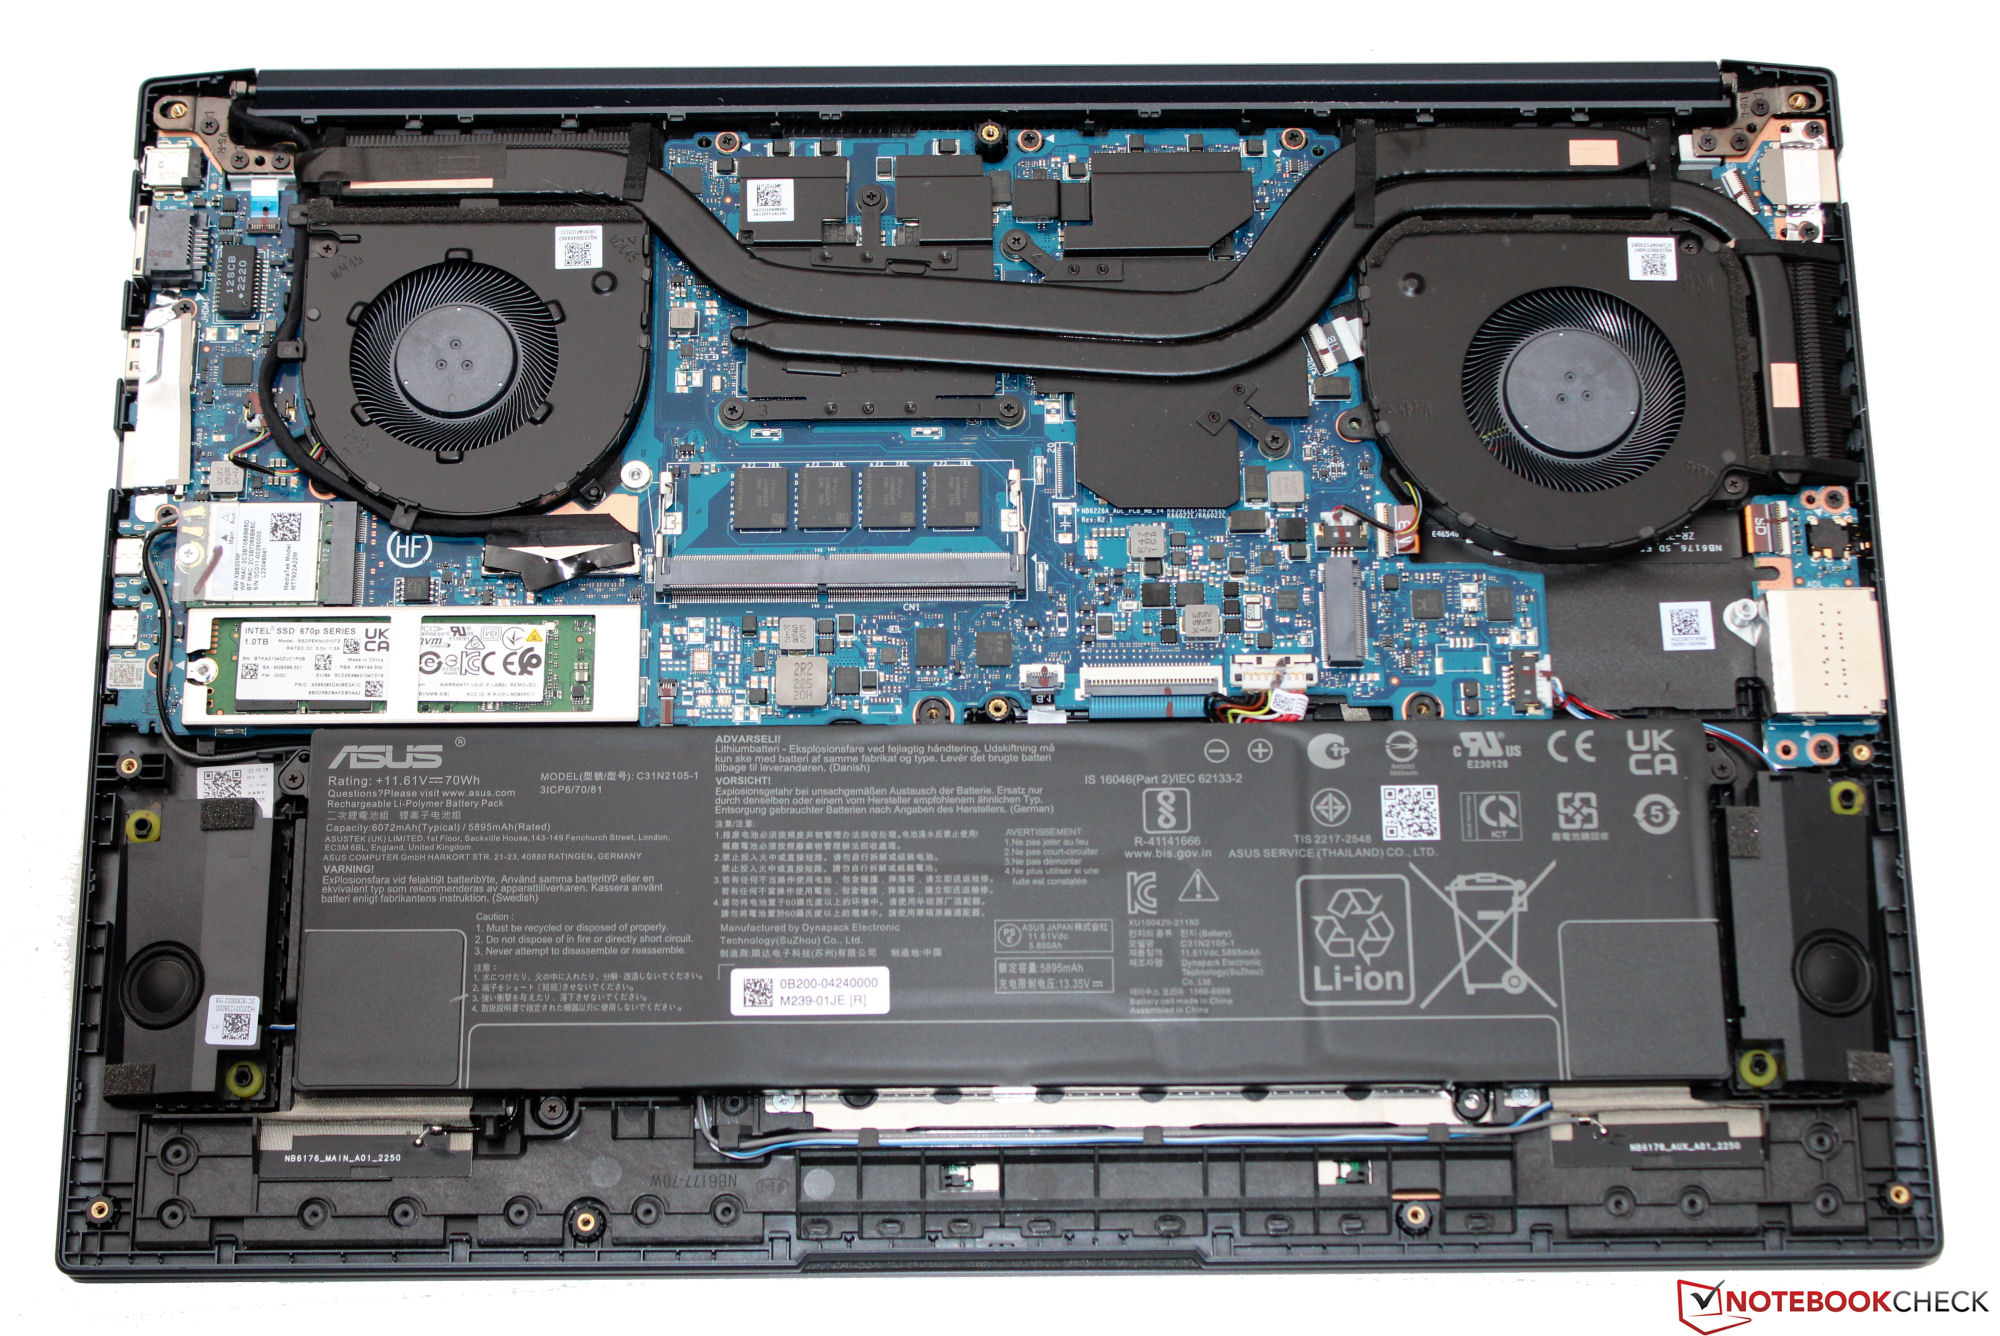
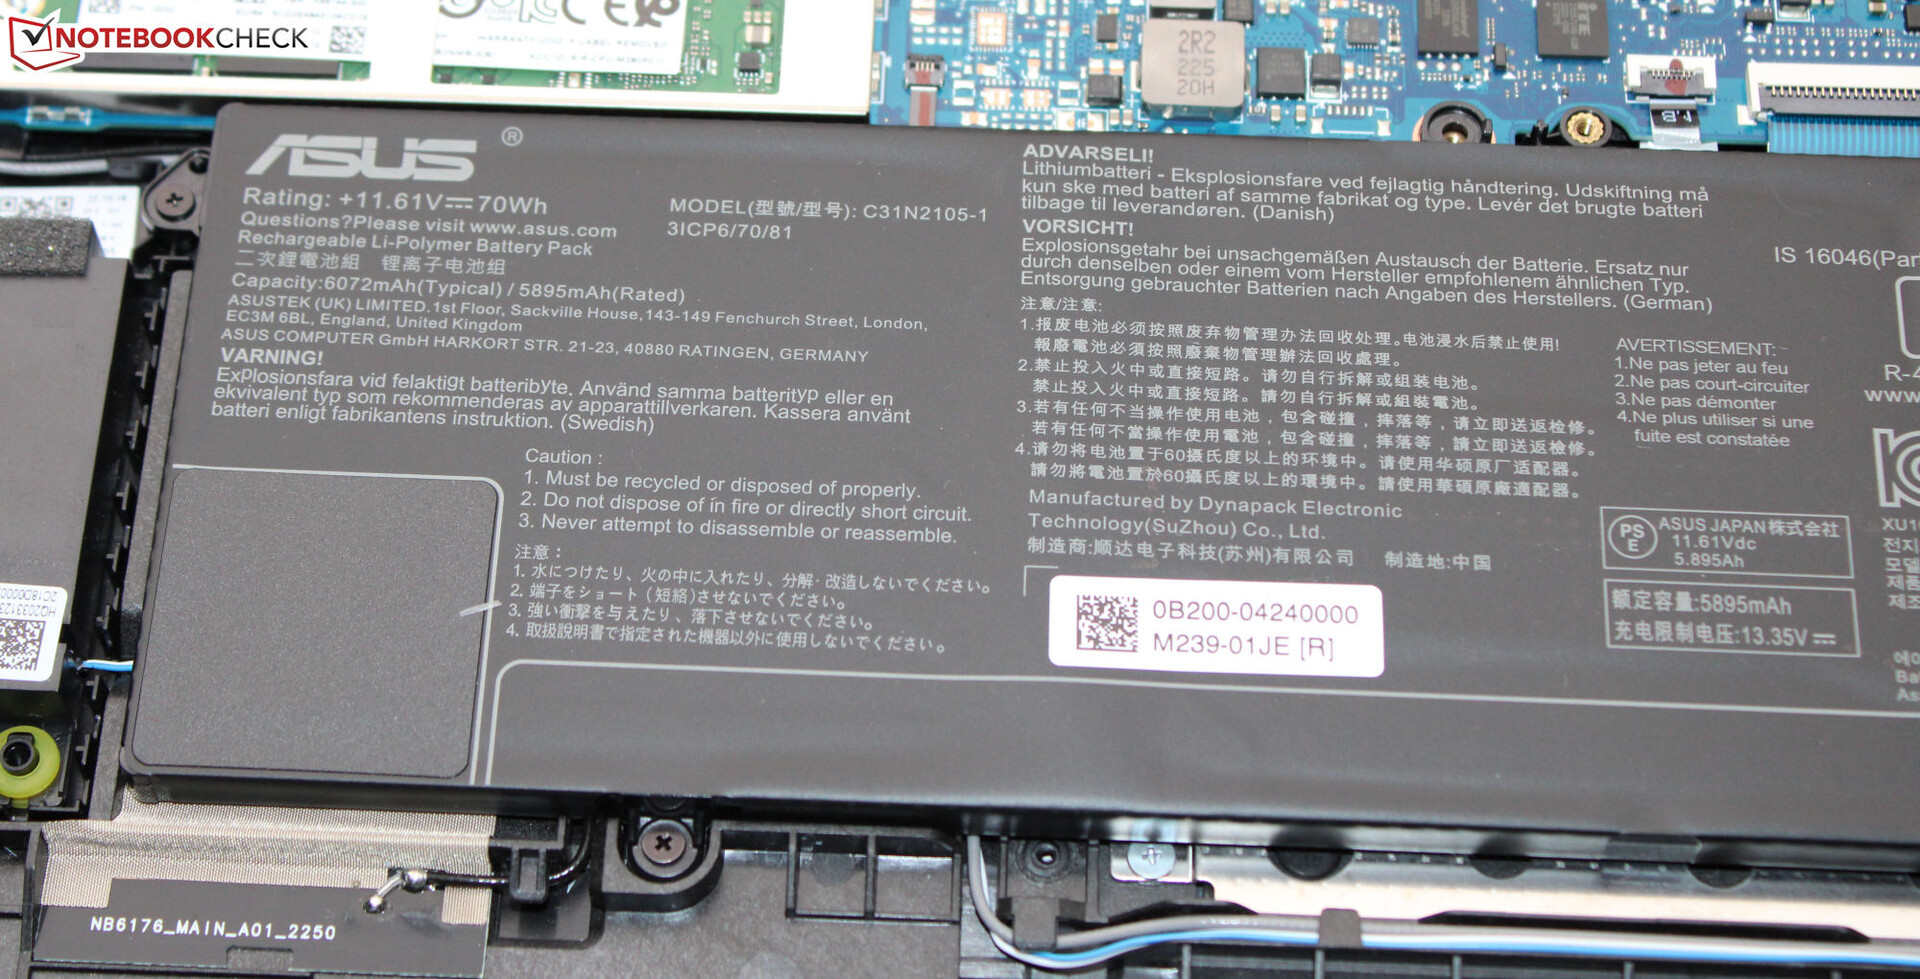
El VivoBook es de color azul oscuro (Quiet Blue) y tiene superficies lisas y mates. Su unidad base (de plástico) y su tapa (trasera de aluminio) pueden retorcerse con demasiada facilidad. El ángulo máximo en el que se puede abrir la tapa es de 180 grados. Se puede acceder a la batería (atornillada, no pegada) y al resto de las entrañas del portátil una vez que se ha retirado la parte inferior de la carcasa.
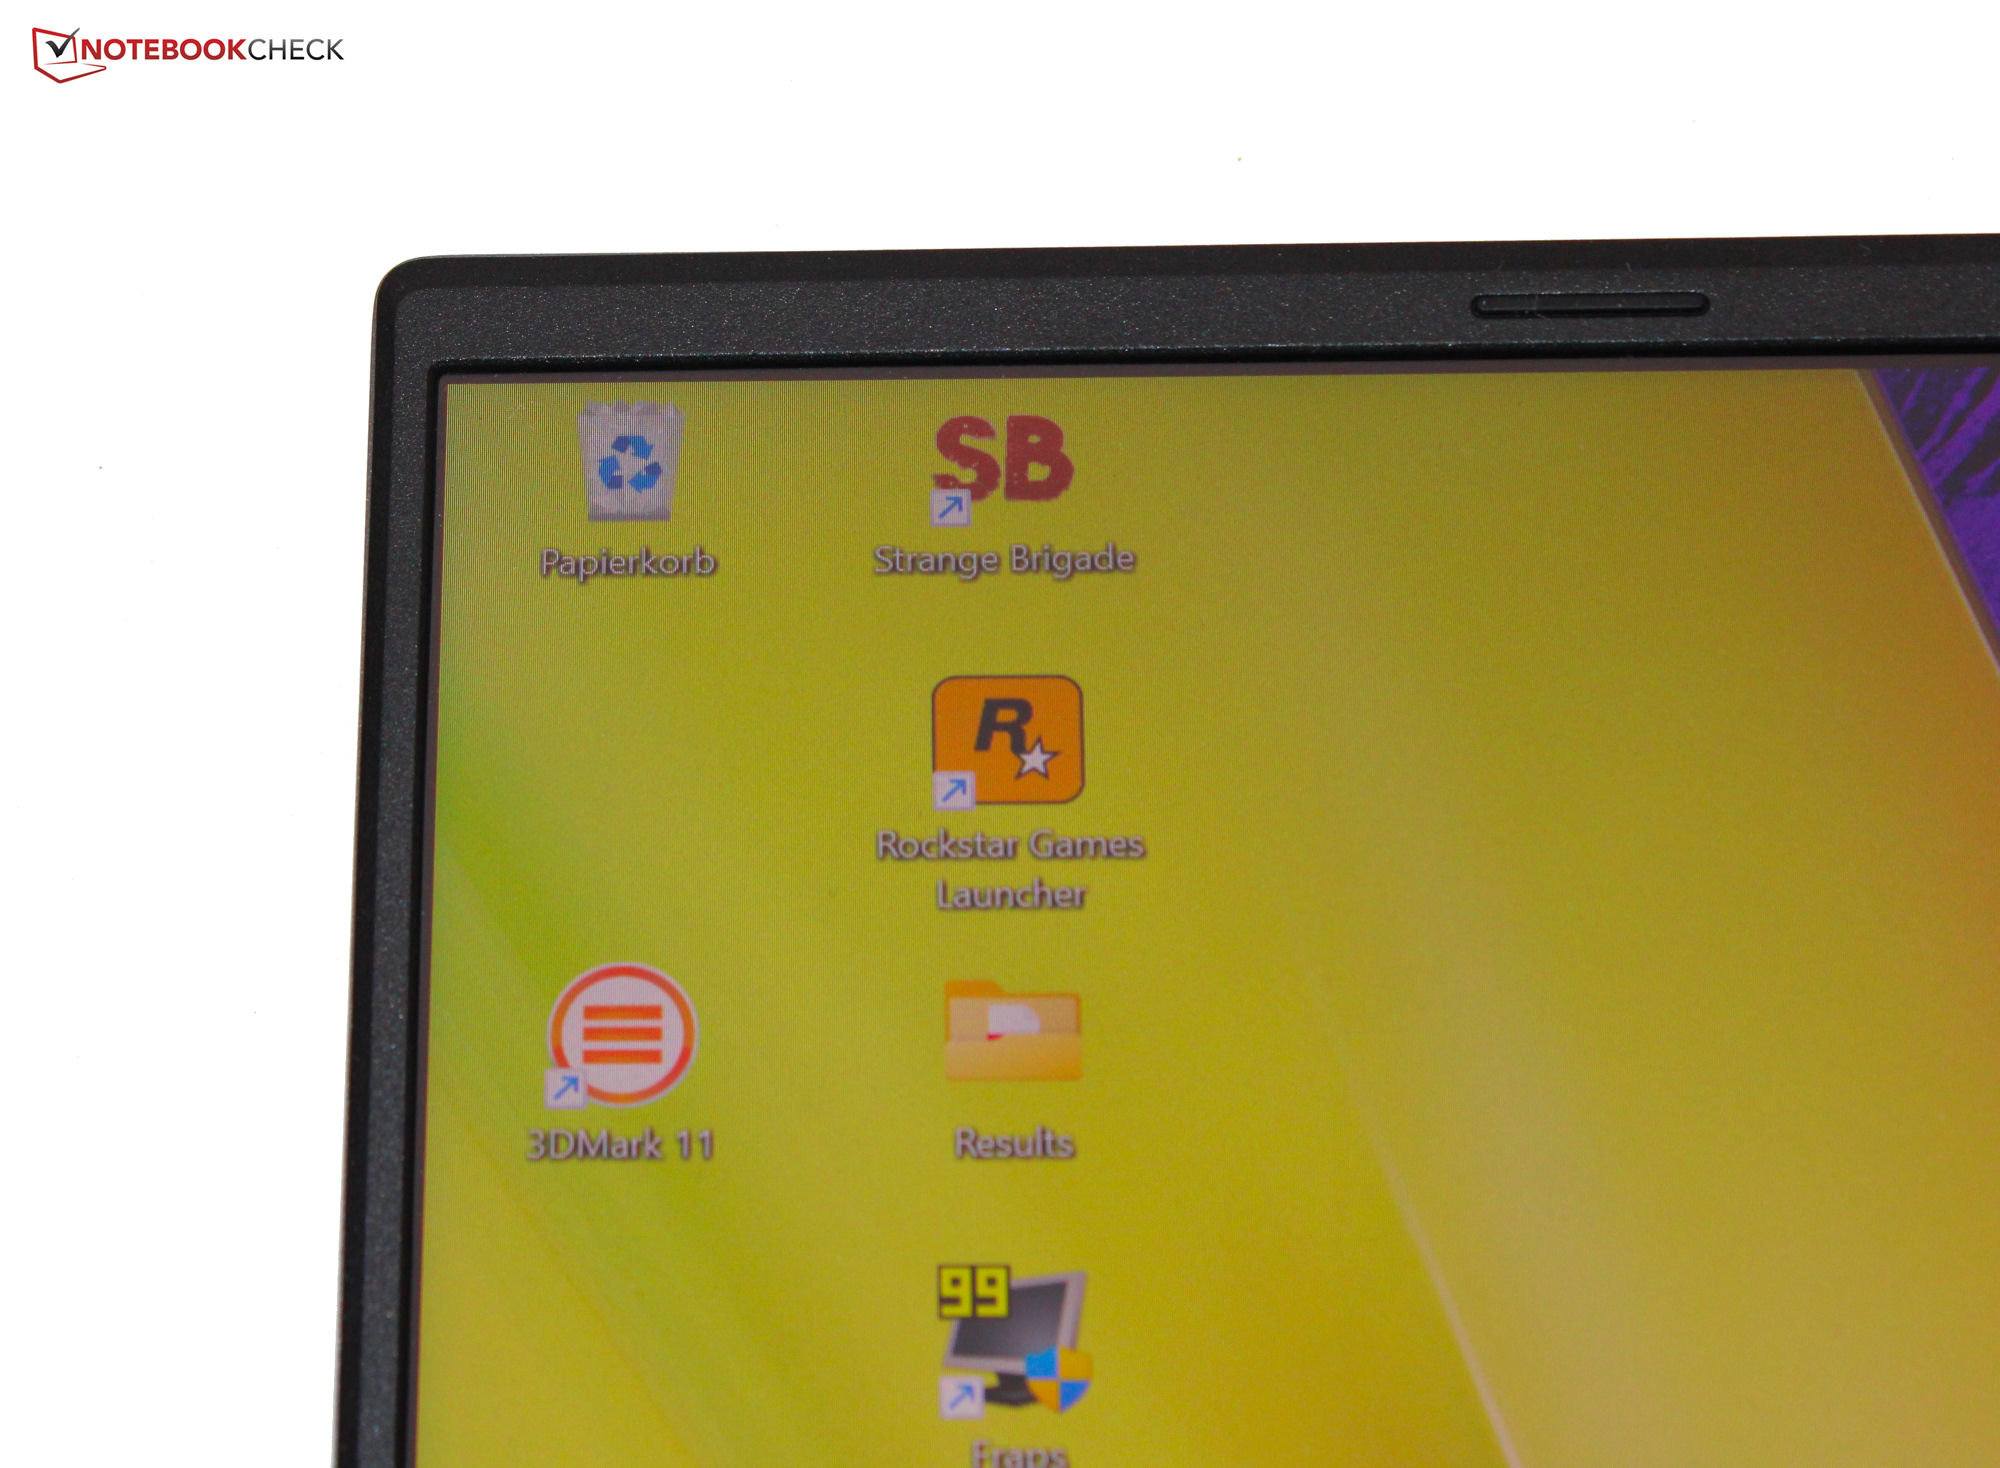
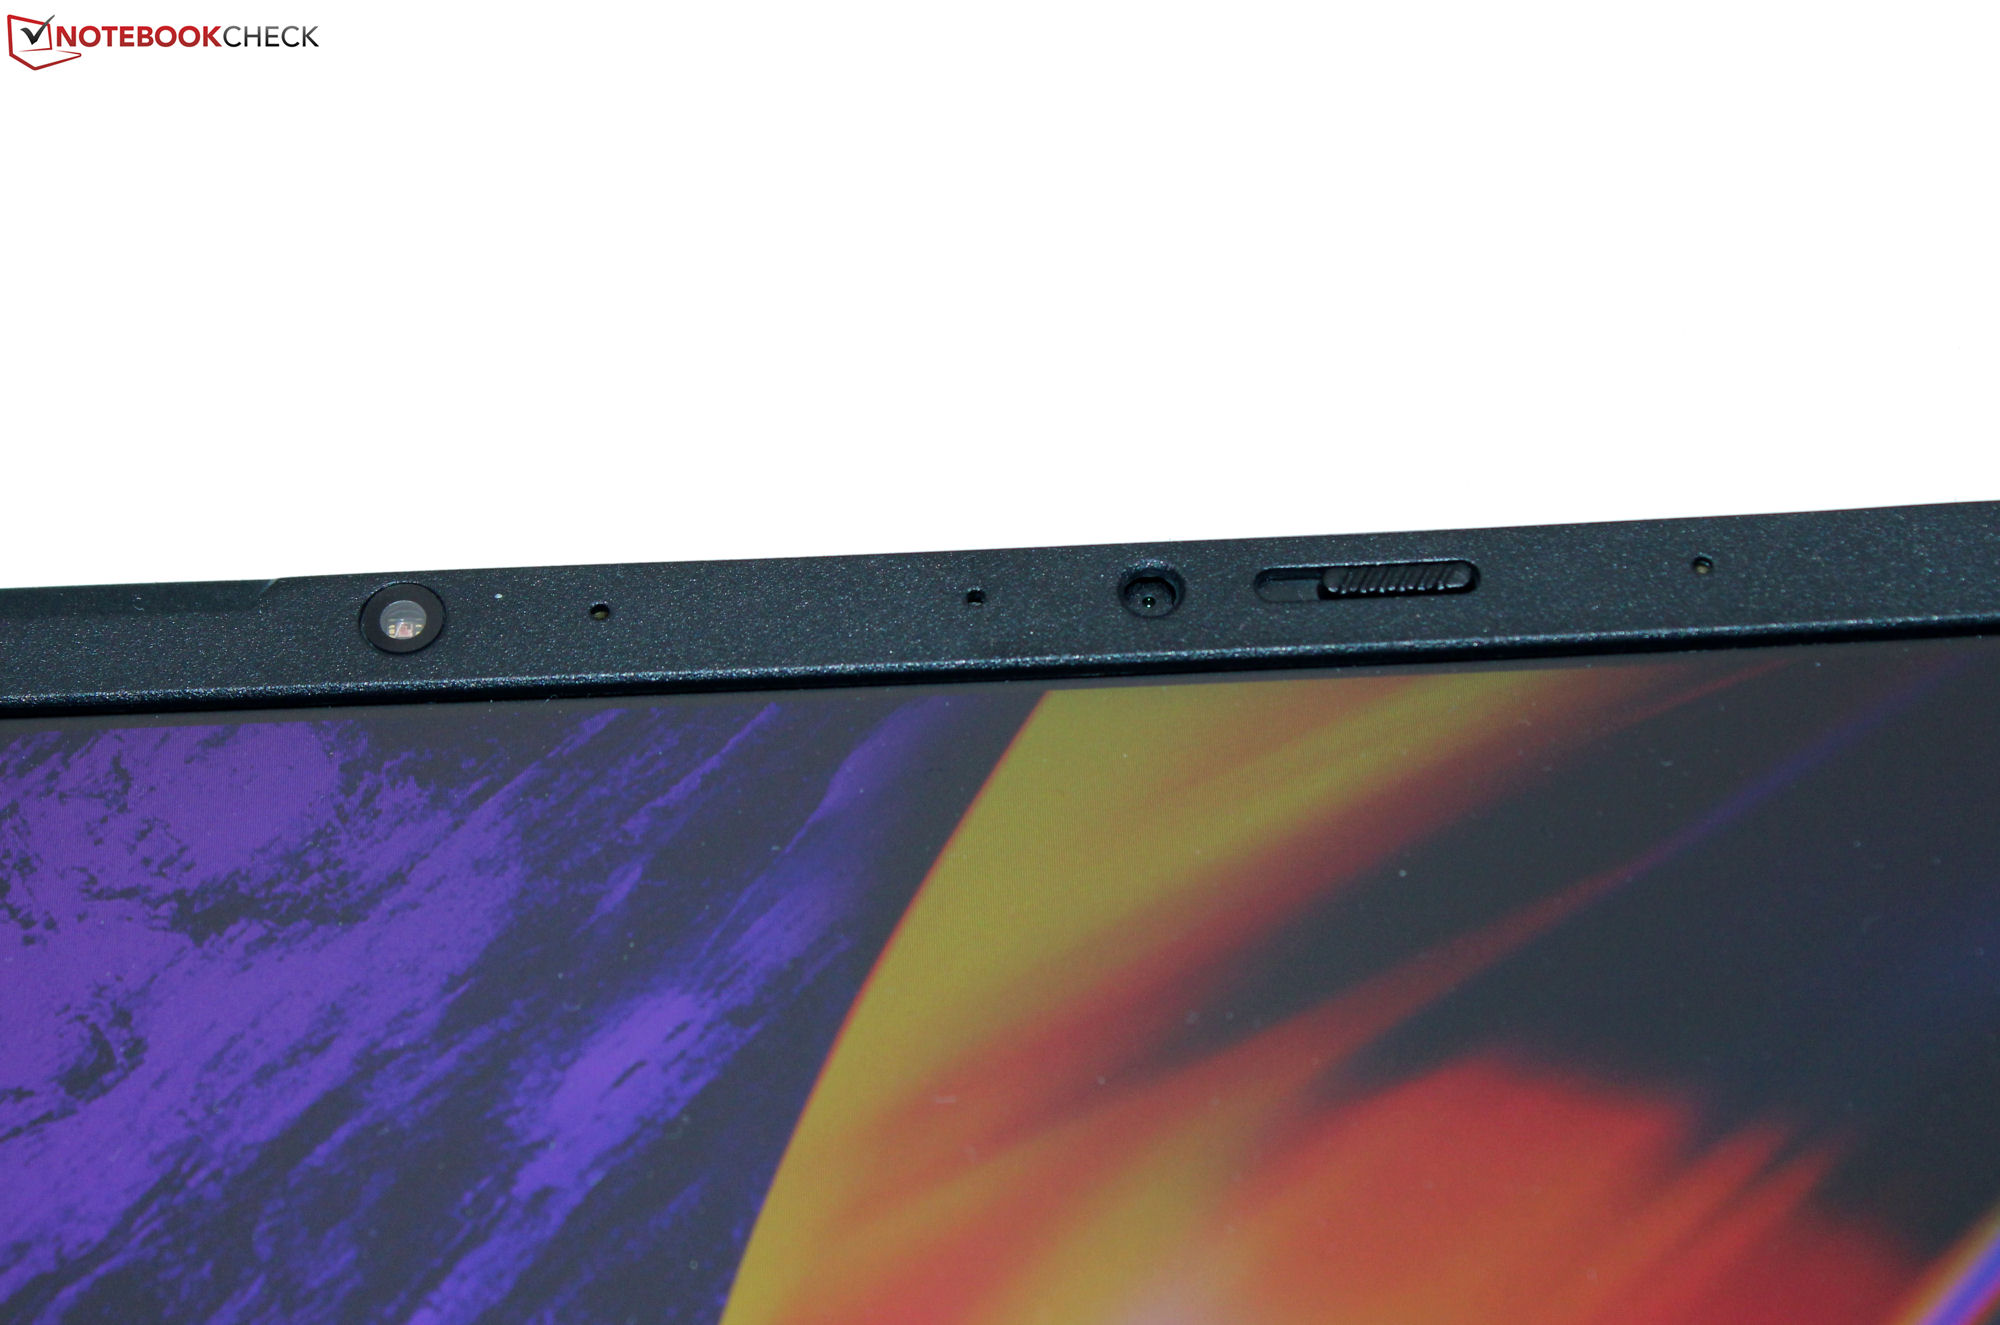
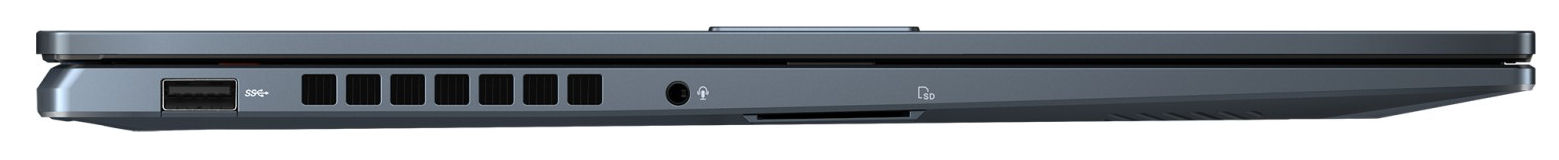
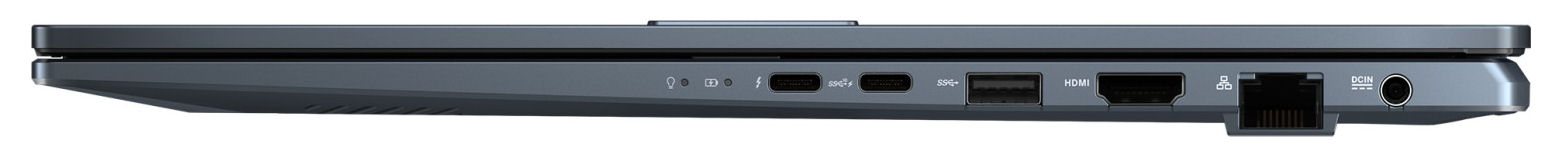
El dispositivo tiene dos puertos USB-A (USB 3.2 Gen 1) y dos puertos USB-C (1x Thunderbolt 4, 1x USB 3.2 Gen 2). Estos últimos admiten el suministro de energía y el puerto TB4 también puede emitir una señal DisplayPort. En total, hay dos salidas de vídeo (1x DP, 1x HDMI). El lector de tarjetas SD (tarjeta de referencia: AV PRO microSD 128 GB V60) ofrece velocidades medias. Un punto positivo: La webcam (2,1 MP, máx. 1.920 x 1.080 píxeles) tiene una cubierta mecánica.
En condiciones óptimas (sin dispositivos WiFi cerca, poca distancia entre el portátil y el PC servidor), se pueden conseguir grandes velocidades de datos WiFi. El portátil utiliza un chip WiFi 6E (Mediatek MT7922). De las conexiones por cable se encarga un chip Realtek (RTL 816878111; 1 GBit/s).
| SD Card Reader | |
| average JPG Copy Test (av. of 3 runs) | |
| Media de la clase Multimedia (23 - 531, n=41, últimos 2 años) | |
| Schenker XMG Fusion 15 (Mid 22) (AV PRO microSD 128 GB V60) | |
| Asus VivoBook Pro 16 (AV Pro SD microSD 128 GB V60) | |
| Dell Inspiron 16 Plus 7620 (Toshiba Exceria Pro SDXC 64 GB UHS-II) | |
| maximum AS SSD Seq Read Test (1GB) | |
| Media de la clase Multimedia (37.3 - 1455, n=40, últimos 2 años) | |
| Asus VivoBook Pro 16 (AV Pro SD microSD 128 GB V60) | |
| Dell Inspiron 16 Plus 7620 (Toshiba Exceria Pro SDXC 64 GB UHS-II) | |


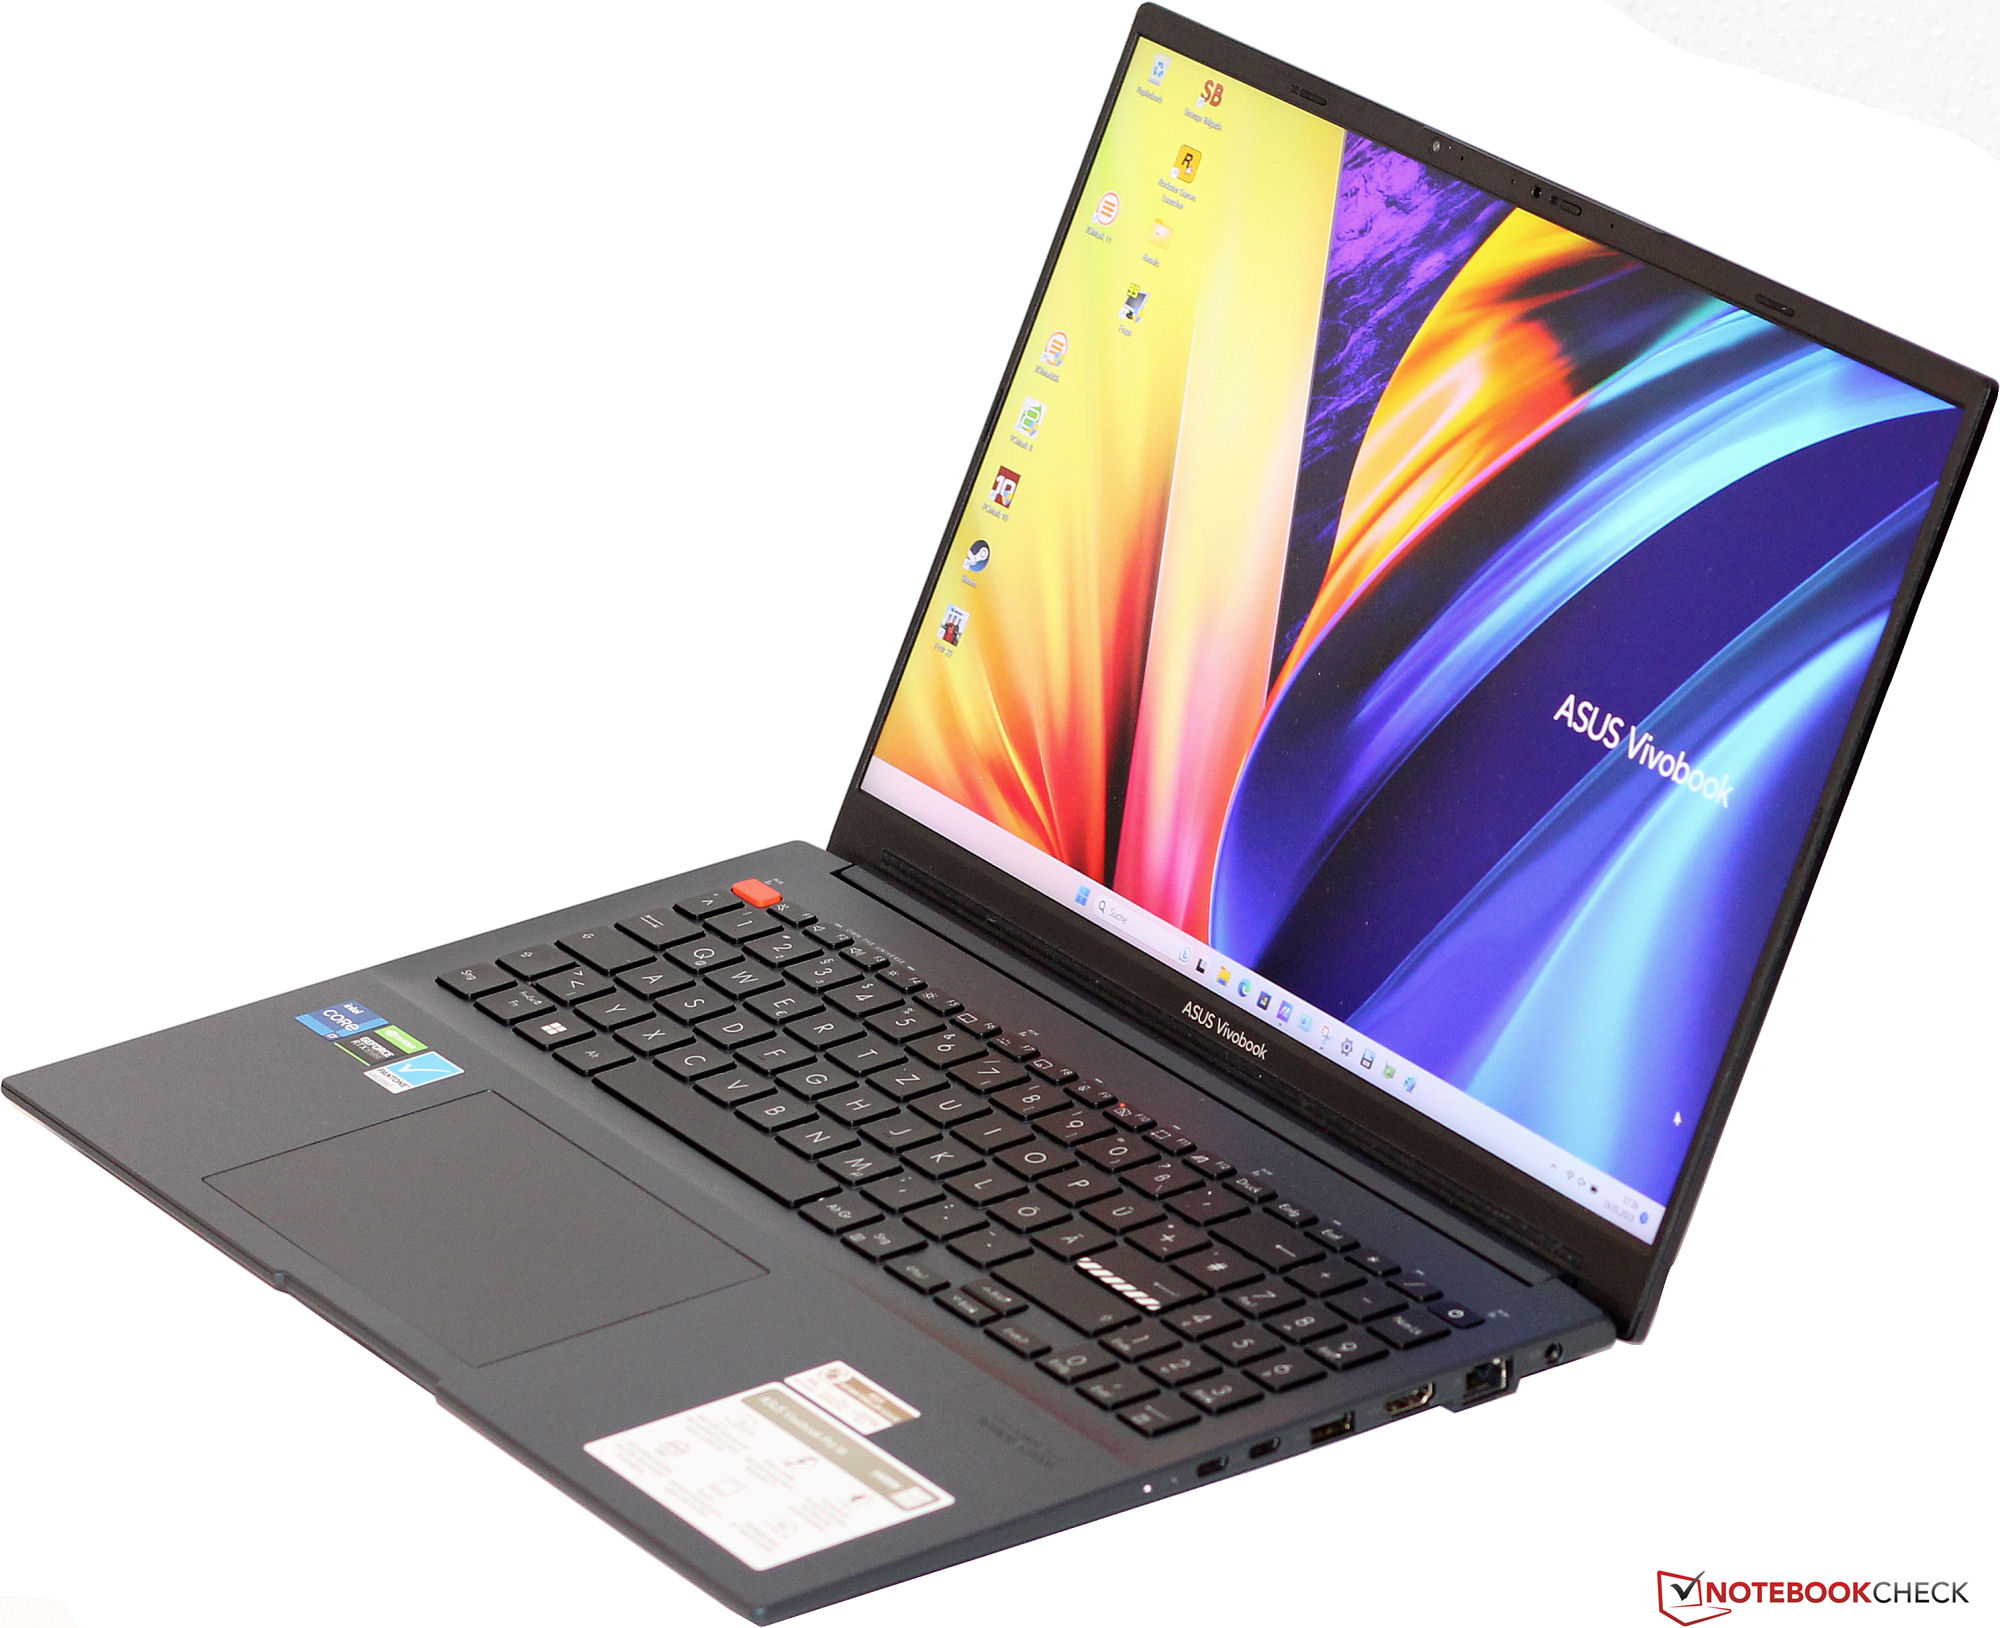
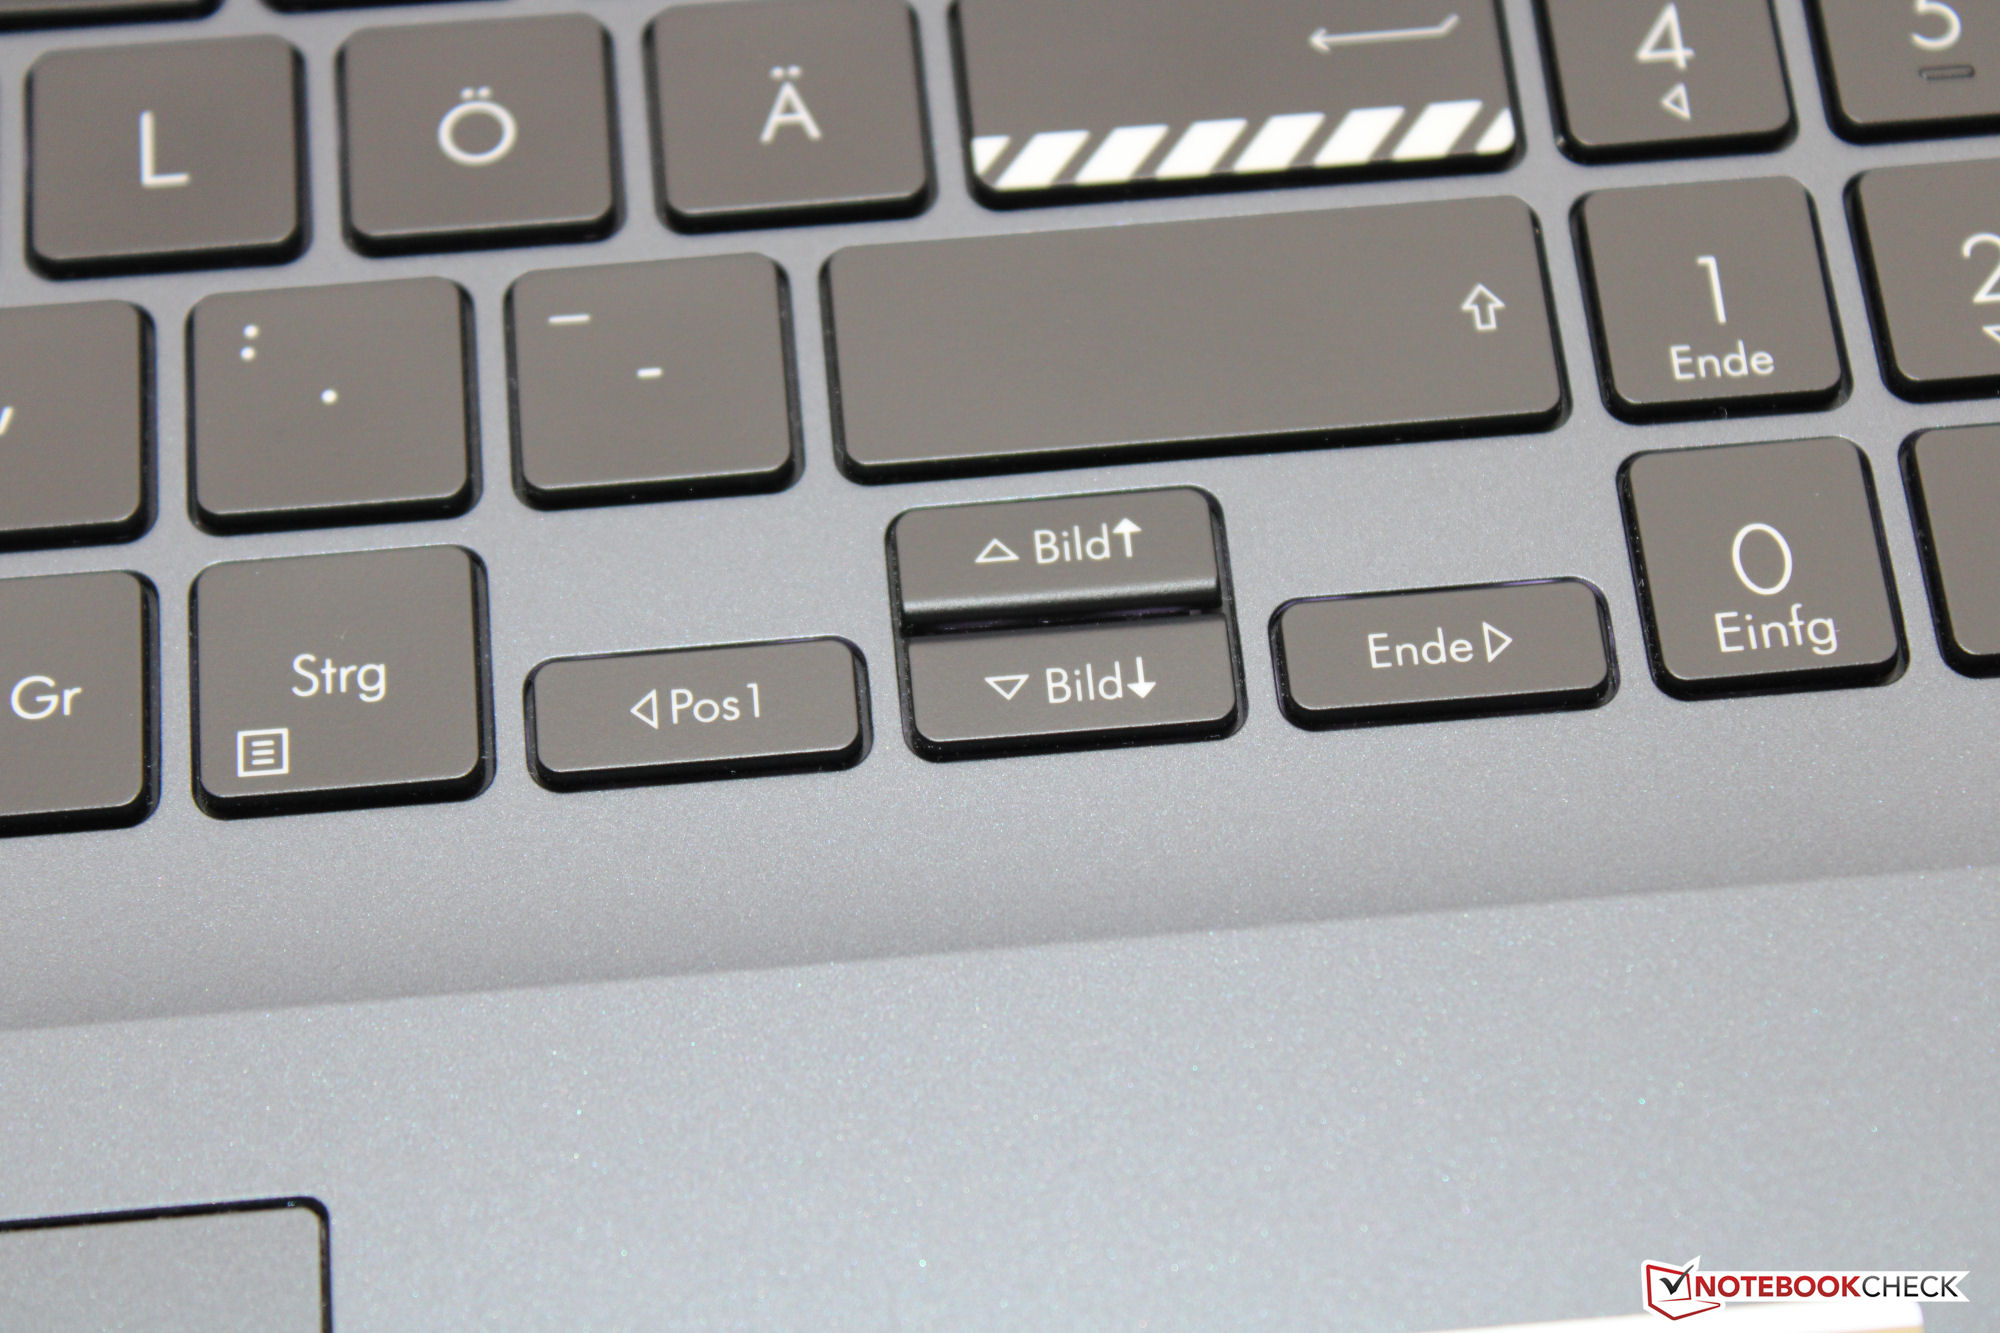
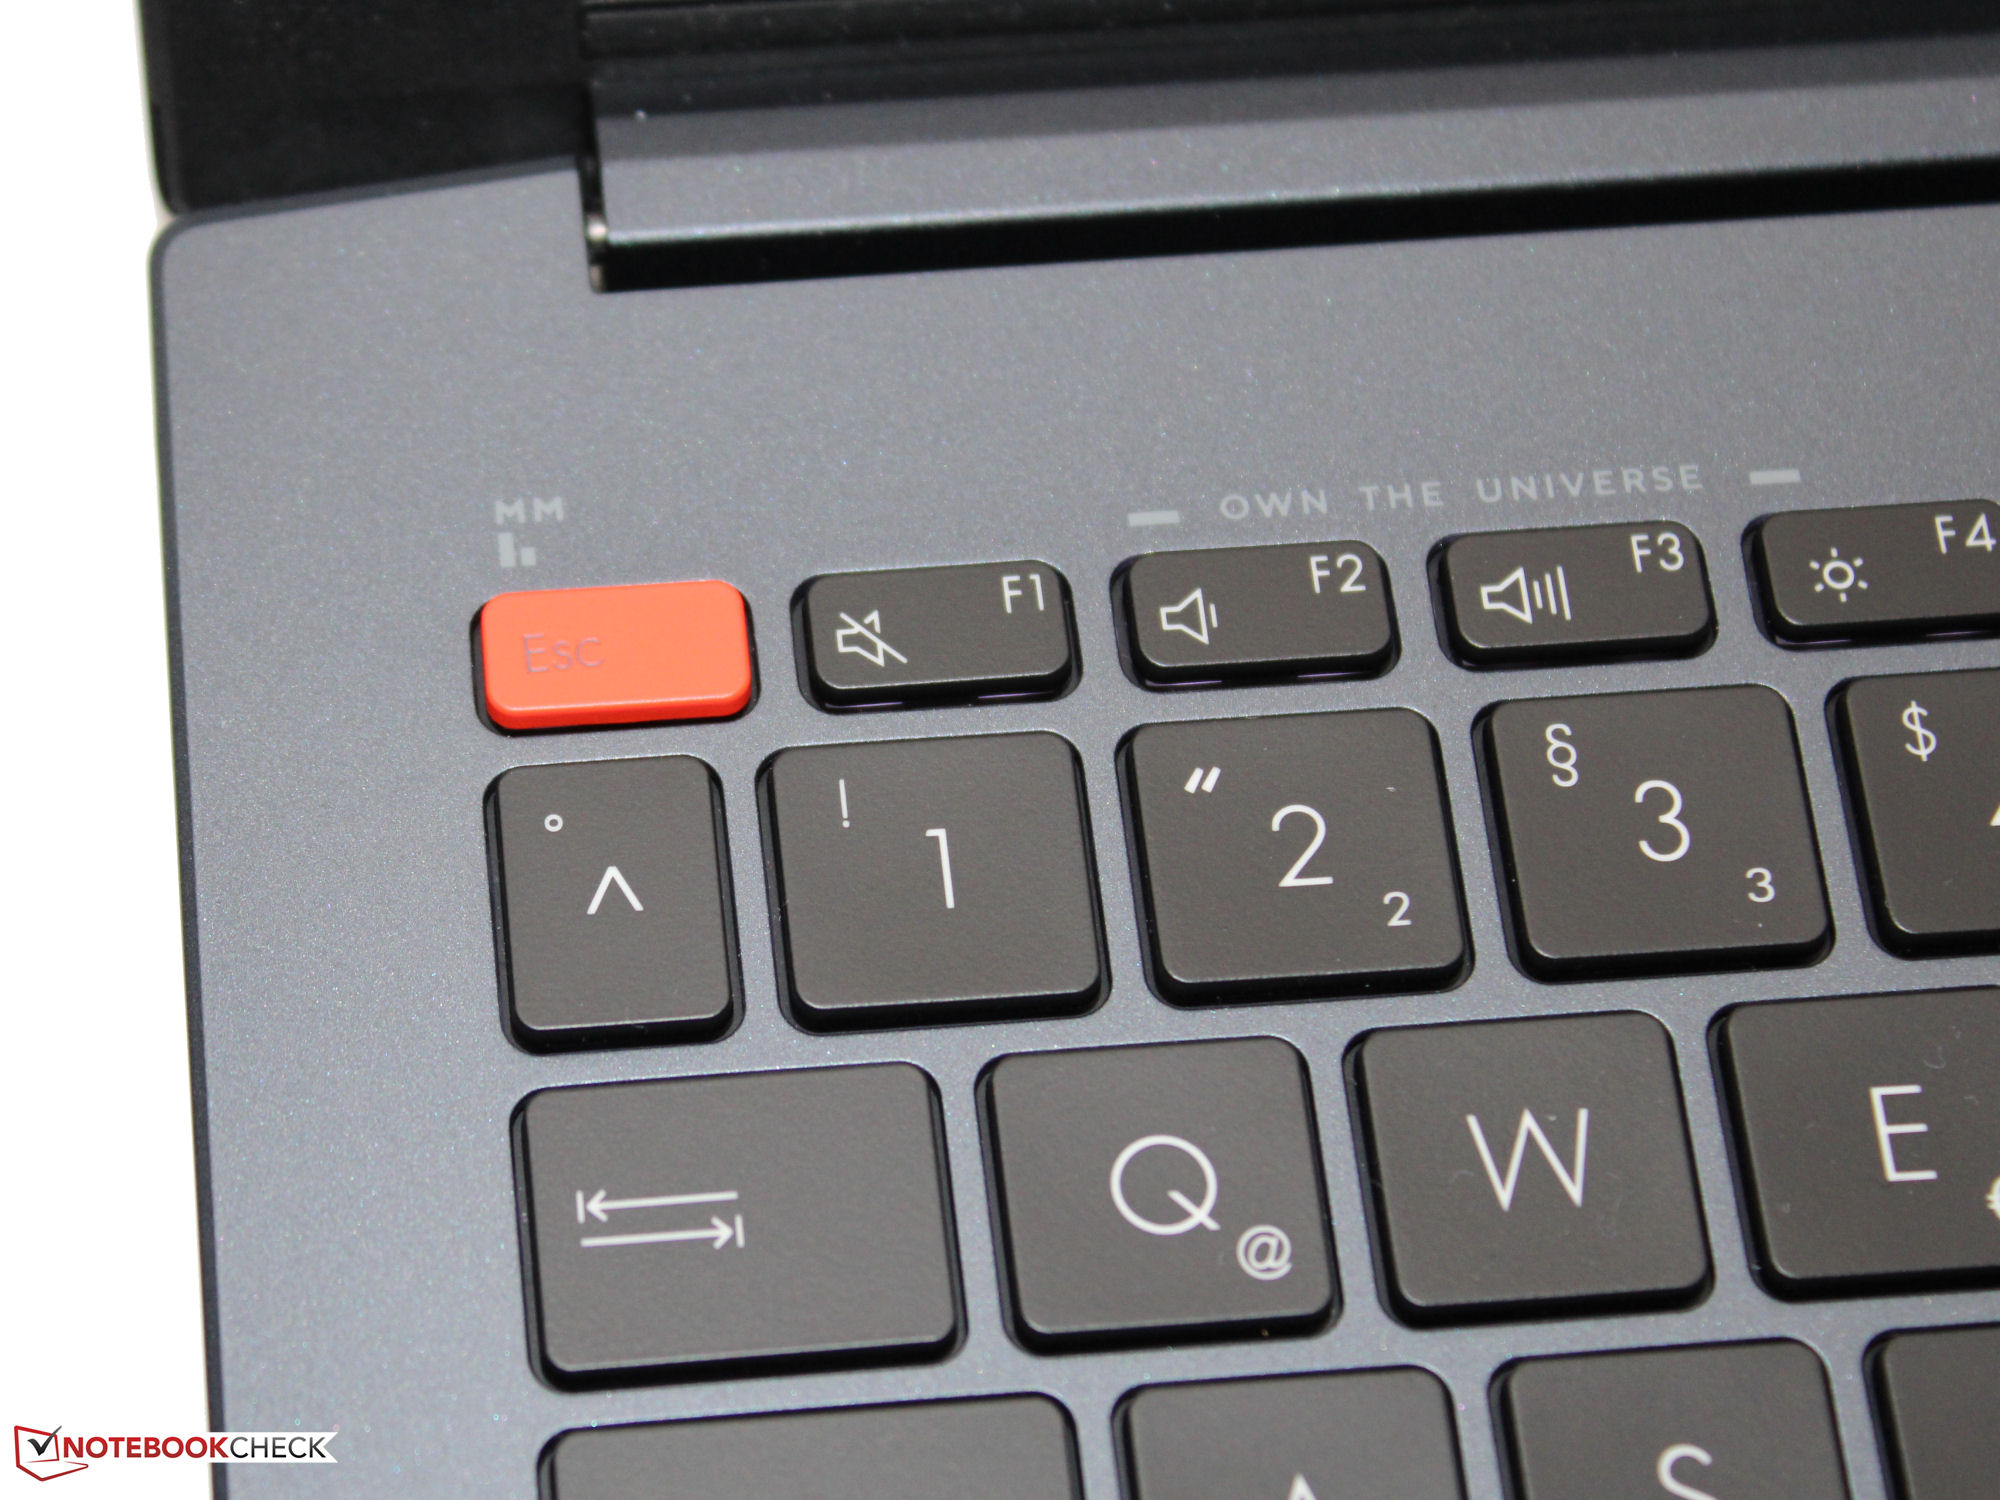
Dispositivos de entrada - El ordenador Asus con teclado iluminado
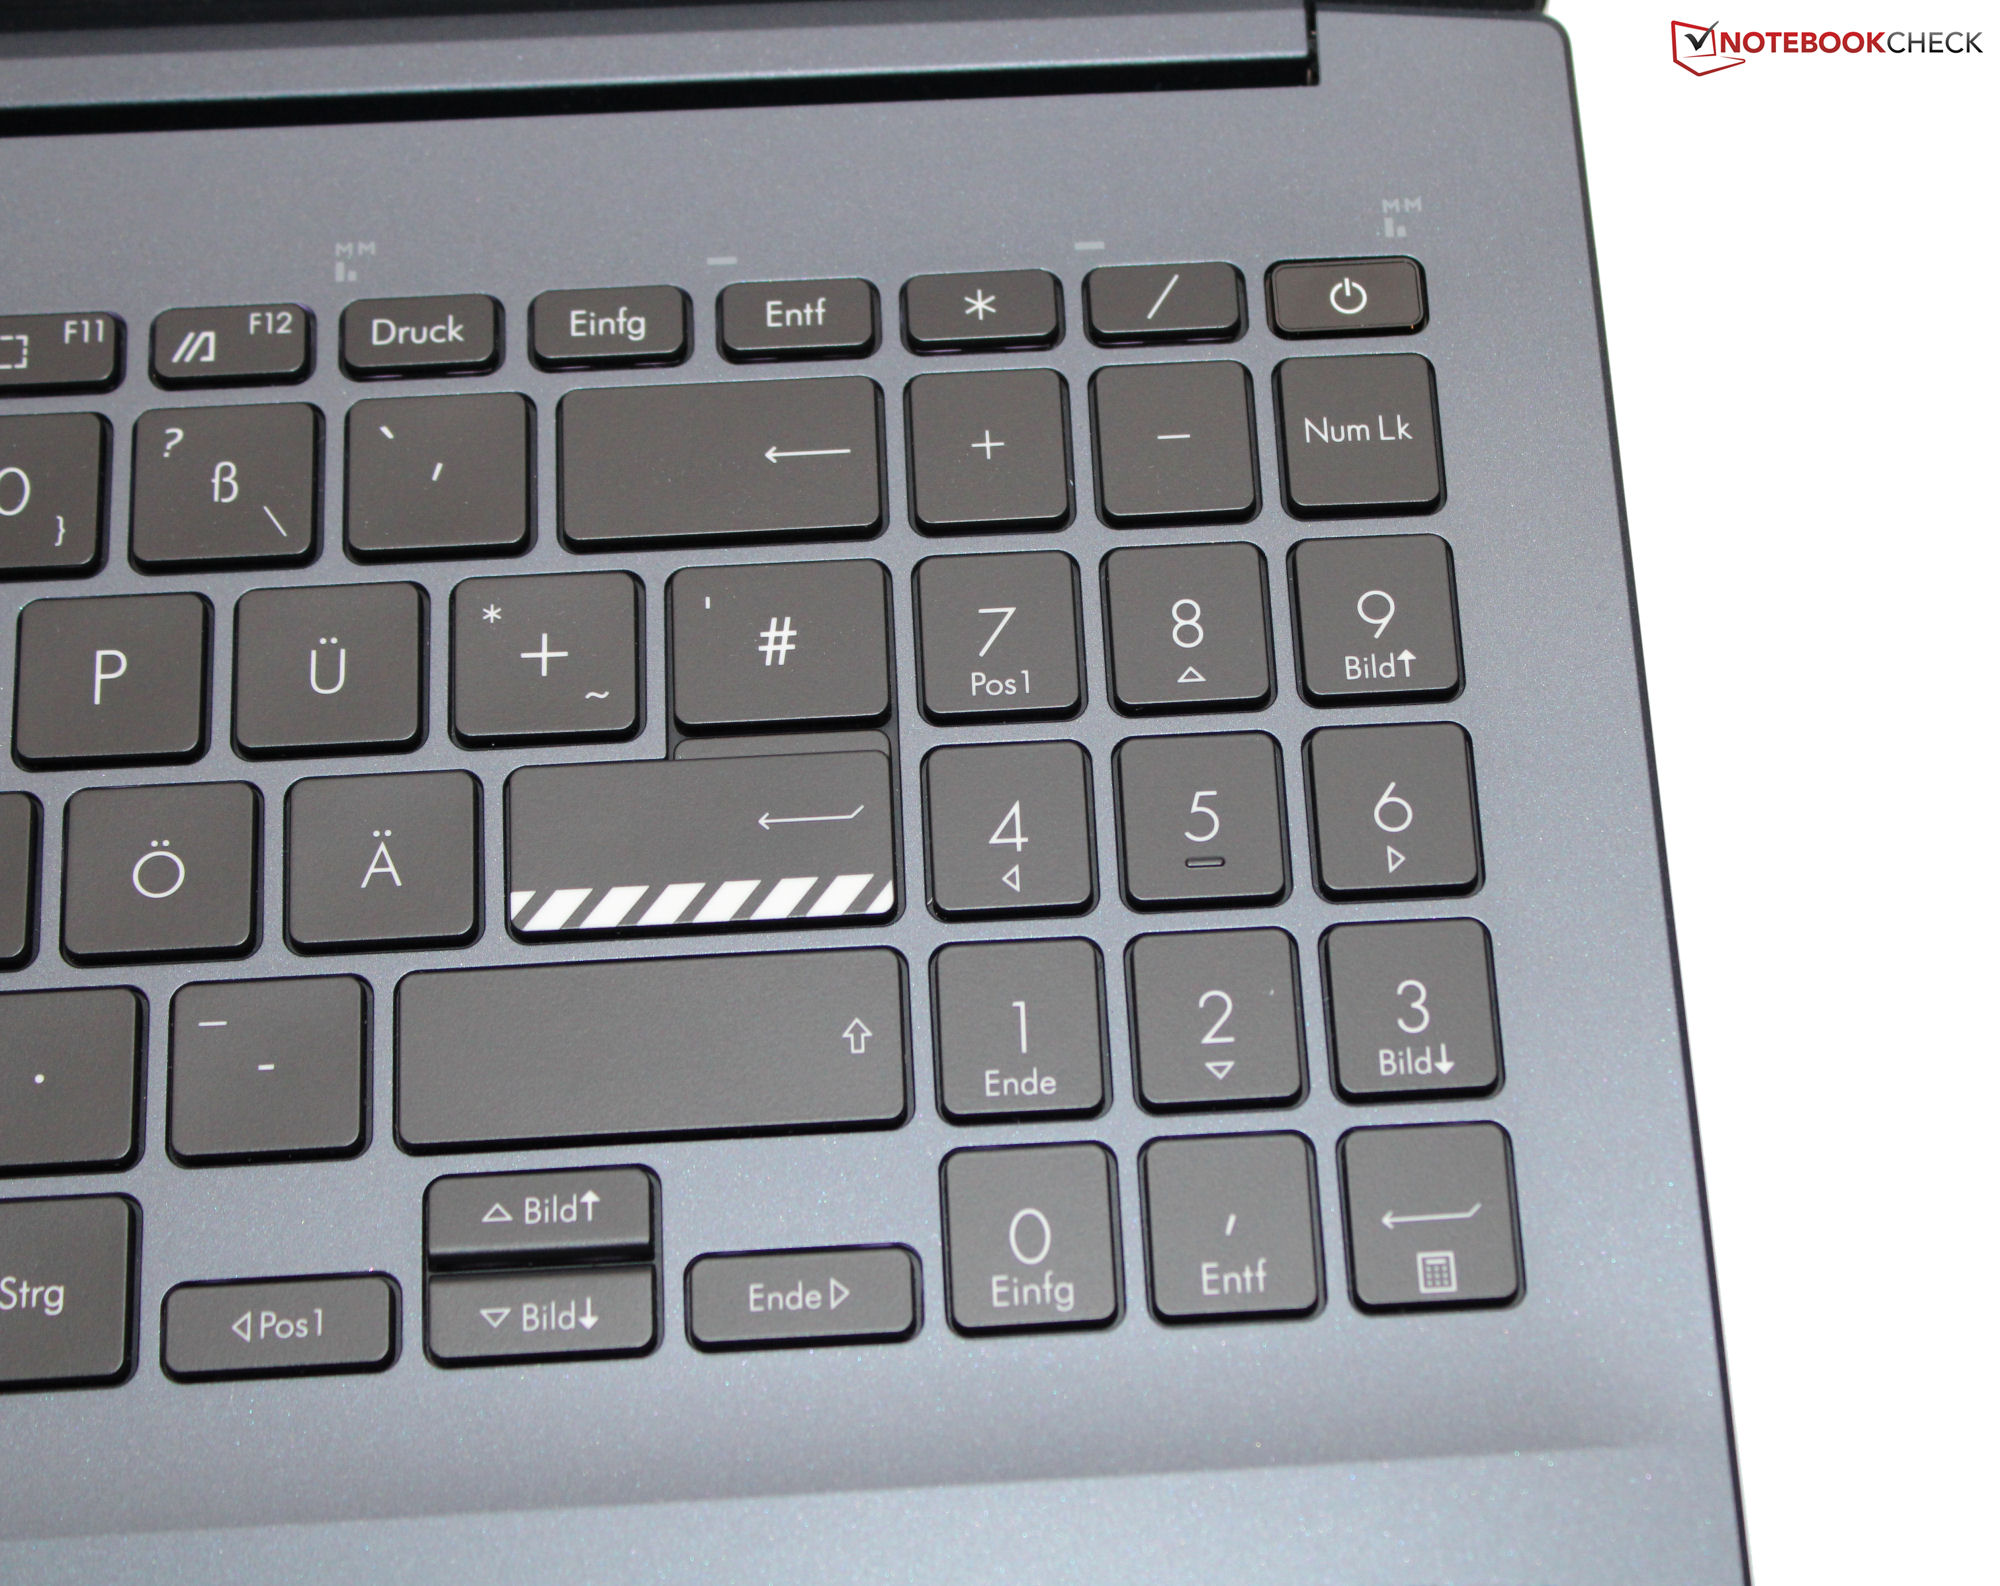
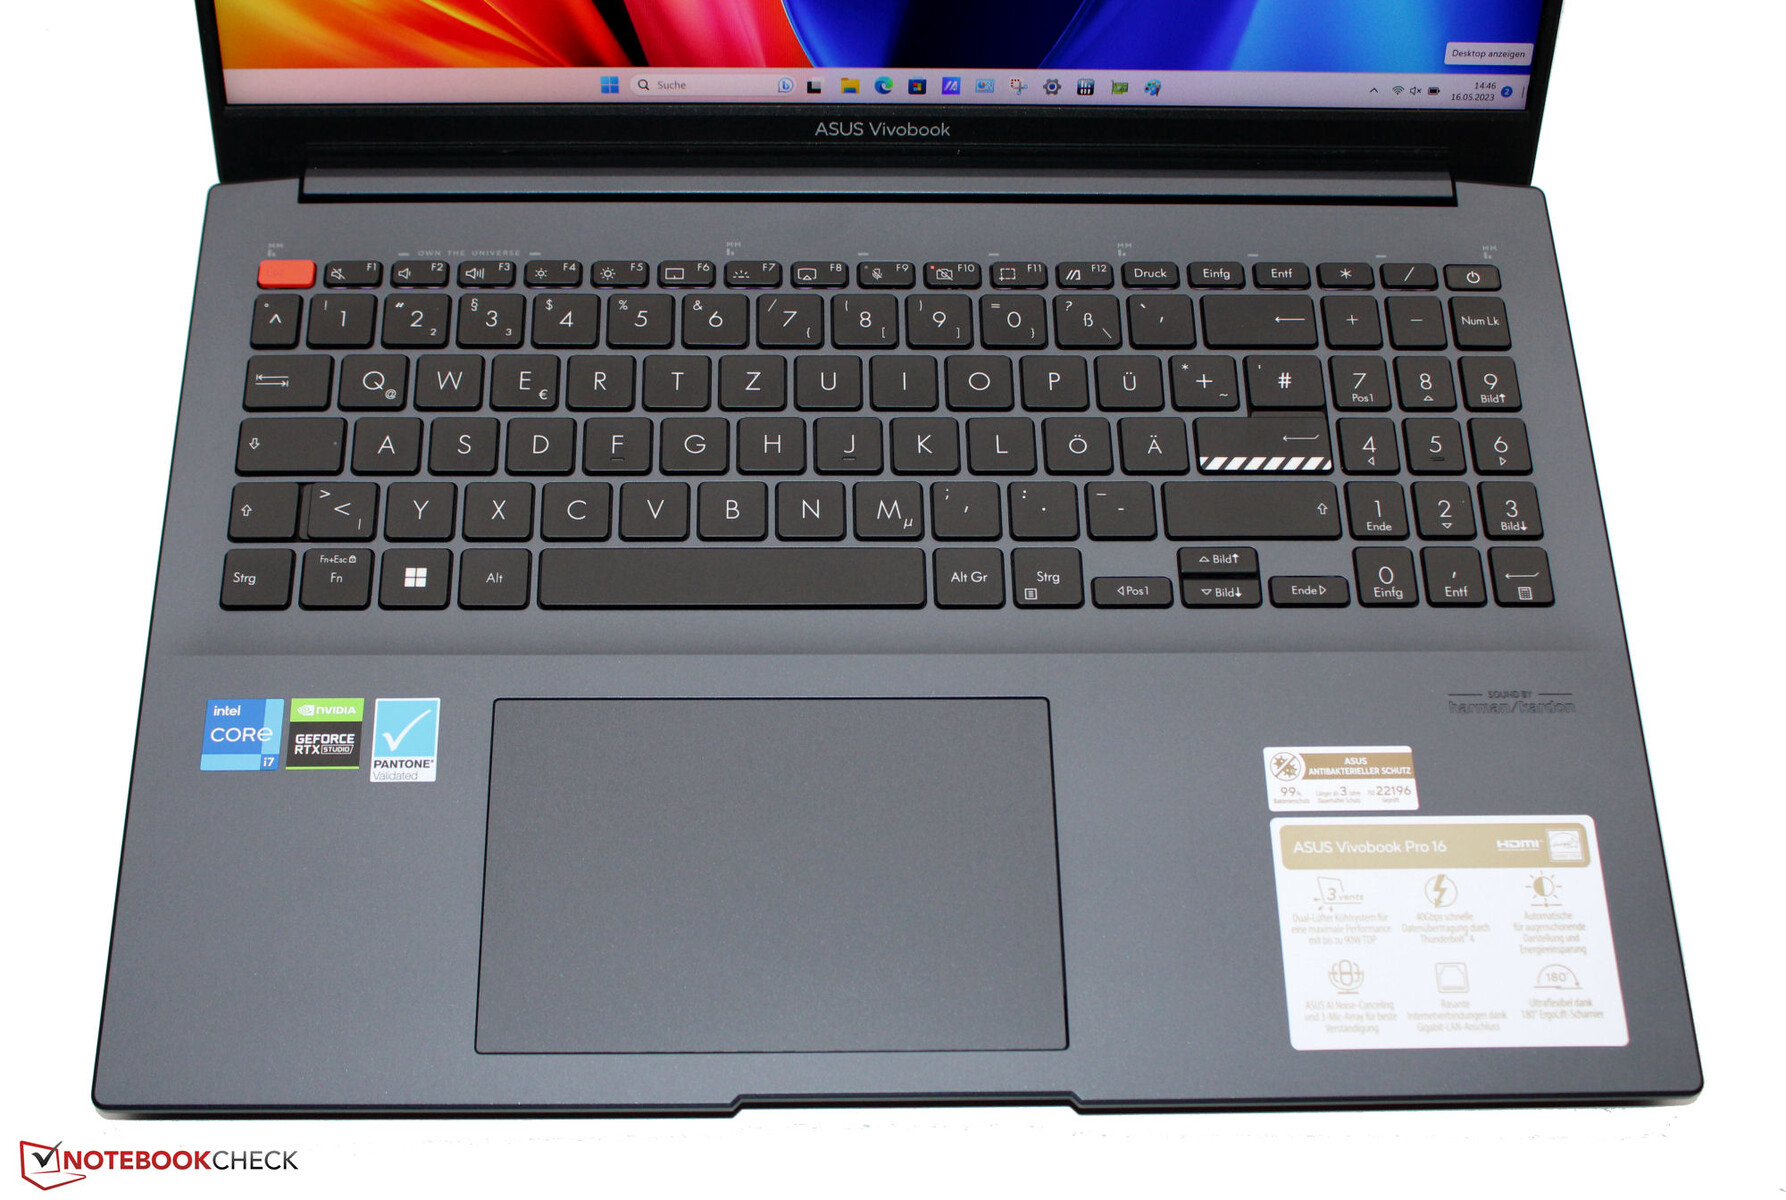
Las teclas del teclado chiclet (parcialmente curvadas y con tres modos de iluminación) tienen una elevación media y un punto de presión claro. Tienen buenos niveles de resistencia, pero podrían ser un poco más nítidas. El teclado cede ligeramente al escribir, pero no es nada negativo. En general, el teclado del portátil Asus está bien para el uso diario.
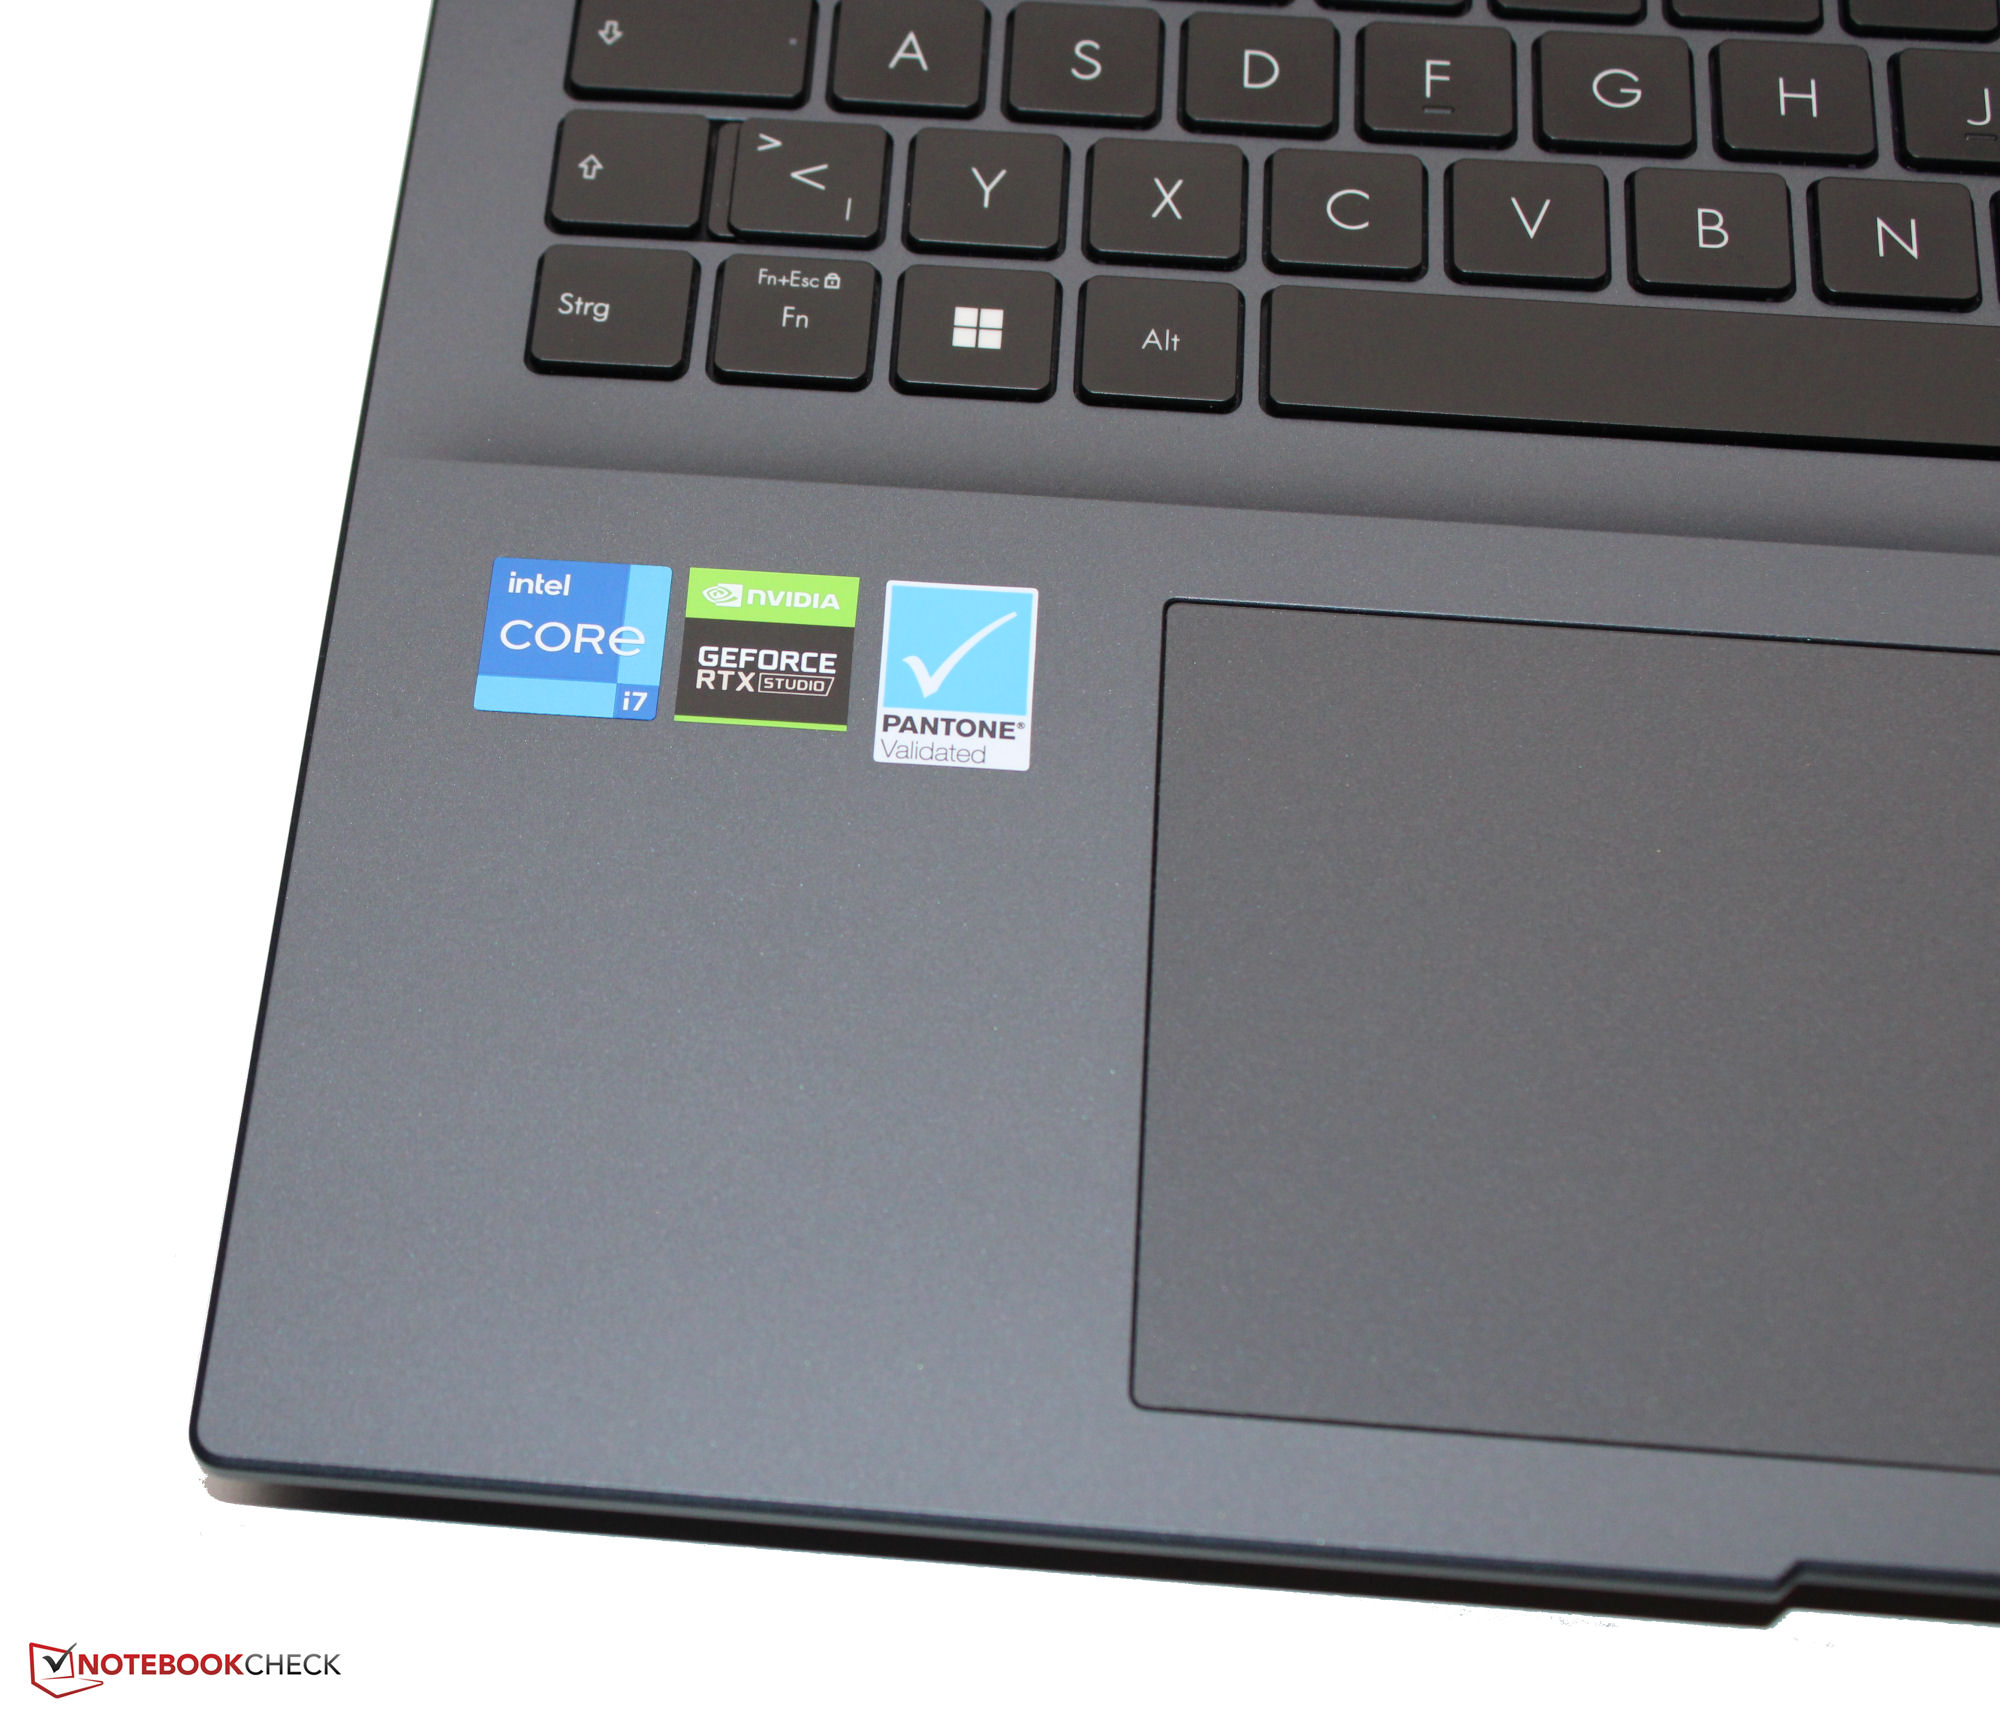
Un click pad (13 x 8,5 cm) reemplaza la necesidad de un ratón y su superficie lisa hace que los dedos se deslicen sobre él cómodamente. Reacciona a las entradas hasta los bordes, tiene una elevación mínima y un punto de presión claro.
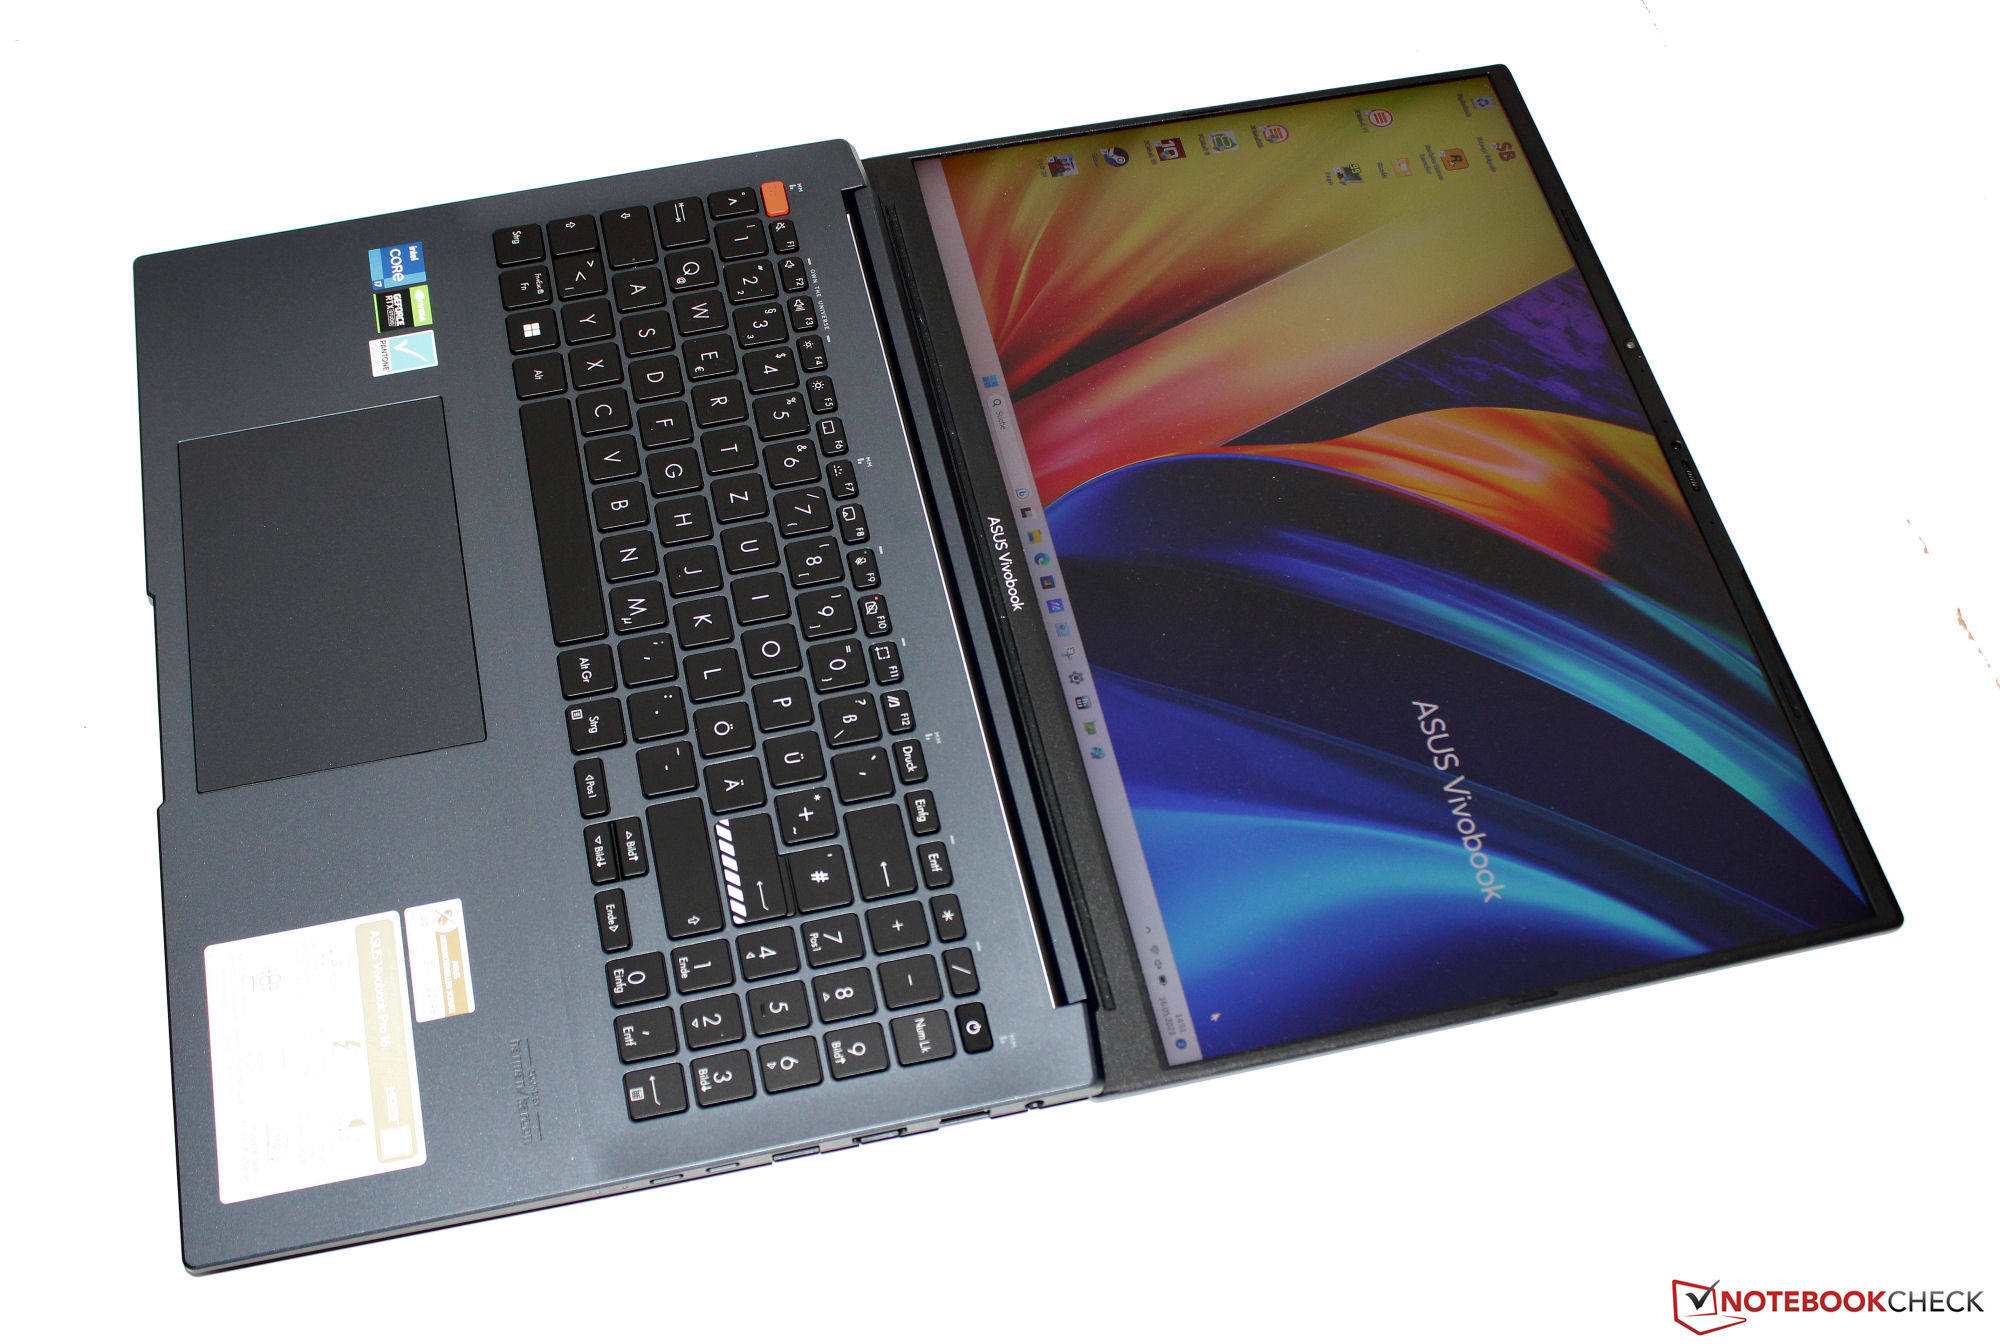
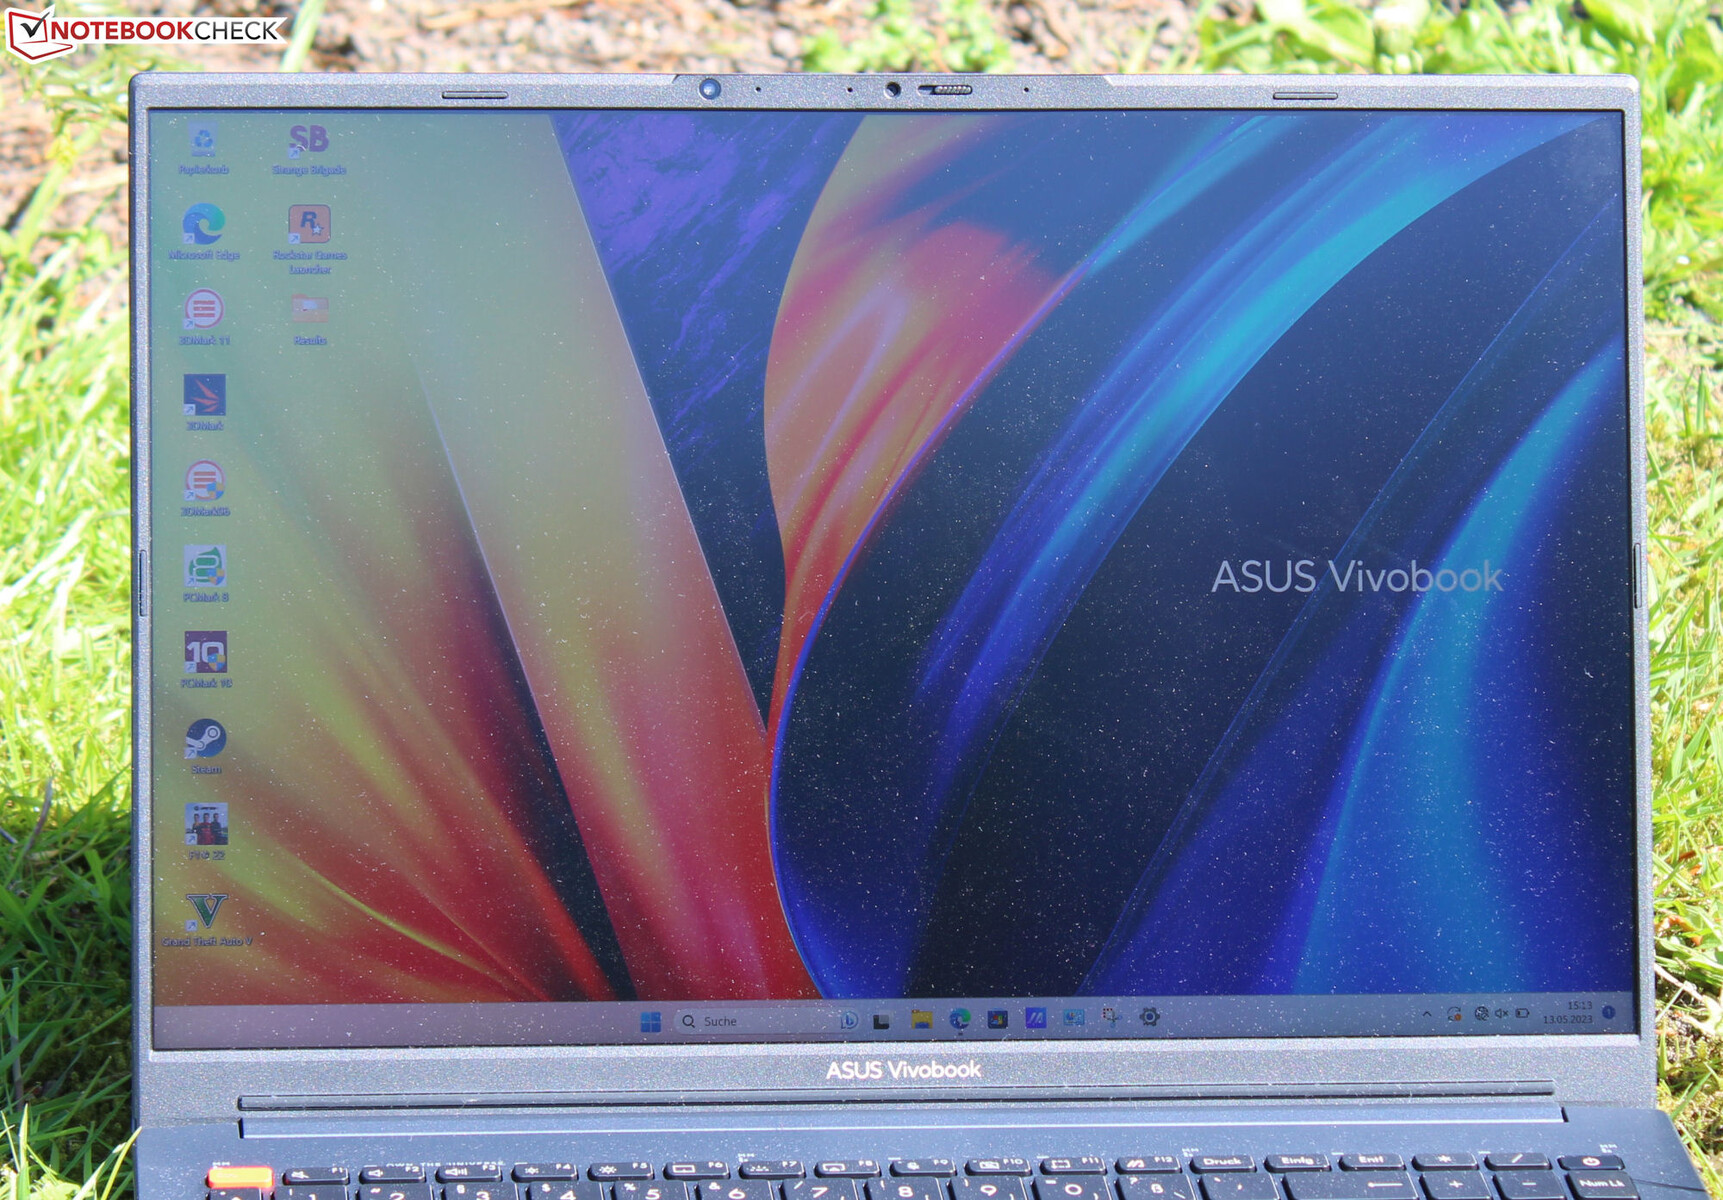
Pantalla: panel 16:10 con cobertura DCI-P3
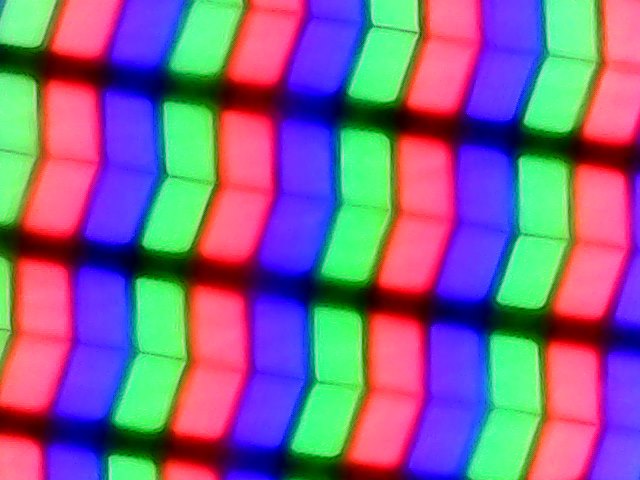
El rápido panel de 120 Hz en formato 16:10 no muestra signos de parpadeo PWM en todos los niveles de brillo. El brillo y el contraste de la pantalla mate de 16 pulgadas (2.560 x 1.600 píxeles) son exactamente como deberían ser (> 300 cd/m² o 1.000:1).
| |||||||||||||||||||||||||
iluminación: 87 %
Brillo con batería: 509 cd/m²
Contraste: 1440:1 (Negro: 0.35 cd/m²)
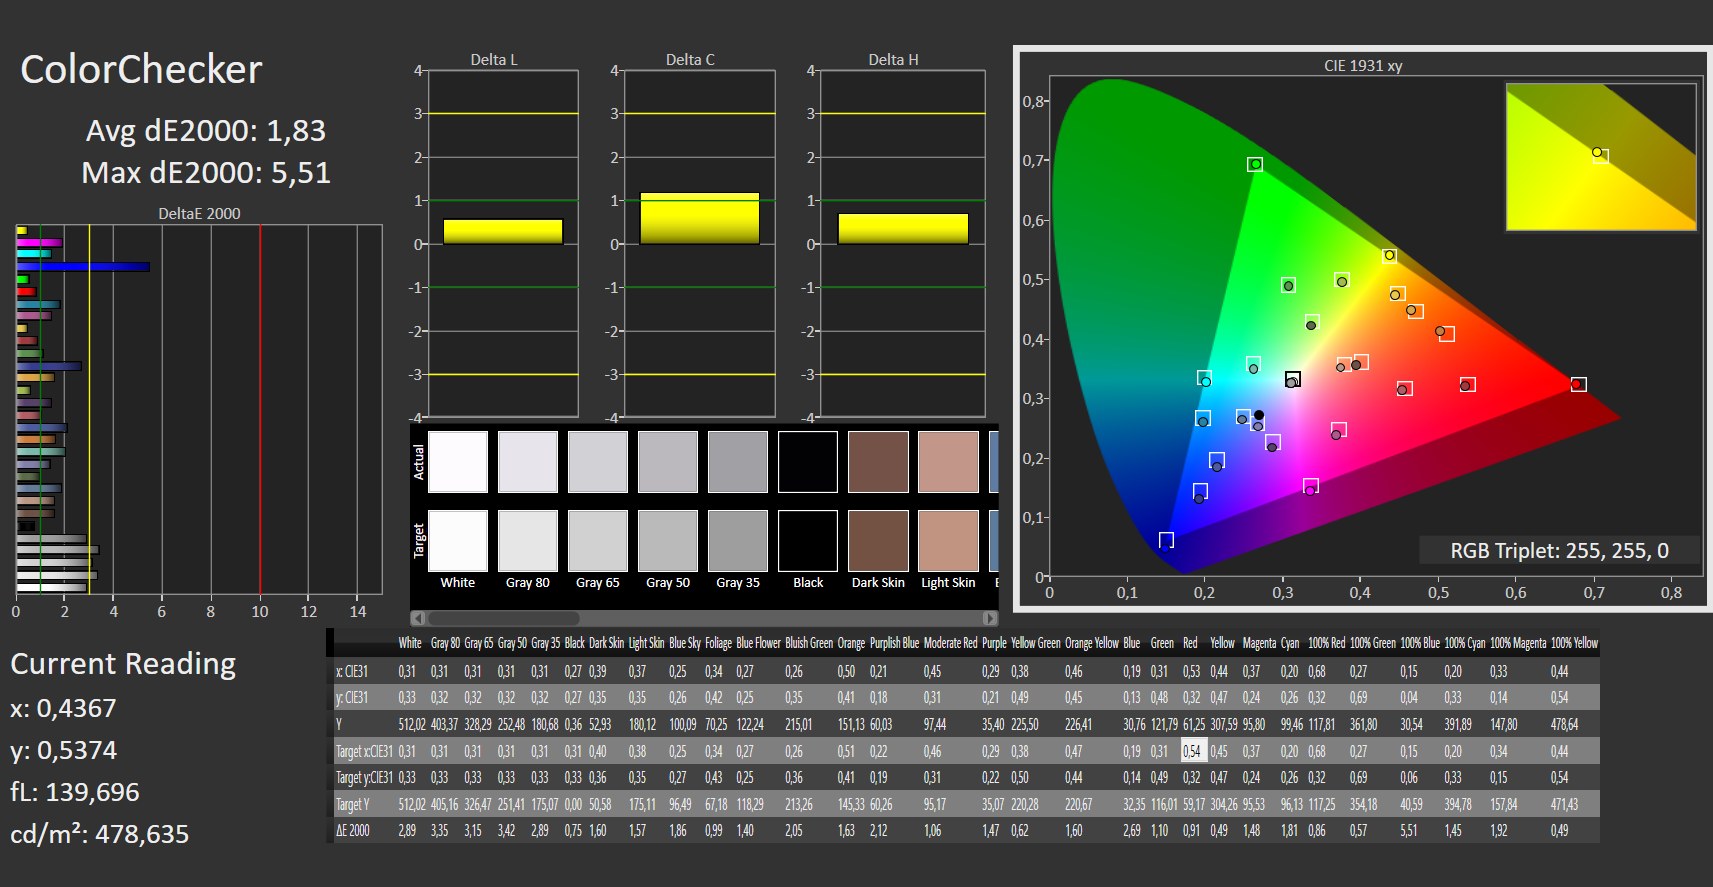
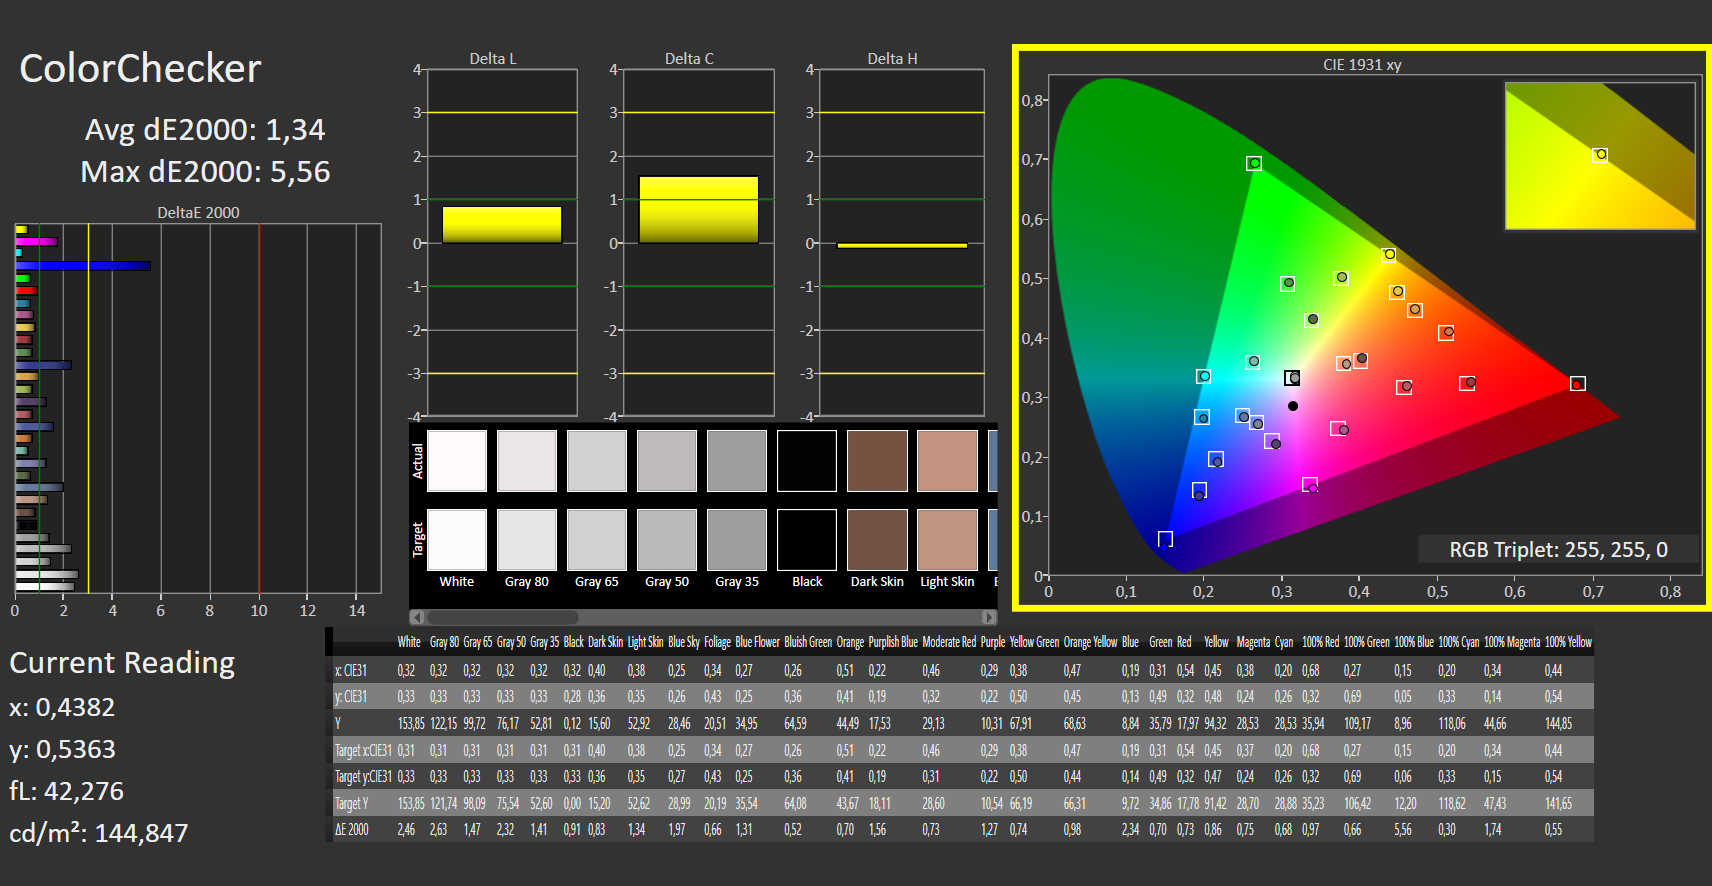
ΔE ColorChecker Calman: 1.83 | ∀{0.5-29.43 Ø4.71}
calibrated: 1.34
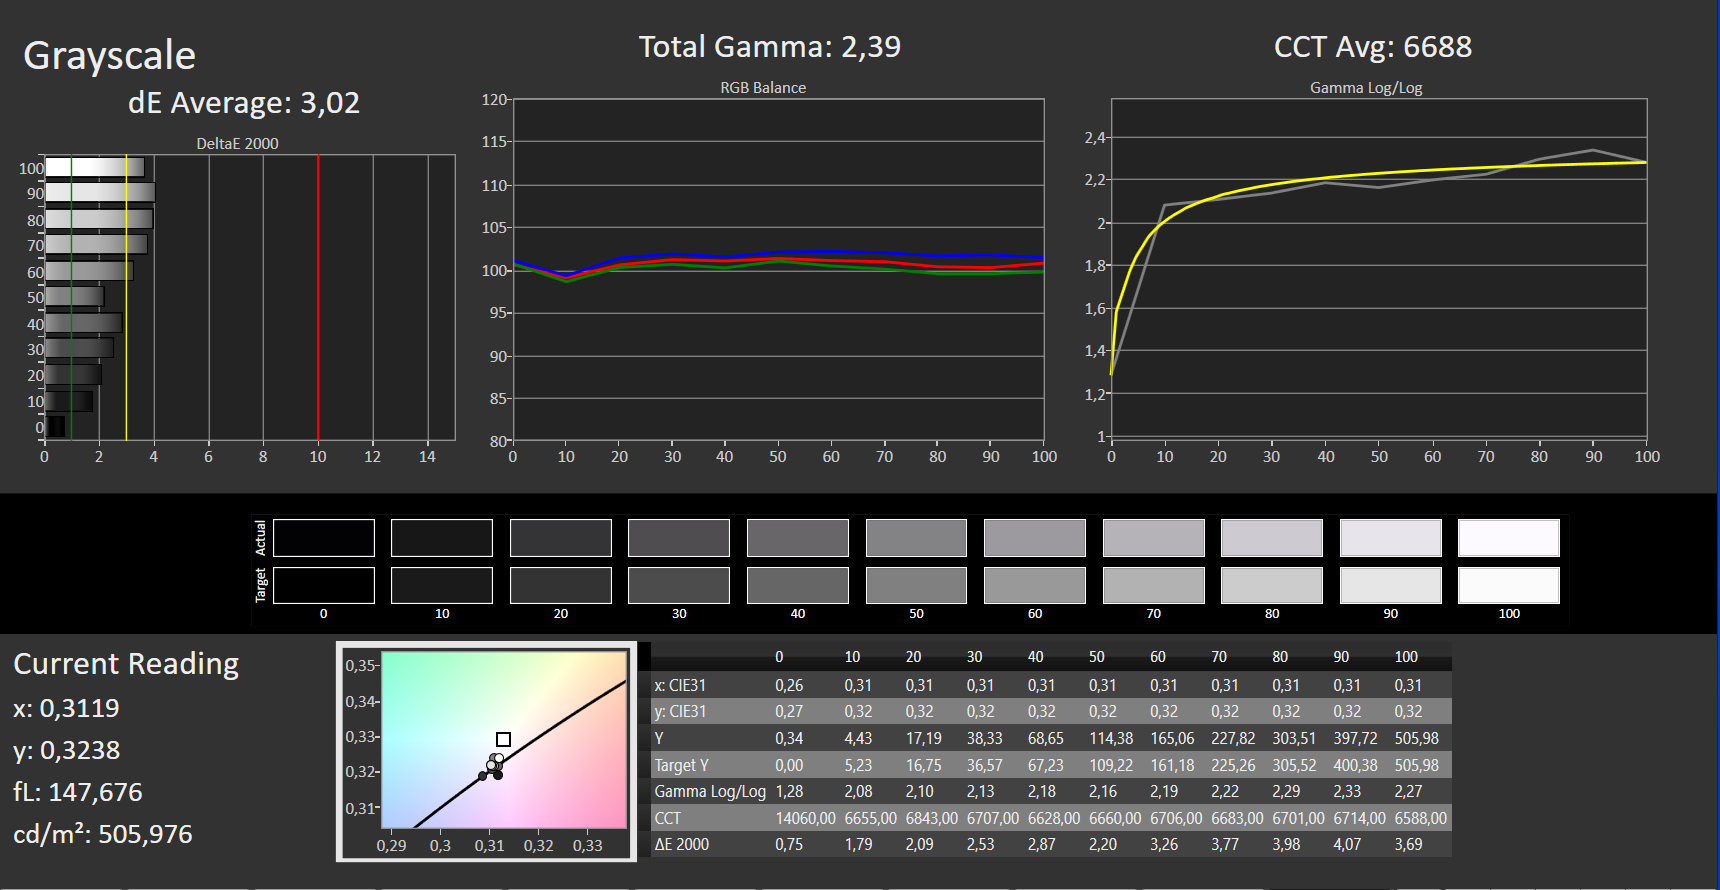
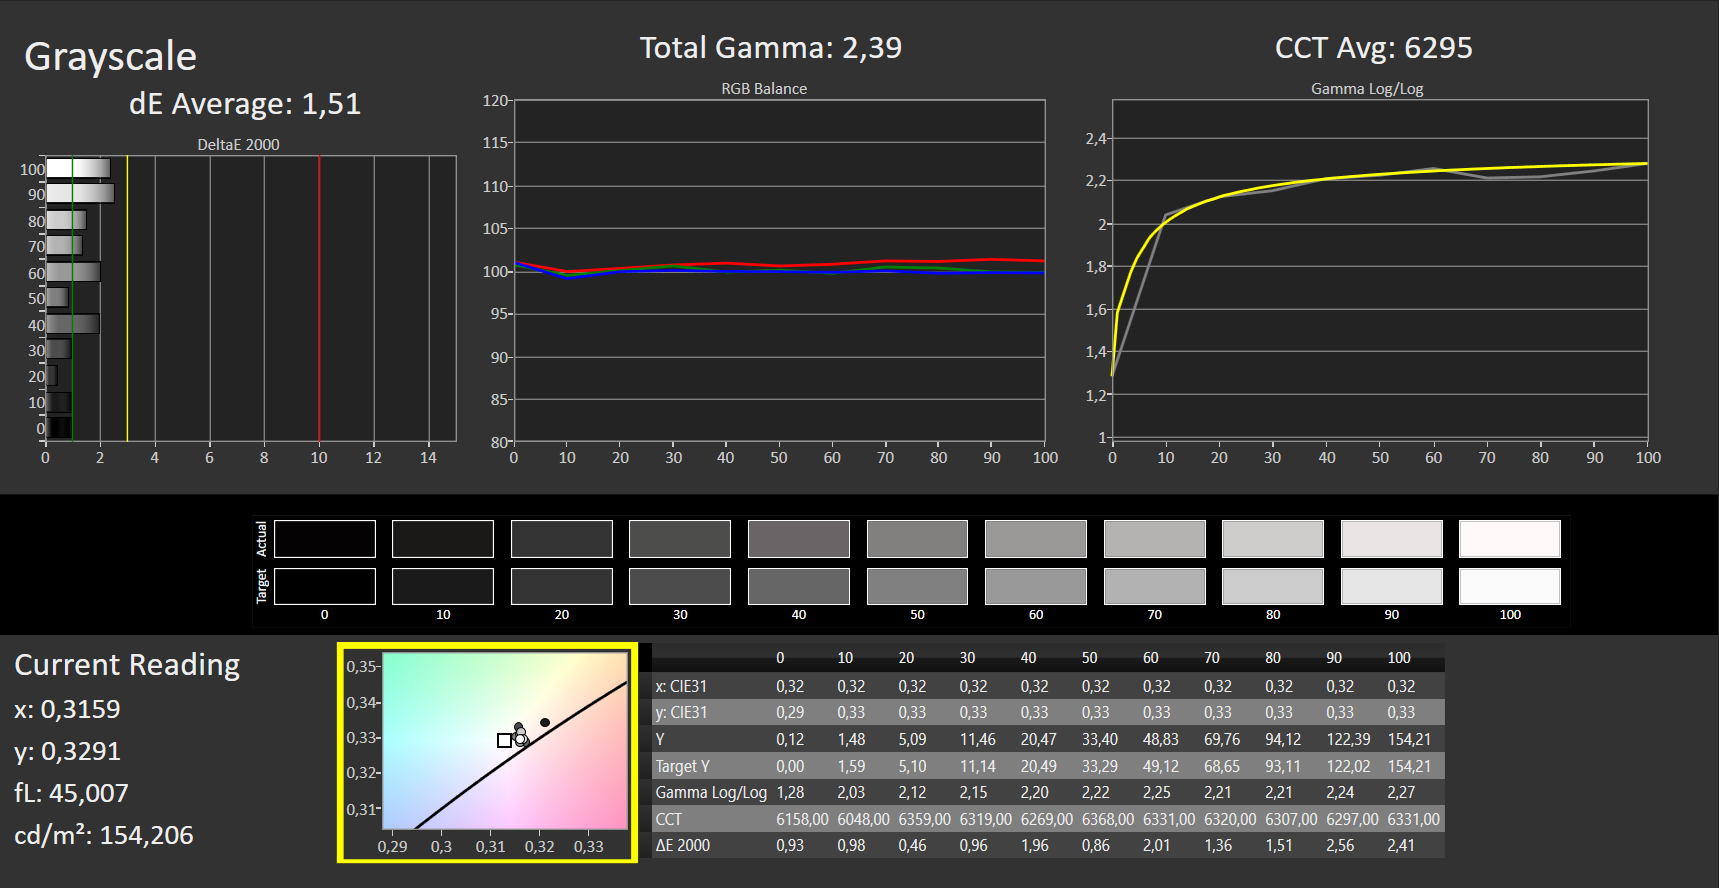
ΔE Greyscale Calman: 3.02 | ∀{0.09-98 Ø4.96}
86.1% AdobeRGB 1998 (Argyll 3D)
99.9% sRGB (Argyll 3D)
98.5% Display P3 (Argyll 3D)
Gamma: 2.39
CCT: 6688 K
| Asus VivoBook Pro 16 Au Optronics B160QAN02.L, IPS, 2560x1600, 16" | Dell Inspiron 16 Plus 7620 BOE NE16N41, IPS, 3072x1920, 16" | Schenker XMG Fusion 15 (Mid 22) BOE CQ NE156QHM-NY2, IPS, 2560x1440, 15.6" | Acer Swift X SFX16-52G-77RX B160QAN02.M, IPS-LED, 2560x1600, 16" | |
|---|---|---|---|---|
| Display | -14% | -19% | -11% | |
| Display P3 Coverage (%) | 98.5 | 70.8 -28% | 67.3 -32% | 76.4 -22% |
| sRGB Coverage (%) | 99.9 | 99.5 0% | 96.7 -3% | 100 0% |
| AdobeRGB 1998 Coverage (%) | 86.1 | 73.2 -15% | 68.2 -21% | 76.6 -11% |
| Response Times | -1025% | -234% | -819% | |
| Response Time Grey 50% / Grey 80% * (ms) | 2 ? | 38 ? -1800% | 11.6 ? -480% | 33 ? -1550% |
| Response Time Black / White * (ms) | 8 ? | 28 ? -250% | 7 ? 12% | 15 ? -88% |
| PWM Frequency (Hz) | ||||
| Screen | 7% | -32% | -4% | |
| Brightness middle (cd/m²) | 504 | 288.9 -43% | 326 -35% | 411 -18% |
| Brightness (cd/m²) | 465 | 276 -41% | 303 -35% | 378 -19% |
| Brightness Distribution (%) | 87 | 92 6% | 89 2% | 83 -5% |
| Black Level * (cd/m²) | 0.35 | 0.26 26% | 0.33 6% | 0.29 17% |
| Contrast (:1) | 1440 | 1111 -23% | 988 -31% | 1417 -2% |
| Colorchecker dE 2000 * | 1.83 | 1.88 -3% | 2.73 -49% | 2.18 -19% |
| Colorchecker dE 2000 max. * | 5.51 | 4.37 21% | 9.54 -73% | 4.84 12% |
| Colorchecker dE 2000 calibrated * | 1.34 | 0.42 69% | 1.36 -1% | 1.48 -10% |
| Greyscale dE 2000 * | 3.02 | 1.4 54% | 5.2 -72% | 2.68 11% |
| Gamma | 2.39 92% | 2.3 96% | 2.074 106% | 2.43 91% |
| CCT | 6688 97% | 6634 98% | 6911 94% | 6717 97% |
| Media total (Programa/Opciones) | -344% /
-145% | -95% /
-58% | -278% /
-122% |
* ... más pequeño es mejor
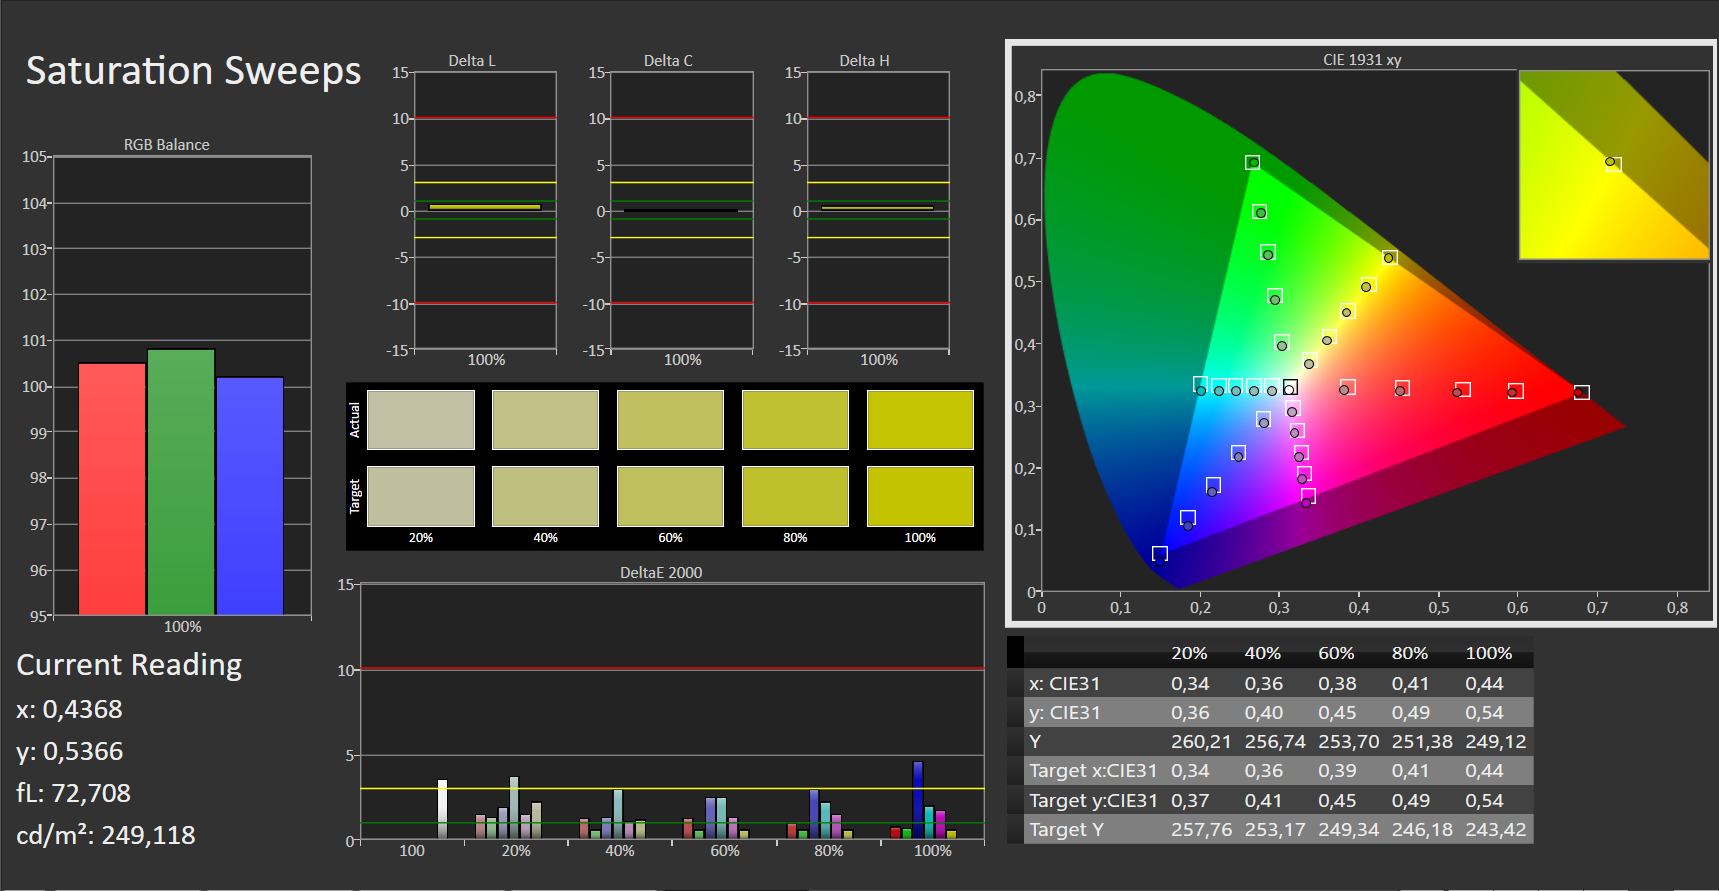
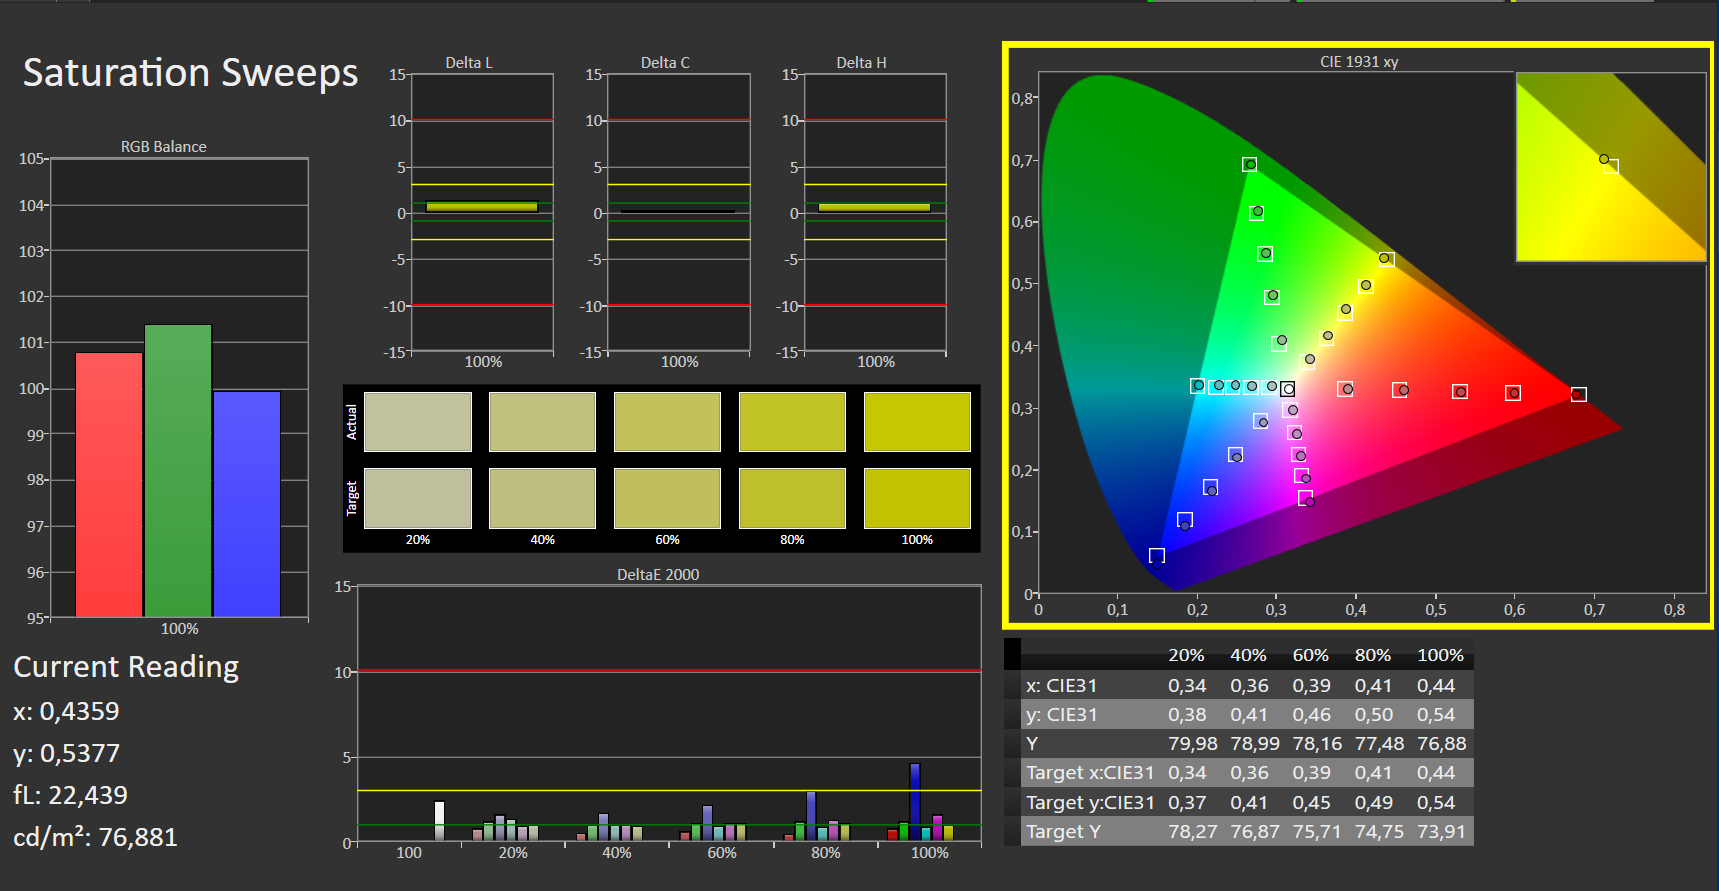
La certificación X Rite Pantone de la pantalla permite una representación muy natural del color: Con desviaciones en torno a 1,8, ofrece resultados aceptables (DeltaE < 3) nada más sacarla de la caja. Calibrándolo se consigue una desviación menor de 1,3 y unos tonos grises más equilibrados. La precisión del color no es un problema: el panel puede representar todo el espacio de color DCI P3 y el 86% del espacio Adobe RGB.
Tiempos de respuesta del display
| ↔ Tiempo de respuesta de Negro a Blanco | ||
|---|---|---|
| 8 ms ... subida ↗ y bajada ↘ combinada | ↗ 1 ms subida |  |
| ↘ 7 ms bajada | ||
| La pantalla mostró tiempos de respuesta rápidos en nuestros tests y debería ser adecuada para juegos. En comparación, todos los dispositivos de prueba van de ##min### (mínimo) a 240 (máximo) ms. » 22 % de todos los dispositivos son mejores. Esto quiere decir que el tiempo de respuesta medido es mejor que la media (19.8 ms) de todos los dispositivos testados. | ||
| ↔ Tiempo de respuesta 50% Gris a 80% Gris | ||
| 2 ms ... subida ↗ y bajada ↘ combinada | ↗ 1 ms subida |  |
| ↘ 1 ms bajada | ||
| La pantalla mostró tiempos de respuesta muy rápidos en nuestros tests y debería ser adecuada para juegos frenéticos. En comparación, todos los dispositivos de prueba van de ##min### (mínimo) a 636 (máximo) ms. » 10 % de todos los dispositivos son mejores. Esto quiere decir que el tiempo de respuesta medido es mejor que la media (31 ms) de todos los dispositivos testados. | ||
Parpadeo de Pantalla / PWM (Pulse-Width Modulation)
| Parpadeo de Pantalla / PWM no detectado |     | ||
Comparación: 52 % de todos los dispositivos testados no usaron PWM para atenuar el display. Si se usó, medimos una media de 7747 (mínimo: 5 - máxmo: 343500) Hz. | |||
Su panel IPS de ángulo de visión estable puede leerse fácilmente desde cualquier ángulo. En exteriores, la pantalla suele permanecer legible siempre que el sol no incida con demasiada fuerza.
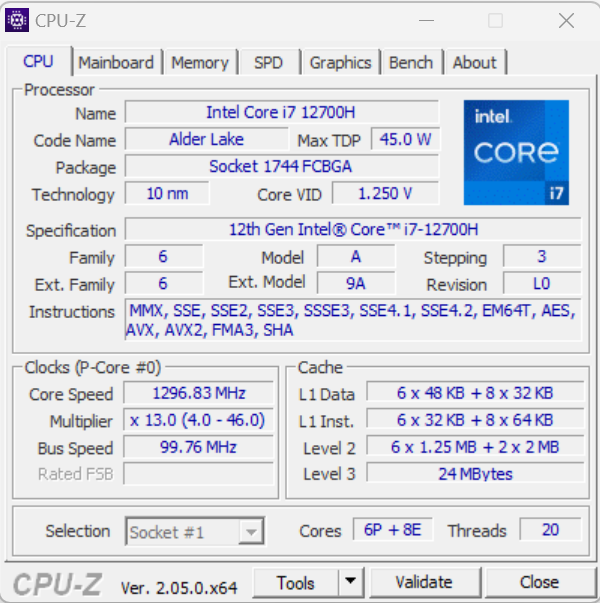
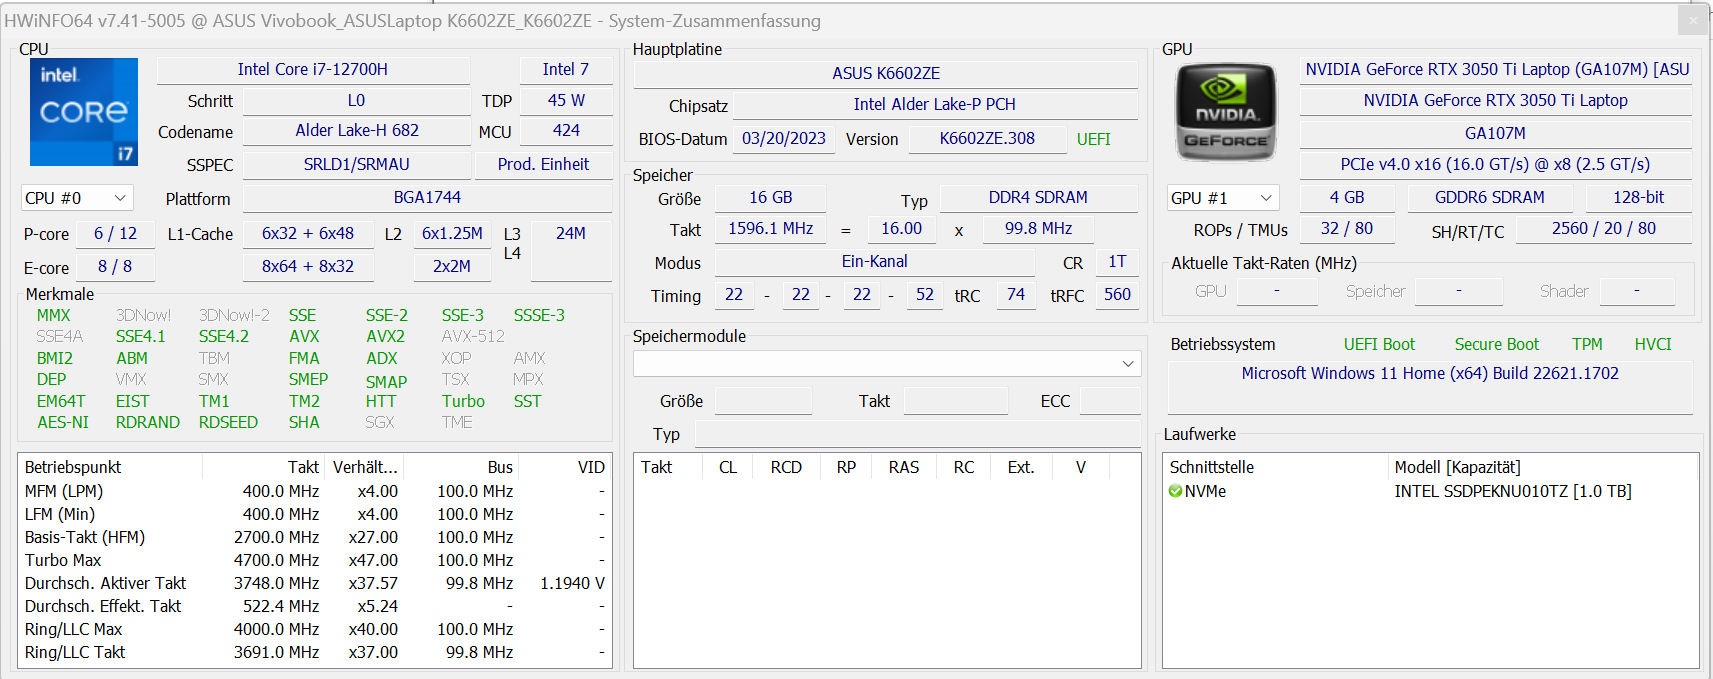
Rendimiento - Alder Lake y Ampere
La serie VivoBook Pro 16 consta de 5 gamas de modelos (véase número de modelo) que se basan en distintas generaciones de CPU y GPU. El actual modelo K6602ZE usa CPUs Alder Lake y una GPUGeForce-RTX-3050-TgPU. El PVPR de nuestro dispositivo de pruebas es de 1.247 $. No había otras variantes disponibles en el momento de las pruebas.
Condiciones de ensayo
Puedes cambiar entre tres modos de refrigeración específicos del fabricante (ver tabla) usando la combinación de teclas "Fn" + "F". Usamos el "modo estándar" (pruebas) y el "modo susurro" (test de batería).
| Modo Rendimiento | Modo Estándar | Modo Susurro | |
|---|---|---|---|
| Límite de potencia 1 (HWInfo) | 80 vatios | 50 vatios | 28 vatios |
| Límite de potencia 2 (HWInfo) | 120 vatios | 120 vatios | 120 vatios |
| TGP (Witcher 3) | 65 vatios | 50 vatios | 25 vatios |
Procesador
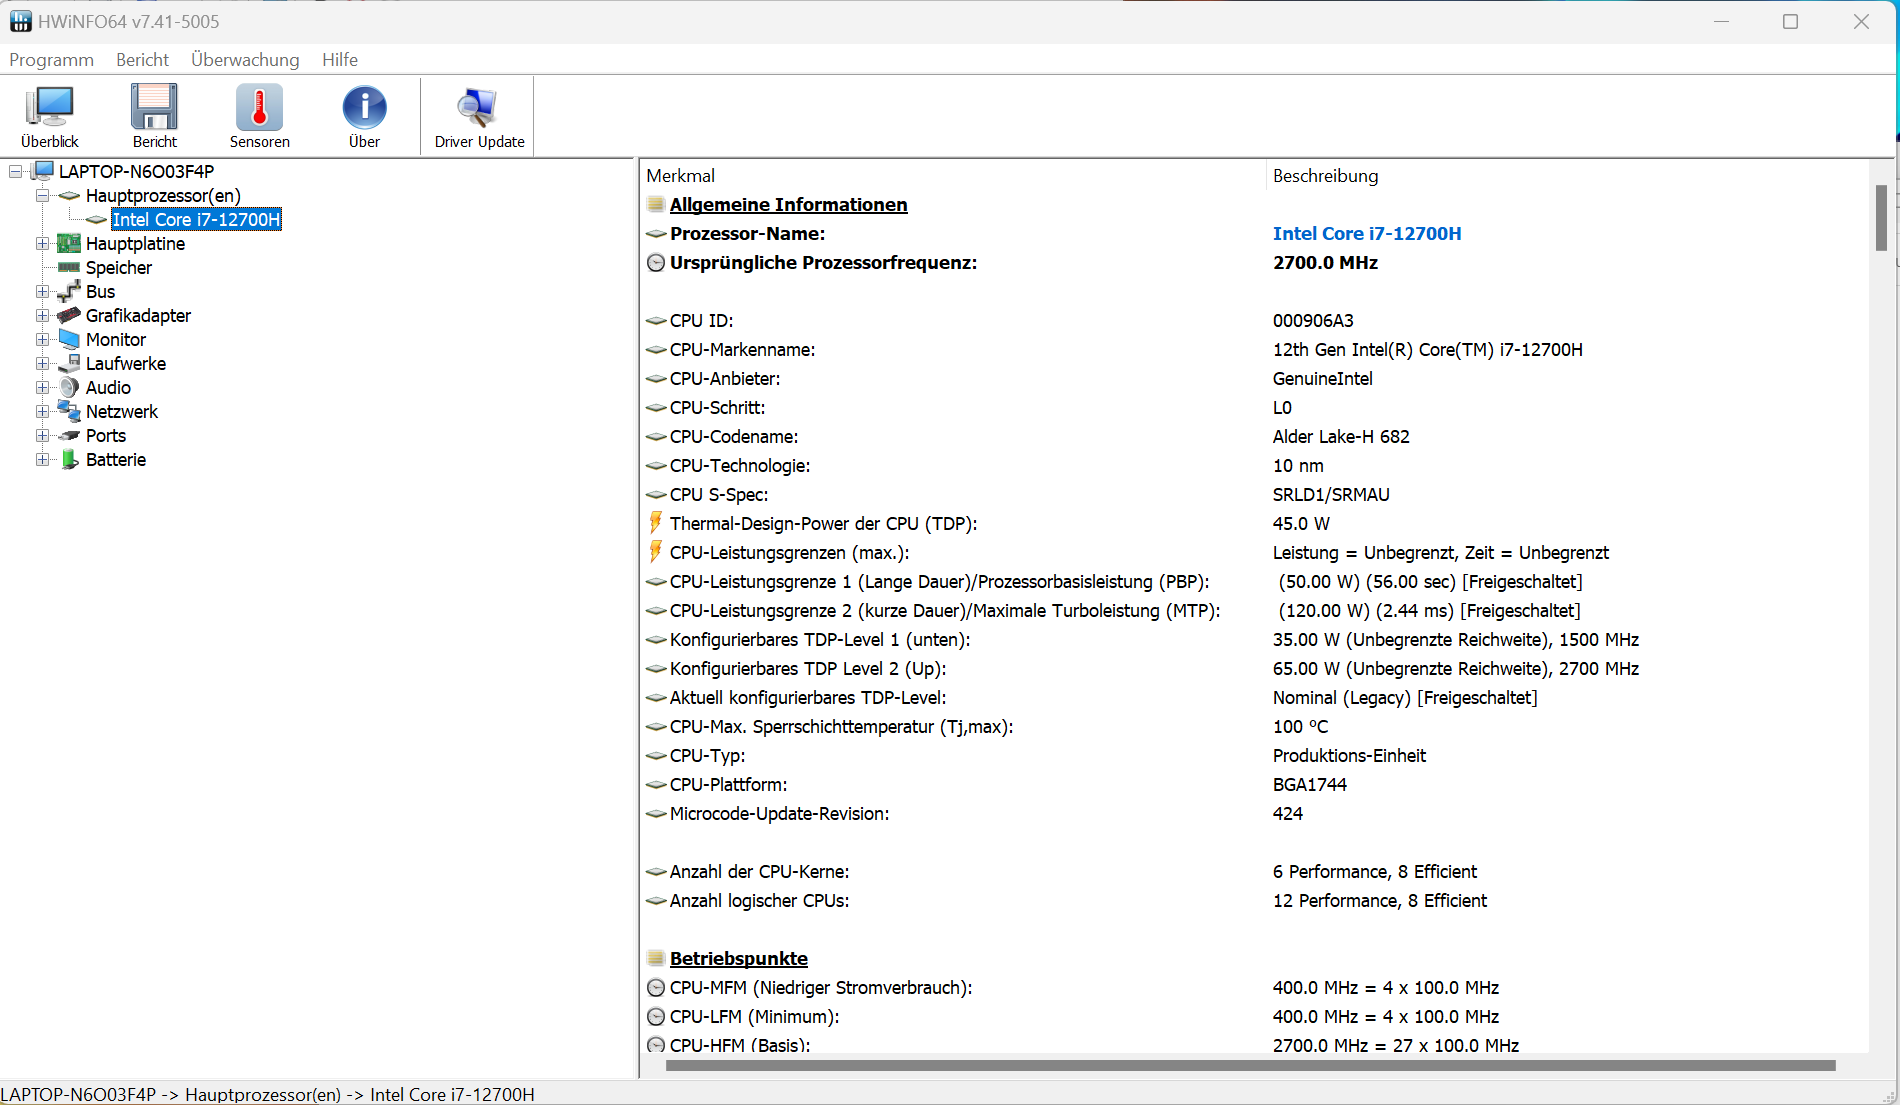
El portátilCore-i7-12700H(Alder Lake) consta de 6 núcleos de rendimiento (hyper threading, 2,4 - 4,7 GHz) y 8 núcleos de eficiencia (sin hyper threading, 1,8 - 3,5 GHz). En total, suman 20 núcleos lógicos de CPU.
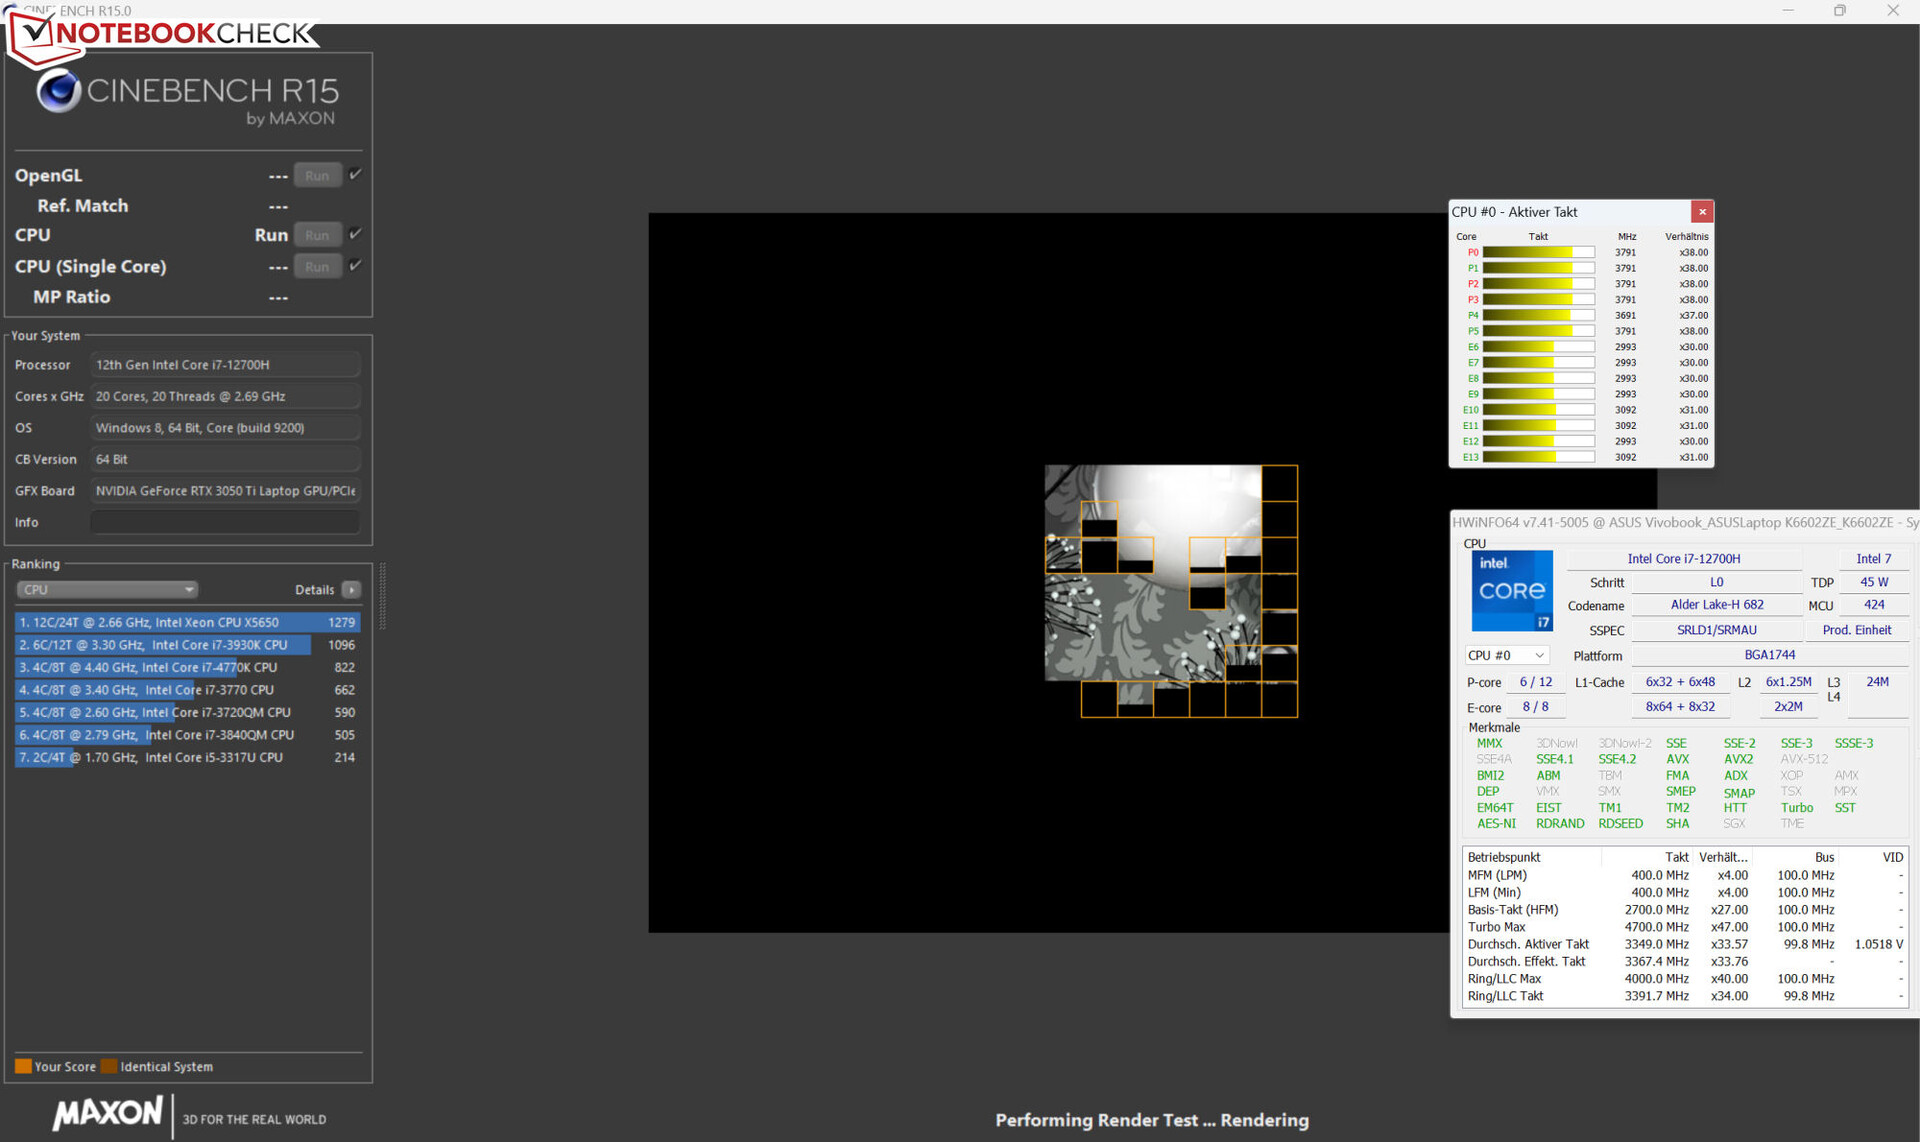
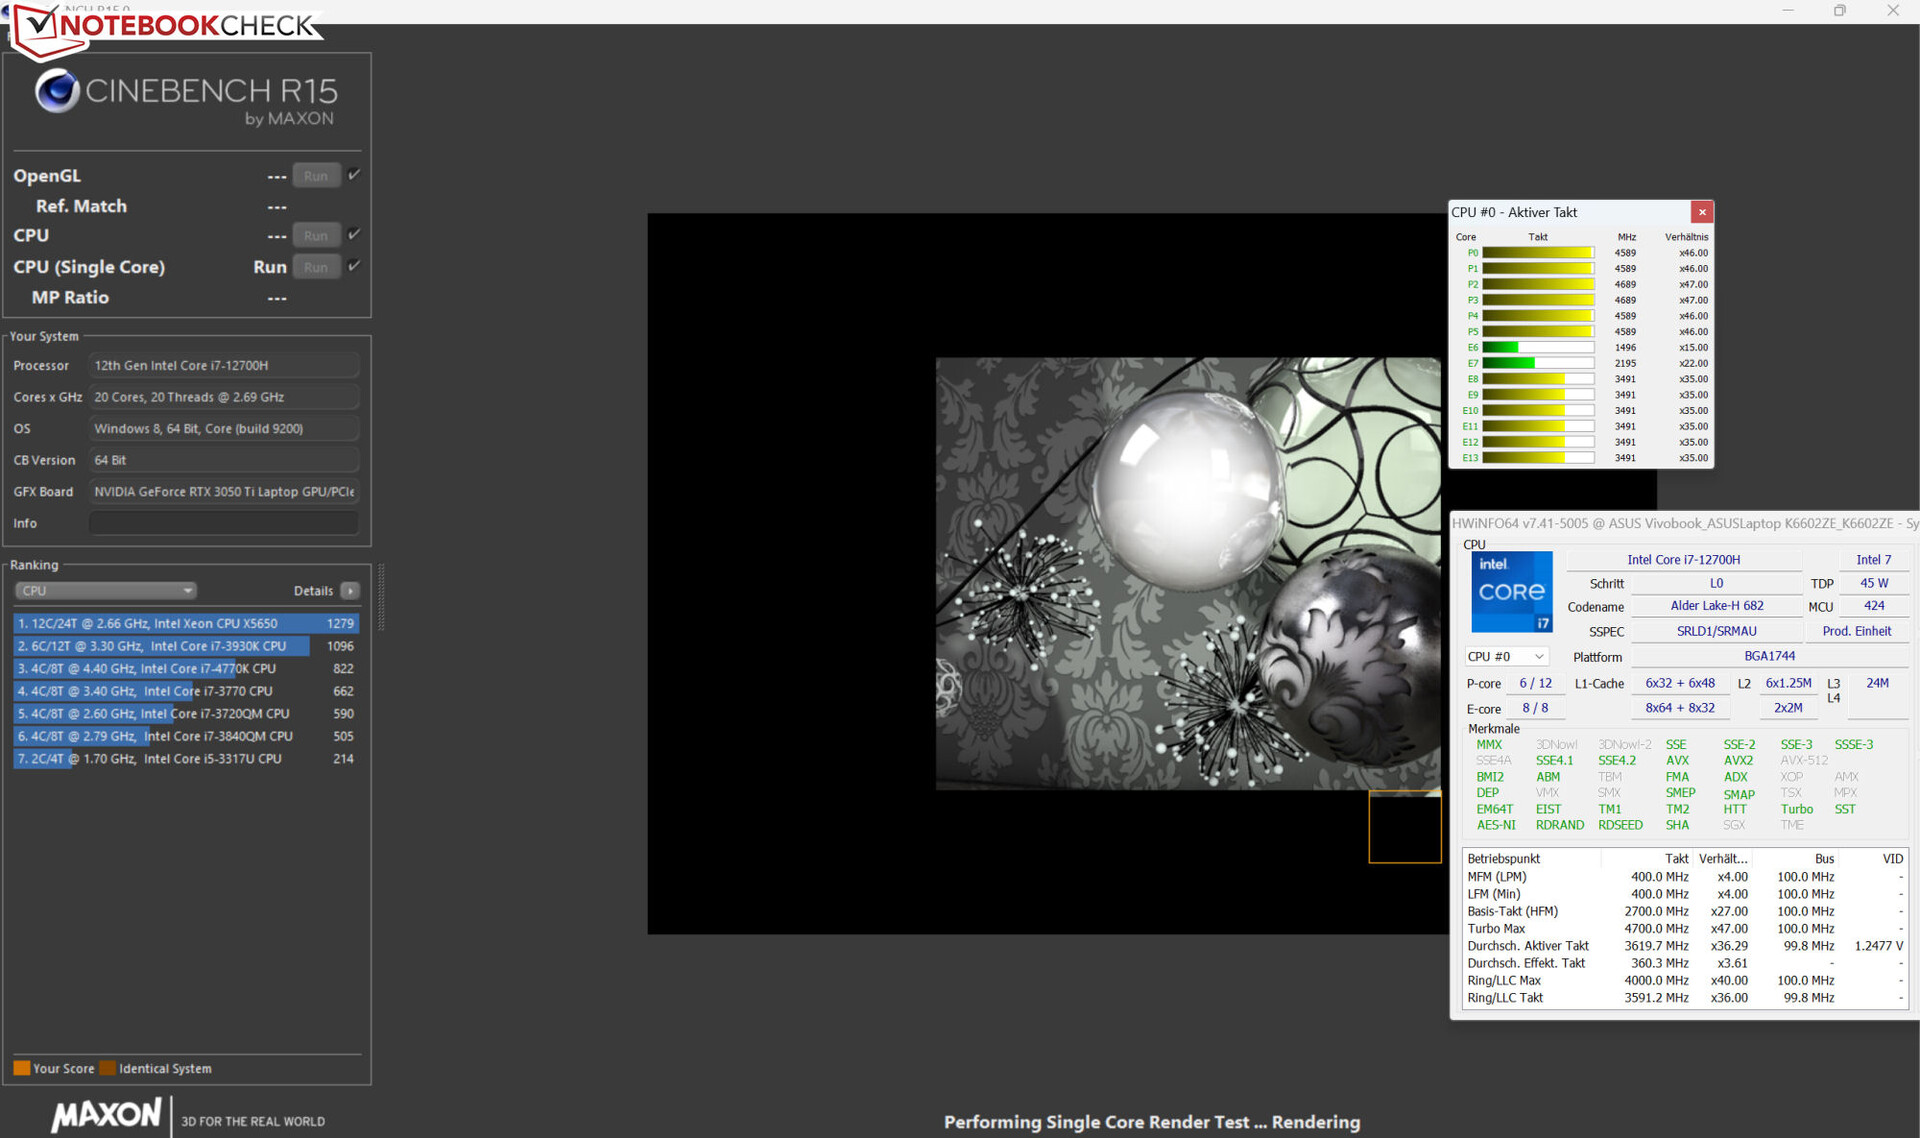
Medimos los mejores resultados del benchmark usando el "modo rendimiento" activado - aunque, la distancia con el "modo estándar" fue mínima. En cualquier caso, estos valores están por debajo de la media de la CPU. En modo batería, su rendimiento monohilo (127 puntos) se redujo en mayor medida que su rendimiento multihilo (1.695 puntos).
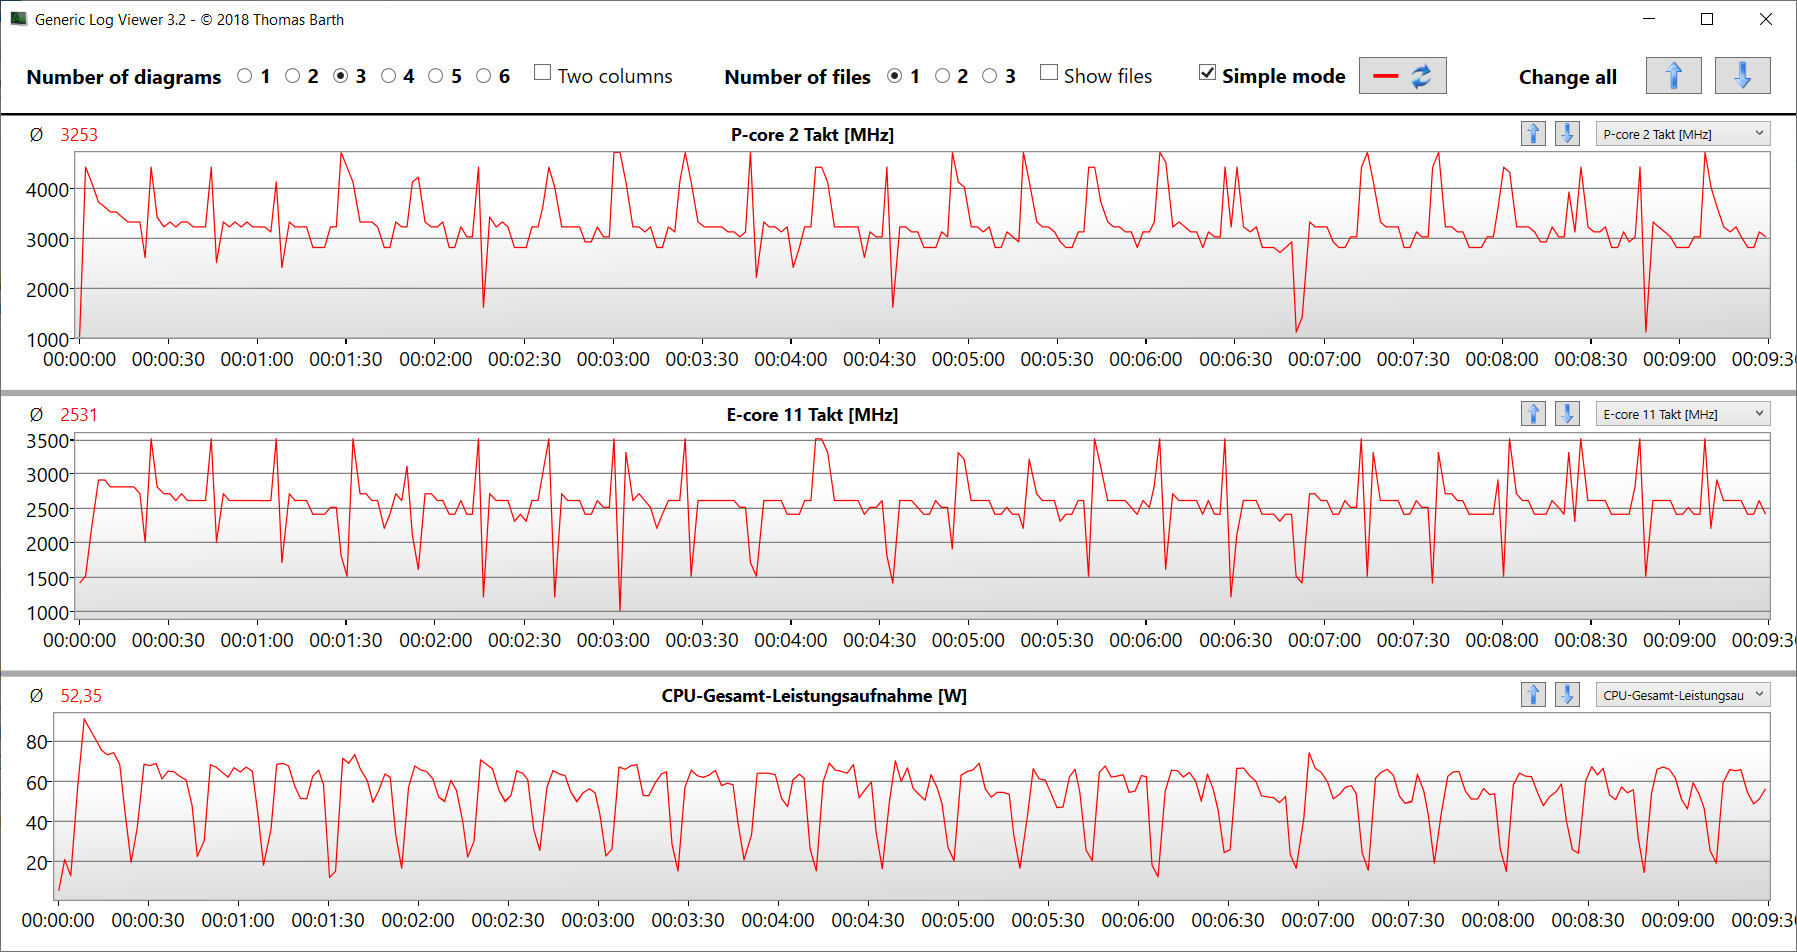
Así lo demostró la prueba de bucle CB15: La carga multihilo continua hizo que la velocidad de reloj del turbo cayera de la primera a la cuarta ejecución. Posteriormente, las tasas se mantuvieron constantes. El uso del "modo de rendimiento" no produjo ninguna mejora del rendimiento.
Cinebench R15 Multi continuous test
| CPU Performance rating - Percent | |
| Media de la clase Multimedia | |
| Medio Intel Core i7-12700H | |
| Dell Inspiron 16 Plus 7620 | |
| Asus VivoBook Pro 16 | |
| Acer Swift X SFX16-52G-77RX | |
| Schenker XMG Fusion 15 (Mid 22) | |
* ... más pequeño es mejor
AIDA64: FP32 Ray-Trace | FPU Julia | CPU SHA3 | CPU Queen | FPU SinJulia | FPU Mandel | CPU AES | CPU ZLib | FP64 Ray-Trace | CPU PhotoWorxx
| Performance rating | |
| Media de la clase Multimedia | |
| Schenker XMG Fusion 15 (Mid 22) | |
| Asus VivoBook Pro 16 | |
| Dell Inspiron 16 Plus 7620 | |
| Medio Intel Core i7-12700H | |
| Acer Swift X SFX16-52G-77RX | |
| AIDA64 / FP32 Ray-Trace | |
| Media de la clase Multimedia (2214 - 50388, n=56, últimos 2 años) | |
| Asus VivoBook Pro 16 (v6.75.6100) | |
| Dell Inspiron 16 Plus 7620 (v6.70.6000) | |
| Schenker XMG Fusion 15 (Mid 22) (v6.70.6000) | |
| Medio Intel Core i7-12700H (2585 - 17957, n=64) | |
| Acer Swift X SFX16-52G-77RX (v6.70.6000) | |
| AIDA64 / FPU Julia | |
| Media de la clase Multimedia (12867 - 201874, n=57, últimos 2 años) | |
| Asus VivoBook Pro 16 (v6.75.6100) | |
| Dell Inspiron 16 Plus 7620 (v6.70.6000) | |
| Schenker XMG Fusion 15 (Mid 22) (v6.70.6000) | |
| Medio Intel Core i7-12700H (12439 - 90760, n=64) | |
| Acer Swift X SFX16-52G-77RX (v6.70.6000) | |
| AIDA64 / CPU SHA3 | |
| Schenker XMG Fusion 15 (Mid 22) (v6.70.6000) | |
| Media de la clase Multimedia (626 - 8623, n=57, últimos 2 años) | |
| Asus VivoBook Pro 16 (v6.75.6100) | |
| Medio Intel Core i7-12700H (833 - 4242, n=64) | |
| Dell Inspiron 16 Plus 7620 (v6.70.6000) | |
| Acer Swift X SFX16-52G-77RX (v6.70.6000) | |
| AIDA64 / CPU Queen | |
| Asus VivoBook Pro 16 (v6.75.6100) | |
| Medio Intel Core i7-12700H (57923 - 103202, n=63) | |
| Dell Inspiron 16 Plus 7620 (v6.70.6000) | |
| Schenker XMG Fusion 15 (Mid 22) | |
| Acer Swift X SFX16-52G-77RX (v6.70.6000) | |
| Media de la clase Multimedia (13483 - 181505, n=44, últimos 2 años) | |
| AIDA64 / FPU SinJulia | |
| Medio Intel Core i7-12700H (3249 - 9939, n=64) | |
| Asus VivoBook Pro 16 (v6.75.6100) | |
| Media de la clase Multimedia (886 - 28794, n=57, últimos 2 años) | |
| Schenker XMG Fusion 15 (Mid 22) (v6.70.6000) | |
| Dell Inspiron 16 Plus 7620 (v6.70.6000) | |
| Acer Swift X SFX16-52G-77RX (v6.70.6000) | |
| AIDA64 / FPU Mandel | |
| Media de la clase Multimedia (6395 - 105740, n=56, últimos 2 años) | |
| Schenker XMG Fusion 15 (Mid 22) (v6.70.6000) | |
| Asus VivoBook Pro 16 (v6.75.6100) | |
| Dell Inspiron 16 Plus 7620 (v6.70.6000) | |
| Medio Intel Core i7-12700H (7135 - 44760, n=64) | |
| Acer Swift X SFX16-52G-77RX (v6.70.6000) | |
| AIDA64 / CPU AES | |
| Schenker XMG Fusion 15 (Mid 22) (v6.70.6000) | |
| Medio Intel Core i7-12700H (31839 - 144360, n=64) | |
| Asus VivoBook Pro 16 (v6.75.6100) | |
| Media de la clase Multimedia (8171 - 126790, n=57, últimos 2 años) | |
| Dell Inspiron 16 Plus 7620 (v6.70.6000) | |
| Acer Swift X SFX16-52G-77RX (v6.70.6000) | |
| AIDA64 / CPU ZLib | |
| Media de la clase Multimedia (143.8 - 2022, n=57, últimos 2 años) | |
| Dell Inspiron 16 Plus 7620 (v6.70.6000) | |
| Medio Intel Core i7-12700H (305 - 1171, n=64) | |
| Asus VivoBook Pro 16 (v6.75.6100) | |
| Schenker XMG Fusion 15 (Mid 22) (v6.70.6000) | |
| Acer Swift X SFX16-52G-77RX (v6.70.6000) | |
| AIDA64 / FP64 Ray-Trace | |
| Media de la clase Multimedia (1014 - 26875, n=57, últimos 2 años) | |
| Asus VivoBook Pro 16 (v6.75.6100) | |
| Schenker XMG Fusion 15 (Mid 22) (v6.70.6000) | |
| Dell Inspiron 16 Plus 7620 (v6.70.6000) | |
| Medio Intel Core i7-12700H (1437 - 9692, n=64) | |
| Acer Swift X SFX16-52G-77RX (v6.70.6000) | |
| AIDA64 / CPU PhotoWorxx | |
| Media de la clase Multimedia (8187 - 88154, n=57, últimos 2 años) | |
| Acer Swift X SFX16-52G-77RX (v6.70.6000) | |
| Dell Inspiron 16 Plus 7620 (v6.70.6000) | |
| Medio Intel Core i7-12700H (12863 - 52207, n=64) | |
| Schenker XMG Fusion 15 (Mid 22) (v6.70.6000) | |
| Asus VivoBook Pro 16 (v6.75.6100) | |
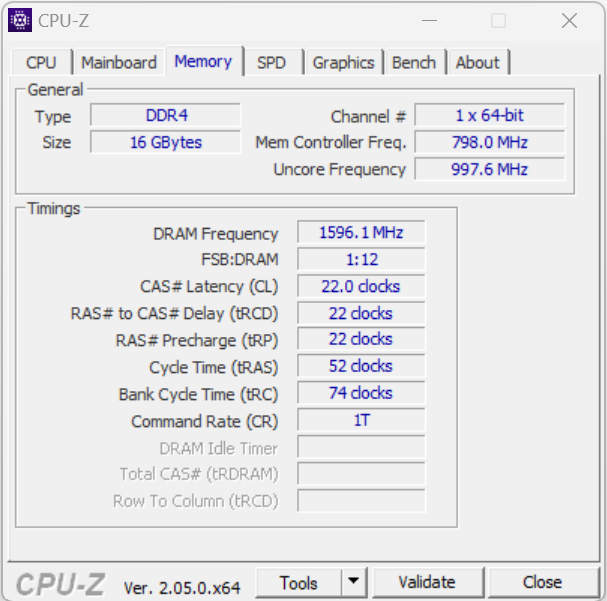
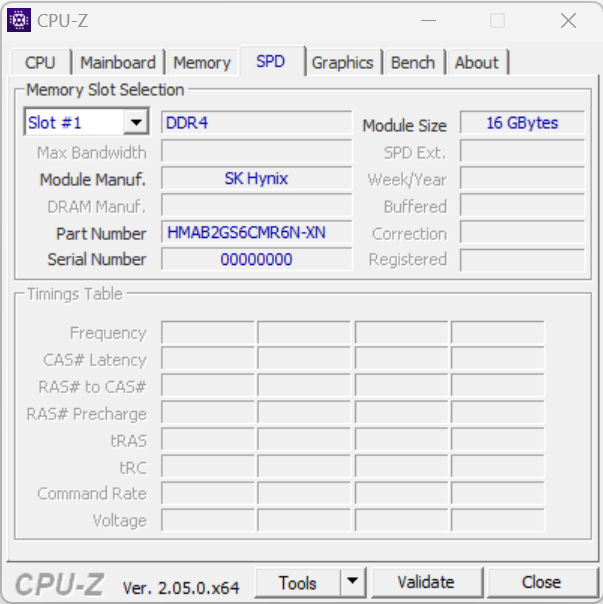
Rendimiento del sistema
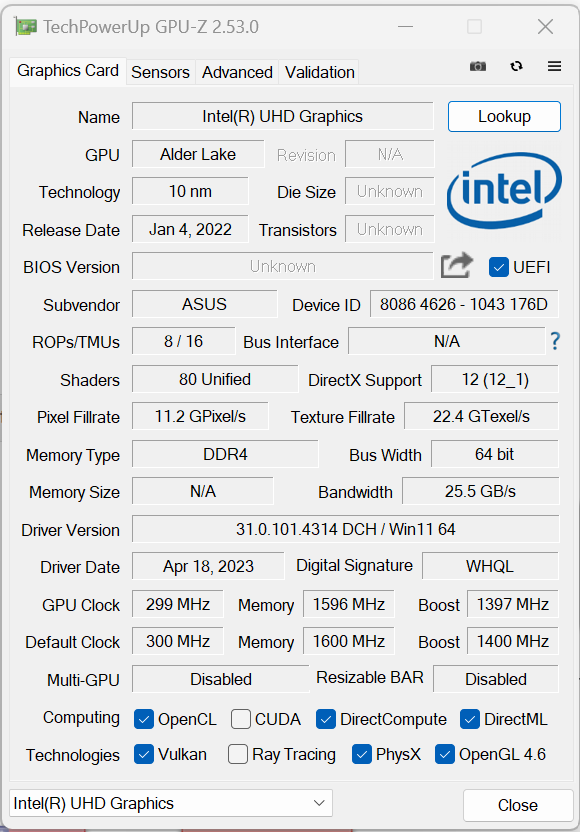
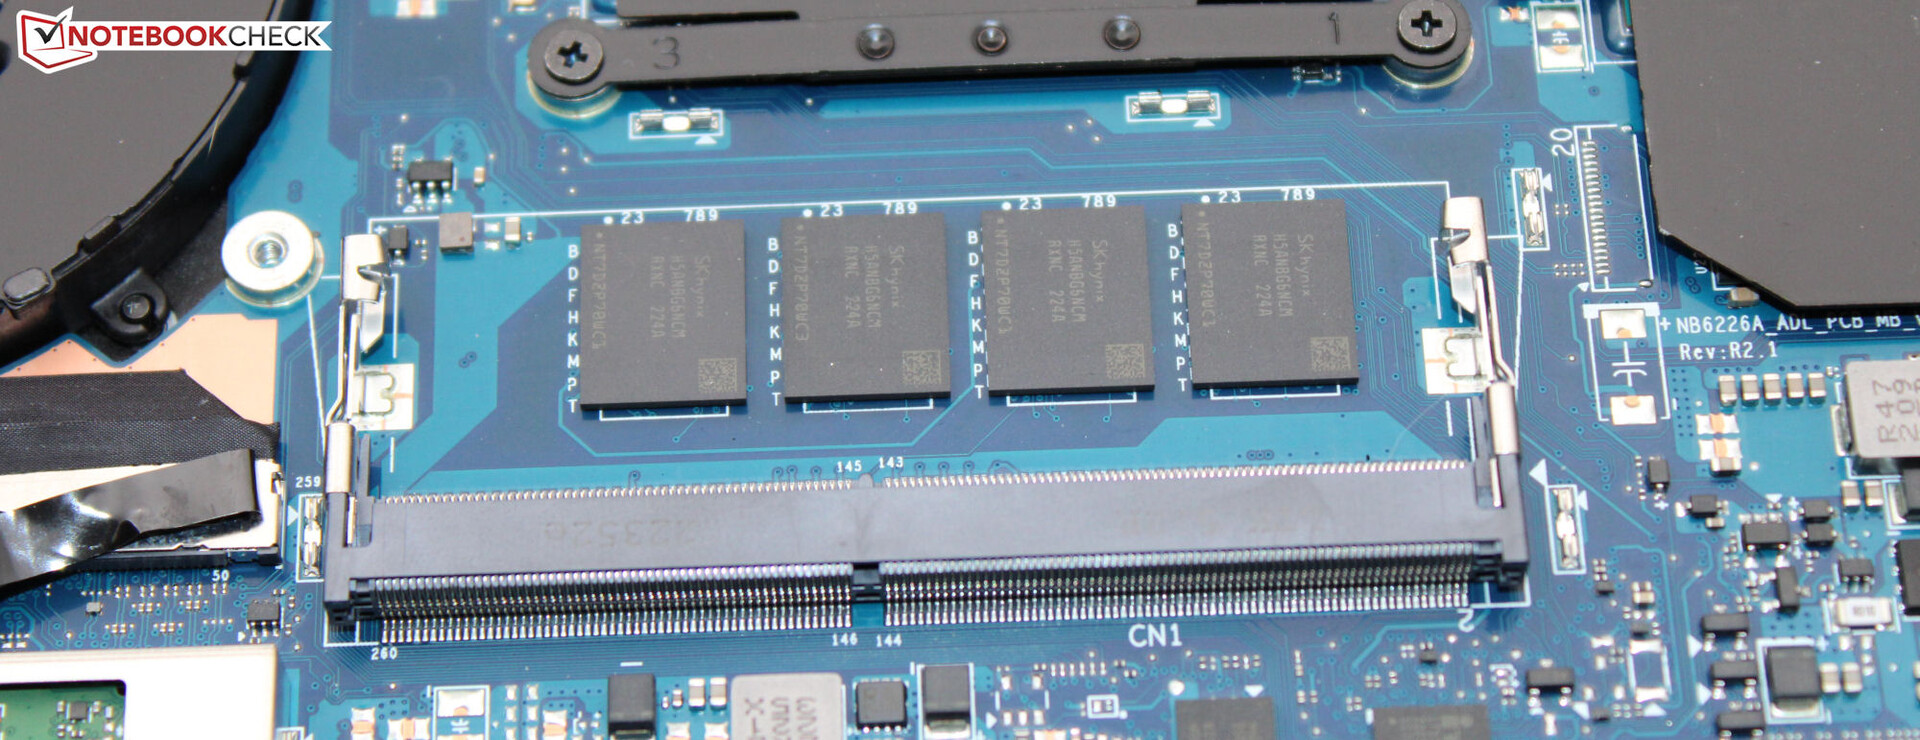
Su sistema de funcionamiento fluido domina los juegos, el streaming y el renderizado. Una parte de su potencia de procesamiento está ociosa, ya que la RAM (16 GB, DDR4-3200, integrada) sólo funciona en modo monocanal. Instalar un módulo de memoria (= modo de doble canal activo) solucionaría este problema, y también aumentaría sus velocidades de datos a niveles similares a los de sus competidores con el mismo almacenamiento.
CrossMark: Overall | Productivity | Creativity | Responsiveness
| PCMark 10 / Score | |
| Media de la clase Multimedia (4325 - 10386, n=55, últimos 2 años) | |
| Dell Inspiron 16 Plus 7620 | |
| Medio Intel Core i7-12700H, NVIDIA GeForce RTX 3050 Ti Laptop GPU (6623 - 7075, n=5) | |
| Asus VivoBook Pro 16 | |
| Schenker XMG Fusion 15 (Mid 22) | |
| Acer Swift X SFX16-52G-77RX | |
| PCMark 10 / Essentials | |
| Acer Swift X SFX16-52G-77RX | |
| Media de la clase Multimedia (8025 - 11664, n=54, últimos 2 años) | |
| Medio Intel Core i7-12700H, NVIDIA GeForce RTX 3050 Ti Laptop GPU (9540 - 10970, n=5) | |
| Dell Inspiron 16 Plus 7620 | |
| Schenker XMG Fusion 15 (Mid 22) | |
| Asus VivoBook Pro 16 | |
| PCMark 10 / Productivity | |
| Media de la clase Multimedia (7323 - 18233, n=54, últimos 2 años) | |
| Dell Inspiron 16 Plus 7620 | |
| Medio Intel Core i7-12700H, NVIDIA GeForce RTX 3050 Ti Laptop GPU (8530 - 9555, n=5) | |
| Asus VivoBook Pro 16 | |
| Schenker XMG Fusion 15 (Mid 22) | |
| Acer Swift X SFX16-52G-77RX | |
| PCMark 10 / Digital Content Creation | |
| Media de la clase Multimedia (3651 - 16240, n=54, últimos 2 años) | |
| Dell Inspiron 16 Plus 7620 | |
| Asus VivoBook Pro 16 | |
| Medio Intel Core i7-12700H, NVIDIA GeForce RTX 3050 Ti Laptop GPU (8855 - 9542, n=5) | |
| Acer Swift X SFX16-52G-77RX | |
| Schenker XMG Fusion 15 (Mid 22) | |
| CrossMark / Overall | |
| Media de la clase Multimedia (866 - 2728, n=63, últimos 2 años) | |
| Dell Inspiron 16 Plus 7620 | |
| Acer Swift X SFX16-52G-77RX | |
| Medio Intel Core i7-12700H, NVIDIA GeForce RTX 3050 Ti Laptop GPU (1654 - 1872, n=5) | |
| Asus VivoBook Pro 16 | |
| Schenker XMG Fusion 15 (Mid 22) | |
| CrossMark / Productivity | |
| Media de la clase Multimedia (931 - 2489, n=63, últimos 2 años) | |
| Acer Swift X SFX16-52G-77RX | |
| Asus VivoBook Pro 16 | |
| Medio Intel Core i7-12700H, NVIDIA GeForce RTX 3050 Ti Laptop GPU (1595 - 1792, n=5) | |
| Dell Inspiron 16 Plus 7620 | |
| Schenker XMG Fusion 15 (Mid 22) | |
| CrossMark / Creativity | |
| Media de la clase Multimedia (907 - 3465, n=63, últimos 2 años) | |
| Dell Inspiron 16 Plus 7620 | |
| Medio Intel Core i7-12700H, NVIDIA GeForce RTX 3050 Ti Laptop GPU (1699 - 1993, n=5) | |
| Acer Swift X SFX16-52G-77RX | |
| Asus VivoBook Pro 16 | |
| Schenker XMG Fusion 15 (Mid 22) | |
| CrossMark / Responsiveness | |
| Asus VivoBook Pro 16 | |
| Acer Swift X SFX16-52G-77RX | |
| Schenker XMG Fusion 15 (Mid 22) | |
| Medio Intel Core i7-12700H, NVIDIA GeForce RTX 3050 Ti Laptop GPU (1383 - 1768, n=5) | |
| Media de la clase Multimedia (605 - 2024, n=63, últimos 2 años) | |
| Dell Inspiron 16 Plus 7620 | |
| PCMark 8 Home Score Accelerated v2 | 4565 puntos | |
| PCMark 8 Work Score Accelerated v2 | 5386 puntos | |
| PCMark 10 Score | 6652 puntos | |
ayuda | ||
| AIDA64 / Memory Copy | |
| Media de la clase Multimedia (11299 - 132135, n=57, últimos 2 años) | |
| Acer Swift X SFX16-52G-77RX | |
| Dell Inspiron 16 Plus 7620 | |
| Medio Intel Core i7-12700H (25615 - 80511, n=64) | |
| Schenker XMG Fusion 15 (Mid 22) | |
| Asus VivoBook Pro 16 | |
| AIDA64 / Memory Read | |
| Media de la clase Multimedia (11624 - 174586, n=57, últimos 2 años) | |
| Acer Swift X SFX16-52G-77RX | |
| Dell Inspiron 16 Plus 7620 | |
| Medio Intel Core i7-12700H (25586 - 79442, n=64) | |
| Schenker XMG Fusion 15 (Mid 22) | |
| Asus VivoBook Pro 16 | |
| AIDA64 / Memory Write | |
| Media de la clase Multimedia (11755 - 134998, n=57, últimos 2 años) | |
| Acer Swift X SFX16-52G-77RX | |
| Dell Inspiron 16 Plus 7620 | |
| Medio Intel Core i7-12700H (23679 - 88660, n=64) | |
| Schenker XMG Fusion 15 (Mid 22) | |
| Asus VivoBook Pro 16 | |
| AIDA64 / Memory Latency | |
| Media de la clase Multimedia (7 - 535, n=56, últimos 2 años) | |
| Acer Swift X SFX16-52G-77RX | |
| Dell Inspiron 16 Plus 7620 | |
| Schenker XMG Fusion 15 (Mid 22) | |
| Asus VivoBook Pro 16 | |
| Medio Intel Core i7-12700H (76.2 - 133.9, n=62) | |
* ... más pequeño es mejor
Latencia del CPD
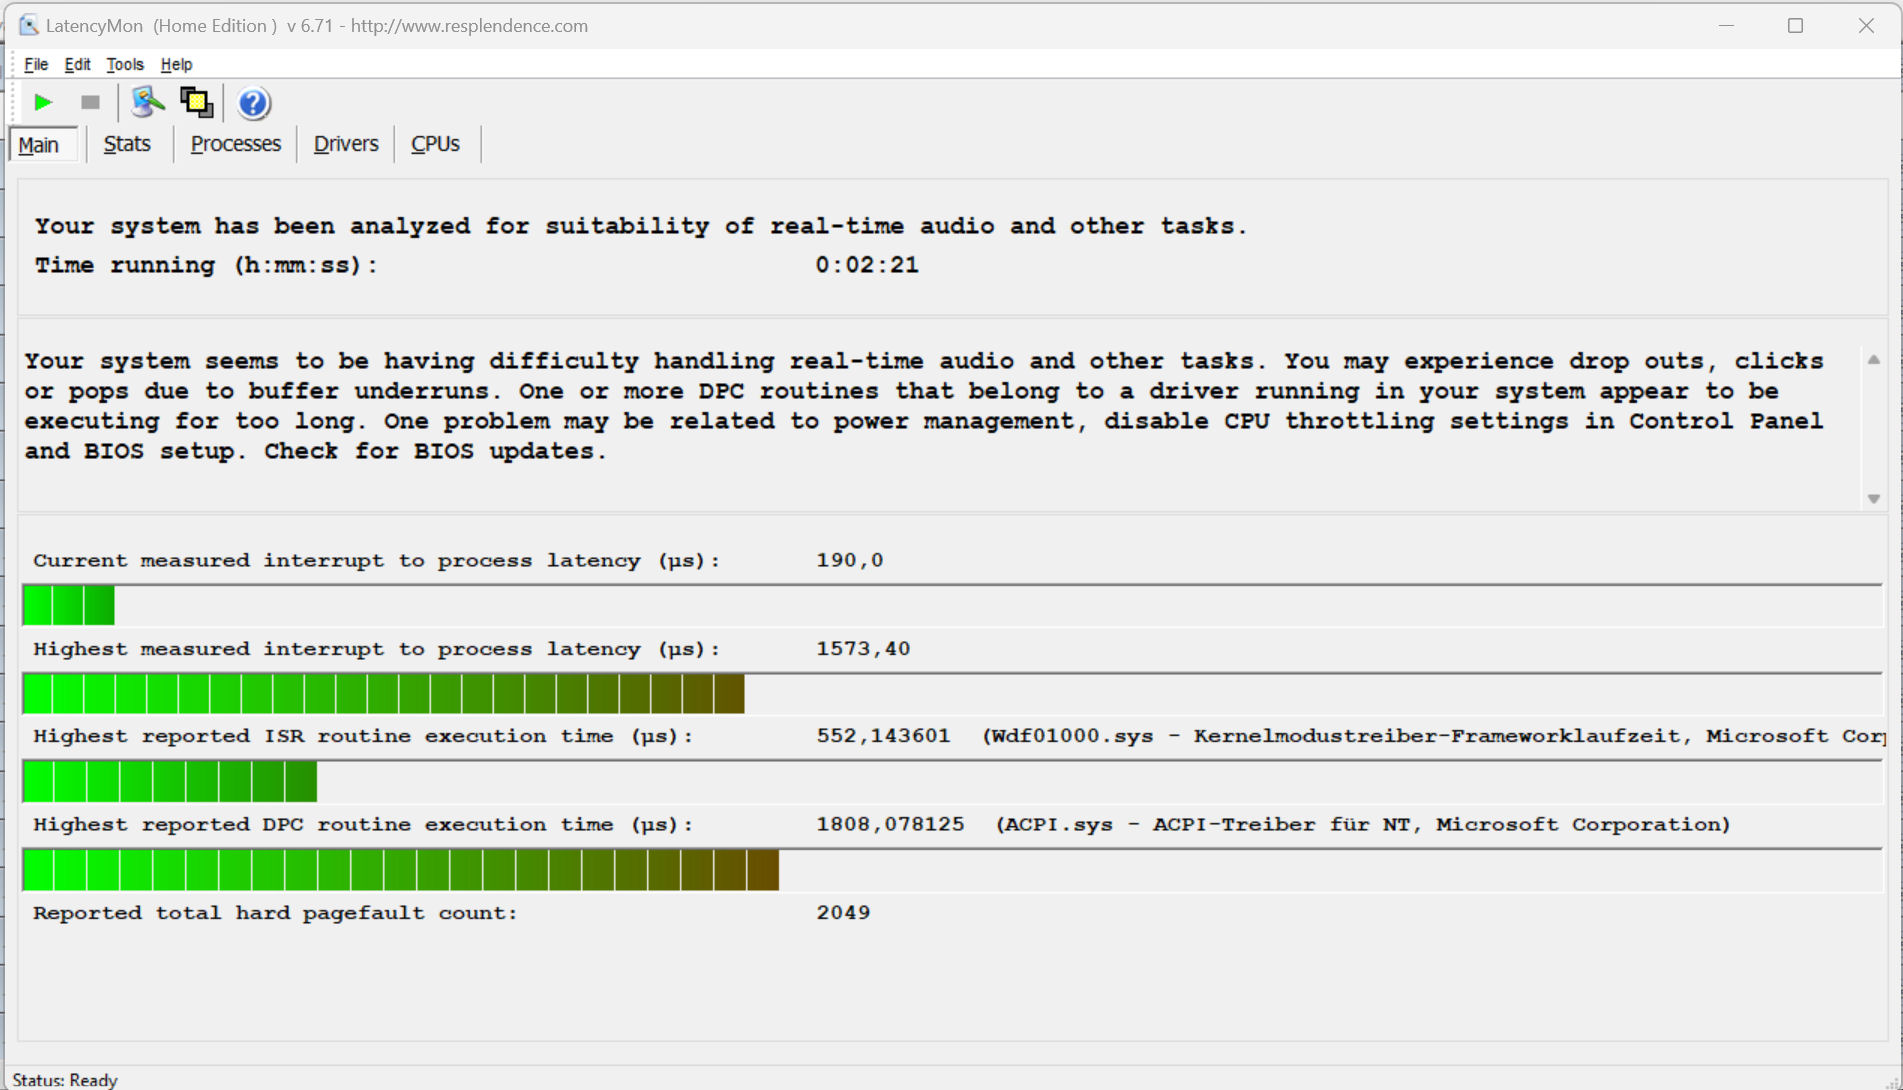
La prueba de monitorización de latencia estandarizada (navegación web, reproducción de vídeo 4k, Prime95 a alta carga) reveló algunas anomalías. El sistema no parece adecuado para la edición de vídeo y audio en tiempo real. Futuras actualizaciones de software podrían suponer mejoras o incluso degradaciones.
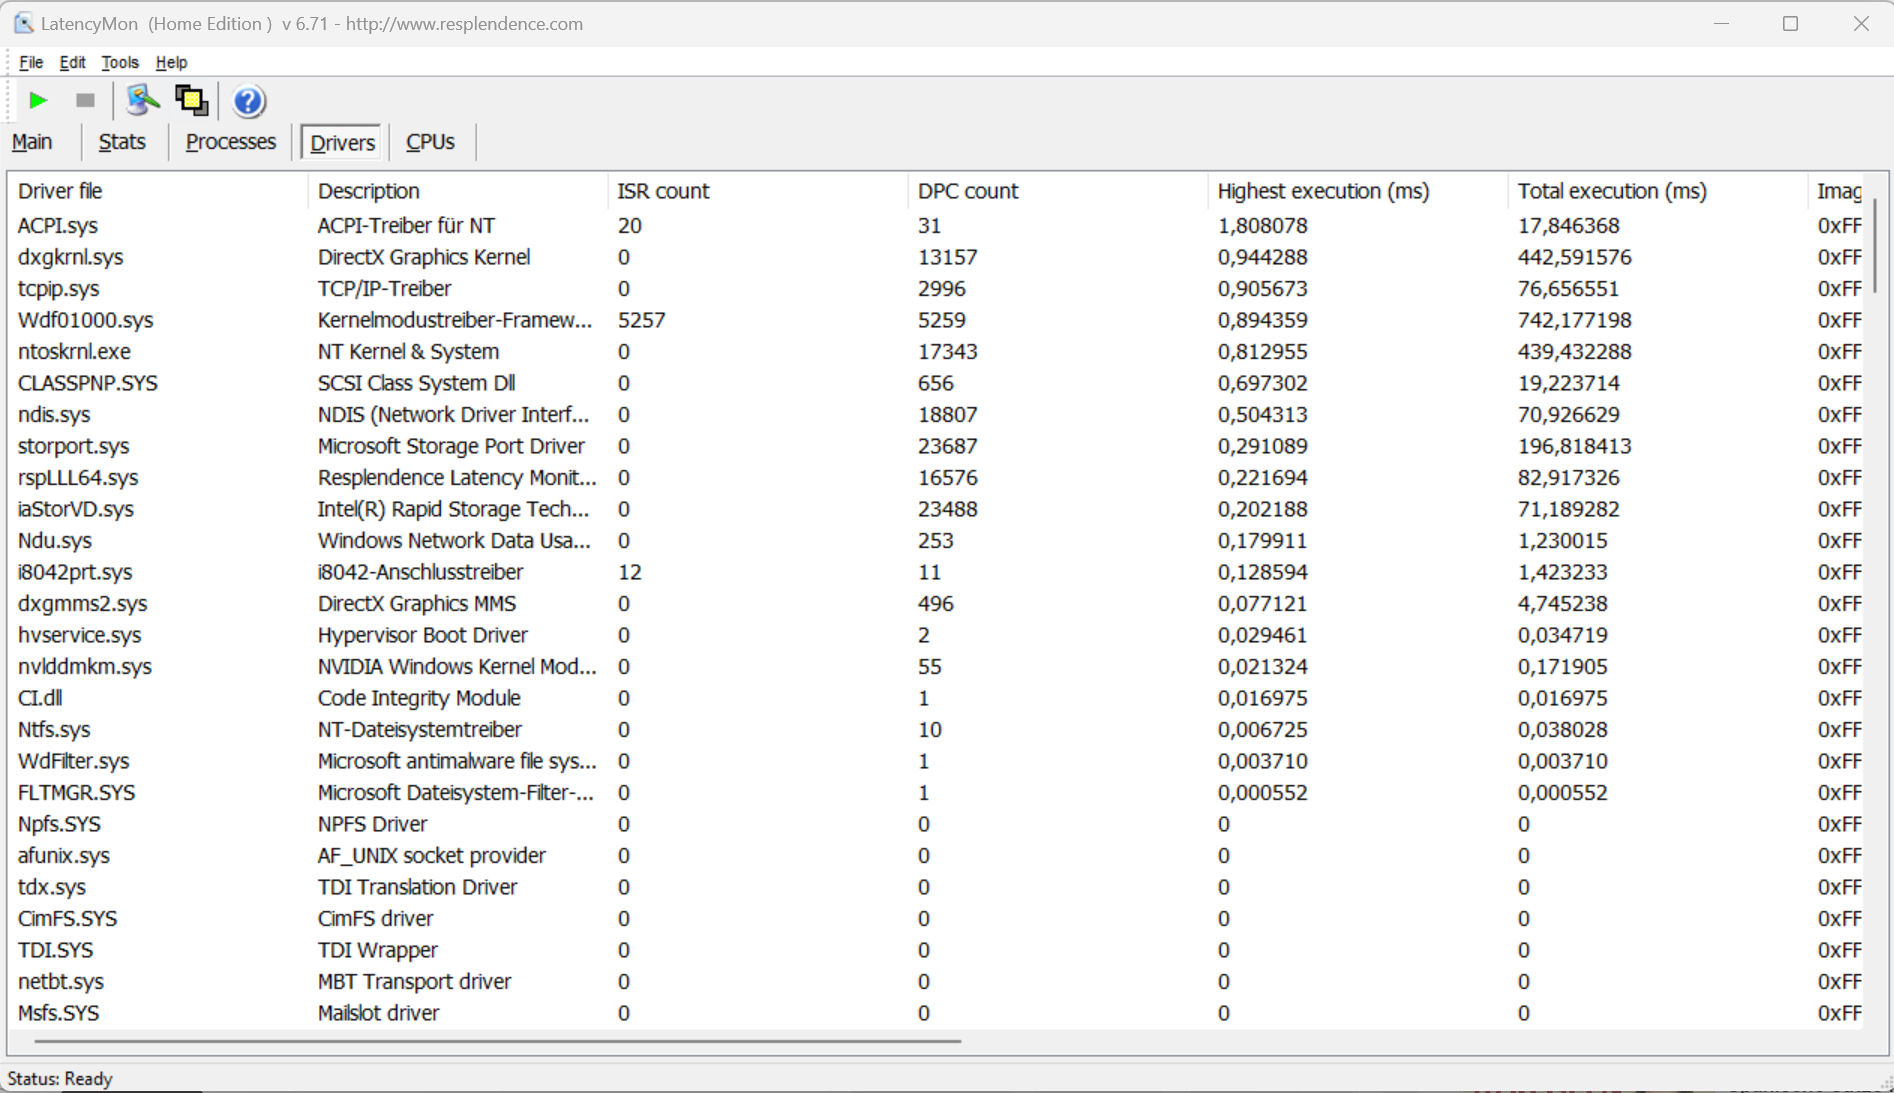
| DPC Latencies / LatencyMon - interrupt to process latency (max), Web, Youtube, Prime95 | |
| Schenker XMG Fusion 15 (Mid 22) | |
| Asus VivoBook Pro 16 | |
| Dell Inspiron 16 Plus 7620 | |
| Acer Swift X SFX16-52G-77RX | |
* ... más pequeño es mejor
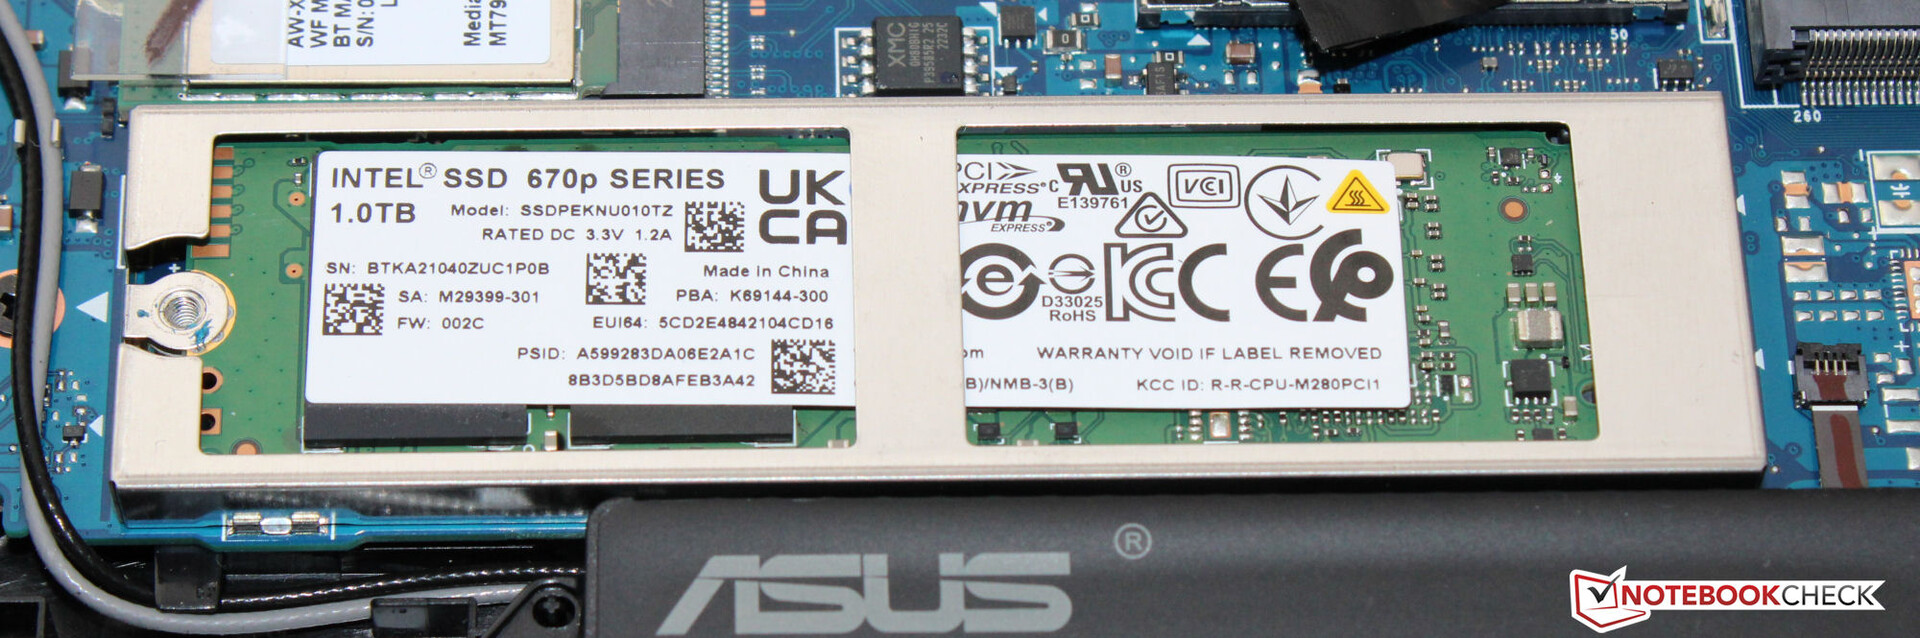
Dispositivos de almacenamiento
Asus ha equipado el portátil con un SSD PCIe-3 (M.2-2280) de Intel, que tiene una capacidad de 1 TB. Ofrece buenas velocidades de datos, pero no puede clasificarse como un SSD de élite. El ordenador ofrece espacio para un segundo SSD.

* ... más pequeño es mejor
reading continuous performance: DiskSpd Read Loop, Queue Depth 8
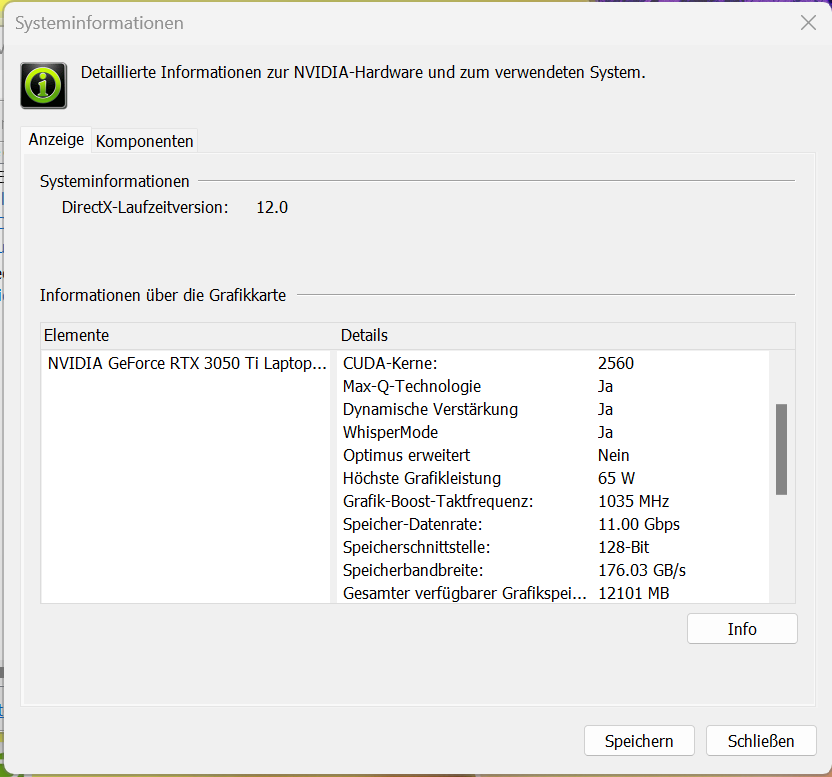
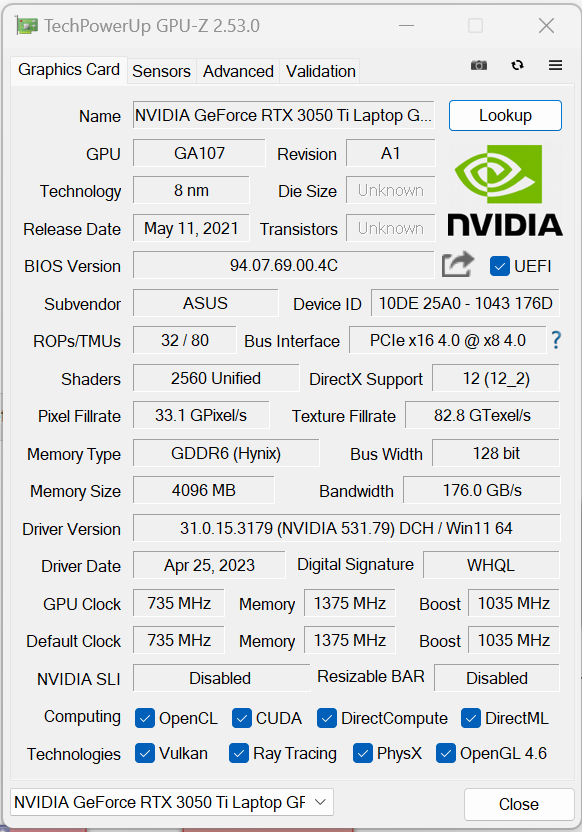
Tarjeta gráfica
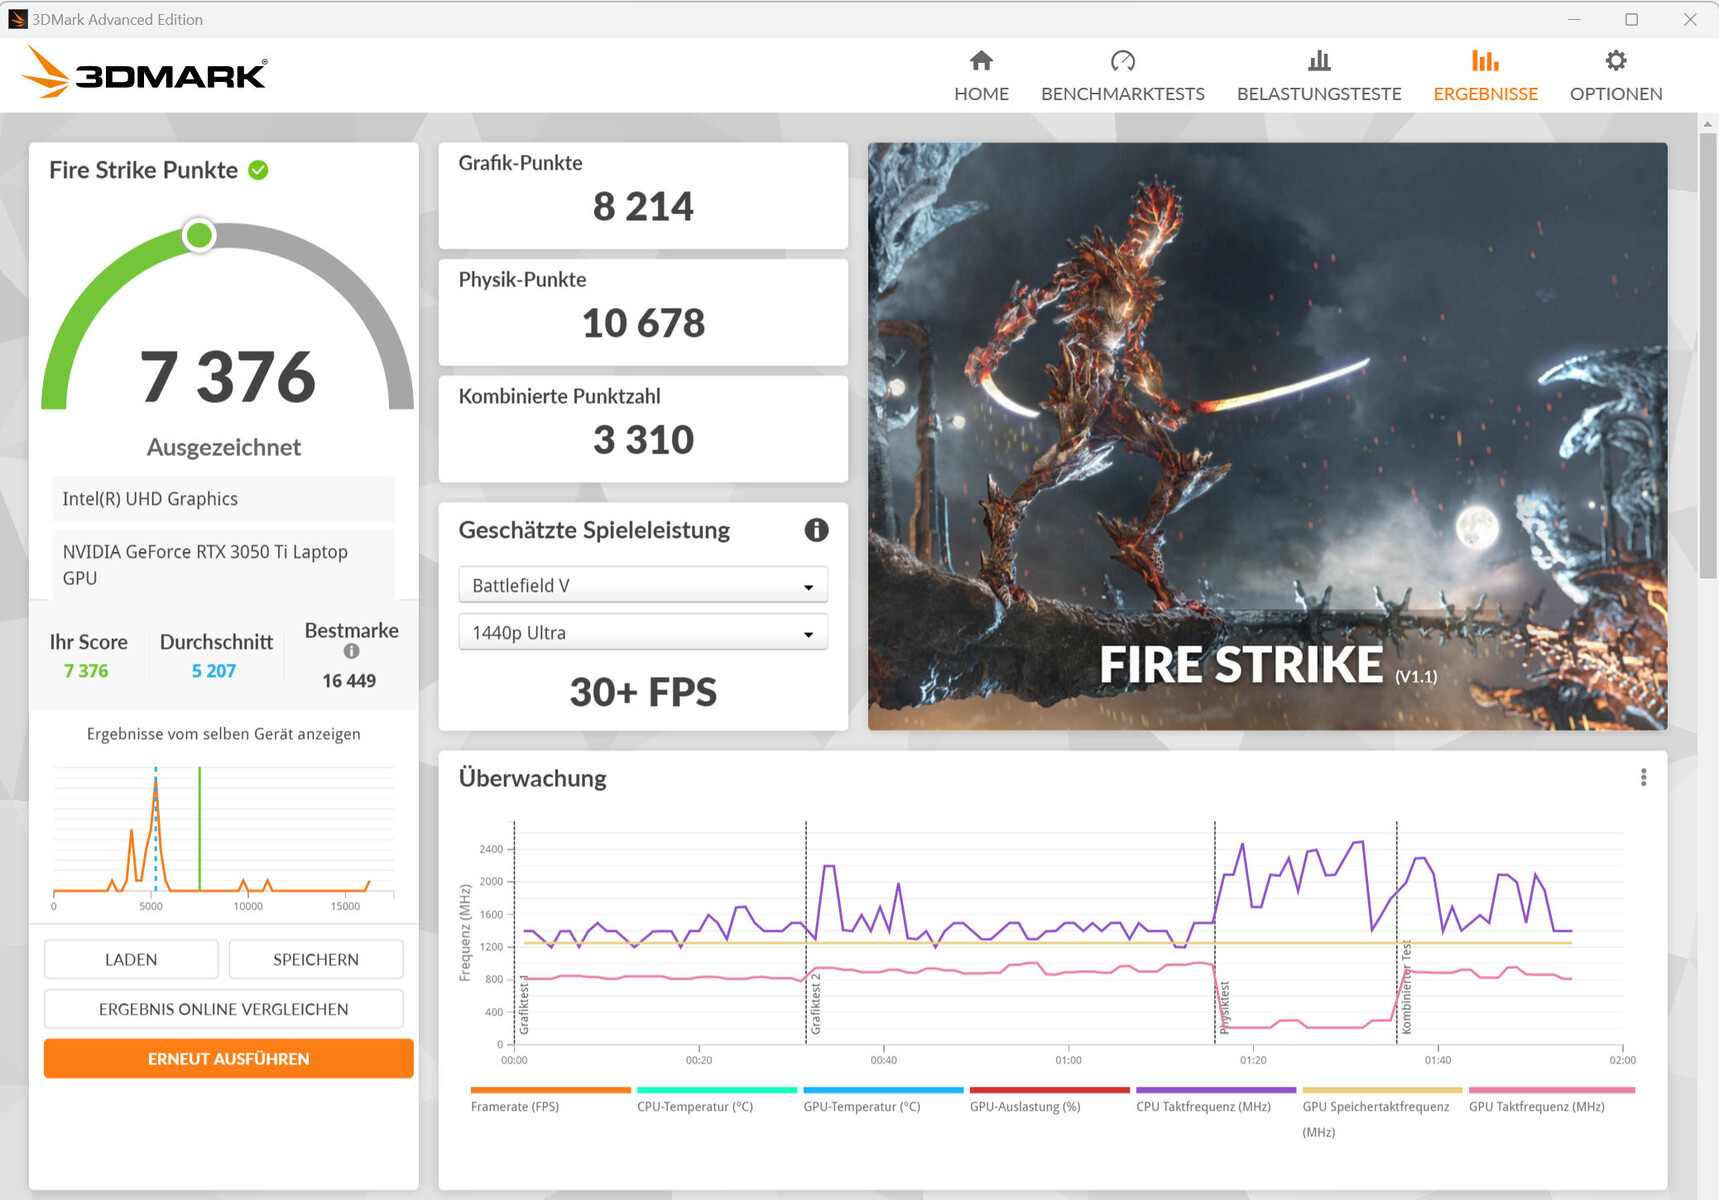
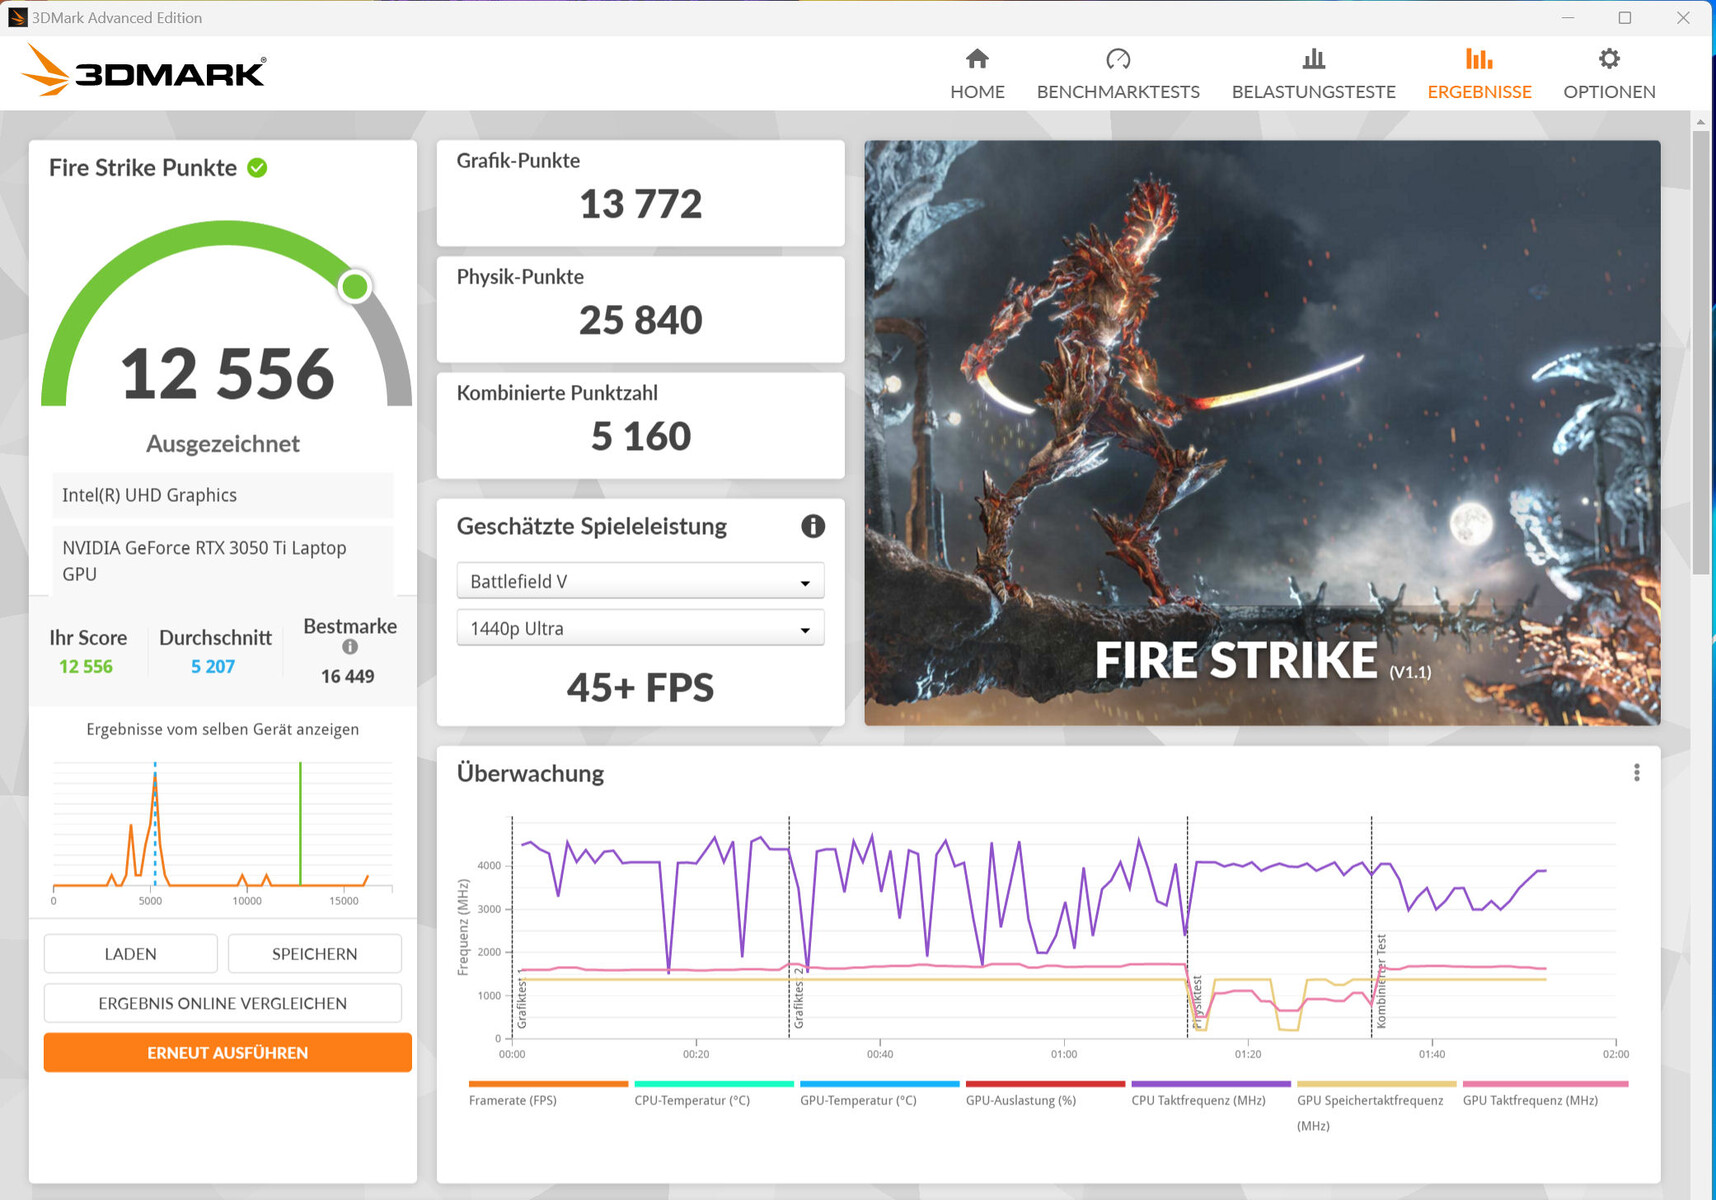
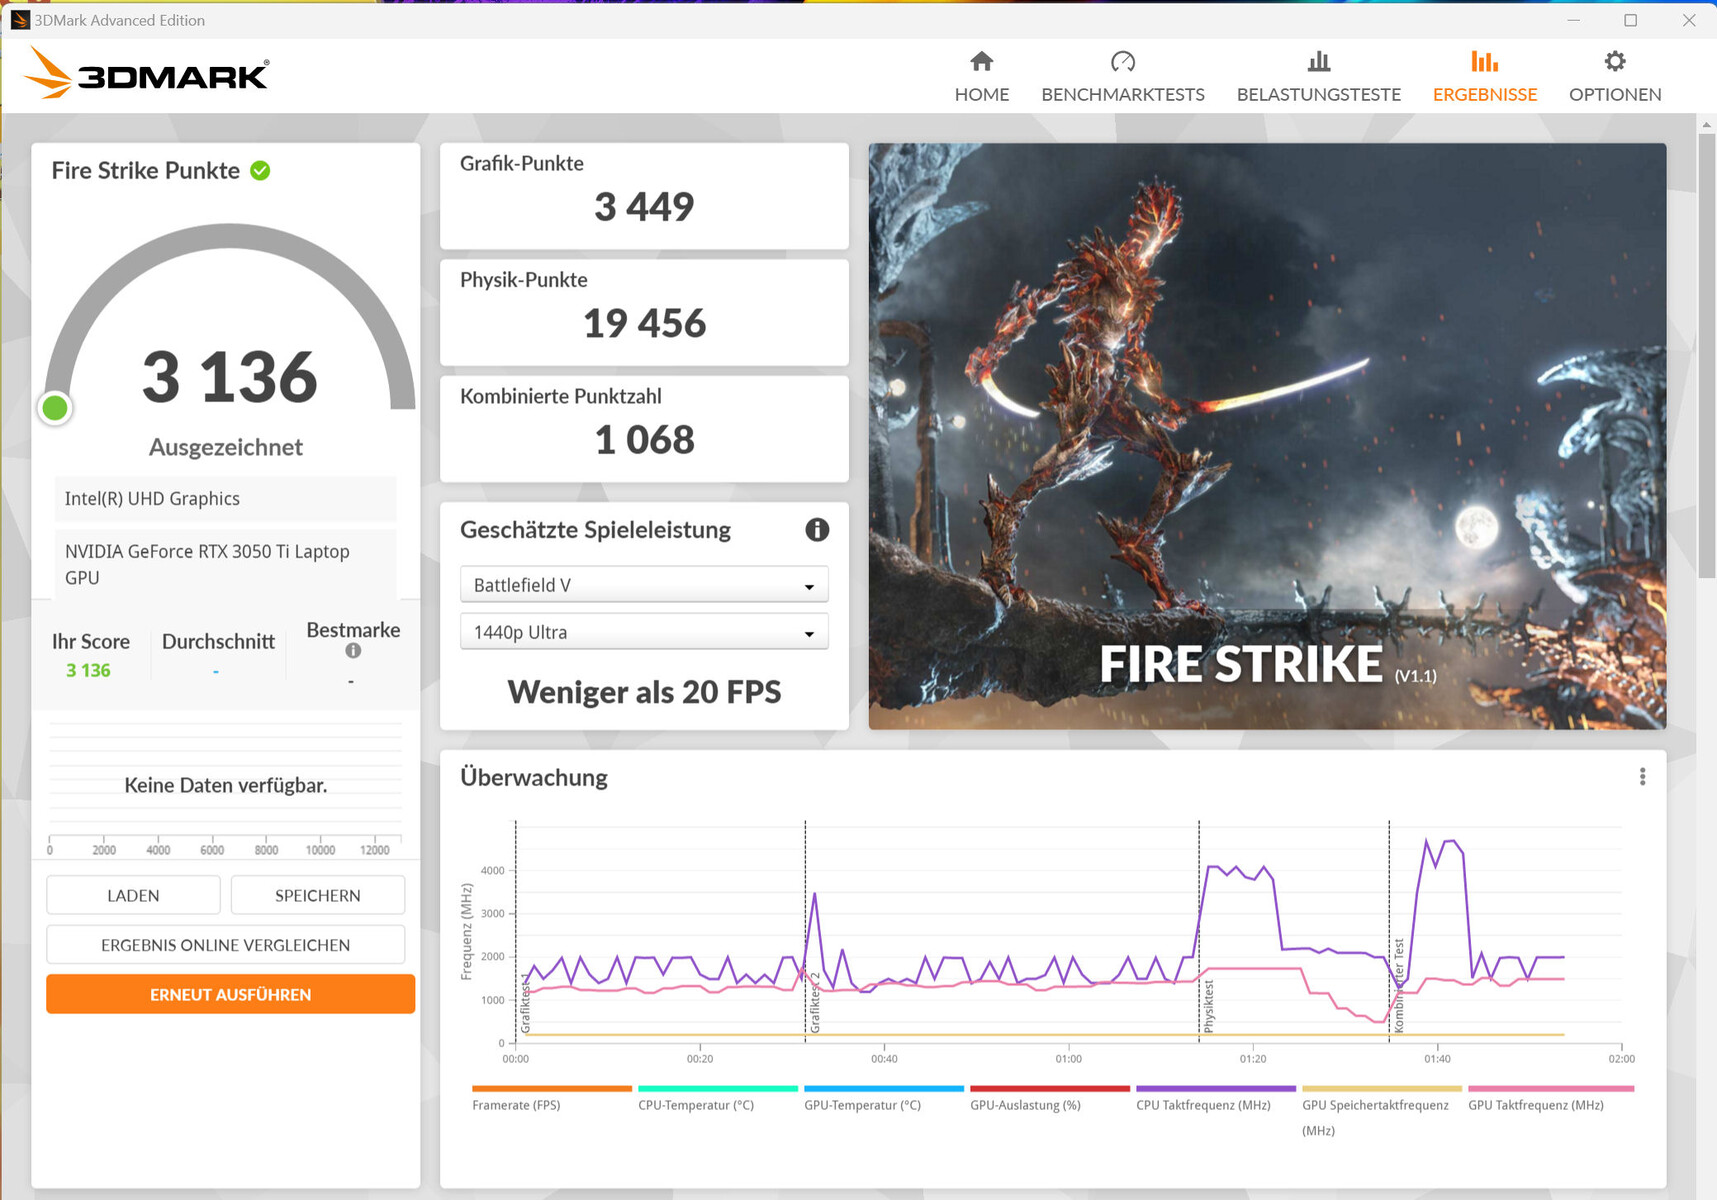
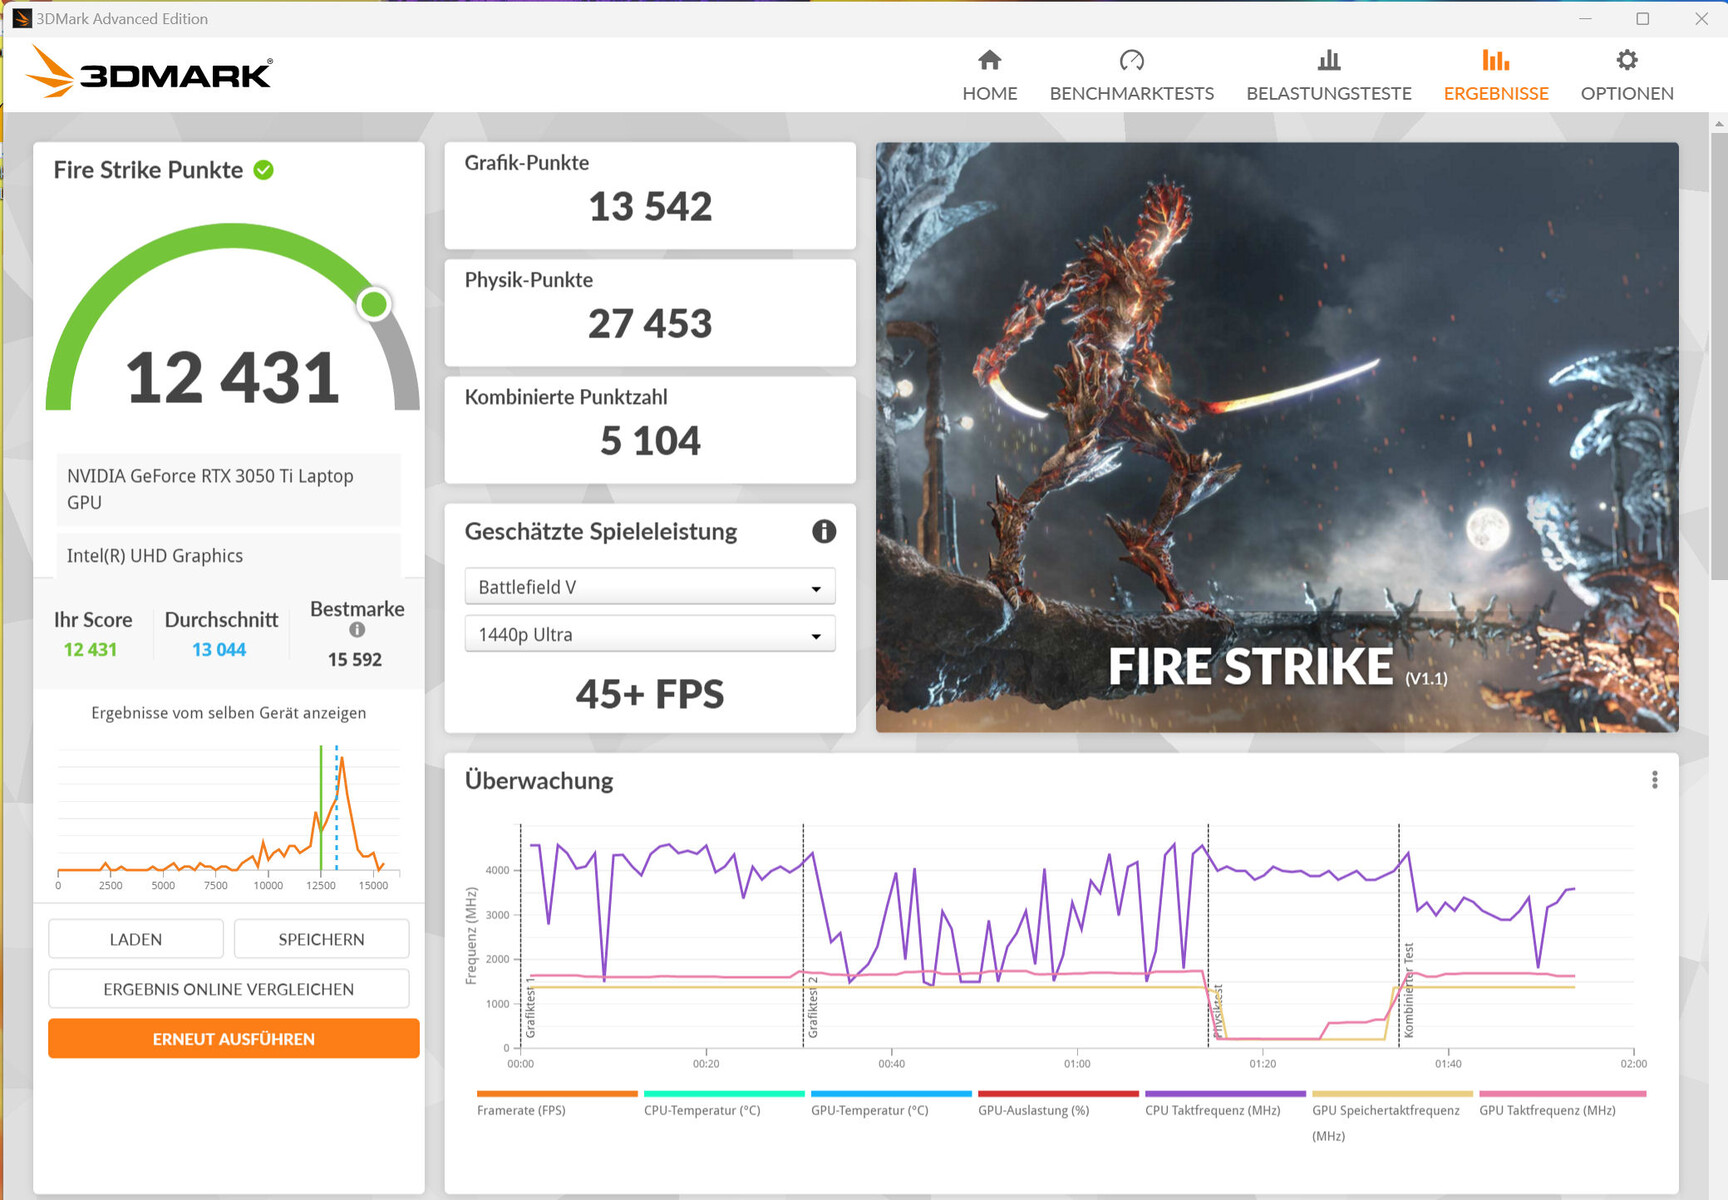
Nuestros benchmarks y pruebas de juegos revelaron que la GeForce RTX 3050 Tiportátil (TGP: 65 vatios) por debajo de la media de la GPU ("modo estándar"). El uso del "modo de rendimiento" llevó a tasas entre un 10 y un 15% superiores; según la prueba Witcher 3, la TGP se agotó. El uso del modo dGPU (a través de la aplicación MyAsus) no produjo ninguna mejora en el rendimiento.
El ordenador permite jugar en FHD usando ajustes de bajos a altos y en HD usando ajustes de bajos a medios (modo susurro). Este último redujo la TGP a 25 vatios, lo que resultó en menores emisiones de ruido.
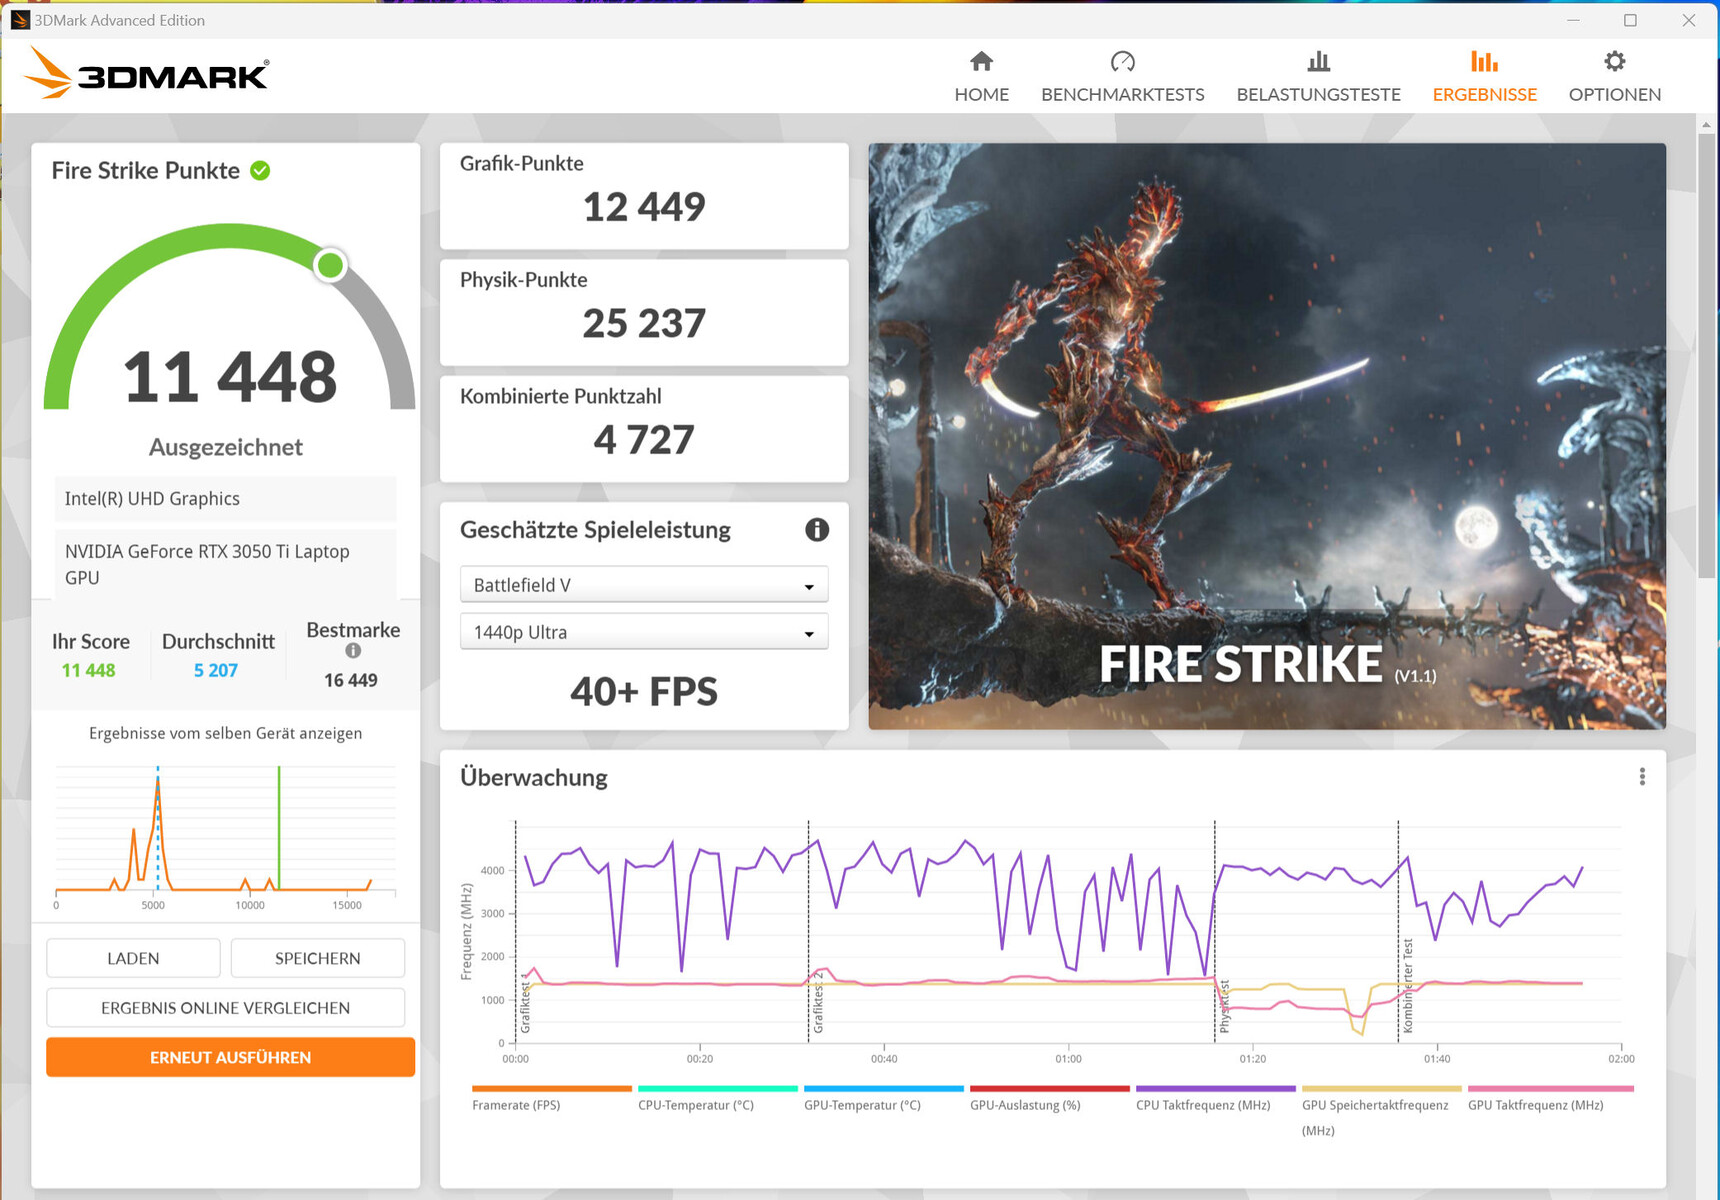
| 3DMark 06 Standard Score | 45370 puntos | |
| 3DMark 11 Performance | 16180 puntos | |
| 3DMark Cloud Gate Standard Score | 45033 puntos | |
| 3DMark Fire Strike Score | 11448 puntos | |
| 3DMark Time Spy Score | 4969 puntos | |
ayuda | ||
| V-Ray Benchmark Next 4.10 | |
| GPU | |
| Schenker XMG Fusion 15 (Mid 22) (v4.10.07 ) | |
| Media de la clase Multimedia (32 - 1191, n=55, últimos 2 años) | |
| Medio NVIDIA GeForce RTX 3050 Ti Laptop GPU (171 - 216, n=22) | |
| Asus VivoBook Pro 16 (v4.10.07 ) | |
| Acer Swift X SFX16-52G-77RX (v4.10.07 ) | |
| CPU | |
| Media de la clase Multimedia (4772 - 35165, n=55, últimos 2 años) | |
| Asus VivoBook Pro 16 (v4.10.07 ) | |
| Acer Swift X SFX16-52G-77RX (v4.10.07 ) | |
| Schenker XMG Fusion 15 (Mid 22) (v4.10.07 ) | |
| Medio NVIDIA GeForce RTX 3050 Ti Laptop GPU (5796 - 16665, n=22) | |
* ... más pequeño es mejor
| The Witcher 3 - 1920x1080 Ultra Graphics & Postprocessing (HBAO+) | |
| Schenker XMG Fusion 15 (Mid 22) | |
| Dell Inspiron 16 Plus 7620 | |
| Media de la clase Multimedia (11 - 121, n=11, últimos 2 años) | |
| Medio NVIDIA GeForce RTX 3050 Ti Laptop GPU (19 - 58.5, n=29) | |
| Asus VivoBook Pro 16 | |
| Acer Swift X SFX16-52G-77RX | |
| Final Fantasy XV Benchmark - 1920x1080 High Quality | |
| Schenker XMG Fusion 15 (Mid 22) (1.3) | |
| Media de la clase Multimedia (7.61 - 144.4, n=61, últimos 2 años) | |
| Dell Inspiron 16 Plus 7620 (1.3) | |
| Medio NVIDIA GeForce RTX 3050 Ti Laptop GPU (23.5 - 106, n=24) | |
| Asus VivoBook Pro 16 (1.3) | |
| Acer Swift X SFX16-52G-77RX (1.3) | |
| Strange Brigade - 1920x1080 ultra AA:ultra AF:16 | |
| Schenker XMG Fusion 15 (Mid 22) (1.47.22.14 D3D12) | |
| Media de la clase Multimedia (13.3 - 303, n=61, últimos 2 años) | |
| Dell Inspiron 16 Plus 7620 (1.47.22.14 D3D12) | |
| Medio NVIDIA GeForce RTX 3050 Ti Laptop GPU (34.8 - 101.3, n=25) | |
| Asus VivoBook Pro 16 (1.47.22.14 D3D12) | |
| Acer Swift X SFX16-52G-77RX (1.47.22.14 D3D12) | |
| Dota 2 Reborn - 1920x1080 ultra (3/3) best looking | |
| Dell Inspiron 16 Plus 7620 | |
| Schenker XMG Fusion 15 (Mid 22) | |
| Medio NVIDIA GeForce RTX 3050 Ti Laptop GPU (67.3 - 145, n=27) | |
| Asus VivoBook Pro 16 | |
| Media de la clase Multimedia (29 - 179.9, n=63, últimos 2 años) | |
| Acer Swift X SFX16-52G-77RX | |
Witcher 3 FPS diagram
| bajo | medio | alto | ultra | QHD | |
|---|---|---|---|---|---|
| GTA V (2015) | 175.1 | 170.9 | 111.9 | 53.8 | 39 |
| The Witcher 3 (2015) | 218.5 | 150.8 | 87.6 | 47.1 | |
| Dota 2 Reborn (2015) | 134.6 | 118.9 | 108.5 | 101.6 | |
| Final Fantasy XV Benchmark (2018) | 112.7 | 65 | 46.2 | 32 | |
| X-Plane 11.11 (2018) | 125.4 | 110.2 | 90.5 | ||
| Strange Brigade (2018) | 241 | 121.2 | 98.3 | 84.5 | 61 |
| Doom Eternal (2020) | 188.1 | 120 | |||
| Flight Simulator 2020 (2020) | 99 | 52.1 | 38.4 | 26.4 | 19.6 |
| F1 22 (2022) | 127.5 | 115.3 | 73.1 | 24.3 | 17.4 |
| FIFA 23 (2022) | 78.2 | ||||
| Uncharted Legacy of Thieves Collection (2022) | 48.4 | 30.5 | 20.6 | 20 | 14.1 |
| Call of Duty Modern Warfare 2 2022 (2022) | 63 | 58 | 44 | 36 | |
| Spider-Man Miles Morales (2022) | 66.6 | 53.6 | 44.8 | 36.8 | 26.3 |
| The Callisto Protocol (2022) | 82.5 | 62.2 | 58.3 | 31.7 | 21.4 |
| Need for Speed Unbound (2022) | 73.9 | 62.6 | 35.5 | 27.9 | 15.6 |
| High On Life (2023) | 104.7 | 77.5 | 60.3 | 50.8 | 31.8 |
| The Witcher 3 v4 (2023) | 88.4 | 75.6 | 36.8 | 32.4 | 19.6 |
| Dead Space Remake (2023) | 37.2 | 35.1 | 28.2 | 24.6 | 9.81 |
| Hogwarts Legacy (2023) | 63.9 | 50 | 40.2 | 32.8 | 25 |
| Returnal (2023) | 52 | 50 | 45 | 34 | 27 |
| Atomic Heart (2023) | 94.3 | 71.4 | 41.6 | 32.3 | 24.5 |
| Company of Heroes 3 (2023) | 106.2 | 91.1 | 68.4 | 68.5 | 48.8 |
| Sons of the Forest (2023) | 54.9 | 38.8 | 35.4 | 33.3 | 25.6 |
| Resident Evil 4 Remake (2023) | 74.6 | 47.4 | 41 | 8.97 | 7.82 |
| The Last of Us (2023) | 44.9 | 32.9 | 25.6 | ||
| Dead Island 2 (2023) | 95.7 | 75.7 | 64.1 | 58 | 45.9 |
| Star Wars Jedi Survivor (2023) | 36.9 | 31 | 28.9 | 25.8 | 15.4 |
Emisiones y potencia - El ordenador Asus es ruidoso
Emisiones sonoras
En modo inactivo, así como en el uso diario (oficina, internet), el portátil funciona en general silenciosamente - incluso en silencio a veces. A plena carga, medimos emisiones de ruido de hasta 61.5 dB(A) ("modo rendimiento") - demasiado alto. Usando el "modo estándar" conseguimos una relación ruido-rendimiento más equilibrada - aun así, el disipador hizo bastante ruido.
el "modo susurro" será probablemente la primera opción de la mayoría de los usuarios, ya que hace exactamente lo que dice en la lata: los ventiladores funcionan a baja velocidad incluso bajo carga y apenas se oyen, a expensas de la potencia de procesamiento. Se puede jugar, pero sólo en HD.
Ruido
| Ocioso |
| 25.2 / 25.2 / 25.2 dB(A) |
| Carga |
| 55.1 / 61.5 dB(A) |
 | ||
30 dB silencioso 40 dB(A) audible 50 dB(A) ruidosamente alto |
||
min: | ||
| Asus VivoBook Pro 16 GeForce RTX 3050 Ti Laptop GPU, i7-12700H, Intel SSD 670p SSDPEKNU010TZ | Dell Inspiron 16 Plus 7620 GeForce RTX 3050 Ti Laptop GPU, i7-12700H, Kioxia BG5 KBG50ZNS512G | Schenker XMG Fusion 15 (Mid 22) GeForce RTX 3070 Laptop GPU, i7-11800H, Samsung SSD 980 Pro 1TB MZ-V8P1T0BW | Acer Swift X SFX16-52G-77RX A370M, i7-1260P, WDC PC SN810 1TB | |
|---|---|---|---|---|
| Noise | 3% | 0% | 8% | |
| apagado / medio ambiente * (dB) | 25.2 | 23.3 8% | 26 -3% | 25 1% |
| Idle Minimum * (dB) | 25.2 | 25.7 -2% | 26 -3% | 25 1% |
| Idle Average * (dB) | 25.2 | 26.1 -4% | 28 -11% | 25 1% |
| Idle Maximum * (dB) | 25.2 | 30.6 -21% | 31 -23% | 25 1% |
| Load Average * (dB) | 55.1 | 46.2 16% | 45 18% | 44.7 19% |
| Load Maximum * (dB) | 61.5 | 49.4 20% | 48 22% | 45.6 26% |
| Witcher 3 ultra * (dB) | 49.2 | 46 |
* ... más pequeño es mejor
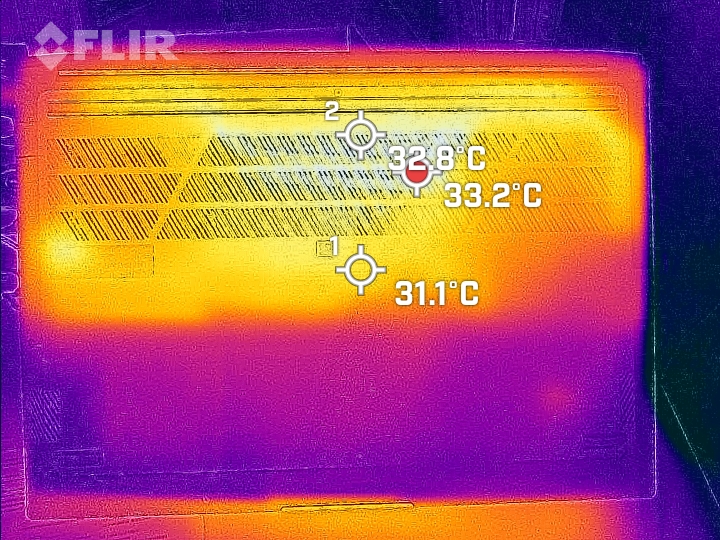
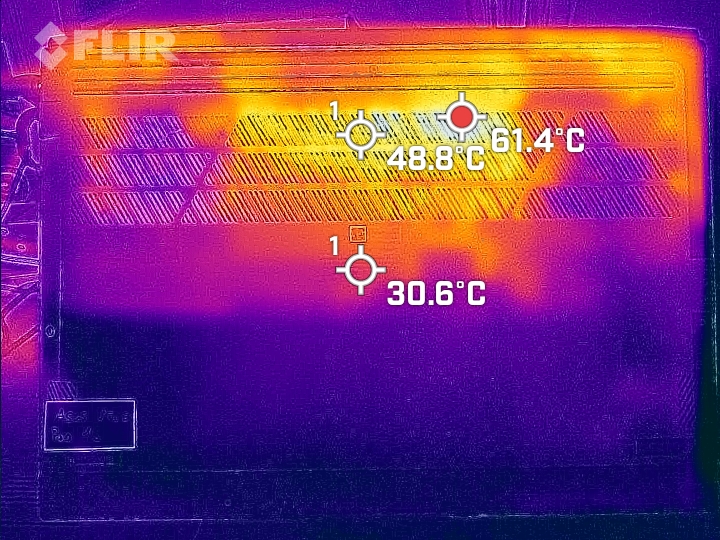
Temperatura
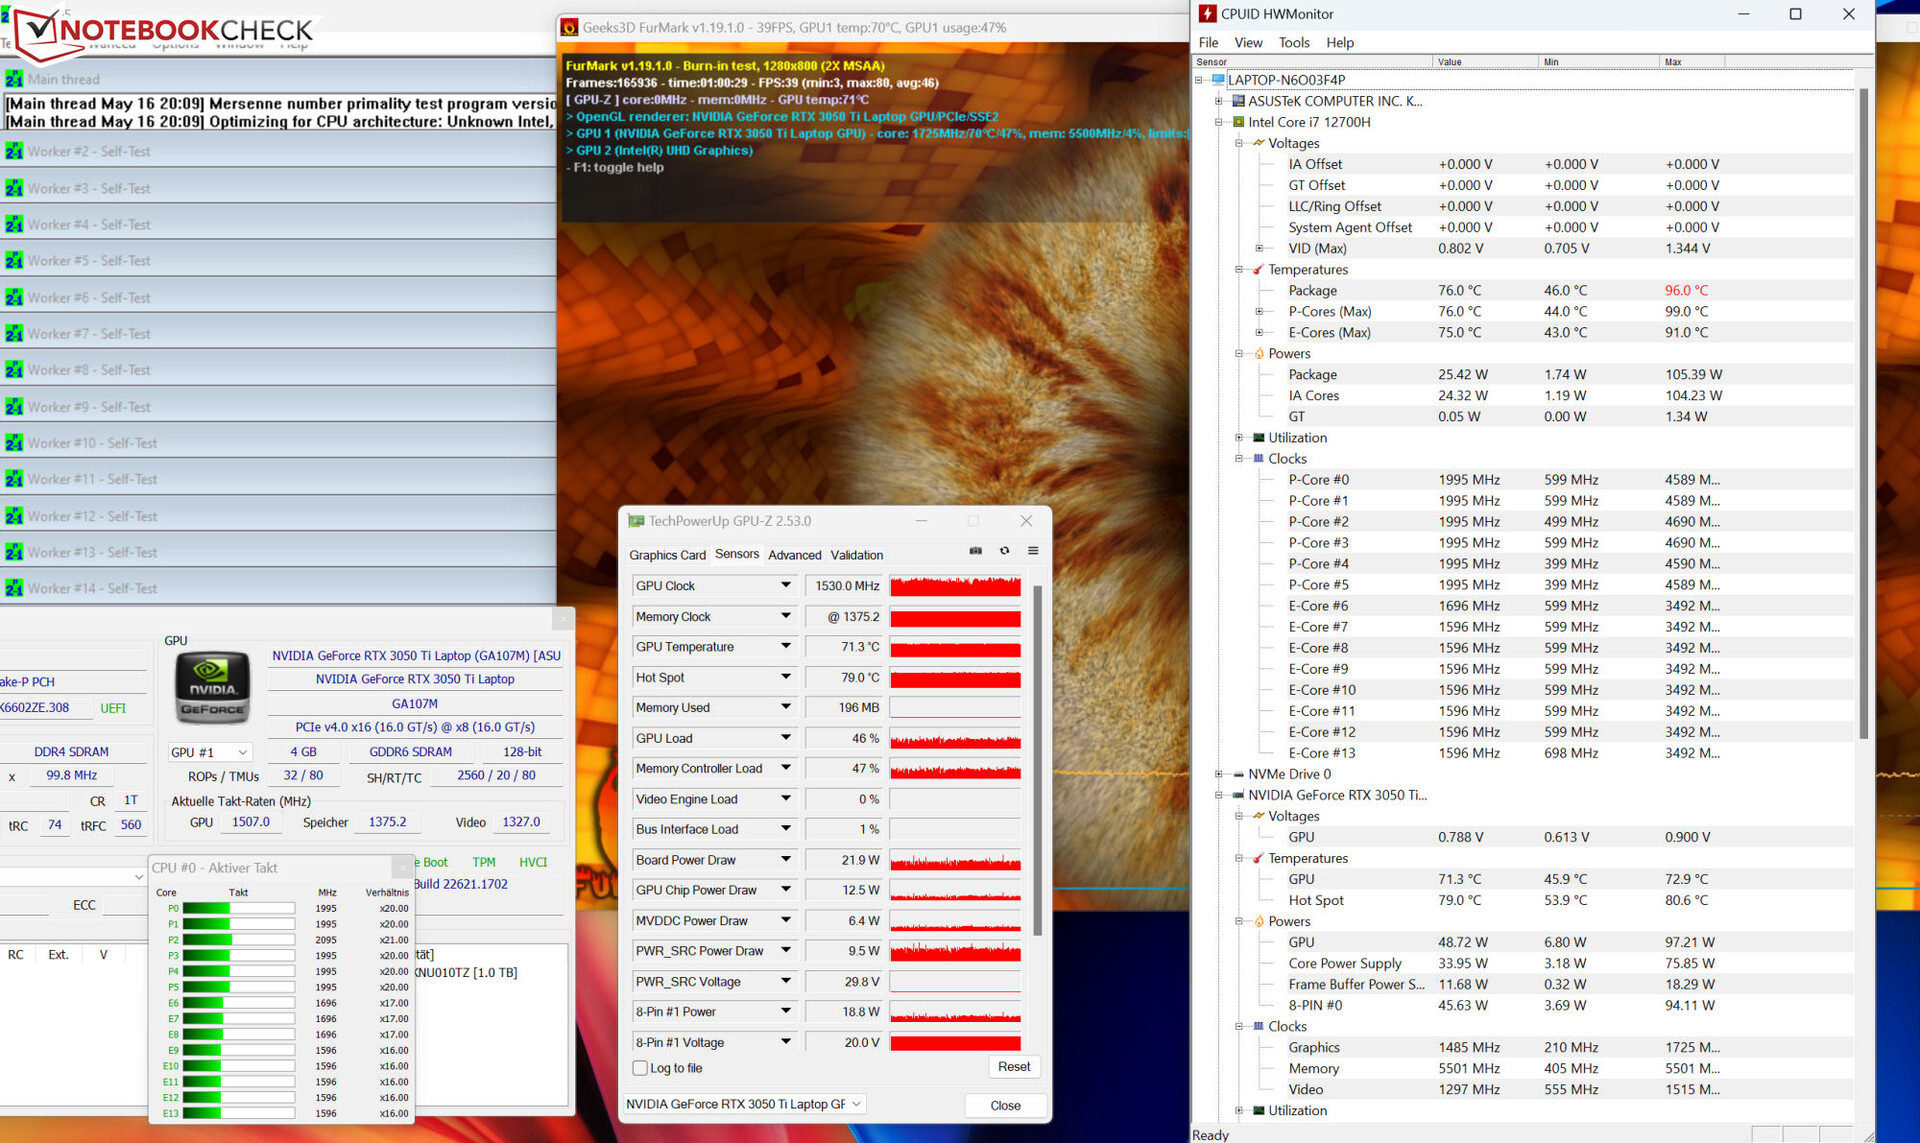
Bajo carga, el portátil alcanzó temperaturas bastante altas, pero de media sus temperaturas alcanzaron niveles moderados. Esto significa que medimos un máximo de 55.5 °C durante nuestra prueba de estrés. En el uso diario, sin embargo, las temperaturas se encuentran generalmente dentro de un rango aceptable.
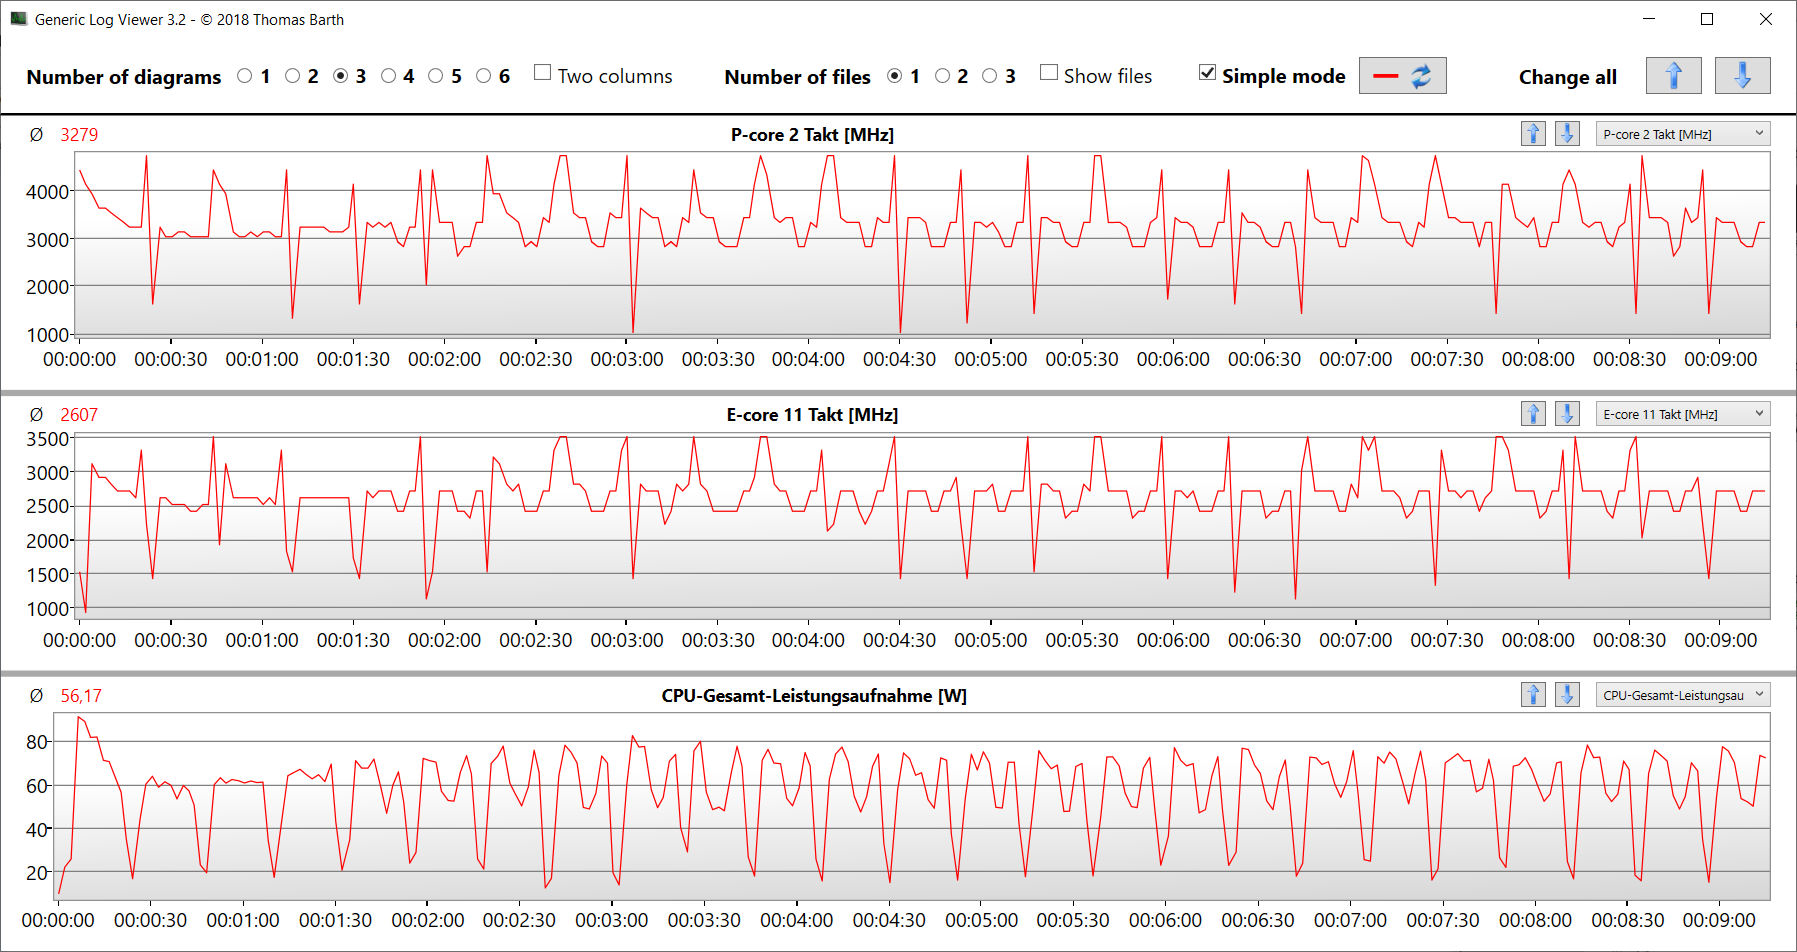
La prueba de estrés (Prime95 y Furmark en uso continuo) simula un escenario extremo para comprobar la estabilidad del sistema a plena carga. La CPU comenzó la prueba de estrés con velocidades de reloj medias (P: 3,2 - 3,3 GHz; E: 2,7 GHz) y el núcleo gráfico tenía una velocidad de 1,1 - 1,4 GHz. Mientras que las frecuencias de la CPU bajaron a lo largo de la prueba, las de la GPU subieron un poco.
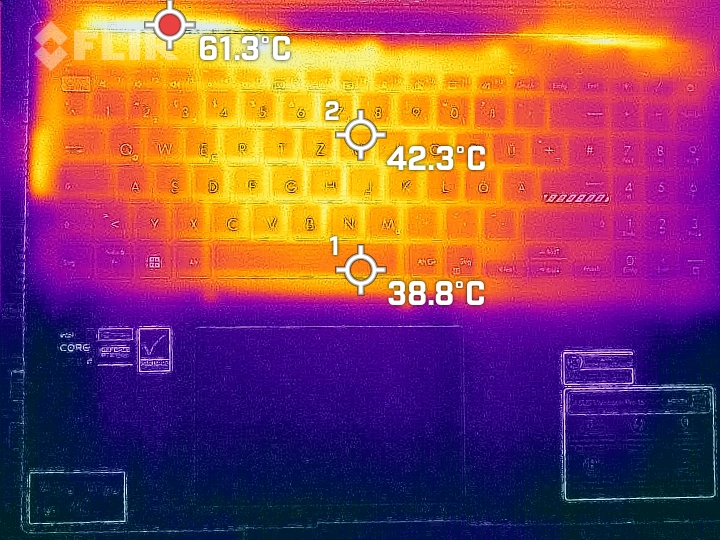
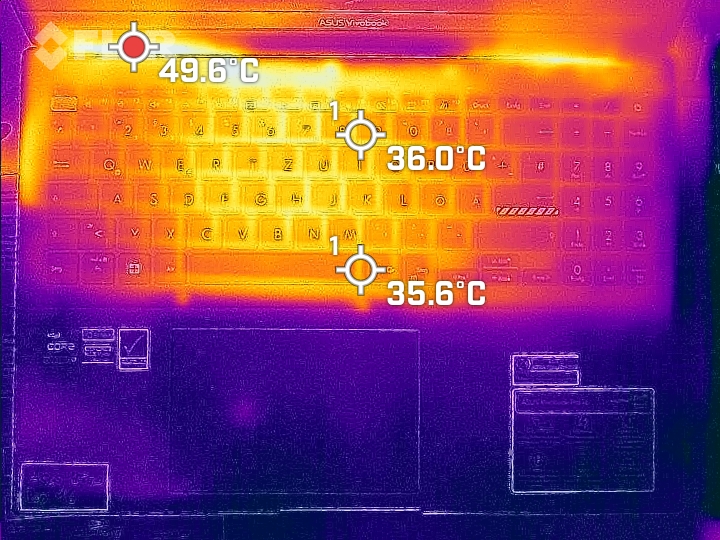
(±) La temperatura máxima en la parte superior es de 44.2 °C / 112 F, frente a la media de 36.8 °C / 98 F, que oscila entre 21 y 71 °C para la clase Multimedia.
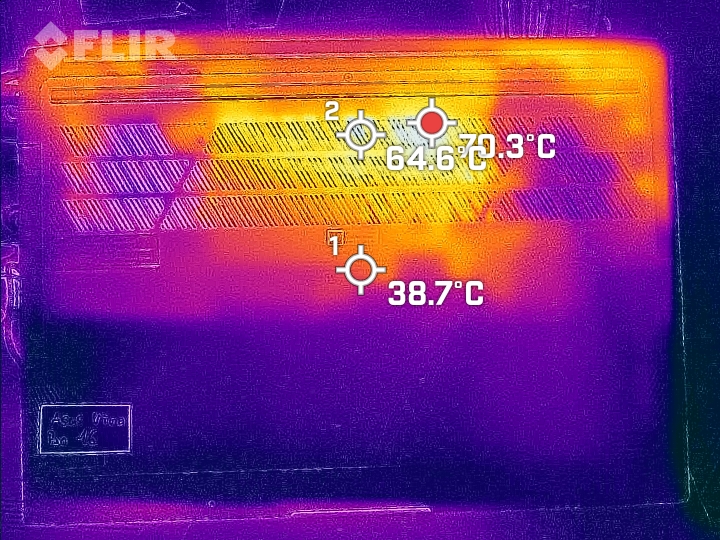
(-) El fondo se calienta hasta un máximo de 53 °C / 127 F, frente a la media de 39.1 °C / 102 F
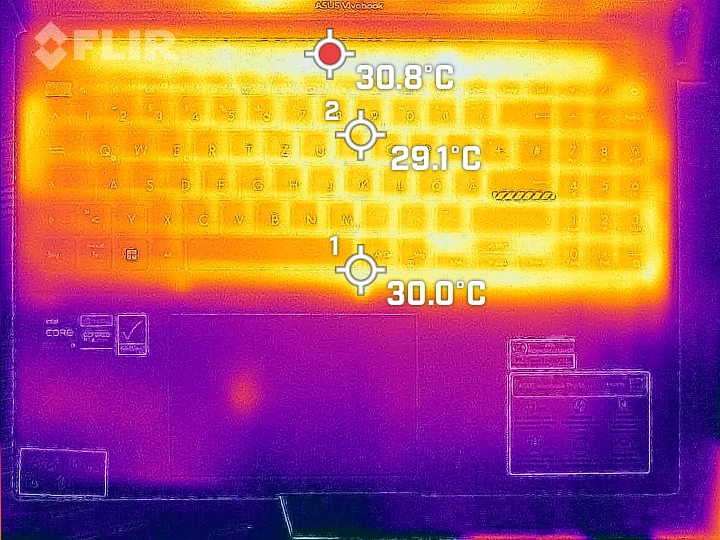
(+) En reposo, la temperatura media de la parte superior es de 27.9 °C / 82# F, frente a la media del dispositivo de 31.3 °C / 88 F.
(±) Jugando a The Witcher 3, la temperatura media de la parte superior es de 33.3 °C / 92 F, frente a la media del dispositivo de 31.3 °C / 88 F.
(+) El reposamanos y el panel táctil están a una temperatura inferior a la de la piel, con un máximo de 23.7 °C / 74.7 F y, por tanto, son fríos al tacto.
(+) La temperatura media de la zona del reposamanos de dispositivos similares fue de 28.7 °C / 83.7 F (+5 °C / 9 F).
| Asus VivoBook Pro 16 Intel Core i7-12700H, NVIDIA GeForce RTX 3050 Ti Laptop GPU | Dell Inspiron 16 Plus 7620 Intel Core i7-12700H, NVIDIA GeForce RTX 3050 Ti Laptop GPU | Schenker XMG Fusion 15 (Mid 22) Intel Core i7-11800H, NVIDIA GeForce RTX 3070 Laptop GPU | Acer Swift X SFX16-52G-77RX Intel Core i7-1260P, Intel Arc A370M | |
|---|---|---|---|---|
| Heat | 10% | -13% | 3% | |
| Maximum Upper Side * (°C) | 44.2 | 46 -4% | 52 -18% | 49.4 -12% |
| Maximum Bottom * (°C) | 53 | 45.8 14% | 63 -19% | 55.5 -5% |
| Idle Upper Side * (°C) | 32.1 | 29.2 9% | 37 -15% | 28.4 12% |
| Idle Bottom * (°C) | 38.4 | 31 19% | 38 1% | 32.6 15% |
* ... más pequeño es mejor
Altavoces
Los altavoces estéreo producen un sonido decente, pero sin apenas graves.
Asus VivoBook Pro 16 análisis de audio
(+) | los altavoces pueden reproducir a un volumen relativamente alto (#88.5 dB)
Graves 100 - 315 Hz
(-) | casi sin bajos - de media 20.8% inferior a la mediana
(±) | la linealidad de los graves es media (12.8% delta a frecuencia anterior)
Medios 400 - 2000 Hz
(+) | medios equilibrados - a sólo 2.2% de la mediana
(+) | los medios son lineales (4.7% delta a la frecuencia anterior)
Altos 2 - 16 kHz
(±) | máximos más altos - de media 7.4% más altos que la mediana
(+) | los máximos son lineales (5.9% delta a la frecuencia anterior)
Total 100 - 16.000 Hz
(±) | la linealidad del sonido global es media (16.2% de diferencia con la mediana)
En comparación con la misma clase
» 41% de todos los dispositivos probados de esta clase eran mejores, 7% similares, 51% peores
» El mejor tuvo un delta de 5%, la media fue 17%, el peor fue ###max##%
En comparación con todos los dispositivos probados
» 26% de todos los dispositivos probados eran mejores, 6% similares, 68% peores
» El mejor tuvo un delta de 4%, la media fue 23%, el peor fue ###max##%
Dell Inspiron 16 Plus 7620 análisis de audio
(+) | los altavoces pueden reproducir a un volumen relativamente alto (#87.8 dB)
Graves 100 - 315 Hz
(-) | casi sin bajos - de media 22.2% inferior a la mediana
(±) | la linealidad de los graves es media (9.7% delta a frecuencia anterior)
Medios 400 - 2000 Hz
(+) | medios equilibrados - a sólo 3.3% de la mediana
(+) | los medios son lineales (5.3% delta a la frecuencia anterior)
Altos 2 - 16 kHz
(+) | máximos equilibrados - a sólo 2.5% de la mediana
(+) | los máximos son lineales (4.7% delta a la frecuencia anterior)
Total 100 - 16.000 Hz
(+) | el sonido global es lineal (13.4% de diferencia con la mediana)
En comparación con la misma clase
» 28% de todos los dispositivos probados de esta clase eran mejores, 5% similares, 68% peores
» El mejor tuvo un delta de 5%, la media fue 17%, el peor fue ###max##%
En comparación con todos los dispositivos probados
» 14% de todos los dispositivos probados eran mejores, 4% similares, 83% peores
» El mejor tuvo un delta de 4%, la media fue 23%, el peor fue ###max##%
Consumo de energía
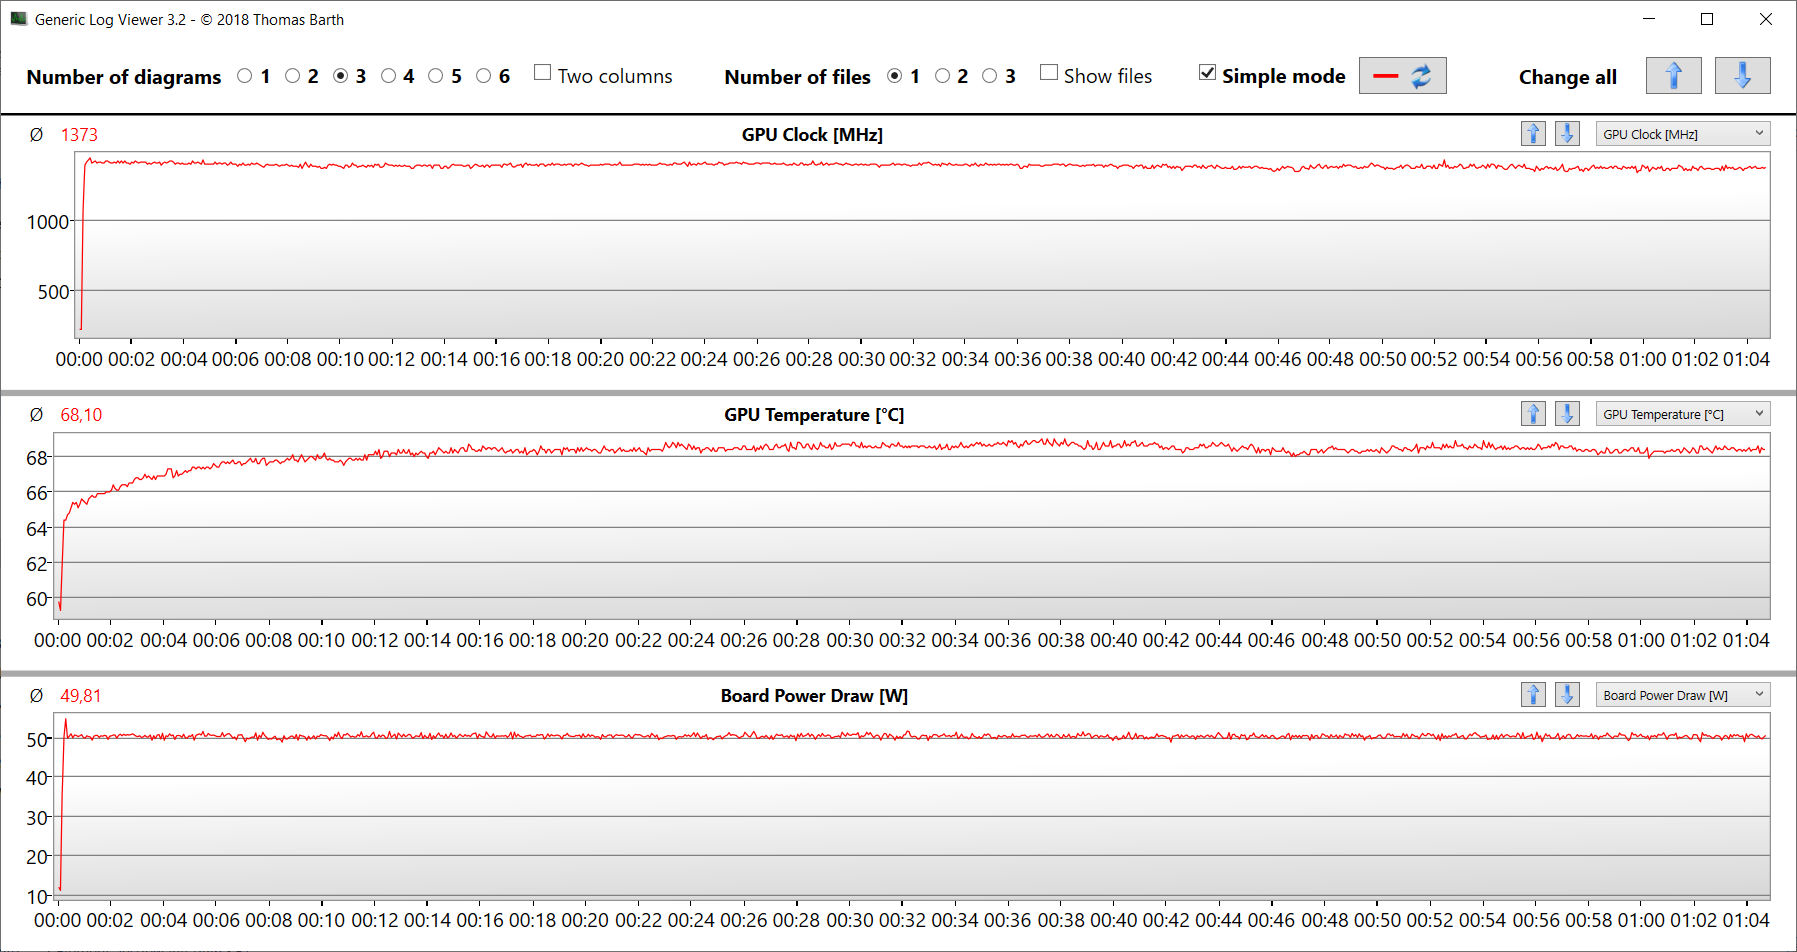
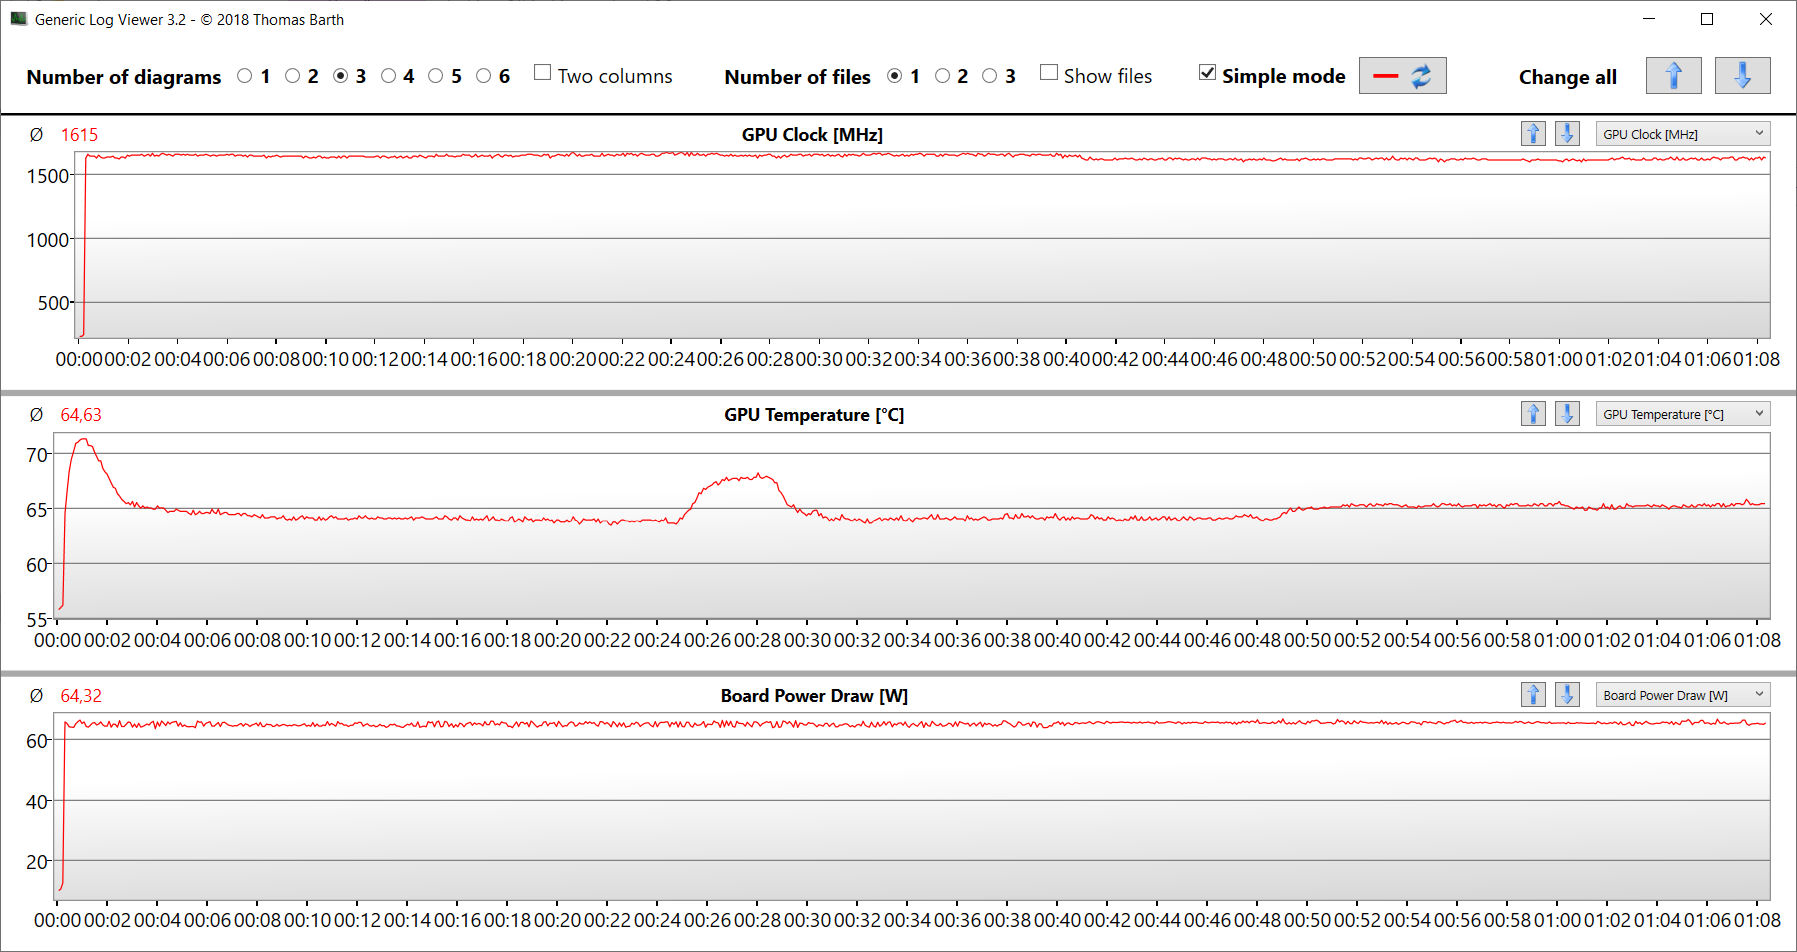
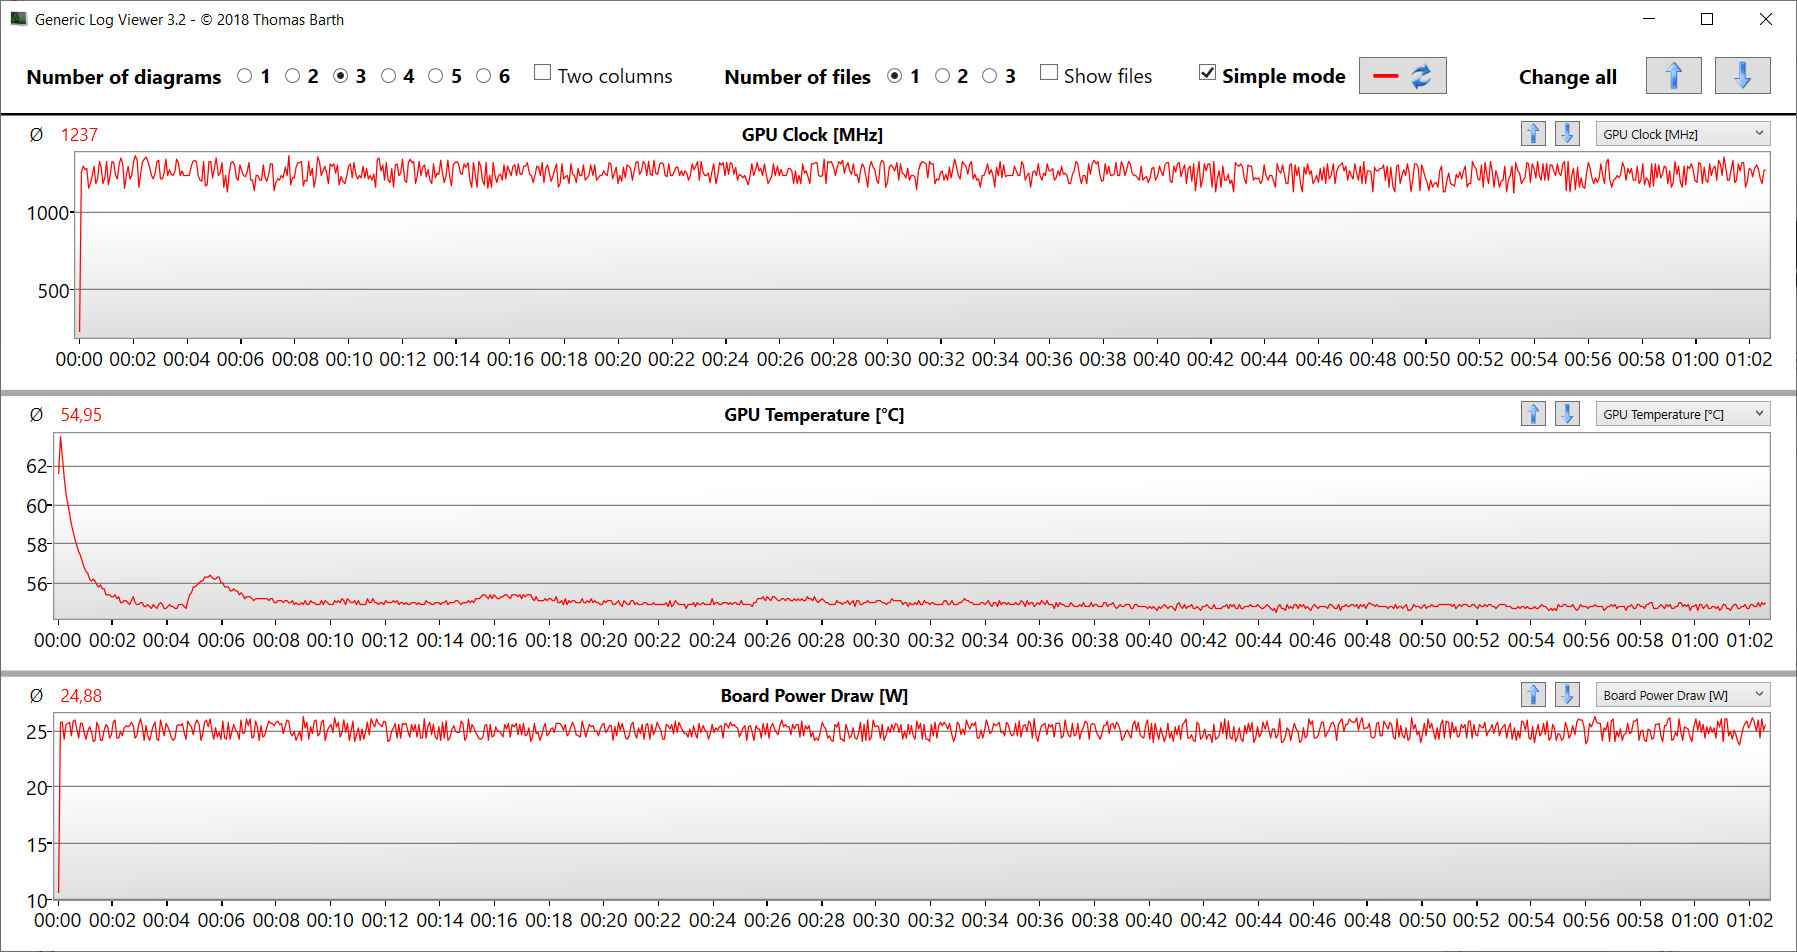
El portátil no mostró ningún índice de consumo de energía llamativo. Los valores que medimos están en un nivel normal para el hardware instalado. La prueba Witcher 3 se realizó con un consumo de energía constante. Su fuente de alimentación (150 vatios) está suficientemente dimensionada.
| Off / Standby | |
| Ocioso | |
| Carga |
|
Clave:
min: | |
| Asus VivoBook Pro 16 i7-12700H, GeForce RTX 3050 Ti Laptop GPU, Intel SSD 670p SSDPEKNU010TZ, IPS, 2560x1600, 16" | Dell Inspiron 16 Plus 7620 i7-12700H, GeForce RTX 3050 Ti Laptop GPU, Kioxia BG5 KBG50ZNS512G, IPS, 3072x1920, 16" | Schenker XMG Fusion 15 (Mid 22) i7-11800H, GeForce RTX 3070 Laptop GPU, Samsung SSD 980 Pro 1TB MZ-V8P1T0BW, IPS, 2560x1440, 15.6" | Acer Swift X SFX16-52G-77RX i7-1260P, A370M, WDC PC SN810 1TB, IPS-LED, 2560x1600, 16" | Medio NVIDIA GeForce RTX 3050 Ti Laptop GPU | Media de la clase Multimedia | |
|---|---|---|---|---|---|---|
| Power Consumption | 12% | -26% | 42% | 10% | 33% | |
| Idle Minimum * (Watt) | 8.7 | 6.8 22% | 12 -38% | 3.7 57% | 8.2 ? 6% | 5.68 ? 35% |
| Idle Average * (Watt) | 13.1 | 9.6 27% | 17 -30% | 7.6 42% | 12.6 ? 4% | 10.2 ? 22% |
| Idle Maximum * (Watt) | 18.3 | 17 7% | 24 -31% | 11.1 39% | 17.2 ? 6% | 12.4 ? 32% |
| Load Average * (Watt) | 116 | 117.5 -1% | 106 9% | 70 40% | 92 ? 21% | 65.4 ? 44% |
| Witcher 3 ultra * (Watt) | 117.6 | 113.1 4% | 159.9 -36% | 68.8 41% | ||
| Load Maximum * (Watt) | 162 | 137.4 15% | 208 -28% | 108 33% | 139.1 ? 14% | 113.3 ? 30% |
* ... más pequeño es mejor
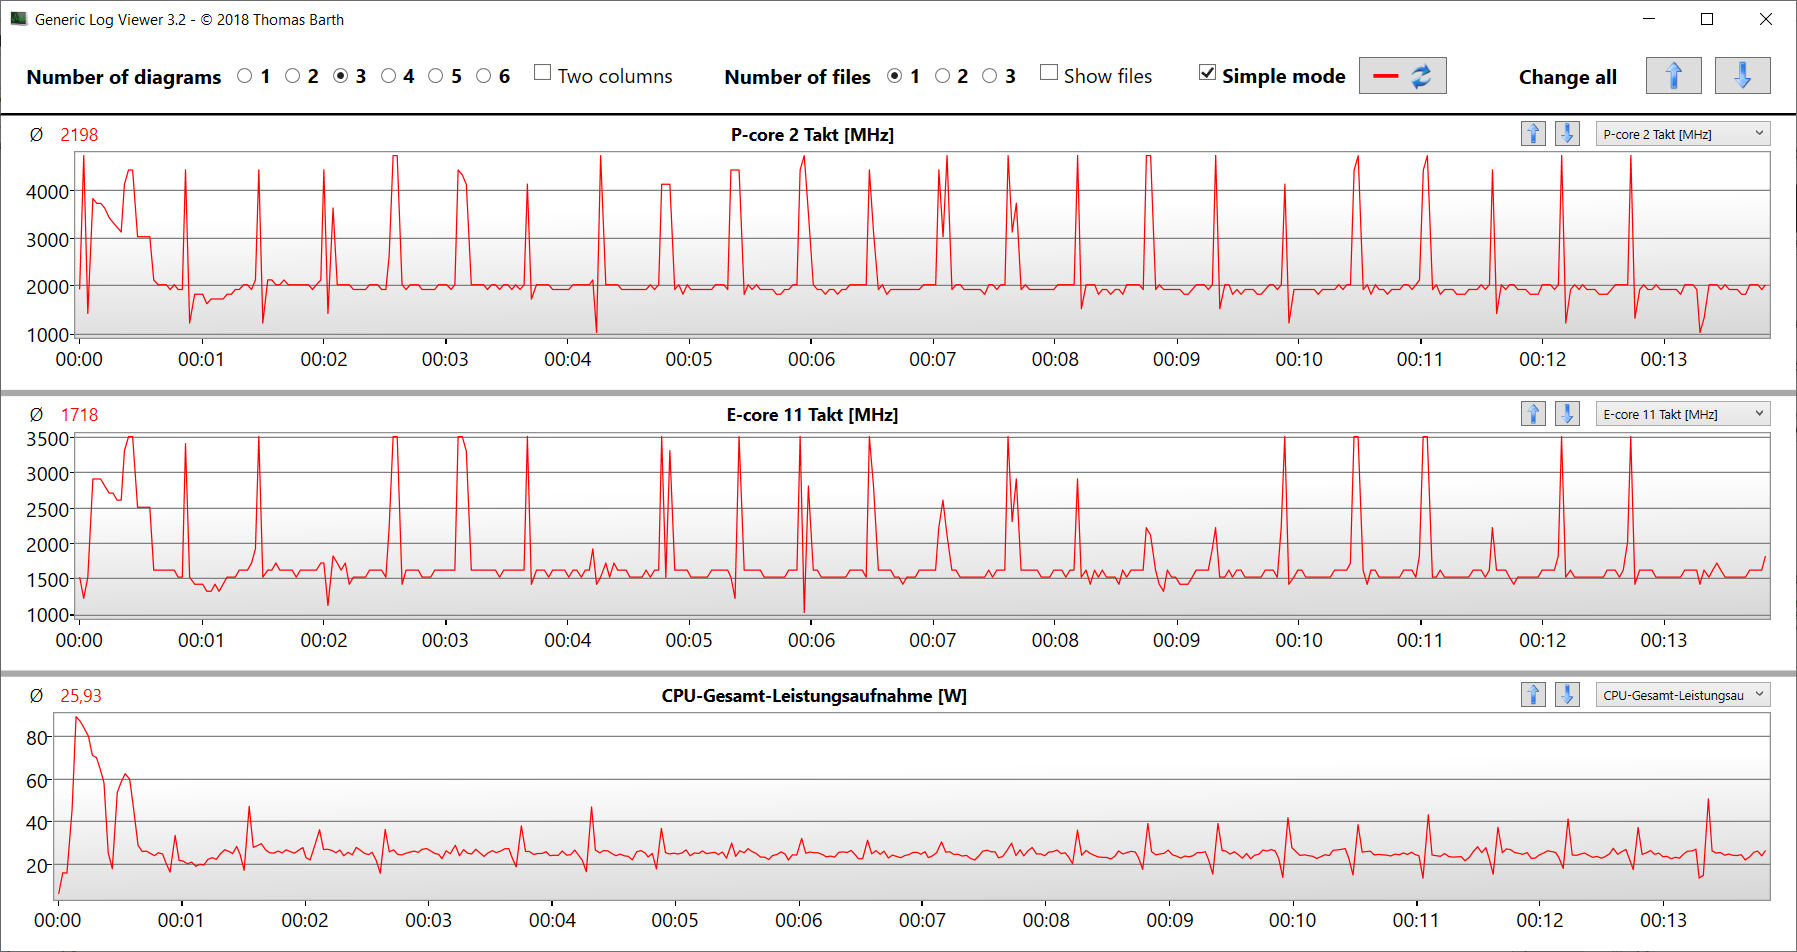
power consumption Witcher 3 / stress test
Power consumption with external monitor
Duración de la batería
El portátil de 16 pulgadas logró una duración de 7:14 h en nuestra prueba práctica de WLAN (mapeo de la carga al llamar a sitios web a través de un script) - un valor decente, pero no estupendo. En el campo de la comparación, el VivoBook ocupa el último lugar.
Pro
Contra
Veredicto - Un todoterreno multimedia con una pantalla impresionante
Edición de vídeo y fotos, streaming, renderizado y juegos: Todo esto forma parte de los puntos fuertes del VivoBook Pro 16. SuCore 7-12700HyGeForce RTX 3050 Tiofrecen toda la potencia necesaria - ambos componentes funcionan consistentemente con altas frecuencias de reloj. Aunque no se aprovecha todo su potencial, ya que la RAM sólo funciona en modo monocanal.
El VivoBook Pro 16 de Asus es un portátil apto para jugones y creadores que no dan demasiada importancia a tener el hardware más nuevo.
El portátil sólo se calienta un poco en carga, pero puede llegar a ser muy ruidoso - o demasiado, incluso. Un punto positivo: El dispositivo ofrece un modo susurro que puede reducir las emisiones de ruido que produce el portátil a expensas de su rendimiento, lo que al menos puede permitir trabajar un poco más relajado.
Su construcción compacta, su peso relativamente pequeño (1,9 kg) y su decente autonomía (WLAN: 7:15 h) hacen del VivoBook un dispositivo bastante móvil. Un punto positivo: La batería se puede cargar usando una fuente de alimentación USB-C (mín. 65 vatios, 20 V) - ambos puertos USB-C soportan la entrega de energía. No tienes que seguir usando la fuente de alimentación propietaria incluida.
Nuestro modelo de pruebas no tiene pantalla OLED, pero suele estar disponible en la serie VivoBook Pro 16. No deberías echarla de menos: La pantalla IPS instalada (16 pulgadas, 2.560 x 1.600 pixels) en formato 16:10 impresiona por su brillo, buen contraste, ángulos de visión estables, cortos tiempos de reacción, gran representación del color y excelente cobertura del espacio de color.
como alternativa, puede echar un vistazo alDell Inspiron 16 Plus 7620: Con un rendimiento comparable, ofrece tiempos de ejecución considerablemente mejores. Una alternativa económica es elAcer Swift X 16que ofrece un rendimiento gráfico inferior, pero puede ofrecer tiempos de ejecución muy buenos y un precio de unos 1.000 dólares.
Precio y disponibilidad
La versión del Asus VivoBook Pro 16 que hemos probado se puede comprar en Amazon por 1.247 dólares.
Asus VivoBook Pro 16
- 05/22/2023 v7 (old)
Sascha Mölck
Transparencia
La selección de los dispositivos que se van a reseñar corre a cargo de nuestro equipo editorial. La muestra de prueba fue proporcionada al autor en calidad de préstamo por el fabricante o el minorista a los efectos de esta reseña. El prestamista no tuvo ninguna influencia en esta reseña, ni el fabricante recibió una copia de la misma antes de su publicación. No había ninguna obligación de publicar esta reseña. Como empresa de medios independiente, Notebookcheck no está sujeta a la autoridad de fabricantes, minoristas o editores.
Así es como prueba Notebookcheck
Cada año, Notebookcheck revisa de forma independiente cientos de portátiles y smartphones utilizando procedimientos estandarizados para asegurar que todos los resultados son comparables. Hemos desarrollado continuamente nuestros métodos de prueba durante unos 20 años y hemos establecido los estándares de la industria en el proceso. En nuestros laboratorios de pruebas, técnicos y editores experimentados utilizan equipos de medición de alta calidad. Estas pruebas implican un proceso de validación en varias fases. Nuestro complejo sistema de clasificación se basa en cientos de mediciones y puntos de referencia bien fundamentados, lo que mantiene la objetividad.Price comparison

