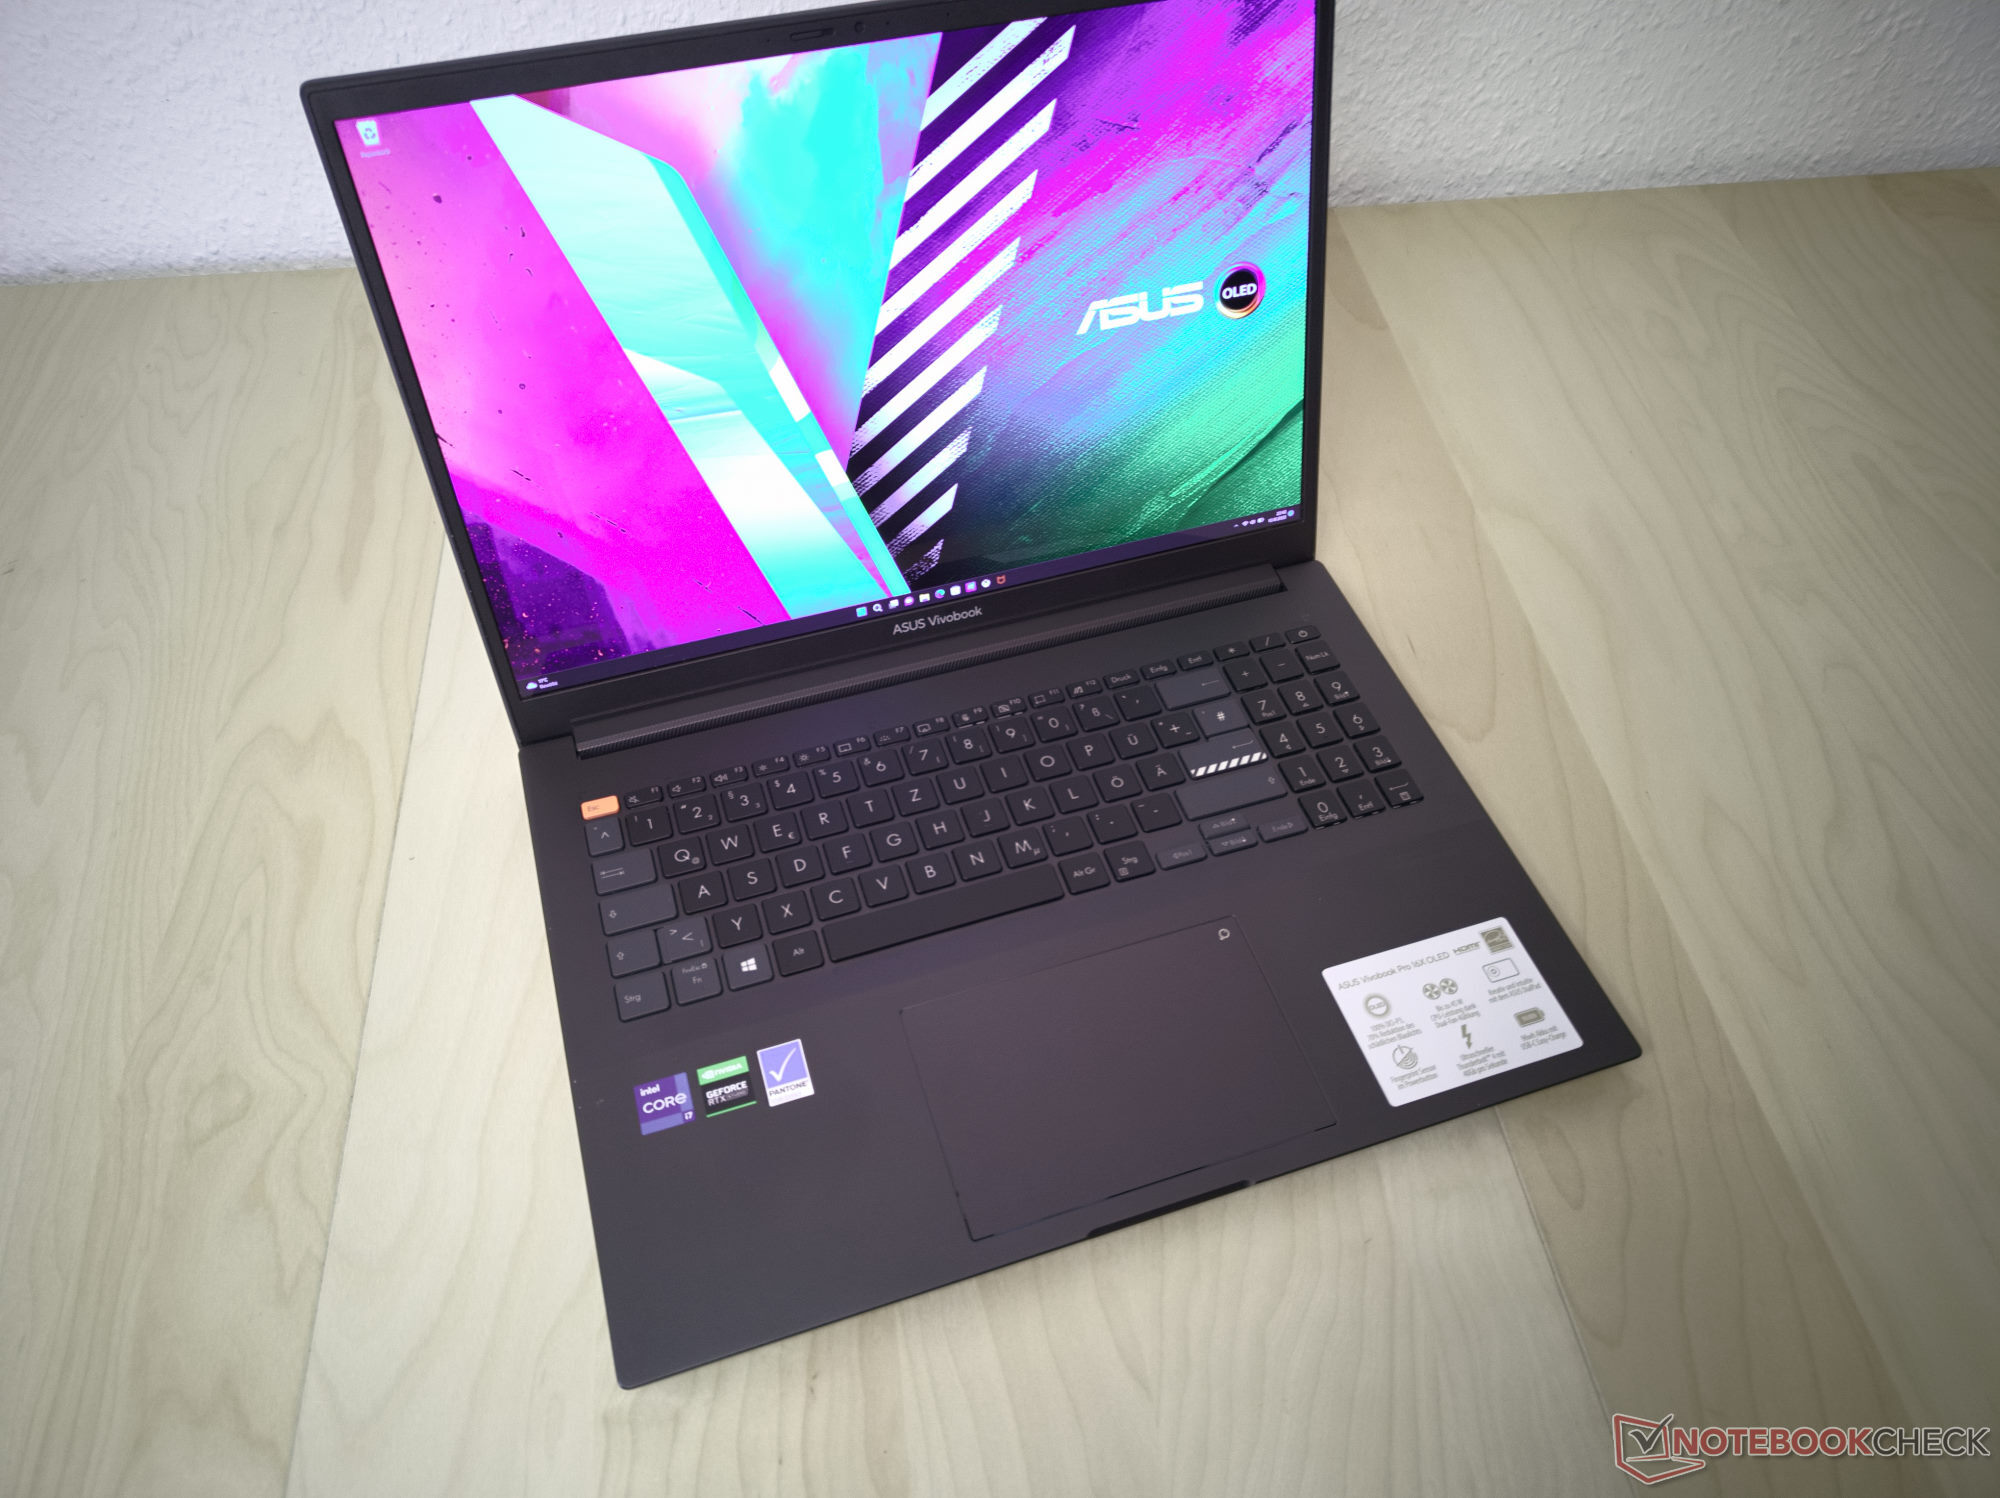
Análisis del portátil Asus Vivobook Pro 16X: El sistema de Asus con una pantalla OLED de alta gama

Teniendo en cuenta sus características, el Asus Vivobook Pro 16X parece estar dirigido a los creadores. Está equipado con una excelente pantalla OLED 16:10 y logra buenos resultados en varios benchmarks. Esto se consigue con un Intel Core i7-11370H de última generación y una Nvidia GeForce RTX 3050. Como alternativa, el Vivobook Pro 16X también está disponible en otras numerosas configuraciones, que incluyen los últimos procesadores AMD o Intel y varias opciones de GPU Nvidia.
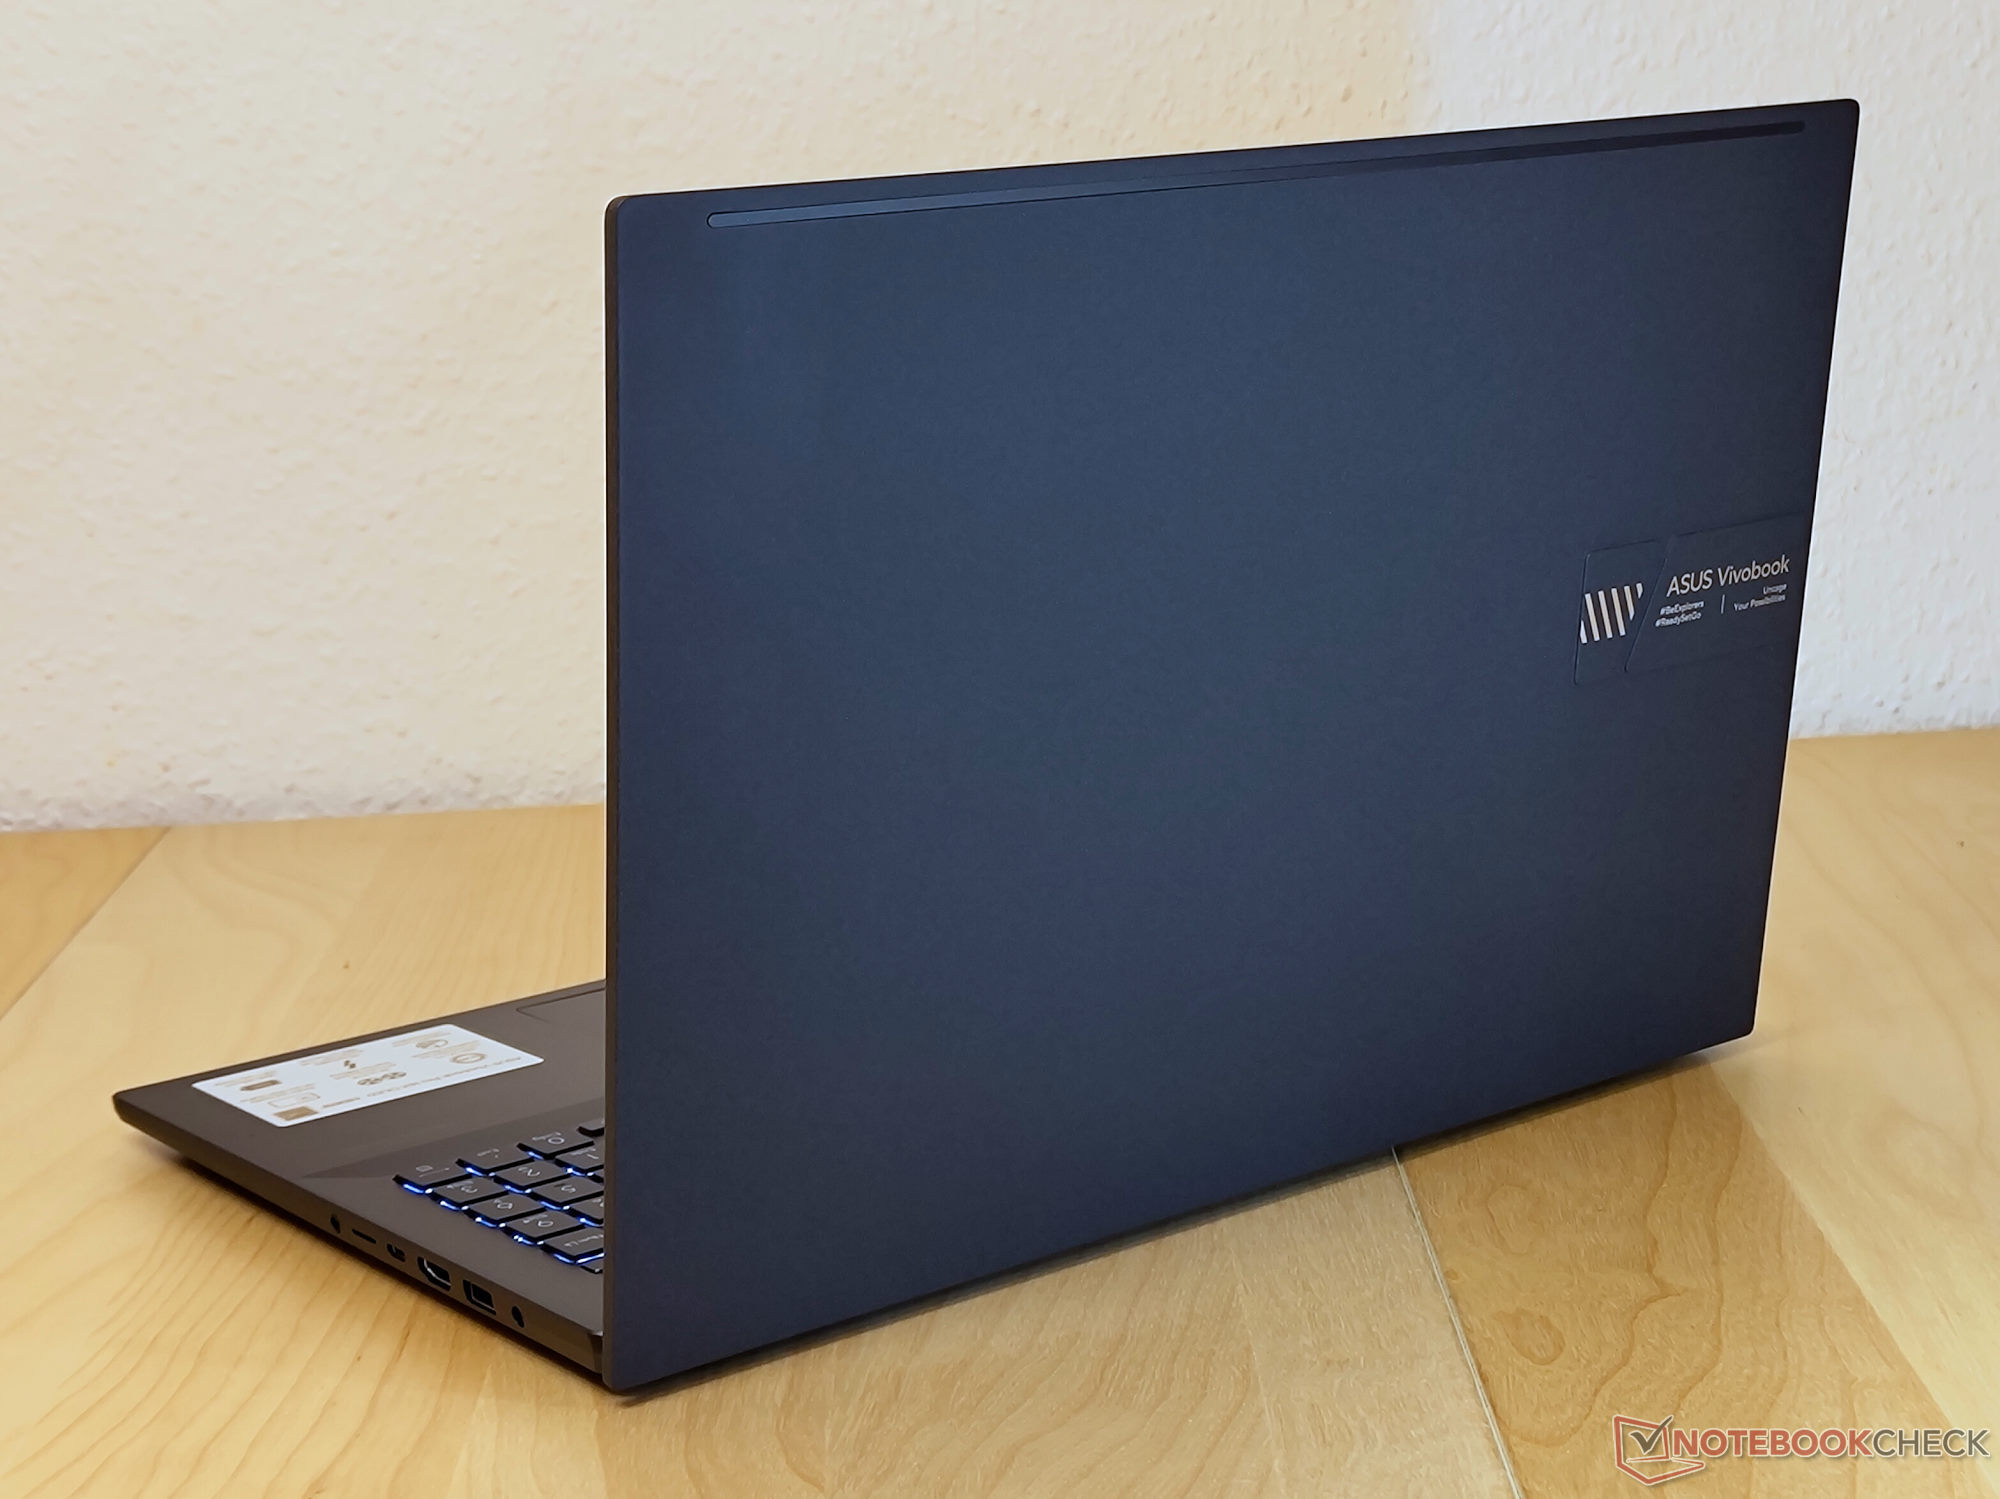
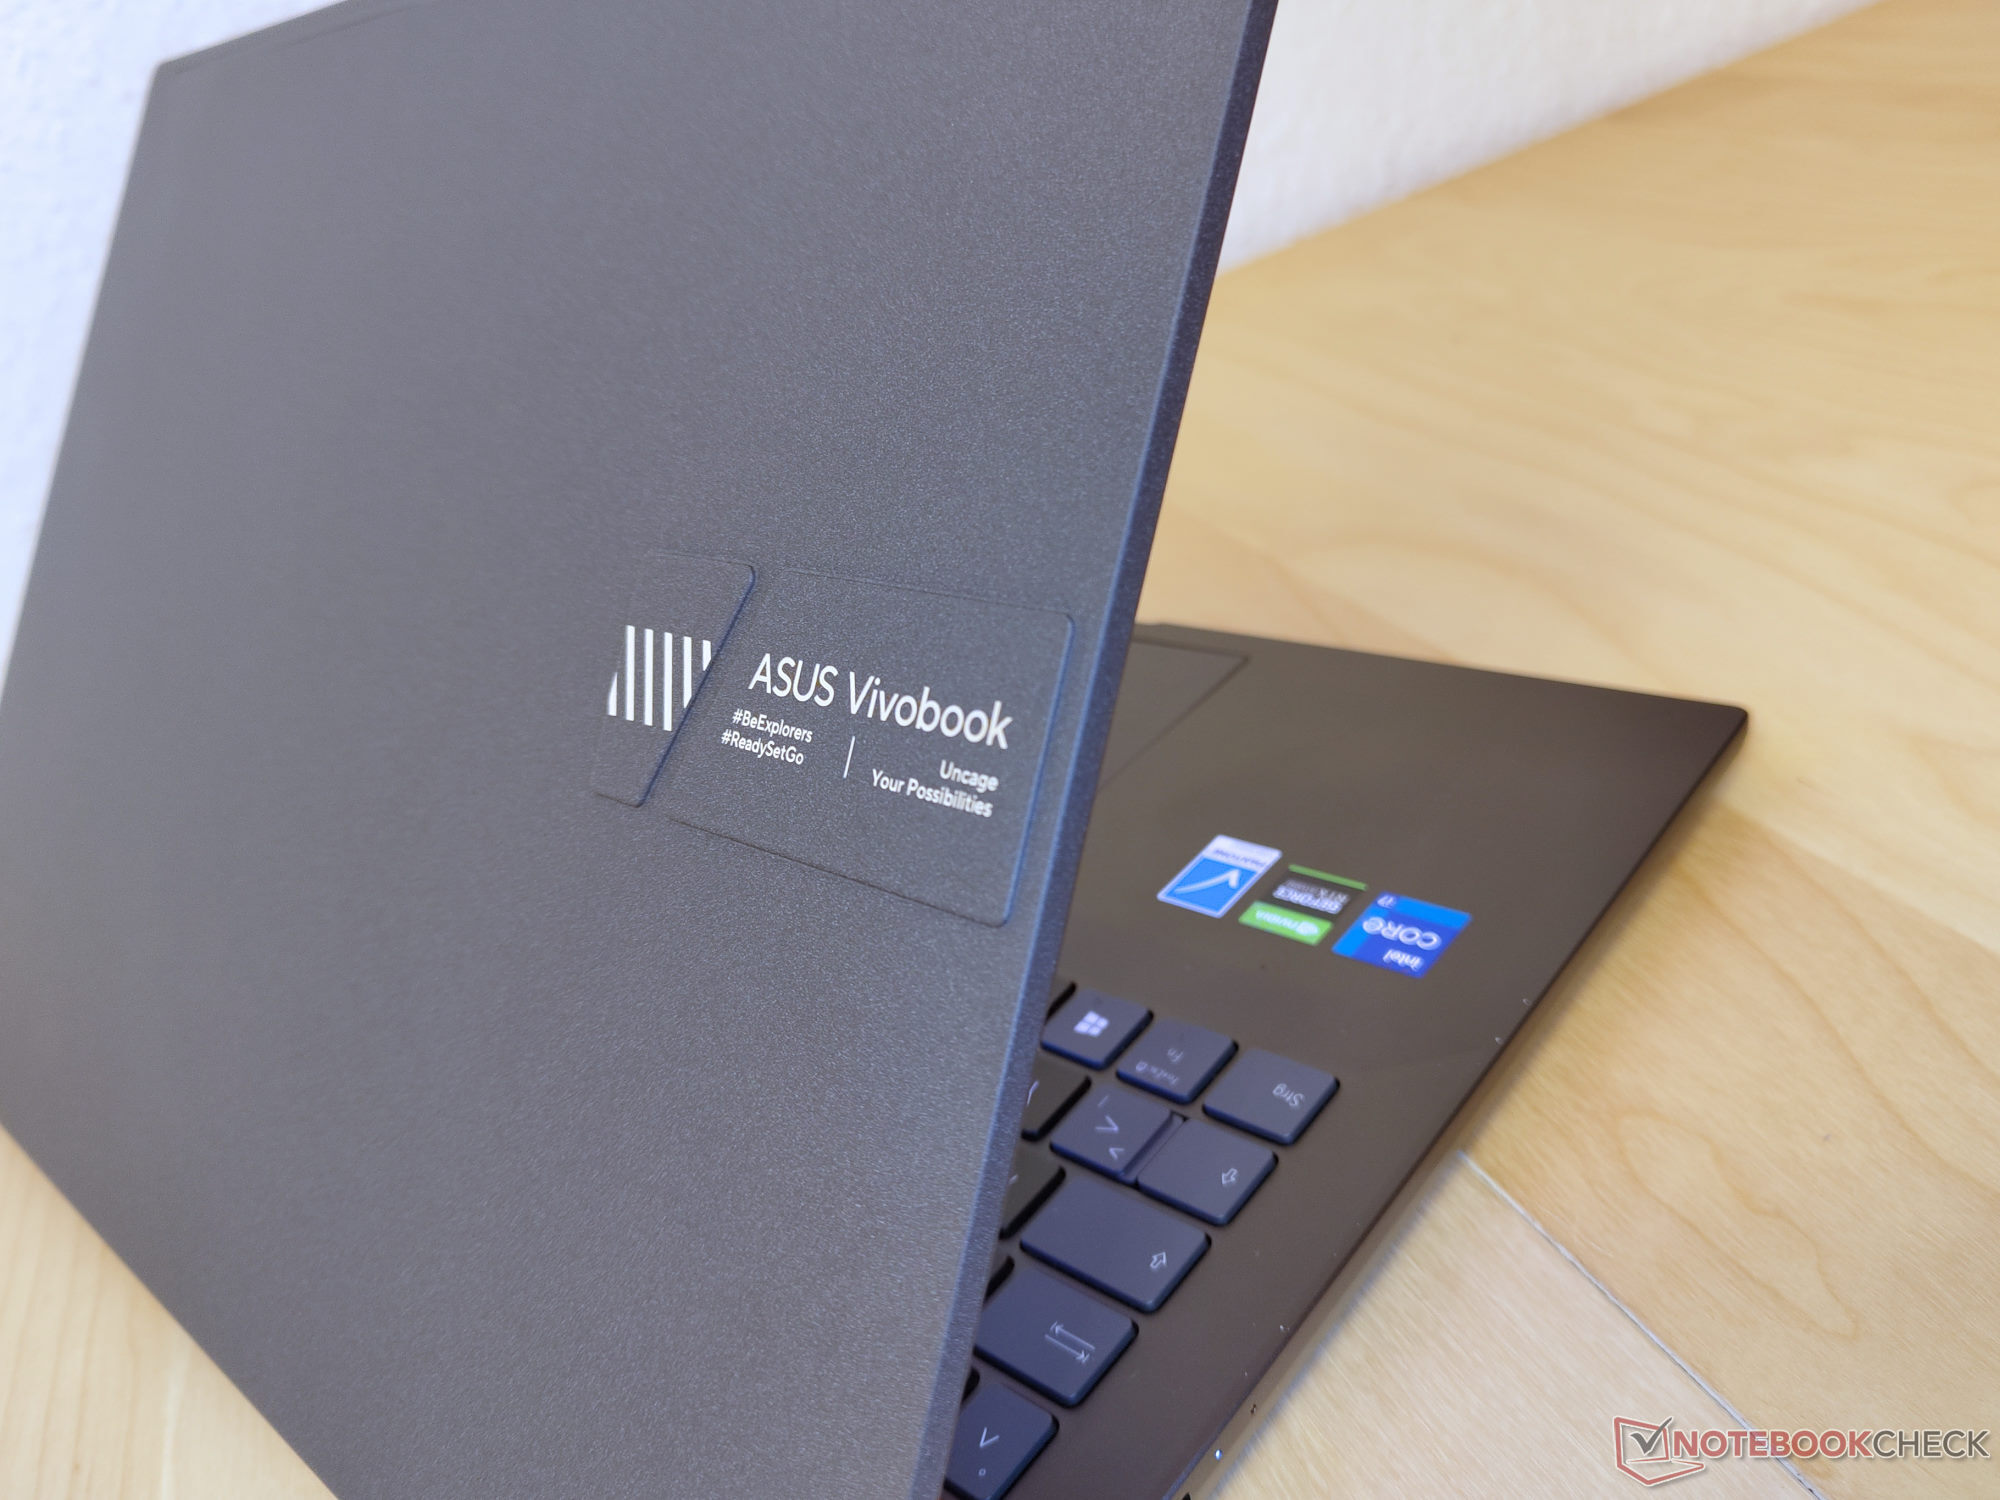
La presentación visual del portátil se beneficia del generoso uso del aluminio. Gracias a su acabado trenzado, la tapa es especialmente resistente a los arañazos y la grasa.
Dado que el portátil multimedia está equipado con potentes componentes, hemos seleccionado portátiles de varias categorías para nuestra comparación. Por ejemplo, tanto el más barato Dell Inspiron 16 Plus 7610 como el mucho más caro ThinkPad X1 Extreme G4 son muy similares en términos de características. A pesar de ello, el Vivobook es capaz de diferenciarse de la competencia gracias a su excelente pantalla OLED.
Posibles contendientes en la comparación
Valoración | Fecha | Modelo | Peso | Altura | Tamaño | Resolución | Precio |
|---|---|---|---|---|---|---|---|
| 83.7 % v7 (old) | 11/2022 | Asus VivoBook Pro 16X OLED N7600PC-L2026X i7-11370H, GeForce RTX 3050 4GB Laptop GPU | 2 kg | 18.9 mm | 16.00" | 3840x2400 | |
| 84.2 % v7 (old) | 10/2022 | MSI Summit E16 Flip A12UDT-031 i7-1280P, GeForce RTX 3050 Ti Laptop GPU | 1.9 kg | 16.85 mm | 16.00" | 2560x1600 | |
| 89 % v7 (old) | 03/2022 | Microsoft Surface Laptop Studio i7 RTX 3050 Ti i7-11370H, GeForce RTX 3050 Ti Laptop GPU | 1.8 kg | 19 mm | 14.40" | 2400x1600 | |
| 86.7 % v7 (old) | 08/2021 | Dell Inspiron 16 Plus 7610 i7-11800H, GeForce RTX 3050 4GB Laptop GPU | 2 kg | 18.99 mm | 16.00" | 3072x1920 | |
| 89 % v7 (old) | 11/2021 | Lenovo ThinkPad X1 Extreme G4-20Y5CTO1WW (3050 Ti) i7-11800H, GeForce RTX 3050 Ti Laptop GPU | 2 kg | 18.2 mm | 16.00" | 3840x2400 | |
| 83.2 % v7 (old) | 09/2021 | Schenker XMG Focus 15 i7-11800H, GeForce RTX 3050 Ti Laptop GPU | 1.9 kg | 22 mm | 15.60" | 1920x1080 |
Caja - Aluminio superior, inferior y central
Aunque no resulte evidente a primera vista, casi todo el chasis del Vivobook 16X es de aluminio. La unidad base fue pintada en color antracita, mientras que un revestimiento gris oscuro cubre la tapa. Este último es mate, muy robusto, y no atrae la grasa. Asus lo comercializa como revestimiento de tejido. Dependiendo del ángulo en el que la luz incide en la superficie, puede parecer muy suave o muy áspera. Hay un logo característico de Asus en un área separada en la parte posterior de la tapa. Por lo demás, el diseño del portátil multimedia es relativamente sencillo.
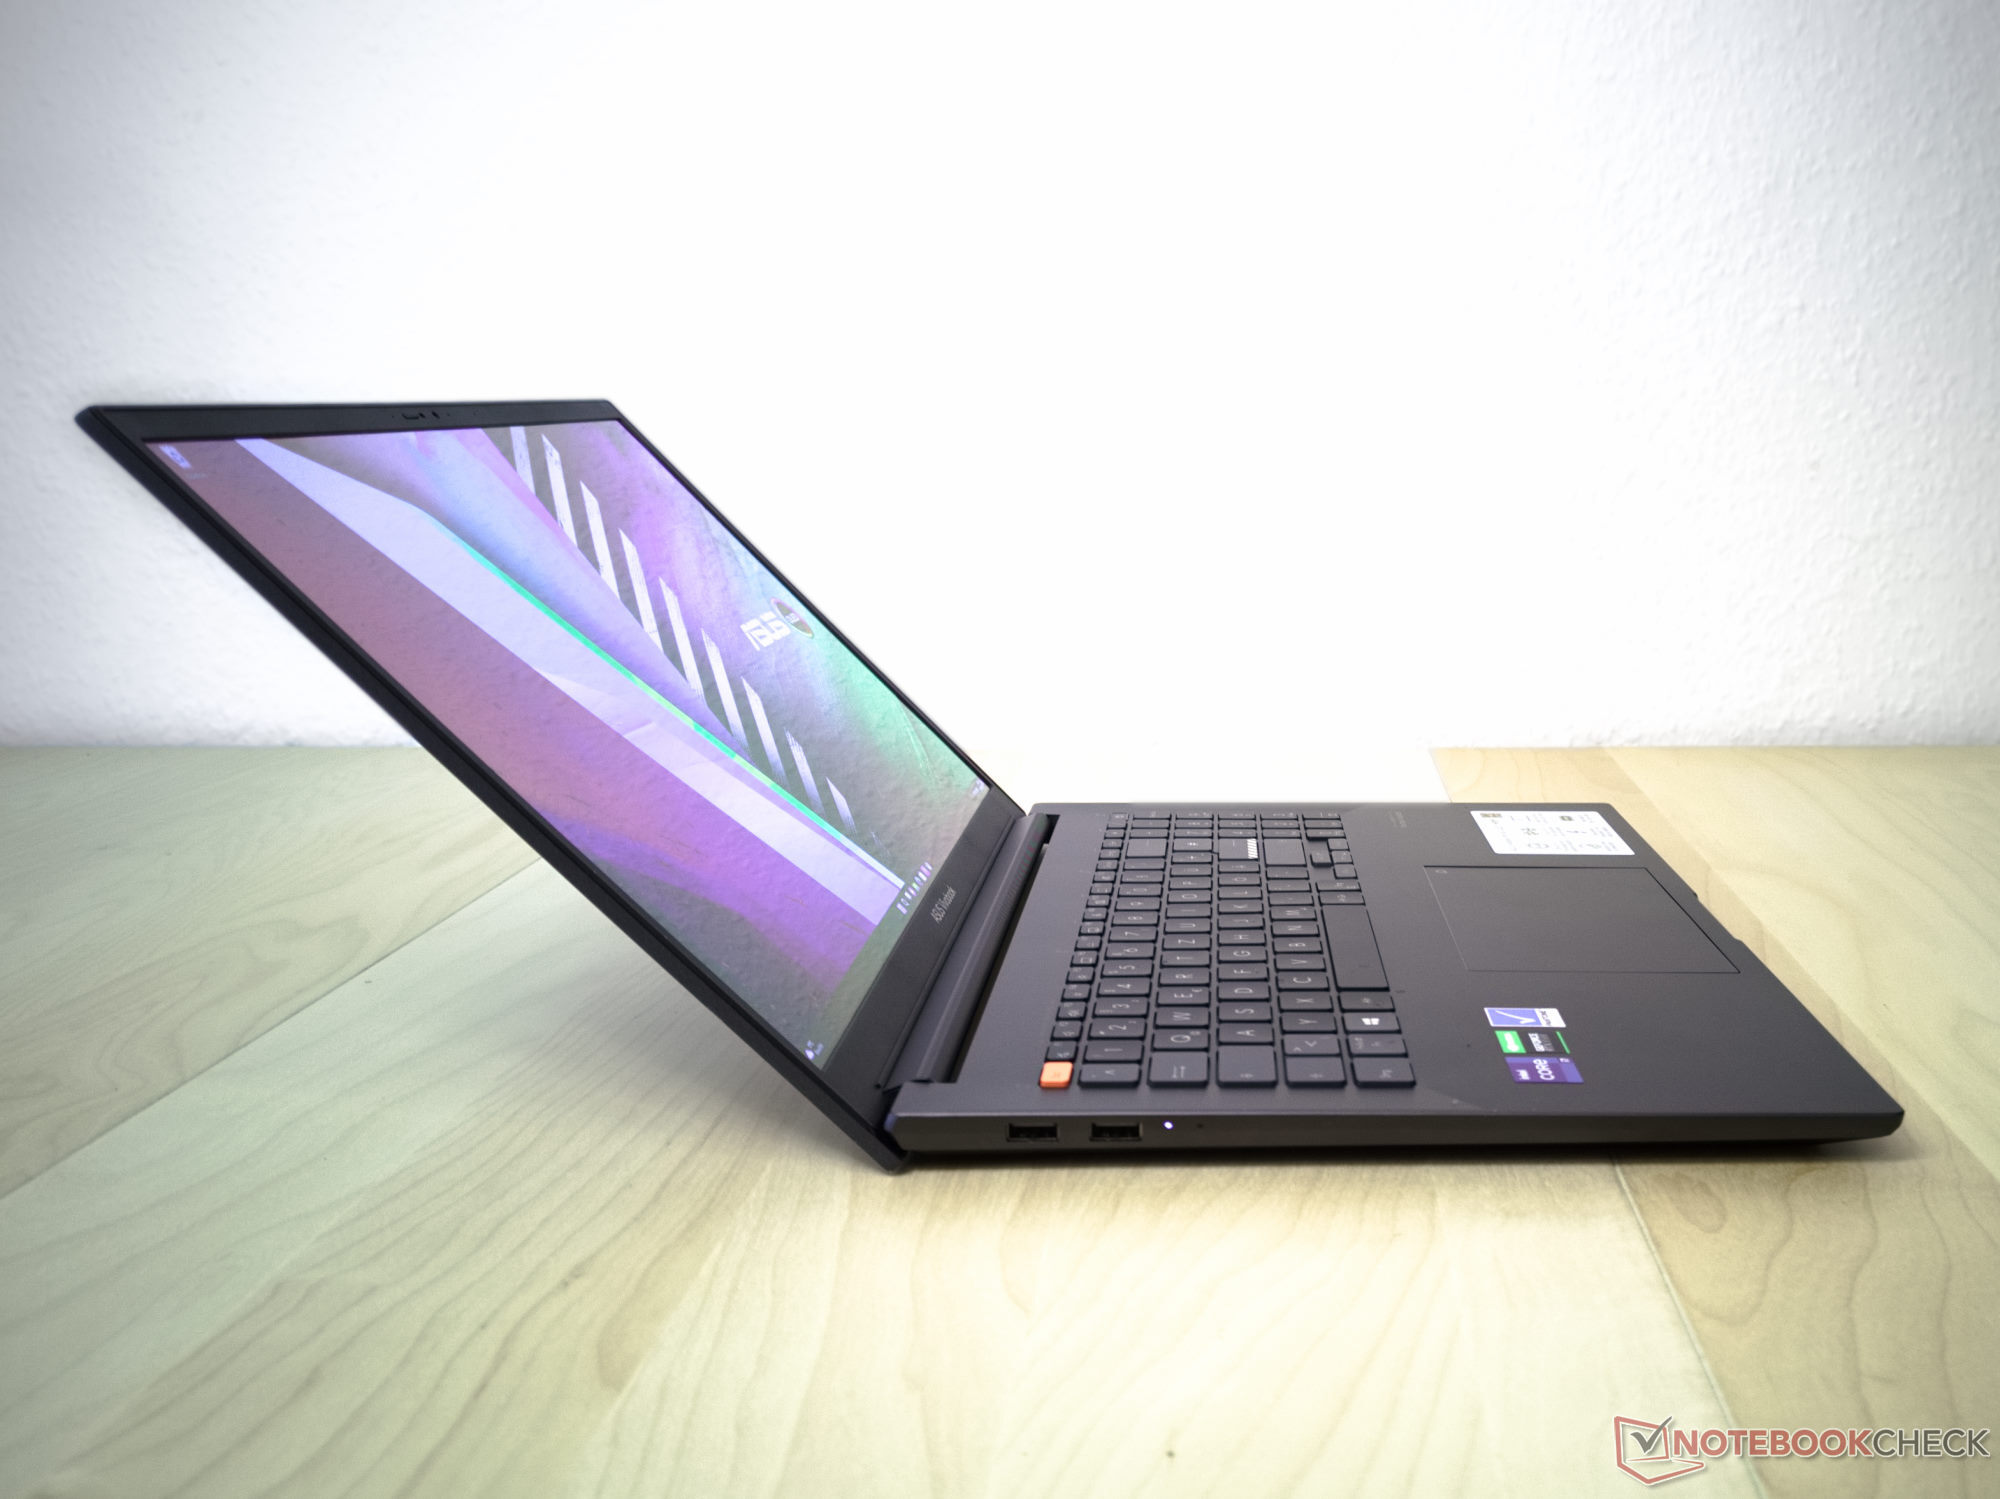
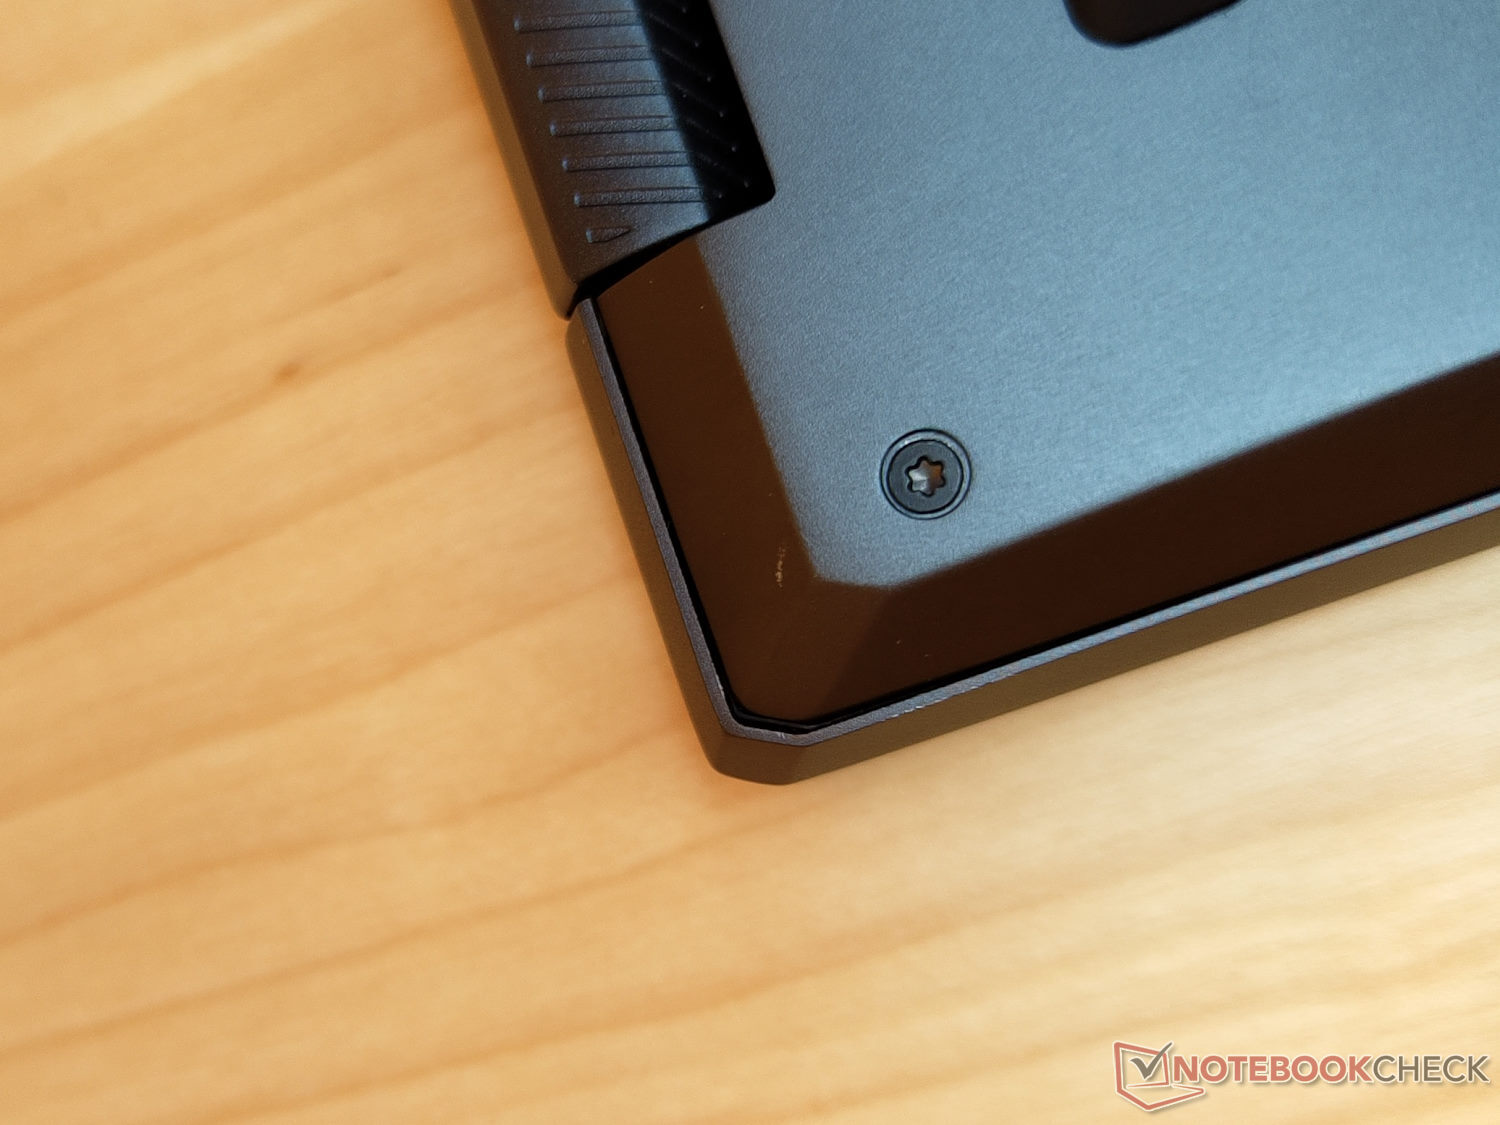
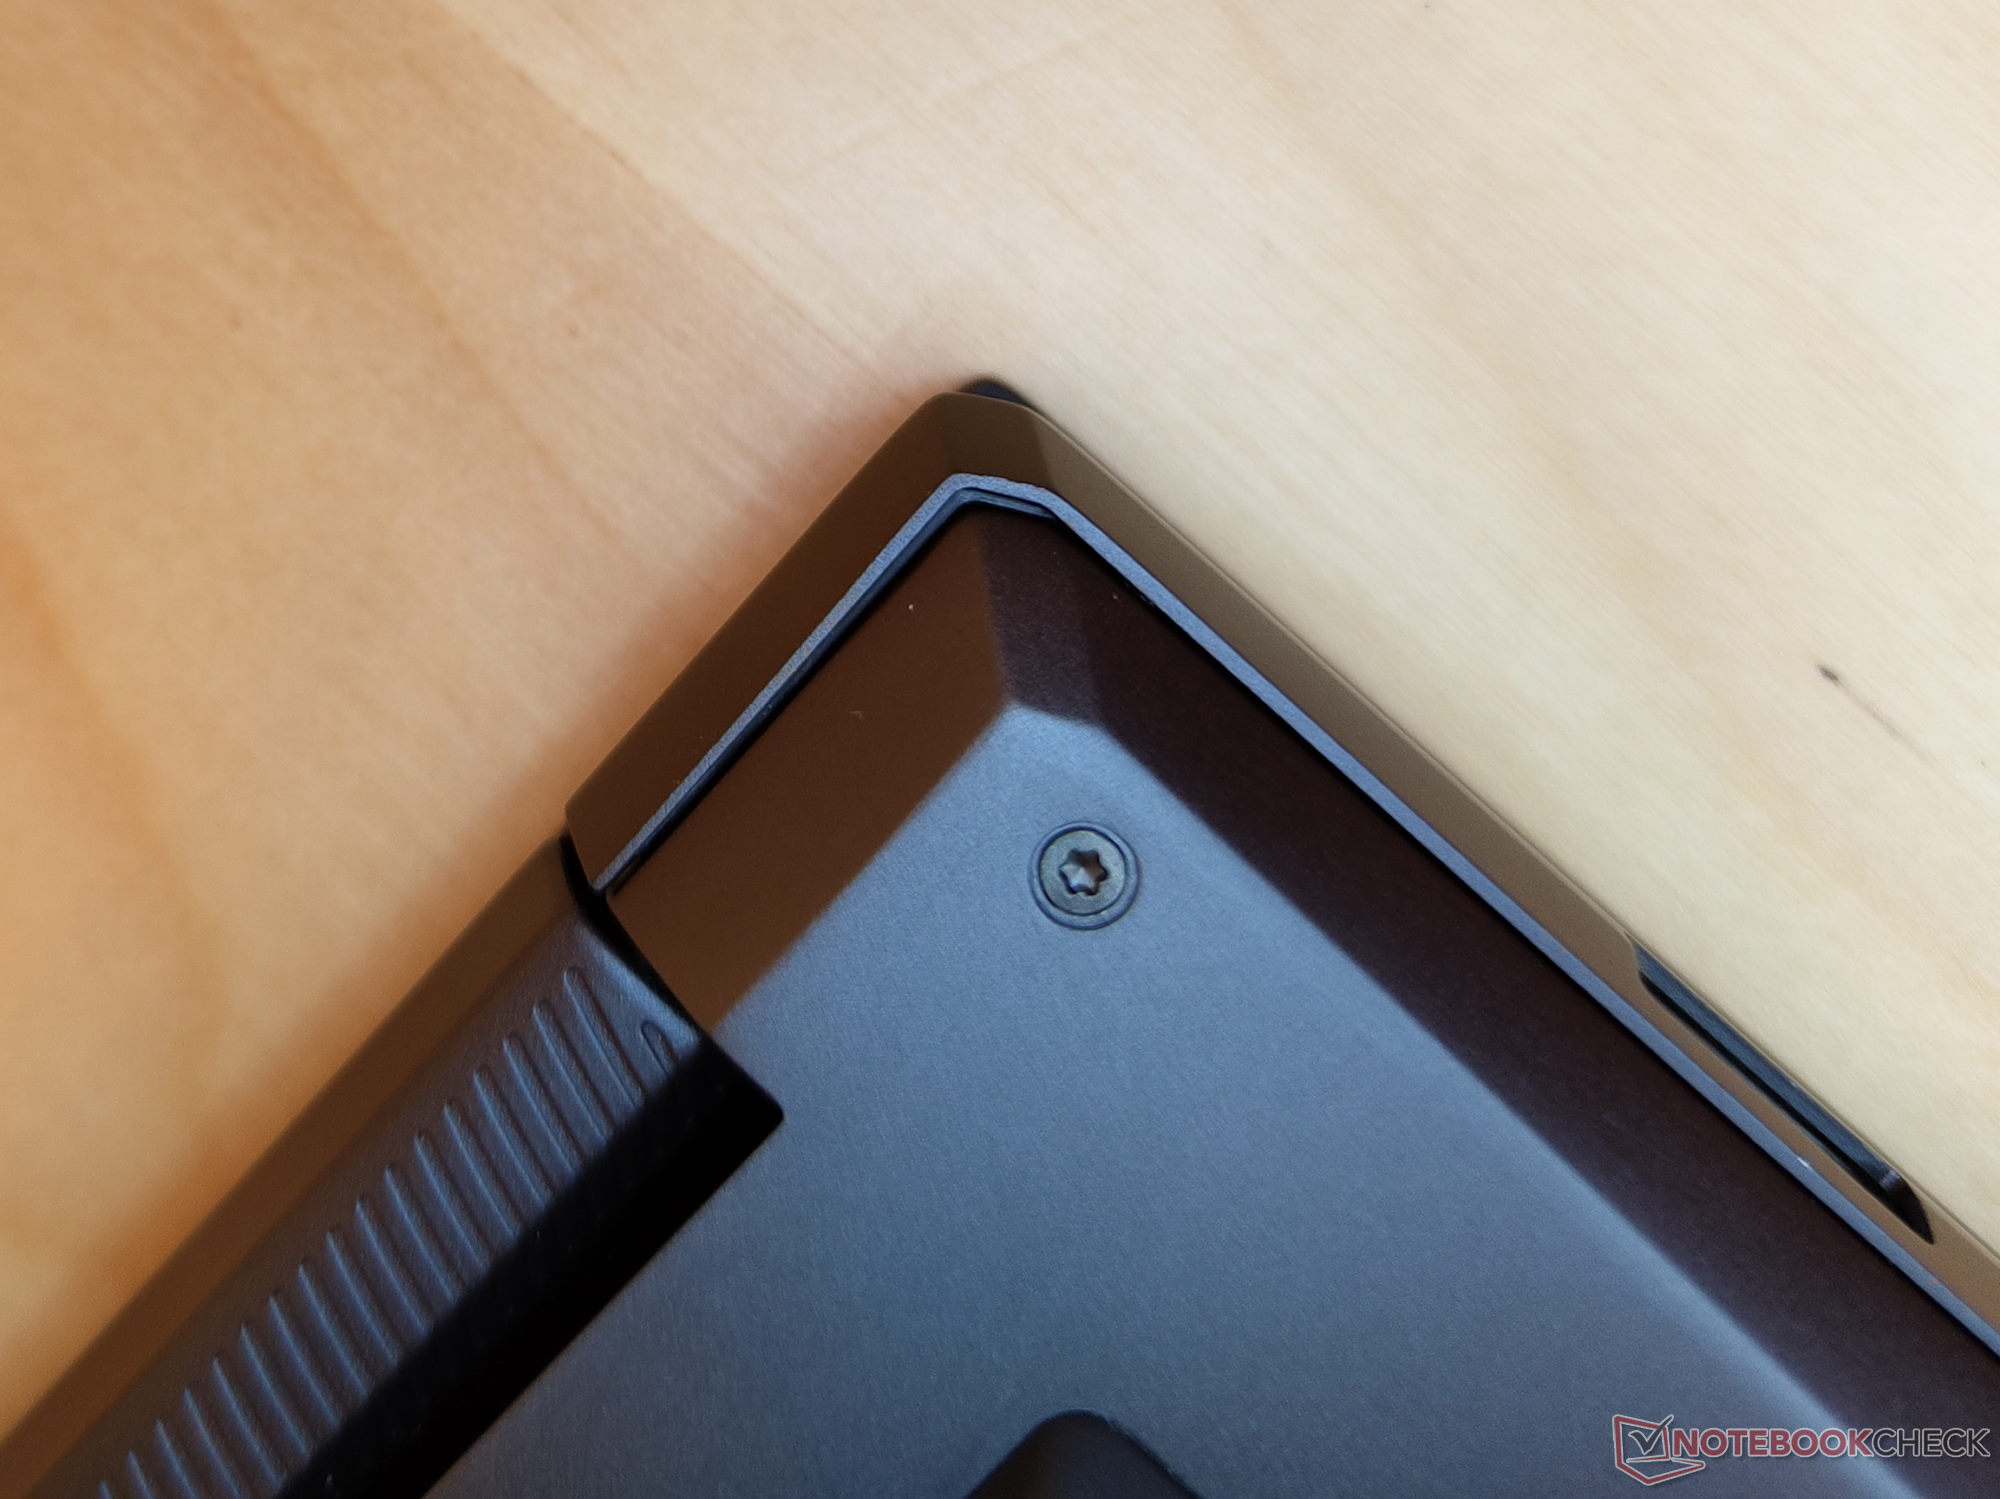
La rigidez del sistema de 16 pulgadas se beneficia notablemente del generoso uso del metal. No pudimos torcer significativamente la unidad base del portátil desde las esquinas. Si bien no ocurre lo mismo con la pantalla, al menos no notamos ningún crujido. Aunque la tapa puede abrirse hasta un ángulo máximo de unos 130 grados con una sola mano, no hay grandes tambaleos. Desafortunadamente, los espacios libres no son perfectamente uniformes en varios lugares. En la esquina inferior izquierda del clickpad, hay un hueco que deja al descubierto las partes internas de la carcasa. Asimismo, hay varios puntos con espacios desiguales en la parte inferior. Nuestra galería de imágenes muestra algunos ejemplos de los huecos que encontramos. Esto nos lleva a preguntarnos si los huecos más grandes están pensados para compensar una mayor expansión térmica o si las tolerancias de fabricación son simplemente demasiado grandes.
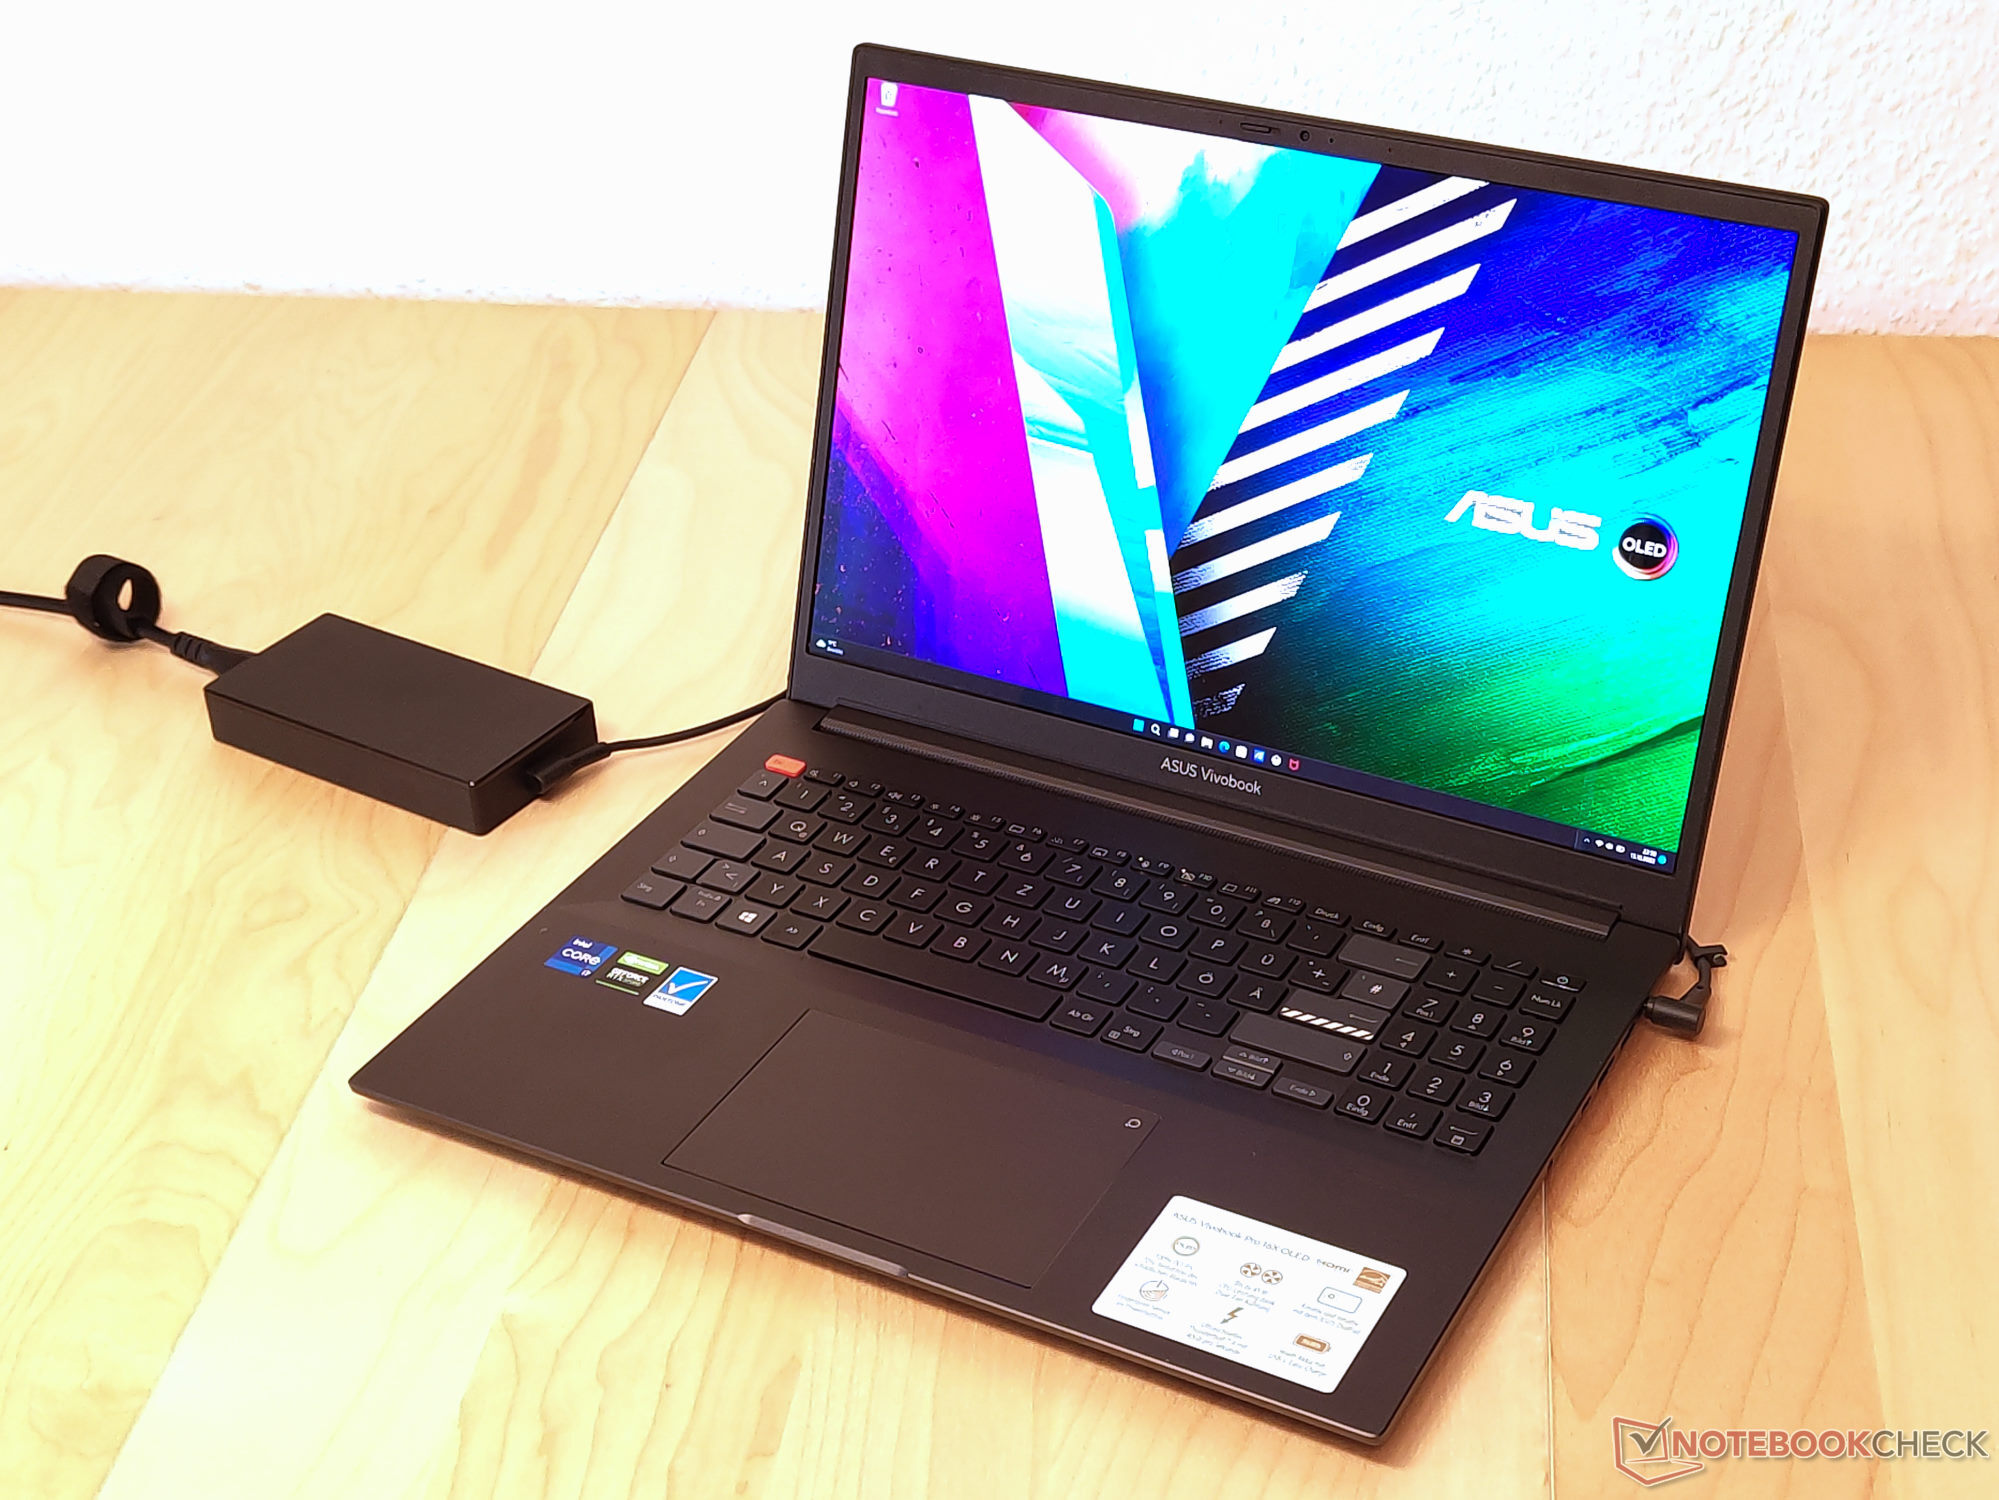
Debido a los biseles bastante delgados, el Vivobook 16X OLED tiende a ser ligeramente más pequeño que otros portátiles de 16 pulgadas a pesar de ser un dispositivo de 16 pulgadas en sí. Además, es bastante delgado si se tiene en cuenta la GPU dedicada y la potente CPU. Por el contrario, el peso es bastante elevado. Con 1969 g (~4,34 lb), difícilmente puede calificarse de ligero. Si a esto le sumamos los 446 g adicionales del adaptador de CA y su cable, la Vivobook 16X pesa 2,4 kg en total.
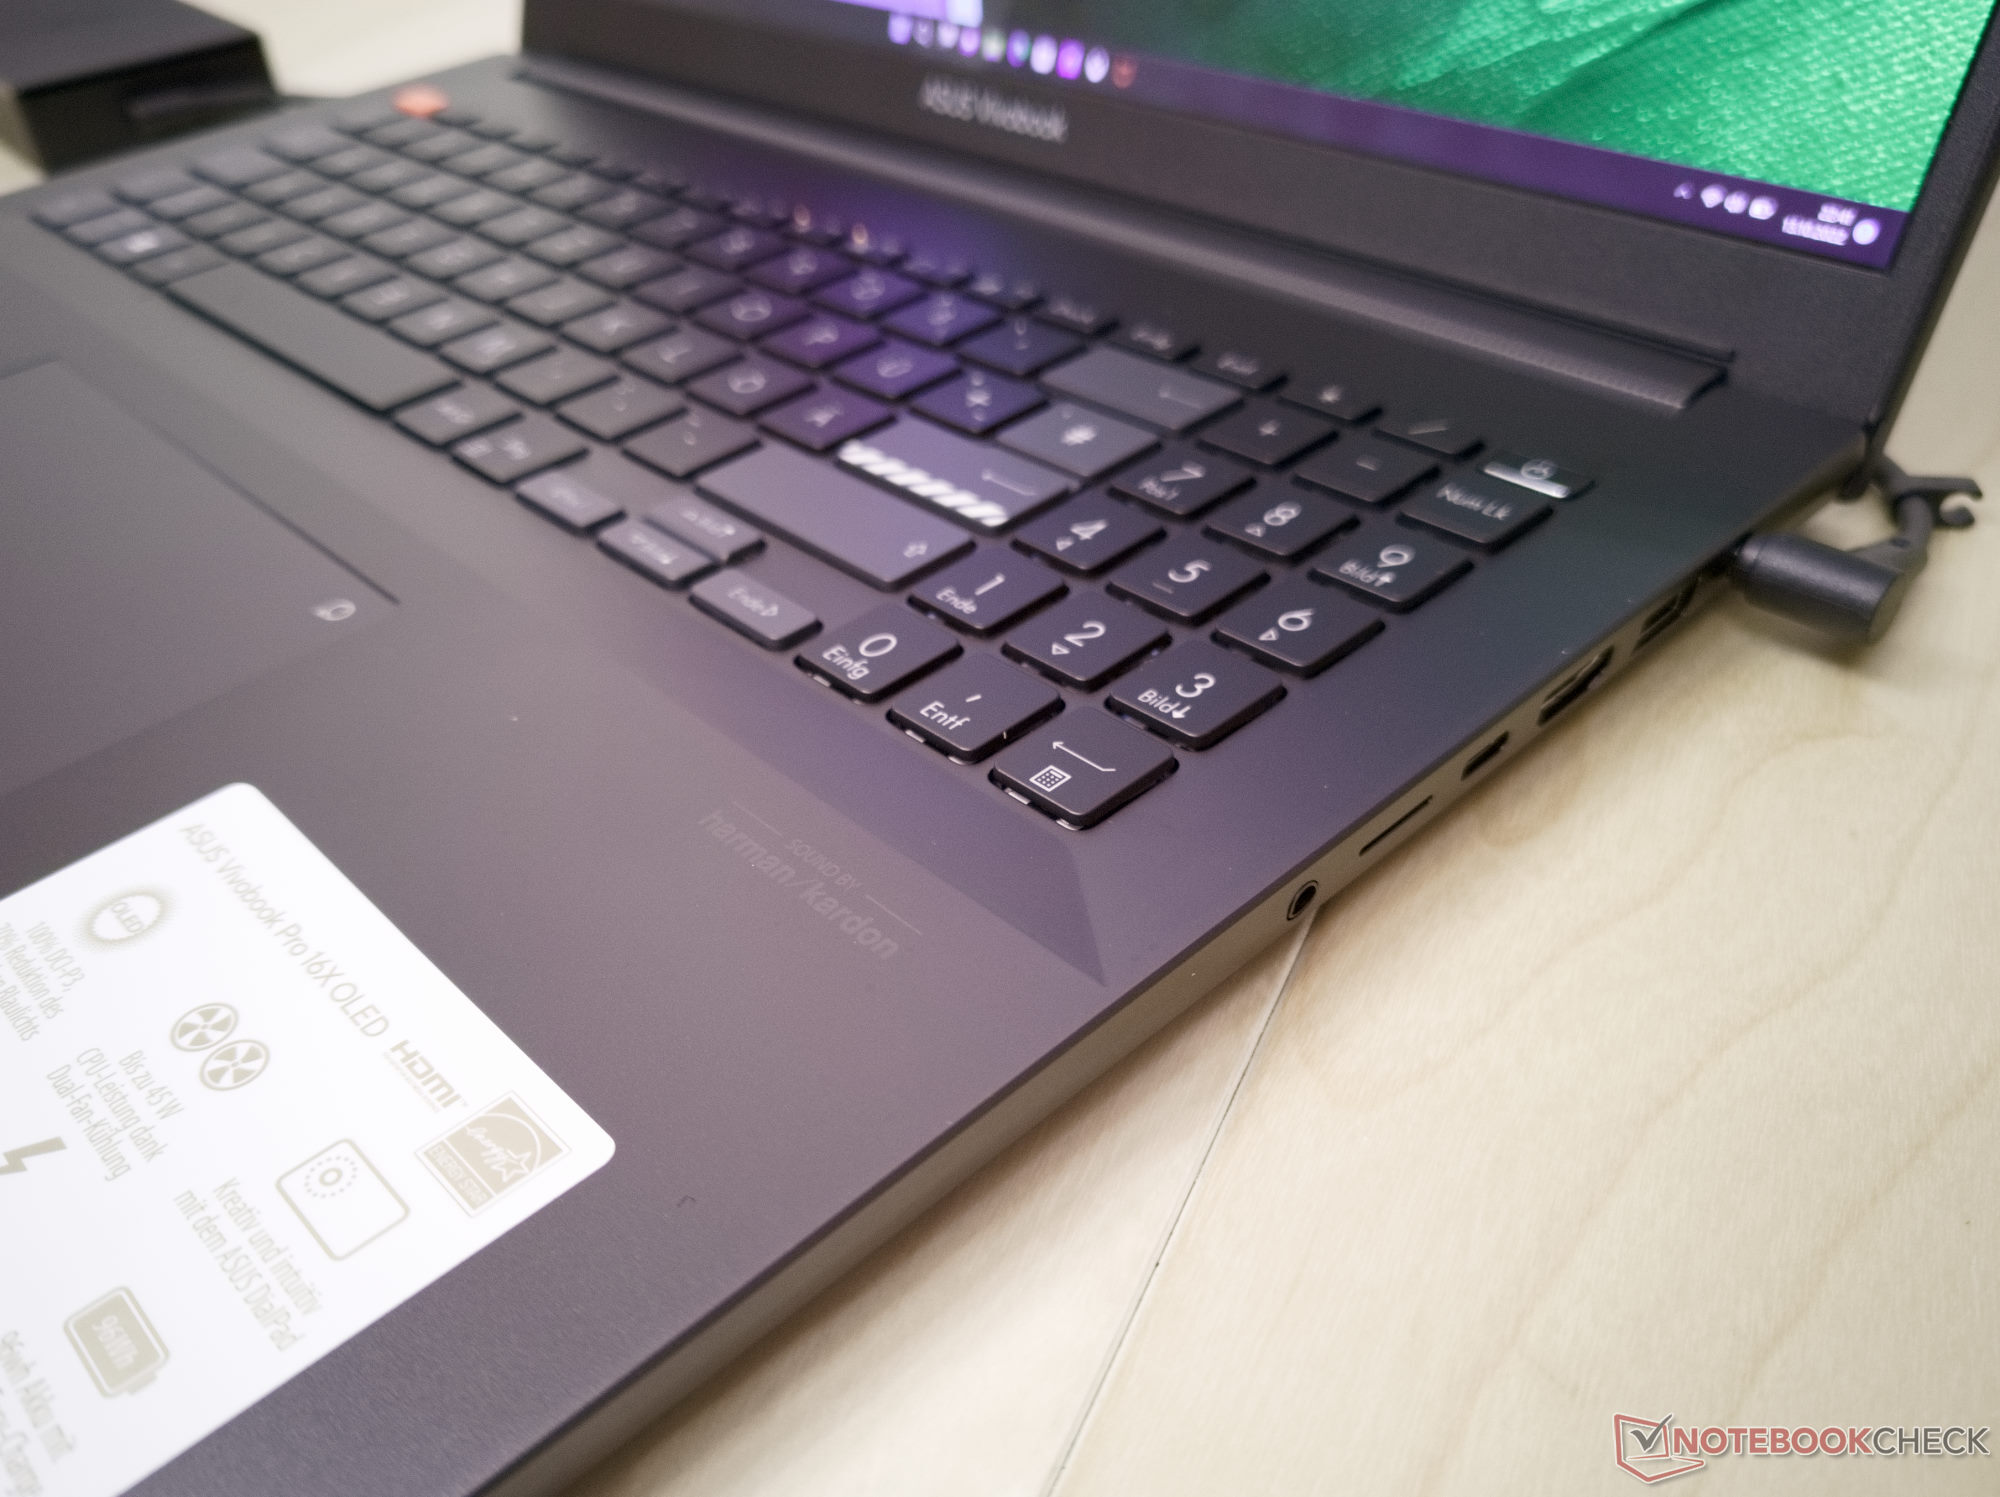
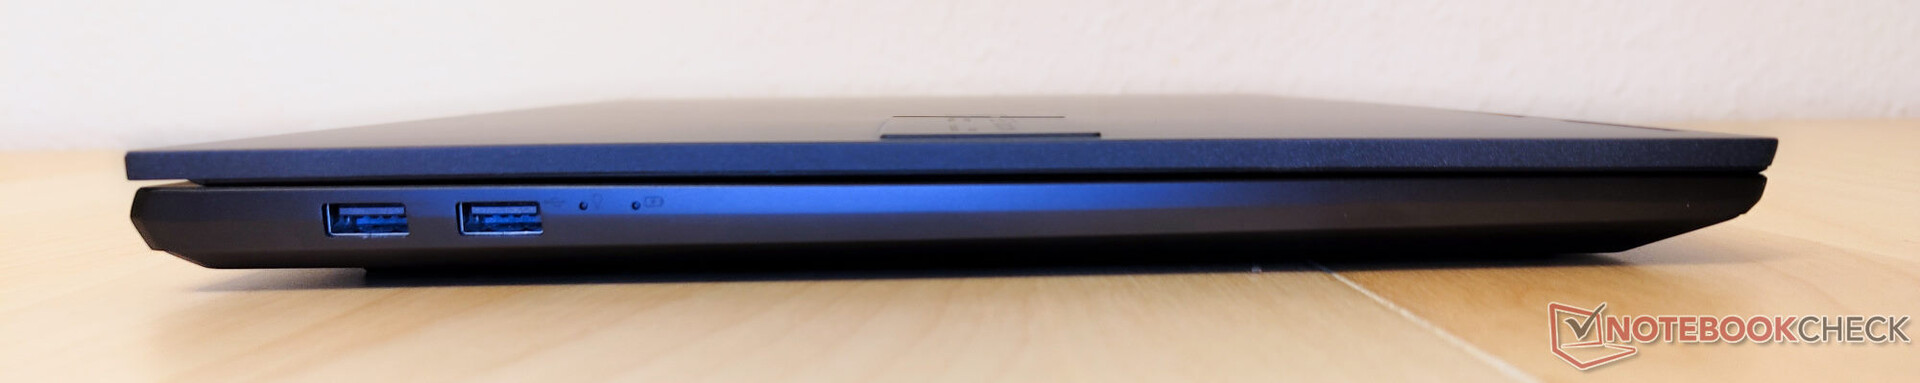
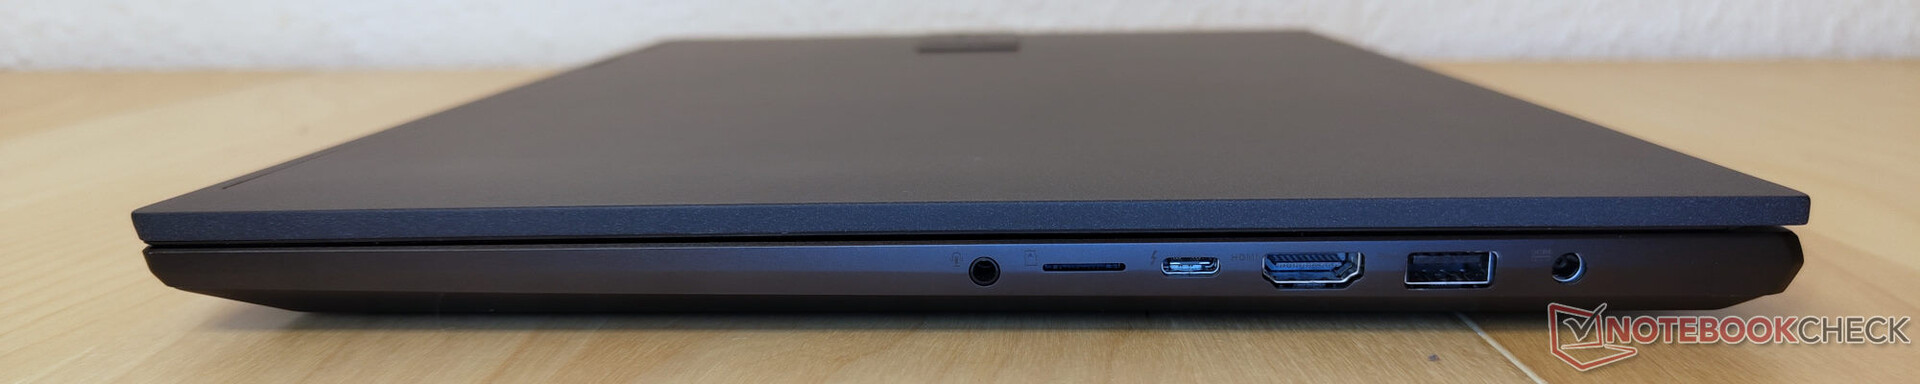
Conectividad - USB-C con Thunderbolt 4 a la derecha, USB 2.0 a la izquierda
Gracias al USB tipo C con Thunderbolt 4 y Power Delivery, así como a 3x USB tipo A y HDMI 2.1, los usuarios obtienen mucha flexibilidad en términos de accesorios. Esto hace que el lento lector de tarjetas microSD sea una opción francamente imprevisible. Para un dispositivo dirigido a los creadores de contenidos, un lector de tarjetas SD de tamaño completo con velocidades de transferencia decentes podría haber sido una mejor opción. Los dos puertos USB tipo A de la izquierda sólo admiten USB 2.0. La mayoría de los puertos utilizables están situados a la derecha. Para los usuarios diestros que deseen utilizar un ratón externo, esto puede ser un pequeño inconveniente.
Lector de tarjetas SD
El lector de tarjetas SD no es uno de los puntos fuertes del Vivobook. Como sólo se conecta a través de USB 2.0, no puede alcanzar buenas velocidades ni siquiera con nuestra tarjeta de referencia AV PRO microSD 128 GB V60. El hecho de que ni siquiera las tarjetas microSD puedan insertarse completamente, es también algo decepcionante.
| SD Card Reader | |
| average JPG Copy Test (av. of 3 runs) | |
| MSI Summit E16 Flip A12UDT-031 (AV Pro SD microSD 128 GB V60) | |
| Lenovo ThinkPad X1 Extreme G4-20Y5CTO1WW (3050 Ti) (AV Pro V60) | |
| Media de la clase Multimedia (23 - 531, n=43, últimos 2 años) | |
| Schenker XMG Focus 15 (AV PRO microSD 128 GB V60) | |
| Asus VivoBook Pro 16X OLED N7600PC-L2026X | |
| Dell Inspiron 16 Plus 7610 (AV PRO microSD 128 GB V60) | |
| maximum AS SSD Seq Read Test (1GB) | |
| Media de la clase Multimedia (27.9 - 1455, n=42, últimos 2 años) | |
| Lenovo ThinkPad X1 Extreme G4-20Y5CTO1WW (3050 Ti) (AV Pro V60) | |
| MSI Summit E16 Flip A12UDT-031 (AV Pro SD microSD 128 GB V60) | |
| Schenker XMG Focus 15 (AV PRO microSD 128 GB V60) | |
| Asus VivoBook Pro 16X OLED N7600PC-L2026X | |
| Dell Inspiron 16 Plus 7610 (AV PRO microSD 128 GB V60) | |
Comunicación
Un chasis metálico suele complicar la colocación de las antenas Wi-Fi para el fabricante. Este también parece ser el caso del Asus Vivobook 16X, ya que los 700 Mb/s de subida y descarga están por debajo de lo que esperamos del Wi-Fi 6 y también son inferiores en nuestra comparación.
Cámara web
Asus utiliza una webcam de 0,9-MP, que es una opción común para los portátiles de consumo. Desafortunadamente, su calidad es igualmente pobre como resultado. Como el Lenovo Thinkbook 14 G4 y 15 G4 han demostrado recientemente, hay margen de mejora.


")
")
Seguridad
Hay un sensor de huellas dactilares integrado en el botón de encendido. Otras características de seguridad se limitan al TPM 2.0 del Intel Core i7 y otras soluciones de software.
Accesorios
El paquete del Vivobook 16X OLED sólo incluye lo esencial. El adaptador de CA, la documentación y el portátil están empaquetados con pequeñas cantidades de plástico.
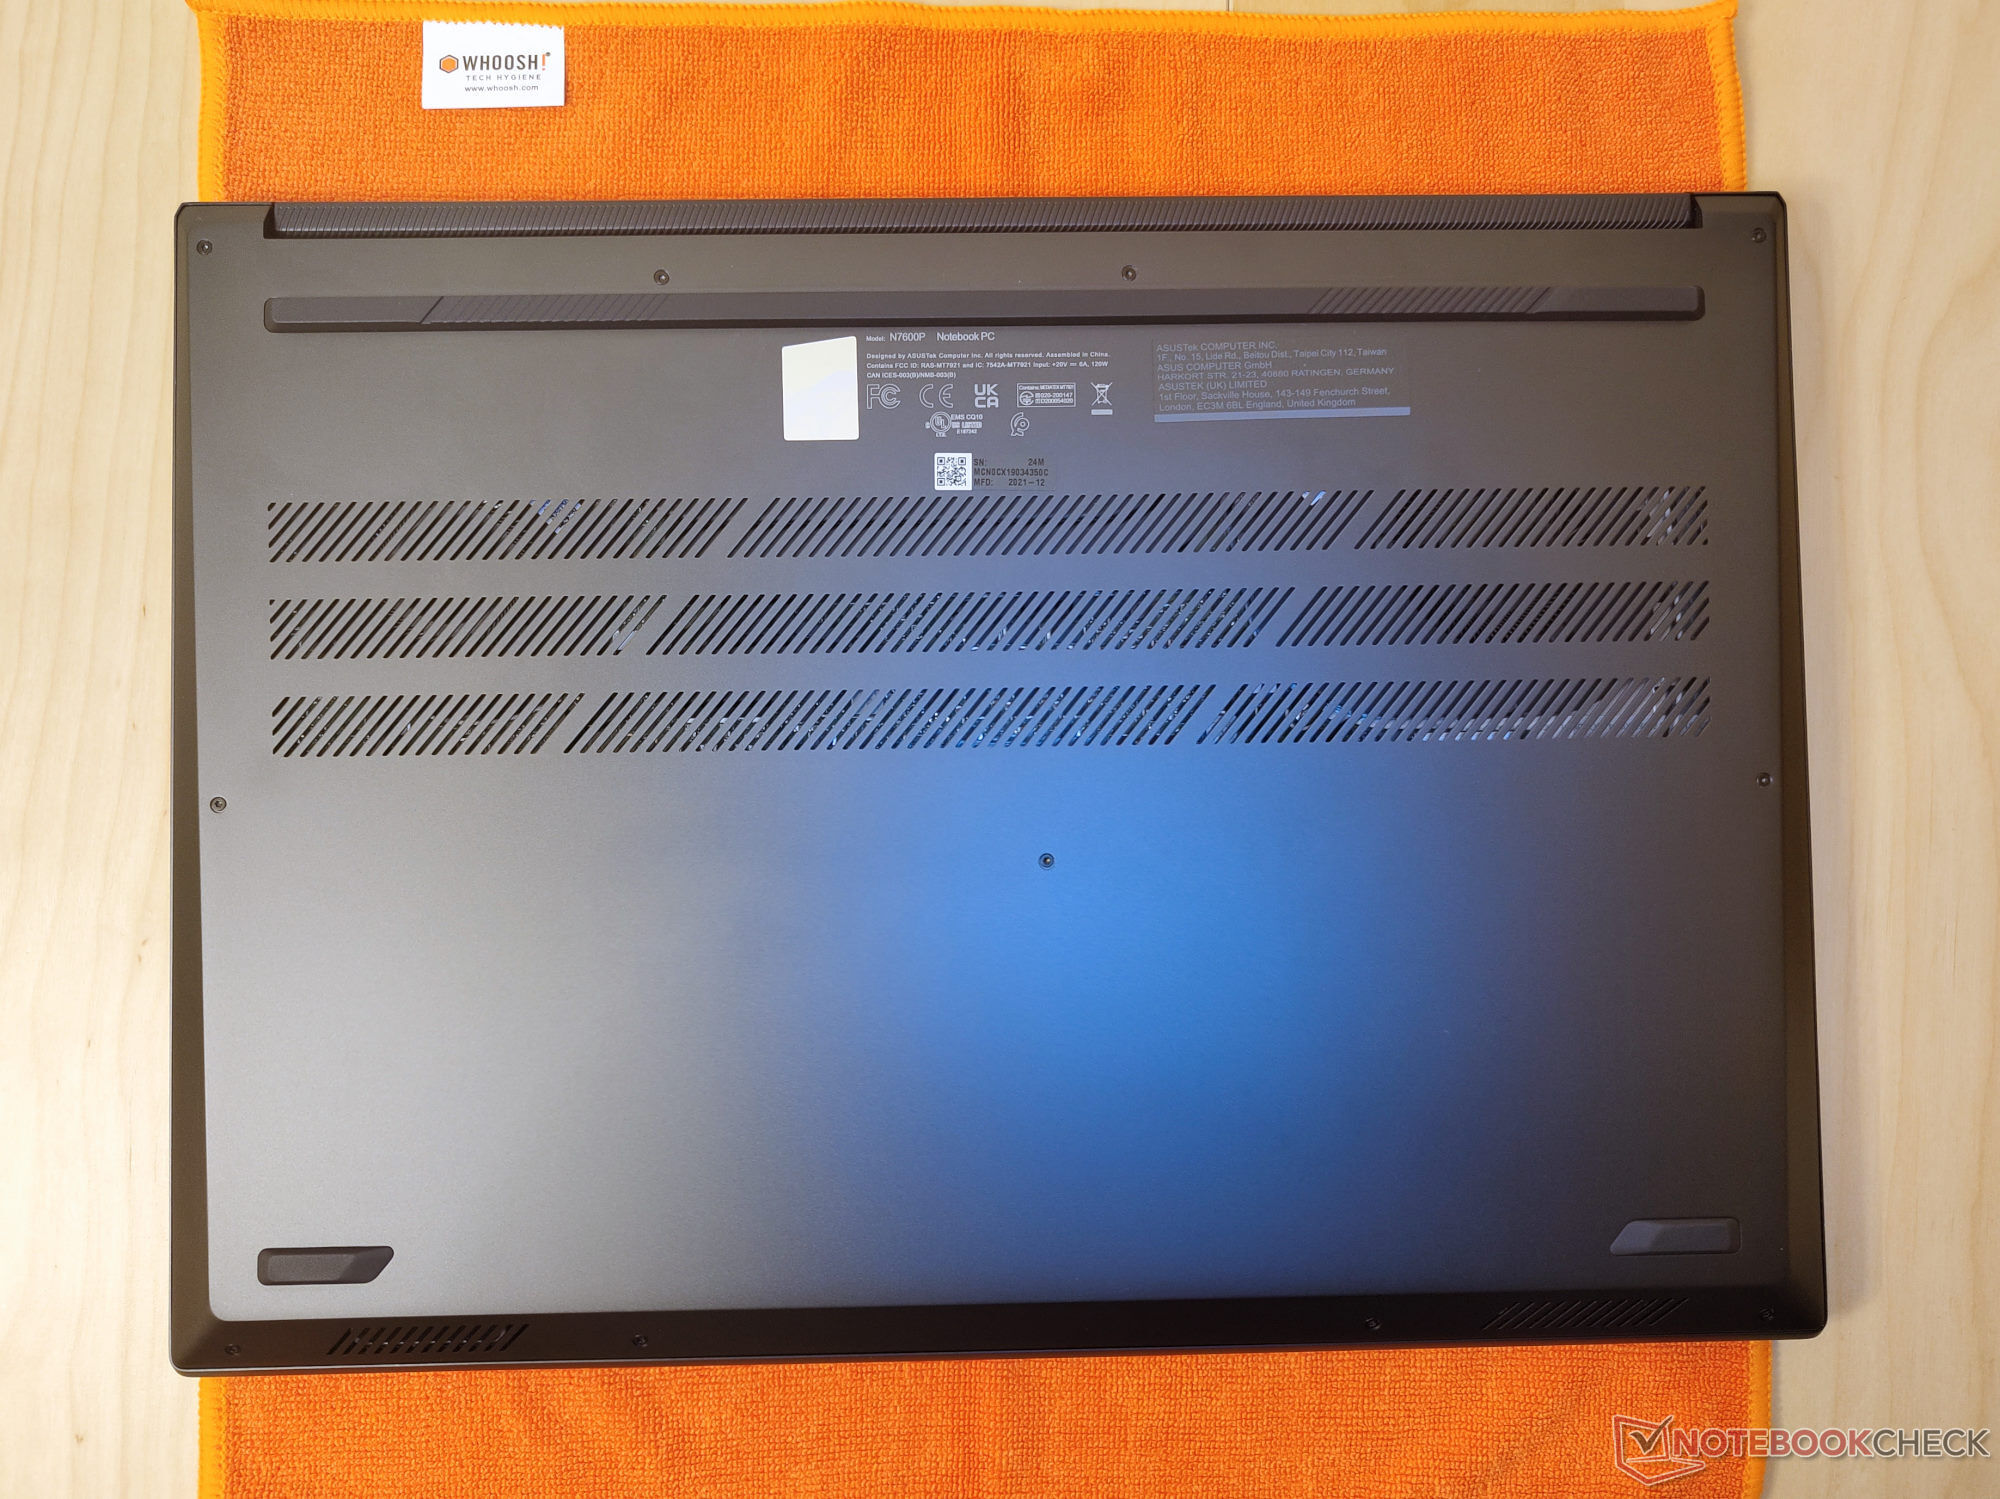
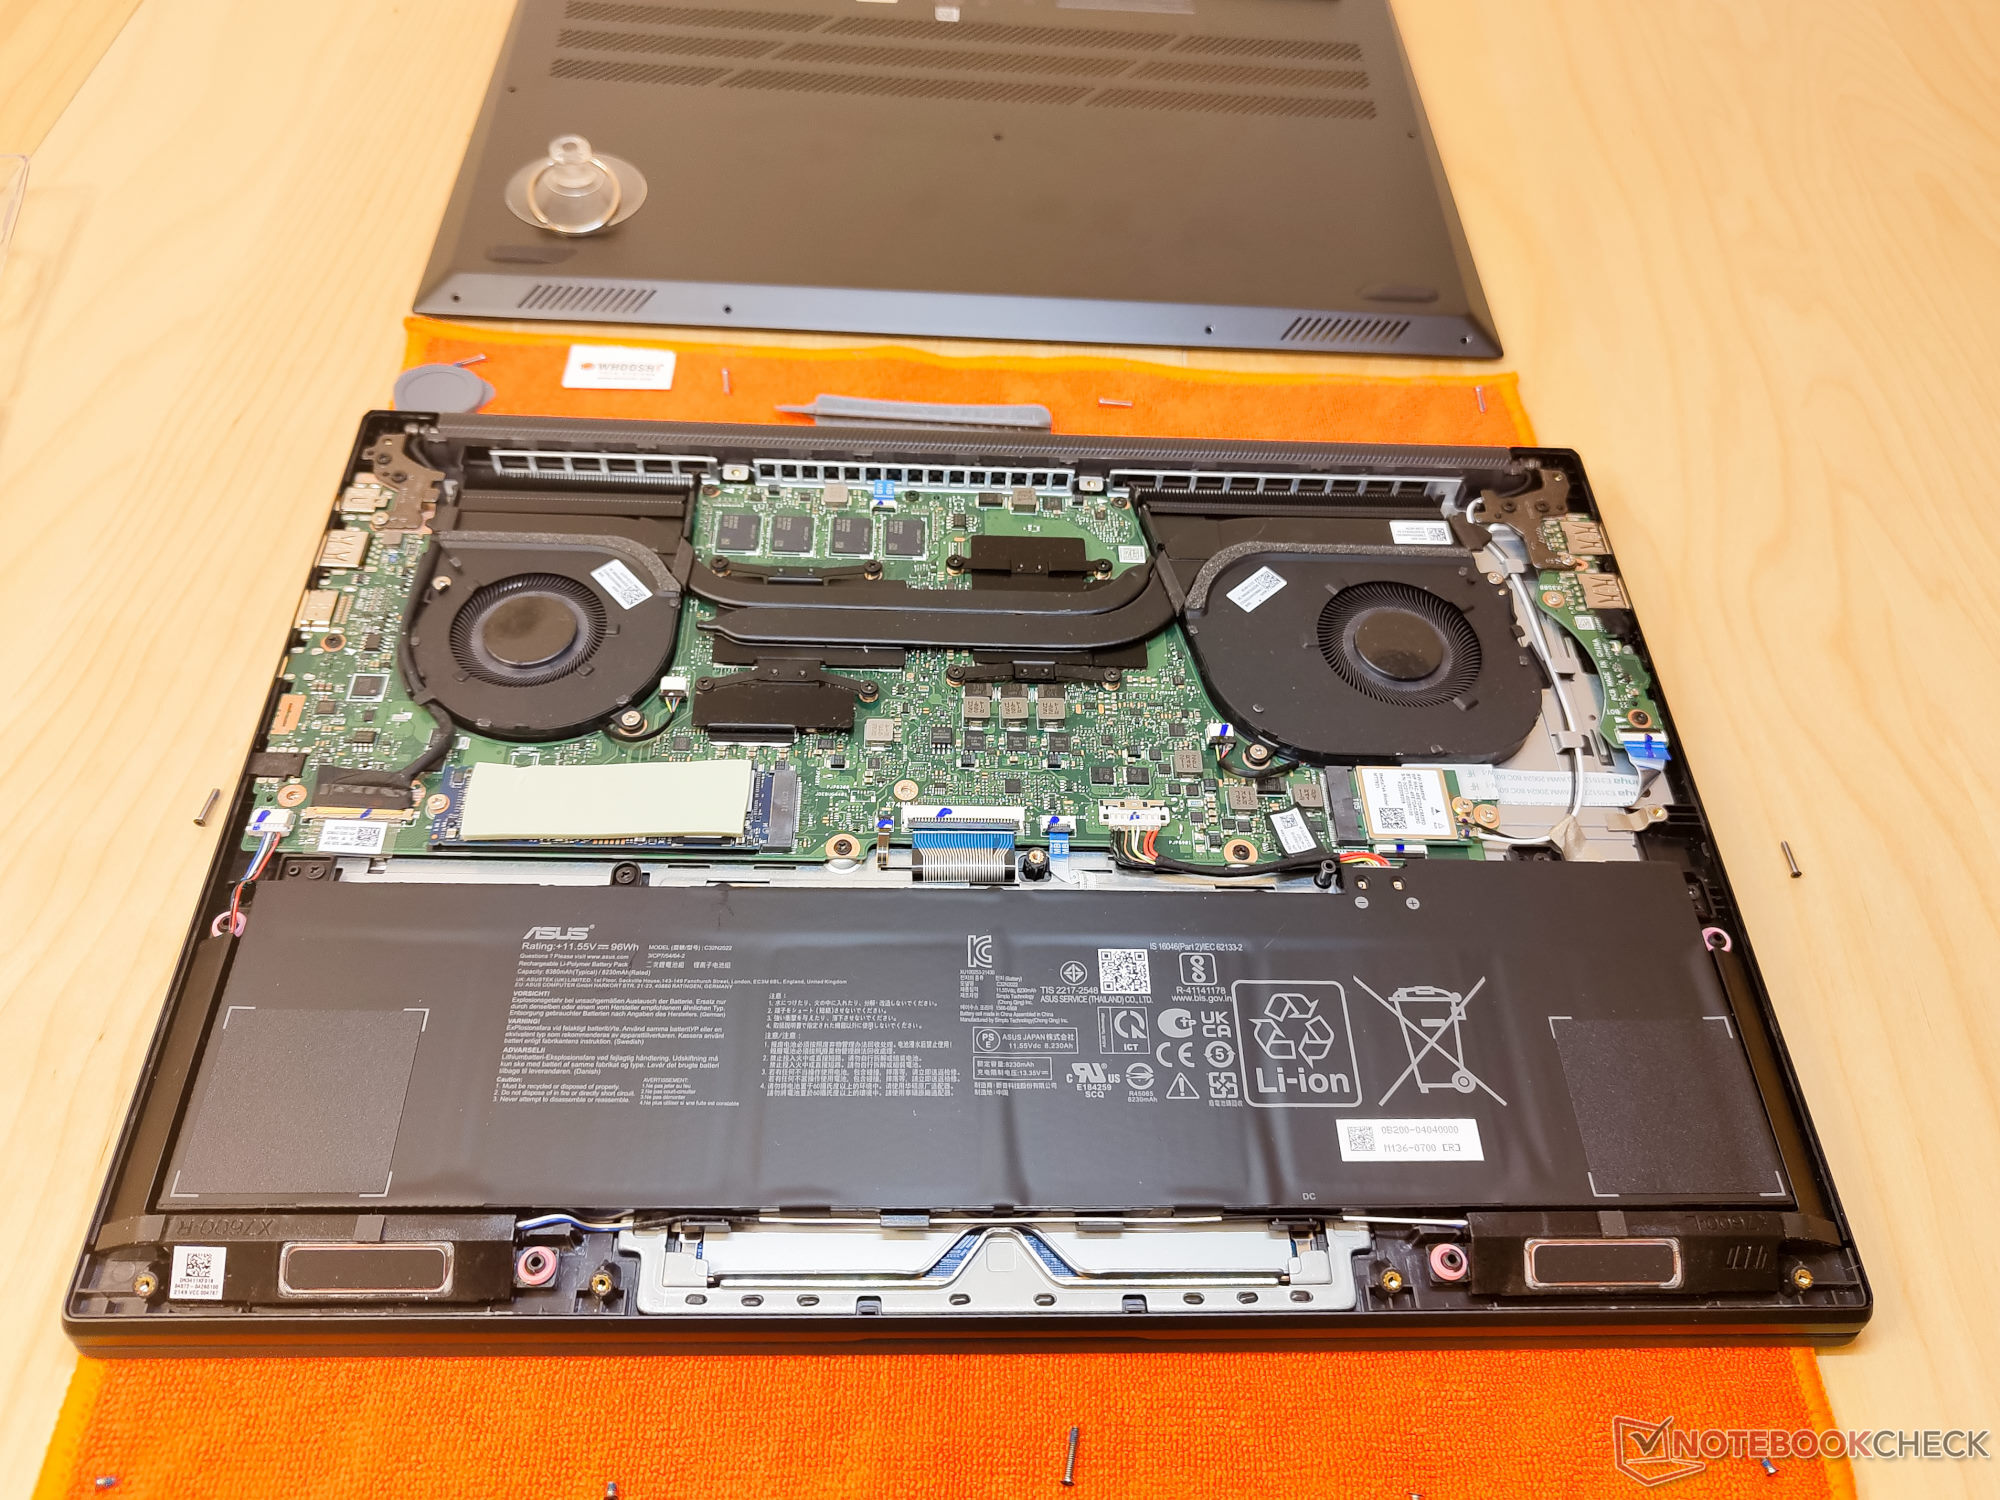
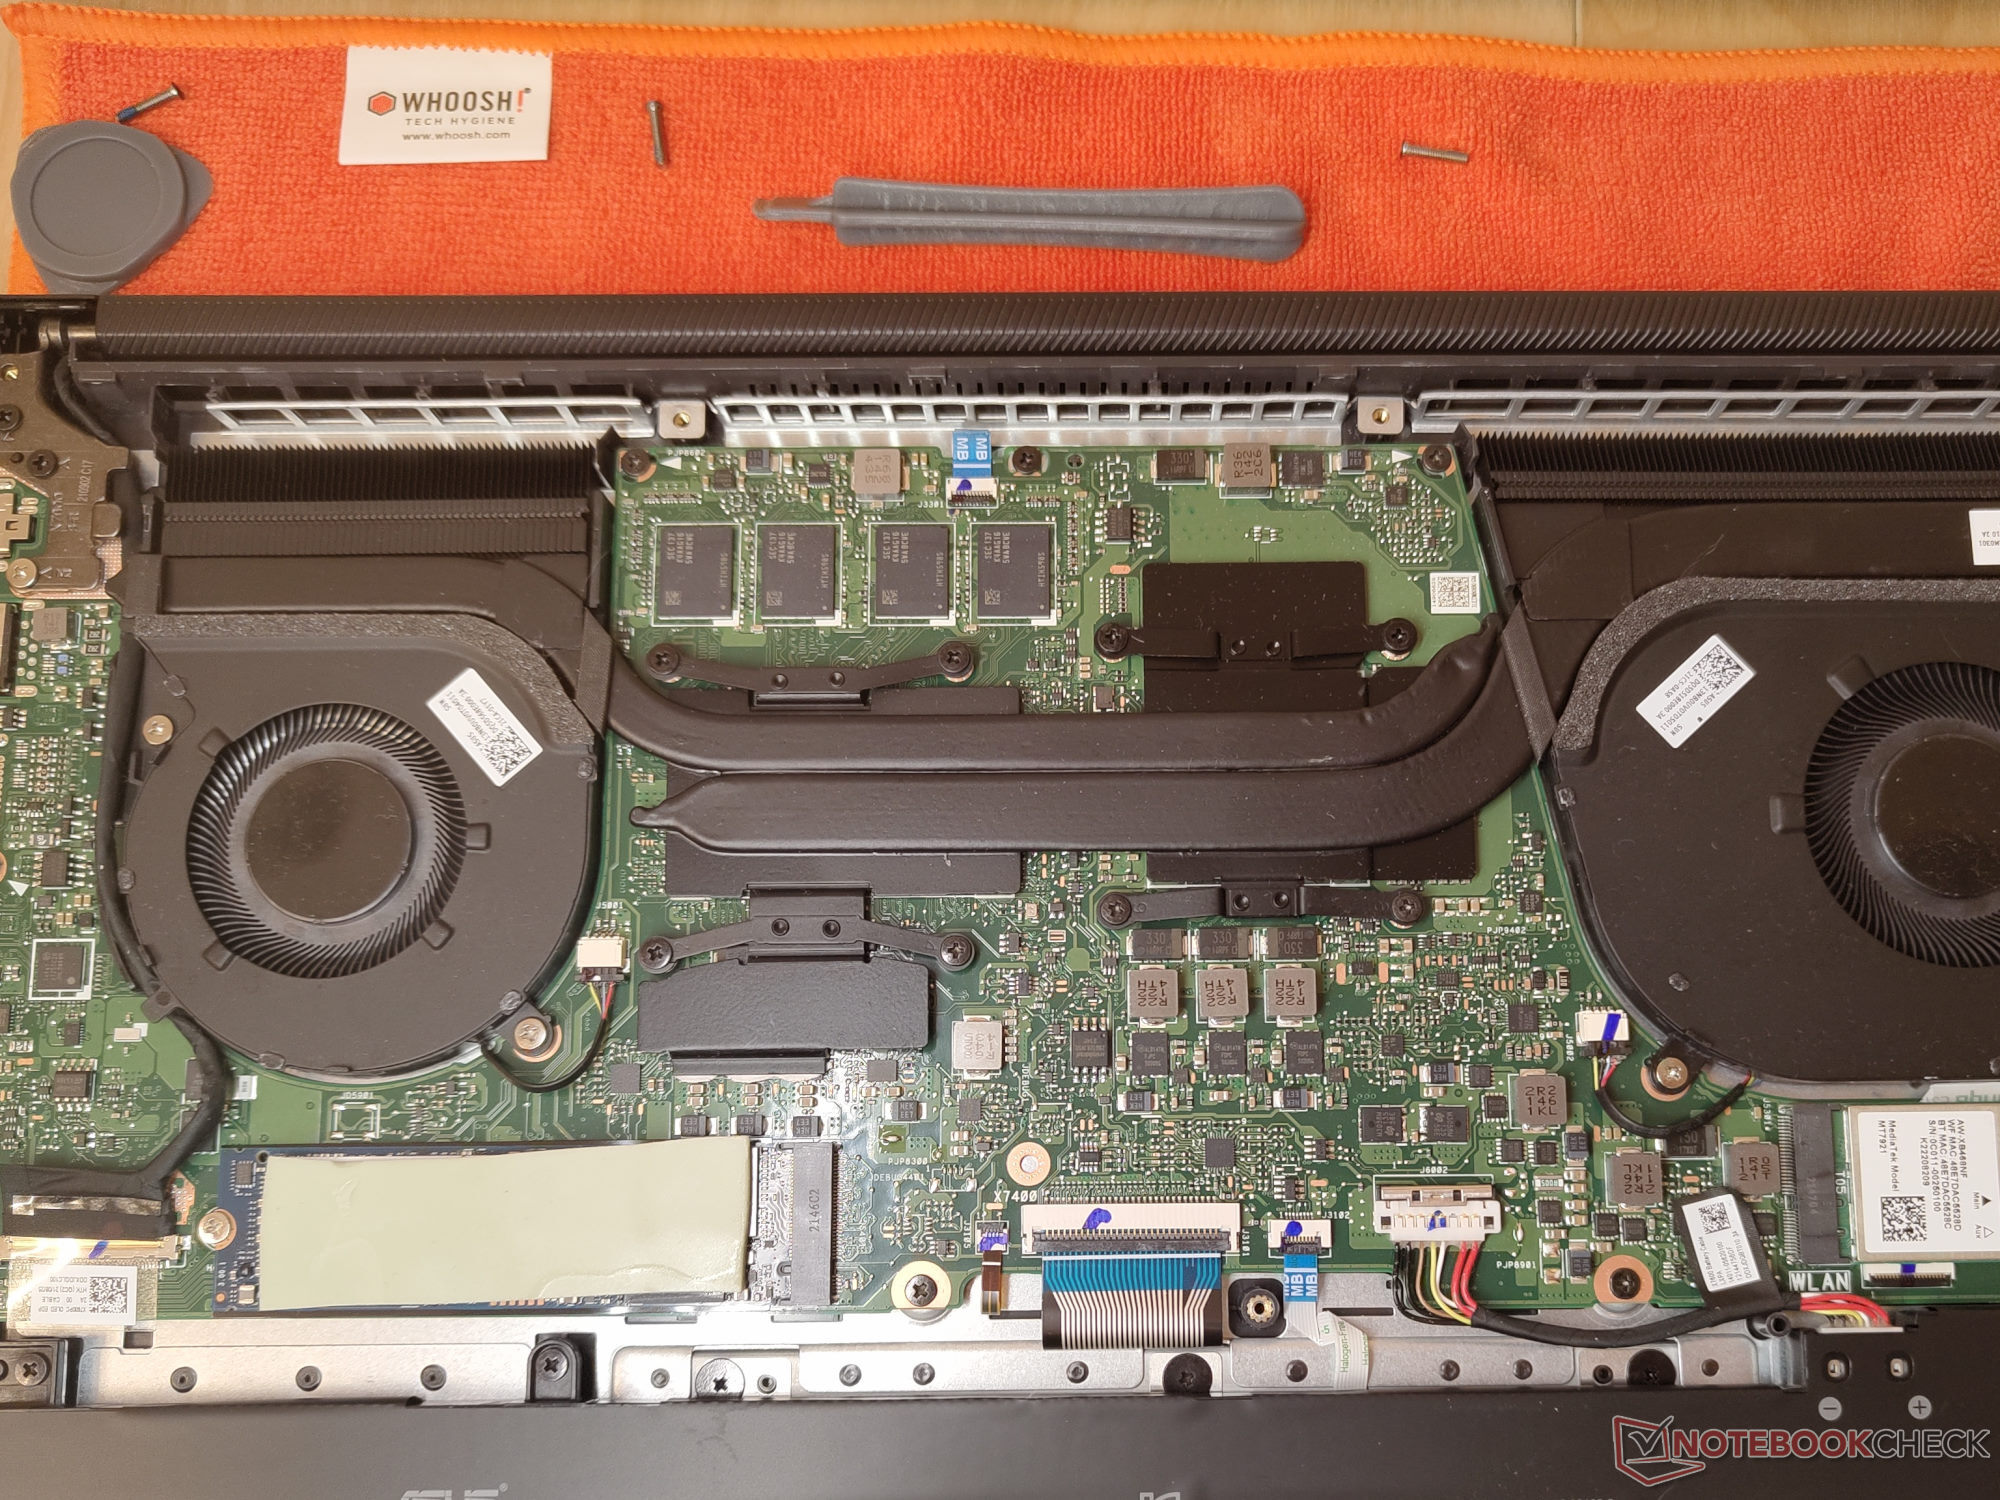
Mantenimiento
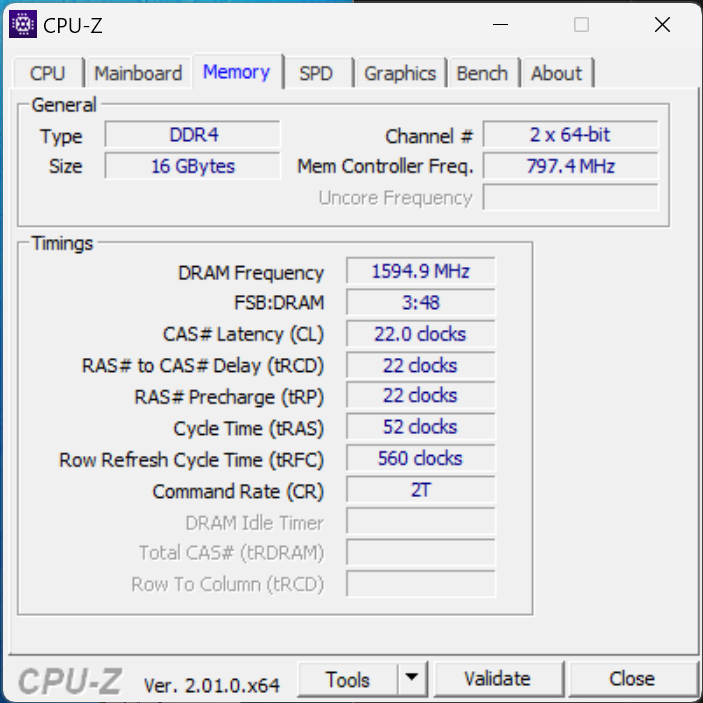
La unidad base está asegurada por 11 tornillos TX5. Después de aflojarlos, la parte inferior sigue sin poder retirarse fácilmente. Aquí, recomendamos una ventosa y un spudger de plástico para desprender la tapa con cuidado. los 16 GB de RAM están soldados a la placa base y, por tanto, no se pueden actualizar. Las actualizaciones fáciles se limitan al módulo Wi-Fi y al SSD M.2. No hay otras partes actualizables en el Vivobook.
Garantía
La Vivobook Pro 16X tiene una garantía limitada de un año si se compra en Estados Unidos.
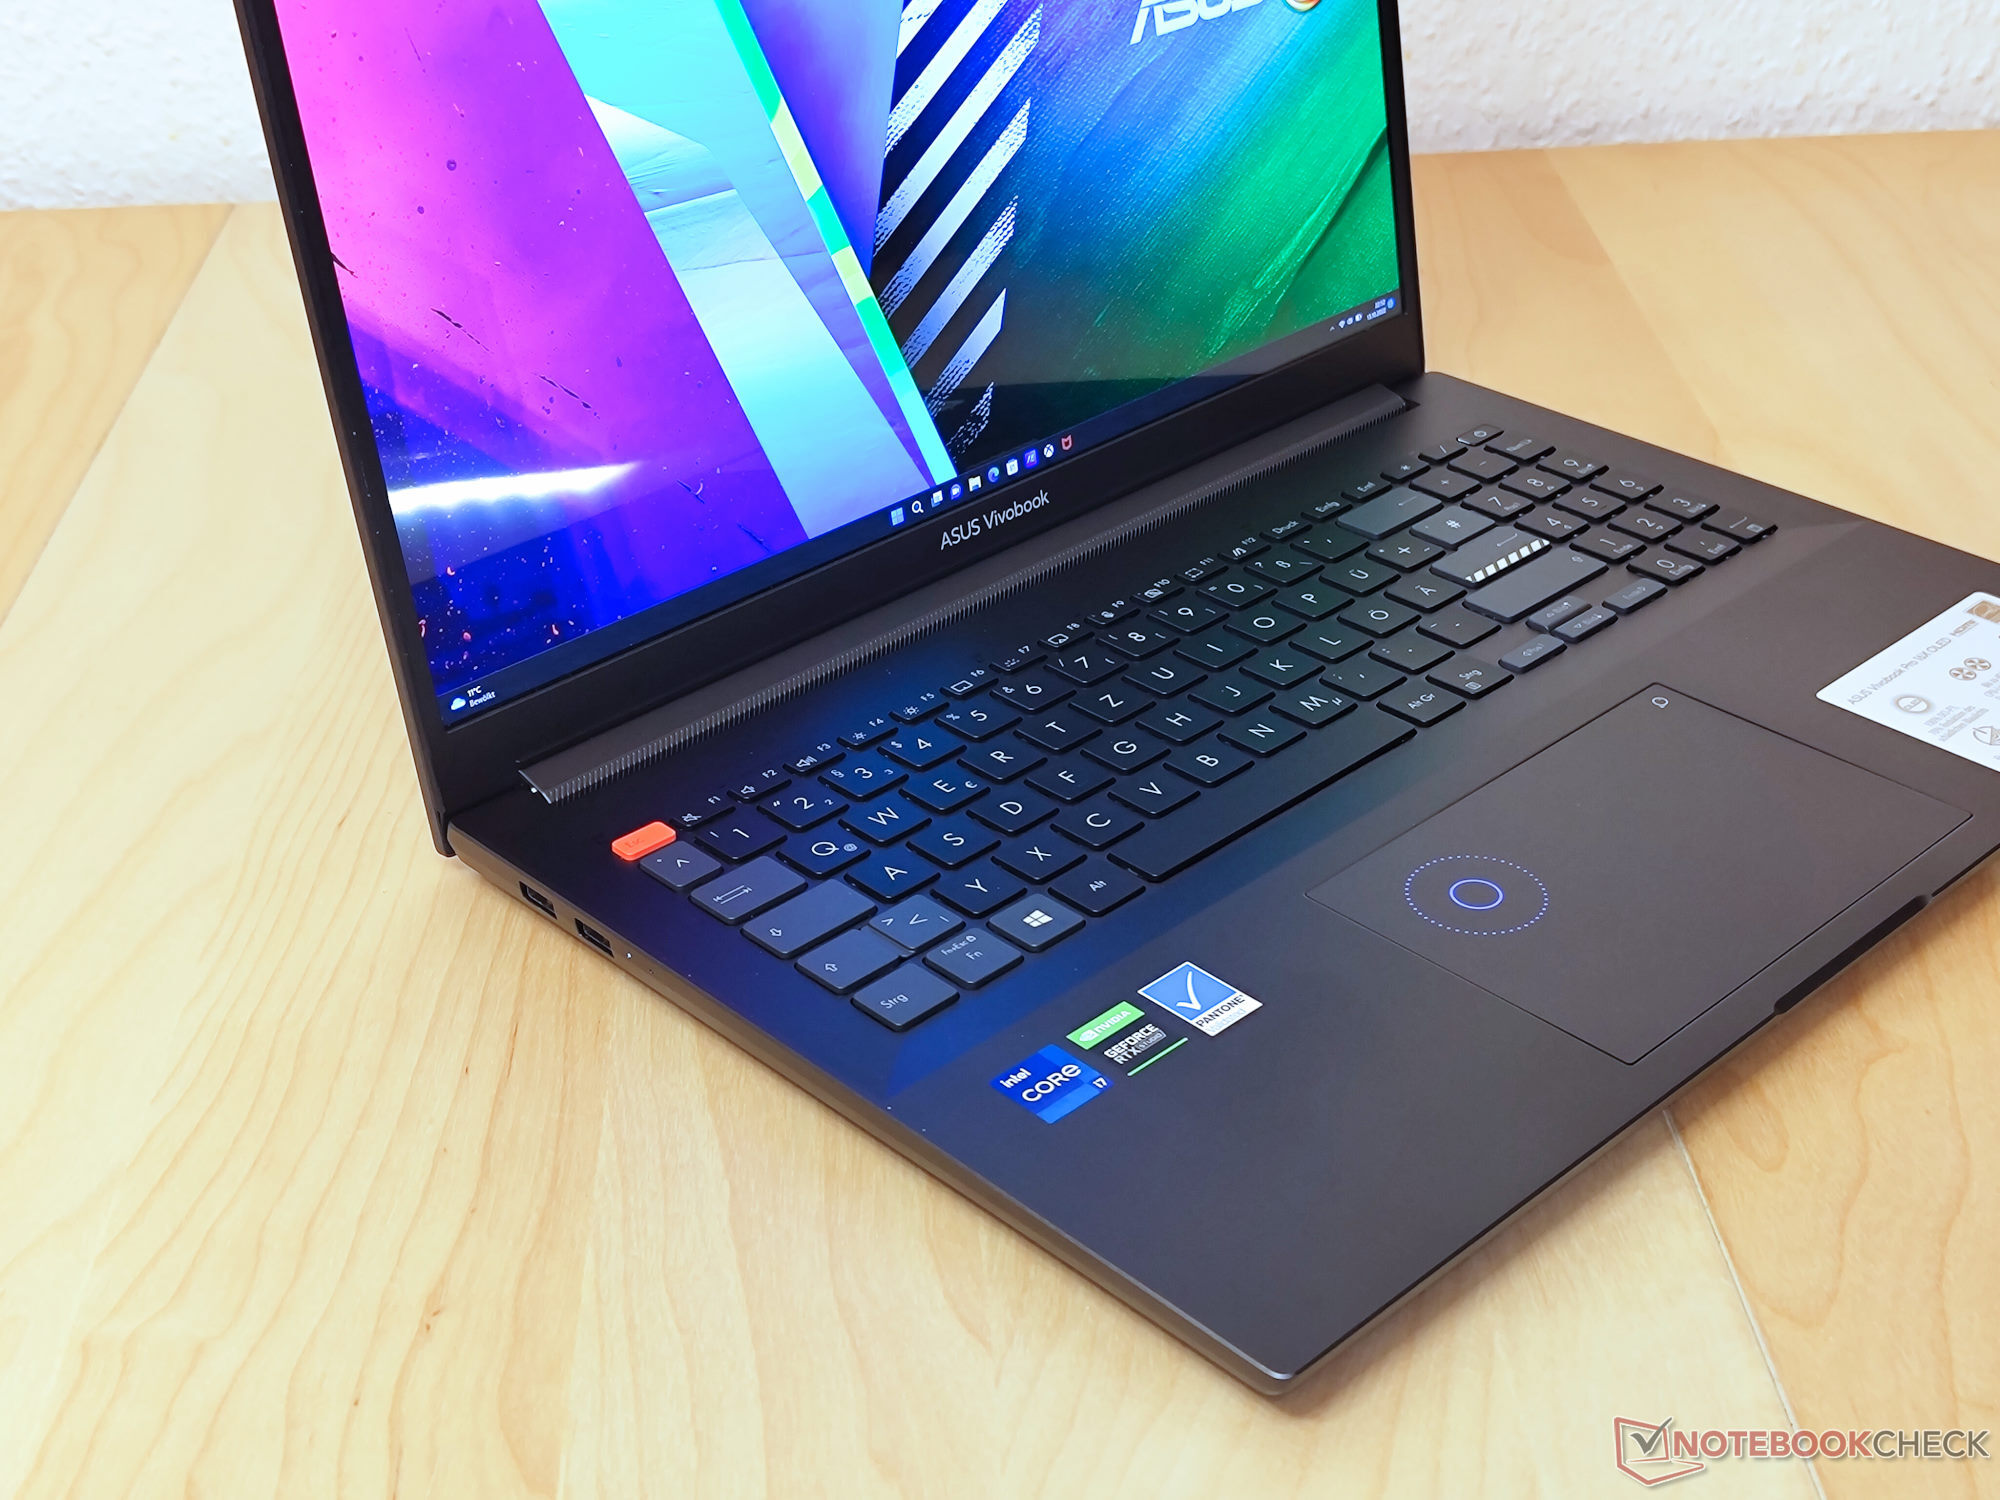
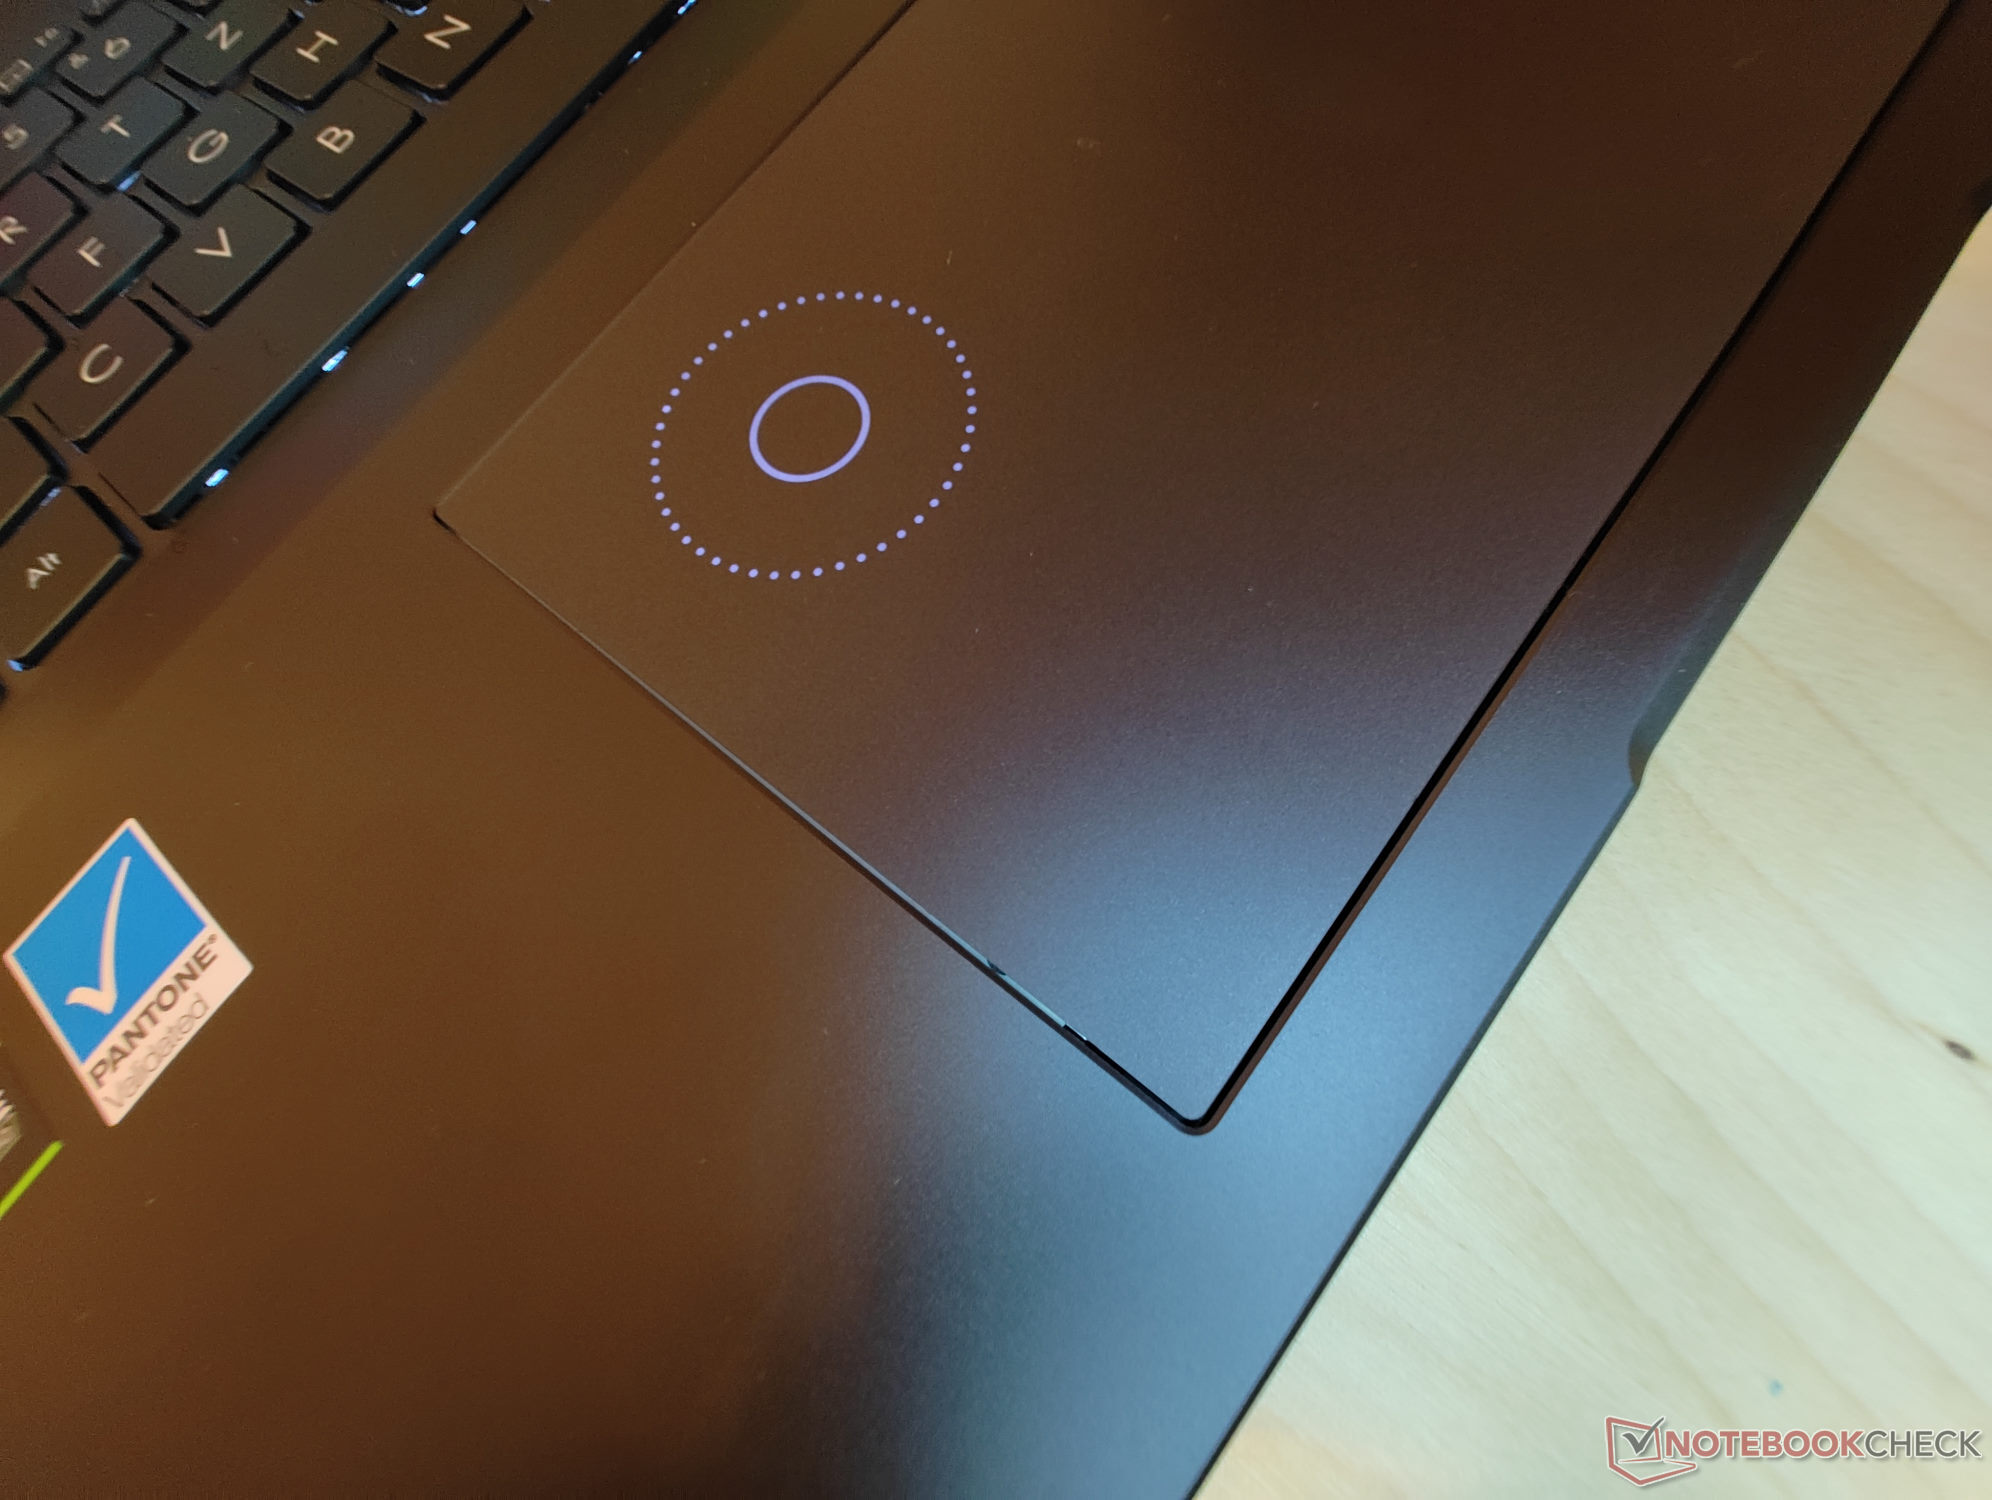
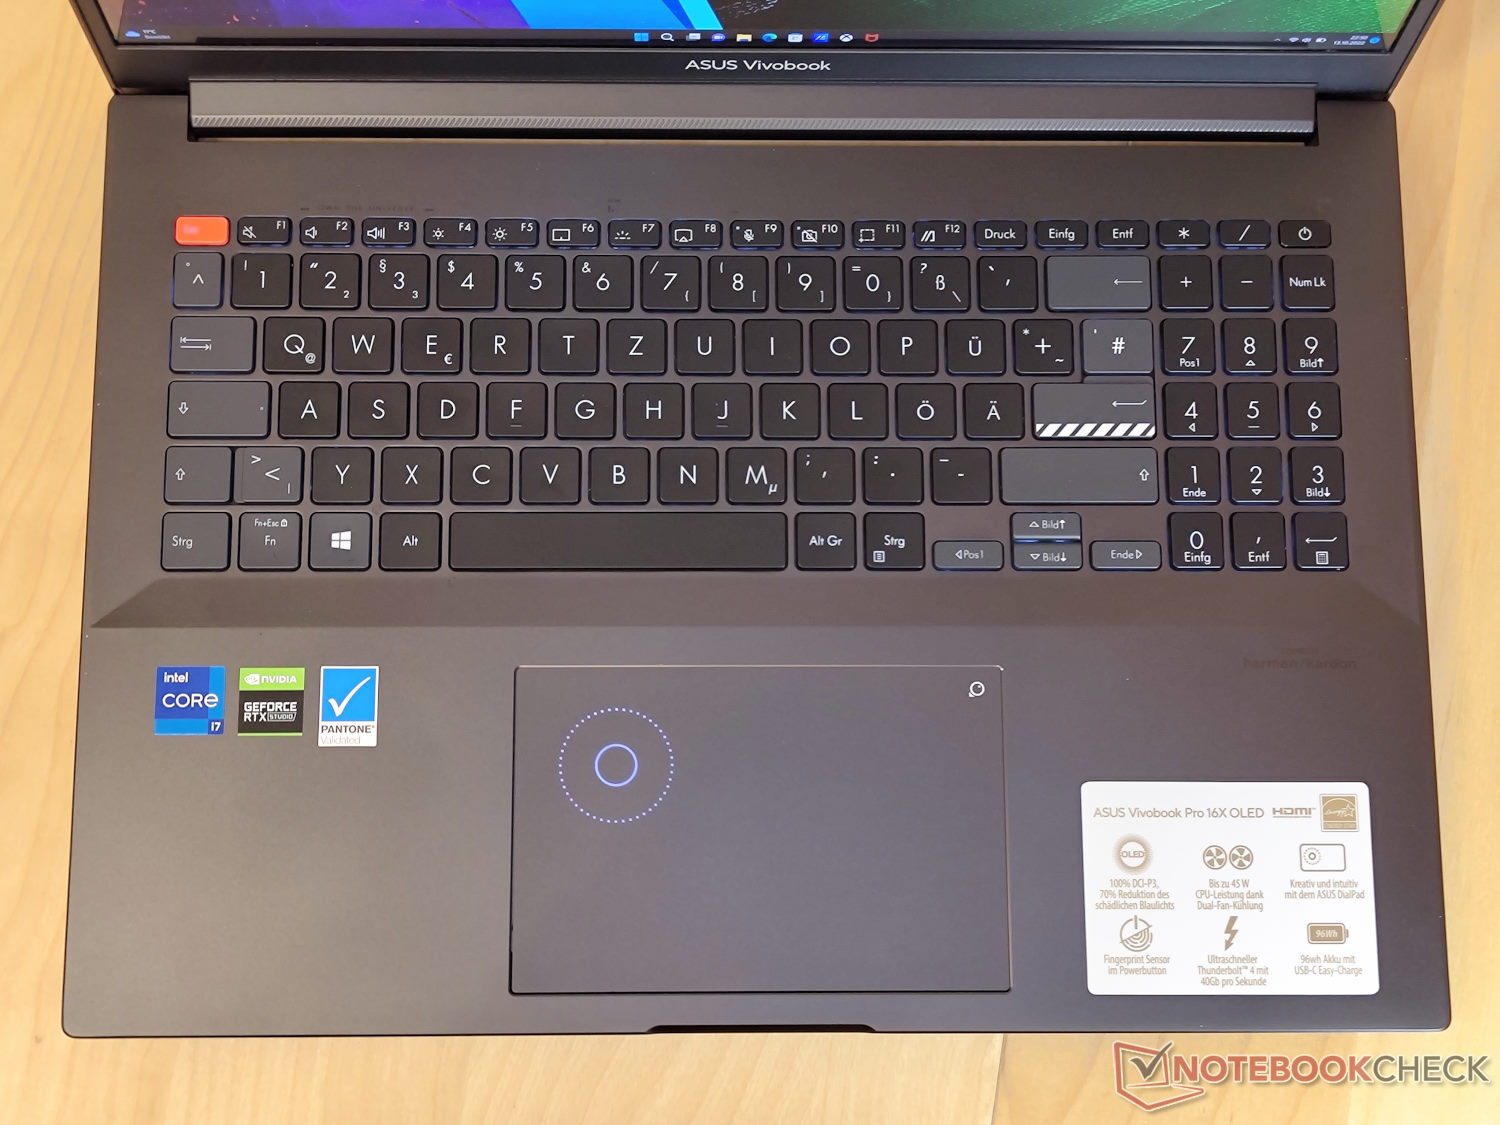
Dispositivos de entrada - Asus Dail y un teclado de tamaño normal
Teclado
El teclado del Vivobook Pro 16X aprovecha el espacio disponible en el portátil de 16 pulgadas y ofrece un teclado numérico además de las teclas de altura normal. Se puede acceder a las funciones más comunes a través de las teclas de función. Los botones cuadrados de 15 mm (~0,59 pulgadas) ofrecen un cómodo recorrido de 1,6 mm (~0,06 pulgadas) y una buena respuesta háptica.
Teclado táctil
Al igual que en otros modelos de Asus, el Vivobook Pro 16X también viene con Asus Dial integrado en el touchpad. La superficie de entrada permite a los usuarios cambiar varios ajustes tras acceder a la función con un deslizamiento hacia abajo desde la esquina superior derecha. Como alternativa, también están disponibles las funciones de Microsoft Surface Dial. El clickpad tiene una diagonal de 15,5 cm y buenas propiedades de deslizamiento, además de una gran capacidad de respuesta.
Pantalla - Windows PC con 16:10 OLED

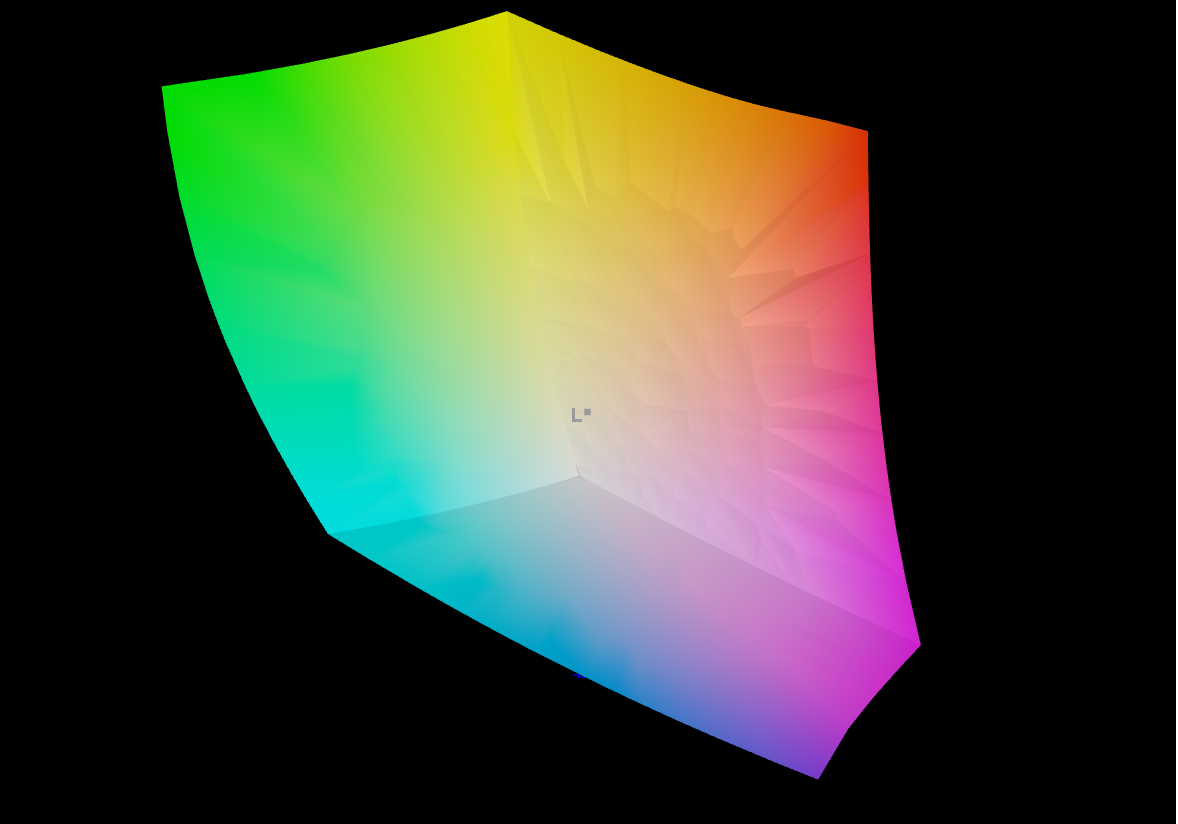
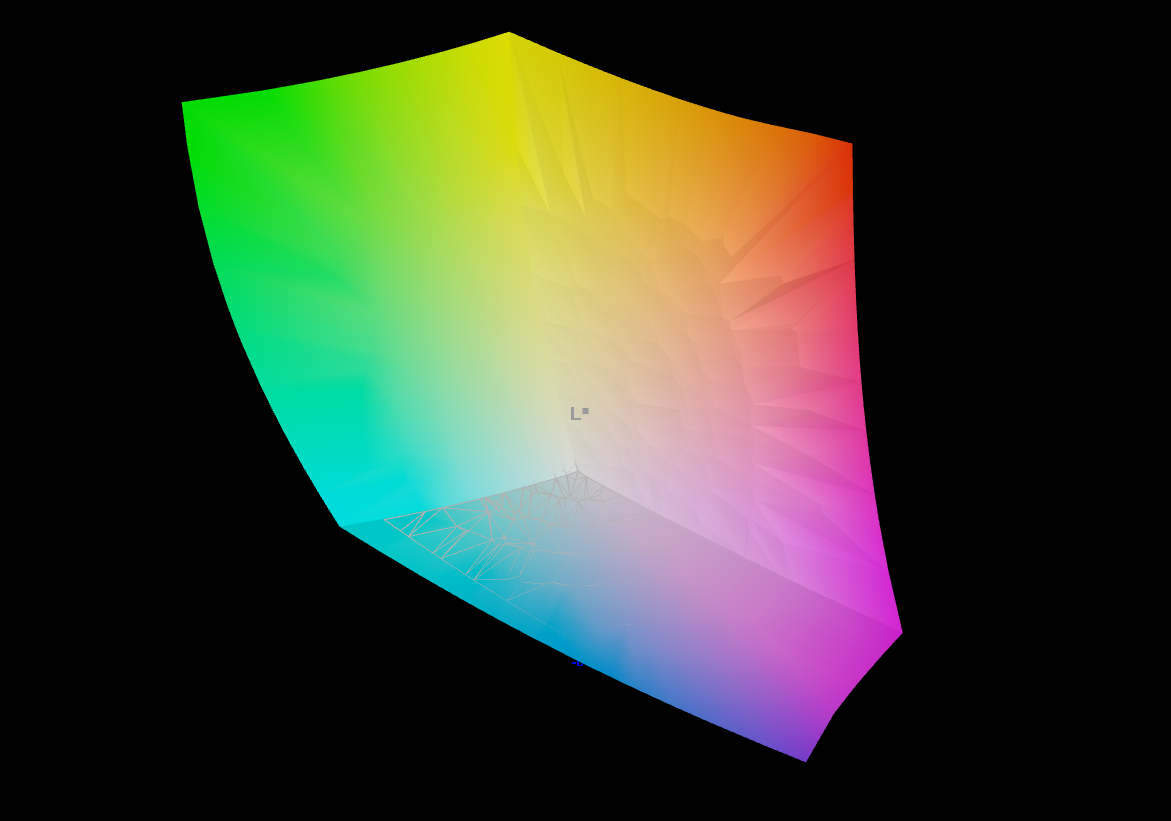
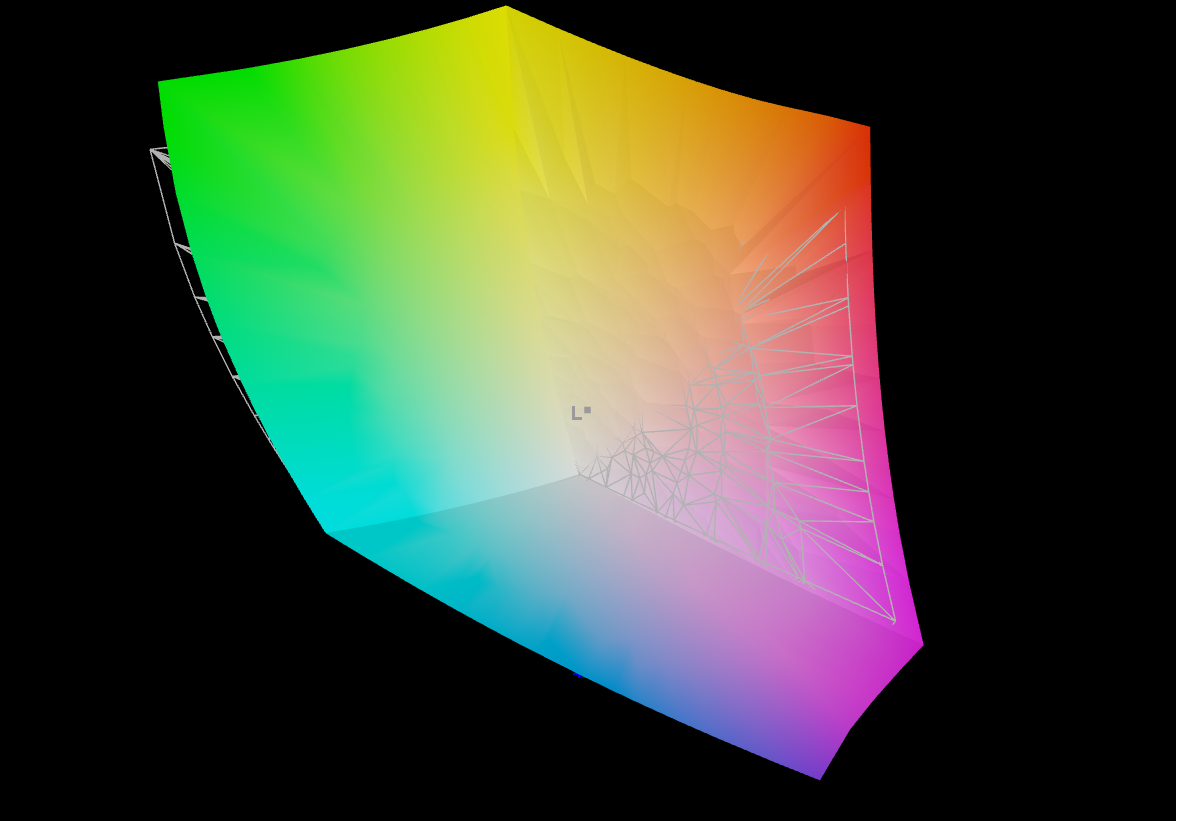
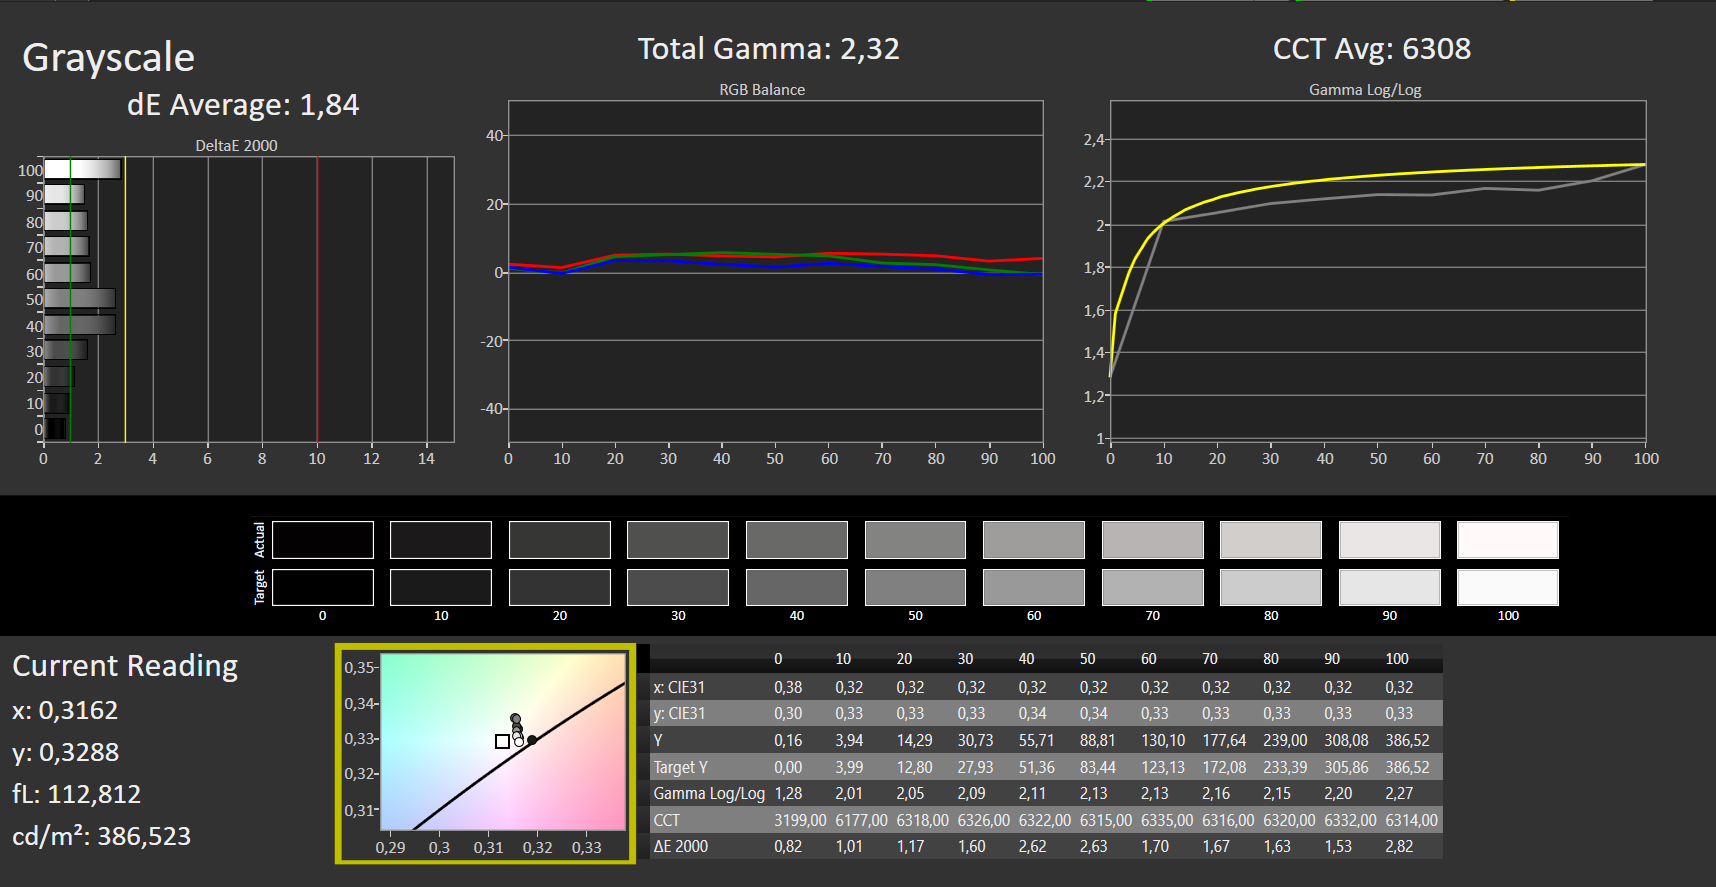
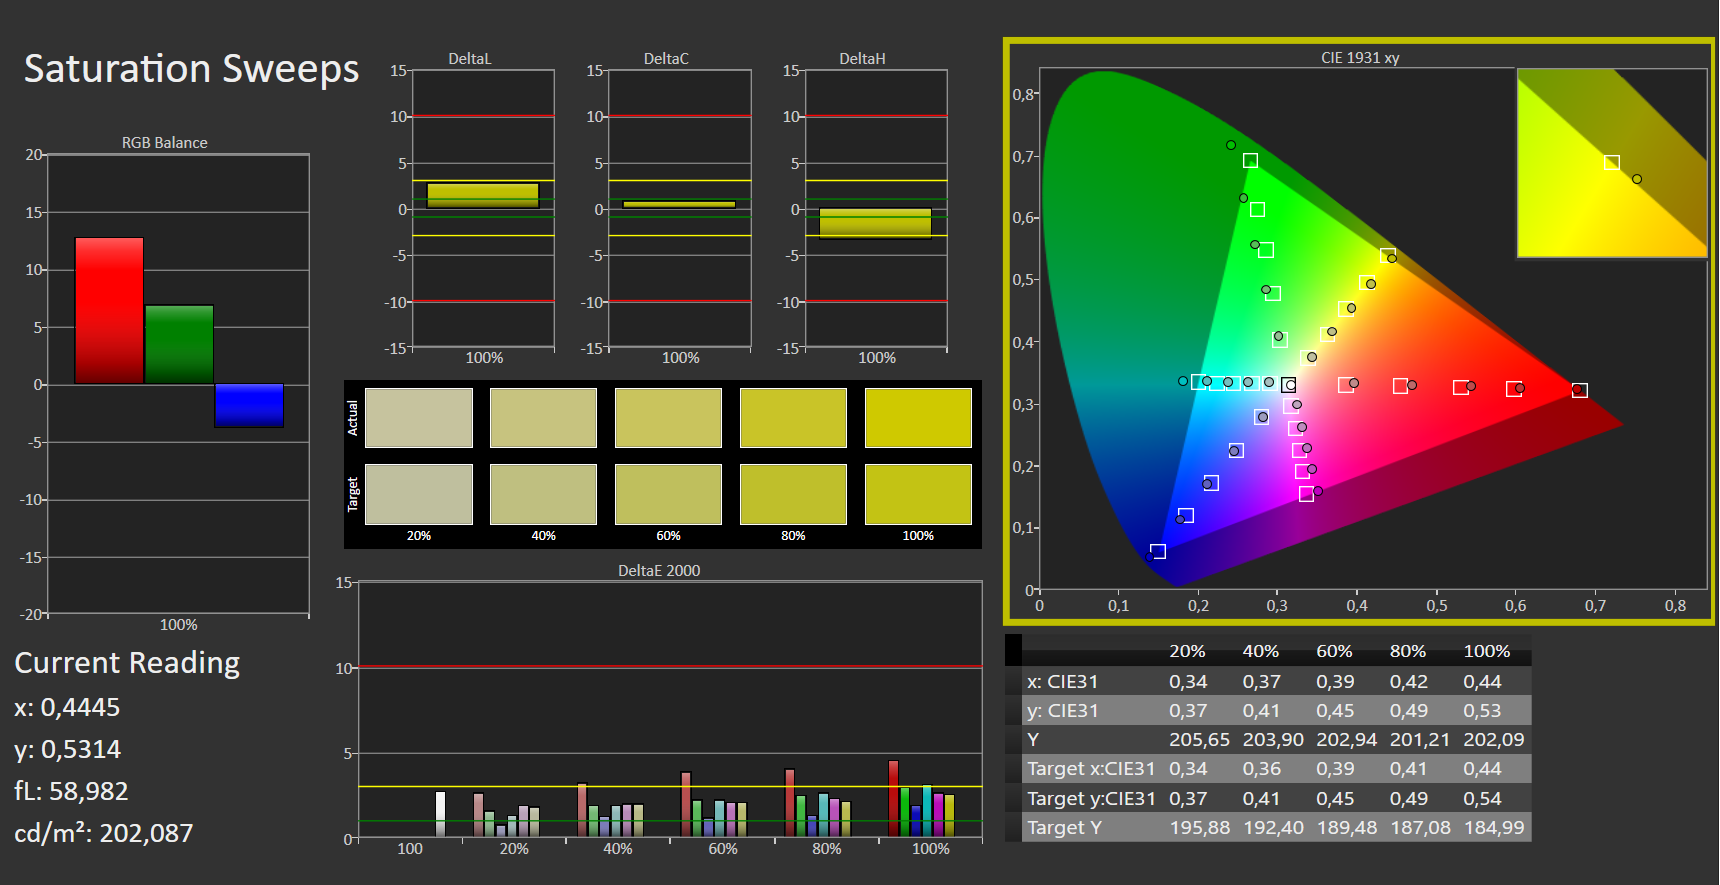
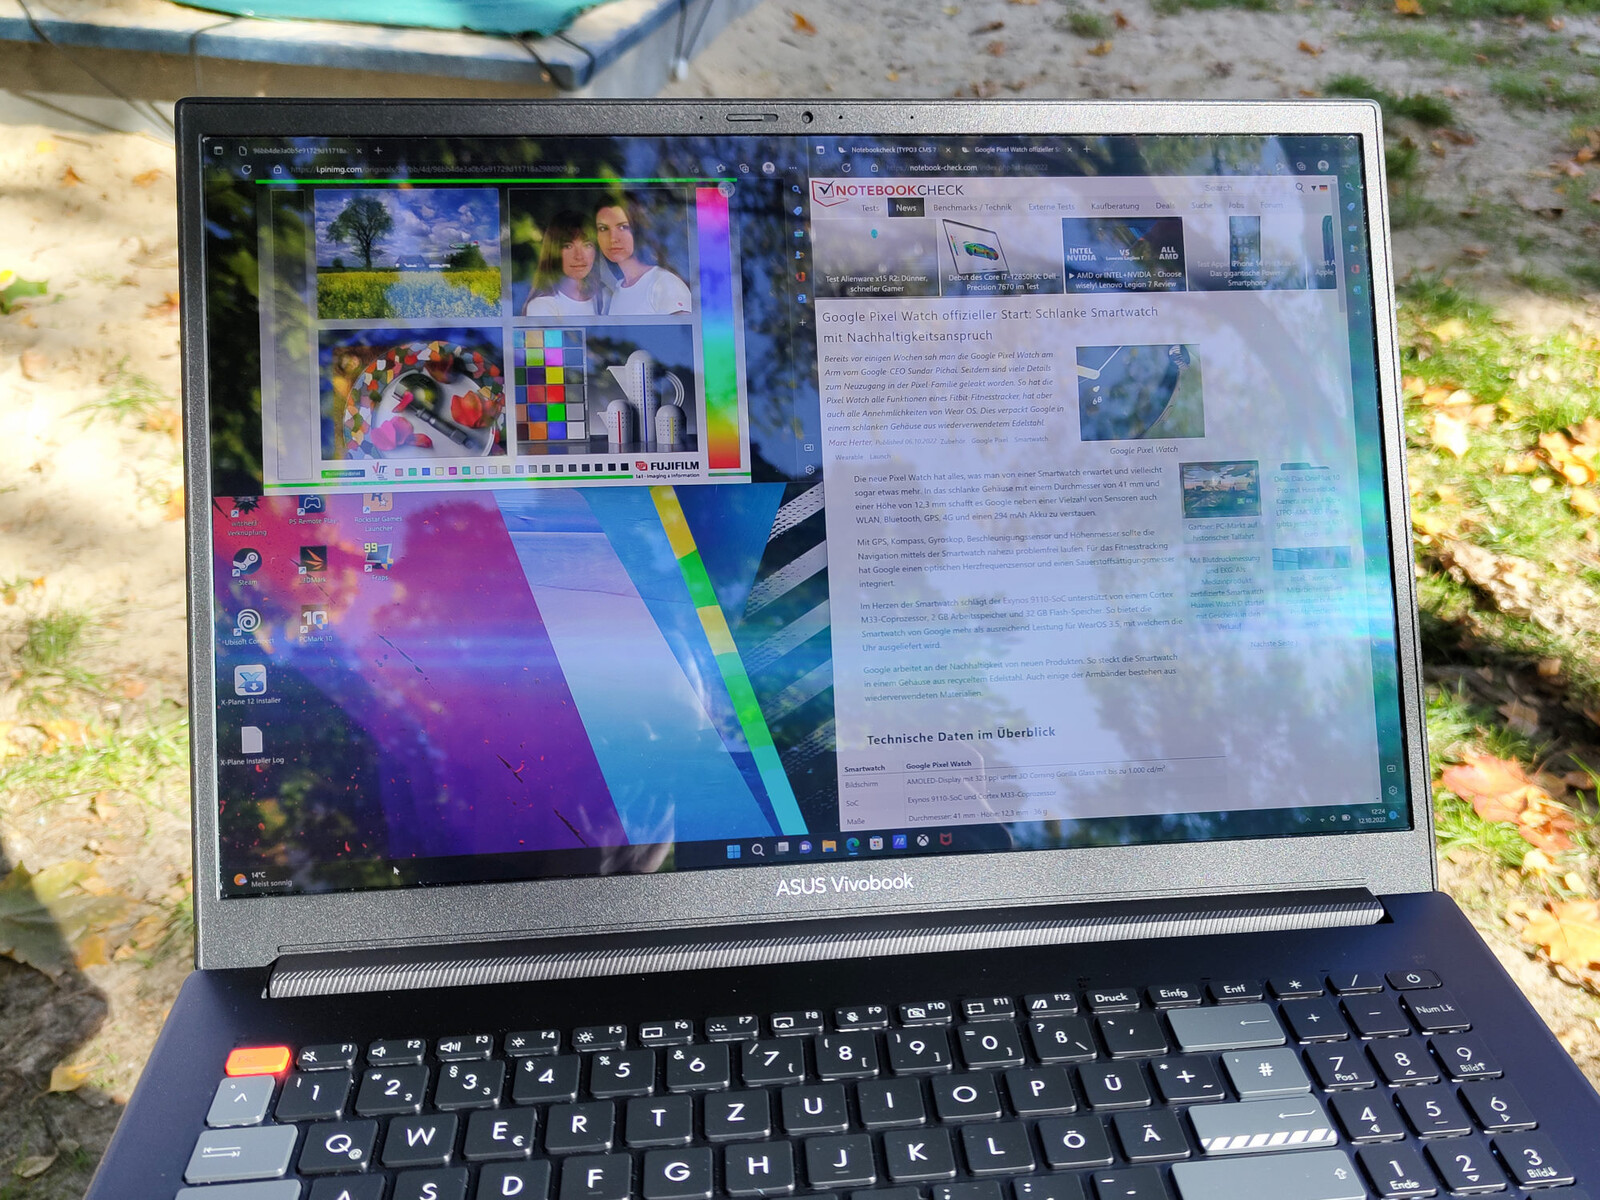
La gran pantalla de la Vivobook Pro 16X OLED es su mejor característica con diferencia - esto es algo bueno y malo a la vez. La pantalla está validada por Pantone para una excelente cobertura del espacio de color con muy bajas desviaciones de color de fábrica. La pantalla 16:10 ofrece colores naturales, un alto brillo máximo y una resolución nativa de 3840 x 2400 píxeles. Sin embargo, el panel OLED brillante también tiene sus inconvenientes. Los deslumbramientos y los reflejos son habituales bajo la luz del sol o en condiciones de iluminación subóptimas.
La iluminación es muy uniforme, lo que es típico de las pantallas OLED. La desviación máxima de la media de 390 nits es de sólo 7 nits. Debido a la tecnología subyacente, no hay sangrado de pantalla. Asimismo, la relación de contraste de 2394:1 es excelente.
| |||||||||||||||||||||||||
iluminación: 96 %
Brillo con batería: 383 cd/m²
Contraste: 14185:1 (Negro: 0.027 cd/m²)
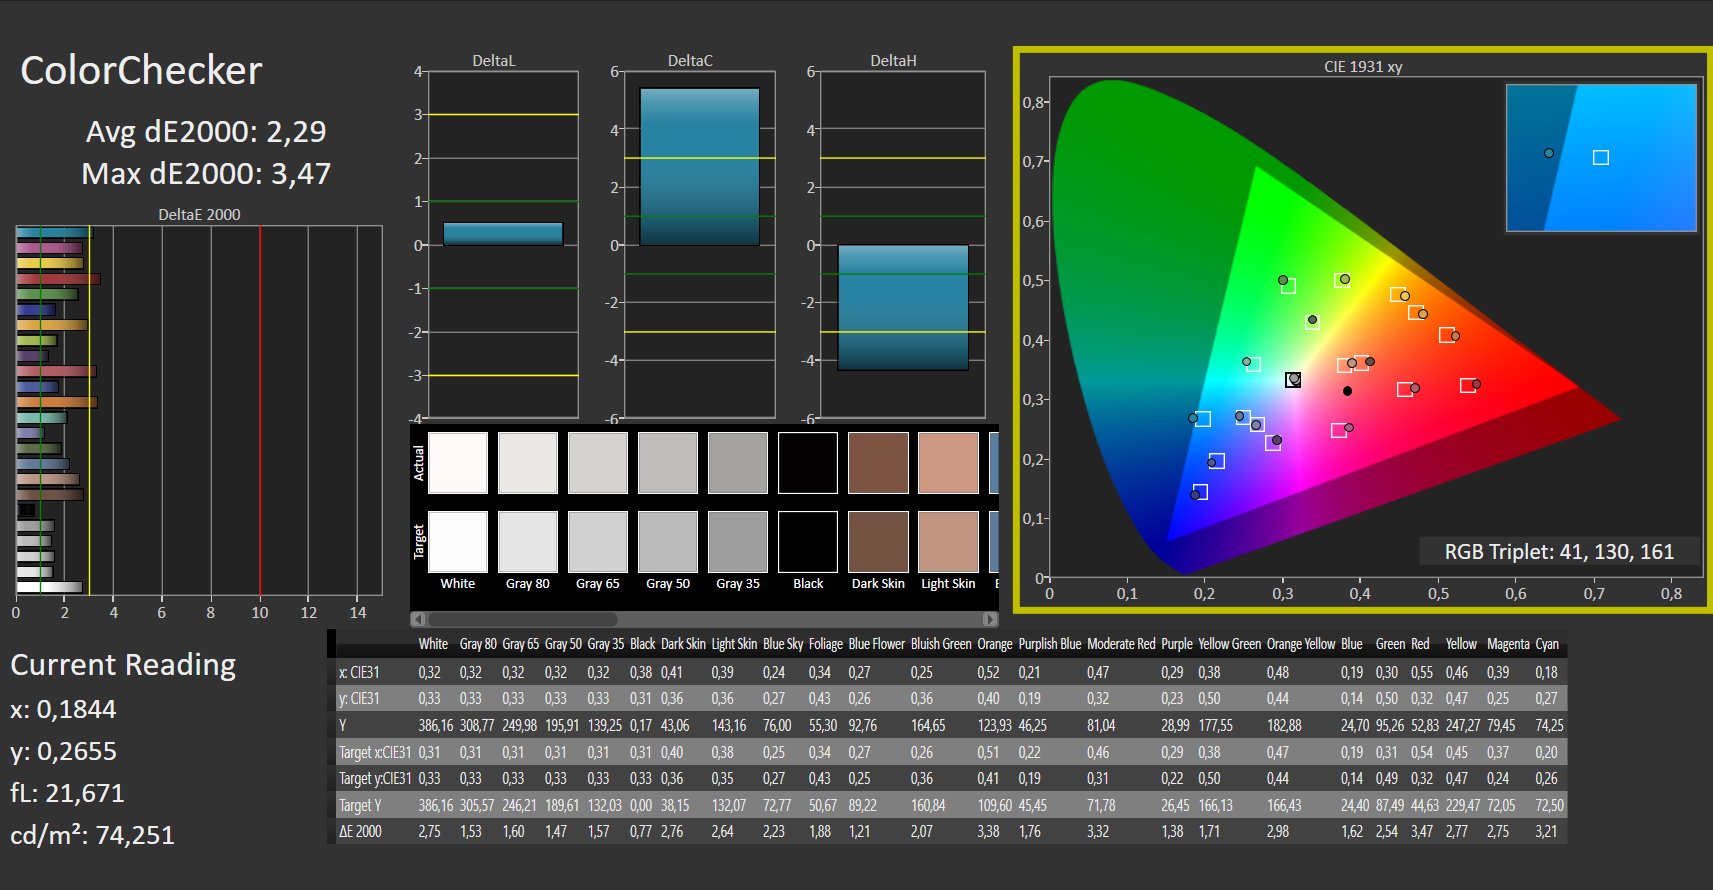
ΔE ColorChecker Calman: 2.29 | ∀{0.5-29.43 Ø4.73}
ΔE Greyscale Calman: 1.84 | ∀{0.09-98 Ø4.97}
98.05% AdobeRGB 1998 (Argyll 3D)
100% sRGB (Argyll 3D)
99.9% Display P3 (Argyll 3D)
Gamma: 2.32
CCT: 6308 K
| Asus VivoBook Pro 16X OLED N7600PC-L2026X Samsung ATNA60YV02-0, OLED, 3840x2400, 16" | MSI Summit E16 Flip A12UDT-031 AU Optronics B16QAN02.N, IPS, 2560x1600, 16" | Microsoft Surface Laptop Studio i7 RTX 3050 Ti LQ144P1JX01, IPS, 2400x1600, 14.4" | Dell Inspiron 16 Plus 7610 AU Optronics B160QAN, IPS, 3072x1920, 16" | Lenovo ThinkPad X1 Extreme G4-20Y5CTO1WW (3050 Ti) LP160UQ1-SPB1, IPS LED, 3840x2400, 16" | Schenker XMG Focus 15 LG Philips LP156WFG-SPB5, IPS, 1920x1080, 15.6" | |
|---|---|---|---|---|---|---|
| Display | -4% | -13% | -17% | -6% | -24% | |
| Display P3 Coverage (%) | 99.9 | 98.9 -1% | 80.6 -19% | 74.1 -26% | 84.3 -16% | 64.6 -35% |
| sRGB Coverage (%) | 100 | 100 0% | 99.9 0% | 99.4 -1% | 98.3 -2% | 95.3 -5% |
| AdobeRGB 1998 Coverage (%) | 98.05 | 86.5 -12% | 78.5 -20% | 75.8 -23% | 97.8 0% | 66.5 -32% |
| Response Times | -775% | -3420% | -3280% | -3950% | -1020% | |
| Response Time Grey 50% / Grey 80% * (ms) | 1 | 13 ? -1200% | 58.4 ? -5740% | 49.2 ? -4820% | 60 ? -5900% | 18 ? -1700% |
| Response Time Black / White * (ms) | 2 ? | 9 ? -350% | 24 ? -1100% | 36.8 ? -1740% | 42 ? -2000% | 8.8 ? -340% |
| PWM Frequency (Hz) | 247 ? | 5000 ? | ||||
| Screen | -161% | -118% | -114% | -208% | -196% | |
| Brightness middle (cd/m²) | 383 | 314 -18% | 497 30% | 296.8 -23% | 639 67% | 418 9% |
| Brightness (cd/m²) | 390 | 294 -25% | 491 26% | 292 -25% | 612 57% | 376 -4% |
| Brightness Distribution (%) | 96 | 89 -7% | 92 -4% | 87 -9% | 84 -12% | 83 -14% |
| Black Level * (cd/m²) | 0.027 | 0.28 -937% | 0.29 -974% | 0.21 -678% | 0.47 -1641% | 0.41 -1419% |
| Contrast (:1) | 14185 | 1121 -92% | 1714 -88% | 1413 -90% | 1360 -90% | 1020 -93% |
| Colorchecker dE 2000 * | 2.29 | 3.08 -34% | 1.2 48% | 2.56 -12% | 2.2 4% | 1.67 27% |
| Colorchecker dE 2000 max. * | 3.47 | 5.49 -58% | 2.8 19% | 4.76 -37% | 5.3 -53% | 3.88 -12% |
| Greyscale dE 2000 * | 1.84 | 3.99 -117% | 1.9 -3% | 2.6 -41% | 1.7 8% | 2.9 -58% |
| Gamma | 2.32 95% | 2.3 96% | 2.14 103% | 2.07 106% | 2.31 95% | 2.26 97% |
| CCT | 6308 103% | 6219 105% | 6821 95% | 6628 98% | 6390 102% | 6209 105% |
| Colorchecker dE 2000 calibrated * | 0.88 | 0.8 | 1.86 | 1.4 | 0.98 | |
| Media total (Programa/Opciones) | -313% /
-219% | -1184% /
-602% | -1137% /
-579% | -1388% /
-737% | -413% /
-283% |
* ... más pequeño es mejor
La validación Pantone de una pantalla no se traduce necesariamente en una amplia cobertura del espacio de color o en colores extremadamente precisos en todos los casos. El sistema de color Pantone se introdujo para que los colores de los productos y las impresiones fueran más comparables y predecibles. Aunque el sistema de color, que abarca 1867 colores individuales para las impresiones y muchos más colores específicos para los productos, es bastante amplio, no necesariamente cubre por completo grandes espacios de color como DisplayP3. Por ello, un monitor que sólo cubra el espacio de color sRGB, más pequeño, puede cumplir los requisitos del sistema de correspondencia Pantone. Además, las desviaciones de color fuera del sistema Pantone pueden ser mayores.
En resumen, sigue mereciendo la pena determinar qué espacios de color puede mostrar una pantalla y para qué casos de uso es adecuada, incluso en el caso de una pantalla validada por Pantone. Los requisitos para la edición de vídeo pueden ser muy diferentes a los del diseño gráfico para medios impresos.
El panel OLED del Asus Vivobook cubre casi el 100% de los tres espacios de color relevantes. Gracias a la buena cobertura de AdobeRGB y DisplayP3, la pantalla es muy adecuada para la fotografía y la edición de vídeo, respectivamente.
La pantalla validada por Pantone del Asus Vivobook tiene una desviación de color muy baja de fábrica. En nuestra prueba con el software CalMAN ColorChecker, las desviaciones de color máximas sólo superan ligeramente el valor deltaE objetivo de 3. Con un deltaE medio de 2,29, la pantalla entra cómodamente en el rango ideal.
Tiempos de respuesta del display
| ↔ Tiempo de respuesta de Negro a Blanco | ||
|---|---|---|
| 2 ms ... subida ↗ y bajada ↘ combinada | ↗ 1 ms subida |  |
| ↘ 1 ms bajada | ||
| La pantalla mostró tiempos de respuesta muy rápidos en nuestros tests y debería ser adecuada para juegos frenéticos. En comparación, todos los dispositivos de prueba van de ##min### (mínimo) a 240 (máximo) ms. » 11 % de todos los dispositivos son mejores. Esto quiere decir que el tiempo de respuesta medido es mejor que la media (19.9 ms) de todos los dispositivos testados. | ||
| ↔ Tiempo de respuesta 50% Gris a 80% Gris | ||
| 1 ms ... subida ↗ y bajada ↘ combinada | ↗ 0 ms subida |  |
| ↘ 0 ms bajada | ||
| La pantalla mostró tiempos de respuesta muy rápidos en nuestros tests y debería ser adecuada para juegos frenéticos. En comparación, todos los dispositivos de prueba van de ##min### (mínimo) a 636 (máximo) ms. » 4 % de todos los dispositivos son mejores. Esto quiere decir que el tiempo de respuesta medido es mejor que la media (31.1 ms) de todos los dispositivos testados. | ||
Parpadeo de Pantalla / PWM (Pulse-Width Modulation)
| Parpadeo de Pantalla / PWM detectado | 247 Hz | ≤ 50 % de brillo |  |
La retroiluminación del display parpadea a 247 Hz (seguramente usa PWM - Pulse-Width Modulation) a un brillo del 50 % e inferior. Sobre este nivel de brillo no debería darse parpadeo / PWM. La frecuencia de 247 Hz es relativamente baja, por lo que la gente sensible debería ver parpadeos y padecer fatiga visual por la pantalla (usado al brillo indicado a continuación). Comparación: 52 % de todos los dispositivos testados no usaron PWM para atenuar el display. Si se usó, medimos una media de 7797 (mínimo: 5 - máxmo: 343500) Hz. | |||
Como es habitual, el parpadeo de la pantalla OLED varía en función de la configuración del brillo, así como de las imágenes mostradas. En el caso de la Vivobook Pro 16X, sólo detectamos parpadeo en niveles de brillo del 50 por ciento o inferiores. Como era de esperar, la pantalla no se oscurece simultáneamente en su totalidad y en su lugar sólo baja el brillo en ciertas filas. Esto reduce la fatiga visual en la pantalla OLED en comparación con una pantalla LCD con la misma frecuencia de parpadeo.


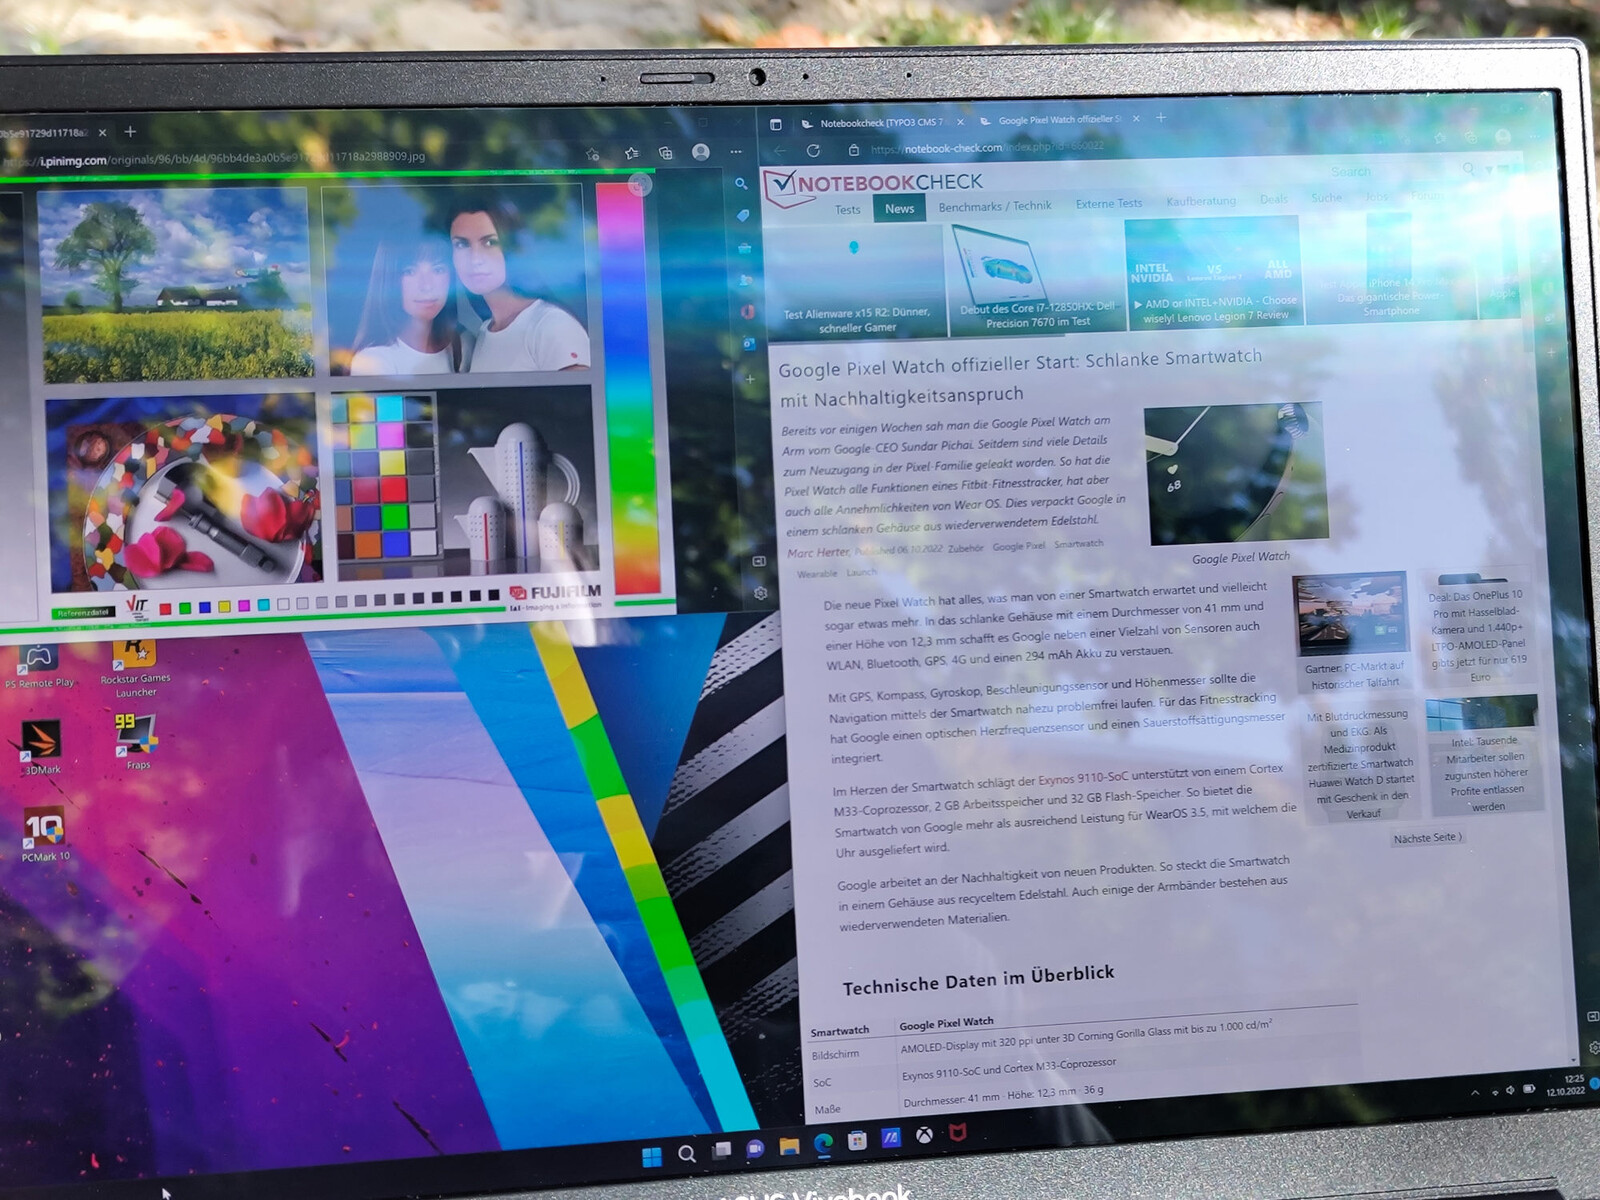
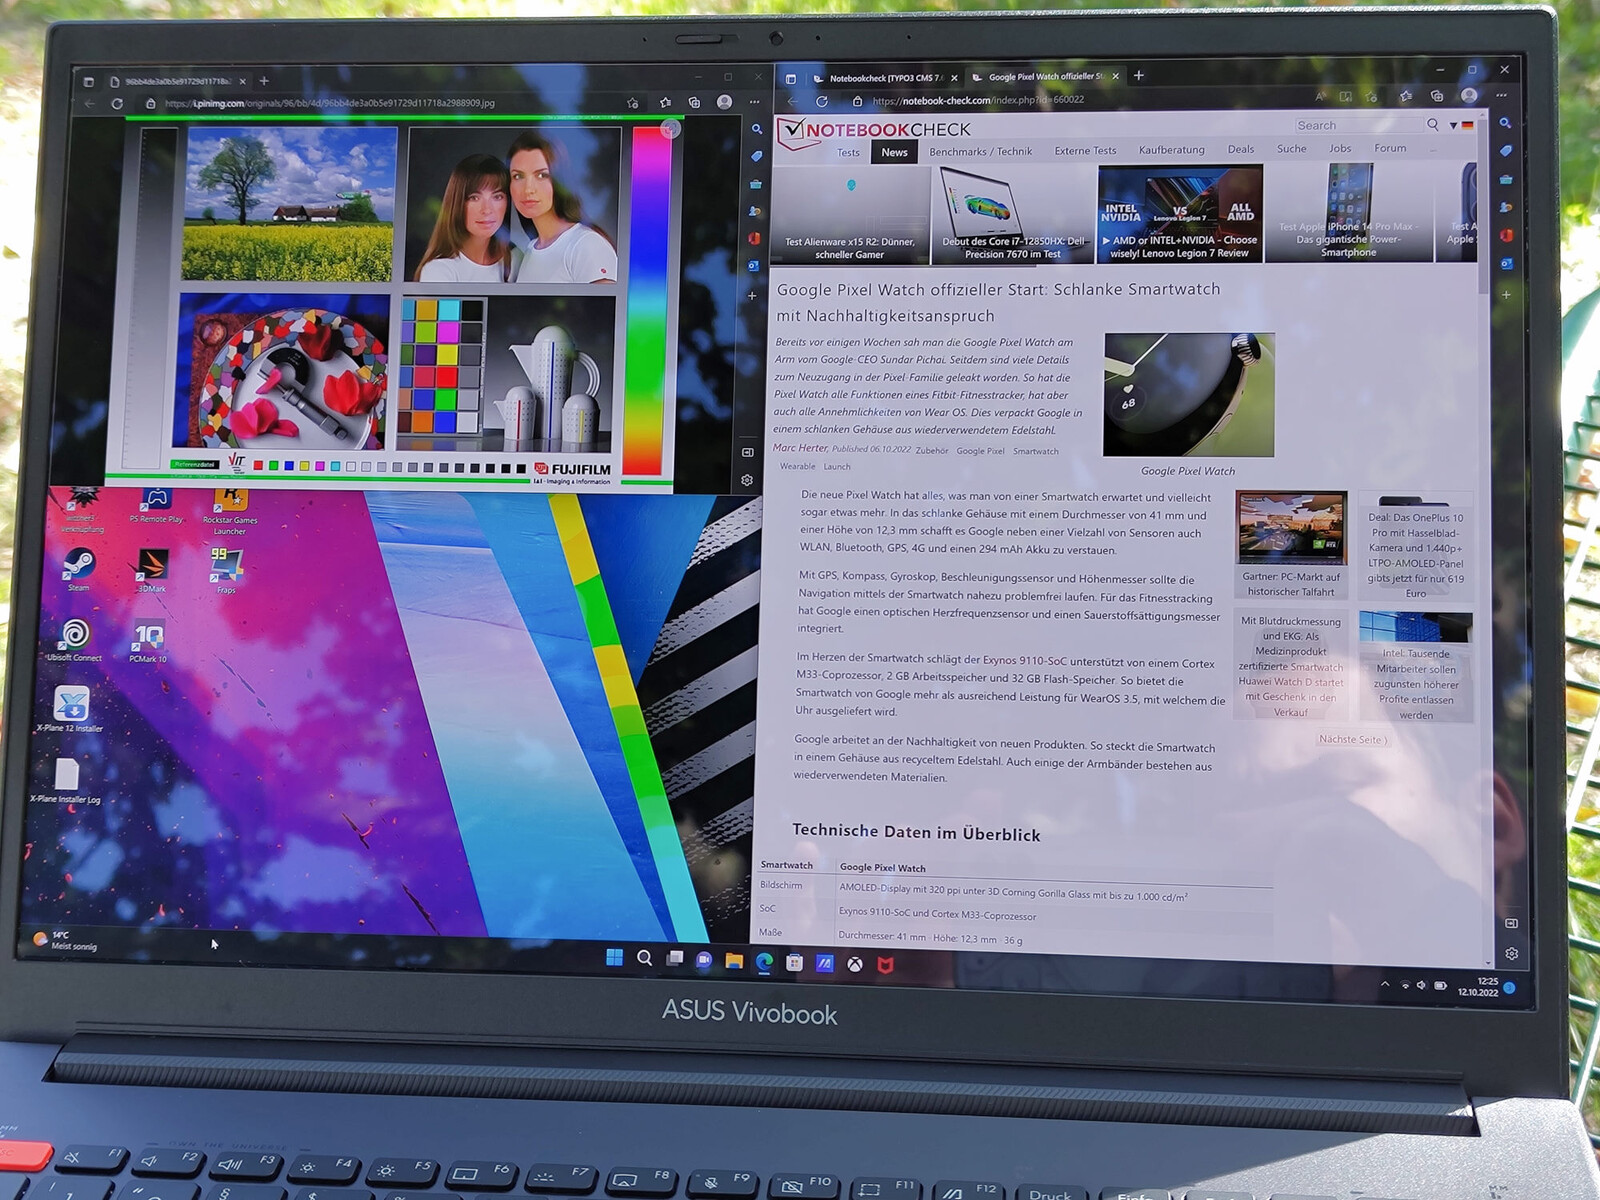
A pesar de su elevado brillo máximo, la pantalla OLED brillante no es adecuada para su uso en exteriores. Los deslumbramientos y los reflejos degradan la calidad de la imagen percibida, especialmente cuando brilla el sol. En ángulos especialmente desfavorables bajo el sol u otras fuentes de luz brillantes, la pantalla OLED muestra los característicos patrones de refracción verdes.
La pantalla de 16 pulgadas no muestra ninguna debilidad en nuestro análisis de ángulos de visión. Incluso desde ángulos extremos, el brillo percibido y la precisión del color de la pantalla son excelentes.
Rendimiento - Alegría y pena con los controladores de Nvidia Studio
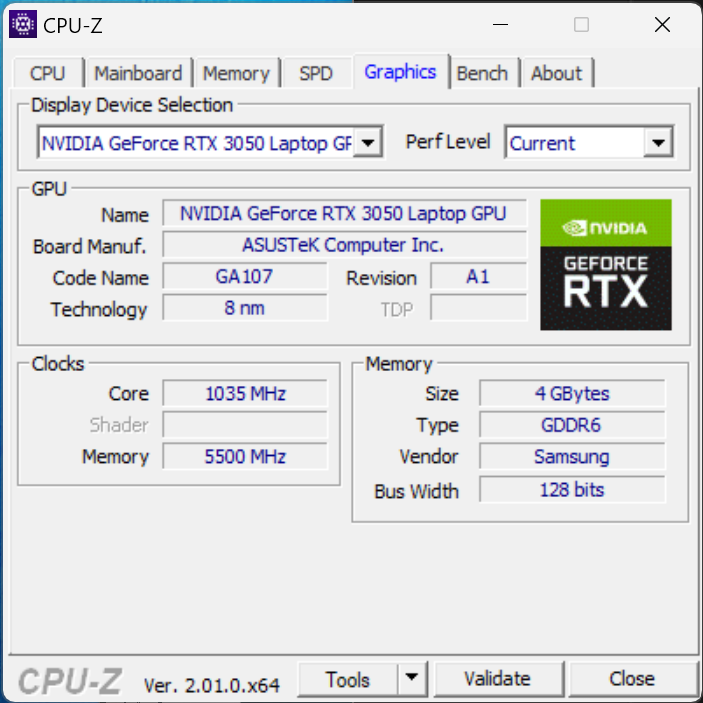
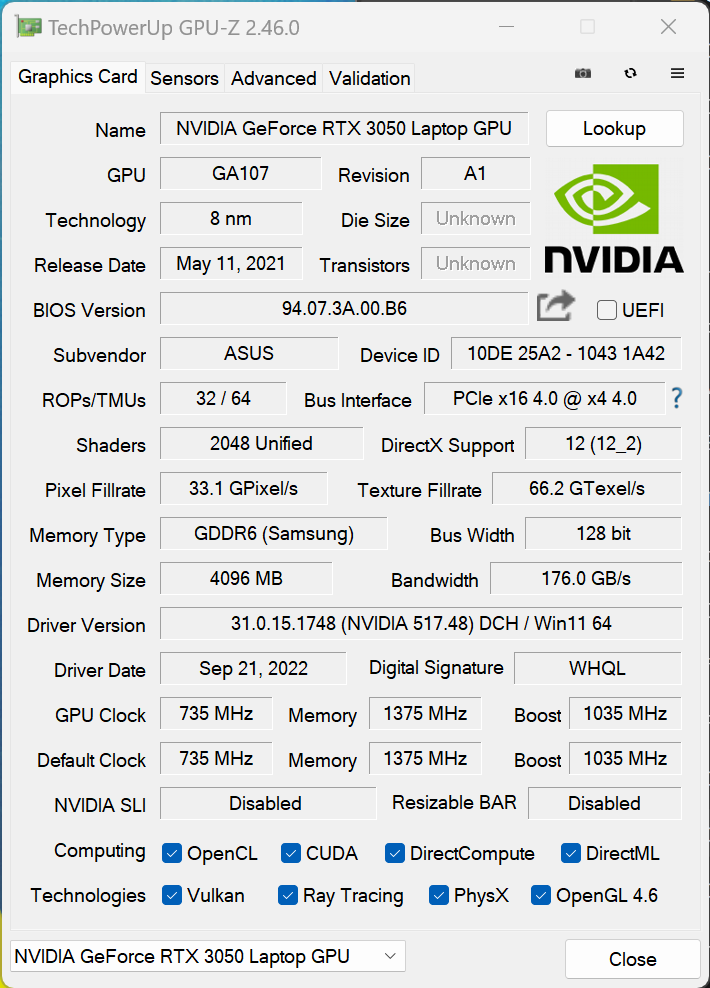
Hay varias configuraciones disponibles del Asus Vivobook Pro 16X OLED. Aparte de los procesadores Intel de 11ª y 12ª generación, el fabricante también ofrece CPUs de las series AMD-Ryzen-5000 y AMD-Ryzen-6000. Las opciones de dGPU van desde la Nvidia GeForce RTX 3050 hasta la GPU 3070 Ti.
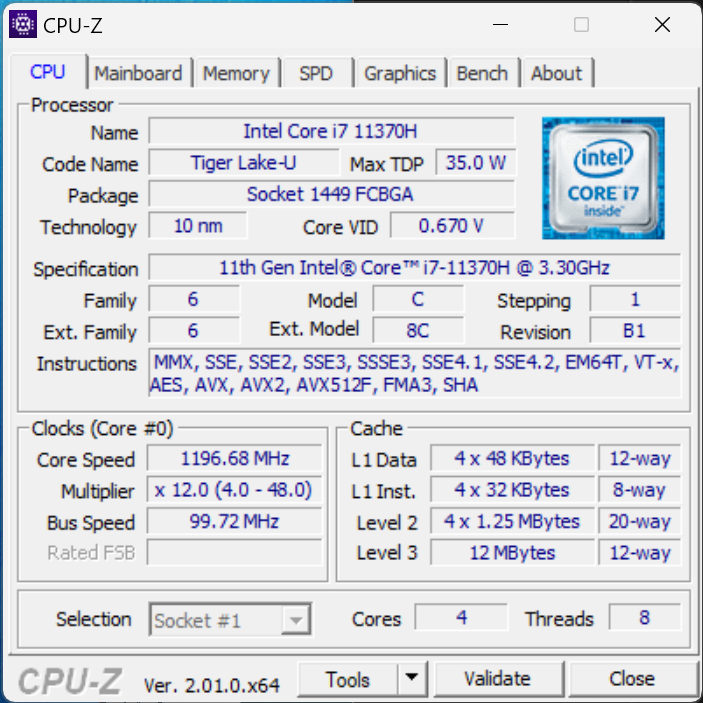
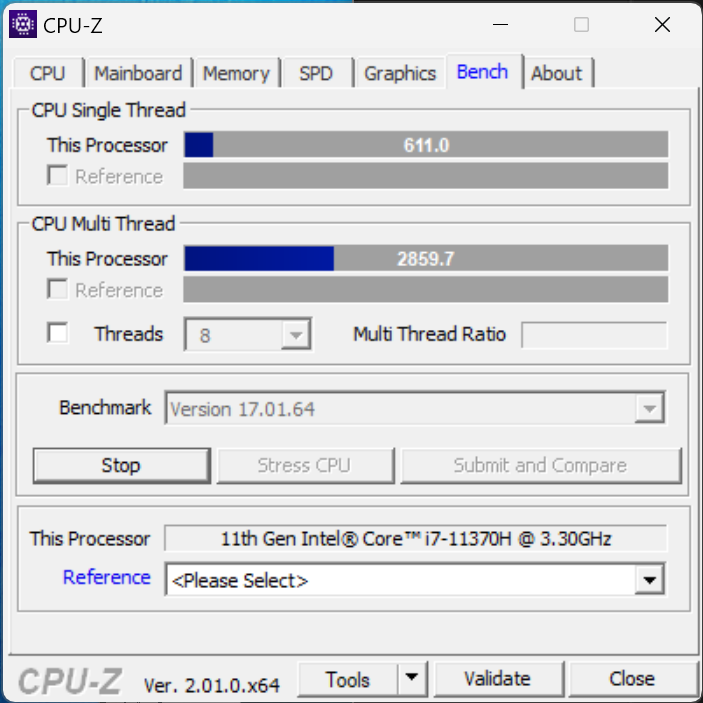
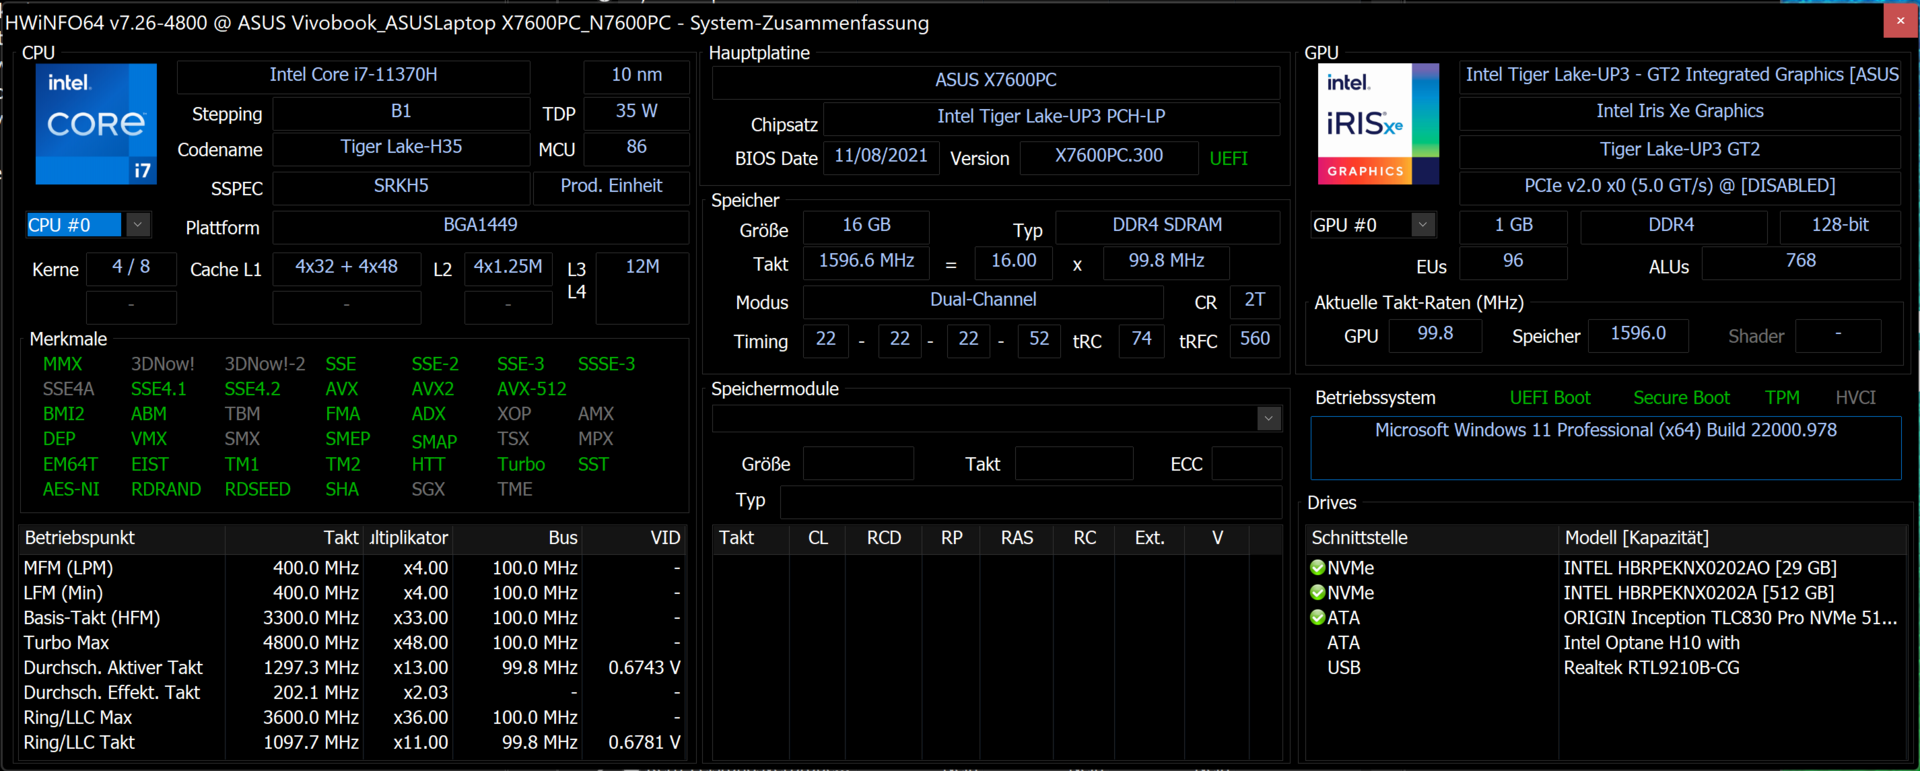
Nuestra configuración se basa en un Intel Core i7 11370H CPU, una GeForce RTX 3050 Y 16 GB de RAM.
Condiciones de la prueba
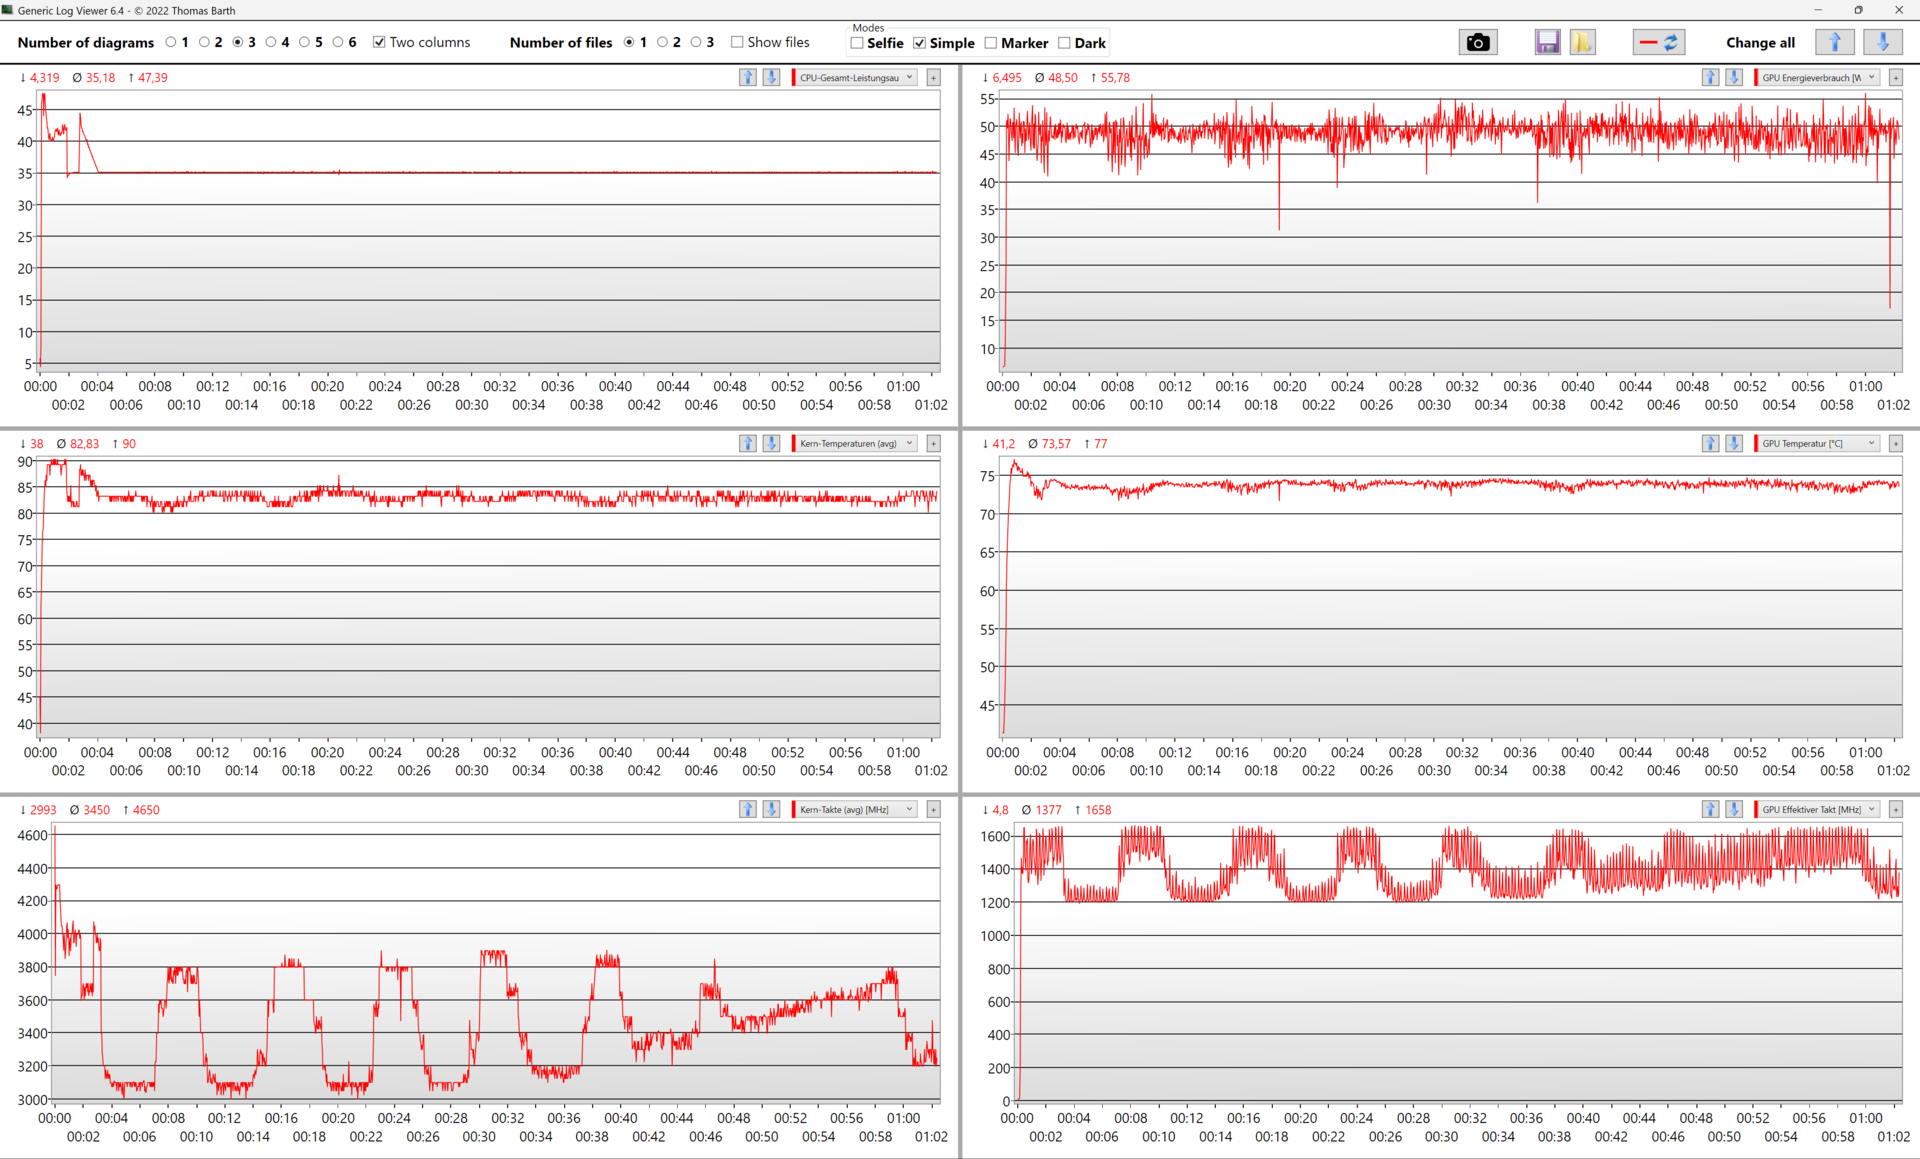
En cuanto a la configuración de energía del portátil, Asus utiliza valores que superan el TDP recomendado por Intel en algunos casos. Según nuestros registros, elIntel Core i7 11370Hmantiene un consumo de energía de hasta 45 W durante periodos cortos. Sin embargo, el consumo de energía de la CPU puede bajar a 25 W, dependiendo de la configuración del ventilador. La GPU dedicada Nvidia GeForce RTX 3050 del Vivobook está limitada a 50 vatios. El modelo parece ser la variante Max-Q más pequeña de la tarjeta gráfica. Para consumir los 50 vatios completos, la tarjeta gráfica tiene que hacer uso del presupuesto de energía que comparte con el procesador. El consumo combinado no debe superar los 85 vatios en el modo de rendimiento. Mientras tanto, los modos por defecto y susurro permiten un consumo combinado de sólo 60 y 45 vatios, respectivamente.
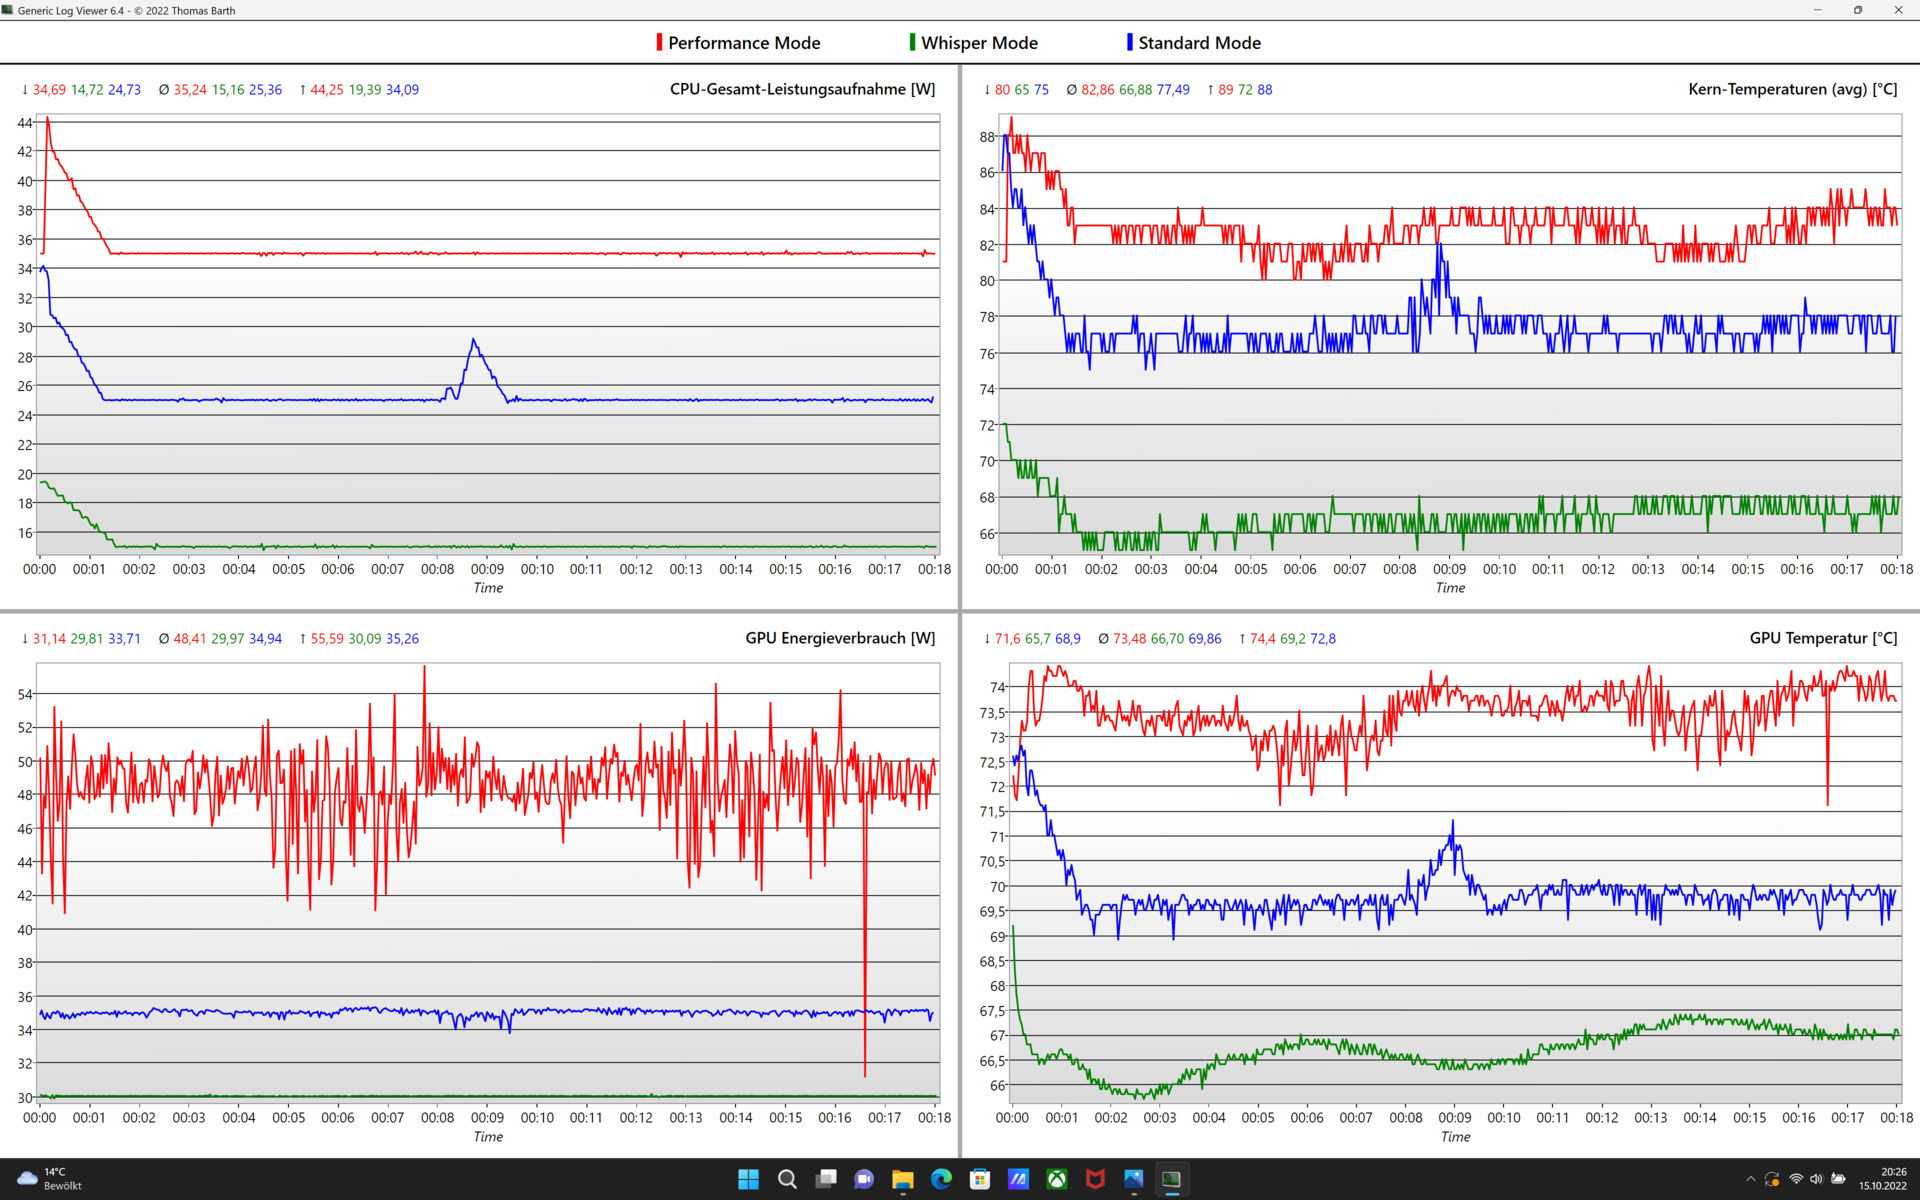
Seleccionamos el modo de rendimiento de Asus antes de realizar los siguientes benchmarks. Para determinar la duración de la batería, elegimos el modo de ahorro de energía. Para nuestras pruebas de ruido, utilizamos los tres modos de ventilador.
Procesador
Nuestro dispositivo de pruebas utiliza una CPU Intel Core i7-11370H. Este procesador está diseñado para portátiles delgados pero potentes y el TDP puede configurarse con relativa libertad. Con 35 vatios, Asus incluso supera el valor máximo recomendado por Intel. Sin embargo, este valor sólo se alcanza cuando se estresa la CPU e incluso entonces se limita a unos pocos minutos. 55 vatios de rendimiento de refuerzo significa que el SoC de Intel tiene mucho margen de maniobra. Dicho esto, el Asus Vivobook Pro es más un velocista que un corredor de maratón. El alto nivel de rendimiento, que el portátil es capaz de alcanzar con el 11370H, cae rápidamente después de poco tiempo. El i7 de la 11ª generación tampoco puede competir con los procesadores mucho más potentes de la 12ª generación de Intel.
Dado que el uso normal requiere con mayor frecuencia ráfagas cortas de rendimiento, el Vivobook es agradablemente sensible durante el uso diario. Por el contrario, el portátil multimedia se queda atrás en los benchmarks con un estrés prolongado.
Cinebench R15 Multi Loop
Cinebench R23: Multi Core | Single Core
Cinebench R20: CPU (Multi Core) | CPU (Single Core)
Cinebench R15: CPU Multi 64Bit | CPU Single 64Bit
Blender: v2.79 BMW27 CPU
7-Zip 18.03: 7z b 4 | 7z b 4 -mmt1
Geekbench 5.5: Multi-Core | Single-Core
HWBOT x265 Benchmark v2.2: 4k Preset
LibreOffice : 20 Documents To PDF
R Benchmark 2.5: Overall mean
| CPU Performance rating | |
| Media de la clase Multimedia | |
| MSI Summit E16 Flip A12UDT-031 | |
| Lenovo ThinkPad X1 Extreme G4-20Y5CTO1WW (3050 Ti) | |
| Schenker XMG Focus 15 | |
| Dell Inspiron 16 Plus 7610 -2! | |
| Microsoft Surface Laptop Studio i7 RTX 3050 Ti | |
| Medio Intel Core i7-11370H | |
| Xiaomi Mi NoteBook Pro | |
| Asus VivoBook Pro 16X OLED N7600PC-L2026X | |
| Cinebench R23 / Multi Core | |
| Media de la clase Multimedia (4861 - 33362, n=81, últimos 2 años) | |
| MSI Summit E16 Flip A12UDT-031 | |
| Lenovo ThinkPad X1 Extreme G4-20Y5CTO1WW (3050 Ti) | |
| Schenker XMG Focus 15 | |
| Dell Inspiron 16 Plus 7610 | |
| Microsoft Surface Laptop Studio i7 RTX 3050 Ti | |
| Medio Intel Core i7-11370H (3696 - 6646, n=12) | |
| Xiaomi Mi NoteBook Pro | |
| Asus VivoBook Pro 16X OLED N7600PC-L2026X | |
| Cinebench R23 / Single Core | |
| Media de la clase Multimedia (1128 - 2459, n=73, últimos 2 años) | |
| MSI Summit E16 Flip A12UDT-031 | |
| Asus VivoBook Pro 16X OLED N7600PC-L2026X | |
| Lenovo ThinkPad X1 Extreme G4-20Y5CTO1WW (3050 Ti) | |
| Dell Inspiron 16 Plus 7610 | |
| Microsoft Surface Laptop Studio i7 RTX 3050 Ti | |
| Xiaomi Mi NoteBook Pro | |
| Medio Intel Core i7-11370H (1081 - 1556, n=11) | |
| Schenker XMG Focus 15 | |
| Cinebench R20 / CPU (Multi Core) | |
| Media de la clase Multimedia (1887 - 12912, n=64, últimos 2 años) | |
| MSI Summit E16 Flip A12UDT-031 | |
| Lenovo ThinkPad X1 Extreme G4-20Y5CTO1WW (3050 Ti) | |
| Schenker XMG Focus 15 | |
| Dell Inspiron 16 Plus 7610 | |
| Microsoft Surface Laptop Studio i7 RTX 3050 Ti | |
| Medio Intel Core i7-11370H (1438 - 2578, n=11) | |
| Xiaomi Mi NoteBook Pro | |
| Asus VivoBook Pro 16X OLED N7600PC-L2026X | |
| Cinebench R20 / CPU (Single Core) | |
| Media de la clase Multimedia (425 - 853, n=64, últimos 2 años) | |
| MSI Summit E16 Flip A12UDT-031 | |
| Asus VivoBook Pro 16X OLED N7600PC-L2026X | |
| Lenovo ThinkPad X1 Extreme G4-20Y5CTO1WW (3050 Ti) | |
| Dell Inspiron 16 Plus 7610 | |
| Microsoft Surface Laptop Studio i7 RTX 3050 Ti | |
| Medio Intel Core i7-11370H (475 - 601, n=11) | |
| Xiaomi Mi NoteBook Pro | |
| Schenker XMG Focus 15 | |
| Cinebench R15 / CPU Multi 64Bit | |
| Media de la clase Multimedia (856 - 5224, n=68, últimos 2 años) | |
| MSI Summit E16 Flip A12UDT-031 | |
| Lenovo ThinkPad X1 Extreme G4-20Y5CTO1WW (3050 Ti) | |
| Schenker XMG Focus 15 | |
| Dell Inspiron 16 Plus 7610 | |
| Asus VivoBook Pro 16X OLED N7600PC-L2026X | |
| Microsoft Surface Laptop Studio i7 RTX 3050 Ti | |
| Medio Intel Core i7-11370H (606 - 1086, n=17) | |
| Xiaomi Mi NoteBook Pro | |
| Cinebench R15 / CPU Single 64Bit | |
| Media de la clase Multimedia (184.8 - 326, n=66, últimos 2 años) | |
| MSI Summit E16 Flip A12UDT-031 | |
| Lenovo ThinkPad X1 Extreme G4-20Y5CTO1WW (3050 Ti) | |
| Dell Inspiron 16 Plus 7610 | |
| Asus VivoBook Pro 16X OLED N7600PC-L2026X | |
| Asus VivoBook Pro 16X OLED N7600PC-L2026X | |
| Microsoft Surface Laptop Studio i7 RTX 3050 Ti | |
| Xiaomi Mi NoteBook Pro | |
| Medio Intel Core i7-11370H (162.9 - 233, n=15) | |
| Schenker XMG Focus 15 | |
| Blender / v2.79 BMW27 CPU | |
| Xiaomi Mi NoteBook Pro | |
| Medio Intel Core i7-11370H (432 - 762, n=11) | |
| Microsoft Surface Laptop Studio i7 RTX 3050 Ti | |
| Asus VivoBook Pro 16X OLED N7600PC-L2026X | |
| MSI Summit E16 Flip A12UDT-031 | |
| Schenker XMG Focus 15 | |
| Dell Inspiron 16 Plus 7610 | |
| Lenovo ThinkPad X1 Extreme G4-20Y5CTO1WW (3050 Ti) | |
| Media de la clase Multimedia (100 - 557, n=65, últimos 2 años) | |
| 7-Zip 18.03 / 7z b 4 | |
| Media de la clase Multimedia (29095 - 130368, n=62, últimos 2 años) | |
| Lenovo ThinkPad X1 Extreme G4-20Y5CTO1WW (3050 Ti) | |
| Schenker XMG Focus 15 | |
| Dell Inspiron 16 Plus 7610 | |
| MSI Summit E16 Flip A12UDT-031 | |
| Asus VivoBook Pro 16X OLED N7600PC-L2026X | |
| Microsoft Surface Laptop Studio i7 RTX 3050 Ti | |
| Medio Intel Core i7-11370H (18961 - 28520, n=11) | |
| Xiaomi Mi NoteBook Pro | |
| 7-Zip 18.03 / 7z b 4 -mmt1 | |
| Media de la clase Multimedia (3666 - 7545, n=63, últimos 2 años) | |
| Lenovo ThinkPad X1 Extreme G4-20Y5CTO1WW (3050 Ti) | |
| Dell Inspiron 16 Plus 7610 | |
| Asus VivoBook Pro 16X OLED N7600PC-L2026X | |
| Xiaomi Mi NoteBook Pro | |
| Medio Intel Core i7-11370H (5074 - 5550, n=11) | |
| MSI Summit E16 Flip A12UDT-031 | |
| Schenker XMG Focus 15 | |
| Microsoft Surface Laptop Studio i7 RTX 3050 Ti | |
| Geekbench 5.5 / Multi-Core | |
| Media de la clase Multimedia (4652 - 20422, n=62, últimos 2 años) | |
| MSI Summit E16 Flip A12UDT-031 | |
| Schenker XMG Focus 15 | |
| Lenovo ThinkPad X1 Extreme G4-20Y5CTO1WW (3050 Ti) | |
| Microsoft Surface Laptop Studio i7 RTX 3050 Ti | |
| Medio Intel Core i7-11370H (3828 - 6115, n=10) | |
| Xiaomi Mi NoteBook Pro | |
| Asus VivoBook Pro 16X OLED N7600PC-L2026X | |
| Geekbench 5.5 / Single-Core | |
| Media de la clase Multimedia (805 - 2974, n=62, últimos 2 años) | |
| MSI Summit E16 Flip A12UDT-031 | |
| Lenovo ThinkPad X1 Extreme G4-20Y5CTO1WW (3050 Ti) | |
| Xiaomi Mi NoteBook Pro | |
| Microsoft Surface Laptop Studio i7 RTX 3050 Ti | |
| Medio Intel Core i7-11370H (1376 - 1607, n=10) | |
| Asus VivoBook Pro 16X OLED N7600PC-L2026X | |
| Schenker XMG Focus 15 | |
| HWBOT x265 Benchmark v2.2 / 4k Preset | |
| Media de la clase Multimedia (5.26 - 36.1, n=63, últimos 2 años) | |
| Schenker XMG Focus 15 | |
| Lenovo ThinkPad X1 Extreme G4-20Y5CTO1WW (3050 Ti) | |
| Dell Inspiron 16 Plus 7610 | |
| MSI Summit E16 Flip A12UDT-031 | |
| Microsoft Surface Laptop Studio i7 RTX 3050 Ti | |
| Medio Intel Core i7-11370H (4.98 - 8.82, n=11) | |
| Xiaomi Mi NoteBook Pro | |
| Asus VivoBook Pro 16X OLED N7600PC-L2026X | |
| LibreOffice / 20 Documents To PDF | |
| Microsoft Surface Laptop Studio i7 RTX 3050 Ti | |
| Asus VivoBook Pro 16X OLED N7600PC-L2026X | |
| MSI Summit E16 Flip A12UDT-031 | |
| Media de la clase Multimedia (23.9 - 146.7, n=64, últimos 2 años) | |
| Schenker XMG Focus 15 | |
| Dell Inspiron 16 Plus 7610 | |
| Medio Intel Core i7-11370H (23.6 - 56.5, n=11) | |
| Xiaomi Mi NoteBook Pro | |
| Lenovo ThinkPad X1 Extreme G4-20Y5CTO1WW (3050 Ti) | |
| R Benchmark 2.5 / Overall mean | |
| Schenker XMG Focus 15 | |
| Microsoft Surface Laptop Studio i7 RTX 3050 Ti | |
| Xiaomi Mi NoteBook Pro | |
| Medio Intel Core i7-11370H (0.544 - 0.596, n=11) | |
| Dell Inspiron 16 Plus 7610 | |
| Asus VivoBook Pro 16X OLED N7600PC-L2026X | |
| Lenovo ThinkPad X1 Extreme G4-20Y5CTO1WW (3050 Ti) | |
| MSI Summit E16 Flip A12UDT-031 | |
| Media de la clase Multimedia (0.3604 - 0.947, n=63, últimos 2 años) | |
* ... más pequeño es mejor
AIDA64: FP32 Ray-Trace | FPU Julia | CPU SHA3 | CPU Queen | FPU SinJulia | FPU Mandel | CPU AES | CPU ZLib | FP64 Ray-Trace | CPU PhotoWorxx
| Performance rating | |
| Media de la clase Multimedia | |
| Lenovo ThinkPad X1 Extreme G4-20Y5CTO1WW (3050 Ti) | |
| MSI Summit E16 Flip A12UDT-031 | |
| Medio Intel Core i7-11370H | |
| Microsoft Surface Laptop Studio i7 RTX 3050 Ti | |
| Xiaomi Mi NoteBook Pro | |
| Asus VivoBook Pro 16X OLED N7600PC-L2026X | |
| AIDA64 / FP32 Ray-Trace | |
| Media de la clase Multimedia (2214 - 50388, n=60, últimos 2 años) | |
| Lenovo ThinkPad X1 Extreme G4-20Y5CTO1WW (3050 Ti) | |
| MSI Summit E16 Flip A12UDT-031 | |
| Microsoft Surface Laptop Studio i7 RTX 3050 Ti | |
| Medio Intel Core i7-11370H (5204 - 8413, n=10) | |
| Xiaomi Mi NoteBook Pro | |
| Asus VivoBook Pro 16X OLED N7600PC-L2026X | |
| AIDA64 / FPU Julia | |
| Media de la clase Multimedia (12867 - 201874, n=61, últimos 2 años) | |
| MSI Summit E16 Flip A12UDT-031 | |
| Lenovo ThinkPad X1 Extreme G4-20Y5CTO1WW (3050 Ti) | |
| Microsoft Surface Laptop Studio i7 RTX 3050 Ti | |
| Medio Intel Core i7-11370H (23958 - 34020, n=10) | |
| Xiaomi Mi NoteBook Pro | |
| Asus VivoBook Pro 16X OLED N7600PC-L2026X | |
| AIDA64 / CPU SHA3 | |
| Lenovo ThinkPad X1 Extreme G4-20Y5CTO1WW (3050 Ti) | |
| Media de la clase Multimedia (653 - 8623, n=61, últimos 2 años) | |
| MSI Summit E16 Flip A12UDT-031 | |
| Medio Intel Core i7-11370H (1656 - 2297, n=10) | |
| Microsoft Surface Laptop Studio i7 RTX 3050 Ti | |
| Xiaomi Mi NoteBook Pro | |
| Asus VivoBook Pro 16X OLED N7600PC-L2026X | |
| AIDA64 / CPU Queen | |
| MSI Summit E16 Flip A12UDT-031 | |
| Lenovo ThinkPad X1 Extreme G4-20Y5CTO1WW (3050 Ti) | |
| Media de la clase Multimedia (13483 - 181505, n=49, últimos 2 años) | |
| Xiaomi Mi NoteBook Pro | |
| Medio Intel Core i7-11370H (42086 - 52930, n=10) | |
| Microsoft Surface Laptop Studio i7 RTX 3050 Ti | |
| Asus VivoBook Pro 16X OLED N7600PC-L2026X | |
| AIDA64 / FPU SinJulia | |
| Lenovo ThinkPad X1 Extreme G4-20Y5CTO1WW (3050 Ti) | |
| Media de la clase Multimedia (1240 - 28794, n=61, últimos 2 años) | |
| MSI Summit E16 Flip A12UDT-031 | |
| Xiaomi Mi NoteBook Pro | |
| Medio Intel Core i7-11370H (3755 - 5027, n=10) | |
| Microsoft Surface Laptop Studio i7 RTX 3050 Ti | |
| Asus VivoBook Pro 16X OLED N7600PC-L2026X | |
| AIDA64 / FPU Mandel | |
| Media de la clase Multimedia (6395 - 105740, n=60, últimos 2 años) | |
| Lenovo ThinkPad X1 Extreme G4-20Y5CTO1WW (3050 Ti) | |
| MSI Summit E16 Flip A12UDT-031 | |
| Medio Intel Core i7-11370H (14433 - 20417, n=10) | |
| Microsoft Surface Laptop Studio i7 RTX 3050 Ti | |
| Xiaomi Mi NoteBook Pro | |
| Asus VivoBook Pro 16X OLED N7600PC-L2026X | |
| AIDA64 / CPU AES | |
| Lenovo ThinkPad X1 Extreme G4-20Y5CTO1WW (3050 Ti) | |
| Xiaomi Mi NoteBook Pro | |
| Medio Intel Core i7-11370H (44267 - 76866, n=10) | |
| Media de la clase Multimedia (13243 - 126790, n=61, últimos 2 años) | |
| MSI Summit E16 Flip A12UDT-031 | |
| Asus VivoBook Pro 16X OLED N7600PC-L2026X | |
| Microsoft Surface Laptop Studio i7 RTX 3050 Ti | |
| AIDA64 / CPU ZLib | |
| Media de la clase Multimedia (167.2 - 2022, n=61, últimos 2 años) | |
| MSI Summit E16 Flip A12UDT-031 | |
| Lenovo ThinkPad X1 Extreme G4-20Y5CTO1WW (3050 Ti) | |
| Xiaomi Mi NoteBook Pro | |
| Medio Intel Core i7-11370H (289 - 422, n=10) | |
| Microsoft Surface Laptop Studio i7 RTX 3050 Ti | |
| Asus VivoBook Pro 16X OLED N7600PC-L2026X | |
| AIDA64 / FP64 Ray-Trace | |
| Media de la clase Multimedia (1014 - 26875, n=61, últimos 2 años) | |
| Lenovo ThinkPad X1 Extreme G4-20Y5CTO1WW (3050 Ti) | |
| MSI Summit E16 Flip A12UDT-031 | |
| Medio Intel Core i7-11370H (2756 - 4551, n=10) | |
| Microsoft Surface Laptop Studio i7 RTX 3050 Ti | |
| Xiaomi Mi NoteBook Pro | |
| Asus VivoBook Pro 16X OLED N7600PC-L2026X | |
| AIDA64 / CPU PhotoWorxx | |
| Media de la clase Multimedia (12860 - 88154, n=61, últimos 2 años) | |
| MSI Summit E16 Flip A12UDT-031 | |
| Microsoft Surface Laptop Studio i7 RTX 3050 Ti | |
| Medio Intel Core i7-11370H (15892 - 40069, n=10) | |
| Xiaomi Mi NoteBook Pro | |
| Asus VivoBook Pro 16X OLED N7600PC-L2026X | |
| Lenovo ThinkPad X1 Extreme G4-20Y5CTO1WW (3050 Ti) | |
Rendimiento del sistema
En nuestras pruebas de rendimiento del sistema, el Vivobook Pro 16X OLED logra grandes resultados en general. El sistema multimedia se sitúa muy por encima de la media. Al mismo tiempo, sin embargo, el Vivobook no puede igualar a los otros dispositivos de nuestra comparación. El portátil sufre de un rendimiento reducido en PCMark 10 y CrossMark debido a dos problemas. Uno de ellos es la configuración del perfil de rendimiento que limita rápidamente el potencial de rendimiento tanto de la CPU como de la GPU tras un corto periodo de tiempo y el segundo problema es la velocidad bastante lenta de la RAM del portátil. Como resultado, las puntuaciones de las pruebas de memoria AIDA son relativamente bajas y las latencias altas.
A pesar de ello, el Vivobook Pro responde muy bien durante el uso diario y es capaz de gestionar tareas exigentes ocasionalmente sin ningún problema. La mayoría de los benchmarks estresan al portátil mucho más que un flujo de trabajo normal.
CrossMark: Overall | Productivity | Creativity | Responsiveness
| PCMark 10 / Score | |
| Media de la clase Multimedia (4325 - 10386, n=58, últimos 2 años) | |
| Lenovo ThinkPad X1 Extreme G4-20Y5CTO1WW (3050 Ti) | |
| Schenker XMG Focus 15 | |
| Dell Inspiron 16 Plus 7610 | |
| MSI Summit E16 Flip A12UDT-031 | |
| Schenker Vision 14 | |
| Asus VivoBook Pro 16X OLED N7600PC-L2026X | |
| Medio Intel Core i7-11370H, NVIDIA GeForce RTX 3050 4GB Laptop GPU (n=1) | |
| Microsoft Surface Laptop Studio i7 RTX 3050 Ti | |
| Lenovo IdeaPad Slim 7i Pro 14IHU5 | |
| Xiaomi Mi NoteBook Pro | |
| PCMark 10 / Essentials | |
| Lenovo ThinkPad X1 Extreme G4-20Y5CTO1WW (3050 Ti) | |
| Media de la clase Multimedia (8025 - 11664, n=57, últimos 2 años) | |
| Lenovo IdeaPad Slim 7i Pro 14IHU5 | |
| Schenker XMG Focus 15 | |
| Xiaomi Mi NoteBook Pro | |
| Dell Inspiron 16 Plus 7610 | |
| MSI Summit E16 Flip A12UDT-031 | |
| Schenker Vision 14 | |
| Asus VivoBook Pro 16X OLED N7600PC-L2026X | |
| Medio Intel Core i7-11370H, NVIDIA GeForce RTX 3050 4GB Laptop GPU (n=1) | |
| Microsoft Surface Laptop Studio i7 RTX 3050 Ti | |
| PCMark 10 / Productivity | |
| Media de la clase Multimedia (7323 - 18233, n=57, últimos 2 años) | |
| Schenker Vision 14 | |
| Schenker XMG Focus 15 | |
| Asus VivoBook Pro 16X OLED N7600PC-L2026X | |
| Medio Intel Core i7-11370H, NVIDIA GeForce RTX 3050 4GB Laptop GPU (n=1) | |
| Lenovo ThinkPad X1 Extreme G4-20Y5CTO1WW (3050 Ti) | |
| Dell Inspiron 16 Plus 7610 | |
| Microsoft Surface Laptop Studio i7 RTX 3050 Ti | |
| MSI Summit E16 Flip A12UDT-031 | |
| Xiaomi Mi NoteBook Pro | |
| Lenovo IdeaPad Slim 7i Pro 14IHU5 | |
| PCMark 10 / Digital Content Creation | |
| Media de la clase Multimedia (3651 - 16240, n=57, últimos 2 años) | |
| Schenker XMG Focus 15 | |
| Lenovo ThinkPad X1 Extreme G4-20Y5CTO1WW (3050 Ti) | |
| Dell Inspiron 16 Plus 7610 | |
| MSI Summit E16 Flip A12UDT-031 | |
| Schenker Vision 14 | |
| Asus VivoBook Pro 16X OLED N7600PC-L2026X | |
| Medio Intel Core i7-11370H, NVIDIA GeForce RTX 3050 4GB Laptop GPU (n=1) | |
| Microsoft Surface Laptop Studio i7 RTX 3050 Ti | |
| Lenovo IdeaPad Slim 7i Pro 14IHU5 | |
| Xiaomi Mi NoteBook Pro | |
| CrossMark / Overall | |
| Media de la clase Multimedia (866 - 2728, n=67, últimos 2 años) | |
| MSI Summit E16 Flip A12UDT-031 | |
| Schenker Vision 14 | |
| Microsoft Surface Laptop Studio i7 RTX 3050 Ti | |
| Xiaomi Mi NoteBook Pro | |
| Asus VivoBook Pro 16X OLED N7600PC-L2026X | |
| Medio Intel Core i7-11370H, NVIDIA GeForce RTX 3050 4GB Laptop GPU (n=1) | |
| CrossMark / Productivity | |
| Media de la clase Multimedia (931 - 2489, n=67, últimos 2 años) | |
| MSI Summit E16 Flip A12UDT-031 | |
| Schenker Vision 14 | |
| Xiaomi Mi NoteBook Pro | |
| Microsoft Surface Laptop Studio i7 RTX 3050 Ti | |
| Asus VivoBook Pro 16X OLED N7600PC-L2026X | |
| Medio Intel Core i7-11370H, NVIDIA GeForce RTX 3050 4GB Laptop GPU (n=1) | |
| CrossMark / Creativity | |
| Media de la clase Multimedia (907 - 3465, n=67, últimos 2 años) | |
| MSI Summit E16 Flip A12UDT-031 | |
| Microsoft Surface Laptop Studio i7 RTX 3050 Ti | |
| Schenker Vision 14 | |
| Xiaomi Mi NoteBook Pro | |
| Asus VivoBook Pro 16X OLED N7600PC-L2026X | |
| Medio Intel Core i7-11370H, NVIDIA GeForce RTX 3050 4GB Laptop GPU (n=1) | |
| CrossMark / Responsiveness | |
| MSI Summit E16 Flip A12UDT-031 | |
| Media de la clase Multimedia (605 - 2024, n=67, últimos 2 años) | |
| Schenker Vision 14 | |
| Xiaomi Mi NoteBook Pro | |
| Microsoft Surface Laptop Studio i7 RTX 3050 Ti | |
| Asus VivoBook Pro 16X OLED N7600PC-L2026X | |
| Medio Intel Core i7-11370H, NVIDIA GeForce RTX 3050 4GB Laptop GPU (n=1) | |
| PCMark 10 Score | 5619 puntos | |
ayuda | ||
| AIDA64 / Memory Copy | |
| Media de la clase Multimedia (21158 - 132135, n=61, últimos 2 años) | |
| MSI Summit E16 Flip A12UDT-031 | |
| Microsoft Surface Laptop Studio i7 RTX 3050 Ti | |
| Medio Intel Core i7-11370H (32035 - 64524, n=10) | |
| Lenovo ThinkPad X1 Extreme G4-20Y5CTO1WW (3050 Ti) | |
| Xiaomi Mi NoteBook Pro | |
| Asus VivoBook Pro 16X OLED N7600PC-L2026X | |
| AIDA64 / Memory Read | |
| Media de la clase Multimedia (19699 - 174586, n=61, últimos 2 años) | |
| MSI Summit E16 Flip A12UDT-031 | |
| Microsoft Surface Laptop Studio i7 RTX 3050 Ti | |
| Medio Intel Core i7-11370H (37216 - 62417, n=10) | |
| Lenovo ThinkPad X1 Extreme G4-20Y5CTO1WW (3050 Ti) | |
| Xiaomi Mi NoteBook Pro | |
| Asus VivoBook Pro 16X OLED N7600PC-L2026X | |
| AIDA64 / Memory Write | |
| Media de la clase Multimedia (17733 - 134998, n=61, últimos 2 años) | |
| Microsoft Surface Laptop Studio i7 RTX 3050 Ti | |
| MSI Summit E16 Flip A12UDT-031 | |
| Medio Intel Core i7-11370H (36920 - 65610, n=10) | |
| Lenovo ThinkPad X1 Extreme G4-20Y5CTO1WW (3050 Ti) | |
| Asus VivoBook Pro 16X OLED N7600PC-L2026X | |
| Xiaomi Mi NoteBook Pro | |
| AIDA64 / Memory Latency | |
| MSI Summit E16 Flip A12UDT-031 | |
| Media de la clase Multimedia (7 - 535, n=60, últimos 2 años) | |
| Microsoft Surface Laptop Studio i7 RTX 3050 Ti | |
| Asus VivoBook Pro 16X OLED N7600PC-L2026X | |
| Medio Intel Core i7-11370H (73.4 - 103, n=10) | |
| Lenovo ThinkPad X1 Extreme G4-20Y5CTO1WW (3050 Ti) | |
| Xiaomi Mi NoteBook Pro | |
| Dell Inspiron 16 Plus 7610 | |
* ... más pequeño es mejor
Latencia del CPD
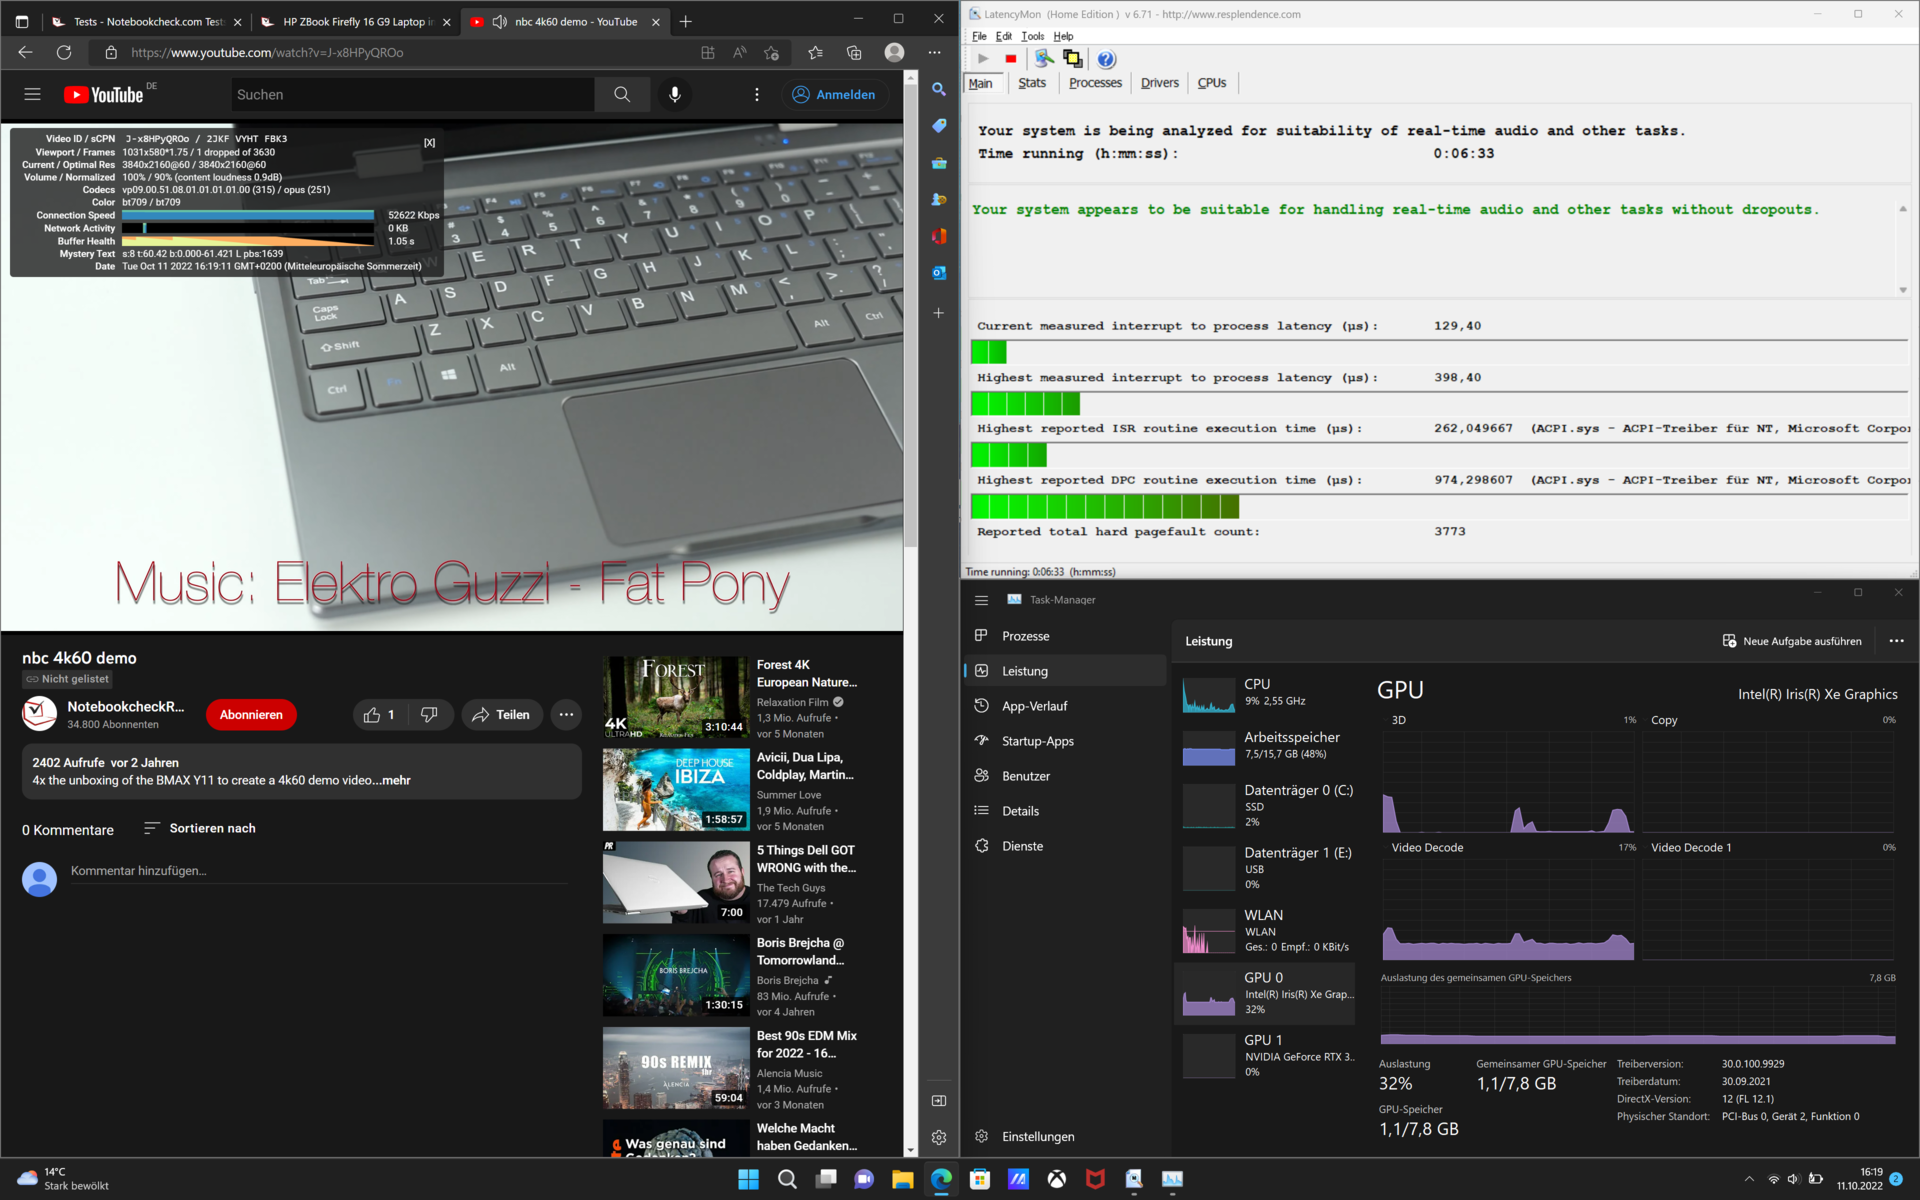
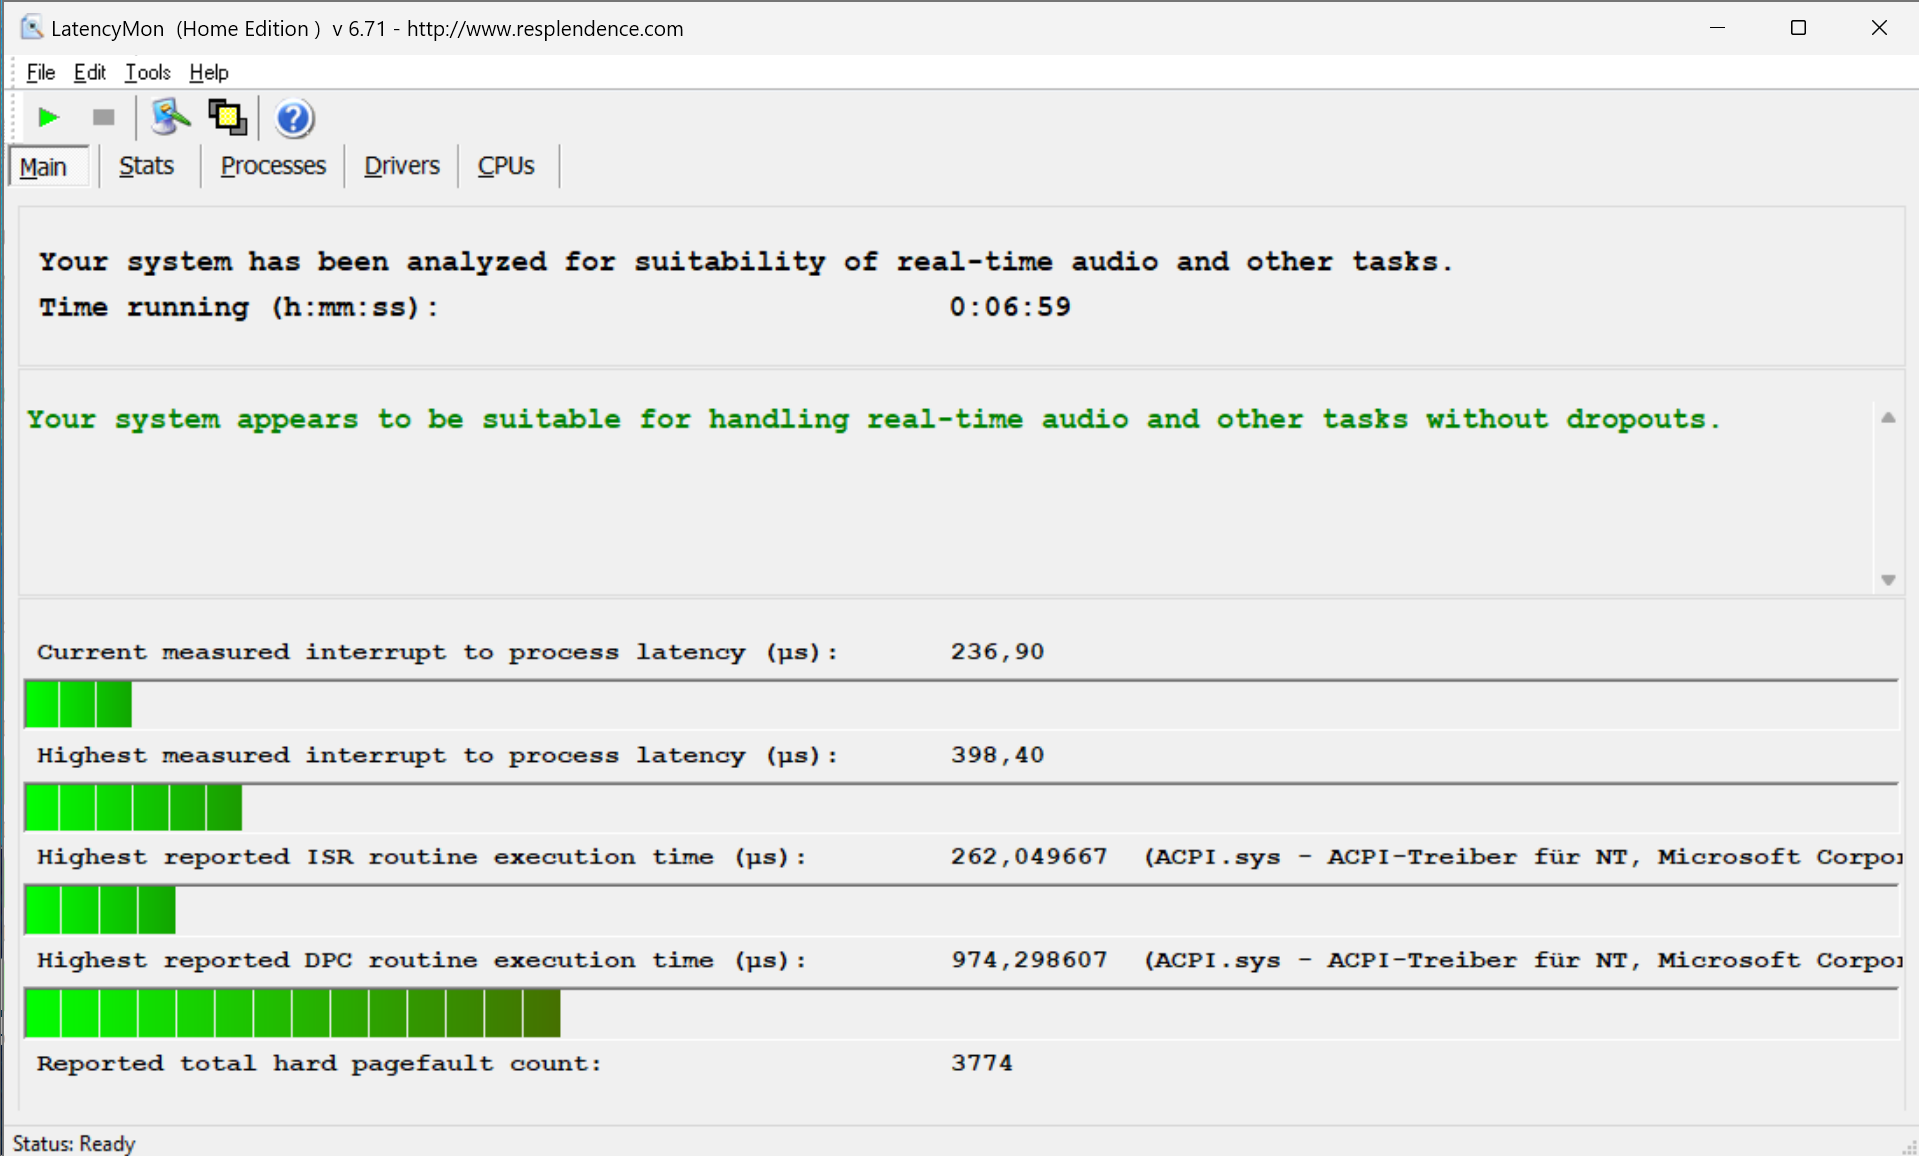
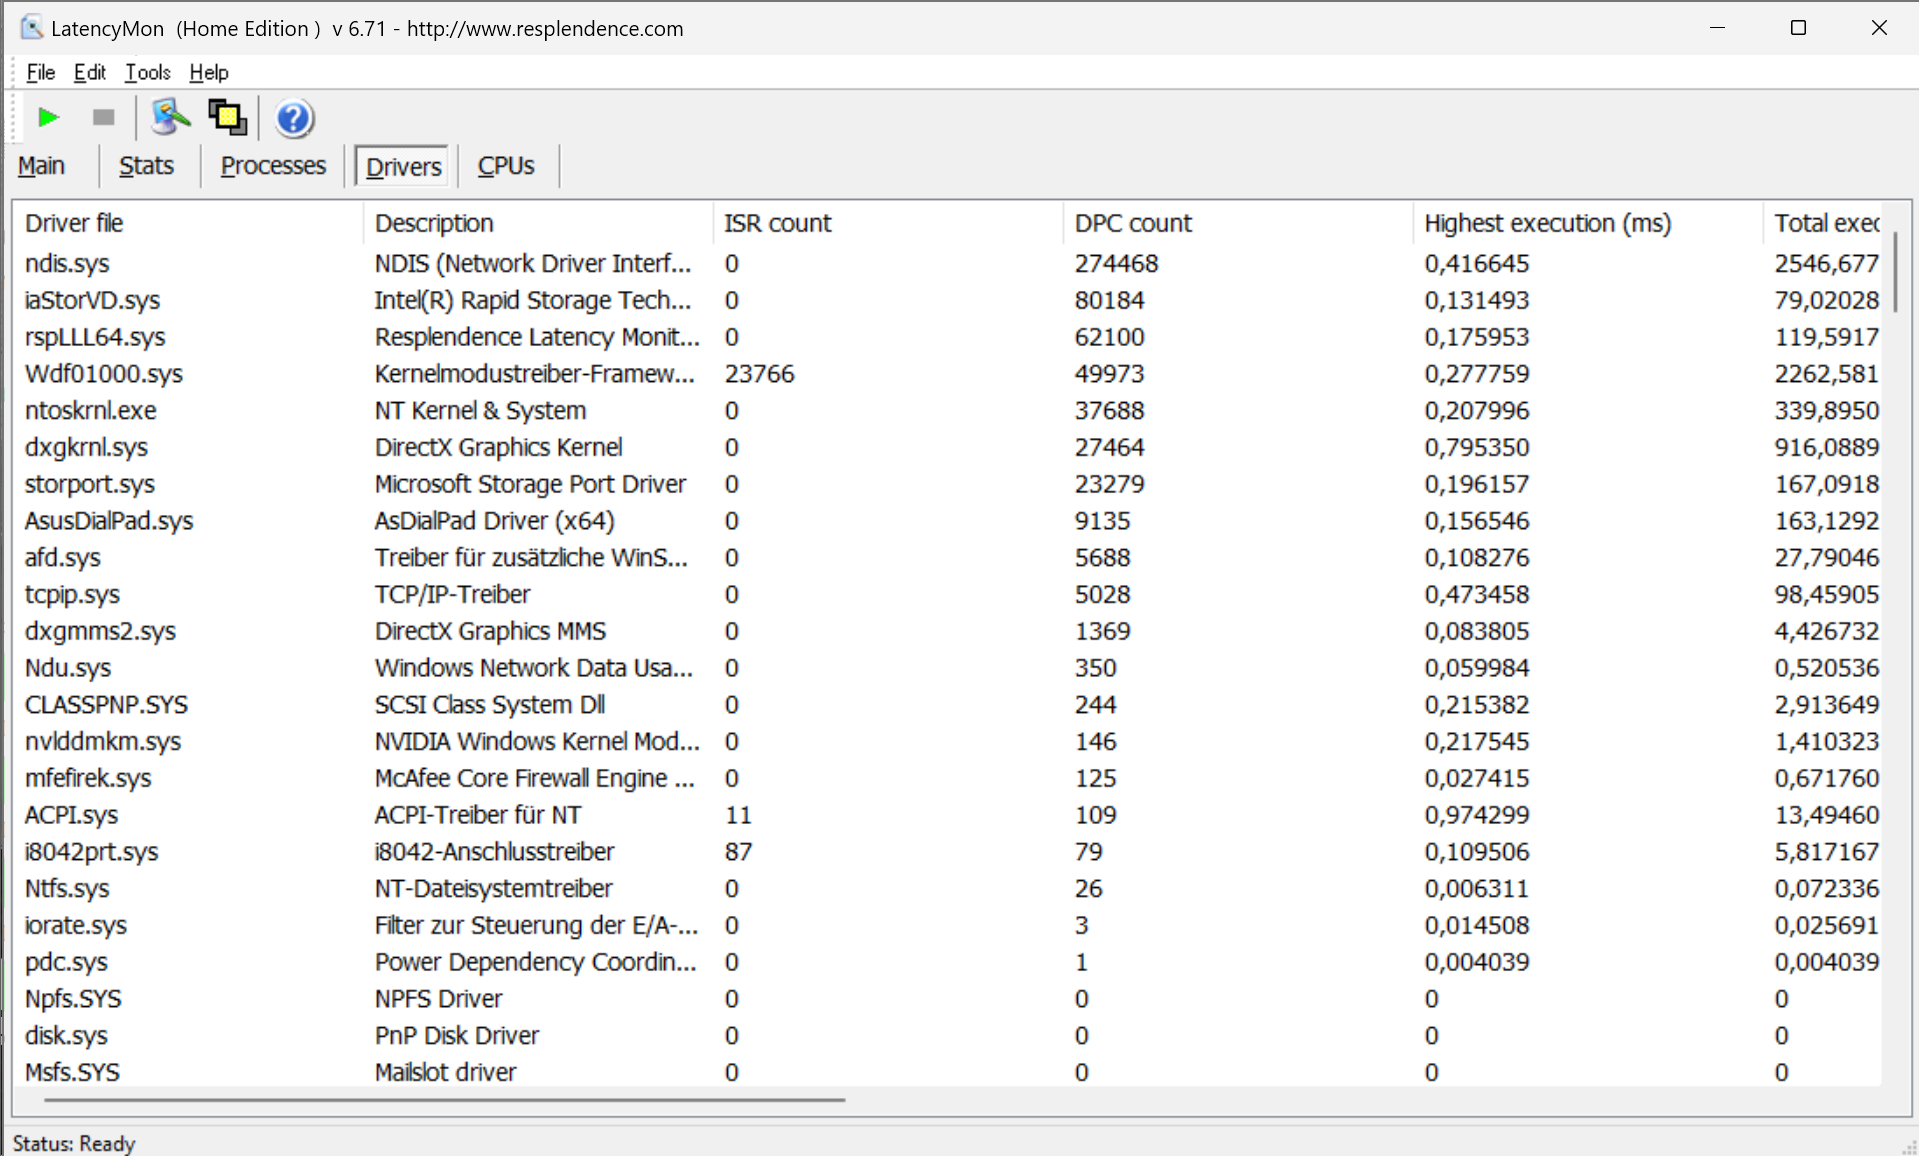
Antes de realizar nuestras pruebas, actualizamos el dispositivo con todos los controladores disponibles y las últimas actualizaciones de Windows. En el Vivobook Pro 16X, esto resulta en latencias DPC muy bajas. Registramos una sola caída de fotogramas durante la reproducción de un vídeo 4K de YouTube a 60 Hz. Con la configuración actual de software y hardware, el portátil funciona muy bien.
| DPC Latencies / LatencyMon - interrupt to process latency (max), Web, Youtube, Prime95 | |
| Dell Inspiron 16 Plus 7610 | |
| Lenovo ThinkPad X1 Extreme G4-20Y5CTO1WW (3050 Ti) | |
| MSI Summit E16 Flip A12UDT-031 | |
| Microsoft Surface Laptop Studio i7 RTX 3050 Ti | |
| Schenker XMG Focus 15 | |
| Asus VivoBook Pro 16X OLED N7600PC-L2026X | |
* ... más pequeño es mejor
Solución de almacenamiento
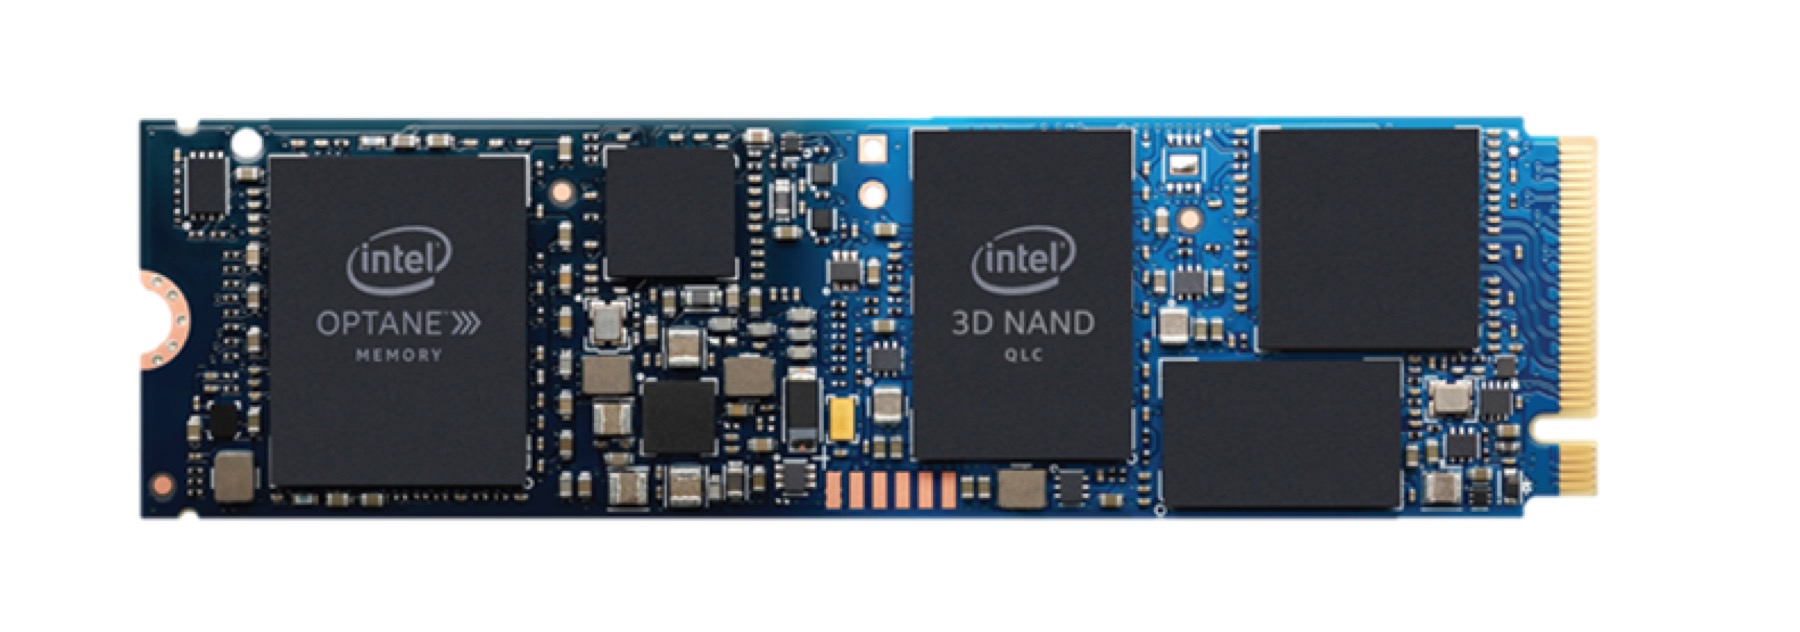
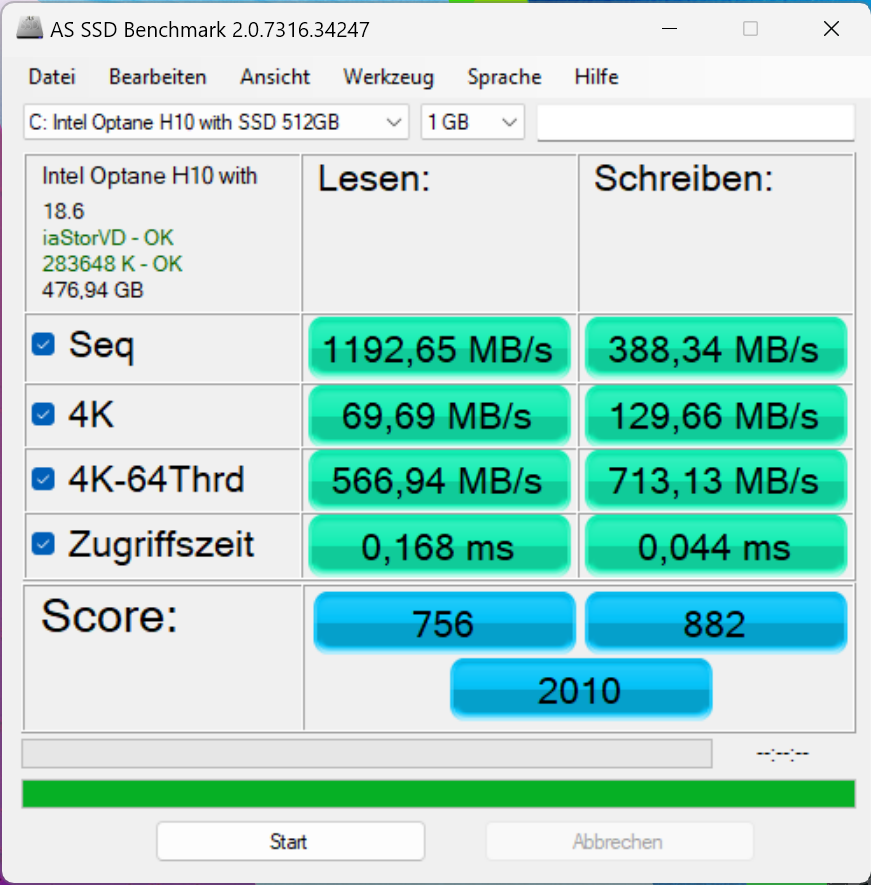
La memoria Optane H10 NVMe SSD de Intel es un concepto interesante. Hay dos tipos de memoria y controladores diferentes en la PCB. Cerca del lado de la interfaz, hay un módulo de memoria Intel QLC 3D NAND de 512 GB con un controlador apropiado. En la parte posterior de la memoria M.2-2280, hay un módulo de memoria Intel Optane de 32-GB. A pesar de esto, ya no es una de las opciones de disco más rápidas. En nuestra Tabla de SSD y HDDel módulo de Intel ocupa ahora uno de los últimos puestos. Hay que tener en cuenta que la unidad con tecnología Intel Optane se presentó por primera vez en 2019, lo que hace que tenga tres años de antigüedad en el momento de escribir este artículo. La unidad SSD NVMe con caché Optane integrada y de baja latencia solo se conecta a través de PCIe3.0x4, en lugar del ya común PCIe 4.0.
Nuestro bucle de lectura DiskSpd muestra rápidamente la disposición interna del SSD. En cuanto el controlador de memoria registra un acceso frecuente a un determinado archivo, éste se transfiere a la memoria Optane y se accede a él desde allí. El resultado es un aumento significativo del rendimiento.

* ... más pequeño es mejor
Disk Throttling: DiskSpd Read Loop, Queue Depth 8
Rendimiento de la GPU
El Vivobook utiliza tanto la iGPU del Intel Core i7 como la de la Nvidia GeForce RTX 3050. Durante las cargas de trabajo poco exigentes, la iGPU está activa. Mientras tanto, la dGPU GeForce se encarga de las tareas más exigentes. En nuestras pruebas, registramos un consumo máximo de 50 vatios de la GPU. Aunque el rendimiento es bueno, hay que tener en cuenta que es la opción más débil de la serie RTX 3000 de Nvidia. Como muestra nuestra prueba de Blender, la GPU es capaz de renderizar rápidamente las escenas. Por el contrario, se queda por debajo de nuestras expectativas en las pruebas 3DMark. Esto puede deberse al driver Nvidia Studio instalado. Está menos optimizado para el rendimiento en juegos. A cambio, muchas aplicaciones profesionales como Blender, Autodesk Maya y Adobe Illustrator reciben un aumento de rendimiento. Un resumen oficial en de los programas que son compatibles con los controladores Nvidia Studioestá disponible en el sitio web del fabricante.
El rendimiento en modo batería es limitado. Aquí, el TGP baja a unos 25 vatios. Esto reduce aproximadamente el rendimiento gráfico a la mitad. Sin embargo, los resultados del benchmark 3DMark sorprendentemente no son tan severamente afectados como se esperaba.
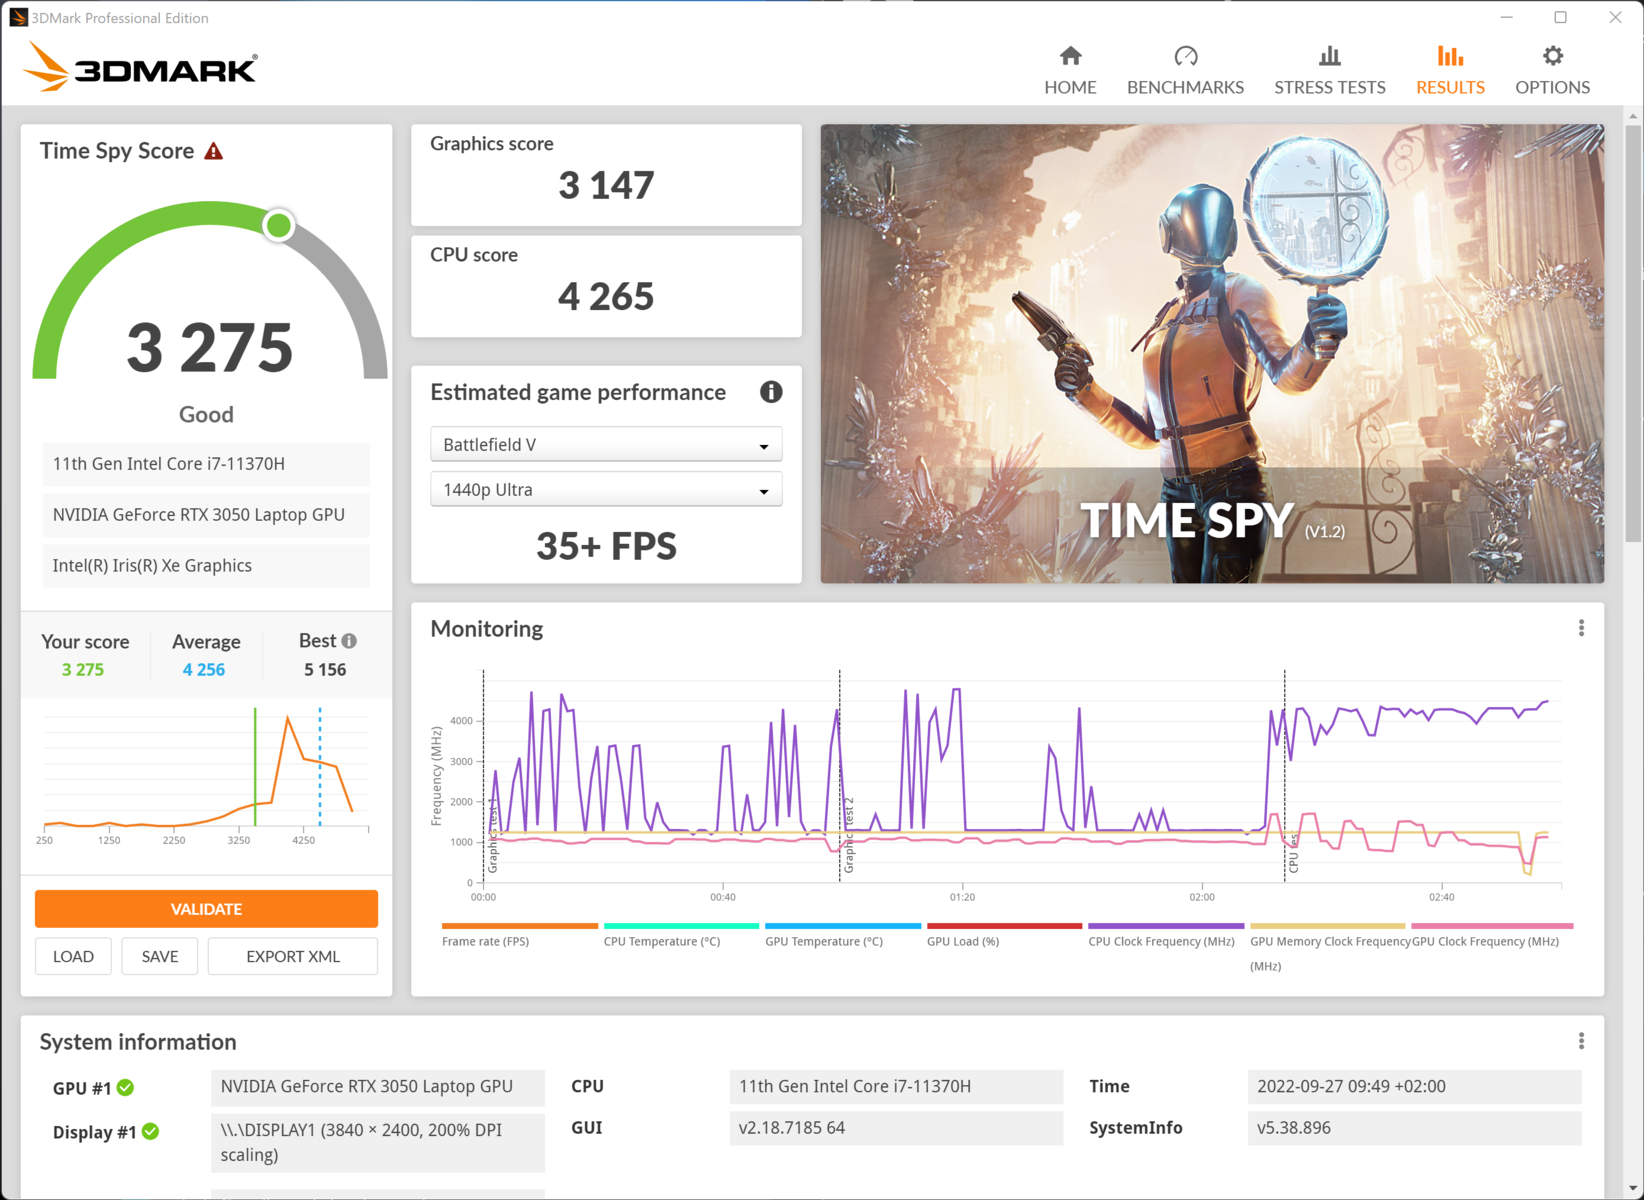
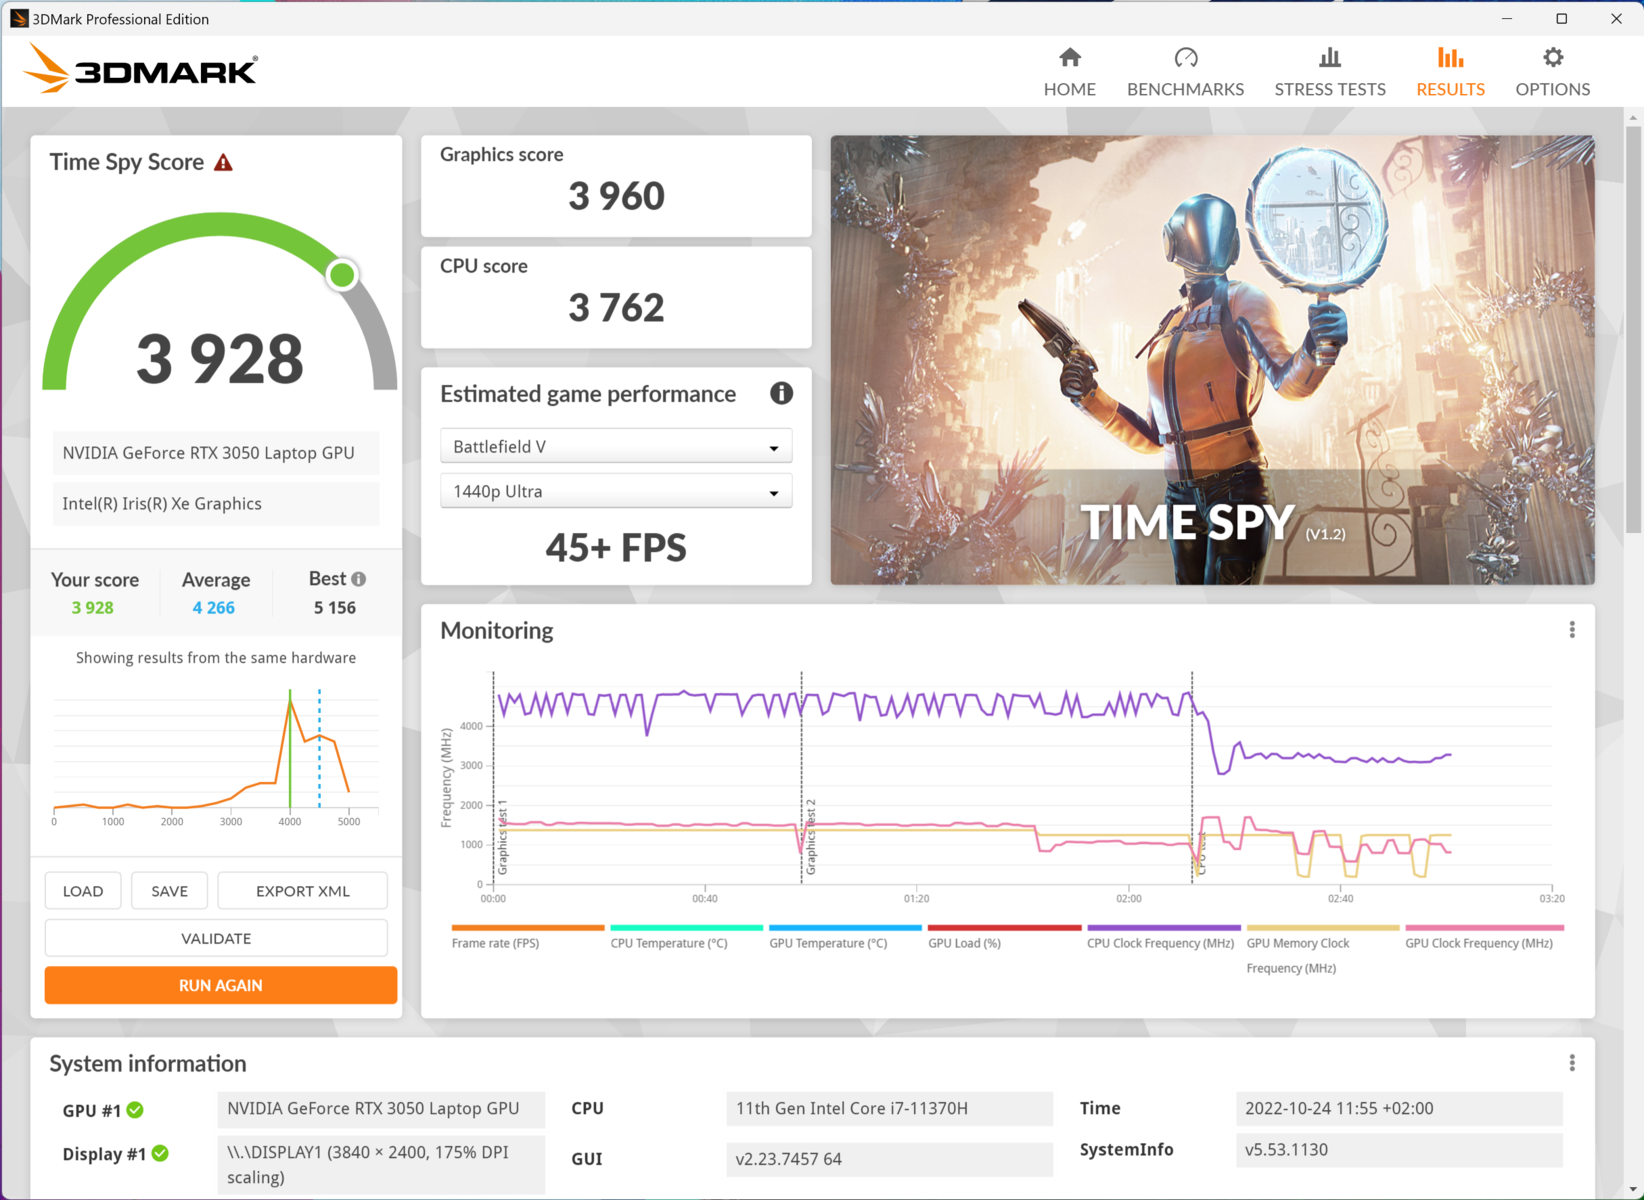
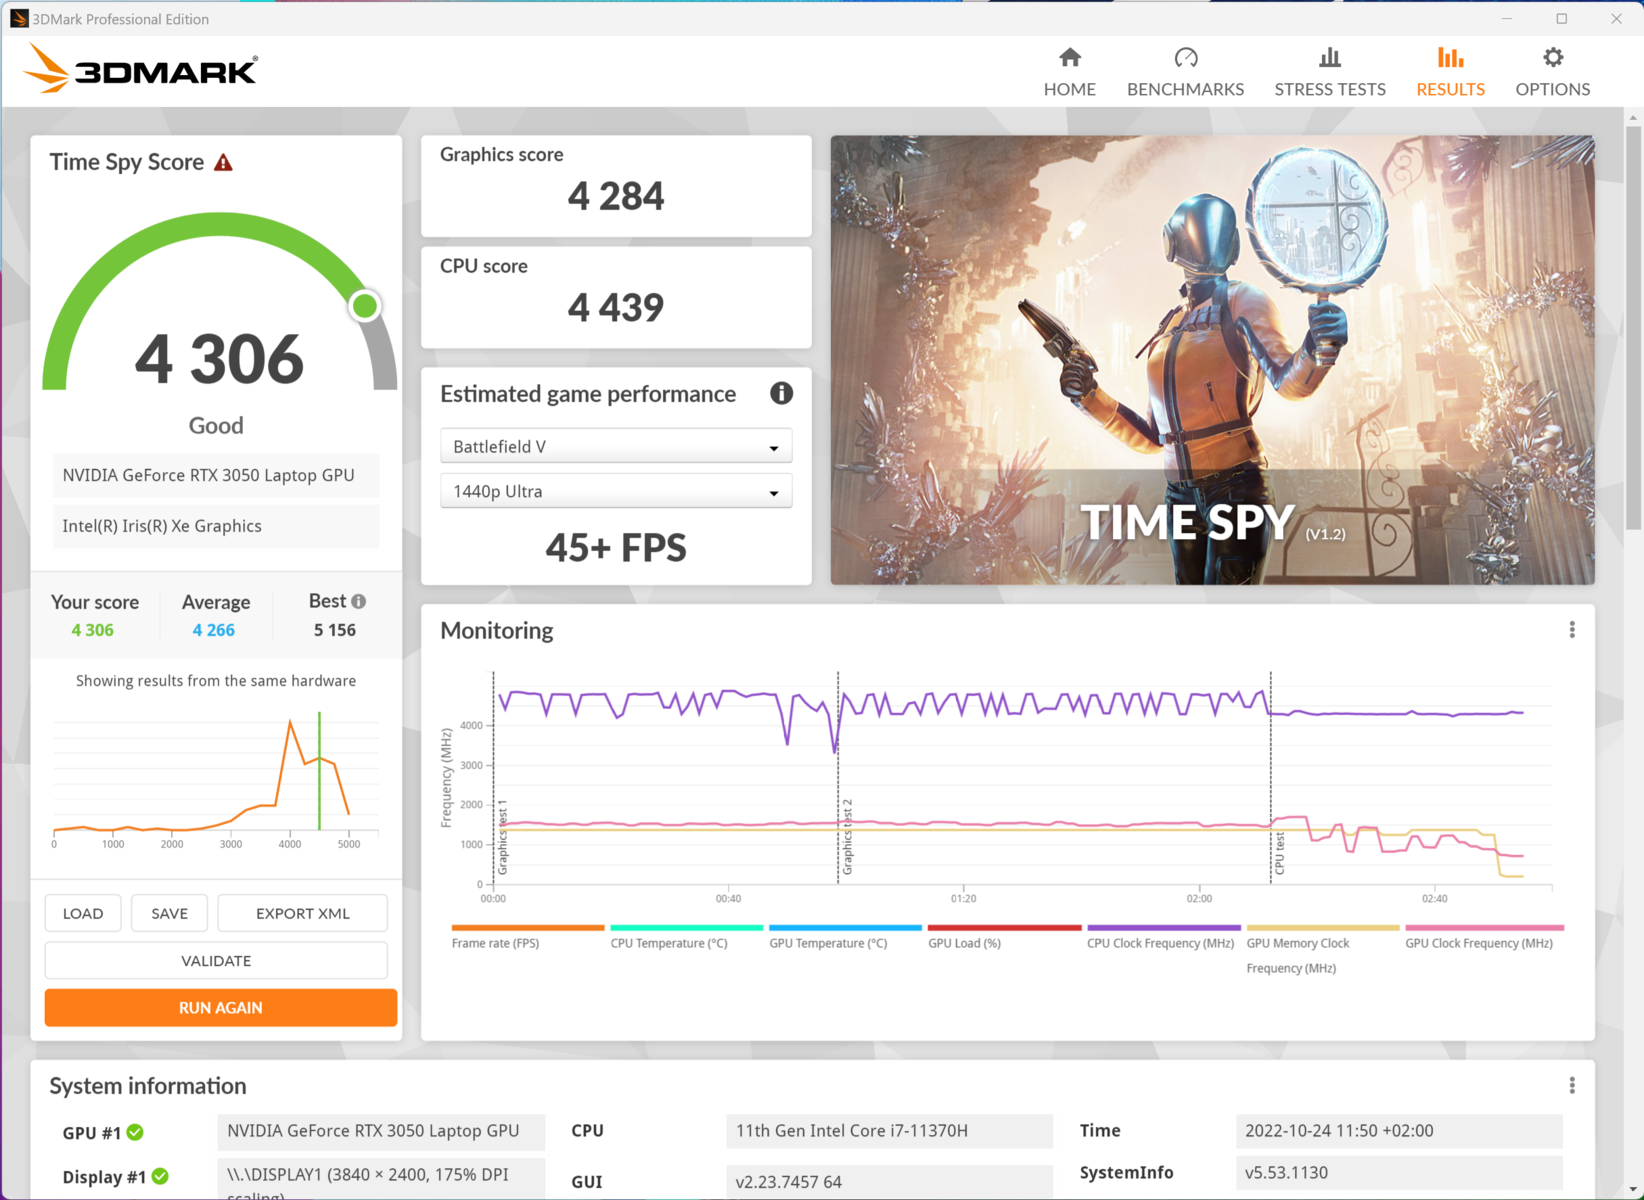
| 3DMark 11 Performance | 13624 puntos | |
| 3DMark Ice Storm Standard Score | 34267 puntos | |
| 3DMark Cloud Gate Standard Score | 20526 puntos | |
| 3DMark Fire Strike Score | 9732 puntos | |
| 3DMark Time Spy Score | 4310 puntos | |
ayuda | ||
* ... más pequeño es mejor
Rendimiento de los juegos
El rendimiento es suficiente para más de 60 FPS en Full HD en casi todos los juegos que probamos. Far Cry 5 es una excepción. El juego muestra un error que indica que los drivers Nvidia Studio no son compatibles. F1 2022 muestra un mensaje de error similar.
Las reservas de rendimiento del 3050 apenas son suficientes para la alta resolución nativa de la pantalla OLED 4K. Aunque las tasas de fotogramas pueden seguir siendo aceptables en ciertos casos, nuestro resumen "Juegos de ordenador en tarjetas gráficas para portátiles" muestra que la RTX 3050 tiende a caer por debajo de los 30 FPS a 4K.
Mientras que el Vivobook logra resultados promedio en general comparado con otros dispositivos en nuestra comparación, el portátil multimedia logra superar algunas alternativas con el nominalmente más rápido 3050 Ti.
| bajo | medio | alto | ultra | QHD | 4K | |
|---|---|---|---|---|---|---|
| GTA V (2015) | 146.6 | 100.4 | 54.9 | |||
| The Witcher 3 (2015) | 193.3 | 117.8 | 61.3 | 47 | ||
| Dota 2 Reborn (2015) | 120.7 | 111.4 | 103.7 | 100.3 | 62.4 | |
| Final Fantasy XV Benchmark (2018) | 62 | 64.8 | 44.4 | 30.2 | ||
| X-Plane 11.11 (2018) | 95.3 | 78.4 | 66.9 | 41.4 | ||
| Far Cry 5 (2018) | 37 | 36 | 35 | 47 | ||
| Strange Brigade (2018) | 244 | 112.5 | 92.4 | 78.9 | ||
| F1 22 (2022) | 112.7 | 104.3 | 75 | 21.8 |
Emisiones - El portátil puede ser silencioso
Emisiones acústicas
Aunque no es del todo silencioso, el Vivobook sigue siendo bastante silencioso bajo la mayoría de las cargas. Durante el uso normal, el portátil no supera los 40 dB(A). El nivel de ruido aumenta hasta los 62,9 dB(A) sólo cuando se juega o se realizan otras tareas informáticas intensivas. Los ventiladores pueden distraer en estos escenarios, particularmente porque el ruido es relativamente alto. En el modo susurro, los ventiladores permanecen muy silenciosos o en reposo.
Independientemente del modo del ventilador, el control del ventilador intenta mantener las velocidades del ventilador bajas durante el mayor tiempo posible. Si bien esto es ventajoso para los niveles de ruido de la Vivobook Pro, es perjudicial para el rendimiento bajo carga.
Ruido
| Ocioso |
| 30 / 30 / 30 dB(A) |
| Carga |
| 57.6 / 62.9 dB(A) |
 | ||
30 dB silencioso 40 dB(A) audible 50 dB(A) ruidosamente alto |
||
min: | ||
Temperaturas
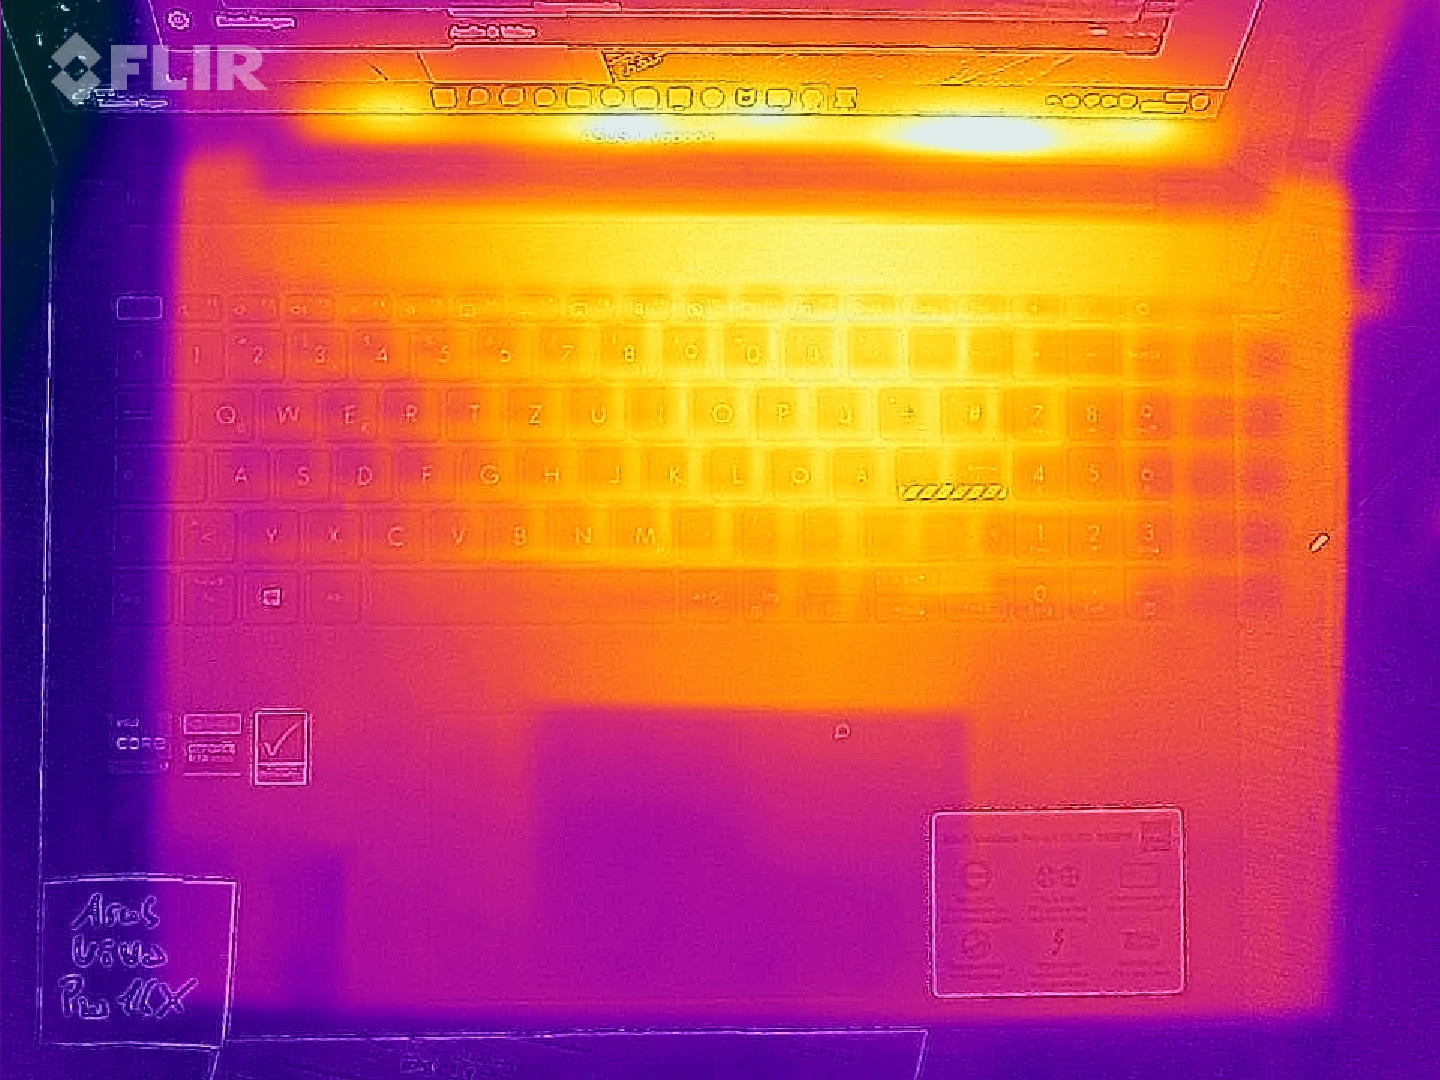
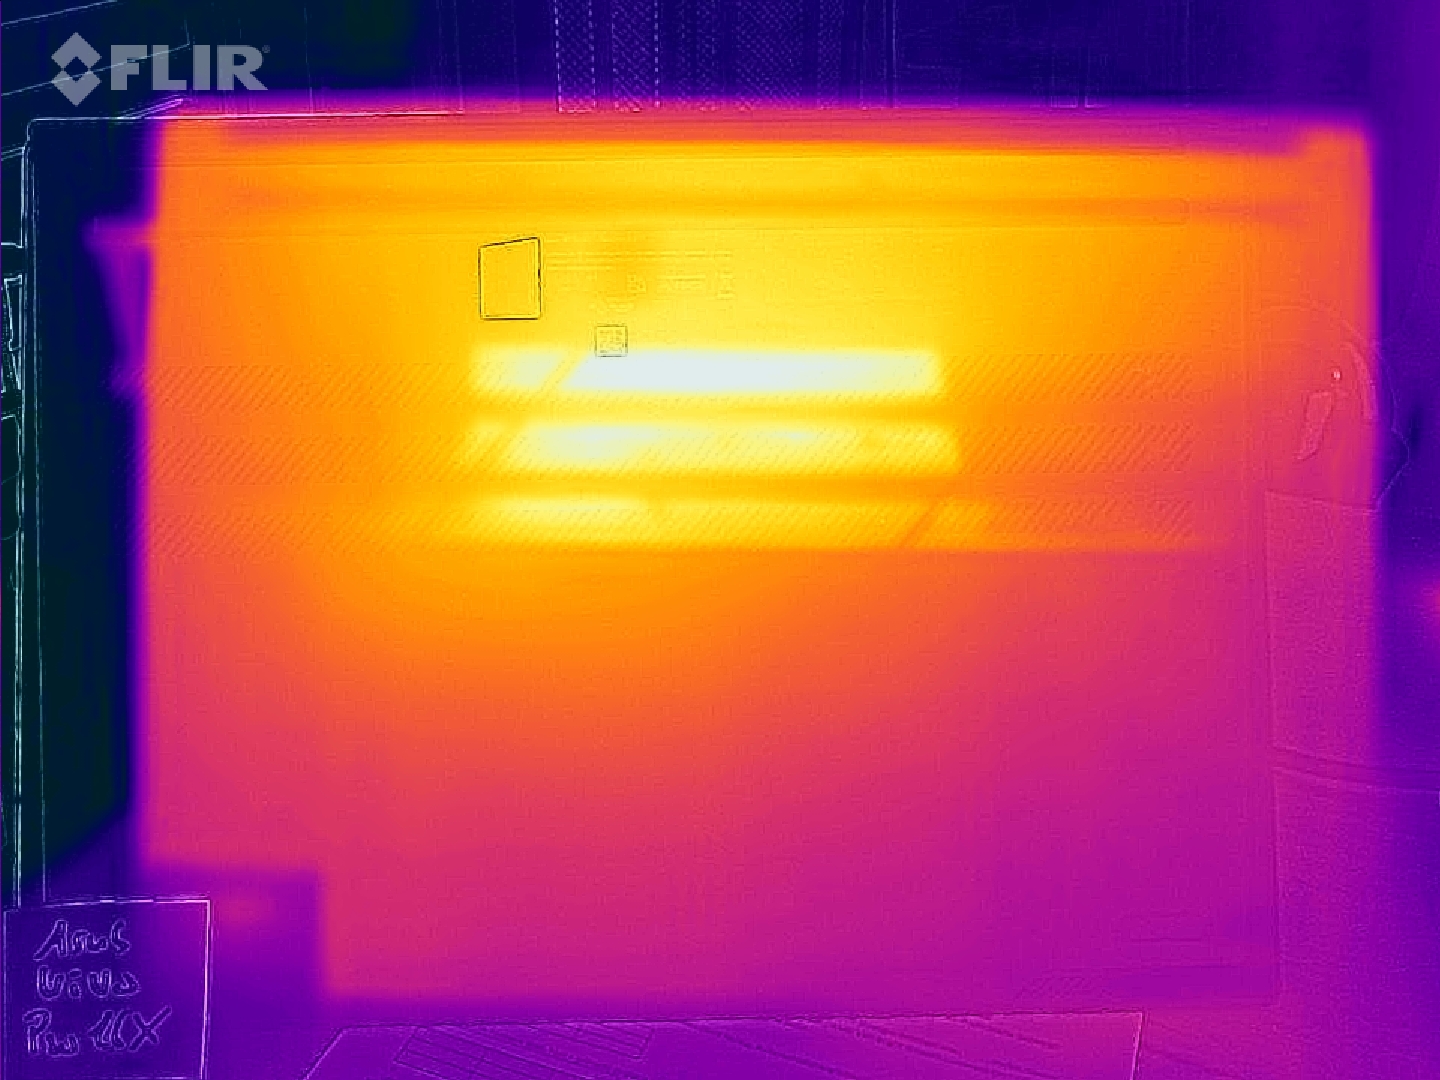
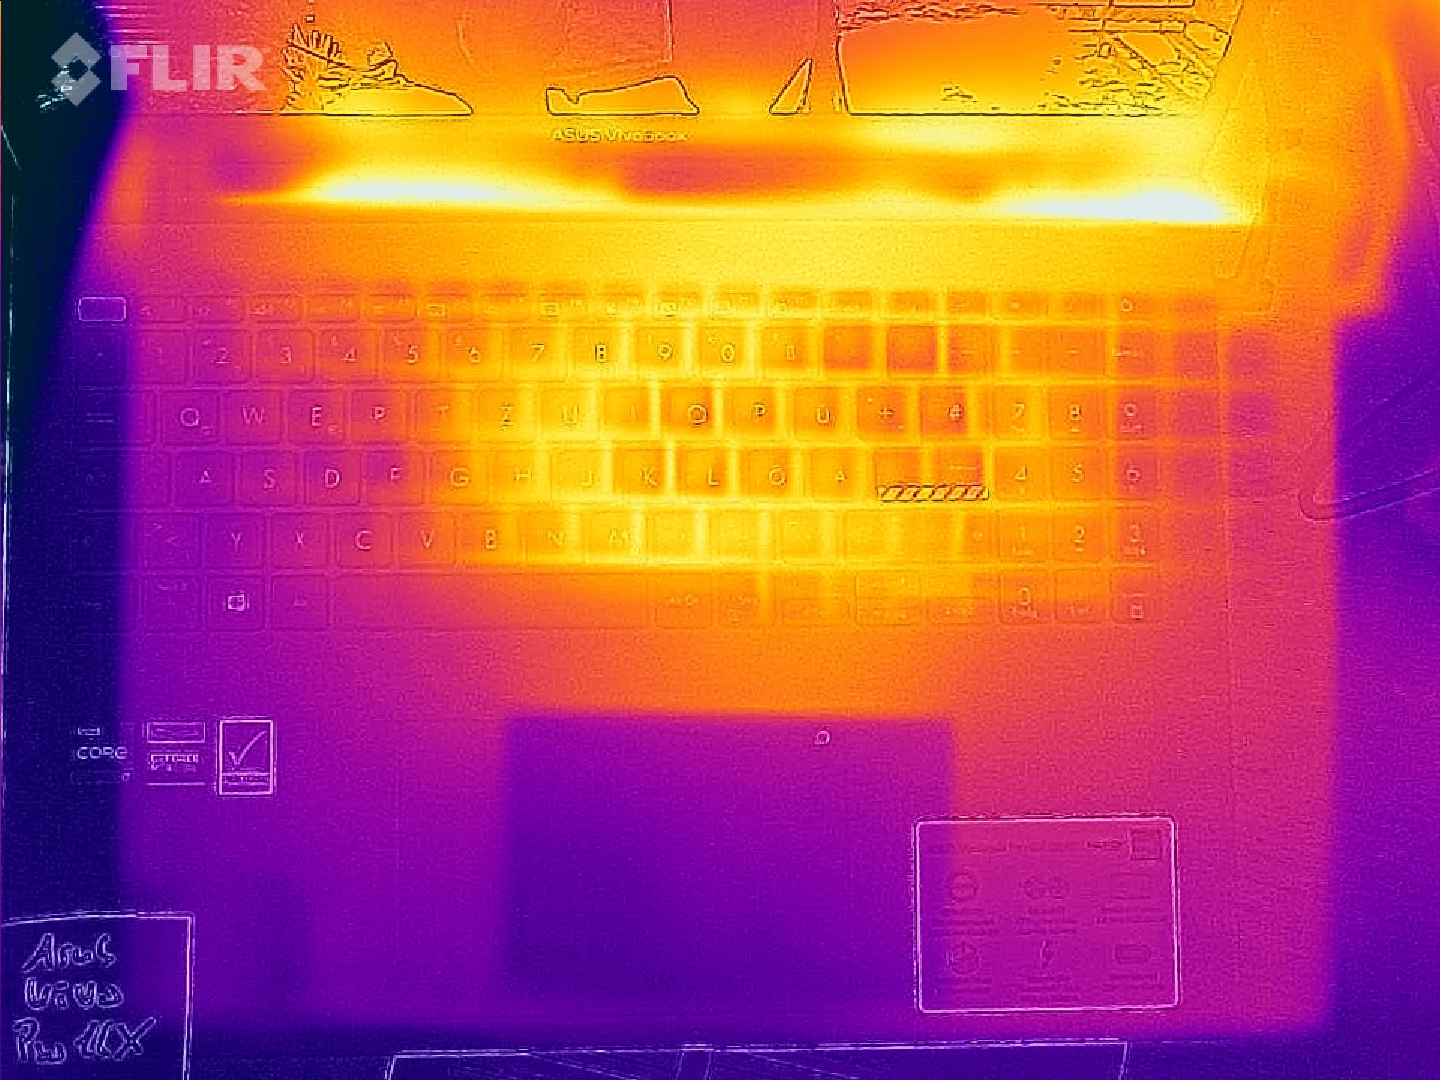
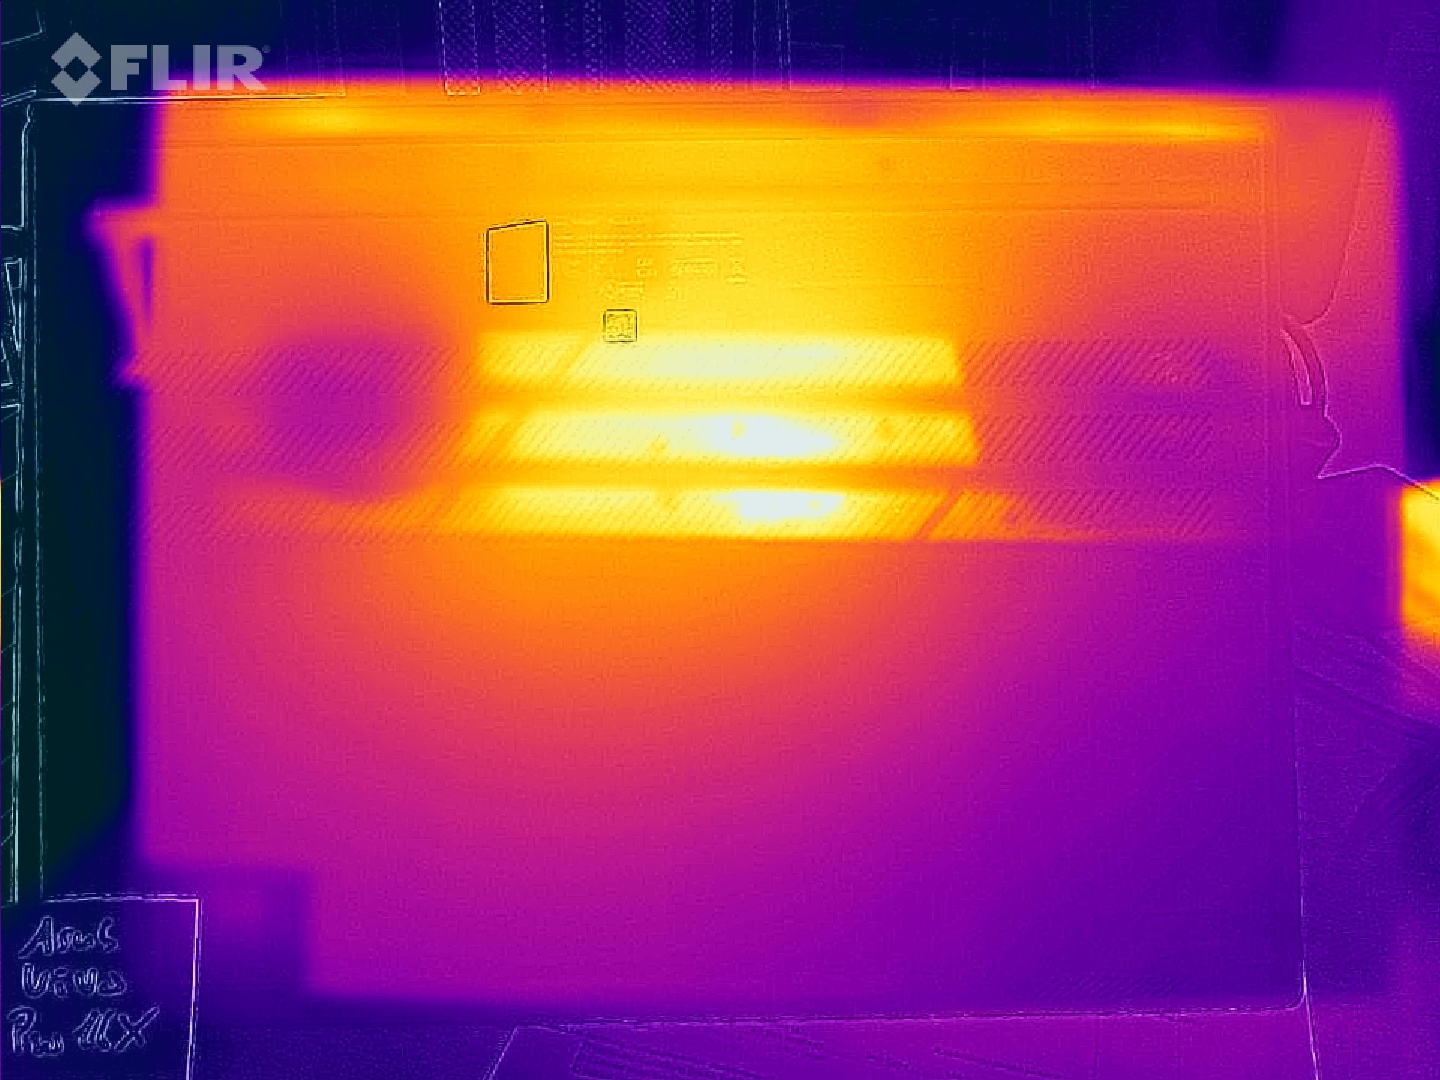
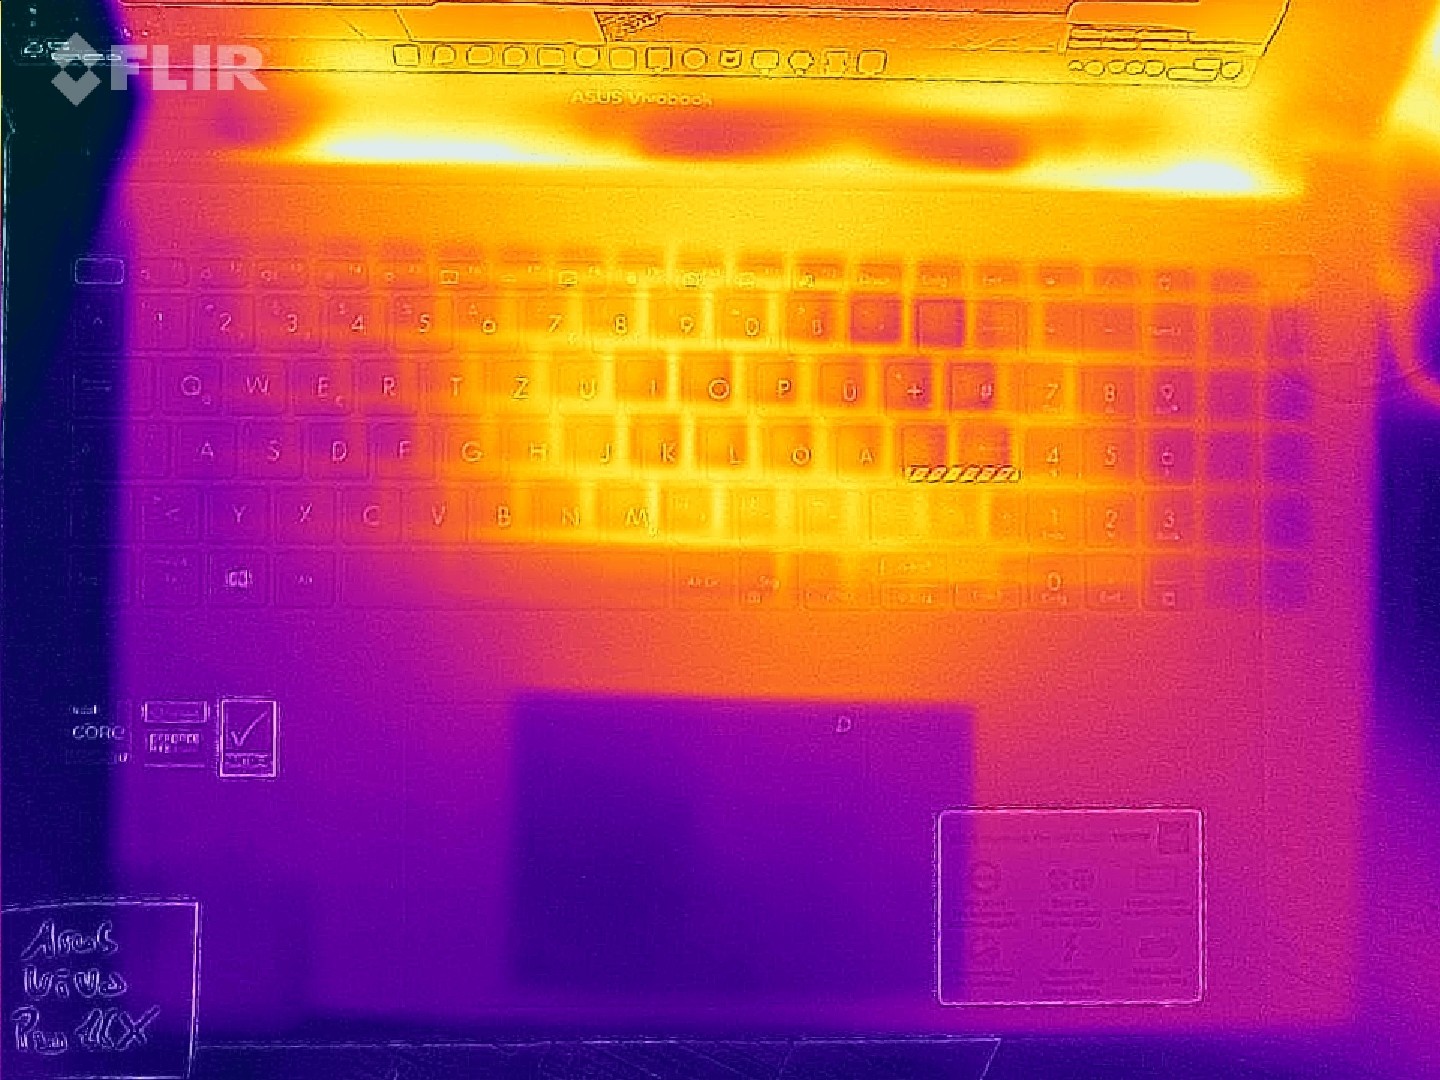
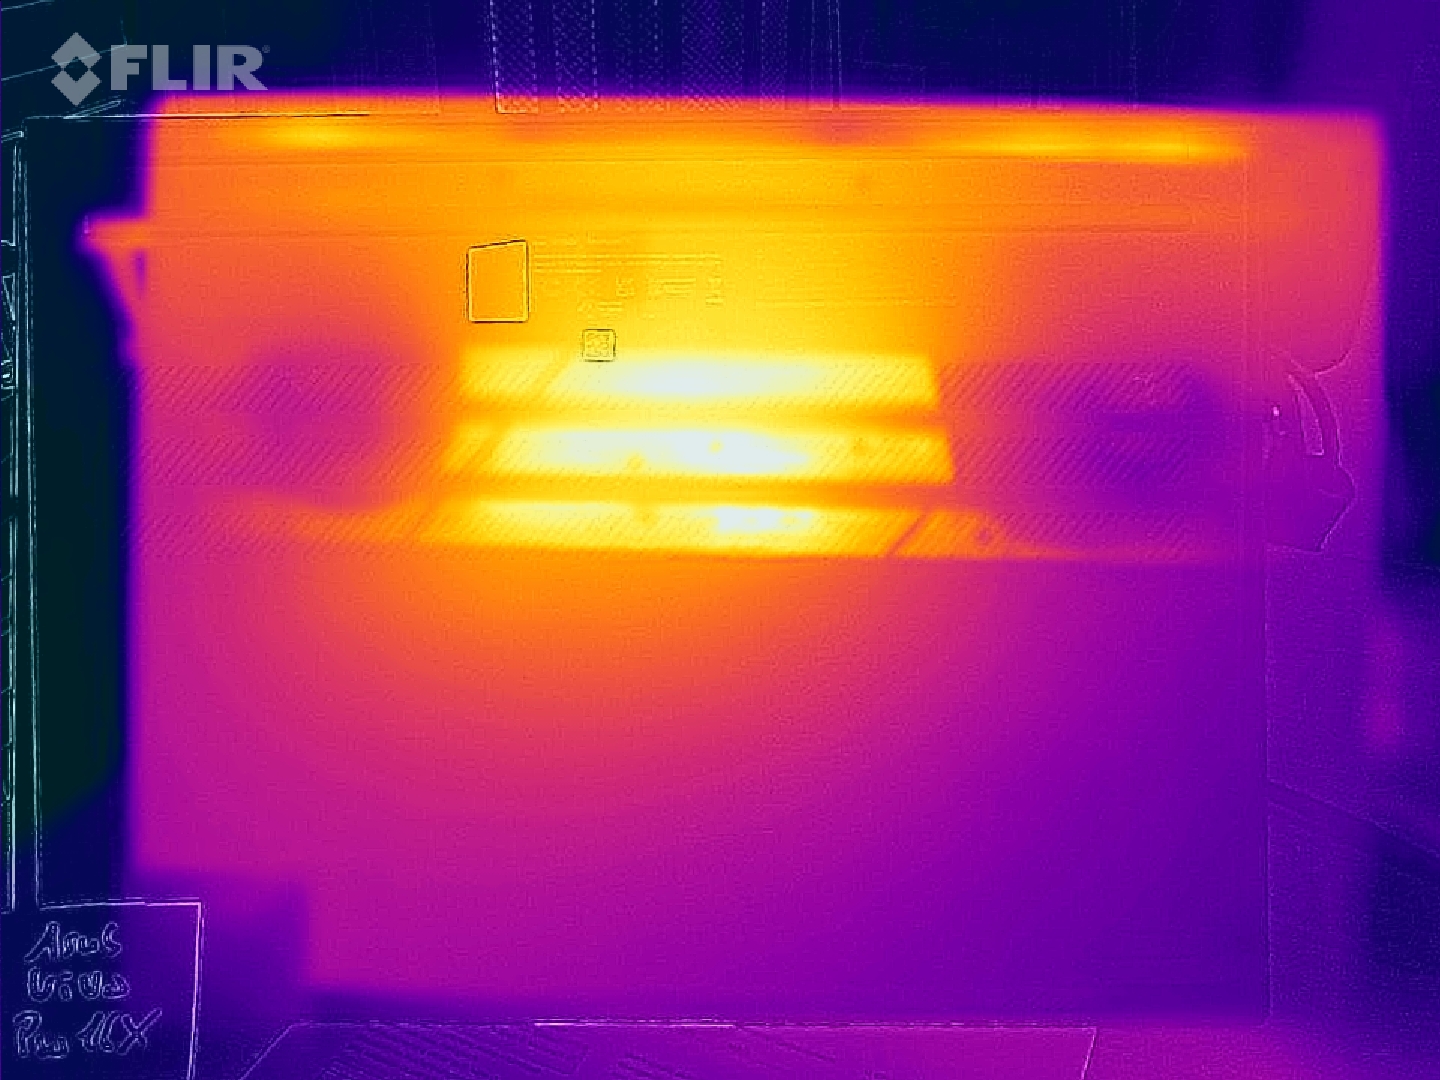
Las temperaturas de la superficie del Vivobook se mantienen en niveles razonables en general, aunque registramos temperaturas de reposo de la palma de la mano de más de 30 °C bajo carga a una temperatura ambiente moderada. Cuando se estresa, los puntos calientes de la parte inferior pueden llegar a ser incómodos. 50 °C (122 °F) en la parte inferior es demasiado alto para ser cómodo durante el uso en el regazo durante períodos prolongados. Afortunadamente, la zona de puntos calientes en el centro del portátil es bastante pequeña. Por lo tanto, la Vivobook Pro puede ser colocada de manera que esto no sea un problema.
| Asus VivoBook Pro 16X OLED N7600PC-L2026X GeForce RTX 3050 4GB Laptop GPU, i7-11370H, Intel Optane Memory H10 with Solid State Storage 32GB + 512GB HBRPEKNX0202A(L/H) | MSI Summit E16 Flip A12UDT-031 GeForce RTX 3050 Ti Laptop GPU, i7-1280P, Samsung PM9A1 MZVL22T0HBLB | Microsoft Surface Laptop Studio i7 RTX 3050 Ti GeForce RTX 3050 Ti Laptop GPU, i7-11370H, SK Hynix PC711 1TB HFS001TDE9X084N | Dell Inspiron 16 Plus 7610 GeForce RTX 3050 4GB Laptop GPU, i7-11800H, Kingston OM3PDP3512B | Lenovo ThinkPad X1 Extreme G4-20Y5CTO1WW (3050 Ti) GeForce RTX 3050 Ti Laptop GPU, i7-11800H, Samsung PM9A1 MZVL21T0HCLR | Schenker XMG Focus 15 GeForce RTX 3050 Ti Laptop GPU, i7-11800H, Samsung SSD 970 EVO Plus 1TB | |
|---|---|---|---|---|---|---|
| Noise | 13% | 21% | 16% | 19% | -2% | |
| apagado / medio ambiente * (dB) | 25.15 | 25 1% | 24.7 2% | 24.4 3% | 23.52 6% | 24 5% |
| Idle Minimum * (dB) | 30 | 25 17% | 24.7 18% | 24.4 19% | 23.52 22% | 25 17% |
| Idle Average * (dB) | 30 | 25 17% | 24.7 18% | 24.4 19% | 23.52 22% | 30 -0% |
| Idle Maximum * (dB) | 30 | 28.9 4% | 24.7 18% | 24.4 19% | 23.52 22% | 43 -43% |
| Load Average * (dB) | 57.6 | 49.3 14% | 33.2 42% | 48.3 16% | 42.9 26% | 56 3% |
| Load Maximum * (dB) | 62.9 | 48.2 23% | 46.7 26% | 48.9 22% | 52.45 17% | 58 8% |
| Witcher 3 ultra * (dB) | 44.5 | 48.9 | 52.5 | 56 |
* ... más pequeño es mejor
(±) La temperatura máxima en la parte superior es de 40.6 °C / 105 F, frente a la media de 36.8 °C / 98 F, que oscila entre 21 y 71 °C para la clase Multimedia.
(-) El fondo se calienta hasta un máximo de 53 °C / 127 F, frente a la media de 39.1 °C / 102 F
(+) En reposo, la temperatura media de la parte superior es de 26.3 °C / 79# F, frente a la media del dispositivo de 31.3 °C / 88 F.
(±) Jugando a The Witcher 3, la temperatura media de la parte superior es de 33.7 °C / 93 F, frente a la media del dispositivo de 31.3 °C / 88 F.
(+) El reposamanos y el panel táctil están a una temperatura inferior a la de la piel, con un máximo de 30.6 °C / 87.1 F y, por tanto, son fríos al tacto.
(±) La temperatura media de la zona del reposamanos de dispositivos similares fue de 28.7 °C / 83.7 F (-1.9 °C / -3.4 F).
| Asus VivoBook Pro 16X OLED N7600PC-L2026X Intel Core i7-11370H, NVIDIA GeForce RTX 3050 4GB Laptop GPU | MSI Summit E16 Flip A12UDT-031 Intel Core i7-1280P, NVIDIA GeForce RTX 3050 Ti Laptop GPU | Microsoft Surface Laptop Studio i7 RTX 3050 Ti Intel Core i7-11370H, NVIDIA GeForce RTX 3050 Ti Laptop GPU | Dell Inspiron 16 Plus 7610 Intel Core i7-11800H, NVIDIA GeForce RTX 3050 4GB Laptop GPU | Lenovo ThinkPad X1 Extreme G4-20Y5CTO1WW (3050 Ti) Intel Core i7-11800H, NVIDIA GeForce RTX 3050 Ti Laptop GPU | Schenker XMG Focus 15 Intel Core i7-11800H, NVIDIA GeForce RTX 3050 Ti Laptop GPU | Xiaomi Mi NoteBook Pro Intel Core i7-11370H, Intel Iris Xe Graphics G7 96EUs | |
|---|---|---|---|---|---|---|---|
| Heat | -6% | 15% | -14% | -5% | -17% | -7% | |
| Maximum Upper Side * (°C) | 40.6 | 49.2 -21% | 42.3 -4% | 46.4 -14% | 49 -21% | 43 -6% | 48 -18% |
| Maximum Bottom * (°C) | 53 | 50.2 5% | 38.2 28% | 54.8 -3% | 44.4 16% | 46 13% | 45.8 14% |
| Idle Upper Side * (°C) | 29 | 29.4 -1% | 23.4 19% | 31.4 -8% | 32.1 -11% | 39 -34% | 32.2 -11% |
| Idle Bottom * (°C) | 28.3 | 30 -6% | 23.5 17% | 36.6 -29% | 29.8 -5% | 40 -41% | 32.2 -14% |
* ... más pequeño es mejor
Prueba de esfuerzo
El rendimiento del Vivobook Pro 16X cae masivamente durante los primeros dos minutos. Posteriormente, el rendimiento del portátil se mantiene constante. Esto también podría considerarse como una ventana de impulso particularmente larga. El procesador comienza la prueba de estrés con unos impresionantes 46 vatios y luego cae lentamente hasta los 35 vatios. Esto coincide con el PL1 máximo teórico del Intel Core i7-11370H. Las temperaturas siguen siendo no críticas incluso bajo estrés continuo. Ninguno de los sensores informa por encima de los 90 °C (194 °F). Como resultado, las temperaturas superficiales siguen siendo cómodas en su mayor parte también.
Altavoces
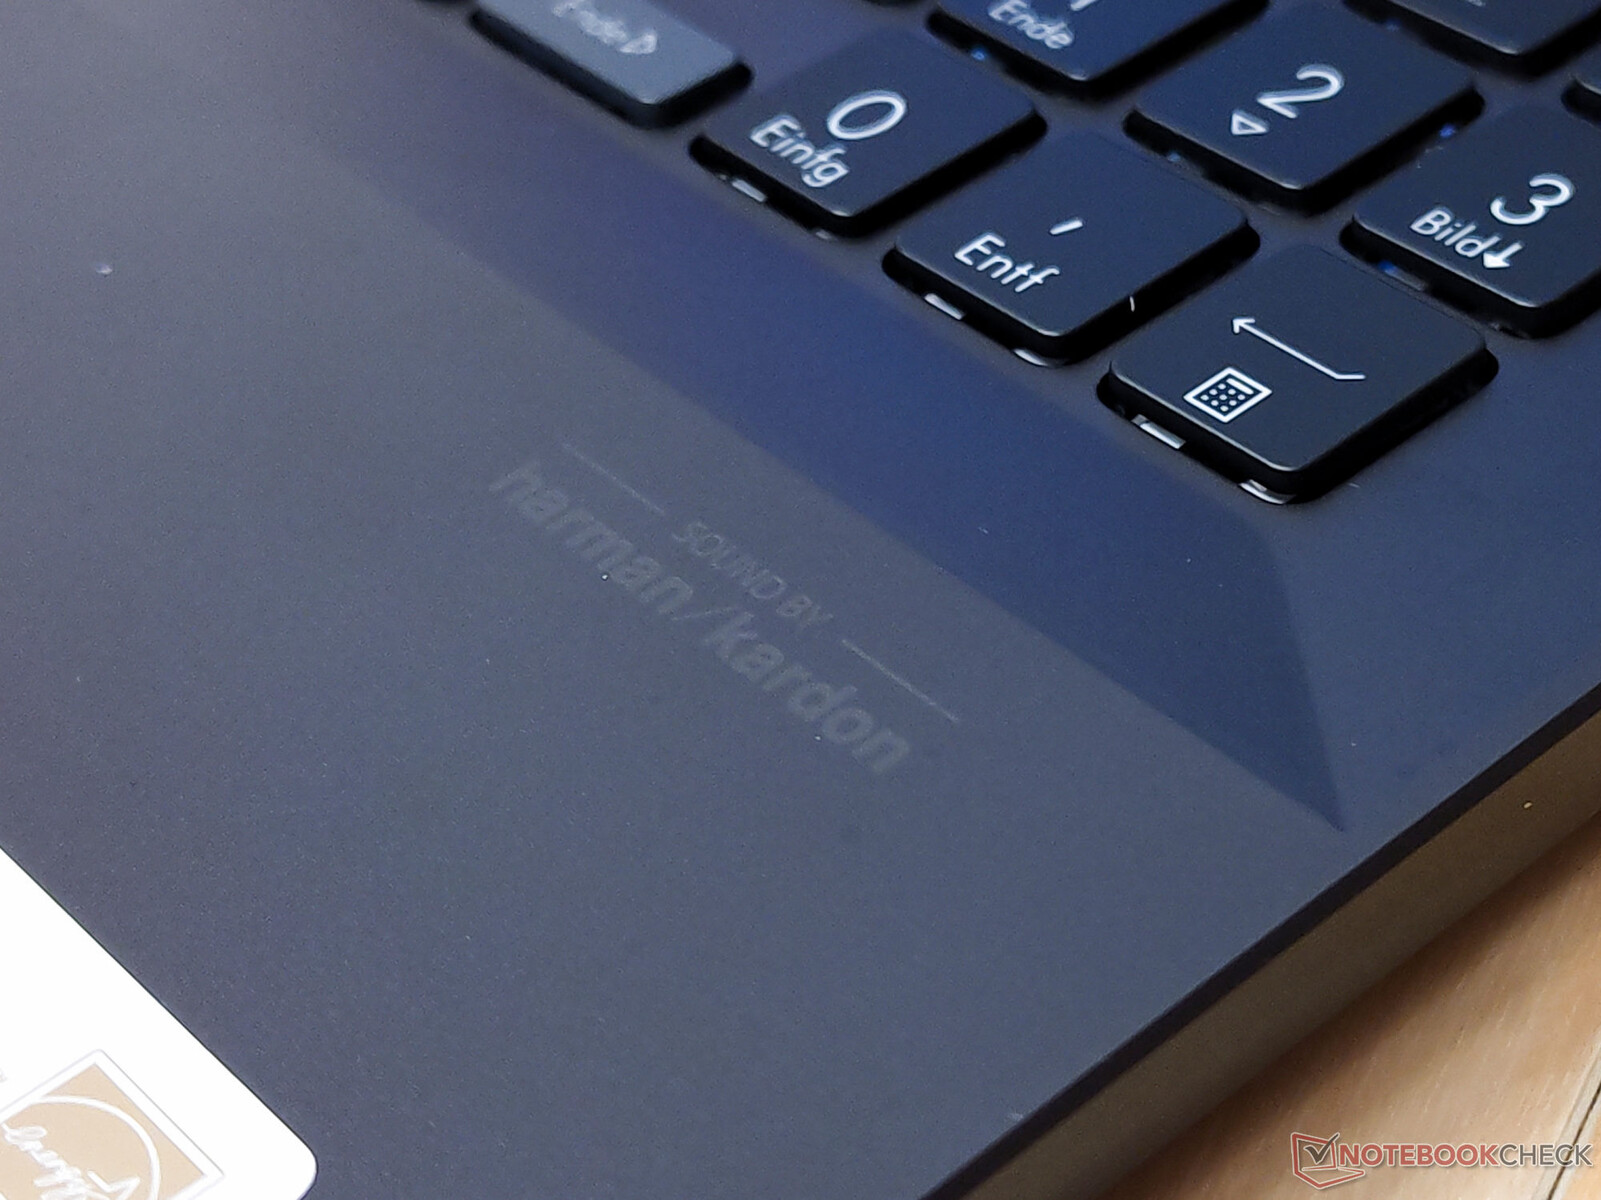
El Vivobook tiene dificultades para producir un sonido lineal. A pesar del logotipo "Sound by Harman/Kardon", la experiencia de audio es relativamente pobre. Los pequeños altavoces carecen de graves. La sobremodulación significativa de las frecuencias más altas es un problema mucho más importante. A menudo son demasiado fuertes incluso a niveles de volumen bajos. En este sentido, hay margen de mejora.
Asus VivoBook Pro 16X OLED N7600PC-L2026X análisis de audio
(+) | los altavoces pueden reproducir a un volumen relativamente alto (#89 dB)
Graves 100 - 315 Hz
(-) | casi sin bajos - de media 19.4% inferior a la mediana
(±) | la linealidad de los graves es media (7.8% delta a frecuencia anterior)
Medios 400 - 2000 Hz
(+) | medios equilibrados - a sólo 1.3% de la mediana
(+) | los medios son lineales (2.7% delta a la frecuencia anterior)
Altos 2 - 16 kHz
(±) | máximos más altos - de media 7.7% más altos que la mediana
(+) | los máximos son lineales (6.8% delta a la frecuencia anterior)
Total 100 - 16.000 Hz
(±) | la linealidad del sonido global es media (16% de diferencia con la mediana)
En comparación con la misma clase
» 41% de todos los dispositivos probados de esta clase eran mejores, 6% similares, 53% peores
» El mejor tuvo un delta de 5%, la media fue 17%, el peor fue ###max##%
En comparación con todos los dispositivos probados
» 25% de todos los dispositivos probados eran mejores, 5% similares, 70% peores
» El mejor tuvo un delta de 4%, la media fue 24%, el peor fue ###max##%
MSI Summit E16 Flip A12UDT-031 análisis de audio
(±) | la sonoridad del altavoz es media pero buena (79.8 dB)
Graves 100 - 315 Hz
(-) | casi sin bajos - de media 23.6% inferior a la mediana
(-) | los graves no son lineales (15.1% delta a la frecuencia anterior)
Medios 400 - 2000 Hz
(±) | medias más altas - de media 5.6% más altas que la mediana
(±) | la linealidad de los medios es media (7.4% delta respecto a la frecuencia anterior)
Altos 2 - 16 kHz
(±) | máximos más altos - de media 5.6% más altos que la mediana
(+) | los máximos son lineales (4.5% delta a la frecuencia anterior)
Total 100 - 16.000 Hz
(±) | la linealidad del sonido global es media (22.6% de diferencia con la mediana)
En comparación con la misma clase
» 68% de todos los dispositivos probados de esta clase eran mejores, 5% similares, 27% peores
» El mejor tuvo un delta de 6%, la media fue 20%, el peor fue ###max##%
En comparación con todos los dispositivos probados
» 67% de todos los dispositivos probados eran mejores, 6% similares, 28% peores
» El mejor tuvo un delta de 4%, la media fue 24%, el peor fue ###max##%
Schenker XMG Focus 15 análisis de audio
(±) | la sonoridad del altavoz es media pero buena (78 dB)
Graves 100 - 315 Hz
(-) | casi sin bajos - de media 25.5% inferior a la mediana
(±) | la linealidad de los graves es media (8.4% delta a frecuencia anterior)
Medios 400 - 2000 Hz
(+) | medios equilibrados - a sólo 4.9% de la mediana
(+) | los medios son lineales (5.6% delta a la frecuencia anterior)
Altos 2 - 16 kHz
(+) | máximos equilibrados - a sólo 1.7% de la mediana
(+) | los máximos son lineales (4.1% delta a la frecuencia anterior)
Total 100 - 16.000 Hz
(±) | la linealidad del sonido global es media (20% de diferencia con la mediana)
En comparación con la misma clase
» 70% de todos los dispositivos probados de esta clase eran mejores, 7% similares, 23% peores
» El mejor tuvo un delta de 6%, la media fue 18%, el peor fue ###max##%
En comparación con todos los dispositivos probados
» 51% de todos los dispositivos probados eran mejores, 8% similares, 41% peores
» El mejor tuvo un delta de 4%, la media fue 24%, el peor fue ###max##%
Gestión de la energía: no hay tiempos de ejecución récord a pesar de la batería de 96 Wh
Consumo de energía
El Vivobook Pro 16X OLED muestra valores de consumo razonables en nuestras pruebas. Por supuesto, el potente hardware requiere algo más de energía cuando se realizan tareas exigentes. En reposo, el consumo de energía del portátil Asus se incrementa ligeramente en unos pocos vatios en comparación con otros dispositivos de nuestra comparativa. Sin embargo, a menudo encontramos que los portátiles con pantallas OLED están en ligera desventaja en este aspecto en comparación con los modelos LCD.
| Off / Standby | |
| Ocioso | |
| Carga |
|
Clave:
min: | |
| Asus VivoBook Pro 16X OLED N7600PC-L2026X i7-11370H, GeForce RTX 3050 4GB Laptop GPU, Intel Optane Memory H10 with Solid State Storage 32GB + 512GB HBRPEKNX0202A(L/H), OLED, 3840x2400, 16" | MSI Summit E16 Flip A12UDT-031 i7-1280P, GeForce RTX 3050 Ti Laptop GPU, Samsung PM9A1 MZVL22T0HBLB, IPS, 2560x1600, 16" | Microsoft Surface Laptop Studio i7 RTX 3050 Ti i7-11370H, GeForce RTX 3050 Ti Laptop GPU, SK Hynix PC711 1TB HFS001TDE9X084N, IPS, 2400x1600, 14.4" | Dell Inspiron 16 Plus 7610 i7-11800H, GeForce RTX 3050 4GB Laptop GPU, Kingston OM3PDP3512B, IPS, 3072x1920, 16" | Lenovo ThinkPad X1 Extreme G4-20Y5CTO1WW (3050 Ti) i7-11800H, GeForce RTX 3050 Ti Laptop GPU, Samsung PM9A1 MZVL21T0HCLR, IPS LED, 3840x2400, 16" | Schenker XMG Focus 15 i7-11800H, GeForce RTX 3050 Ti Laptop GPU, Samsung SSD 970 EVO Plus 1TB, IPS, 1920x1080, 15.6" | Medio NVIDIA GeForce RTX 3050 4GB Laptop GPU | Media de la clase Multimedia | |
|---|---|---|---|---|---|---|---|---|
| Power Consumption | -12% | 30% | -12% | -47% | -89% | -2% | 13% | |
| Idle Minimum * (Watt) | 8.9 | 9.8 -10% | 2.6 71% | 7.7 13% | 10.3 -16% | 23 -158% | 7.17 ? 19% | 5.71 ? 36% |
| Idle Average * (Watt) | 10.2 | 15.3 -50% | 7.1 30% | 10.7 -5% | 22.06 -116% | 25 -145% | 10.4 ? -2% | 10.1 ? 1% |
| Idle Maximum * (Watt) | 12 | 16.3 -36% | 7.9 34% | 16.8 -40% | 23 -92% | 29 -142% | 14.8 ? -23% | 12.4 ? -3% |
| Load Average * (Watt) | 94 | 87 7% | 76.8 18% | 100.39 -7% | 102.57 -9% | 106 -13% | 89.7 ? 5% | 65 ? 31% |
| Witcher 3 ultra * (Watt) | 93.1 | 86.1 8% | 83 11% | 108 -16% | 106 -14% | 128 -37% | ||
| Load Maximum * (Watt) | 112 | 100 11% | 97.3 13% | 129 -15% | 147.8 -32% | 156 -39% | 124.8 ? -11% | 112.2 ? -0% |
* ... más pequeño es mejor
Consumption Witcher 3 / Stress Test
Consumption external Monitor
Duración de la batería
Debido a la alta capacidad de la batería de 96 Wh, se puede esperar una larga duración de la misma. La capacidad casi alcanza el límite legal para un portátil. Sin embargo, la pantalla OLED de 16 pulgadas y alta resolución es claramente generosa con el uso de los recursos de la batería. Con el brillo máximo, nuestro dispositivo de pruebas de Asus sólo dura unas 6:30 horas en nuestro test Wi-Fi del mundo real. Reduciendo el brillo a 150 nits ya se consiguen 2 horas más de autonomía. Un método popular de ahorro de energía para las pantallas OLED es forzar el uso del modo oscuro siempre que sea posible. Cada área brillante de la pantalla consume energía. Dado que durante nuestra prueba de navegación por Internet suelen aparecer muchas zonas blancas de gran tamaño, resulta especialmente implacable para las pantallas OLED.
| Asus VivoBook Pro 16X OLED N7600PC-L2026X i7-11370H, GeForce RTX 3050 4GB Laptop GPU, 96 Wh | MSI Summit E16 Flip A12UDT-031 i7-1280P, GeForce RTX 3050 Ti Laptop GPU, 82 Wh | Microsoft Surface Laptop Studio i7 RTX 3050 Ti i7-11370H, GeForce RTX 3050 Ti Laptop GPU, 58 Wh | Dell Inspiron 16 Plus 7610 i7-11800H, GeForce RTX 3050 4GB Laptop GPU, 86 Wh | Lenovo ThinkPad X1 Extreme G4-20Y5CTO1WW (3050 Ti) i7-11800H, GeForce RTX 3050 Ti Laptop GPU, 90 Wh | Schenker XMG Focus 15 i7-11800H, GeForce RTX 3050 Ti Laptop GPU, 49 Wh | Media de la clase Multimedia | |
|---|---|---|---|---|---|---|---|
| Duración de Batería | -18% | -34% | 44% | -38% | -53% | 44% | |
| Reader / Idle (h) | 11.1 | 20.5 85% | 6.5 -41% | 25.2 ? 127% | |||
| WiFi v1.3 (h) | 8.7 | 7.1 -18% | 8 -8% | 9.9 14% | 6.6 -24% | 3.9 -55% | 12 ? 38% |
| Load (h) | 2.5 | 1 -60% | 3.3 32% | 1.2 -52% | 0.9 -64% | 1.675 ? -33% | |
| H.264 (h) | 12.3 | 6.7 | 16.4 ? |
Pro
Contra
Veredicto - Rendimiento medio, pantalla sobresaliente
La pantalla del Asus Vivobook Pro 16X OLED es posiblemente su mejor característica. El panel OLED brilla con colores naturales y tiempos de respuesta muy rápidos. Sus inconvenientes se limitan casi por completo al uso en exteriores. Las características del portátil coinciden en su mayoría con nuestras expectativas para un portátil multimedia de gama media-alta. Dicho esto, el almacenamiento Optane algo lento y el número de versión inferior en los puertos USB de la izquierda son algo decepcionantes. El USB 2.0 está anticuado para los estándares actuales.
El chasis de aluminio es sutil, pero visualmente atractivo. El revestimiento de tejido es sorprendentemente resistente a la grasa, agradable al tacto, y siempre un espectáculo interesante de contemplar. Desgraciadamente, Asus ha fallado en lo que respecta a la calidad de construcción. La impresión general sufre de holguras desiguales en múltiples áreas.
La fantástica pantalla OLED del Asus Vivobook Pro 16X es el centro de atención. Sin embargo, el portátil también ofrece un nivel de rendimiento medio-alto y una carcasa decente en general. El paquete se completa con características interesantes como Asus Dial.
En cuanto al precio, unos 1600 dólares sitúan al Vivobook en la gama media alta. En relación con otros dispositivos de esta categoría, las características, la calidad de construcción y el diseño son adecuados. Por su parte, el Dell Inspiron 16 Plus 7610 es significativamente más barato. Este último ofrece características similares, una buena pantalla IPS y puede comprarse por poco más de 1000 dólares en varios minoristas. Dicho esto, otras configuraciones del Asus Vivobook 16X también están disponibles por bastante menos, dependiendo del modelo.
Precio y disponibilidad
Una configuración similar del Asus Vivobook está disponible en Amazon.com por unos 1500 dólares. En Newegg, la misma configuración, pero con 16 GB en lugar de 32 GB de RAM es actualmente en venta por 999 dólares (precio normal: 1399 dólares).
Asus VivoBook Pro 16X OLED N7600PC-L2026X
- 11/07/2022 v7 (old)
Marc Herter
Price comparison

