Análisis del BMAX B7 Power: Un mini PC frugal con Intel Core i7 por 400 dólares
El (MaxMini) B7 Power no es el primer dispositivo que probamos de BMAX. El BMAX MaxBook Y11 H1M6 Convertibleobtuvo 75 puntos porcentuales en nuestra prueba. También probamos un predecesor del B7 Power, el BMAX B5 Propero sin puntuarlo. A finales de 2022, el B5 con Intel Gen8 seguía siendo su modelo de gama alta, pero ahora, el B7 Power está equipado con Intel Gen11. Puede que esto no lo convierta en el más moderno pero, a cambio, mantiene el precio agradable y bajo. Actualmente se vende por algo menos de 400 dólares. BMAX también ofrece un B7 Pro que cuenta con unIntel Core i5-1145G7en lugar de unIntel Core i7-11390H.
El B7 Power tiene que competir con otros mini PC. ElGeekom Mini IT11es un candidato con la misma GPU, pero también analizaremos la diferencia de rendimiento en comparación con generaciones de GPU más actuales, como elKit Intel NUC 13 Pro. Entre medias, puedes encontrar elIntel NUC 12 Pro Kitcon Intel Gen12. Otros dispositivos de comparación son elBeelink SEi11y el predecesor del B7 Power, elB5 Pro.
Posibles contendientes en la comparación
Valoración | Fecha | Modelo | Peso | Altura | Tamaño | Resolución | Precio |
|---|---|---|---|---|---|---|---|
| 78.4 % v7 (old) | 09/2023 | BMAX B7 Power G7A2 i7-11390H, Iris Xe G7 96EUs | 363 g | 44 mm | x | ||
| 80.6 % v7 (old) | 07/2023 | Geekom Mini IT11, i7-11390H i7-11390H, Iris Xe G7 96EUs | 536 g | 48 mm | x | ||
| 80.8 % v7 (old) | 04/2023 | Intel NUC 13 Pro Kit NUC13ANK i7-1360P, Iris Xe G7 96EUs | 538 g | 37 mm | x | ||
v (old) | 03/2023 | Intel NUC 12 Pro Kit NUC12WSBi5 i5-1240P, Iris Xe G7 80EUs | 549 g | 45.6 mm | x | ||
v (old) | 09/2022 | Beelink SEi11 Pro i5-11320H, Iris Xe G7 96EUs | 440 g | 40 mm | x | ||
v (old) | 11/2022 | BMAX B5 Pro G7H8 i5-8260U, UHD Graphics 620 | 369 g | 43.2 mm | x |
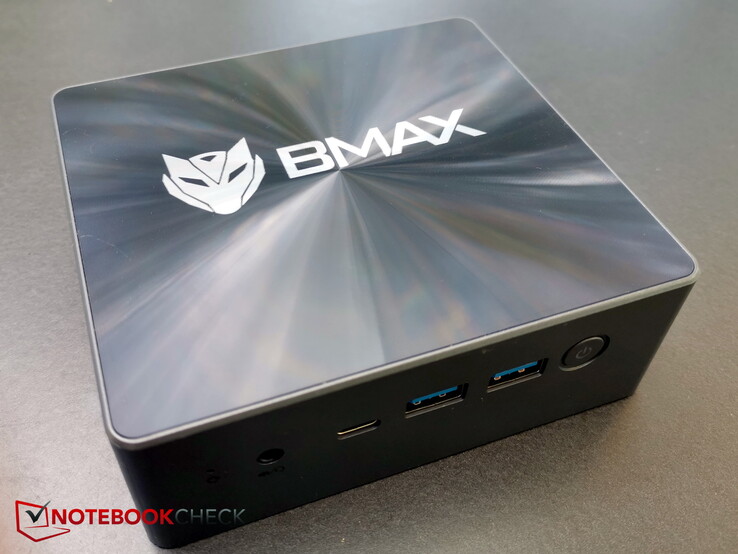
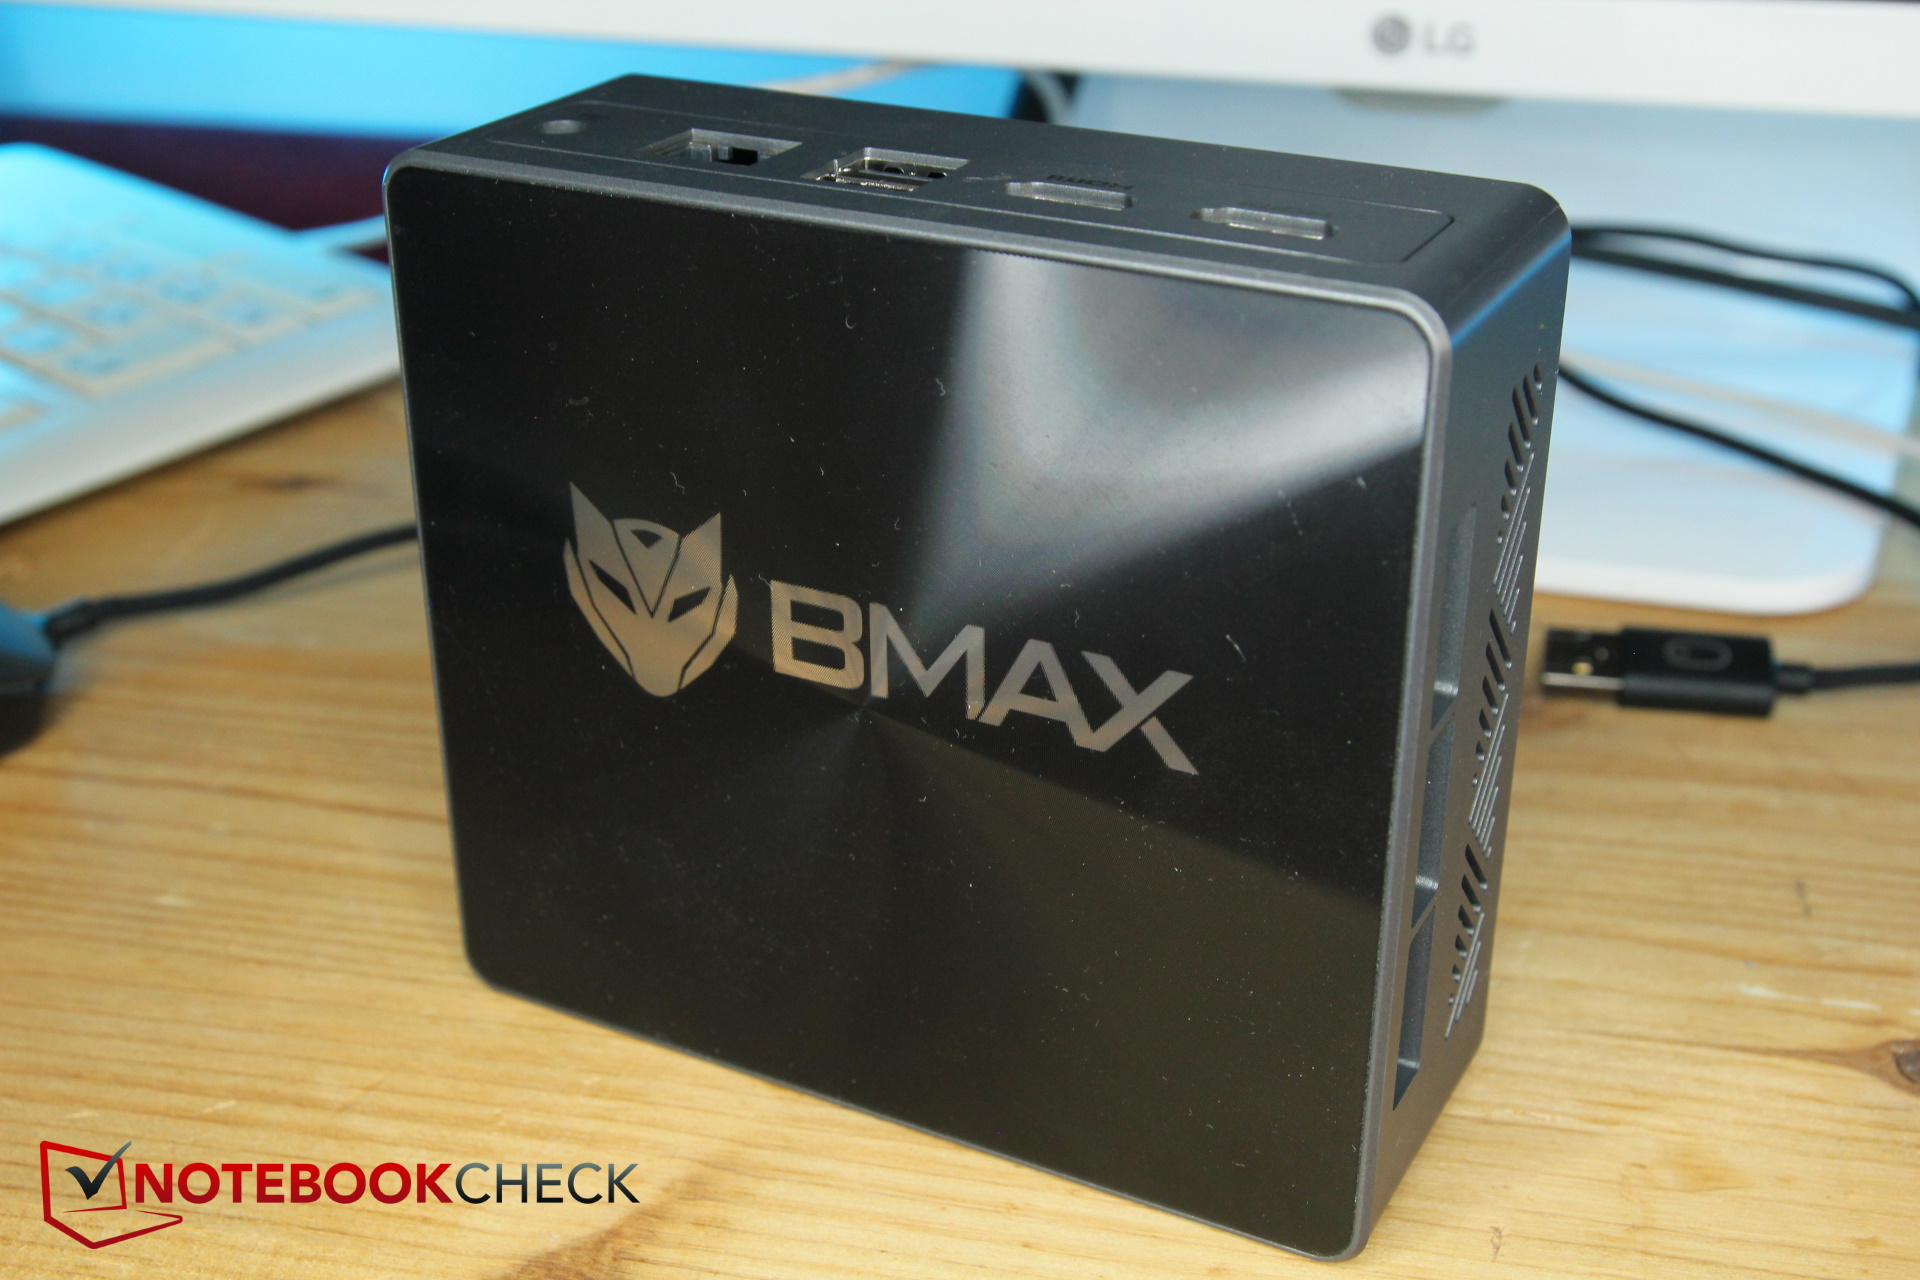
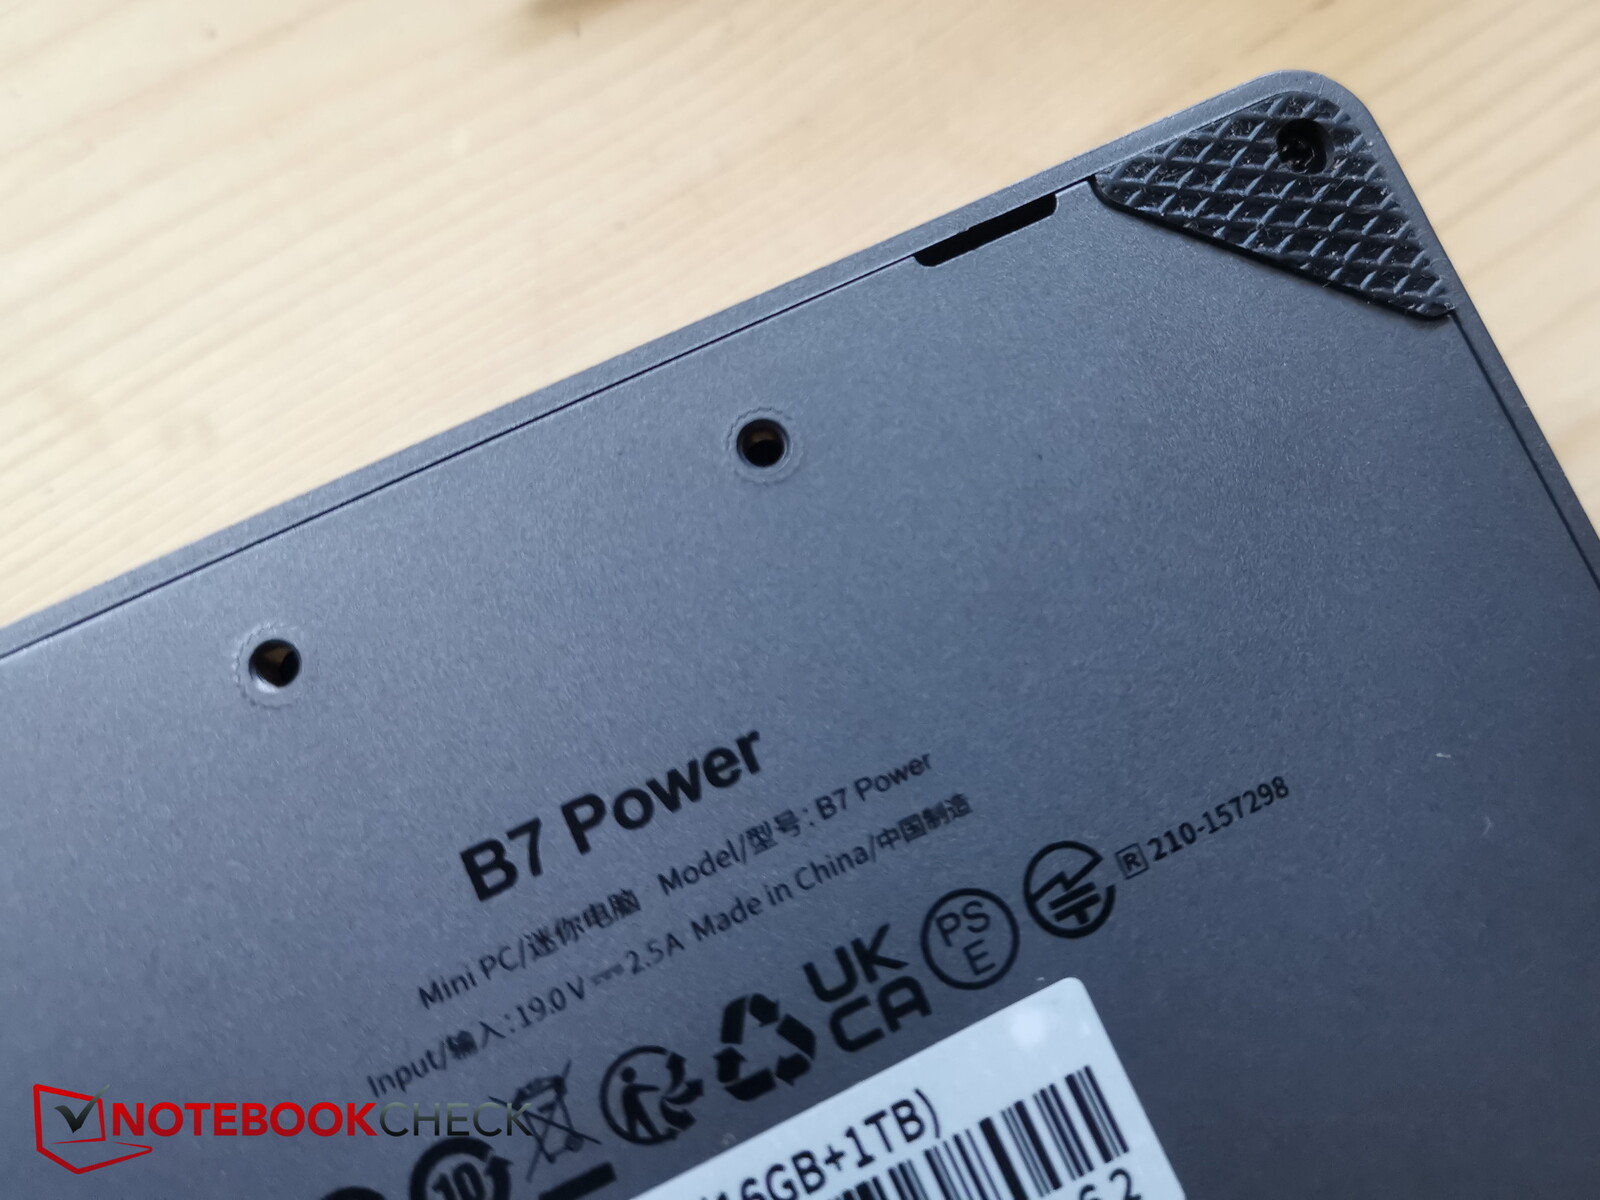
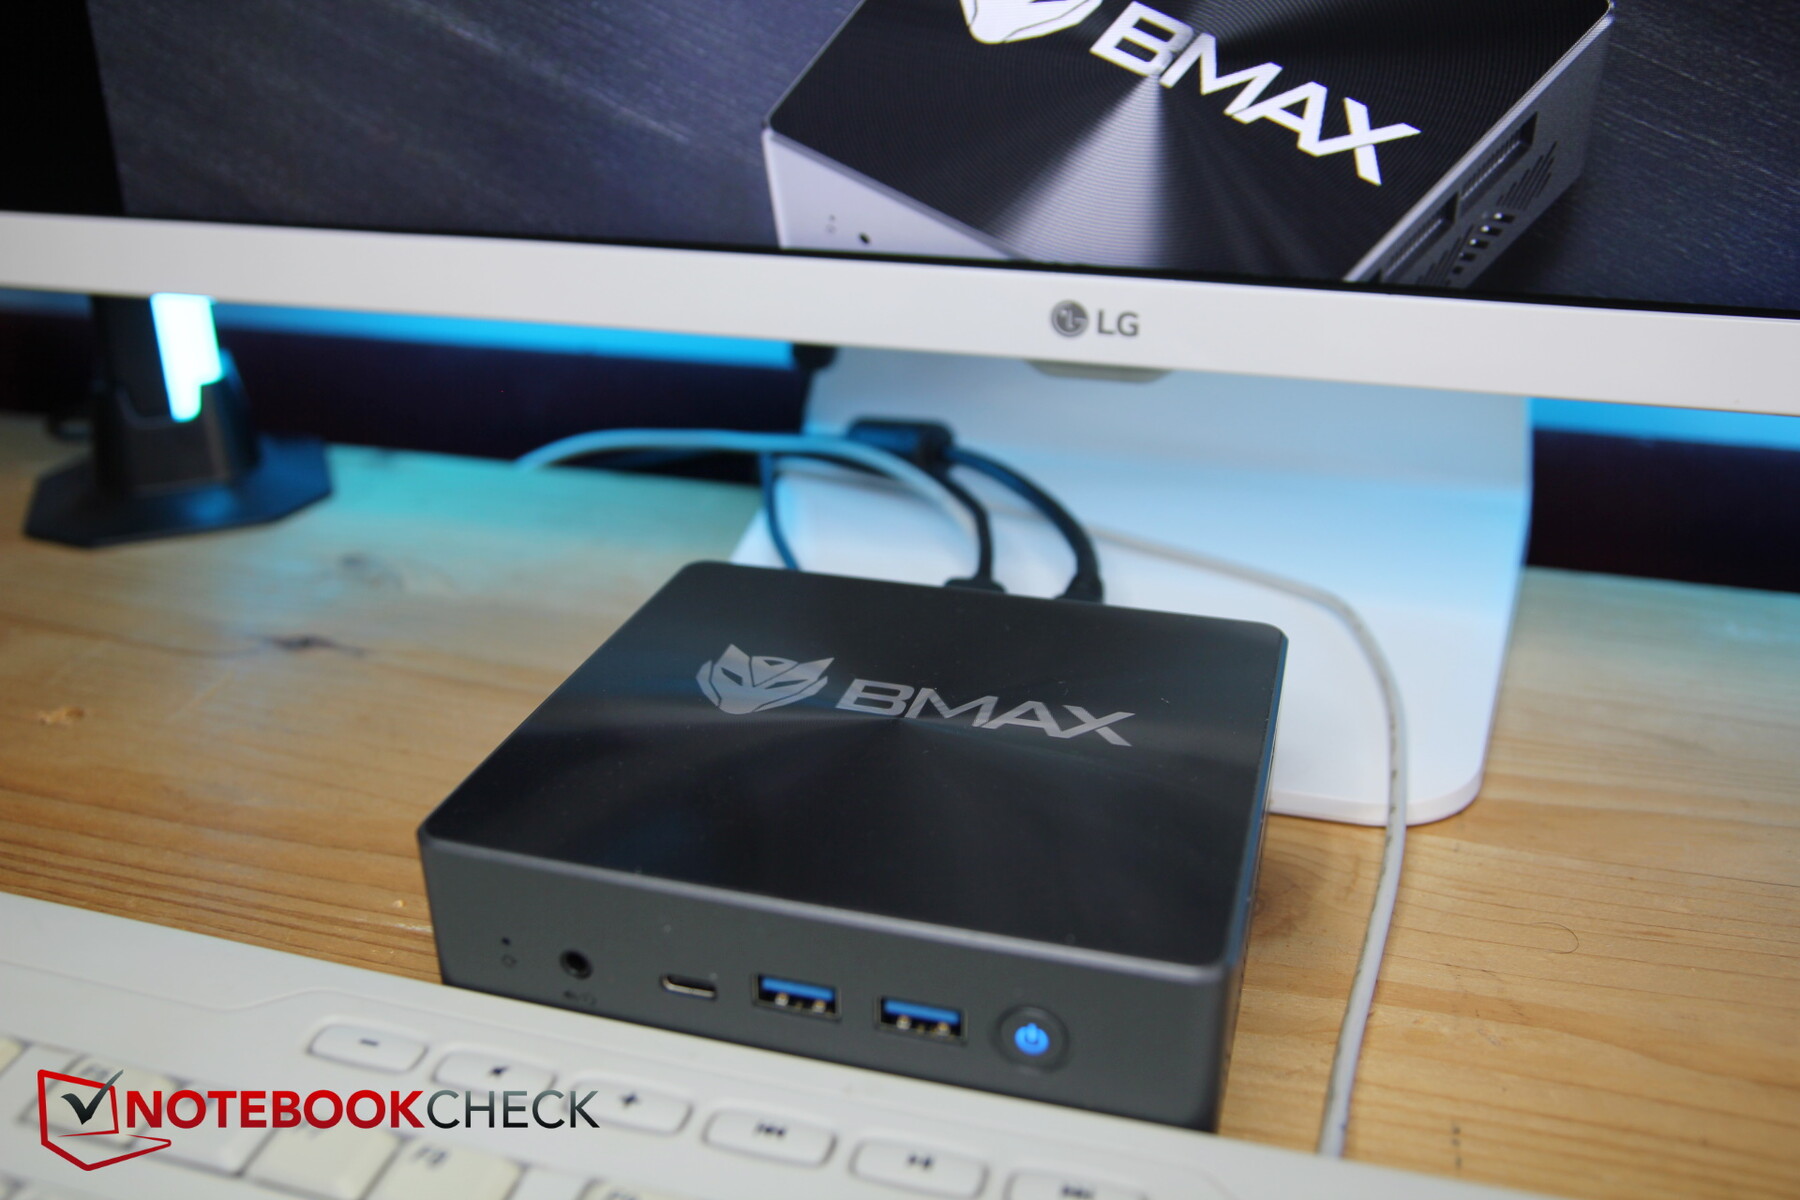
Carcasa - La B7 Power está fabricada en plástico
La carcasa del PC está hecha básicamente de plástico de color gris oscuro a negro. A pesar de su forma rectangular compacta, es bastante resistente. Aunque no deberías intentar doblarlo demasiado, ya que empezarás a oír crujir el plástico. Al mismo tiempo, el plástico confiere al dispositivo un peso reducido de sólo 363 gramos.
La parte superior del B7 Power llama un poco la atención porque hay una especie de impresión con estructura de lente Fresnel sobre el logotipo de BMAX, que hace que la parte superior brille de forma diferente según el ángulo de visión.

El B7 Power es también el más ligero de los mini PC de esta comparativa. Con 363 gramos, pesa bastante menos que los modelos NUC de Intel (al menos 538 gramos). El siguiente competidor más ligero es el mini PC de Beelinkpero con un peso de 440 gramos, ya es bastante más pesado.
Por otro lado, algunos competidores como los NUC de Intel son un poco más pequeños: su parte frontal es unos 8 mm más corta. El Beelink tiene medidas similares.

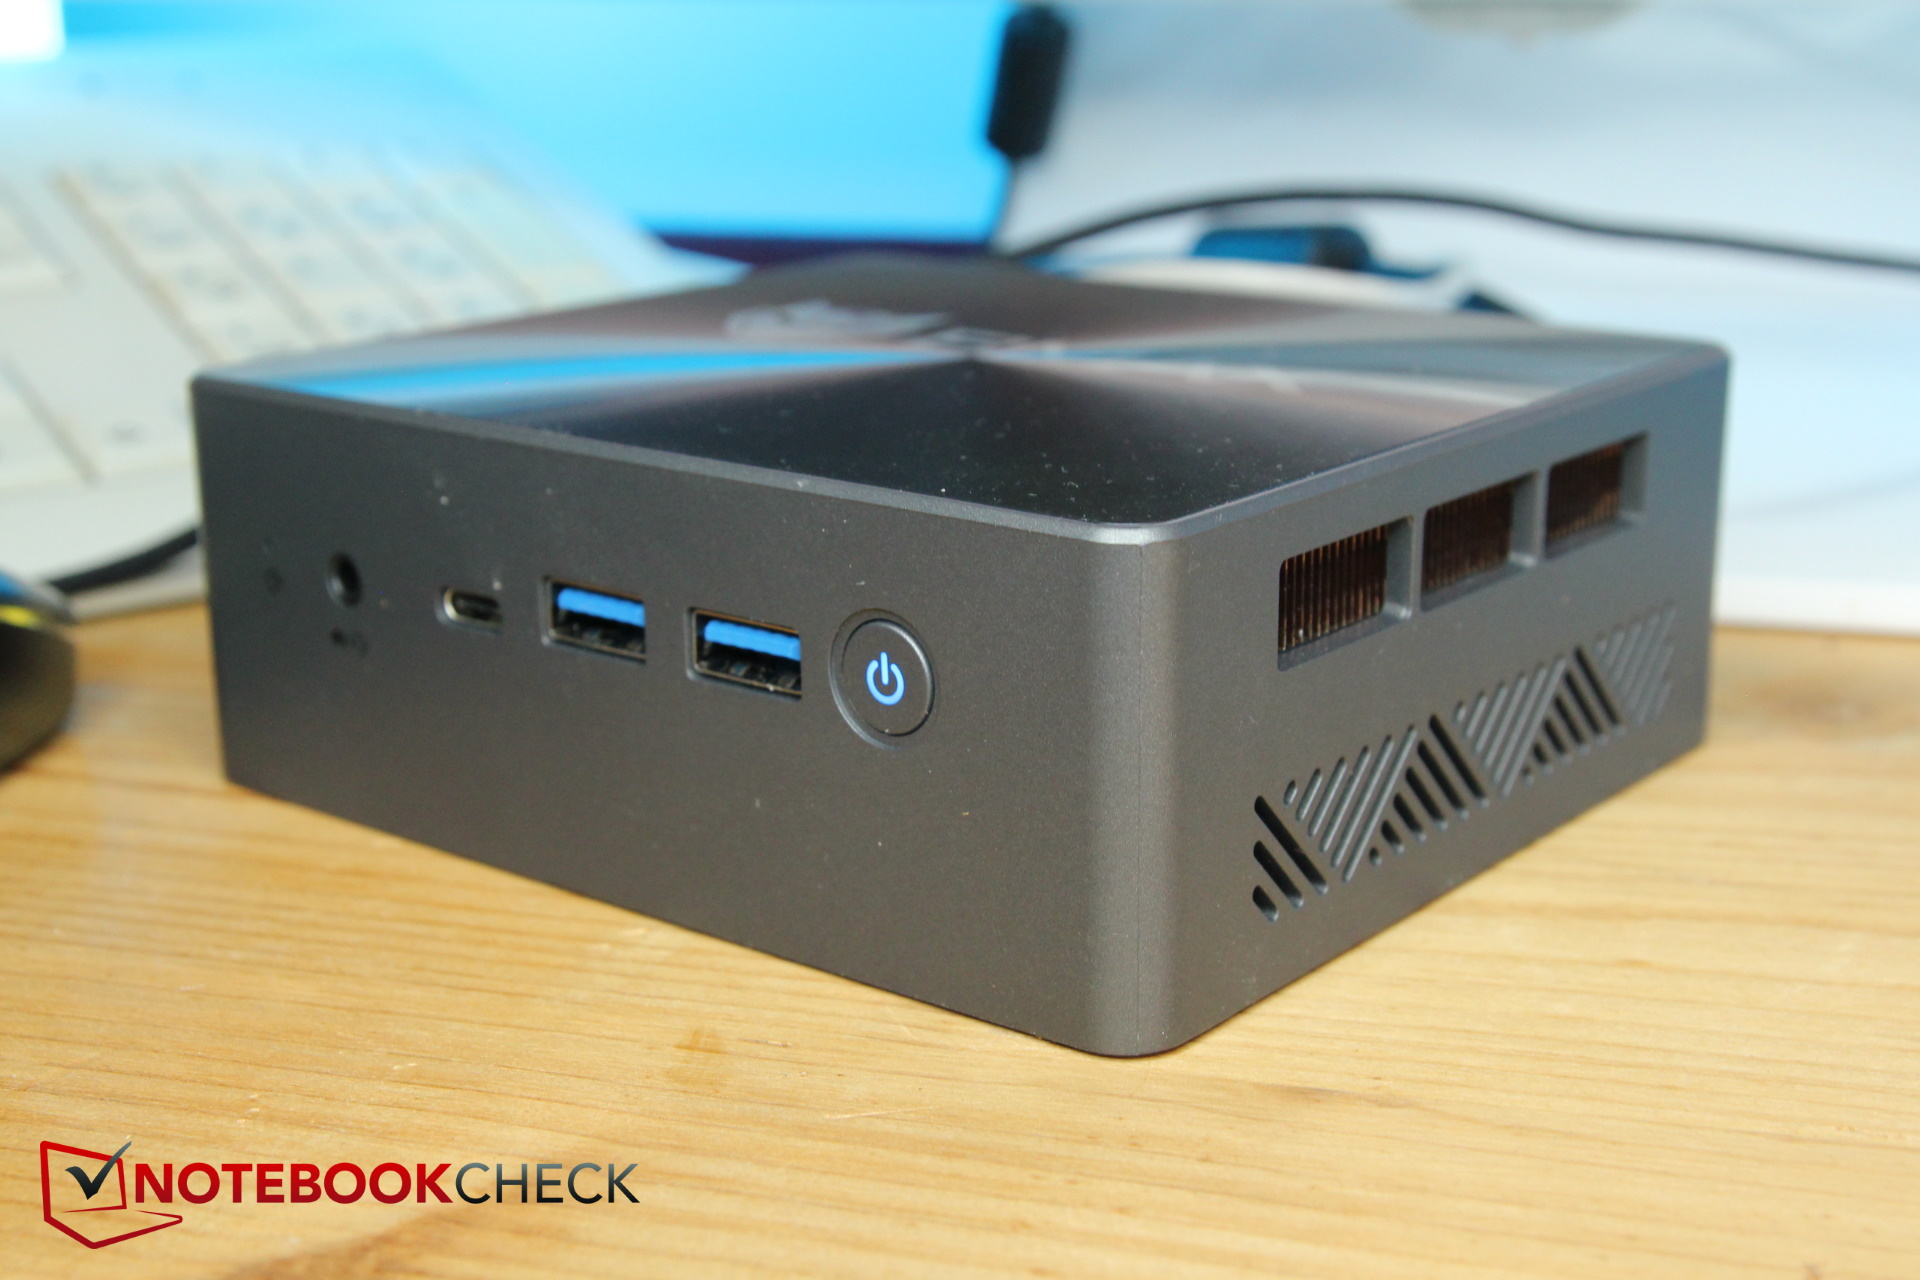
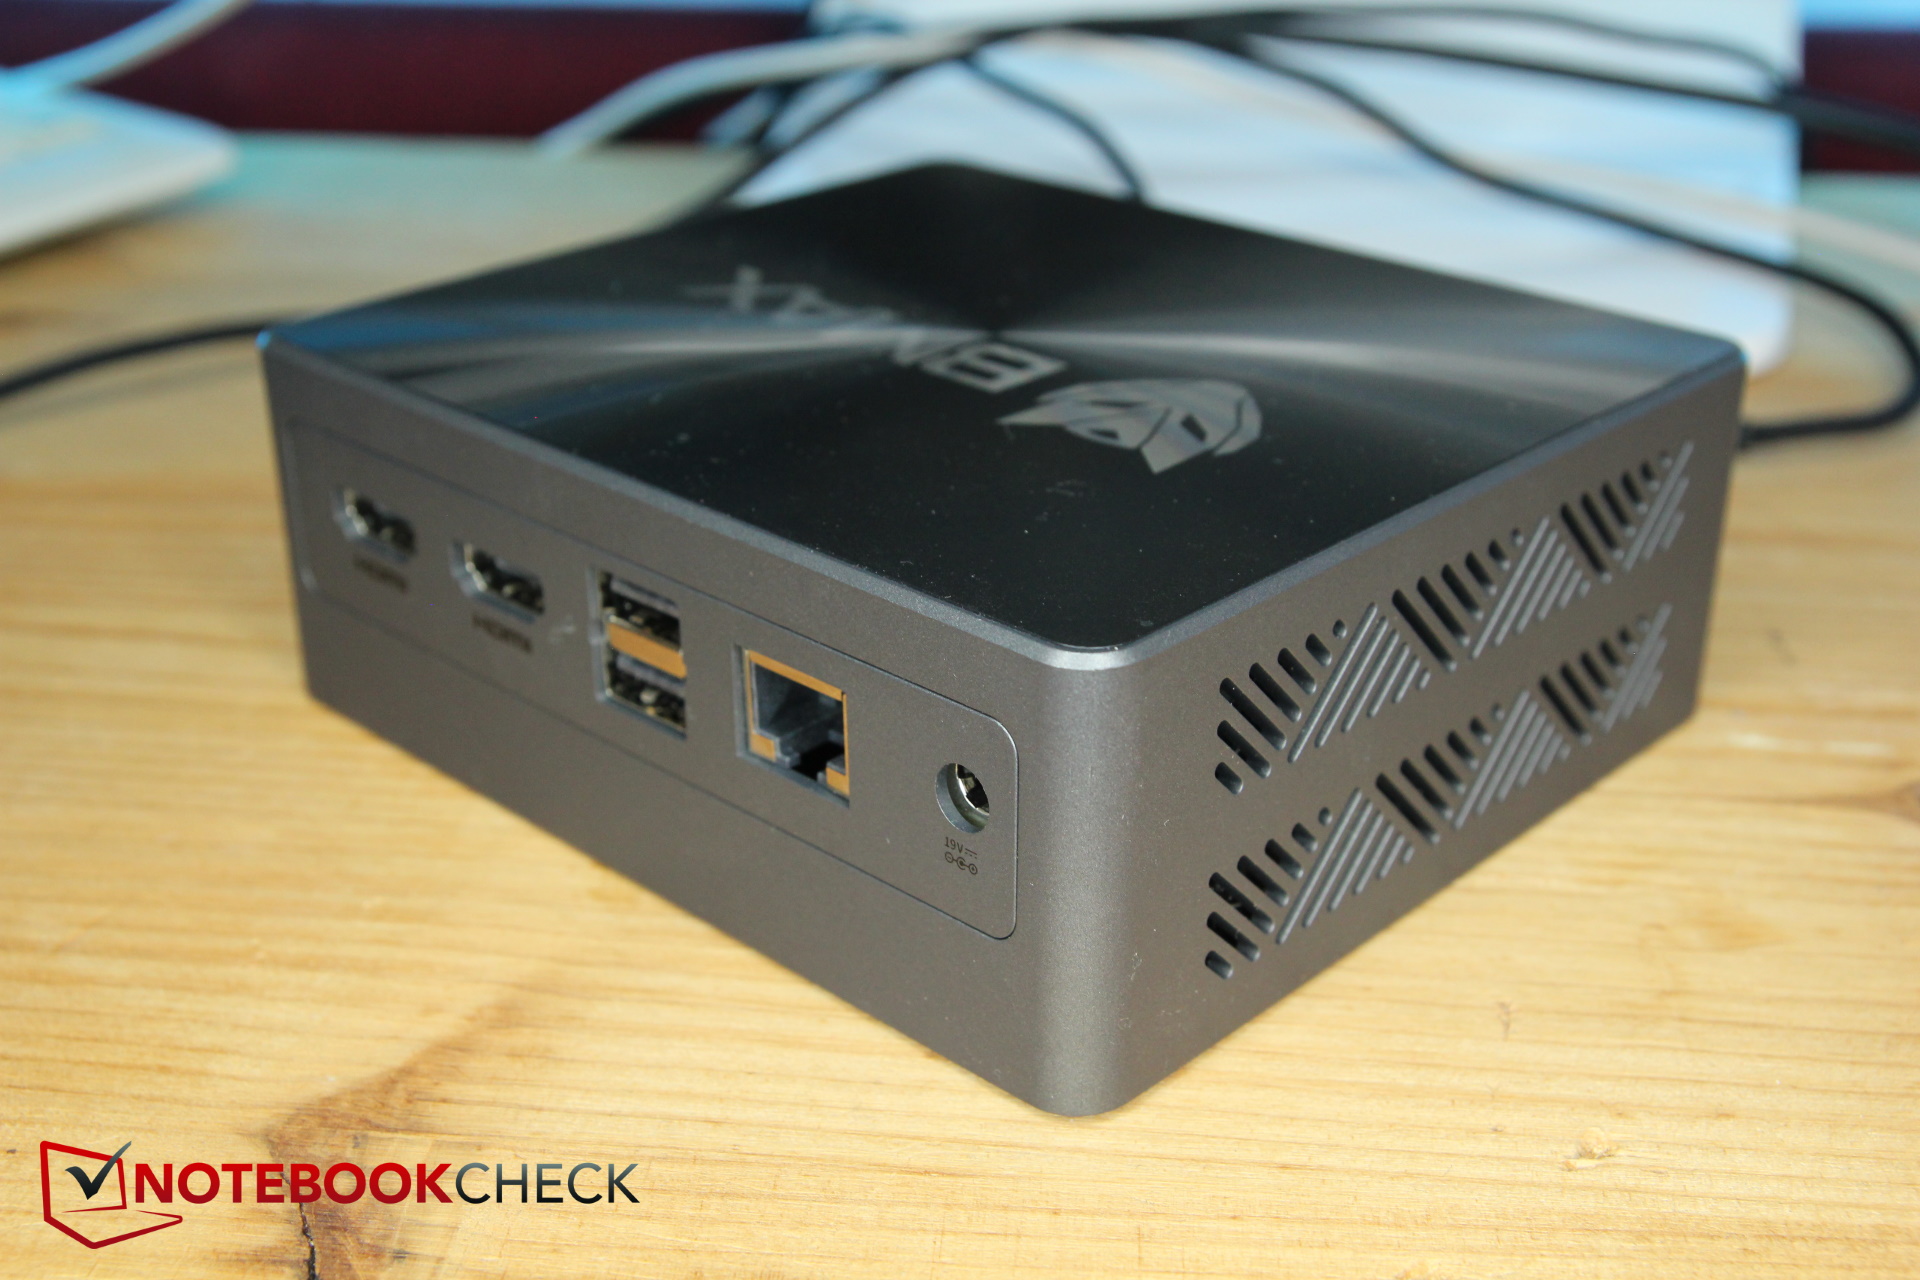
Conectividad - USB-C sin Thunderbolt pero con PD
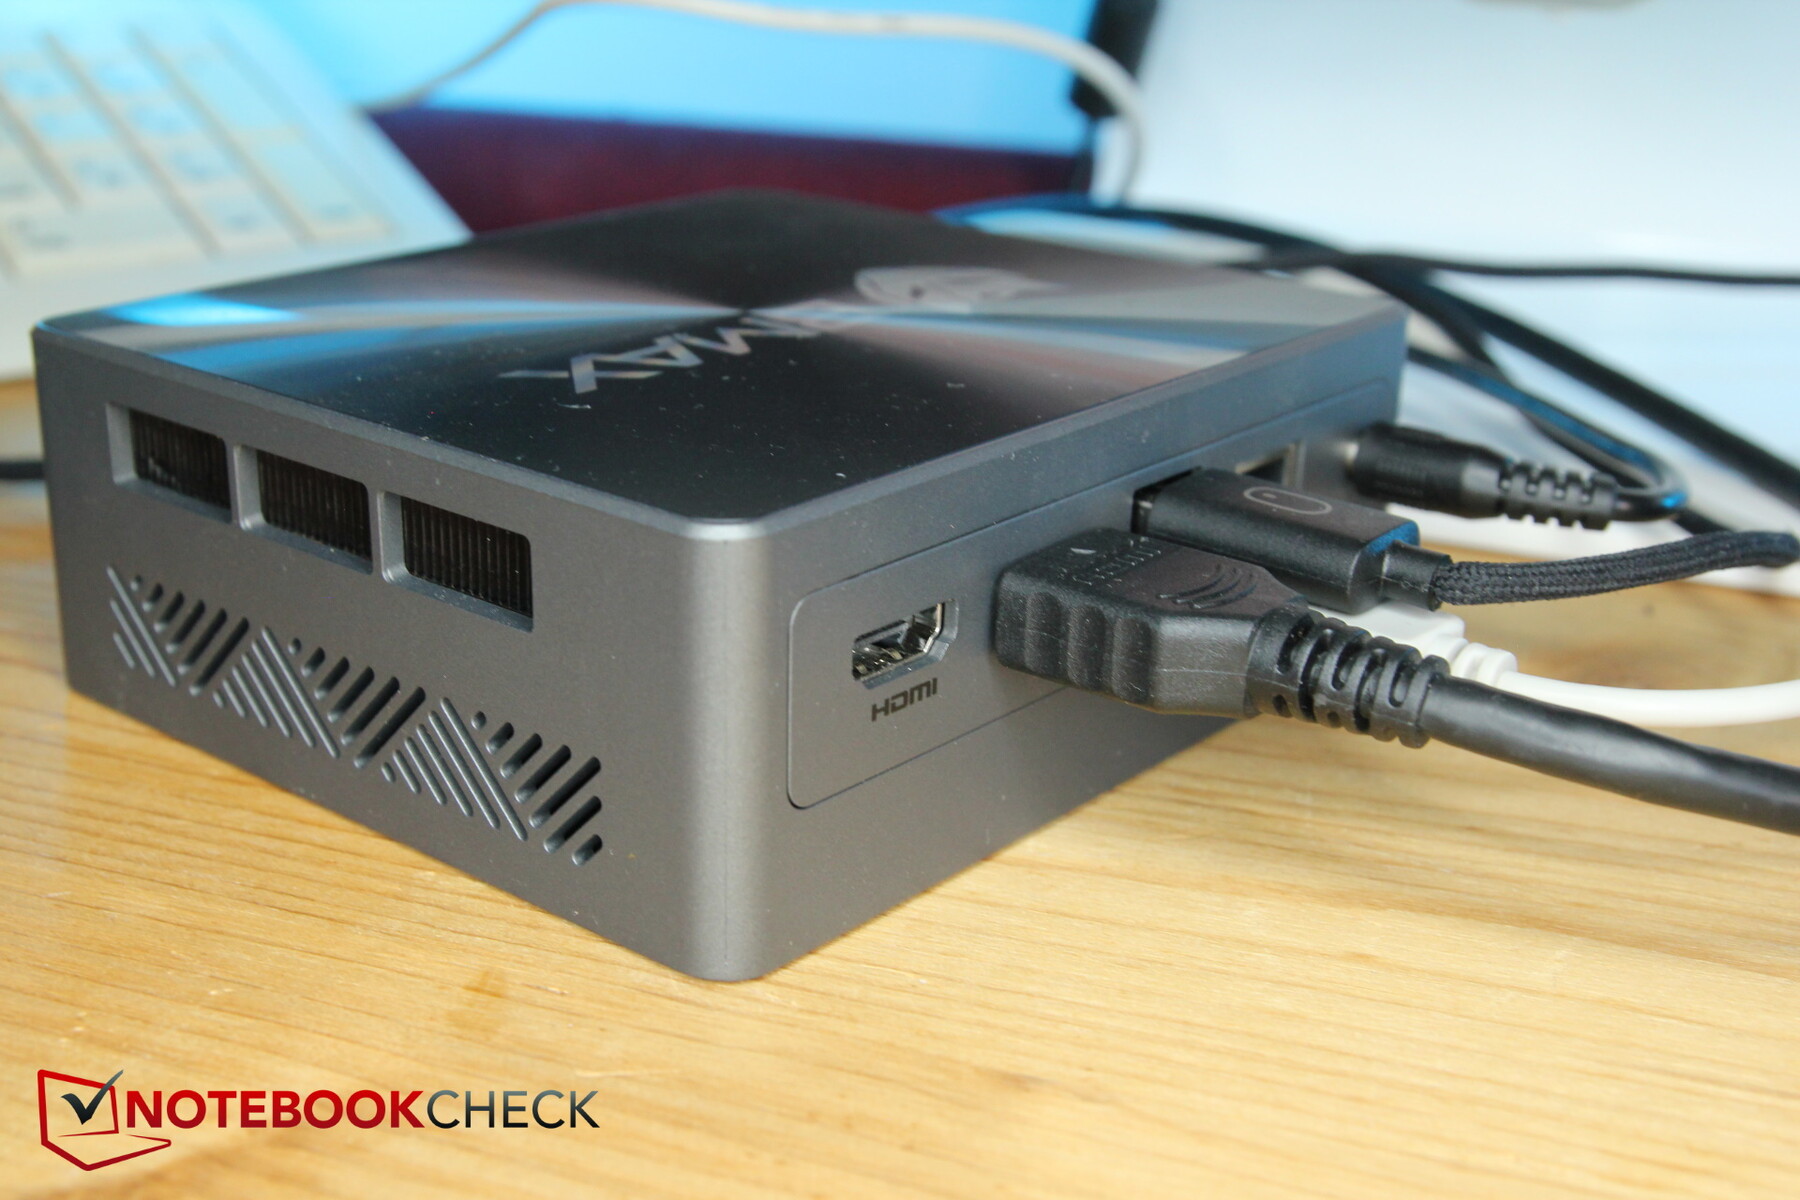
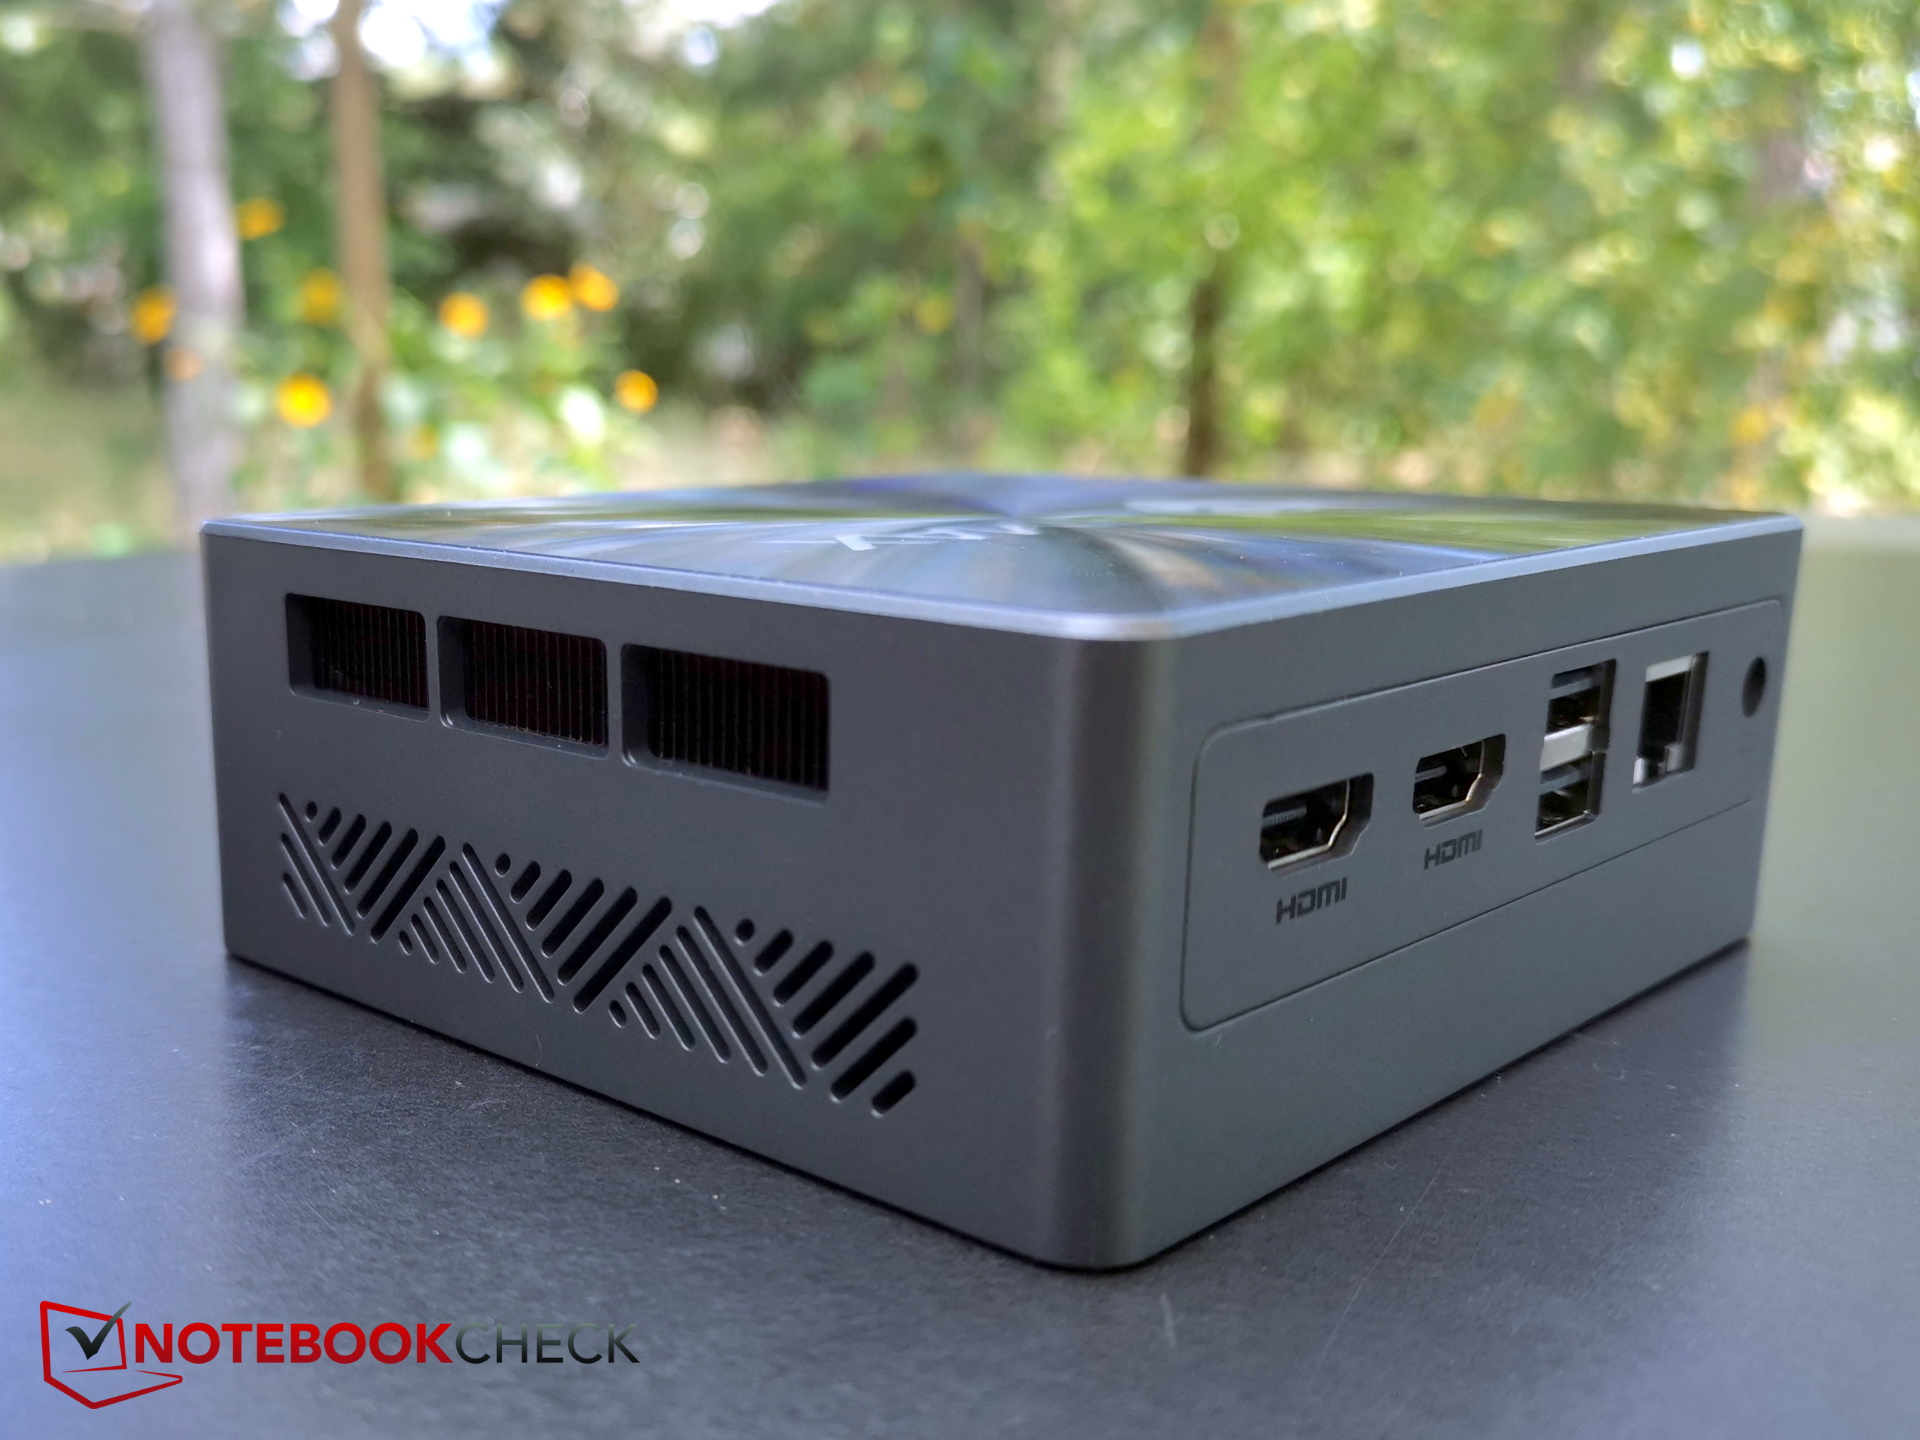
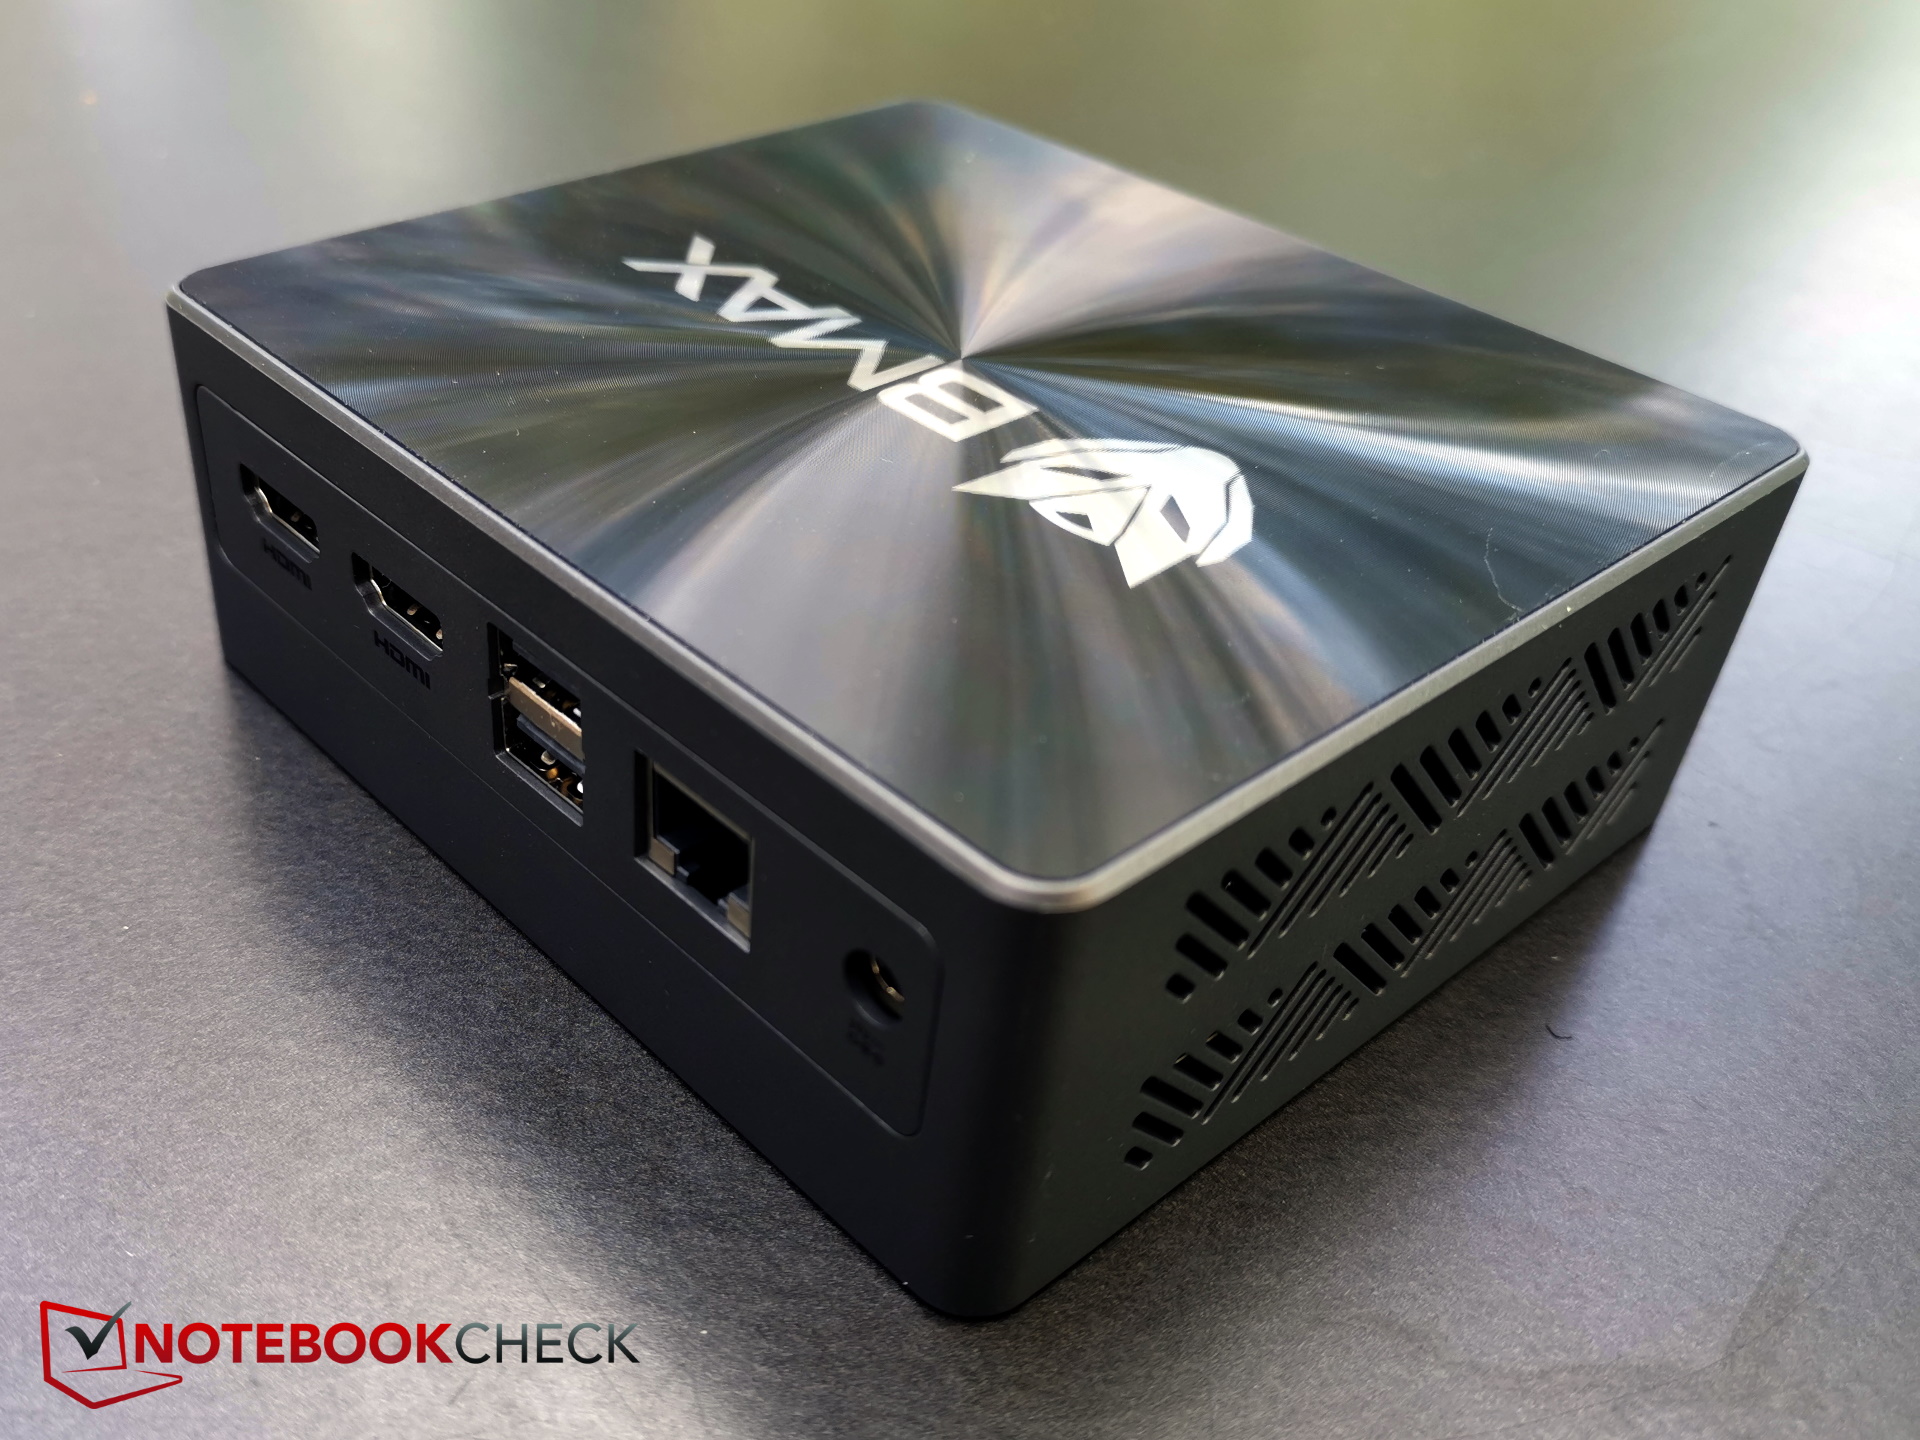
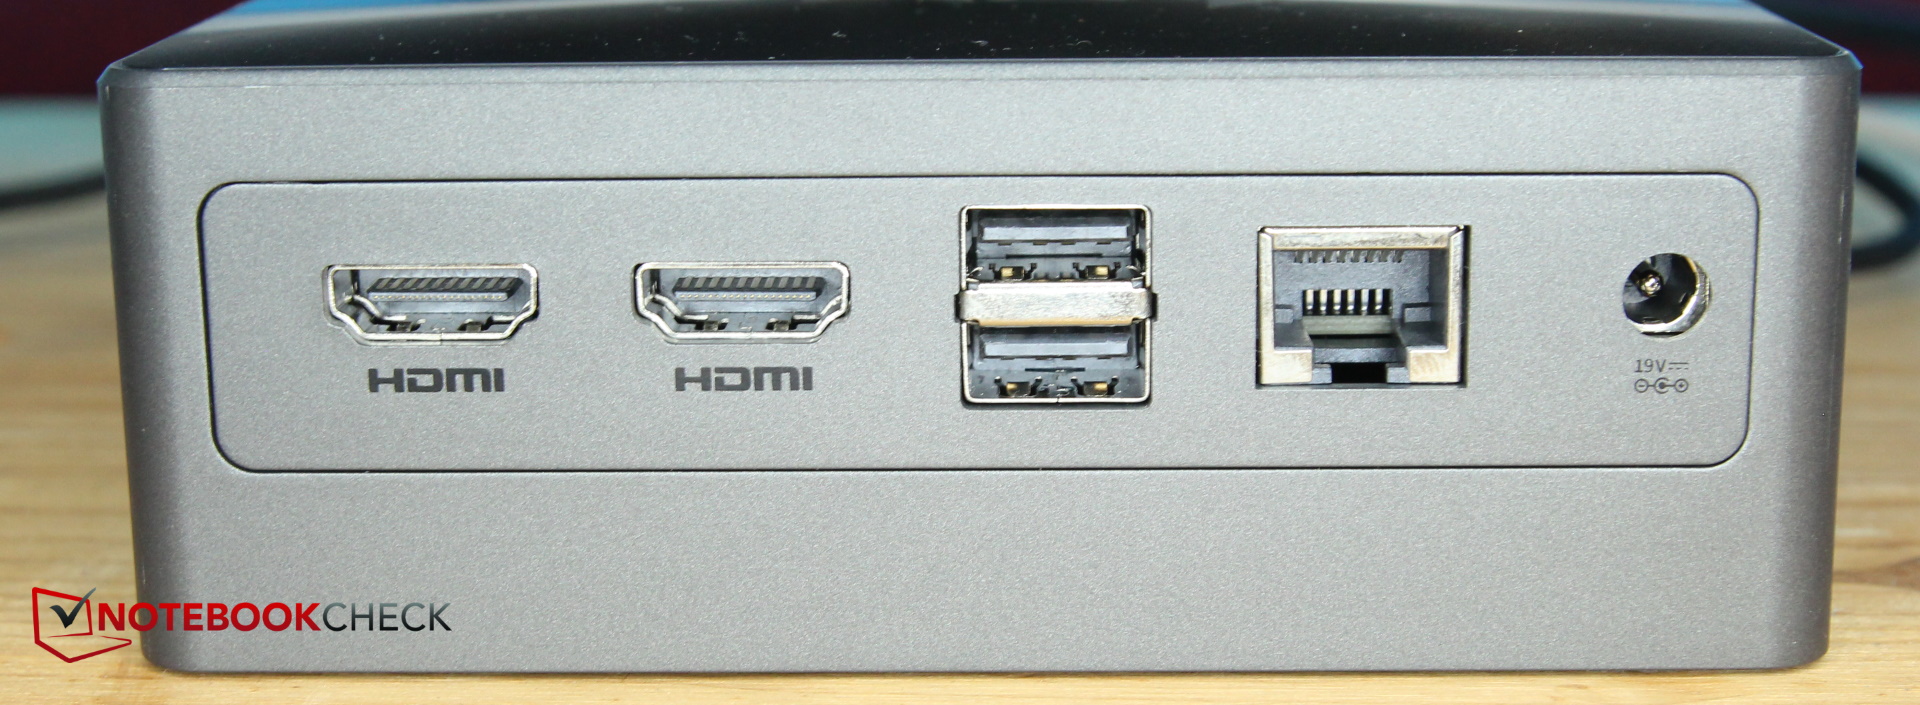
En la parte trasera del PC se encuentran todos los puertos necesarios para conexiones permanentes, incluidos dos puertos USB-A para conectar un ratón y un teclado, dos puertos HDMI 2.0 para conectar hasta dos monitores, así como un puerto LAN y una conexión de alimentación.
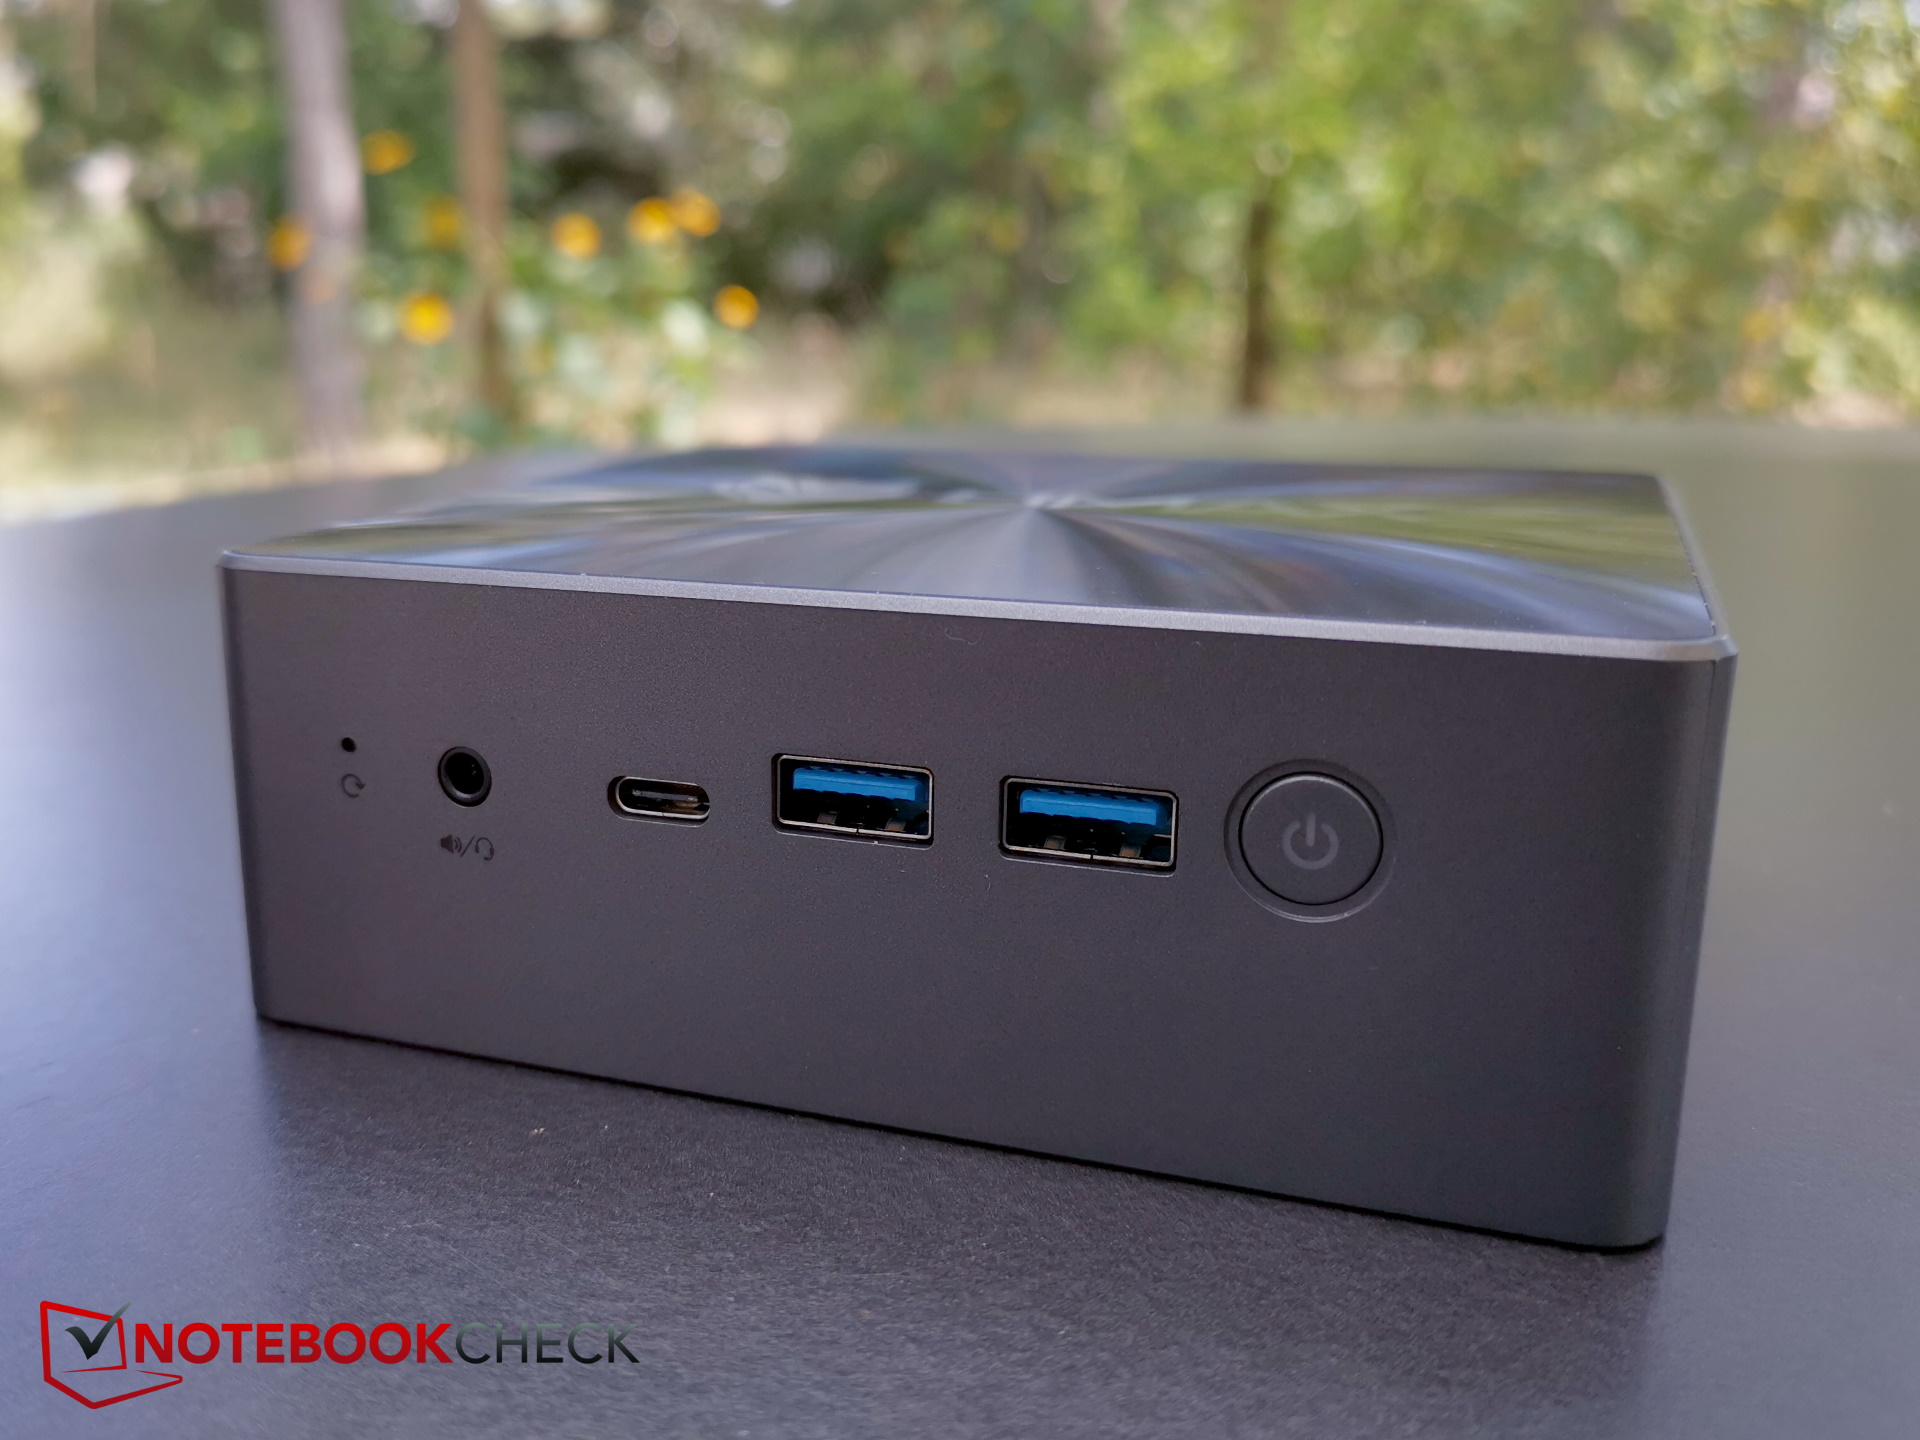
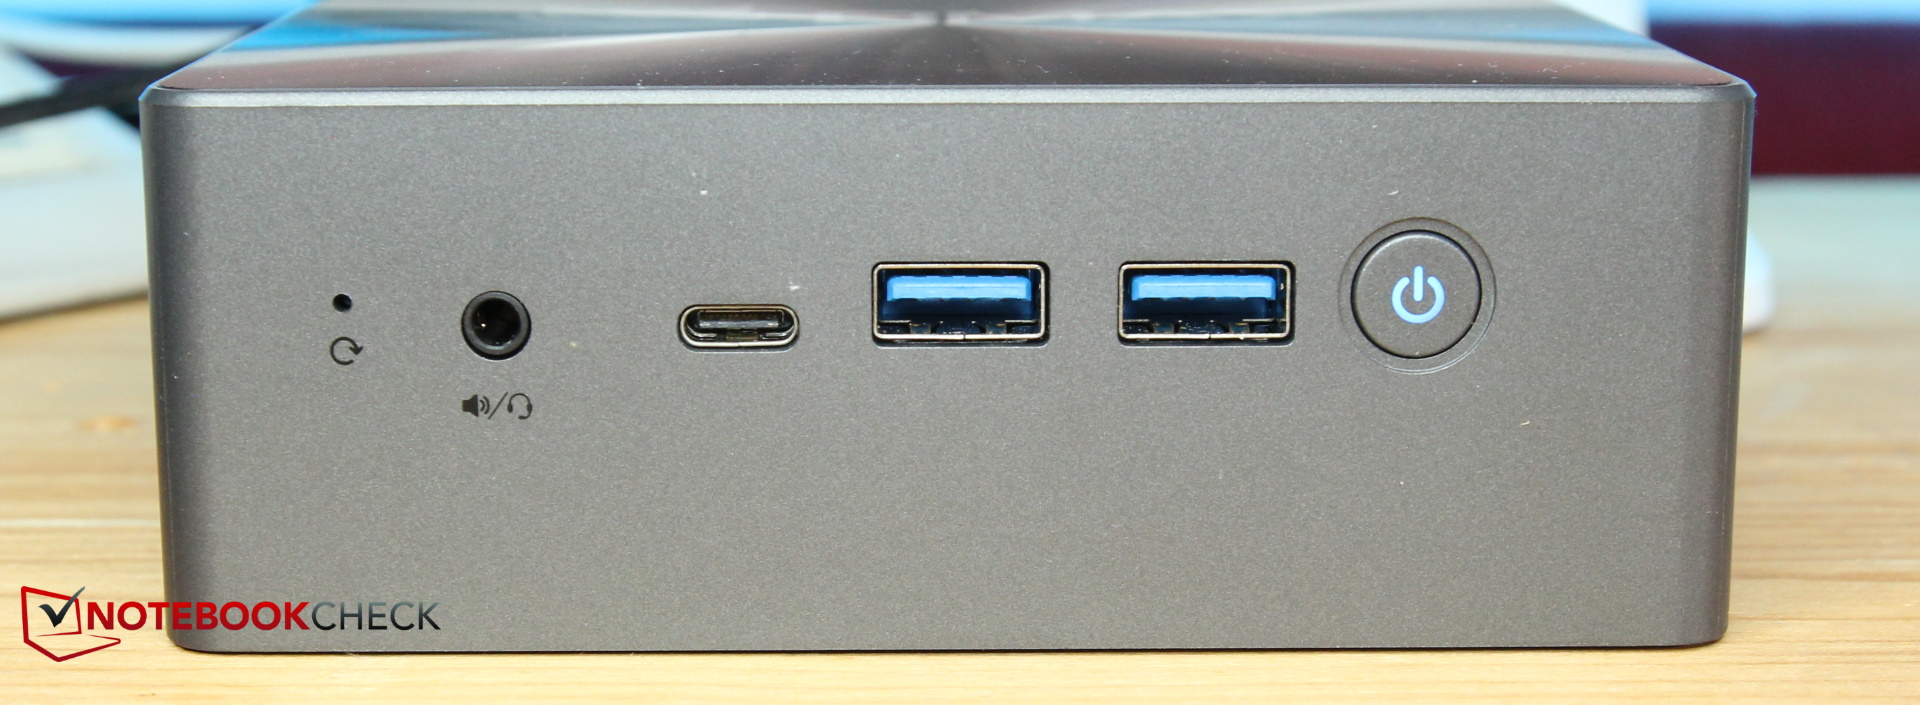
En la parte frontal, hay puertos adicionales para conectar dispositivos USB externos o auriculares. Aquí también se puede encontrar un puerto USB-C. BMAX lo ha indicado como "con todas las funciones". Está claro que no es compatible con Thunderbolt - pero sí con DisplayPort, lo que significa que se pueden conectar un total de tres monitores a la vez al B7 Power.
Este puerto también admite Power Delivery, como confirmó nuestra prueba con dos cargadores USB-C. El cargador de 30 vatios de un MacBook Air no funcionó, pero sí un cargador de 45 vatios. Oficialmente, el B7 requiere 19 V y 2,5 A (47,5 W).
El B7 no tiene lector de tarjetas SD. Hay algunos agujeros para tornillos en la parte inferior del dispositivo que puedes utilizar para conectar el mini PC a la parte posterior de un monitor utilizando el soporte VESA suministrado.
Comunicación
Además de la conexión LAN Gigabit, el B7 Power también puede conectarse por WiFi. Para ello, el fabricante ha instalado un chip de Realtek que supuestamente también soporta WiFi 6. Esto significa que puede conectarse a la red de 5 GHz, pero no a la de 6 GHz.
El mini PC es bastante rápido cuando se trata de 5 GHz. Sin embargo, usando 2,4 GHz "normales" nos da una impresión totalmente distinta. Aquí, las tasas de transferencia del PC en nuestro entorno de pruebas (propiedad alquilada, múltiples redes superpuestas en las inmediaciones) fueron abominables - sólo medimos entre 100 y 150 MB/s.
Seguridad
Por supuesto, también es compatible con TPM gracias a su chip Intel, pero aparte de esto, el B7 Power ni siquiera ofrece un bloqueo Kensington. Sin embargo, es probable que no mucha gente eche esto en falta en un mini PC.
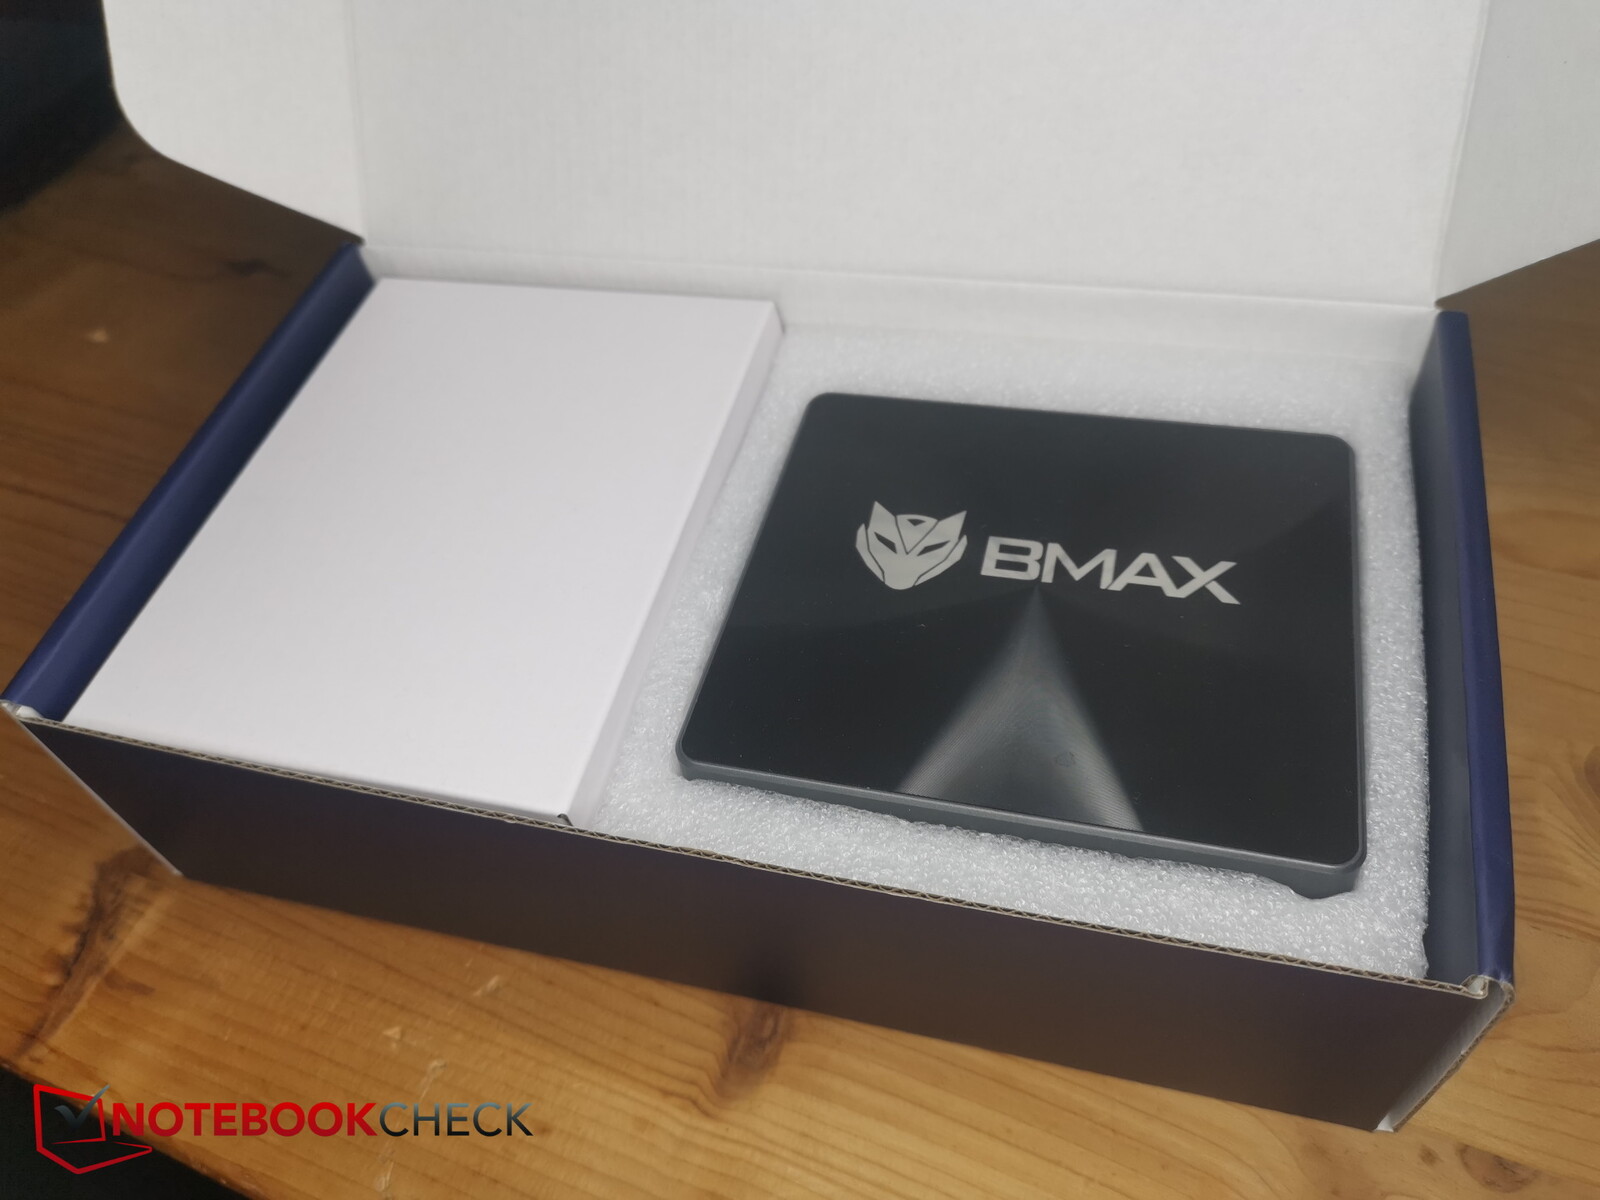
Volumen de suministro y garantía
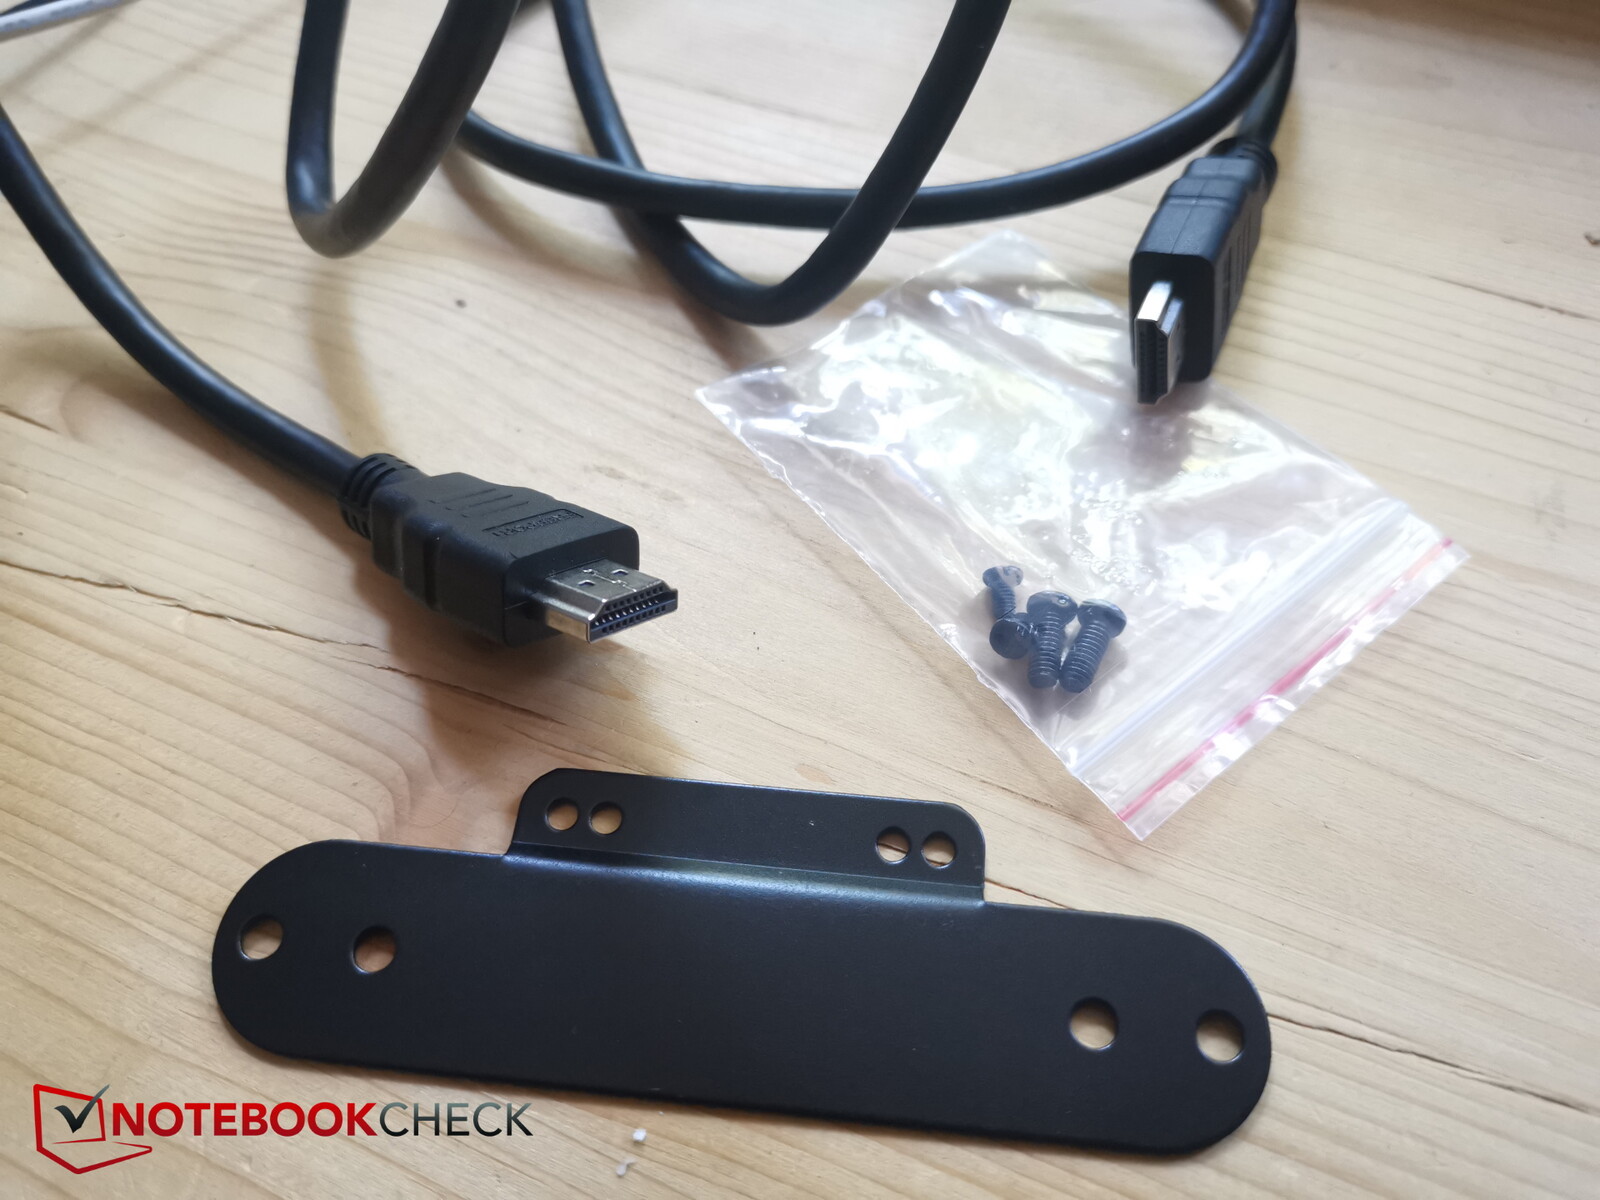
Además del propio mini PC, el fabricante también ha incluido una fuente de alimentación propia, un cable HDMI y un soporte VESA con los tornillos necesarios.
Por el momento, el fabricante no ha hecho ningún comentario sobre si el PC tiene garantía. La legislación local sobre garantías debería cubrir este aspecto.
Mantenimiento
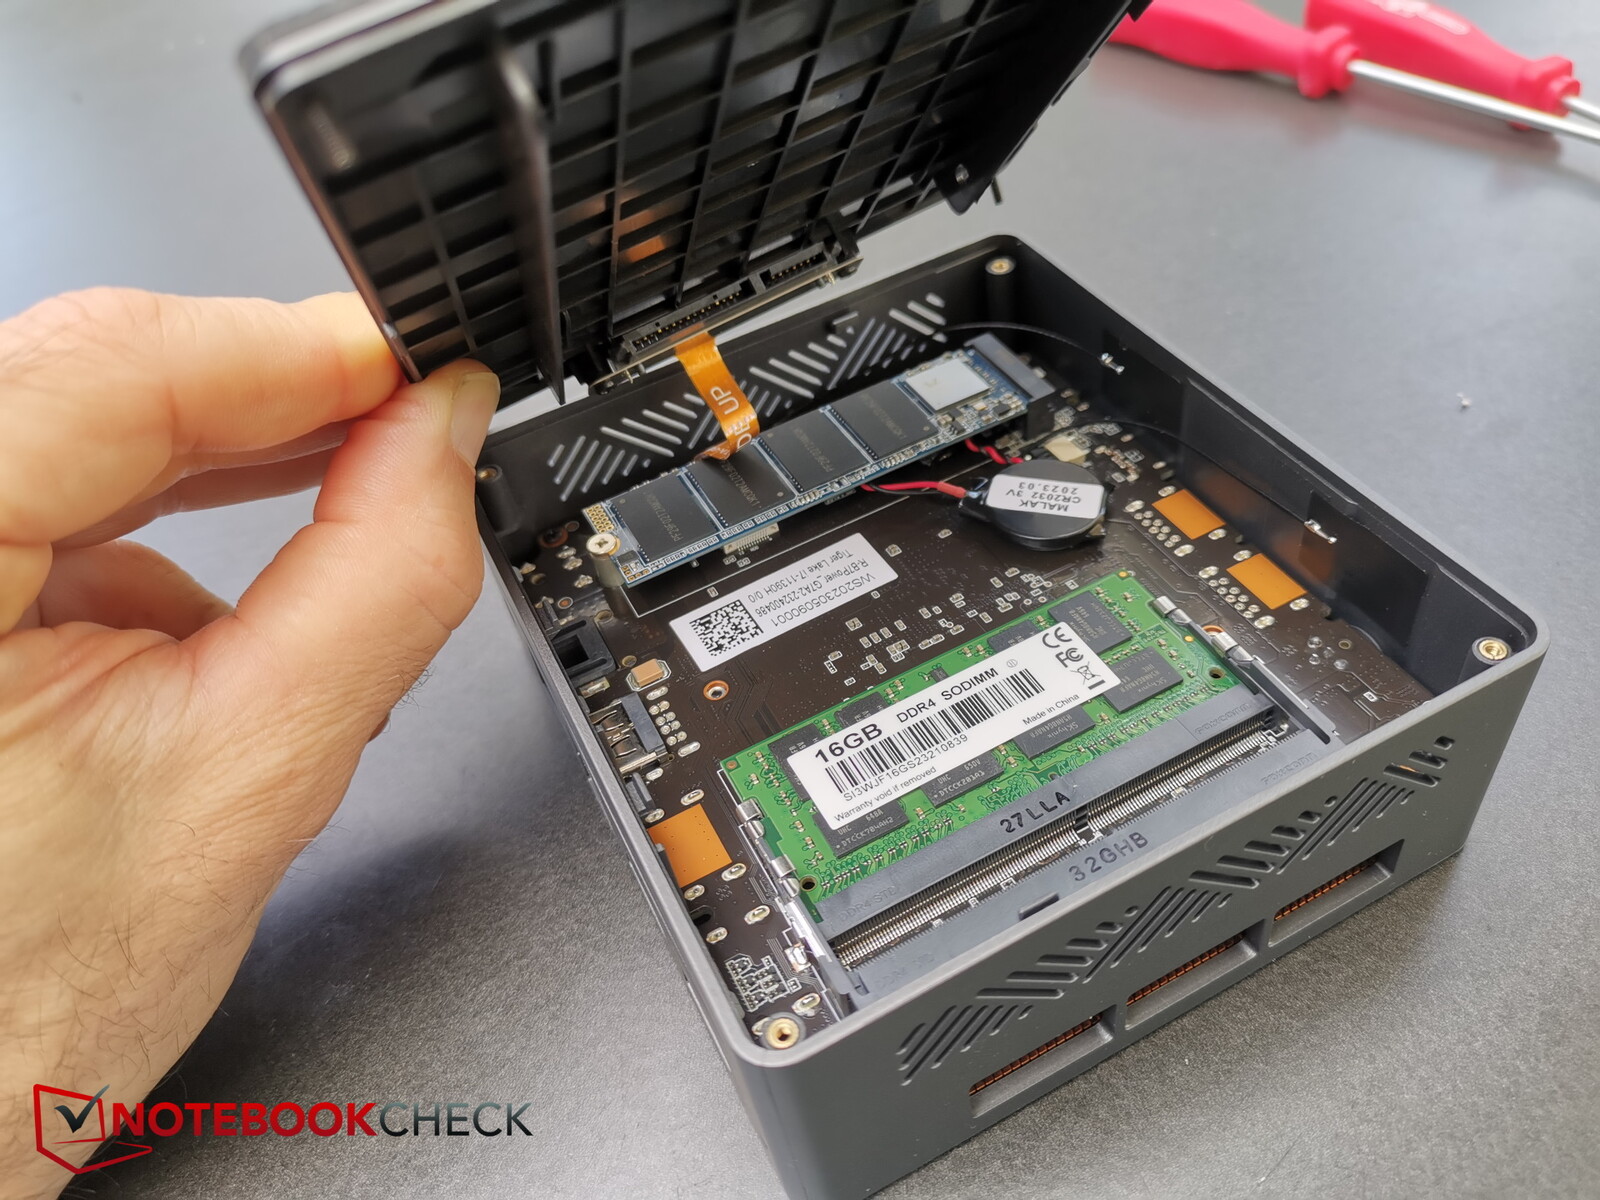
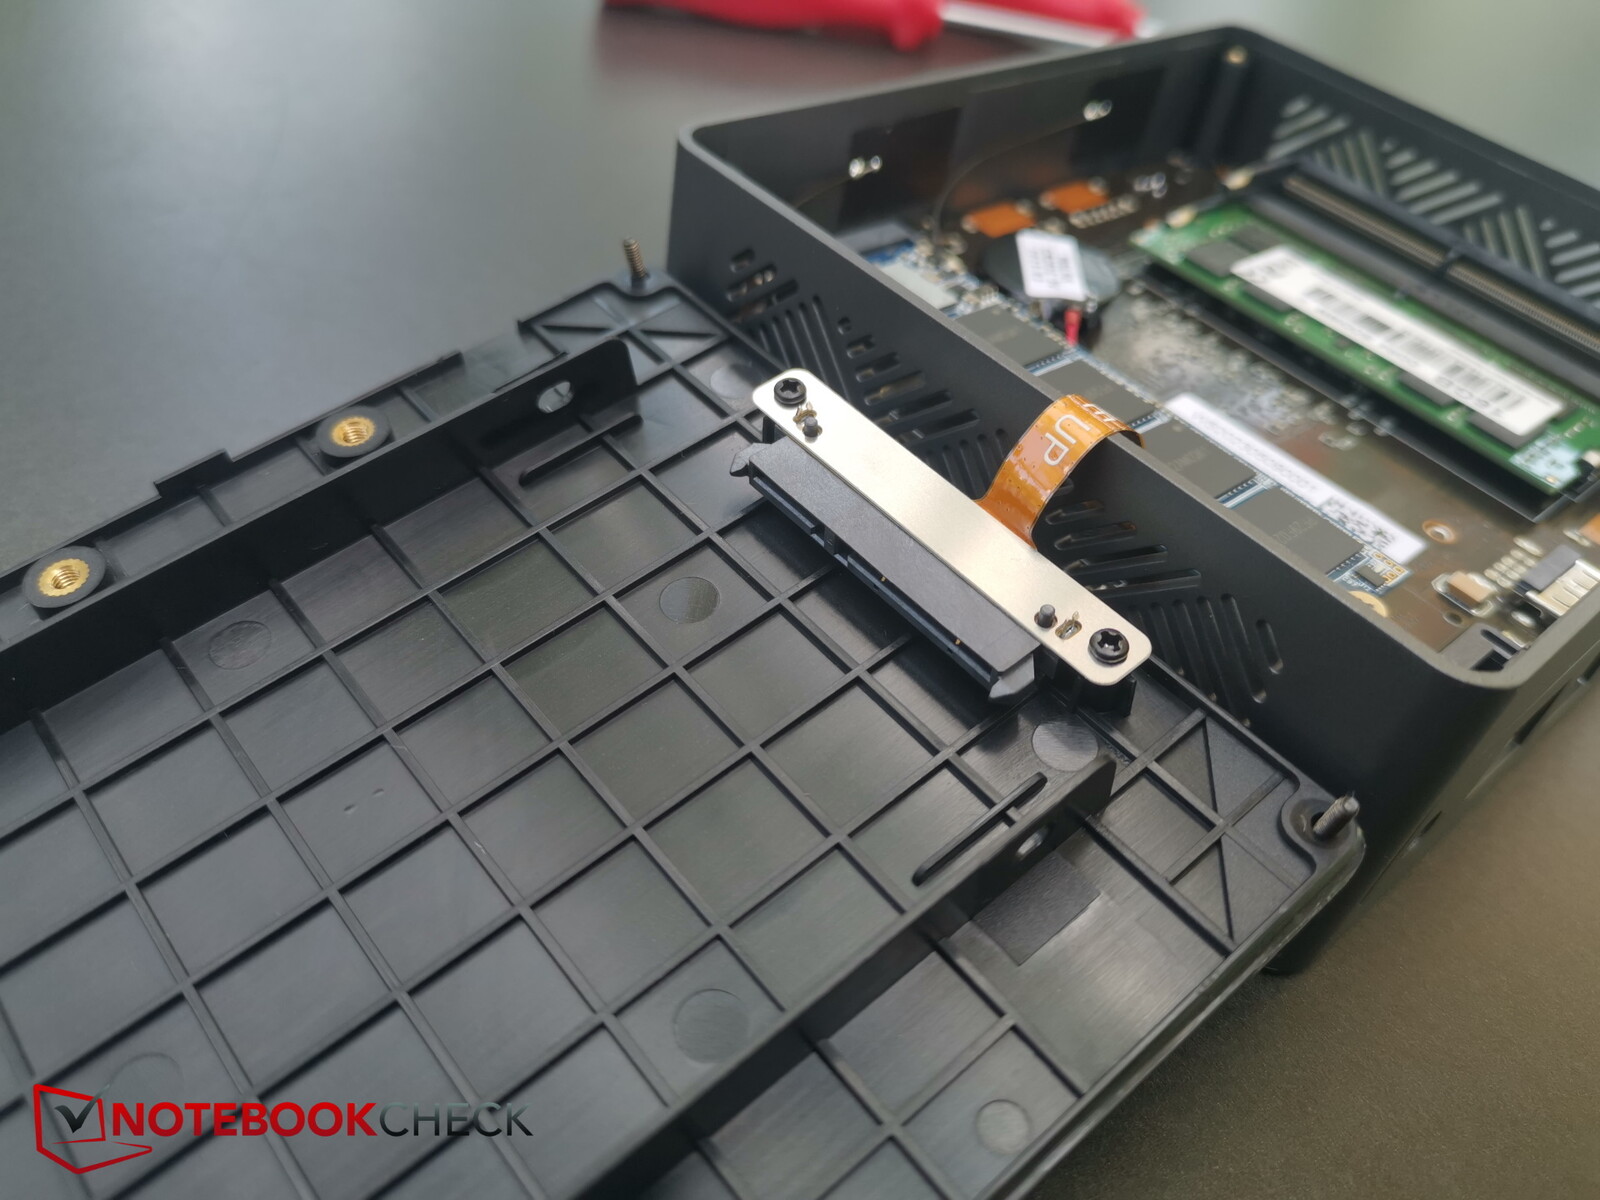
Realizar el mantenimiento del aparato es agradable y sencillo. Sólo 4 tornillos en cruz sujetan la placa inferior. Una vez retirados, se puede girar con cuidado la parte inferior hacia un lado (a la izquierda si se mira de frente y desde arriba). Hay un cable que conecta las dos partes que conecta el puerto SATA en la placa inferior interior a la placa base.
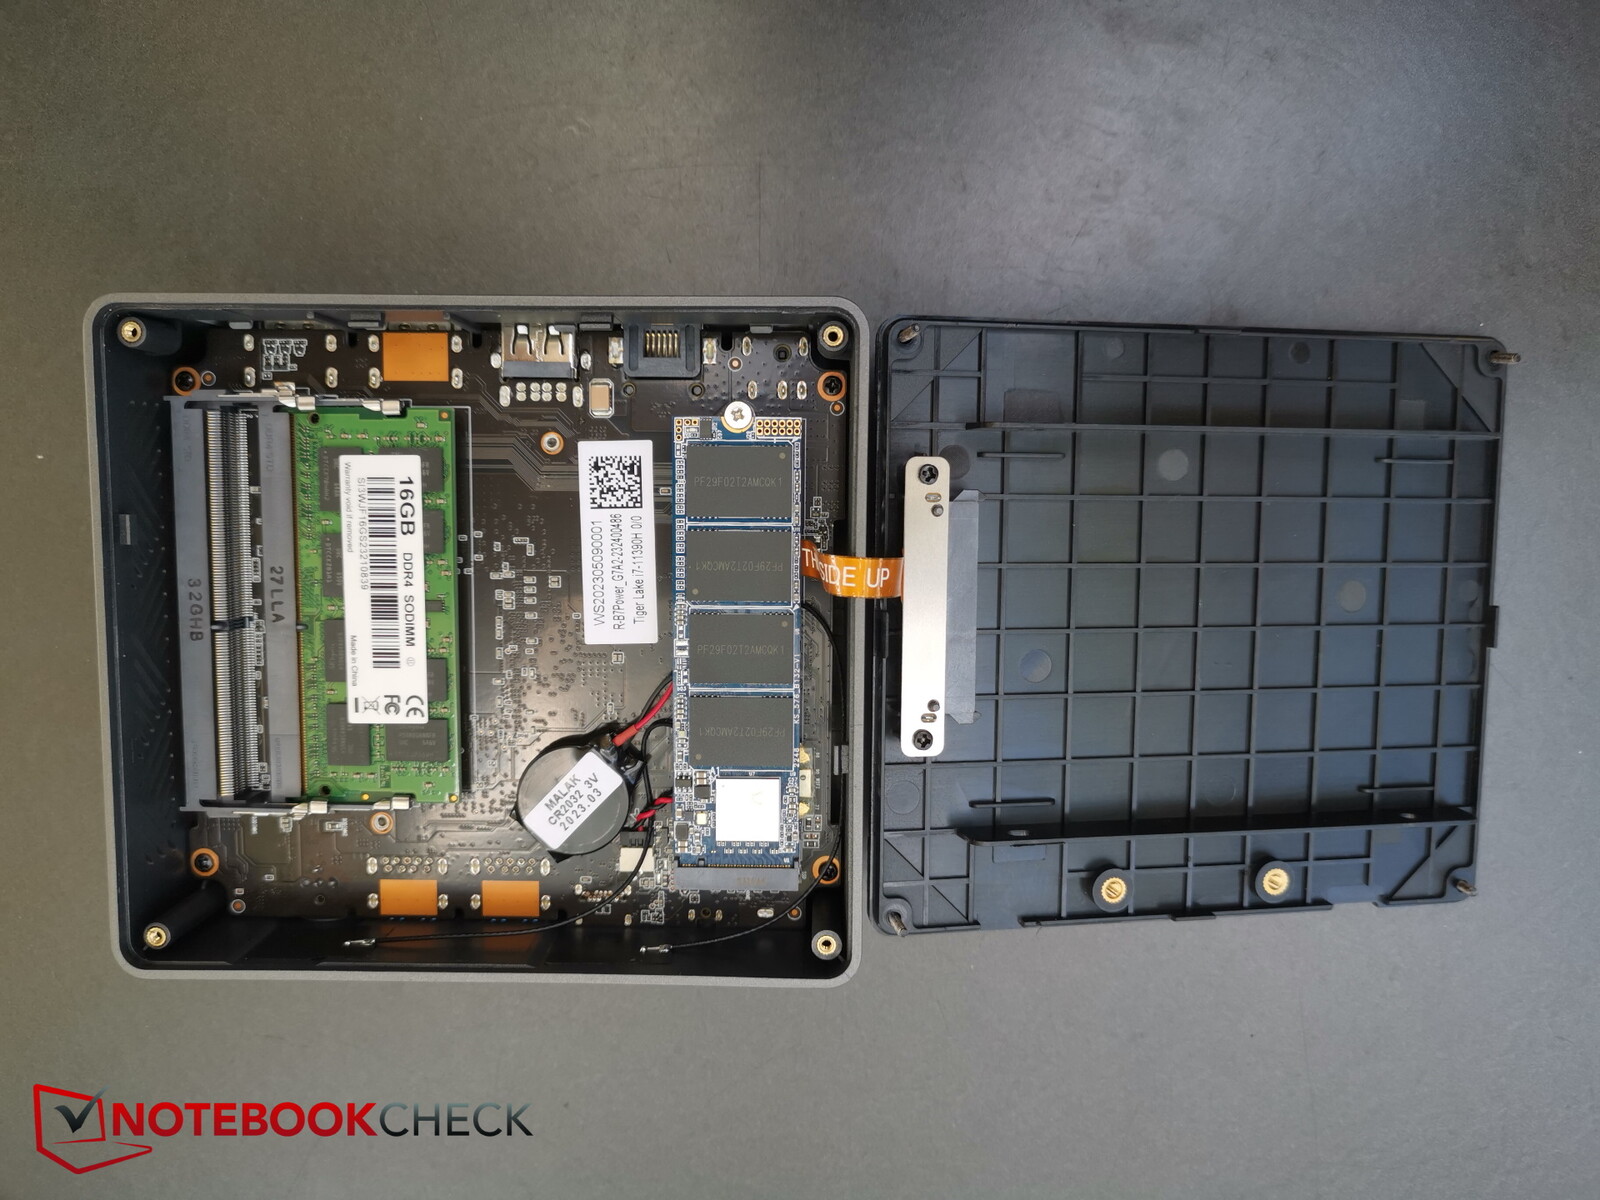
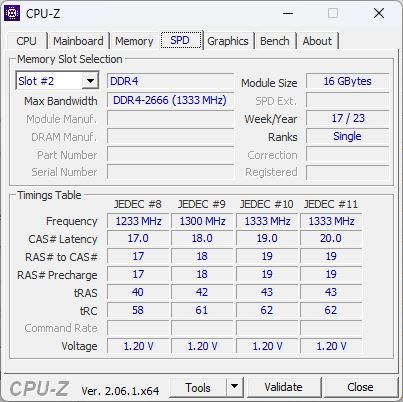
A continuación, puedes acceder a las dos ranuras de memoria RAM, a la unidad SSD NVMe y al puerto SATA mencionado anteriormente para unidades de disco duro o SSD de 2,5 pulgadas. Para acceder a los ventiladores, tendrás que desmontar aún más el dispositivo.

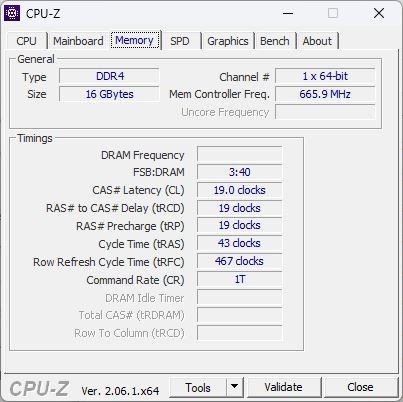
Rendimiento - Lento incluso para Gen11
Intel Gen 11, concretamente elIntel Core i7-11390Hes en general una CPU decente, pero está unos años por detrás de la tecnología actual que rodea a Intel Gen13, que se puede encontrar en elKit Intel NUC 13 Pro. Completan la configuración 16 GB de RAM con opción de ampliación y una unidad SSD de 1 TB. El PC no cuenta con una tarjeta gráfica dedicada, pero los gráficos XE integrados en la CPU funcionan con 96 UE a pleno rendimiento. El PC está pensado principalmente para el uso diario en la oficina y quizá también como consola retro.
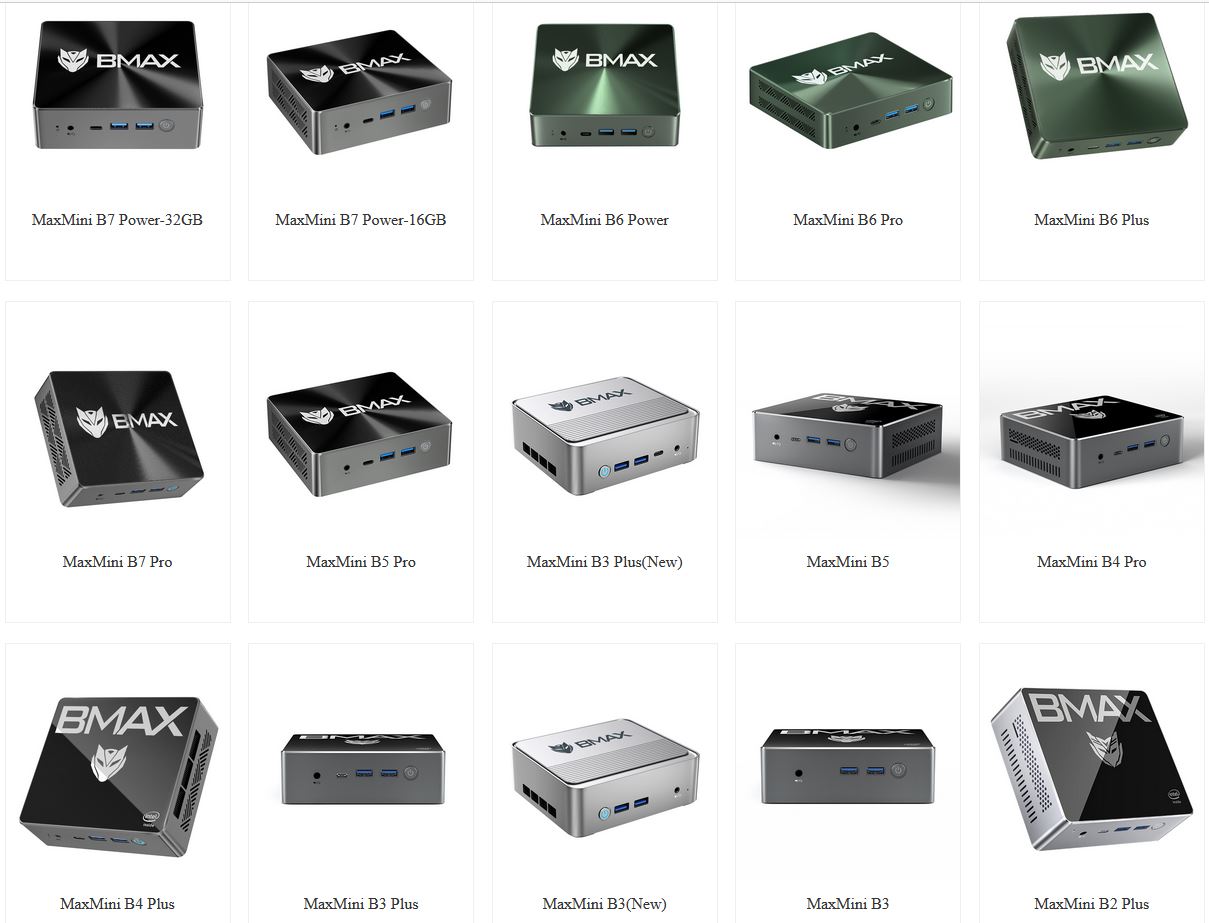
En el sitio web de BMAX se ofrece toda una gama de otros mini PC, incluido el B7 Pro con un procesadori5-1145G7. Sin embargo, el B7 Power ya es el actual modelo de gama alta del fabricante.
Condiciones de ensayo
El B7 Power se siente agradablemente espacioso, ya que no encontrarás ningún bloatware o software propio del fabricante, como Control Center, instalado en el PC. Para obtener los mejores resultados en los benchmarks, probamos el mejor rendimiento en modo Windows.
Nuestra pantalla se quedó en negro durante el primer arranque. Esto se solucionó pulsando la combinación de teclas Windows + P.
Procesador
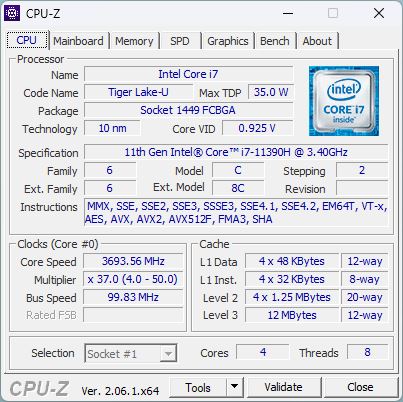
ElIntel Core i7-11390Hsigue formando parte de la serie Tiger Lake - dos de sus 4 núcleos pueden alcanzar individualmente una frecuencia de reloj de hasta 5 GHz. Los 4 núcleos están habilitados para hyper-threading, lo que significa que se pueden procesar 8 hilos a la vez.
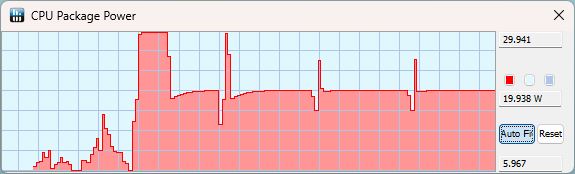
El chip puede configurarse de 28 a 35 vatios (TDP), dependiendo de cuál sea el reloj base garantizado, que puede ir de 2,9 (28 W) a 3,4 GHz (35 W). El extremo inferior del TDP parece estar configurado un poco más para el B7 Power. En nuestro bucle Cinebench R15, el consumo de energía del PC fue de unos 30 vatios durante la primera ejecución. A partir de la segunda ejecución, el B7 sólo alcanzó los 25 vatios y eso sólo muy brevemente; durante la mayor parte del resto de cada ejecución, el mini-PC sólo alcanzó algo menos de 20 vatios.
Tras la primera ejecución de Cinebench R15, el rendimiento del dispositivo cayó un 10% y se mantuvo estable después. Sin embargo, este rendimiento es bastante decepcionante en general. Por supuesto, los NUC 12 y 13 están claramente por delante, pero incluso el Geekom Mini con la misma CPU fue un 17% más rápido en todas las pruebas de CPU. Comparado con los resultados medios del i7-11390H de nuestra base de datos, el rendimiento de la CPU del B7 Power es un 13% inferior. Esto significa que el potencial de la CPU no está ni mucho menos agotado. Incluso el B5 Power con Intel Gen8 apenas pudo ser superado en la prueba Cinebench. Los dos dispositivos están separados por un enorme 87% en la puntuación general de CPU, pero sólo hay un 18% entre ellos cuando se trata del bucle Cinebench.
Cinebench R15 Multi continuous test
Cinebench R23: Multi Core | Single Core
Cinebench R20: CPU (Multi Core) | CPU (Single Core)
Cinebench R15: CPU Multi 64Bit | CPU Single 64Bit
Blender: v2.79 BMW27 CPU
7-Zip 18.03: 7z b 4 | 7z b 4 -mmt1
Geekbench 5.5: Multi-Core | Single-Core
HWBOT x265 Benchmark v2.2: 4k Preset
LibreOffice : 20 Documents To PDF
R Benchmark 2.5: Overall mean
| CPU Performance rating | |
| Media de la clase Mini PC | |
| Intel NUC 13 Pro Kit NUC13ANK | |
| Intel NUC 12 Pro Kit NUC12WSBi5 -2! | |
| Geekom Mini IT11, i7-11390H | |
| Medio Intel Core i7-11390H | |
| Beelink SEi11 Pro | |
| BMAX B7 Power G7A2 | |
| BMAX B5 Pro G7H8 | |
| Cinebench R23 / Multi Core | |
| Media de la clase Mini PC (1571 - 39416, n=98, últimos 2 años) | |
| Intel NUC 13 Pro Kit NUC13ANK | |
| Intel NUC 12 Pro Kit NUC12WSBi5 | |
| Intel NUC 12 Pro Kit NUC12WSBi5 | |
| Intel NUC 12 Pro Kit NUC12WSBi5 | |
| Geekom Mini IT11, i7-11390H | |
| Beelink SEi11 Pro | |
| Medio Intel Core i7-11390H (4570 - 6379, n=3) | |
| BMAX B7 Power G7A2 | |
| BMAX B5 Pro G7H8 | |
| Cinebench R23 / Single Core | |
| Intel NUC 13 Pro Kit NUC13ANK | |
| Media de la clase Mini PC (455 - 2303, n=98, últimos 2 años) | |
| Intel NUC 12 Pro Kit NUC12WSBi5 | |
| Geekom Mini IT11, i7-11390H | |
| Medio Intel Core i7-11390H (1407 - 1602, n=3) | |
| Beelink SEi11 Pro | |
| BMAX B7 Power G7A2 | |
| BMAX B5 Pro G7H8 | |
| Cinebench R20 / CPU (Multi Core) | |
| Media de la clase Mini PC (555 - 15041, n=98, últimos 2 años) | |
| Intel NUC 13 Pro Kit NUC13ANK | |
| Intel NUC 12 Pro Kit NUC12WSBi5 | |
| Geekom Mini IT11, i7-11390H | |
| Beelink SEi11 Pro | |
| Medio Intel Core i7-11390H (1767 - 2362, n=3) | |
| BMAX B7 Power G7A2 | |
| BMAX B5 Pro G7H8 | |
| Cinebench R20 / CPU (Single Core) | |
| Intel NUC 13 Pro Kit NUC13ANK | |
| Media de la clase Mini PC (173.6 - 884, n=98, últimos 2 años) | |
| Intel NUC 12 Pro Kit NUC12WSBi5 | |
| Geekom Mini IT11, i7-11390H | |
| Medio Intel Core i7-11390H (550 - 620, n=3) | |
| Beelink SEi11 Pro | |
| BMAX B7 Power G7A2 | |
| BMAX B5 Pro G7H8 | |
| Cinebench R15 / CPU Multi 64Bit | |
| Media de la clase Mini PC (254 - 5881, n=98, últimos 2 años) | |
| Intel NUC 13 Pro Kit NUC13ANK | |
| Intel NUC 12 Pro Kit NUC12WSBi5 | |
| Intel NUC 12 Pro Kit NUC12WSBi5 | |
| Geekom Mini IT11, i7-11390H | |
| Medio Intel Core i7-11390H (775 - 1041, n=3) | |
| Beelink SEi11 Pro | |
| BMAX B7 Power G7A2 | |
| BMAX B5 Pro G7H8 | |
| Cinebench R15 / CPU Single 64Bit | |
| Intel NUC 13 Pro Kit NUC13ANK | |
| Media de la clase Mini PC (78.3 - 340, n=98, últimos 2 años) | |
| Intel NUC 12 Pro Kit NUC12WSBi5 | |
| Intel NUC 12 Pro Kit NUC12WSBi5 | |
| Geekom Mini IT11, i7-11390H | |
| Medio Intel Core i7-11390H (209 - 239, n=3) | |
| Beelink SEi11 Pro | |
| BMAX B7 Power G7A2 | |
| BMAX B5 Pro G7H8 | |
| Blender / v2.79 BMW27 CPU | |
| BMAX B5 Pro G7H8 | |
| BMAX B7 Power G7A2 | |
| Medio Intel Core i7-11390H (495 - 665, n=3) | |
| Beelink SEi11 Pro | |
| Geekom Mini IT11, i7-11390H | |
| Media de la clase Mini PC (86 - 2330, n=94, últimos 2 años) | |
| Intel NUC 12 Pro Kit NUC12WSBi5 | |
| Intel NUC 13 Pro Kit NUC13ANK | |
| 7-Zip 18.03 / 7z b 4 | |
| Media de la clase Mini PC (8146 - 136872, n=93, últimos 2 años) | |
| Intel NUC 13 Pro Kit NUC13ANK | |
| Intel NUC 12 Pro Kit NUC12WSBi5 | |
| Geekom Mini IT11, i7-11390H | |
| Medio Intel Core i7-11390H (20822 - 28173, n=3) | |
| Beelink SEi11 Pro | |
| BMAX B7 Power G7A2 | |
| BMAX B5 Pro G7H8 | |
| 7-Zip 18.03 / 7z b 4 -mmt1 | |
| Intel NUC 13 Pro Kit NUC13ANK | |
| Geekom Mini IT11, i7-11390H | |
| Media de la clase Mini PC (2454 - 7609, n=94, últimos 2 años) | |
| Medio Intel Core i7-11390H (5539 - 5895, n=3) | |
| BMAX B7 Power G7A2 | |
| Intel NUC 12 Pro Kit NUC12WSBi5 | |
| Beelink SEi11 Pro | |
| BMAX B5 Pro G7H8 | |
| Geekbench 5.5 / Multi-Core | |
| Media de la clase Mini PC (1638 - 24593, n=97, últimos 2 años) | |
| Intel NUC 13 Pro Kit NUC13ANK | |
| Medio Intel Core i7-11390H (4457 - 6297, n=4) | |
| Geekom Mini IT11, i7-11390H | |
| Beelink SEi11 Pro | |
| BMAX B7 Power G7A2 | |
| BMAX B5 Pro G7H8 | |
| Geekbench 5.5 / Single-Core | |
| Intel NUC 13 Pro Kit NUC13ANK | |
| Media de la clase Mini PC (466 - 2395, n=97, últimos 2 años) | |
| Geekom Mini IT11, i7-11390H | |
| Medio Intel Core i7-11390H (1486 - 1677, n=4) | |
| Beelink SEi11 Pro | |
| BMAX B7 Power G7A2 | |
| BMAX B5 Pro G7H8 | |
| HWBOT x265 Benchmark v2.2 / 4k Preset | |
| Media de la clase Mini PC (1.5 - 40.3, n=94, últimos 2 años) | |
| Intel NUC 13 Pro Kit NUC13ANK | |
| Intel NUC 12 Pro Kit NUC12WSBi5 | |
| Geekom Mini IT11, i7-11390H | |
| Beelink SEi11 Pro | |
| Medio Intel Core i7-11390H (5.84 - 7.86, n=3) | |
| BMAX B7 Power G7A2 | |
| BMAX B5 Pro G7H8 | |
| LibreOffice / 20 Documents To PDF | |
| BMAX B5 Pro G7H8 | |
| Media de la clase Mini PC (33.1 - 132.6, n=94, últimos 2 años) | |
| BMAX B7 Power G7A2 | |
| Beelink SEi11 Pro | |
| Intel NUC 12 Pro Kit NUC12WSBi5 | |
| Medio Intel Core i7-11390H (43.2 - 52.6, n=3) | |
| Geekom Mini IT11, i7-11390H | |
| Intel NUC 13 Pro Kit NUC13ANK | |
| R Benchmark 2.5 / Overall mean | |
| BMAX B5 Pro G7H8 | |
| Beelink SEi11 Pro | |
| BMAX B7 Power G7A2 | |
| Medio Intel Core i7-11390H (0.537 - 0.571, n=3) | |
| Geekom Mini IT11, i7-11390H | |
| Intel NUC 12 Pro Kit NUC12WSBi5 | |
| Media de la clase Mini PC (0.3517 - 1.56, n=95, últimos 2 años) | |
| Intel NUC 13 Pro Kit NUC13ANK | |
* ... más pequeño es mejor
AIDA64: FP32 Ray-Trace | FPU Julia | CPU SHA3 | CPU Queen | FPU SinJulia | FPU Mandel | CPU AES | CPU ZLib | FP64 Ray-Trace | CPU PhotoWorxx
| Performance rating | |
| Media de la clase Mini PC | |
| Intel NUC 13 Pro Kit NUC13ANK | |
| Intel NUC 12 Pro Kit NUC12WSBi5 | |
| Beelink SEi11 Pro | |
| Medio Intel Core i7-11390H | |
| Geekom Mini IT11, i7-11390H | |
| BMAX B7 Power G7A2 | |
| BMAX B5 Pro G7H8 | |
| AIDA64 / FP32 Ray-Trace | |
| Media de la clase Mini PC (974 - 82725, n=105, últimos 2 años) | |
| Intel NUC 13 Pro Kit NUC13ANK | |
| Beelink SEi11 Pro | |
| Medio Intel Core i7-11390H (5904 - 7741, n=4) | |
| Geekom Mini IT11, i7-11390H | |
| Intel NUC 12 Pro Kit NUC12WSBi5 | |
| BMAX B7 Power G7A2 | |
| BMAX B5 Pro G7H8 | |
| AIDA64 / FPU Julia | |
| Media de la clase Mini PC (6115 - 363782, n=105, últimos 2 años) | |
| Intel NUC 13 Pro Kit NUC13ANK | |
| Beelink SEi11 Pro | |
| Medio Intel Core i7-11390H (25054 - 32624, n=4) | |
| Intel NUC 12 Pro Kit NUC12WSBi5 | |
| Geekom Mini IT11, i7-11390H | |
| BMAX B7 Power G7A2 | |
| BMAX B5 Pro G7H8 | |
| AIDA64 / CPU SHA3 | |
| Media de la clase Mini PC (385 - 9475, n=105, últimos 2 años) | |
| Intel NUC 13 Pro Kit NUC13ANK | |
| Intel NUC 12 Pro Kit NUC12WSBi5 | |
| Beelink SEi11 Pro | |
| Medio Intel Core i7-11390H (1747 - 2168, n=4) | |
| Geekom Mini IT11, i7-11390H | |
| BMAX B7 Power G7A2 | |
| BMAX B5 Pro G7H8 | |
| AIDA64 / CPU Queen | |
| Media de la clase Mini PC (20501 - 184747, n=89, últimos 2 años) | |
| Intel NUC 13 Pro Kit NUC13ANK | |
| Intel NUC 12 Pro Kit NUC12WSBi5 | |
| Medio Intel Core i7-11390H (47355 - 58761, n=4) | |
| Geekom Mini IT11, i7-11390H | |
| BMAX B7 Power G7A2 | |
| Beelink SEi11 Pro | |
| BMAX B5 Pro G7H8 | |
| AIDA64 / FPU SinJulia | |
| Media de la clase Mini PC (1019 - 31931, n=105, últimos 2 años) | |
| Intel NUC 13 Pro Kit NUC13ANK | |
| Intel NUC 12 Pro Kit NUC12WSBi5 | |
| Beelink SEi11 Pro | |
| Medio Intel Core i7-11390H (4106 - 5412, n=4) | |
| Geekom Mini IT11, i7-11390H | |
| BMAX B5 Pro G7H8 | |
| BMAX B7 Power G7A2 | |
| AIDA64 / FPU Mandel | |
| Media de la clase Mini PC (3322 - 192994, n=105, últimos 2 años) | |
| Intel NUC 13 Pro Kit NUC13ANK | |
| Beelink SEi11 Pro | |
| Medio Intel Core i7-11390H (15441 - 19348, n=4) | |
| Geekom Mini IT11, i7-11390H | |
| Intel NUC 12 Pro Kit NUC12WSBi5 | |
| BMAX B7 Power G7A2 | |
| BMAX B5 Pro G7H8 | |
| AIDA64 / CPU AES | |
| Intel NUC 13 Pro Kit NUC13ANK | |
| Media de la clase Mini PC (9214 - 325960, n=104, últimos 2 años) | |
| Beelink SEi11 Pro | |
| Intel NUC 12 Pro Kit NUC12WSBi5 | |
| Medio Intel Core i7-11390H (57644 - 77817, n=4) | |
| BMAX B7 Power G7A2 | |
| Geekom Mini IT11, i7-11390H | |
| BMAX B5 Pro G7H8 | |
| AIDA64 / CPU ZLib | |
| Media de la clase Mini PC (127.2 - 2431, n=105, últimos 2 años) | |
| Intel NUC 12 Pro Kit NUC12WSBi5 | |
| Intel NUC 13 Pro Kit NUC13ANK | |
| Medio Intel Core i7-11390H (362 - 424, n=4) | |
| Geekom Mini IT11, i7-11390H | |
| Beelink SEi11 Pro | |
| BMAX B7 Power G7A2 | |
| BMAX B5 Pro G7H8 | |
| AIDA64 / FP64 Ray-Trace | |
| Media de la clase Mini PC (537 - 43587, n=105, últimos 2 años) | |
| Intel NUC 13 Pro Kit NUC13ANK | |
| Beelink SEi11 Pro | |
| Geekom Mini IT11, i7-11390H | |
| Medio Intel Core i7-11390H (3138 - 4197, n=4) | |
| Intel NUC 12 Pro Kit NUC12WSBi5 | |
| BMAX B7 Power G7A2 | |
| BMAX B5 Pro G7H8 | |
| AIDA64 / CPU PhotoWorxx | |
| Media de la clase Mini PC (8069 - 96843, n=105, últimos 2 años) | |
| Intel NUC 13 Pro Kit NUC13ANK | |
| Intel NUC 12 Pro Kit NUC12WSBi5 | |
| Beelink SEi11 Pro | |
| Geekom Mini IT11, i7-11390H | |
| Medio Intel Core i7-11390H (11409 - 39871, n=4) | |
| BMAX B5 Pro G7H8 | |
| BMAX B7 Power G7A2 | |
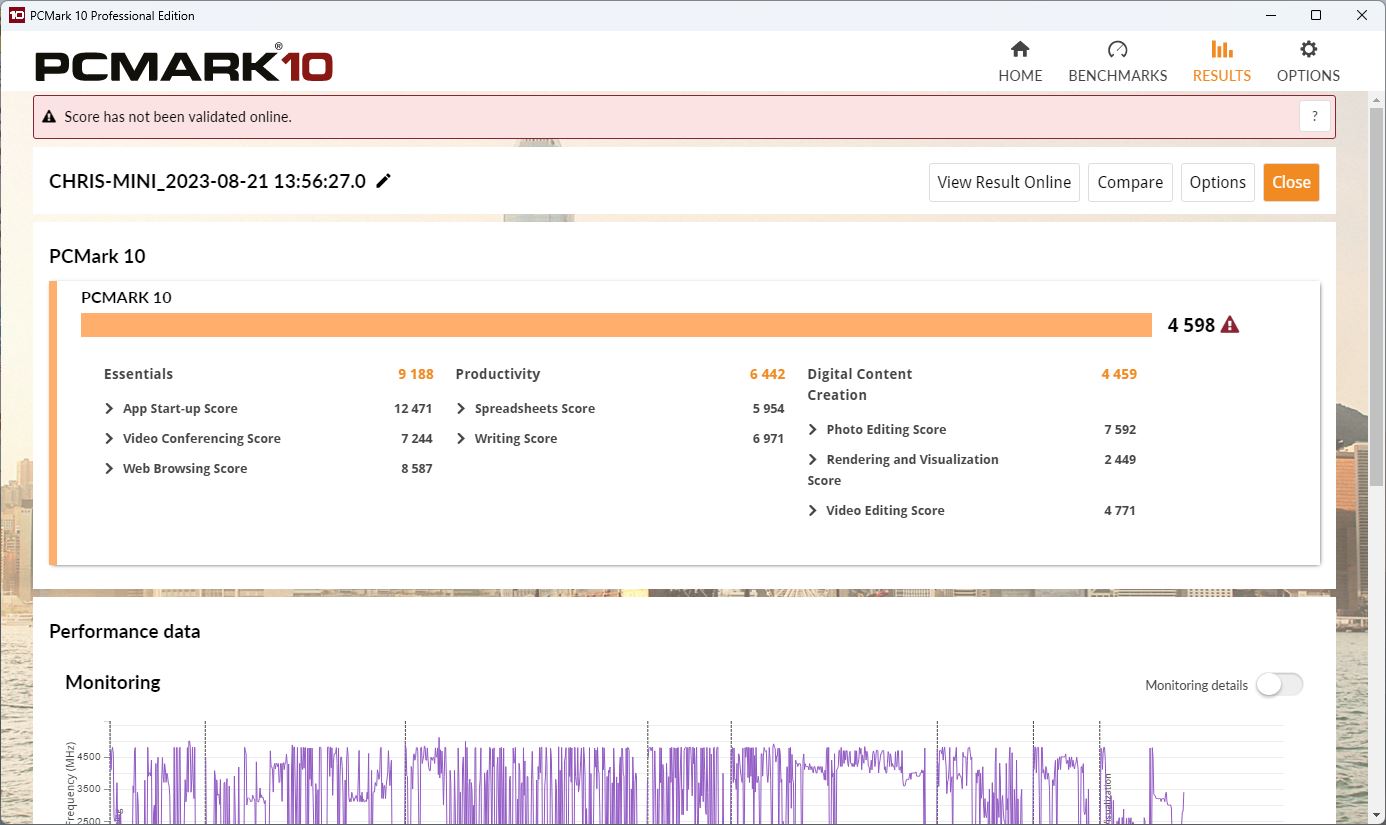
Rendimiento del sistema
Su rendimiento también quedó por detrás de un i7-11390Hen un 9% en PCMark. En CrossMark, sólo quedó un 6% por detrás.
Subjetivamente, el PC sigue rindiendo bien en el uso diario cuando se trata de navegar por la web y completar tareas de oficina.
CrossMark: Overall | Productivity | Creativity | Responsiveness
| PCMark 10 / Score | |
| Media de la clase Mini PC (2191 - 9326, n=104, últimos 2 años) | |
| Intel NUC 13 Pro Kit NUC13ANK | |
| Intel NUC 12 Pro Kit NUC12WSBi5 | |
| Beelink SEi11 Pro | |
| Medio Intel Core i7-11390H, Intel Iris Xe Graphics G7 96EUs (4598 - 5475, n=3) | |
| Geekom Mini IT11, i7-11390H | |
| BMAX B7 Power G7A2 | |
| BMAX B5 Pro G7H8 | |
| PCMark 10 / Essentials | |
| Intel NUC 13 Pro Kit NUC13ANK | |
| Intel NUC 12 Pro Kit NUC12WSBi5 | |
| Beelink SEi11 Pro | |
| Media de la clase Mini PC (5031 - 11997, n=103, últimos 2 años) | |
| Medio Intel Core i7-11390H, Intel Iris Xe Graphics G7 96EUs (9188 - 10451, n=3) | |
| Geekom Mini IT11, i7-11390H | |
| BMAX B7 Power G7A2 | |
| BMAX B5 Pro G7H8 | |
| PCMark 10 / Productivity | |
| Media de la clase Mini PC (3646 - 17739, n=103, últimos 2 años) | |
| Intel NUC 13 Pro Kit NUC13ANK | |
| Intel NUC 12 Pro Kit NUC12WSBi5 | |
| Beelink SEi11 Pro | |
| Medio Intel Core i7-11390H, Intel Iris Xe Graphics G7 96EUs (6442 - 7197, n=3) | |
| Geekom Mini IT11, i7-11390H | |
| BMAX B7 Power G7A2 | |
| BMAX B5 Pro G7H8 | |
| PCMark 10 / Digital Content Creation | |
| Media de la clase Mini PC (1558 - 17556, n=103, últimos 2 años) | |
| Intel NUC 13 Pro Kit NUC13ANK | |
| Intel NUC 12 Pro Kit NUC12WSBi5 | |
| Medio Intel Core i7-11390H, Intel Iris Xe Graphics G7 96EUs (4459 - 5920, n=3) | |
| Beelink SEi11 Pro | |
| Geekom Mini IT11, i7-11390H | |
| BMAX B7 Power G7A2 | |
| BMAX B5 Pro G7H8 | |
| CrossMark / Overall | |
| Intel NUC 13 Pro Kit NUC13ANK | |
| Media de la clase Mini PC (385 - 2244, n=96, últimos 2 años) | |
| Geekom Mini IT11, i7-11390H | |
| Medio Intel Core i7-11390H, Intel Iris Xe Graphics G7 96EUs (1274 - 1438, n=2) | |
| Beelink SEi11 Pro | |
| BMAX B7 Power G7A2 | |
| BMAX B5 Pro G7H8 | |
| CrossMark / Productivity | |
| Intel NUC 13 Pro Kit NUC13ANK | |
| Media de la clase Mini PC (446 - 2790, n=96, últimos 2 años) | |
| Geekom Mini IT11, i7-11390H | |
| Medio Intel Core i7-11390H, Intel Iris Xe Graphics G7 96EUs (1399 - 1523, n=2) | |
| Beelink SEi11 Pro | |
| BMAX B7 Power G7A2 | |
| BMAX B5 Pro G7H8 | |
| CrossMark / Creativity | |
| Intel NUC 13 Pro Kit NUC13ANK | |
| Media de la clase Mini PC (340 - 2879, n=96, últimos 2 años) | |
| Geekom Mini IT11, i7-11390H | |
| Medio Intel Core i7-11390H, Intel Iris Xe Graphics G7 96EUs (1198 - 1359, n=2) | |
| Beelink SEi11 Pro | |
| BMAX B7 Power G7A2 | |
| BMAX B5 Pro G7H8 | |
| CrossMark / Responsiveness | |
| Intel NUC 13 Pro Kit NUC13ANK | |
| Media de la clase Mini PC (363 - 2191, n=96, últimos 2 años) | |
| Geekom Mini IT11, i7-11390H | |
| Beelink SEi11 Pro | |
| Medio Intel Core i7-11390H, Intel Iris Xe Graphics G7 96EUs (1159 - 1434, n=2) | |
| BMAX B7 Power G7A2 | |
| BMAX B5 Pro G7H8 | |
| PCMark 10 Score | 4598 puntos | |
ayuda | ||
| AIDA64 / Memory Copy | |
| Media de la clase Mini PC (15933 - 163031, n=105, últimos 2 años) | |
| Intel NUC 13 Pro Kit NUC13ANK | |
| Intel NUC 12 Pro Kit NUC12WSBi5 | |
| Geekom Mini IT11, i7-11390H | |
| Medio Intel Core i7-11390H (19409 - 64750, n=4) | |
| Beelink SEi11 Pro | |
| BMAX B5 Pro G7H8 | |
| BMAX B7 Power G7A2 | |
| AIDA64 / Memory Read | |
| Media de la clase Mini PC (14143 - 123769, n=105, últimos 2 años) | |
| Intel NUC 12 Pro Kit NUC12WSBi5 | |
| Geekom Mini IT11, i7-11390H | |
| Beelink SEi11 Pro | |
| Intel NUC 13 Pro Kit NUC13ANK | |
| Medio Intel Core i7-11390H (21253 - 59793, n=4) | |
| BMAX B5 Pro G7H8 | |
| BMAX B7 Power G7A2 | |
| AIDA64 / Memory Write | |
| Media de la clase Mini PC (10630 - 216693, n=105, últimos 2 años) | |
| Geekom Mini IT11, i7-11390H | |
| Intel NUC 12 Pro Kit NUC12WSBi5 | |
| Beelink SEi11 Pro | |
| Intel NUC 13 Pro Kit NUC13ANK | |
| Medio Intel Core i7-11390H (19684 - 66881, n=4) | |
| BMAX B5 Pro G7H8 | |
| BMAX B7 Power G7A2 | |
| AIDA64 / Memory Latency | |
| Media de la clase Mini PC (88.1 - 184.8, n=106, últimos 2 años) | |
| Intel NUC 13 Pro Kit NUC13ANK | |
| BMAX B5 Pro G7H8 | |
| Intel NUC 12 Pro Kit NUC12WSBi5 | |
| Beelink SEi11 Pro | |
| Medio Intel Core i7-11390H (66.3 - 95.3, n=4) | |
| Geekom Mini IT11, i7-11390H | |
| BMAX B7 Power G7A2 | |
* ... más pequeño es mejor
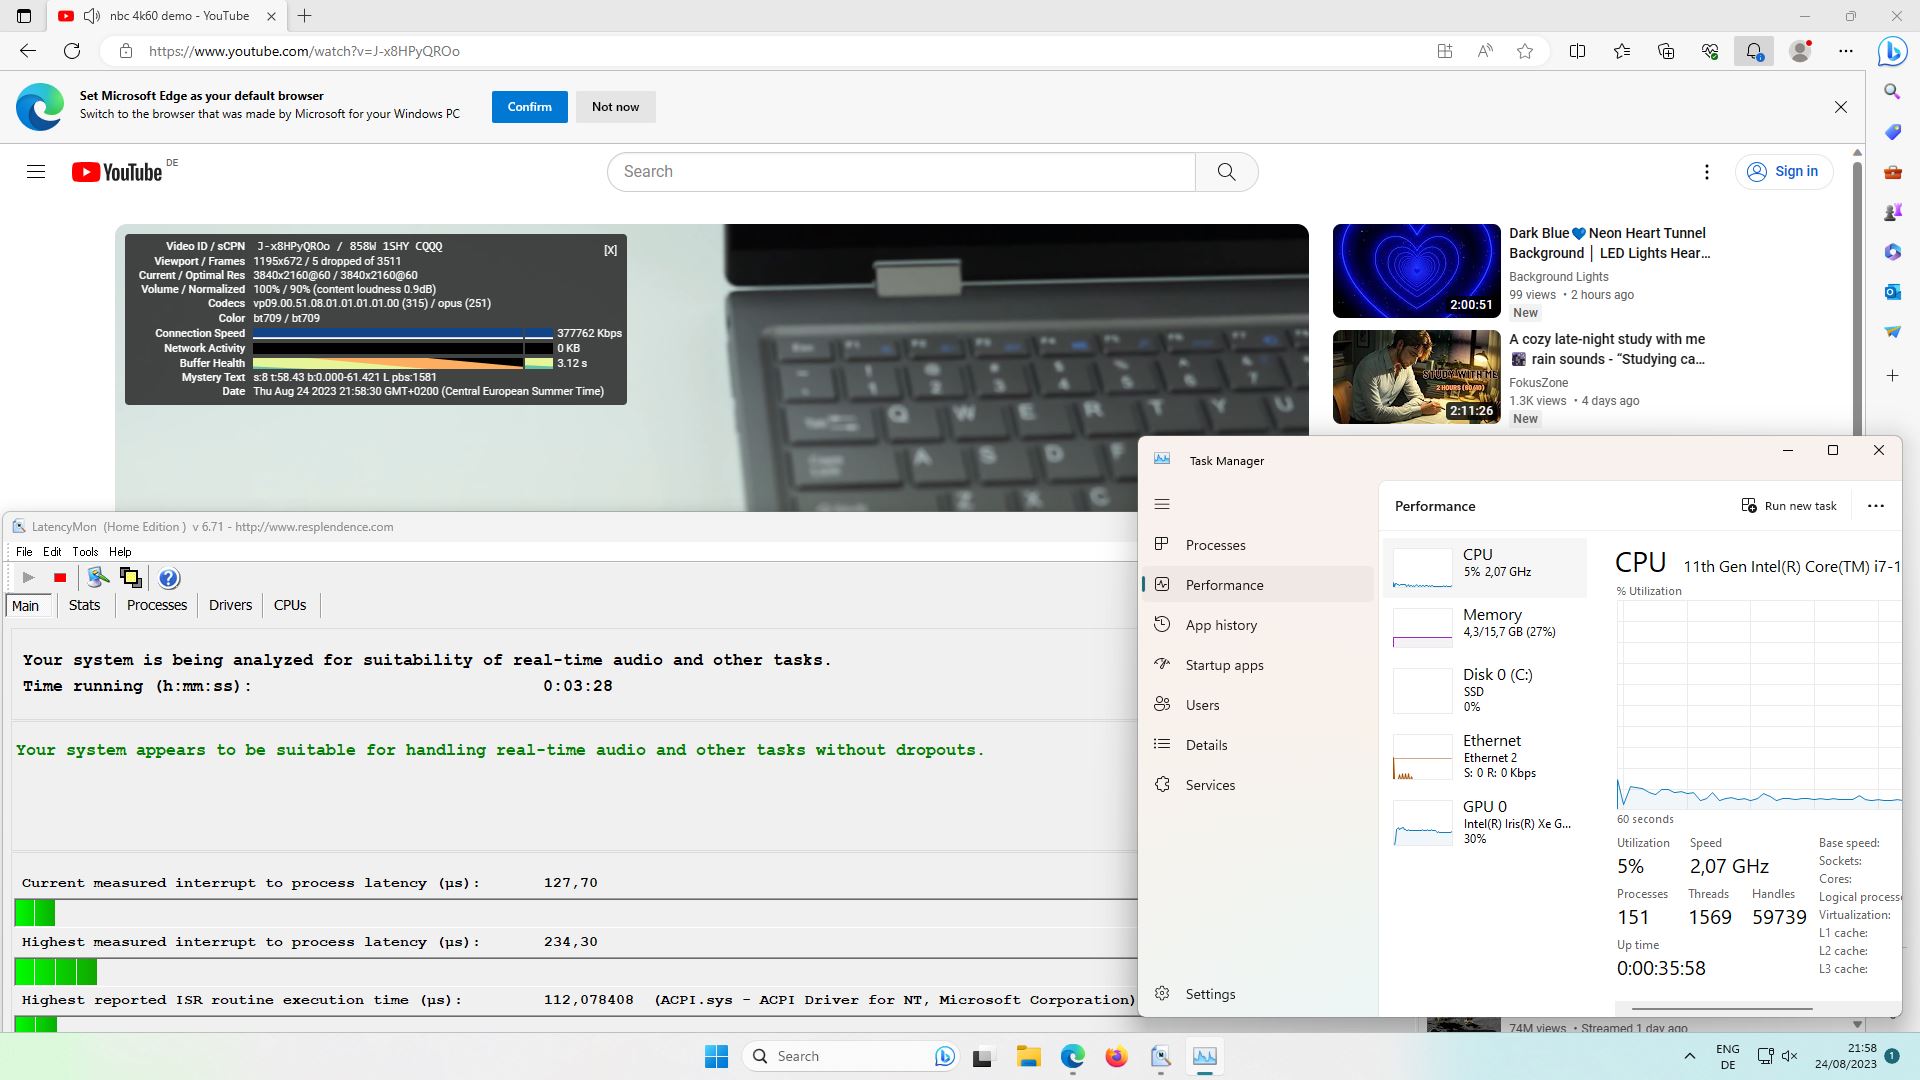
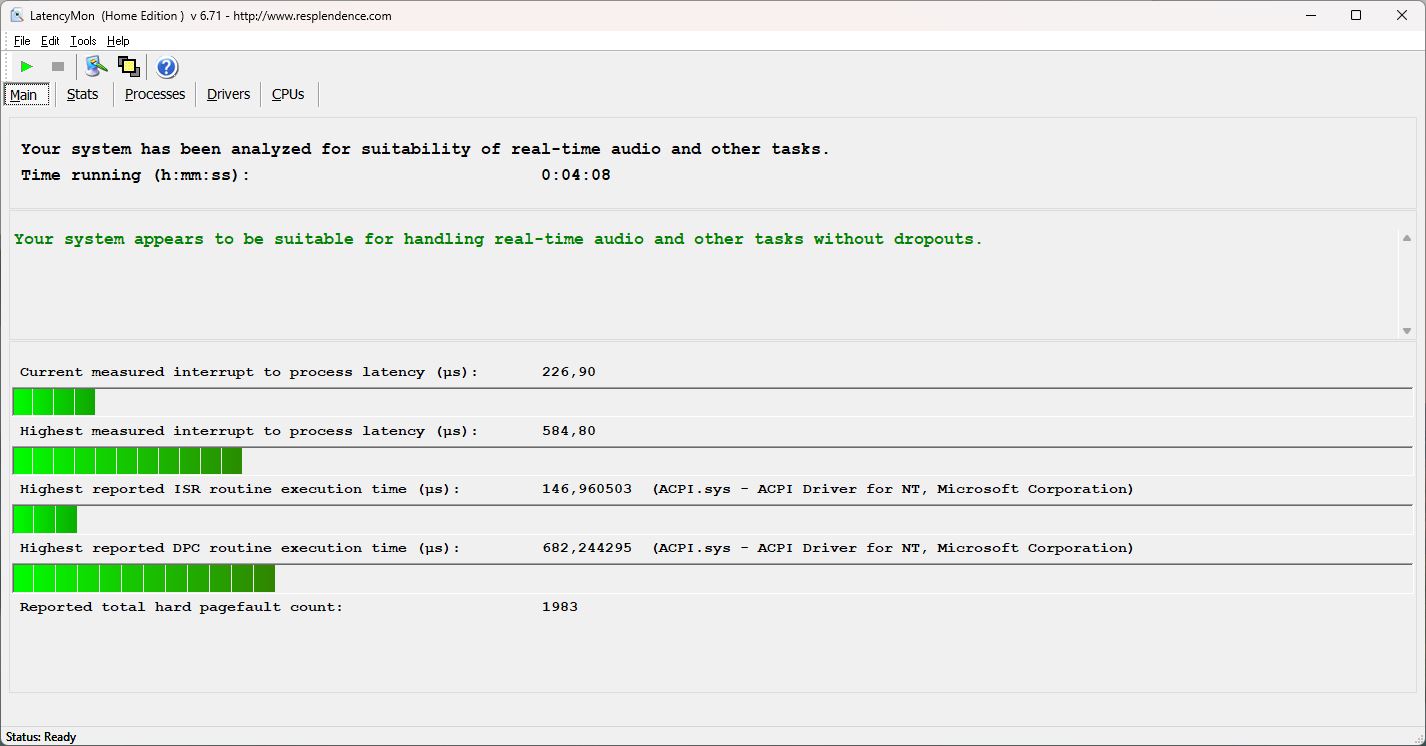
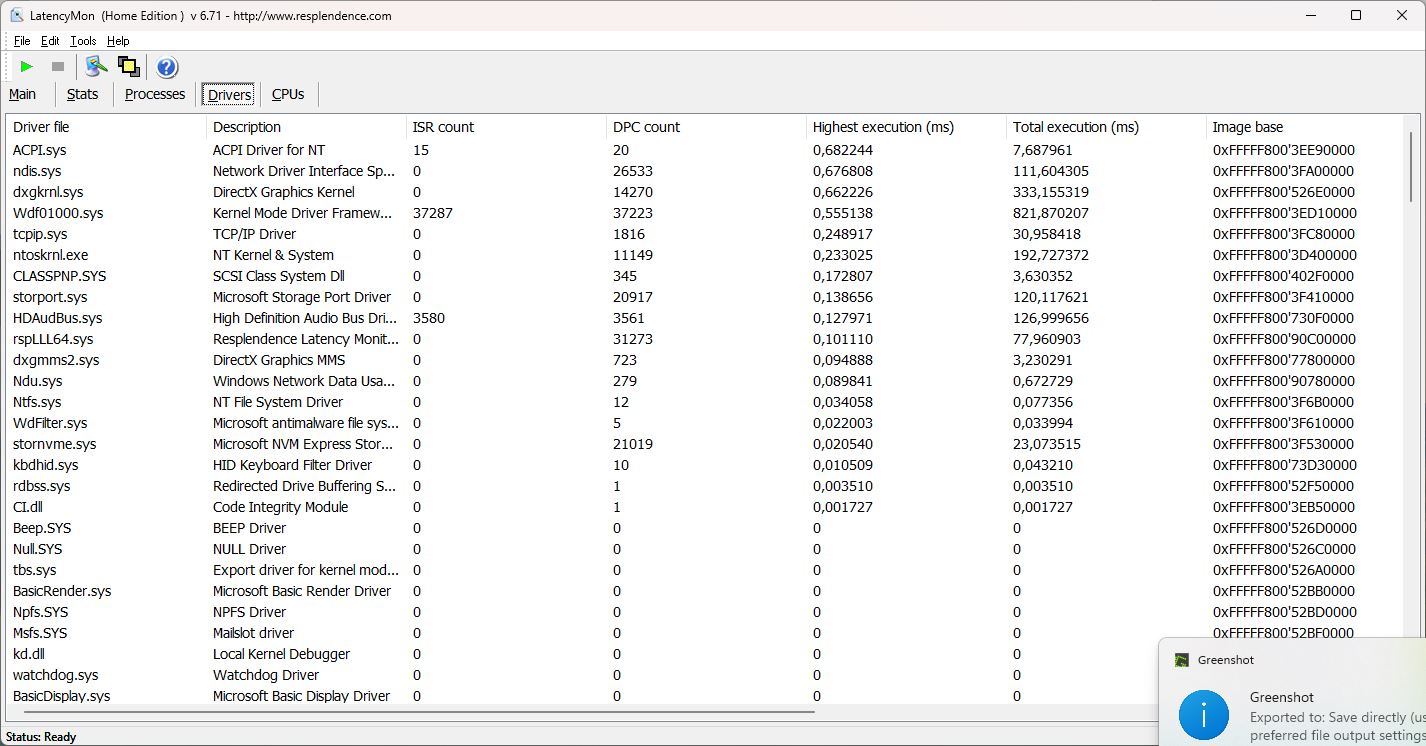
Latencia del CPD
La carga de páginas web no supone ningún problema para el PC cuboid. Incluso pudo abrir fácilmente varias pestañas en nuestro sitio web, lo que contrasta con la mayoría de portátiles para juegos actuales.
A su vez, no consiguió reproducir perfectamente nuestro vídeo 4K/60 fps -observamos tres caídas de fotogramas-, pero aparte de eso, funcionó con bastante fluidez. Esto hace que el B7 sea adecuado para la reproducción de audio en tiempo real & co.
En comparación, las latencias de los NUC de Intel fueron más altas, pero los mini PC de última generación de Geekom y Beelink lo hicieron un poco mejor.
| DPC Latencies / LatencyMon - interrupt to process latency (max), Web, Youtube, Prime95 | |
| Intel NUC 13 Pro Kit NUC13ANK | |
| Intel NUC 12 Pro Kit NUC12WSBi5 | |
| BMAX B7 Power G7A2 | |
| Geekom Mini IT11, i7-11390H | |
| BMAX B5 Pro G7H8 | |
| Beelink SEi11 Pro | |
* ... más pequeño es mejor
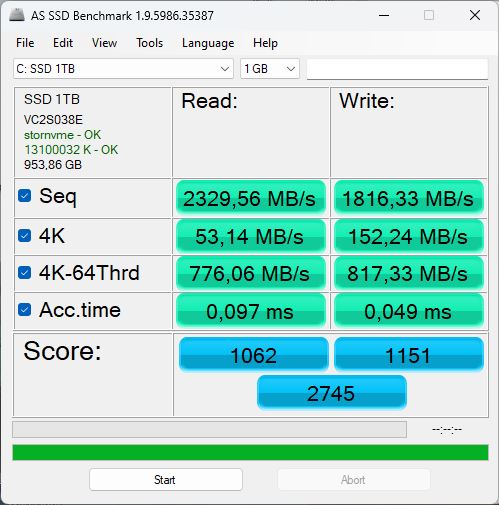
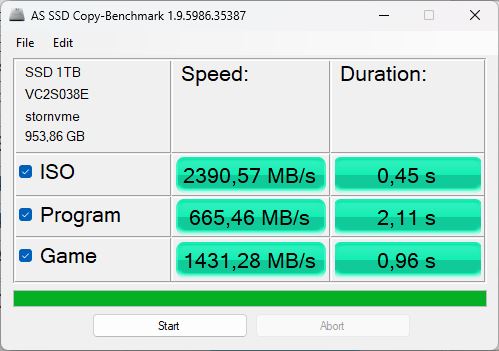
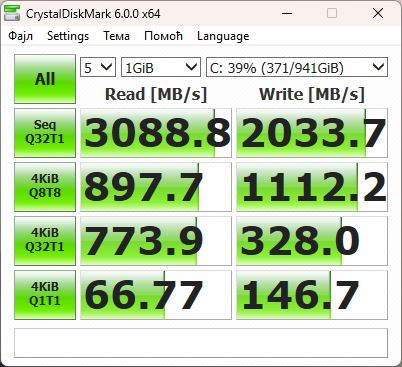
Dispositivos de almacenamiento
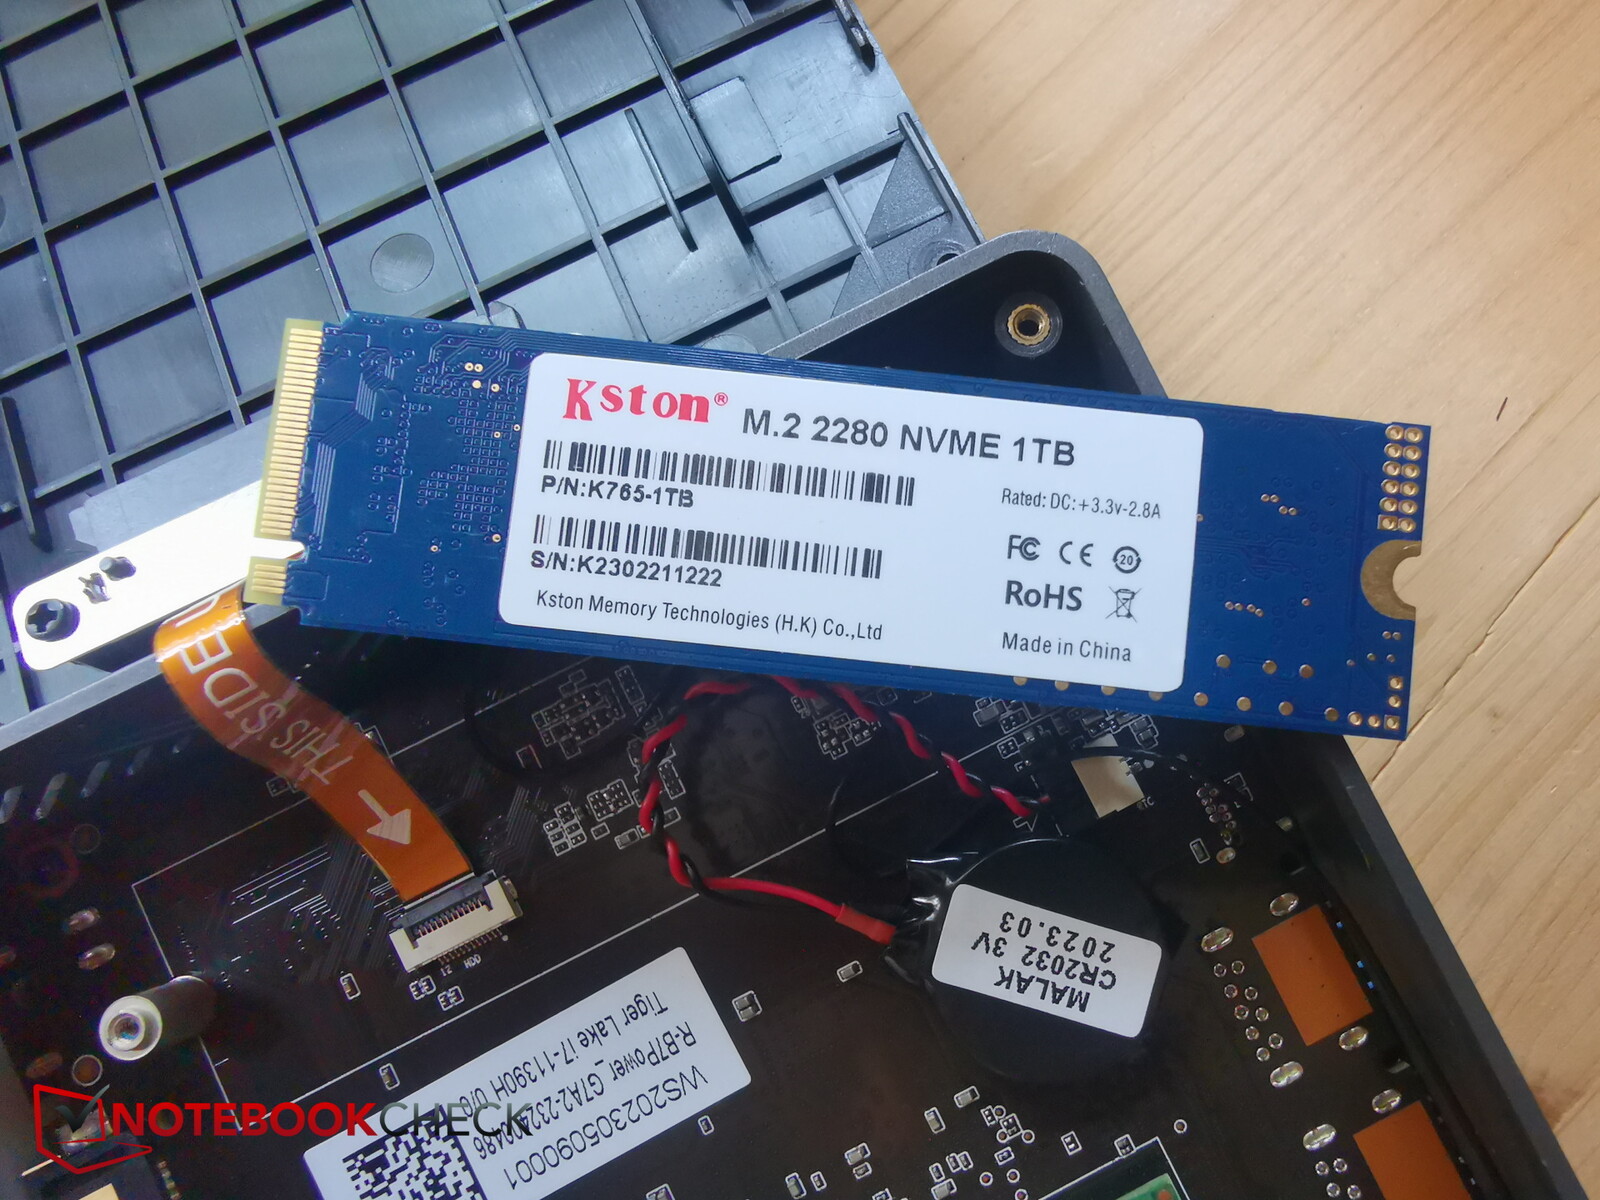
BMAX ha instalado un SSD de 1 TB en el dispositivo - así es también como está etiquetado en todas partes en Windows e incluso en la BIOS. Sólo dice "SSD 1 TB" en todas partes. Para determinar el modelo instalado y su fabricante, tienes que abrir el B7 Power y extraer el SSD. Hay una etiqueta en la parte trasera. Un "Kston K765-1TB" no es muy conocido aqui. En realidad no debería tener ninguna razón para esconderse - en comparación, este modelo aún alcanzó tasas de transmisión decentes. Solo el SSD Samsung dentro delNUC 13lo hizo considerablemente mejor en todas las pruebas.
Lamentablemente, su rendimiento se vio un poco limitado durante los periodos de mayor carga debido a los límites térmicos. No lleva instalada una unidad de refrigeración, pero sería recomendable.

* ... más pequeño es mejor
Reading continuous performance: DiskSpd Read Loop, Queue Depth 8
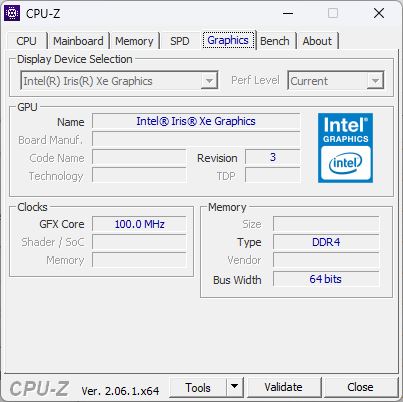
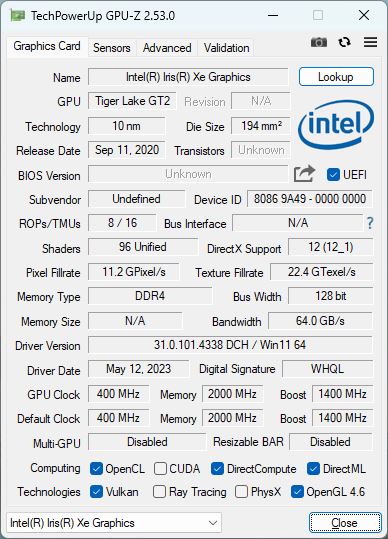
Tarjeta gráfica
Una tarjeta gráfica Intel Iris Xe Graphics G7 96EUsintegrada en el procesador actúa como tarjeta gráfica del PC. Dependiendo del procesador y del consumo de energía, su rendimiento varía bastante.
Incluso en las pruebas 3D, su rendimiento estuvo muy por debajo de la media. De media, la Xe Graphics G7 con 96 UE de nuestra base de datos rindió un 51% mejor Aún así, el B7 Power consiguió un 118% mejor que el B5 con un Intel UHD Graphics 620. Su rendimiento sigue siendo demasiado bajo y el hardware instalado está muy ralentizado. Sus competidores con la misma iGPU se quedaron mucho más cerca de los valores medios y, como resultado, muy por delante del B7. Como era de esperar, elNUC 13 Profue el campeón reinante en este campo.
| 3DMark 11 Performance | 4743 puntos | |
| 3DMark Cloud Gate Standard Score | 13442 puntos | |
| 3DMark Fire Strike Score | 2546 puntos | |
| 3DMark Time Spy Score | 1103 puntos | |
ayuda | ||
* ... más pequeño es mejor
Rendimiento de juego
A pesar de que su nombre contiene el término "potencia", el B7 no está hecho para jugar. Es mucho más adecuado para usos cotidianos como dispositivo de oficina.
Mientras ejecutaba The Witcher 3 Ultra, el PC sólo conseguía entre 8 y 9 fps de media. El Geekom Mini IT11con la misma CPU/iGPU fue un 30% más rápido. El Beelink SEi11 Pro- a pesar de su CPU ligeramente más débil, superó a los otros dos.
En la resolución más baja y con los ajustes de detalle más bajos, se podía alcanzar una media de 48 fps mientras se jugaba a The Witcher 3. En 720p y con detalles medios, se pueden alcanzar los 30 fps.
Far Cry 5 también se podía jugar a duras penas con los ajustes más bajos (1.280 x 720, Bajo, ~ 29 fps). Tendrás que conformarte con juegos más antiguos o menos exigentes y a menudo sólo mientras juegas a éstos con ajustes reducidos. Por otro lado, recomendaríamos usar este PC como consola retro, por ejemplo en combinación con RetroArch.
| Performance rating - Percent | |
| Media de la clase Mini PC | |
| Intel NUC 13 Pro Kit NUC13ANK -3! | |
| Beelink SEi11 Pro -1! | |
| Intel NUC 12 Pro Kit NUC12WSBi5 -5! | |
| Geekom Mini IT11, i7-11390H -2! | |
| BMAX B7 Power G7A2 | |
| BMAX B5 Pro G7H8 -5! | |
| The Witcher 3 - 1920x1080 Ultra Graphics & Postprocessing (HBAO+) | |
| Media de la clase Mini PC (11.9 - 271, n=54, últimos 2 años) | |
| Intel NUC 13 Pro Kit NUC13ANK | |
| Beelink SEi11 Pro | |
| Geekom Mini IT11, i7-11390H | |
| BMAX B7 Power G7A2 | |
| GTA V - 1920x1080 Highest AA:4xMSAA + FX AF:16x | |
| Media de la clase Mini PC (2.71 - 124.7, n=78, últimos 2 años) | |
| Geekom Mini IT11, i7-11390H | |
| Geekom Mini IT11, i7-11390H | |
| BMAX B7 Power G7A2 | |
| Final Fantasy XV Benchmark - 1920x1080 High Quality | |
| Media de la clase Mini PC (5.3 - 209, n=95, últimos 2 años) | |
| Beelink SEi11 Pro | |
| BMAX B7 Power G7A2 | |
| Strange Brigade - 1920x1080 ultra AA:ultra AF:16 | |
| Media de la clase Mini PC (17 - 245, n=48, últimos 2 años) | |
| Intel NUC 13 Pro Kit NUC13ANK | |
| Beelink SEi11 Pro | |
| Geekom Mini IT11, i7-11390H | |
| BMAX B7 Power G7A2 | |
| Dota 2 Reborn - 1920x1080 ultra (3/3) best looking | |
| Media de la clase Mini PC (8.2 - 213, n=103, últimos 2 años) | |
| Intel NUC 13 Pro Kit NUC13ANK | |
| Beelink SEi11 Pro | |
| Geekom Mini IT11, i7-11390H | |
| Intel NUC 12 Pro Kit NUC12WSBi5 | |
| BMAX B7 Power G7A2 | |
| BMAX B5 Pro G7H8 | |
| X-Plane 11.11 - 1920x1080 high (fps_test=3) | |
| Media de la clase Mini PC (4.77 - 147.9, n=87, últimos 2 años) | |
| Beelink SEi11 Pro | |
| BMAX B7 Power G7A2 | |
En el transcurso de una hora, su rendimiento fluctuó mucho al jugar a The Witcher 3, lo que sugiere una ralentización térmica. Al menos, la herramienta CapframeX midió valores fluctuantes entre 7 y unos 20 fps. Este último valor sólo se alcanzó en breves ráfagas: la media de fps fue de 8,8.
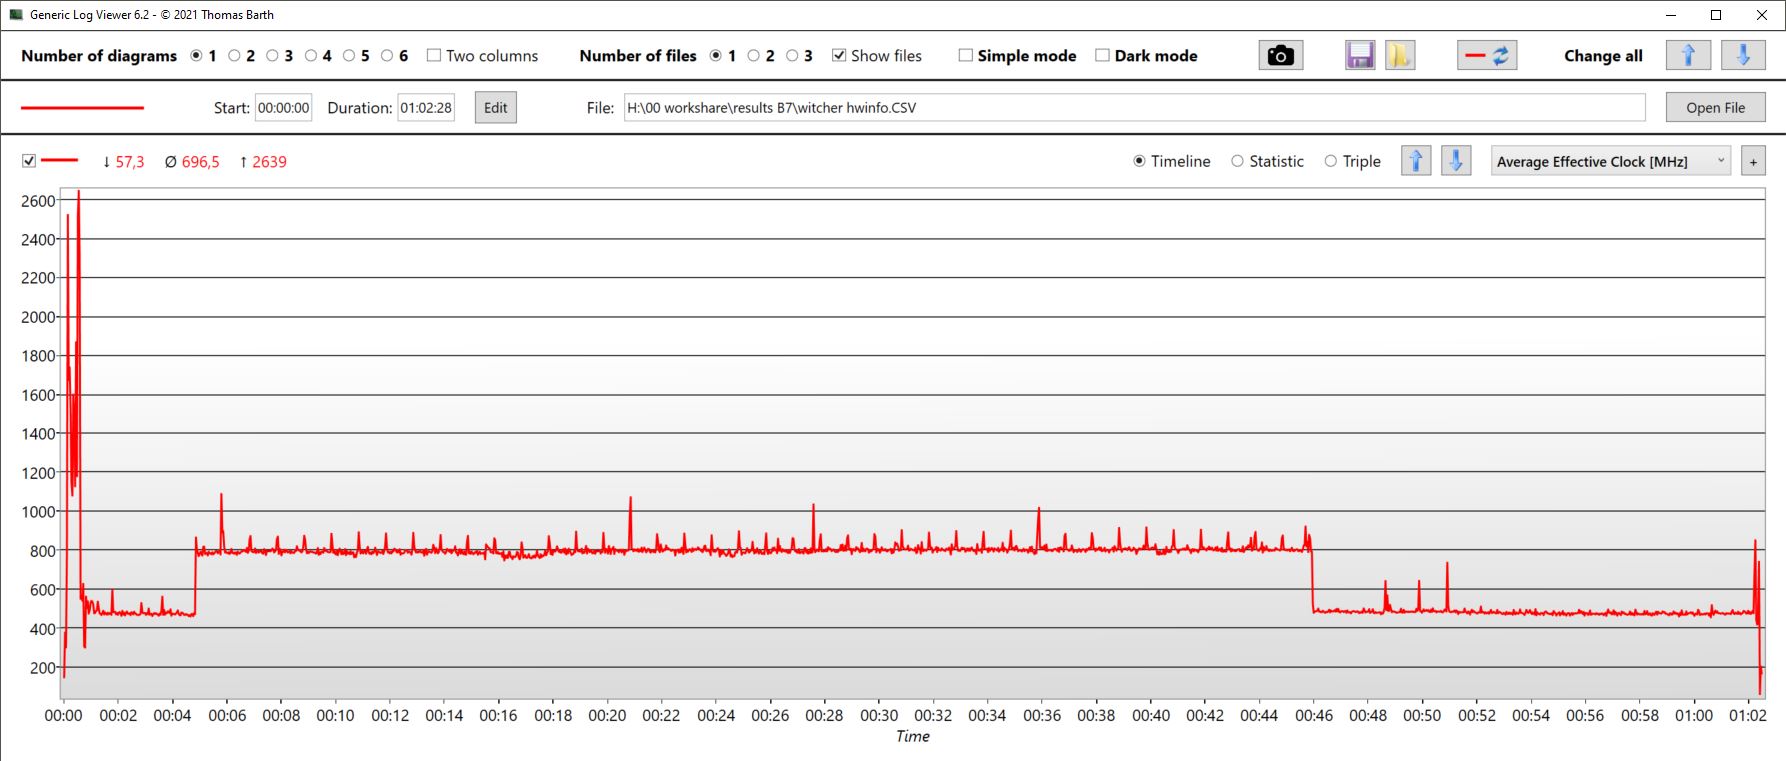
Witcher 3 FPS diagram
| bajo | medio | alto | ultra | |
|---|---|---|---|---|
| GTA V (2015) | 56.4 | 44.8 | 4.13 | |
| The Witcher 3 (2015) | 48.4 | 31.3 | 8.8 | |
| Dota 2 Reborn (2015) | 92.3 | 64.9 | 32.9 | 29.6 |
| Final Fantasy XV Benchmark (2018) | 22.1 | 10.5 | 8.15 | |
| X-Plane 11.11 (2018) | 38 | 30 | 27.9 | |
| Far Cry 5 (2018) | 29 | |||
| Strange Brigade (2018) | 49 | 18.2 | 15.4 | 13.2 |
| Diablo 4 (2023) | 16.3 |
Emisiones - El silencioso B7 Power
Emisiones sonoras
De acuerdo - su rendimiento está por debajo del par, pero ¿puede el B7 Power al menos redimirse en la forma de sus emisiones y mostrarse como un mini PC silencioso y frugal?
El B7 Power sólo tiene un ventilador. Incluso en modo inactivo, se activa al cabo de poco tiempo. Aunque hay que acercar el oído a la carcasa para oír esos 25 dB. Incluso bajo carga máxima, el ventilador no hace mucho ruido - medimos 27 dB.
El NUC13, más potente, es mucho más ruidoso, con emisiones de ruido que superan los 40 dB. El B7 Power es, con diferencia, el mini PC más silencioso de esta comparación.
Ruido
| Ocioso |
| 23 / 25.12 / 25.12 dB(A) |
| Carga |
| 27.15 / 27.15 dB(A) |
 | ||
30 dB silencioso 40 dB(A) audible 50 dB(A) ruidosamente alto |
||
min: | ||
| BMAX B7 Power G7A2 Iris Xe G7 96EUs, i7-11390H, Kston K765-1TB | Geekom Mini IT11, i7-11390H Iris Xe G7 96EUs, i7-11390H, Lexar 1024GB LNM6A1X001T-HNNNG | Intel NUC 13 Pro Kit NUC13ANK Iris Xe G7 96EUs, i7-1360P, Samsung PM9A1 MZVL2512HCJQ | Beelink SEi11 Pro Iris Xe G7 96EUs, i5-11320H, Kingston NV1 SNVS/500GCN | BMAX B5 Pro G7H8 UHD Graphics 620, i5-8260U | |
|---|---|---|---|---|---|
| Noise | -23% | -35% | -13% | -7% | |
| apagado / medio ambiente * (dB) | 23 | 29.7 -29% | 29.8 -30% | 22.8 1% | 23 -0% |
| Idle Minimum * (dB) | 23 | 30.2 -31% | 30.2 -31% | 24.7 -7% | 25.1 -9% |
| Idle Average * (dB) | 25.12 | 30.2 -20% | 31.1 -24% | 24.7 2% | 25.1 -0% |
| Idle Maximum * (dB) | 25.12 | 30.2 -20% | 31.9 -27% | 25.3 -1% | 25.1 -0% |
| Load Average * (dB) | 27.15 | 30.6 -13% | 40 -47% | 33.2 -22% | 28.6 -5% |
| Witcher 3 ultra * (dB) | 27.15 | 30.5 -12% | 34.5 -27% | 30.1 -11% | |
| Load Maximum * (dB) | 27.15 | 36.4 -34% | 40.5 -49% | 37.8 -39% | 34 -25% |
* ... más pequeño es mejor
Temperatura
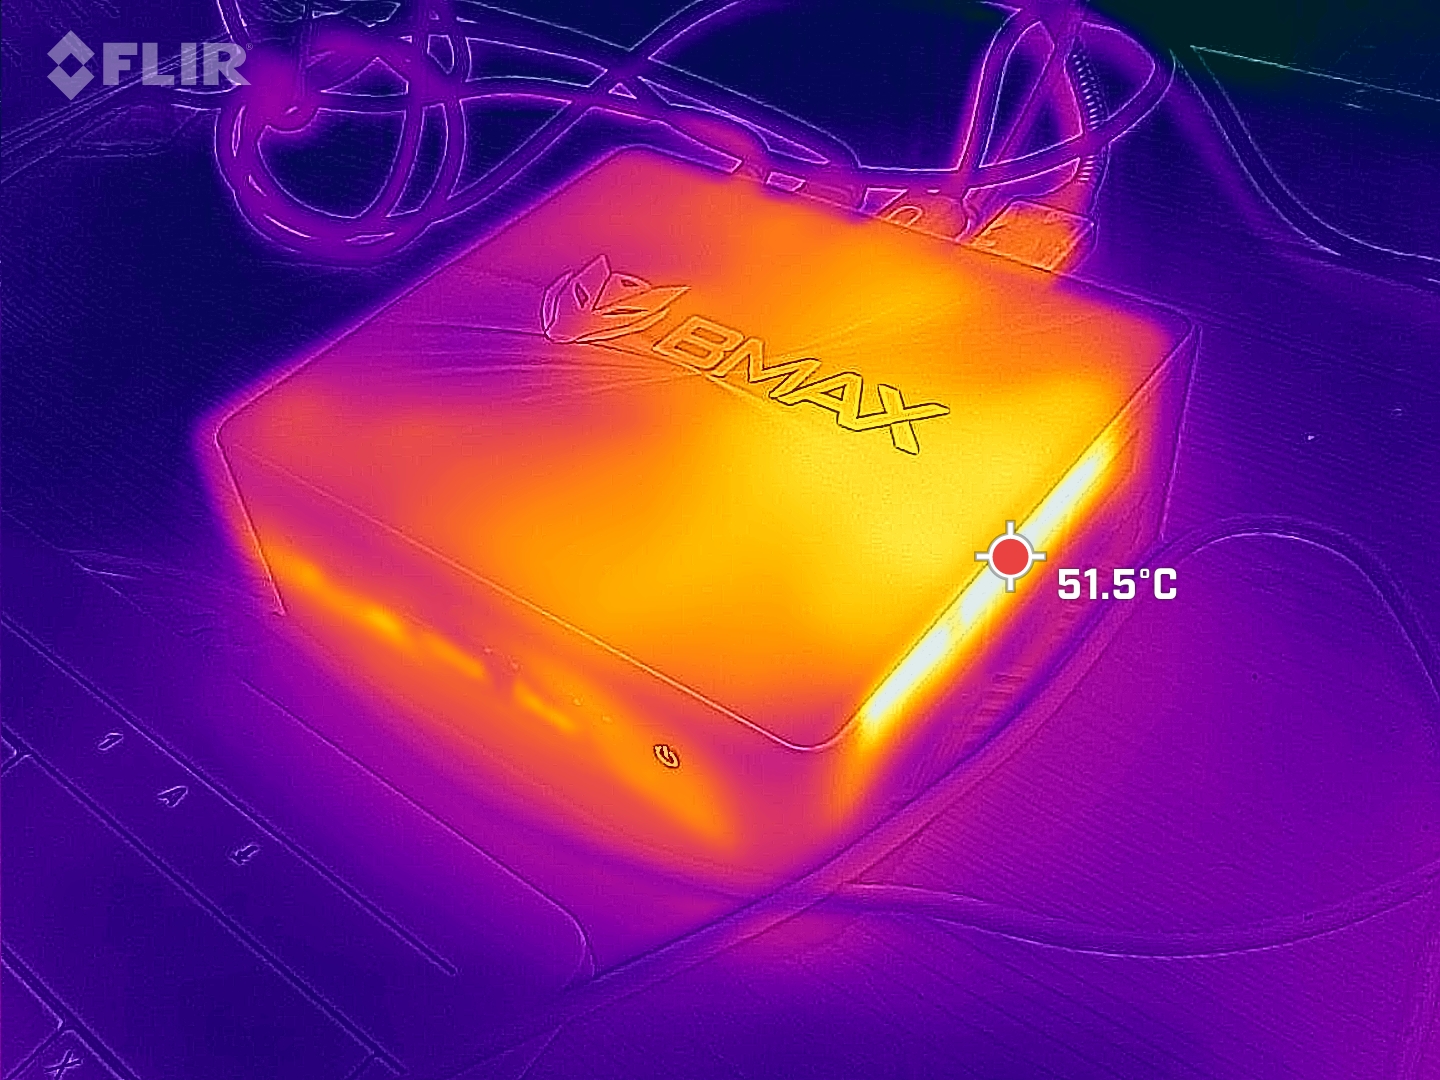
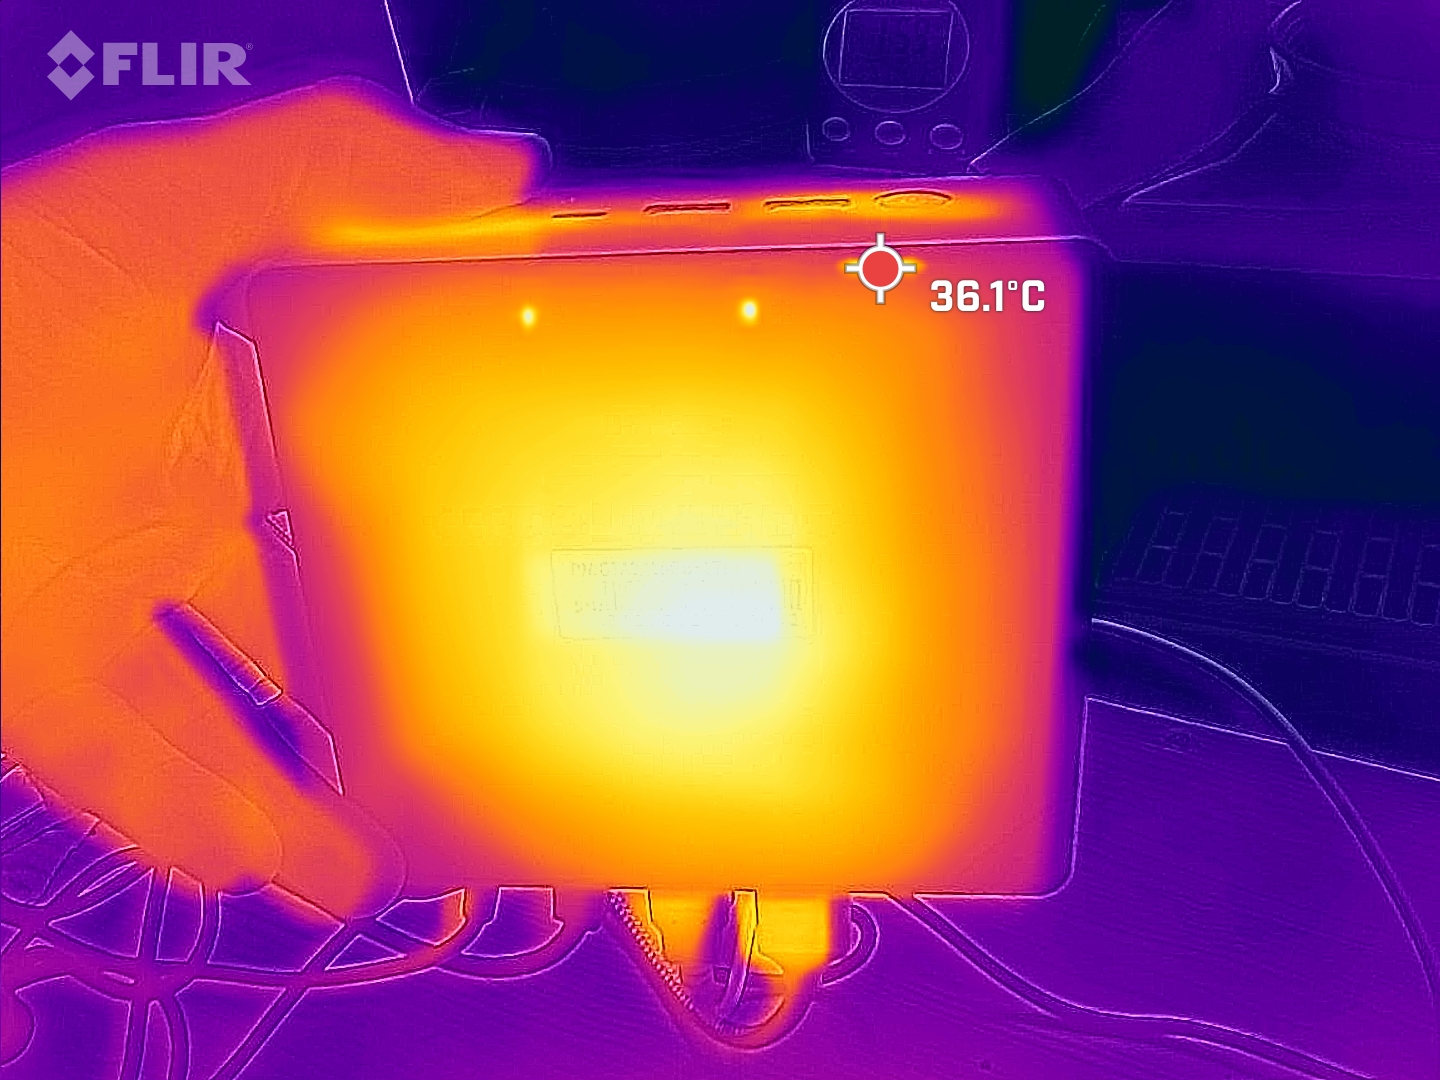
Por otro lado, el silencioso ventilador también lleva a temperaturas bastante altas - pero afortunadamente, sólo donde se asienta la rejilla de aire. La parte superior e inferior de la carcasa sólo alcanzaron temperaturas medias de 43 °C durante las pruebas de juego y estrés. Donde el aire sale de la carcasa en el lado derecho, medimos hasta 54 °C.
(±) La temperatura máxima en la parte superior es de 43 °C / 109 F, frente a la media de 35.4 °C / 96 F, que oscila entre 20.6 y 69.5 °C para la clase Mini PC.
(±) El fondo se calienta hasta un máximo de 42 °C / 108 F, frente a la media de 36.1 °C / 97 F
(±) En reposo, la temperatura media de la parte superior es de 35.2 °C / 95# F, frente a la media del dispositivo de 32.1 °C / 90 F.
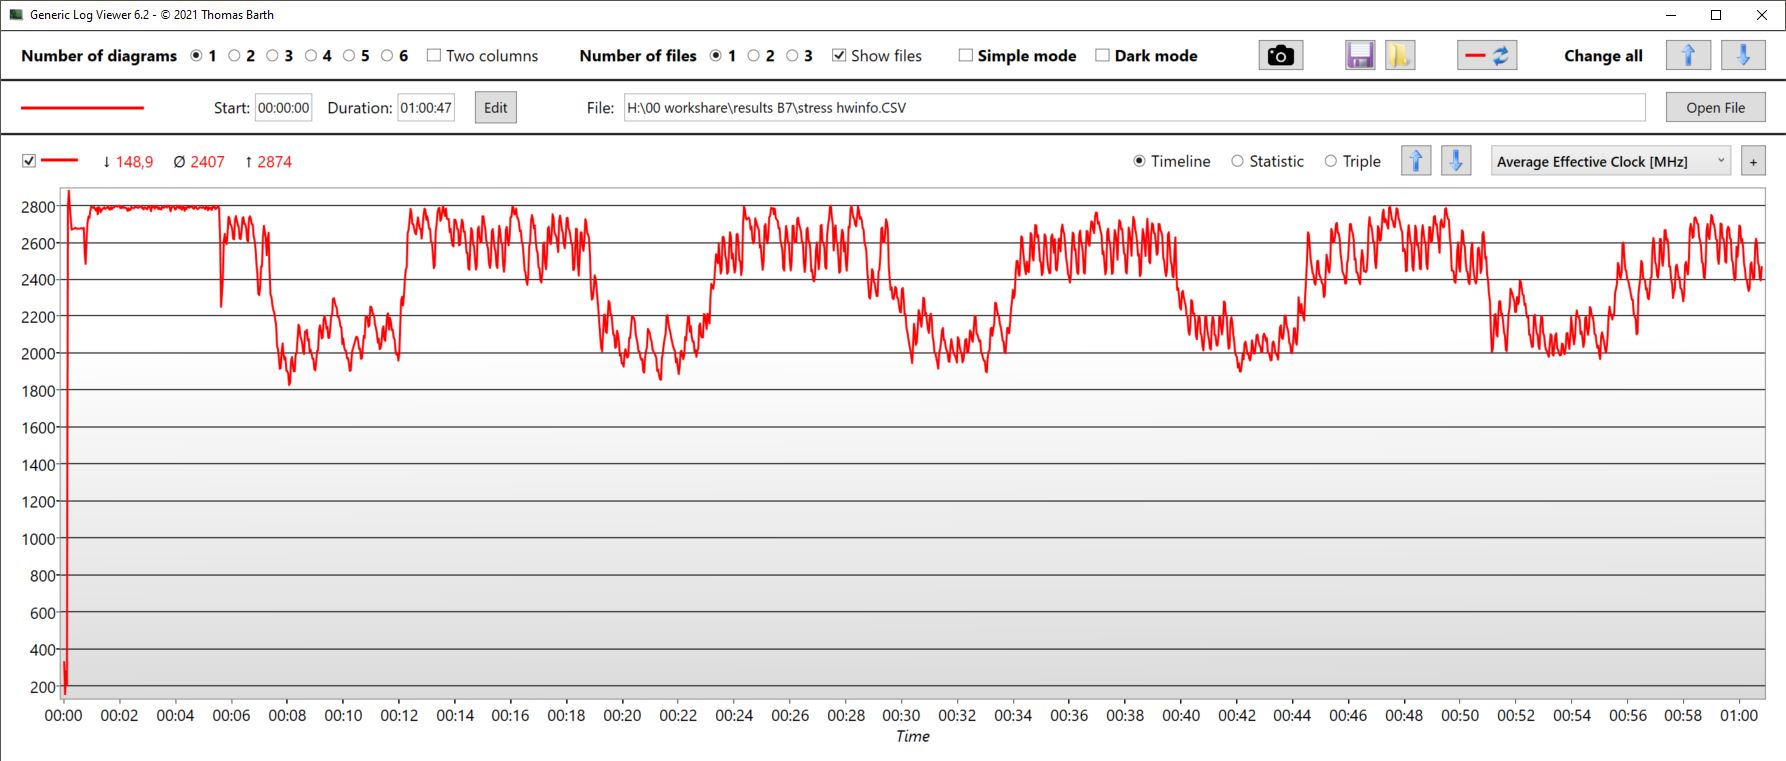
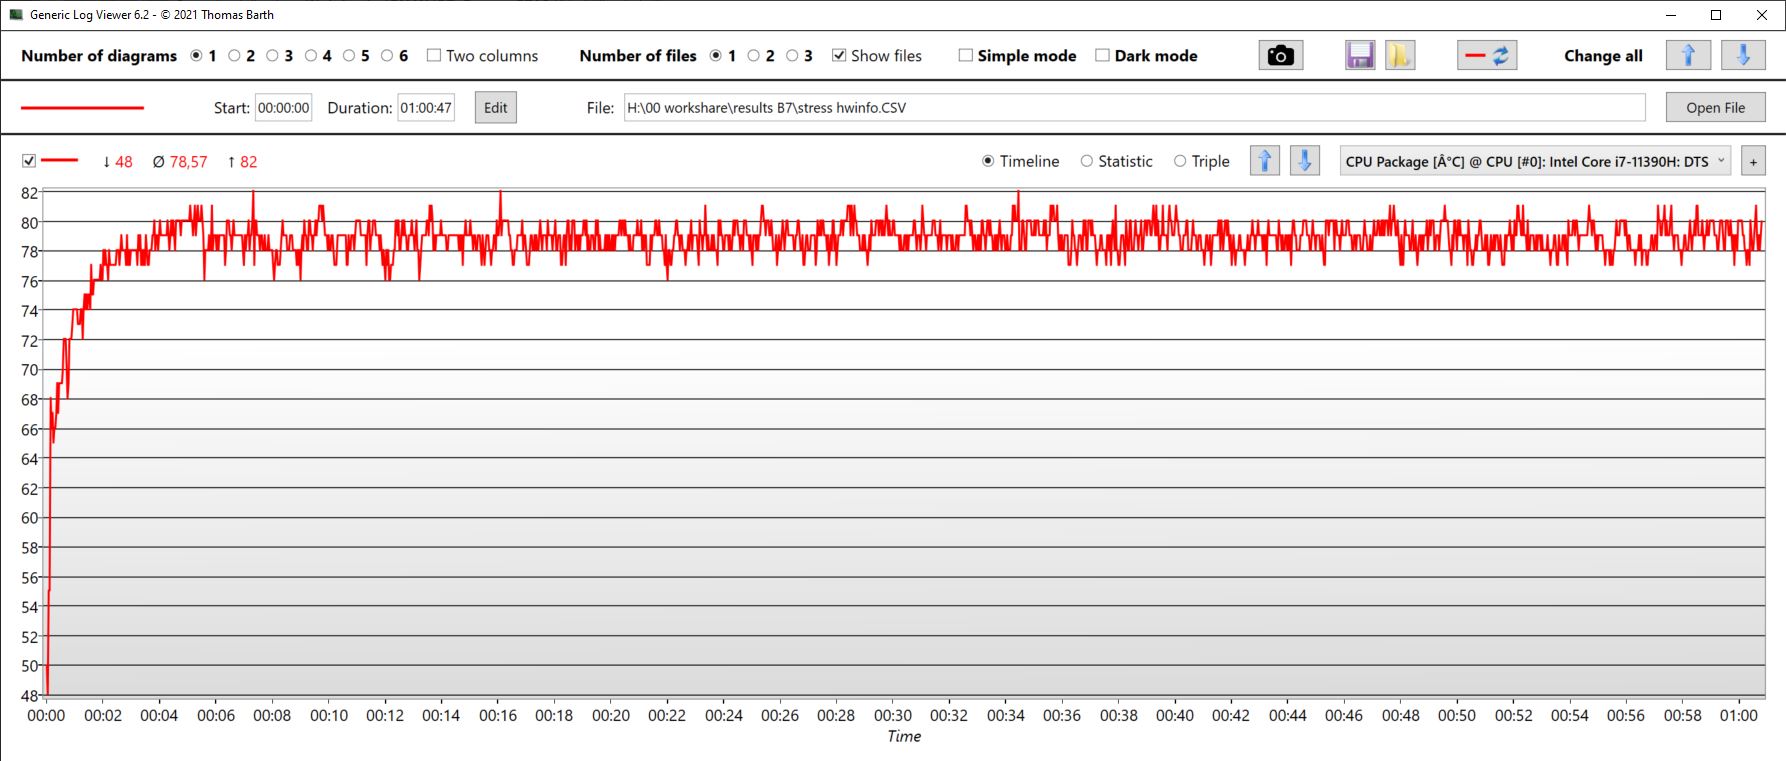
Prueba de esfuerzo
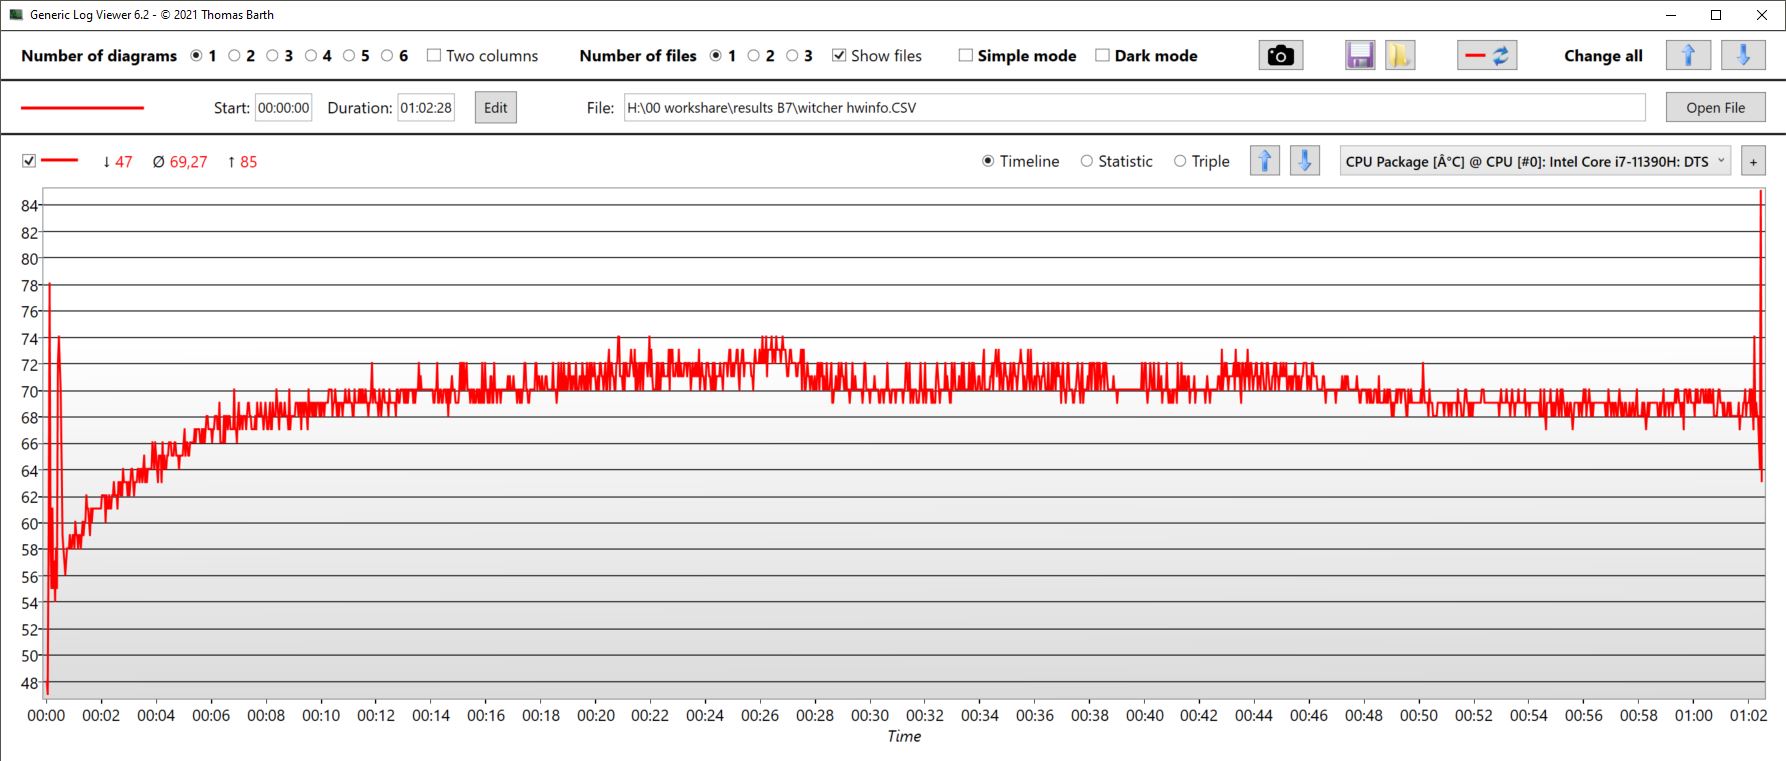
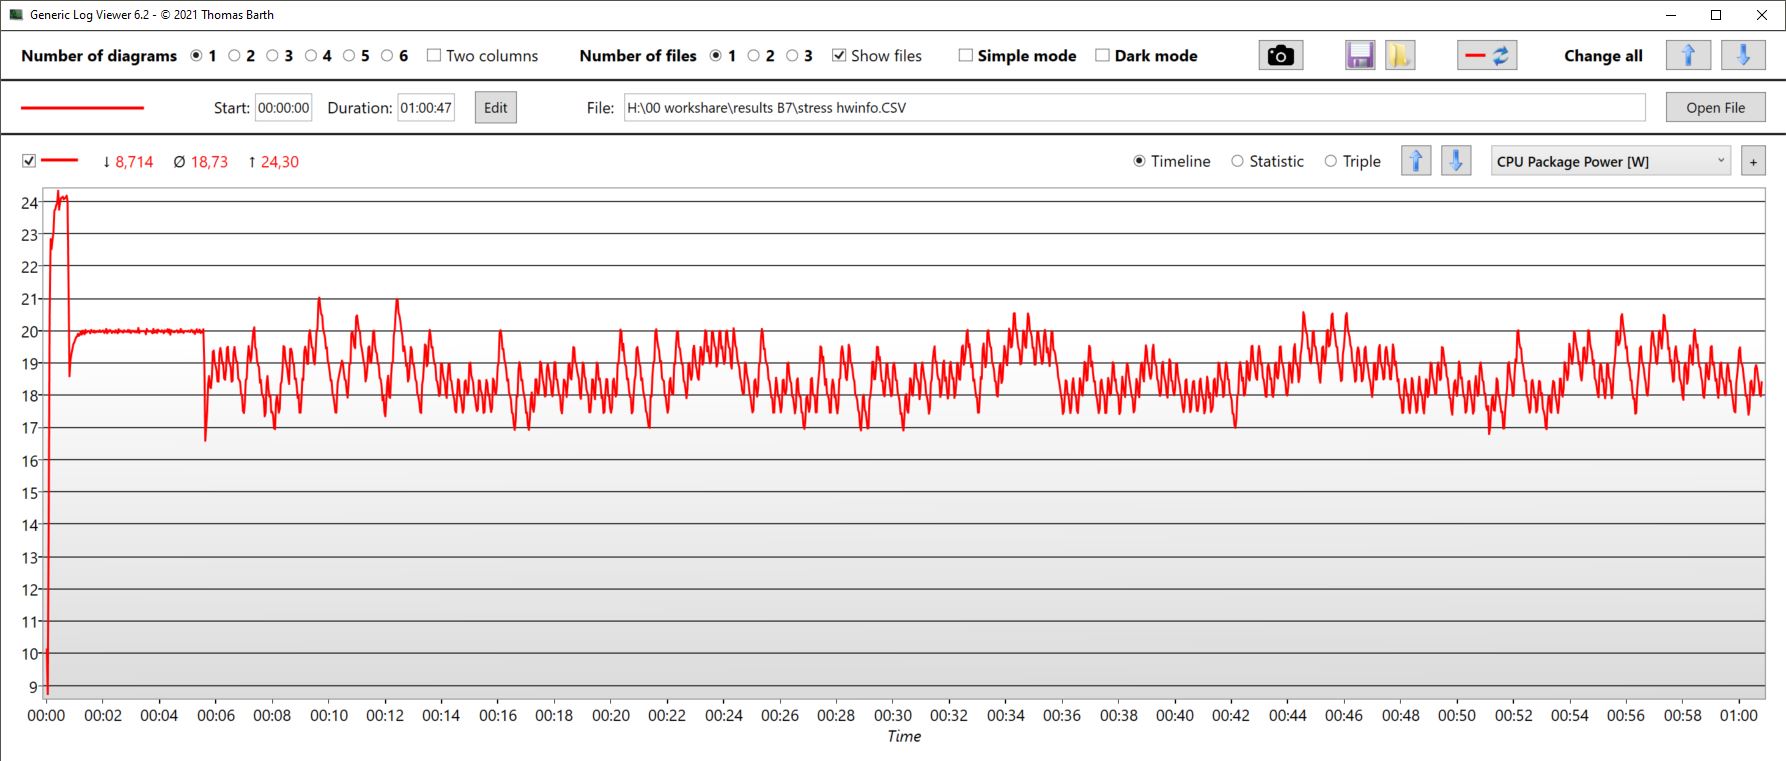
Prime95 y Furmark se ejecutaron simultáneamente en la prueba de estrés. La CPU alcanzó brevemente más de 2,8 GHz. Tras una breve caída, el procesador mantuvo un reloj de 2,8 GHz durante los cinco minutos siguientes, tras lo cual cayó repetidamente a entre 1,8 y 2,3 GHz en ciclos. La temperatura de cada núcleo nunca superó los 78 °C. Sin embargo, la CPU en su conjunto se calentó hasta los 82 °C, pero se mantuvieron los 78 °C de media.
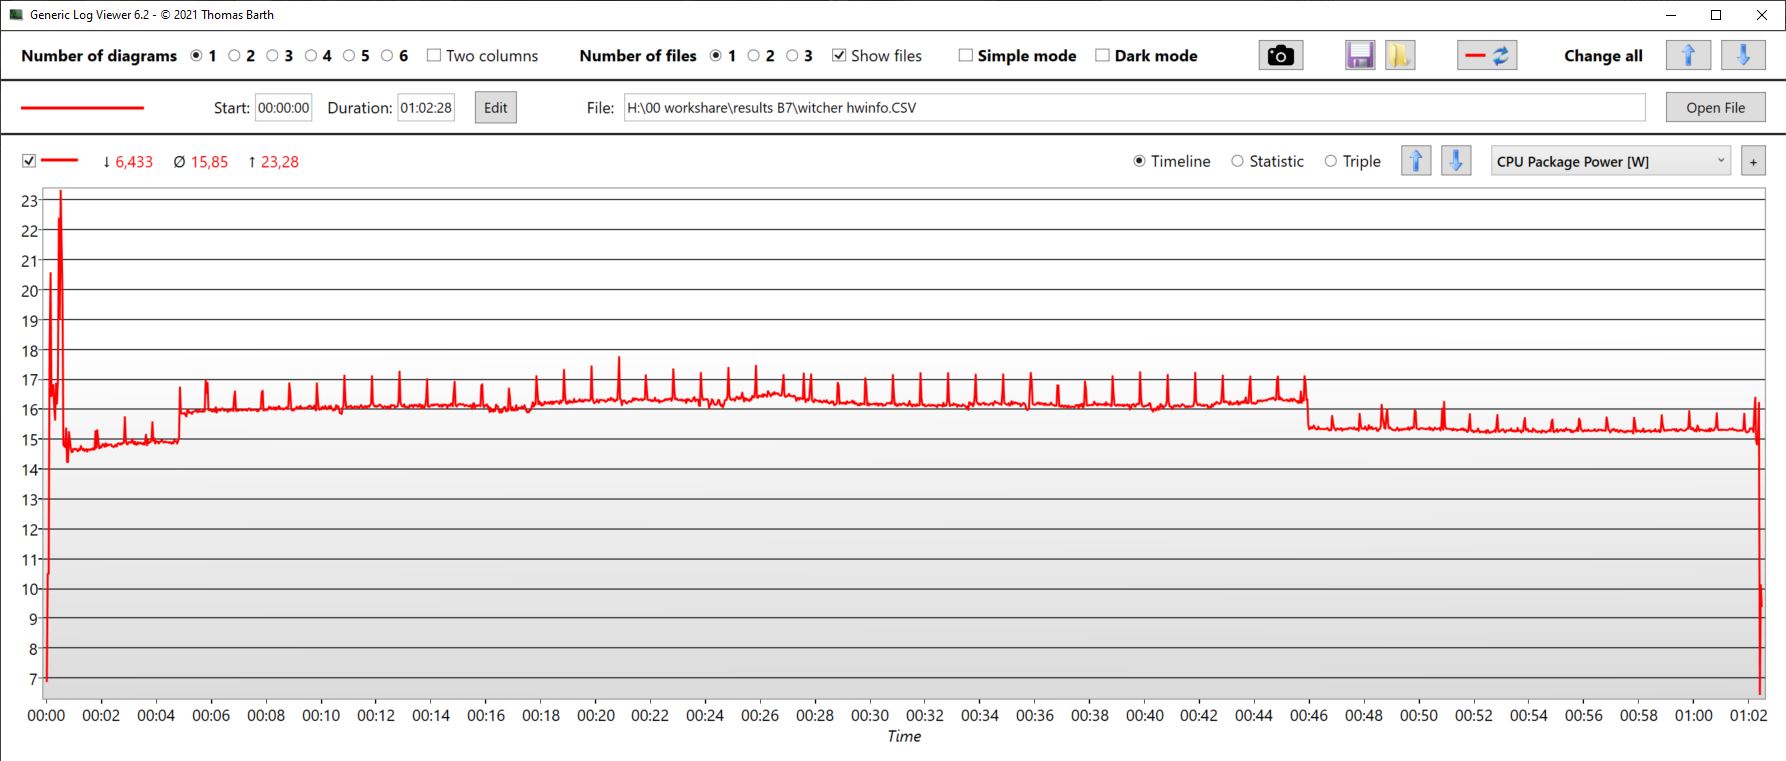
El consumo de energía de la CPU fue de 24 vatios al principio, pero sólo de unos 19 vatios de media.
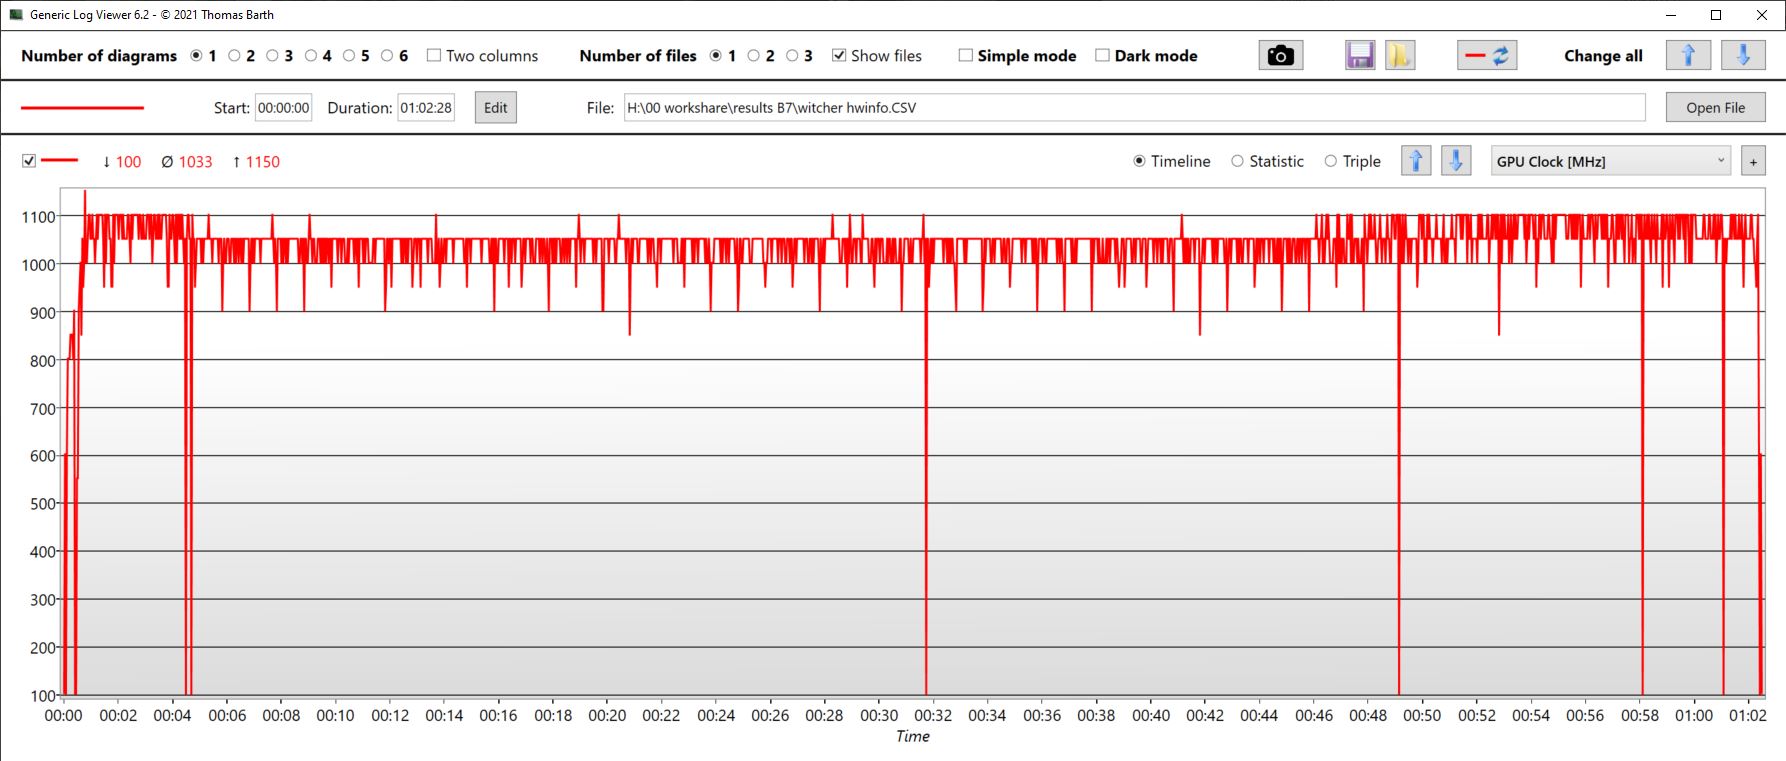
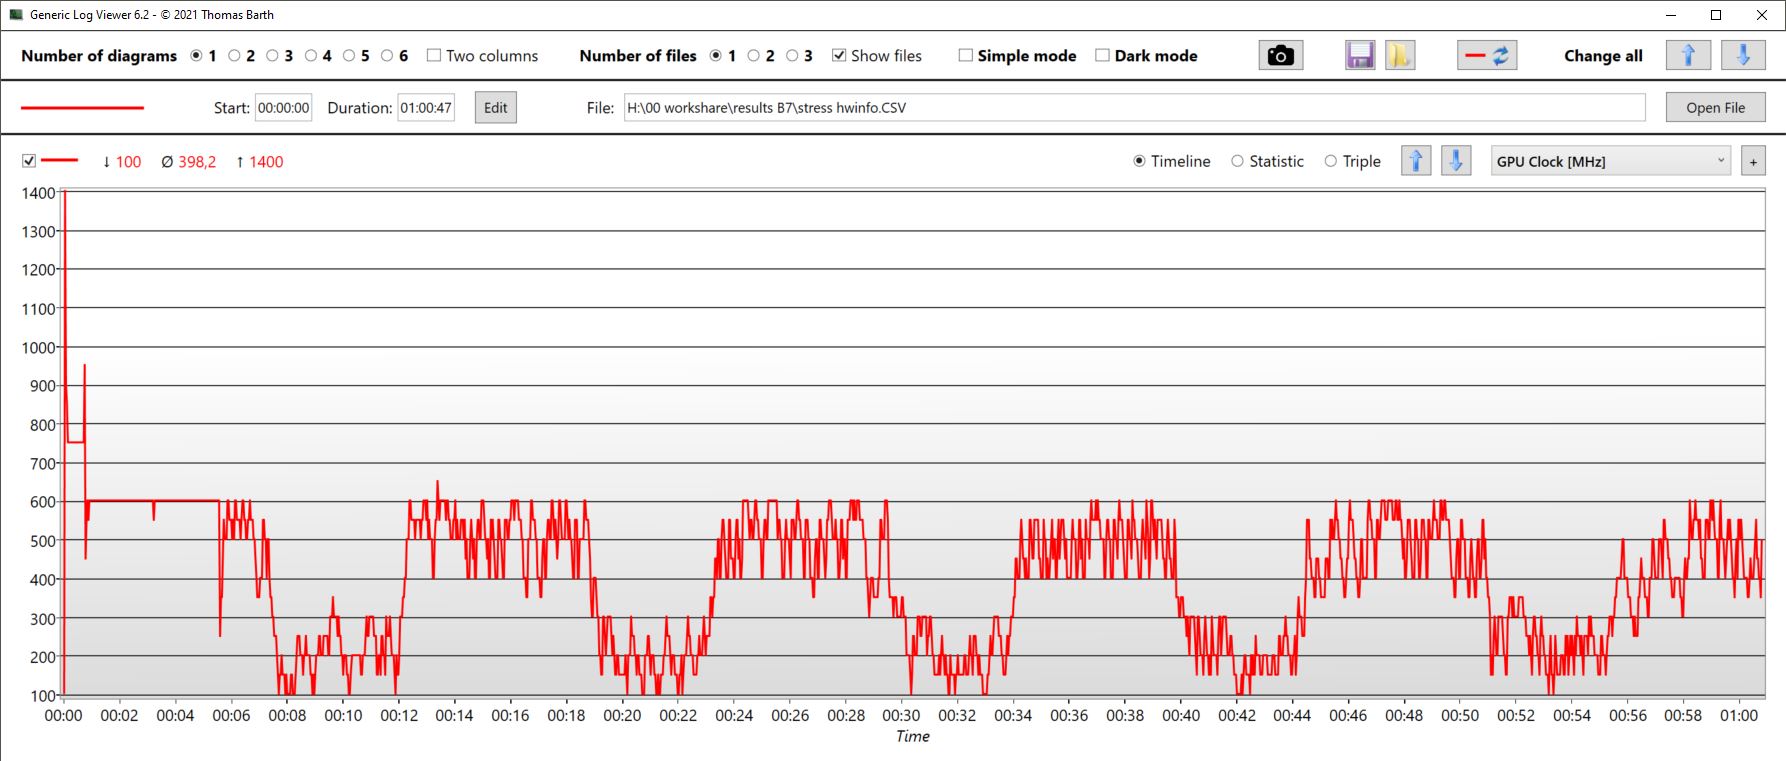
La GPU integrada funcionó a 1,4 GHz durante muy poco tiempo, tras lo cual se produjo la misma caída periódica de reloj de unos 600 MHz a 100-350 MHz. De media, la unidad gráfica funcionó a 400 MHz.
| Reloj dela CPU (GHz) | Reloj de la GPU (MHz) | Temperatura media dela CPU (°C) | Temperatura media de la GPU (°C) | |
| Prime95 + FurMark estrés | 2,4 | 400 | 79 | 79 |
| Witcher 3 estrés | 0,7 | 1033 | 69 | 69 |
Gestión de la energía - La muy frugal BMAX B7
Consumo de energía
En general, el B7 Power es muy frugal. Dependiendo del modo de alimentación, medimos entre 9 y 10 vatios en modo inactivo. El B7 muestra realmente lo frugal que es bajo carga.
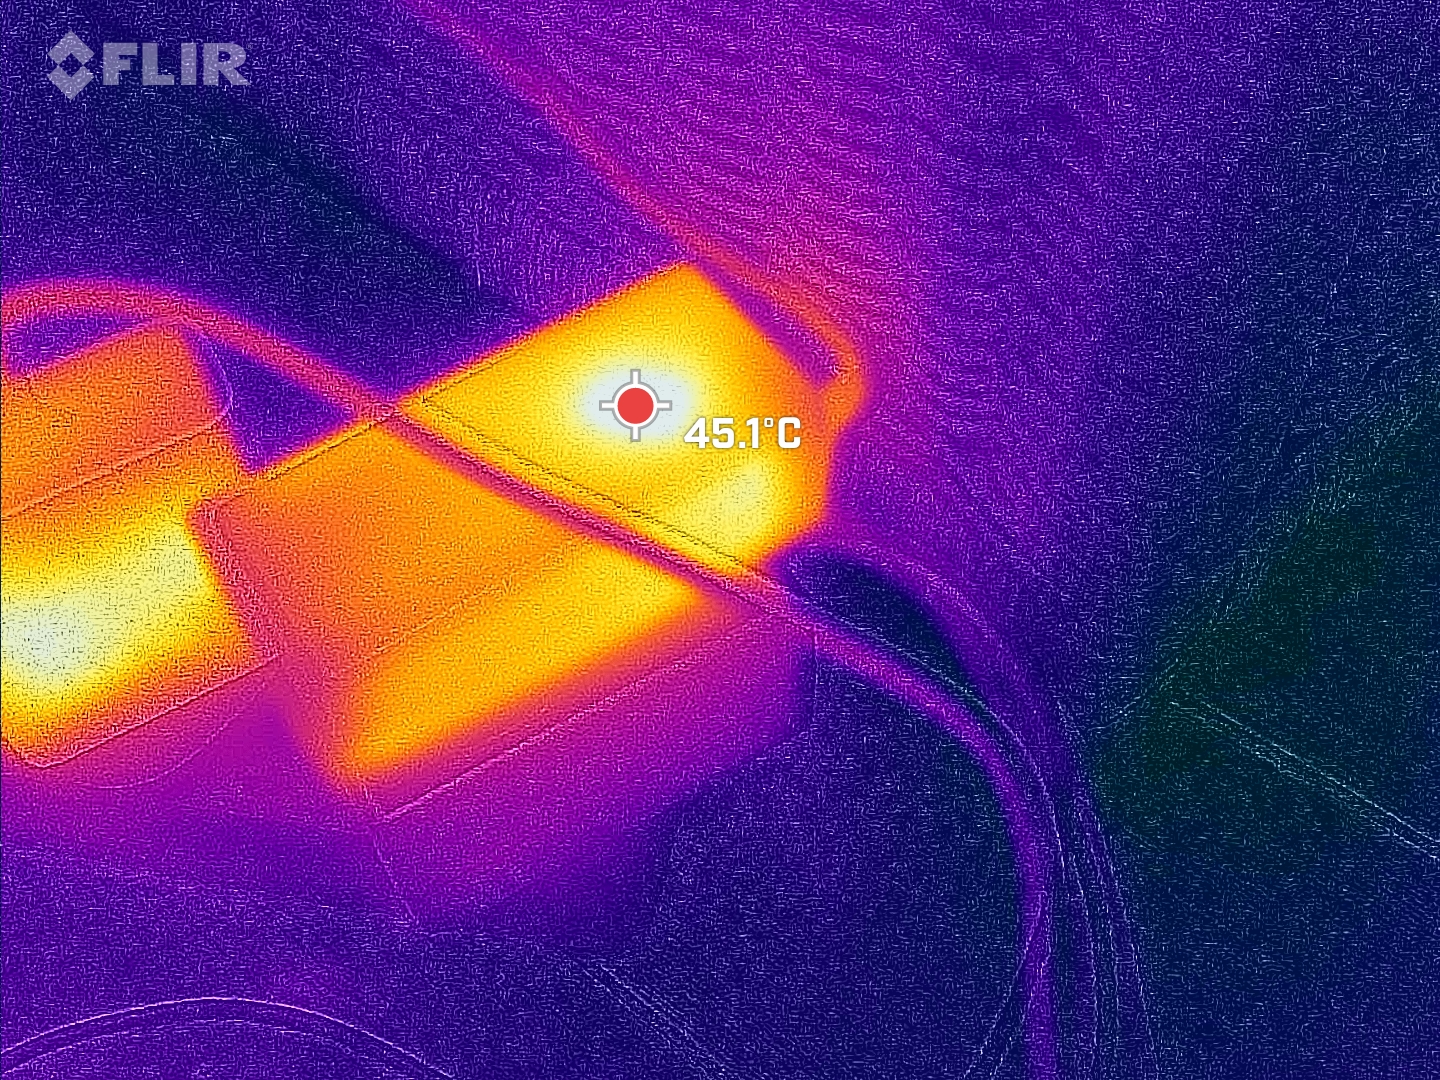
Su consumo máximo absoluto fue temporalmente de algo menos de 44 vatios; sin embargo, de media, el B7 Power no consume continuamente más de 35 vatios. Su pequeña fuente de alimentación tiene una potencia nominal de 47,5 vatios (19 V y 2,5 A). Alternativamente, puedes alimentar el B7 a través de su conexión USB-C, siempre y cuando el cargador cumpla con las especificaciones mínimas.
Atención: si el B7 está apagado, sigue consumiendo casi 1 vatio. Además, los puertos USB se alimentan en bucle a través de ellos. Como resultado, nuestro ratón RGB sigue iluminado aunque esté apagado. Sin el teclado ni el ratón, el B7 consume 830 mW cuando está apagado. Con el ratón y el teclado, su consumo supera en parte 1 vatio. Dependiendo de la aplicación, recomendaríamos una toma de corriente conmutable para el B7 Power.
| Off / Standby | |
| Ocioso | |
| Carga |
|
Clave:
min: | |
| BMAX B7 Power G7A2 i7-11390H, Iris Xe G7 96EUs, Kston K765-1TB, , x, | Geekom Mini IT11, i7-11390H i7-11390H, Iris Xe G7 96EUs, Lexar 1024GB LNM6A1X001T-HNNNG, , x, | Intel NUC 13 Pro Kit NUC13ANK i7-1360P, Iris Xe G7 96EUs, Samsung PM9A1 MZVL2512HCJQ, , x, | Beelink SEi11 Pro i5-11320H, Iris Xe G7 96EUs, Kingston NV1 SNVS/500GCN, , x, | BMAX B5 Pro G7H8 i5-8260U, UHD Graphics 620, , , x, | Medio Intel Iris Xe Graphics G7 96EUs | Media de la clase Mini PC | |
|---|---|---|---|---|---|---|---|
| Power Consumption | -8% | -61% | -48% | -8% | -28% | -88% | |
| Idle Minimum * (Watt) | 9.1 | 7.3 20% | 5.1 44% | 9.8 -8% | 6 34% | 5.51 ? 39% | 8.82 ? 3% |
| Idle Average * (Watt) | 9.5 | 7.8 18% | 5.8 39% | 10.3 -8% | 6.2 35% | 8.66 ? 9% | 10.9 ? -15% |
| Idle Maximum * (Watt) | 10 | 8.4 16% | 10.2 -2% | 10.5 -5% | 6.3 37% | 10.9 ? -9% | 13.9 ? -39% |
| Load Average * (Watt) | 27.1 | 28.7 -6% | 68.1 -151% | 54.2 -100% | 42.8 -58% | 45.6 ? -68% | 65 ? -140% |
| Witcher 3 ultra * (Watt) | 29.1 | 53.1 -82% | 35 -20% | ||||
| Load Maximum * (Watt) | 32.3 | 61.1 -89% | 108.3 -235% | 59 -83% | 55.8 -73% | 67.8 ? -110% | 113.5 ? -251% |
* ... más pequeño es mejor
Power consumption with external monitor
Pro
Contra
Veredicto - Más bien "B7 Económico"
El BMAX B7 Power crea innecesariamente una falsa impresión. El procesador instalado es uno de hace dos generaciones y es muy lento incluso para sus estándares, ya que está ralentizado. Al mismo tiempo, el B7 no tiene por qué avergonzarse de sí mismo, ya que sus puntos fuertes -como lo silencioso y frugal que es- hablan en favor de que el PC se utilice para fines totalmente distintos.
El mini PC X86 es adecuado para todos los usos que requieran un cierto nivel de rendimiento y, al mismo tiempo, mantengan bajos el consumo de energía y las emisiones de ruido. Por ejemplo, como servidor doméstico, consola retro, etc. El B7 Power simplemente se comercializa de forma equivocada. Si sigues comprando un Intel Gen11 en los tiempos que corren, lo más probable es que no busques el máximo rendimiento, por lo que deberían promocionarse más los verdaderos puntos fuertes del B7. Sería mucho más apropiado darle un nombre como B7 Power Server, B7 Home Server o B7 Efficient.
Si buscas la máxima "potencia", el BMAX B7 Power, con su GPU Gen11 estrangulada, es el lugar equivocado. En cambio, si buscas un servidor doméstico o similar, este dispositivo es perfecto para ti.
Precio y disponibilidad
BMAX B7 Power G7A2
- 09/12/2023 v7 (old)
Christian Hintze
Transparencia
La selección de los dispositivos que se van a reseñar corre a cargo de nuestro equipo editorial. La muestra de prueba fue proporcionada al autor en calidad de préstamo por el fabricante o el minorista a los efectos de esta reseña. El prestamista no tuvo ninguna influencia en esta reseña, ni el fabricante recibió una copia de la misma antes de su publicación. No había ninguna obligación de publicar esta reseña. Como empresa de medios independiente, Notebookcheck no está sujeta a la autoridad de fabricantes, minoristas o editores.
Así es como prueba Notebookcheck
Cada año, Notebookcheck revisa de forma independiente cientos de portátiles y smartphones utilizando procedimientos estandarizados para asegurar que todos los resultados son comparables. Hemos desarrollado continuamente nuestros métodos de prueba durante unos 20 años y hemos establecido los estándares de la industria en el proceso. En nuestros laboratorios de pruebas, técnicos y editores experimentados utilizan equipos de medición de alta calidad. Estas pruebas implican un proceso de validación en varias fases. Nuestro complejo sistema de clasificación se basa en cientos de mediciones y puntos de referencia bien fundamentados, lo que mantiene la objetividad.Price comparison

