Estreno del Intel Core i5-8260U: Análisis del mini PC BMAX B5 Pro G7H8
Al igual que Chuwi, BMax se especializa en portátiles, monitores y mini PCs económicos que generalmente son cientos de dólares más baratos que incluso los SKUs más básicos de fabricantes más grandes y conocidos. Su secreto es el uso de CPUs de generaciones anteriores que pueden reducir el coste de los dispositivos de forma significativa
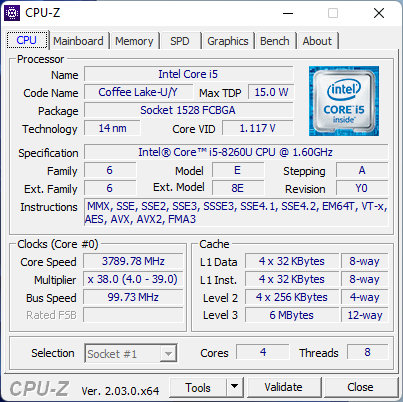
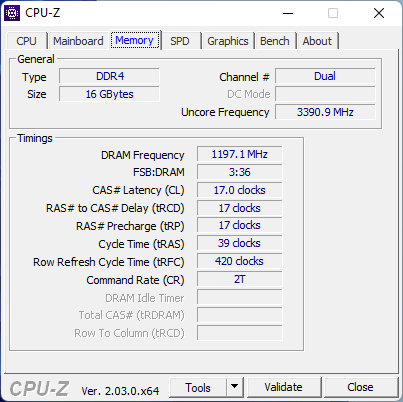
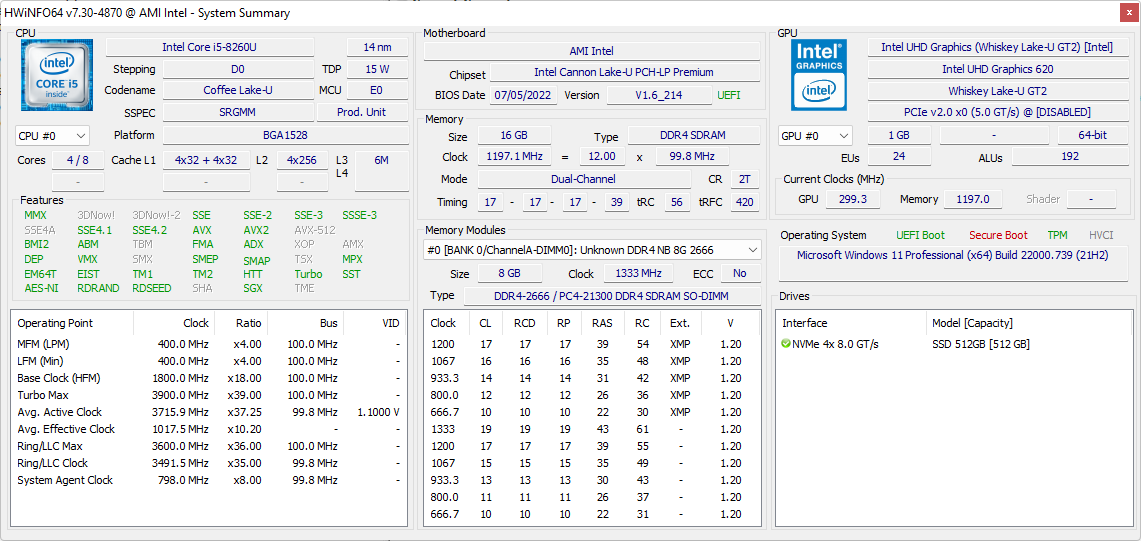
El BMax B5 Pro es el último mini PC del fabricante dirigido a los usuarios de HTPC con presupuestos más ajustados. Destaca por lucir una CPU de 8ª generación de Intel Core U, mientras que los últimos mini PCs utilizan opciones de 12ª generación. Nuestra configuración específica viene con la CPU Coffee Lake Core i5-8260U poco común con 16 GB de RAM, 512 GB de SSD NVMe y Windows 11 precargado por solo 280 dólares en el momento de escribir este artículo. El B5 Pro compite directamente con otros mini PC económicos como el Beelink SEi8 o el GMK NucBox 2.
Más reseñas de BMax:
Posibles contendientes en la comparación
Valoración | Fecha | Modelo | Peso | Altura | Tamaño | Resolución | Precio |
|---|---|---|---|---|---|---|---|
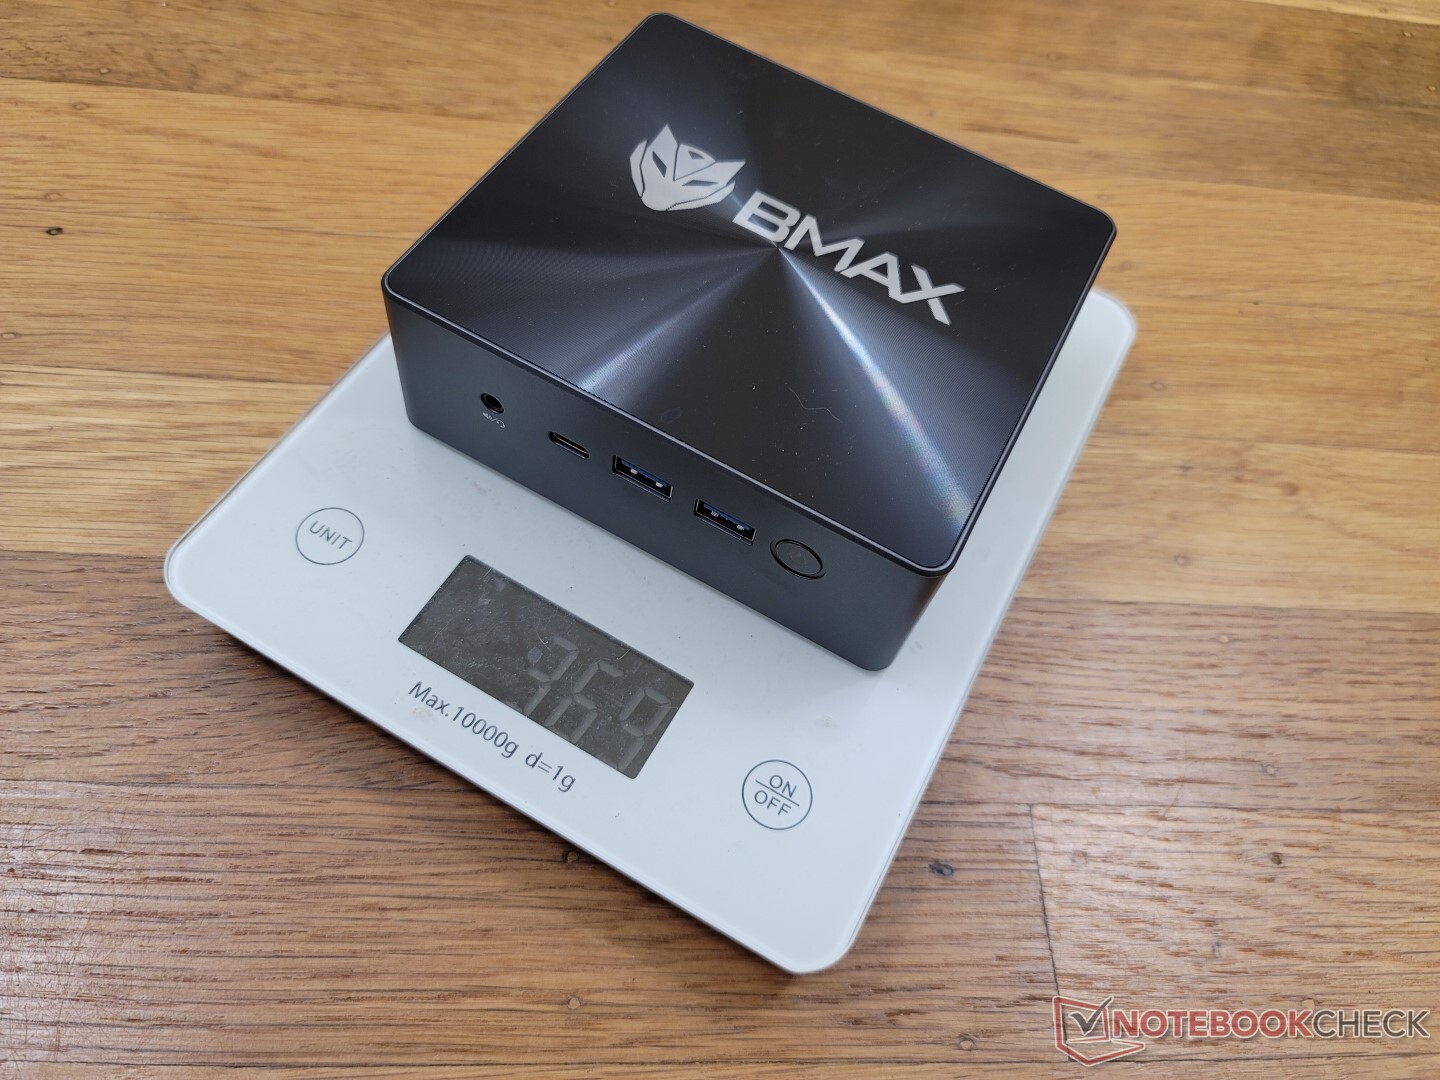
v (old) | 11/2022 | BMAX B5 Pro G7H8 i5-8260U, UHD Graphics 620 | 369 g | 43.2 mm | x | ||
v (old) | 09/2022 | Beelink SEi11 Pro i5-11320H, Iris Xe G7 96EUs | 440 g | 40 mm | x | ||
v (old) | 09/2022 | Beelink U59 N5105 Celeron N5105, UHD Graphics (Jasper Lake 24 EU) | 320 g | 42 mm | x | ||
v (old) | 04/2022 | Beelink SEi8 i3-8109U, Iris Plus Graphics 655 | 346 g | 41 mm | x | ||
v (old) | 10/2022 | Beelink SER Pro Ryzen 5 5600H R5 5600H, Vega 7 | 498 g | 42 mm | x | ||
v (old) | 04/2021 | Intel NUC11TNKi5 i5-1135G7, Iris Xe G7 80EUs | 504 g | 37 mm | x |
Caso - Nada fuera de lo común
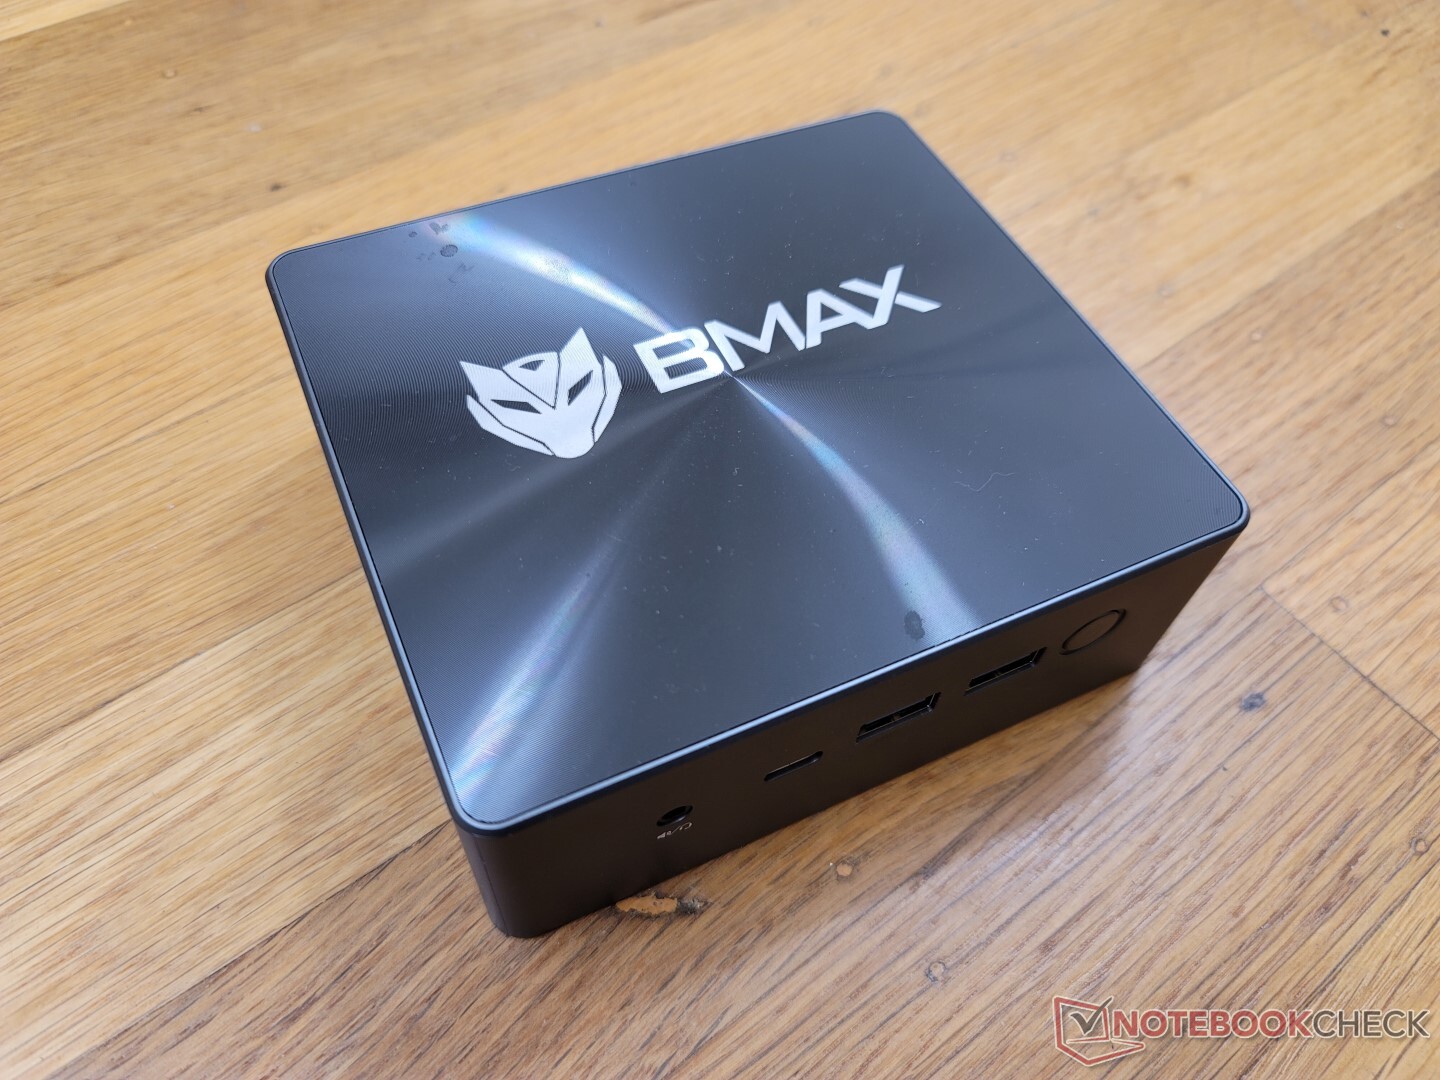
La carcasa es ligeramente más gruesa que la del Intel NUC11TNKi5 para ser casi idéntica a la del Beelink SEi8. La rigidez es fuerte alrededor de los bordes y la parte inferior ya que estas áreas son de metal mientras que la parte superior es de plástico más barato y más susceptible a la deformación. Sigue siendo un diseño fuerte sin fallos evidentes aunque no sea tan pesado como un Intel NUC.
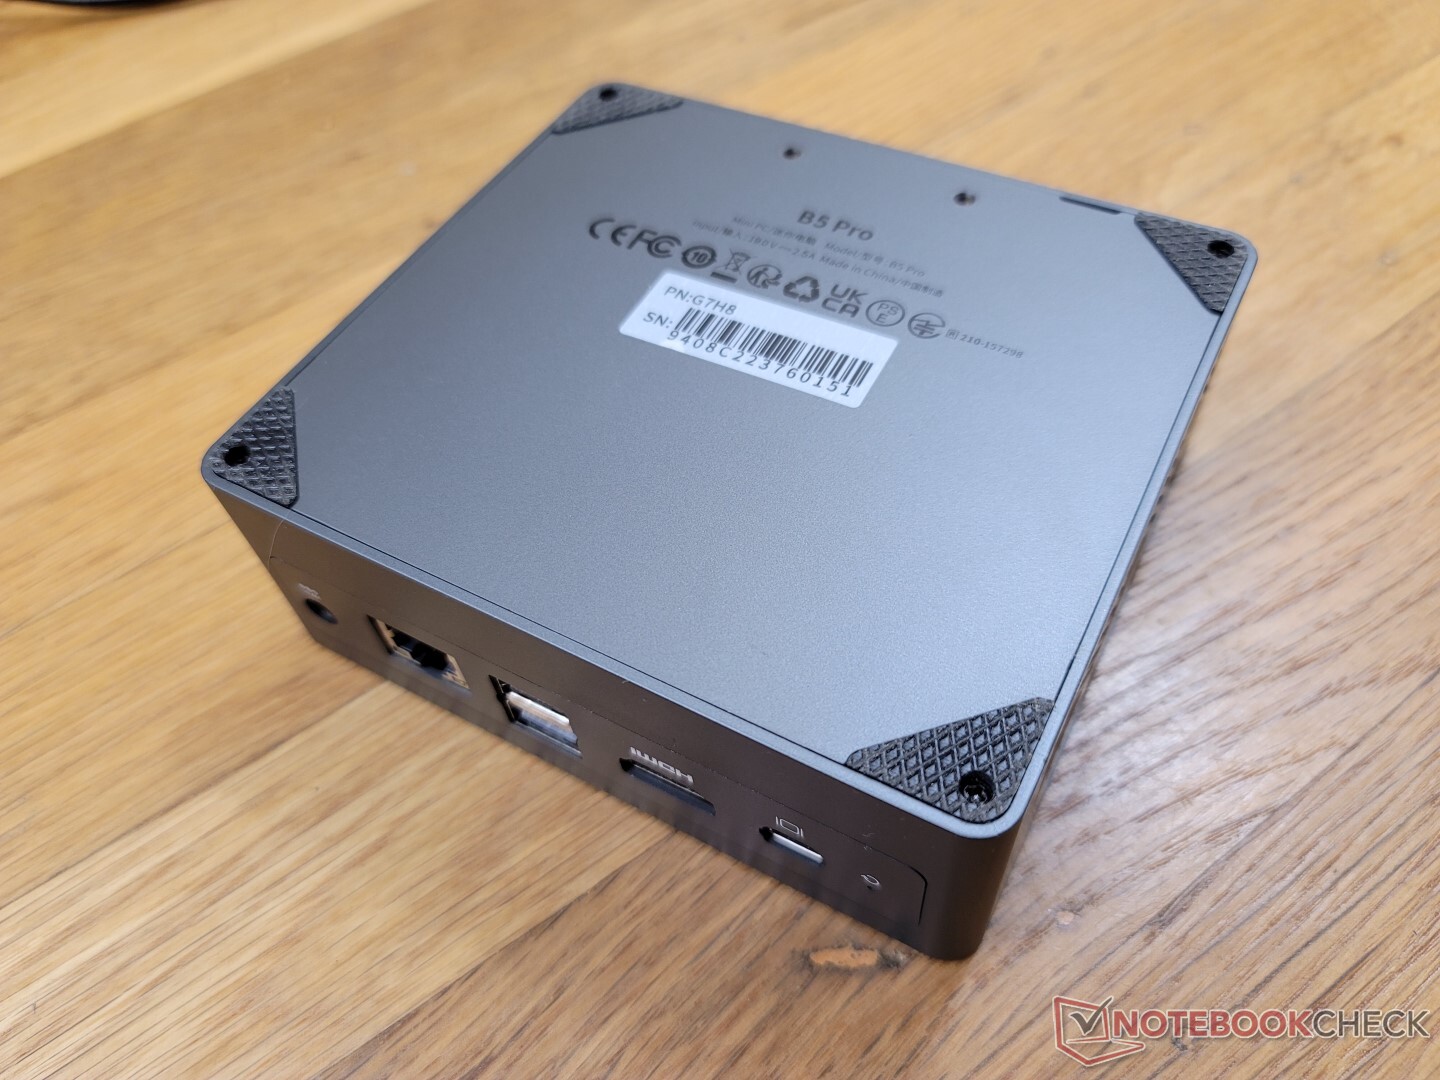
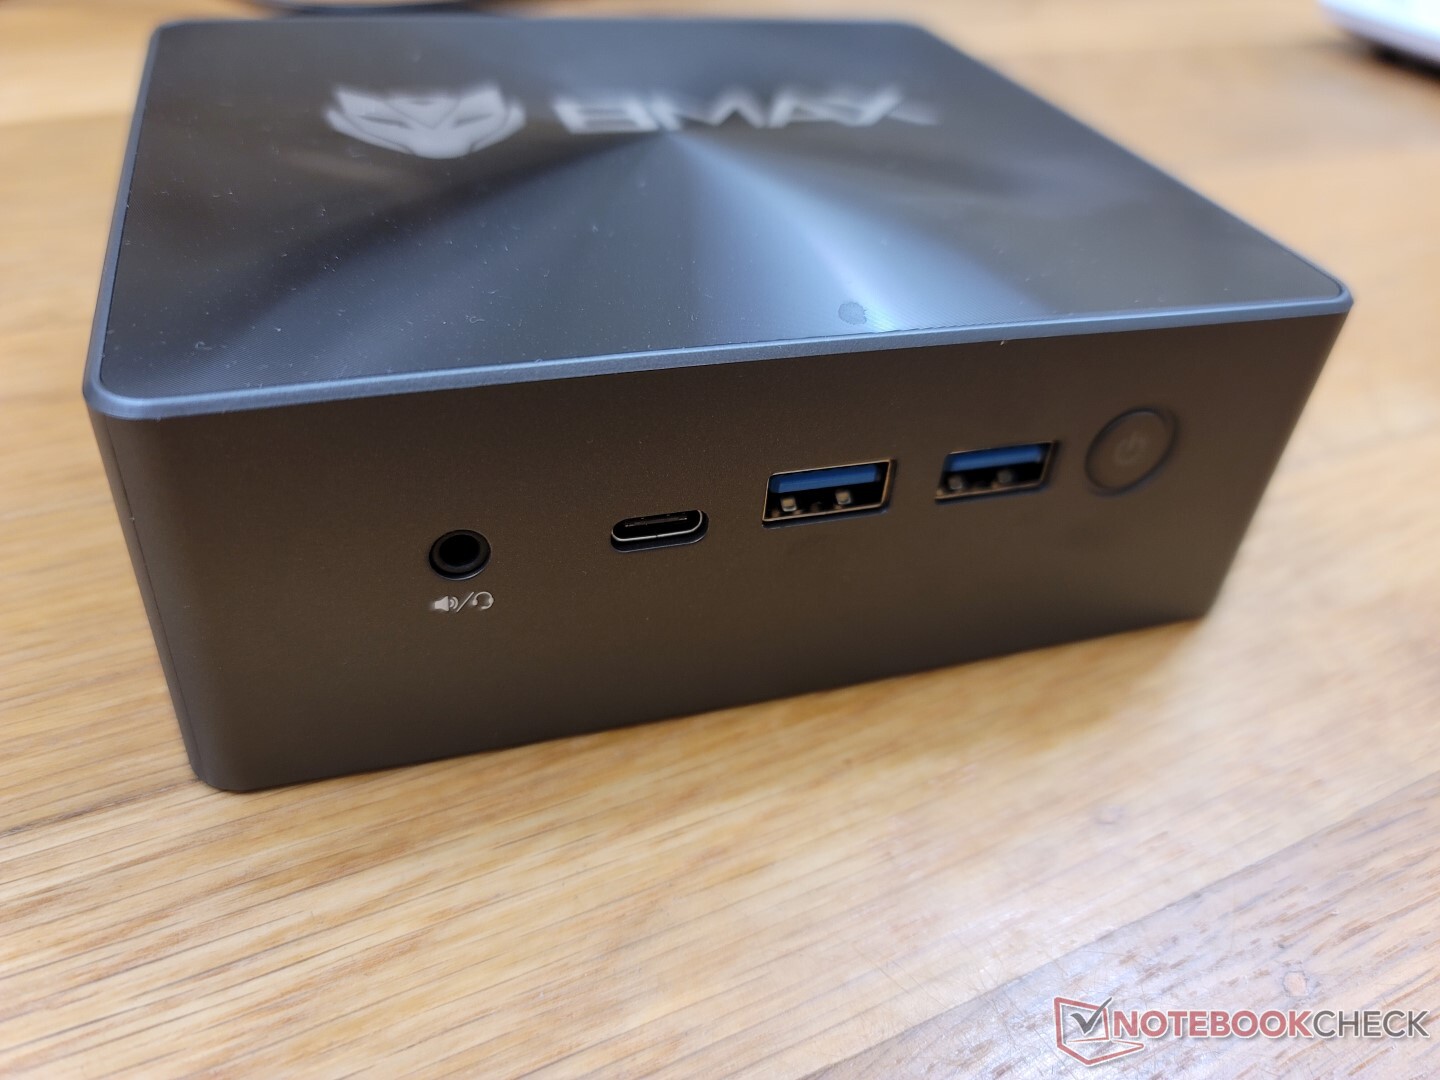
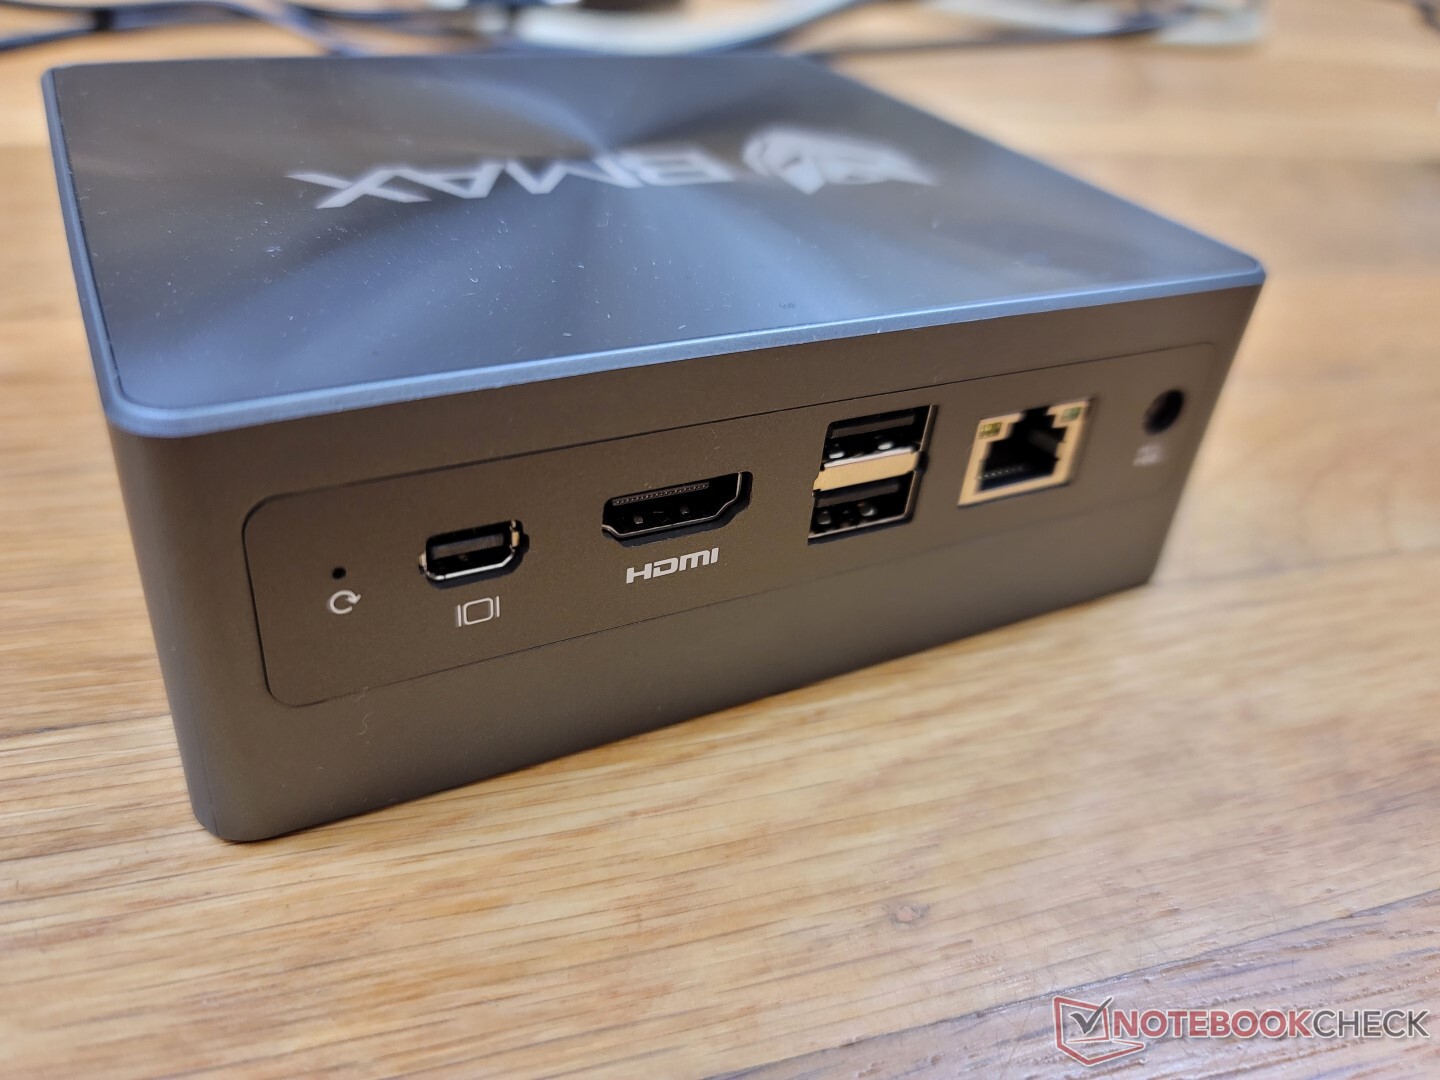
Conectividad - No es compatible con Thunderbolt
El puerto más notable en el B5 Pro es el mini DisplayPort ya que la mayoría de los otros mini PCs en este rango de precios no tienen un mini DisplayPort en absoluto. no admite monitores 4K a 60 Hz a través de HDMI.
El puerto USB-C frontal soporta monitores externos, pero no soporta Power-in o Thunderbolt.
Comunicación
Un RealTek RTL8852BE viene de serie para la conectividad Wi-Fi 6 y Bluetooth 5.2. No hay soporte para Wi-Fi 6E, probablemente para ahorrar costes. Las tasas de transferencia son, por lo demás, estables y sin problemas, aunque no sean tan rápidas como las de la serie Intel AX200/201.
| Networking | |
| iperf3 transmit AX12 | |
| Intel NUC11TNKi5 | |
| Beelink SEi8 | |
| iperf3 receive AX12 | |
| Intel NUC11TNKi5 | |
| Beelink SEi8 | |
| iperf3 receive AXE11000 6GHz | |
| Beelink SER Pro Ryzen 5 5600H | |
| Beelink SEi11 Pro | |
| iperf3 receive AXE11000 | |
| BMAX B5 Pro G7H8 | |
| Beelink U59 N5105 | |
| iperf3 transmit AXE11000 6GHz | |
| Beelink SER Pro Ryzen 5 5600H | |
| Beelink SEi11 Pro | |
| iperf3 transmit AXE11000 | |
| BMAX B5 Pro G7H8 | |
| Beelink U59 N5105 | |
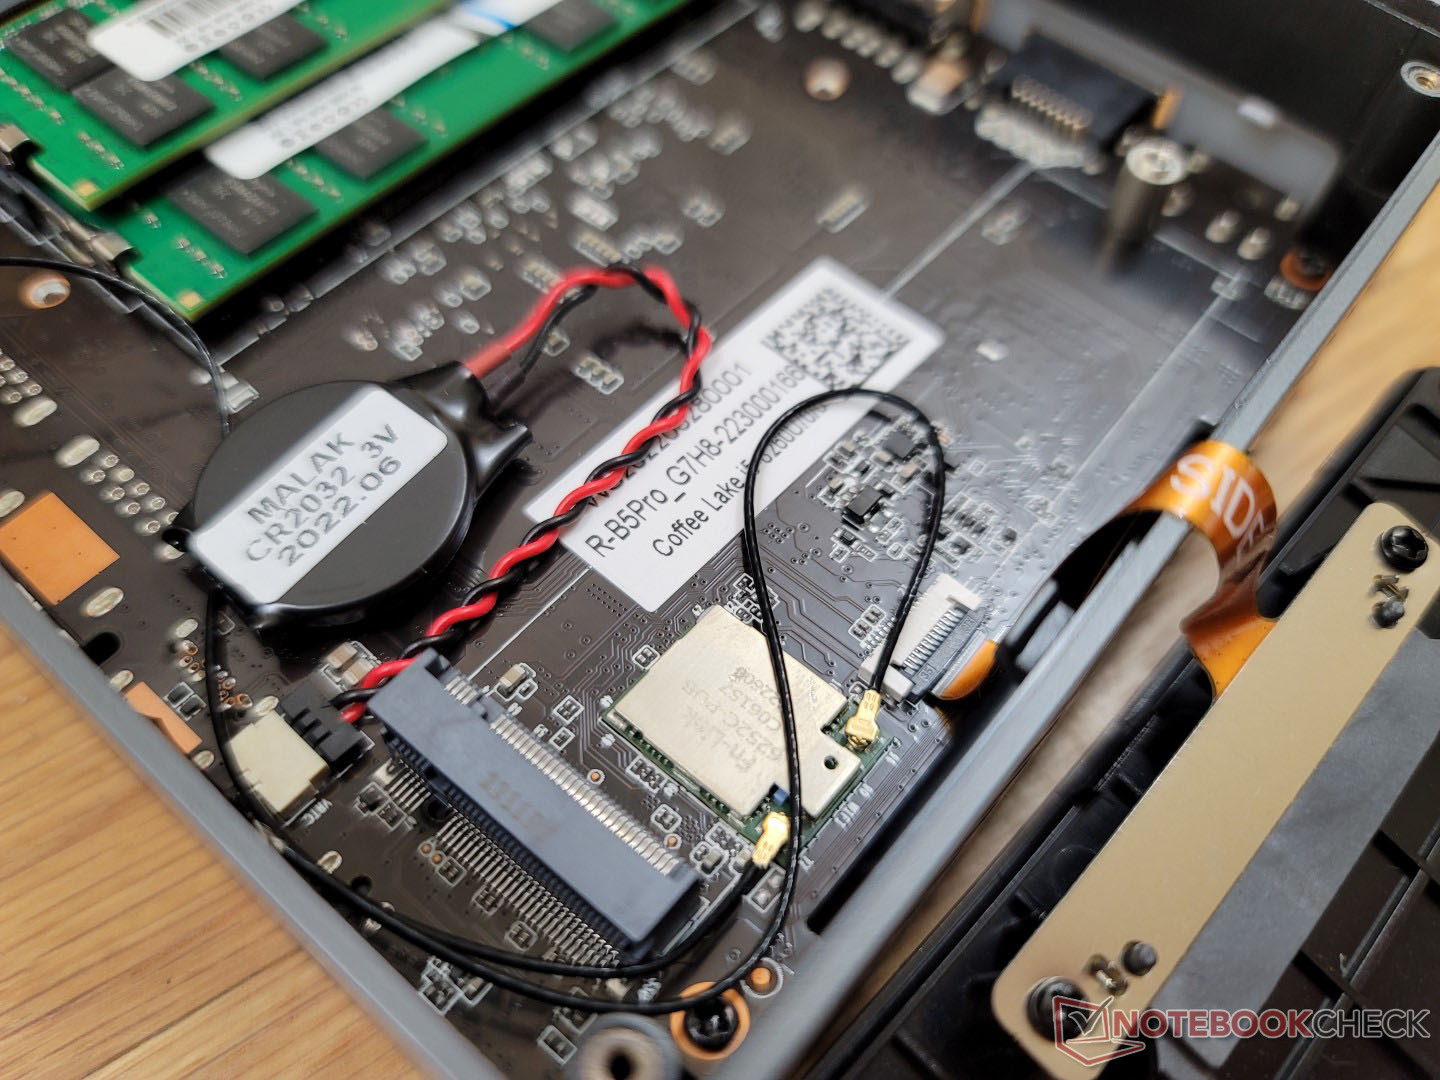
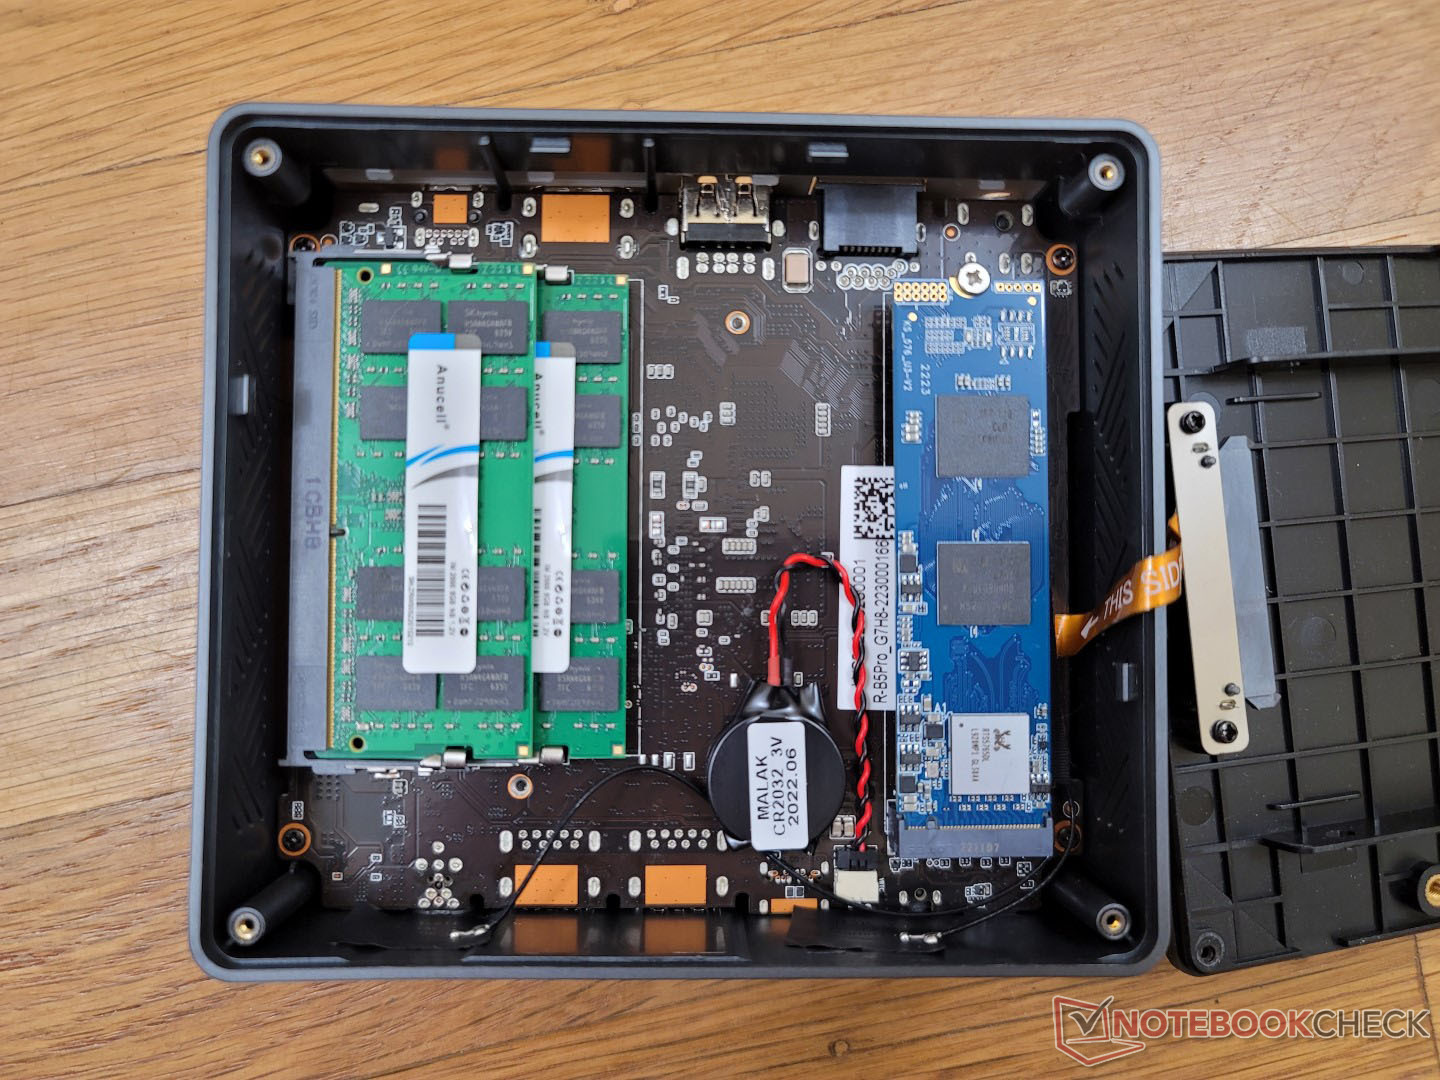
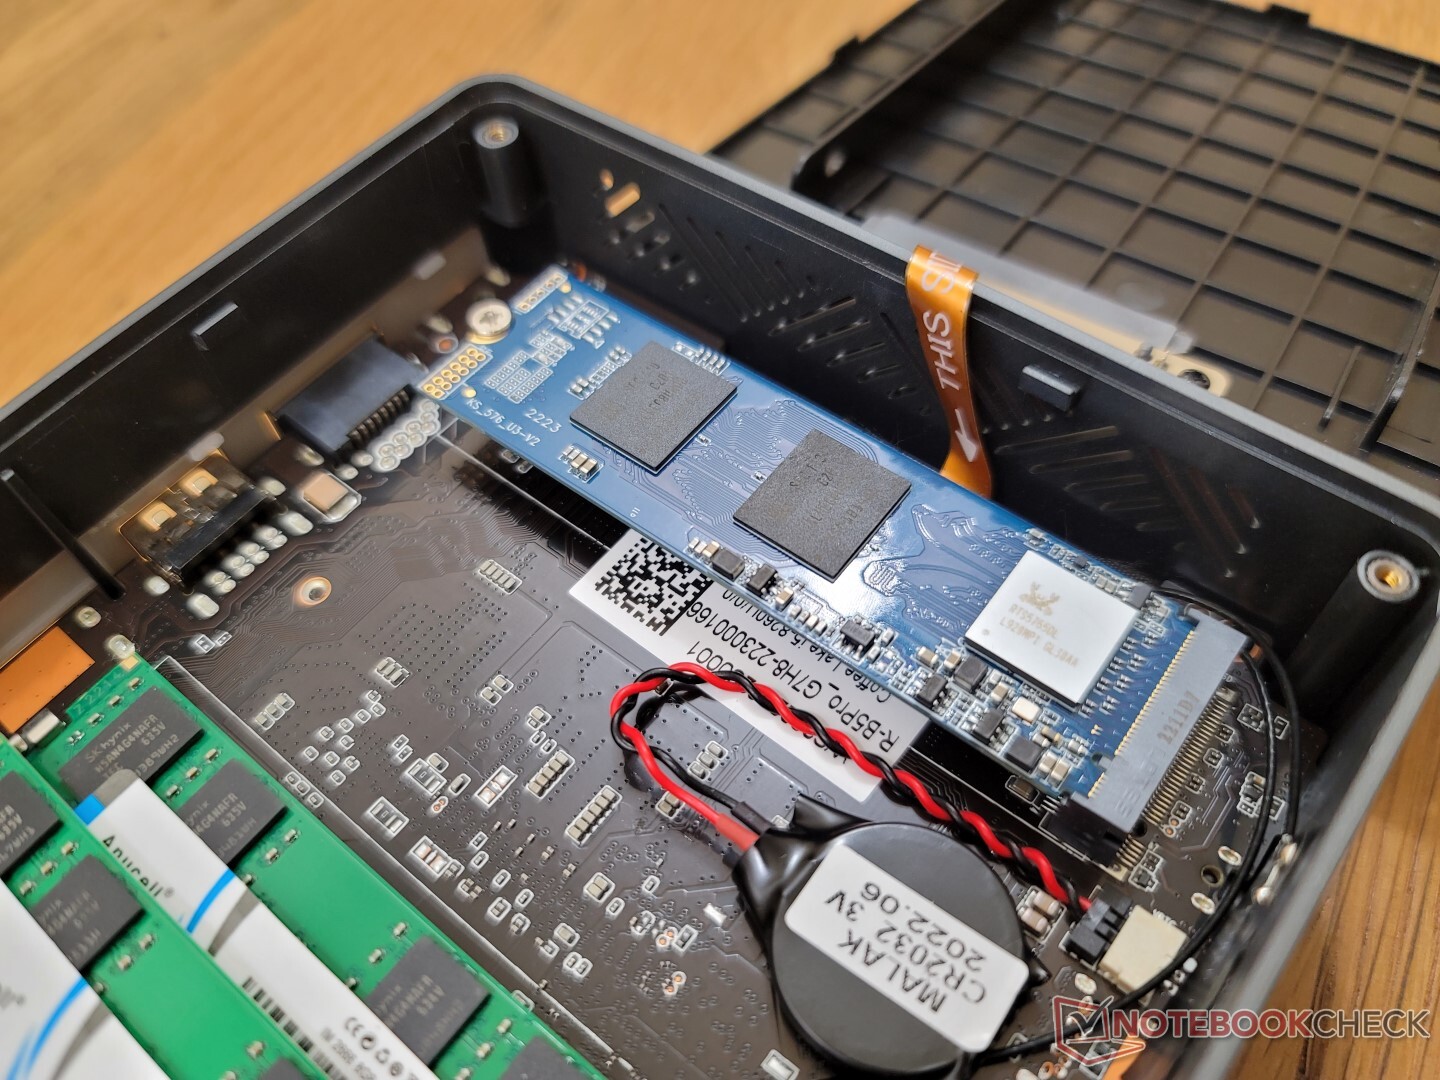
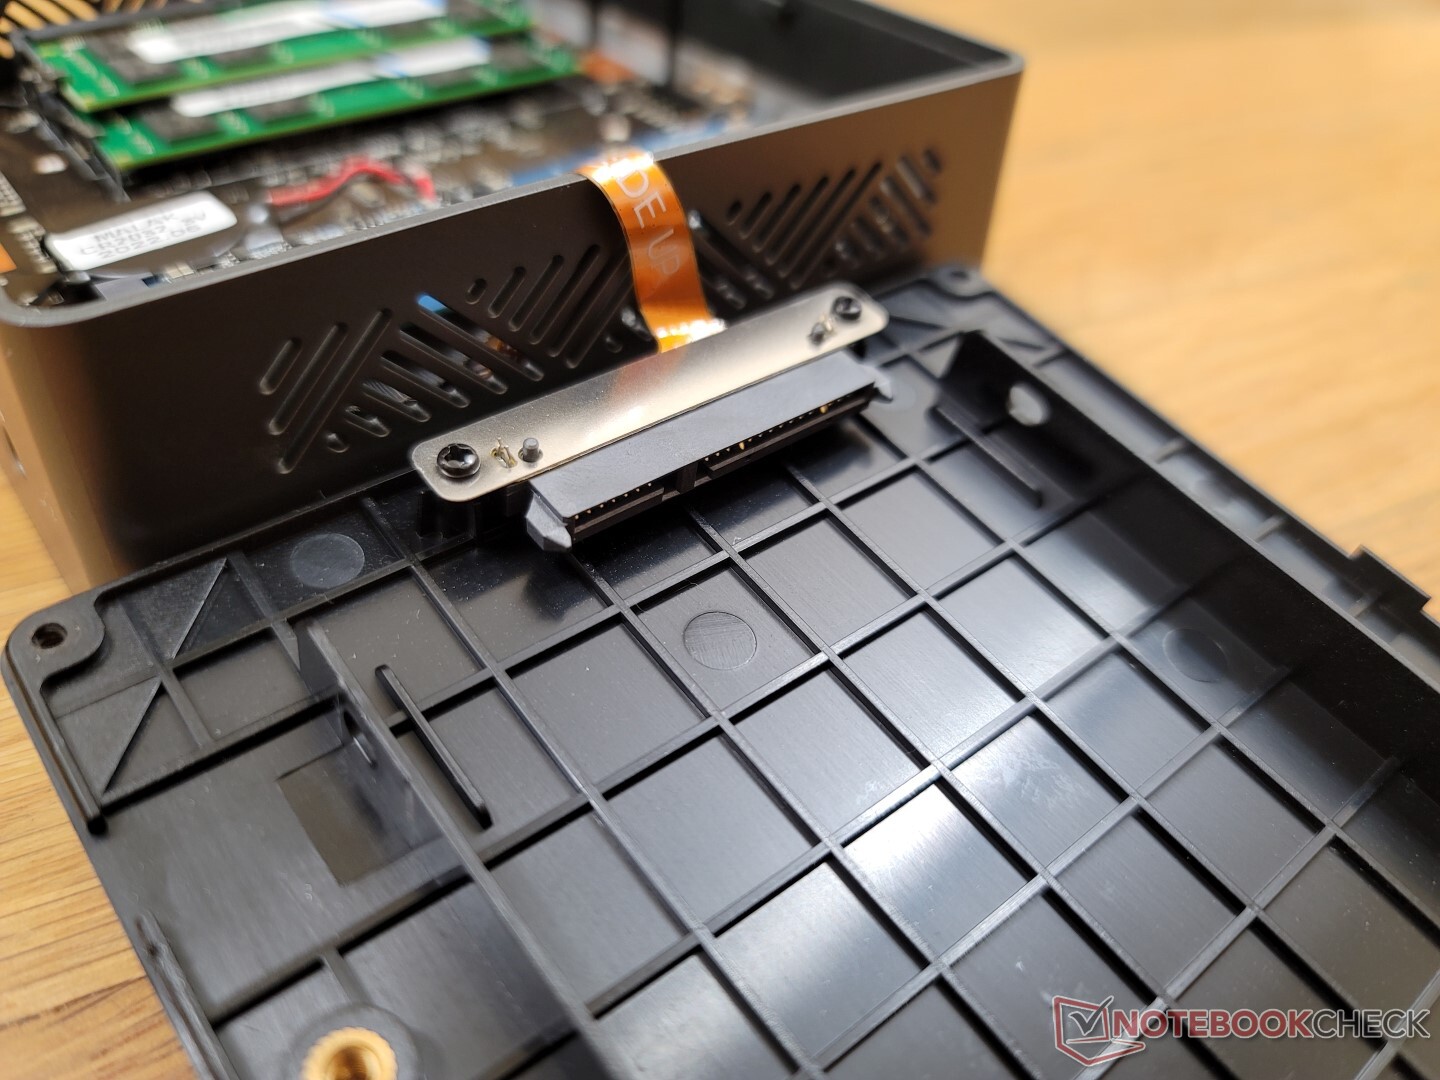
Mantenimiento
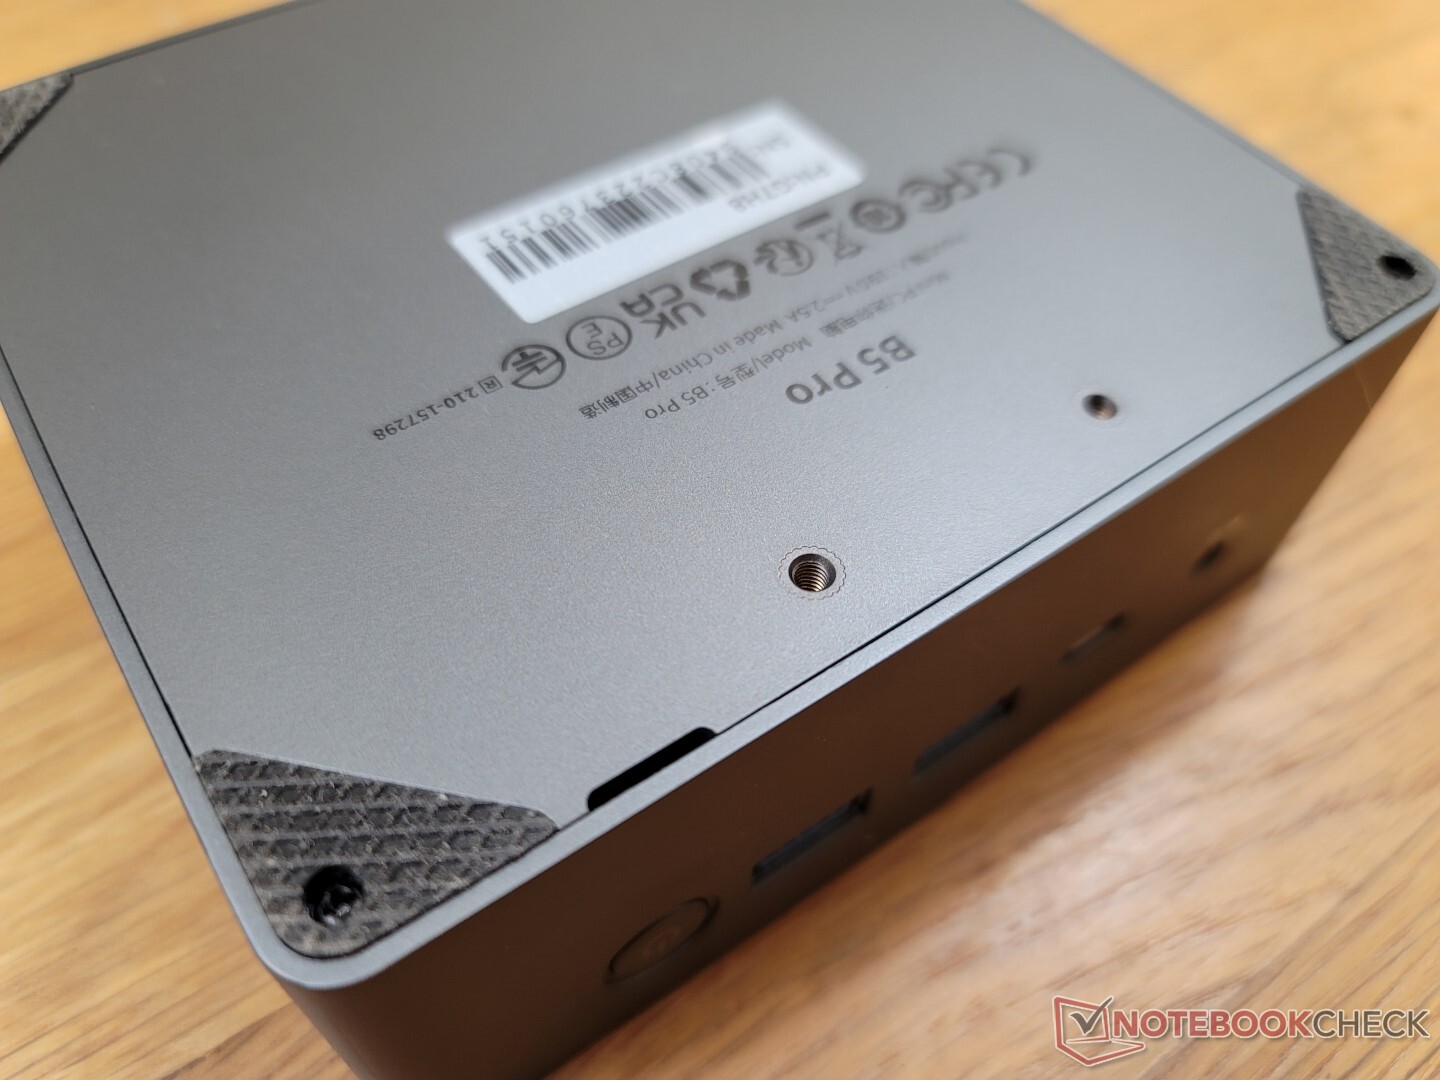
El panel inferior se fija con cuatro tornillos Philips para facilitar el mantenimiento. Sin embargo, a diferencia del Beelink SEi8, el panel inferior del BMax tiene una pequeña hendidura a lo largo de un borde para facilitar el agarre y la extracción
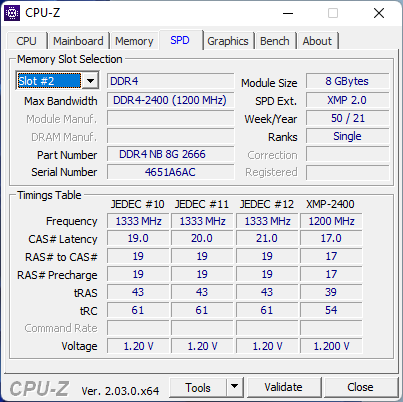
Los usuarios pueden instalar hasta dos módulos DDR4 SODIMM y hasta dos unidades de almacenamiento una vez dentro.
Accesorios y garantía
La caja de venta incluye un cable HDMI y un soporte de montaje VESA extraíble con tornillos junto con el adaptador de CA. Se aplica la garantía limitada de un año estándar si se adquiere en Estados Unidos.
Rendimiento - 8ª generación vs. 12ª generación
Condiciones de la prueba
Configuramos nuestra unidad en el modo de Rendimiento a través de Windows antes de ejecutar cualquier punto de referencia a continuación para obtener las puntuaciones más altas posibles. No hay aplicaciones preinstaladas por el fabricante para una experiencia de usuario limpia de Windows.
Procesador
El rendimiento bruto de la CPU es generalmente comparable al del 10º gen Core i7-1065G7 oCore i5-8259U. Aunque es mucho más lento que el 11º gen Core i5-1135G7 en hasta un 50 por ciento, sigue siendo lo suficientemente rápido para fines multimedia comunes como la navegación web, la transmisión de vídeo y la multitarea moderada.
El Core i5-1235U de 12ª generación Core i5-1235Uque está varias generaciones por delante de nuestro Core i5-8260U, ofrece un rendimiento de hilo único y multihilo aproximadamente un 60 y un 80 por ciento más rápido, respectivamente.
La sostenibilidad del rendimiento es decente. Cuando se ejecuta CineBench R15 xT en un bucle, el rendimiento se reduce en un 11% con el tiempo.
Cinebench R15 Multi Loop
Cinebench R23: Multi Core | Single Core
Cinebench R15: CPU Multi 64Bit | CPU Single 64Bit
Blender: v2.79 BMW27 CPU
7-Zip 18.03: 7z b 4 | 7z b 4 -mmt1
Geekbench 5.5: Multi-Core | Single-Core
HWBOT x265 Benchmark v2.2: 4k Preset
LibreOffice : 20 Documents To PDF
R Benchmark 2.5: Overall mean
| Cinebench R23 / Multi Core | |
| Beelink SER Pro Ryzen 5 5600H | |
| Beelink SEi11 Pro | |
| Asus Vivobook 15 K513EQ | |
| Intel NUC11TNKi5 | |
| Geekom Mini IT8-GM08i5T | |
| Infinix INBook X2 | |
| BMAX B5 Pro G7H8 | |
| Beelink U59 N5105 | |
| Beelink SEi8 | |
| Cinebench R23 / Single Core | |
| Asus Vivobook 15 K513EQ | |
| Beelink SEi11 Pro | |
| Intel NUC11TNKi5 | |
| Beelink SER Pro Ryzen 5 5600H | |
| Infinix INBook X2 | |
| Beelink SEi8 | |
| BMAX B5 Pro G7H8 | |
| Beelink U59 N5105 | |
| Geekbench 5.5 / Multi-Core | |
| Beelink SER Pro Ryzen 5 5600H | |
| Beelink SEi11 Pro | |
| Intel NUC11TNKi5 | |
| Geekom Mini IT8-GM08i5T | |
| Fujitsu Lifebook U939 i5 | |
| Infinix INBook X2 | |
| Beelink U59 N5105 | |
| Beelink SEi8 | |
| BMAX B5 Pro G7H8 | |
| Geekbench 5.5 / Single-Core | |
| Beelink SEi11 Pro | |
| Beelink SER Pro Ryzen 5 5600H | |
| Intel NUC11TNKi5 | |
| Infinix INBook X2 | |
| Fujitsu Lifebook U939 i5 | |
| Geekom Mini IT8-GM08i5T | |
| Beelink SEi8 | |
| Beelink U59 N5105 | |
| BMAX B5 Pro G7H8 | |
* ... más pequeño es mejor
AIDA64: FP32 Ray-Trace | FPU Julia | CPU SHA3 | CPU Queen | FPU SinJulia | FPU Mandel | CPU AES | CPU ZLib | FP64 Ray-Trace | CPU PhotoWorxx
| Performance rating | |
| Beelink SER Pro Ryzen 5 5600H | |
| Beelink SEi11 Pro | |
| Intel NUC11TNKi5 | |
| BMAX B5 Pro G7H8 | |
| Beelink SEi8 | |
| Beelink U59 N5105 | |
| AIDA64 / FP32 Ray-Trace | |
| Beelink SER Pro Ryzen 5 5600H | |
| Beelink SEi11 Pro | |
| Intel NUC11TNKi5 | |
| BMAX B5 Pro G7H8 | |
| Beelink SEi8 | |
| Beelink U59 N5105 | |
| AIDA64 / FPU Julia | |
| Beelink SER Pro Ryzen 5 5600H | |
| Beelink SEi11 Pro | |
| Intel NUC11TNKi5 | |
| BMAX B5 Pro G7H8 | |
| Beelink SEi8 | |
| Beelink U59 N5105 | |
| AIDA64 / CPU SHA3 | |
| Beelink SER Pro Ryzen 5 5600H | |
| Beelink SEi11 Pro | |
| Intel NUC11TNKi5 | |
| BMAX B5 Pro G7H8 | |
| Beelink SEi8 | |
| Beelink U59 N5105 | |
| AIDA64 / CPU Queen | |
| Beelink SER Pro Ryzen 5 5600H | |
| Beelink SEi11 Pro | |
| Intel NUC11TNKi5 | |
| BMAX B5 Pro G7H8 | |
| Beelink SEi8 | |
| Beelink U59 N5105 | |
| AIDA64 / FPU SinJulia | |
| Beelink SER Pro Ryzen 5 5600H | |
| Beelink SEi11 Pro | |
| Intel NUC11TNKi5 | |
| BMAX B5 Pro G7H8 | |
| Beelink SEi8 | |
| Beelink U59 N5105 | |
| AIDA64 / FPU Mandel | |
| Beelink SER Pro Ryzen 5 5600H | |
| Beelink SEi11 Pro | |
| Intel NUC11TNKi5 | |
| BMAX B5 Pro G7H8 | |
| Beelink SEi8 | |
| Beelink U59 N5105 | |
| AIDA64 / CPU AES | |
| Beelink SER Pro Ryzen 5 5600H | |
| Beelink SEi11 Pro | |
| Intel NUC11TNKi5 | |
| Beelink U59 N5105 | |
| BMAX B5 Pro G7H8 | |
| Beelink SEi8 | |
| AIDA64 / CPU ZLib | |
| Beelink SER Pro Ryzen 5 5600H | |
| Intel NUC11TNKi5 | |
| Beelink SEi11 Pro | |
| BMAX B5 Pro G7H8 | |
| Beelink U59 N5105 | |
| Beelink SEi8 | |
| AIDA64 / FP64 Ray-Trace | |
| Beelink SER Pro Ryzen 5 5600H | |
| Beelink SEi11 Pro | |
| Intel NUC11TNKi5 | |
| BMAX B5 Pro G7H8 | |
| Beelink SEi8 | |
| Beelink U59 N5105 | |
| AIDA64 / CPU PhotoWorxx | |
| Beelink SEi11 Pro | |
| Beelink SER Pro Ryzen 5 5600H | |
| BMAX B5 Pro G7H8 | |
| Intel NUC11TNKi5 | |
| Beelink SEi8 | |
| Beelink U59 N5105 | |
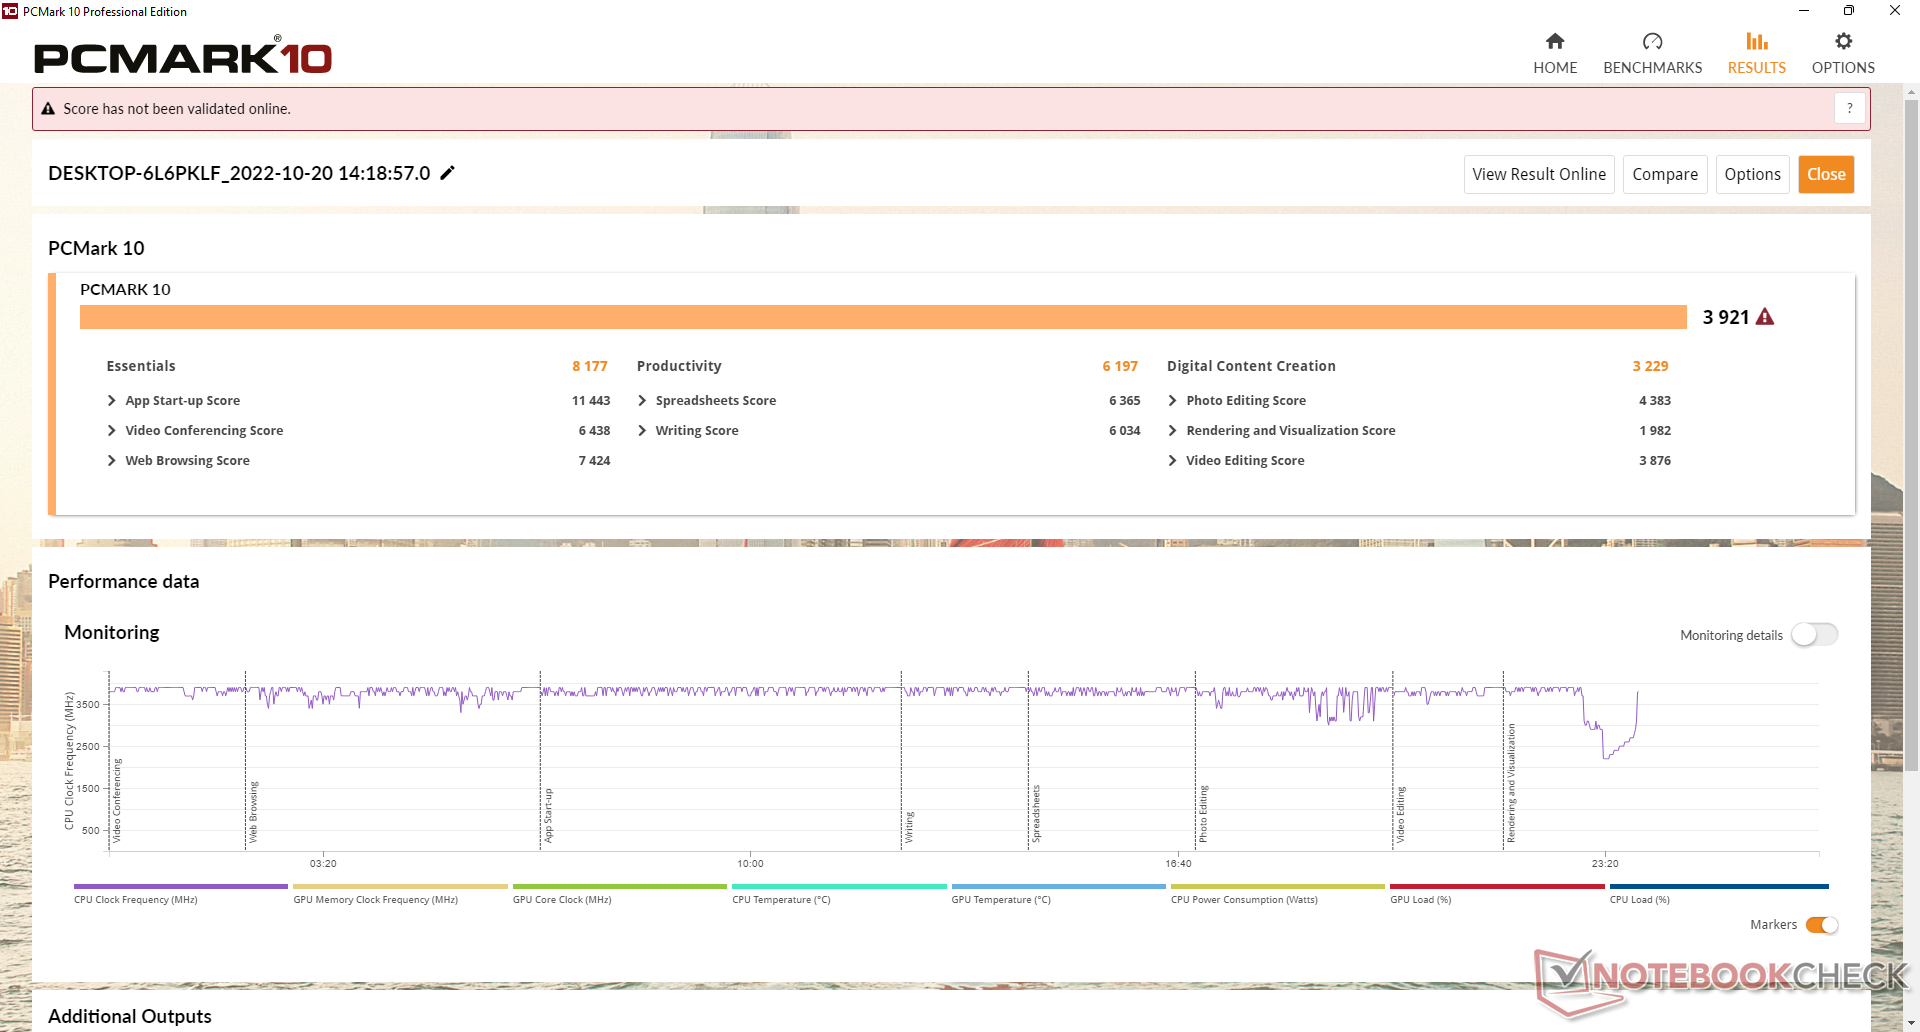
Rendimiento del sistema
Los resultados de PCMark 10 son comparables a los del Beelink SEi8, que también utiliza una CPU Core de 8ª generación más antigua. Los mini PCs con CPUs de 11ª generación más recientes, como el Intel NUC11TNKi5, son capaces de ofrecer puntuaciones de creación de contenidos digitales significativamente más altas gracias a sus GPUs integradas más rápidas.
CrossMark: Overall | Productivity | Creativity | Responsiveness
| PCMark 10 / Score | |
| Beelink SER Pro Ryzen 5 5600H | |
| Beelink SEi11 Pro | |
| Intel NUC11TNKi5 | |
| BMAX B5 Pro G7H8 | |
| Beelink SEi8 | |
| Beelink U59 N5105 | |
| PCMark 10 / Essentials | |
| Beelink SER Pro Ryzen 5 5600H | |
| Beelink SEi11 Pro | |
| Intel NUC11TNKi5 | |
| BMAX B5 Pro G7H8 | |
| Beelink SEi8 | |
| Beelink U59 N5105 | |
| PCMark 10 / Productivity | |
| Beelink SER Pro Ryzen 5 5600H | |
| Beelink SEi11 Pro | |
| BMAX B5 Pro G7H8 | |
| Intel NUC11TNKi5 | |
| Beelink SEi8 | |
| Beelink U59 N5105 | |
| PCMark 10 / Digital Content Creation | |
| Beelink SER Pro Ryzen 5 5600H | |
| Beelink SEi11 Pro | |
| Intel NUC11TNKi5 | |
| BMAX B5 Pro G7H8 | |
| Beelink SEi8 | |
| Beelink U59 N5105 | |
| CrossMark / Overall | |
| Beelink SEi11 Pro | |
| Beelink SER Pro Ryzen 5 5600H | |
| BMAX B5 Pro G7H8 | |
| Beelink U59 N5105 | |
| CrossMark / Productivity | |
| Beelink SEi11 Pro | |
| Beelink SER Pro Ryzen 5 5600H | |
| BMAX B5 Pro G7H8 | |
| Beelink U59 N5105 | |
| CrossMark / Creativity | |
| Beelink SER Pro Ryzen 5 5600H | |
| Beelink SEi11 Pro | |
| BMAX B5 Pro G7H8 | |
| Beelink U59 N5105 | |
| CrossMark / Responsiveness | |
| Beelink SEi11 Pro | |
| Beelink SER Pro Ryzen 5 5600H | |
| BMAX B5 Pro G7H8 | |
| Beelink U59 N5105 | |
| PCMark 10 Score | 3921 puntos | |
ayuda | ||
| AIDA64 / Memory Copy | |
| Beelink SER Pro Ryzen 5 5600H | |
| Beelink SEi11 Pro | |
| Beelink SEi8 | |
| BMAX B5 Pro G7H8 | |
| Beelink U59 N5105 | |
| Intel NUC11TNKi5 | |
| AIDA64 / Memory Read | |
| Beelink SER Pro Ryzen 5 5600H | |
| Beelink SEi11 Pro | |
| BMAX B5 Pro G7H8 | |
| Beelink SEi8 | |
| Intel NUC11TNKi5 | |
| Beelink U59 N5105 | |
| AIDA64 / Memory Write | |
| Beelink SEi11 Pro | |
| Beelink SER Pro Ryzen 5 5600H | |
| BMAX B5 Pro G7H8 | |
| Beelink U59 N5105 | |
| Intel NUC11TNKi5 | |
| Beelink SEi8 | |
| AIDA64 / Memory Latency | |
| BMAX B5 Pro G7H8 | |
| Intel NUC11TNKi5 | |
| Beelink SEi11 Pro | |
| Beelink SER Pro Ryzen 5 5600H | |
| Beelink U59 N5105 | |
| Beelink SEi8 | |
* ... más pequeño es mejor
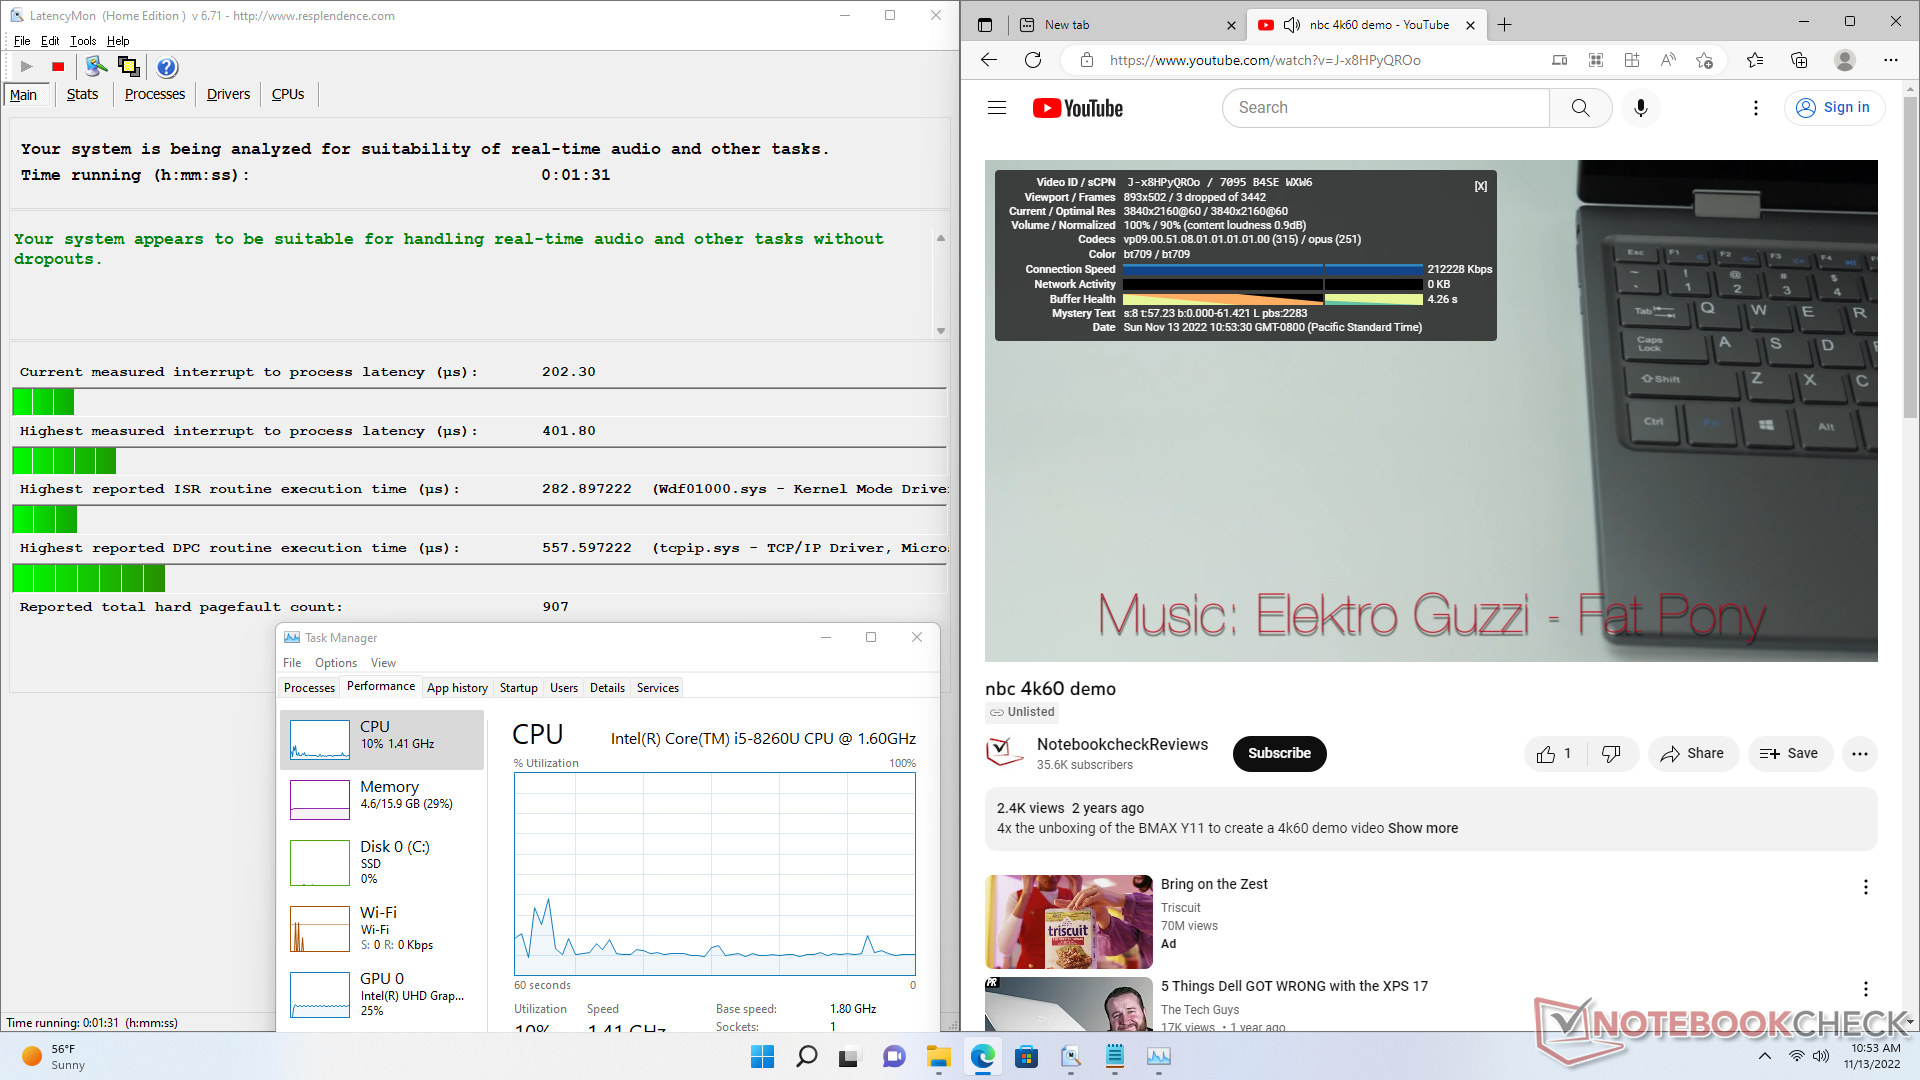
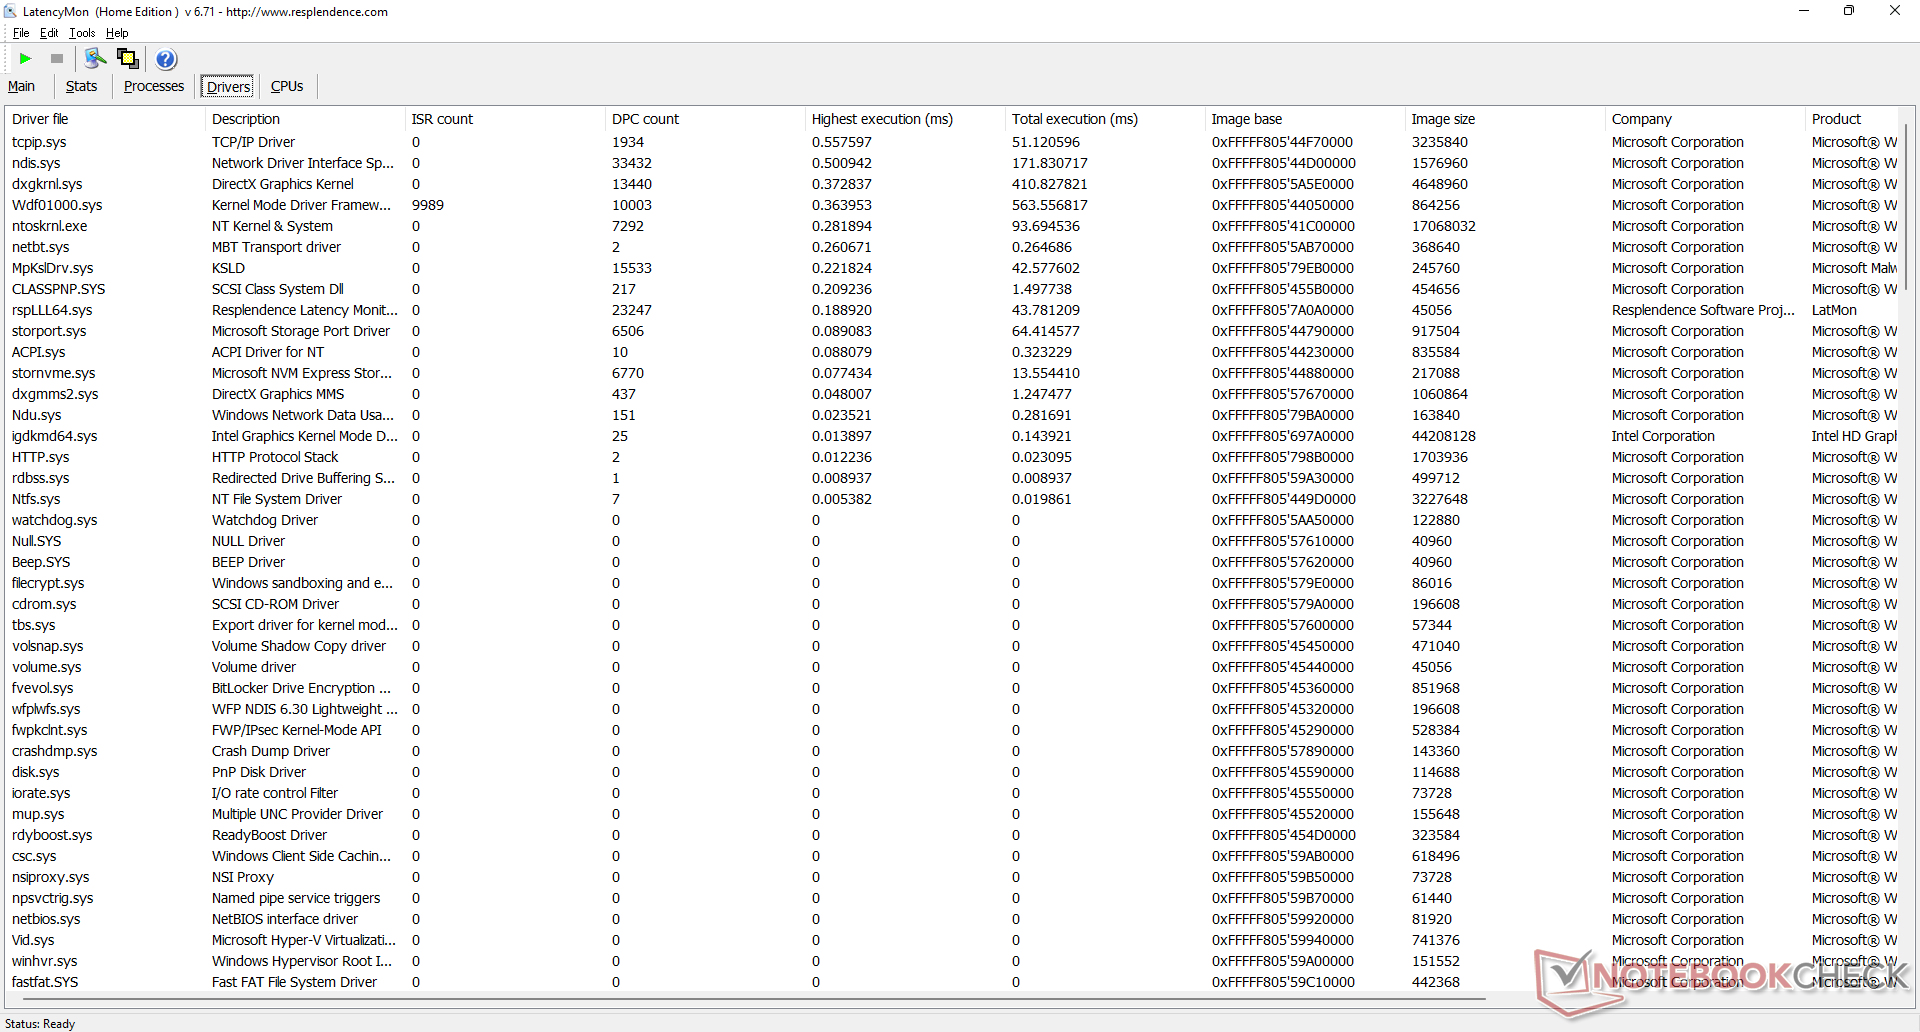
Latencia del CPD
LatencyMon no revela problemas importantes de CPD al navegar por la web. la reproducción de vídeo 4K a 60 FPS también es excelente, con solo 3 fotogramas perdidos durante nuestra prueba de un minuto de duración.
| DPC Latencies / LatencyMon - interrupt to process latency (max), Web, Youtube, Prime95 | |
| Beelink SEi8 | |
| Beelink U59 N5105 | |
| Beelink SER Pro Ryzen 5 5600H | |
| Intel NUC11TNKi5 | |
| BMAX B5 Pro G7H8 | |
| Beelink SEi11 Pro | |
* ... más pequeño es mejor
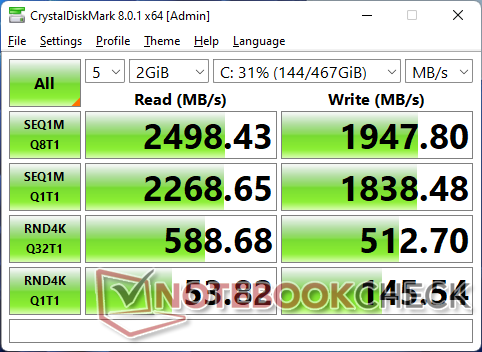
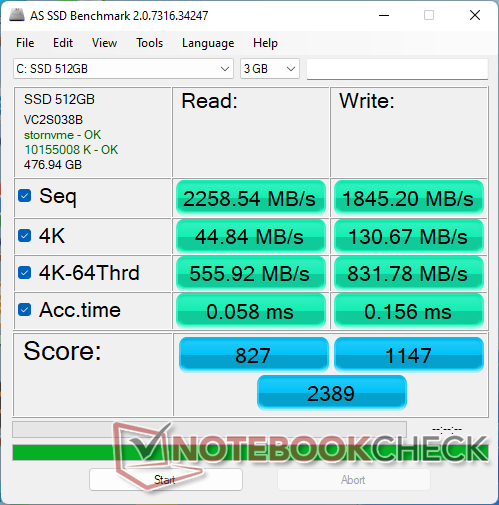
Dispositivos de almacenamiento - Hasta dos unidades
El B5 Pro utiliza una unidad SSD M.2 PCIe3 x4 genérica con un Controlador RealTek RTS5763DL para ahorrar costes. El rendimiento no es óptimo, sin embargo, ya que las tasas de lectura caen de su máximo inicial de ~2400 MB/s a sólo ~1700 MB/s cuando la unidad se estresa.

| Drive Performance rating - Percent | |
| Beelink SER Pro Ryzen 5 5600H -11! | |
| BMAX B5 Pro G7H8 | |
| Beelink SEi11 Pro | |
| Beelink SEi8 | |
| Beelink U59 N5105 | |
| Intel NUC11TNKi5 | |
* ... más pequeño es mejor
Disk Throttling: DiskSpd Read Loop, Queue Depth 8
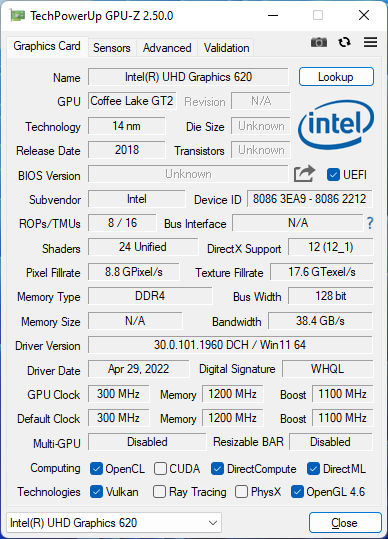
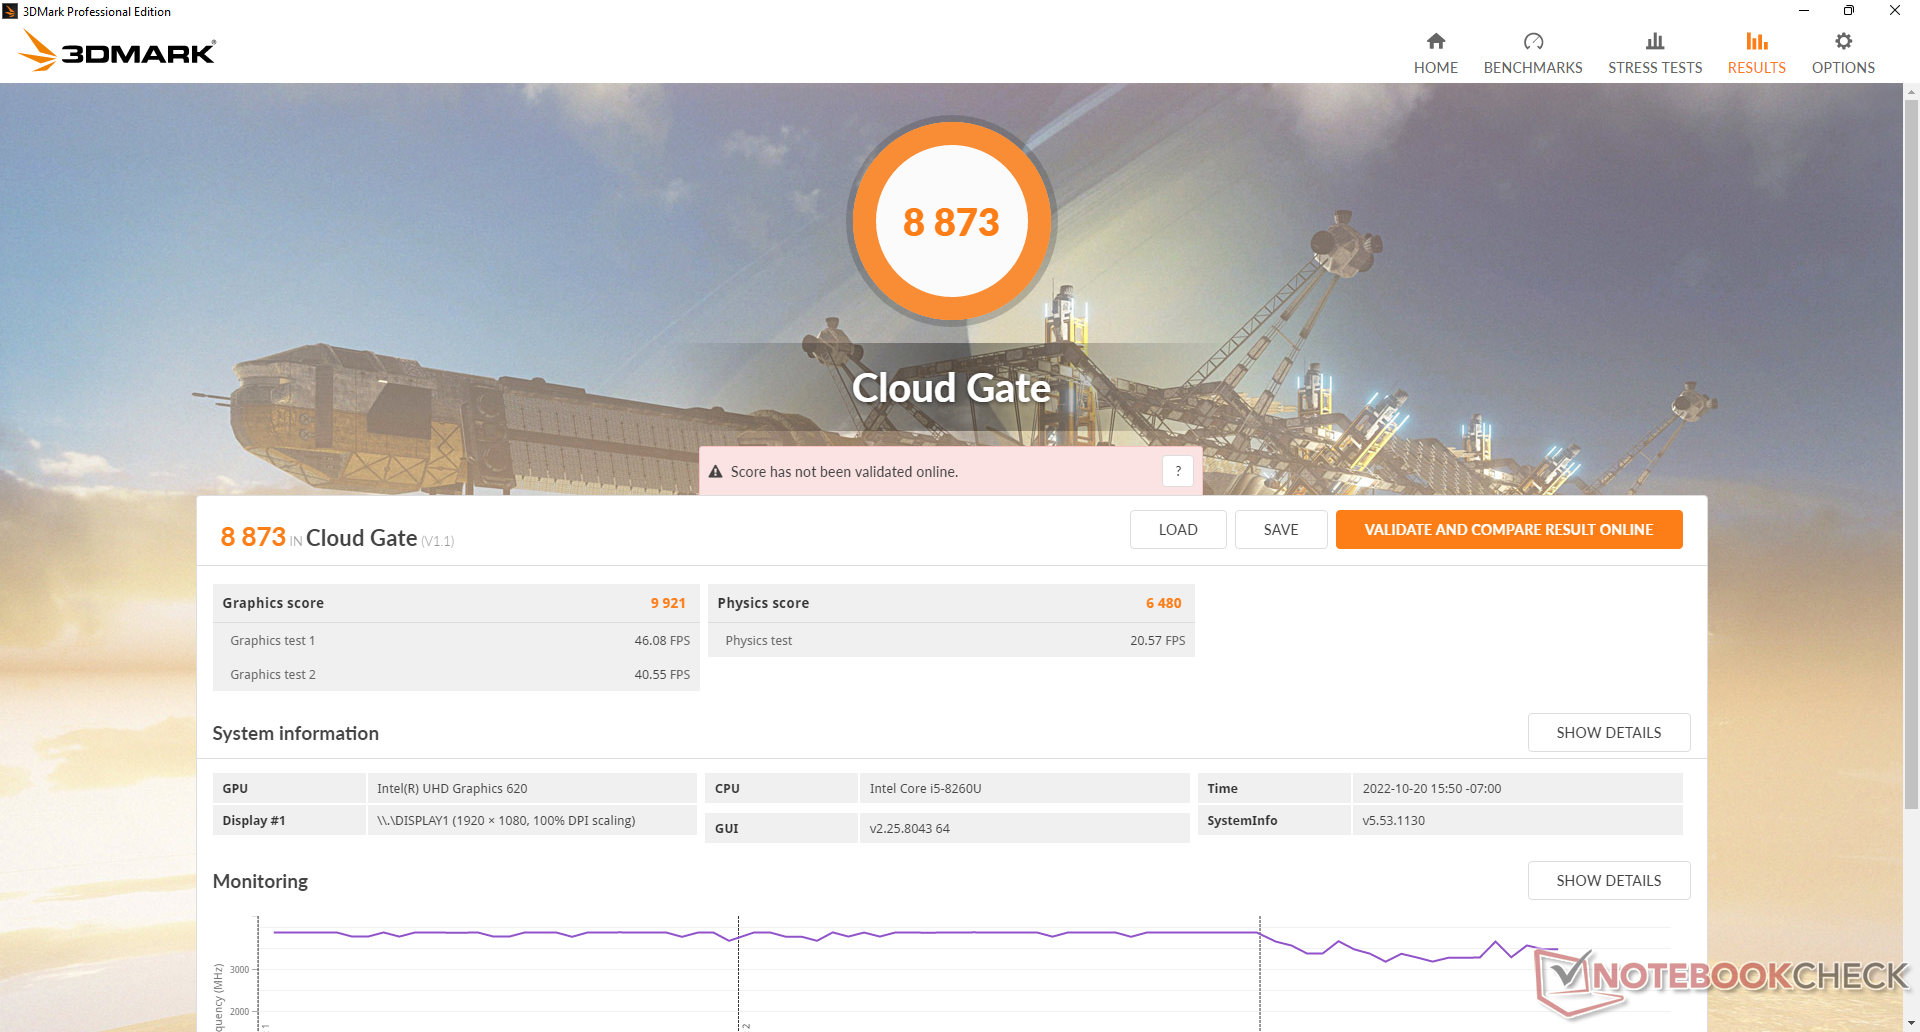
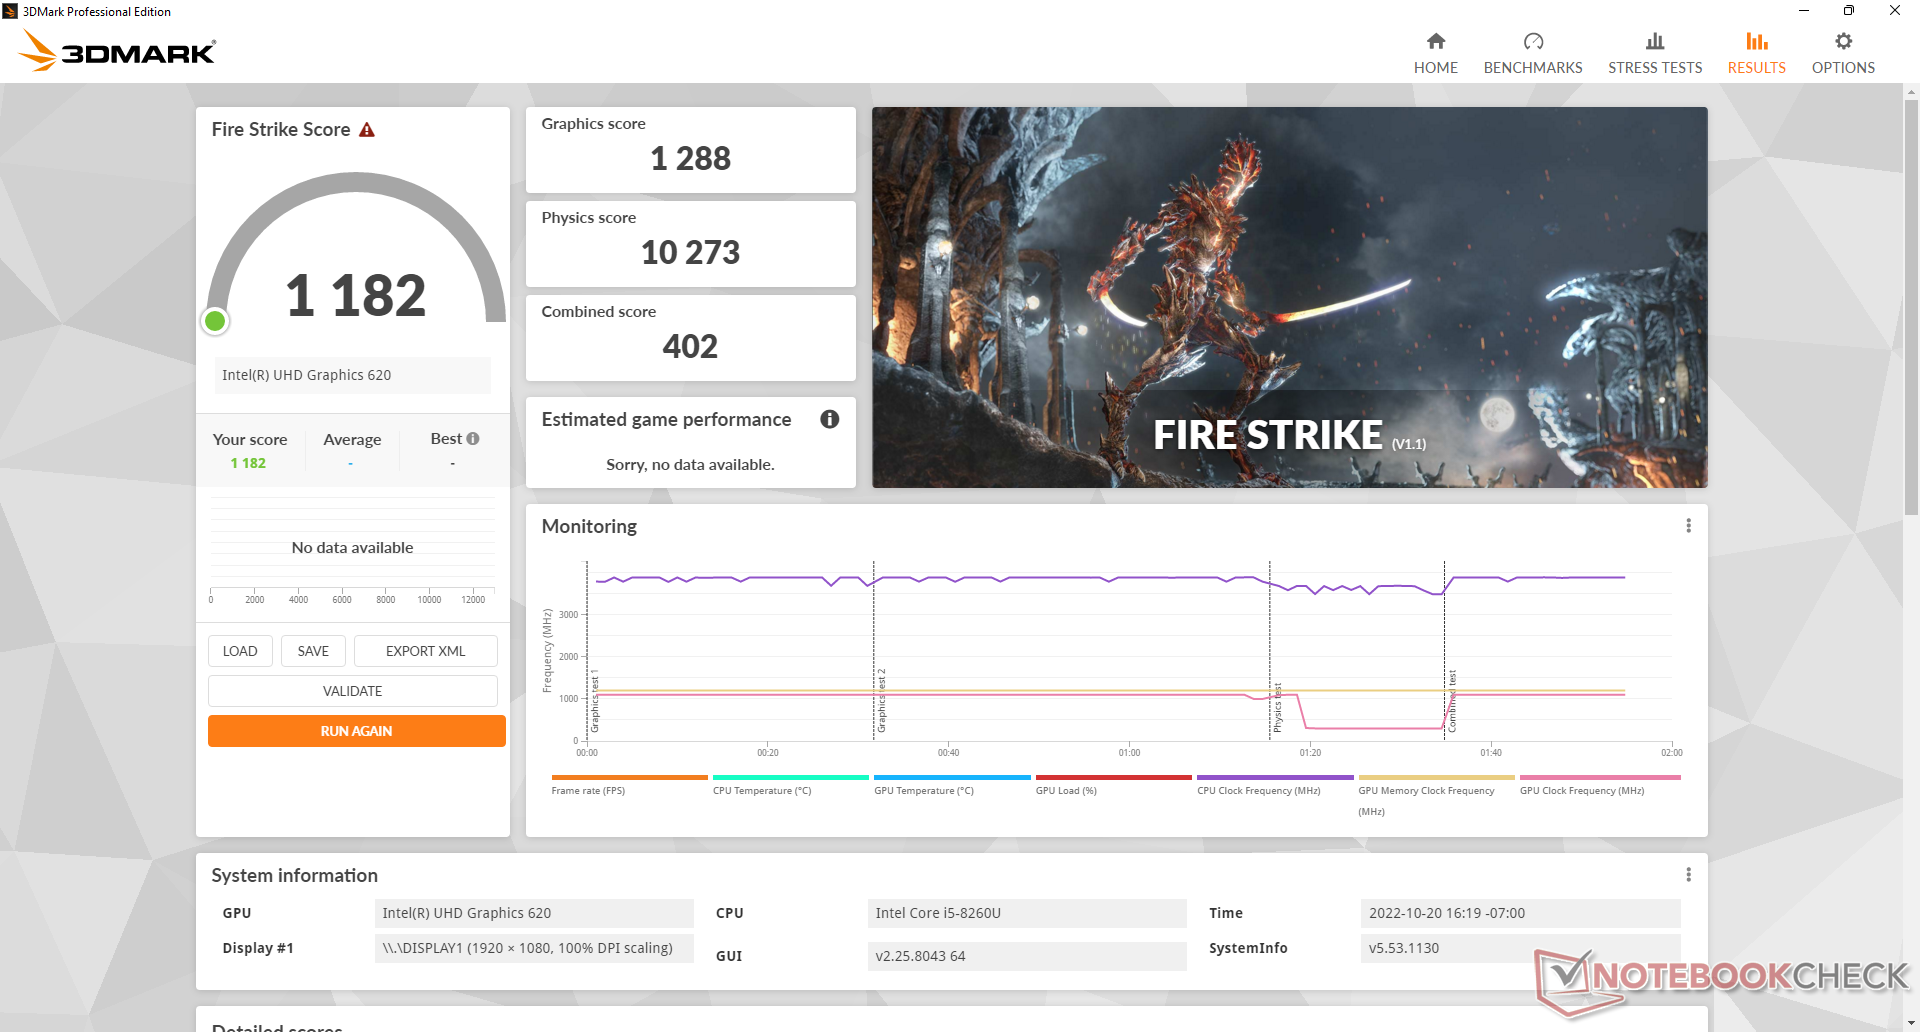
Rendimiento de la GPU
El rendimiento de los gráficos es pobre para los estándares actuales. Los Iris Xe 80 EUs en muchas CPUs modernas de la serie U de Core i5, por ejemplo, ofrece un rendimiento entre 2 y 2,5 veces más rápido que nuestro anticuado UHD Graphics 620. La mayoría de los juegos son injugables y algunos ni siquiera se inician, incluyendo X-Plane.
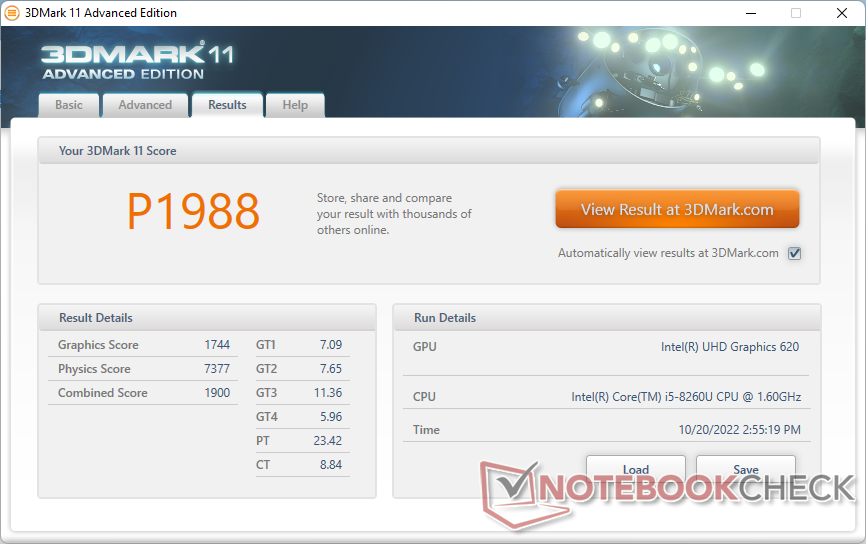
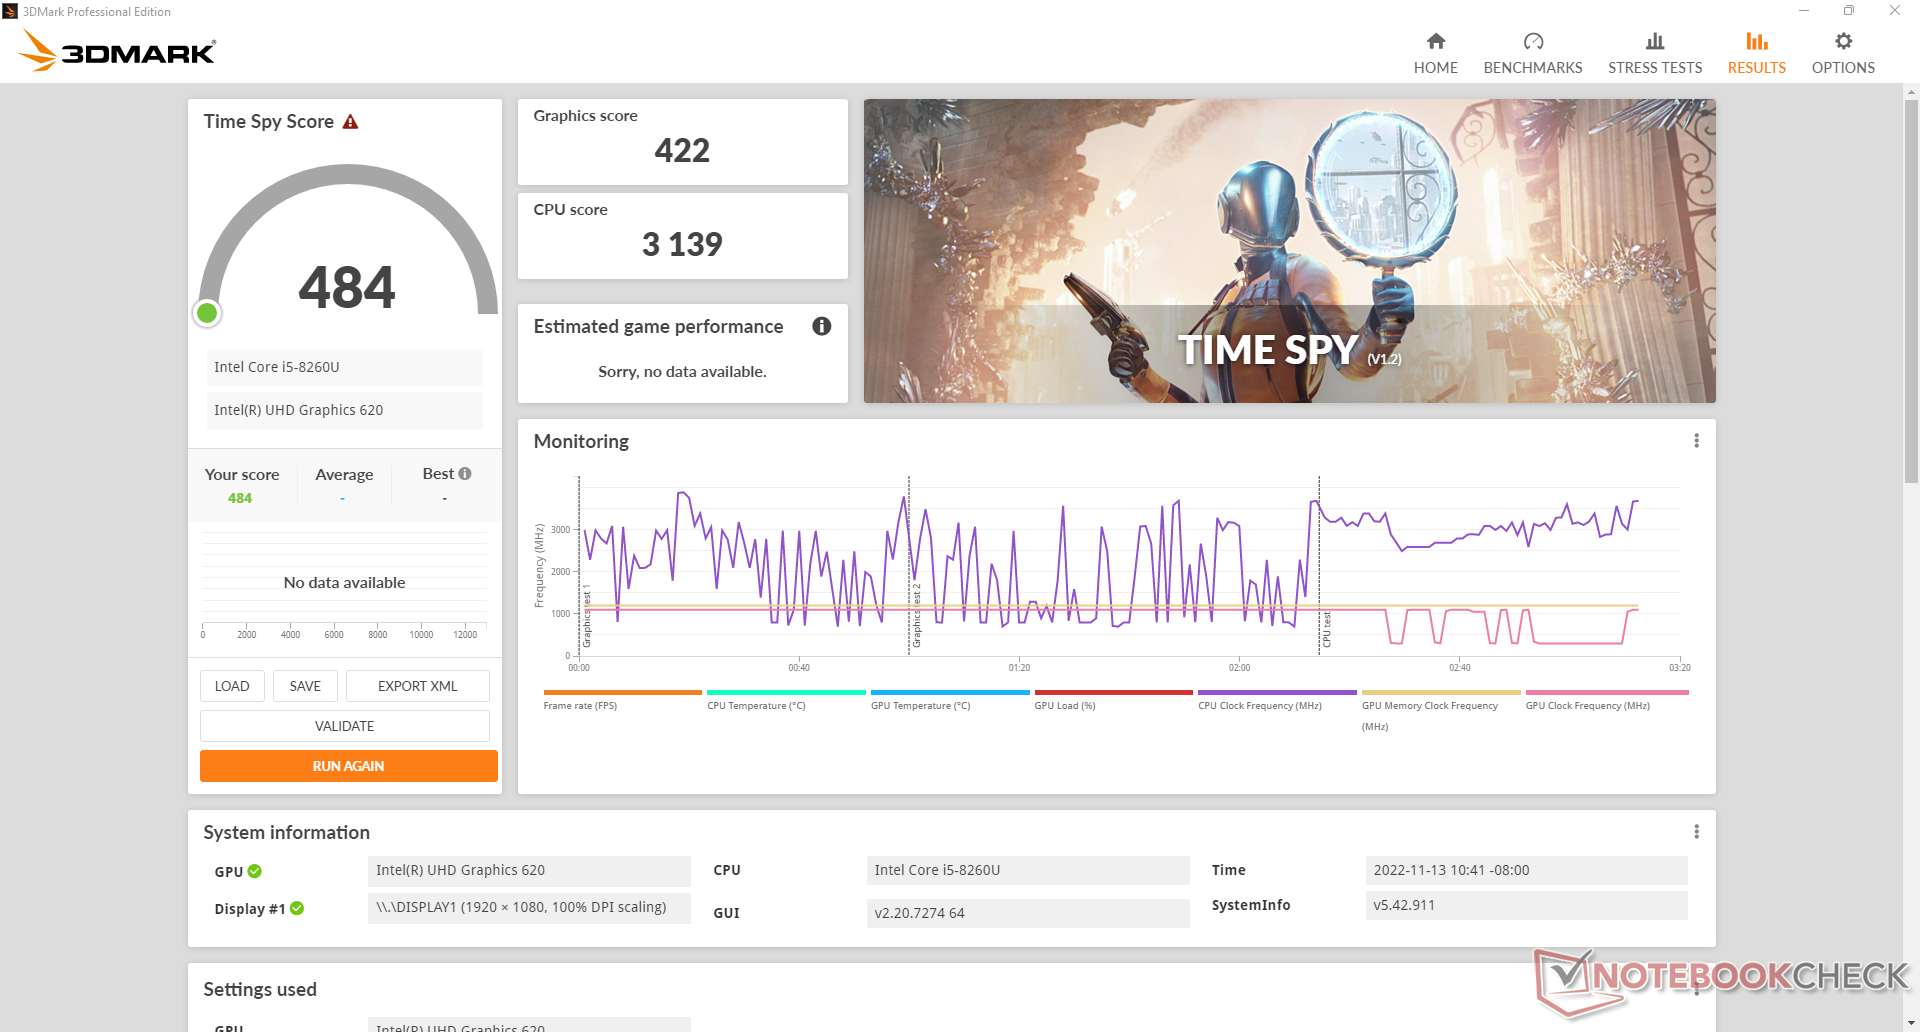
| 3DMark 11 Performance | 1988 puntos | |
| 3DMark Cloud Gate Standard Score | 8873 puntos | |
| 3DMark Fire Strike Score | 1182 puntos | |
| 3DMark Time Spy Score | 484 puntos | |
ayuda | ||
| Blender - v3.3 Classroom CPU (ordenar por valor) | |
| BMAX B5 Pro G7H8 | |
| Beelink SEi11 Pro | |
| Beelink U59 N5105 | |
| Beelink SER Pro Ryzen 5 5600H | |
* ... más pequeño es mejor
| Performance rating - Percent | |
| Asus Vivobook 15 K513EQ | |
| Beelink SER Pro Ryzen 5 5600H | |
| Beelink SEi11 Pro -1! | |
| Intel NUC11TNKi5 -3! | |
| Infinix INBook X2 -2! | |
| Beelink SEi8 -3! | |
| Fujitsu Lifebook U939 i5 -4! | |
| Beelink U59 N5105 -3! | |
| BMAX B5 Pro G7H8 -5! | |
| The Witcher 3 - 1920x1080 Ultra Graphics & Postprocessing (HBAO+) | |
| Asus Vivobook 15 K513EQ | |
| Beelink SER Pro Ryzen 5 5600H | |
| Beelink SEi11 Pro | |
| Infinix INBook X2 | |
| Beelink U59 N5105 | |
| GTA V - 1920x1080 Highest AA:4xMSAA + FX AF:16x | |
| Asus Vivobook 15 K513EQ | |
| Beelink SER Pro Ryzen 5 5600H | |
| Final Fantasy XV Benchmark - 1920x1080 High Quality | |
| Beelink SEi11 Pro | |
| Asus Vivobook 15 K513EQ | |
| Beelink SER Pro Ryzen 5 5600H | |
| Intel NUC11TNKi5 | |
| Infinix INBook X2 | |
| Beelink SEi8 | |
| Strange Brigade - 1920x1080 ultra AA:ultra AF:16 | |
| Beelink SER Pro Ryzen 5 5600H | |
| Beelink SEi11 Pro | |
| Asus Vivobook 15 K513EQ | |
| Dota 2 Reborn - 1920x1080 ultra (3/3) best looking | |
| Asus Vivobook 15 K513EQ | |
| Beelink SER Pro Ryzen 5 5600H | |
| Beelink SEi11 Pro | |
| Intel NUC11TNKi5 | |
| Infinix INBook X2 | |
| Beelink SEi8 | |
| Fujitsu Lifebook U939 i5 | |
| Beelink U59 N5105 | |
| BMAX B5 Pro G7H8 | |
| X-Plane 11.11 - 1920x1080 high (fps_test=3) | |
| Asus Vivobook 15 K513EQ | |
| Beelink SEi11 Pro | |
| Beelink SER Pro Ryzen 5 5600H | |
| Intel NUC11TNKi5 | |
| Infinix INBook X2 | |
| Fujitsu Lifebook U939 i5 | |
| Beelink SEi8 | |
| Beelink U59 N5105 | |
| The Witcher 3 | |
| 1024x768 Low Graphics & Postprocessing | |
| Beelink SEi11 Pro | |
| Asus Vivobook 15 K513EQ | |
| Beelink SER Pro Ryzen 5 5600H | |
| Intel NUC11TNKi5 | |
| Infinix INBook X2 | |
| BMAX B5 Pro G7H8 | |
| Beelink U59 N5105 | |
| Fujitsu Lifebook U939 i5 | |
| 1366x768 Medium Graphics & Postprocessing | |
| Beelink SEi11 Pro | |
| Beelink SER Pro Ryzen 5 5600H | |
| Asus Vivobook 15 K513EQ | |
| Infinix INBook X2 | |
| Beelink U59 N5105 | |
| BMAX B5 Pro G7H8 | |
| 1920x1080 High Graphics & Postprocessing (Nvidia HairWorks Off) | |
| Asus Vivobook 15 K513EQ | |
| Beelink SEi11 Pro | |
| Beelink SER Pro Ryzen 5 5600H | |
| Infinix INBook X2 | |
| Beelink U59 N5105 | |
| BMAX B5 Pro G7H8 | |
| Final Fantasy XV Benchmark - 1280x720 Lite Quality | |
| Asus Vivobook 15 K513EQ | |
| Beelink SER Pro Ryzen 5 5600H | |
| Beelink SEi11 Pro | |
| Intel NUC11TNKi5 | |
| Infinix INBook X2 | |
| Geekom Mini IT8-GM08i5T | |
| Beelink SEi8 | |
| Beelink U59 N5105 | |
| BMAX B5 Pro G7H8 | |
Witcher 3 FPS Chart
| bajo | medio | alto | ultra | |
|---|---|---|---|---|
| The Witcher 3 (2015) | 23.8 | 13.5 | 7.3 | |
| Dota 2 Reborn (2015) | 42.4 | 8.6 | 5.6 | 5.6 |
| Final Fantasy XV Benchmark (2018) | 5.61 |
Emisiones
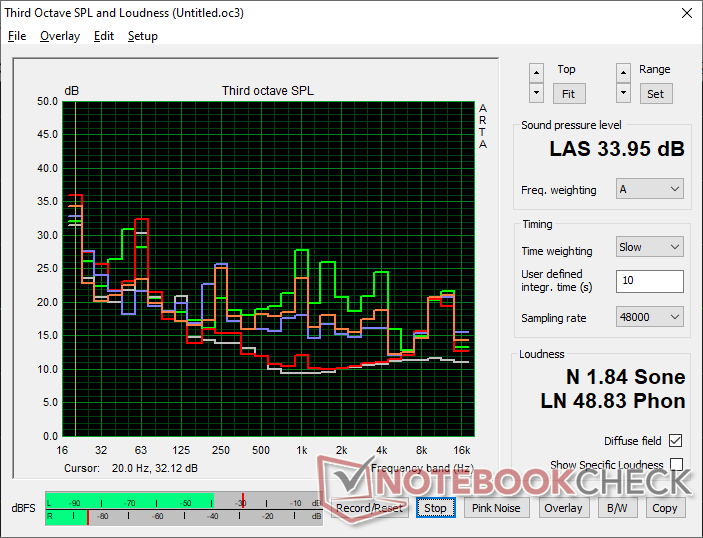
Ruido del sistema - No se oye nada
El ventilador interno está casi siempre activo a unos 25 dB(A) contra un fondo silencioso de 23 dB(A) incluso cuando no se ejecuta ninguna aplicación. Afortunadamente, este rango tan bajo es lo suficientemente silencioso como para ser imperceptible en la mayoría de los escenarios. La ejecución de cargas más altas, como los juegos, induce un ruido del ventilador en el rango de 30 a 34 dB(A), que sigue siendo muy silencioso, especialmente en entornos de HTPC.
Ruido
| Ocioso |
| 25.1 / 25.1 / 25.1 dB(A) |
| Carga |
| 28.6 / 34 dB(A) |
 | ||
30 dB silencioso 40 dB(A) audible 50 dB(A) ruidosamente alto |
||
min: | ||
| BMAX B5 Pro G7H8 UHD Graphics 620, i5-8260U | Beelink SEi11 Pro Iris Xe G7 96EUs, i5-11320H, Kingston NV1 SNVS/500GCN | Beelink U59 N5105 UHD Graphics (Jasper Lake 24 EU), Celeron N5105, Silicon Motion AZW 512G NV428 | Beelink SEi8 Iris Plus Graphics 655, i3-8109U, Intel SSD 660p SSDPEKNW512G8 | Beelink SER Pro Ryzen 5 5600H Vega 7, R5 5600H, Kingston NV1 SNVS/500GCN | Intel NUC11TNKi5 Iris Xe G7 80EUs, i5-1135G7, Transcend M.2 SSD 430S TS512GMTS430S | |
|---|---|---|---|---|---|---|
| Noise | -5% | 14% | -14% | -7% | -32% | |
| apagado / medio ambiente * (dB) | 23 | 22.8 1% | 21.5 7% | 24.5 -7% | 22.8 1% | 24.8 -8% |
| Idle Minimum * (dB) | 25.1 | 24.7 2% | 22.1 12% | 26.5 -6% | 26.1 -4% | 35.6 -42% |
| Idle Average * (dB) | 25.1 | 24.7 2% | 22.1 12% | 26.5 -6% | 26.1 -4% | 35.6 -42% |
| Idle Maximum * (dB) | 25.1 | 25.3 -1% | 22.1 12% | 31.1 -24% | 28.7 -14% | 35.6 -42% |
| Load Average * (dB) | 28.6 | 33.2 -16% | 23.9 16% | 37.7 -32% | 32.3 -13% | 36.2 -27% |
| Witcher 3 ultra * (dB) | 30.1 | 34.5 -15% | 24.4 19% | 32.8 -9% | 38 -26% | |
| Load Maximum * (dB) | 34 | 37.8 -11% | 26.8 21% | 37.5 -10% | 36.4 -7% | 47.6 -40% |
* ... más pequeño es mejor
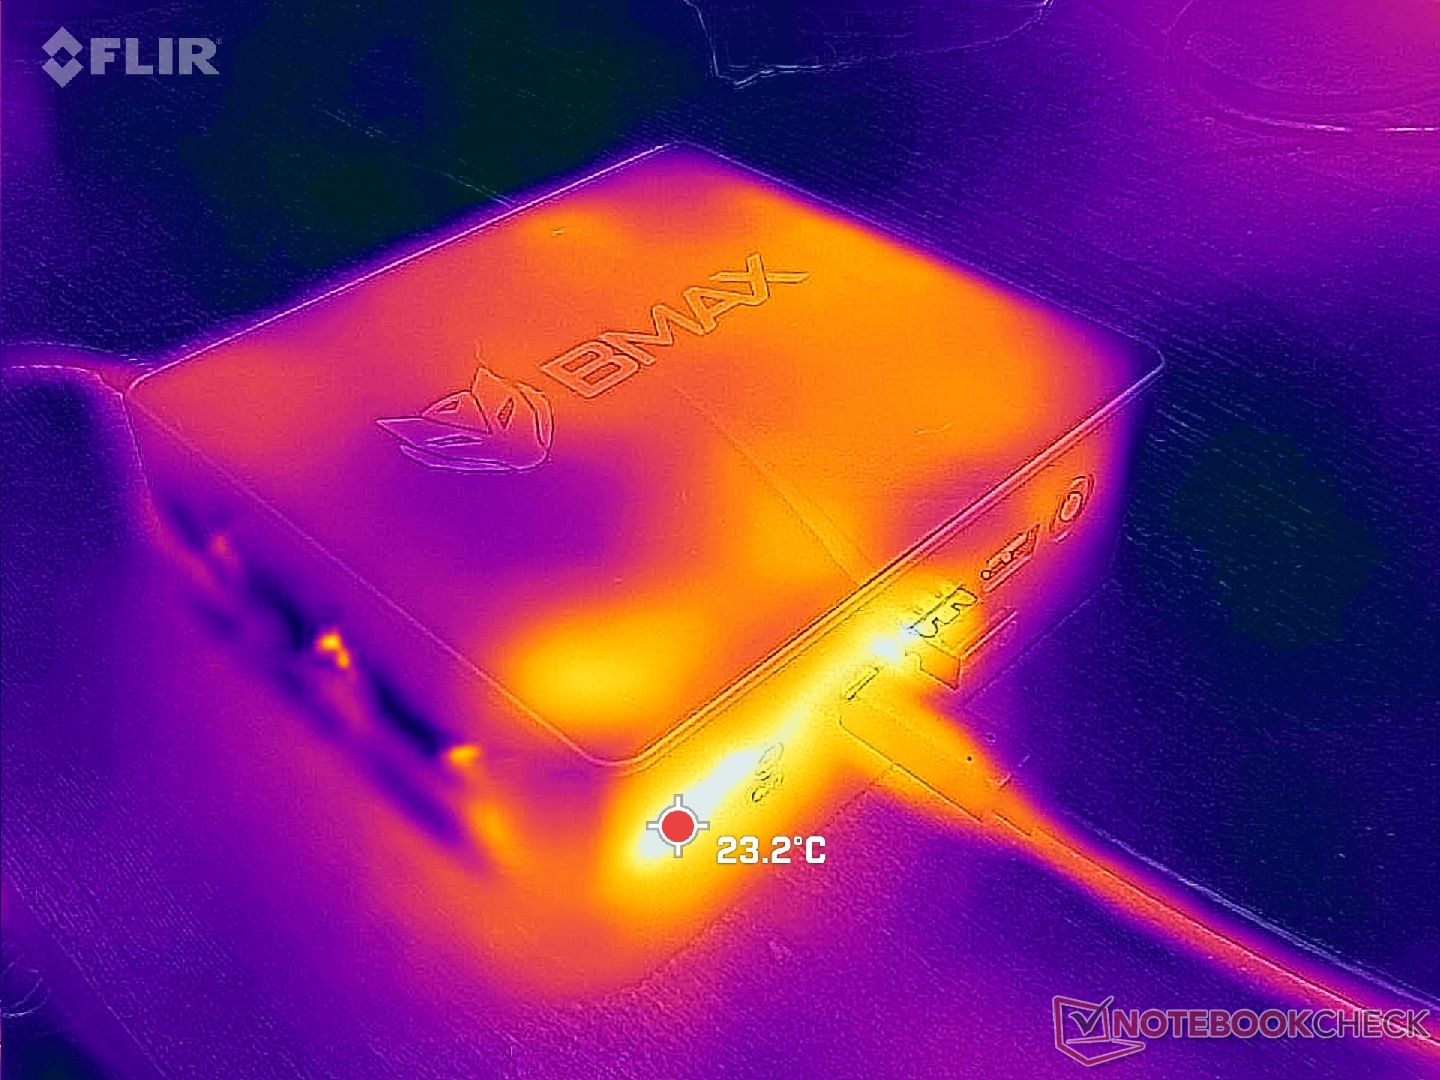
Temperatura
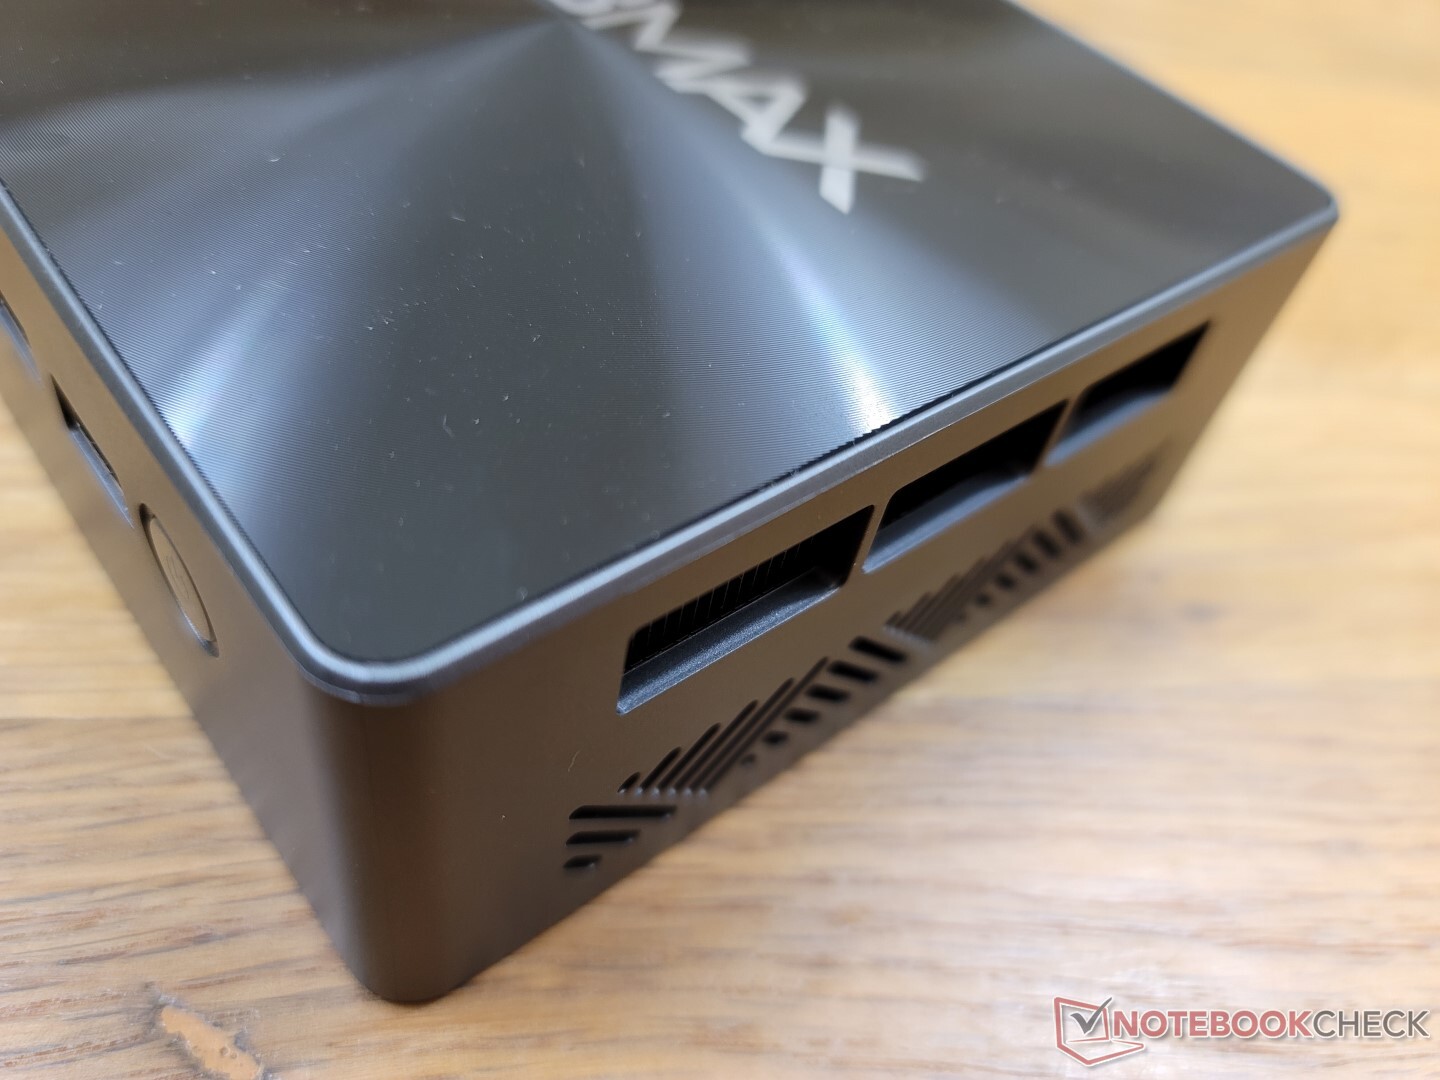
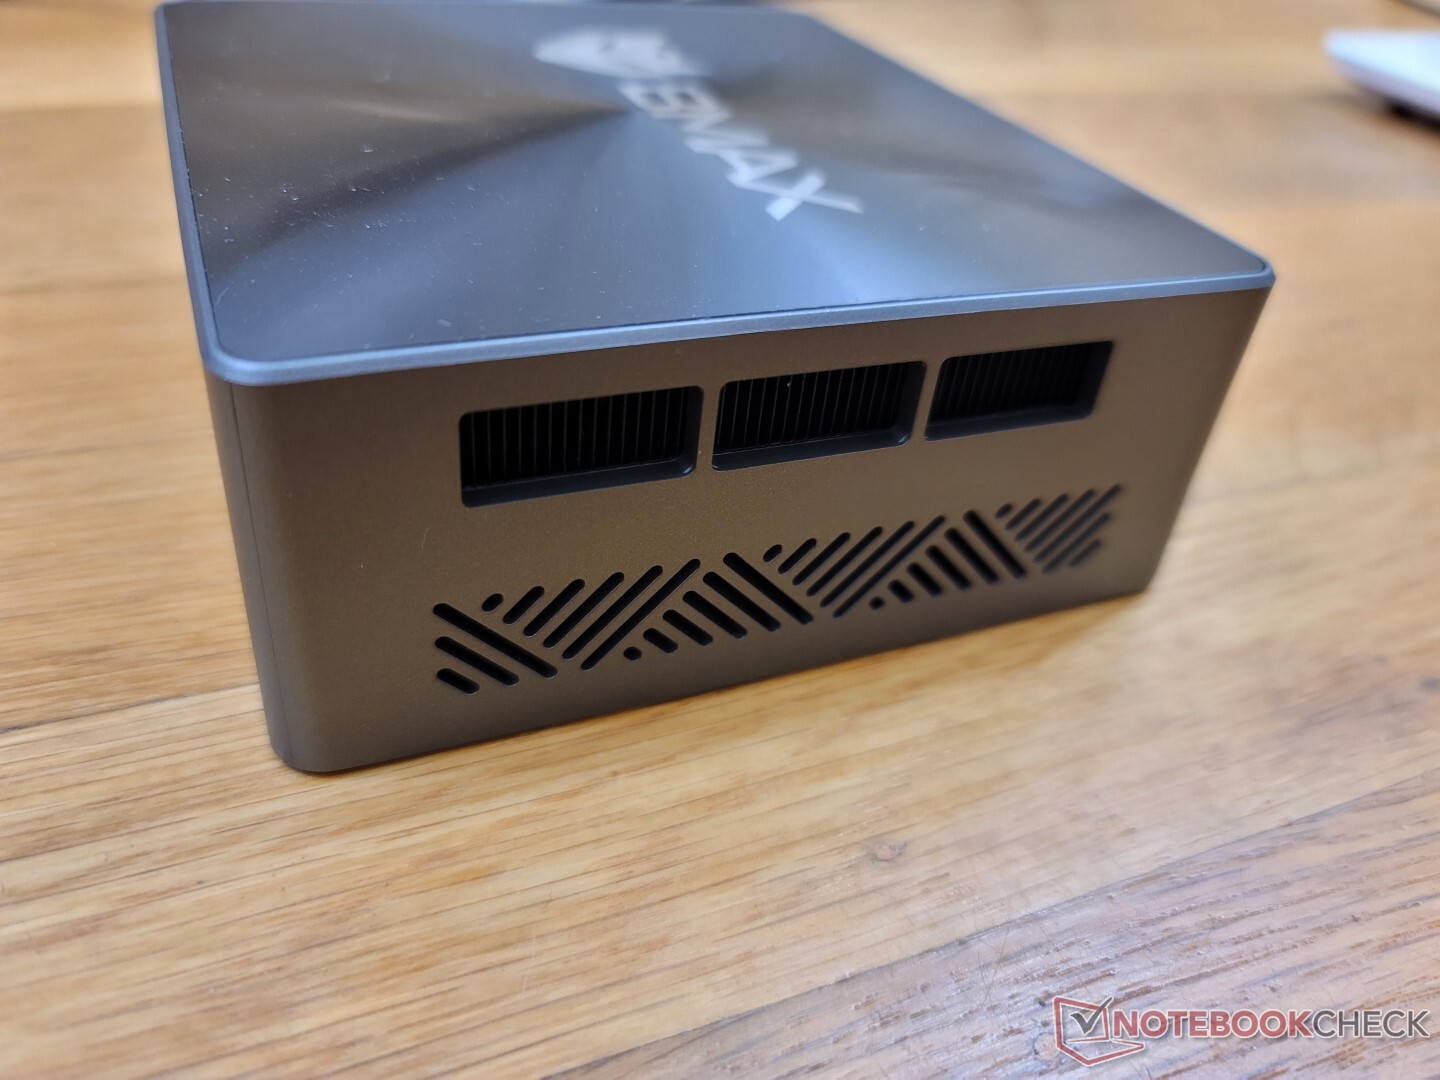
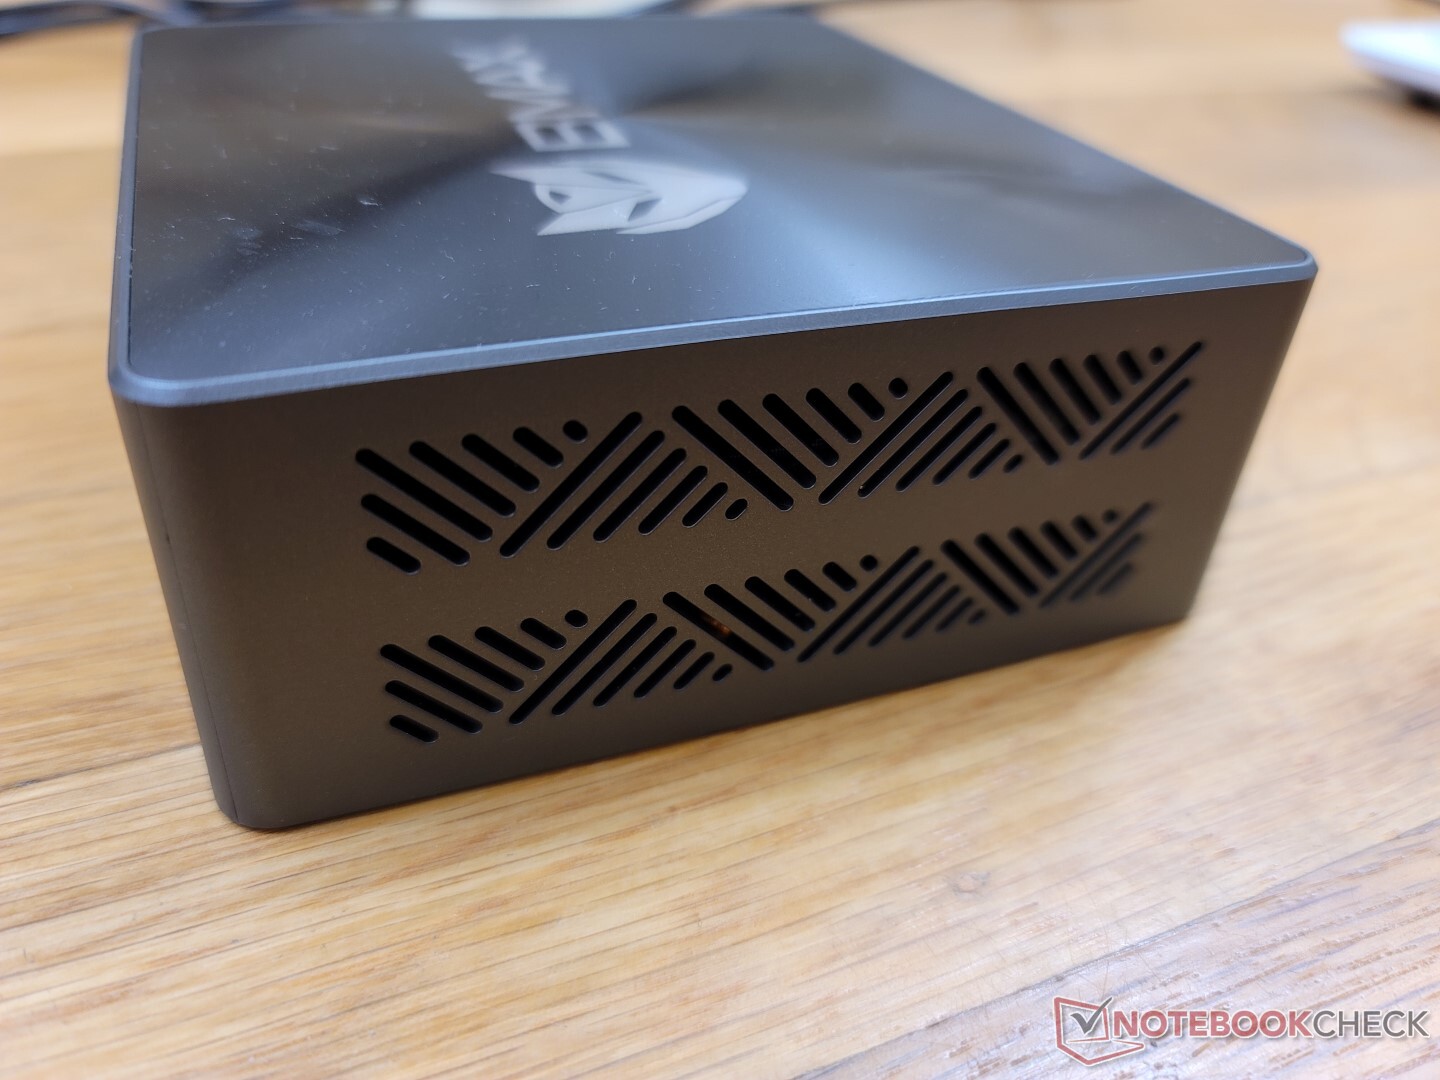
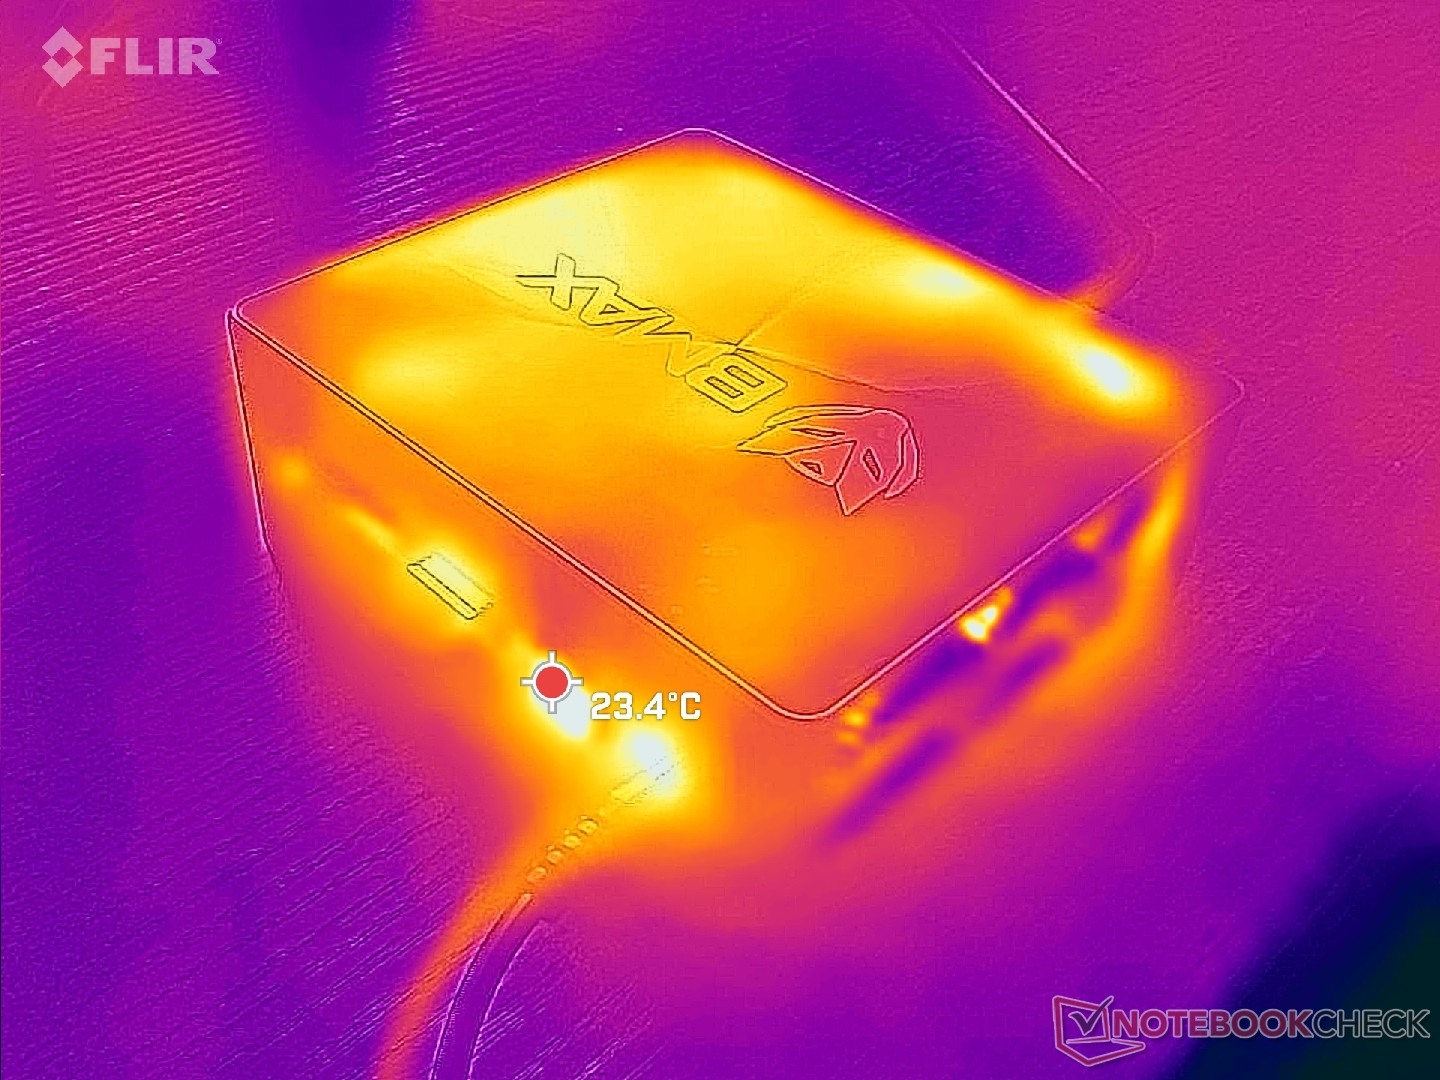
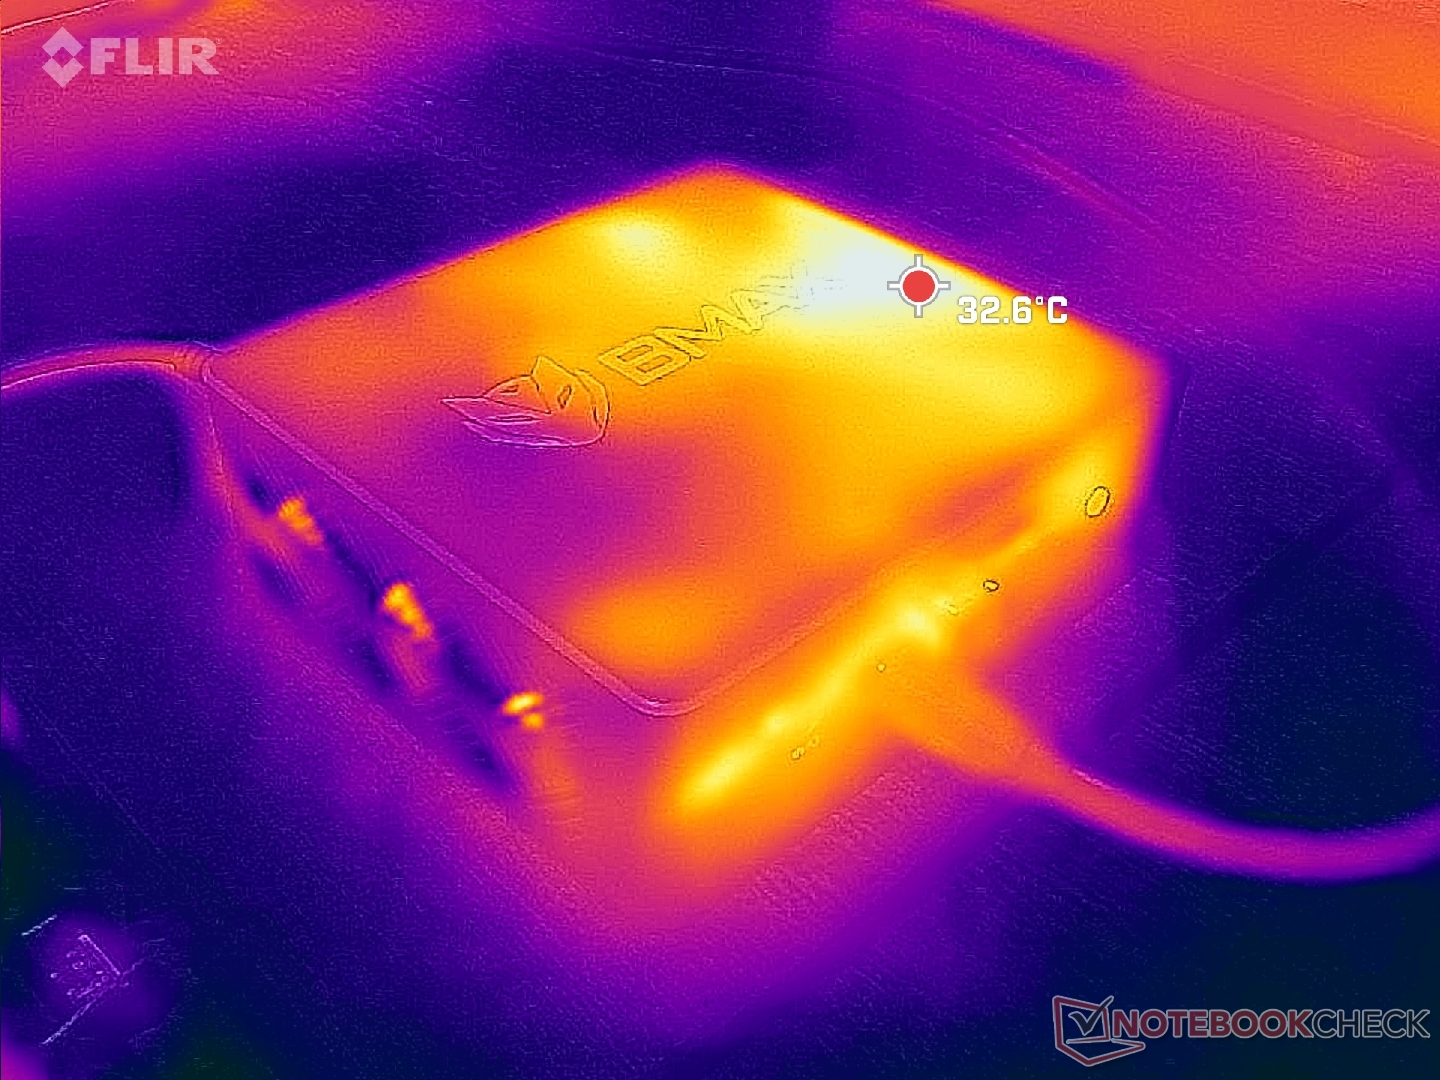
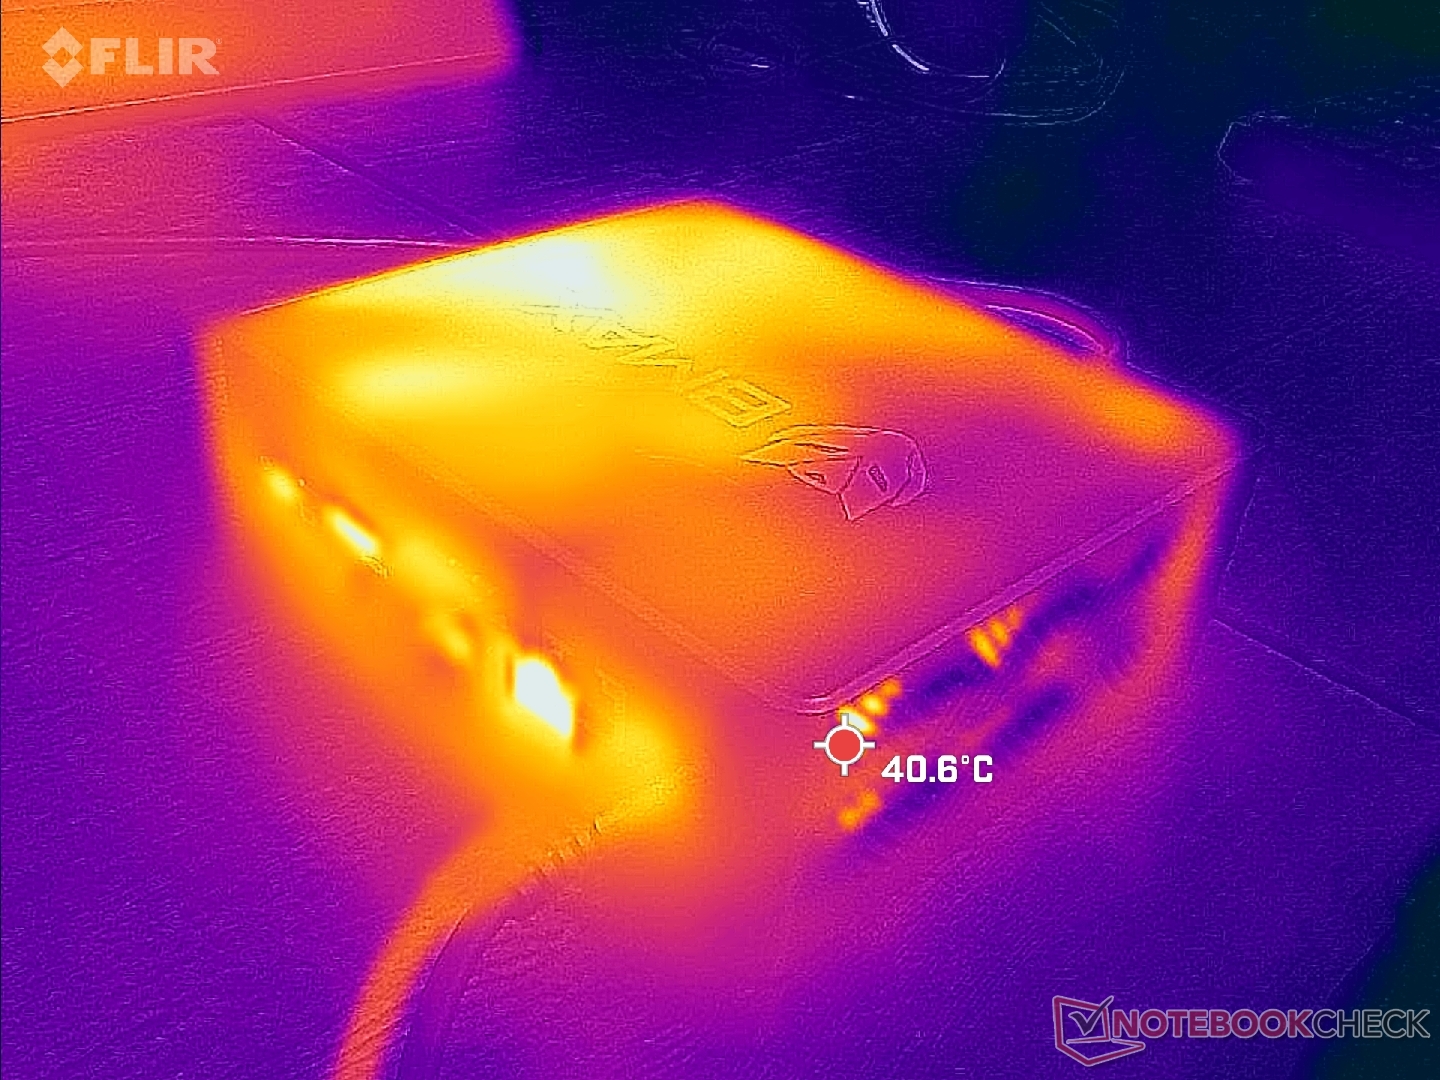
Las temperaturas de la superficie nunca son incómodas. El punto caliente de la parte superior, por ejemplo, sólo alcanza unos 33 C cuando se somete a un alto estrés de procesamiento. El calor se escapa por el lado derecho del chasis, a diferencia del NUC de Intel, donde el calor se escapa por la parte trasera
Se pueden colocar objetos con seguridad en la parte superior de la unidad ya que no hay rejillas de ventilación allí.
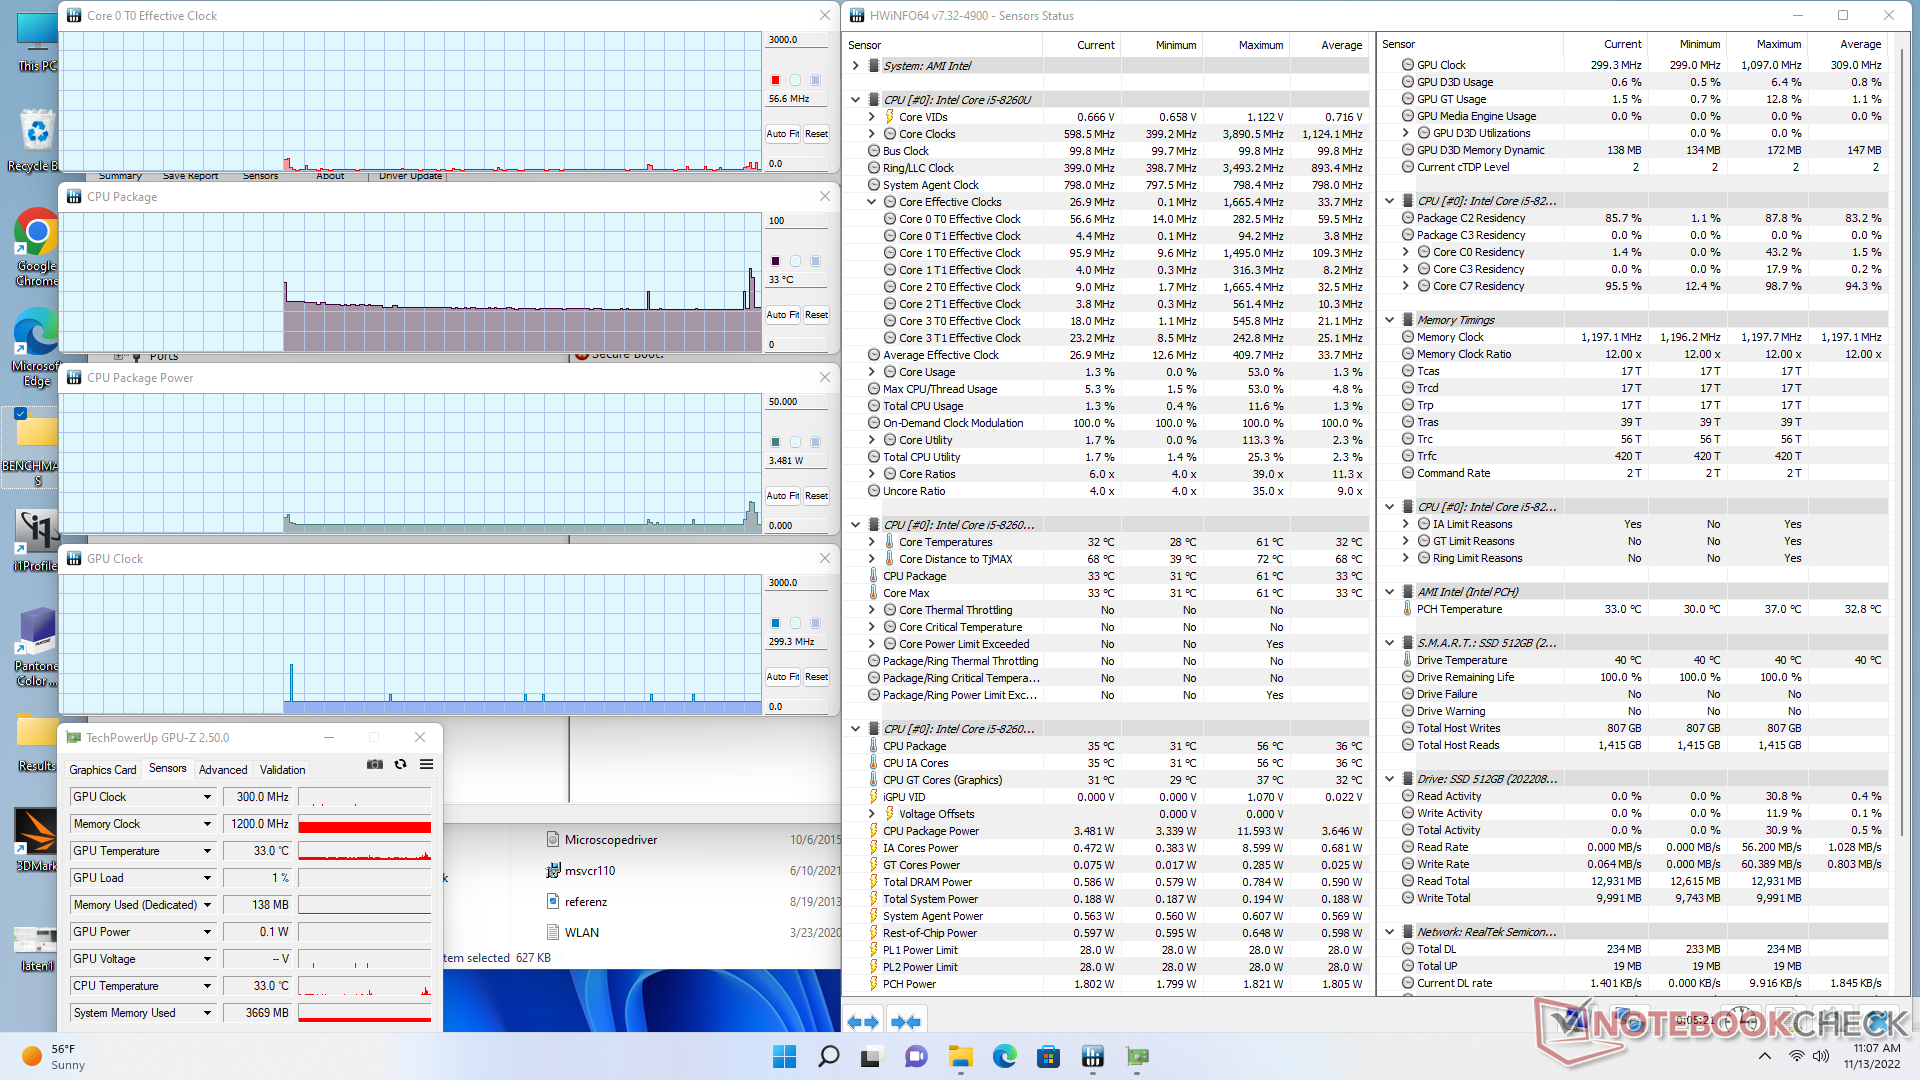
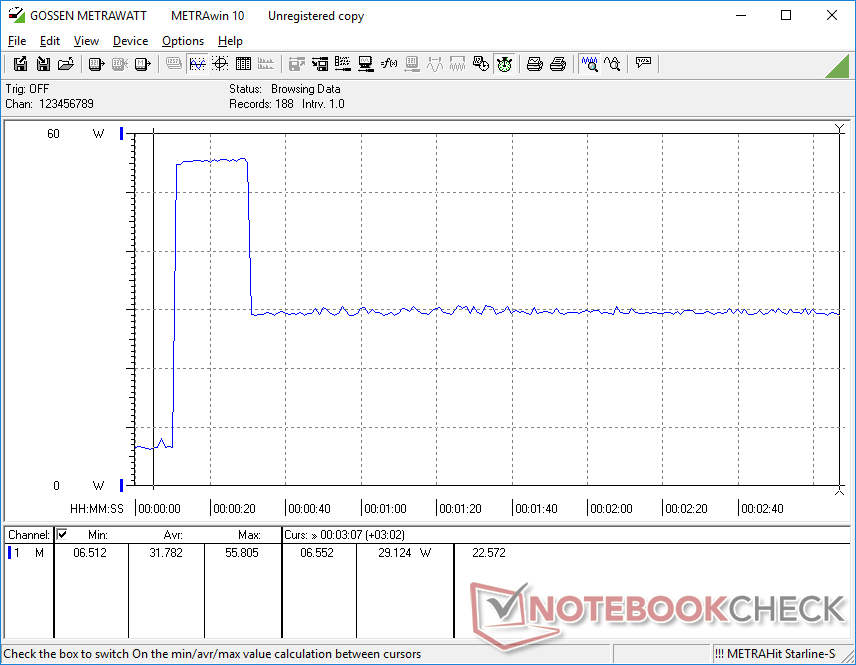
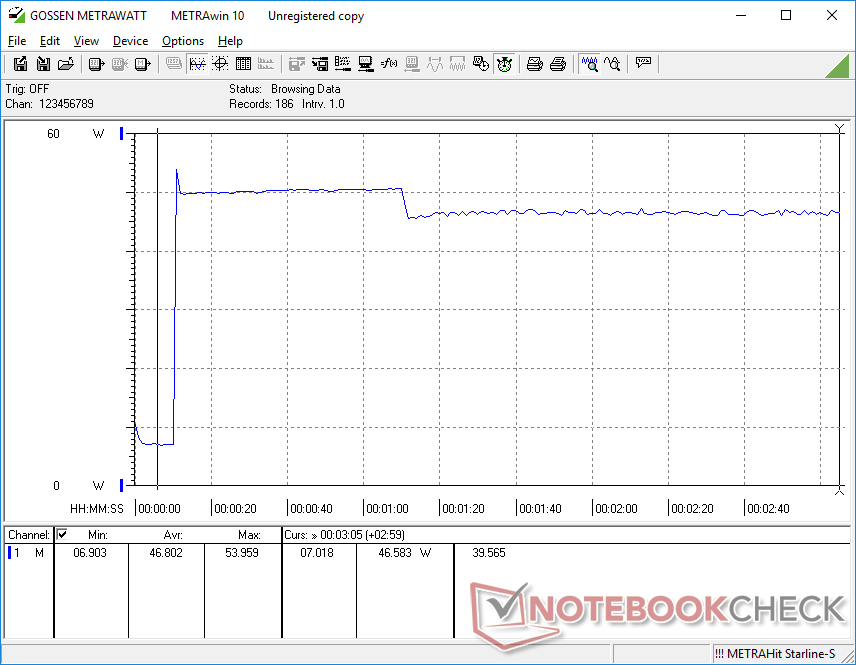
Prueba de esfuerzo
Cuando se estresa con Prime95, la CPU aumenta a 2,8 GHz y 28 W durante unos 20 segundos o hasta que la temperatura del núcleo alcanza los 76 C. A continuación, la velocidad de reloj y el consumo de energía de la placa se estabilizan en 1,5 GHz y 12 W, respectivamente, para mantener una temperatura del núcleo más fría de 60 C. Repitiendo esta misma prueba en el Beelink SEi8 resultaría en relojes de núcleo más rápidos y temperaturas más cálidas de 2,8 GHz y 80 C, respectivamente. El potencial Turbo Boost del B5 Pro es, por tanto, limitado, lo que se corresponde con lo que observamos durante nuestra prueba de estrés CineBench anteriormente.
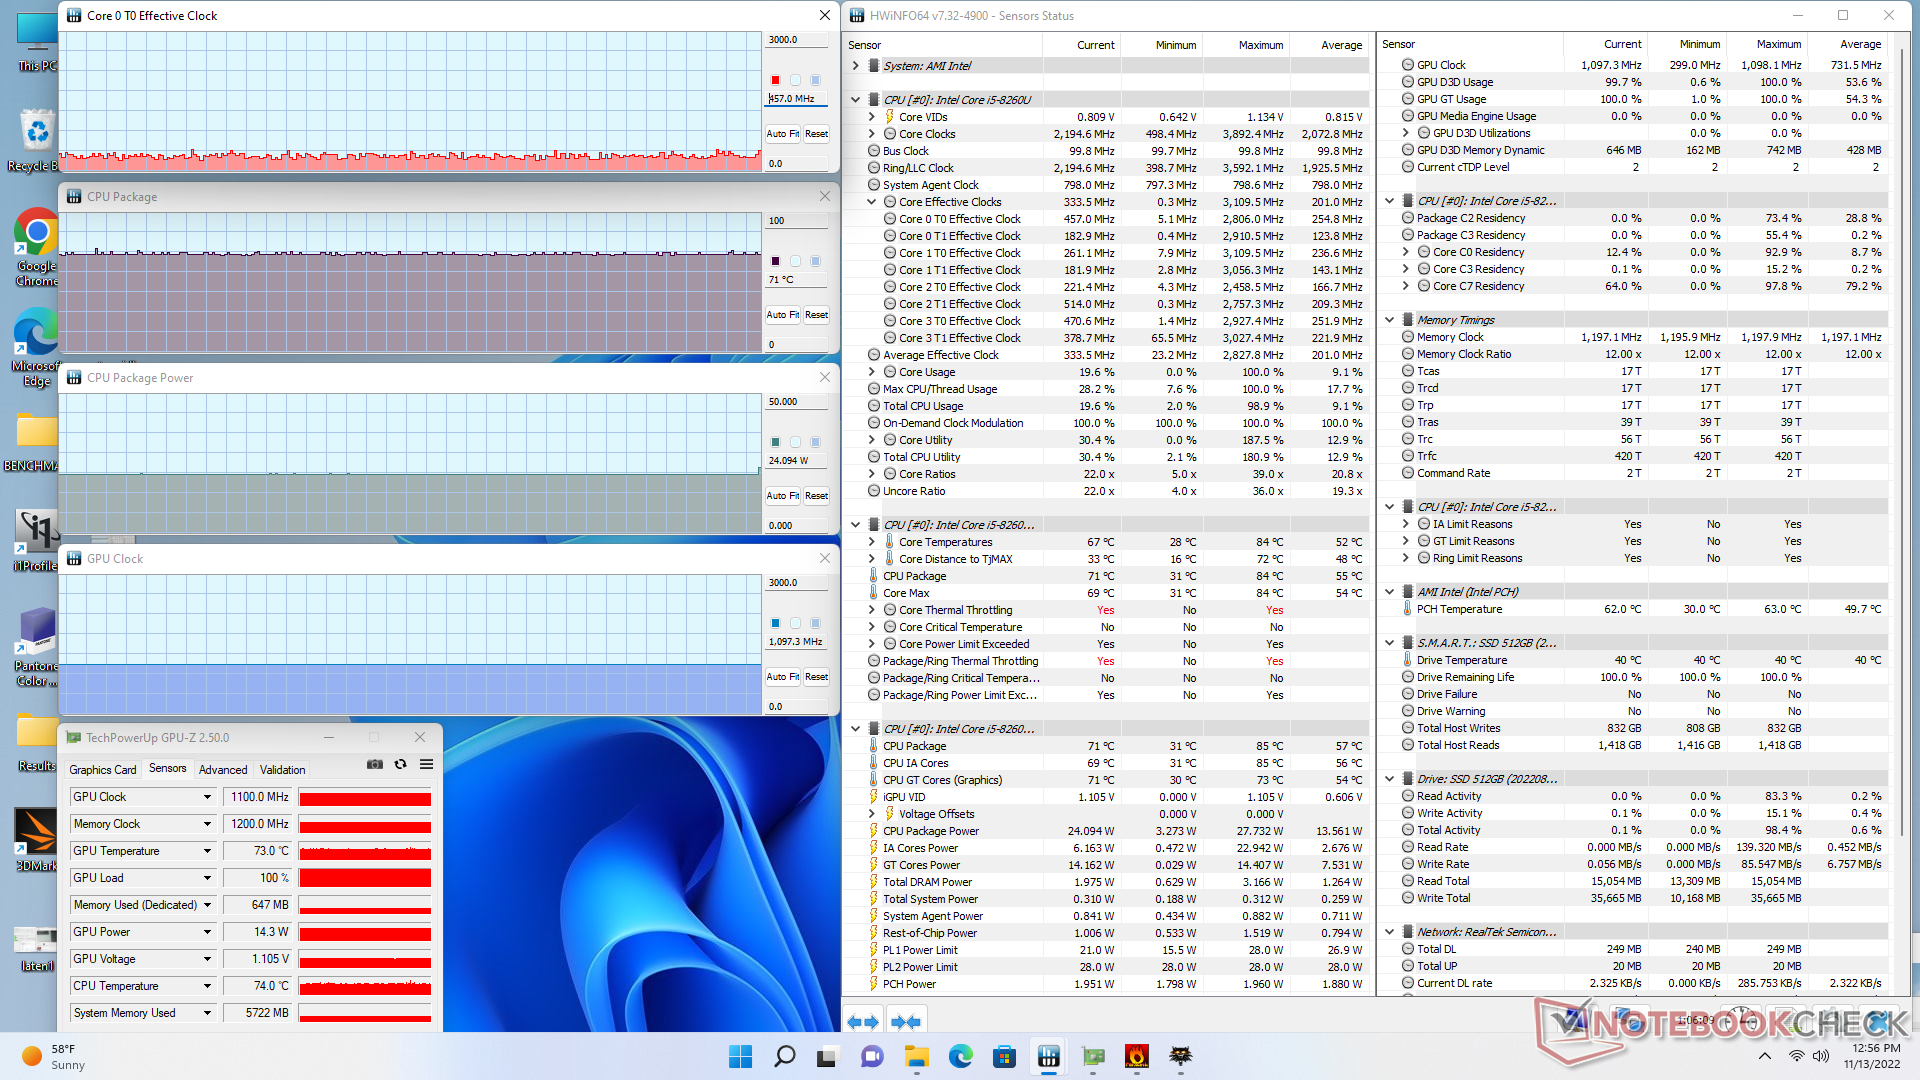
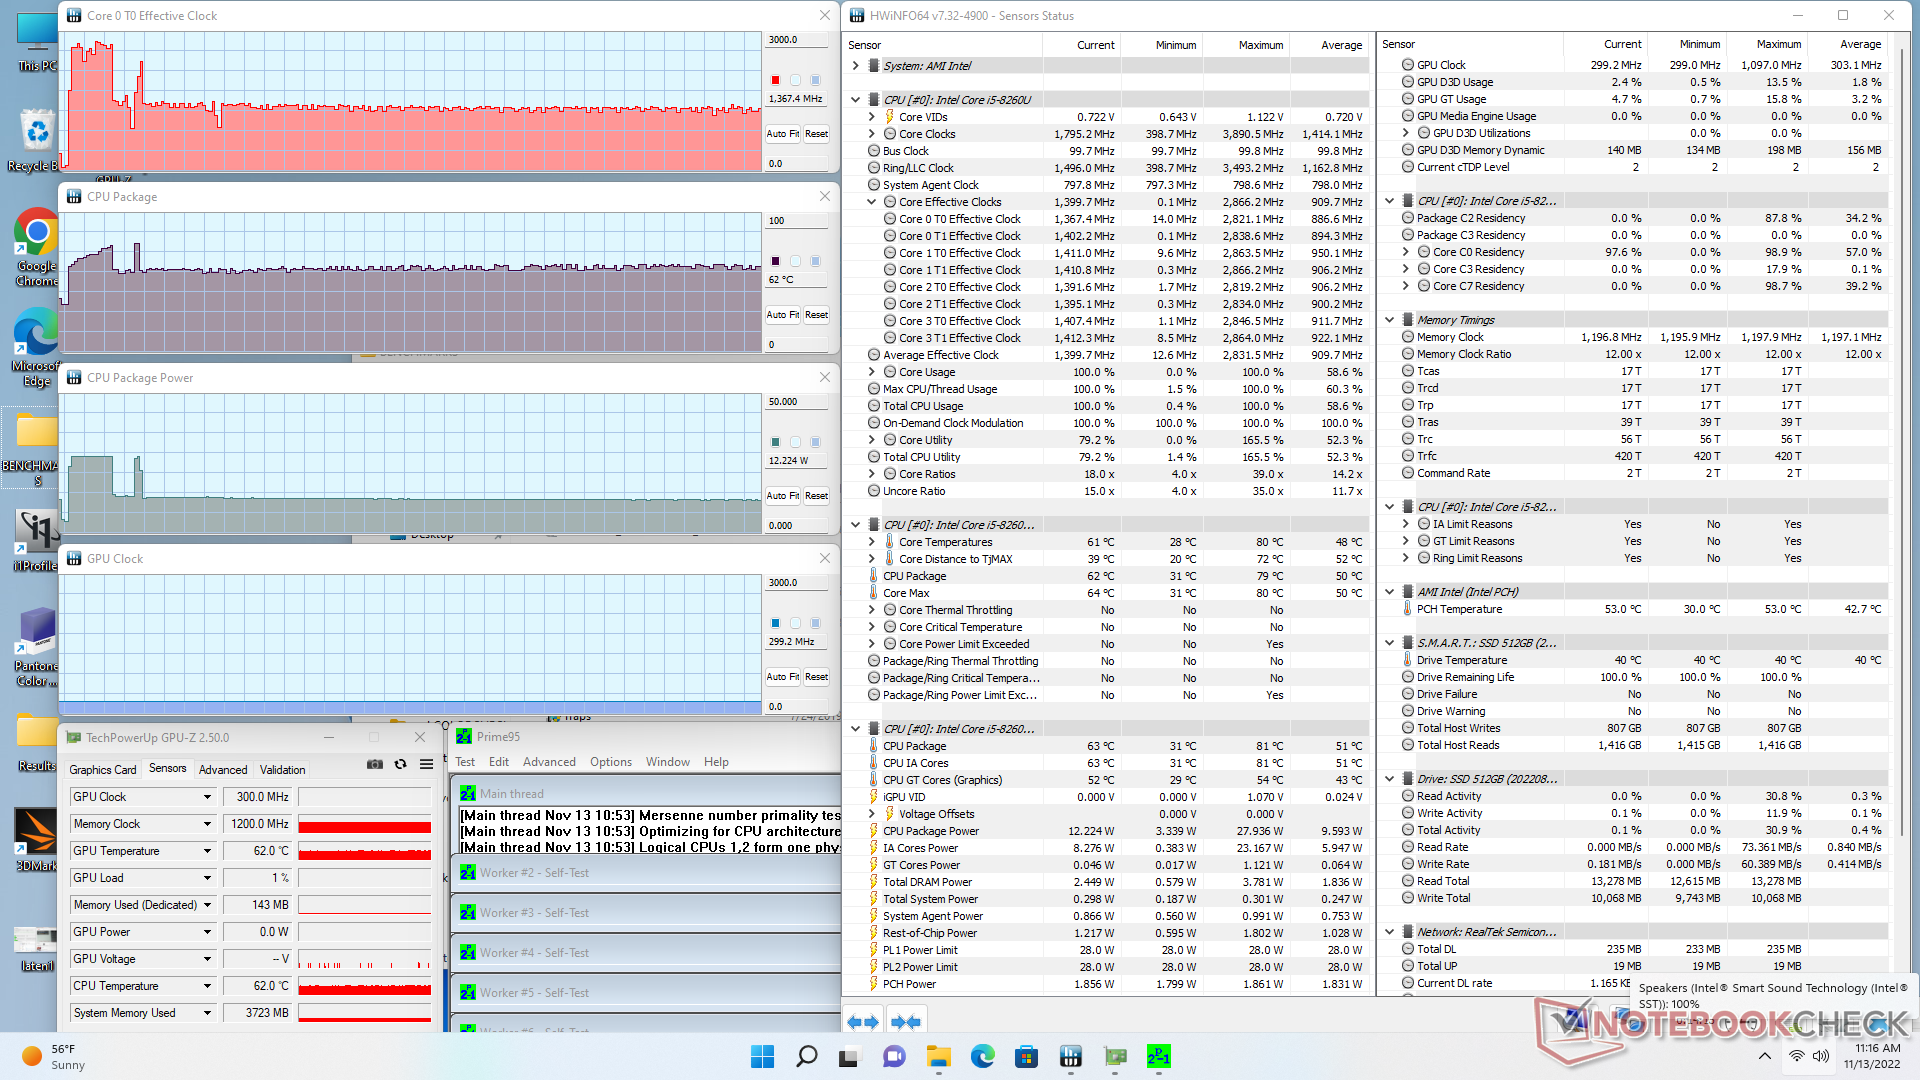
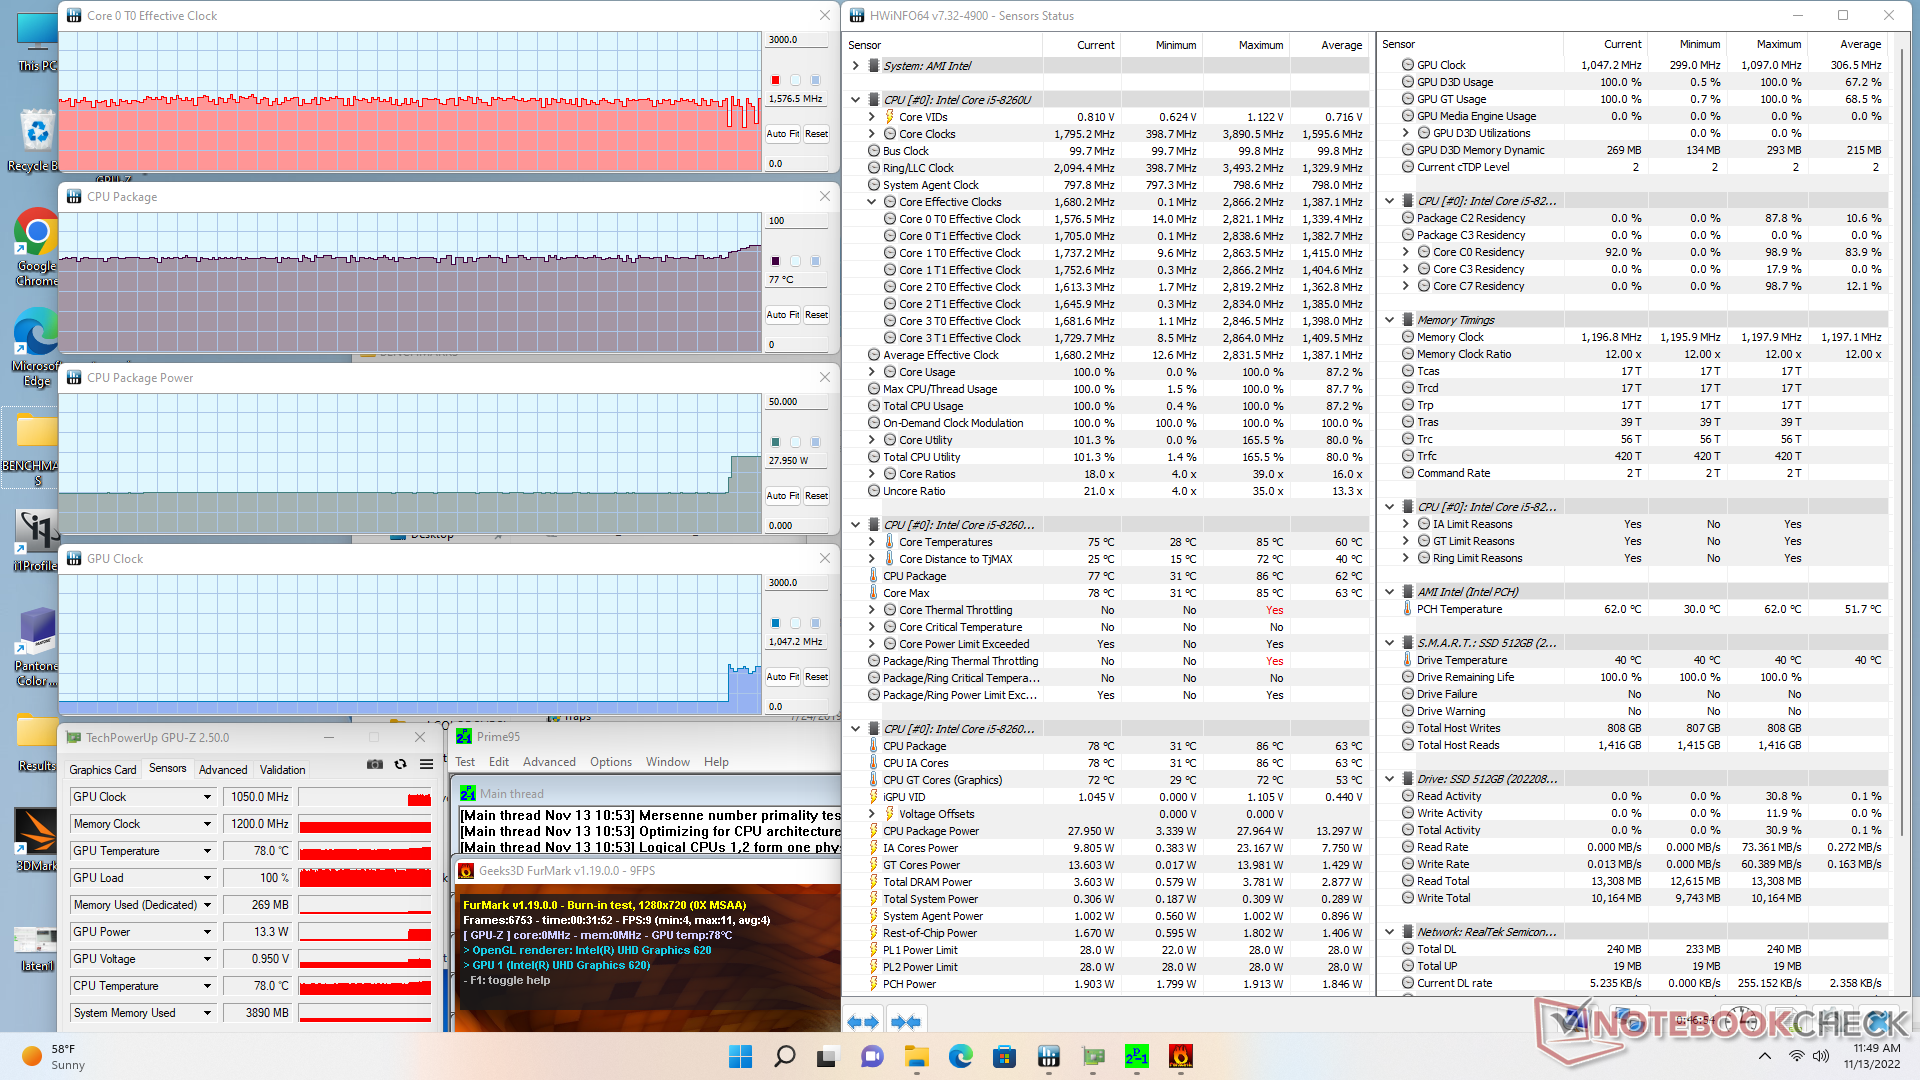
| Reloj dela CPU (GHz) | Reloj de la GPU (MHz) | Temperatura media de la CPU (°C) | |
| Sistema en reposo | -- | -- | 33 |
| Prime95 Stress | 1.3 | -- | 62 |
| Prime95+ FurMark Stress | 1.6 | 300 | 67 |
| Witcher 3 Estrés | ~400 | 1100 | 71 |
Gestión de la energía
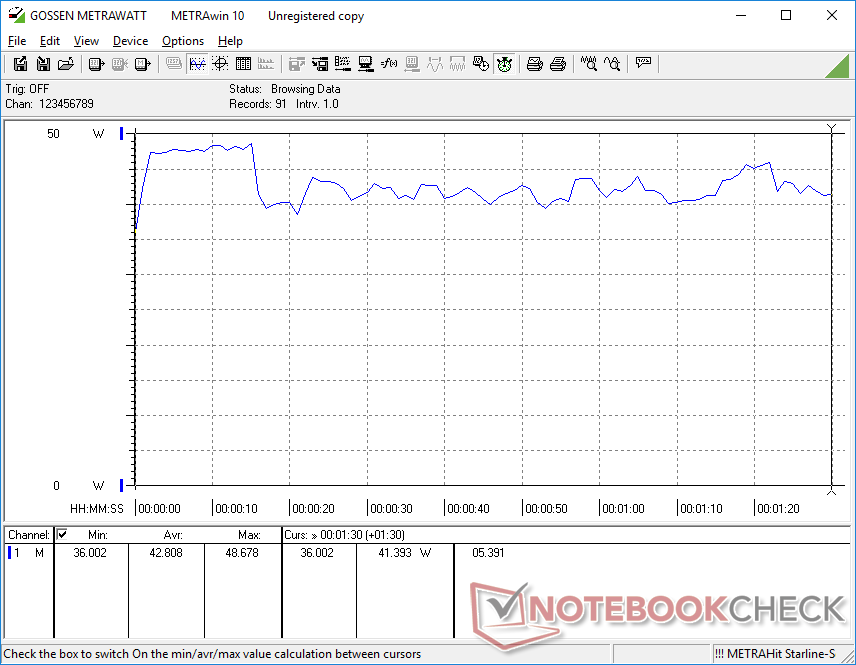
Consumo de energía - Muy poco exigente
El consumo total es inferior al de muchos mini PC con CPUs más recientes como el Intel NUC11TNKi5 y su Core i5-1135G7 de 11ª generación. El rendimiento por vatio, sin embargo, favorece significativamente a este último. Aunque los usuarios pueden ahorrarse unos cuantos vatios con el BMax, los mini PC con CPU de última generación, como el mencionado NUC, pueden ofrecer más del doble de rendimiento gráfico o un 50% más de rendimiento de la CPU
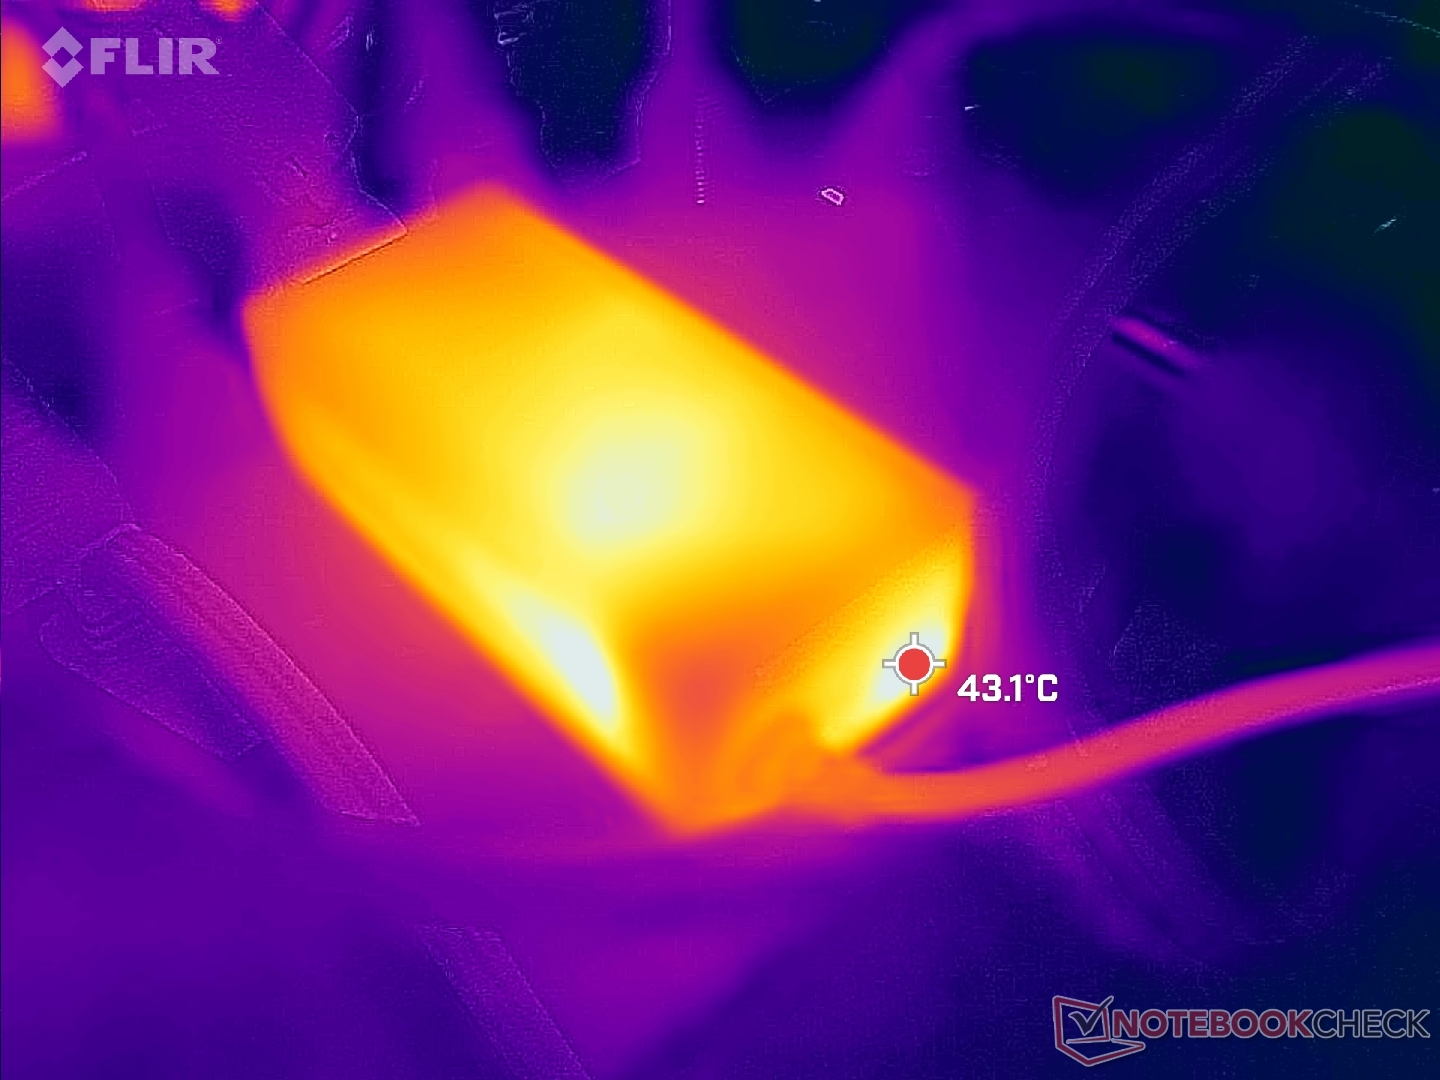
Hemos podido registrar un consumo máximo de 55,9 W del pequeño (~9,8 x 4,3 x 3,7 cm) adaptador de CA de 48 W cuando la CPU está al 100 por ciento de utilización. Esta tasa es sólo temporal, como muestran nuestros gráficos de abajo.
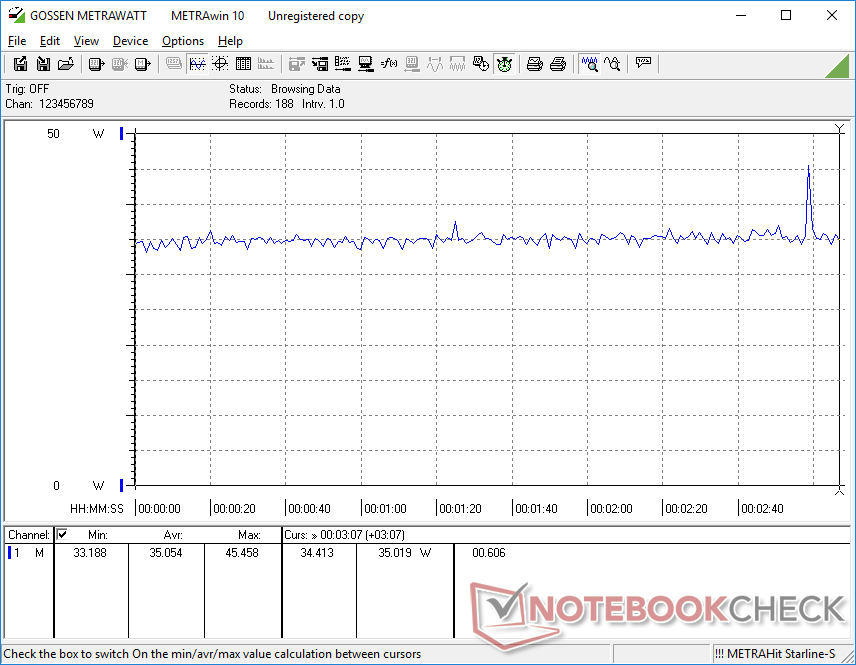
| Off / Standby | |
| Ocioso | |
| Carga |
|
Clave:
min: | |
| BMAX B5 Pro G7H8 i5-8260U, UHD Graphics 620, , , x, | Beelink SEi11 Pro i5-11320H, Iris Xe G7 96EUs, Kingston NV1 SNVS/500GCN, , x, | Beelink U59 N5105 Celeron N5105, UHD Graphics (Jasper Lake 24 EU), Silicon Motion AZW 512G NV428, , x, | Beelink SEi8 i3-8109U, Iris Plus Graphics 655, Intel SSD 660p SSDPEKNW512G8, , x, | Beelink SER Pro Ryzen 5 5600H R5 5600H, Vega 7, Kingston NV1 SNVS/500GCN, , x, | Intel NUC11TNKi5 i5-1135G7, Iris Xe G7 80EUs, Transcend M.2 SSD 430S TS512GMTS430S, , x, | |
|---|---|---|---|---|---|---|
| Power Consumption | -47% | 2% | -13% | -15% | -58% | |
| Idle Minimum * (Watt) | 6 | 9.8 -63% | 6.7 -12% | 7.5 -25% | 5.4 10% | 11.5 -92% |
| Idle Average * (Watt) | 6.2 | 10.3 -66% | 8.1 -31% | 7.6 -23% | 8.2 -32% | 12.4 -100% |
| Idle Maximum * (Watt) | 6.3 | 10.5 -67% | 11.6 -84% | 9.2 -46% | 8.3 -32% | 12.9 -105% |
| Load Average * (Watt) | 42.8 | 54.2 -27% | 23.9 44% | 41.1 4% | 49.3 -15% | 40.7 5% |
| Witcher 3 ultra * (Watt) | 35 | 53.1 -52% | 19.1 45% | 46.1 -32% | 43.9 -25% | |
| Load Maximum * (Watt) | 55.8 | 59 -6% | 28.8 48% | 41.4 26% | 50.2 10% | 73.5 -32% |
* ... más pequeño es mejor
Power Consumption Witcher 3 / Stresstest
Power Consumption external Monitor
Pro
Contra
Veredicto - Opción económica para fines básicos de HTPC
Si lo que buscas es maximizar la rentabilidad, el BMax B5 Pro debería estar entre los primeros de tu lista. Ofrece un amplio SSD NVMe de 512 GB, espacio para un segundo SSD, 16 GB de RAM extraíble, Windows 11 Pro con licencia ya instalado, ruido de ventilador silencioso y un procesador comparable al 10º gen Core i7-1065G7 todo por menos de 300 dólares. El Core i5-8260U se impone a cualquier Core i3, Celeron, Atom o Ryzen 3 actual, que son demasiado comunes en este rango de precios.
El BMax B5 Pro es un paquete completo por casi la mitad del precio de un NUC de Intel sin necesidad de conformarse con procesadores Celeron o Atom de bajo nivel.
El principal inconveniente del modelo es su débil rendimiento gráfico, que realmente no debería ser un problema, ya que nadie debería comprar el B5 Pro para jugar. El rendimiento gráfico sigue siendo suficiente para un cómodo streaming 4K60.
Nos gustaría ver más puertos USB-C, soporte para USB-C Power Delivery, y un puerto HDMI 2.0 o mejor en futuras revisiones.
Precio y disponibilidad
Amazon actualmente está enviando nuestra configuración exacta de BMax B5 Pro por $380 USD o $280 USD después de aplicar el código de cupón en el momento de la publicación.
Price comparison

