Intel Core i7-11390H
El SoC de cuatro núcleos de gama alta basado en Tiger Lake (serie H35) está diseñado para portátiles y estaciones de trabajo finos y ligeros. Los cuatro núcleos del procesador funcionan a una frecuencia base de 2,9 a 3,4 GHz (TDP de 28 a 35 W) y a una frecuencia boost de hasta 5 GHz. La GPU G7 integrada ofrece 96 núcleos a 400 - 1400 MHz.
--
El Intel Core i7-11390H es un SoC de cuatro núcleos de gama alta para portátiles de juego finos y ligeros y estaciones de trabajo móviles. Está basado en la generación Tiger Lake H35 y se anunció a mediados de 2021 como actualización. Cuenta con cuatro núcleos de procesador Willow Cove (8 hilos gracias a HyperThreading). La velocidad de reloj base depende de la configuración del TDP y puede variar entre 2,9 (28 W TDP) y 3,4 GHz (35 W). En comparación con el i7-11375H, el 11390H ahora también puede acelerar con dos núcleos hasta 5 GHz y los cuatro núcleos pueden alcanzar una velocidad de reloj superior de 300 MHz, es decir, 4,6 GHz. Ambos i7 utilizan toda la caché de capa 3 de 12 MB.
El SoC también incluye la iGPU Xe mejorada con 96 UEs habilitadas, a una velocidad de reloj de hasta 1400 MHz.
Además, los SoCs Tiger Lake añaden soporte para PCIe 4 (cuatro carriles), aceleración por hardware de IA e integración parcial de Thunderbolt 4/USB 4 y Wi-Fi 6 en el chip.
Rendimiento
El 11390H medio de nuestra base de datos iguala al AMD Ryzen 5 4600U y al Intel Core i7-10710U en términos de rendimiento multihilo para ser una opción decente de gama media, siempre que no seas muy exigente con los tiempos de carga.
El chip se fabrica en el proceso SuperFin de 10 nm de segunda generación de Intel, que se espera que sea comparable al proceso de 7 nm de TSMC (por ejemplo, la serie Ryzen 4000).
Serie Intel Tiger Lake Nombre código Tiger Lake-H35 Serie: Tiger Lake Tiger Lake-H35 Velocidad de reloj 3400 - 5000 MHz Caché de Nivel 1 320 KB Caché de Nivel 2 5 MB Caché de Nivel 3 12 MB Número de Núcleos/Subprocesos 4 / 8 Consumo de Corriente (TDP = Thermal Design Power) 35 Watt Tecnología de producción 10 nm Temperatura Máx. 100 °C Conector BGA1449 Recursos DDR4-3200/LPDDR4x-4266 RAM, PCIe 4, 4 GT/s bus, DL Boost, GNA, MMX, SSE, SSE2, SSE3, SSSE3, SSE4.1, SSE4.2, AVX, AVX2, AVX-512, BMI2, ABM, FMA, ADX, VMX, SMEP, SMAP, EIST, TM1, TM2, HT, Turbo, SST, AES-NI, RDRAND, RDSEED, SHA GPU Intel Iris Xe Graphics G7 96EUs (400 - 1400 MHz)64 Bit soporte para 64 Bit Architecture x86 Fecha de anuncio 09/01/2021 Enlace de Producto (externo) Intel Tiger Lake i7-11390H
Benchmarks Performance Rating - CB R15 + R20 + 7-Zip + X265 + Blender + 3DM11 CPU
38.2 pt (56%)
...
Intel Core i7-1250U
AMD Ryzen 5 7530U
...
AMD Ryzen 9 7945HX3D
Cinebench R23 - Cinebench R23 Multi Core
min: 4570 de promedio: 5622 mediana: 5917 (10%) max: 6379 Points
CPU TDP 19 W TDP 35 W TDP 45 W 72% 93% 100%
...
Intel Core i5-1230U
Intel Core i3-1215U
...
AMD Ryzen 9 7945HX3D
Cinebench R23 - Cinebench R23 Single Core
min: 1407 de promedio: 1537 mediana: 1602 (71%) max: 1602 Points
CPU TDP 19 W TDP 35 W TDP 45 W 88% 100% 100%
...
AMD Ryzen 7 7735HS
AMD Ryzen 9 PRO 6950HS
AMD Ryzen 9 5980HS
Intel Core i7-1260U
AMD Ryzen 7 7736U
Intel Core i5-1240U
AMD Ryzen 9 PRO 7940HS
Intel Core i7-1250U
...
Intel Core i7-1370P
Cinebench R20 - Cinebench R20 CPU (Single Core)
min: 550 de promedio: 595 mediana: 614 (71%) max: 620 Points
CPU TDP 19 W TDP 35 W TDP 45 W 89% 100% 99%
...
AMD Ryzen 5 7535HS
Intel Core i7-1260U
AMD Ryzen 9 PRO 6950HS
AMD Ryzen 7 7735HS
Intel Core i5-1240U
AMD Ryzen 9 5980HS
Intel Core i3-1215U
AMD Ryzen 9 PRO 7940HS
...
Intel Core i7-1370P
Cinebench R20 - Cinebench R20 CPU (Multi Core)
min: 1767 de promedio: 2138 mediana: 2284 (10%) max: 2362 Points
CPU TDP 19 W TDP 35 W TDP 45 W 75% 97% 100%
...
Intel Core i5-1038NG7
Apple M1
Intel Core i3-1215U
Apple M2
...
AMD Ryzen 9 7945HX3D
Cinebench R15 - Cinebench R15 CPU Multi 64 Bit
min: 775 de promedio: 923 mediana: 953 (10%) max: 1041 Points
CPU TDP 19 W TDP 35 W TDP 45 W 74% 92% 100%
...
Apple M1
Intel Xeon E-2176M
Intel Xeon E-2186M
...
AMD Ryzen 9 7945HX3D
0 55 110 165 220 275 330 385 440 495 550 605 660 715 770 825 880 935 990 Tooltip BMAX B7 Power G7A2: Ø695 (685.89-775.39)
Geekom Mini IT11, i7-11390H: Ø946 (931.81-953.22)
Honor MagicBook View 14: Ø962 (931.29-1041.07)
Cinebench R15 - Cinebench R15 CPU Single 64 Bit
min: 209 de promedio: 226.7 mediana: 232 (71%) max: 239 Points
CPU TDP 19 W TDP 35 W TDP 45 W 87% 97% 100%
...
Apple M2
Intel Core i7-1250U
Intel Core i5-1240U
Intel Core i3-1215U
AMD Ryzen 5 7530U
AMD Ryzen 7 7730U
Intel Core i7-1265U
...
AMD Ryzen 9 7945HX3D
Cinebench R11.5 - Cinebench R11.5 CPU Multi 64 Bit
10.7 Points (15%)
...
Intel Core i5-9400H
Intel Core i3-1215U
Intel Xeon E-2176M
...
AMD Ryzen 9 7945HX
Cinebench R11.5 - Cinebench R11.5 CPU Single 64 Bit
2.8 Points (71%)
...
AMD Ryzen 7 7730U
Intel Core i3-1215U
AMD Ryzen 5 7535HS
AMD Ryzen 7 7735U
AMD Ryzen 9 PRO 6950HS
...
Intel Core i9-13980HX
Cinebench R10 - Cinebench R10 Rend. Single (32bit)
9604 puntos (58%)
...
Intel Core i5-13500HX
Intel Core i5-1335U
Intel Core i9-12900HX
Intel Core i5-13500H
Intel Core i7-1355U
Intel Core i7-13620H
Intel Core i7-1360P
Intel Core i7-13705H
Intel Core i7-13700H
Intel Core i7-13650HX
Intel Core i9-13950HX
...
Intel Core i9-13980HX
Cinebench R10 - Cinebench R10 Rend. Multi (32bit)
29456 puntos (21%)
...
AMD Ryzen 7 7735U
...
Intel Core i9-13980HX
Cinebench R10 - Cinebench R10 Rend. Multi (64bit)
39426 Points (28%)
...
Intel Core i7-9750H
Intel Core i3-1215U
...
Intel Core i9-13980HX
Cinebench R10 - Cinebench R10 Rend. Single (64bit)
12516 Points (68%)
...
Intel Core i5-1230U
Intel Core i3-1215U
Intel Core i5-1245U
Intel Core i5-1335U
Intel Core i7-1265U
...
Intel Core i9-13980HX
wPrime 2.10 - wPrime 2.0 1024m *
196.9 s (2%)
...
Intel Core i9-13980HX
AMD Ryzen 7 7735U
Intel Core i7-8706G
Intel Core i7-13700H
...
VIA C3-M C3-M-1200
wPrime 2.10 - wPrime 2.0 32m *
6.5 s (1%)
...
AMD Ryzen 9 7945HX3D
Intel Core i7-8559U
Intel Core i7-8706G
...
min: 6144 de promedio: 6375 mediana: 6374.5 (12%) max: 6605 puntos
CPU TDP 35 W TDP 45 W 93% 100%
...
Intel Core i5-1245U
Intel Core i7-9750H
AMD Ryzen 7 7735HS
AMD Ryzen 5 7535HS
Intel Core i7-8559U
...
AMD Ryzen 9 7945HX3D
7-Zip 18.03 - 7-Zip 18.03 Multli Thread 4 runs
min: 20822 de promedio: 24957 mediana: 25876 (16%) max: 28173 MIPS
CPU TDP 19 W TDP 35 W TDP 45 W 74% 92% 100%
...
Intel Core i3-1215U
Intel Core i7-8559U
...
AMD Ryzen 9 7945HX3D
7-Zip 18.03 - 7-Zip 18.03 Single Thread 4 runs
min: 5539 de promedio: 5705 mediana: 5682 (68%) max: 5895 MIPS
CPU TDP 19 W TDP 35 W TDP 45 W 94% 100% 96%
...
Intel Core i5-13500HX
AMD Ryzen 9 5980HS
Intel Core i7-12800HX
AMD Ryzen 5 7535HS
Intel Core i7-1360P
Intel Core i5-13500H
Intel Core i7-13620H
Intel Core i7-12850HX
...
AMD Ryzen 9 7945HX3D
X264 HD Benchmark 4.0 - x264 Pass 2
min: 55.2 de promedio: 58.6 mediana: 58.6 (21%) max: 61.9 fps
CPU TDP 35 W TDP 45 W 89% 100%
...
Intel Core i7-8706G
Intel Core i3-1215U
Intel Xeon E-2176M
Intel Core i7-9750H
...
Intel Core i9-13900HX
X264 HD Benchmark 4.0 - x264 Pass 1
min: 214.5 de promedio: 232.3 mediana: 232.3 (55%) max: 250.1 fps
CPU TDP 35 W TDP 45 W 86% 100%
...
AMD Ryzen 7 7735U
Intel Core i5-1340P
AMD Ryzen 7 7730U
...
Intel Core i9-13900HX
HWBOT x265 Benchmark v2.2 - HWBOT x265 4k Preset
min: 5.84 de promedio: 7.1 mediana: 7.6 (16%) max: 7.86 fps
CPU TDP 19 W TDP 35 W TDP 45 W 74% 97% 100%
...
Intel Core i5-8400H
...
AMD Ryzen 9 7945HX3D
0 1 2 3 4 5 6 7 8 9 10 11 12 13 14 15 16 Tooltip BMAX B7 Power G7A2: Ø6.41 (0.54-11.8)
Geekom Mini IT11, i7-11390H: Ø8 (0.98-14.3)
Honor MagicBook View 14: Ø8.38 (1.19-16.2)
TrueCrypt - TrueCrypt Serpent
min: 0.509 de promedio: 0.6 mediana: 0.6 (19%) max: 0.62 GB/s
CPU TDP 35 W TDP 45 W 82% 100%
...
Intel Xeon E-2176M
...
AMD Ryzen 9 7945HX
TrueCrypt - TrueCrypt Twofish
min: 0.838 de promedio: 0.9 mediana: 0.9 (17%) max: 0.98 GB/s
CPU TDP 35 W TDP 45 W 86% 100%
...
Intel Core i7-8559U
...
Intel Core i9-13980HX
TrueCrypt - TrueCrypt AES
min: 5.4 de promedio: 6.1 mediana: 6.1 (18%) max: 6.7 GB/s
CPU TDP 35 W TDP 45 W 81% 100%
...
Intel Xeon E-2176M
...
AMD Ryzen 9 7945HX
Blender - Blender 3.3 Classroom CPU *
min: 943 de promedio: 1101 mediana: 1101 (14%) max: 1259 Seconds
CPU TDP 19 W TDP 35 W 100% 105%
...
Intel Core i5-1335U
Intel Core i7-1265U
Apple M1
Intel Core i5-8400H
Intel Core i3-1215U
...
Blender - Blender 2.79 BMW27 CPU *
min: 495 de promedio: 558 mediana: 513 (4%) max: 665 Seconds
CPU TDP 19 W TDP 35 W TDP 45 W 100% 101% 101%
...
Intel Xeon E-2176M
Apple M1
Intel Core i5-8400H
...
R Benchmark 2.5 - R Benchmark 2.5 *
min: 0.537 de promedio: 0.6 mediana: 0.5 (12%) max: 0.571 sec
CPU TDP 19 W TDP 35 W TDP 45 W 100% 101% 101%
...
Intel Core i3-1215U
...
3DMark 06 - CPU - 3DMark 06 - CPU
min: 10089 de promedio: 10151 mediana: 10150.5 (22%) max: 10212 Points
...
AMD Ryzen 7 7735U
Intel Core i7-1355U
Intel Core i7-9750H
...
Intel Core i9-13980HX
Super Pi mod 1.5 XS 1M - Super Pi mod 1.5 XS 1M *
min: 6.7 de promedio: 6.8 mediana: 6.8 (1%) max: 6.842 s
CPU TDP 35 W TDP 45 W 100% 100%
...
Intel Core i9-13950HX
Intel Core i9-13900HX
AMD Ryzen 9 7945HX3D
AMD Ryzen 9 7945HX
Intel Core i7-13650HX
Intel Core i7-1355U
Intel Core i7-13620H
Intel Core i7-1360P
Intel Core i7-13700H
Intel Core i7-13705H
Intel Core i5-1230U
AMD Ryzen 9 7940HS
Intel Core i5-13500H
...
VIA C3-M C3-M-1200
Super Pi mod 1.5 XS 2M - Super Pi mod 1.5 XS 2M *
min: 14.6 de promedio: 14.7 mediana: 14.7 (1%) max: 14.733 s
CPU TDP 35 W TDP 45 W 100% 100%
AMD Ryzen 9 7945HX
AMD Ryzen 9 7945HX3D
Intel Core i7-13700H
Intel Core i7-1360P
Intel Core i7-13650HX
Intel Core i7-1355U
Intel Core i5-1230U
Intel Core i7-13620H
Intel Core i9-13980HX
...
Super Pi Mod 1.5 XS 32M - Super Pi mod 1.5 XS 32M *
min: 348.305 de promedio: 349.8 mediana: 349.8 (2%) max: 351.3 s
CPU TDP 35 W TDP 45 W 100% 100%
Intel Core i9-13950HX
AMD Ryzen 9 7945HX
AMD Ryzen 9 7945HX3D
Intel Core i5-13500H
Intel Core i9-13980HX
Intel Core i5-1230U
AMD Ryzen 9 PRO 6950HS
...
VIA C3-M C3-M-1200
3DMark Vantage - 3DM Vant. Perf. CPU no Physx
min: 33890 de promedio: 34012 mediana: 34012 (32%) max: 34134 Points
...
Intel Core i7-1265U
Intel Core i7-1355U
Intel Xeon E-2176M
...
AMD Ryzen 9 7945HX
3DMark 11 - 3DM11 Performance Physics
min: 7311 de promedio: 10440 mediana: 10604 (29%) max: 13242 Points
CPU TDP 19 W TDP 35 W TDP 45 W 55% 80% 100%
...
Intel Core i5-1230U
...
AMD Ryzen 9 7945HX3D
3DMark - 3DMark Ice Storm Physics
min: 9451 de promedio: 46134 mediana: 52957 (44%) max: 75994 Points
CPU TDP 35 W TDP 45 W 41% 100%
...
AMD Ryzen 7 7735U
Intel Core i7-7700HQ
Intel Processor N95
...
Intel Core i9-12900HX
3DMark - 3DMark Ice Storm Extreme Physics
min: 9451 de promedio: 31285 mediana: 31284.5 (26%) max: 53118 Points
...
AMD Ryzen Embedded R1505G
...
Intel Core i9-12900HX
3DMark - 3DMark Ice Storm Unlimited Physics
min: 64799 de promedio: 65805 mediana: 65804.5 (55%) max: 66810 Points
...
Intel Core i7-1265U
...
Intel Core i7-13700H
3DMark - 3DMark Cloud Gate Physics
min: 8079 de promedio: 8821 mediana: 8292.5 (21%) max: 10618 Points
CPU TDP 19 W TDP 35 W TDP 45 W 76% 78% 100%
...
Intel Xeon E-2176M
Intel Core i7-1355U
Intel Core i7-1265U
Intel Core i5-1335U
...
AMD Ryzen 9 7945HX
3DMark - 3DMark Fire Strike Standard Physics
min: 9456 de promedio: 11705 mediana: 10814 (20%) max: 15737 Points
CPU TDP 19 W TDP 35 W TDP 45 W 62% 68% 100%
...
Intel Core i5-1230U
...
AMD Ryzen 9 7945HX3D
3DMark - 3DMark Time Spy CPU
min: 3391 de promedio: 4236 mediana: 4598 (23%) max: 4719 Points
CPU TDP 19 W TDP 35 W 73% 100%
...
Intel Core i7-7700HQ
...
Intel Core i9-13980HX
Geekbench 6.1 - 6.2 - Geekbench 6.2 Single-Core
2114 puntos (69%)
Intel Processor N95
Intel Core i5-8400H
AMD Ryzen 7 7730U
AMD Ryzen 5 7535HS
AMD Ryzen 7 7735HS
AMD Ryzen 7 7840U
AMD Ryzen 9 PRO 7940HS
Intel Core i5-1335U
Apple M1
Intel Core i5-13500H
...
Intel Core i9-13950HX
Geekbench 6.1 - 6.2 - Geekbench 6.2 Multi-Core
5066 puntos (24%)
Intel Processor N95
Intel Core i5-8400H
AMD Ryzen 7 7730U
AMD Ryzen 7 7840U
Apple M1
AMD Ryzen 5 7535HS
Intel Core i5-1335U
Intel Core i7-1355U
...
AMD Ryzen 9 7945HX3D
Geekbench 5.2 - 5.5 - Geekbench 5.1 - 5.4 64 Bit Single-Core
min: 1486 de promedio: 1599 mediana: 1615.5 (70%) max: 1677 puntos
CPU TDP ? TDP 19 W TDP 35 W TDP 45 W 93% 89% 100% 100%
...
Intel Core i7-1260U
Intel Core i3-1215U
Intel Xeon W-11855M
Intel Core i5-1240U
Intel Core i7-1250U
...
AMD Ryzen 9 7945HX3D
Geekbench 5.2 - 5.5 - Geekbench 5.1 - 5.4 64 Bit Multi-Core
min: 4457 de promedio: 5306 mediana: 5235.5 (18%) max: 6297 puntos
CPU TDP ? TDP 19 W TDP 35 W TDP 45 W 85% 71% 81% 100%
...
Intel Xeon E-2186M
Intel Core i7-1180G7
Intel Core i7-9750H
...
AMD Ryzen 9 7945HX3D
Geekbench 5.0 - Geekbench 5.0 64 Bit Single-Core
1655 puntos (7%)
...
Intel Core i5-1245U
Intel Core i5-1335U
Intel Core i7-1265U
Intel Core i5-1345U
Intel Core i5-13500H
Intel Core i7-12850HX
Intel Core i7-12800HX
Intel Core i7-1360P
...
Intel Core i9-13980HX
Geekbench 5.0 - Geekbench 5.0 64 Bit Multi-Core
5025 puntos (16%)
...
Intel Core i7-1065G7
Intel Core i7-8559U
Intel Core i7-1180G7
Intel Core i5-1230U
...
Intel Core i9-13980HX
Geekbench 4.1 - 4.4 - Geekbench 4.1 - 4.4 64 Bit Single-Core
min: 7105 de promedio: 7126 mediana: 7125.5 (74%) max: 7146 puntos
CPU TDP 35 W TDP 45 W 100% 99%
...
Intel Core i3-1215U
Intel Core i5-1335U
Intel Core i5-1245U
Intel Core i7-1265U
Intel Core i7-1360P
AMD Ryzen 9 7940HS
Intel Core i5-13500H
Intel Core i7-13650HX
...
Intel Core i9-13900HX
Geekbench 4.1 - 4.4 - Geekbench 4.1 - 4.4 64 Bit Multi-Core
min: 20385 de promedio: 22986 mediana: 22986 (26%) max: 25587 puntos
CPU TDP 35 W TDP 45 W 80% 100%
...
Intel Core i7-9750H
Intel Core i3-1215U
...
Intel Core i9-13900HX
Mozilla Kraken 1.1 - Kraken 1.1 Total Score *
min: 589 de promedio: 632 mediana: 645.5 (1%) max: 647 ms
CPU TDP 19 W TDP 35 W TDP 45 W 100% 100% 100%
...
AMD Ryzen 5 7535HS
AMD Ryzen 7 7730U
Intel Core i5-1230U
...
Sunspider - Sunspider 1.0 Total Score *
117.6 ms (1%)
...
Intel Core i5-5257U
Intel Core i5-7267U
Intel Core i5-6360U
Intel Core i5-7360U
Intel Core i3-7130U
...
WebXPRT 4 - WebXPRT 4 Score
204 Points (61%)
...
AMD Ryzen 7 7736U
AMD Ryzen 7 7840U
AMD Ryzen 5 7530U
Intel Core i5-1230U
AMD Ryzen 7 7730U
Intel Core i7-1260U
...
AMD Ryzen 9 7945HX3D
WebXPRT 3 - WebXPRT 3 Score
min: 261 de promedio: 266.5 mediana: 266.5 (56%) max: 272 Points
CPU TDP 35 W TDP 45 W 96% 100%
...
AMD Ryzen 5 7530U
AMD Ryzen 7 7730U
Intel Core i5-1240U
Apple M1
Intel Core i7-1265U
Intel Core i7-1250U
Intel Core i5-1245U
...
AMD Ryzen 9 7945HX3D
CrossMark - CrossMark Overall
min: 1274 de promedio: 1356 mediana: 1356 (52%) max: 1438 Points
CPU TDP 19 W TDP 35 W 89% 100%
...
Intel Core i3-1215U
AMD Ryzen 7 7735U
AMD Ryzen 9 PRO 6950HS
Intel Core i5-1240U
Intel Core i7-1250U
...
Intel Core i9-12900HX
Power Consumption - Prime95 Power Consumption - external Monitor *
min: 35 de promedio: 48.6 mediana: 53.2 (9%) max: 57.6 Watt
CPU TDP 19 W TDP 35 W TDP 45 W 104% 100% 101%
...
AMD Ryzen 7 7730U
Intel Core i5-1240U
Intel Core i7-1360P
Intel Core i5-1340P
Intel Core i5-1245U
...
Intel Core i9-13900HK
0 5 10 15 20 25 30 35 40 45 50 55 60 Tooltip BMAX B7 Power G7A2: Ø34.8 (26.588-45.48)
Honor MagicBook View 14: Ø53.2 (48.6-60.5)
Geekom Mini IT11, i7-11390H: Ø57.6 (47.9-61.1)
Power Consumption - Cinebench R15 Multi Power Consumption - external Monitor *
min: 35 de promedio: 49.5 mediana: 50.7 (11%) max: 62.9 Watt
CPU TDP 19 W TDP 35 W TDP 45 W 107% 103% 100%
...
Intel Core i5-1240U
Intel Core i3-1215U
Intel Core i7-1265U
AMD Ryzen 7 7730U
Intel Core i5-1345U
Intel Core i7-1355U
...
AMD Ryzen 9 7845HX
0 5 10 15 20 25 30 35 40 45 50 55 60 65 Tooltip BMAX B7 Power G7A2: Ø34.9 (27.512-43.782)
Geekom Mini IT11, i7-11390H: Ø50.7 (48-54.1)
Honor MagicBook View 14: Ø62.9 (58.7-67.2)
Power Consumption - Idle Power Consumption - external Monitor *
min: 8.39 de promedio: 9.2 mediana: 9.2 (8%) max: 10 Watt
CPU TDP 19 W TDP 35 W 100% 101%
...
Intel Core i7-13705H
Intel Celeron N4505
Intel Core i5-13500H
Apple M2 Max
AMD Ryzen 7 7735HS
...
0 1 2 3 4 5 6 7 8 9 10 11 Tooltip Geekom Mini IT11, i7-11390H: Ø8.39 (7.73-10.5)
BMAX B7 Power G7A2: Ø9.97 (8.951-11.617)
Power Consumption - Cinebench R15 Multi Power Efficiency - external Monitor
min: 16.6 de promedio: 19.4 mediana: 19.4 (14%) max: 22.1 Points per Watt
CPU TDP 19 W TDP 45 W 100% 75%
...
Intel Core i7-13620H
Intel Core i7-1065G7
Intel Core i9-12900HX
Intel Core i5-1230U
Intel Core i5-1035G7
Intel Core i9-13900H
...
- Gama de valores de las pruebas para esta tarjeta gráfica
- Valores medios de las pruebas para esta tarjeta gráfica
* Smaller numbers mean a higher performance
v1.25
log 20. 19:21:23
#0 no ids found in url (should be separated by "_") +0s ... 0s
#1 not redirecting to Ajax server +0s ... 0s
#2 did not recreate cache, as it is less than 5 days old! Created at Mon, 18 Sep 2023 15:16:08 +0200 +0.001s ... 0.001s
#3 no comparison url found in template nbc.compare_page_2 needed +0.007s ... 0.008s
#4 no comparison url found in template nbc.compare_page_2 needed +0s ... 0.009s
#5 no comparison url found in template nbc.compare_page_2 needed +0s ... 0.009s
#6 no comparison url found in template nbc.compare_page_2 needed +0s ... 0.009s
#7 composed specs +0s ... 0.009s
#8 did output specs +0s ... 0.009s
#9 getting avg benchmarks for device 13167 +0.014s ... 0.023s
#10 got single benchmarks 13167 +0.019s ... 0.042s
#11 got avg benchmarks for devices +0s ... 0.042s
#12 min, max, avg, median took s +0.821s ... 0.863s
#13 no comparison url found in template nbc.compare_page_2 needed +0s ... 0.864s
#14 return log +0s ... 0.864s
Análisis para el Intel Core i7-11390H procesador
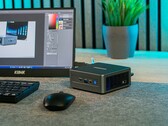
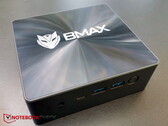
Análisis del BMAX B7 Power: Un mini PC frugal con Intel Core i7 por 400 dólares 
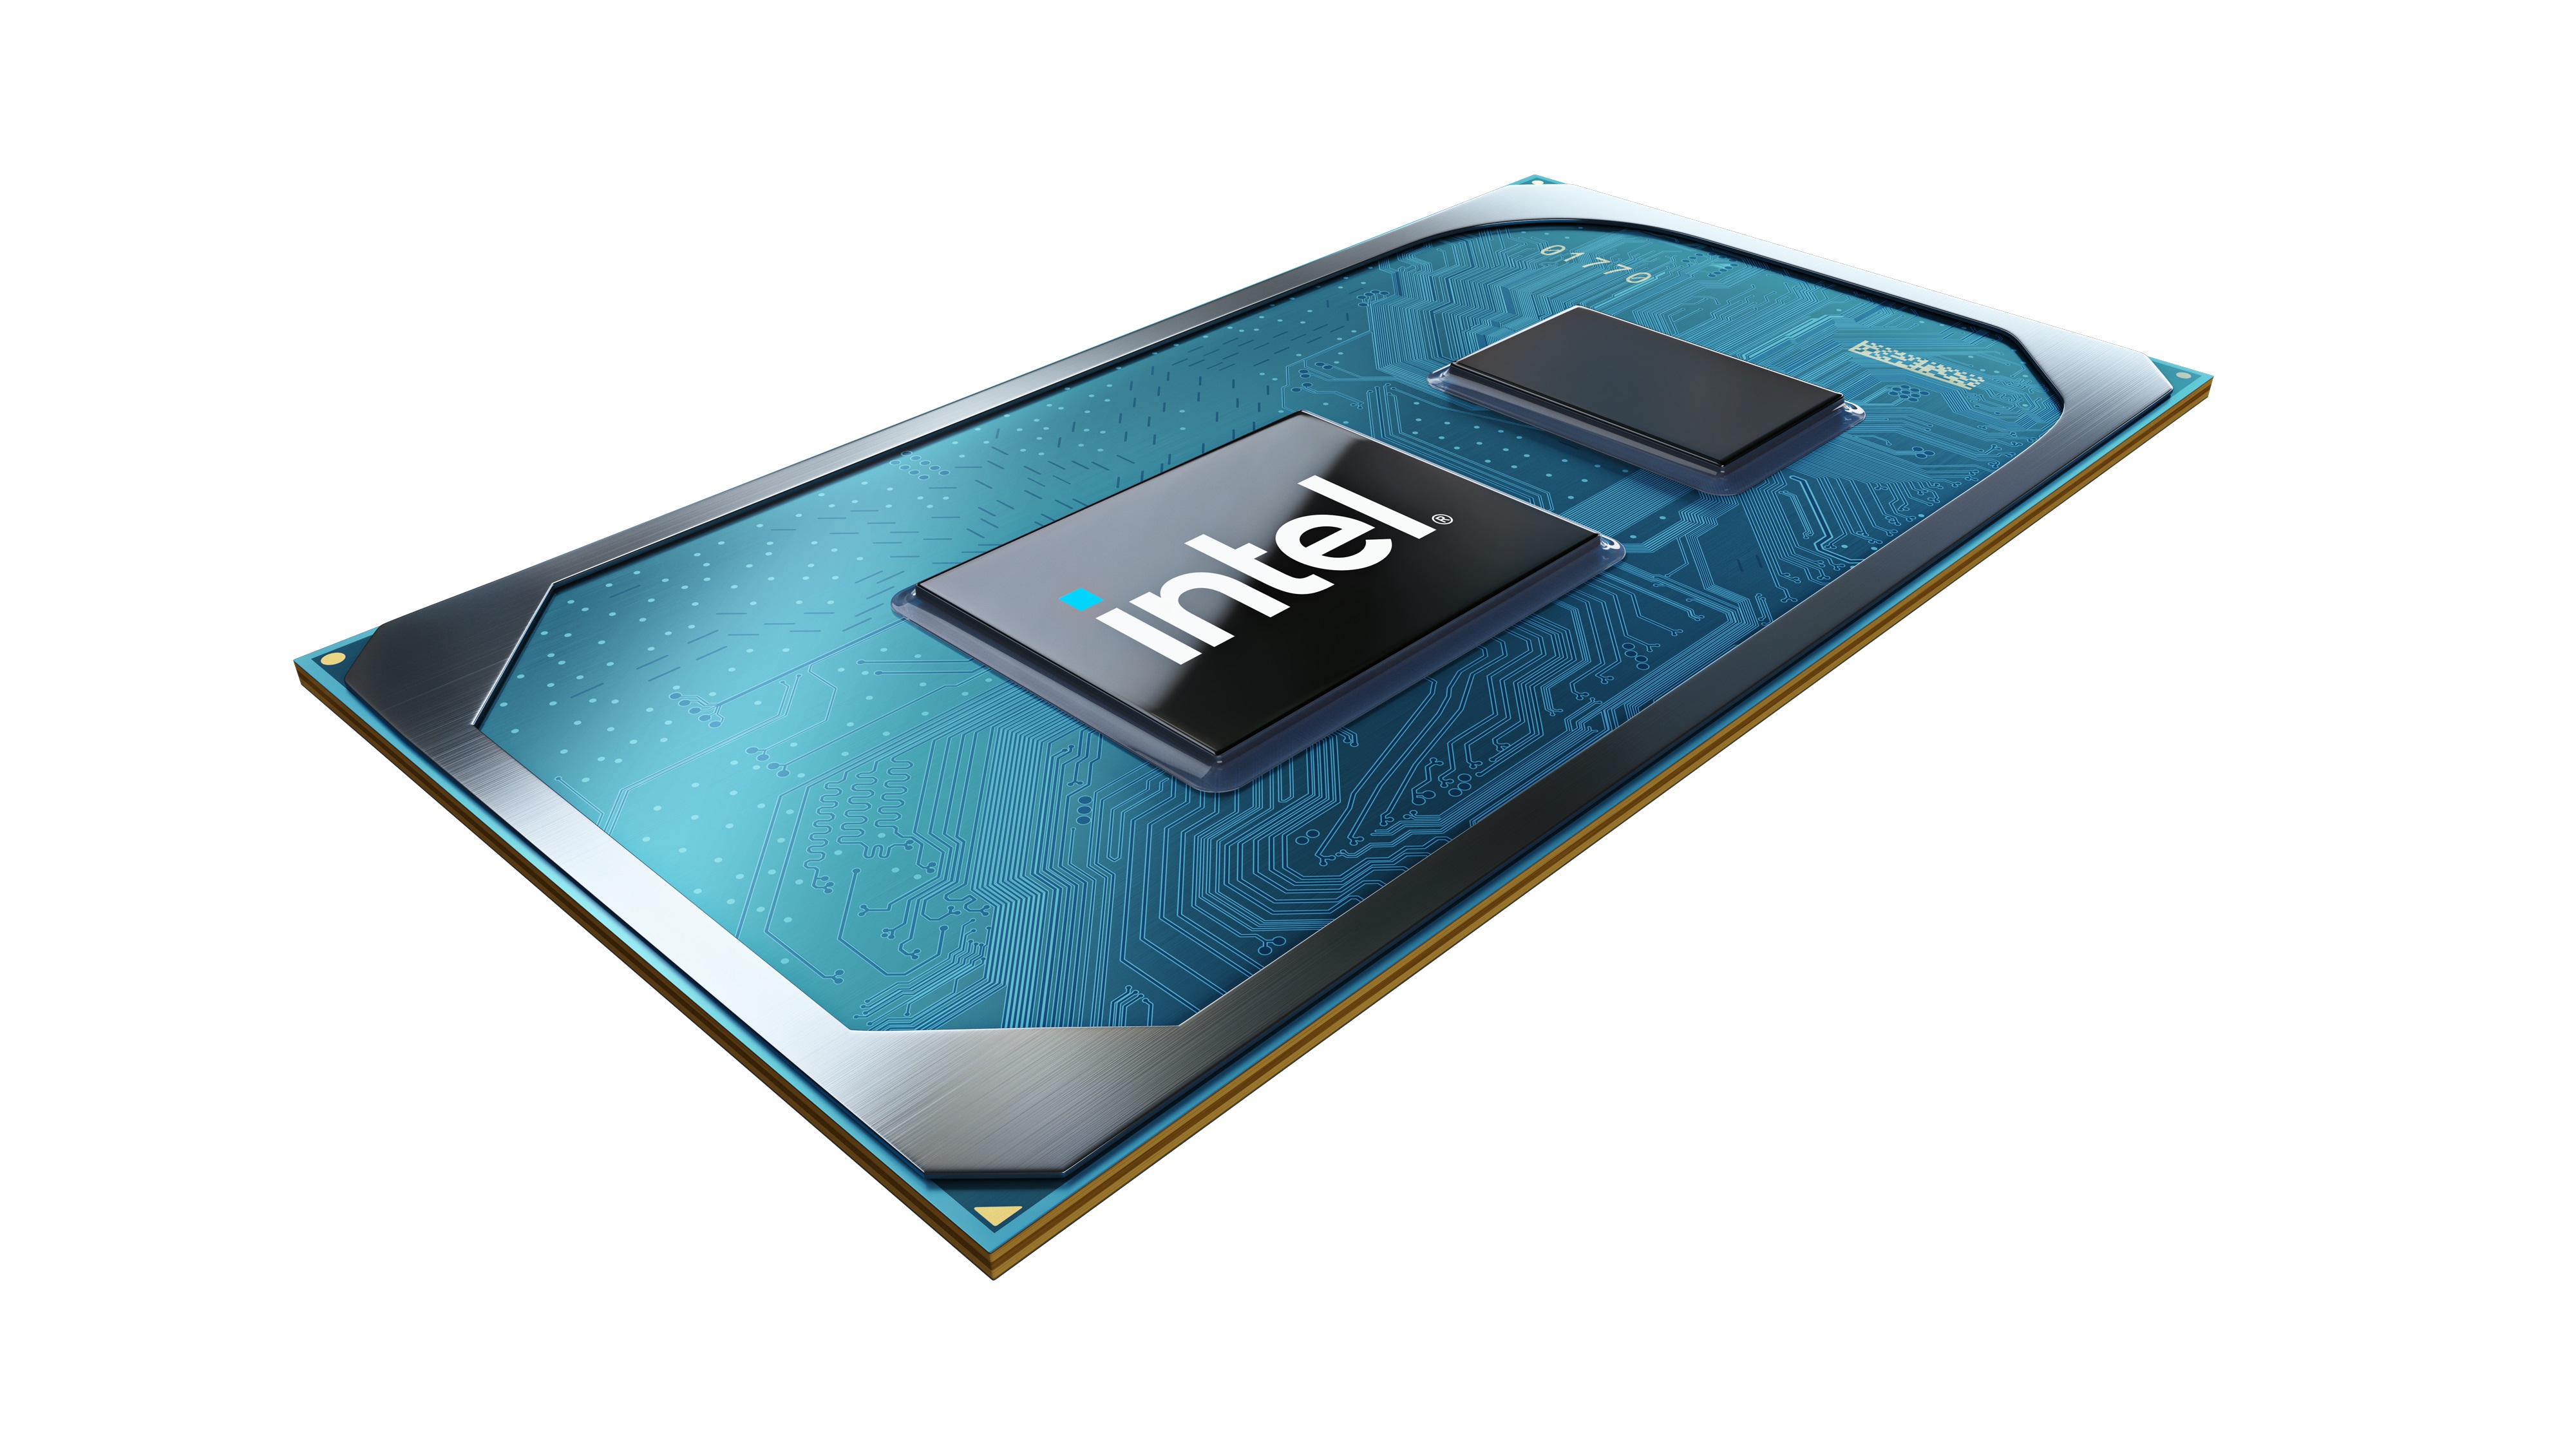
Como la propia Intel ya no fabrica mini PC, otros fabricantes se han apresurado a llenar el hueco. BMAX es un fabricante chino que ofrece precios bajos. Su mode...
Intel Core i7-11390H | Intel Iris Xe Graphics G7 96EUs | | 363 g
Análisis del Geekom Mini IT11: El competidor de Intel NUC con un Core i7-11390H y USB4 está al límite El Geekom Mini IT11 actualmente no es uno de los dispositivos más potentes cuando se trata de rendimiento puro. Sin embargo, Geekom ha actualizado su Mini IT11 ...
Intel Core i7-11390H | Intel Iris Xe Graphics G7 96EUs | | 536 g
Honor Análisis del MagicBook View 14: un portátil de 14 pulgadas para los amantes de lo táctil Gracias a sus reducidas dimensiones y su bajo peso, el MagicBook View 14 es ideal para su uso móvil. A pesar de su tamaño compacto, este equipo de 14 pulgadas c...
Intel Core i7-11390H | Intel Iris Xe Graphics G7 96EUs | 14.20" | 1.5 kg
Dell Inspiron 15 5510, i7-11390H MX450 : NVIDIA GeForce MX450, 15.60", 0 kg
análise externo » Dell Inspiron 15 5510, i7-11390H MX450
HP Spectre x360 16-f0035 : NVIDIA GeForce RTX 3050 4GB Laptop GPU, 16.00", 2 kg
análise externo » HP Spectre x360 16-f0035
HP Envy 14-eb1035nr : NVIDIA GeForce RTX 3050 4GB Laptop GPU, 14.00", 1.5 kg
análise externo » HP Envy 14-eb1035nr
HP Spectre x360 16-f0008ca : NVIDIA GeForce RTX 3050 4GB Laptop GPU, 16.00", 2 kg
análise externo » HP Spectre x360 16-f0008ca
Honor MagicBook View 14 : Intel Iris Xe Graphics G7 96EUs, 14.20", 1.5 kg
análise externo » Honor MagicBook View 14
Acer Swift X SFX16-51G-76HE : NVIDIA GeForce RTX 3050 Ti Laptop GPU, 16.00", 1.8 kg
análise externo » Acer Swift X SFX16-51G-76HE
Please share our article, every link counts!
Otras CPUs de la serie Tiger Lake » Intel Core i9-11900KB 8x 3.3 GHz - 5.3 GHz
» Intel Core i7-11600H 6x 2.9 GHz - 4.6 GHz
» Intel Xeon W-11855M 6x 3.2 GHz - 4.9 GHz
» Intel Core i5-11500H 6x 2.9 GHz - 4.6 GHz
» Intel Core i7-1180G7 4x 2.2 GHz - 4.6 GHz
» Intel Core i5-1140G7 4x 1.8 GHz - 4.2 GHz
» Intel Celeron 6205 2x
CPUs de alrededor + Intel Core i7-9750H 6x 2.6 GHz - 4.5 GHz
+ Apple M2 8x 2.42 GHz - 3.48 GHz
+ Intel Xeon E-2176M 6x 2.7 GHz - 4.4 GHz
- Apple M1 8x 2.06 GHz - 3.22 GHz
Klaus Hinum (Update: 2023-01- 1)