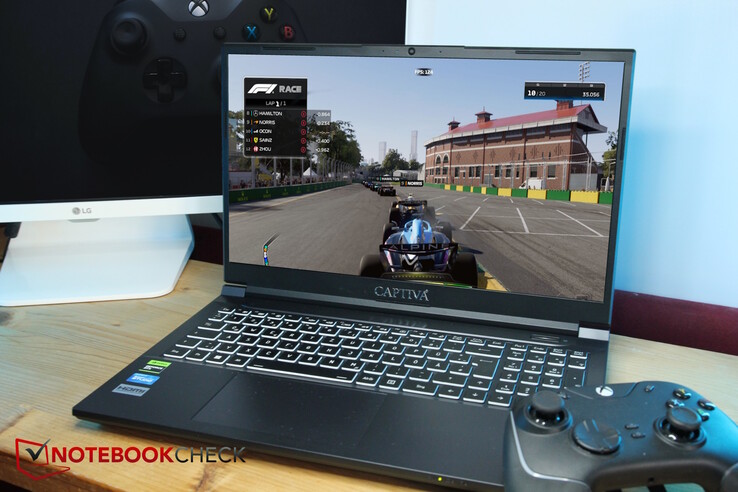
Análisis del Captiva Advanced Gaming I74-121 (Clevo V150RND): Un portátil gaming barato con una potente RTX 4060
En unas pocas tiendas online selectas se pueden empezar a ver portátiles (para juegos) de Captiva, pero ¿quién es este fabricante? Captiva es una filial de Ecom Trading GmbH, un mayorista informático alemán con sede en Dachau. Por lo que parece, la mayoría de sus portátiles se fabrican en China. Como nunca antes habíamos probado portátiles de Captiva, ¡ya es hora de que lo hagamos!
Puedes encontrar versiones de 17 y 15 pulgadas del portátil Captiva que difieren principalmente en la configuración del hardware. Sólo los de 17 pulgadas vienen opcionalmente con uni9-13900HX- los dispositivos de 15 pulgadas sólo vienen con uni5-13500Hinstalado. Además, nuestro modelo de pruebas está equipado con unaRTX 4060. Alternativamente, usted puede conseguir el portátil con unRTX 4070y la versión de 17 pulgadas también se puede conseguir con unaRTX 4080.
Nuestra configuración cuesta unos 1.800 dólares. Entre los competidores se incluyen otros portátiles para juegos de introducción como elMSI Cyborg 15, Dell G15 5530, Lenovo Legion Slim 5 16APH8, Lenovo LOQ 15y el Schenker XMG Core 15 M22.
Posibles contendientes en la comparación
Valoración | Fecha | Modelo | Peso | Altura | Tamaño | Resolución | Precio |
|---|---|---|---|---|---|---|---|
| 85.7 % v7 (old) | 09/2023 | Captiva Advanced Gaming I74-121 i5-13500H, GeForce RTX 4060 Laptop GPU | 2.3 kg | 29 mm | 15.60" | 1920x1080 | |
| 82.4 % v7 (old) | 04/2023 | MSI Cyborg 15 A12VF i7-12650H, GeForce RTX 4060 Laptop GPU | 2 kg | 22.9 mm | 15.60" | 1920x1080 | |
| 84.2 % v7 (old) | 06/2023 | Dell G15 5530 i7-13650HX, GeForce RTX 4060 Laptop GPU | 3 kg | 26.95 mm | 15.60" | 1920x1080 | |
| 87.7 % v7 (old) | 08/2023 | Lenovo Legion Slim 5 16APH8 R7 7840HS, GeForce RTX 4060 Laptop GPU | 2.4 kg | 25.2 mm | 16.00" | 2560x1600 | |
| 85.7 % v7 (old) | 07/2023 | Lenovo LOQ 15APH8 R7 7840HS, GeForce RTX 4050 Laptop GPU | 2.5 kg | 25.2 mm | 15.60" | 1920x1080 | |
| 87.9 % v7 (old) | 01/2023 | Schenker XMG Core 15 (M22) R7 6800H, GeForce RTX 3060 Laptop GPU | 2.1 kg | 23 mm | 15.60" | 2560x1440 |
Caso - El Captiva barebone es un secreto (Clevo)
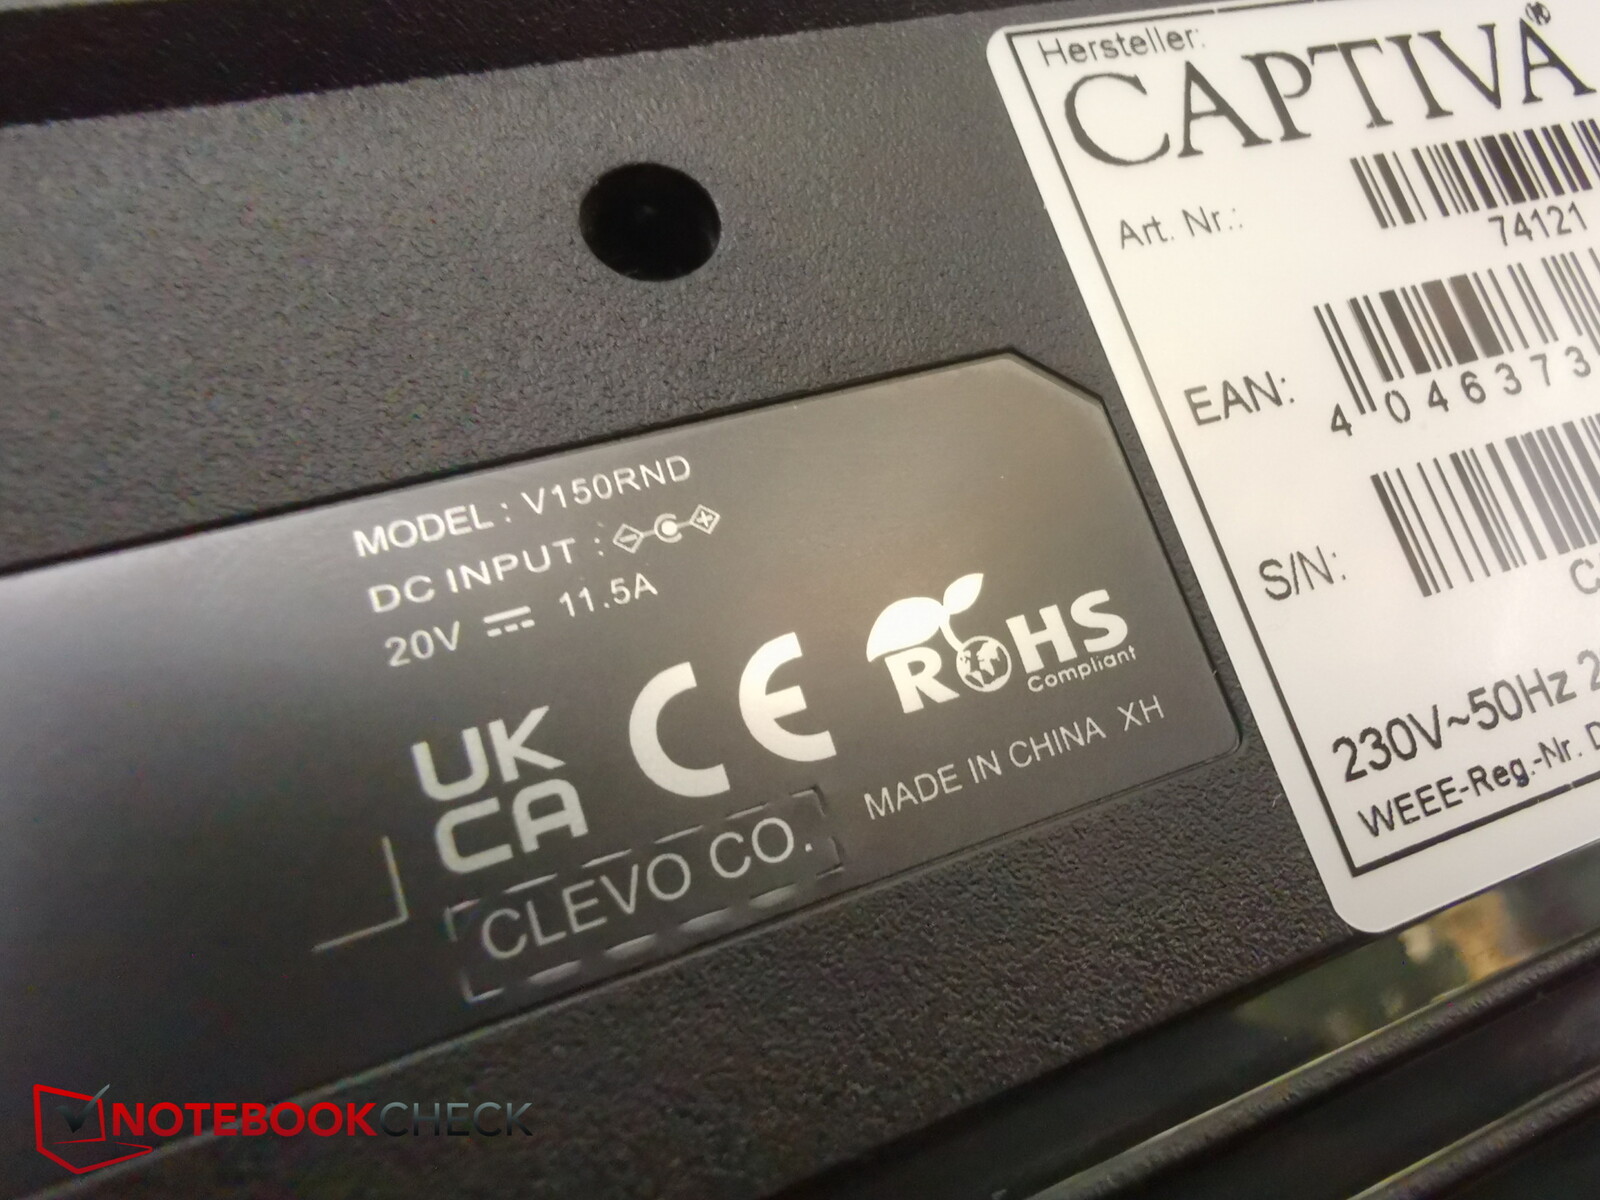
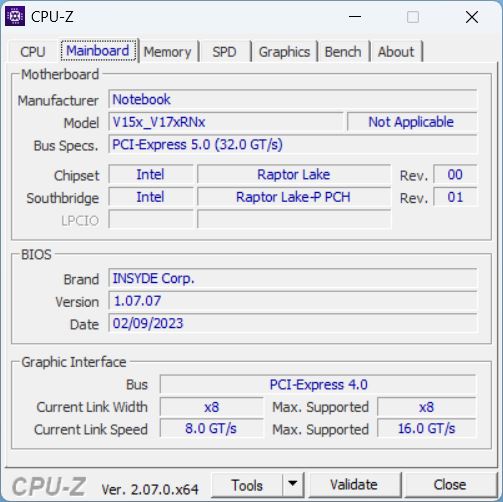
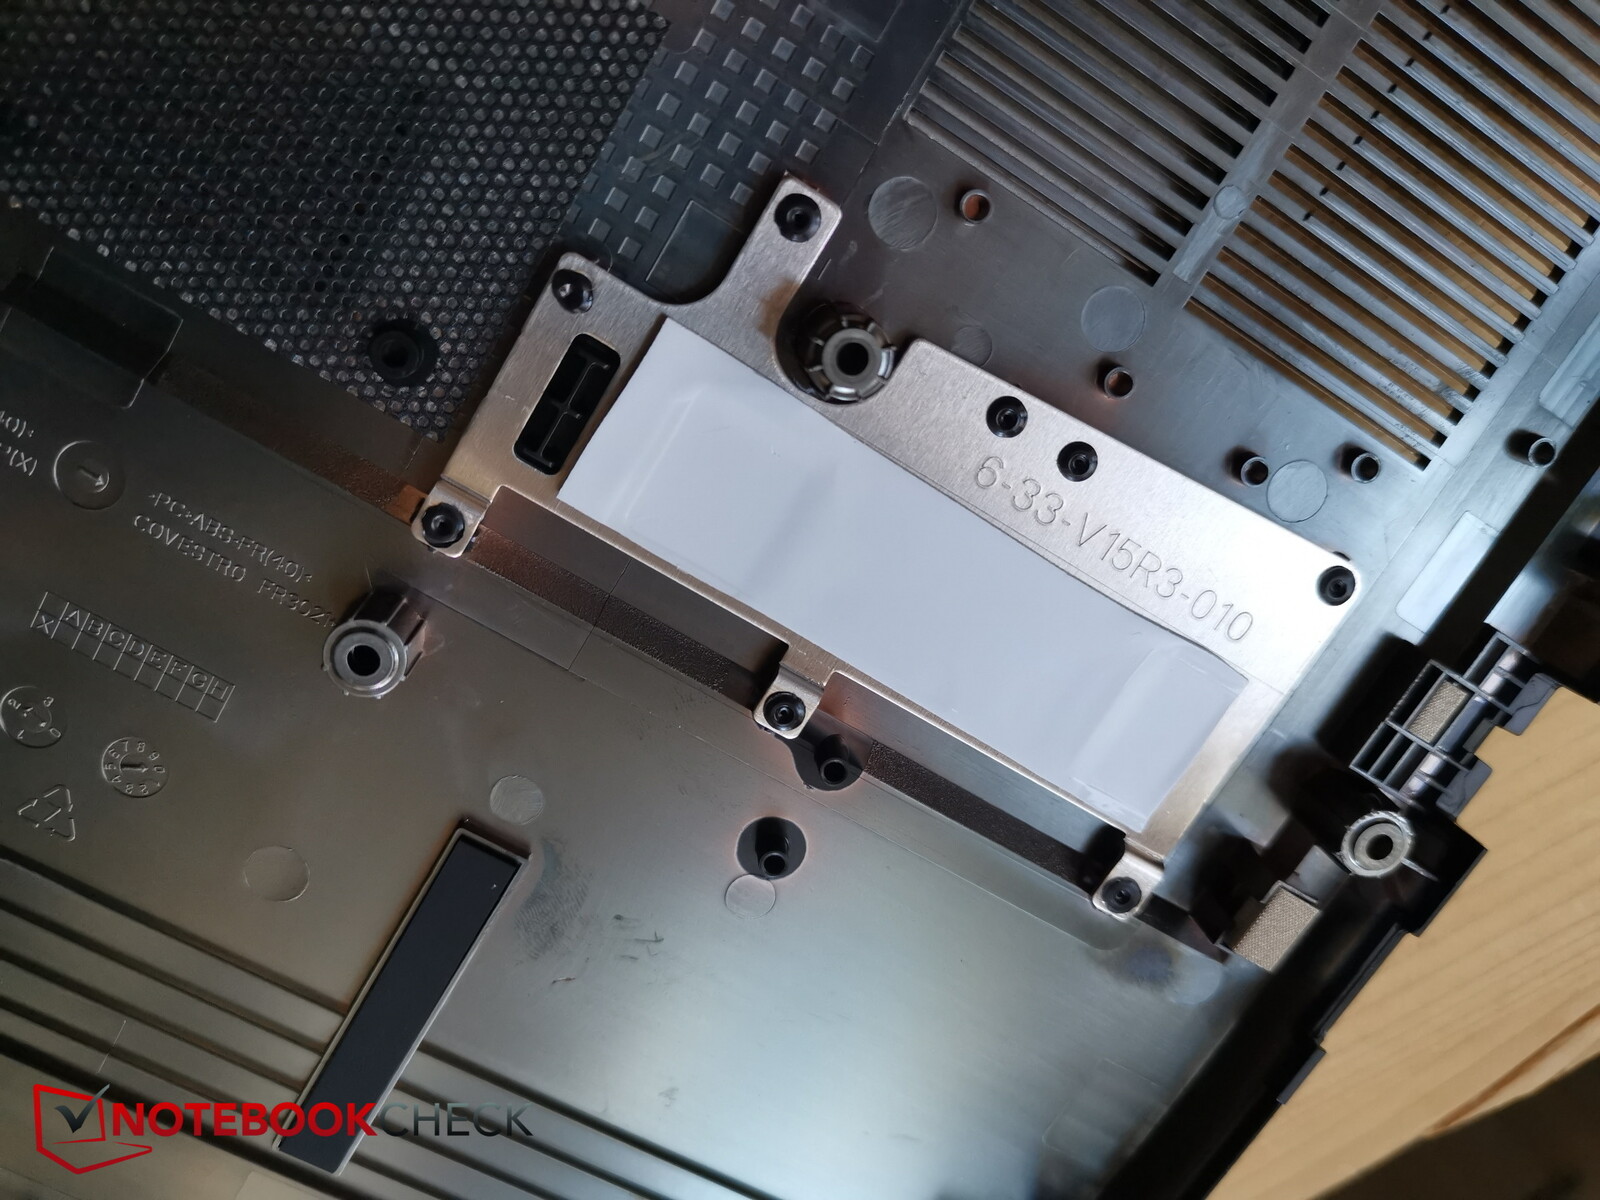
Cuando preguntamos, Captiva se negó a decirnos qué barebone se utiliza - aparentemente están hechos "especialmente para Captiva". Sin embargo, una pegatina en la parte inferior nos revela que se trata del fabricante Clevo. No nos queda claro por qué Captiva oculta esta información. Hemos identificado el barebone Clevo como Clevo V150RND.
La carcasa interior del portátil recuerda a la del Gigabyte G5 cuando está abierta. El teclado está ligeramente encastrado y la distribución también es similar, aunque no parece ser exactamente la misma.
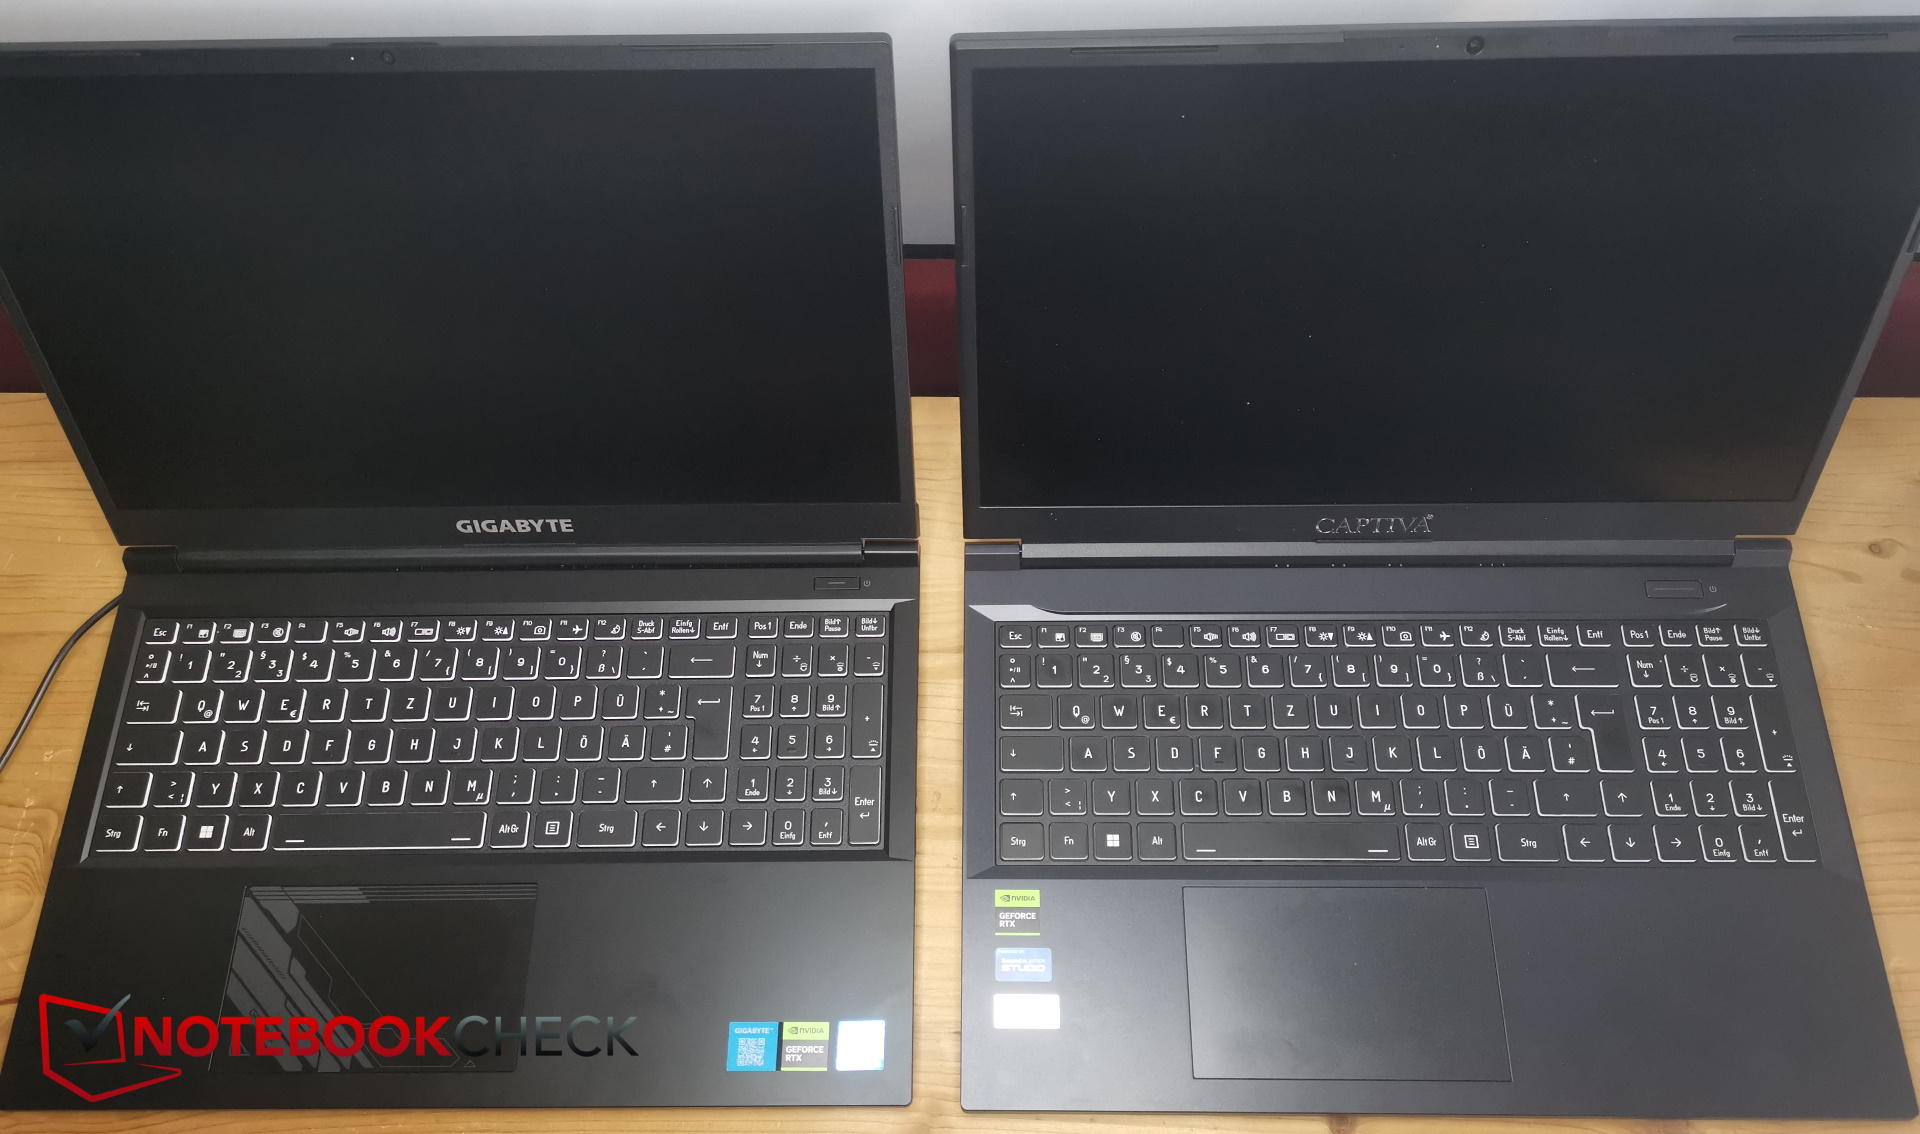
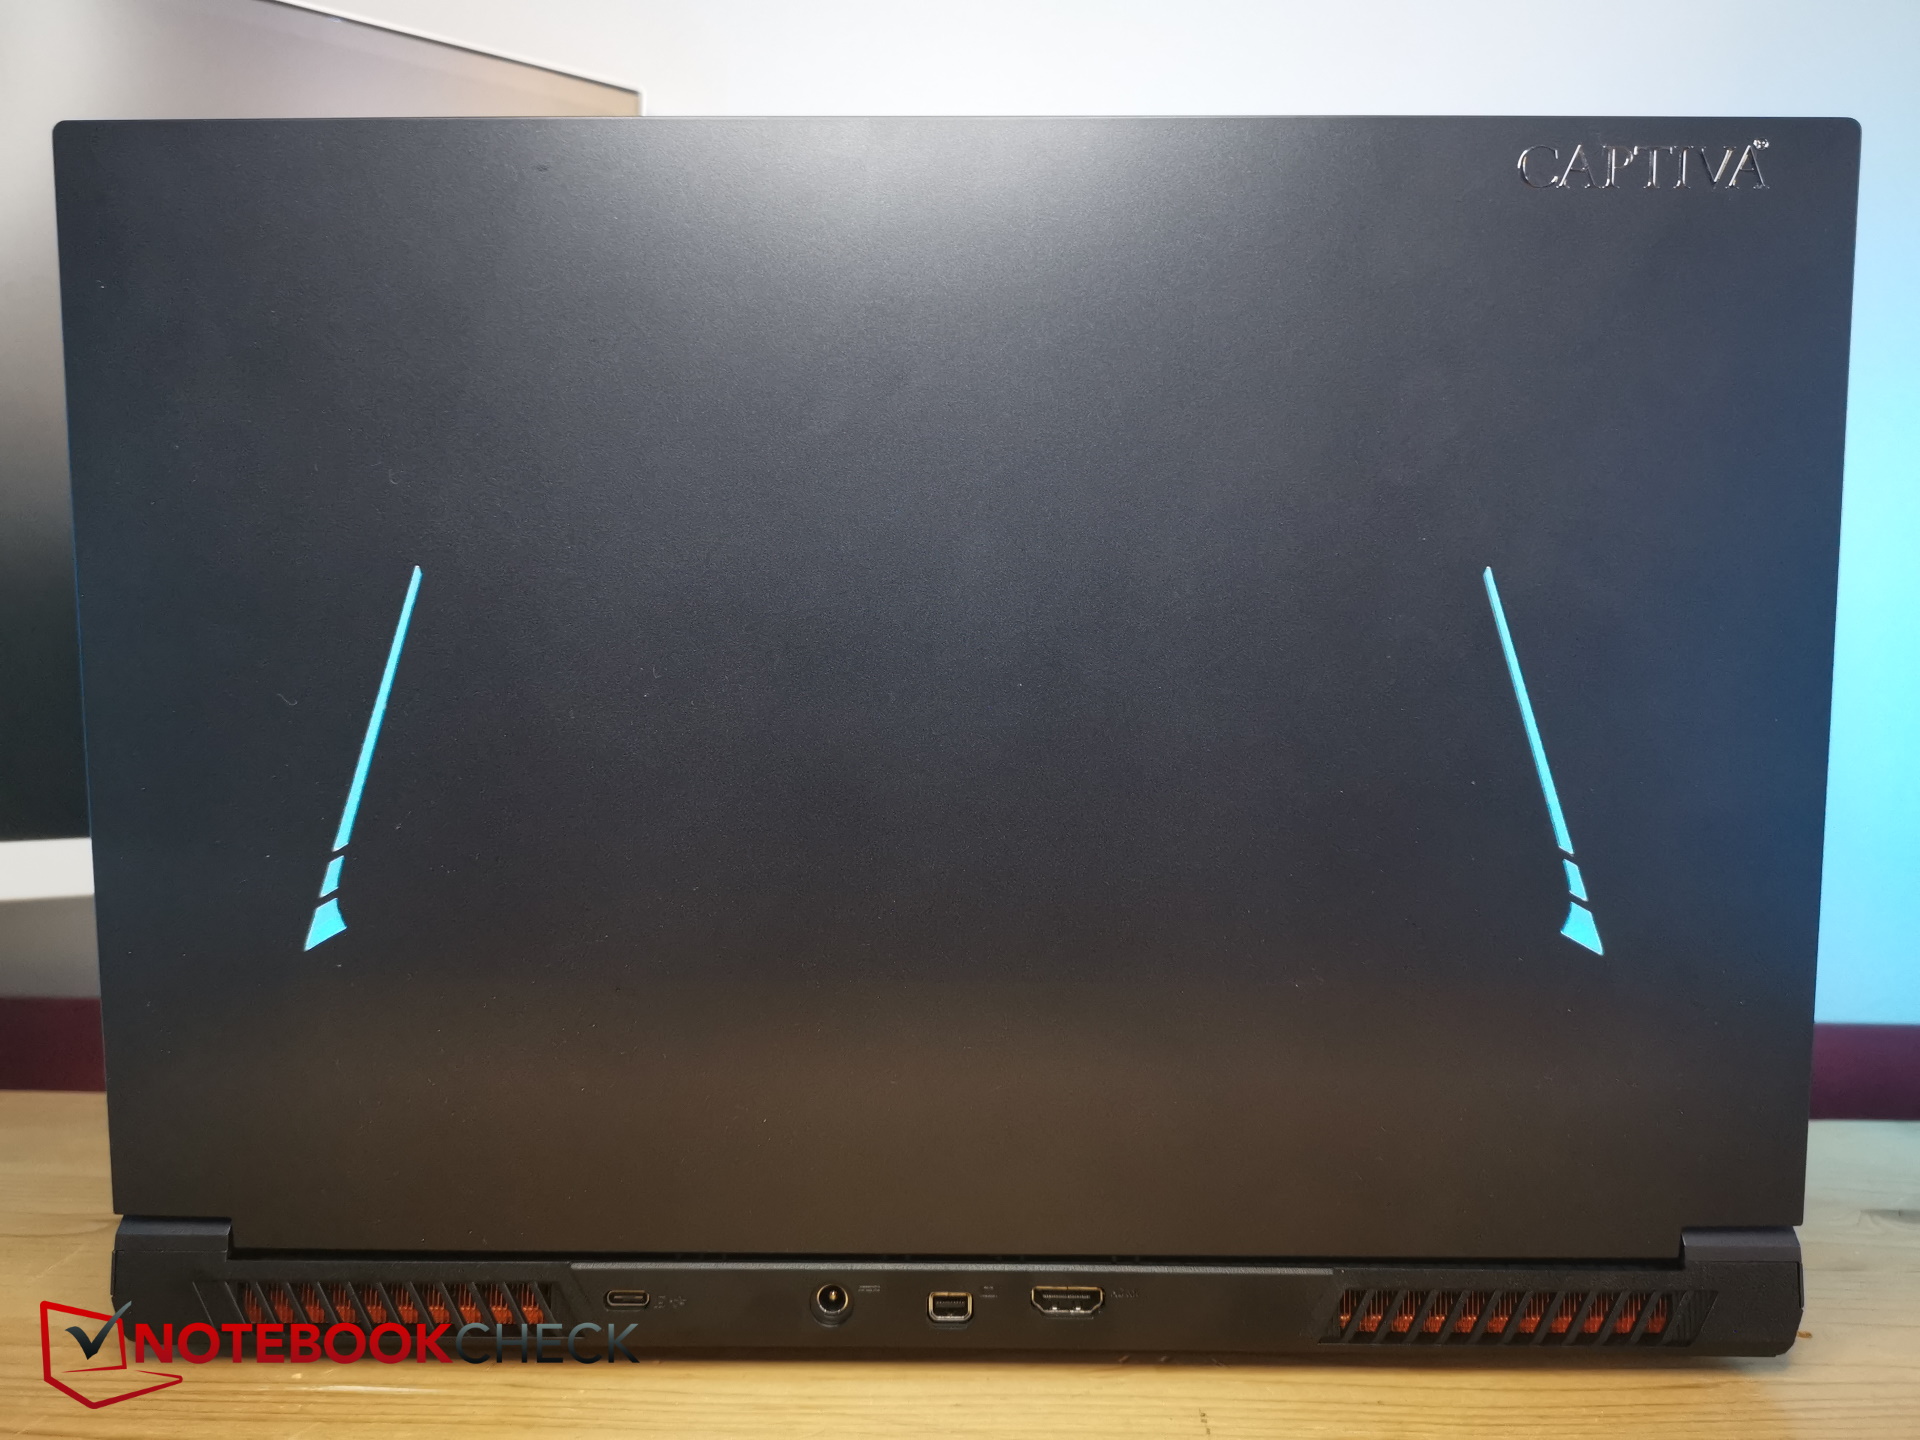
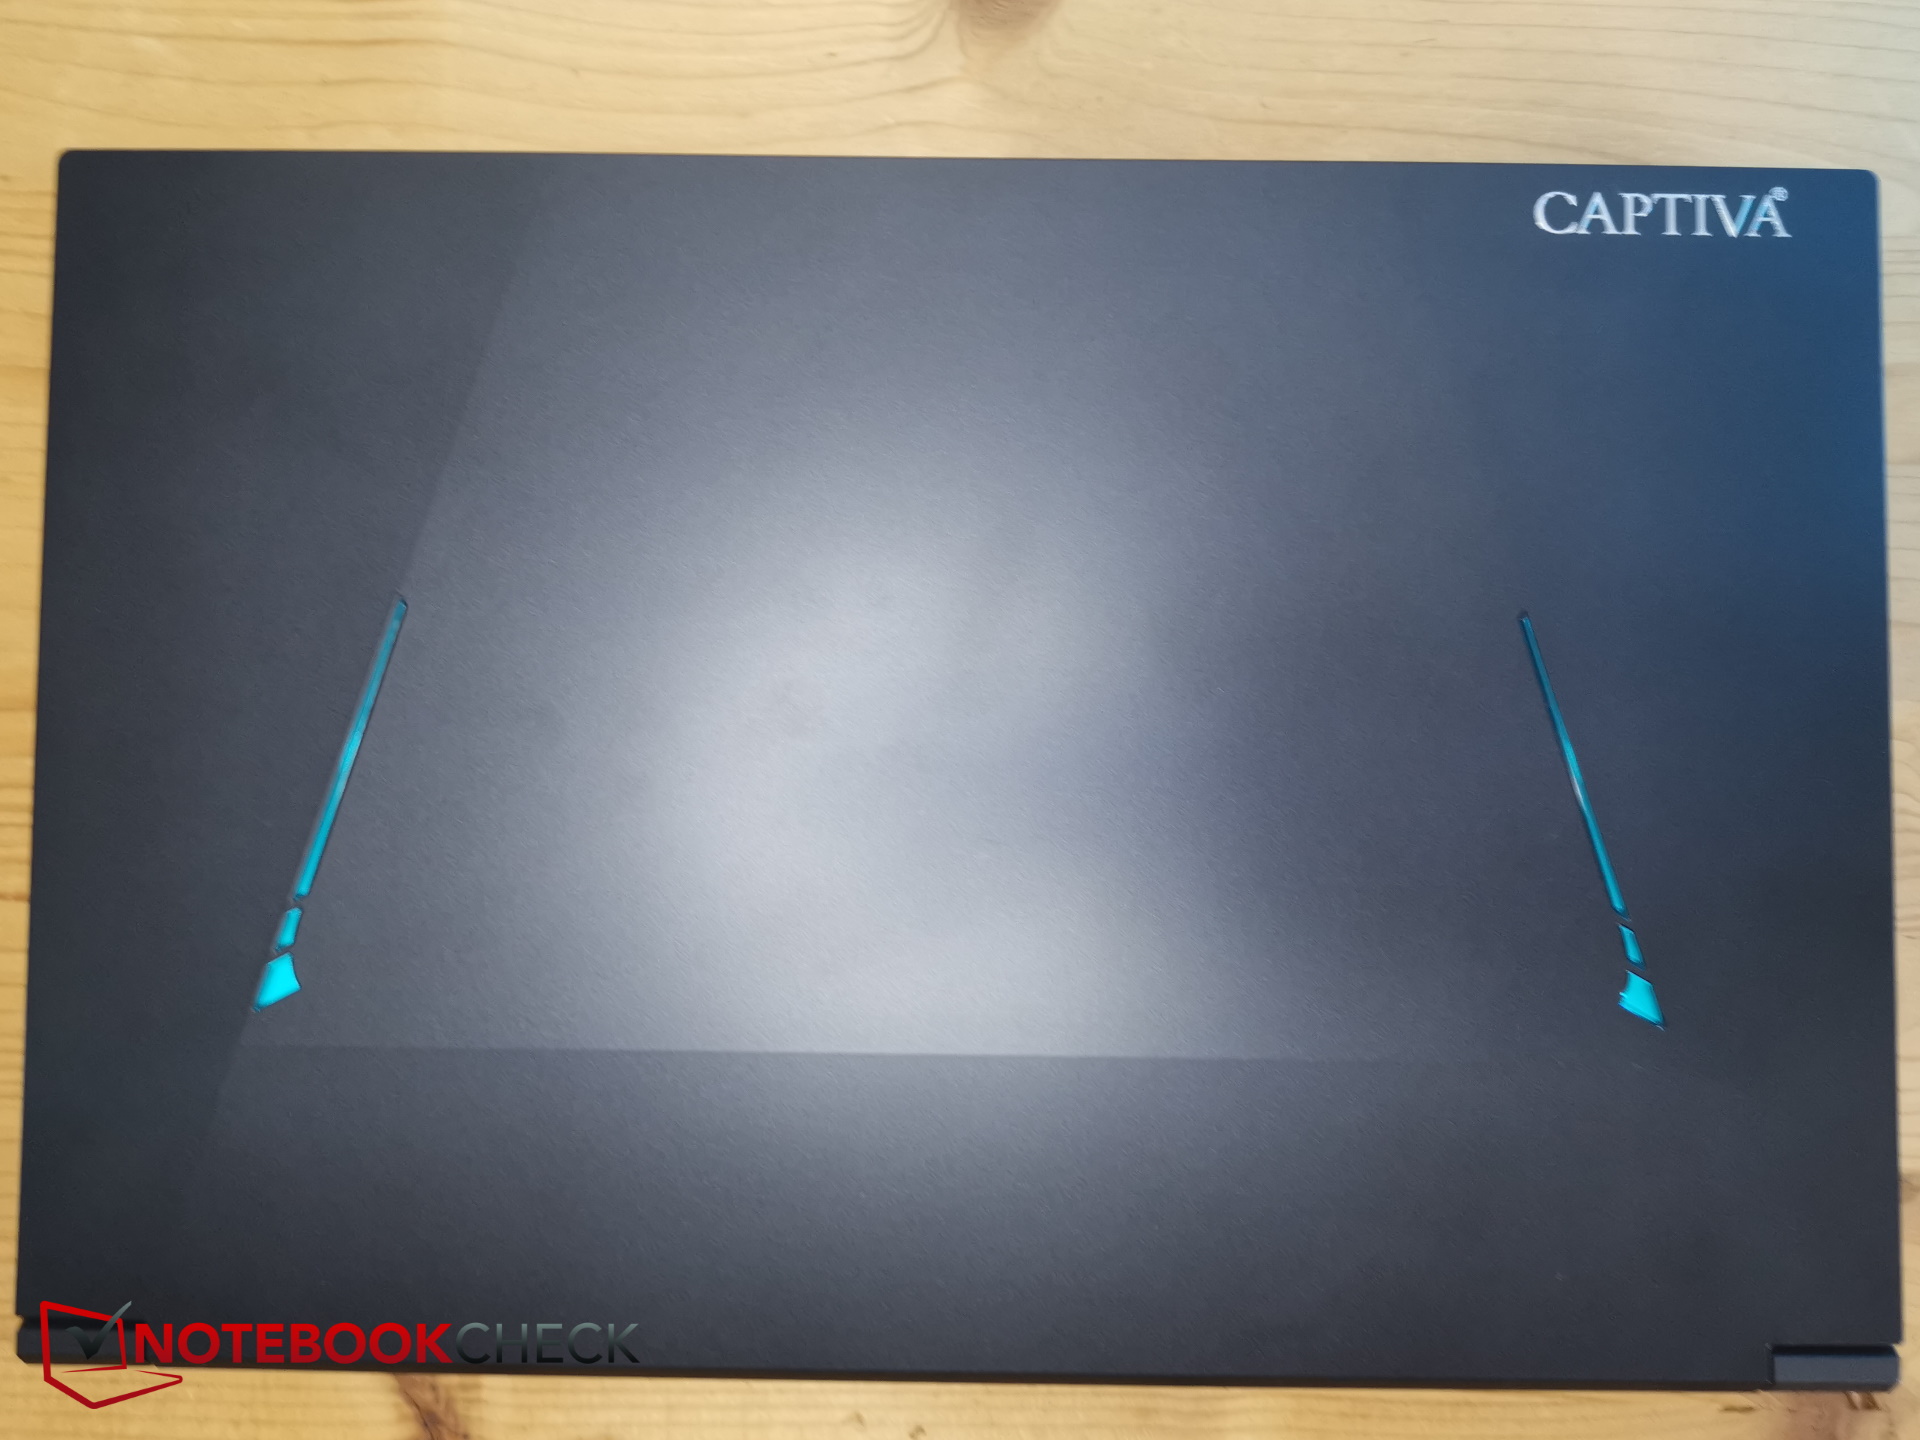
Por fuera, ambos modelos parecen bastante diferentes, aunque sus dimensiones sean similares. El portátil Captiva es bastante más grueso que el G5. En la parte superior, hay tiras de LED azules inclinadas en la superficie negra mate; en una esquina, brillan las letras plateadas "Captiva". Además, la parte superior del I74-121 no es totalmente lisa, sino que tiene una ligera curva.
El único material utilizado es el plástico, pero su base es suficientemente rígida y no se oye ningún crujido al intentar doblarla. No notamos ningún hueco inusual y su construcción es en general bastante buena.
La bisagra ancha es buena pero no excelente: sólo permite un ángulo de apertura máximo de 135 a 140 grados.
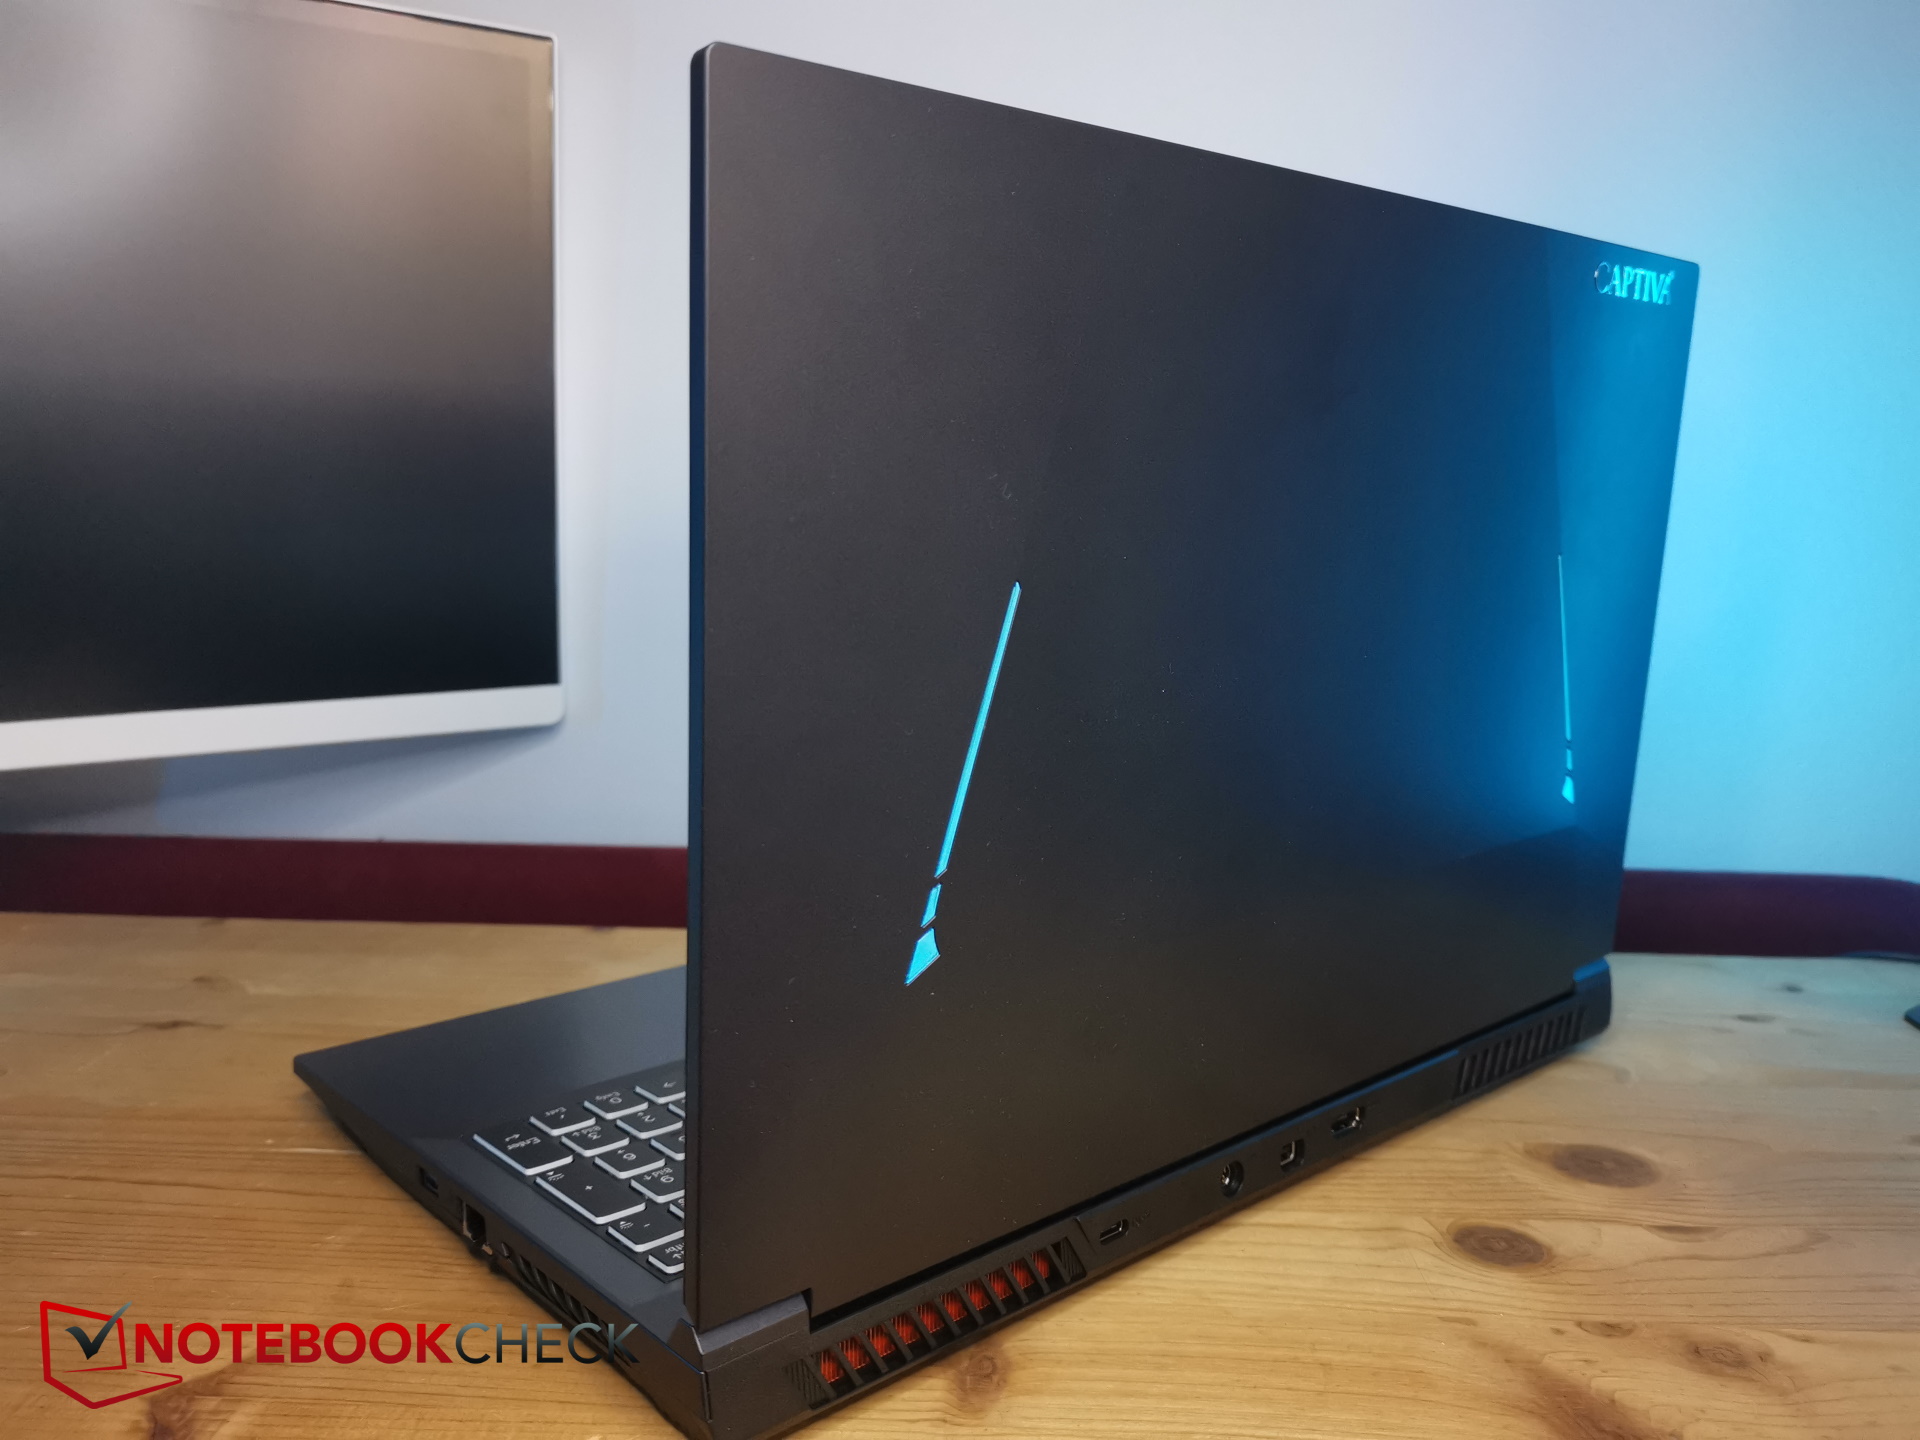
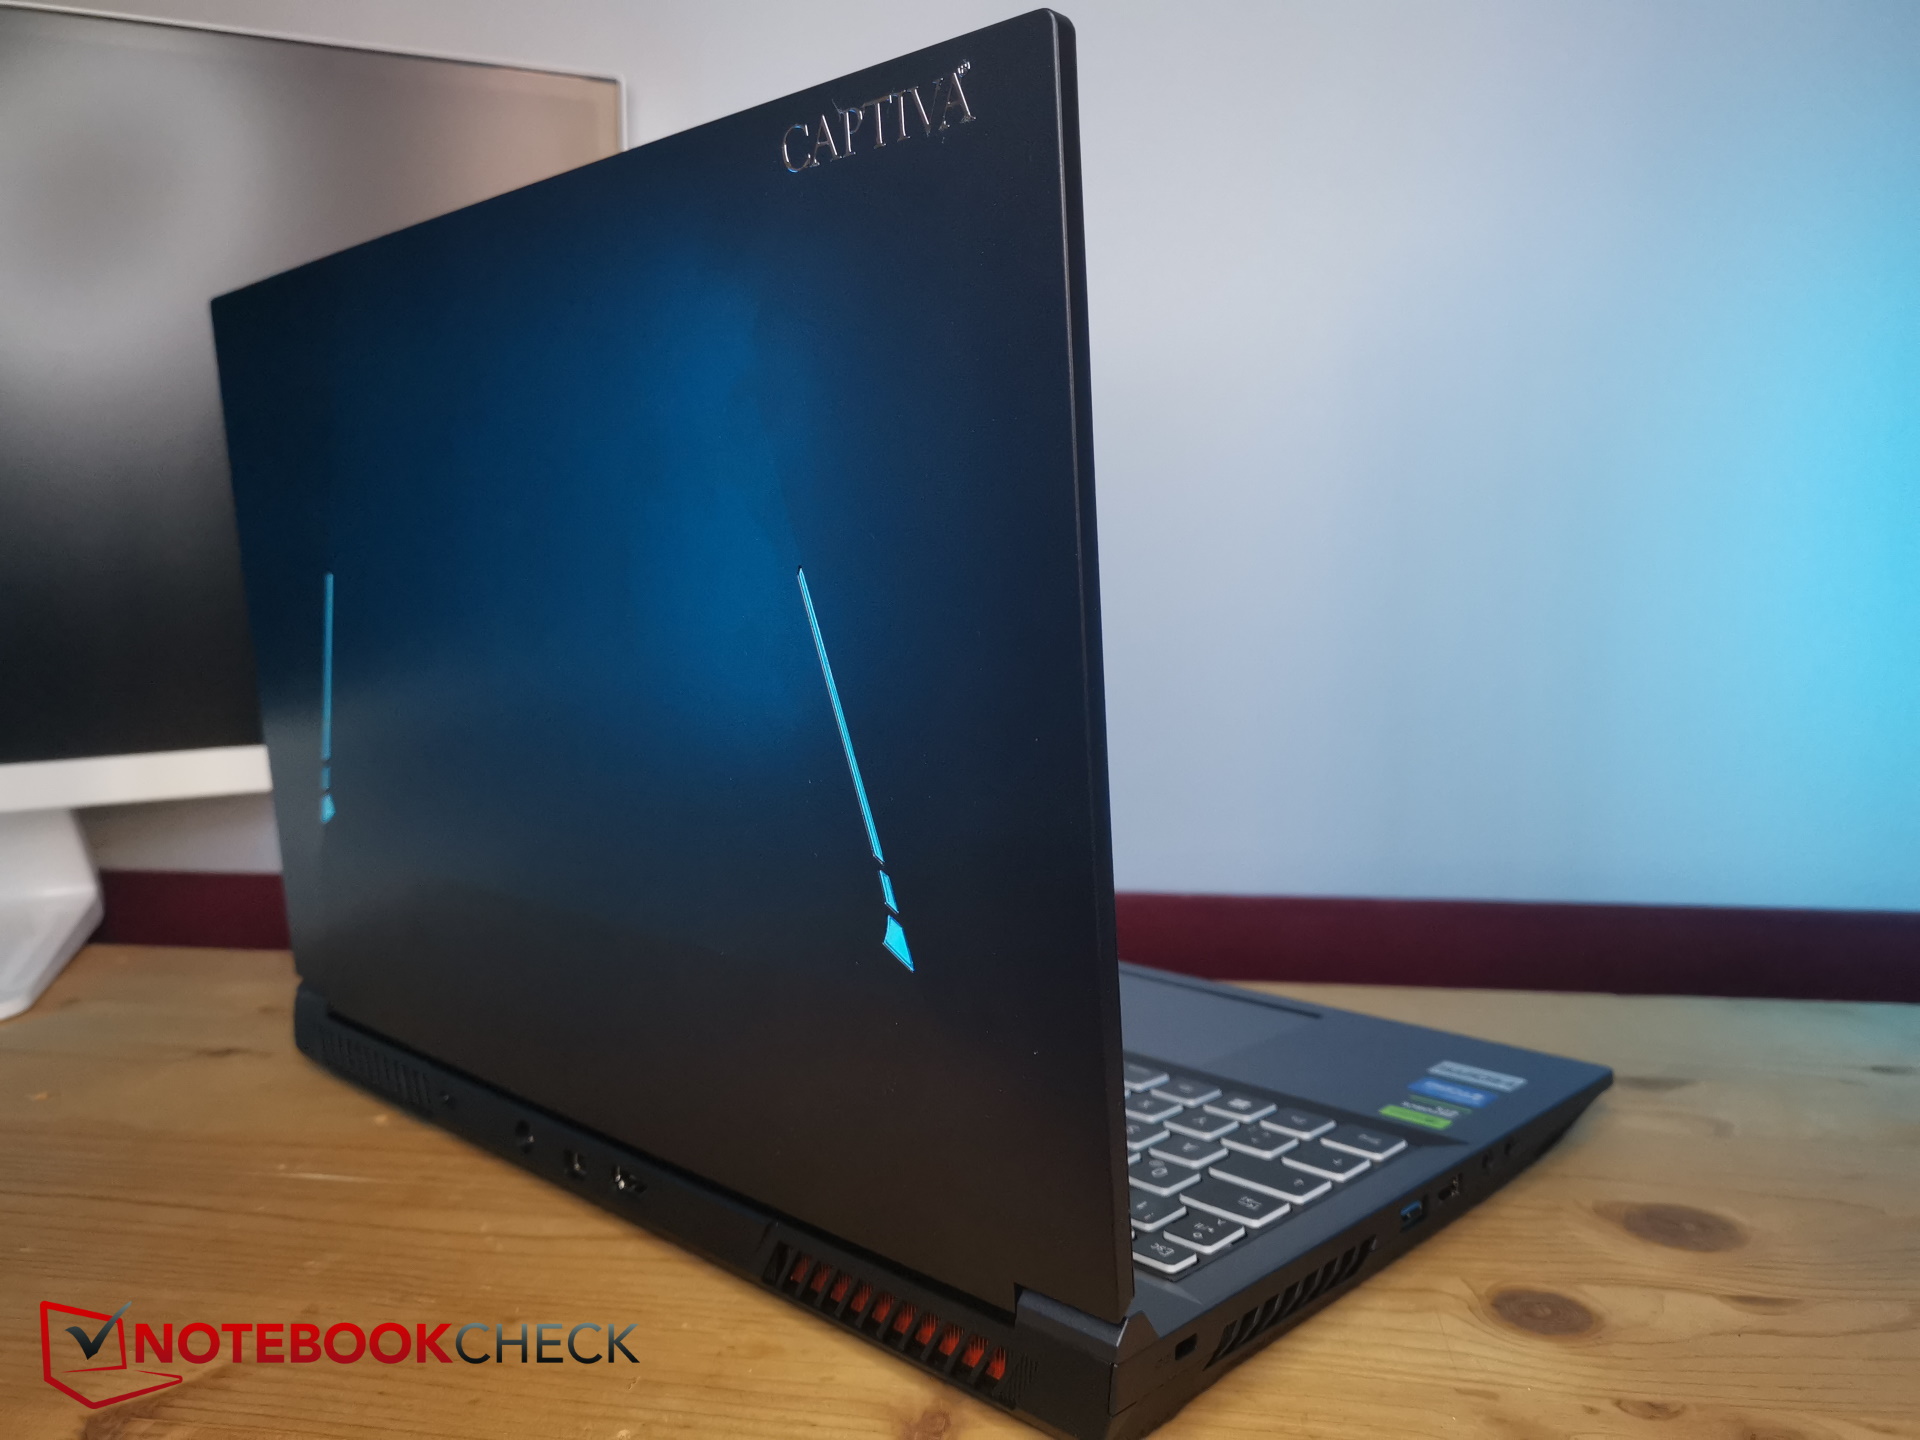
Como resultado de su diseño minimalista, el portátil Captiva es uno de los dispositivos más pequeños dentro del campo de comparación, especialmente en lo que se refiere a profundidad. A su vez, también es uno de los portátiles más gruesos de esta comparación. El fabricante ha declarado un grosor de 28 mm, pero hemos medido al menos 29 mm a lo largo del borde central de la parte trasera del dispositivo.
Tiene un peso medio - los dispositivos Schenker y MSI son ligeramente más ligeros y el resto es más pesado, especialmente el Dell G15.
Conectividad - Ligeramente anticuada
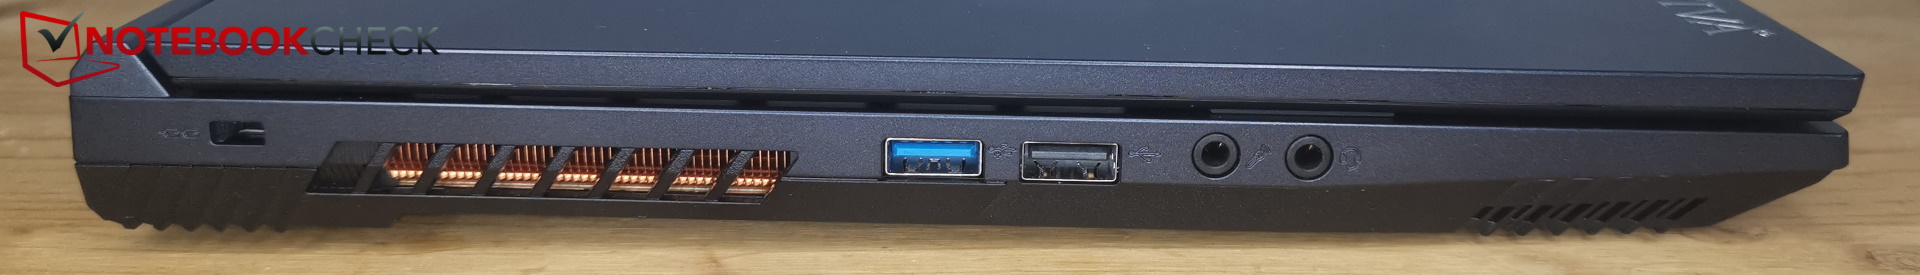
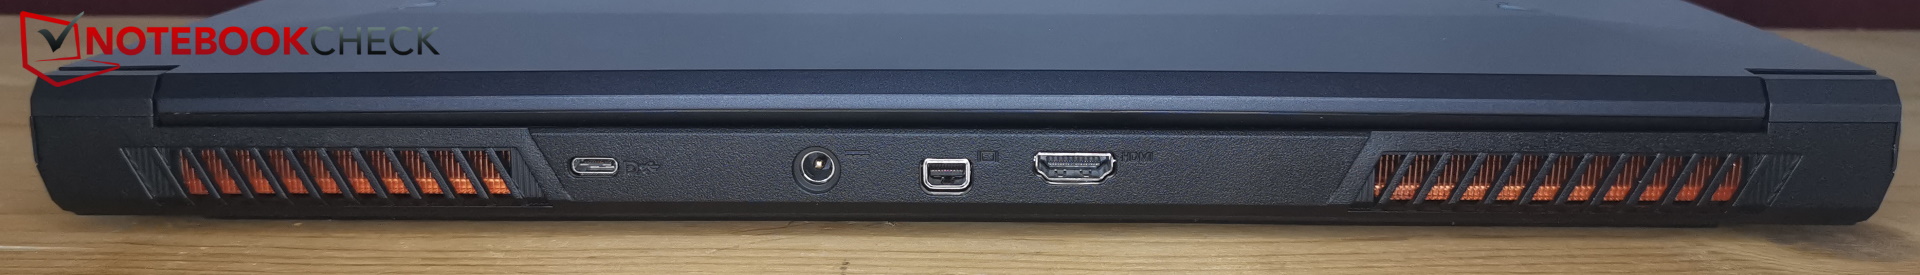
A primera vista, el portátil presenta todas las opciones de conectividad más importantes. Tras un segundo vistazo, queda claro que no es así - o al menos que están desfasadas.
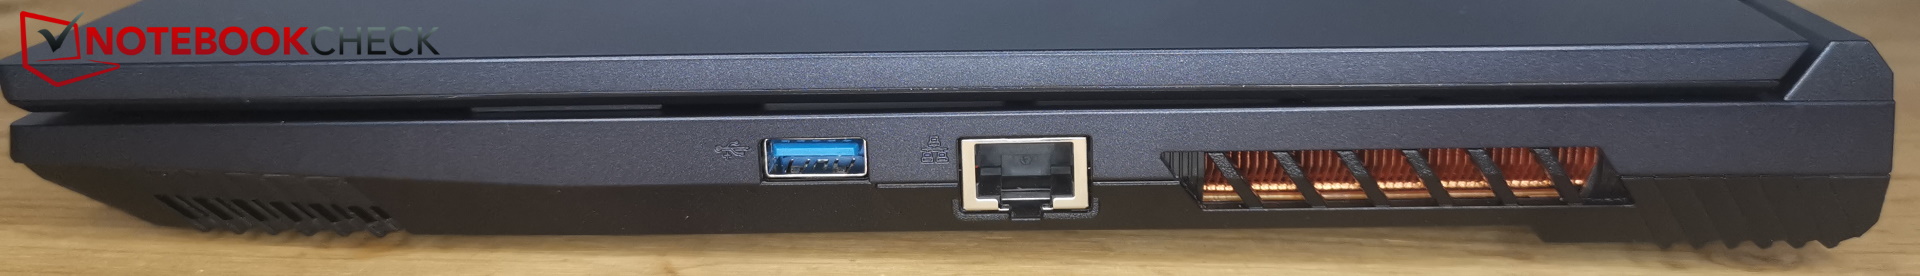
Uno de sus puertos USB-A sigue siendo de tipo 2.0, falta Thunderbolt y tampoco tiene lector de tarjetas SD. Al menos, el portátil está preparado para RV gracias a su conexión MiniDP. Uno de los dos puertos USB-A 3.2 tiene velocidad Gen2 y el otro sólo Gen1. Cuál es la conexión más rápida no puede identificarse desde fuera.
Los dos puertos USB-A del lado izquierdo están colocados muy juntos, lo que significa que las memorias USB gruesas no se pueden conectar una al lado de la otra. Todos los demás puertos tienen suficiente espacio entre ellos. Sin embargo, la conexión de red está en el lado derecho - un poco molesto si utilizas un ratón con la mano derecha.
Comunicación
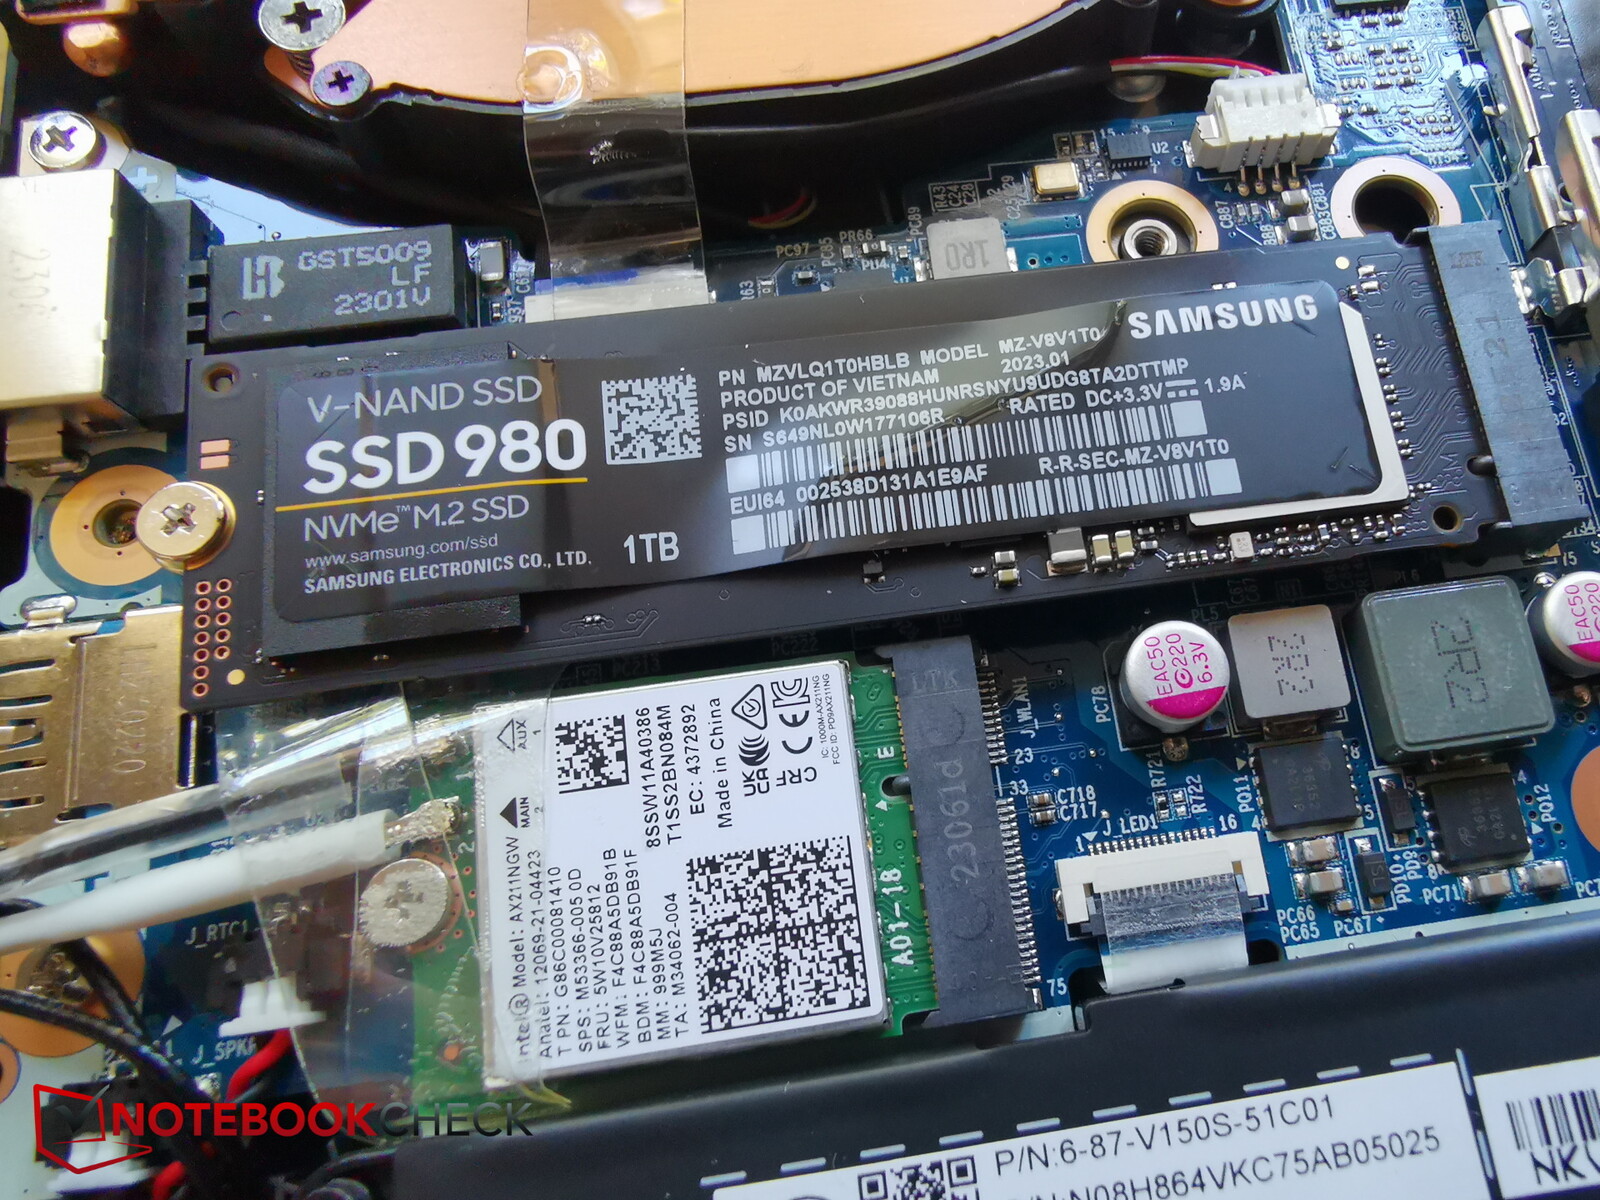
El módulo Intel AX211 del portátil Captiva soporta WiFi 6E, lo que significa que puede recibir y emitir usando frecuencias de 2,4 GHz, 6 GHz y 6GHz. Usando 6 GHz, sus velocidades de transferencia son buenas, aunque, cuando usa 5 GHz, el portátil es el más débil dentro del campo de comparación.
Cámara web
Su webcam tampoco está del todo actualizada. En lugar de una moderna webcam Full HD, el portátil usa una anticuada webcam HD con una resolución de 720p.
Su desviación de color es buena y baja, pero incluso en buenas condiciones de luz, la imagen es bastante granulada y no muestra mucho detalle.


Seguridad
El chip Intel incorpora TPM y el dispositivo cuenta con un bloqueo Kensington, pero como ocurre en muchos portátiles para juegos, el Captiva no tiene escáner de huellas dactilares.
Volumen de suministro y garantía
Aparte del propio portátil y la fuente de alimentación propietaria, la entrega incluye toda la documentación habitual, 2 tornillos pequeños y un CD de controladores. Este último es un poco inútil, ya que el portátil no tiene unidad de CD; una memoria USB de controladores como la que incluye Schenker habría tenido mucho más sentido.
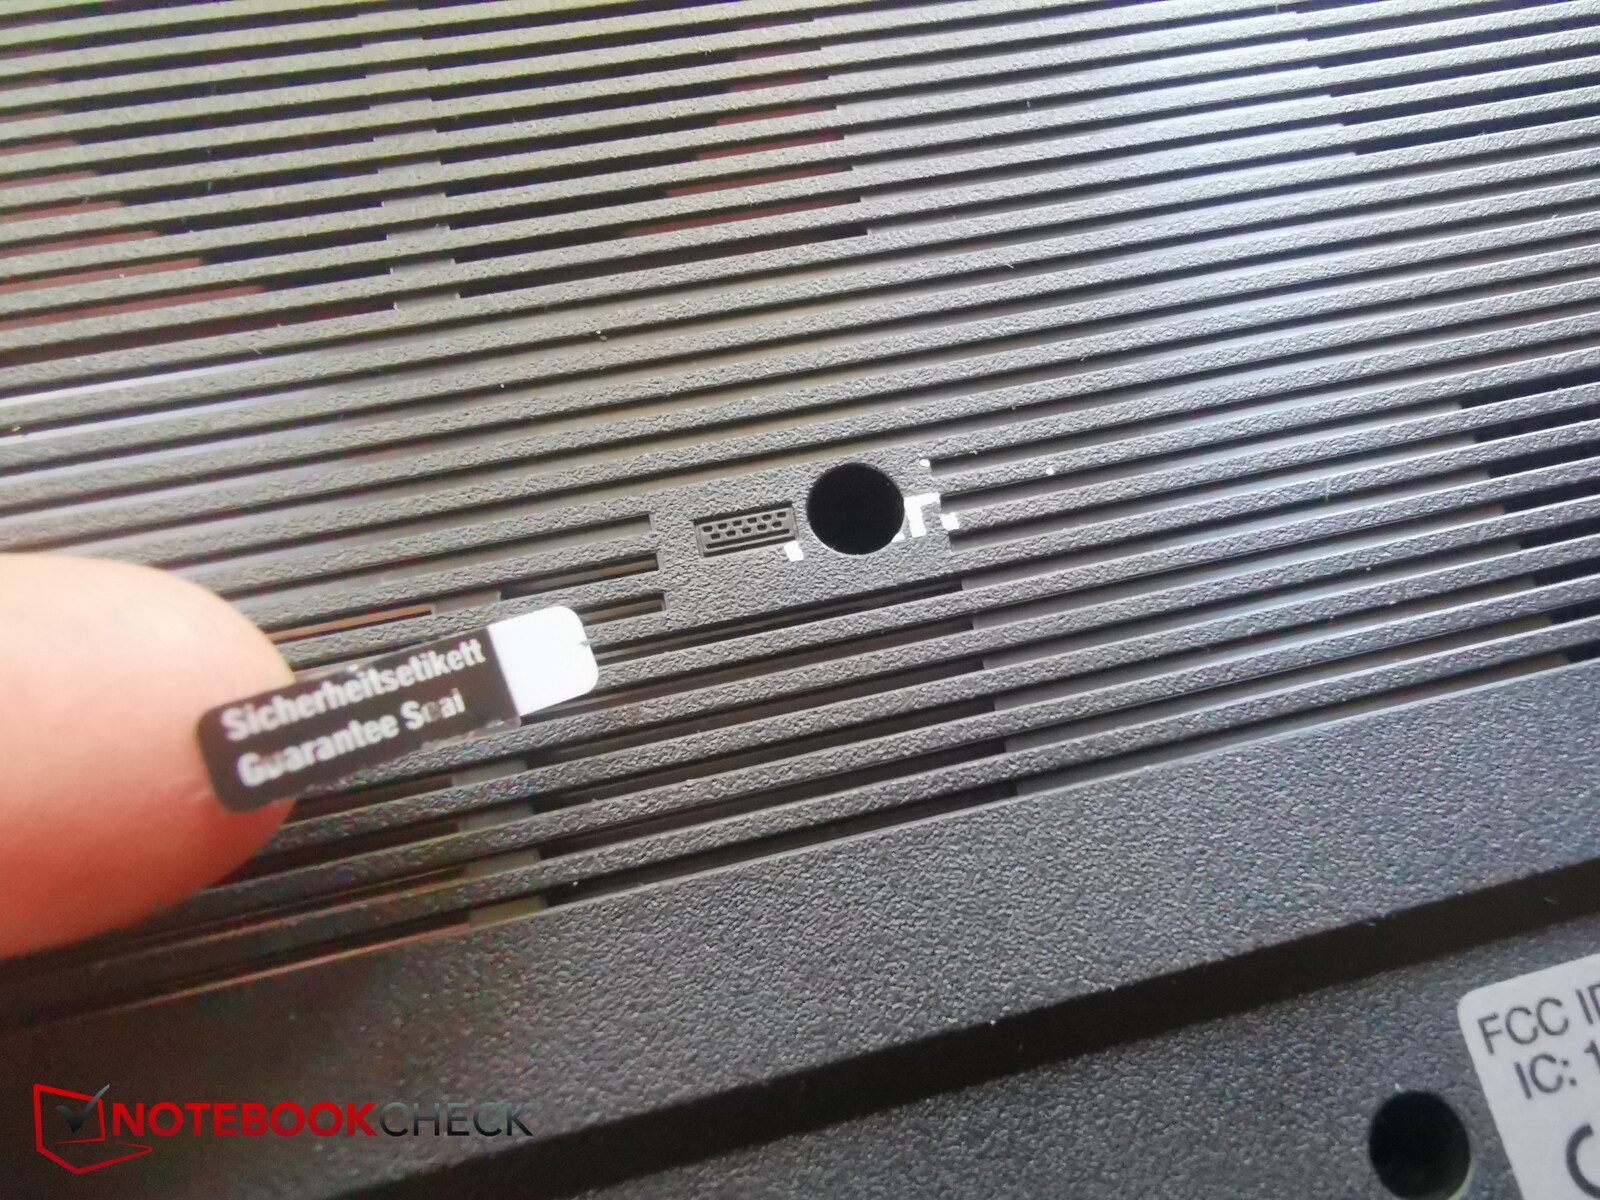
Mantenimiento
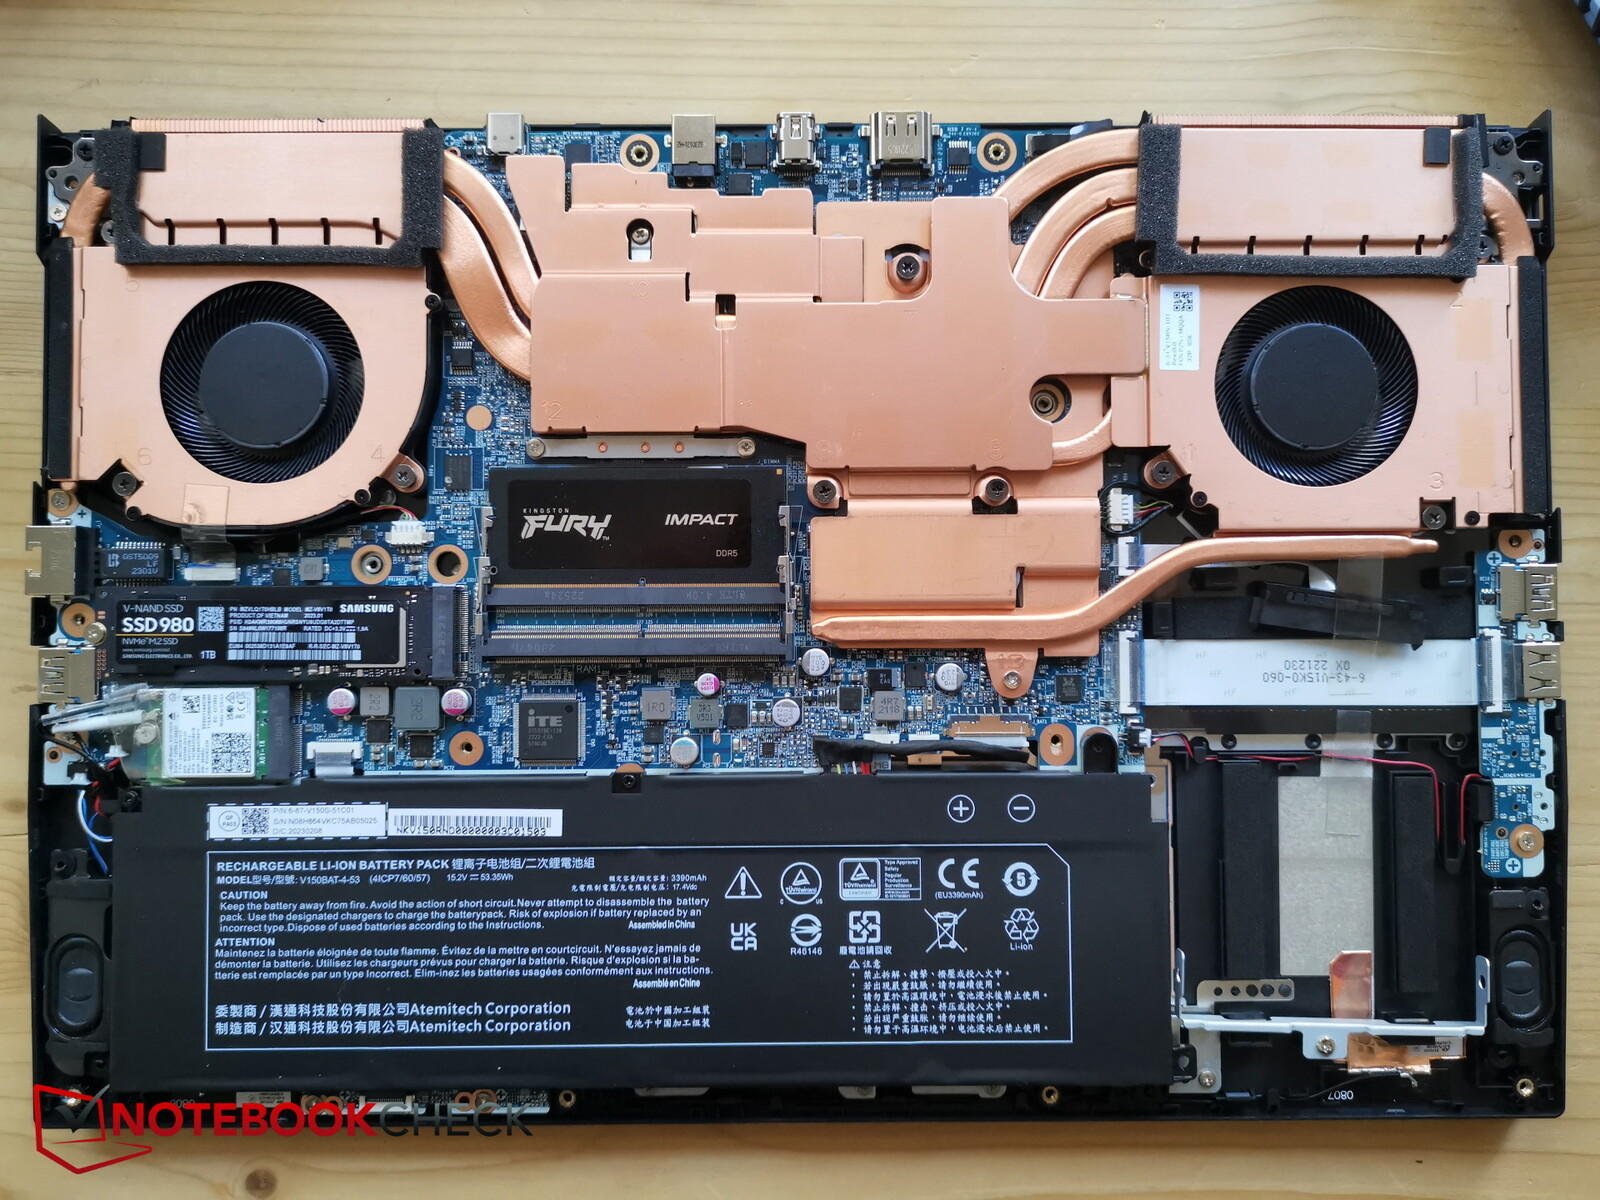
De los 14 tornillos en cruz en total (que afortunadamente son todos del mismo tamaño), uno está situado debajo de un sello de garantía. Según Captiva, la garantía expira en cuanto se abre el aparato. El fabricante nos dio permiso para romper el precinto.
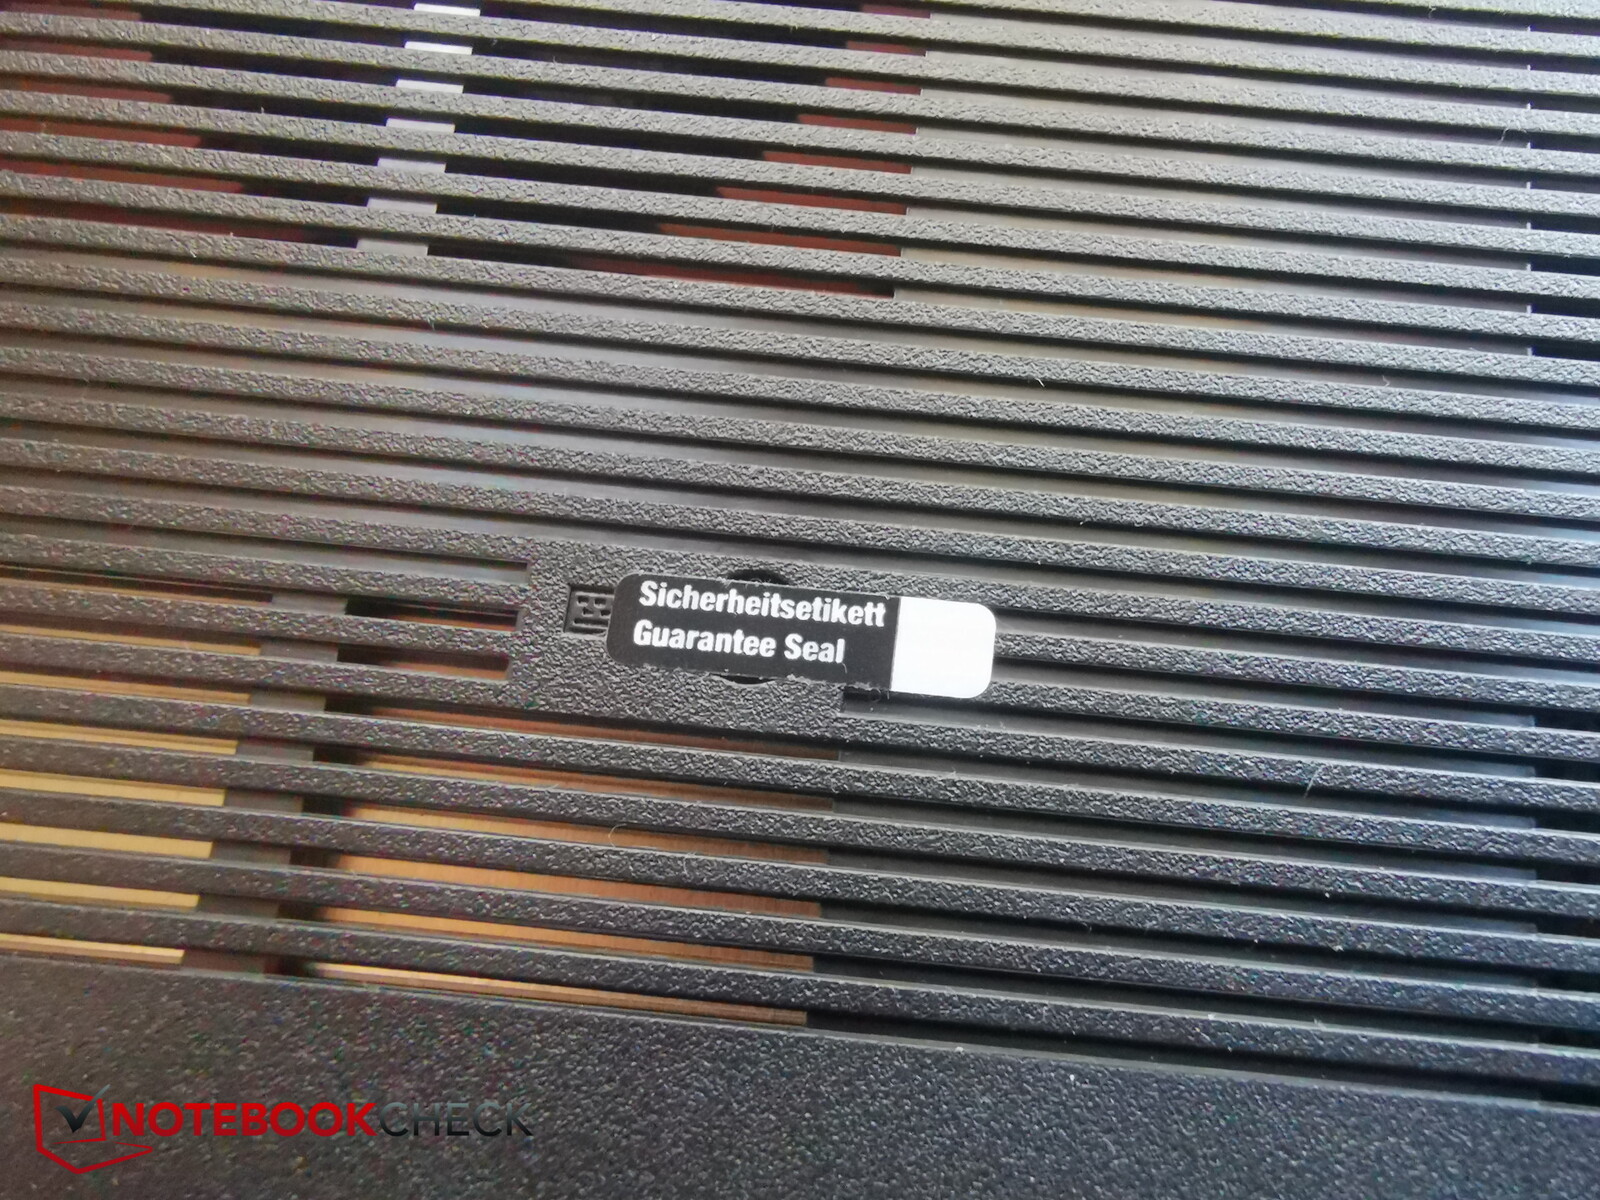
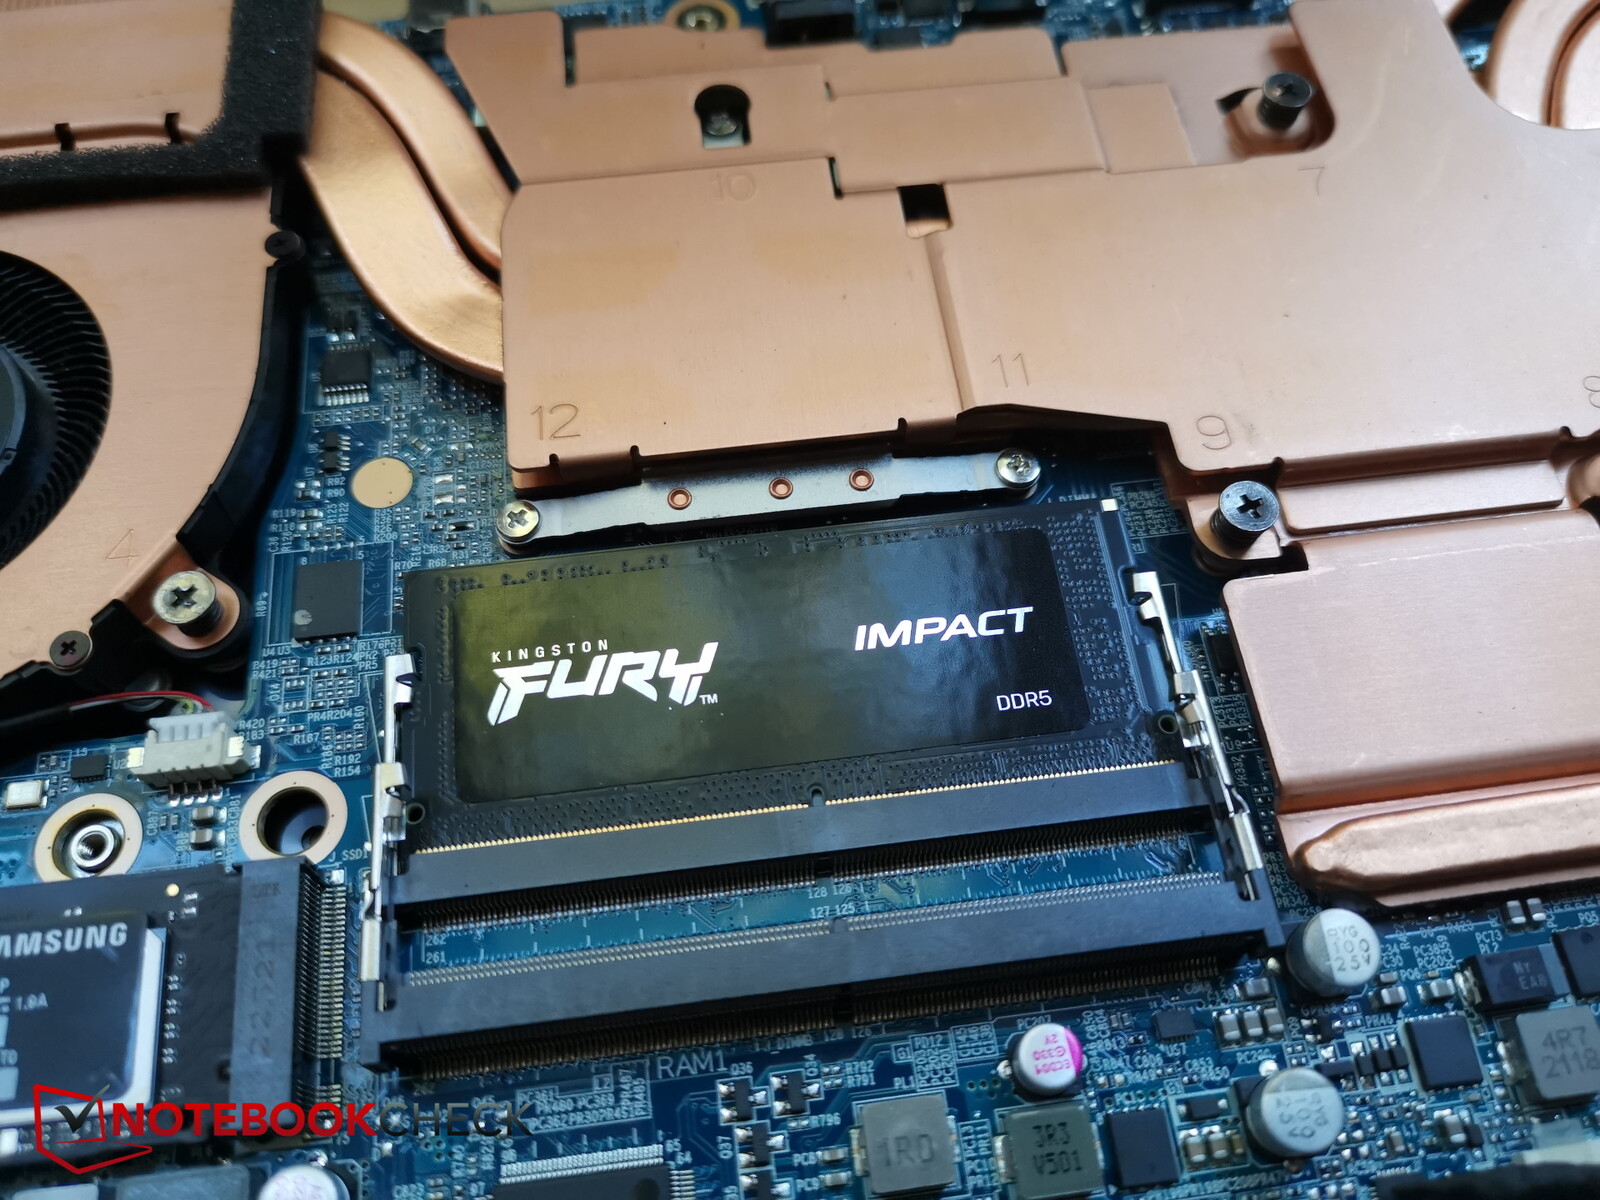
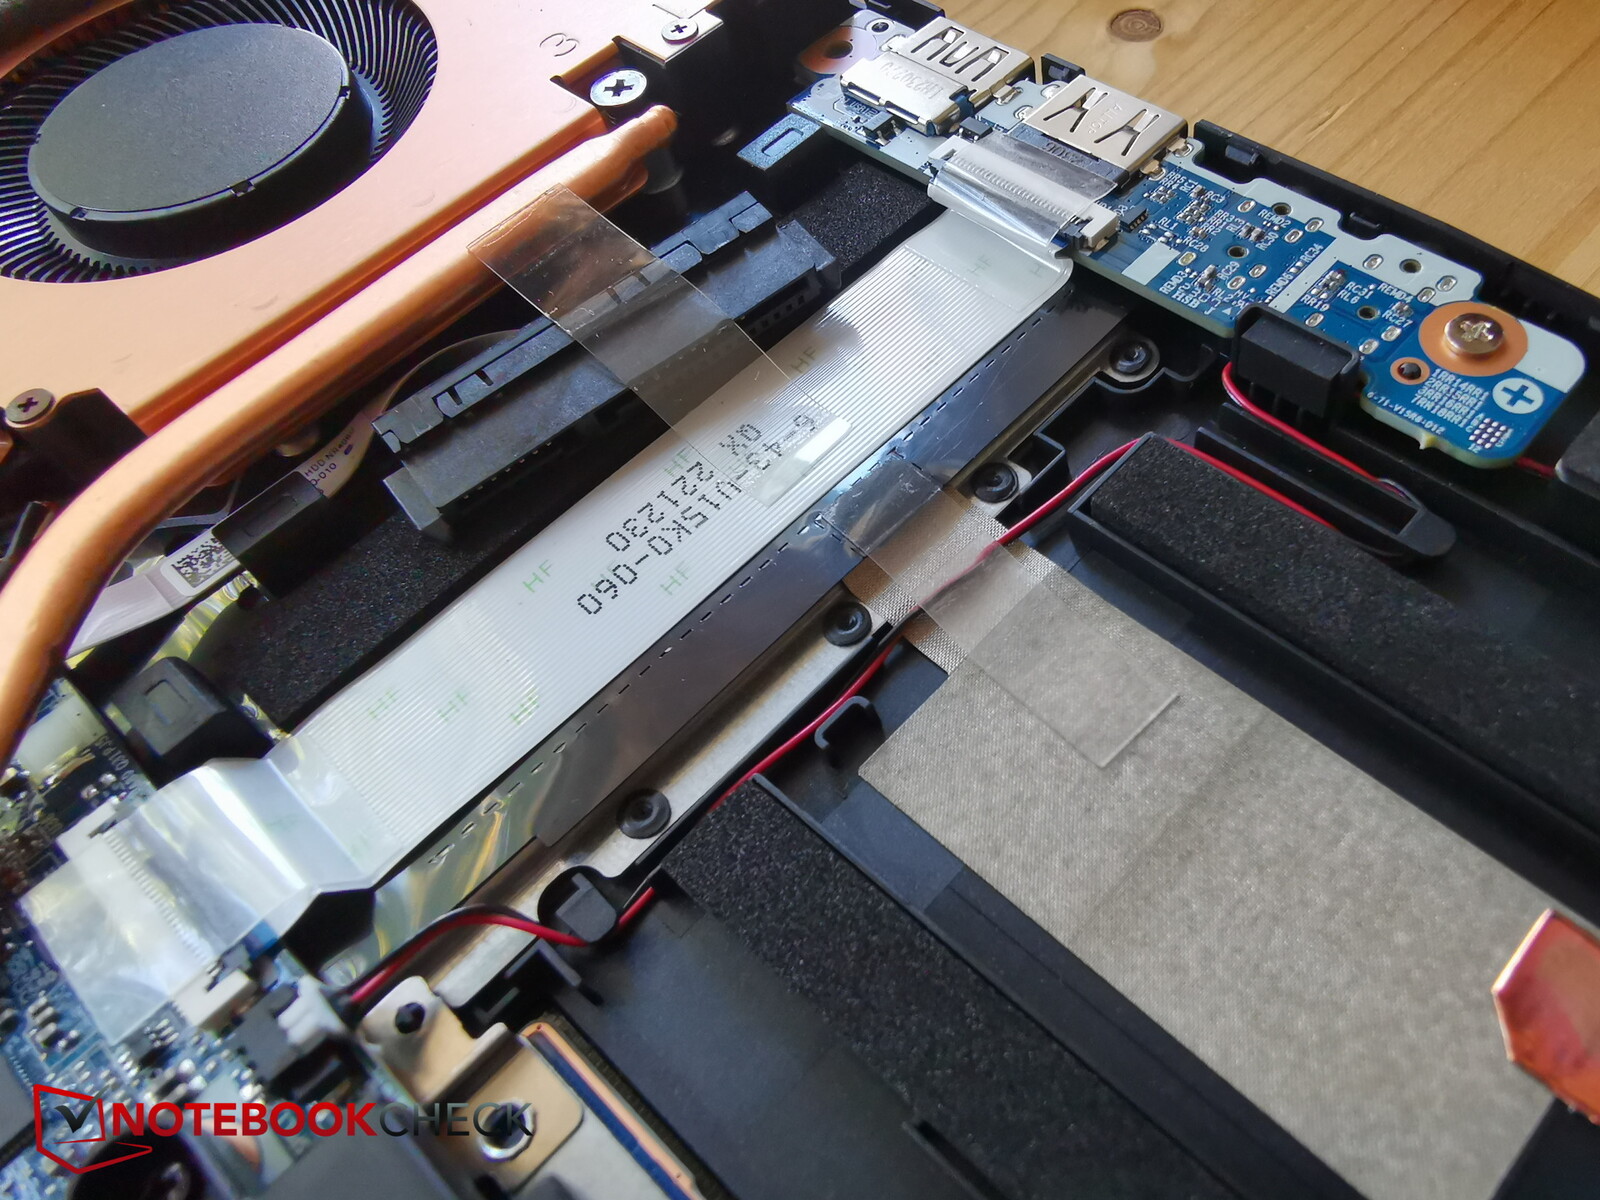
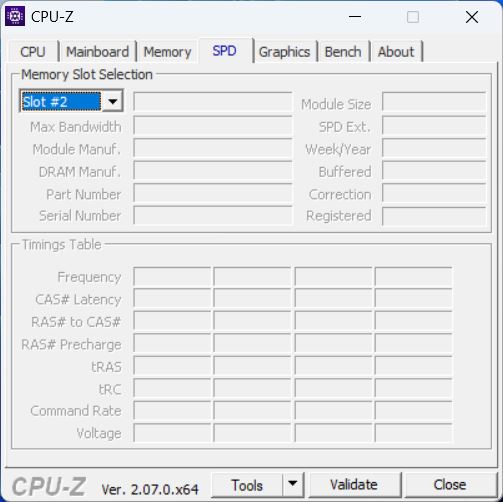
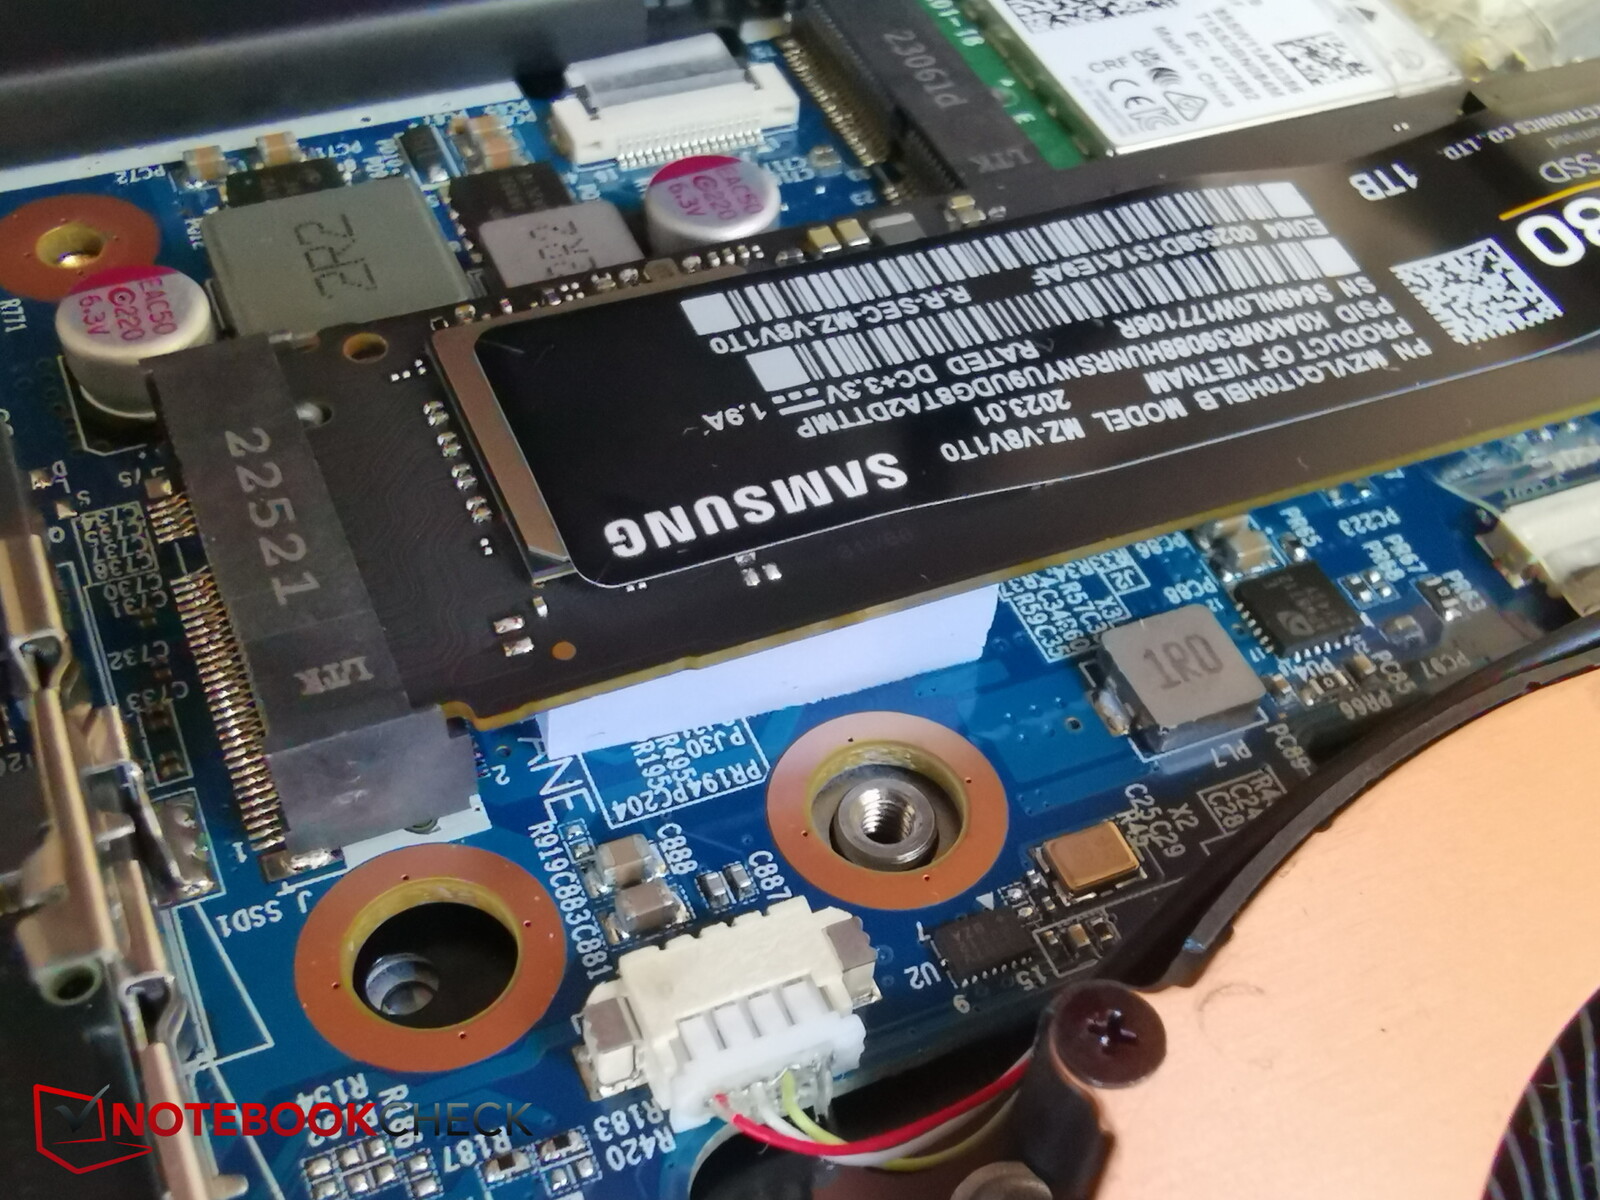
Después de quitar los tornillos, es súper fácil sacar la placa inferior sin necesidad de herramientas. Debajo, se puede ver el sistema de refrigeración que consta de dos ventiladores y un montón de cobre en el medio, los dos bancos de RAM de los cuales uno está desocupado, el SSD intercambiable, así como el módulo WiFi intercambiable.
En lugar de una segunda ranura NVMe, hay una ranura SATA que puede alojar unidades de 2,5 pulgadas. Aparte del sello de garantía, es muy fácil realizar tareas de mantenimiento en este portátil.
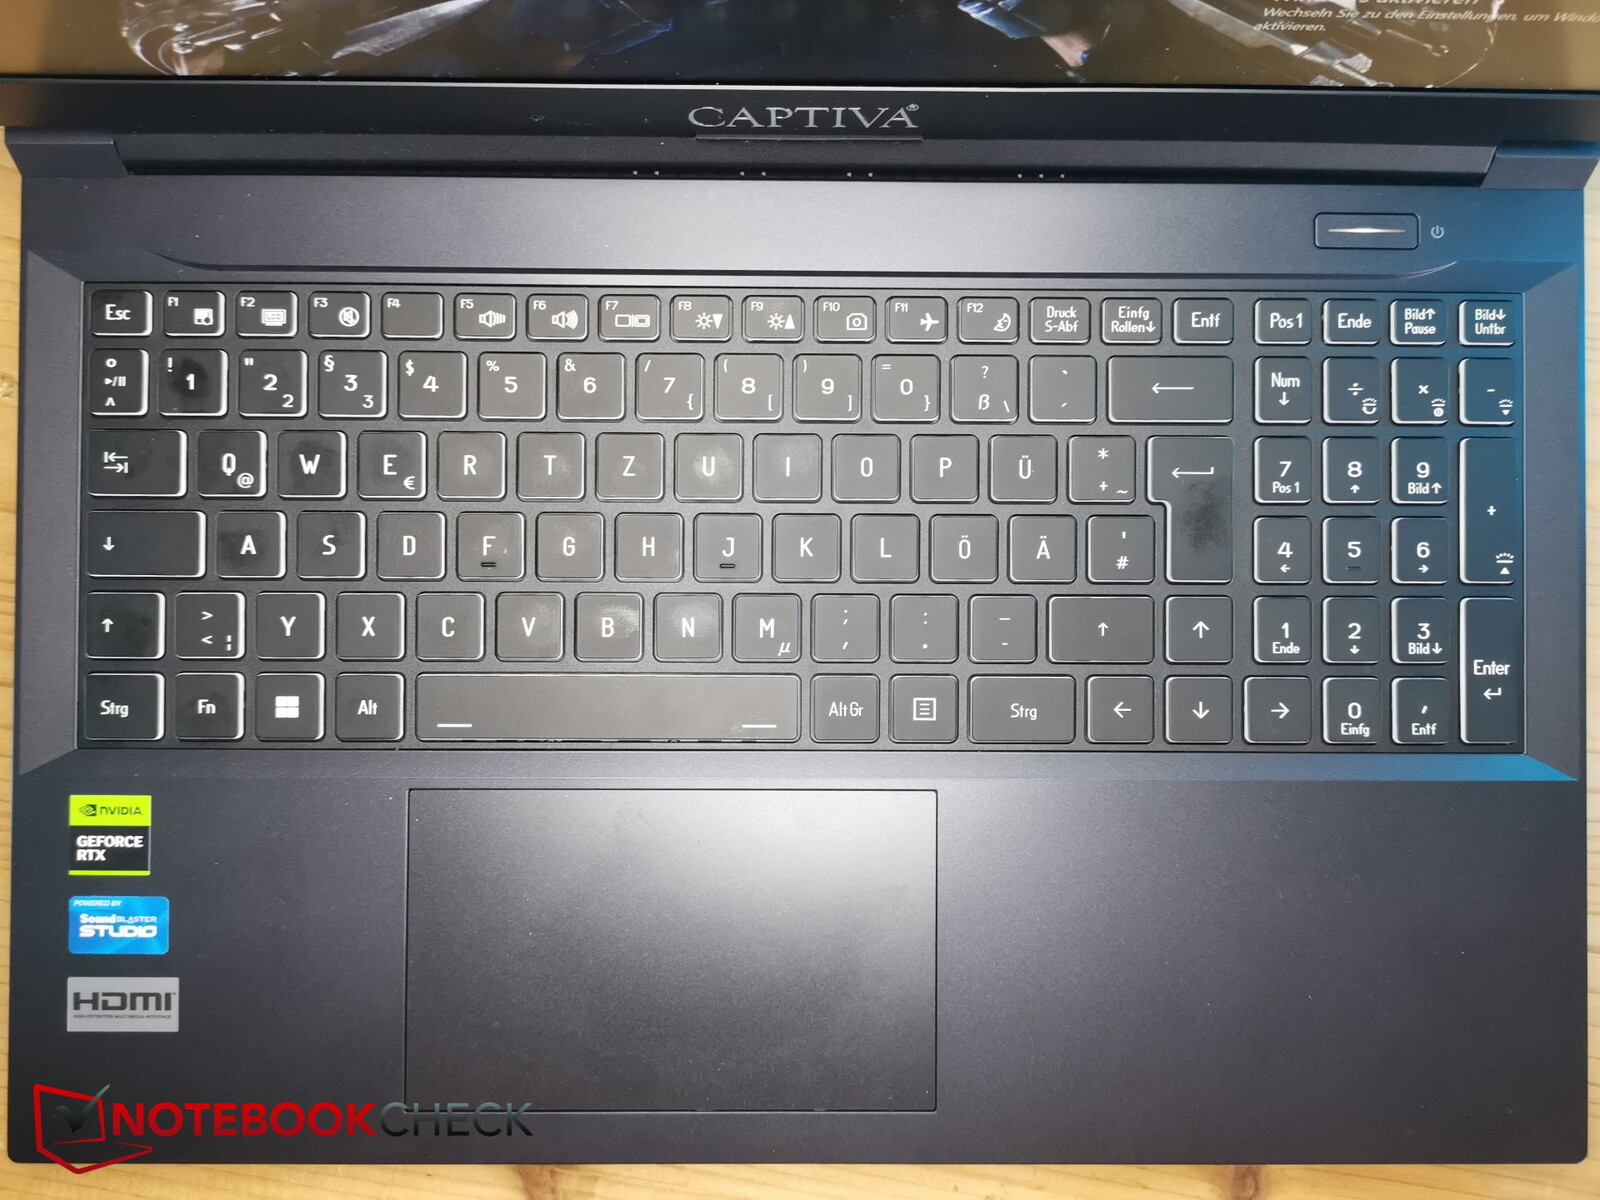
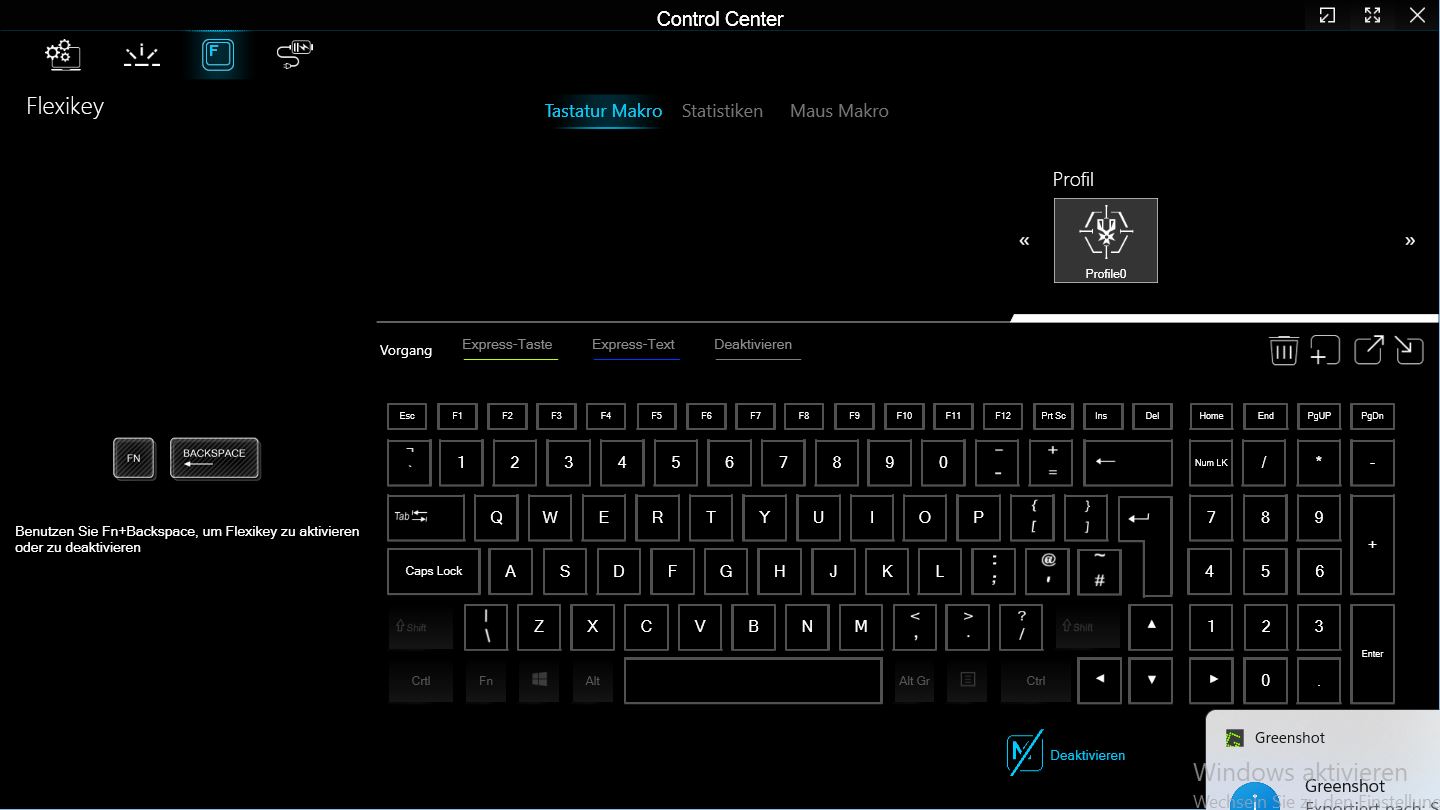
Dispositivos de entrada: sólidos y aptos para el uso diario
Teclado
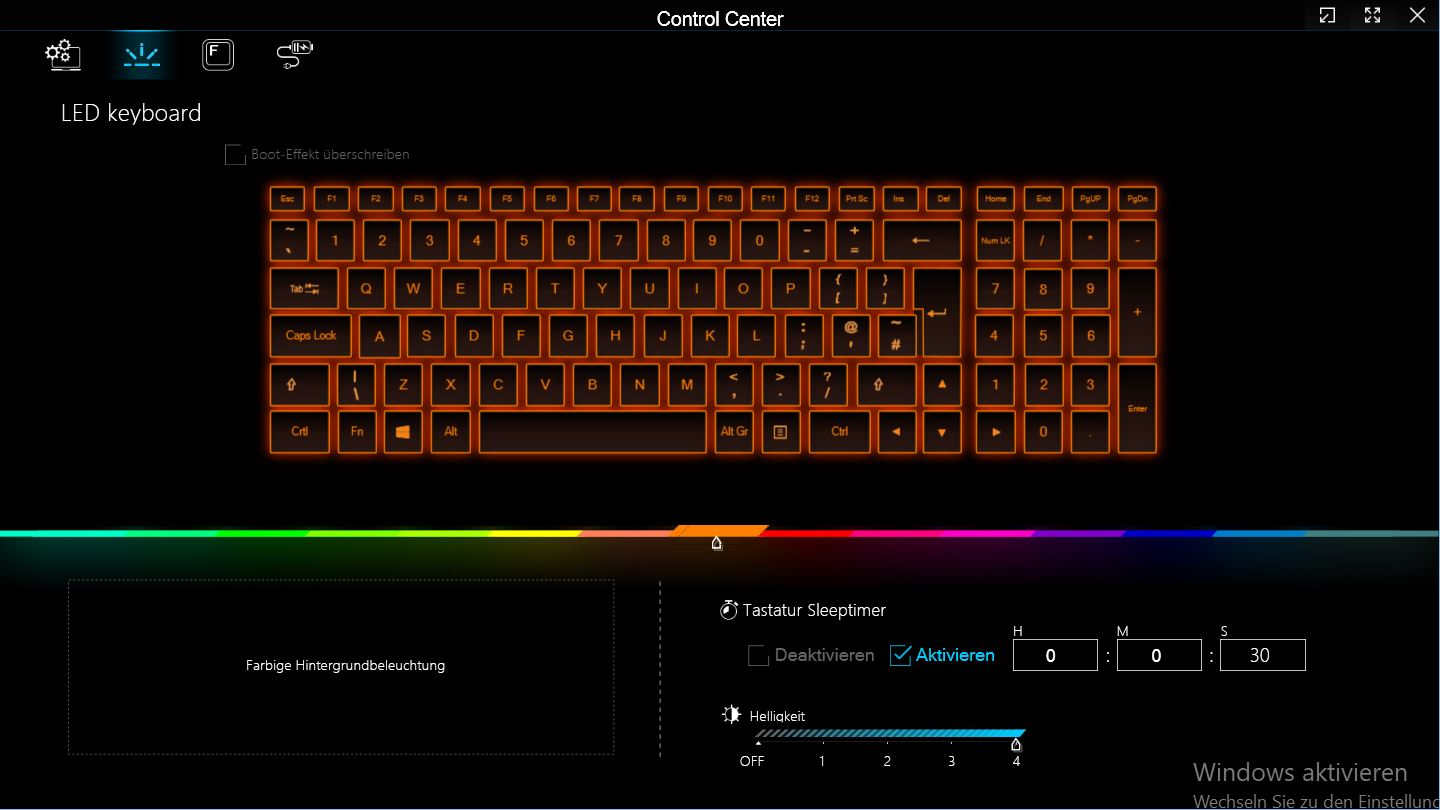
La distribución del teclado es funcional y sin problemas. Las teclas de dirección tienen el tamaño normal (aprox. 15 x 15 mm), el teclado numérico tiene teclas más pequeñas (15 x 12,6 mm) y se conecta sin problemas en el lado derecho. En la parte superior derecha hay un botón extra para el encendido.
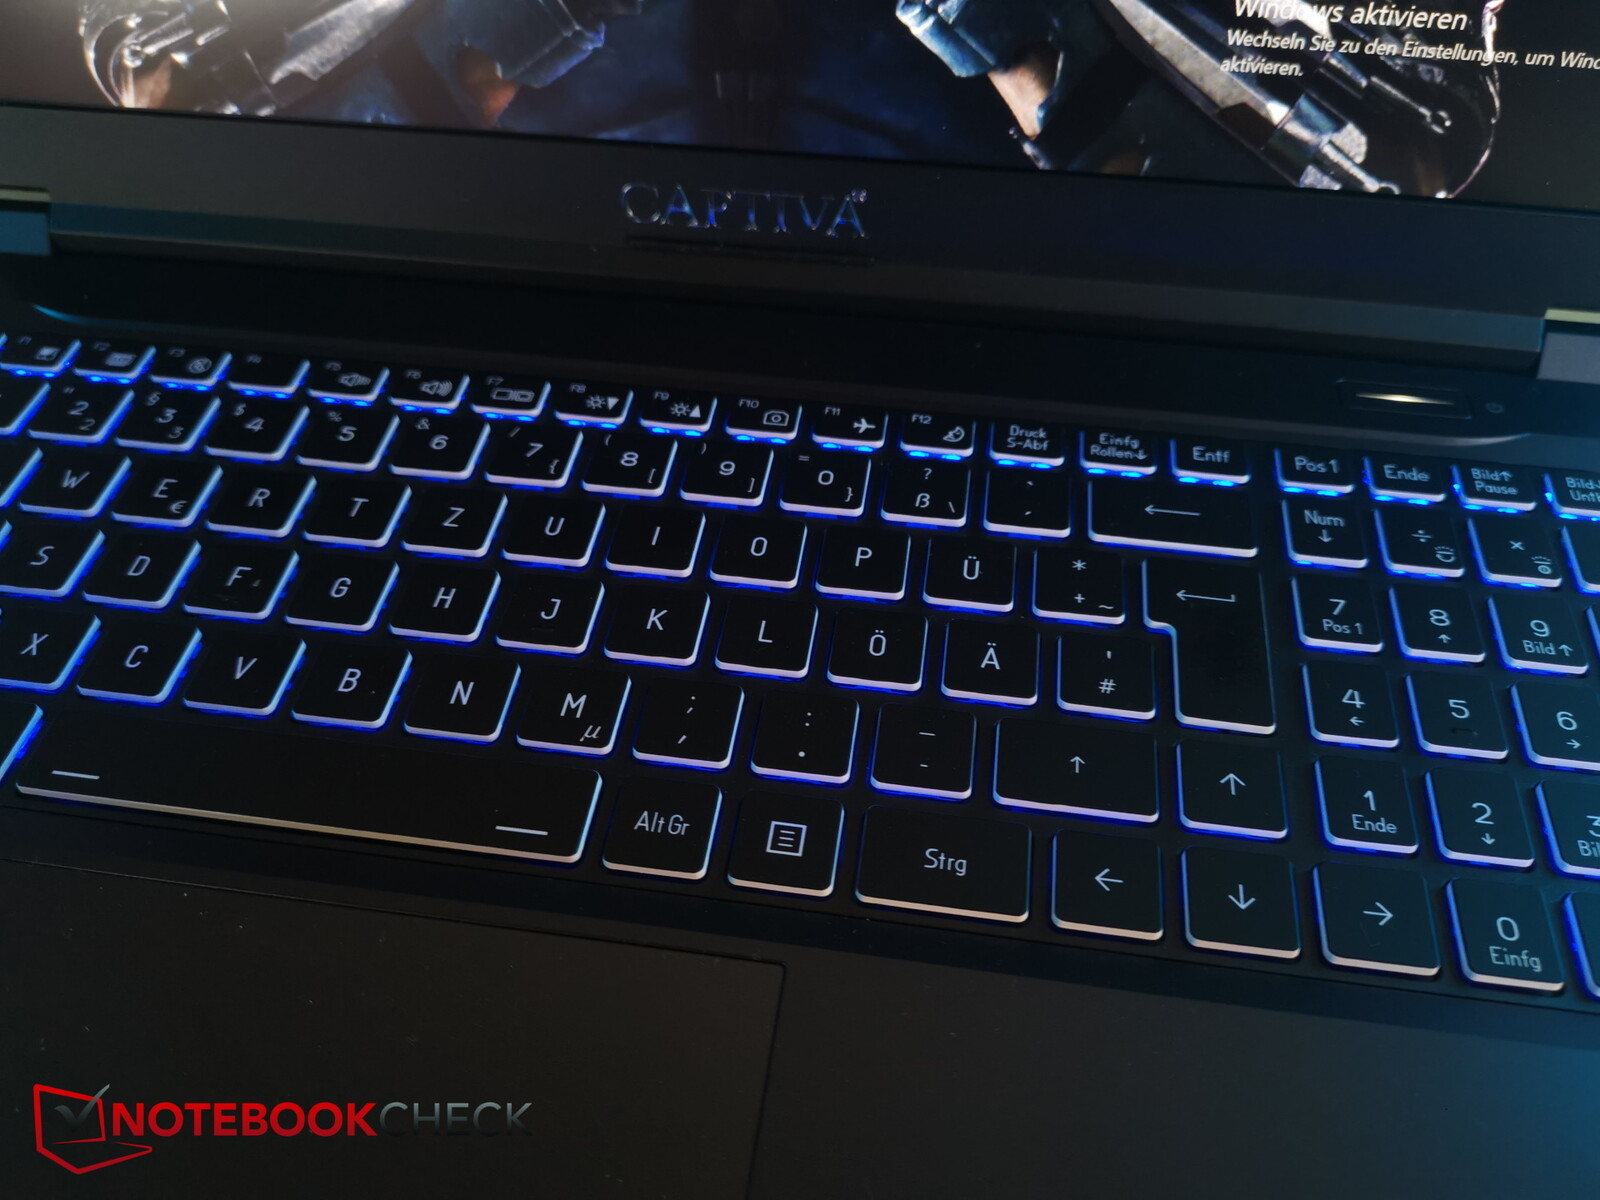
Las teclas tienen una elevación cómoda, no demasiado corta, con una retroalimentación decente. Los ruidos producidos al teclear son muy moderados. Además, el etiquetado de las teclas es muy legible y se mantiene en condiciones de luz más oscuras gracias a su retroiluminación multicolor de una zona.
Panel táctil
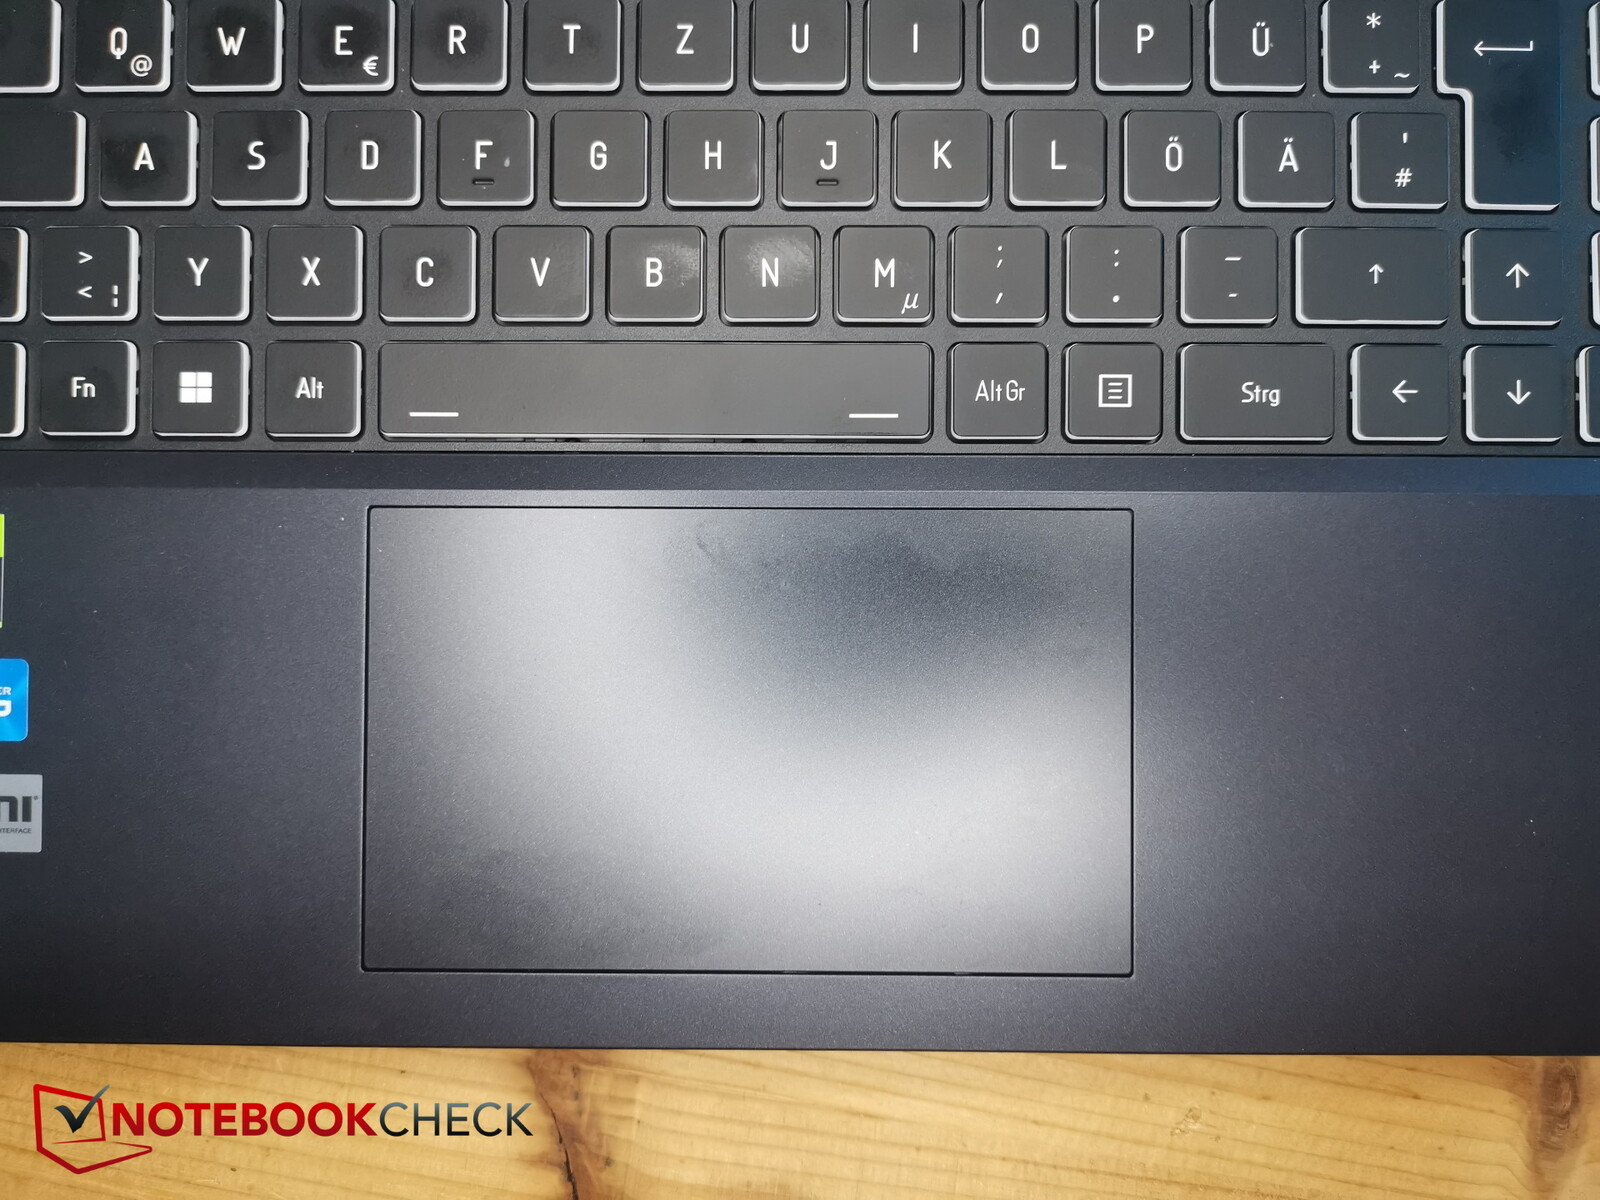
Como consecuencia del teclado numérico, el touchpad (12 x 7,2 cm) está situado ligeramente a la izquierda, lo que parece correcto. Puede pegarse un poco durante los movimientos lentos o si te sudan las manos, pero en situaciones normales, los dedos se deslizan suavemente sobre la superficie.
Las teclas integradas también tienen buenos niveles de retroalimentación - el ruido de clic es un poco más fuerte, pero no es molesto.
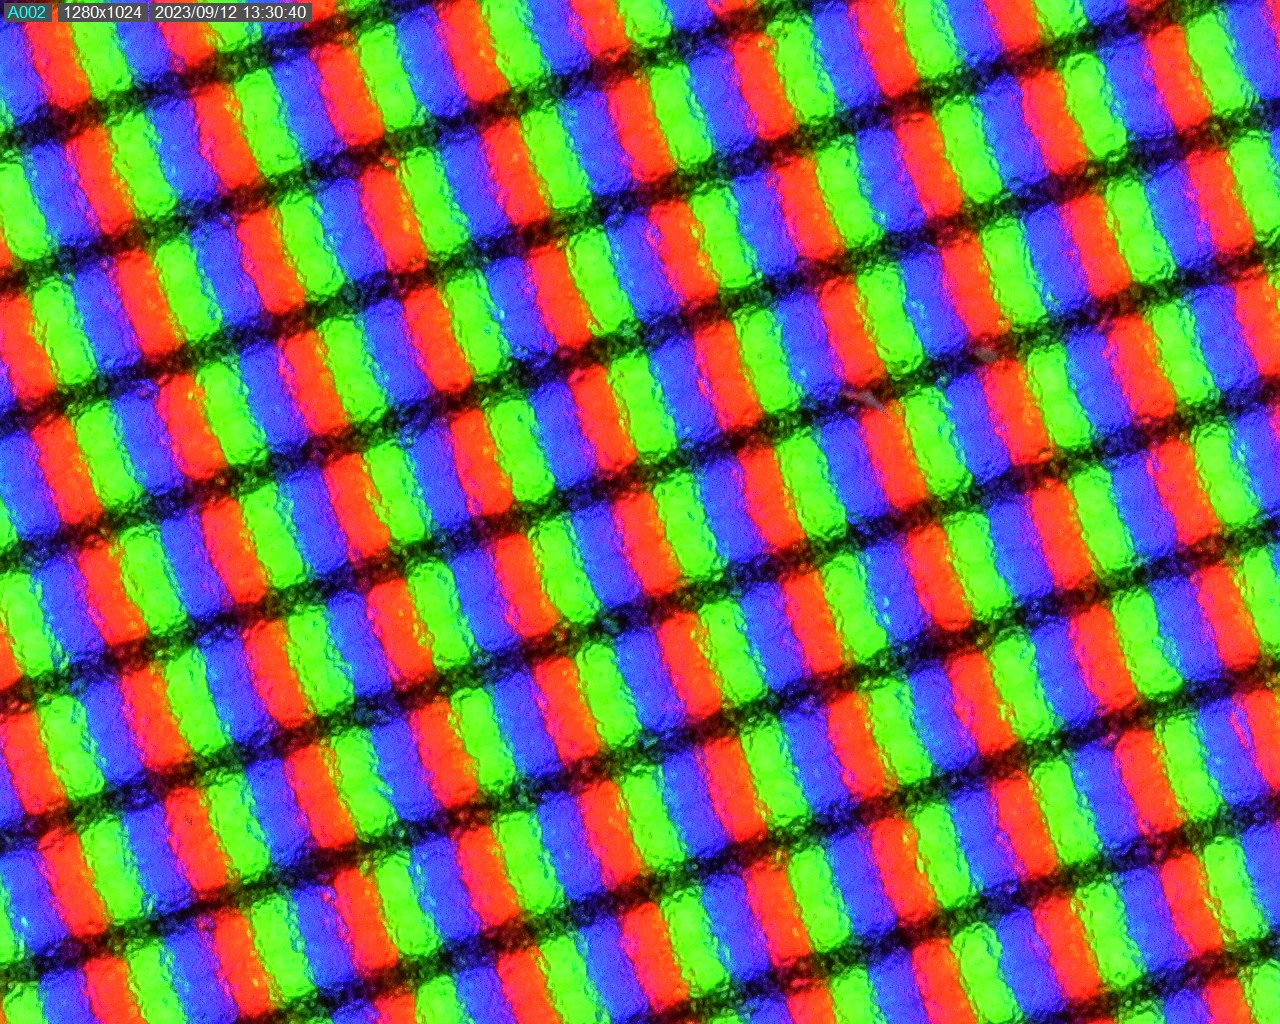
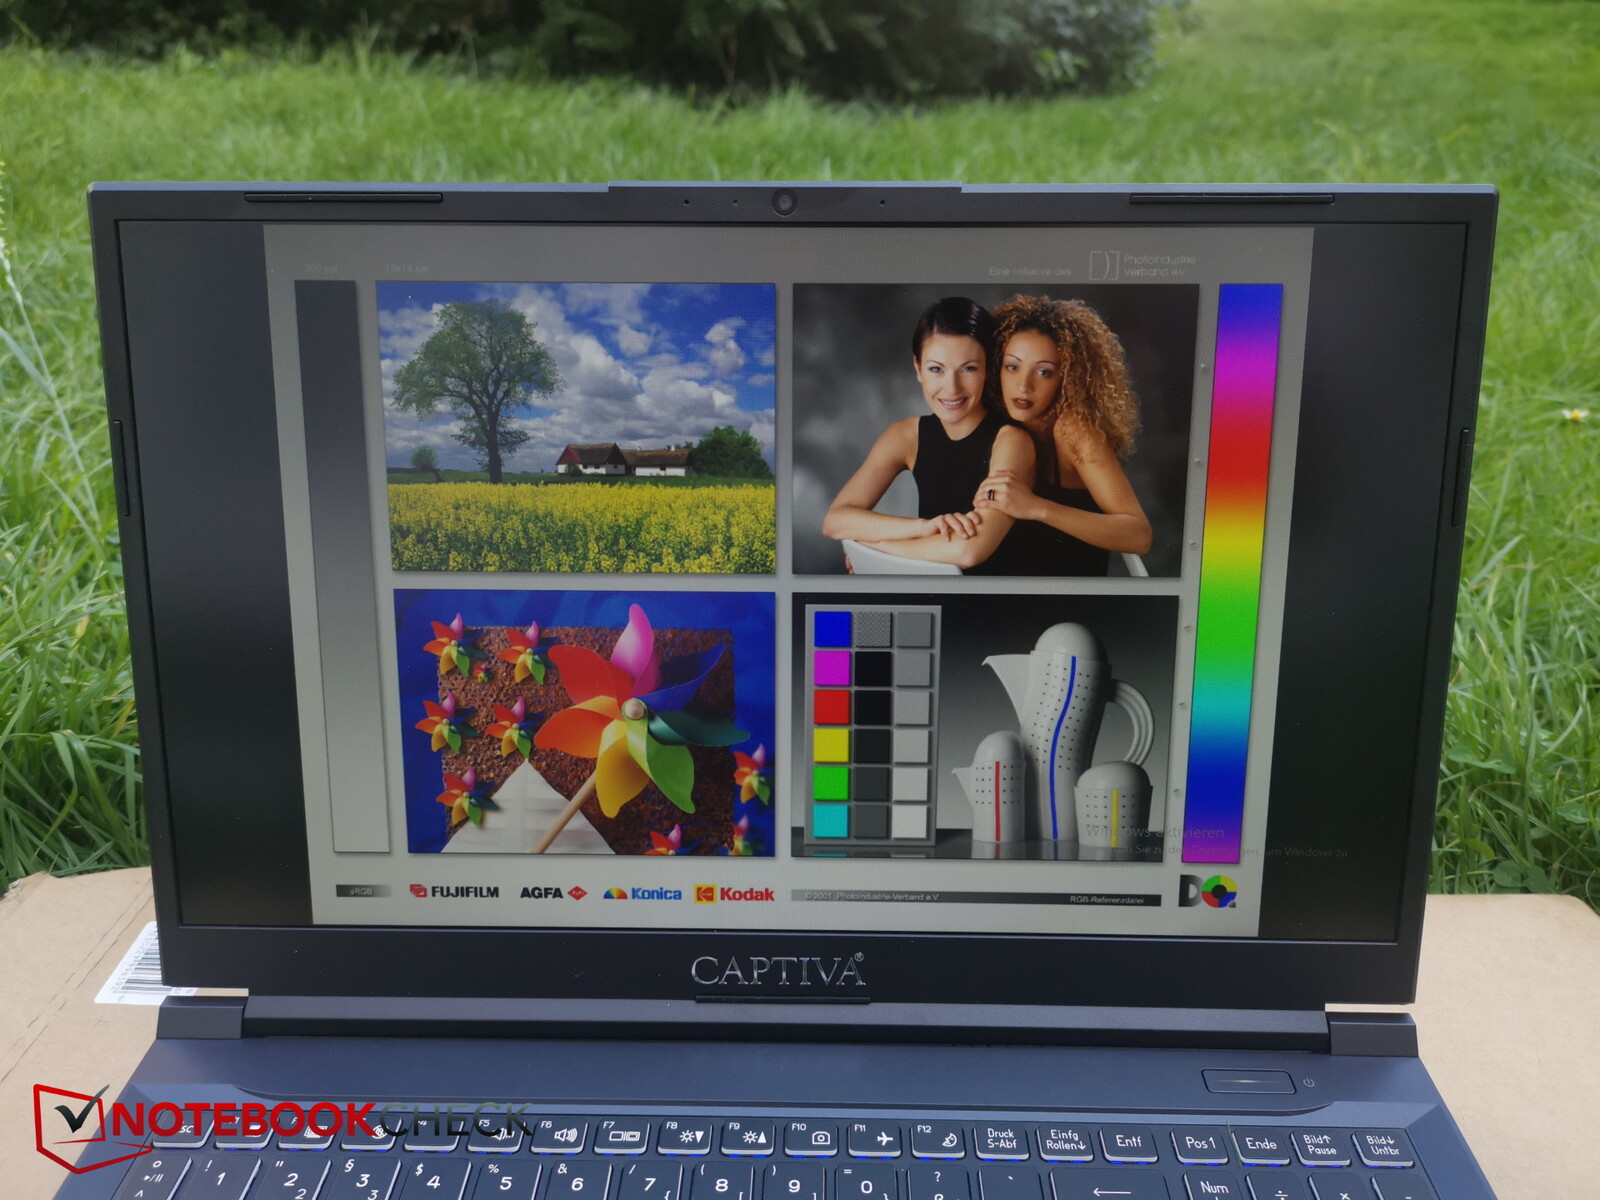
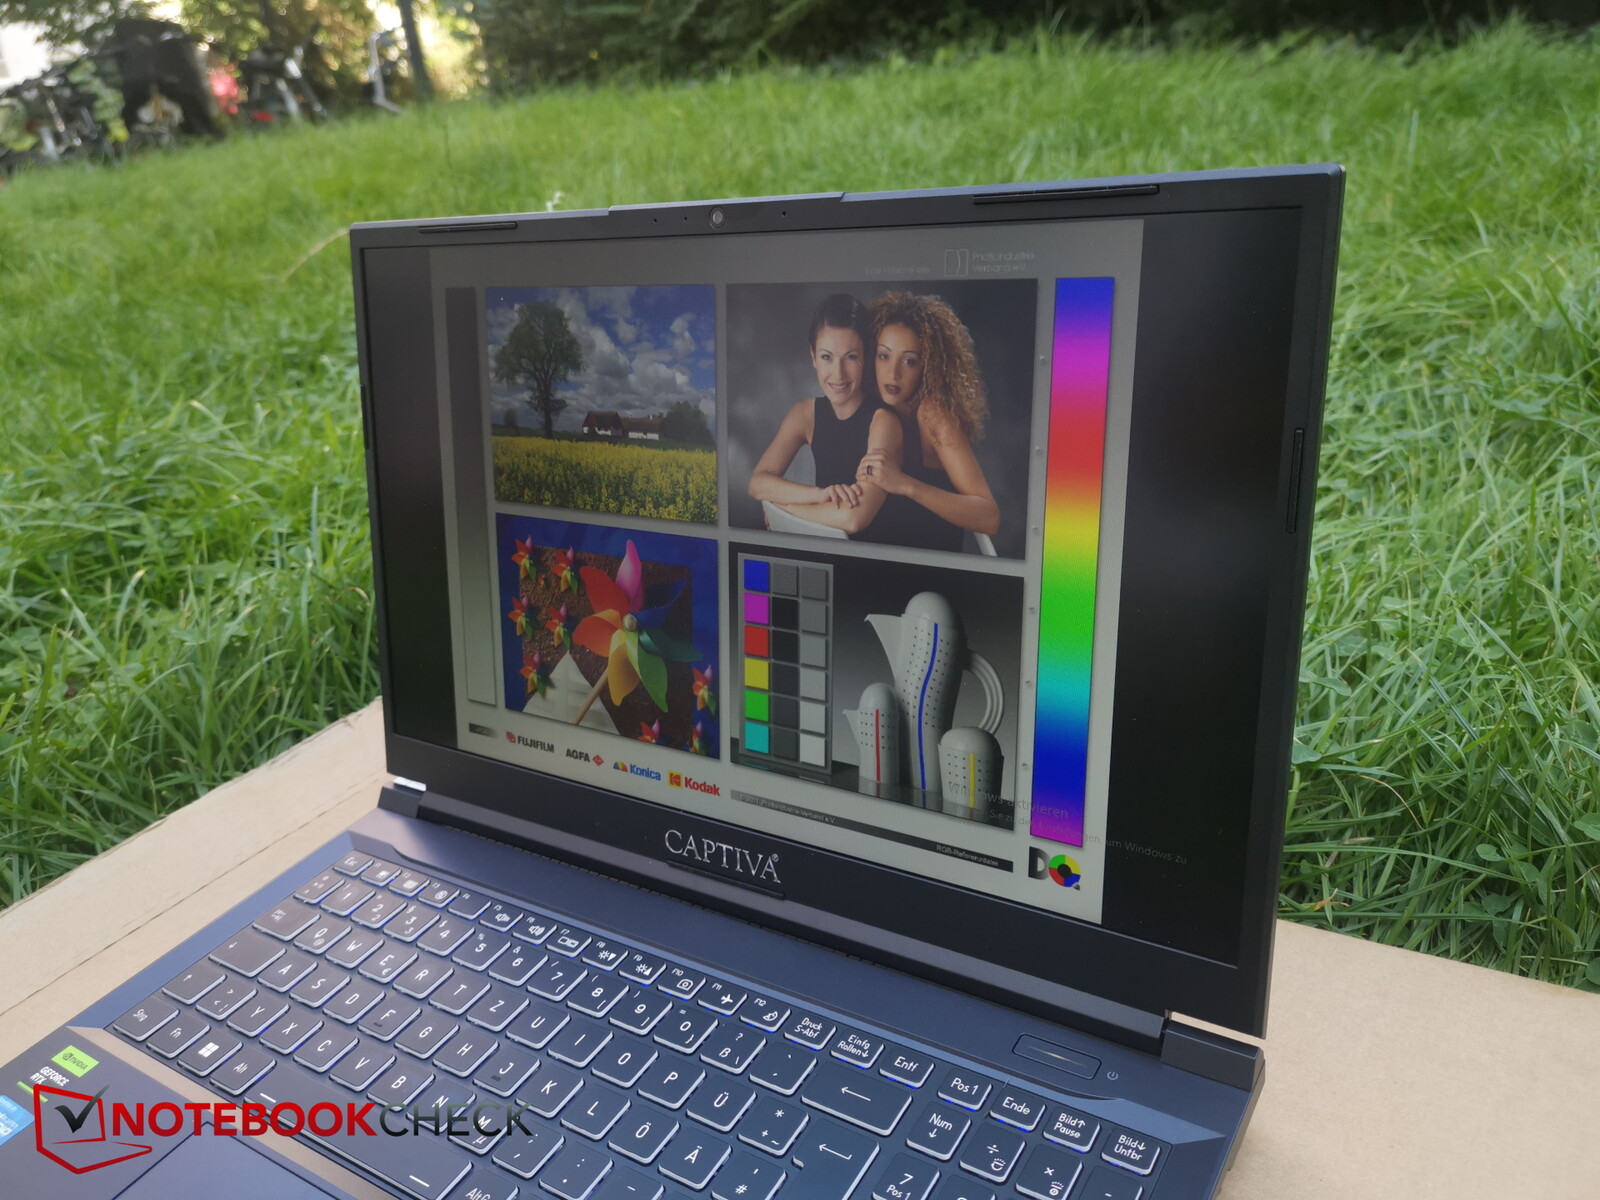
Pantalla - El Advanced Gaming sólo tiene Full HD
Captiva ha instalado un panel Full HD de 144 Hz de BOE en el portátil. Probamos el mismo panel en el Gigabyte A5 K1. Aquí, la pantalla es un poco más brillante (324 vs. 281 nits) pero a su vez, su valor de negro y contraste son ligeramente más pobres. Su iluminación del 90% es suficiente.
Las velocidades de reacción del panel son buenas, no notamos ningún parpadeo PWM y sólo hay una pequeña cantidad de sangrado de retroiluminación que apenas se nota.
| |||||||||||||||||||||||||
iluminación: 90 %
Brillo con batería: 346 cd/m²
Contraste: 989:1 (Negro: 0.35 cd/m²)
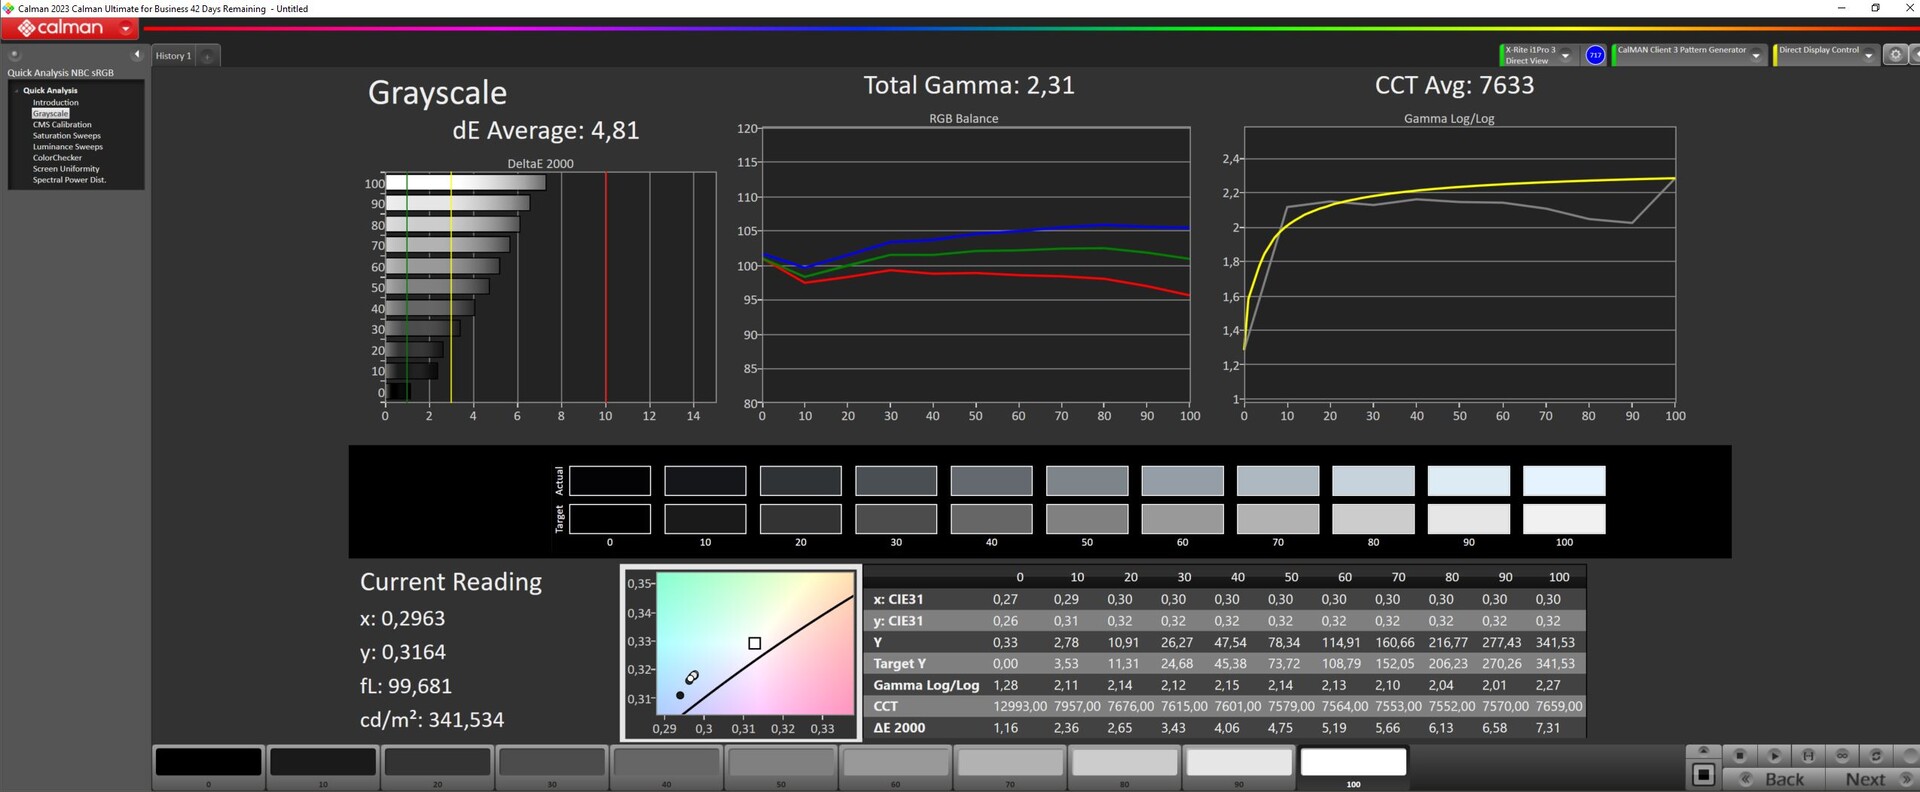
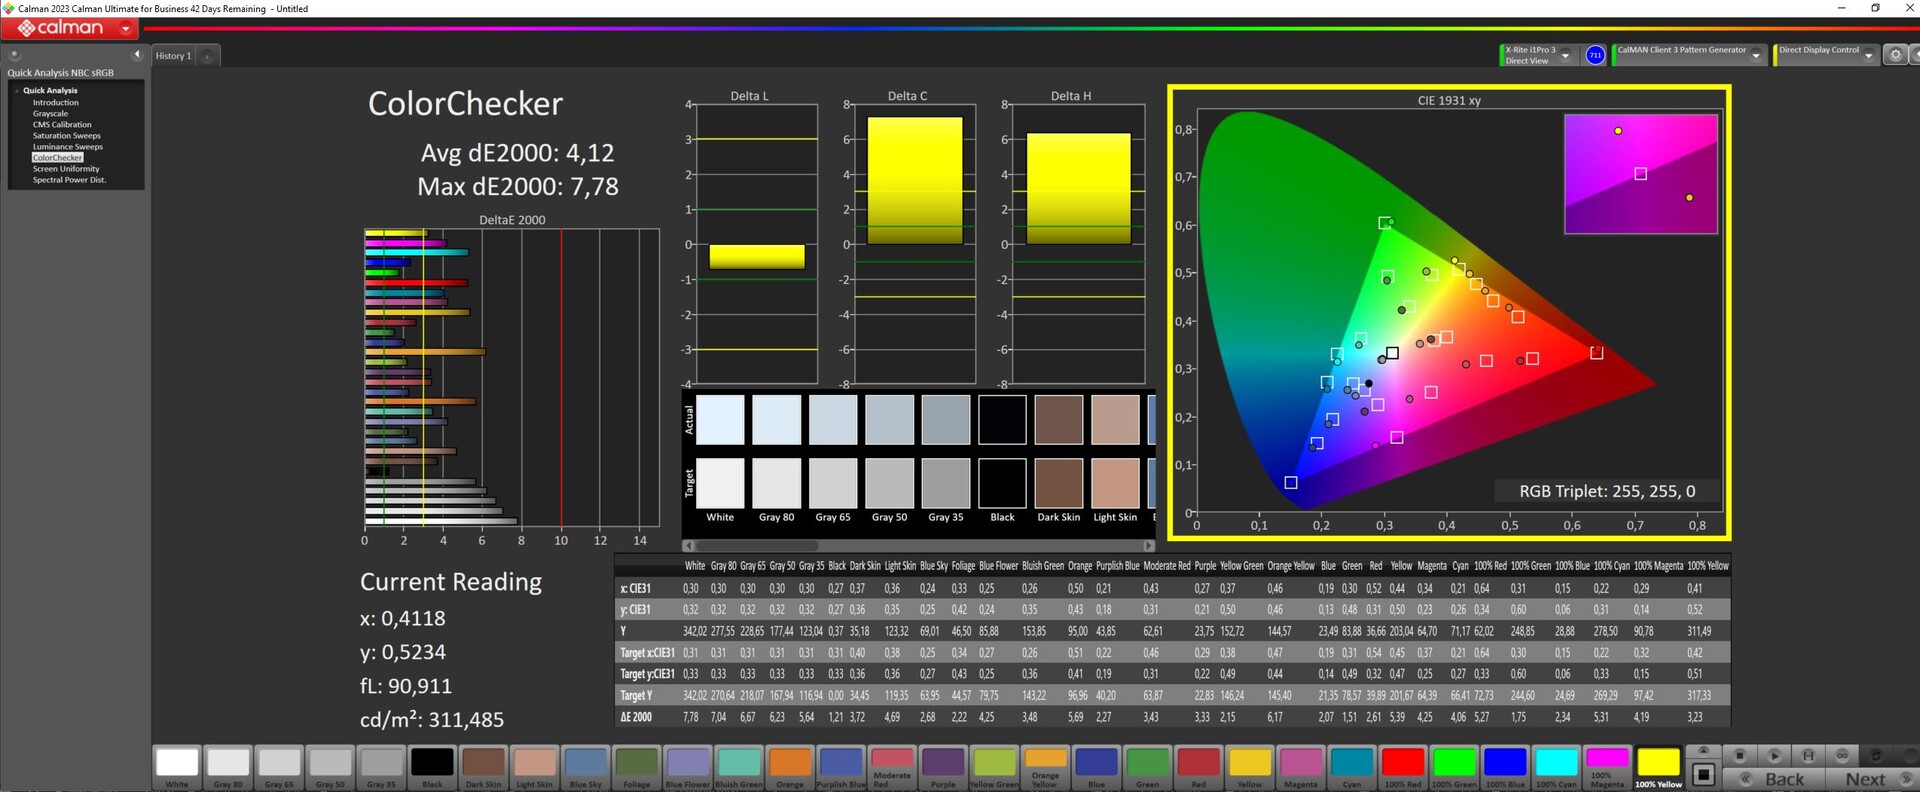
ΔE ColorChecker Calman: 4.12 | ∀{0.5-29.43 Ø4.71}
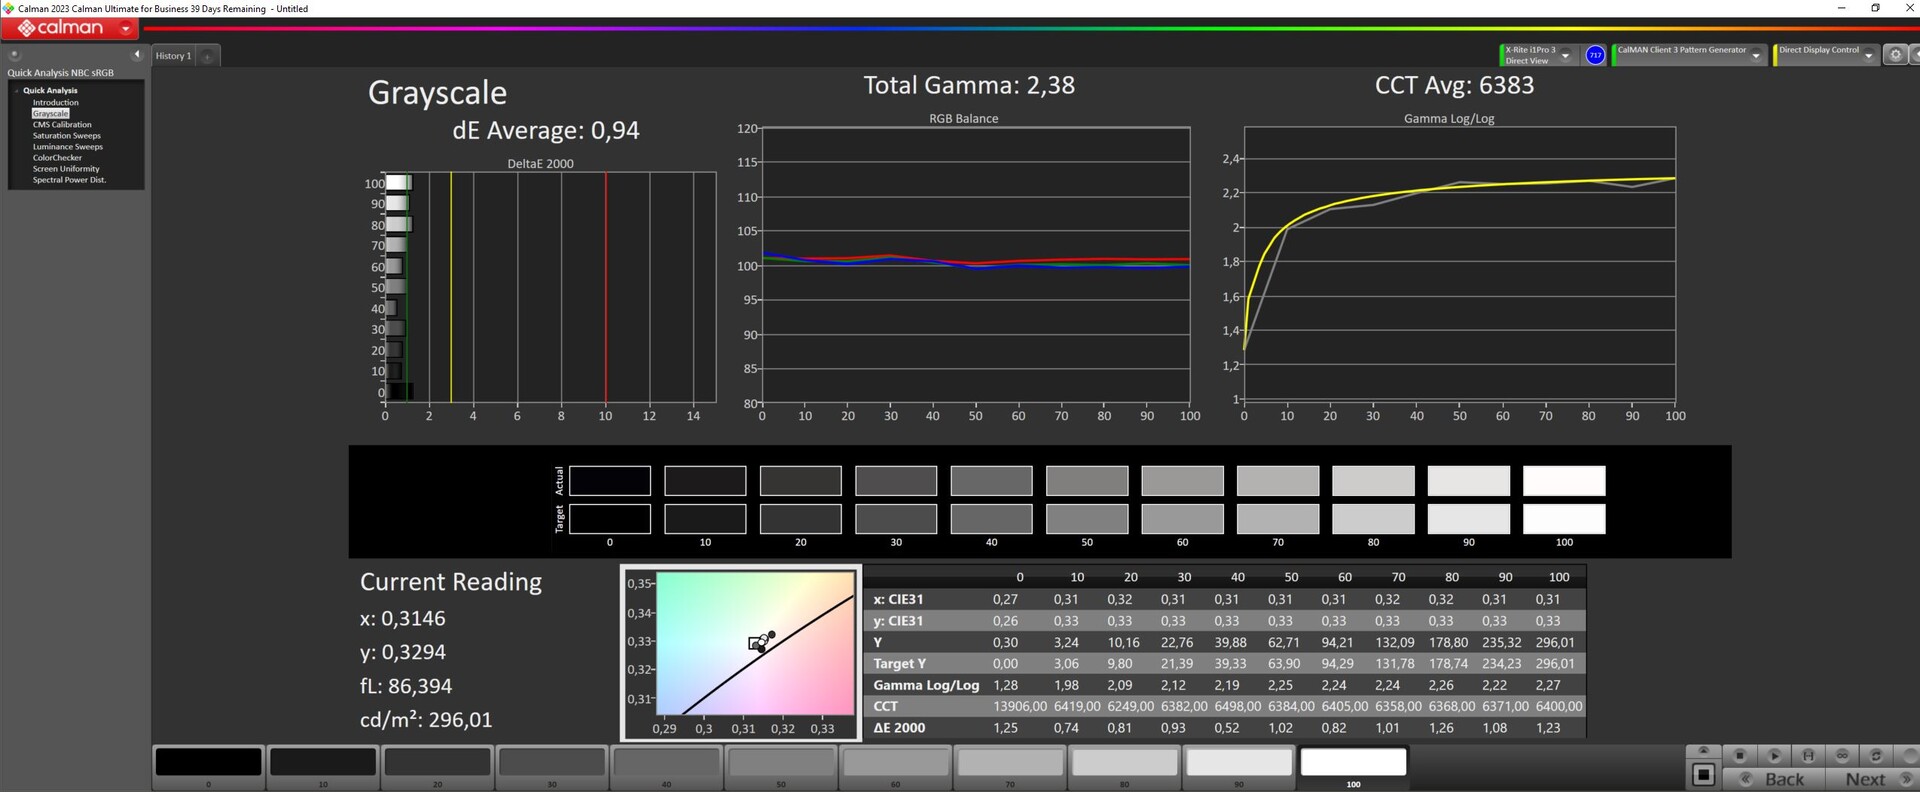
calibrated: 1.22
ΔE Greyscale Calman: 4.81 | ∀{0.09-98 Ø4.96}
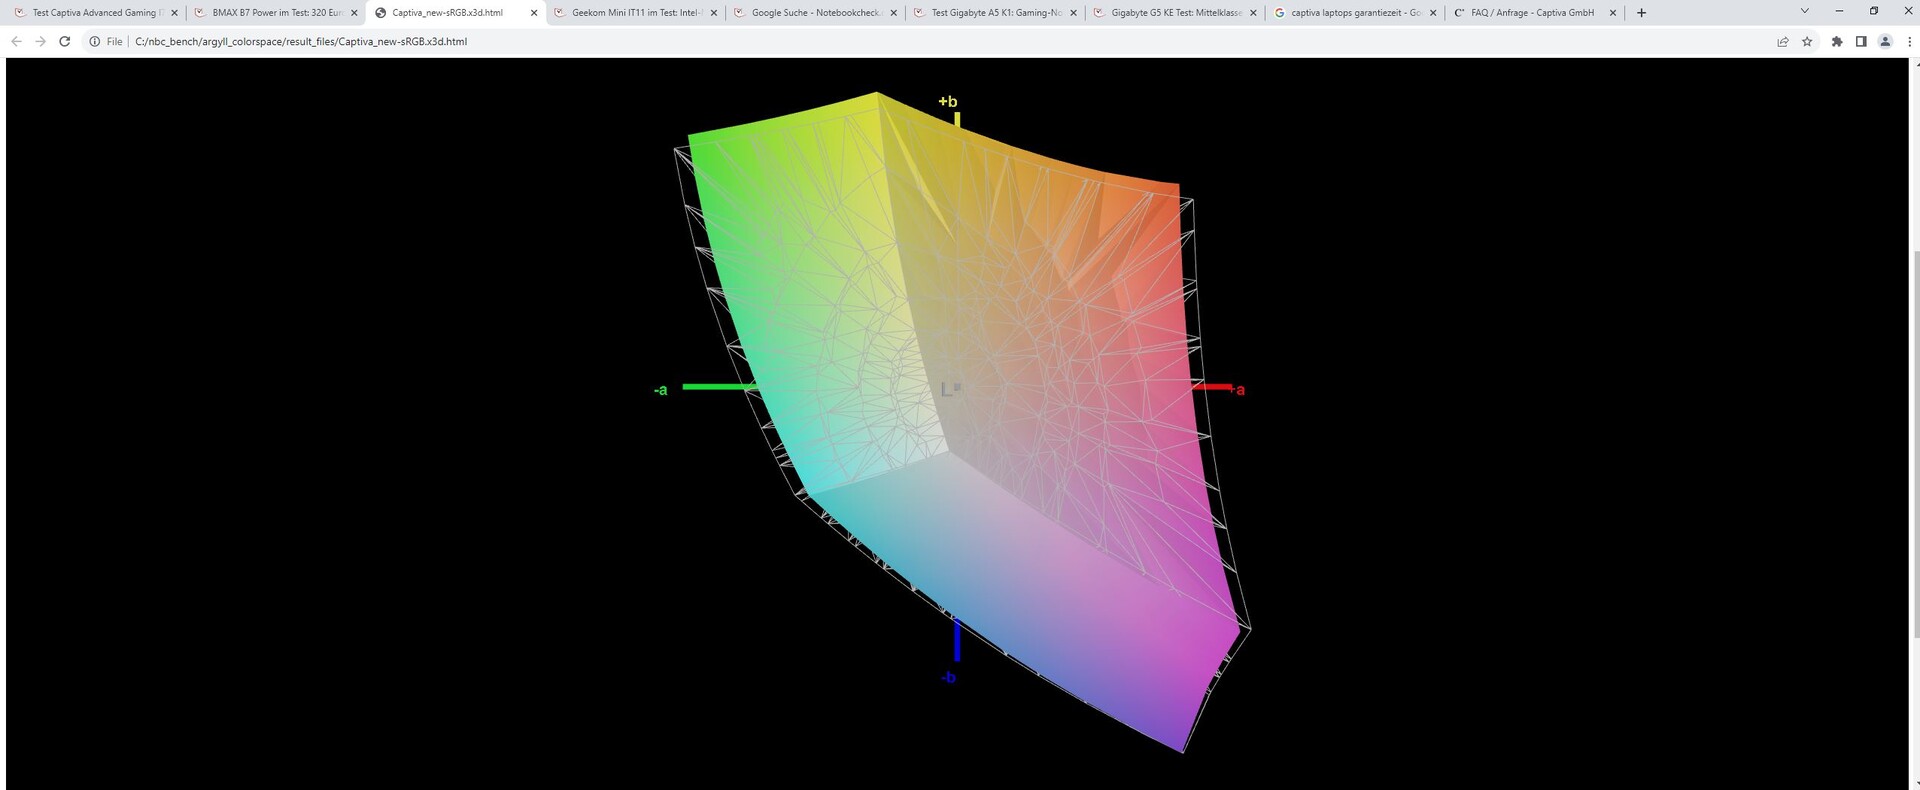
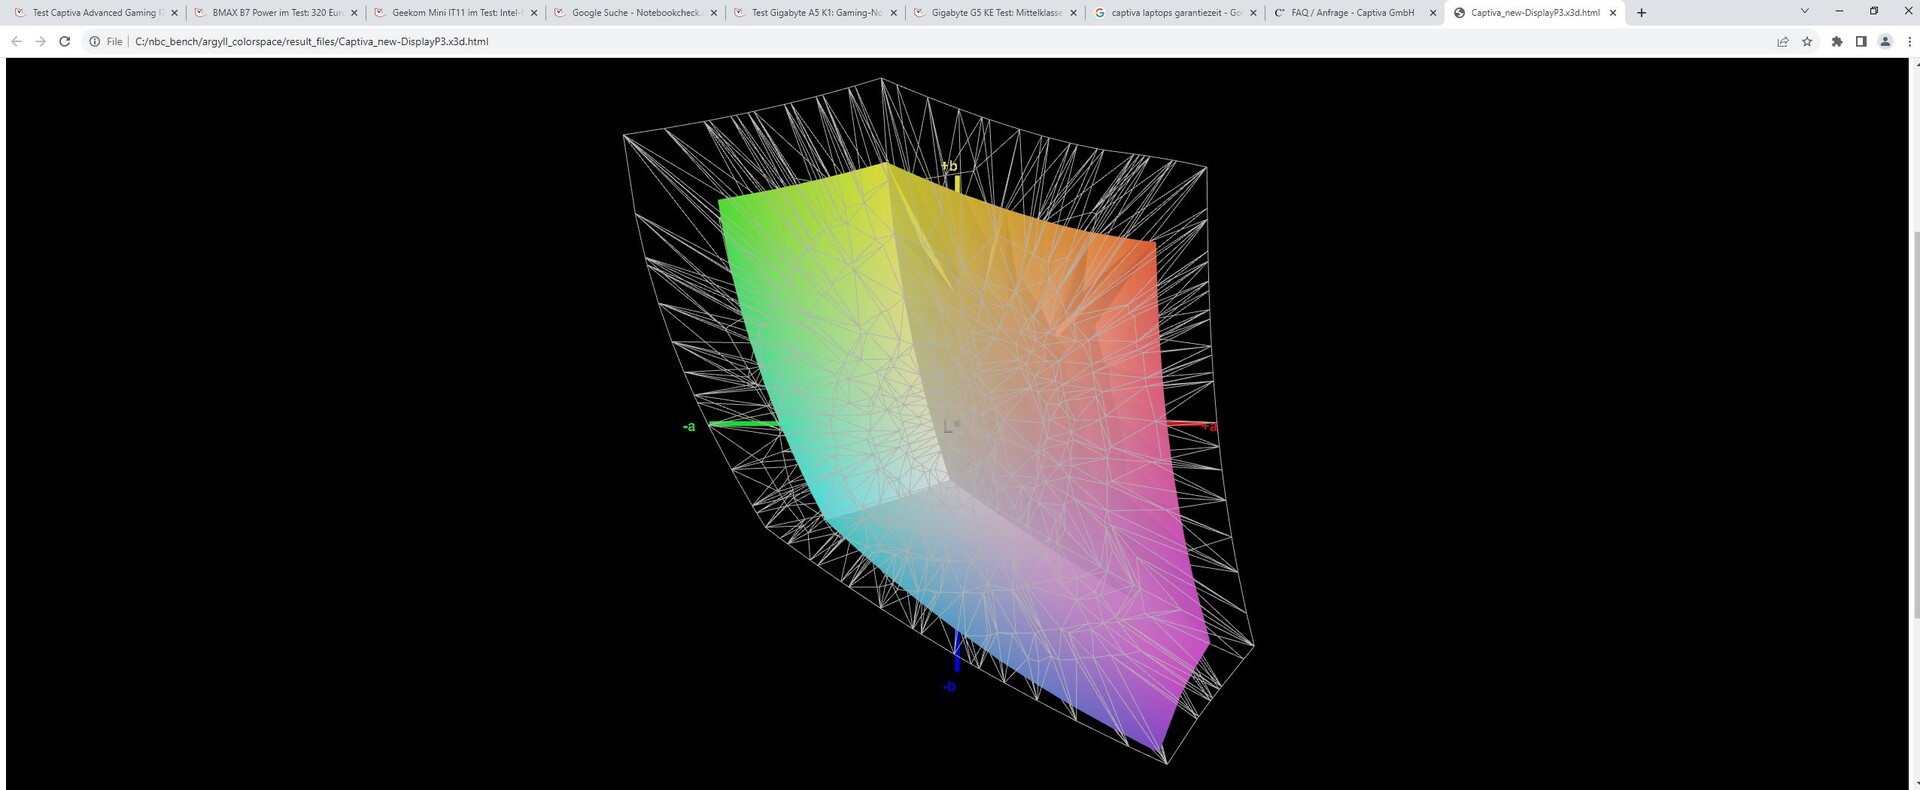
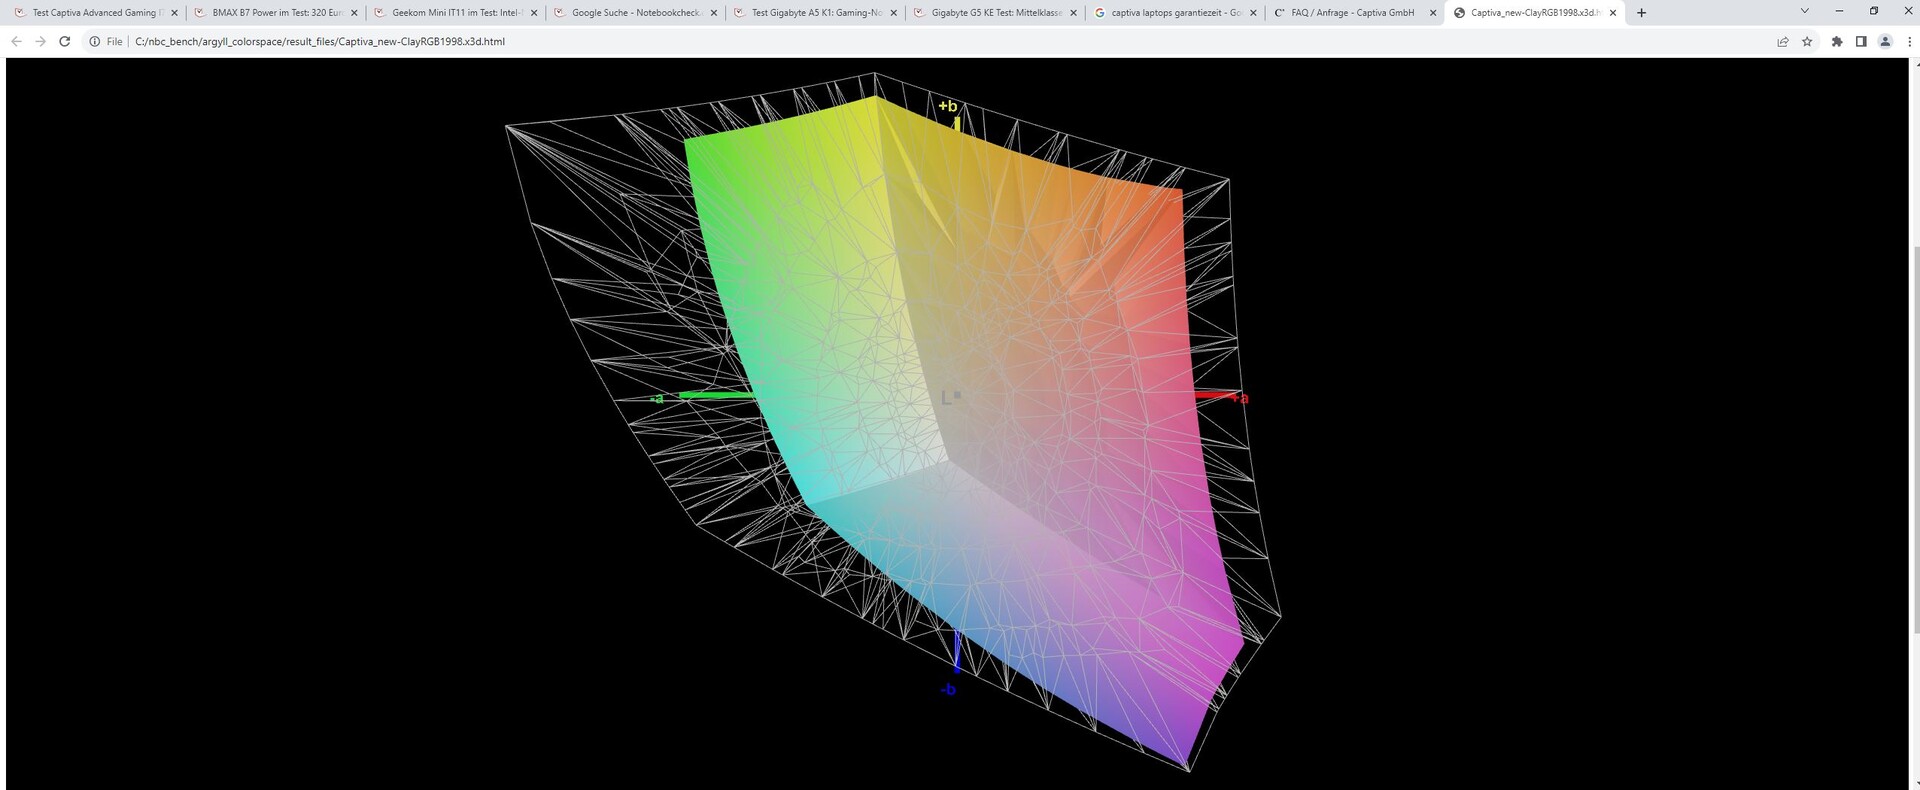
66% AdobeRGB 1998 (Argyll 3D)
93.2% sRGB (Argyll 3D)
64% Display P3 (Argyll 3D)
Gamma: 2.31
CCT: 7633 K
| Captiva Advanced Gaming I74-121 BOE08B3, IPS, 1920x1080, 15.6" | MSI Cyborg 15 A12VF AU Optronics B156HAN15.1, IPS, 1920x1080, 15.6" | Dell G15 5530 AUO B156HAN, IPS, 1920x1080, 15.6" | Lenovo Legion Slim 5 16APH8 BOE NJ NE160QDM-NYC, IPS, 2560x1600, 16" | Lenovo LOQ 15APH8 BOE NJ NE156FHM-NX3, IPS, 1920x1080, 15.6" | Schenker XMG Core 15 (M22) CSOT MNF601CA1-1, IPS, 2560x1440, 15.6" | |
|---|---|---|---|---|---|---|
| Display | -34% | 11% | 7% | -36% | 7% | |
| Display P3 Coverage (%) | 64 | 42.3 -34% | 73.1 14% | 69.3 8% | 40.2 -37% | 68.8 8% |
| sRGB Coverage (%) | 93.2 | 62.6 -33% | 98.4 6% | 100 7% | 60.2 -35% | 99.3 7% |
| AdobeRGB 1998 Coverage (%) | 66 | 43.7 -34% | 74.4 13% | 70 6% | 41.5 -37% | 69.9 6% |
| Response Times | -213% | 31% | -59% | -490% | -111% | |
| Response Time Grey 50% / Grey 80% * (ms) | 5 ? | 22 ? -340% | 3.39 ? 32% | 10.7 ? -114% | 42.7 ? -754% | 16 ? -220% |
| Response Time Black / White * (ms) | 7.55 ? | 14 ? -85% | 5.35 ? 29% | 7.8 ? -3% | 24.5 ? -225% | 7.6 ? -1% |
| PWM Frequency (Hz) | 21620 ? | |||||
| Screen | -19% | -0% | 27% | -14% | -0% | |
| Brightness middle (cd/m²) | 346 | 247 -29% | 320 -8% | 371.6 7% | 346.2 0% | 378 9% |
| Brightness (cd/m²) | 324 | 234 -28% | 316 -2% | 343 6% | 329 2% | 371 15% |
| Brightness Distribution (%) | 90 | 89 -1% | 94 4% | 84 -7% | 81 -10% | 93 3% |
| Black Level * (cd/m²) | 0.35 | 0.25 29% | 0.21 40% | 0.44 -26% | 0.31 11% | 0.33 6% |
| Contrast (:1) | 989 | 988 0% | 1524 54% | 845 -15% | 1117 13% | 1145 16% |
| Colorchecker dE 2000 * | 4.12 | 3.78 8% | 4.55 -10% | 1.52 63% | 4.19 -2% | 2.84 31% |
| Colorchecker dE 2000 max. * | 7.78 | 6.42 17% | 9.83 -26% | 2.68 66% | 19.19 -147% | 5.51 29% |
| Colorchecker dE 2000 calibrated * | 1.22 | 3.94 -223% | 1.51 -24% | 0.33 73% | 1.66 -36% | 2.75 -125% |
| Greyscale dE 2000 * | 4.81 | 2.16 55% | 6.2 -29% | 1.2 75% | 2.6 46% | 4.08 15% |
| Gamma | 2.31 95% | 2.33 94% | 2.07 106% | 2.1 105% | 2.19 100% | 2.4 92% |
| CCT | 7633 85% | 6906 94% | 6479 100% | 6503 100% | 6749 96% | 5841 111% |
| Media total (Programa/Opciones) | -89% /
-50% | 14% /
7% | -8% /
10% | -180% /
-87% | -35% /
-14% |
* ... más pequeño es mejor
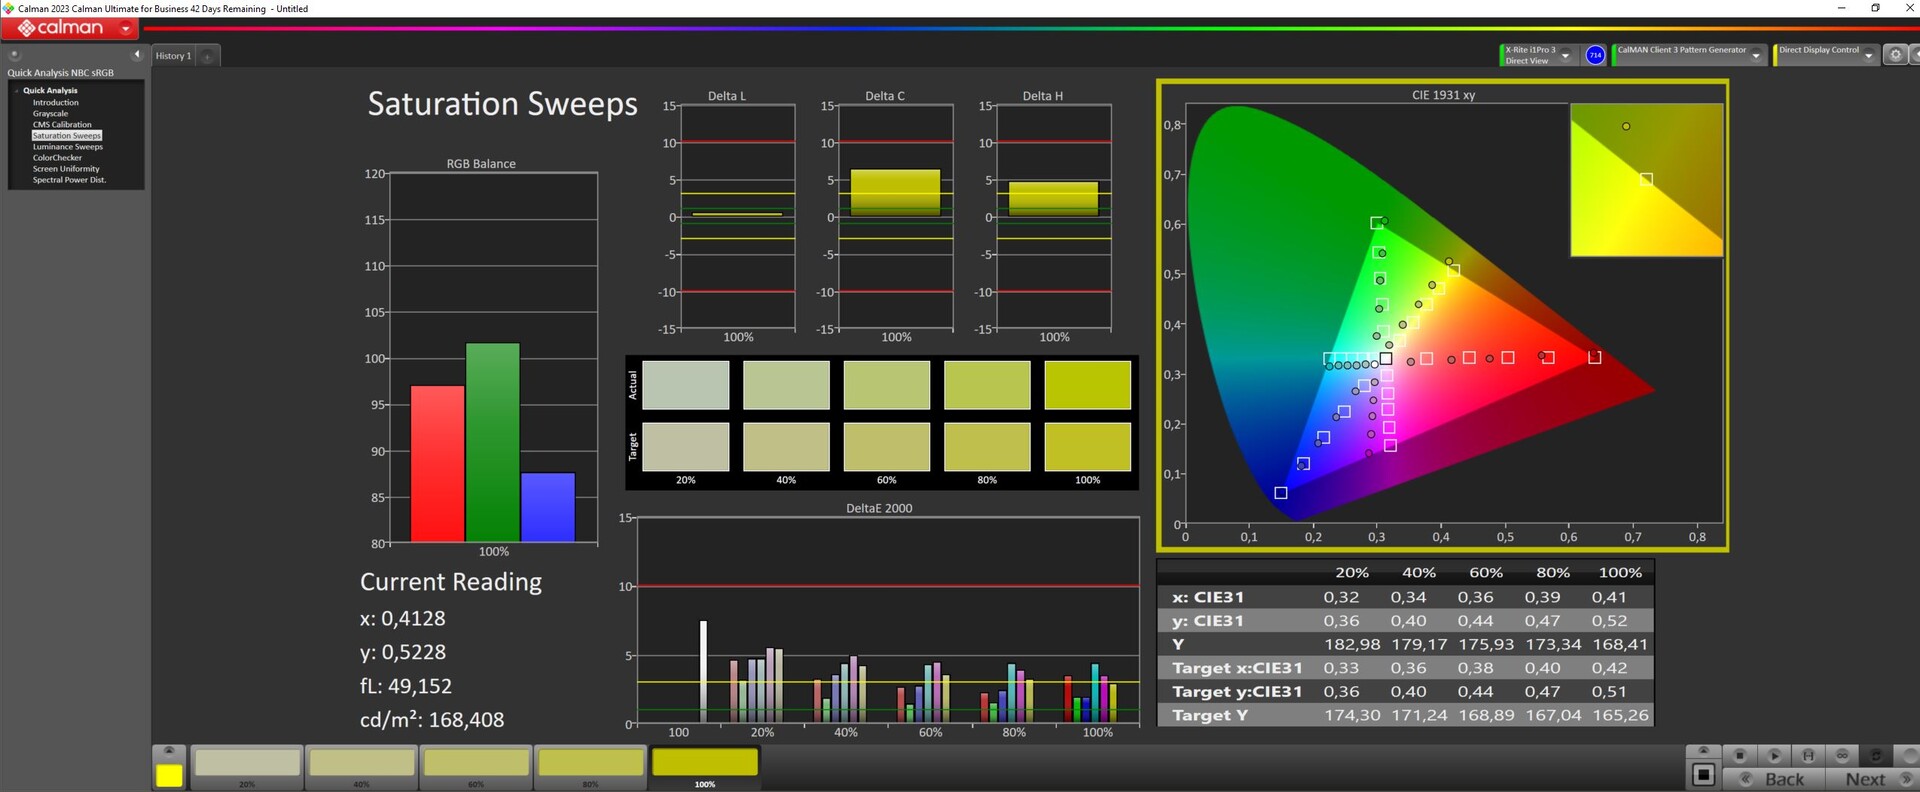
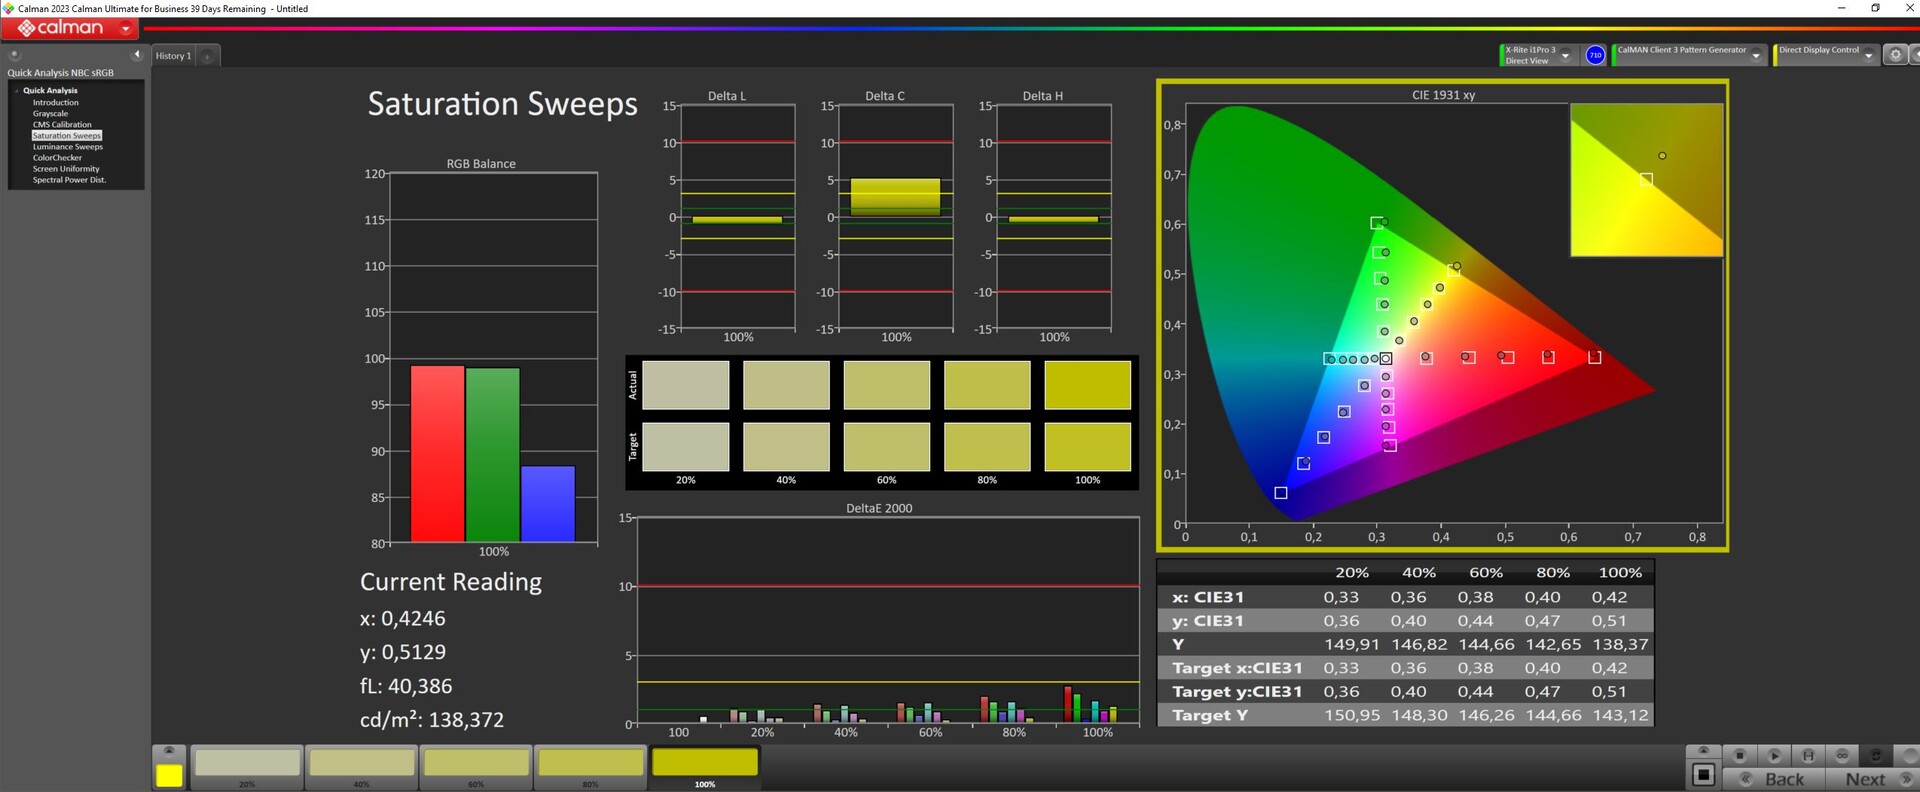
El panel BOE no tiene una cobertura del espacio de color terriblemente buena. Incluso sRGB sólo cubre el 93%, DisplayP3 y AdobeRGB alrededor del 65%.
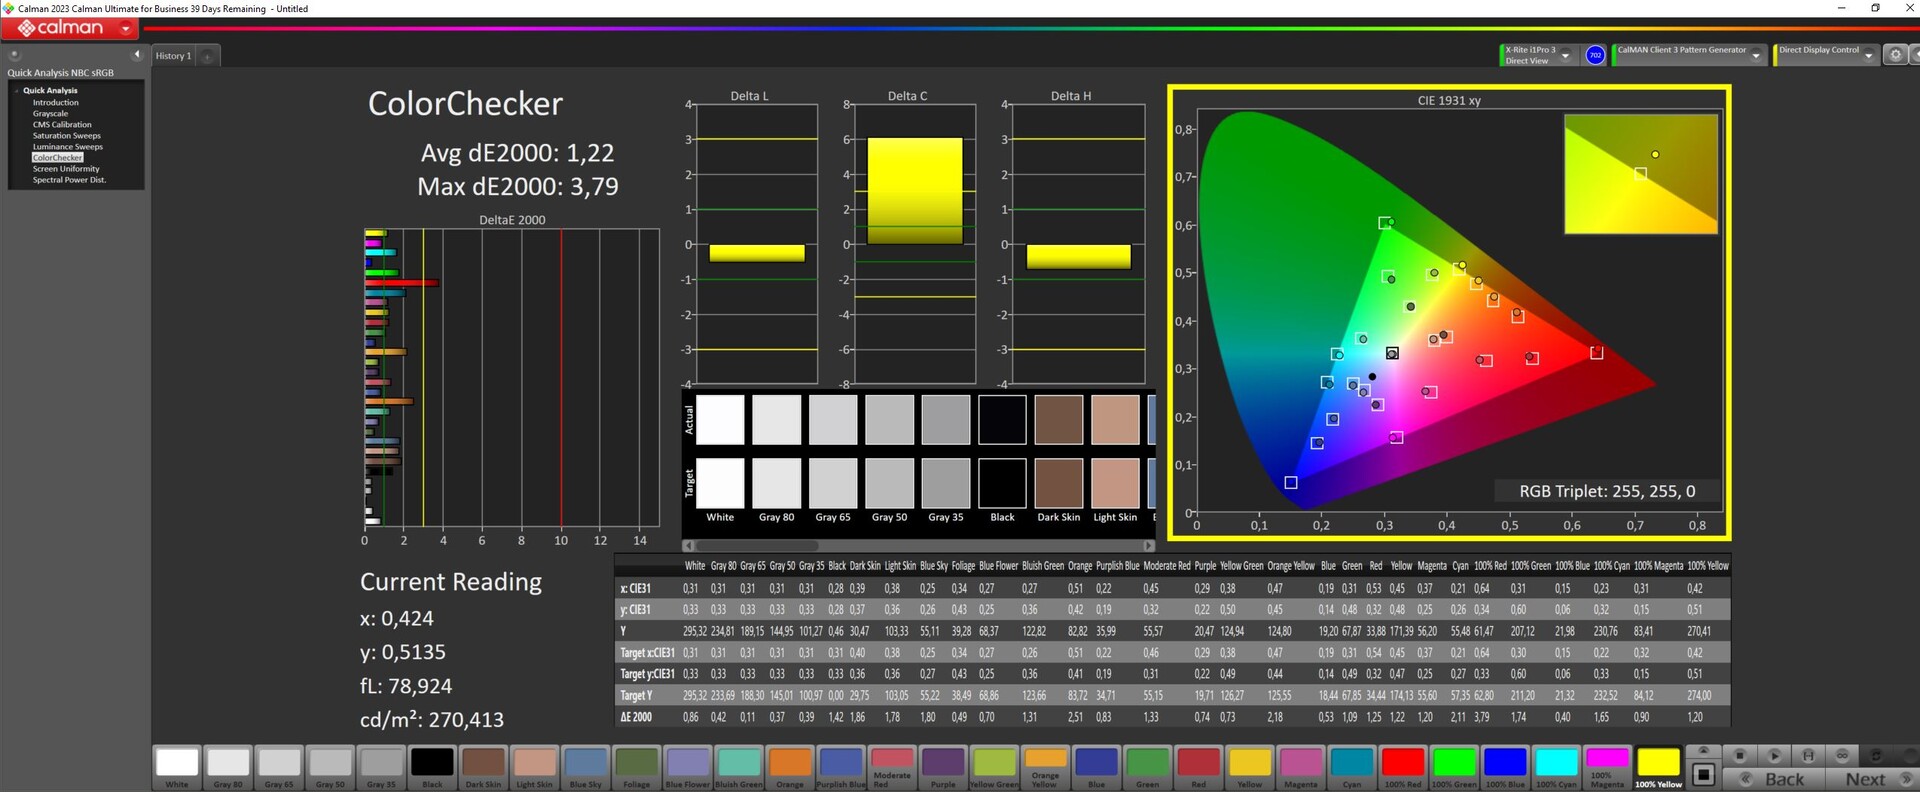
De fábrica, el panel está calibrado de forma subóptima y sus desviaciones de color son bastante elevadas. Una calibración con ayuda de un dispositivo de medición del color XRite y el software Calman redujo significativamente los valores DeltaE del color y la escala de grises. Antes, las desviaciones eran superiores a 4 y después, rondaban 1.
Nuestro perfil icc calibrado puede descargarse gratuitamente si se desplaza un poco más arriba.
Tiempos de respuesta del display
| ↔ Tiempo de respuesta de Negro a Blanco | ||
|---|---|---|
| 7.55 ms ... subida ↗ y bajada ↘ combinada | ↗ 3.7 ms subida | 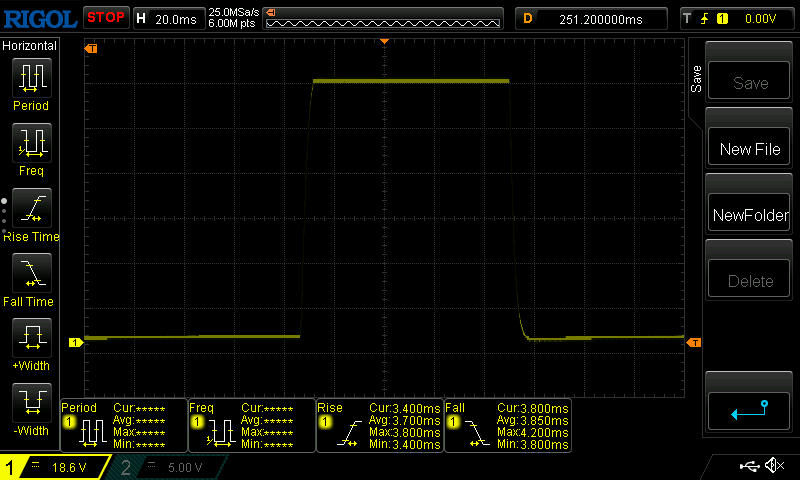 |
| ↘ 3.85 ms bajada | ||
| La pantalla mostró tiempos de respuesta muy rápidos en nuestros tests y debería ser adecuada para juegos frenéticos. En comparación, todos los dispositivos de prueba van de ##min### (mínimo) a 240 (máximo) ms. » 22 % de todos los dispositivos son mejores. Esto quiere decir que el tiempo de respuesta medido es mejor que la media (19.8 ms) de todos los dispositivos testados. | ||
| ↔ Tiempo de respuesta 50% Gris a 80% Gris | ||
| 5 ms ... subida ↗ y bajada ↘ combinada | ↗ 2.422 ms subida | 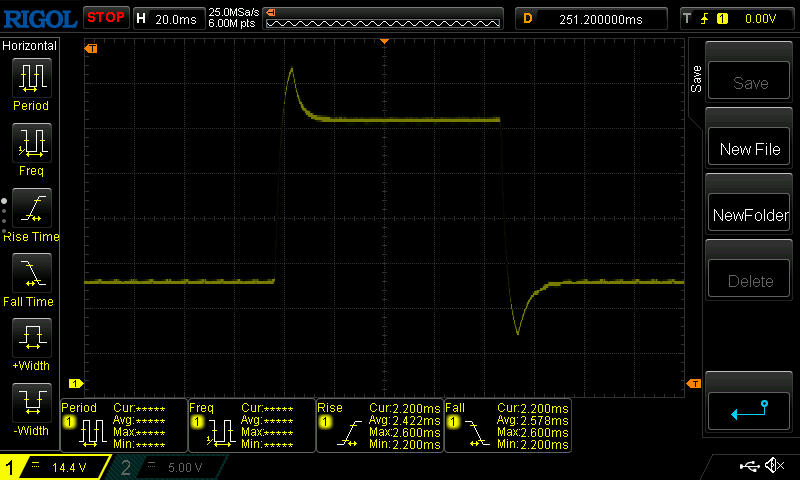 |
| ↘ 2.578 ms bajada | ||
| La pantalla mostró tiempos de respuesta muy rápidos en nuestros tests y debería ser adecuada para juegos frenéticos. En comparación, todos los dispositivos de prueba van de ##min### (mínimo) a 636 (máximo) ms. » 17 % de todos los dispositivos son mejores. Esto quiere decir que el tiempo de respuesta medido es mejor que la media (31 ms) de todos los dispositivos testados. | ||
Parpadeo de Pantalla / PWM (Pulse-Width Modulation)
| Parpadeo de Pantalla / PWM no detectado |  | ||
Comparación: 52 % de todos los dispositivos testados no usaron PWM para atenuar el display. Si se usó, medimos una media de 7751 (mínimo: 5 - máxmo: 343500) Hz. | |||
En el exterior, se puede leer perfectamente en la pantalla a la sombra. Su superficie mate evita la mayoría de los reflejos y su brillo es suficiente con más de 300 nits. Sin embargo, tendrás que evitar la luz solar directa.

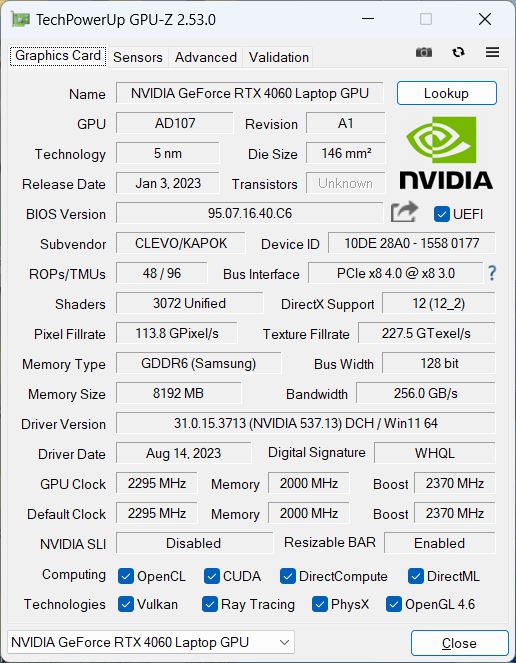
Rendimiento - El i5-13500H con una RTX 4060 (140 W)
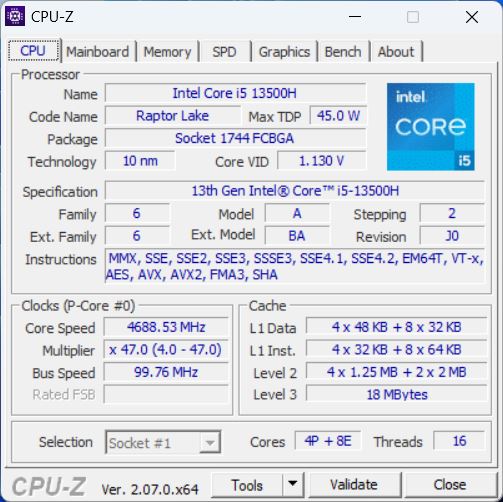
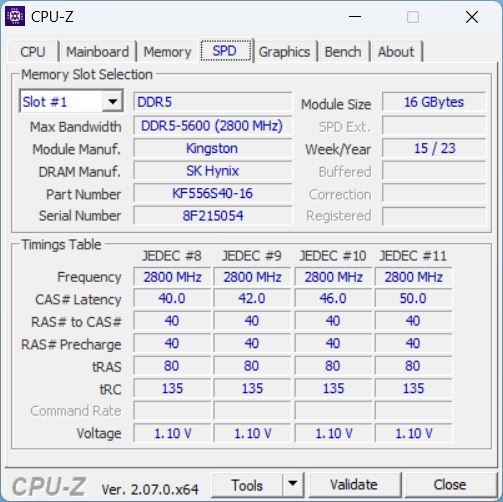
Nuestro modelo de 15 pulgadas está equipado con unCore i5-13500Hy unaRTX 406016 GB de RAM y un SSD de 1 TB, lo que lo convierte en un portátil de juegos de nivel básico a medio. Su pantalla Full HD 16:9 y su precio relativamente bajo sugieren que se puede clasificar más como un dispositivo económico.
Como alternativa, puedes adquirir el portátil con una tarjeta gráficaRTX 4070en lugar de una RTX 4060 - pero solo los modelos de 17 pulgadas te dan la opción de elegir unaRTX 4080así como los procesadores Intel HX significativamente más rápidos.
Condiciones de ensayo
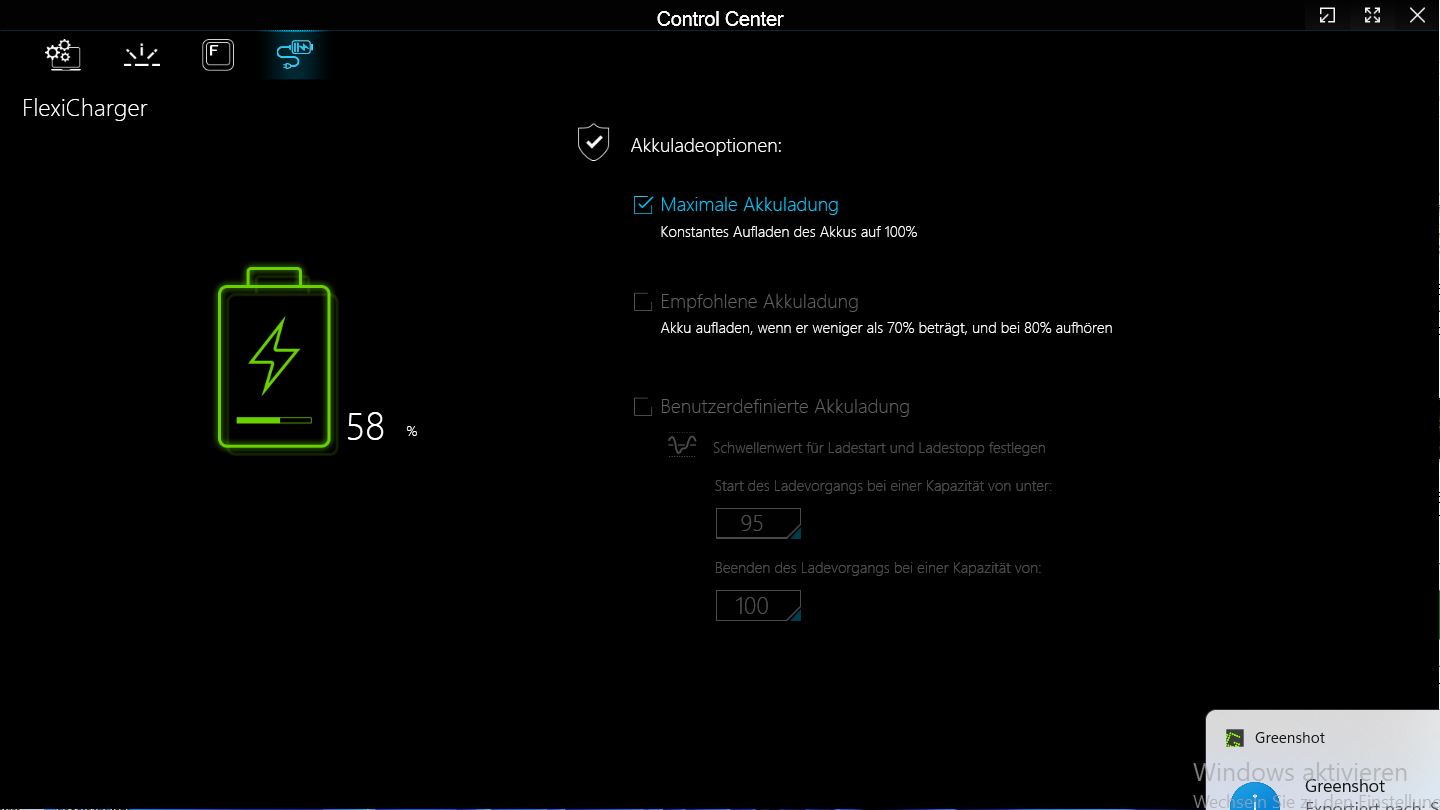
El Centro de Control está instalado en el Captiva. Dispone de los ajustes habituales para controlar el rendimiento, el teclado, la webcam, etc. Se puede elegir entre cuatro modos de rendimiento: modo de rendimiento, modo de entretenimiento, modo de ahorro de energía y modo silencioso.
Para obtener los mejores resultados en los benchmarks, seleccionamos el modo de rendimiento, aunque también hablaremos un poco más de los otros modos durante nuestras pruebas.

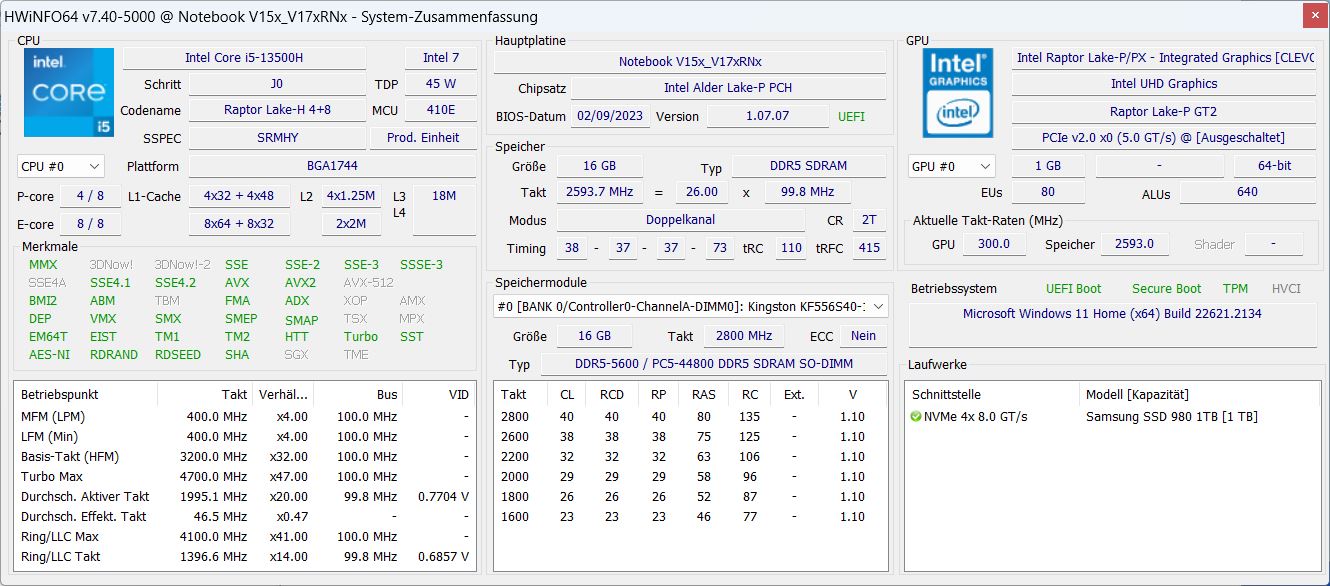
Procesador
La Intel Core i5-13500H es una CPU de gama media de la serie Raptor Lake H lanzada en enero de 2023. La CPU cuenta con cuatro núcleos de rendimiento y ocho núcleos de eficiencia. Esto suma 16 subprocesos, ya que sólo los núcleos P admiten hyper-threading, con frecuencias de entre 2,6 y 4,7 GHz (boost de un núcleo, el boost multinúcleo permite un máximo de 4,6 GHz). Los núcleos E van de 1,9 a 3,5 GHz.
En nuestro bucle Cinebench R15, su rendimiento se mantuvo muy estable y no notamos ninguna caída de rendimiento tras las primeras ejecuciones.
A lo largo de todas las pruebas de CPU, el i5-13500H del Captiva logró resultados ligeramente superiores a la media en comparación con todos los demás portátiles con la misma CPU de nuestra base de datos. El Dell G15 con su CPU HX sigue siendo bastante más rápido, pero los dispositivos Lenovo con CPUs AMD actuales sólo tenían una ligera ventaja en velocidad.
En modo batería, el TGP se hunde a unos 20 vatios y el rendimiento de la CPU cae alrededor de un 50%.
Cinebench R15 Multi continuous test
Cinebench R23: Multi Core | Single Core
Cinebench R20: CPU (Multi Core) | CPU (Single Core)
Cinebench R15: CPU Multi 64Bit | CPU Single 64Bit
Blender: v2.79 BMW27 CPU
7-Zip 18.03: 7z b 4 | 7z b 4 -mmt1
Geekbench 5.5: Multi-Core | Single-Core
HWBOT x265 Benchmark v2.2: 4k Preset
LibreOffice : 20 Documents To PDF
R Benchmark 2.5: Overall mean
| CPU Performance rating | |
| Media de la clase Gaming | |
| Dell G15 5530 | |
| Lenovo Legion Slim 5 16APH8 | |
| Lenovo LOQ 15APH8 | |
| Captiva Advanced Gaming I74-121 | |
| MSI Cyborg 15 A12VF | |
| Medio Intel Core i5-13500H | |
| Schenker XMG Core 15 (M22) | |
| Cinebench R23 / Multi Core | |
| Media de la clase Gaming (10488 - 42661, n=108, últimos 2 años) | |
| Dell G15 5530 | |
| Lenovo Legion Slim 5 16APH8 | |
| Lenovo LOQ 15APH8 | |
| Captiva Advanced Gaming I74-121 | |
| Medio Intel Core i5-13500H (13542 - 16335, n=5) | |
| Schenker XMG Core 15 (M22) | |
| MSI Cyborg 15 A12VF | |
| Cinebench R23 / Single Core | |
| Media de la clase Gaming (1166 - 2415, n=108, últimos 2 años) | |
| Dell G15 5530 | |
| Lenovo Legion Slim 5 16APH8 | |
| Lenovo LOQ 15APH8 | |
| Captiva Advanced Gaming I74-121 | |
| MSI Cyborg 15 A12VF | |
| Medio Intel Core i5-13500H (1704 - 1799, n=5) | |
| Schenker XMG Core 15 (M22) | |
| Cinebench R20 / CPU (Multi Core) | |
| Media de la clase Gaming (4029 - 16433, n=107, últimos 2 años) | |
| Dell G15 5530 | |
| Lenovo Legion Slim 5 16APH8 | |
| Lenovo LOQ 15APH8 | |
| Captiva Advanced Gaming I74-121 | |
| Schenker XMG Core 15 (M22) | |
| MSI Cyborg 15 A12VF | |
| Medio Intel Core i5-13500H (5108 - 6212, n=5) | |
| Cinebench R20 / CPU (Single Core) | |
| Media de la clase Gaming (442 - 913, n=107, últimos 2 años) | |
| Dell G15 5530 | |
| Lenovo Legion Slim 5 16APH8 | |
| Lenovo LOQ 15APH8 | |
| Captiva Advanced Gaming I74-121 | |
| MSI Cyborg 15 A12VF | |
| Medio Intel Core i5-13500H (655 - 687, n=5) | |
| Schenker XMG Core 15 (M22) | |
| Cinebench R15 / CPU Multi 64Bit | |
| Media de la clase Gaming (1578 - 6330, n=106, últimos 2 años) | |
| Dell G15 5530 | |
| Lenovo LOQ 15APH8 | |
| Lenovo Legion Slim 5 16APH8 | |
| Captiva Advanced Gaming I74-121 | |
| Schenker XMG Core 15 (M22) | |
| Medio Intel Core i5-13500H (2234 - 2475, n=5) | |
| MSI Cyborg 15 A12VF | |
| Cinebench R15 / CPU Single 64Bit | |
| Media de la clase Gaming (188.8 - 350, n=107, últimos 2 años) | |
| Lenovo Legion Slim 5 16APH8 | |
| Lenovo LOQ 15APH8 | |
| Dell G15 5530 | |
| Captiva Advanced Gaming I74-121 | |
| Medio Intel Core i5-13500H (243 - 261, n=5) | |
| Schenker XMG Core 15 (M22) | |
| MSI Cyborg 15 A12VF | |
| Blender / v2.79 BMW27 CPU | |
| MSI Cyborg 15 A12VF | |
| Medio Intel Core i5-13500H (205 - 263, n=6) | |
| Schenker XMG Core 15 (M22) | |
| Captiva Advanced Gaming I74-121 | |
| Lenovo LOQ 15APH8 | |
| Lenovo Legion Slim 5 16APH8 | |
| Dell G15 5530 | |
| Media de la clase Gaming (79 - 330, n=105, últimos 2 años) | |
| 7-Zip 18.03 / 7z b 4 | |
| Media de la clase Gaming (33491 - 148086, n=106, últimos 2 años) | |
| Dell G15 5530 | |
| Lenovo Legion Slim 5 16APH8 | |
| Schenker XMG Core 15 (M22) | |
| Lenovo LOQ 15APH8 | |
| Captiva Advanced Gaming I74-121 | |
| MSI Cyborg 15 A12VF | |
| Medio Intel Core i5-13500H (50846 - 58567, n=6) | |
| 7-Zip 18.03 / 7z b 4 -mmt1 | |
| Lenovo Legion Slim 5 16APH8 | |
| Media de la clase Gaming (4199 - 7436, n=106, últimos 2 años) | |
| Lenovo LOQ 15APH8 | |
| Captiva Advanced Gaming I74-121 | |
| Dell G15 5530 | |
| Schenker XMG Core 15 (M22) | |
| MSI Cyborg 15 A12VF | |
| Medio Intel Core i5-13500H (5500 - 5885, n=6) | |
| Geekbench 5.5 / Multi-Core | |
| Media de la clase Gaming (6460 - 28263, n=106, últimos 2 años) | |
| Dell G15 5530 | |
| Lenovo Legion Slim 5 16APH8 | |
| MSI Cyborg 15 A12VF | |
| Medio Intel Core i5-13500H (9312 - 11465, n=5) | |
| Captiva Advanced Gaming I74-121 | |
| Schenker XMG Core 15 (M22) | |
| Lenovo LOQ 15APH8 | |
| Geekbench 5.5 / Single-Core | |
| Media de la clase Gaming (986 - 2474, n=106, últimos 2 años) | |
| Lenovo Legion Slim 5 16APH8 | |
| Dell G15 5530 | |
| Lenovo LOQ 15APH8 | |
| MSI Cyborg 15 A12VF | |
| Captiva Advanced Gaming I74-121 | |
| Medio Intel Core i5-13500H (1674 - 1762, n=5) | |
| Schenker XMG Core 15 (M22) | |
| HWBOT x265 Benchmark v2.2 / 4k Preset | |
| Media de la clase Gaming (11.5 - 44.4, n=106, últimos 2 años) | |
| Dell G15 5530 | |
| Lenovo Legion Slim 5 16APH8 | |
| Schenker XMG Core 15 (M22) | |
| Captiva Advanced Gaming I74-121 | |
| Lenovo LOQ 15APH8 | |
| MSI Cyborg 15 A12VF | |
| MSI Cyborg 15 A12VF | |
| Medio Intel Core i5-13500H (14.4 - 17.9, n=6) | |
| LibreOffice / 20 Documents To PDF | |
| Schenker XMG Core 15 (M22) | |
| Captiva Advanced Gaming I74-121 | |
| Medio Intel Core i5-13500H (44 - 65.5, n=5) | |
| Media de la clase Gaming (33.2 - 88.8, n=106, últimos 2 años) | |
| Dell G15 5530 | |
| Lenovo LOQ 15APH8 | |
| MSI Cyborg 15 A12VF | |
| Lenovo Legion Slim 5 16APH8 | |
| R Benchmark 2.5 / Overall mean | |
| Medio Intel Core i5-13500H (0.471 - 0.51, n=6) | |
| Captiva Advanced Gaming I74-121 | |
| Schenker XMG Core 15 (M22) | |
| MSI Cyborg 15 A12VF | |
| Lenovo LOQ 15APH8 | |
| Lenovo Legion Slim 5 16APH8 | |
| Media de la clase Gaming (0.3439 - 0.759, n=107, últimos 2 años) | |
| Dell G15 5530 | |
* ... más pequeño es mejor
AIDA64: FP32 Ray-Trace | FPU Julia | CPU SHA3 | CPU Queen | FPU SinJulia | FPU Mandel | CPU AES | CPU ZLib | FP64 Ray-Trace | CPU PhotoWorxx
| Performance rating | |
| Media de la clase Gaming | |
| Lenovo Legion Slim 5 16APH8 | |
| Lenovo LOQ 15APH8 | |
| Dell G15 5530 | |
| Schenker XMG Core 15 (M22) | |
| Captiva Advanced Gaming I74-121 | |
| Medio Intel Core i5-13500H | |
| MSI Cyborg 15 A12VF | |
| AIDA64 / FP32 Ray-Trace | |
| Media de la clase Gaming (10227 - 85542, n=106, últimos 2 años) | |
| Lenovo LOQ 15APH8 | |
| Lenovo Legion Slim 5 16APH8 | |
| Dell G15 5530 | |
| Schenker XMG Core 15 (M22) | |
| Captiva Advanced Gaming I74-121 | |
| Medio Intel Core i5-13500H (11081 - 15390, n=6) | |
| MSI Cyborg 15 A12VF | |
| AIDA64 / FPU Julia | |
| Media de la clase Gaming (51376 - 372155, n=106, últimos 2 años) | |
| Lenovo LOQ 15APH8 | |
| Lenovo Legion Slim 5 16APH8 | |
| Schenker XMG Core 15 (M22) | |
| Dell G15 5530 | |
| Captiva Advanced Gaming I74-121 | |
| MSI Cyborg 15 A12VF | |
| Medio Intel Core i5-13500H (56813 - 74251, n=6) | |
| AIDA64 / CPU SHA3 | |
| Media de la clase Gaming (2180 - 10115, n=106, últimos 2 años) | |
| Lenovo LOQ 15APH8 | |
| Lenovo Legion Slim 5 16APH8 | |
| Dell G15 5530 | |
| Captiva Advanced Gaming I74-121 | |
| Schenker XMG Core 15 (M22) | |
| Medio Intel Core i5-13500H (2621 - 3623, n=6) | |
| MSI Cyborg 15 A12VF | |
| AIDA64 / CPU Queen | |
| Lenovo Legion Slim 5 16APH8 | |
| Lenovo LOQ 15APH8 | |
| Media de la clase Gaming (49785 - 173351, n=90, últimos 2 años) | |
| Dell G15 5530 | |
| Schenker XMG Core 15 (M22) | |
| Captiva Advanced Gaming I74-121 | |
| MSI Cyborg 15 A12VF | |
| Medio Intel Core i5-13500H (77835 - 85727, n=6) | |
| AIDA64 / FPU SinJulia | |
| Lenovo Legion Slim 5 16APH8 | |
| Lenovo LOQ 15APH8 | |
| Media de la clase Gaming (4424 - 33636, n=106, últimos 2 años) | |
| Schenker XMG Core 15 (M22) | |
| Dell G15 5530 | |
| MSI Cyborg 15 A12VF | |
| Captiva Advanced Gaming I74-121 | |
| Medio Intel Core i5-13500H (7249 - 8086, n=6) | |
| AIDA64 / FPU Mandel | |
| Media de la clase Gaming (25115 - 196829, n=106, últimos 2 años) | |
| Lenovo LOQ 15APH8 | |
| Lenovo Legion Slim 5 16APH8 | |
| Schenker XMG Core 15 (M22) | |
| Dell G15 5530 | |
| Captiva Advanced Gaming I74-121 | |
| Medio Intel Core i5-13500H (27820 - 38336, n=6) | |
| MSI Cyborg 15 A12VF | |
| AIDA64 / CPU AES | |
| Captiva Advanced Gaming I74-121 | |
| Media de la clase Gaming (39258 - 247074, n=106, últimos 2 años) | |
| Medio Intel Core i5-13500H (62657 - 120493, n=6) | |
| Dell G15 5530 | |
| Lenovo LOQ 15APH8 | |
| Lenovo Legion Slim 5 16APH8 | |
| Schenker XMG Core 15 (M22) | |
| MSI Cyborg 15 A12VF | |
| AIDA64 / CPU ZLib | |
| Media de la clase Gaming (574 - 2531, n=106, últimos 2 años) | |
| Dell G15 5530 | |
| Lenovo LOQ 15APH8 | |
| Lenovo Legion Slim 5 16APH8 | |
| Captiva Advanced Gaming I74-121 | |
| Medio Intel Core i5-13500H (782 - 992, n=6) | |
| Schenker XMG Core 15 (M22) | |
| MSI Cyborg 15 A12VF | |
| AIDA64 / FP64 Ray-Trace | |
| Media de la clase Gaming (5509 - 45446, n=106, últimos 2 años) | |
| Lenovo LOQ 15APH8 | |
| Lenovo Legion Slim 5 16APH8 | |
| Dell G15 5530 | |
| Schenker XMG Core 15 (M22) | |
| Captiva Advanced Gaming I74-121 | |
| Medio Intel Core i5-13500H (5955 - 8495, n=6) | |
| MSI Cyborg 15 A12VF | |
| AIDA64 / CPU PhotoWorxx | |
| Media de la clase Gaming (12271 - 89891, n=106, últimos 2 años) | |
| Dell G15 5530 | |
| MSI Cyborg 15 A12VF | |
| Lenovo Legion Slim 5 16APH8 | |
| Medio Intel Core i5-13500H (20212 - 37618, n=6) | |
| Schenker XMG Core 15 (M22) | |
| Captiva Advanced Gaming I74-121 | |
| Lenovo LOQ 15APH8 | |
Rendimiento del sistema
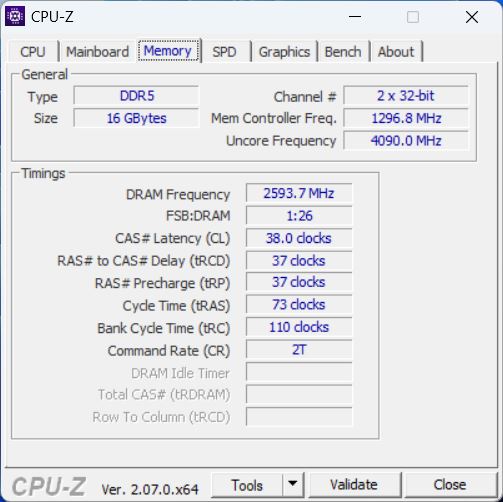
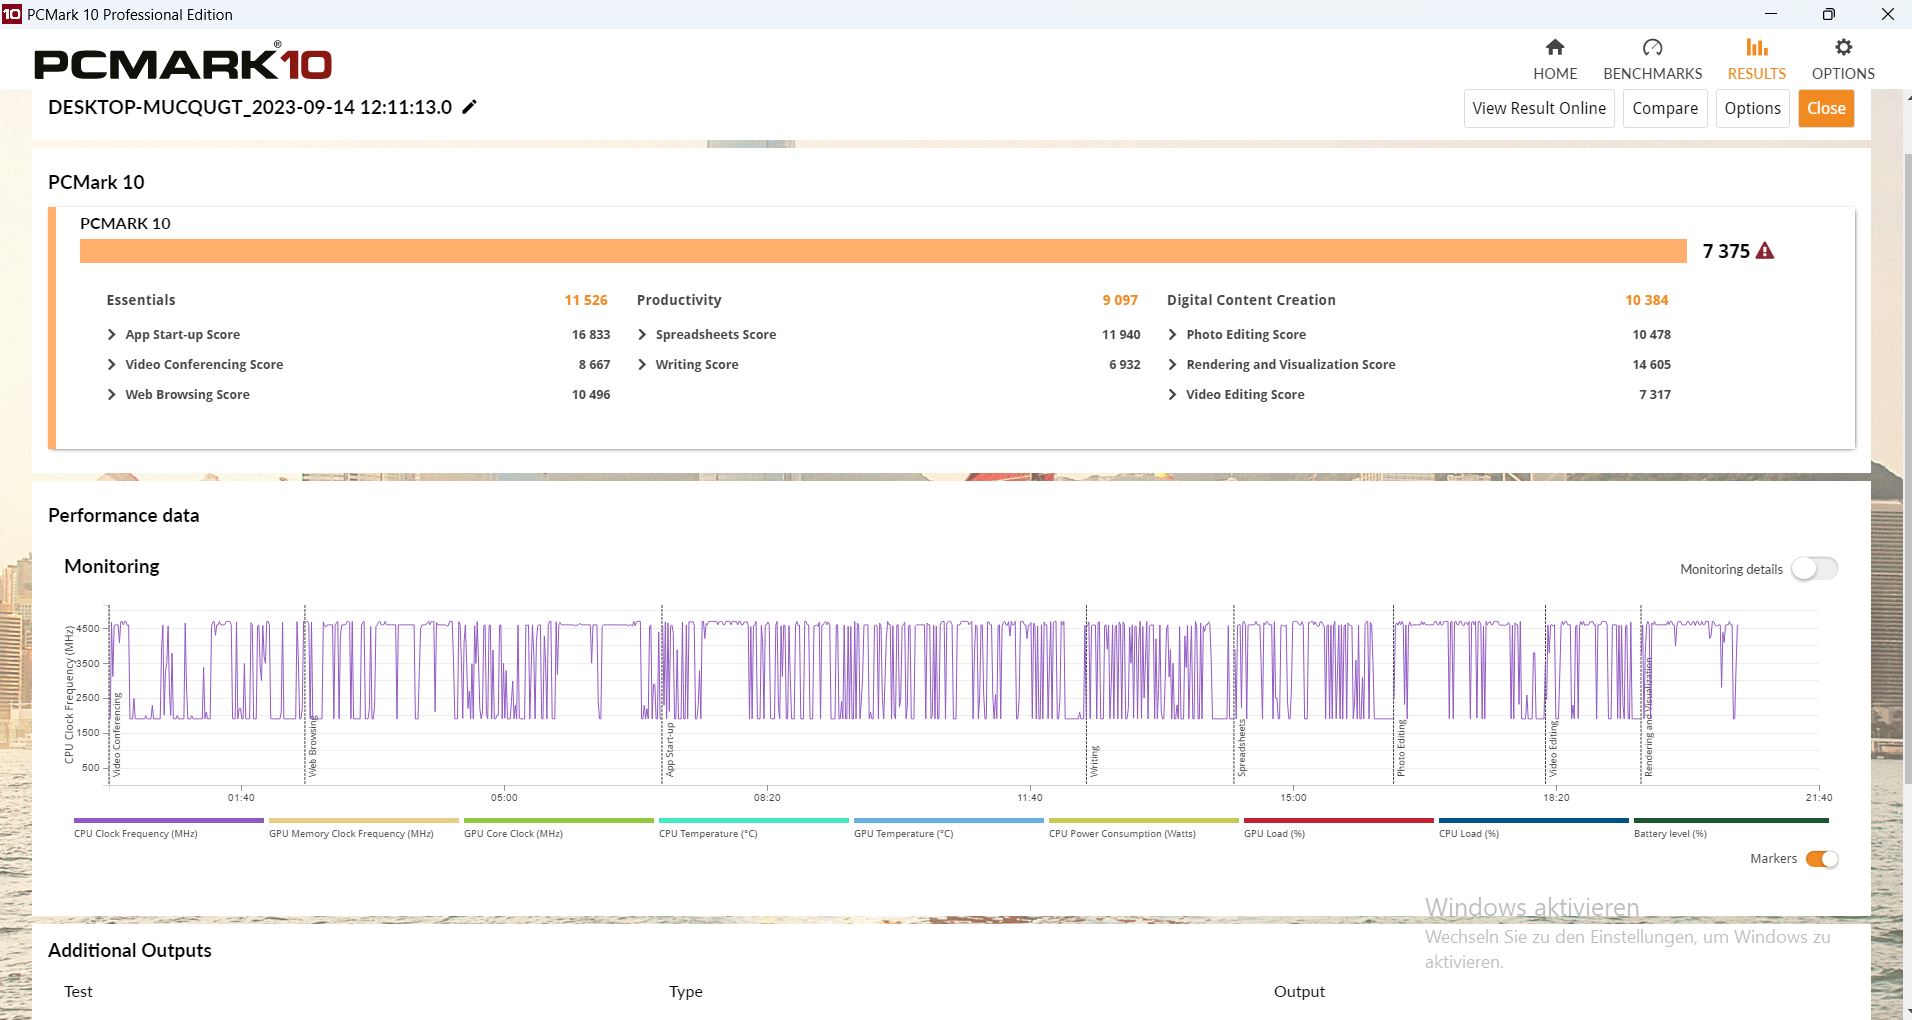
La puntuación PCMark del portátil Captiva fue la esperada. En la subprueba Essentials, incluso quedó por encima. En cambio, el portátil flaqueó en productividad, lo que probablemente se deba a su RAM ligeramente más lenta, como muestra AIDA. En general, el dispositivo logró resultados superiores a la media para un portátil de juegos.
CrossMark: Overall | Productivity | Creativity | Responsiveness
| PCMark 10 / Score | |
| Media de la clase Gaming (5828 - 12414, n=94, últimos 2 años) | |
| Lenovo Legion Slim 5 16APH8 | |
| Lenovo LOQ 15APH8 | |
| Captiva Advanced Gaming I74-121 | |
| Medio Intel Core i5-13500H, NVIDIA GeForce RTX 4060 Laptop GPU (n=1) | |
| Schenker XMG Core 15 (M22) | |
| MSI Cyborg 15 A12VF | |
| Dell G15 5530 | |
| PCMark 10 / Essentials | |
| Captiva Advanced Gaming I74-121 | |
| Medio Intel Core i5-13500H, NVIDIA GeForce RTX 4060 Laptop GPU (n=1) | |
| Lenovo Legion Slim 5 16APH8 | |
| Dell G15 5530 | |
| Schenker XMG Core 15 (M22) | |
| MSI Cyborg 15 A12VF | |
| Media de la clase Gaming (8810 - 11935, n=98, últimos 2 años) | |
| Lenovo LOQ 15APH8 | |
| PCMark 10 / Productivity | |
| Media de la clase Gaming (6845 - 25323, n=96, últimos 2 años) | |
| Lenovo Legion Slim 5 16APH8 | |
| Dell G15 5530 | |
| Lenovo LOQ 15APH8 | |
| MSI Cyborg 15 A12VF | |
| Schenker XMG Core 15 (M22) | |
| Captiva Advanced Gaming I74-121 | |
| Medio Intel Core i5-13500H, NVIDIA GeForce RTX 4060 Laptop GPU (n=1) | |
| PCMark 10 / Digital Content Creation | |
| Media de la clase Gaming (7602 - 19954, n=96, últimos 2 años) | |
| Lenovo Legion Slim 5 16APH8 | |
| Lenovo LOQ 15APH8 | |
| Captiva Advanced Gaming I74-121 | |
| Medio Intel Core i5-13500H, NVIDIA GeForce RTX 4060 Laptop GPU (n=1) | |
| Schenker XMG Core 15 (M22) | |
| MSI Cyborg 15 A12VF | |
| Dell G15 5530 | |
| CrossMark / Overall | |
| Media de la clase Gaming (1366 - 2409, n=95, últimos 2 años) | |
| Dell G15 5530 | |
| Lenovo Legion Slim 5 16APH8 | |
| MSI Cyborg 15 A12VF | |
| Captiva Advanced Gaming I74-121 | |
| Medio Intel Core i5-13500H, NVIDIA GeForce RTX 4060 Laptop GPU (n=1) | |
| Lenovo LOQ 15APH8 | |
| Schenker XMG Core 15 (M22) | |
| CrossMark / Productivity | |
| Media de la clase Gaming (1386 - 2254, n=95, últimos 2 años) | |
| Lenovo Legion Slim 5 16APH8 | |
| Dell G15 5530 | |
| MSI Cyborg 15 A12VF | |
| Captiva Advanced Gaming I74-121 | |
| Medio Intel Core i5-13500H, NVIDIA GeForce RTX 4060 Laptop GPU (n=1) | |
| Lenovo LOQ 15APH8 | |
| Schenker XMG Core 15 (M22) | |
| CrossMark / Creativity | |
| Media de la clase Gaming (1343 - 2786, n=95, últimos 2 años) | |
| Dell G15 5530 | |
| Lenovo Legion Slim 5 16APH8 | |
| MSI Cyborg 15 A12VF | |
| Schenker XMG Core 15 (M22) | |
| Captiva Advanced Gaming I74-121 | |
| Medio Intel Core i5-13500H, NVIDIA GeForce RTX 4060 Laptop GPU (n=1) | |
| Lenovo LOQ 15APH8 | |
| CrossMark / Responsiveness | |
| Media de la clase Gaming (1226 - 2334, n=95, últimos 2 años) | |
| MSI Cyborg 15 A12VF | |
| Captiva Advanced Gaming I74-121 | |
| Medio Intel Core i5-13500H, NVIDIA GeForce RTX 4060 Laptop GPU (n=1) | |
| Dell G15 5530 | |
| Lenovo Legion Slim 5 16APH8 | |
| Lenovo LOQ 15APH8 | |
| Schenker XMG Core 15 (M22) | |
| PCMark 10 Score | 7375 puntos | |
ayuda | ||
| AIDA64 / Memory Copy | |
| Media de la clase Gaming (21750 - 129946, n=106, últimos 2 años) | |
| Lenovo Legion Slim 5 16APH8 | |
| Dell G15 5530 | |
| MSI Cyborg 15 A12VF | |
| Schenker XMG Core 15 (M22) | |
| Medio Intel Core i5-13500H (36916 - 57830, n=6) | |
| Captiva Advanced Gaming I74-121 | |
| Lenovo LOQ 15APH8 | |
| AIDA64 / Memory Read | |
| Media de la clase Gaming (22956 - 118858, n=106, últimos 2 años) | |
| Dell G15 5530 | |
| MSI Cyborg 15 A12VF | |
| Lenovo Legion Slim 5 16APH8 | |
| Medio Intel Core i5-13500H (41676 - 65633, n=6) | |
| Schenker XMG Core 15 (M22) | |
| Captiva Advanced Gaming I74-121 | |
| Lenovo LOQ 15APH8 | |
| AIDA64 / Memory Write | |
| Lenovo Legion Slim 5 16APH8 | |
| Media de la clase Gaming (22297 - 135096, n=106, últimos 2 años) | |
| Dell G15 5530 | |
| MSI Cyborg 15 A12VF | |
| Schenker XMG Core 15 (M22) | |
| Medio Intel Core i5-13500H (36826 - 60523, n=6) | |
| Captiva Advanced Gaming I74-121 | |
| Lenovo LOQ 15APH8 | |
| AIDA64 / Memory Latency | |
| Media de la clase Gaming (75.3 - 259, n=106, últimos 2 años) | |
| Lenovo LOQ 15APH8 | |
| Lenovo Legion Slim 5 16APH8 | |
| Medio Intel Core i5-13500H (86.2 - 96.1, n=6) | |
| MSI Cyborg 15 A12VF | |
| Dell G15 5530 | |
| Captiva Advanced Gaming I74-121 | |
| Schenker XMG Core 15 (M22) | |
* ... más pequeño es mejor
Latencia del CPD
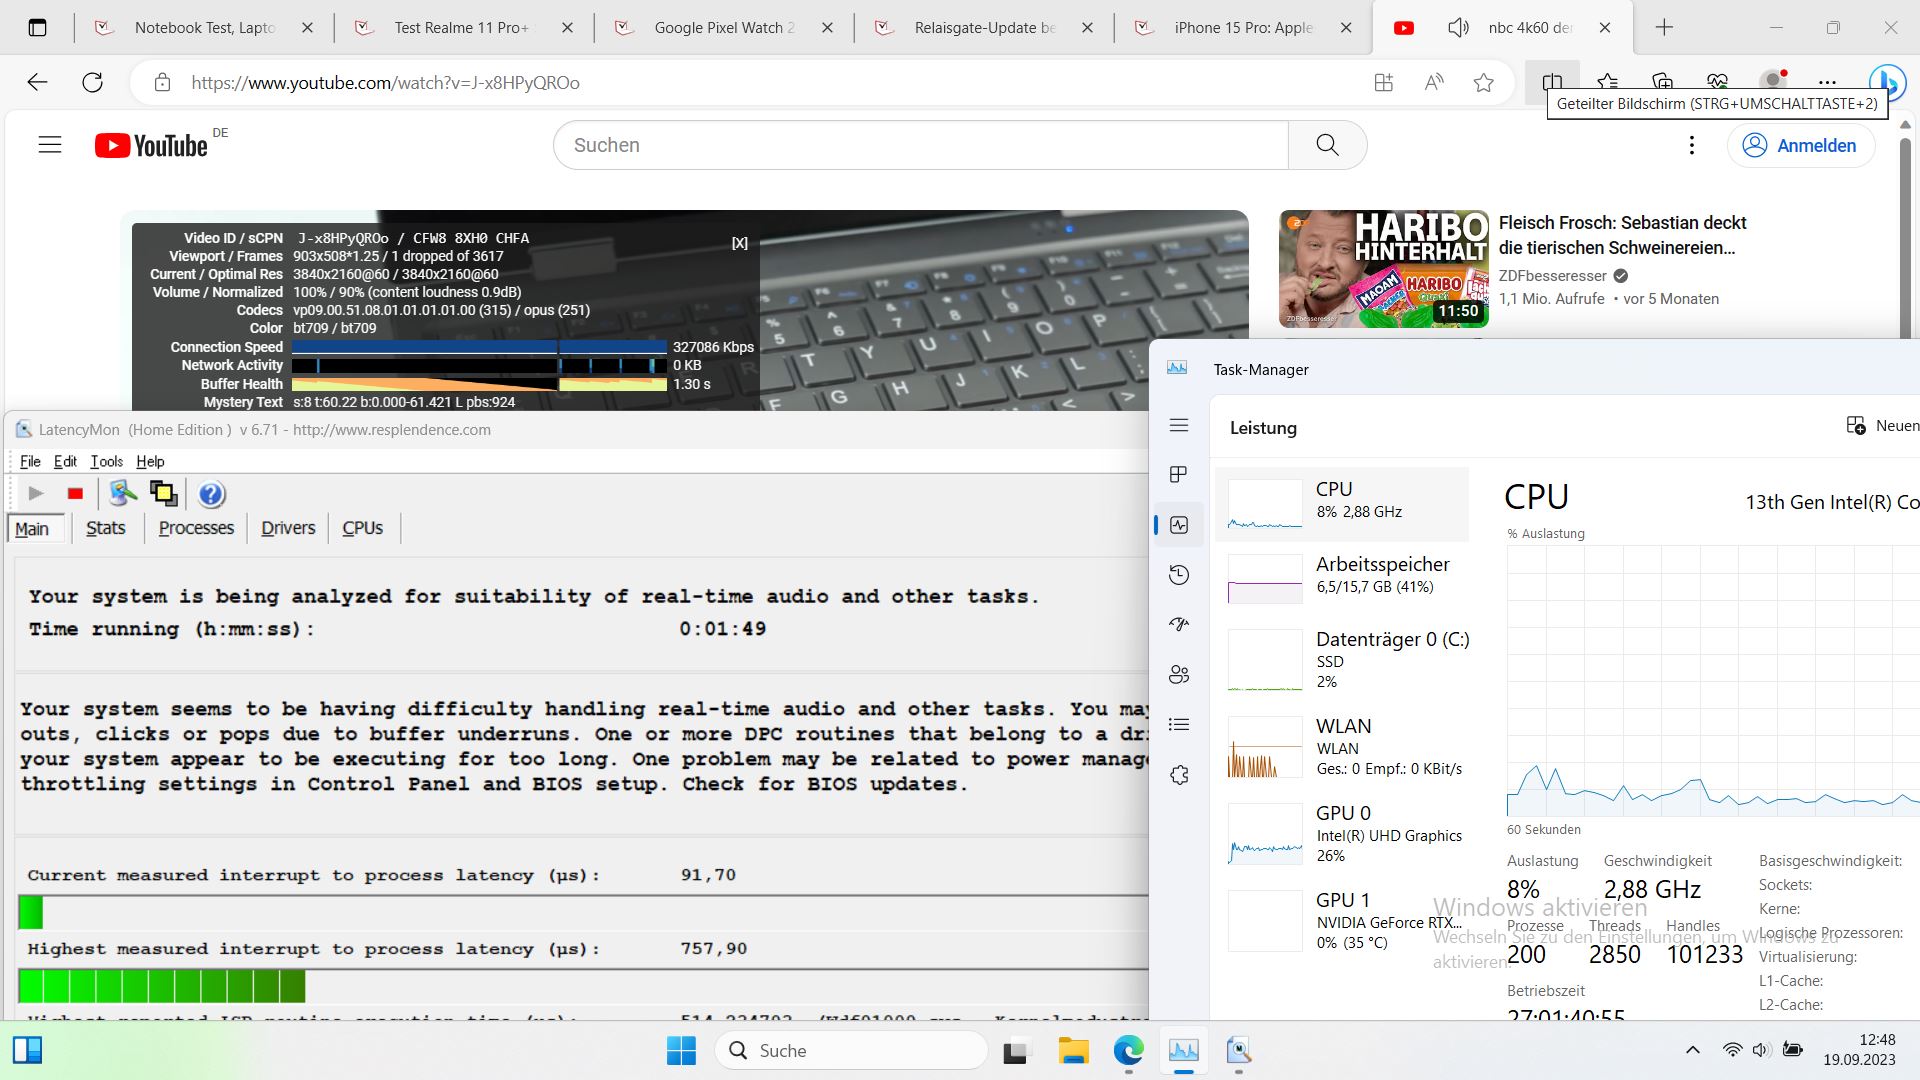
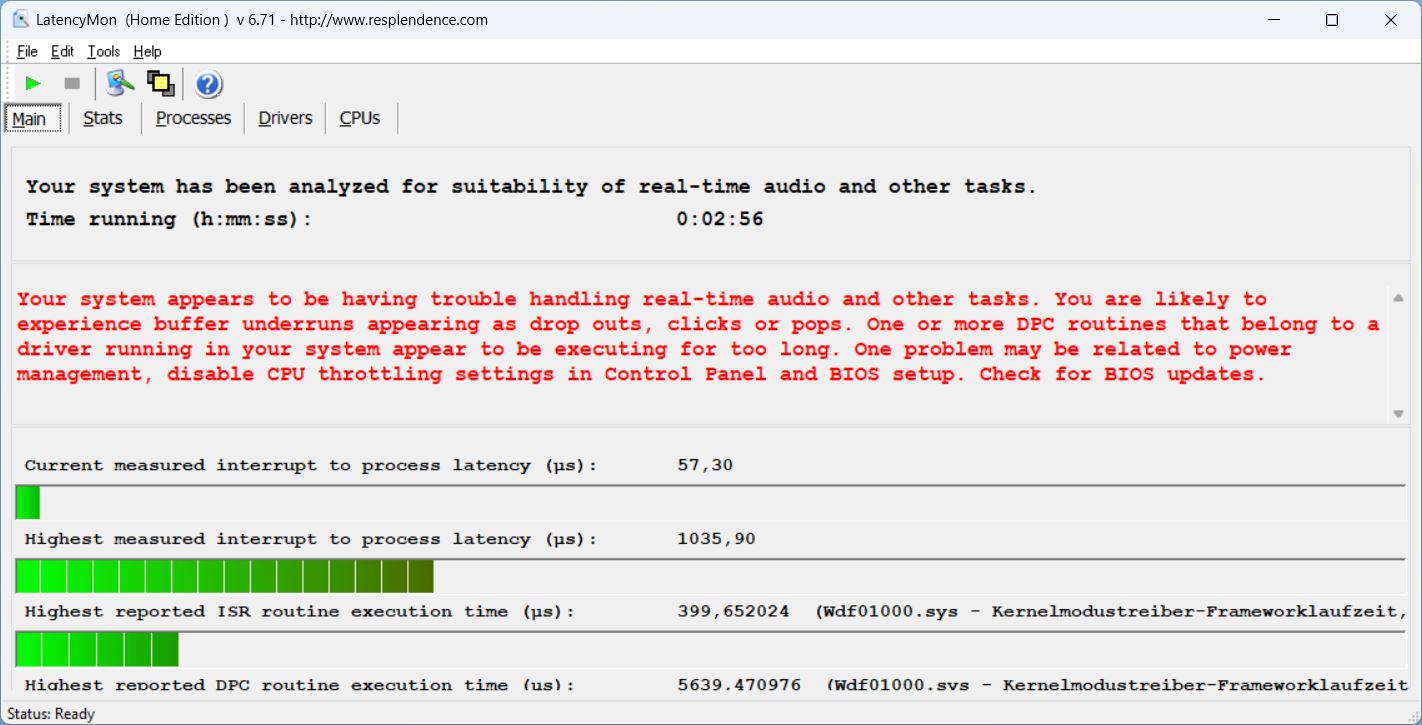
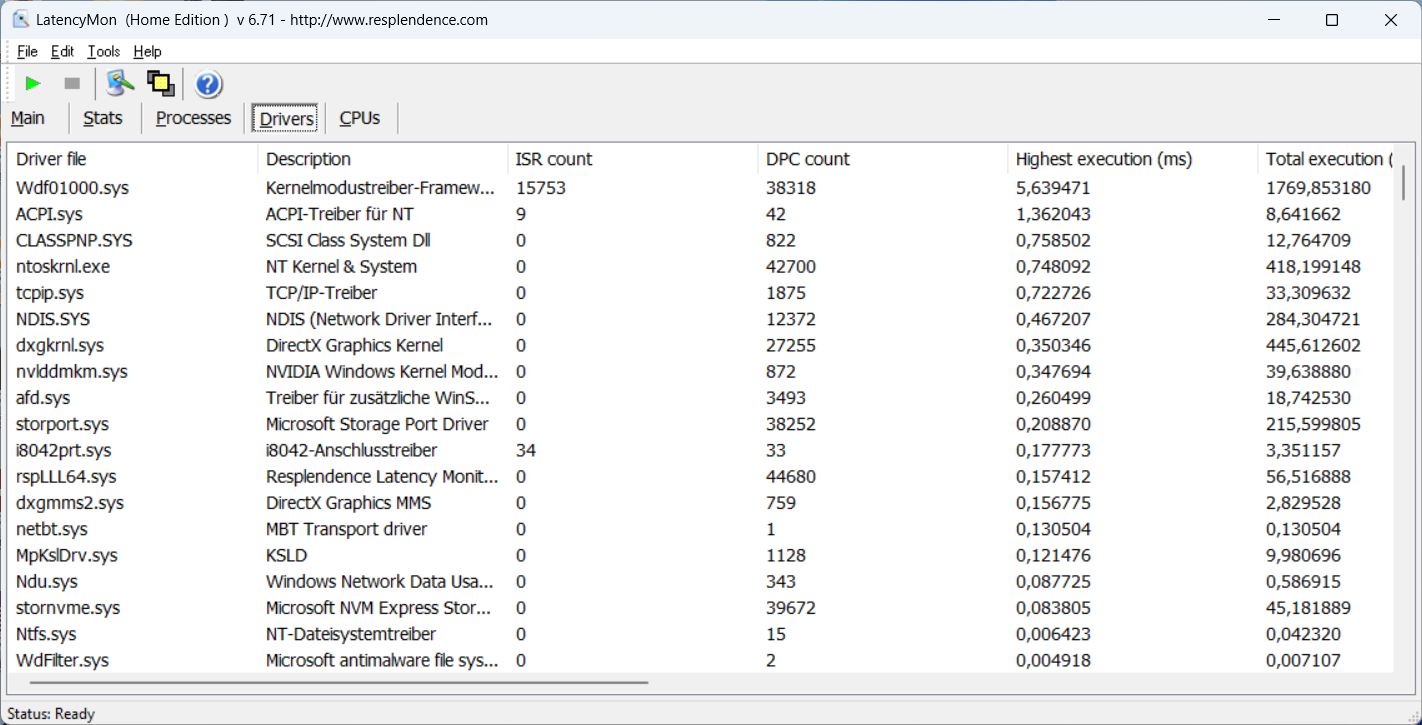
Al abrir varias pestañas del navegador o nuestro sitio web, el Captiva no mostró ningún problema, ni siquiera con varias pestañas. Los primeros pequeños problemas se observaron al abrir nuestro vídeo 4K/60 fps de YouTube. Las latencias fueron relativamente bajas: salvo un fotograma perdido, el vídeo se reprodujo sin problemas.
| DPC Latencies / LatencyMon - interrupt to process latency (max), Web, Youtube, Prime95 | |
| Dell G15 5530 | |
| Schenker XMG Core 15 (M22) | |
| Lenovo LOQ 15APH8 | |
| MSI Cyborg 15 A12VF | |
| Captiva Advanced Gaming I74-121 | |
| Lenovo Legion Slim 5 16APH8 | |
* ... más pequeño es mejor
Dispositivos de almacenamiento
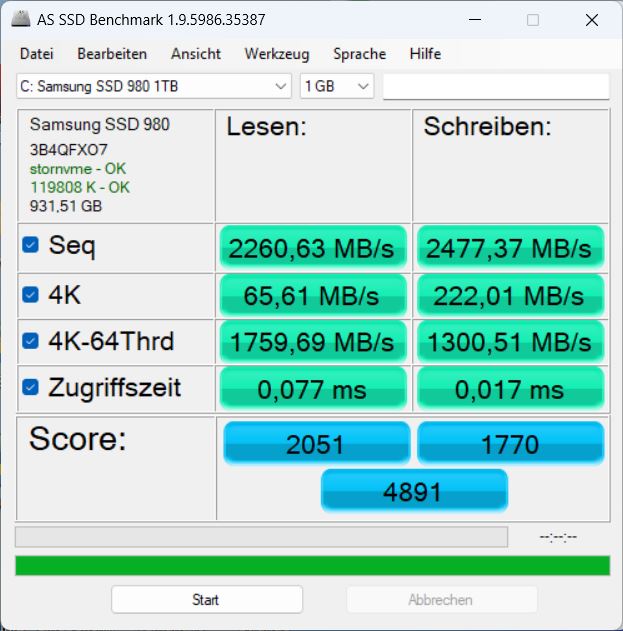
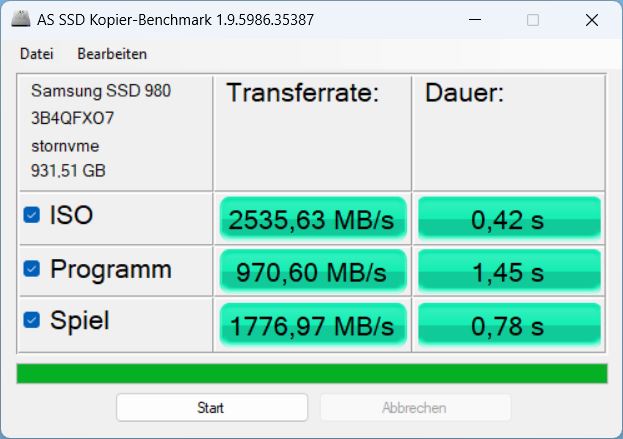
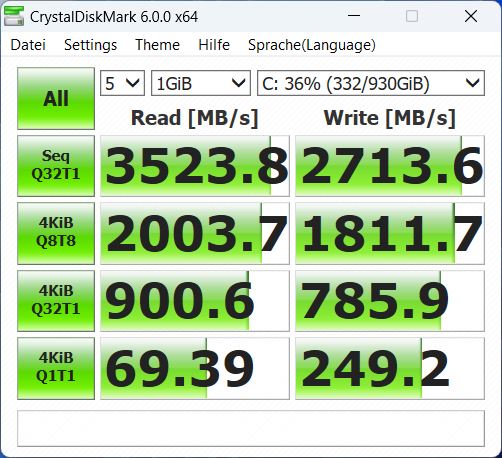
El Captiva no muestra debilidades cuando se trata de almacenamiento masivo. En nuestro modelo de pruebas, hay instalado un muy conocido Samsung SSD 980 con 1 TB de almacenamiento. Puede que aún sea de la generación PCIe 3.0, pero es uno de sus mejores modelos. A estas alturas, también hay algunos SSDs más rápidos (como muestra nuestra comparación), pero este dispositivo de almacenamiento sigue logrando resultados medios superiores.
En el Captiva, el SSD rindió un 10% más rápido que el modelo medio (Samsung 980 de 1 TB) de nuestra base de datos y, además, su rendimiento fue constante durante un largo periodo de tiempo y el ahogo térmico nunca fue un problema.

* ... más pequeño es mejor
Reading continuous performance: DiskSpd Read Loop, Queue Depth 8
Tarjeta gráfica
El Captiva se basa en laNvidia Geforce RTX 4060como tarjeta gráfica y tiene acceso a hasta 140 vatios incluyendo Dynamic Boost.
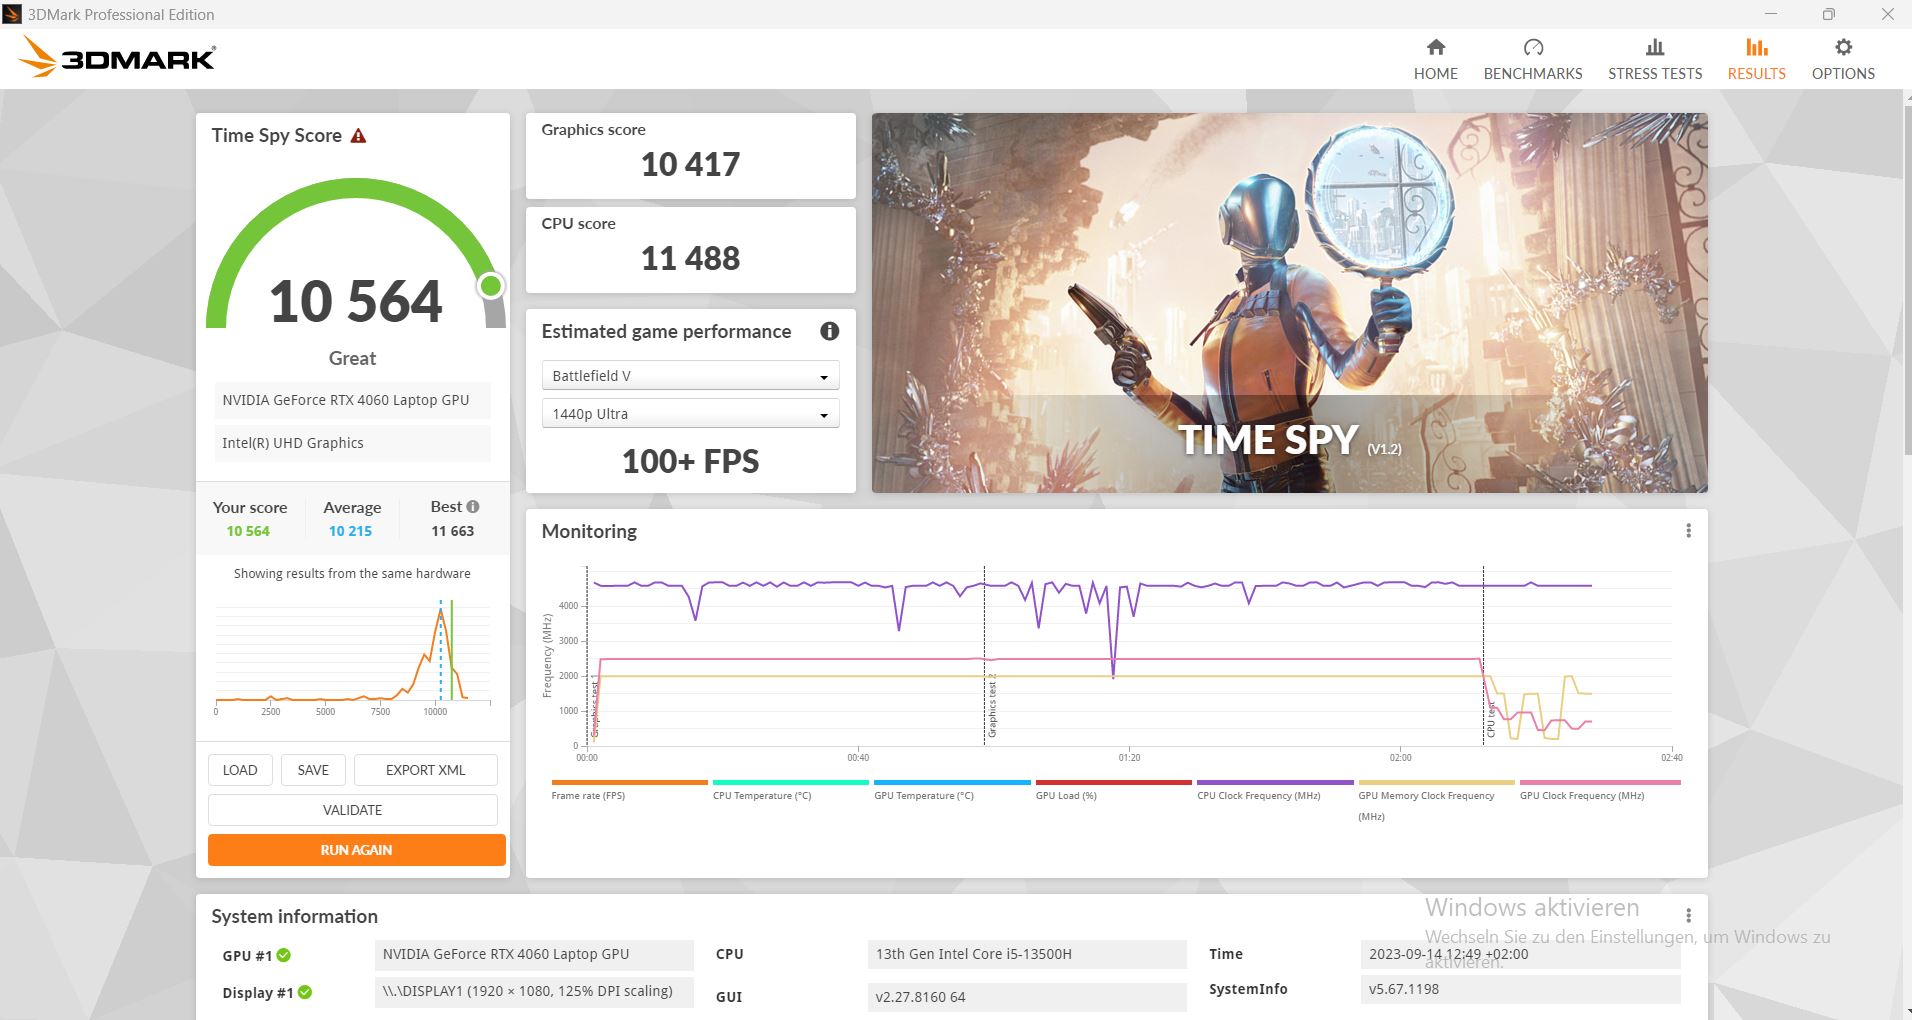
Si bien el rendimiento del procesador se situó en el campo de la media baja, los resultados del banco de pruebas 3DMark del portátil lo llevaron a la cima - sólo elDell G15fue capaz de seguirle el ritmo. ElLOQ 15y elCyborg 15con la misma GPU fueron claramente derrotados.
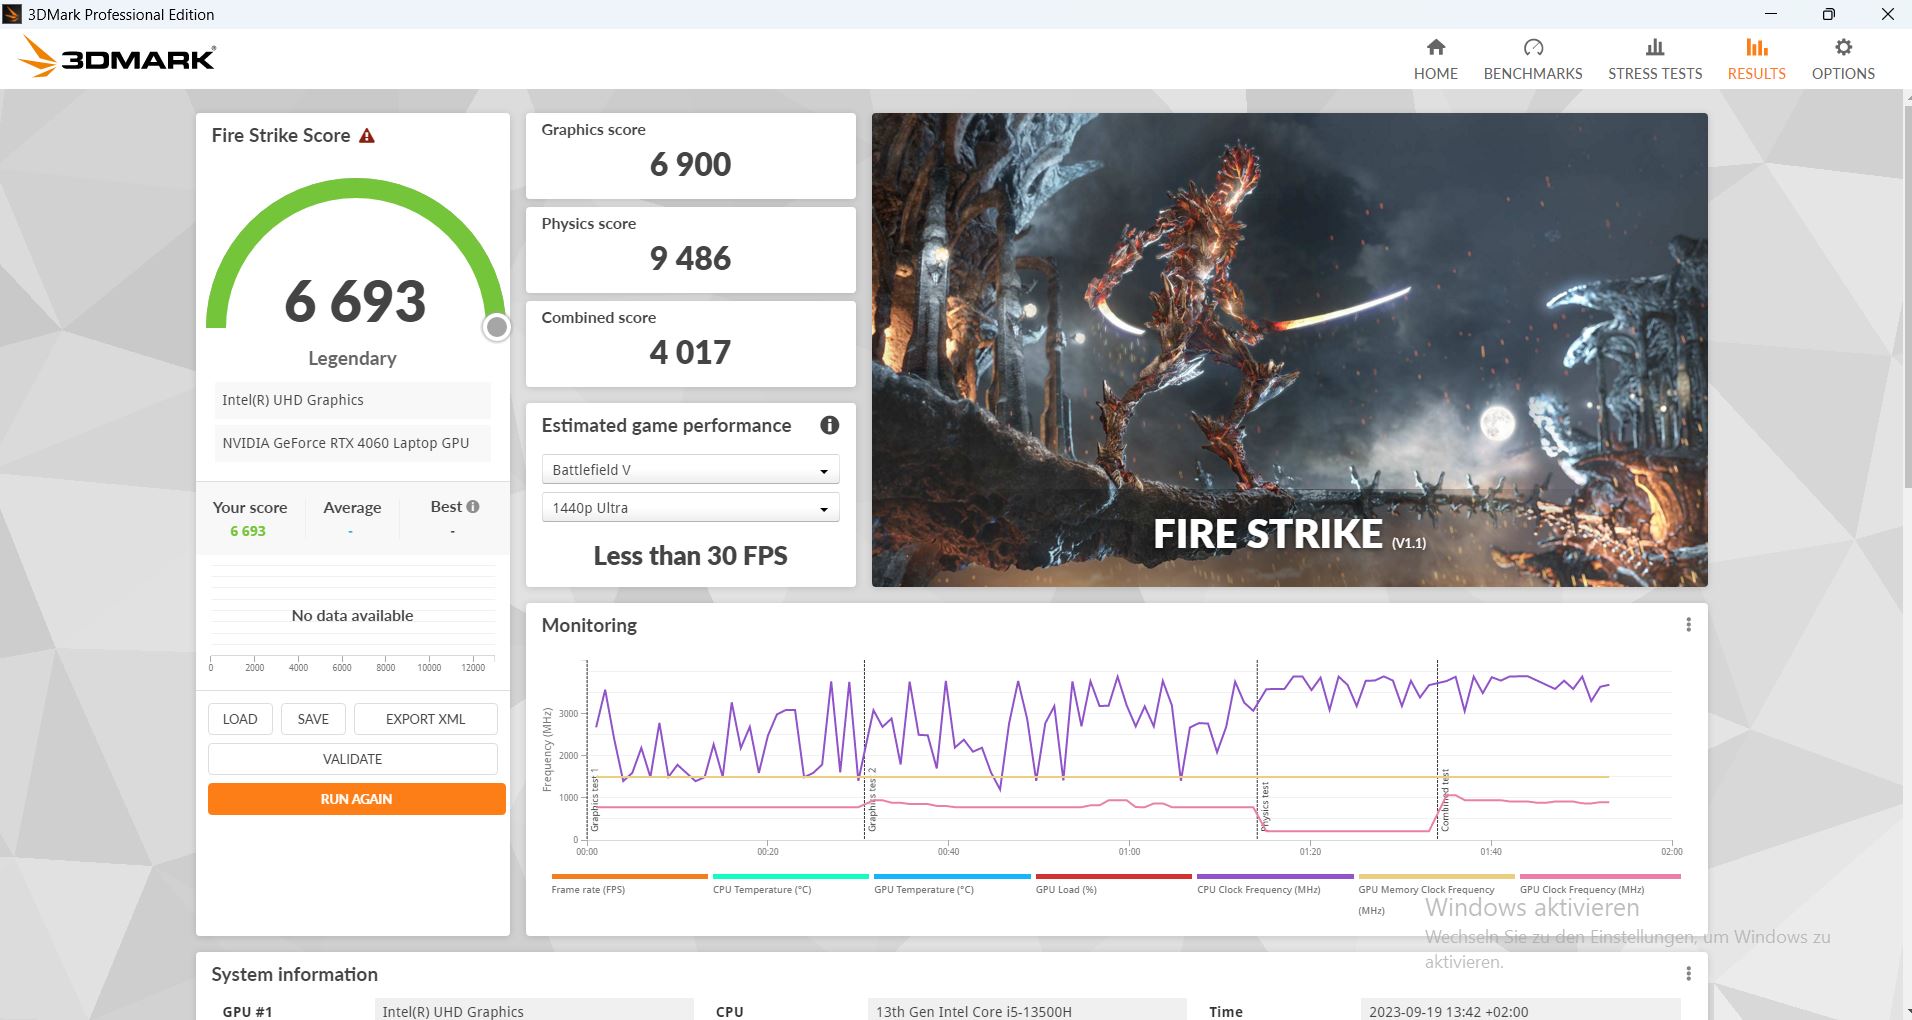
Lejos de una toma de corriente, su rendimiento 3D se hunde considerablemente. De los 23.571 puntos iniciales conseguidos durante la prueba en Fire Strike, ahora sólo logra 6.693 puntos. Es decir, ¡un 72% menos!

| 3DMark 11 Performance | 30608 puntos | |
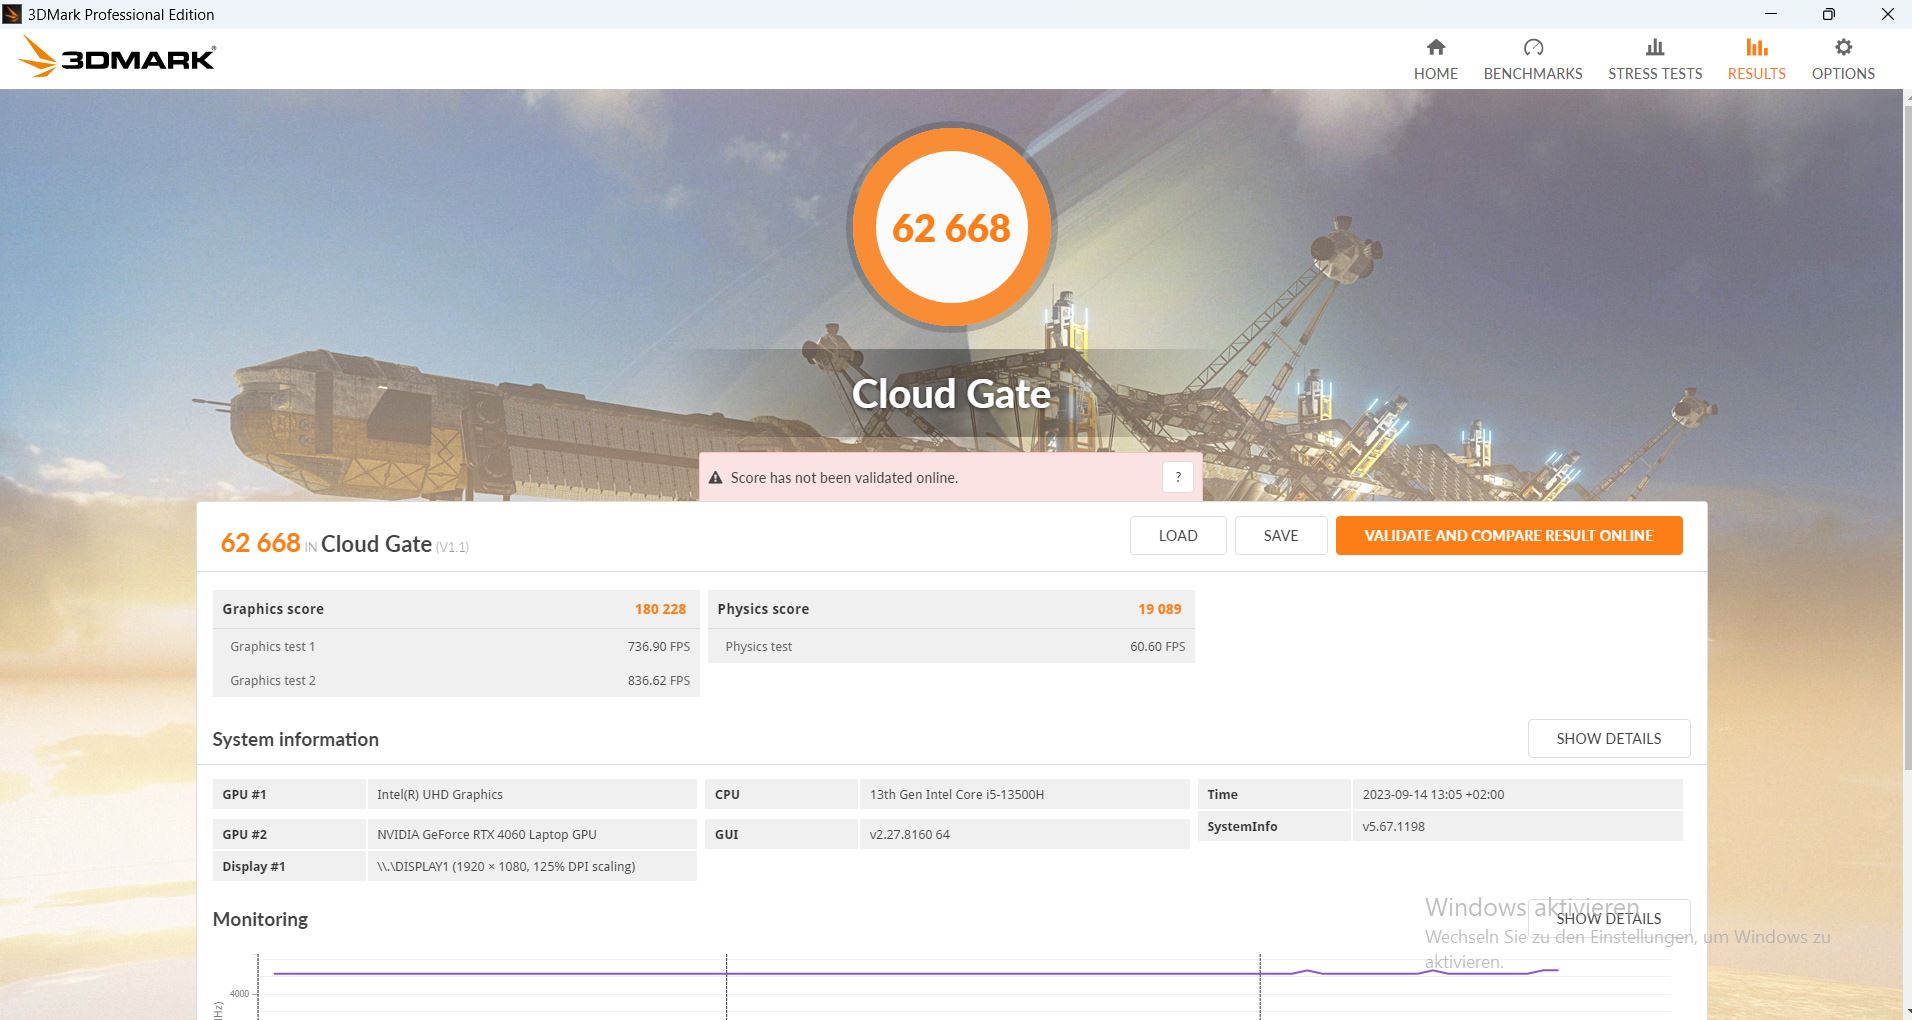
| 3DMark Cloud Gate Standard Score | 62668 puntos | |
| 3DMark Fire Strike Score | 23571 puntos | |
| 3DMark Time Spy Score | 10564 puntos | |
ayuda | ||
* ... más pequeño es mejor
Rendimiento en juegos
El Captiva mantuvo un reñido duelo con elDell G15en todo lo que se refiere a juegos, también - este último se las arregló para salir victorioso. Esto se debe probablemente a su mejor rendimiento de la CPU en los juegos con el enfoque correspondiente.
En total, el Captiva es capaz de ejecutar sin problemas casi todos los juegos actuales en resoluciones muy altas y quedó justo por encima de la media de todos los portátiles con la misma GPU que tenemos almacenados en nuestra base de datos.
| Performance rating - Percent | |
| Media de la clase Gaming | |
| Dell G15 5530 | |
| Captiva Advanced Gaming I74-121 | |
| Lenovo Legion Slim 5 16APH8 | |
| MSI Cyborg 15 A12VF | |
| Schenker XMG Core 15 (M22) | |
| Lenovo LOQ 15APH8 | |
| The Witcher 3 - 1920x1080 Ultra Graphics & Postprocessing (HBAO+) | |
| Media de la clase Gaming (104.7 - 240, n=7, últimos 2 años) | |
| Dell G15 5530 | |
| Captiva Advanced Gaming I74-121 | |
| Lenovo Legion Slim 5 16APH8 | |
| Lenovo LOQ 15APH8 | |
| Schenker XMG Core 15 (M22) | |
| MSI Cyborg 15 A12VF | |
| GTA V - 1920x1080 Highest AA:4xMSAA + FX AF:16x | |
| Media de la clase Gaming (48.3 - 186.9, n=94, últimos 2 años) | |
| Captiva Advanced Gaming I74-121 | |
| Dell G15 5530 | |
| Lenovo Legion Slim 5 16APH8 | |
| Schenker XMG Core 15 (M22) | |
| MSI Cyborg 15 A12VF | |
| Lenovo LOQ 15APH8 | |
| Final Fantasy XV Benchmark - 1920x1080 High Quality | |
| Media de la clase Gaming (41 - 215, n=95, últimos 2 años) | |
| Captiva Advanced Gaming I74-121 | |
| Dell G15 5530 | |
| Lenovo Legion Slim 5 16APH8 | |
| Schenker XMG Core 15 (M22) | |
| Lenovo LOQ 15APH8 | |
| MSI Cyborg 15 A12VF | |
| Strange Brigade - 1920x1080 ultra AA:ultra AF:16 | |
| Media de la clase Gaming (76.3 - 458, n=87, últimos 2 años) | |
| Dell G15 5530 | |
| Captiva Advanced Gaming I74-121 | |
| Lenovo Legion Slim 5 16APH8 | |
| Lenovo LOQ 15APH8 | |
| Schenker XMG Core 15 (M22) | |
| MSI Cyborg 15 A12VF | |
| Dota 2 Reborn - 1920x1080 ultra (3/3) best looking | |
| Media de la clase Gaming (84.8 - 252, n=108, últimos 2 años) | |
| Dell G15 5530 | |
| Captiva Advanced Gaming I74-121 | |
| Lenovo Legion Slim 5 16APH8 | |
| MSI Cyborg 15 A12VF | |
| Lenovo LOQ 15APH8 | |
| Schenker XMG Core 15 (M22) | |
| The Witcher 3 | |
| 1920x1080 High Graphics & Postprocessing (Nvidia HairWorks Off) | |
| Media de la clase Gaming (341 - 404, n=2, últimos 2 años) | |
| Dell G15 5530 | |
| Captiva Advanced Gaming I74-121 | |
| Medio NVIDIA GeForce RTX 4060 Laptop GPU (110 - 229, n=36) | |
| Lenovo Legion Slim 5 16APH8 | |
| Lenovo LOQ 15APH8 | |
| Schenker XMG Core 15 (M22) | |
| MSI Cyborg 15 A12VF | |
| 1920x1080 Ultra Graphics & Postprocessing (HBAO+) | |
| Media de la clase Gaming (104.7 - 240, n=7, últimos 2 años) | |
| Dell G15 5530 | |
| Captiva Advanced Gaming I74-121 | |
| Medio NVIDIA GeForce RTX 4060 Laptop GPU (77 - 159.7, n=42) | |
| Lenovo Legion Slim 5 16APH8 | |
| Lenovo LOQ 15APH8 | |
| Schenker XMG Core 15 (M22) | |
| MSI Cyborg 15 A12VF | |
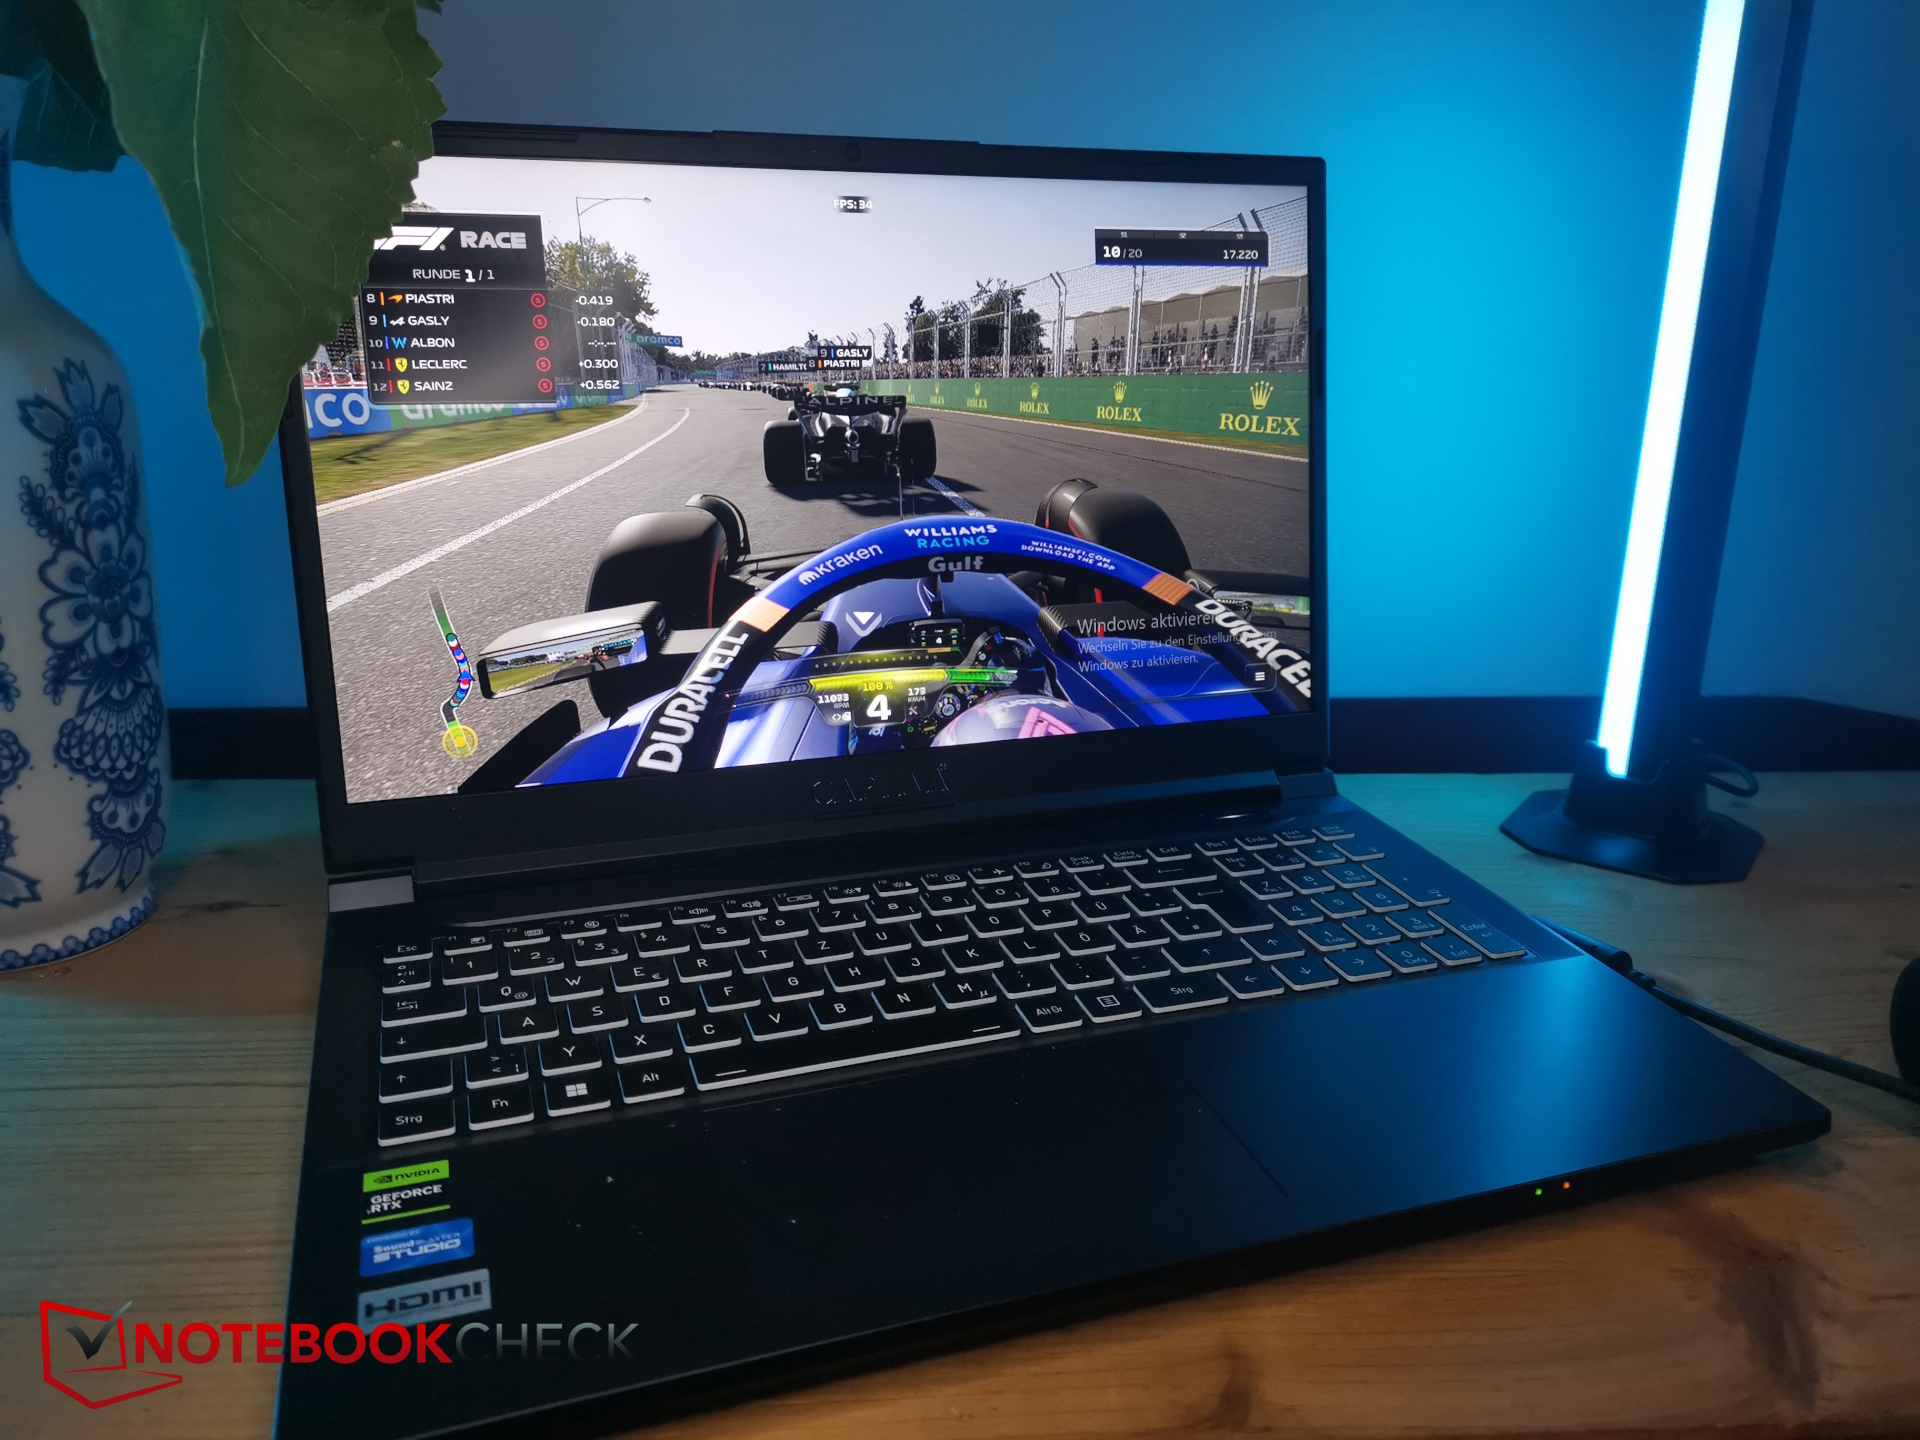
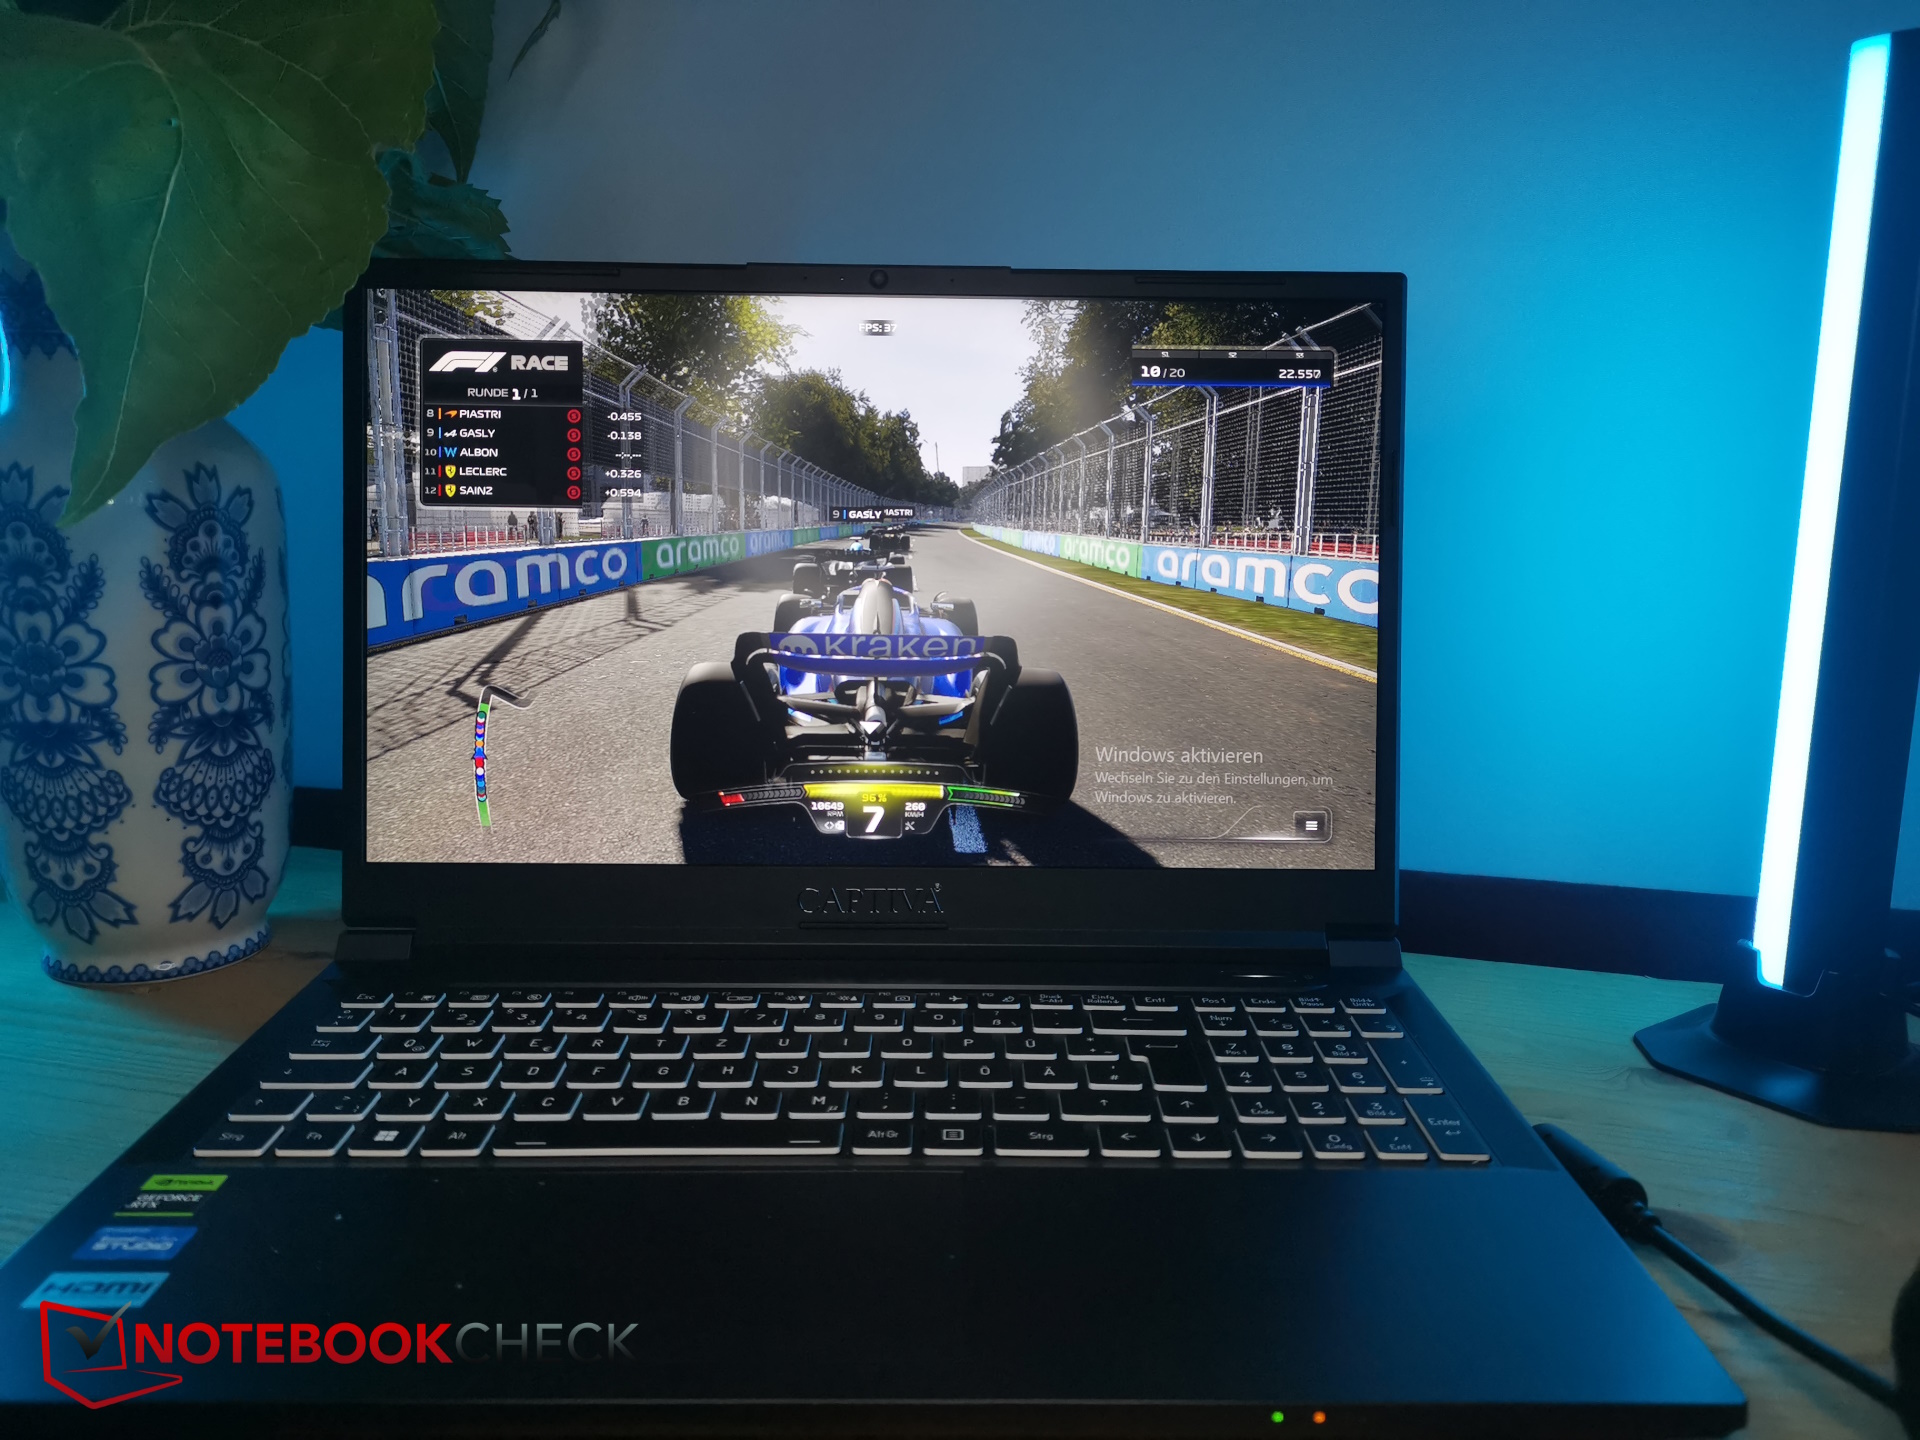
| F1 23 | |
| 1920x1080 Ultra High Preset AA:T AF:16x | |
| Medio NVIDIA GeForce RTX 4060 Laptop GPU (43.8 - 119.9, n=13) | |
| Captiva Advanced Gaming I74-121 | |
| 1920x1080 High Preset AA:T AF:16x | |
| Captiva Advanced Gaming I74-121 | |
| Medio NVIDIA GeForce RTX 4060 Laptop GPU (143.7 - 207, n=13) | |
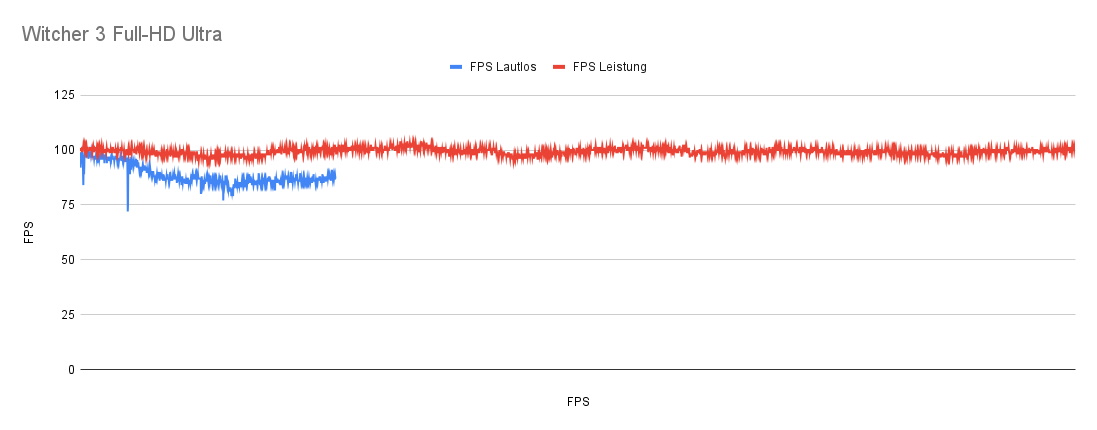
Aparte del habitual ritmo diurno y nocturno, la tasa de imágenes por segundo en The Witcher 3 se mantuvo muy estable. Sólo elDell G15 fue ligeramente más rápido.
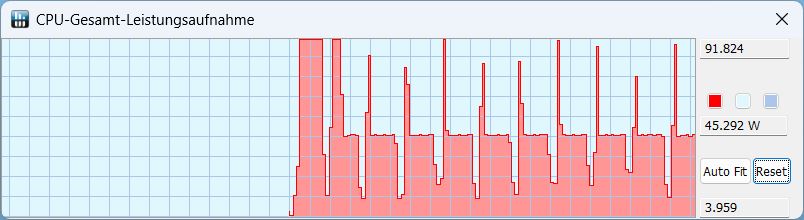
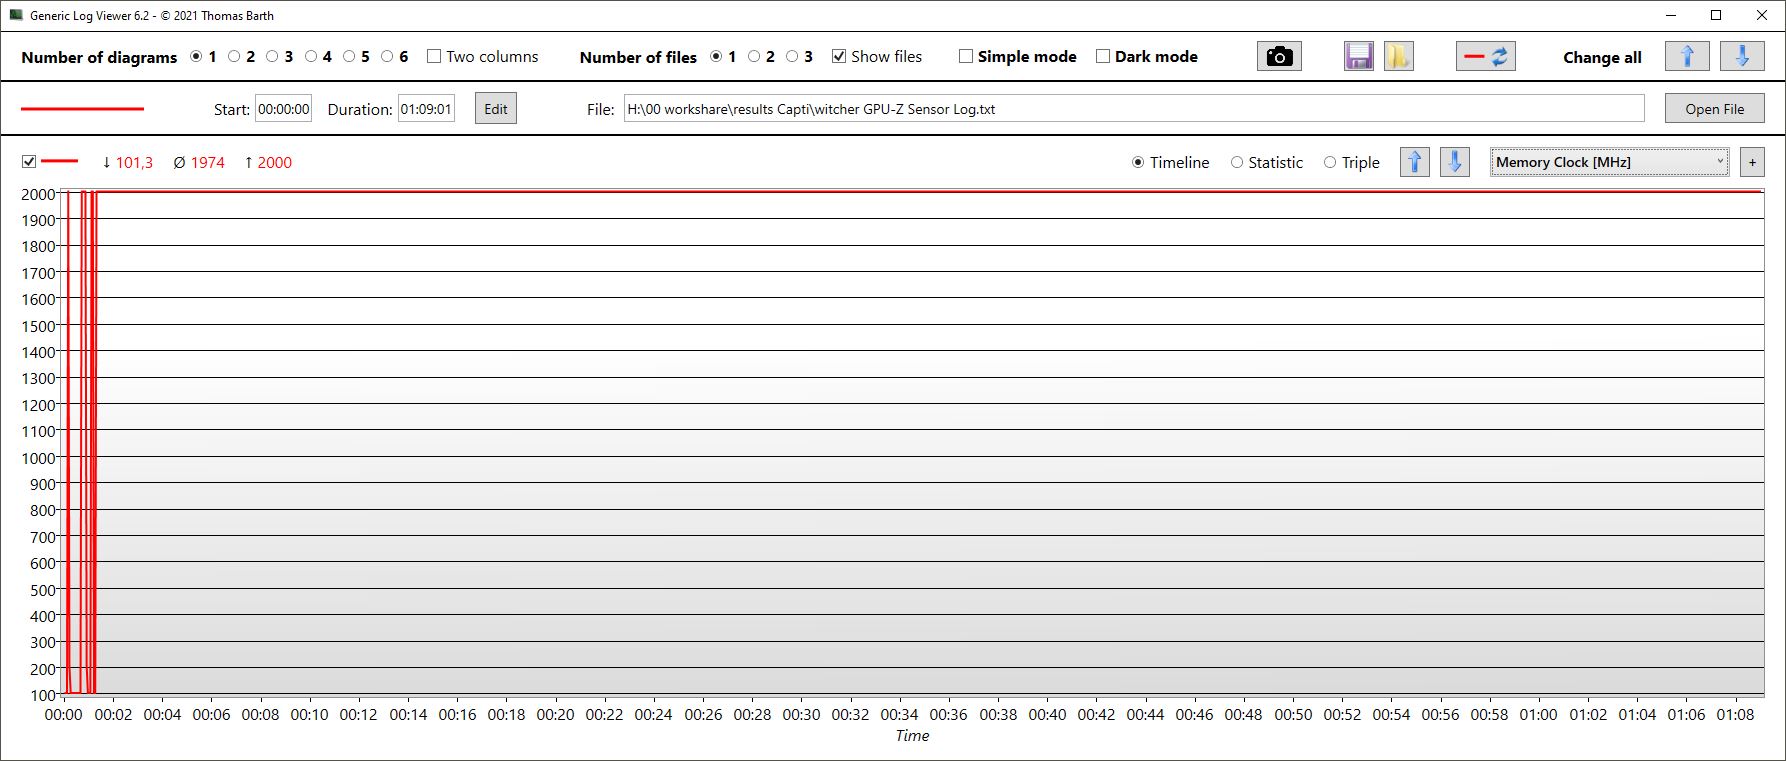
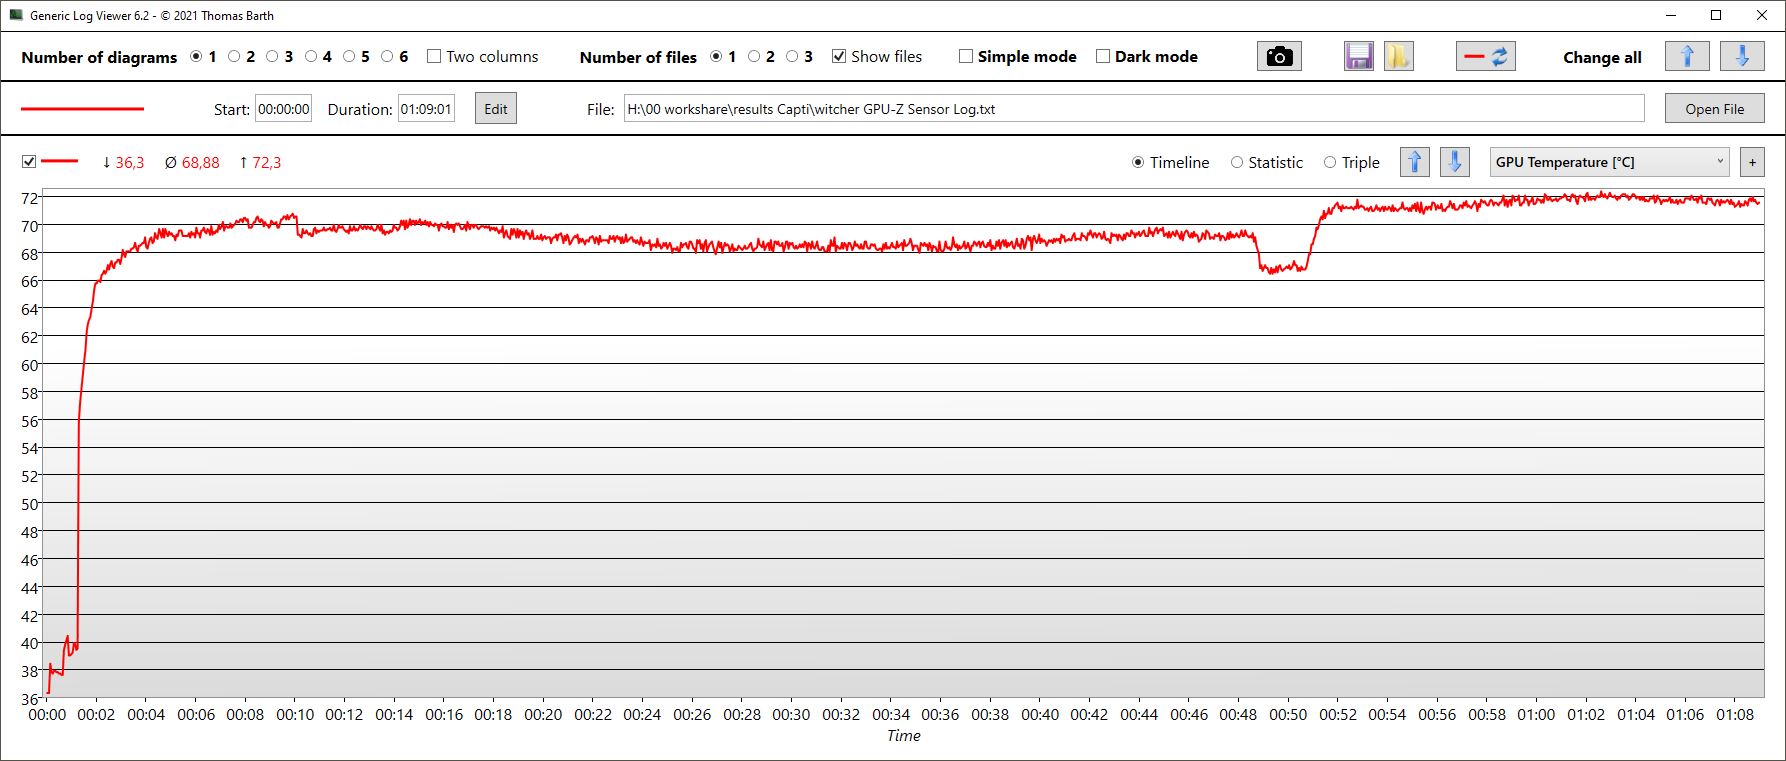
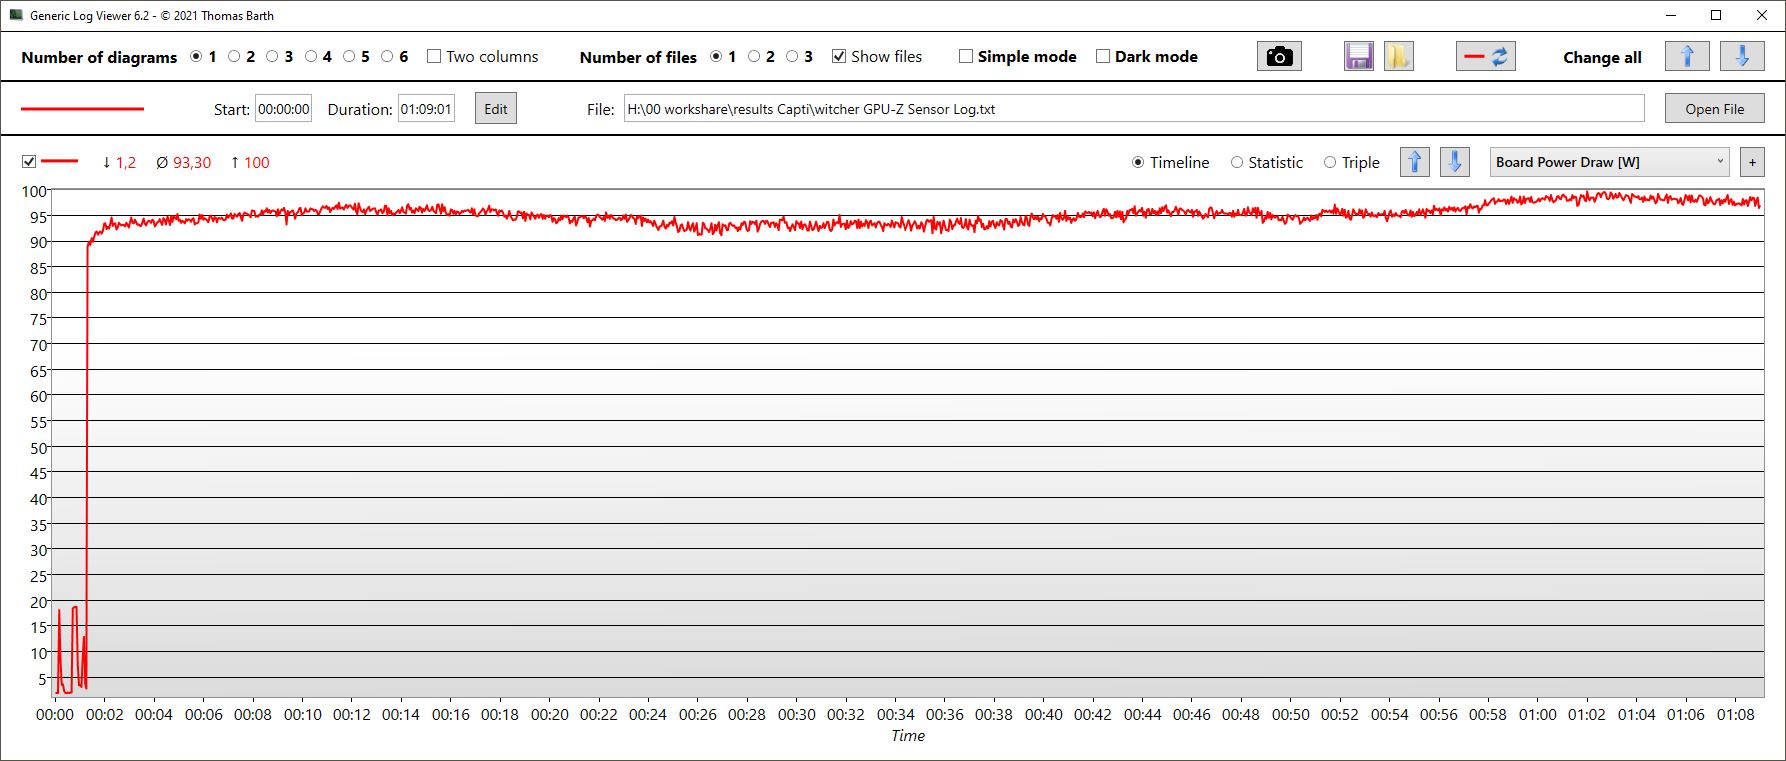
La GPU funcionó constantemente a más de 2.400 MHz durante la hora que duró la prueba comparativa de The Witcher 3, y el reloj de la memoria se mantuvo constante a 2.000 MHz. Durante este tiempo, la GPU se calentó hasta los 72 °C y el consumo de energía rondó los 95 vatios.
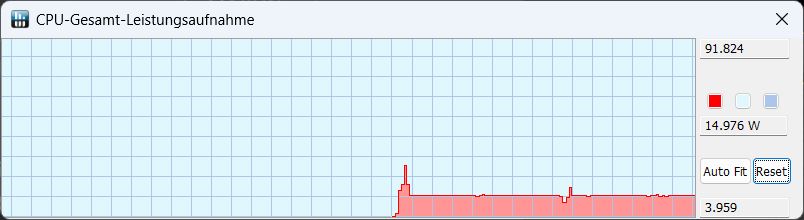
La CPU redujo su TDP a unos 30 vatios durante el mismo tiempo y se calentó a unos 77 °C.
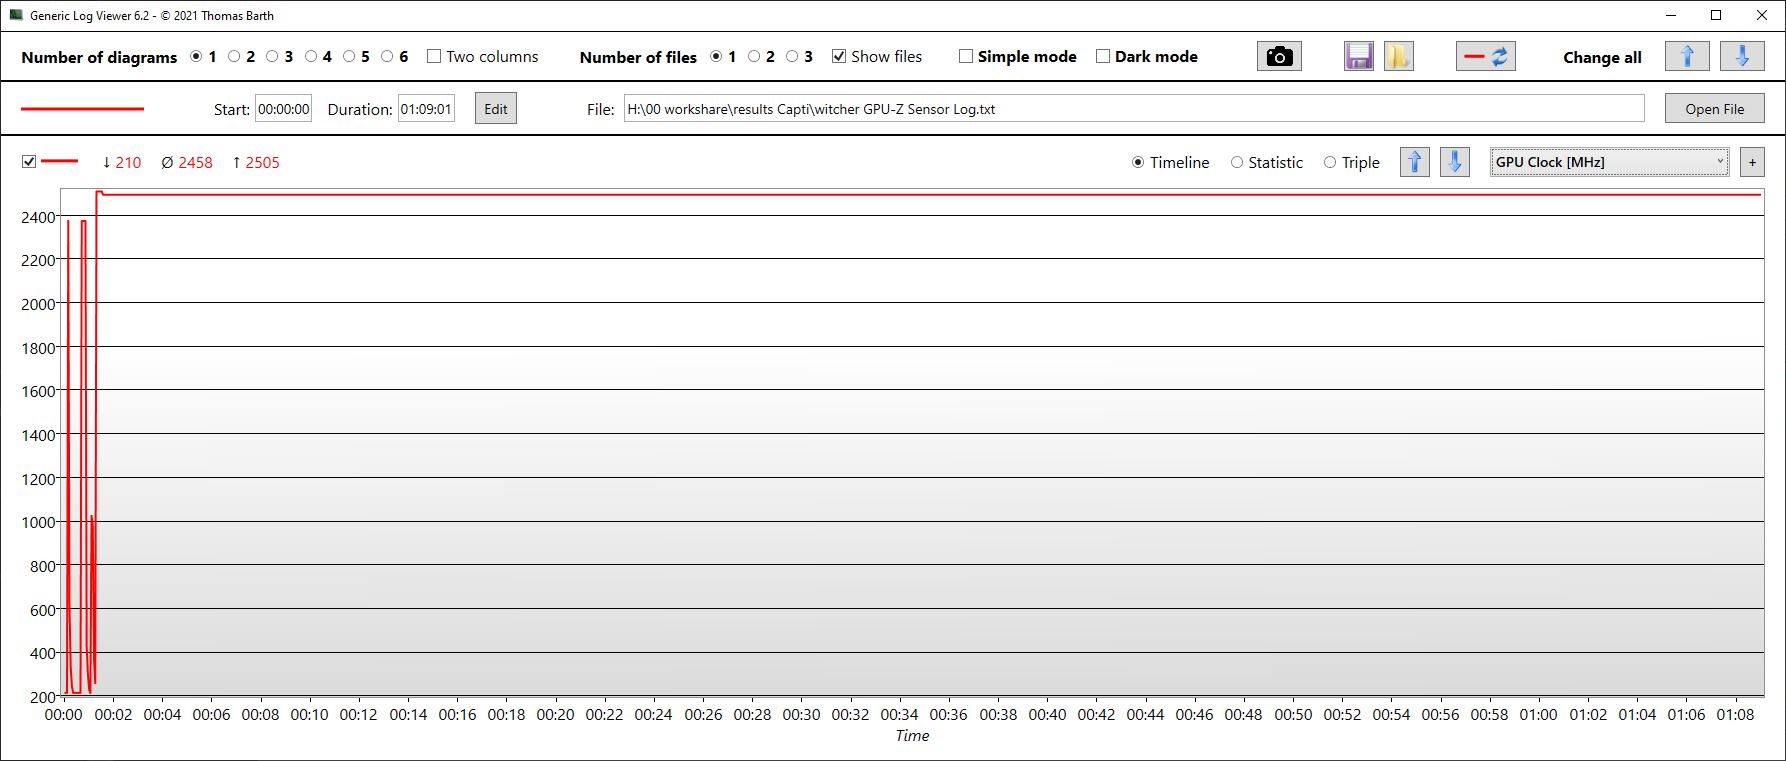
Witcher 3 FPS diagram
El modo de entretenimiento dio como resultado prácticamente los mismos valores y ni siquiera era mucho más silencioso.
En modo silencioso, el PC es bastante más silencioso (31.43 dB). Los ventiladores menos activos hacen que la temperatura de la GPU aumente mucho más rápido. Tras unos 3,5 minutos, la temperatura ya estaba en 87 °C, lo que hizo que el reloj de la GPU y el consumo de energía descendieran ligeramente. Después, la temperatura se mantuvo constante en 89 °C. El TGP bajó de 100 vatios a 80 vatios. Al mismo tiempo, la velocidad de fotogramas pasó de 100 fps a sólo 85 fps.
| bajo | medio | alto | ultra | QHD | |
|---|---|---|---|---|---|
| GTA V (2015) | 186.5 | 182.4 | 177.2 | 117 | |
| The Witcher 3 (2015) | 367 | 296 | 199 | 101 | |
| Dota 2 Reborn (2015) | 181 | 168.1 | 147.2 | 140.5 | |
| Final Fantasy XV Benchmark (2018) | 185.6 | 148 | 102.2 | 75.6 | |
| X-Plane 11.11 (2018) | 142.7 | 128.1 | 99.4 | ||
| Far Cry 5 (2018) | 175 | 153 | 147 | 138 | |
| Strange Brigade (2018) | 470 | 276 | 219 | 187.9 | |
| F1 23 (2023) | 221 | 225 | 184 | 59 |
Emisiones - Frías pero no silenciosas
Emisiones sonoras
Los dos ventiladores del Captiva Advanced Gaming están casi siempre activos, incluso en el llamado "modo silencioso". Aún así, los ventiladores funcionan muy silenciosamente en modo inactivo. Mientras juega, el portátil se vuelve bastante ruidoso y alcanza las mismas emisiones de ruido que bajo carga máxima. Desafortunadamente, no notamos ninguna diferencia, por ejemplo como pudimos en elLenovo LOQ.
Al menos, sus emisiones de ruido máximas no son fuera de lo común - son más o menos las mismas que en otros portátiles de juegos. El Dell G15 es más silencioso a pesar de tener el mismo rendimiento 3D.
El modo entretenimiento no produjo resultados más silenciosos en nuestra prueba. Al usar el modo silencioso, los niveles de ruido de juego bajaron considerablemente y en modo inactivo, los ventiladores siguieron activos.
El Witcher 3 Full HD Ultra
| Modo/valor | Emisiones sonoras en dB | FPS |
|---|---|---|
| Rendimiento | 55 | 101 |
| Entretenimiento | 55 | 101 |
| Silencioso | 31.43 | 85 (caída lenta a partir de 100 fps) |
Ruido
| Ocioso |
| 23 / 25.67 / 25.67 dB(A) |
| Carga |
| 38.52 / 54.17 dB(A) |
 | ||
30 dB silencioso 40 dB(A) audible 50 dB(A) ruidosamente alto |
||
min: | ||
| Captiva Advanced Gaming I74-121 GeForce RTX 4060 Laptop GPU, i5-13500H, Samsung SSD 980 1TB MZ-V8V1T0BW | MSI Cyborg 15 A12VF GeForce RTX 4060 Laptop GPU, i7-12650H, Samsung PM9B1 1024GB MZVL41T0HBLB | Dell G15 5530 GeForce RTX 4060 Laptop GPU, i7-13650HX, SSTC CL4-3D512-Q11 | Lenovo Legion Slim 5 16APH8 GeForce RTX 4060 Laptop GPU, R7 7840HS, SK hynix PC801 HFS512GEJ9X115N | Lenovo LOQ 15APH8 GeForce RTX 4050 Laptop GPU, R7 7840HS, Micron 2450 512GB MTFDKCD512TFK | Schenker XMG Core 15 (M22) GeForce RTX 3060 Laptop GPU, R7 6800H, Samsung SSD 980 Pro 1TB MZ-V8P1T0BW | |
|---|---|---|---|---|---|---|
| Noise | -30% | 5% | 2% | 2% | 1% | |
| apagado / medio ambiente * (dB) | 23 | 27 -17% | 20.41 11% | 22.9 -0% | 23.1 -0% | 23 -0% |
| Idle Minimum * (dB) | 23 | 27 -17% | 26.85 -17% | 23.1 -0% | 23.1 -0% | 23 -0% |
| Idle Average * (dB) | 25.67 | 37.5 -46% | 26.85 -5% | 23.1 10% | 23.1 10% | 23 10% |
| Idle Maximum * (dB) | 25.67 | 38 -48% | 26.85 -5% | 27.7 -8% | 25.2 2% | 23 10% |
| Load Average * (dB) | 38.52 | 56.3 -46% | 27.65 28% | 33.3 14% | 44.3 -15% | 42.41 -10% |
| Witcher 3 ultra * (dB) | 54.17 | 47.9 12% | 54 -0% | 45.8 15% | 54.71 -1% | |
| Load Maximum * (dB) | 54.17 | 56.3 -4% | 47.86 12% | 54 -0% | 52 4% | 55.05 -2% |
* ... más pequeño es mejor
Temperatura
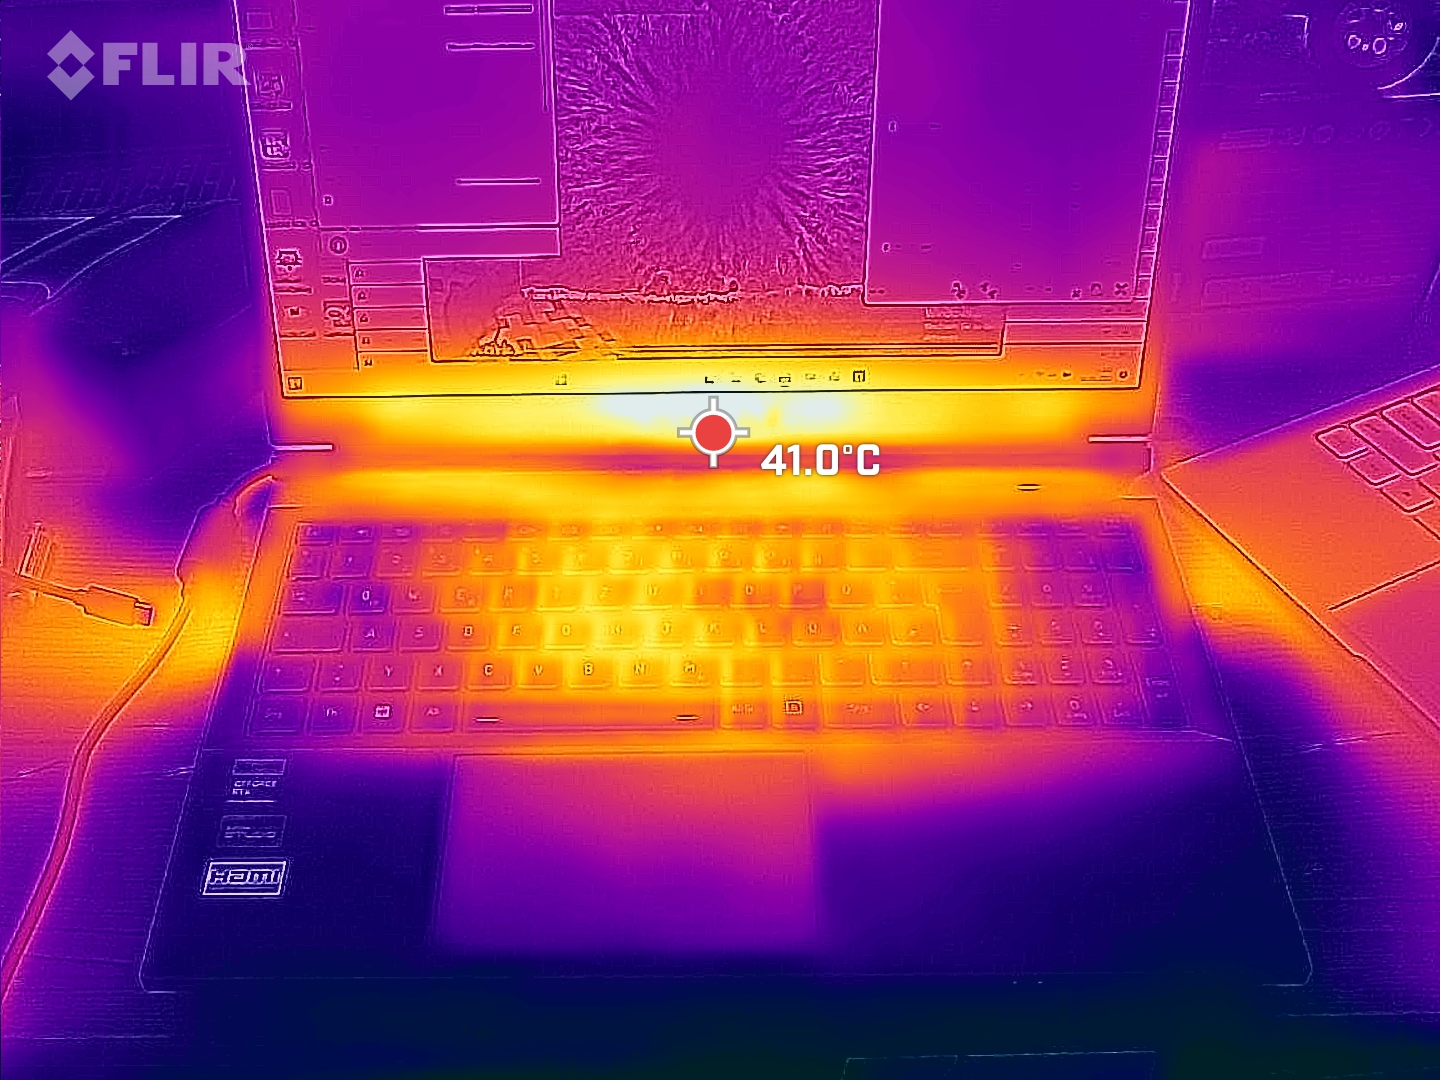
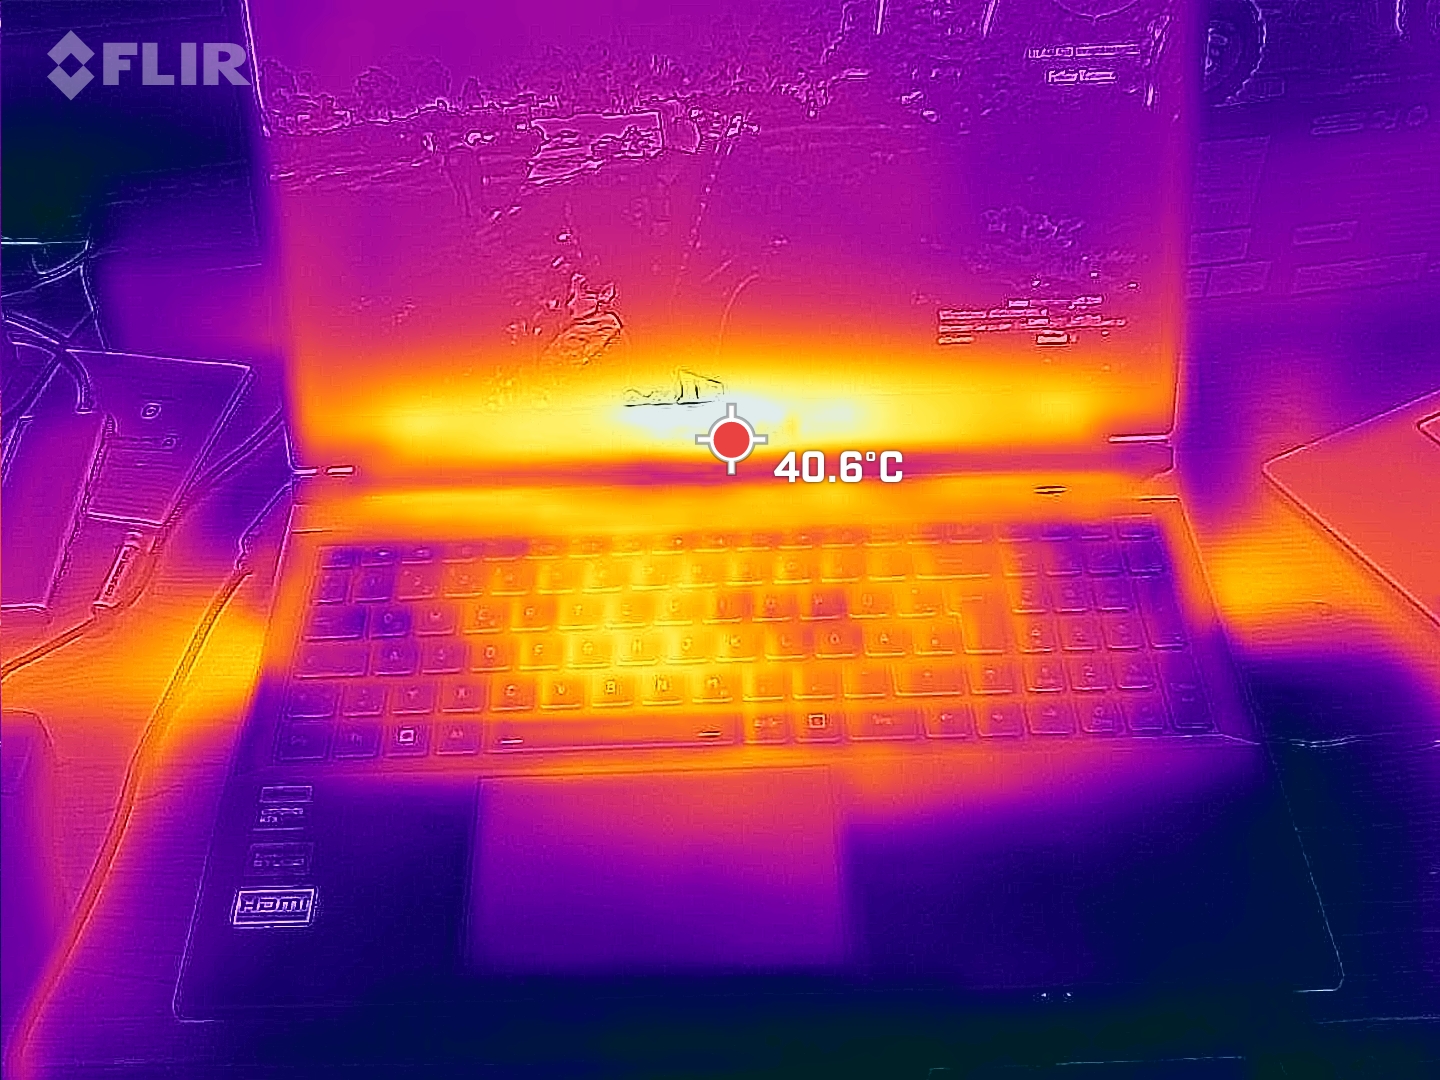
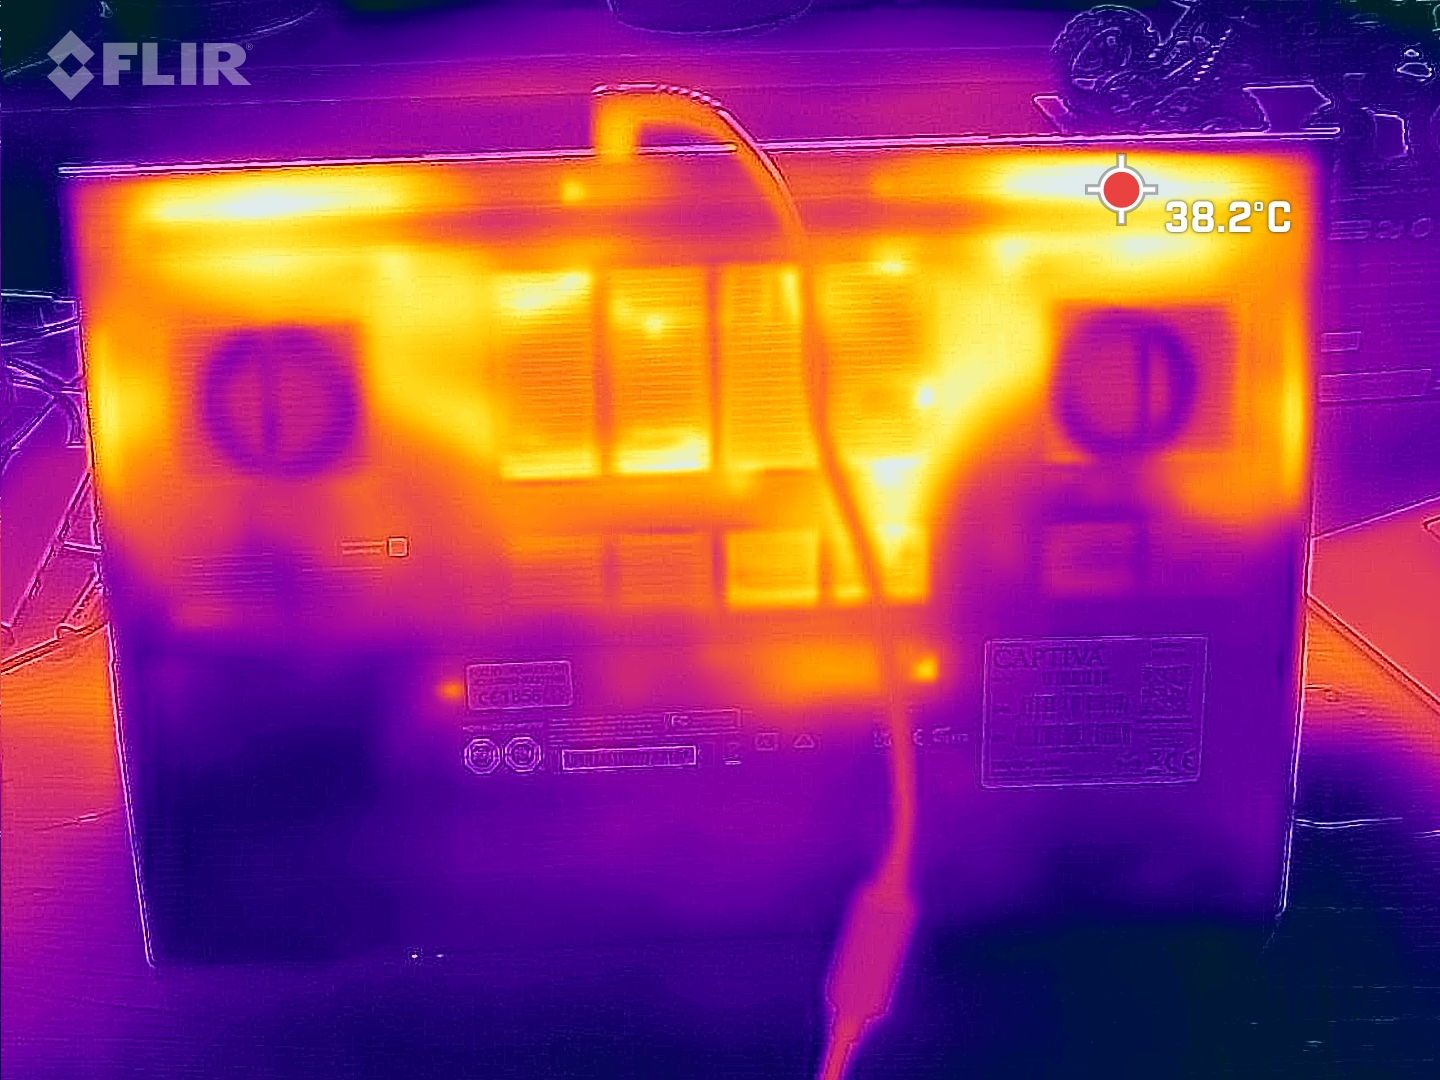
Gracias al generoso uso de cobre del portátil y a sus ventiladores, el dispositivo de juego se mantiene relativamente fresco. Incluso a plena carga tras una hora, sólo medimos un máximo de 42 °C. Aquí, elDell G15muestra realmente lo que cuestan los ventiladores más silenciosos - ¡alcanza temperaturas de más de 60 °C!
(±) La temperatura máxima en la parte superior es de 41 °C / 106 F, frente a la media de 40.4 °C / 105 F, que oscila entre 21.2 y 68.8 °C para la clase Gaming.
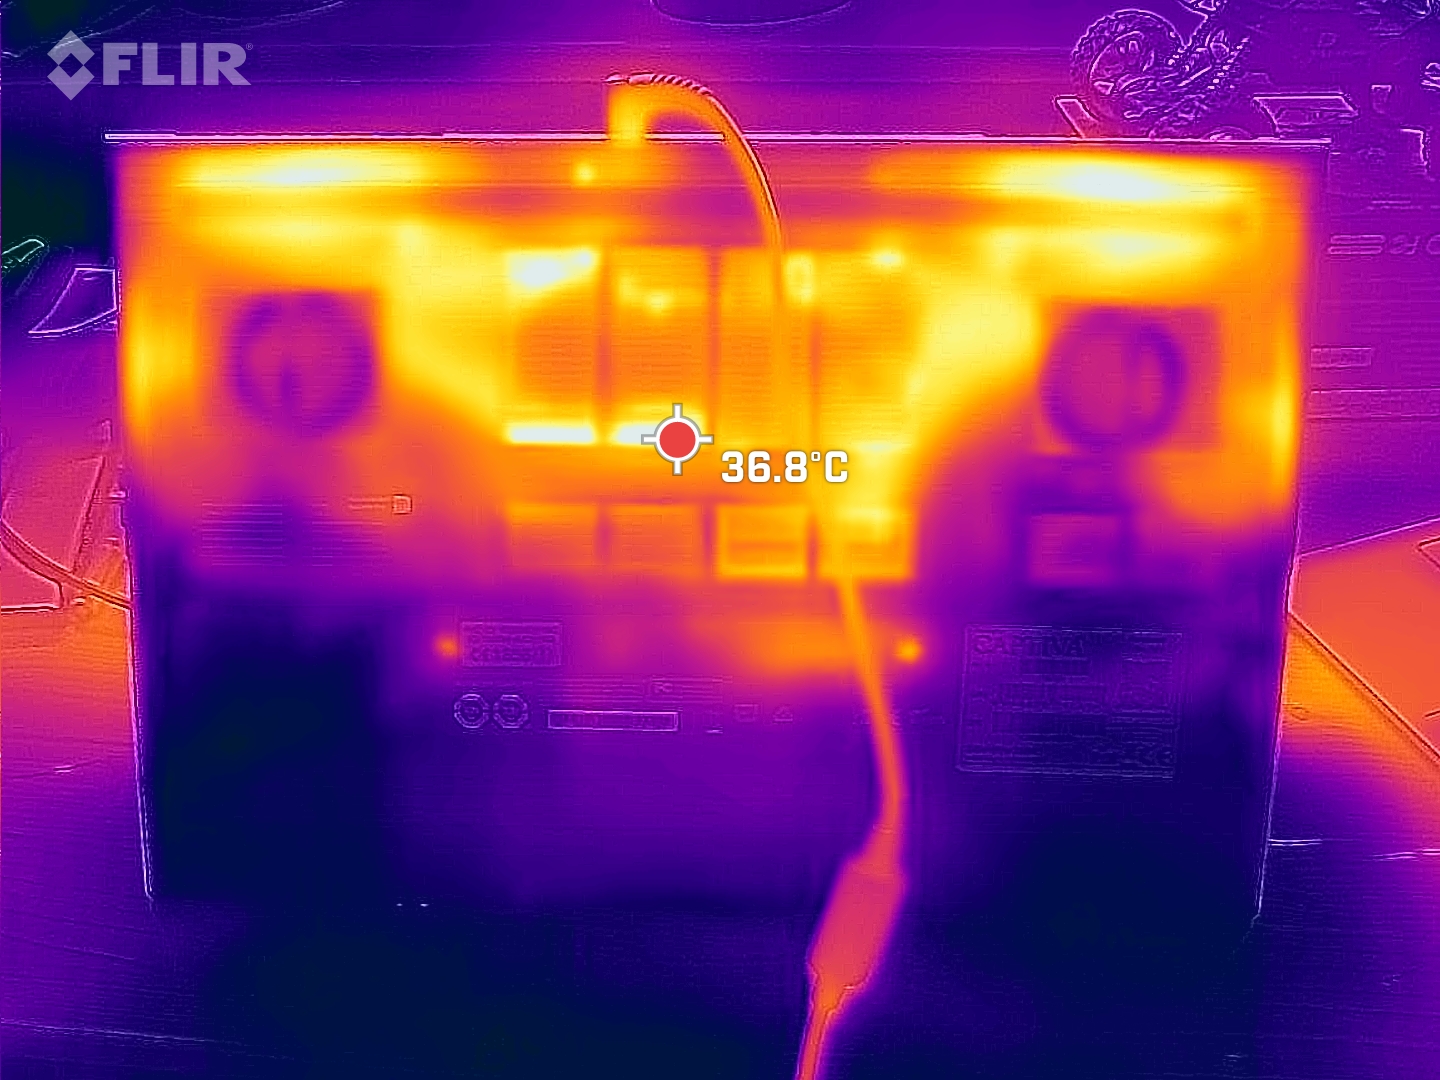
(±) El fondo se calienta hasta un máximo de 42 °C / 108 F, frente a la media de 43.2 °C / 110 F
(+) En reposo, la temperatura media de la parte superior es de 28.3 °C / 83# F, frente a la media del dispositivo de 33.9 °C / 93 F.
(±) Jugando a The Witcher 3, la temperatura media de la parte superior es de 32.9 °C / 91 F, frente a la media del dispositivo de 33.9 °C / 93 F.
(+) El reposamanos y el panel táctil están a una temperatura inferior a la de la piel, con un máximo de 30 °C / 86 F y, por tanto, son fríos al tacto.
(±) La temperatura media de la zona del reposamanos de dispositivos similares fue de 28.8 °C / 83.8 F (-1.2 °C / -2.2 F).
| Captiva Advanced Gaming I74-121 Intel Core i5-13500H, NVIDIA GeForce RTX 4060 Laptop GPU | MSI Cyborg 15 A12VF Intel Core i7-12650H, NVIDIA GeForce RTX 4060 Laptop GPU | Dell G15 5530 Intel Core i7-13650HX, NVIDIA GeForce RTX 4060 Laptop GPU | Lenovo Legion Slim 5 16APH8 AMD Ryzen 7 7840HS, NVIDIA GeForce RTX 4060 Laptop GPU | Lenovo LOQ 15APH8 AMD Ryzen 7 7840HS, NVIDIA GeForce RTX 4050 Laptop GPU | Schenker XMG Core 15 (M22) AMD Ryzen 7 6800H, NVIDIA GeForce RTX 3060 Laptop GPU | |
|---|---|---|---|---|---|---|
| Heat | 7% | -20% | 10% | -1% | -5% | |
| Maximum Upper Side * (°C) | 41 | 47.5 -16% | 54 -32% | 40.6 1% | 44.4 -8% | 48 -17% |
| Maximum Bottom * (°C) | 42 | 35.5 15% | 62.2 -48% | 42 -0% | 52 -24% | 51 -21% |
| Idle Upper Side * (°C) | 32 | 27.7 13% | 33.4 -4% | 27.8 13% | 28 12% | 28 12% |
| Idle Bottom * (°C) | 35 | 29.5 16% | 33.4 5% | 26.6 24% | 29.6 15% | 33 6% |
* ... más pequeño es mejor
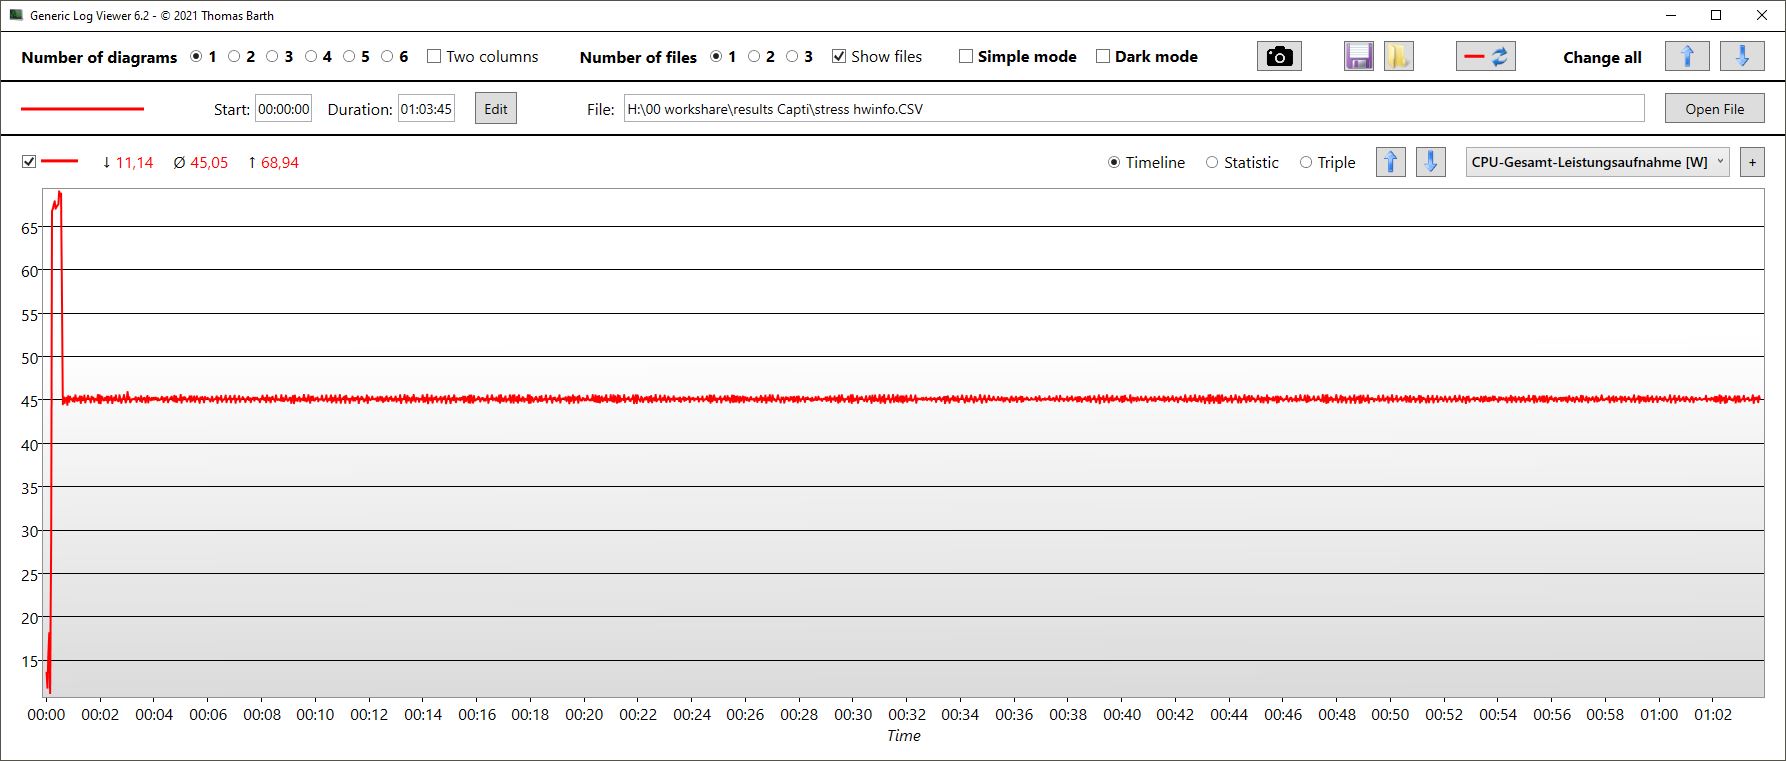
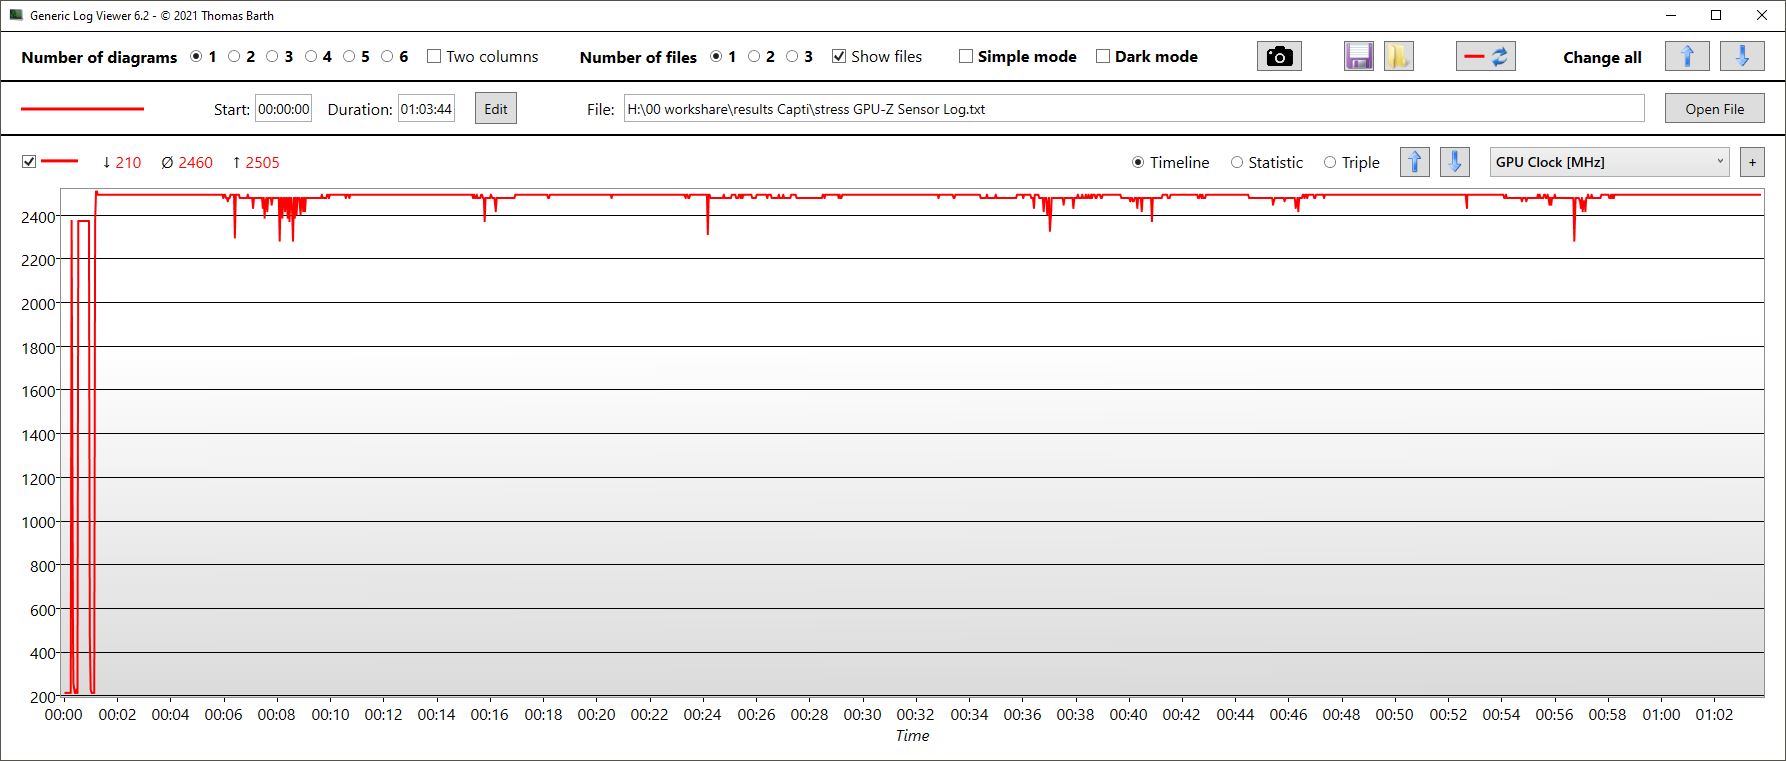
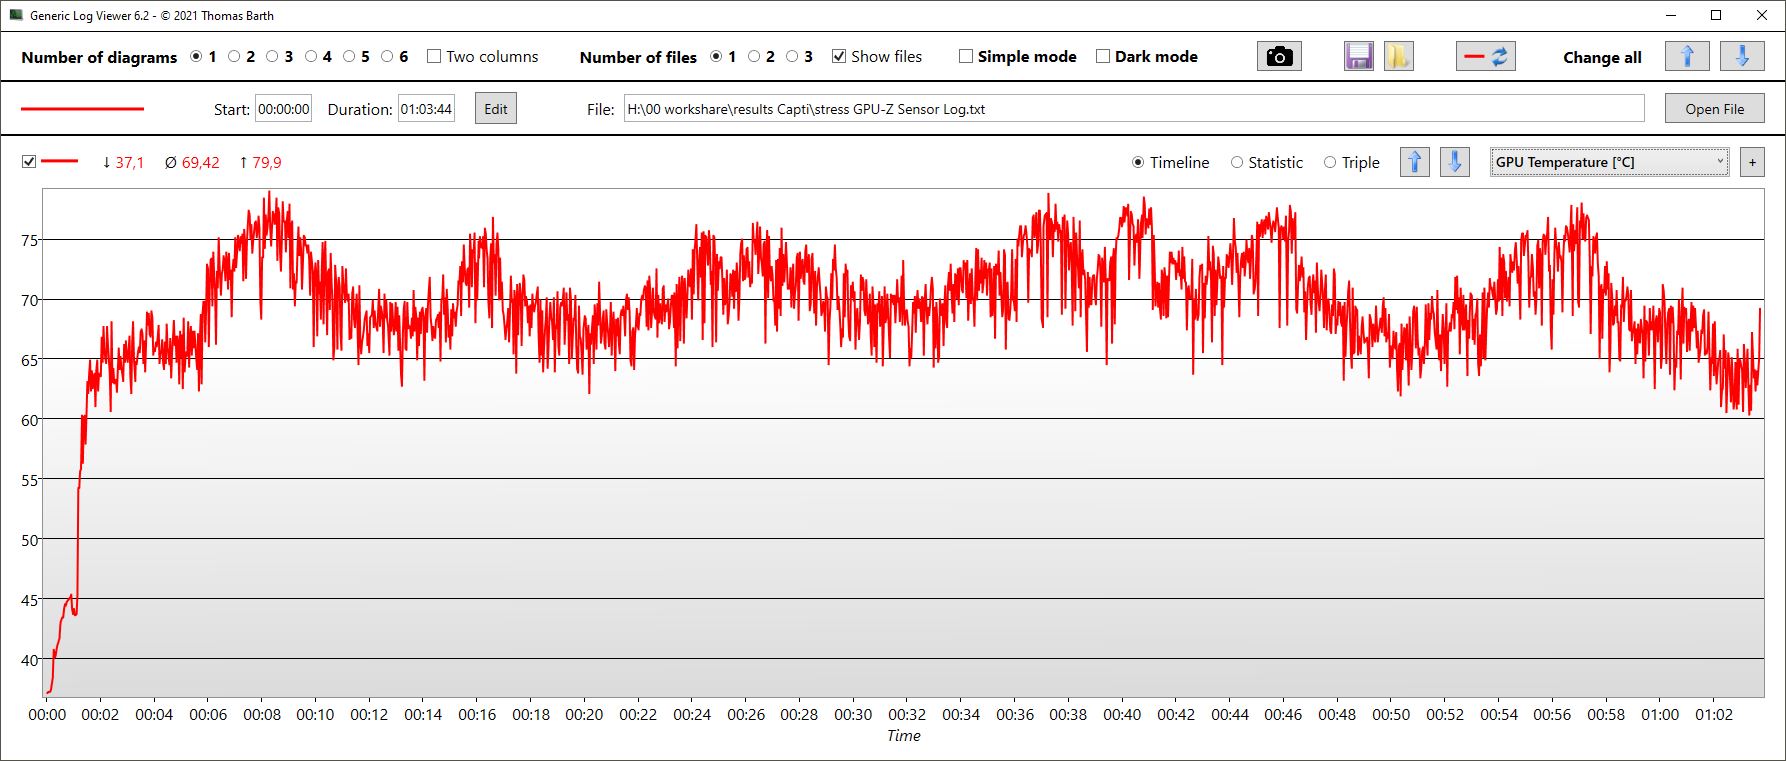
Prueba de esfuerzo
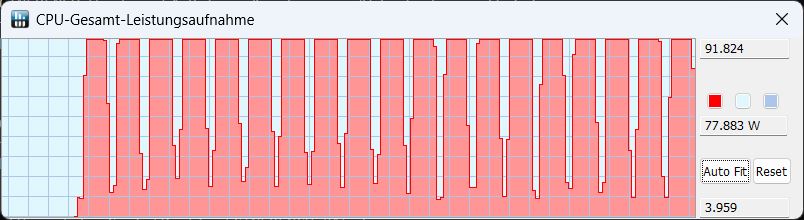
La velocidad de reloj de la CPU se mantuvo sorprendentemente constante durante nuestra prueba de estrés de una hora. Se alcanzó una media de unos 3,1 GHz. La CPU se calentó hasta unos 72 °C y tuvo un TDP constante de 45 vatios.
La GPU se comportó de forma similar: Su reloj fue de 2.460 MHz, el de la memoria de 2.000 MHz, y la temperatura fue de 69 °C de media.
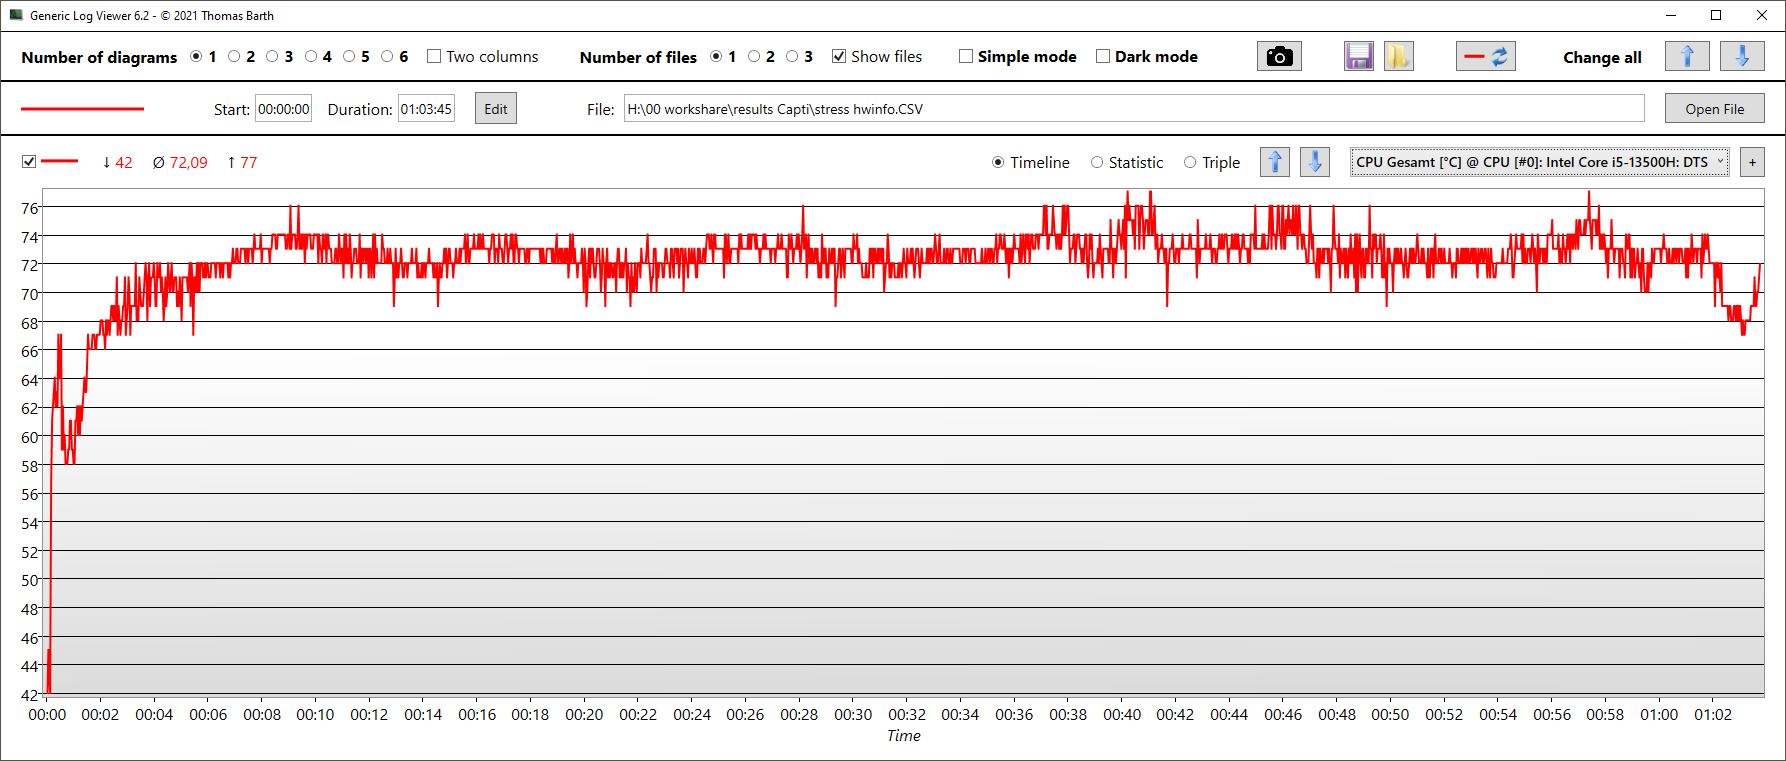
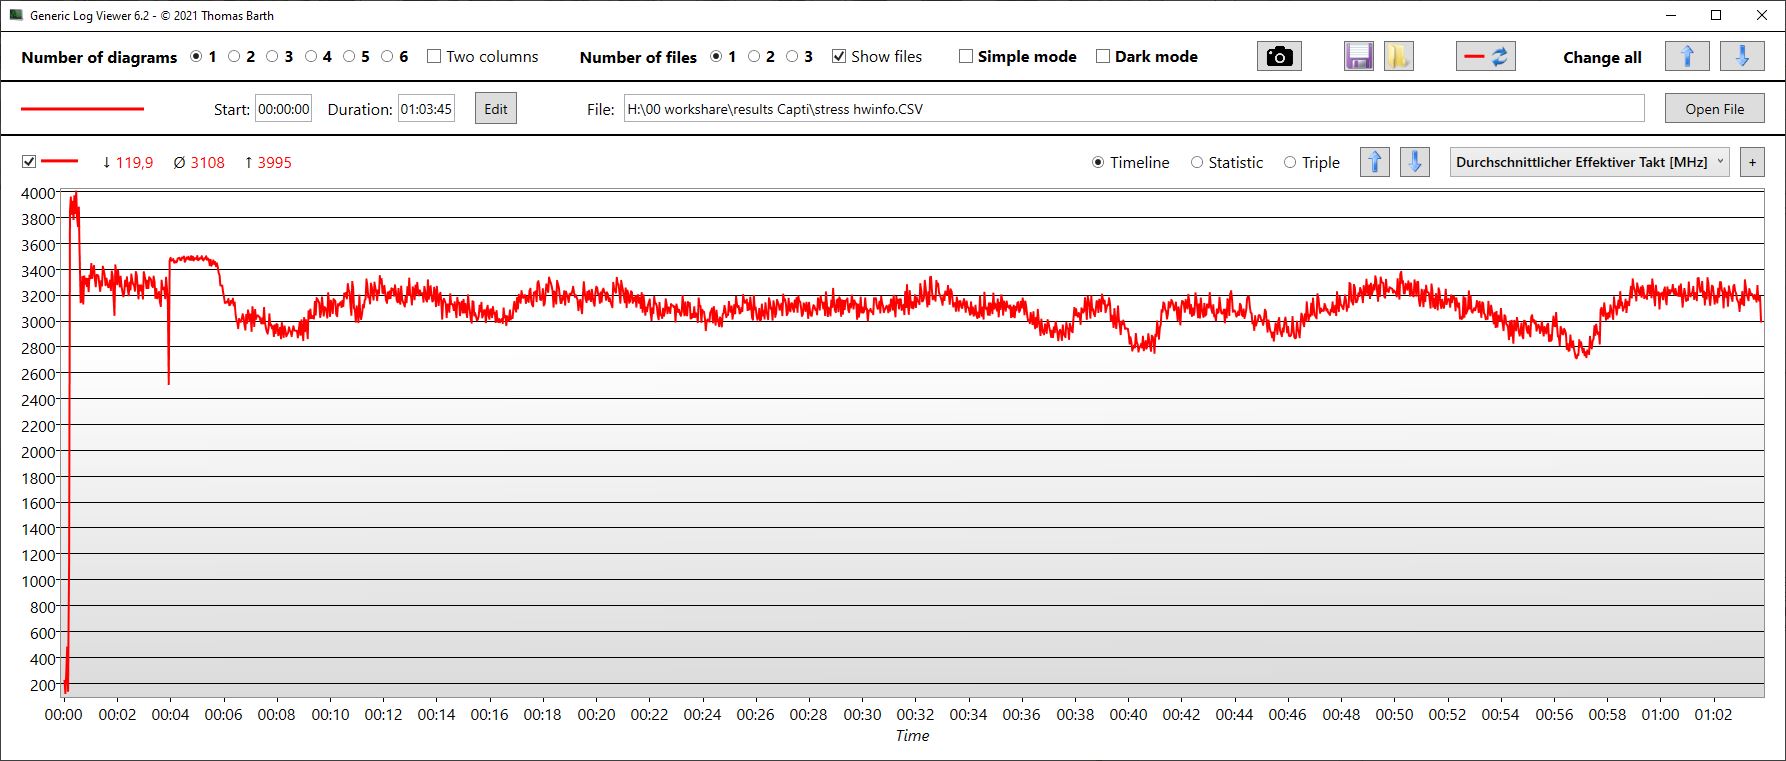
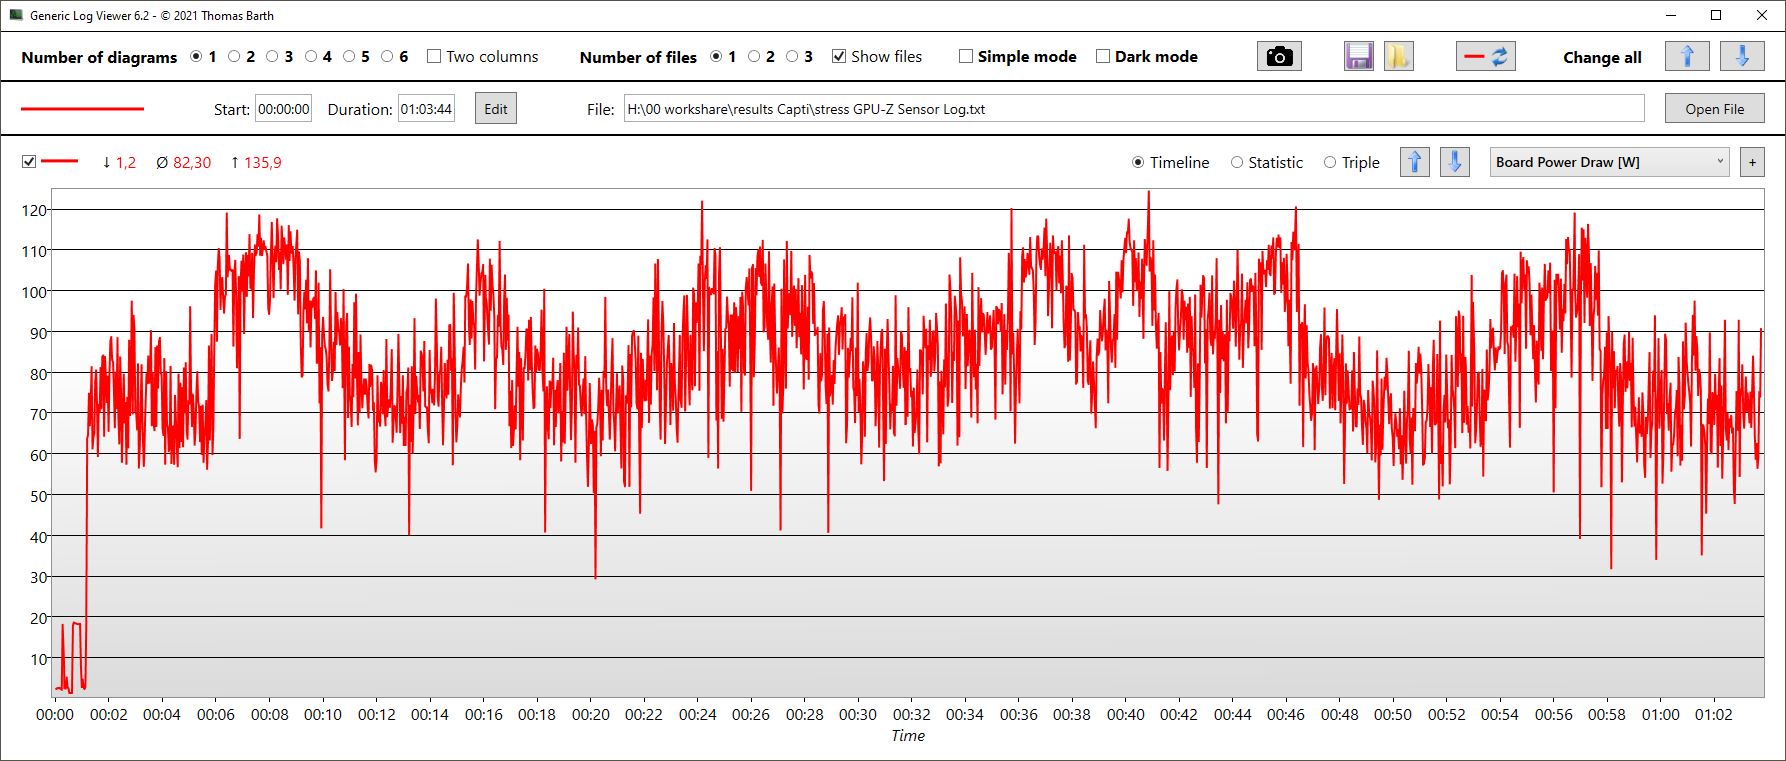
| RelojCPU (GHz) | Reloj GPU (MHz) | Temperatura mediaCPU (°C) | Temperatura media GPU (°C) | |
| Prime95 + FurMark Estrés | 3,1 | 2.460 | 72 | 69 |
| Witcher 3 Estrés | 0,8 | 2.400 | 77 | 72 |
Altavoces
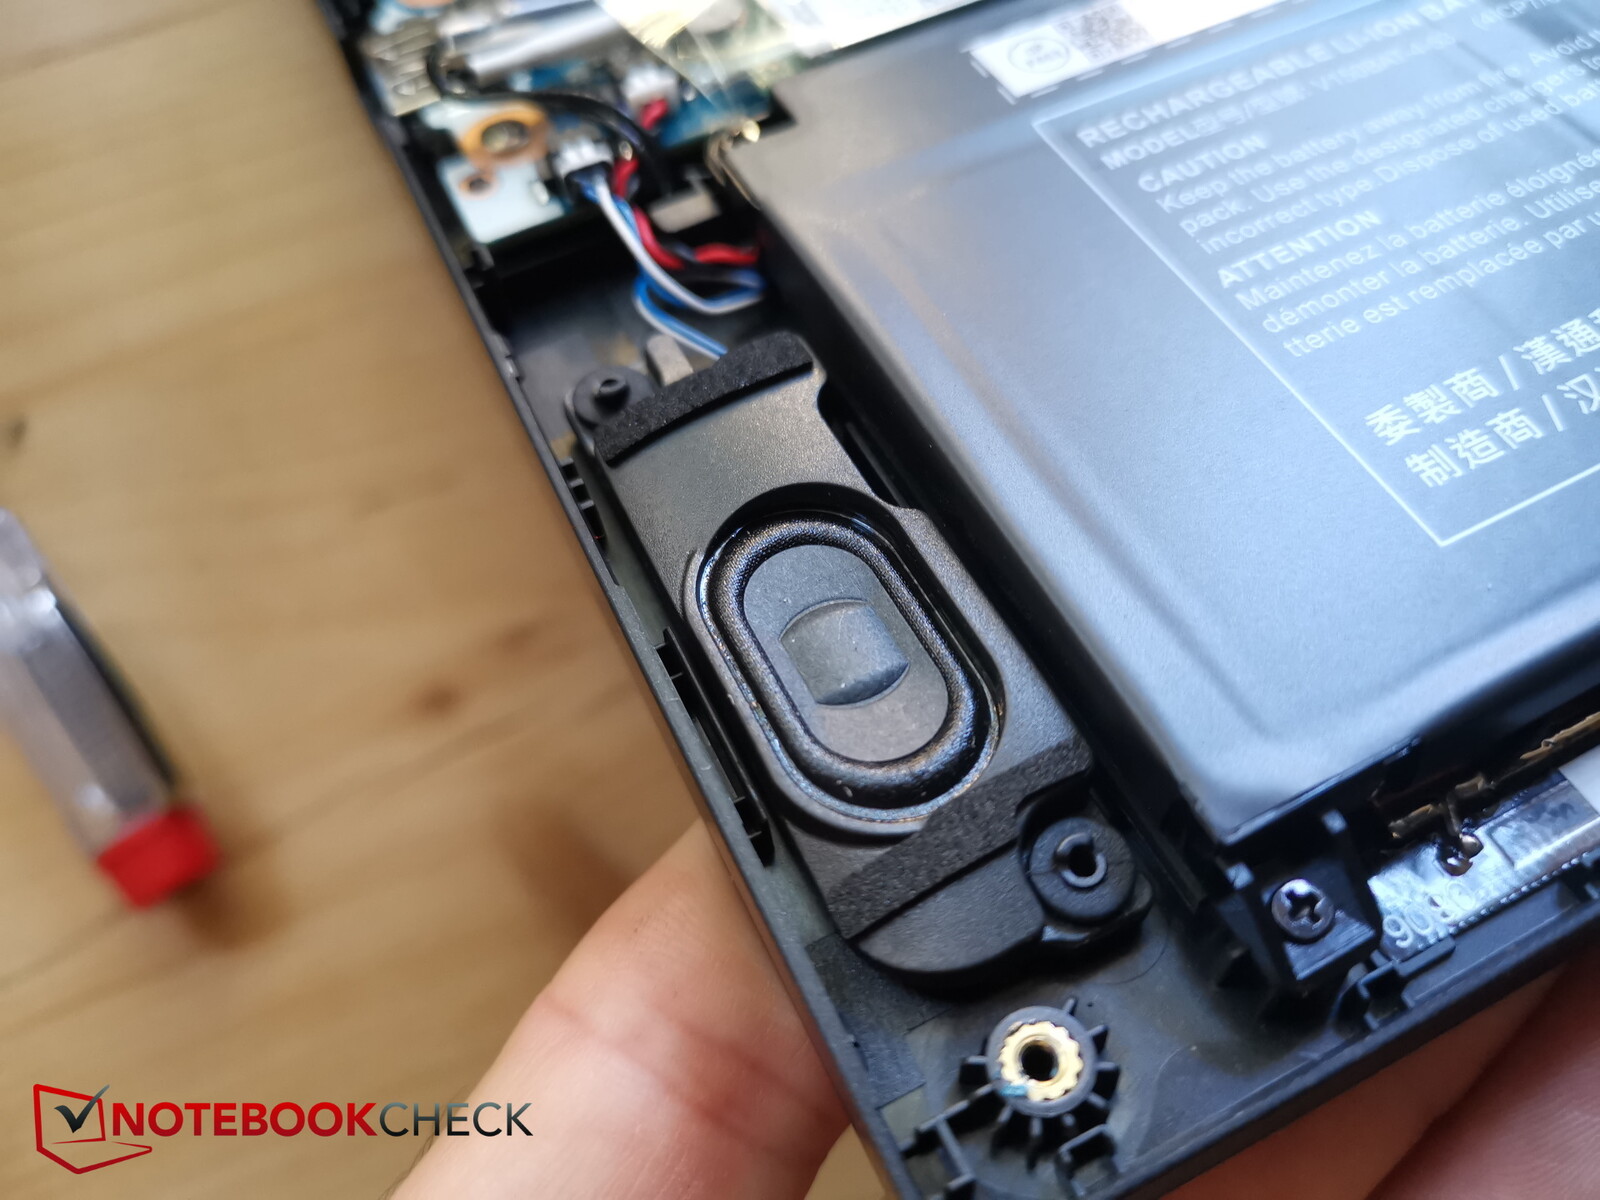
El Captiva ha instalado altavoces estéreo en la zona de las esquinas delanteras. Irradian hacia abajo, podrían ser un poco más fuertes, apenas tienen graves y, por lo demás, son bastante mediocres.
Además de los puertos digitales, dispone de dos tomas para conectar otros dispositivos de audio: una para auriculares y cascos y otra para micrófonos.
Captiva Advanced Gaming I74-121 análisis de audio
(±) | la sonoridad del altavoz es media pero buena (79.02 dB)
Graves 100 - 315 Hz
(-) | casi sin bajos - de media 27.2% inferior a la mediana
(±) | la linealidad de los graves es media (12.7% delta a frecuencia anterior)
Medios 400 - 2000 Hz
(±) | medias más altas - de media 10% más altas que la mediana
(±) | la linealidad de los medios es media (14.2% delta respecto a la frecuencia anterior)
Altos 2 - 16 kHz
(+) | máximos equilibrados - a sólo 4.3% de la mediana
(±) | la linealidad de los máximos es media (9.9% delta a frecuencia anterior)
Total 100 - 16.000 Hz
(-) | el sonido global no es lineal (30.3% de diferencia con la mediana)
En comparación con la misma clase
» 96% de todos los dispositivos probados de esta clase eran mejores, 2% similares, 3% peores
» El mejor tuvo un delta de 6%, la media fue 18%, el peor fue ###max##%
En comparación con todos los dispositivos probados
» 89% de todos los dispositivos probados eran mejores, 3% similares, 9% peores
» El mejor tuvo un delta de 4%, la media fue 23%, el peor fue ###max##%
Apple MacBook Pro 16 2021 M1 Pro análisis de audio
(+) | los altavoces pueden reproducir a un volumen relativamente alto (#84.7 dB)
Graves 100 - 315 Hz
(+) | buen bajo - sólo 3.8% lejos de la mediana
(+) | el bajo es lineal (5.2% delta a la frecuencia anterior)
Medios 400 - 2000 Hz
(+) | medios equilibrados - a sólo 1.3% de la mediana
(+) | los medios son lineales (2.1% delta a la frecuencia anterior)
Altos 2 - 16 kHz
(+) | máximos equilibrados - a sólo 1.9% de la mediana
(+) | los máximos son lineales (2.7% delta a la frecuencia anterior)
Total 100 - 16.000 Hz
(+) | el sonido global es lineal (4.6% de diferencia con la mediana)
En comparación con la misma clase
» 0% de todos los dispositivos probados de esta clase eran mejores, 0% similares, 100% peores
» El mejor tuvo un delta de 5%, la media fue 17%, el peor fue ###max##%
En comparación con todos los dispositivos probados
» 0% de todos los dispositivos probados eran mejores, 0% similares, 100% peores
» El mejor tuvo un delta de 4%, la media fue 23%, el peor fue ###max##%
Gestión de la energía - El Captiva tiene una batería pequeña
Consumo de energía
El portátil Captiva podría ser un poco más frugal en modo inactivo, pero sus índices de consumo son por lo demás razonables a la vista de su rendimiento. El Dell G15, que es casi igual de potente cuando se trata de juegos, consume considerablemente más debido a su procesador HX más potente.
Los otros competidores más débiles están ralentizados y, como resultado, son mucho más frugales bajo carga.
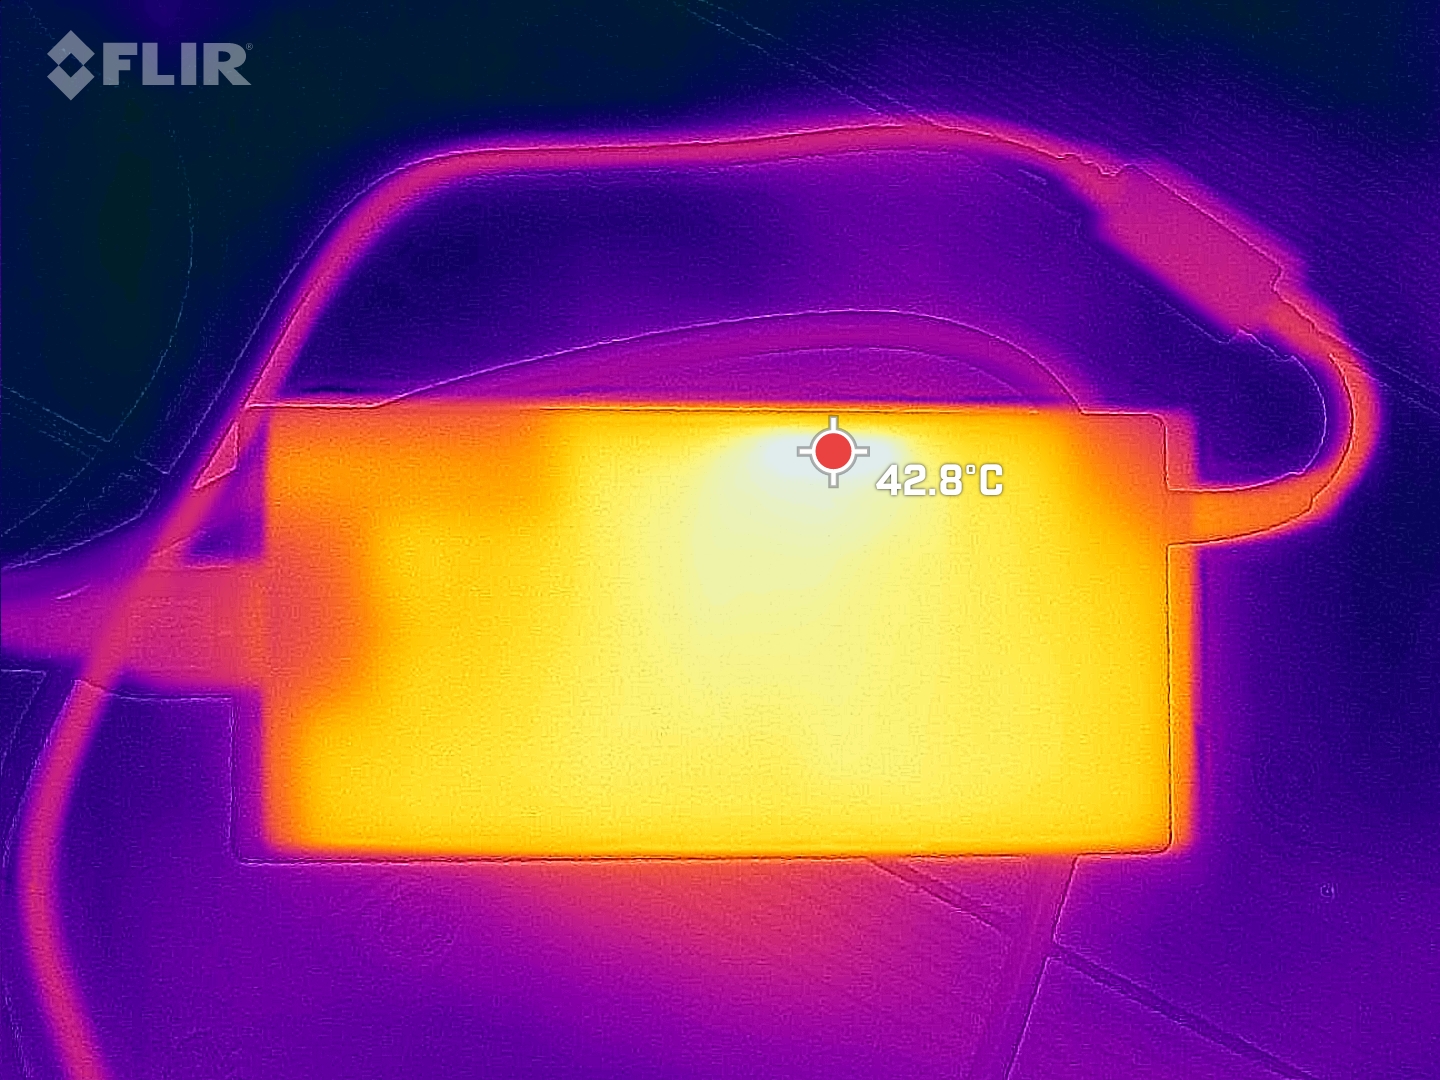
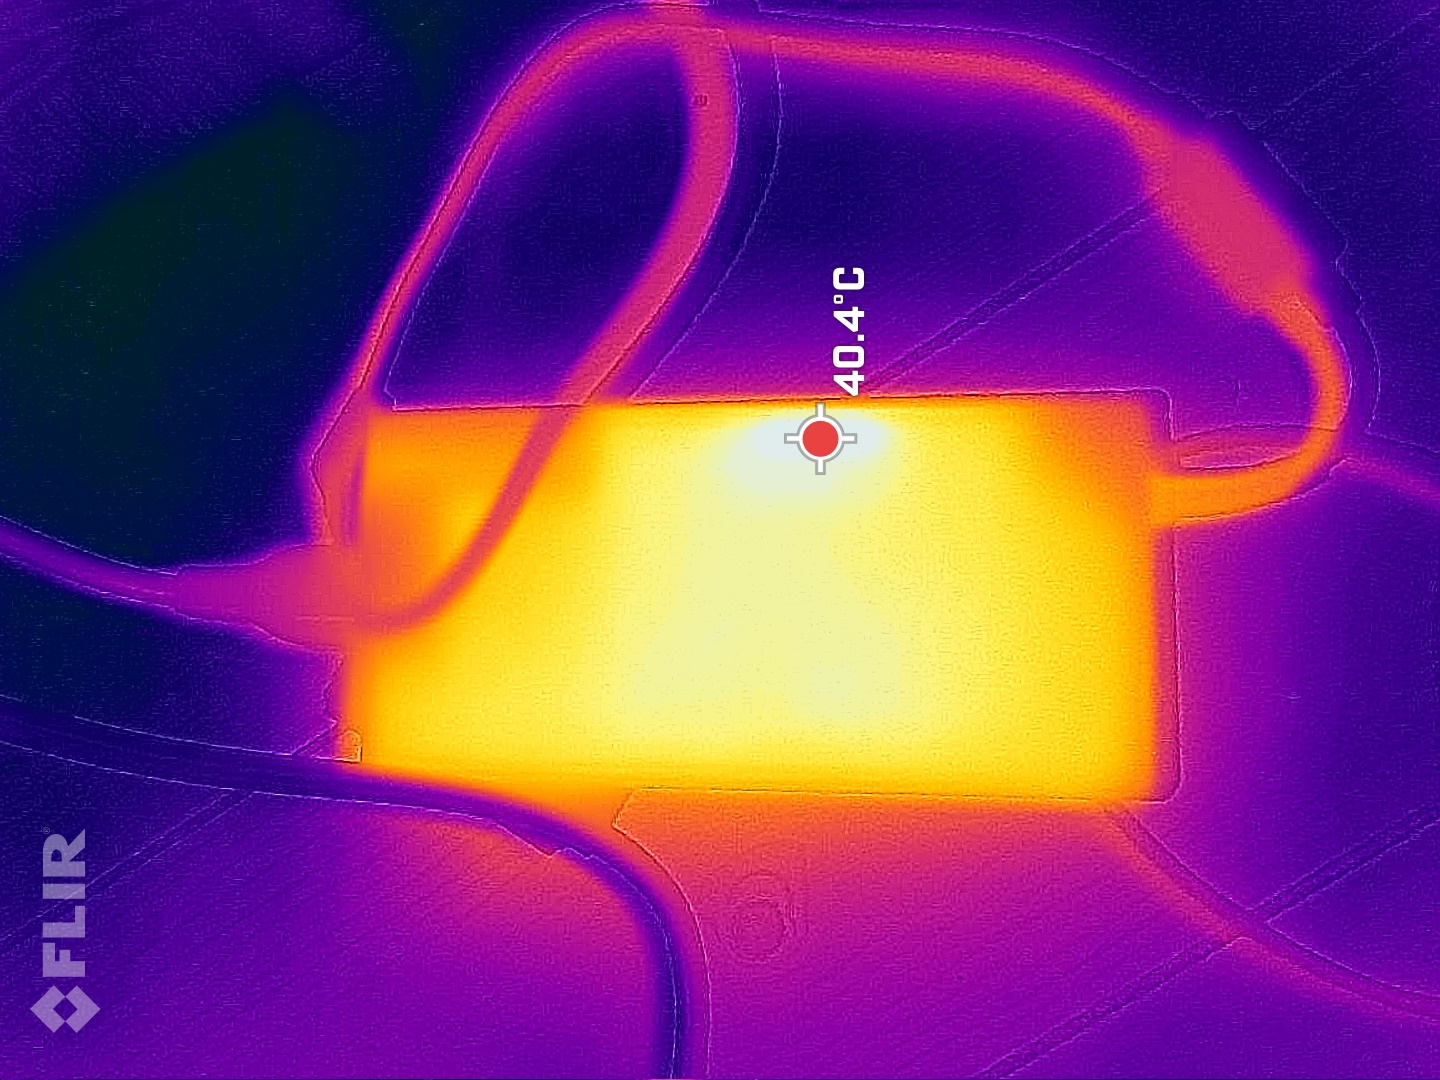
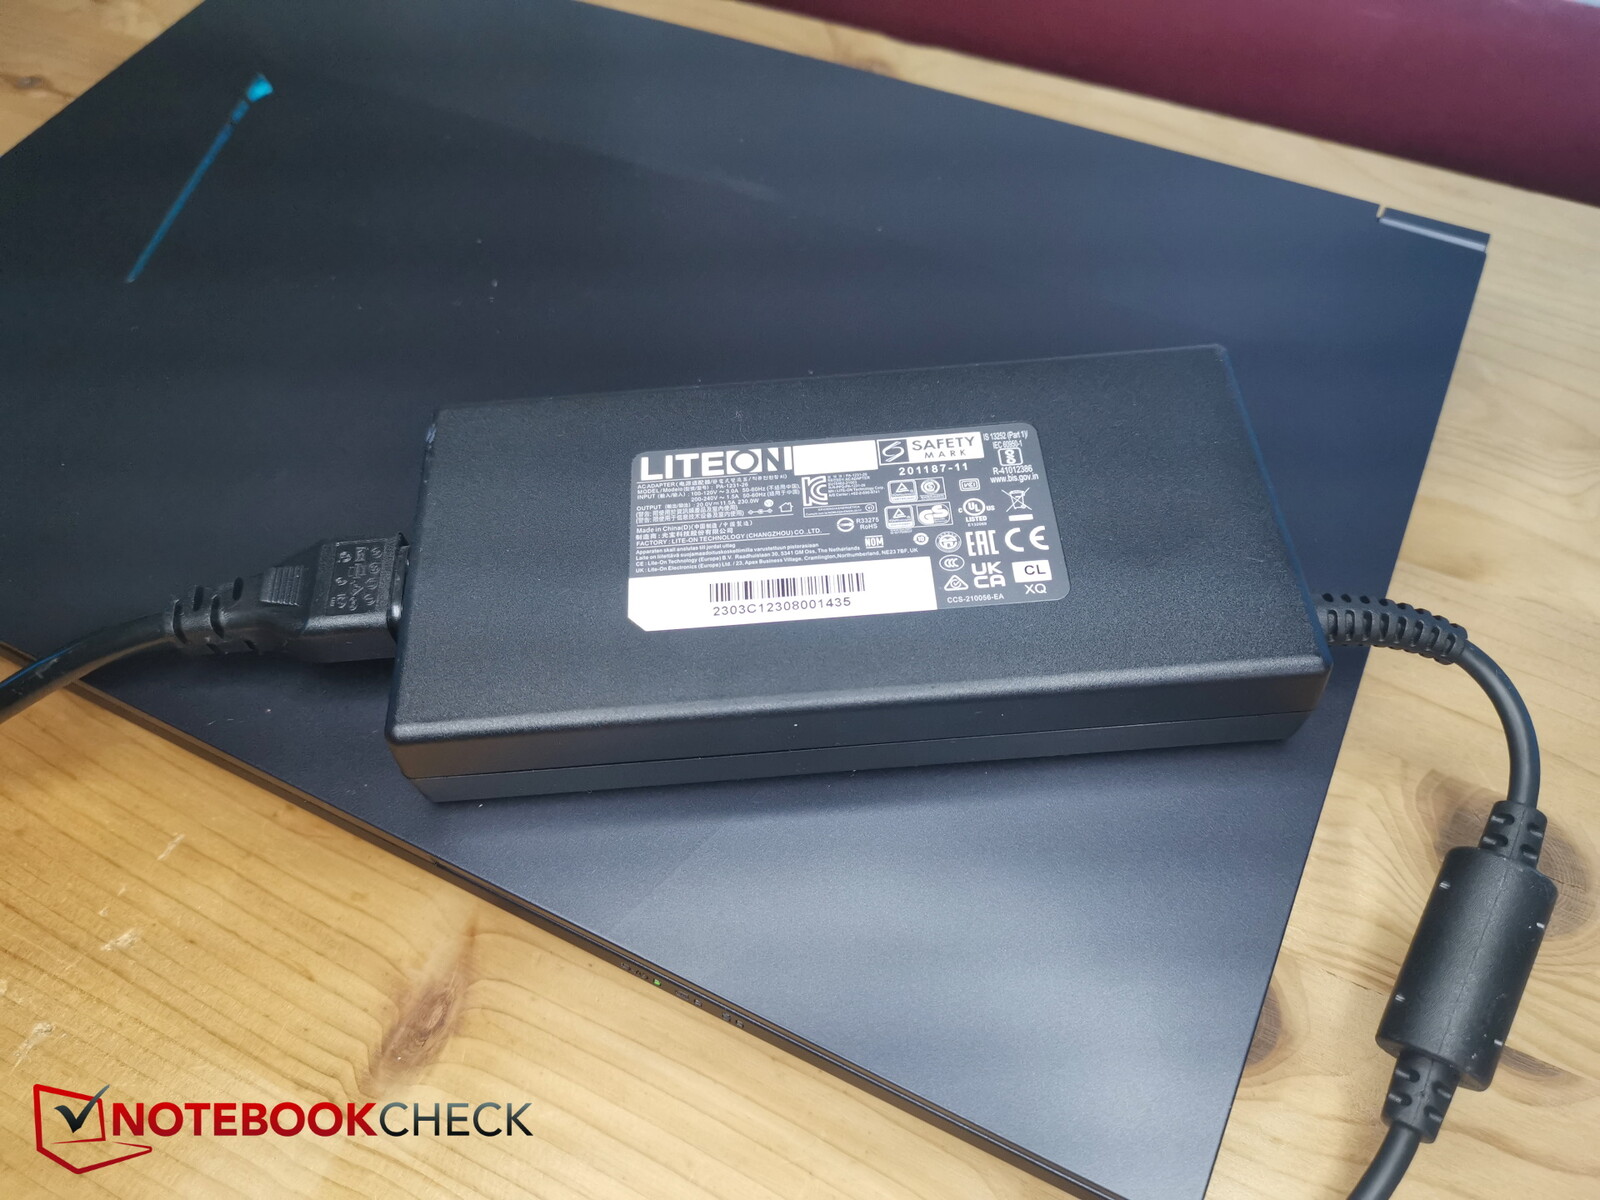
Medimos una carga máxima de 219 vatios durante un breve periodo de tiempo, que la fuente de alimentación de 230 vatios pudo manejar bien.
| Off / Standby | |
| Ocioso | |
| Carga |
|
Clave:
min: | |
| Captiva Advanced Gaming I74-121 i5-13500H, GeForce RTX 4060 Laptop GPU, Samsung SSD 980 1TB MZ-V8V1T0BW, IPS, 1920x1080, 15.6" | MSI Cyborg 15 A12VF i7-12650H, GeForce RTX 4060 Laptop GPU, Samsung PM9B1 1024GB MZVL41T0HBLB, IPS, 1920x1080, 15.6" | Dell G15 5530 i7-13650HX, GeForce RTX 4060 Laptop GPU, SSTC CL4-3D512-Q11, IPS, 1920x1080, 15.6" | Lenovo Legion Slim 5 16APH8 R7 7840HS, GeForce RTX 4060 Laptop GPU, SK hynix PC801 HFS512GEJ9X115N, IPS, 2560x1600, 16" | Lenovo LOQ 15APH8 R7 7840HS, GeForce RTX 4050 Laptop GPU, Micron 2450 512GB MTFDKCD512TFK, IPS, 1920x1080, 15.6" | Schenker XMG Core 15 (M22) R7 6800H, GeForce RTX 3060 Laptop GPU, Samsung SSD 980 Pro 1TB MZ-V8P1T0BW, IPS, 2560x1440, 15.6" | Medio NVIDIA GeForce RTX 4060 Laptop GPU | Media de la clase Gaming | |
|---|---|---|---|---|---|---|---|---|
| Power Consumption | 44% | 9% | 17% | 12% | 9% | 11% | -7% | |
| Idle Minimum * (Watt) | 18.4 | 6 67% | 8.4 54% | 9.4 49% | 15 18% | 11.8 36% | 11.5 ? 37% | 13 ? 29% |
| Idle Average * (Watt) | 20 | 8.8 56% | 14.98 25% | 15.5 22% | 17.7 11% | 14.7 26% | 16 ? 20% | 19 ? 5% |
| Idle Maximum * (Watt) | 20.7 | 11.9 43% | 15.56 25% | 24.4 -18% | 21.5 -4% | 15 28% | 20.3 ? 2% | 24.6 ? -19% |
| Load Average * (Watt) | 85 | 89 -5% | 96.8 -14% | 74.1 13% | 73.5 14% | 100 -18% | 92.9 ? -9% | 110.7 ? -30% |
| Witcher 3 ultra * (Watt) | 164 | 90.3 45% | 186 -13% | 112.9 31% | 138.6 15% | 184 -12% | ||
| Load Maximum * (Watt) | 219 | 99 55% | 271.42 -24% | 206.5 6% | 176.5 19% | 237 -8% | 210 ? 4% | 259 ? -18% |
* ... más pequeño es mejor
Power consumption Witcher 3 / Stress test
Power consumption with external monitor
Tiempos de ejecución
Equipado con una batería de 53 Wh, el Captiva de bajo precio no es el mejor; el Dell G15 tiene una batería de 86 Wh, Schenker y Lenovo usan 60 Wh, y sólo el MSI Cyborg usa también 53 Wh.
Posteriormente, el Captiva duró algo menos de 5 horas en nuestro test WLAN y de vídeo cuando usaba su propio modo de ahorro de energía.
| Captiva Advanced Gaming I74-121 i5-13500H, GeForce RTX 4060 Laptop GPU, 53 Wh | MSI Cyborg 15 A12VF i7-12650H, GeForce RTX 4060 Laptop GPU, 53.5 Wh | Dell G15 5530 i7-13650HX, GeForce RTX 4060 Laptop GPU, 86 Wh | Lenovo Legion Slim 5 16APH8 R7 7840HS, GeForce RTX 4060 Laptop GPU, 80 Wh | Lenovo LOQ 15APH8 R7 7840HS, GeForce RTX 4050 Laptop GPU, 60 Wh | Schenker XMG Core 15 (M22) R7 6800H, GeForce RTX 3060 Laptop GPU, 62 Wh | Media de la clase Gaming | |
|---|---|---|---|---|---|---|---|
| Duración de Batería | 50% | 4% | 5% | 5% | 8% | 33% | |
| H.264 (h) | 4.9 | 8 63% | 6.8 39% | 8.32 ? 70% | |||
| WiFi v1.3 (h) | 5.3 | 7.5 42% | 6.5 23% | 7.1 34% | 7.4 40% | 7.8 47% | 7.11 ? 34% |
| Load (h) | 1.6 | 2.3 44% | 0.8 -50% | 1.2 -25% | 1.1 -31% | 1.1 -31% | 1.502 ? -6% |
| Reader / Idle (h) | 13.6 | 11.7 | 9.8 | 8.27 ? | |||
| Witcher 3 ultra (h) | 0.8 |
Pro
Contra
Veredicto - Centrado en lo esencial de un portátil para juegos
Puede que el Captiva Advanced Gaming no utilice el procesador más rápido pero, aun así, no deja dudas sobre el rendimiento 3D de su RTX 4060 ligeramente por encima de la media. Posteriormente, el fabricante se centra en lo esencial: el rendimiento de juego.
Por el precio relativamente bajo de 1.800 dólares, también tiene que hacer algunos compromisos. Esto incluye la falta de Thunderbolt y un lector de tarjetas SD, así como su anticuado puerto USB 2.0.
El Captiva Advanced Gaming I74-121 ofrece un rendimiento 3D bastante alto por un precio relativamente bajo. Hay que hacer concesiones en cuanto a sus opciones de conectividad.
Hay algunas alternativas viables, aunque su precio es tentadoramente bajo. En muchas comparaciones, elDell G15es uno de sus competidores más duros. Ofrece un mejor rendimiento de la CPU y una batería más grande, pero a cambio se calienta mucho más y tiene un consumo más elevado.
Precio y disponibilidad
Nuestro modelo de prueba cuesta unos 1.800 dólares. Actualmente no está a la venta en ninguna tienda online estadounidense.
Puedes ver dispositivos similares, como el Dell G15, en Amazon.
Captiva Advanced Gaming I74-121
- 09/22/2023 v7 (old)
Christian Hintze
Transparencia
La selección de los dispositivos que se van a reseñar corre a cargo de nuestro equipo editorial. La muestra de prueba fue proporcionada al autor en calidad de préstamo por el fabricante o el minorista a los efectos de esta reseña. El prestamista no tuvo ninguna influencia en esta reseña, ni el fabricante recibió una copia de la misma antes de su publicación. No había ninguna obligación de publicar esta reseña. Como empresa de medios independiente, Notebookcheck no está sujeta a la autoridad de fabricantes, minoristas o editores.
Así es como prueba Notebookcheck
Cada año, Notebookcheck revisa de forma independiente cientos de portátiles y smartphones utilizando procedimientos estandarizados para asegurar que todos los resultados son comparables. Hemos desarrollado continuamente nuestros métodos de prueba durante unos 20 años y hemos establecido los estándares de la industria en el proceso. En nuestros laboratorios de pruebas, técnicos y editores experimentados utilizan equipos de medición de alta calidad. Estas pruebas implican un proceso de validación en varias fases. Nuestro complejo sistema de clasificación se basa en cientos de mediciones y puntos de referencia bien fundamentados, lo que mantiene la objetividad.Price comparison

