Análisis del Dell G15 5530: Una alternativa viable a Alienware ahora con Raptor Lake-HX

La serie G de Dell pretende acercar la destreza de Alienware a quienes prefieren no pagar un dineral por un portátil capaz de jugar. Durante el MWC 2023, Dell presentó las series series G15 y G16 renovadas con opciones de GPU Intel Raptor Lake-HX y Nvidia GeForce RTX serie 40.
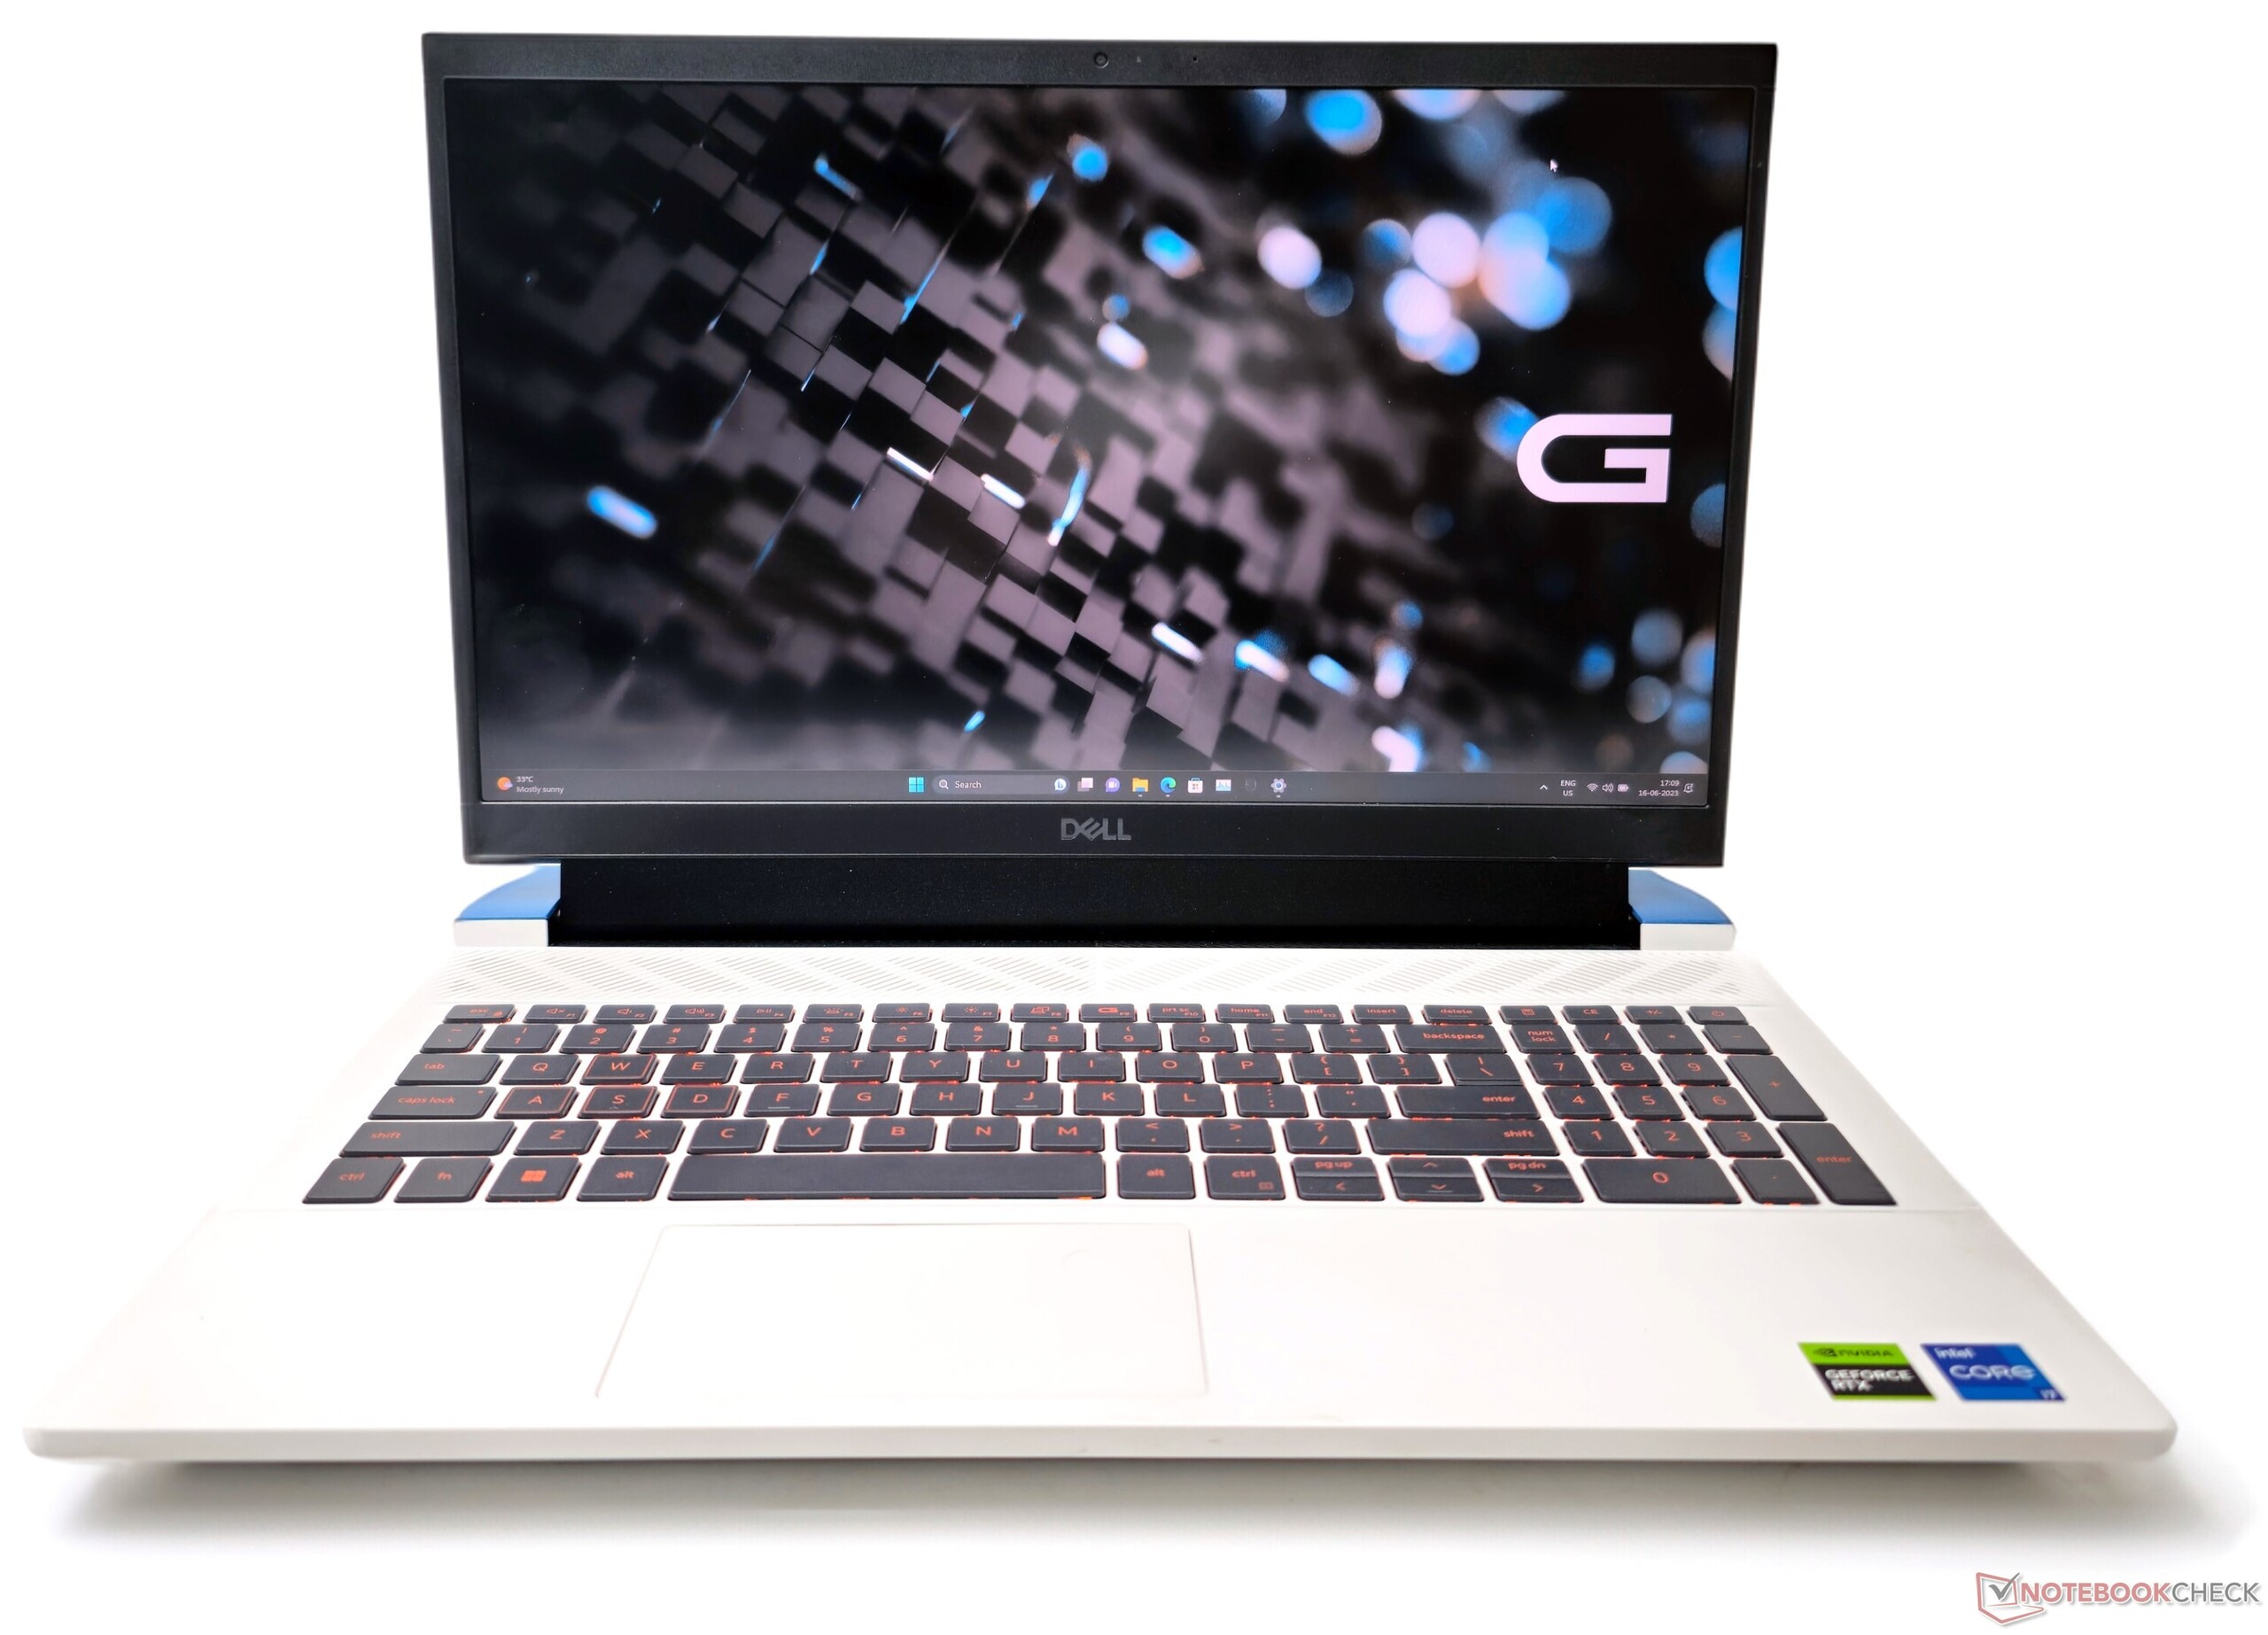
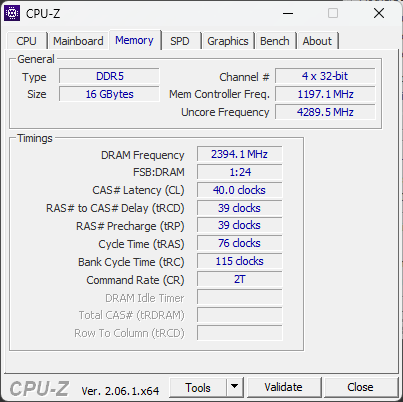
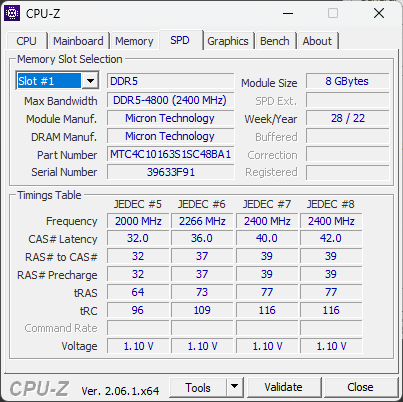
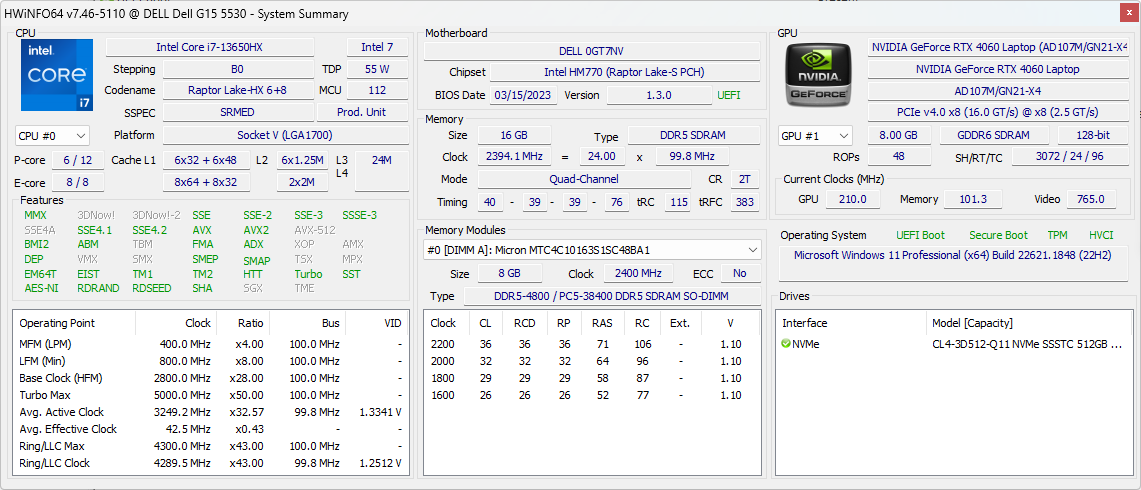
Ahora tenemos con nosotros el Dell G15 5530 con una configuración de gama alta que cuenta con el procesador Intel Core i7-13650HX, GPU Nvidia GeForce RTX 4060 para portátiles, 16 GB de RAM DDR5-4800, 512 GB de SSD NVMe y una pantalla FHD G-Sync de 15,6 pulgadas y 165 Hz.
En este análisis, damos una vuelta con el Dell G15 5530 y vemos lo bien que le va frente a la competencia por el precio de 1.58.990 ₹ (1.449 € o 1659,99 US$).
Posibles contendientes en la comparación
Valoración | Fecha | Modelo | Peso | Altura | Tamaño | Resolución | Precio |
|---|---|---|---|---|---|---|---|
| 84.2 % v7 (old) | 06/2023 | Dell G15 5530 i7-13650HX, GeForce RTX 4060 Laptop GPU | 3 kg | 26.95 mm | 15.60" | 1920x1080 | |
| 87.4 % v7 (old) | 03/2023 | Asus ROG Strix G18 G814JI i7-13650HX, GeForce RTX 4070 Laptop GPU | 3 kg | 31 mm | 18.00" | 2560x1600 | |
| 87.9 % v7 (old) | 05/2023 | Lenovo Legion Pro 5 16IRX8 i7-13700HX, GeForce RTX 4060 Laptop GPU | 2.5 kg | 26.8 mm | 16.00" | 2560x1600 | |
| 89.7 % v7 (old) | 06/2023 | Asus ROG Flow X16 GV601V i9-13900H, GeForce RTX 4060 Laptop GPU | 2.1 kg | 19.4 mm | 16.00" | 2560x1600 | |
| 82.1 % v7 (old) | 02/2023 | MSI Katana 17 B13VFK i7-13620H, GeForce RTX 4060 Laptop GPU | 2.8 kg | 25.2 mm | 17.30" | 1920x1080 | |
| 86.9 % v7 (old) | 06/2023 | Asus TUF Gaming A16 FA617XS R9 7940HS, Radeon RX 7600S | 2.2 kg | 22.1 mm | 16.00" | 1920x1200 | |
| 88.4 % v7 (old) | 04/2023 | Asus ROG Strix G17 G713PI R9 7945HX, GeForce RTX 4070 Laptop GPU | 2.8 kg | 30.7 mm | 17.30" | 2560x1440 | |
| 89 % v7 (old) | 04/2023 | Medion Erazer Major X20 i9-13900HX, GeForce RTX 4070 Laptop GPU | 2.4 kg | 29 mm | 16.00" | 2560x1600 |
Chasis: Peso pesado de plástico complementado con un voluminoso bloque de alimentación
Dell parece haber recortado en RGB pizzazz esta vez, a diferencia de lo que hemos visto anteriormente con elG15 5520y G15 5521 Special Edition. El chasis del 5530 es más o menos idéntico al del G15 5510.
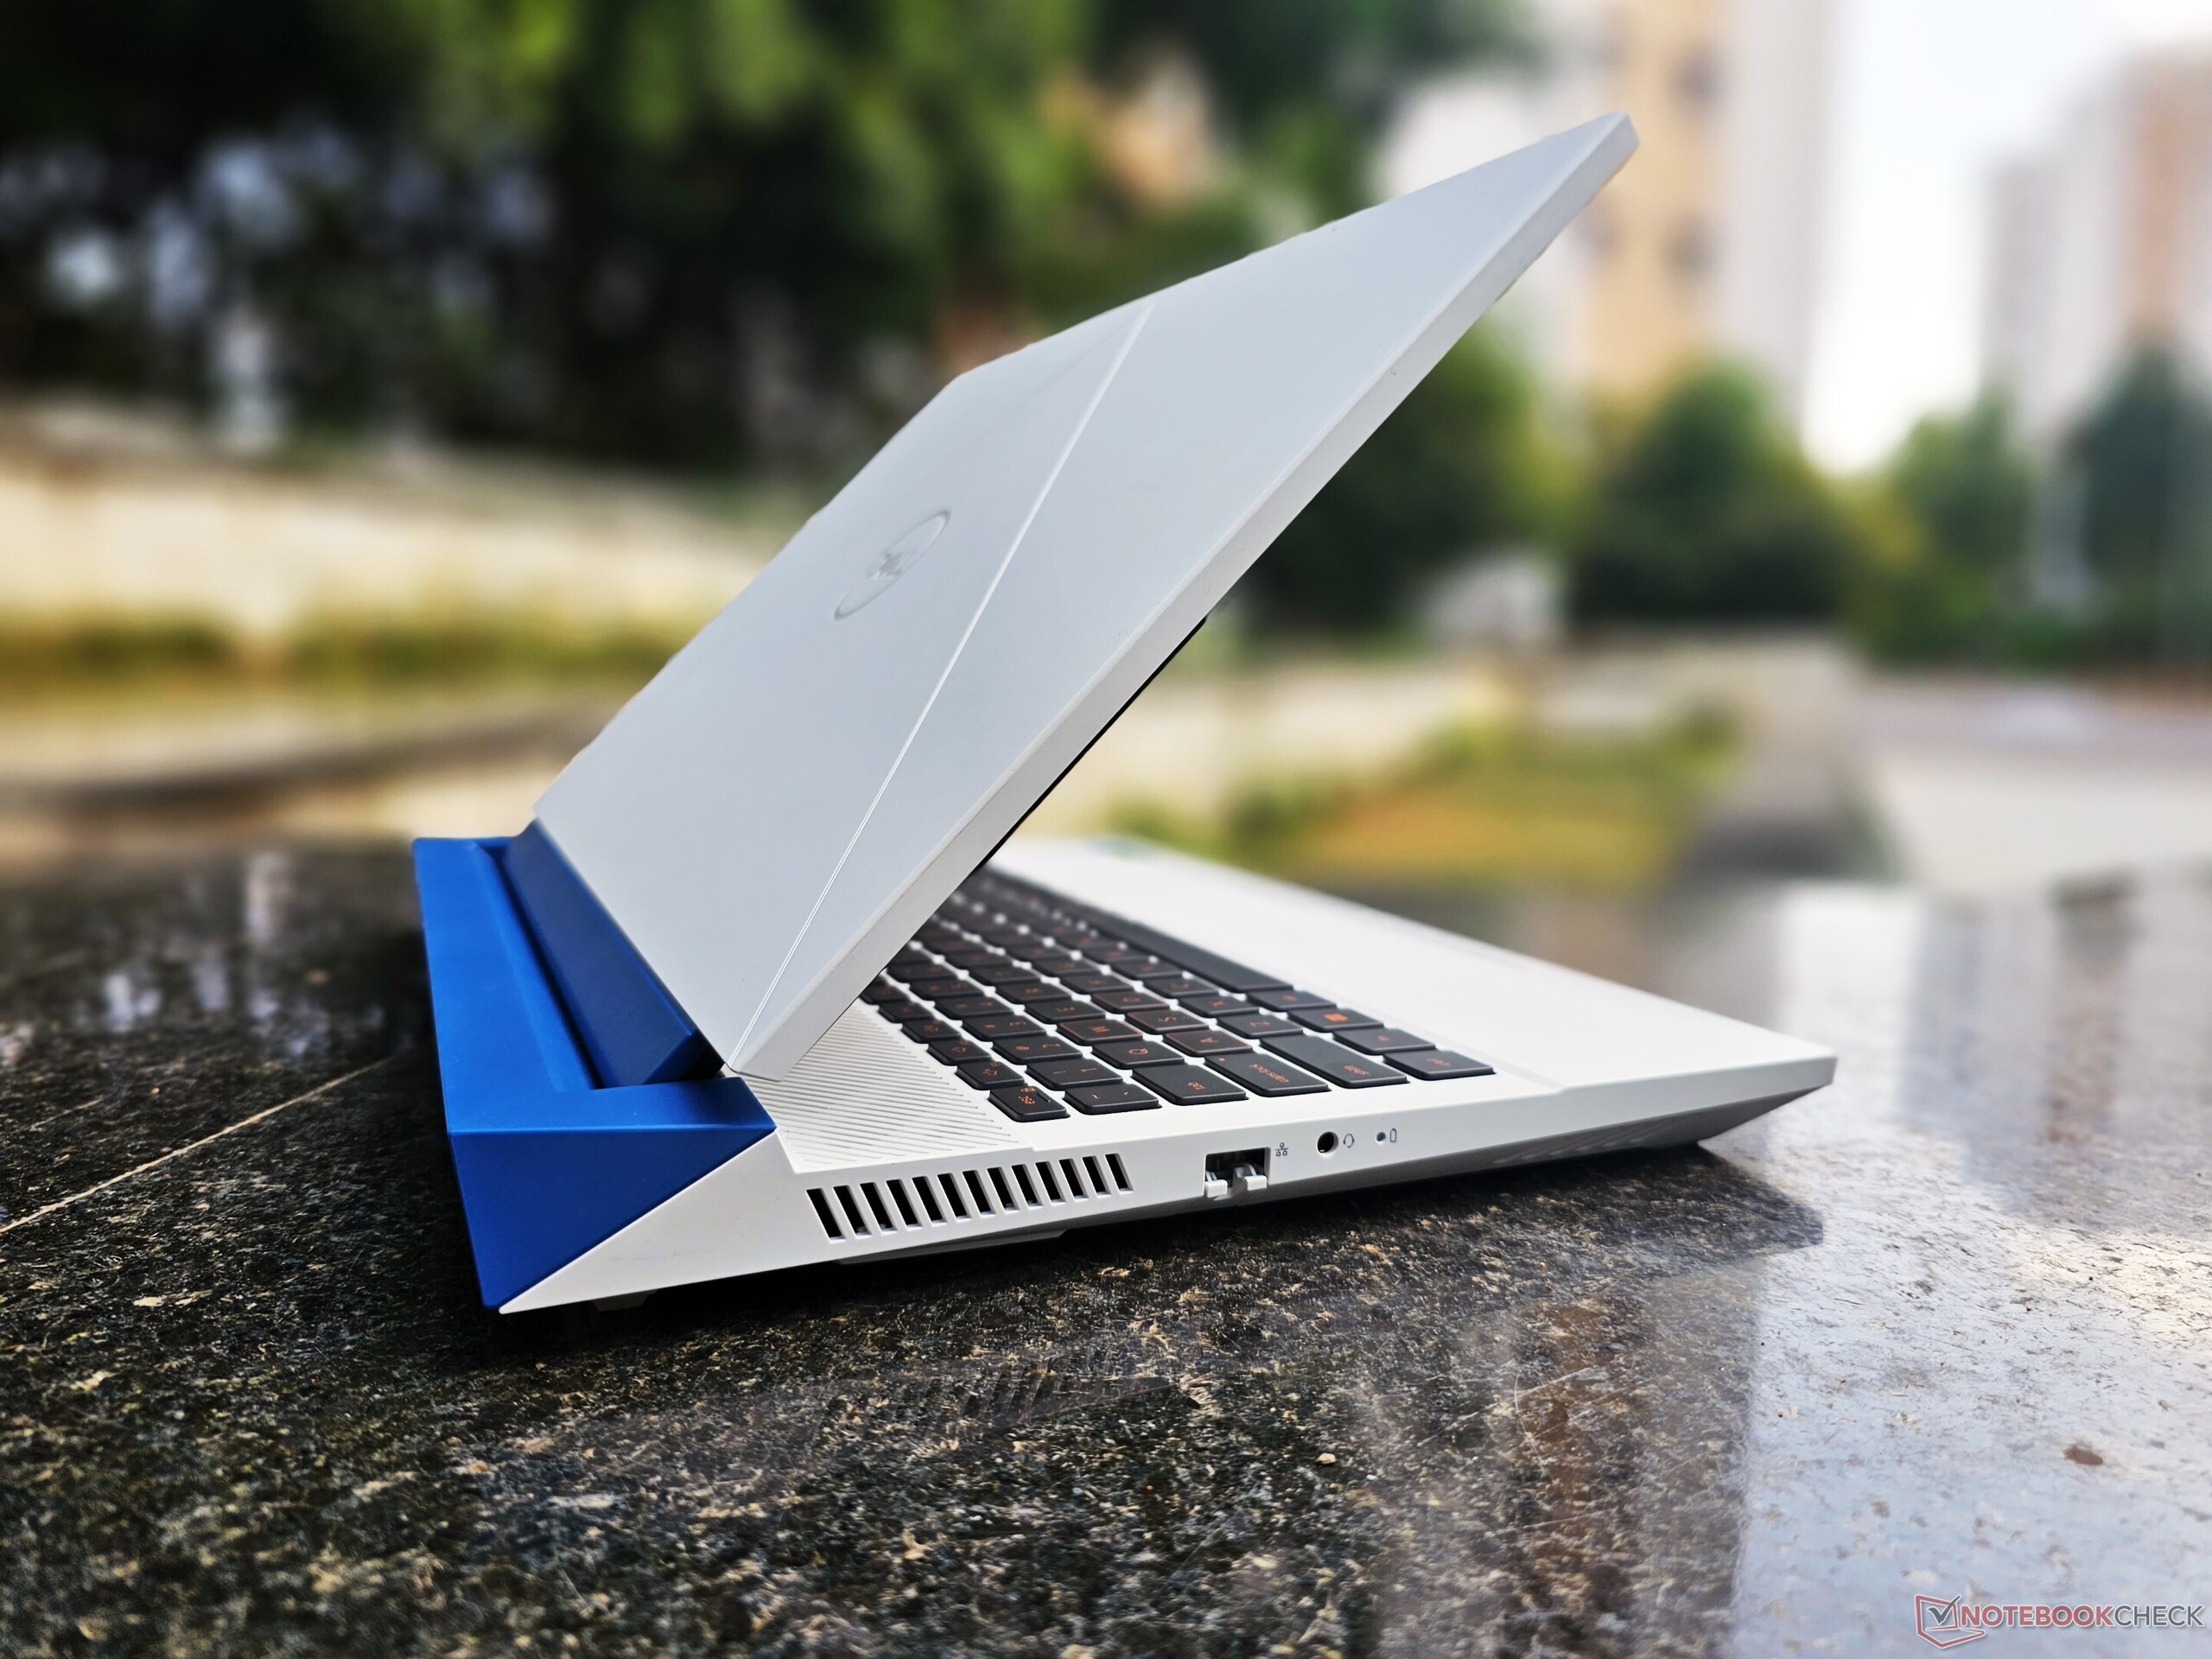
Nuestra unidad G15 5530 es la variante Quantum White con un estante térmico Deep Space Blue. Además, Dell ofrece dos opciones alternativas de color para este modelo: Dark Shadow Gray con un estante térmico Negro y Pop Purple con un estante térmico Neo Mint.
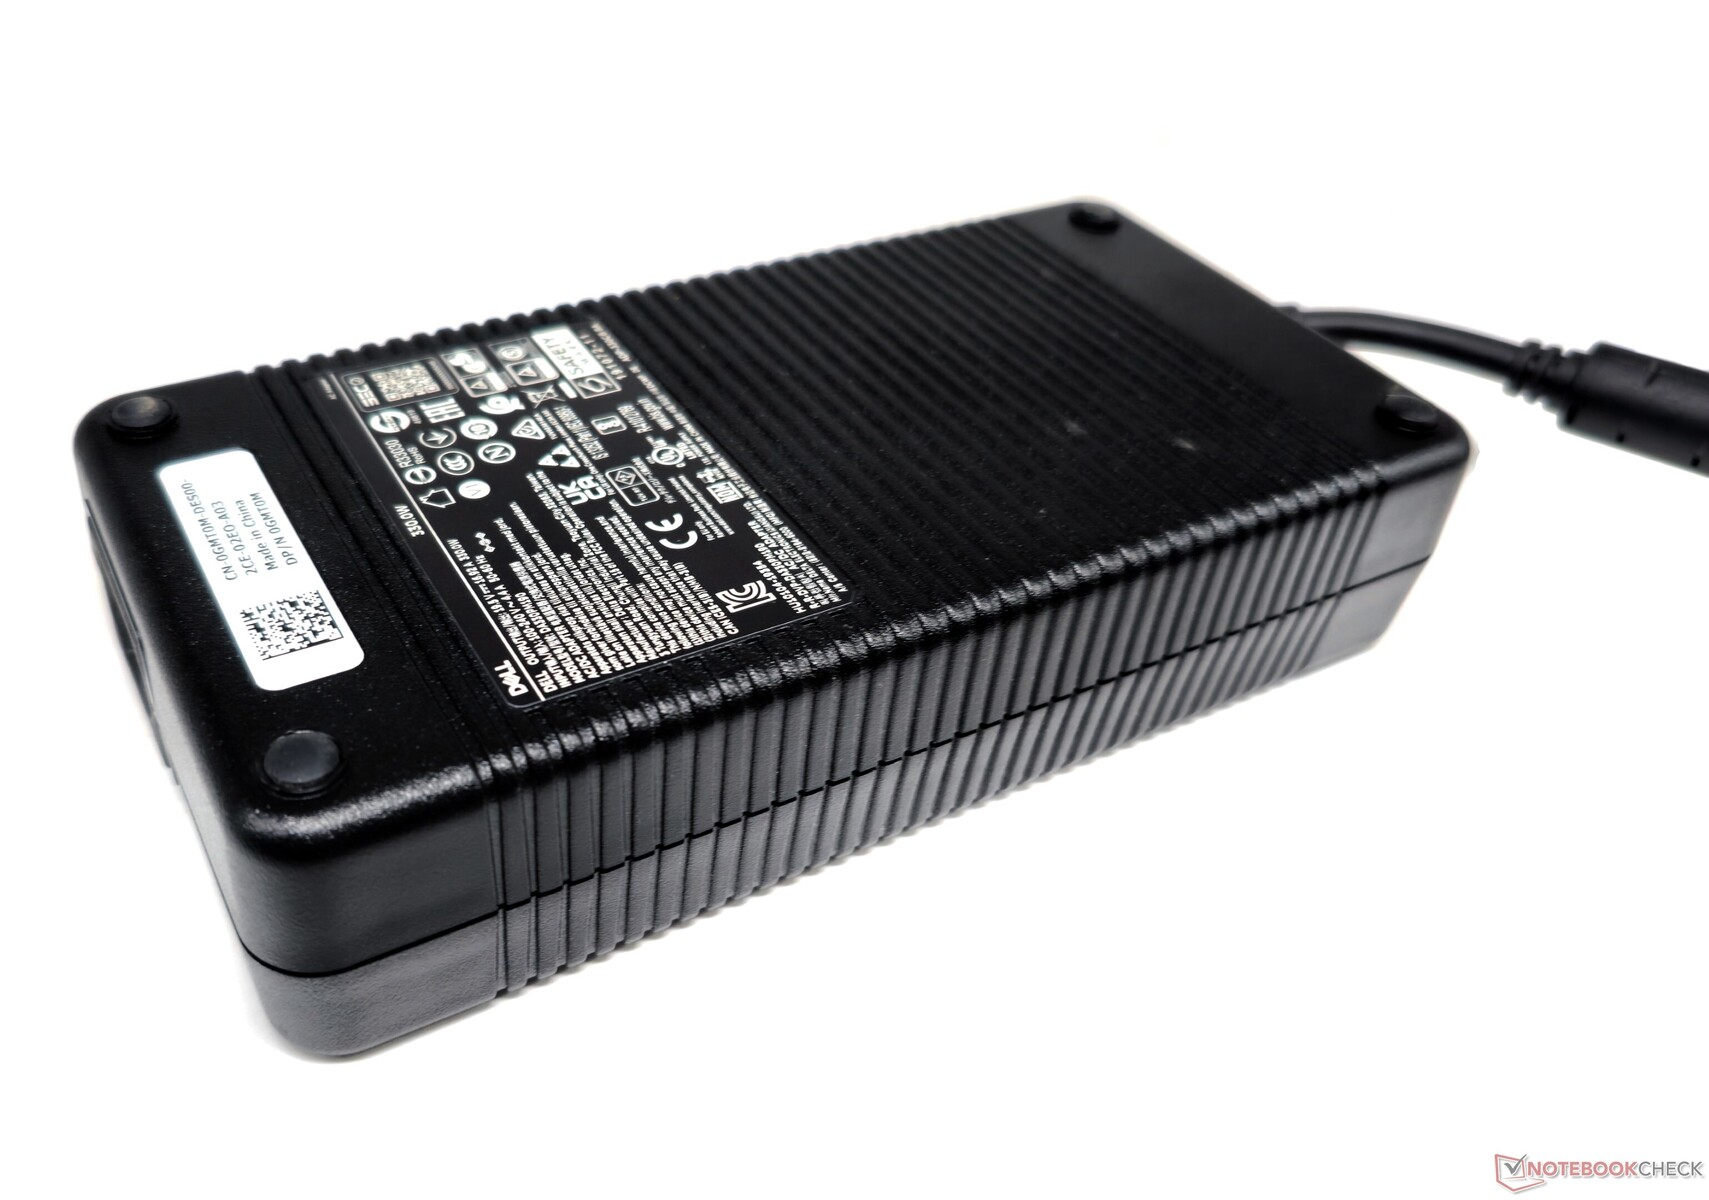
El portátil G15 5530 tiene un chasis de plástico que pesa casi 3 kg, lo que es su principal inconveniente. A su peso hay que añadir un adaptador de corriente de 330 W y 1,34 kg, por lo que los jugadores pueden esperar un buen entrenamiento cargando con este portátil.
Las bisagras de nuestra unidad parecían algo rígidas, pero la tapa se puede abrir con un solo dedo con algo de esfuerzo. Aunque la tapa se flexiona fácilmente con una fuerza mínima, se mantiene estable sin tambalearse en condiciones normales de uso.
No hay sorpresas en el diseño general del chasis, pero las esquinas afiladas y el peso pueden no ser del agrado de todos.

Conectividad: Distribución de puertos no ideal para jugadores
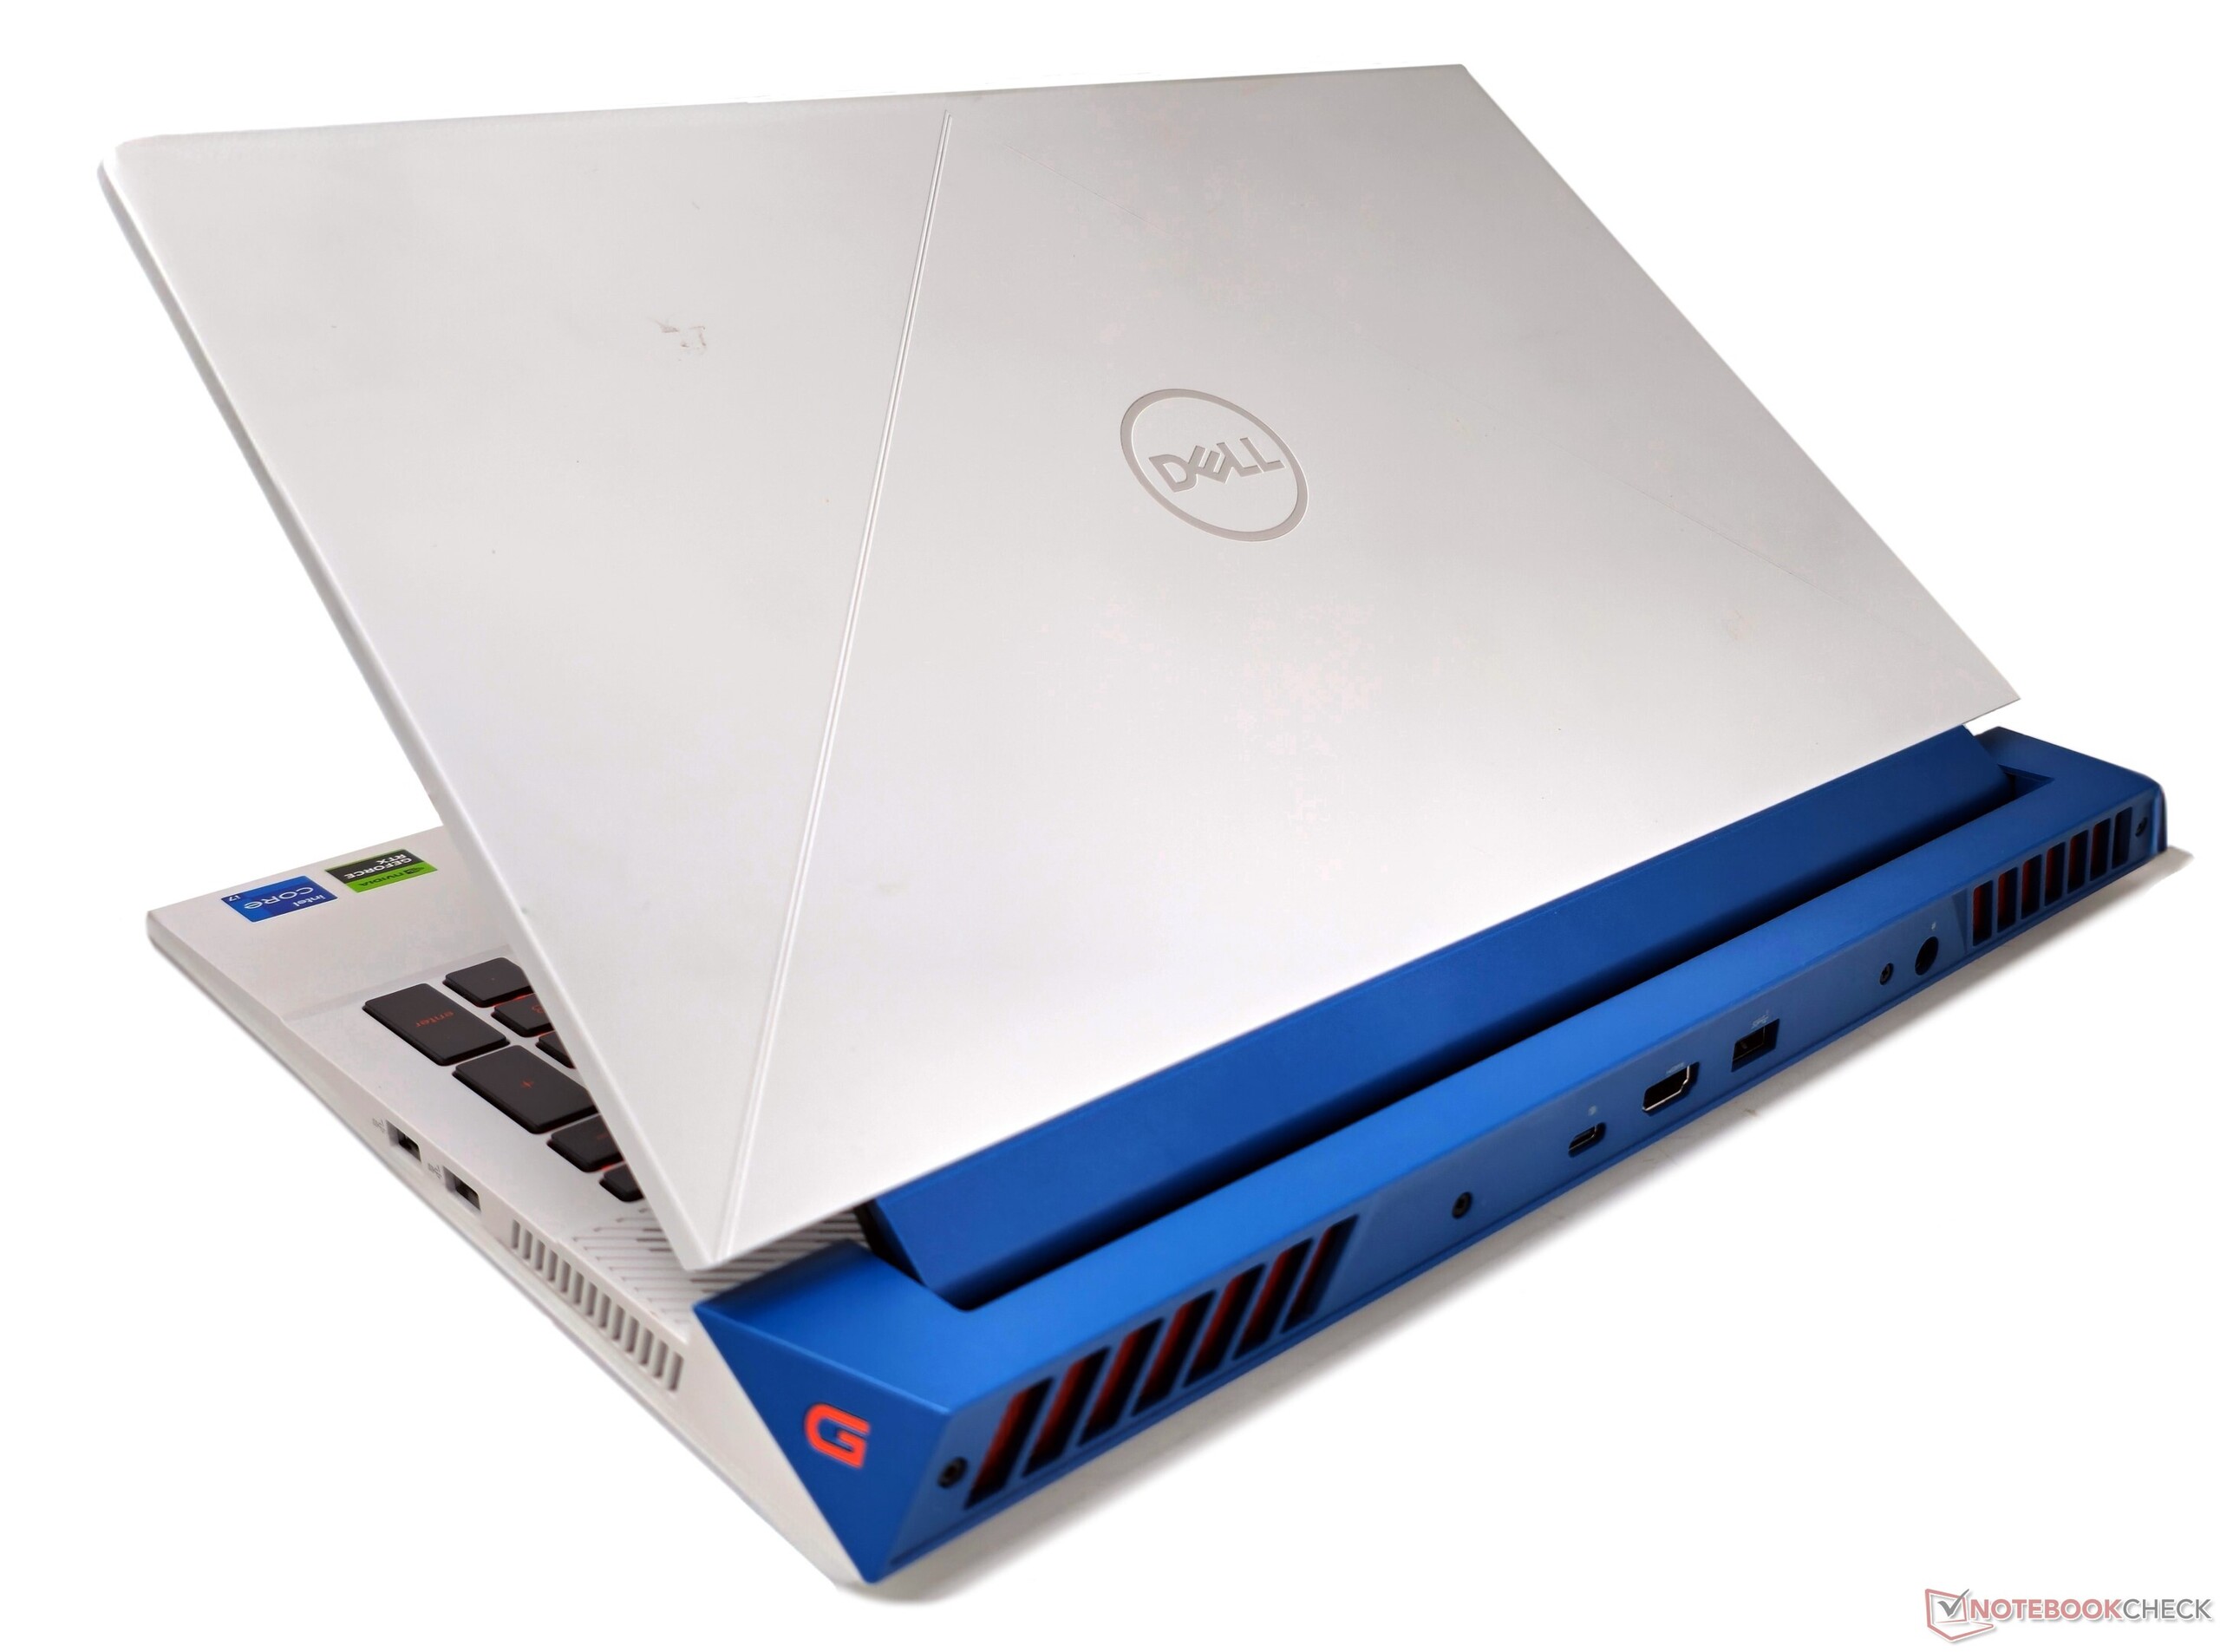
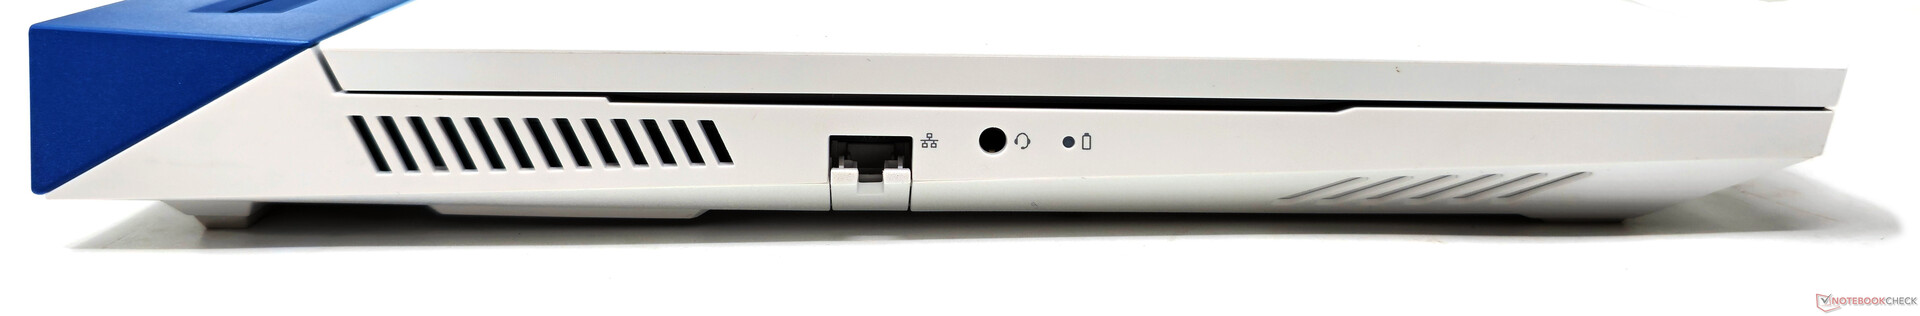
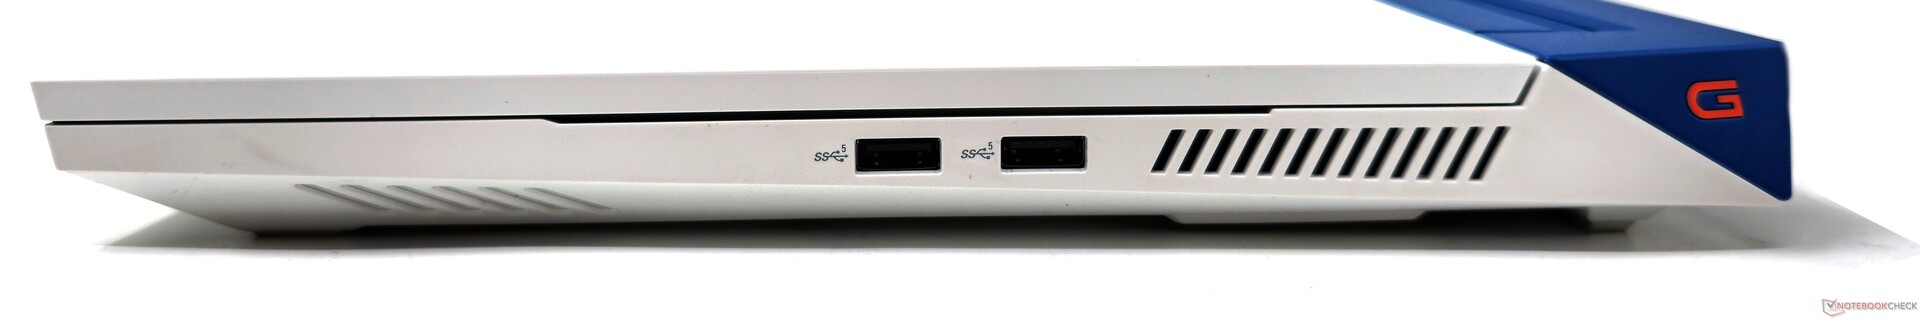
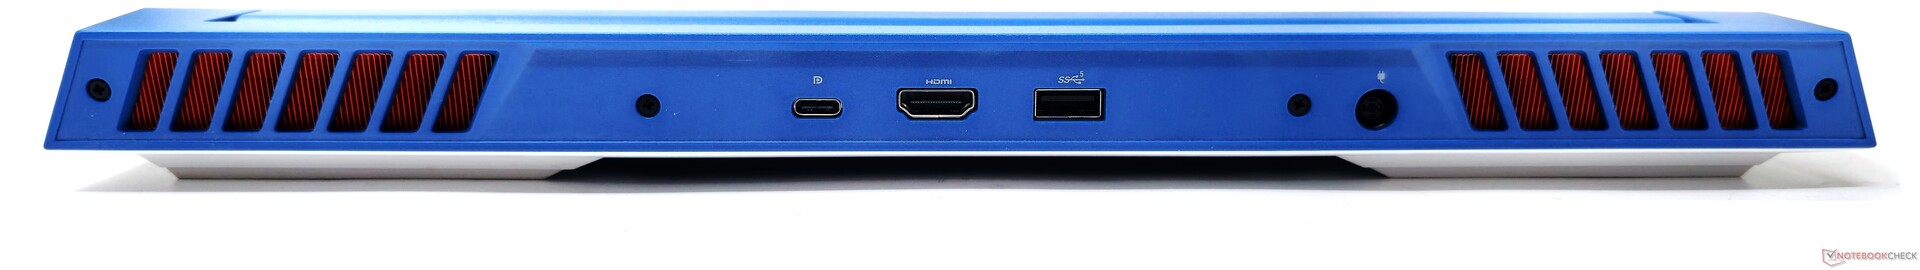
La ubicación de los puertos del G15 5530 es menos que ideal. Sólo el puerto LAN y la clavija de auriculares están presentes a la izquierda, mientras que el lado derecho tiene dos puertos USB 3.2 Gen1 Type-A. El resto de puertos están en la trasera. El resto de puertos están situados en la parte trasera.
La ausencia de puertos USB en el lado izquierdo puede ser molesta para la conectividad periférica, especialmente para los jugones que usan un ratón con cable.
Además, el único puerto USB Type-C ofrece la funcionalidad DisplayPort-out pero carece de Power Delivery. Como resultado, el portátil no se puede cargar sin usar el voluminoso adaptador de corriente.
Comunicación
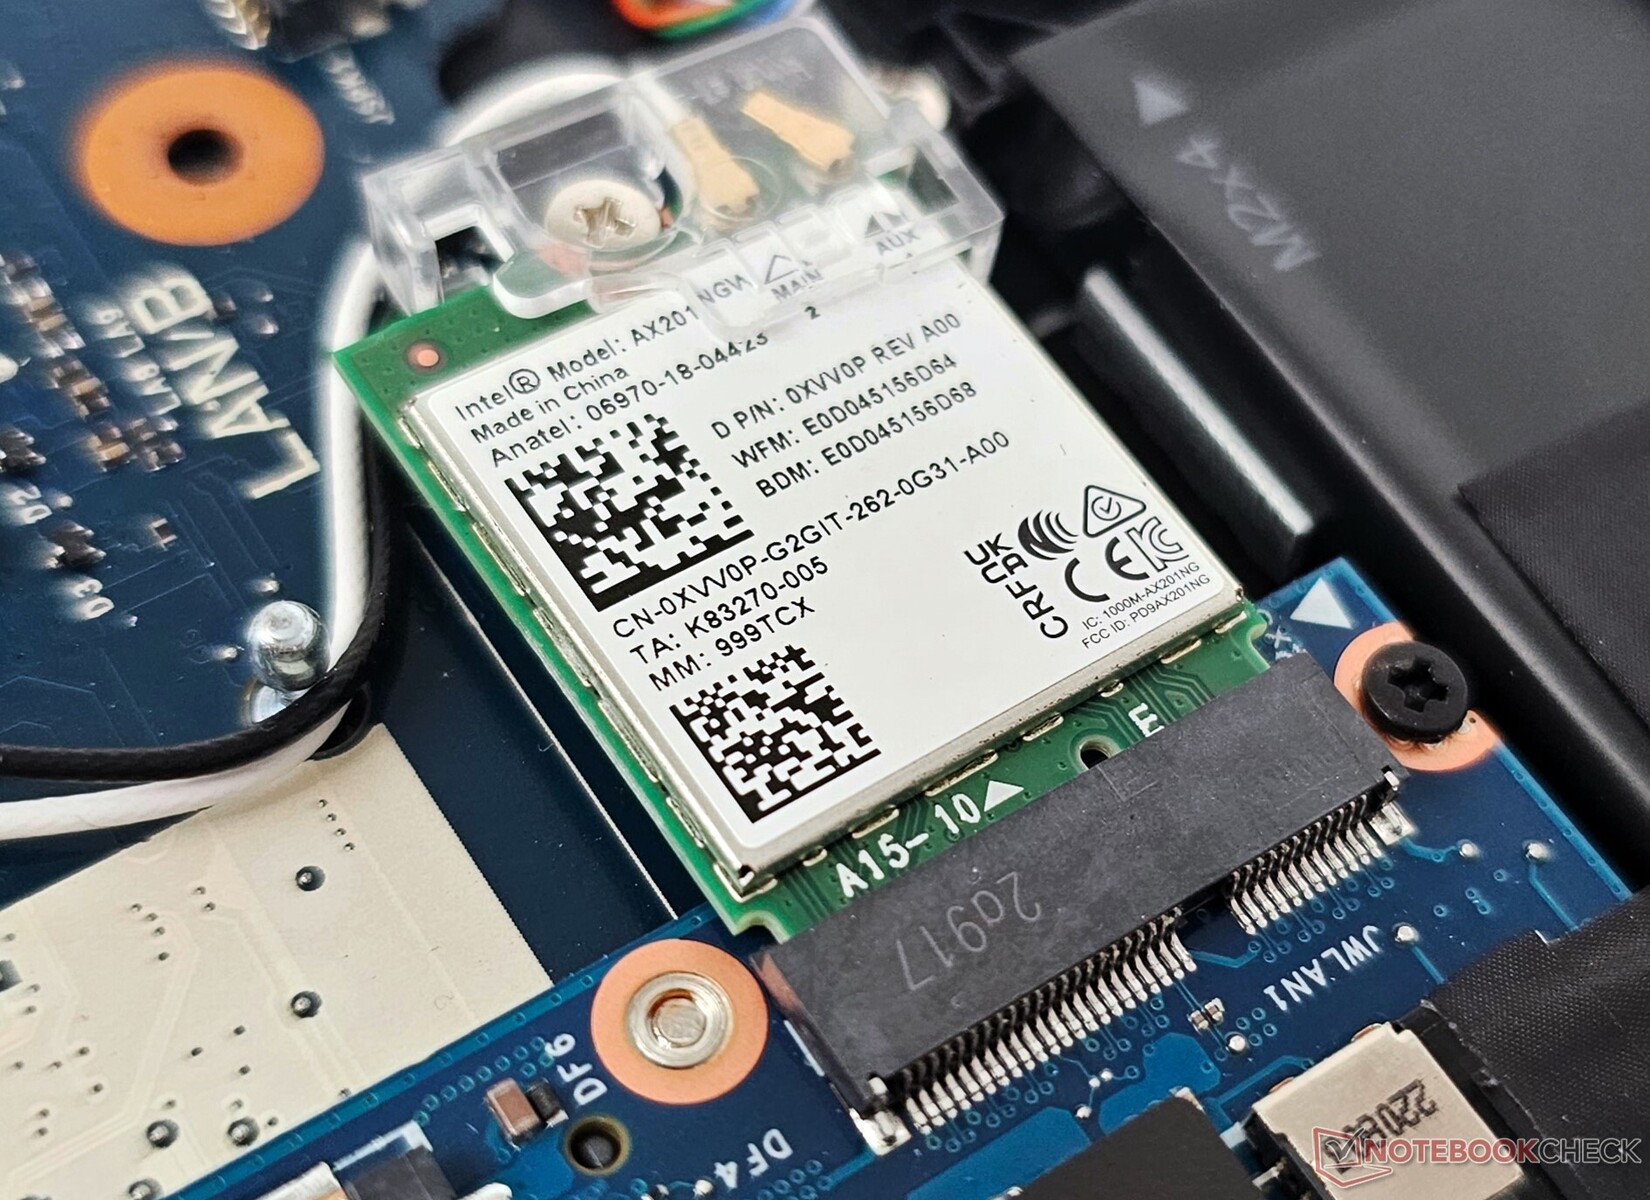
Aunque la tarjeta WLAN Intel AX201 del G15 5530 carece de soporte para Wi-Fi 6E, encontramos que su implementación en el G15 5530 sigue ofreciendo un rendimiento excelente.
Nuestras pruebas, realizadas con el router de referencia Asus ROG Rapture GT-AXE11000, mostraron un rendimiento relativamente estable cuando el portátil se situó a 1 m del router con una línea de visión despejada y sin interferencias externas.
Cámara web
La calidad de imagen de la webcam 720p no es nada del otro mundo, con grandes desviaciones de color (sobre todo en tonos azules) y falta de nitidez y claridad general.


Seguridad
Aparte del módulo TPM 2.0, el G15 5530 no ofrece ninguna función de seguridad adicional ni inicio de sesión biométrico.
Accesorios y garantía
No hay más accesorios en la caja que el adaptador de corriente de 330 W y la documentación habitual.
En la India, Dell ofrece de serie un año de asistencia premium in situ para hardware y software.
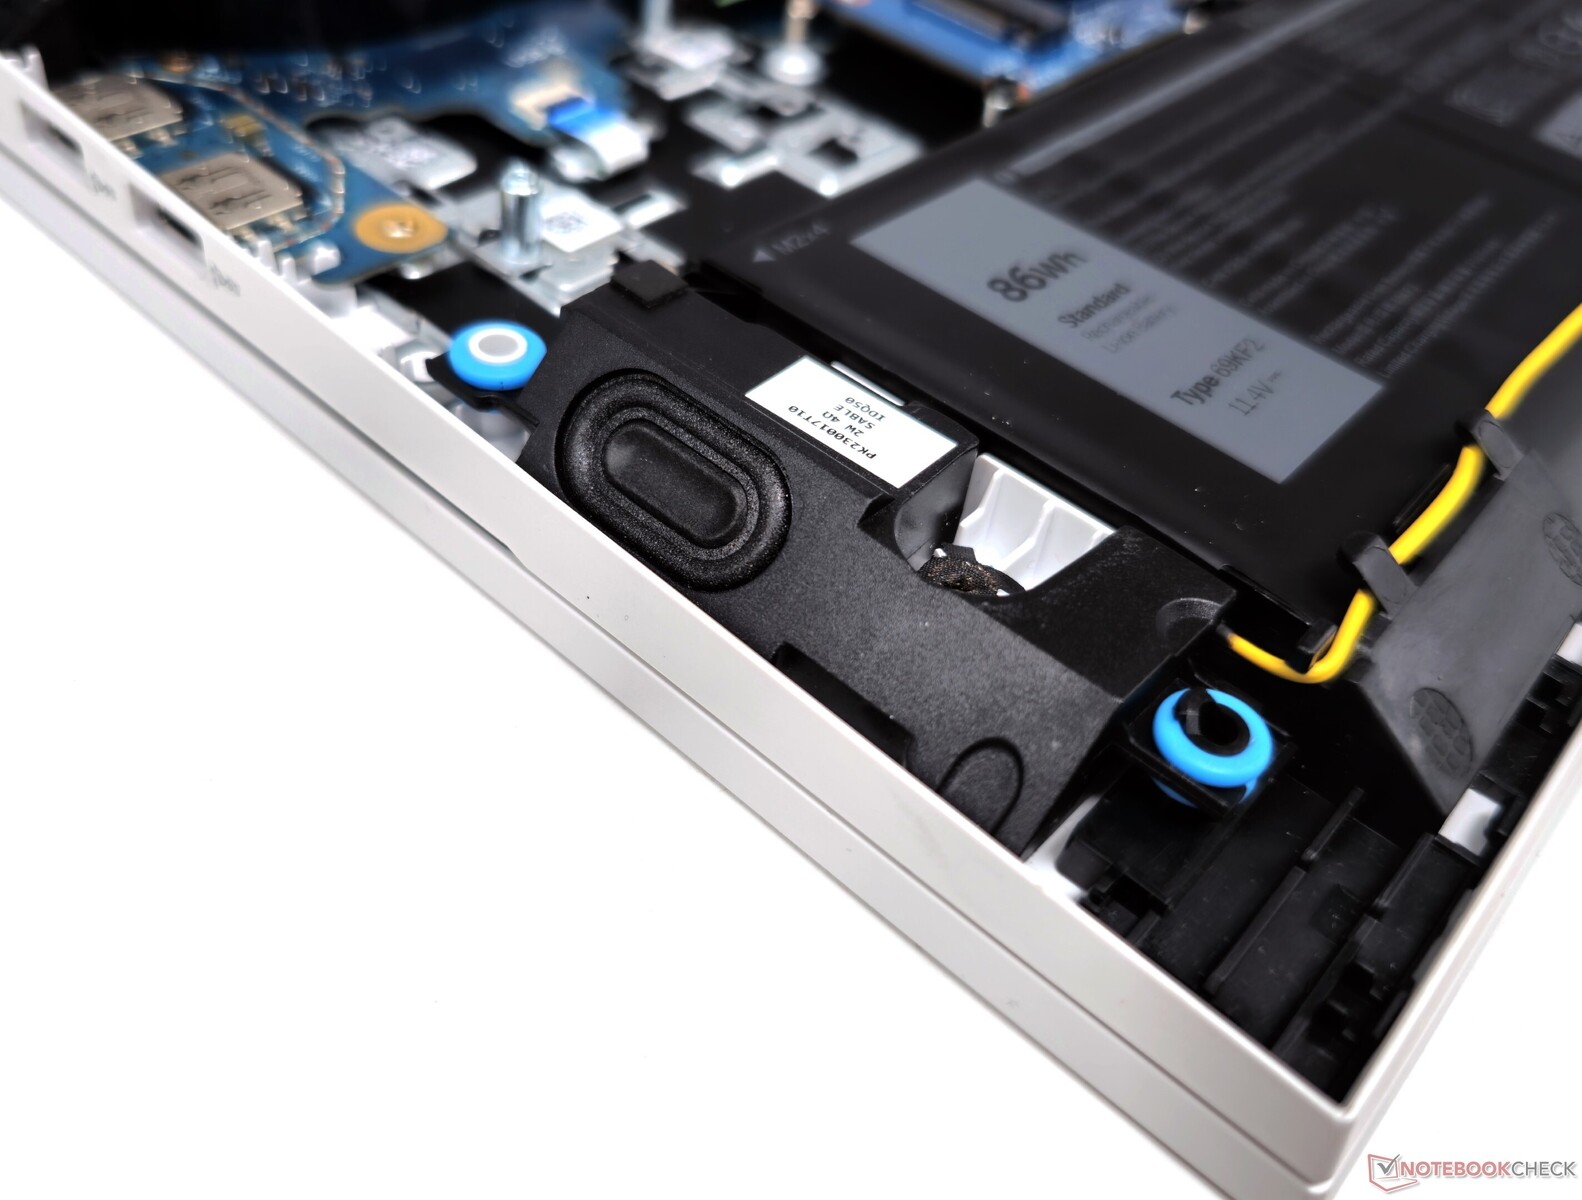
Mantenimiento
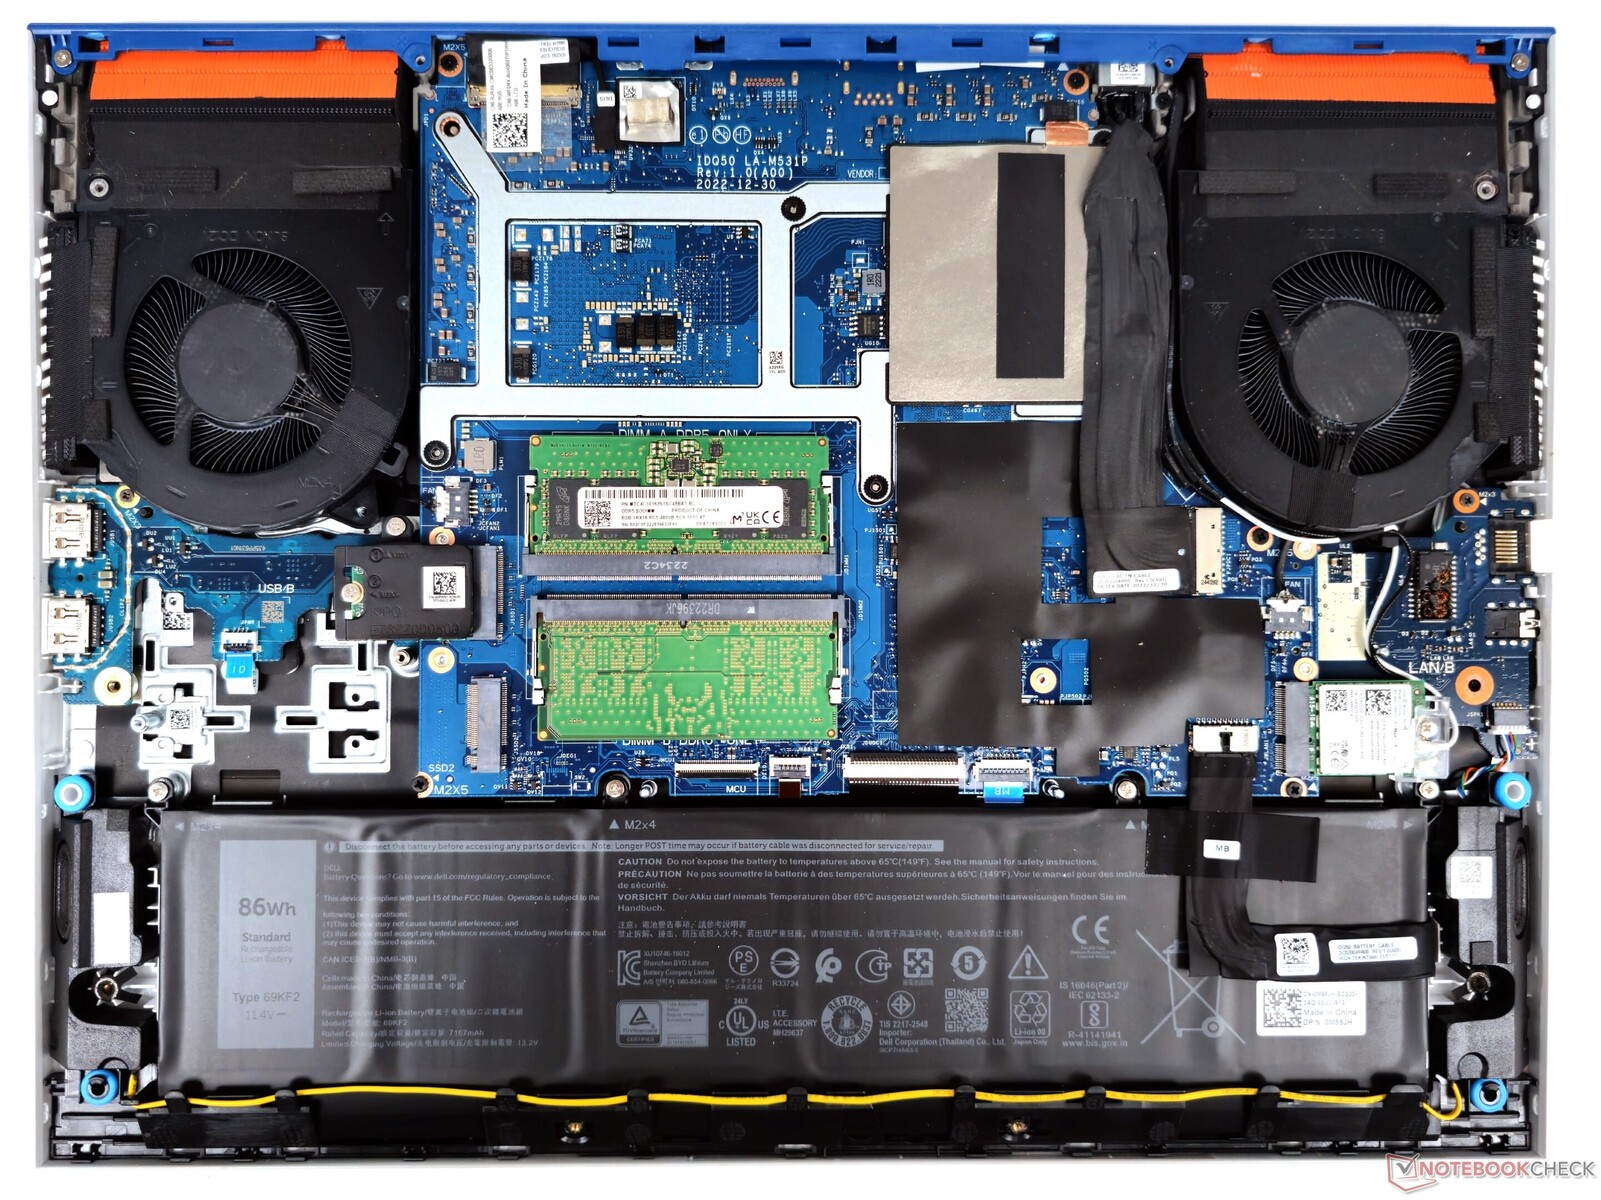
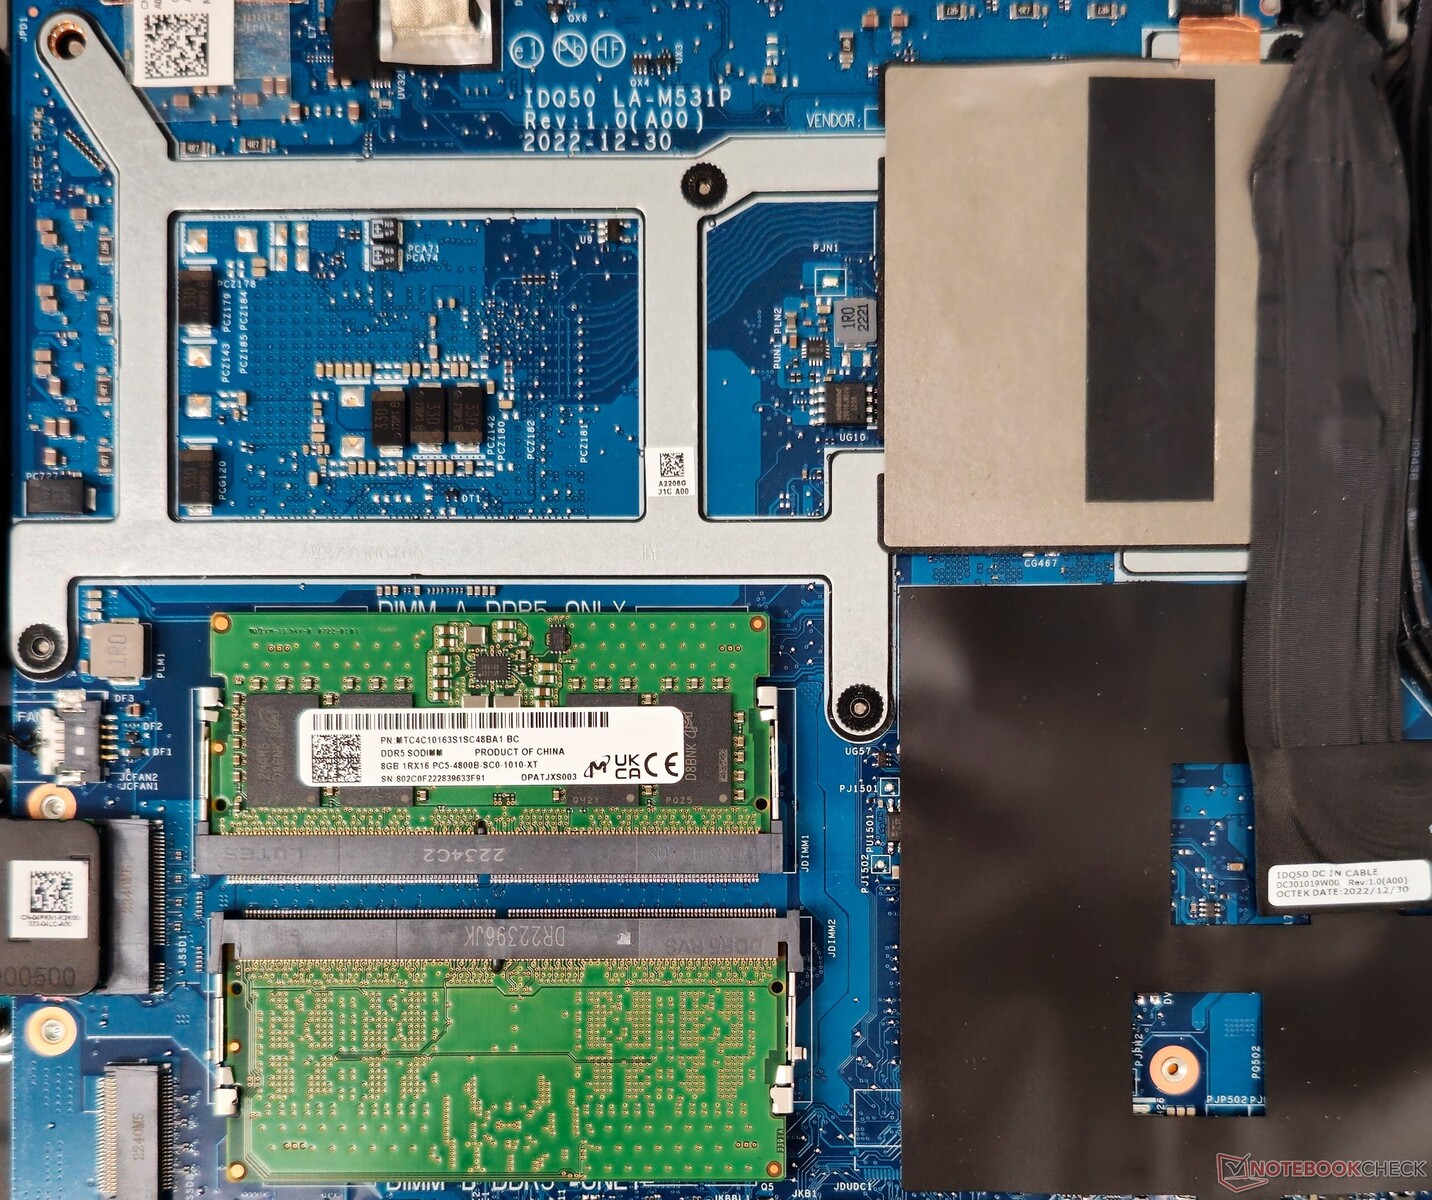
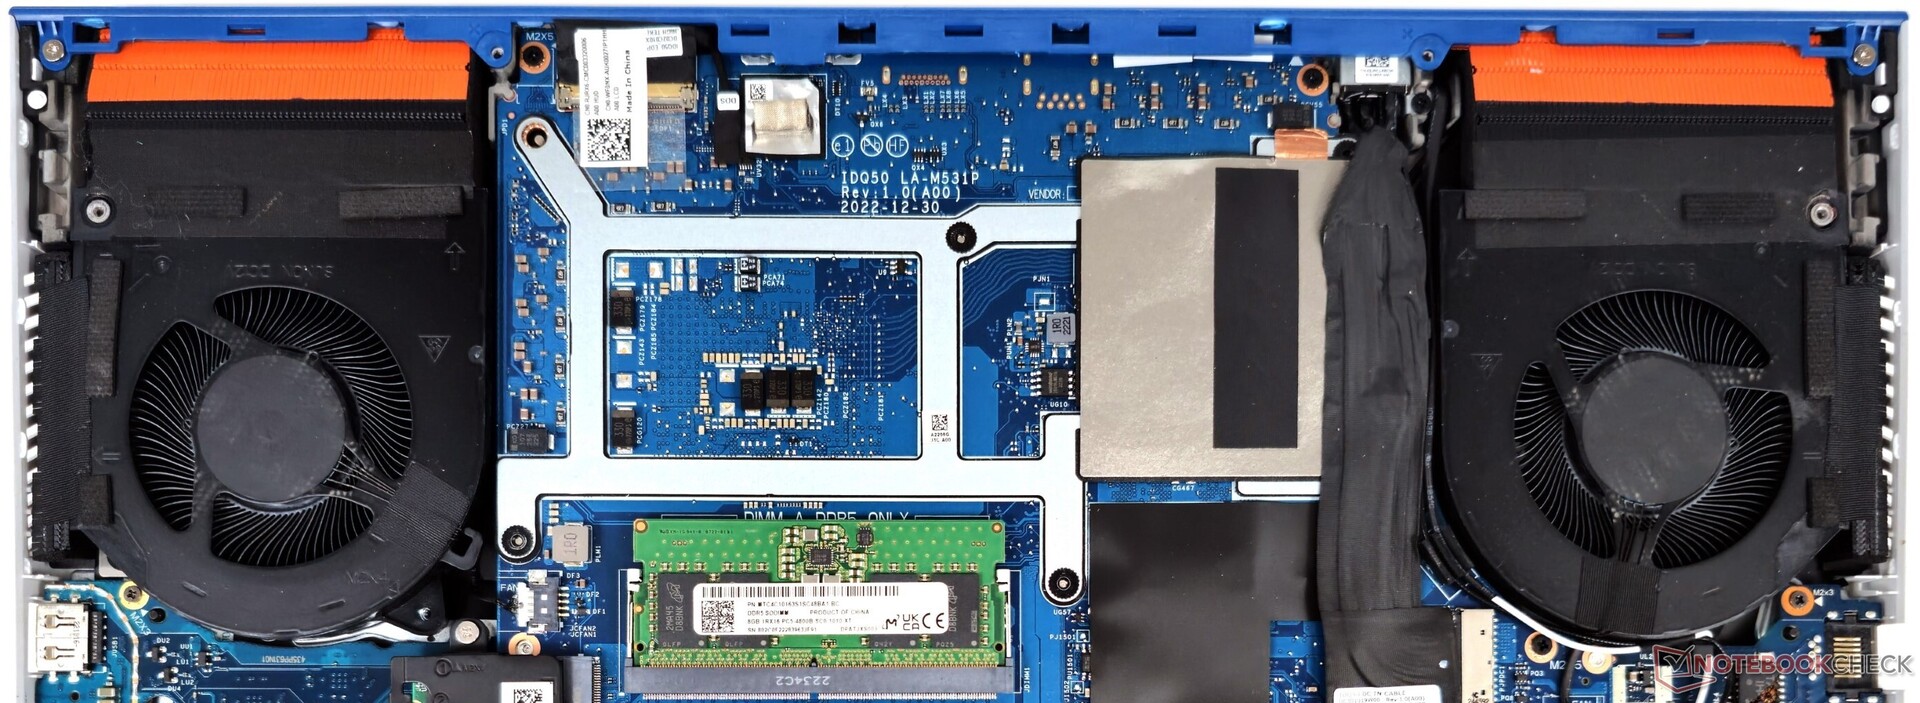
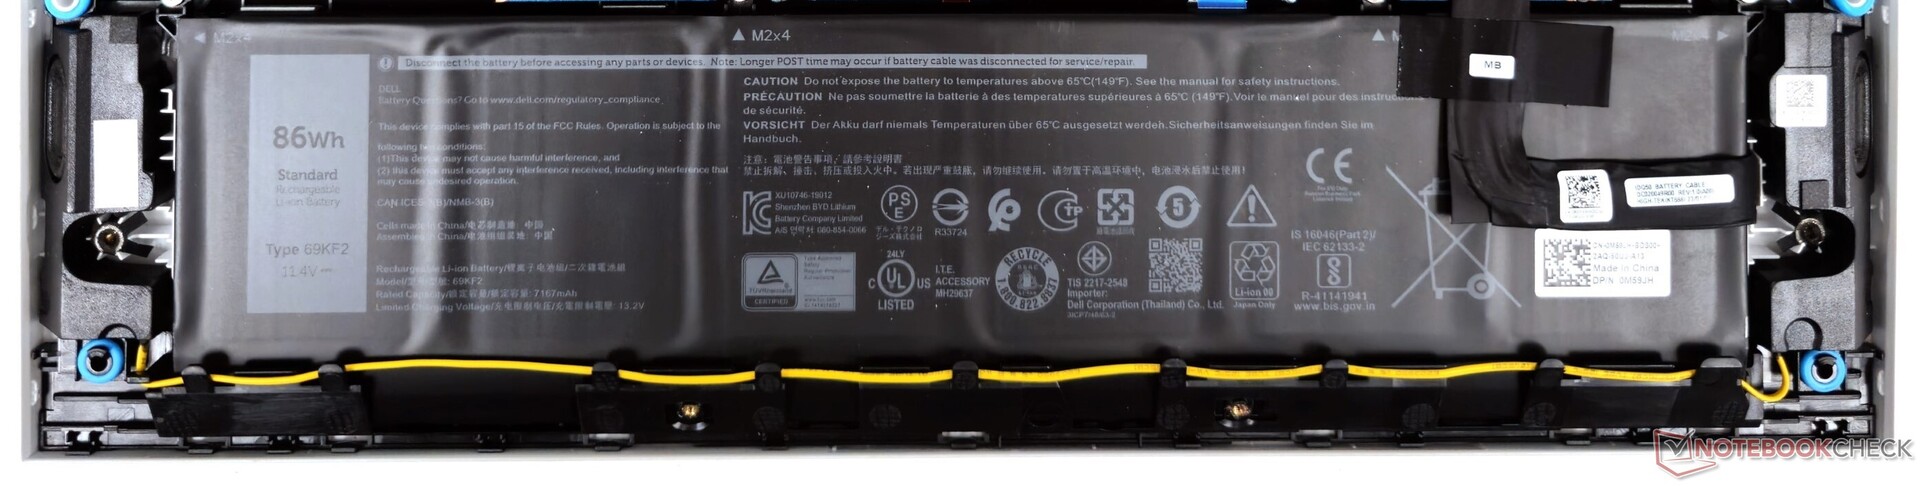
El panel posterior de la G15 5530 puede abrirse fácilmente retirando 10 tornillos PH00. El sistema de refrigeración se encuentra en la parte inferior de la placa. La WLAN, SSD, y RAM DDR5 son actualizables.
Dell usa ranuras M.2 2242 no convencionales (M-key) para el almacenamiento. Los usuarios deberían tener esto en cuenta al añadir o reemplazar unidades NVMe. La batería se puede desenroscar y cambiar si es necesario.
Dispositivos de entrada: Teclas planas con poco recorrido y un touchpad estrecho
Teclado
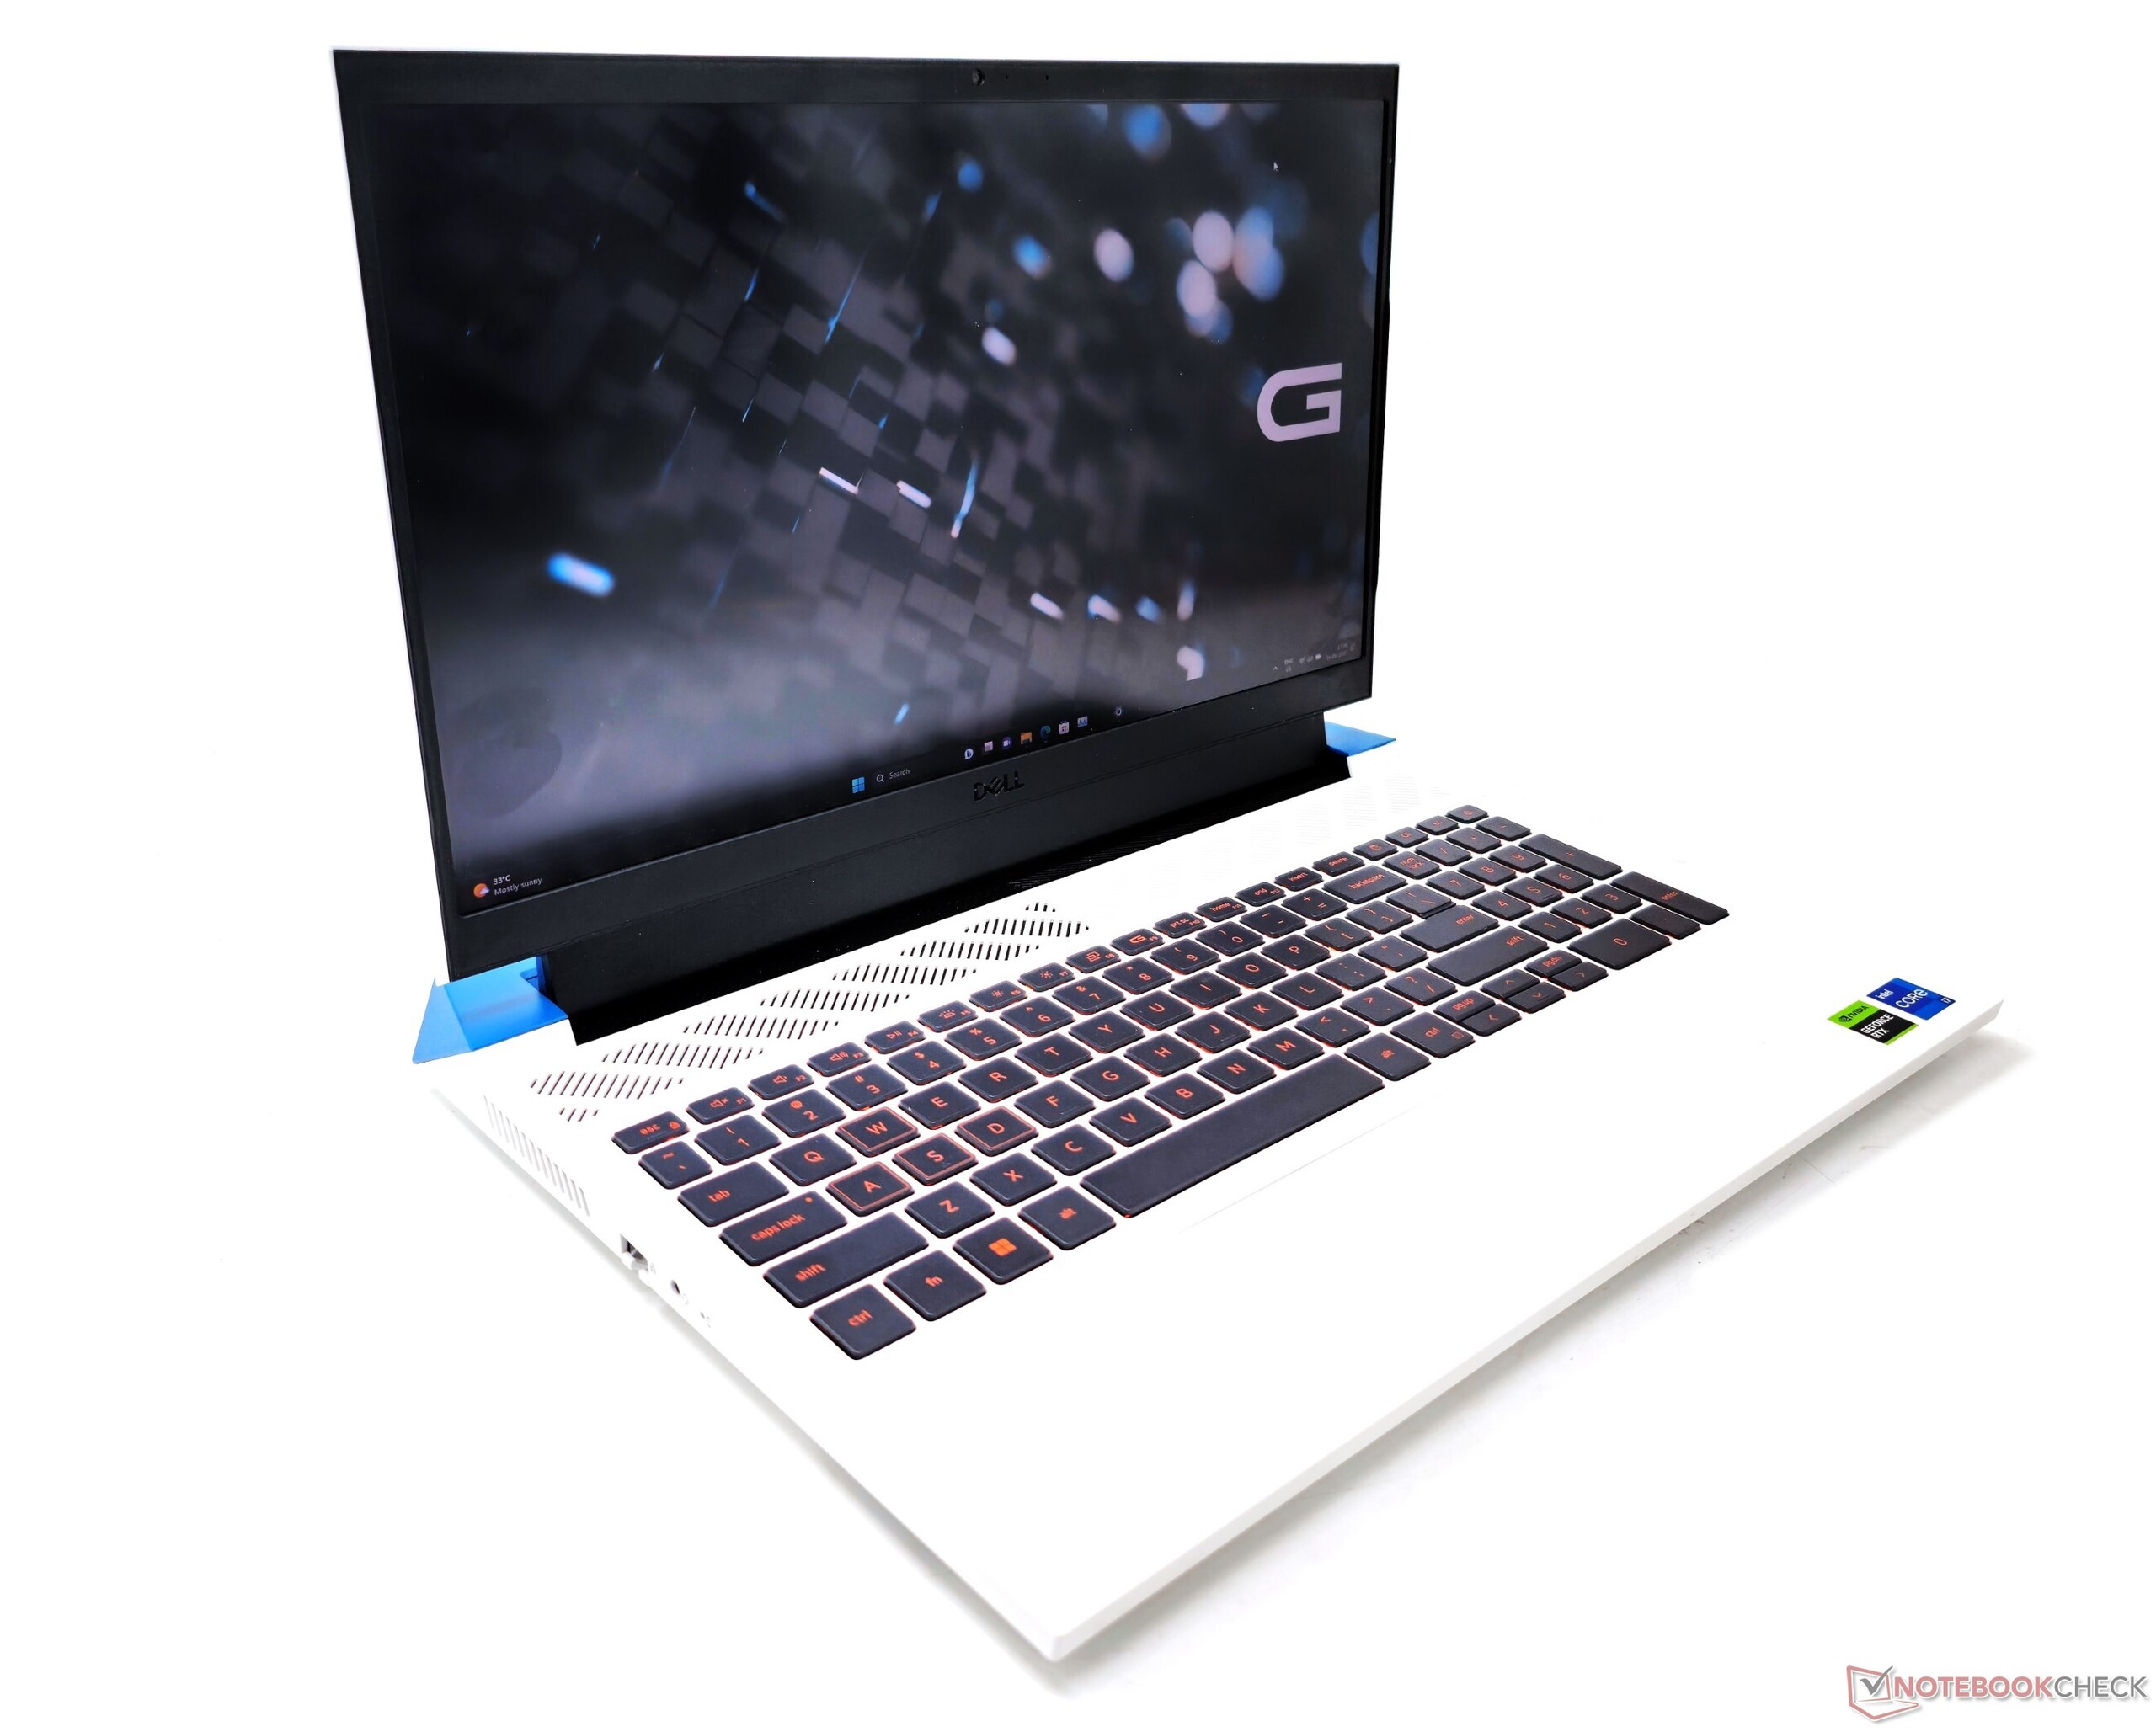
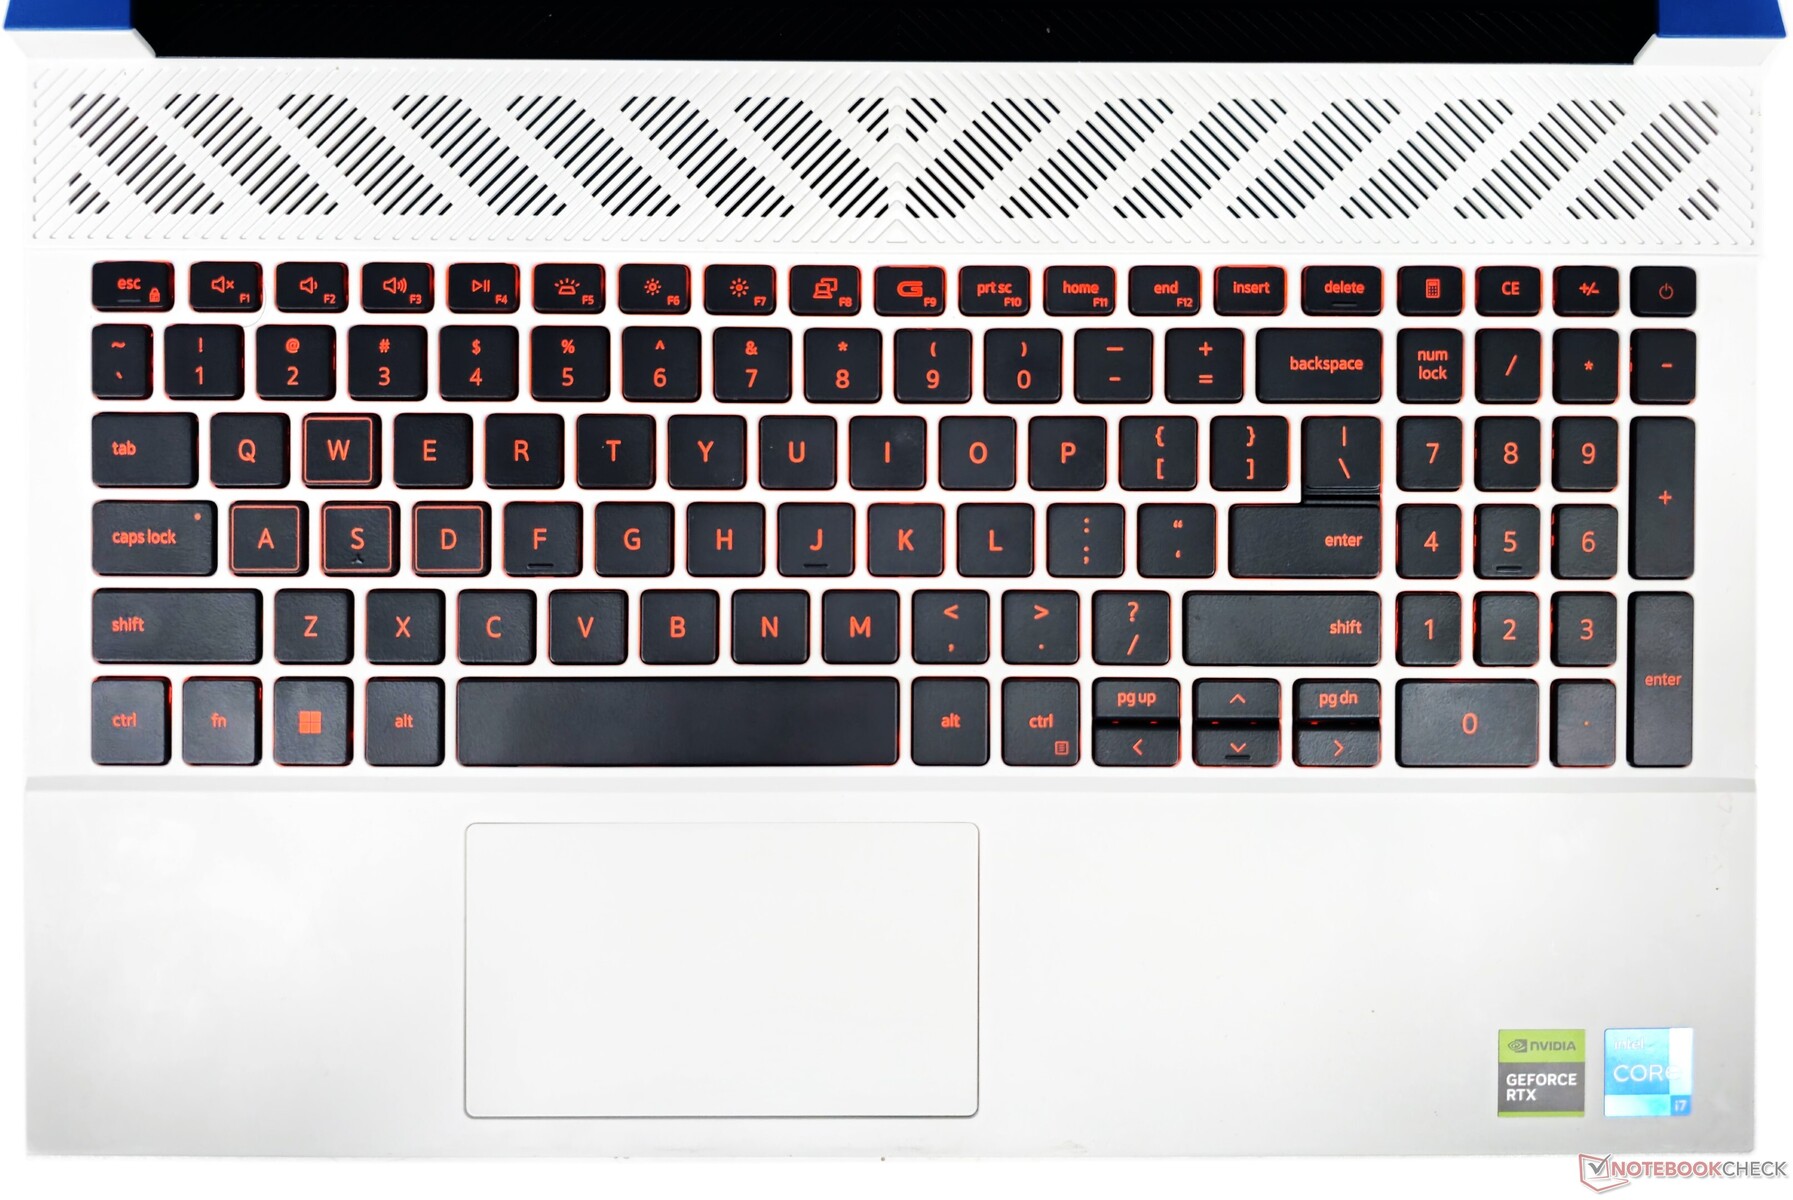
El teclado del G15 5530 tiene una flexión mínima y cuenta con teclas planas y espaciadas uniformemente que ofrecen un recorrido algo superficial. Incluye un teclado numérico junto con atajos de calculadora para mayor comodidad. Sin embargo, esta disposición hace que las teclas Re Pág y Av Pág estén apiñadas junto con las diminutas teclas de flecha.
Según Dell, el teclado del G15 5530 está equipado con retroiluminación RGB de 4 zonas. Sin embargo, en nuestra unidad, sólo había LEDs naranjas con un ajuste de brillo de dos niveles. Además, el teclado no fue reconocido en el Alienware Command Center, limitando las opciones de personalización.
La tecla F9 incluye un atajo Game Shift, que permite cambiar instantáneamente al máximo rendimiento y velocidad del ventilador siempre que sea necesario.
Panel táctil
El touchpad de 6 cm x 10,5 cm parece estrecho en comparación con otros portátiles 2023. Dicho esto, ofrece un deslizado suave, soporta gestos Windows Precision, y responde incluso en las esquinas.
Los clics pueden ser ruidosos a veces, lo que podría ser una pequeña molestia para aquellos que prefieren una entrada más silenciosa.
Los dispositivos de entrada del G15 no son malos en sí, pero los usuarios seguramente se beneficiarán de un teclado y un ratón externos.
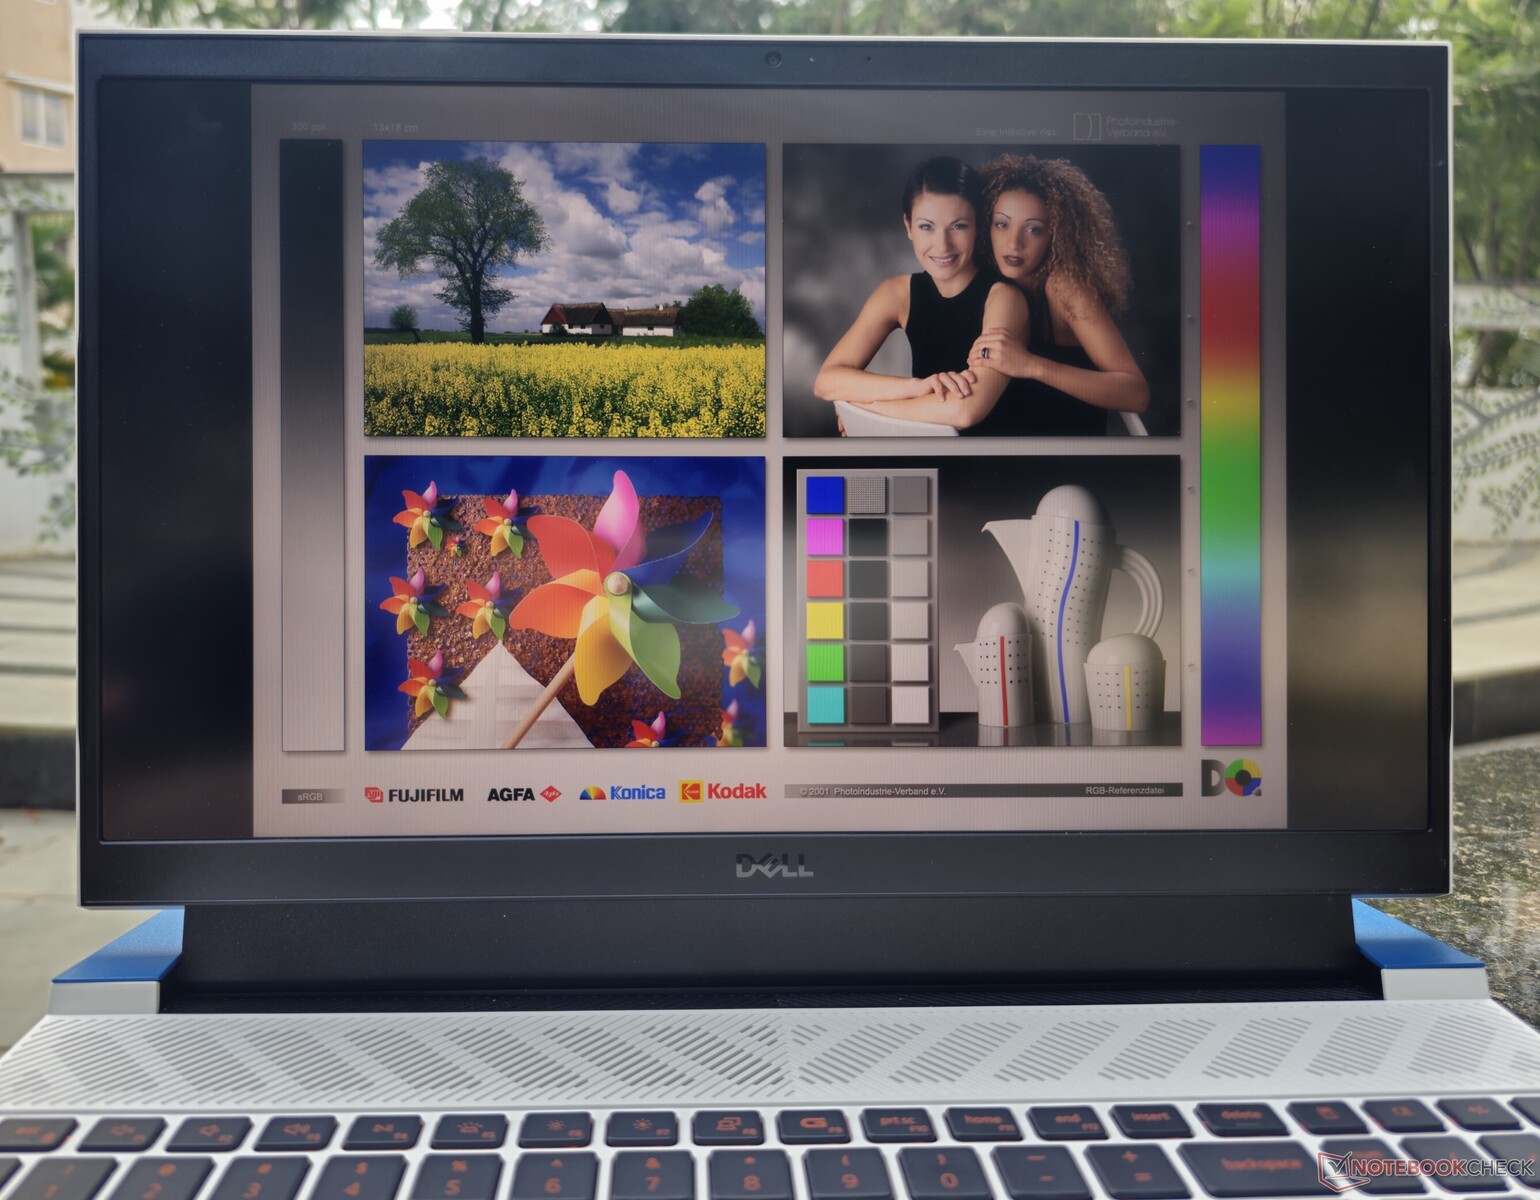
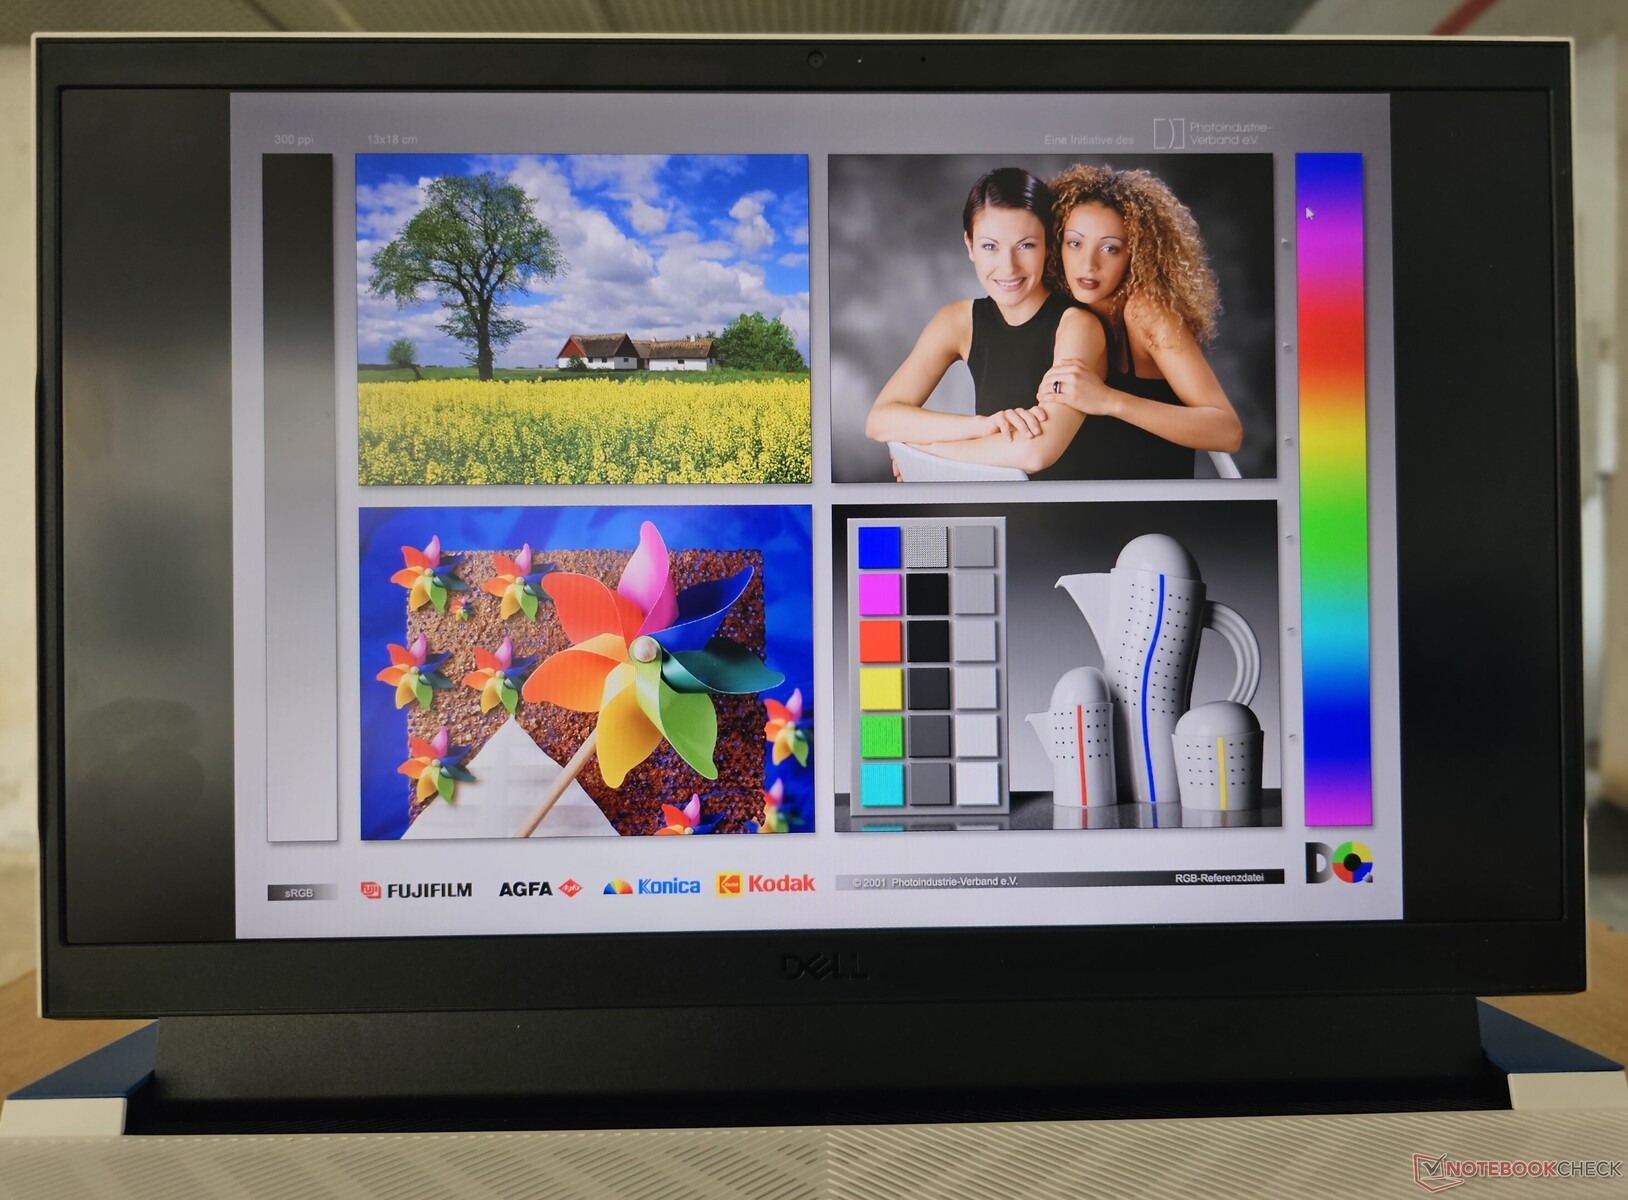
Pantalla: panel 1080p de 165 Hz con sobreimpresión
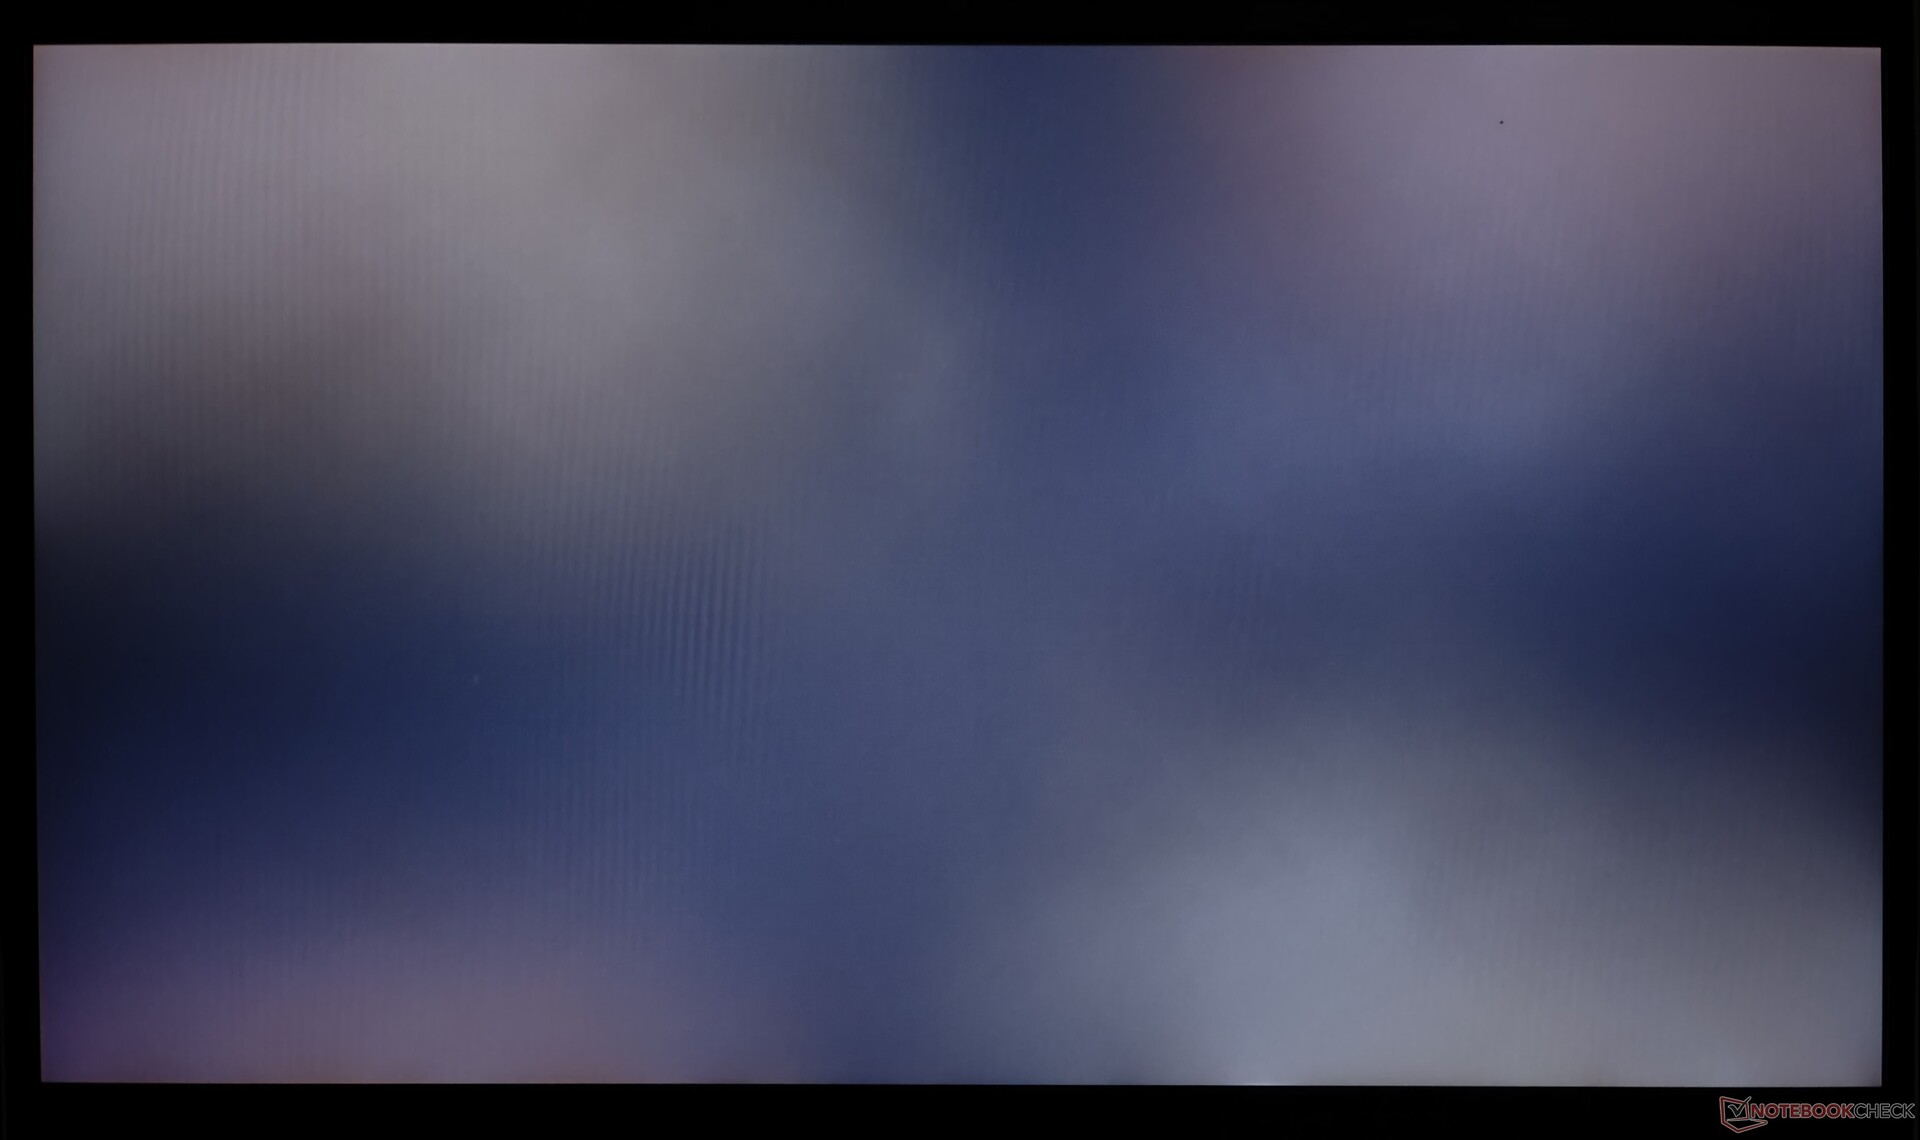
Dell equipa el G15 con un panel IPS AUO 1080p que ofrece una tasa de refresco de 165 Hz con G-Sync. Vemos un sangrado de luz negra significativo en las esquinas, como es típico en las pantallas IPS.
La distribución del brillo es bastante uniforme al 94% y el ratio de contraste es un respetable 1524:1, lo que debería ofrecer una buena experiencia de visualización para juegos.

| |||||||||||||||||||||||||
iluminación: 94 %
Brillo con batería: 321 cd/m²
Contraste: 1524:1 (Negro: 0.21 cd/m²)
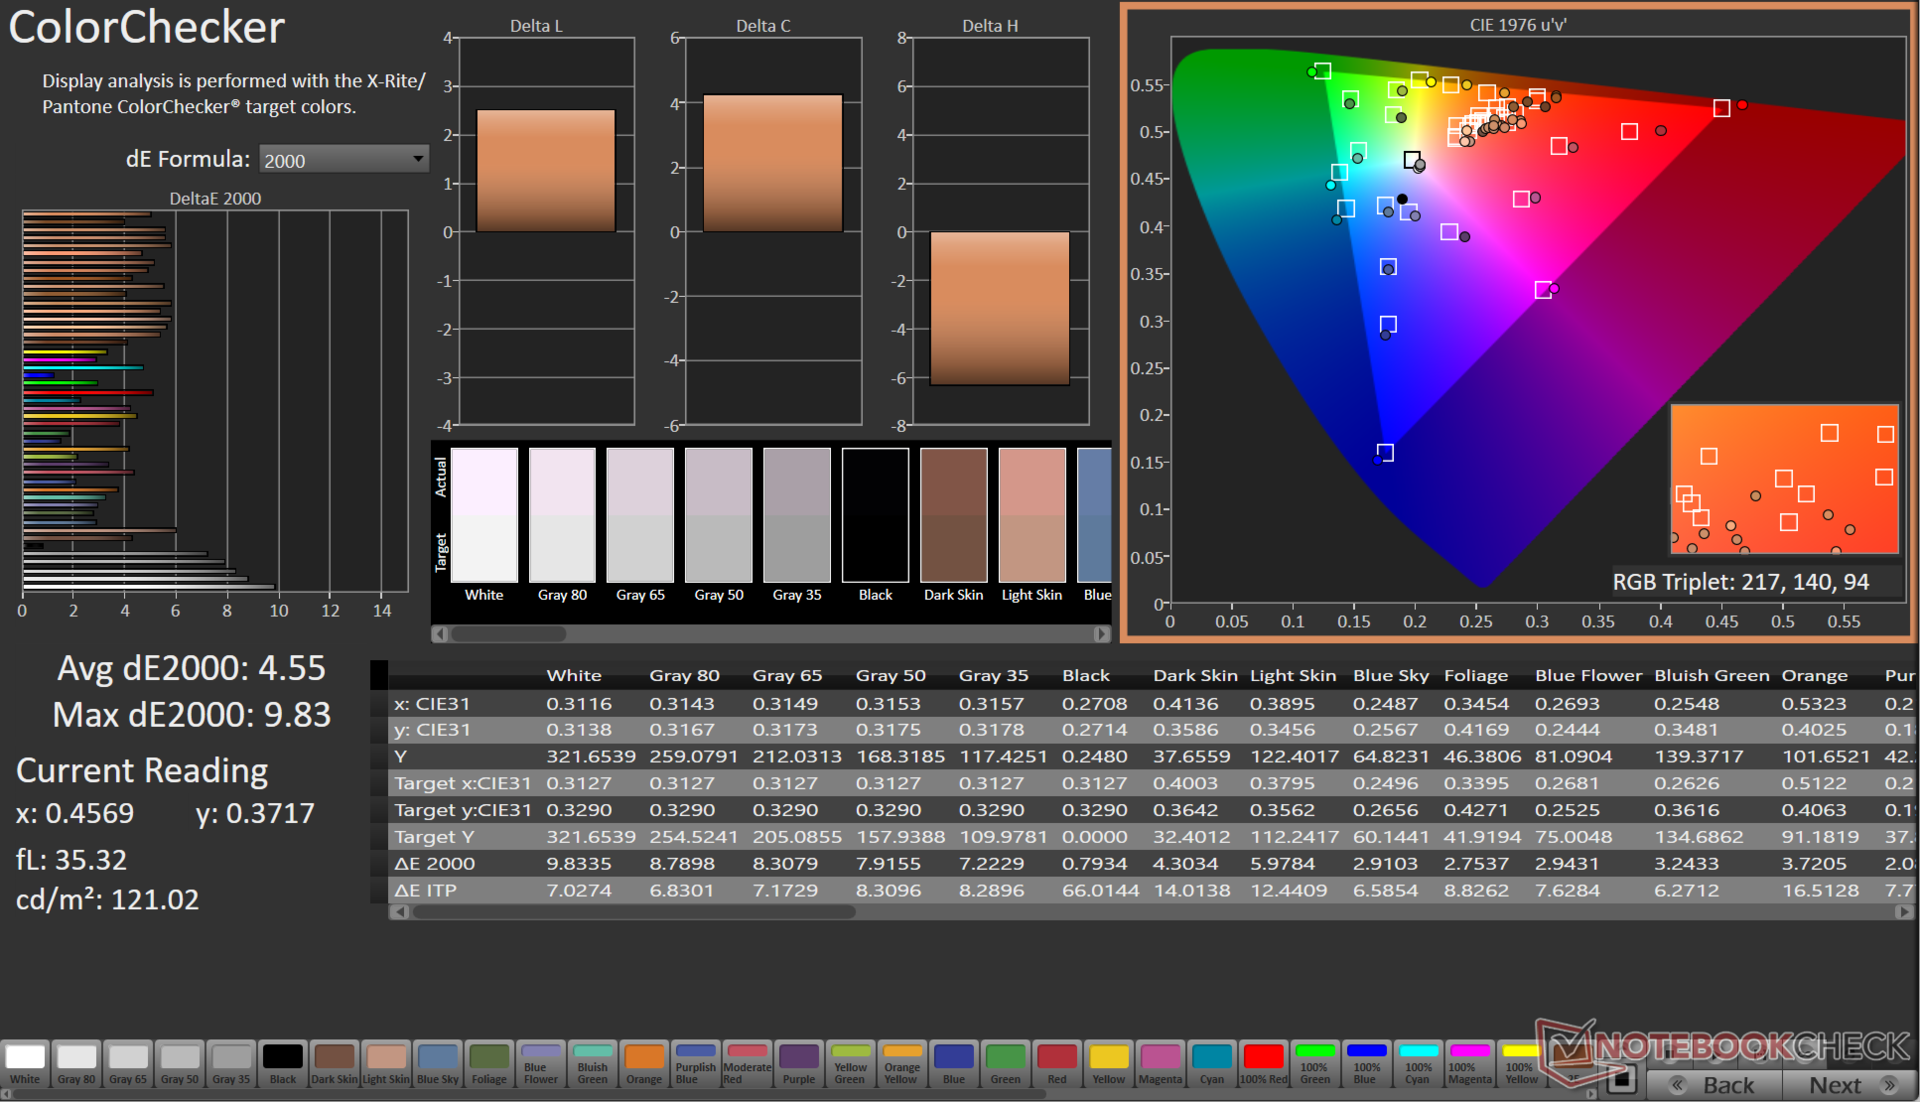
ΔE ColorChecker Calman: 4.55 | ∀{0.5-29.43 Ø4.71}
calibrated: 1.51
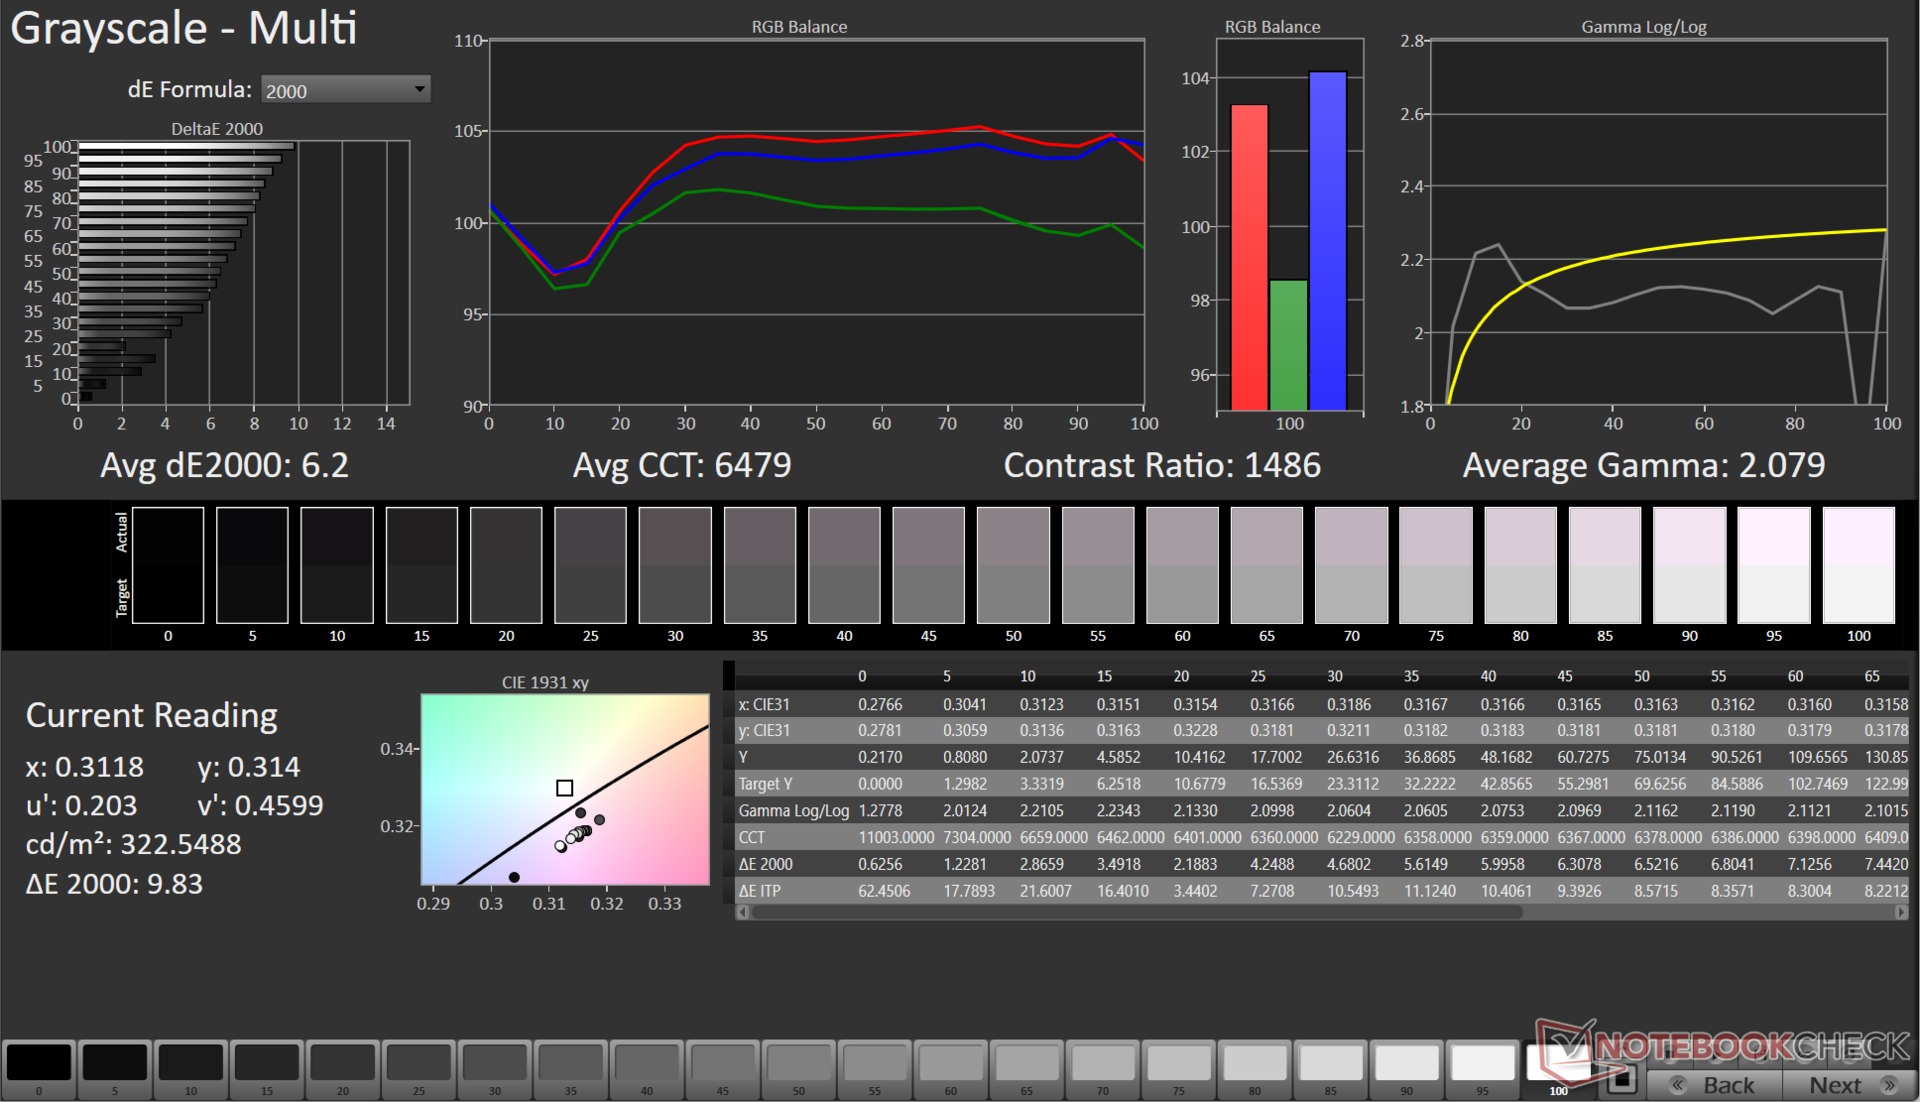
ΔE Greyscale Calman: 6.2 | ∀{0.09-98 Ø4.96}
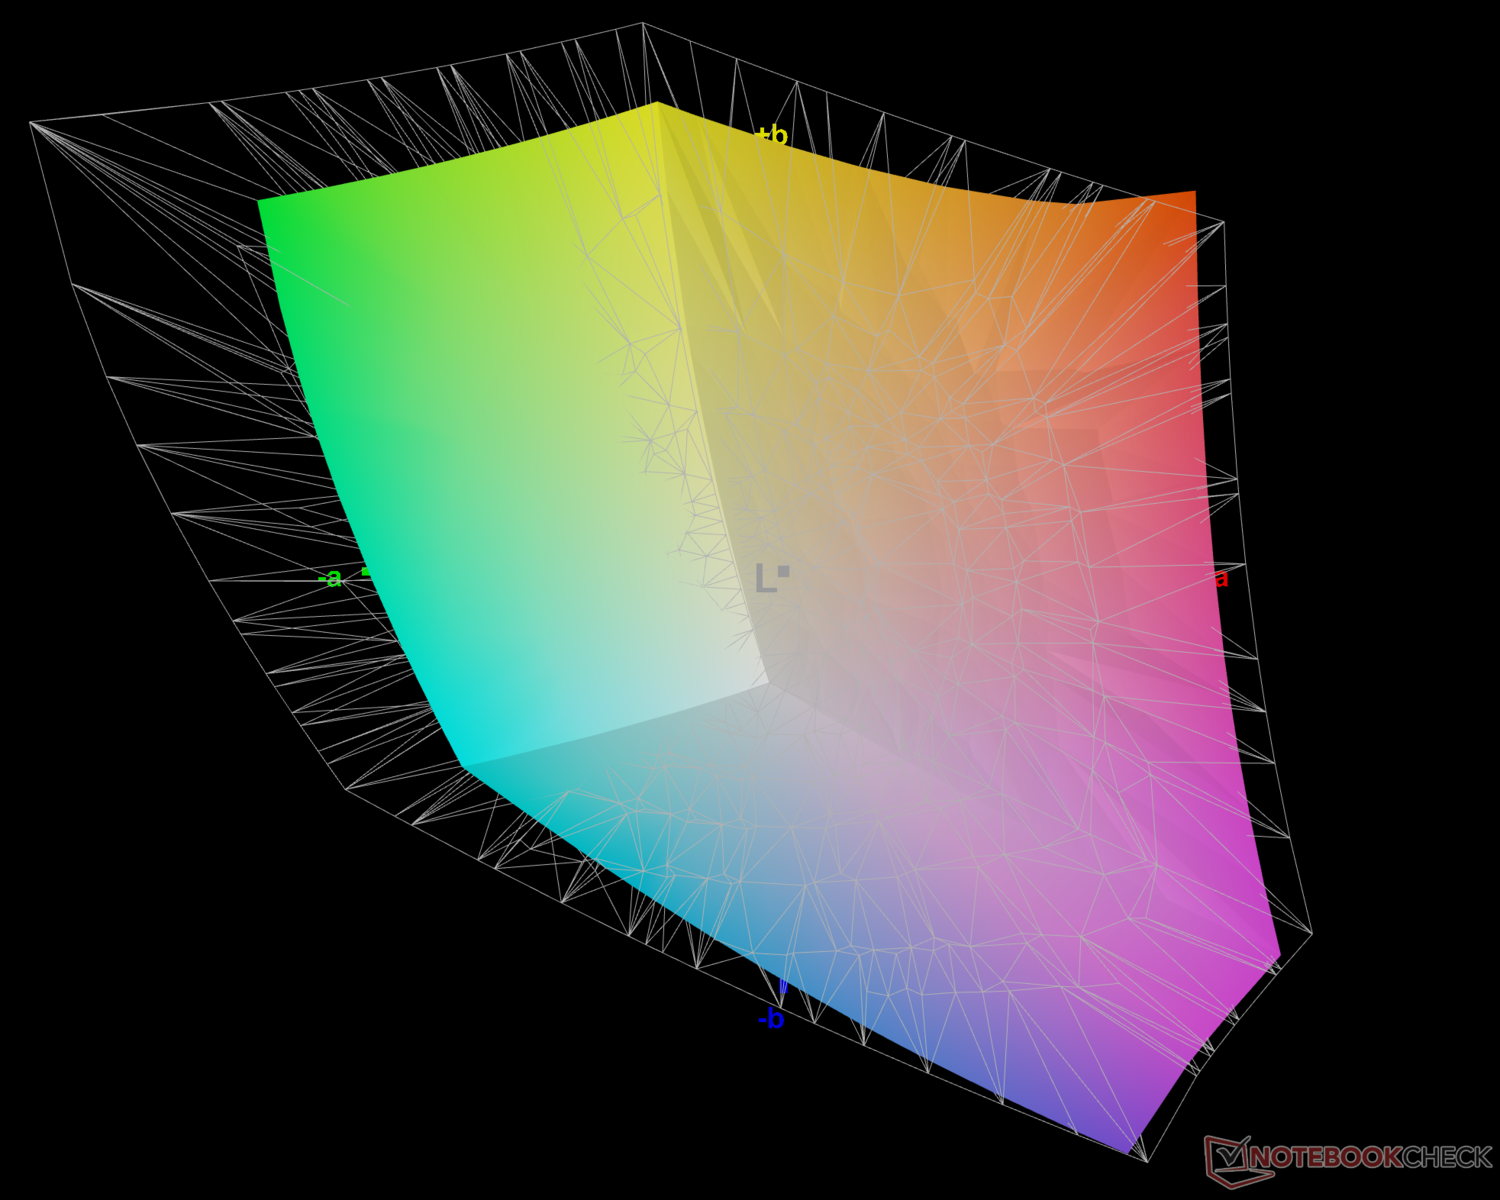
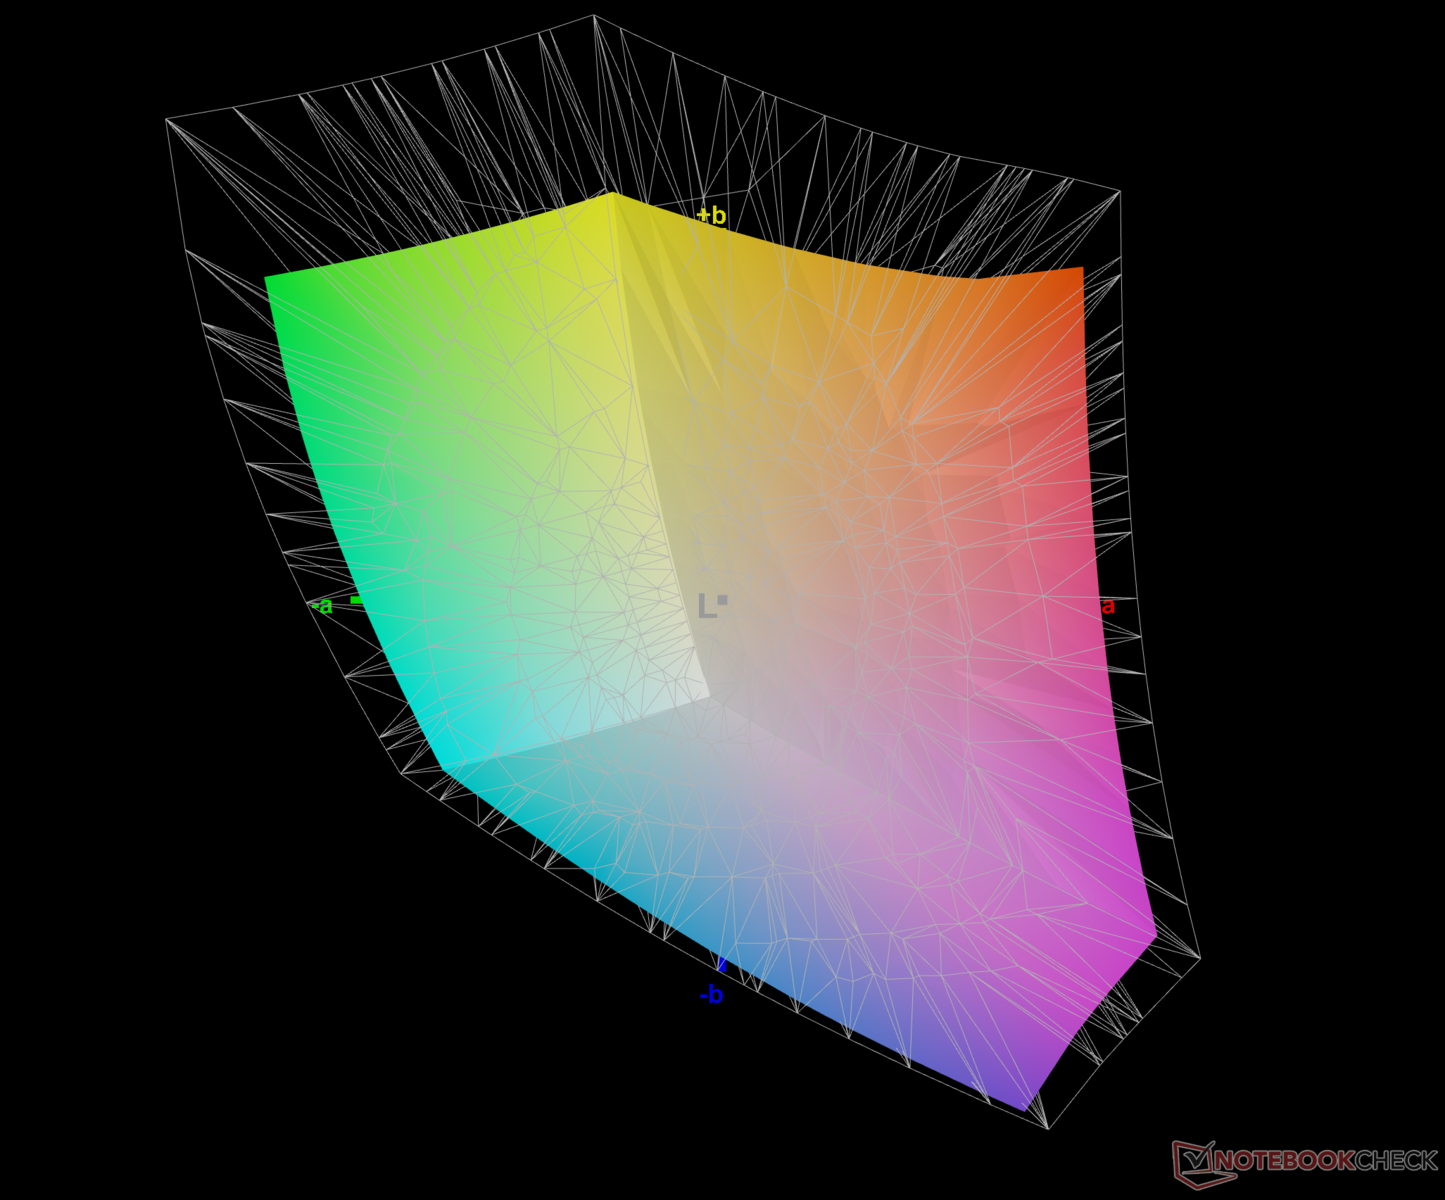
74.4% AdobeRGB 1998 (Argyll 3D)
98.4% sRGB (Argyll 3D)
73.1% Display P3 (Argyll 3D)
Gamma: 2.07
CCT: 6479 K
| Dell G15 5530 AUO B156HAN, IPS, 1920x1080, 15.6" | Asus ROG Strix G18 G814JI NE180QDM-NZ2 (BOE0B35), IPS, 2560x1600, 18" | Lenovo Legion Pro 5 16IRX8 AU Optronics B160QAN03.1, IPS, 2560x1600, 16" | Asus ROG Flow X16 GV601V TMX1603 (TL160ADMP03-0), IPS, 2560x1600, 16" | MSI Katana 17 B13VFK B173HAN04.9, IPS LED, 1920x1080, 17.3" | Asus TUF Gaming A16 FA617XS BOE NE160WUM-NX2, IPS, 1920x1200, 16" | Asus ROG Strix G17 G713PI BOE0B69, IPS, 2560x1440, 17.3" | Medion Erazer Major X20 BOE CQ NE160QDM-NZ1, IPS, 2560x1600, 16" | |
|---|---|---|---|---|---|---|---|---|
| Display | 17% | -1% | 16% | -42% | -4% | 17% | -3% | |
| Display P3 Coverage (%) | 73.1 | 98.1 34% | 71.2 -3% | 96.61 32% | 40.8 -44% | 69.3 -5% | 98.3 34% | 69.4 -5% |
| sRGB Coverage (%) | 98.4 | 99.9 2% | 98.8 0% | 99.92 2% | 61 -38% | 97.3 -1% | 100 2% | 98 0% |
| AdobeRGB 1998 Coverage (%) | 74.4 | 85.6 15% | 73.3 -1% | 84.63 14% | 42.2 -43% | 70.7 -5% | 85.9 15% | 70.9 -5% |
| Response Times | -67% | -211% | -27% | -630% | -224% | -59% | -161% | |
| Response Time Grey 50% / Grey 80% * (ms) | 3.39 ? | 5.6 ? -65% | 14.5 ? -328% | 3.8 ? -12% | 33 ? -873% | 15.6 ? -360% | 5.3 ? -56% | 13.1 ? -286% |
| Response Time Black / White * (ms) | 5.35 ? | 9 ? -68% | 10.4 ? -94% | 7.6 ? -42% | 26 ? -386% | 10 ? -87% | 8.6 ? -61% | 7.3 ? -36% |
| PWM Frequency (Hz) | 21620 ? | |||||||
| Screen | 14% | 21% | 21% | -32% | 21% | 17% | 12% | |
| Brightness middle (cd/m²) | 320 | 471 47% | 405.7 27% | 486 52% | 267 -17% | 301 -6% | 327 2% | 374 17% |
| Brightness (cd/m²) | 316 | 422 34% | 368 16% | 469 48% | 256 -19% | 294 -7% | 320 1% | 357 13% |
| Brightness Distribution (%) | 94 | 83 -12% | 87 -7% | 91 -3% | 93 -1% | 94 0% | 89 -5% | 92 -2% |
| Black Level * (cd/m²) | 0.21 | 0.47 -124% | 0.38 -81% | 0.39 -86% | 0.21 -0% | 0.21 -0% | 0.38 -81% | 0.33 -57% |
| Contrast (:1) | 1524 | 1002 -34% | 1068 -30% | 1246 -18% | 1271 -17% | 1433 -6% | 861 -44% | 1133 -26% |
| Colorchecker dE 2000 * | 4.55 | 2.05 55% | 1.65 64% | 2.27 50% | 4.7 -3% | 1.79 61% | 1.01 78% | 2.43 47% |
| Colorchecker dE 2000 max. * | 9.83 | 4.15 58% | 4.2 57% | 5.73 42% | 20.4 -108% | 3.48 65% | 4.01 59% | 3.97 60% |
| Colorchecker dE 2000 calibrated * | 1.51 | 0.8 47% | 0.53 65% | 0.6 60% | 4.5 -198% | 1.2 21% | 0.41 73% | 1.4 7% |
| Greyscale dE 2000 * | 6.2 | 2.8 55% | 1.2 81% | 3.36 46% | 1.5 76% | 2.5 60% | 1.6 74% | 3.1 50% |
| Gamma | 2.07 106% | 2.204 100% | 2.3 96% | 2.46 89% | 2.12 104% | 2.265 97% | 2.168 101% | 2.191 100% |
| CCT | 6479 100% | 7122 91% | 6453 101% | 6625 98% | 6552 99% | 6157 106% | 6659 98% | 6194 105% |
| Media total (Programa/Opciones) | -12% /
3% | -64% /
-17% | 3% /
13% | -235% /
-119% | -69% /
-19% | -8% /
7% | -51% /
-16% |
* ... más pequeño es mejor
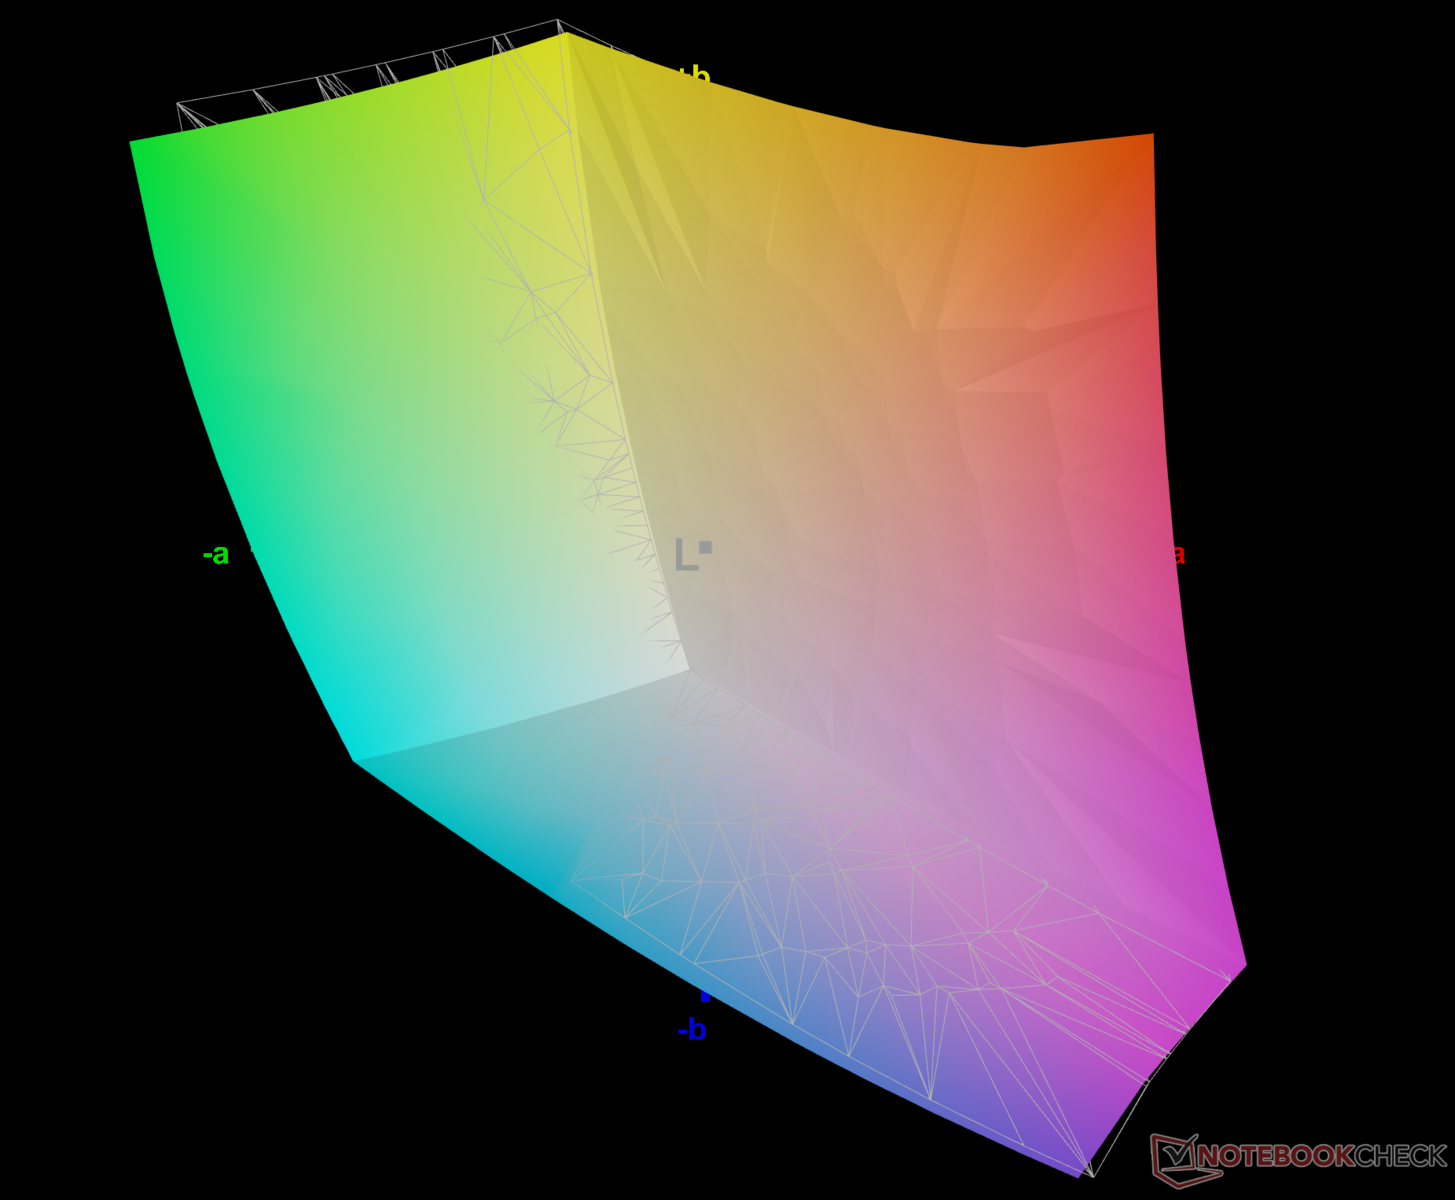
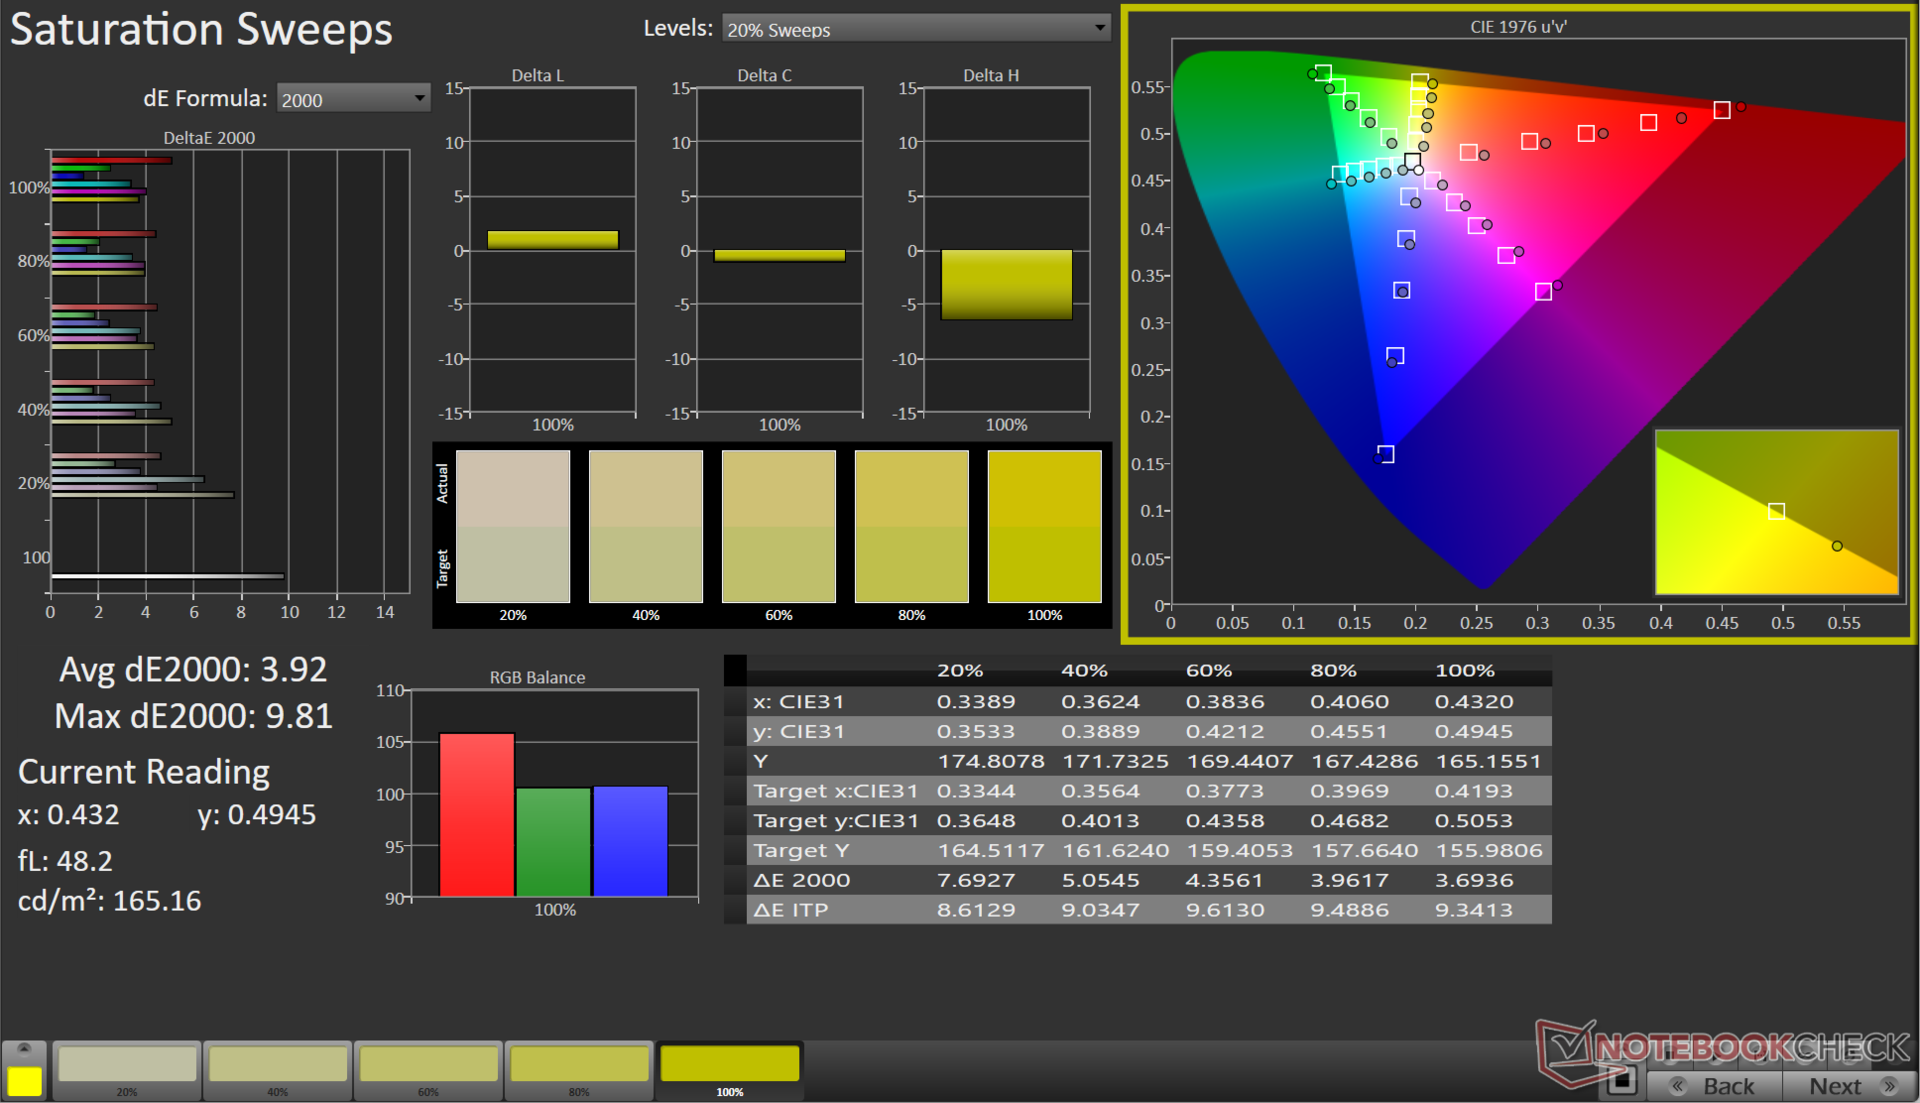
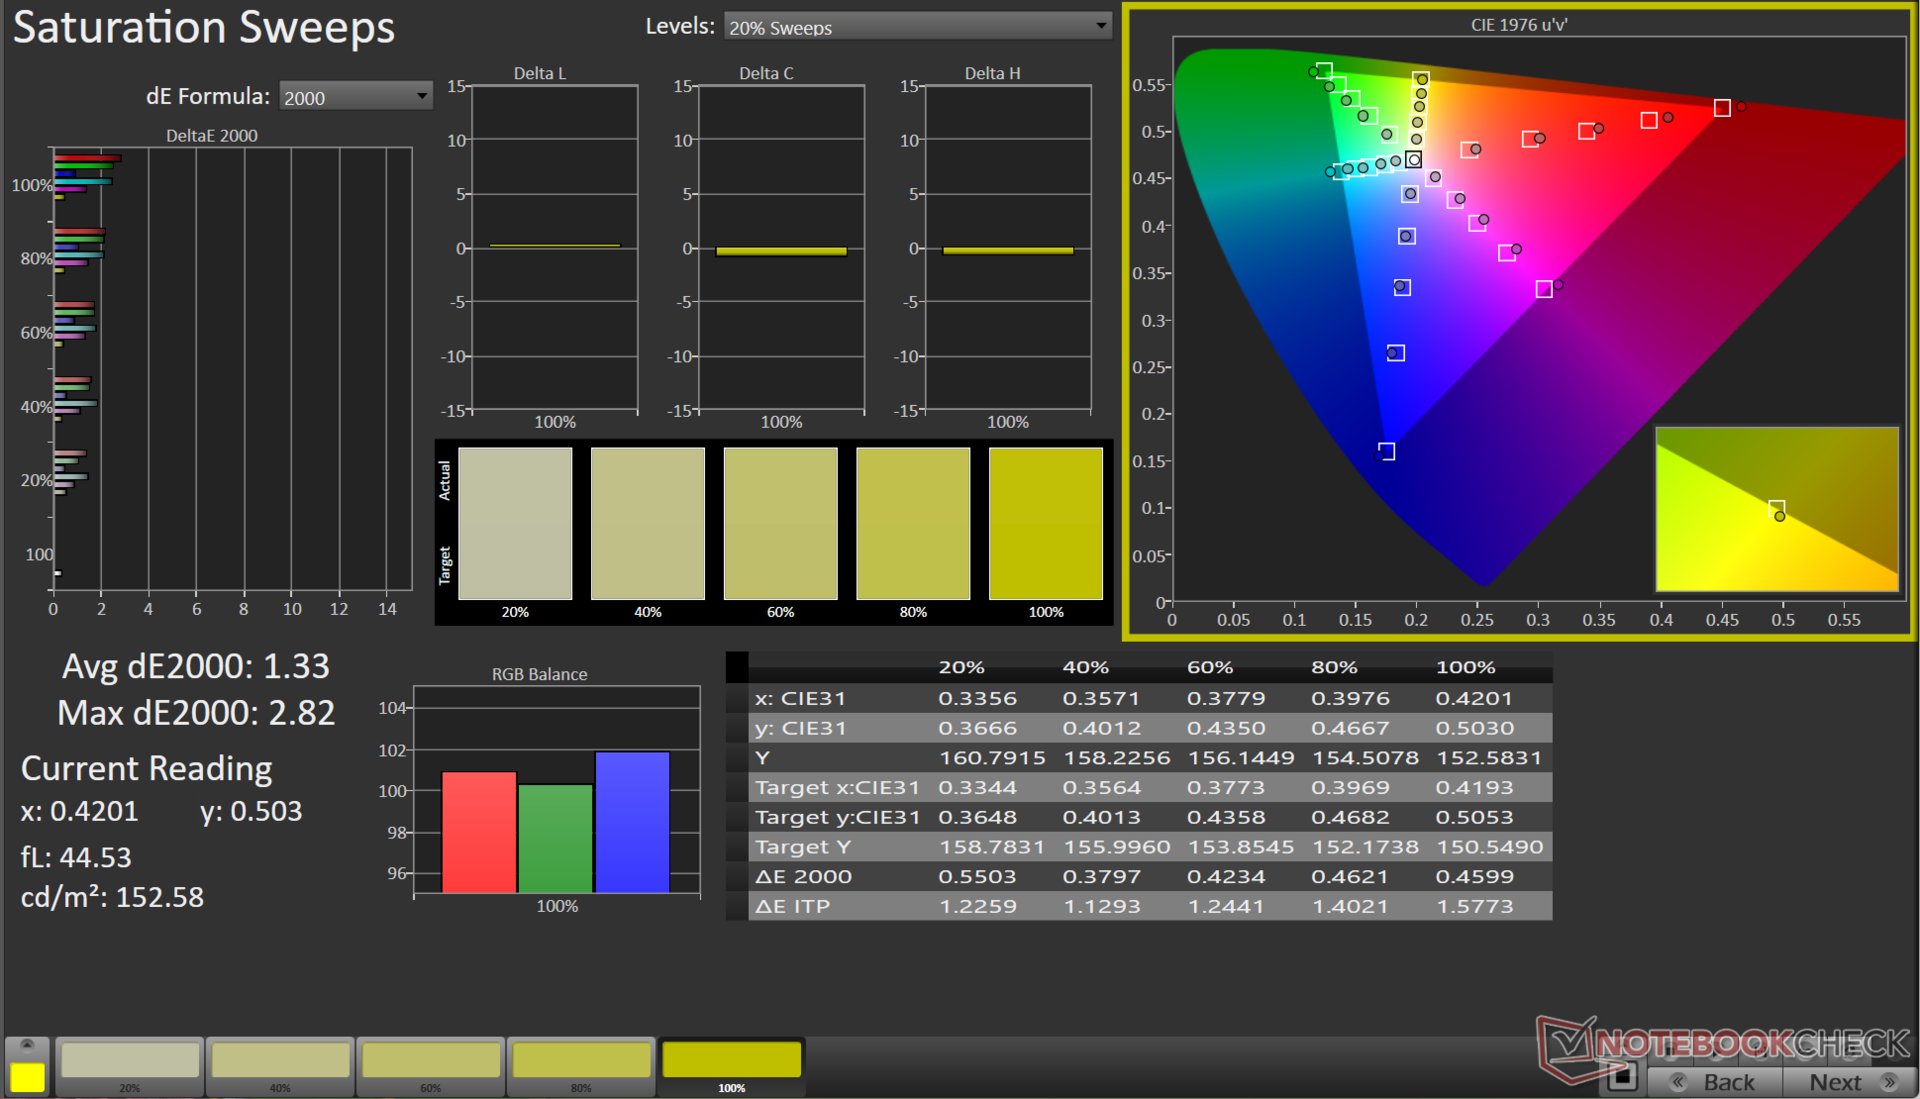
La pantalla cubre casi toda la gama de colores sRGB con un rendimiento decente también en los espacios de color Adobe RGB y Display P3, lo que debería ser adecuado para juegos y para realizar ediciones básicas.
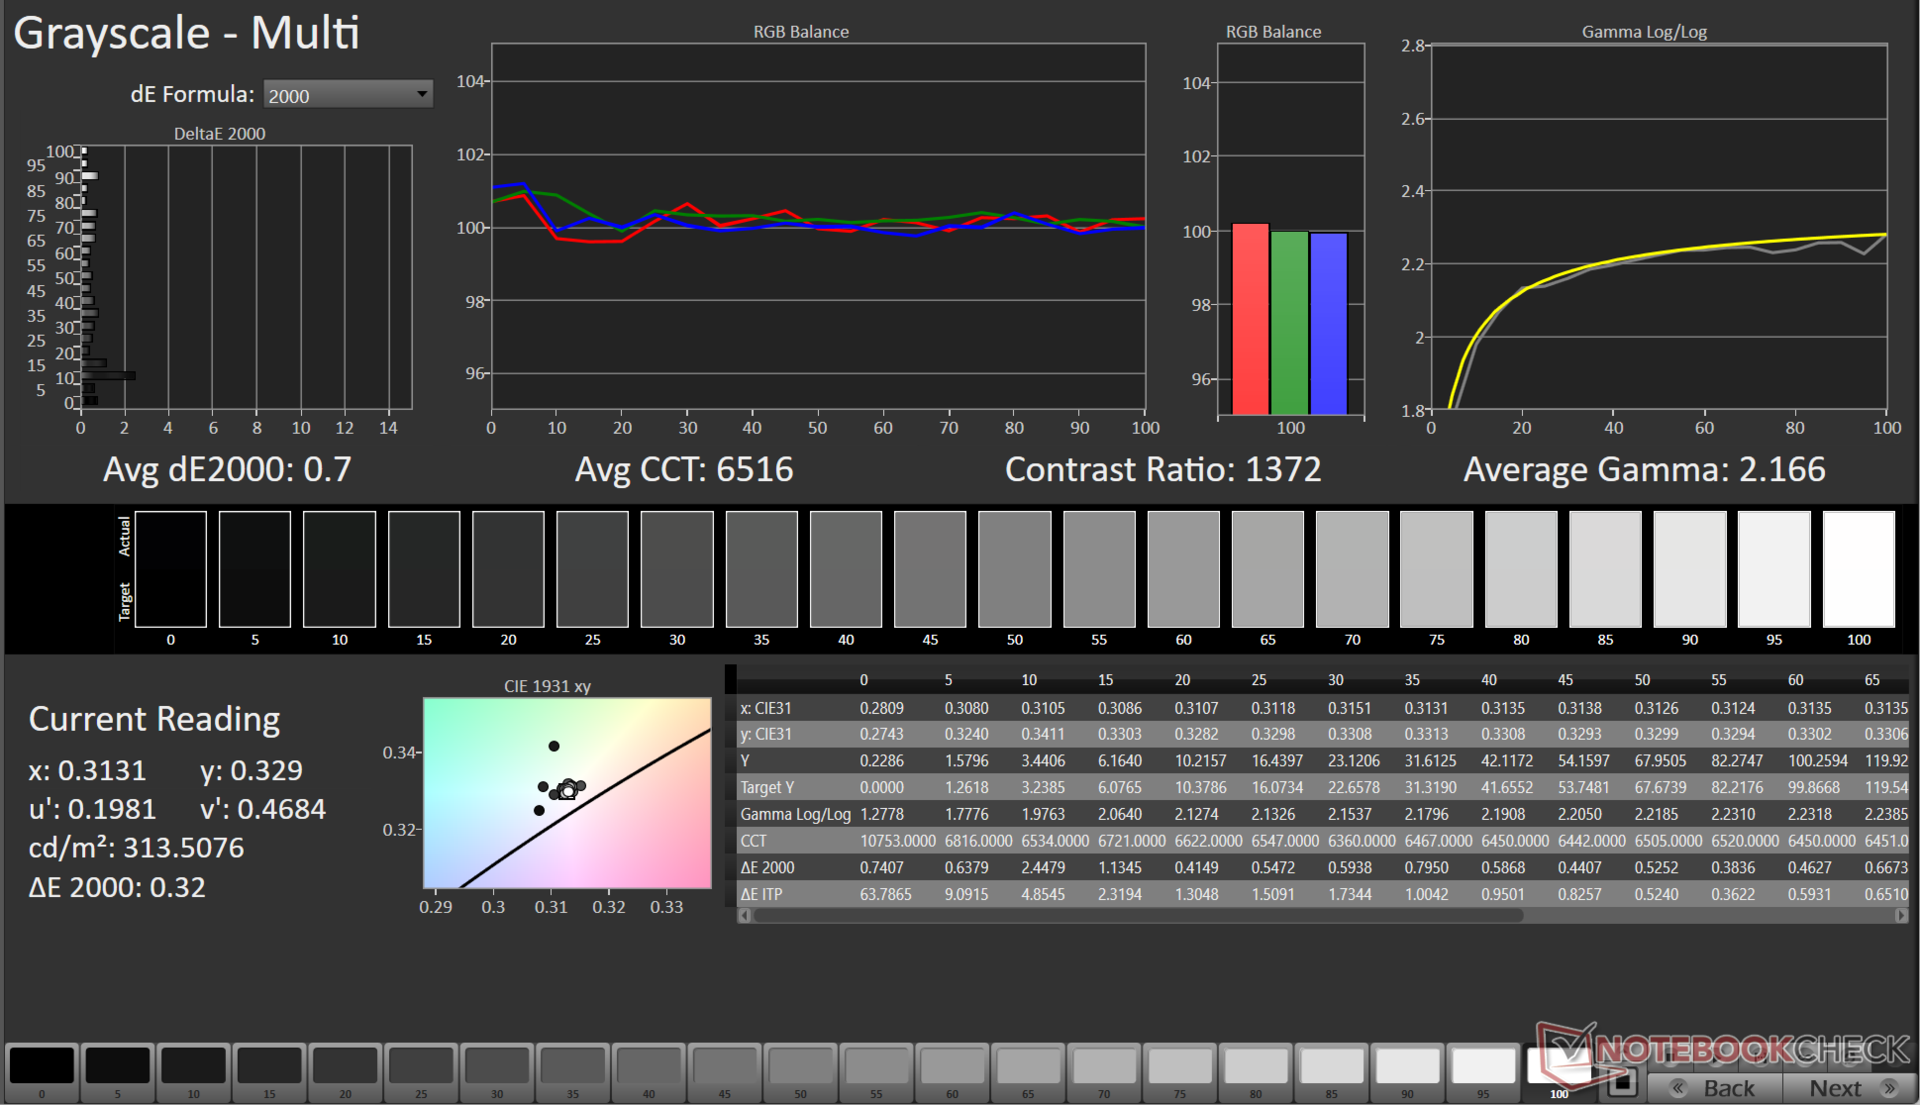
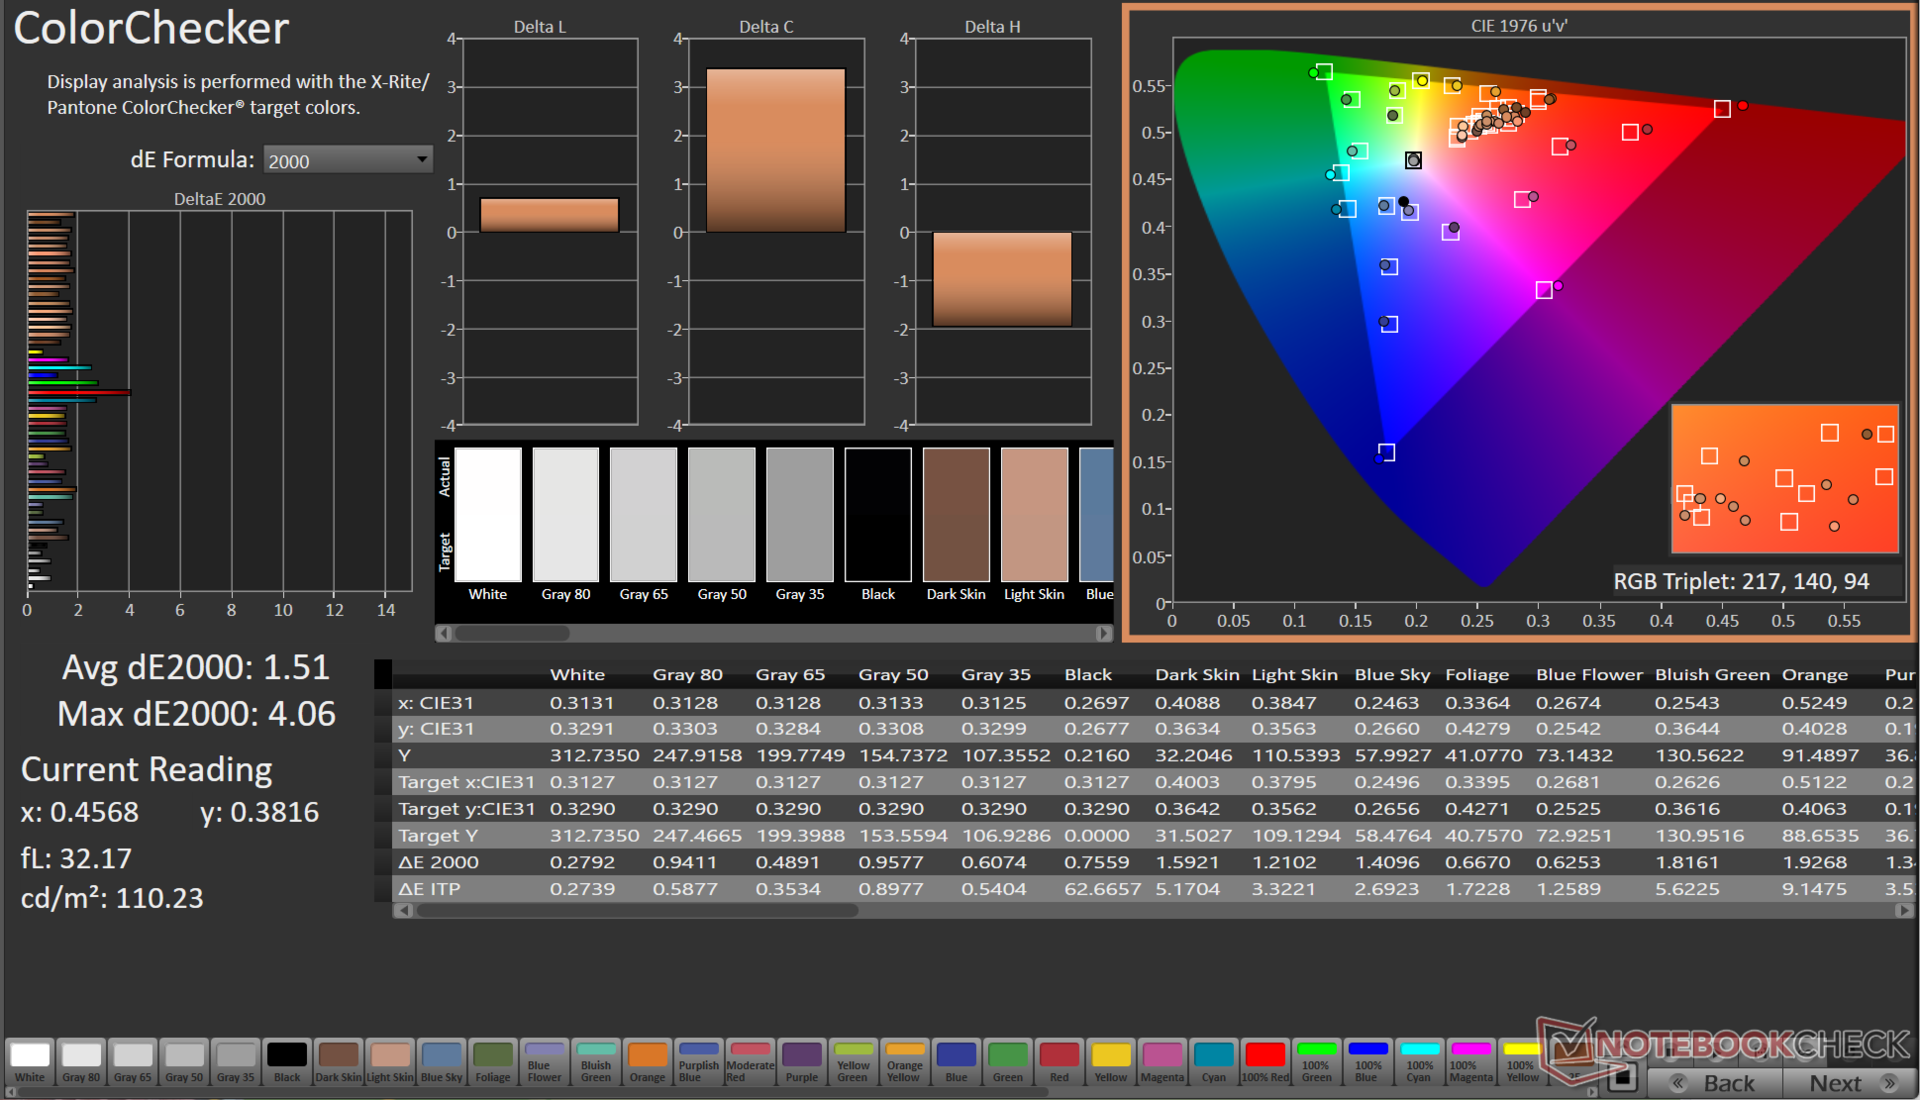
La precisión del color de la G15 muestra desviaciones notables. Sin embargo, pudimos conseguir mejoras espectaculares con nuestra rutina de calibración utilizando el espectrofotómetro X-Rite i1Basic Pro 3 y el software de calibración del color Calman Ultimate de Portrait Display.
El Delta E 2000 medio de la escala de grises pudo reducirse a 0,7, mientras que el Delta E 2000 medio del ColorChecker mejoró hasta 1,51.
El archivo ICC calibrado puede descargarse desde el enlace anterior.
Tiempos de respuesta del display
| ↔ Tiempo de respuesta de Negro a Blanco | ||
|---|---|---|
| 5.35 ms ... subida ↗ y bajada ↘ combinada | ↗ 2.34 ms subida | 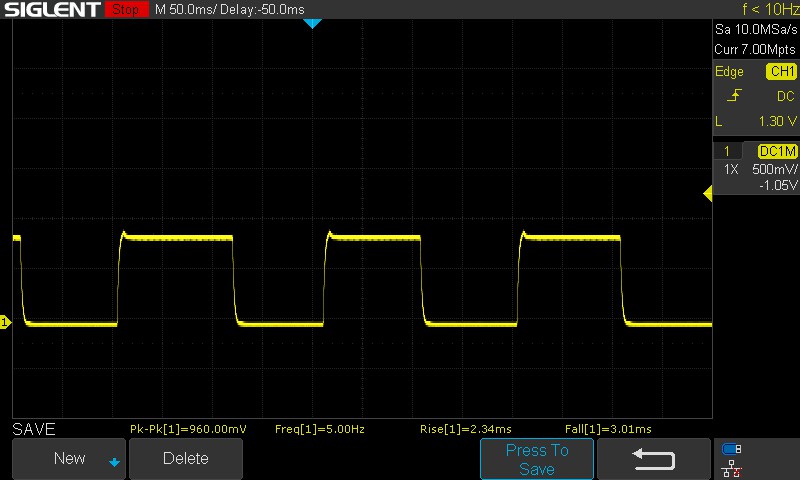 |
| ↘ 3.01 ms bajada | ||
| La pantalla mostró tiempos de respuesta muy rápidos en nuestros tests y debería ser adecuada para juegos frenéticos. En comparación, todos los dispositivos de prueba van de ##min### (mínimo) a 240 (máximo) ms. » 18 % de todos los dispositivos son mejores. Esto quiere decir que el tiempo de respuesta medido es mejor que la media (19.8 ms) de todos los dispositivos testados. | ||
| ↔ Tiempo de respuesta 50% Gris a 80% Gris | ||
| 3.39 ms ... subida ↗ y bajada ↘ combinada | ↗ 1.4 ms subida | 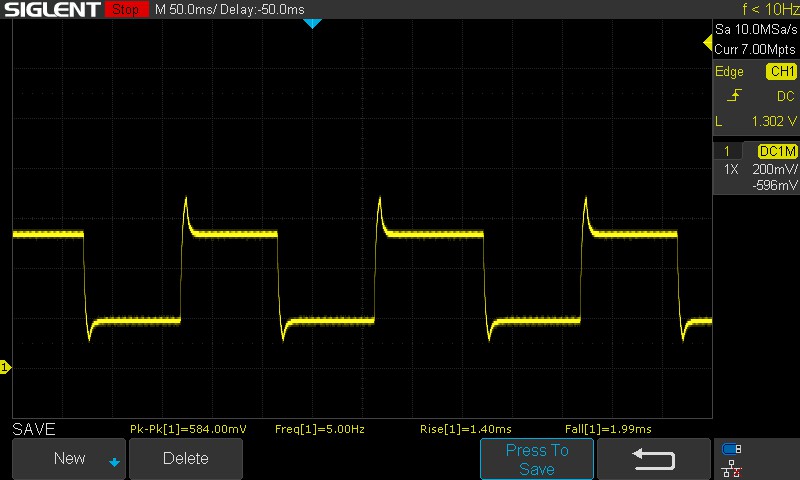 |
| ↘ 1.99 ms bajada | ||
| La pantalla mostró tiempos de respuesta muy rápidos en nuestros tests y debería ser adecuada para juegos frenéticos. En comparación, todos los dispositivos de prueba van de ##min### (mínimo) a 636 (máximo) ms. » 14 % de todos los dispositivos son mejores. Esto quiere decir que el tiempo de respuesta medido es mejor que la media (31 ms) de todos los dispositivos testados. | ||
Parpadeo de Pantalla / PWM (Pulse-Width Modulation)
| Parpadeo de Pantalla / PWM detectado | 21620 Hz | ≤ 100 % de brillo | 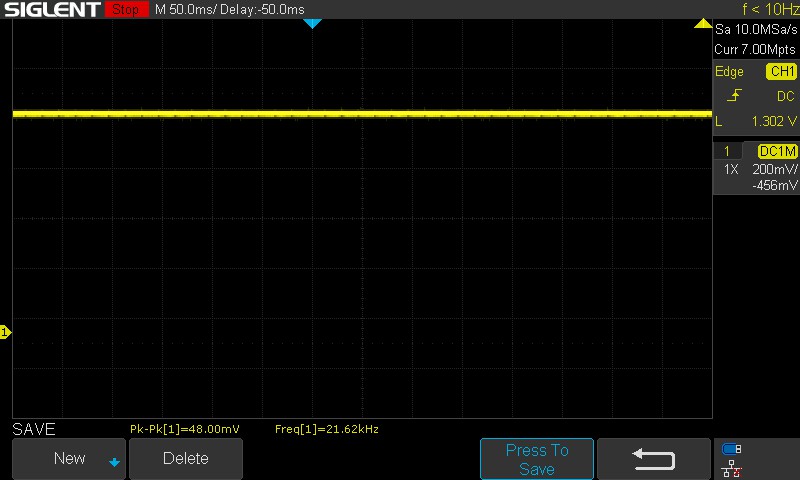 |
La retroiluminación del display parpadea a 21620 Hz (seguramente usa PWM - Pulse-Width Modulation) a un brillo del 100 % e inferior. Sobre este nivel de brillo no debería darse parpadeo / PWM. La frecuencia de 21620 Hz es bastante alta, por lo que la mayoría de gente sensible al parpadeo no debería ver parpadeo o tener fatiga visual. Comparación: 52 % de todos los dispositivos testados no usaron PWM para atenuar el display. Si se usó, medimos una media de 7757 (mínimo: 5 - máxmo: 343500) Hz. | |||
El panel del G15 emplea overdrive para lograr tiempos de respuesta más bajos. Vale la pena notar que no hay opción para desactivar la sobremarcha del panel a través del Centro de Comando Alienware.
Aunque el panel no utiliza PWM para ajustar el brillo, aún muestra parpadeos. Sin embargo, es poco probable que cause fatiga ocular significativa o molestia para la mayoría de usuarios debido a su alta frecuencia.
Para más información, consulta nuestro artículo "Por qué el PWM es un dolor de cabeza". Además, la Tabla de clasificación PWM ofrece una visión general de las frecuencias PWM medidas en todos los dispositivos analizados hasta la fecha.
La visualización en exteriores no plantea mayores problemas siempre que no incida luz solar directa sobre la pantalla. Los ángulos de visión son amplios y relativamente estables, salvo por una pérdida perceptible de brillo en los extremos.

Rendimiento: En la línea esperada para un combo Core i7-13650HX y RTX 4060
Nuestra unidad Dell G15 5530 está alimentada por el Intel Core i7-13650HX y laGPU Nvidia GeForce RTX 4060 para portátiles. Dependiendo de la región, los compradores también pueden configurar este portátil con un Core i5-13450HX y una GPU RTX 3050 DE 6 GB o GPU RTX 4050 para portátiles.
Ten en cuenta que la opción RTX 3050 solo está disponible en combinación con el Core i5-13450HX.
Condiciones de ensayo
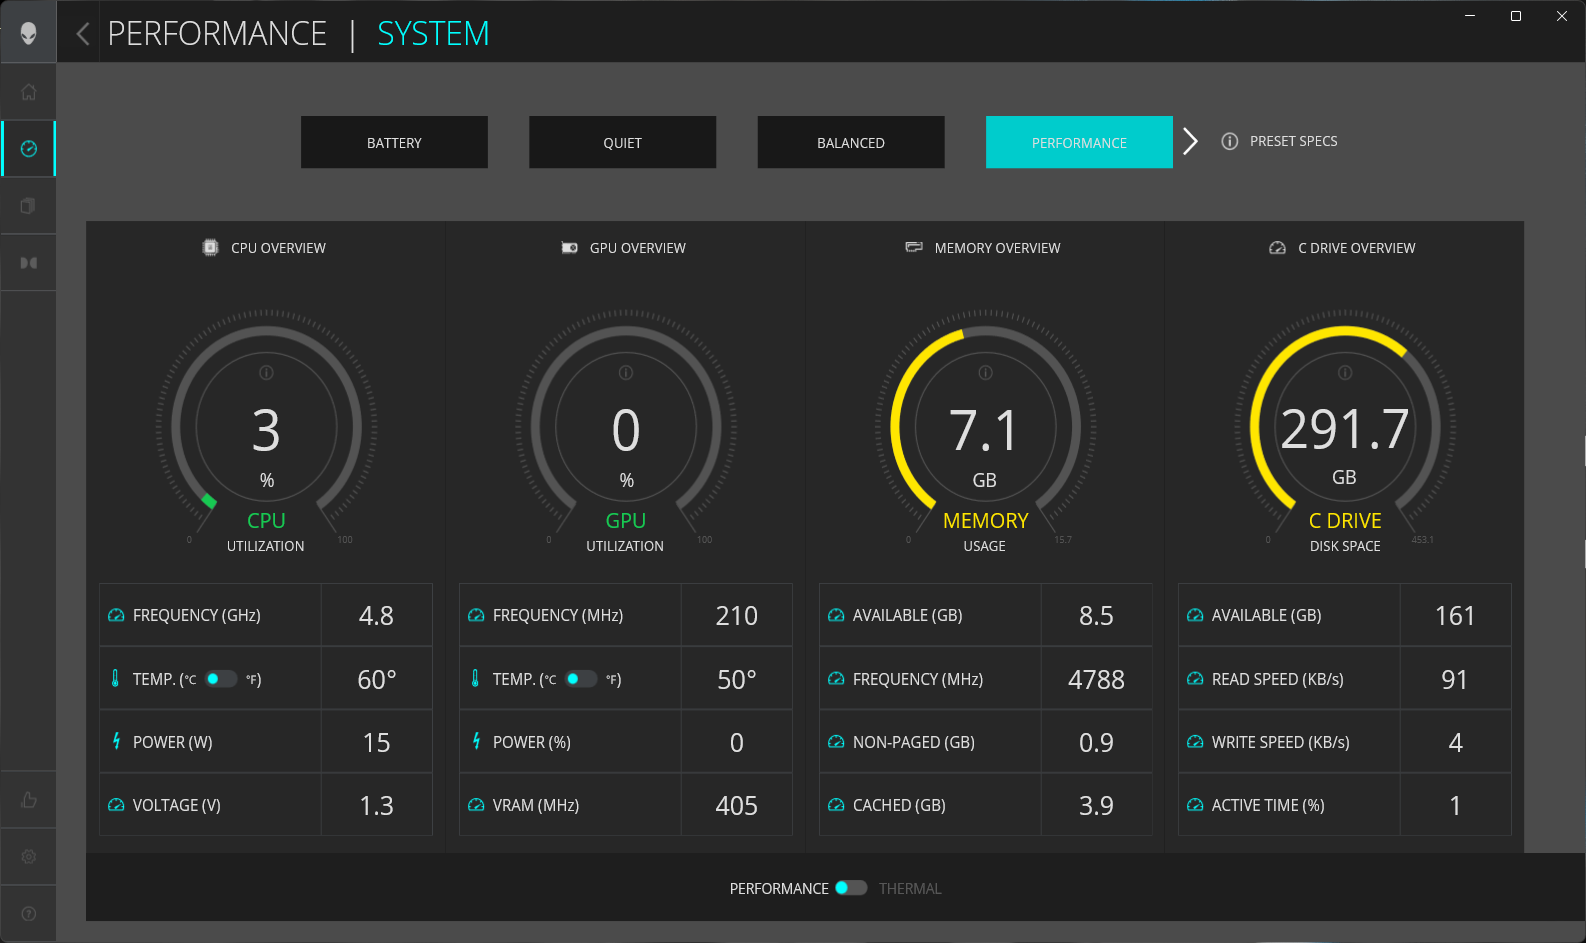
El Alienware Command Center ofrece cuatro preajustes de rendimiento predefinidos entre los que elegir, pero también permite a los usuarios crear y personalizar sus propios perfiles.
Usamos el modo Rendimiento para todas las pruebas, excepto para evaluar la duración de la batería, para lo que usamos el perfil Batería.
La siguiente tabla ilustra las variaciones en la potencia base del procesador (PBP) y la potencia turbo máxima (MTP) para cada escenario:
| Modo de rendimiento | PL1 (PBP) / Tau | PL2 (MTP) / Tau | PL4 |
|---|---|---|---|
| Batería | 55 W / 56 s | 157 W / 2,44 ms | 242 W |
| Silencioso | 55 W / 56 s | 157 W / 2,44 ms | 242 W |
| Equilibrada | 157 W / 56 s | 157 W / 2,44 ms | 242 W |
| Rendimiento | 191 W / 56 s | 191 W / 2,44 ms | 242 W |
Procesador
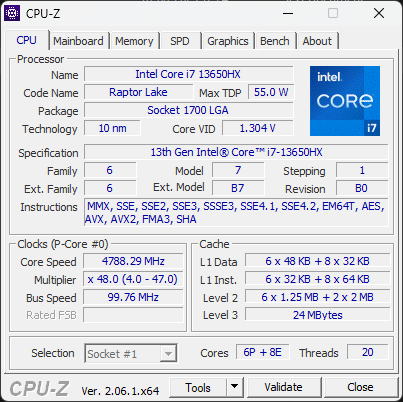
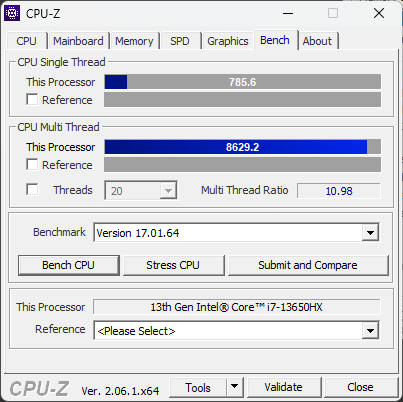
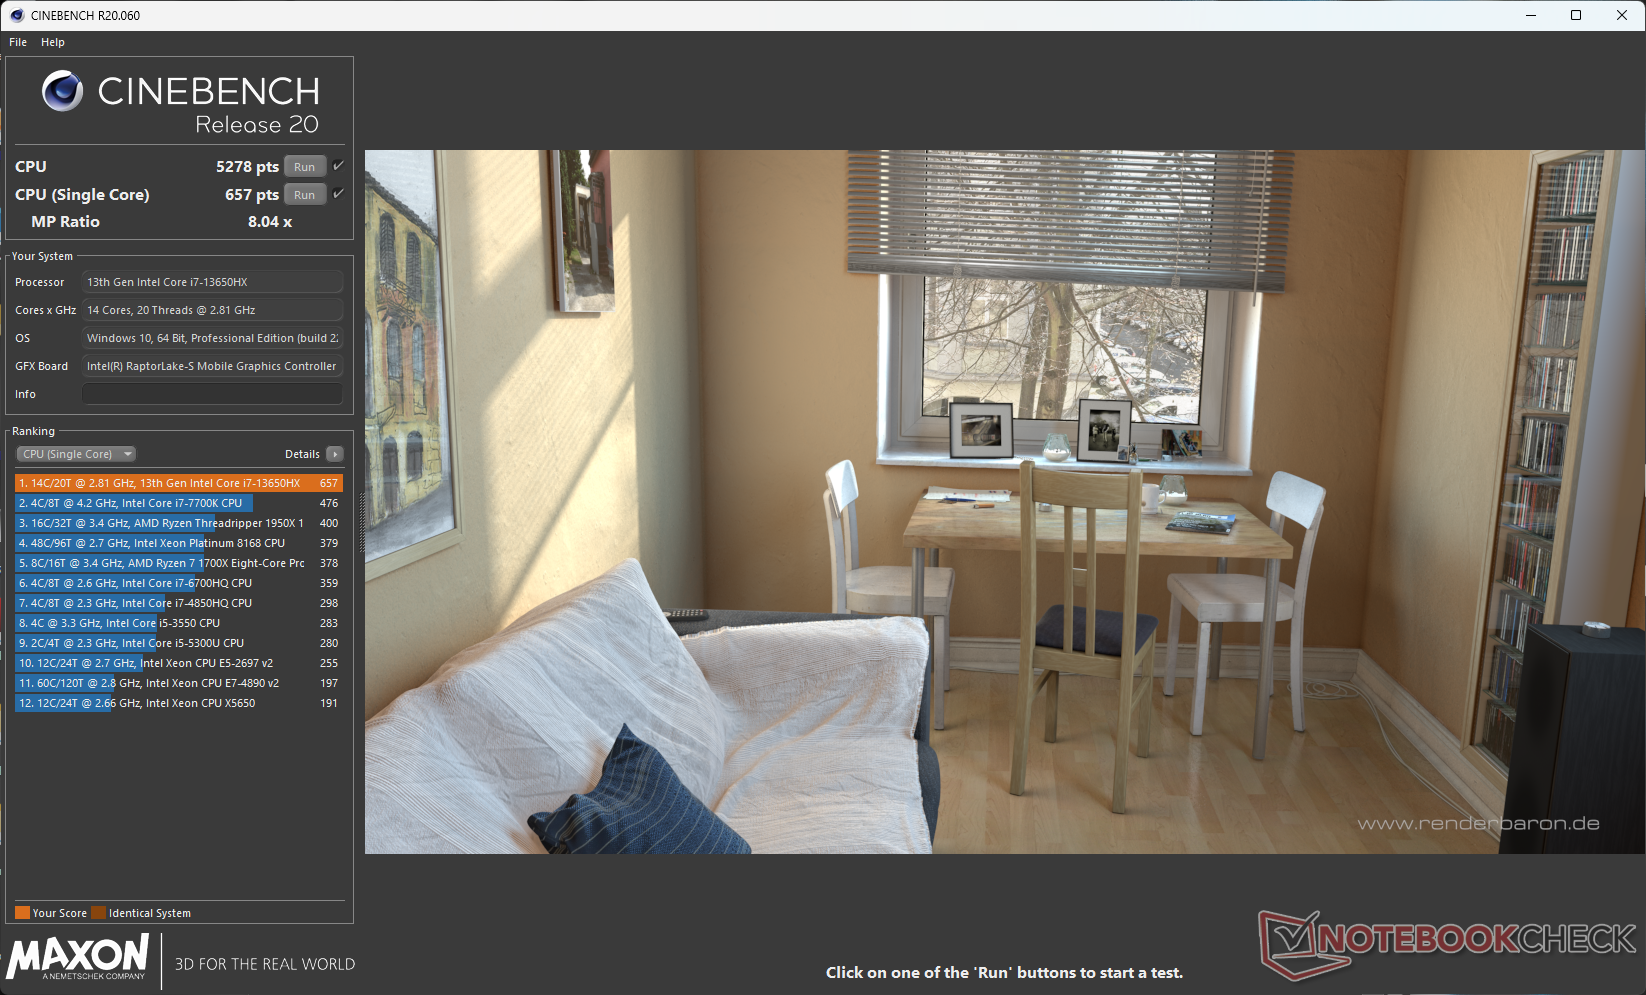
El Intel Core i7-13650HX es una pieza Raptor Lake-HX de 14 núcleos y 20 hilos que ofrece un aumento de un solo núcleo hasta 4,9 GHz en sus núcleos P.
En el test Cinebench R15 multi-core loop, el G15 5530 empieza a la par con el Asus ROG Strix G18, que usa la misma CPU. Sin embargo, observamos una ligera ralentización a mitad de la prueba. Por lo demás, el rendimiento general de la CPU es casi idéntico en ambos modelos.
El Core i7-13650HX del G15 5530 ofrece una buena ventaja en las pruebas multi-core sobre el Ryzen 9 7940HS del Asus TUF Gaming A16, pero este último se las arregla para mantenerse a corta distancia en rendimiento acumulativo debido a sus altas ganancias single-core.
Cinebench R15 Multi Loop
Cinebench R23: Multi Core | Single Core
Cinebench R20: CPU (Multi Core) | CPU (Single Core)
Cinebench R15: CPU Multi 64Bit | CPU Single 64Bit
Blender: v2.79 BMW27 CPU
7-Zip 18.03: 7z b 4 | 7z b 4 -mmt1
Geekbench 5.5: Multi-Core | Single-Core
HWBOT x265 Benchmark v2.2: 4k Preset
LibreOffice : 20 Documents To PDF
R Benchmark 2.5: Overall mean
| CPU Performance rating | |
| Asus ROG Strix G17 G713PI | |
| Medion Erazer Major X20 | |
| Media de la clase Gaming | |
| Asus ROG Flow X16 GV601V | |
| Dell G15 5530 | |
| Asus ROG Strix G18 G814JI | |
| Lenovo Legion Pro 5 16IRX8 | |
| Medio Intel Core i7-13650HX | |
| Asus TUF Gaming A16 FA617XS | |
| MSI Katana 17 B13VFK | |
| Cinebench R23 / Multi Core | |
| Asus ROG Strix G17 G713PI | |
| Medion Erazer Major X20 | |
| Media de la clase Gaming (10488 - 42661, n=107, últimos 2 años) | |
| Asus ROG Strix G18 G814JI | |
| Dell G15 5530 | |
| Medio Intel Core i7-13650HX (18744 - 21006, n=6) | |
| Lenovo Legion Pro 5 16IRX8 | |
| Asus ROG Flow X16 GV601V | |
| Asus TUF Gaming A16 FA617XS | |
| MSI Katana 17 B13VFK | |
| Cinebench R23 / Single Core | |
| Medion Erazer Major X20 | |
| Asus ROG Flow X16 GV601V | |
| Media de la clase Gaming (1166 - 2415, n=107, últimos 2 años) | |
| Asus ROG Strix G18 G814JI | |
| Asus ROG Strix G17 G713PI | |
| Dell G15 5530 | |
| Medio Intel Core i7-13650HX (1693 - 1903, n=6) | |
| MSI Katana 17 B13VFK | |
| Asus TUF Gaming A16 FA617XS | |
| Lenovo Legion Pro 5 16IRX8 | |
| Cinebench R20 / CPU (Multi Core) | |
| Medion Erazer Major X20 | |
| Media de la clase Gaming (4029 - 16433, n=106, últimos 2 años) | |
| Asus ROG Strix G17 G713PI | |
| Dell G15 5530 | |
| Asus ROG Strix G18 G814JI | |
| Medio Intel Core i7-13650HX (7197 - 8021, n=5) | |
| Asus ROG Flow X16 GV601V | |
| Lenovo Legion Pro 5 16IRX8 | |
| Asus TUF Gaming A16 FA617XS | |
| MSI Katana 17 B13VFK | |
| Cinebench R20 / CPU (Single Core) | |
| Media de la clase Gaming (442 - 913, n=106, últimos 2 años) | |
| Medion Erazer Major X20 | |
| Asus ROG Flow X16 GV601V | |
| Asus ROG Strix G18 G814JI | |
| Medio Intel Core i7-13650HX (700 - 728, n=5) | |
| Asus ROG Strix G17 G713PI | |
| Dell G15 5530 | |
| Asus TUF Gaming A16 FA617XS | |
| MSI Katana 17 B13VFK | |
| Lenovo Legion Pro 5 16IRX8 | |
| Cinebench R15 / CPU Multi 64Bit | |
| Asus ROG Strix G17 G713PI | |
| Medion Erazer Major X20 | |
| Media de la clase Gaming (1578 - 6330, n=105, últimos 2 años) | |
| Lenovo Legion Pro 5 16IRX8 | |
| Dell G15 5530 | |
| Asus ROG Strix G18 G814JI | |
| Asus ROG Flow X16 GV601V | |
| Medio Intel Core i7-13650HX (2864 - 3147, n=5) | |
| Asus TUF Gaming A16 FA617XS | |
| MSI Katana 17 B13VFK | |
| Cinebench R15 / CPU Single 64Bit | |
| Medion Erazer Major X20 | |
| Media de la clase Gaming (188.8 - 350, n=106, últimos 2 años) | |
| Asus ROG Strix G17 G713PI | |
| Asus ROG Flow X16 GV601V | |
| Asus TUF Gaming A16 FA617XS | |
| Asus ROG Strix G18 G814JI | |
| Dell G15 5530 | |
| Medio Intel Core i7-13650HX (256 - 275, n=5) | |
| Lenovo Legion Pro 5 16IRX8 | |
| MSI Katana 17 B13VFK | |
| Blender / v2.79 BMW27 CPU | |
| MSI Katana 17 B13VFK | |
| Asus TUF Gaming A16 FA617XS | |
| Asus ROG Flow X16 GV601V | |
| Medio Intel Core i7-13650HX (158 - 226, n=5) | |
| Dell G15 5530 | |
| Asus ROG Strix G18 G814JI | |
| Lenovo Legion Pro 5 16IRX8 | |
| Media de la clase Gaming (79 - 330, n=104, últimos 2 años) | |
| Medion Erazer Major X20 | |
| Asus ROG Strix G17 G713PI | |
| 7-Zip 18.03 / 7z b 4 | |
| Asus ROG Strix G17 G713PI | |
| Medion Erazer Major X20 | |
| Media de la clase Gaming (33491 - 148086, n=105, últimos 2 años) | |
| Asus ROG Strix G18 G814JI | |
| Lenovo Legion Pro 5 16IRX8 | |
| Dell G15 5530 | |
| Medio Intel Core i7-13650HX (73927 - 80057, n=5) | |
| Asus ROG Flow X16 GV601V | |
| Asus TUF Gaming A16 FA617XS | |
| MSI Katana 17 B13VFK | |
| 7-Zip 18.03 / 7z b 4 -mmt1 | |
| Asus ROG Strix G17 G713PI | |
| Medion Erazer Major X20 | |
| Asus TUF Gaming A16 FA617XS | |
| Media de la clase Gaming (4199 - 7436, n=105, últimos 2 años) | |
| Asus ROG Flow X16 GV601V | |
| Asus ROG Strix G18 G814JI | |
| Medio Intel Core i7-13650HX (5828 - 6125, n=5) | |
| Dell G15 5530 | |
| MSI Katana 17 B13VFK | |
| Lenovo Legion Pro 5 16IRX8 | |
| Geekbench 5.5 / Multi-Core | |
| Medion Erazer Major X20 | |
| Asus ROG Strix G17 G713PI | |
| Media de la clase Gaming (6460 - 28263, n=105, últimos 2 años) | |
| Asus ROG Strix G18 G814JI | |
| Lenovo Legion Pro 5 16IRX8 | |
| Dell G15 5530 | |
| Asus ROG Flow X16 GV601V | |
| Medio Intel Core i7-13650HX (12509 - 14778, n=5) | |
| Asus TUF Gaming A16 FA617XS | |
| MSI Katana 17 B13VFK | |
| Geekbench 5.5 / Single-Core | |
| Media de la clase Gaming (986 - 2474, n=105, últimos 2 años) | |
| Asus ROG Strix G17 G713PI | |
| Medion Erazer Major X20 | |
| Asus TUF Gaming A16 FA617XS | |
| Asus ROG Flow X16 GV601V | |
| Dell G15 5530 | |
| Medio Intel Core i7-13650HX (1810 - 1866, n=5) | |
| Asus ROG Strix G18 G814JI | |
| MSI Katana 17 B13VFK | |
| Lenovo Legion Pro 5 16IRX8 | |
| HWBOT x265 Benchmark v2.2 / 4k Preset | |
| Asus ROG Strix G17 G713PI | |
| Medion Erazer Major X20 | |
| Media de la clase Gaming (11.5 - 44.4, n=105, últimos 2 años) | |
| Lenovo Legion Pro 5 16IRX8 | |
| Asus ROG Strix G18 G814JI | |
| Dell G15 5530 | |
| Asus ROG Flow X16 GV601V | |
| Medio Intel Core i7-13650HX (18.9 - 23.6, n=5) | |
| Asus TUF Gaming A16 FA617XS | |
| MSI Katana 17 B13VFK | |
| LibreOffice / 20 Documents To PDF | |
| Asus ROG Strix G18 G814JI | |
| MSI Katana 17 B13VFK | |
| Media de la clase Gaming (33.2 - 88.8, n=105, últimos 2 años) | |
| Medio Intel Core i7-13650HX (38.9 - 58.8, n=5) | |
| Dell G15 5530 | |
| Asus ROG Strix G17 G713PI | |
| Medion Erazer Major X20 | |
| Asus TUF Gaming A16 FA617XS | |
| Asus ROG Flow X16 GV601V | |
| Lenovo Legion Pro 5 16IRX8 | |
| R Benchmark 2.5 / Overall mean | |
| Lenovo Legion Pro 5 16IRX8 | |
| MSI Katana 17 B13VFK | |
| Asus ROG Strix G18 G814JI | |
| Medio Intel Core i7-13650HX (0.4217 - 0.4461, n=6) | |
| Media de la clase Gaming (0.3439 - 0.759, n=106, últimos 2 años) | |
| Dell G15 5530 | |
| Asus TUF Gaming A16 FA617XS | |
| Asus ROG Flow X16 GV601V | |
| Asus ROG Strix G17 G713PI | |
| Medion Erazer Major X20 | |
* ... más pequeño es mejor
El siguiente gráfico ilustra cómo varían varios parámetros de la CPU en cada modo de rendimiento durante un bucle multinúcleo de Cinebench R15.
Los modos Performance y Balanced muestran frecuencias medias similares en torno a los 3,6 GHz, mientras que el modo Quiet se conforma con una media de 2,6 GHz.
El modo Equilibrado es unos 9 W más económico que el Rendimiento en términos de consumo máximo de la CPU. Sin embargo, las temperaturas del núcleo son más o menos idénticas en ambos modos.
Merece la pena señalar que, aunque el modo Quiet consume sólo unos 50,5 W de media, también supone una pérdida de rendimiento del 23%.
En batería, el rendimiento mononúcleo de Cinebench R20 sólo se ve afectado en un 7%. Sin embargo, la puntuación multinúcleo cae un 34%.
AIDA64: FP32 Ray-Trace | FPU Julia | CPU SHA3 | CPU Queen | FPU SinJulia | FPU Mandel | CPU AES | CPU ZLib | FP64 Ray-Trace | CPU PhotoWorxx
| Performance rating | |
| Asus ROG Strix G17 G713PI | |
| Media de la clase Gaming | |
| Medion Erazer Major X20 | |
| Asus TUF Gaming A16 FA617XS | |
| Lenovo Legion Pro 5 16IRX8 | |
| Asus ROG Strix G18 G814JI | |
| Dell G15 5530 | |
| Medio Intel Core i7-13650HX | |
| Asus ROG Flow X16 GV601V | |
| MSI Katana 17 B13VFK | |
| AIDA64 / FP32 Ray-Trace | |
| Asus ROG Strix G17 G713PI | |
| Media de la clase Gaming (10227 - 85542, n=105, últimos 2 años) | |
| Asus TUF Gaming A16 FA617XS | |
| Medion Erazer Major X20 | |
| Lenovo Legion Pro 5 16IRX8 | |
| Asus ROG Strix G18 G814JI | |
| Dell G15 5530 | |
| Medio Intel Core i7-13650HX (13404 - 20012, n=5) | |
| MSI Katana 17 B13VFK | |
| Asus ROG Flow X16 GV601V | |
| AIDA64 / FPU Julia | |
| Asus ROG Strix G17 G713PI | |
| Media de la clase Gaming (51376 - 238426, n=105, últimos 2 años) | |
| Medion Erazer Major X20 | |
| Asus TUF Gaming A16 FA617XS | |
| Lenovo Legion Pro 5 16IRX8 | |
| Asus ROG Strix G18 G814JI | |
| Dell G15 5530 | |
| Medio Intel Core i7-13650HX (68241 - 97317, n=5) | |
| Asus ROG Flow X16 GV601V | |
| MSI Katana 17 B13VFK | |
| AIDA64 / CPU SHA3 | |
| Asus ROG Strix G17 G713PI | |
| Media de la clase Gaming (2180 - 10115, n=105, últimos 2 años) | |
| Medion Erazer Major X20 | |
| Lenovo Legion Pro 5 16IRX8 | |
| Asus TUF Gaming A16 FA617XS | |
| Asus ROG Strix G18 G814JI | |
| Dell G15 5530 | |
| Asus ROG Flow X16 GV601V | |
| Medio Intel Core i7-13650HX (3127 - 4487, n=5) | |
| MSI Katana 17 B13VFK | |
| AIDA64 / CPU Queen | |
| Asus ROG Strix G17 G713PI | |
| Medion Erazer Major X20 | |
| Asus TUF Gaming A16 FA617XS | |
| Media de la clase Gaming (49785 - 173351, n=90, últimos 2 años) | |
| Lenovo Legion Pro 5 16IRX8 | |
| Asus ROG Flow X16 GV601V | |
| Asus ROG Strix G18 G814JI | |
| Medio Intel Core i7-13650HX (108627 - 110589, n=5) | |
| Dell G15 5530 | |
| MSI Katana 17 B13VFK | |
| AIDA64 / FPU SinJulia | |
| Asus ROG Strix G17 G713PI | |
| Asus TUF Gaming A16 FA617XS | |
| Medion Erazer Major X20 | |
| Media de la clase Gaming (4424 - 33636, n=105, últimos 2 años) | |
| Lenovo Legion Pro 5 16IRX8 | |
| Asus ROG Flow X16 GV601V | |
| Dell G15 5530 | |
| Asus ROG Strix G18 G814JI | |
| Medio Intel Core i7-13650HX (9134 - 10887, n=5) | |
| MSI Katana 17 B13VFK | |
| AIDA64 / FPU Mandel | |
| Asus ROG Strix G17 G713PI | |
| Media de la clase Gaming (25115 - 128721, n=105, últimos 2 años) | |
| Asus TUF Gaming A16 FA617XS | |
| Medion Erazer Major X20 | |
| Lenovo Legion Pro 5 16IRX8 | |
| Asus ROG Strix G18 G814JI | |
| Dell G15 5530 | |
| Medio Intel Core i7-13650HX (33391 - 48323, n=5) | |
| Asus ROG Flow X16 GV601V | |
| MSI Katana 17 B13VFK | |
| AIDA64 / CPU AES | |
| Asus ROG Strix G17 G713PI | |
| Medion Erazer Major X20 | |
| Media de la clase Gaming (39258 - 247074, n=105, últimos 2 años) | |
| Lenovo Legion Pro 5 16IRX8 | |
| Asus TUF Gaming A16 FA617XS | |
| Dell G15 5530 | |
| Asus ROG Strix G18 G814JI | |
| Asus ROG Flow X16 GV601V | |
| Medio Intel Core i7-13650HX (64436 - 85343, n=5) | |
| MSI Katana 17 B13VFK | |
| AIDA64 / CPU ZLib | |
| Asus ROG Strix G17 G713PI | |
| Medion Erazer Major X20 | |
| Media de la clase Gaming (574 - 2531, n=105, últimos 2 años) | |
| Lenovo Legion Pro 5 16IRX8 | |
| Dell G15 5530 | |
| Asus ROG Strix G18 G814JI | |
| Medio Intel Core i7-13650HX (1136 - 1285, n=5) | |
| Asus ROG Flow X16 GV601V | |
| Asus TUF Gaming A16 FA617XS | |
| MSI Katana 17 B13VFK | |
| AIDA64 / FP64 Ray-Trace | |
| Asus ROG Strix G17 G713PI | |
| Media de la clase Gaming (5509 - 45446, n=105, últimos 2 años) | |
| Asus TUF Gaming A16 FA617XS | |
| Medion Erazer Major X20 | |
| Lenovo Legion Pro 5 16IRX8 | |
| Asus ROG Strix G18 G814JI | |
| Dell G15 5530 | |
| Medio Intel Core i7-13650HX (7270 - 10900, n=5) | |
| Asus ROG Flow X16 GV601V | |
| MSI Katana 17 B13VFK | |
| AIDA64 / CPU PhotoWorxx | |
| Media de la clase Gaming (12271 - 89891, n=105, últimos 2 años) | |
| Medion Erazer Major X20 | |
| Asus ROG Strix G18 G814JI | |
| Medio Intel Core i7-13650HX (36170 - 43289, n=5) | |
| Asus ROG Flow X16 GV601V | |
| Dell G15 5530 | |
| Lenovo Legion Pro 5 16IRX8 | |
| MSI Katana 17 B13VFK | |
| Asus ROG Strix G17 G713PI | |
| Asus TUF Gaming A16 FA617XS | |
Nuestro Intel Core i7-13650HX ofrece más información y comparaciones de rendimiento.
Rendimiento del sistema
El G15 5530 obtiene una puntuación global en PCMark 10 inferior a la de la competencia, pero no nos encontramos con ningún contratiempo en la informática de propósito general.
El MSI Katana 17 con un Core i7-13620H logra superar ligeramente al G15 5530 en las puntuaciones generales de PCMark 10 y CrossMark.
CrossMark: Overall | Productivity | Creativity | Responsiveness
AIDA64: Memory Copy | Memory Read | Memory Write | Memory Latency
| PCMark 10 / Score | |
| Media de la clase Gaming (5828 - 12414, n=93, últimos 2 años) | |
| Asus TUF Gaming A16 FA617XS | |
| Asus ROG Flow X16 GV601V | |
| Lenovo Legion Pro 5 16IRX8 | |
| Medion Erazer Major X20 | |
| Asus ROG Strix G17 G713PI | |
| Medio Intel Core i7-13650HX, NVIDIA GeForce RTX 4060 Laptop GPU (6984 - 7613, n=3) | |
| MSI Katana 17 B13VFK | |
| Dell G15 5530 | |
| Asus ROG Strix G18 G814JI | |
| PCMark 10 / Essentials | |
| Medion Erazer Major X20 | |
| Asus ROG Flow X16 GV601V | |
| Asus ROG Strix G17 G713PI | |
| Dell G15 5530 | |
| Lenovo Legion Pro 5 16IRX8 | |
| Asus TUF Gaming A16 FA617XS | |
| MSI Katana 17 B13VFK | |
| Media de la clase Gaming (8810 - 11935, n=97, últimos 2 años) | |
| Medio Intel Core i7-13650HX, NVIDIA GeForce RTX 4060 Laptop GPU (9532 - 11151, n=3) | |
| Asus ROG Strix G18 G814JI | |
| PCMark 10 / Productivity | |
| Media de la clase Gaming (6845 - 25323, n=95, últimos 2 años) | |
| Asus ROG Strix G17 G713PI | |
| Asus TUF Gaming A16 FA617XS | |
| Asus ROG Flow X16 GV601V | |
| Medio Intel Core i7-13650HX, NVIDIA GeForce RTX 4060 Laptop GPU (9961 - 10204, n=3) | |
| Dell G15 5530 | |
| Medion Erazer Major X20 | |
| MSI Katana 17 B13VFK | |
| Lenovo Legion Pro 5 16IRX8 | |
| Asus ROG Strix G18 G814JI | |
| PCMark 10 / Digital Content Creation | |
| Media de la clase Gaming (7602 - 19954, n=95, últimos 2 años) | |
| Lenovo Legion Pro 5 16IRX8 | |
| Asus TUF Gaming A16 FA617XS | |
| Asus ROG Flow X16 GV601V | |
| Medio Intel Core i7-13650HX, NVIDIA GeForce RTX 4060 Laptop GPU (8323 - 11686, n=3) | |
| Medion Erazer Major X20 | |
| MSI Katana 17 B13VFK | |
| Asus ROG Strix G17 G713PI | |
| Dell G15 5530 | |
| Asus ROG Strix G18 G814JI | |
| CrossMark / Overall | |
| Asus ROG Strix G17 G713PI | |
| Media de la clase Gaming (1366 - 2409, n=94, últimos 2 años) | |
| Asus ROG Flow X16 GV601V | |
| Medio Intel Core i7-13650HX, NVIDIA GeForce RTX 4060 Laptop GPU (1839 - 1951, n=3) | |
| MSI Katana 17 B13VFK | |
| Medion Erazer Major X20 | |
| Dell G15 5530 | |
| Asus TUF Gaming A16 FA617XS | |
| Lenovo Legion Pro 5 16IRX8 | |
| CrossMark / Productivity | |
| Asus ROG Strix G17 G713PI | |
| Asus ROG Flow X16 GV601V | |
| Media de la clase Gaming (1386 - 2254, n=94, últimos 2 años) | |
| Medio Intel Core i7-13650HX, NVIDIA GeForce RTX 4060 Laptop GPU (1730 - 1864, n=3) | |
| MSI Katana 17 B13VFK | |
| Dell G15 5530 | |
| Asus TUF Gaming A16 FA617XS | |
| Medion Erazer Major X20 | |
| Lenovo Legion Pro 5 16IRX8 | |
| CrossMark / Creativity | |
| Asus ROG Strix G17 G713PI | |
| Media de la clase Gaming (1343 - 2786, n=94, últimos 2 años) | |
| Asus ROG Flow X16 GV601V | |
| Medion Erazer Major X20 | |
| Dell G15 5530 | |
| Medio Intel Core i7-13650HX, NVIDIA GeForce RTX 4060 Laptop GPU (2020 - 2063, n=3) | |
| MSI Katana 17 B13VFK | |
| Asus TUF Gaming A16 FA617XS | |
| Lenovo Legion Pro 5 16IRX8 | |
| CrossMark / Responsiveness | |
| MSI Katana 17 B13VFK | |
| Medio Intel Core i7-13650HX, NVIDIA GeForce RTX 4060 Laptop GPU (1544 - 1907, n=3) | |
| Media de la clase Gaming (1226 - 2334, n=94, últimos 2 años) | |
| Asus ROG Flow X16 GV601V | |
| Asus ROG Strix G17 G713PI | |
| Lenovo Legion Pro 5 16IRX8 | |
| Medion Erazer Major X20 | |
| Dell G15 5530 | |
| Asus TUF Gaming A16 FA617XS | |
| AIDA64 / Memory Copy | |
| Media de la clase Gaming (21750 - 129946, n=105, últimos 2 años) | |
| Medion Erazer Major X20 | |
| Asus ROG Strix G18 G814JI | |
| Asus ROG Flow X16 GV601V | |
| Asus TUF Gaming A16 FA617XS | |
| Medio Intel Core i7-13650HX, NVIDIA GeForce RTX 4060 Laptop GPU (59266 - 59896, n=3) | |
| Dell G15 5530 | |
| Lenovo Legion Pro 5 16IRX8 | |
| MSI Katana 17 B13VFK | |
| Asus ROG Strix G17 G713PI | |
| AIDA64 / Memory Read | |
| Media de la clase Gaming (22956 - 118858, n=105, últimos 2 años) | |
| Medion Erazer Major X20 | |
| Asus ROG Strix G18 G814JI | |
| Asus ROG Flow X16 GV601V | |
| Medio Intel Core i7-13650HX, NVIDIA GeForce RTX 4060 Laptop GPU (67305 - 68612, n=3) | |
| Dell G15 5530 | |
| Lenovo Legion Pro 5 16IRX8 | |
| MSI Katana 17 B13VFK | |
| Asus TUF Gaming A16 FA617XS | |
| Asus ROG Strix G17 G713PI | |
| AIDA64 / Memory Write | |
| Media de la clase Gaming (22297 - 135096, n=105, últimos 2 años) | |
| Asus TUF Gaming A16 FA617XS | |
| Lenovo Legion Pro 5 16IRX8 | |
| Medion Erazer Major X20 | |
| Asus ROG Flow X16 GV601V | |
| Asus ROG Strix G18 G814JI | |
| Dell G15 5530 | |
| Medio Intel Core i7-13650HX, NVIDIA GeForce RTX 4060 Laptop GPU (58028 - 60298, n=3) | |
| Asus ROG Strix G17 G713PI | |
| MSI Katana 17 B13VFK | |
| AIDA64 / Memory Latency | |
| Media de la clase Gaming (75.3 - 259, n=105, últimos 2 años) | |
| MSI Katana 17 B13VFK | |
| Asus ROG Flow X16 GV601V | |
| Dell G15 5530 | |
| Medion Erazer Major X20 | |
| Medio Intel Core i7-13650HX, NVIDIA GeForce RTX 4060 Laptop GPU (90.4 - 90.8, n=3) | |
| Asus TUF Gaming A16 FA617XS | |
| Asus ROG Strix G17 G713PI | |
| Asus ROG Strix G18 G814JI | |
| Lenovo Legion Pro 5 16IRX8 | |
* ... más pequeño es mejor
| PCMark 8 Home Score Accelerated v2 | 4748 puntos | |
| PCMark 8 Work Score Accelerated v2 | 6712 puntos | |
| PCMark 10 Score | 6984 puntos | |
ayuda | ||
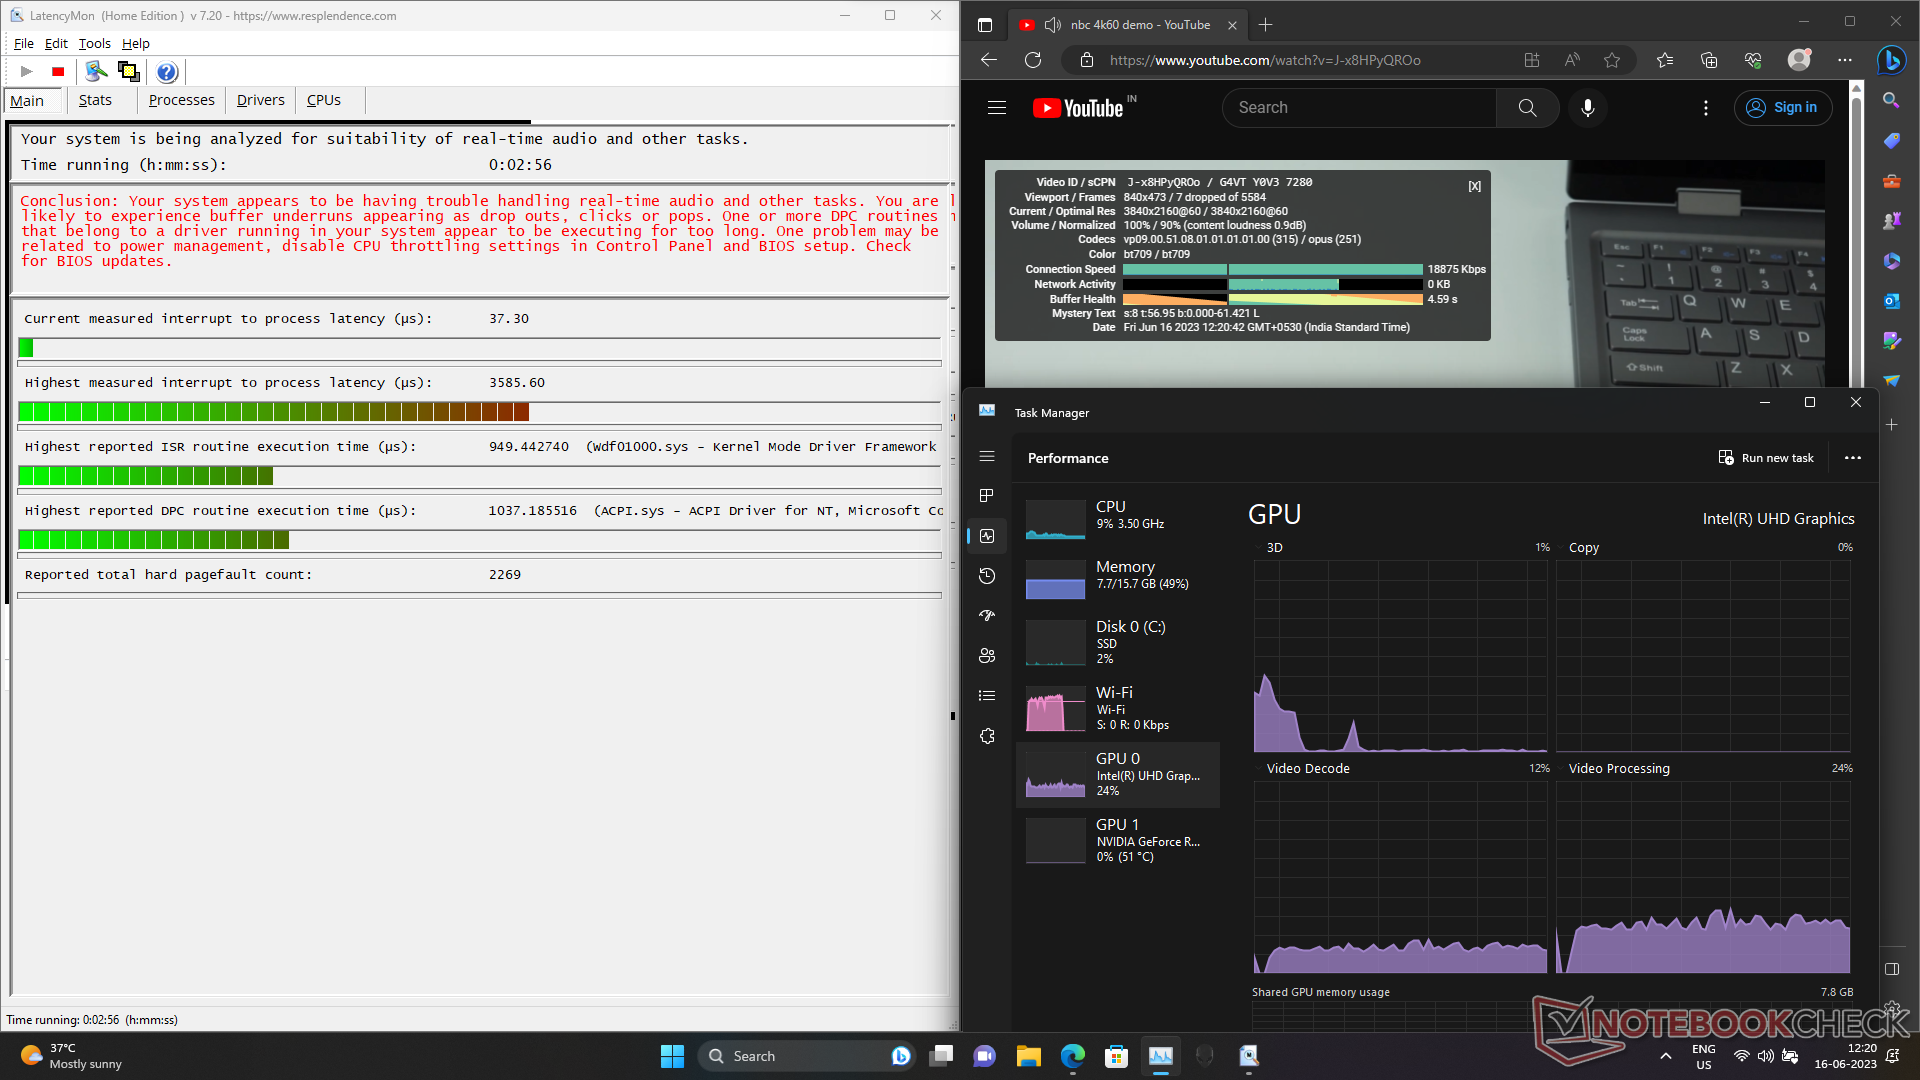
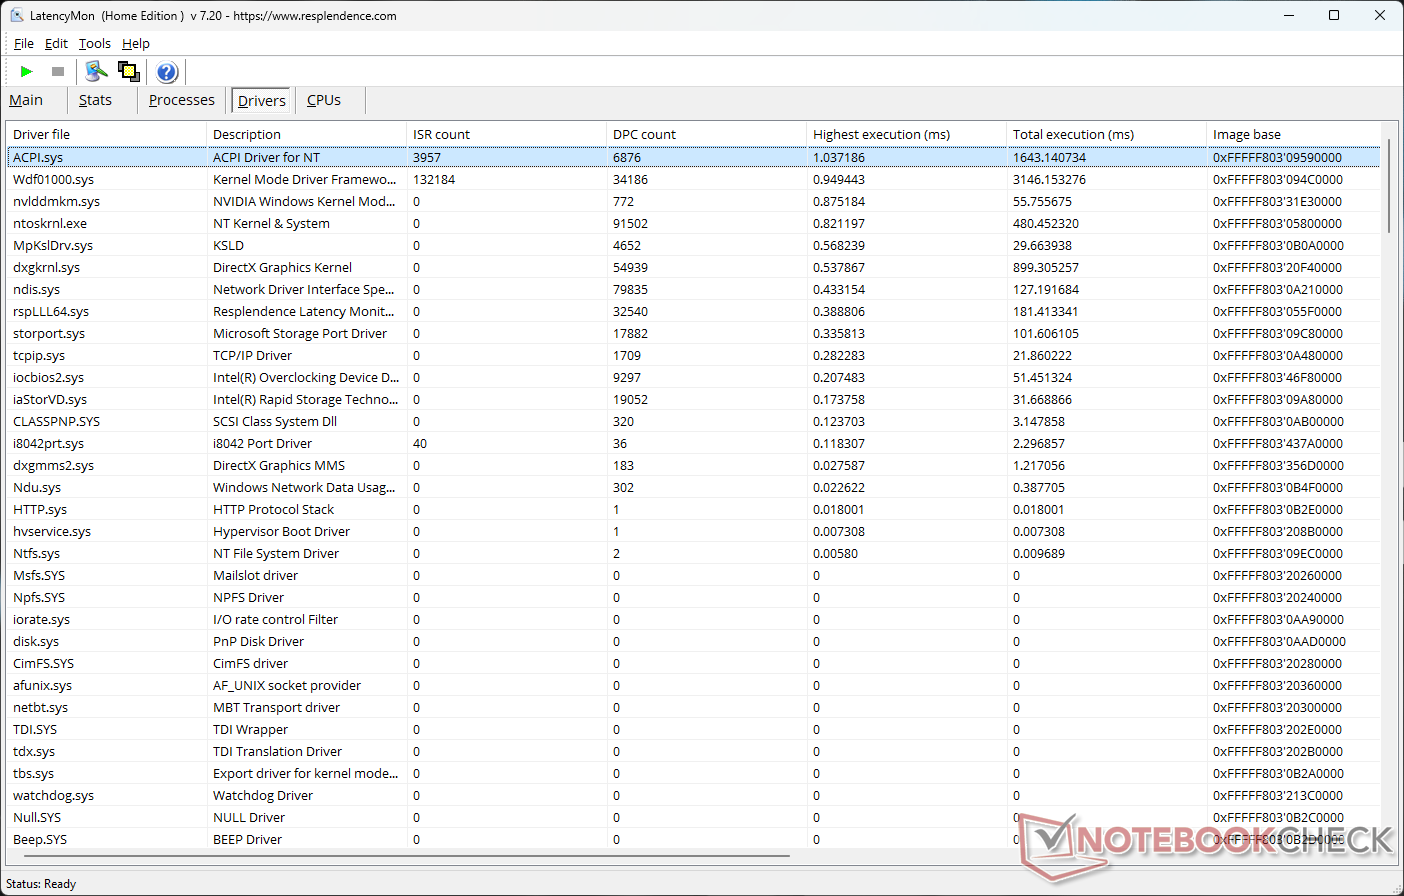
Latencia del CPD
El G15 5530 sufre una alta latencia de interrupción a proceso de 3585,6 µs debido a los altos tiempos de ejecución del controlador ACPI.sys.
| DPC Latencies / LatencyMon - interrupt to process latency (max), Web, Youtube, Prime95 | |
| Dell G15 5530 | |
| MSI Katana 17 B13VFK | |
| Medion Erazer Major X20 | |
| Asus ROG Strix G17 G713PI | |
| Asus ROG Flow X16 GV601V | |
| Asus TUF Gaming A16 FA617XS | |
| Asus ROG Strix G18 G814JI | |
| Lenovo Legion Pro 5 16IRX8 | |
* ... más pequeño es mejor
Dispositivos de almacenamiento
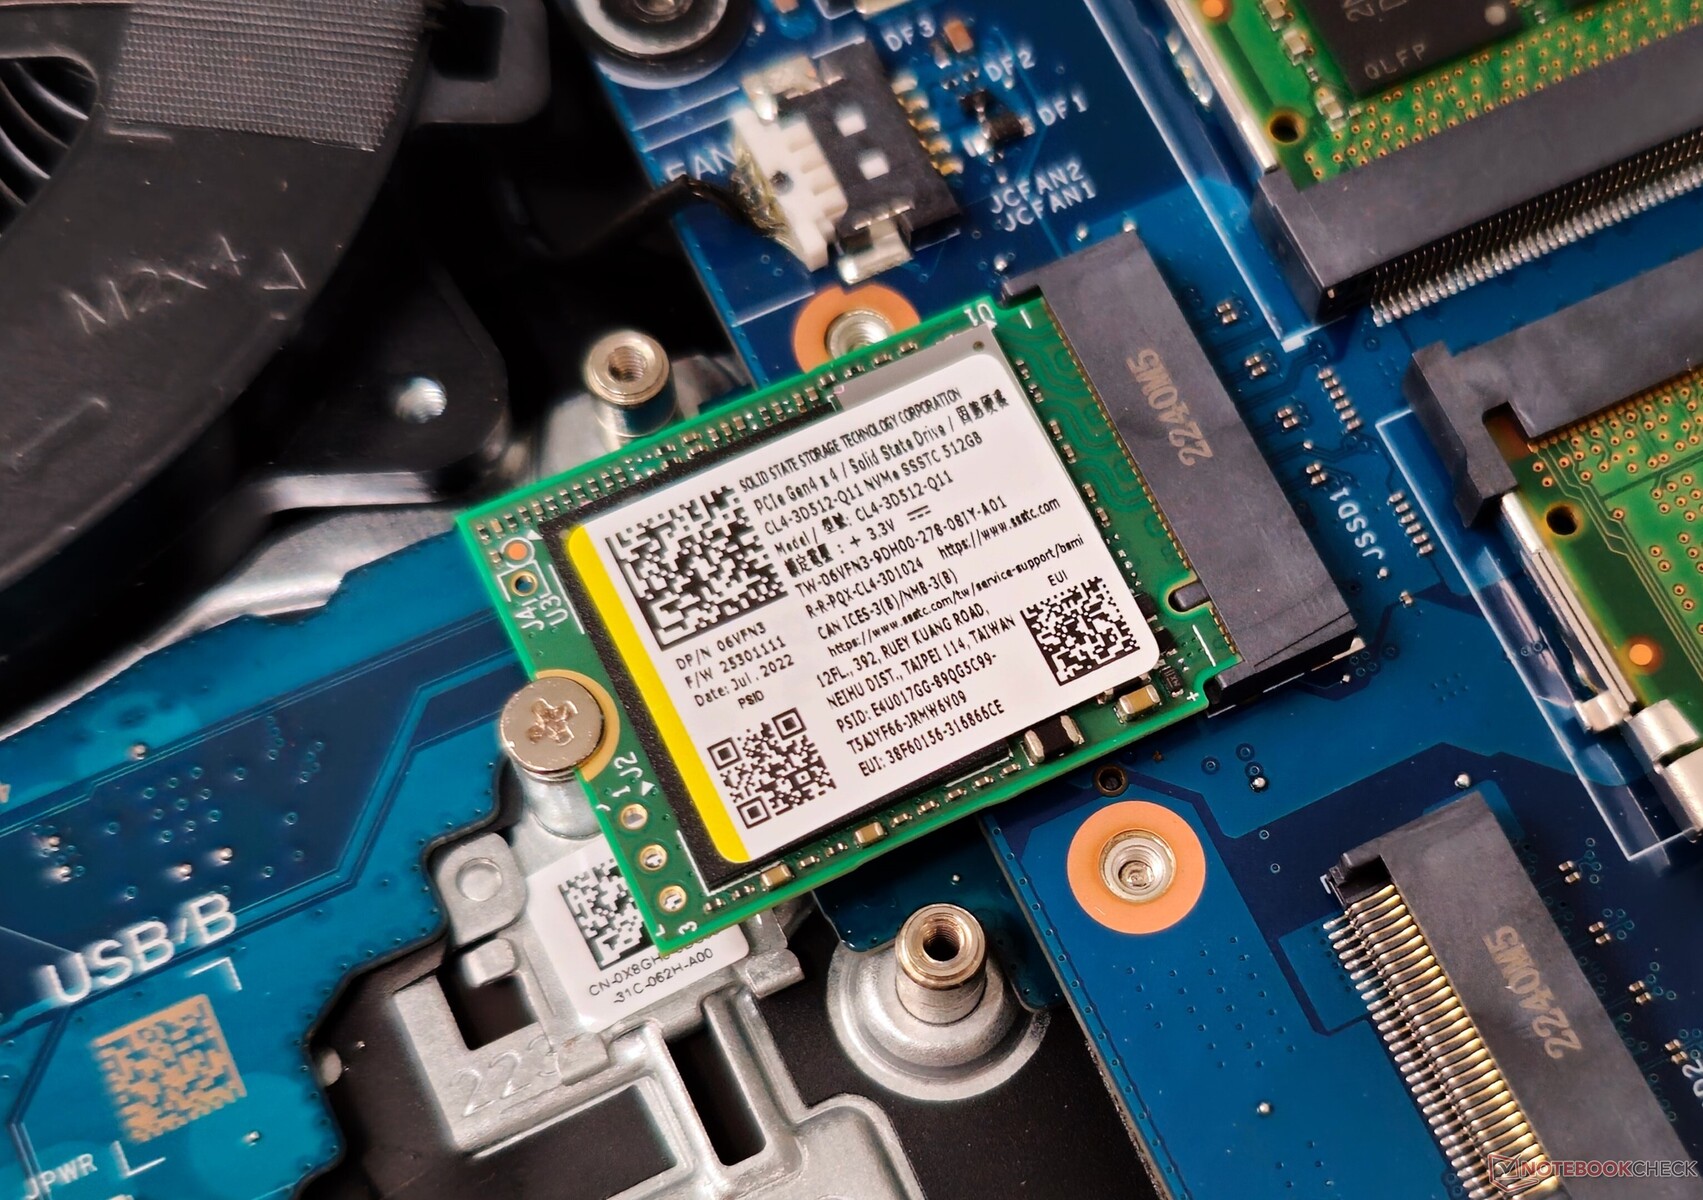
Dell ofrece dos ranuras M.2 2242 para unidades de almacenamiento en lugar de la más ubicua variedad M.2 2280.
Los usuarios deberían actualizar la unidad si pretenden instalar un gran número de juegos, ya que la imagen de fábrica sólo ofrece 398 GB libres de los 512 GB de capacidad.
Con lecturas secuenciales de menos de 3.000 MB/s y escrituras secuenciales en torno a los 500 MB/s, el rendimiento del SSTC CL4 dista mucho de ser impresionante.
No hay posibilidad de ampliar el almacenamiento mediante unidades SATA de 2,5 pulgadas.

* ... más pequeño es mejor
El SSD ofrece lecturas sostenidas a una profundidad de cola de 8, pero sólo después de que el rendimiento caiga drásticamente en la décima ejecución.
Disk Throttling: DiskSpd Read Loop, Queue Depth 8
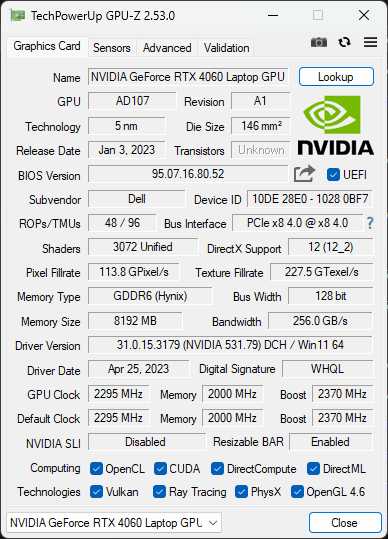
Rendimiento de la GPU
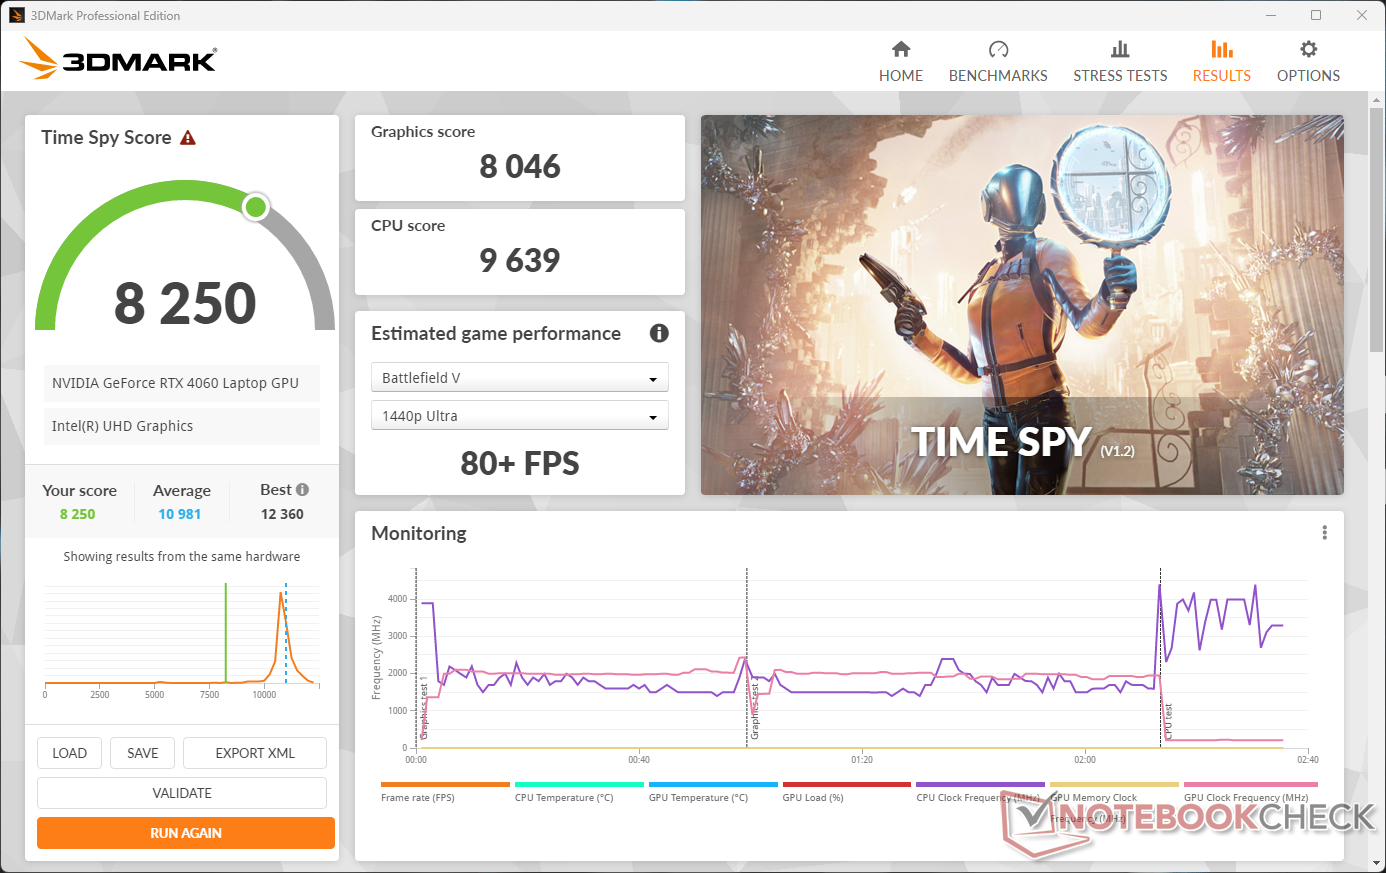
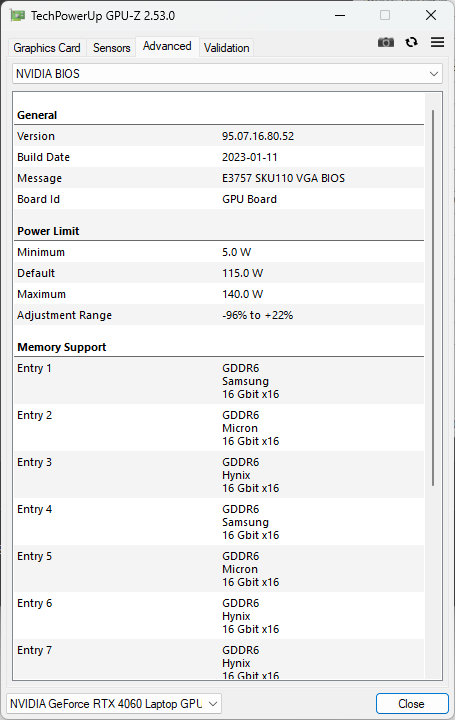
La GPU Nvidia GeForce RTX 4060 de 140 W para portátiles rinde en las líneas esperadas en las pruebas 3DMark acumulativas. Curiosamente, el MSI Katana 17 con una RTX 4060 de 105 W tiene una ligera ventaja de rendimiento sobre otros portátiles con RTX 4060 en la comparación.
Por otro lado, el G15 5530 compensa esta diferencia de rendimiento en las pruebas Blender.
puntuación 3DMark Time Spy La puntuación gráfica cae un 24% en batería.
| 3DMark 11 Performance | 32321 puntos | |
| 3DMark Ice Storm Standard Score | 242288 puntos | |
| 3DMark Cloud Gate Standard Score | 66116 puntos | |
| 3DMark Fire Strike Score | 24323 puntos | |
| 3DMark Fire Strike Extreme Score | 12237 puntos | |
| 3DMark Time Spy Score | 11007 puntos | |
ayuda | ||
| Blender / v3.3 Classroom OPTIX/RTX | |
| MSI Katana 17 B13VFK | |
| Asus ROG Strix G18 G814JI | |
| Medio NVIDIA GeForce RTX 4060 Laptop GPU (19 - 28, n=53) | |
| Asus ROG Flow X16 GV601V | |
| Lenovo Legion Pro 5 16IRX8 | |
| Dell G15 5530 | |
| Asus ROG Strix G17 G713PI | |
| Medion Erazer Major X20 | |
| Media de la clase Gaming (9 - 32, n=106, últimos 2 años) | |
| Blender / v3.3 Classroom CUDA | |
| MSI Katana 17 B13VFK | |
| Medio NVIDIA GeForce RTX 4060 Laptop GPU (39 - 53, n=53) | |
| Asus ROG Flow X16 GV601V | |
| Dell G15 5530 | |
| Lenovo Legion Pro 5 16IRX8 | |
| Asus ROG Strix G18 G814JI | |
| Asus ROG Strix G17 G713PI | |
| Medion Erazer Major X20 | |
| Media de la clase Gaming (15 - 228, n=106, últimos 2 años) | |
| Blender / v3.3 Classroom CPU | |
| MSI Katana 17 B13VFK | |
| Asus ROG Flow X16 GV601V | |
| Medio NVIDIA GeForce RTX 4060 Laptop GPU (189 - 452, n=53) | |
| Asus TUF Gaming A16 FA617XS | |
| Dell G15 5530 | |
| Asus ROG Strix G18 G814JI | |
| Lenovo Legion Pro 5 16IRX8 | |
| Media de la clase Gaming (122 - 565, n=102, últimos 2 años) | |
| Medion Erazer Major X20 | |
| Asus ROG Strix G17 G713PI | |
* ... más pequeño es mejor
Rendimiento en juegos
La GPU RTX 4060 para portátiles es capaz de alcanzar frecuencias de cuadro de tres dígitos por segundo (fps) en juegos relativamente antiguos con ajustes de 1080p Ultra. Incluso en los juegos más recientes, puede ofrecer de forma constante frecuencias de cuadro muy por encima de 60 fps a 1080p Ultra.
Para los usuarios interesados en jugar a resoluciones más altas usando un monitor externo, activar Nvidia DLSS (Deep Learning Super Sampling) o AMD FSR (FidelityFX Super Resolution) en los títulos compatibles puede proporcionar buenos aumentos de fps.
| The Witcher 3 - 1920x1080 Ultra Graphics & Postprocessing (HBAO+) | |
| Media de la clase Gaming (104.7 - 240, n=7, últimos 2 años) | |
| Medion Erazer Major X20 | |
| Asus ROG Strix G17 G713PI | |
| Asus ROG Strix G18 G814JI | |
| Lenovo Legion Pro 5 16IRX8 | |
| Asus ROG Flow X16 GV601V | |
| MSI Katana 17 B13VFK | |
| Dell G15 5530 | |
| Asus TUF Gaming A16 FA617XS | |
| Cyberpunk 2077 1.6 | |
| 1920x1080 High Preset | |
| Lenovo Legion Pro 5 16IRX8 | |
| Dell G15 5530 | |
| Asus ROG Strix G17 G713PI | |
| Asus ROG Flow X16 GV601V | |
| Medio NVIDIA GeForce RTX 4060 Laptop GPU (63.5 - 114.9, n=16) | |
| 1920x1080 Ultra Preset | |
| Lenovo Legion Pro 5 16IRX8 | |
| Asus ROG Strix G17 G713PI | |
| Dell G15 5530 | |
| Asus ROG Flow X16 GV601V | |
| Medio NVIDIA GeForce RTX 4060 Laptop GPU (57.9 - 93.2, n=18) | |
| MSI Katana 17 B13VFK | |
| 1920x1080 Ray Tracing Ultra Preset (DLSS off) | |
| Medio NVIDIA GeForce RTX 4060 Laptop GPU (25.6 - 60, n=6) | |
| Dell G15 5530 | |
| Asus ROG Flow X16 GV601V | |
| MSI Katana 17 B13VFK | |
Witcher 3 Tabla de FPS
El sistema de refrigeración de la G15 5530 parece ser bastante eficaz, como se desprende de las velocidades de fotogramas relativamente estables que se ven a continuación en El Witcher 3 prueba de estrés.
| bajo | medio | alto | ultra | |
|---|---|---|---|---|
| GTA V (2015) | 182.6 | 175.3 | 172.8 | 111.8 |
| The Witcher 3 (2015) | 407 | 335 | 205 | 104.6 |
| Dota 2 Reborn (2015) | 179.9 | 163.8 | 154.9 | 144.8 |
| Final Fantasy XV Benchmark (2018) | 212 | 137.3 | 100.1 | |
| X-Plane 11.11 (2018) | 160.1 | 146.8 | 115.6 | |
| Far Cry 5 (2018) | 168 | 152 | 146 | 139 |
| Strange Brigade (2018) | 467 | 281 | 222 | 189.6 |
| Cyberpunk 2077 1.6 (2022) | 123.2 | 99.4 | 86.1 | 80 |
| F1 22 (2022) | 244 | 235 | 177.7 | 66.1 |
Echa un vistazo a nuestro GPU Nvidia GeForce RTX 4060 para portátiles para ver más comparaciones de rendimiento.
Emisiones: Se calienta cuando se estresa
Ruido del sistema
Bajo carga, el G15 puede generar emisiones de ruido justo por debajo de la marca de 50 dB(A). Curiosamente, el modo Silencioso produce un nivel de presión sonora (SPL) más alto comparado con los modos Equilibrado y Rendimiento incluso con una carga ligera de 3DMark 06. Dicho esto, el ruido máximo del ventilador se mantiene por debajo de 40 dB(A) en este perfil.
No se observaron grandes regresiones de rendimiento en los diferentes perfiles cuando se probó con The Witcher 3 a 1080p Ultra.
Ruido
| Ocioso |
| 26.85 / 26.85 / 26.85 dB(A) |
| Carga |
| 27.65 / 47.86 dB(A) |
 | ||
30 dB silencioso 40 dB(A) audible 50 dB(A) ruidosamente alto |
||
min: | ||
Como se mencionó anteriormente, el modo silencioso puede mostrar algunas limitaciones en el rendimiento de la CPU, pero aún así debería permitir velocidades de fotogramas satisfactorias manteniendo el ruido del ventilador en un nivel aceptable.
| Modo de rendimiento | En ralentí dB(A) | Carga media dB(A) | Carga máxima dB(A) | El Witcher 3 1080p Ultra dB(A) |
|---|---|---|---|---|
| Batería | 20,90 | 32,60 | 33,21 | 44,36 / 104 fps |
| Silenciosa | 20,74 | 32,95 | 37,68 | 37,63 / 99 fps |
| Equilibrado | 20,80 | 26,40 | 45,97 | 45,92 / 104 fps |
| Rendimiento | 26,85 | 27,65 | 47,86 | 47,86 / 105 fps |
| Dell G15 5530 Intel Core i7-13650HX, GeForce RTX 4060 Laptop GPU | Asus ROG Strix G18 G814JI Intel Core i7-13650HX, GeForce RTX 4070 Laptop GPU | Lenovo Legion Pro 5 16IRX8 Intel Core i7-13700HX, GeForce RTX 4060 Laptop GPU | Asus ROG Flow X16 GV601V Intel Core i9-13900H, GeForce RTX 4060 Laptop GPU | MSI Katana 17 B13VFK Intel Core i7-13620H, GeForce RTX 4060 Laptop GPU | Asus TUF Gaming A16 FA617XS AMD Ryzen 9 7940HS, Radeon RX 7600S | Asus ROG Strix G17 G713PI AMD Ryzen 9 7945HX, GeForce RTX 4070 Laptop GPU | Medion Erazer Major X20 Intel Core i9-13900HX, GeForce RTX 4070 Laptop GPU | |
|---|---|---|---|---|---|---|---|---|
| Noise | -10% | -3% | -4% | -24% | -13% | -14% | -21% | |
| apagado / medio ambiente * (dB) | 20.41 | 25 -22% | 23 -13% | 24 -18% | 24.5 -20% | 25 -22% | 25 -22% | 24 -18% |
| Idle Minimum * (dB) | 26.85 | 26 3% | 23.1 14% | 24 11% | 24.5 9% | 25 7% | 26 3% | 25 7% |
| Idle Average * (dB) | 26.85 | 28 -4% | 23.1 14% | 24 11% | 24.5 9% | 26 3% | 29 -8% | 29 -8% |
| Idle Maximum * (dB) | 26.85 | 29 -8% | 26.6 1% | 24 11% | 40 -49% | 28 -4% | 30 -12% | 31 -15% |
| Load Average * (dB) | 27.65 | 41 -48% | 34.7 -25% | 36.71 -33% | 48.3 -75% | 43 -56% | 46 -66% | 50 -81% |
| Witcher 3 ultra * (dB) | 47.9 | 44 8% | 47.6 1% | 50.92 -6% | 56 -17% | 51 -6% | 46 4% | 53 -11% |
| Load Maximum * (dB) | 47.86 | 46 4% | 54.8 -15% | 50.92 -6% | 59.1 -23% | 53 -11% | 47 2% | 57 -19% |
* ... más pequeño es mejor
Temperatura
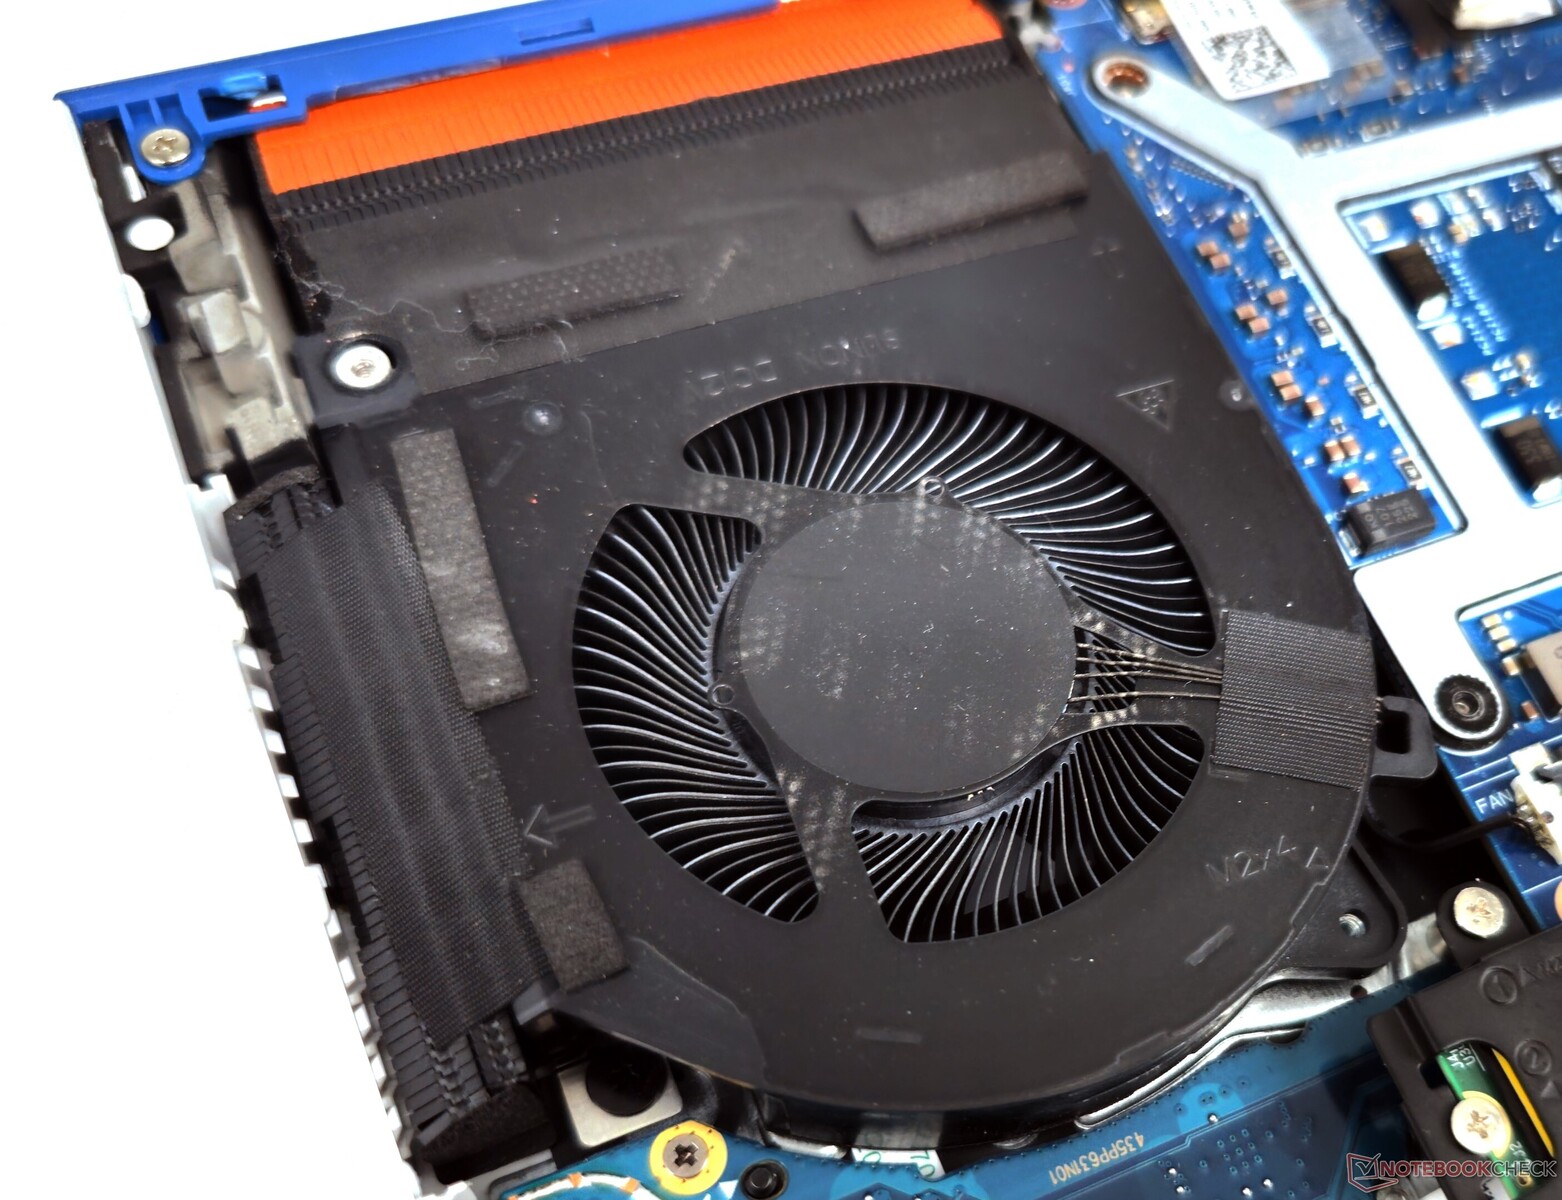
Según Dell, los G15 5530 equipados con una RTX 4050 y superiores usan un sistema de refrigeración por cámara de vapor, junto con el material de interfaz térmica Element 31, similar a sus primos Alienware.
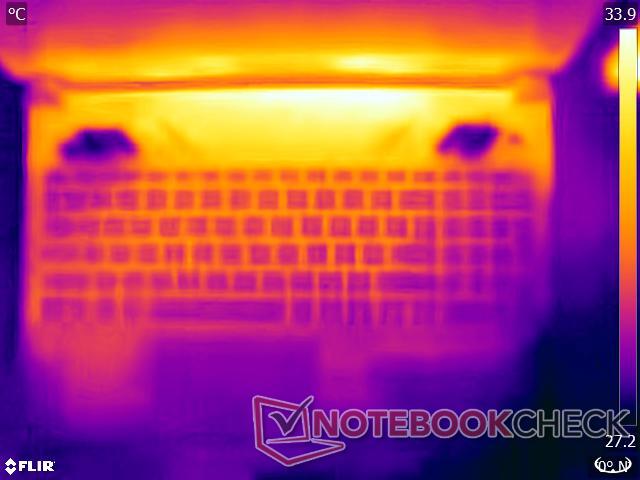
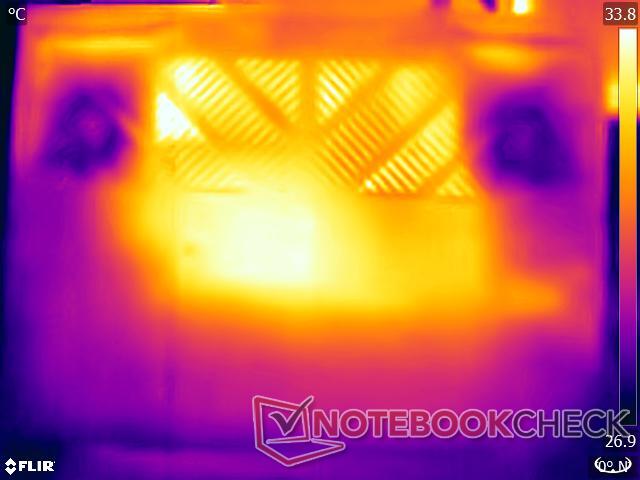
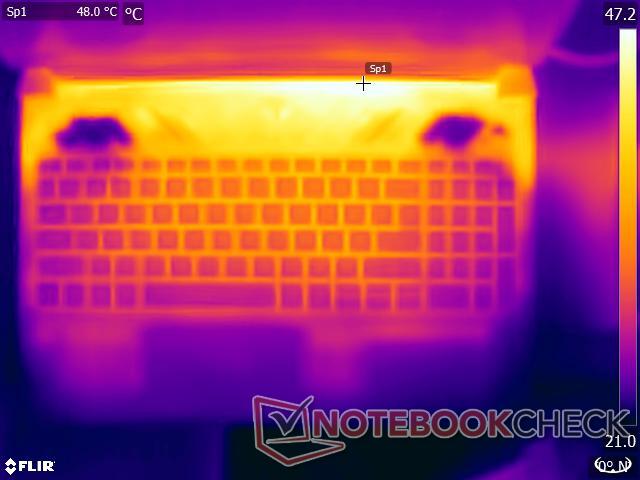
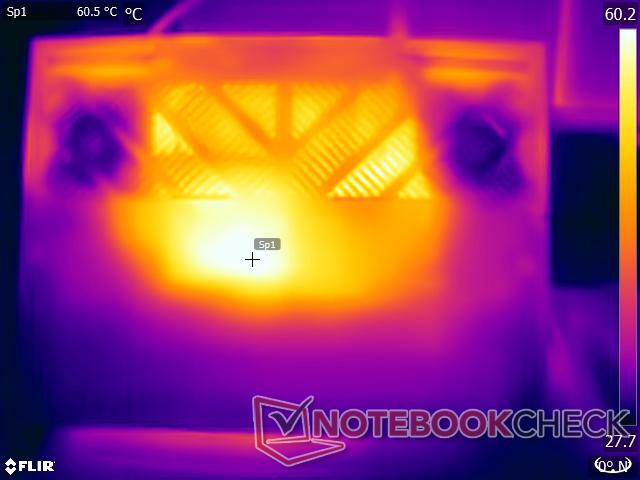
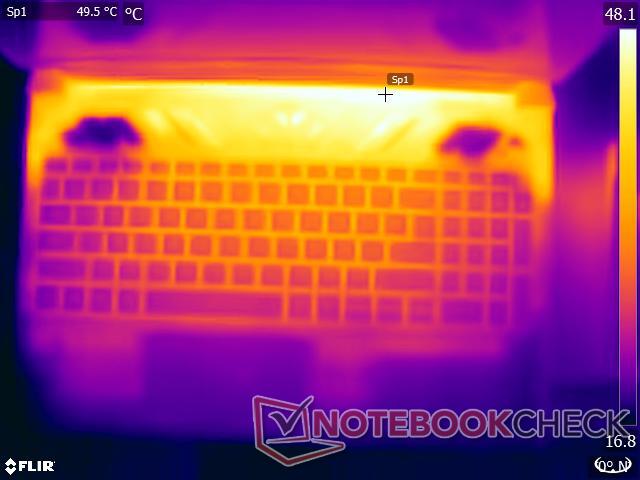
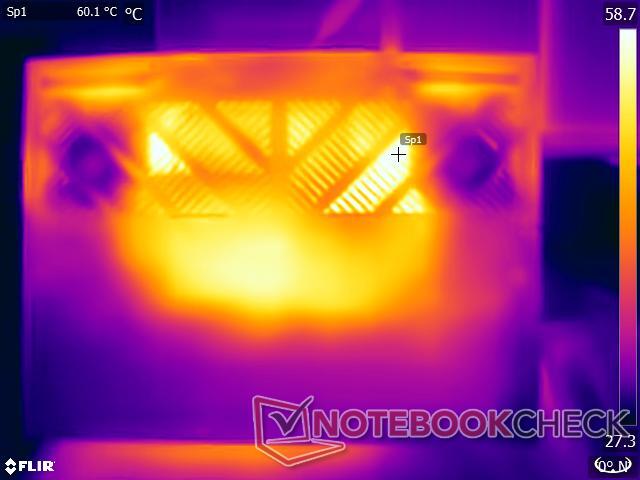
A pesar de la presencia de una cámara de vapor, observamos altas temperaturas superficiales bajo carga. Los reposamanos y las áreas del touchpad permanecen relativamente frescas, no obstante.
(-) La temperatura máxima en la parte superior es de 54 °C / 129 F, frente a la media de 40.4 °C / 105 F, que oscila entre 21.2 y 68.8 °C para la clase Gaming.
(-) El fondo se calienta hasta un máximo de 62.2 °C / 144 F, frente a la media de 43.2 °C / 110 F
(+) En reposo, la temperatura media de la parte superior es de 31 °C / 88# F, frente a la media del dispositivo de 33.9 °C / 93 F.
(-) Jugando a The Witcher 3, la temperatura media de la parte superior es de 41.9 °C / 107 F, frente a la media del dispositivo de 33.9 °C / 93 F.
(+) Los reposamanos y el panel táctil alcanzan como máximo la temperatura de la piel (34.4 °C / 93.9 F) y, por tanto, no están calientes.
(-) La temperatura media de la zona del reposamanos de dispositivos similares fue de 28.8 °C / 83.8 F (-5.6 °C / -10.1 F).
| Dell G15 5530 Intel Core i7-13650HX, NVIDIA GeForce RTX 4060 Laptop GPU | Asus ROG Strix G18 G814JI Intel Core i7-13650HX, NVIDIA GeForce RTX 4070 Laptop GPU | Lenovo Legion Pro 5 16IRX8 Intel Core i7-13700HX, NVIDIA GeForce RTX 4060 Laptop GPU | Asus ROG Flow X16 GV601V Intel Core i9-13900H, NVIDIA GeForce RTX 4060 Laptop GPU | MSI Katana 17 B13VFK Intel Core i7-13620H, NVIDIA GeForce RTX 4060 Laptop GPU | Asus TUF Gaming A16 FA617XS AMD Ryzen 9 7940HS, AMD Radeon RX 7600S | Asus ROG Strix G17 G713PI AMD Ryzen 9 7945HX, NVIDIA GeForce RTX 4070 Laptop GPU | Medion Erazer Major X20 Intel Core i9-13900HX, NVIDIA GeForce RTX 4070 Laptop GPU | |
|---|---|---|---|---|---|---|---|---|
| Heat | 16% | 13% | 11% | 13% | 11% | 14% | 3% | |
| Maximum Upper Side * (°C) | 54 | 45 17% | 42.8 21% | 46 15% | 41.6 23% | 53 2% | 42 22% | 46 15% |
| Maximum Bottom * (°C) | 62.2 | 47 24% | 50 20% | 41 34% | 43.1 31% | 48 23% | 41 34% | 49 21% |
| Idle Upper Side * (°C) | 33.4 | 28 16% | 29.6 11% | 36 -8% | 32 4% | 30 10% | 33 1% | 37 -11% |
| Idle Bottom * (°C) | 33.4 | 31 7% | 34 -2% | 33 1% | 35.8 -7% | 30 10% | 34 -2% | 38 -14% |
* ... más pequeño es mejor
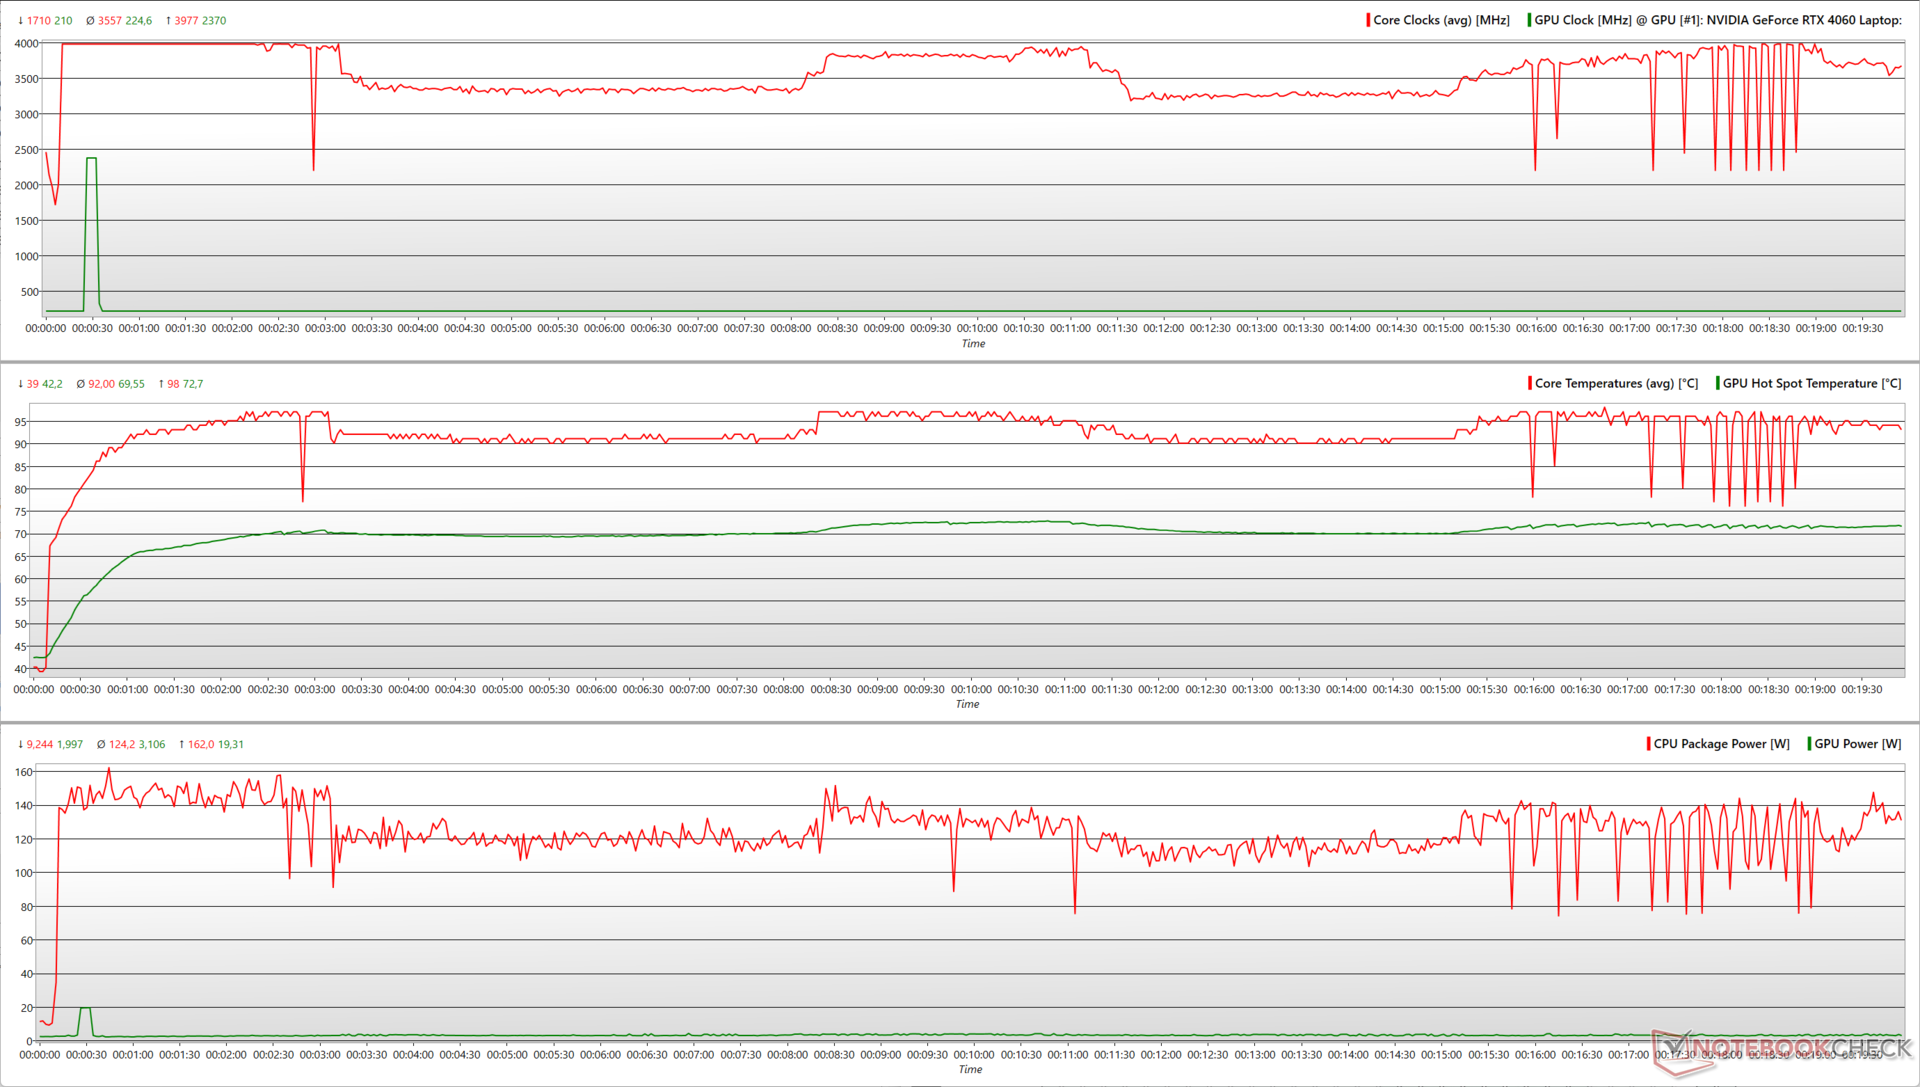
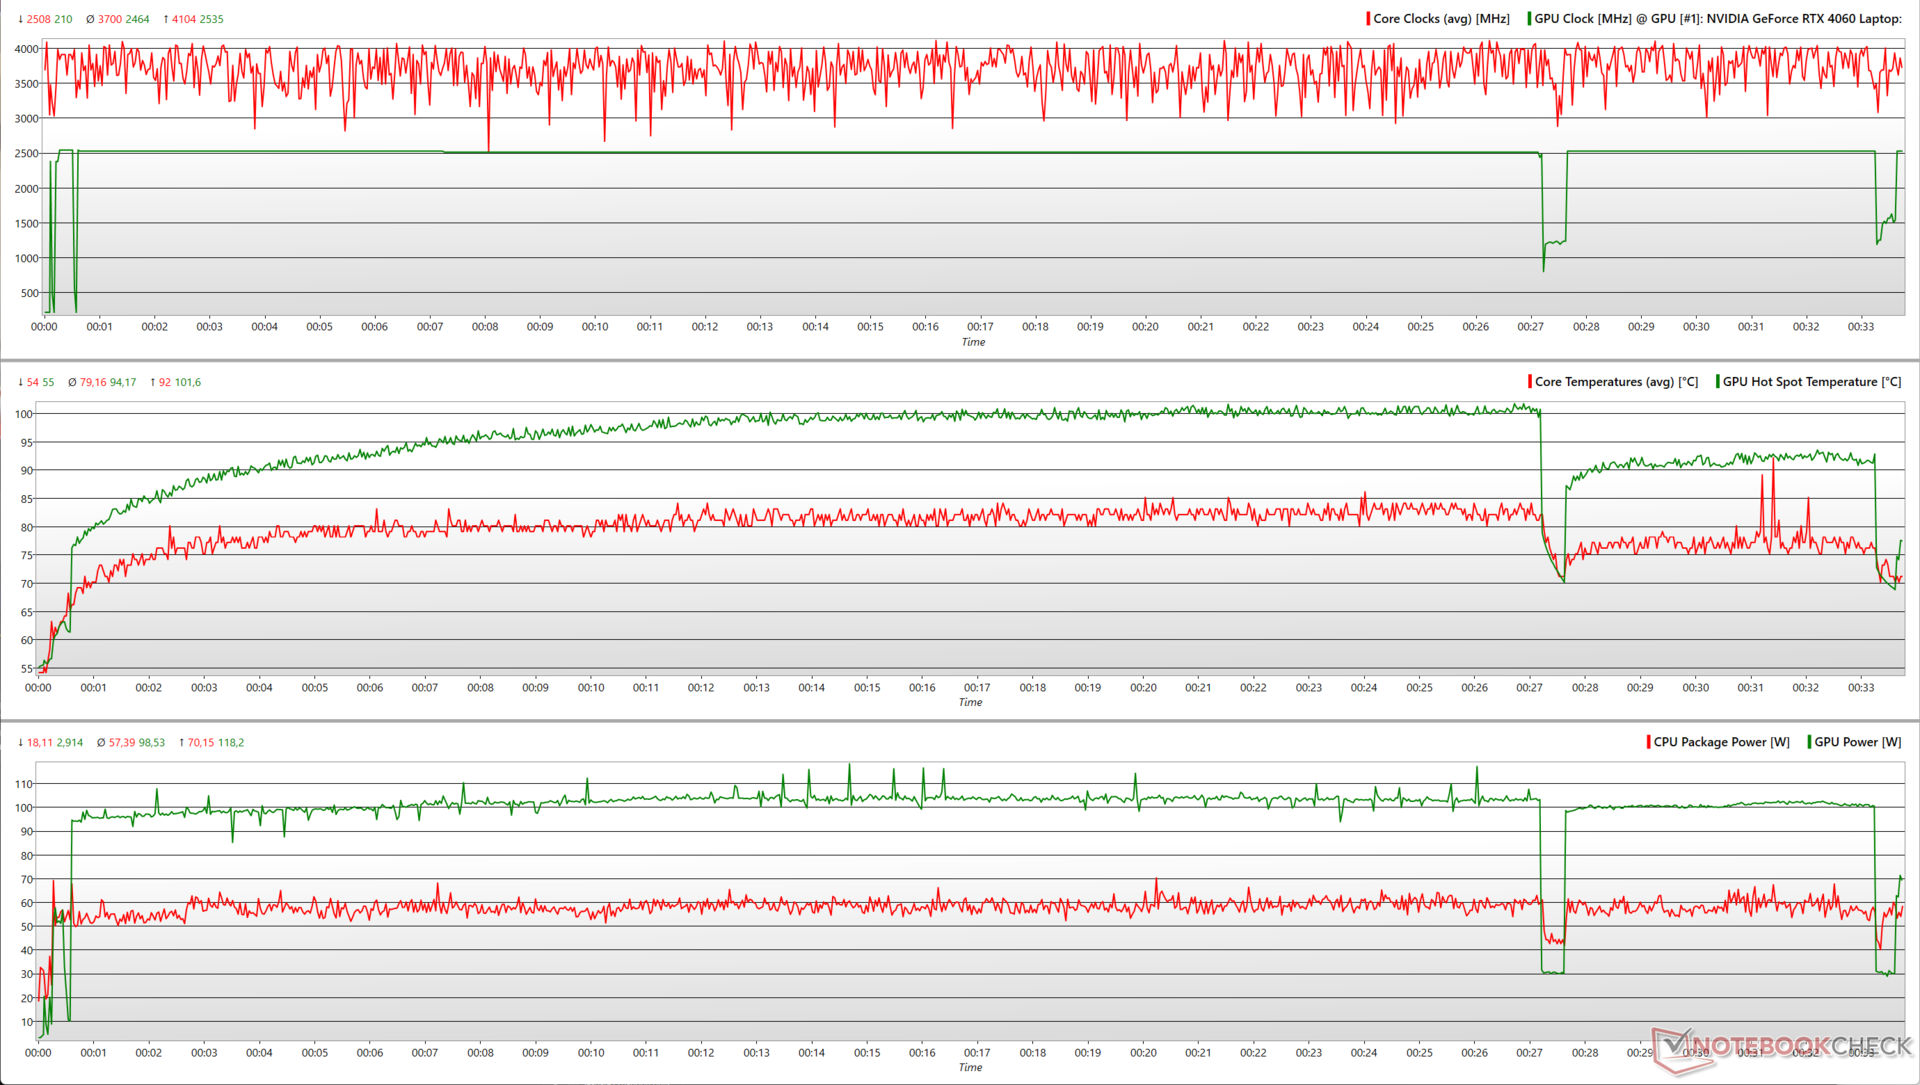
Prueba de resistencia
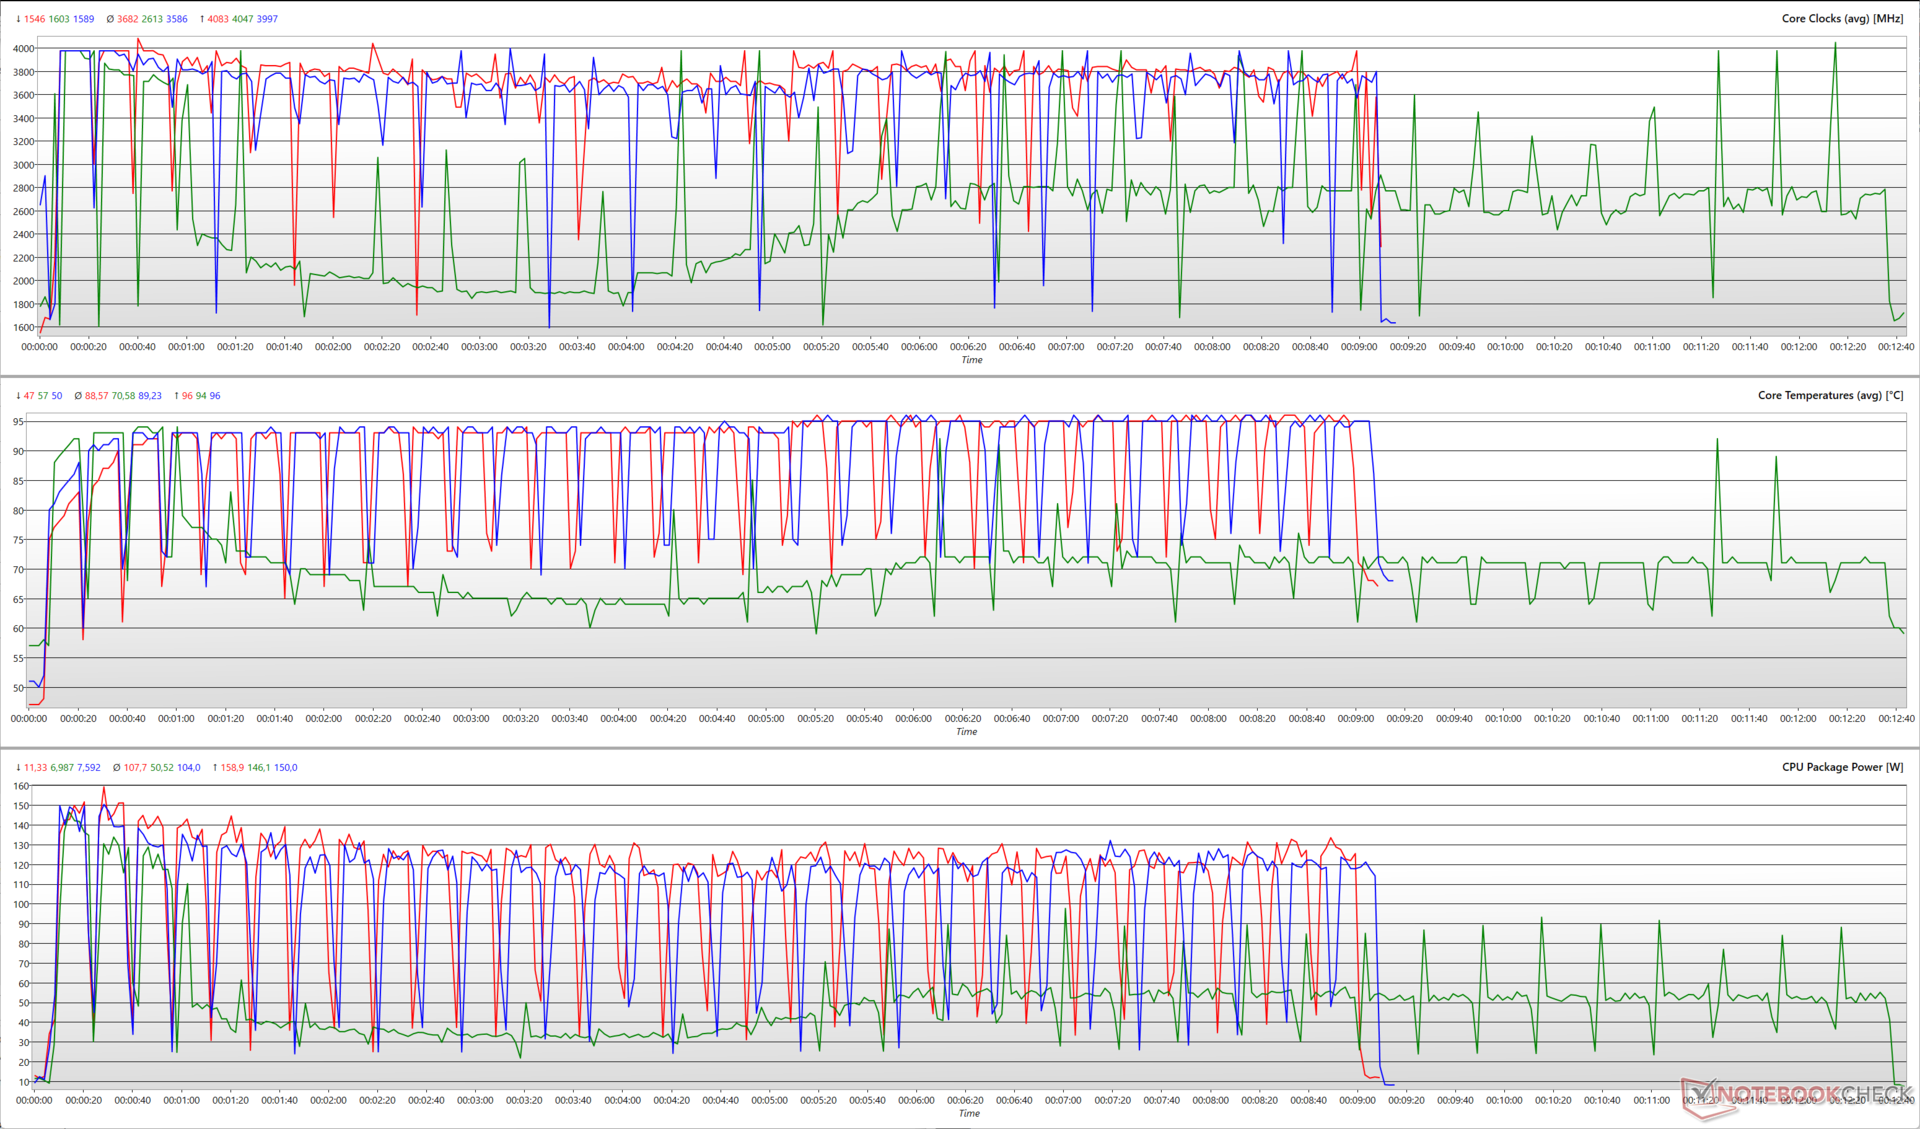
Durante las pruebas de estrés con las grandes FFT de Prime95, el Core i7-13650HX alcanza una potencia máxima de 162 W y una frecuencia máxima de casi 4 GHz. Sin embargo, este elevado consumo y frecuencia no se mantienen, y la CPU se estabiliza en una potencia media de 124 W durante toda la prueba de estrés.
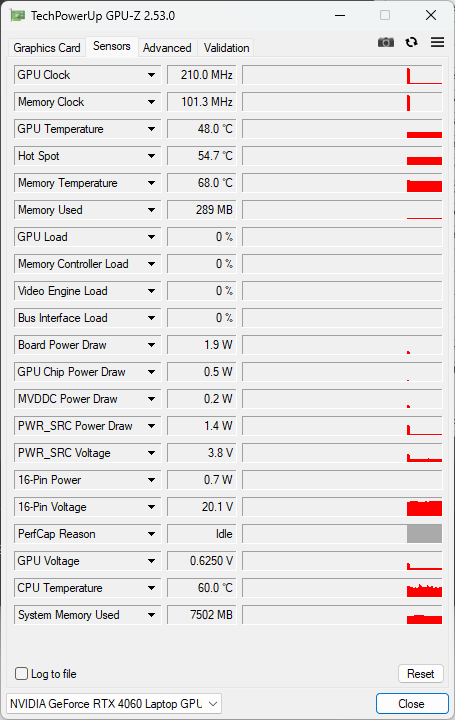
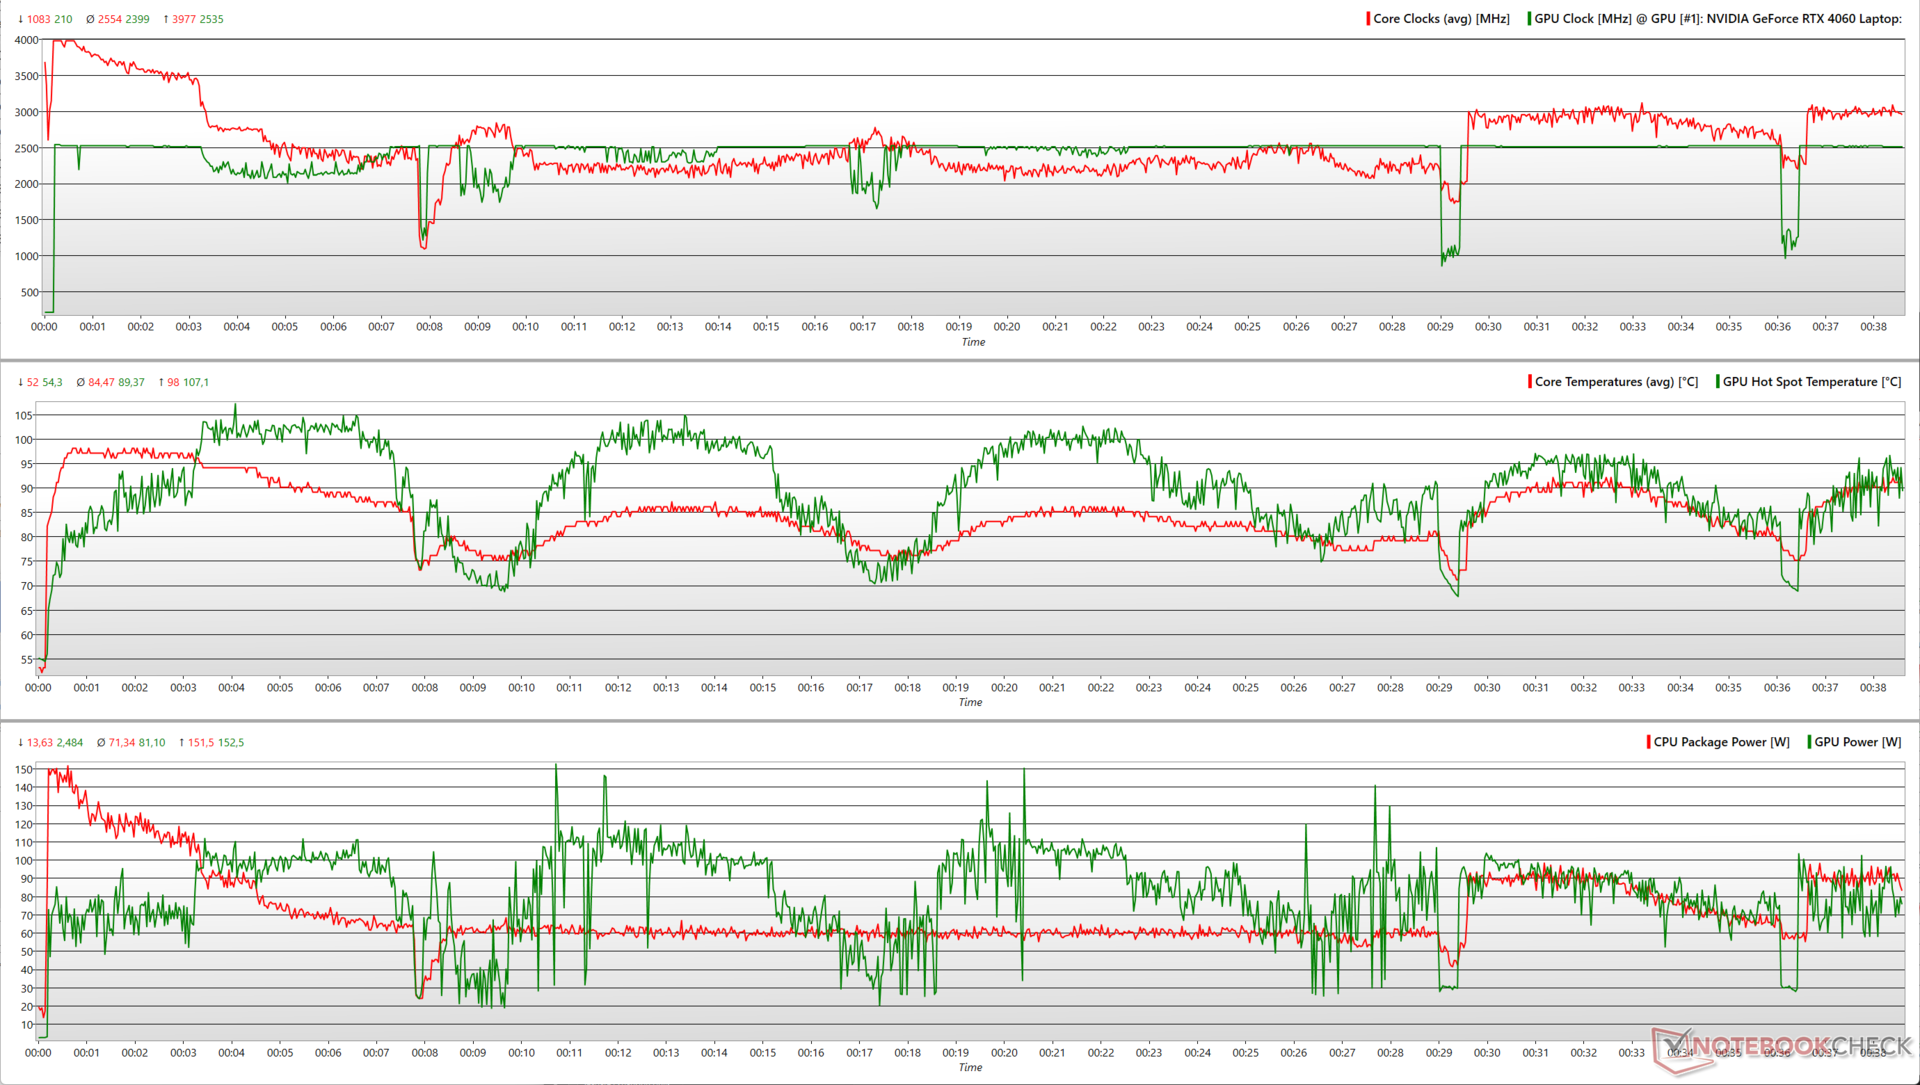
Cuando se introduce FurMark, la GPU RTX 4060 alcanza un consumo máximo de 152,5 W con una velocidad de reloj de 2.535 MHz. Finalmente, tanto la CPU como la GPU se estabilizan en un consumo medio de 71 W (a 2,5 GHz) y 81 W (a 2.399 MHz), respectivamente.
| Prueba de estrés | Relojdela CPU (GHz) | Reloj de la GPU (MHz) | Temperatura media dela CPU (°C) | Temperatura media de la GPU (°C) |
| Sistema en reposo | 1,6 | 210 | 39 | 36,3 |
| Prime95 | 3,7 | 210 | 92 | 61,3 |
| Prime95 + FurMark | 3,05 | 2.505 | 84,5 | 89,3 |
| El Witcher 3 1080p Ultra | 4 | 1.485 | 79 | 94 |
La CPU y la GPU muestran una respuesta más predecible durante las pruebas de estrés con The Witcher 3 a 1080p Ultra. Alcanzan frecuencias máximas de 4,1 GHz y 2.535 MHz, respectivamente, con un consumo máximo de 70 W para la CPU y 118 W para la GPU. Se produce una breve caída de las métricas de la CPU y la GPU en torno a los 30 minutos de la prueba, pero recuperan rápidamente sus velocidades de reloj originales.
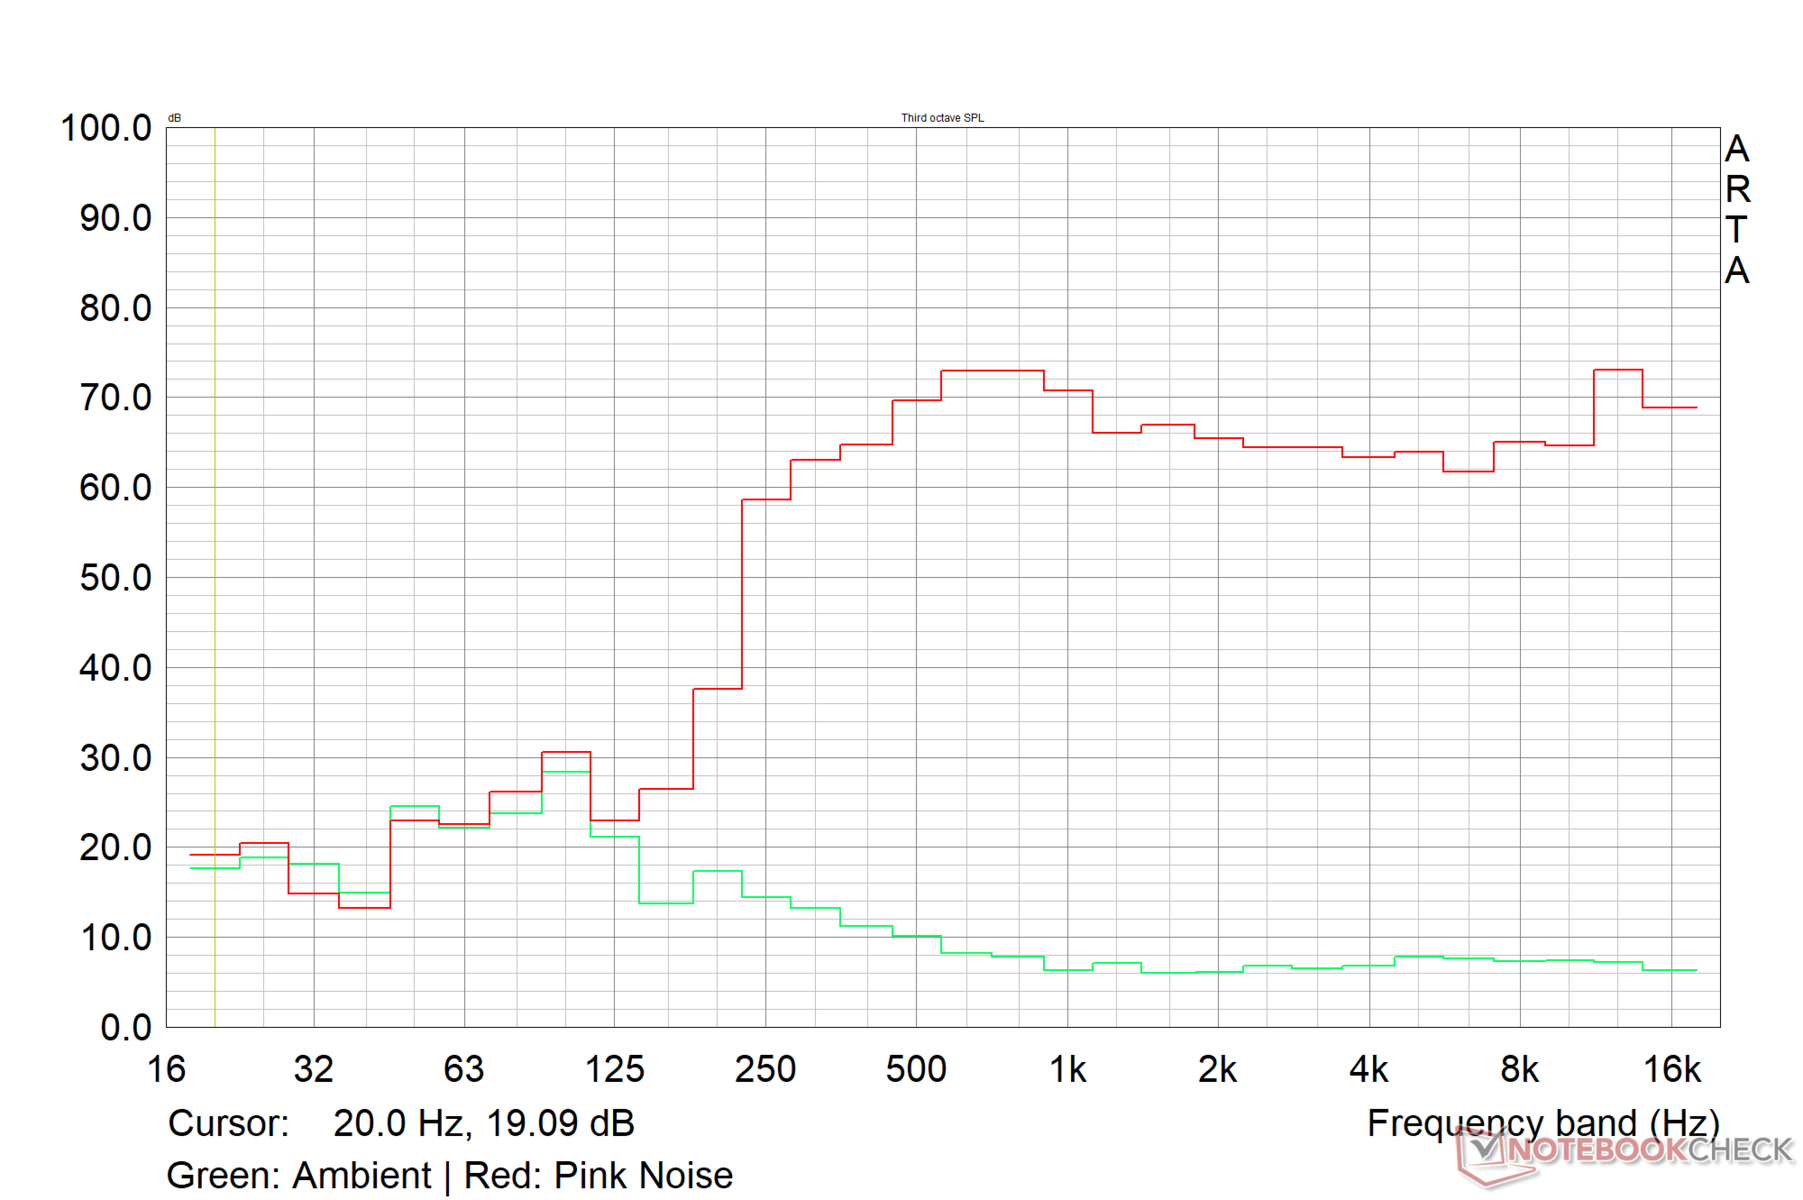
Altavoces
Los altavoces del G15 son razonablemente fuertes a 79.6 dB(A). Sin embargo, parece que Dell podría haber utilizado el chasis grande más eficazmente para proporcionar una respuesta de bajo más fuerte. En el lado positivo, los medios y altos se reproducen bien.
La calidad de audio es aceptable, pero los usuarios pueden obtener una mejor experiencia de audio conectando dispositivos de audio externos a través de la clavija de audio de 3,5 mm o por Bluetooth.
Dell G15 5530 análisis de audio
(±) | la sonoridad del altavoz es media pero buena (79.6 dB)
Graves 100 - 315 Hz
(-) | casi sin bajos - de media 24.7% inferior a la mediana
(-) | los graves no son lineales (15.2% delta a la frecuencia anterior)
Medios 400 - 2000 Hz
(+) | medios equilibrados - a sólo 4.1% de la mediana
(+) | los medios son lineales (4.2% delta a la frecuencia anterior)
Altos 2 - 16 kHz
(+) | máximos equilibrados - a sólo 0.8% de la mediana
(+) | los máximos son lineales (2.2% delta a la frecuencia anterior)
Total 100 - 16.000 Hz
(±) | la linealidad del sonido global es media (16.3% de diferencia con la mediana)
En comparación con la misma clase
» 41% de todos los dispositivos probados de esta clase eran mejores, 6% similares, 53% peores
» El mejor tuvo un delta de 6%, la media fue 18%, el peor fue ###max##%
En comparación con todos los dispositivos probados
» 27% de todos los dispositivos probados eran mejores, 6% similares, 68% peores
» El mejor tuvo un delta de 4%, la media fue 23%, el peor fue ###max##%
Apple MacBook Pro 16 2021 M1 Pro análisis de audio
(+) | los altavoces pueden reproducir a un volumen relativamente alto (#84.7 dB)
Graves 100 - 315 Hz
(+) | buen bajo - sólo 3.8% lejos de la mediana
(+) | el bajo es lineal (5.2% delta a la frecuencia anterior)
Medios 400 - 2000 Hz
(+) | medios equilibrados - a sólo 1.3% de la mediana
(+) | los medios son lineales (2.1% delta a la frecuencia anterior)
Altos 2 - 16 kHz
(+) | máximos equilibrados - a sólo 1.9% de la mediana
(+) | los máximos son lineales (2.7% delta a la frecuencia anterior)
Total 100 - 16.000 Hz
(+) | el sonido global es lineal (4.6% de diferencia con la mediana)
En comparación con la misma clase
» 0% de todos los dispositivos probados de esta clase eran mejores, 0% similares, 100% peores
» El mejor tuvo un delta de 5%, la media fue 17%, el peor fue ###max##%
En comparación con todos los dispositivos probados
» 0% de todos los dispositivos probados eran mejores, 0% similares, 100% peores
» El mejor tuvo un delta de 4%, la media fue 23%, el peor fue ###max##%
Gestión de la energía: Poco económico bajo carga
Consumo de energía
Mientras que el G15 5530 demuestra un consumo de energía razonablemente eficiente en reposo, consume más energía bajo carga en comparación con el ROG Strix G18 equipado con una RTX 4070.
El Lenovo Legion Pro 5 16equipado con un Core i7-13700HX y RTX 4060, muestra una inversión de roles con un consumo de energía ligeramente inferior bajo carga que el G15 5530, pero un mayor consumo de energía en reposo.
El enorme adaptador de corriente de 330 W suministrado es capaz de mantener el G15 adecuadamente alimentado incluso bajo estrés.
| Off / Standby | |
| Ocioso | |
| Carga |
|
Clave:
min: | |
| Dell G15 5530 i7-13650HX, GeForce RTX 4060 Laptop GPU, IPS, 1920x1080, 15.6" | Asus ROG Strix G18 G814JI i7-13650HX, GeForce RTX 4070 Laptop GPU, IPS, 2560x1600, 18" | Lenovo Legion Pro 5 16IRX8 i7-13700HX, GeForce RTX 4060 Laptop GPU, IPS, 2560x1600, 16" | Asus ROG Flow X16 GV601V i9-13900H, GeForce RTX 4060 Laptop GPU, IPS, 2560x1600, 16" | MSI Katana 17 B13VFK i7-13620H, GeForce RTX 4060 Laptop GPU, IPS LED, 1920x1080, 17.3" | Asus TUF Gaming A16 FA617XS R9 7940HS, Radeon RX 7600S, IPS, 1920x1200, 16" | Asus ROG Strix G17 G713PI R9 7945HX, GeForce RTX 4070 Laptop GPU, IPS, 2560x1440, 17.3" | Medion Erazer Major X20 i9-13900HX, GeForce RTX 4070 Laptop GPU, IPS, 2560x1600, 16" | Medio NVIDIA GeForce RTX 4060 Laptop GPU | Media de la clase Gaming | |
|---|---|---|---|---|---|---|---|---|---|---|
| Power Consumption | -10% | -66% | 1% | 1% | 19% | -35% | -26% | -9% | -30% | |
| Idle Minimum * (Watt) | 8.4 | 8 5% | 24.5 -192% | 9.6 -14% | 12.2 -45% | 7 17% | 15 -79% | 12 -43% | 11.5 ? -37% | 13 ? -55% |
| Idle Average * (Watt) | 14.98 | 15 -0% | 29.2 -95% | 16 -7% | 14.9 1% | 10 33% | 20 -34% | 16 -7% | 16 ? -7% | 19 ? -27% |
| Idle Maximum * (Watt) | 15.56 | 26 -67% | 34.3 -120% | 16.9 -9% | 15.8 -2% | 15 4% | 29 -86% | 26 -67% | 20.3 ? -30% | 24.6 ? -58% |
| Load Average * (Watt) | 96.8 | 102 -5% | 98.7 -2% | 104 -7% | 85.22 12% | 86 11% | 121 -25% | 115 -19% | 92.9 ? 4% | 110.7 ? -14% |
| Witcher 3 ultra * (Watt) | 186 | 178.6 4% | 178.6 4% | 142 24% | 151.1 19% | 160.6 14% | 179.8 3% | 191.6 -3% | ||
| Load Maximum * (Watt) | 271.42 | 267 2% | 249.6 8% | 214 21% | 212.8 22% | 172 37% | 246 9% | 319 -18% | 210 ? 23% | 259 ? 5% |
* ... más pequeño es mejor
Power Consumption: The Witcher 3 / Stress test
Power Consumption: External monitor
Duración de la batería
El G15 cambia al perfil de alimentación Batería cuando se desenchufa. Sin embargo, la frecuencia de actualización no se reduce automáticamente a 60 Hz.
La batería de 86 WHr proporciona tiempos de funcionamiento decentes siempre que el portátil no esté sometido a mucho estrés. Por ejemplo, durante la reproducción de vídeo 1080p a 150 nits, la batería puede durar casi 7 horas. Sin embargo, cuando se juega al mismo nivel de brillo, la batería apenas dura una hora.
| Dell G15 5530 Intel Core i7-13650HX, GeForce RTX 4060 Laptop GPU, 86 Wh | Asus ROG Strix G18 G814JI Intel Core i7-13650HX, GeForce RTX 4070 Laptop GPU, 90 Wh | Lenovo Legion Pro 5 16IRX8 Intel Core i7-13700HX, GeForce RTX 4060 Laptop GPU, 80 Wh | Asus ROG Flow X16 GV601V Intel Core i9-13900H, GeForce RTX 4060 Laptop GPU, 90 Wh | MSI Katana 17 B13VFK Intel Core i7-13620H, GeForce RTX 4060 Laptop GPU, 53.5 Wh | Asus TUF Gaming A16 FA617XS AMD Ryzen 9 7940HS, Radeon RX 7600S, 90 Wh | Asus ROG Strix G17 G713PI AMD Ryzen 9 7945HX, GeForce RTX 4070 Laptop GPU, 90 Wh | Medion Erazer Major X20 Intel Core i9-13900HX, GeForce RTX 4070 Laptop GPU, 62.3 Wh | Media de la clase Gaming | |
|---|---|---|---|---|---|---|---|---|---|
| Duración de Batería | 38% | -31% | 47% | -15% | 62% | -8% | 7% | 40% | |
| H.264 (h) | 6.8 | 8.9 31% | 12.4 82% | 2.8 -59% | 4.2 -38% | 8.32 ? 22% | |||
| WiFi v1.3 (h) | 6.5 | 8.1 25% | 3.4 -48% | 7.9 22% | 2.9 -55% | 12.4 91% | 4.3 -34% | 3.9 -40% | 7.11 ? 9% |
| Witcher 3 ultra (h) | 0.8 | 1.1 38% | |||||||
| Load (h) | 0.8 | 1.2 50% | 0.7 -13% | 1.5 88% | 1 25% | 0.9 13% | 1 25% | 1.6 100% | 1.502 ? 88% |
| Reader / Idle (h) | 11.7 | 6.7 | 20.3 | 5.8 | 8.27 ? |
Pro
Contra
Veredicto: Intenta hacerlo bien sin arruinarse

El renovado Dell G15 5530 aporta la potencia del Intel Raptor Lake-HX de sobremesa a un chasis pesado pero moderno, complementado con un voluminoso adaptador de corriente.
El G15 5530 tiene muchas cosas buenas a su favor. Tiene un buen rendimiento Wi-Fi y un rápido panel IPS 1080p con una reproducción del color decente. El mantenimiento y las actualizaciones son fáciles, siempre que no te importe la ranura SSD M.2 2242 poco convencional.
En cuanto al rendimiento, la combinación de Core i7-13650HX y GPU Nvidia GeForce RTX 4060 de 140 W para portátiles ofrece un rendimiento sólido para juegos en Ultra 1080p, con potencial para resoluciones superiores usando DLSS o FSR. En su mayor parte, el G15 5530 rinde a la par con elLenovo Legion Pro 5 16 con un Core i7-13700HX.
El Dell G15 5530 ofrece un gran rendimiento, actualizaciones sencillas y es una alternativa asequible a sus hermanos Alienware siempre que puedas pasar por alto su volumen y vivir con algunos de sus compromisos"
Sin embargo, hay que hacer algunas concesiones inevitables. La ubicación de los puertos no es muy ideal, el almacenamiento es lento, no hay alimentación USB y la webcam decepciona para un dispositivo de 2023. Las temperaturas superficiales y el consumo de energía bajo carga también son elevados para esta configuración. Incluso un Asus ROG Strix G17 con un AMD Ryzen 9 7945HX y RTX 4070 consume menos energía bajo carga.
Con todo, el Dell G15 5530 hace lo que puede para equilibrar potencia y precio, y definitivamente merece una consideración si estás buscando un portátil de juego en torno a los ₹1.50.000 (US$1.400).
Precio y disponibilidad
El Dell G15 5530 puede configurarse y adquirirse directamente en las tiendas en línea Dell India y Dell US. El G15 5530 con la RTX 4060 también aparece en Amazon US.
AmazonIndia tiene una versión RTX 4050 con disponibilidad desconocida. El Dell G15 5530 con Core i7-13650HX, RTX 4050, y un SSD de 1 TB se puede conseguir en Best Buy por US$1,150.
Dell G15 5530
- 06/25/2023 v7 (old)
Vaidyanathan Subramaniam
Transparencia
La selección de los dispositivos que se van a reseñar corre a cargo de nuestro equipo editorial. La muestra de prueba fue proporcionada al autor en calidad de préstamo por el fabricante o el minorista a los efectos de esta reseña. El prestamista no tuvo ninguna influencia en esta reseña, ni el fabricante recibió una copia de la misma antes de su publicación. No había ninguna obligación de publicar esta reseña. Como empresa de medios independiente, Notebookcheck no está sujeta a la autoridad de fabricantes, minoristas o editores.
Así es como prueba Notebookcheck
Cada año, Notebookcheck revisa de forma independiente cientos de portátiles y smartphones utilizando procedimientos estandarizados para asegurar que todos los resultados son comparables. Hemos desarrollado continuamente nuestros métodos de prueba durante unos 20 años y hemos establecido los estándares de la industria en el proceso. En nuestros laboratorios de pruebas, técnicos y editores experimentados utilizan equipos de medición de alta calidad. Estas pruebas implican un proceso de validación en varias fases. Nuestro complejo sistema de clasificación se basa en cientos de mediciones y puntos de referencia bien fundamentados, lo que mantiene la objetividad.Price comparison

