Análisis del portátil Lenovo Legion Slim 5 16APH8: Diseño infravalorado con una GPU de bajo rendimiento

El Legion Slim 5 16 es la versión más delgada y ligera del actual Legion Pro 5 16. Es un portátil para juegos de gama media-alta entre los más baratos LOQ 15 o la serie IdeaPad Gaming y los más caros Legion Slim 7 16.
Nuestra unidad de pruebas es la de gama más alta con CPU Ryzen 7 7840HS Zen 4, GPU GeForce RTX 4060 y pantalla IPS 1600p por unos 1200 $. Hay SKU inferiores con Ryzen 5 7640HS, RTX 4050 y pantalla de 1200p a partir de 1000 dólares.
Las alternativas al Legion Slim 5 16APH8 incluyen otros portátiles de juego de 16 pulgadas como el Acer Nitro 16 AN16, Dell G16 7620, Asus Zephyrus M16, o el Asus TUF Gaming A16.
Más opiniones sobre Lenovo:
- ThinkPad T16 G2
- Legion Slim 5 16
- Yoga Pro 9i 16
- LOQ 15
- Yoga Book 9i 2 en 1
Posibles contendientes en la comparación
Valoración | Fecha | Modelo | Peso | Altura | Tamaño | Resolución | Precio |
|---|---|---|---|---|---|---|---|
| 87.7 % v7 (old) | 08/2023 | Lenovo Legion Slim 5 16APH8 R7 7840HS, GeForce RTX 4060 Laptop GPU | 2.4 kg | 25.2 mm | 16.00" | 2560x1600 | |
| 86.7 % v7 (old) | 08/2023 | Acer Nitro 16 AN16-41-R7YE R5 7535HS, GeForce RTX 4050 Laptop GPU | 2.6 kg | 27.9 mm | 16.00" | 1920x1200 | |
| 89 % v7 (old) | 08/2023 | Lenovo Legion Pro 5 16ARX8 (R5 7645HX, RTX 4050) R5 7645HX, GeForce RTX 4050 Laptop GPU | 2.5 kg | 27.3 mm | 16.00" | 2560x1600 | |
| 87.4 % v7 (old) | 07/2023 | HP Omen 16-wf000 i7-13700HX, GeForce RTX 4080 Laptop GPU | 2.4 kg | 23.6 mm | 16.10" | 2560x1440 | |
| 86.1 % v7 (old) | 10/2022 | Dell G16 7620 i7-12700H, GeForce RTX 3060 Laptop GPU | 2.6 kg | 26.9 mm | 16.00" | 2560x1600 | |
| 86.9 % v7 (old) | 06/2023 | Asus TUF Gaming A16 FA617XS R9 7940HS, Radeon RX 7600S | 2.2 kg | 22.1 mm | 16.00" | 1920x1200 |
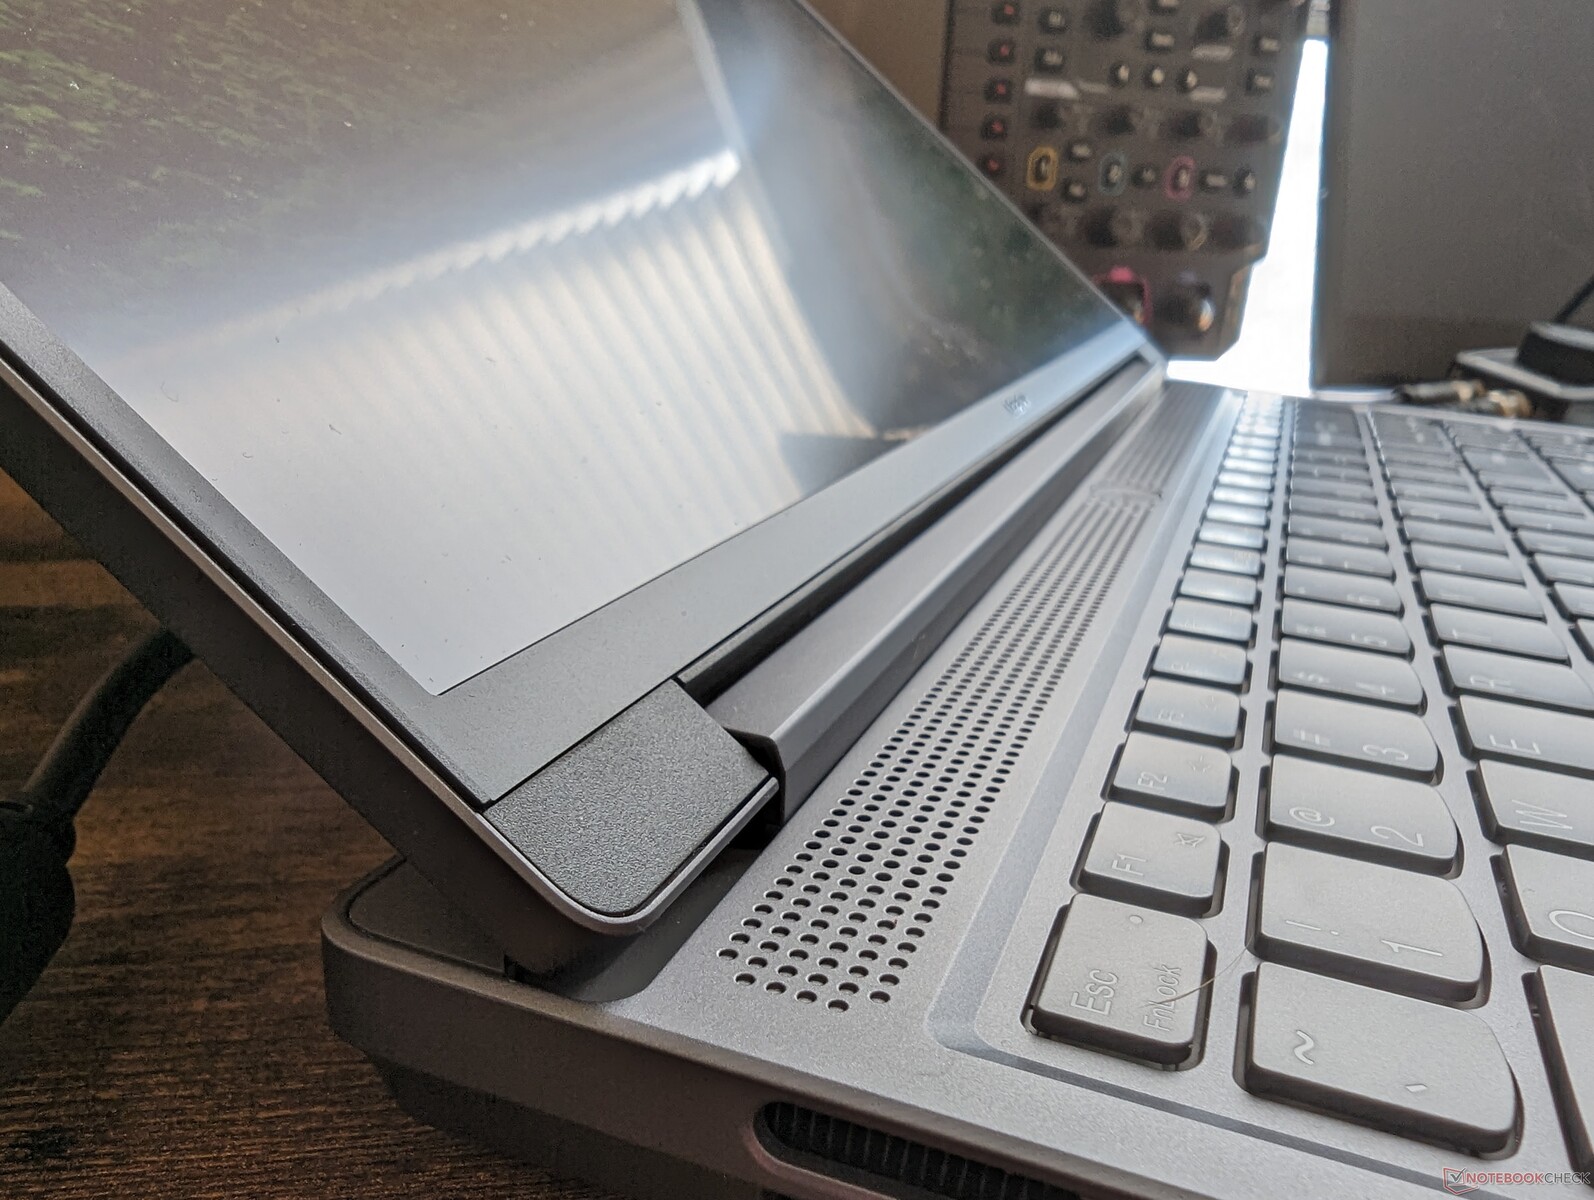
Caso - Legion Pro 5 parece voluminoso en comparación
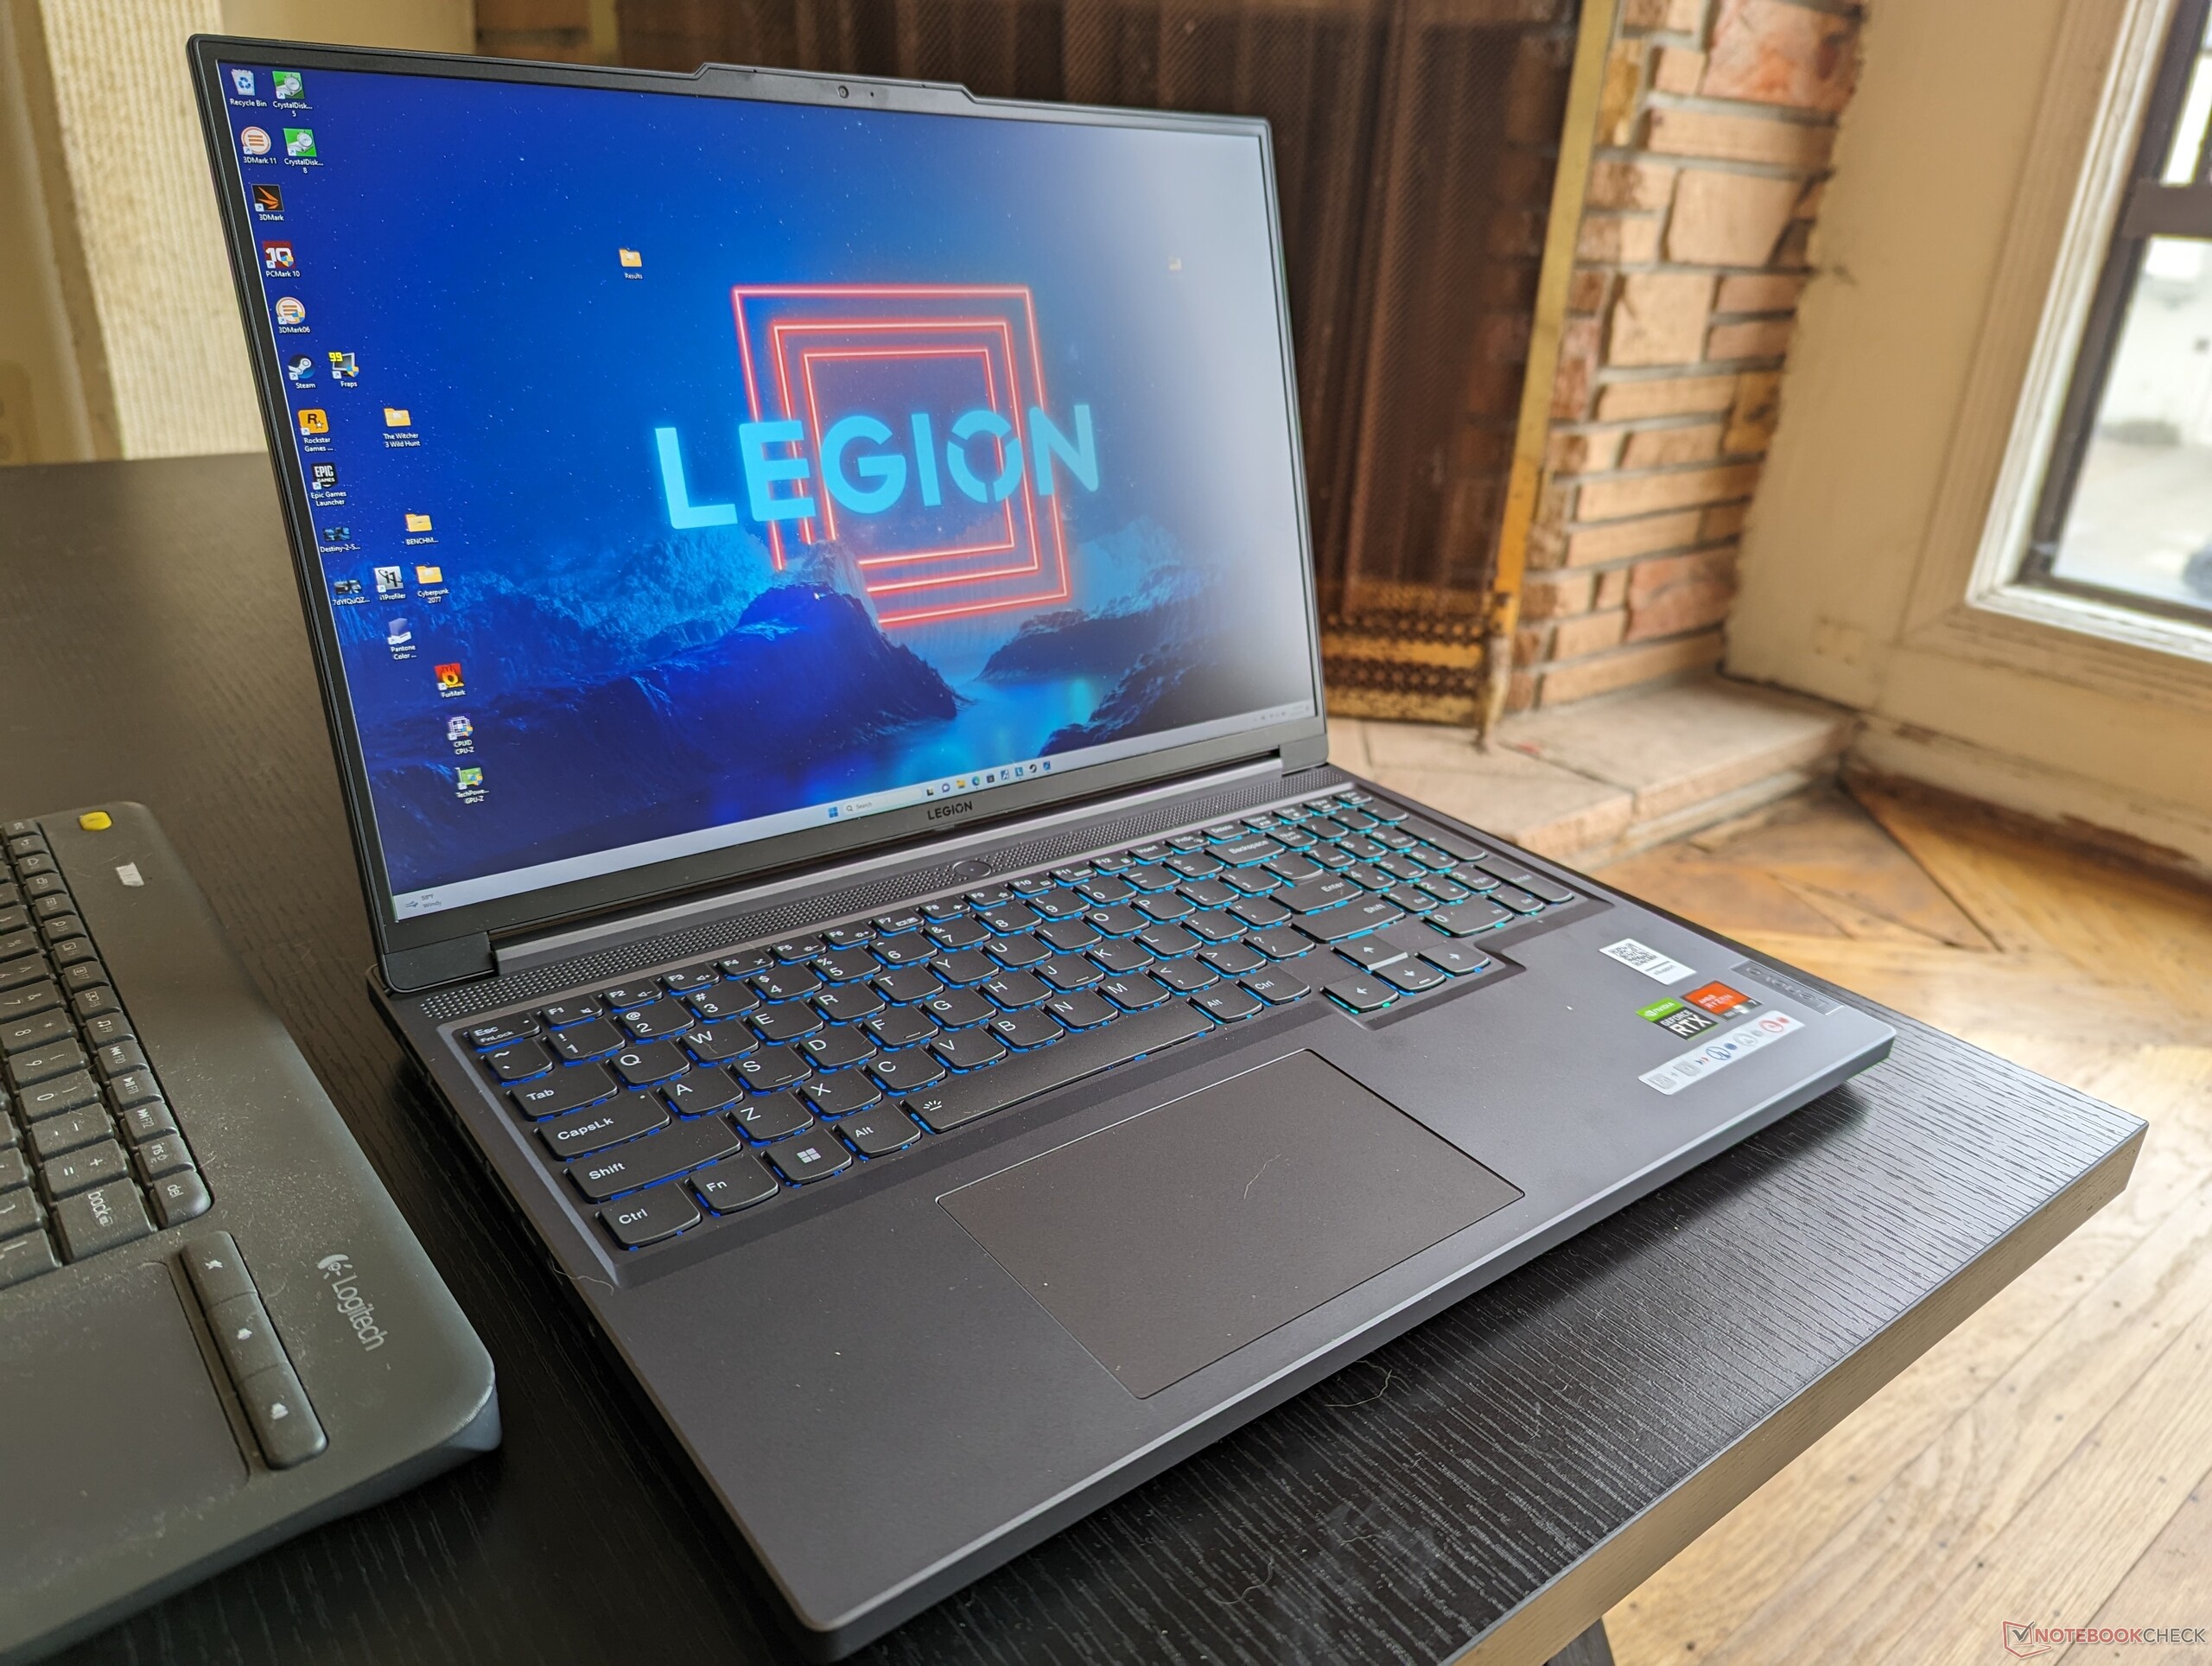
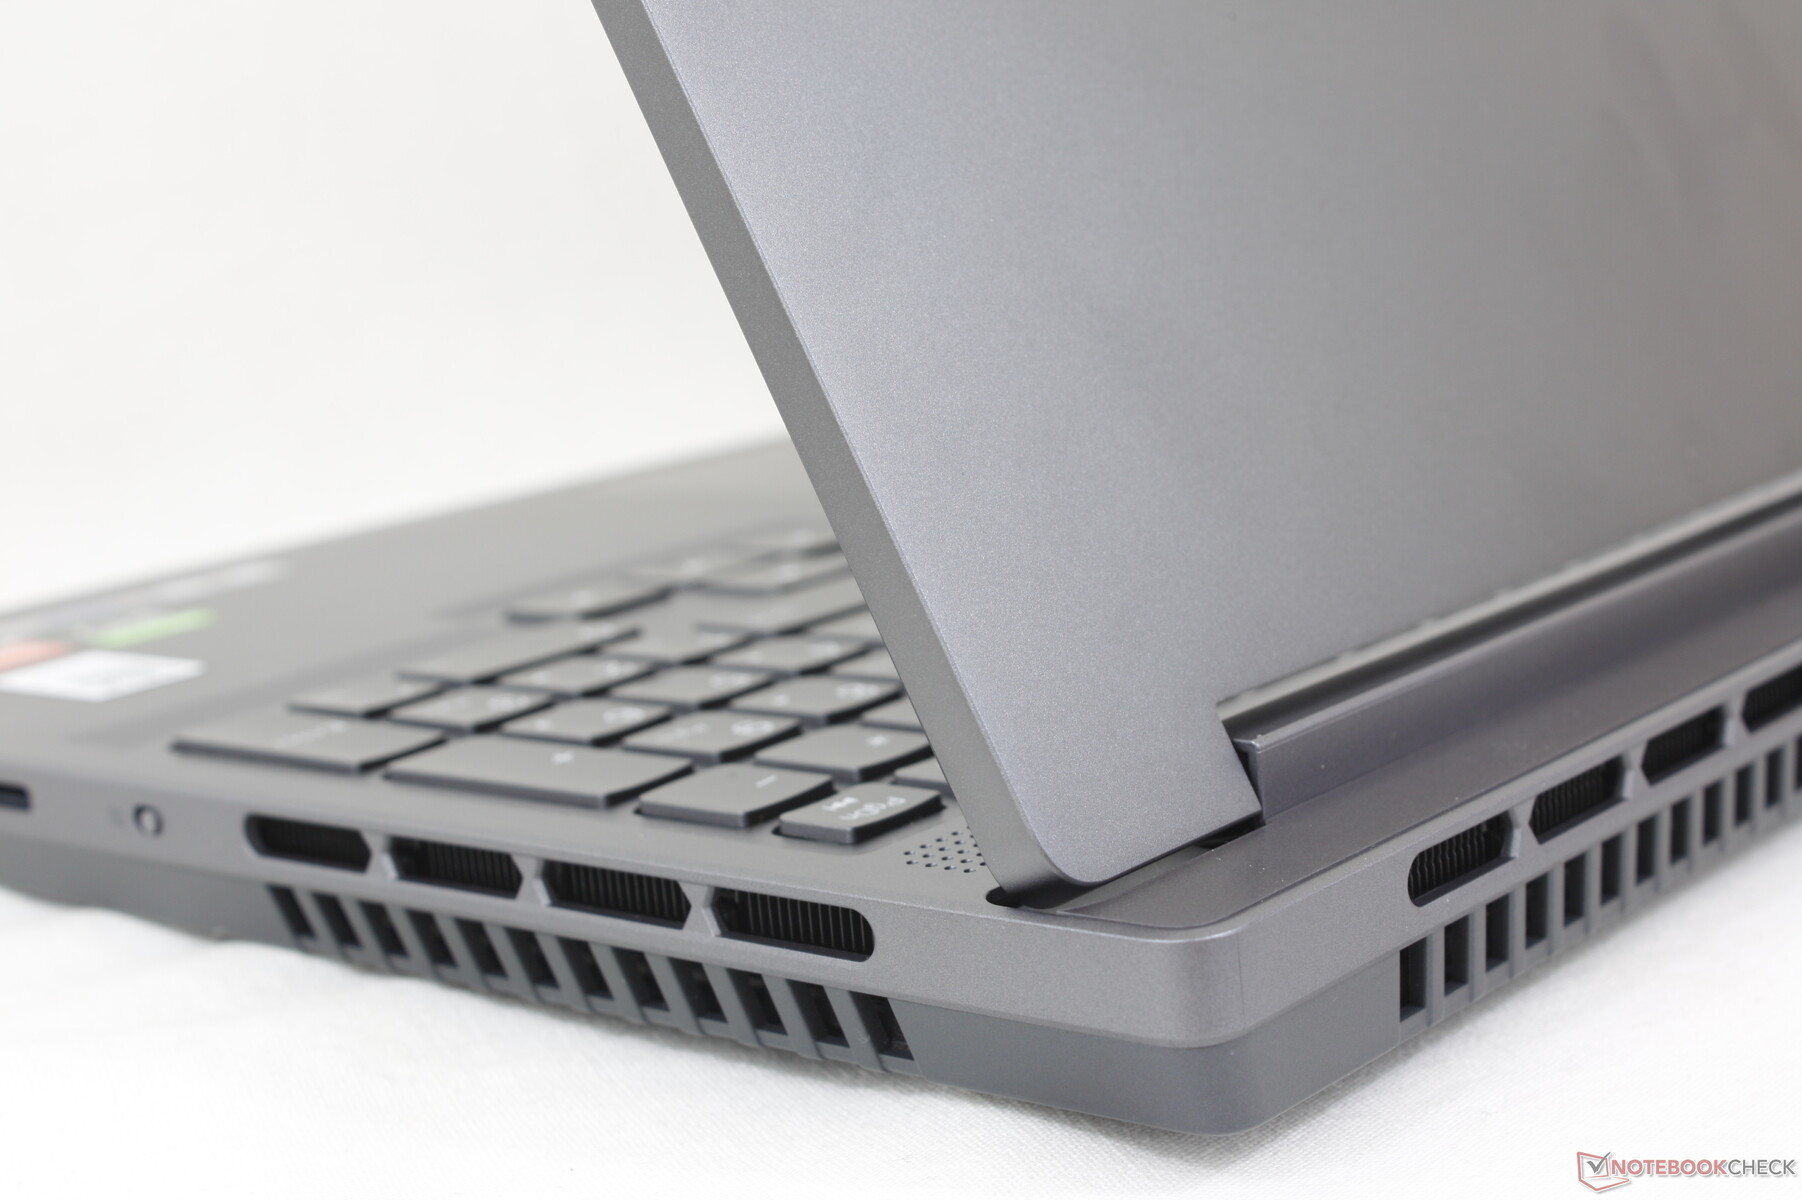
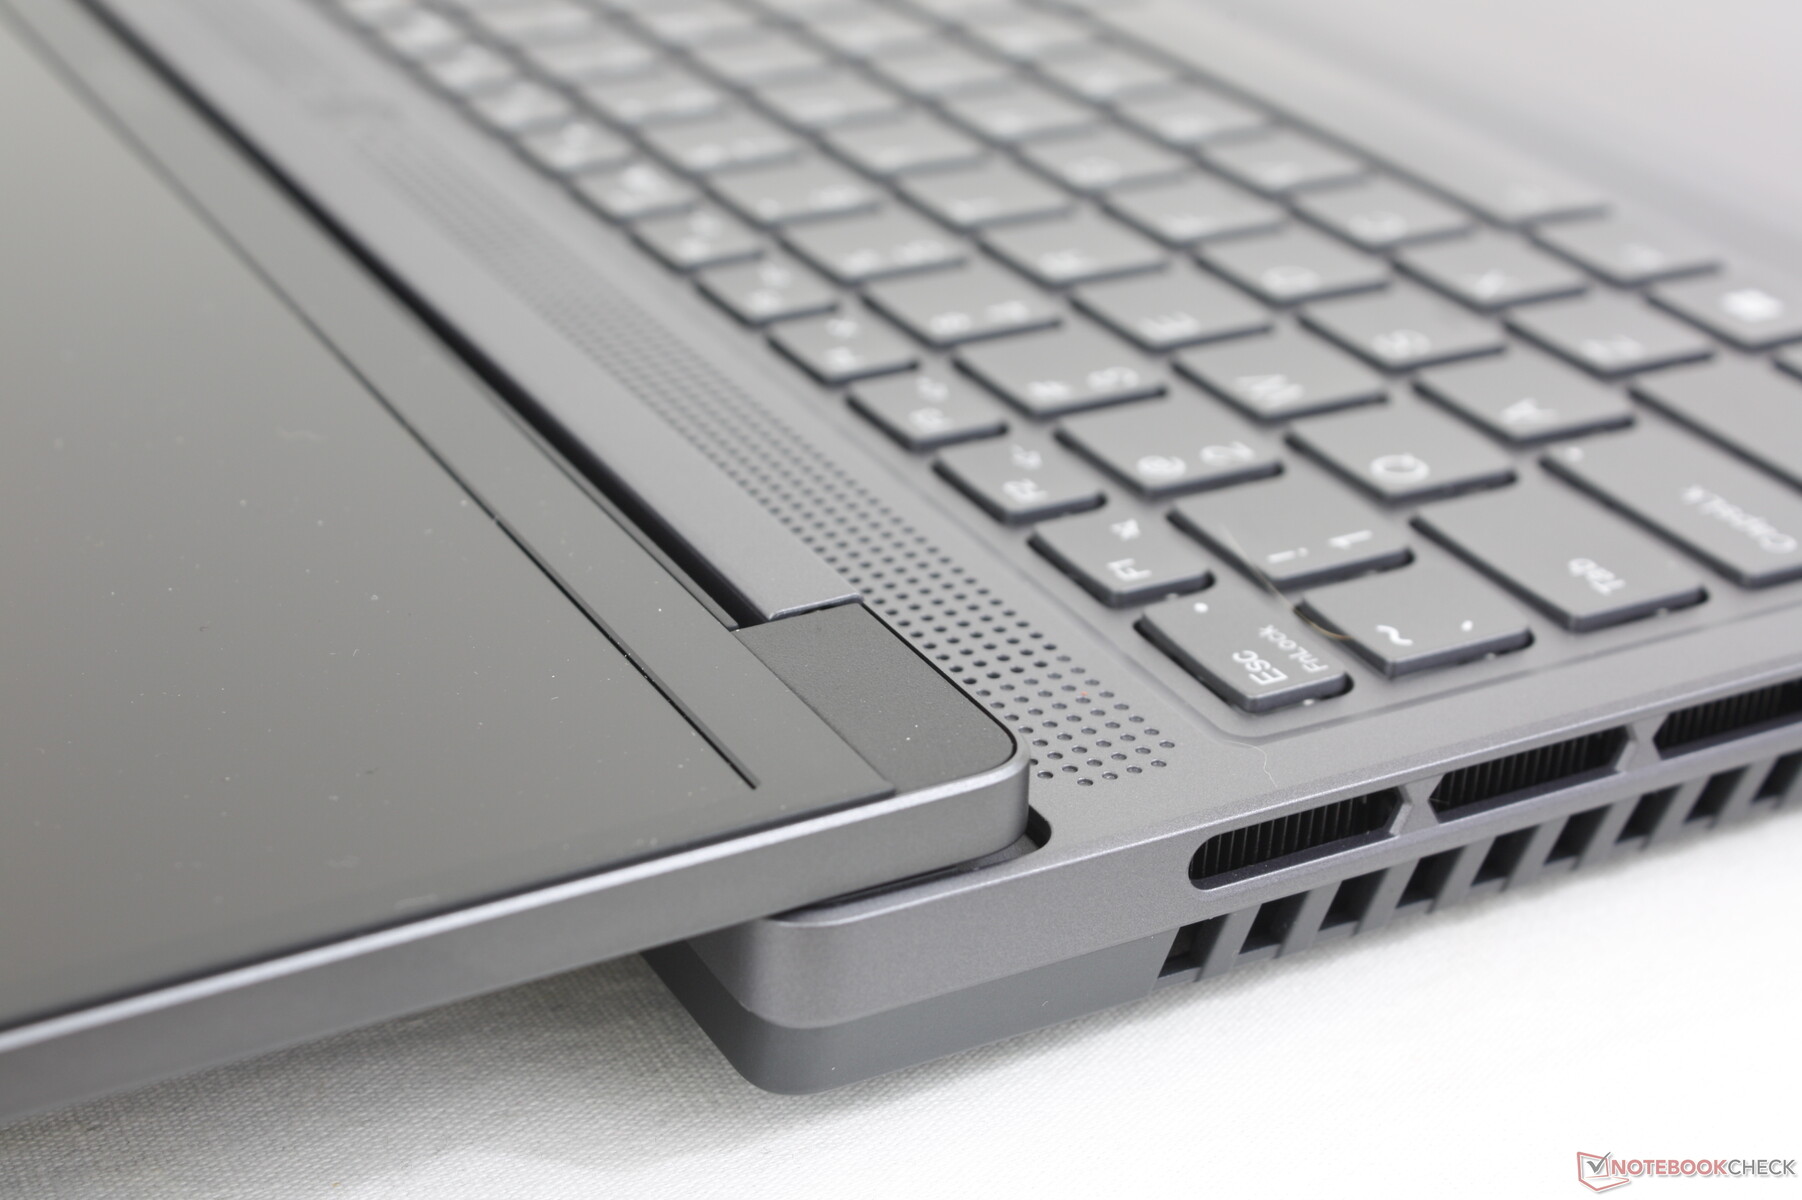
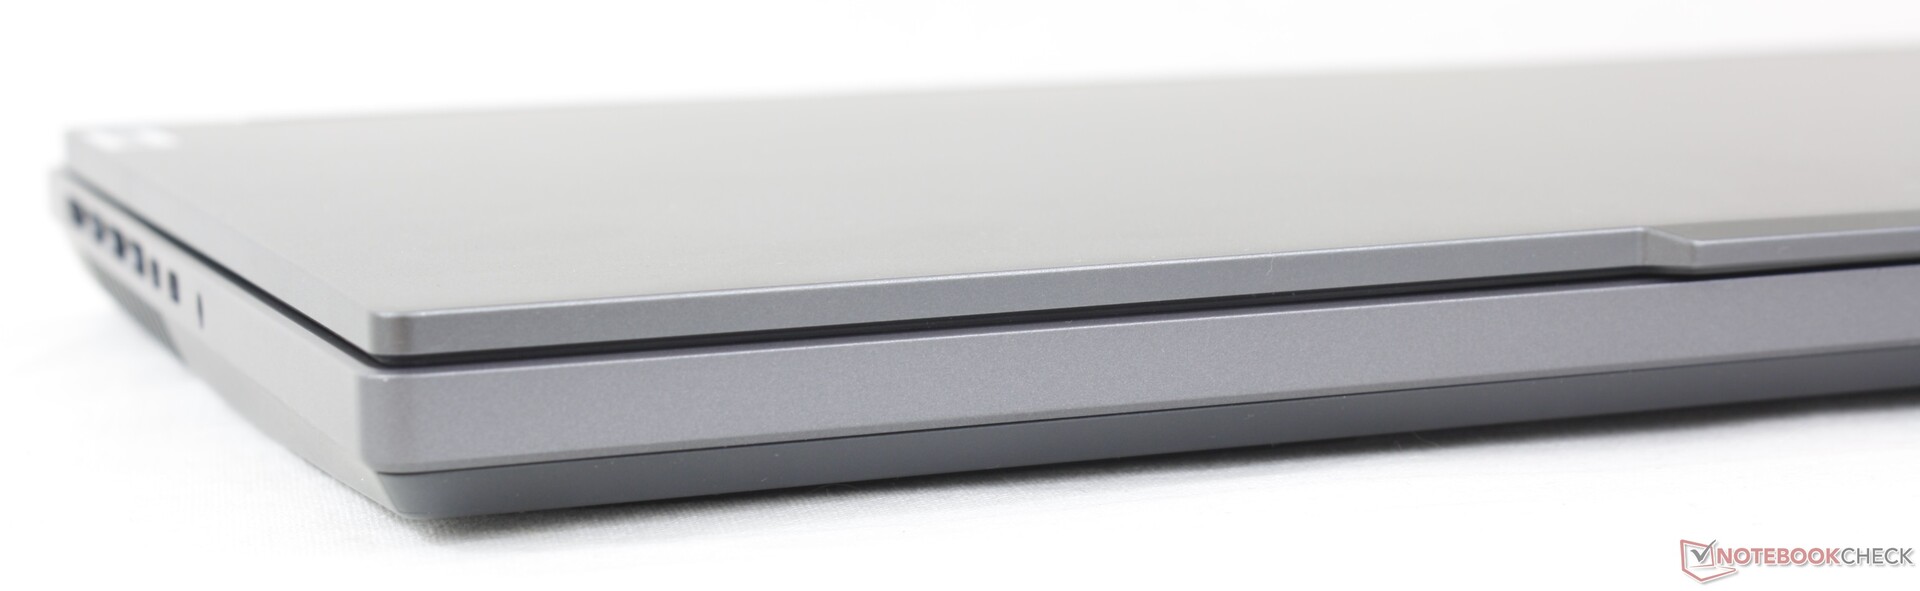
Legion Slim 5 elimina los bordes duros y los salientes del diseño de Legion Pro 5 para ofrecer un aspecto más fino y limpio. Esto se nota sobre todo en la parte trasera, los laterales y la placa inferior, donde las superficies son ahora más planas y menos recargadas.
A diferencia del LOQ 15 o el Legion Pro 7 de aluminio, el Legion Pro 5 es un poco de ambos con su base de plástico y su cubierta superior de aluminio. Por lo demás, la rigidez del chasis sigue siendo comparable a la del Legion Pro 5 para una buena primera impresión. La base sigue siendo rígida, pero se notan algunos crujidos al intentar girar sus esquinas.
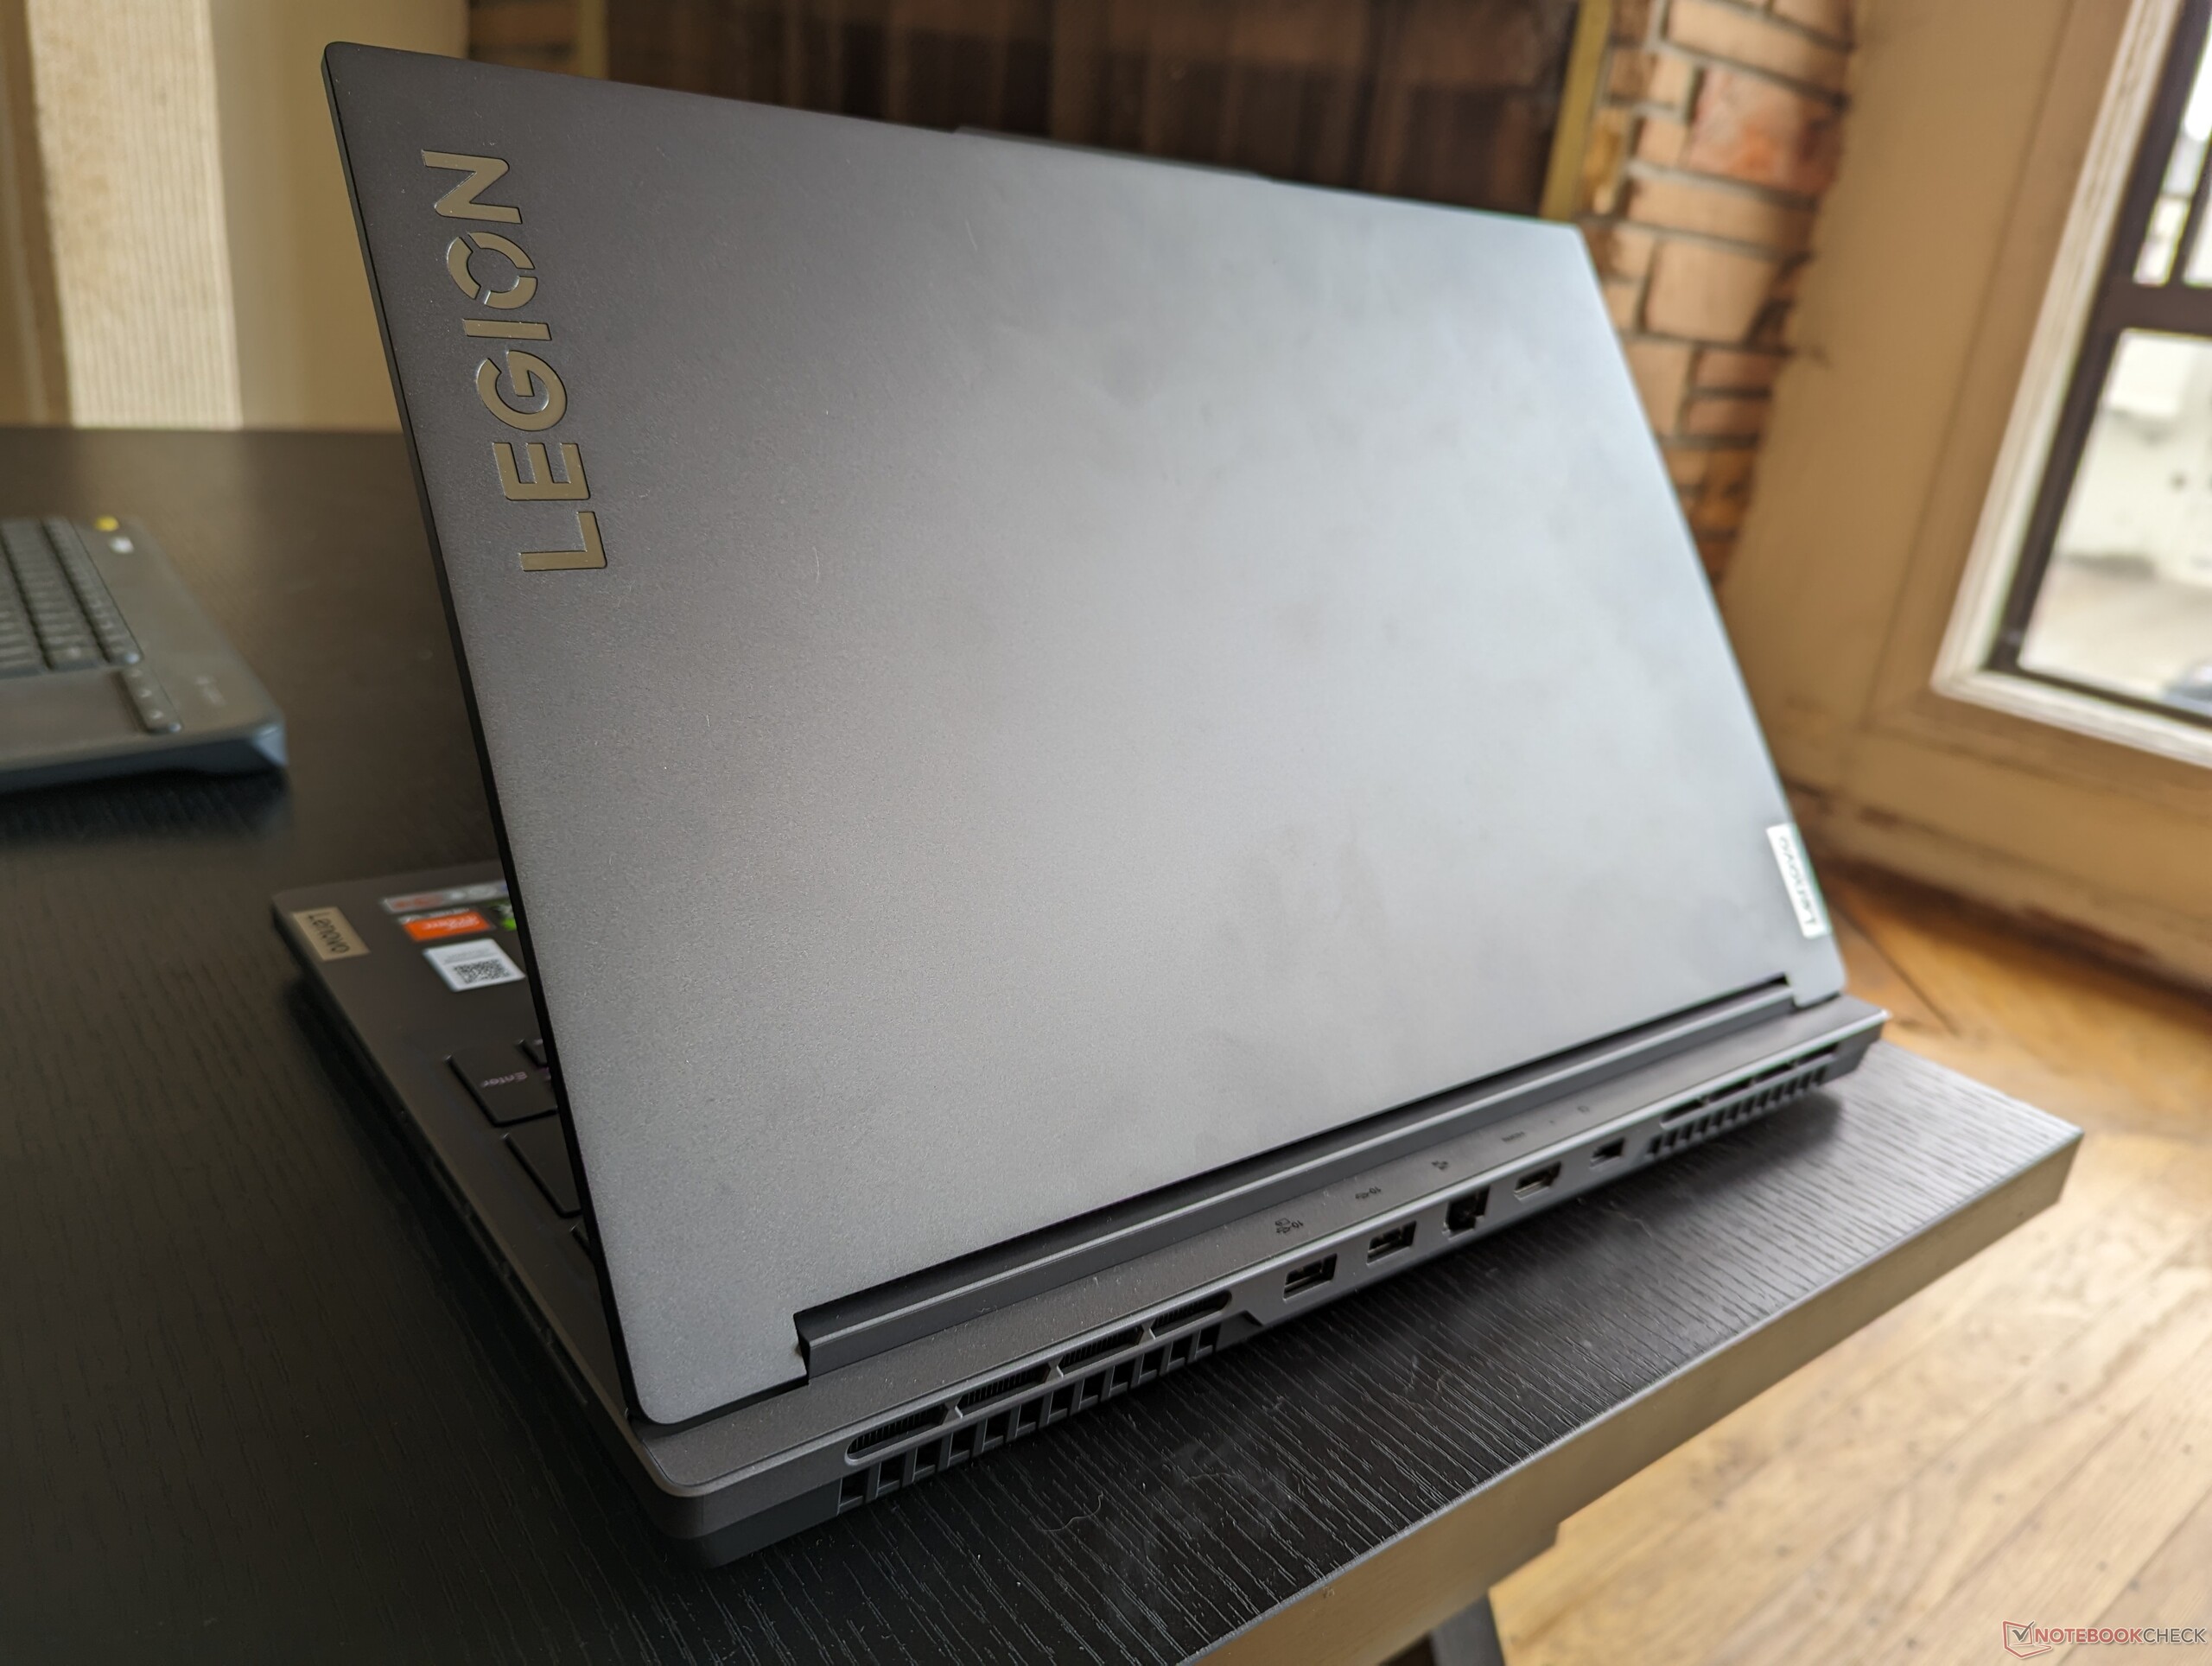
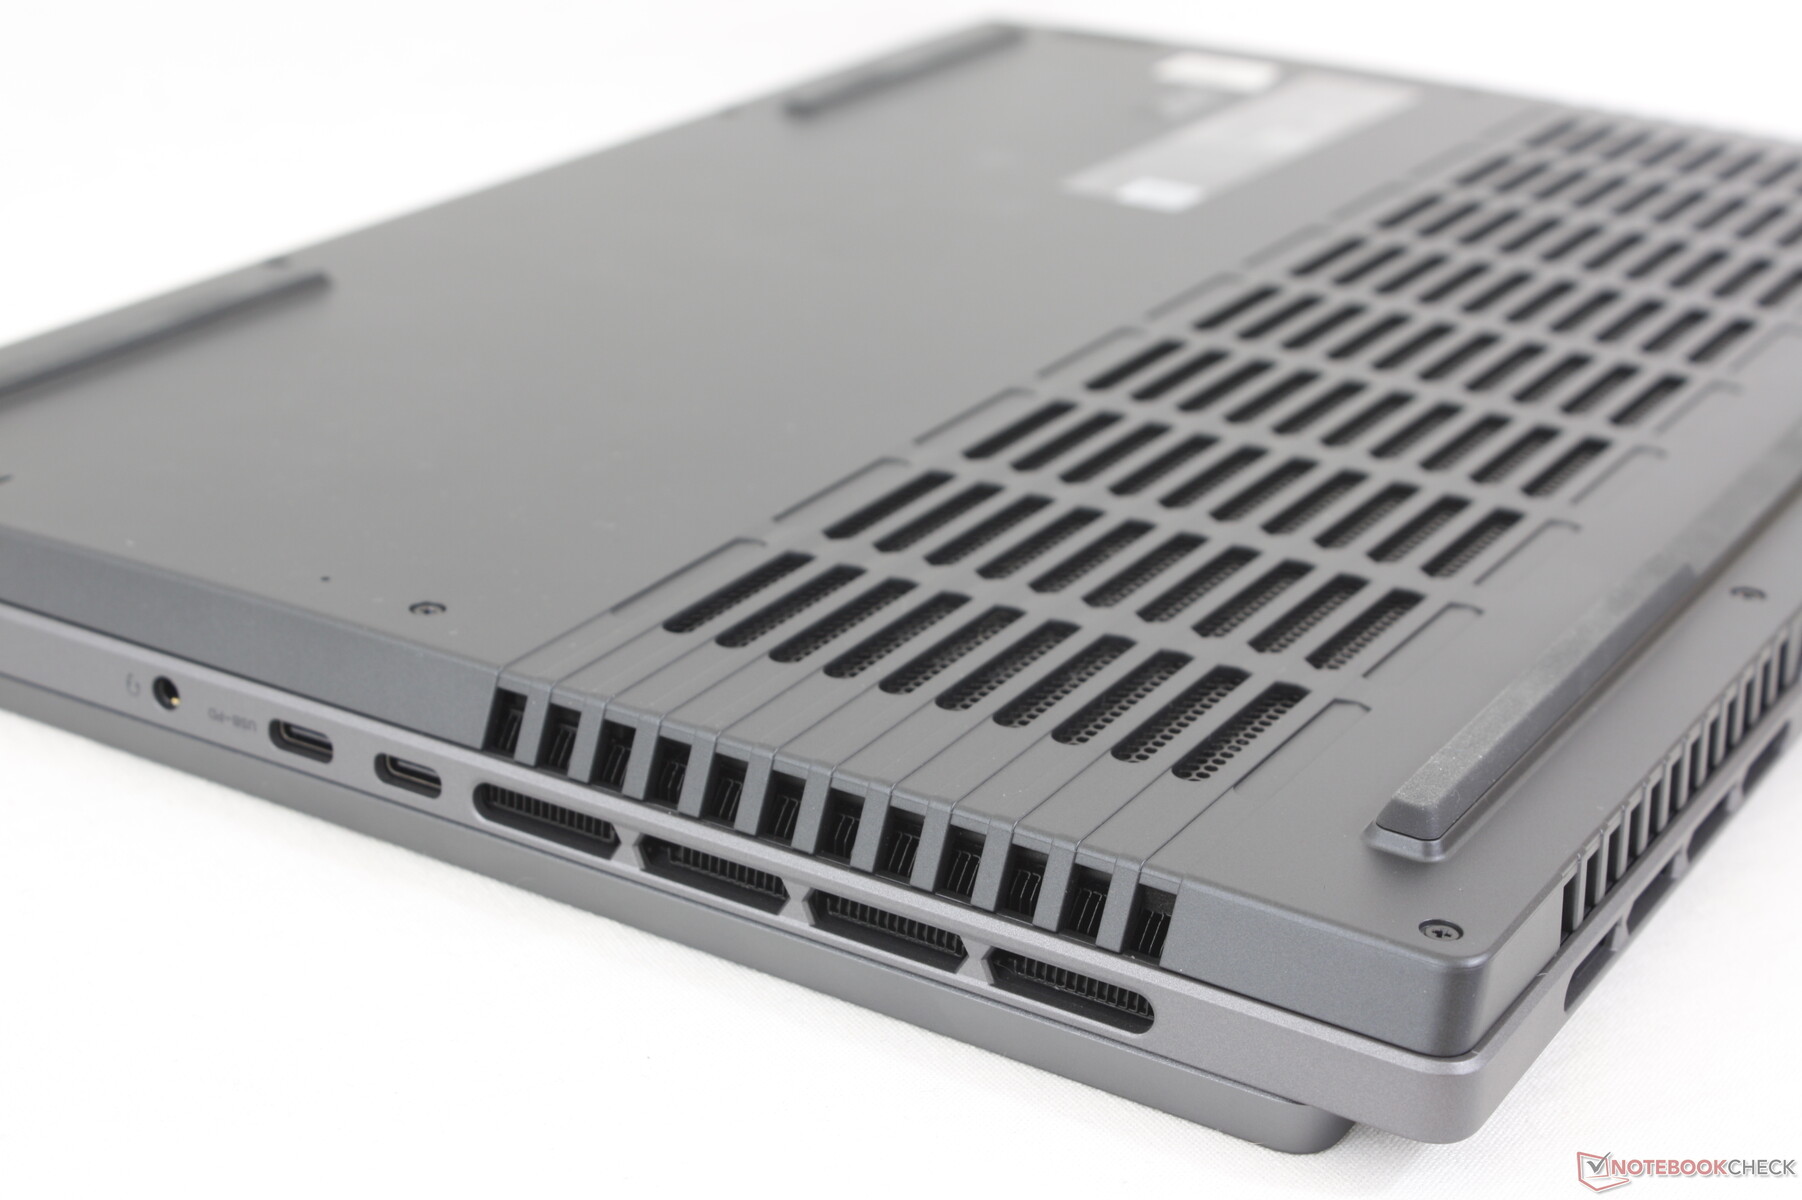
A diferencia de la mayoría de portátiles, nuestro modelo Lenovo viene en dos grosores diferentes dependiendo de la configuración gráfica. Las unidades con la RTX 4060 tienen un grosor de 25,2 mm, mientras que las unidades con la RTX 4050 o 3050, más lentas, tienen un grosor de solo 21,9 mm. Nuestra unidad RTX 4060 es solo 2 mm más delgada que la más potente Legion Pro 5, por lo que es un poco exagerado decir que es un portátil de juegos "delgado". De hecho, el Legion Slim 5 RTX 4060 es más grueso que muchas otras alternativas de 16 pulgadas como el HP Omen 16 o elAsus TUF Gaming A16.
Conectividad
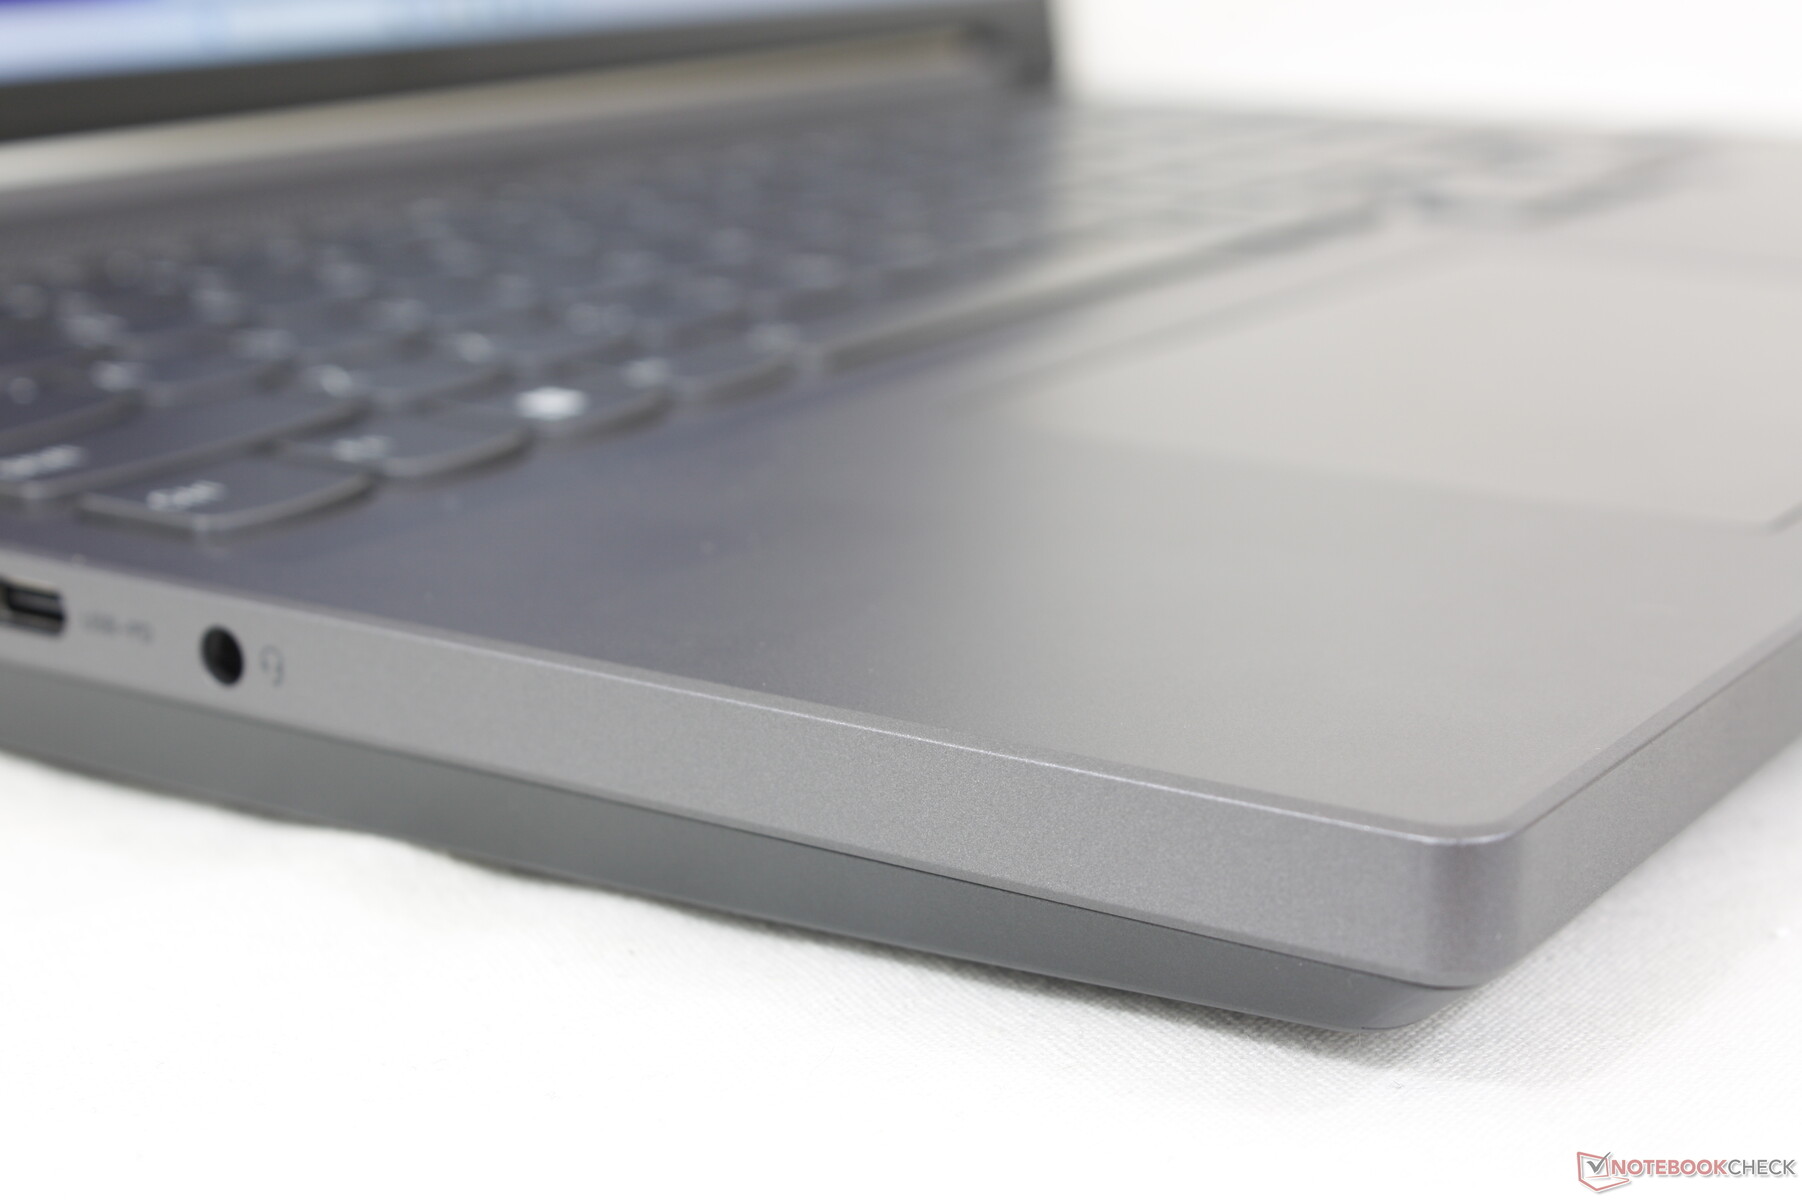
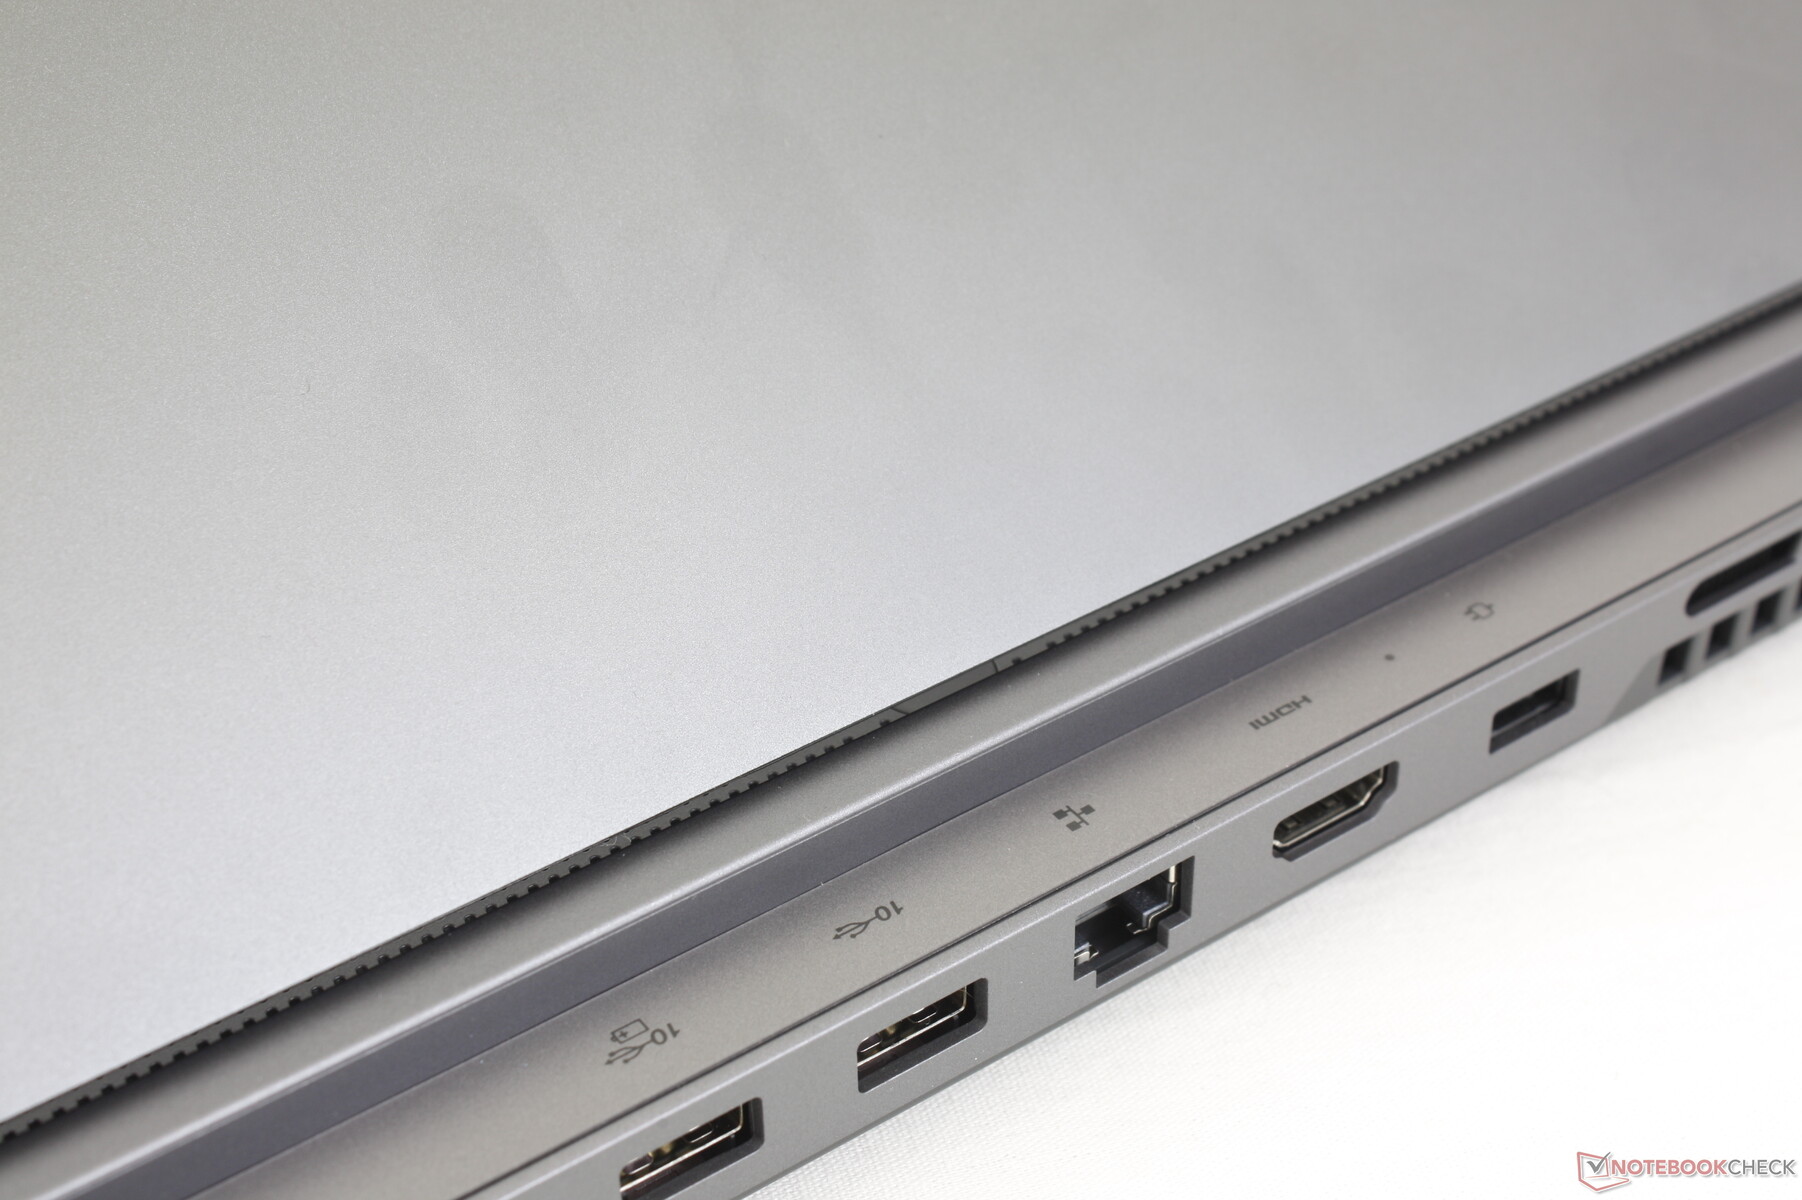
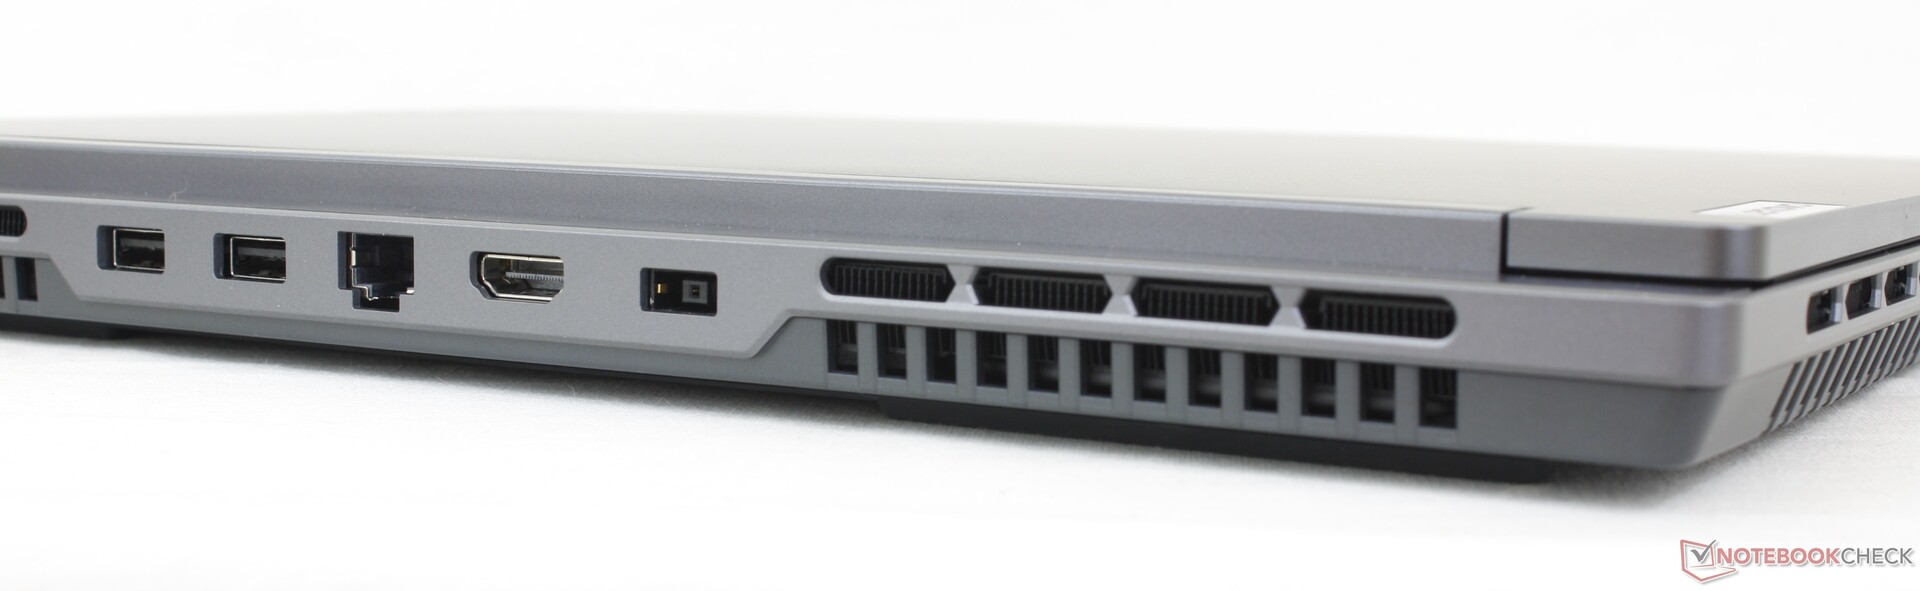
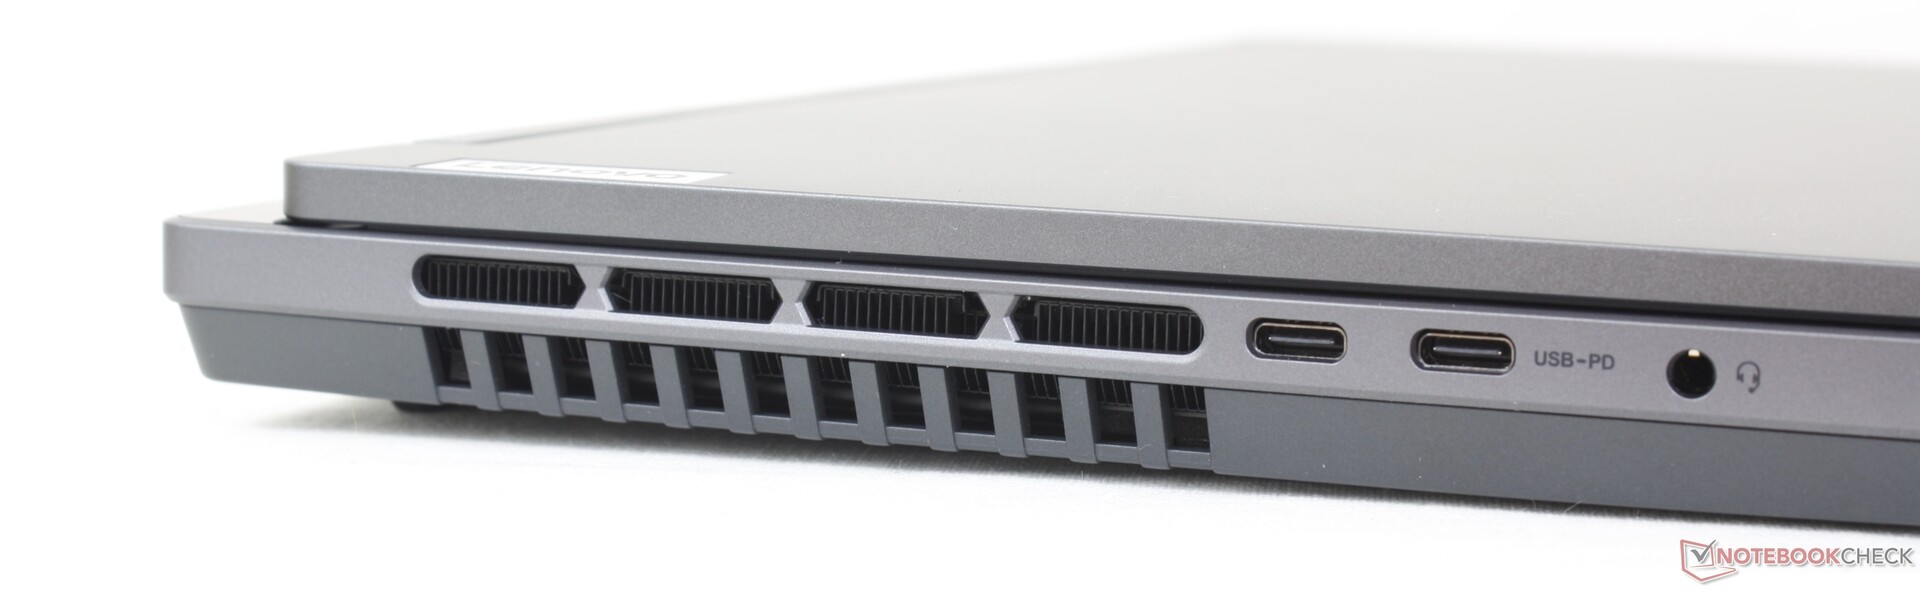
Las opciones de puertos son las mismas que en el HP Omen 16, aunque con una posición diferente. El más grueso Legion Pro 5 tiene aún más puertos USB para un total de seis, pero cuatro en nuestro Legion Slim 5 deberían ser suficientes para la mayoría de los usuarios.
Hay que tener en cuenta que Thunderbolt y USB4 no son compatibles. Además, sólo uno de los dos puertos USB-C soporta Power Delivery, lo que significa que el sistema sólo se puede recargar a través de uno de los puertos. Afortunadamente, este puerto está etiquetado en el modelo.
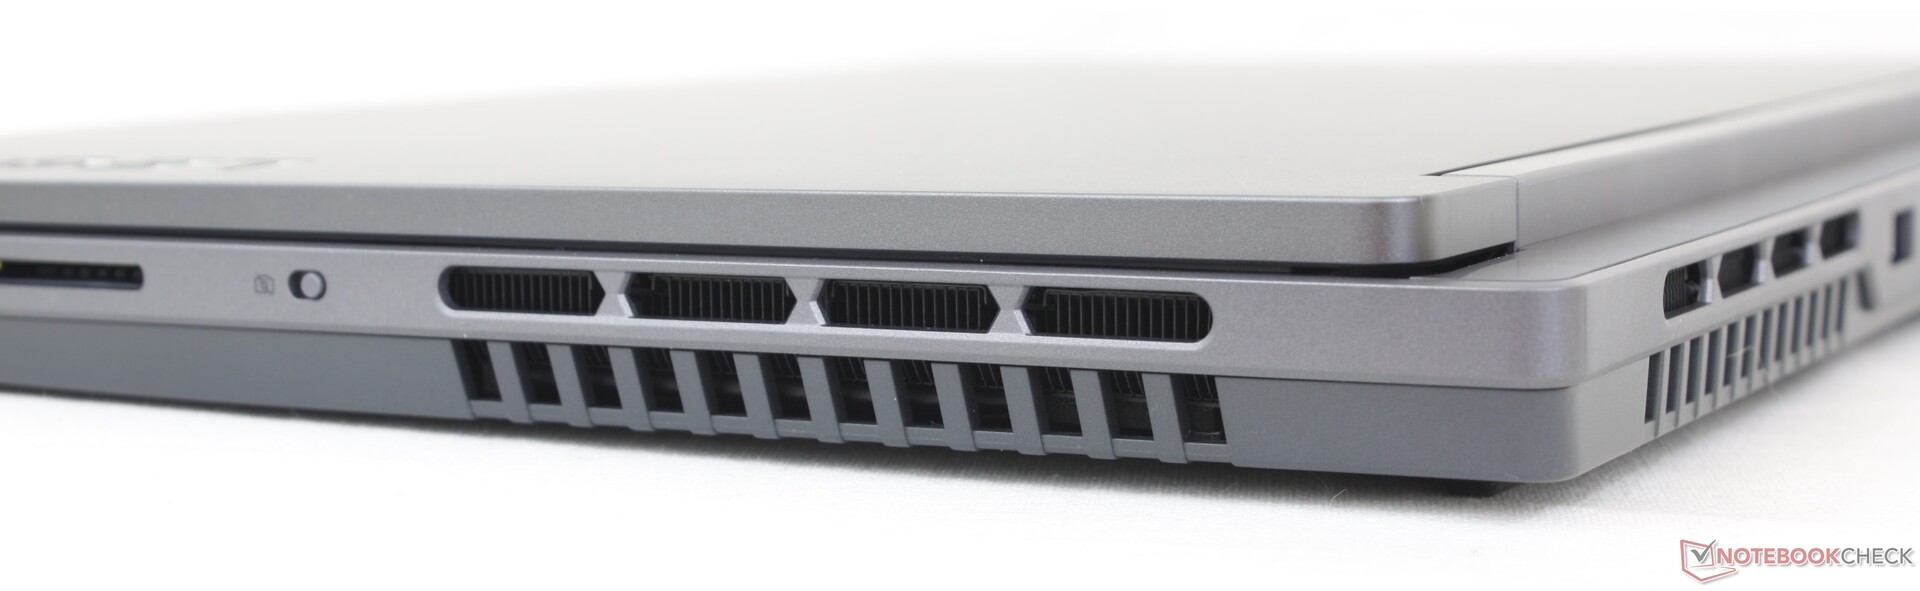
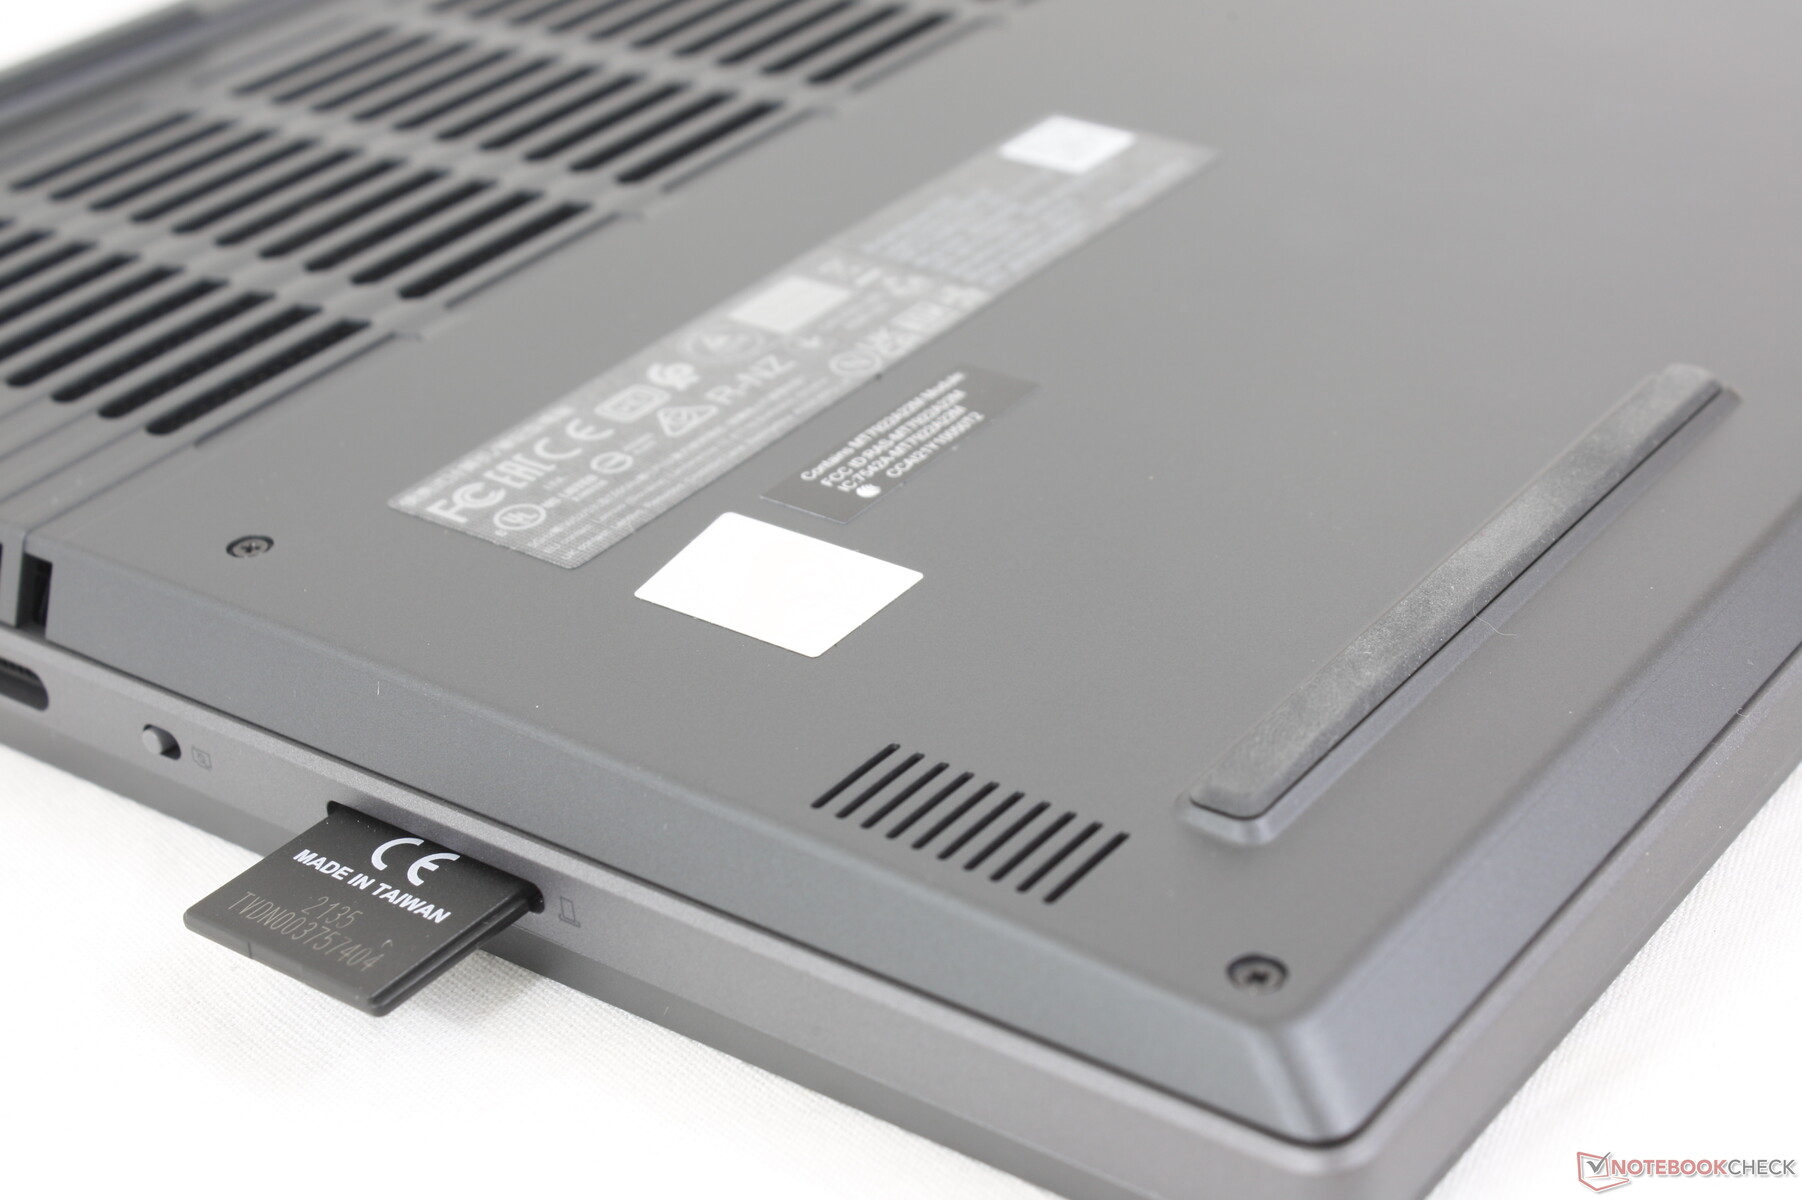
Lector de tarjetas SD
La velocidad de transferencia del lector SD integrado es más de dos veces más lenta que la del lector del modelo más caro, elLegion Slim 7i 16 Gen 8. Pasar 1 GB de fotos de nuestra tarjeta de prueba PNY UHS-II al escritorio lleva unos 27 segundos, frente a los 12 segundos de la Slim 7i 16.
| SD Card Reader | |
| average JPG Copy Test (av. of 3 runs) | |
| Lenovo Legion Slim 7i 16 Gen 8 (Toshiba Exceria Pro SDXC 64 GB UHS-II) | |
| Acer Nitro 16 AN16-41-R7YE (AV PRO microSD 128 GB V60) | |
| Lenovo Legion Slim 5 16APH8 (PNY EliteX-Pro60 V60 256 GB) | |
| maximum AS SSD Seq Read Test (1GB) | |
| Lenovo Legion Slim 7i 16 Gen 8 (Toshiba Exceria Pro SDXC 64 GB UHS-II) | |
| Acer Nitro 16 AN16-41-R7YE (AV PRO microSD 128 GB V60) | |
| Lenovo Legion Slim 5 16APH8 (PNY EliteX-Pro60 V60 256 GB) | |
Comunicación
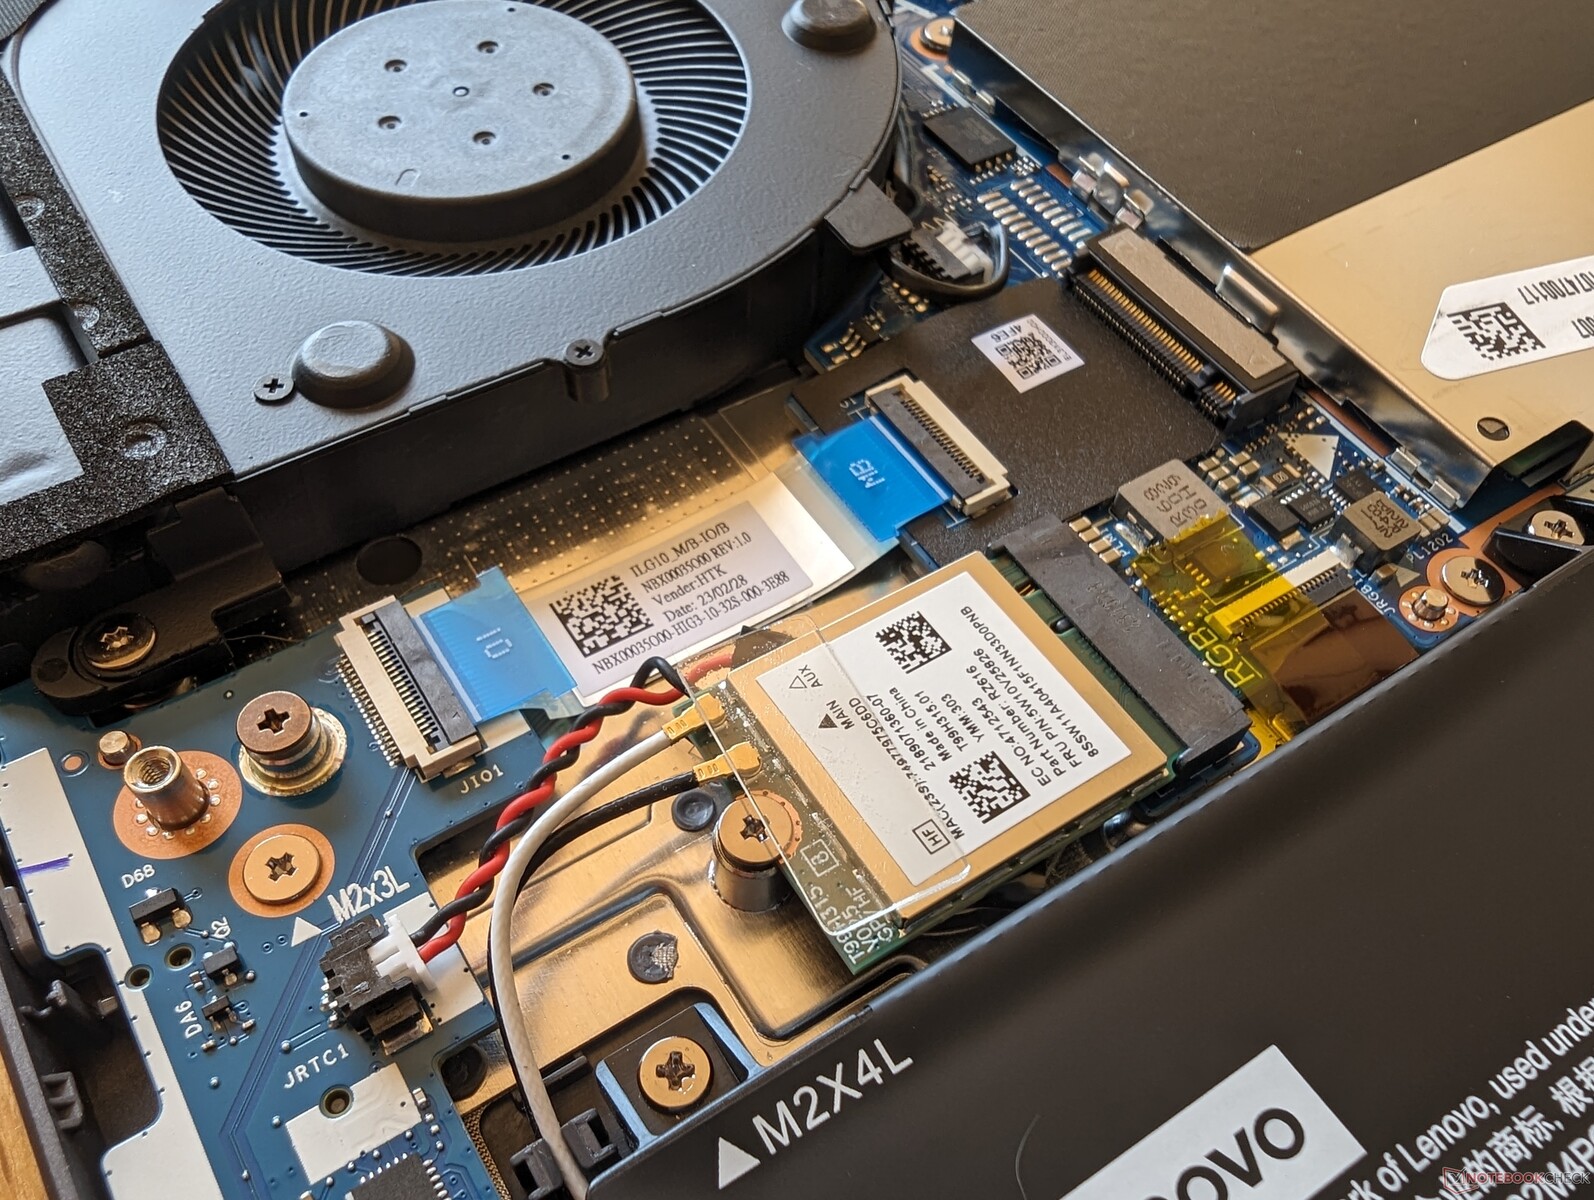
Un MediaTek MT7922 viene de serie para la conectividad Wi-Fi 6E y Bluetooth 5.2. Un Intel AX211 habría sido probablemente más caro y nos alegramos de no ver el más lento Realtek RTL8852BE. Las velocidades de transferencia son constantes y fiables cuando se conecta a nuestra red Asus AXE11000 de 6 GHz.
Cámara web
La webcam de 2 MP es cada vez más habitual en los portátiles de juegos para sustituir a las turbias soluciones de 1 MP de los modelos más antiguos. La cámara puede desactivarse electrónicamente en lugar de con un obturador físico, aunque no admite infrarrojos.


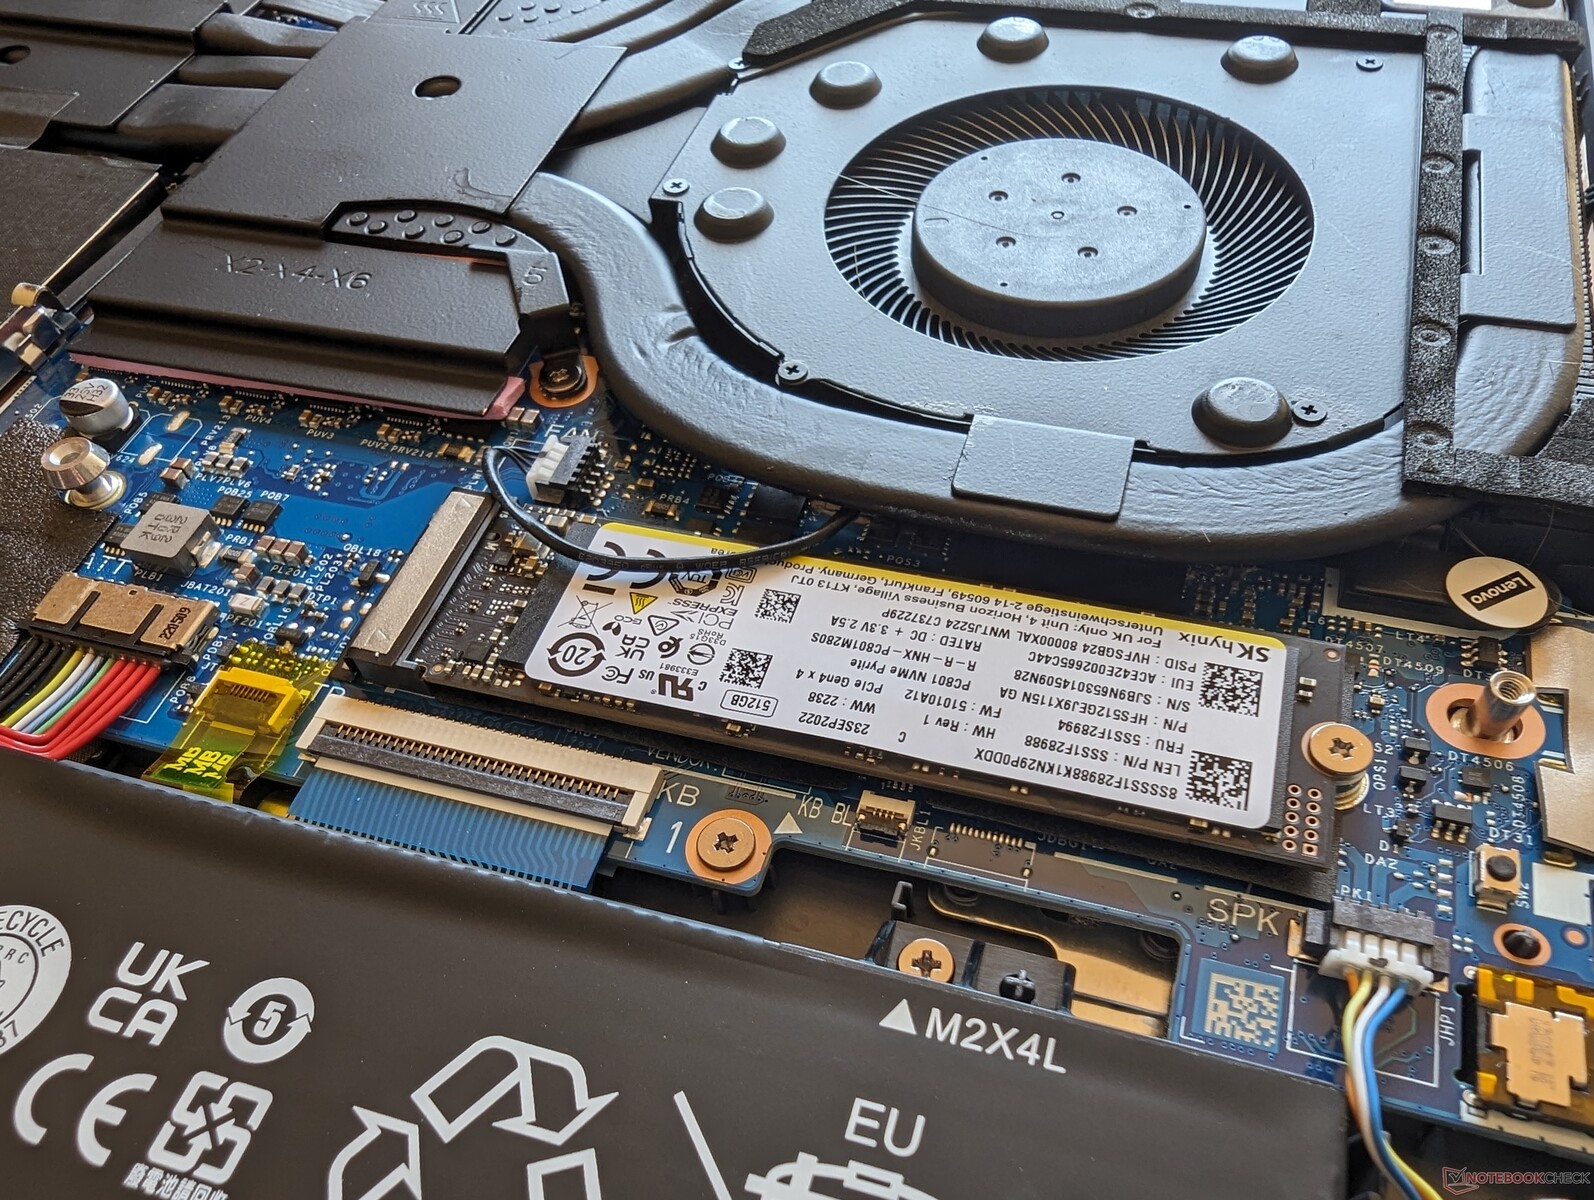
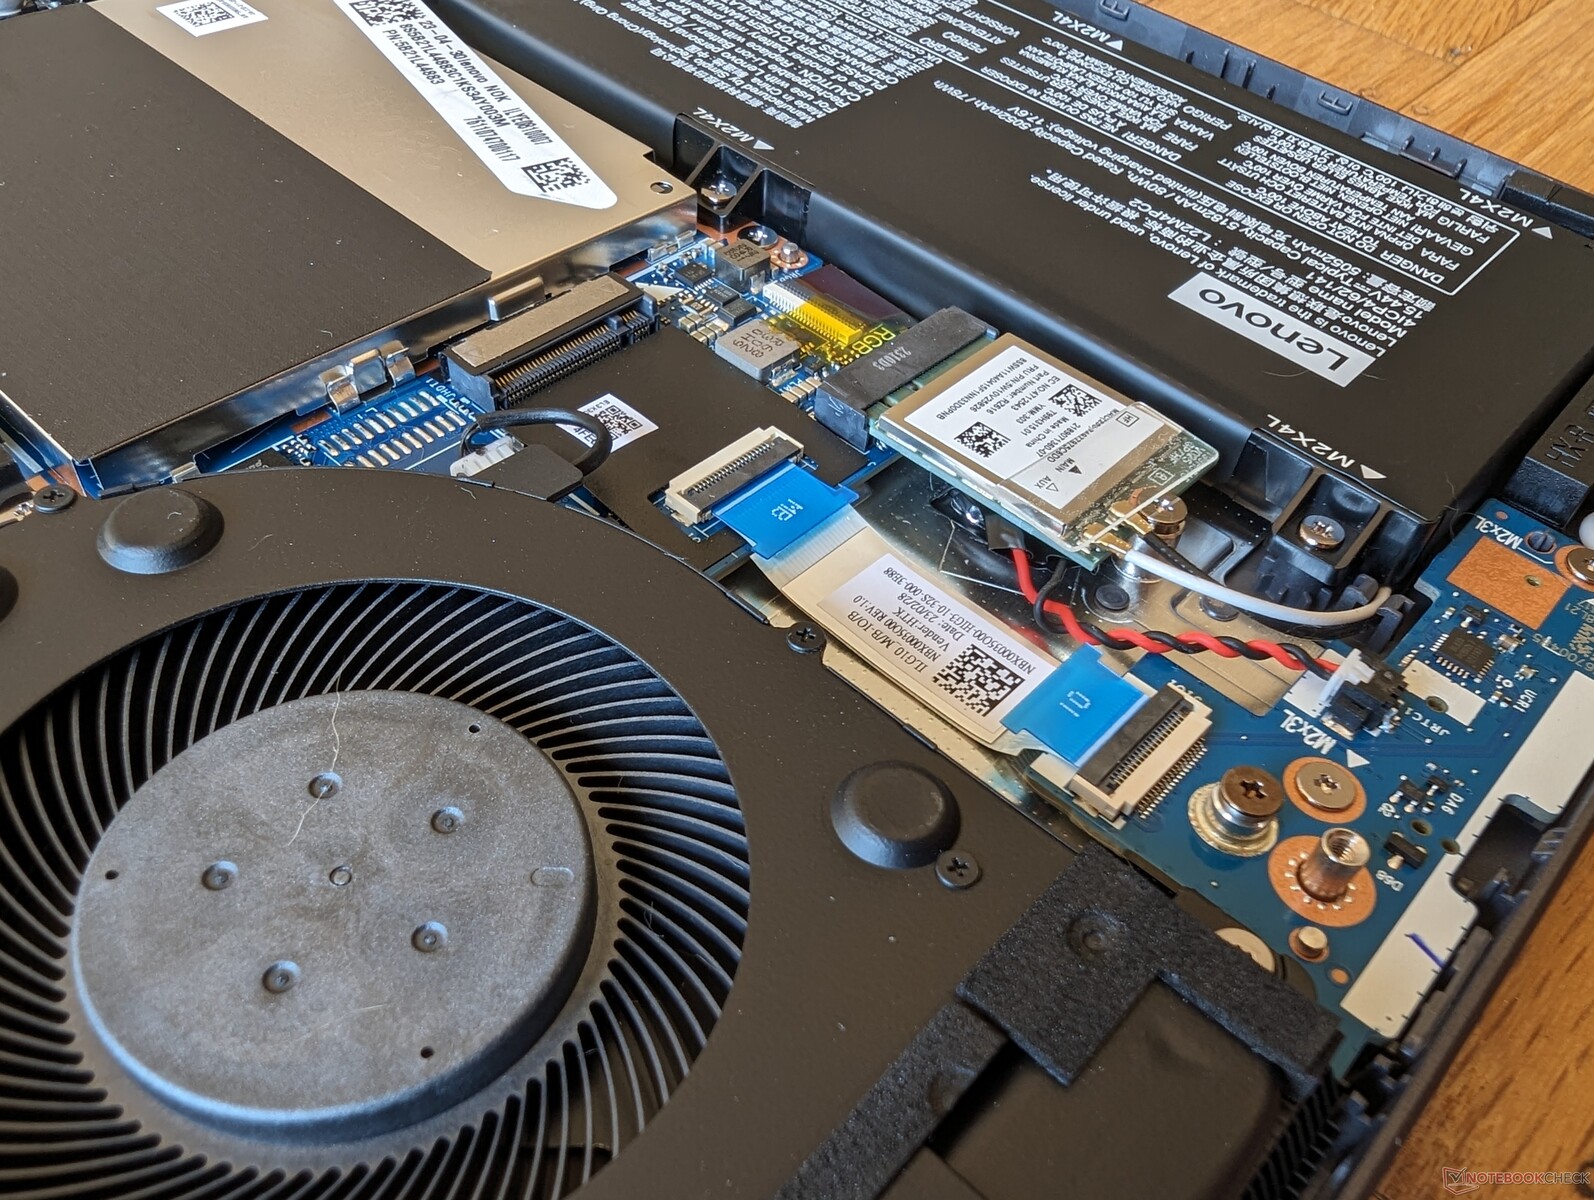
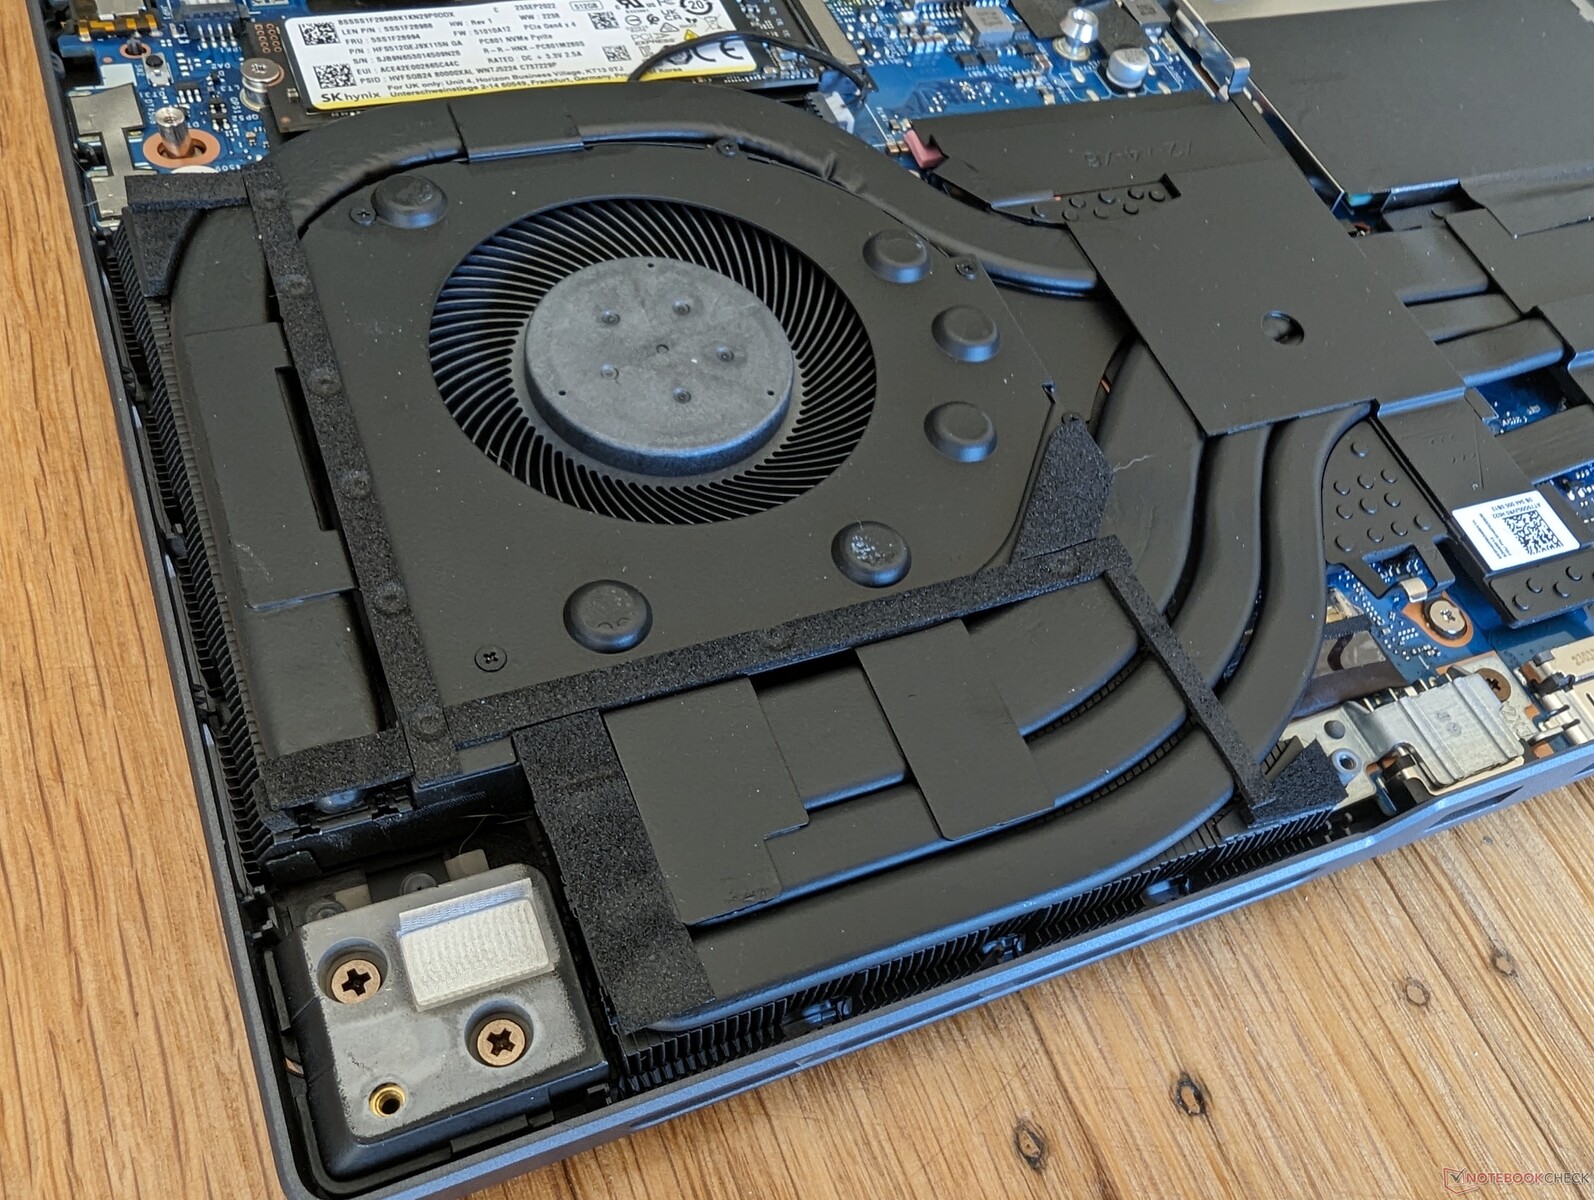
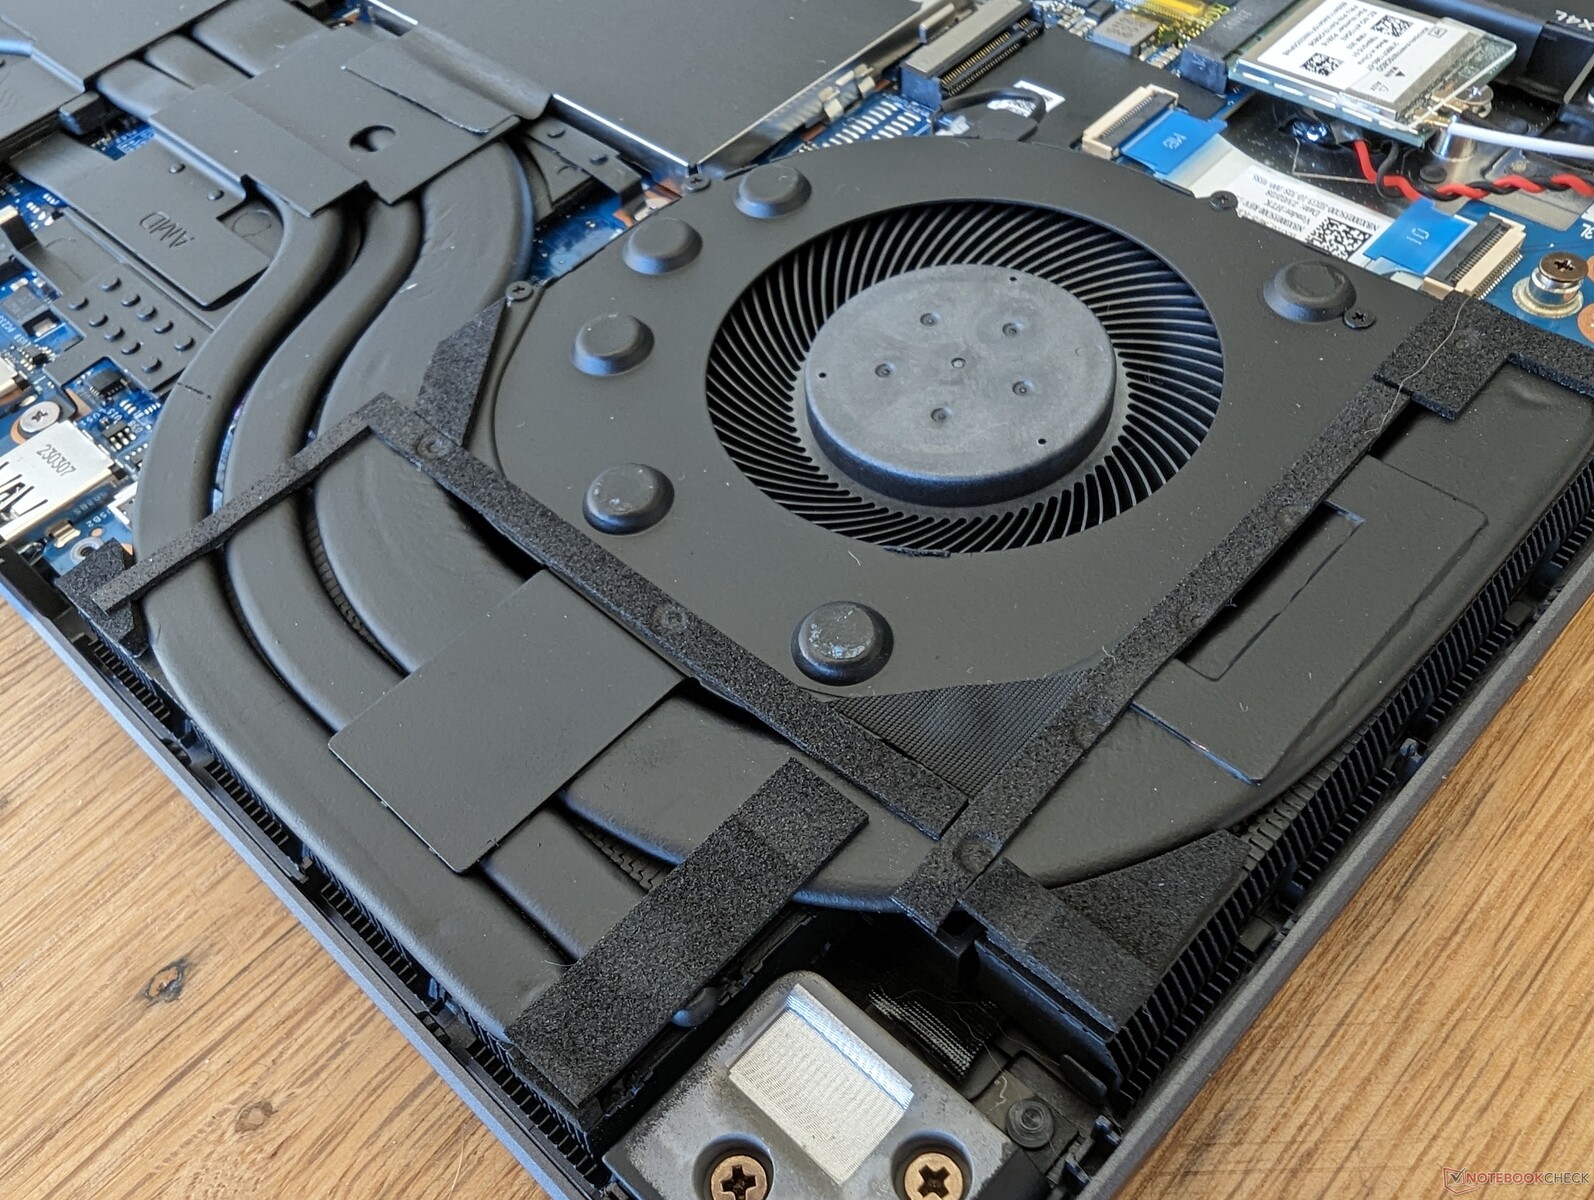
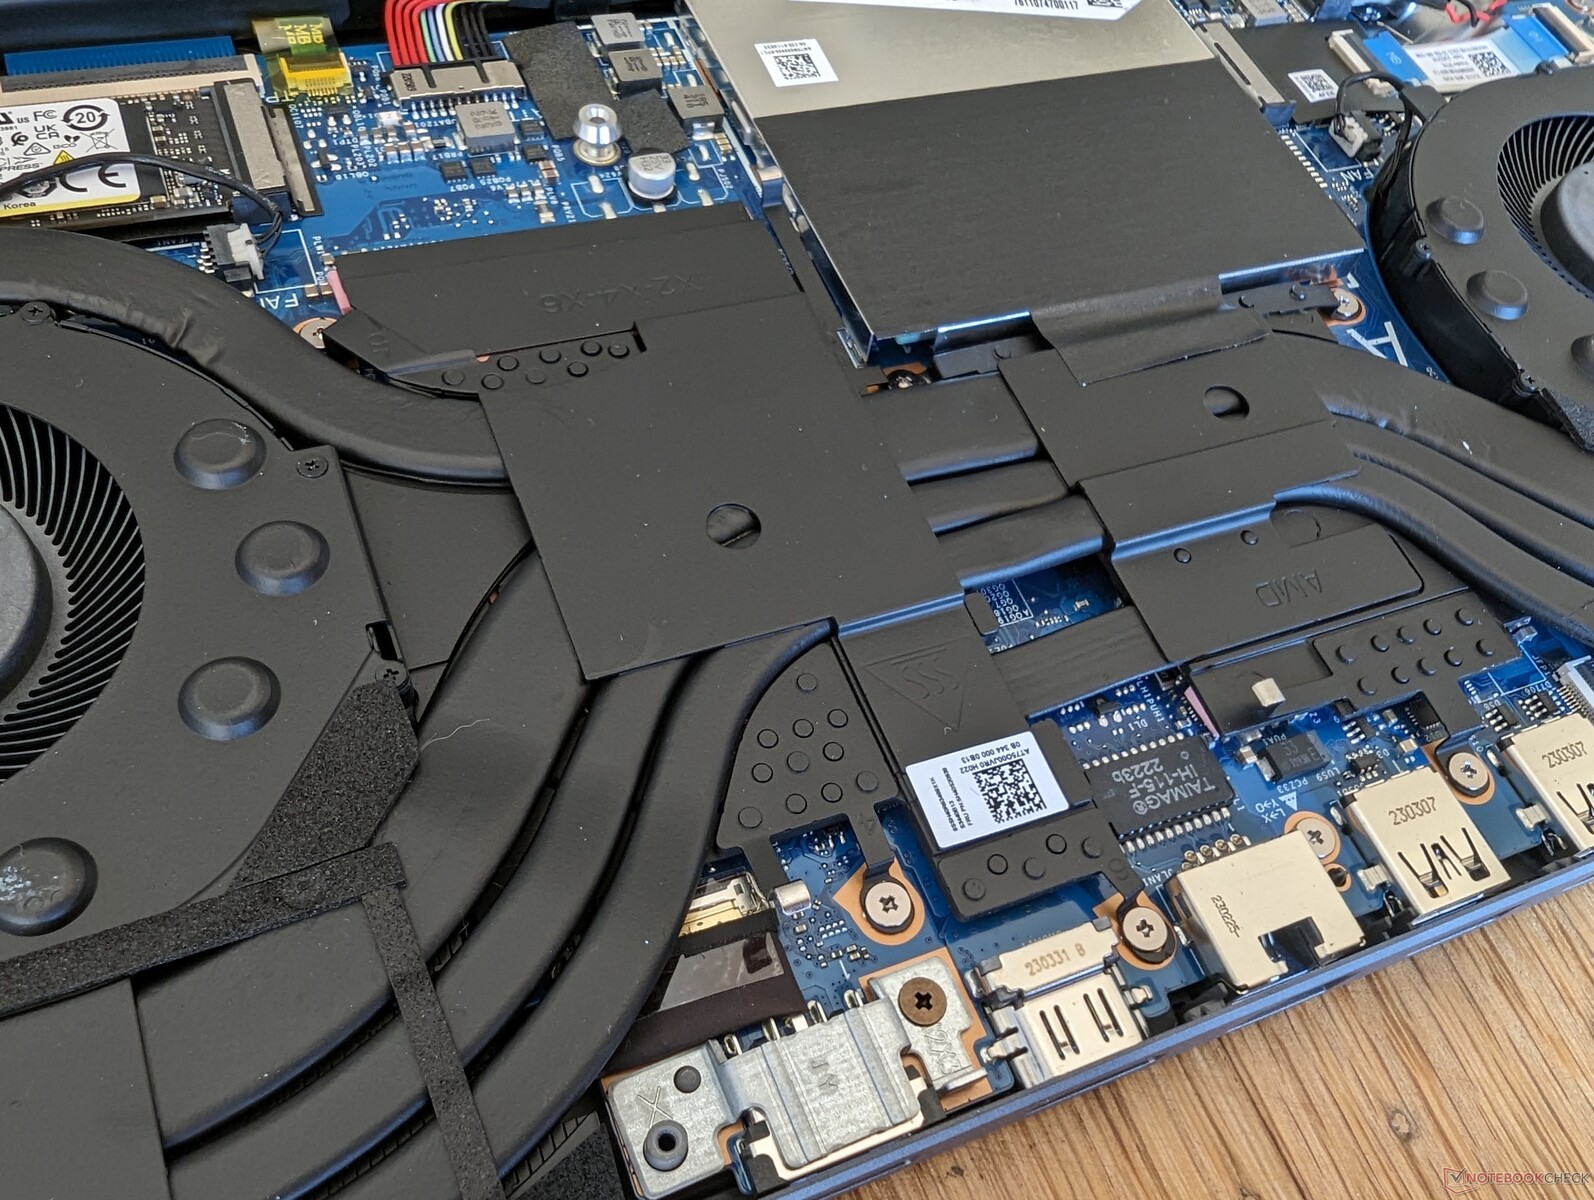
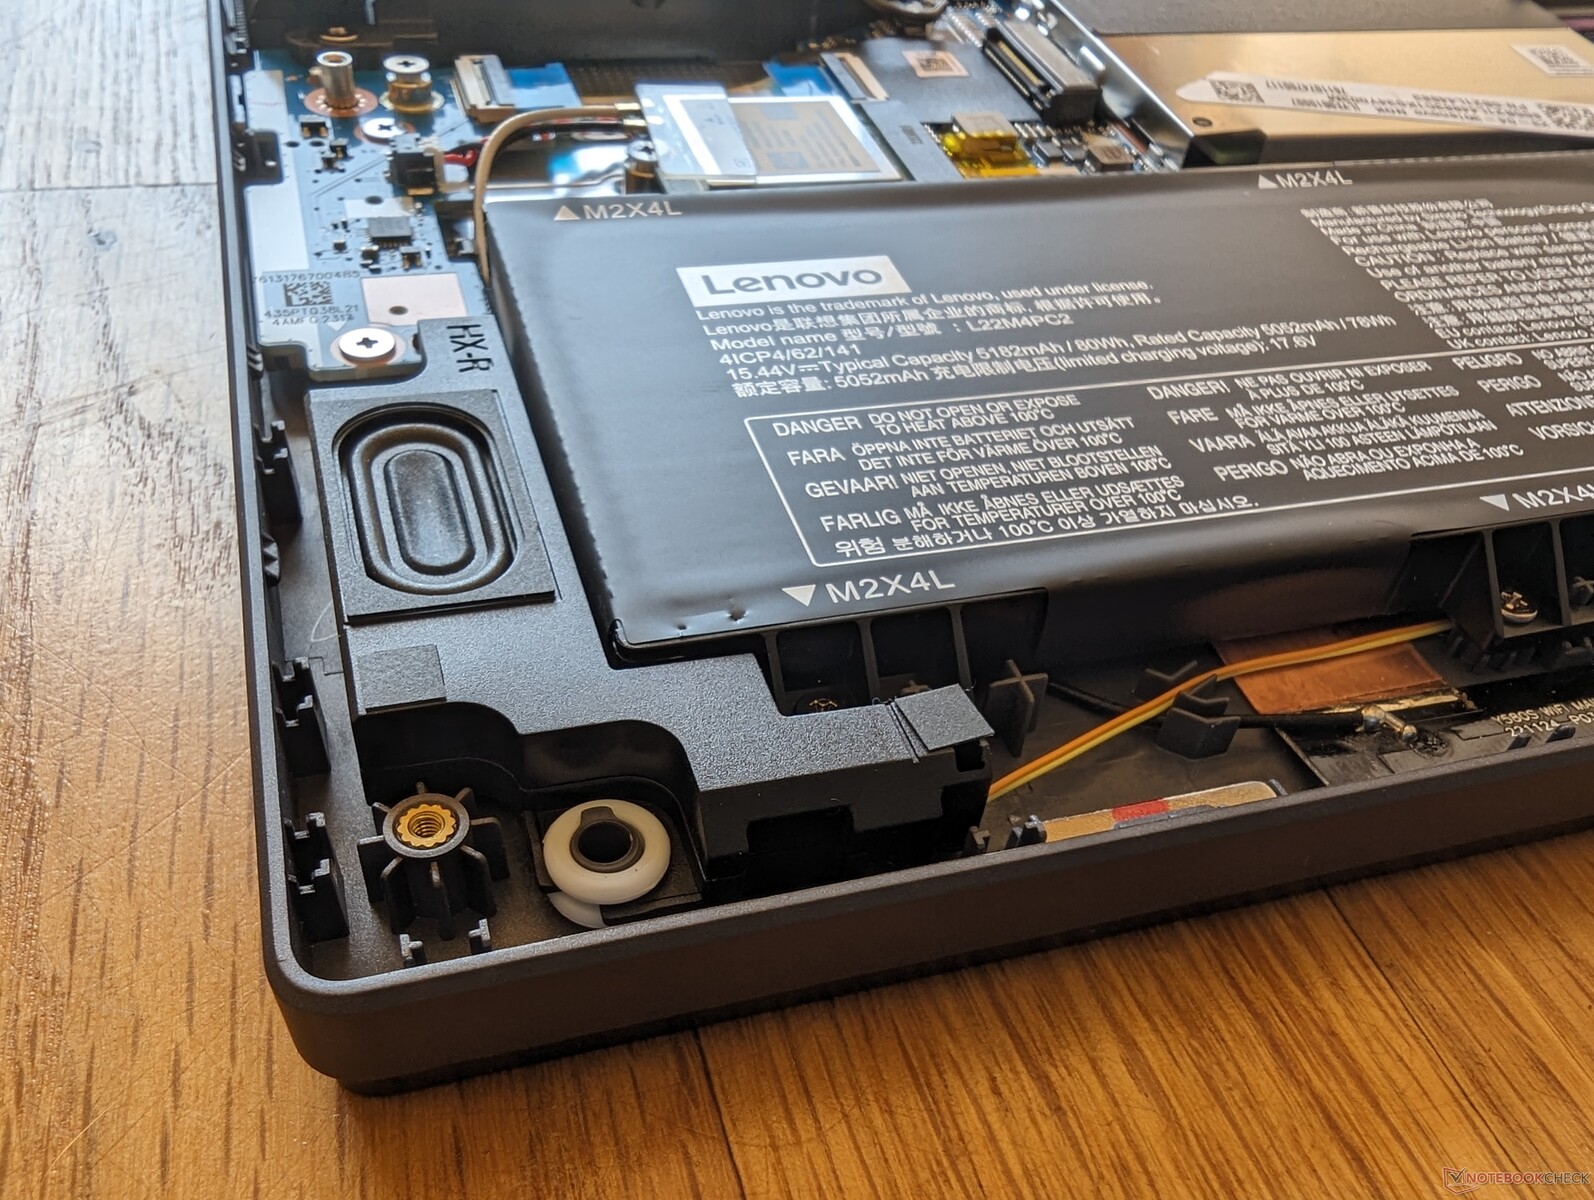
Mantenimiento
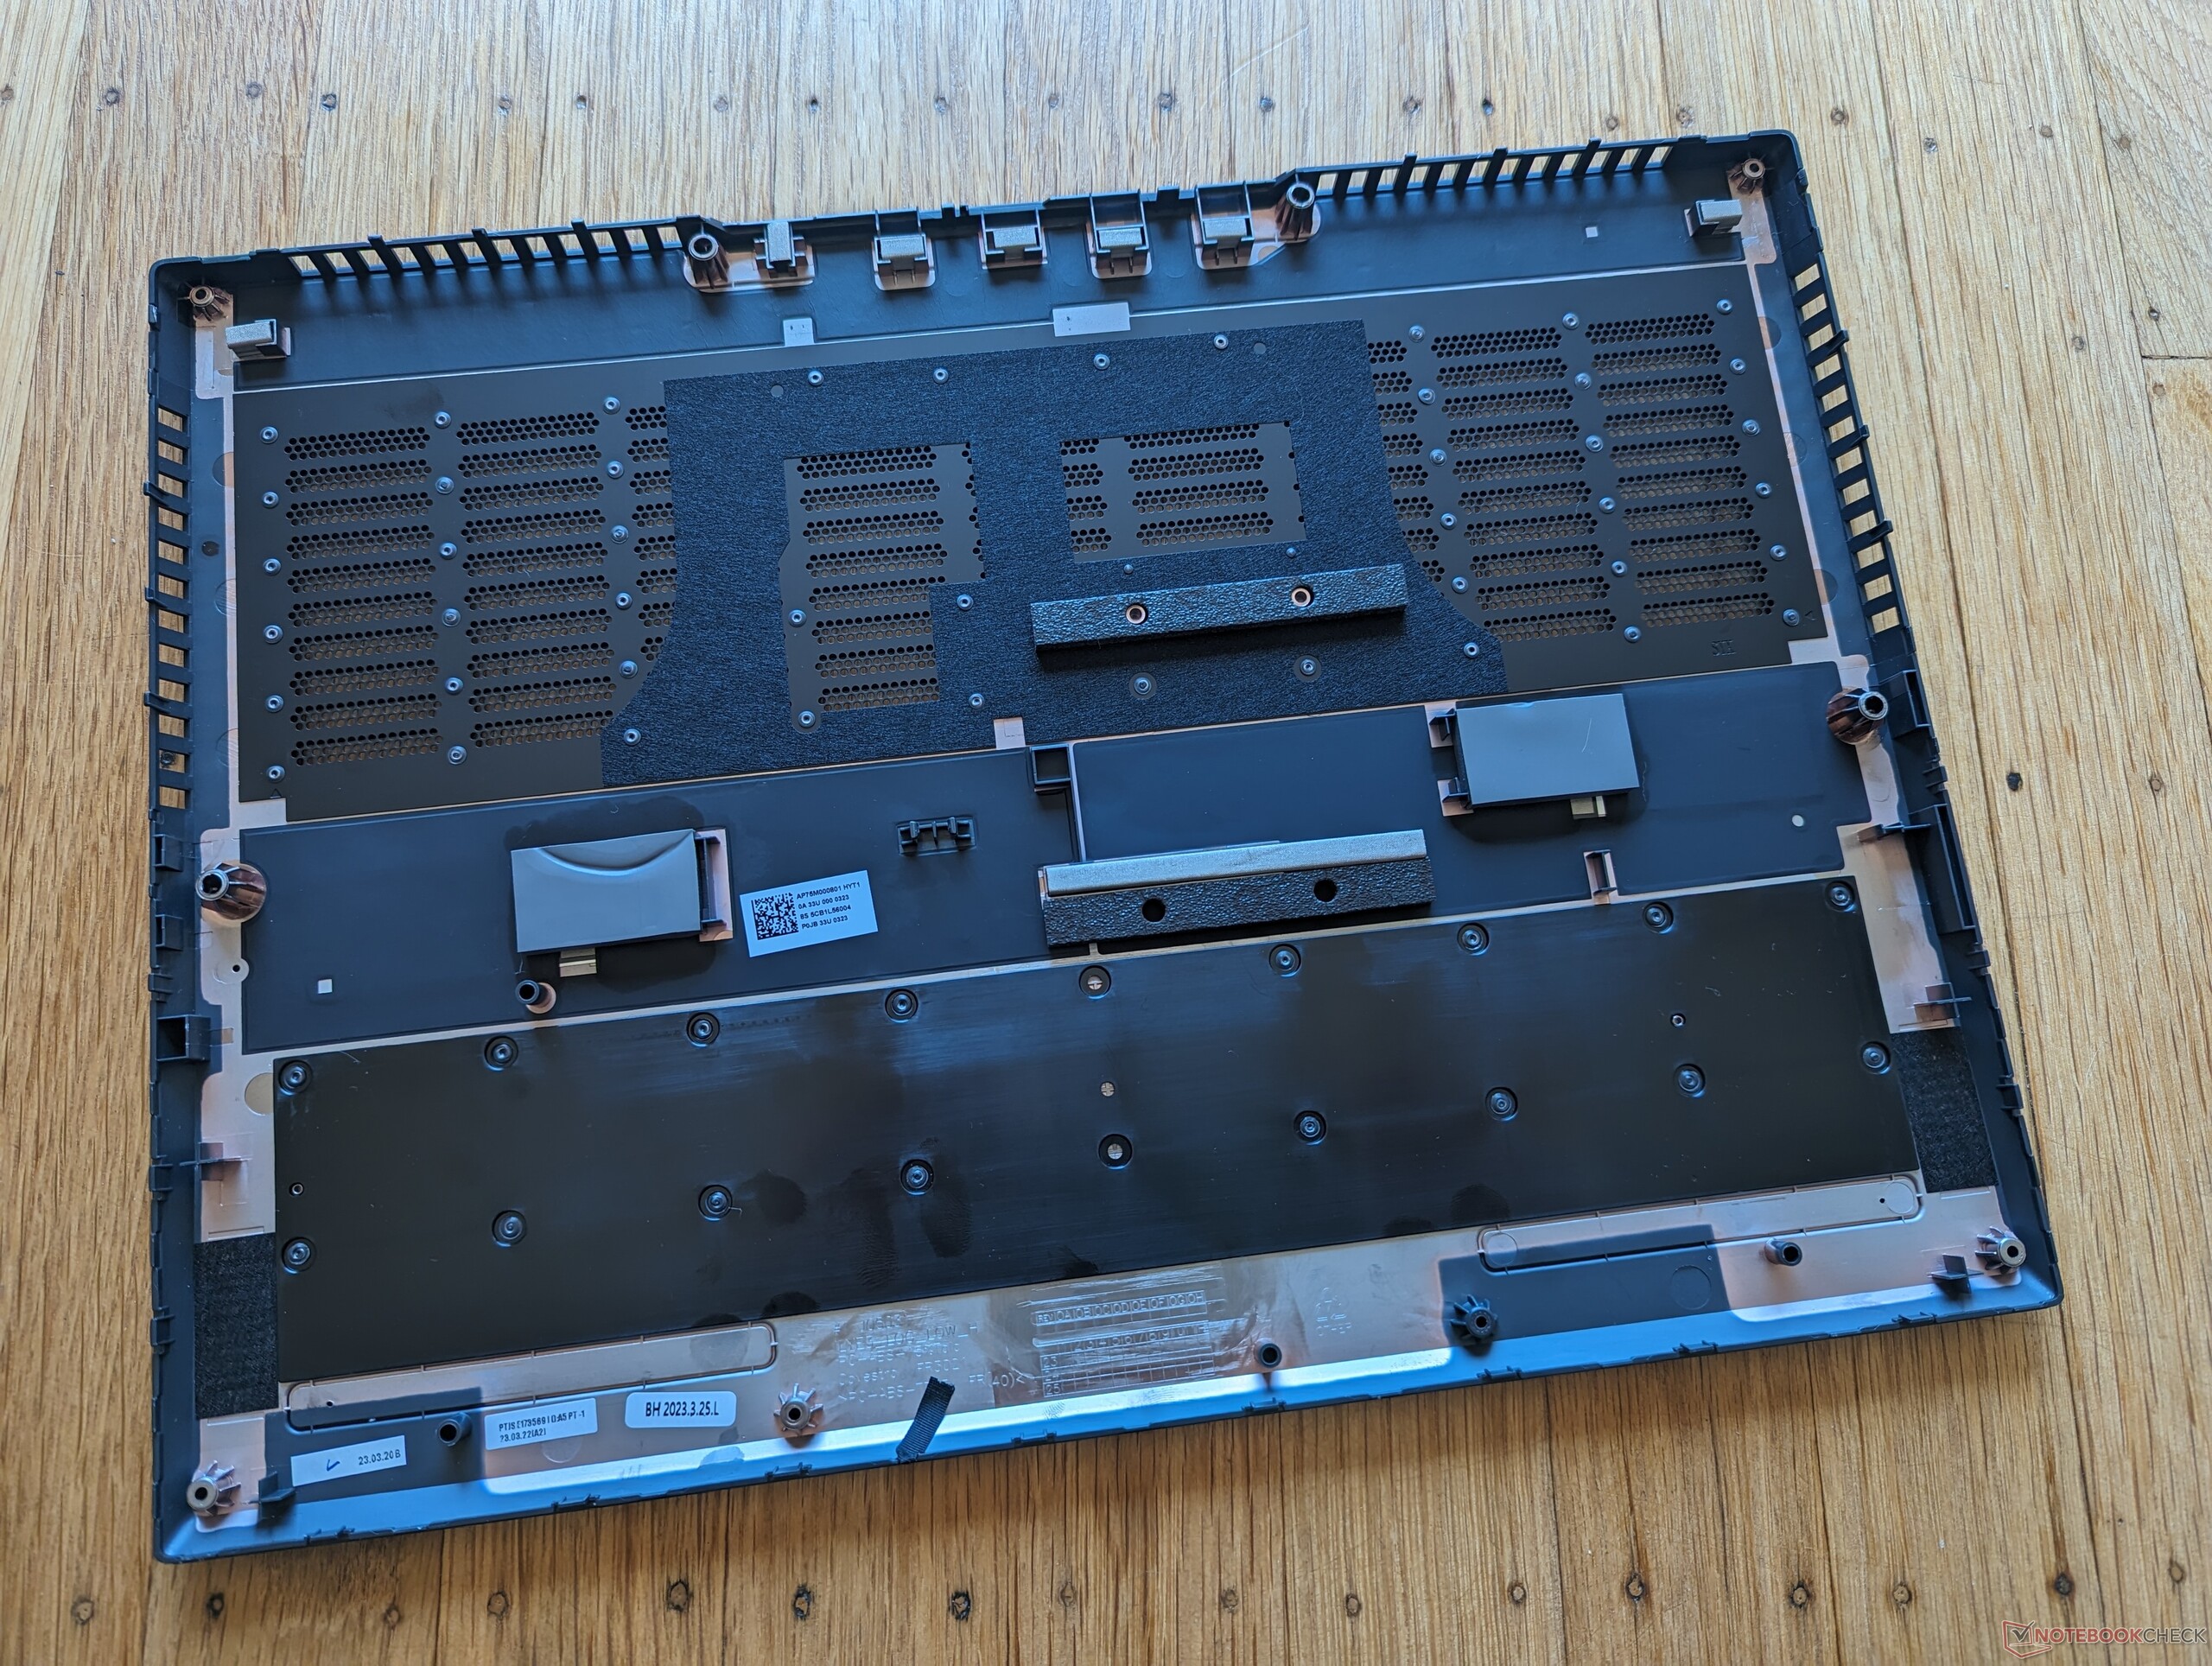
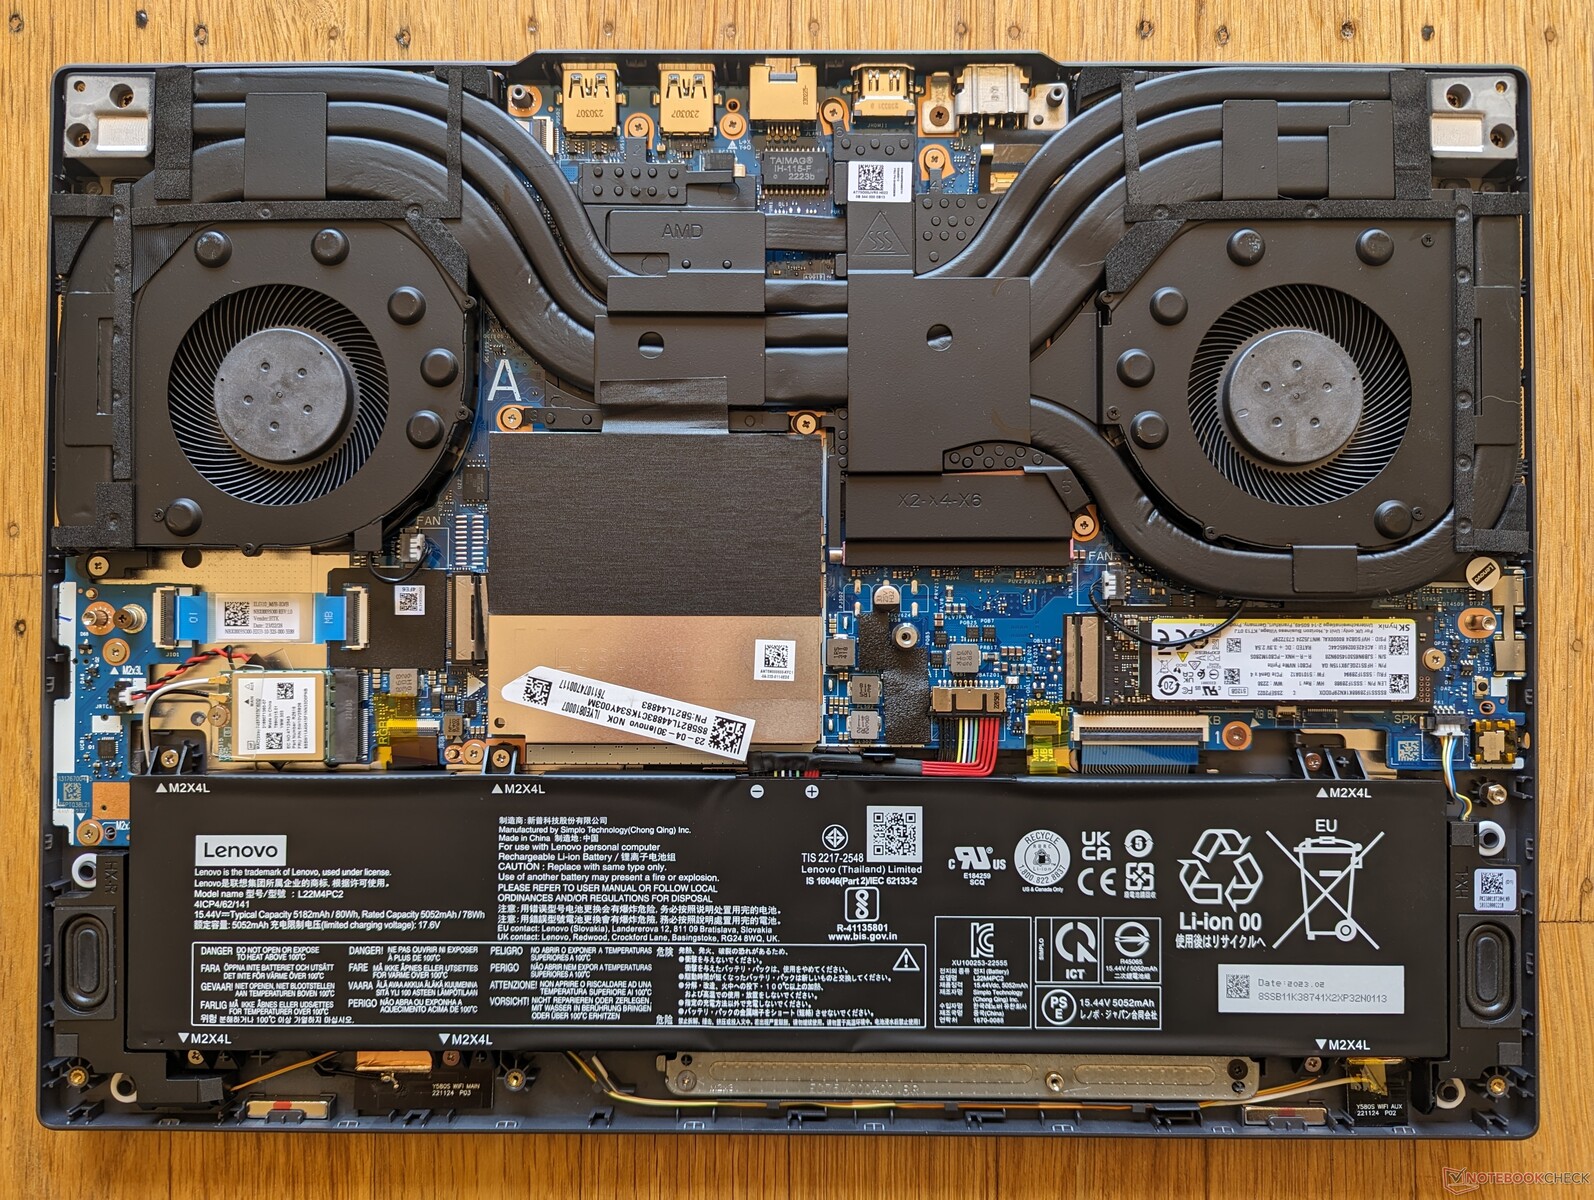
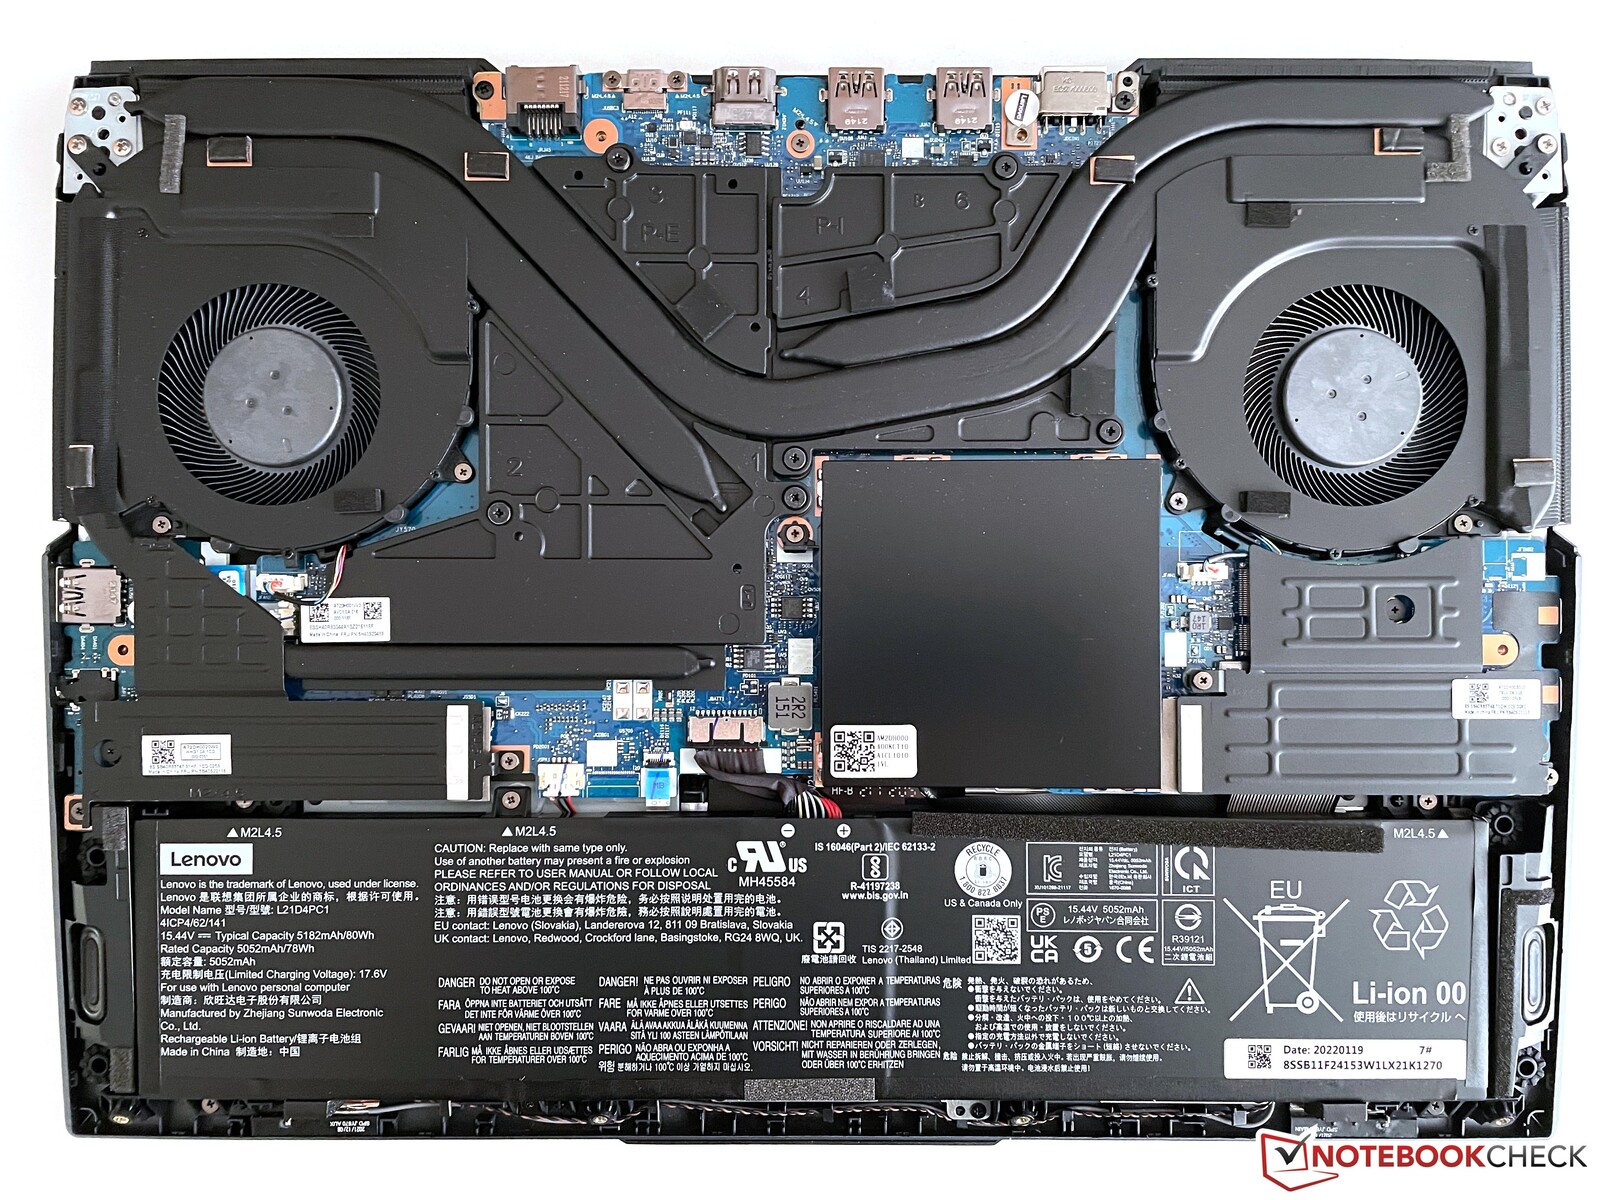
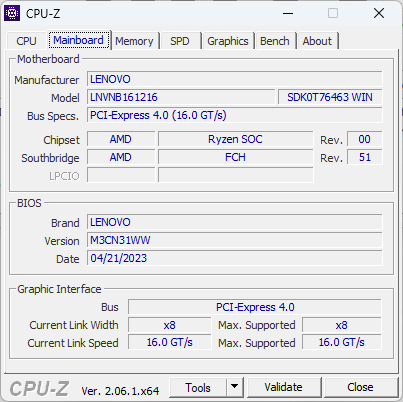
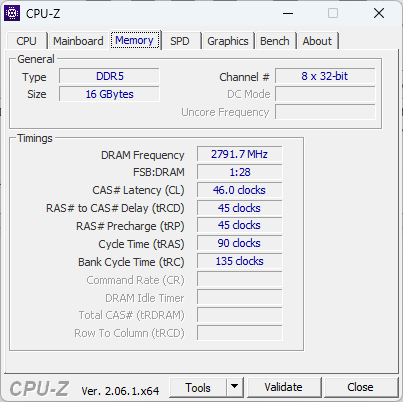
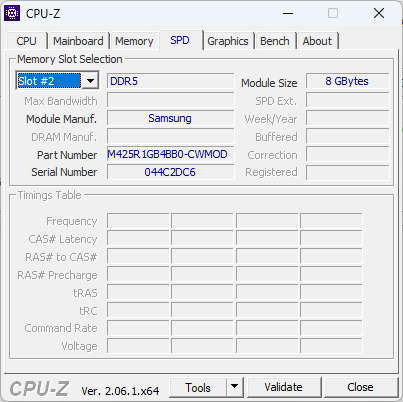
El panel inferior sólo requiere un destornillador Phillips para quitarlo. Los componentes principales son fácilmente ampliables, como en el Legion 5 Pro 16 más grueso, incluyendo las 2 ranuras SODIMM, las 2 ranuras M.2 2280, el módulo WLAN y la batería.
Accesorios y garantía
La caja no incluye más accesorios que el adaptador de CA y la documentación. Si se adquiere en EE.UU., se aplica la garantía limitada de un año habitual del fabricante.
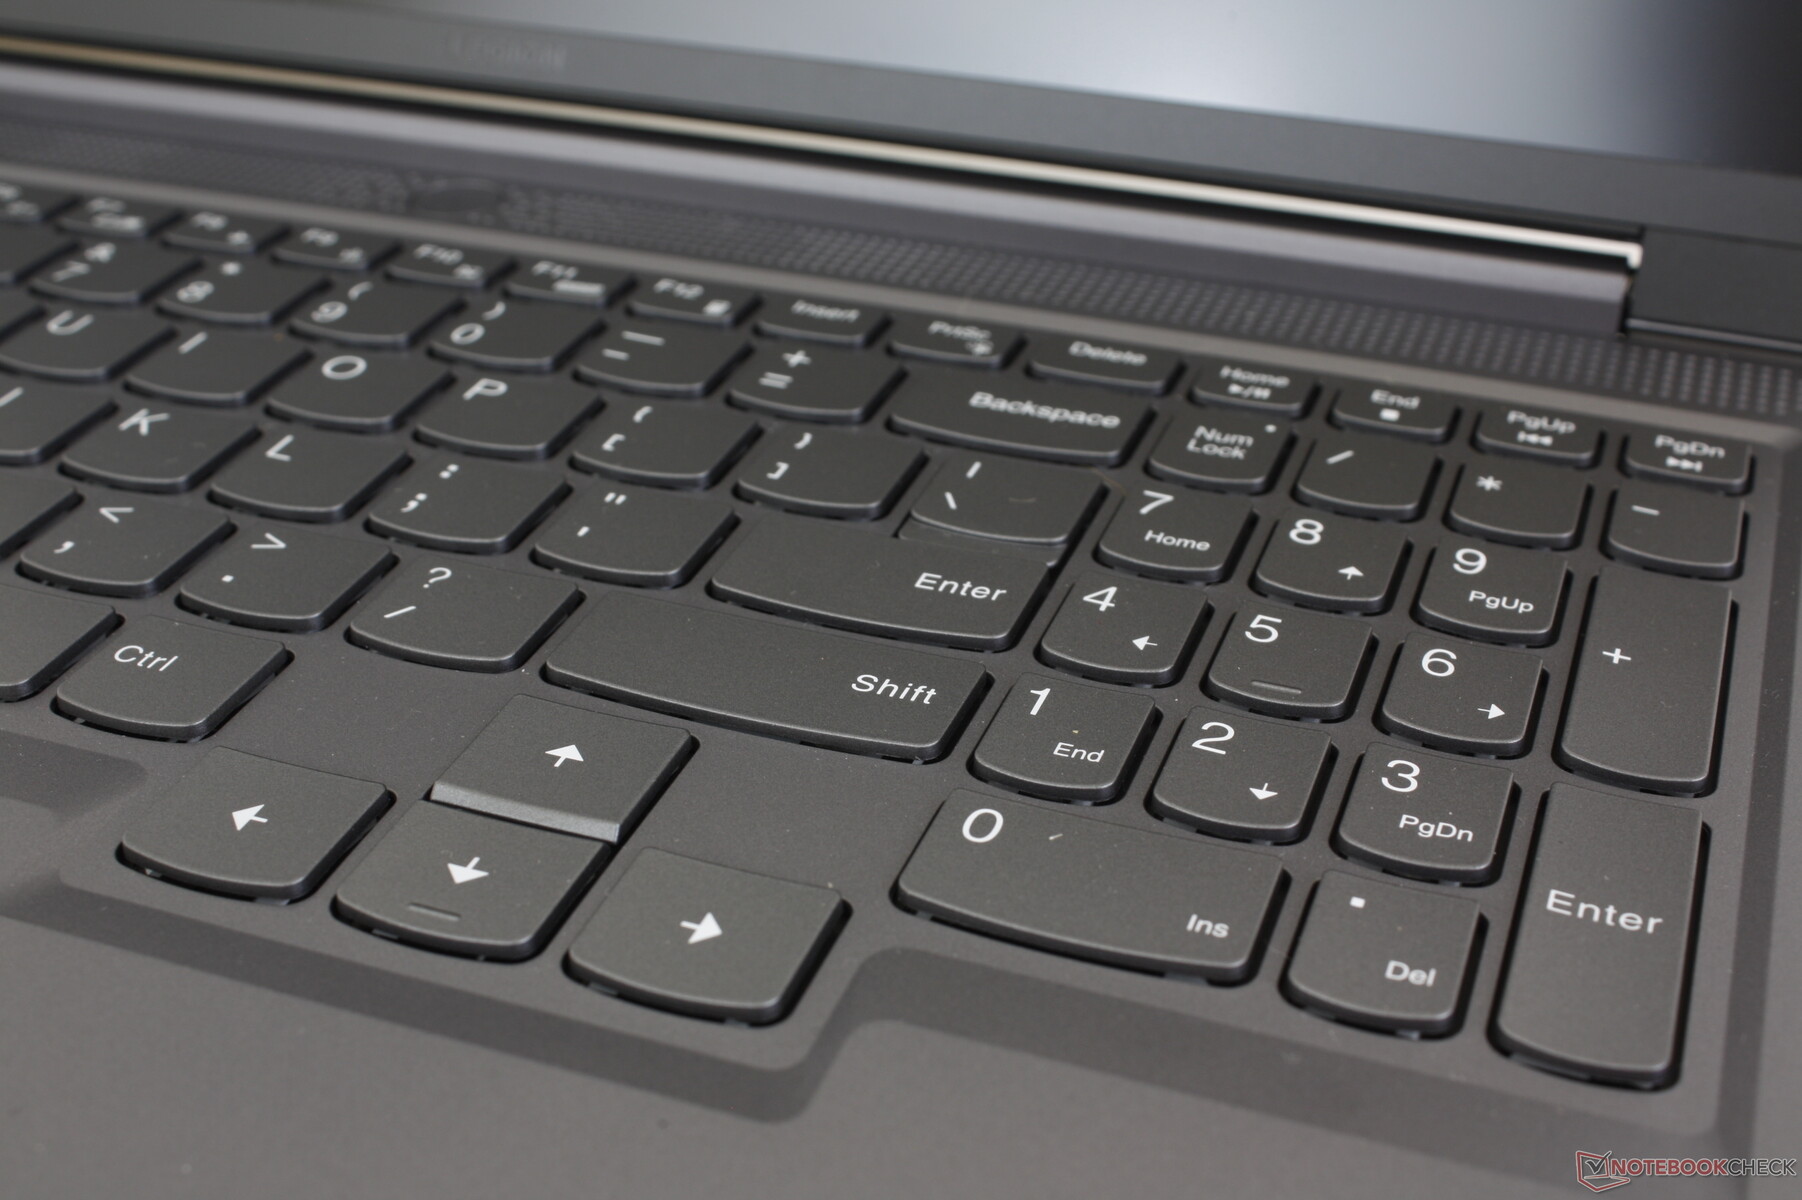
Dispositivos de entrada - Sin iluminación RGB por tecla
Teclado
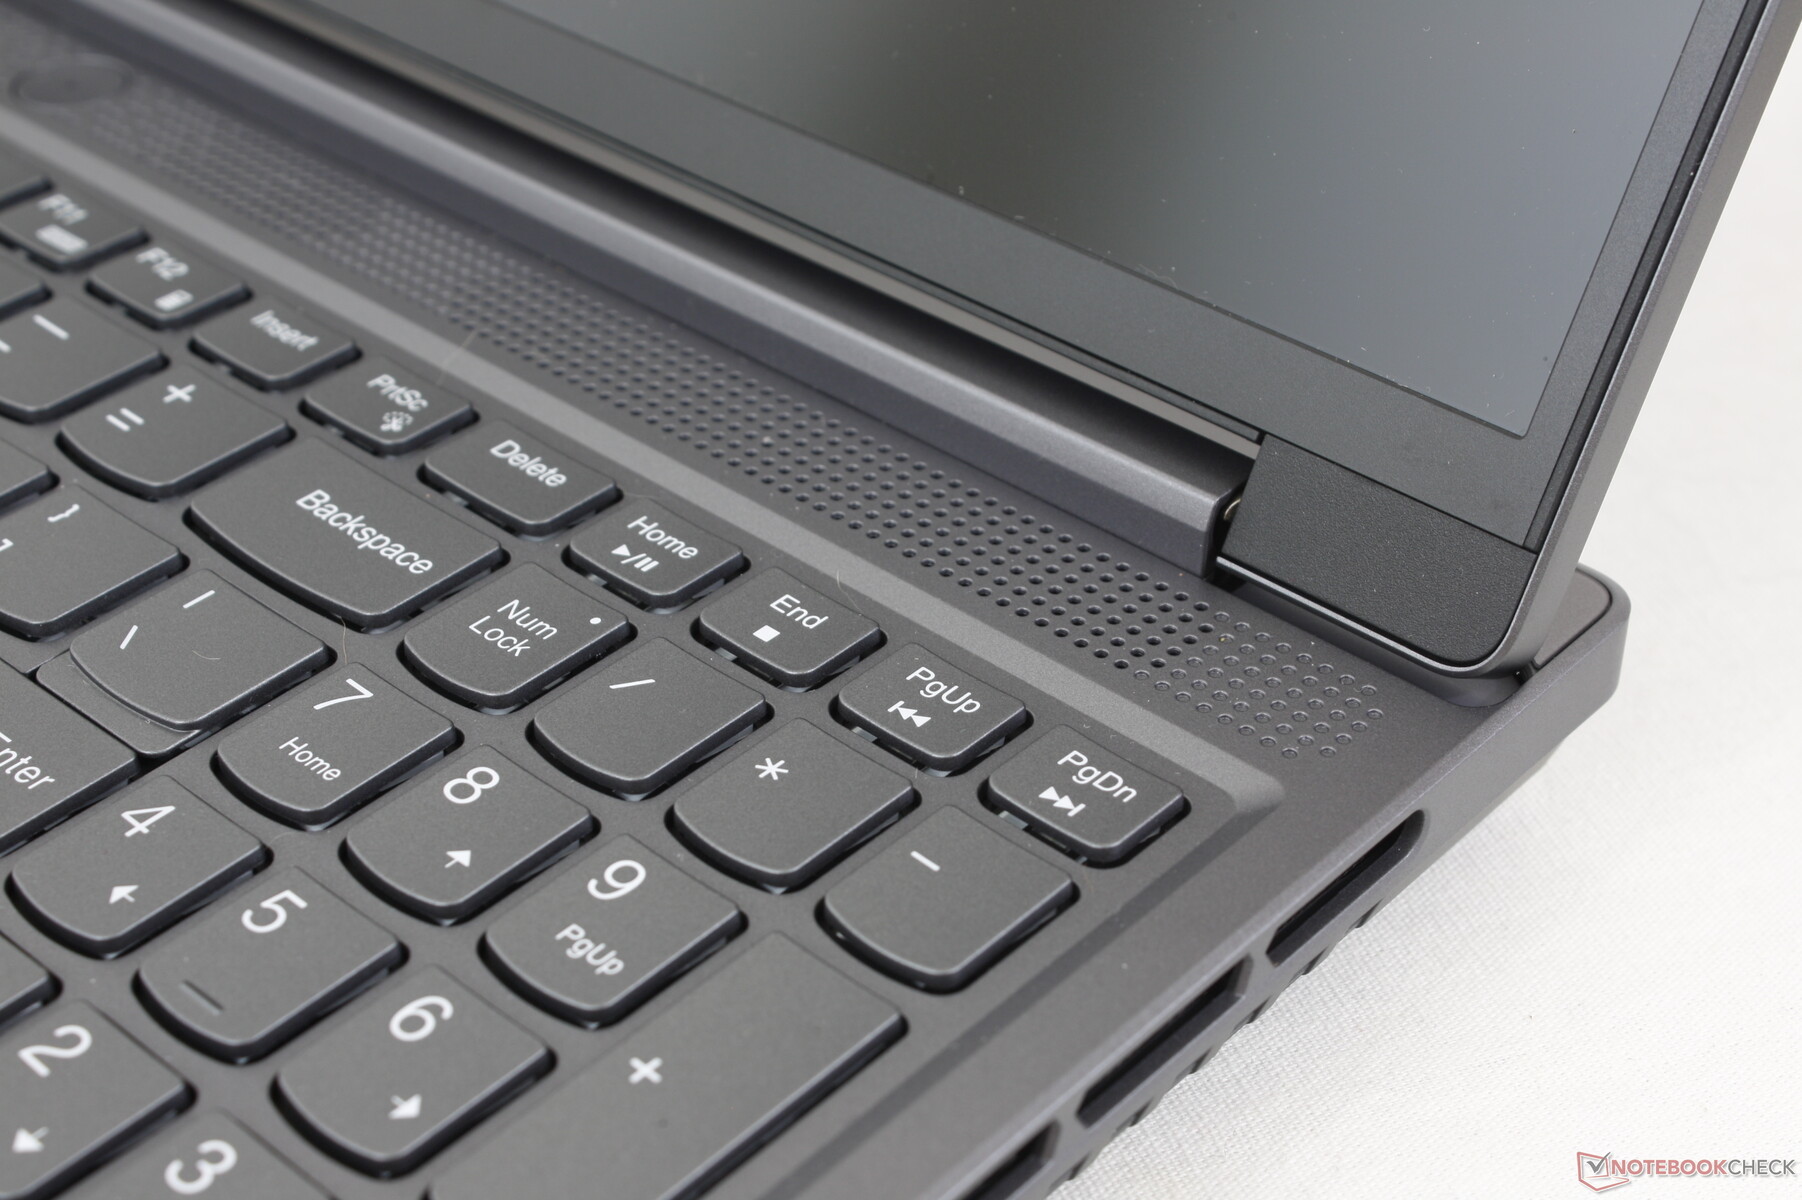
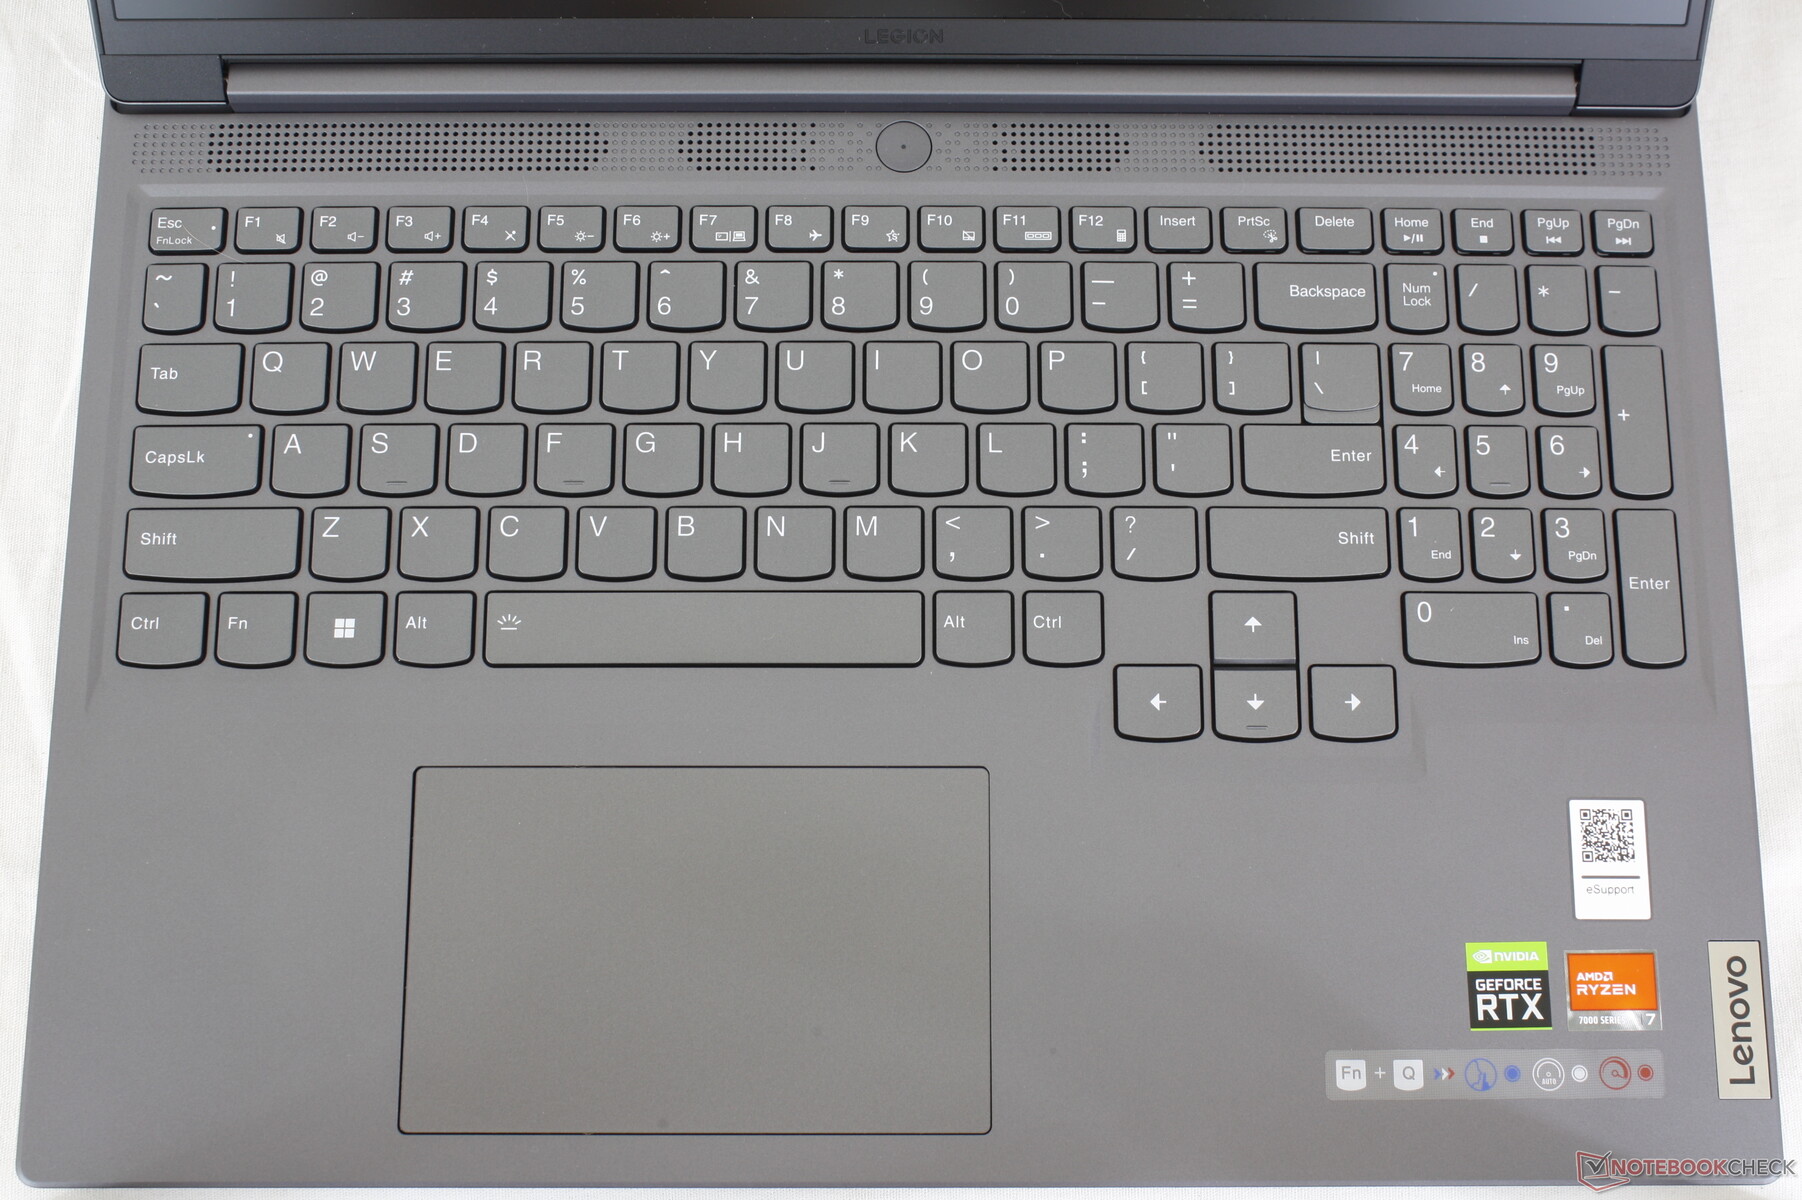
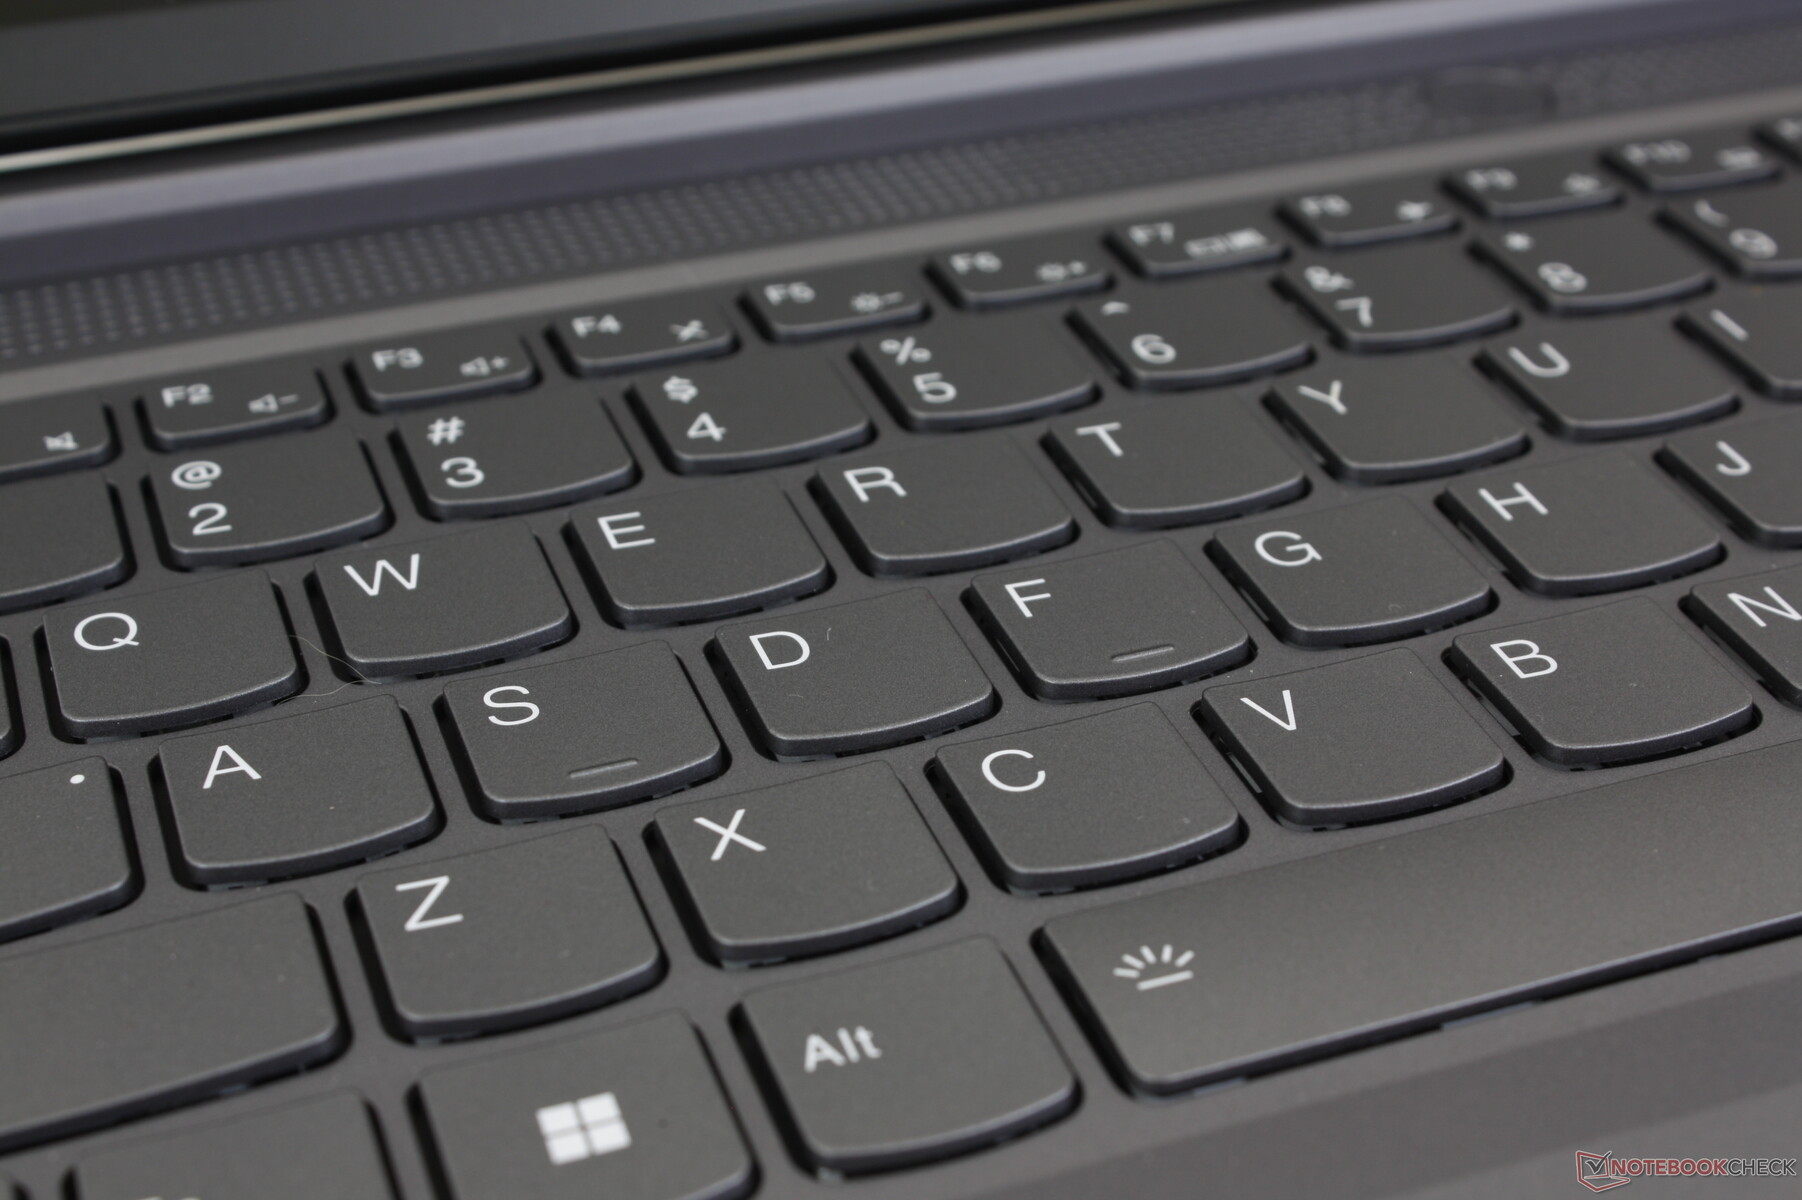
Aparte de los pocos modelos insignia con opciones de teclas mecánicas, la mayoría de los portátiles Legion ofrecen una experiencia de escritura similar, ya que Lenovo utiliza la misma distribución de teclado en gran parte de la serie. Así, los usuarios que hayan tecleado en el más caro Legion Slim 7i 16 o incluso en el antiguo Legion 5 15 se sentirán como en casa con el Legion Slim 5. En cambio, el principal factor diferenciador entre los teclados de nuestro Legion Slim 5 de gama media y el Legion Slim 7 de gama superior es la iluminación. Este último incluye iluminación RGB por tecla, mientras que nuestro Legion Slim 5 sólo tiene iluminación RGB de cuatro zonas.
Apreciamos el teclado numérico integrado y las teclas de flecha grandes, que pueden resultar útiles para juegos de carreras y DOTA 2 Reborn, respectivamente. Otros portátiles para juegos como elAsus TUF Gaming A16oOmen 16tienen teclas de dirección más estrechas o no tienen numpad.
Panel táctil
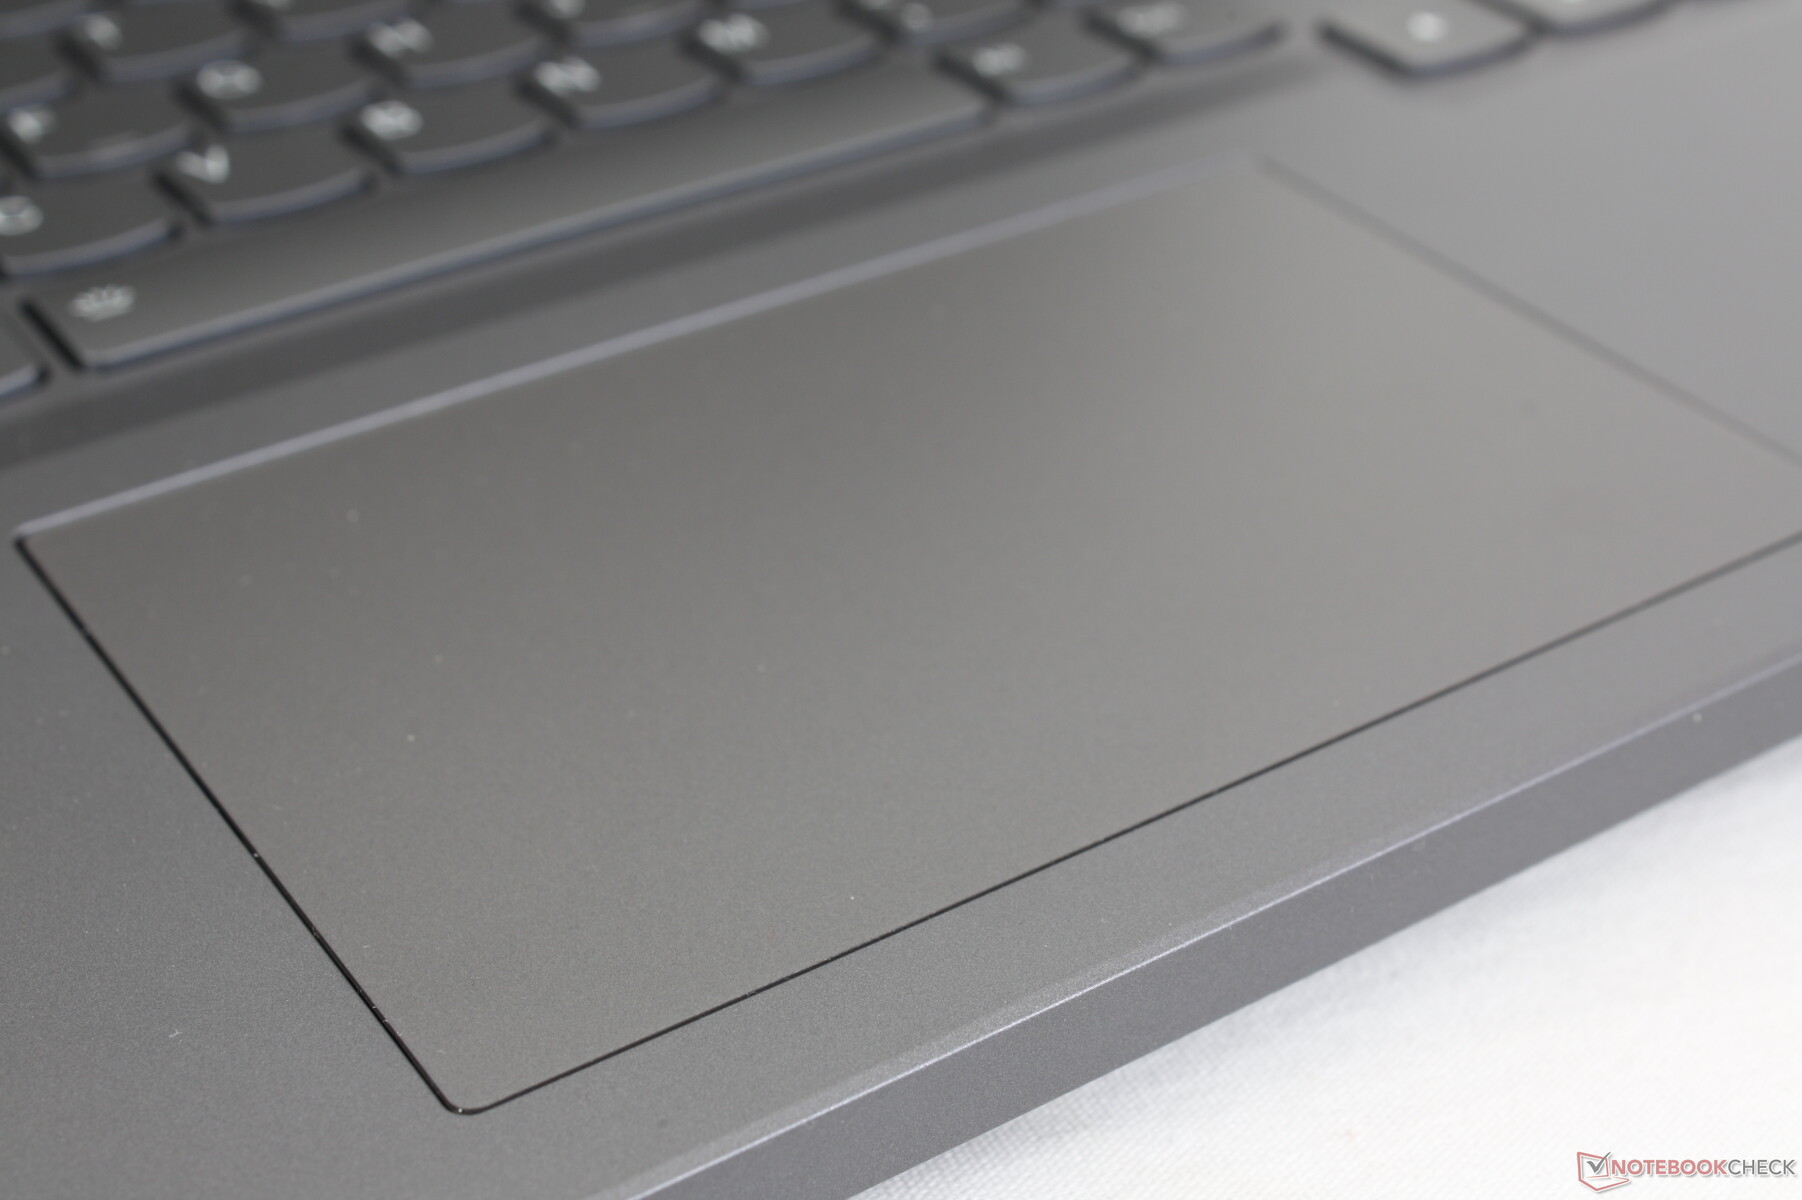
La superficie es idéntica a la del clickpad del Legion Slim 7i 16 con 12 x 7,5 cm. Aunque no es tan grande como el teclado del Razer Blade 16tiene un tamaño cómodo y un clic agudo y satisfactorio al pulsarlo. Sin embargo, la tracción es bastante pegajosa, por lo que el deslizamiento puede resultar más irregular de lo habitual, especialmente al realizar acciones como arrastrar y soltar.
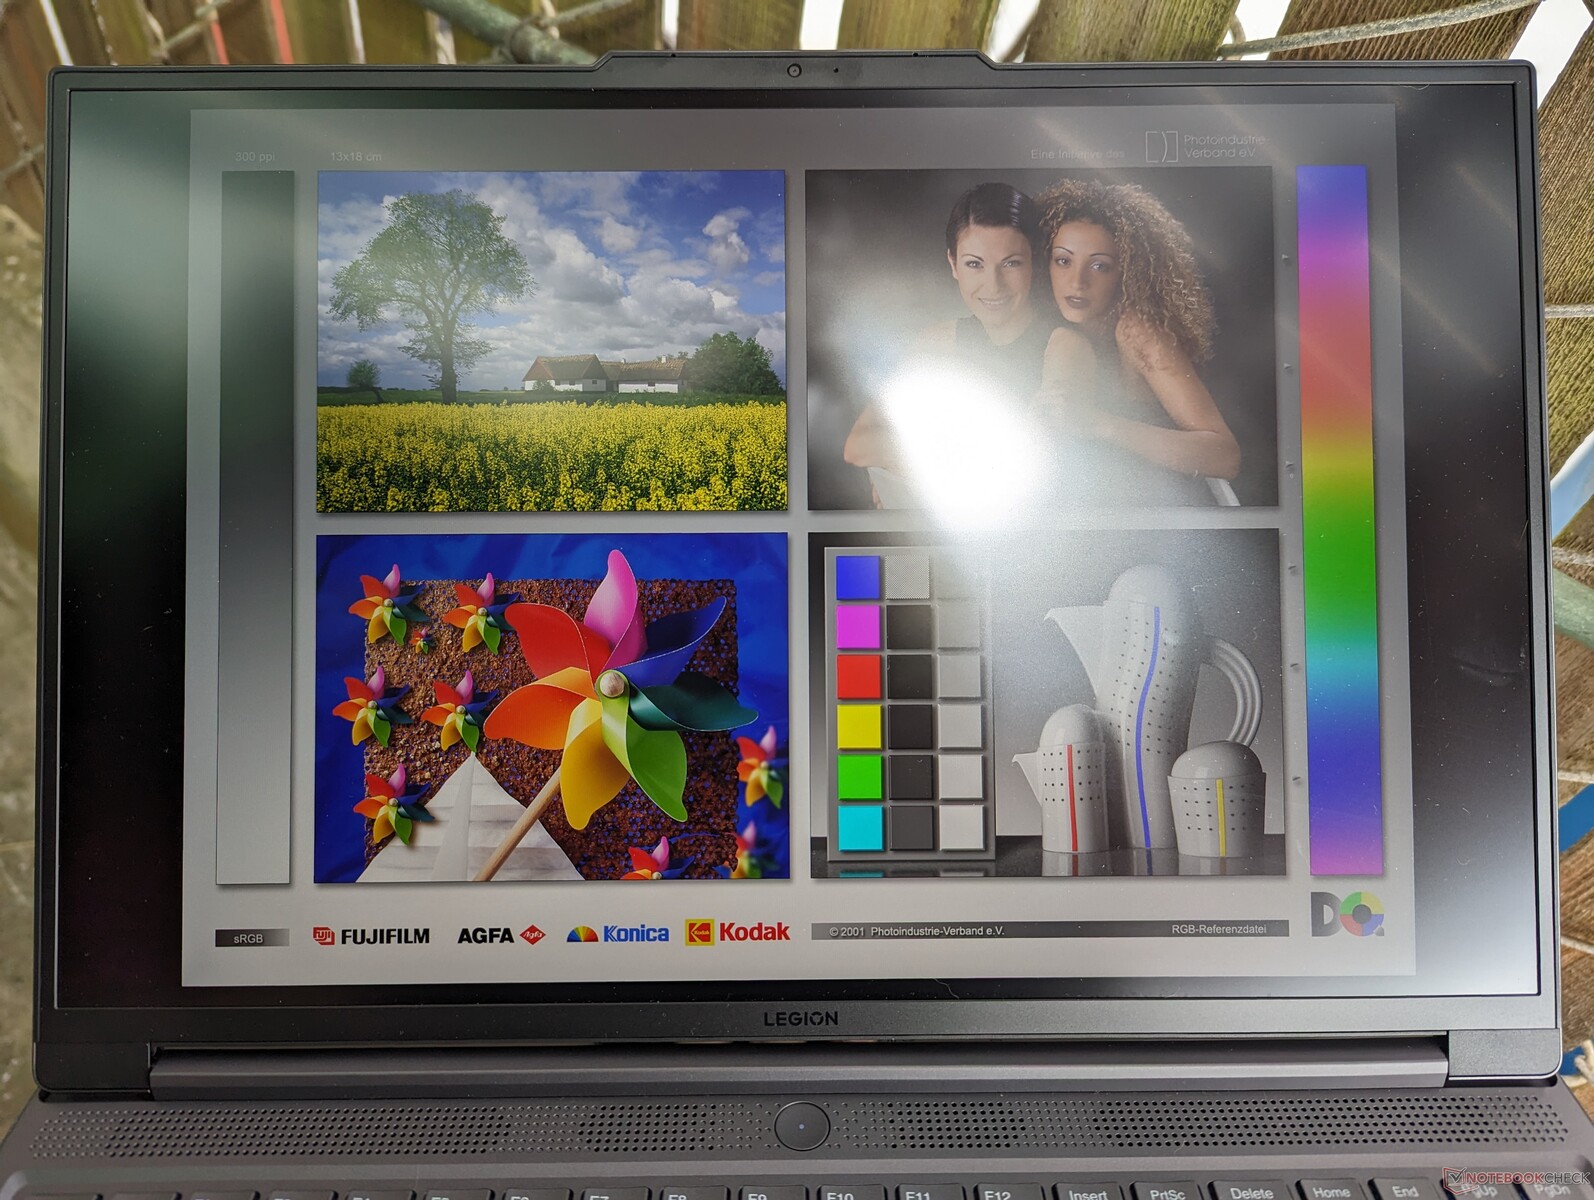
Pantalla - Excelentes características para el precio
Hay dos opciones de visualización disponibles:
- 2560 x 1600, 165 Hz, 100% sRGB, 300 nits, certificado Pantone
- 1920 x 1200, 144 Hz, 60% sRGB, 300 nits
Nuestras mediciones sólo reflejan la opción en negrita. Por lo demás, ambos paneles son compatibles con G-Sync y FreeSync Premium. Recomendamos evitar el panel 1200p más barato debido a su estrecho espacio de color NTSC del 45%, especialmente si la precisión del color es una necesidad.
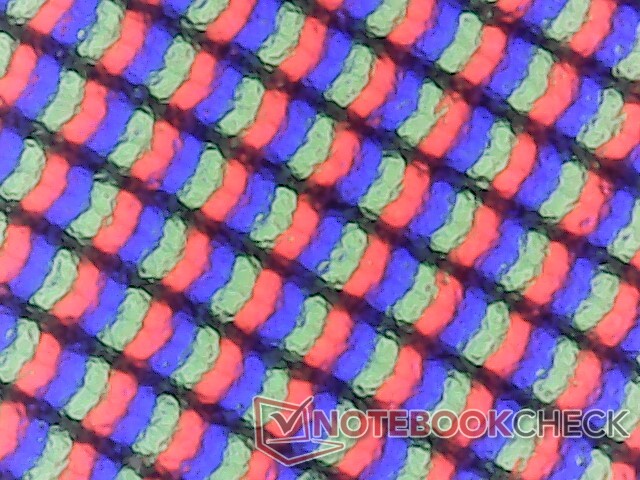
El panel BOE NE160QDM de nuestra unidad también se puede encontrar en el Dell G16 7620 por lo que ambos modelos ofrecen experiencias visuales muy similares. Este panel en particular es perfecto para los juegos de portátiles debido a sus rápidos tiempos de respuesta, colores profundos, rápida frecuencia de actualización de 165 Hz y resolución nativa QHD, que combina bien con la mayoría de GPU móviles.
| |||||||||||||||||||||||||
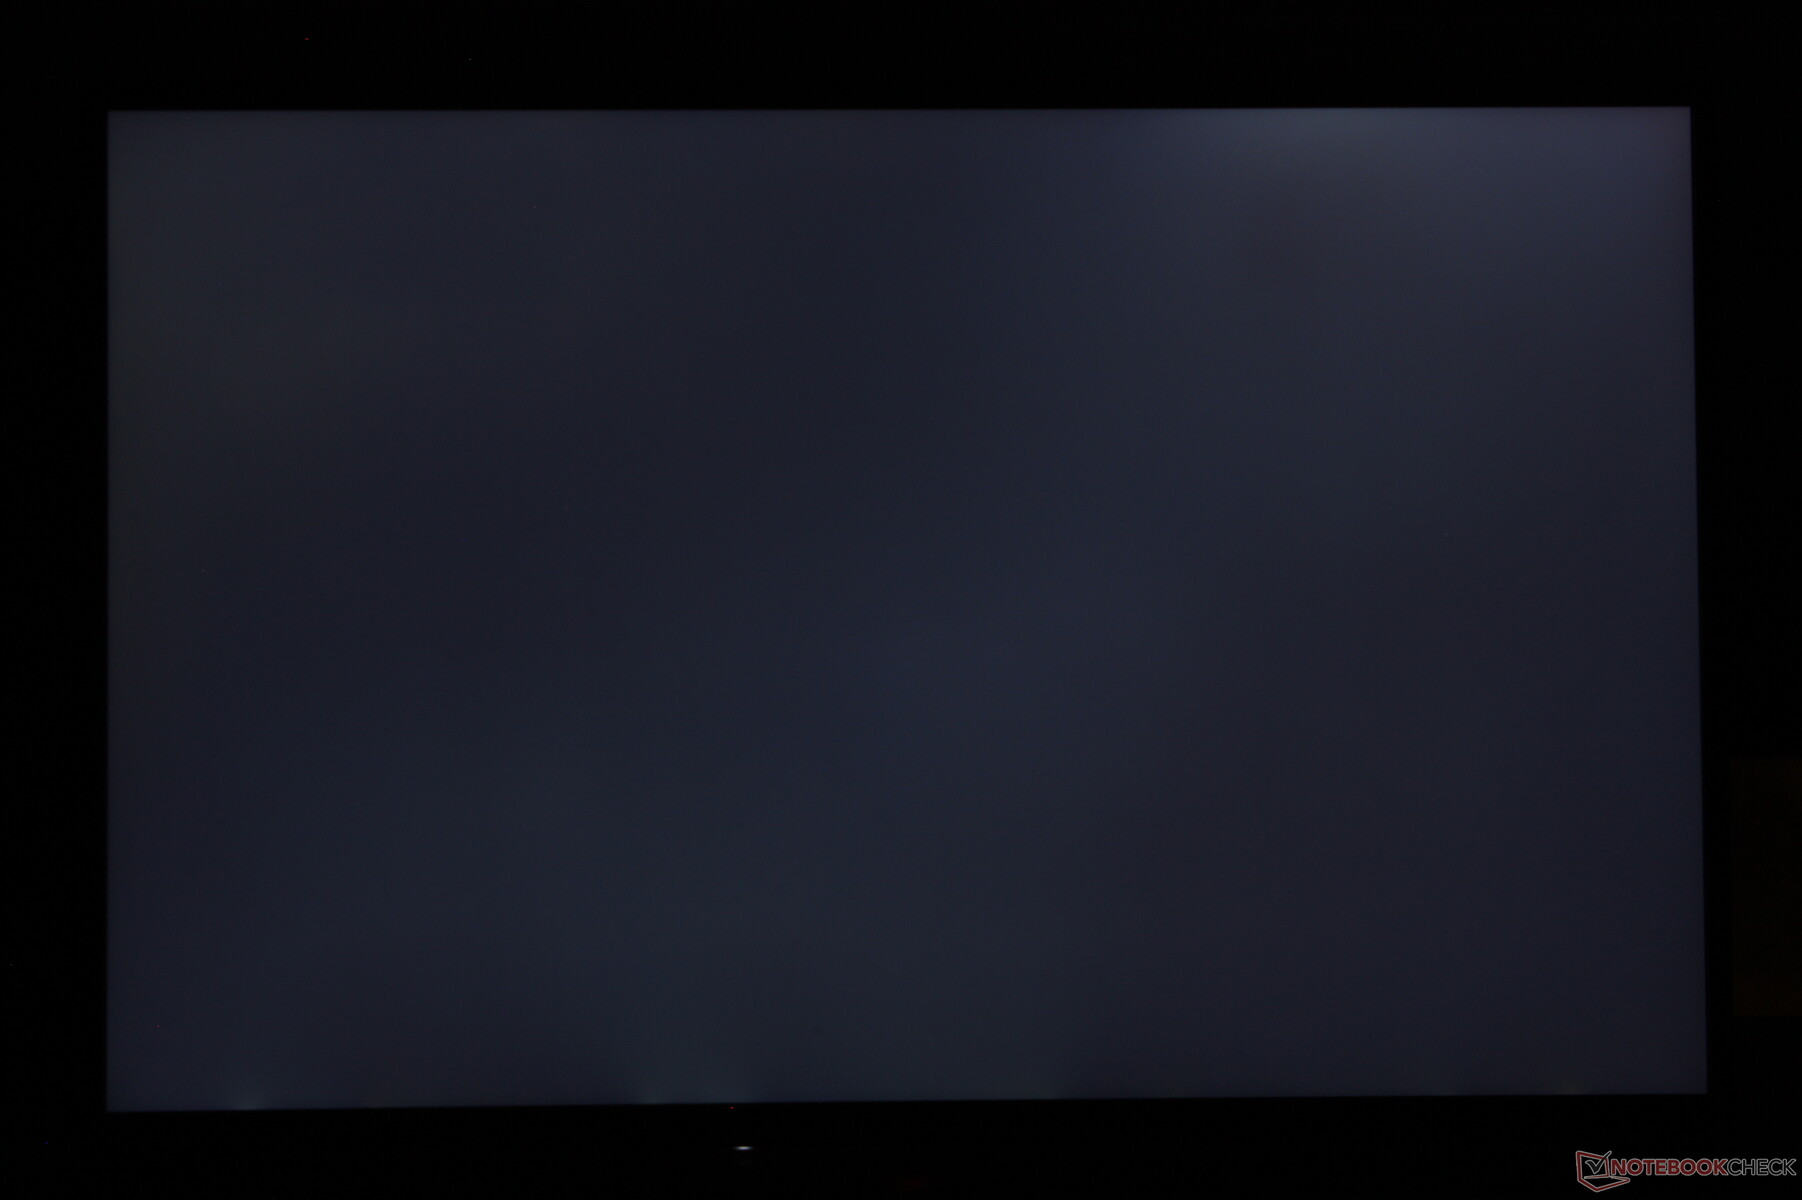
iluminación: 84 %
Brillo con batería: 371.6 cd/m²
Contraste: 845:1 (Negro: 0.44 cd/m²)
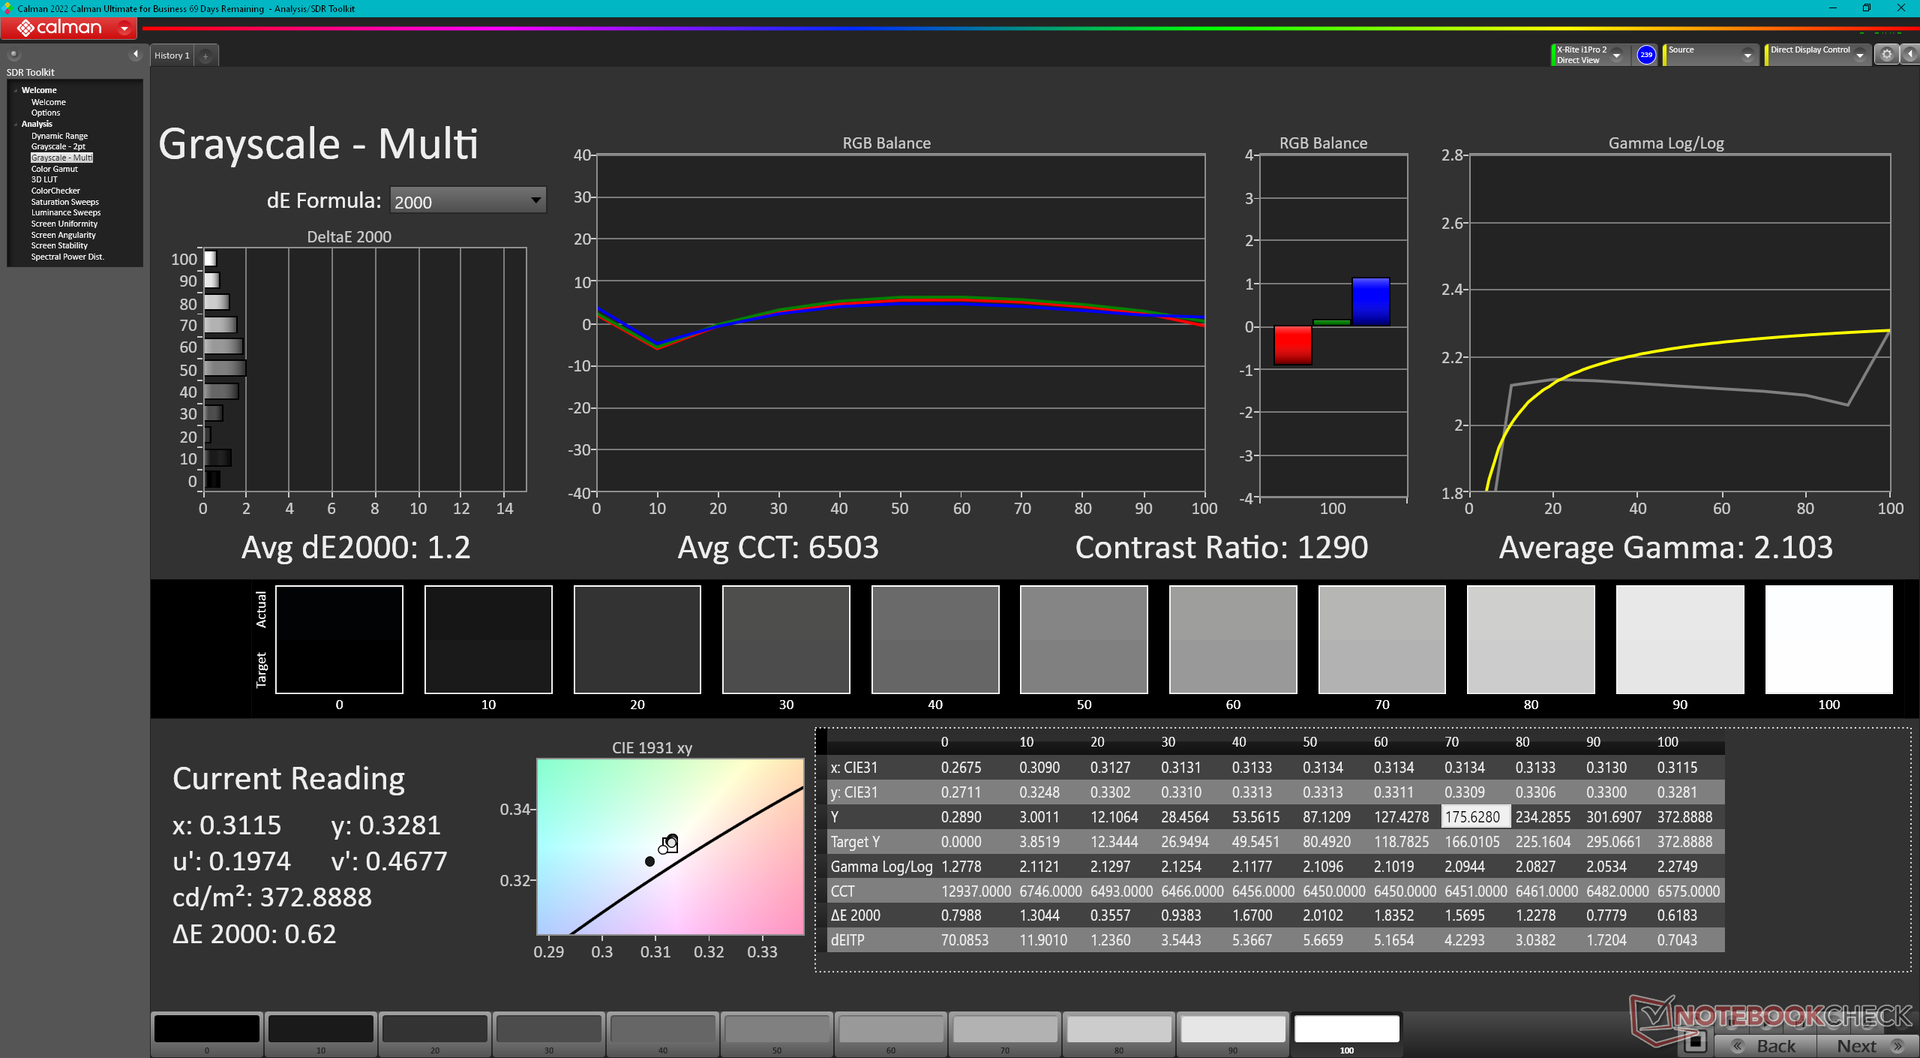
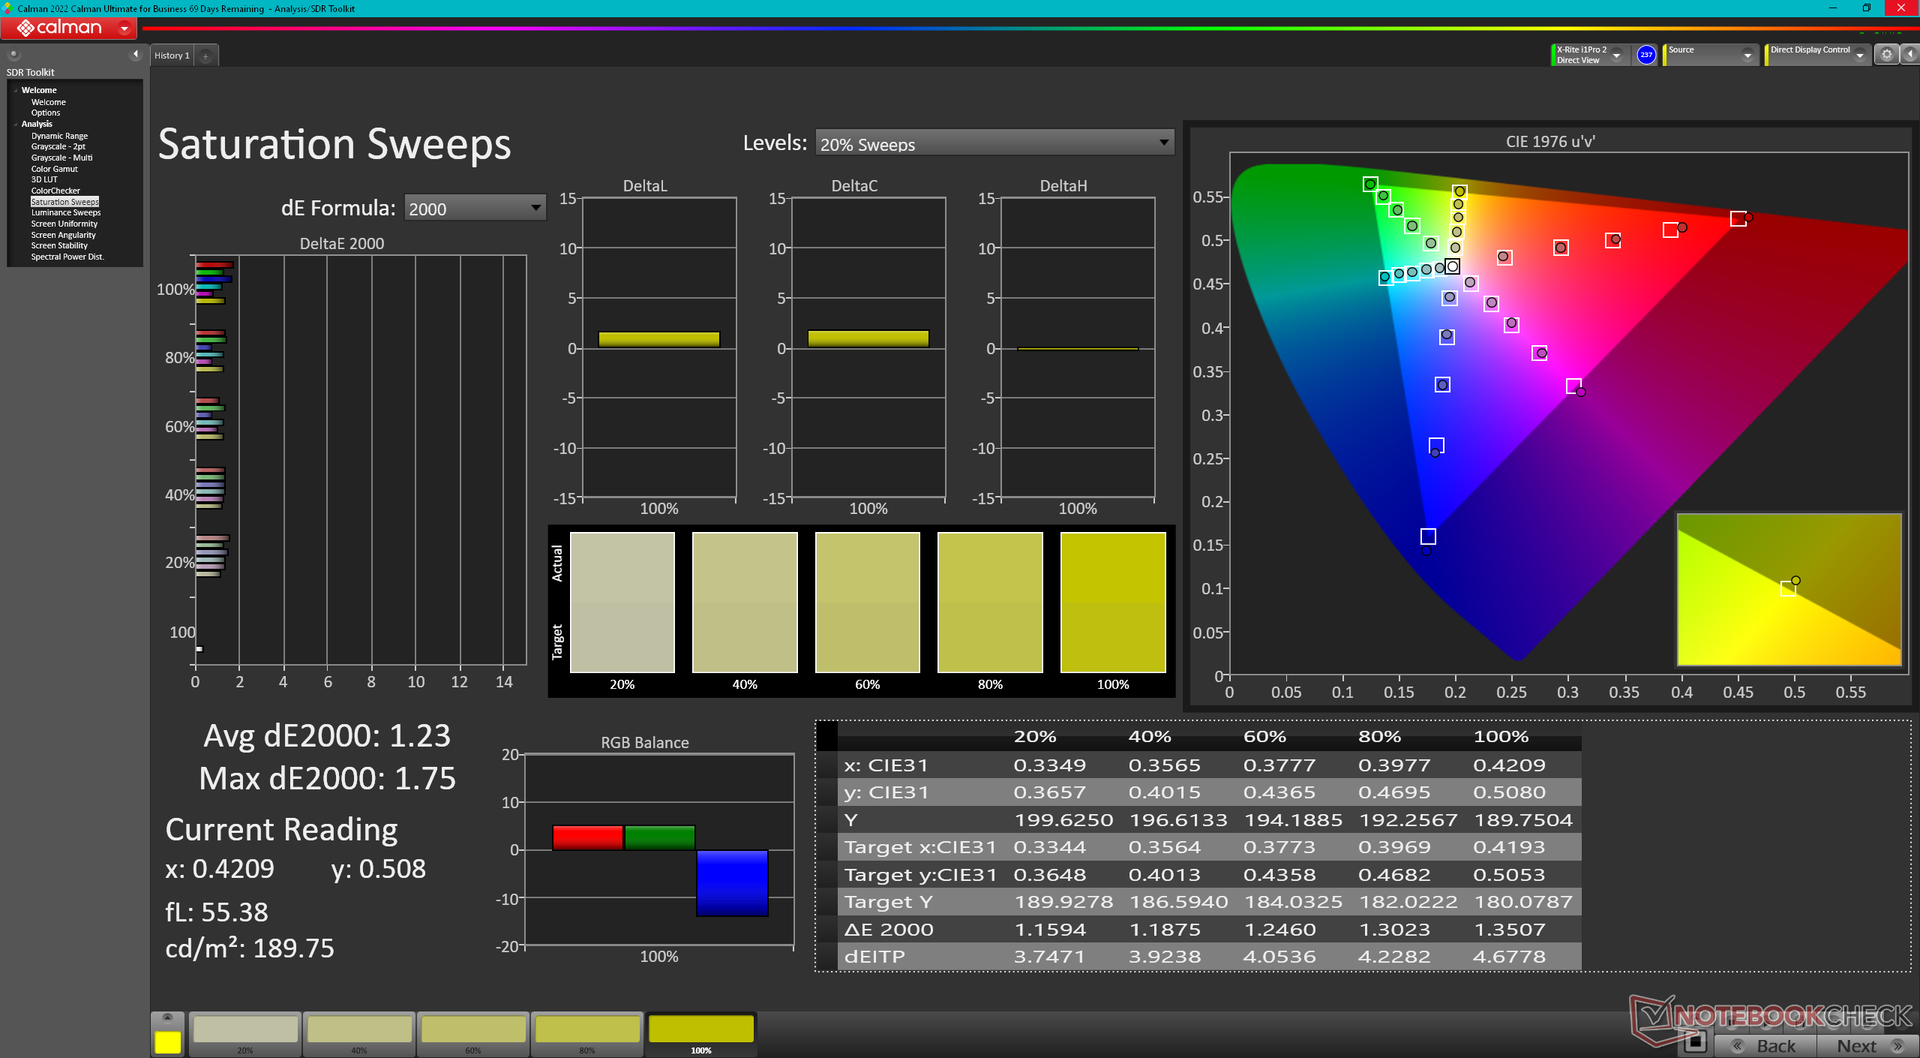
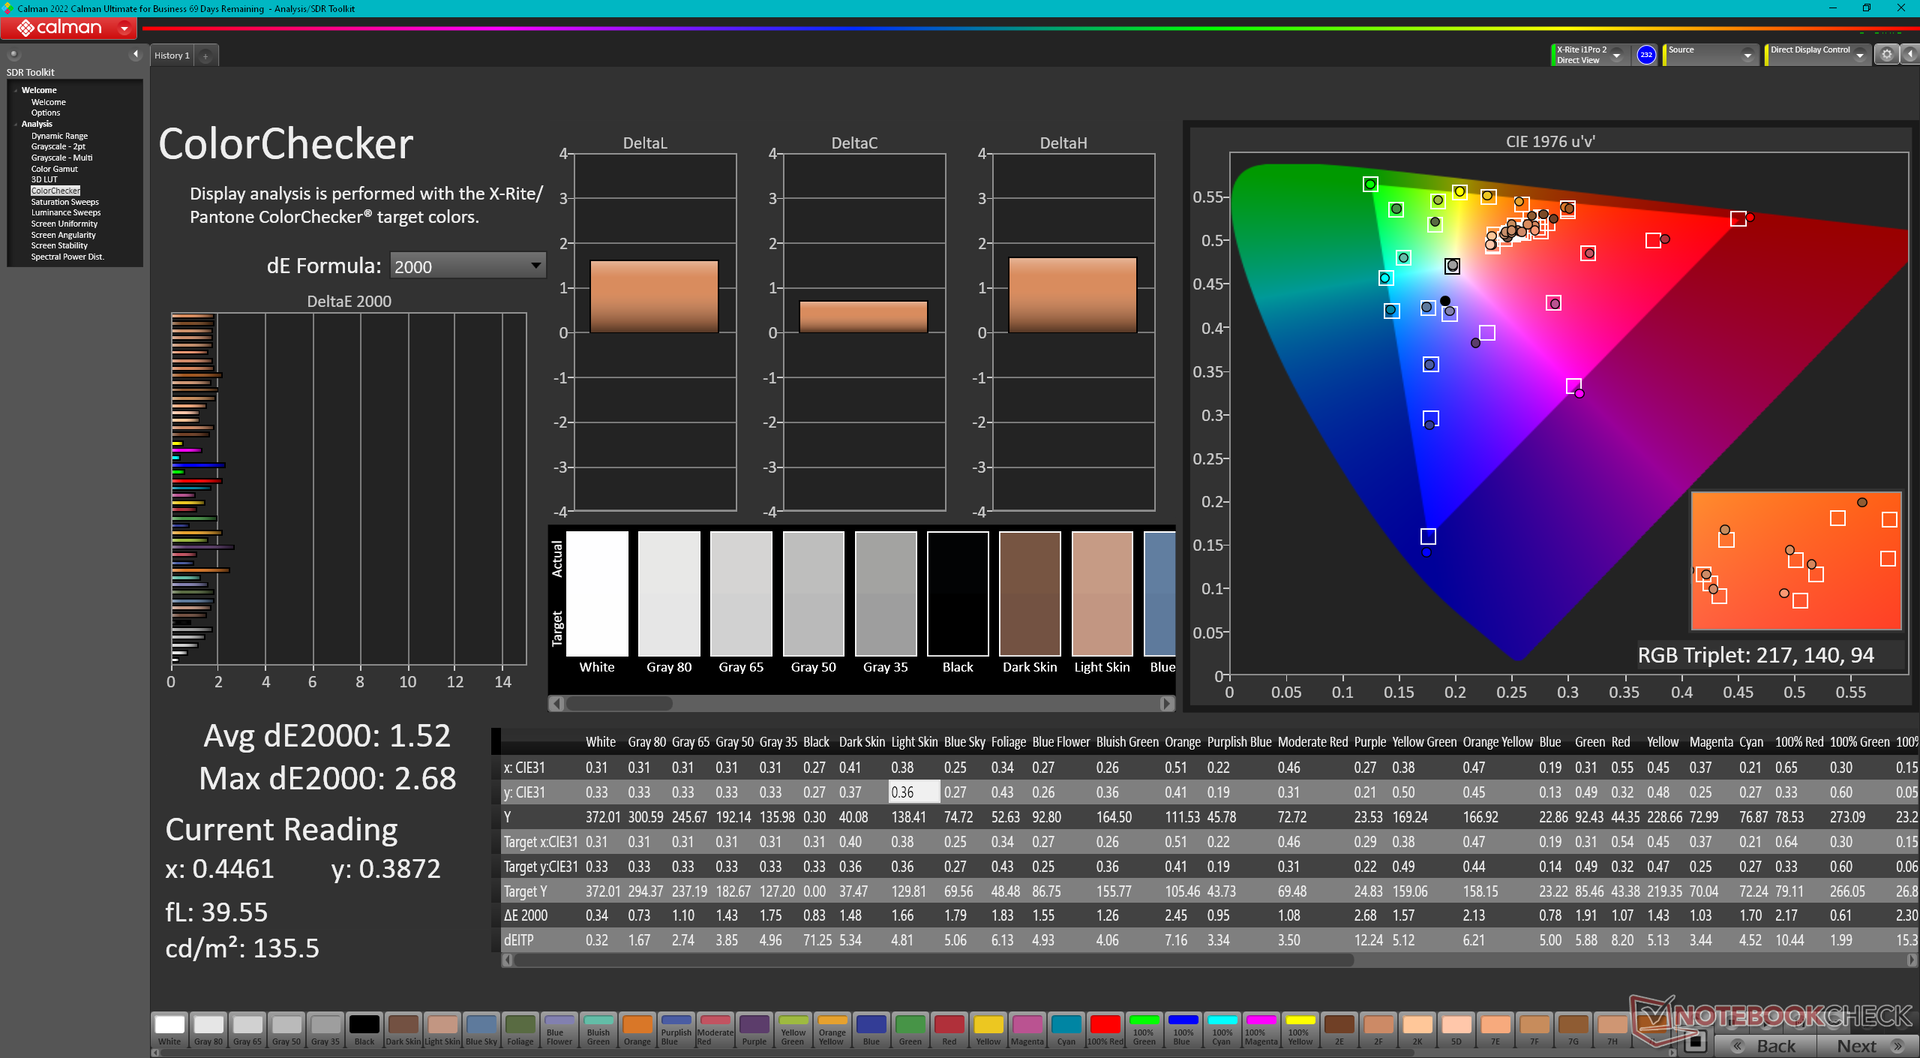
ΔE ColorChecker Calman: 1.52 | ∀{0.5-29.43 Ø4.71}
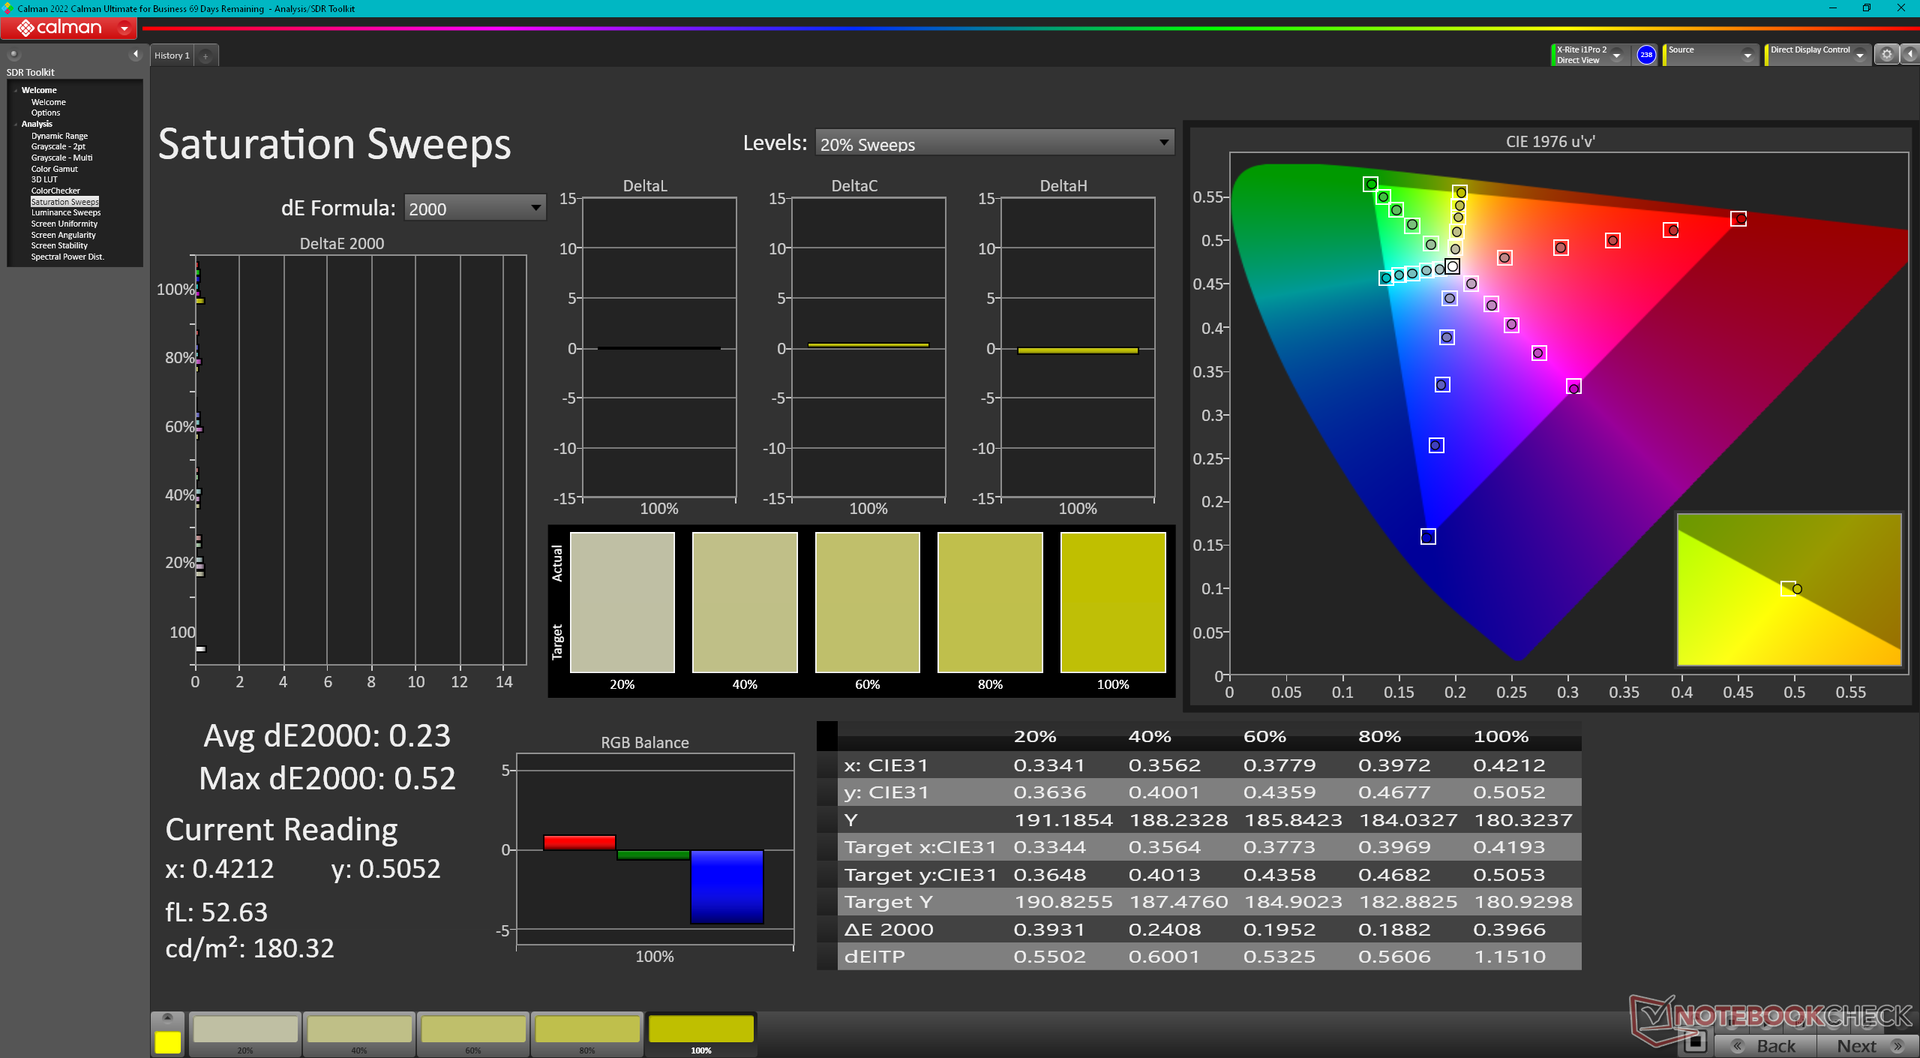
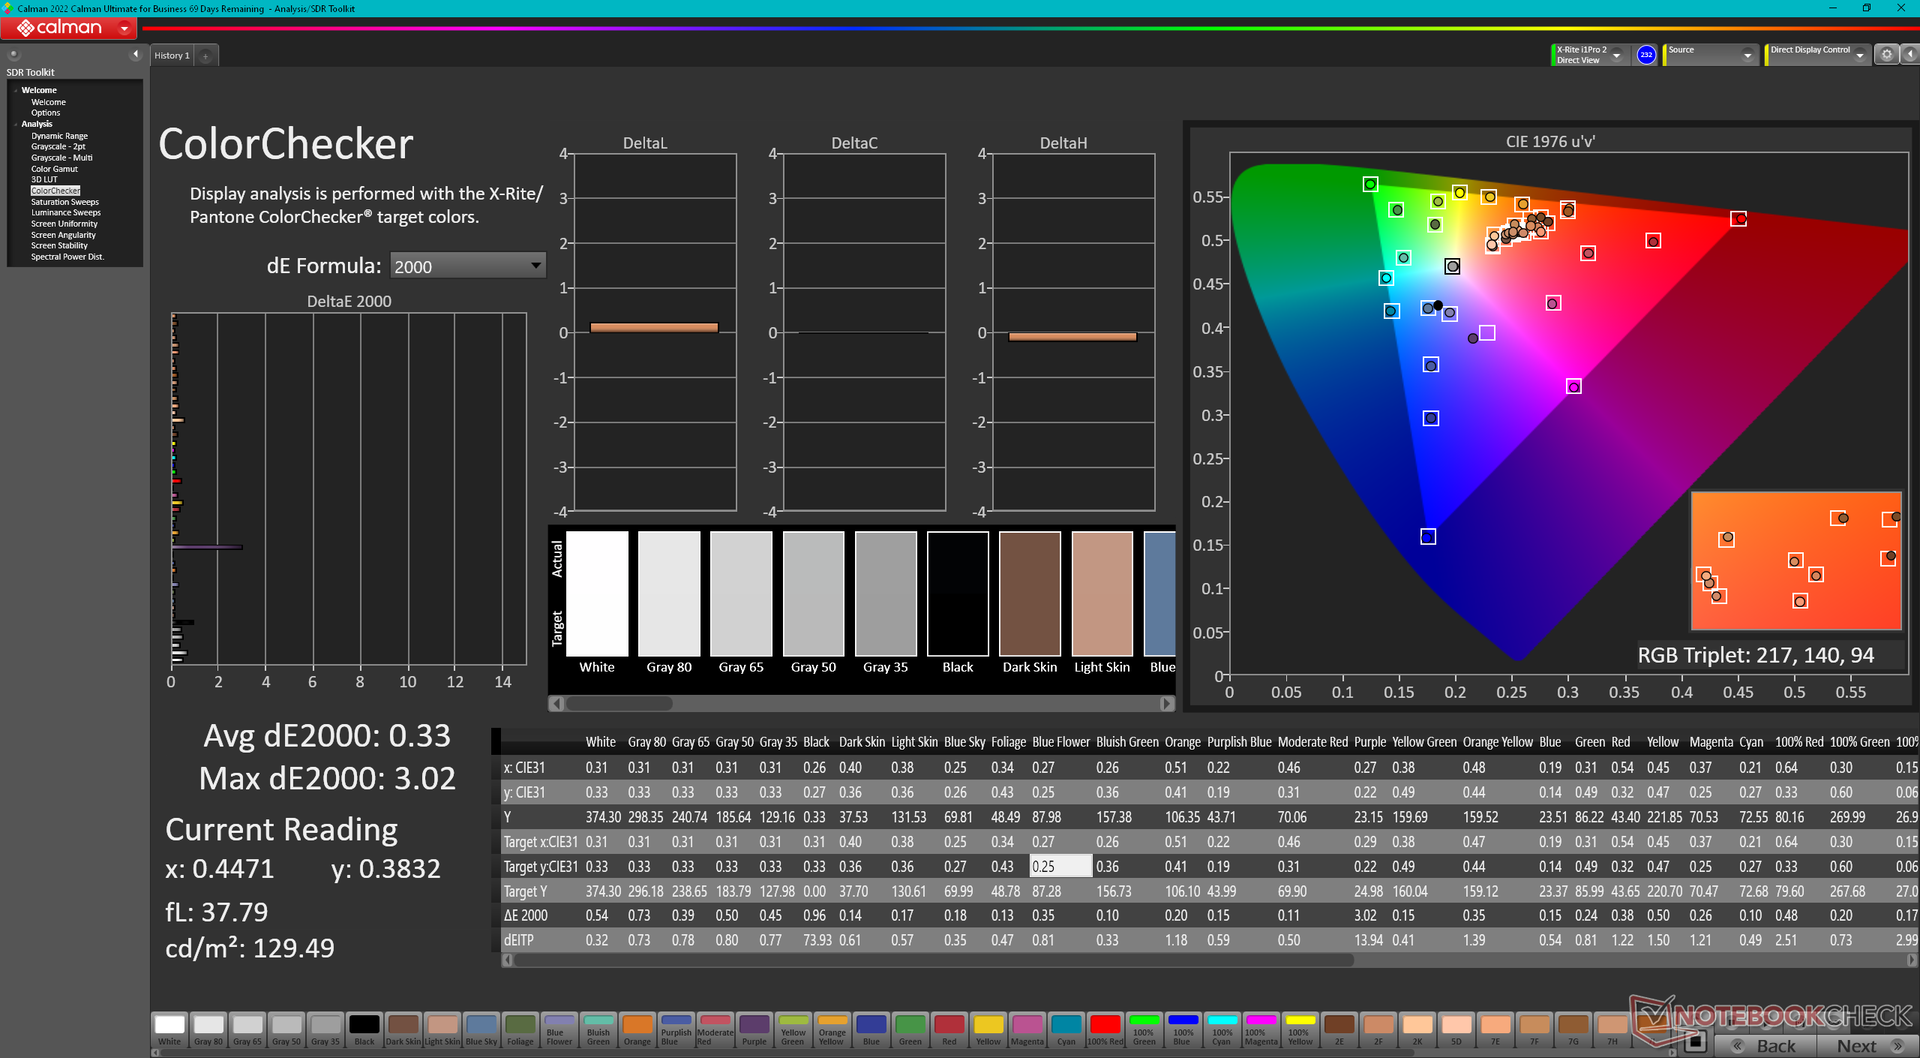
calibrated: 0.33
ΔE Greyscale Calman: 1.2 | ∀{0.09-98 Ø4.96}
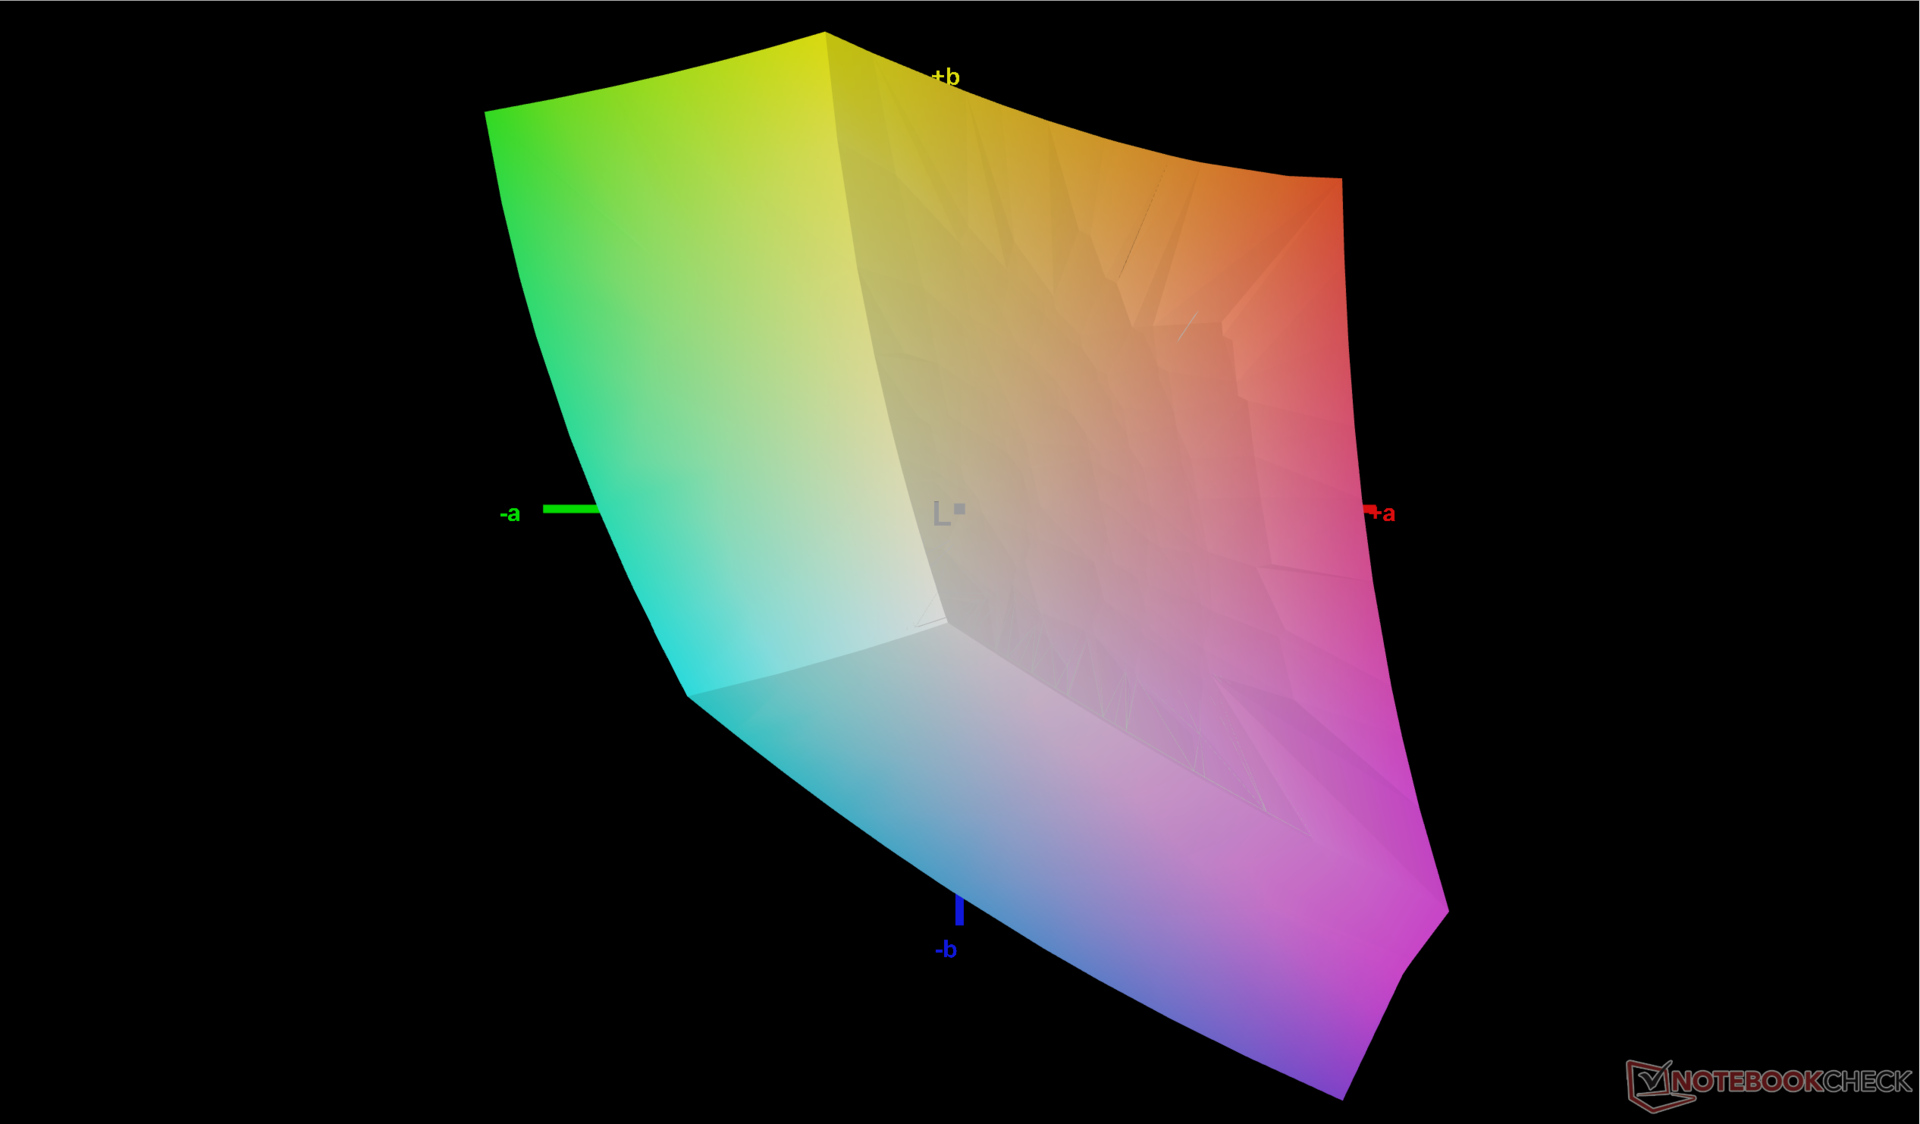
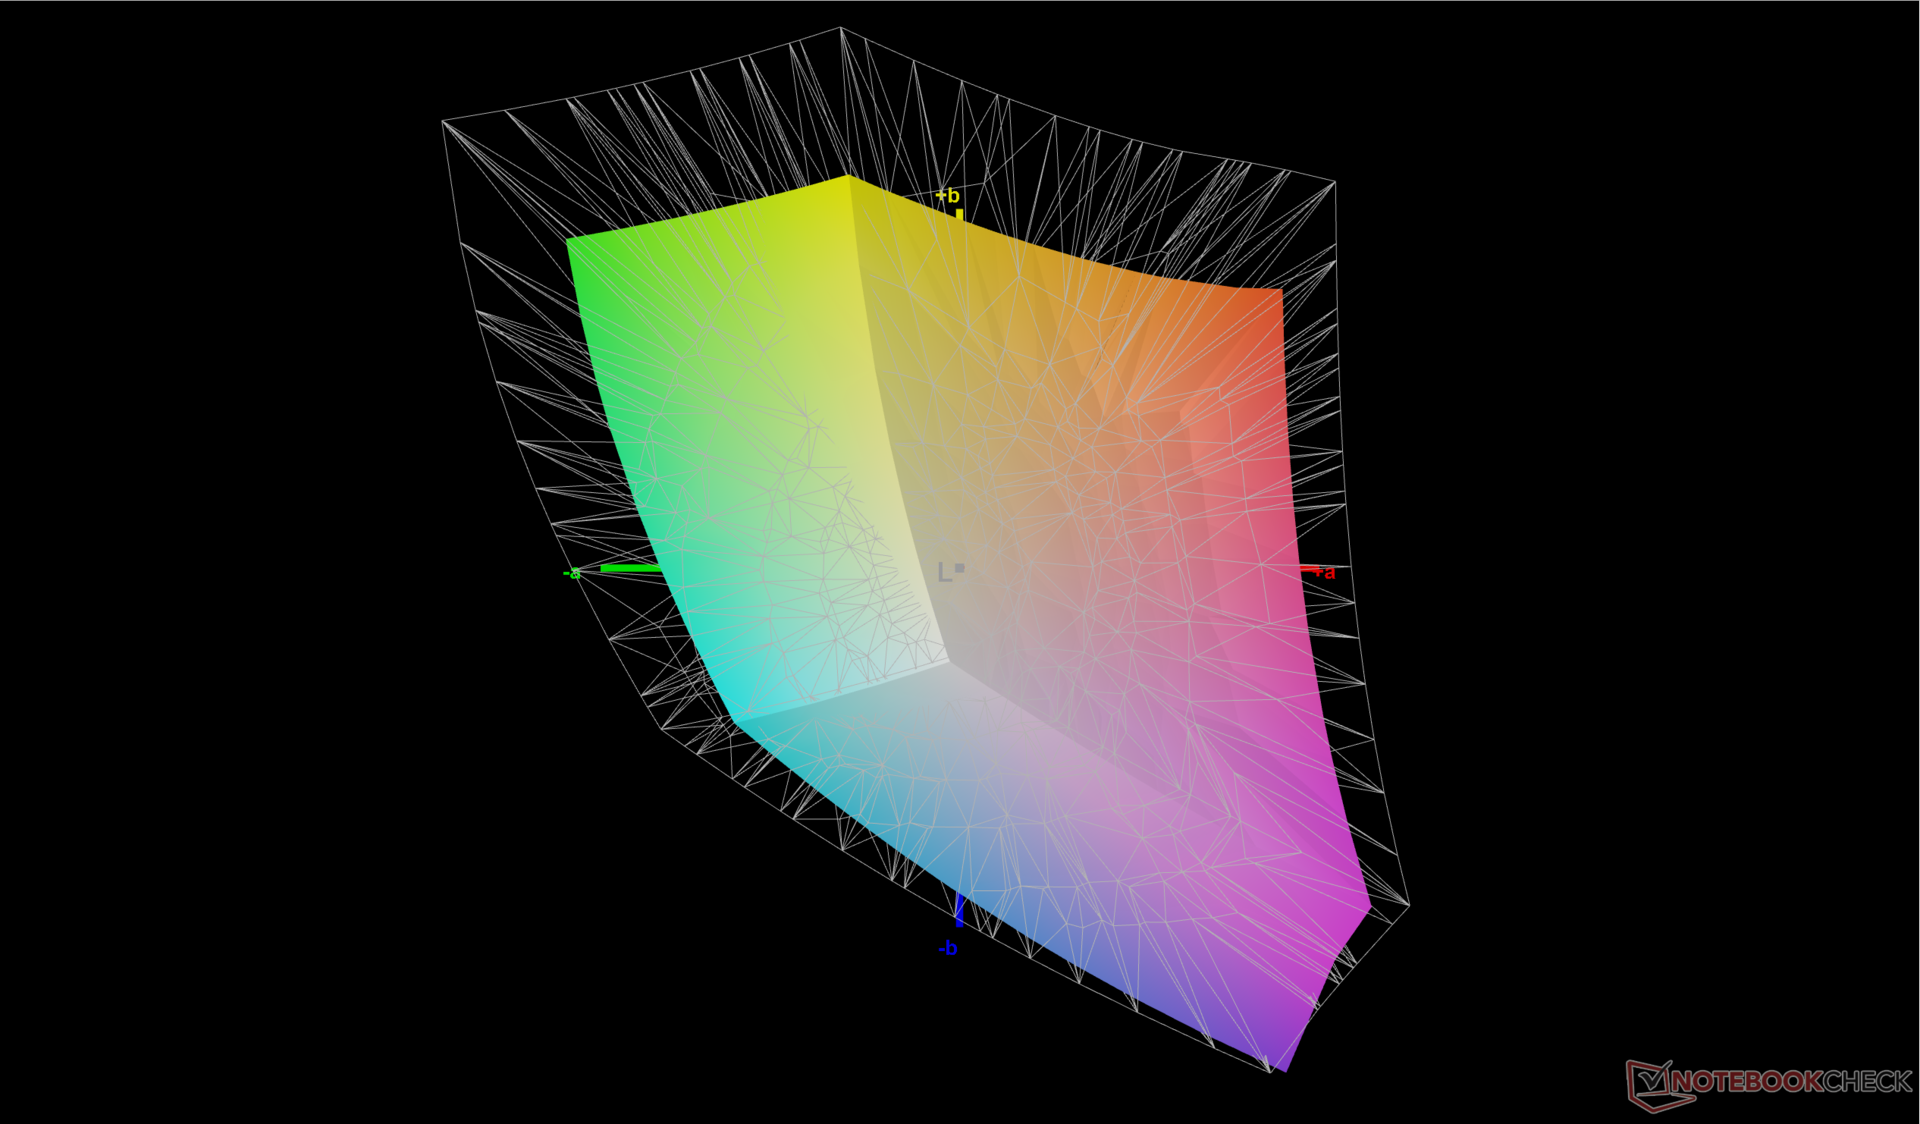
70% AdobeRGB 1998 (Argyll 3D)
100% sRGB (Argyll 3D)
69.3% Display P3 (Argyll 3D)
Gamma: 2.1
CCT: 6503 K
| Lenovo Legion Slim 5 16APH8 BOE NJ NE160QDM-NYC, IPS, 2560x1600, 16" | Acer Nitro 16 AN16-41-R7YE AU Optronics B160UAN01.Q, IPS, 1920x1200, 16" | Lenovo Legion Pro 5 16ARX8 (R5 7645HX, RTX 4050) CSOT T3 MNG007DA2-2, IPS, 2560x1600, 16" | HP Omen 16-wf000 BOE0B7D, IPS, 2560x1440, 16.1" | Dell G16 7620 BOE NE16QDM, IPS, 2560x1600, 16" | Asus TUF Gaming A16 FA617XS BOE NE160WUM-NX2, IPS, 1920x1200, 16" | |
|---|---|---|---|---|---|---|
| Display | 8% | 2% | 0% | -1% | -1% | |
| Display P3 Coverage (%) | 69.3 | 80 15% | 71.6 3% | 69 0% | 68.3 -1% | 69.3 0% |
| sRGB Coverage (%) | 100 | 99.4 -1% | 99.8 0% | 99.2 -1% | 98 -2% | 97.3 -3% |
| AdobeRGB 1998 Coverage (%) | 70 | 77.4 11% | 72.9 4% | 71.2 2% | 70.5 1% | 70.7 1% |
| Response Times | 14% | 11% | 17% | -7% | -37% | |
| Response Time Grey 50% / Grey 80% * (ms) | 10.7 ? | 11.2 ? -5% | 12 ? -12% | 4.6 ? 57% | 8.6 ? 20% | 15.6 ? -46% |
| Response Time Black / White * (ms) | 7.8 ? | 5.2 ? 33% | 5.2 ? 33% | 9.7 ? -24% | 10.4 ? -33% | 10 ? -28% |
| PWM Frequency (Hz) | ||||||
| Screen | -134% | -24% | -29% | -51% | -35% | |
| Brightness middle (cd/m²) | 371.6 | 415 12% | 543 46% | 310.9 -16% | 369.4 -1% | 301 -19% |
| Brightness (cd/m²) | 343 | 380 11% | 516 50% | 296 -14% | 348 1% | 294 -14% |
| Brightness Distribution (%) | 84 | 84 0% | 87 4% | 91 8% | 83 -1% | 94 12% |
| Black Level * (cd/m²) | 0.44 | 0.36 18% | 0.58 -32% | 0.35 20% | 0.32 27% | 0.21 52% |
| Contrast (:1) | 845 | 1153 36% | 936 11% | 888 5% | 1154 37% | 1433 70% |
| Colorchecker dE 2000 * | 1.52 | 4.71 -210% | 1.35 11% | 2.18 -43% | 1.78 -17% | 1.79 -18% |
| Colorchecker dE 2000 max. * | 2.68 | 6.98 -160% | 3.22 -20% | 3.58 -34% | 4.41 -65% | 3.48 -30% |
| Colorchecker dE 2000 calibrated * | 0.33 | 2.68 -712% | 1.31 -297% | 0.52 -58% | 1.22 -270% | 1.2 -264% |
| Greyscale dE 2000 * | 1.2 | 3.6 -200% | 1.03 14% | 2.8 -133% | 3.2 -167% | 2.5 -108% |
| Gamma | 2.1 105% | 2.182 101% | 2.38 92% | 2.18 101% | 2.2 100% | 2.265 97% |
| CCT | 6503 100% | 7153 91% | 6452 101% | 6002 108% | 6750 96% | 6157 106% |
| Media total (Programa/Opciones) | -37% /
-82% | -4% /
-13% | -4% /
-17% | -20% /
-34% | -24% /
-28% |
* ... más pequeño es mejor
La pantalla está muy bien calibrada de fábrica, con unos valores medios de escala de grises y deltaE de color de sólo 1,2 y 1,52, respectivamente. Por tanto, no es necesaria una calibración por parte del usuario final para sacar el máximo partido al panel sRGB completo.

Tiempos de respuesta del display
| ↔ Tiempo de respuesta de Negro a Blanco | ||
|---|---|---|
| 7.8 ms ... subida ↗ y bajada ↘ combinada | ↗ 3.9 ms subida | 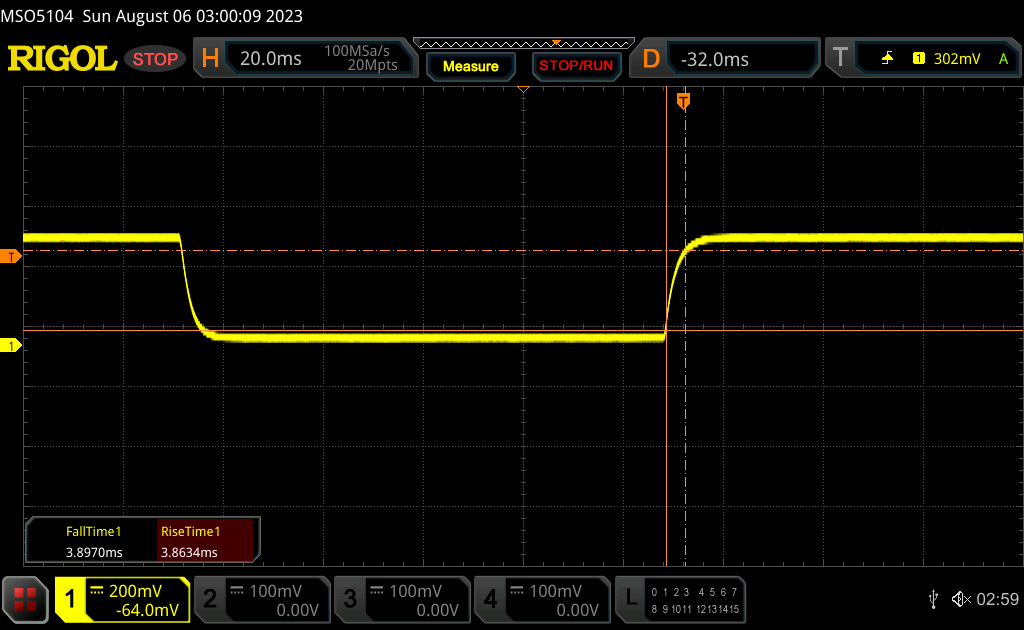 |
| ↘ 3.9 ms bajada | ||
| La pantalla mostró tiempos de respuesta muy rápidos en nuestros tests y debería ser adecuada para juegos frenéticos. En comparación, todos los dispositivos de prueba van de ##min### (mínimo) a 240 (máximo) ms. » 22 % de todos los dispositivos son mejores. Esto quiere decir que el tiempo de respuesta medido es mejor que la media (19.8 ms) de todos los dispositivos testados. | ||
| ↔ Tiempo de respuesta 50% Gris a 80% Gris | ||
| 10.7 ms ... subida ↗ y bajada ↘ combinada | ↗ 5.2 ms subida | 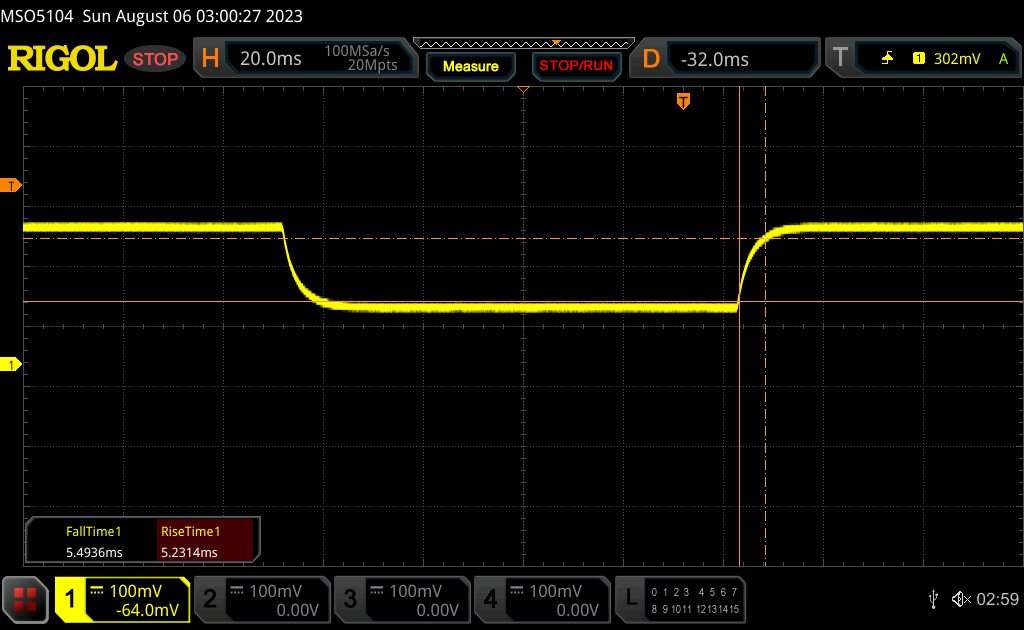 |
| ↘ 5.5 ms bajada | ||
| La pantalla mostró buenos tiempos de respuesta en nuestros tests pero podría ser demasiado lenta para los jugones competitivos. En comparación, todos los dispositivos de prueba van de ##min### (mínimo) a 636 (máximo) ms. » 24 % de todos los dispositivos son mejores. Esto quiere decir que el tiempo de respuesta medido es mejor que la media (31 ms) de todos los dispositivos testados. | ||
Parpadeo de Pantalla / PWM (Pulse-Width Modulation)
| Parpadeo de Pantalla / PWM no detectado | 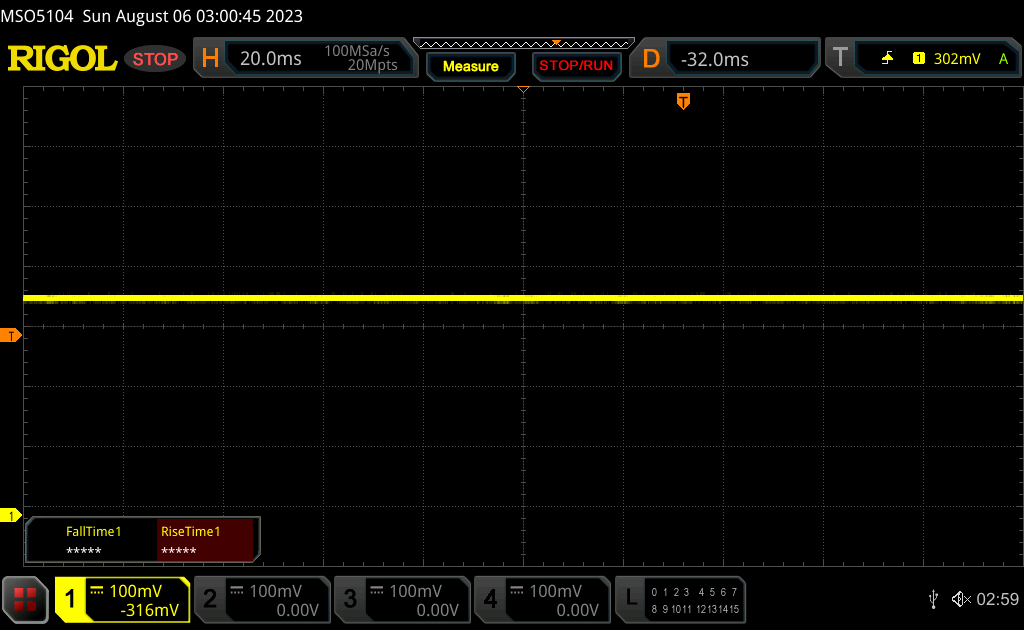 | ||
Comparación: 52 % de todos los dispositivos testados no usaron PWM para atenuar el display. Si se usó, medimos una media de 7754 (mínimo: 5 - máxmo: 343500) Hz. | |||
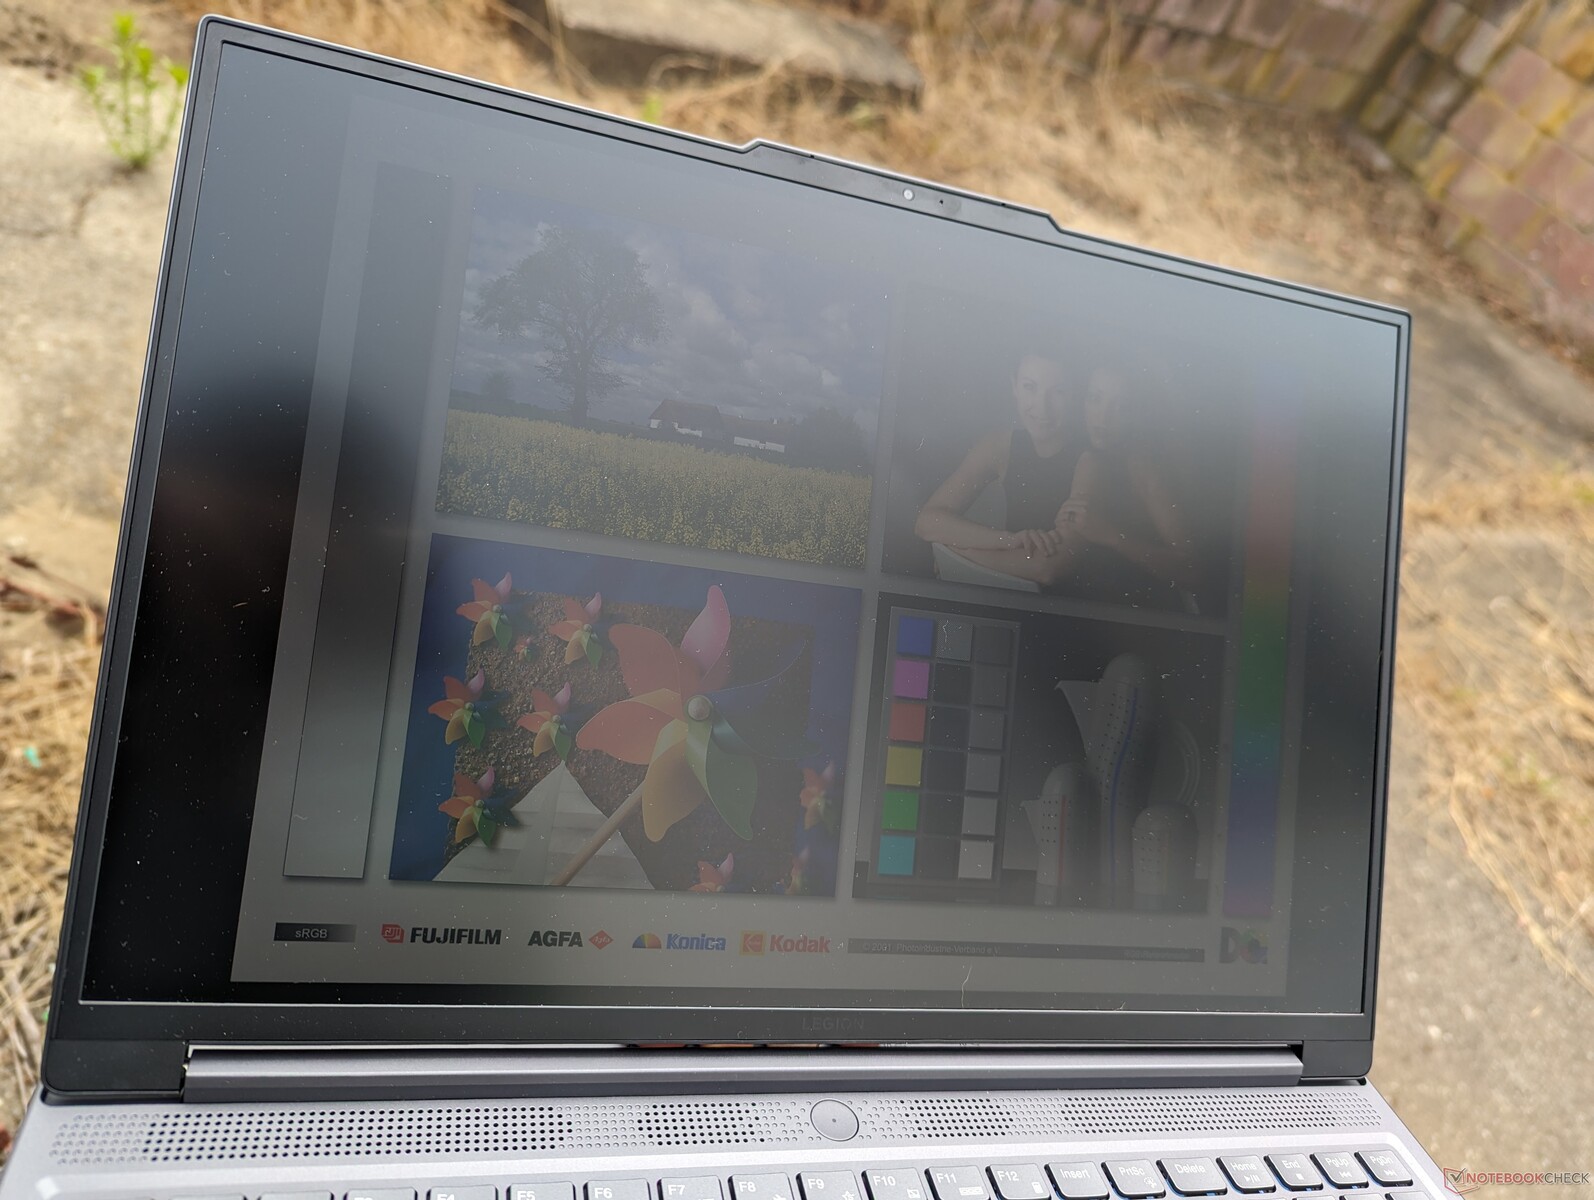
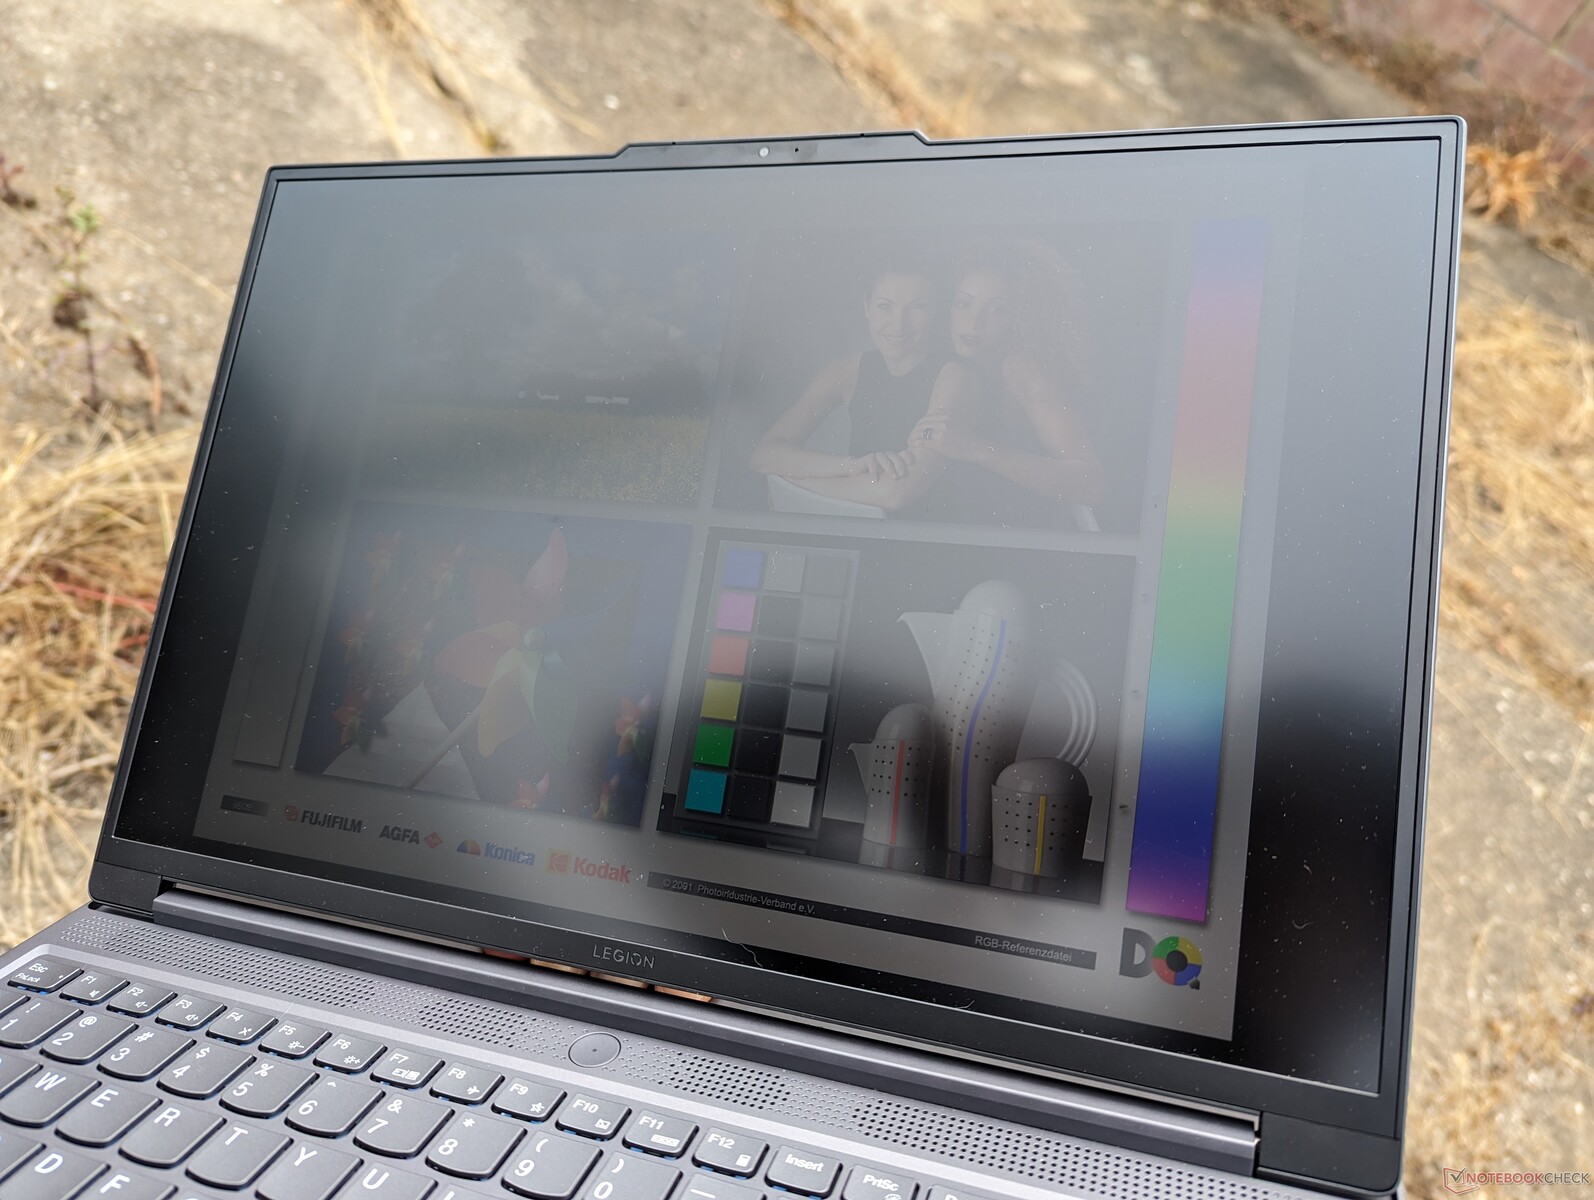
Con unos 370 nits, nuestra pantalla es más tenue que la de 540 nits del Legion Pro 5, más caro. Sin embargo, el rango de 300 a 400 nits es típico de la mayoría de portátiles de juego, por lo que la visibilidad en exteriores no es notablemente mejor o peor que otros del mismo rango de precios. Conviene trabajar a la sombra siempre que sea posible para reducir los reflejos y evitar los colores desvaídos.
Rendimiento - El AMD Zen 4 de gama media impresiona
Condiciones de ensayo
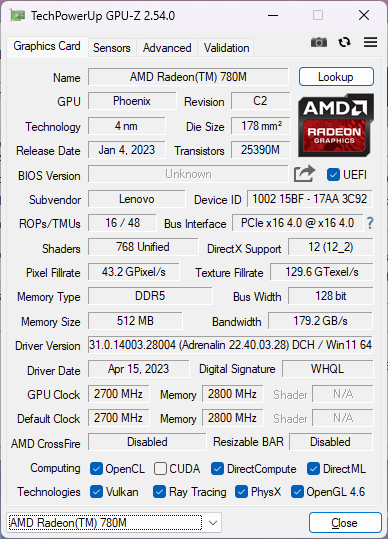
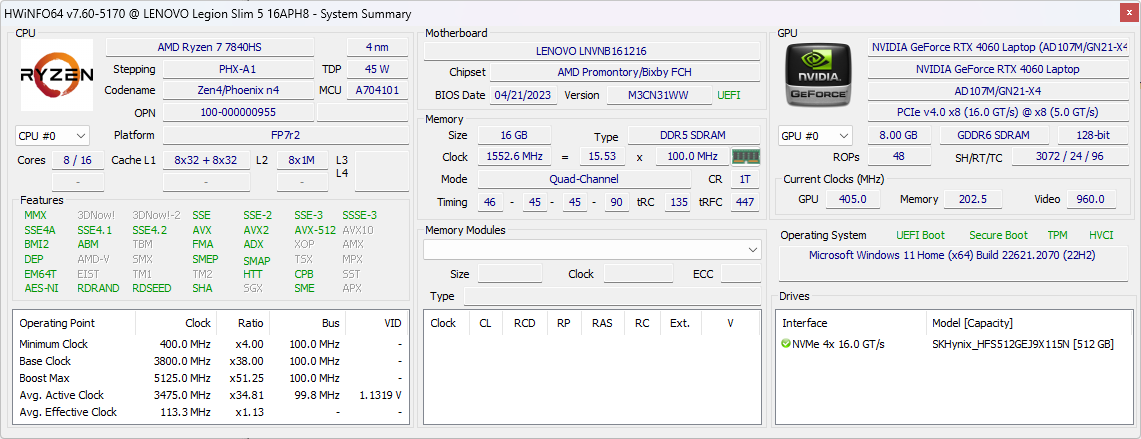
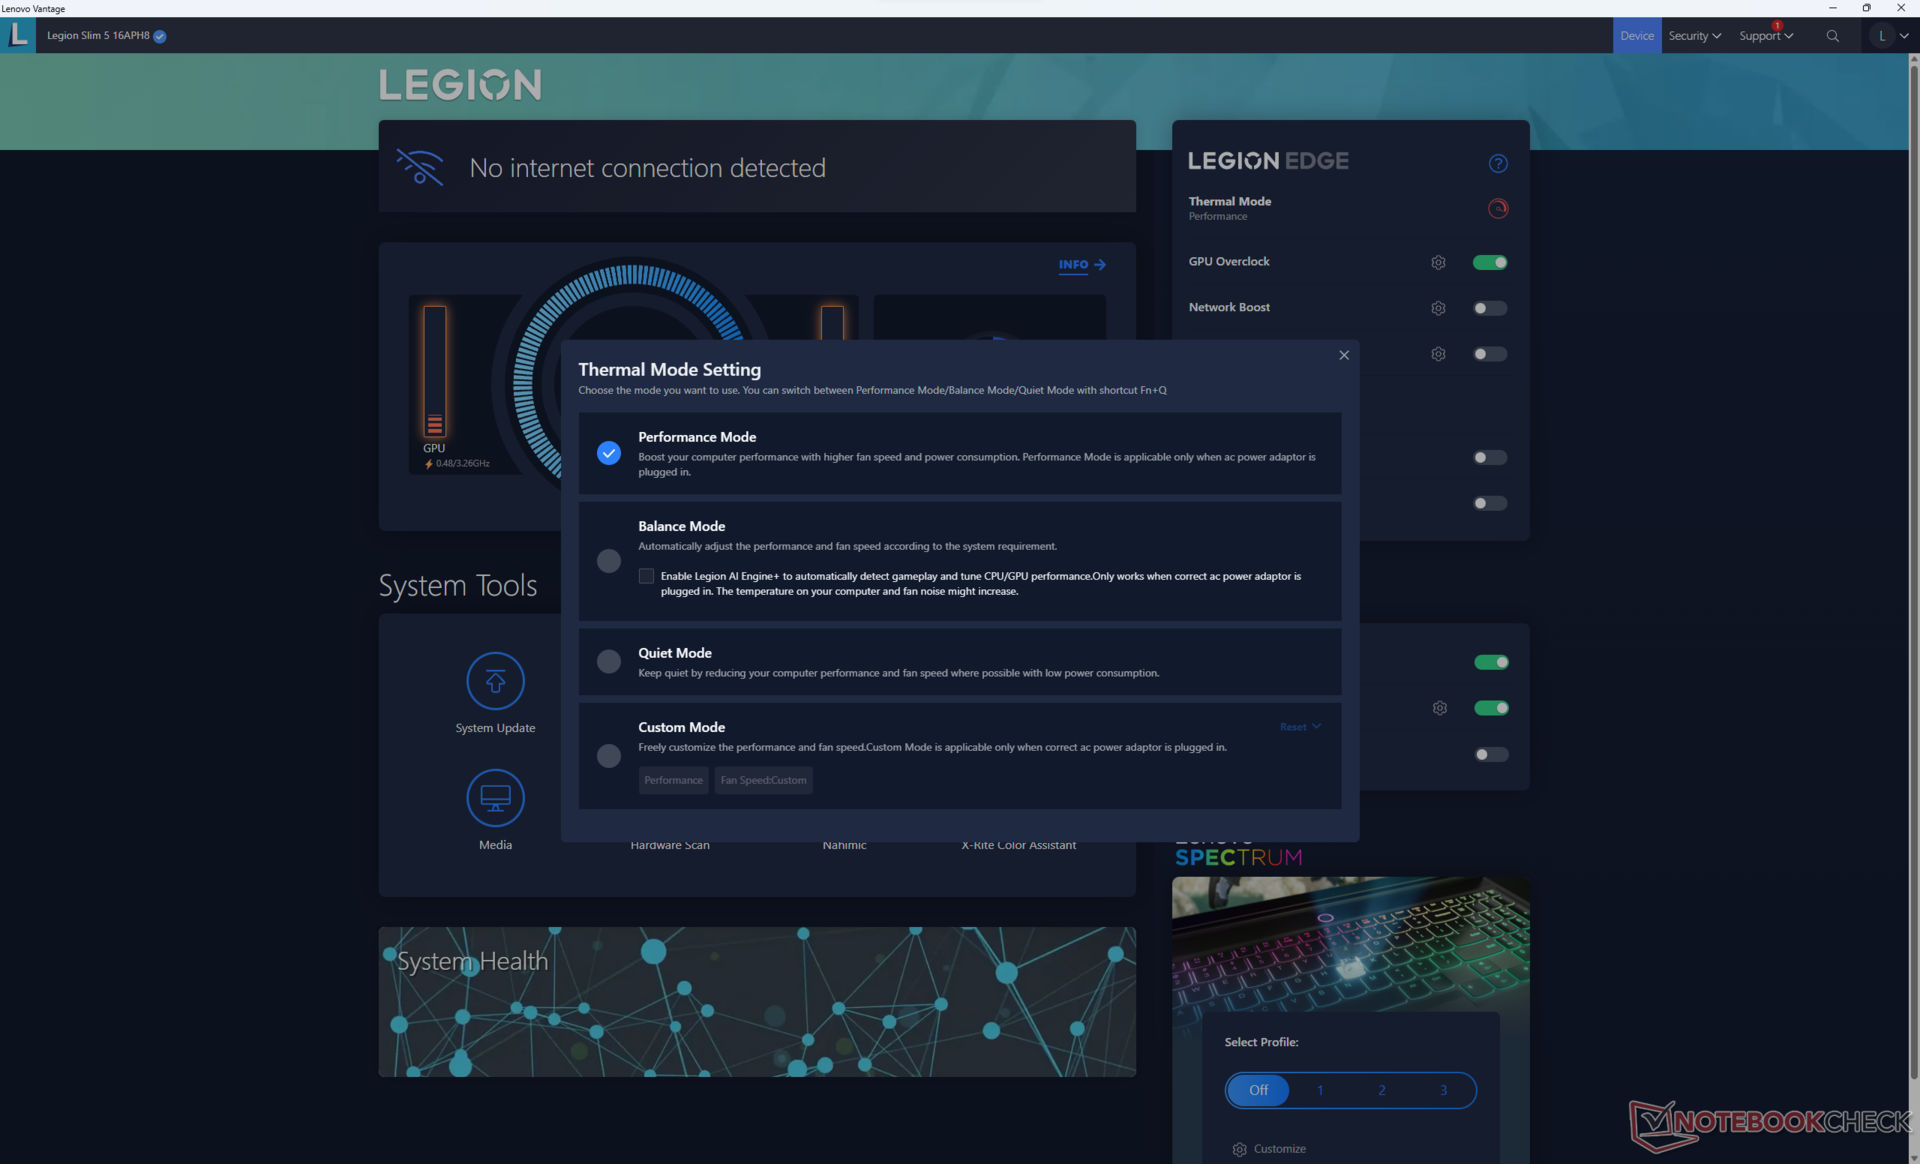
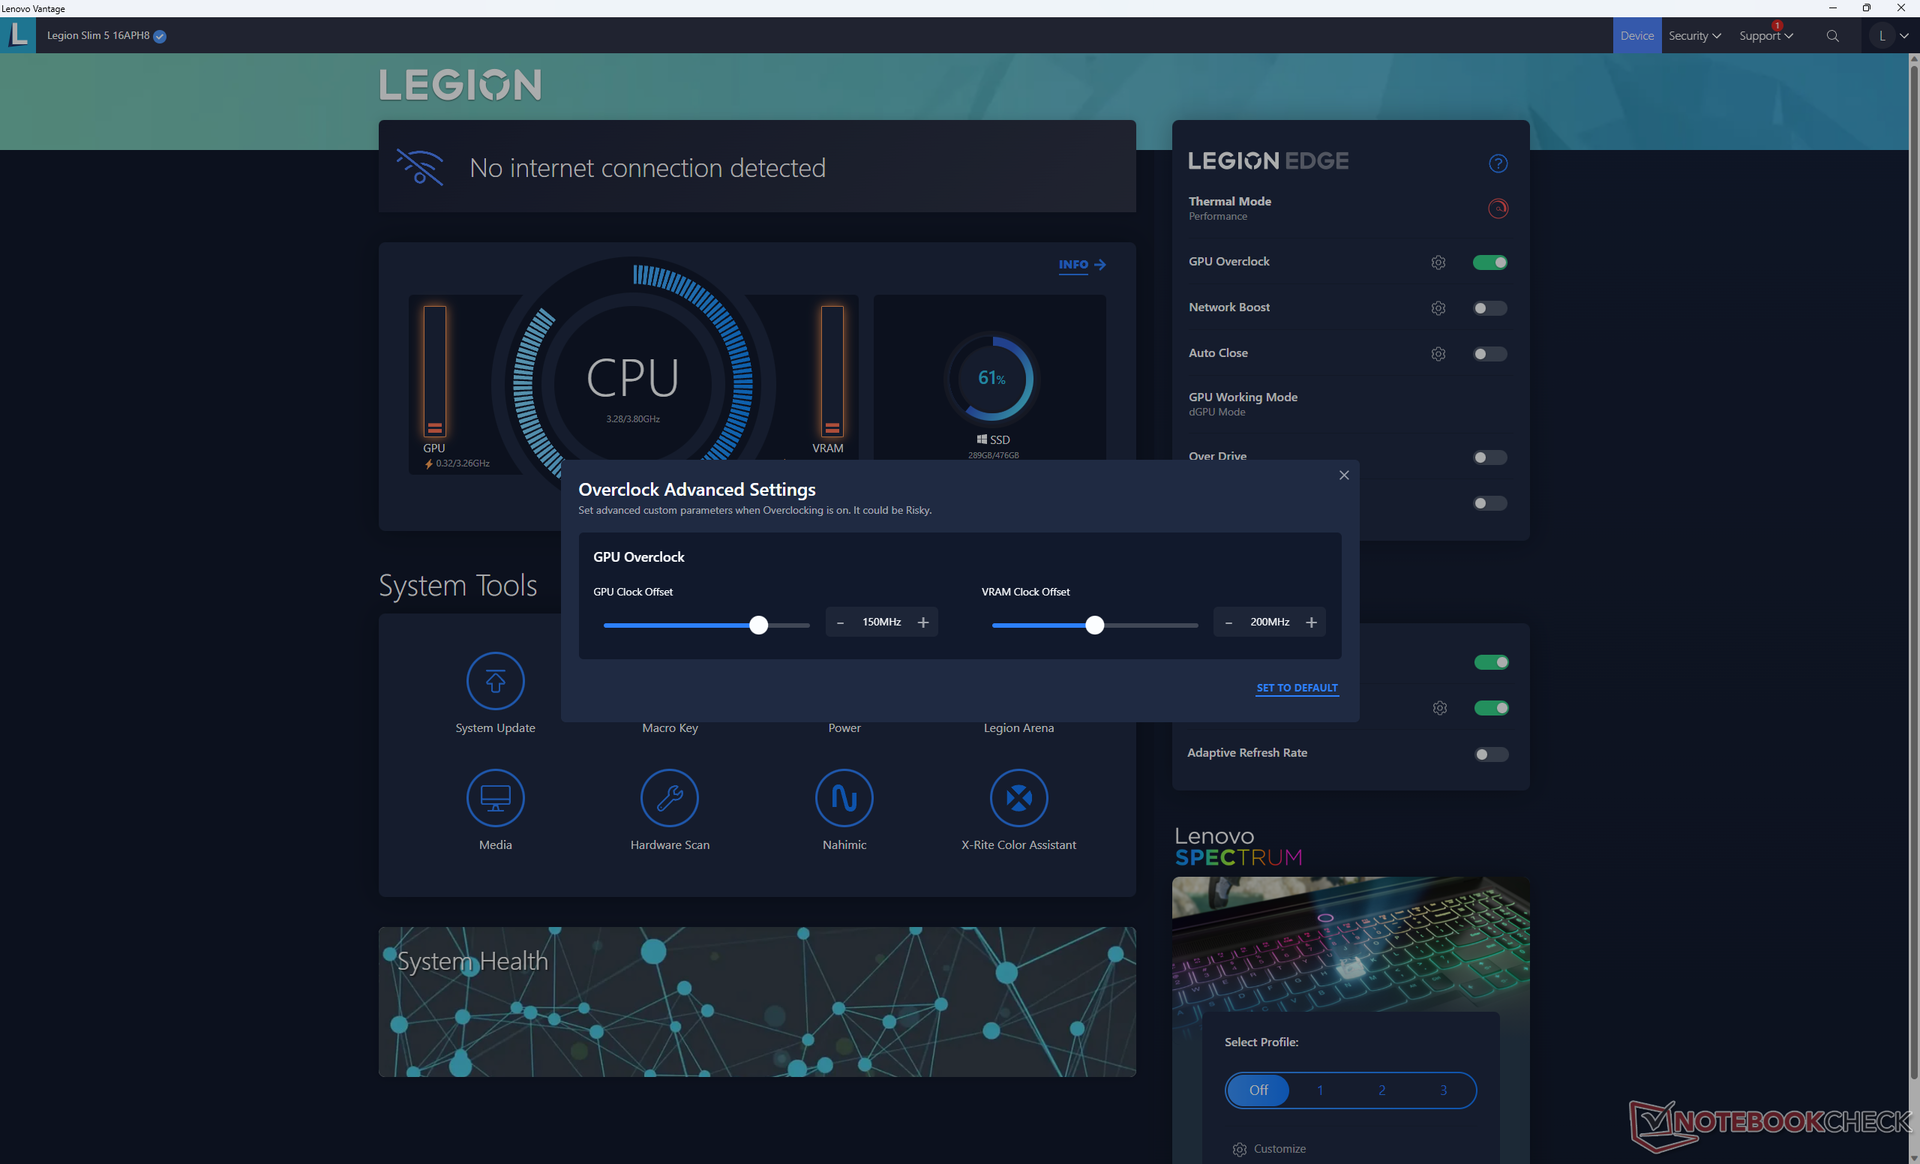
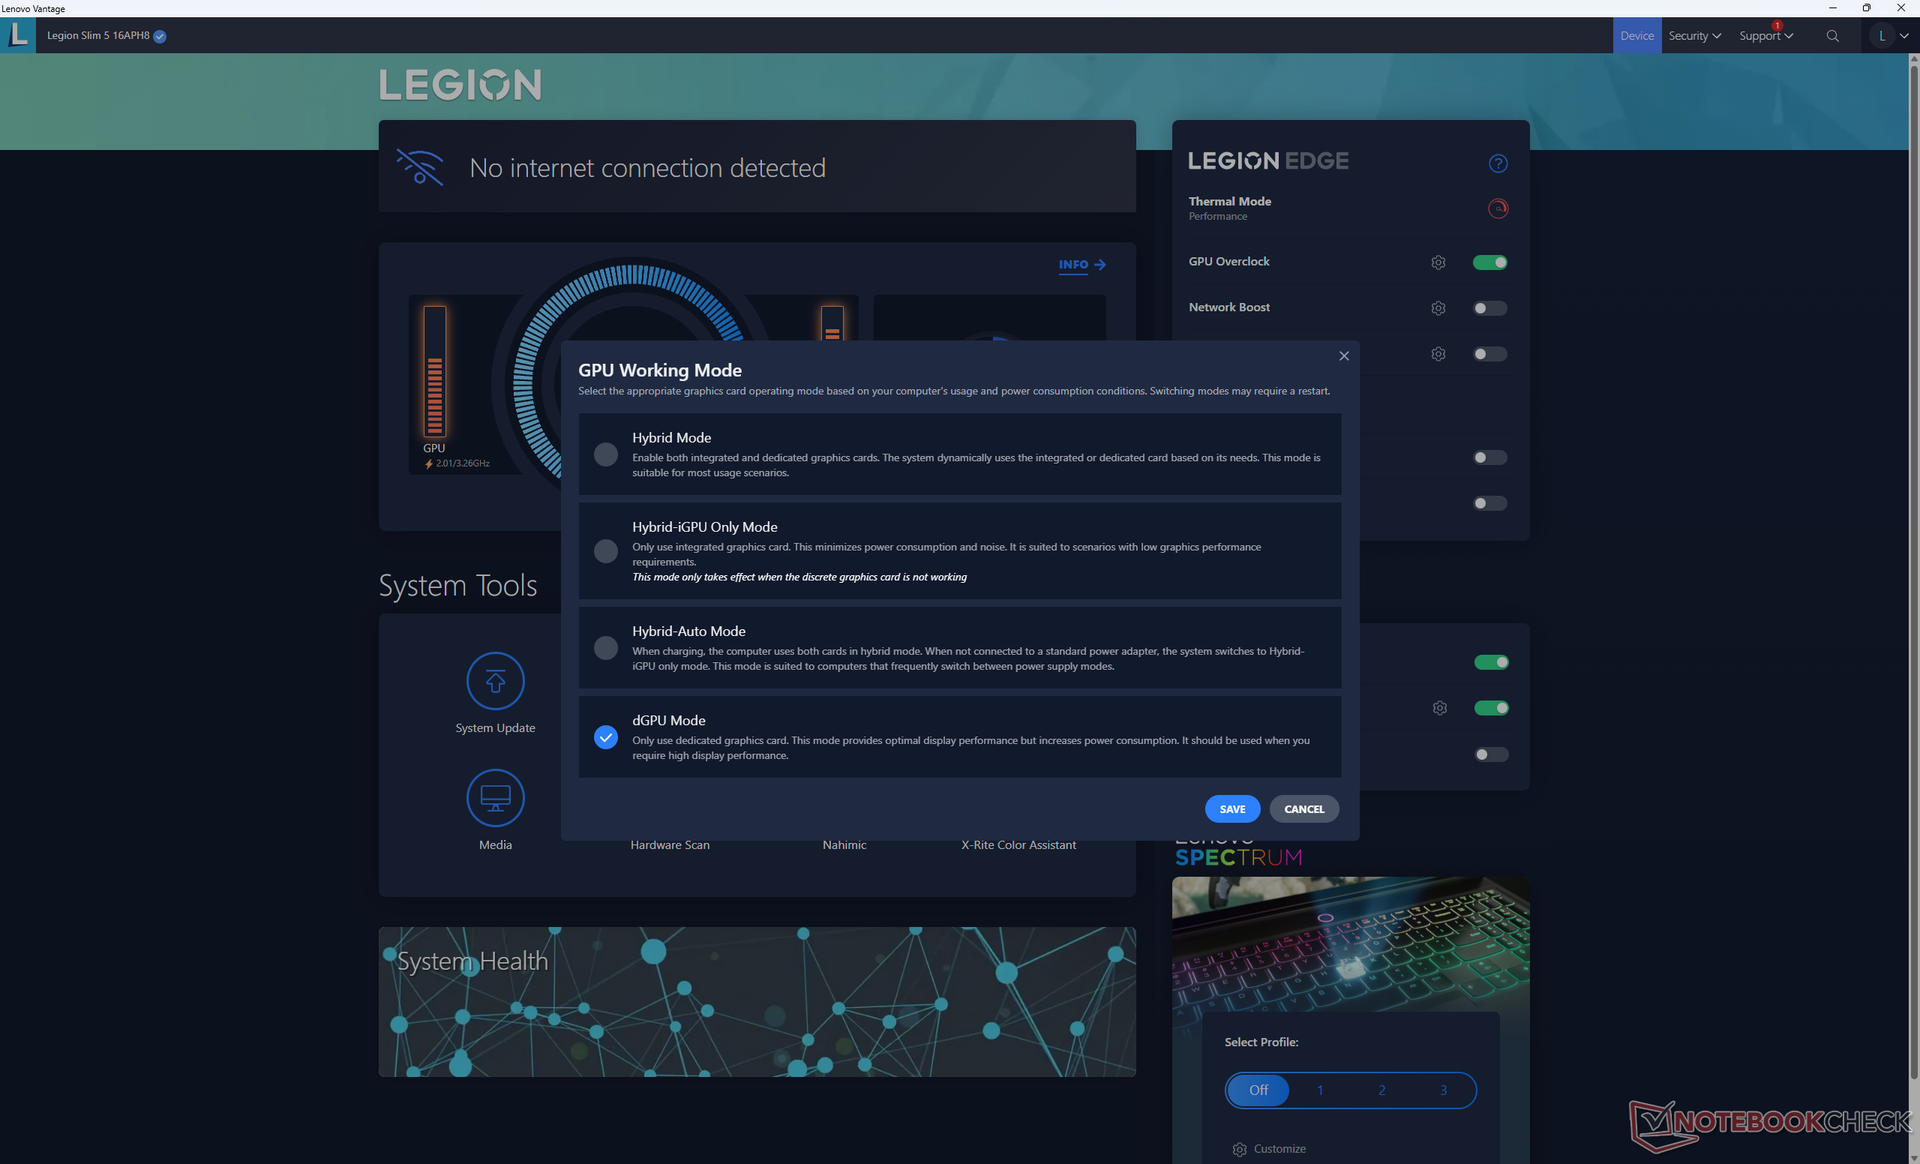
Configuramos nuestra unidad en modo dGPU y en modo Rendimiento a través de Lenovo Vantage y Windows antes de ejecutar los benchmarks que se muestran a continuación. También activamos la configuración predeterminada de overclocking de la GPU (+150 MHz de reloj, +200 MHz de VRAM). Vantage es el centro de control para perfiles de rendimiento, modos de GPU, actualizaciones de BIOS y otras características específicas del modelo, como se muestra en las capturas de pantalla a continuación.
Advanced Optimus sólo es compatible con el modo Hybrid.
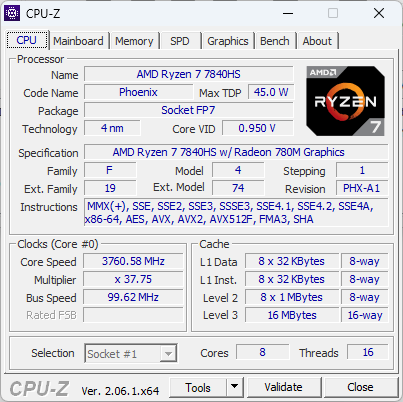
Procesador
El 8-core Ryzen 7 7840HS puede que no sea común, pero rinde muy bien con unos resultados que están solo un 5 por ciento por detrás del Ryzen 7 7745HX o hasta un 15 por ciento por detrás del competidor 13th gen Core i7-13700HX. Es más comparable al Core i7-12700H que se suele encontrar en los portátiles para juegos de 2022.
El cambio al procesador de 6 núcleos Ryzen 5 7640HS se espera que reduzca el rendimiento multihilo en un 25 por ciento, según el tiempo que hemos pasado con el Lenovo LOQ 15APH8.
Cinebench R15 Multi Loop
Cinebench R23: Multi Core | Single Core
Cinebench R20: CPU (Multi Core) | CPU (Single Core)
Cinebench R15: CPU Multi 64Bit | CPU Single 64Bit
Blender: v2.79 BMW27 CPU
7-Zip 18.03: 7z b 4 | 7z b 4 -mmt1
Geekbench 5.5: Multi-Core | Single-Core
HWBOT x265 Benchmark v2.2: 4k Preset
LibreOffice : 20 Documents To PDF
R Benchmark 2.5: Overall mean
* ... más pequeño es mejor
AIDA64: FP32 Ray-Trace | FPU Julia | CPU SHA3 | CPU Queen | FPU SinJulia | FPU Mandel | CPU AES | CPU ZLib | FP64 Ray-Trace | CPU PhotoWorxx
| Performance rating | |
| Medio AMD Ryzen 7 7840HS | |
| Lenovo Legion Slim 5 16APH8 | |
| Asus TUF Gaming A16 FA617XS | |
| HP Omen 16-wf000 | |
| Lenovo Legion Pro 5 16ARX8 (R5 7645HX, RTX 4050) | |
| Dell G16 7620 | |
| Acer Nitro 16 AN16-41-R7YE | |
| AIDA64 / FP32 Ray-Trace | |
| Lenovo Legion Slim 5 16APH8 | |
| Asus TUF Gaming A16 FA617XS | |
| Medio AMD Ryzen 7 7840HS (22845 - 28921, n=21) | |
| Lenovo Legion Pro 5 16ARX8 (R5 7645HX, RTX 4050) | |
| HP Omen 16-wf000 | |
| Dell G16 7620 | |
| Acer Nitro 16 AN16-41-R7YE | |
| AIDA64 / FPU Julia | |
| Asus TUF Gaming A16 FA617XS | |
| Lenovo Legion Slim 5 16APH8 | |
| Medio AMD Ryzen 7 7840HS (97164 - 123167, n=21) | |
| HP Omen 16-wf000 | |
| Lenovo Legion Pro 5 16ARX8 (R5 7645HX, RTX 4050) | |
| Acer Nitro 16 AN16-41-R7YE | |
| Dell G16 7620 | |
| AIDA64 / CPU SHA3 | |
| Lenovo Legion Slim 5 16APH8 | |
| Medio AMD Ryzen 7 7840HS (4293 - 5155, n=21) | |
| Asus TUF Gaming A16 FA617XS | |
| HP Omen 16-wf000 | |
| Lenovo Legion Pro 5 16ARX8 (R5 7645HX, RTX 4050) | |
| Dell G16 7620 | |
| Acer Nitro 16 AN16-41-R7YE | |
| AIDA64 / CPU Queen | |
| Asus TUF Gaming A16 FA617XS | |
| Lenovo Legion Slim 5 16APH8 | |
| Medio AMD Ryzen 7 7840HS (102271 - 125820, n=21) | |
| HP Omen 16-wf000 | |
| Dell G16 7620 | |
| Lenovo Legion Pro 5 16ARX8 (R5 7645HX, RTX 4050) | |
| Acer Nitro 16 AN16-41-R7YE | |
| AIDA64 / FPU SinJulia | |
| Asus TUF Gaming A16 FA617XS | |
| Lenovo Legion Slim 5 16APH8 | |
| Medio AMD Ryzen 7 7840HS (13767 - 15525, n=21) | |
| HP Omen 16-wf000 | |
| Lenovo Legion Pro 5 16ARX8 (R5 7645HX, RTX 4050) | |
| Dell G16 7620 | |
| Acer Nitro 16 AN16-41-R7YE | |
| AIDA64 / FPU Mandel | |
| Lenovo Legion Slim 5 16APH8 | |
| Asus TUF Gaming A16 FA617XS | |
| Medio AMD Ryzen 7 7840HS (52084 - 65812, n=21) | |
| Lenovo Legion Pro 5 16ARX8 (R5 7645HX, RTX 4050) | |
| HP Omen 16-wf000 | |
| Acer Nitro 16 AN16-41-R7YE | |
| Dell G16 7620 | |
| AIDA64 / CPU ZLib | |
| HP Omen 16-wf000 | |
| Lenovo Legion Slim 5 16APH8 | |
| Asus TUF Gaming A16 FA617XS | |
| Medio AMD Ryzen 7 7840HS (944 - 1123, n=21) | |
| Dell G16 7620 | |
| Lenovo Legion Pro 5 16ARX8 (R5 7645HX, RTX 4050) | |
| Acer Nitro 16 AN16-41-R7YE | |
| AIDA64 / FP64 Ray-Trace | |
| Lenovo Legion Slim 5 16APH8 | |
| Asus TUF Gaming A16 FA617XS | |
| Medio AMD Ryzen 7 7840HS (12248 - 15599, n=21) | |
| Lenovo Legion Pro 5 16ARX8 (R5 7645HX, RTX 4050) | |
| HP Omen 16-wf000 | |
| Dell G16 7620 | |
| Acer Nitro 16 AN16-41-R7YE | |
| AIDA64 / CPU PhotoWorxx | |
| HP Omen 16-wf000 | |
| Medio AMD Ryzen 7 7840HS (17615 - 41516, n=21) | |
| Dell G16 7620 | |
| Lenovo Legion Slim 5 16APH8 | |
| Asus TUF Gaming A16 FA617XS | |
| Acer Nitro 16 AN16-41-R7YE | |
| Lenovo Legion Pro 5 16ARX8 (R5 7645HX, RTX 4050) | |
Rendimiento del sistema
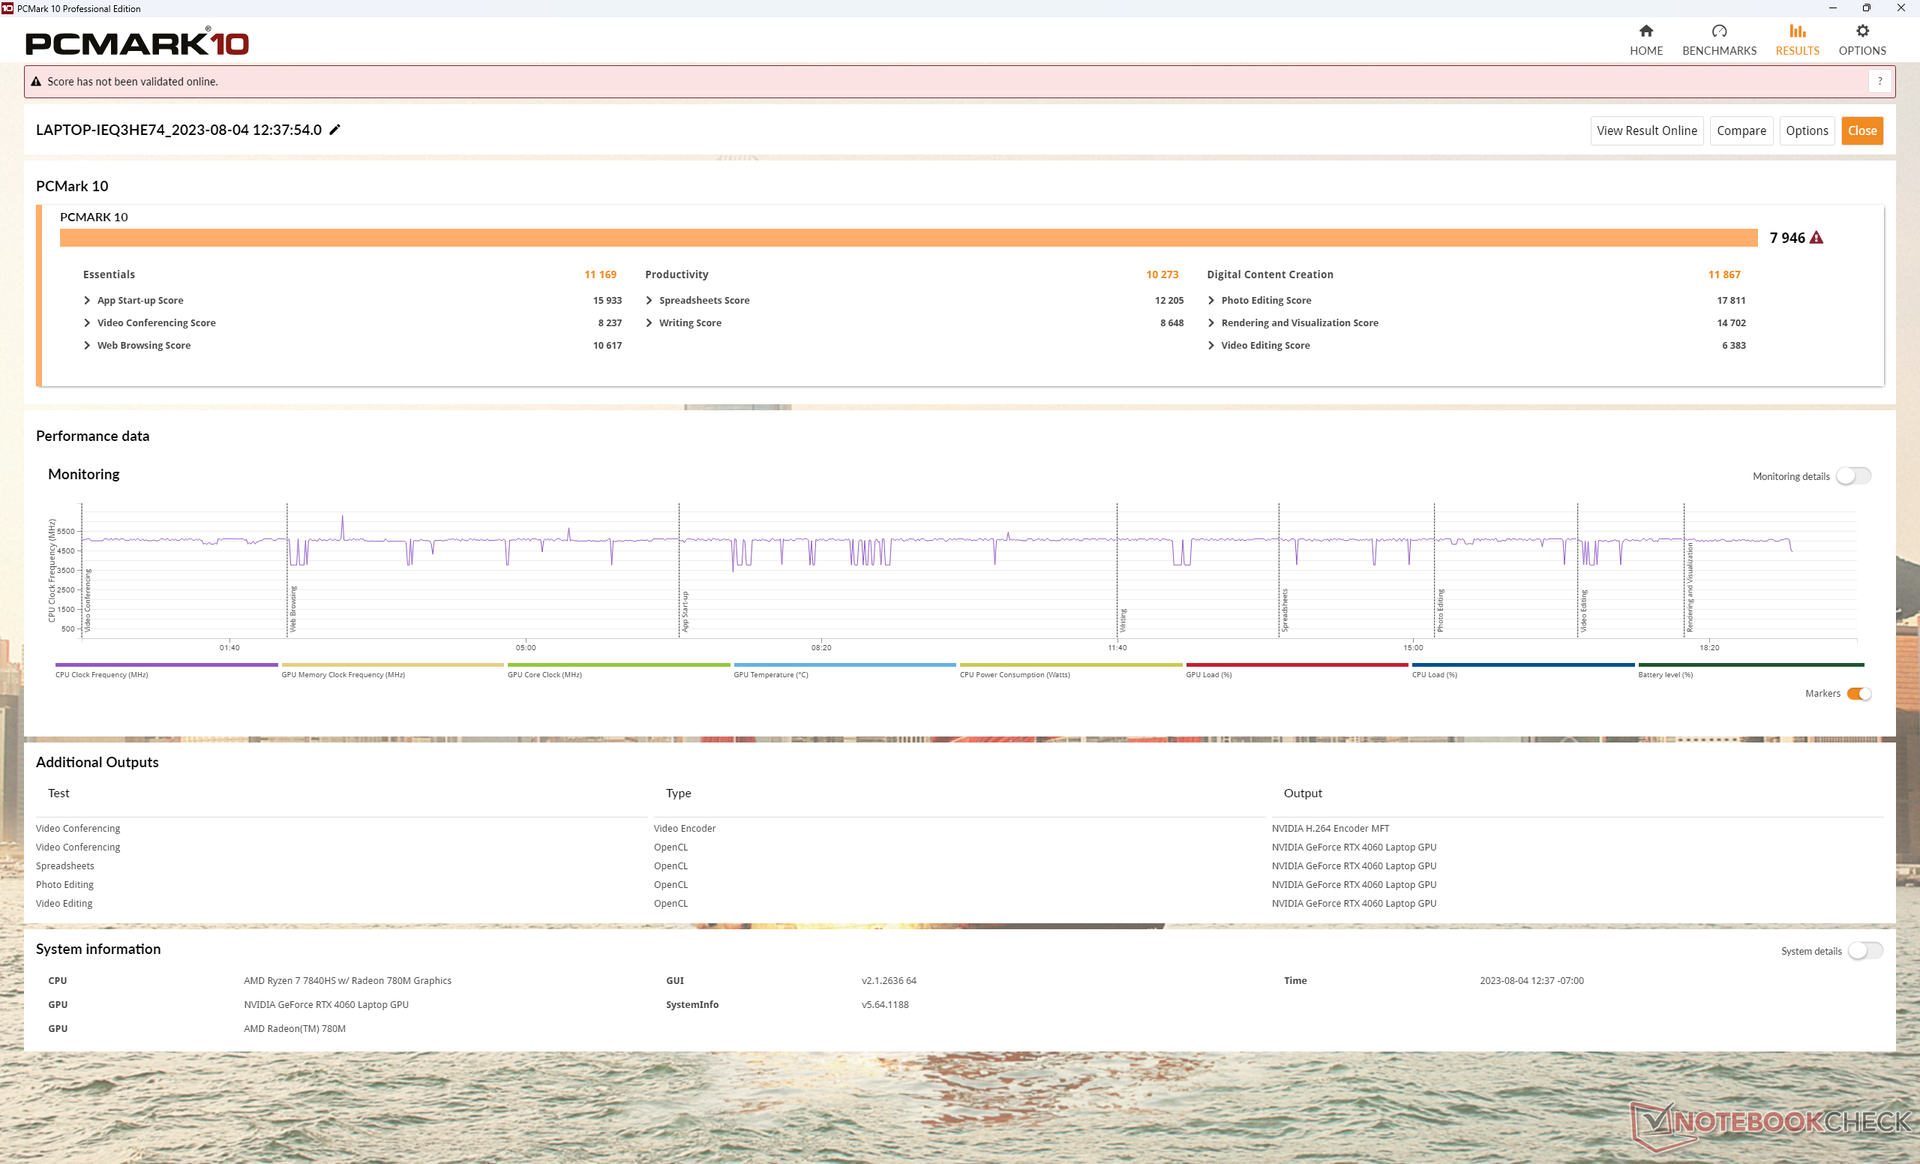
Las puntuaciones en PCMark son comparables a las de alternativas como el Asus TUF Gaming A16 o el HP Omen 16 a pesar de sus diferencias de procesador. Esto significa que el sistema Lenovo puede ejecutar tareas ofimáticas y cargas de trabajo con fiabilidad a pesar de ser un portátil de juego.
CrossMark: Overall | Productivity | Creativity | Responsiveness
| PCMark 10 / Score | |
| Lenovo Legion Pro 5 16ARX8 (R5 7645HX, RTX 4050) | |
| Lenovo Legion Slim 5 16APH8 | |
| Asus TUF Gaming A16 FA617XS | |
| HP Omen 16-wf000 | |
| Medio AMD Ryzen 7 7840HS, NVIDIA GeForce RTX 4060 Laptop GPU (7502 - 7946, n=4) | |
| Dell G16 7620 | |
| Acer Nitro 16 AN16-41-R7YE | |
| PCMark 10 / Essentials | |
| Lenovo Legion Pro 5 16ARX8 (R5 7645HX, RTX 4050) | |
| Lenovo Legion Slim 5 16APH8 | |
| Medio AMD Ryzen 7 7840HS, NVIDIA GeForce RTX 4060 Laptop GPU (10441 - 11169, n=4) | |
| Asus TUF Gaming A16 FA617XS | |
| HP Omen 16-wf000 | |
| Dell G16 7620 | |
| Acer Nitro 16 AN16-41-R7YE | |
| PCMark 10 / Productivity | |
| Lenovo Legion Pro 5 16ARX8 (R5 7645HX, RTX 4050) | |
| Asus TUF Gaming A16 FA617XS | |
| Lenovo Legion Slim 5 16APH8 | |
| Medio AMD Ryzen 7 7840HS, NVIDIA GeForce RTX 4060 Laptop GPU (9575 - 10273, n=4) | |
| HP Omen 16-wf000 | |
| Dell G16 7620 | |
| Acer Nitro 16 AN16-41-R7YE | |
| PCMark 10 / Digital Content Creation | |
| HP Omen 16-wf000 | |
| Medio AMD Ryzen 7 7840HS, NVIDIA GeForce RTX 4060 Laptop GPU (11464 - 12418, n=4) | |
| Asus TUF Gaming A16 FA617XS | |
| Lenovo Legion Slim 5 16APH8 | |
| Dell G16 7620 | |
| Lenovo Legion Pro 5 16ARX8 (R5 7645HX, RTX 4050) | |
| Acer Nitro 16 AN16-41-R7YE | |
| CrossMark / Overall | |
| Lenovo Legion Pro 5 16ARX8 (R5 7645HX, RTX 4050) | |
| Medio AMD Ryzen 7 7840HS, NVIDIA GeForce RTX 4060 Laptop GPU (1800 - 1866, n=3) | |
| Lenovo Legion Slim 5 16APH8 | |
| Dell G16 7620 | |
| Asus TUF Gaming A16 FA617XS | |
| HP Omen 16-wf000 | |
| Acer Nitro 16 AN16-41-R7YE | |
| CrossMark / Productivity | |
| Lenovo Legion Pro 5 16ARX8 (R5 7645HX, RTX 4050) | |
| Medio AMD Ryzen 7 7840HS, NVIDIA GeForce RTX 4060 Laptop GPU (1743 - 1821, n=3) | |
| Lenovo Legion Slim 5 16APH8 | |
| Asus TUF Gaming A16 FA617XS | |
| Dell G16 7620 | |
| HP Omen 16-wf000 | |
| Acer Nitro 16 AN16-41-R7YE | |
| CrossMark / Creativity | |
| Lenovo Legion Pro 5 16ARX8 (R5 7645HX, RTX 4050) | |
| Asus TUF Gaming A16 FA617XS | |
| HP Omen 16-wf000 | |
| Lenovo Legion Slim 5 16APH8 | |
| Dell G16 7620 | |
| Medio AMD Ryzen 7 7840HS, NVIDIA GeForce RTX 4060 Laptop GPU (1908 - 1966, n=3) | |
| Acer Nitro 16 AN16-41-R7YE | |
| CrossMark / Responsiveness | |
| Lenovo Legion Pro 5 16ARX8 (R5 7645HX, RTX 4050) | |
| Medio AMD Ryzen 7 7840HS, NVIDIA GeForce RTX 4060 Laptop GPU (1522 - 1776, n=3) | |
| Dell G16 7620 | |
| Lenovo Legion Slim 5 16APH8 | |
| HP Omen 16-wf000 | |
| Asus TUF Gaming A16 FA617XS | |
| Acer Nitro 16 AN16-41-R7YE | |
| PCMark 10 Score | 7946 puntos | |
ayuda | ||
| AIDA64 / Memory Copy | |
| Medio AMD Ryzen 7 7840HS (30937 - 72158, n=21) | |
| HP Omen 16-wf000 | |
| Lenovo Legion Slim 5 16APH8 | |
| Asus TUF Gaming A16 FA617XS | |
| Dell G16 7620 | |
| Acer Nitro 16 AN16-41-R7YE | |
| Lenovo Legion Pro 5 16ARX8 (R5 7645HX, RTX 4050) | |
| AIDA64 / Memory Read | |
| HP Omen 16-wf000 | |
| Dell G16 7620 | |
| Asus TUF Gaming A16 FA617XS | |
| Lenovo Legion Slim 5 16APH8 | |
| Medio AMD Ryzen 7 7840HS (30497 - 62147, n=21) | |
| Acer Nitro 16 AN16-41-R7YE | |
| Lenovo Legion Pro 5 16ARX8 (R5 7645HX, RTX 4050) | |
| AIDA64 / Memory Write | |
| Medio AMD Ryzen 7 7840HS (34590 - 93323, n=21) | |
| Lenovo Legion Slim 5 16APH8 | |
| Asus TUF Gaming A16 FA617XS | |
| HP Omen 16-wf000 | |
| Dell G16 7620 | |
| Acer Nitro 16 AN16-41-R7YE | |
| Lenovo Legion Pro 5 16ARX8 (R5 7645HX, RTX 4050) | |
| AIDA64 / Memory Latency | |
| Dell G16 7620 | |
| Lenovo Legion Slim 5 16APH8 | |
| Medio AMD Ryzen 7 7840HS (85.1 - 112, n=21) | |
| Asus TUF Gaming A16 FA617XS | |
| Acer Nitro 16 AN16-41-R7YE | |
| HP Omen 16-wf000 | |
| Lenovo Legion Pro 5 16ARX8 (R5 7645HX, RTX 4050) | |
* ... más pequeño es mejor
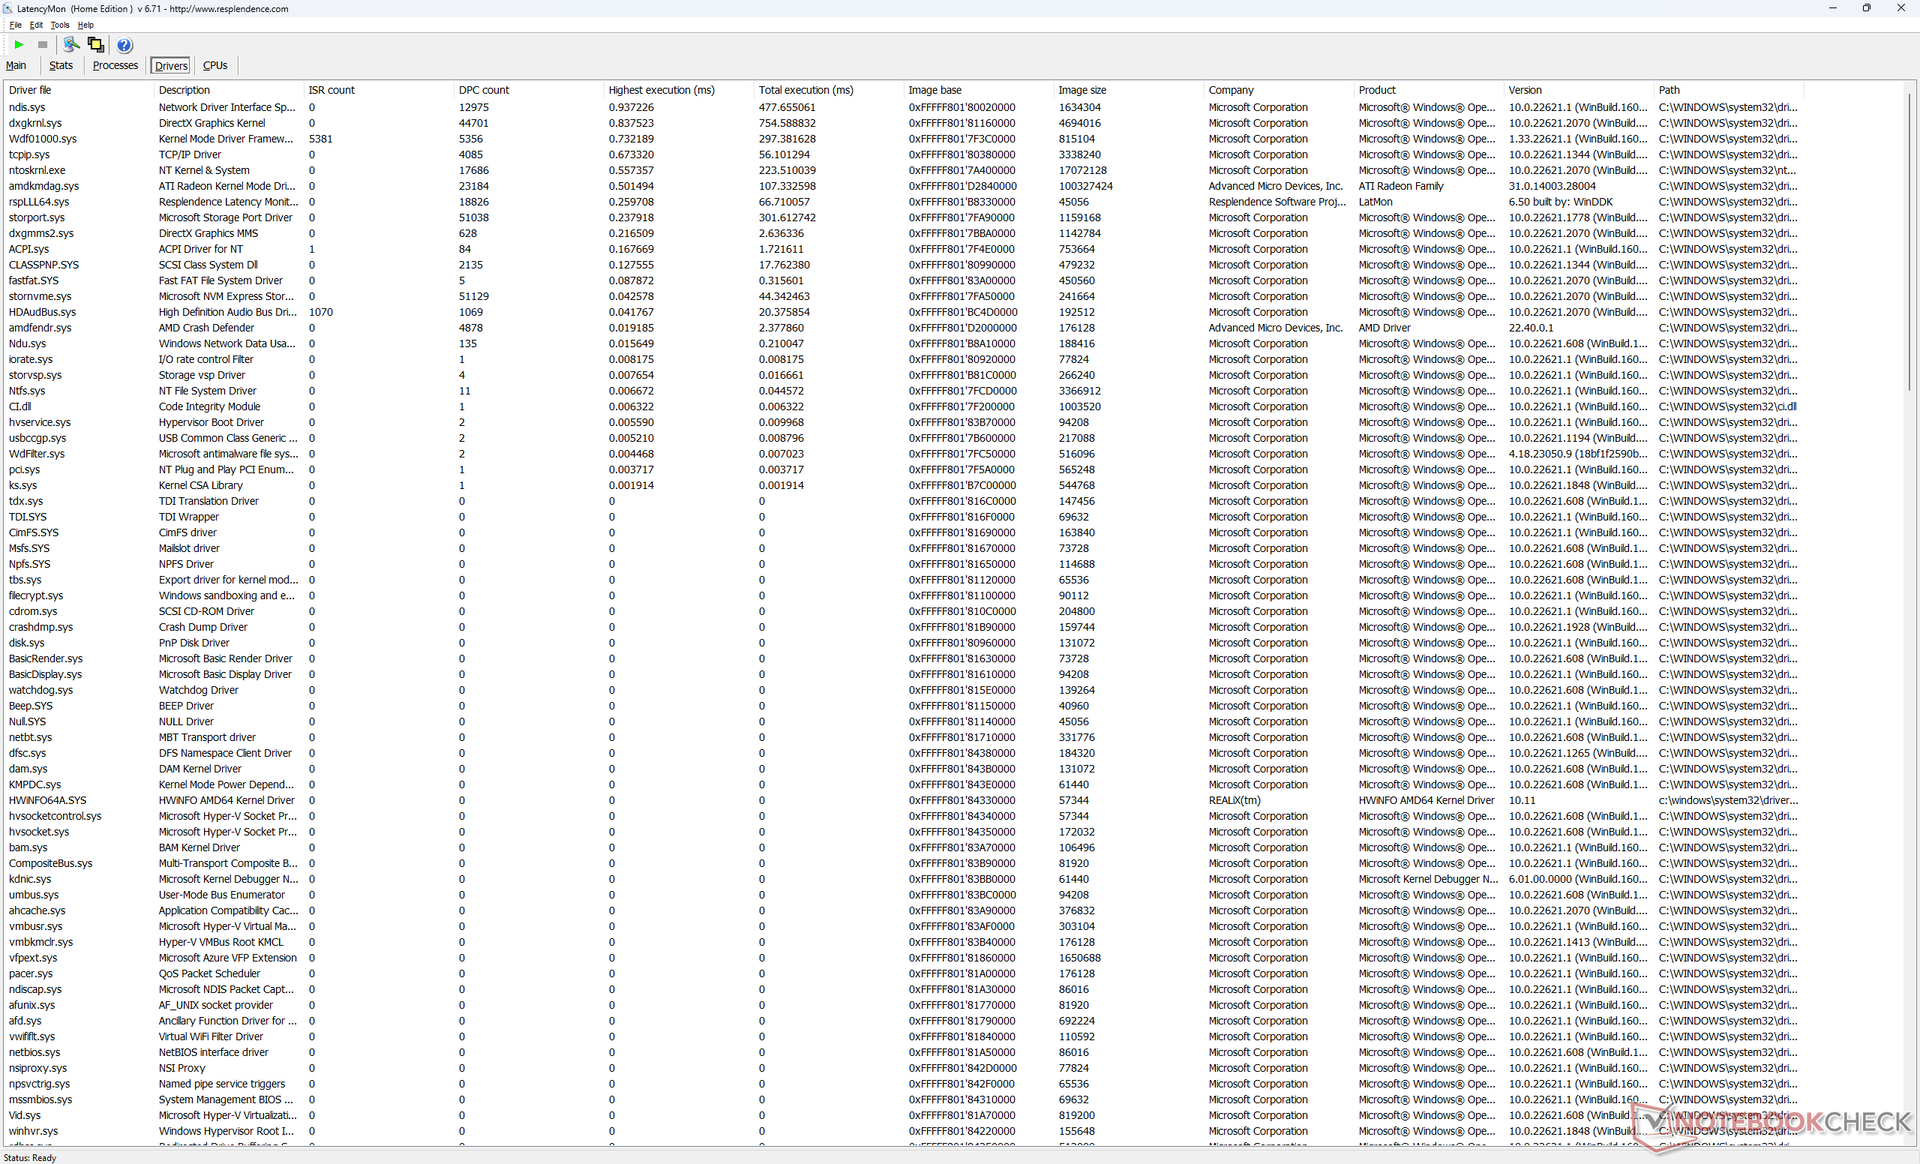
Latencia del CPD
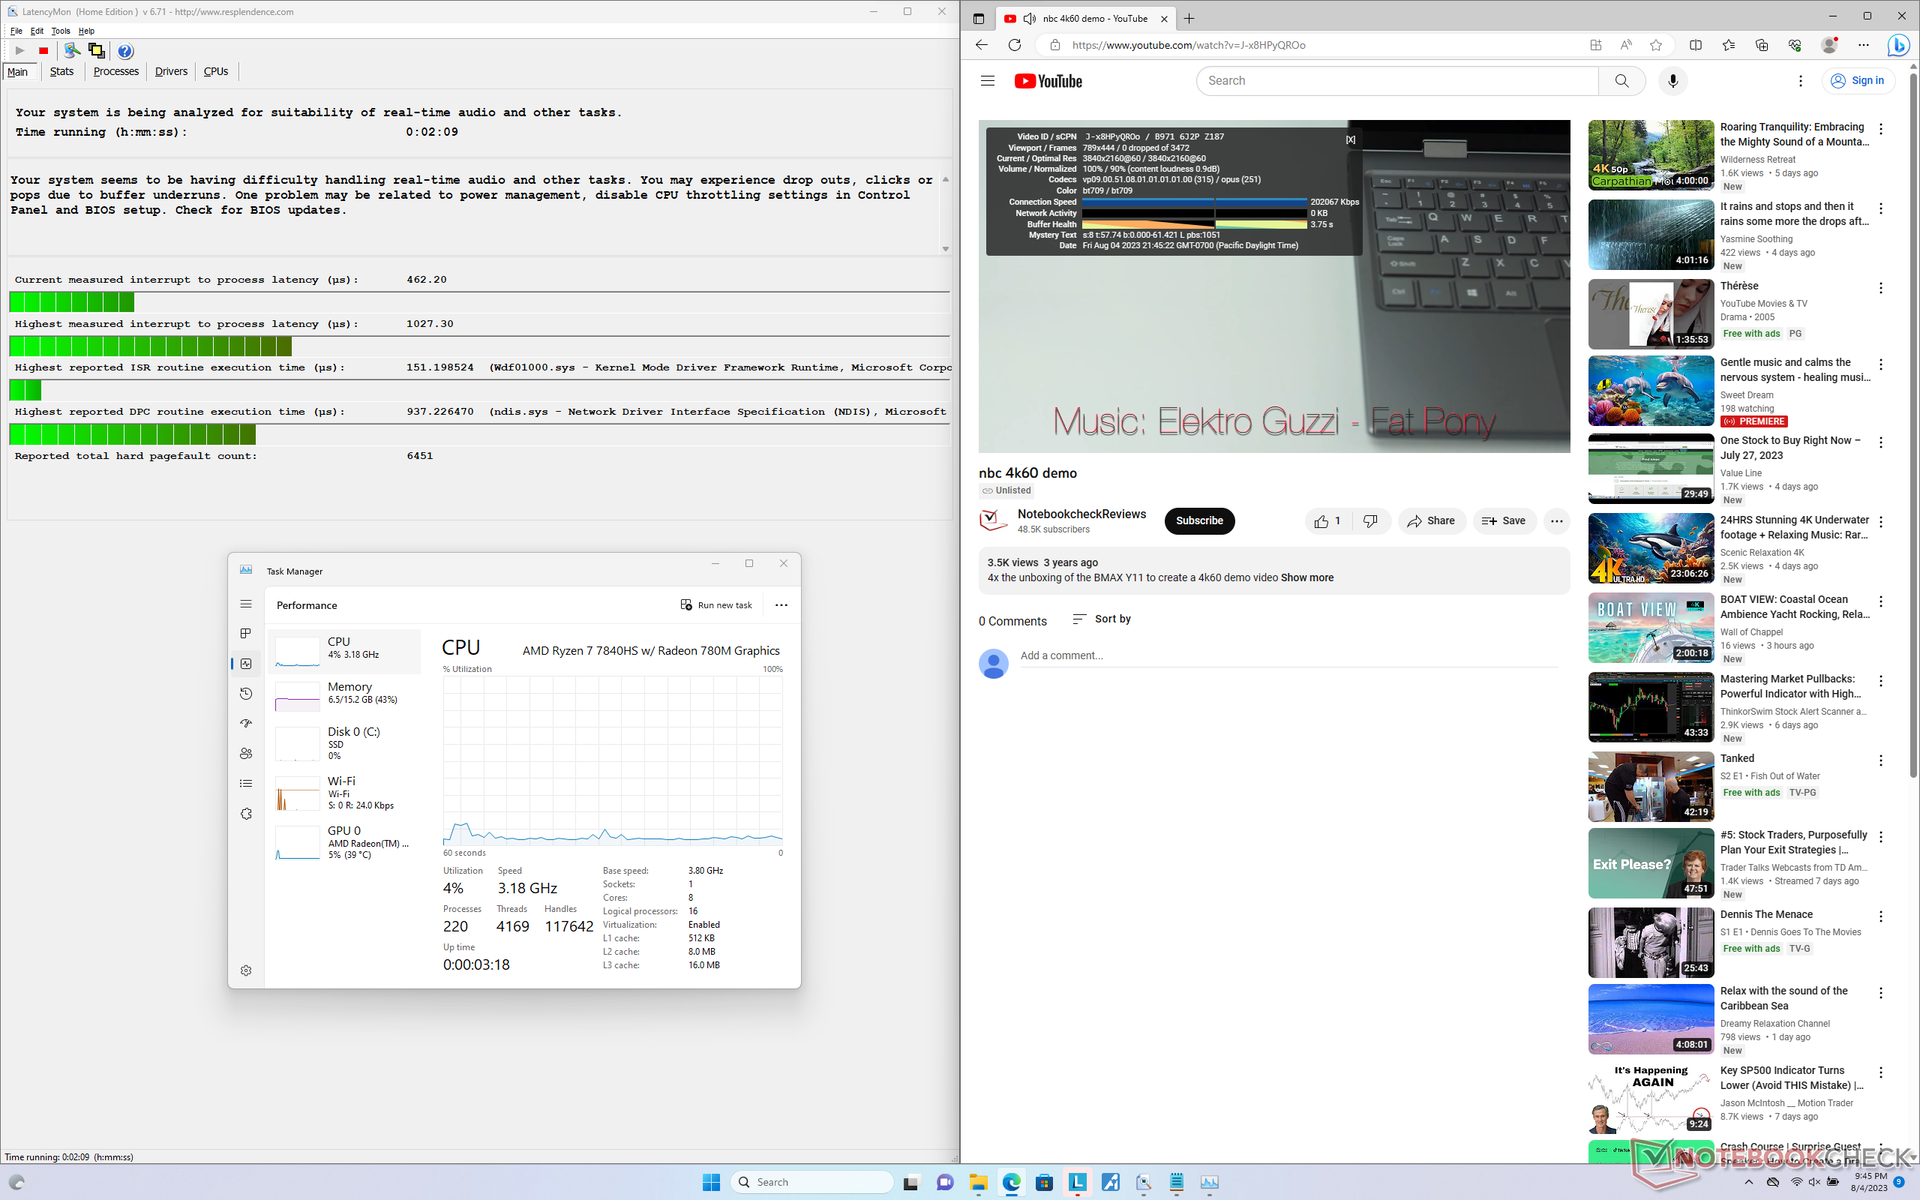
LatencyMon sólo revela problemas menores de CPD al abrir varias pestañas de nuestra página de inicio. por lo demás, la reproducción de vídeo 4K a 60 FPS es perfecta y no se registran caídas de fotogramas.
| DPC Latencies / LatencyMon - interrupt to process latency (max), Web, Youtube, Prime95 | |
| HP Omen 16-wf000 | |
| Asus TUF Gaming A16 FA617XS | |
| Lenovo Legion Slim 5 16APH8 | |
| Dell G16 7620 | |
| Acer Nitro 16 AN16-41-R7YE | |
| Lenovo Legion Pro 5 16ARX8 (R5 7645HX, RTX 4050) | |
* ... más pequeño es mejor
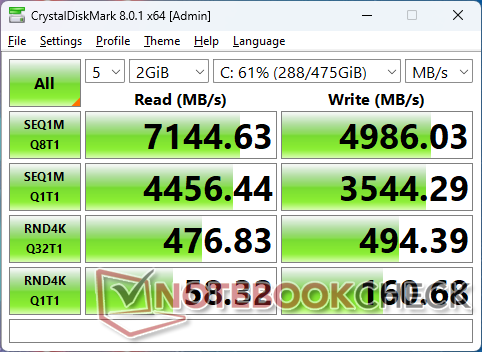
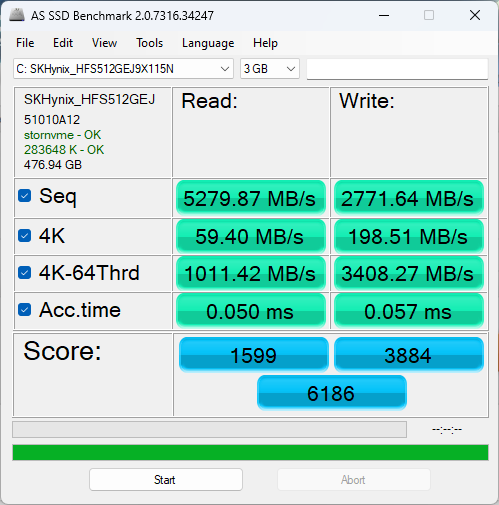
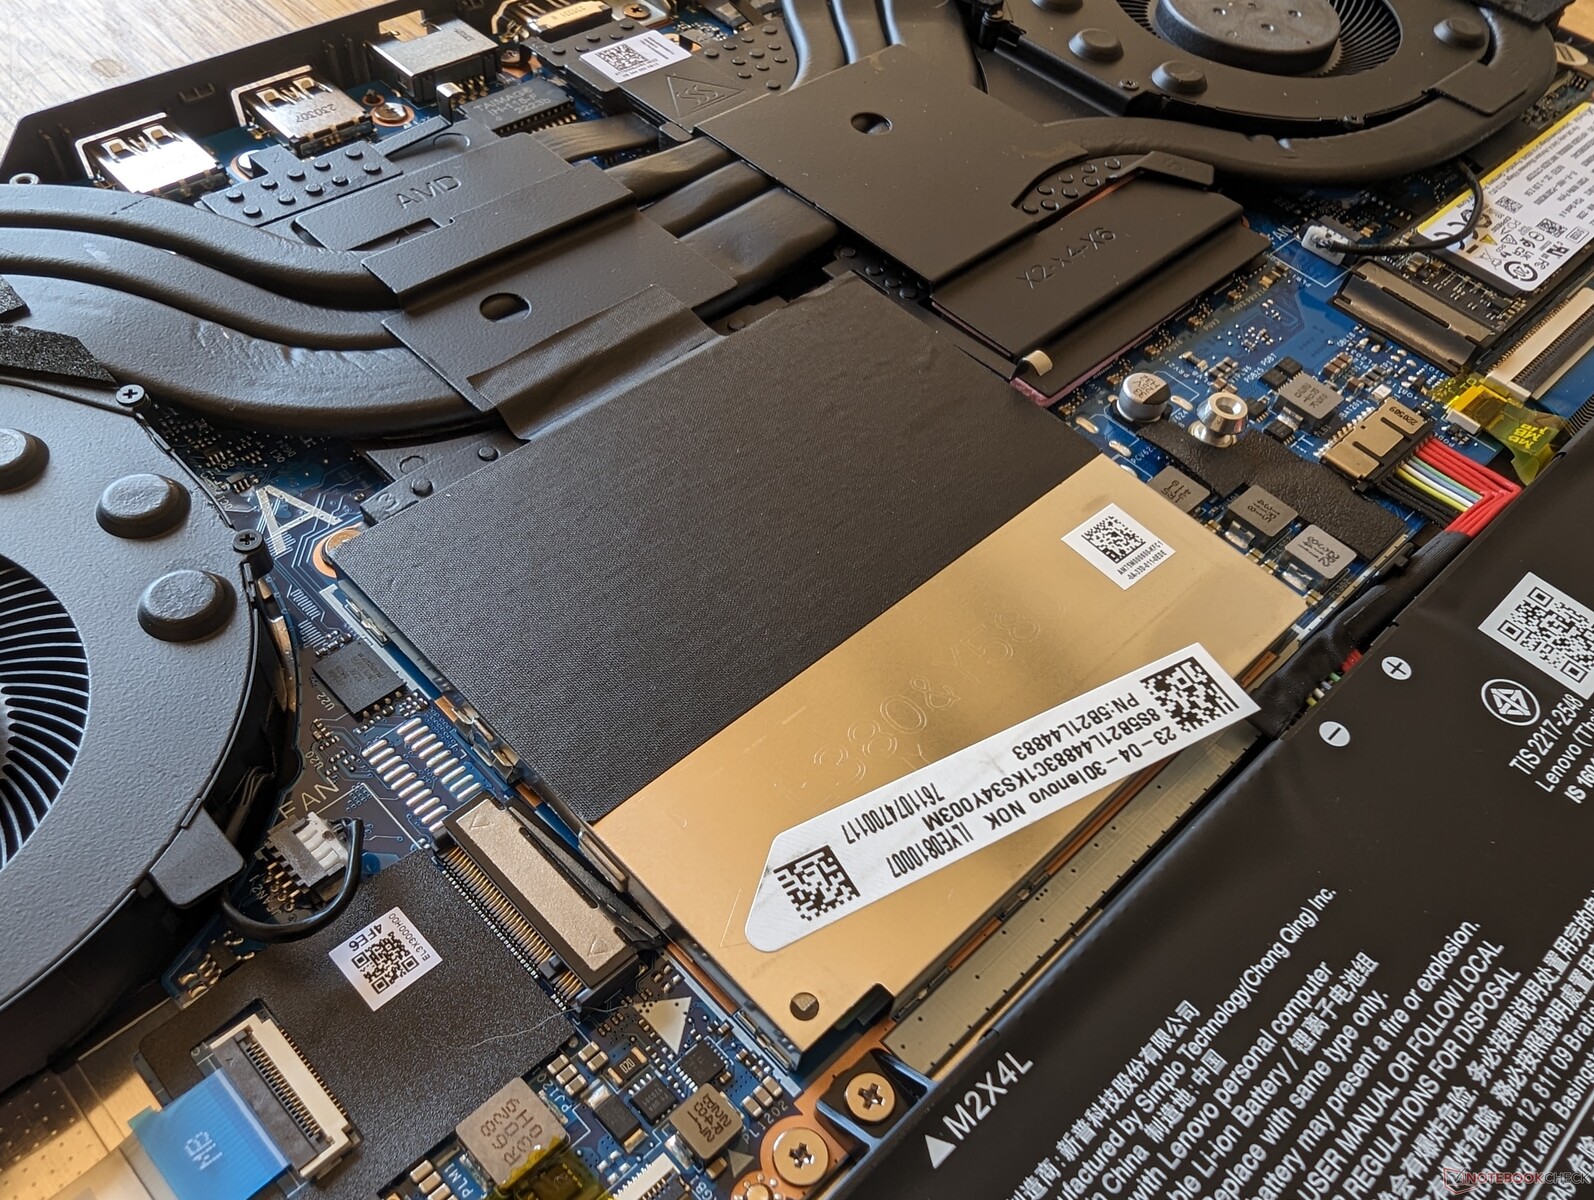
Dispositivos de almacenamiento: hasta dos SSD NVMe
Nuestra unidad de prueba viene con el mismoSK hynix PC801 PCIe4 x4 NVMe SSD que se encuentra en los modelos más caros Legion Pro 5 o Legion Slim 7. La unidad no mostró problemas para mantener una tasa de transferencia máxima de 6900 MB/s durante periodos prolongados. En cambio, la SSD del Alienware x16 R1 comenzaría a ralentizarse después de unos minutos en nuestra prueba de estrés DiskSpd como se muestra en el gráfico siguiente. Se incluyen almohadillas térmicas para cada una de las dos ranuras M.2 SSD para ayudar a disipar el calor en la parte inferior del chasis Legion.

| Drive Performance rating - Percent | |
| Lenovo Legion Pro 5 16ARX8 (R5 7645HX, RTX 4050) | |
| Dell G16 7620 | |
| HP Omen 16-wf000 | |
| Lenovo Legion Slim 5 16APH8 | |
| Acer Nitro 16 AN16-41-R7YE | |
| Asus TUF Gaming A16 FA617XS | |
* ... más pequeño es mejor
Disk Throttling: DiskSpd Read Loop, Queue Depth 8
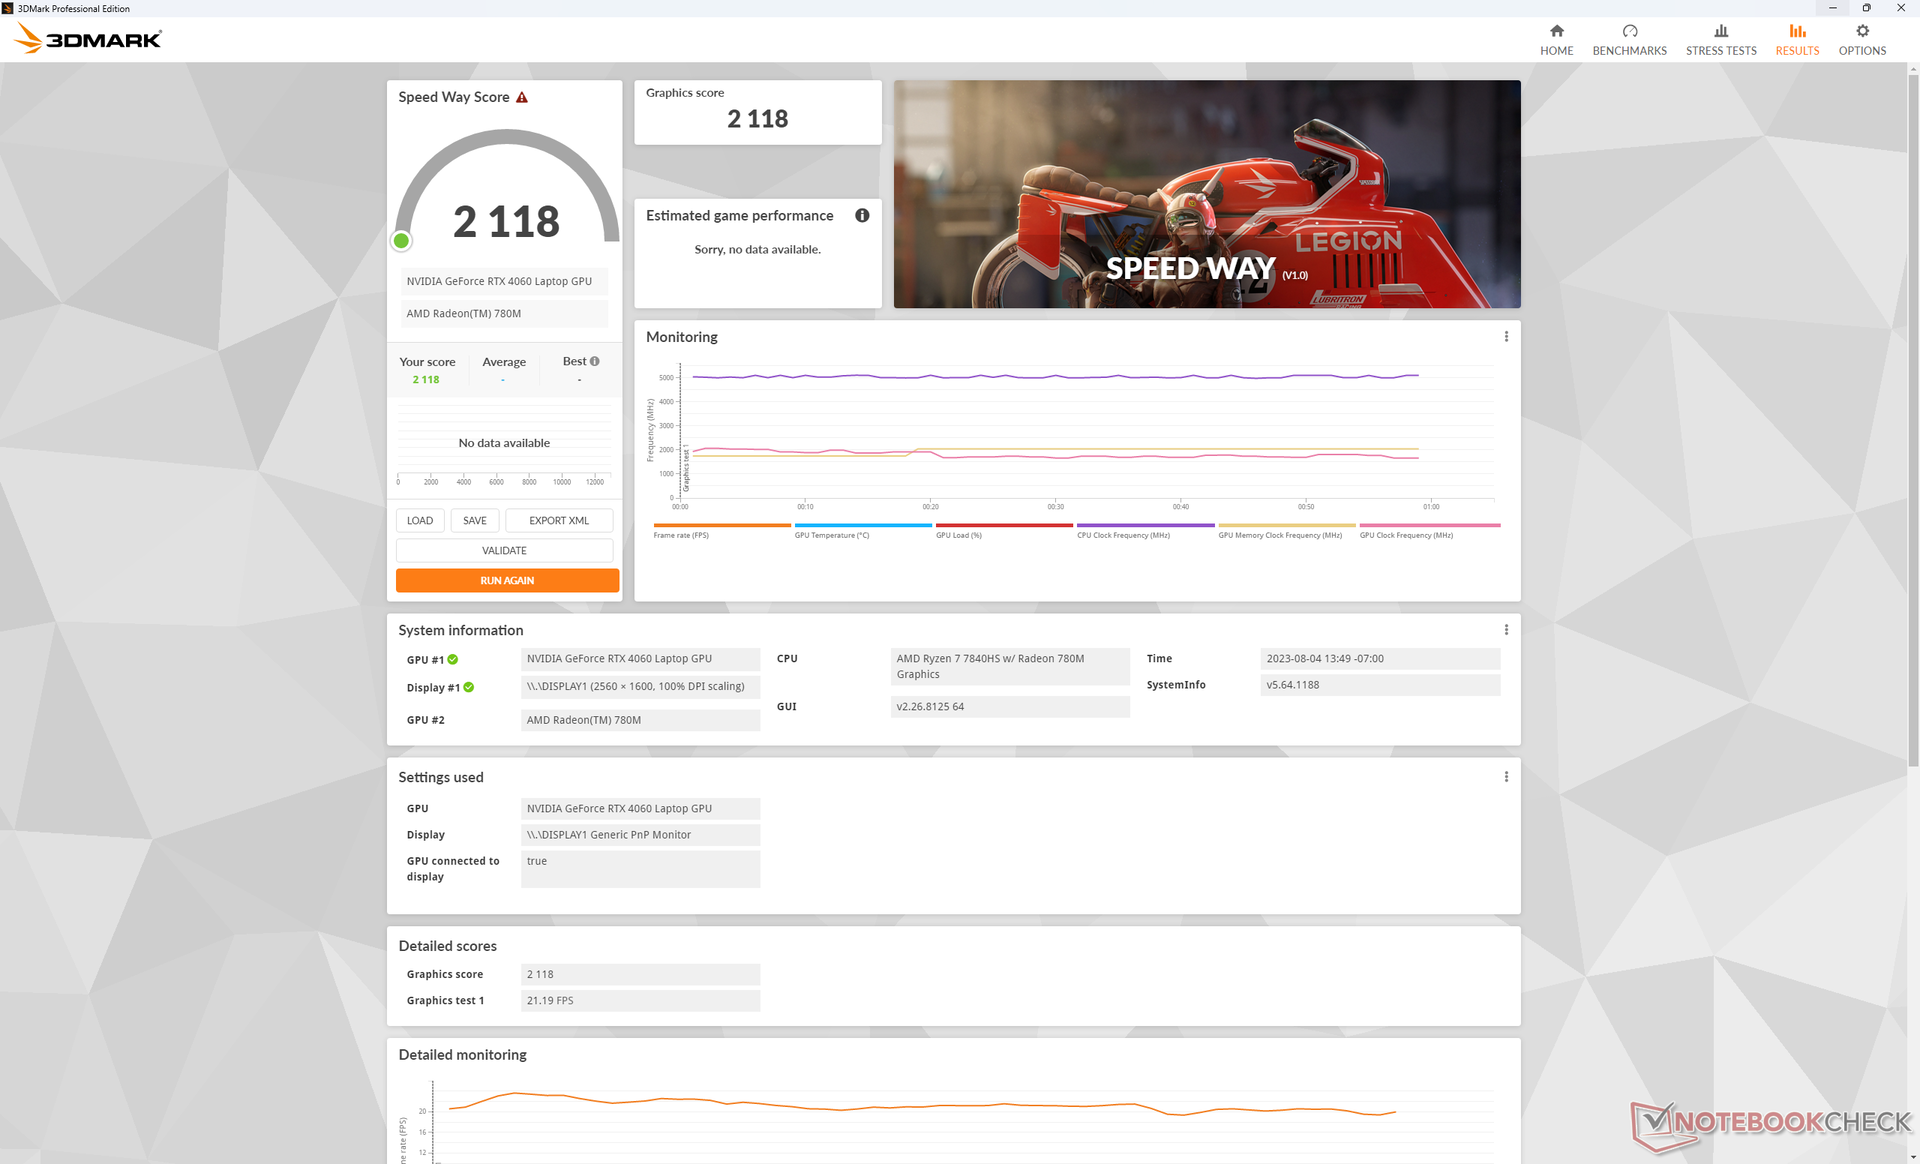
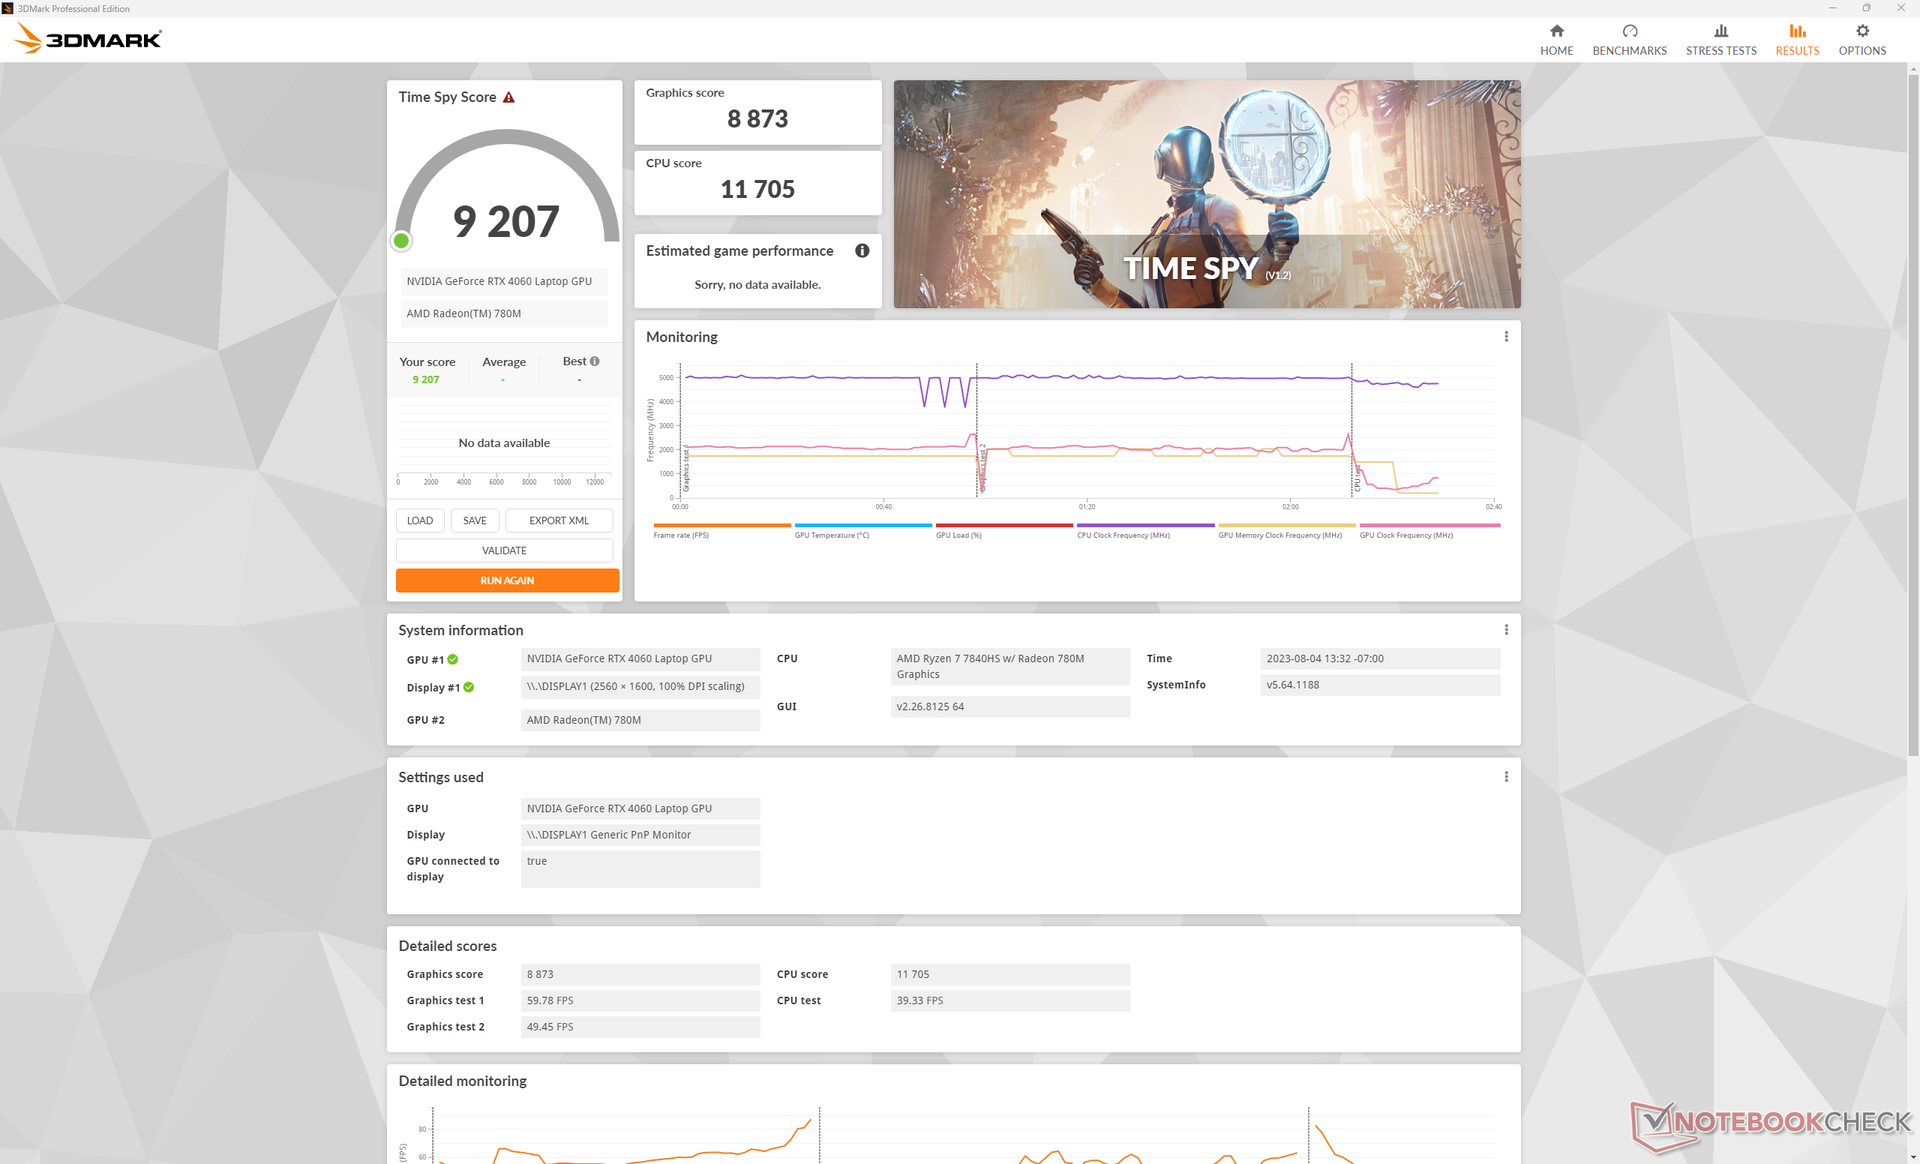
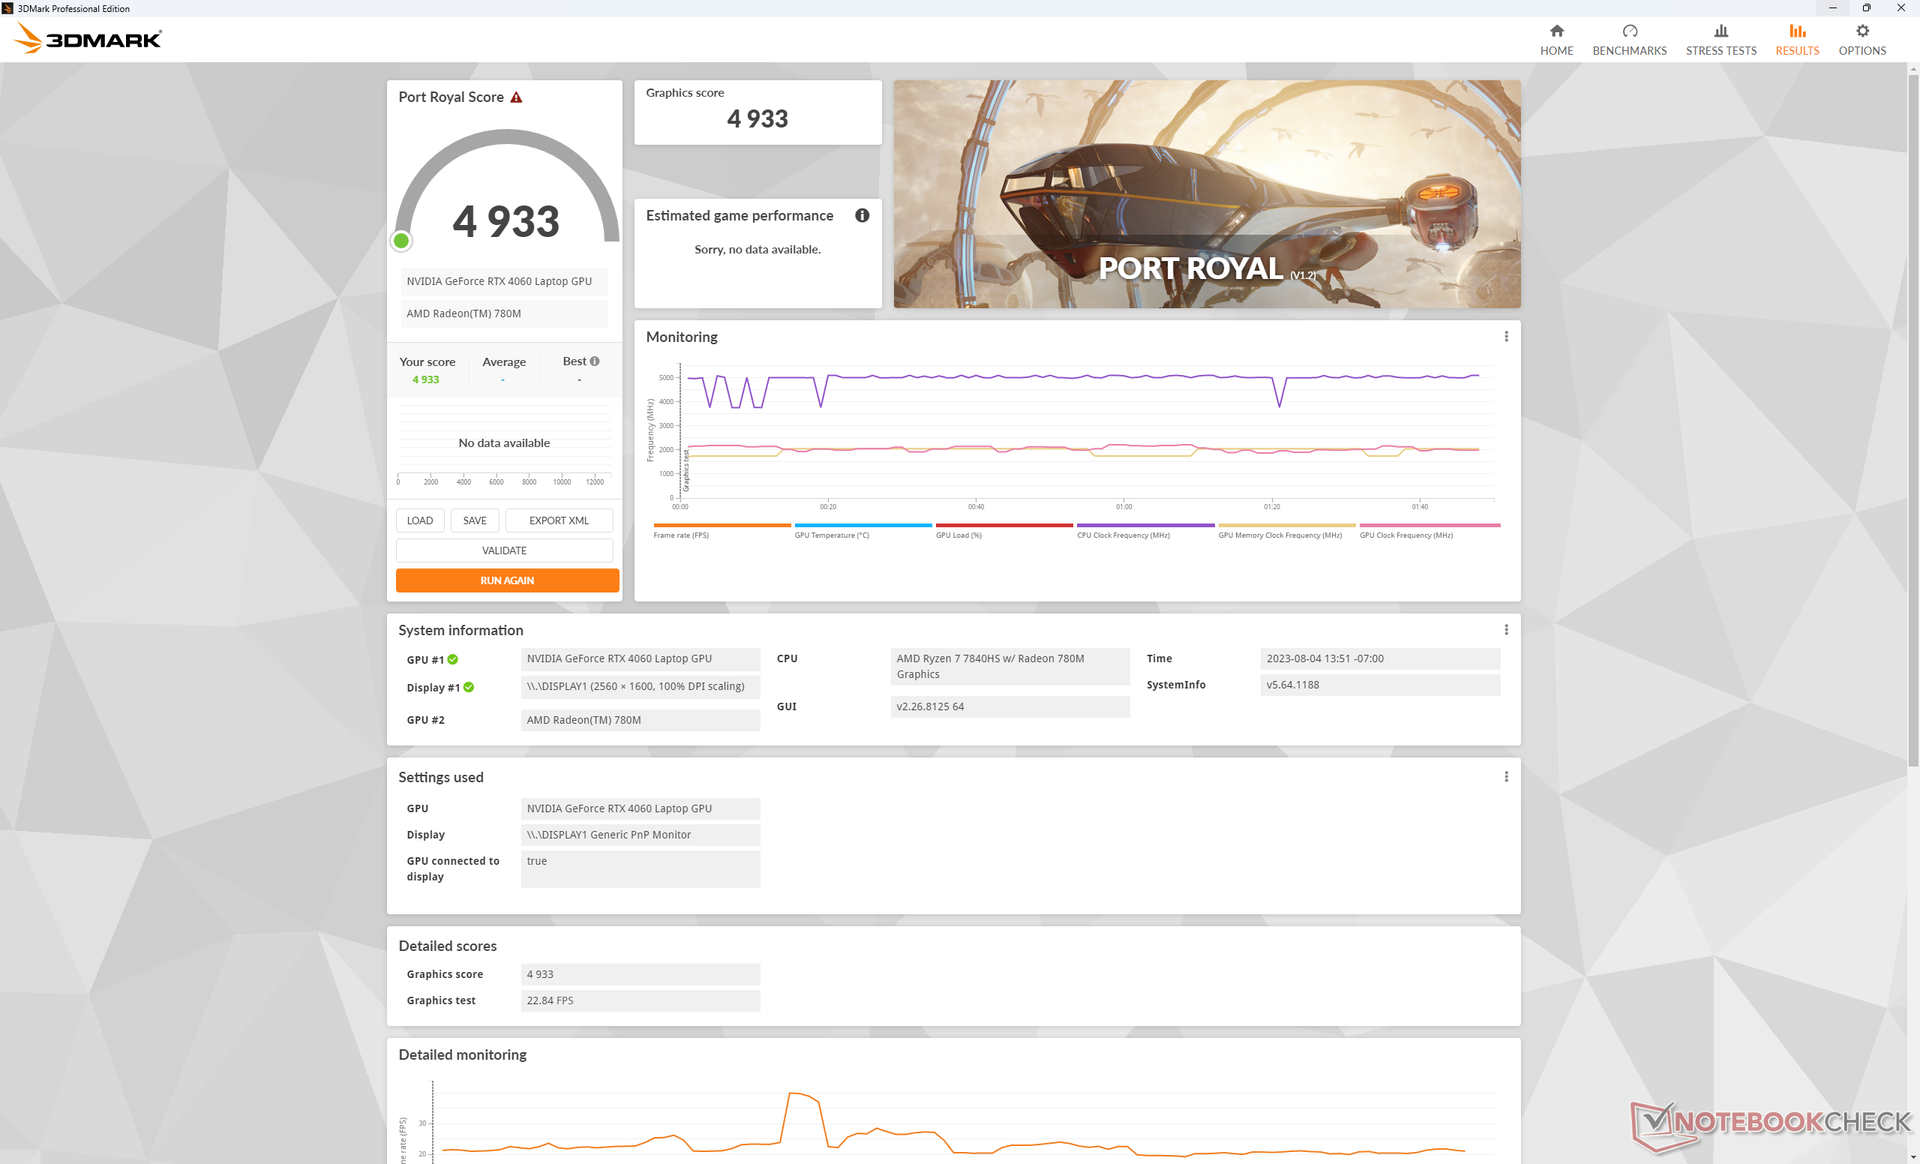
Rendimiento de la GPU: objetivo TGP de 100 W, pero sólo 60 W en condiciones reales
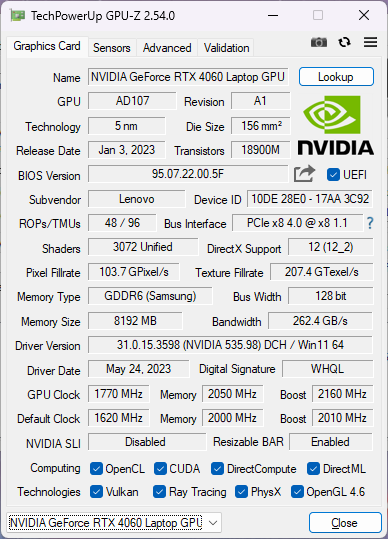
Mientras que el Legion Pro 5 puede configurarse con la CPU Ryzen 7 7745HX con gráficos GeForce RTX 4070, el Legion Slim 5 está limitado al más lento Ryzen 7 7740HS con RTX 4060 gráficos. Curiosamente, el panel de control Nvidia afirma una potencia gráfica máxima de 140 W en nuestra unidad mientras que las especificaciones oficiales de Lenovo afirman un objetivo de sólo 100 W. Sólo somos capaces de alcanzar un consumo de GPU de sólo 60 W al ejecutar juegos.
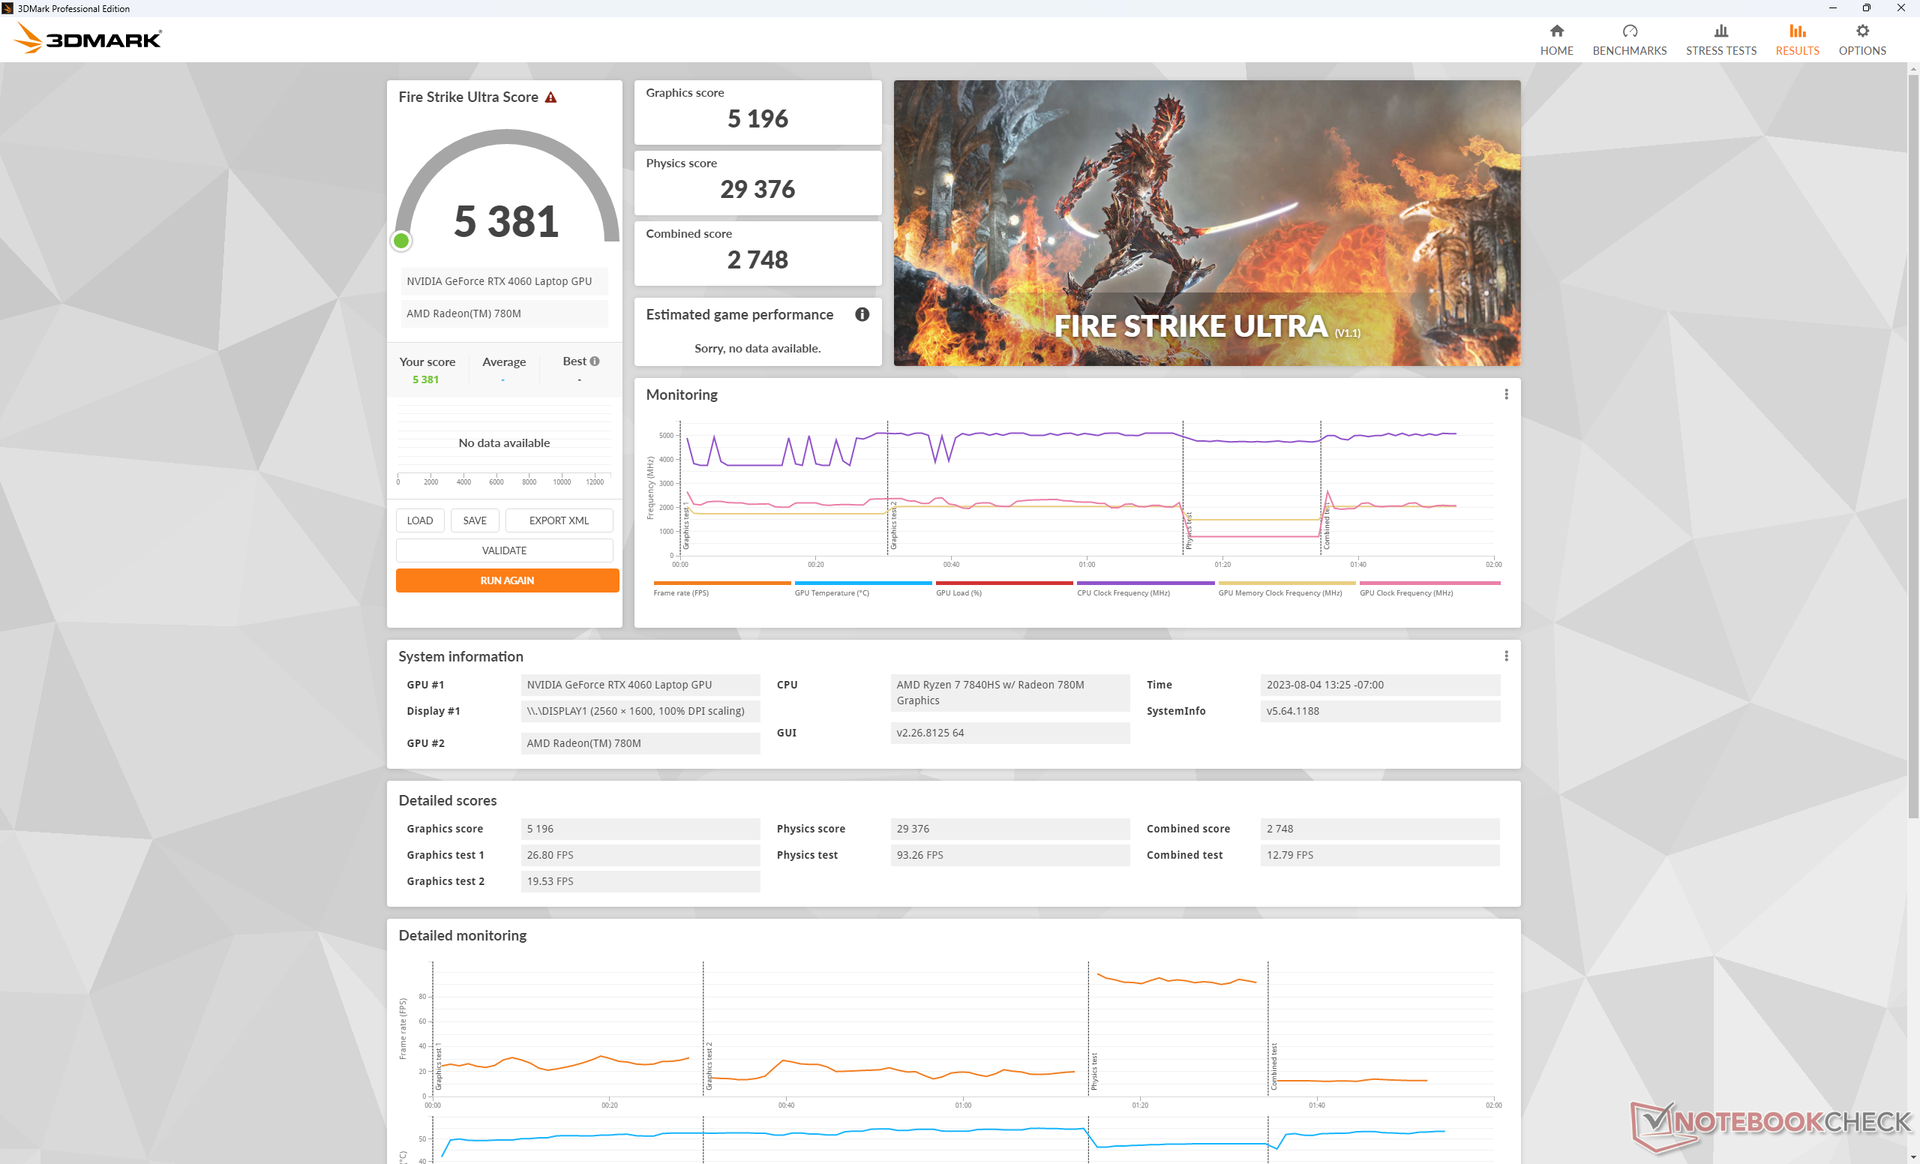
El rendimiento gráfico es entre un 5 y un 8 por ciento más lento que el de la media de portátiles de nuestra base de datos equipados con la misma GPU RTX 4060 móvil, lo que es decepcionante porque ese déficit sitúa a nuestra RTX 4060 mucho más cerca de la RTX 4050 en términos de rendimiento. De hecho, las GPU GeForce RTX 4050 del Legion Pro 5 16 y LOQ 15 están esencialmente a la par con la RTX 4060 en nuestro Legion Slim 5 según las pruebas 3DMark.
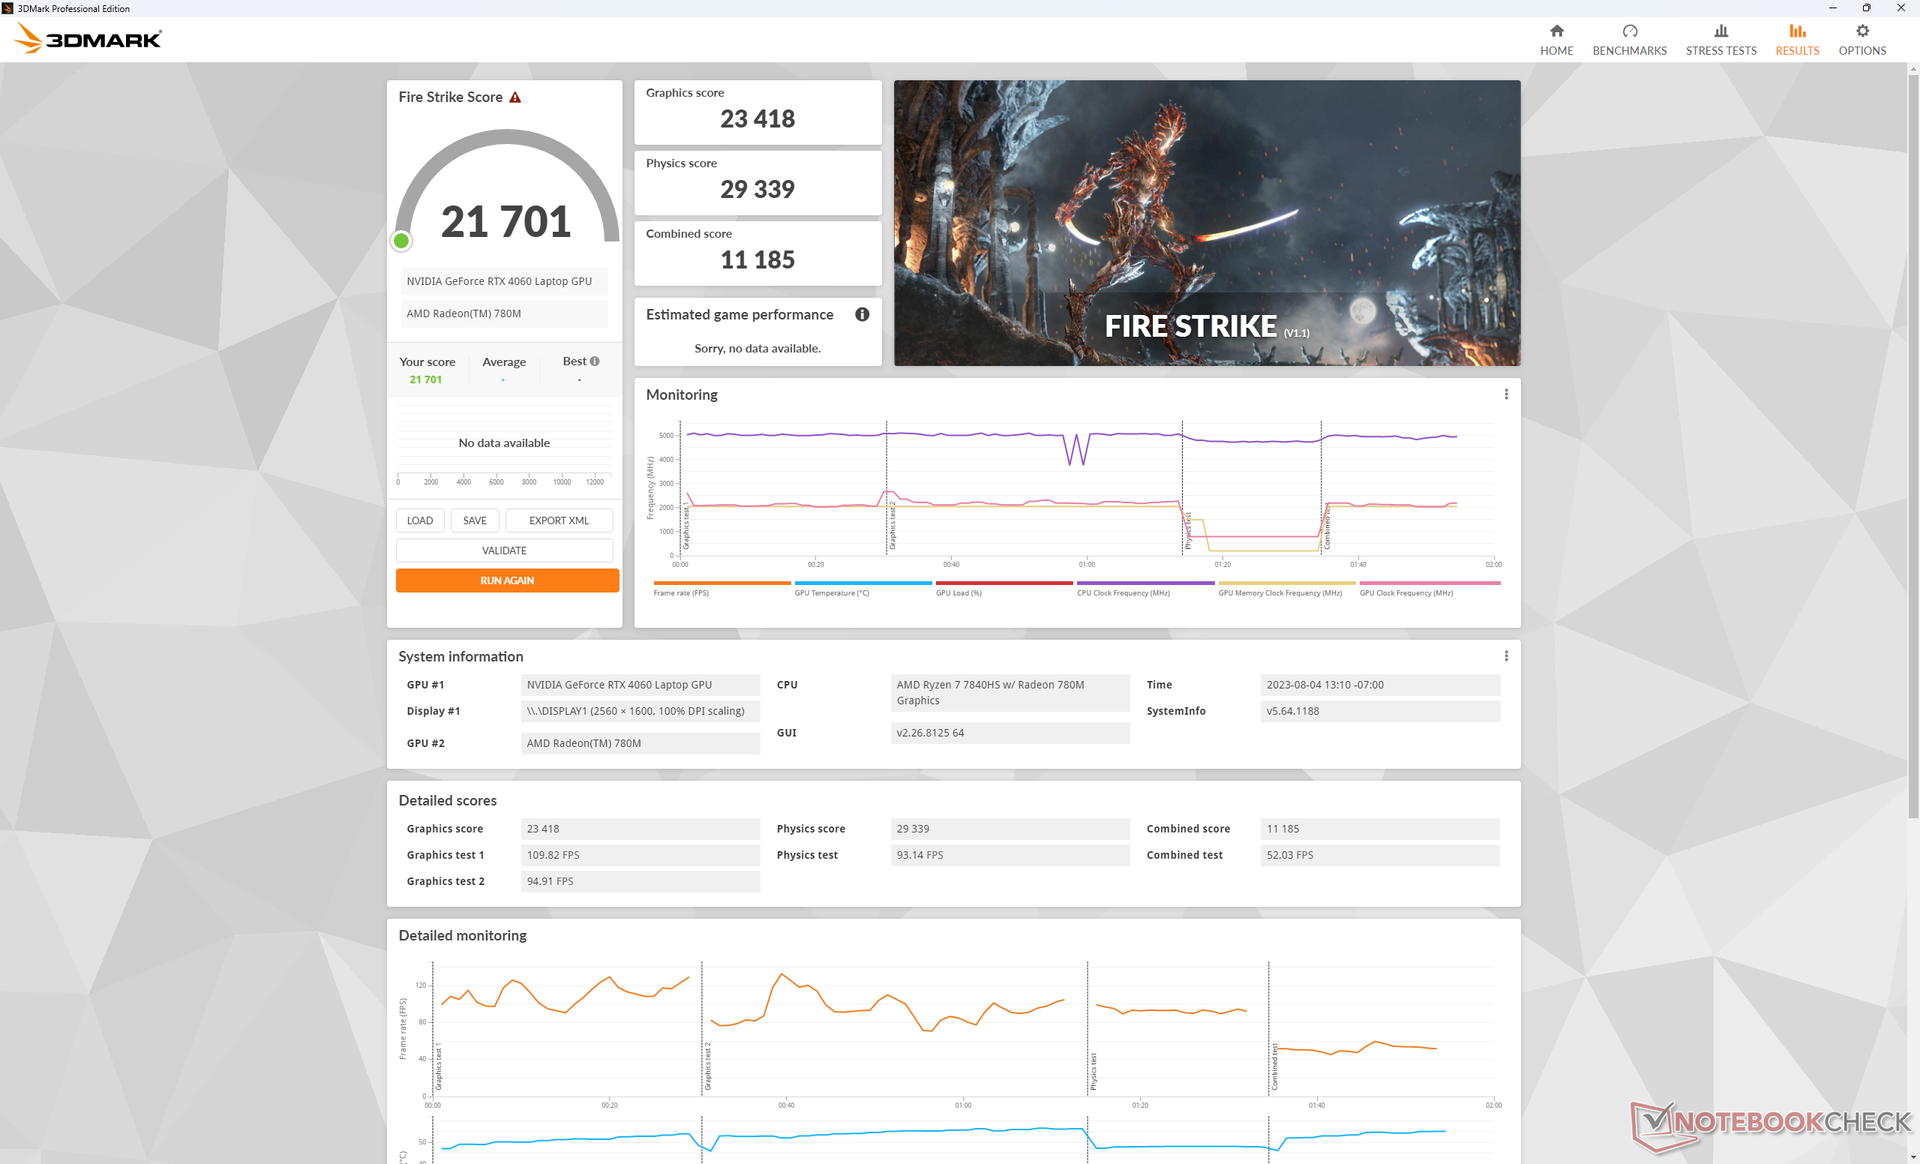
La situación se vuelve aún más extraña al cambiar entre los modos Equilibrado y Rendimiento. Normalmente, el modo Rendimiento en la mayoría de portátiles para juegos aumentaría el rendimiento gráfico entre un 10 y un 20 por ciento respecto al modo Equilibrado, pero no parece haber diferencia en nuestro Legion Slim 5. las puntuaciones 3DMark en modo Equilibrado serían esencialmente idénticas a nuestras puntuaciones en modo Rendimiento, como se muestra en la tabla Fire Strike a continuación. Este comportamiento se analiza con más detalle en nuestra sección de Pruebas de estrés.
| Perfil de potencia | Puntuación gráfica | Puntuación física | Puntuación combinada |
| Batería | 15850 (-32%) | 27206 (-7%) | 6943 (-38%) |
| Equilibrada | 23181 (-1%) | 28488 (-3%) | 10888 (-3%) |
| Rendimiento | 23418 | 29339 | 11185 |
Tenga en cuenta que nuestro escritorio GeForce RTX 4060 Ti Blender puntuación CUDA a continuación es incorrecta debido a un error durante la evaluación comparativa.
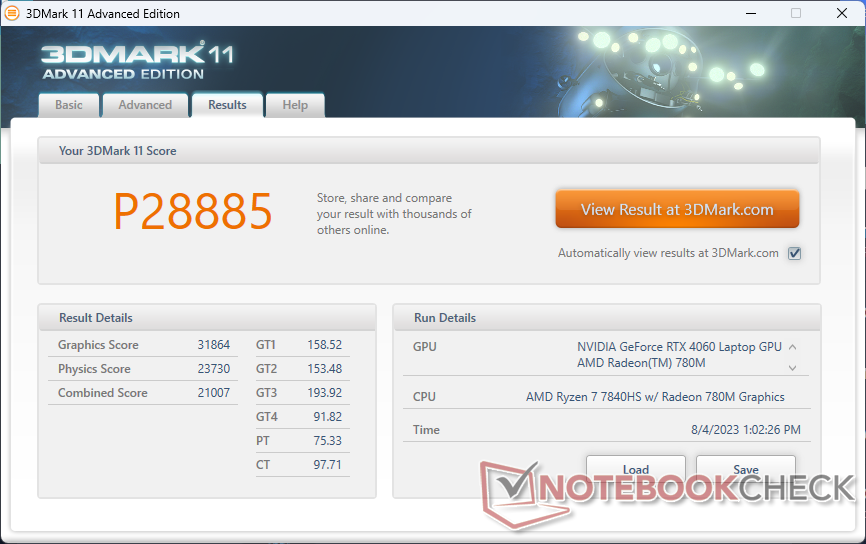
| 3DMark 11 Performance | 28885 puntos | |
| 3DMark Fire Strike Score | 21701 puntos | |
| 3DMark Time Spy Score | 9207 puntos | |
ayuda | ||
* ... más pequeño es mejor
Rendimiento en juegos
El rendimiento al ejecutar juegos a 1080p es solo ligeramente superior al de la RTX 4050 en un 5-10% en la mayoría de títulos. Al ejecutar Cyberpunk 2077, Final Fantasy XV o Tiny Tina's Wonderlands, por ejemplo, nuestra Legion Slim 5 apenas superaría a la LOQ 15 más barata con la mitad de RAM. La ventaja de rendimiento crecería a nuestro favor si se ejecutara en resoluciones y configuraciones más bajas, pero la mayoría de los jugadores apuntarán a 1080p o más. El Legion Pro 5 16 con la misma RTX 4060 superaría a nuestro Legion Slim 5 hasta en un 25% en algunos casos, como muestran nuestras tablas comparativas a continuación.
Witcher 3 FPS Chart
| bajo | medio | alto | ultra | QHD | 4K | |
|---|---|---|---|---|---|---|
| GTA V (2015) | 180.1 | 172.8 | 164.2 | 101 | 83 | 76.3 |
| The Witcher 3 (2015) | 350.9 | 289.1 | 180.2 | 93.2 | 57 | |
| Dota 2 Reborn (2015) | 167.5 | 151.3 | 142.7 | 135.6 | 115.7 | |
| Final Fantasy XV Benchmark (2018) | 209 | 131 | 94.3 | 67.7 | 37.6 | |
| X-Plane 11.11 (2018) | 110.1 | 106.3 | 83.3 | 70.9 | ||
| Strange Brigade (2018) | 375 | 242 | 193 | 168.2 | 115.1 | 61.8 |
| Cyberpunk 2077 1.6 (2022) | 136.1 | 113.7 | 84.7 | 69.4 | 40.7 | 17.4 |
| Tiny Tina's Wonderlands (2022) | 197.4 | 164.3 | 104.8 | 80.3 | 54.3 | 26.7 |
| F1 22 (2022) | 233 | 226 | 166.8 | 55.1 | 35.5 | 16.6 |
| Returnal (2023) | 99 | 93 | 87 | 75 | 52 | 29 |
Emisiones
Ruido del sistema - Casi el mismo que Legion Pro 5 16
El ruido del ventilador depende en gran medida de la configuración del perfil de potencia. Si está en modo equilibrado, el ruido del ventilador al ejecutar cargas típicas como navegadores web o flujos de vídeo oscilaría entre 27 y 29 dB(A), lo que es audible pero no distrae. Molestamente, los ventiladores ocasionalmente alcanzan los 33 dB(A) por periodos cortos antes de volver a su rango normal.
El ruido del ventilador Witcher 3 en modo Equilibrado alcanzaba un pico de 48 dB(A) comparado con 54 dB(A) en modo Rendimiento. Estos máximos son similares a los que registramos en elLegion Pro 5 16IRX8 equipada con la misma GPU RTX 4060. Por lo general, se recomiendan auriculares para niveles de ruido en el rango medio de 50 dB(A).
Ruido
| Ocioso |
| 23.1 / 23.1 / 27.7 dB(A) |
| Carga |
| 33.3 / 54 dB(A) |
 | ||
30 dB silencioso 40 dB(A) audible 50 dB(A) ruidosamente alto |
||
min: | ||
| Lenovo Legion Slim 5 16APH8 GeForce RTX 4060 Laptop GPU, R7 7840HS, SK hynix PC801 HFS512GEJ9X115N | Lenovo Legion Pro 5 16IRX8 GeForce RTX 4060 Laptop GPU, i7-13700HX, SK hynix PC801 HFS512GEJ9X115N | Acer Nitro 16 AN16-41-R7YE GeForce RTX 4050 Laptop GPU, R5 7535HS, SK hynix HFS512GEJ9X125N | HP Omen 16-wf000 GeForce RTX 4080 Laptop GPU, i7-13700HX, SK hynix PC801 HFS002TEJ9X101N | Dell G16 7620 GeForce RTX 3060 Laptop GPU, i7-12700H, WDC PC SN810 512GB | Asus TUF Gaming A16 FA617XS Radeon RX 7600S, R9 7940HS, Micron 2400 MTFDKBA512QFM | |
|---|---|---|---|---|---|---|
| Noise | 2% | -2% | -12% | -4% | -7% | |
| apagado / medio ambiente * (dB) | 22.9 | 23 -0% | 24 -5% | 23 -0% | 23.2 -1% | 25 -9% |
| Idle Minimum * (dB) | 23.1 | 23.1 -0% | 25 -8% | 29.6 -28% | 28.3 -23% | 25 -8% |
| Idle Average * (dB) | 23.1 | 23.1 -0% | 26 -13% | 29.8 -29% | 28.8 -25% | 26 -13% |
| Idle Maximum * (dB) | 27.7 | 26.6 4% | 27 3% | 30.4 -10% | 28.9 -4% | 28 -1% |
| Load Average * (dB) | 33.3 | 34.7 -4% | 42 -26% | 33.8 -2% | 32.4 3% | 43 -29% |
| Witcher 3 ultra * (dB) | 54 | 47.6 12% | 43 20% | 57 -6% | 48.3 11% | 51 6% |
| Load Maximum * (dB) | 54 | 54.8 -1% | 45 17% | 58.3 -8% | 48.1 11% | 53 2% |
* ... más pequeño es mejor
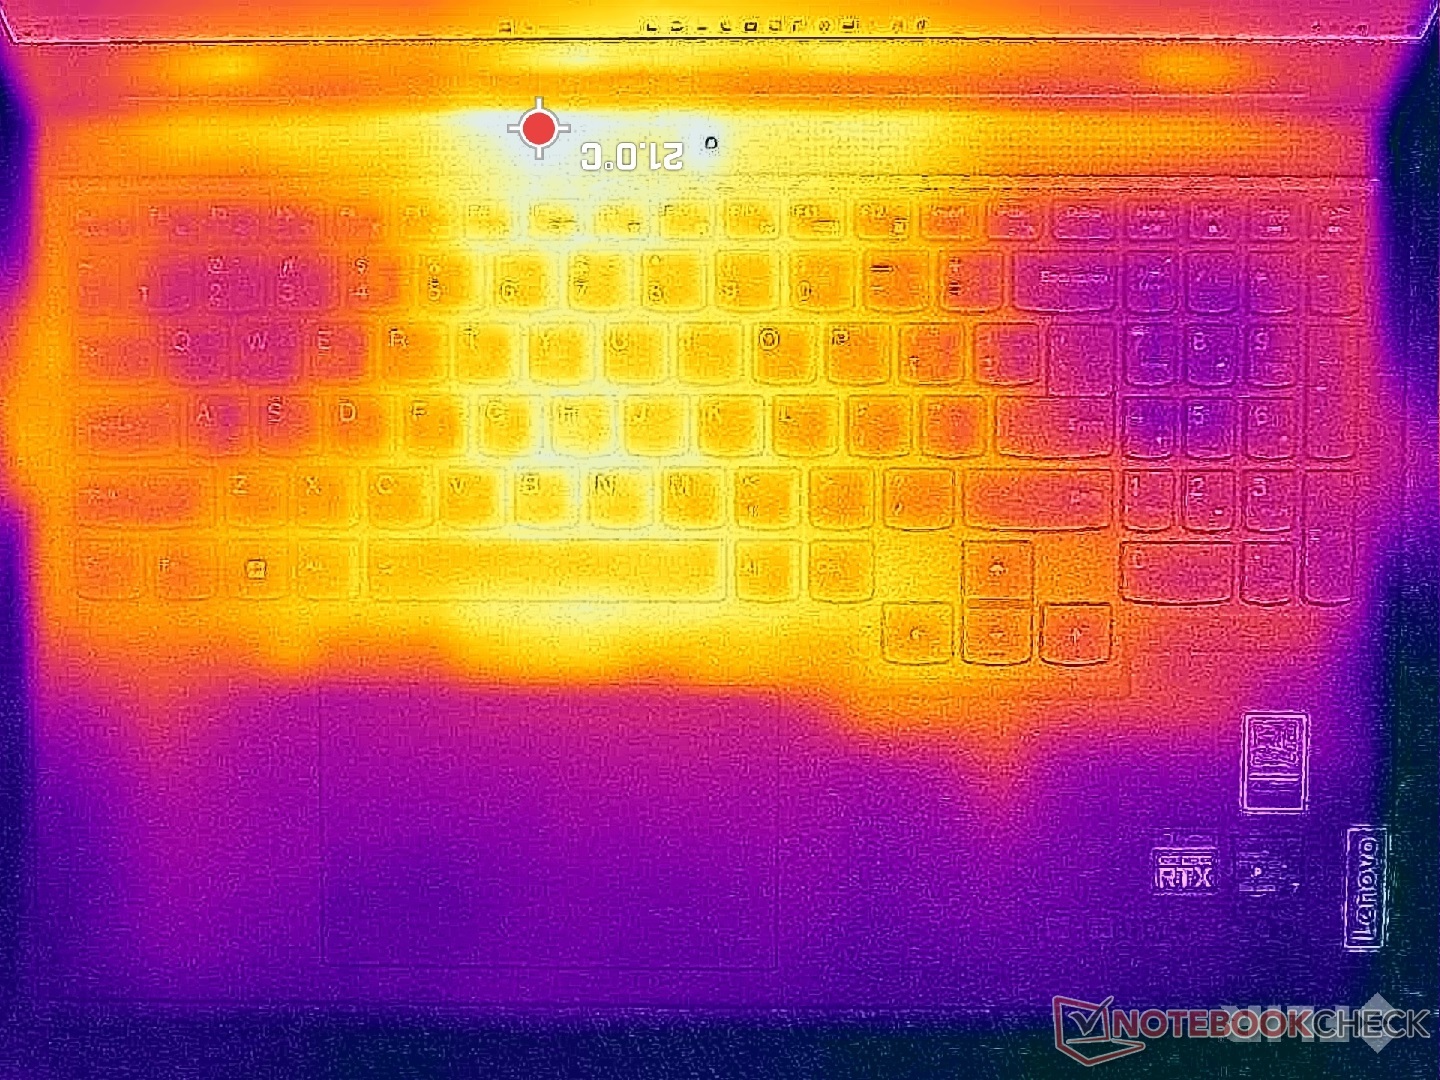
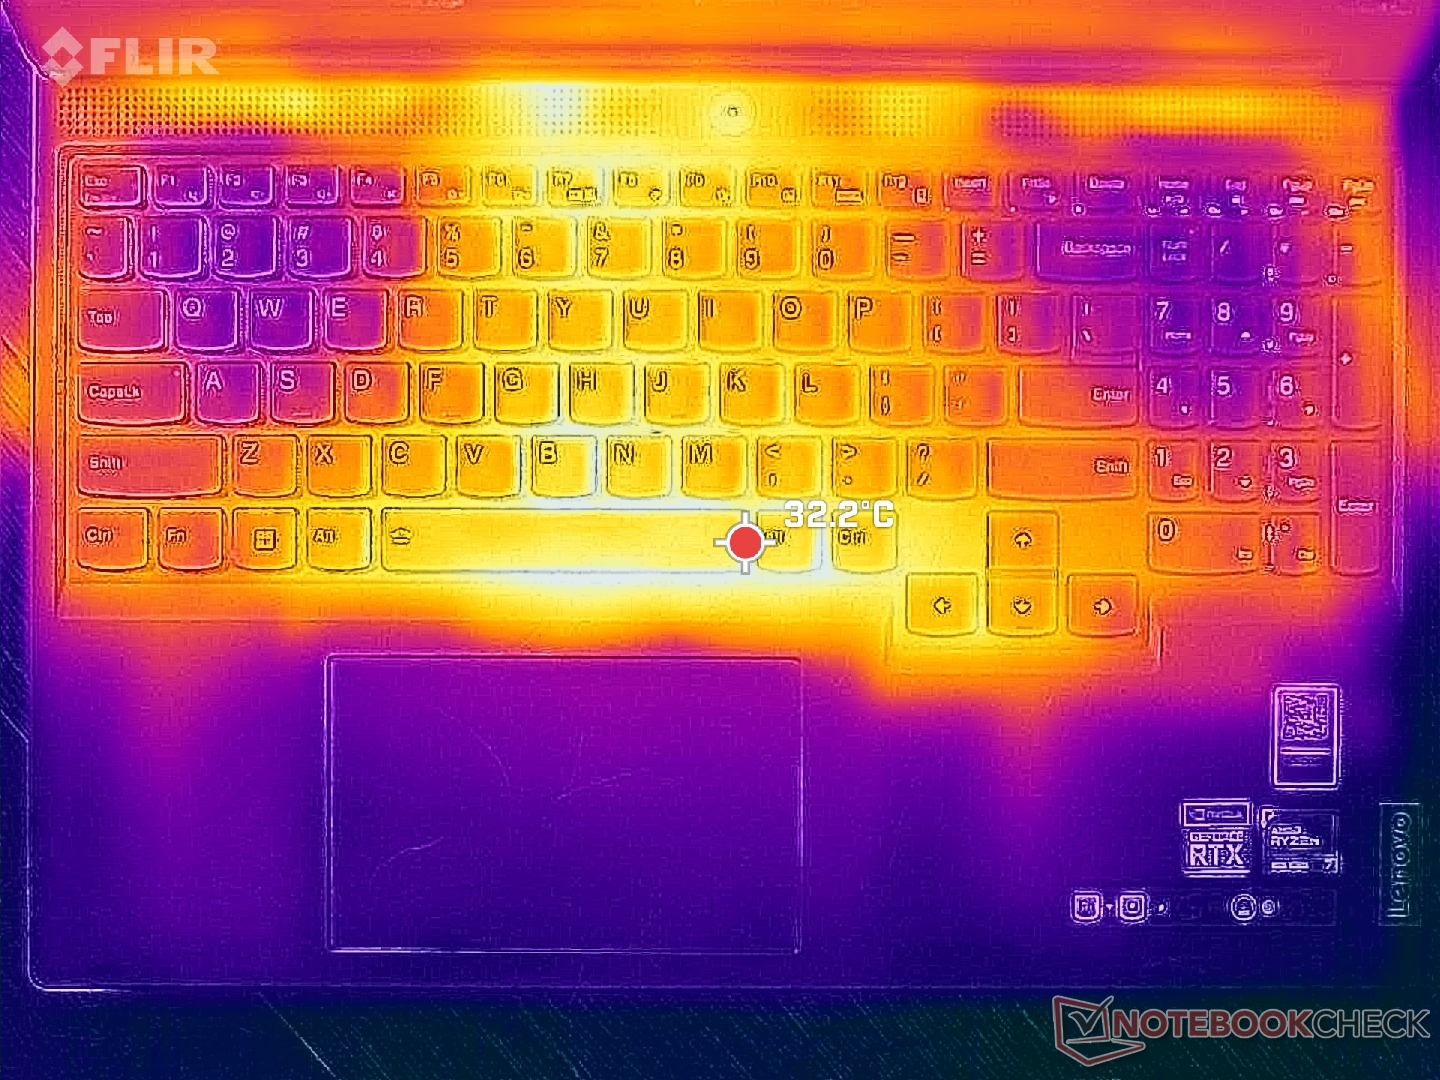
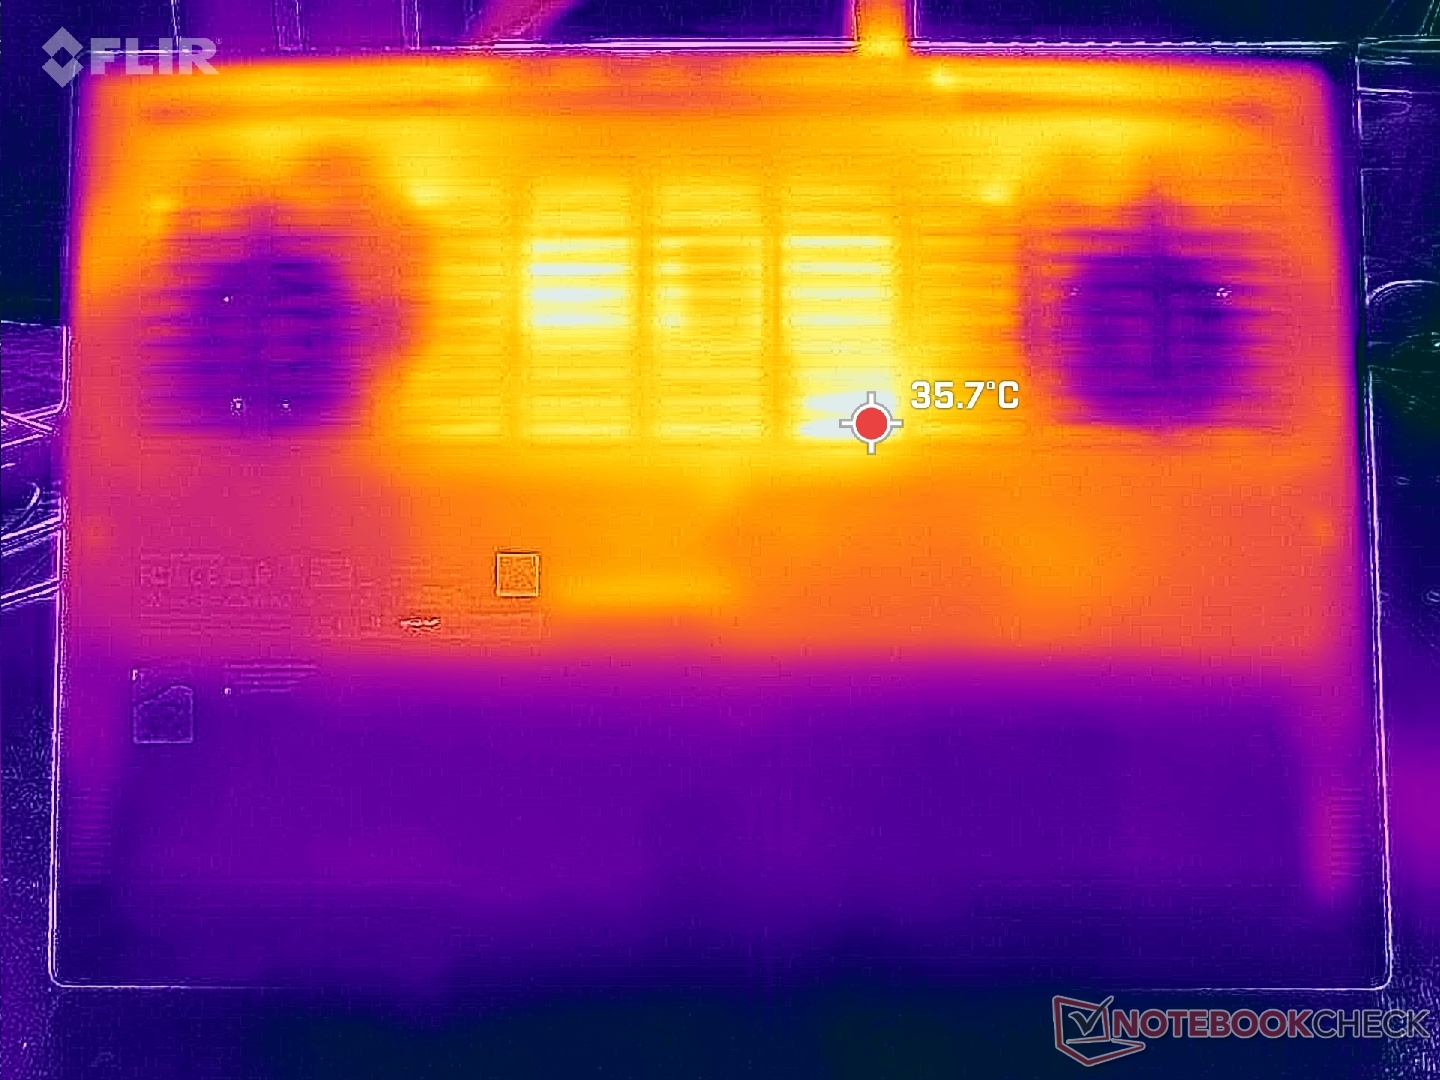
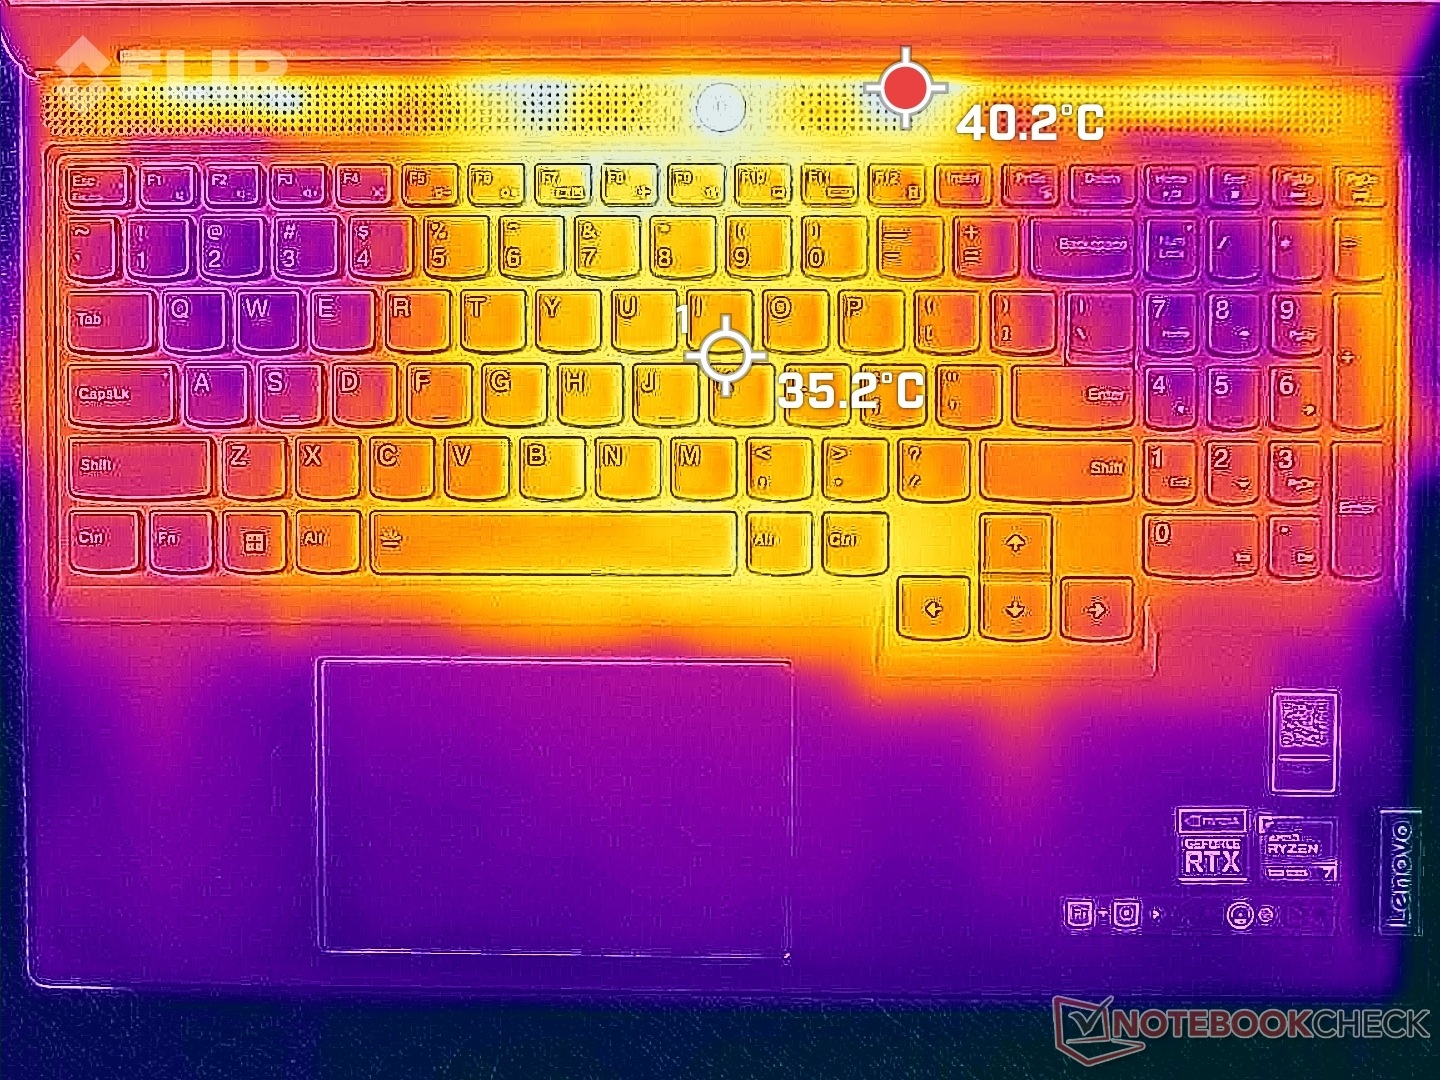
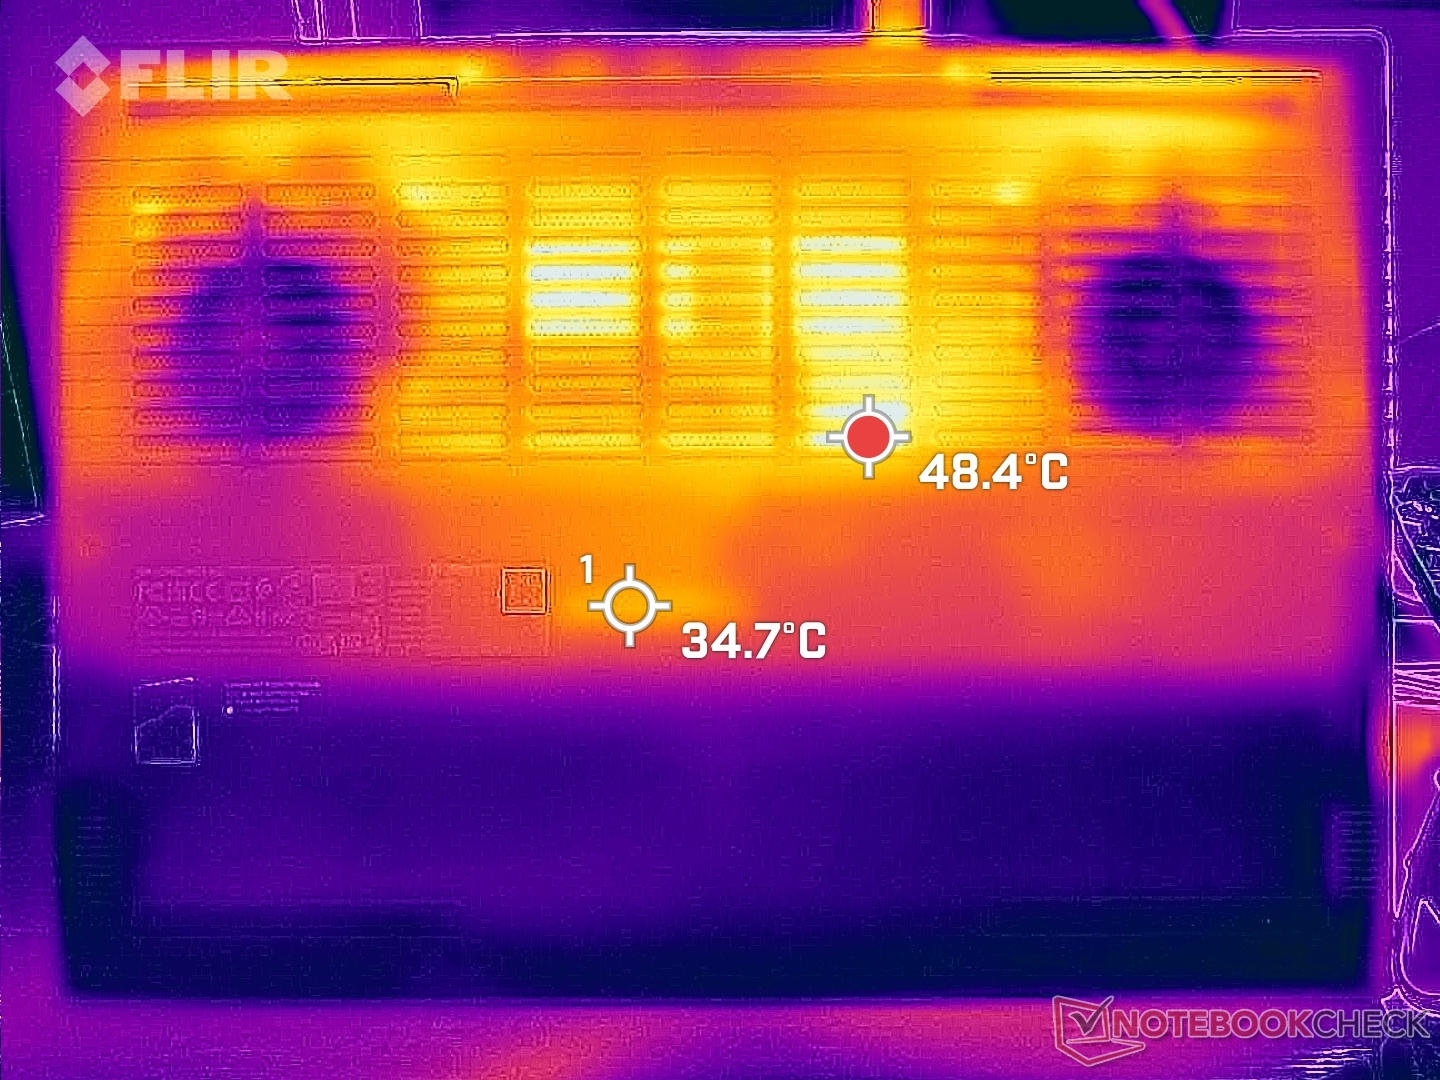
Temperatura: más fría de lo esperado
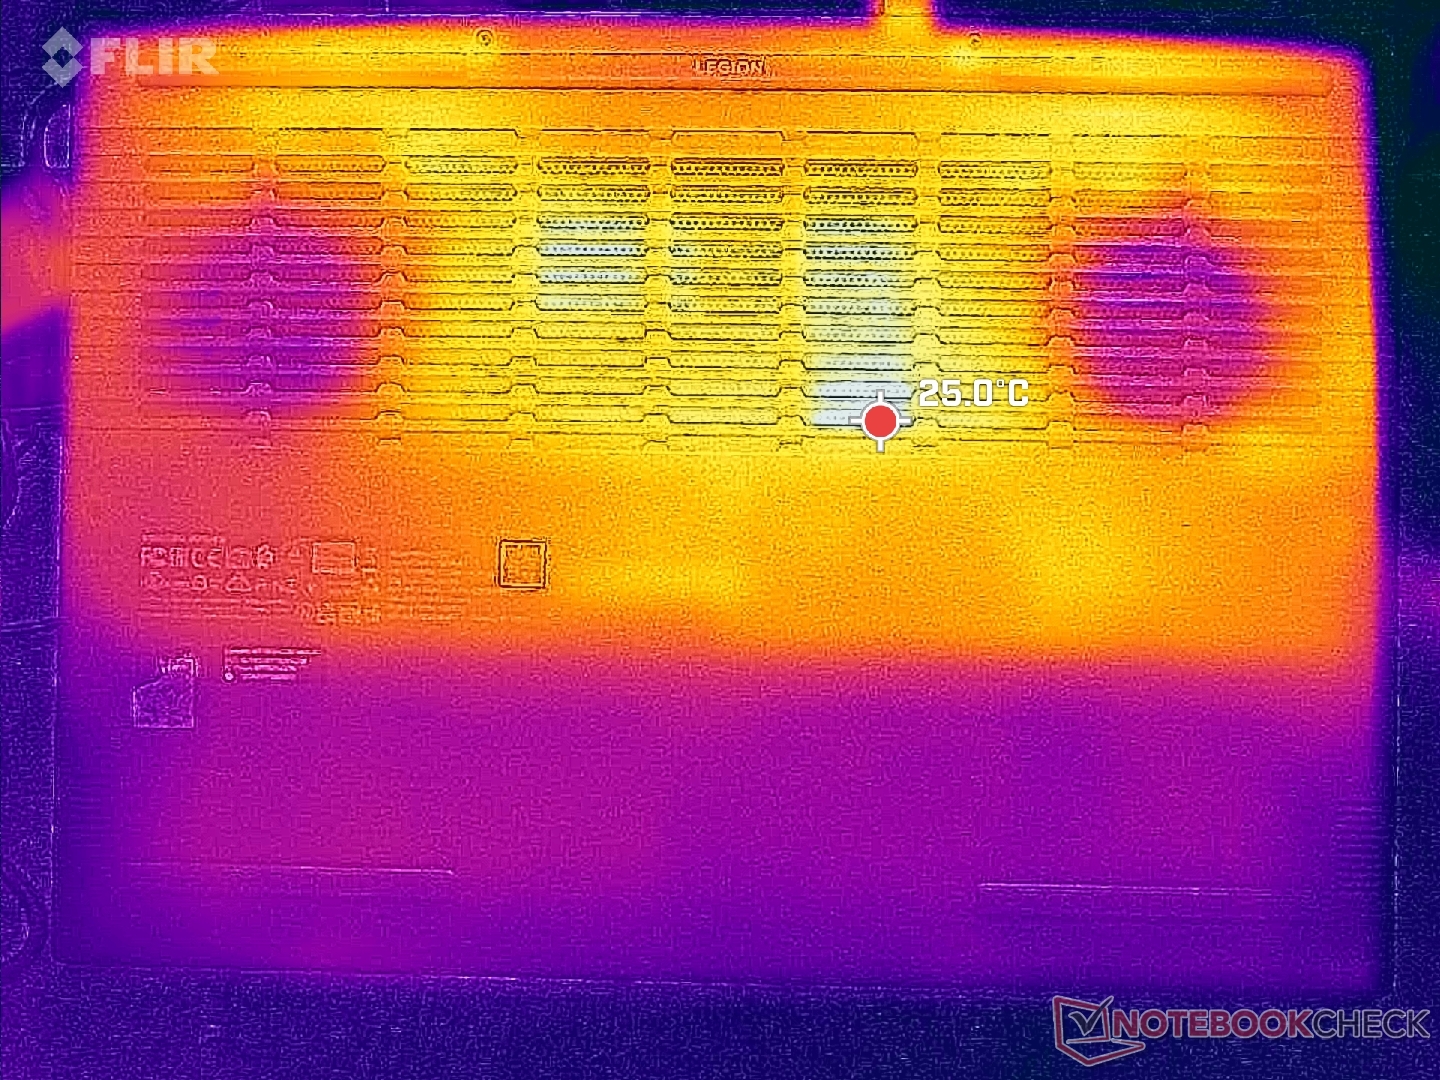
Las temperaturas de la superficie son inferiores a las que registramos en el Legion Pro 5 y en algunos competidores como elDell G16 7620. Los puntos calientes al ejecutar cargas exigentes en nuestra unidad alcanzaban hasta 42 C en los lados superior e inferior, respectivamente, en comparación con los 54 C de cada uno de los sistemas Legion Pro 5 y Dell antes mencionados. Las temperaturas superficiales son de las más frescas que hemos visto en un portátil de juego delgado y esto puede atribuirse a las temperaturas relativamente frescas del núcleo al jugar, como se demuestra en nuestra sección de prueba de estrés a continuación.
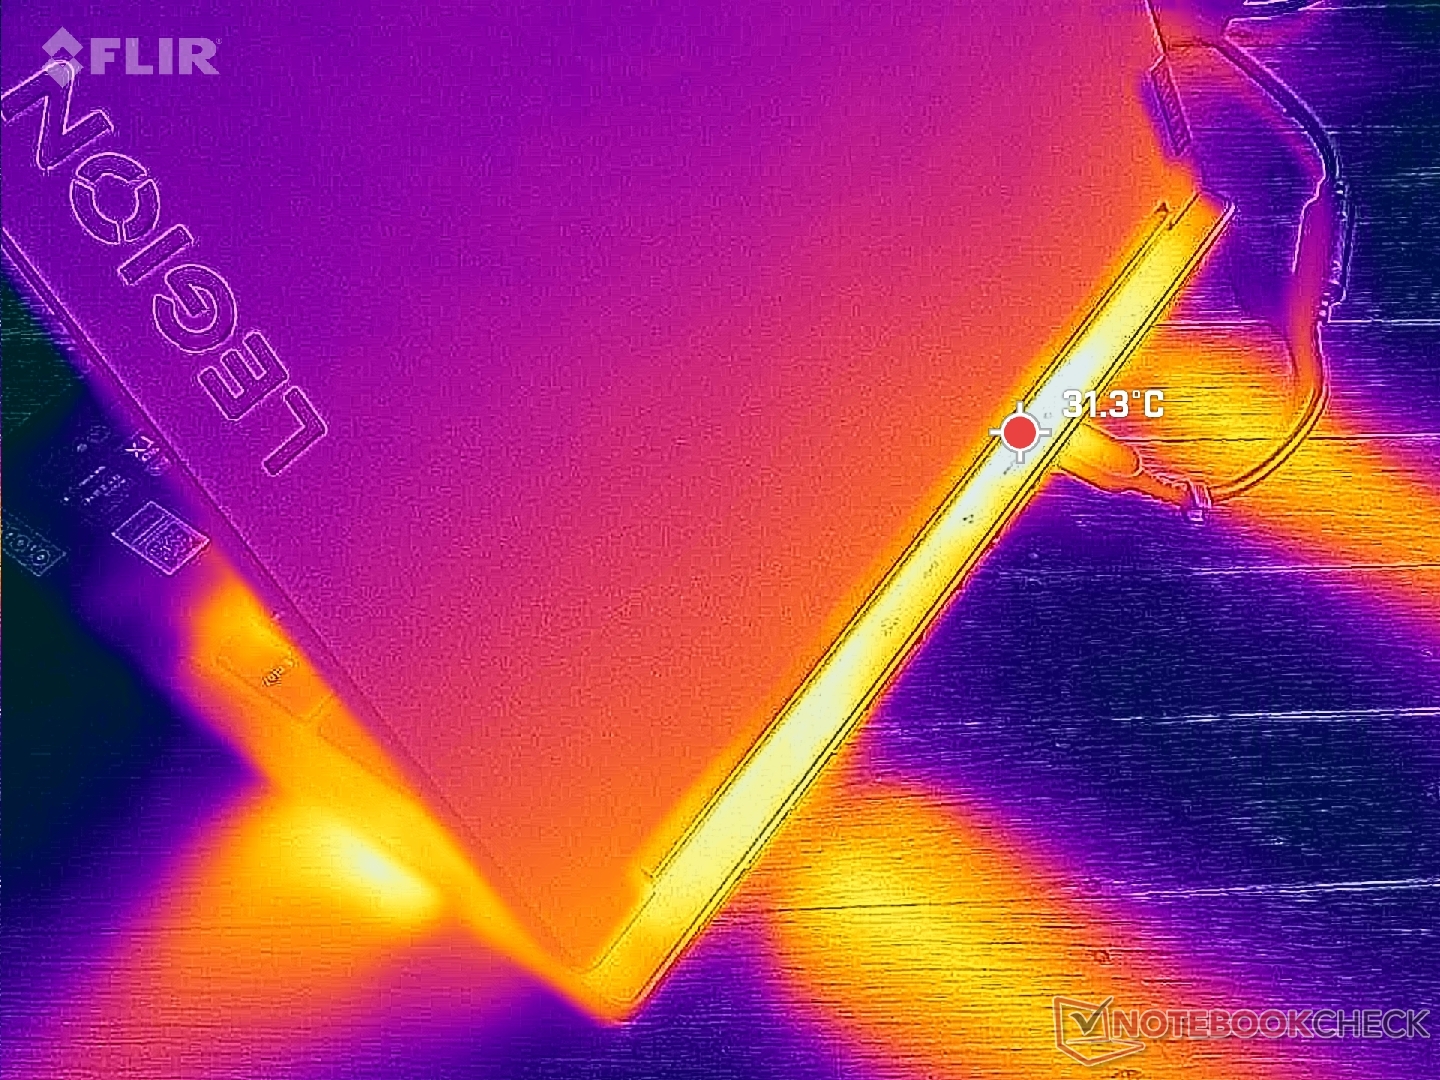
(±) La temperatura máxima en la parte superior es de 40.6 °C / 105 F, frente a la media de 40.4 °C / 105 F, que oscila entre 21.2 y 68.8 °C para la clase Gaming.
(±) El fondo se calienta hasta un máximo de 42 °C / 108 F, frente a la media de 43.2 °C / 110 F
(+) En reposo, la temperatura media de la parte superior es de 24.6 °C / 76# F, frente a la media del dispositivo de 33.9 °C / 93 F.
(+) Jugando a The Witcher 3, la temperatura media de la parte superior es de 28.1 °C / 83 F, frente a la media del dispositivo de 33.9 °C / 93 F.
(+) El reposamanos y el panel táctil están a una temperatura inferior a la de la piel, con un máximo de 27 °C / 80.6 F y, por tanto, son fríos al tacto.
(±) La temperatura media de la zona del reposamanos de dispositivos similares fue de 28.8 °C / 83.8 F (+1.8 °C / 3.2 F).
| Lenovo Legion Slim 5 16APH8 AMD Ryzen 7 7840HS, NVIDIA GeForce RTX 4060 Laptop GPU | Acer Nitro 16 AN16-41-R7YE AMD Ryzen 5 7535HS, NVIDIA GeForce RTX 4050 Laptop GPU | Lenovo Legion Pro 5 16ARX8 (R5 7645HX, RTX 4050) AMD Ryzen 5 7645HX, NVIDIA GeForce RTX 4050 Laptop GPU | HP Omen 16-wf000 Intel Core i7-13700HX, NVIDIA GeForce RTX 4080 Laptop GPU | Dell G16 7620 Intel Core i7-12700H, NVIDIA GeForce RTX 3060 Laptop GPU | Asus TUF Gaming A16 FA617XS AMD Ryzen 9 7940HS, AMD Radeon RX 7600S | |
|---|---|---|---|---|---|---|
| Heat | -30% | -28% | -10% | -5% | -17% | |
| Maximum Upper Side * (°C) | 40.6 | 51 -26% | 45 -11% | 45 -11% | 47.6 -17% | 53 -31% |
| Maximum Bottom * (°C) | 42 | 63 -50% | 54 -29% | 48.8 -16% | 54 -29% | 48 -14% |
| Idle Upper Side * (°C) | 27.8 | 34 -22% | 36 -29% | 29.2 -5% | 23 17% | 30 -8% |
| Idle Bottom * (°C) | 26.6 | 32 -20% | 38 -43% | 28.8 -8% | 24.6 8% | 30 -13% |
* ... más pequeño es mejor
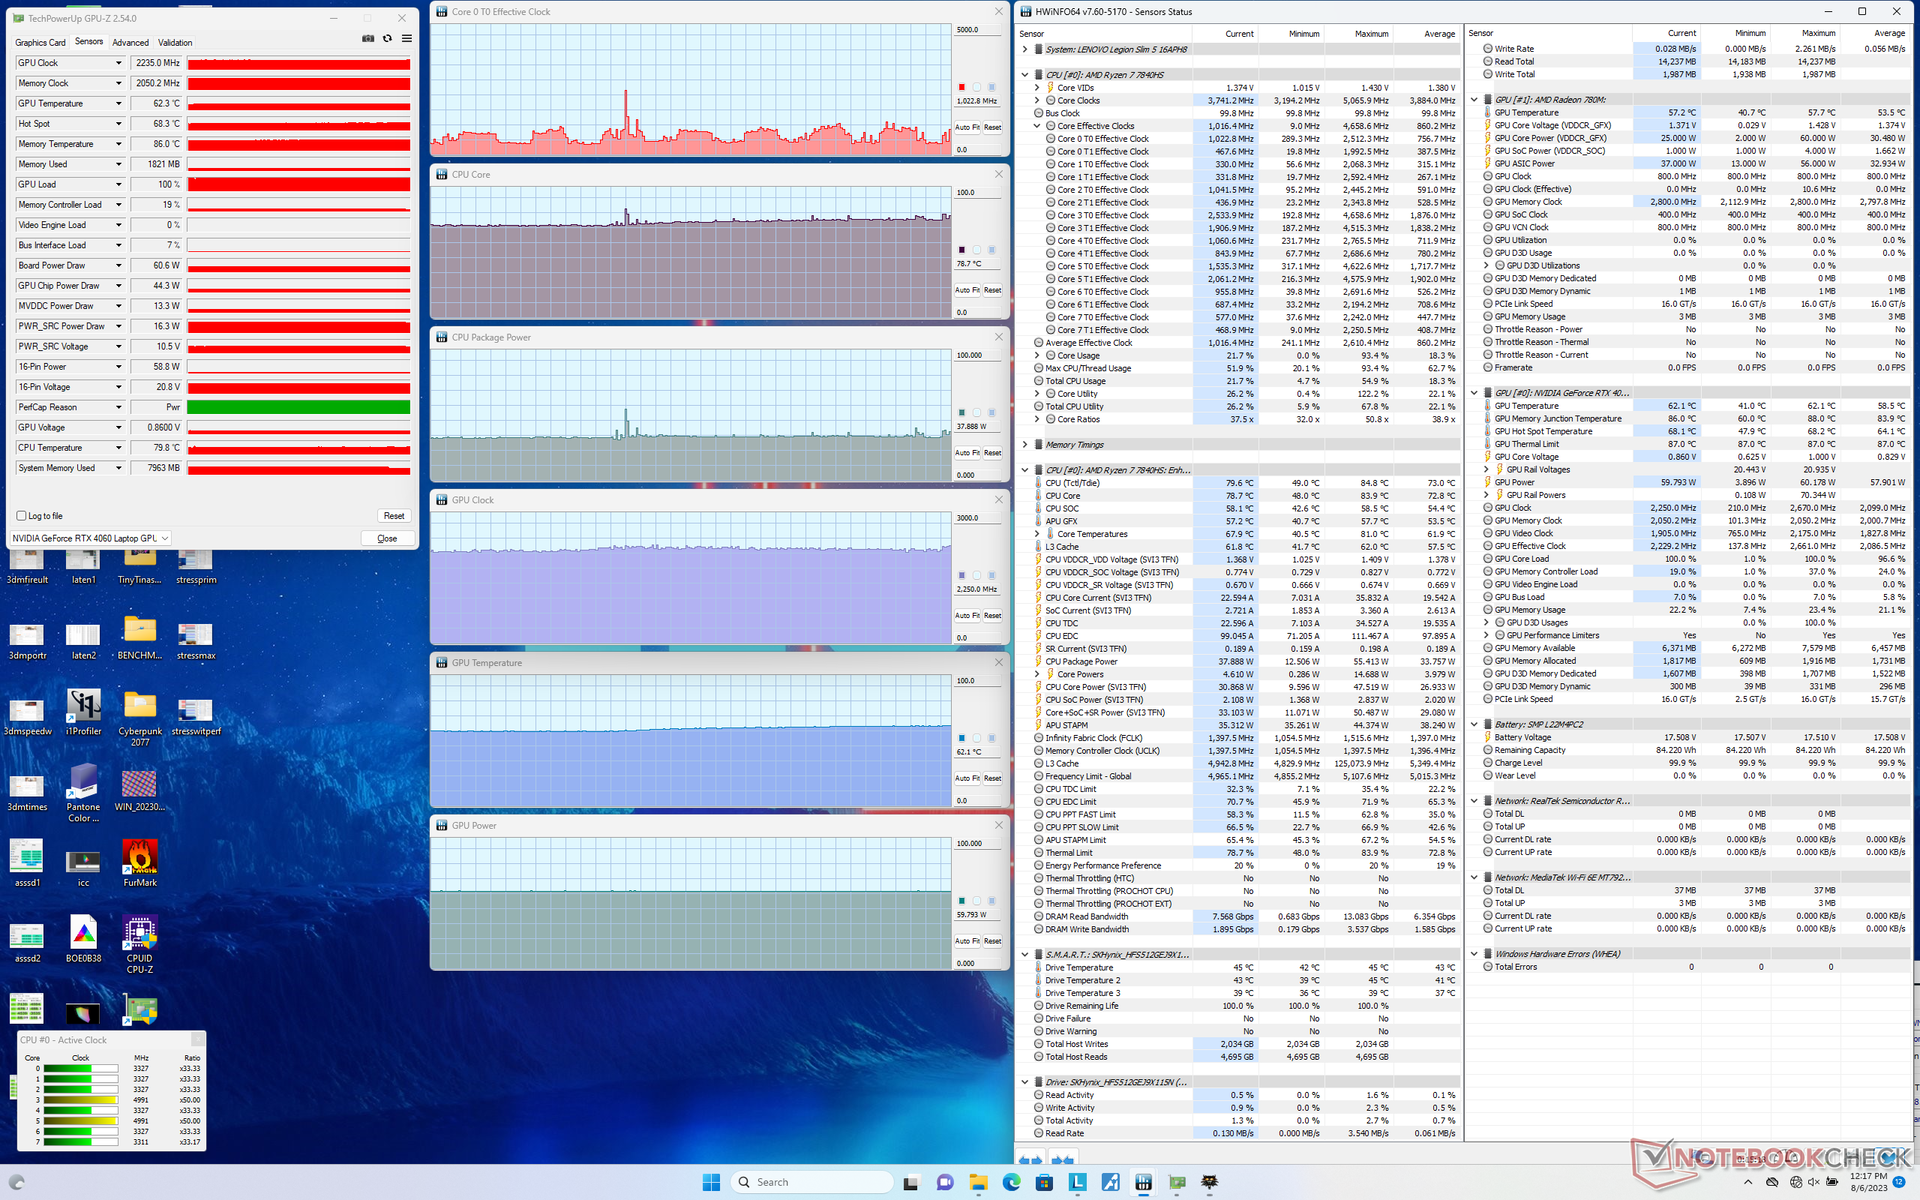
Prueba de resistencia
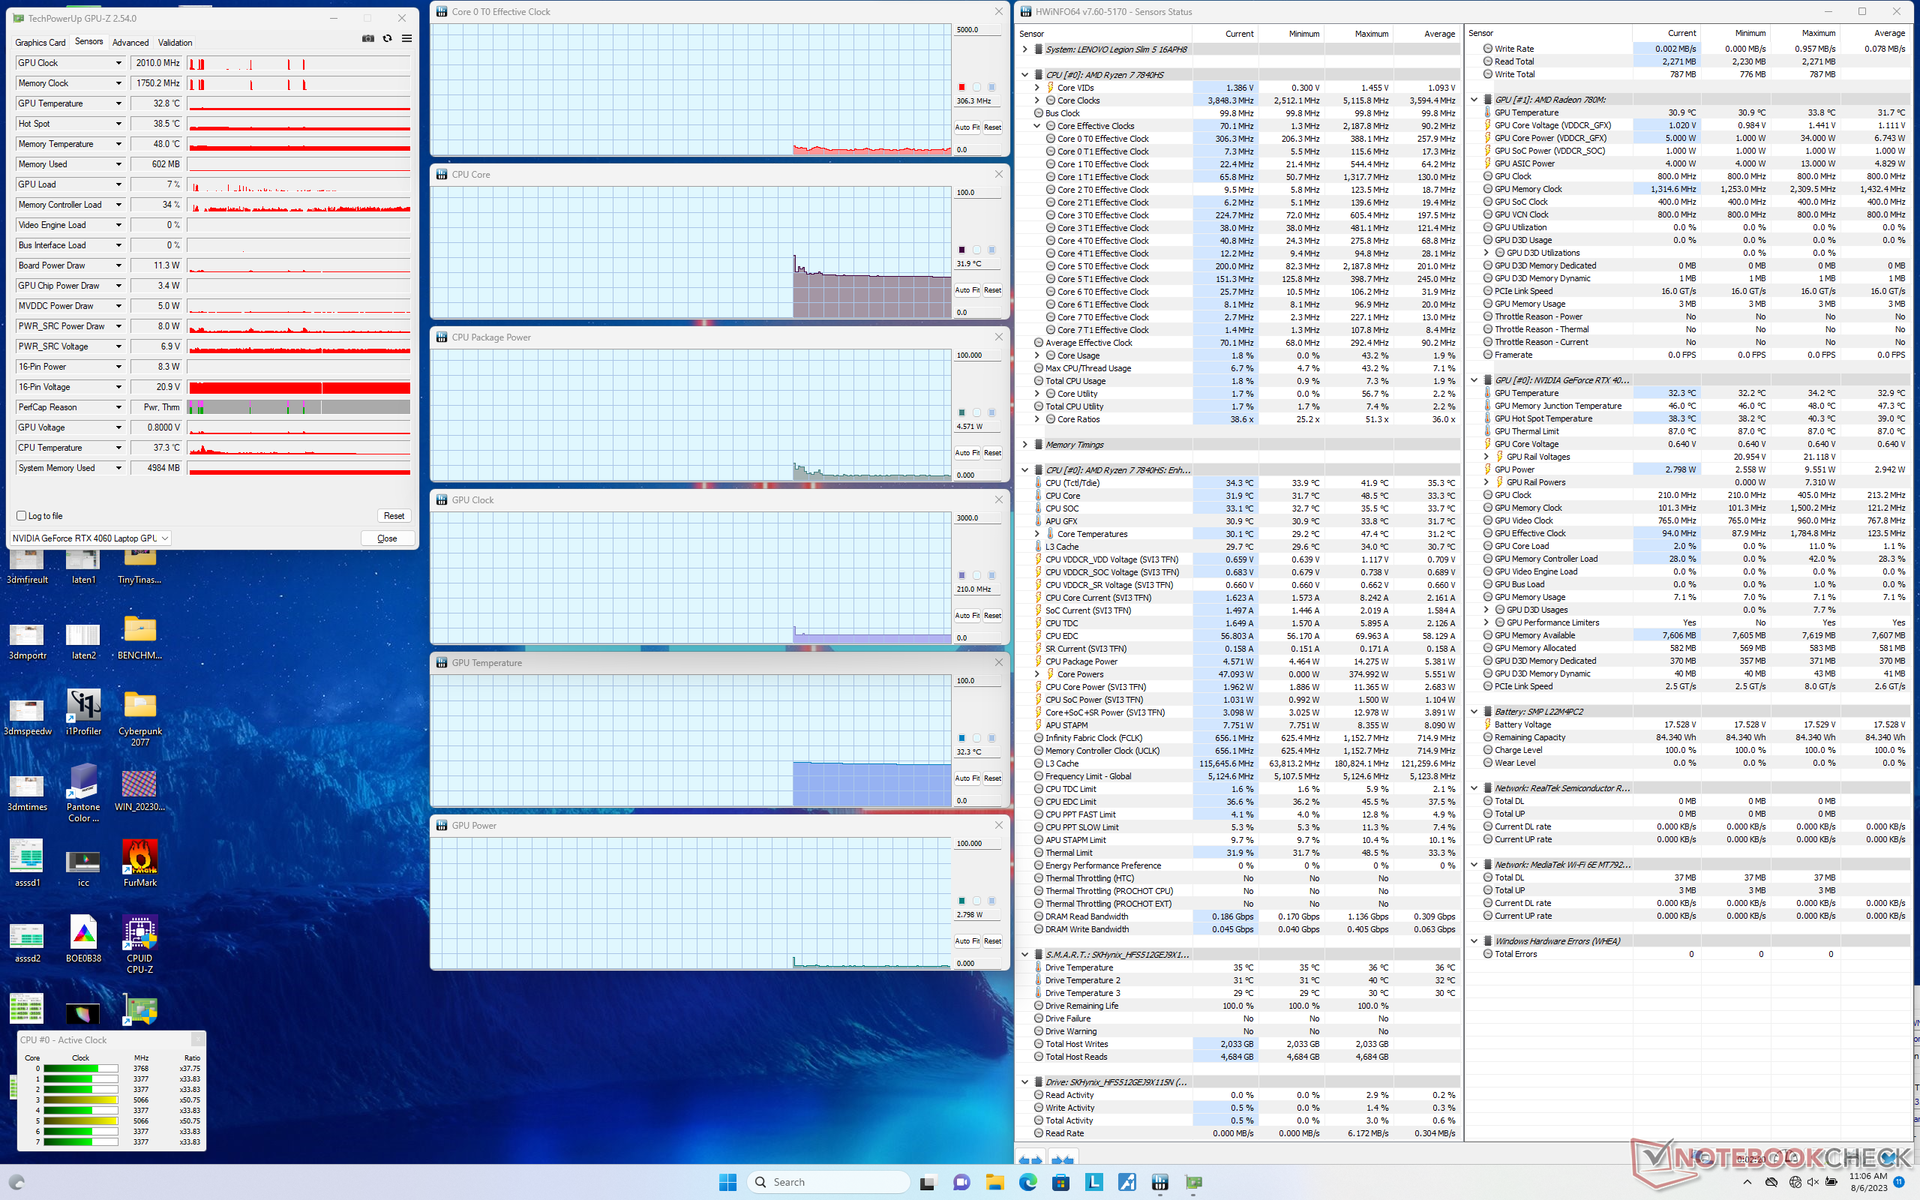
Al ejecutar Prime95 para estresar la CPU, las frecuencias de reloj y el consumo de la placa se disparaban a 4,8 GHz y 88 W, respectivamente, antes de estabilizarse rápidamente en 4,3 GHz y 82 W a partir de entonces. La temperatura del núcleo se estabilizaba en unos agradables 100 C, frente a los 84 C del Intel Legion Pro 5. Definitivamente, el Legion Slim 5 está llevando al límite su solución de refrigeración, más que en la mayoría de portátiles para juegos.
Siguiendo con nuestros hallazgos en la sección Rendimiento de la GPU, el rendimiento gráfico parece ser idéntico entre los modos Equilibrado y Rendimiento. Cuando se ejecuta Witcher 3por ejemplo, el consumo de la GPU alcanza un pico de 60 W en cada uno de los dos modos, lo que es significativamente inferior a la afirmación de Lenovo de 100 W. Volver a ejecutar nuestra prueba en el más exigente Cyberpunk 2077 mostraría resultados máximos similares de 60 W. Este límite de potencia inferior a lo esperado probablemente esté impidiendo que nuestra RTX 4060 rinda más a la par que otros portátiles de juego con la misma GPU.
Las temperaturas del núcleo en modo Rendimiento son entre 4 y 8 C más bajas que en modo Equilibrado, como muestra la siguiente tabla, ya que el ruido del ventilador es más fuerte en modo Rendimiento a pesar de no haber diferencias de rendimiento.
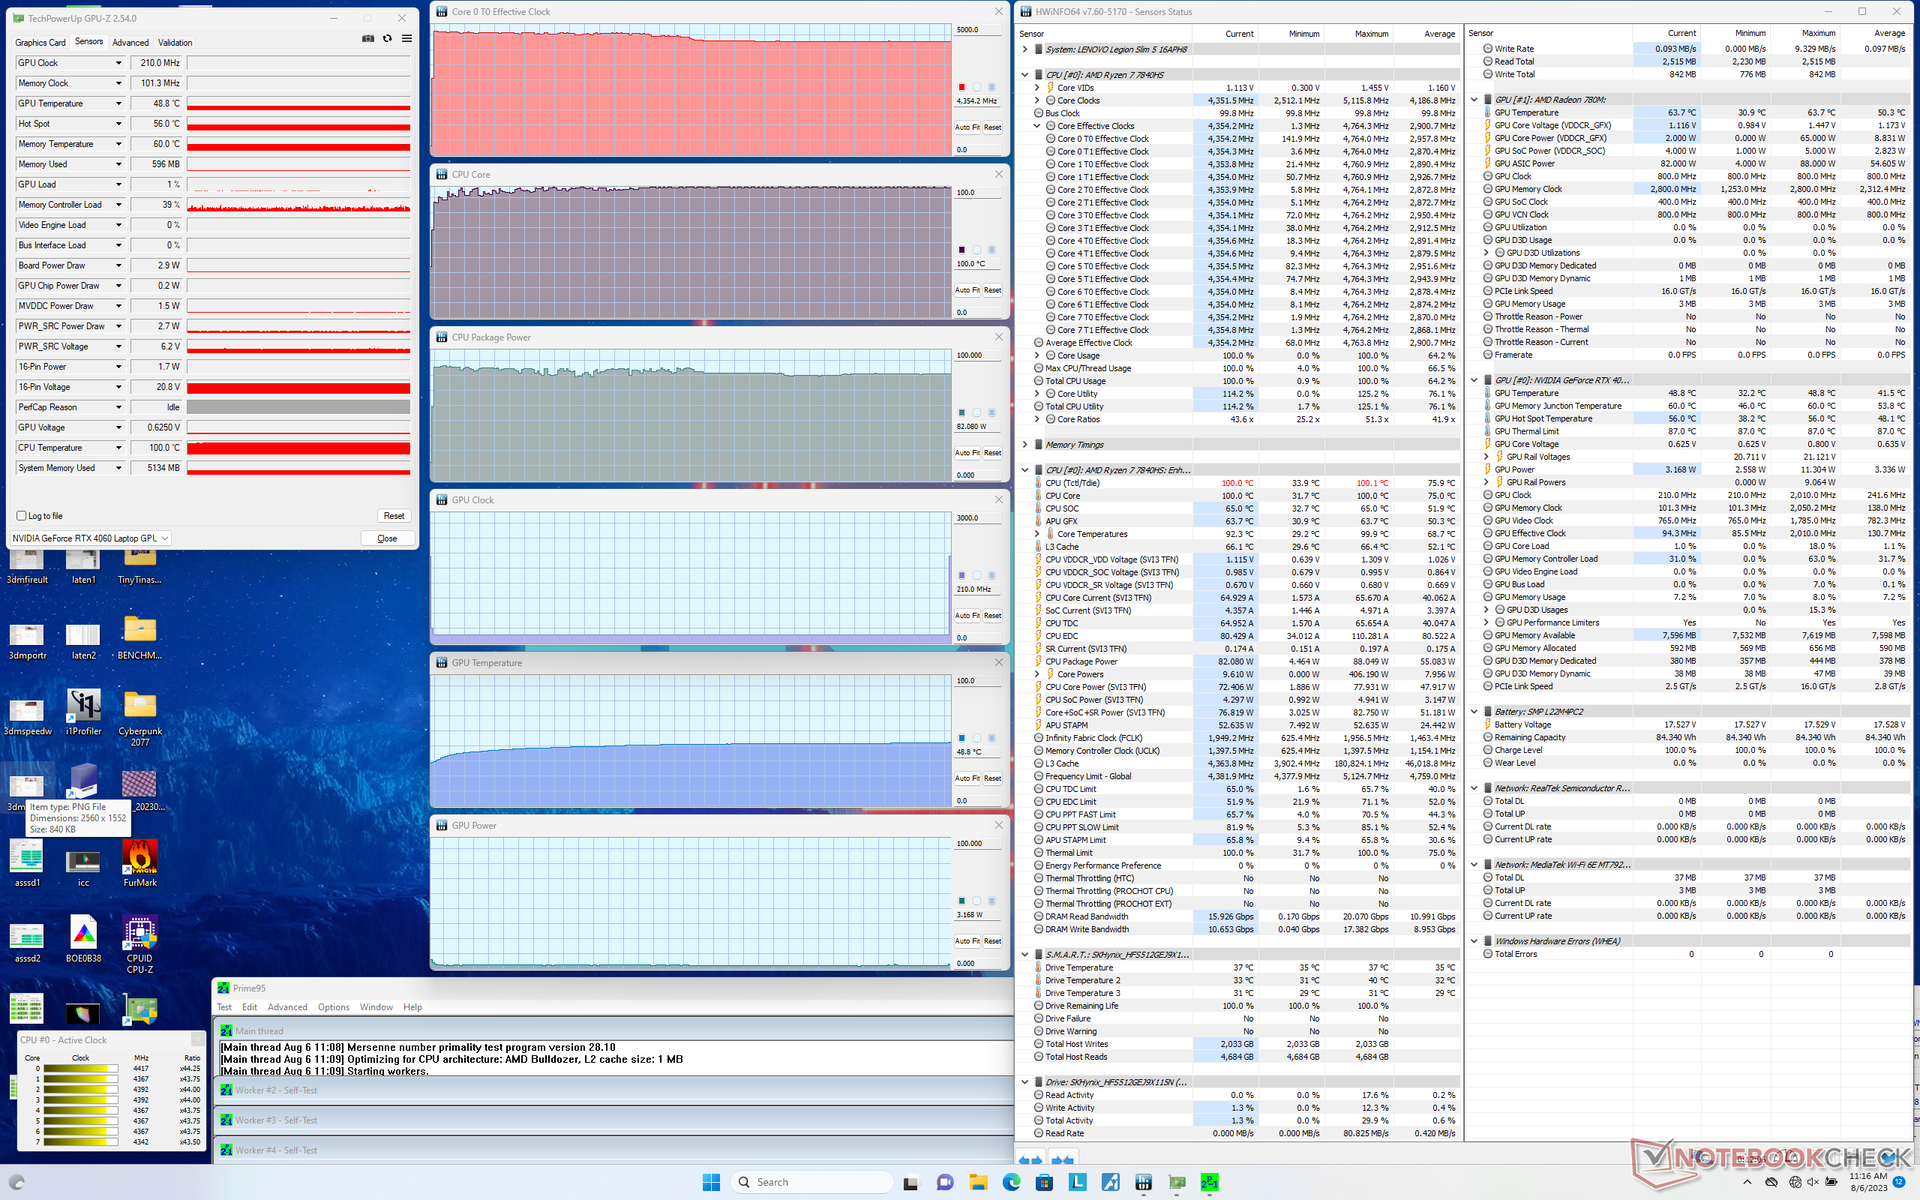
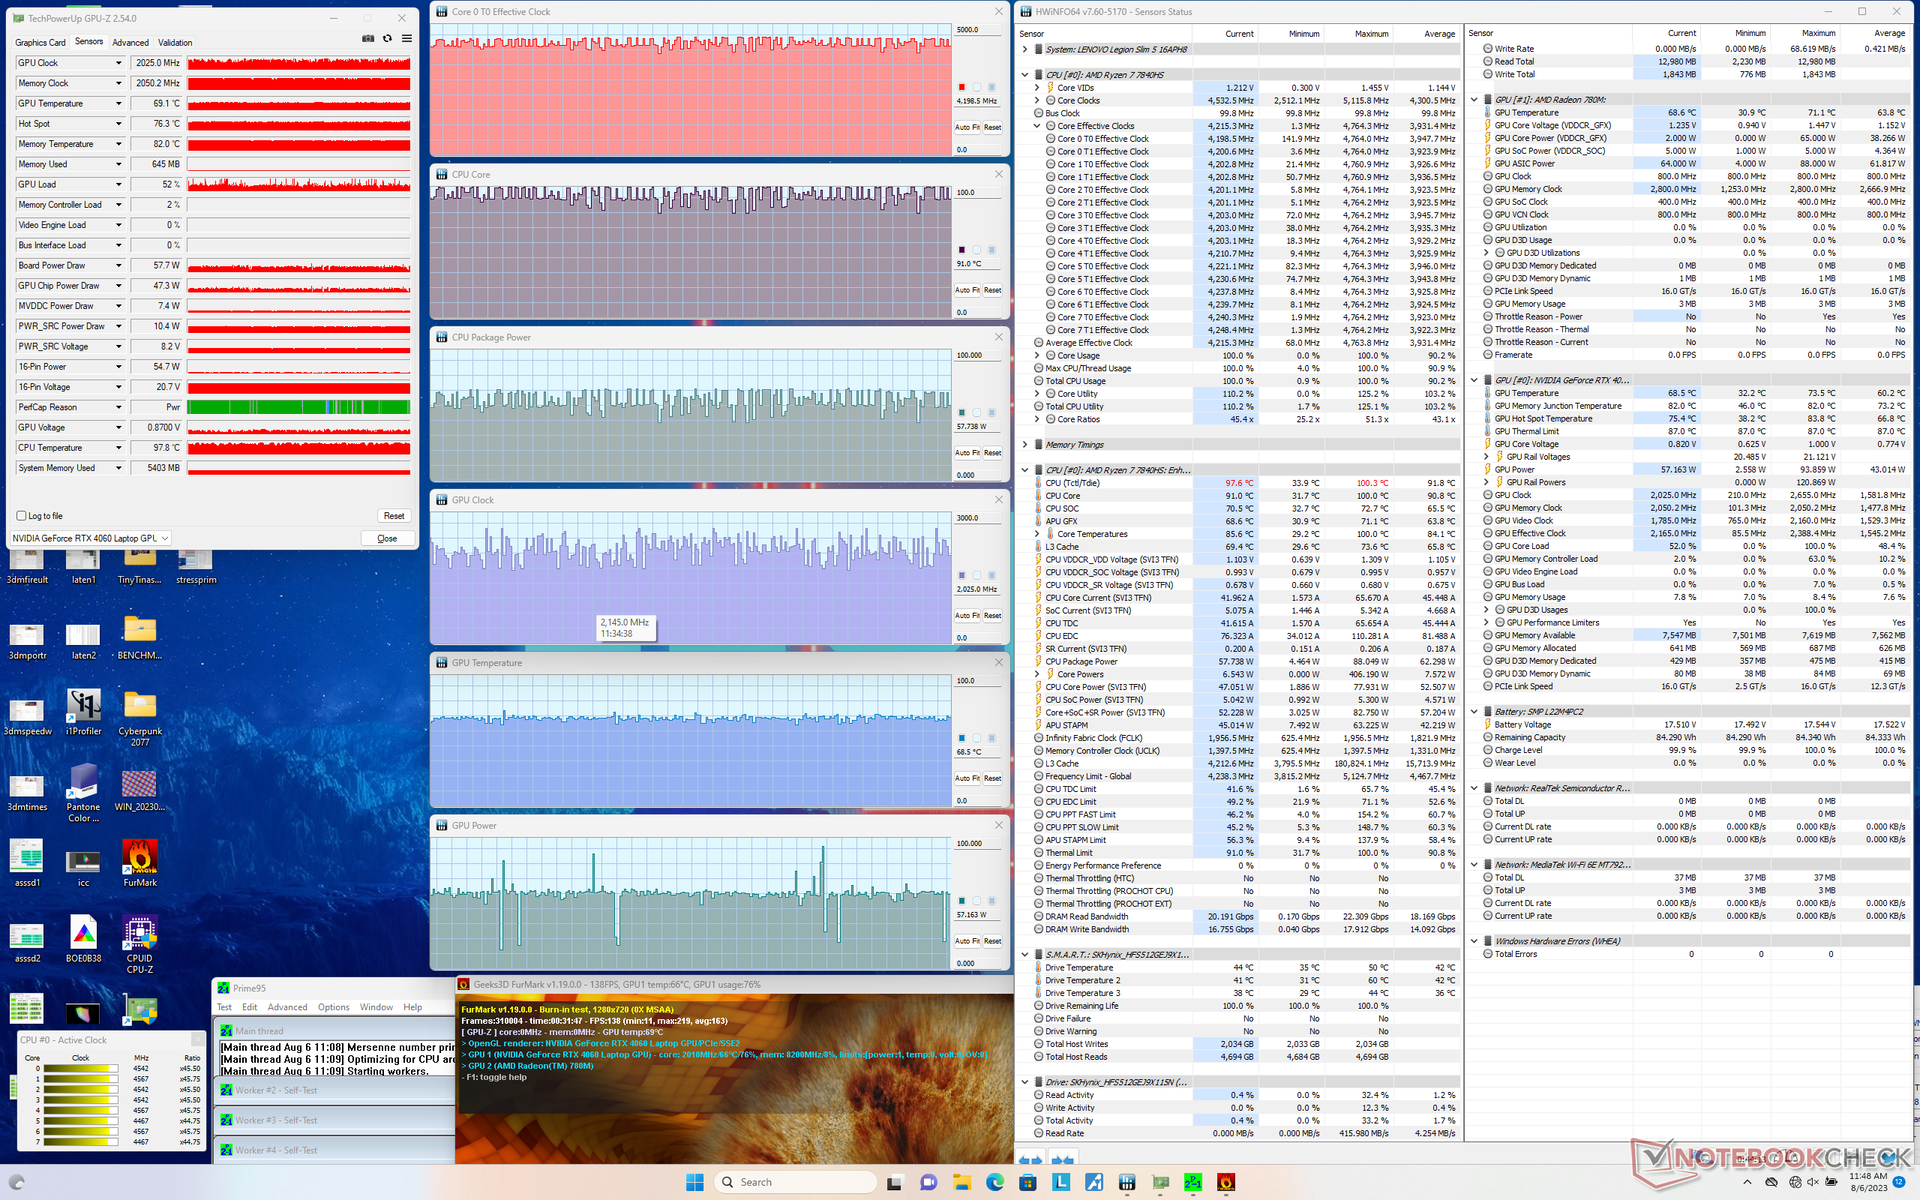

| RelojCPU (GHz) | Reloj GPU (MHz) | Temperatura mediaCPU (°C) | Temperatura media GPU (°C) | |
| Sistema en reposo | -- | -- | 32 | 32 |
| Prime95 Stress | 4,4 | -- | 100 | 49 |
| Prime95+ FurMark Stress | 4.0 - 4.3 | ~2025 | 90 - 100 | 69 |
| Witcher 3 Estrés (modoequilibrado) | 0,5 - 1,1 | 2250 | 79 | 62 |
| Witcher 3 Tensión (modoRendimiento) | 0,5 - 1,1 | 2220 | 71 | 58 |
Altavoces
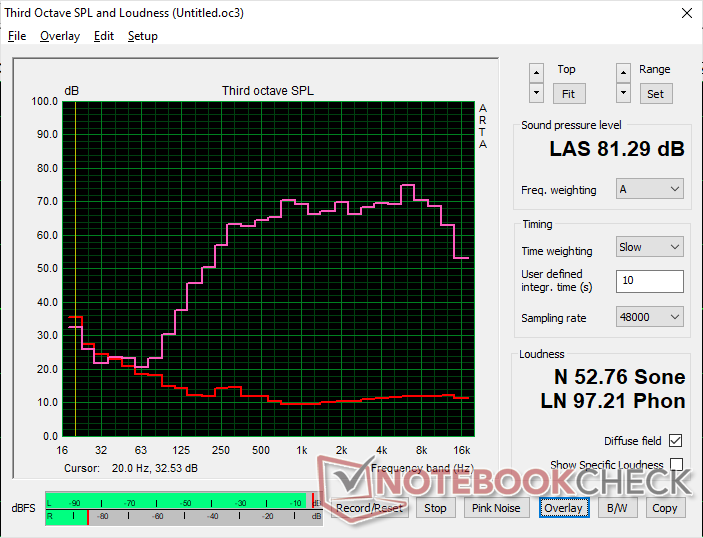
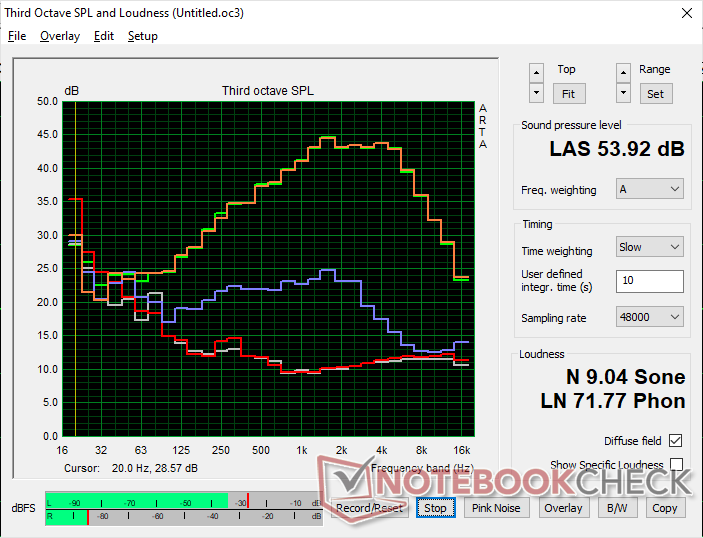
Lenovo Legion Slim 5 16APH8 análisis de audio
(±) | la sonoridad del altavoz es media pero buena (81.3 dB)
Graves 100 - 315 Hz
(-) | casi sin bajos - de media 19% inferior a la mediana
(±) | la linealidad de los graves es media (12.2% delta a frecuencia anterior)
Medios 400 - 2000 Hz
(+) | medios equilibrados - a sólo 2.2% de la mediana
(+) | los medios son lineales (3.7% delta a la frecuencia anterior)
Altos 2 - 16 kHz
(+) | máximos equilibrados - a sólo 3.3% de la mediana
(+) | los máximos son lineales (5% delta a la frecuencia anterior)
Total 100 - 16.000 Hz
(+) | el sonido global es lineal (14.7% de diferencia con la mediana)
En comparación con la misma clase
» 29% de todos los dispositivos probados de esta clase eran mejores, 7% similares, 64% peores
» El mejor tuvo un delta de 6%, la media fue 18%, el peor fue ###max##%
En comparación con todos los dispositivos probados
» 19% de todos los dispositivos probados eran mejores, 4% similares, 77% peores
» El mejor tuvo un delta de 4%, la media fue 23%, el peor fue ###max##%
Apple MacBook Pro 16 2021 M1 Pro análisis de audio
(+) | los altavoces pueden reproducir a un volumen relativamente alto (#84.7 dB)
Graves 100 - 315 Hz
(+) | buen bajo - sólo 3.8% lejos de la mediana
(+) | el bajo es lineal (5.2% delta a la frecuencia anterior)
Medios 400 - 2000 Hz
(+) | medios equilibrados - a sólo 1.3% de la mediana
(+) | los medios son lineales (2.1% delta a la frecuencia anterior)
Altos 2 - 16 kHz
(+) | máximos equilibrados - a sólo 1.9% de la mediana
(+) | los máximos son lineales (2.7% delta a la frecuencia anterior)
Total 100 - 16.000 Hz
(+) | el sonido global es lineal (4.6% de diferencia con la mediana)
En comparación con la misma clase
» 0% de todos los dispositivos probados de esta clase eran mejores, 0% similares, 100% peores
» El mejor tuvo un delta de 5%, la media fue 17%, el peor fue ###max##%
En comparación con todos los dispositivos probados
» 0% de todos los dispositivos probados eran mejores, 0% similares, 100% peores
» El mejor tuvo un delta de 4%, la media fue 23%, el peor fue ###max##%
Gestión de la energía - Eficiencia energética
Consumo de energía
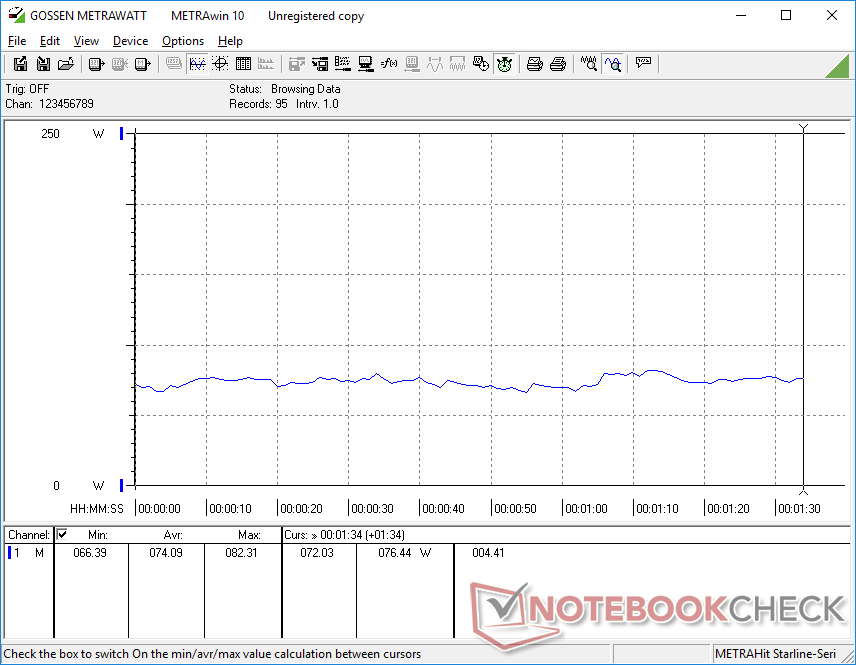
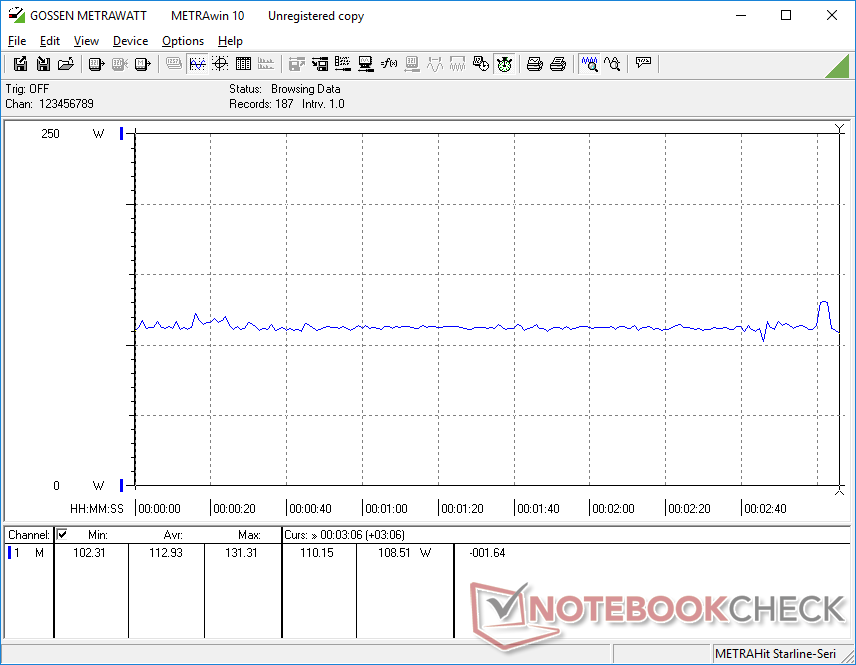
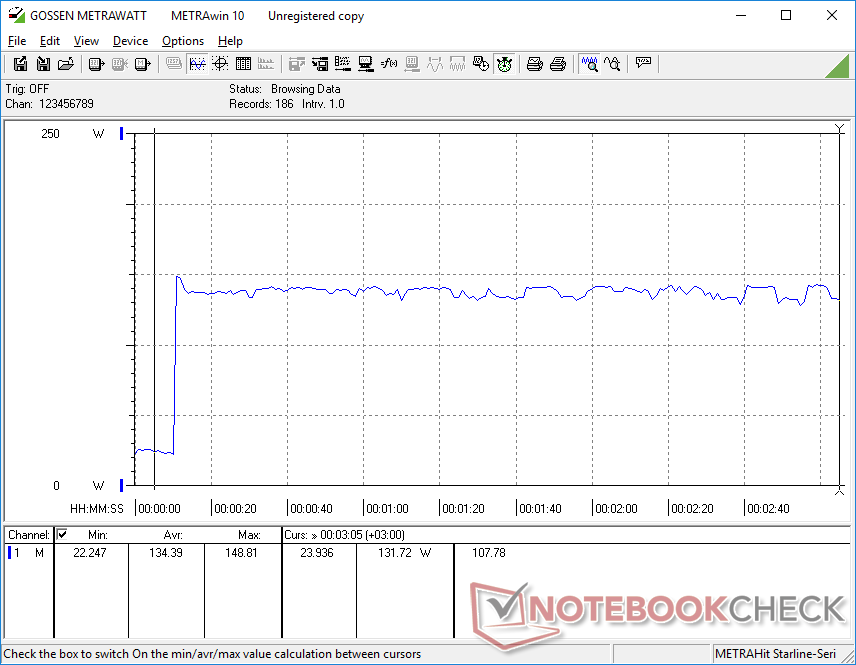
El consumo de energía en reposo en el escritorio oscilaría entre 9 W y 25 W, lo que no es inusual para los portátiles de juegos. Lo que es inusual, sin embargo, es el bajo consumo de energía cuando se ejecutan juegos. Witcher 3por ejemplo, el Pro 5 16IRX8 consume 113 W, frente a los 179 W del Pro 5 16IRX8 Legion Pro 5 16IRX8 equipado con la misma GPU RTX 4060. Es cierto que este último viene con una CPU Intel HX de mayor consumo, pero la diferencia de consumo entre los dos modelos sigue siendo inusualmente amplia incluso teniendo en cuenta las diferencias de procesador. Además, el Legion Pro 5 16ARX8 con la RTX 4050 más lenta consumiría más energía que nuestro Legion Slim 5 también al jugar (126 W frente a 116 W).
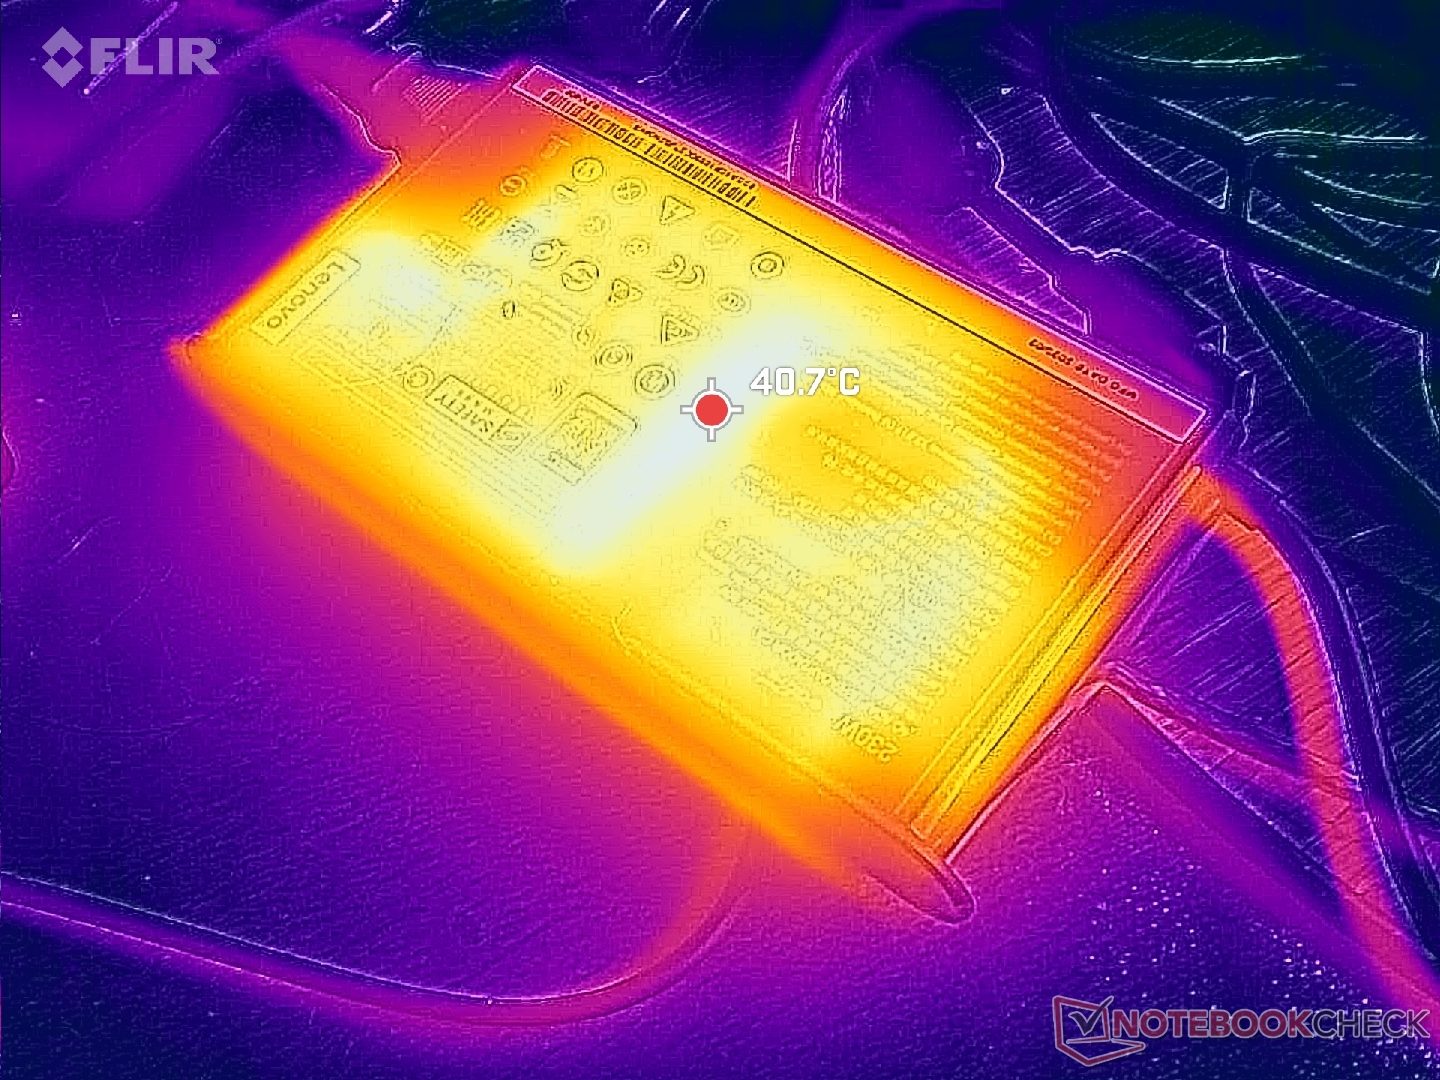
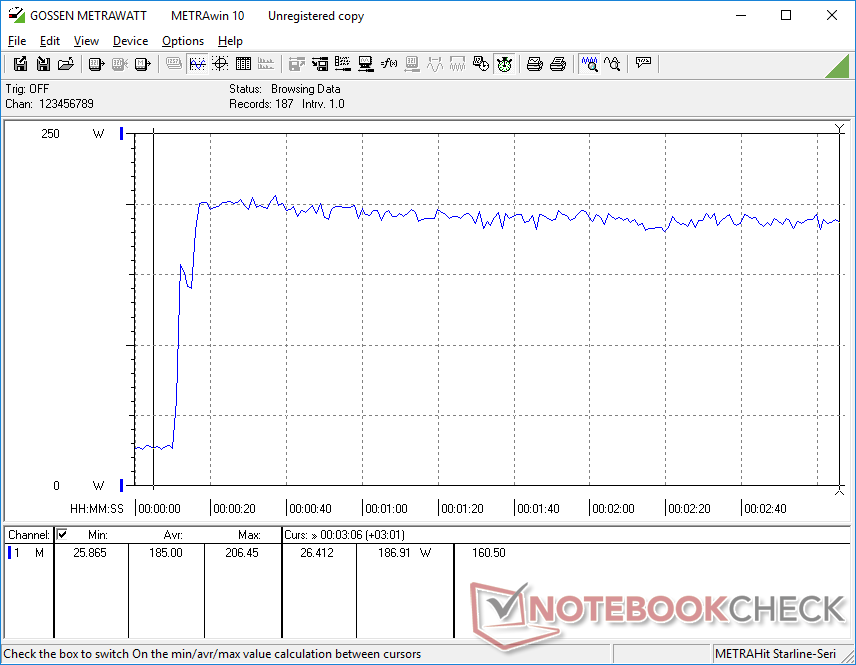
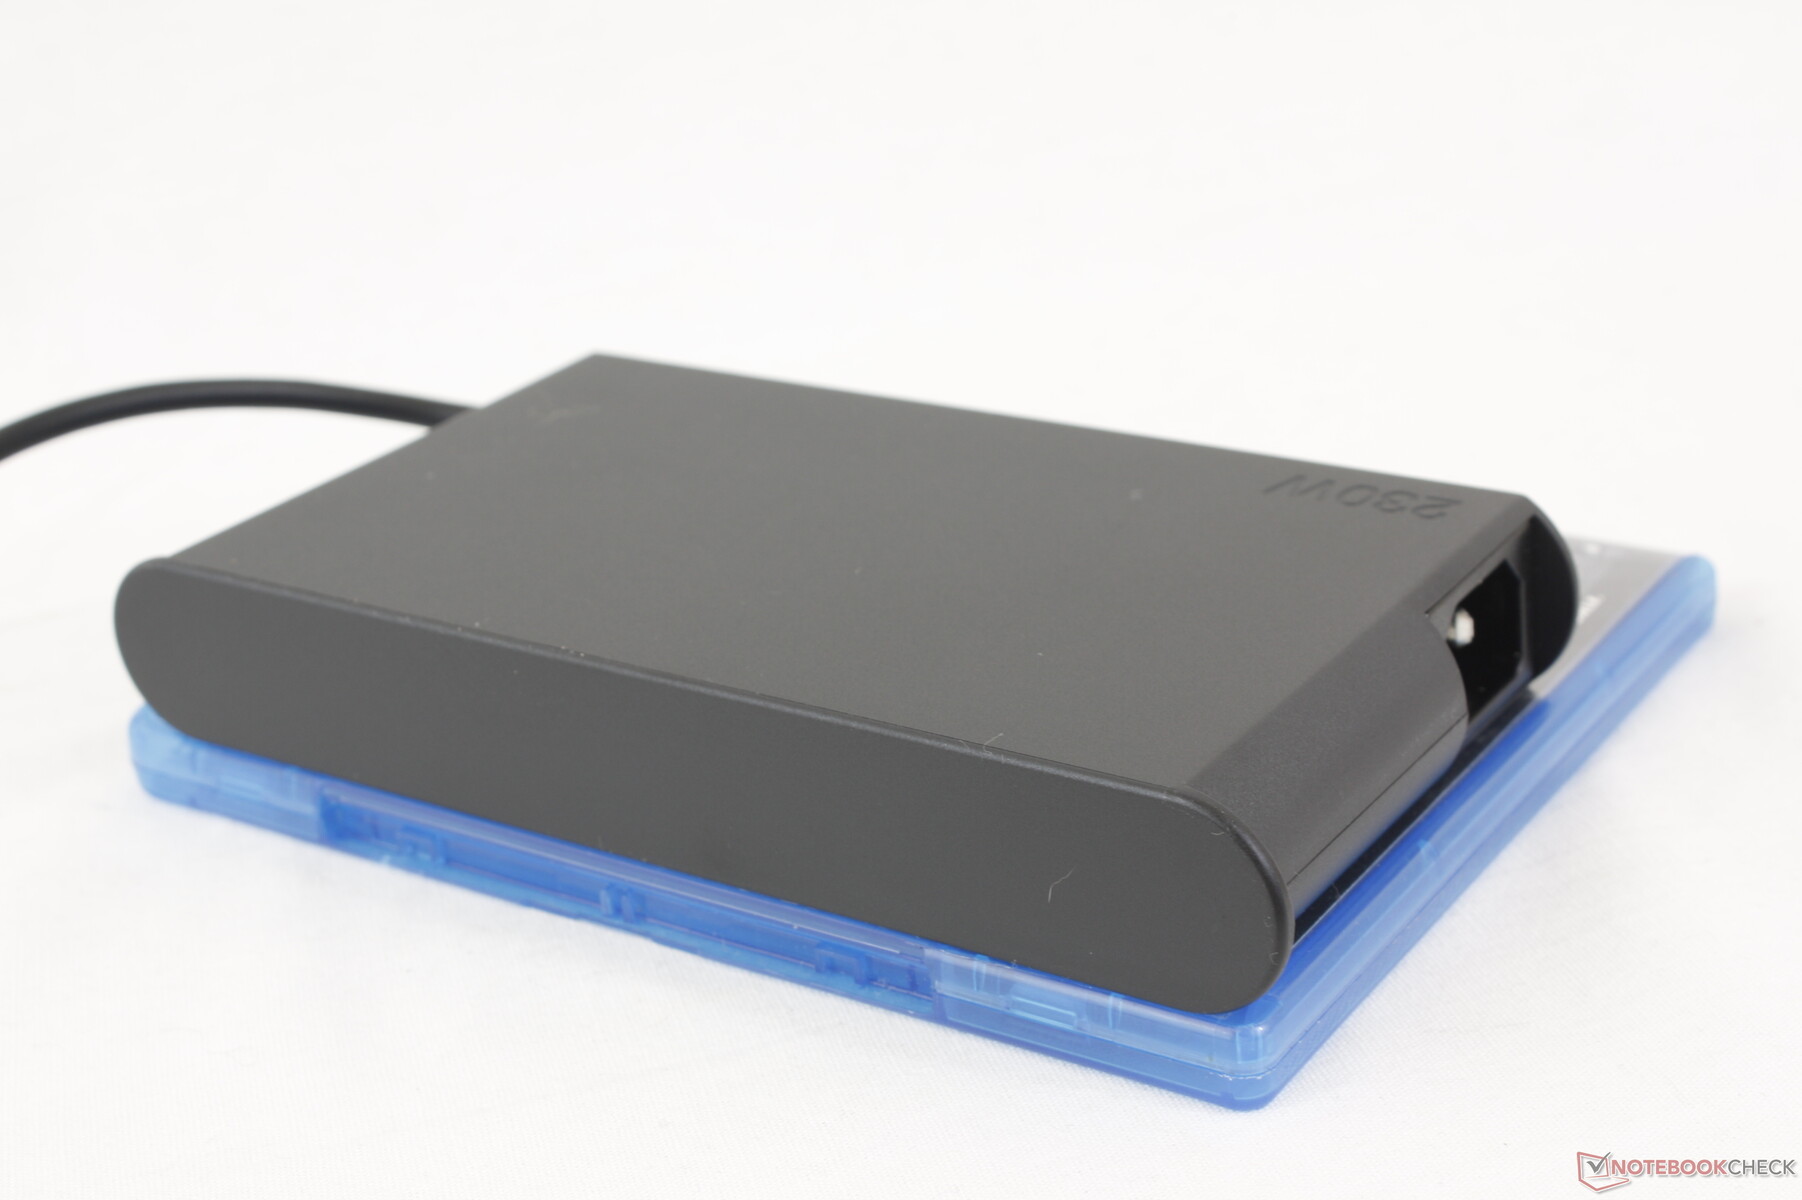
Podemos medir un consumo máximo de 207 W con el adaptador de CA de 230 W y tamaño medio (~16.8 x 8.6 x 2.5 cm) cuando CPU y GPU están al 100% de uso. El consumo disminuye con el tiempo antes de estabilizarse en torno a los 180 W.
| Off / Standby | |
| Ocioso | |
| Carga |
|
Clave:
min: | |
| Lenovo Legion Slim 5 16APH8 R7 7840HS, GeForce RTX 4060 Laptop GPU, SK hynix PC801 HFS512GEJ9X115N, IPS, 2560x1600, 16" | Acer Nitro 16 AN16-41-R7YE R5 7535HS, GeForce RTX 4050 Laptop GPU, SK hynix HFS512GEJ9X125N, IPS, 1920x1200, 16" | Lenovo Legion Pro 5 16ARX8 (R5 7645HX, RTX 4050) R5 7645HX, GeForce RTX 4050 Laptop GPU, SK hynix PC801 HFS512GEJ9X115N, IPS, 2560x1600, 16" | Dell G16 7620 i7-12700H, GeForce RTX 3060 Laptop GPU, WDC PC SN810 512GB, IPS, 2560x1600, 16" | Asus TUF Gaming A16 FA617XS R9 7940HS, Radeon RX 7600S, Micron 2400 MTFDKBA512QFM, IPS, 1920x1200, 16" | Lenovo Legion Pro 5 16IRX8 i7-13700HX, GeForce RTX 4060 Laptop GPU, SK hynix PC801 HFS512GEJ9X115N, IPS, 2560x1600, 16" | |
|---|---|---|---|---|---|---|
| Power Consumption | -22% | -13% | -35% | 10% | -67% | |
| Idle Minimum * (Watt) | 9.4 | 19 -102% | 13 -38% | 14.4 -53% | 7 26% | 24.5 -161% |
| Idle Average * (Watt) | 15.5 | 20 -29% | 17.4 -12% | 17.8 -15% | 10 35% | 29.2 -88% |
| Idle Maximum * (Watt) | 24.4 | 23 6% | 21.8 11% | 31.5 -29% | 15 39% | 34.3 -41% |
| Load Average * (Watt) | 74.1 | 80 -8% | 96.4 -30% | 101.2 -37% | 86 -16% | 98.7 -33% |
| Witcher 3 ultra * (Watt) | 112.9 | 125.8 -11% | 125 -11% | 176.9 -57% | 160.6 -42% | 178.6 -58% |
| Load Maximum * (Watt) | 206.5 | 184 11% | 204 1% | 242.9 -18% | 172 17% | 249.6 -21% |
* ... más pequeño es mejor
Power Consumption Witcher 3 / Stresstest
Power Consumption external Monitor
Duración de la batería
La duración de la batería es respetable, con algo más de siete horas de uso real de la red WLAN, lo que supone al menos una o dos horas más que en la competencia Omen 16 o Dell G16 7620. La capacidad de la batería es idéntica a la del Legion Pro 5 a pesar de sus diferencias de tamaño.
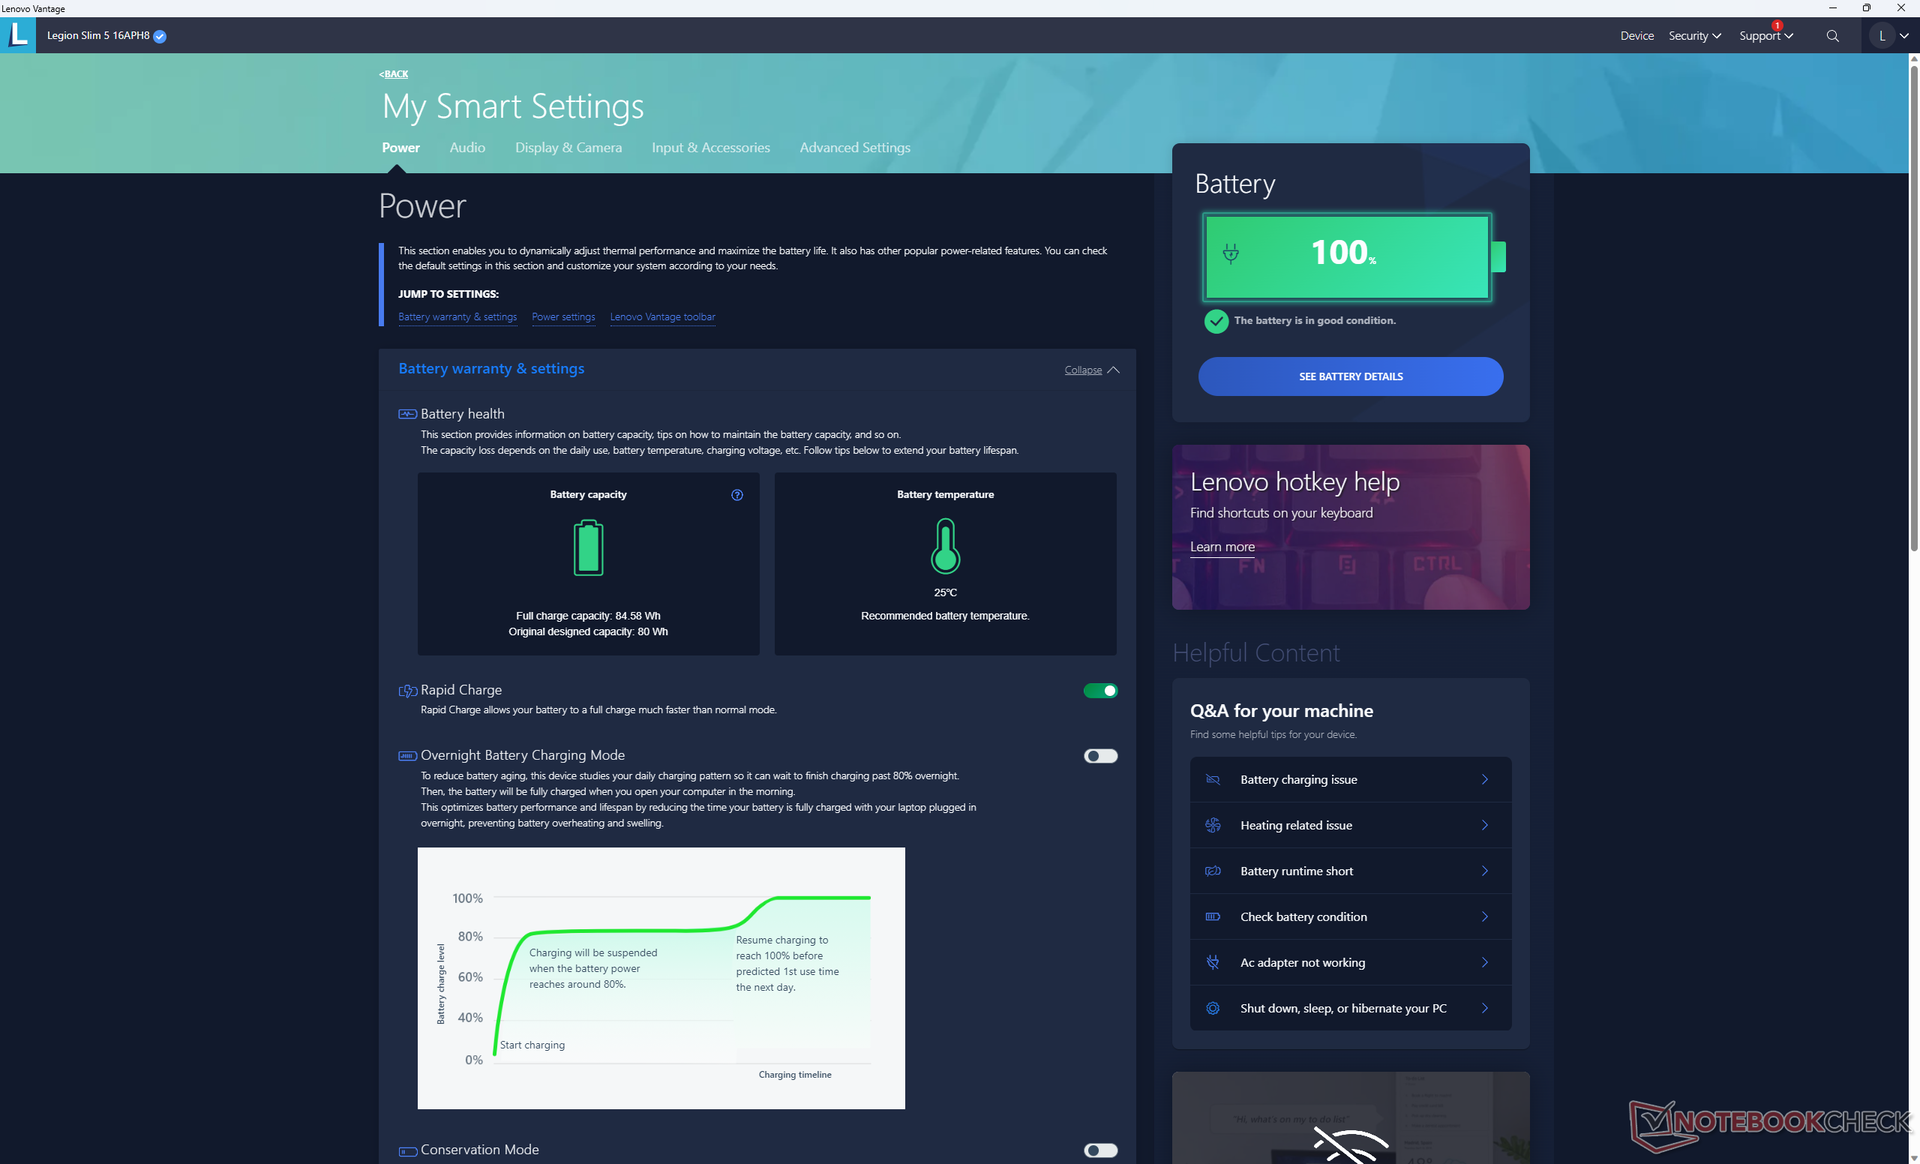
La carga de vacío a plena capacidad con el adaptador de CA incluido es muy rápida, unos 45 minutos en comparación con los 90 minutos de la mayoría de los otros portátiles. La carga rápida de Lenovo está activada por defecto. El sistema también se puede recargar por USB-C, pero la mayoría de adaptadores USB-C no son compatibles; del puñado que probamos, sólo el adaptador USB-C "oficial" de 140 W de Lenovo pudo cargar nuestro portátil.
| Lenovo Legion Slim 5 16APH8 R7 7840HS, GeForce RTX 4060 Laptop GPU, 80 Wh | Acer Nitro 16 AN16-41-R7YE R5 7535HS, GeForce RTX 4050 Laptop GPU, 90 Wh | Lenovo Legion Pro 5 16ARX8 (R5 7645HX, RTX 4050) R5 7645HX, GeForce RTX 4050 Laptop GPU, 80 Wh | HP Omen 16-wf000 i7-13700HX, GeForce RTX 4080 Laptop GPU, 83 Wh | Dell G16 7620 i7-12700H, GeForce RTX 3060 Laptop GPU, 84 Wh | Asus TUF Gaming A16 FA617XS R9 7940HS, Radeon RX 7600S, 90 Wh | |
|---|---|---|---|---|---|---|
| Duración de Batería | 47% | -21% | -30% | -37% | 41% | |
| Reader / Idle (h) | 11.7 | 12 3% | 5.5 -53% | 7.1 -39% | 20.3 74% | |
| WiFi v1.3 (h) | 7.1 | 11 55% | 5.6 -21% | 5.1 -28% | 5 -30% | 12.4 75% |
| Load (h) | 1.2 | 2.2 83% | 1.1 -8% | 0.7 -42% | 0.9 -25% | |
| H.264 (h) | 10.8 | 5.4 | 12.4 | |||
| Witcher 3 ultra (h) | 0.8 |
Pro
Contra
Veredicto - GPU de bajo rendimiento con una pantalla por lo demás estupenda y un diseño atractivo
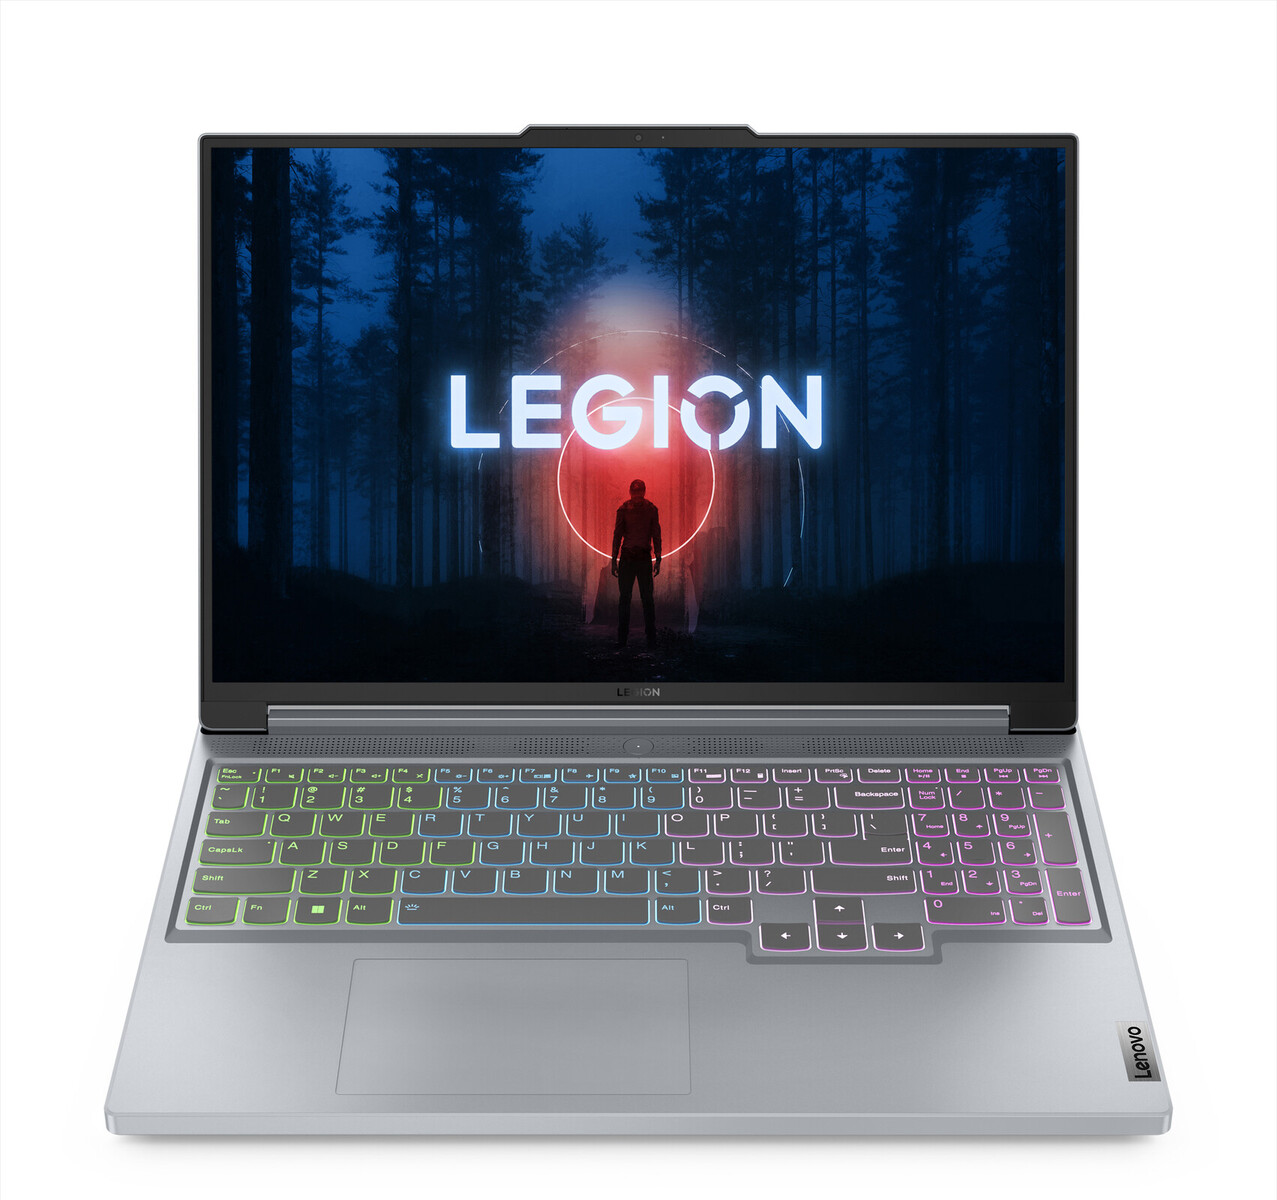
Visualmente, el Legion Slim 5 es una mejora sobre el Legion Pro 5y es uno de los portátiles para juegos más atractivos en el rango de precios de $1000 a $1200. La calidad de la pantalla también es admirable en nuestra configuración 1600p con su excelente calibración, tiempos de respuesta rápidos, frecuencias de actualización rápidas y colores sRGB completos para ser apto para la mayoría de los jugadores y editores de contenido.
En términos de rendimiento, sin embargo, existe la posibilidad de que un error en el modelo le impida rendir más rápido en el modo Rendimiento frente al modo Equilibrado. El techo de potencia de 60 W de la GPU se mantendría constante entre los dos perfiles de potencia, por lo que las únicas diferencias notables entre los dos modos parecen ser el ruido del ventilador y la temperatura. Este comportamiento es contrario a lo que hemos observado en otros modelos de Legion. Hemos notificado a Lenovo nuestros hallazgos y la página se actualizará si algo cambia.
El Legion Slim 5 16 tiene un aspecto estupendo y su pantalla de 1600p es excelente para su precio. Sin embargo, su opción GeForce RTX 4060 es más lenta que en la mayoría de portátiles con la misma GPU.
Debido al problema anterior, recomendamos considerar el Legion Pro 5 16 G8 por ahora, especialmente porque puede superar al Legion Slim 5 entre un 15 y un 25 por ciento incluso cuando está configurado con la misma GPU GeForce RTX 4060. Como alternativa, los usuarios aún pueden considerar la configuración Legion Slim 5 RTX 4050 con la pantalla de 1600p ya que la opción RTX 4060 actualmente tiene un rendimiento inferior.
Precio y disponibilidad
Lenovo ya está comercializando su serie Legion Slim 5 a partir de 1020 USD para la configuración Ryzen 5/RTX 4050/1200p básica hasta 1220 USD para la configuración Ryzen 7/RTX 4060/1600p analizada.
Lenovo Legion Slim 5 16APH8
- 08/11/2023 v7 (old)
DeepL / Allen Ngo
Transparencia
La selección de los dispositivos que se van a reseñar corre a cargo de nuestro equipo editorial. La muestra de prueba fue proporcionada al autor en calidad de préstamo por el fabricante o el minorista a los efectos de esta reseña. El prestamista no tuvo ninguna influencia en esta reseña, ni el fabricante recibió una copia de la misma antes de su publicación. No había ninguna obligación de publicar esta reseña. Como empresa de medios independiente, Notebookcheck no está sujeta a la autoridad de fabricantes, minoristas o editores.
Así es como prueba Notebookcheck
Cada año, Notebookcheck revisa de forma independiente cientos de portátiles y smartphones utilizando procedimientos estandarizados para asegurar que todos los resultados son comparables. Hemos desarrollado continuamente nuestros métodos de prueba durante unos 20 años y hemos establecido los estándares de la industria en el proceso. En nuestros laboratorios de pruebas, técnicos y editores experimentados utilizan equipos de medición de alta calidad. Estas pruebas implican un proceso de validación en varias fases. Nuestro complejo sistema de clasificación se basa en cientos de mediciones y puntos de referencia bien fundamentados, lo que mantiene la objetividad.Price comparison

