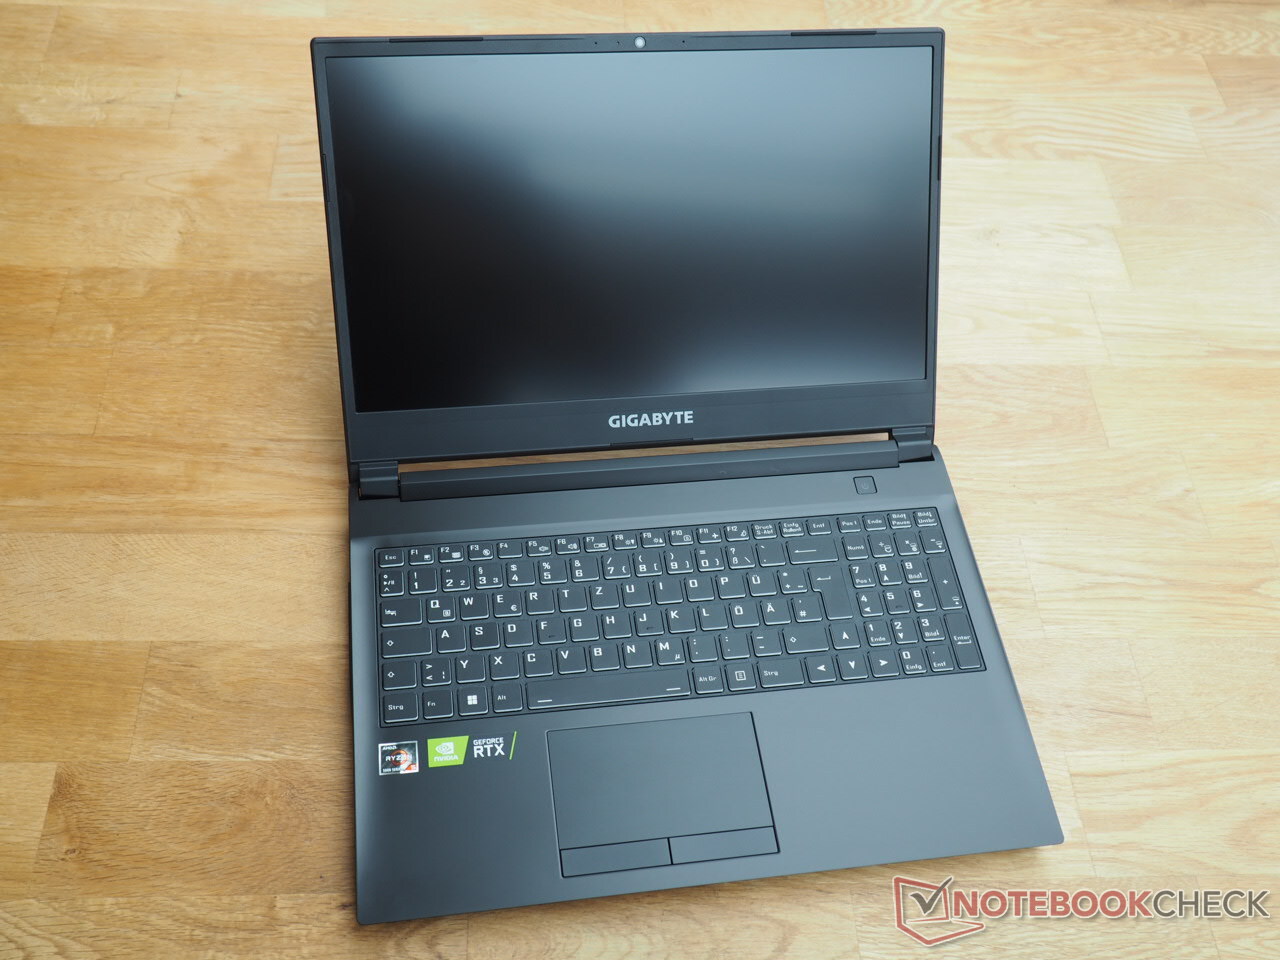
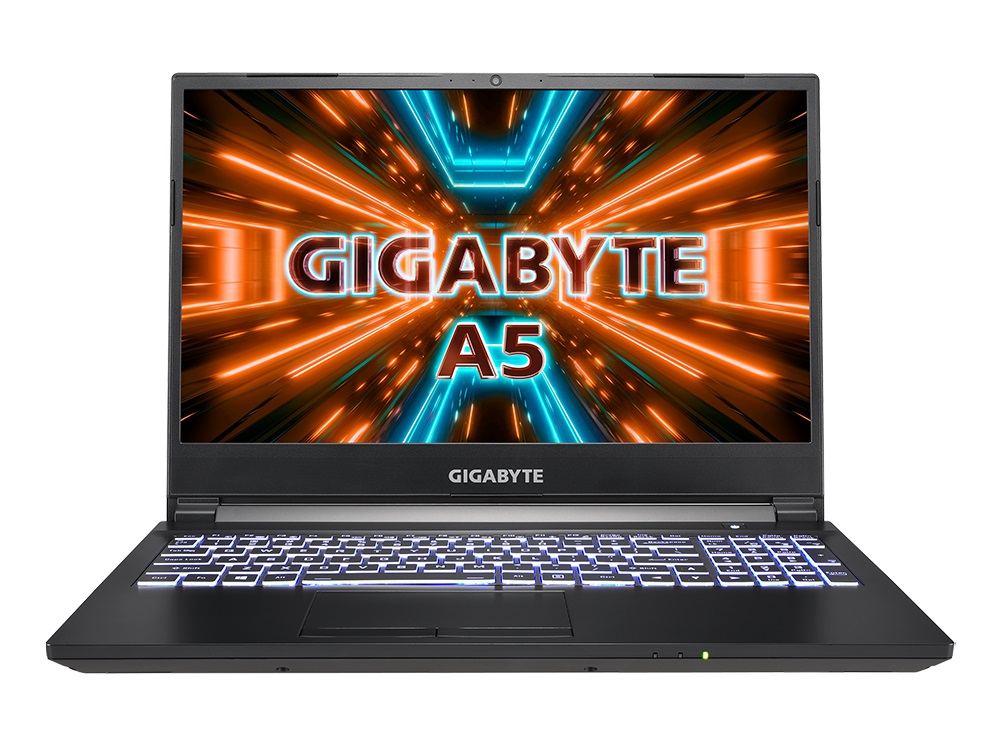
Análisis del Gigabyte A5 K1: El portátil para juegos de la vieja escuela

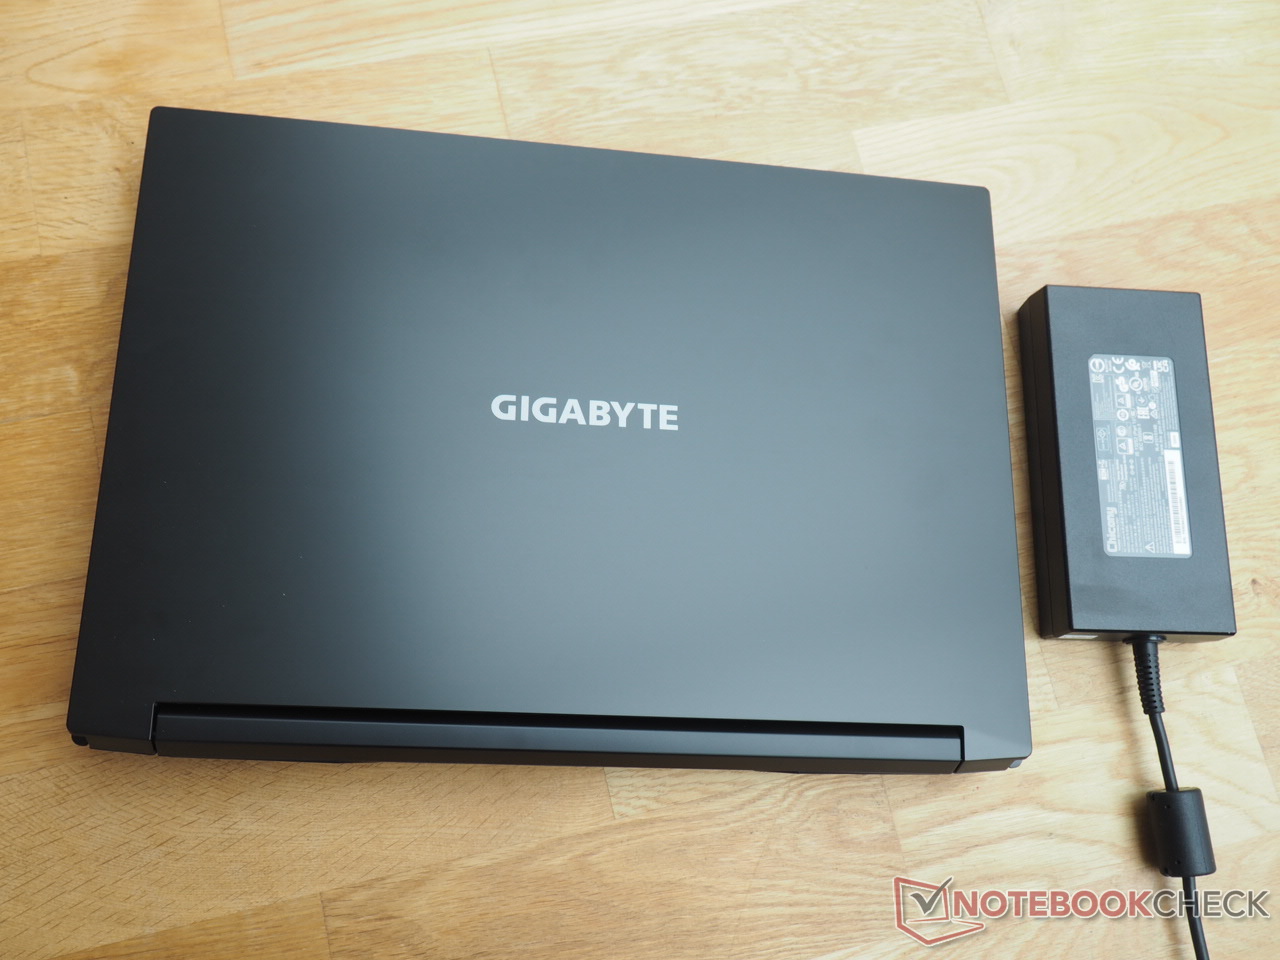
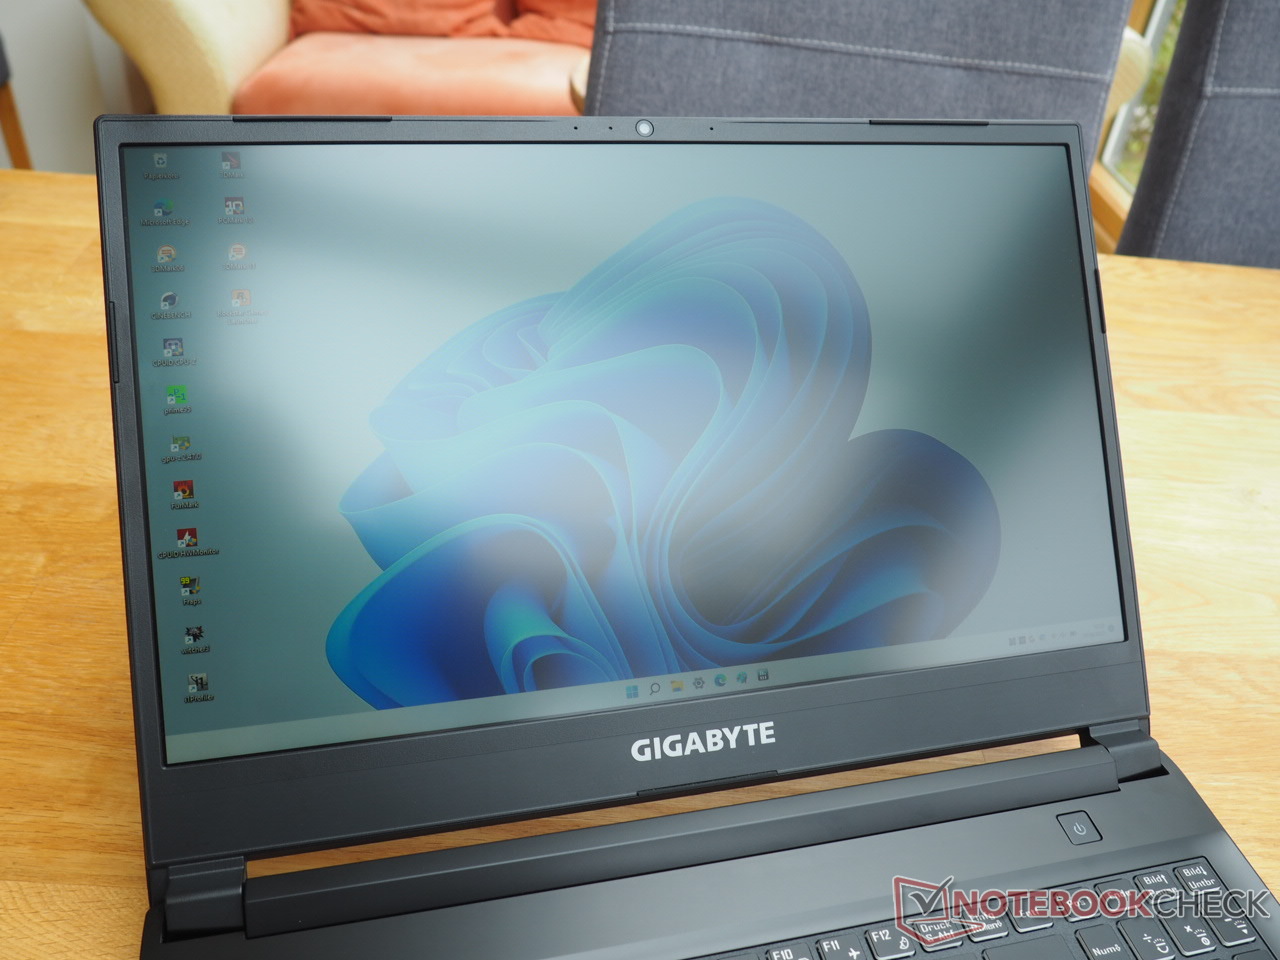
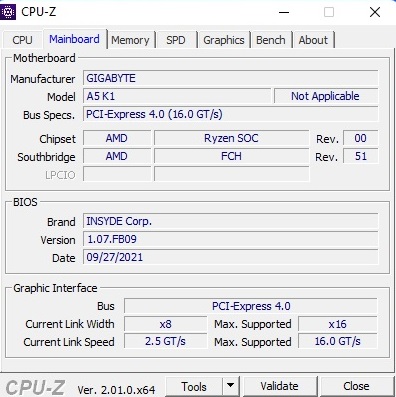
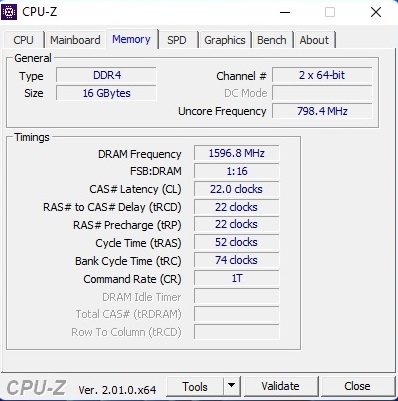
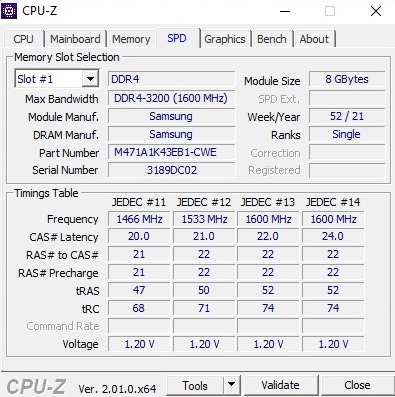
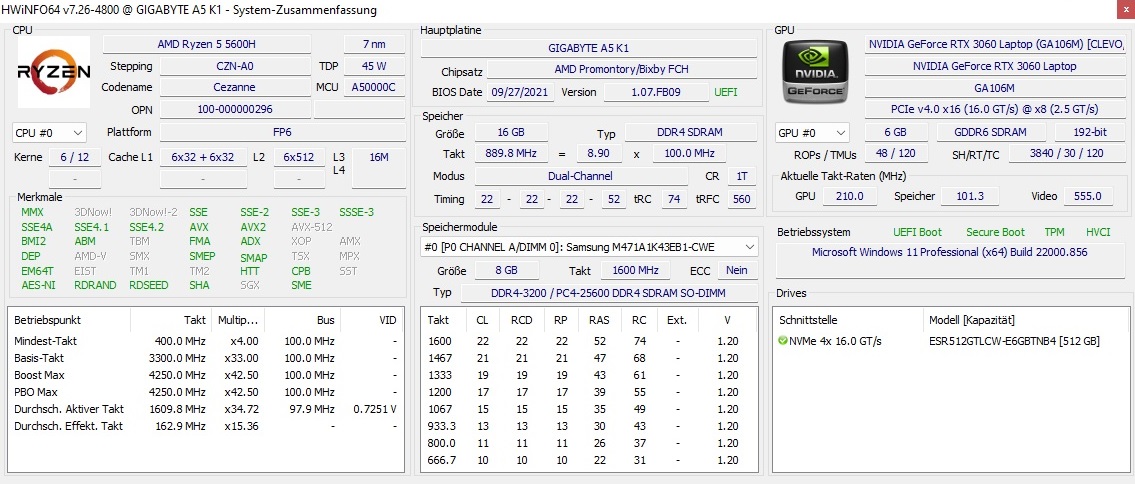
Después de haber probado el poco menos de 1.800 euros (~1788 dólares)A5 X1 con Ryzen 9 5900HX y GeForce RTX 3070, Gigabyte nos ha enviado ahora el mucho más barato A5 K1, que también tiene 16 GB de RAM DDR4 (2x 8 GB Dual Channel) y un SSD basado en NVMe de 512 GB, pero tiene que conformarse con menos potencia de CPU y GPU. Sin embargo, unRyzen 5 5600H y una GeForce RTX 3060 son muy respetables por unos 900 euros (~894 dólares). En este rango de precios a menudo sólo se consigue una GeForce RTX 3050 o 3050 Ti. Gigabyte (o el fabricante de barebones Clevo) utiliza un panel mate de 144 Hz con 1920 x 1080 píxeles para la pantalla. Atención: El ordenador sólo viene con FreeDOS. Sin embargo, Gigabyte tuvo la amabilidad de instalar Windows 11 Pro para nosotros por adelantado.
Entre los competidores de la A5 K1 se encuentran otros gamers de 15 pulgadas con GeForce RTX 3060 o su equivalente Radeon RX 6600M como el Asus TUF Gaming F15 FX507ZM, el Lenovo Legion 5 15ACH6A y el MSI Alpha 15 B5EEKque son, excepto el Legion, mucho más caros. Estos últimos portátiles aparecen en las tablas como dispositivos de comparación.
Posibles contendientes en la comparación
Valoración | Fecha | Modelo | Peso | Altura | Tamaño | Resolución | Precio |
|---|---|---|---|---|---|---|---|
| 82.3 % v7 (old) | 09/2022 | Gigabyte A5 K1 R5 5600H, GeForce RTX 3060 Laptop GPU | 2.2 kg | 34 mm | 15.60" | 1920x1080 | |
| 87.2 % v7 (old) | 03/2022 | Asus TUF Gaming F15 FX507ZM i7-12700H, GeForce RTX 3060 Laptop GPU | 2.1 kg | 24.95 mm | 15.60" | 1920x1080 | |
| 82.6 % v7 (old) | 05/2022 | Lenovo Legion 5 15ACH6A-82NW0010GE R5 5600H, Radeon RX 6600M | 2.5 kg | 25.75 mm | 15.60" | 1920x1080 | |
| 82.6 % v7 (old) | 01/2022 | MSI Alpha 15 B5EEK-008 R7 5800H, Radeon RX 6600M | 2.4 kg | 23.95 mm | 15.60" | 1920x1080 | |
| 84.1 % v7 (old) | 01/2022 | Gigabyte A5 X1 R9 5900HX, GeForce RTX 3070 Laptop GPU | 2.2 kg | 25.3 mm | 15.60" | 1920x1080 |
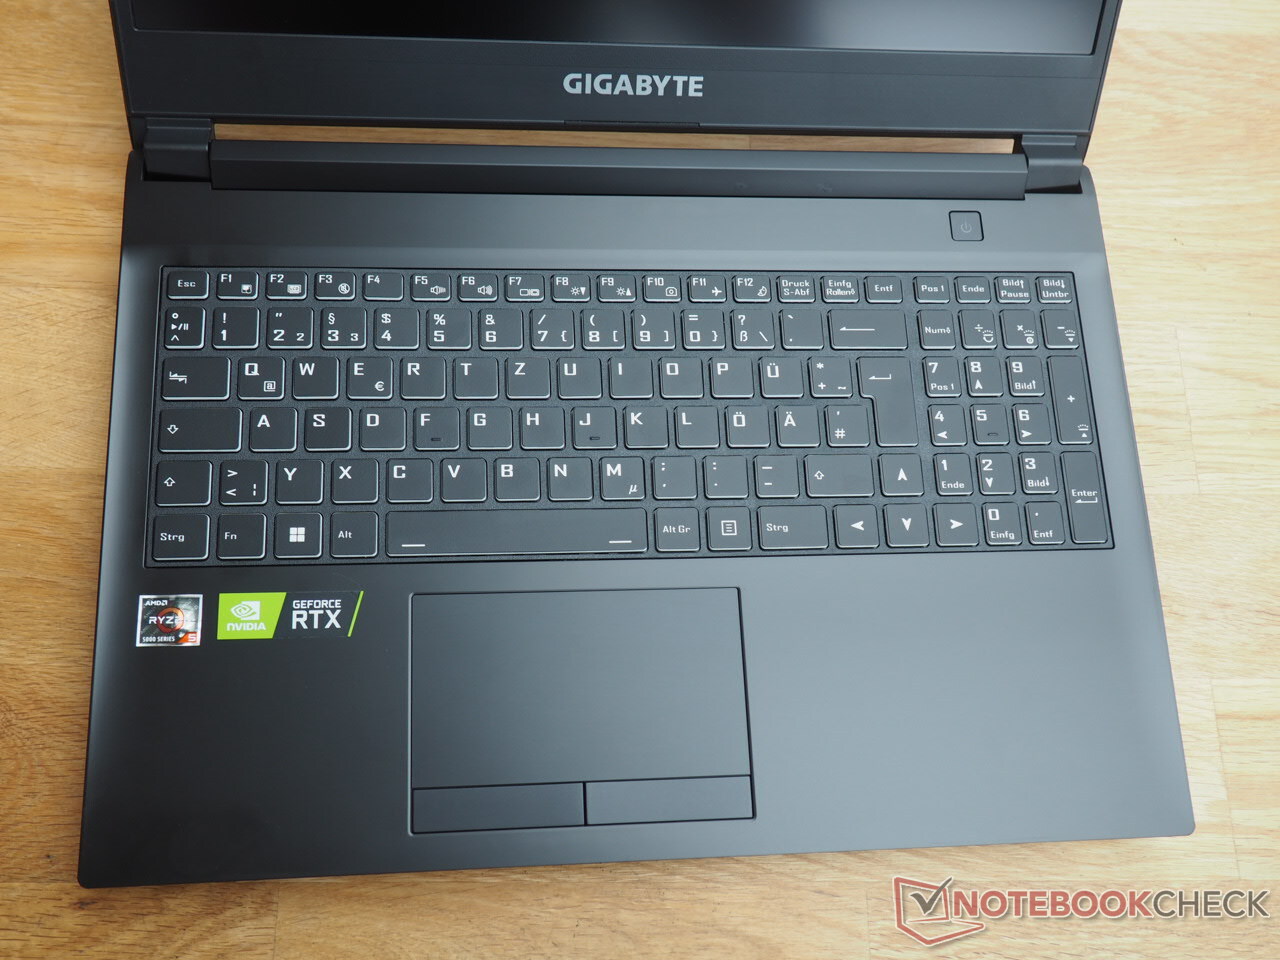
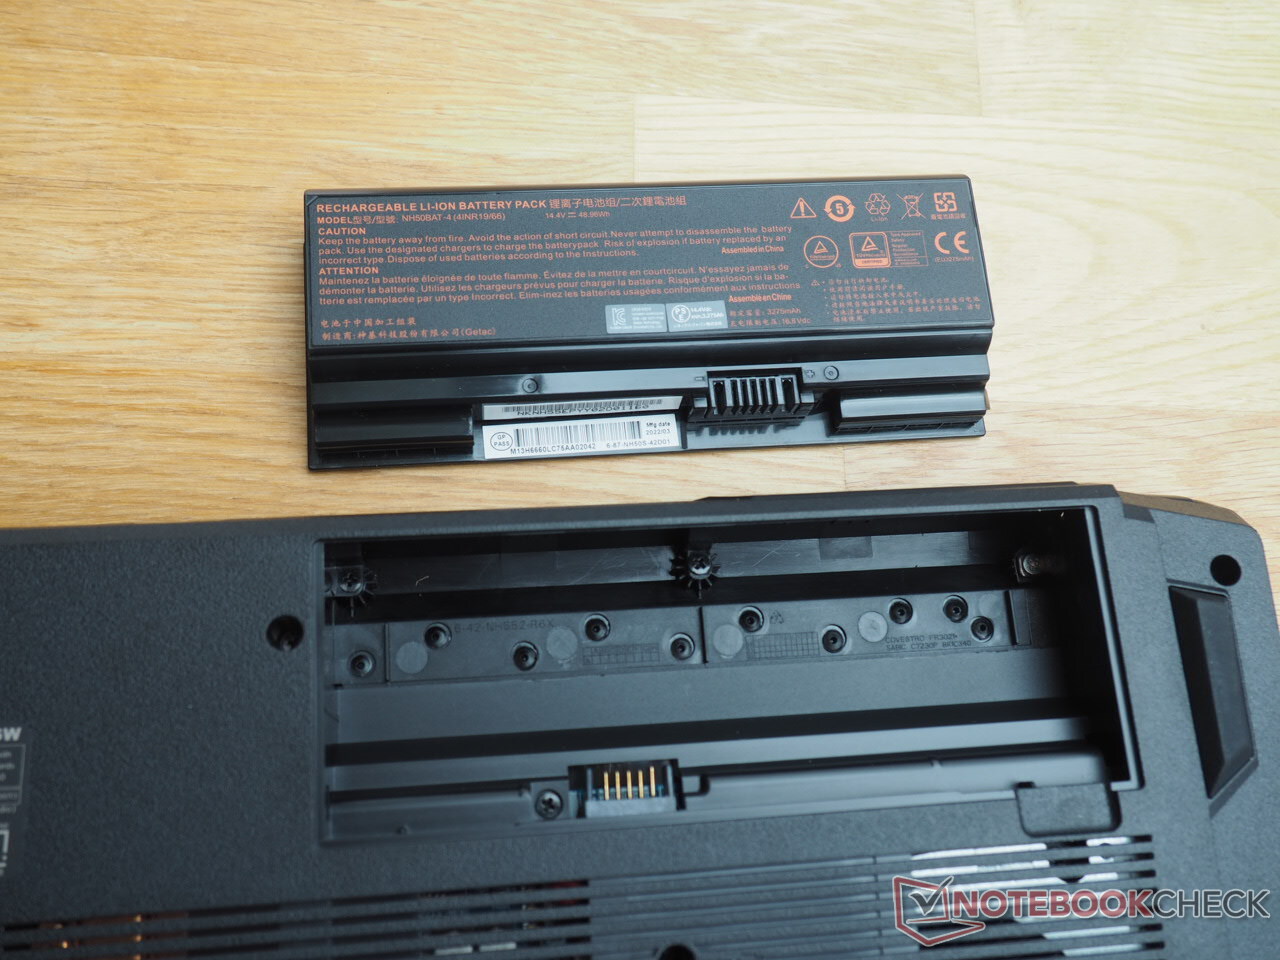
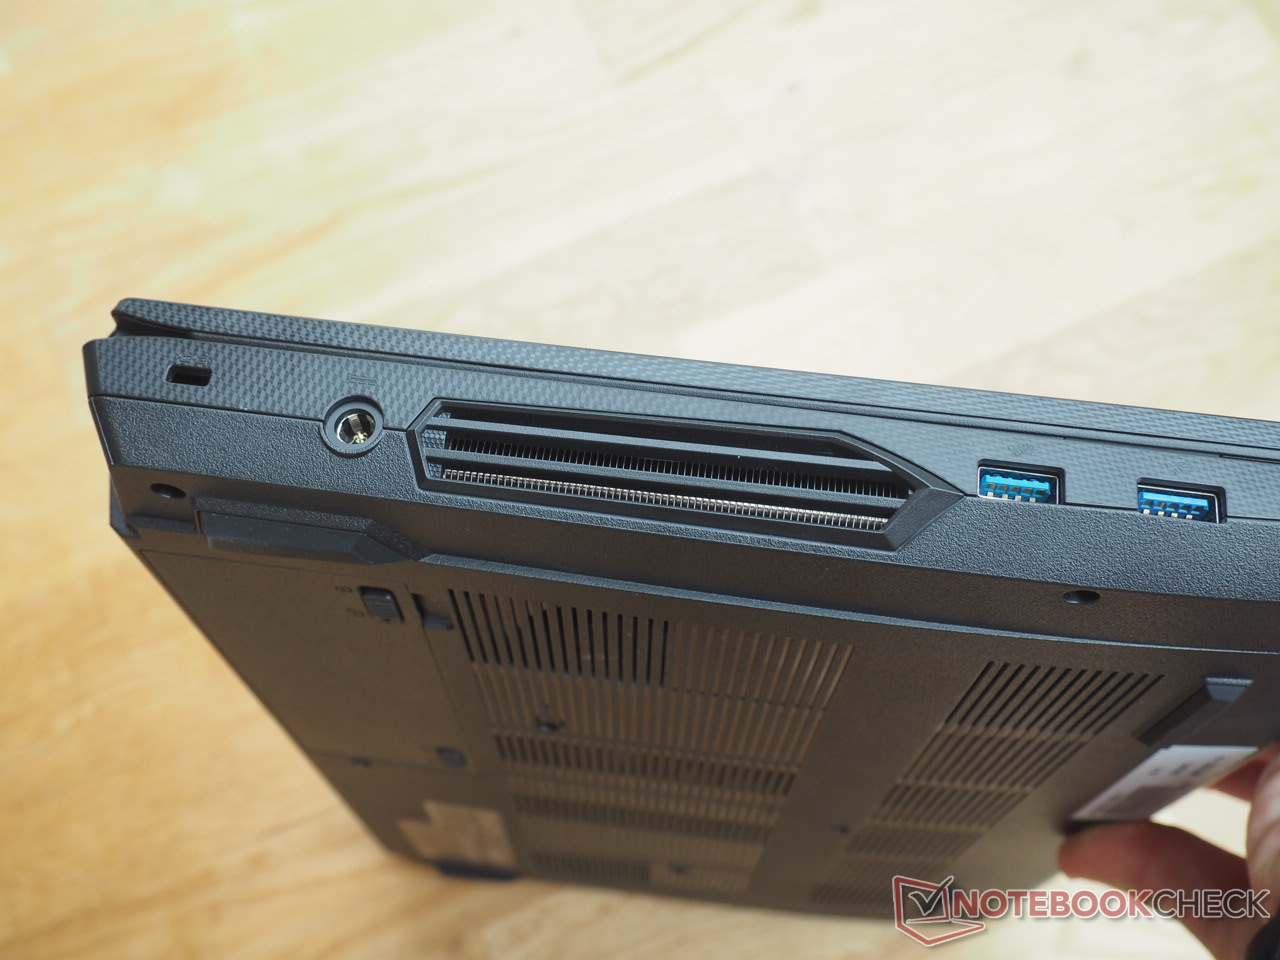
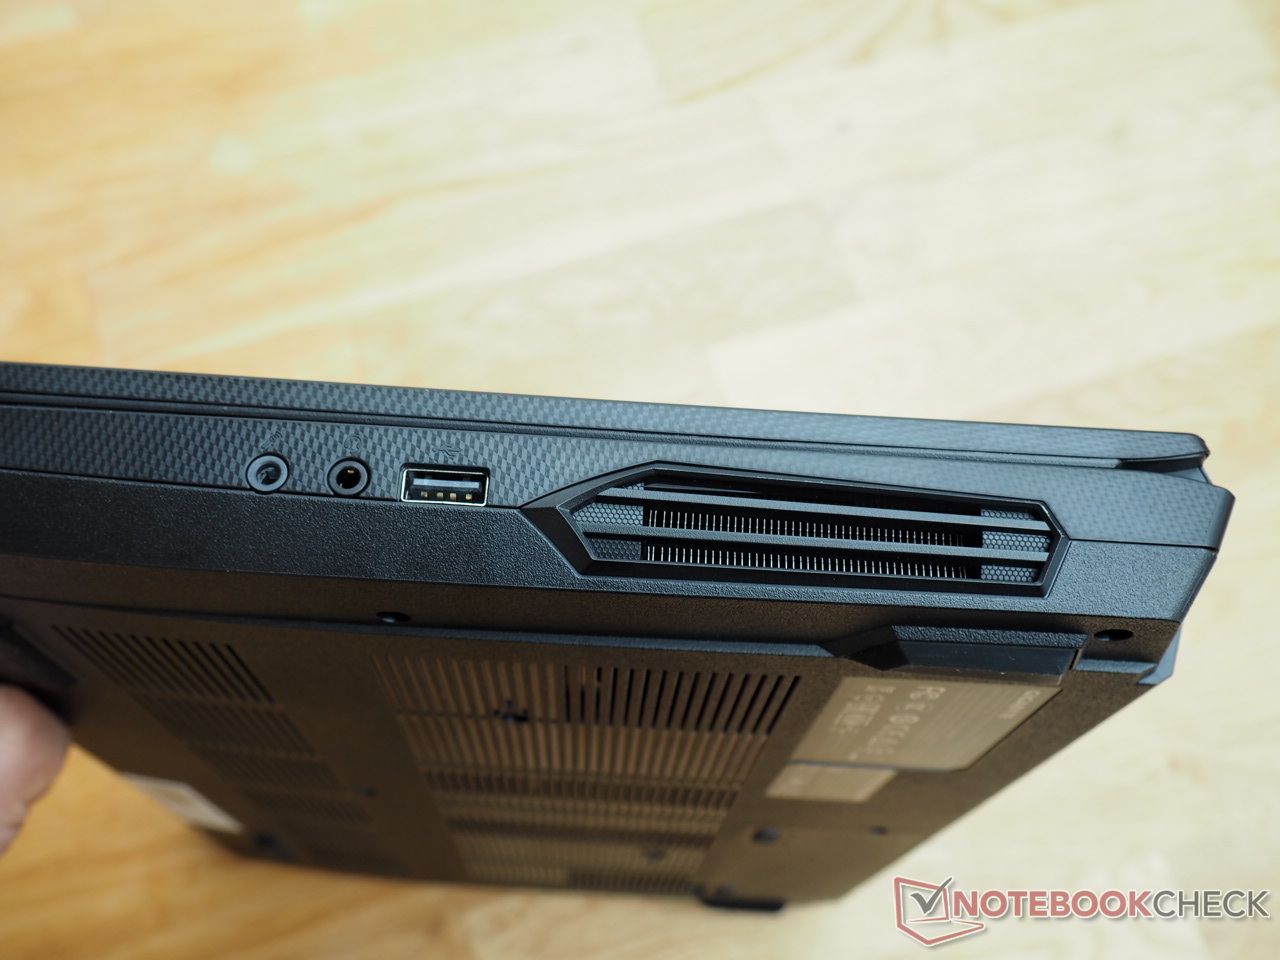
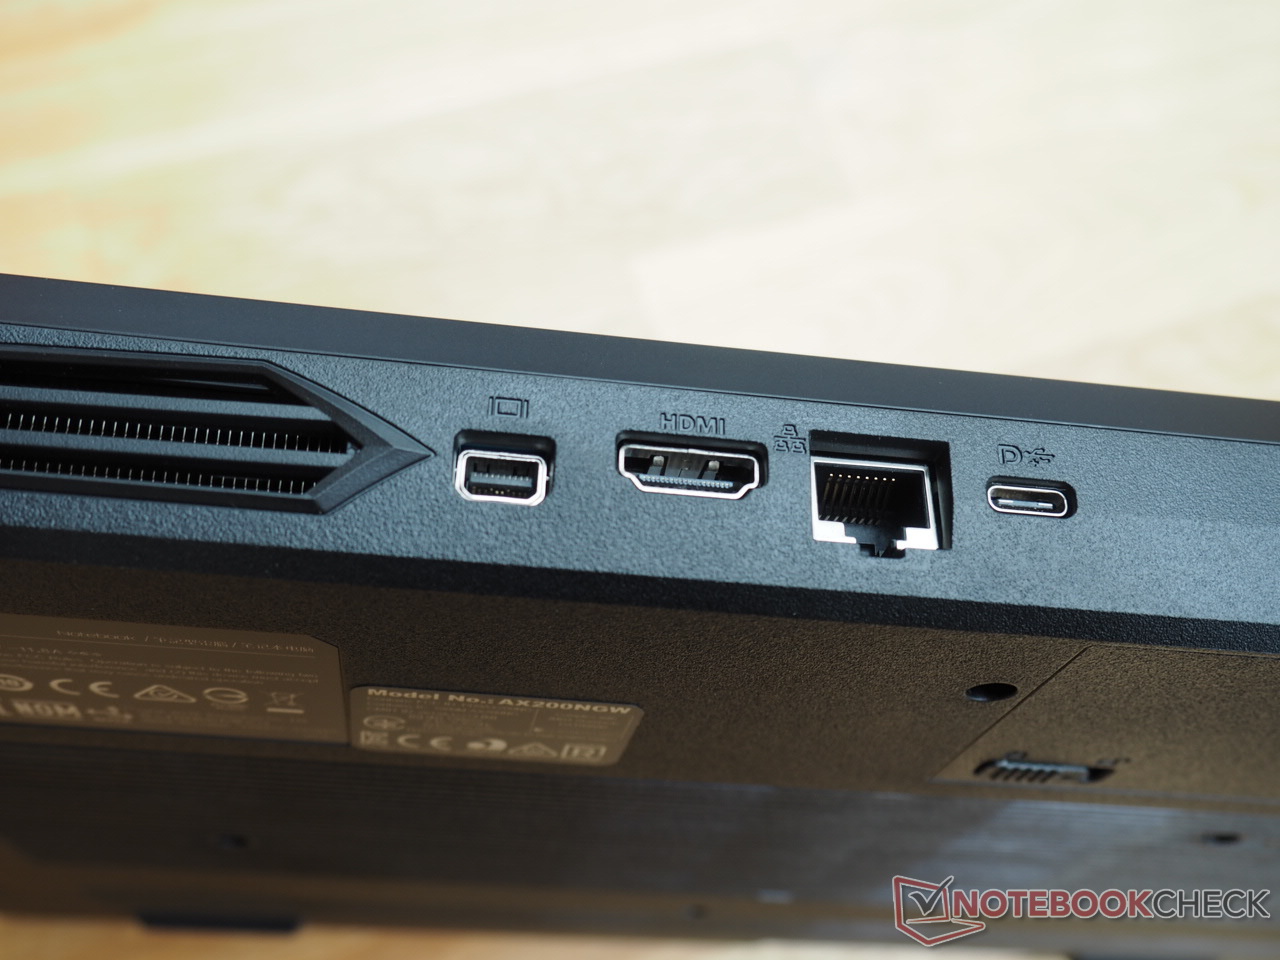
Dado que el chasis es idéntico en su construcción al del A5 X1, salvo por cambios mínimos (los laterales están ahora texturizados/estructurados en algunas partes), no reevaluaremos la carcasa, los puertos y los dispositivos de entrada en este artículo. Puede encontrar la información correspondiente en el informe de pruebas vinculado.
Comunicación
| Networking | |
| iperf3 transmit AXE11000 | |
| Gigabyte A5 K1 | |
| Media de la clase Gaming (560 - 1862, n=88, últimos 2 años) | |
| Medio Intel Wi-Fi 6 AX200 (429 - 1748, n=28) | |
| iperf3 receive AXE11000 | |
| Gigabyte A5 K1 | |
| Media de la clase Gaming (680 - 1745, n=88, últimos 2 años) | |
| Medio Intel Wi-Fi 6 AX200 (451 - 1746, n=28) | |
Cámara web


Mostrar
La pantalla puntúa un poco menos en comparación con el A5 X1, pero sigue estando a un nivel bastante bueno en general.
| |||||||||||||||||||||||||
iluminación: 83 %
Brillo con batería: 295 cd/m²
Contraste: 1017:1 (Negro: 0.29 cd/m²)
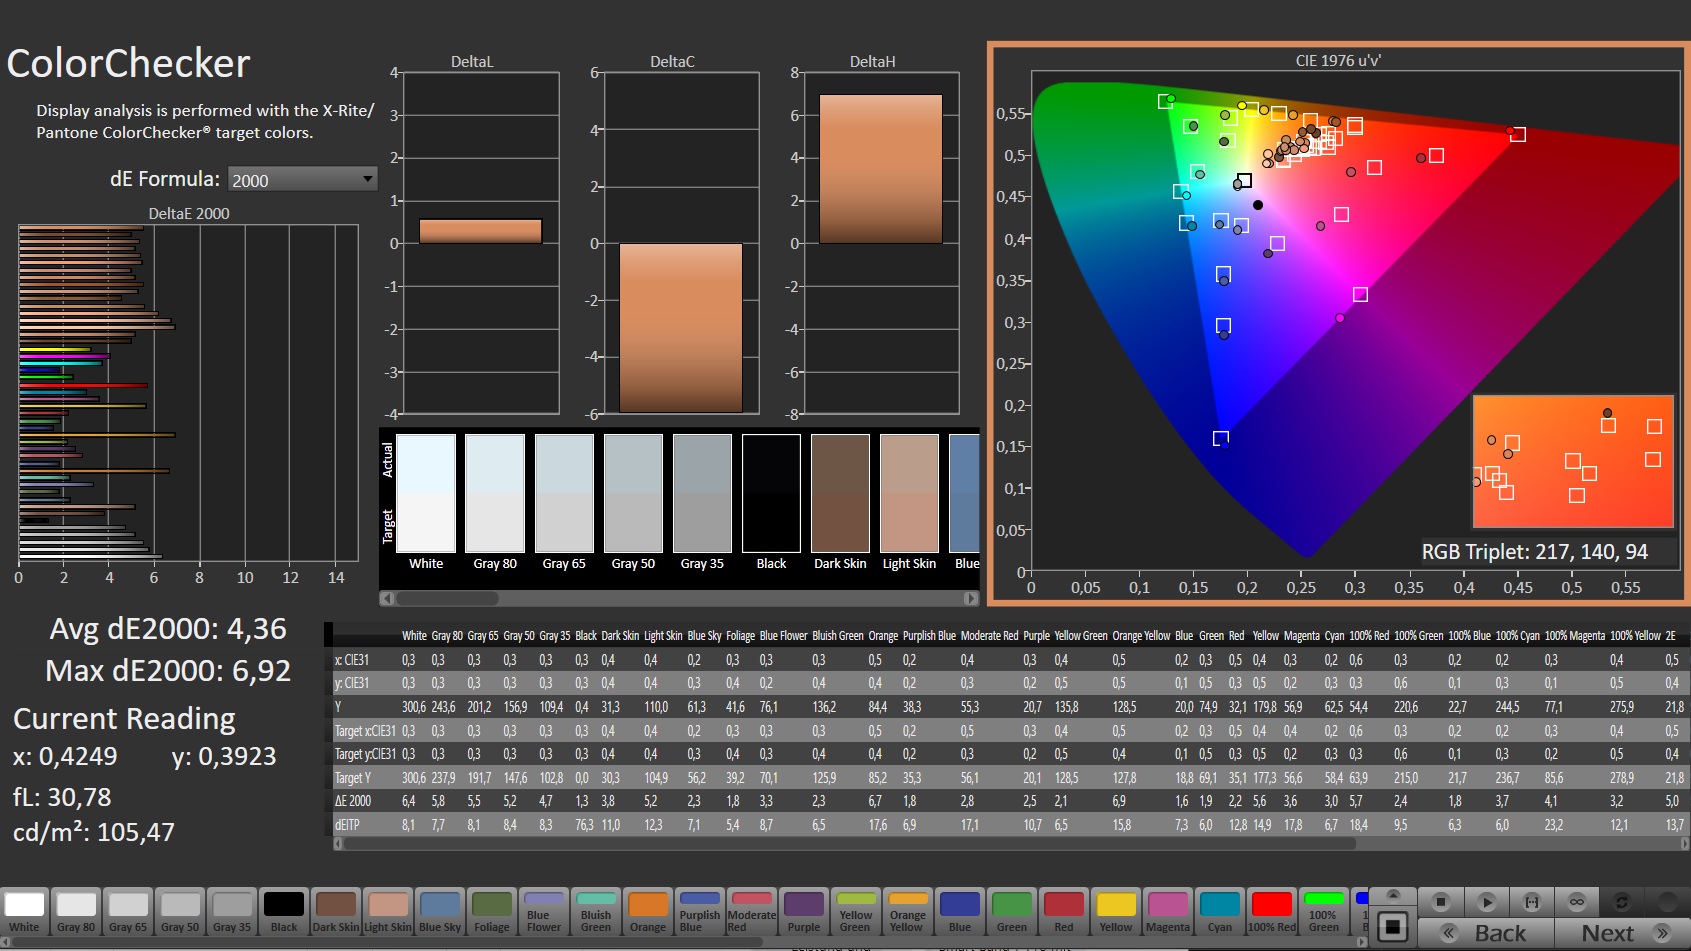
ΔE ColorChecker Calman: 4.36 | ∀{0.5-29.43 Ø4.71}
calibrated: 1.2
ΔE Greyscale Calman: 3.9 | ∀{0.09-98 Ø4.96}
66.1% AdobeRGB 1998 (Argyll 3D)
92.5% sRGB (Argyll 3D)
64.4% Display P3 (Argyll 3D)
Gamma: 2.106
CCT: 7300 K
| Gigabyte A5 K1 BOEhydis NV156FHM-N4K (BOE08B3), IPS, 1920x1080, 15.6" | Asus TUF Gaming F15 FX507ZM TL156VDXP0101, IPS, 1920x1080, 15.6" | Lenovo Legion 5 15ACH6A-82NW0010GE LGD06A5, IPS, 1920x1080, 15.6" | MSI Alpha 15 B5EEK-008 AU Optronics B156HAN08.0, IPS, 1920x1080, 15.6" | Gigabyte A5 X1 AU Optronics B156HAN12.0, IPS, 1920x1080, 15.6" | |
|---|---|---|---|---|---|
| Display | 4% | 9% | 1% | 7% | |
| Display P3 Coverage (%) | 64.4 | 66.4 3% | 71.1 10% | 65.9 2% | 69.6 8% |
| sRGB Coverage (%) | 92.5 | 97 5% | 99.1 7% | 91.6 -1% | 98.6 7% |
| AdobeRGB 1998 Coverage (%) | 66.1 | 68.5 4% | 72.3 9% | 67 1% | 70.8 7% |
| Response Times | 13% | 17% | 44% | 25% | |
| Response Time Grey 50% / Grey 80% * (ms) | 14.5 ? | 5.6 ? 61% | 15 ? -3% | 5.06 ? 65% | 4.8 ? 67% |
| Response Time Black / White * (ms) | 9.5 ? | 12.8 ? -35% | 6 ? 37% | 7.44 ? 22% | 11.2 ? -18% |
| PWM Frequency (Hz) | |||||
| Screen | 27% | 7% | -10% | 3% | |
| Brightness middle (cd/m²) | 295 | 353.7 20% | 371 26% | 311 5% | 335 14% |
| Brightness (cd/m²) | 281 | 340 21% | 328 17% | 325 16% | 325 16% |
| Brightness Distribution (%) | 83 | 89 7% | 85 2% | 84 1% | 90 8% |
| Black Level * (cd/m²) | 0.29 | 0.34 -17% | 0.32 -10% | 0.22 24% | 0.4 -38% |
| Contrast (:1) | 1017 | 1040 2% | 1159 14% | 1414 39% | 838 -18% |
| Colorchecker dE 2000 * | 4.36 | 1.74 60% | 3.25 25% | 5.06 -16% | 2.63 40% |
| Colorchecker dE 2000 max. * | 6.92 | 3.63 48% | 6.33 9% | 8.37 -21% | 7.71 -11% |
| Colorchecker dE 2000 calibrated * | 1.2 | 0.5 58% | 1.11 7% | 2.62 -118% | 0.97 19% |
| Greyscale dE 2000 * | 3.9 | 2.1 46% | 4.94 -27% | 4.8 -23% | 4 -3% |
| Gamma | 2.106 104% | 2.3 96% | 2.45 90% | 2.12 104% | 2.129 103% |
| CCT | 7300 89% | 6257 104% | 6064 107% | 8002 81% | 7434 87% |
| Media total (Programa/Opciones) | 15% /
20% | 11% /
9% | 12% /
-0% | 12% /
7% |
* ... más pequeño es mejor
En lugar de un panel de AU Optronics, nuestra configuración de prueba del A5 K1 tenía un panel BOE a bordo. Además de la iluminación (el display tiene problemas de sangrado de pantalla visible), el brillo también podría ser mejor. Una media de 281 cd/m² podría ser suficiente para la mayoría de los entornos de interior, pero rápidamente se deseará una luminosidad mayor en lugares más luminosos como jardines de invierno, balcones o terrazas. El hermano más caro aún logra 325 cd/m² aquí.
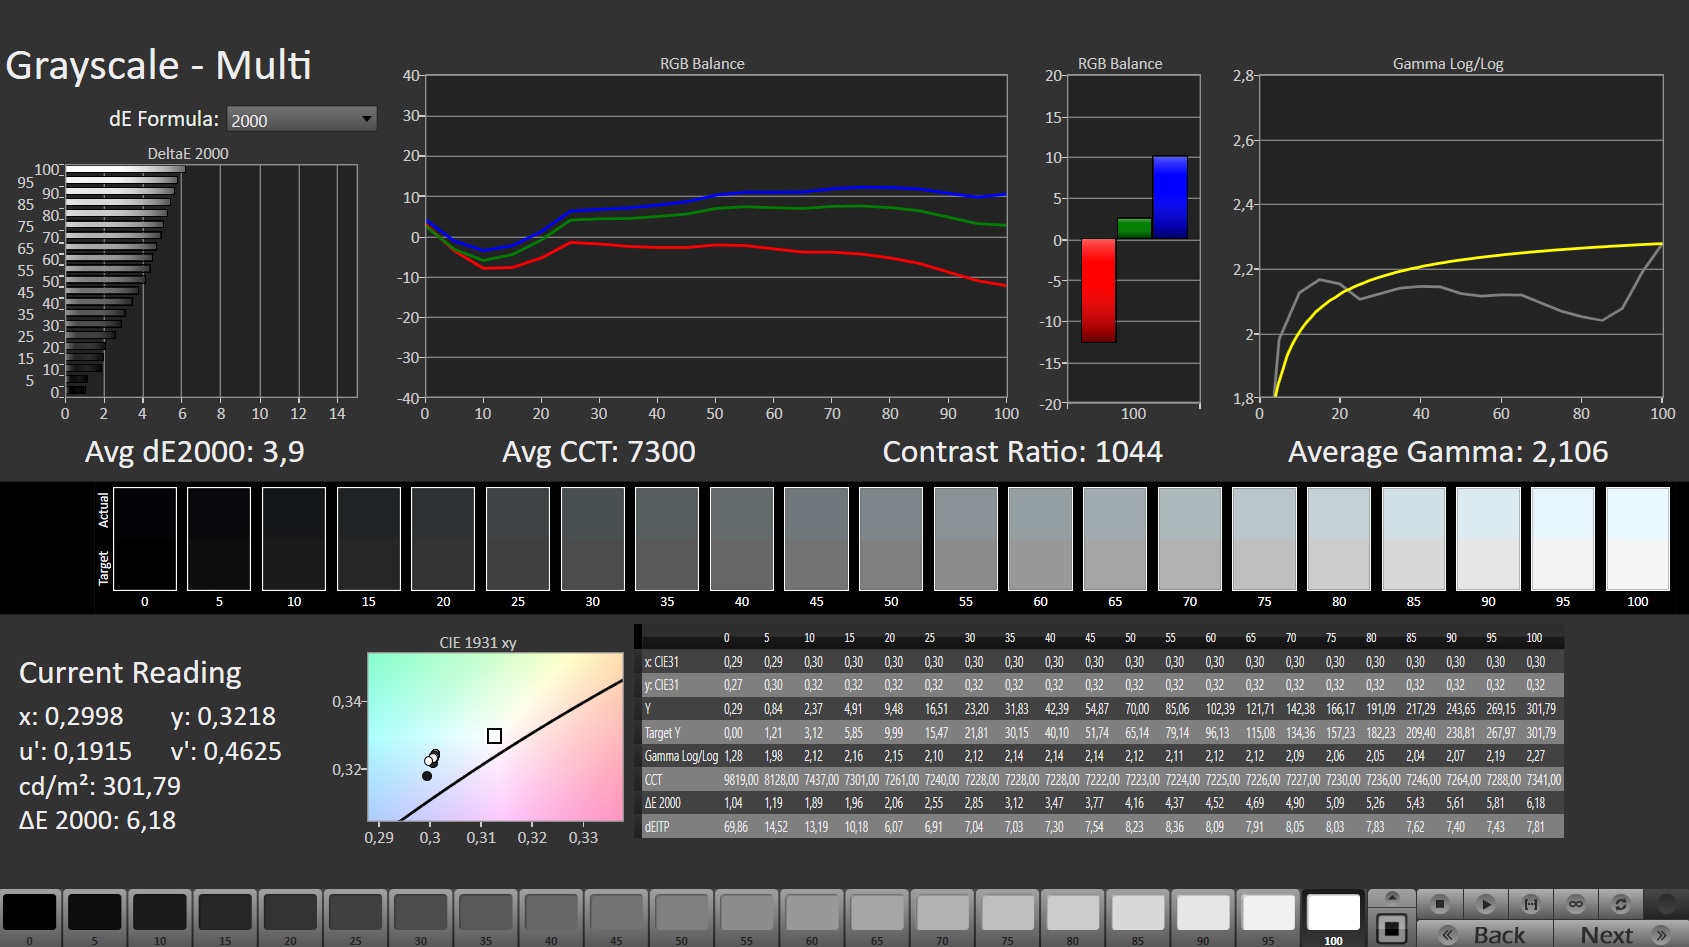
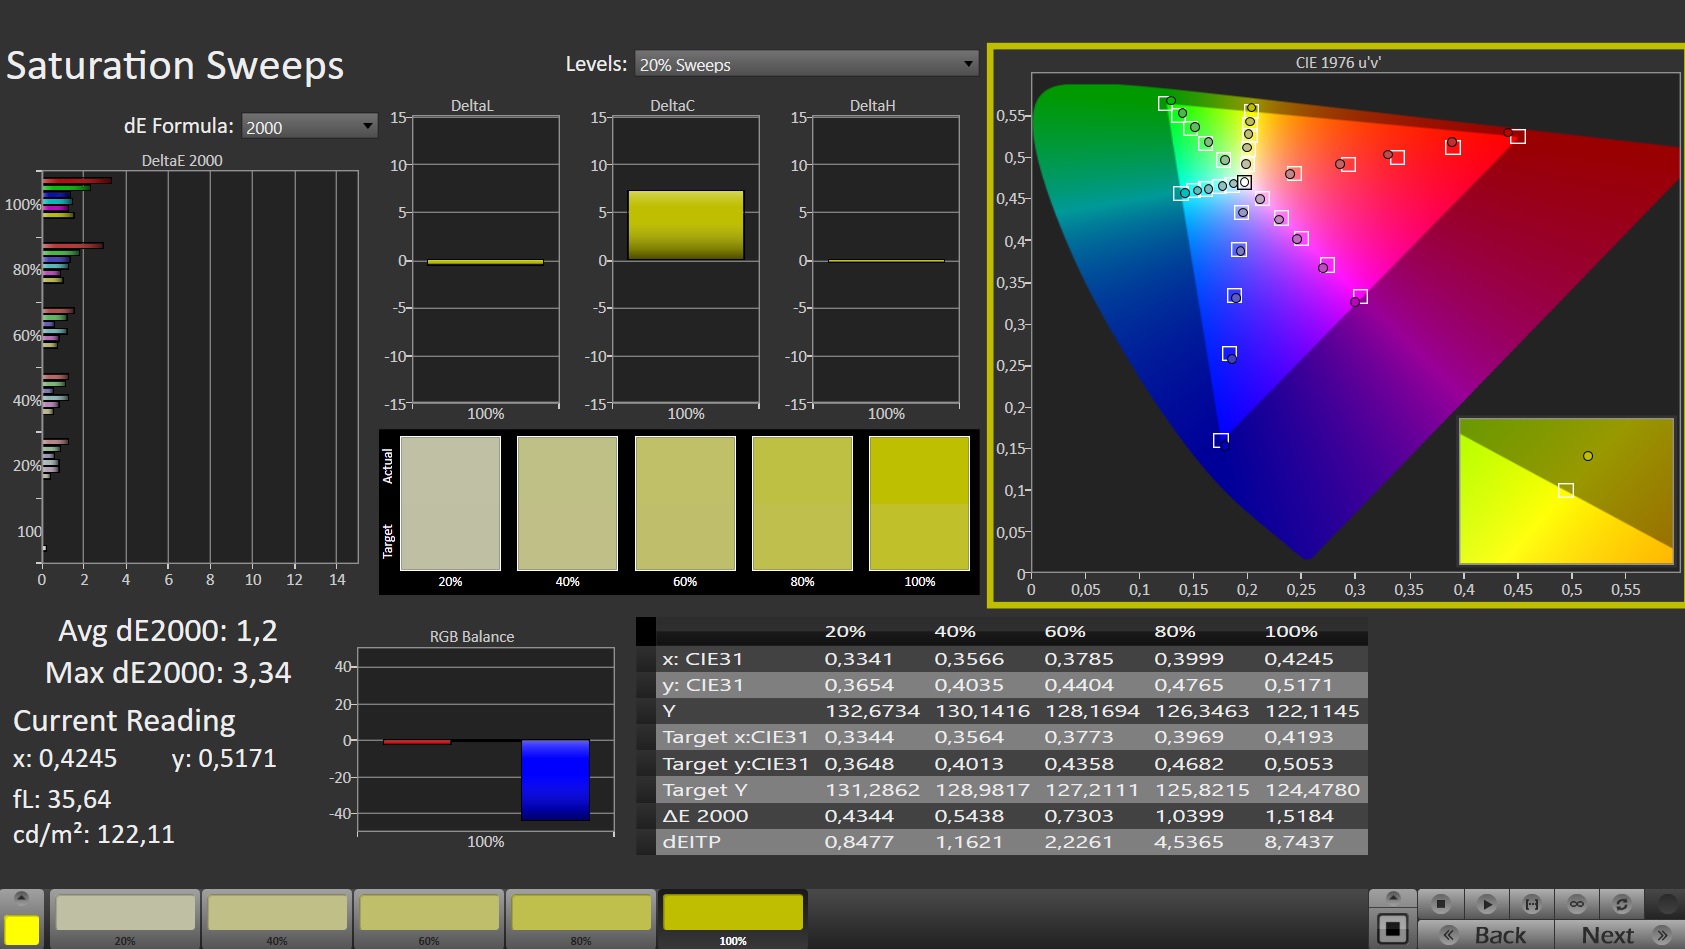
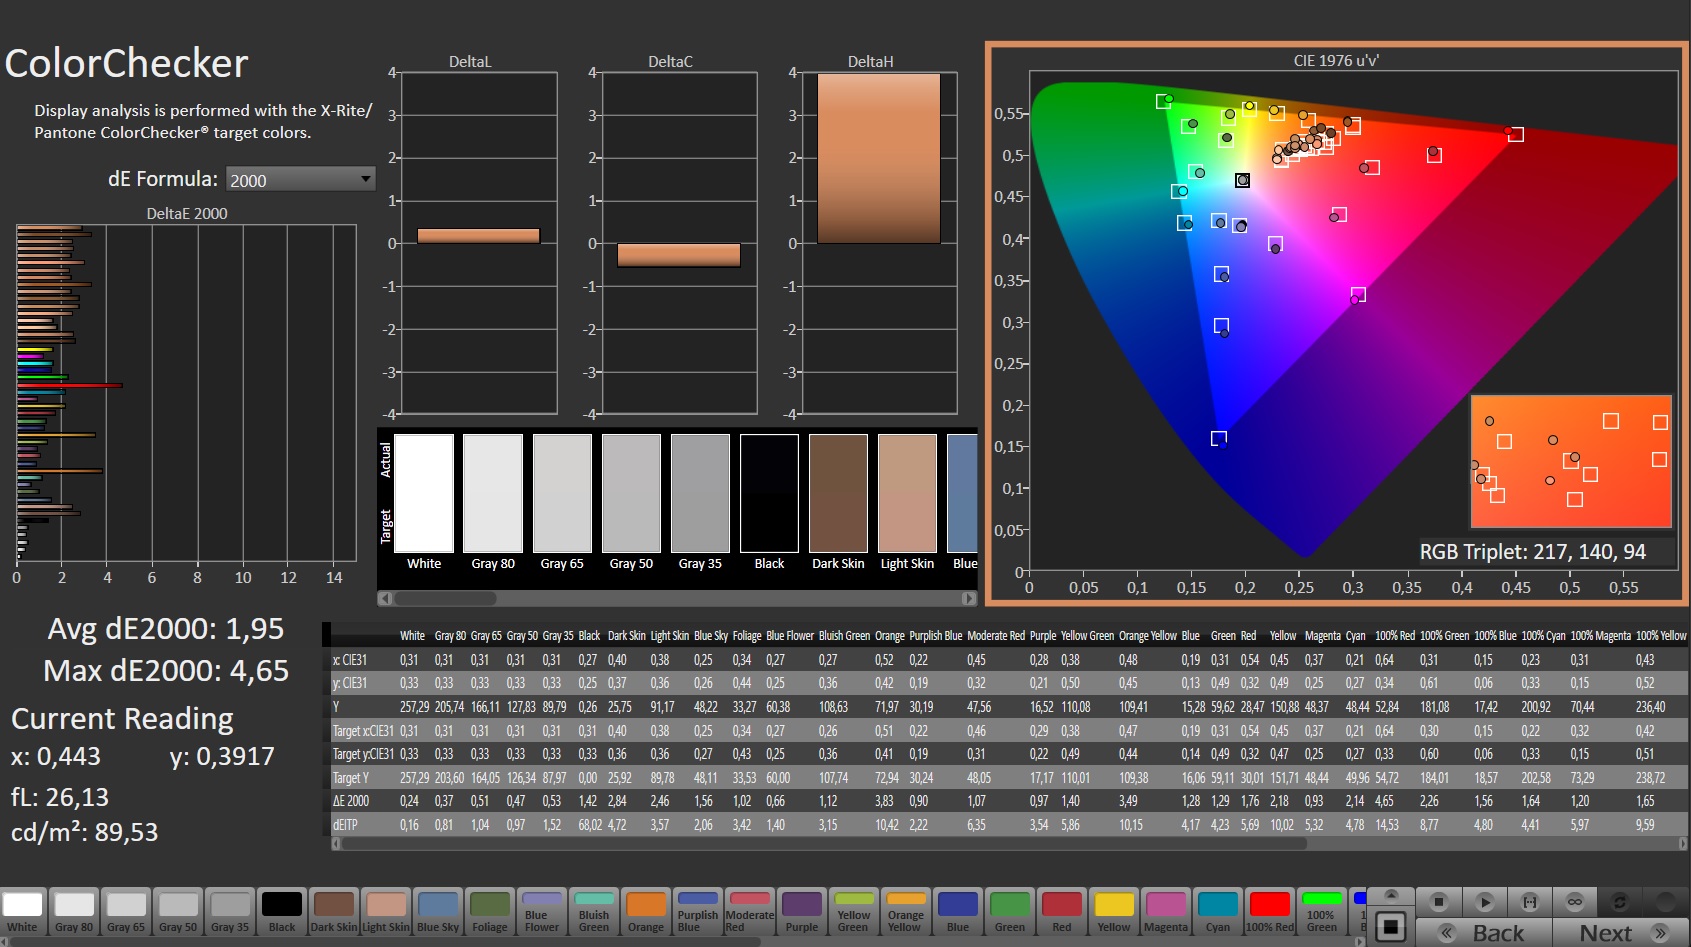
La ventaja de la A5 K1 es el valor de negro ligeramente inferior (0,29 frente a 0,4 cd/m²), lo que se traduce en un contraste notablemente mayor sobre el papel (1.107:1 frente a 838:1). Sin embargo, las diferencias son limitadas en la práctica porque el A5 X1 ofrece un espacio de color más amplio.
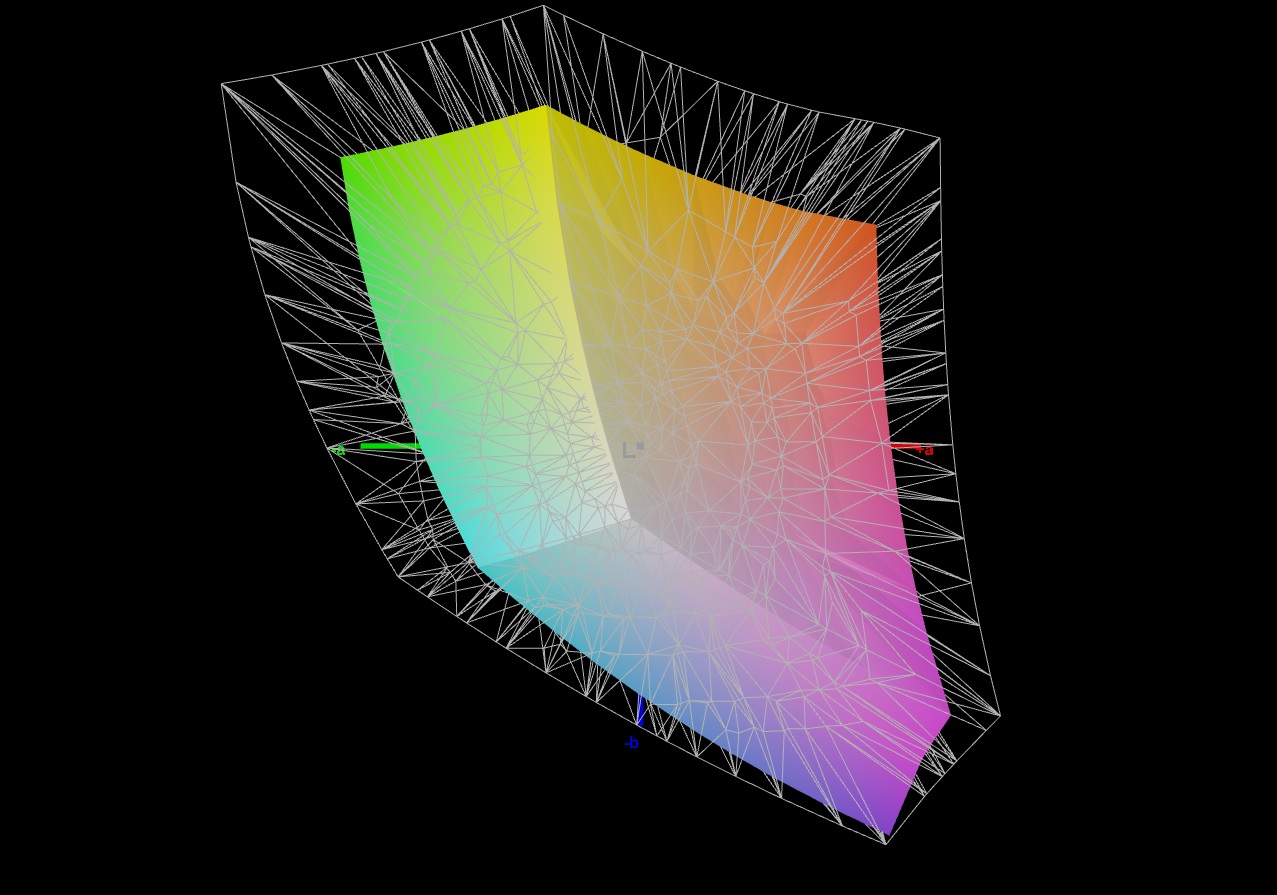
Este último también está ligeramente por delante en términos de precisión del color. Los ángulos de visión y los tiempos de respuesta son satisfactorios en ambos dispositivos.
Tiempos de respuesta del display
| ↔ Tiempo de respuesta de Negro a Blanco | ||
|---|---|---|
| 9.5 ms ... subida ↗ y bajada ↘ combinada | ↗ 5.5 ms subida | 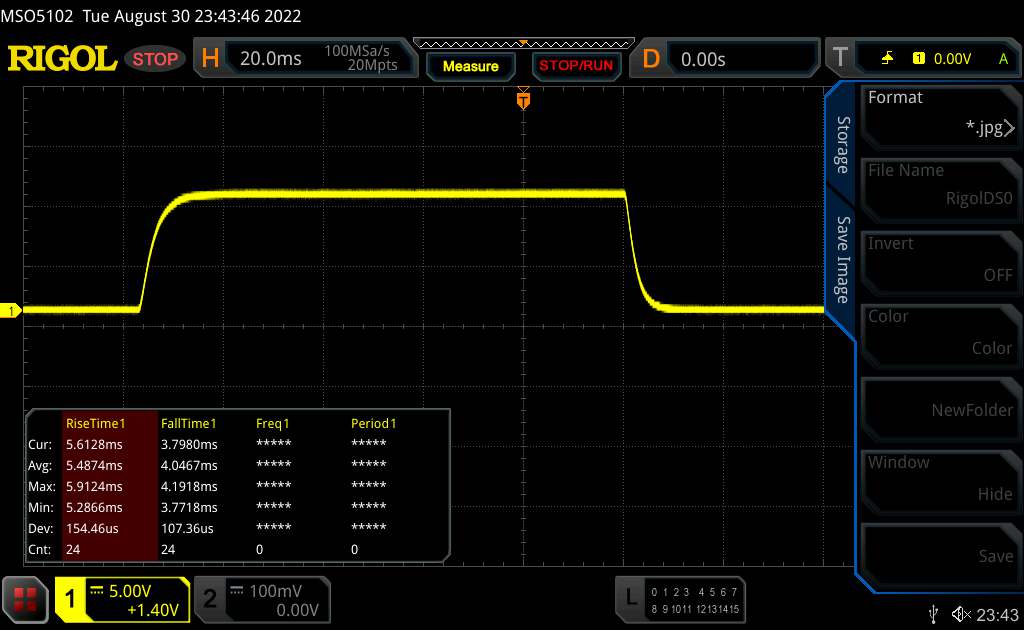 |
| ↘ 4 ms bajada | ||
| La pantalla mostró tiempos de respuesta rápidos en nuestros tests y debería ser adecuada para juegos. En comparación, todos los dispositivos de prueba van de ##min### (mínimo) a 240 (máximo) ms. » 26 % de todos los dispositivos son mejores. Esto quiere decir que el tiempo de respuesta medido es mejor que la media (19.8 ms) de todos los dispositivos testados. | ||
| ↔ Tiempo de respuesta 50% Gris a 80% Gris | ||
| 14.5 ms ... subida ↗ y bajada ↘ combinada | ↗ 6.8 ms subida | 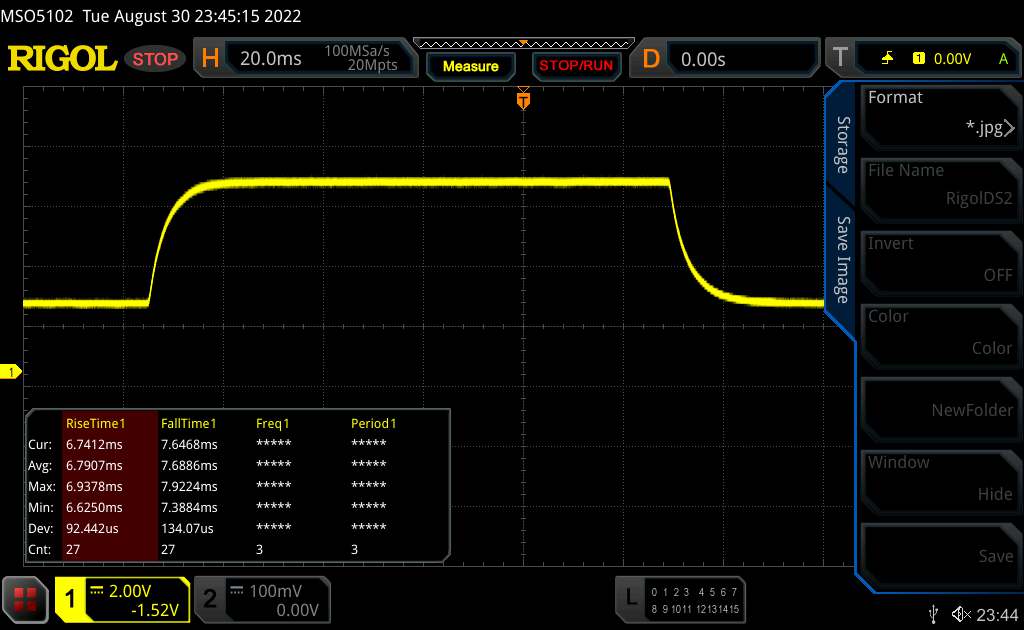 |
| ↘ 7.7 ms bajada | ||
| La pantalla mostró buenos tiempos de respuesta en nuestros tests pero podría ser demasiado lenta para los jugones competitivos. En comparación, todos los dispositivos de prueba van de ##min### (mínimo) a 636 (máximo) ms. » 29 % de todos los dispositivos son mejores. Esto quiere decir que el tiempo de respuesta medido es mejor que la media (31 ms) de todos los dispositivos testados. | ||
Parpadeo de Pantalla / PWM (Pulse-Width Modulation)
| Parpadeo de Pantalla / PWM no detectado |  | ||
Comparación: 52 % de todos los dispositivos testados no usaron PWM para atenuar el display. Si se usó, medimos una media de 7754 (mínimo: 5 - máxmo: 343500) Hz. | |||
Potencia
Con una CPU hexa-core y una GPU de 6 GB, el A5 K1 se encuentra cómodo entre la gama media y la alta. los 16 GB de RAM tampoco están mal para el precio anunciado.
Condiciones de la prueba
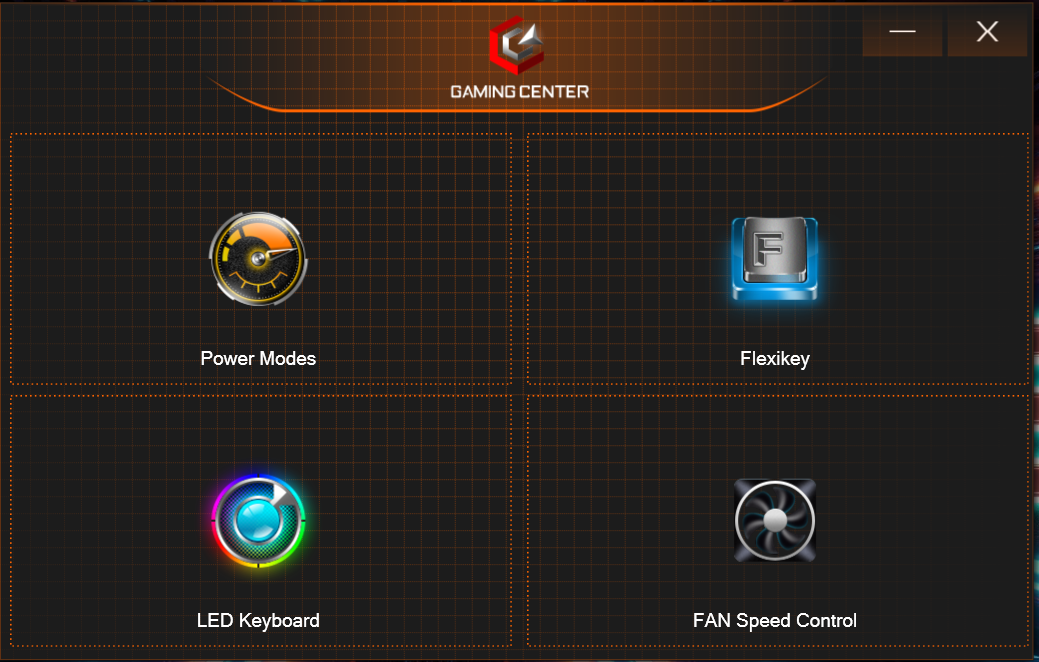
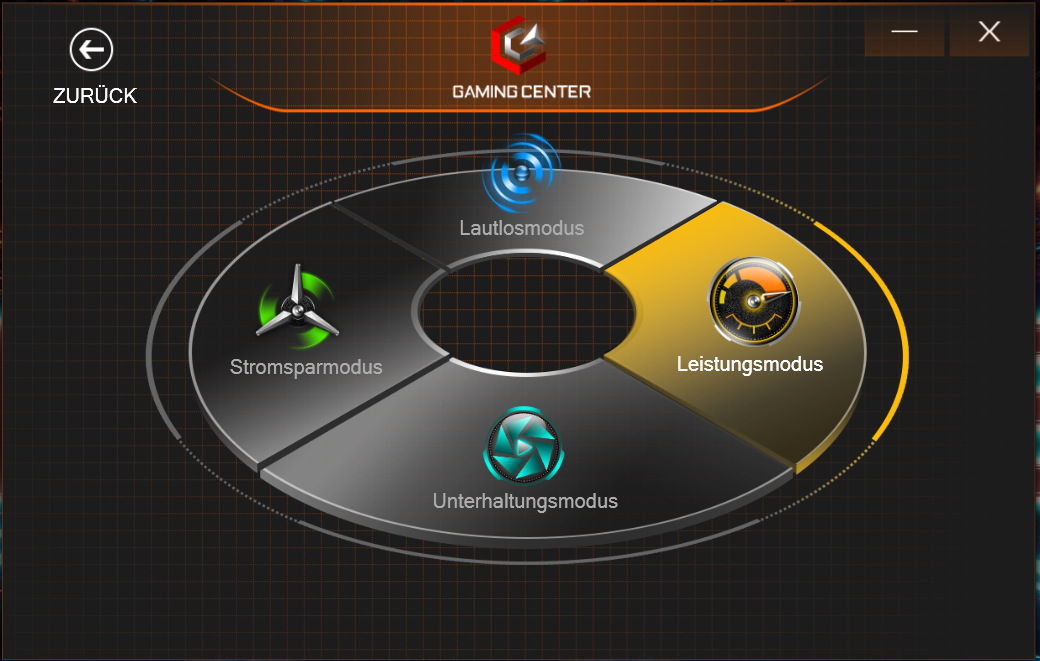
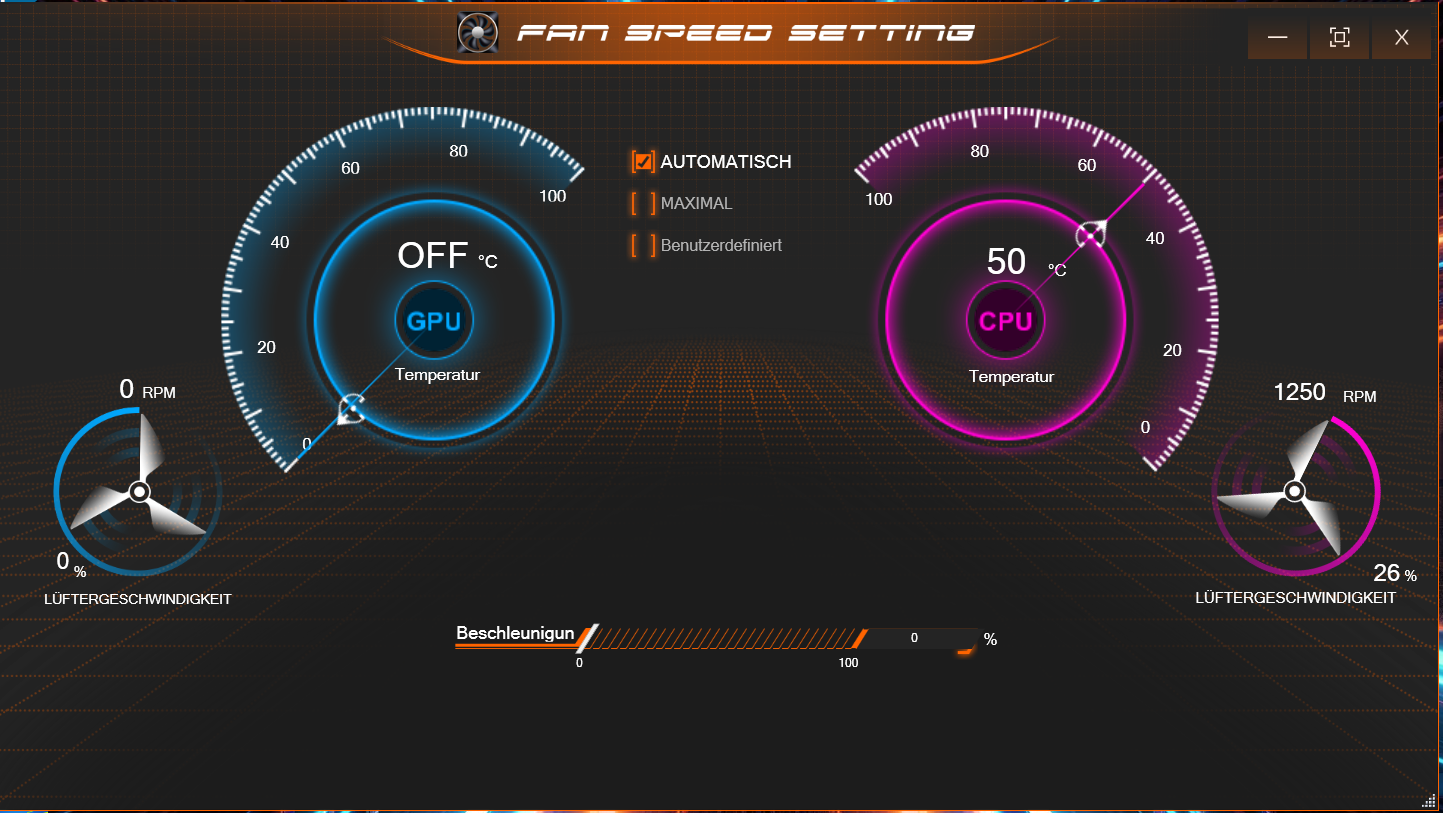
Entre otras cosas, el modo de energía puede cambiarse en el Gaming Center precargado, que es visualmente familiar de otros Clevo barebones. Aparte de la prueba de batería, que se realizó en modo de entretenimiento, nuestras mediciones se realizaron con el perfil de energía (incluyendo la configuración automática de la velocidad del ventilador). Para una mayor duración de la batería y un menor ruido de funcionamiento, recomendamos el modo de ahorro de energía y el modo silencioso, que no hace honor a su nombre.
Procesador
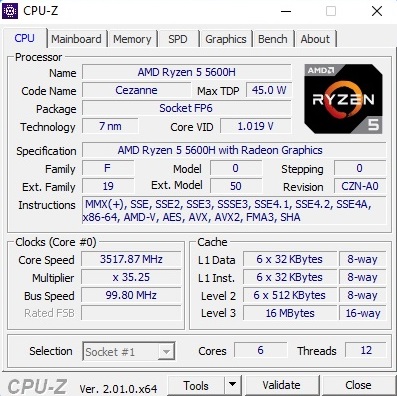
El Ryzen 5 5600H es un compañero ideal para la GeForce RTX 3060. El modelo de seis núcleos de la generación Cezanne de AMD ofrece 16 MB de caché L3 y puede procesar hasta 12 hilos en paralelo mediante SMT. El TDP del chip de 7 nm es de 45 vatios. Aunque el Ryzen 5 5600H, como es lógico, no puede competir con los hermanos más fuertes de AMD Ryzen 7 5800H y Ryzen 9 5900HX, el procesador ofrece un buen rendimiento. En la prueba de bucle con Cinebench R15, el resultado se mantuvo muy consistente y estuvo a la par con el Lenovo Legion 5, que también está equipado con un 5600H.
Cinebench R15 Multi Endurance test
Cinebench R23: Multi Core | Single Core
Cinebench R20: CPU (Multi Core) | CPU (Single Core)
Cinebench R15: CPU Multi 64Bit | CPU Single 64Bit
Blender: v2.79 BMW27 CPU
7-Zip 18.03: 7z b 4 | 7z b 4 -mmt1
Geekbench 5.5: Multi-Core | Single-Core
HWBOT x265 Benchmark v2.2: 4k Preset
LibreOffice : 20 Documents To PDF
R Benchmark 2.5: Overall mean
| CPU Performance rating | |
| Media de la clase Gaming | |
| Asus TUF Gaming F15 FX507ZM | |
| Gigabyte A5 X1 | |
| MSI Alpha 15 B5EEK-008 | |
| Lenovo Legion 5 15ACH6A-82NW0010GE | |
| Gigabyte A5 K1 | |
| Medio AMD Ryzen 5 5600H | |
| Cinebench R23 / Multi Core | |
| Media de la clase Gaming (10488 - 42661, n=107, últimos 2 años) | |
| Asus TUF Gaming F15 FX507ZM | |
| Gigabyte A5 X1 | |
| MSI Alpha 15 B5EEK-008 | |
| Lenovo Legion 5 15ACH6A-82NW0010GE | |
| Gigabyte A5 K1 | |
| Medio AMD Ryzen 5 5600H (7945 - 10416, n=13) | |
| Cinebench R23 / Single Core | |
| Media de la clase Gaming (1166 - 2415, n=107, últimos 2 años) | |
| Asus TUF Gaming F15 FX507ZM | |
| Gigabyte A5 X1 | |
| MSI Alpha 15 B5EEK-008 | |
| Gigabyte A5 K1 | |
| Lenovo Legion 5 15ACH6A-82NW0010GE | |
| Medio AMD Ryzen 5 5600H (1316 - 1381, n=13) | |
| Cinebench R20 / CPU (Multi Core) | |
| Media de la clase Gaming (4029 - 16433, n=106, últimos 2 años) | |
| Asus TUF Gaming F15 FX507ZM | |
| Gigabyte A5 X1 | |
| MSI Alpha 15 B5EEK-008 | |
| Lenovo Legion 5 15ACH6A-82NW0010GE | |
| Gigabyte A5 K1 | |
| Medio AMD Ryzen 5 5600H (3074 - 4059, n=16) | |
| Cinebench R20 / CPU (Single Core) | |
| Media de la clase Gaming (442 - 913, n=106, últimos 2 años) | |
| Asus TUF Gaming F15 FX507ZM | |
| Gigabyte A5 X1 | |
| MSI Alpha 15 B5EEK-008 | |
| Gigabyte A5 K1 | |
| Lenovo Legion 5 15ACH6A-82NW0010GE | |
| Medio AMD Ryzen 5 5600H (527 - 538, n=15) | |
| Cinebench R15 / CPU Multi 64Bit | |
| Media de la clase Gaming (1578 - 6330, n=105, últimos 2 años) | |
| Asus TUF Gaming F15 FX507ZM | |
| Gigabyte A5 X1 | |
| MSI Alpha 15 B5EEK-008 | |
| Lenovo Legion 5 15ACH6A-82NW0010GE | |
| Gigabyte A5 K1 | |
| Medio AMD Ryzen 5 5600H (1319 - 1723, n=16) | |
| Cinebench R15 / CPU Single 64Bit | |
| Media de la clase Gaming (188.8 - 350, n=106, últimos 2 años) | |
| Asus TUF Gaming F15 FX507ZM | |
| Gigabyte A5 X1 | |
| MSI Alpha 15 B5EEK-008 | |
| Gigabyte A5 K1 | |
| Lenovo Legion 5 15ACH6A-82NW0010GE | |
| Medio AMD Ryzen 5 5600H (218 - 225, n=14) | |
| Blender / v2.79 BMW27 CPU | |
| Medio AMD Ryzen 5 5600H (300 - 384, n=14) | |
| Lenovo Legion 5 15ACH6A-82NW0010GE | |
| Gigabyte A5 K1 | |
| MSI Alpha 15 B5EEK-008 | |
| Gigabyte A5 X1 | |
| Asus TUF Gaming F15 FX507ZM | |
| Media de la clase Gaming (79 - 330, n=104, últimos 2 años) | |
| 7-Zip 18.03 / 7z b 4 | |
| Media de la clase Gaming (33491 - 148086, n=105, últimos 2 años) | |
| Asus TUF Gaming F15 FX507ZM | |
| Gigabyte A5 X1 | |
| MSI Alpha 15 B5EEK-008 | |
| Gigabyte A5 K1 | |
| Lenovo Legion 5 15ACH6A-82NW0010GE | |
| Medio AMD Ryzen 5 5600H (36315 - 46562, n=14) | |
| 7-Zip 18.03 / 7z b 4 -mmt1 | |
| Media de la clase Gaming (4199 - 7436, n=105, últimos 2 años) | |
| Gigabyte A5 X1 | |
| MSI Alpha 15 B5EEK-008 | |
| Gigabyte A5 K1 | |
| Asus TUF Gaming F15 FX507ZM | |
| Medio AMD Ryzen 5 5600H (5213 - 5446, n=14) | |
| Lenovo Legion 5 15ACH6A-82NW0010GE | |
| Geekbench 5.5 / Multi-Core | |
| Media de la clase Gaming (6460 - 28263, n=105, últimos 2 años) | |
| Asus TUF Gaming F15 FX507ZM | |
| Gigabyte A5 X1 | |
| MSI Alpha 15 B5EEK-008 | |
| Gigabyte A5 K1 | |
| Lenovo Legion 5 15ACH6A-82NW0010GE | |
| Medio AMD Ryzen 5 5600H (4990 - 7253, n=14) | |
| Geekbench 5.5 / Single-Core | |
| Media de la clase Gaming (986 - 2474, n=105, últimos 2 años) | |
| Asus TUF Gaming F15 FX507ZM | |
| Gigabyte A5 X1 | |
| MSI Alpha 15 B5EEK-008 | |
| Gigabyte A5 K1 | |
| Lenovo Legion 5 15ACH6A-82NW0010GE | |
| Medio AMD Ryzen 5 5600H (1365 - 1445, n=14) | |
| HWBOT x265 Benchmark v2.2 / 4k Preset | |
| Media de la clase Gaming (11.5 - 44.4, n=105, últimos 2 años) | |
| Asus TUF Gaming F15 FX507ZM | |
| Gigabyte A5 X1 | |
| MSI Alpha 15 B5EEK-008 | |
| Gigabyte A5 K1 | |
| Lenovo Legion 5 15ACH6A-82NW0010GE | |
| Medio AMD Ryzen 5 5600H (9.92 - 13.3, n=14) | |
| LibreOffice / 20 Documents To PDF | |
| Gigabyte A5 X1 | |
| Gigabyte A5 K1 | |
| Medio AMD Ryzen 5 5600H (52.2 - 81.5, n=14) | |
| MSI Alpha 15 B5EEK-008 | |
| Lenovo Legion 5 15ACH6A-82NW0010GE | |
| Asus TUF Gaming F15 FX507ZM | |
| Media de la clase Gaming (33.2 - 88.8, n=105, últimos 2 años) | |
| R Benchmark 2.5 / Overall mean | |
| Medio AMD Ryzen 5 5600H (0.526 - 0.596, n=14) | |
| Lenovo Legion 5 15ACH6A-82NW0010GE | |
| Gigabyte A5 K1 | |
| MSI Alpha 15 B5EEK-008 | |
| Gigabyte A5 X1 | |
| Asus TUF Gaming F15 FX507ZM | |
| Media de la clase Gaming (0.3439 - 0.759, n=106, últimos 2 años) | |
* ... más pequeño es mejor
AIDA64: FP32 Ray-Trace | FPU Julia | CPU SHA3 | CPU Queen | FPU SinJulia | FPU Mandel | CPU AES | CPU ZLib | FP64 Ray-Trace | CPU PhotoWorxx
| Performance rating | |
| Media de la clase Gaming | |
| Gigabyte A5 X1 | |
| MSI Alpha 15 B5EEK-008 | |
| Asus TUF Gaming F15 FX507ZM | |
| Lenovo Legion 5 15ACH6A-82NW0010GE | |
| Gigabyte A5 K1 | |
| Medio AMD Ryzen 5 5600H | |
| AIDA64 / FP32 Ray-Trace | |
| Media de la clase Gaming (10227 - 85542, n=105, últimos 2 años) | |
| Gigabyte A5 X1 | |
| MSI Alpha 15 B5EEK-008 | |
| Lenovo Legion 5 15ACH6A-82NW0010GE | |
| Gigabyte A5 K1 | |
| Medio AMD Ryzen 5 5600H (9181 - 12636, n=14) | |
| Asus TUF Gaming F15 FX507ZM | |
| AIDA64 / FPU Julia | |
| Media de la clase Gaming (51376 - 238426, n=105, últimos 2 años) | |
| Gigabyte A5 X1 | |
| MSI Alpha 15 B5EEK-008 | |
| Lenovo Legion 5 15ACH6A-82NW0010GE | |
| Gigabyte A5 K1 | |
| Medio AMD Ryzen 5 5600H (51994 - 78250, n=14) | |
| Asus TUF Gaming F15 FX507ZM | |
| AIDA64 / CPU SHA3 | |
| Media de la clase Gaming (2180 - 10115, n=105, últimos 2 años) | |
| Gigabyte A5 X1 | |
| Asus TUF Gaming F15 FX507ZM | |
| MSI Alpha 15 B5EEK-008 | |
| Lenovo Legion 5 15ACH6A-82NW0010GE | |
| Gigabyte A5 K1 | |
| Medio AMD Ryzen 5 5600H (1587 - 2675, n=14) | |
| AIDA64 / CPU Queen | |
| Media de la clase Gaming (49785 - 173351, n=90, últimos 2 años) | |
| Gigabyte A5 X1 | |
| Asus TUF Gaming F15 FX507ZM | |
| MSI Alpha 15 B5EEK-008 | |
| Gigabyte A5 K1 | |
| Lenovo Legion 5 15ACH6A-82NW0010GE | |
| Medio AMD Ryzen 5 5600H (66699 - 77213, n=14) | |
| AIDA64 / FPU SinJulia | |
| Media de la clase Gaming (4424 - 33636, n=105, últimos 2 años) | |
| Gigabyte A5 X1 | |
| MSI Alpha 15 B5EEK-008 | |
| Asus TUF Gaming F15 FX507ZM | |
| Gigabyte A5 K1 | |
| Lenovo Legion 5 15ACH6A-82NW0010GE | |
| Medio AMD Ryzen 5 5600H (8340 - 9159, n=14) | |
| AIDA64 / FPU Mandel | |
| Media de la clase Gaming (25115 - 128721, n=105, últimos 2 años) | |
| Gigabyte A5 X1 | |
| MSI Alpha 15 B5EEK-008 | |
| Lenovo Legion 5 15ACH6A-82NW0010GE | |
| Gigabyte A5 K1 | |
| Medio AMD Ryzen 5 5600H (28268 - 43274, n=14) | |
| Asus TUF Gaming F15 FX507ZM | |
| AIDA64 / CPU AES | |
| Gigabyte A5 X1 | |
| MSI Alpha 15 B5EEK-008 | |
| Media de la clase Gaming (39258 - 247074, n=105, últimos 2 años) | |
| Lenovo Legion 5 15ACH6A-82NW0010GE | |
| Medio AMD Ryzen 5 5600H (39852 - 98939, n=14) | |
| Asus TUF Gaming F15 FX507ZM | |
| Gigabyte A5 K1 | |
| AIDA64 / CPU ZLib | |
| Media de la clase Gaming (574 - 2531, n=105, últimos 2 años) | |
| Asus TUF Gaming F15 FX507ZM | |
| Gigabyte A5 X1 | |
| MSI Alpha 15 B5EEK-008 | |
| Lenovo Legion 5 15ACH6A-82NW0010GE | |
| Gigabyte A5 K1 | |
| Medio AMD Ryzen 5 5600H (507 - 649, n=14) | |
| AIDA64 / FP64 Ray-Trace | |
| Media de la clase Gaming (5509 - 45446, n=105, últimos 2 años) | |
| Gigabyte A5 X1 | |
| MSI Alpha 15 B5EEK-008 | |
| Lenovo Legion 5 15ACH6A-82NW0010GE | |
| Gigabyte A5 K1 | |
| Medio AMD Ryzen 5 5600H (4811 - 6652, n=14) | |
| Asus TUF Gaming F15 FX507ZM | |
| AIDA64 / CPU PhotoWorxx | |
| Media de la clase Gaming (12271 - 89891, n=105, últimos 2 años) | |
| Asus TUF Gaming F15 FX507ZM | |
| MSI Alpha 15 B5EEK-008 | |
| Gigabyte A5 K1 | |
| Gigabyte A5 X1 | |
| Medio AMD Ryzen 5 5600H (7419 - 24746, n=14) | |
| Lenovo Legion 5 15ACH6A-82NW0010GE | |
Rendimiento del sistema
Aunque obtuvo la peor puntuación en las pruebas de PCMark 10, el rendimiento del sistema del A5 K1 es mayormente convincente. 6.341 puntos son definitivamente respetables a la vista del precio del portátil.
CrossMark: Overall | Productivity | Creativity | Responsiveness
| PCMark 10 / Score | |
| Media de la clase Gaming (5828 - 12414, n=93, últimos 2 años) | |
| Asus TUF Gaming F15 FX507ZM | |
| Lenovo Legion 5 15ACH6A-82NW0010GE | |
| MSI Alpha 15 B5EEK-008 | |
| Gigabyte A5 X1 | |
| Medio AMD Ryzen 5 5600H, NVIDIA GeForce RTX 3060 Laptop GPU (6341 - 6615, n=2) | |
| Gigabyte A5 K1 | |
| PCMark 10 / Essentials | |
| Media de la clase Gaming (8810 - 11935, n=97, últimos 2 años) | |
| Lenovo Legion 5 15ACH6A-82NW0010GE | |
| Asus TUF Gaming F15 FX507ZM | |
| Gigabyte A5 K1 | |
| Gigabyte A5 X1 | |
| MSI Alpha 15 B5EEK-008 | |
| Medio AMD Ryzen 5 5600H, NVIDIA GeForce RTX 3060 Laptop GPU (9639 - 10127, n=2) | |
| PCMark 10 / Productivity | |
| Media de la clase Gaming (6845 - 25323, n=95, últimos 2 años) | |
| Gigabyte A5 X1 | |
| Lenovo Legion 5 15ACH6A-82NW0010GE | |
| Asus TUF Gaming F15 FX507ZM | |
| Medio AMD Ryzen 5 5600H, NVIDIA GeForce RTX 3060 Laptop GPU (8829 - 9027, n=2) | |
| MSI Alpha 15 B5EEK-008 | |
| Gigabyte A5 K1 | |
| PCMark 10 / Digital Content Creation | |
| Media de la clase Gaming (7602 - 19954, n=95, últimos 2 años) | |
| Asus TUF Gaming F15 FX507ZM | |
| MSI Alpha 15 B5EEK-008 | |
| Lenovo Legion 5 15ACH6A-82NW0010GE | |
| Gigabyte A5 X1 | |
| Medio AMD Ryzen 5 5600H, NVIDIA GeForce RTX 3060 Laptop GPU (7740 - 9026, n=2) | |
| Gigabyte A5 K1 | |
| CrossMark / Overall | |
| Media de la clase Gaming (1366 - 2409, n=94, últimos 2 años) | |
| Medio AMD Ryzen 5 5600H, NVIDIA GeForce RTX 3060 Laptop GPU (n=1) | |
| MSI Alpha 15 B5EEK-008 | |
| CrossMark / Productivity | |
| Media de la clase Gaming (1386 - 2254, n=94, últimos 2 años) | |
| Medio AMD Ryzen 5 5600H, NVIDIA GeForce RTX 3060 Laptop GPU (n=1) | |
| MSI Alpha 15 B5EEK-008 | |
| CrossMark / Creativity | |
| Media de la clase Gaming (1343 - 2786, n=94, últimos 2 años) | |
| MSI Alpha 15 B5EEK-008 | |
| Medio AMD Ryzen 5 5600H, NVIDIA GeForce RTX 3060 Laptop GPU (n=1) | |
| CrossMark / Responsiveness | |
| Media de la clase Gaming (1226 - 2334, n=94, últimos 2 años) | |
| Medio AMD Ryzen 5 5600H, NVIDIA GeForce RTX 3060 Laptop GPU (n=1) | |
| MSI Alpha 15 B5EEK-008 | |
| PCMark 10 Score | 6341 puntos | |
ayuda | ||
| AIDA64 / Memory Copy | |
| Media de la clase Gaming (21750 - 129946, n=105, últimos 2 años) | |
| Asus TUF Gaming F15 FX507ZM | |
| Gigabyte A5 K1 | |
| MSI Alpha 15 B5EEK-008 | |
| Gigabyte A5 X1 | |
| Medio AMD Ryzen 5 5600H (20549 - 42141, n=14) | |
| Lenovo Legion 5 15ACH6A-82NW0010GE | |
| AIDA64 / Memory Read | |
| Media de la clase Gaming (22956 - 118858, n=105, últimos 2 años) | |
| Asus TUF Gaming F15 FX507ZM | |
| Gigabyte A5 K1 | |
| MSI Alpha 15 B5EEK-008 | |
| Gigabyte A5 X1 | |
| Medio AMD Ryzen 5 5600H (22917 - 47595, n=14) | |
| Lenovo Legion 5 15ACH6A-82NW0010GE | |
| AIDA64 / Memory Write | |
| Media de la clase Gaming (22297 - 135096, n=105, últimos 2 años) | |
| Asus TUF Gaming F15 FX507ZM | |
| MSI Alpha 15 B5EEK-008 | |
| Gigabyte A5 K1 | |
| Gigabyte A5 X1 | |
| Medio AMD Ryzen 5 5600H (20226 - 44872, n=14) | |
| Lenovo Legion 5 15ACH6A-82NW0010GE | |
| AIDA64 / Memory Latency | |
| Media de la clase Gaming (75.3 - 259, n=105, últimos 2 años) | |
| Lenovo Legion 5 15ACH6A-82NW0010GE | |
| MSI Alpha 15 B5EEK-008 | |
| Medio AMD Ryzen 5 5600H (75 - 89.1, n=14) | |
| Gigabyte A5 X1 | |
| Gigabyte A5 K1 | |
| Asus TUF Gaming F15 FX507ZM | |
* ... más pequeño es mejor
Latencias del CPD
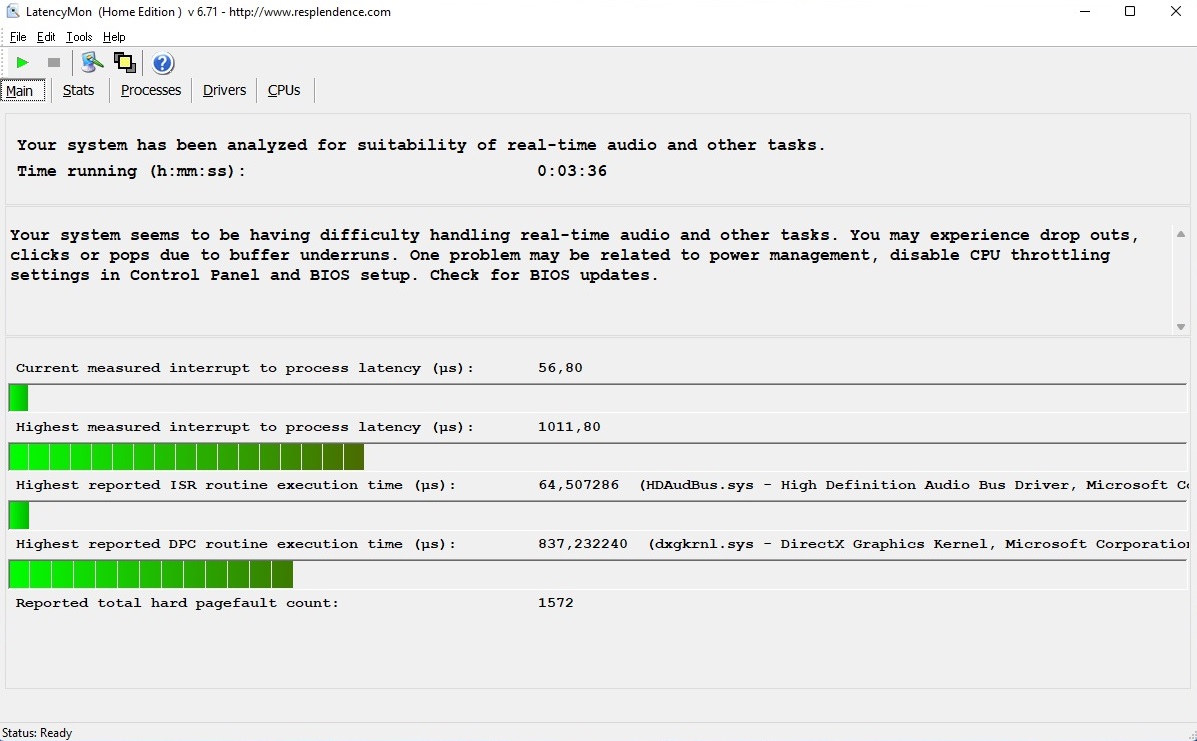
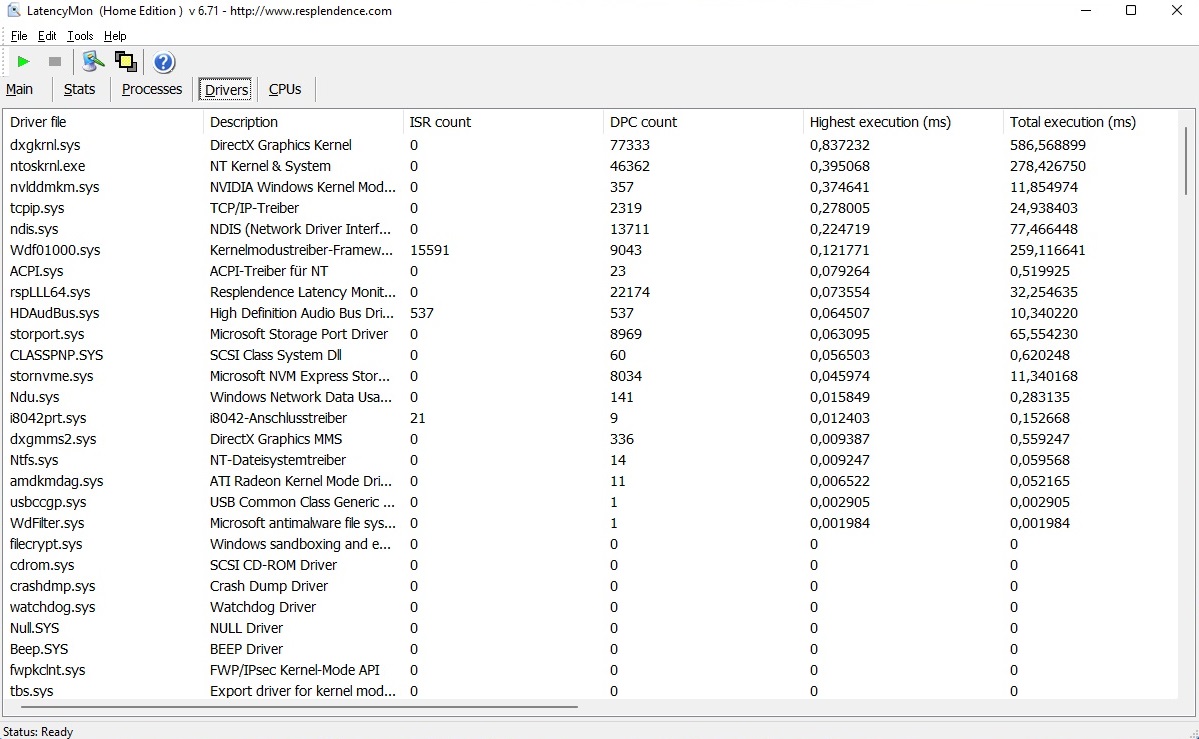
El portátil lo hace peor en términos de latencia. Según la herramienta LatencyMon, los que quieran editar audio o vídeo en tiempo real deberían buscar una alternativa (o hacerlo manualmente), y muchos portátiles revelan puntos débiles aquí.
| DPC Latencies / LatencyMon - interrupt to process latency (max), Web, Youtube, Prime95 | |
| Gigabyte A5 K1 | |
| MSI Alpha 15 B5EEK-008 | |
| Lenovo Legion 5 15ACH6A-82NW0010GE | |
| Asus TUF Gaming F15 FX507ZM | |
| Gigabyte A5 X1 | |
* ... más pequeño es mejor
Almacenamiento masivo
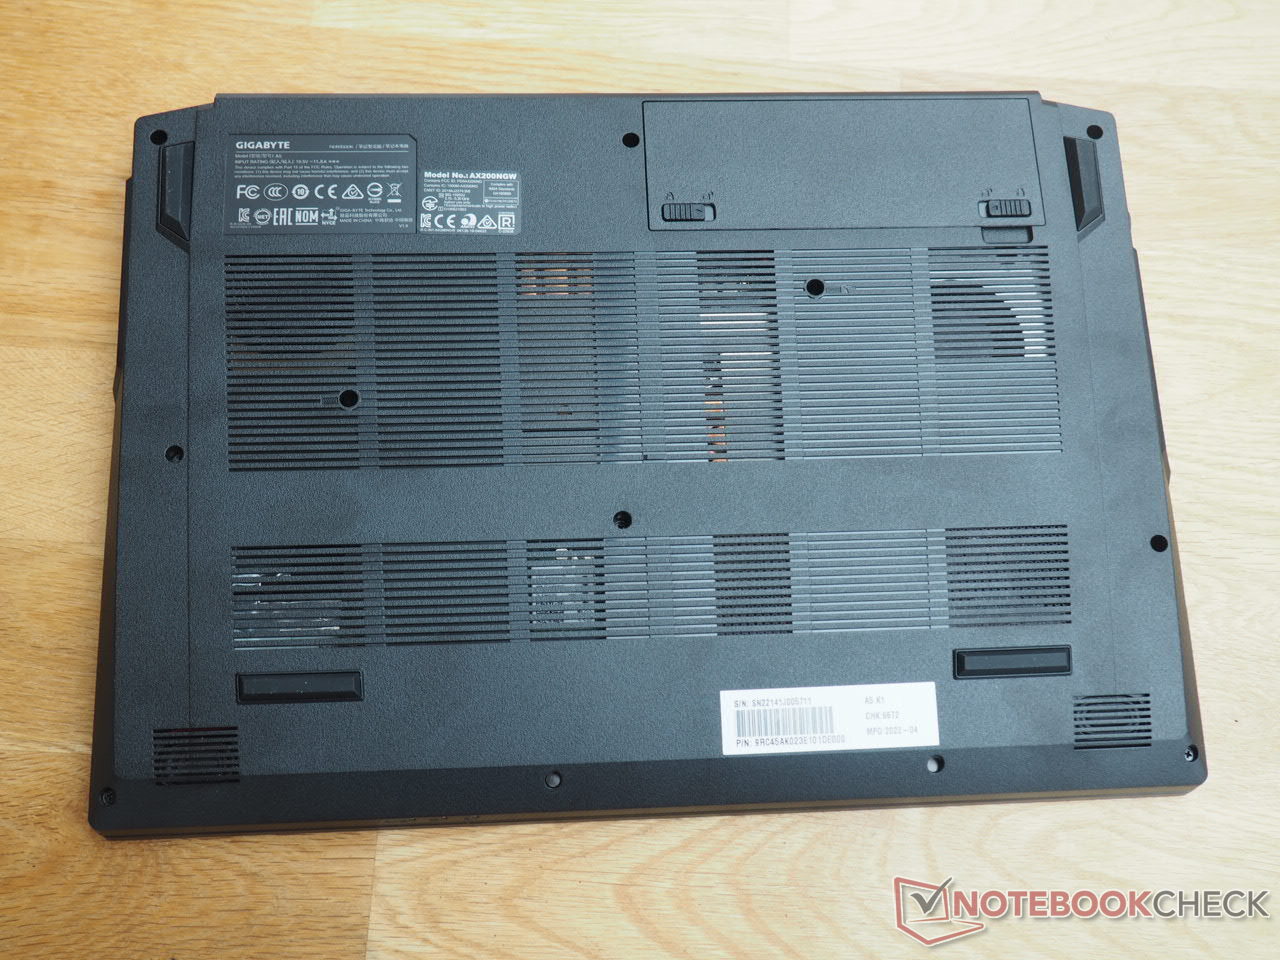
El SSD de 512 GB instalado no es ni particularmente rápido ni particularmente lento para una unidad NVMe, pero rinde en el medio campo de los dispositivos de la comparación. Tenemos que criticar el rendimiento a largo plazo en particular. En la prueba a largo plazo con DiskSpd, la velocidad cayó masivamente tras varias ejecuciones y luego se estableció en un nivel medio. Como nota positiva, la carcasa puede albergar hasta dos unidades M.2 (PCIe 2280) y una unidad de 2,5 pulgadas.

| Drive Performance rating - Percent | |
| Media de la clase Gaming | |
| Asus TUF Gaming F15 FX507ZM | |
| Medio ESR512GTLG-E6GBTNB4 | |
| Gigabyte A5 K1 | |
| MSI Alpha 15 B5EEK-008 | |
| Gigabyte A5 X1 | |
| Lenovo Legion 5 15ACH6A-82NW0010GE | |
* ... más pequeño es mejor
Read continuous power: DiskSpd Read Loop, Queue Depth 8
Tarjeta gráfica
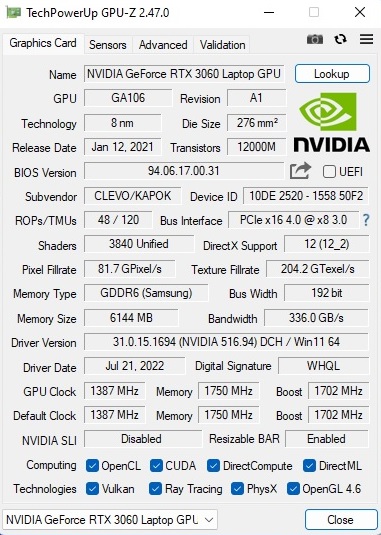
La GeForce RTX 3060 es una GPU de trazado de rayos basada en la arquitectura Ampere de Nvidia. El modelo DirectX 12 tiene 3.840 unidades de sombreado, aunque el rendimiento depende mucho de la configuración TGP. Gigabyte elige un valor muy alto para la RTX 3060 con un máximo de 130 vatios, lo que también puede verse en los resultados del benchmark. Estos son casi un 10% mejores que la media de la 3060 determinada anteriormente. La RTX 3070, por otro lado, es un 20% más rápida en la parte de la GPU. La configuración de la memoria ya no está a la altura. la VRAM de 6 GB ya alcanza sus límites en juegos exigentes - al menos en resoluciones y ajustes más altos. Los jugadores apasionados deberían usar al menos una GPU de 8 GB.
| 3DMark Performance rating - Percent | |
| Media de la clase Gaming | |
| Gigabyte A5 X1 -1! | |
| Lenovo Legion 5 15ACH6A-82NW0010GE -1! | |
| Asus TUF Gaming F15 FX507ZM | |
| Gigabyte A5 K1 | |
| Medio NVIDIA GeForce RTX 3060 Laptop GPU | |
| MSI Alpha 15 B5EEK-008 | |
| 3DMark 11 Performance | 22909 puntos | |
| 3DMark Cloud Gate Standard Score | 44621 puntos | |
| 3DMark Fire Strike Score | 19308 puntos | |
| 3DMark Time Spy Score | 8551 puntos | |
ayuda | ||
Rendimiento de los juegos
En la resolución nativa de 1.920 x 1.080, el A5 K1 puede ejecutar casi todos los juegos actuales de forma muy fluida con detalles altos hasta el máximo. Más de 60 FPS no es una excepción, sino la regla, lo que beneficia a la pantalla de 144 Hz.
| The Witcher 3 | |
| 1920x1080 High Graphics & Postprocessing (Nvidia HairWorks Off) | |
| Media de la clase Gaming (341 - 404, n=2, últimos 2 años) | |
| Asus TUF Gaming F15 FX507ZM | |
| Gigabyte A5 X1 | |
| Gigabyte A5 K1 | |
| Medio NVIDIA GeForce RTX 3060 Laptop GPU (81 - 186.8, n=41) | |
| Lenovo Legion 5 15ACH6A-82NW0010GE | |
| MSI Alpha 15 B5EEK-008 | |
| 1920x1080 Ultra Graphics & Postprocessing (HBAO+) | |
| Media de la clase Gaming (104.7 - 240, n=7, últimos 2 años) | |
| Gigabyte A5 X1 | |
| Asus TUF Gaming F15 FX507ZM | |
| Lenovo Legion 5 15ACH6A-82NW0010GE | |
| Gigabyte A5 K1 | |
| Medio NVIDIA GeForce RTX 3060 Laptop GPU (58.2 - 91.5, n=48) | |
| MSI Alpha 15 B5EEK-008 | |
De forma análoga al bucle de la CPU, también hubo algunos problemas con la tarjeta gráfica en la prueba de larga duración (60 minutos,El sitio web Witcher 3) no mostró ninguna anomalía. La GeForce RTX 3060 funcionó con una tasa de frames estable.
Witcher 3 FPS-Diagram
| bajo | medio | alto | ultra | |
|---|---|---|---|---|
| GTA V (2015) | 154.2 | 91.4 | ||
| The Witcher 3 (2015) | 153 | 78.8 | ||
| Dota 2 Reborn (2015) | 143.1 | 129.6 | 123.1 | 115.4 |
| Final Fantasy XV Benchmark (2018) | 84.8 | |||
| X-Plane 11.11 (2018) | 99.1 | 84.1 | 69.6 | |
| Strange Brigade (2018) | 172.9 | 149.1 | ||
| God of War (2022) | 74 | 52.8 | ||
| Rainbow Six Extraction (2022) | 155 | 125 | ||
| Dying Light 2 (2022) | 64.4 | |||
| Elden Ring (2022) | 60 | 60 | ||
| Elex 2 (2022) | 73 | 68.9 | ||
| Ghostwire Tokyo (2022) | 126 | 124 | ||
| Vampire Bloodhunt (2022) | 157 | 152 | ||
| F1 22 (2022) | 135 | 53 | ||
| The Quarry (2022) | 82.7 | 66.4 |
Emisiones
Emisiones acústicas
Como era de esperar, el elevado TGP del RTX 3060 se produce a costa del desarrollo del ruido. Cuando se usa el modo de rendimiento, el 15 pulgadas alcanza un nivel muy alto de 56 a 58 dB(A) bajo carga. Se trata de un nivel de ruido molesto que obliga a usar auriculares, aunque algunos rivales alcanzan un volumen similar, aunque éstos ofrecen chasis más finos. Los Clevo barebones suelen tener que aceptar muchas críticas en modo inactivo y durante tareas sencillas como ofimática, vídeo y web. Sin embargo, el A5 K1 sorprende positivamente aquí porque los ventiladores están parcialmente inactivos y la frecuencia e intensidad de las fases de arranque son limitadas para los estándares de Clevo. No obstante, el ruido potencial es uno de los puntos débiles del dispositivo.
Ruido
| Ocioso |
| 26 / 29 / 32 dB(A) |
| Carga |
| 57 / 58 dB(A) |
 | ||
30 dB silencioso 40 dB(A) audible 50 dB(A) ruidosamente alto |
||
min: | ||
| Gigabyte A5 K1 R5 5600H, GeForce RTX 3060 Laptop GPU | Asus TUF Gaming F15 FX507ZM i7-12700H, GeForce RTX 3060 Laptop GPU | Lenovo Legion 5 15ACH6A-82NW0010GE R5 5600H, Radeon RX 6600M | MSI Alpha 15 B5EEK-008 R7 5800H, Radeon RX 6600M | Gigabyte A5 X1 R9 5900HX, GeForce RTX 3070 Laptop GPU | |
|---|---|---|---|---|---|
| Noise | 14% | 6% | 1% | 0% | |
| apagado / medio ambiente * (dB) | 26 | 23.2 11% | 25 4% | 25.49 2% | 25 4% |
| Idle Minimum * (dB) | 26 | 23.6 9% | 25 4% | 29.57 -14% | 27 -4% |
| Idle Average * (dB) | 29 | 23.6 19% | 25 14% | 29.57 -2% | 29 -0% |
| Idle Maximum * (dB) | 32 | 25.4 21% | 34.5 -8% | 29.57 8% | 32 -0% |
| Load Average * (dB) | 57 | 38 33% | 51.1 10% | 48.61 15% | 57 -0% |
| Witcher 3 ultra * (dB) | 56 | 54.1 3% | 59 -5% | 56 -0% | |
| Load Maximum * (dB) | 58 | 57.2 1% | 51.3 12% | 57.66 1% | 58 -0% |
* ... más pequeño es mejor
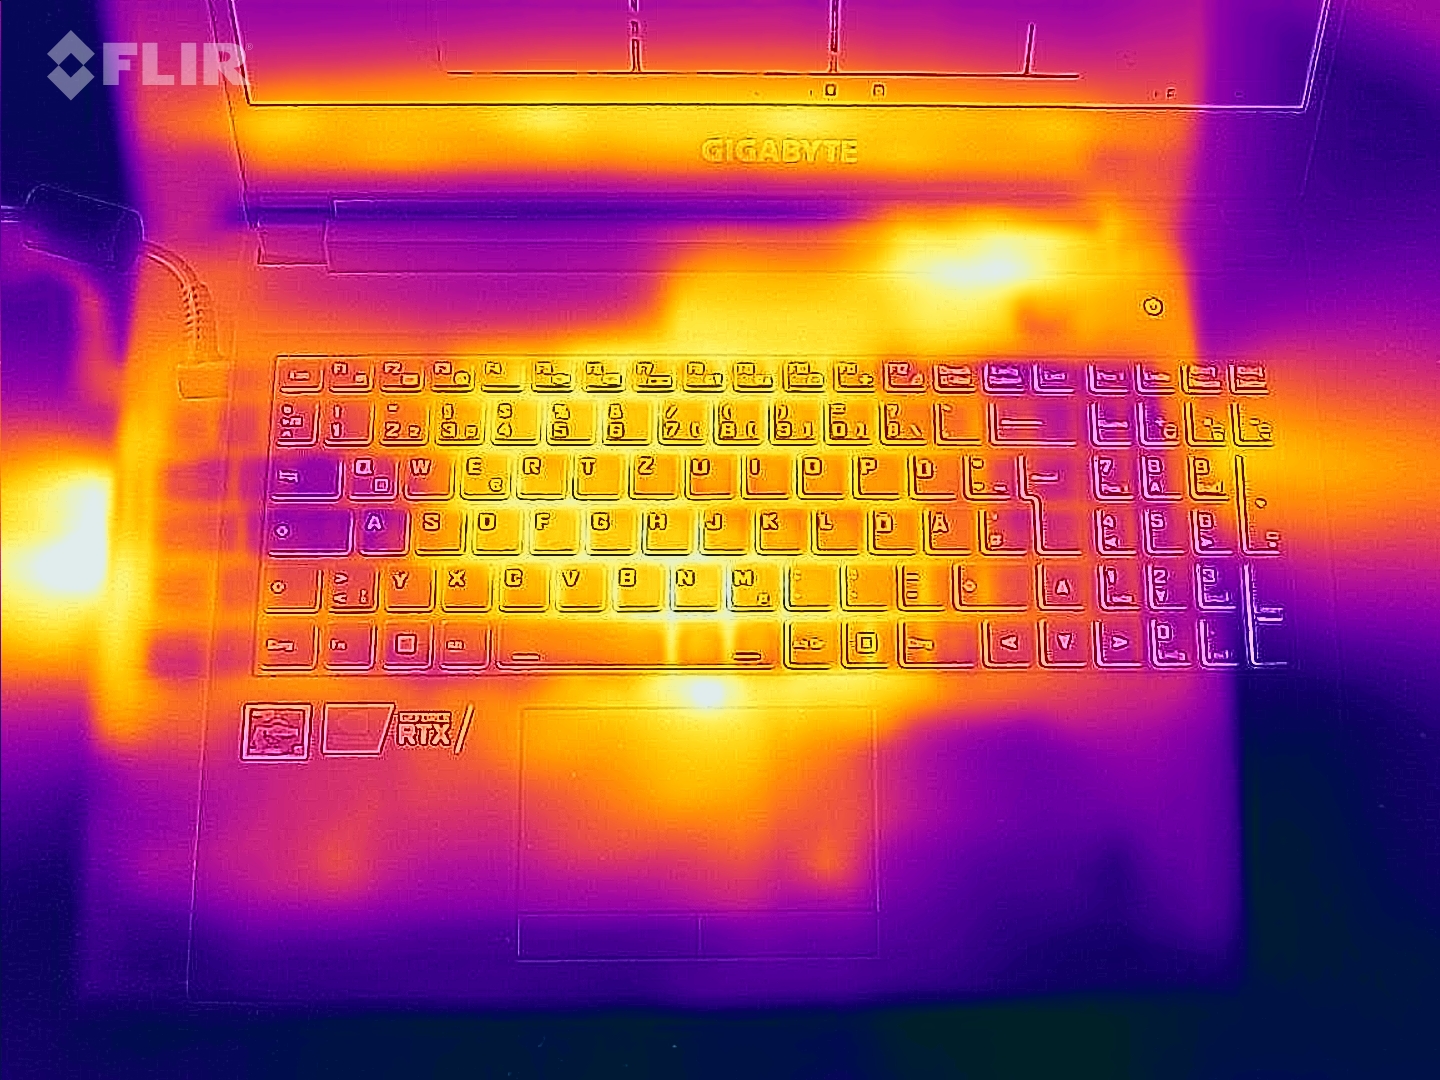
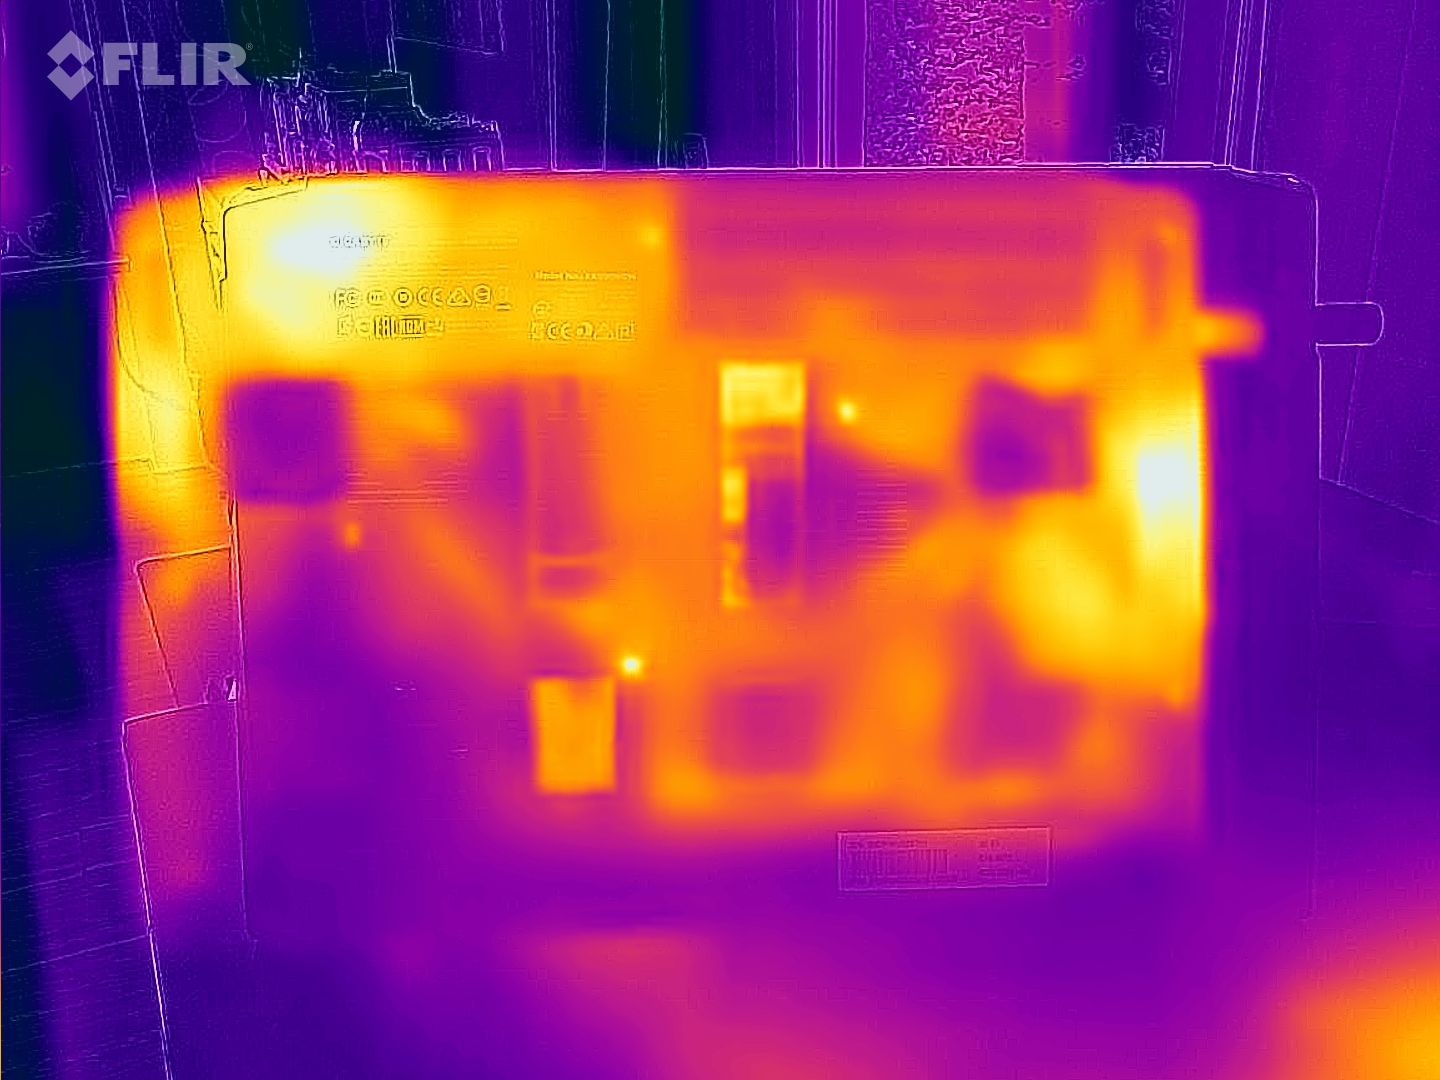
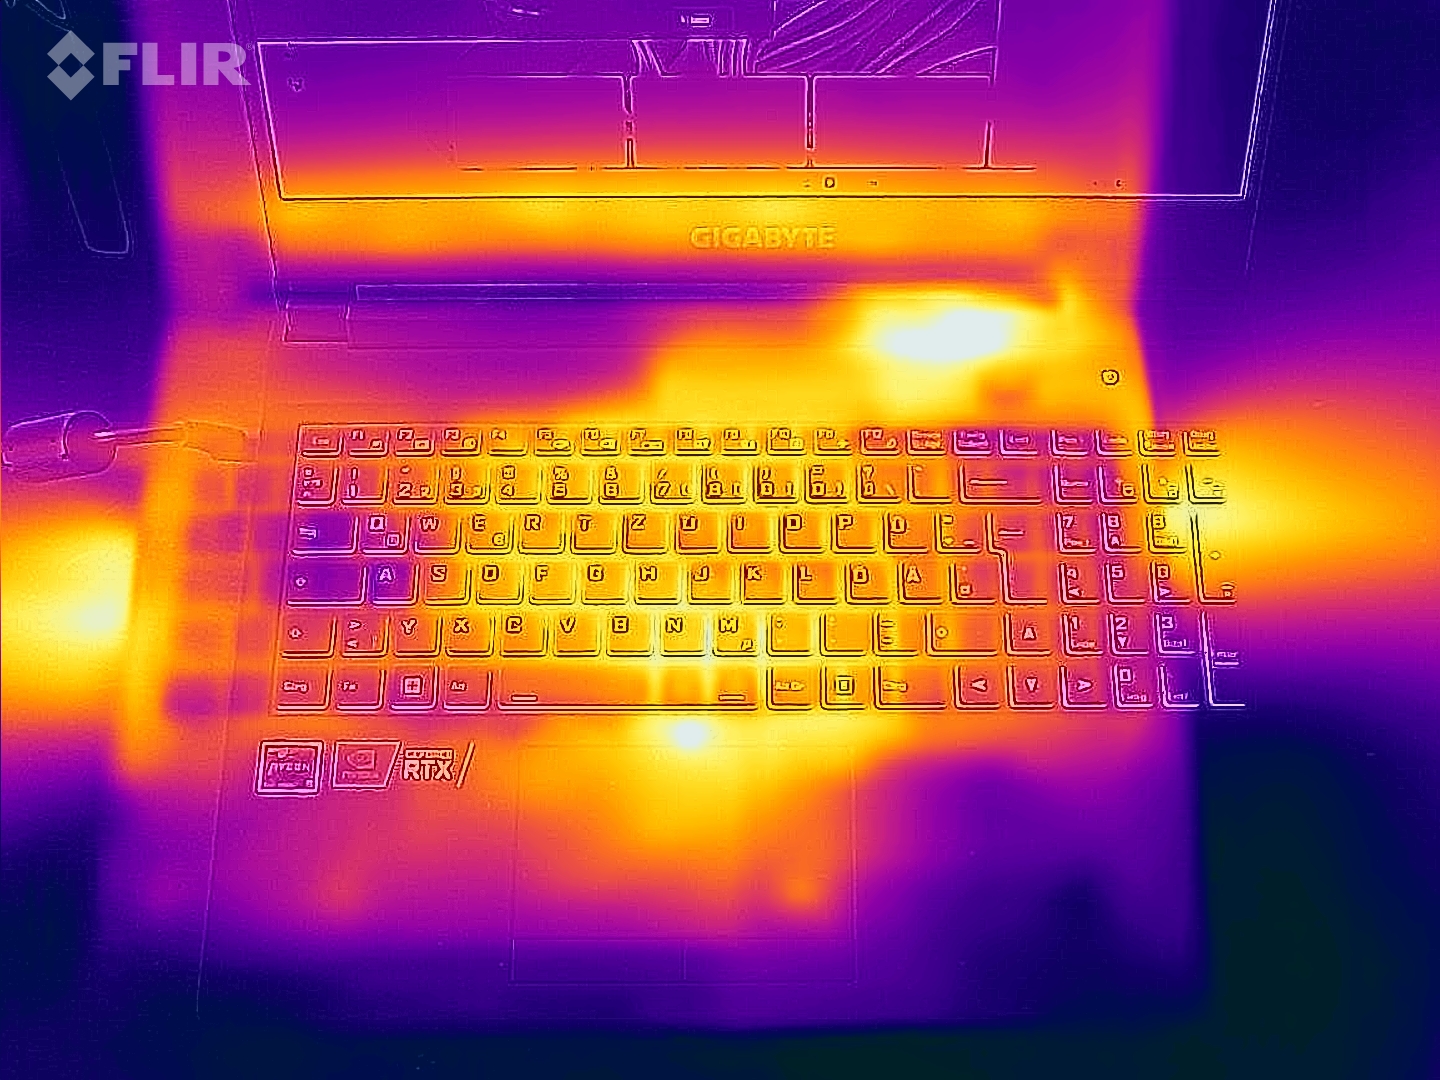
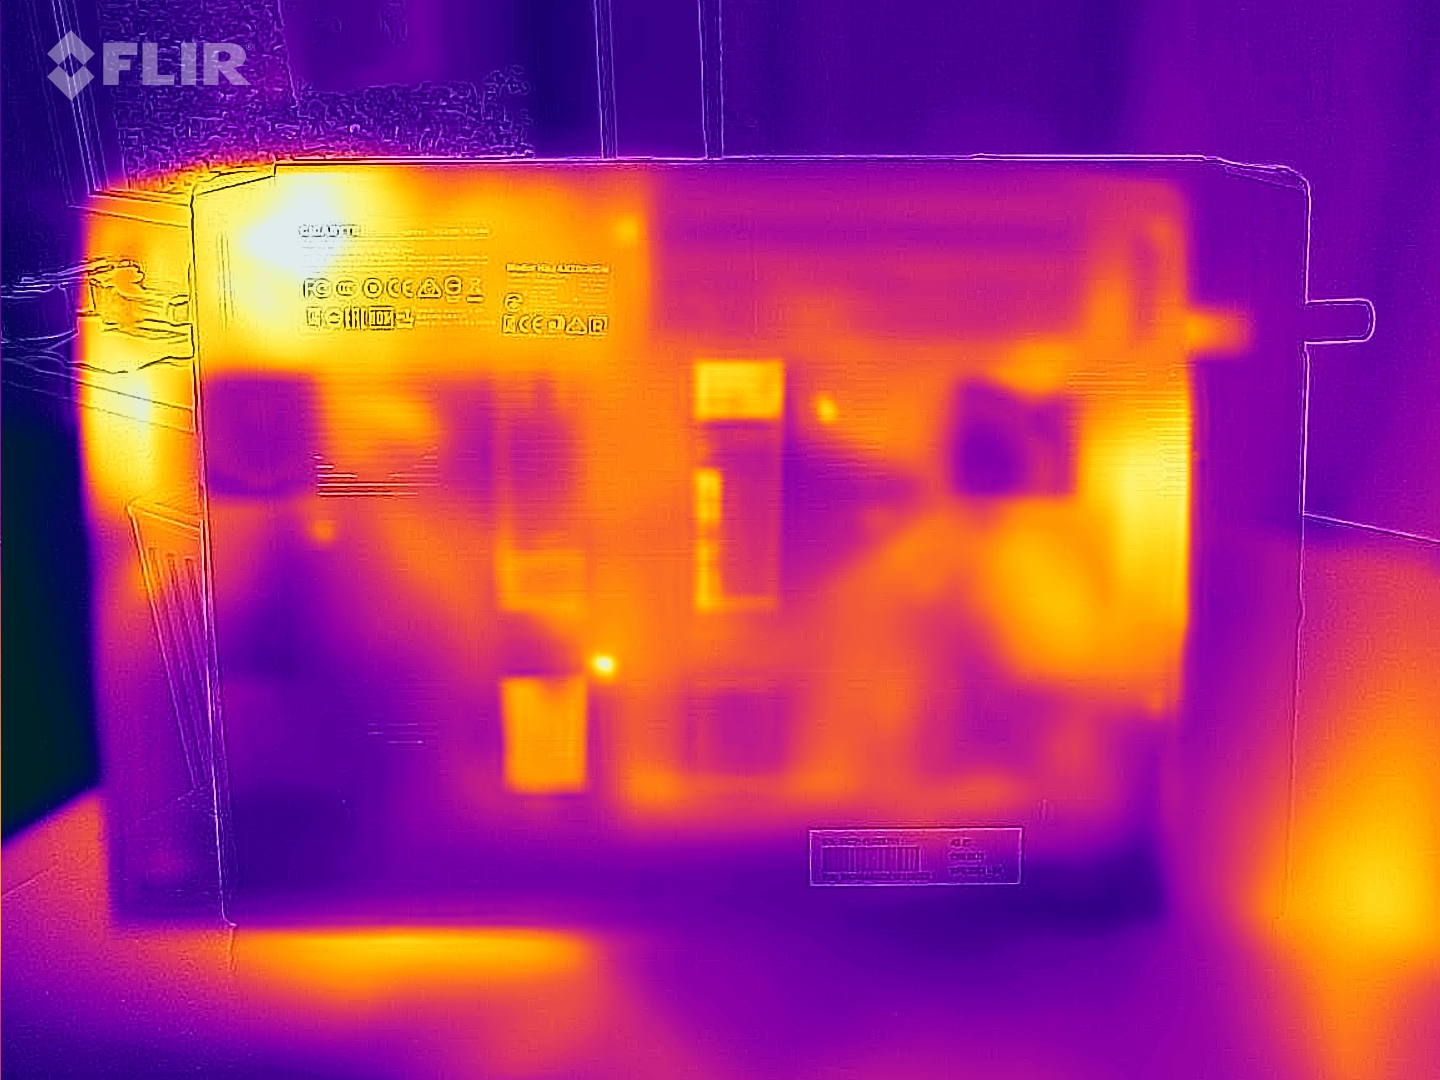
Temperatura
El desarrollo de la temperatura del A5 K1 tampoco es brillante - a pesar de la generosa altura. Un máximo de 50 °C en la parte superior y 51 °C en la inferior tras 60 minutos de carga completa son más que muchos portátiles más delgados con un equipamiento comparable.
(-) La temperatura máxima en la parte superior es de 50 °C / 122 F, frente a la media de 40.4 °C / 105 F, que oscila entre 21.2 y 68.8 °C para la clase Gaming.
(-) El fondo se calienta hasta un máximo de 51 °C / 124 F, frente a la media de 43.2 °C / 110 F
(+) En reposo, la temperatura media de la parte superior es de 27.9 °C / 82# F, frente a la media del dispositivo de 33.9 °C / 93 F.
(-) Jugando a The Witcher 3, la temperatura media de la parte superior es de 42.7 °C / 109 F, frente a la media del dispositivo de 33.9 °C / 93 F.
(-) El reposamanos y el touchpad pueden calentarse mucho al tacto con un máximo de 44 °C / 111.2 F.
(-) La temperatura media de la zona del reposamanos de dispositivos similares fue de 28.8 °C / 83.8 F (-15.2 °C / -27.4 F).
| Gigabyte A5 K1 R5 5600H, GeForce RTX 3060 Laptop GPU | Asus TUF Gaming F15 FX507ZM i7-12700H, GeForce RTX 3060 Laptop GPU | Lenovo Legion 5 15ACH6A-82NW0010GE R5 5600H, Radeon RX 6600M | MSI Alpha 15 B5EEK-008 R7 5800H, Radeon RX 6600M | Gigabyte A5 X1 R9 5900HX, GeForce RTX 3070 Laptop GPU | |
|---|---|---|---|---|---|
| Heat | -8% | 6% | 4% | 6% | |
| Maximum Upper Side * (°C) | 50 | 44.4 11% | 39.9 20% | 44.4 11% | 47 6% |
| Maximum Bottom * (°C) | 51 | 48.8 4% | 43.8 14% | 48.6 5% | 51 -0% |
| Idle Upper Side * (°C) | 30 | 37.8 -26% | 34.1 -14% | 31.2 -4% | 27 10% |
| Idle Bottom * (°C) | 33 | 39.6 -20% | 31.7 4% | 32.2 2% | 30 9% |
* ... más pequeño es mejor
Prueba de esfuerzo
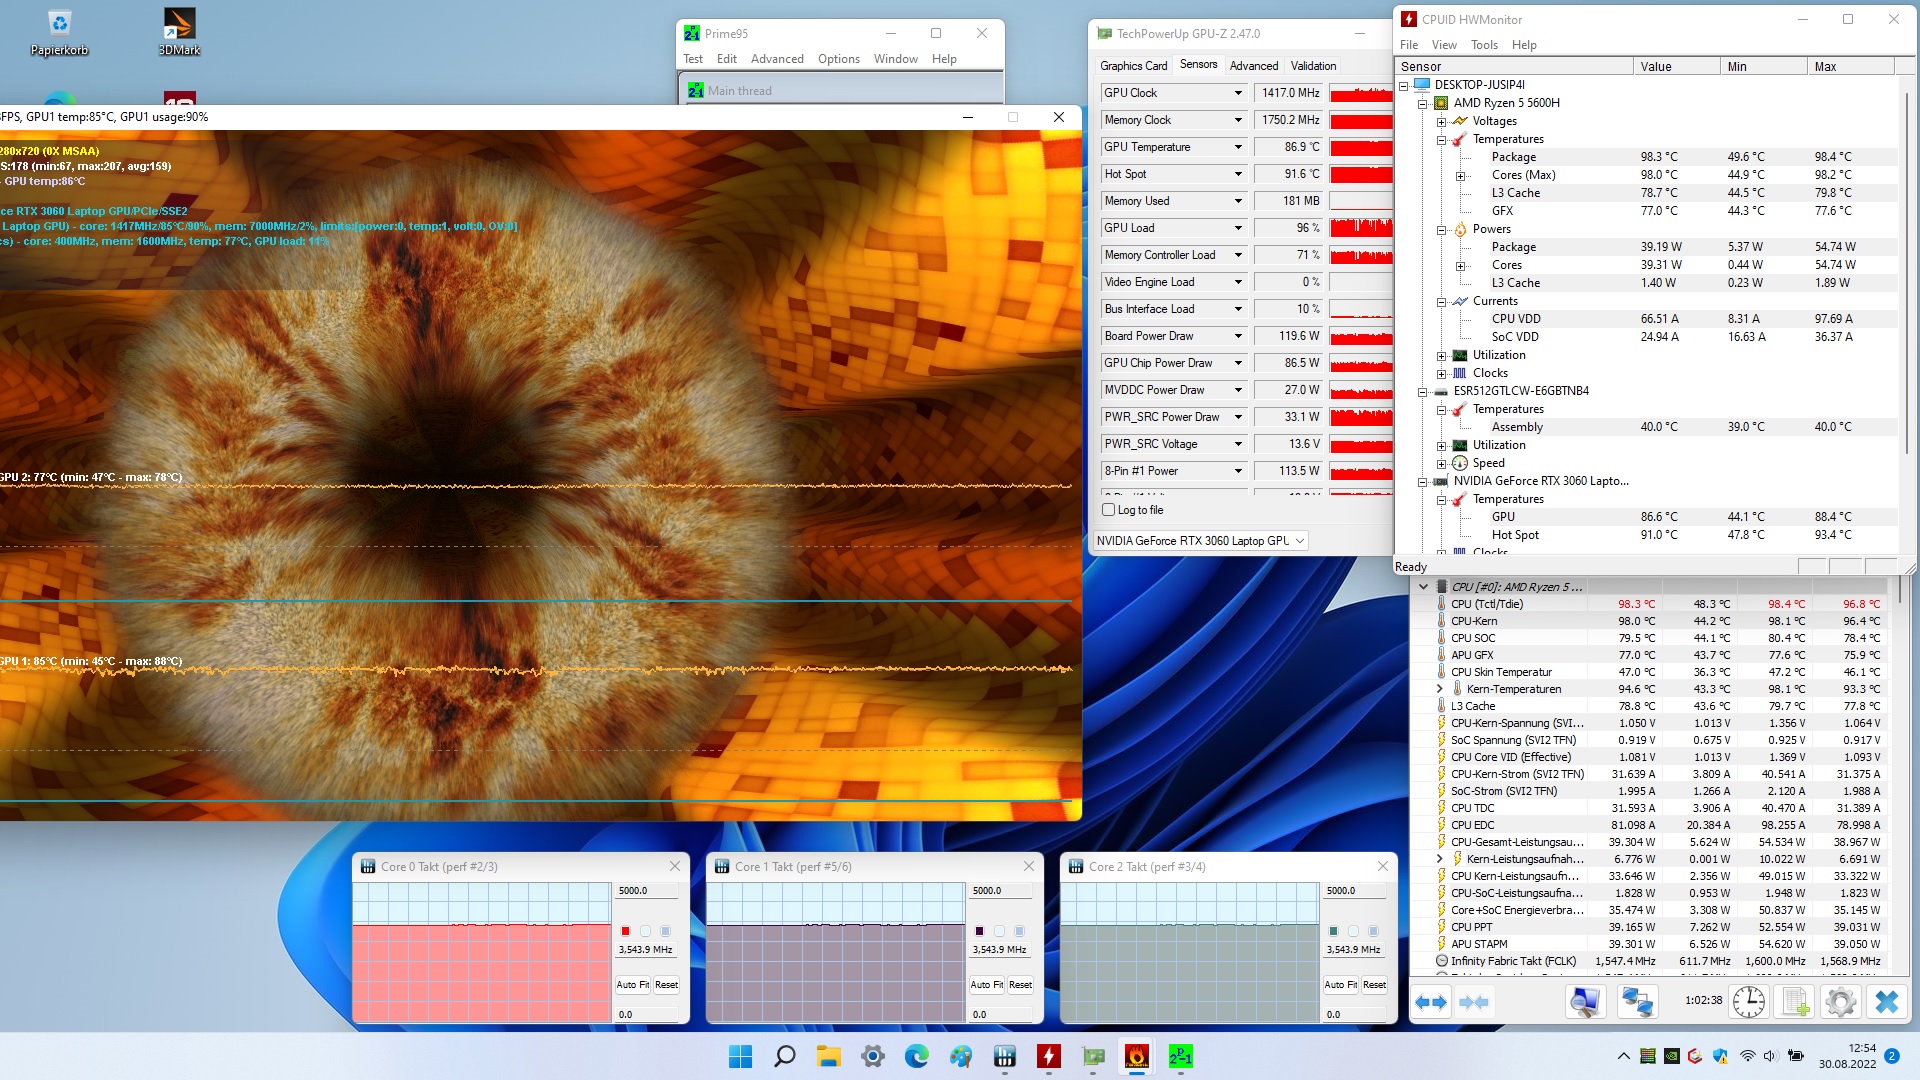
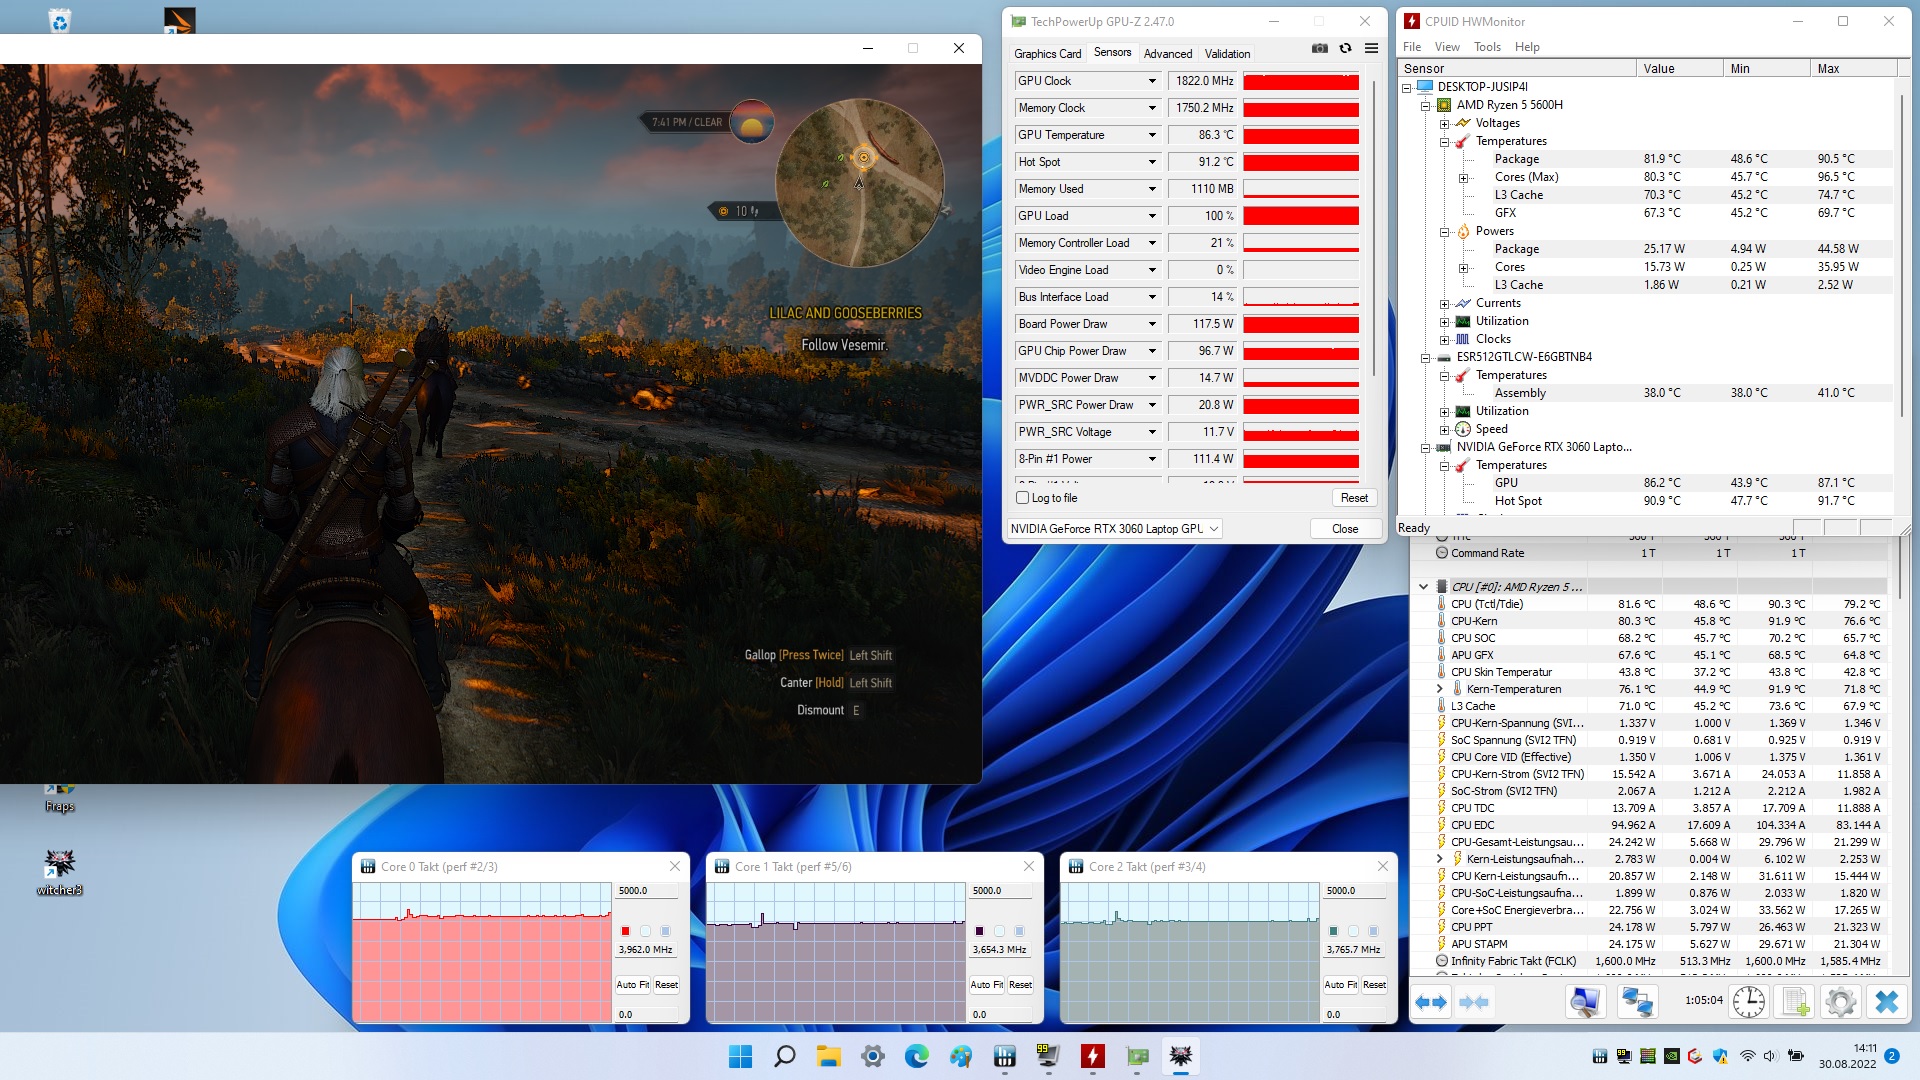
La situación no es necesariamente mejor dentro de la carcasa. Aunque la CPU y la GPU no se ralentizaron durante el test de estrés con las herramientas FurMark y Prime95, lo que no es una cuestión de rutina, un máximo de 98 °C para el Ryzen 5 5600H y hasta 88 °C para la GeForce RTX 3060 (datos de la herramienta HWMonitor) están al límite.
Altavoz
Gigabyte A5 K1 análisis de audio
(+) | los altavoces pueden reproducir a un volumen relativamente alto (#82 dB)
Graves 100 - 315 Hz
(-) | casi sin bajos - de media 28.4% inferior a la mediana
(±) | la linealidad de los graves es media (14.8% delta a frecuencia anterior)
Medios 400 - 2000 Hz
(+) | medios equilibrados - a sólo 4.9% de la mediana
(±) | la linealidad de los medios es media (8.1% delta respecto a la frecuencia anterior)
Altos 2 - 16 kHz
(±) | máximos más altos - de media 6.2% más altos que la mediana
(±) | la linealidad de los máximos es media (8.4% delta a frecuencia anterior)
Total 100 - 16.000 Hz
(±) | la linealidad del sonido global es media (22.8% de diferencia con la mediana)
En comparación con la misma clase
» 82% de todos los dispositivos probados de esta clase eran mejores, 5% similares, 13% peores
» El mejor tuvo un delta de 6%, la media fue 18%, el peor fue ###max##%
En comparación con todos los dispositivos probados
» 68% de todos los dispositivos probados eran mejores, 5% similares, 27% peores
» El mejor tuvo un delta de 4%, la media fue 23%, el peor fue ###max##%
Asus TUF Gaming F15 FX507ZM análisis de audio
(±) | la sonoridad del altavoz es media pero buena (76.7 dB)
Graves 100 - 315 Hz
(±) | lubina reducida - en promedio 13.7% inferior a la mediana
(±) | la linealidad de los graves es media (10.1% delta a frecuencia anterior)
Medios 400 - 2000 Hz
(±) | medias más altas - de media 5.2% más altas que la mediana
(+) | los medios son lineales (4.9% delta a la frecuencia anterior)
Altos 2 - 16 kHz
(+) | máximos equilibrados - a sólo 4.1% de la mediana
(±) | la linealidad de los máximos es media (8.6% delta a frecuencia anterior)
Total 100 - 16.000 Hz
(±) | la linealidad del sonido global es media (15.9% de diferencia con la mediana)
En comparación con la misma clase
» 38% de todos los dispositivos probados de esta clase eran mejores, 7% similares, 56% peores
» El mejor tuvo un delta de 6%, la media fue 18%, el peor fue ###max##%
En comparación con todos los dispositivos probados
» 25% de todos los dispositivos probados eran mejores, 5% similares, 70% peores
» El mejor tuvo un delta de 4%, la media fue 23%, el peor fue ###max##%
Gestión de la energía
Consumo de energía
Gracias al cambio de gráficos (Nvidia Optimus), el portátil es razonablemente frugal en modo inactivo con 10 a 17 vatios. Bajo carga, pudimos sacar entre 113 y 245 vatios del portátil de 15 pulgadas, que es un consumo típico para el hardware instalado y el rendimiento ofrecido.
| Off / Standby | |
| Ocioso | |
| Carga |
|
Clave:
min: | |
| Gigabyte A5 K1 R5 5600H, GeForce RTX 3060 Laptop GPU | Asus TUF Gaming F15 FX507ZM i7-12700H, GeForce RTX 3060 Laptop GPU | Lenovo Legion 5 15ACH6A-82NW0010GE R5 5600H, Radeon RX 6600M | MSI Alpha 15 B5EEK-008 R7 5800H, Radeon RX 6600M | Gigabyte A5 X1 R9 5900HX, GeForce RTX 3070 Laptop GPU | Media de la clase Gaming | |
|---|---|---|---|---|---|---|
| Power Consumption | 1% | -6% | 18% | -5% | -27% | |
| Idle Minimum * (Watt) | 10 | 6.3 37% | 10 -0% | 9.1 9% | 10 -0% | 13 ? -30% |
| Idle Average * (Watt) | 12 | 9.8 18% | 13.2 -10% | 14.61 -22% | 12 -0% | 19 ? -58% |
| Idle Maximum * (Watt) | 17 | 26.5 -56% | 15.6 8% | 15.05 11% | 16 6% | 24.6 ? -45% |
| Load Average * (Watt) | 113 | 103.8 8% | 178 -58% | 77.8 31% | 124 -10% | 110.7 ? 2% |
| Witcher 3 ultra * (Watt) | 181.4 | 189 -4% | 181 -0% | 131 28% | 204 -12% | |
| Load Maximum * (Watt) | 245 | 241.9 1% | 180 27% | 114.42 53% | 272 -11% | 259 ? -6% |
* ... más pequeño es mejor
Power consumption - The Witcher 3 / Stresstest
Power consumption with external monitor
Duración de la batería
La duración de la batería está a la par con la de su hermano más caro. Algo menos de 7 horas de navegación por internet vía WLAN (brillo de pantalla reducido a 150 cd/m²) sólo son superadas por algunos rivales. Sin embargo, éstos también ofrecen baterías más grandes (80+ Wh en lugar de 49 Wh).
| Gigabyte A5 K1 R5 5600H, GeForce RTX 3060 Laptop GPU, 48.96 Wh | Asus TUF Gaming F15 FX507ZM i7-12700H, GeForce RTX 3060 Laptop GPU, 90 Wh | Lenovo Legion 5 15ACH6A-82NW0010GE R5 5600H, Radeon RX 6600M, 80 Wh | MSI Alpha 15 B5EEK-008 R7 5800H, Radeon RX 6600M, 90 Wh | Gigabyte A5 X1 R9 5900HX, GeForce RTX 3070 Laptop GPU, 48.96 Wh | Media de la clase Gaming | |
|---|---|---|---|---|---|---|
| Duración de Batería | -30% | 33% | 26% | -7% | 3% | |
| WiFi v1.3 (h) | 6.9 | 4.8 -30% | 9.2 33% | 8.7 26% | 6.4 -7% | 7.11 ? 3% |
| Reader / Idle (h) | 15.8 | 12.8 | 12.3 | 10.1 | 8.27 ? | |
| Load (h) | 1.1 | 2 | 1.5 | 1.3 | 1.502 ? | |
| H.264 (h) | 9.8 | 7.3 | 8.32 ? | |||
| Witcher 3 ultra (h) | 1.9 |
Pro
Contra
Veredicto
Si se ignora el precio, el Gigabyte A5 K1 lo tiene difícil contra la competencia de 15 pulgadas de velocidad similar. Además del fuerte ruido en modo 3D (modo de rendimiento), hay que mencionar en el lado negativo el alto desarrollo de temperatura de los componentes. A pesar de la carcasa relativamente gruesa, el portátil se calienta mucho y hace mucho ruido bajo carga, lo que no habla precisamente del sistema de refrigeración.
Hablando de la carcasa: El chasis no es particularmente bueno en términos de calidad. Las superficies de plástico parecen bastante baratas y también tienden a traquetear. En la mayoría de las demás disciplinas - ya sean los dispositivos de entrada, la pantalla, la conectividad o la duración de la batería - el portátil Gigabyte es bastante poco espectacular y no destaca entre la multitud, ni positiva ni negativamente
Sin embargo, aquellos que presten atención principalmente a la relación precio-rendimiento tendrán una oferta bastante buena con el A5 K1.
La mayoría de portátiles de juego de menos de 1.000 euros son más lentos o tienen que conformarse con una pantalla más pobre (palabra clave: espacio de color).
Precio y disponibilidad
El Gigabyte A5 K1 analizado con Ryzen 5 5600H, GeForce RTX 3060, 16 GB de RAM y 512 GB de SSD está disponible por unos 900 Euros en varias tiendas online (por ejemplo, Notebooksbilliger).
Gigabyte A5 K1
- 09/01/2022 v7 (old)
Florian Glaser
Price comparison
