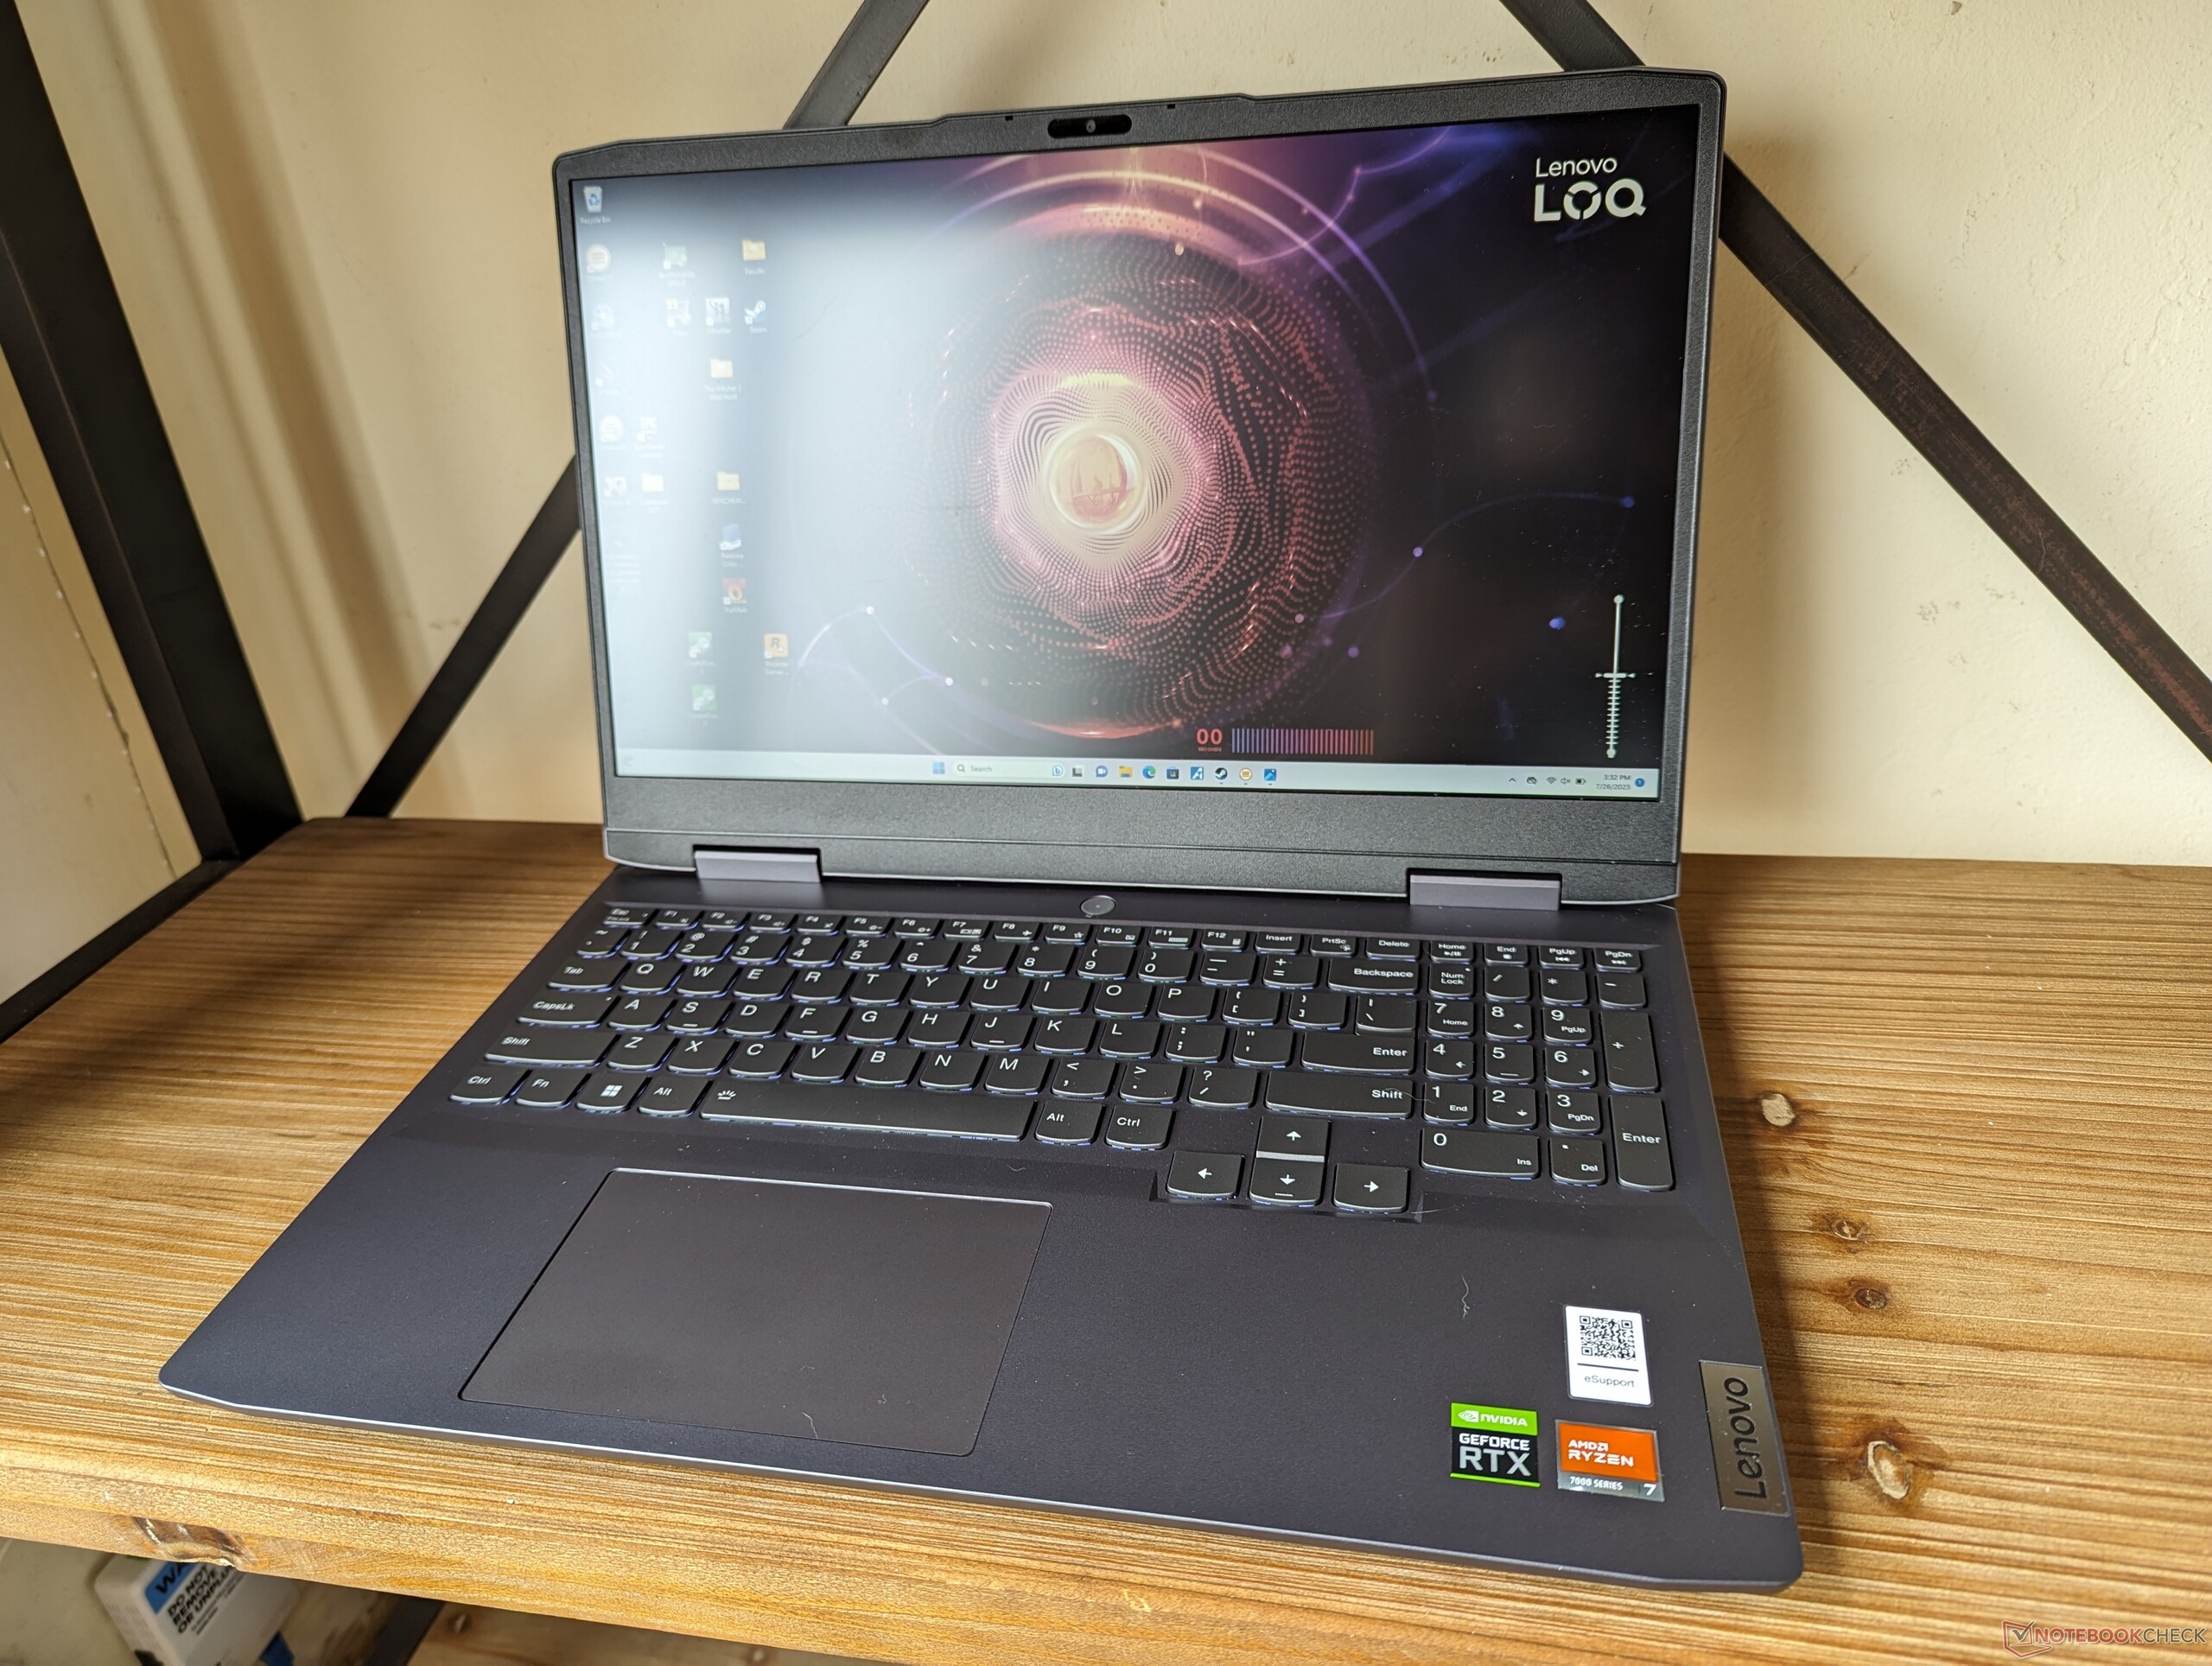
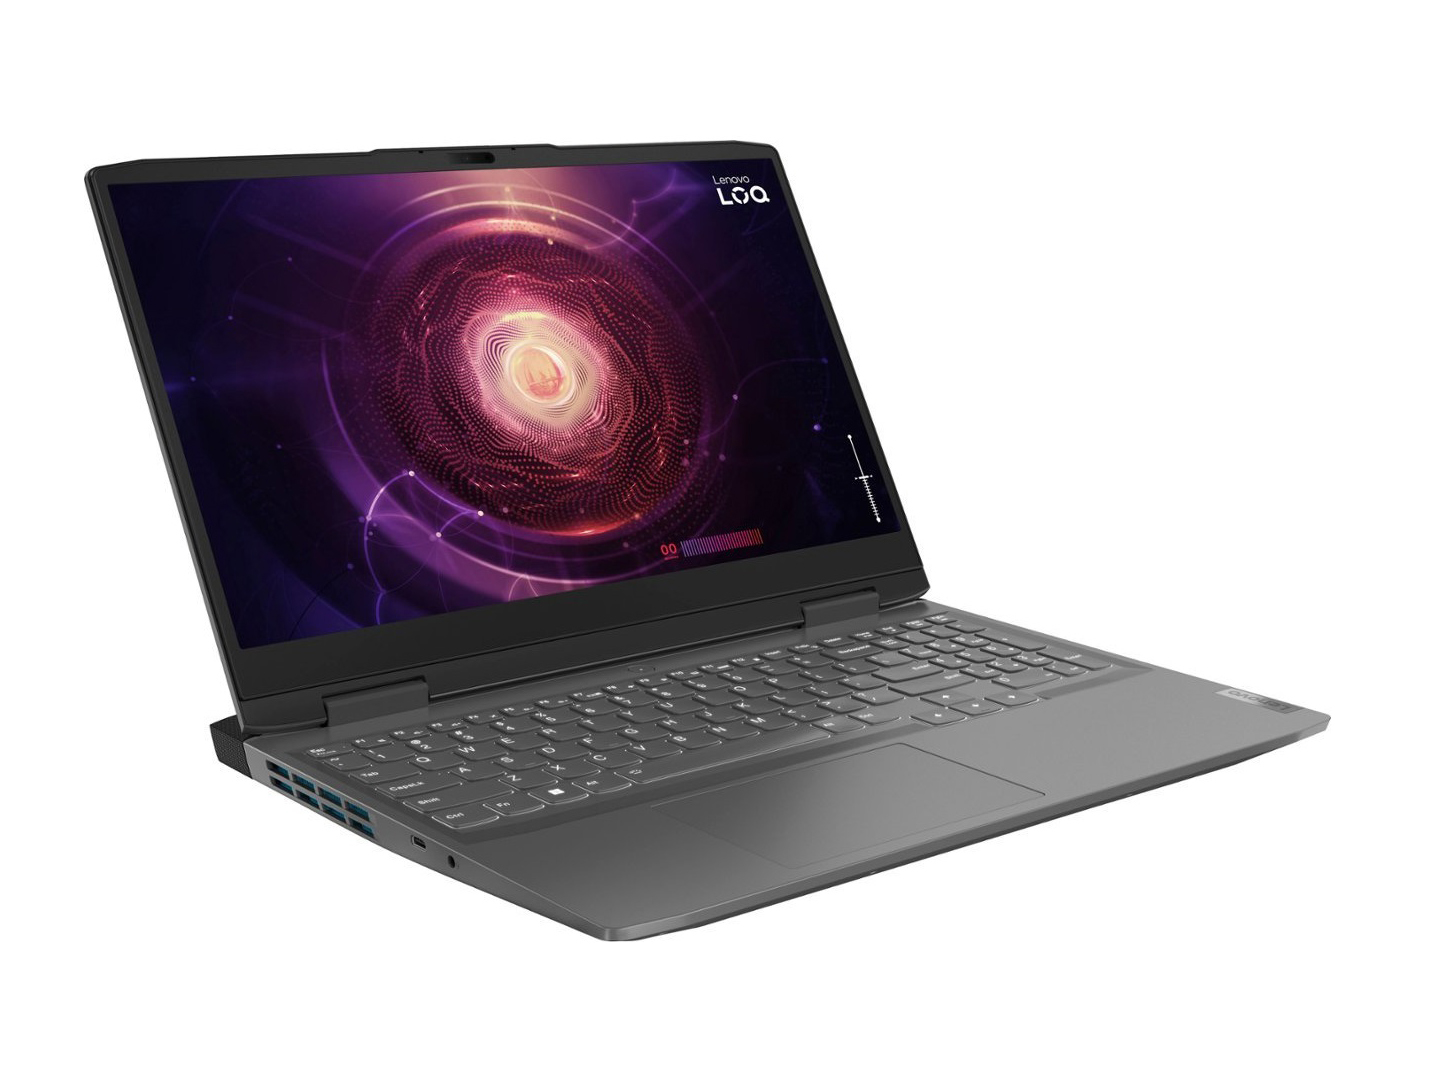
Análisis del portátil Lenovo LOQ 15 Ryzen 7 7840HS: No lo llames Legion

La familia LOQ está formada por los portátiles para juegos económicos de Lenovo diseñados para sustituir a los antiguos Serie IdeaPad Gaming 3. El nuevo nombre LOQ ayuda a crear distancia entre sus productos de juegos económicos y la serie Ideapad más orientada a la oficina en casa o a los estudiantes. Tampoco es un producto de Legion, ya que Lenovo quiere posicionar el nombre Legion como una serie "insignia" con máquinas de juego de gama alta.
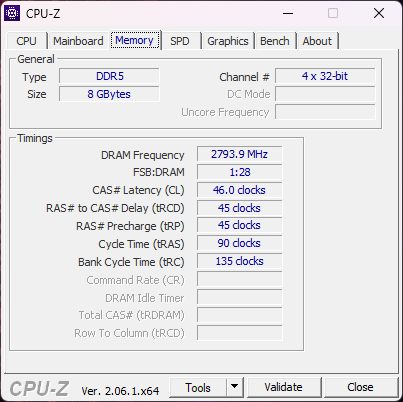
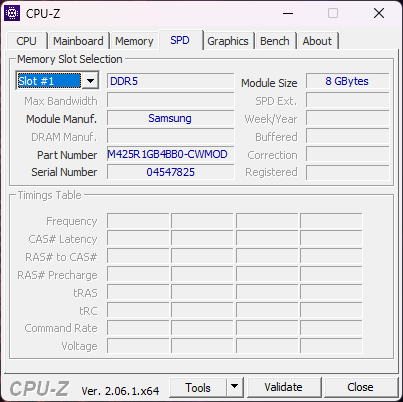
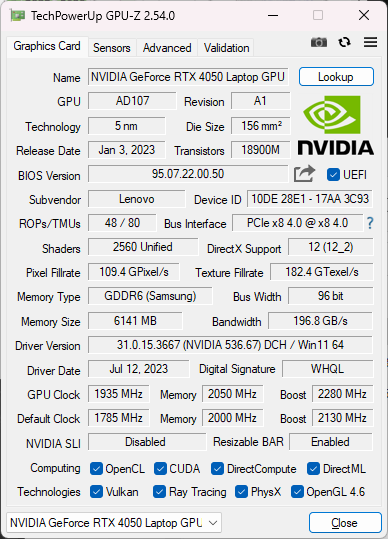
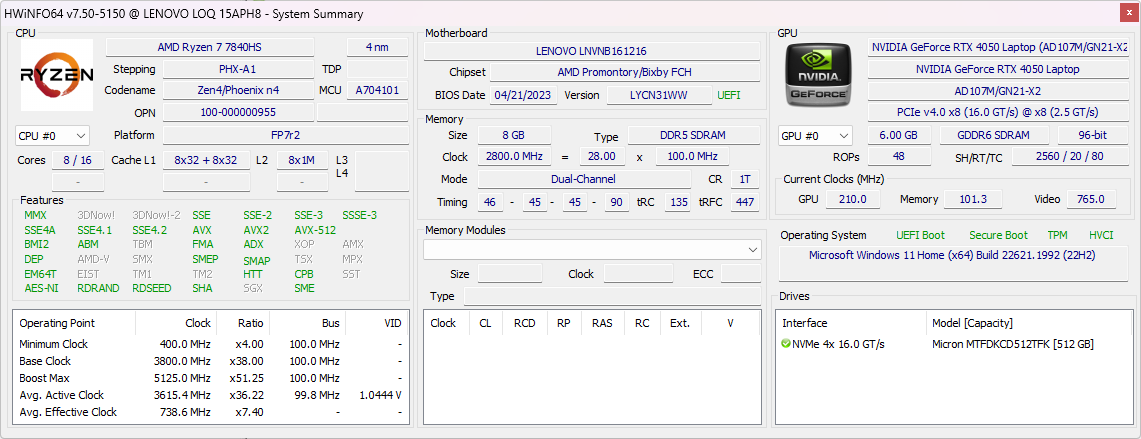
Nuestra unidad de análisis es una versión AMD de gama media (15APH8) con CPU Zen 4 Ryzen 7 7840HS, GPU GeForce RTX 4050 y pantalla IPS 1080p 144 Hz a un precio de venta de unos 1000 dólares. Sólo viene con 8 GB de RAM, pero afortunadamente es ampliable por el usuario. Existen SKU más baratas y más caras con Ryzen 5 7640HS, RTX 3050 o 4060, y pantalla 1080p 60 Hz a 1440p 165 Hz que oscilan entre menos de 800 USD y más de 1.100 USD. Las versiones Intel del LOQ 15 (15IRH8) también están disponibles en tamaños de pantalla de 15 y 16 pulgadas (LOQ 16).
Entre los competidores se encuentran otros portátiles económicos de 15 pulgadas para juegos como el Dell G15 5530,Asus TUF A15 FA507,MSI Cyborg 15o HP Victus 15.
Más opiniones sobre Lenovo:
Posibles contendientes en la comparación
Valoración | Fecha | Modelo | Peso | Altura | Tamaño | Resolución | Precio |
|---|---|---|---|---|---|---|---|
| 85.7 % v7 (old) | 07/2023 | Lenovo LOQ 15APH8 R7 7840HS, GeForce RTX 4050 Laptop GPU | 2.5 kg | 25.2 mm | 15.60" | 1920x1080 | |
| 87.5 % v7 (old) | 11/2022 | Lenovo Legion 5 15IAH7H 82RB i7-12700H, GeForce RTX 3060 Laptop GPU | 2.4 kg | 19.99 mm | 15.60" | 1920x1080 | |
| 84.2 % v7 (old) | 06/2023 | Dell G15 5530 i7-13650HX, GeForce RTX 4060 Laptop GPU | 3 kg | 26.95 mm | 15.60" | 1920x1080 | |
| 86.3 % v7 (old) | 06/2023 | Asus TUF A15 FA507 R7 7735HS, GeForce RTX 4050 Laptop GPU | 2.2 kg | 24.9 mm | 15.60" | 1920x1080 | |
| 82.4 % v7 (old) | 04/2023 | MSI Cyborg 15 A12VF i7-12650H, GeForce RTX 4060 Laptop GPU | 2 kg | 22.9 mm | 15.60" | 1920x1080 | |
| 81 % v7 (old) | 01/2023 | HP Victus 15 fa0020nr i7-12700H, GeForce RTX 3050 Ti Laptop GPU | 2.3 kg | 23.6 mm | 15.60" | 1920x1080 |
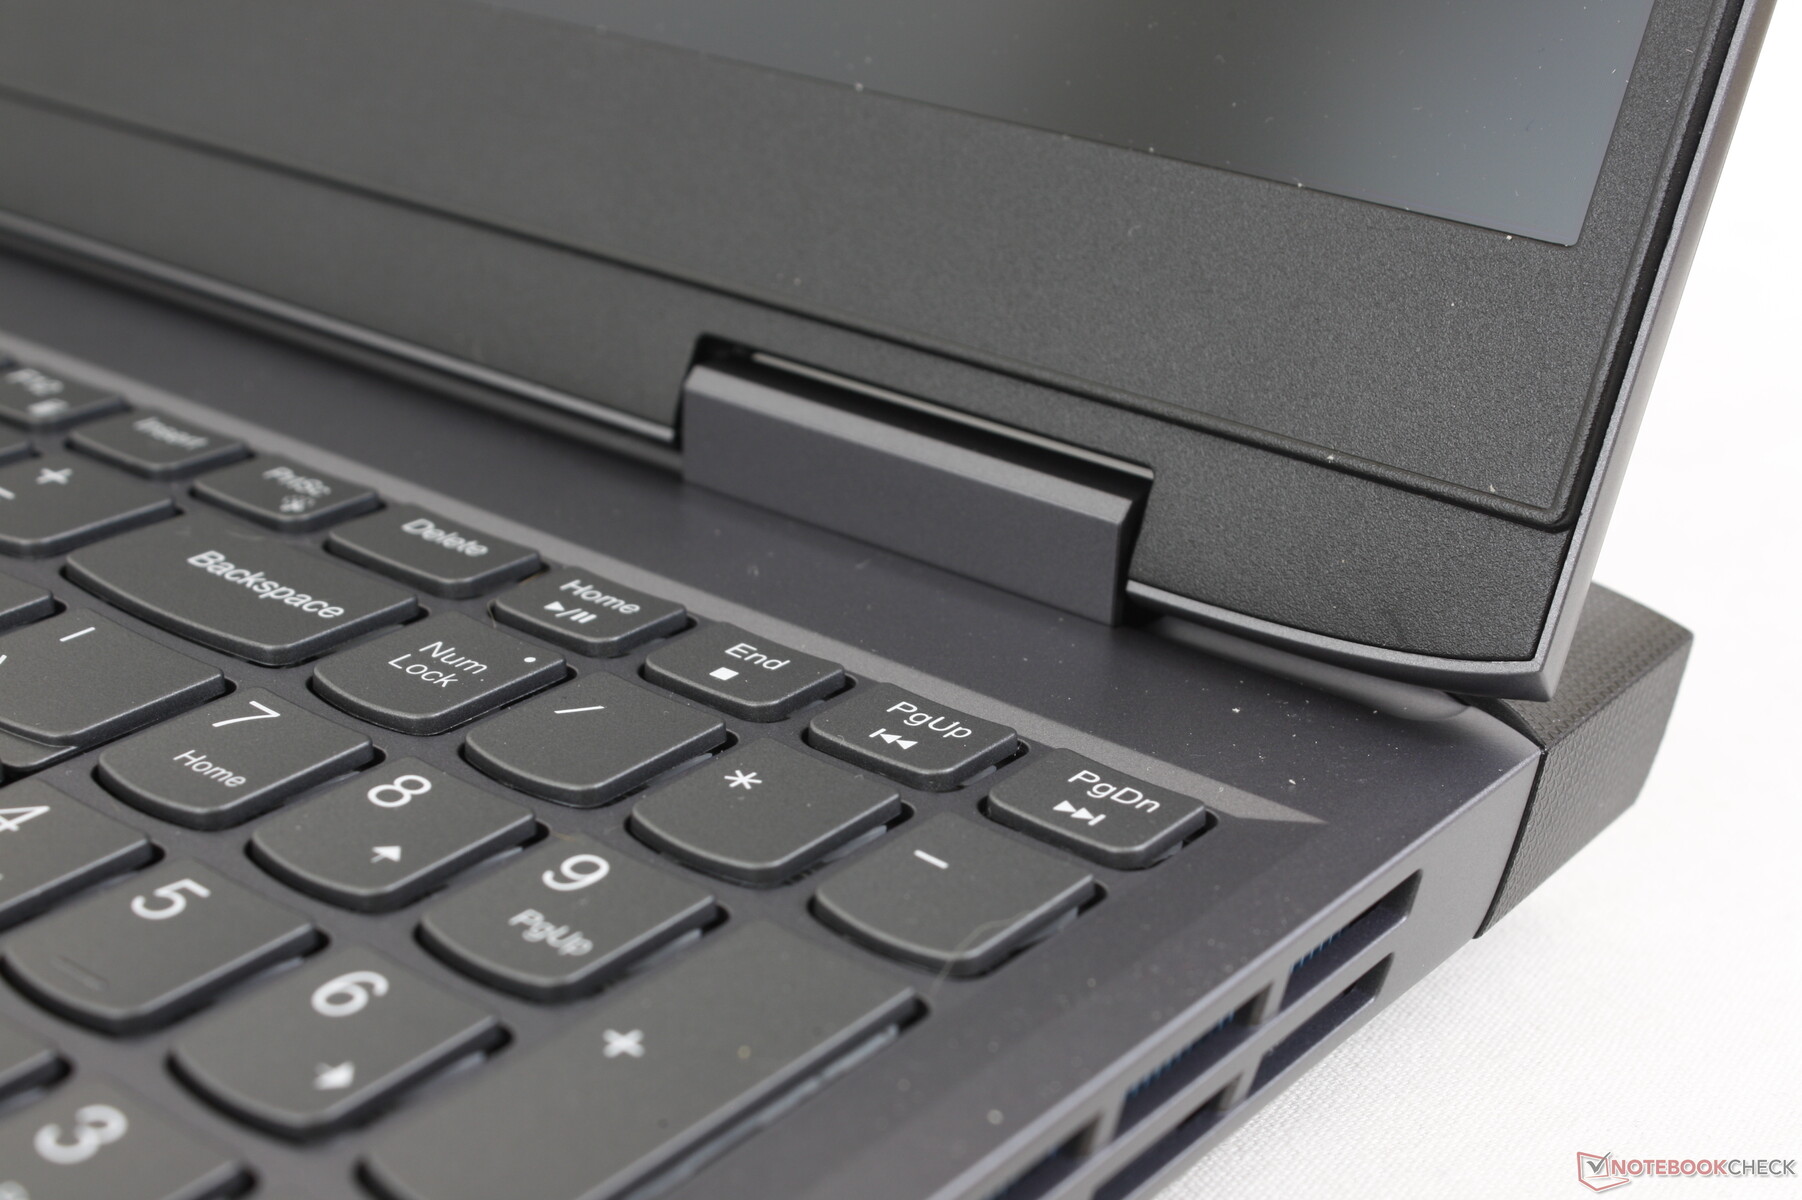
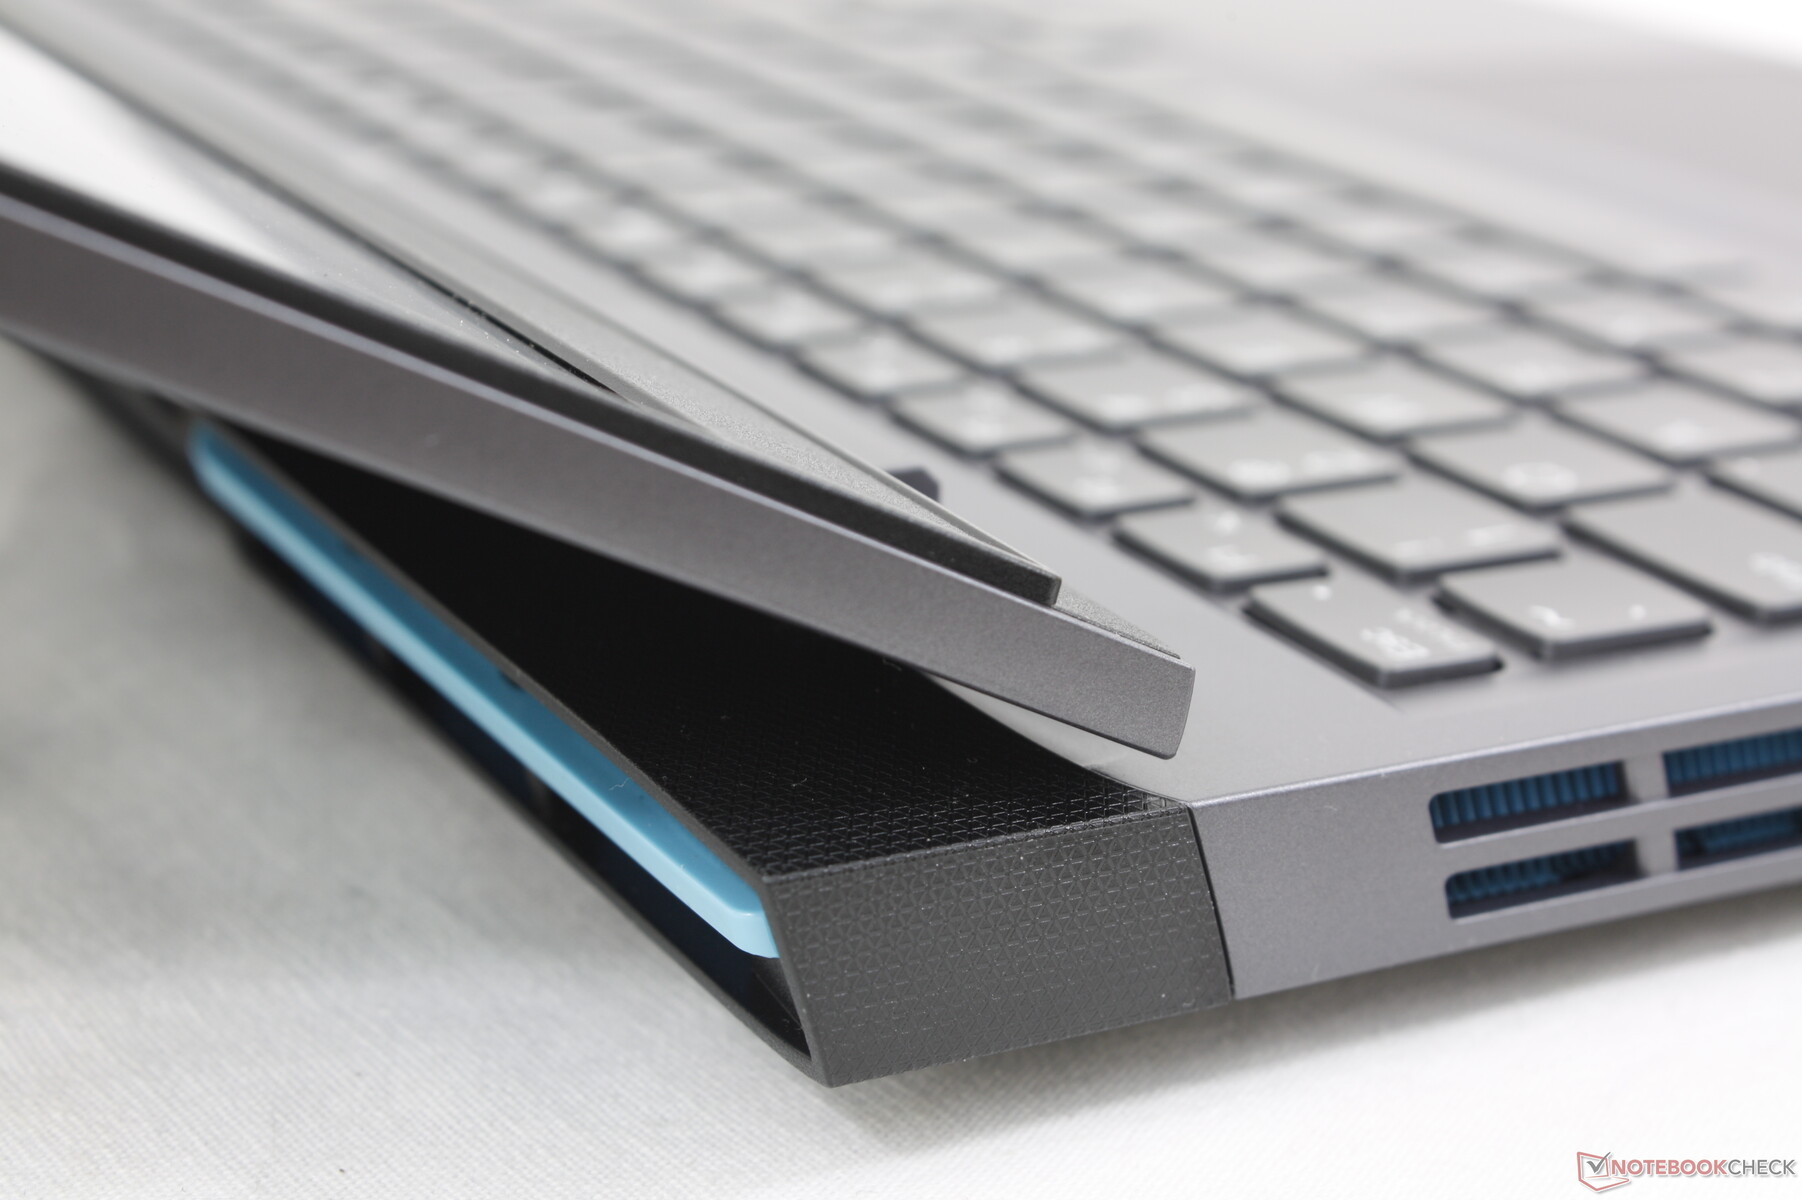
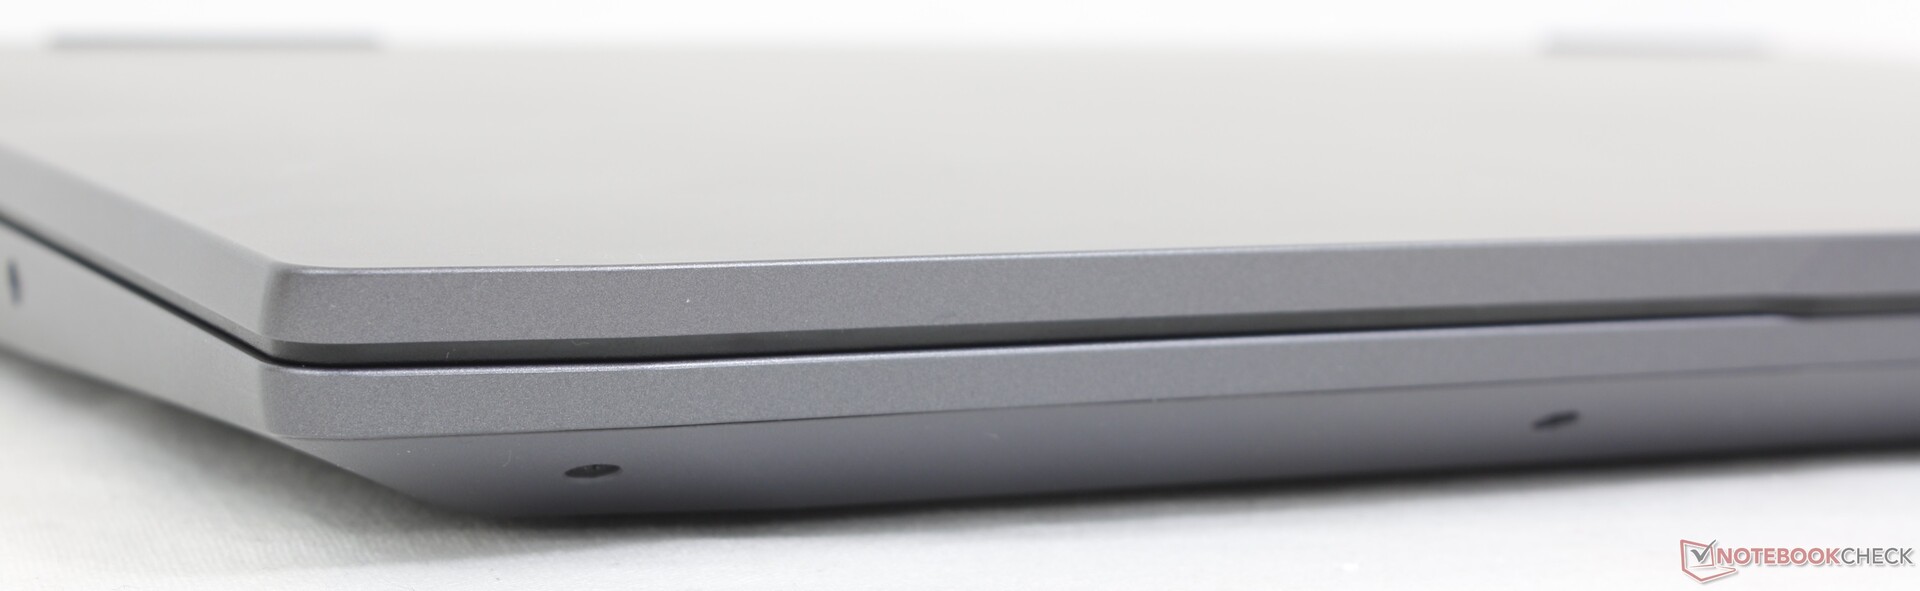
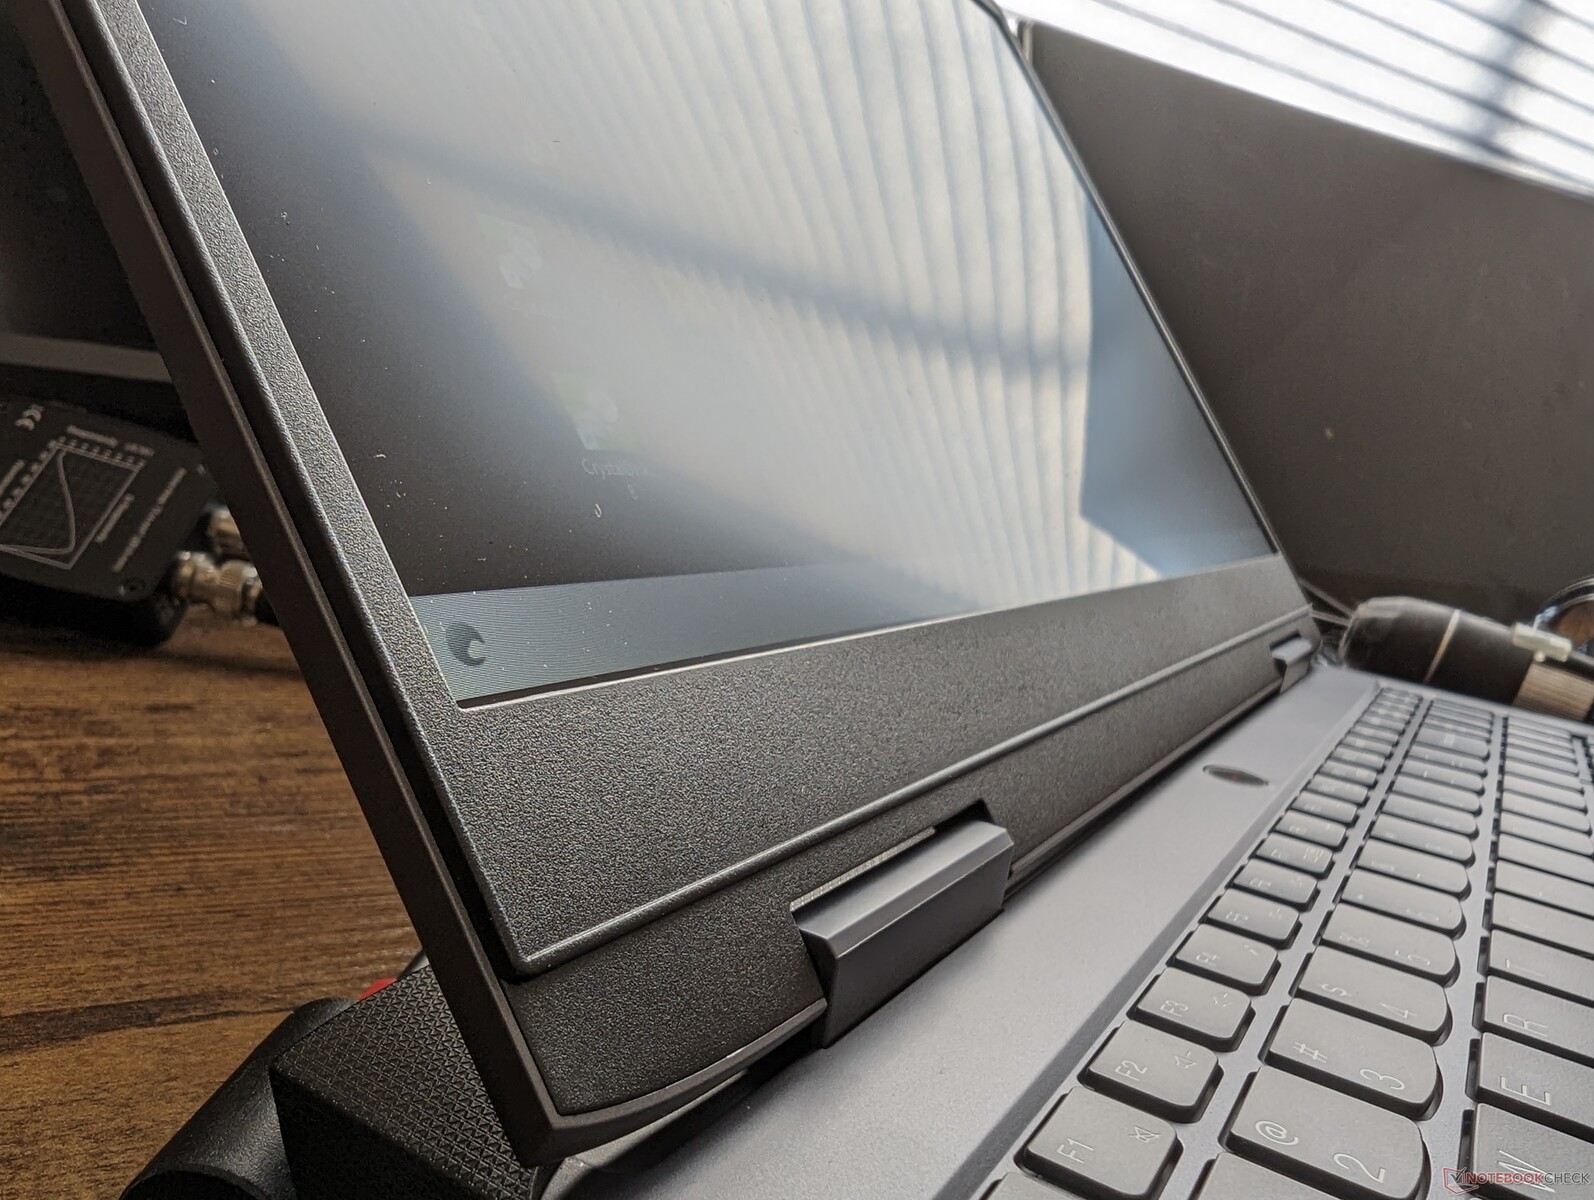
Maletín - Esencialmente un plástico Legion
Que no sea un producto de Legion no significa que no pueda inspirarse en el diseño de Legion. El chasis LOQ 15 puede describirse mejor como un Legion 5 15 ya que todos los materiales del esqueleto metálico del Legion se han sustituido por plástico ABS tanto en la cubierta superior como en la parte inferior. Da la sensación de ser más barato como resultado de estos cambios, pero eso es lo normal cuando se compara con otros portátiles de juego económicos como el MSI Cyborg 15 o el HP Victus 15, en los que también predomina el plástico.
La rigidez del chasis es más débil en los reposamanos y el centro del teclado. Aplicar presión en estas áreas deformaría la superficie ligeramente más que en la mayoría de otros portátiles de juego incluyendo los económicos como el HP Victus 15. Afortunadamente no es motivo de preocupación y el resto del portátil parece sólido para su precio.
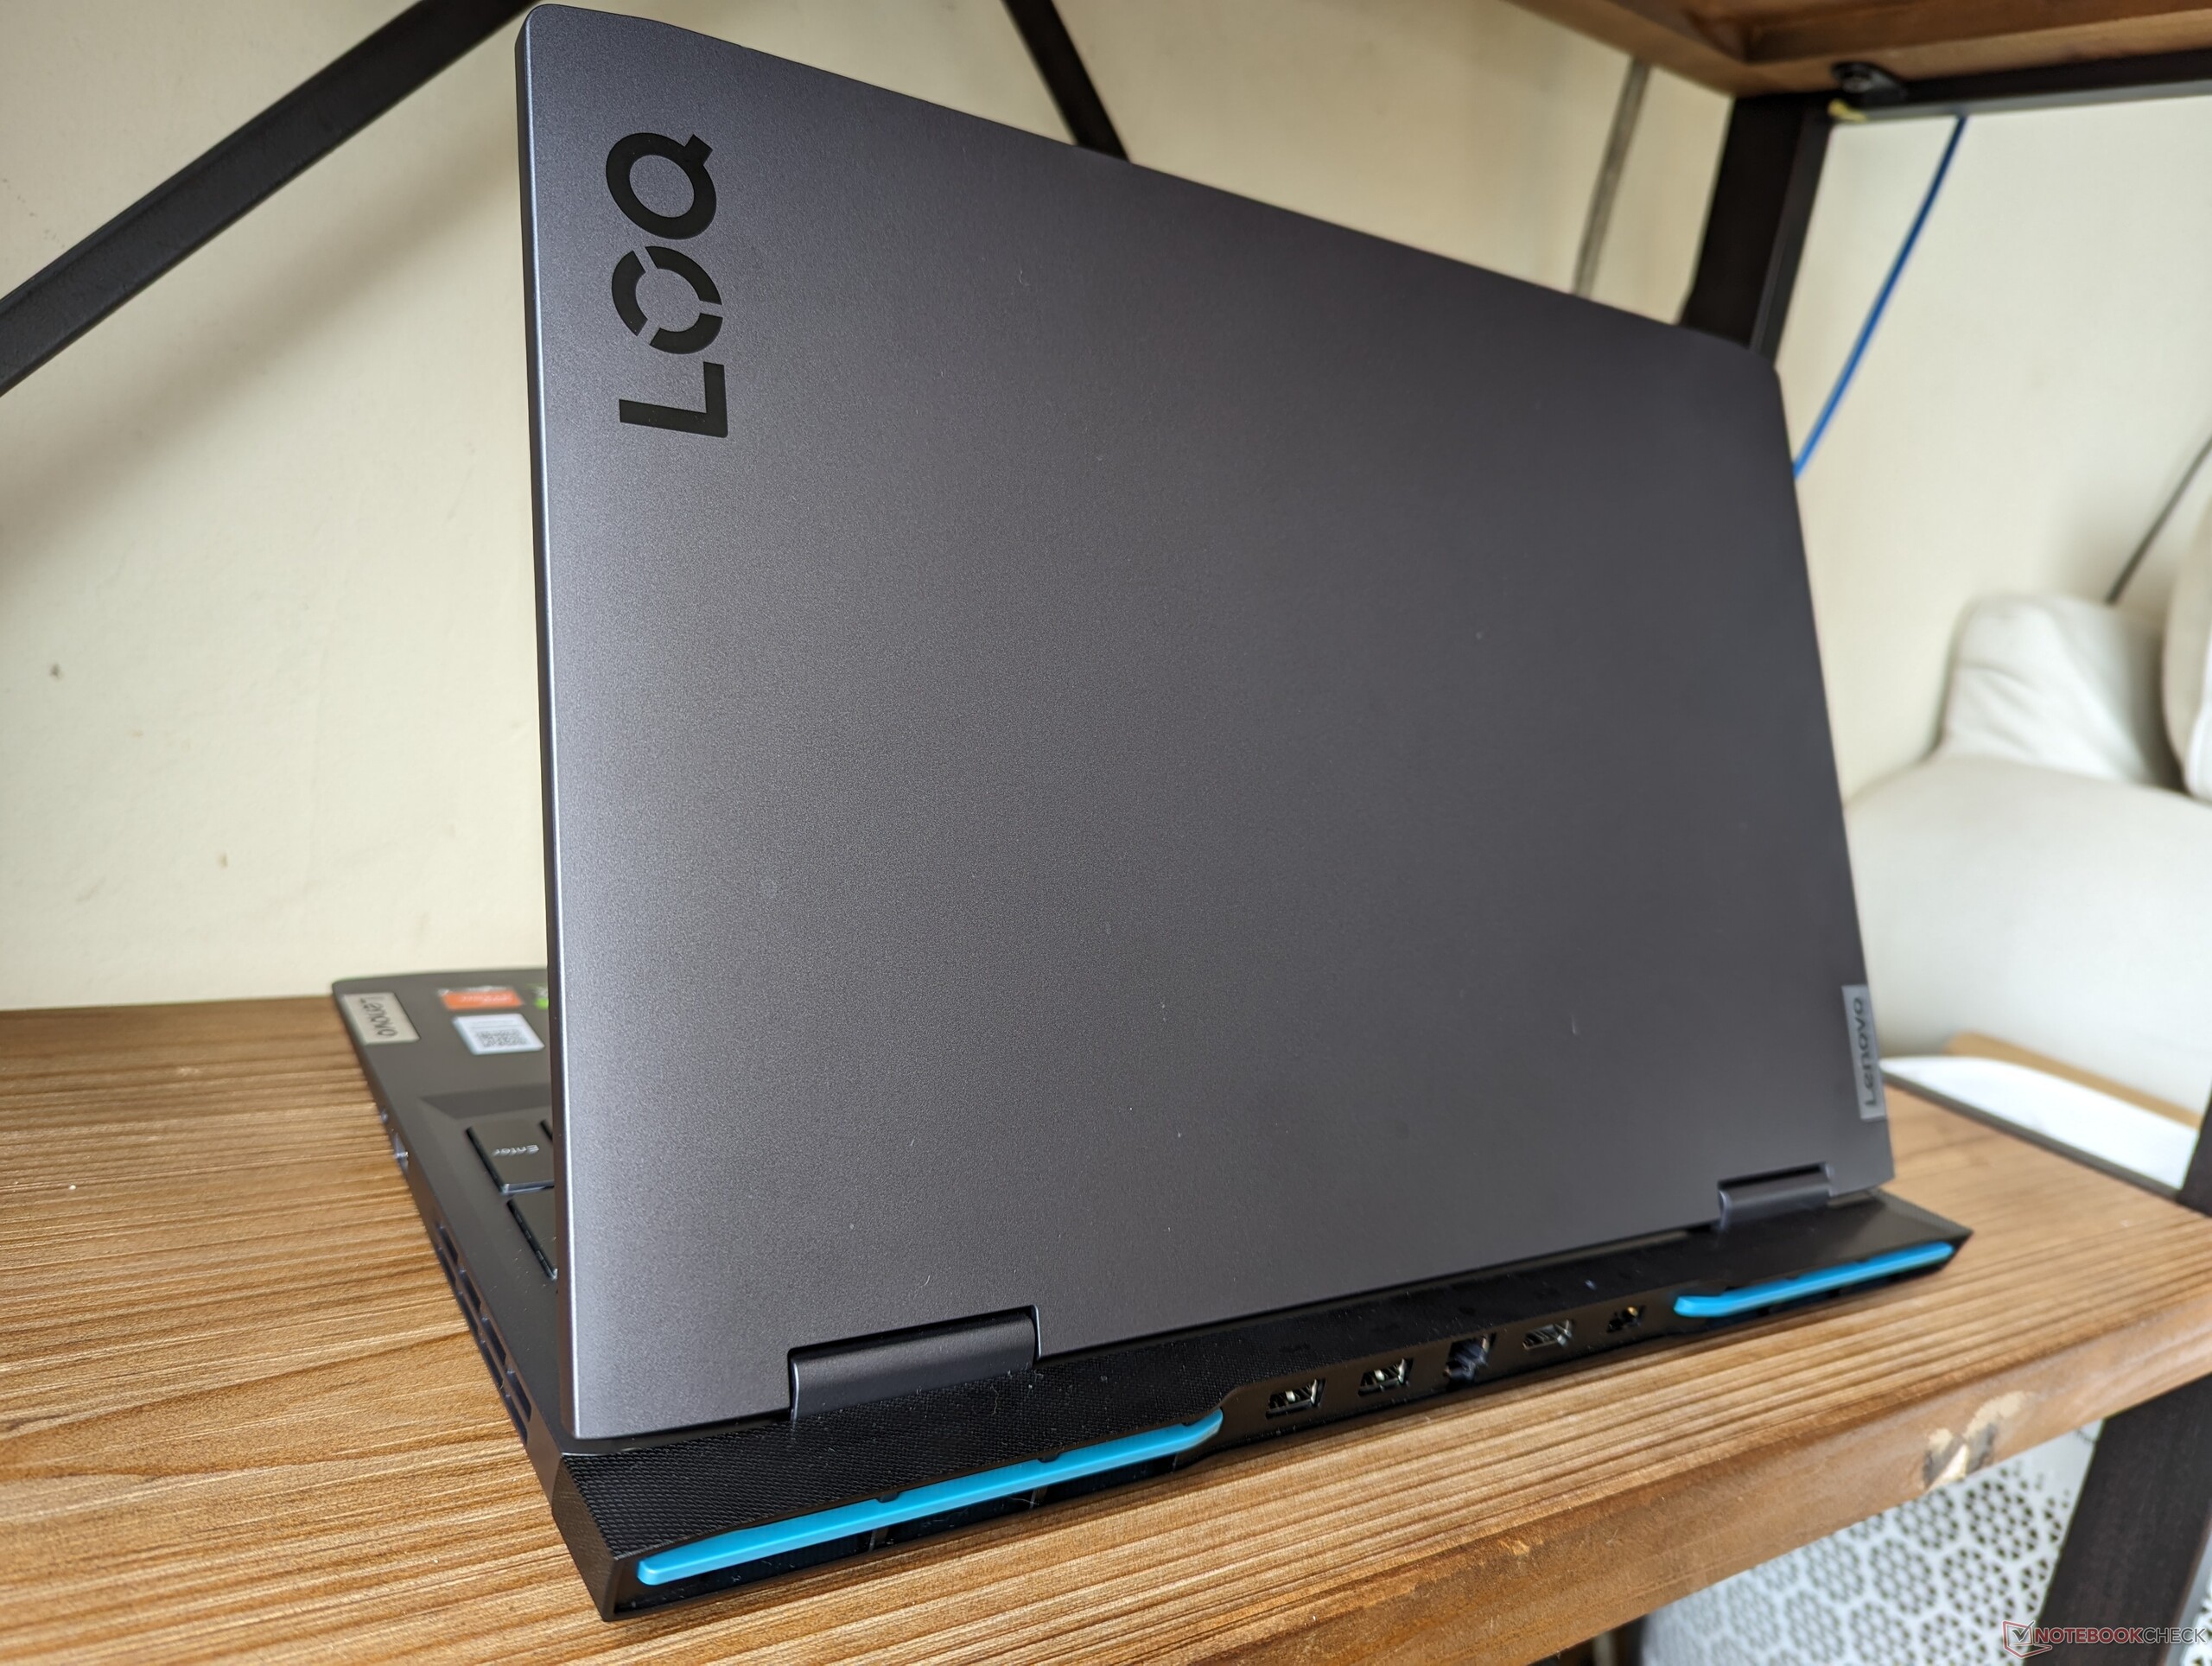
El LOQ 15 es ligeramente más grueso y pesado que la mayoría de los portátiles de juego económicos, incluido el Asus TUF A15,HP Victus 15o el MSI Cyborg 15 debido en parte a su gran trasera extendida. Una excepción notable es el voluminoso Dell G15 5530 que es aún más pesado y grande.
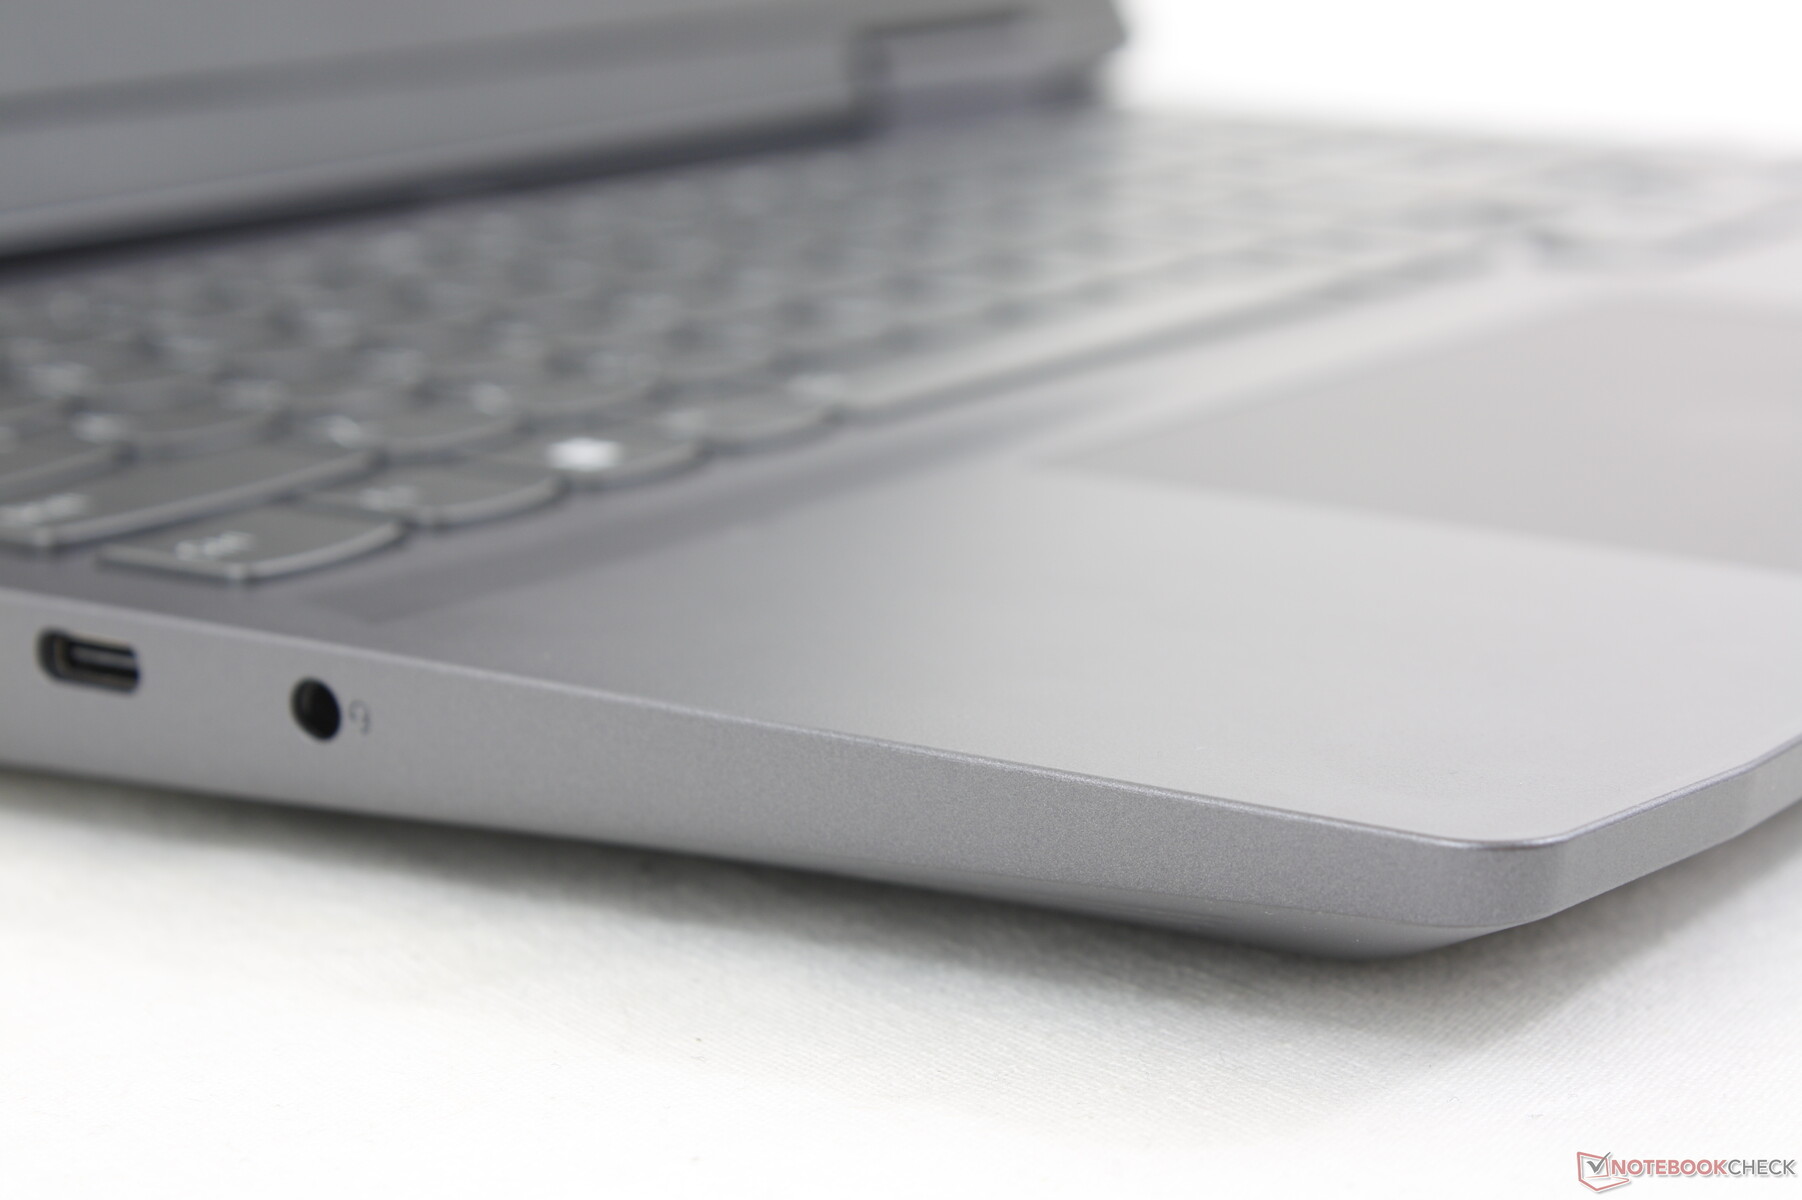
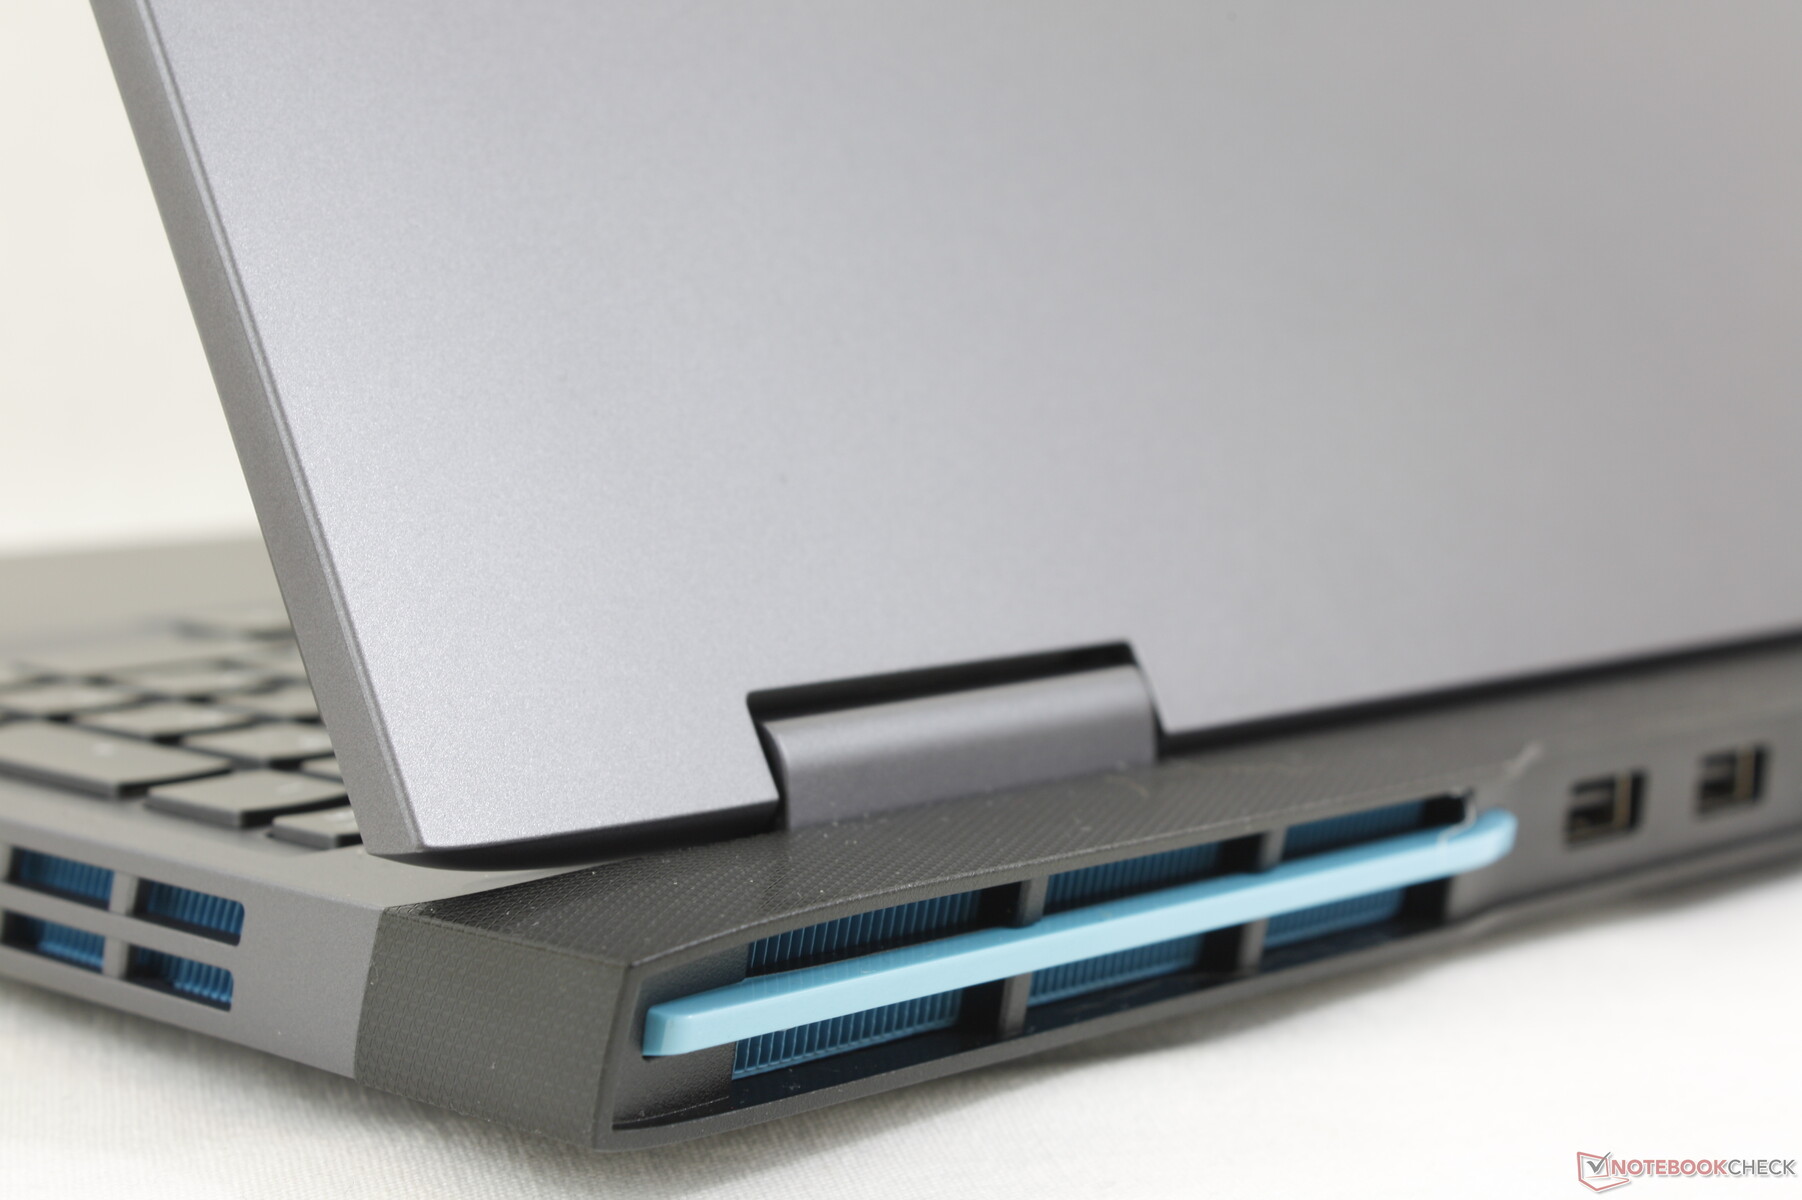
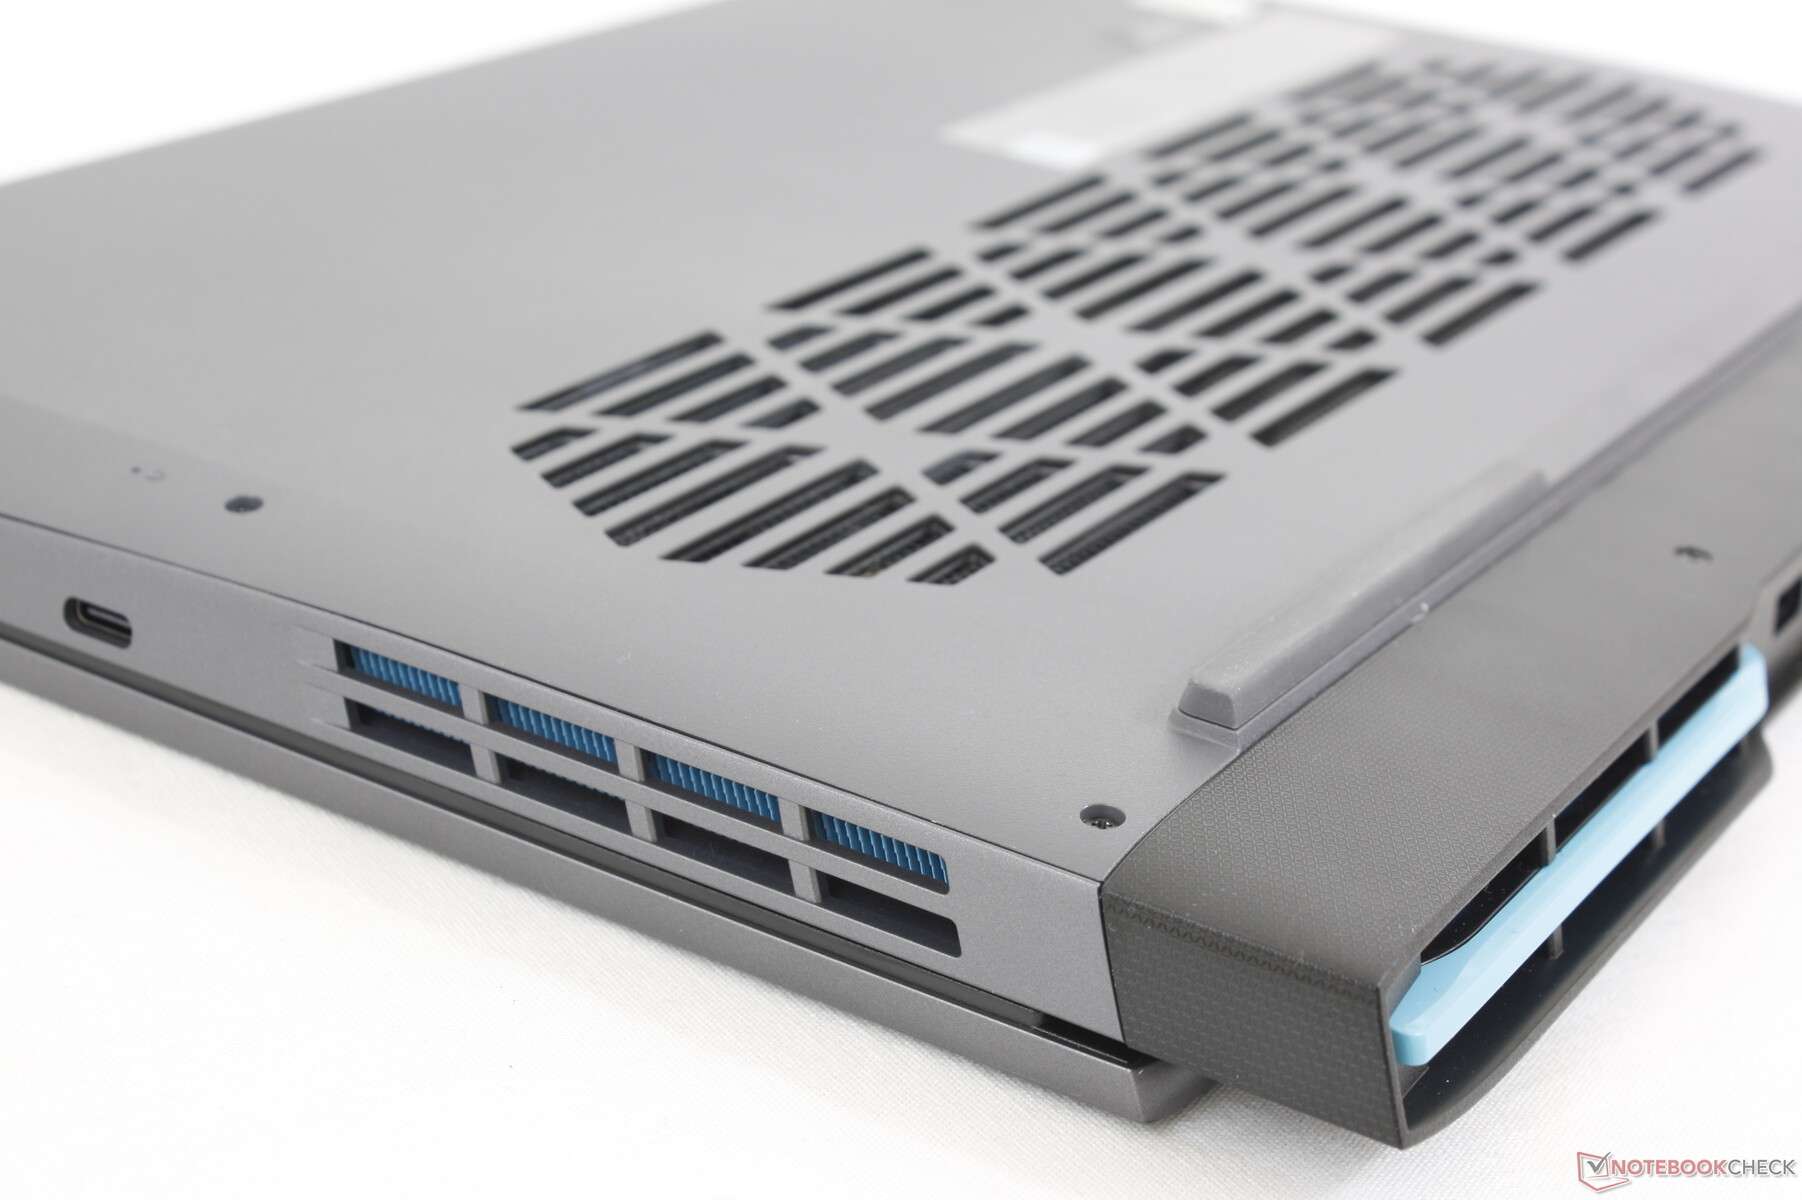
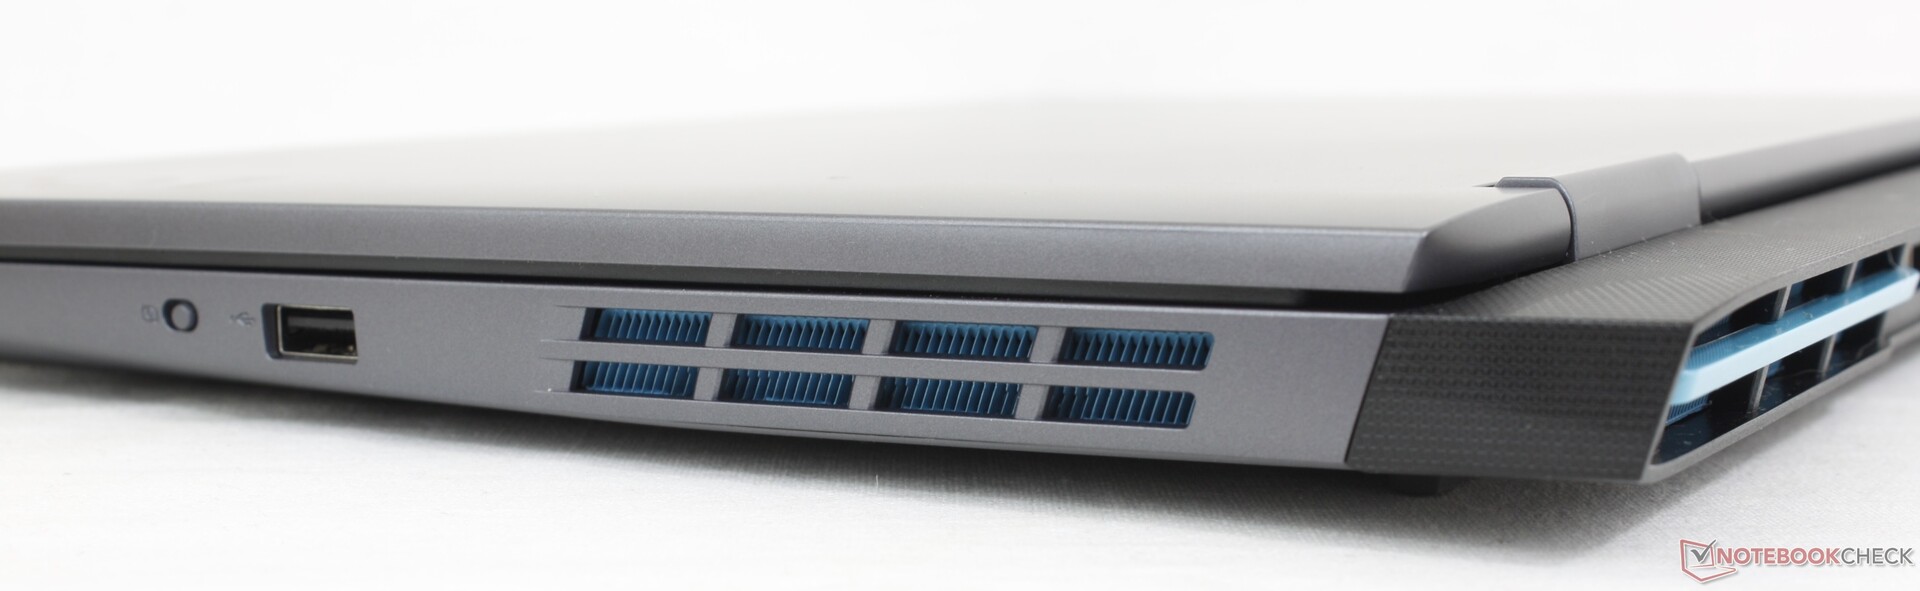
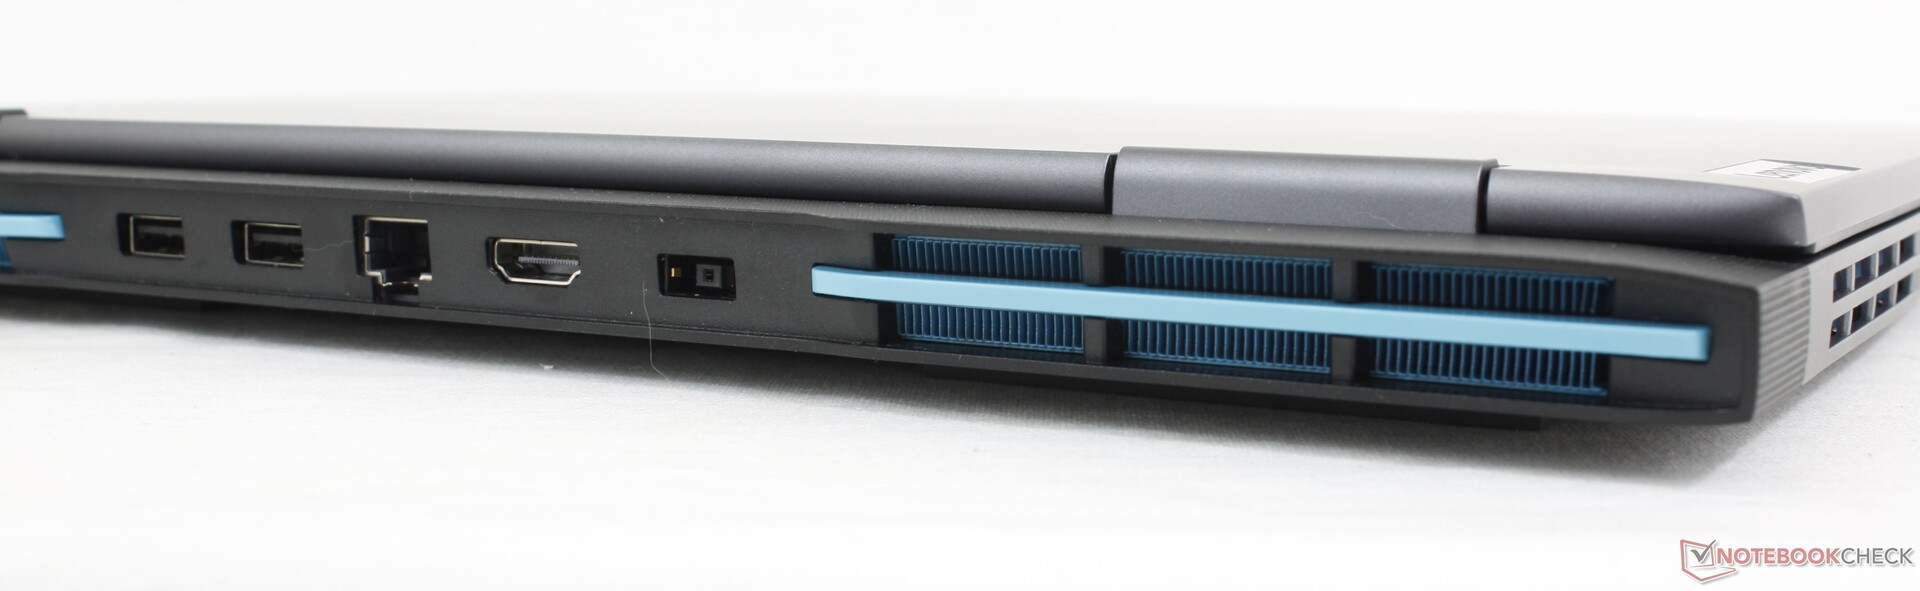
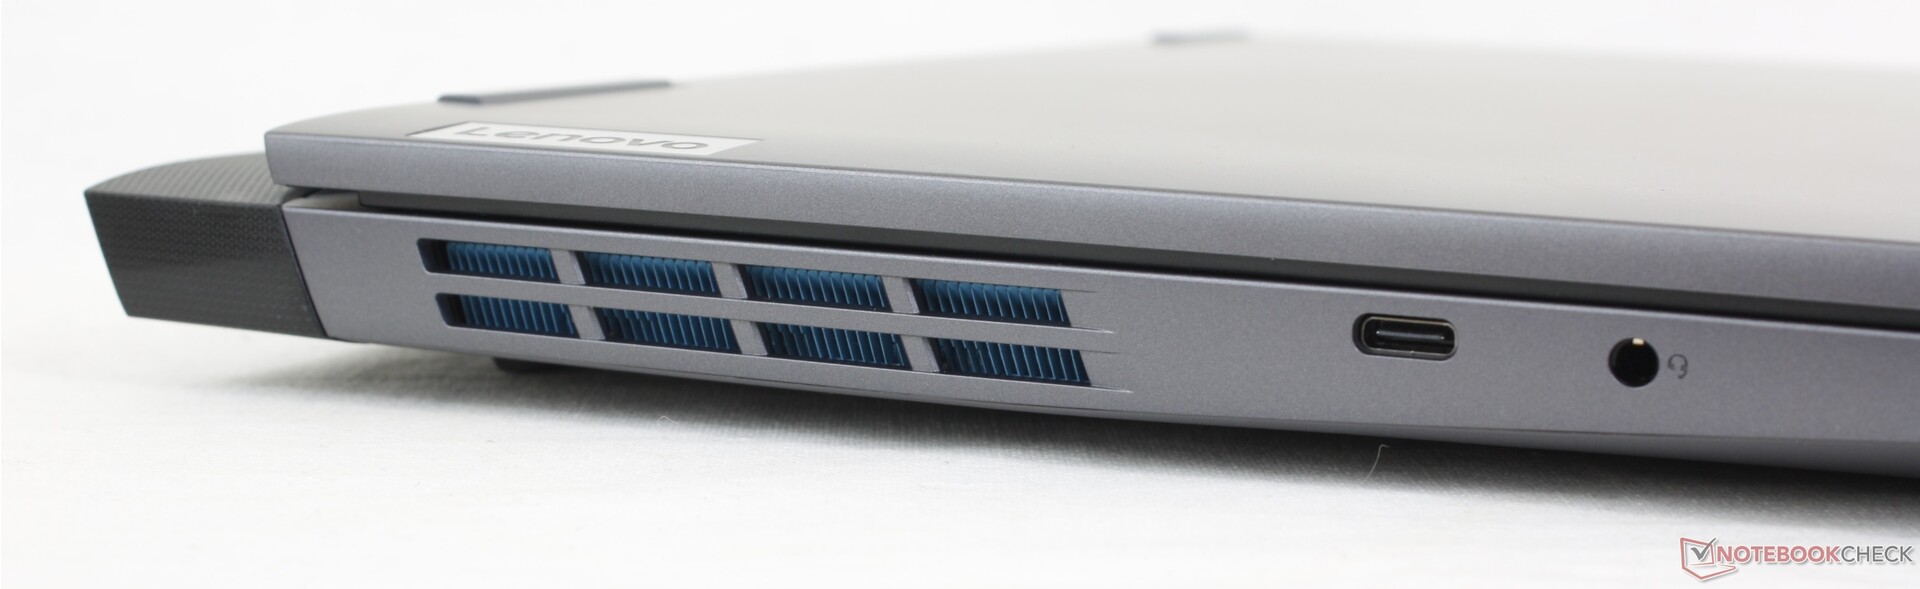
Conectividad - Sin USB4 ni Thunderbolt
Las opciones de puerto incluyen todo lo del IdeaPad Gaming 3 15 del año pasado más un puerto USB-A adicional. La mayoría de puertos están en la trasera, pero el único puerto USB-C se ha movido al borde izquierdo esta vez para facilitar el acceso.
Comunicación
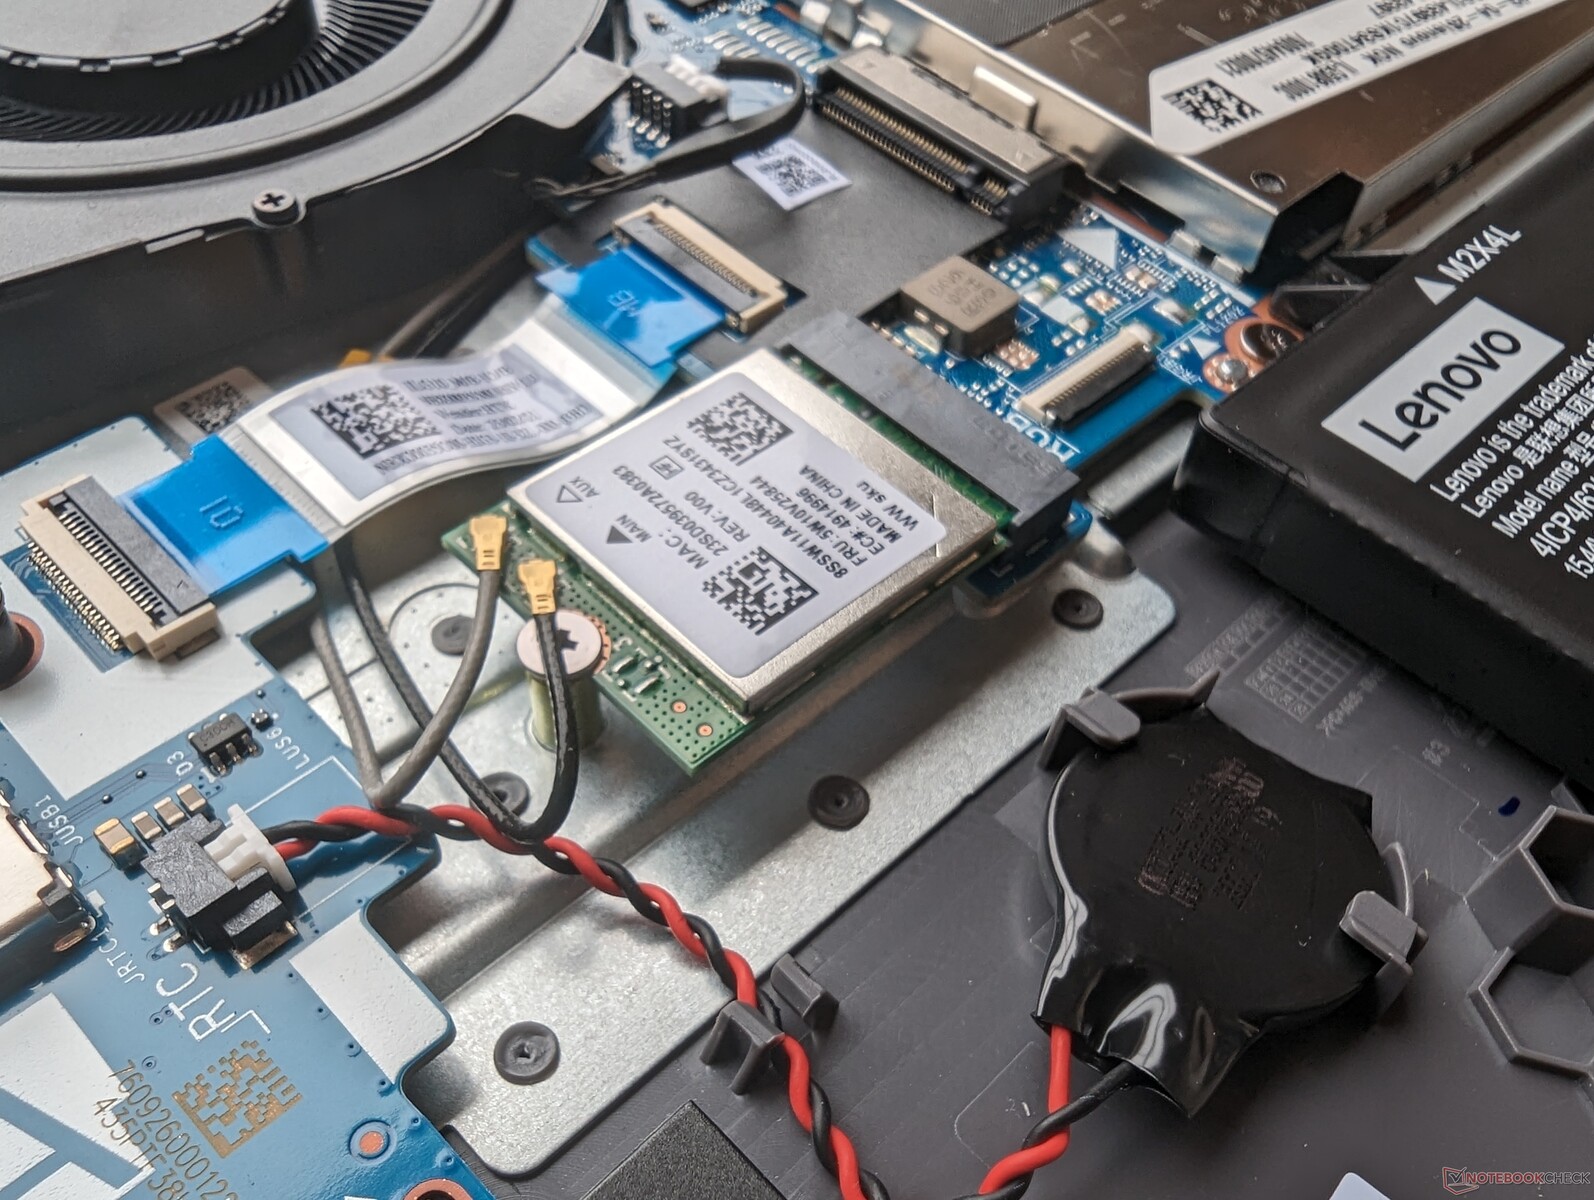
El Realtek RTL8852BE ofrece conectividad Wi-Fi 6 y Bluetooth 5.1 sin soporte Wi-Fi 6E o 6 GHz, probablemente para ahorrar costes. No obstante, las velocidades de transferencia son constantes y fiables cuando se empareja con nuestro router de pruebas Asus AXE11000.
| Networking | |
| iperf3 transmit AXE11000 | |
| MSI Cyborg 15 A12VF | |
| Dell G15 5530 | |
| Lenovo Legion 5 15IAH7H 82RB | |
| Asus TUF A15 FA507 | |
| Lenovo LOQ 15APH8 | |
| HP Victus 15 fa0020nr | |
| iperf3 receive AXE11000 | |
| MSI Cyborg 15 A12VF | |
| Dell G15 5530 | |
| Lenovo Legion 5 15IAH7H 82RB | |
| Asus TUF A15 FA507 | |
| HP Victus 15 fa0020nr | |
| Lenovo LOQ 15APH8 | |
| iperf3 transmit AXE11000 6GHz | |
| Lenovo Legion 5 15IAH7H 82RB | |
| iperf3 receive AXE11000 6GHz | |
| Lenovo Legion 5 15IAH7H 82RB | |
Cámara web
La webcam de 2 MP es una mejora respecto a las webcams de 1 MP de las antiguas series Legion 5 15 o IdeaPad Gaming 15. Se incluye un interruptor de apagado de cámara mientras que el IR no aparece por ninguna parte.


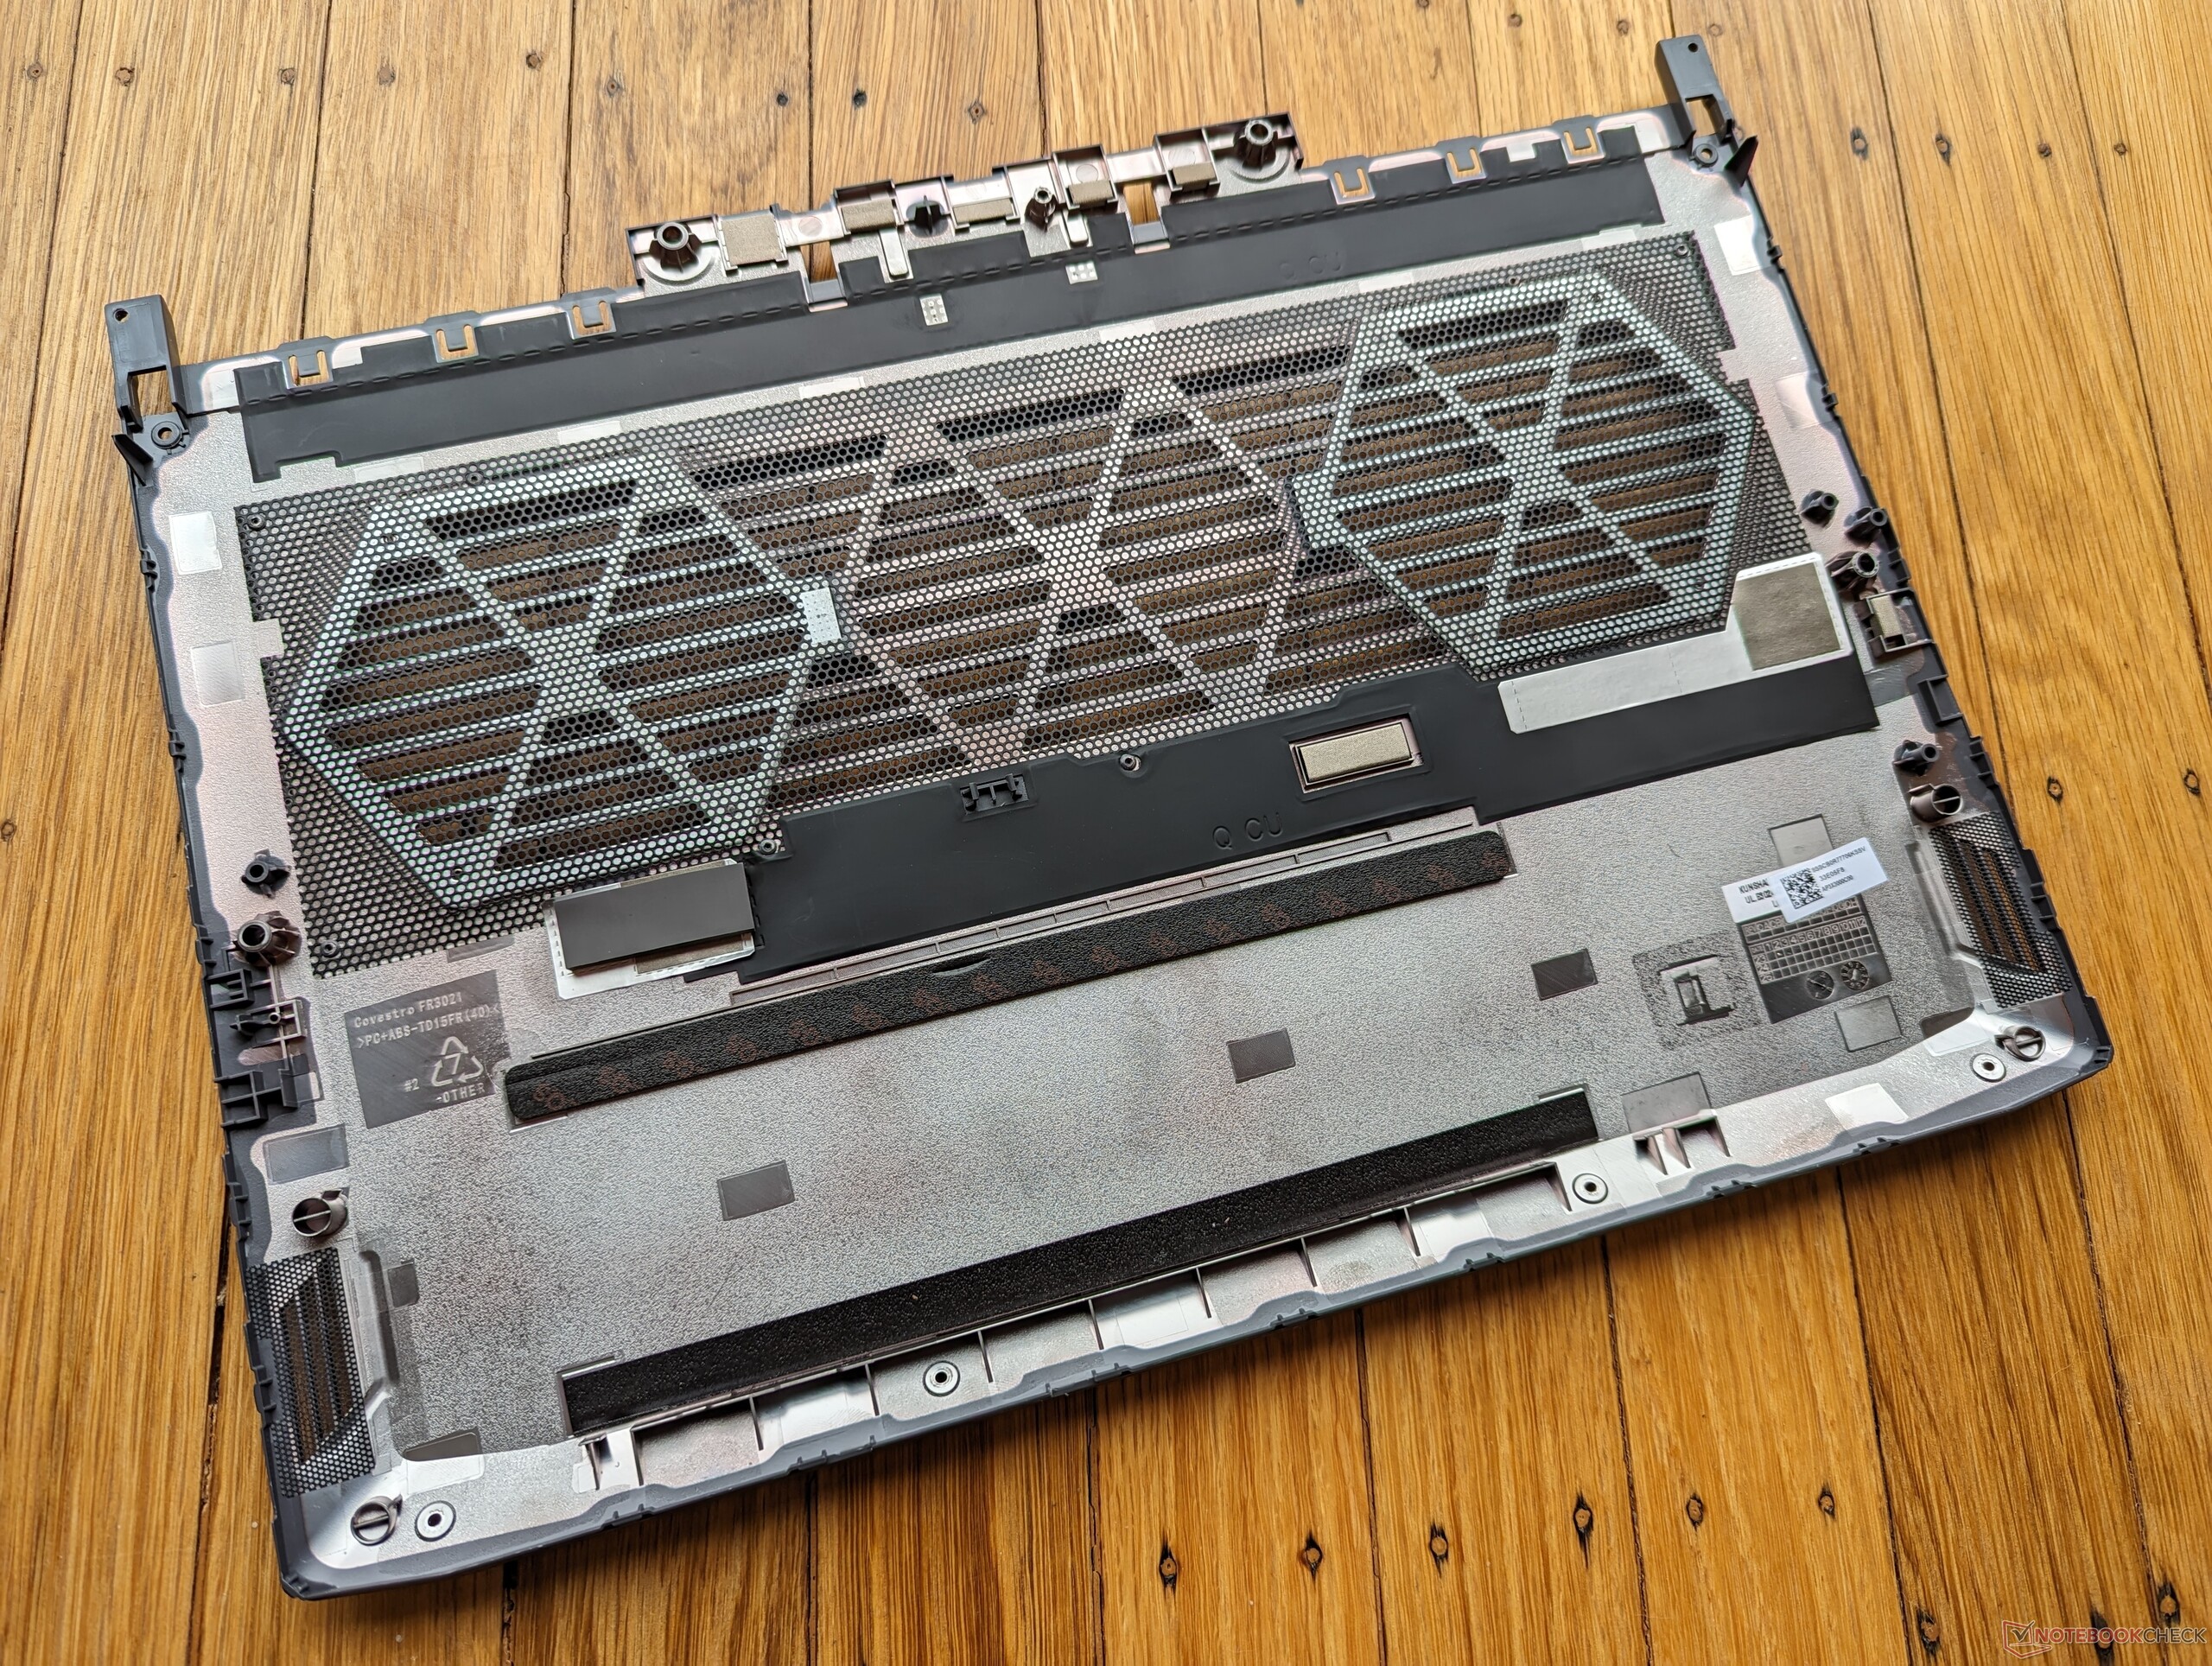
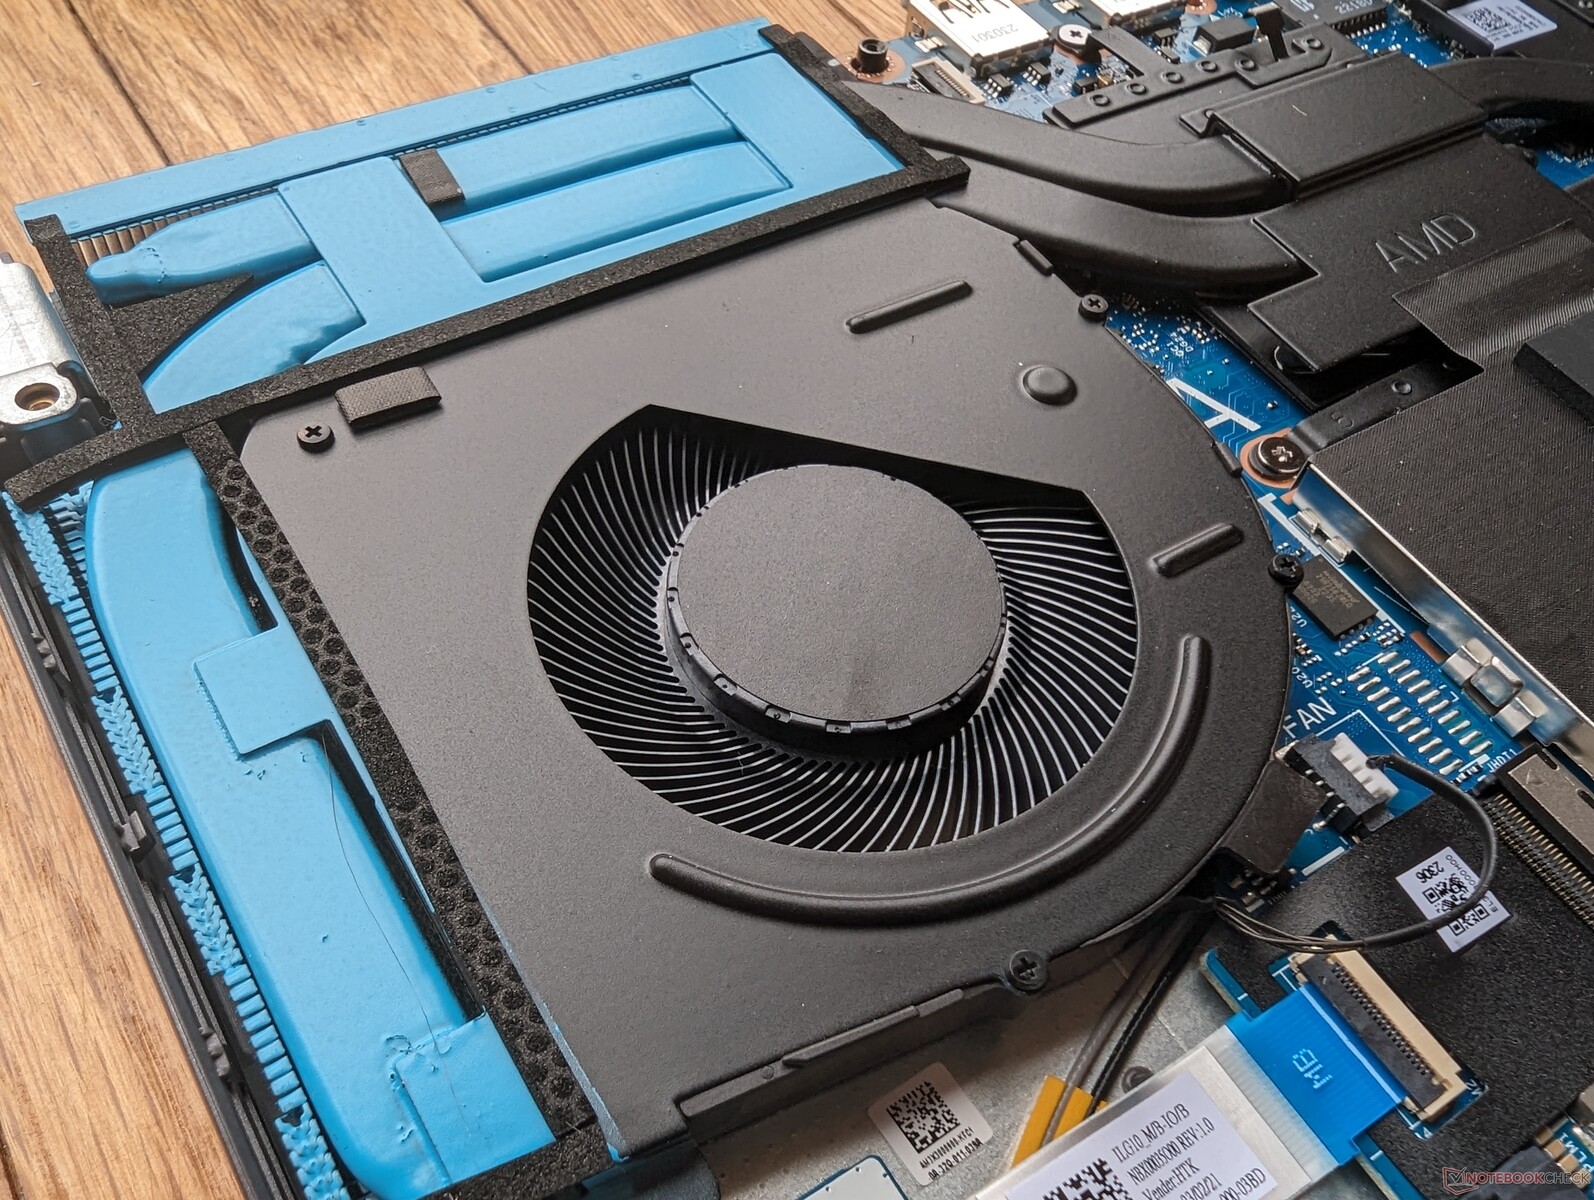
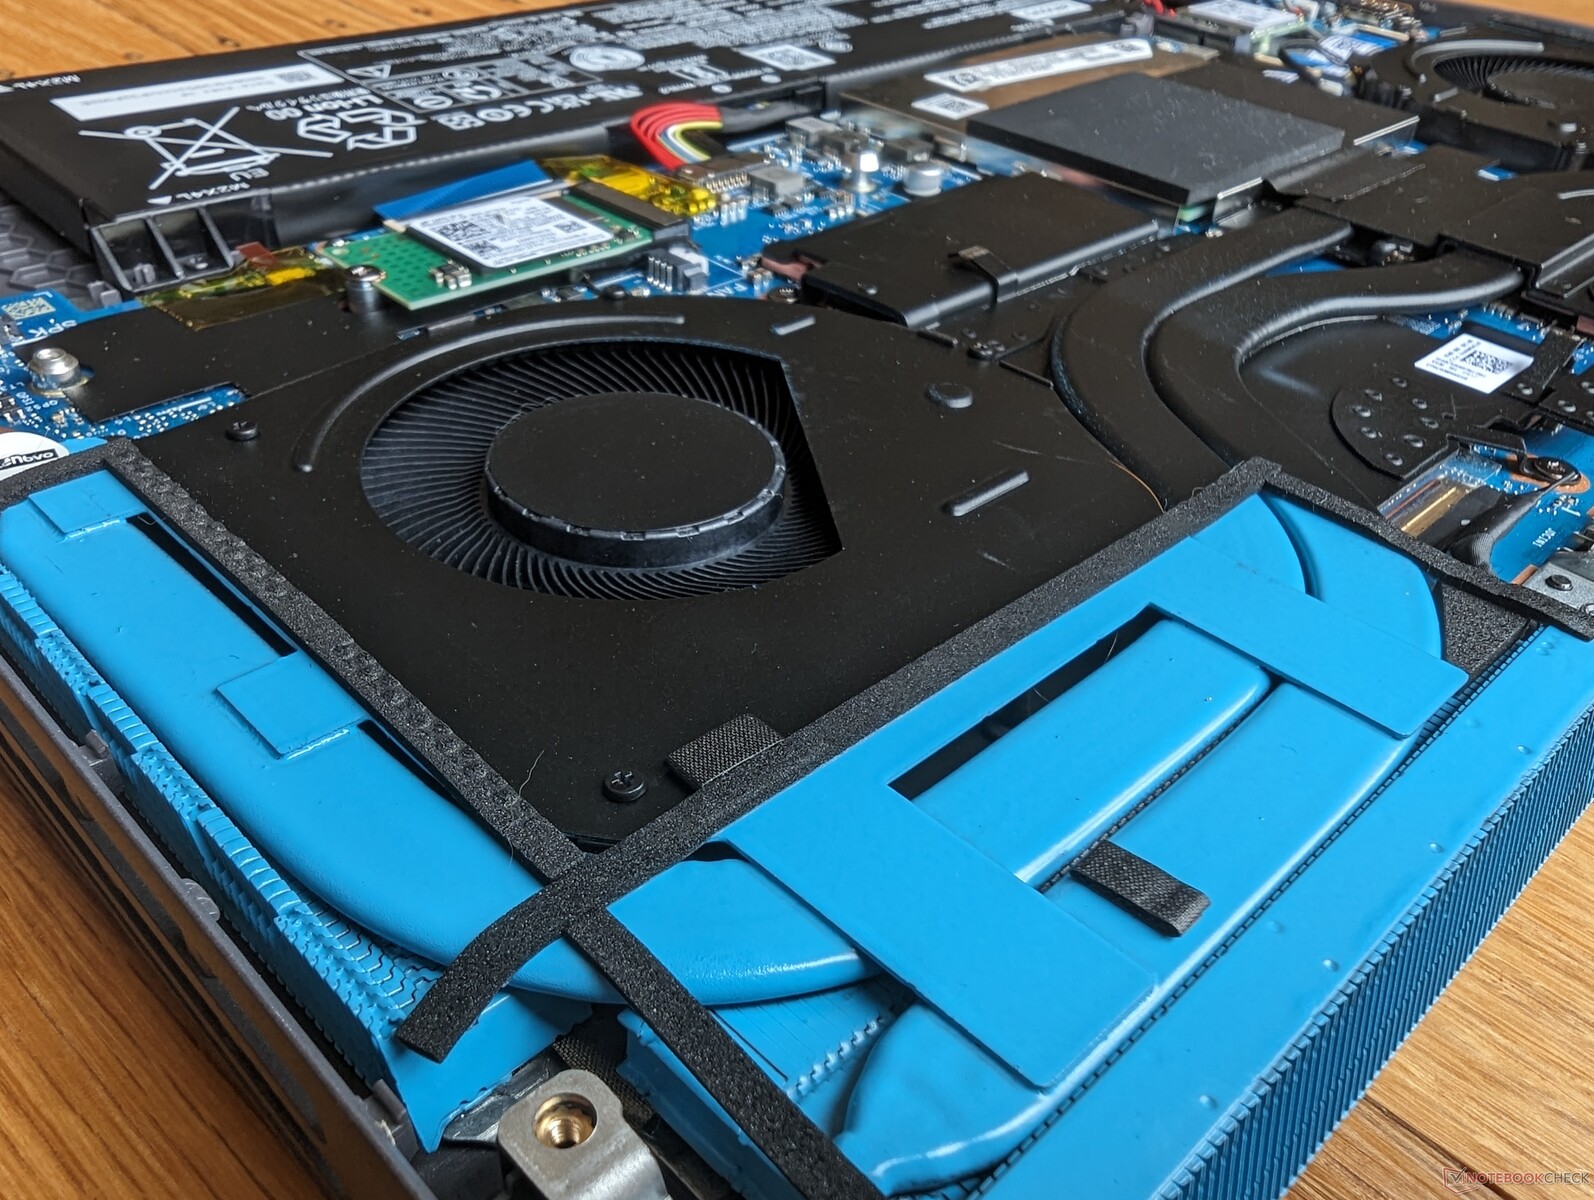
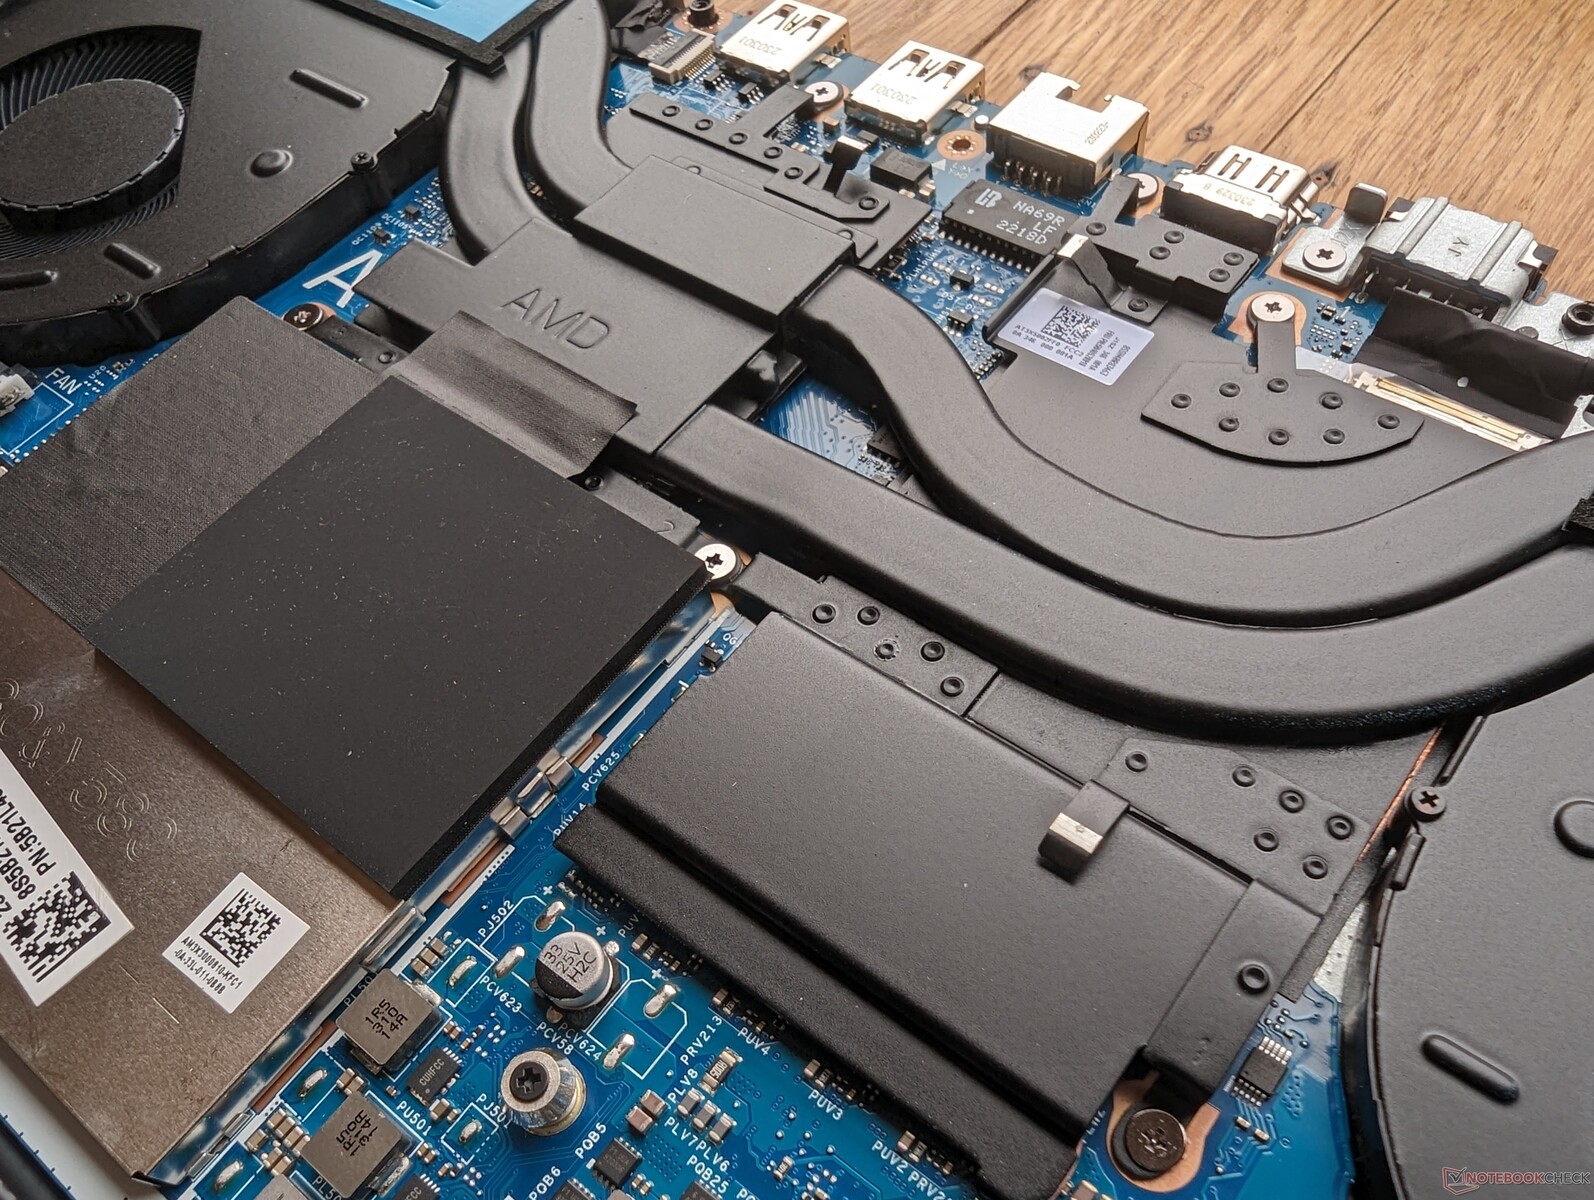
Mantenimiento
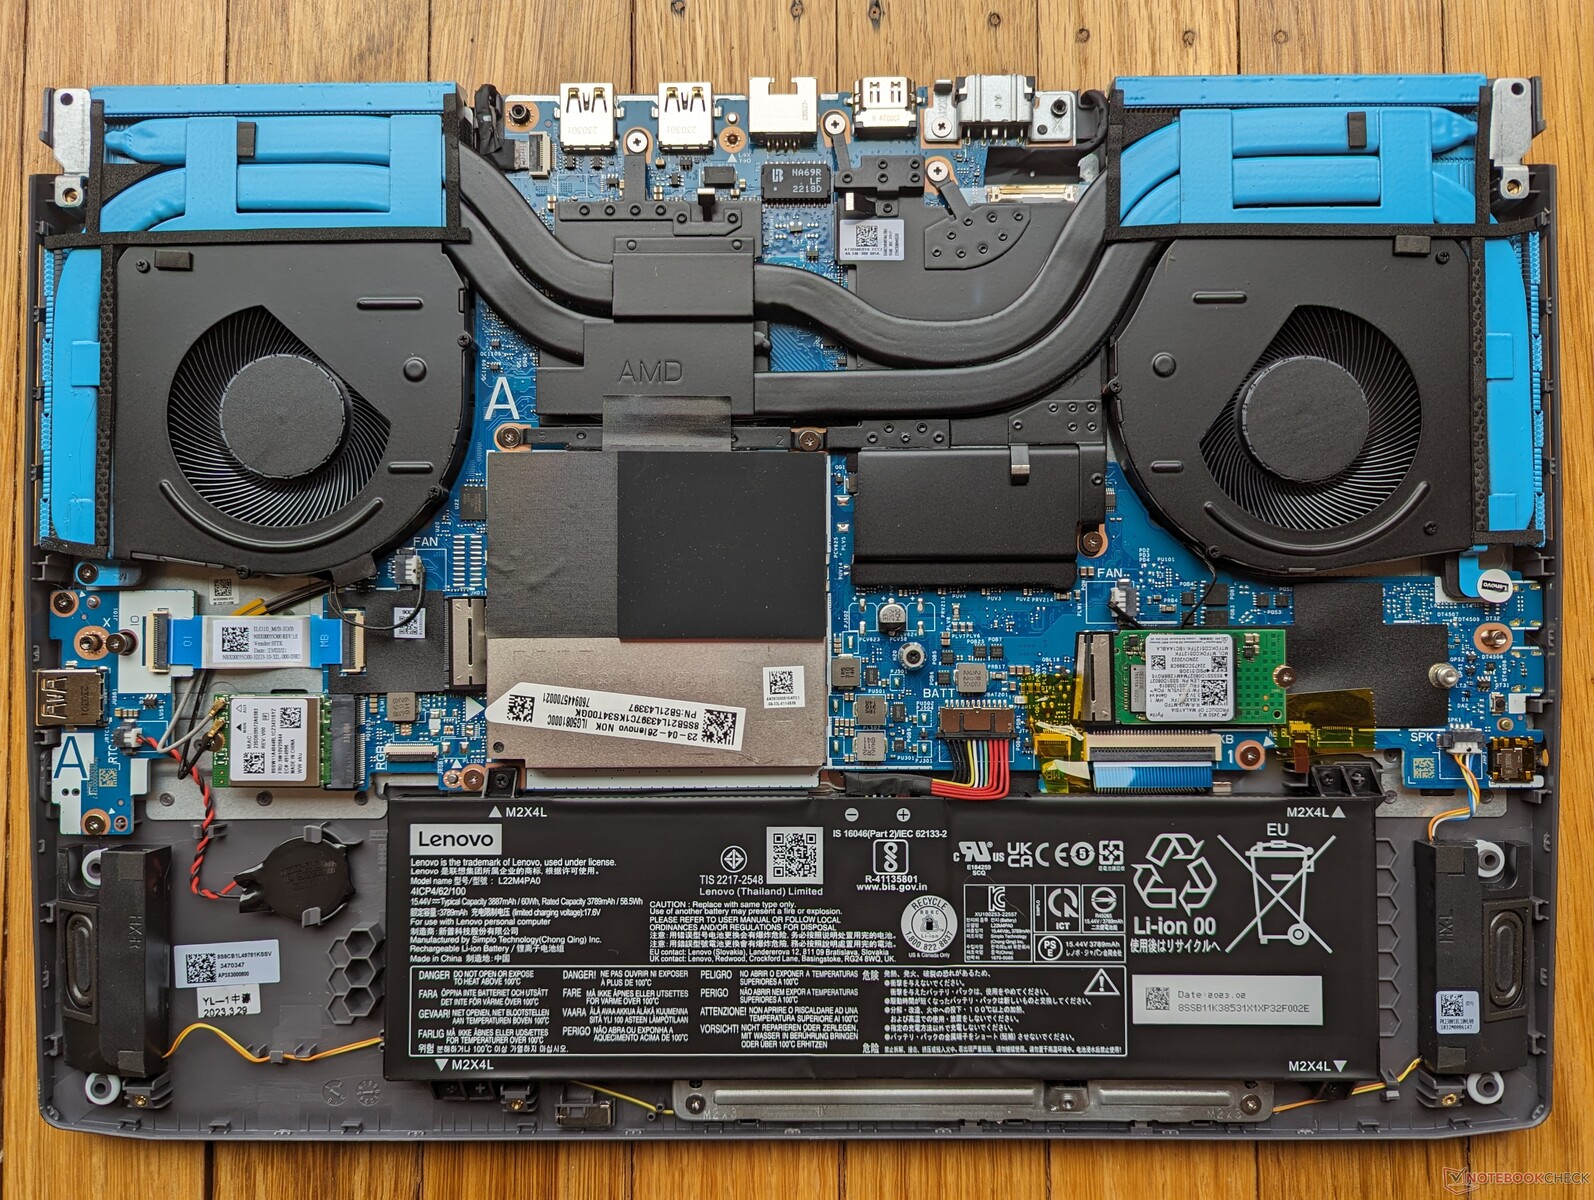
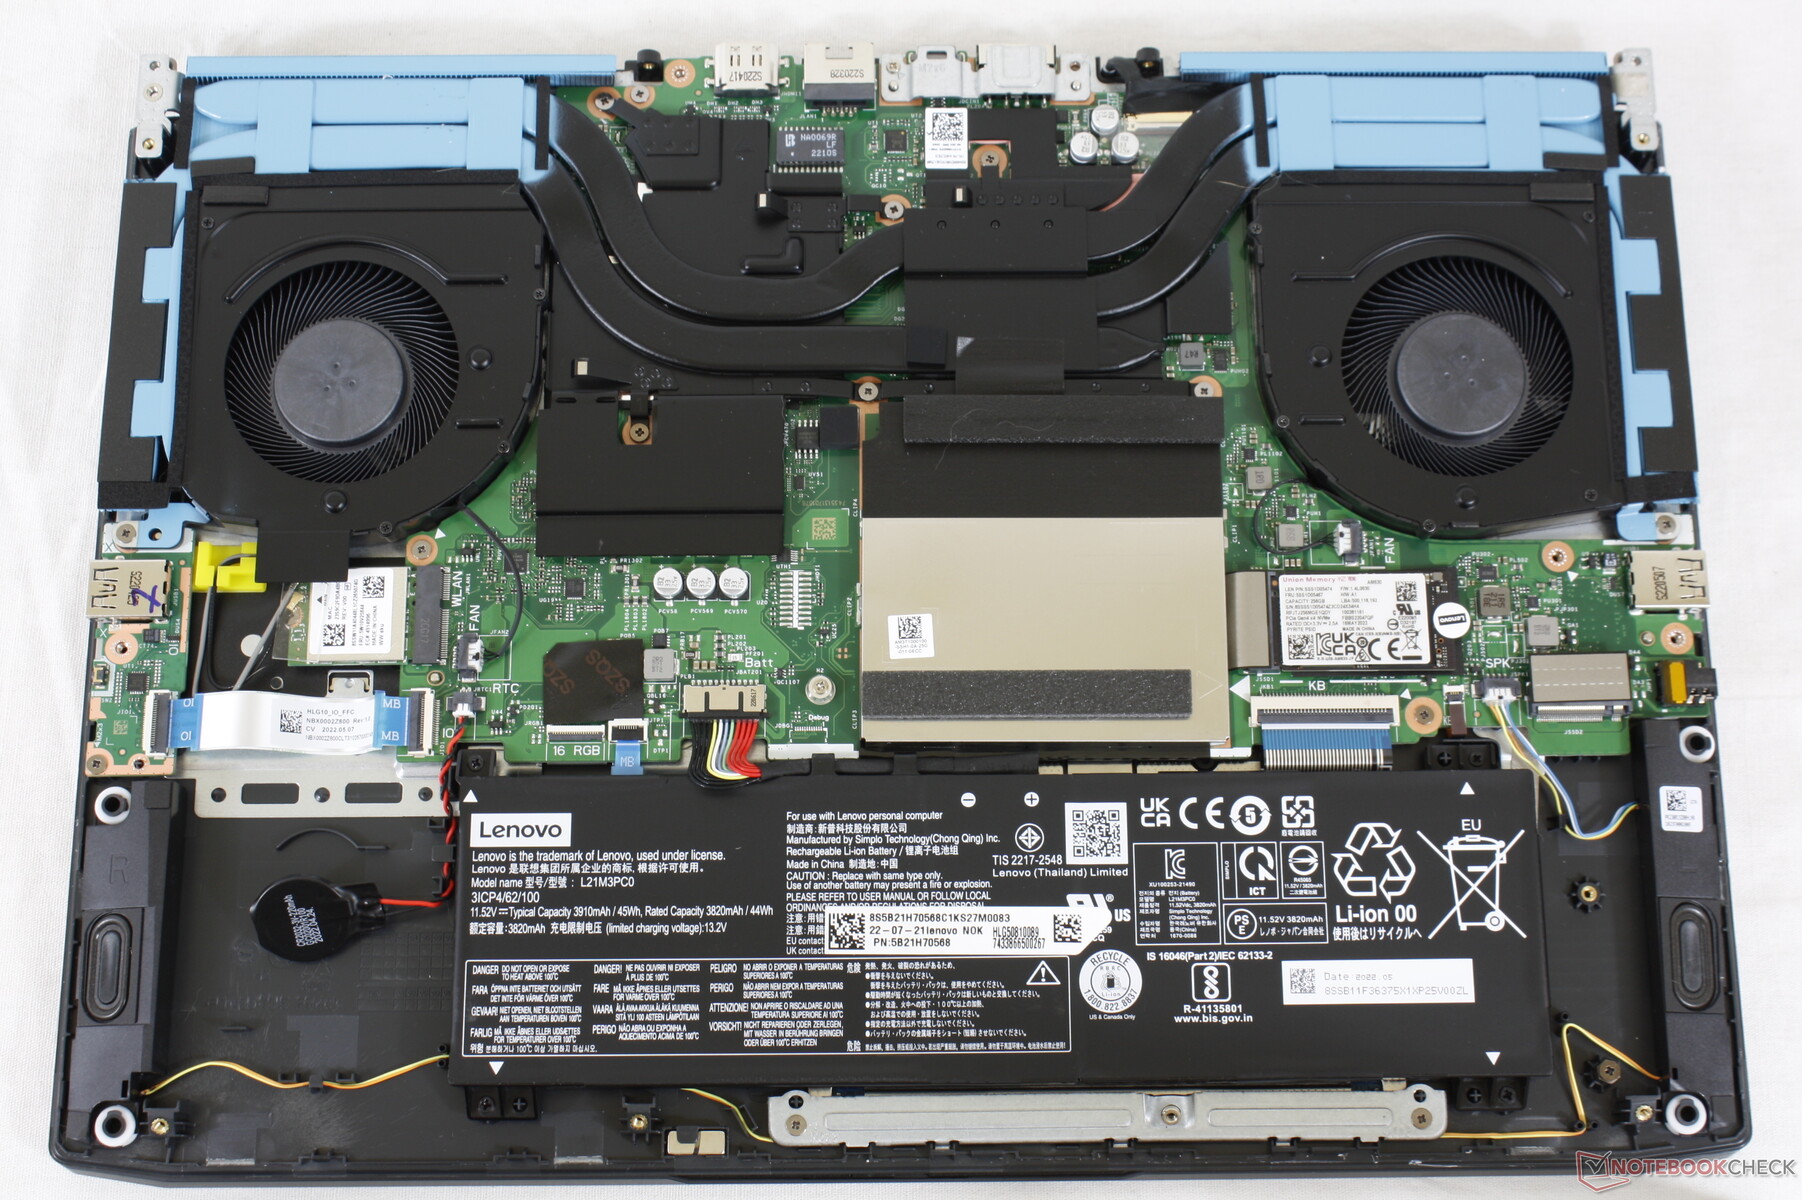
Las mejoras para el usuario final requieren un poco más de esfuerzo que en la mayoría de portátiles para juegos, ya que primero hay que retirar la parte trasera del chasis antes de poder sacar el panel inferior. Un total de 13 tornillos Phillips fijan las partes inferior y trasera.
Accesorios y garantía
No hay más extras en la caja que el adaptador de CA y la documentación. Se aplica la garantía estándar limitada de un año del fabricante si se compra en EE.UU.
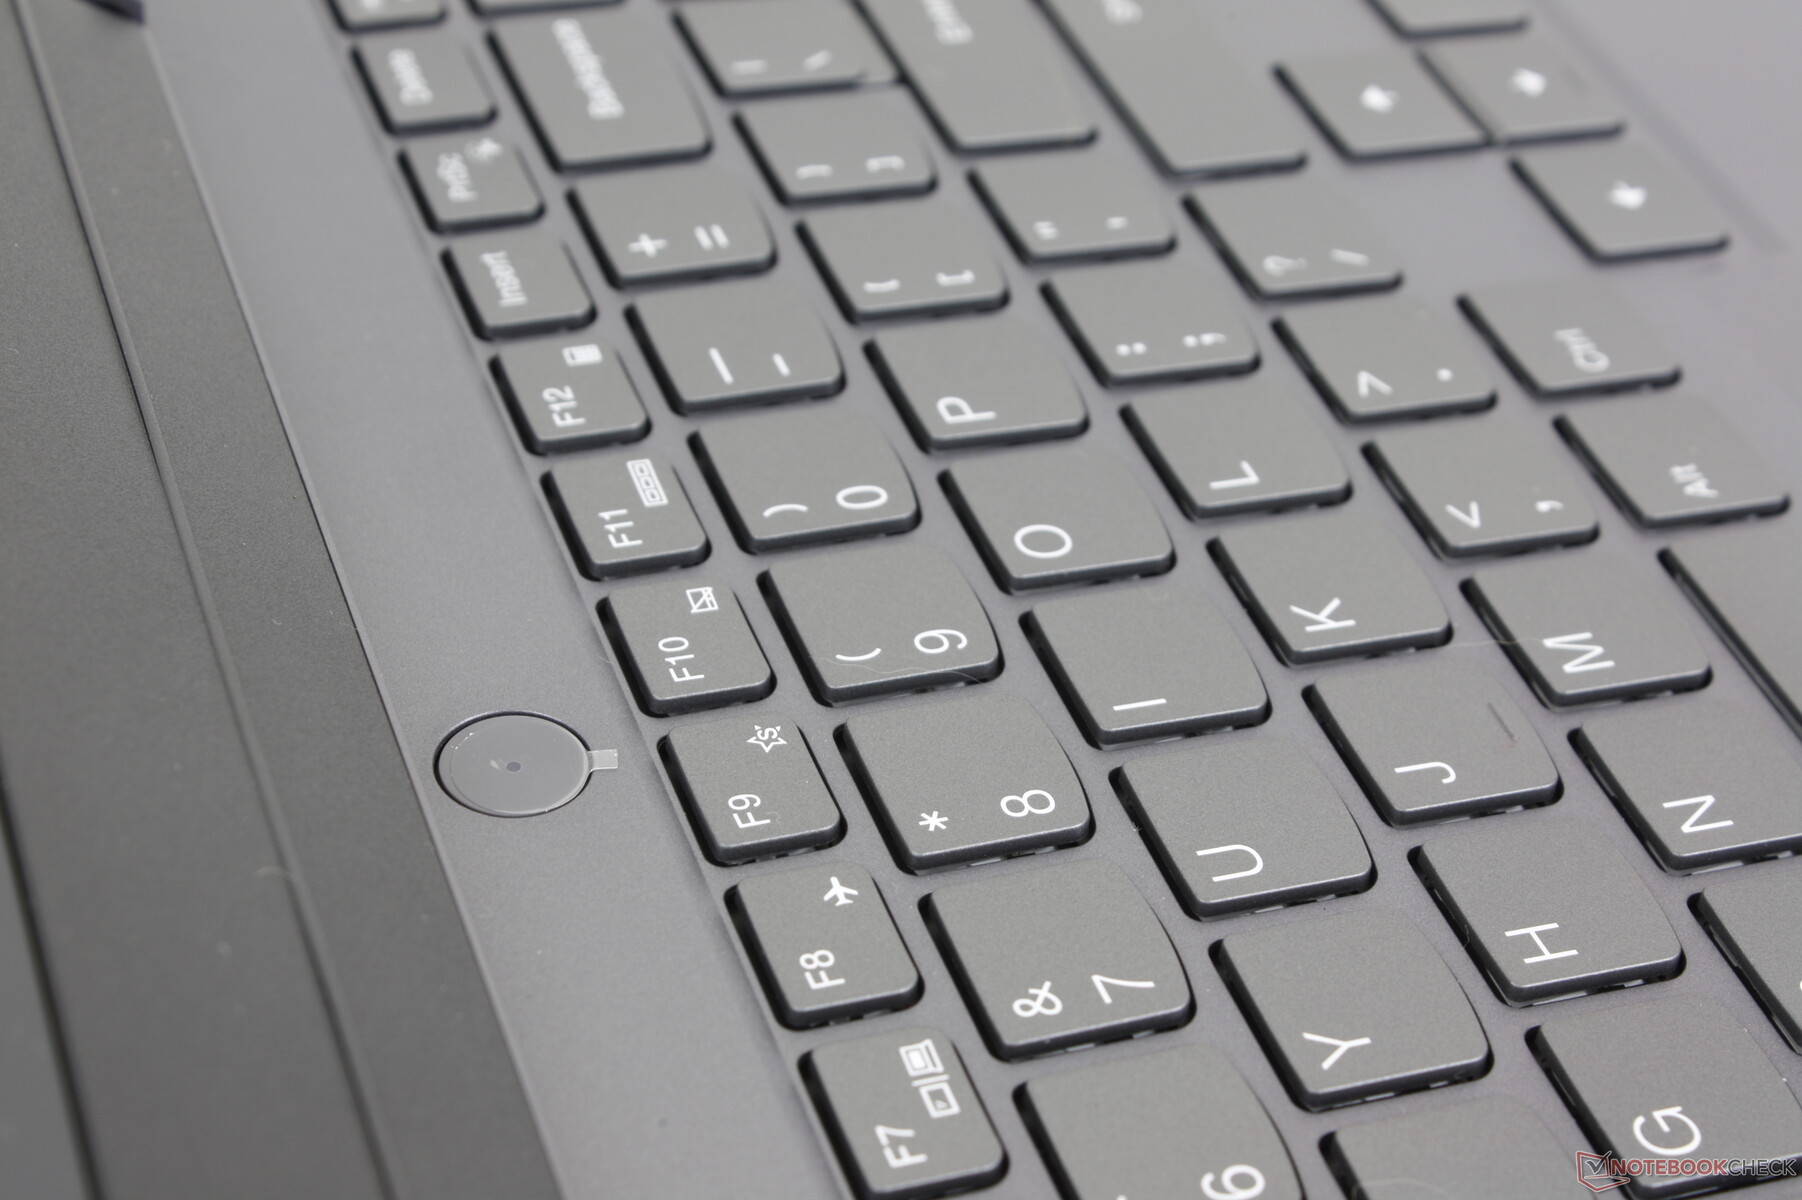
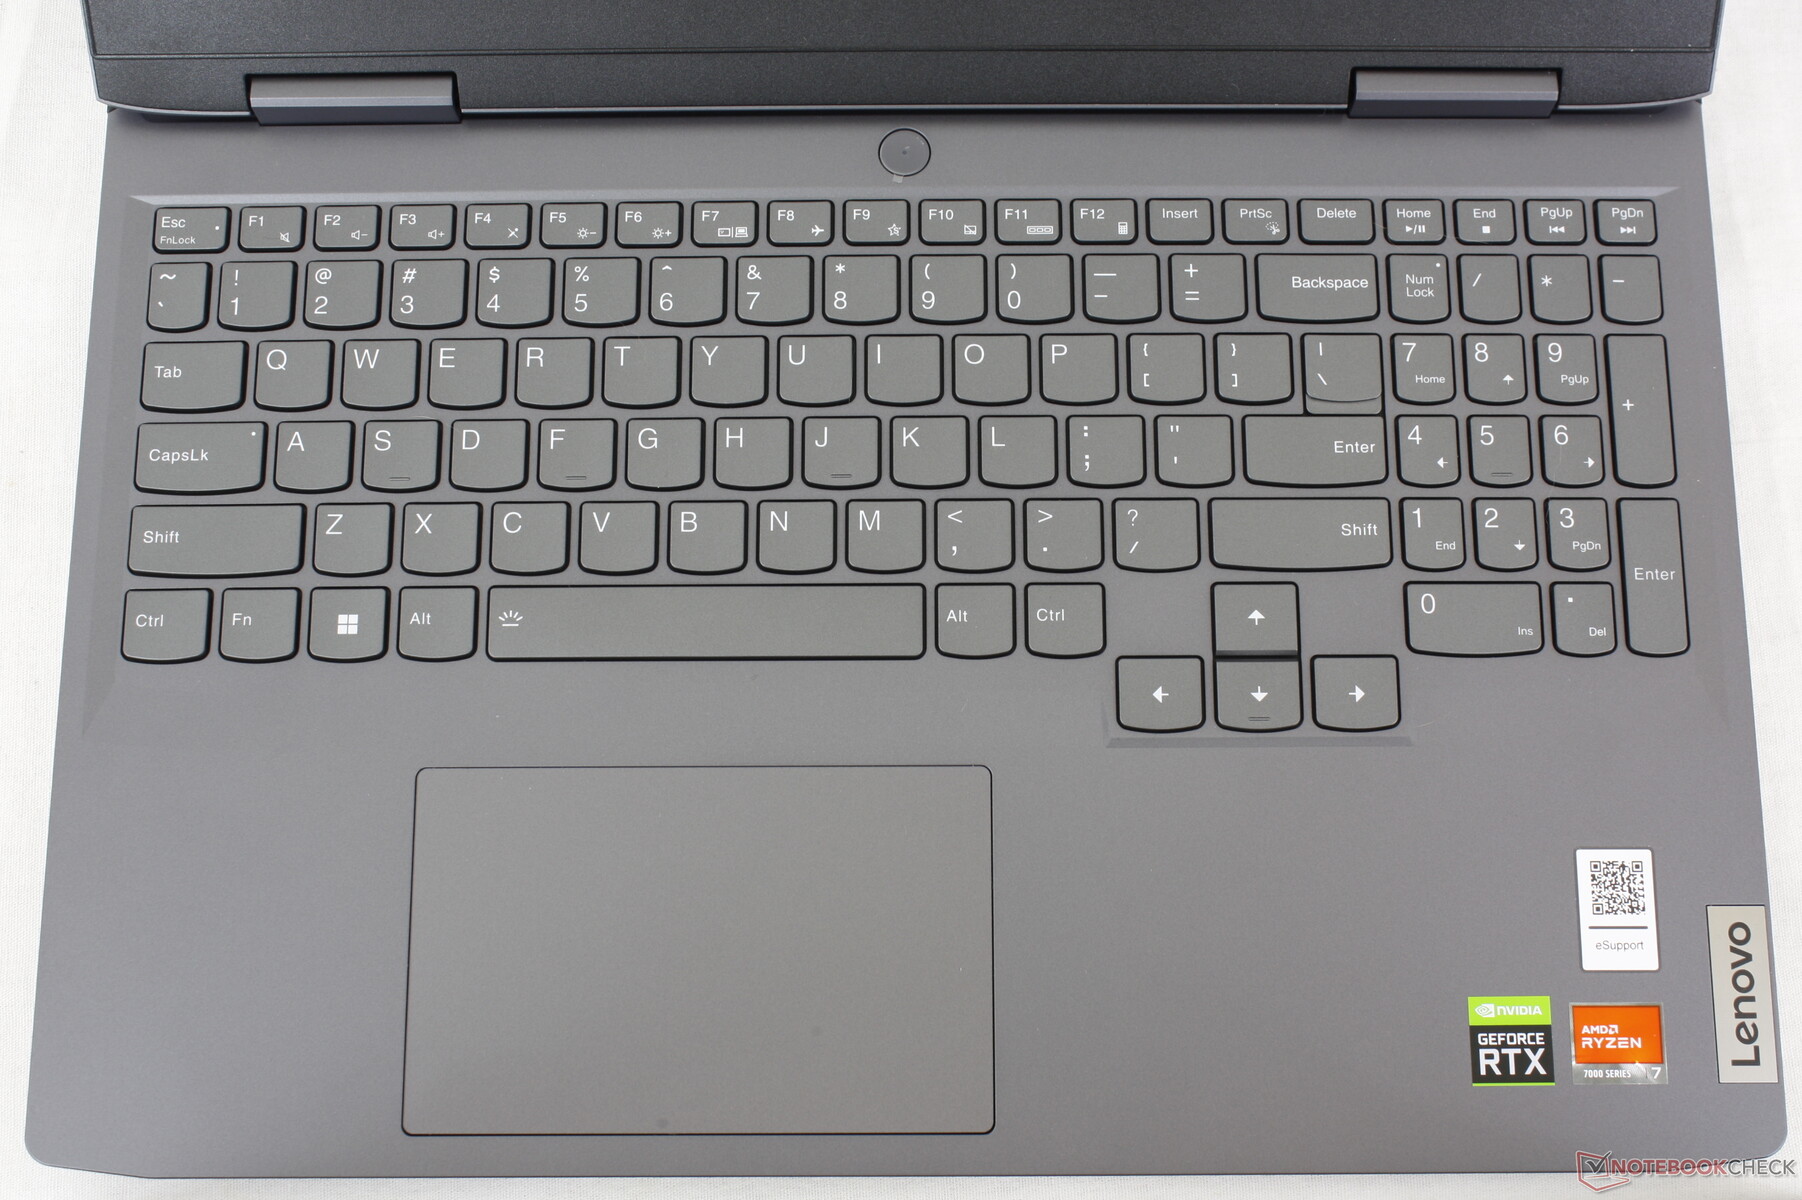
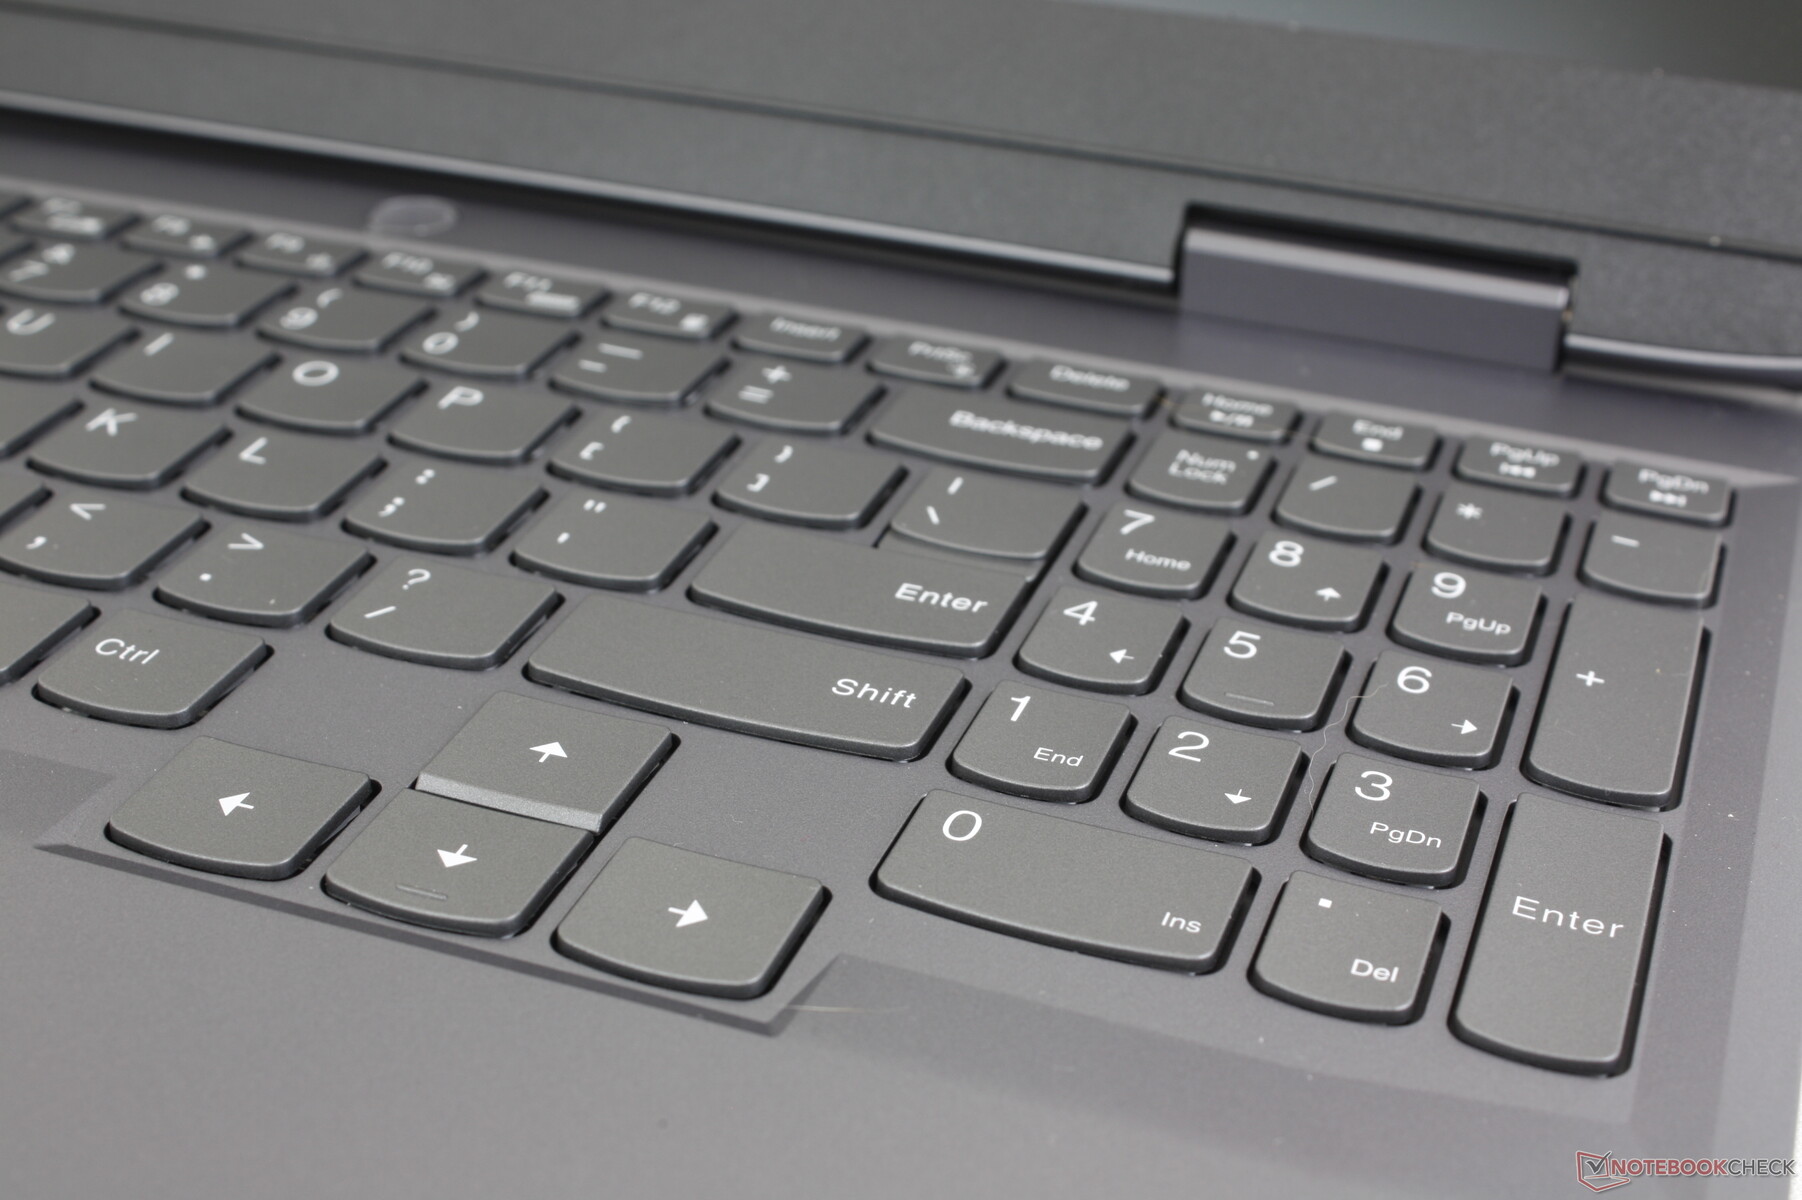
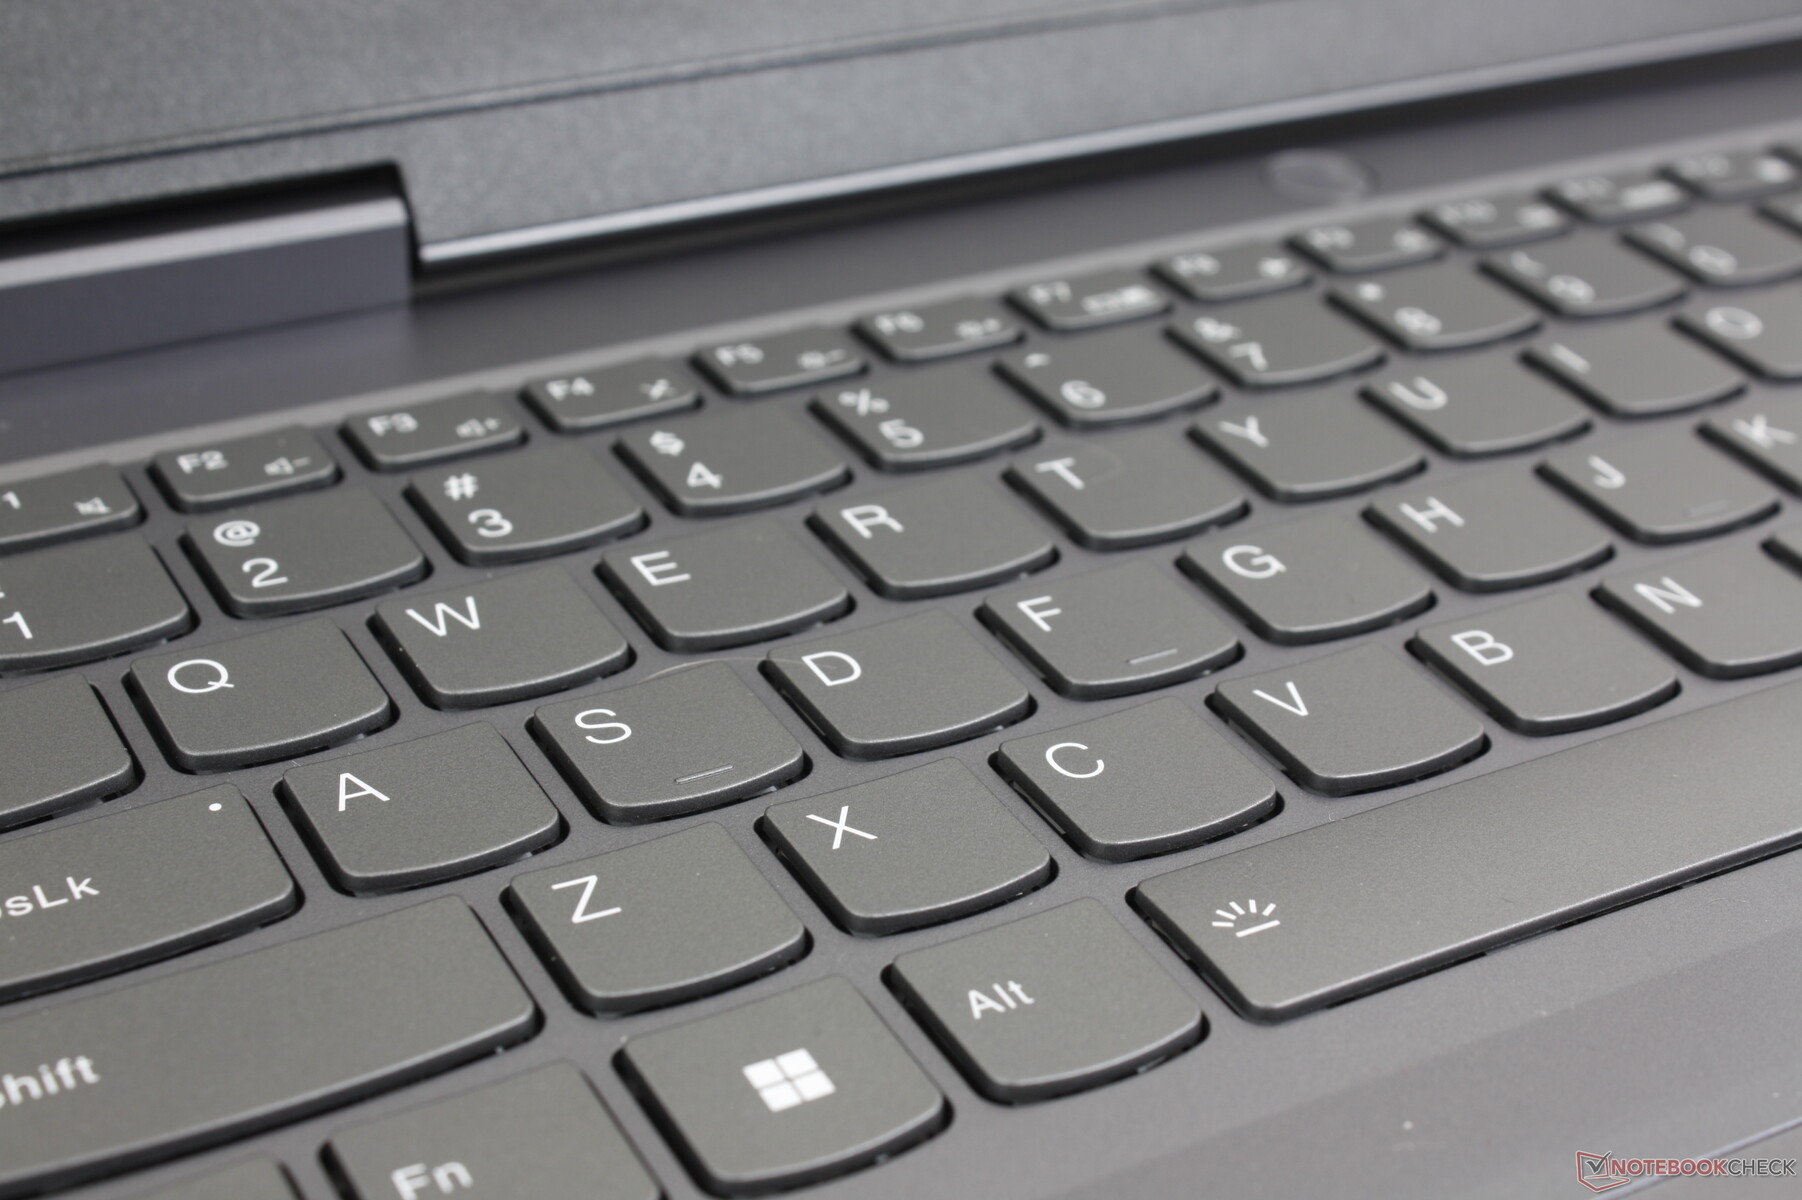
Dispositivos de entrada - Muy parecido a un IdeaPad
Teclado
El teclado sigue siendo idéntico al del IdeaPad Gaming 3 15 a pesar del cambio de nombre. Si has tecleado en un portátil IdeaPad o Yoga en el pasado, el teclado del LOQ 15 te resultará familiar al instante. Subjetivamente, las teclas del LOQ 15 son un poco más firmes y precisas de lo habitual para una mejor experiencia de escritura que en un Asus VivoBook o HP Pavilion 15.
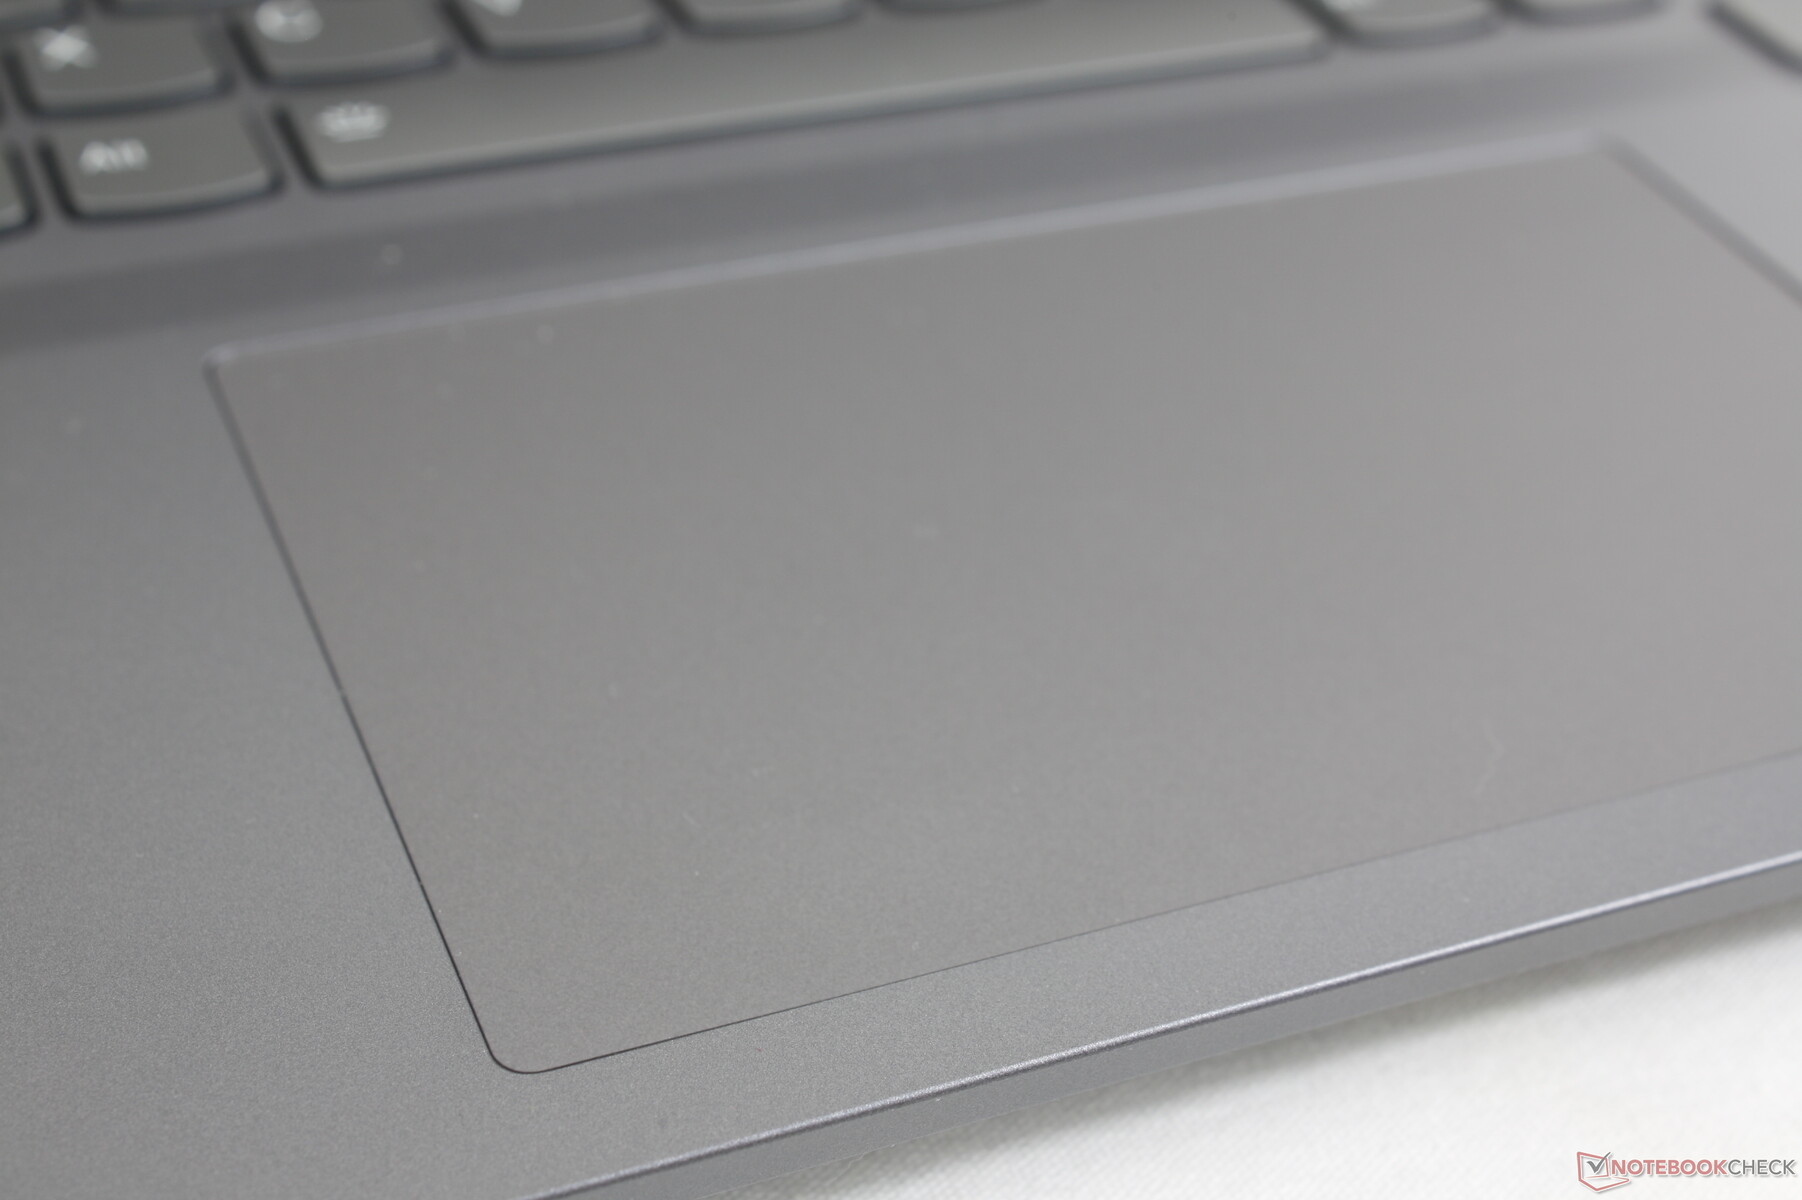
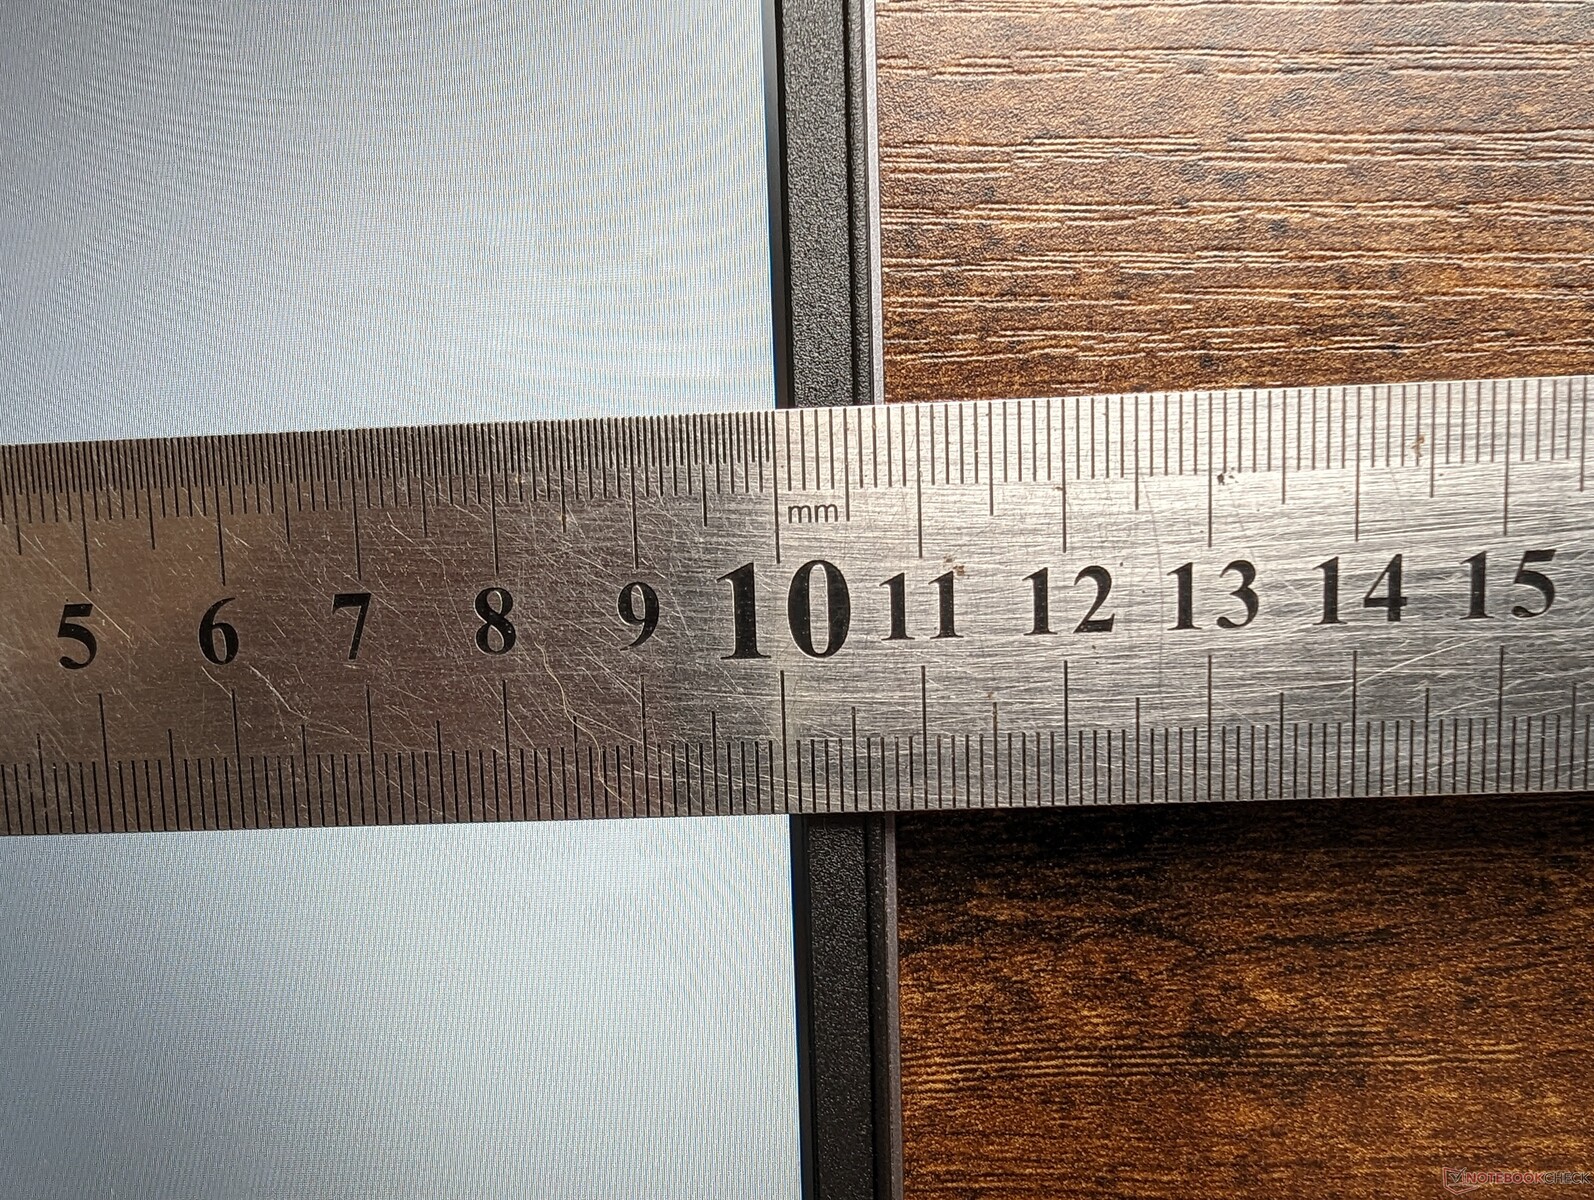
Panel táctil
El clickpad es ligeramente más pequeño que el del IdeaPad Gaming 3 15 del año pasado (12 x 7,5 cm frente a 12,5 x 7,5 cm). Sin embargo, el clickpad en el LOQ 15 se siente más firme y clickier que el clickpad en el IdeaPad para ser más satisfactorio de usar. El ruido es notablemente más fuerte como resultado de la respuesta más nítida.
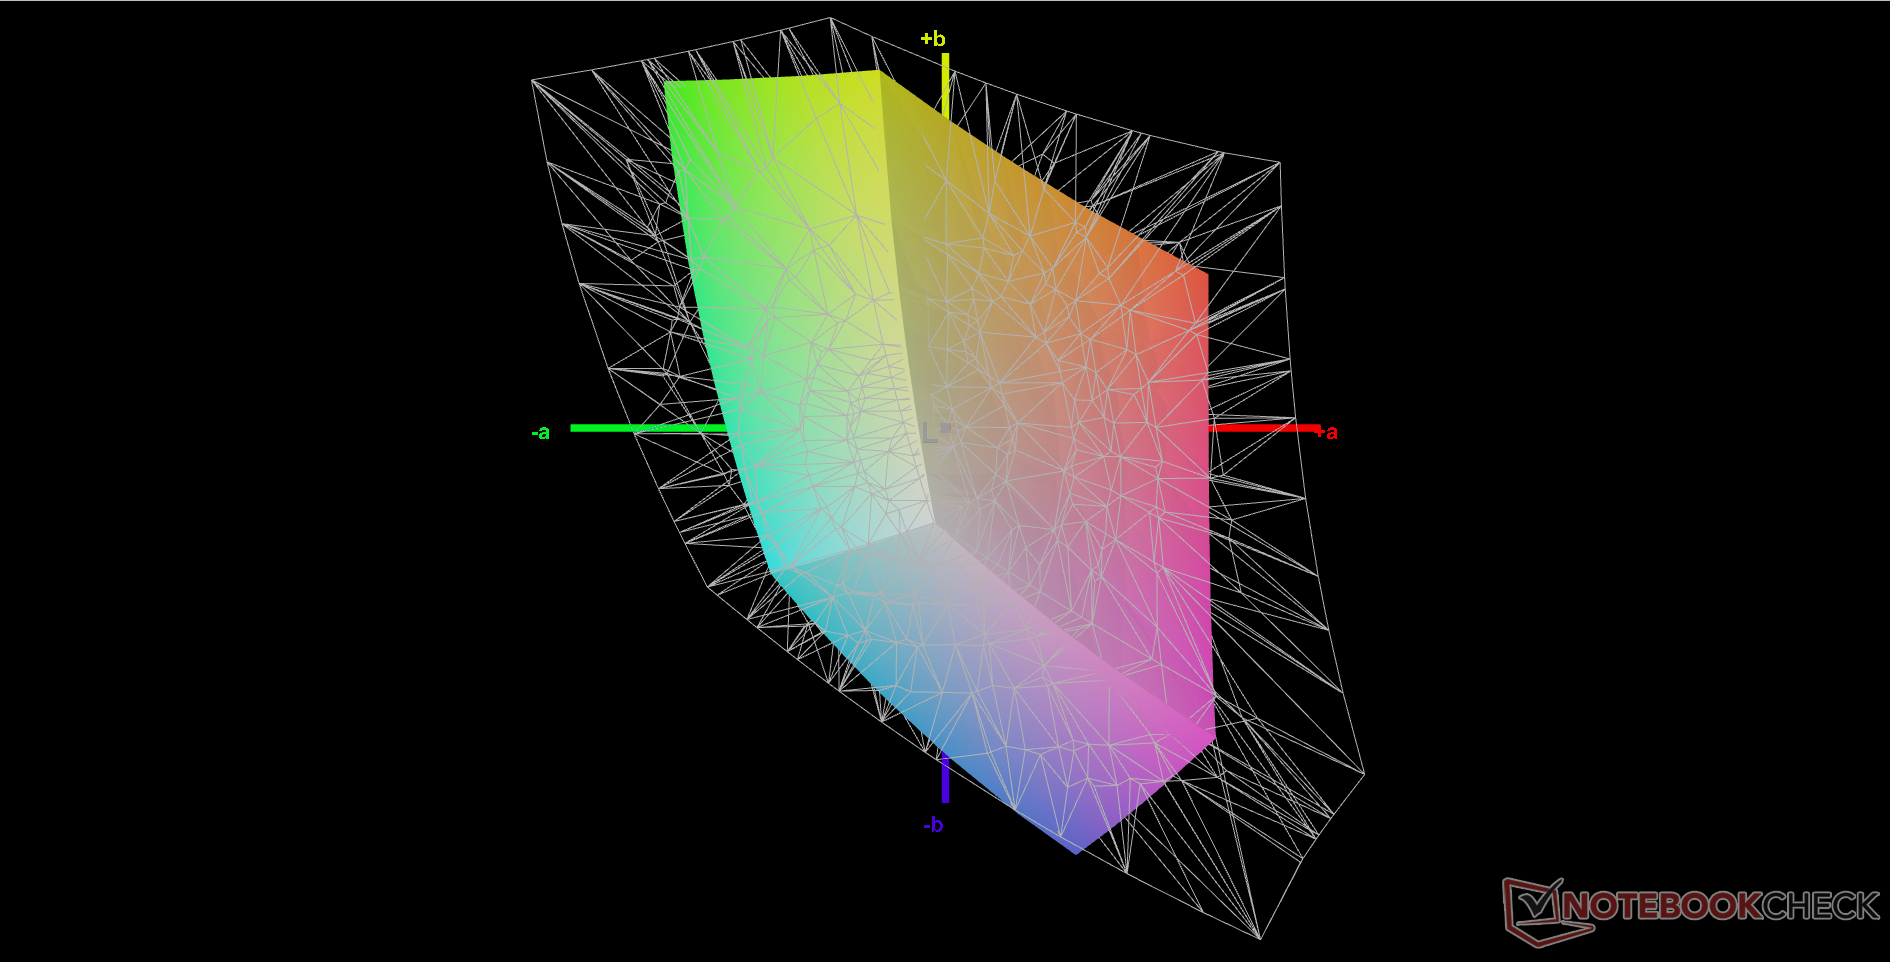
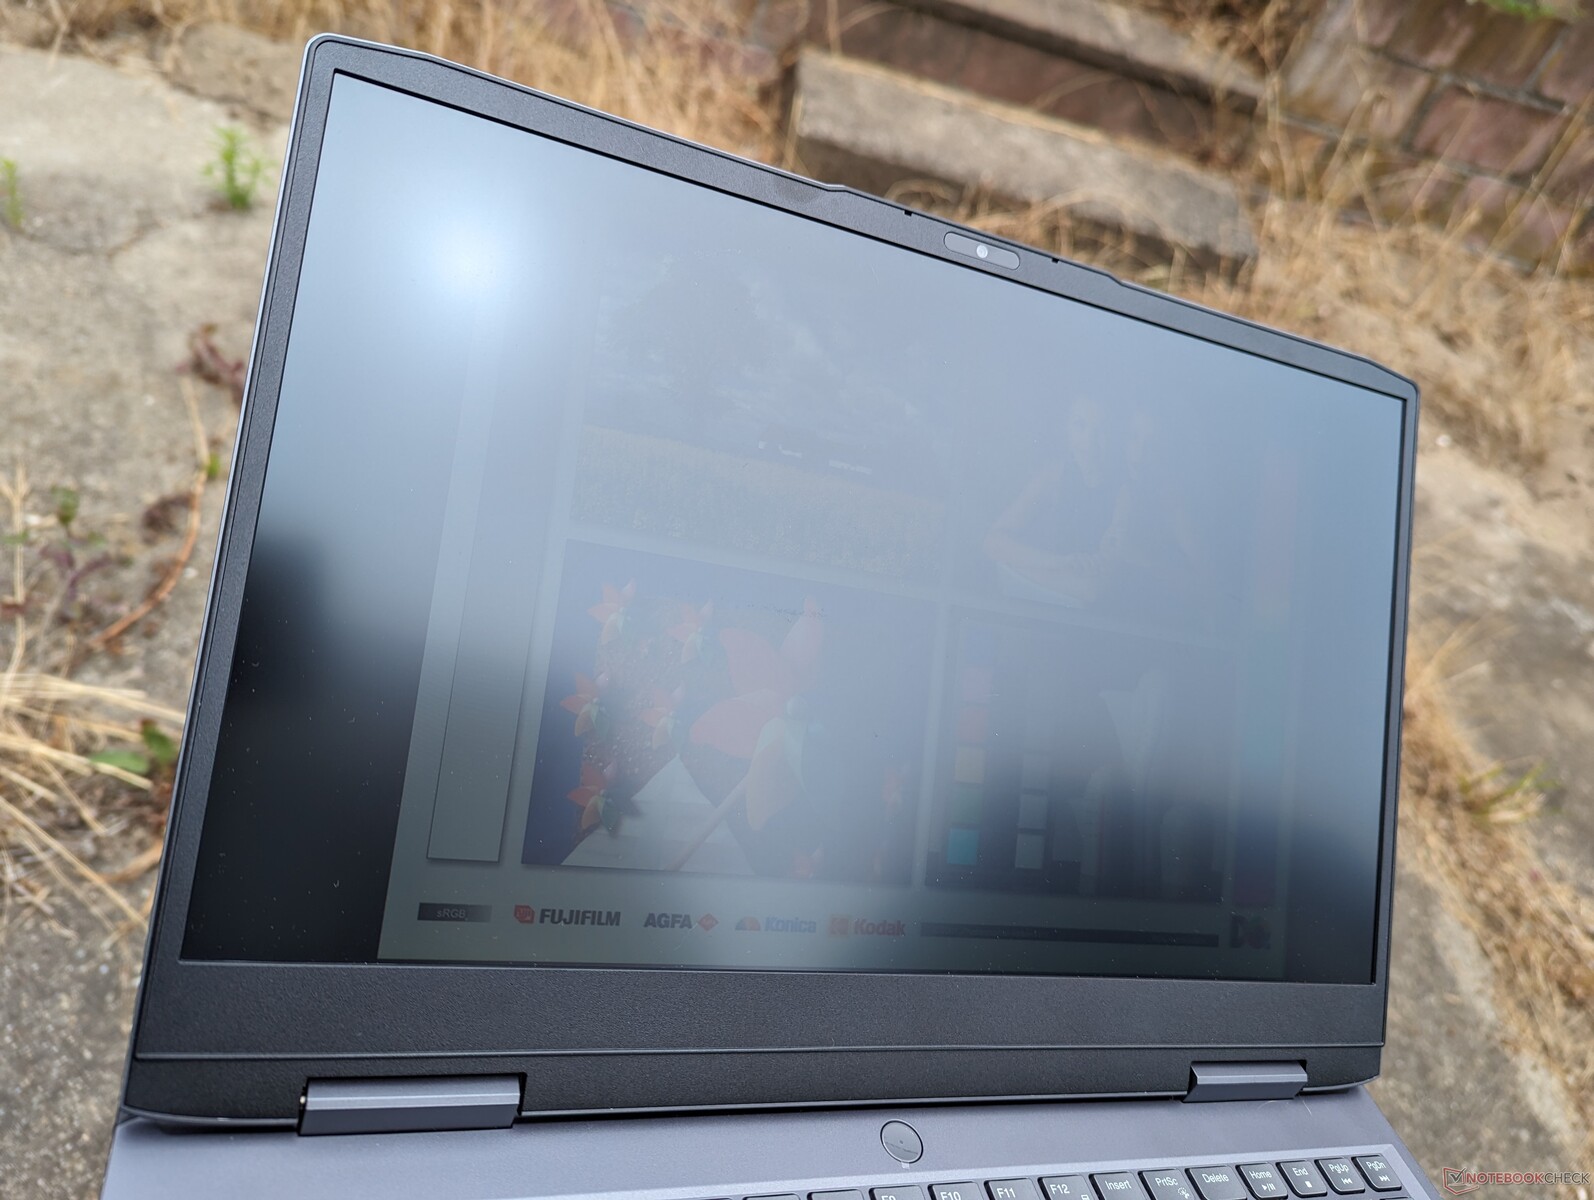
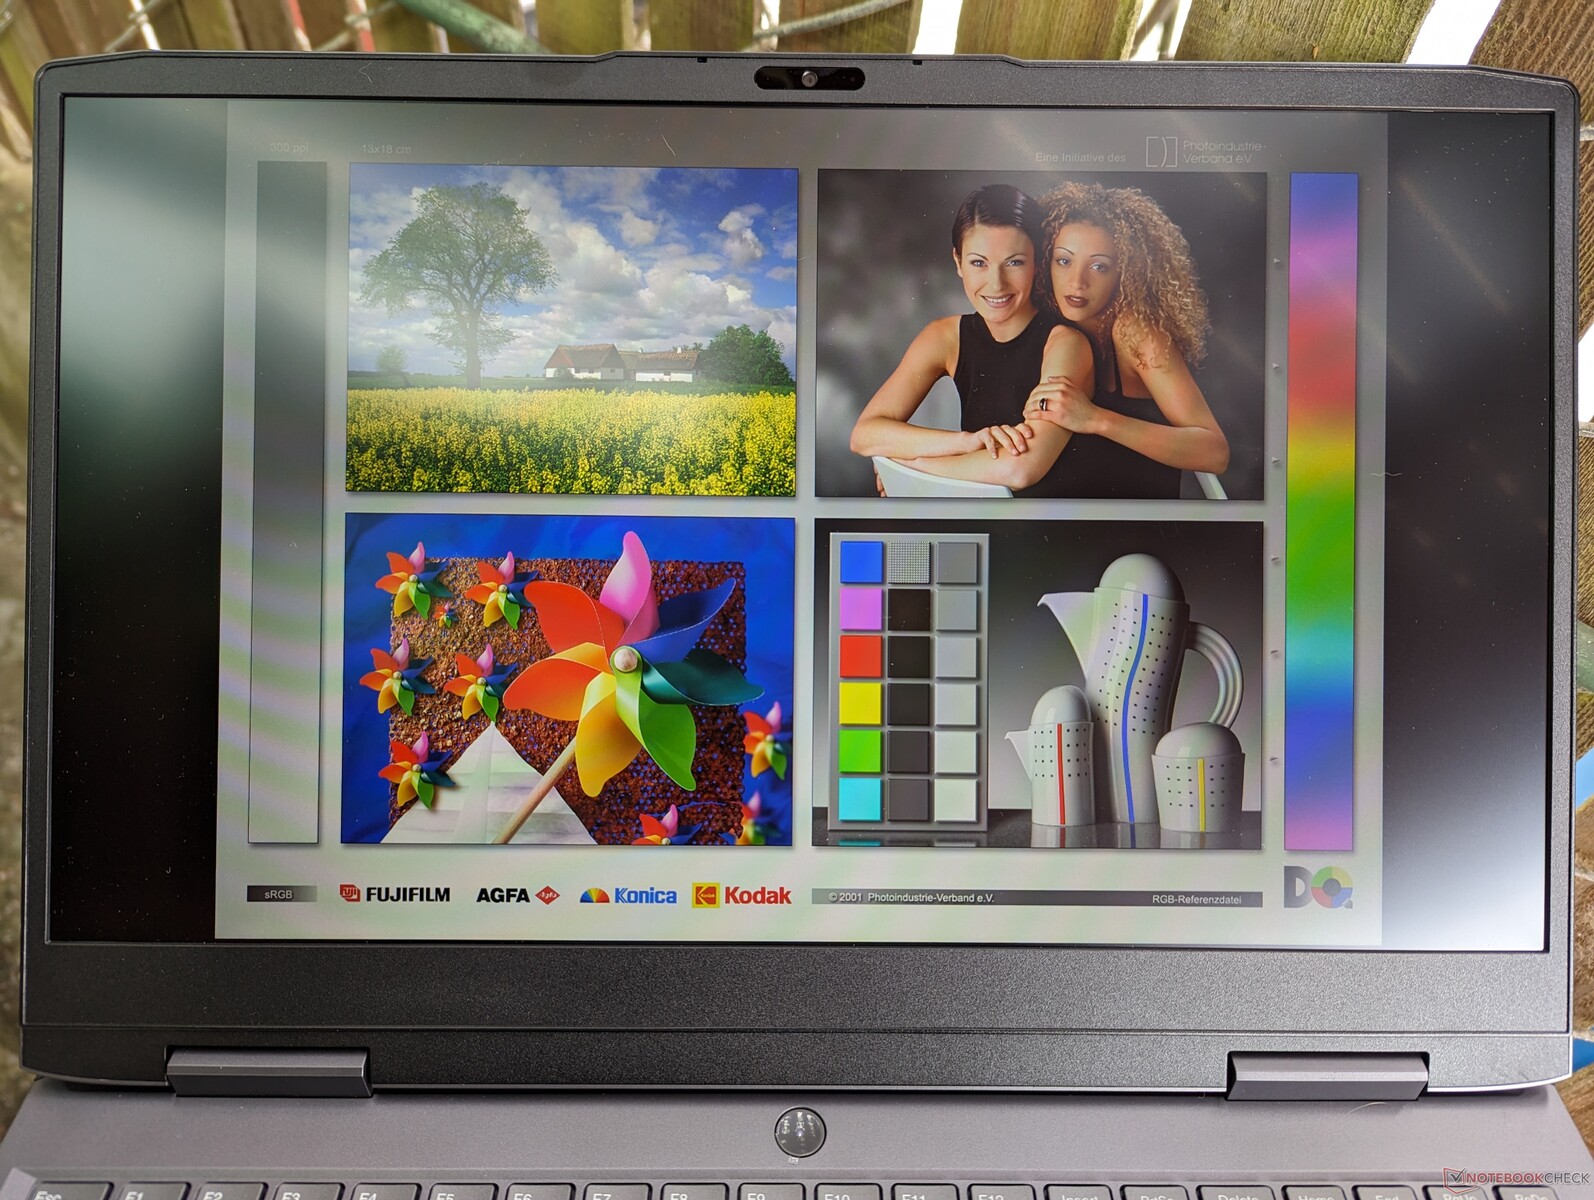
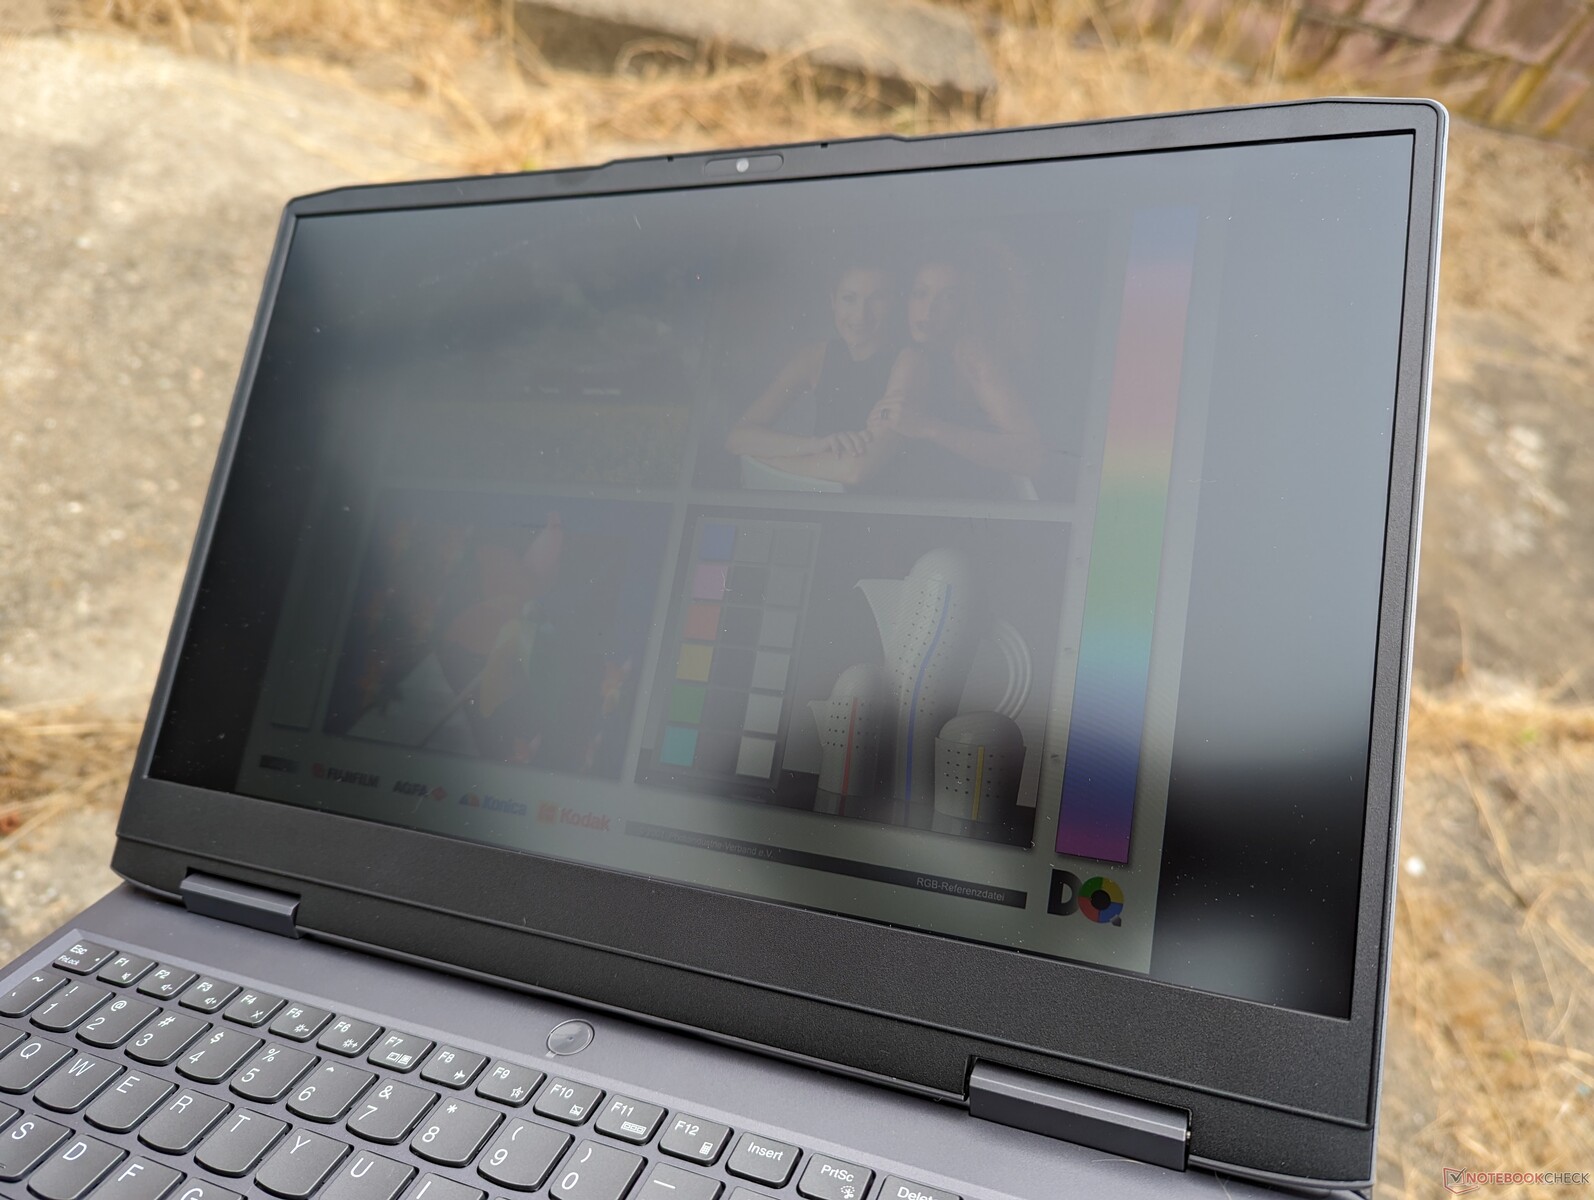
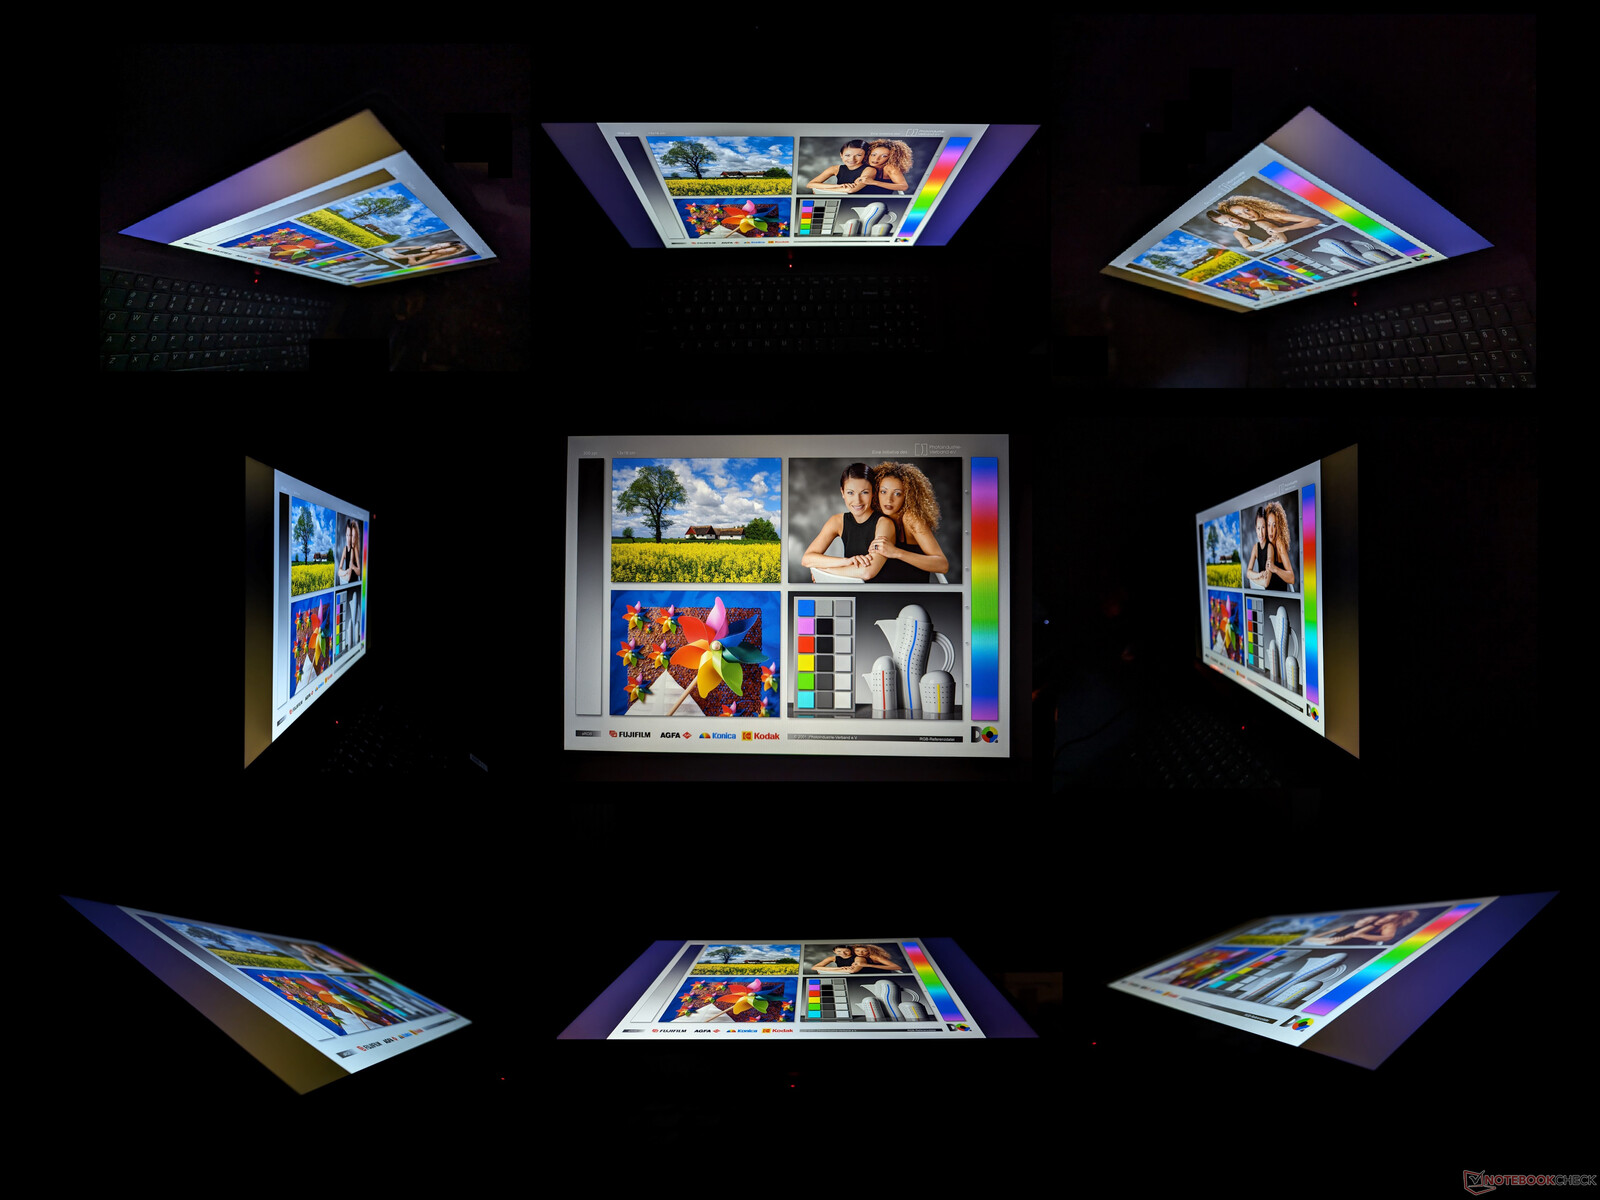
Pantalla - 1080p combina bien con la GeForce RTX 4050
Hay tres configuraciones de pantalla disponibles, todas ellas con paneles IPS:
- 1080p, 300 nits, 60% sRGB, 60 Hz
- 1080p, 350 nits, 60% sRGB, 144 Hz, Advanced Optimus, G-Sync
- 1440p, 350 nits, 100% sRGB, 165 Hz, Advanced Optimus, G-Sync
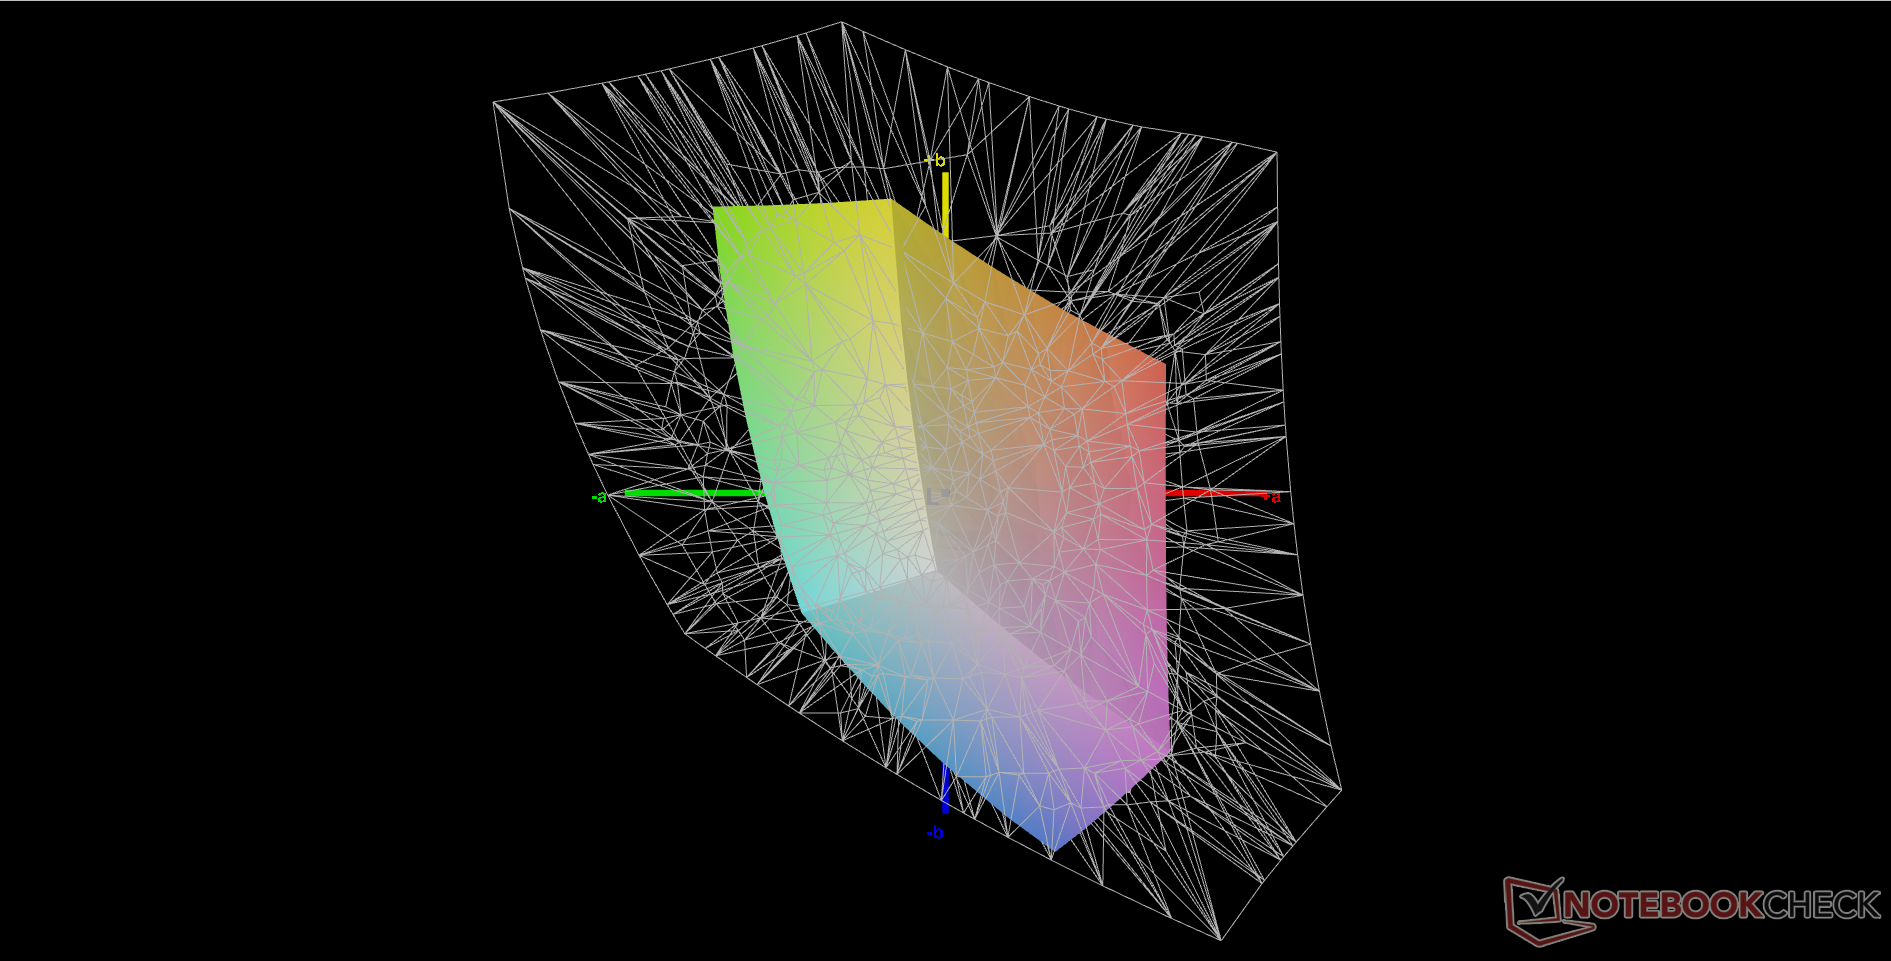
Nuestra configuración y mediciones reflejan sólo la opción en negrita de arriba. Aunque 1080p es suficiente para una máquina de juego barata, la limitada cobertura de color y los tiempos de respuesta relativamente lentos se notan inmediatamente a través de colores menos profundos y efecto fantasma, respectivamente. Si te gusta la edición de gráficos o los shooters en primera persona, entonces es recomendable conectar un monitor externo con mejores colores y tiempos de respuesta más rápidos o seleccionar la opción de panel 1440p de mayor calidad. El competidorAsus TUF A15 ofrece un panel 1080p con cobertura sRGB completa mientras que nuestro Lenovo no.

| |||||||||||||||||||||||||
iluminación: 81 %
Brillo con batería: 346.2 cd/m²
Contraste: 1117:1 (Negro: 0.31 cd/m²)
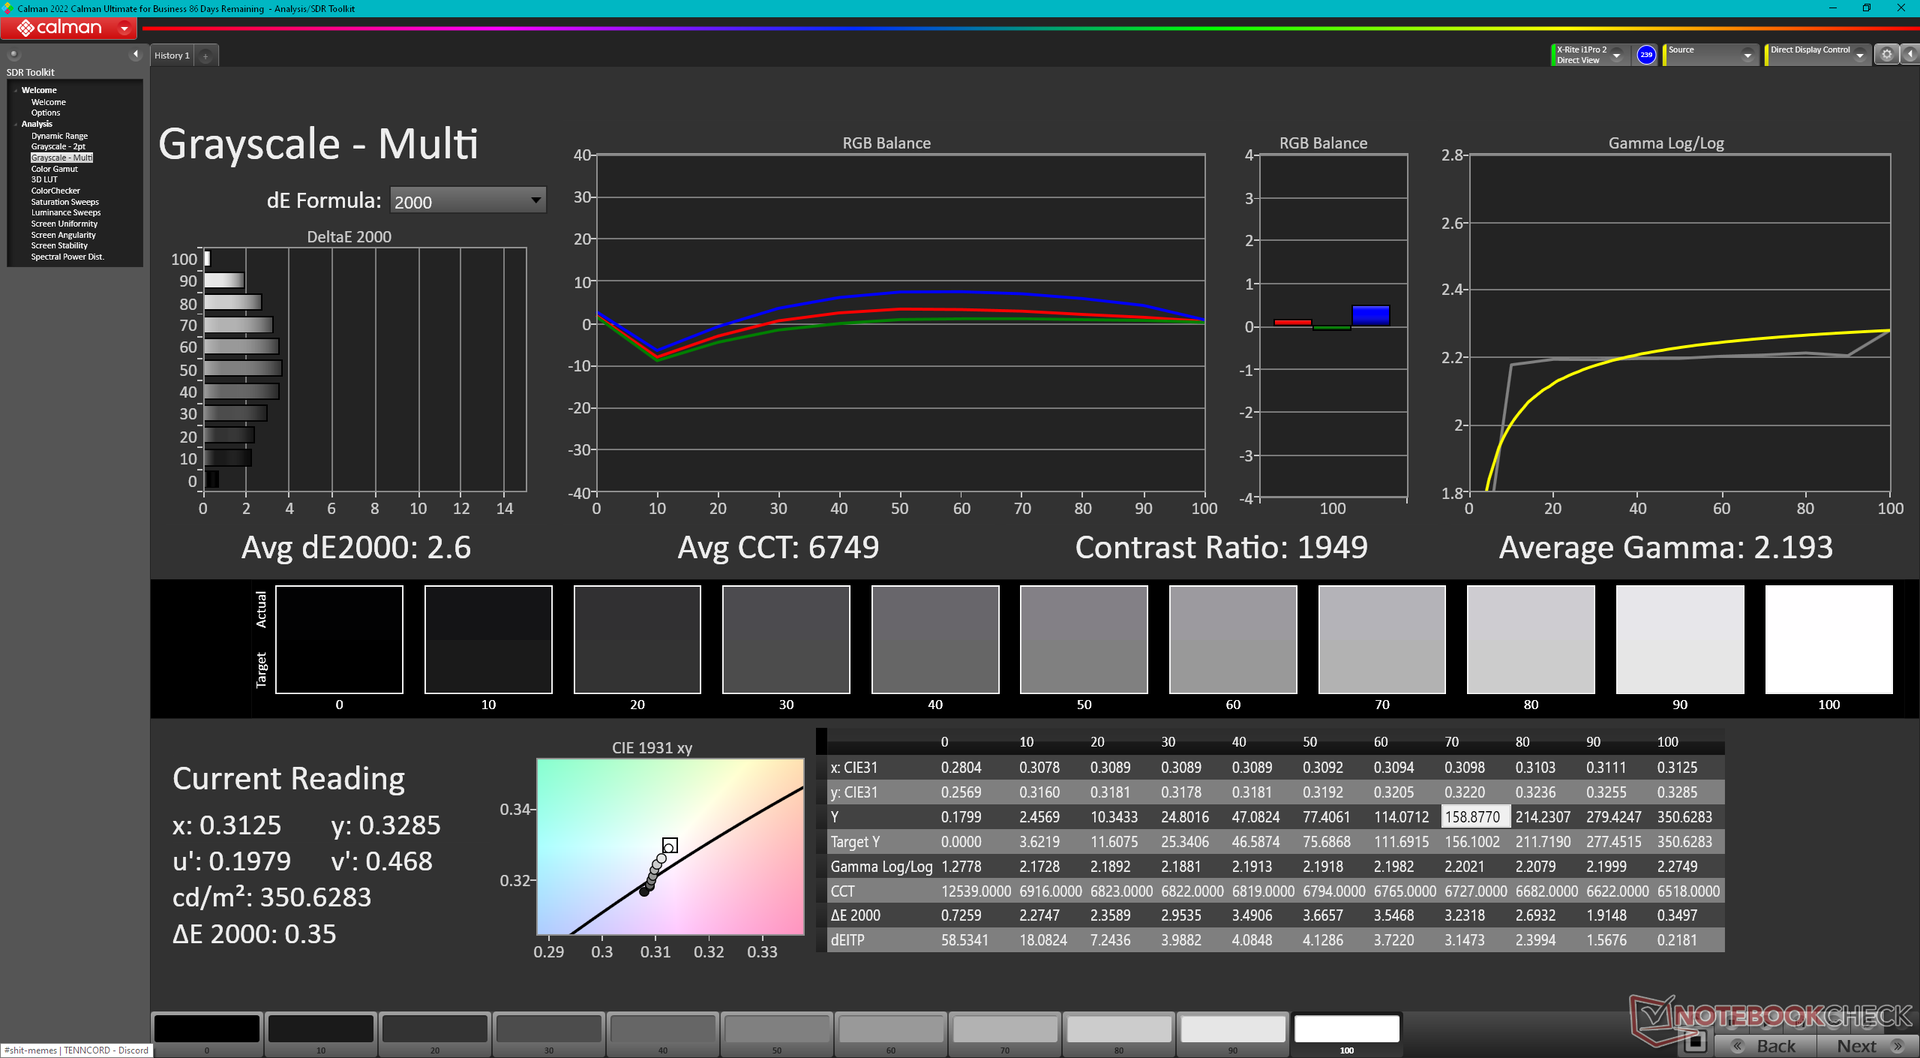
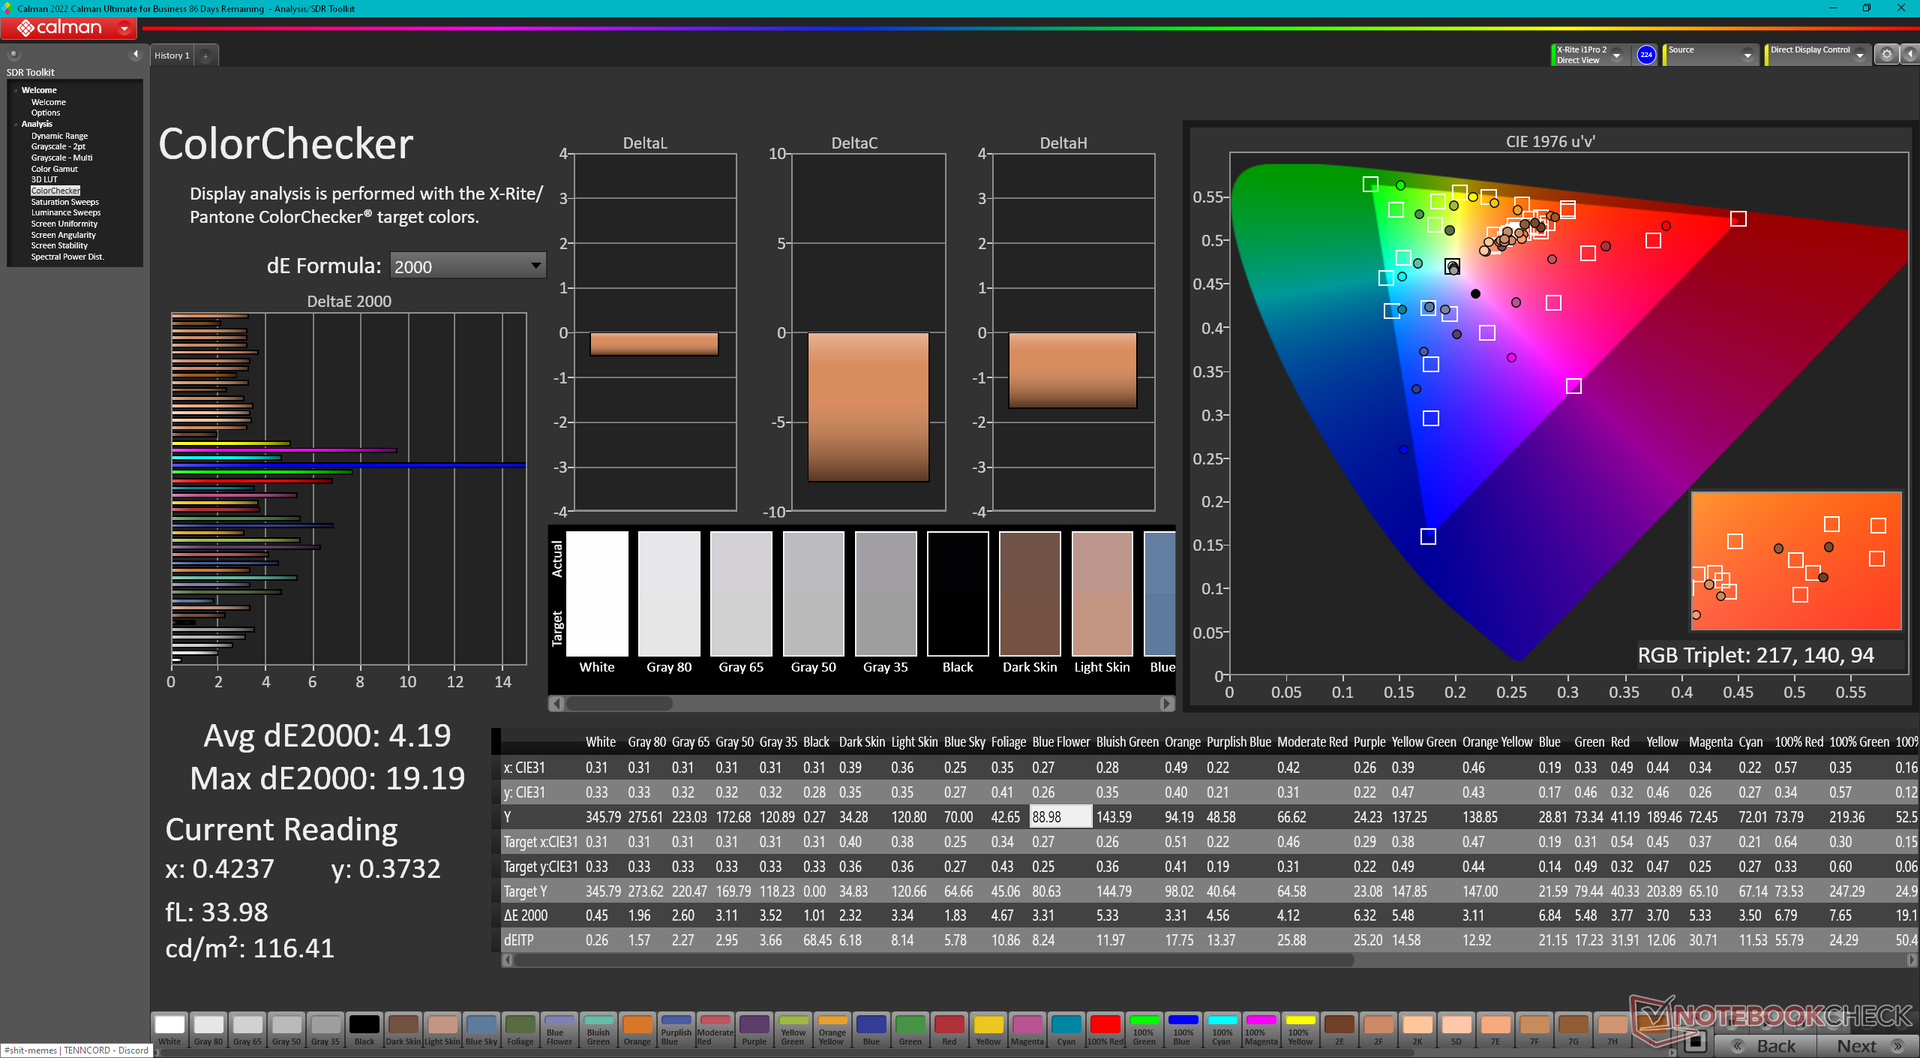
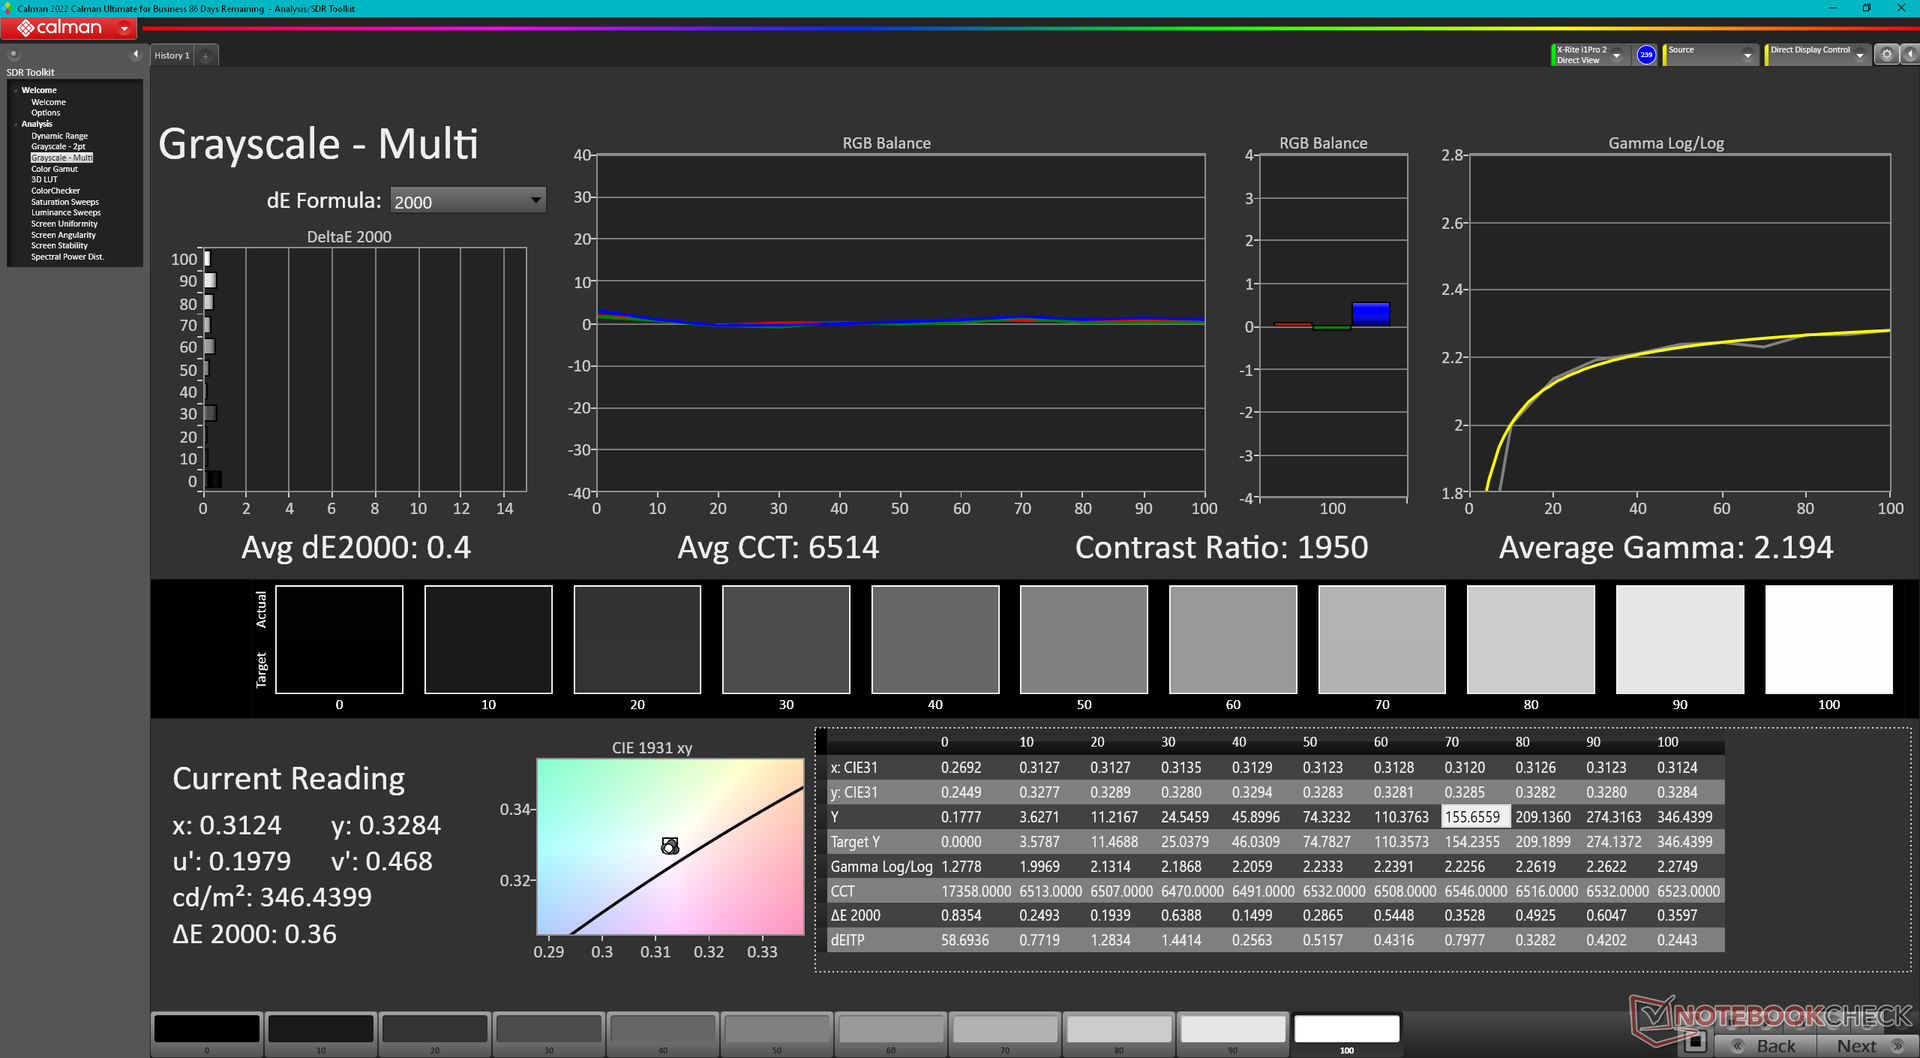
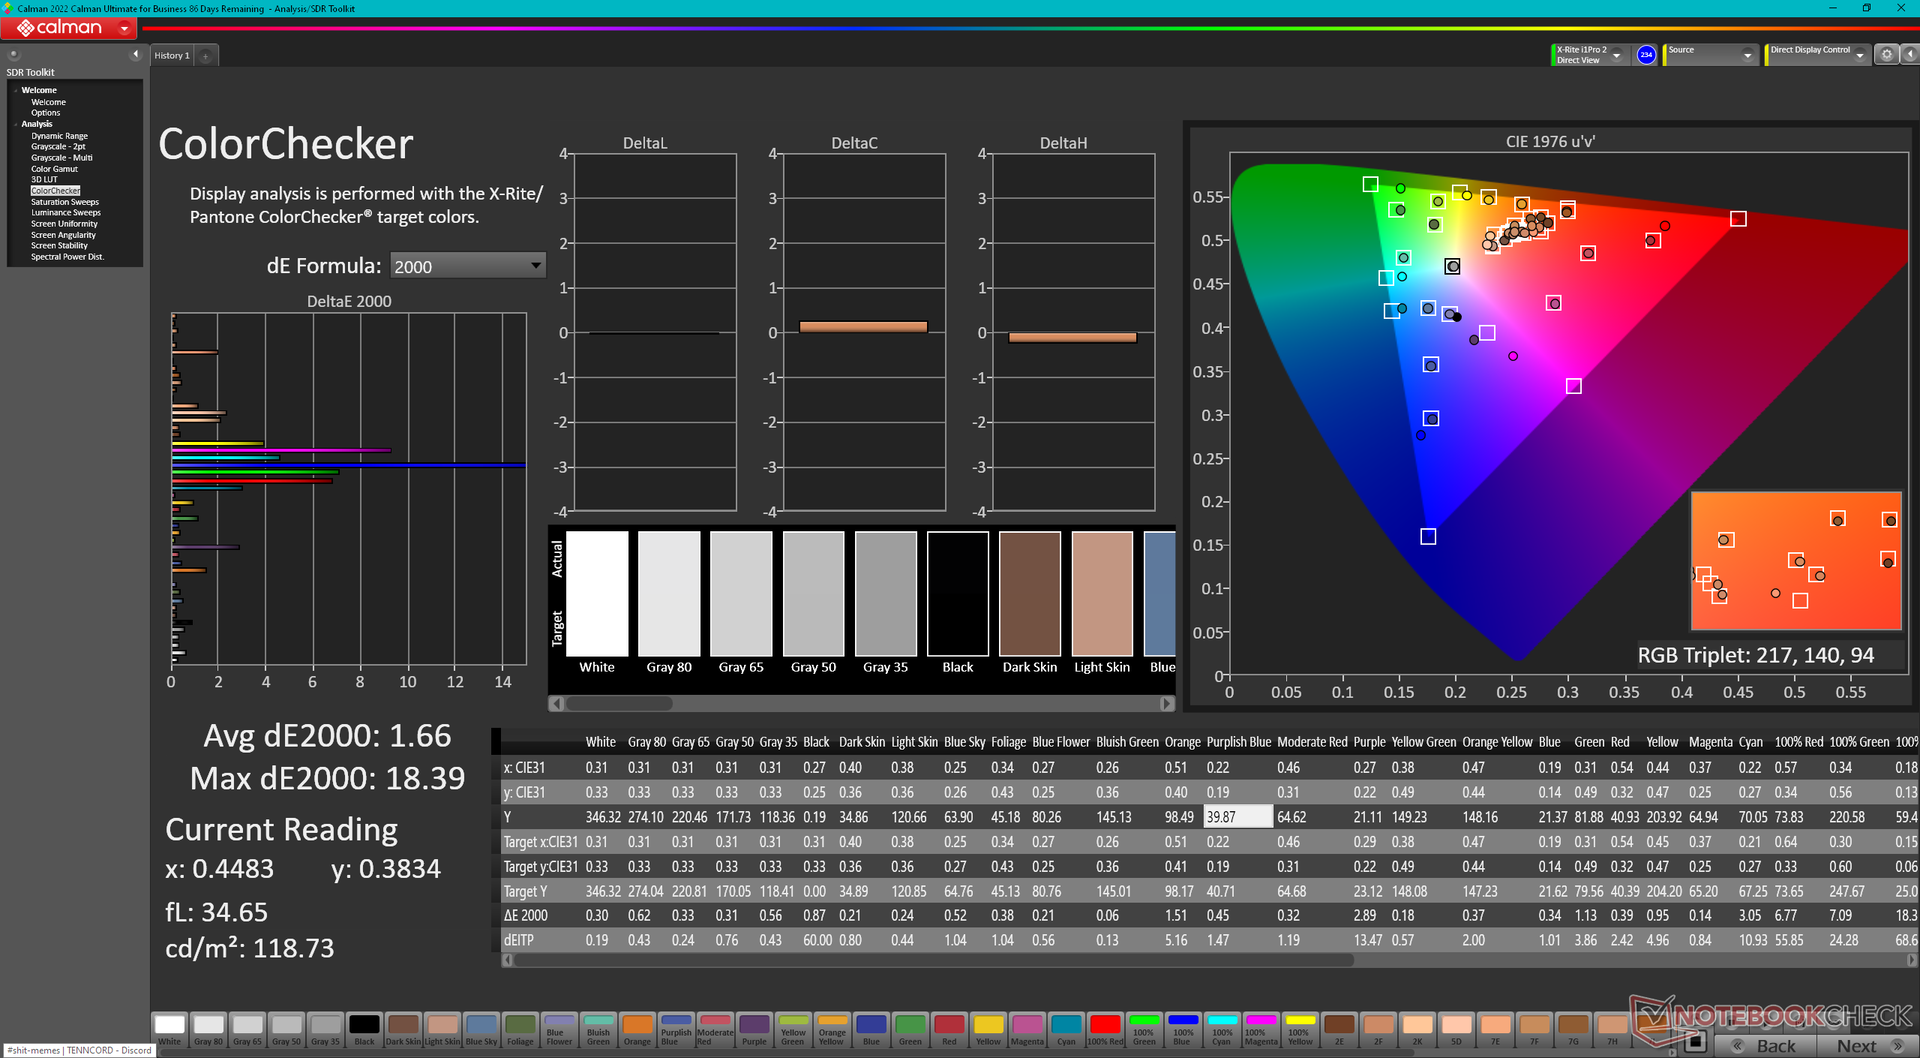
ΔE ColorChecker Calman: 4.19 | ∀{0.5-29.43 Ø4.71}
calibrated: 1.66
ΔE Greyscale Calman: 2.6 | ∀{0.09-98 Ø4.96}
41.5% AdobeRGB 1998 (Argyll 3D)
60.2% sRGB (Argyll 3D)
40.2% Display P3 (Argyll 3D)
Gamma: 2.19
CCT: 6749 K
| Lenovo LOQ 15APH8 BOE NJ NE156FHM-NX3, IPS, 1920x1080, 15.6" | Lenovo Legion 5 15IAH7H 82RB CSOT MNF601CA1-3, IPS, 1920x1080, 15.6" | Dell G15 5530 AUO B156HAN, IPS, 1920x1080, 15.6" | Asus TUF A15 FA507 N156HMA-GA1, IPS, 1920x1080, 15.6" | MSI Cyborg 15 A12VF AU Optronics B156HAN15.1, IPS, 1920x1080, 15.6" | HP Victus 15 fa0020nr CMN1521, IPS, 1920x1080, 15.6" | |
|---|---|---|---|---|---|---|
| Display | 69% | 75% | 60% | 5% | 4% | |
| Display P3 Coverage (%) | 40.2 | 69.1 72% | 73.1 82% | 64.9 61% | 42.3 5% | 42 4% |
| sRGB Coverage (%) | 60.2 | 99.5 65% | 98.4 63% | 96.5 60% | 62.6 4% | 62.7 4% |
| AdobeRGB 1998 Coverage (%) | 41.5 | 70 69% | 74.4 79% | 66.6 60% | 43.7 5% | 43.4 5% |
| Response Times | 58% | 85% | 22% | 46% | 4% | |
| Response Time Grey 50% / Grey 80% * (ms) | 42.7 ? | 14.8 ? 65% | 3.39 ? 92% | 30.4 ? 29% | 22 ? 48% | 35.2 ? 18% |
| Response Time Black / White * (ms) | 24.5 ? | 12 ? 51% | 5.35 ? 78% | 20.8 ? 15% | 14 ? 43% | 27.2 ? -11% |
| PWM Frequency (Hz) | 21620 ? | |||||
| Screen | -4% | -2% | 28% | -9% | 1% | |
| Brightness middle (cd/m²) | 346.2 | 363.5 5% | 320 -8% | 288 -17% | 247 -29% | 284.3 -18% |
| Brightness (cd/m²) | 329 | 350 6% | 316 -4% | 271 -18% | 234 -29% | 262 -20% |
| Brightness Distribution (%) | 81 | 89 10% | 94 16% | 91 12% | 89 10% | 87 7% |
| Black Level * (cd/m²) | 0.31 | 0.39 -26% | 0.21 32% | 0.17 45% | 0.25 19% | 0.17 45% |
| Contrast (:1) | 1117 | 932 -17% | 1524 36% | 1694 52% | 988 -12% | 1672 50% |
| Colorchecker dE 2000 * | 4.19 | 3.68 12% | 4.55 -9% | 1.9 55% | 3.78 10% | 4.52 -8% |
| Colorchecker dE 2000 max. * | 19.19 | 8.92 54% | 9.83 49% | 3.3 83% | 6.42 67% | 18.67 3% |
| Colorchecker dE 2000 calibrated * | 1.66 | 0.53 68% | 1.51 9% | 0.9 46% | 3.94 -137% | 1.55 7% |
| Greyscale dE 2000 * | 2.6 | 6.5 -150% | 6.2 -138% | 2.7 -4% | 2.16 17% | 4.1 -58% |
| Gamma | 2.19 100% | 2.2 100% | 2.07 106% | 2.32 95% | 2.33 94% | 2.3 96% |
| CCT | 6749 96% | 5995 108% | 6479 100% | 6535 99% | 6906 94% | 6529 100% |
| Media total (Programa/Opciones) | 41% /
20% | 53% /
27% | 37% /
34% | 14% /
2% | 3% /
2% |
* ... más pequeño es mejor
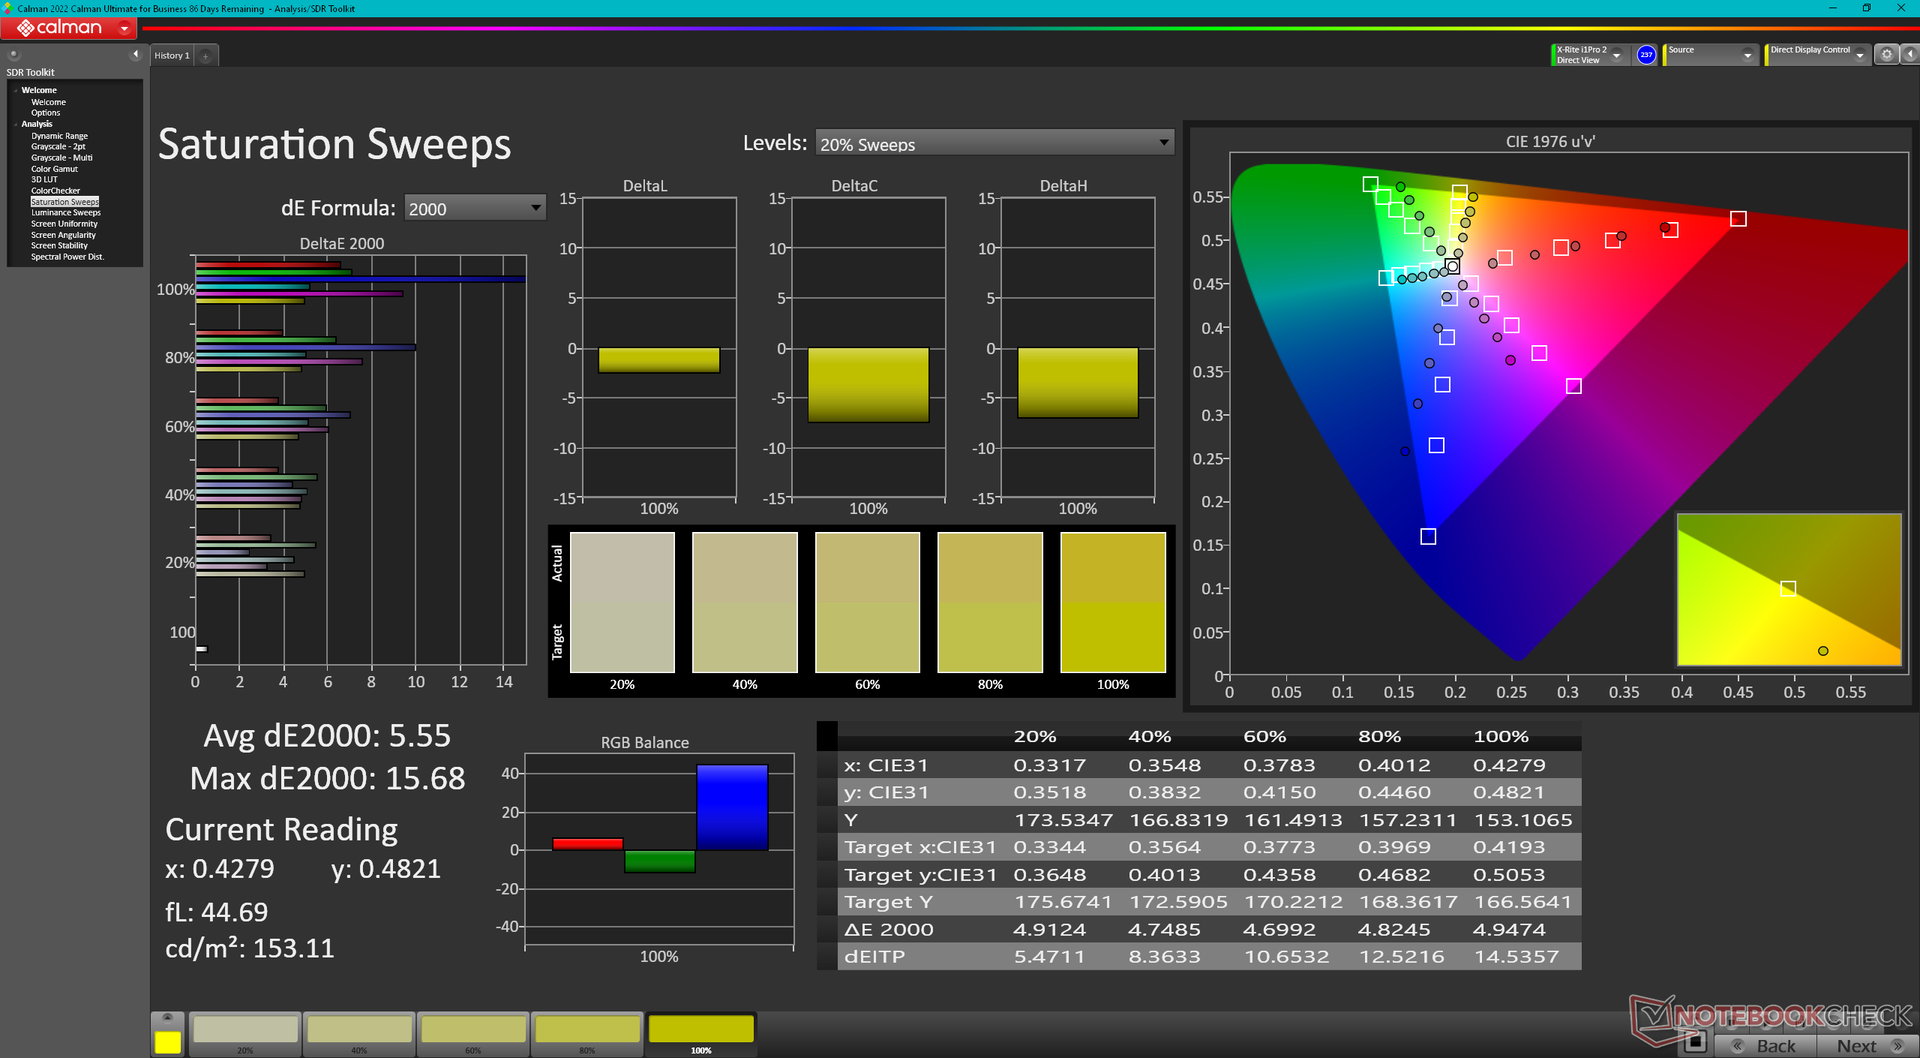
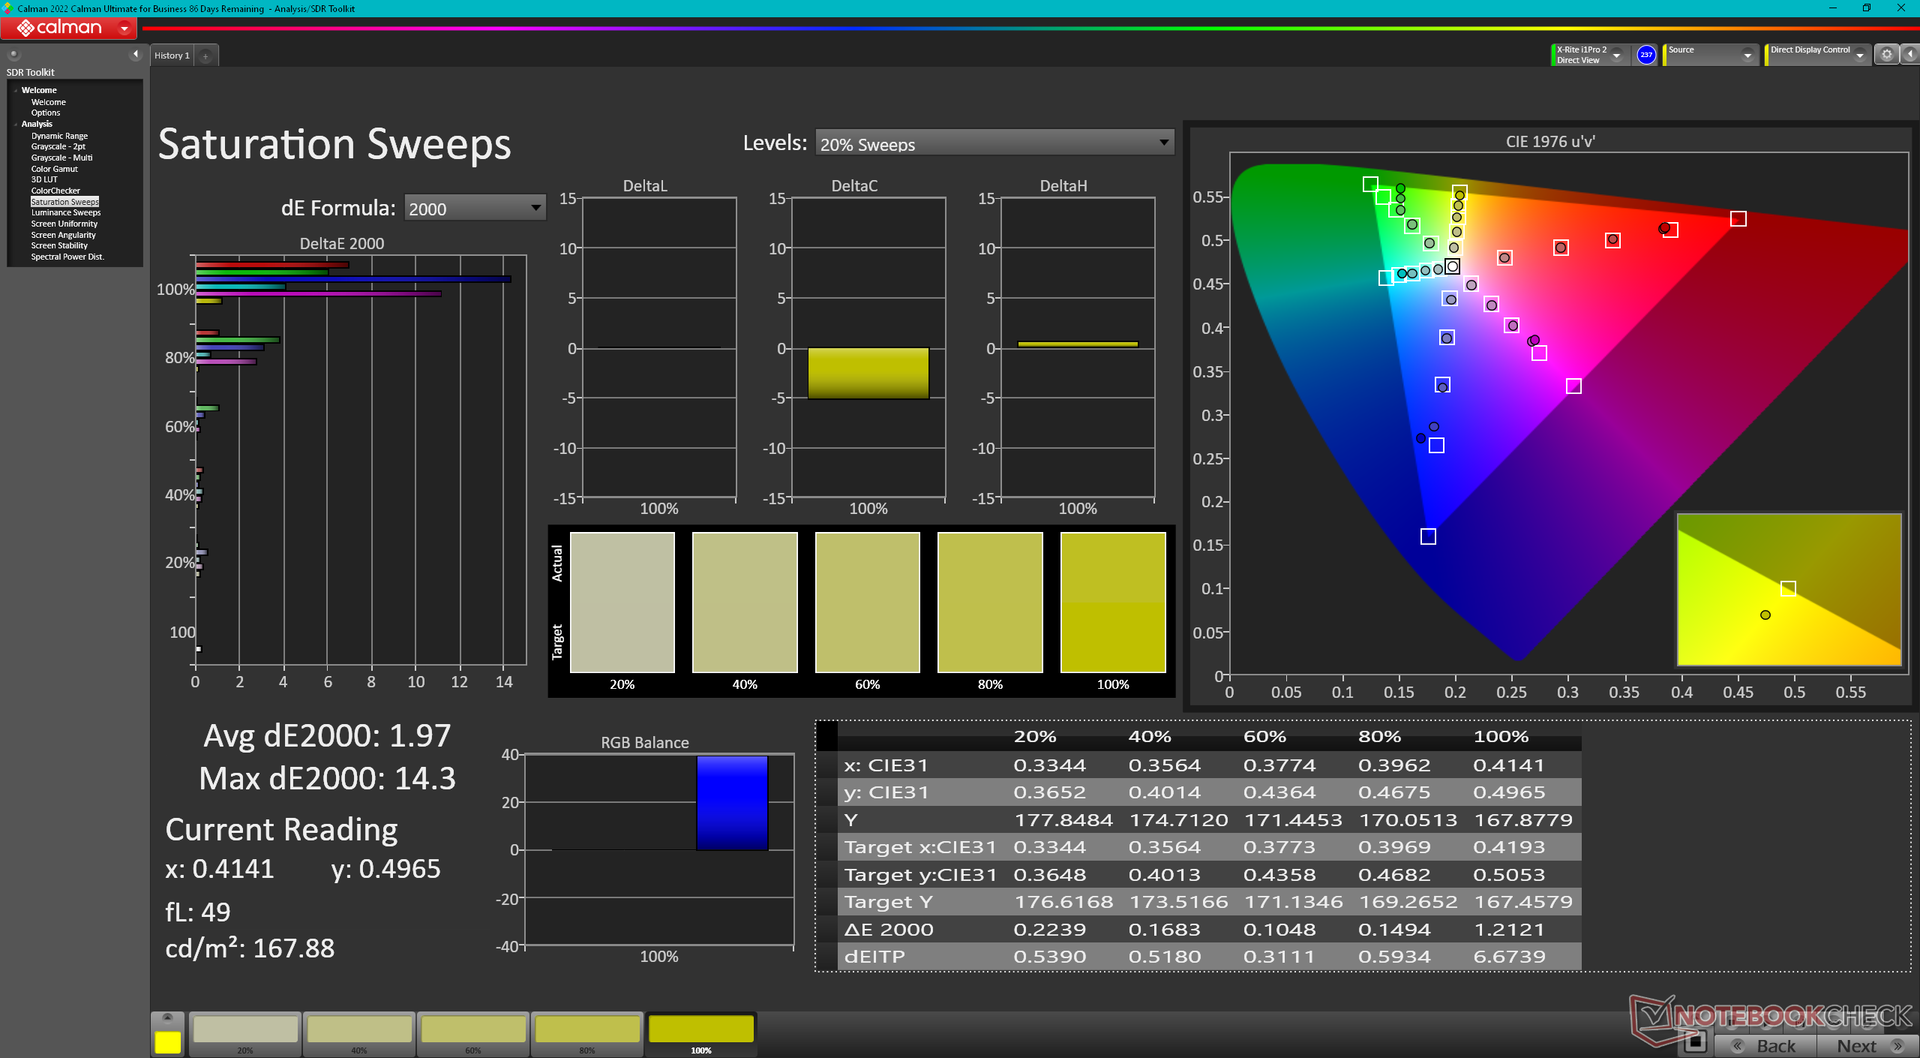
Los valores medios de escala de grises y deltaE de color no son terribles para un portátil de juegos económico, con sólo 2.6 y 4.19, respectivamente. Podemos reducir estos valores a sólo 0.4 y 1.66 tras una calibración adecuada con nuestro colorímetro X-Rite. Sin embargo, hay que tener en cuenta que los colores siguen siendo cada vez más imprecisos a niveles de saturación más altos debido a la estrecha gama de colores mencionada anteriormente.
Nuestro perfil ICM calibrado está disponible más arriba de forma gratuita.
Tiempos de respuesta del display
| ↔ Tiempo de respuesta de Negro a Blanco | ||
|---|---|---|
| 24.5 ms ... subida ↗ y bajada ↘ combinada | ↗ 12.2 ms subida | 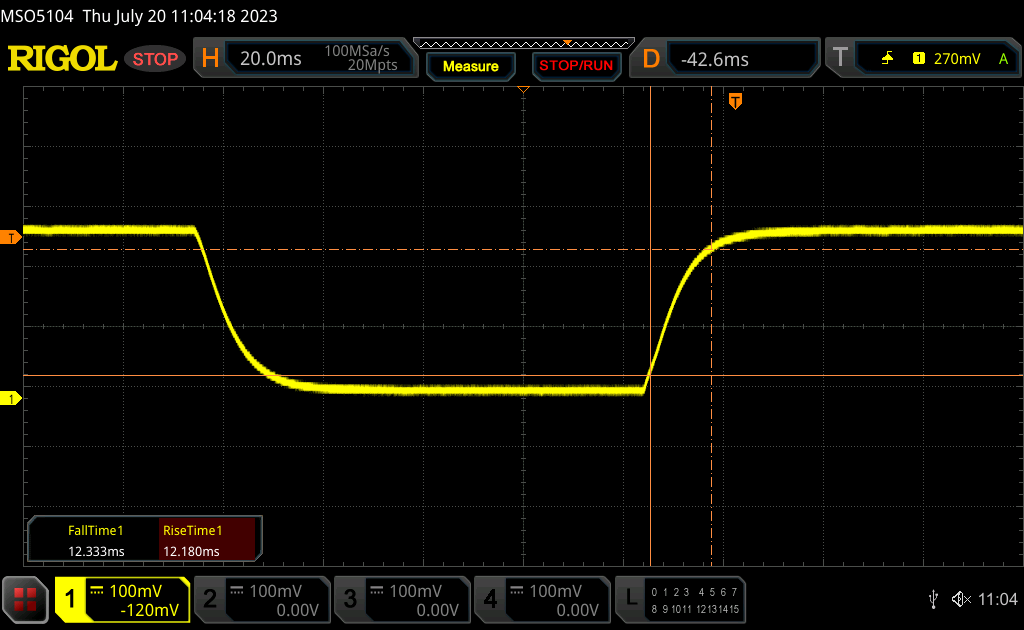 |
| ↘ 12.3 ms bajada | ||
| La pantalla mostró buenos tiempos de respuesta en nuestros tests pero podría ser demasiado lenta para los jugones competitivos. En comparación, todos los dispositivos de prueba van de ##min### (mínimo) a 240 (máximo) ms. » 58 % de todos los dispositivos son mejores. Eso quiere decir que el tiempo de respuesta es peor que la media (19.8 ms) de todos los dispositivos testados. | ||
| ↔ Tiempo de respuesta 50% Gris a 80% Gris | ||
| 42.7 ms ... subida ↗ y bajada ↘ combinada | ↗ 19.2 ms subida | 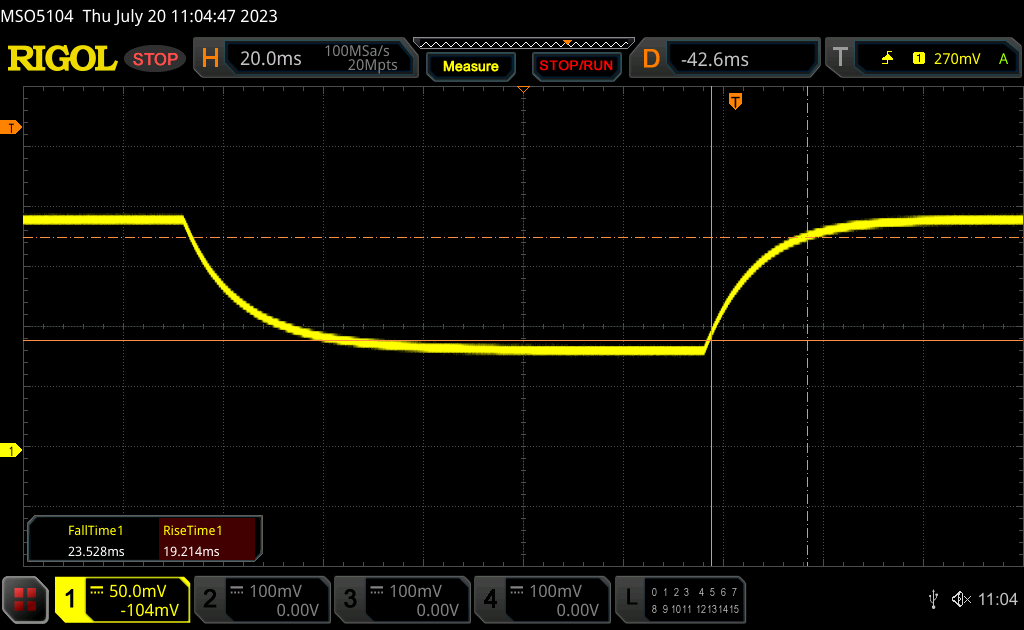 |
| ↘ 23.5 ms bajada | ||
| La pantalla mostró tiempos de respuesta lentos en nuestros tests y podría ser demasiado lenta para los jugones. En comparación, todos los dispositivos de prueba van de ##min### (mínimo) a 636 (máximo) ms. » 70 % de todos los dispositivos son mejores. Eso quiere decir que el tiempo de respuesta es peor que la media (31 ms) de todos los dispositivos testados. | ||
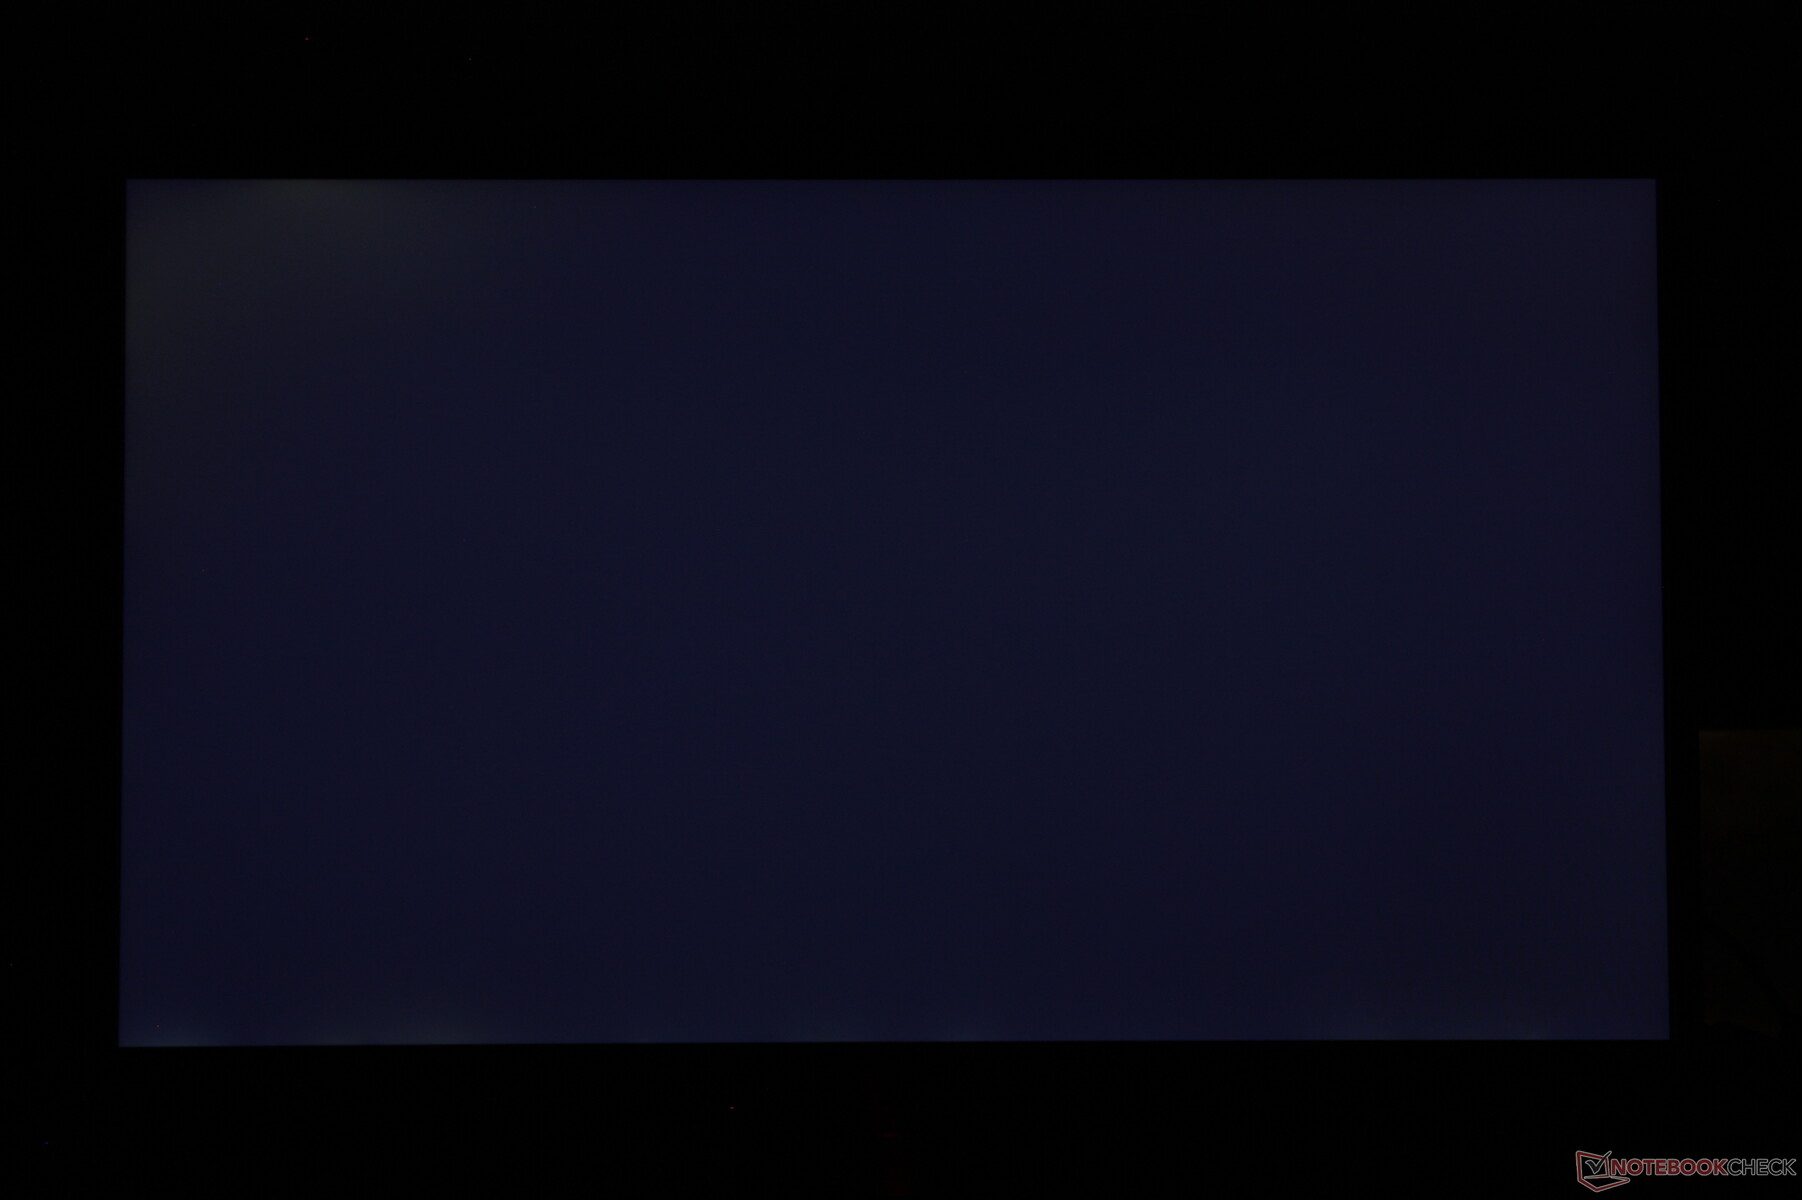
Parpadeo de Pantalla / PWM (Pulse-Width Modulation)
| Parpadeo de Pantalla / PWM no detectado | 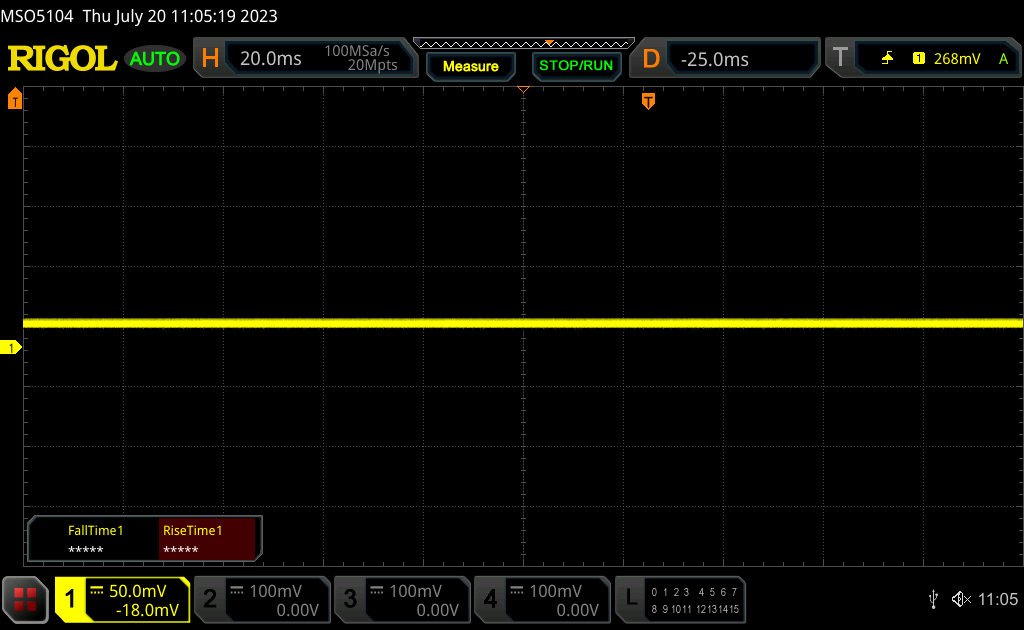 | ||
Comparación: 52 % de todos los dispositivos testados no usaron PWM para atenuar el display. Si se usó, medimos una media de 7754 (mínimo: 5 - máxmo: 343500) Hz. | |||
La mayoría de portátiles de juego con paneles IPS tienden a caer en el rango de 300 nits de brillo y el LOQ 15 no es una excepción. Así, la visibilidad en exteriores está en la media de la categoría sin nada digno de mención. Cualquier cosa más brillante que un lugar sombrío causará un inmenso resplandor y lavará los colores de la pantalla.
Rendimiento - Gama media AMD Zen 4
Condiciones de ensayo
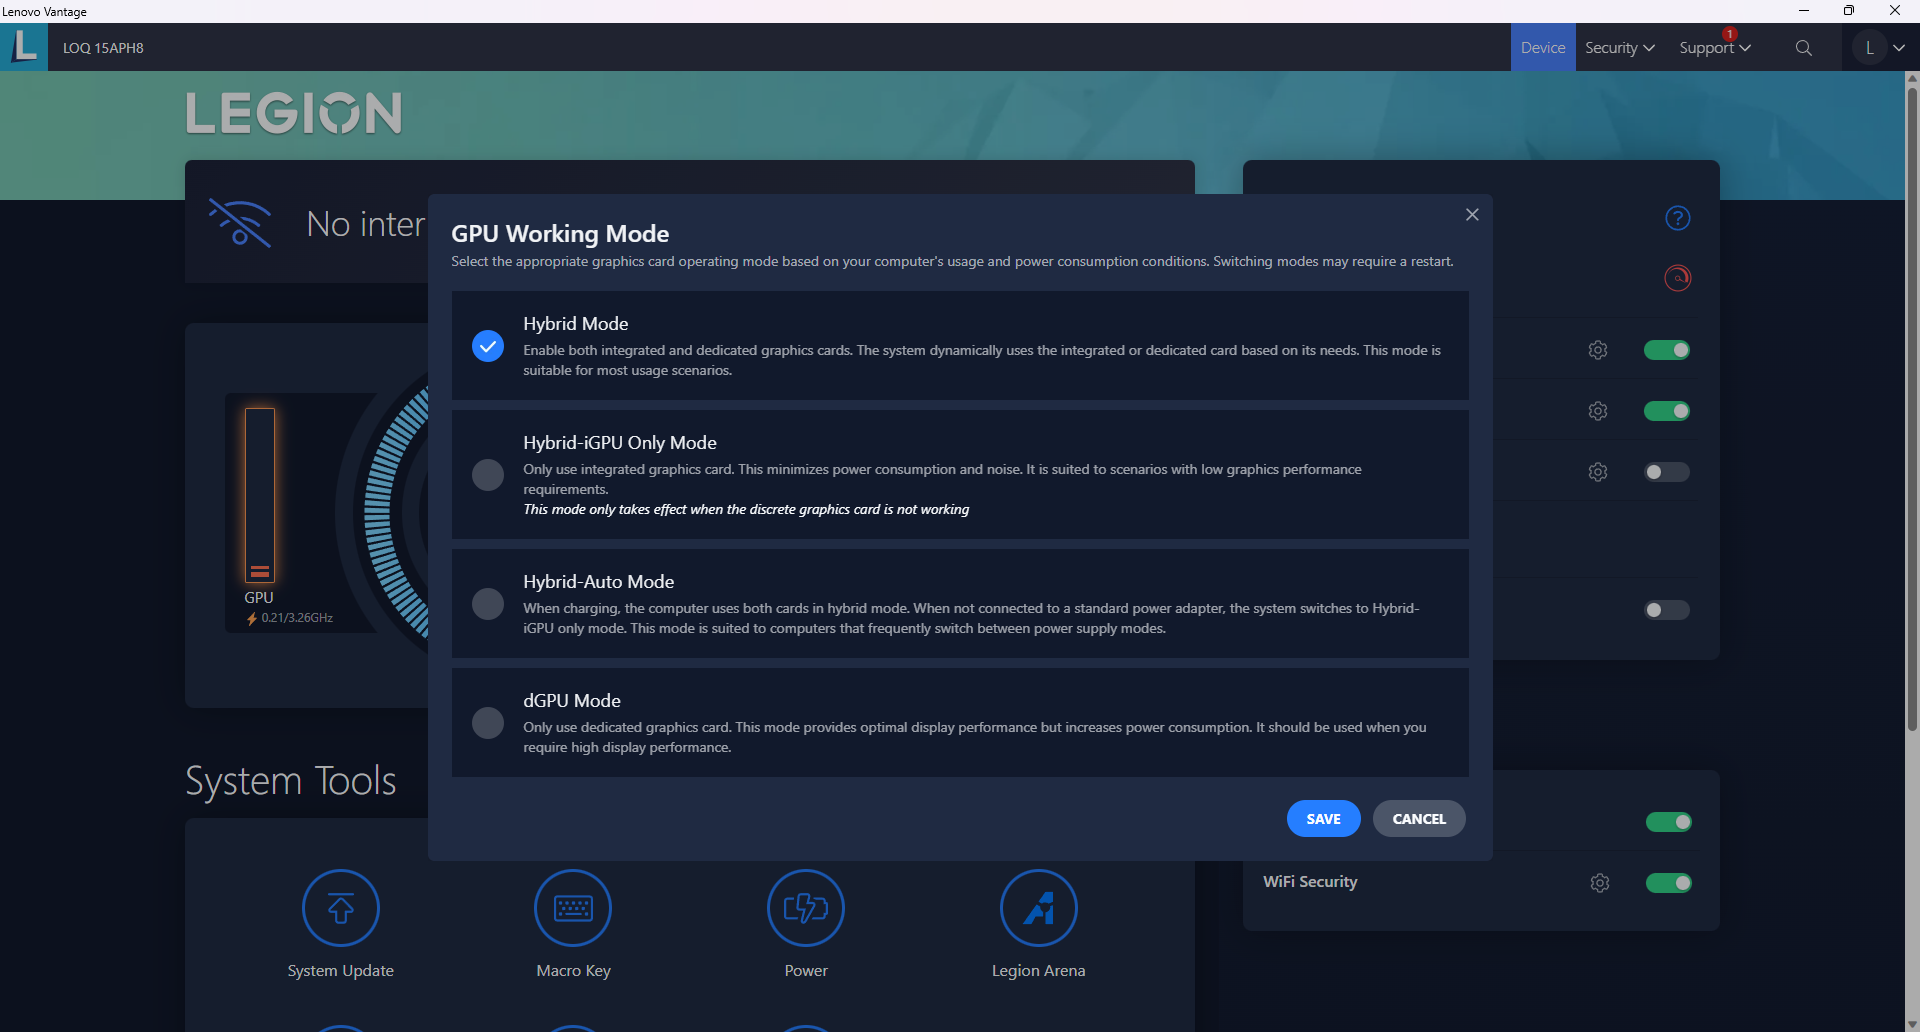
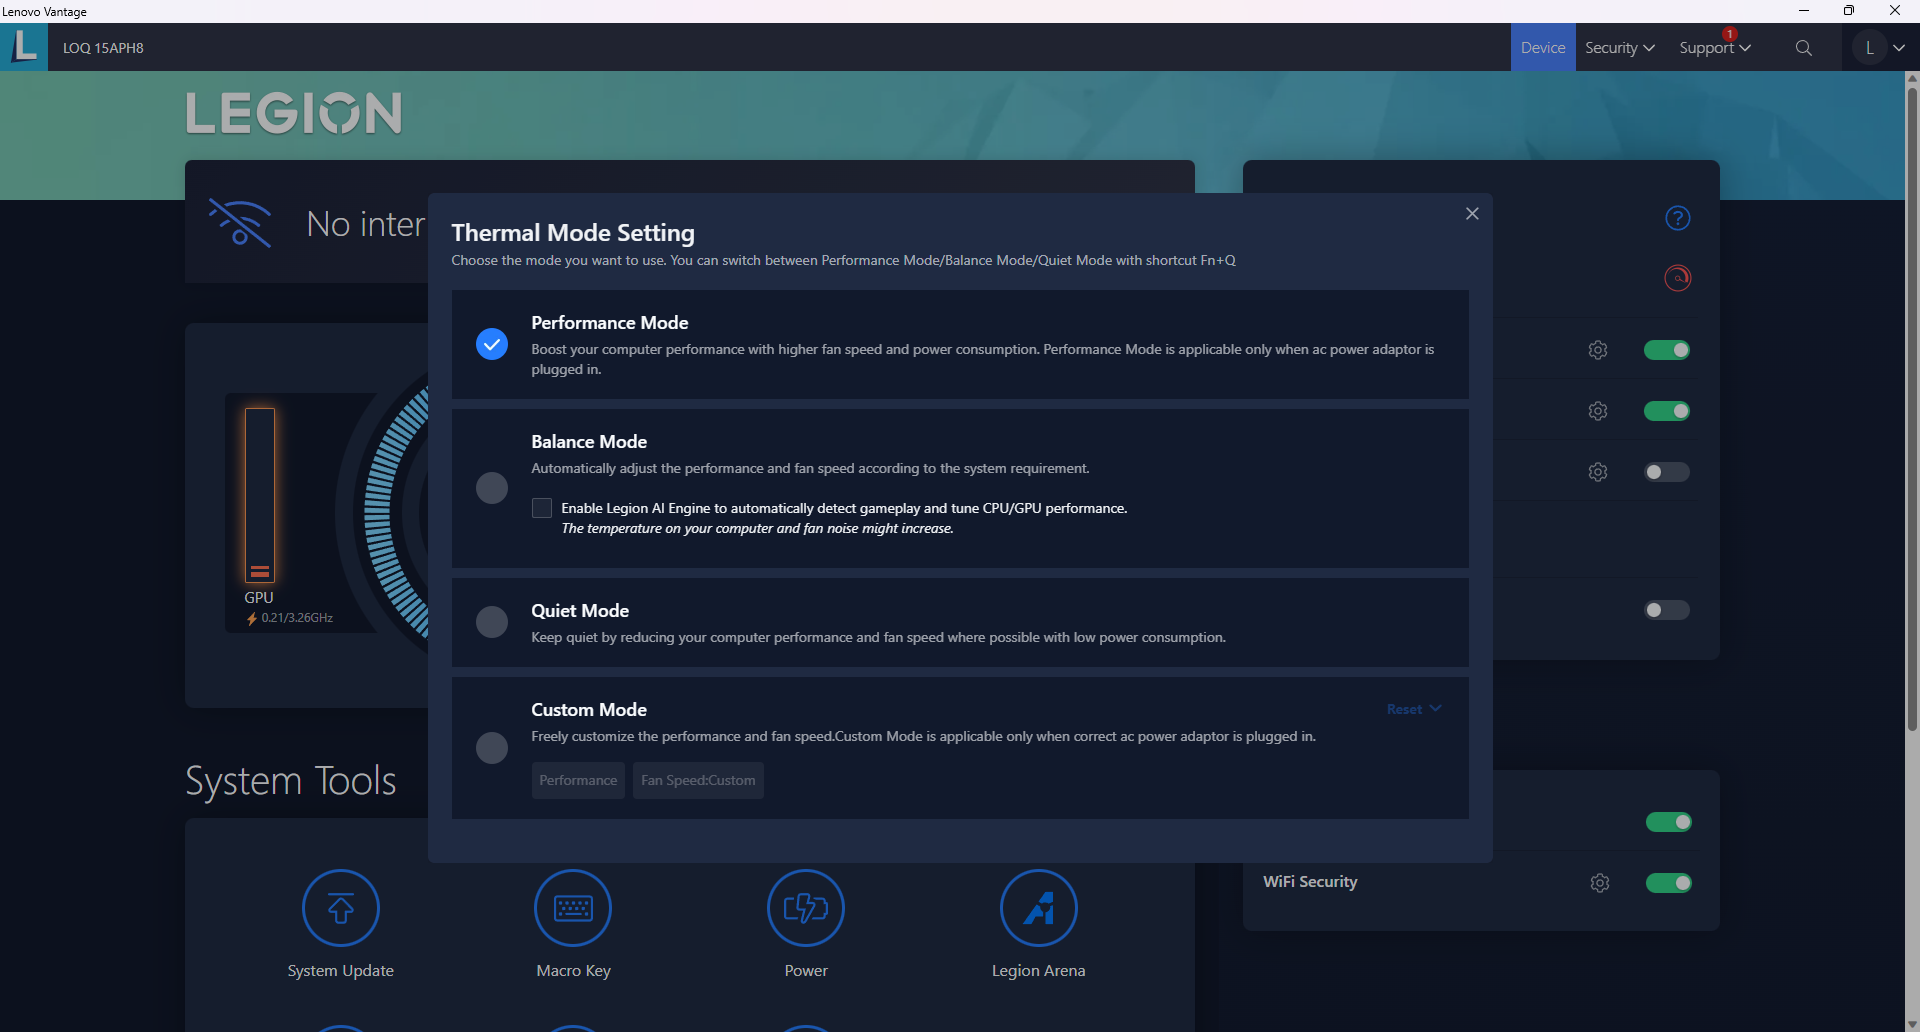
Configuramos nuestra unidad en modo Rendimiento tanto a través de Windows como de Lenovo Vantage antes de ejecutar los benchmarks que se muestran a continuación. También nos aseguramos de configurar el sistema en modo dGPU, ya que Advanced Optimus es compatible. Se recomienda que los usuarios se familiaricen con el software Vantage, ya que es el eje central para las actualizaciones del BIOS de Lenovo, ajustes de energía, información de garantía, y otras características específicas del modelo.
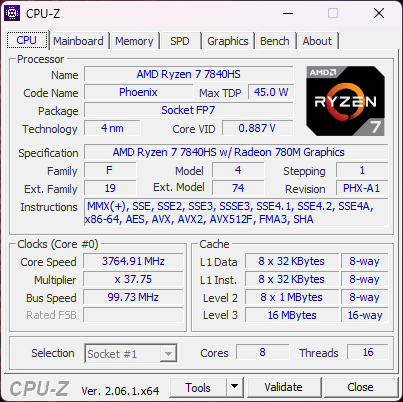
Procesador
ElRyzen 7 7840HS es un ligero escalón por debajo del Ryzen 7 7745HX con un déficit de rendimiento de sólo el 5%. Por lo tanto, el rendimiento general es comparable al de la 12ª generación Core i7-12700H que equipaban la mayoría de portátiles de juego de 2022. Nos alivia que la serie LOQ se distribuya con CPU Zen 4 en lugar de opciones Zen 3 renombradas como el Ryzen 7 7735HS que es notablemente más lenta y mucho menos impresionante.
La actualización a la versión Intel del LOQ 15 con el Core i7-13700H se espera que aumente el rendimiento de la CPU en aproximadamente un 20 por ciento basado en nuestro tiempo con el reciente Aorus 15X.
Cinebench R15 Multi Loop
Cinebench R23: Multi Core | Single Core
Cinebench R20: CPU (Multi Core) | CPU (Single Core)
Cinebench R15: CPU Multi 64Bit | CPU Single 64Bit
Blender: v2.79 BMW27 CPU
7-Zip 18.03: 7z b 4 | 7z b 4 -mmt1
Geekbench 5.5: Multi-Core | Single-Core
HWBOT x265 Benchmark v2.2: 4k Preset
LibreOffice : 20 Documents To PDF
R Benchmark 2.5: Overall mean
* ... más pequeño es mejor
AIDA64: FP32 Ray-Trace | FPU Julia | CPU SHA3 | CPU Queen | FPU SinJulia | FPU Mandel | CPU AES | CPU ZLib | FP64 Ray-Trace | CPU PhotoWorxx
| Performance rating | |
| Medio AMD Ryzen 7 7840HS | |
| Lenovo LOQ 15APH8 | |
| Lenovo Legion 5 15IAH7H 82RB | |
| Dell G15 5530 | |
| Asus TUF A15 FA507 | |
| MSI Cyborg 15 A12VF | |
| HP Victus 15 fa0020nr | |
| AIDA64 / FP32 Ray-Trace | |
| Lenovo LOQ 15APH8 | |
| Medio AMD Ryzen 7 7840HS (22845 - 28921, n=21) | |
| Dell G15 5530 | |
| Lenovo Legion 5 15IAH7H 82RB | |
| Asus TUF A15 FA507 | |
| HP Victus 15 fa0020nr | |
| MSI Cyborg 15 A12VF | |
| AIDA64 / FPU Julia | |
| Lenovo LOQ 15APH8 | |
| Medio AMD Ryzen 7 7840HS (97164 - 123167, n=21) | |
| Asus TUF A15 FA507 | |
| Dell G15 5530 | |
| Lenovo Legion 5 15IAH7H 82RB | |
| MSI Cyborg 15 A12VF | |
| HP Victus 15 fa0020nr | |
| AIDA64 / CPU SHA3 | |
| Lenovo LOQ 15APH8 | |
| Medio AMD Ryzen 7 7840HS (4293 - 5155, n=21) | |
| Dell G15 5530 | |
| Lenovo Legion 5 15IAH7H 82RB | |
| Asus TUF A15 FA507 | |
| MSI Cyborg 15 A12VF | |
| HP Victus 15 fa0020nr | |
| AIDA64 / CPU Queen | |
| Lenovo LOQ 15APH8 | |
| Medio AMD Ryzen 7 7840HS (102271 - 125820, n=21) | |
| Dell G15 5530 | |
| Asus TUF A15 FA507 | |
| Lenovo Legion 5 15IAH7H 82RB | |
| HP Victus 15 fa0020nr | |
| MSI Cyborg 15 A12VF | |
| AIDA64 / FPU SinJulia | |
| Lenovo LOQ 15APH8 | |
| Medio AMD Ryzen 7 7840HS (13767 - 15525, n=21) | |
| Asus TUF A15 FA507 | |
| Dell G15 5530 | |
| Lenovo Legion 5 15IAH7H 82RB | |
| MSI Cyborg 15 A12VF | |
| HP Victus 15 fa0020nr | |
| AIDA64 / FPU Mandel | |
| Lenovo LOQ 15APH8 | |
| Medio AMD Ryzen 7 7840HS (52084 - 65812, n=21) | |
| Asus TUF A15 FA507 | |
| Dell G15 5530 | |
| Lenovo Legion 5 15IAH7H 82RB | |
| HP Victus 15 fa0020nr | |
| MSI Cyborg 15 A12VF | |
| AIDA64 / CPU AES | |
| Lenovo Legion 5 15IAH7H 82RB | |
| Medio AMD Ryzen 7 7840HS (67389 - 177158, n=21) | |
| Dell G15 5530 | |
| Lenovo LOQ 15APH8 | |
| Asus TUF A15 FA507 | |
| MSI Cyborg 15 A12VF | |
| HP Victus 15 fa0020nr | |
| AIDA64 / CPU ZLib | |
| Dell G15 5530 | |
| Lenovo Legion 5 15IAH7H 82RB | |
| Lenovo LOQ 15APH8 | |
| Medio AMD Ryzen 7 7840HS (944 - 1123, n=21) | |
| MSI Cyborg 15 A12VF | |
| HP Victus 15 fa0020nr | |
| Asus TUF A15 FA507 | |
| AIDA64 / FP64 Ray-Trace | |
| Lenovo LOQ 15APH8 | |
| Medio AMD Ryzen 7 7840HS (12248 - 15599, n=21) | |
| Dell G15 5530 | |
| Lenovo Legion 5 15IAH7H 82RB | |
| Asus TUF A15 FA507 | |
| HP Victus 15 fa0020nr | |
| MSI Cyborg 15 A12VF | |
| AIDA64 / CPU PhotoWorxx | |
| Medio AMD Ryzen 7 7840HS (17615 - 41516, n=21) | |
| Dell G15 5530 | |
| MSI Cyborg 15 A12VF | |
| Lenovo Legion 5 15IAH7H 82RB | |
| Asus TUF A15 FA507 | |
| HP Victus 15 fa0020nr | |
| Lenovo LOQ 15APH8 | |
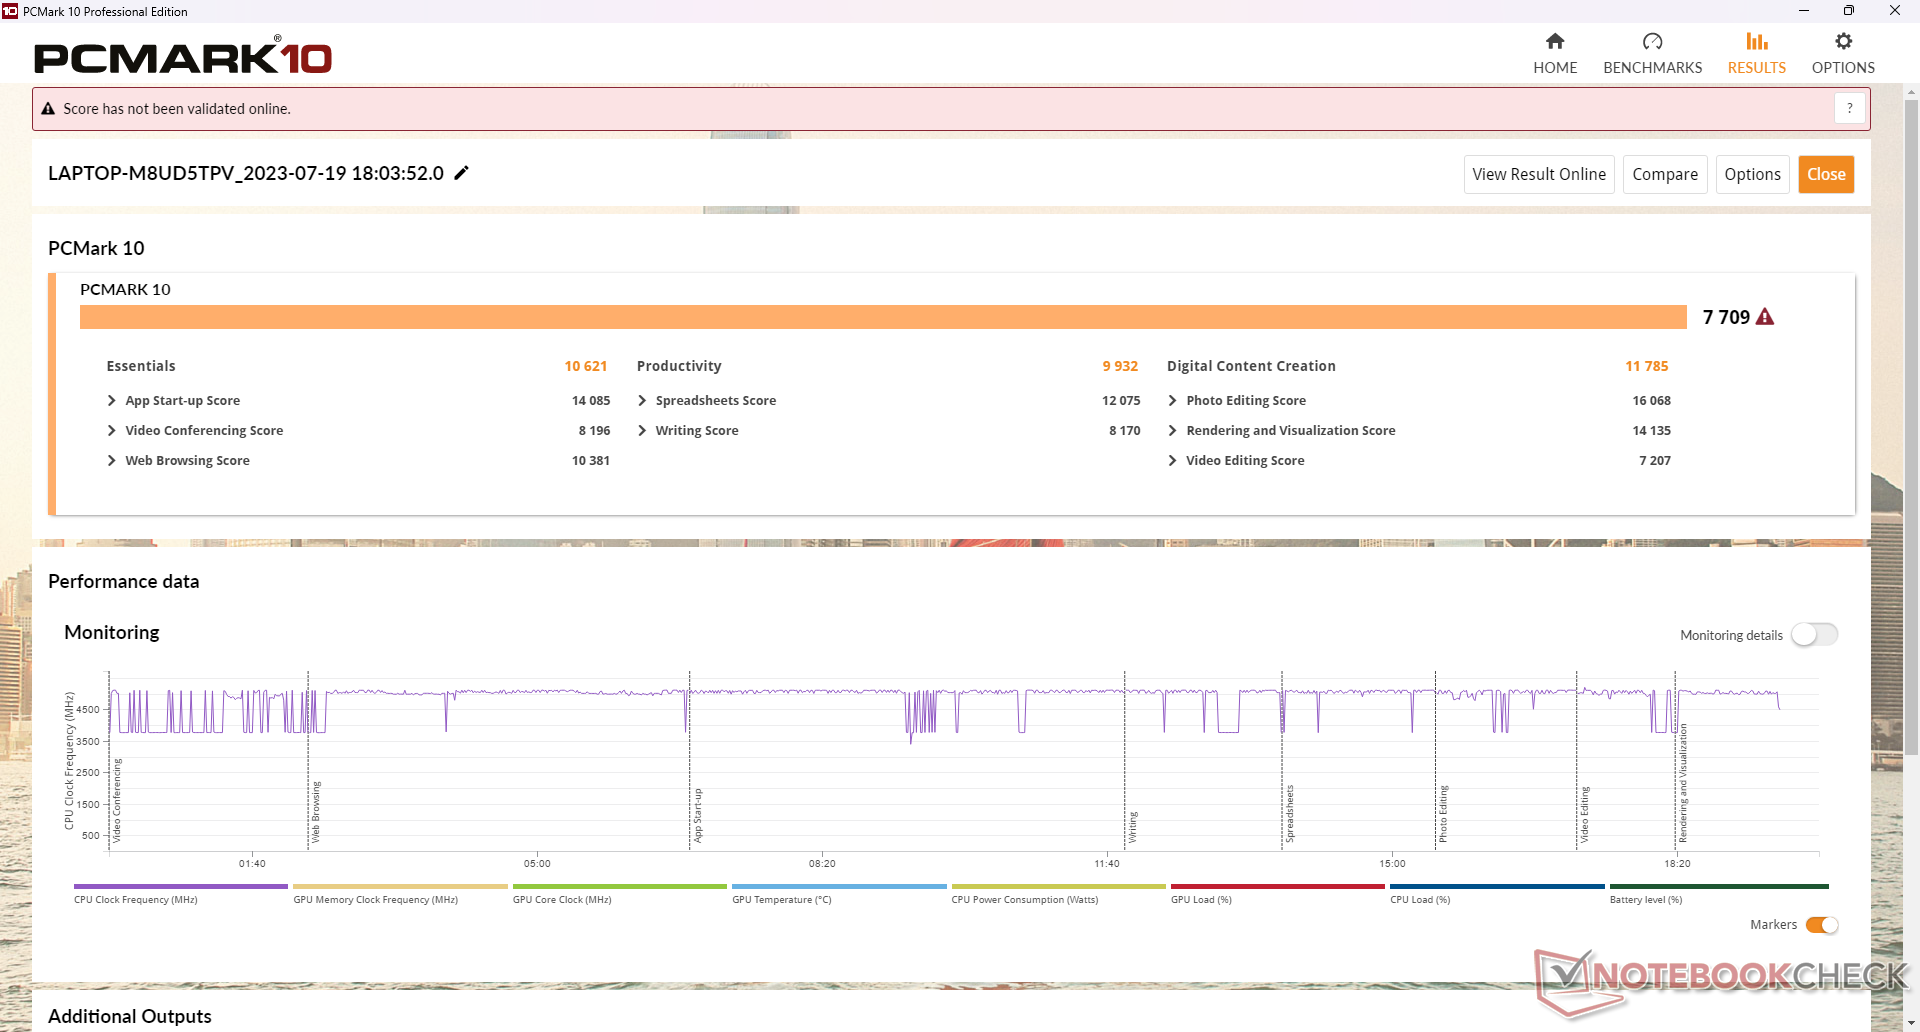
Rendimiento del sistema
Los resultados de PCMark 10 son comparables a los de modelos de la competencia como el Dell G15 5530 e incluso apenas superan al antiguo 2022 Lenovo Legion 5 15. Sin embargo, las pruebas de memoria AIDA64 son sólo la mitad de rápidas en nuestra unidad LOQ 15 debido a sus limitados 8 GB de RAM monocanal. Recomendamos añadir un segundo módulo de RAM para un total de 16 GB siempre que sea posible.
CrossMark: Overall | Productivity | Creativity | Responsiveness
| PCMark 10 / Score | |
| Lenovo Legion 5 15IAH7H 82RB | |
| Lenovo LOQ 15APH8 | |
| Medio AMD Ryzen 7 7840HS, NVIDIA GeForce RTX 4050 Laptop GPU (7683 - 7709, n=2) | |
| Asus TUF A15 FA507 | |
| MSI Cyborg 15 A12VF | |
| Dell G15 5530 | |
| HP Victus 15 fa0020nr | |
| PCMark 10 / Essentials | |
| Lenovo Legion 5 15IAH7H 82RB | |
| Dell G15 5530 | |
| Medio AMD Ryzen 7 7840HS, NVIDIA GeForce RTX 4050 Laptop GPU (10621 - 10755, n=2) | |
| MSI Cyborg 15 A12VF | |
| Lenovo LOQ 15APH8 | |
| Asus TUF A15 FA507 | |
| HP Victus 15 fa0020nr | |
| PCMark 10 / Productivity | |
| Lenovo Legion 5 15IAH7H 82RB | |
| Dell G15 5530 | |
| Medio AMD Ryzen 7 7840HS, NVIDIA GeForce RTX 4050 Laptop GPU (9932 - 9980, n=2) | |
| Lenovo LOQ 15APH8 | |
| MSI Cyborg 15 A12VF | |
| Asus TUF A15 FA507 | |
| HP Victus 15 fa0020nr | |
| PCMark 10 / Digital Content Creation | |
| Lenovo Legion 5 15IAH7H 82RB | |
| Lenovo LOQ 15APH8 | |
| Medio AMD Ryzen 7 7840HS, NVIDIA GeForce RTX 4050 Laptop GPU (11467 - 11785, n=2) | |
| Asus TUF A15 FA507 | |
| HP Victus 15 fa0020nr | |
| MSI Cyborg 15 A12VF | |
| Dell G15 5530 | |
| CrossMark / Overall | |
| Lenovo Legion 5 15IAH7H 82RB | |
| Dell G15 5530 | |
| MSI Cyborg 15 A12VF | |
| Medio AMD Ryzen 7 7840HS, NVIDIA GeForce RTX 4050 Laptop GPU (1586 - 1749, n=2) | |
| HP Victus 15 fa0020nr | |
| Lenovo LOQ 15APH8 | |
| Asus TUF A15 FA507 | |
| CrossMark / Productivity | |
| Lenovo Legion 5 15IAH7H 82RB | |
| Dell G15 5530 | |
| MSI Cyborg 15 A12VF | |
| Medio AMD Ryzen 7 7840HS, NVIDIA GeForce RTX 4050 Laptop GPU (1625 - 1677, n=2) | |
| Lenovo LOQ 15APH8 | |
| HP Victus 15 fa0020nr | |
| Asus TUF A15 FA507 | |
| CrossMark / Creativity | |
| Dell G15 5530 | |
| Lenovo Legion 5 15IAH7H 82RB | |
| MSI Cyborg 15 A12VF | |
| HP Victus 15 fa0020nr | |
| Medio AMD Ryzen 7 7840HS, NVIDIA GeForce RTX 4050 Laptop GPU (1628 - 1930, n=2) | |
| Asus TUF A15 FA507 | |
| Lenovo LOQ 15APH8 | |
| CrossMark / Responsiveness | |
| Lenovo Legion 5 15IAH7H 82RB | |
| MSI Cyborg 15 A12VF | |
| Dell G15 5530 | |
| Medio AMD Ryzen 7 7840HS, NVIDIA GeForce RTX 4050 Laptop GPU (1364 - 1480, n=2) | |
| HP Victus 15 fa0020nr | |
| Lenovo LOQ 15APH8 | |
| Asus TUF A15 FA507 | |
| PCMark 10 Score | 7709 puntos | |
ayuda | ||
| AIDA64 / Memory Copy | |
| Medio AMD Ryzen 7 7840HS (30937 - 72158, n=21) | |
| Dell G15 5530 | |
| MSI Cyborg 15 A12VF | |
| Lenovo Legion 5 15IAH7H 82RB | |
| Asus TUF A15 FA507 | |
| HP Victus 15 fa0020nr | |
| Lenovo LOQ 15APH8 | |
| AIDA64 / Memory Read | |
| Dell G15 5530 | |
| MSI Cyborg 15 A12VF | |
| Lenovo Legion 5 15IAH7H 82RB | |
| Medio AMD Ryzen 7 7840HS (30497 - 62147, n=21) | |
| Asus TUF A15 FA507 | |
| HP Victus 15 fa0020nr | |
| Lenovo LOQ 15APH8 | |
| AIDA64 / Memory Write | |
| Medio AMD Ryzen 7 7840HS (34590 - 93323, n=21) | |
| Dell G15 5530 | |
| Lenovo Legion 5 15IAH7H 82RB | |
| MSI Cyborg 15 A12VF | |
| Asus TUF A15 FA507 | |
| HP Victus 15 fa0020nr | |
| Lenovo LOQ 15APH8 | |
| AIDA64 / Memory Latency | |
| Lenovo Legion 5 15IAH7H 82RB | |
| Lenovo LOQ 15APH8 | |
| Medio AMD Ryzen 7 7840HS (85.1 - 112, n=21) | |
| MSI Cyborg 15 A12VF | |
| Dell G15 5530 | |
| Asus TUF A15 FA507 | |
| HP Victus 15 fa0020nr | |
* ... más pequeño es mejor
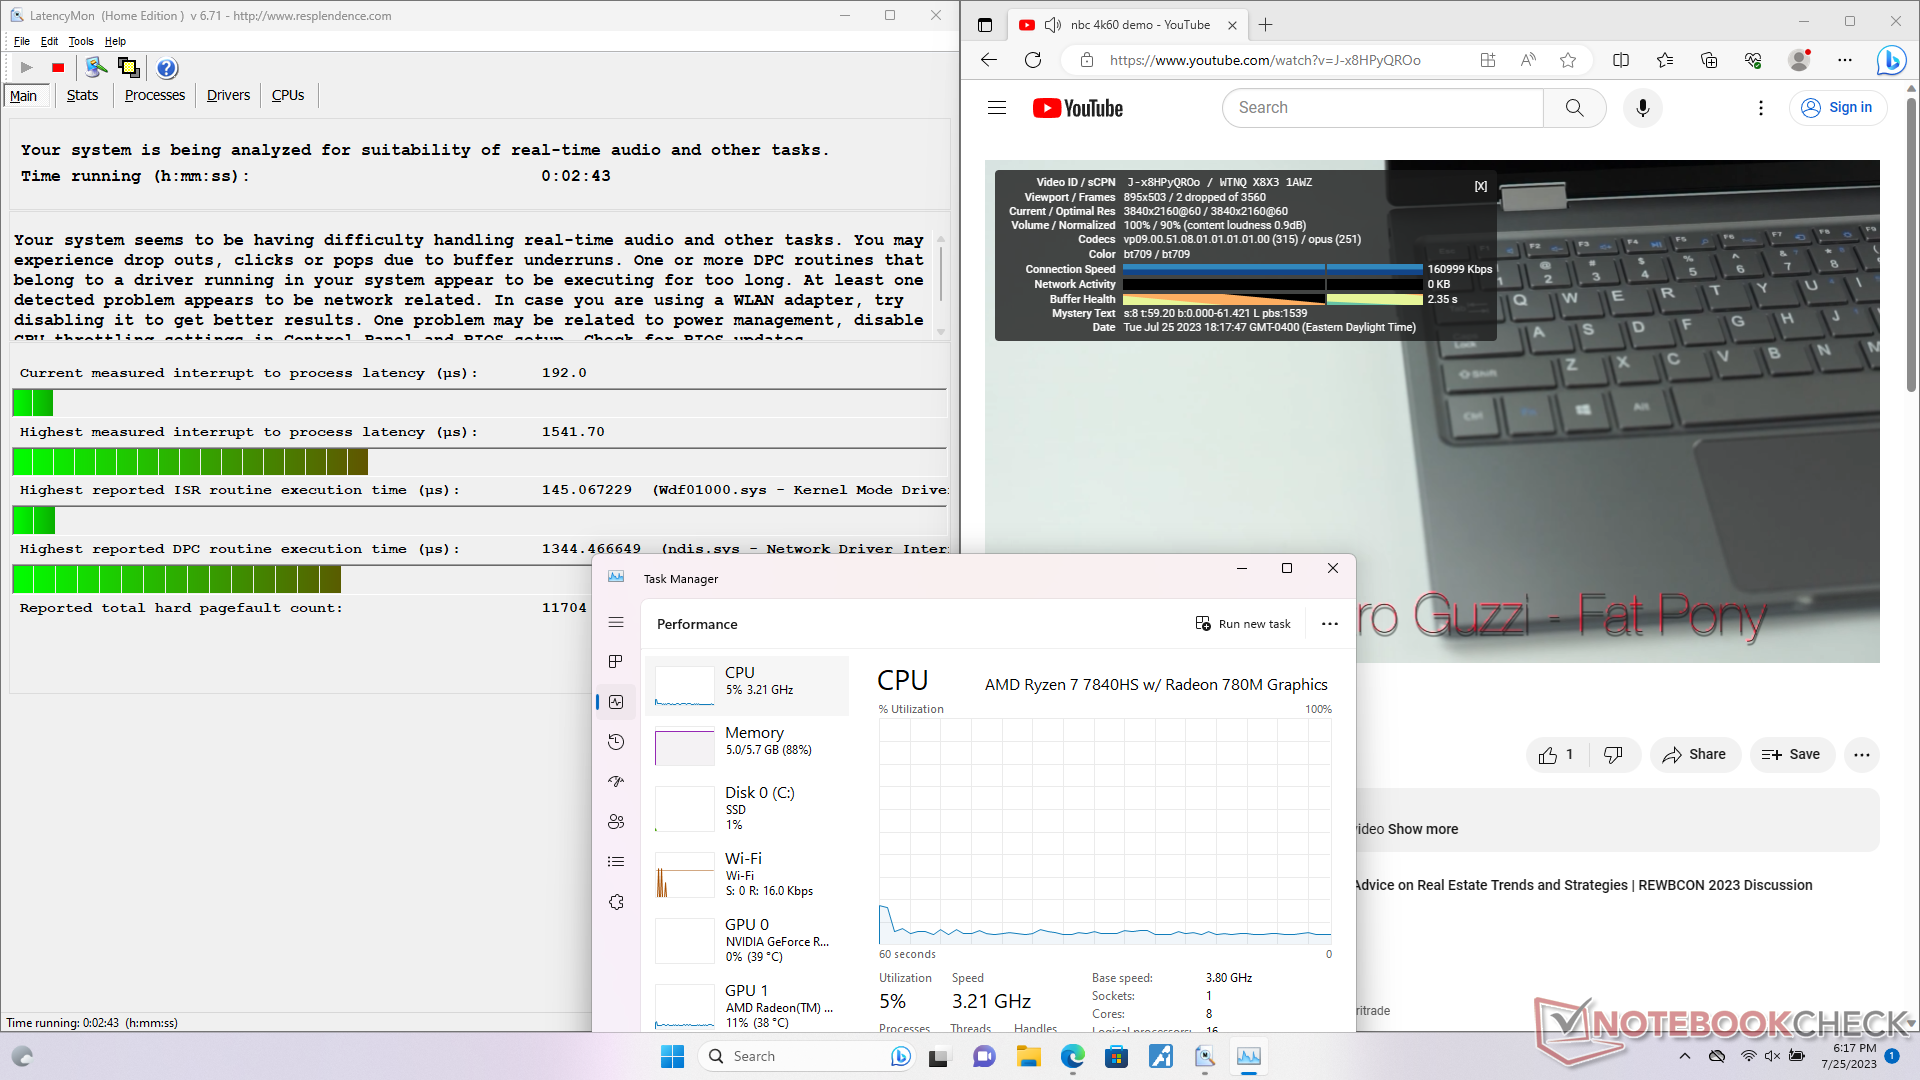
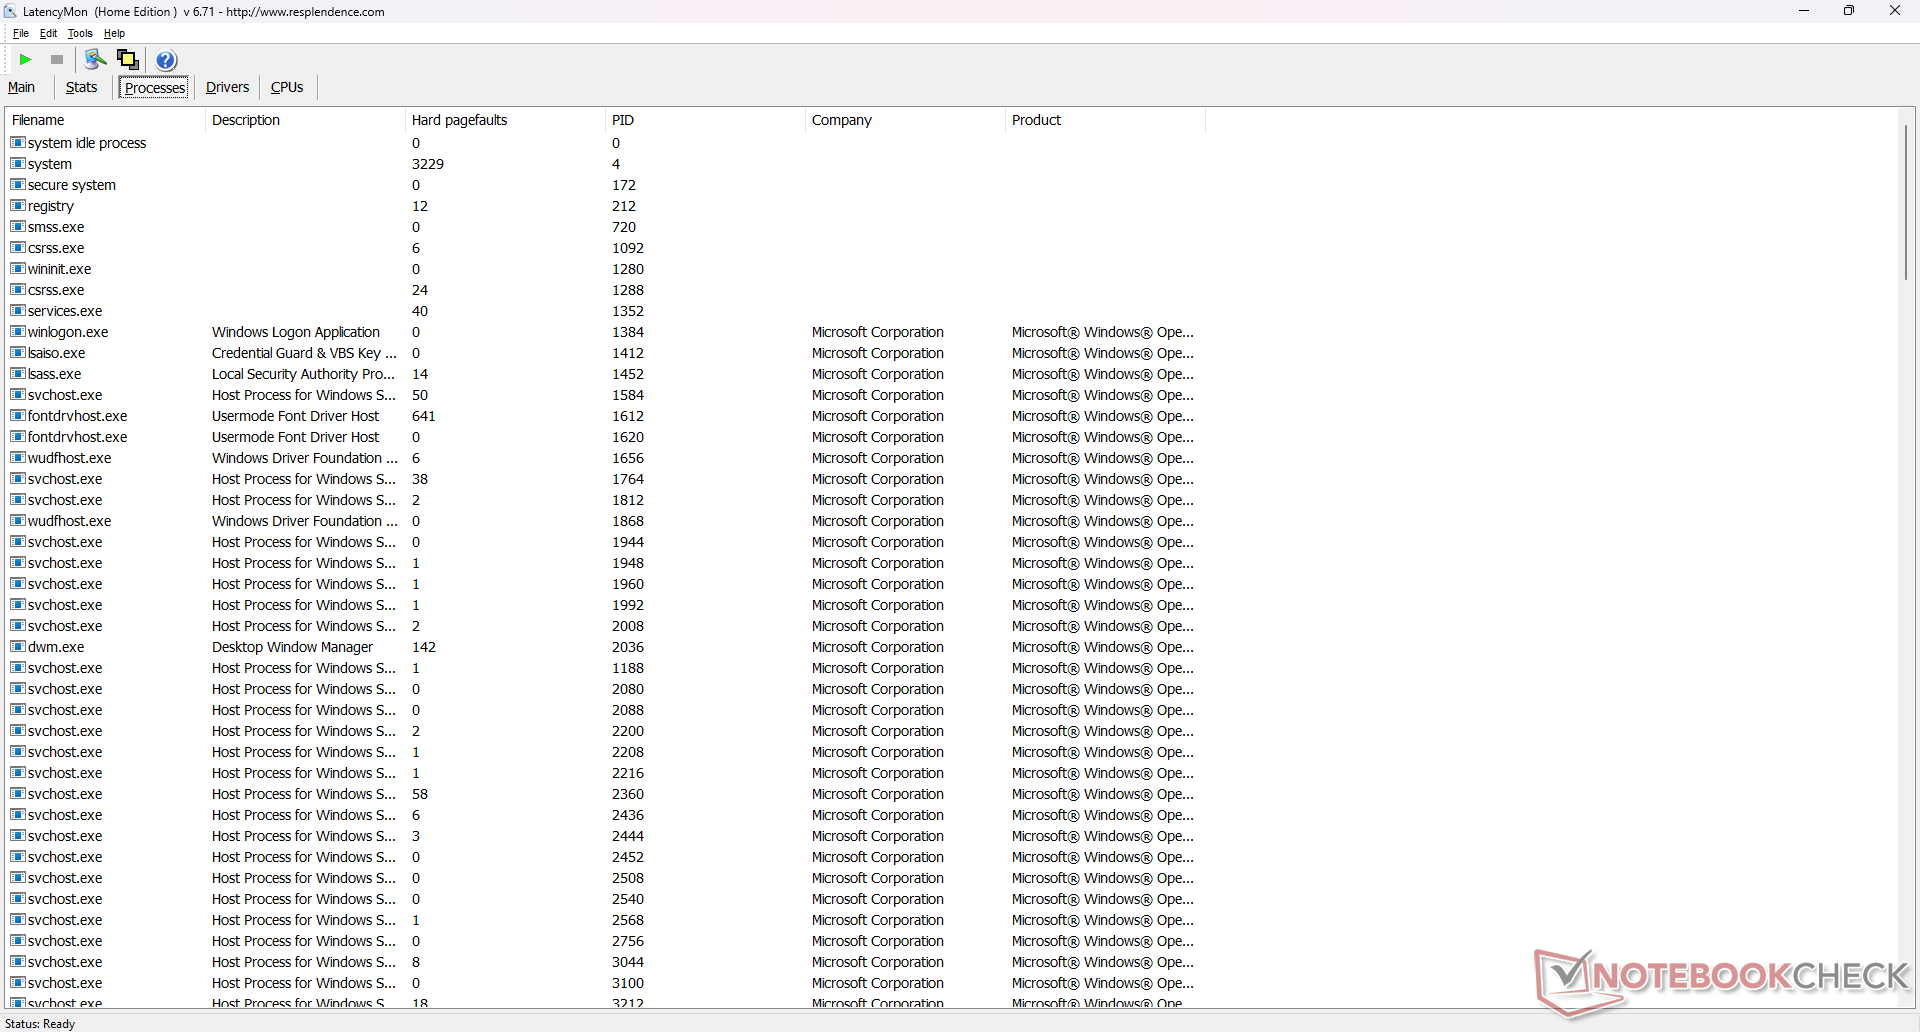
Latencia del CPD
LatencyMon revela problemas menores de CPD al abrir varias pestañas de nuestra página de inicio. la reproducción de vídeo 4K a 60 FPS es casi perfecta, con sólo 2 fotogramas perdidos durante un minuto.
| DPC Latencies / LatencyMon - interrupt to process latency (max), Web, Youtube, Prime95 | |
| Dell G15 5530 | |
| HP Victus 15 fa0020nr | |
| Lenovo LOQ 15APH8 | |
| MSI Cyborg 15 A12VF | |
| Lenovo Legion 5 15IAH7H 82RB | |
* ... más pequeño es mejor
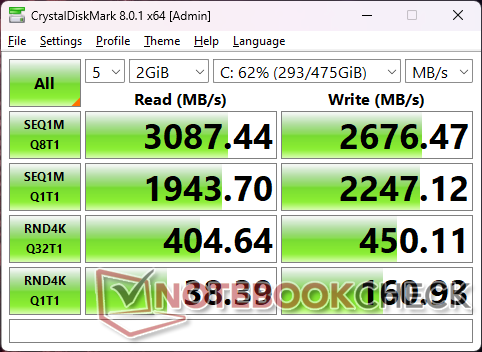
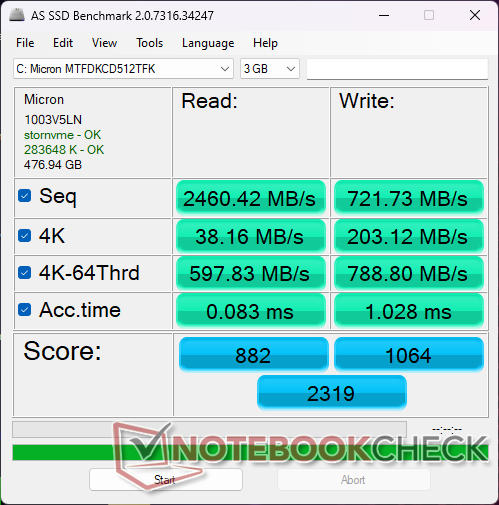
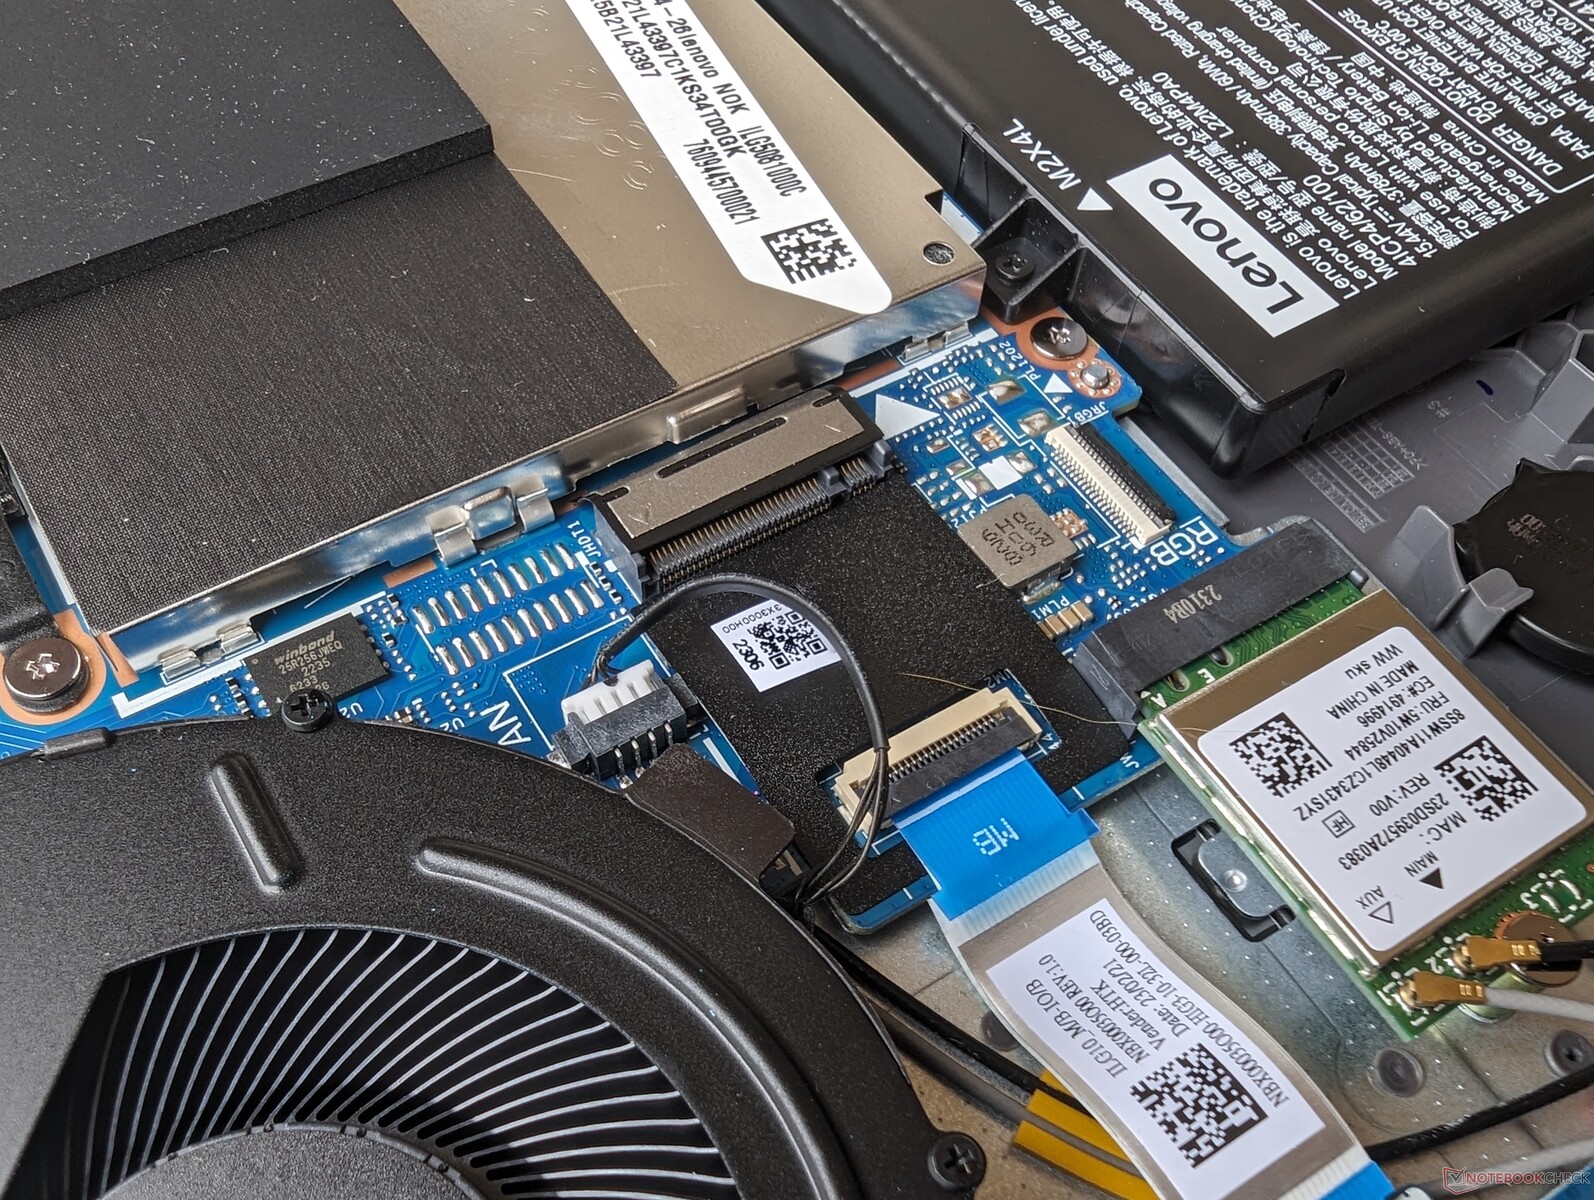
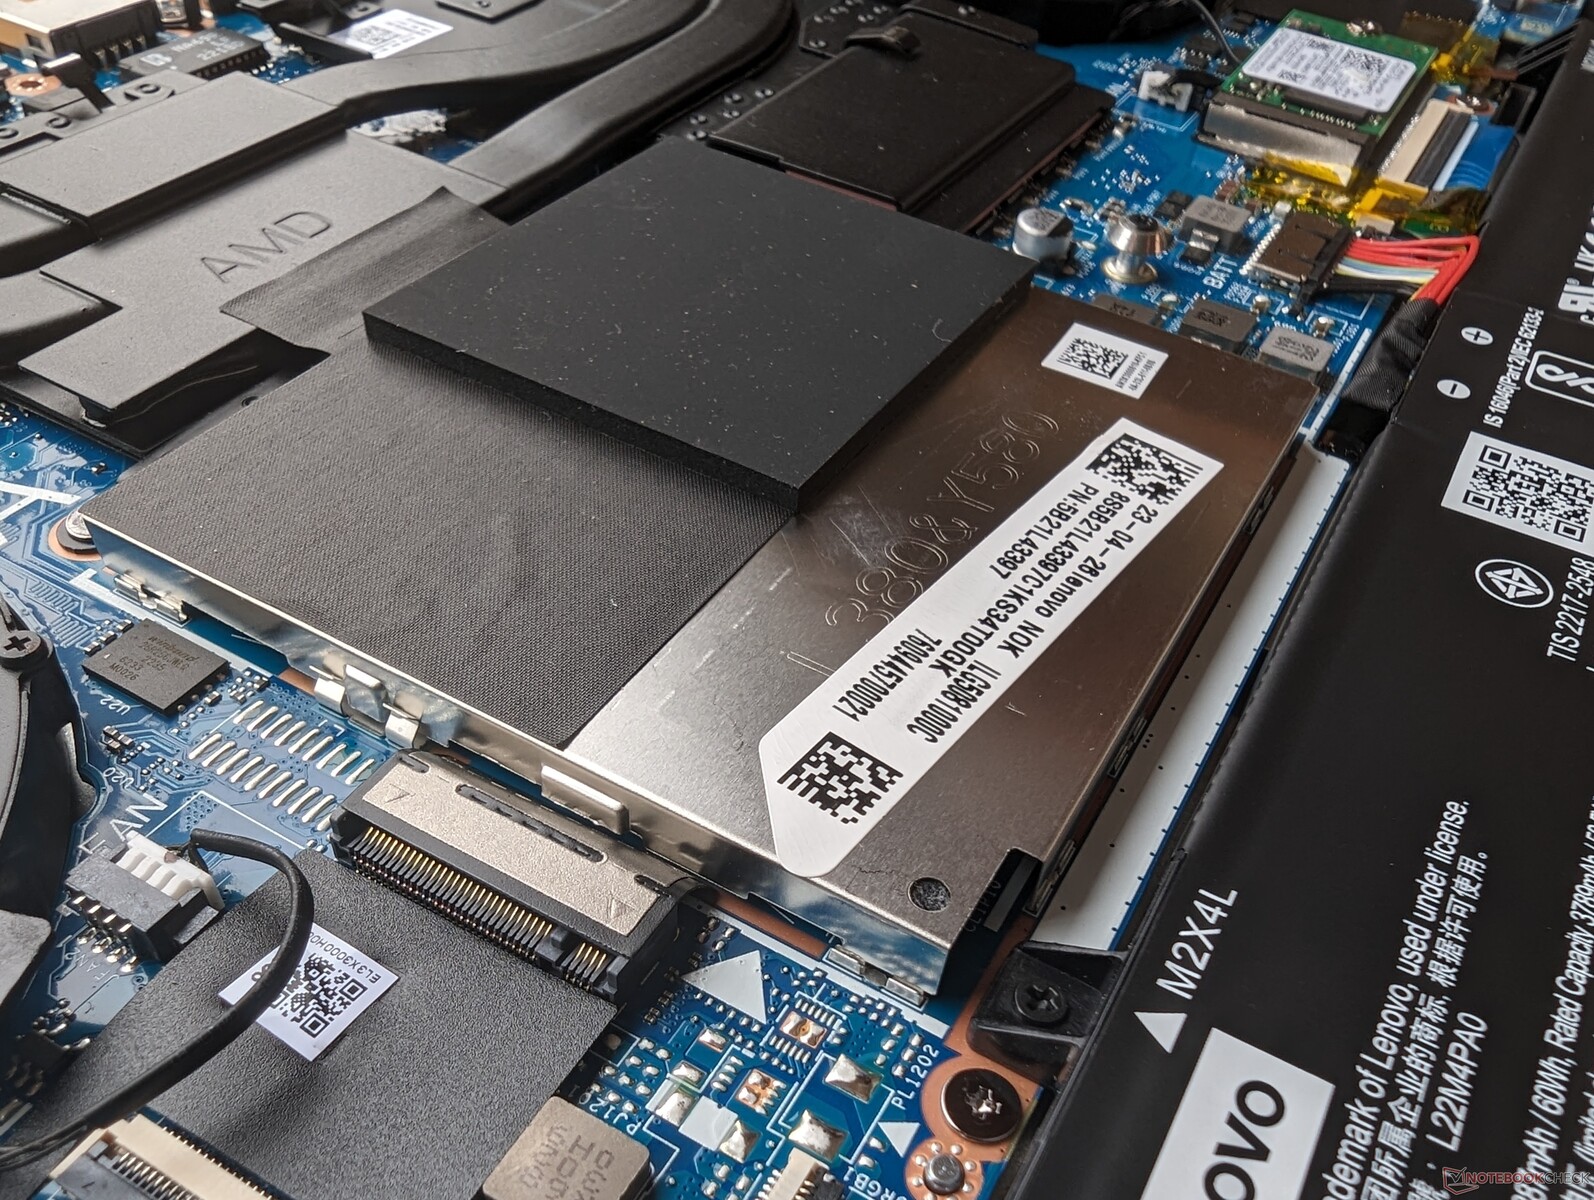
Dispositivos de almacenamiento - Compatibilidad con PCIe4 x4 NVMe
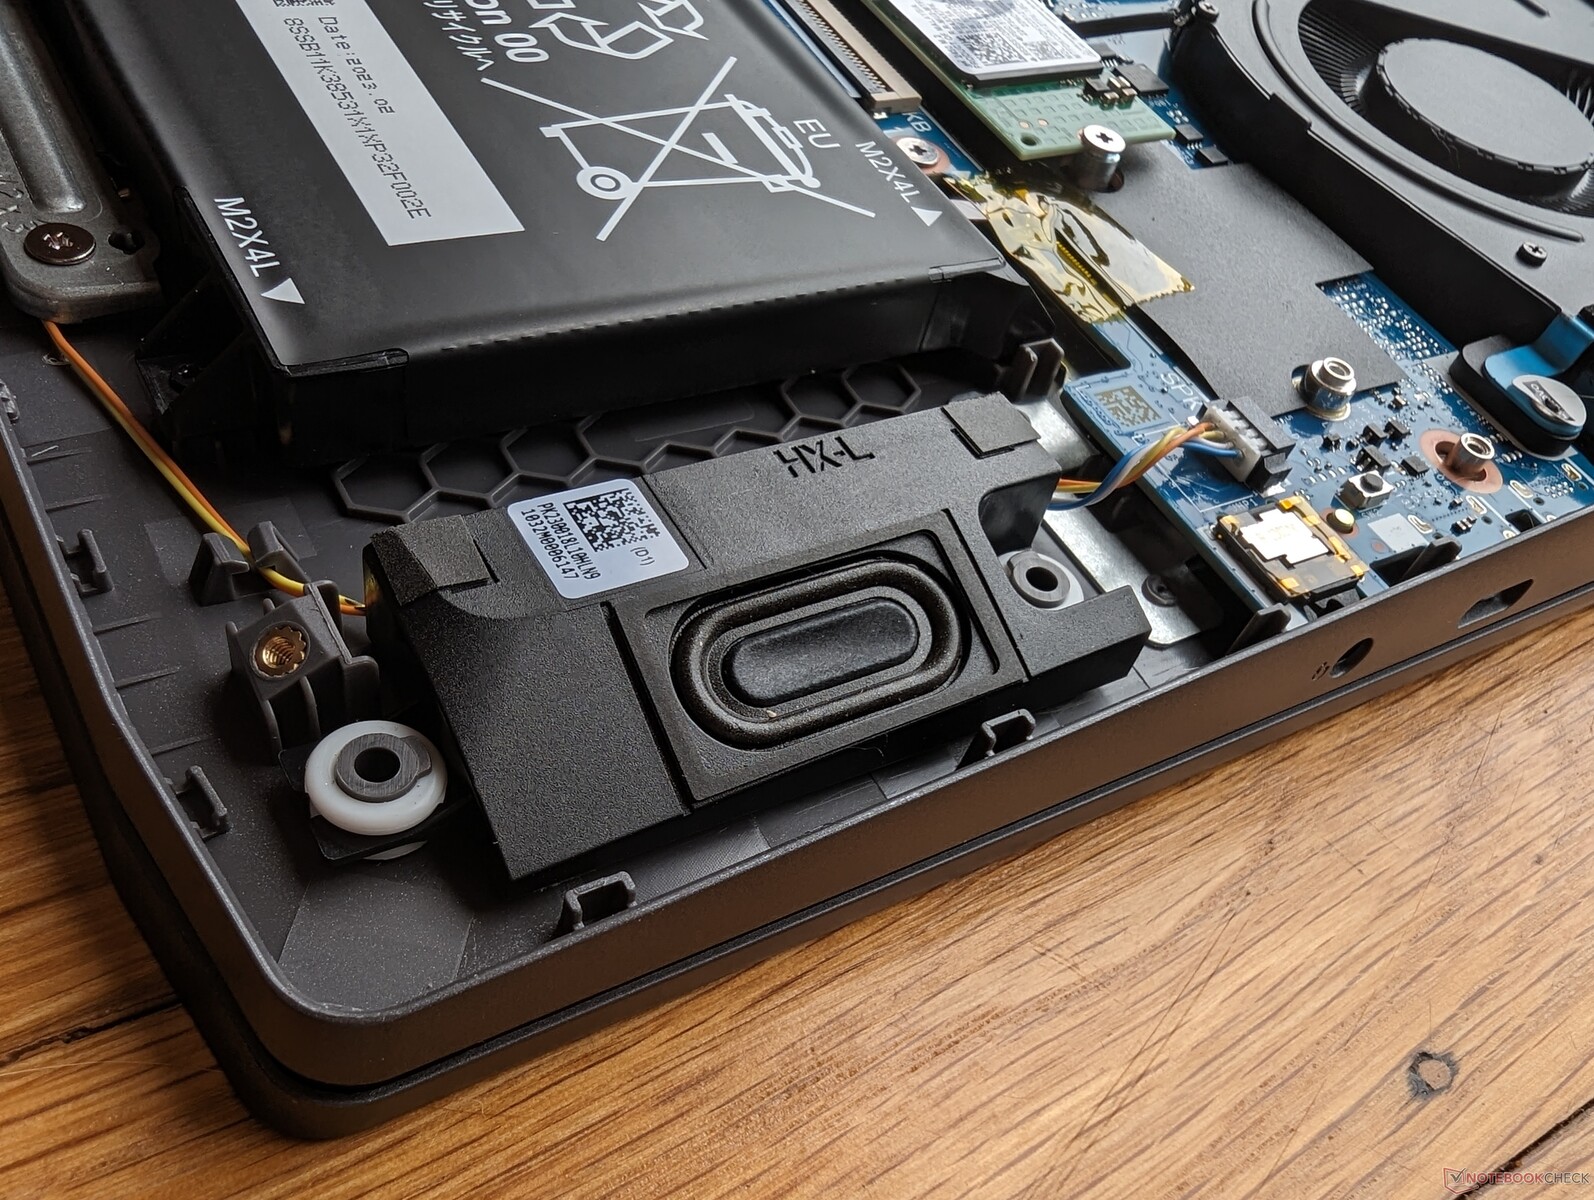
Nuestra unidad se entrega con unSSD NVMe Micron 2450 PCIe4 x4 capaz de mantener velocidades de lectura reales de hasta 2600 MB/s sin ralentización alguna. Admite hasta dos SSD internas, pero la segunda unidad debe tener 42 mm de longitud, como muestran las imágenes siguientes.
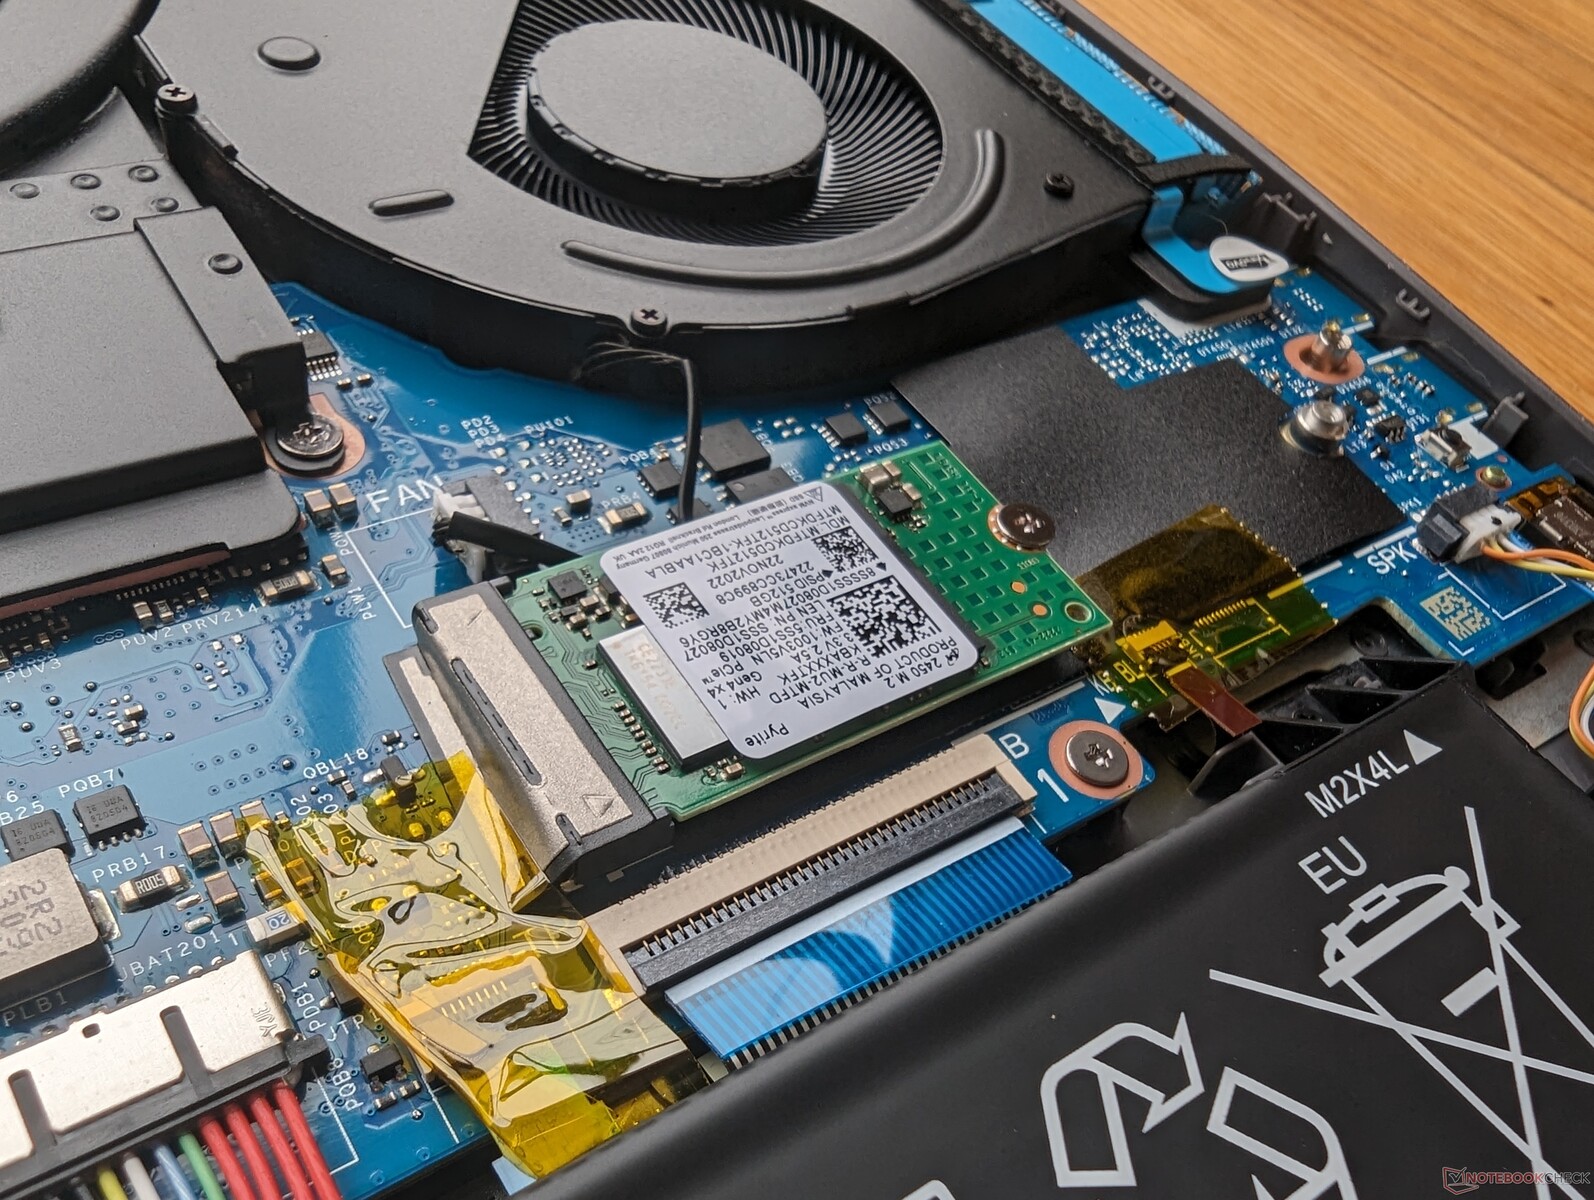

| Drive Performance rating - Percent | |
| Lenovo Legion 5 15IAH7H 82RB | |
| HP Victus 15 fa0020nr | |
| MSI Cyborg 15 A12VF | |
| Asus TUF A15 FA507 | |
| Dell G15 5530 | |
| Lenovo LOQ 15APH8 | |
* ... más pequeño es mejor
Disk Throttling: DiskSpd Read Loop, Queue Depth 8
Rendimiento de la GPU
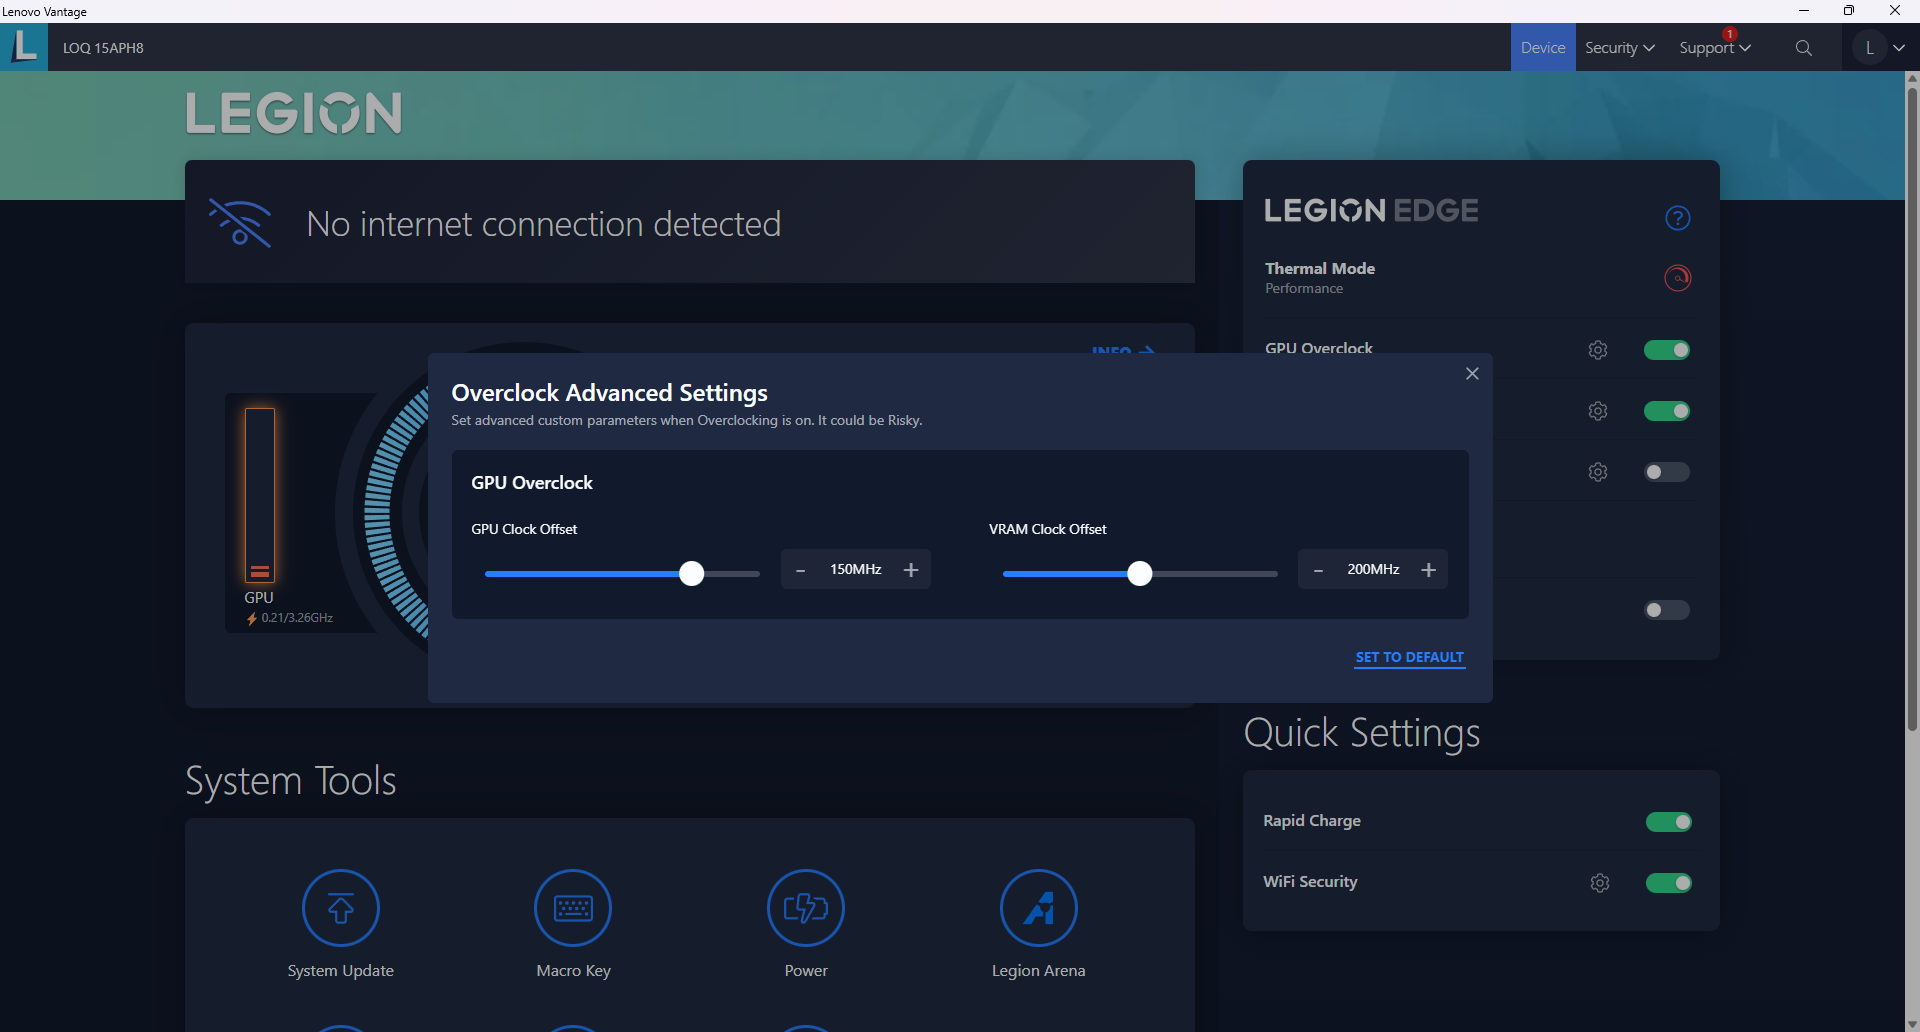
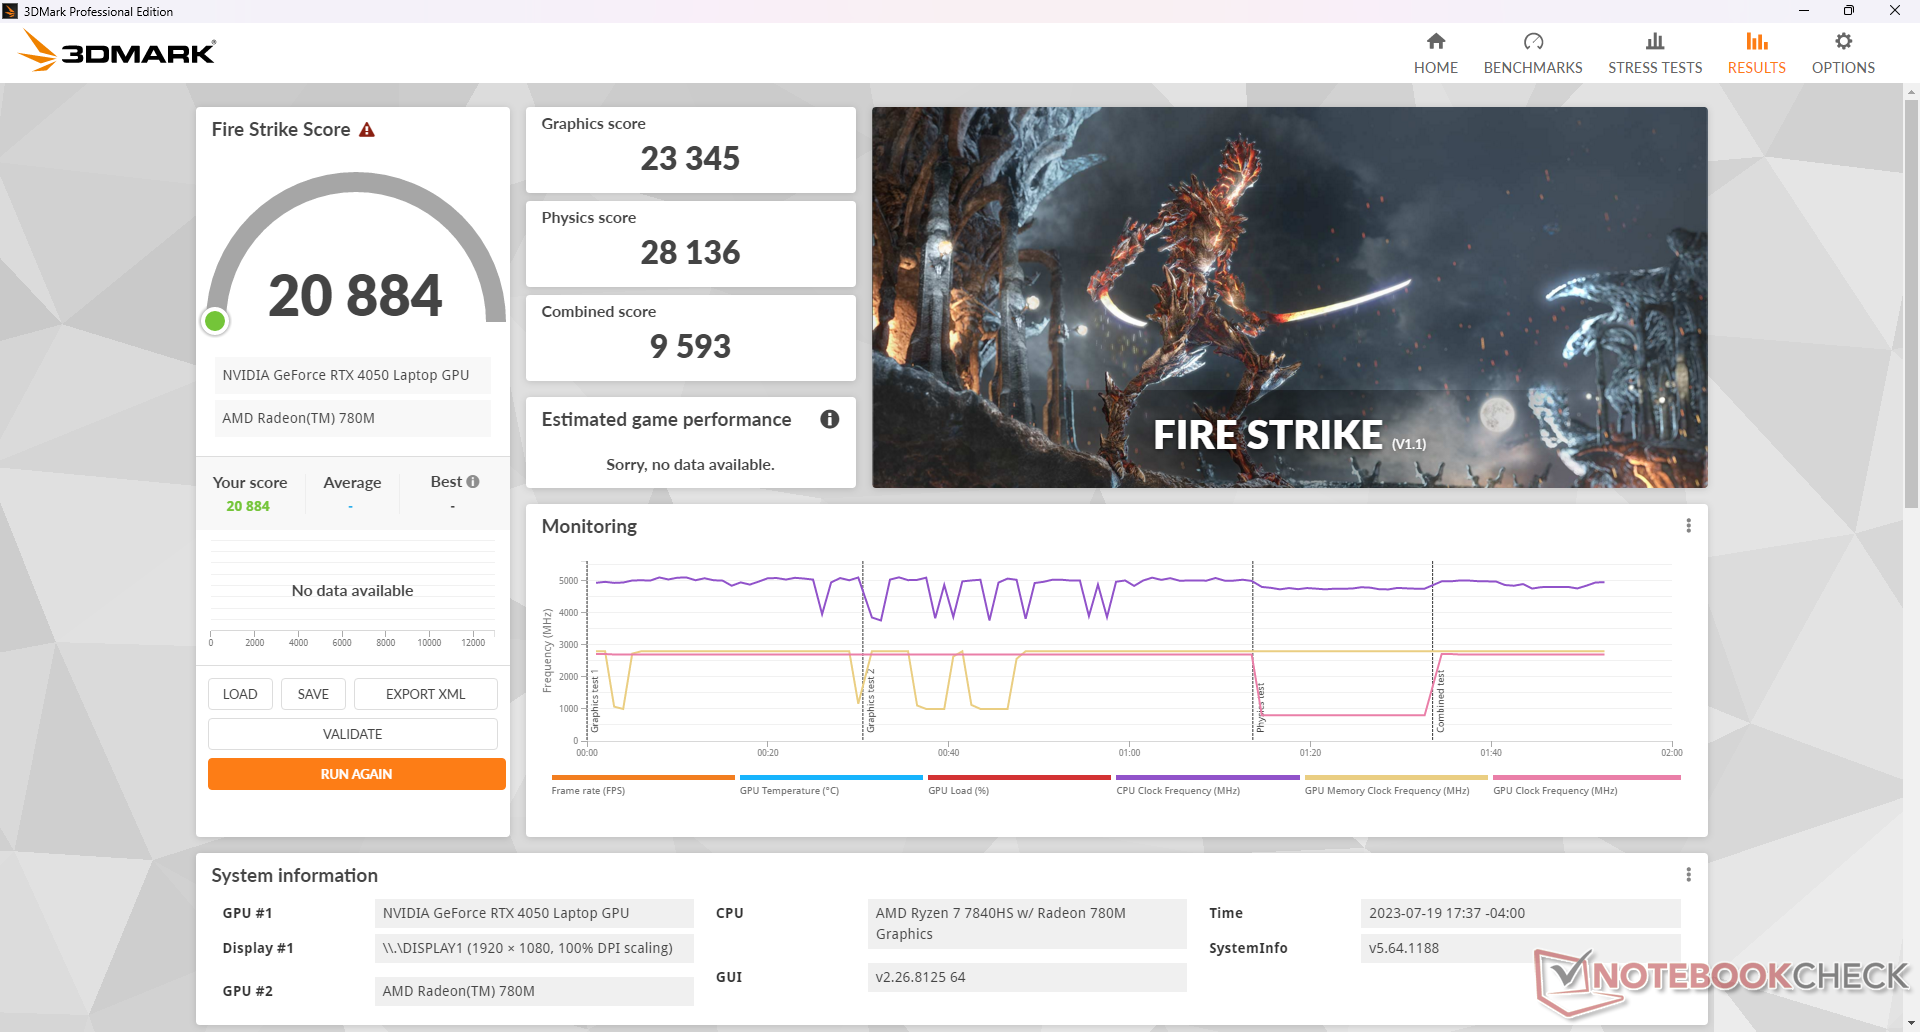
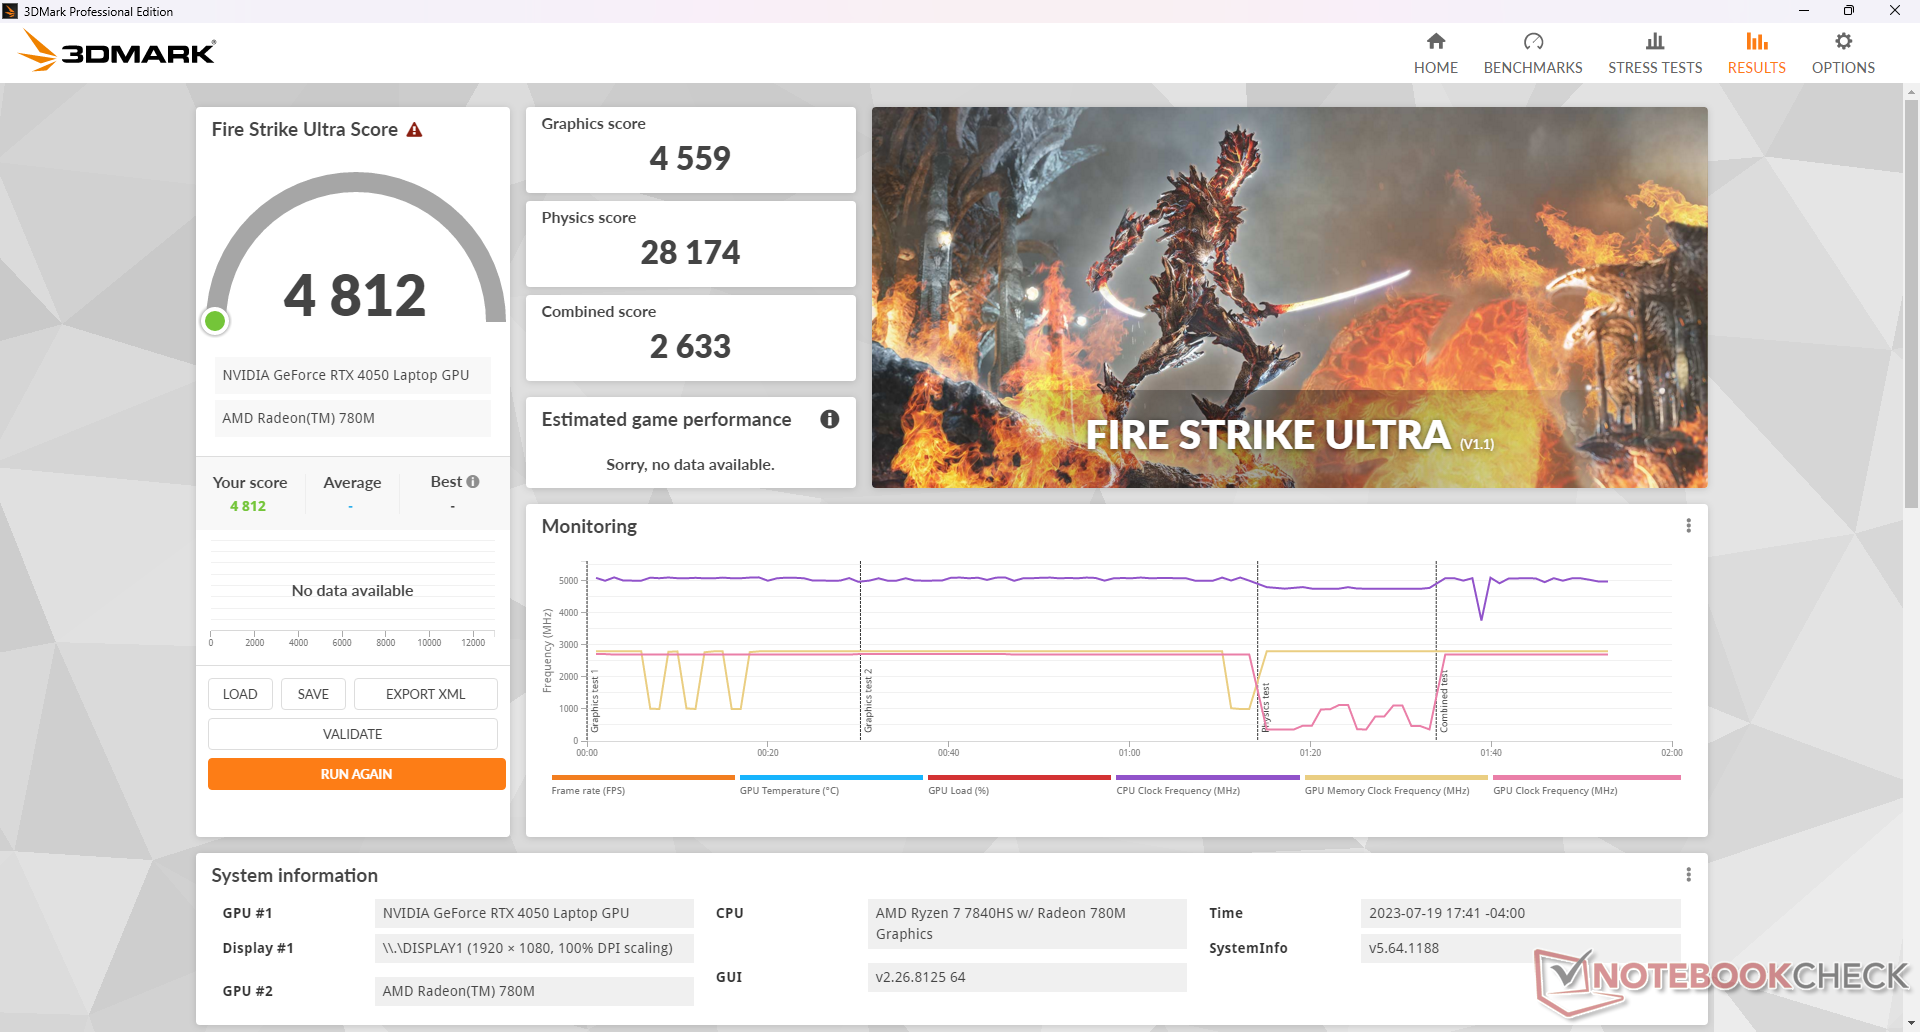
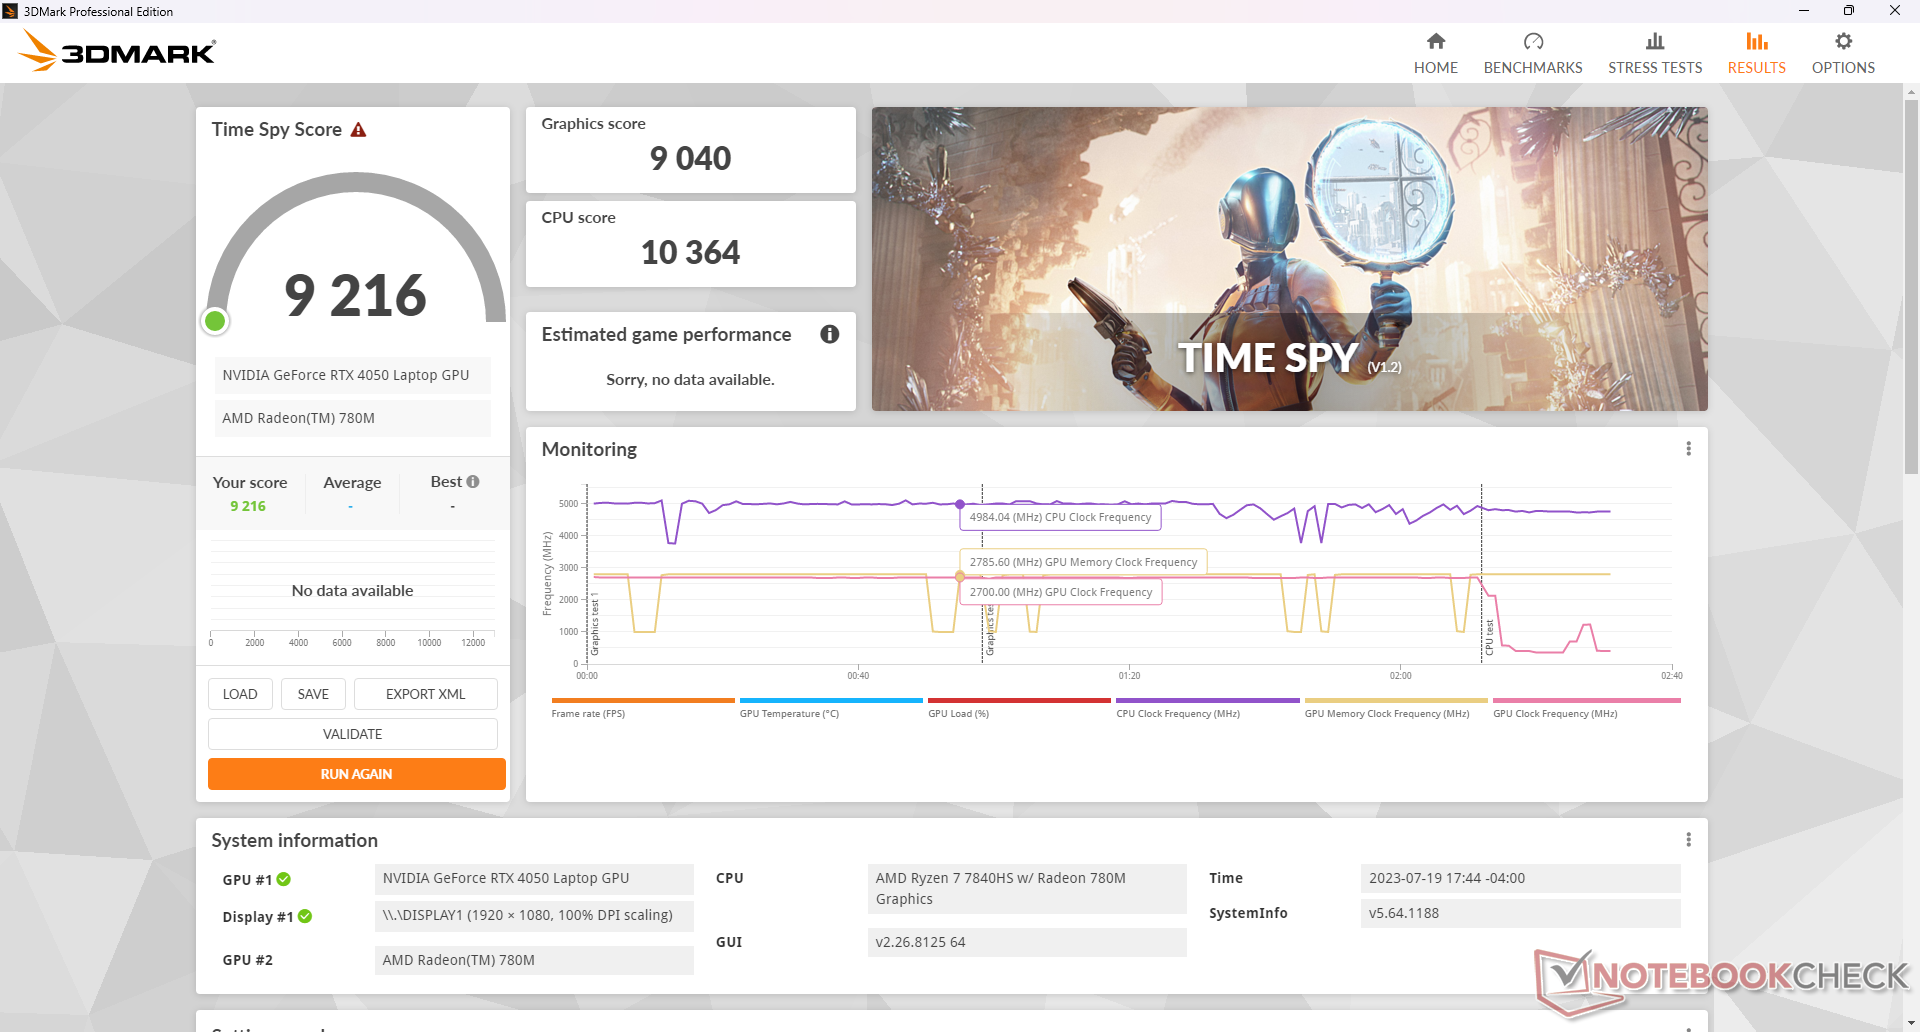
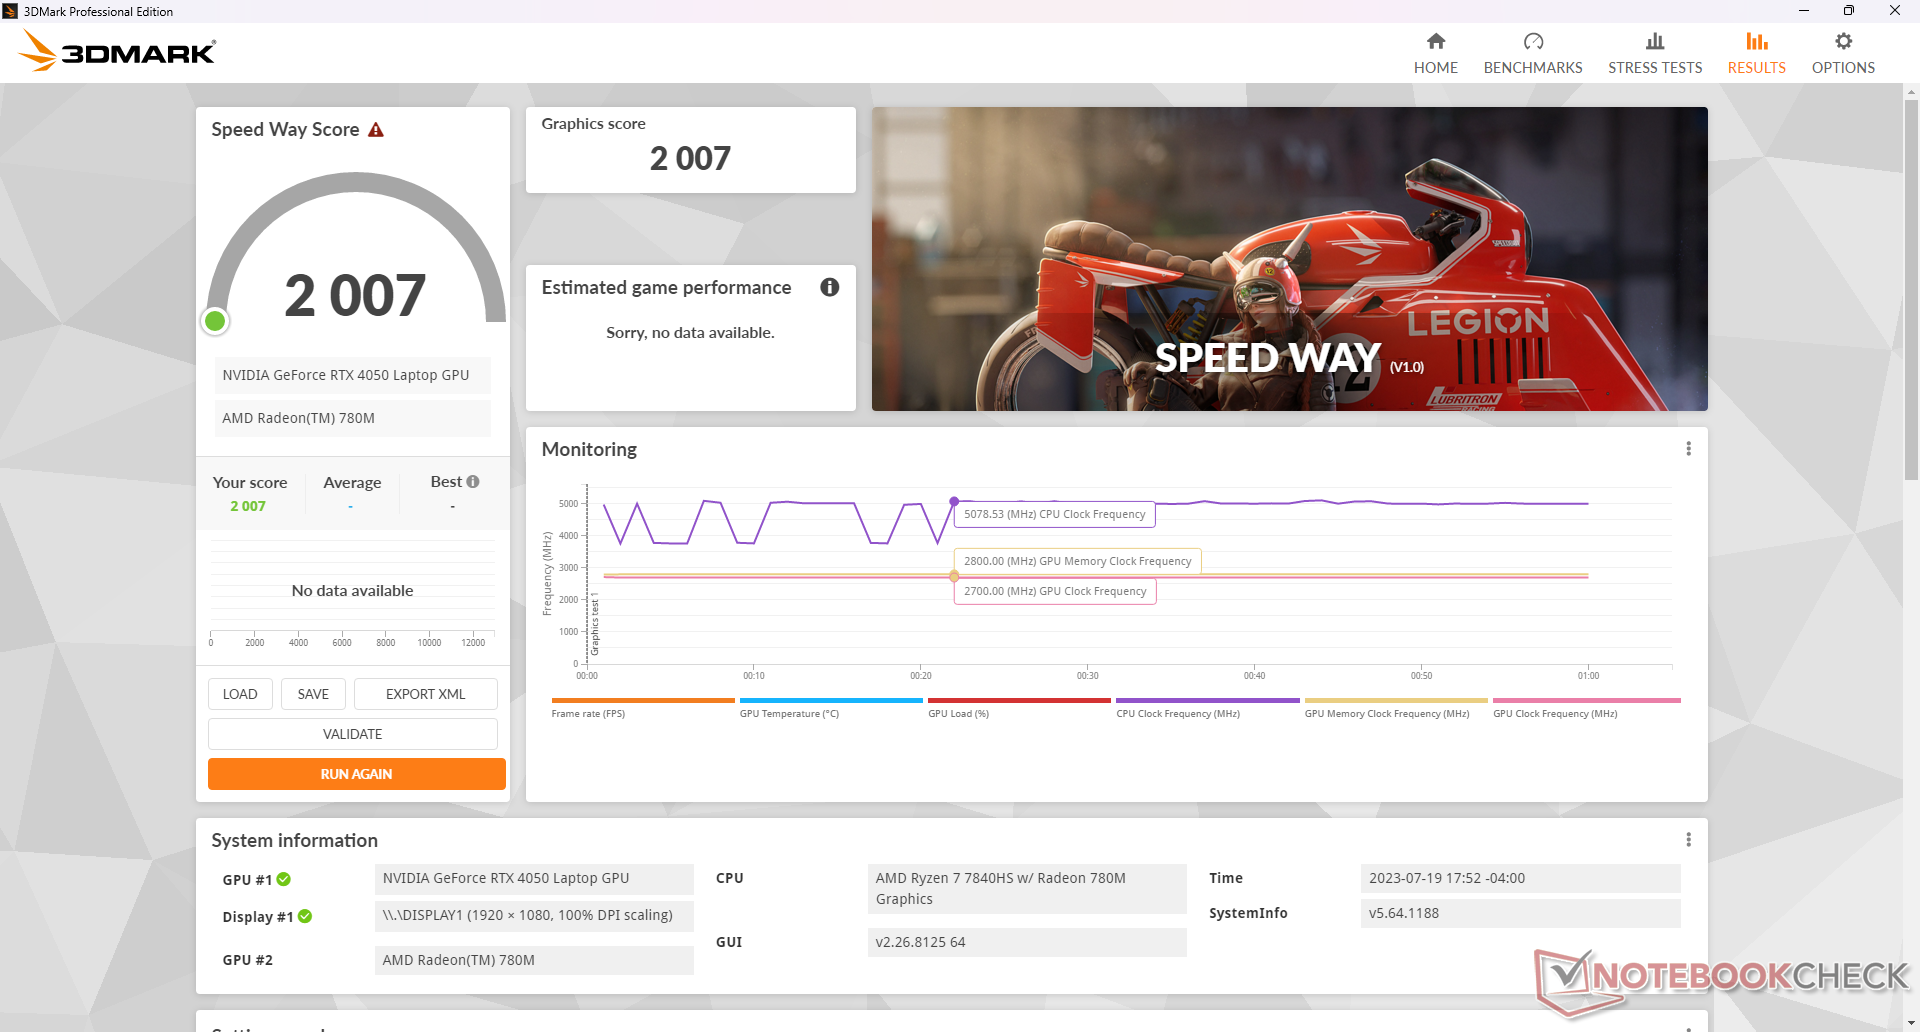
El rendimiento gráfico es muy bueno con puntuaciones 3DMark que son aproximadamente un 10 por ciento más altas que la media de portátiles de nuestra base de datos equipados con la misma GeForce RTX 4050 GPU. El rendimiento en bruto está a la par con la rTX 3060 portátil como era de esperar.
El cambio a la RTX 3050 reduciría el rendimiento de la GPU hasta en un 45%, mientras que la actualización a la configuración RTX 4060 aumentaría el rendimiento entre un 15 y un 20 por ciento. Para los jugadores con un presupuesto ajustado, recomendamos las opciones RTX 4050 o RTX 4060.
Funcionar con batería reduce el rendimiento. Una prueba de Fire Strike con batería arrojaría unas puntuaciones de Física y Gráficos de 25672 y 16335 puntos, respectivamente, frente a los 28136 y 23345 puntos de la red eléctrica.
Ejecutar el sistema en modo Equilibrado en lugar de en modo Rendimiento afectará ligeramente al rendimiento, como muestran nuestros resultados de Fire Strike en la tabla siguiente.
| Perfil de potencia | Puntuación gráfica | Puntuación física | Puntuación combinada |
| Equilibrado | 22598 (-3%) | 25910 (-8%) | 9507 (-1%) |
| Rendimiento | 23345 | 28136 | 9593 |
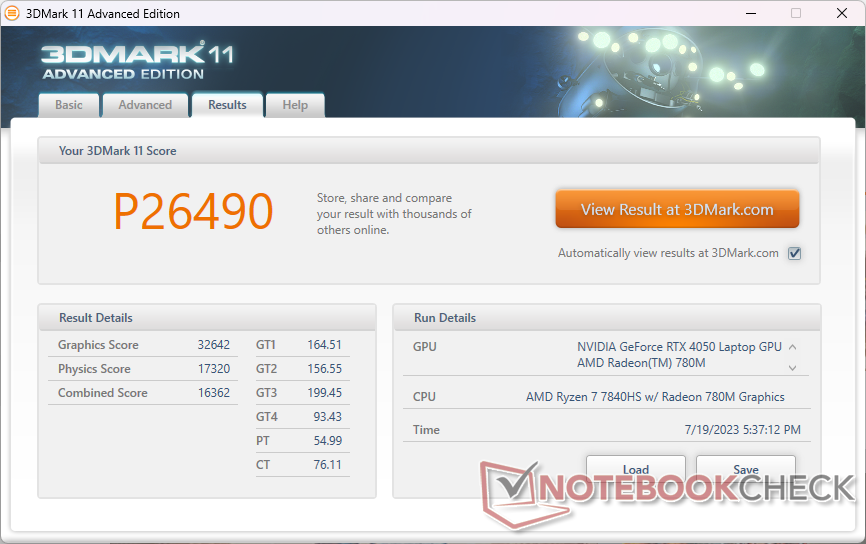
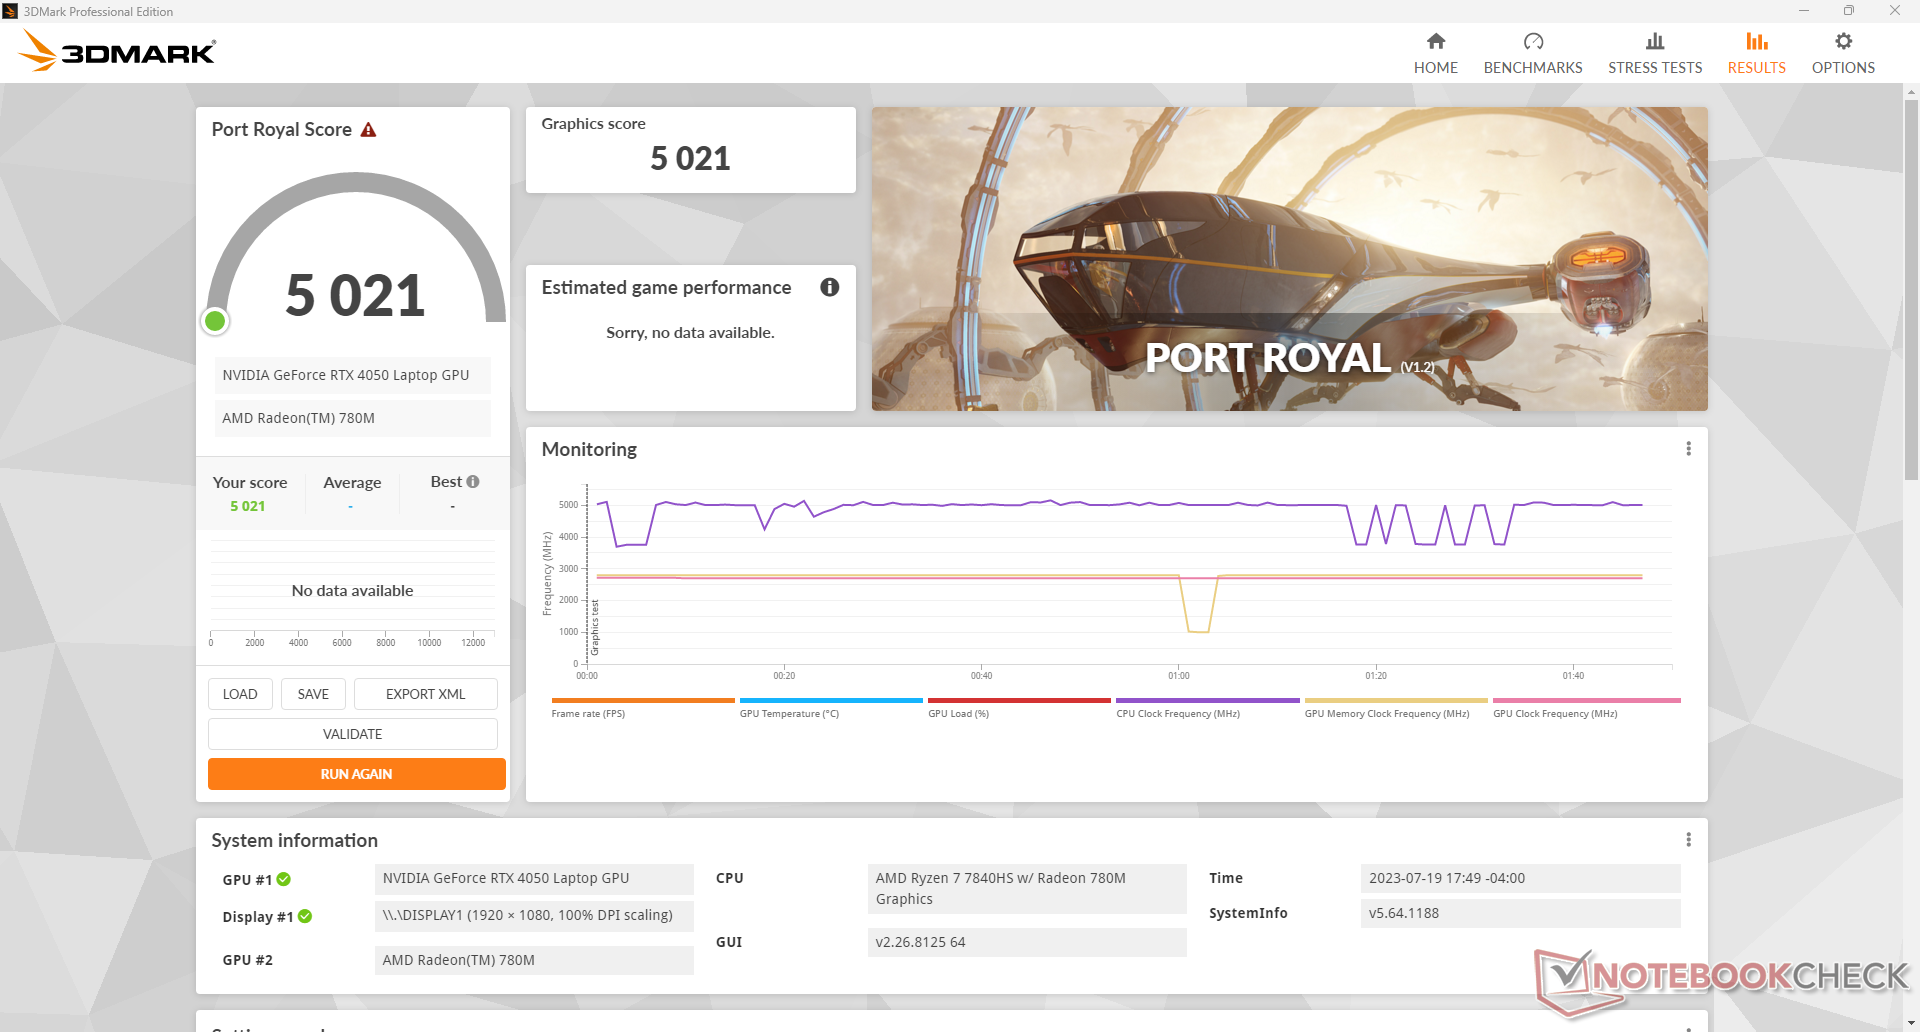
| 3DMark 11 Performance | 26490 puntos | |
| 3DMark Fire Strike Score | 20884 puntos | |
| 3DMark Time Spy Score | 9216 puntos | |
ayuda | ||
* ... más pequeño es mejor
Rendimiento en juegos
Sorprendentemente, los 8 GB de RAM del sistema tienen poco impacto en el rendimiento de juego del sistema. De hecho, las tasas de frames están donde esperamos que estén en la mayoría de los casos en comparación con otros portátiles con la misma GPU RTX 4050, si no ligeramente más rápido. Hay algunas excepciones, sin embargo, en las que ciertos ajustes gráficos Ultra bloquearían el juego debido a limitaciones de memoria, incluyendo F1 22 y Returnal.
Witcher 3 FPS Chart
| bajo | medio | alto | ultra | |
|---|---|---|---|---|
| GTA V (2015) | 163.6 | 156 | 132.9 | 78.4 |
| The Witcher 3 (2015) | 286.5 | 251.2 | 165 | 83.8 |
| Dota 2 Reborn (2015) | 148 | 134.9 | 130 | 123.9 |
| Final Fantasy XV Benchmark (2018) | 166.8 | 122.4 | 86.1 | |
| X-Plane 11.11 (2018) | 113.2 | 101.4 | 81.3 | |
| Strange Brigade (2018) | 309 | 214 | 177 | 156.6 |
| Cyberpunk 2077 1.6 (2022) | 117 | 106.4 | 82.2 | 70.1 |
| Tiny Tina's Wonderlands (2022) | 169.2 | 148.8 | 99.5 | 77.3 |
| F1 22 (2022) | 191.2 | 184.3 | 163.2 | |
| Returnal (2023) | 66 | 66 | 63 | 53 |
Emisiones
Ruido del sistema - Loud Gamer
El ruido del ventilador tiende a establecerse en 25 dB(A) contra un fondo silencioso de 23 dB(A) durante la navegación ligera o el streaming, que es esencialmente inaudible en un entorno típico de oficina o habitación. Si se ejecutaWitcher 3 en modo Rendimiento puede llegar a 46 dB(A), mientras que jugar en modo Equilibrado es un poco más silencioso con 44 dB(A). Sin embargo, este último modo conlleva un pequeño impacto en el rendimiento, como ya se ha indicado.
Si la CPU y la GPU están al 100% de su capacidad, el ruido del ventilador puede alcanzar los 52 dB(A), casi tan alto como el delCyborg 15.
Ruido
| Ocioso |
| 23.1 / 23.1 / 25.2 dB(A) |
| Carga |
| 44.3 / 52 dB(A) |
 | ||
30 dB silencioso 40 dB(A) audible 50 dB(A) ruidosamente alto |
||
min: | ||
| Lenovo LOQ 15APH8 GeForce RTX 4050 Laptop GPU, R7 7840HS, Micron 2450 512GB MTFDKCD512TFK | Lenovo Legion 5 15IAH7H 82RB GeForce RTX 3060 Laptop GPU, i7-12700H | Dell G15 5530 GeForce RTX 4060 Laptop GPU, i7-13650HX, SSTC CL4-3D512-Q11 | Asus TUF A15 FA507 GeForce RTX 4050 Laptop GPU, R7 7735HS, Micron 2400 MTFDKBA512QFM | MSI Cyborg 15 A12VF GeForce RTX 4060 Laptop GPU, i7-12650H, Samsung PM9B1 1024GB MZVL41T0HBLB | HP Victus 15 fa0020nr GeForce RTX 3050 Ti Laptop GPU, i7-12700H, Samsung PM9A1 MZVL2512HCJQ | |
|---|---|---|---|---|---|---|
| Noise | 1% | 2% | 9% | -30% | -1% | |
| apagado / medio ambiente * (dB) | 23.1 | 23.3 -1% | 20.41 12% | 23.3 -1% | 27 -17% | 24.8 -7% |
| Idle Minimum * (dB) | 23.1 | 23.5 -2% | 26.85 -16% | 23.3 -1% | 27 -17% | 26.2 -13% |
| Idle Average * (dB) | 23.1 | 23.5 -2% | 26.85 -16% | 23.3 -1% | 37.5 -62% | 29.2 -26% |
| Idle Maximum * (dB) | 25.2 | 26.8 -6% | 26.85 -7% | 23.3 8% | 38 -51% | 29.4 -17% |
| Load Average * (dB) | 44.3 | 29.3 34% | 27.65 38% | 29.6 33% | 56.3 -27% | 29.9 33% |
| Witcher 3 ultra * (dB) | 45.8 | 51.4 -12% | 47.9 -5% | 43 6% | 41.1 10% | |
| Load Maximum * (dB) | 52 | 53 -2% | 47.86 8% | 43 17% | 56.3 -8% | 45.5 12% |
* ... más pequeño es mejor
Temperatura
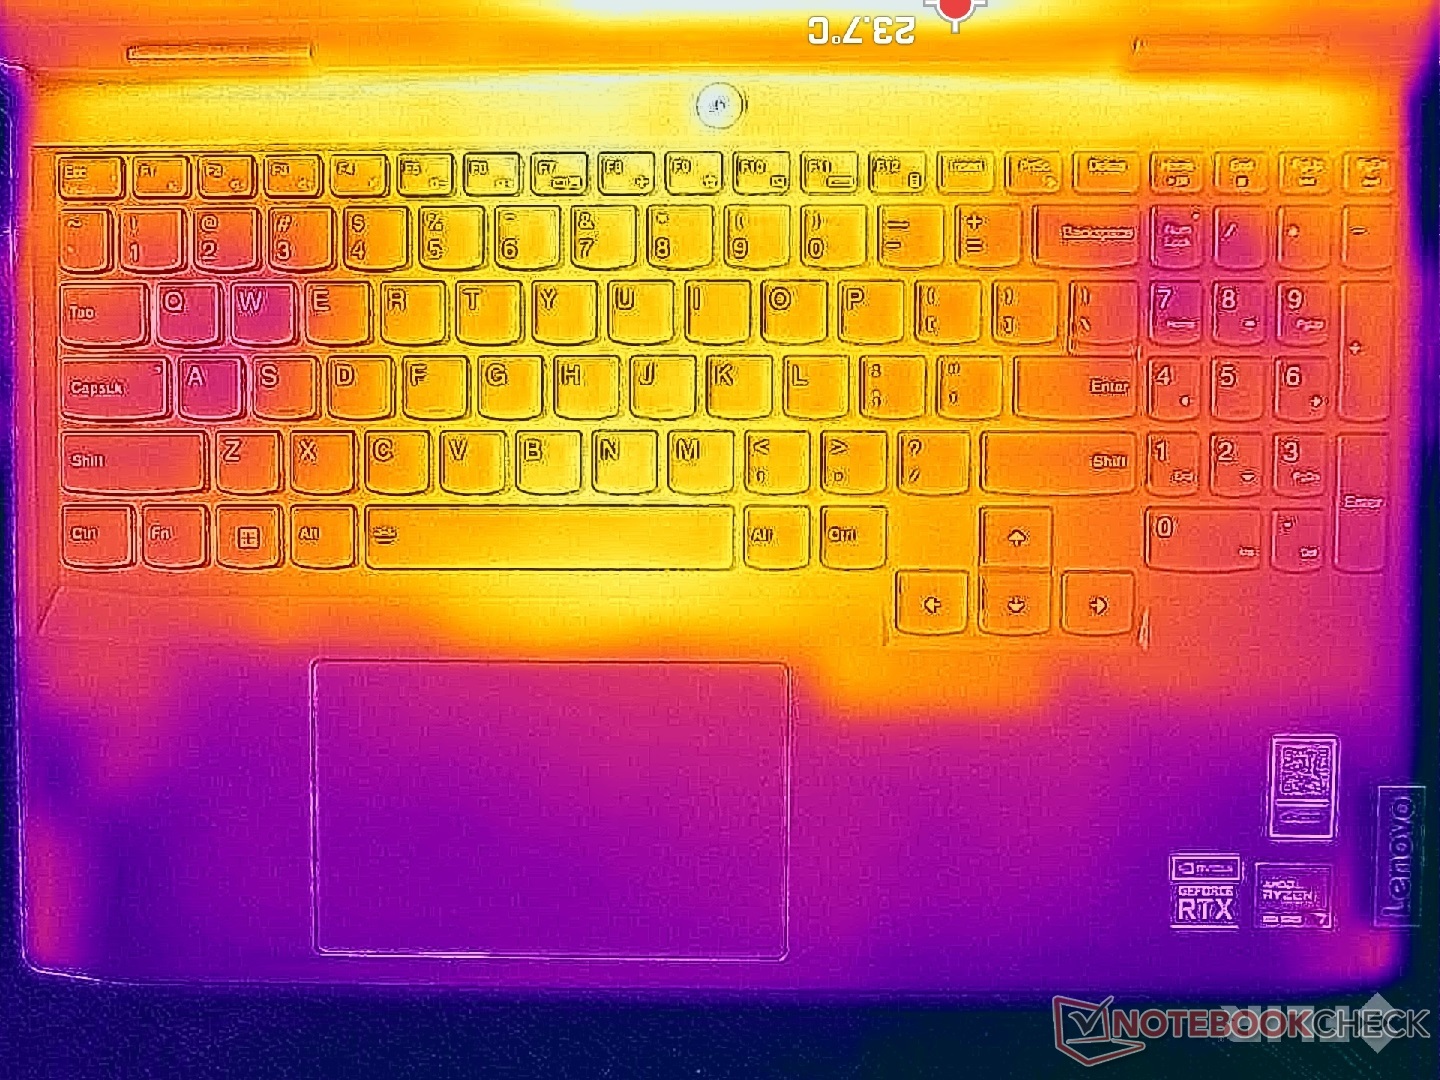
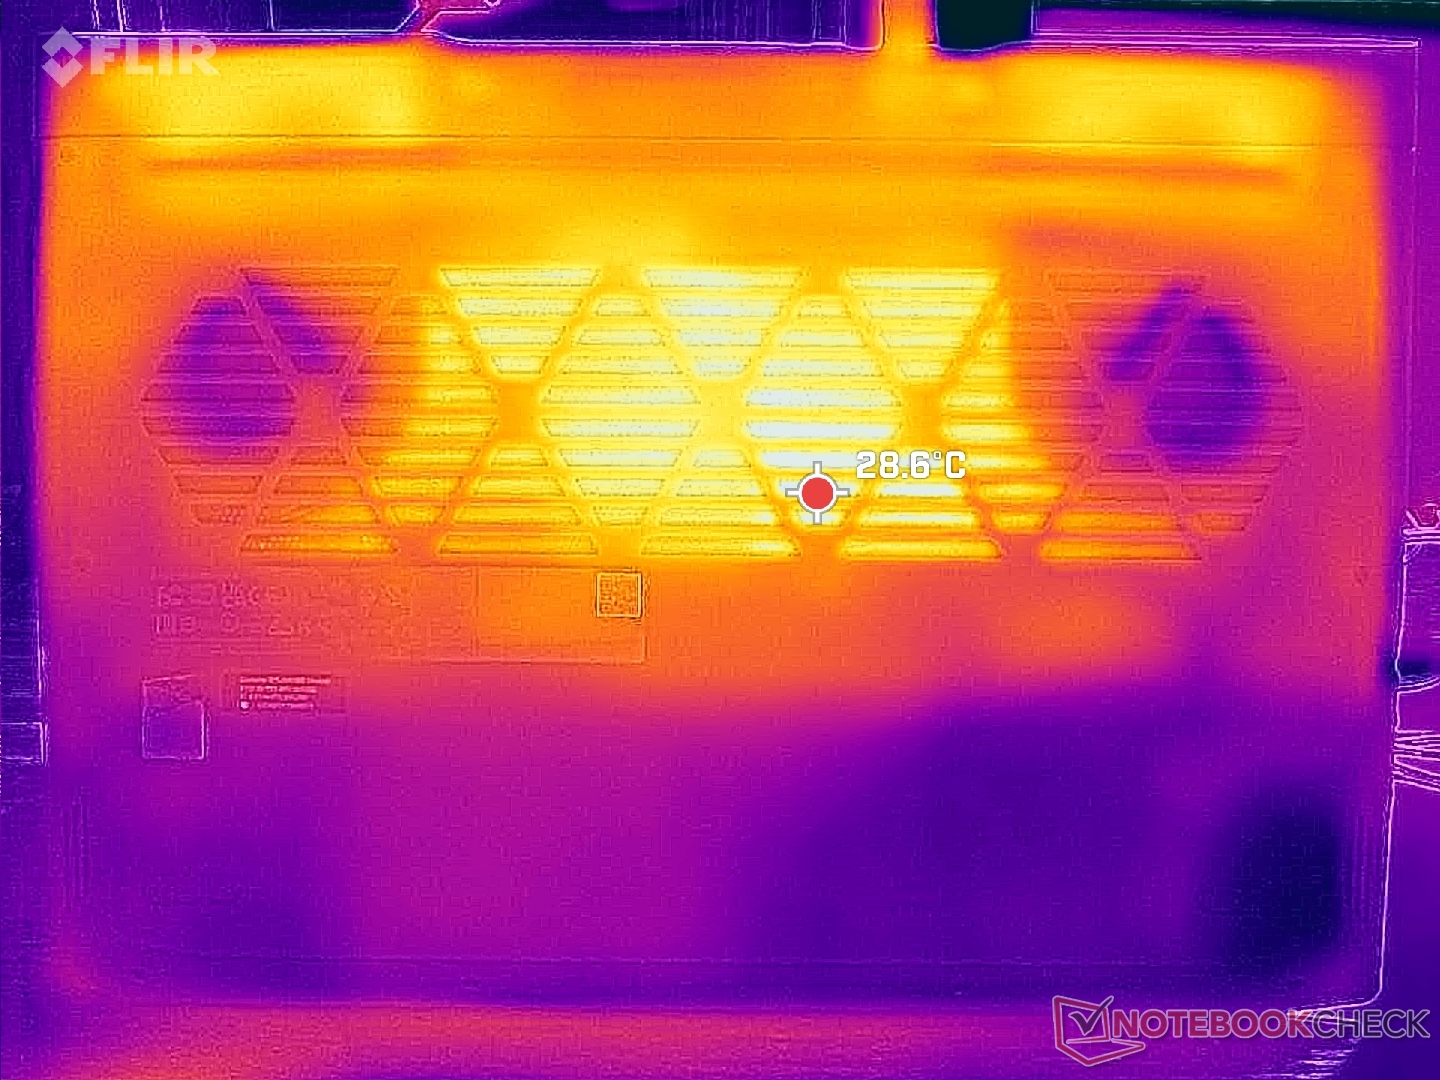
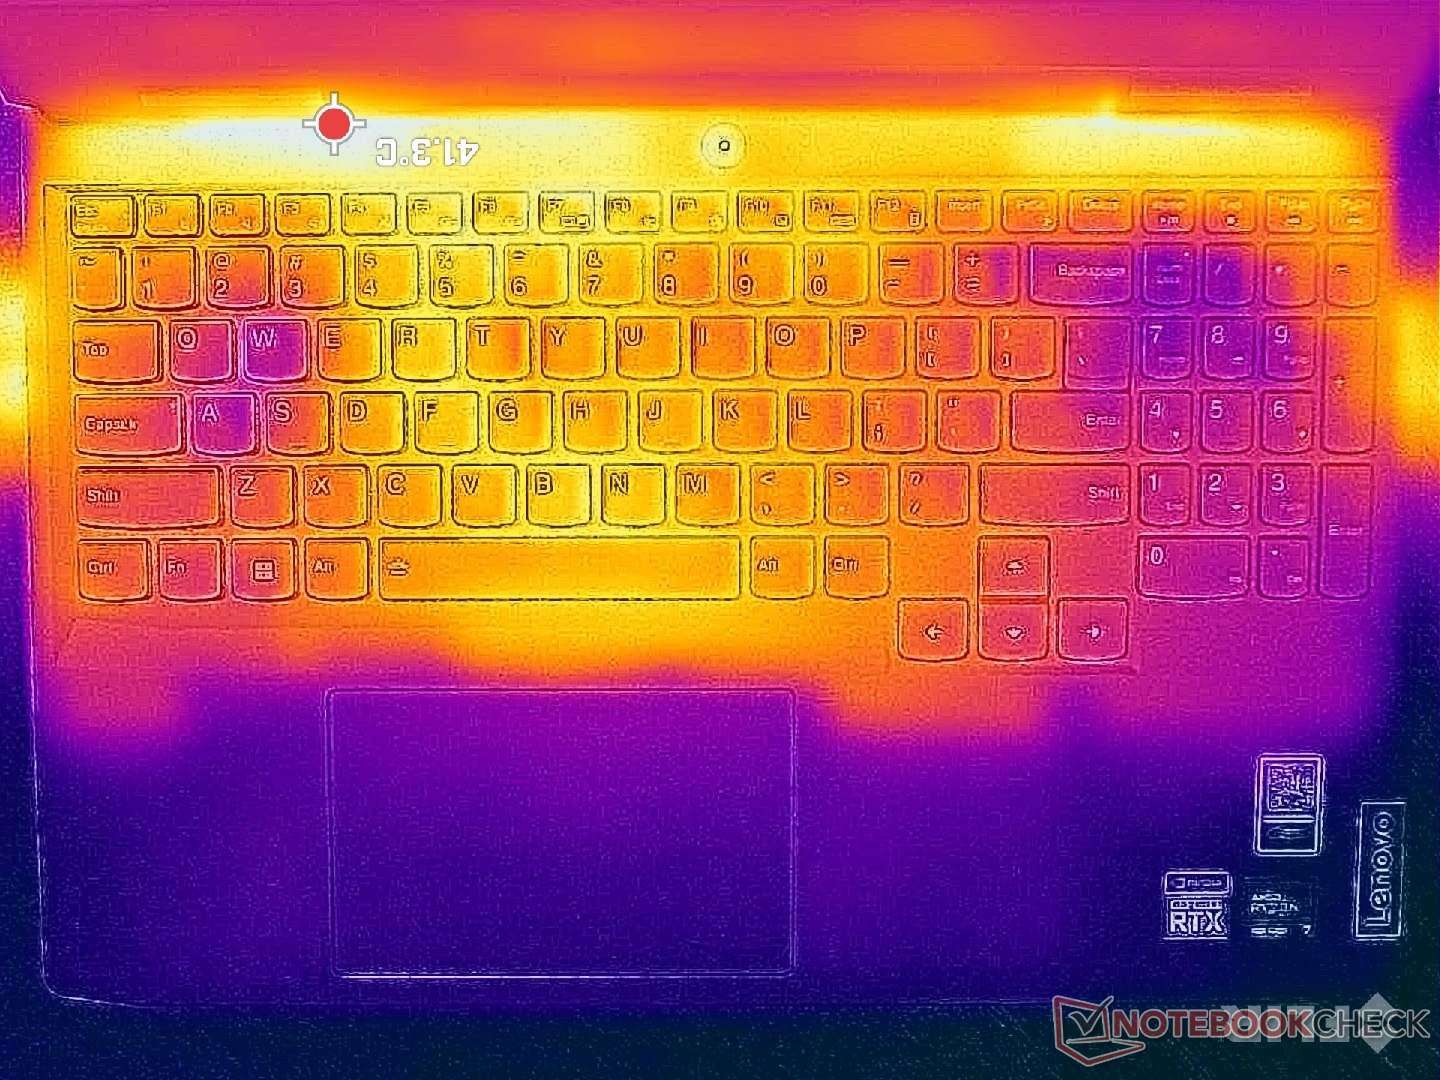
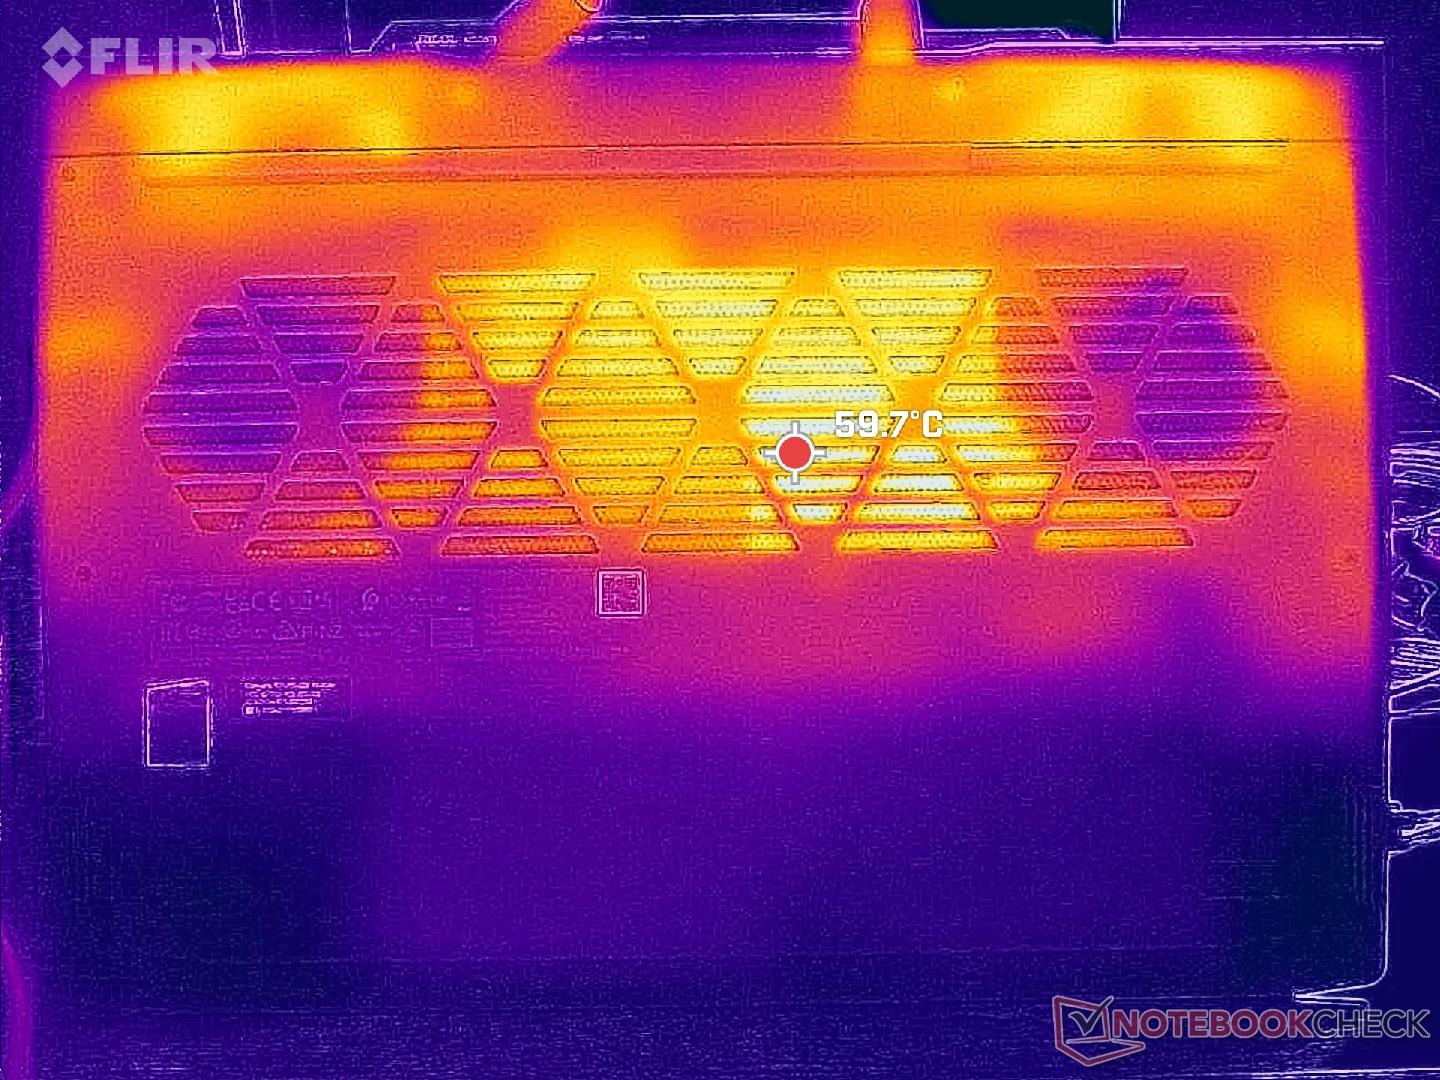
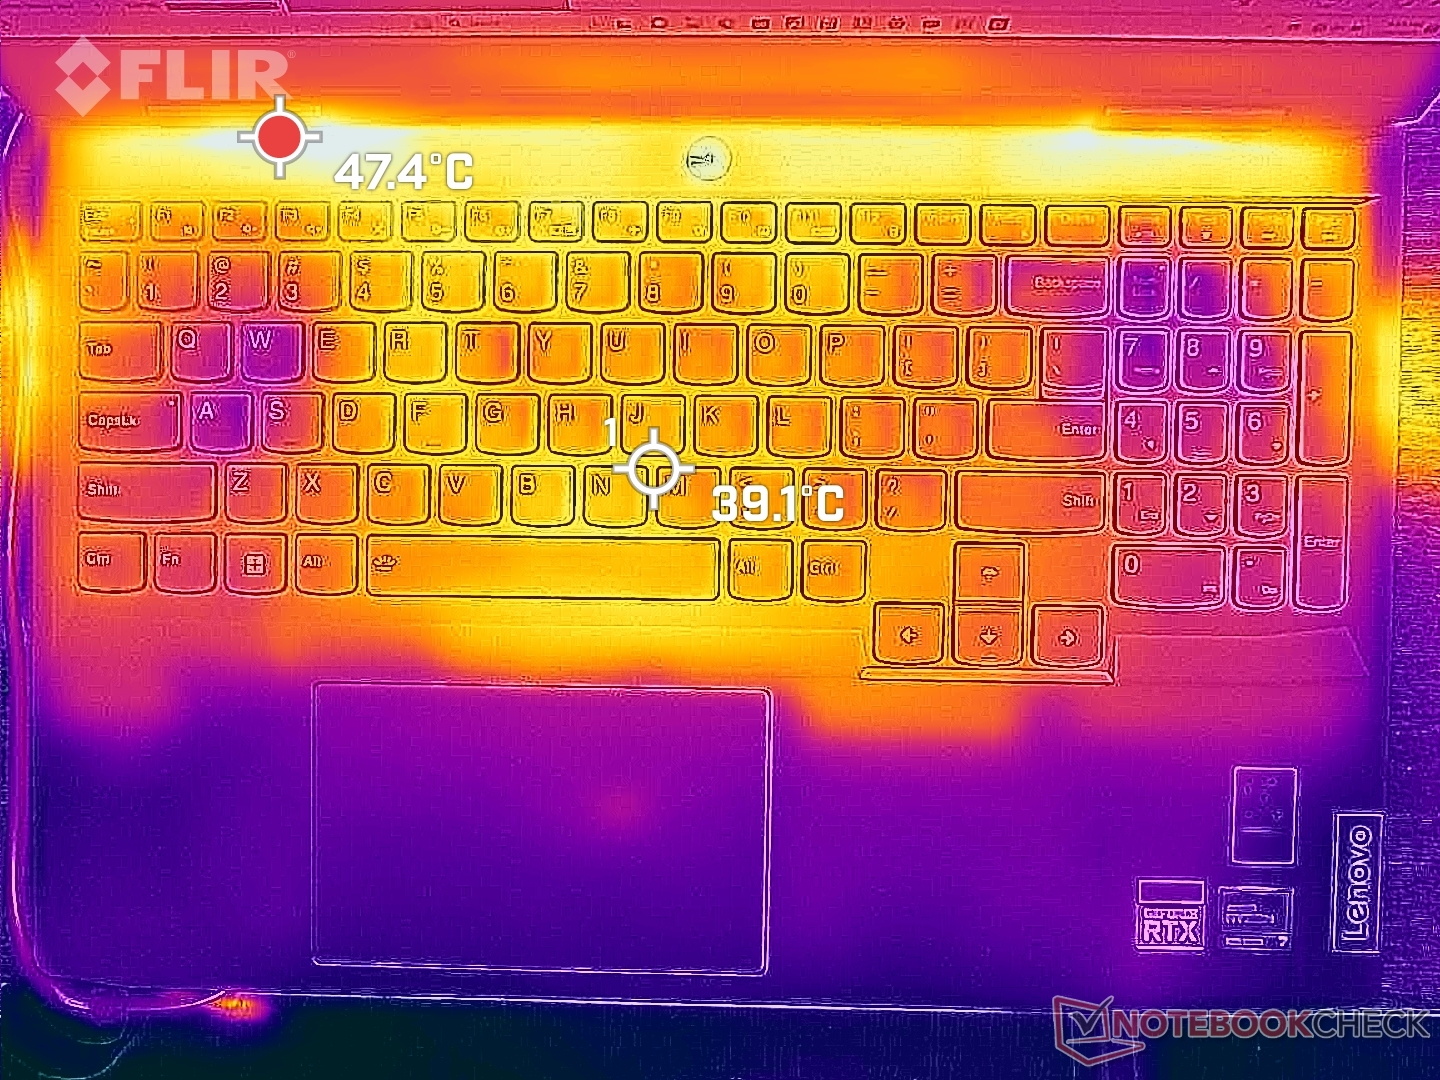
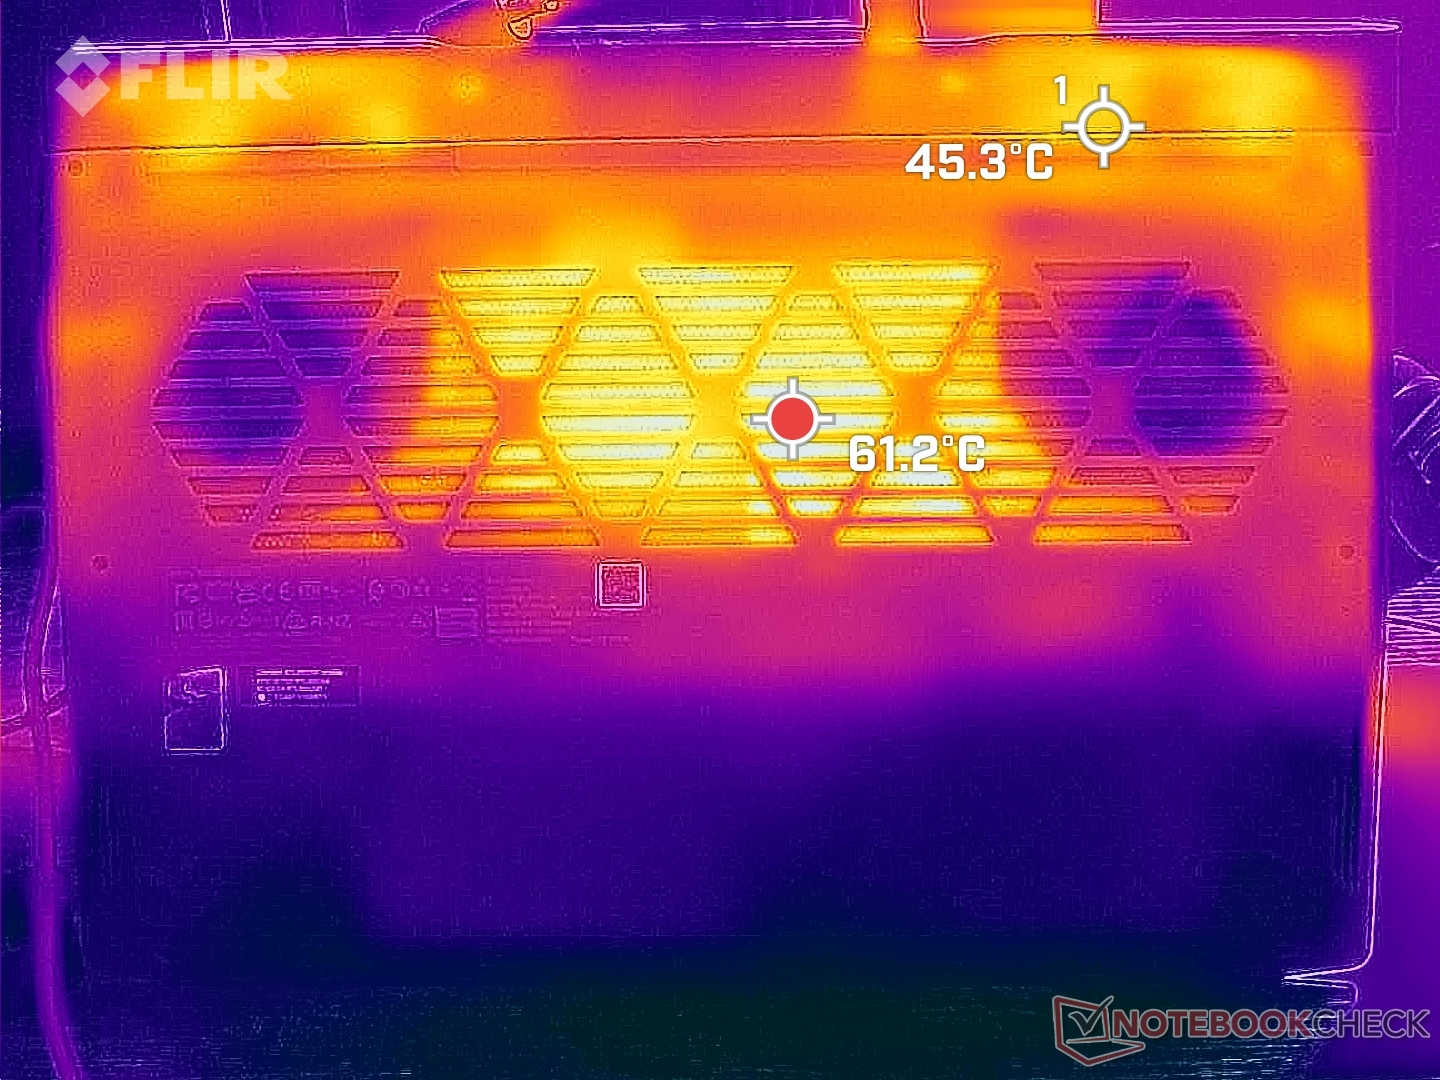
Las temperaturas de la superficie bajo carga pueden ser muy altas, de hasta 50 ºC, frente a los 38 ºC del HP Victus 15. Afortunadamente, los puntos calientes del LOQ 15 están en la parte trasera, donde es poco probable que toquen los dedos. Las teclas WASD, el teclado numérico y los reposamanos permanecen mucho más fríos que la parte trasera y el centro del teclado cuando se juega, como muestran los mapas de temperatura de abajo.
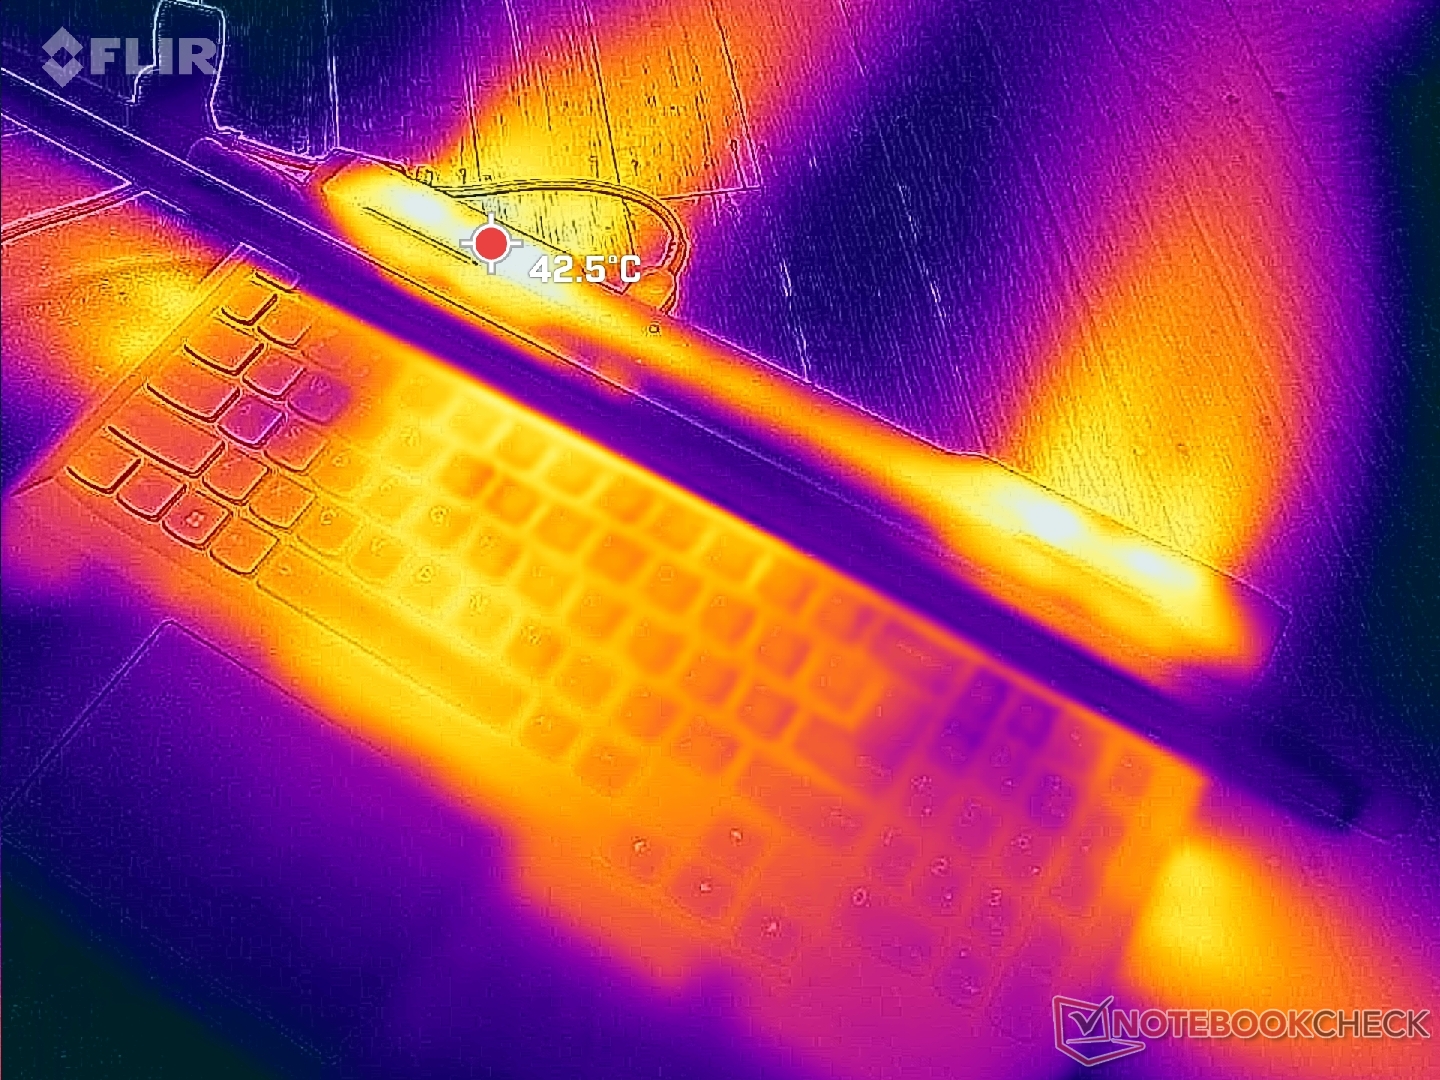
(±) La temperatura máxima en la parte superior es de 44.4 °C / 112 F, frente a la media de 40.4 °C / 105 F, que oscila entre 21.2 y 68.8 °C para la clase Gaming.
(-) El fondo se calienta hasta un máximo de 52 °C / 126 F, frente a la media de 43.2 °C / 110 F
(+) En reposo, la temperatura media de la parte superior es de 25.1 °C / 77# F, frente a la media del dispositivo de 33.9 °C / 93 F.
(±) Jugando a The Witcher 3, la temperatura media de la parte superior es de 32.7 °C / 91 F, frente a la media del dispositivo de 33.9 °C / 93 F.
(+) El reposamanos y el panel táctil están a una temperatura inferior a la de la piel, con un máximo de 30 °C / 86 F y, por tanto, son fríos al tacto.
(±) La temperatura media de la zona del reposamanos de dispositivos similares fue de 28.8 °C / 83.8 F (-1.2 °C / -2.2 F).
| Lenovo LOQ 15APH8 AMD Ryzen 7 7840HS, NVIDIA GeForce RTX 4050 Laptop GPU | Lenovo Legion 5 15IAH7H 82RB Intel Core i7-12700H, NVIDIA GeForce RTX 3060 Laptop GPU | Dell G15 5530 Intel Core i7-13650HX, NVIDIA GeForce RTX 4060 Laptop GPU | Asus TUF A15 FA507 AMD Ryzen 7 7735HS, NVIDIA GeForce RTX 4050 Laptop GPU | MSI Cyborg 15 A12VF Intel Core i7-12650H, NVIDIA GeForce RTX 4060 Laptop GPU | HP Victus 15 fa0020nr Intel Core i7-12700H, NVIDIA GeForce RTX 3050 Ti Laptop GPU | |
|---|---|---|---|---|---|---|
| Heat | 7% | -19% | 4% | 7% | 23% | |
| Maximum Upper Side * (°C) | 44.4 | 37.8 15% | 54 -22% | 48.9 -10% | 47.5 -7% | 37.2 16% |
| Maximum Bottom * (°C) | 52 | 51 2% | 62.2 -20% | 44.6 14% | 35.5 32% | 35.4 32% |
| Idle Upper Side * (°C) | 28 | 25.8 8% | 33.4 -19% | 27.1 3% | 27.7 1% | 22.4 20% |
| Idle Bottom * (°C) | 29.6 | 28.8 3% | 33.4 -13% | 27.5 7% | 29.5 -0% | 22.6 24% |
* ... más pequeño es mejor
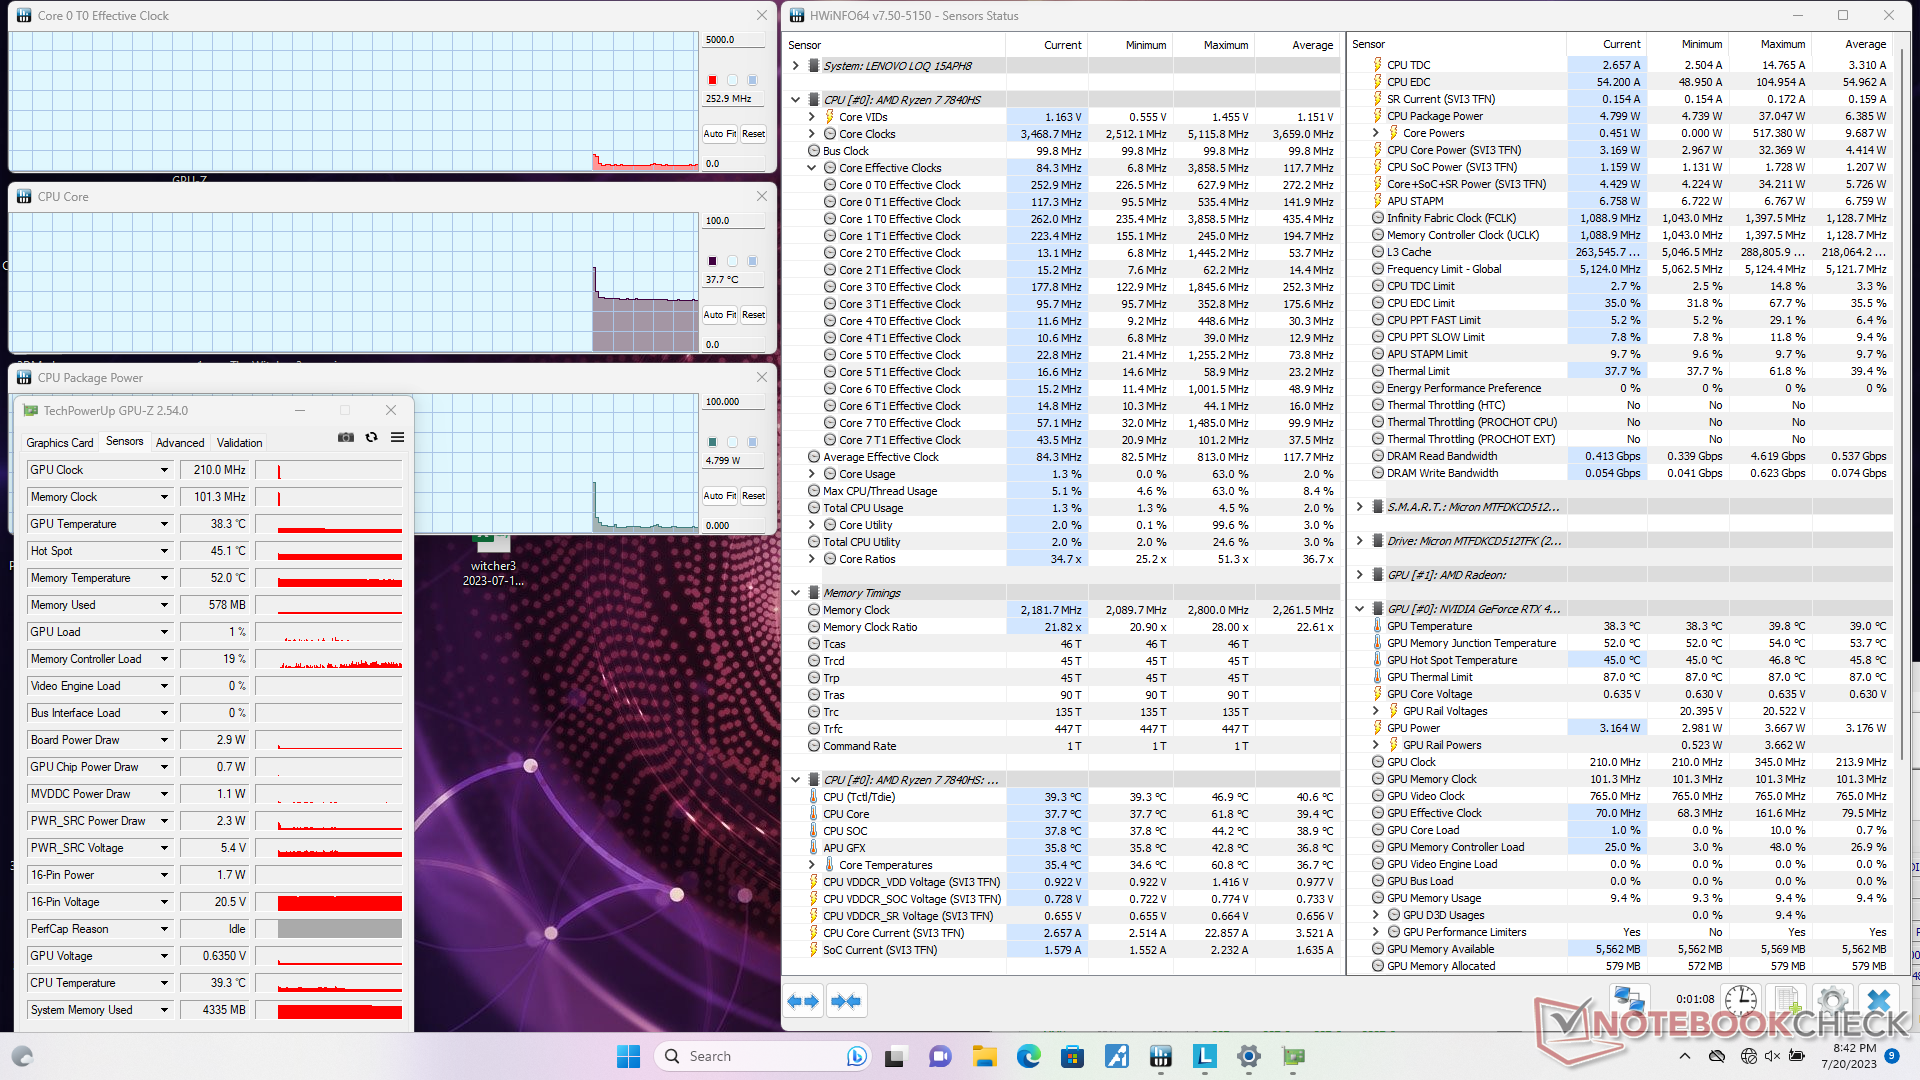
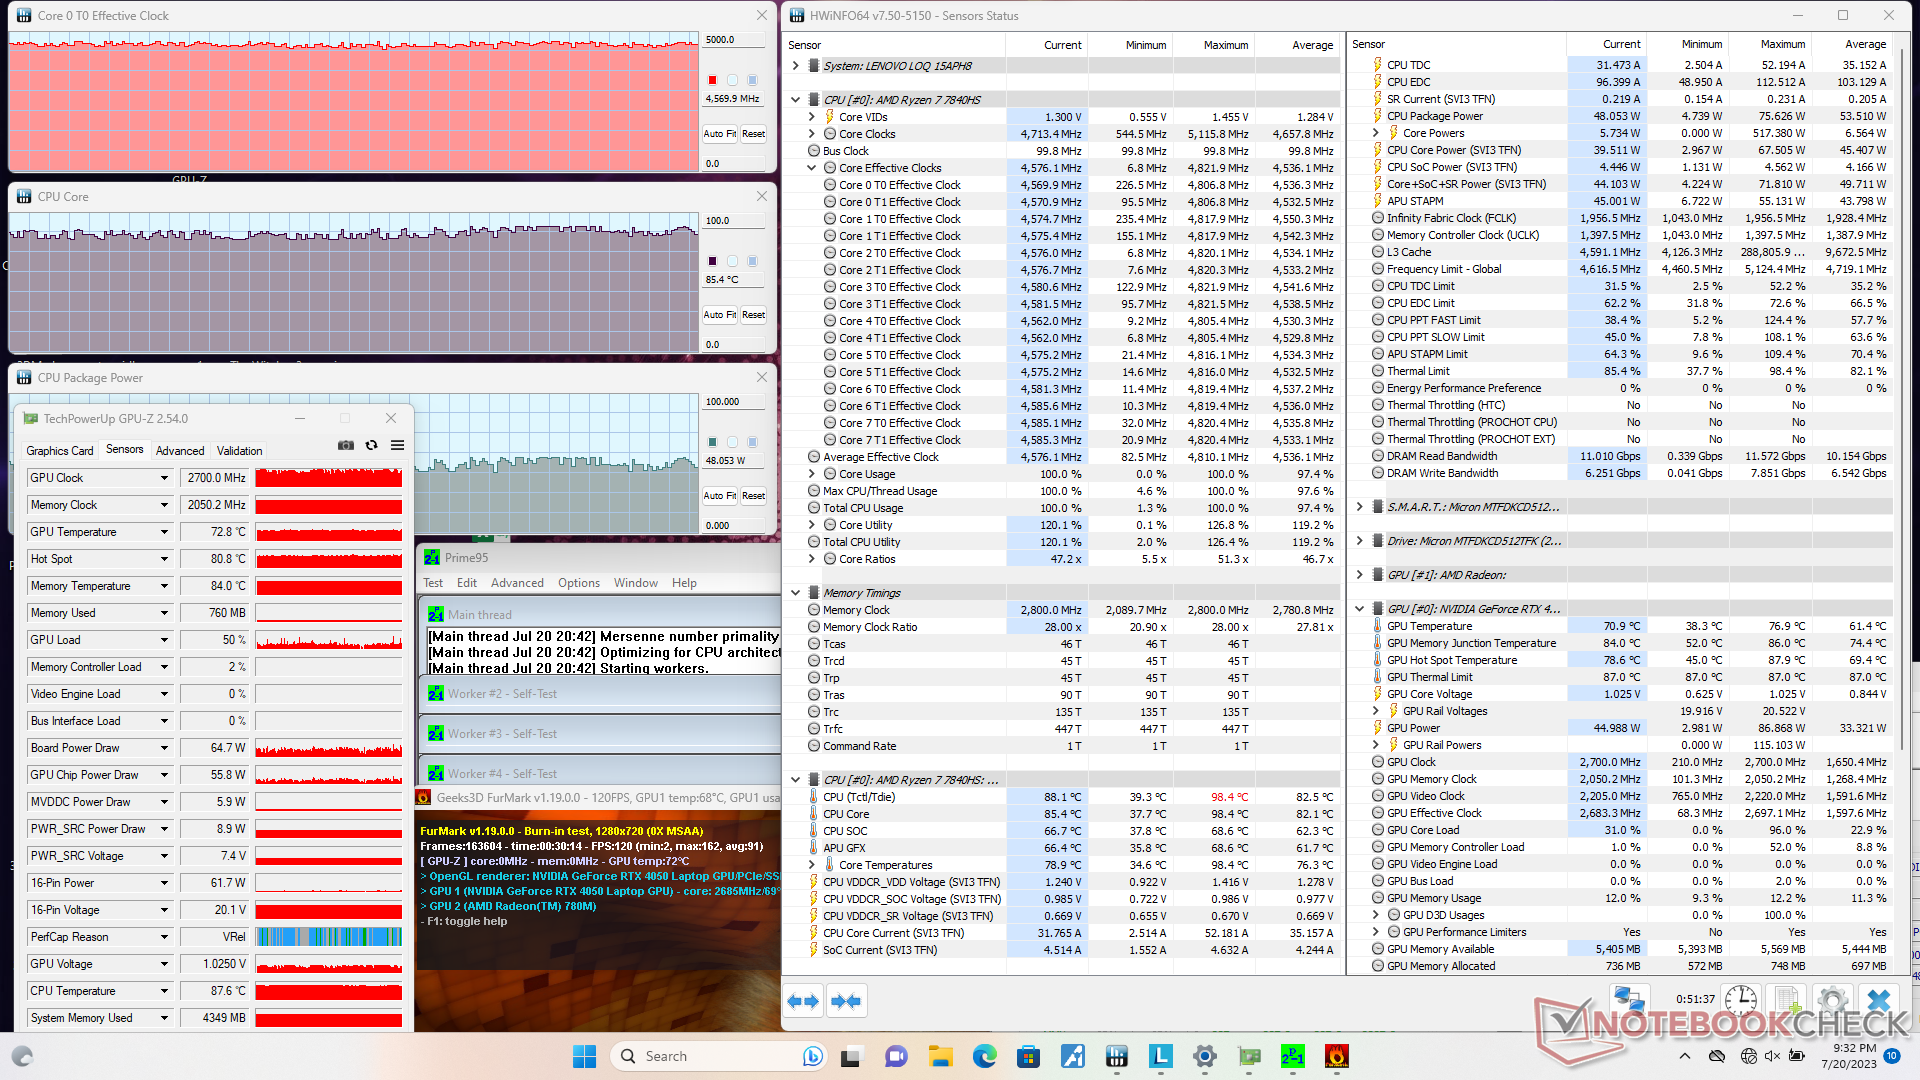
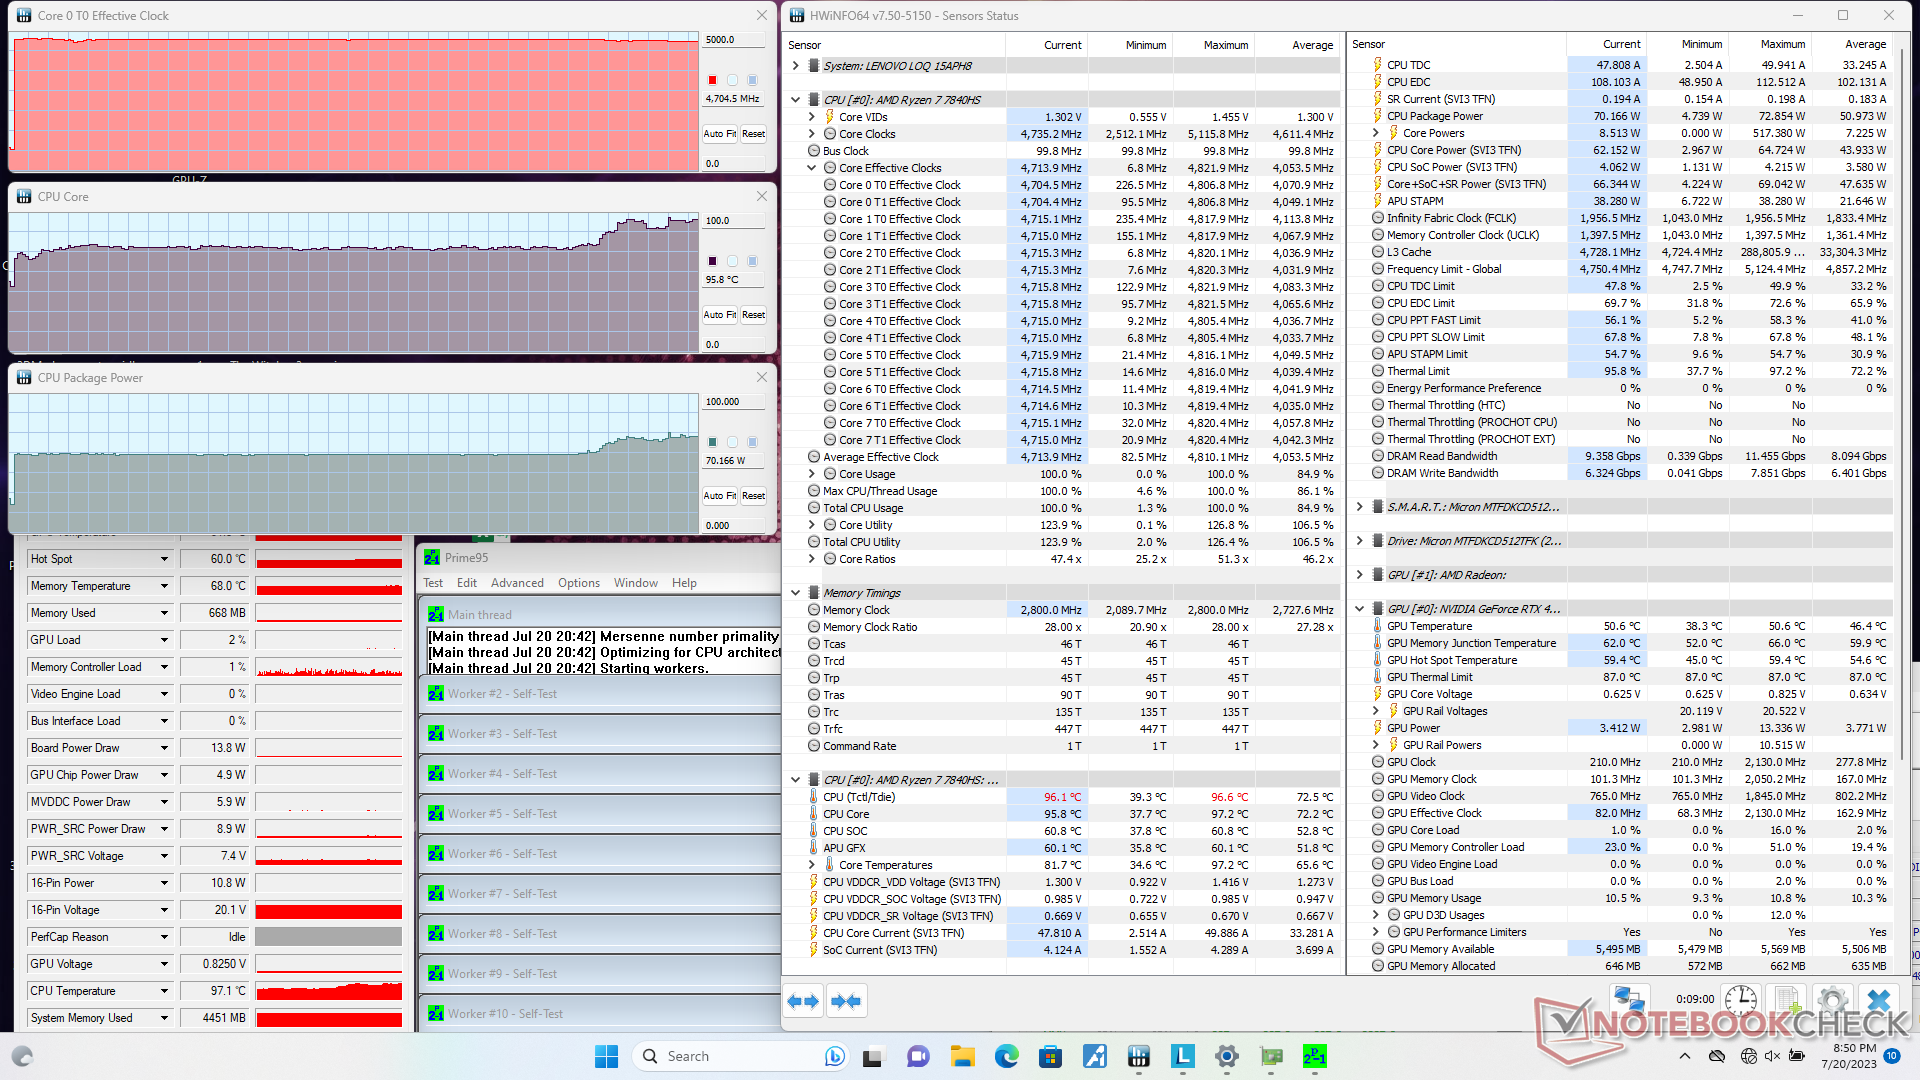
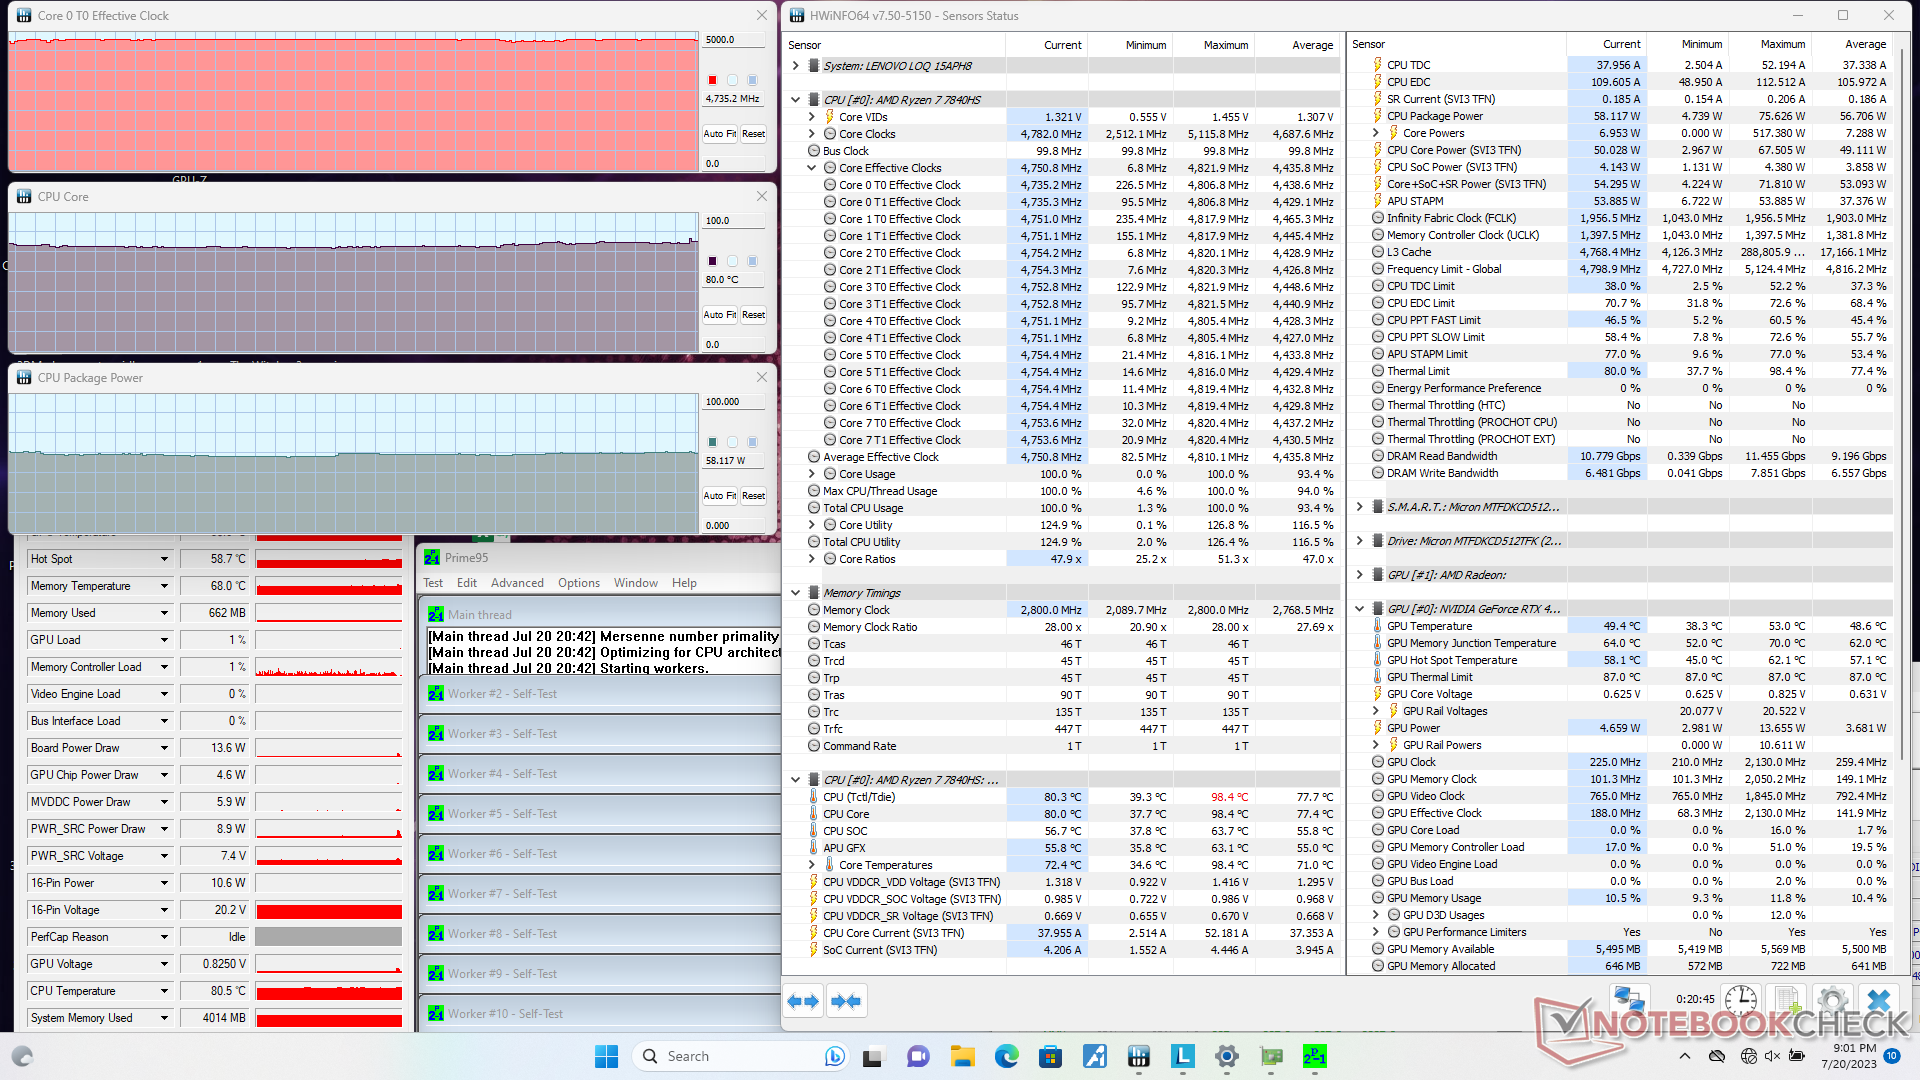
Prueba de resistencia
La velocidad de reloj de la CPU, la temperatura y el consumo de energía de la placa alcanzaron los 4,8 GHz, 75 C y 58 W, respectivamente, al iniciar el estrés Prime95. La velocidad de reloj y el consumo de energía de la placa se mantienen durante largos periodos y la temperatura del núcleo se estabiliza en 80 C, frente a los 76 C del Victus 15 con tecnología Intel Victus 15.
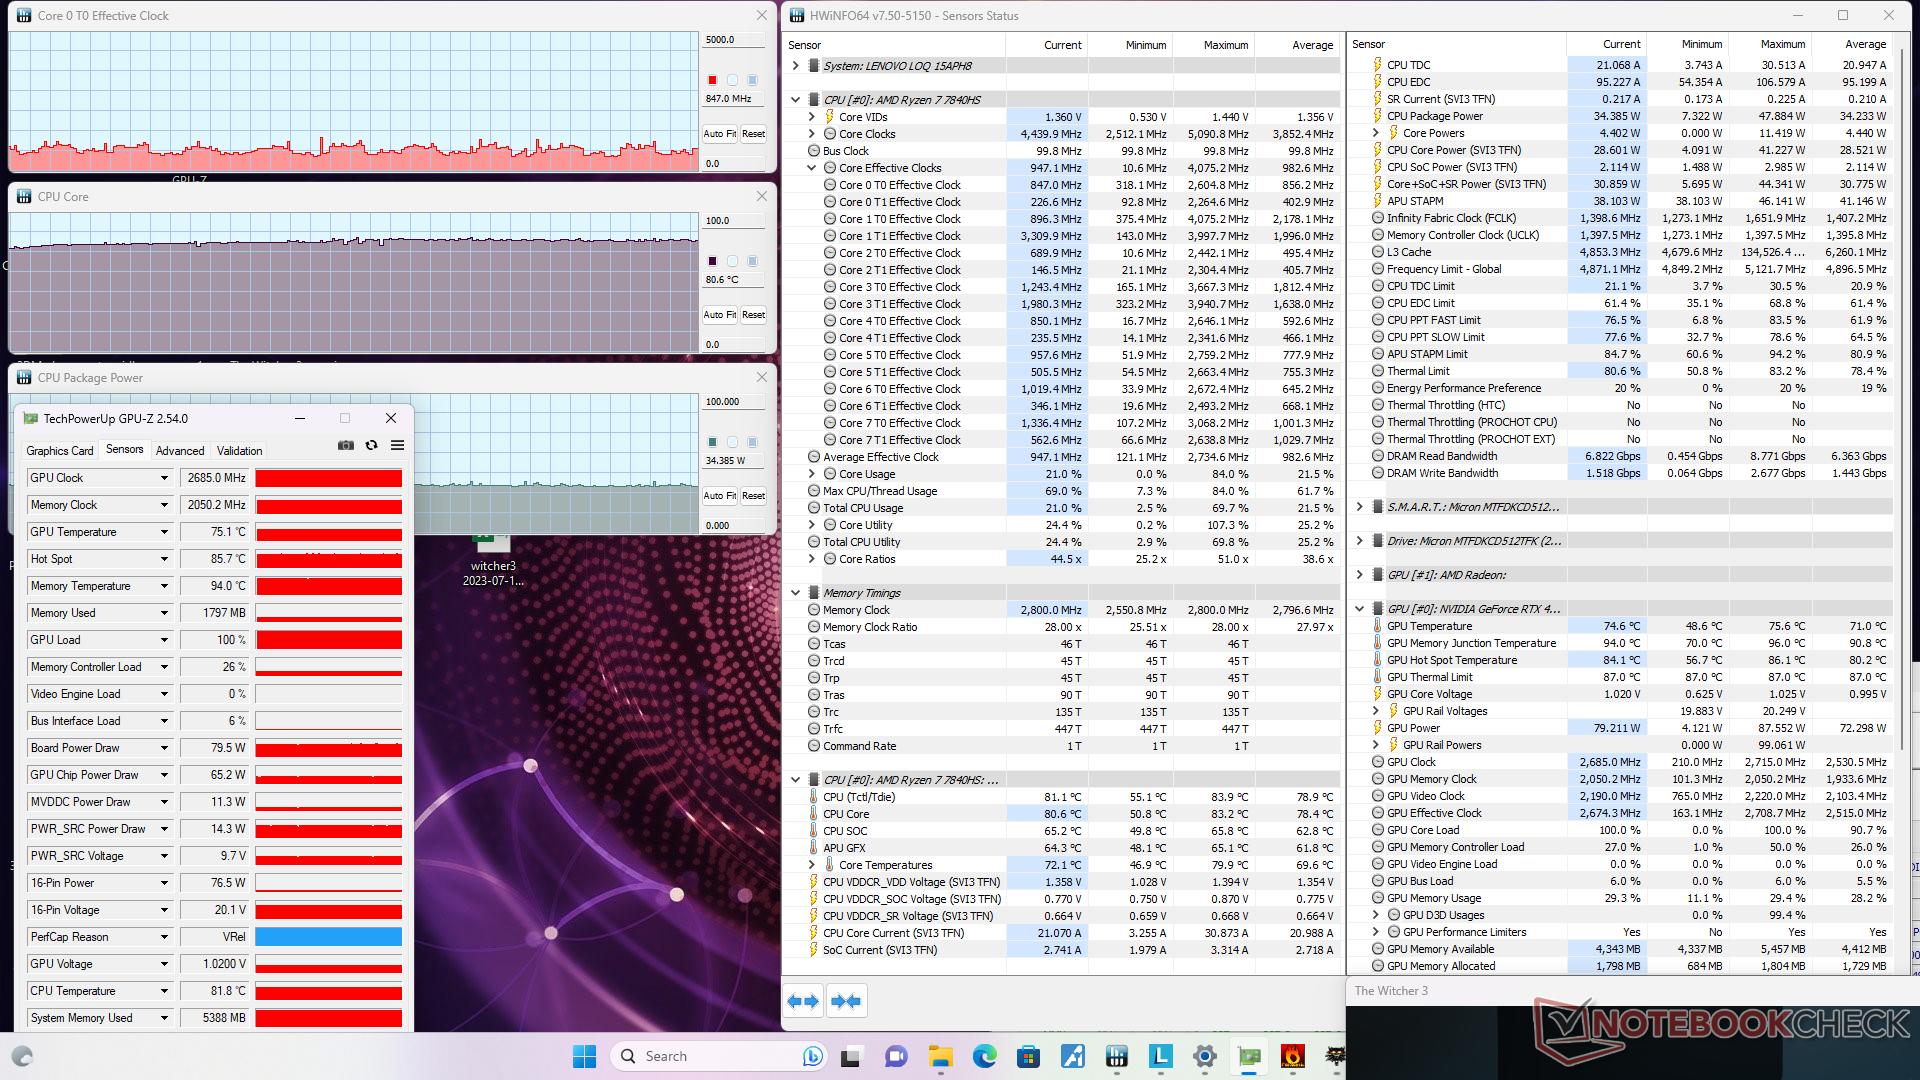
Cuando se ejecuta Witcher 3 en modo Rendimiento, la GPU Nvidia se estabiliza en 2685 MHz, 75 C y 80 W. No hay cambios significativos si se ejecuta en modo Equilibrado, lo que coincide con nuestras observaciones en la sección Rendimiento de la GPU anterior. En cambio, el consumo de energía de la placa de la CPU disminuiría hasta 15 W. Por tanto, el modo Equilibrado afectaría más al rendimiento de la CPU que al de la GPU.

| RelojCPU (GHz) | Reloj GPU (MHz) | Temperatura mediaCPU (°C) | Temperatura media GPU (°C) | |
| Sistema en reposo | -- | -- | 37 | 38 |
| Prime95 Stress | 4,7 | -- | 80 | 49 |
| Prime95+ FurMark Estrés | 4,5 | 2700 | 85 | 73 |
| Witcher 3 Estrés (modoequilibrado) | ~0,9 | 2685 | 69 | 73 |
| Witcher 3 Estrés (modoRendimiento) | ~0,8 | 2685 | 81 | 75 |
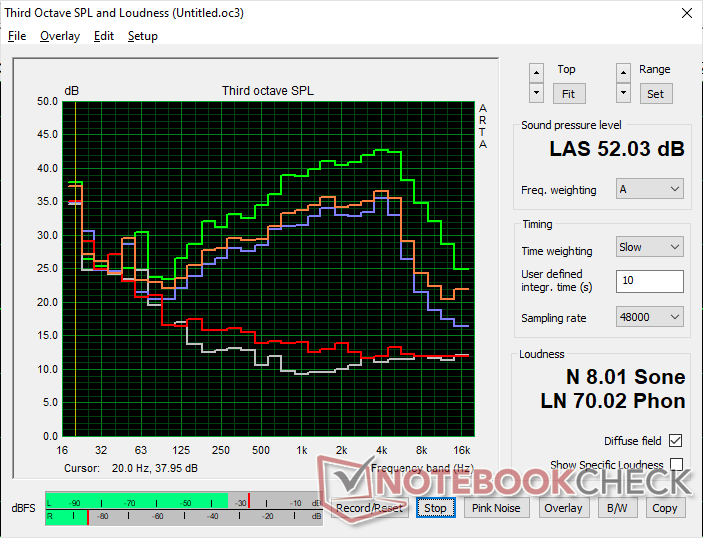
Altavoces
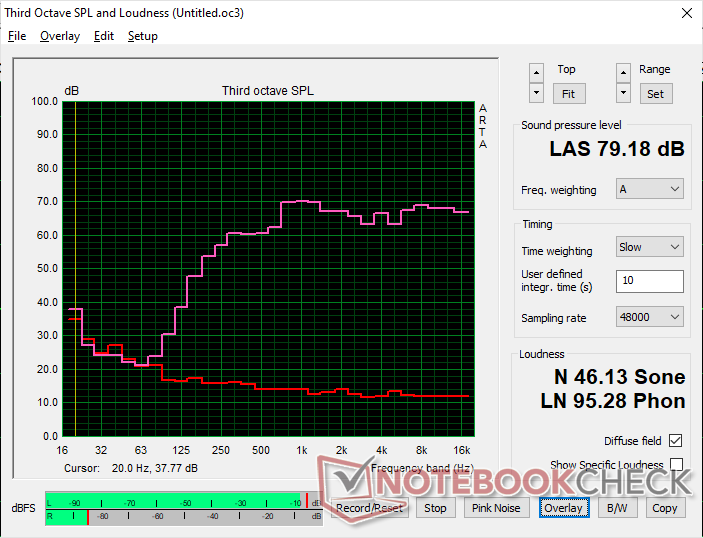
Lenovo LOQ 15APH8 análisis de audio
(±) | la sonoridad del altavoz es media pero buena (79.2 dB)
Graves 100 - 315 Hz
(-) | casi sin bajos - de media 17.6% inferior a la mediana
(±) | la linealidad de los graves es media (11.8% delta a frecuencia anterior)
Medios 400 - 2000 Hz
(+) | medios equilibrados - a sólo 3.7% de la mediana
(+) | los medios son lineales (3.1% delta a la frecuencia anterior)
Altos 2 - 16 kHz
(+) | máximos equilibrados - a sólo 1.9% de la mediana
(+) | los máximos son lineales (4.7% delta a la frecuencia anterior)
Total 100 - 16.000 Hz
(+) | el sonido global es lineal (14.3% de diferencia con la mediana)
En comparación con la misma clase
» 26% de todos los dispositivos probados de esta clase eran mejores, 7% similares, 67% peores
» El mejor tuvo un delta de 6%, la media fue 18%, el peor fue ###max##%
En comparación con todos los dispositivos probados
» 18% de todos los dispositivos probados eran mejores, 4% similares, 78% peores
» El mejor tuvo un delta de 4%, la media fue 23%, el peor fue ###max##%
Apple MacBook Pro 16 2021 M1 Pro análisis de audio
(+) | los altavoces pueden reproducir a un volumen relativamente alto (#84.7 dB)
Graves 100 - 315 Hz
(+) | buen bajo - sólo 3.8% lejos de la mediana
(+) | el bajo es lineal (5.2% delta a la frecuencia anterior)
Medios 400 - 2000 Hz
(+) | medios equilibrados - a sólo 1.3% de la mediana
(+) | los medios son lineales (2.1% delta a la frecuencia anterior)
Altos 2 - 16 kHz
(+) | máximos equilibrados - a sólo 1.9% de la mediana
(+) | los máximos son lineales (2.7% delta a la frecuencia anterior)
Total 100 - 16.000 Hz
(+) | el sonido global es lineal (4.6% de diferencia con la mediana)
En comparación con la misma clase
» 0% de todos los dispositivos probados de esta clase eran mejores, 0% similares, 100% peores
» El mejor tuvo un delta de 5%, la media fue 17%, el peor fue ###max##%
En comparación con todos los dispositivos probados
» 0% de todos los dispositivos probados eran mejores, 0% similares, 100% peores
» El mejor tuvo un delta de 4%, la media fue 23%, el peor fue ###max##%
Gestión de la energía: un combo de CPU y GPU muy eficiente
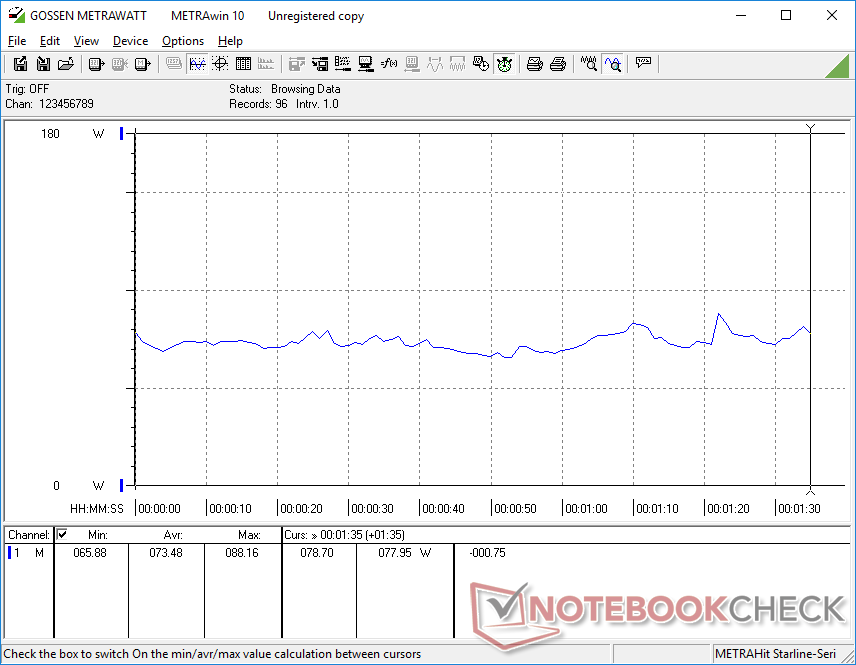
Consumo de energía
El consumo de energía en juegos es muy similar al del año pasado IdeaPad Gaming 3 15 del año pasado a pesar del significativo aumento del 60-70% en rendimiento gráfico respecto a la RTX 3050 Ti y del 15-20% en rendimiento de procesador respecto al Core i5-12500H. Las ganancias en rendimiento por vatio son, por tanto, excelentes para una máquina de juegos económica.
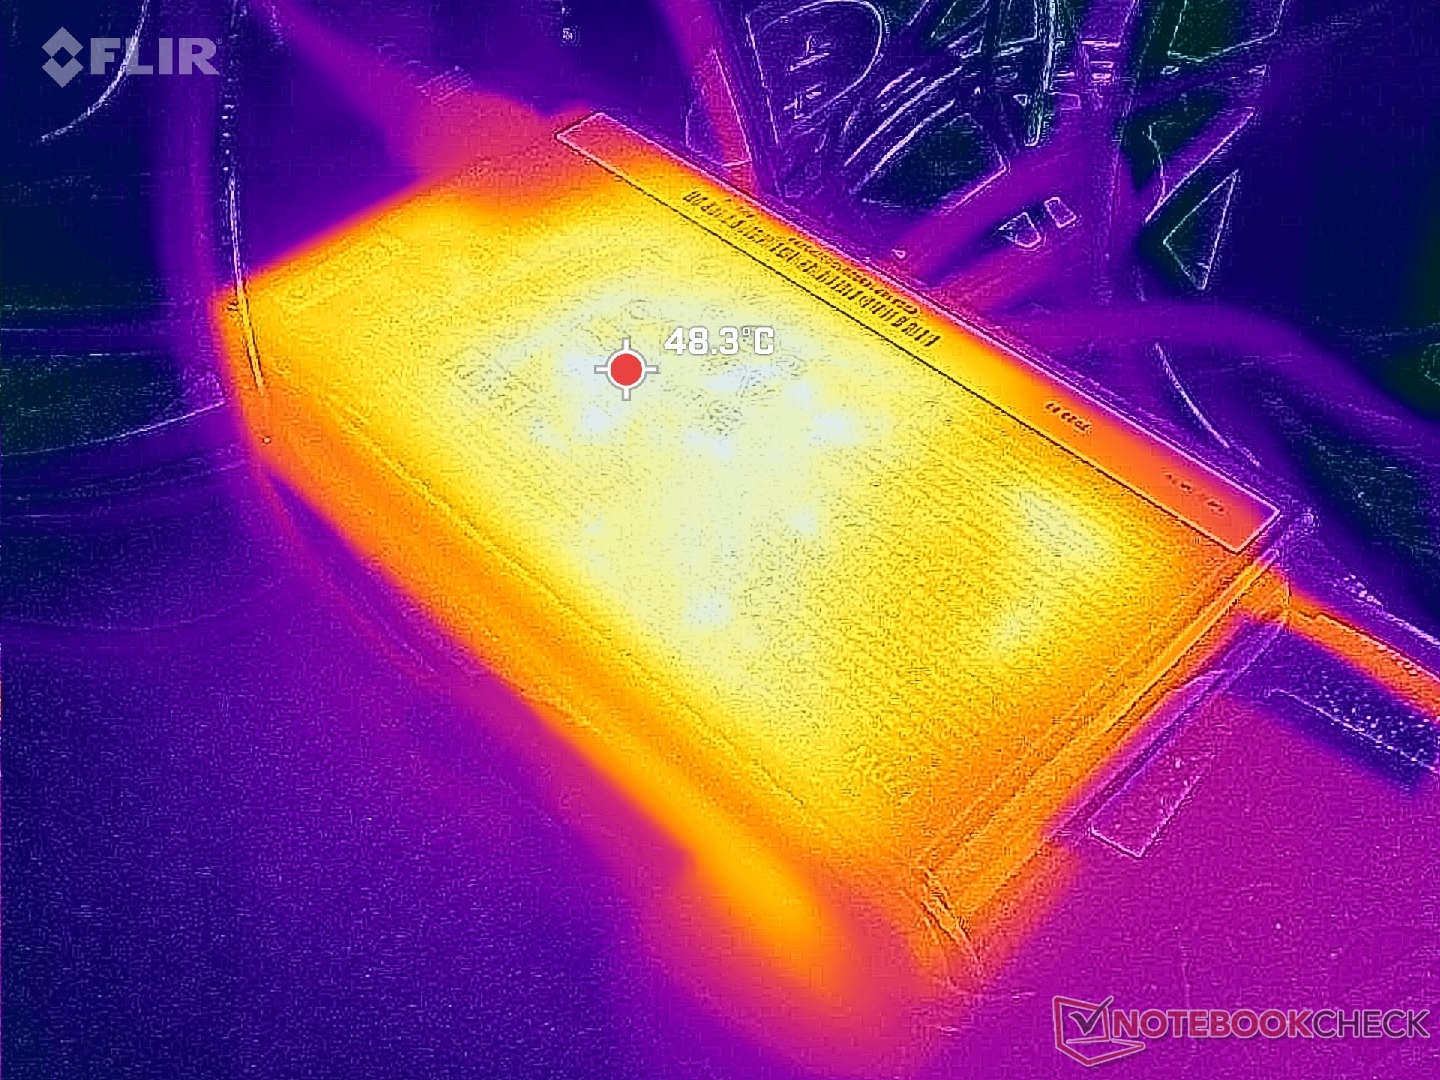
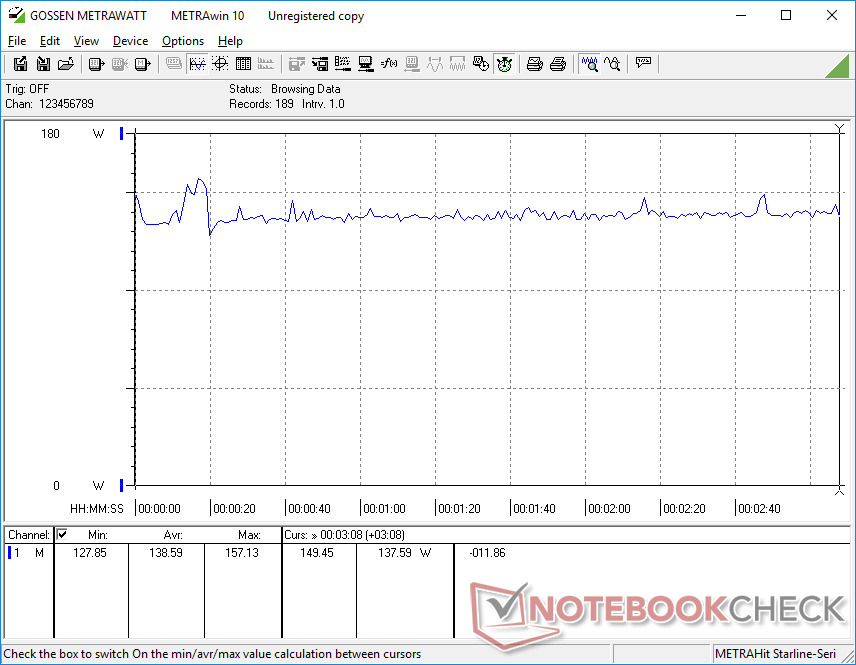
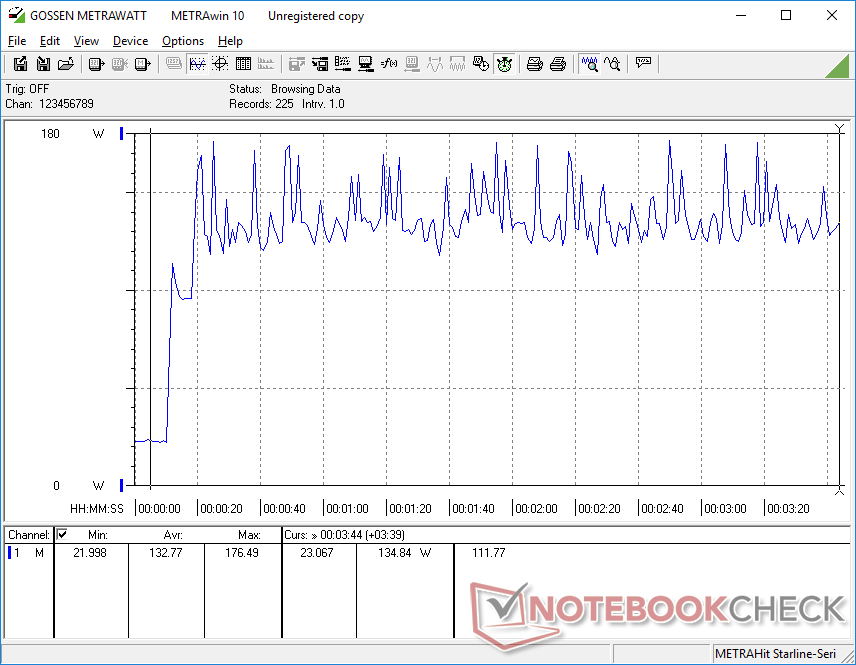
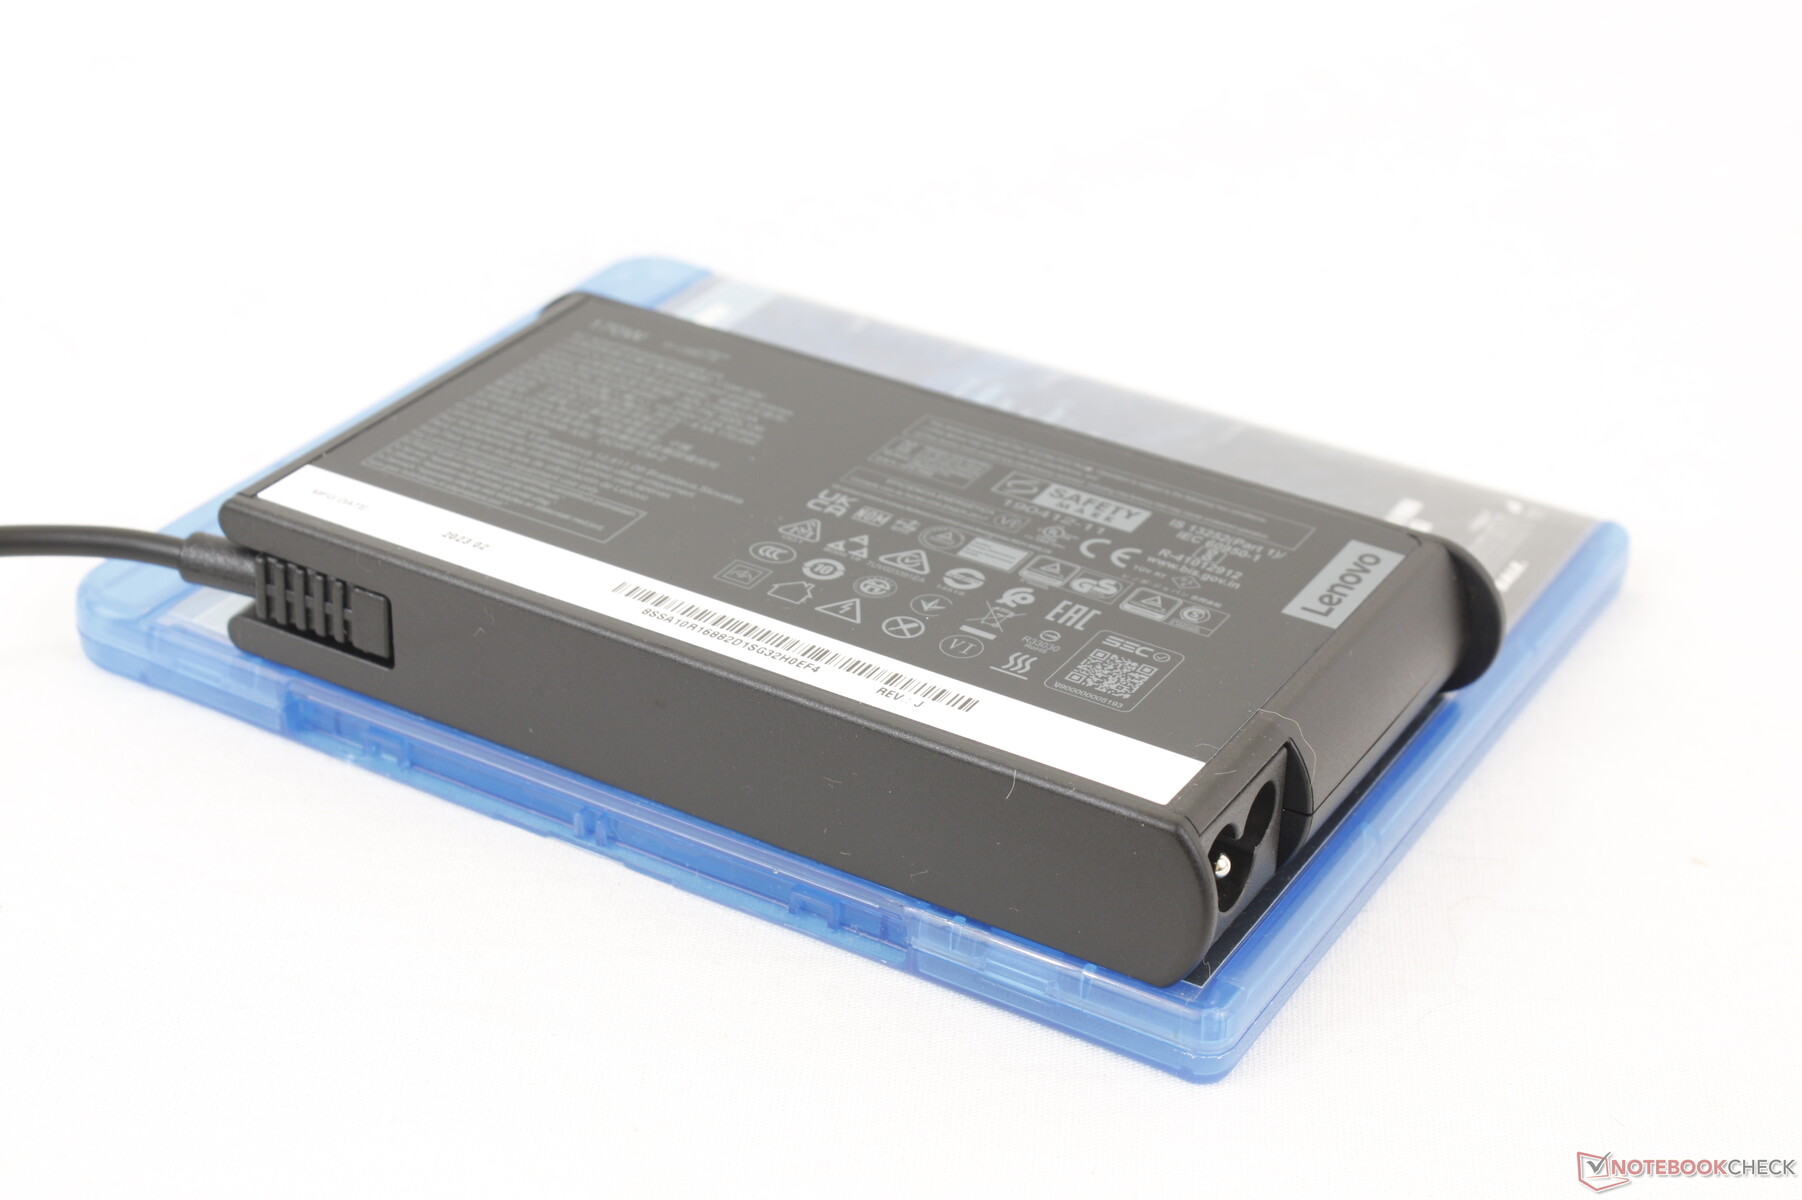
Registramos un consumo máximo de 177 W con el adaptador de CA de 170 W y tamaño medio (~15 x 7,8 x 2,3 cm) cuando la CPU y la GPU están al 100% de su capacidad. Por tanto, la tasa de carga se ralentizará si se ejecutan simultáneamente cargas altas como juegos.
| Off / Standby | |
| Ocioso | |
| Carga |
|
Clave:
min: | |
| Lenovo LOQ 15APH8 R7 7840HS, GeForce RTX 4050 Laptop GPU, Micron 2450 512GB MTFDKCD512TFK, IPS, 1920x1080, 15.6" | Lenovo Legion 5 15IAH7H 82RB i7-12700H, GeForce RTX 3060 Laptop GPU, , IPS, 1920x1080, 15.6" | Dell G15 5530 i7-13650HX, GeForce RTX 4060 Laptop GPU, SSTC CL4-3D512-Q11, IPS, 1920x1080, 15.6" | Asus TUF A15 FA507 R7 7735HS, GeForce RTX 4050 Laptop GPU, Micron 2400 MTFDKBA512QFM, IPS, 1920x1080, 15.6" | MSI Cyborg 15 A12VF i7-12650H, GeForce RTX 4060 Laptop GPU, Samsung PM9B1 1024GB MZVL41T0HBLB, IPS, 1920x1080, 15.6" | HP Victus 15 fa0020nr i7-12700H, GeForce RTX 3050 Ti Laptop GPU, Samsung PM9A1 MZVL2512HCJQ, IPS, 1920x1080, 15.6" | |
|---|---|---|---|---|---|---|
| Power Consumption | -55% | -6% | 19% | 36% | 10% | |
| Idle Minimum * (Watt) | 15 | 19.8 -32% | 8.4 44% | 8 47% | 6 60% | 5.1 66% |
| Idle Average * (Watt) | 17.7 | 26.2 -48% | 14.98 15% | 12.1 32% | 8.8 50% | 15.1 15% |
| Idle Maximum * (Watt) | 21.5 | 48.2 -124% | 15.56 28% | 12.5 42% | 11.9 45% | 18.9 12% |
| Load Average * (Watt) | 73.5 | 102.9 -40% | 96.8 -32% | 74.9 -2% | 89 -21% | 114.5 -56% |
| Witcher 3 ultra * (Watt) | 138.6 | 186.7 -35% | 186 -34% | 136.6 1% | 90.3 35% | 113.9 18% |
| Load Maximum * (Watt) | 176.5 | 268 -52% | 271.42 -54% | 185 -5% | 99 44% | 165.8 6% |
* ... más pequeño es mejor
Power Consumption Witcher 3 / Stresstest
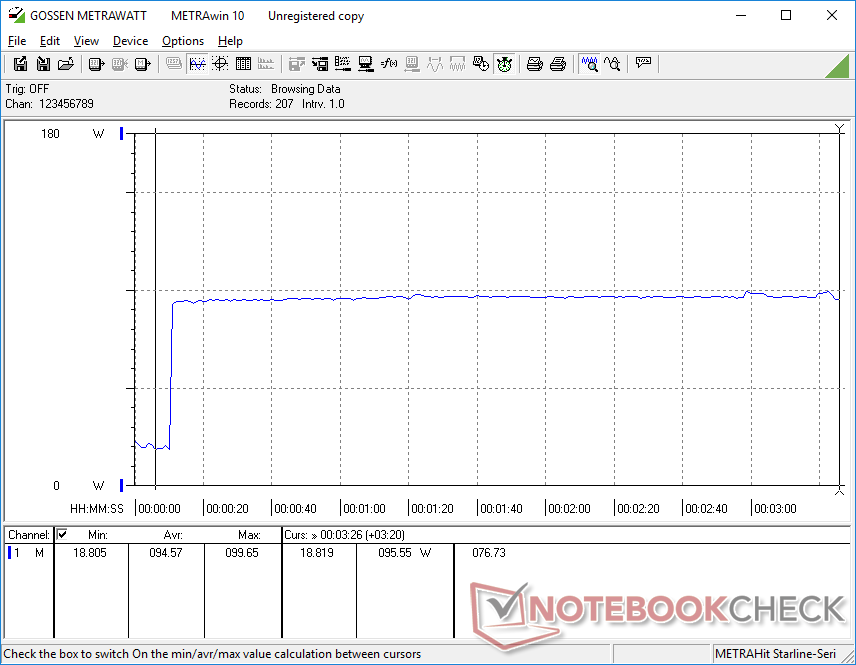
Power Consumption external Monitor
Duración de la batería
Nuestra batería de 60 Wh es relativamente pequeña, ya que la mayoría de portátiles de juego de 15 pulgadas suelen venir con baterías de 70 Wh o más. No obstante, la autonomía sigue siendo respetable, con casi 7,5 horas de navegación real por WLAN, comparable a la delCyborg 15.
La carga de vacío a plena capacidad con el adaptador de CA incluido es muy rápida, unos 45 minutos, o aproximadamente el doble de rápido que en la mayoría de portátiles para juegos. La carga rápida de Lenovo está activada por defecto a través del software Vantage.
El sistema se puede recargar por USB-C, pero la compatibilidad con la mayoría de adaptadores USB-C AC no está garantizada. Lenovo vende su propio adaptador USB-C AC de 140 W que debería ser compatible con la mayoría de portátiles Lenovo.
| Lenovo LOQ 15APH8 R7 7840HS, GeForce RTX 4050 Laptop GPU, 60 Wh | Lenovo Legion 5 15IAH7H 82RB i7-12700H, GeForce RTX 3060 Laptop GPU, 80 Wh | Dell G15 5530 i7-13650HX, GeForce RTX 4060 Laptop GPU, 86 Wh | Asus TUF A15 FA507 R7 7735HS, GeForce RTX 4050 Laptop GPU, 90 Wh | MSI Cyborg 15 A12VF i7-12650H, GeForce RTX 4060 Laptop GPU, 53.5 Wh | HP Victus 15 fa0020nr i7-12700H, GeForce RTX 3050 Ti Laptop GPU, 70 Wh | |
|---|---|---|---|---|---|---|
| Duración de Batería | -16% | -20% | 25% | 50% | -48% | |
| Reader / Idle (h) | 9.8 | 8.1 -17% | 13.6 39% | 2.6 -73% | ||
| WiFi v1.3 (h) | 7.4 | 5 -32% | 6.5 -12% | 11.7 58% | 7.5 1% | 2.1 -72% |
| Load (h) | 1.1 | 1.1 0% | 0.8 -27% | 1 -9% | 2.3 109% | 1.1 0% |
| H.264 (h) | 6.8 | 12.5 | 8 | |||
| Witcher 3 ultra (h) | 0.8 |
Pro
Contra
Veredicto - Ryzen 7 7840HS y GeForce RTX 4050 logran un gran equilibrio
Para una máquina de juegos económica con sólo 8 GB de RAM de sistema ampliable, el Lenovo LOQ 15 rinde mejor de lo esperado y con un excelente rendimiento por vatio en comparación con portátiles de juegos con CPU de la serie Core-H de 12ª generación como el IdeaPad Gaming 15 o elHP Victus 15. Su panel 1080p G-Sync combina muy bien con la GeForce RTX 4050 para juegos fluidos a 60 FPS en títulos modernos, que es un objetivo razonable para cualquier portátil de juegos barato.
El chasis de plástico y los 8 GB de RAM son un inconveniente, pero la facilidad de actualización y el rápido rendimiento por su precio ayudan a situar al LOQ 15 por encima del resto en la categoría de 1000 USD o menos.
El principal inconveniente del LOQ 15 es su limitada gama cromática y sus tiempos de respuesta medios en blanco y negro y grisáceo. La opción de panel 1440p de gama alta resuelve estos problemas, pero el consiguiente aumento de precio se acercaría terriblemente a un modelo Legion 5 y la propuesta de valor del LOQ 15 empezaría a disminuir. El precio de 1.000 dólares o menos es el punto óptimo para el LOQ 15, sobre todo porque el Ryzen 7 7840HS y la GeForce RTX 4050 están a la altura del Core i7-12700H y la RTX 3060 que equipaban muchos portátiles de juego de 2022 que se vendían por cerca de 1.500 dólares. Los principales fabricantes de la competencia, como MSI, HP o Asus, aún no han ofrecido portátiles de juego asequibles con las mismas opciones de Ryzen 7 7840HS en el momento de escribir estas líneas.
Precio y disponibilidad
Best Buy está enviando actualmente el Lenovo LOQ 15 en nuestra configuración exacta por $1100 USD. Lenovo tiene configuraciones adicionales disponibles directamente en su sitio web por precios más baratos.
Lenovo LOQ 15APH8
- 07/26/2023 v7 (old)
Allen Ngo
Transparencia
La selección de los dispositivos que se van a reseñar corre a cargo de nuestro equipo editorial. La muestra de prueba fue proporcionada al autor en calidad de préstamo por el fabricante o el minorista a los efectos de esta reseña. El prestamista no tuvo ninguna influencia en esta reseña, ni el fabricante recibió una copia de la misma antes de su publicación. No había ninguna obligación de publicar esta reseña. Como empresa de medios independiente, Notebookcheck no está sujeta a la autoridad de fabricantes, minoristas o editores.
Así es como prueba Notebookcheck
Cada año, Notebookcheck revisa de forma independiente cientos de portátiles y smartphones utilizando procedimientos estandarizados para asegurar que todos los resultados son comparables. Hemos desarrollado continuamente nuestros métodos de prueba durante unos 20 años y hemos establecido los estándares de la industria en el proceso. En nuestros laboratorios de pruebas, técnicos y editores experimentados utilizan equipos de medición de alta calidad. Estas pruebas implican un proceso de validación en varias fases. Nuestro complejo sistema de clasificación se basa en cientos de mediciones y puntos de referencia bien fundamentados, lo que mantiene la objetividad.Price comparison

