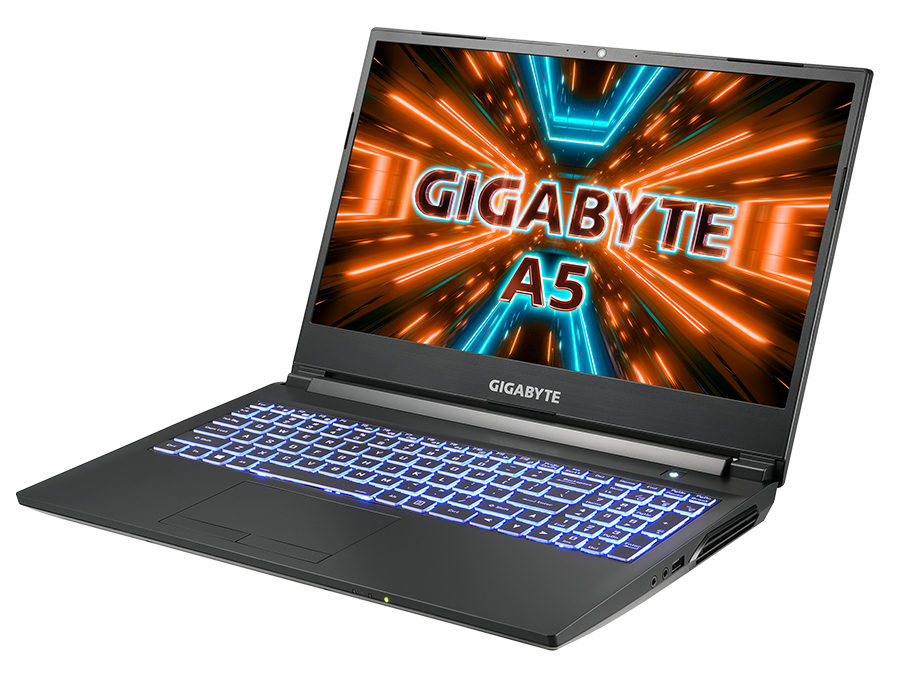
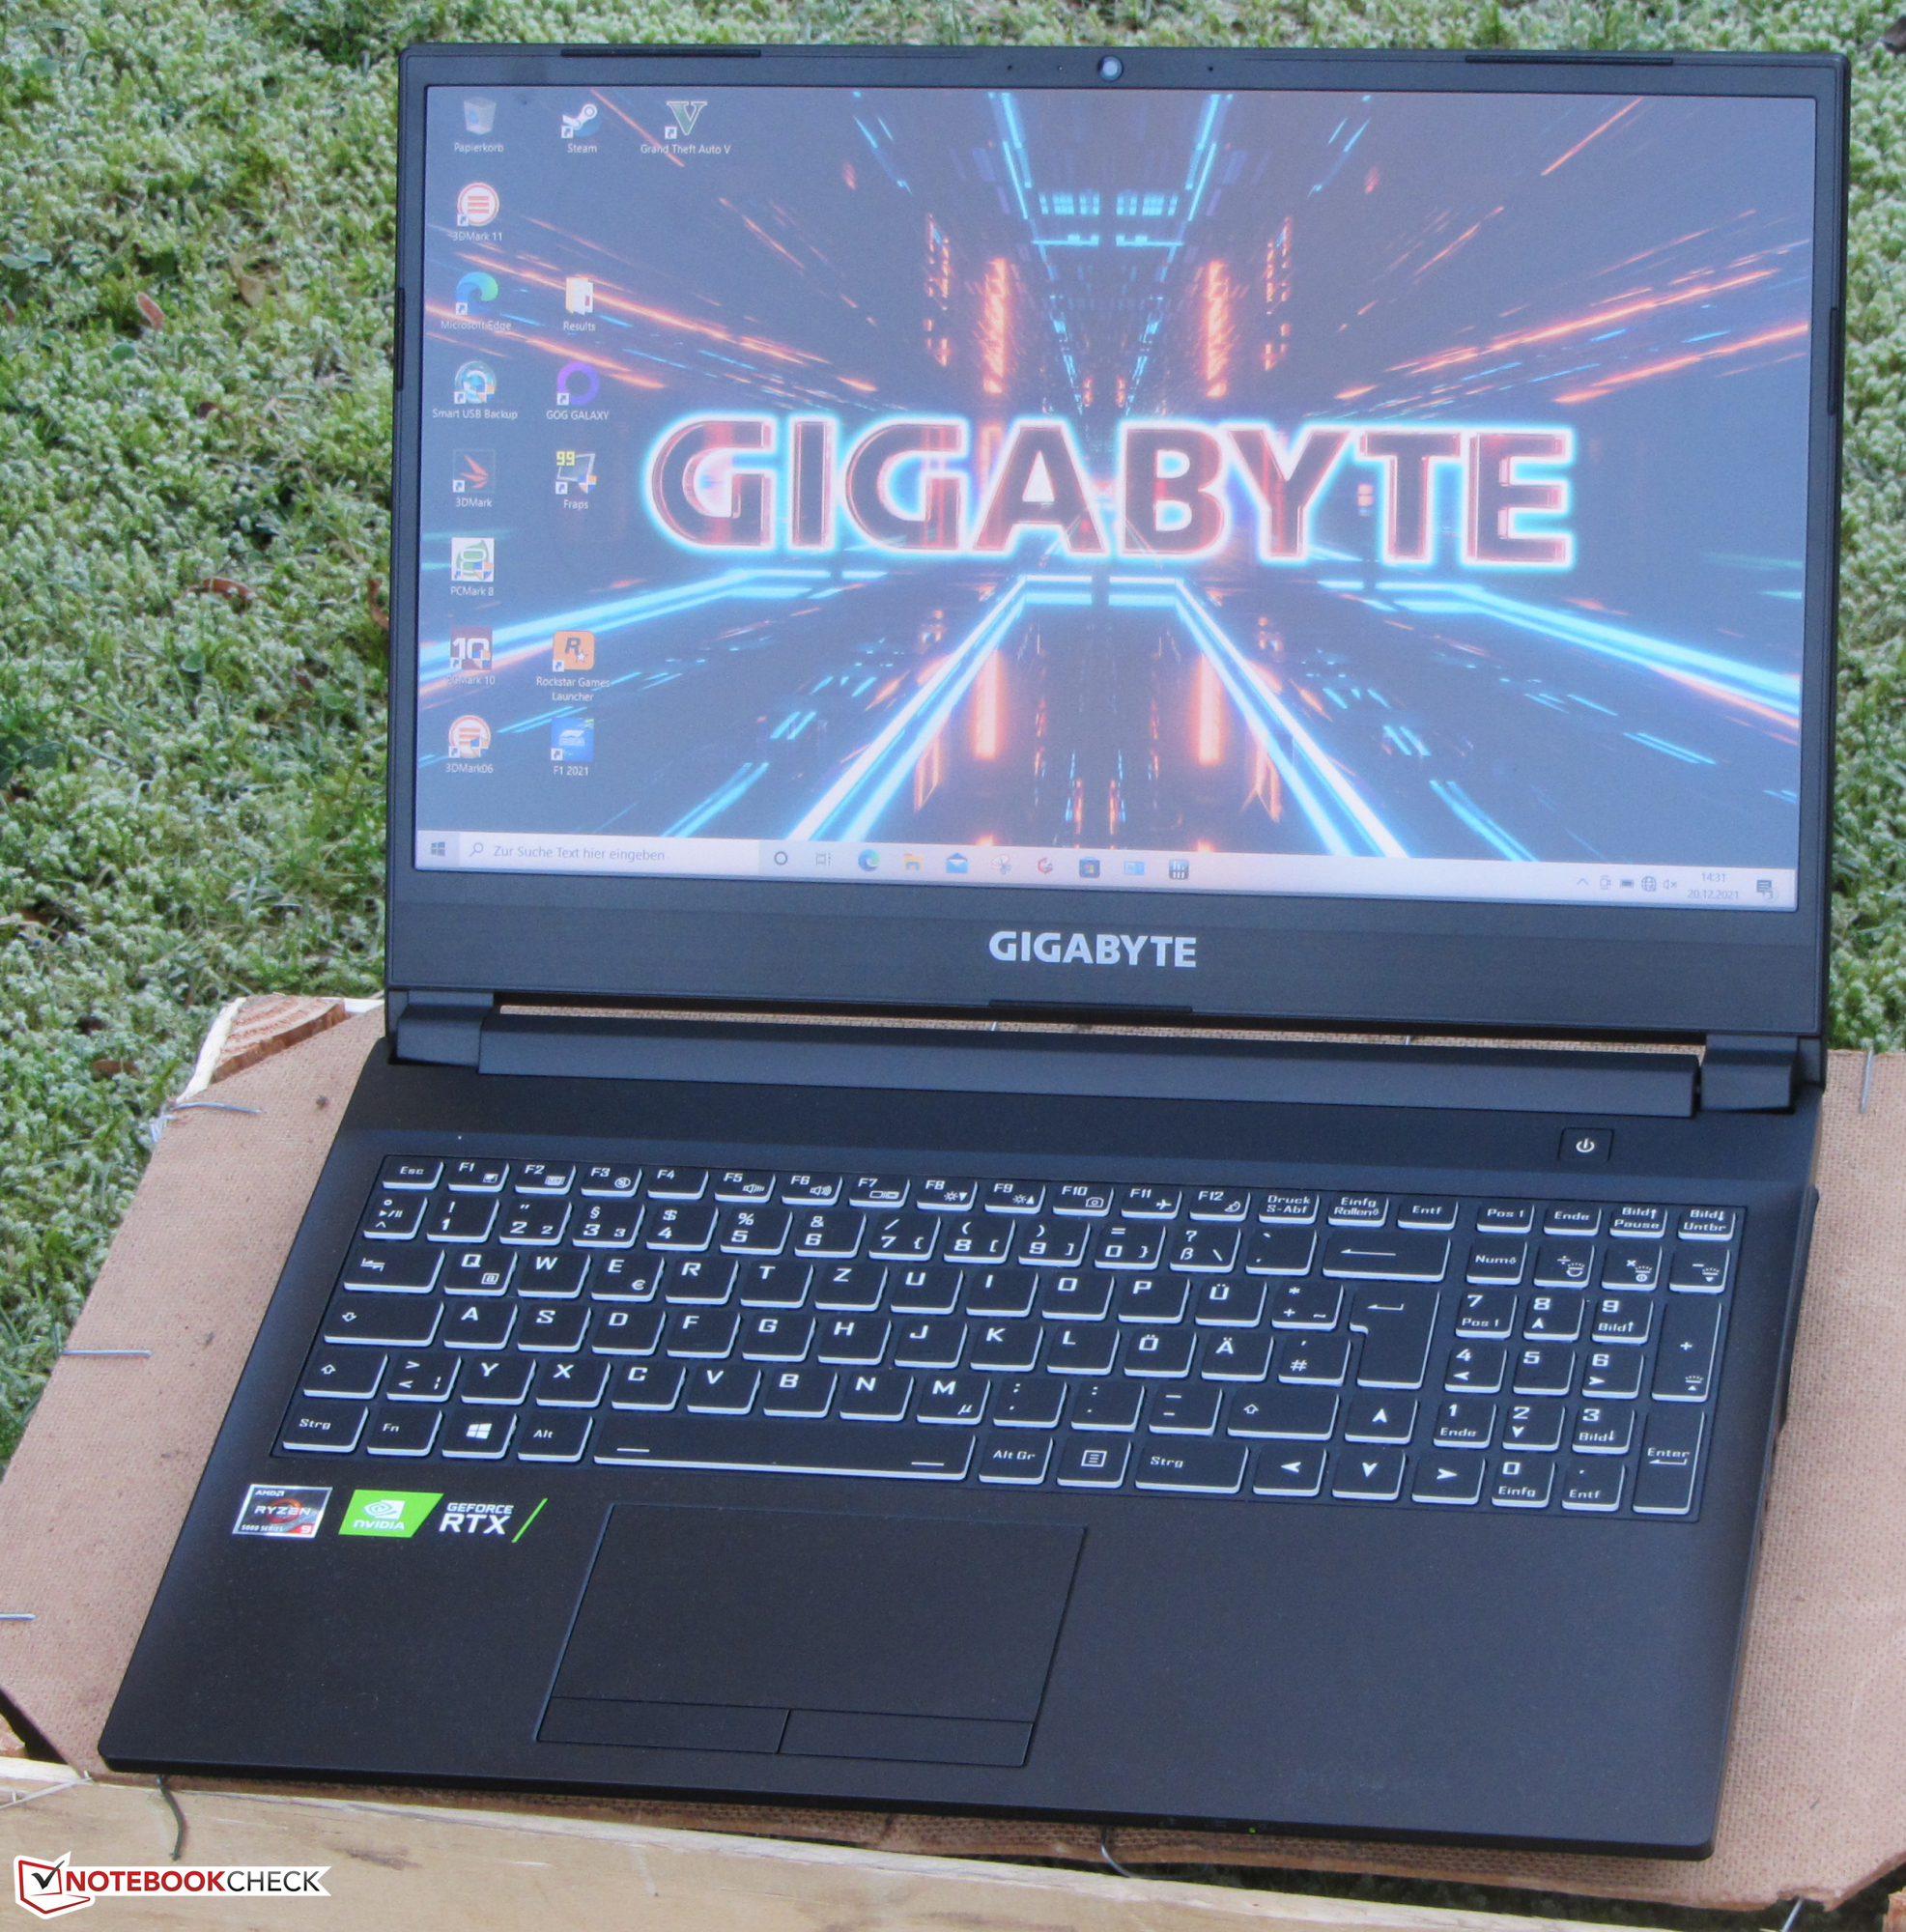
Análisis del Gigabyte A5 X1: Potente portátil para juegos

El portátil para juegos de 15,6 pulgadas de Gigabyte está alimentado por unRyzen 9 5900HX-APU y unaGeForce RTX 3070 portátil GPU. Nuestro modelo puede comprarse por algo menos de 1,800 Euros. La competencia incluye dispositivos como el MSI Katana GF66 11UG, elAcer Nitro 5 AN515-45, elSchenker XMG Apex 15y el HP Omen 16
Possible contenders in comparison
Valoración | Fecha | Modelo | Peso | Altura | Tamaño | Resolución | Precio |
|---|---|---|---|---|---|---|---|
| 84.1 % v7 (old) | 01/2022 | Gigabyte A5 X1 R9 5900HX, GeForce RTX 3070 Laptop GPU | 2.2 kg | 25.3 mm | 15.60" | 1920x1080 | |
| 86.6 % v7 (old) | 10/2021 | HP Omen 16-b0085ng i7-11800H, GeForce RTX 3070 Laptop GPU | 2.4 kg | 23 mm | 16.10" | 1920x1080 | |
| 79.2 % v7 (old) | 09/2021 | MSI Katana GF66 11UG-220 i7-11800H, GeForce RTX 3070 Laptop GPU | 2.3 kg | 25 mm | 15.60" | 1920x1080 | |
| 82.2 % v7 (old) | 08/2021 | Acer Nitro 5 AN515-45-R1JH R7 5800H, GeForce RTX 3070 Laptop GPU | 2.3 kg | 23.9 mm | 15.60" | 2560x1440 | |
| 84.4 % v7 (old) | 11/2021 | Schenker XMG Apex 15 NH57E PS R7 5800H, GeForce RTX 3060 Laptop GPU | 2.1 kg | 29 mm | 15.60" | 1920x1080 |
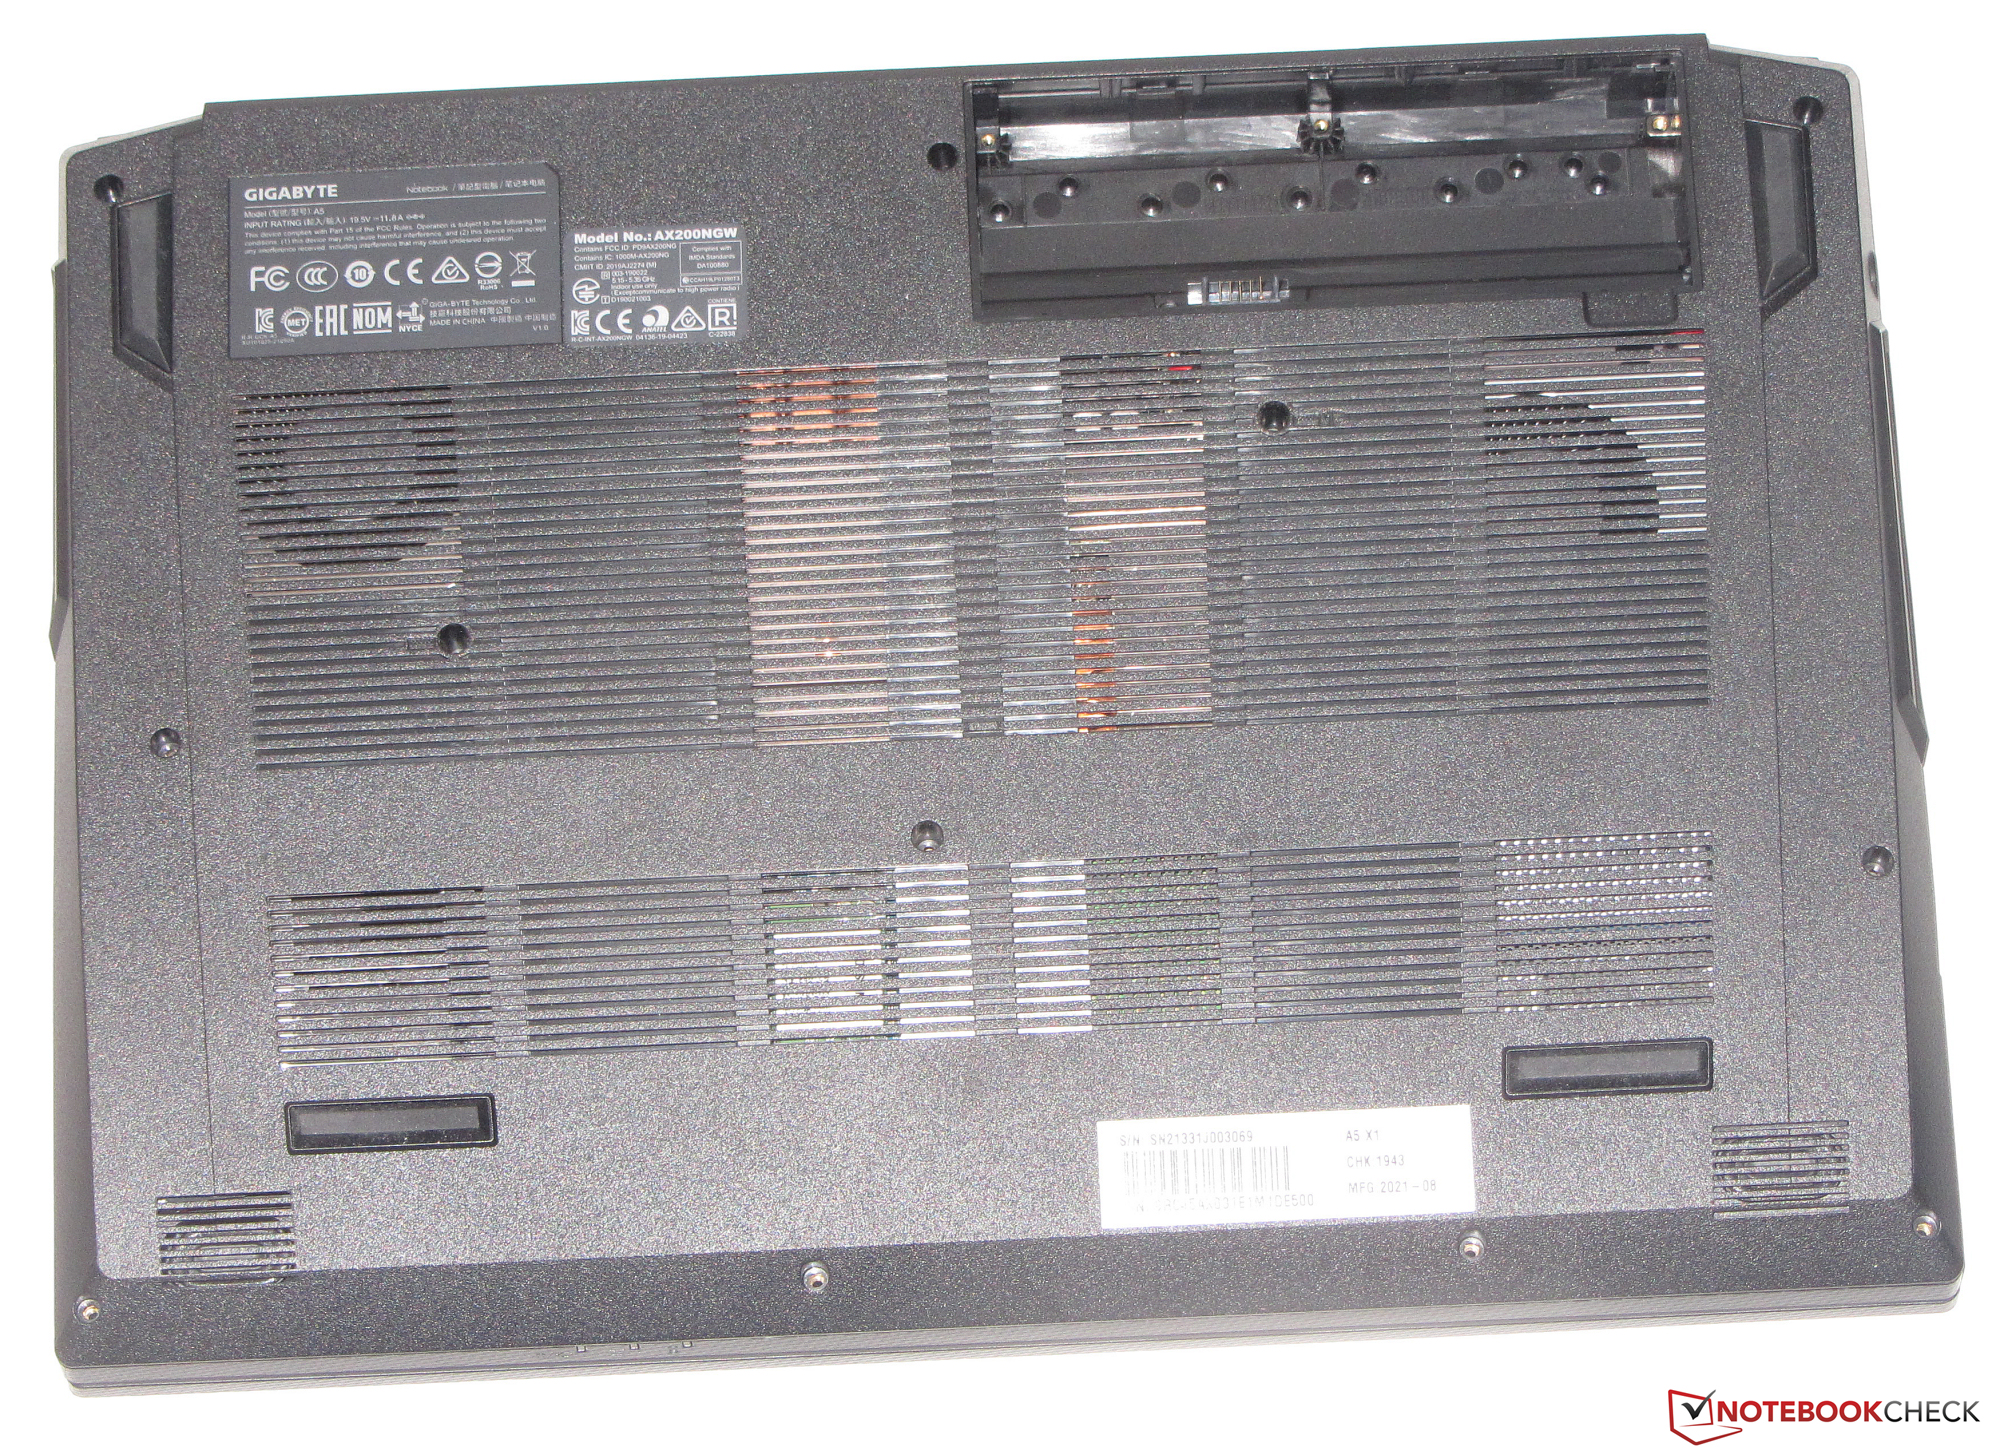
Caja - El A5 viene en un chasis de plástico
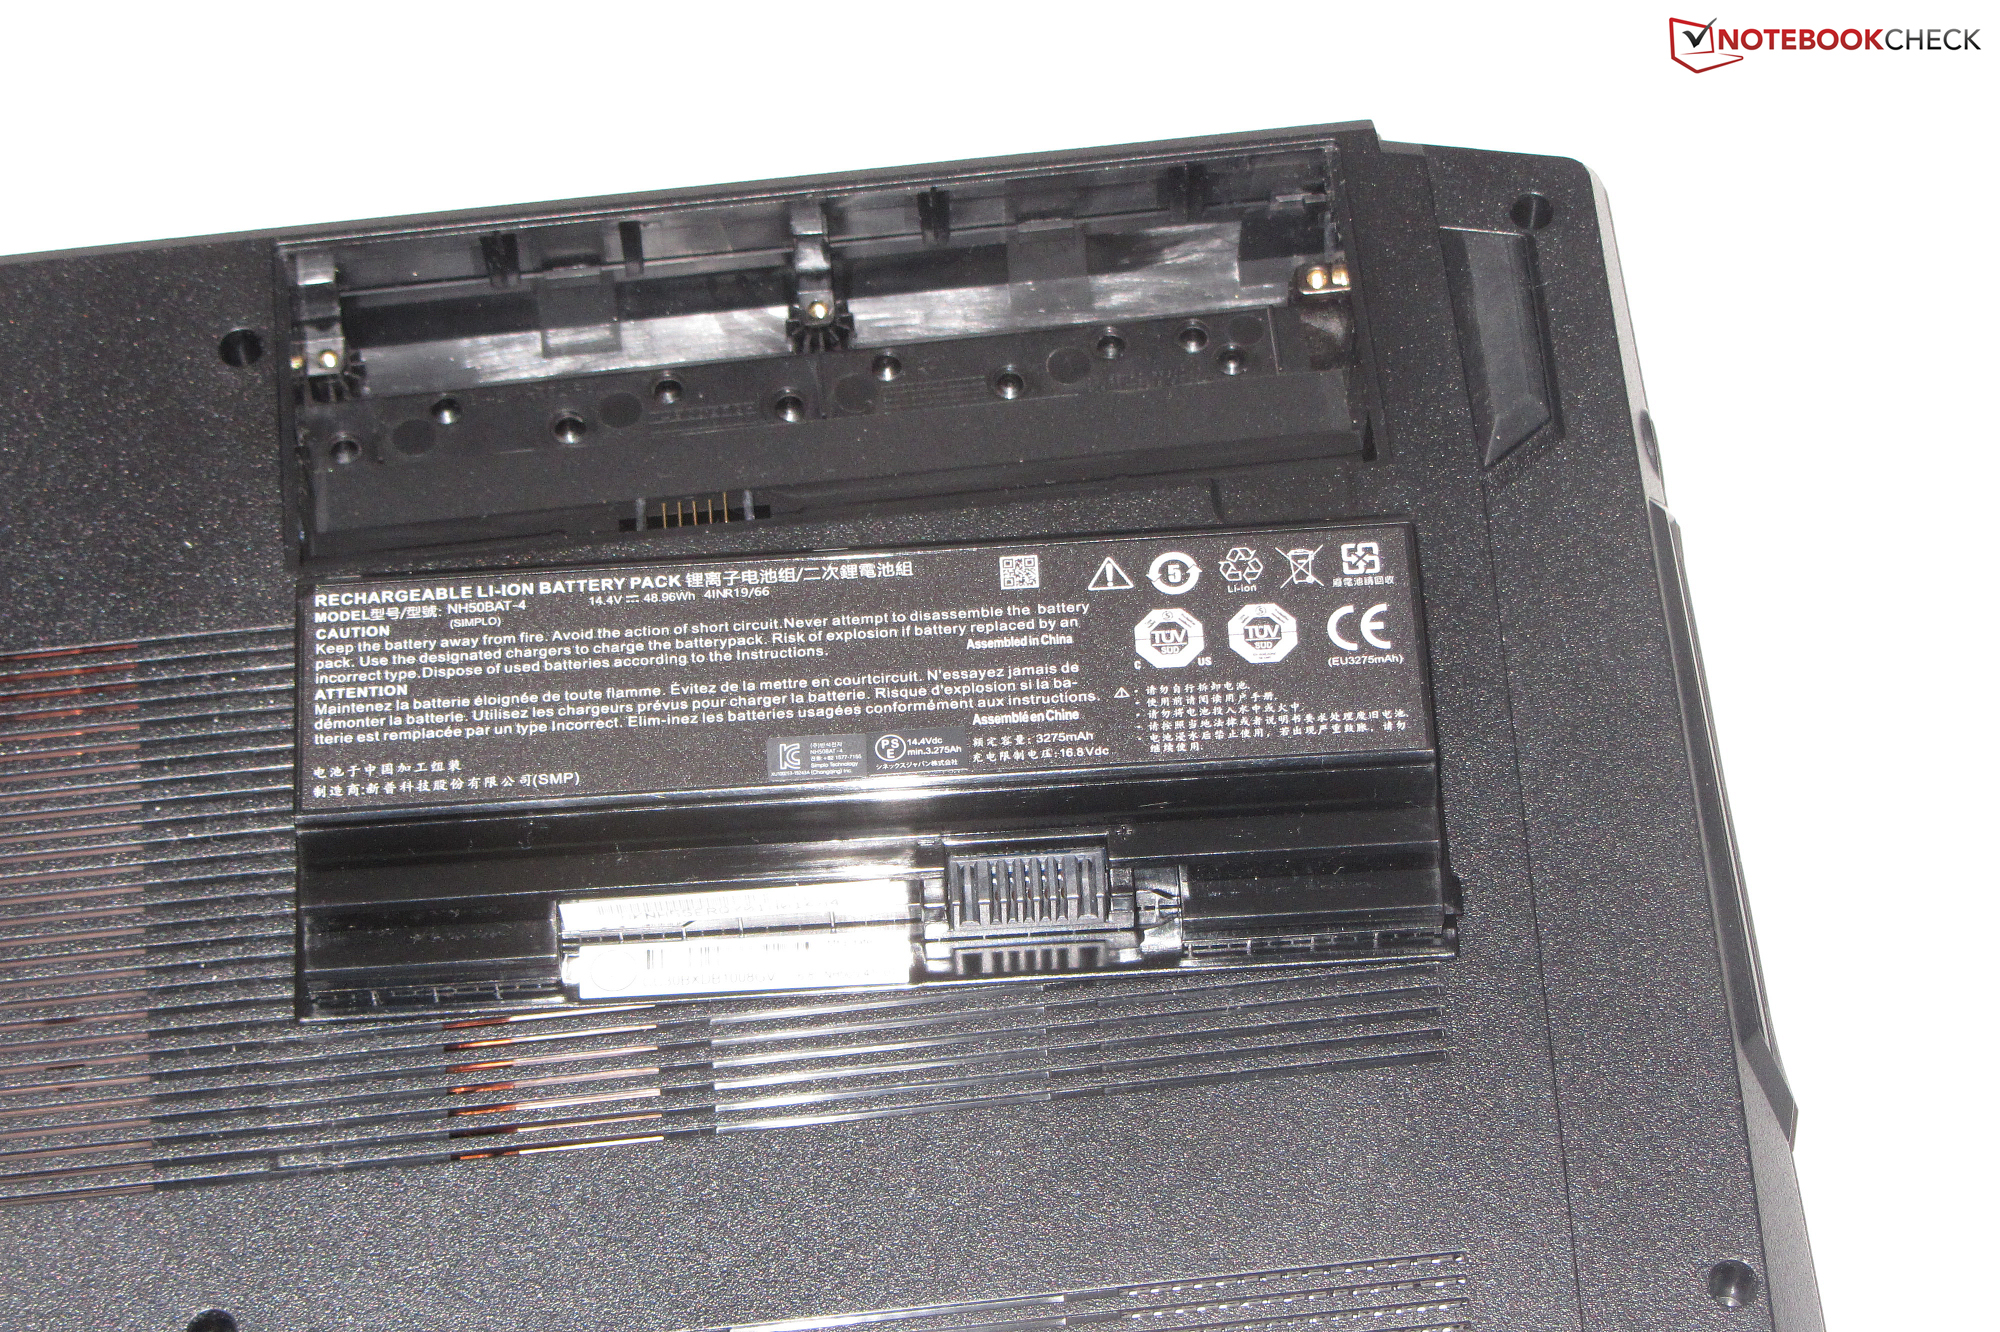
La carcasa del A5 no ofrece materiales de alta calidad. Gigabyte opta por una carcasa de plástico negro con un diseño que puede describirse como sobrio y funcional - el portátil no llama la atención. La parte trasera de la tapa y la parte superior de la unidad base tienen superficies mate y lisas, mientras que las superficies de la cubierta inferior y los estrechos bordes de la tapa son rugosas. El portátil no viene con una escotilla de mantenimiento. La batería se puede extraer desde el exterior.
El chasis no revela ningún defecto de fabricación. Las dimensiones de los huecos son precisas y no hay salientes de material. Aunque la unidad base se puede torcer un poco, toda la situación se mantiene dentro de los límites. Por otro lado, la tapa carece de rigidez. Las bisagras mantienen la tapa firmemente en su posición y sólo permiten que se tambalee ligeramente. El ángulo máximo de apertura es de unos 120 grados. Es posible abrir la tapa con una sola mano
En términos de peso y tamaño, los portátiles de nuestra comparativa no difieren mucho. El A5 es uno de los dispositivos más ligeros
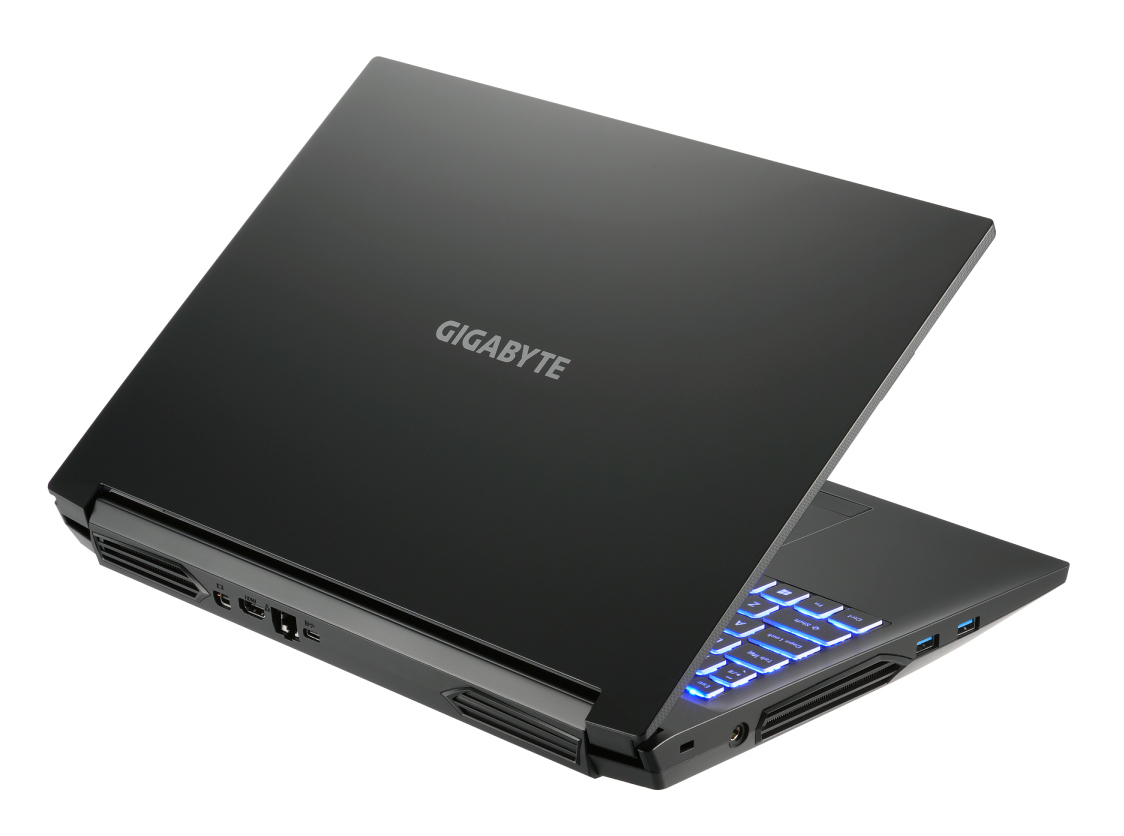
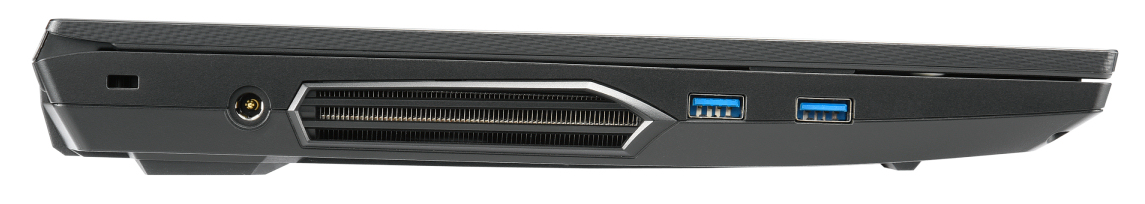
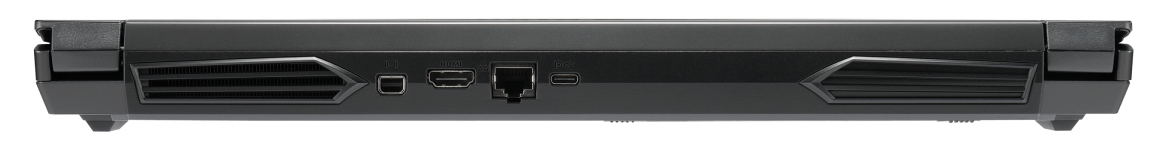
Conectividad - Portátil Gigabyte sin Thunderbolt
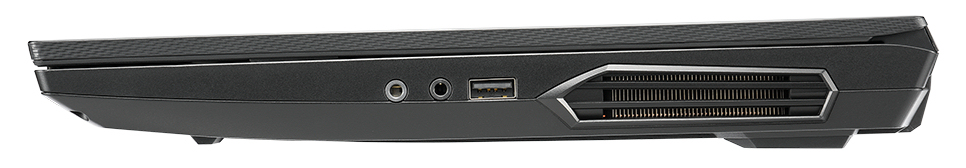
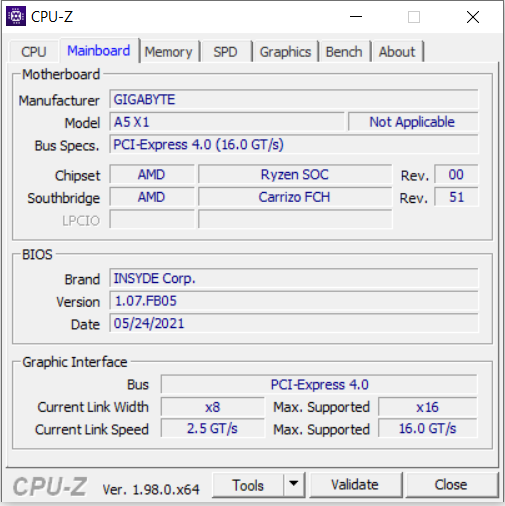
El A5 viene con tres puertos USB-A (1x USB 2.0, 1x USB 3.2 Gen 1, 1x USB 3.2 Gen 2) y un puerto USB-C (USB 3.2 Gen 2). Este último soporta DisplayPort a través de USB-C. Esto quiere decir que hay tres salidas de vídeo junto con el puerto HDMI y el Mini DisplayPort dedicado. Gigabyte no ha dotado al portátil gaming de un lector de tarjetas de memoria.
Los puertos se distribuyen a lo largo de tres de los lados del portátil. Las tres salidas de vídeo, así como el puerto Ethernet, se encuentran en la parte trasera del dispositivo. En consecuencia, los cables correspondientes van hacia la parte trasera sin estorbar
Comunicación
El módulo WLAN está equipado con un chip (AX200) de Intel que soporta los estándares 802.11a/b/g/n/ac/ax. Las velocidades de transmisión determinadas en condiciones óptimas (sin otros dispositivos WLAN cerca, distancia corta entre el portátil y el PC servidor) son excelentes. El controlador Realtek RTL8125 Gigabit Ethernet se encarga de las conexiones de red por cable. Realiza sus tareas sin problemas
Cámara web
La cámara web integrada (0,9 MP) es una sorpresa positiva: Los colores de las fotos tomadas sólo se desvían del objetivo en una pequeña medida - rara vez vemos esto. Por lo demás, la cámara ofrece la calidad estándar

")
")
Accesorios
Además de los documentos habituales (guía de inicio rápido e información sobre la garantía), el portátil viene con tornillos (para conectar una unidad de almacenamiento de 2,5 pulgadas al marco de montaje), y una almohadilla térmica (para un segundo SSD)
Mantenimiento
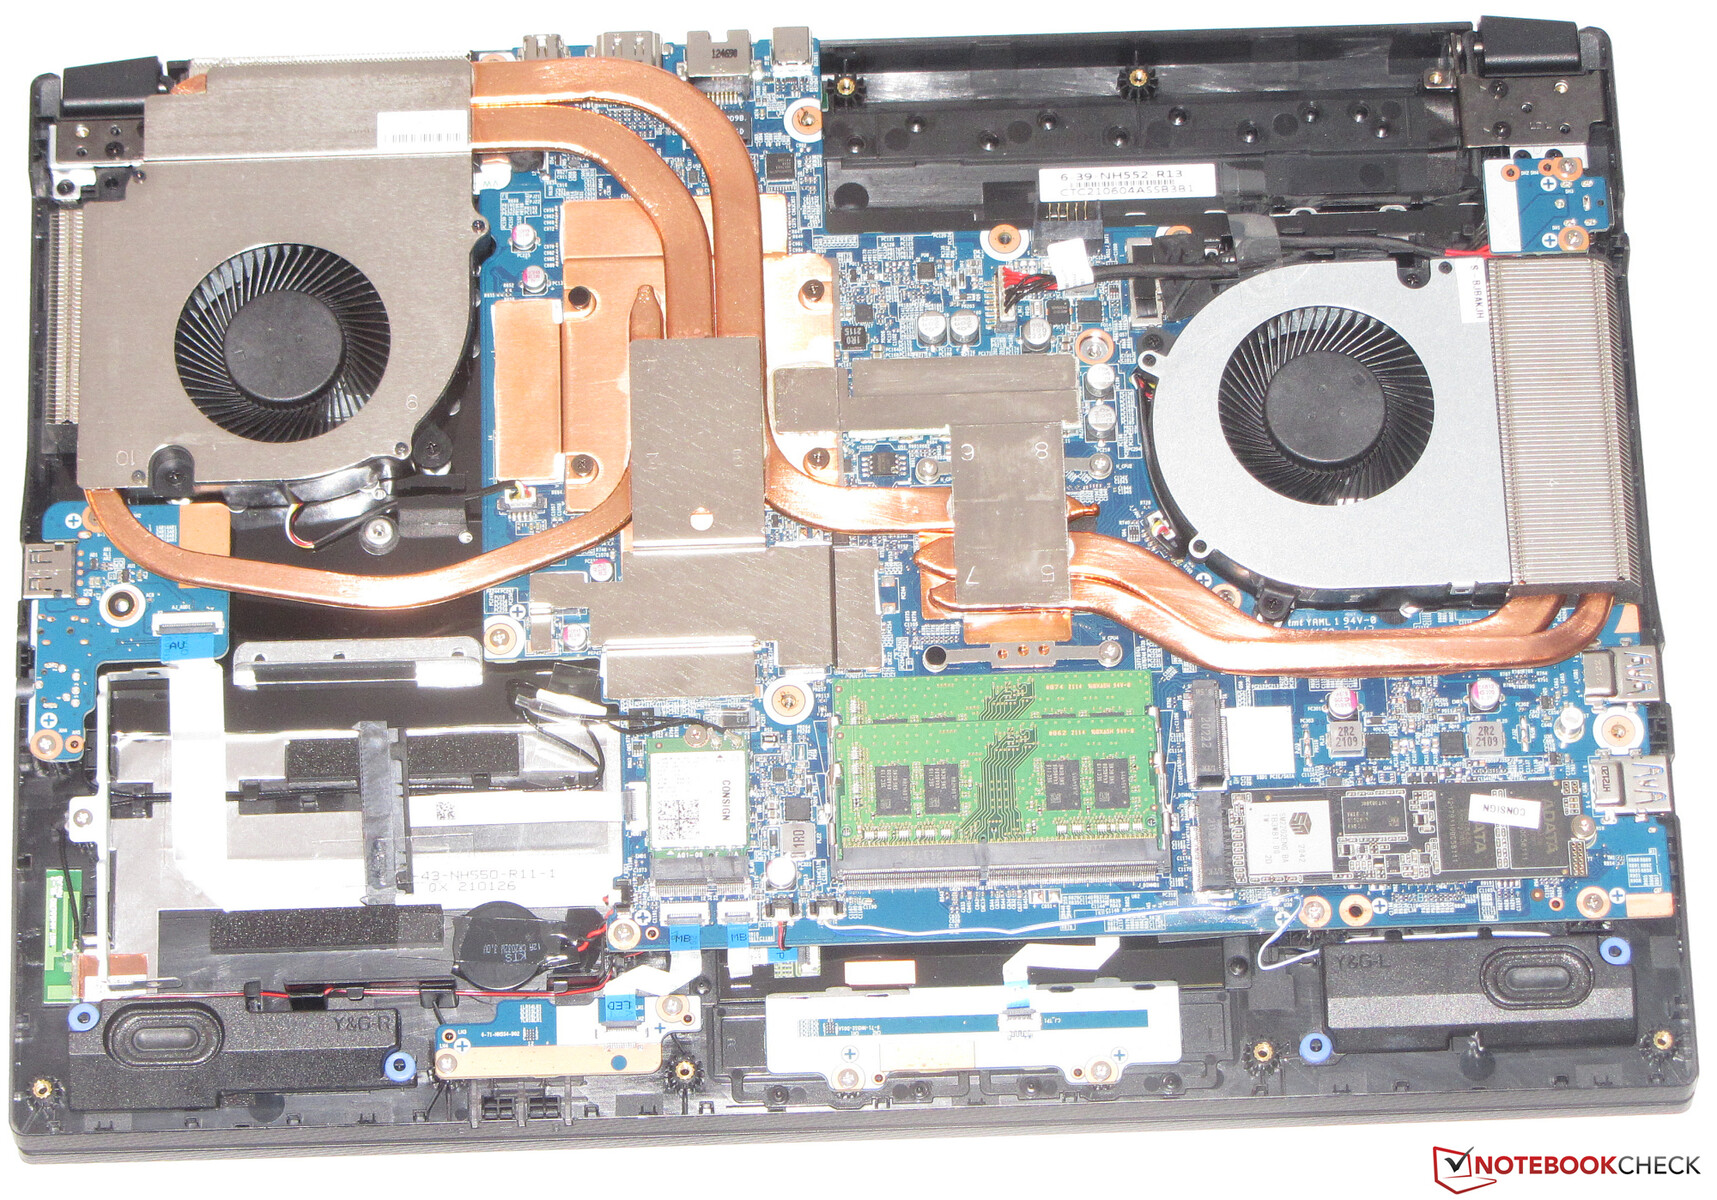
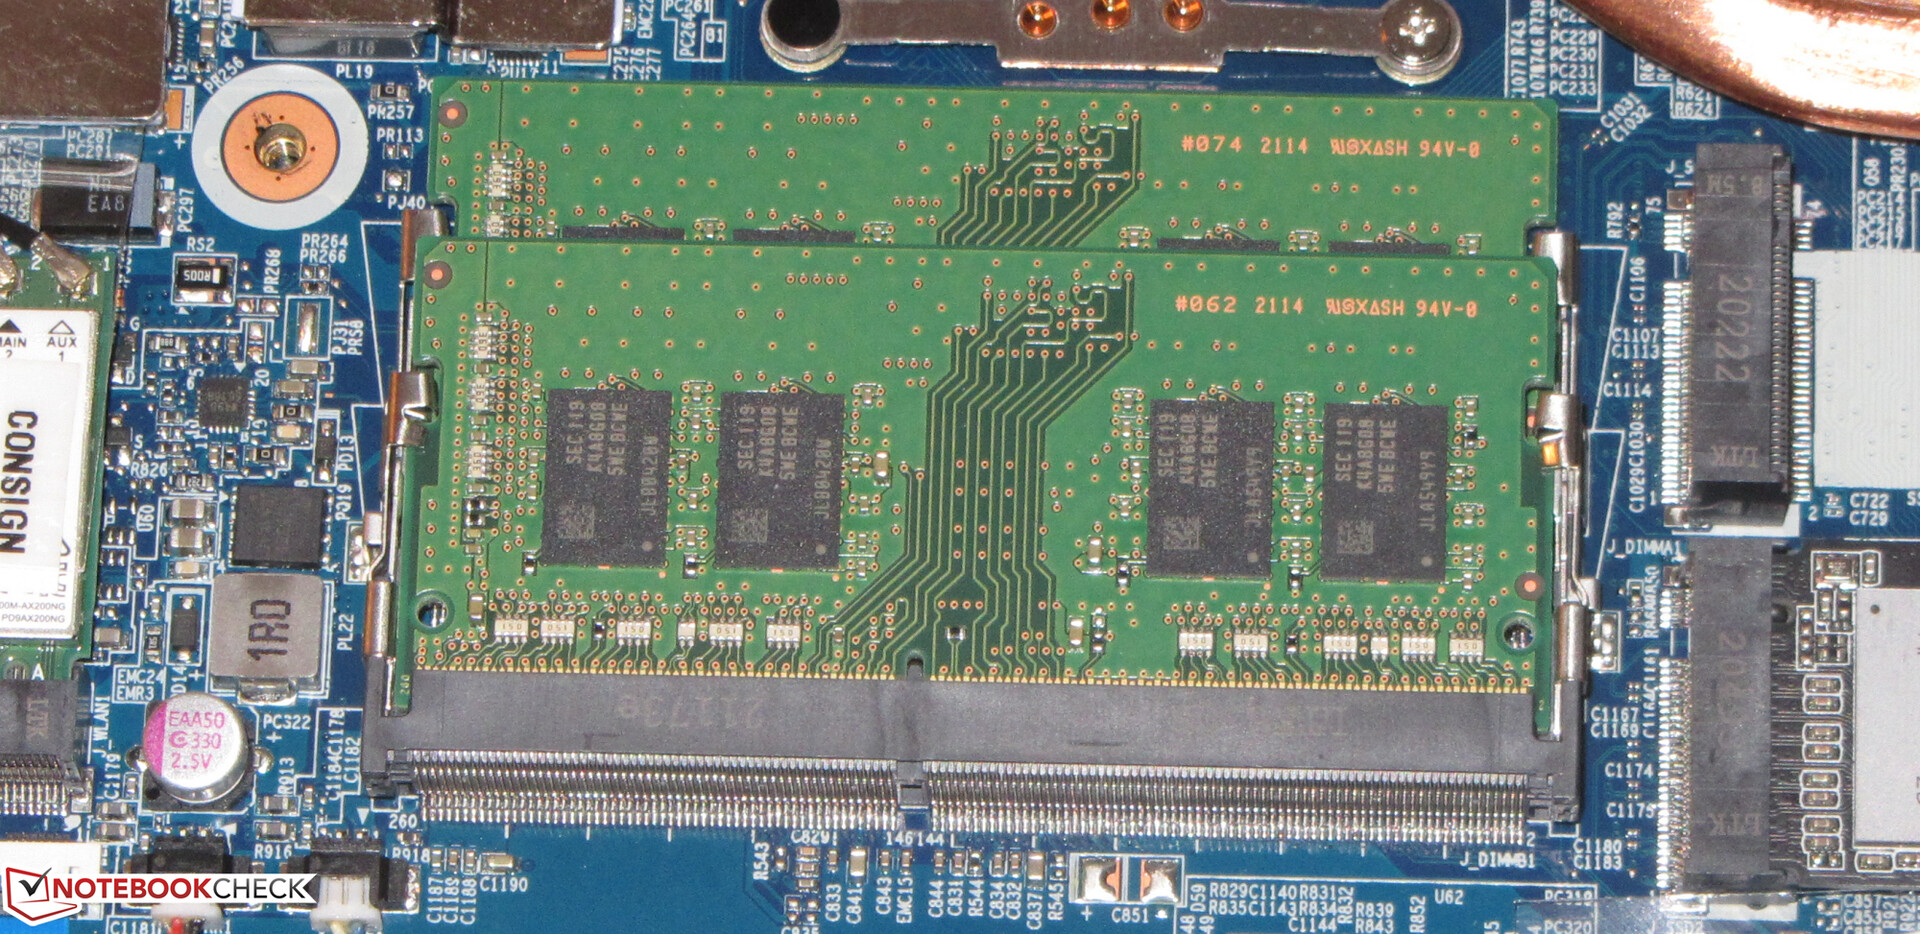
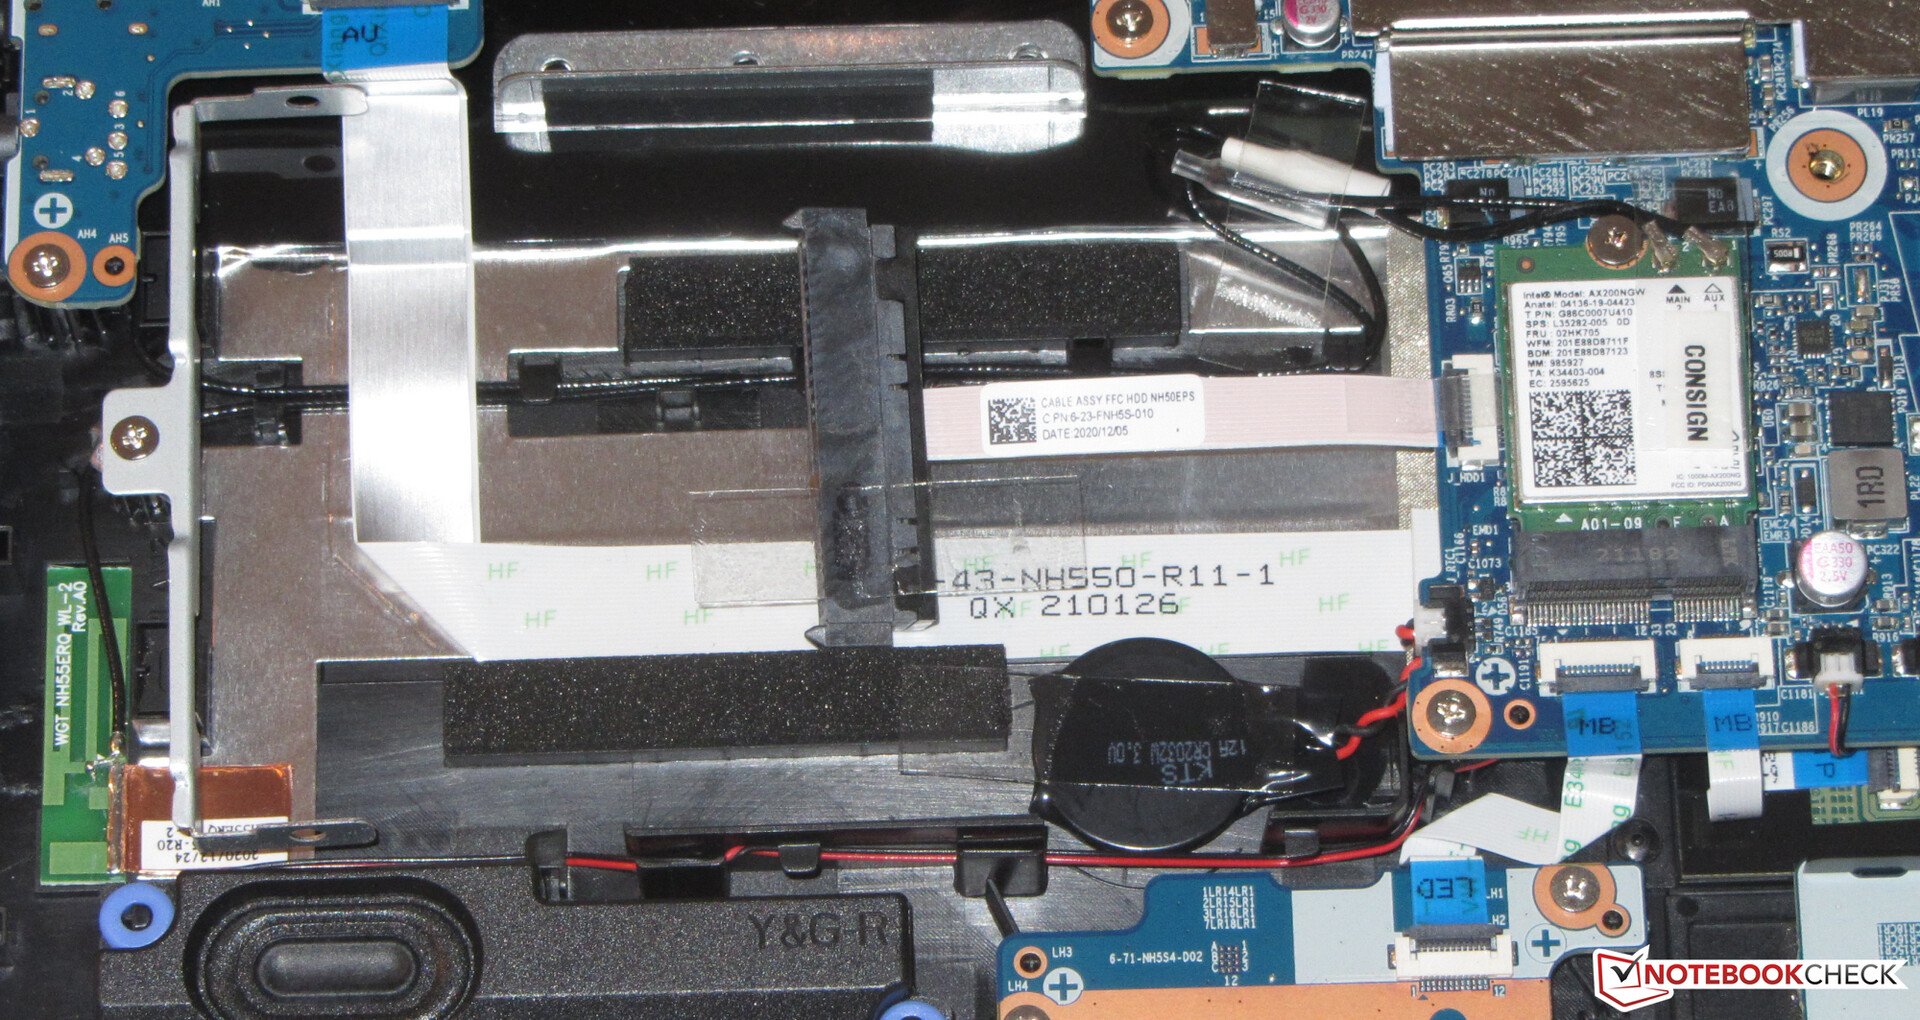
Una vez aflojados todos los tornillos de la parte inferior del dispositivo (también hay tornillos en el compartimento de la batería), se puede sacar la cubierta inferior con la ayuda de una espátula plana o una herramienta de acabado de juntas - la cubierta inferior se asienta con bastante fuerza en algunos lugares. Después de eso, puedes acceder al SSD, la segunda ranura M.2, el puerto SATA, el módulo WLAN, la RAM, la batería de la BIOS, y los ventiladores
Garantía
Gigabyte concede al 15,6 pulgadas una garantía de dos años. No hay extensiones de garantía disponibles
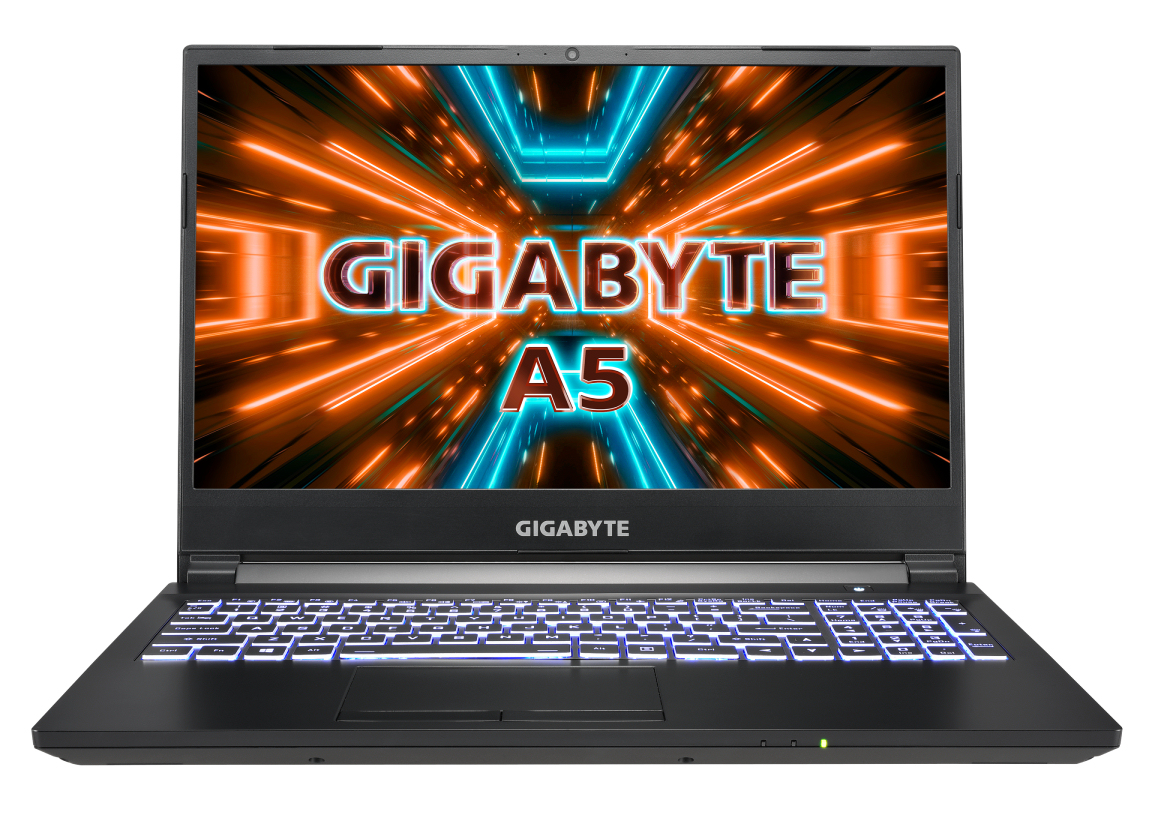
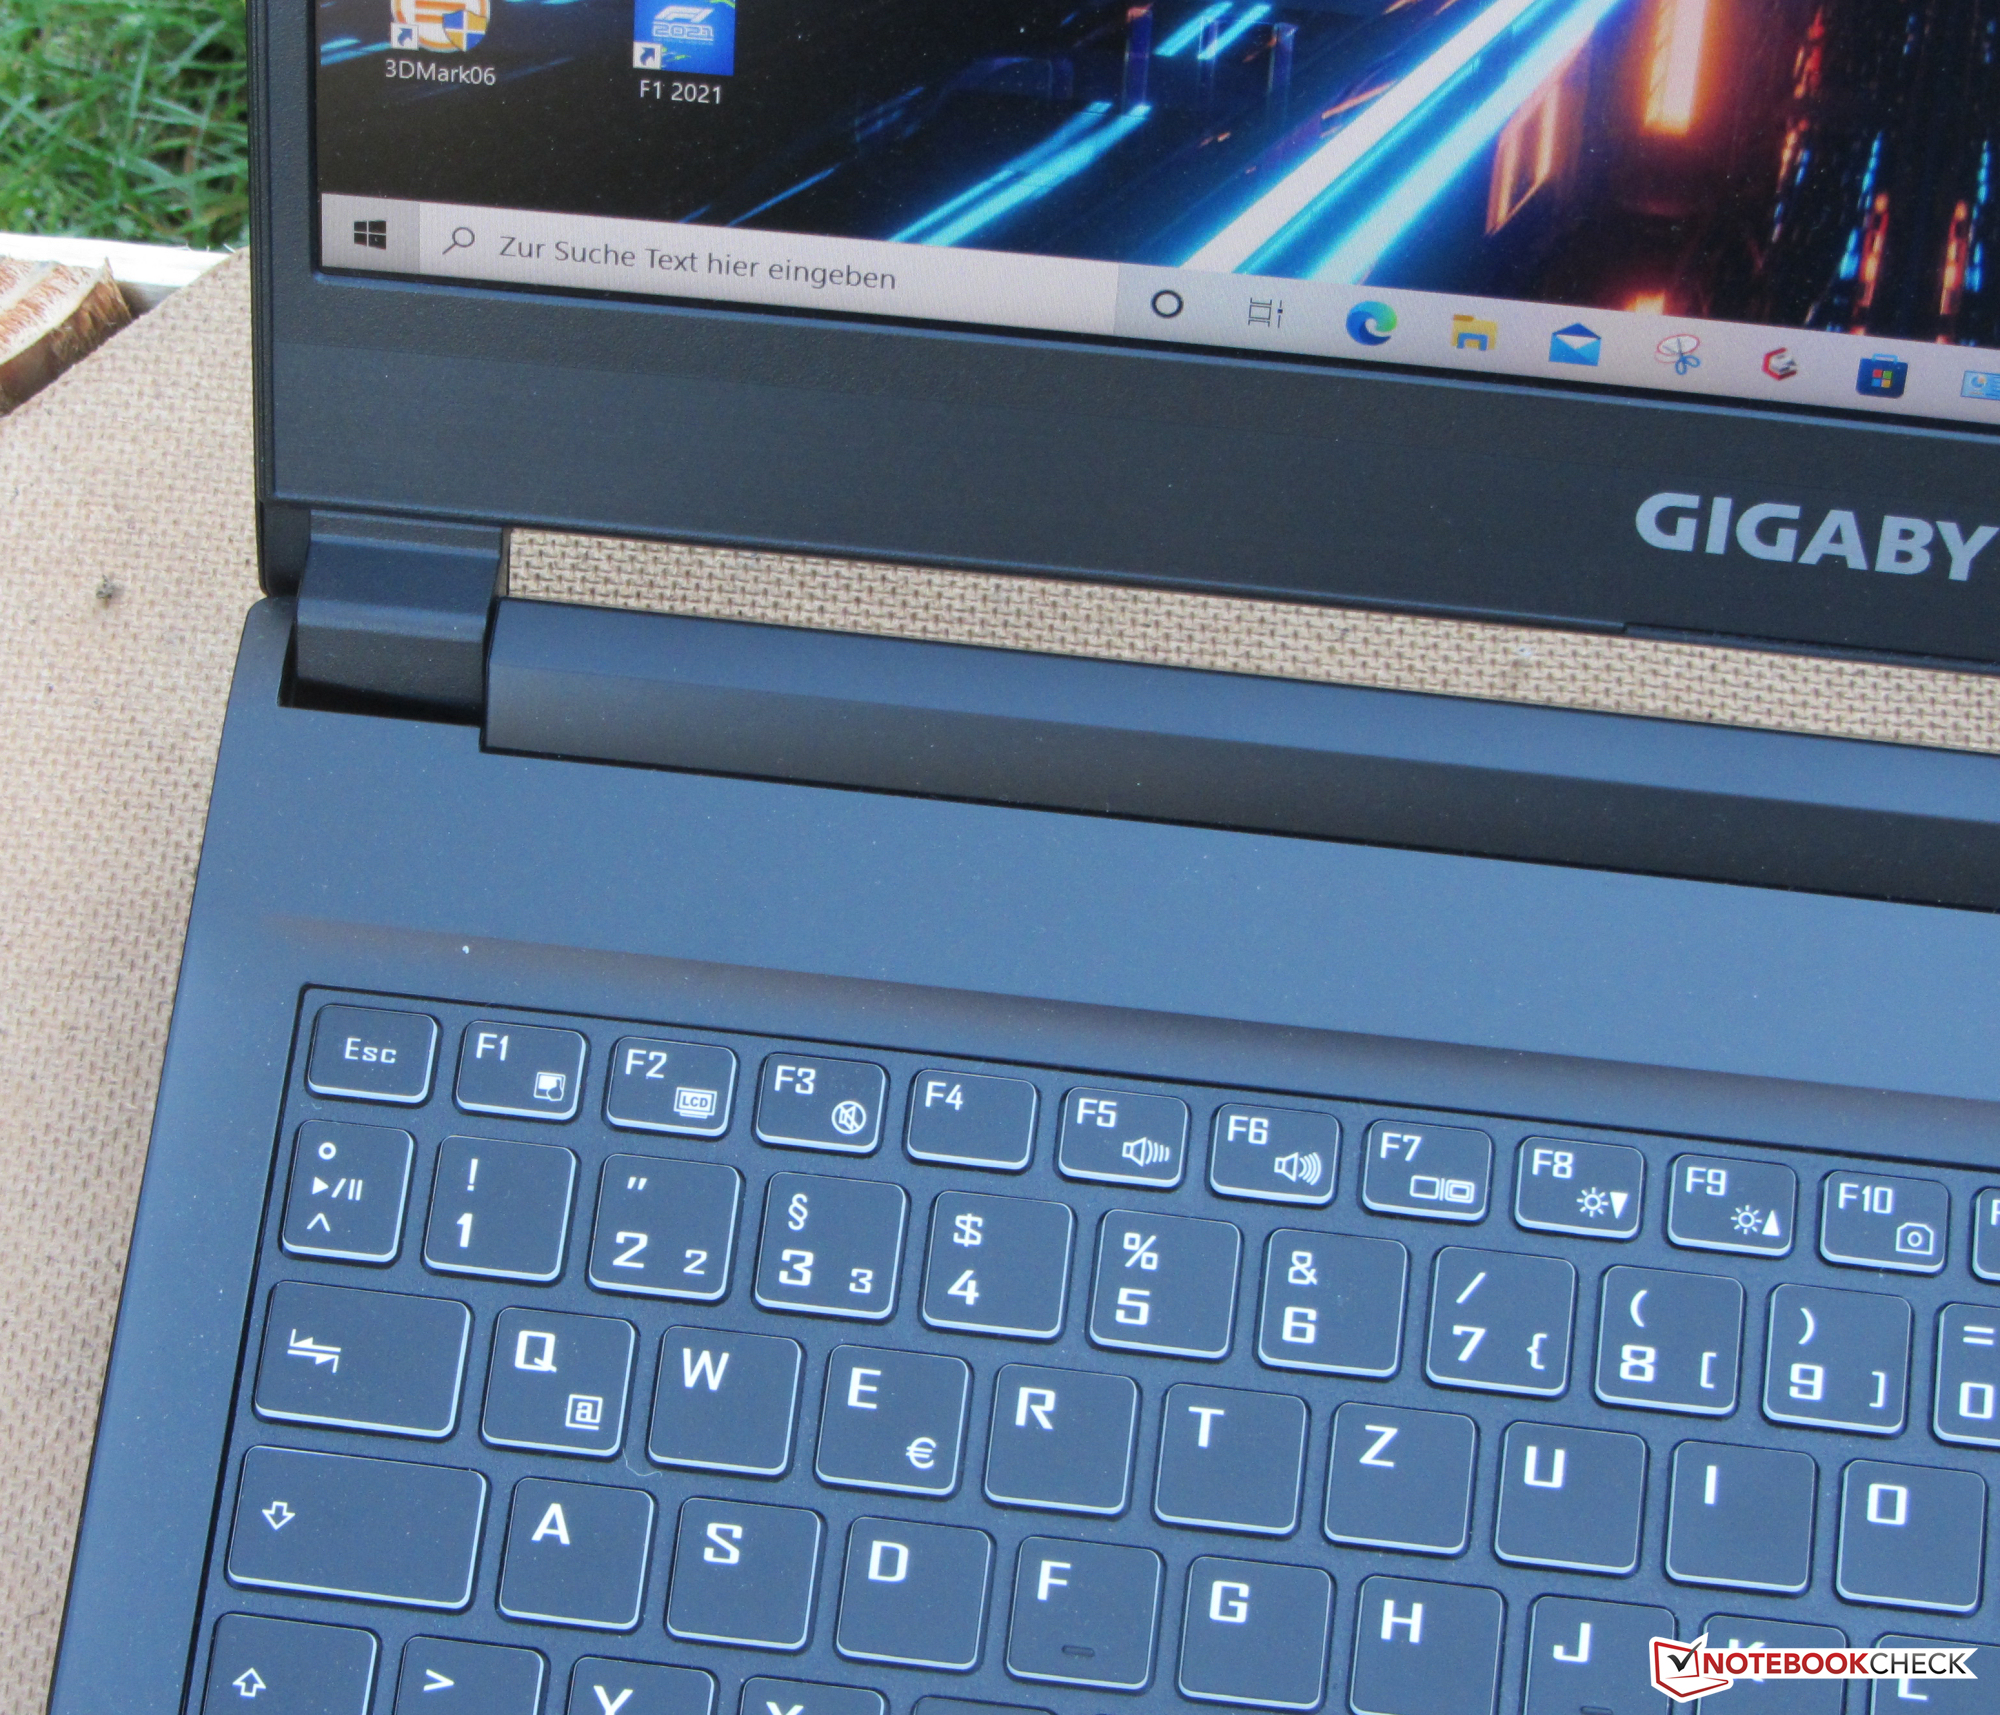
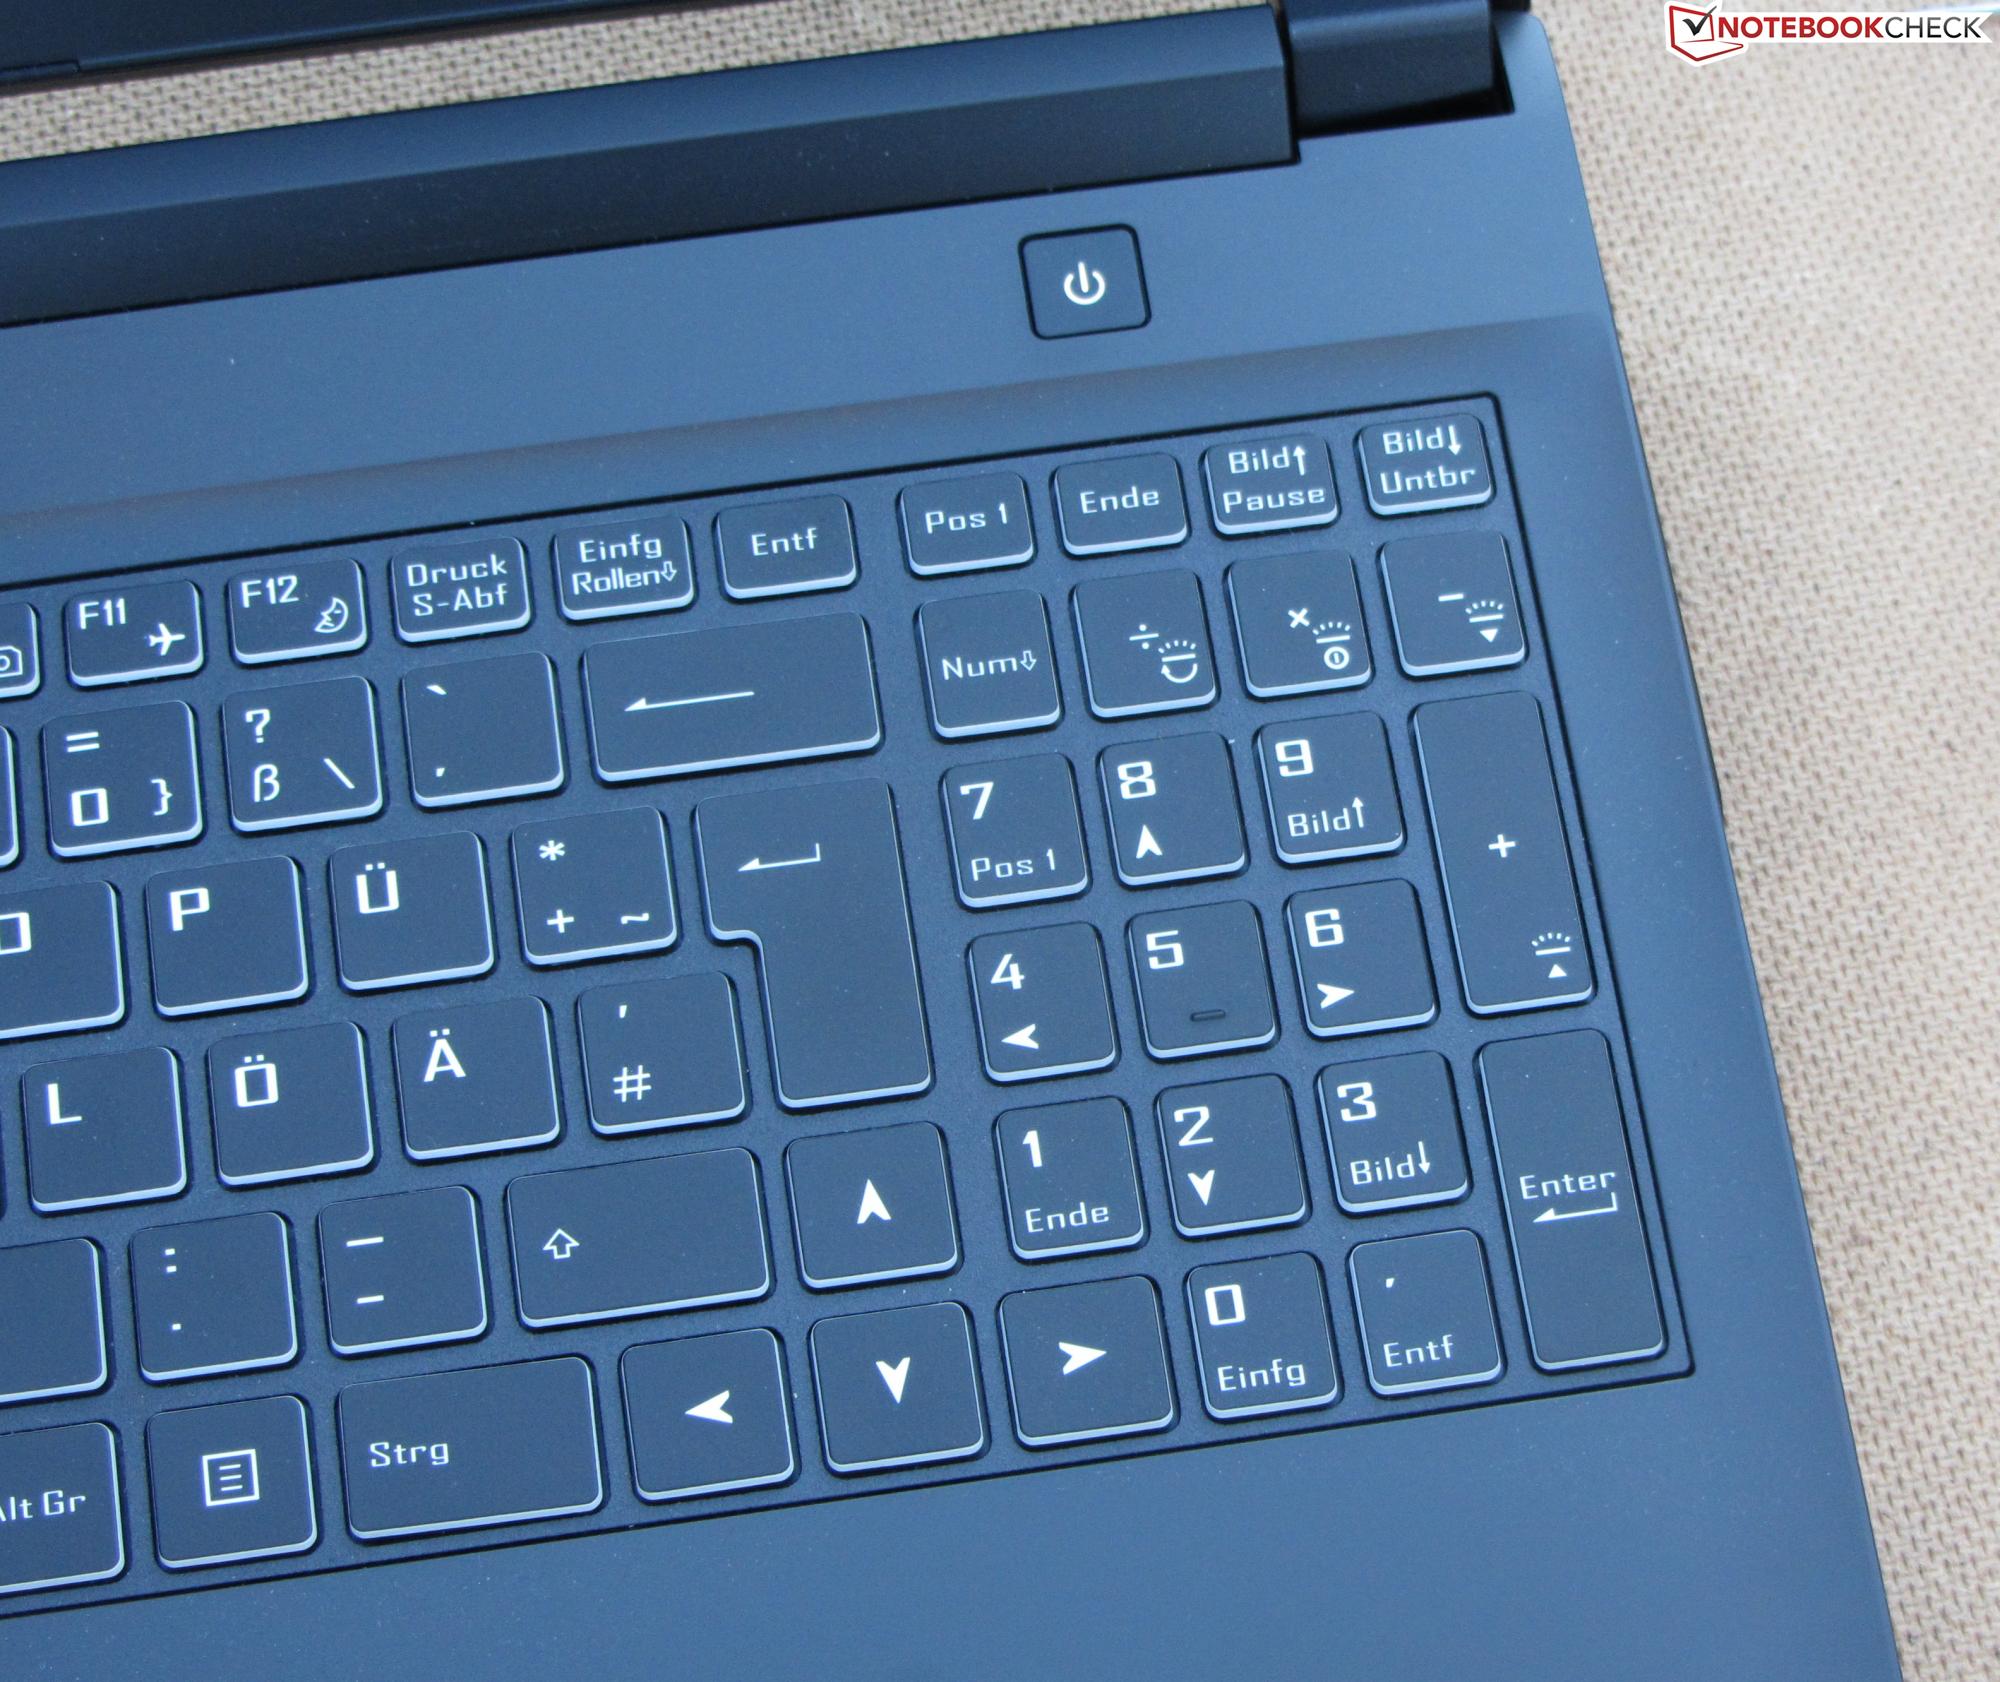
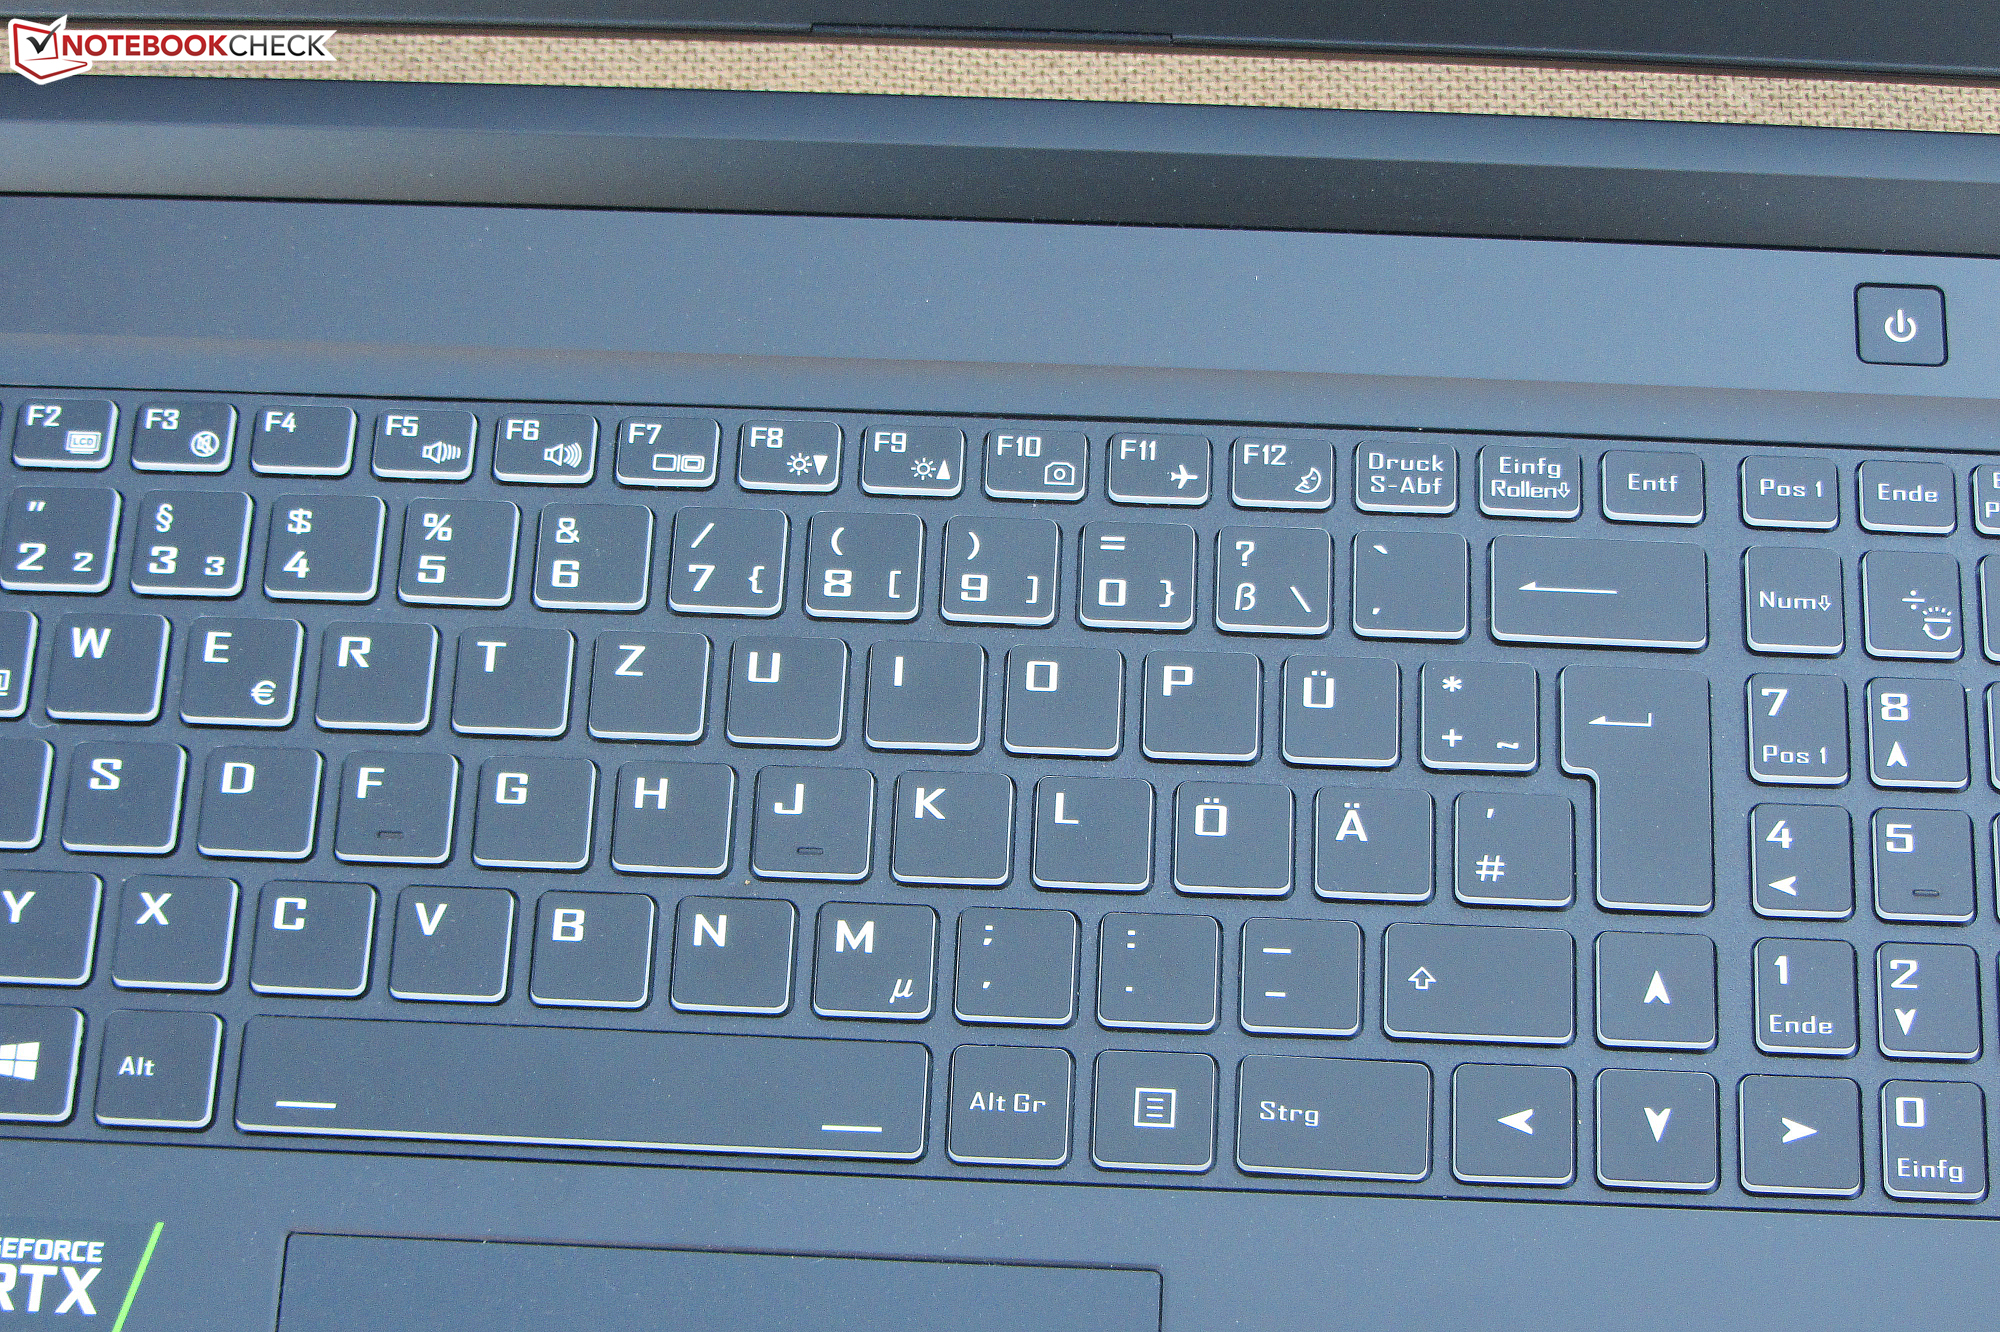
Dispositivos de entrada - El teclado viene con retroiluminación
Teclado
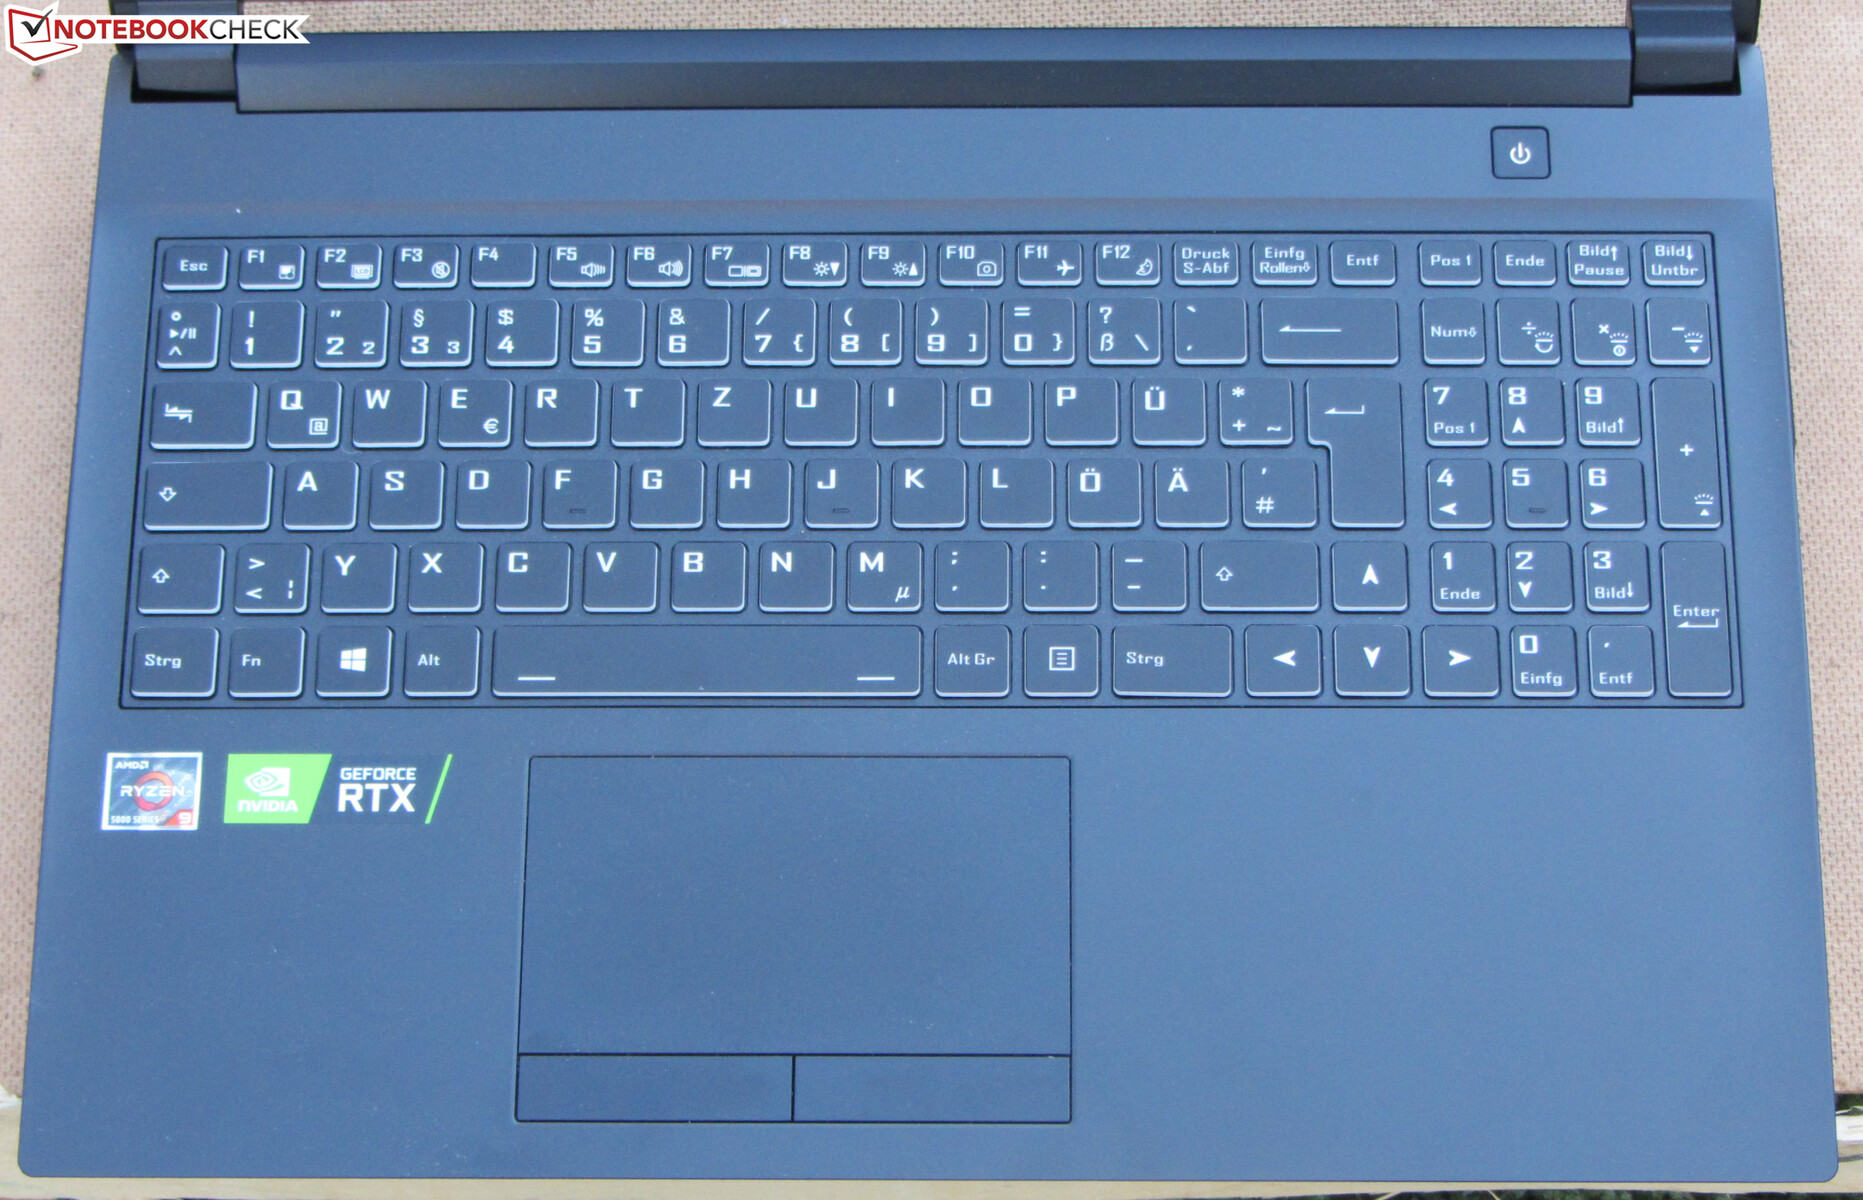
El A5 viene con un teclado chiclet retroiluminado que incluye un teclado numérico. Las teclas planas y suaves ofrecen un recorrido medio y un punto de presión claro. Sin embargo, la resistencia que ofrecen las teclas podría ser más nítida. El teclado cede ligeramente al escribir. Sin embargo, no resultó ser demasiado molesto. En general, Gigabyte ofrece aquí un teclado adecuado para el uso diario
Panel táctil
Una almohadilla táctil multitáctil (aprox. 11 x 6,3 cm) sirve como sustituto del ratón. Su superficie lisa facilita el deslizamiento de los dedos sobre ella. También responde a las entradas en las esquinas. Los dos botones del ratón ofrecen un recorrido corto, pero un punto de presión muy claro
Pantalla - 240 Hz IPS
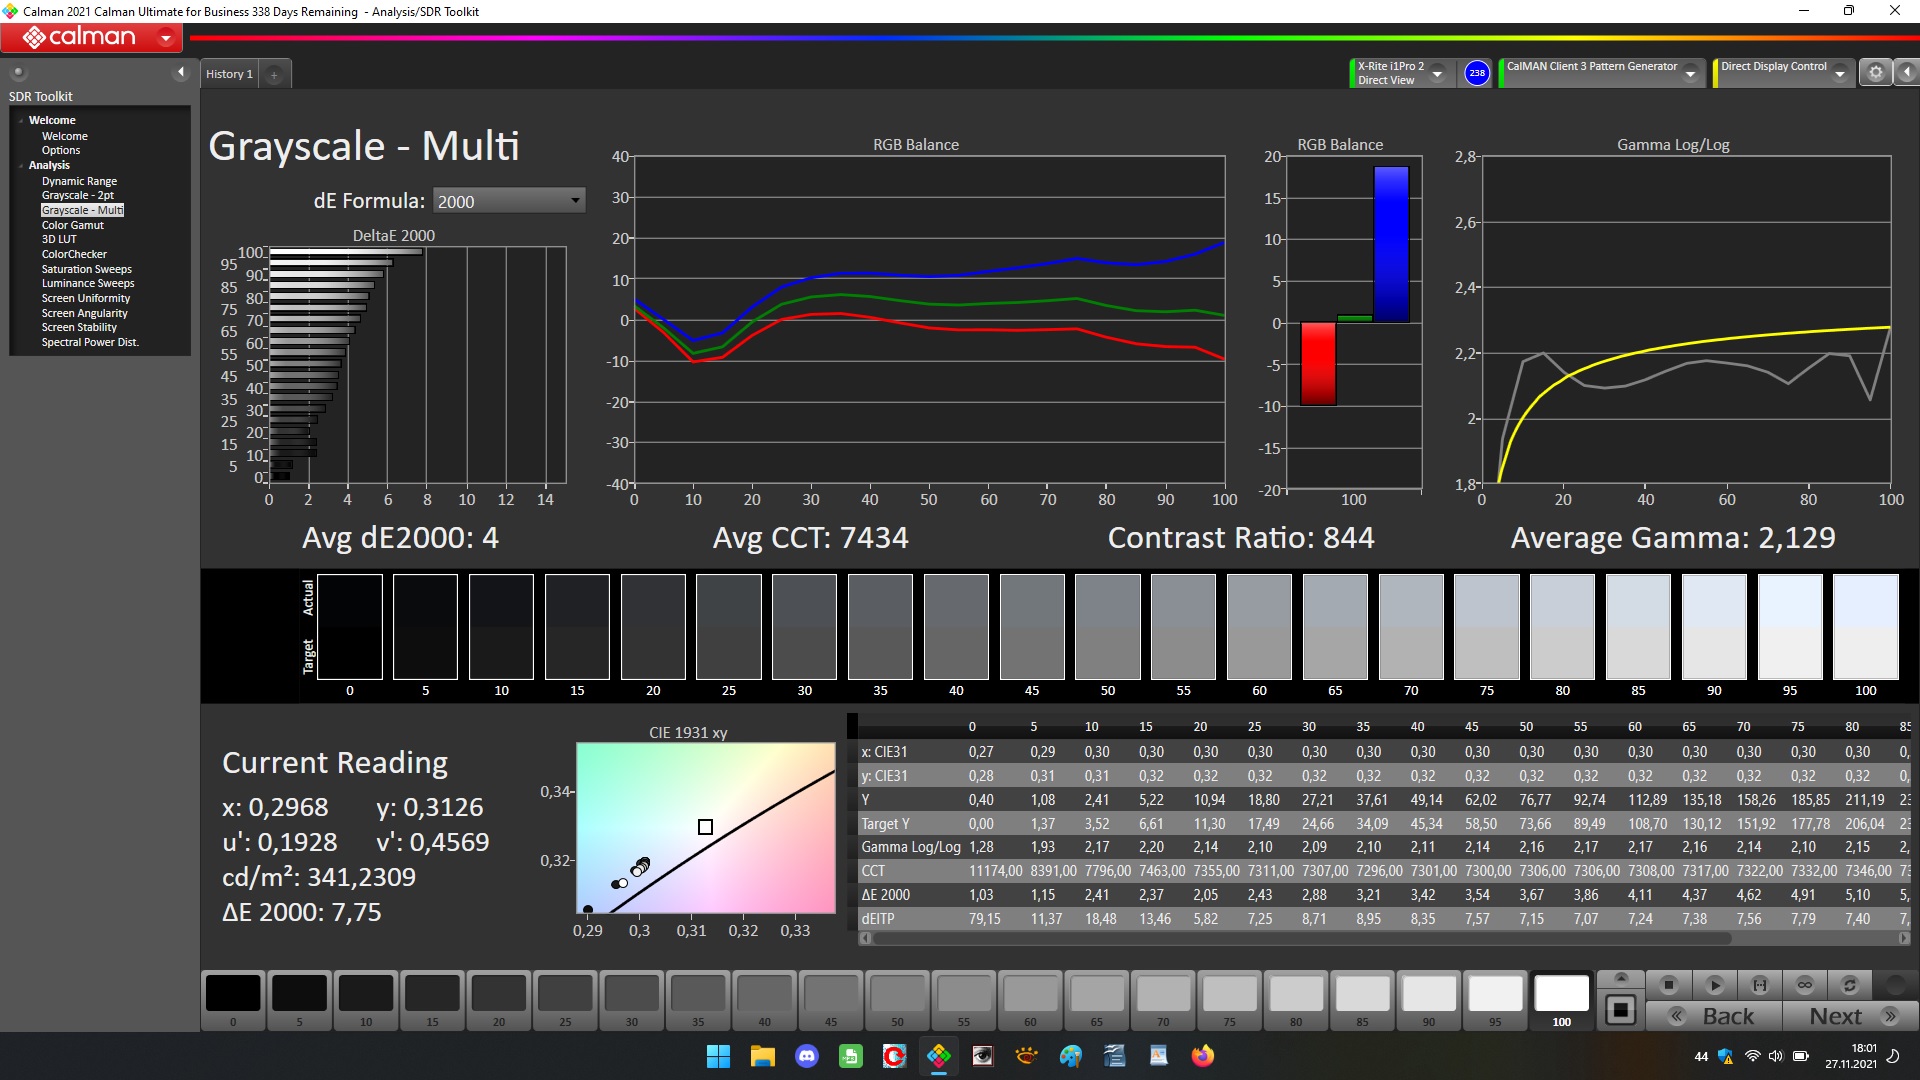
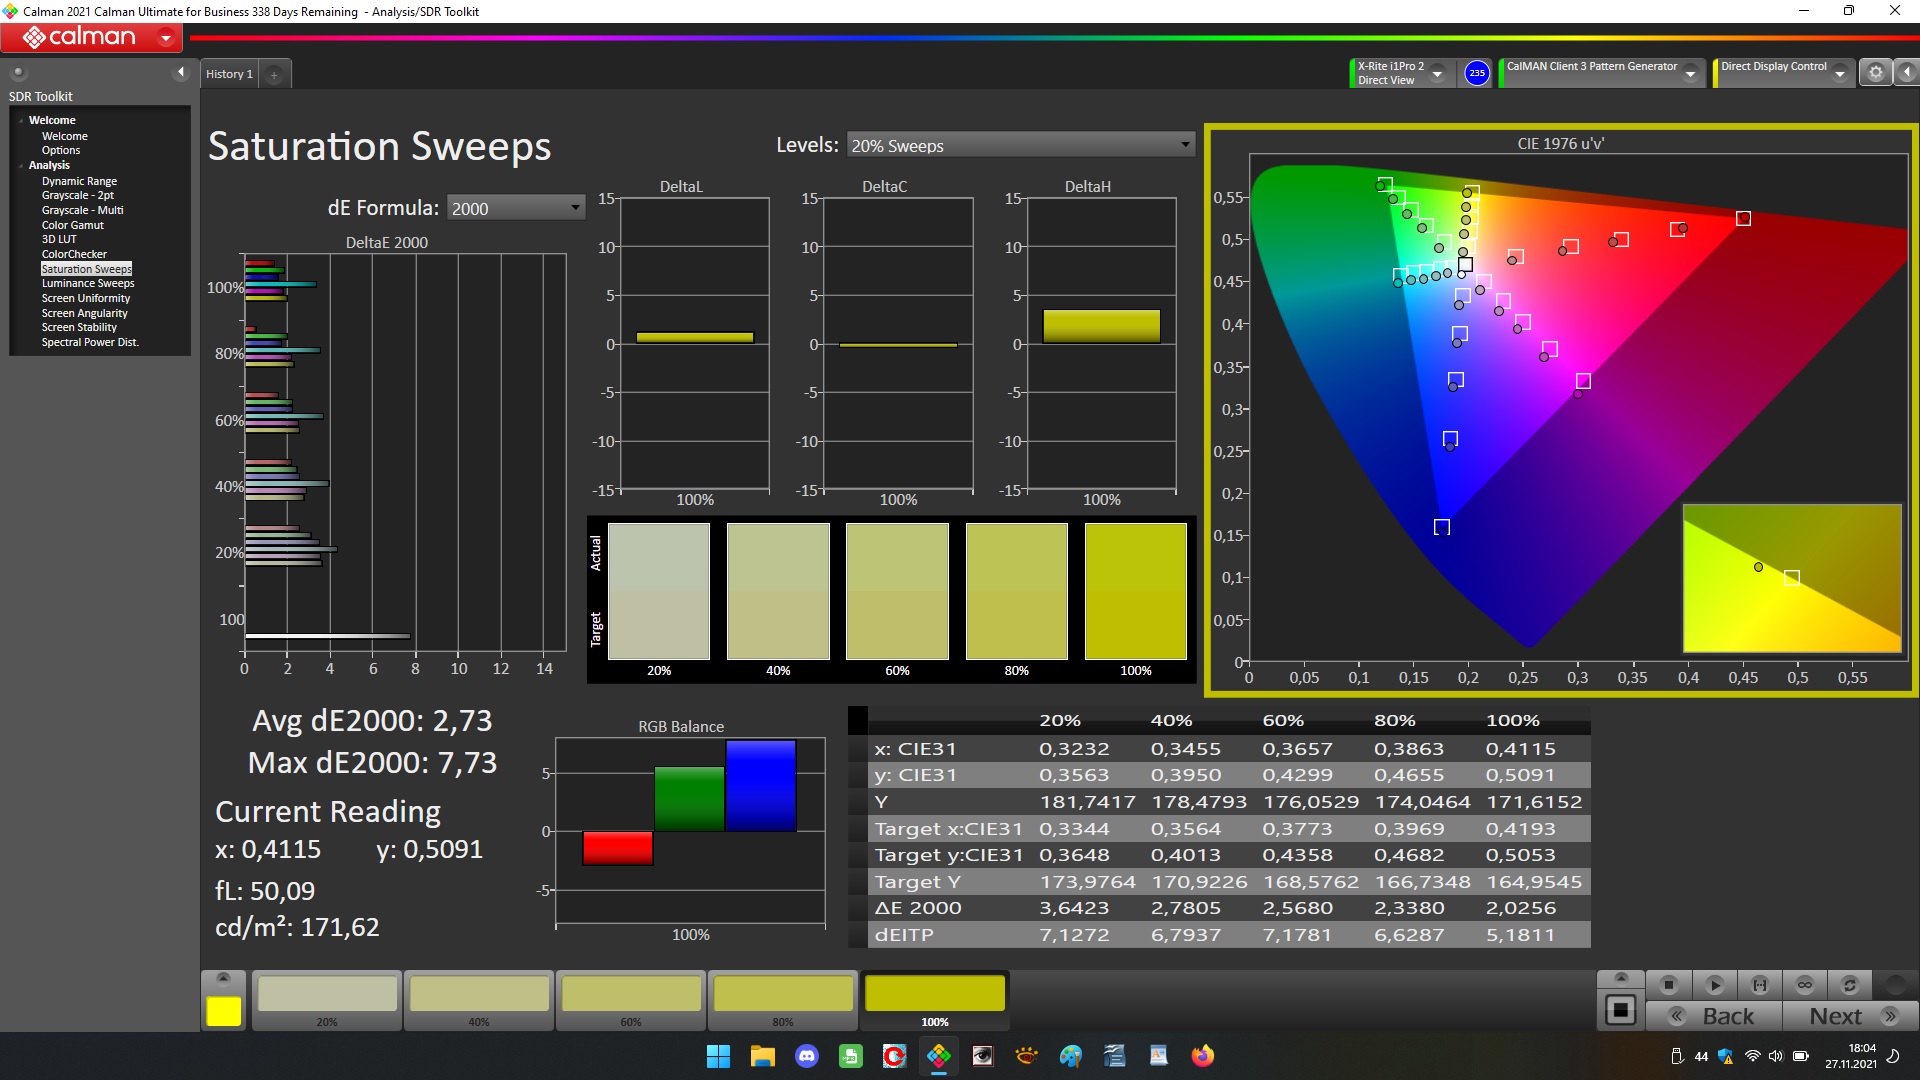
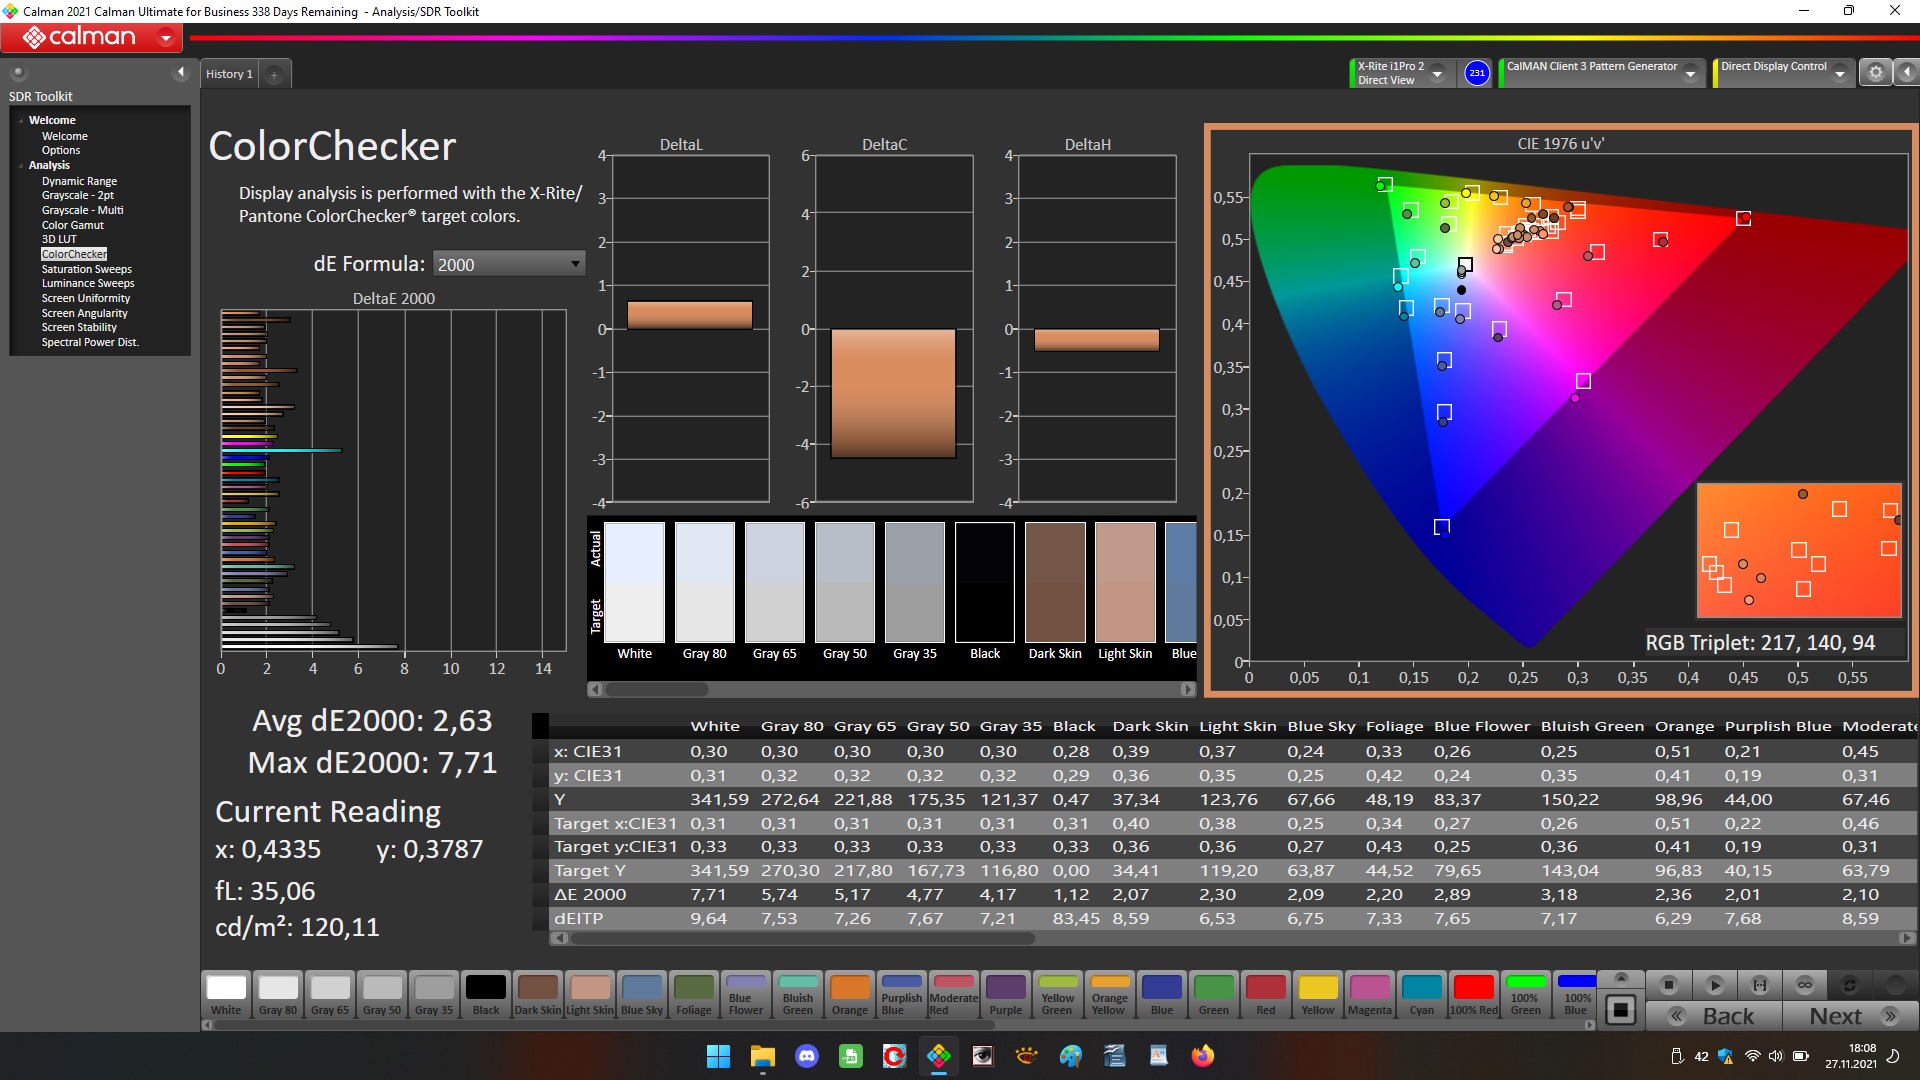
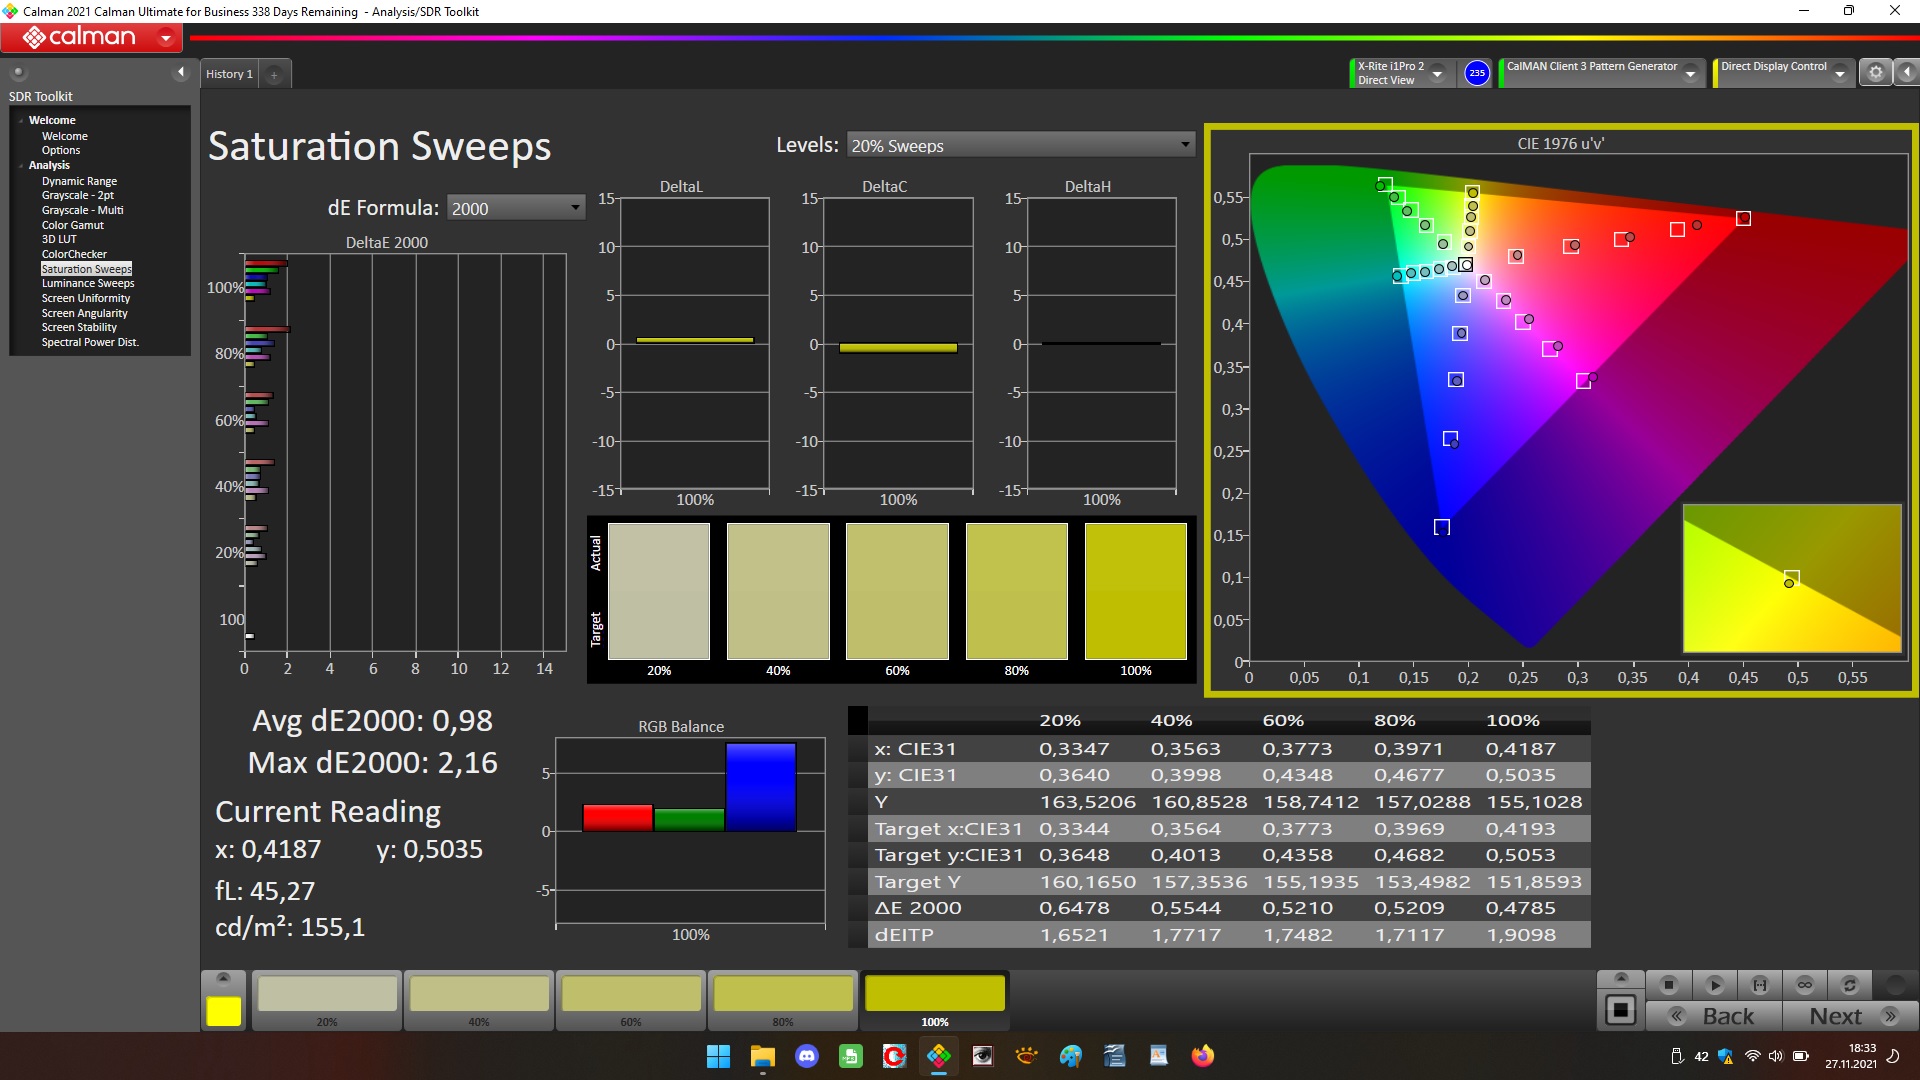
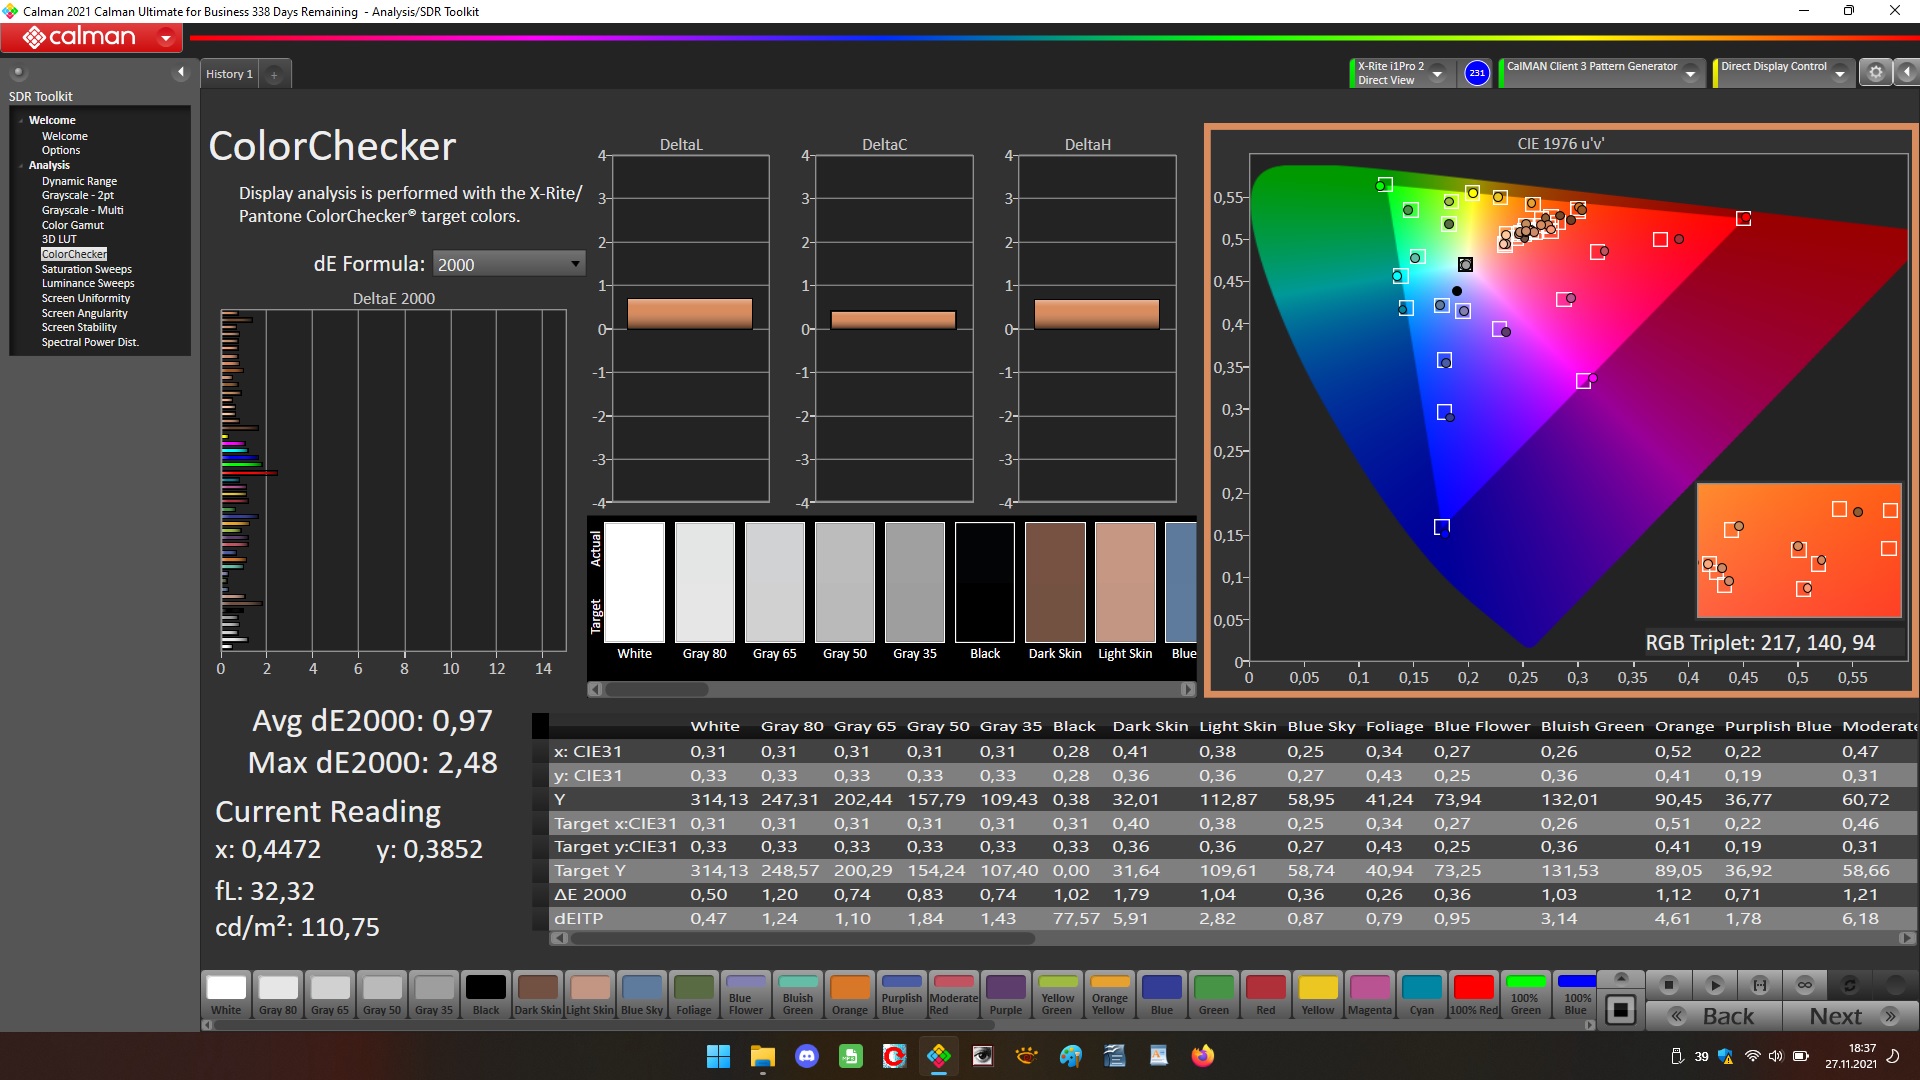
Mientras que el brillo (324,7 cd/m²) de la pantalla mate de 15,6 pulgadas (1920x1080 píxeles) cumple el objetivo (> 300 cd/m²), el contraste (838:1) es demasiado bajo. Consideramos que los valores superiores a 1.000:1 son buenos. El panel de 240 Hz proporciona tiempos de respuesta rápidos. No se detectó parpadeo PWM
| |||||||||||||||||||||||||
iluminación: 90 %
Brillo con batería: 335 cd/m²
Contraste: 838:1 (Negro: 0.4 cd/m²)
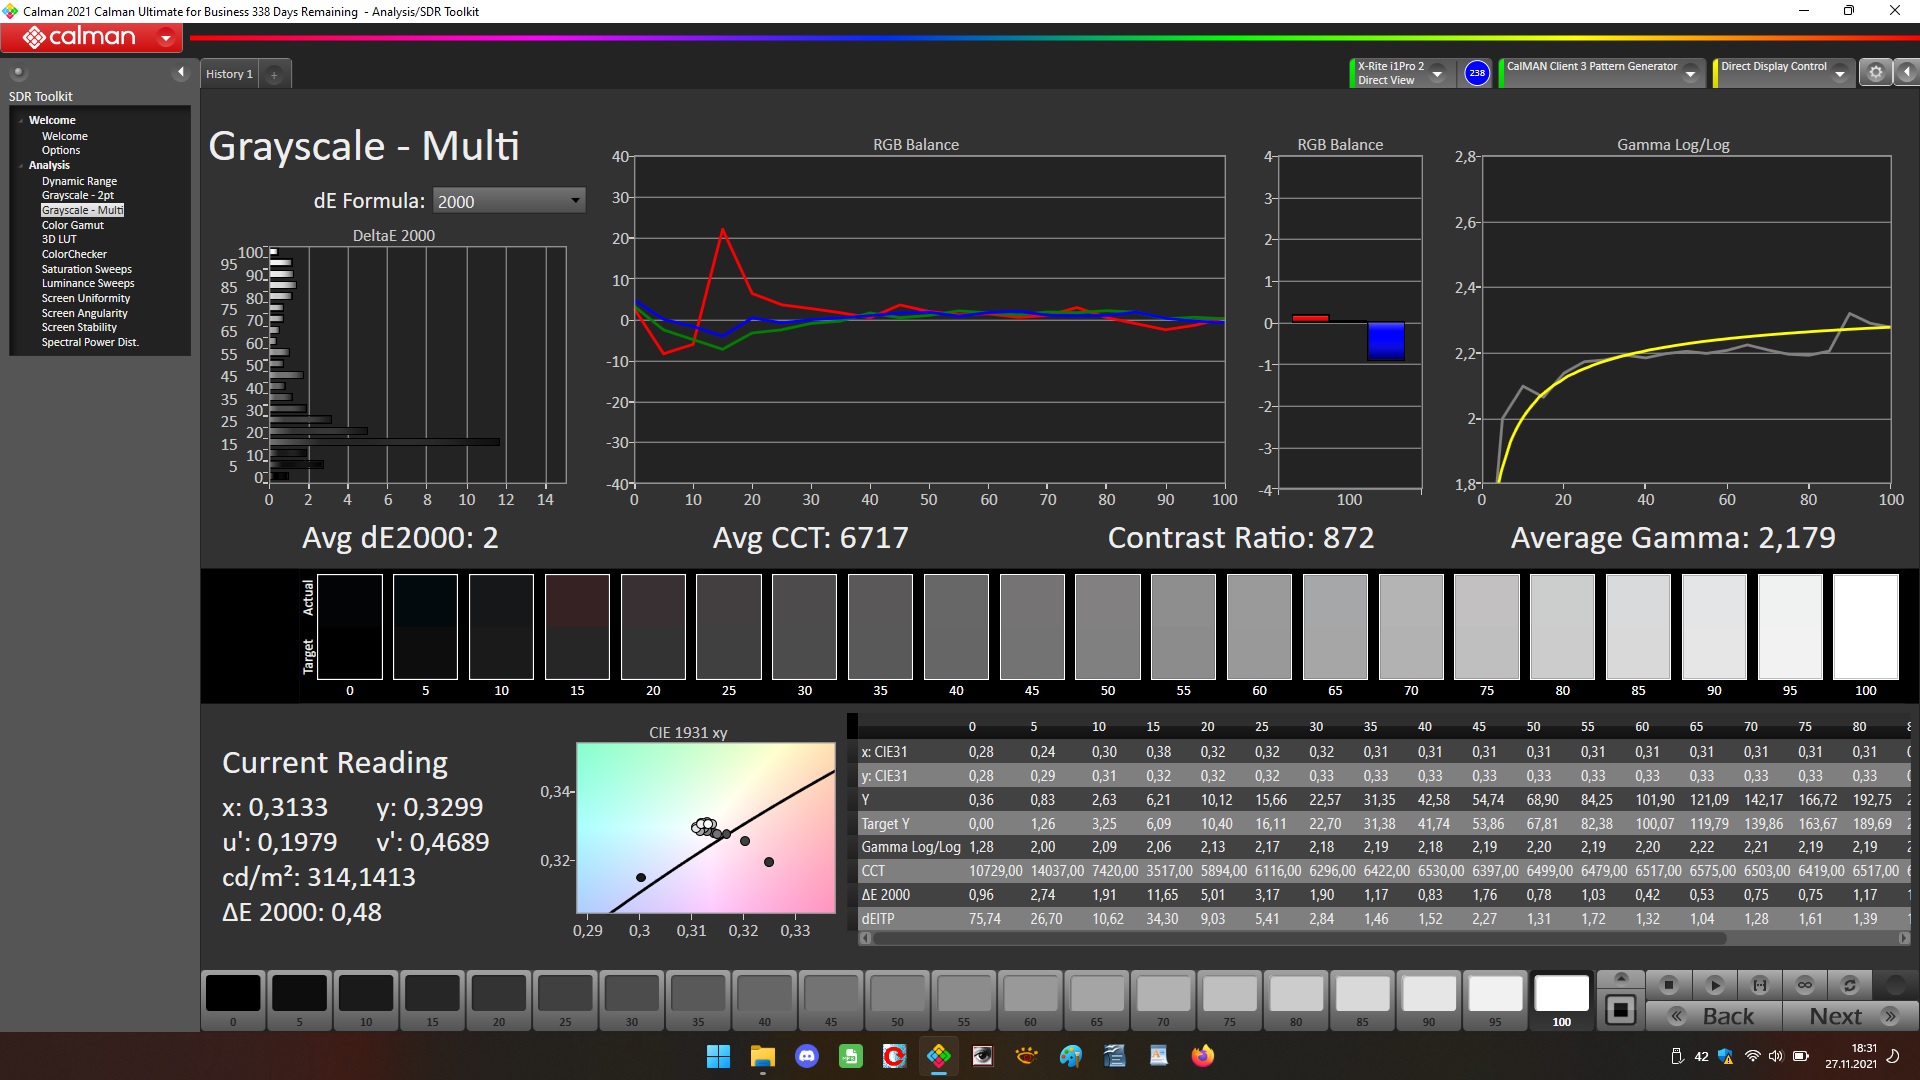
ΔE ColorChecker Calman: 2.63 | ∀{0.5-29.43 Ø4.71}
calibrated: 0.97
ΔE Greyscale Calman: 4 | ∀{0.09-98 Ø4.96}
70.8% AdobeRGB 1998 (Argyll 3D)
98.6% sRGB (Argyll 3D)
69.6% Display P3 (Argyll 3D)
Gamma: 2.129
CCT: 7434 K
| Gigabyte A5 X1 AU Optronics B156HAN12.0, IPS, 1920x1080, 15.6" | HP Omen 16-b0085ng BOE09BE, IPS, 1920x1080, 16.1" | MSI Katana GF66 11UG-220 AU Optronics B156HAN08.0, IPS, 1920x1080, 15.6" | Acer Nitro 5 AN515-45-R1JH BOE BOE09B8, IPS, 2560x1440, 15.6" | Schenker XMG Apex 15 NH57E PS LG Philips LGD0625 (LP156WFG-SPB3), IPS, 1920x1080, 15.6" | |
|---|---|---|---|---|---|
| Display | 3% | -6% | -4% | -6% | |
| Display P3 Coverage (%) | 69.6 | 72.3 4% | 65.4 -6% | 66.2 -5% | 64.5 -7% |
| sRGB Coverage (%) | 98.6 | 99.5 1% | 91.3 -7% | 96.3 -2% | 95.9 -3% |
| AdobeRGB 1998 Coverage (%) | 70.8 | 73.8 4% | 66.7 -6% | 67.1 -5% | 65.8 -7% |
| Response Times | -39% | -27% | -82% | -109% | |
| Response Time Grey 50% / Grey 80% * (ms) | 4.8 ? | 8 ? -67% | 7.4 ? -54% | 14 ? -192% | 15 -213% |
| Response Time Black / White * (ms) | 11.2 ? | 12.4 ? -11% | 11.2 ? -0% | 8 ? 29% | 11.6 -4% |
| PWM Frequency (Hz) | |||||
| Screen | -29% | -21% | -17% | 4% | |
| Brightness middle (cd/m²) | 335 | 405 21% | 307 -8% | 349 4% | 393 17% |
| Brightness (cd/m²) | 325 | 378 16% | 321 -1% | 304 -6% | 353 9% |
| Brightness Distribution (%) | 90 | 87 -3% | 83 -8% | 79 -12% | 83 -8% |
| Black Level * (cd/m²) | 0.4 | 0.34 15% | 0.27 32% | 0.535 -34% | 0.47 -17% |
| Contrast (:1) | 838 | 1191 42% | 1137 36% | 652 -22% | 836 0% |
| Colorchecker dE 2000 * | 2.63 | 3.7 -41% | 4.67 -78% | 3.11 -18% | 2.84 -8% |
| Colorchecker dE 2000 max. * | 7.71 | 7.77 -1% | 7.53 2% | 9.57 -24% | 7.15 7% |
| Colorchecker dE 2000 calibrated * | 0.97 | 3.49 -260% | 2.41 -148% | 0.67 31% | |
| Greyscale dE 2000 * | 4 | 5.88 -47% | 4.5 -13% | 5 -25% | 3.73 7% |
| Gamma | 2.129 103% | 2.57 86% | 2.276 97% | 2.36 93% | 2.53 87% |
| CCT | 7434 87% | 6342 102% | 6824 95% | 6976 93% | 7312 89% |
| Color Space (Percent of AdobeRGB 1998) (%) | 73.76 | ||||
| Color Space (Percent of sRGB) (%) | 99.47 | ||||
| Media total (Programa/Opciones) | -22% /
-23% | -18% /
-19% | -34% /
-24% | -37% /
-14% |
* ... más pequeño es mejor
La pantalla ya muestra una buena reproducción del color al sacarla de la caja, y la desviación del color está dentro del objetivo. Sin embargo, la calibración de la pantalla sigue proporcionando mejoras significativas. La pantalla no puede reproducir completamente los espacios de color AdobeRGB (71%) y DCI-P3 (70%), el espacio de color sRGB se reproduce al 99%
Tiempos de respuesta del display
| ↔ Tiempo de respuesta de Negro a Blanco | ||
|---|---|---|
| 11.2 ms ... subida ↗ y bajada ↘ combinada | ↗ 5.2 ms subida | 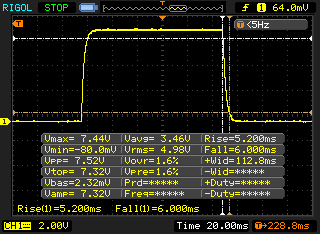 |
| ↘ 6 ms bajada | ||
| La pantalla mostró buenos tiempos de respuesta en nuestros tests pero podría ser demasiado lenta para los jugones competitivos. En comparación, todos los dispositivos de prueba van de ##min### (mínimo) a 240 (máximo) ms. » 30 % de todos los dispositivos son mejores. Esto quiere decir que el tiempo de respuesta medido es mejor que la media (19.8 ms) de todos los dispositivos testados. | ||
| ↔ Tiempo de respuesta 50% Gris a 80% Gris | ||
| 4.8 ms ... subida ↗ y bajada ↘ combinada | ↗ 1.4 ms subida | 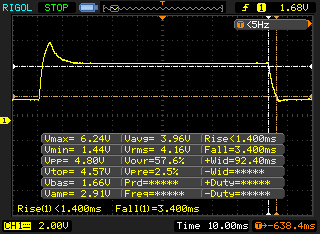 |
| ↘ 3.4 ms bajada | ||
| La pantalla mostró tiempos de respuesta muy rápidos en nuestros tests y debería ser adecuada para juegos frenéticos. En comparación, todos los dispositivos de prueba van de ##min### (mínimo) a 636 (máximo) ms. » 17 % de todos los dispositivos son mejores. Esto quiere decir que el tiempo de respuesta medido es mejor que la media (30.9 ms) de todos los dispositivos testados. | ||
Parpadeo de Pantalla / PWM (Pulse-Width Modulation)
| Parpadeo de Pantalla / PWM no detectado | 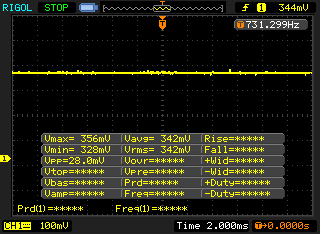 | ||
Comparación: 52 % de todos los dispositivos testados no usaron PWM para atenuar el display. Si se usó, medimos una media de 7741 (mínimo: 5 - máxmo: 343500) Hz. | |||
El panel IPS de ángulo de visión estable puede leerse desde cualquier posición. La lectura de la pantalla en exteriores es posible cuando el sol no brilla demasiado

Rendimiento - El Gigabyte A5 es una potencia
Con el A5 X1, Gigabyte tiene un portátil para juegos de 15,6 pulgadas en su línea que lleva todos los juegos modernos sin problemas a la pantalla
Condiciones de la prueba
El Centro de Control preinstalado permite elegir un perfil de rendimiento (ver tabla), entre otras cosas. Las pruebas de rendimiento se ejecutaron con el perfil "Modo de rendimiento", que incluye el control automático del ventilador. Algunas pruebas se ejecutaron adicionalmente bajo los tres perfiles restantes. Los resultados se pueden encontrar en las tablas comparativas. Para las pruebas de batería se utilizó el perfil "Modo de entretenimiento"
| Modo de rendimiento | Modo de entretenimiento | Modo de ahorro de energía | Modo silencioso | |
|---|---|---|---|---|
| Límite de potencia 1 | 54 vatios | 52 vatios | 25 vatios | 42 vatios |
| Límite de potencia 2 | 65 vatios | 63 vatios | 30 vatios | 60 vatios |
Procesador
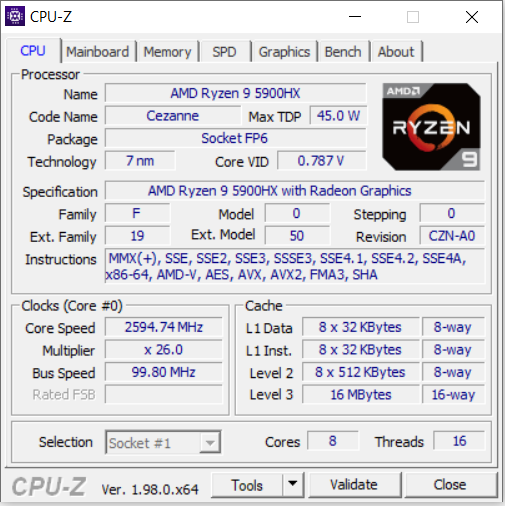
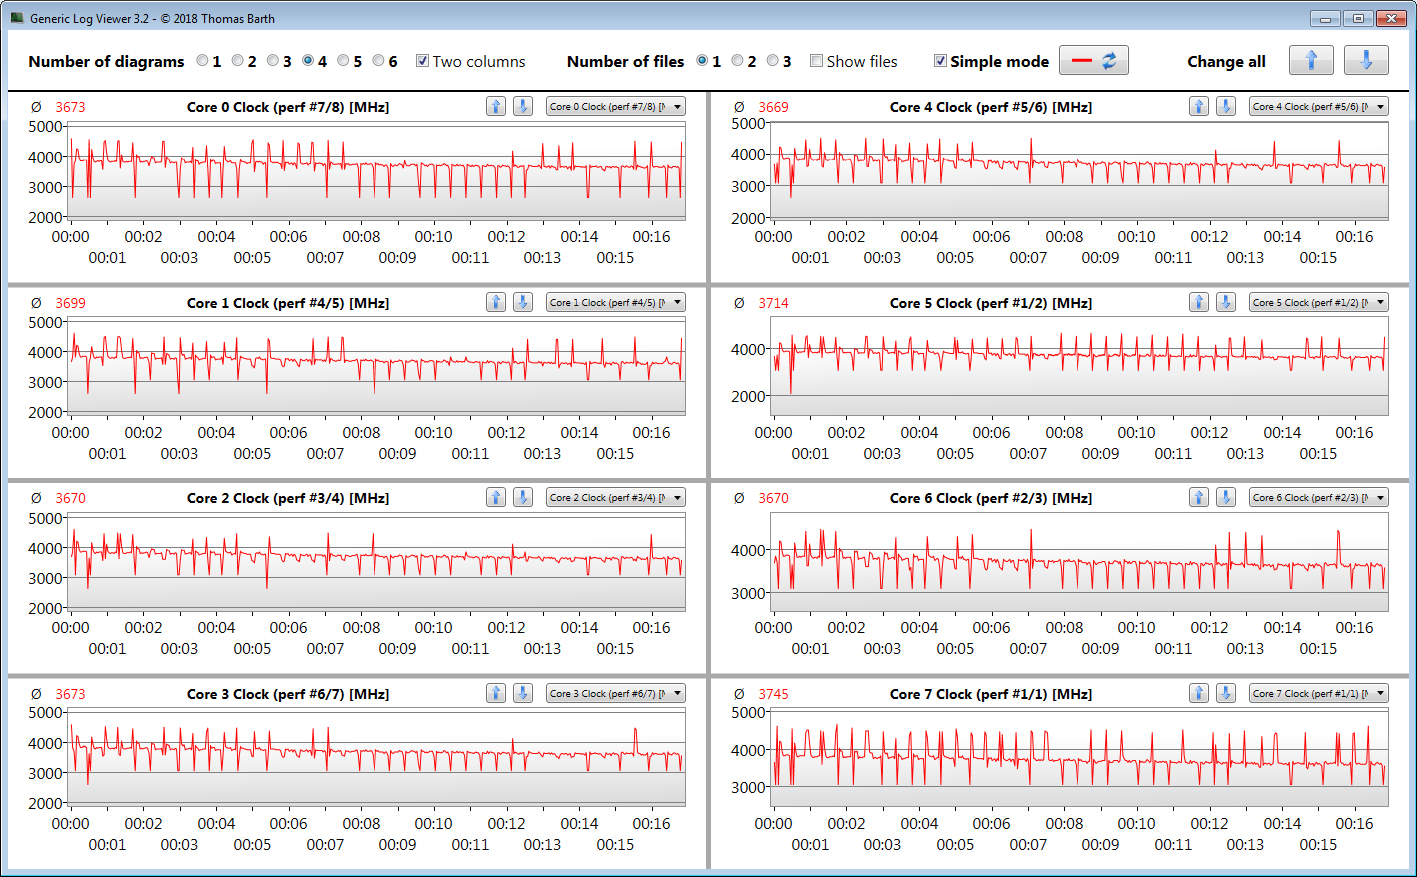
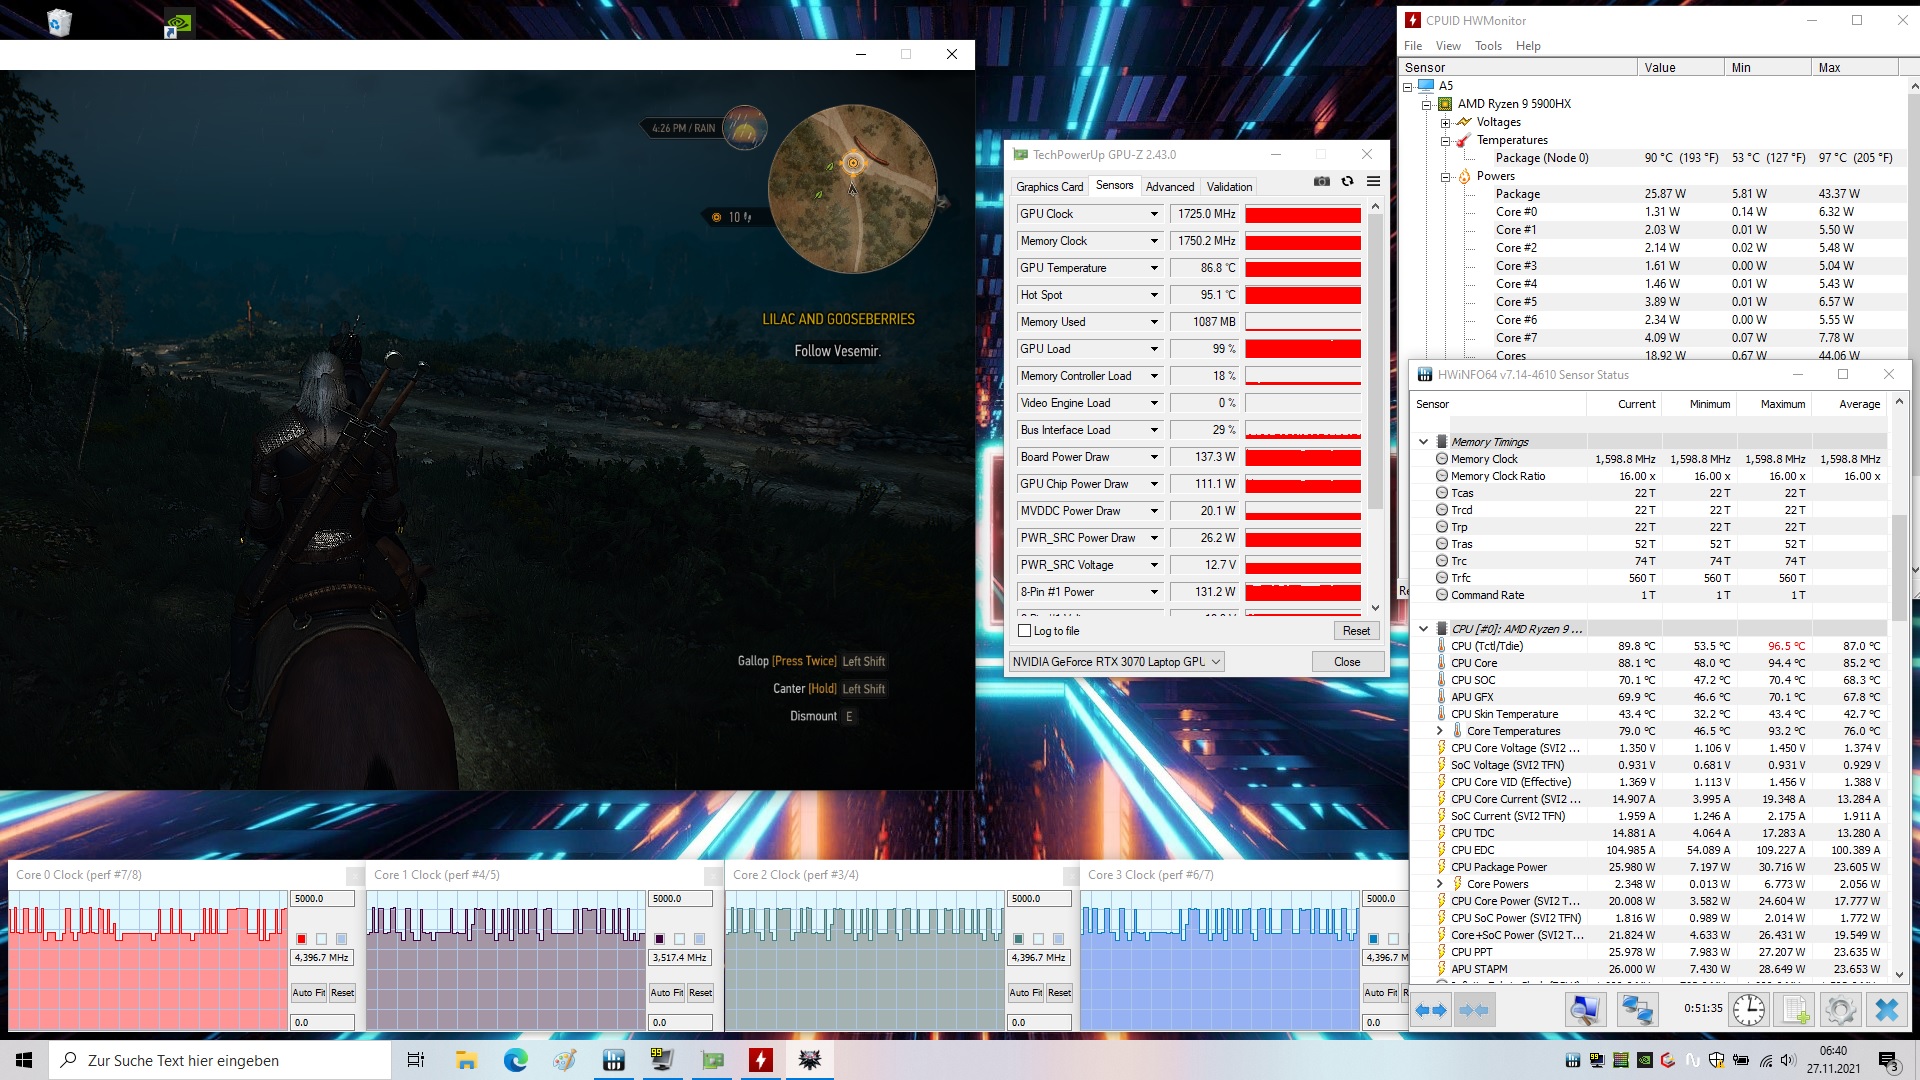
La parte de la CPU delRyzen 9 5900HX (Cezanne) consiste en un procesador octa-core que funciona a una velocidad de reloj base de 3,3 GHz. Se puede aumentar hasta 4,65 GHz mediante Turbo. Soporta multithreading simultáneo (dos hilos por núcleo).
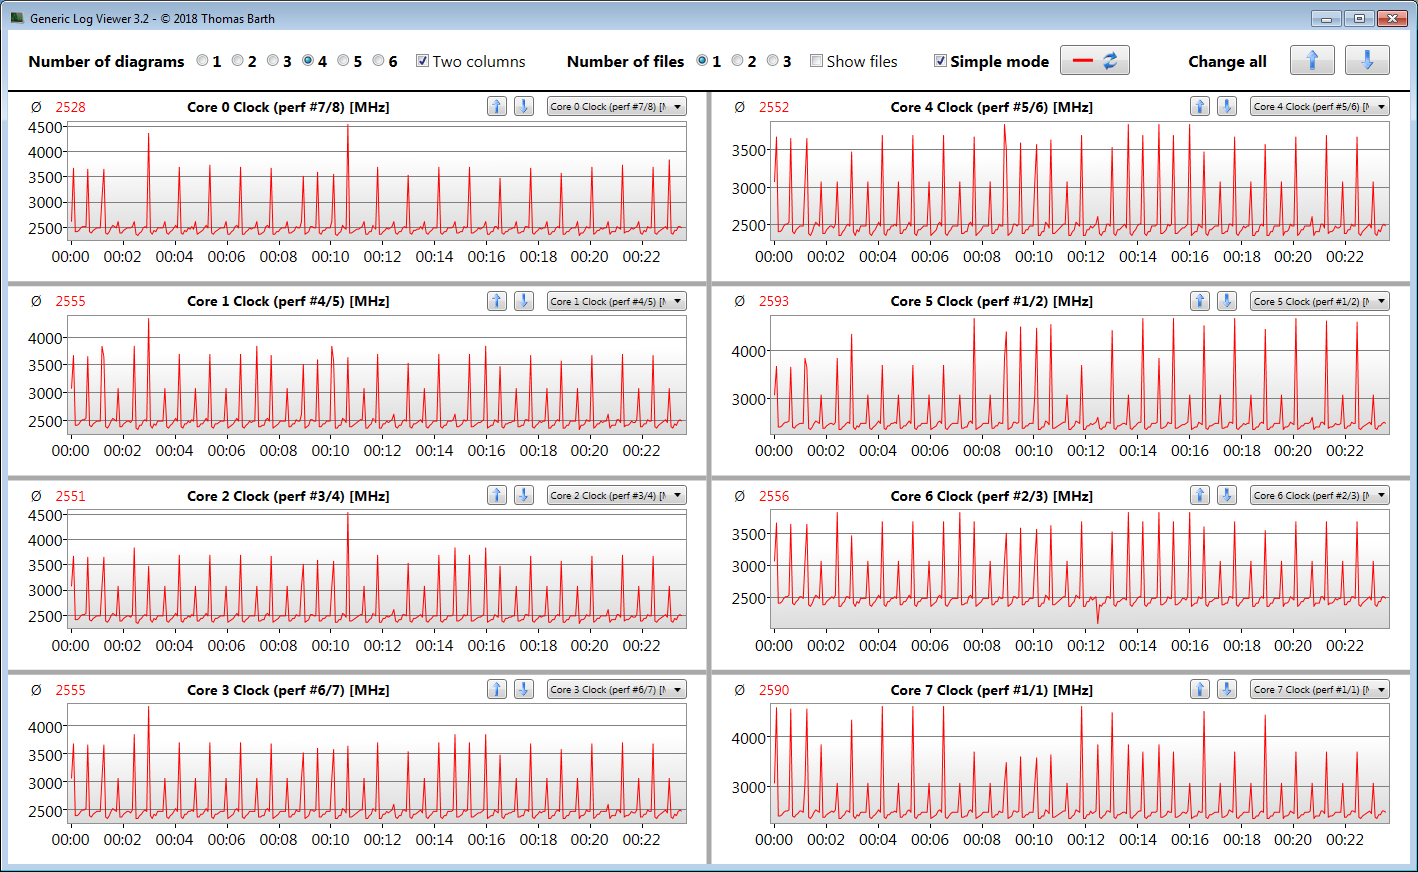
La prueba multihilo del benchmark Cinebench R15 se procesa a 4,2 GHz durante un breve periodo de tiempo, tras el cual la velocidad de reloj baja a entre 4 y 4,1 GHz. La prueba monohilo se ejecuta entre 3,6 y 4,65 GHz. Con la energía de la batería, la CPU funciona a entre 2,4 y 2,5 GHz (multihilo) y entre 2,2 y 3,5 GHz (monohilo), respectivamente.
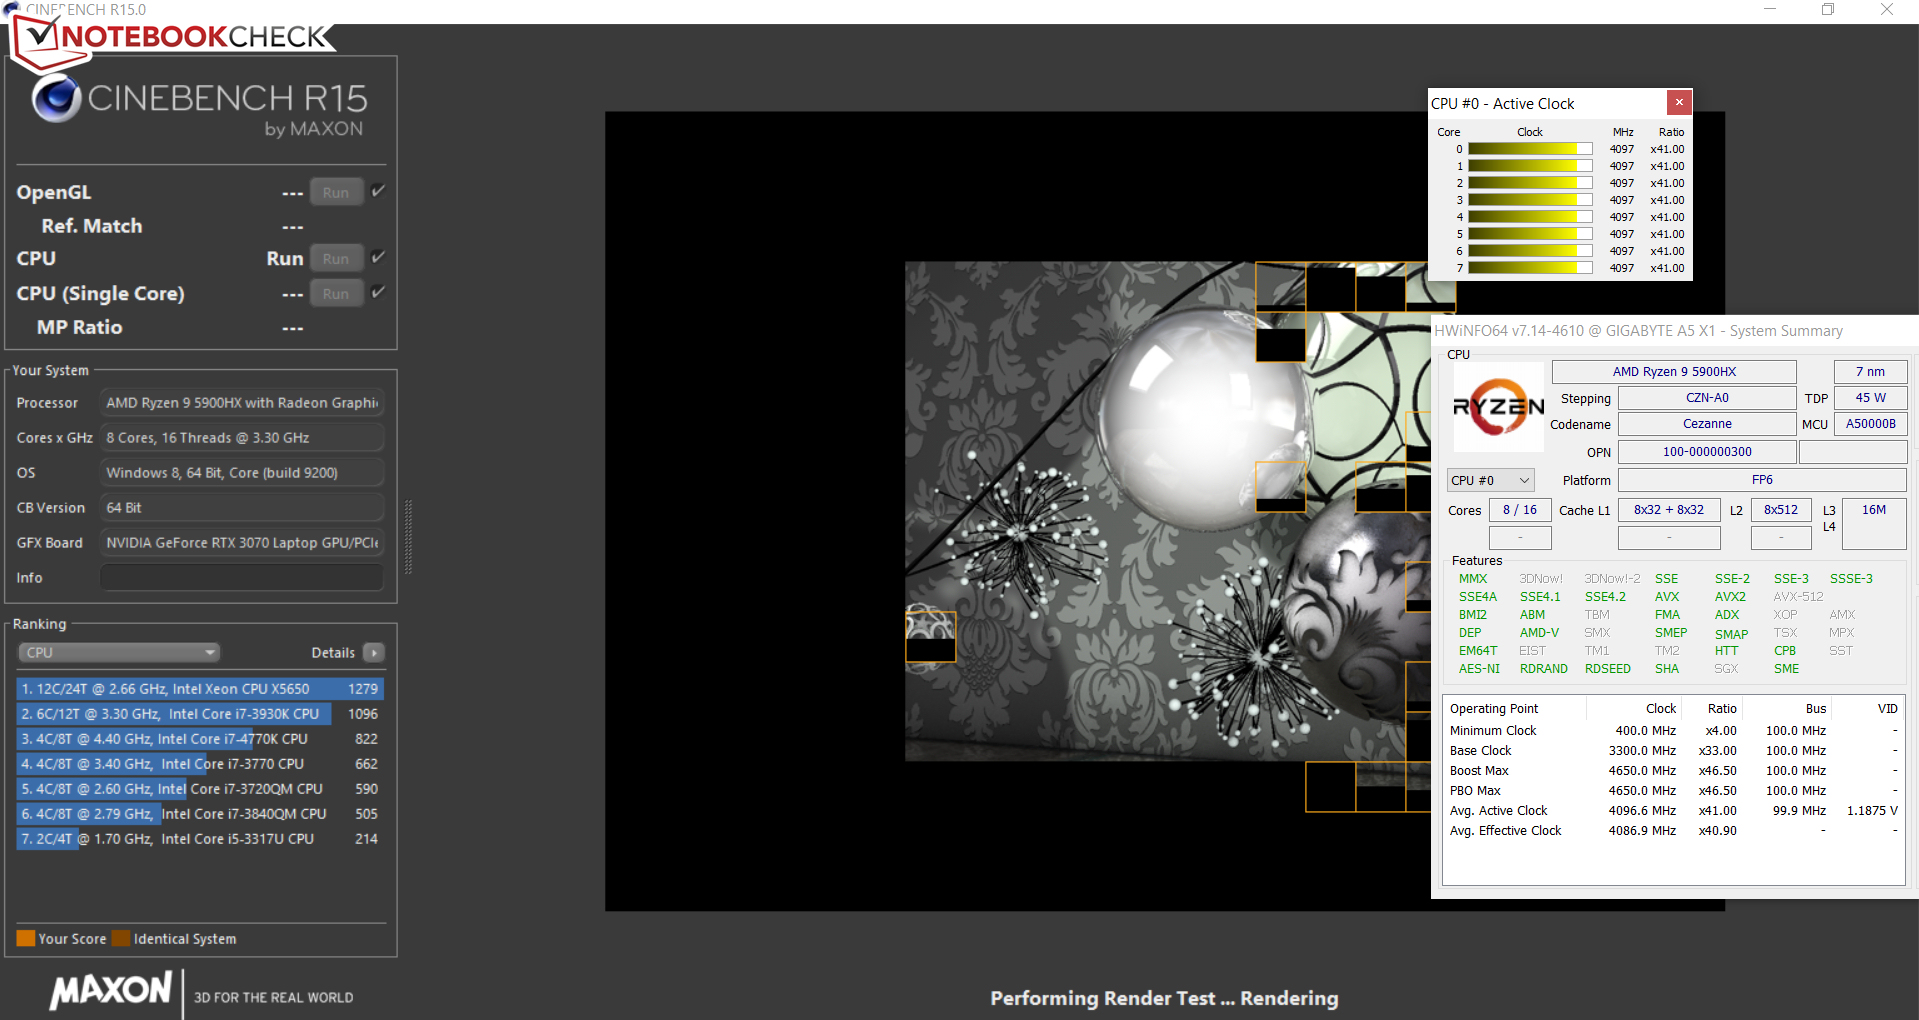
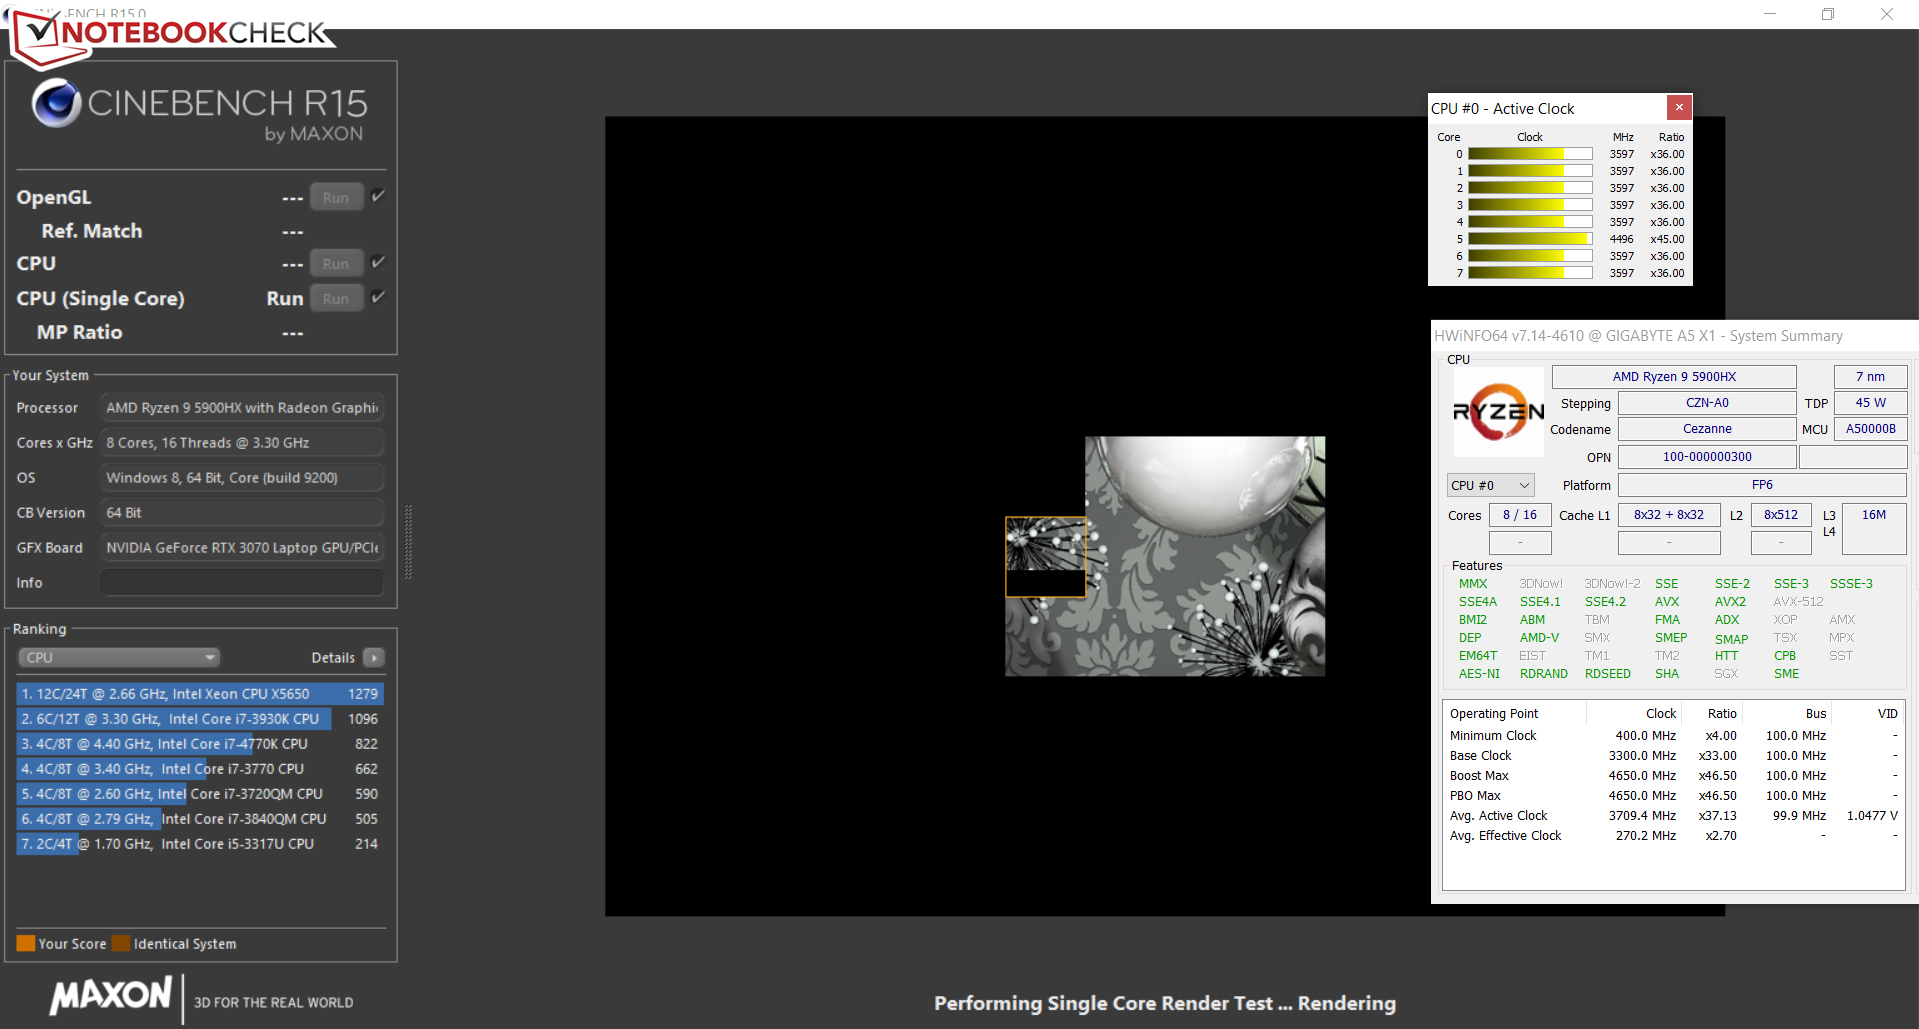
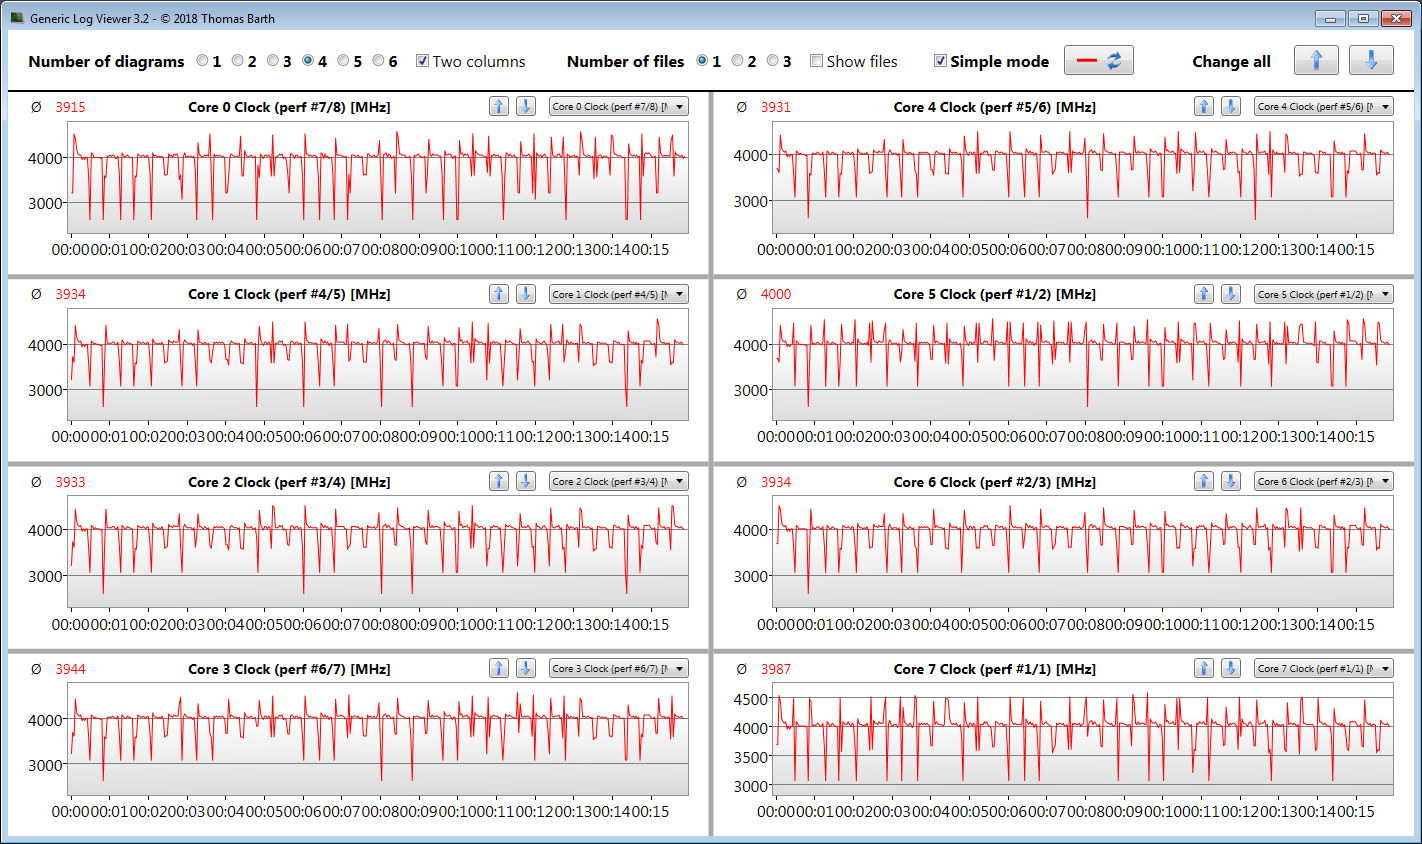
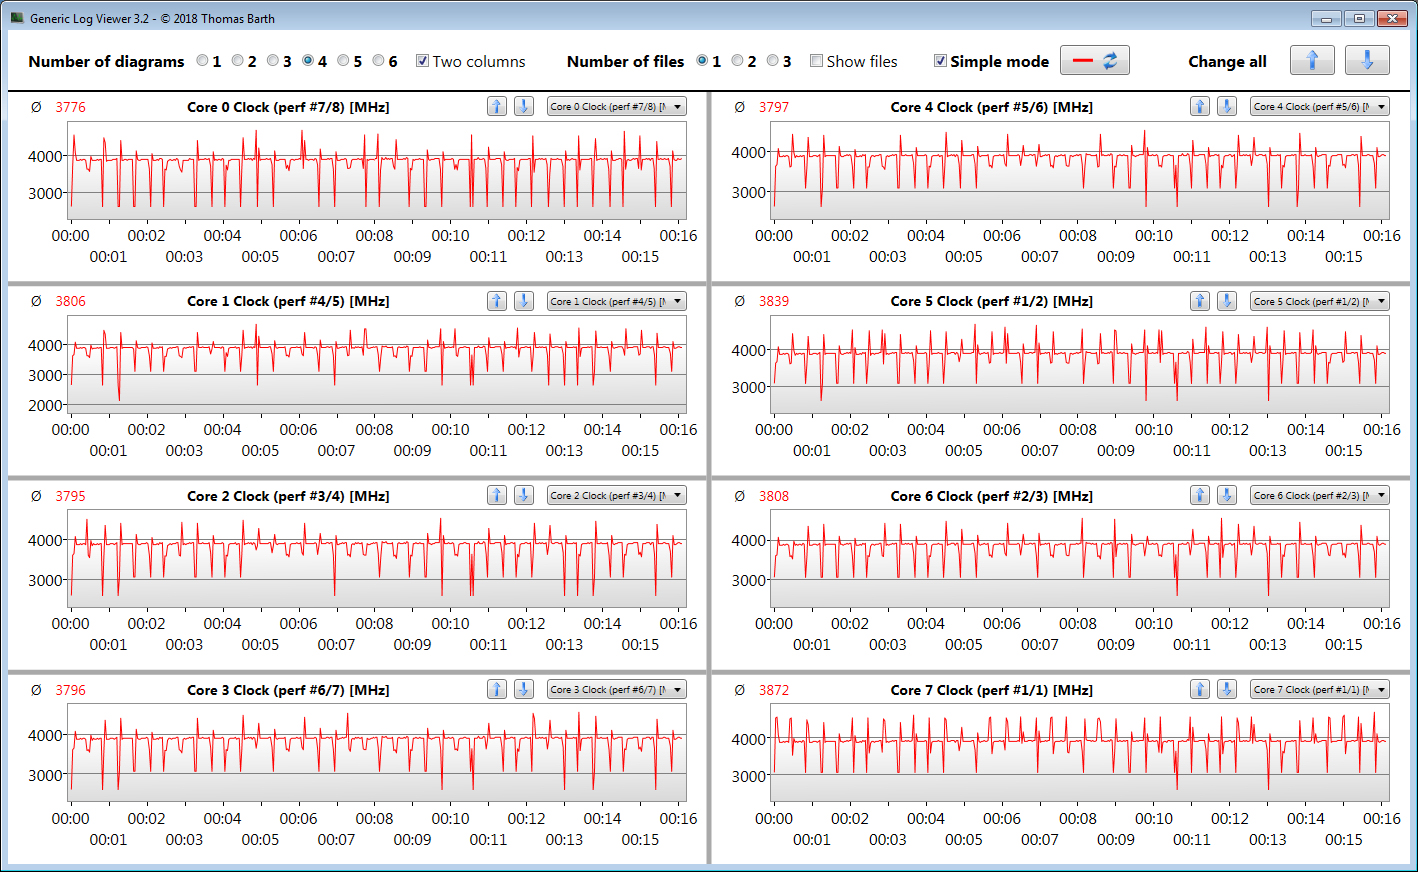
Verificamos si el Turbo de la CPU se usa consistentemente cuando está conectado ejecutando la prueba multihilo del benchmark Cinebench R15 en un bucle continuo durante al menos 30 minutos. El Turbo se utiliza en gran medida.
Cinebench R15 Multi endurance test
| CPU Performance rating - Percent | |
| Media de la clase Gaming | |
| Gigabyte A5 X1 | |
| HP Omen 16-b0085ng | |
| Gigabyte A5 X1 | |
| Medio AMD Ryzen 9 5900HX | |
| Schenker XMG Apex 15 NH57E PS | |
| Gigabyte A5 X1 | |
| Gigabyte A5 X1 | |
| Acer Nitro 5 AN515-45-R1JH | |
| MSI Katana GF66 11UG-220 | |
| Cinebench R23 | |
| Multi Core | |
| Media de la clase Gaming (10488 - 42661, n=104, últimos 2 años) | |
| Gigabyte A5 X1 | |
| Gigabyte A5 X1 (Unterhaltungsmodus) | |
| Gigabyte A5 X1 (Lautlosmodus) | |
| Schenker XMG Apex 15 NH57E PS | |
| Medio AMD Ryzen 9 5900HX (6622 - 14363, n=30) | |
| HP Omen 16-b0085ng | |
| Acer Nitro 5 AN515-45-R1JH | |
| Gigabyte A5 X1 (Stromsparmodus) | |
| MSI Katana GF66 11UG-220 | |
| Single Core | |
| Media de la clase Gaming (1601 - 2415, n=104, últimos 2 años) | |
| MSI Katana GF66 11UG-220 | |
| HP Omen 16-b0085ng | |
| Gigabyte A5 X1 | |
| Gigabyte A5 X1 (Stromsparmodus) | |
| Gigabyte A5 X1 (Unterhaltungsmodus) | |
| Medio AMD Ryzen 9 5900HX (1218 - 1499, n=29) | |
| Gigabyte A5 X1 (Lautlosmodus) | |
| Acer Nitro 5 AN515-45-R1JH | |
| Schenker XMG Apex 15 NH57E PS | |
| Cinebench R20 | |
| CPU (Multi Core) | |
| Media de la clase Gaming (4029 - 16433, n=103, últimos 2 años) | |
| Gigabyte A5 X1 | |
| Gigabyte A5 X1 (Unterhaltungsmodus) | |
| Schenker XMG Apex 15 NH57E PS | |
| Medio AMD Ryzen 9 5900HX (2242 - 5476, n=30) | |
| HP Omen 16-b0085ng | |
| Gigabyte A5 X1 (Lautlosmodus) | |
| Acer Nitro 5 AN515-45-R1JH | |
| Gigabyte A5 X1 (Stromsparmodus) | |
| MSI Katana GF66 11UG-220 | |
| CPU (Single Core) | |
| Media de la clase Gaming (622 - 913, n=103, últimos 2 años) | |
| HP Omen 16-b0085ng | |
| MSI Katana GF66 11UG-220 | |
| Gigabyte A5 X1 | |
| Gigabyte A5 X1 (Stromsparmodus) | |
| Gigabyte A5 X1 (Unterhaltungsmodus) | |
| Medio AMD Ryzen 9 5900HX (471 - 584, n=29) | |
| Gigabyte A5 X1 (Lautlosmodus) | |
| Acer Nitro 5 AN515-45-R1JH | |
| Schenker XMG Apex 15 NH57E PS | |
| Cinebench R15 | |
| CPU Multi 64Bit | |
| Media de la clase Gaming (1578 - 6330, n=102, últimos 2 años) | |
| Gigabyte A5 X1 | |
| HP Omen 16-b0085ng | |
| MSI Katana GF66 11UG-220 (fan in full speed) | |
| MSI Katana GF66 11UG-220 (Factory settings) | |
| Gigabyte A5 X1 (Unterhaltungsmodus) | |
| Schenker XMG Apex 15 NH57E PS | |
| Gigabyte A5 X1 (Lautlosmodus) | |
| Medio AMD Ryzen 9 5900HX (1076 - 2267, n=29) | |
| Acer Nitro 5 AN515-45-R1JH | |
| Gigabyte A5 X1 (Stromsparmodus) | |
| CPU Single 64Bit | |
| Media de la clase Gaming (188.8 - 350, n=103, últimos 2 años) | |
| Gigabyte A5 X1 (Stromsparmodus) | |
| Gigabyte A5 X1 (Unterhaltungsmodus) | |
| Gigabyte A5 X1 (Lautlosmodus) | |
| Medio AMD Ryzen 9 5900HX (197 - 243, n=25) | |
| Gigabyte A5 X1 | |
| Acer Nitro 5 AN515-45-R1JH | |
| Schenker XMG Apex 15 NH57E PS | |
| MSI Katana GF66 11UG-220 | |
| MSI Katana GF66 11UG-220 | |
| HP Omen 16-b0085ng | |
| Blender - v2.79 BMW27 CPU | |
| MSI Katana GF66 11UG-220 | |
| Gigabyte A5 X1 (Stromsparmodus) | |
| Acer Nitro 5 AN515-45-R1JH | |
| Medio AMD Ryzen 9 5900HX (219 - 442, n=29) | |
| Gigabyte A5 X1 (Lautlosmodus) | |
| Schenker XMG Apex 15 NH57E PS | |
| Gigabyte A5 X1 (Unterhaltungsmodus) | |
| Gigabyte A5 X1 | |
| HP Omen 16-b0085ng | |
| Media de la clase Gaming (79 - 330, n=101, últimos 2 años) | |
| 7-Zip 18.03 | |
| 7z b 4 | |
| Media de la clase Gaming (33491 - 148086, n=102, últimos 2 años) | |
| Gigabyte A5 X1 | |
| Gigabyte A5 X1 (Unterhaltungsmodus) | |
| Gigabyte A5 X1 (Lautlosmodus) | |
| Schenker XMG Apex 15 NH57E PS | |
| Medio AMD Ryzen 9 5900HX (36011 - 62503, n=29) | |
| HP Omen 16-b0085ng | |
| Acer Nitro 5 AN515-45-R1JH | |
| Gigabyte A5 X1 (Stromsparmodus) | |
| MSI Katana GF66 11UG-220 | |
| 7z b 4 -mmt1 | |
| Media de la clase Gaming (4824 - 7436, n=102, últimos 2 años) | |
| Gigabyte A5 X1 (Stromsparmodus) | |
| Gigabyte A5 X1 (Unterhaltungsmodus) | |
| Gigabyte A5 X1 (Lautlosmodus) | |
| Gigabyte A5 X1 | |
| Medio AMD Ryzen 9 5900HX (4791 - 5905, n=29) | |
| HP Omen 16-b0085ng | |
| Schenker XMG Apex 15 NH57E PS | |
| MSI Katana GF66 11UG-220 | |
| Acer Nitro 5 AN515-45-R1JH | |
| Geekbench 5.5 | |
| Multi-Core | |
| Media de la clase Gaming (6460 - 28263, n=102, últimos 2 años) | |
| HP Omen 16-b0085ng | |
| Gigabyte A5 X1 | |
| Gigabyte A5 X1 (Unterhaltungsmodus) | |
| Schenker XMG Apex 15 NH57E PS | |
| Medio AMD Ryzen 9 5900HX (5057 - 9294, n=27) | |
| Gigabyte A5 X1 (Lautlosmodus) | |
| Gigabyte A5 X1 (Stromsparmodus) | |
| Acer Nitro 5 AN515-45-R1JH | |
| MSI Katana GF66 11UG-220 | |
| Single-Core | |
| Media de la clase Gaming (1403 - 2474, n=102, últimos 2 años) | |
| HP Omen 16-b0085ng | |
| MSI Katana GF66 11UG-220 | |
| Gigabyte A5 X1 (Stromsparmodus) | |
| Gigabyte A5 X1 | |
| Medio AMD Ryzen 9 5900HX (1271 - 1574, n=27) | |
| Gigabyte A5 X1 (Unterhaltungsmodus) | |
| Schenker XMG Apex 15 NH57E PS | |
| Acer Nitro 5 AN515-45-R1JH | |
| Gigabyte A5 X1 (Lautlosmodus) | |
| HWBOT x265 Benchmark v2.2 - 4k Preset | |
| Media de la clase Gaming (11.5 - 44.4, n=102, últimos 2 años) | |
| HP Omen 16-b0085ng | |
| Gigabyte A5 X1 | |
| Gigabyte A5 X1 (Unterhaltungsmodus) | |
| Schenker XMG Apex 15 NH57E PS | |
| Medio AMD Ryzen 9 5900HX (8.26 - 17.1, n=29) | |
| Gigabyte A5 X1 (Lautlosmodus) | |
| Acer Nitro 5 AN515-45-R1JH | |
| Gigabyte A5 X1 (Stromsparmodus) | |
| MSI Katana GF66 11UG-220 | |
| LibreOffice - 20 Documents To PDF | |
| Gigabyte A5 X1 | |
| Acer Nitro 5 AN515-45-R1JH | |
| Schenker XMG Apex 15 NH57E PS | |
| Medio AMD Ryzen 9 5900HX (44.1 - 87.4, n=29) | |
| Gigabyte A5 X1 (Stromsparmodus) | |
| Gigabyte A5 X1 (Lautlosmodus) | |
| Gigabyte A5 X1 (Unterhaltungsmodus) | |
| Media de la clase Gaming (33.2 - 88.8, n=102, últimos 2 años) | |
| MSI Katana GF66 11UG-220 | |
| HP Omen 16-b0085ng | |
| R Benchmark 2.5 - Overall mean | |
| HP Omen 16-b0085ng | |
| MSI Katana GF66 11UG-220 | |
| Acer Nitro 5 AN515-45-R1JH | |
| Schenker XMG Apex 15 NH57E PS | |
| Gigabyte A5 X1 (Unterhaltungsmodus) | |
| Medio AMD Ryzen 9 5900HX (0.48 - 0.599, n=29) | |
| Gigabyte A5 X1 (Lautlosmodus) | |
| Gigabyte A5 X1 | |
| Gigabyte A5 X1 (Stromsparmodus) | |
| Media de la clase Gaming (0.3439 - 0.59, n=102, últimos 2 años) | |
* ... más pequeño es mejor
AIDA64: FP32 Ray-Trace | FPU Julia | CPU SHA3 | CPU Queen | FPU SinJulia | FPU Mandel | CPU AES | CPU ZLib | FP64 Ray-Trace | CPU PhotoWorxx
| Performance rating | |
| Media de la clase Gaming | |
| Gigabyte A5 X1 | |
| Gigabyte A5 X1 | |
| Gigabyte A5 X1 | |
| Medio AMD Ryzen 9 5900HX | |
| Schenker XMG Apex 15 NH57E PS | |
| Acer Nitro 5 AN515-45-R1JH | |
| Gigabyte A5 X1 | |
| HP Omen 16-b0085ng -9! | |
| MSI Katana GF66 11UG-220 -9! | |
| AIDA64 / FP32 Ray-Trace | |
| Media de la clase Gaming (10227 - 85542, n=102, últimos 2 años) | |
| Gigabyte A5 X1 (v6.50.5800) | |
| Gigabyte A5 X1 (v6.50.5800, Unterhaltungsmodus) | |
| Gigabyte A5 X1 (v6.50.5800, Lautlosmodus) | |
| Medio AMD Ryzen 9 5900HX (12470 - 16014, n=26) | |
| Schenker XMG Apex 15 NH57E PS (v6.50.5800) | |
| Acer Nitro 5 AN515-45-R1JH (v6.33.5700) | |
| Gigabyte A5 X1 (v6.50.5800, Stromsparmodus) | |
| AIDA64 / FPU Julia | |
| Media de la clase Gaming (51376 - 372155, n=102, últimos 2 años) | |
| Gigabyte A5 X1 (v6.50.5800) | |
| Gigabyte A5 X1 (v6.50.5800, Unterhaltungsmodus) | |
| Schenker XMG Apex 15 NH57E PS (v6.50.5800) | |
| Medio AMD Ryzen 9 5900HX (79554 - 101008, n=26) | |
| Gigabyte A5 X1 (v6.50.5800, Lautlosmodus) | |
| Acer Nitro 5 AN515-45-R1JH (v6.33.5700) | |
| Gigabyte A5 X1 (v6.50.5800, Stromsparmodus) | |
| AIDA64 / CPU SHA3 | |
| Media de la clase Gaming (2180 - 10115, n=102, últimos 2 años) | |
| Gigabyte A5 X1 (v6.50.5800) | |
| Gigabyte A5 X1 (v6.50.5800, Unterhaltungsmodus) | |
| Medio AMD Ryzen 9 5900HX (2754 - 3444, n=26) | |
| Schenker XMG Apex 15 NH57E PS (v6.50.5800) | |
| Gigabyte A5 X1 (v6.50.5800, Lautlosmodus) | |
| Acer Nitro 5 AN515-45-R1JH (v6.33.5700) | |
| Gigabyte A5 X1 (v6.50.5800, Stromsparmodus) | |
| AIDA64 / CPU Queen | |
| Media de la clase Gaming (49785 - 173351, n=86, últimos 2 años) | |
| Gigabyte A5 X1 (v6.50.5800, Unterhaltungsmodus) | |
| Gigabyte A5 X1 (v6.50.5800) | |
| Gigabyte A5 X1 (v6.50.5800, Lautlosmodus) | |
| Medio AMD Ryzen 9 5900HX (87865 - 105123, n=26) | |
| Schenker XMG Apex 15 NH57E PS (v6.50.5800) | |
| Acer Nitro 5 AN515-45-R1JH (v6.33.5700) | |
| Gigabyte A5 X1 (v6.50.5800, Stromsparmodus) | |
| AIDA64 / FPU SinJulia | |
| Media de la clase Gaming (4424 - 33636, n=102, últimos 2 años) | |
| Gigabyte A5 X1 (v6.50.5800, Unterhaltungsmodus) | |
| Gigabyte A5 X1 (v6.50.5800) | |
| Medio AMD Ryzen 9 5900HX (10899 - 12806, n=26) | |
| Gigabyte A5 X1 (v6.50.5800, Lautlosmodus) | |
| Schenker XMG Apex 15 NH57E PS (v6.50.5800) | |
| Acer Nitro 5 AN515-45-R1JH (v6.33.5700) | |
| Gigabyte A5 X1 (v6.50.5800, Stromsparmodus) | |
| AIDA64 / FPU Mandel | |
| Media de la clase Gaming (25115 - 196829, n=102, últimos 2 años) | |
| Gigabyte A5 X1 (v6.50.5800) | |
| Gigabyte A5 X1 (v6.50.5800, Unterhaltungsmodus) | |
| Schenker XMG Apex 15 NH57E PS (v6.50.5800) | |
| Medio AMD Ryzen 9 5900HX (43685 - 55702, n=26) | |
| Gigabyte A5 X1 (v6.50.5800, Lautlosmodus) | |
| Acer Nitro 5 AN515-45-R1JH (v6.33.5700) | |
| Gigabyte A5 X1 (v6.50.5800, Stromsparmodus) | |
| AIDA64 / CPU AES | |
| Gigabyte A5 X1 (v6.50.5800) | |
| Gigabyte A5 X1 (v6.50.5800, Unterhaltungsmodus) | |
| Medio AMD Ryzen 9 5900HX (109927 - 137901, n=26) | |
| Gigabyte A5 X1 (v6.50.5800, Lautlosmodus) | |
| Schenker XMG Apex 15 NH57E PS (v6.50.5800) | |
| Acer Nitro 5 AN515-45-R1JH (v6.33.5700) | |
| Gigabyte A5 X1 (v6.50.5800, Stromsparmodus) | |
| Media de la clase Gaming (39258 - 247074, n=102, últimos 2 años) | |
| AIDA64 / CPU ZLib | |
| Media de la clase Gaming (574 - 2531, n=102, últimos 2 años) | |
| Gigabyte A5 X1 (v6.50.5800) | |
| Gigabyte A5 X1 (v6.50.5800, Unterhaltungsmodus) | |
| Medio AMD Ryzen 9 5900HX (706 - 878, n=26) | |
| Gigabyte A5 X1 (v6.50.5800, Lautlosmodus) | |
| Schenker XMG Apex 15 NH57E PS (v6.50.5800) | |
| Acer Nitro 5 AN515-45-R1JH (v6.33.5700) | |
| Gigabyte A5 X1 (v6.50.5800, Stromsparmodus) | |
| MSI Katana GF66 11UG-220 (v6.33.5700) | |
| HP Omen 16-b0085ng (v6.33.5700) | |
| AIDA64 / FP64 Ray-Trace | |
| Media de la clase Gaming (5509 - 45446, n=102, últimos 2 años) | |
| Gigabyte A5 X1 (v6.50.5800) | |
| Gigabyte A5 X1 (v6.50.5800, Unterhaltungsmodus) | |
| Gigabyte A5 X1 (v6.50.5800, Lautlosmodus) | |
| Medio AMD Ryzen 9 5900HX (6664 - 8644, n=26) | |
| Schenker XMG Apex 15 NH57E PS (v6.50.5800) | |
| Acer Nitro 5 AN515-45-R1JH (v6.33.5700) | |
| Gigabyte A5 X1 (v6.50.5800, Stromsparmodus) | |
| AIDA64 / CPU PhotoWorxx | |
| Media de la clase Gaming (12271 - 89891, n=102, últimos 2 años) | |
| Gigabyte A5 X1 (v6.50.5800, Lautlosmodus) | |
| Gigabyte A5 X1 (v6.50.5800, Unterhaltungsmodus) | |
| Gigabyte A5 X1 (v6.50.5800, Stromsparmodus) | |
| Schenker XMG Apex 15 NH57E PS (v6.50.5800) | |
| Gigabyte A5 X1 (v6.50.5800) | |
| Medio AMD Ryzen 9 5900HX (14344 - 25533, n=26) | |
| Acer Nitro 5 AN515-45-R1JH (v6.33.5700) | |
Rendimiento del sistema
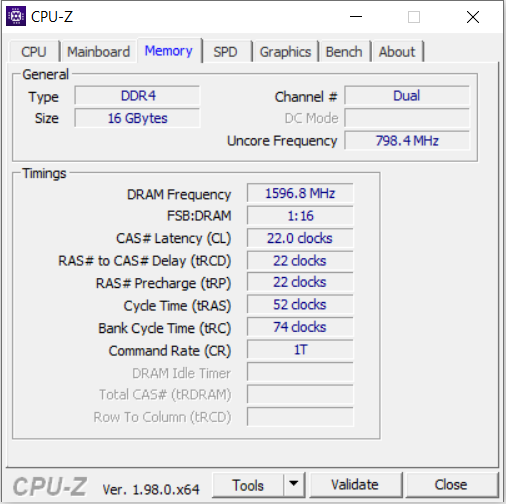
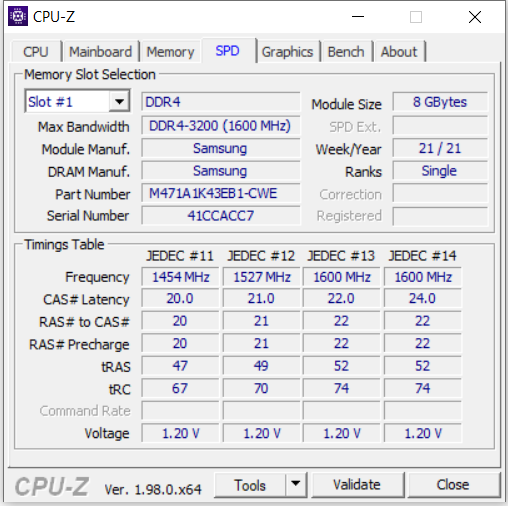
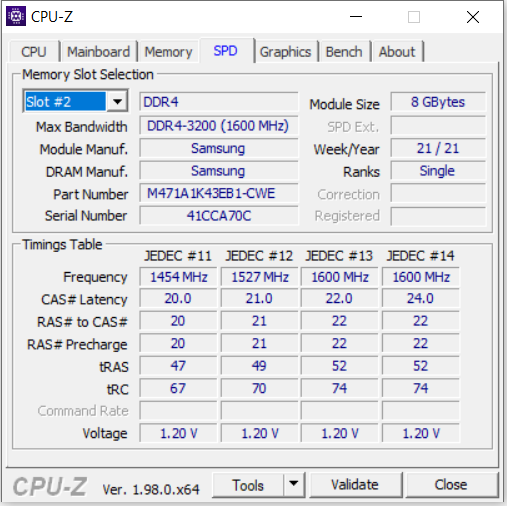
El sistema, rápido y fluido, ofrece suficiente potencia de cálculo para juegos, edición de vídeo y procesamiento de imágenes durante años. Las tasas de transferencia de la RAM integrada están a un nivel normal para una memoria DDR4-3200. Esto se complementa con los muy buenos resultados de PCMark
| PCMark 8 Home Score Accelerated v2 | 5419 puntos | |
| PCMark 8 Creative Score Accelerated v2 | 6593 puntos | |
| PCMark 8 Work Score Accelerated v2 | 6263 puntos | |
| PCMark 10 Score | 6875 puntos | |
ayuda | ||
| PCMark 10 / Score | |
| Media de la clase Gaming (5828 - 12414, n=93, últimos 2 años) | |
| HP Omen 16-b0085ng | |
| Medio AMD Ryzen 9 5900HX, NVIDIA GeForce RTX 3070 Laptop GPU (6875 - 6967, n=4) | |
| Gigabyte A5 X1 | |
| Acer Nitro 5 AN515-45-R1JH | |
| Schenker XMG Apex 15 NH57E PS | |
| MSI Katana GF66 11UG-220 | |
| PCMark 10 / Essentials | |
| HP Omen 16-b0085ng | |
| Media de la clase Gaming (8810 - 11935, n=97, últimos 2 años) | |
| Medio AMD Ryzen 9 5900HX, NVIDIA GeForce RTX 3070 Laptop GPU (9991 - 10413, n=3) | |
| Gigabyte A5 X1 | |
| Acer Nitro 5 AN515-45-R1JH | |
| Schenker XMG Apex 15 NH57E PS | |
| MSI Katana GF66 11UG-220 | |
| PCMark 10 / Productivity | |
| Media de la clase Gaming (6845 - 25323, n=95, últimos 2 años) | |
| Medio AMD Ryzen 9 5900HX, NVIDIA GeForce RTX 3070 Laptop GPU (9301 - 9381, n=3) | |
| Gigabyte A5 X1 | |
| Acer Nitro 5 AN515-45-R1JH | |
| MSI Katana GF66 11UG-220 | |
| HP Omen 16-b0085ng | |
| Schenker XMG Apex 15 NH57E PS | |
| PCMark 10 / Digital Content Creation | |
| Media de la clase Gaming (7602 - 19954, n=95, últimos 2 años) | |
| HP Omen 16-b0085ng | |
| Medio AMD Ryzen 9 5900HX, NVIDIA GeForce RTX 3070 Laptop GPU (9383 - 9561, n=3) | |
| MSI Katana GF66 11UG-220 | |
| Gigabyte A5 X1 | |
| Schenker XMG Apex 15 NH57E PS | |
| Acer Nitro 5 AN515-45-R1JH | |
| AIDA64 / Memory Copy | |
| Media de la clase Gaming (21750 - 129946, n=102, últimos 2 años) | |
| Schenker XMG Apex 15 NH57E PS (v6.50.5800) | |
| Gigabyte A5 X1 (v6.50.5800) | |
| Medio AMD Ryzen 9 5900HX (36725 - 43318, n=26) | |
| Acer Nitro 5 AN515-45-R1JH (v6.33.5700) | |
| AIDA64 / Memory Read | |
| Media de la clase Gaming (22956 - 118858, n=102, últimos 2 años) | |
| Schenker XMG Apex 15 NH57E PS (v6.50.5800) | |
| Gigabyte A5 X1 (v6.50.5800) | |
| Medio AMD Ryzen 9 5900HX (41378 - 47593, n=26) | |
| Acer Nitro 5 AN515-45-R1JH (v6.33.5700) | |
| AIDA64 / Memory Write | |
| Media de la clase Gaming (22297 - 135096, n=102, últimos 2 años) | |
| Schenker XMG Apex 15 NH57E PS (v6.50.5800) | |
| Gigabyte A5 X1 (v6.50.5800) | |
| Medio AMD Ryzen 9 5900HX (32536 - 46718, n=26) | |
| Acer Nitro 5 AN515-45-R1JH (v6.33.5700) | |
| AIDA64 / Memory Latency | |
| Media de la clase Gaming (75.3 - 165.4, n=102, últimos 2 años) | |
| Medio AMD Ryzen 9 5900HX (73.5 - 97.1, n=26) | |
| Schenker XMG Apex 15 NH57E PS (v6.50.5800) | |
| Gigabyte A5 X1 (v6.50.5800) | |
| Acer Nitro 5 AN515-45-R1JH (v6.33.5700) | |
| MSI Katana GF66 11UG-220 (v6.33.5700) | |
| MSI Katana GF66 11UG-220 (v6.33.5700) | |
| HP Omen 16-b0085ng (v6.33.5700) | |
* ... más pequeño es mejor
Latencias del CPD
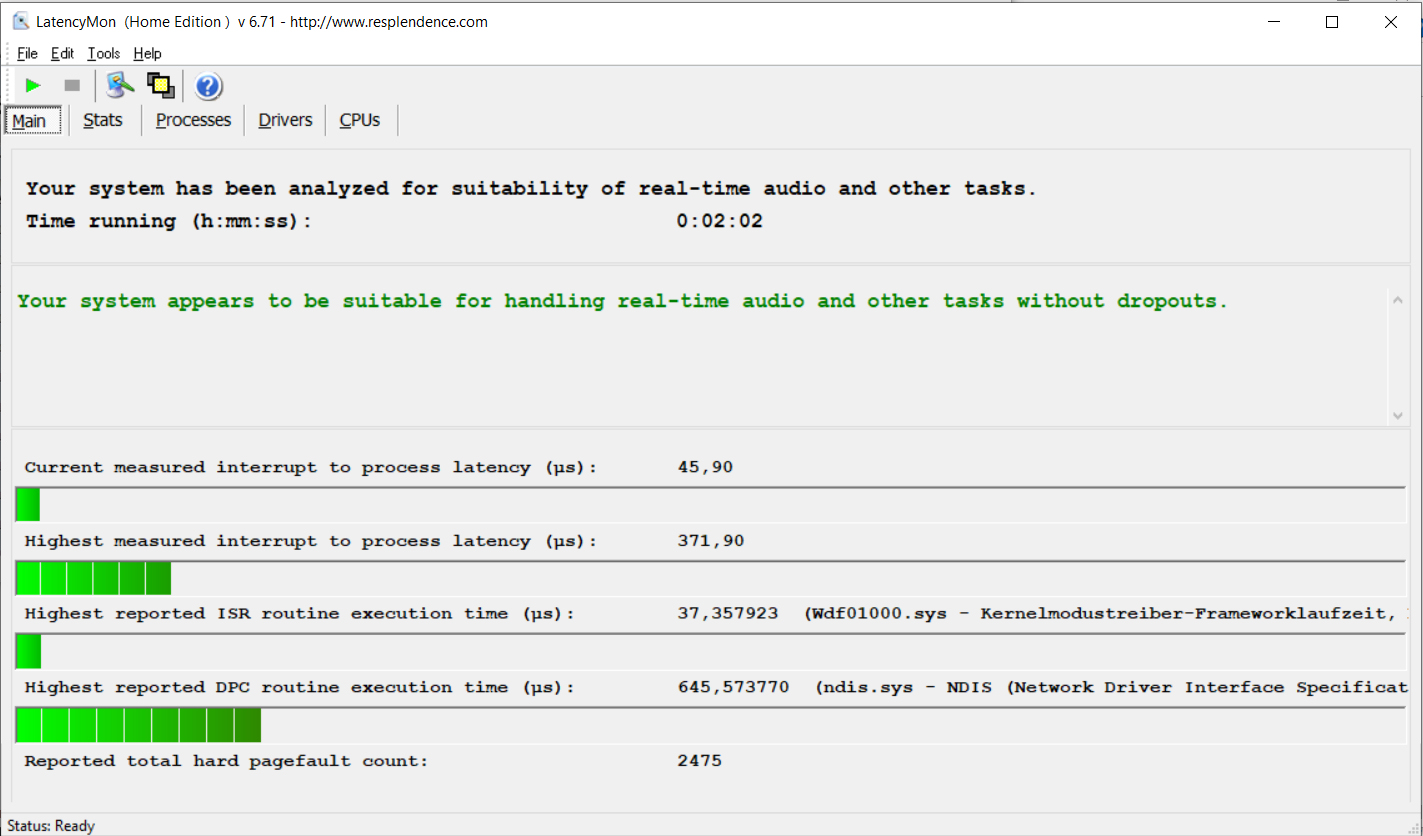
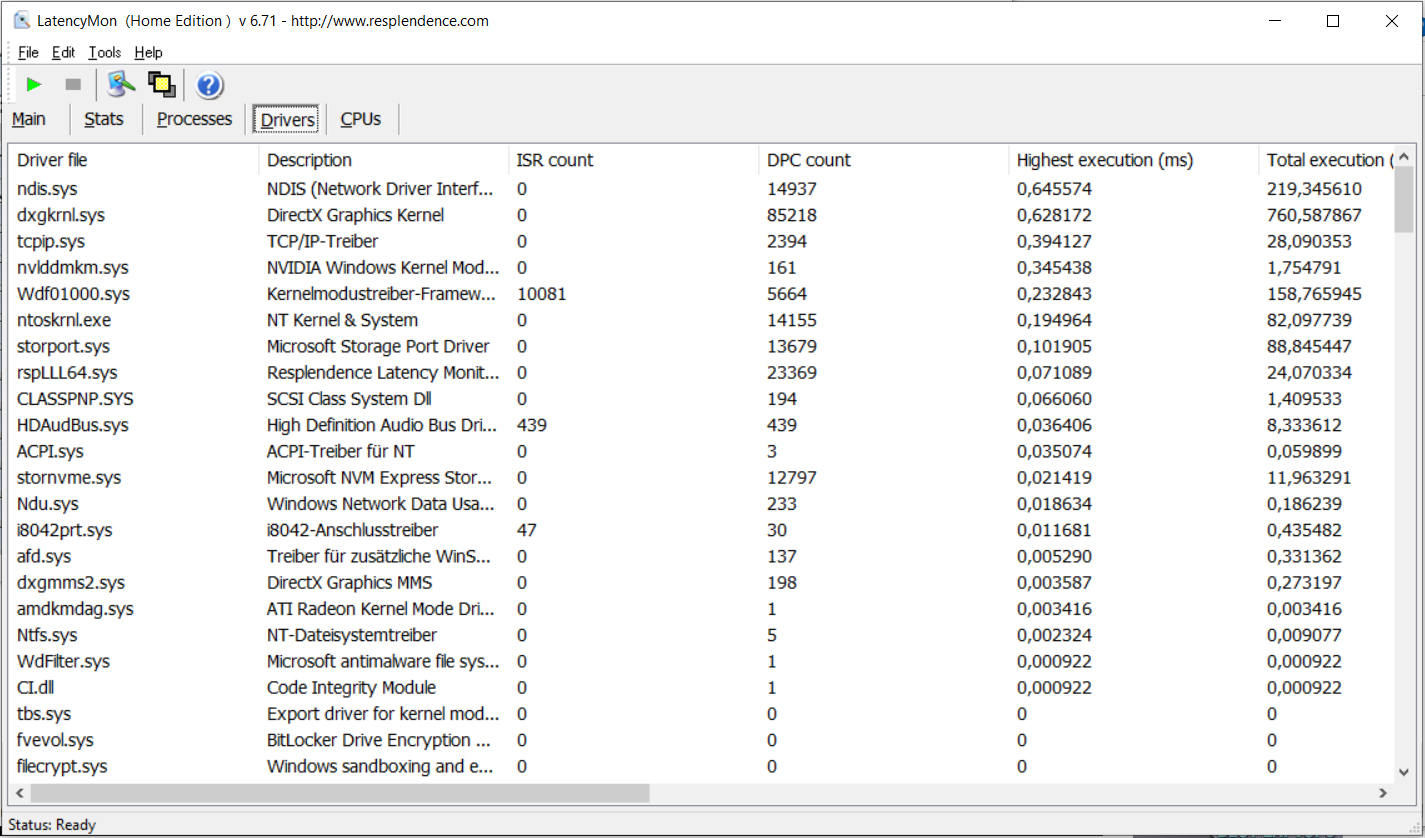
Nuestra prueba de monitorización de latencia estandarizada (navegación web, reproducción de vídeo 4K, Prime95 de alta carga) no reveló ningún problema con las latencias del CPD. El sistema parece adecuado para la edición de vídeo y audio en tiempo real. Las futuras actualizaciones de software podrían mejorar o incluso empeorar el rendimiento
| DPC Latencies / LatencyMon - interrupt to process latency (max), Web, Youtube, Prime95 | |
| Schenker XMG Apex 15 NH57E PS | |
| MSI Katana GF66 11UG-220 | |
| HP Omen 16-b0085ng | |
| Acer Nitro 5 AN515-45-R1JH | |
| Gigabyte A5 X1 | |
* ... más pequeño es mejor
Almacenamiento
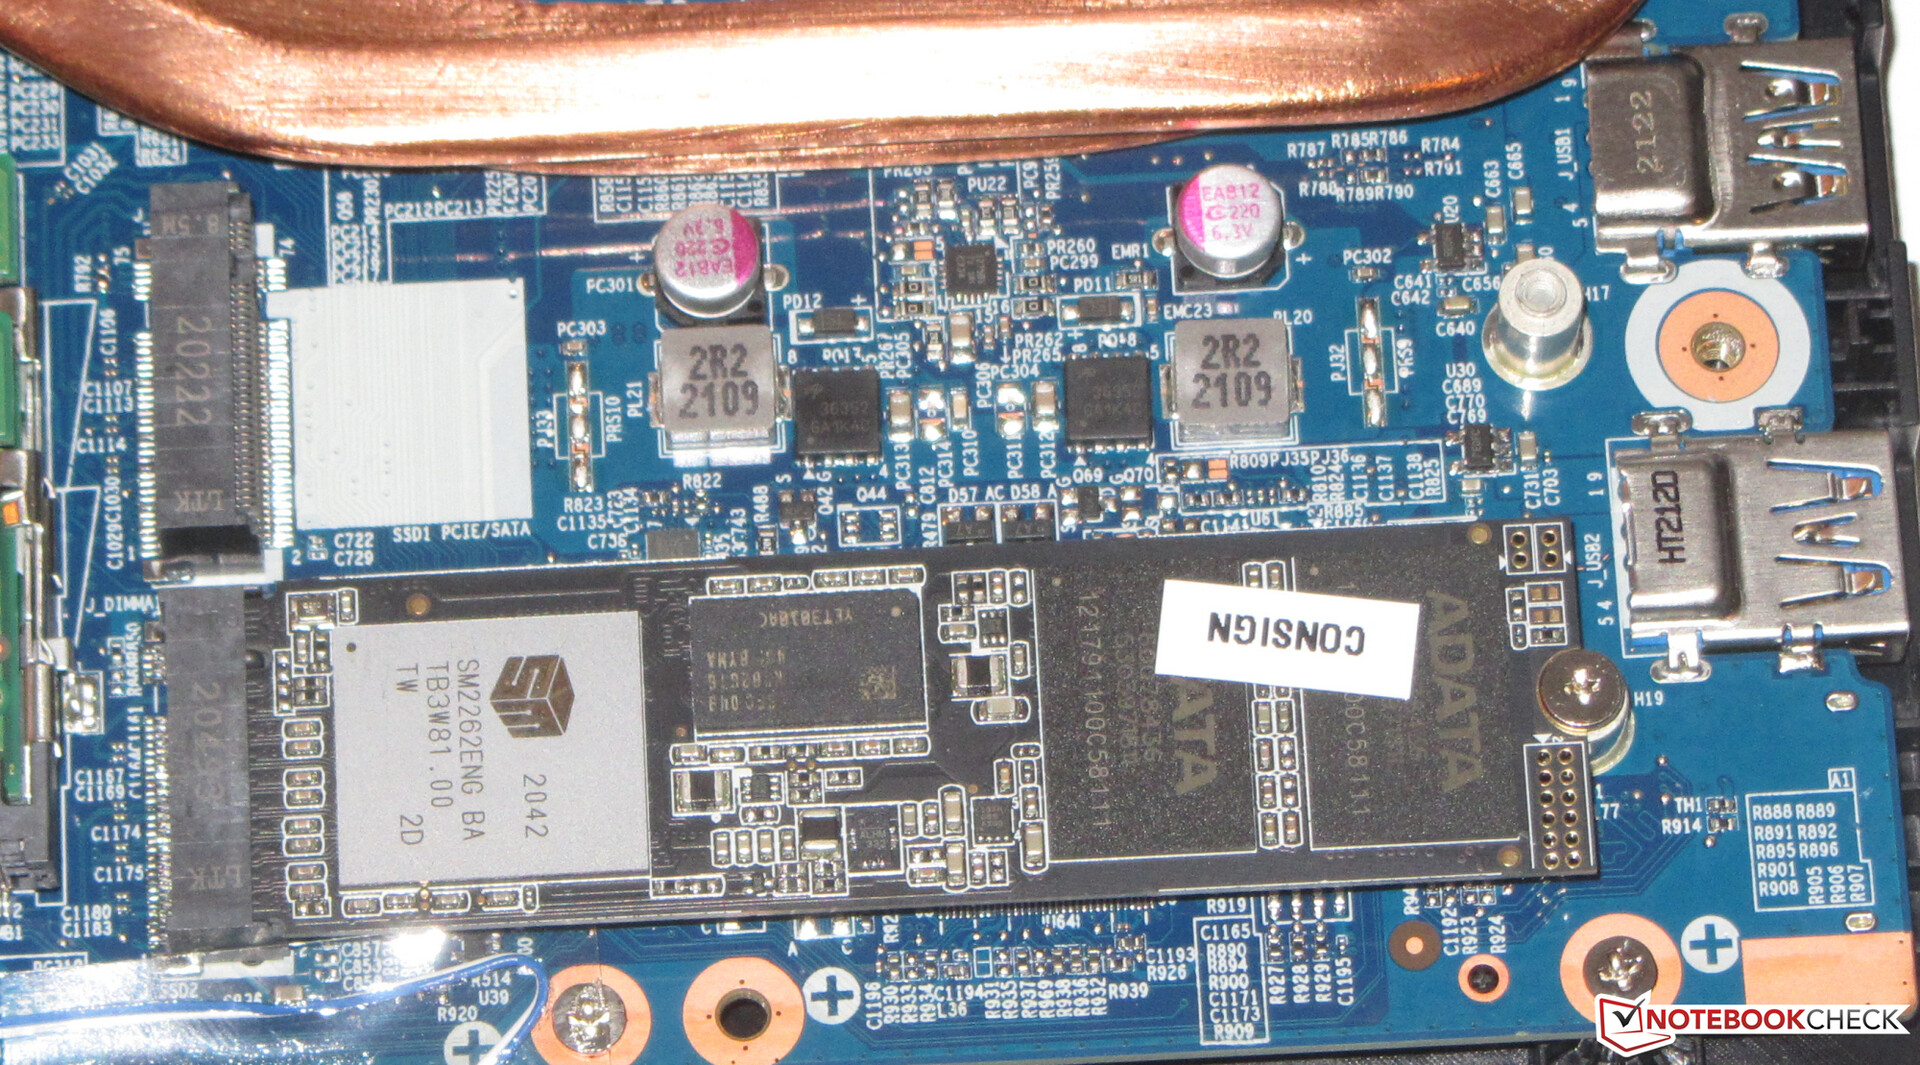
Un SSD NVMe (M.2-2280) de Adata sirve como unidad de sistema. Ofrece 512 GB de espacio de almacenamiento y ofrece buenas tasas de transferencia - sin embargo, no está entre los mejores modelos SSD. El portátil puede acomodar un segundo SSD NVMe (M.2-2280). Ambas ranuras M.2 soportan PCIe Gen 4. Además, también hay espacio para una unidad de almacenamiento de 2.5 pulgadas (la ranura SATA y el marco de montaje se encuentran dentro del portátil, los tornillos están en la caja)

* ... más pequeño es mejor
Continuous load read: DiskSpd Read Loop, Queue Depth 8
Tarjeta gráfica
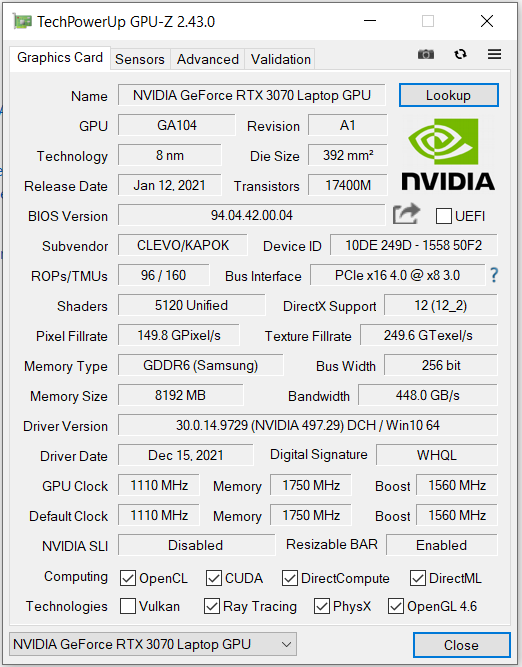
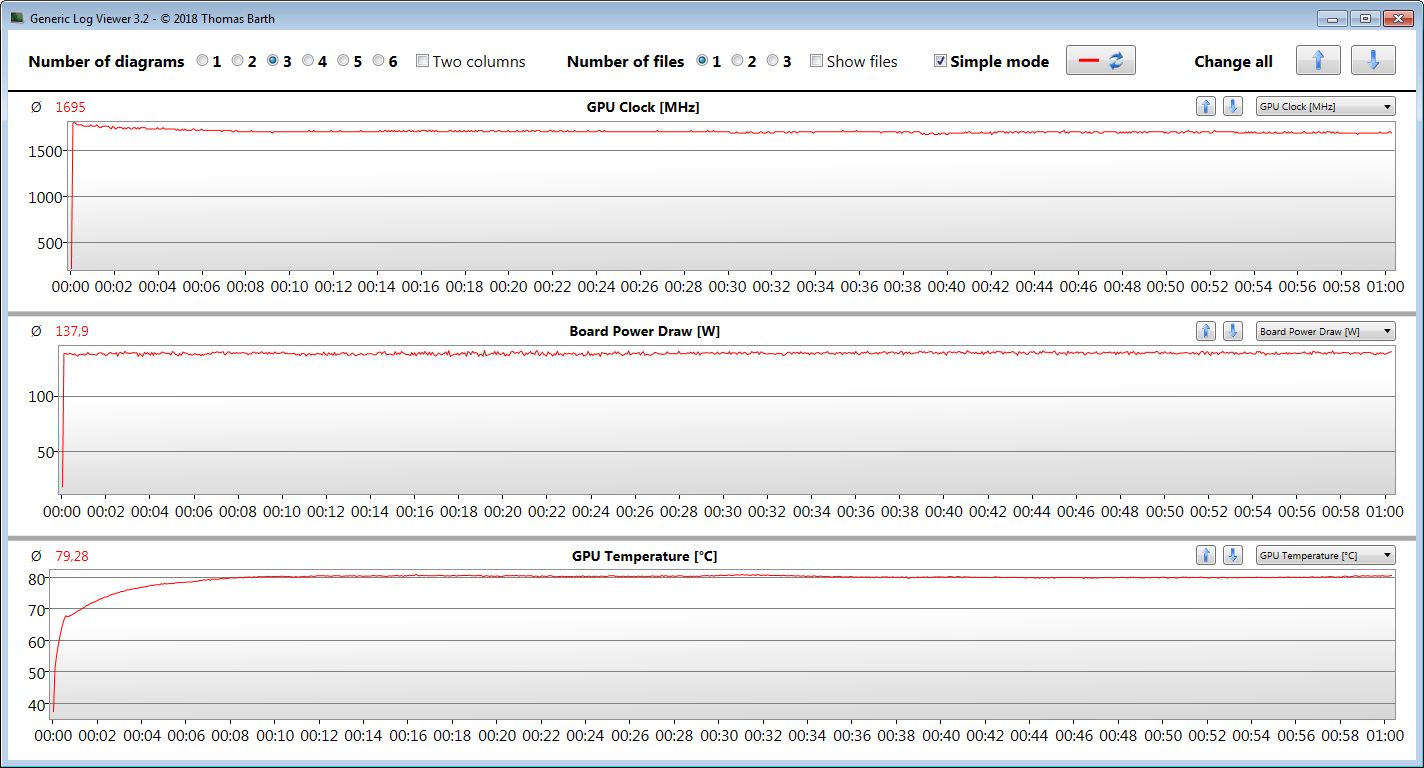
El rendimiento real de una GPU RTX 3000 depende de algunos factores: La refrigeración, la configuración de la memoria y el TGP máximo que elija el fabricante del portátil dentro de los límites definidos por Nvidia. Gigabyte concede la GeForce RTX 3070(resumen de todos los portátiles RTX 3070 incluyendo sus TGPs) un TGP máximo de 140 vatios (125 vatios + 15 vatios de Dynamic Boost).
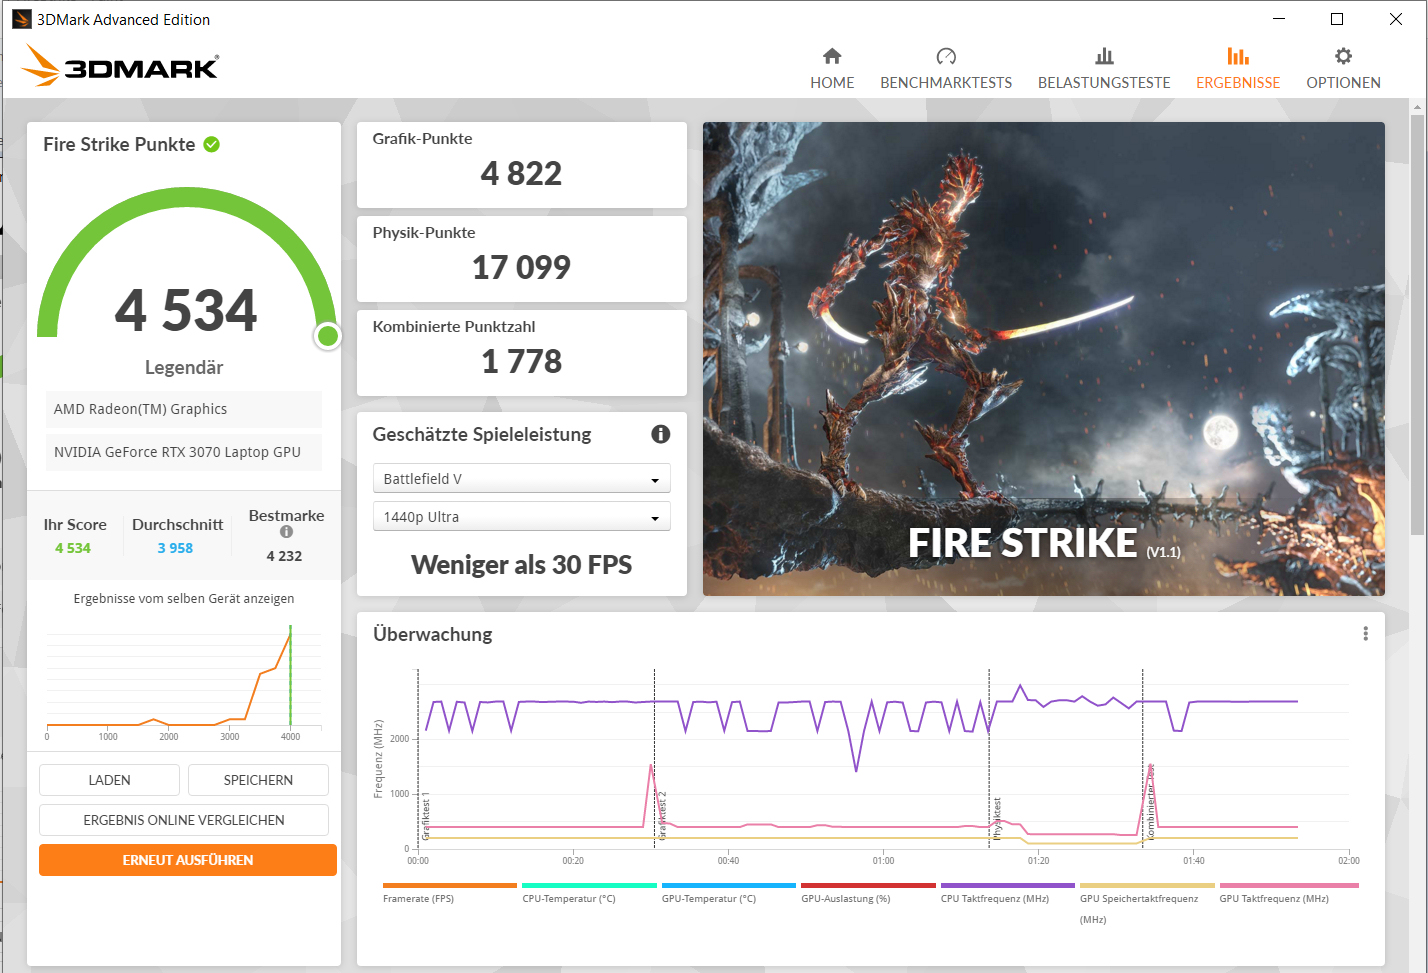
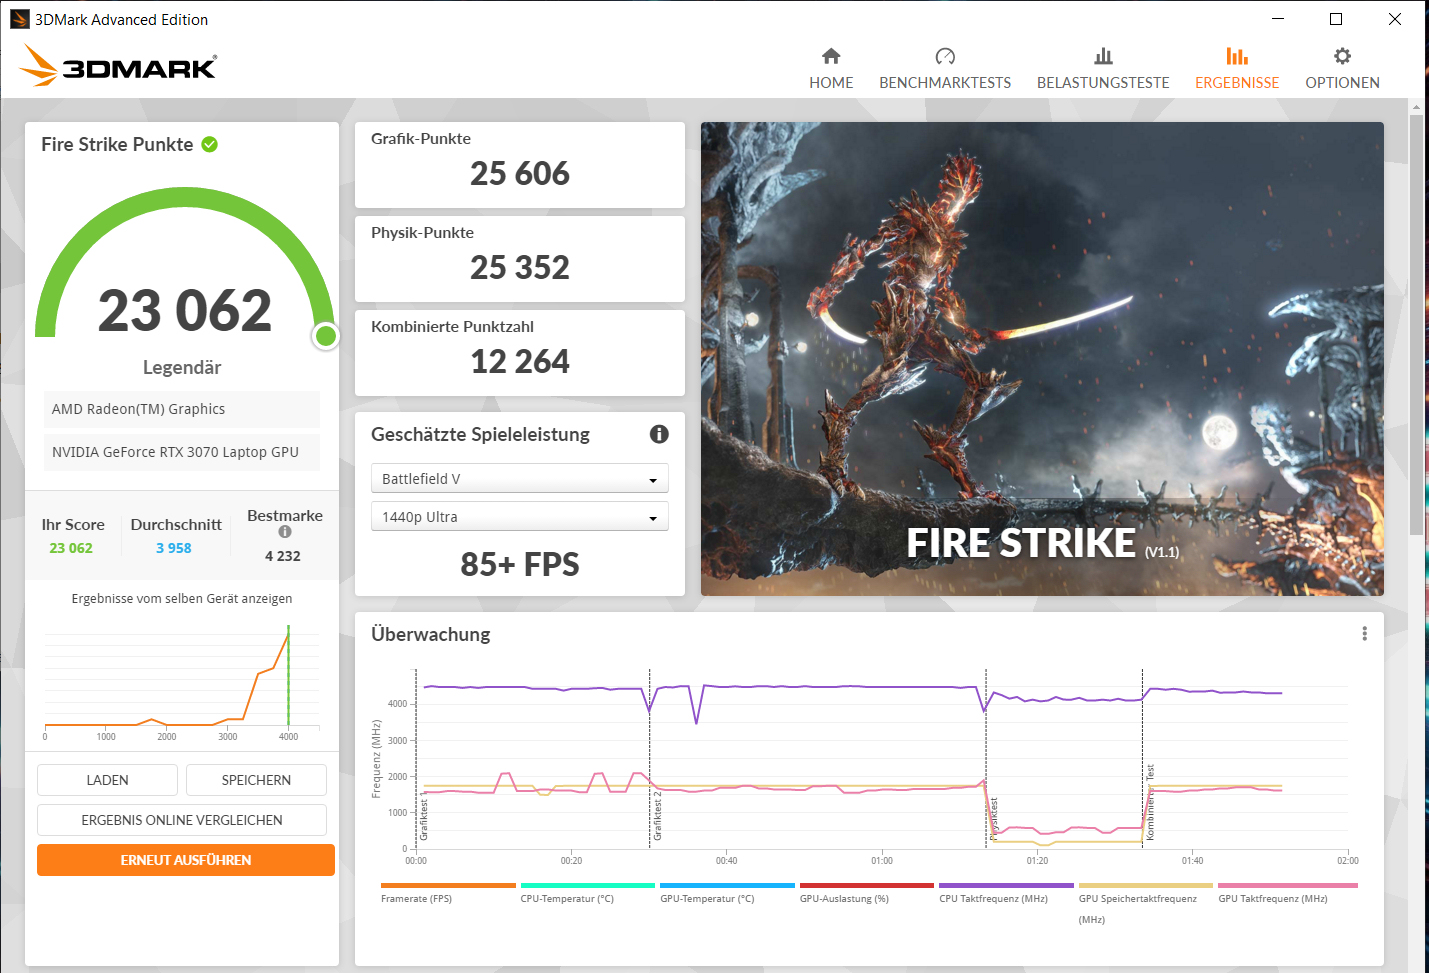
Los resultados de 3DMark superan la media de la RTX 3070 que se ha determinado hasta ahora. Los índices delHP Omen 16 competidor inmediato suelen estar a la par - a pesar de su menor TGP. Esto podría ser un indicio de que el A5 no siempre es capaz de explotar su TGP máximo. Sin embargo, nuestra prueba Witcher 3demuestra su potencial fundamental.
La GPU puede acceder a la rápida memoria gráfica GDDR6 (8.192 MB). El núcleo gráfico Vega 8 integrado en el procesador está activo, y el portátil funciona con la solución de conmutación gráfica Optimus de Nvidia.


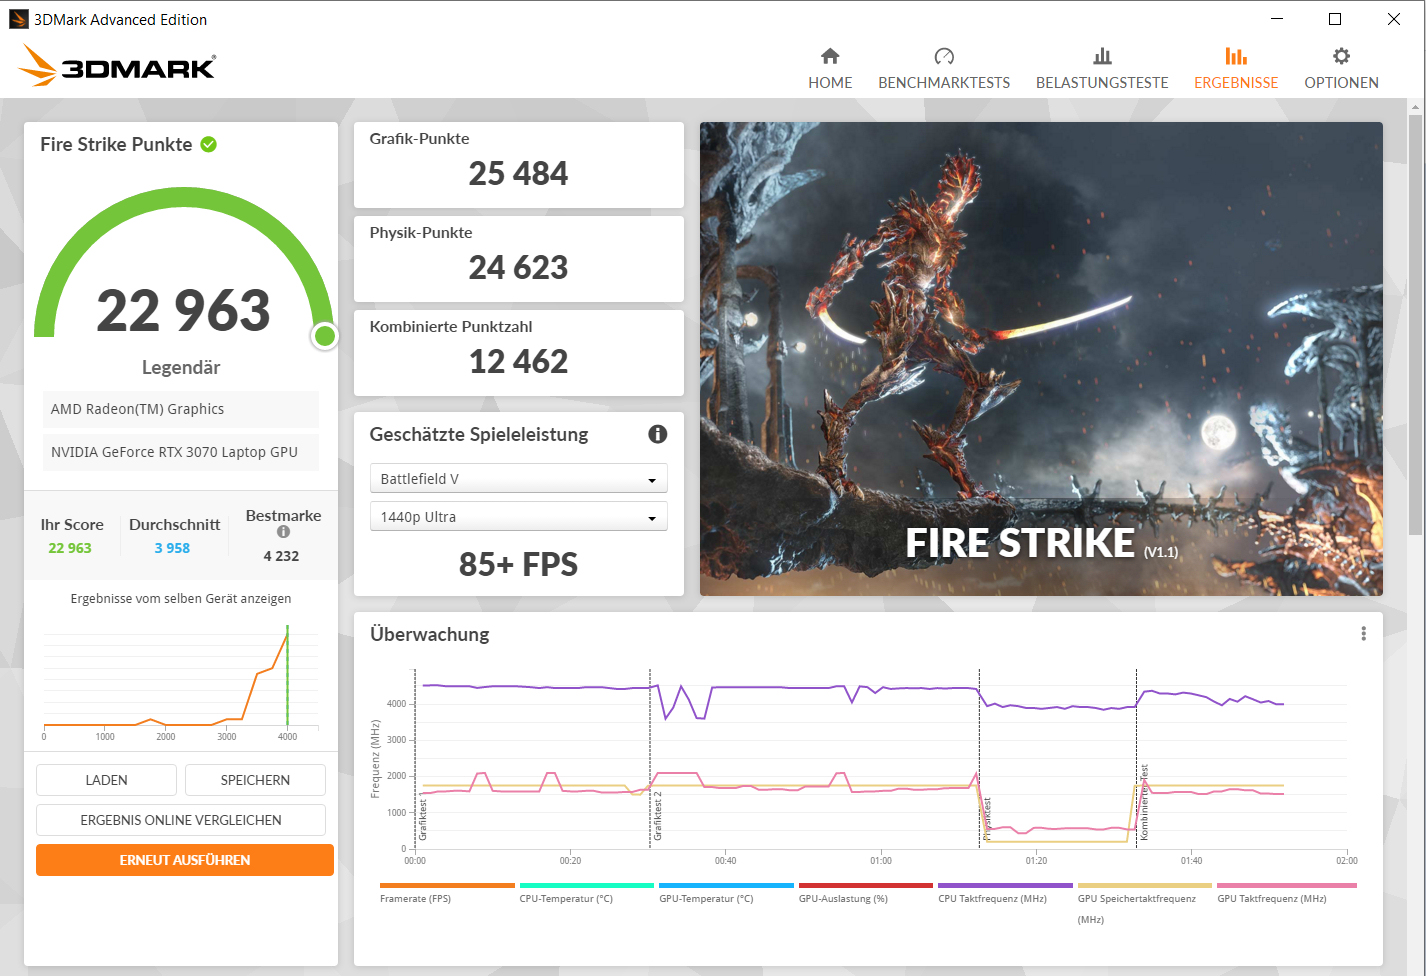
| 3DMark 06 Standard Score | 45160 puntos | |
| 3DMark 11 Performance | 27915 puntos | |
| 3DMark Cloud Gate Standard Score | 50228 puntos | |
| 3DMark Fire Strike Score | 24068 puntos | |
| 3DMark Time Spy Score | 10535 puntos | |
ayuda | ||
| 3DMark Performance rating - Percent | |
| Media de la clase Gaming | |
| Gigabyte A5 X1 | |
| Gigabyte A5 X1 | |
| Gigabyte A5 X1 | |
| HP Omen 16-b0085ng | |
| Medio NVIDIA GeForce RTX 3070 Laptop GPU | |
| Schenker XMG Apex 15 NH57E PS | |
| MSI Katana GF66 11UG-220 -1! | |
| Acer Nitro 5 AN515-45-R1JH | |
| Gigabyte A5 X1 | |
| 3DMark 11 - 1280x720 Performance GPU | |
| Media de la clase Gaming (21841 - 80022, n=103, últimos 2 años) | |
| Gigabyte A5 X1 | |
| HP Omen 16-b0085ng | |
| Gigabyte A5 X1 (Unterhaltungsmodus) | |
| Gigabyte A5 X1 (Lautlosmodus) | |
| Medio NVIDIA GeForce RTX 3070 Laptop GPU (12535 - 38275, n=54) | |
| MSI Katana GF66 11UG-220 | |
| Schenker XMG Apex 15 NH57E PS | |
| Acer Nitro 5 AN515-45-R1JH | |
| Gigabyte A5 X1 (Stromsparmodus) | |
| 3DMark | |
| 1920x1080 Fire Strike Graphics | |
| Media de la clase Gaming (18629 - 62849, n=112, últimos 2 años) | |
| Gigabyte A5 X1 | |
| Gigabyte A5 X1 (Unterhaltungsmodus) | |
| Gigabyte A5 X1 (Lautlosmodus) | |
| HP Omen 16-b0085ng | |
| Medio NVIDIA GeForce RTX 3070 Laptop GPU (7178 - 29128, n=52) | |
| Schenker XMG Apex 15 NH57E PS | |
| Acer Nitro 5 AN515-45-R1JH | |
| Gigabyte A5 X1 (Stromsparmodus) | |
| 2560x1440 Time Spy Graphics | |
| Media de la clase Gaming (6387 - 26212, n=112, últimos 2 años) | |
| Gigabyte A5 X1 | |
| HP Omen 16-b0085ng | |
| Gigabyte A5 X1 (Unterhaltungsmodus) | |
| Gigabyte A5 X1 (Lautlosmodus) | |
| Medio NVIDIA GeForce RTX 3070 Laptop GPU (2644 - 11019, n=53) | |
| Schenker XMG Apex 15 NH57E PS | |
| MSI Katana GF66 11UG-220 | |
| Acer Nitro 5 AN515-45-R1JH | |
| Gigabyte A5 X1 (Stromsparmodus) | |
Rendimiento de los juegos
El portátil muestra todos los juegos más recientes sin problemas a una resolución Full HD (1920x1080 píxeles) y con los ajustes de máxima calidad. También sería posible usar resoluciones superiores conectando un monitor adecuado. Los frame rates están por encima de la media en la comparación con la RTX 3070
| The Witcher 3 - 1920x1080 Ultra Graphics & Postprocessing (HBAO+) | |
| Media de la clase Gaming (104.7 - 240, n=7, últimos 2 años) | |
| Gigabyte A5 X1 | |
| Gigabyte A5 X1 (Lautlosmodus) | |
| HP Omen 16-b0085ng | |
| Medio NVIDIA GeForce RTX 3070 Laptop GPU (34.9 - 109, n=52) | |
| Schenker XMG Apex 15 NH57E PS | |
| Acer Nitro 5 AN515-45-R1JH | |
| MSI Katana GF66 11UG-220 | |
| Gigabyte A5 X1 (Stromsparmodus) | |
| Dota 2 Reborn - 1920x1080 ultra (3/3) best looking | |
| Media de la clase Gaming (84.8 - 252, n=104, últimos 2 años) | |
| HP Omen 16-b0085ng | |
| Gigabyte A5 X1 | |
| MSI Katana GF66 11UG-220 | |
| Medio NVIDIA GeForce RTX 3070 Laptop GPU (26.9 - 163.9, n=58) | |
| Schenker XMG Apex 15 NH57E PS | |
| Gigabyte A5 X1 (Lautlosmodus) | |
| Gigabyte A5 X1 (Unterhaltungsmodus) | |
| Gigabyte A5 X1 (Stromsparmodus) | |
| Acer Nitro 5 AN515-45-R1JH | |
| X-Plane 11.11 - 1920x1080 high (fps_test=3) | |
| Media de la clase Gaming (55.5 - 148.5, n=106, últimos 2 años) | |
| HP Omen 16-b0085ng | |
| Medio NVIDIA GeForce RTX 3070 Laptop GPU (12.4 - 118.8, n=61) | |
| MSI Katana GF66 11UG-220 | |
| MSI Katana GF66 11UG-220 | |
| Schenker XMG Apex 15 NH57E PS | |
| Gigabyte A5 X1 | |
| Gigabyte A5 X1 (Unterhaltungsmodus) | |
| Gigabyte A5 X1 (Lautlosmodus) | |
| Gigabyte A5 X1 (Stromsparmodus) | |
| Acer Nitro 5 AN515-45-R1JH | |
| Final Fantasy XV Benchmark - 1920x1080 High Quality | |
| Media de la clase Gaming (64.2 - 215, n=91, últimos 2 años) | |
| Gigabyte A5 X1 (1.3) | |
| Gigabyte A5 X1 (1.3, Unterhaltungsmodus) | |
| Medio NVIDIA GeForce RTX 3070 Laptop GPU (27.9 - 107, n=49) | |
| Acer Nitro 5 AN515-45-R1JH (1.3) | |
| Gigabyte A5 X1 (1.3, Lautlosmodus) | |
| MSI Katana GF66 11UG-220 (1.3) | |
| Gigabyte A5 X1 (1.3, Stromsparmodus) | |
| GTA V - 1920x1080 Highest AA:4xMSAA + FX AF:16x | |
| Media de la clase Gaming (67.1 - 186.9, n=90, últimos 2 años) | |
| HP Omen 16-b0085ng | |
| Gigabyte A5 X1 | |
| MSI Katana GF66 11UG-220 | |
| Gigabyte A5 X1 (Unterhaltungsmodus) | |
| Gigabyte A5 X1 (Lautlosmodus) | |
| Medio NVIDIA GeForce RTX 3070 Laptop GPU (21.7 - 125.8, n=50) | |
| Gigabyte A5 X1 (Stromsparmodus) | |
| Schenker XMG Apex 15 NH57E PS | |
| Acer Nitro 5 AN515-45-R1JH | |
| Strange Brigade - 1920x1080 ultra AA:ultra AF:16 | |
| Media de la clase Gaming (113.6 - 458, n=83, últimos 2 años) | |
| HP Omen 16-b0085ng (1.47.22.14 D3D12) | |
| Gigabyte A5 X1 (1.47.22.14 D3D12, Lautlosmodus) | |
| Gigabyte A5 X1 (1.47.22.14 D3D12) | |
| Medio NVIDIA GeForce RTX 3070 Laptop GPU (36.2 - 194, n=46) | |
| Schenker XMG Apex 15 NH57E PS (1.47.22.14 D3D12) | |
| MSI Katana GF66 11UG-220 (1.47.22.14 D3D12) | |
| Acer Nitro 5 AN515-45-R1JH (1.47.22.14 D3D12) | |
| F1 2021 - 1920x1080 Ultra High Preset + Raytracing AA:T AF:16x | |
| Gigabyte A5 X1 (831795) | |
| Gigabyte A5 X1 (831795, Unterhaltungsmodus) | |
| Gigabyte A5 X1 (831795, Lautlosmodus) | |
| Medio NVIDIA GeForce RTX 3070 Laptop GPU (33.1 - 123.1, n=23) | |
| MSI Katana GF66 11UG-220 (800360) | |
| Gigabyte A5 X1 (831795, Stromsparmodus) | |
| Far Cry 6 | |
| 1920x1080 Ultra Graphics Quality + HD Textures AA:T | |
| Media de la clase Gaming (n=1últimos 2 años) | |
| Medio NVIDIA GeForce RTX 3070 Laptop GPU (74 - 102.3, n=5) | |
| Gigabyte A5 X1 | |
| 1920x1080 Ultra Graphics Quality + HD Textures + DXR AA:T | |
| Media de la clase Gaming (n=1últimos 2 años) | |
| Gigabyte A5 X1 | |
| Medio NVIDIA GeForce RTX 3070 Laptop GPU (19.1 - 69, n=3) | |
| Riders Republic - 1920x1080 Ultra Preset | |
| Medio NVIDIA GeForce RTX 3070 Laptop GPU (98 - 111, n=4) | |
| Gigabyte A5 X1 | |
| Forza Horizon 5 - 1920x1080 Extreme Preset | |
| Medio NVIDIA GeForce RTX 3070 Laptop GPU (75 - 86, n=5) | |
| Gigabyte A5 X1 | |
| Battlefield 2042 | |
| 1920x1080 Ultra Preset | |
| Medio NVIDIA GeForce RTX 3070 Laptop GPU (86.6 - 102, n=2) | |
| Gigabyte A5 X1 | |
| 1920x1080 Ultra Preset + Ray Tracing | |
| Medio NVIDIA GeForce RTX 3070 Laptop GPU (69.3 - 81.7, n=2) | |
| Gigabyte A5 X1 | |
| Halo Infinite - 1920x1080 Ultra Preset | |
| Medio NVIDIA GeForce RTX 3070 Laptop GPU (90.1 - 102, n=2) | |
| Gigabyte A5 X1 | |
Para comprobar si la velocidad de fotogramas se mantiene prácticamente constante durante un periodo de tiempo prolongado, dejamos que el juego The Witcher 3 funcionara durante unos 60 minutos a resolución Full HD y con los ajustes de máxima calidad. El personaje no se mueve. No se encontró una caída de la tasa de imágenes por segundo
The Witcher 3 FPS diagram
| bajo | medio | alto | ultra | |
|---|---|---|---|---|
| GTA V (2015) | 179 | 172 | 155 | 94.7 |
| The Witcher 3 (2015) | 309 | 261 | 171 | 101 |
| Dota 2 Reborn (2015) | 152 | 146 | 131 | 124 |
| Final Fantasy XV Benchmark (2018) | 170 | 127 | 95.4 | |
| X-Plane 11.11 (2018) | 103 | 90 | 75.7 | |
| Far Cry 5 (2018) | 137 | 118 | 114 | 107 |
| Strange Brigade (2018) | 334 | 195 | 179 | 169 |
| F1 2021 (2021) | 291 | 199 | 171 | 114 |
| Far Cry 6 (2021) | 119 | 101 | 91 | 84 |
| Riders Republic (2021) | 163 | 122 | 106 | 98 |
| Forza Horizon 5 (2021) | 191 | 120 | 109 | 75 |
| Battlefield 2042 (2021) | 134 | 107 | 95.5 | 86.6 |
| Halo Infinite (2021) | 106 | 93.9 | 90.1 |
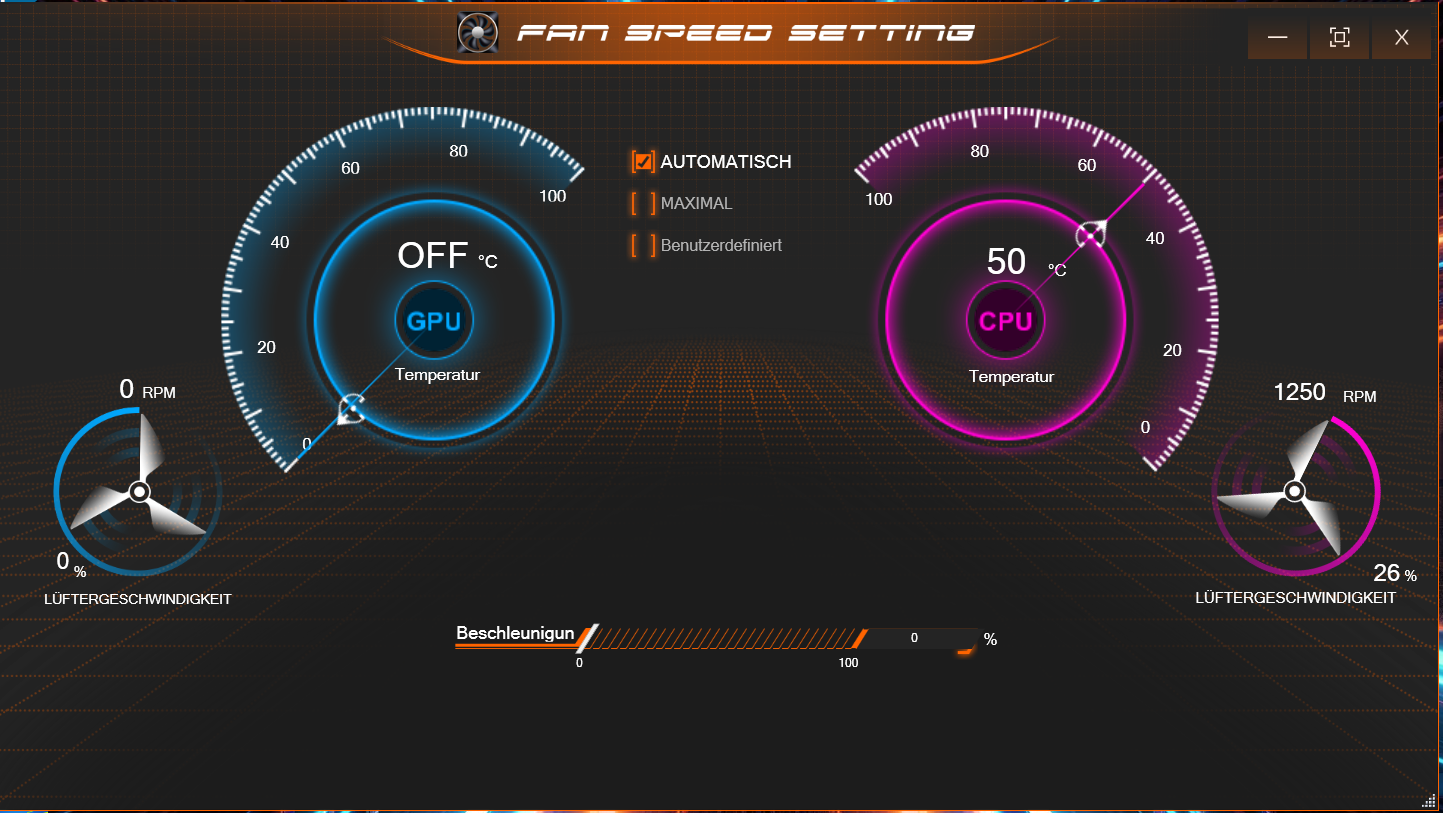
Emisiones - El X1 produce mucho ruido bajo carga
Emisiones acústicas
Los dos ventiladores suelen generar poco ruido en el uso diario (oficina, Internet). Sin embargo, de vez en cuando suben innecesariamente - el nivel de presión sonora puede subir a valores superiores a los 40 dB(A). Gigabyte debería hacer más ajustes en este sentido. Con un máximo de 58 dB(A) (test de estrés) y 56 dB(A) (nuestro test The Witcher 3 ), las cosas se ponen bastante ruidosas bajo carga. ElOmen 16 sólo puntúa ligeramente mejor que el A5. ElMSI Katana GF66 es considerablemente más silencioso.
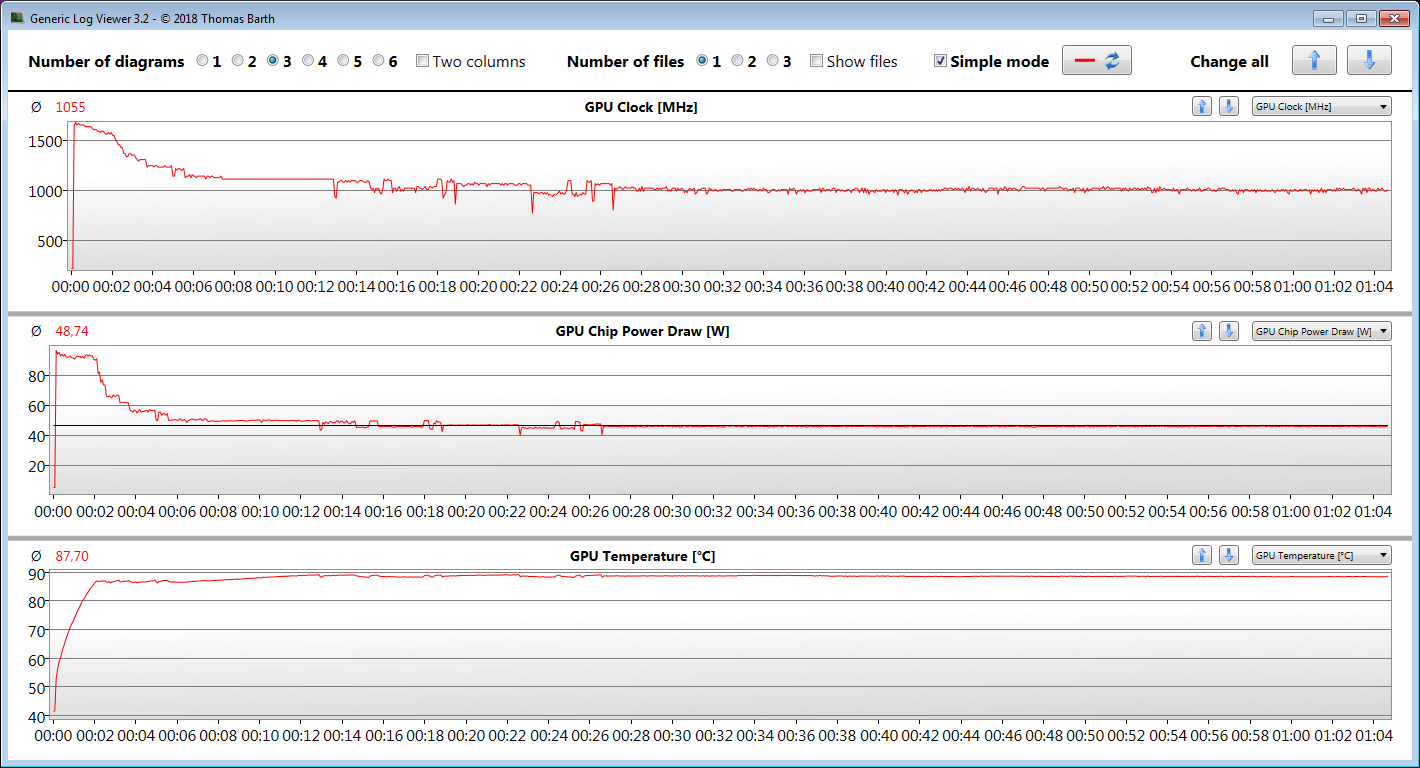
El nivel de ruido bajo carga puede reducirse significativamente usando el perfil de rendimiento "Modo Silencioso". En este caso, los ventiladores funcionan a velocidades muy bajas y sólo emiten un silencioso silbido. Aunque la CPU puede seguir funcionando a altas velocidades de reloj de forma continua en este escenario, la velocidad de reloj de la GPU se reduce bastante rápido por razones térmicas. Esto queda ilustrado en nuestra prueba de Witcher 3. No obstante, los juegos siguen siendo posibles, aunque con una configuración reducida.
Ruido
| Ocioso |
| 27 / 29 / 32 dB(A) |
| Carga |
| 57 / 58 dB(A) |
 | ||
30 dB silencioso 40 dB(A) audible 50 dB(A) ruidosamente alto |
||
min: | ||
| Gigabyte A5 X1 GeForce RTX 3070 Laptop GPU, R9 5900HX | HP Omen 16-b0085ng GeForce RTX 3070 Laptop GPU, i7-11800H | MSI Katana GF66 11UG-220 GeForce RTX 3070 Laptop GPU, i7-11800H | Acer Nitro 5 AN515-45-R1JH GeForce RTX 3070 Laptop GPU, R7 5800H | Schenker XMG Apex 15 NH57E PS GeForce RTX 3060 Laptop GPU, R7 5800H | |
|---|---|---|---|---|---|
| Noise | 12% | -1% | 9% | 14% | |
| apagado / medio ambiente * (dB) | 25 | 23 8% | 25 -0% | 25 -0% | 23 8% |
| Idle Minimum * (dB) | 27 | 23 15% | 34 -26% | 25 7% | 23 15% |
| Idle Average * (dB) | 29 | 23 21% | 35 -21% | 25 14% | 23 21% |
| Idle Maximum * (dB) | 32 | 34.81 -9% | 36 -13% | 32.2 -1% | 26.4 17% |
| Load Average * (dB) | 57 | 35.02 39% | 48 16% | 45.8 20% | 34.25 40% |
| Witcher 3 ultra * (dB) | 56 | 52 7% | 46 18% | 58.4 -4% | |
| Load Maximum * (dB) | 58 | 56 3% | 49 16% | 49.1 15% | 58.42 -1% |
* ... más pequeño es mejor
Temperatura
Las temperaturas de la carcasa se mantienen dentro de la zona verde en el uso diario (oficina, Internet). Bajo carga (test de estrés, nuestra prueba The Witcher 3 ), el portátil se calienta notablemente, pero no en exceso. En casos extremos, la CPU se calienta hasta más de 90 °C
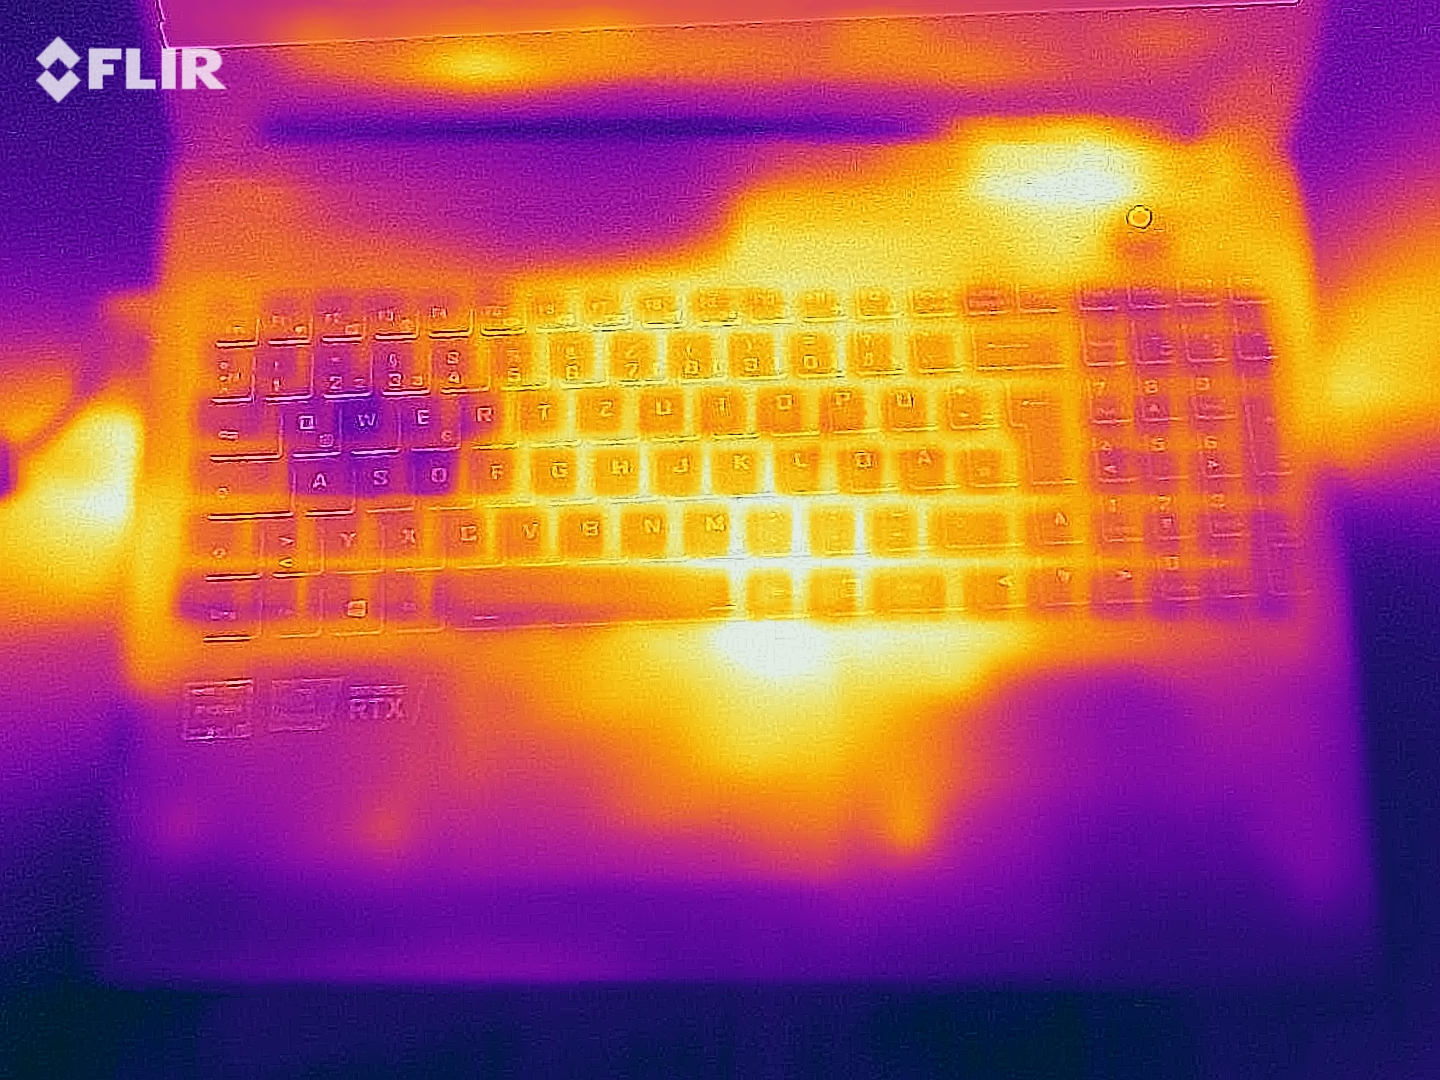
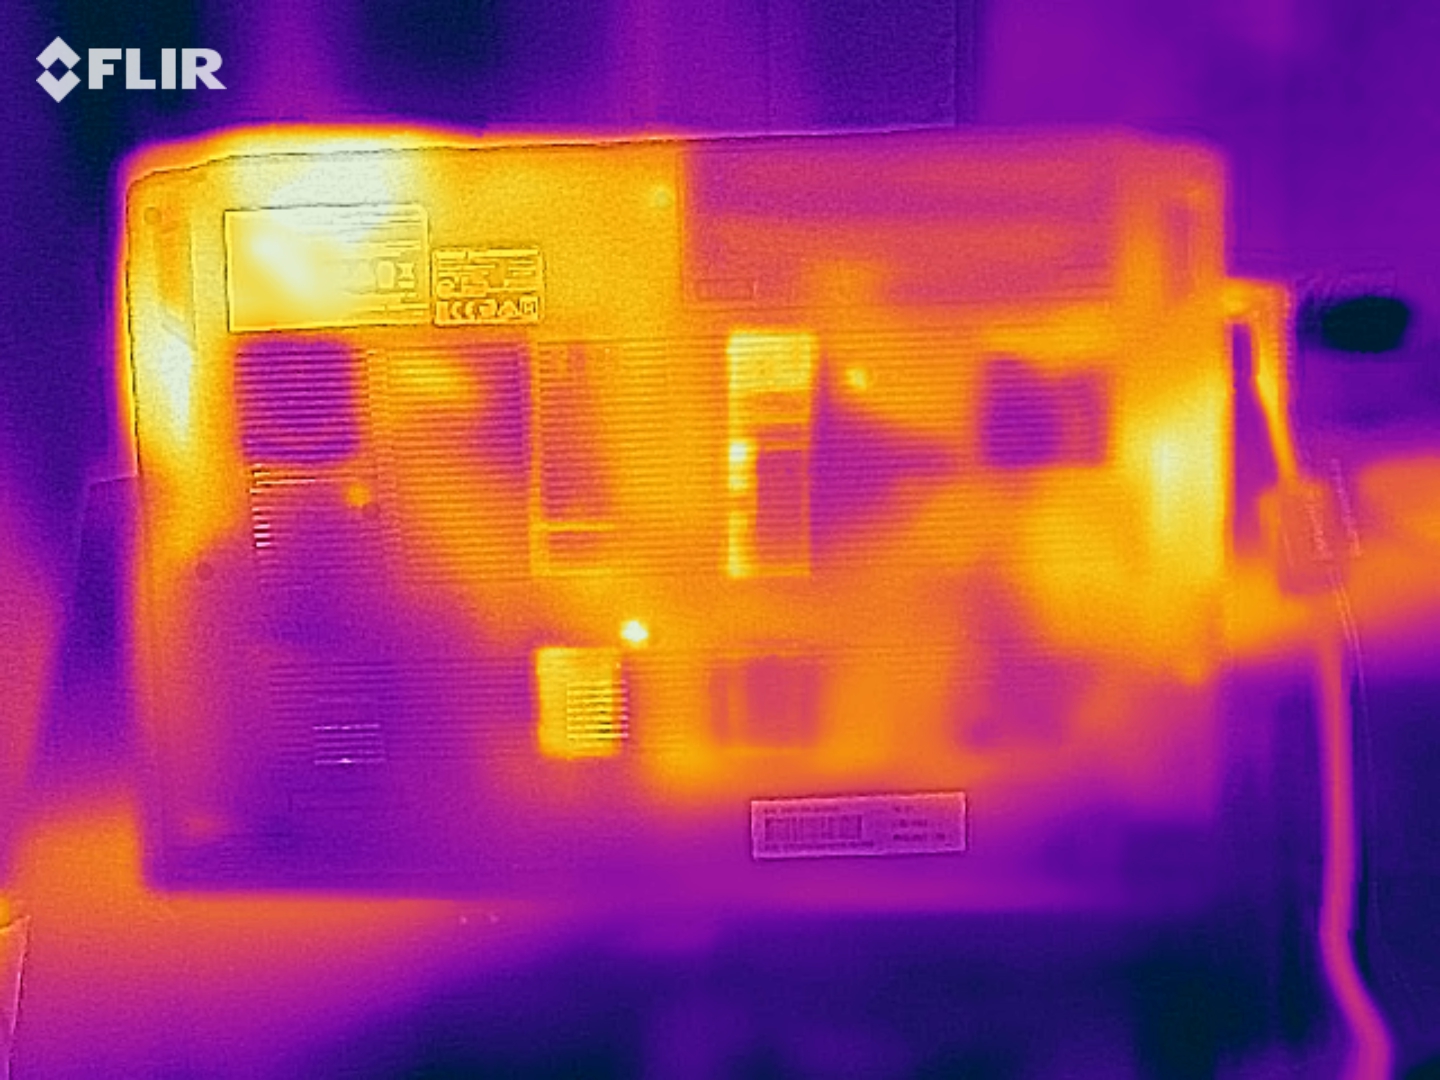

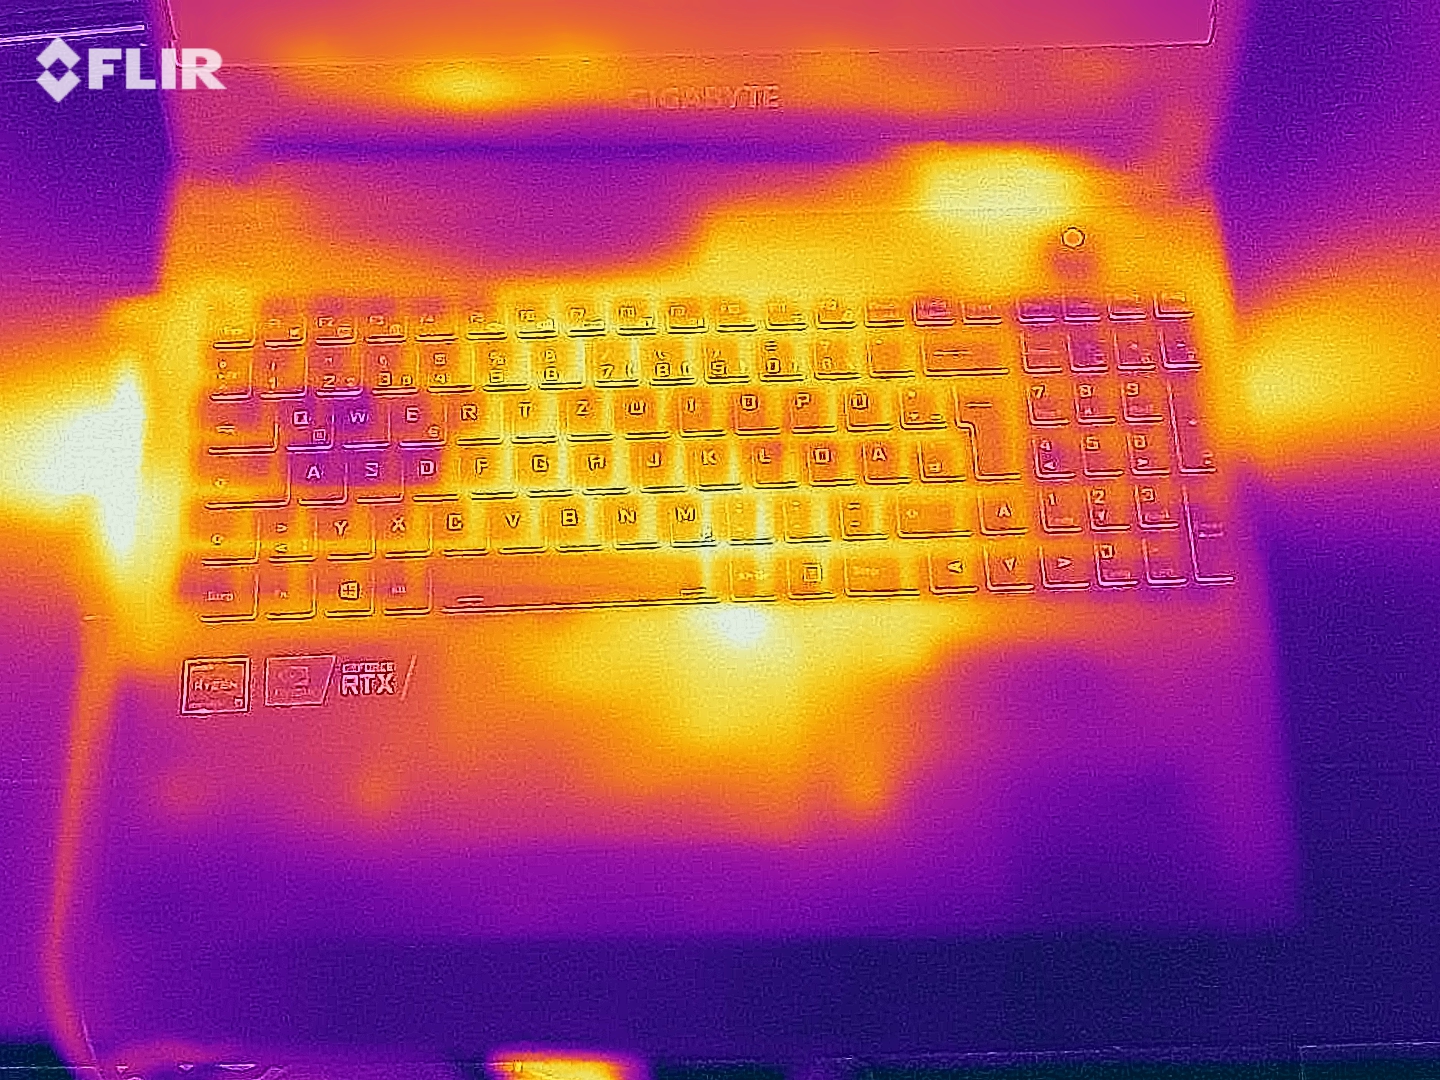
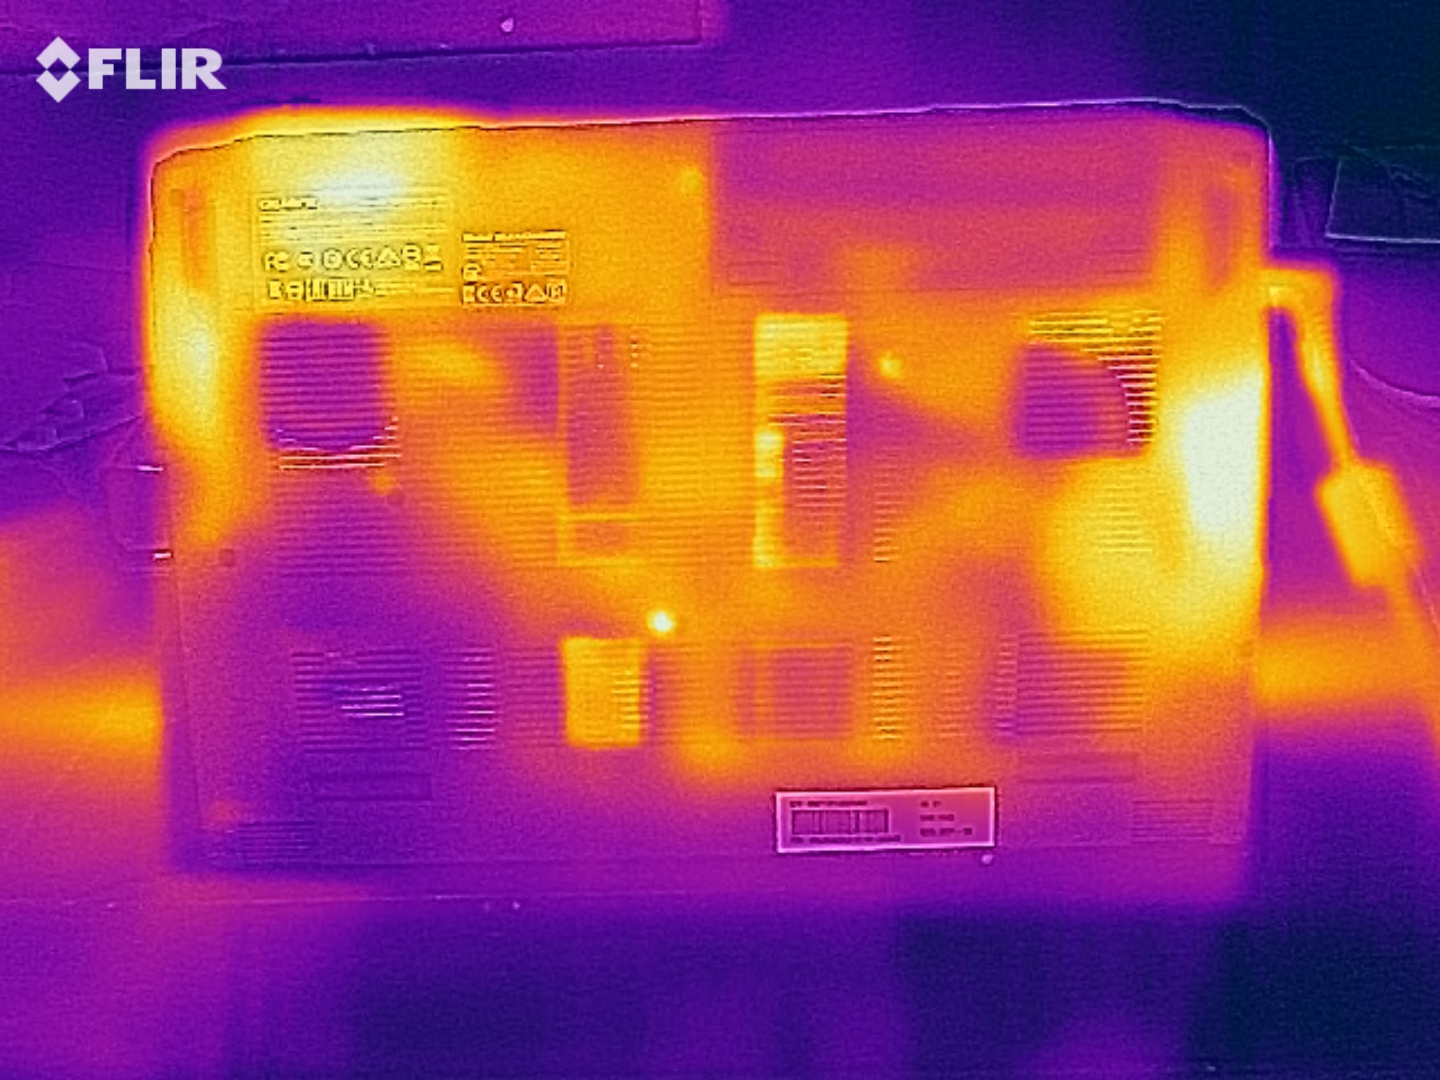
(-) La temperatura máxima en la parte superior es de 47 °C / 117 F, frente a la media de 40.4 °C / 105 F, que oscila entre 21.2 y 68.8 °C para la clase Gaming.
(-) El fondo se calienta hasta un máximo de 51 °C / 124 F, frente a la media de 43.2 °C / 110 F
(+) En reposo, la temperatura media de la parte superior es de 25.9 °C / 79# F, frente a la media del dispositivo de 33.9 °C / 93 F.
(-) Jugando a The Witcher 3, la temperatura media de la parte superior es de 44.4 °C / 112 F, frente a la media del dispositivo de 33.9 °C / 93 F.
(-) El reposamanos y el touchpad pueden calentarse mucho al tacto con un máximo de 47 °C / 116.6 F.
(-) La temperatura media de la zona del reposamanos de dispositivos similares fue de 28.8 °C / 83.8 F (-18.2 °C / -32.8 F).
| Gigabyte A5 X1 AMD Ryzen 9 5900HX, NVIDIA GeForce RTX 3070 Laptop GPU | HP Omen 16-b0085ng Intel Core i7-11800H, NVIDIA GeForce RTX 3070 Laptop GPU | MSI Katana GF66 11UG-220 Intel Core i7-11800H, NVIDIA GeForce RTX 3070 Laptop GPU | Acer Nitro 5 AN515-45-R1JH AMD Ryzen 7 5800H, NVIDIA GeForce RTX 3070 Laptop GPU | Schenker XMG Apex 15 NH57E PS AMD Ryzen 7 5800H, NVIDIA GeForce RTX 3060 Laptop GPU | |
|---|---|---|---|---|---|
| Heat | -16% | -10% | -10% | 6% | |
| Maximum Upper Side * (°C) | 47 | 48 -2% | 56 -19% | 53.2 -13% | 36 23% |
| Maximum Bottom * (°C) | 51 | 55 -8% | 49 4% | 58.2 -14% | 38 25% |
| Idle Upper Side * (°C) | 27 | 33 -22% | 36 -33% | 29.5 -9% | 31 -15% |
| Idle Bottom * (°C) | 30 | 39 -30% | 28 7% | 31.2 -4% | 33 -10% |
* ... más pequeño es mejor
Prueba de esfuerzo
La CPU y la GPU completan la prueba de estrés (Prime95 y FurMark se ejecutan durante al menos una hora) a 3,8 GHz y unos 1.755 MHz, respectivamente. La prueba de estrés representa un escenario extremo. Con esta prueba, comprobamos si el sistema se mantiene estable a plena carga
Altavoces
Los altavoces estéreo producen un sonido decente al que le faltan graves. Sin embargo, el volumen máximo debería ser mayor. Se recomiendan auriculares o altavoces externos para una mejor experiencia de sonido
Gigabyte A5 X1 análisis de audio
(±) | la sonoridad del altavoz es media pero buena (80 dB)
Graves 100 - 315 Hz
(-) | casi sin bajos - de media 22% inferior a la mediana
(±) | la linealidad de los graves es media (12.5% delta a frecuencia anterior)
Medios 400 - 2000 Hz
(+) | medios equilibrados - a sólo 1.9% de la mediana
(+) | los medios son lineales (6% delta a la frecuencia anterior)
Altos 2 - 16 kHz
(+) | máximos equilibrados - a sólo 4.2% de la mediana
(+) | los máximos son lineales (6% delta a la frecuencia anterior)
Total 100 - 16.000 Hz
(±) | la linealidad del sonido global es media (17% de diferencia con la mediana)
En comparación con la misma clase
» 45% de todos los dispositivos probados de esta clase eran mejores, 12% similares, 43% peores
» El mejor tuvo un delta de 6%, la media fue 18%, el peor fue ###max##%
En comparación con todos los dispositivos probados
» 31% de todos los dispositivos probados eran mejores, 8% similares, 61% peores
» El mejor tuvo un delta de 4%, la media fue 23%, el peor fue ###max##%
Gestión de la energía: el portátil Gigabyte ofrece una duración de la batería decente
Consumo de energía
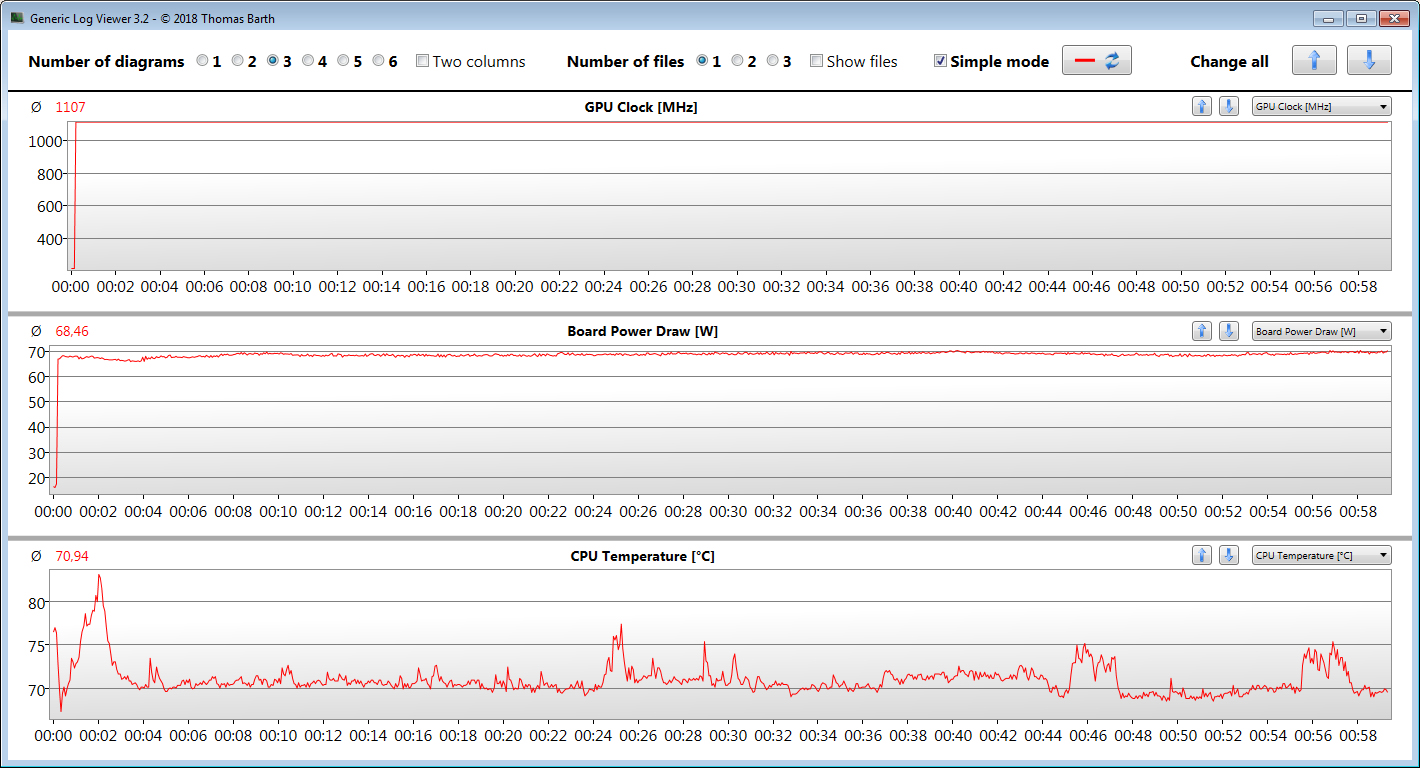
En uso inactivo o bajo carga baja, el consumo de energía del A5 es normal para el hardware instalado aquí - la competencia basada en Intel requiere un poco más de energía en algunos casos. El test de estrés y nuestro test Witcher 3aumentan el consumo de energía del portátil Gigabyte hasta 272 vatios y una media de 204 vatios, respectivamente. Esto lo convierte en el dispositivo que más energía consume dentro de nuestro campo de comparación. Dado que la batería no se agotó, el adaptador de corriente incluido (potencia nominal: 230 vatios) parece tener capacidad suficiente. Los siguientes gráficos ilustran el consumo de energía bastante constante del portátil durante la prueba de estrés y nuestra prueba The Witcher 3
| Off / Standby | |
| Ocioso | |
| Carga |
|
Clave:
min: | |
| Gigabyte A5 X1 R9 5900HX, GeForce RTX 3070 Laptop GPU | HP Omen 16-b0085ng i7-11800H, GeForce RTX 3070 Laptop GPU | MSI Katana GF66 11UG-220 i7-11800H, GeForce RTX 3070 Laptop GPU | Acer Nitro 5 AN515-45-R1JH R7 5800H, GeForce RTX 3070 Laptop GPU | Schenker XMG Apex 15 NH57E PS R7 5800H, GeForce RTX 3060 Laptop GPU | Medio NVIDIA GeForce RTX 3070 Laptop GPU | Media de la clase Gaming | |
|---|---|---|---|---|---|---|---|
| Power Consumption | -4% | 11% | 13% | 3% | -35% | -26% | |
| Idle Minimum * (Watt) | 10 | 12 -20% | 8 20% | 8.8 12% | 10.5 -5% | 15.6 ? -56% | 13.1 ? -31% |
| Idle Average * (Watt) | 12 | 18 -50% | 12 -0% | 13 -8% | 15 -25% | 20.1 ? -68% | 19 ? -58% |
| Idle Maximum * (Watt) | 16 | 21 -31% | 22 -38% | 14.6 9% | 17 -6% | 29.4 ? -84% | 24.6 ? -54% |
| Load Average * (Watt) | 124 | 94 24% | 98 21% | 133 -7% | 109 12% | 110.8 ? 11% | 111.3 ? 10% |
| Witcher 3 ultra * (Watt) | 204 | 147 28% | 152 25% | 134 34% | 186 9% | ||
| Load Maximum * (Watt) | 272 | 199 27% | 162 40% | 164 40% | 186 32% | 214 ? 21% | 260 ? 4% |
* ... más pequeño es mejor
The Witcher 3 energy consumption
Energy consumption with an external monitor
Duración de la batería
El portátil de 15,6 pulgadas logra duraciones de 6:21 horas y 7:15 horas en la prueba Wi-Fi (acceso a sitios web a través de un script) y la prueba de vídeo (cortometraje Big Buck Bunny (codificación H.264, Full HD) ejecutado en bucle), respectivamente. Las funciones de ahorro de energía del portátil están desactivadas durante ambas pruebas, y el brillo de la pantalla está ajustado a unos 150 cd/m². Además, los módulos inalámbricos están desactivados para la prueba de vídeo
| Gigabyte A5 X1 R9 5900HX, GeForce RTX 3070 Laptop GPU, 48.96 Wh | HP Omen 16-b0085ng i7-11800H, GeForce RTX 3070 Laptop GPU, 83 Wh | MSI Katana GF66 11UG-220 i7-11800H, GeForce RTX 3070 Laptop GPU, 90 Wh | Acer Nitro 5 AN515-45-R1JH R7 5800H, GeForce RTX 3070 Laptop GPU, 57.5 Wh | Schenker XMG Apex 15 NH57E PS R7 5800H, GeForce RTX 3060 Laptop GPU, 49 Wh | Media de la clase Gaming | |
|---|---|---|---|---|---|---|
| Duración de Batería | 0% | -12% | -12% | -9% | 4% | |
| Reader / Idle (h) | 10.1 | 9.1 -10% | 9.2 -9% | 7.84 ? -22% | ||
| H.264 (h) | 7.3 | 5.4 -26% | 6.9 -5% | 4.6 -37% | 8.27 ? 13% | |
| WiFi v1.3 (h) | 6.4 | 7.6 19% | 5.3 -17% | 5.7 -11% | 6.5 2% | 7.08 ? 11% |
| Load (h) | 1.3 | 1.4 8% | 1.2 -8% | 1 -23% | 1.4 8% | 1.496 ? 15% |
Pro
Contra
Veredicto - El A5 X1 hace lo que debe hacer
ElRyzen 9 5900HX APUy elGeForce RTX 3070 para portátiles (TGP máx.: 140 vatios) llevan todos los juegos más recientes a la pantalla Full HD con todo detalle. También son posibles resoluciones superiores a Full HD si se conecta un monitor adecuado. La CPU y la GPU funcionan a una velocidad de reloj elevada y constante
Gigabyte ofrece un sólido portátil para juegos con el A5 X1.
El portátil se calienta notablemente bajo carga, pero no en exceso. El desarrollo del ruido está en línea con la clase: El portátil se vuelve ruidoso bajo carga. El perfil de energía del "Modo Silencioso" lleva a una disminución significativa del ruido. La reducida potencia de cálculo resultante sigue siendo suficiente para jugar - con algunos compromisos
La escasa capacidad de almacenamiento (512 GB) puede ampliarse con un segundo SSD M.2 y/o una unidad de almacenamiento de 2.5 pulgadas. La pantalla mate y de ángulo de visión estable (Full HD, IPS, 240 Hz) gana puntos en términos de brillo, reproducción del color y cobertura del espacio de color. Sin embargo, su contraste es demasiado bajo. La duración de la batería está perfectamente bien. Es una pena que la batería no se pueda cargar por USB-C
Una alternativa al A5 X1 sería el HP Omen 16. Ofrece una pantalla ligeramente mayor y Thunderbolt 4, pero el portátil HP apenas puede aprovechar la batería mucho mayor (83 Wh).
Precio y disponibilidad
En el momento de escribir este artículo, el Gigabyte A5 X1 se puede encontrar en Amazon en la configuración que probamos (Ryzen 9 5900HX, GeForce RTX 3070, 16 GB de RAM, 512 GB de SSD) a un precio de actualmente rebajado de 1.699 $
Gigabyte A5 X1
- 01/03/2022 v7 (old)
Sascha Mölck
Price comparison

