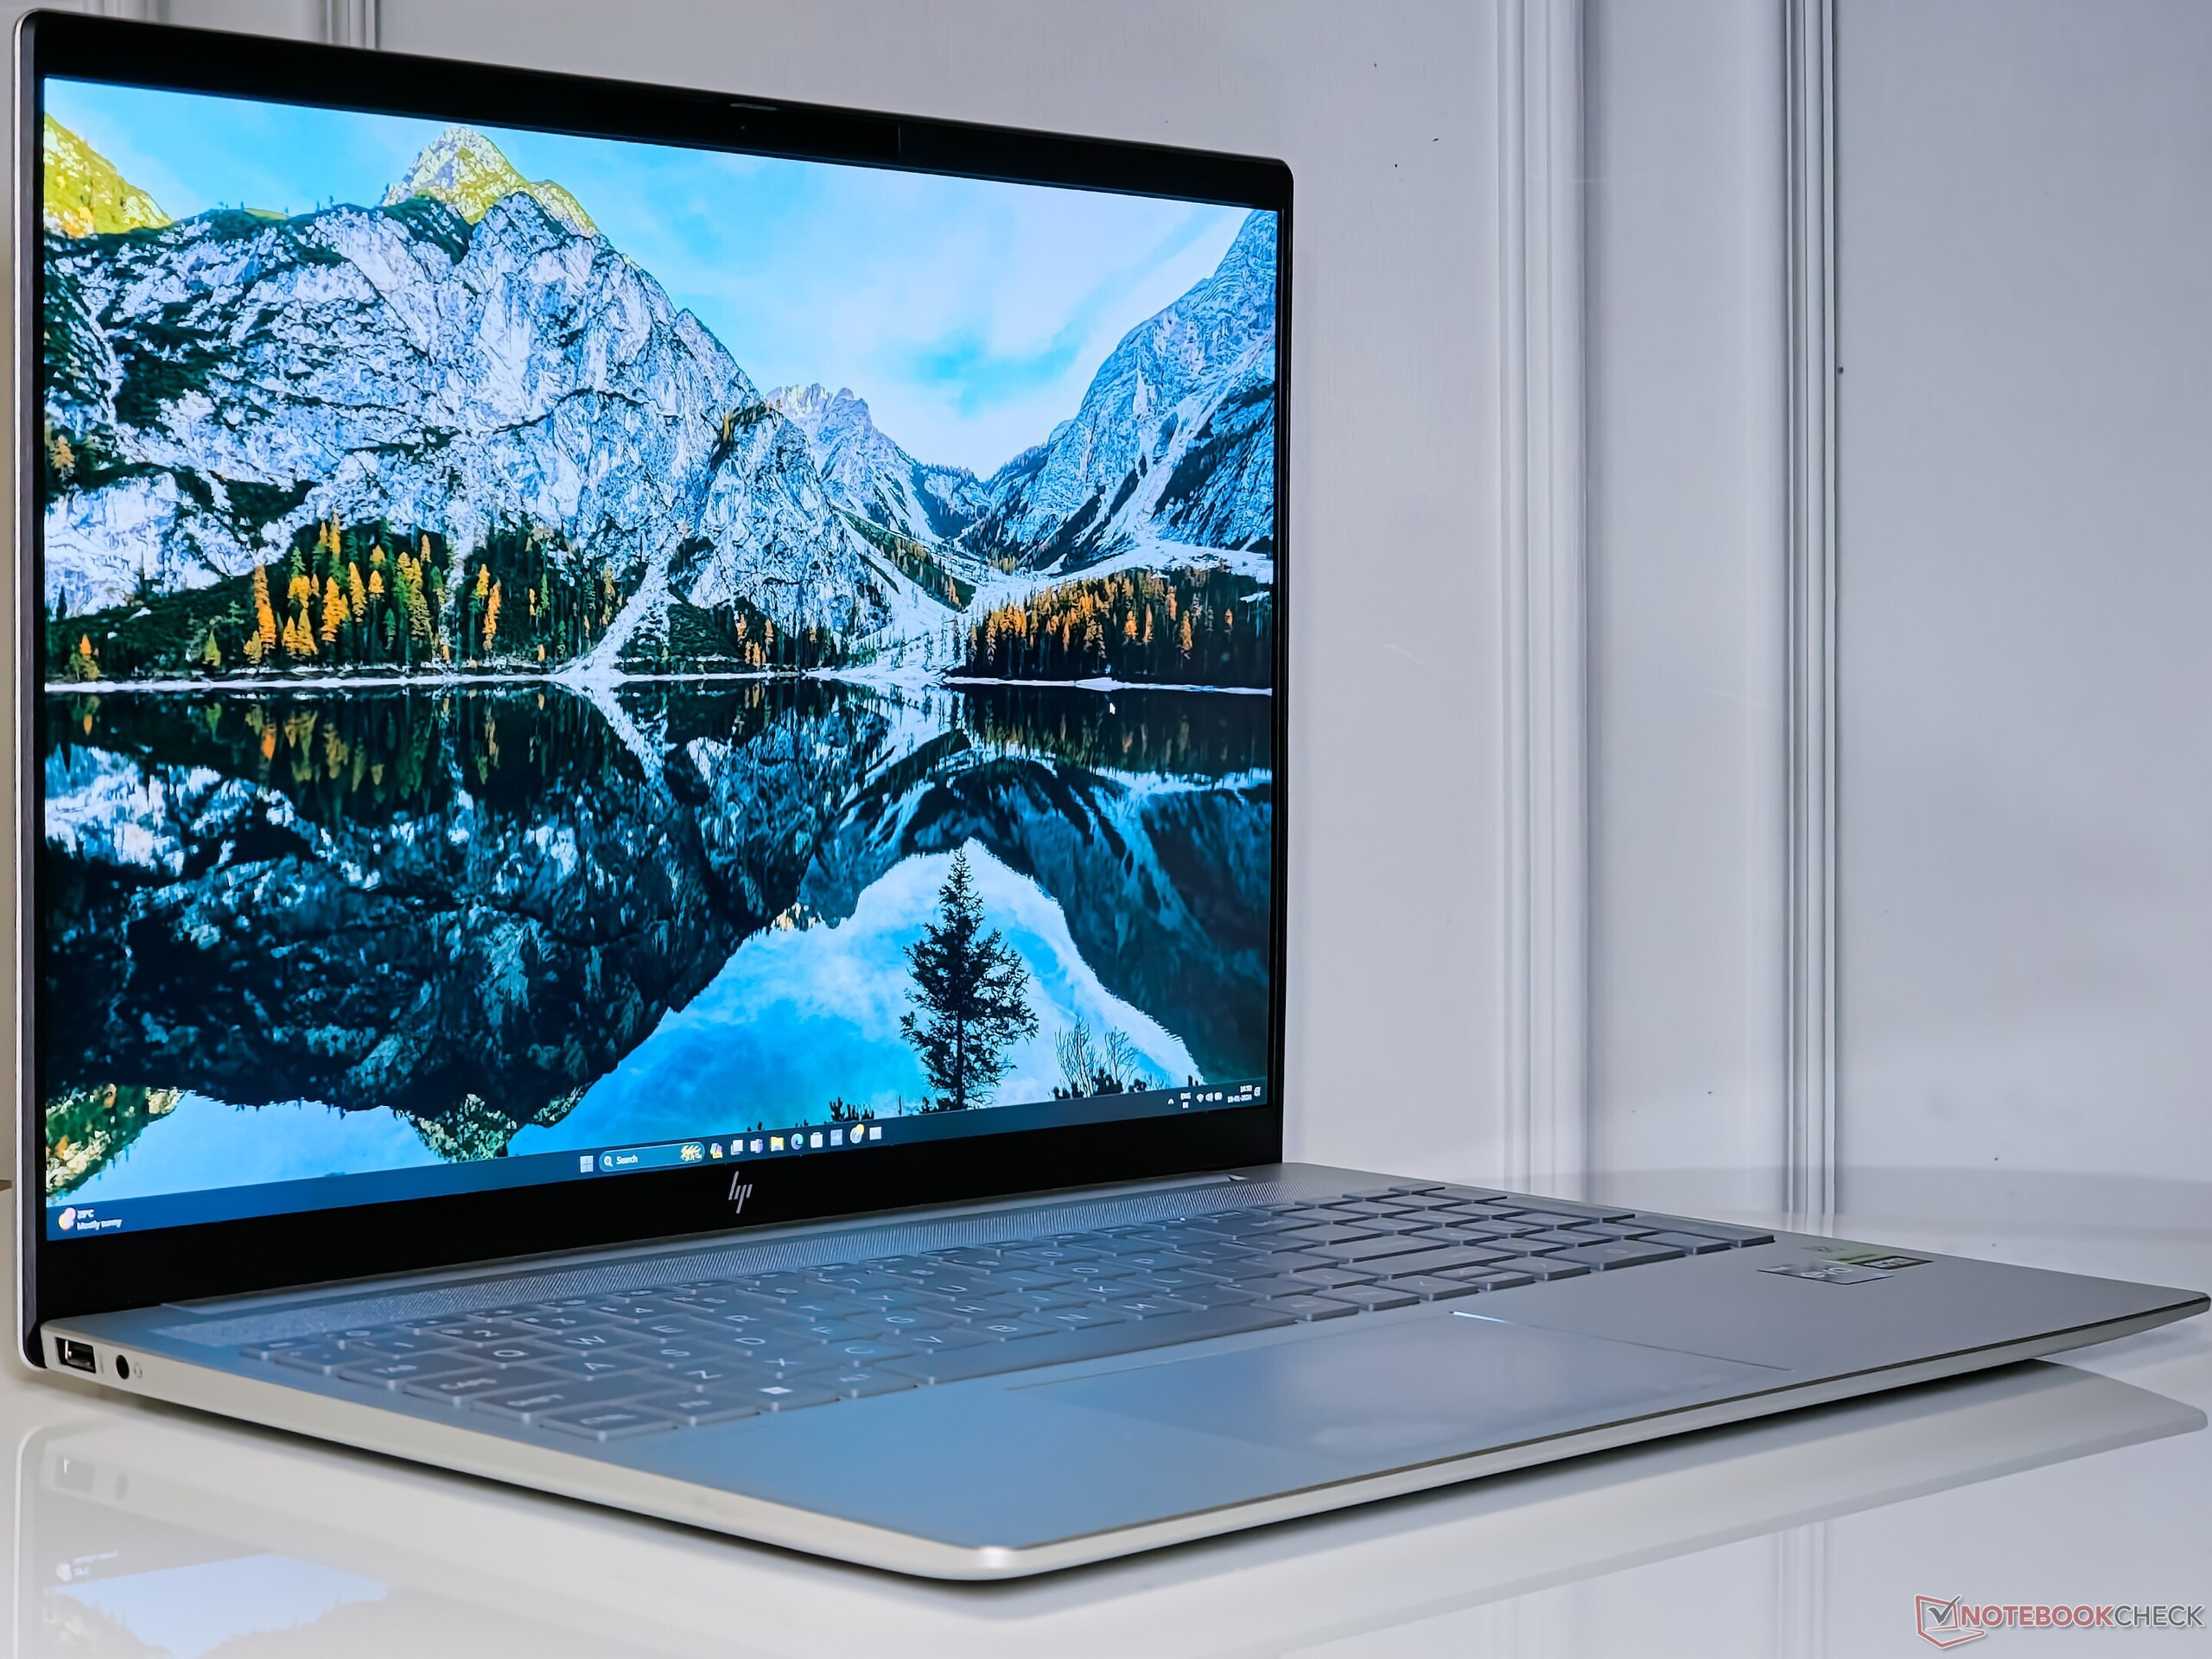
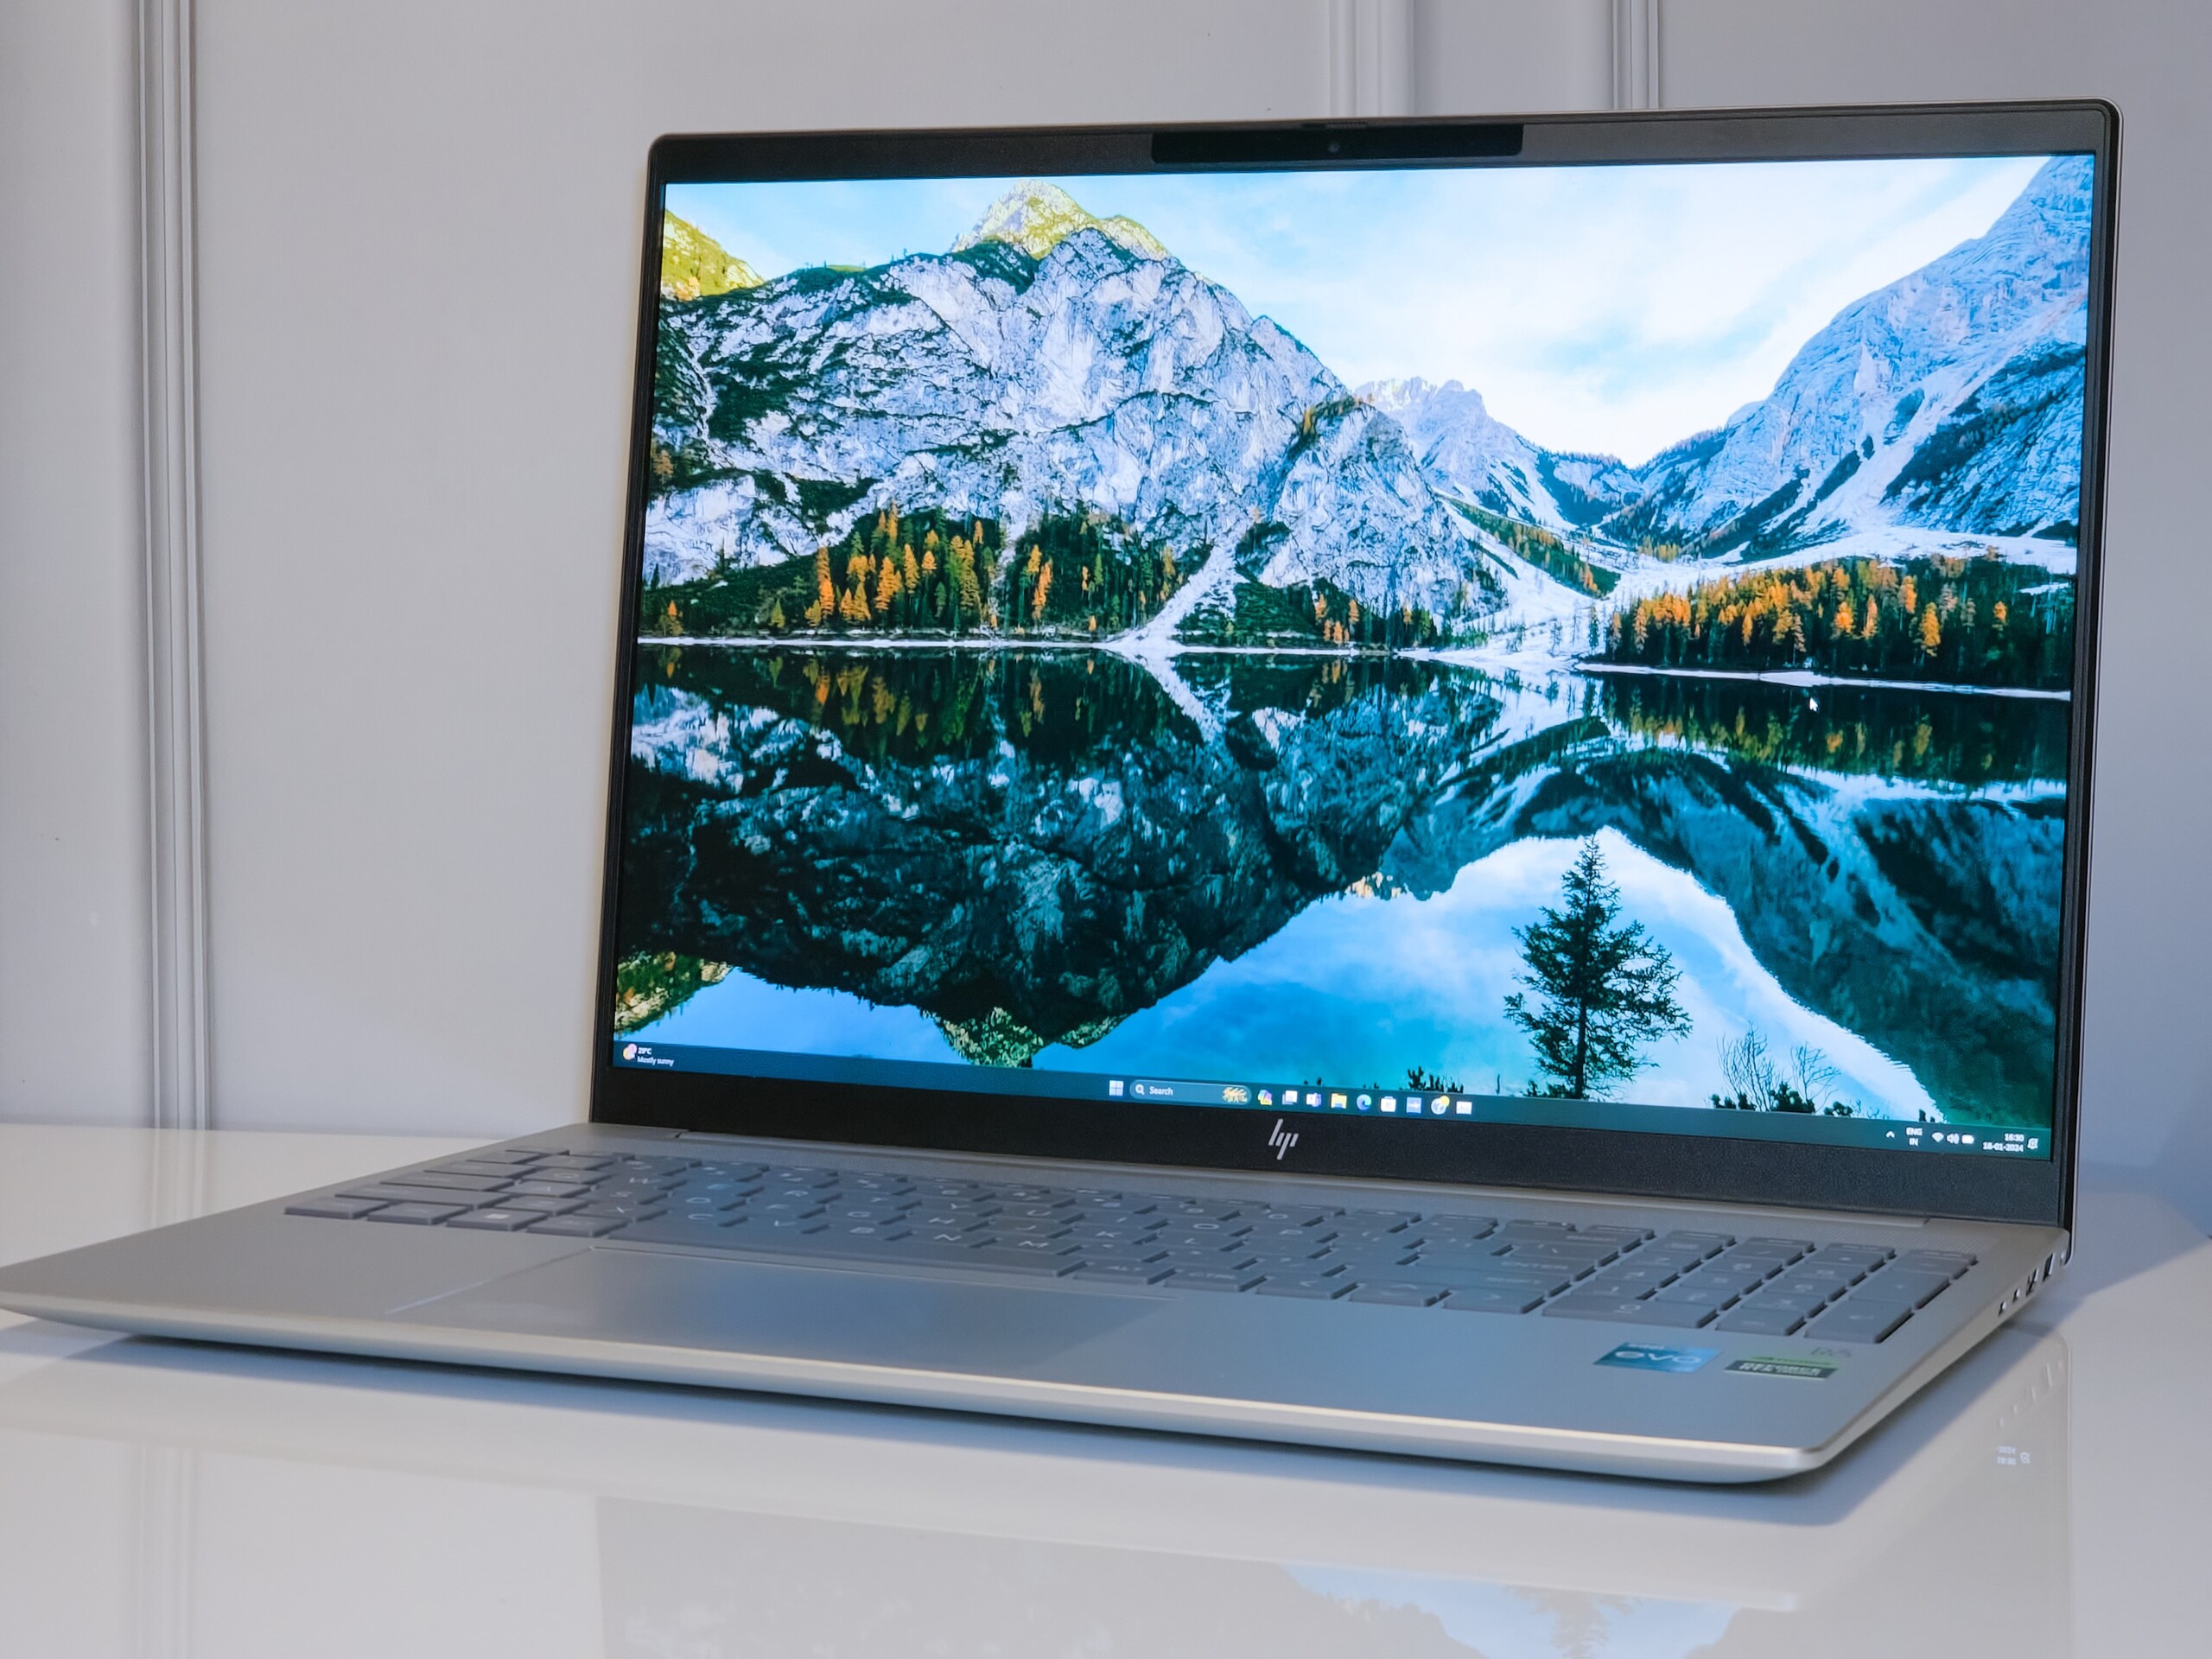
Análisis del HP Pavilion Plus 16: Portátil multimedia premium que podría haberse beneficiado de una RTX 4050
")
HP presentó recientemente dos nuevos modelos Pavilion Plus como alternativa más asequible a la serie Envy. Anteriormente revisamos el Pavilion Plus 14 en ambos Intel Raptor Lake y AMD Zen 4 de AMD. Ahora, echamos un vistazo al Pavilion Plus 16, más grande.
El Pavilion Plus 16 renuncia al panel OLED "IMAX Enhanced" del Pavilion Plus 14, pero en su lugar ofrece un procesador de la serie H y gráficos Nvidia opcionales.
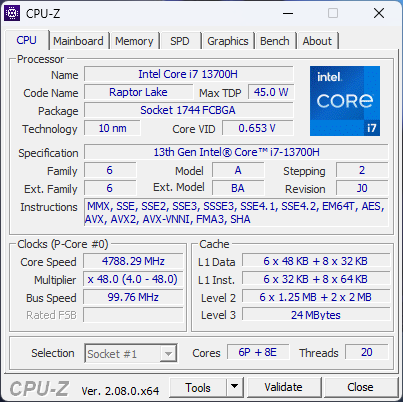
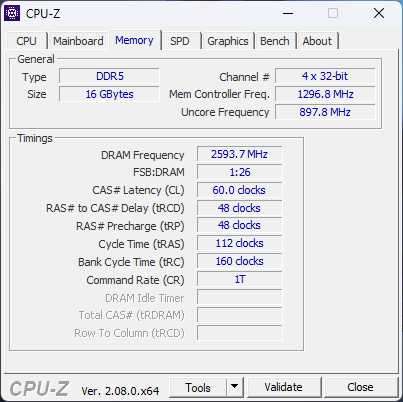
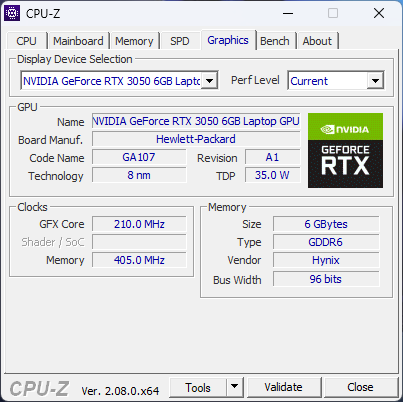
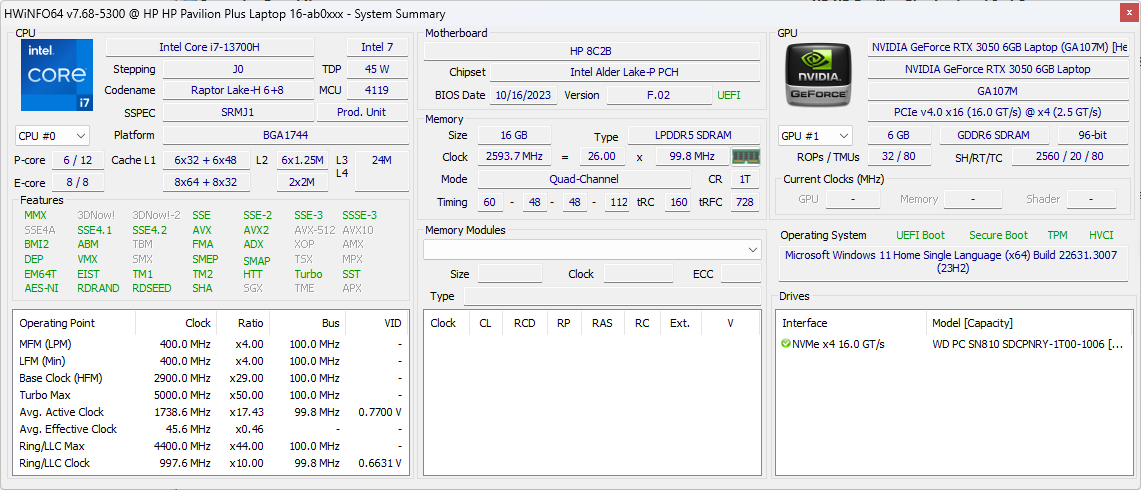
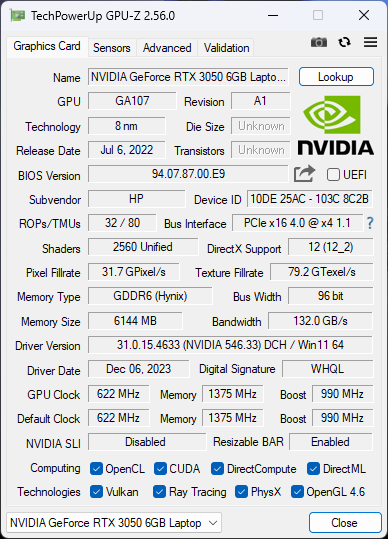
Nuestra unidad Pavilion Plus 16 cuenta con un Intel Core i7-13700H junto con 16 GB de RAM, 1 TB de SSD y una pantalla IPS de 16 pulgadas 2560 x 1600 120 Hz. El Pavilion Plus 16 se encuentra entre el puñado de portátiles que incorporan el procesador GPU Nvidia GeForce RTX 3050 de 6 GB para portátiles. Esta configuración le costará ₹1.24.999 (1.350 dólares) en la tienda oficial de HP en India.
Posibles contendientes en la comparación
Valoración | Fecha | Modelo | Peso | Altura | Tamaño | Resolución | Precio |
|---|---|---|---|---|---|---|---|
| 88.7 % v7 (old) | 02/2024 | HP Pavilion Plus 16-ab0456tx i7-13700H, GeForce RTX 3050 6GB Laptop GPU | 1.9 kg | 19.9 mm | 16.00" | 2560x1600 | |
| 88.2 % v7 (old) | 01/2024 | Schenker Vision 14 M23 RTX 3050 i7-13700H, GeForce RTX 3050 6GB Laptop GPU | 1.3 kg | 16.6 mm | 14.00" | 2880x1800 | |
| 87.1 % v7 (old) | 08/2023 | Dell Inspiron 16 Plus 7630 i7-13700H, GeForce RTX 4060 Laptop GPU | 2.2 kg | 19.95 mm | 16.00" | 2560x1600 | |
| 85.6 % v7 (old) | 08/2023 | Asus VivoBook 14X K3405 i5-13500H, GeForce RTX 3050 4GB Laptop GPU | 1.4 kg | 18.9 mm | 14.00" | 2880x1800 | |
| 89.2 % v7 (old) | 04/2023 | Lenovo Slim Pro 7 14ARP8 R7 7735HS, GeForce RTX 3050 6GB Laptop GPU | 1.6 kg | 15.6 mm | 14.50" | 2560x1600 | |
| 87.6 % v7 (old) | 11/2023 | Asus VivoBook Pro 16 K6602VU i9-13900H, GeForce RTX 4050 Laptop GPU | 1.9 kg | 19 mm | 16.00" | 3200x2000 | |
| 89.4 % v7 (old) | 04/2023 | Samsung Galaxy Book3 Ultra 16 i7-13700H, GeForce RTX 4050 Laptop GPU | 1.8 kg | 16.5 mm | 16.00" | 2880x1800 |
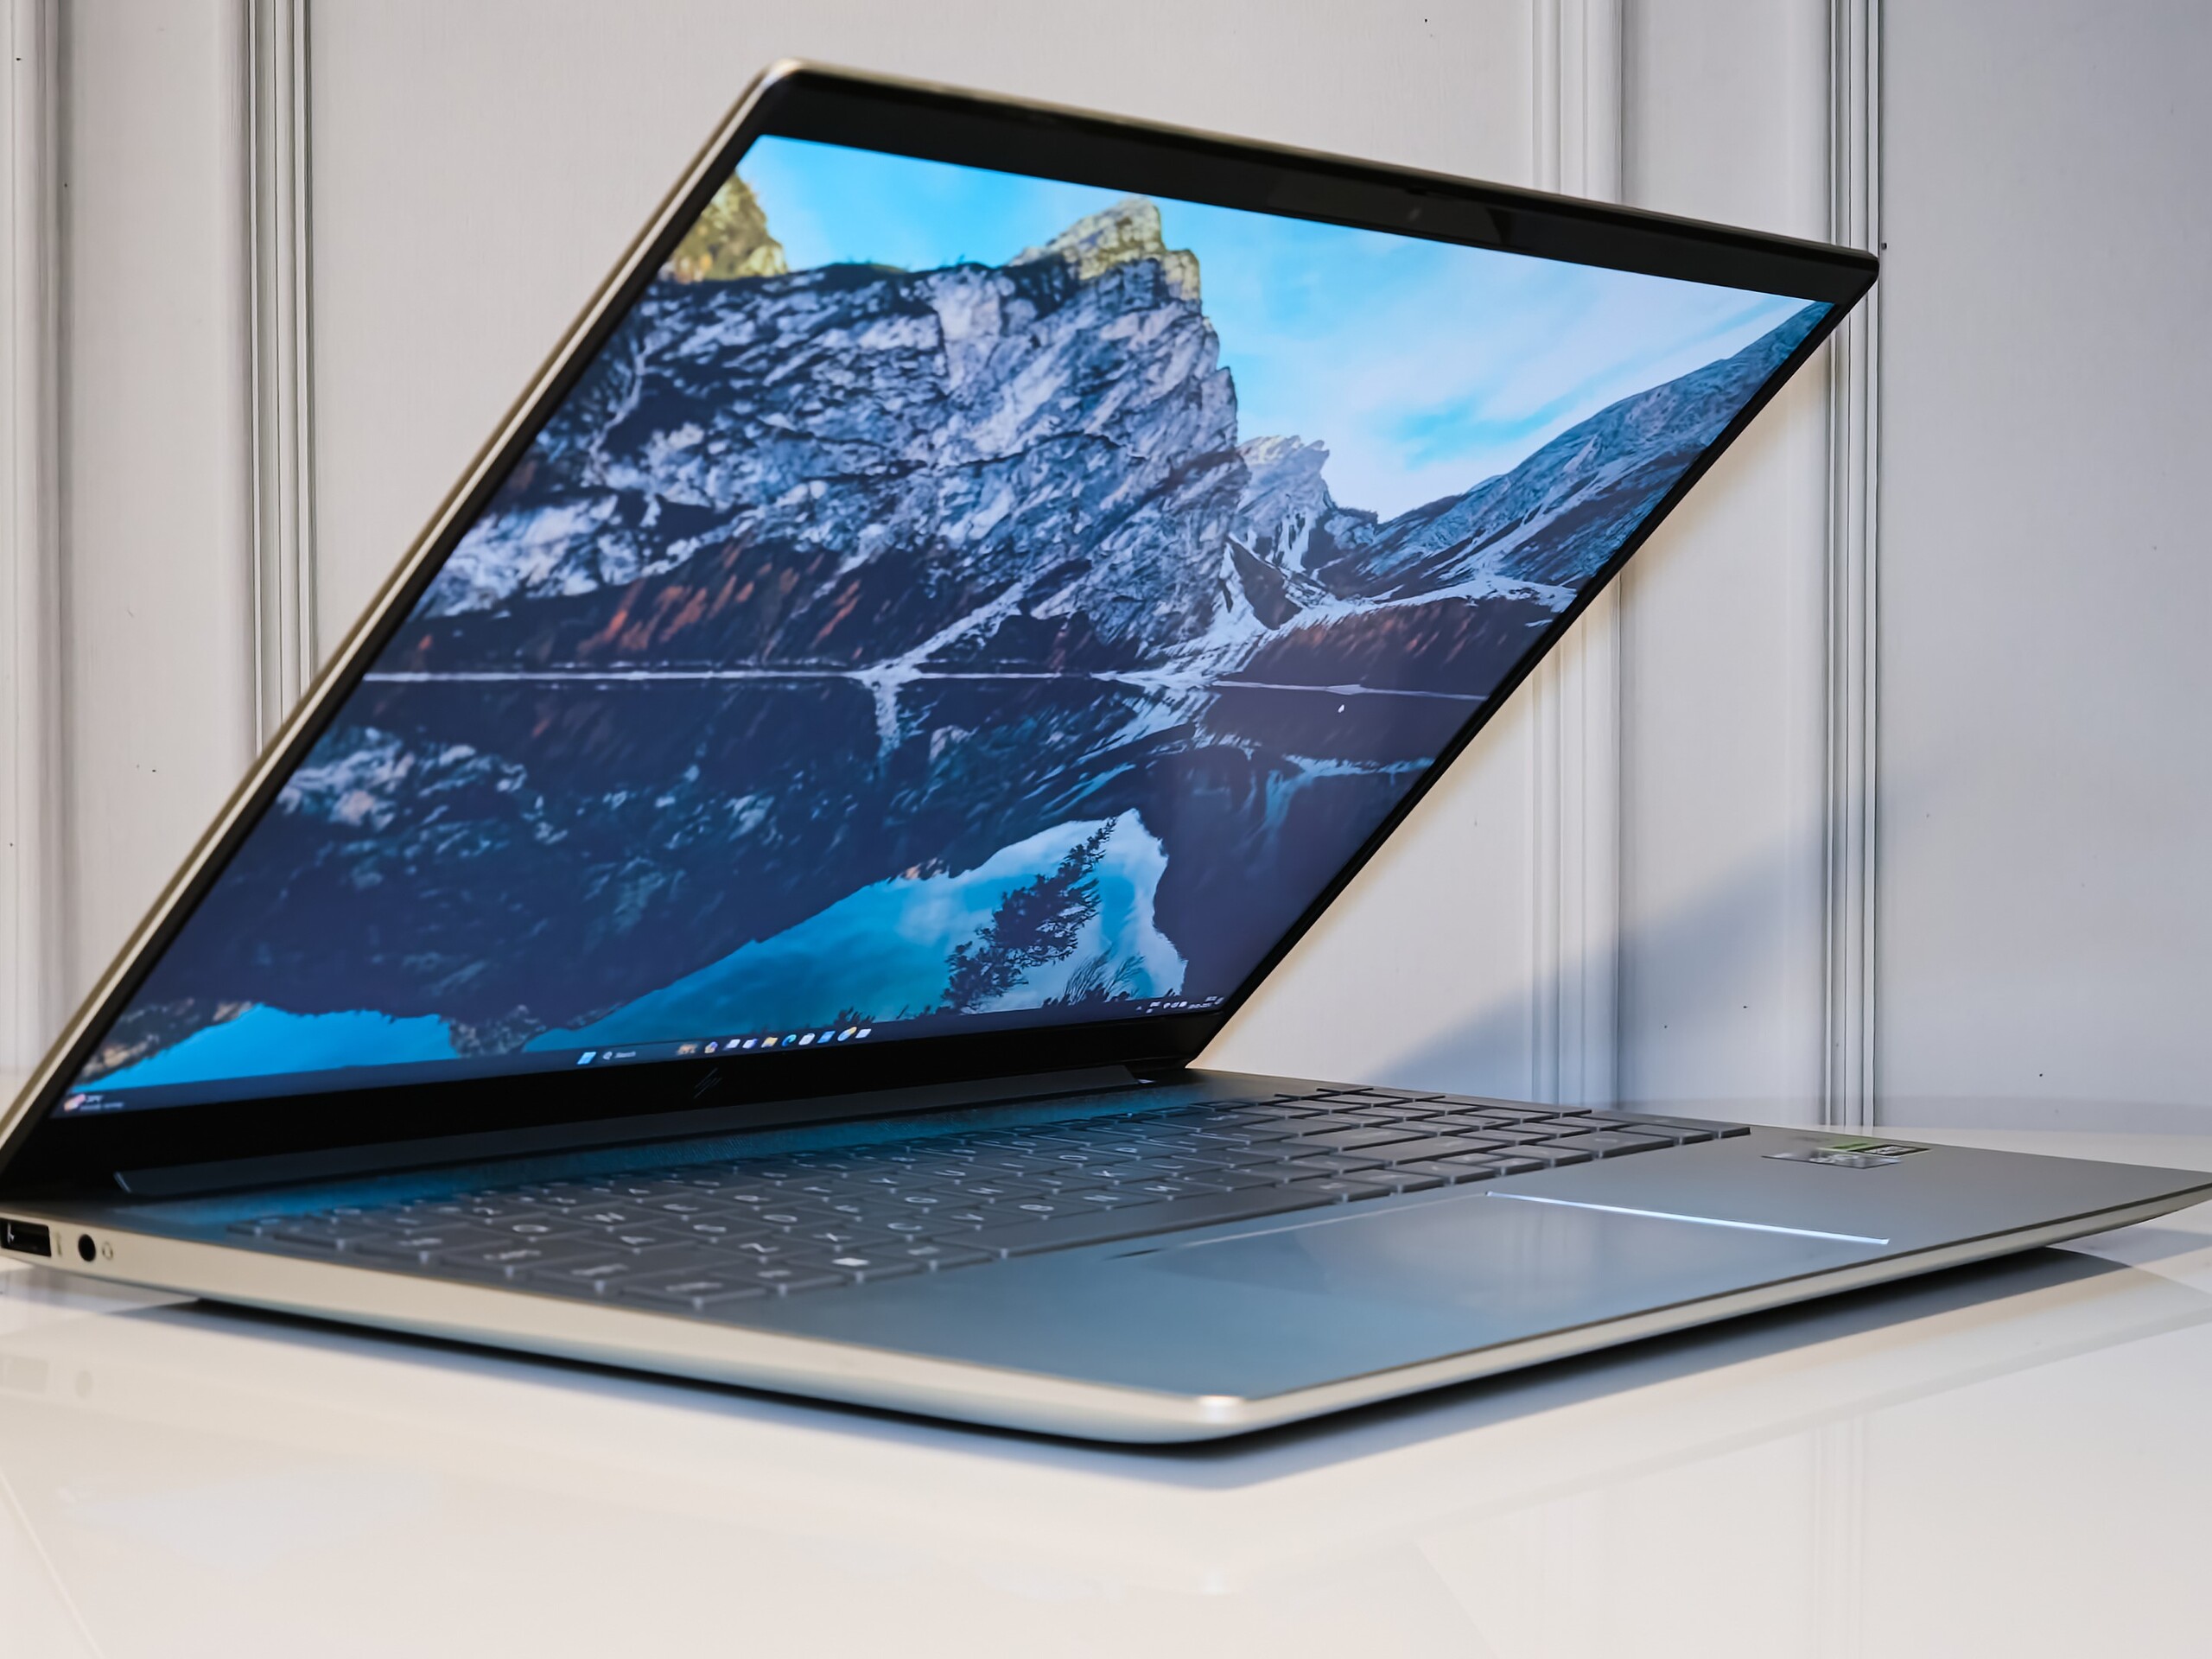
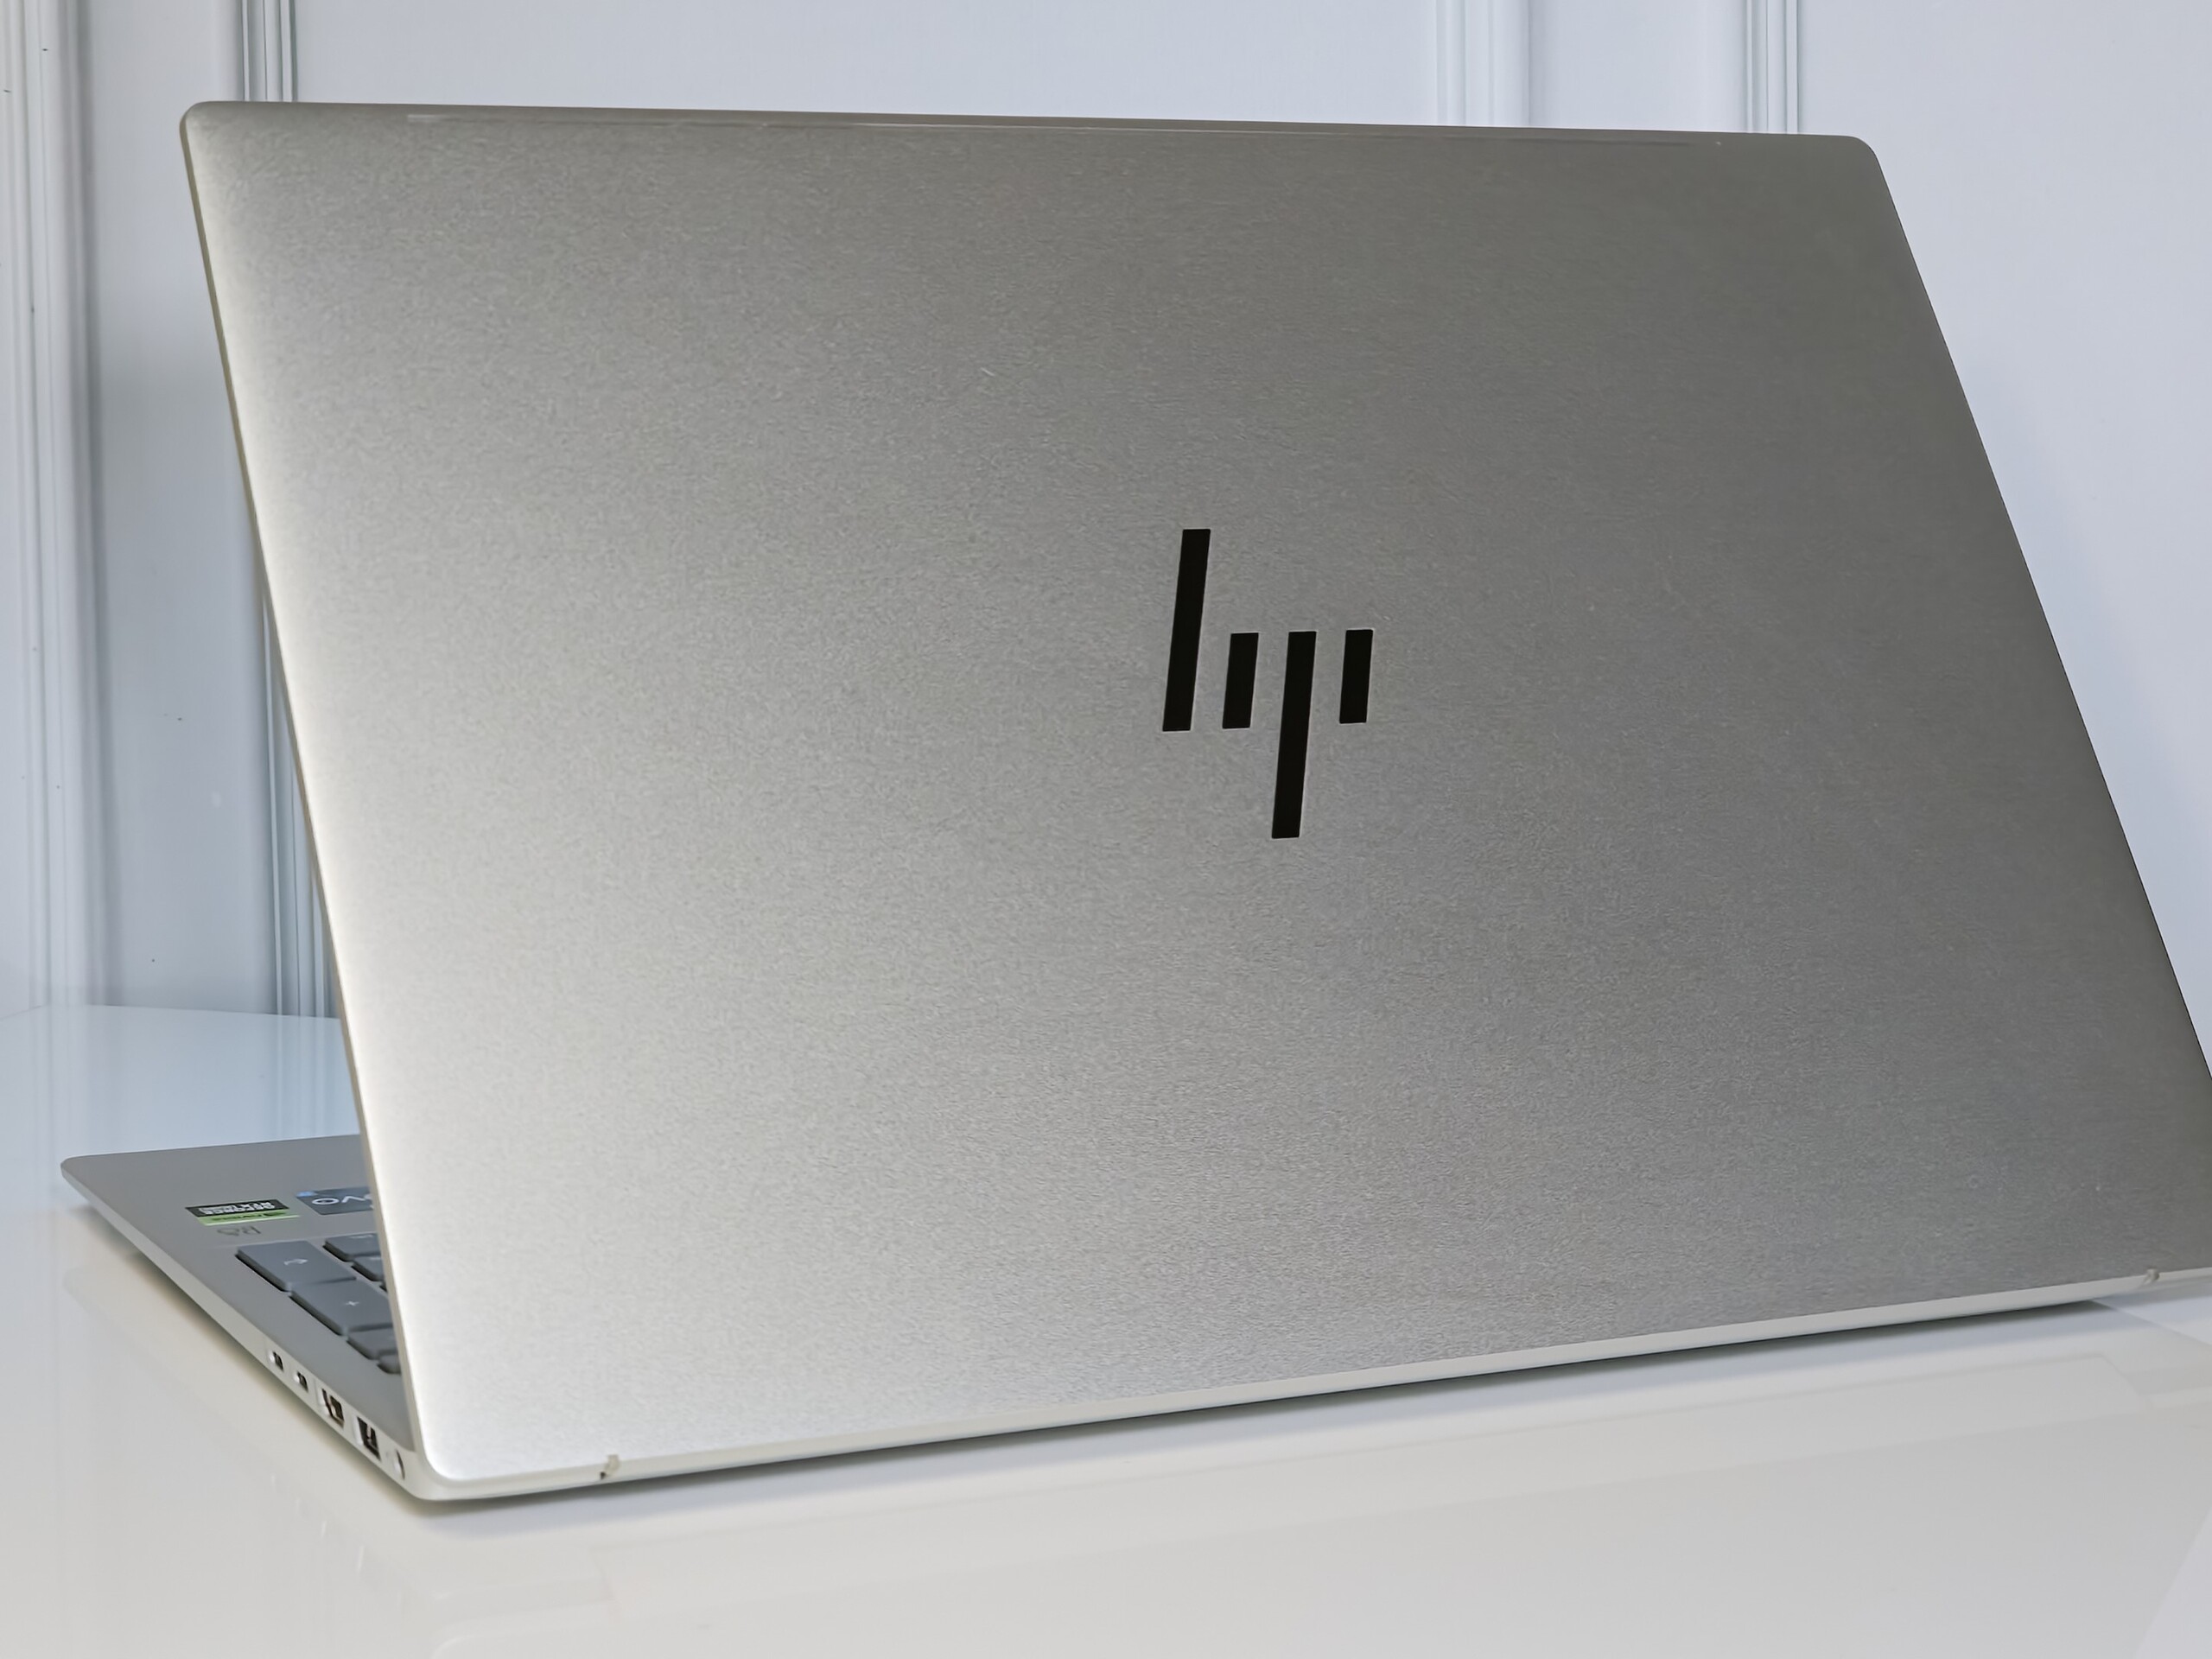
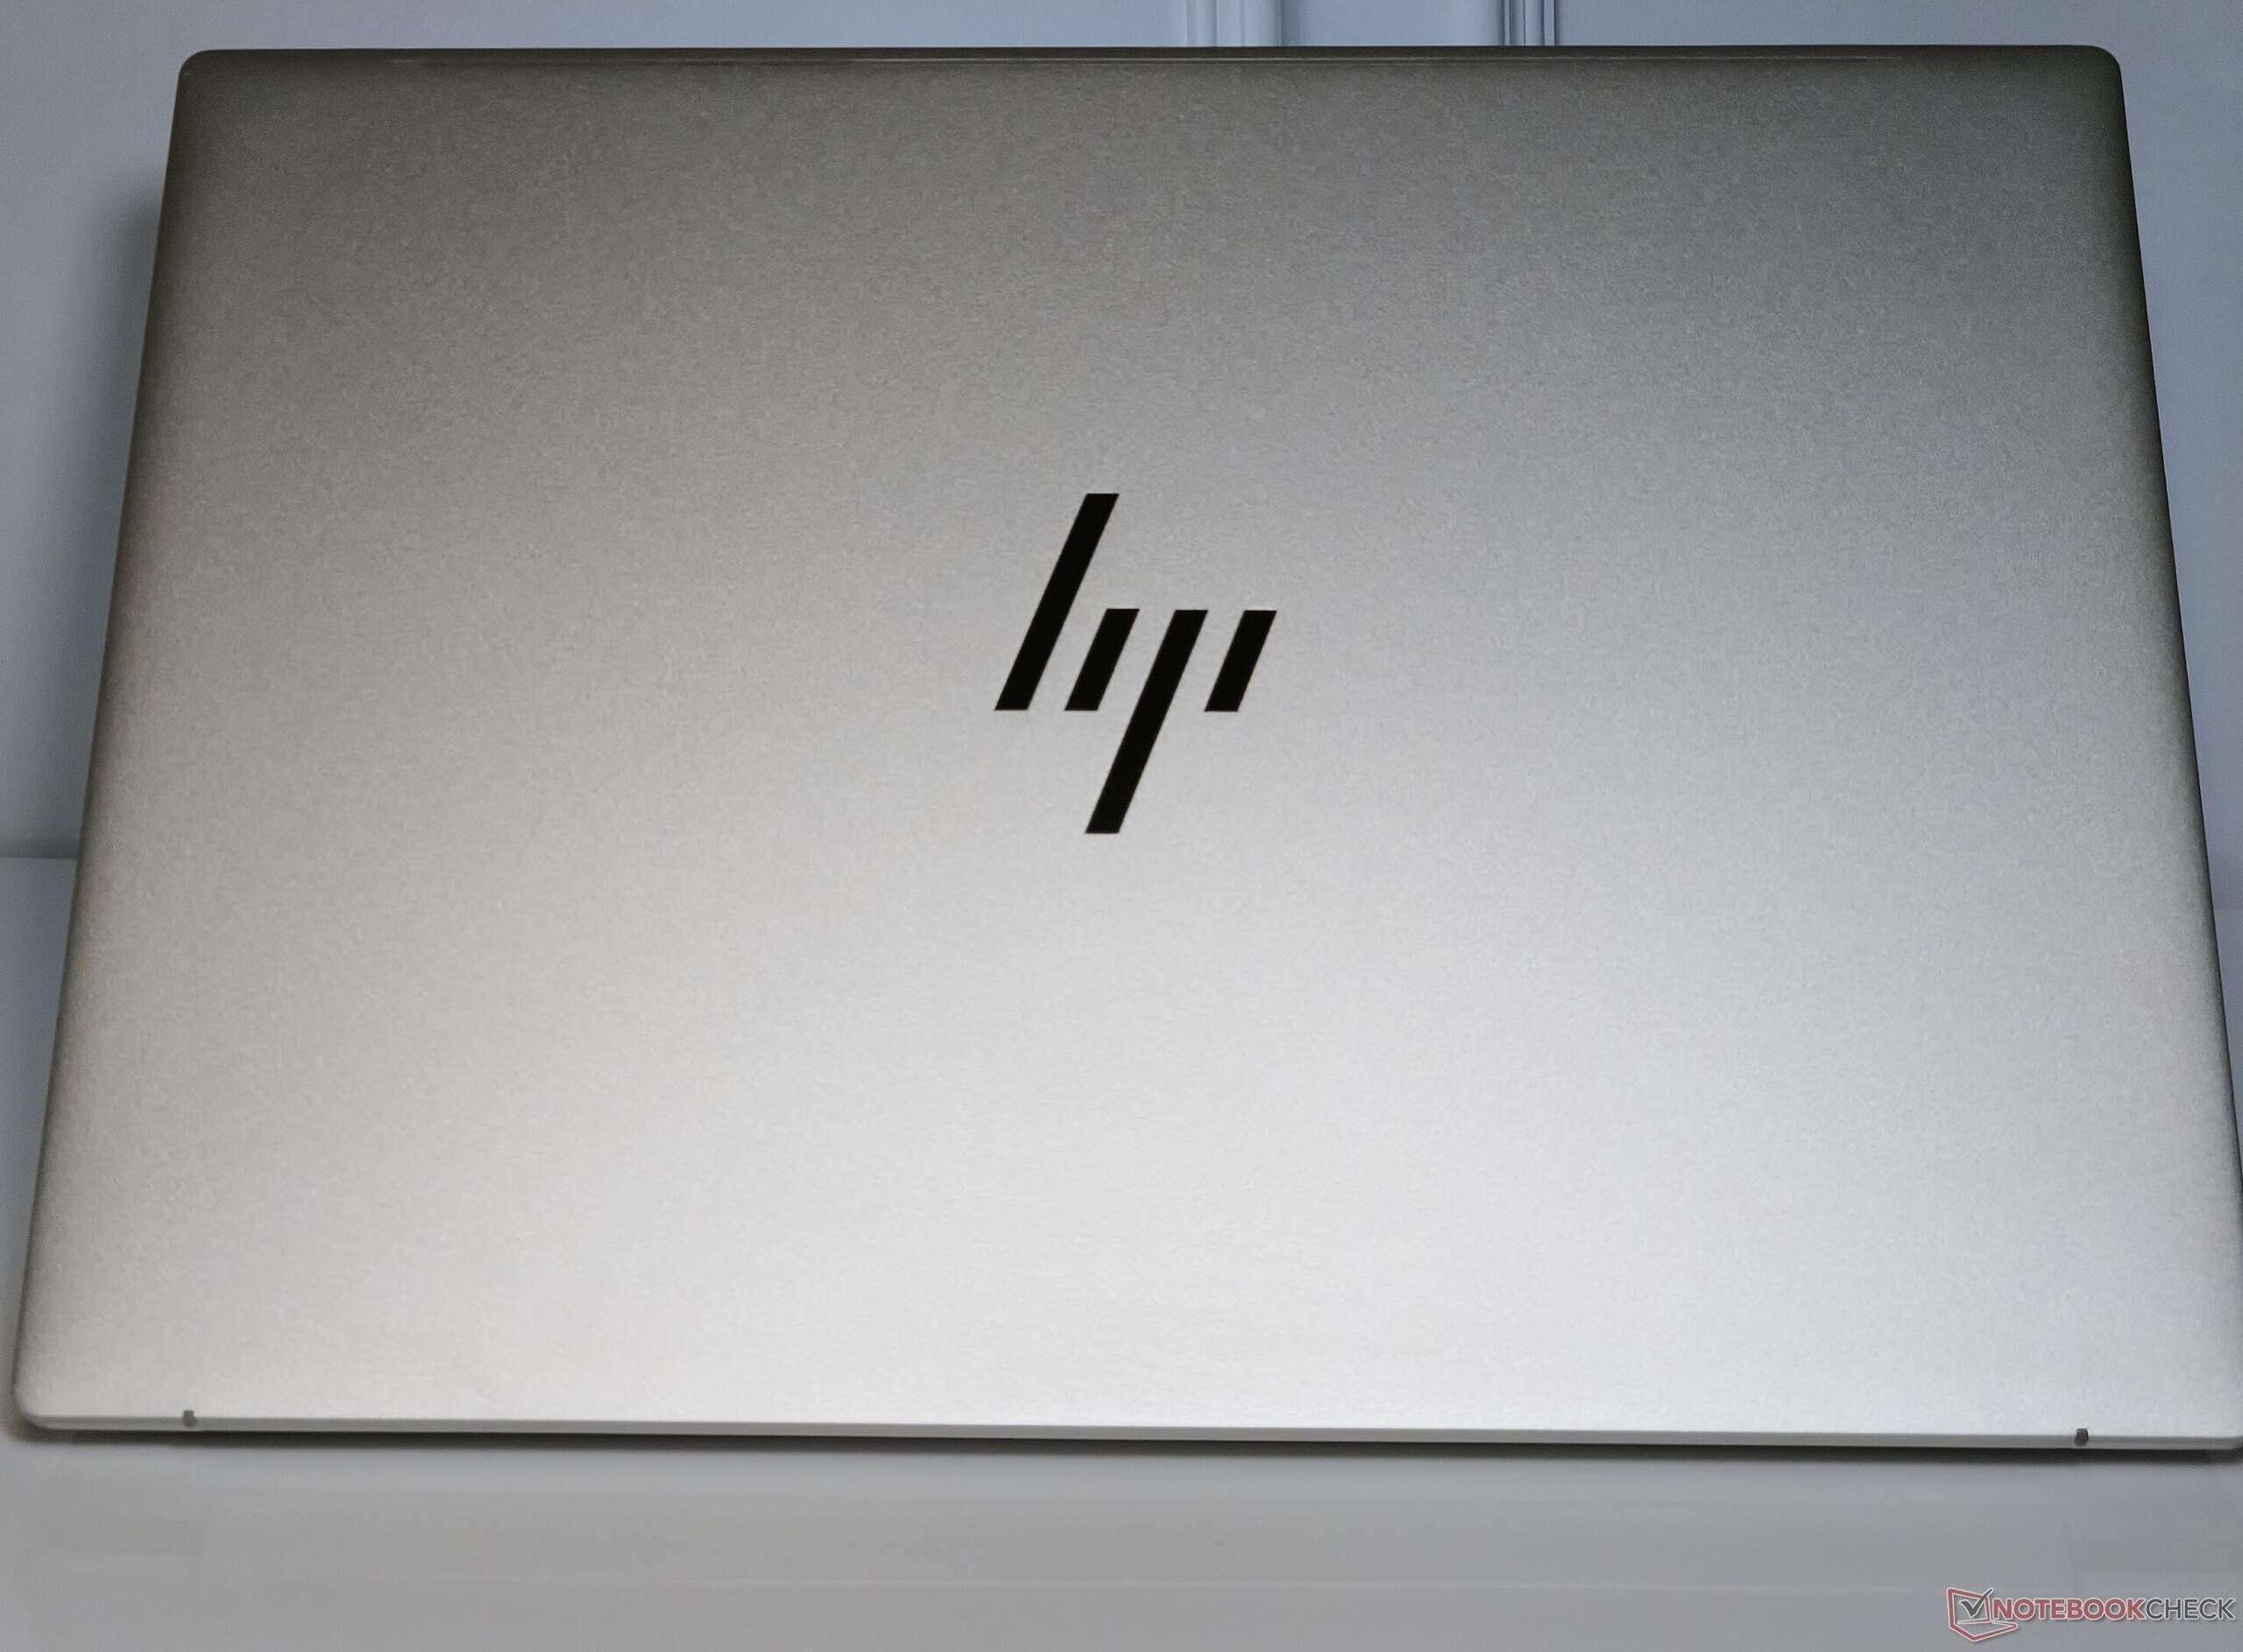
Chasis: Construcción robusta totalmente metálica
Similar a la Pavilion Plus 14, la Pavilion Plus 16 luce una construcción metálica Natural Silver para las cubiertas A, C y D, mientras que la tapa es de aluminio.
La calidad general de construcción deja poco lugar a quejas. No notamos ninguna flexión particular en la tapa ni en la cubierta del teclado.
HP anuncia una relación pantalla-cuerpo del 89,74%, pero el valor medido es del 83%. Con 1,9 kg, el portátil tiene un peso similar al de otros portátiles multimedia de 16 pulgadas en boga.
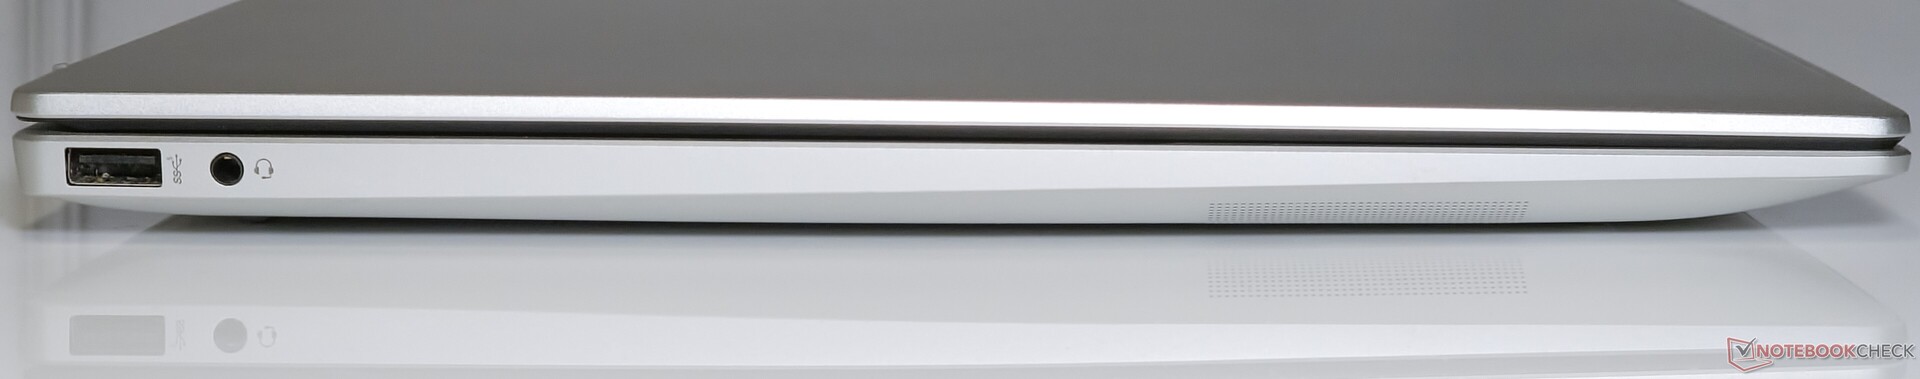
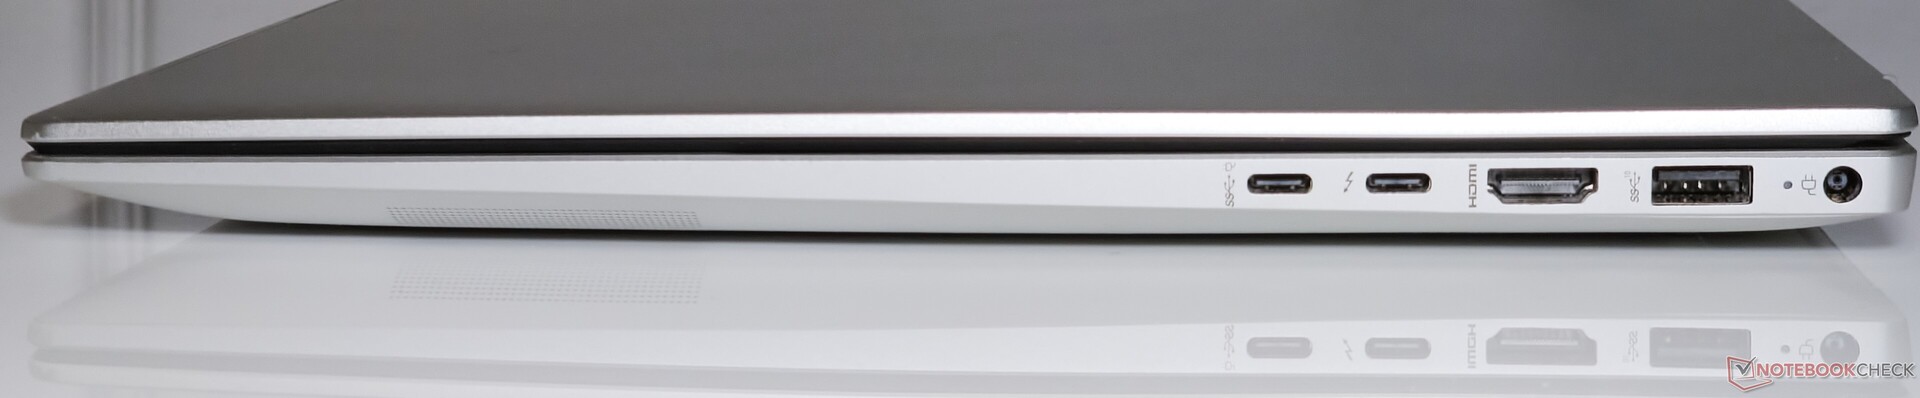
Conectividad: Rendimiento WLAN constante
El Pavilion Plus 16 ofrece una decente selección de puertos que incluye un USB Tipo-A y puertos USB Tipo-C, incluyendo Thunderbolt 4.
La colocación de los puertos está bien y no obstaculiza la conectividad periférica adyacente, pero uno de los puertos Tipo-C podría haber estado en el lado izquierdo para una distribución más uniforme.
Comunicación
El rendimiento iPerf3 del Pavilion Plus 16 en la banda de 5 GHz es un poco más lento que el que observamos con el Asus VivoBook Pro 16 con la misma tarjeta WLAN Intel Wi-Fi 6E AX211.
El Pavilion compensa esta deficiencia frente al VivoBook Pro 16 en el rendimiento de recepción a 6 GHz, pero no por mucho.
el rendimiento iPerf3 tanto en la banda de 5 GHz como en la de 6 GHz es bastante consistente sin ningún contratiempo a diferencia de lo que vemos con el Lenovo Slim Pro 7 con un chip MediaTek Wi-Fi 6E MT7922.
| Networking / iperf3 transmit AXE11000 | |
| Asus VivoBook 14X K3405 | |
| HP Pavilion Plus 16-ab0456tx | |
| Asus VivoBook Pro 16 K6602VU | |
| Samsung Galaxy Book3 Ultra 16 | |
| Media de la clase Multimedia (606 - 1978, n=61, últimos 2 años) | |
| Lenovo Slim Pro 7 14ARP8 | |
| Dell Inspiron 16 Plus 7630 | |
| Medio Intel Wi-Fi 6E AX211 (64 - 1921, n=276) | |
| Networking / iperf3 receive AXE11000 | |
| Asus VivoBook 14X K3405 | |
| Asus VivoBook Pro 16 K6602VU | |
| HP Pavilion Plus 16-ab0456tx | |
| Samsung Galaxy Book3 Ultra 16 | |
| Lenovo Slim Pro 7 14ARP8 | |
| Medio Intel Wi-Fi 6E AX211 (582 - 1890, n=276) | |
| Media de la clase Multimedia (682 - 1818, n=61, últimos 2 años) | |
| Dell Inspiron 16 Plus 7630 | |
| Networking / iperf3 transmit AXE11000 6GHz | |
| HP Pavilion Plus 16-ab0456tx | |
| Dell Inspiron 16 Plus 7630 | |
| Media de la clase Multimedia (869 - 2373, n=25, últimos 2 años) | |
| Asus VivoBook 14X K3405 | |
| Asus VivoBook Pro 16 K6602VU | |
| Medio Intel Wi-Fi 6E AX211 (385 - 1851, n=226) | |
| Networking / iperf3 receive AXE11000 6GHz | |
| HP Pavilion Plus 16-ab0456tx | |
| Media de la clase Multimedia (1212 - 2361, n=25, últimos 2 años) | |
| Asus VivoBook Pro 16 K6602VU | |
| Asus VivoBook 14X K3405 | |
| Medio Intel Wi-Fi 6E AX211 (700 - 1857, n=226) | |
| Dell Inspiron 16 Plus 7630 | |
Cámara web
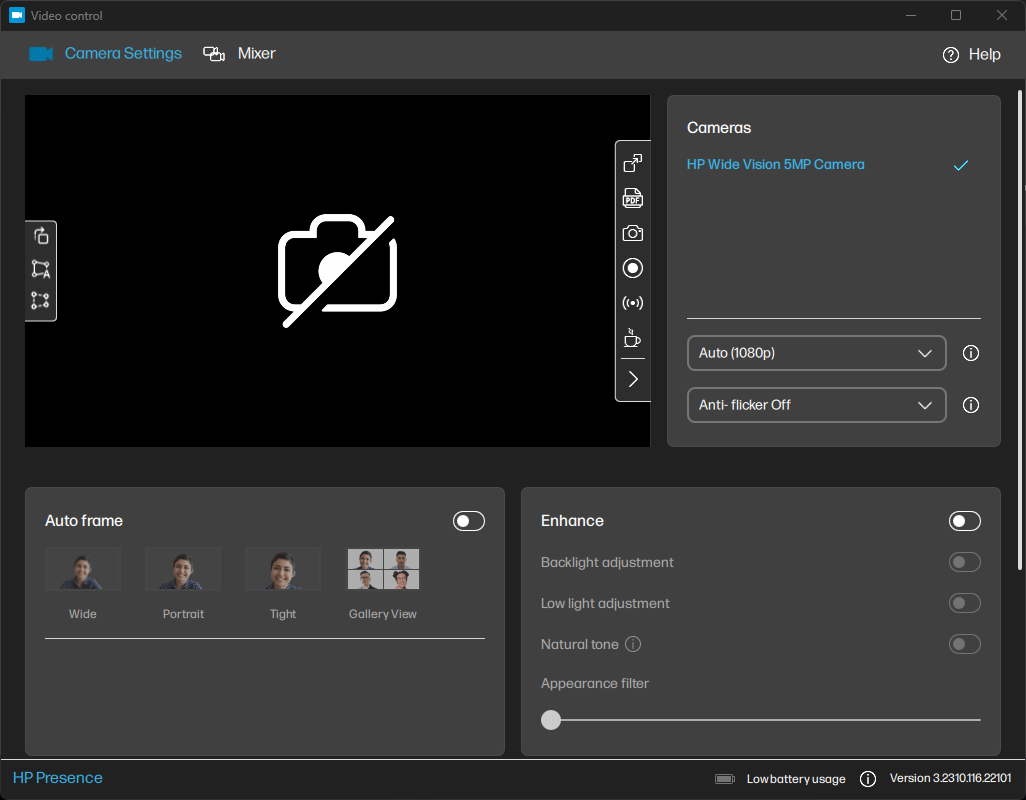
La webcam de 5 MP produce imágenes decentes que son bastante útiles para videoconferencias. Los detalles se conservan bastante bien para una webcam de portátil, pero la cámara puede tener dificultades con poca luz.
HP proporciona algunas utilidades ingeniosas como HP Enhanced Lighting que ilumina la pantalla alrededor del sujeto y una aplicación Video Control que ofrece opciones adicionales de encuadre y ajuste de la imagen.


Seguridad
HP proporciona una cámara IR compatible con Windows Hello para la Pavilion Plus 16 junto con un obturador de privacidad para la cámara web. La cámara IR funcionó razonablemente rápido durante el tiempo que pasamos con el dispositivo.
Además, un módulo TPM 2.0 está presente para cumplir con los requisitos de seguridad de Windows 11.
Accesorios y garantía
No hay accesorios adicionales en la caja, aparte del adaptador de corriente de 135 W y la documentación habitual.
HP ofrece un año de garantía para la Pavilion Plus 16 en la India. Los compradores pueden ampliar esta garantía hasta tres años más adquiriendo los HP Care Packs elegibles https://www.hp.com/in-en/shop/carepackfinder.
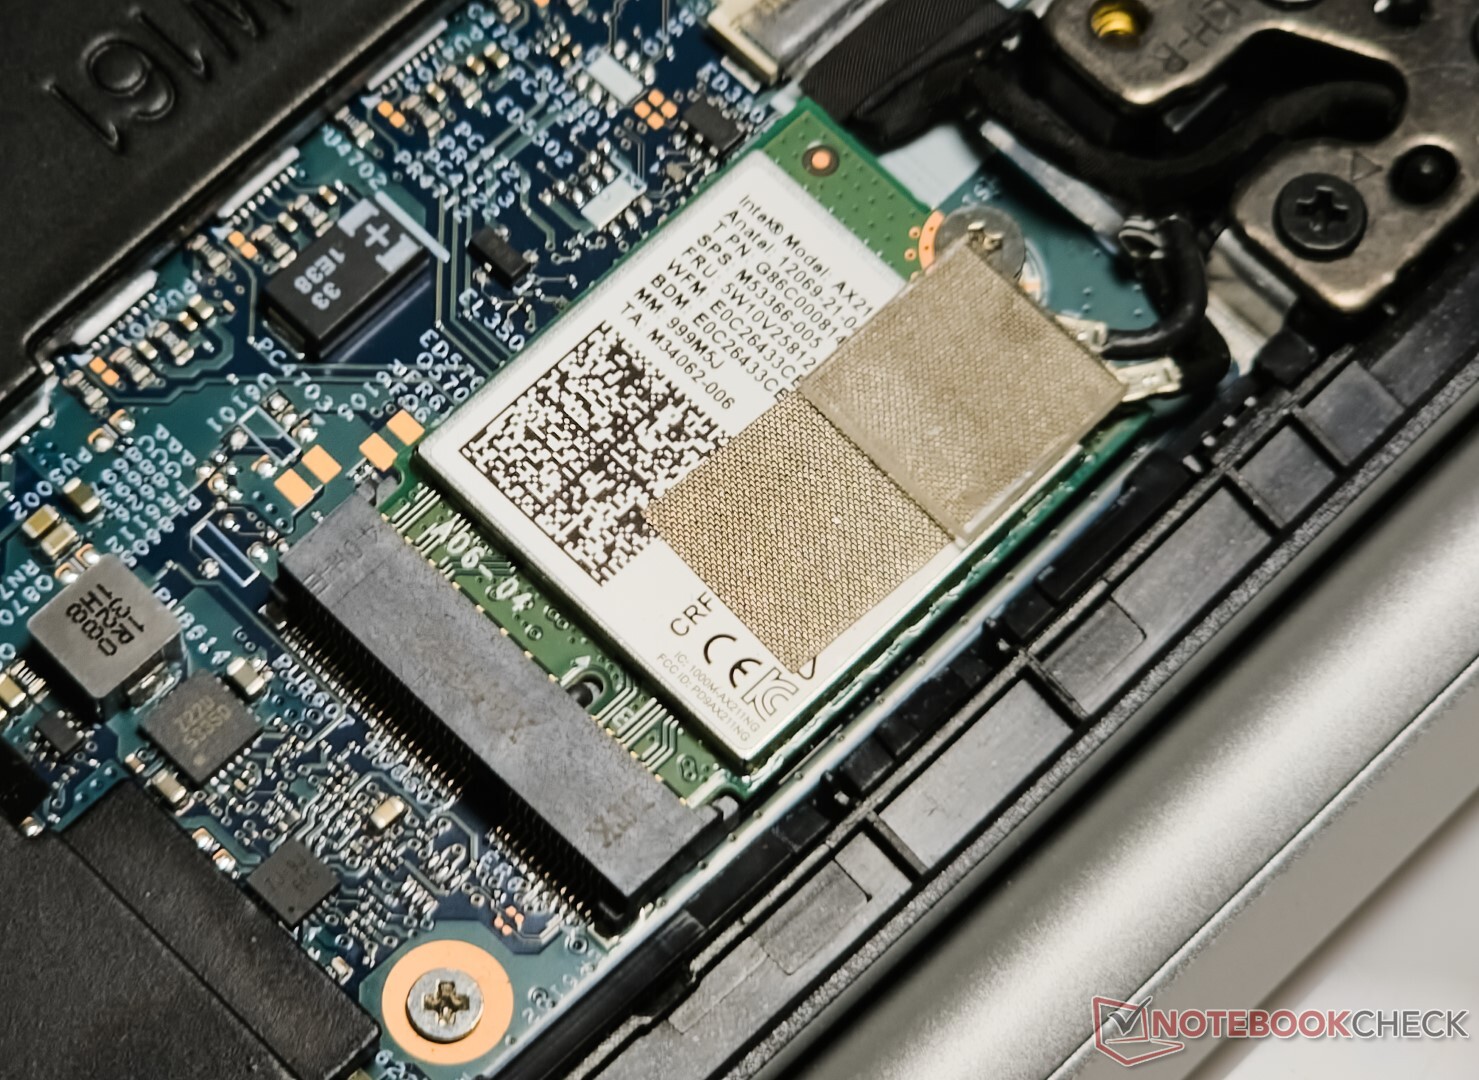
Mantenimiento
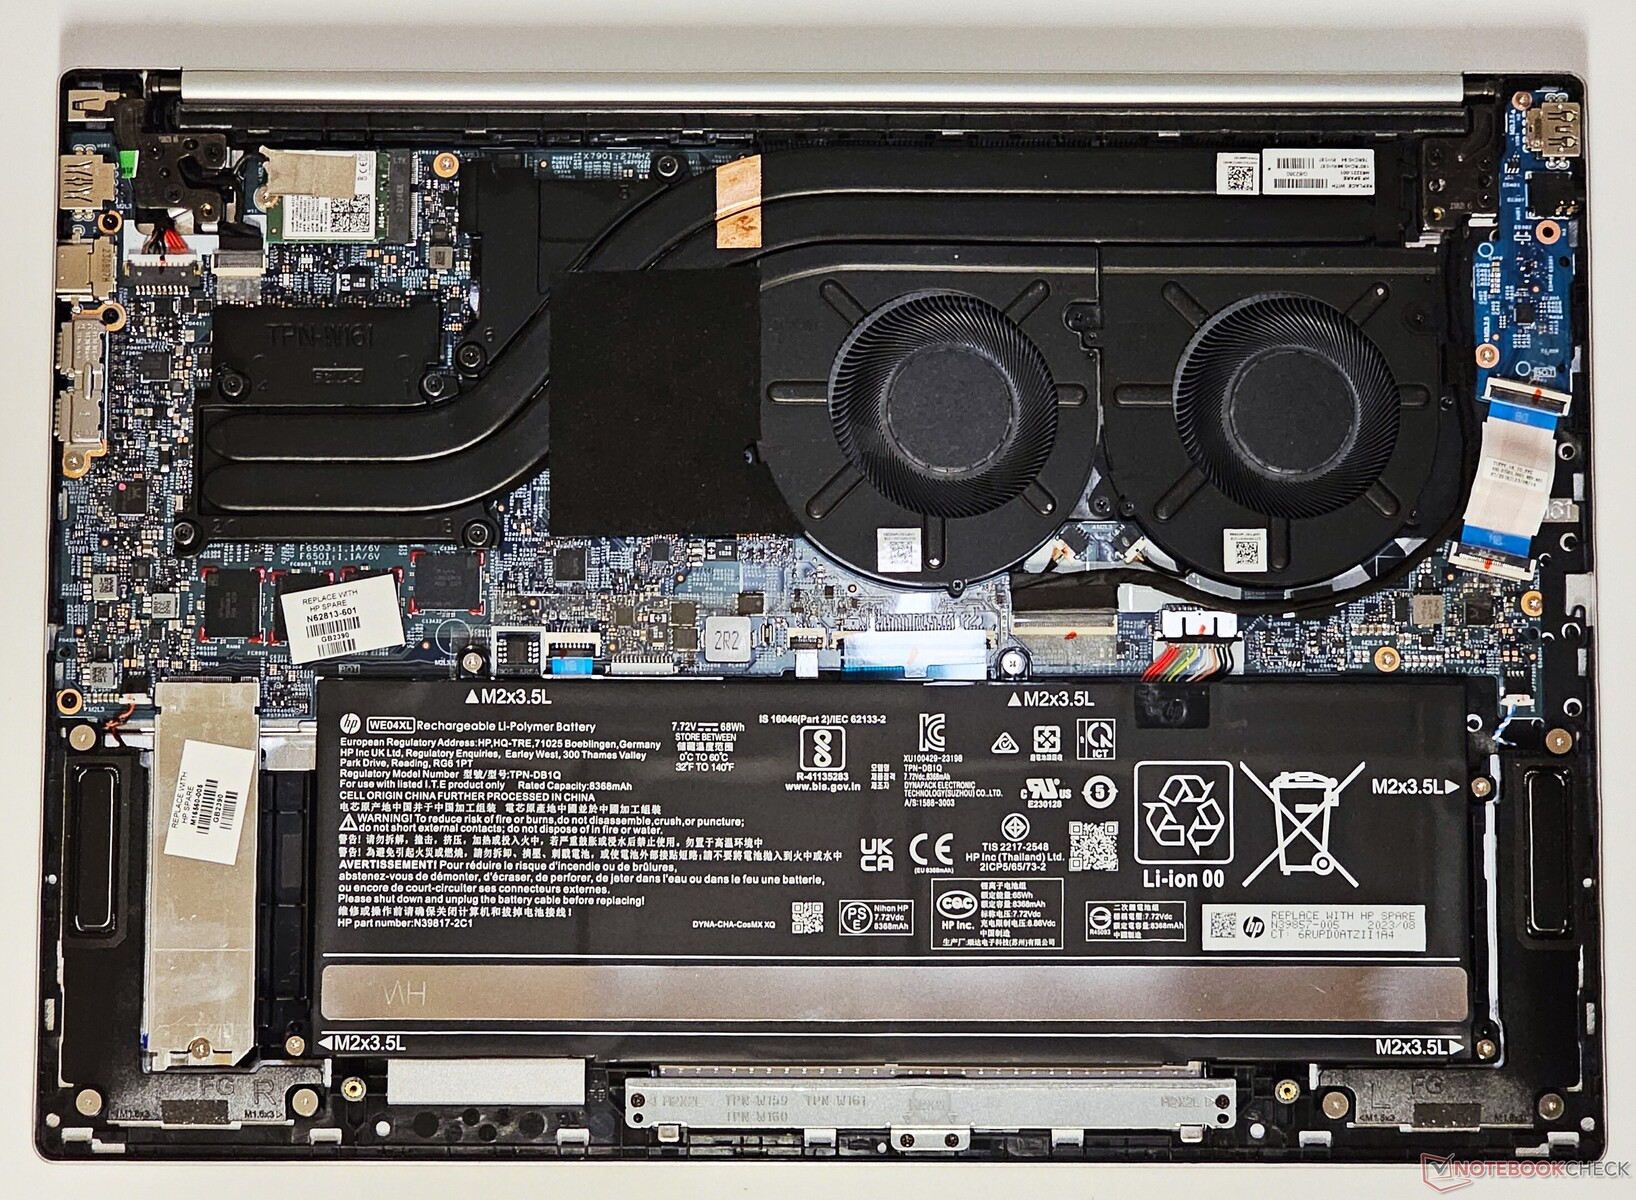
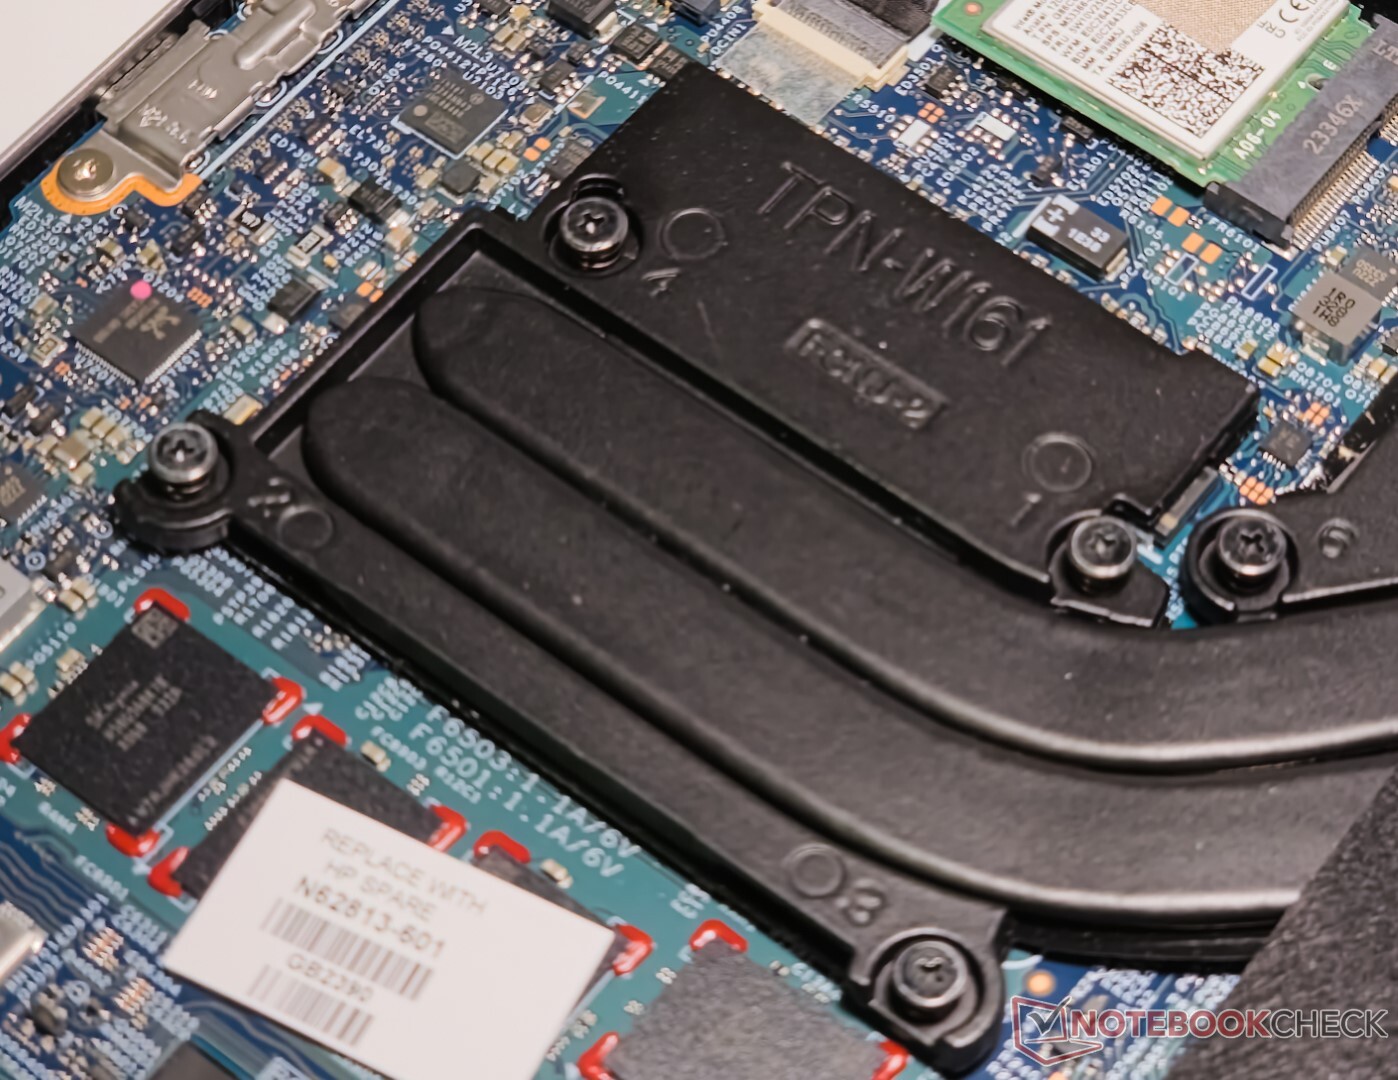
El panel inferior puede abrirse a palanca tras retirar los cuatro tornillos PH0. La memoria viene soldada, pero la tarjeta WLAN, el SSD NVMe y el paquete de baterías pueden sustituirse si es necesario.
Dispositivos de entrada: Teclado numérico de tamaño normal con un tacto decente
Teclado
El teclado del Pavilion Plus 16 ofrece una experiencia de escritura decente. Las teclas grises ofrecen un buen contraste con el color Plata Natural del chasis. El teclado numérico es espacioso y resulta útil para hacer cálculos numéricos en Excel. Sin embargo, carece de indicador de Bloq Num.
El botón de encendido está situado justo al lado de la tecla Supr, lo que puede confundir a los usuarios novatos. Las teclas de flecha superior e inferior también resultan estrechas. Una retroiluminación blanca de tres niveles ayuda a la legibilidad con poca luz.
Panel táctil
El touchpad de 12,5 cm x 8 cm parece espacioso y ofrece una experiencia de deslizamiento suave con una buena respuesta. Sin embargo, el recorrido no es tan profundo.
Todo el touchpad actúa como el botón izquierdo del ratón. Los clics hacia el centro y la base del touchpad son más sensibles que los de la parte superior.
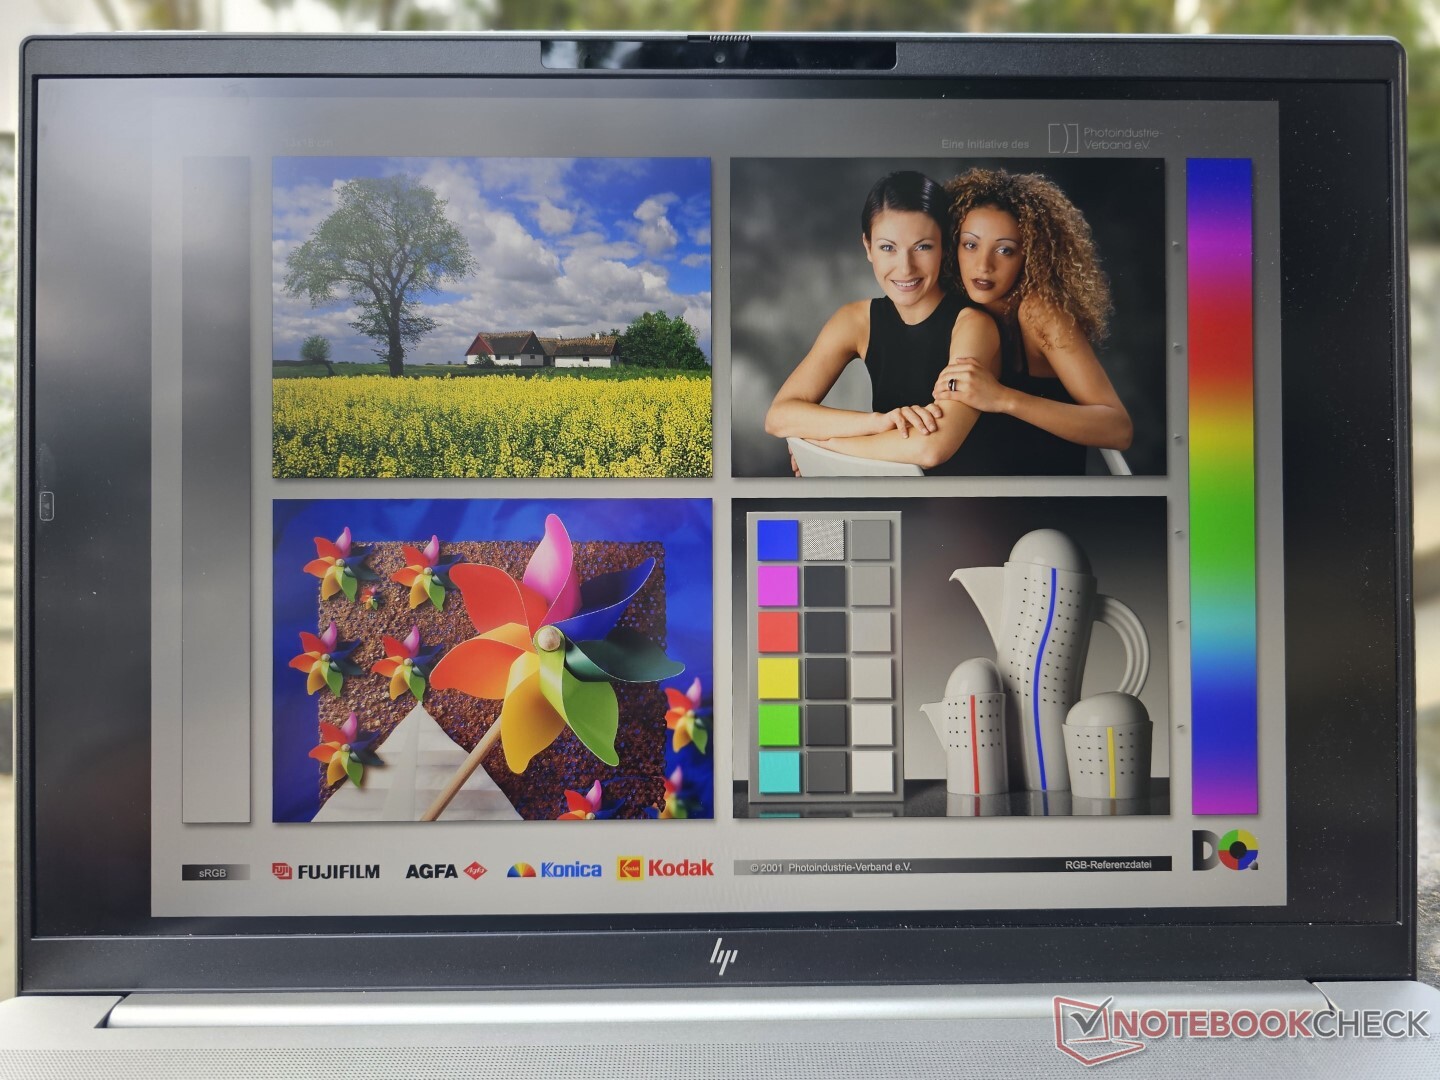
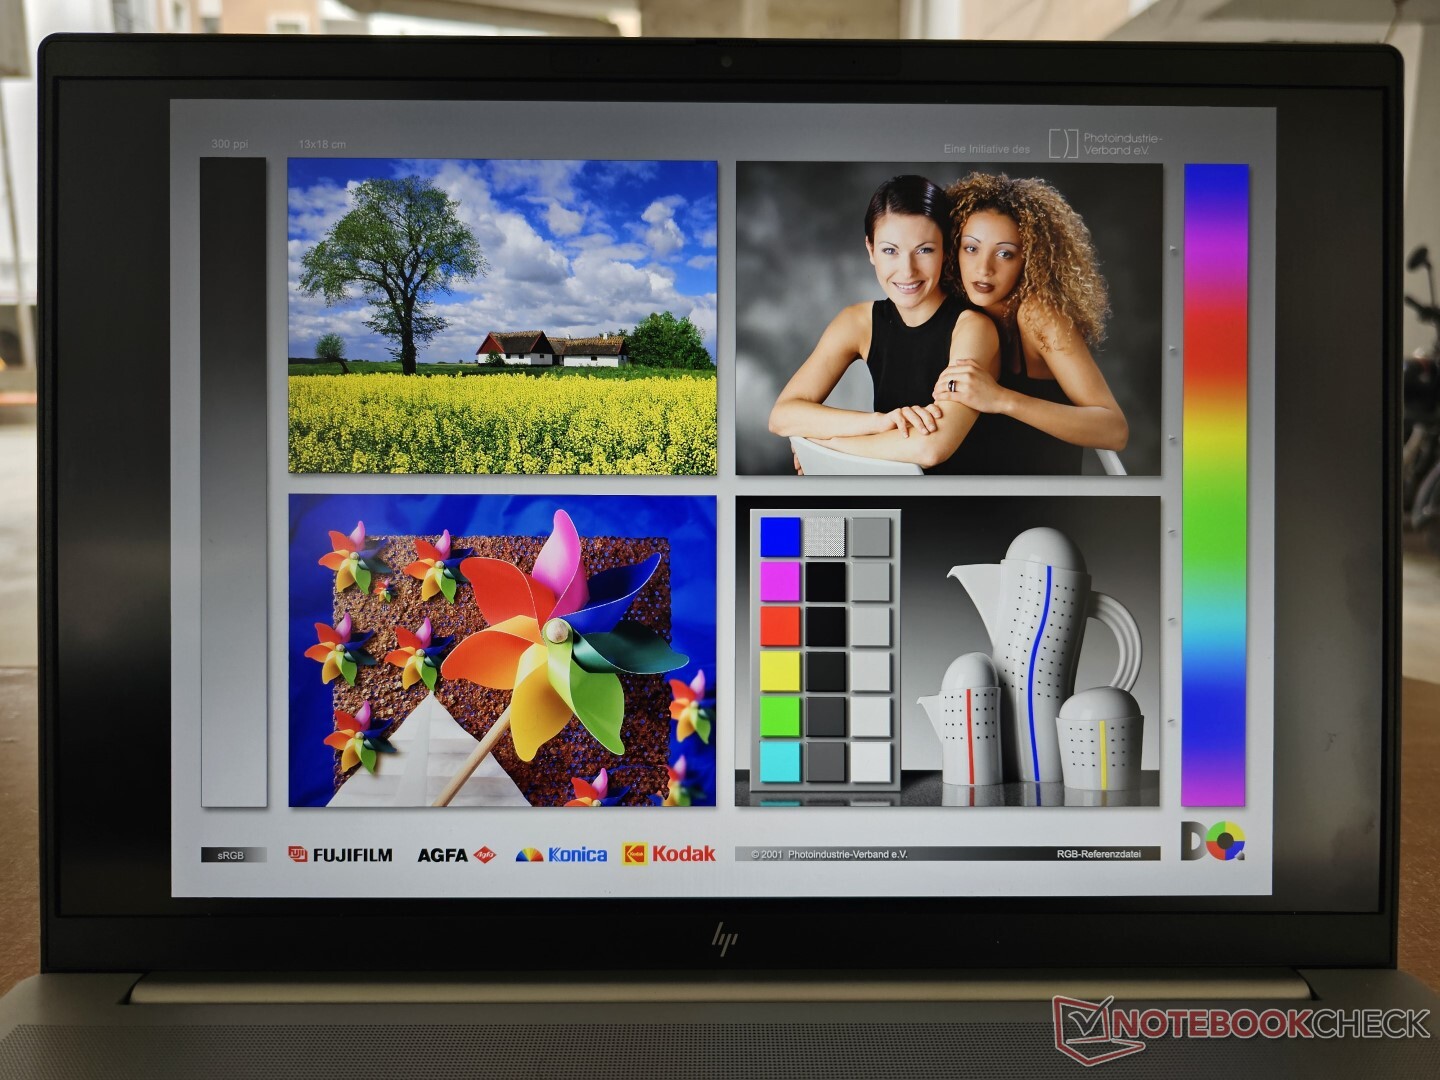
Pantalla: panel WQXGA de 120 Hz con un perfil de color decente y sin PWM
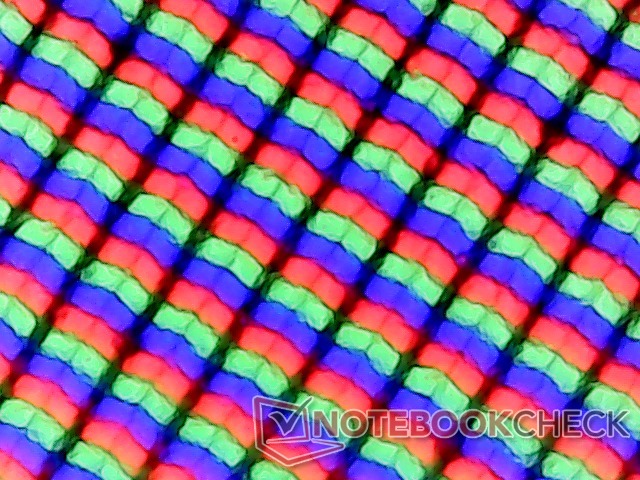
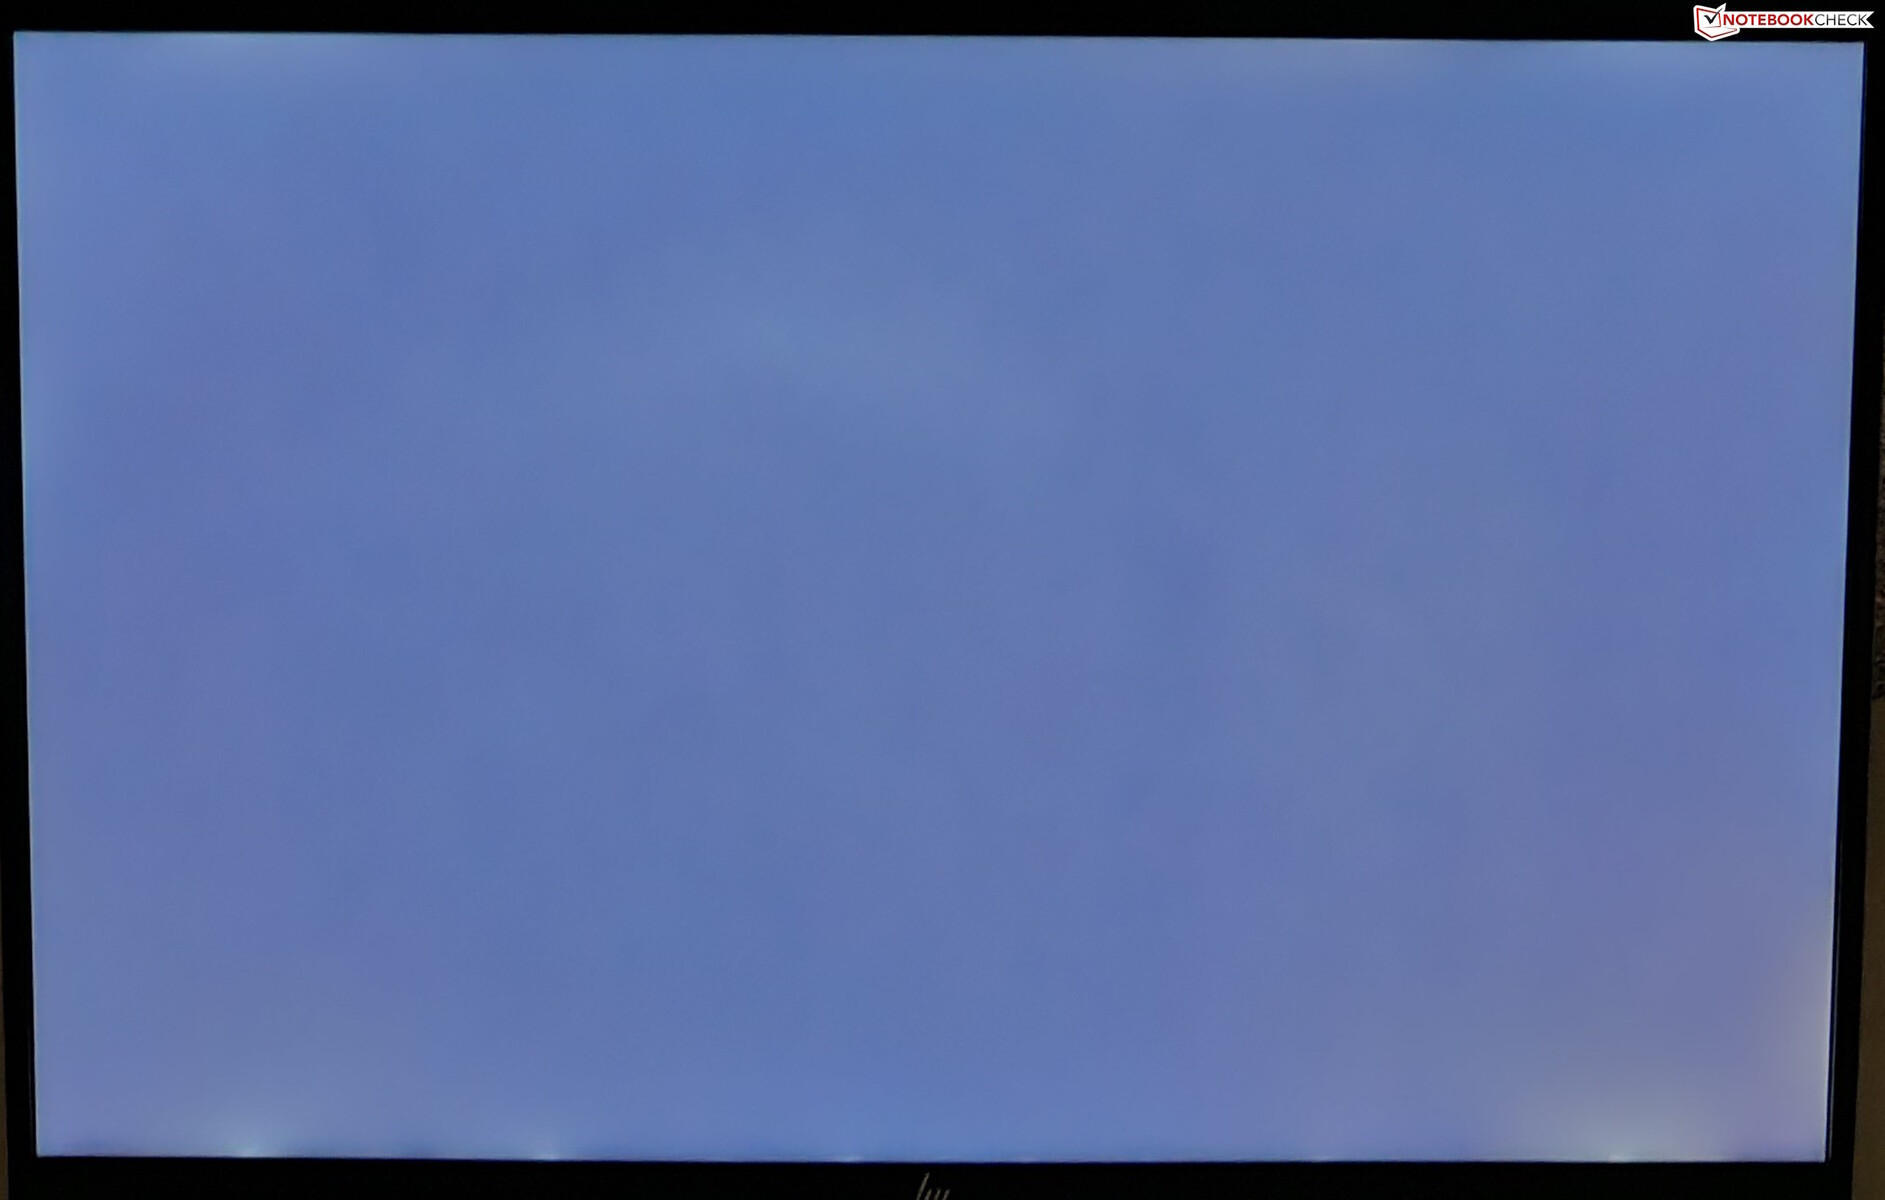
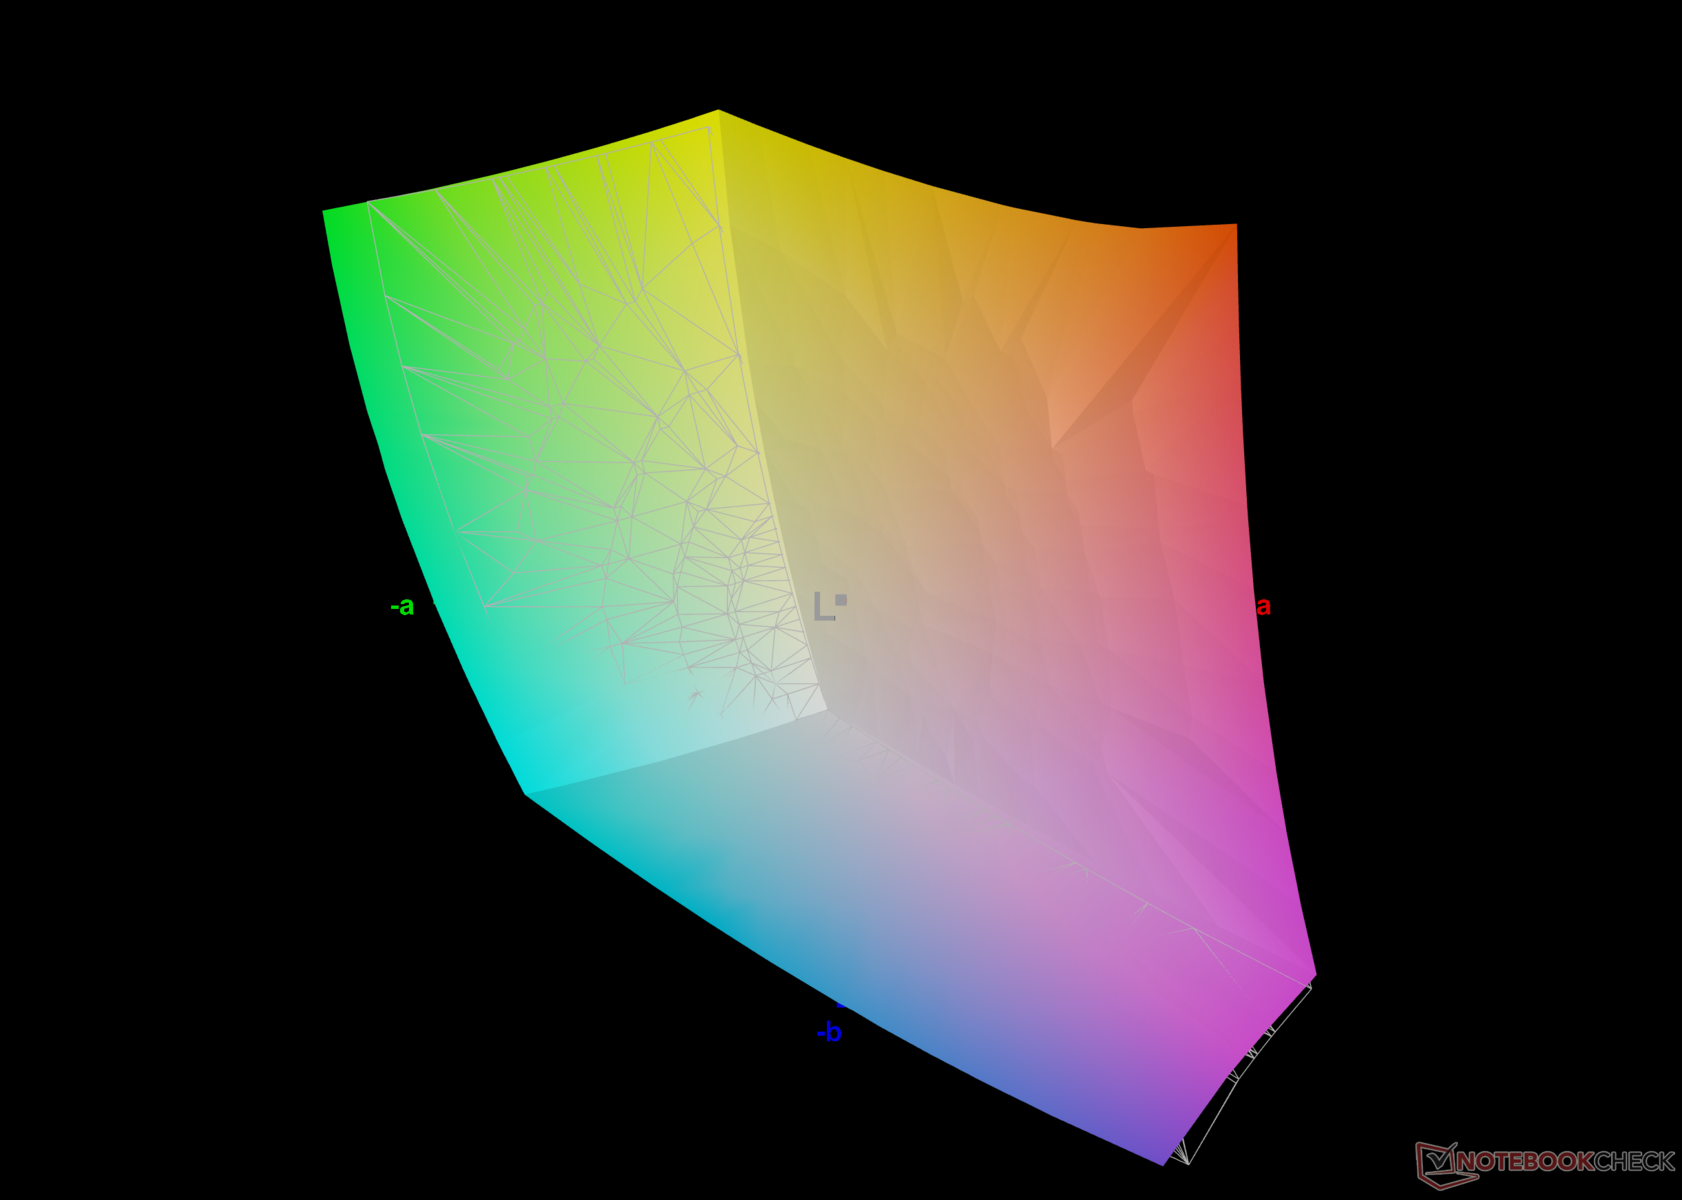
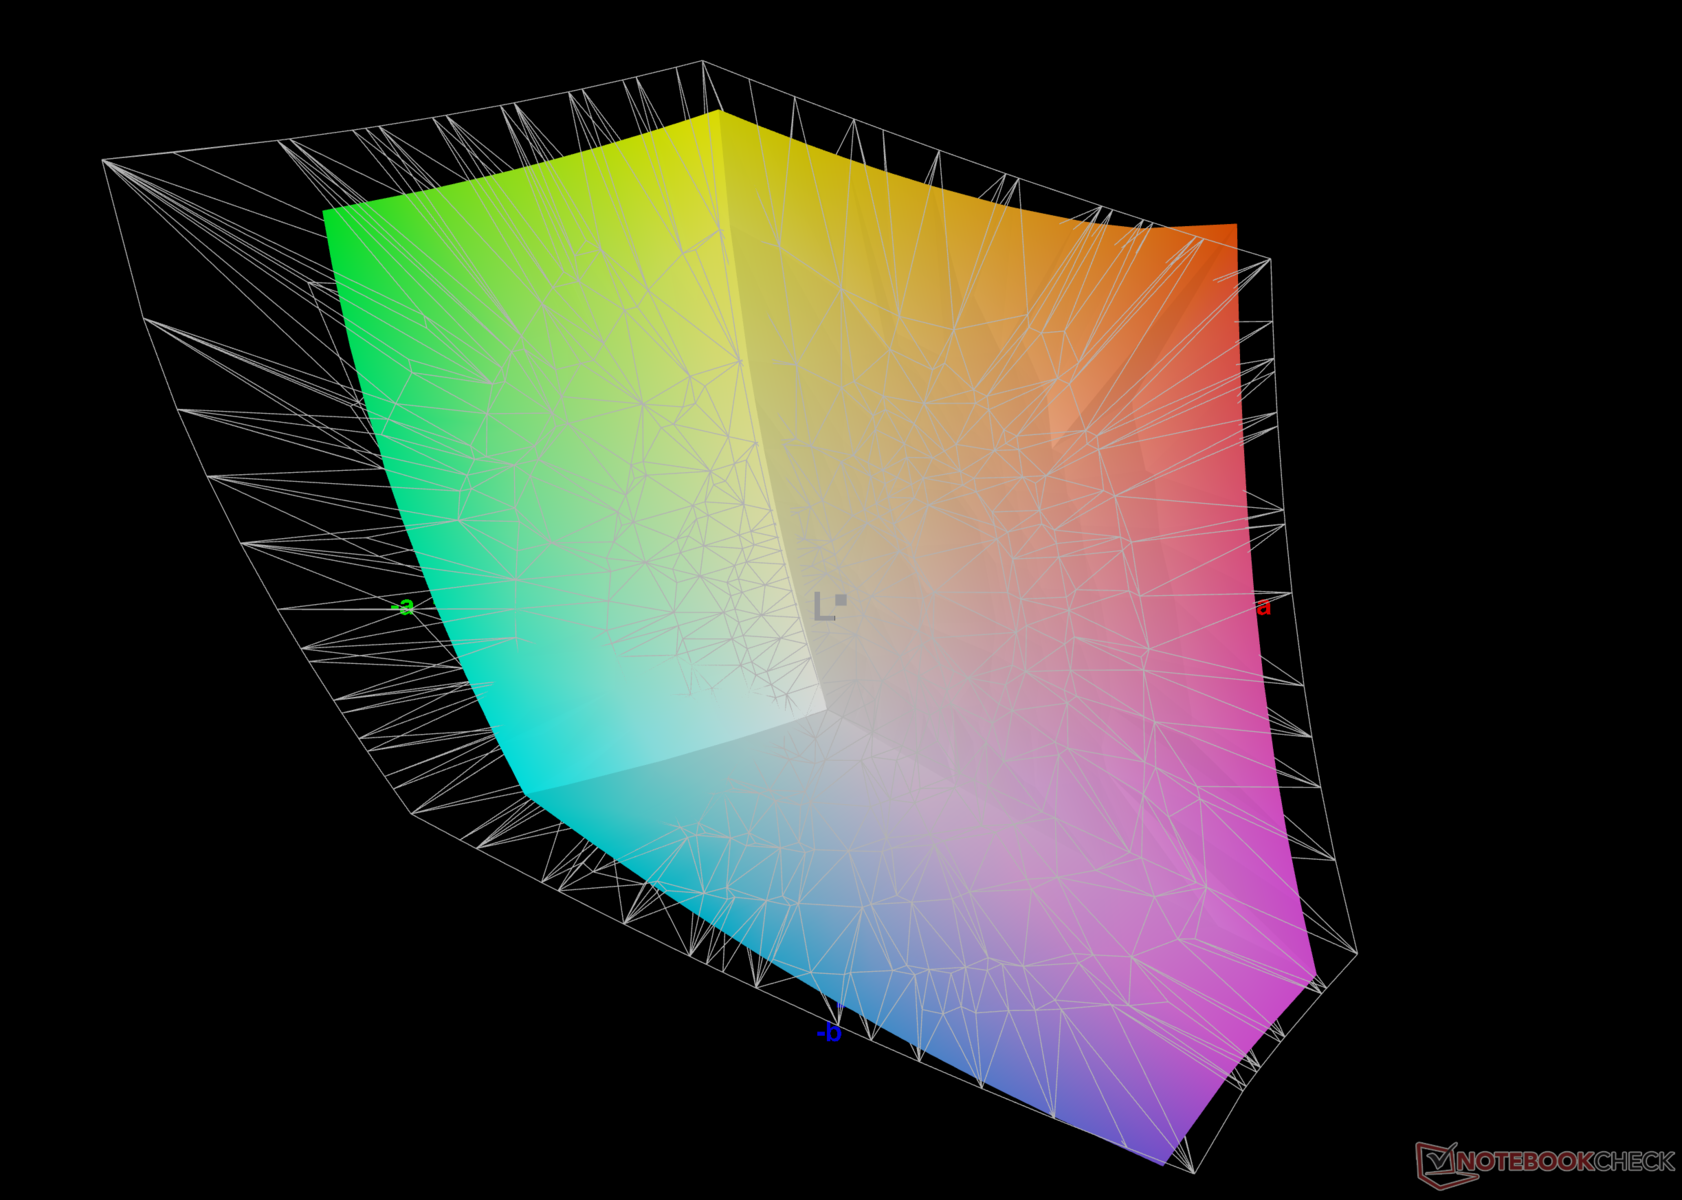
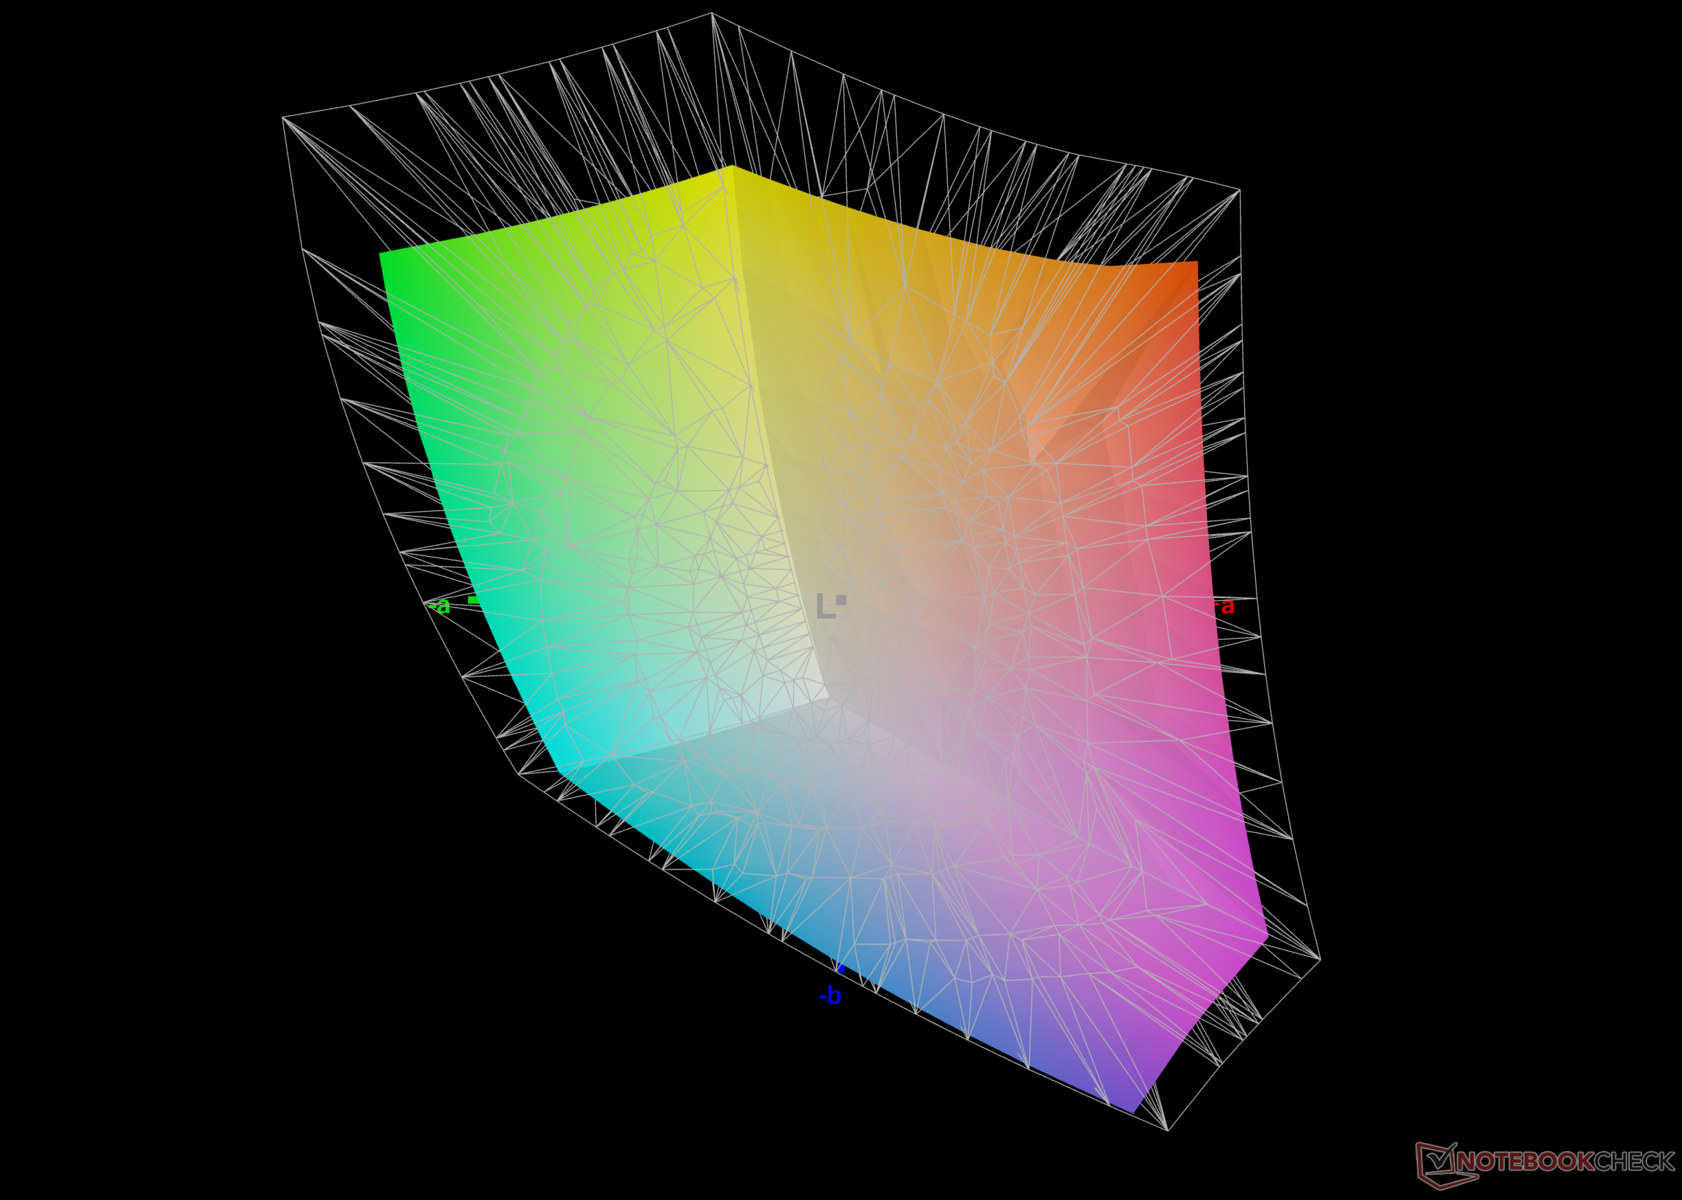
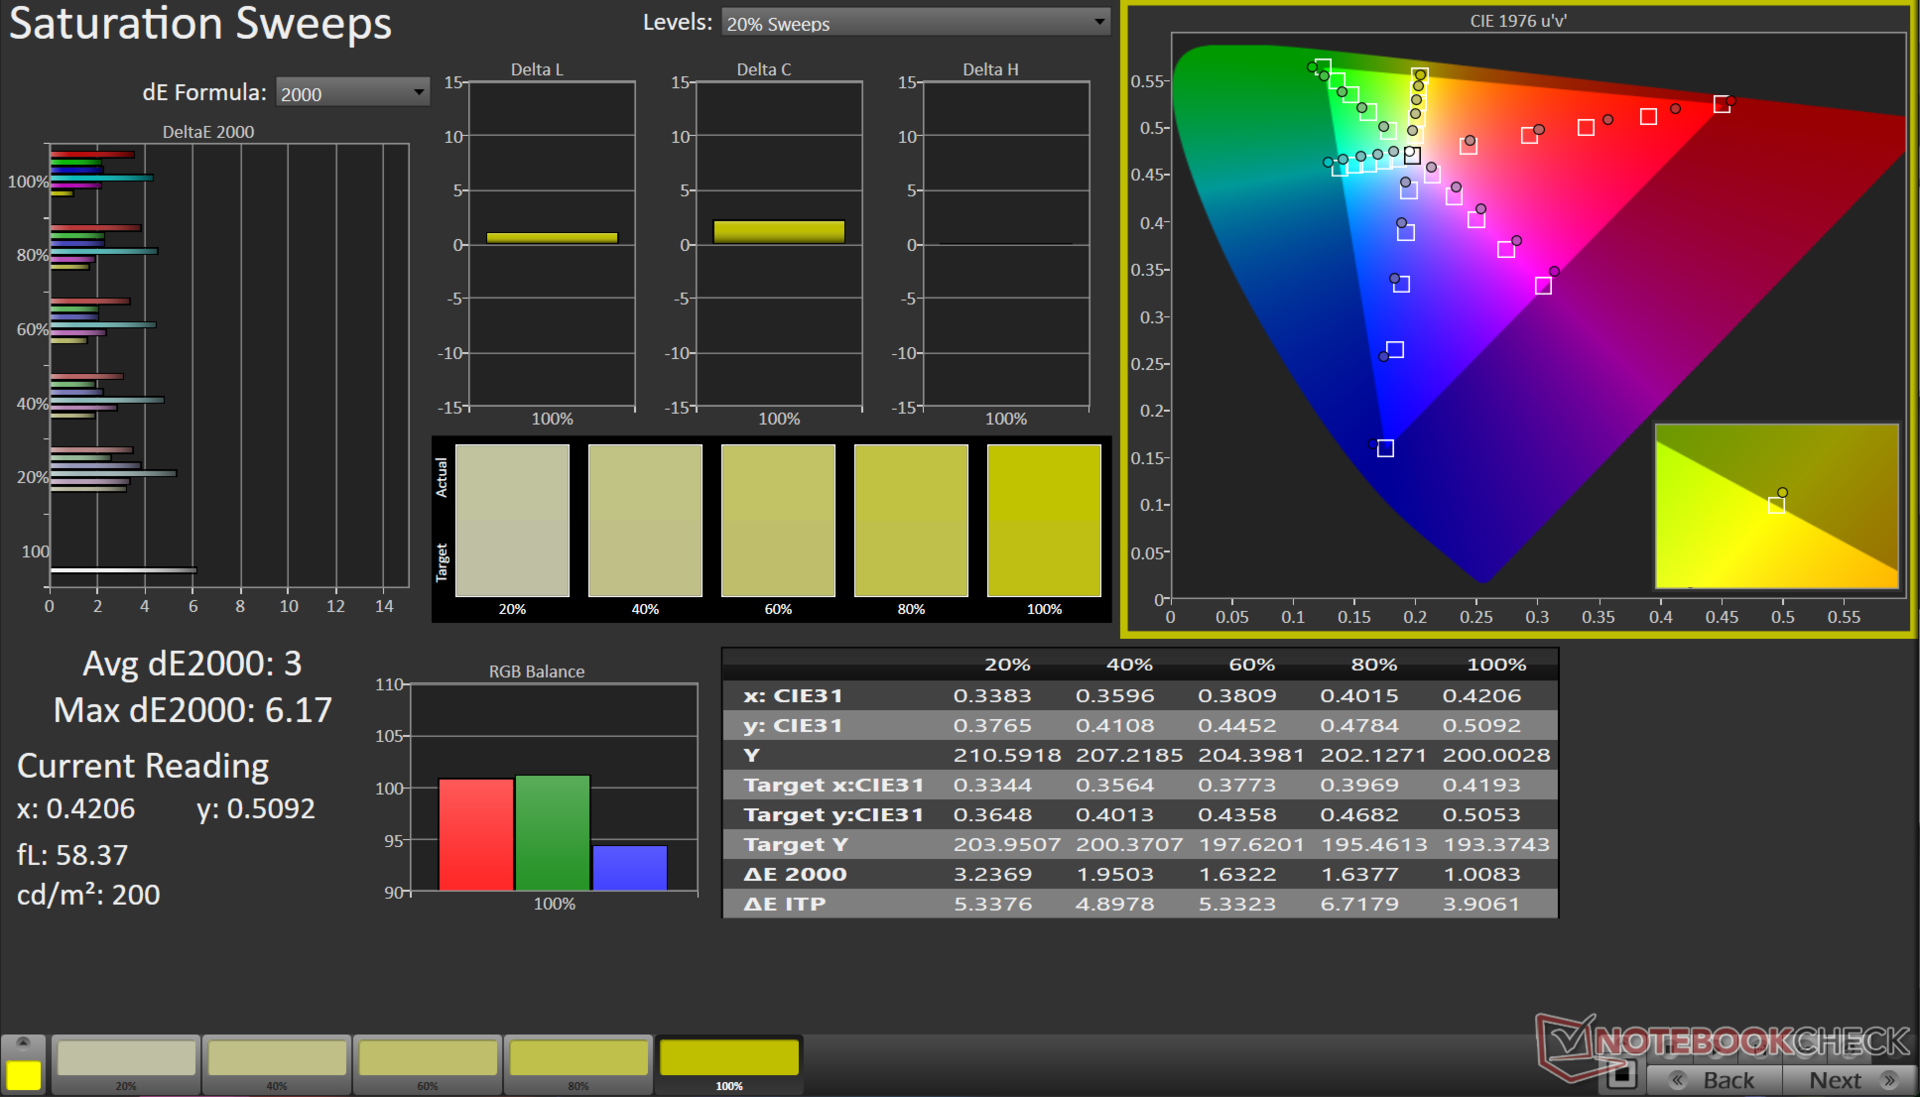
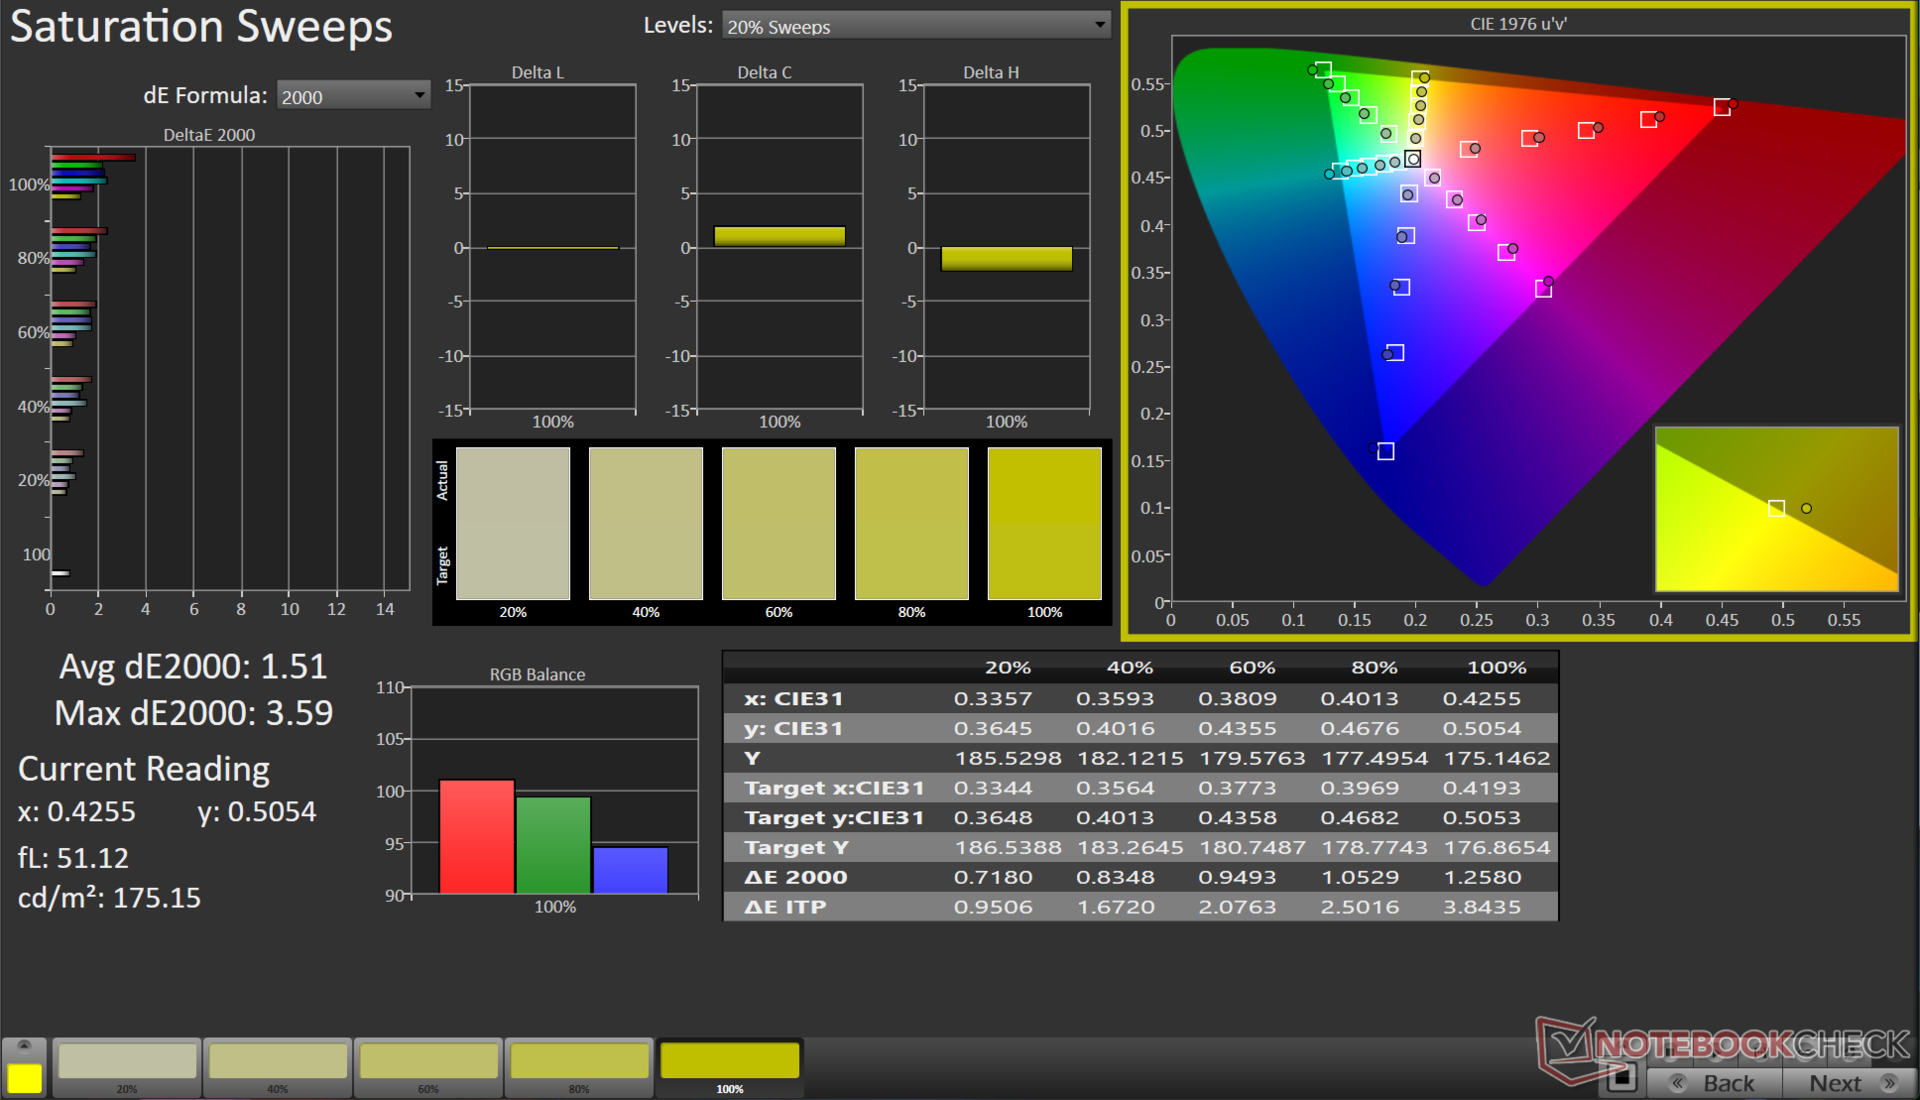
El Pavilion Plus 16 viene con un panel IPS de 16 pulgadas 16:10 2560 x 1600 WQXGA con una frecuencia de actualización de 120 Hz y un brillo nominal de 400 nits.
Hemos medido hasta 415 nits de brillo máximo con una media de 394 nits y una buena distribución del 90%. Al ser un panel IPS, la pantalla no es inmune al sangrado de la retroiluminación - esto se puede notar en las esquinas inferiores bajo exposición prolongada.
Subjetivamente, el Pavilion Plus 16 ofrece una buena experiencia de visualización que debería ser adecuada tanto para el trabajo como para el entretenimiento.
| |||||||||||||||||||||||||
iluminación: 90 %
Brillo con batería: 401 cd/m²
Contraste: 1185:1 (Negro: 0.34 cd/m²)
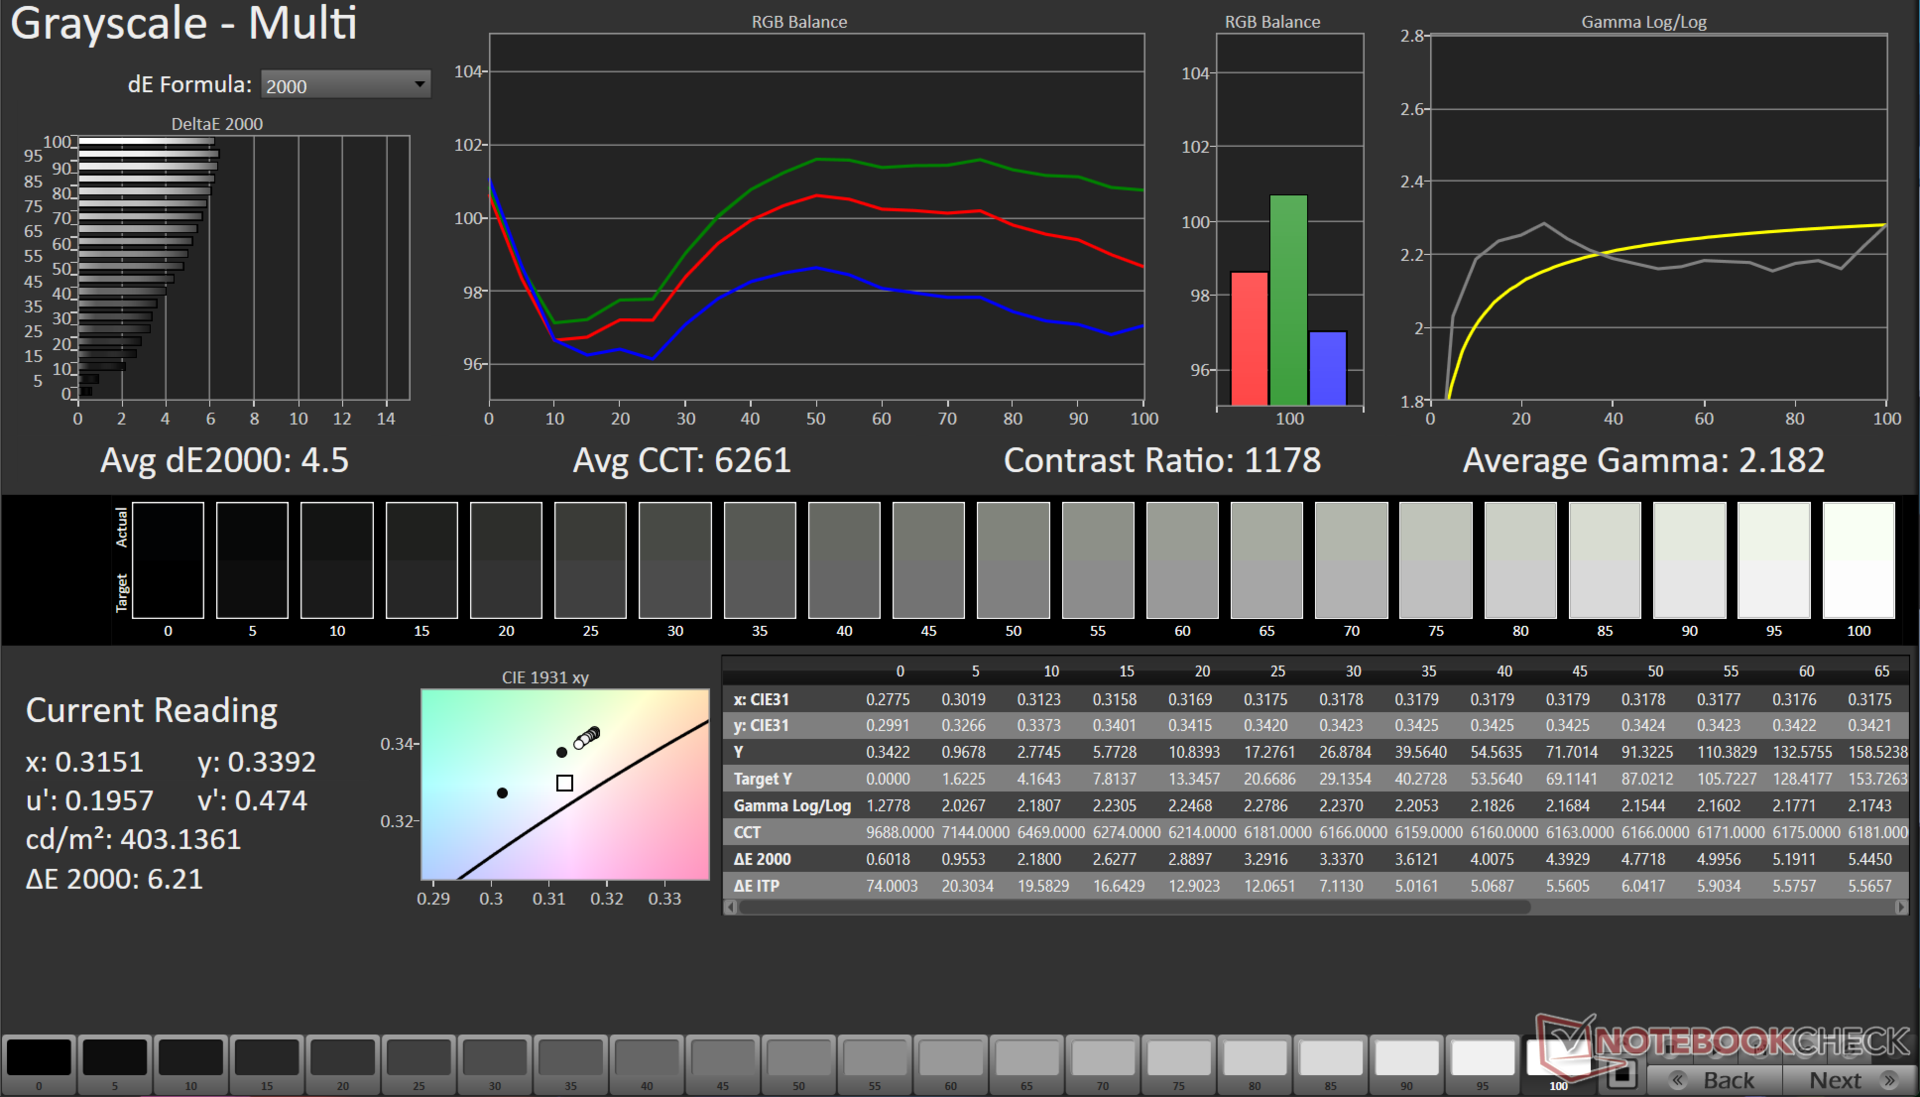
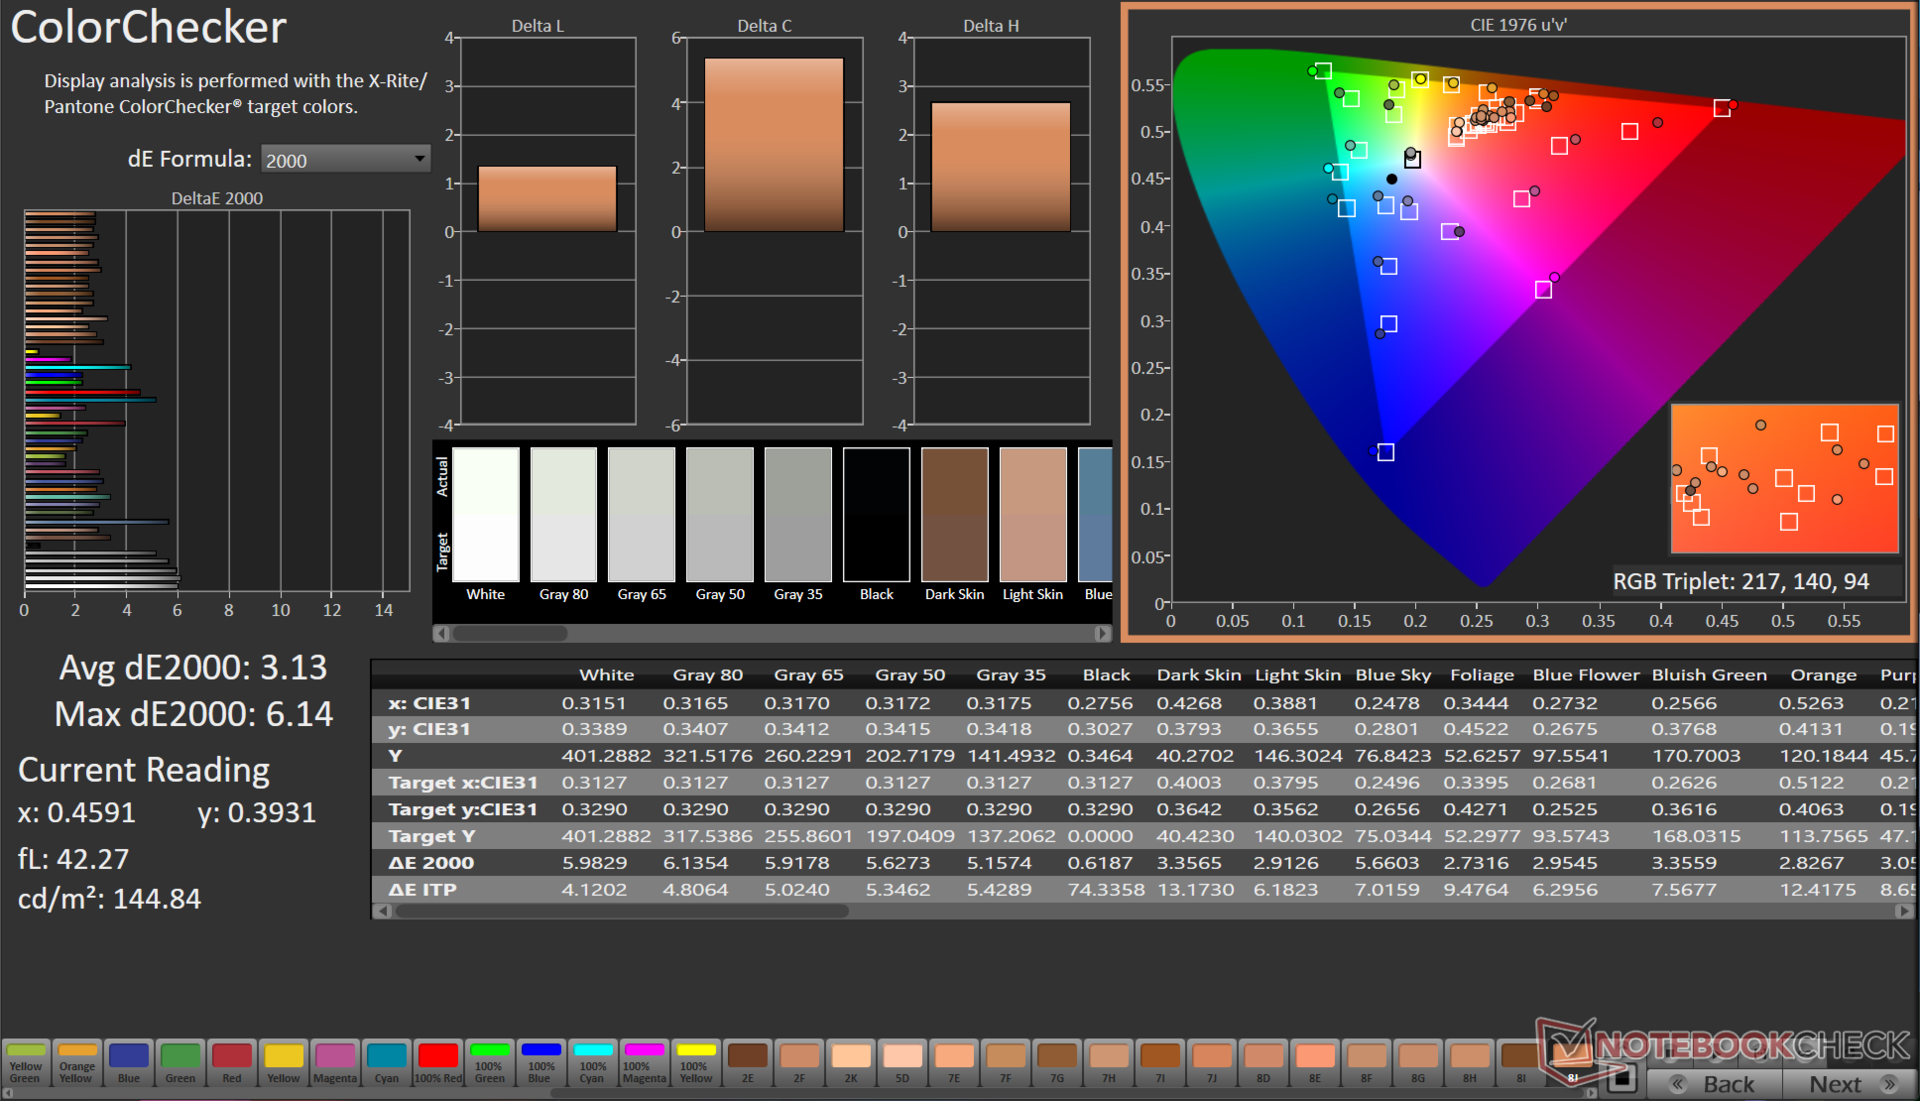
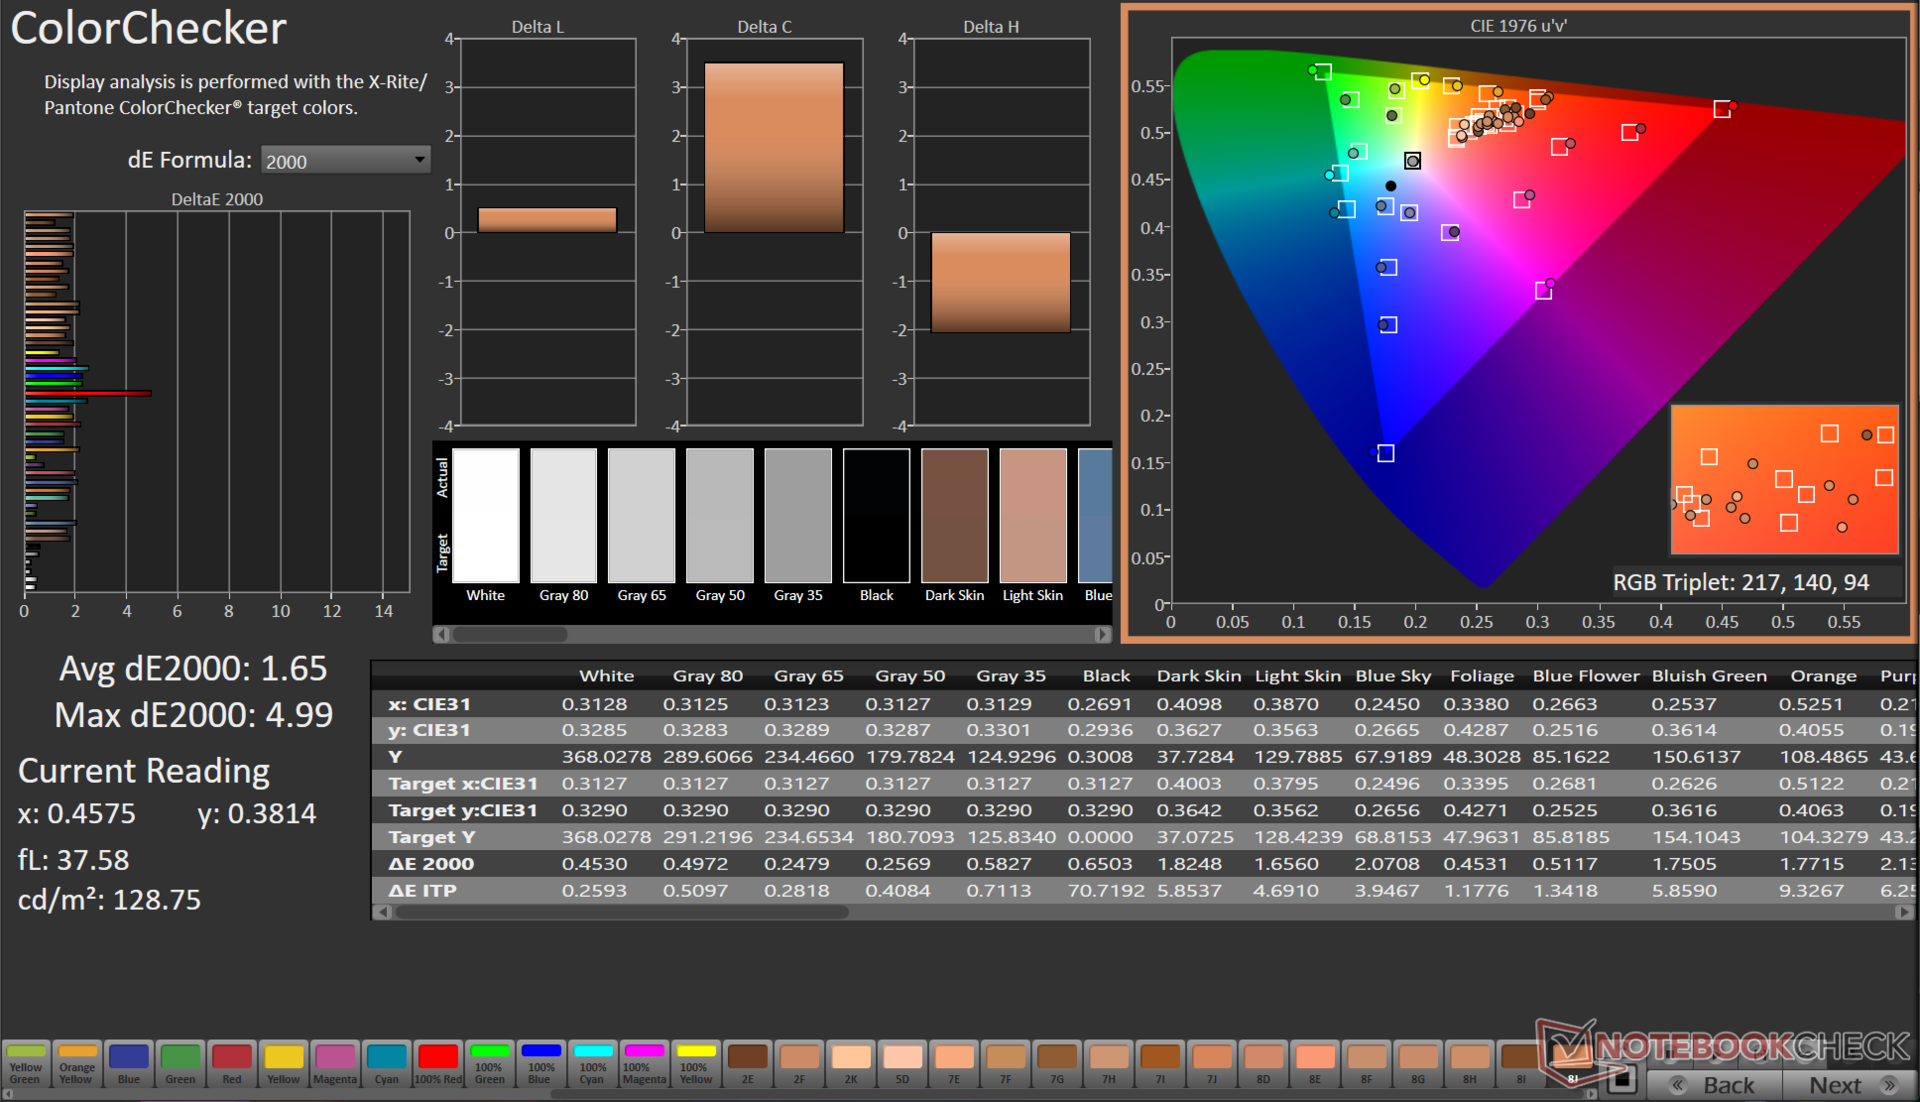
ΔE ColorChecker Calman: 3.13 | ∀{0.5-29.43 Ø4.73}
calibrated: 1.65
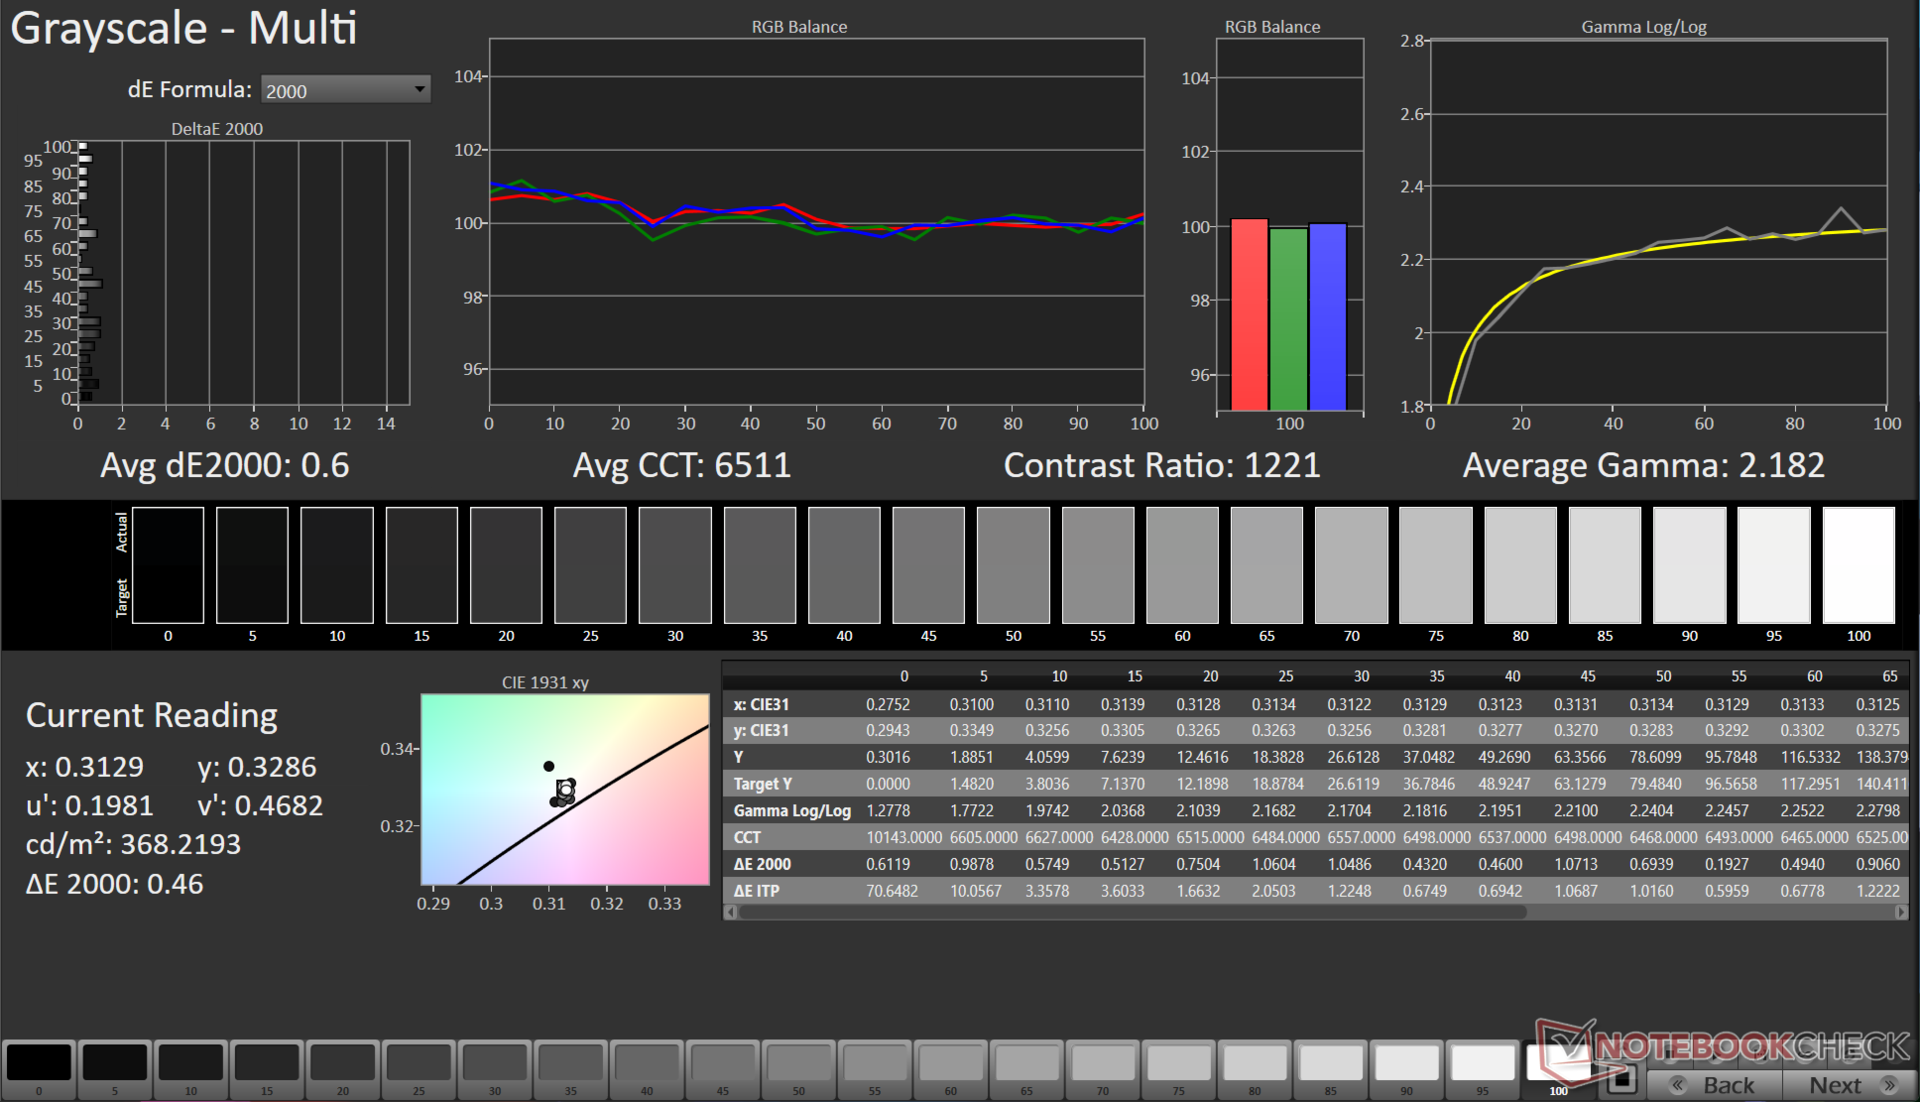
ΔE Greyscale Calman: 4.5 | ∀{0.09-98 Ø4.97}
76.5% AdobeRGB 1998 (Argyll 3D)
99% sRGB (Argyll 3D)
74.6% Display P3 (Argyll 3D)
Gamma: 2.18
CCT: 6261 K
| HP Pavilion Plus 16-ab0456tx AU Optronics AUOFDA4, IPS, 2560x1600, 16" | Schenker Vision 14 2023 CSOT T3 MNE007ZA1-3, IPS, 2880x1800, 14" | Dell Inspiron 16 Plus 7630 LG Philips 160WQ2, IPS, 2560x1600, 16" | Asus VivoBook 14X K3405 Samsung ATNA40YK07-1, , 2880x1800, 14" | Lenovo Slim Pro 7 14ARP8 LEN89C1, IPS, 2560x1600, 14.5" | Asus VivoBook Pro 16 K6602VU Samsung ATNA60BX01-1, OLED, 3200x2000, 16" | Samsung Galaxy Book3 Ultra 16 Samsung ATNA60CL03-0, AMOLED, 2880x1800, 16" | |
|---|---|---|---|---|---|---|---|
| Display | 0% | -3% | 20% | -2% | 20% | 20% | |
| Display P3 Coverage (%) | 74.6 | 74.7 0% | 70.1 -6% | 99.9 34% | 72.9 -2% | 98.7 32% | 99.9 34% |
| sRGB Coverage (%) | 99 | 99.6 1% | 99.6 1% | 100 1% | 98.2 -1% | 99.7 1% | 100 1% |
| AdobeRGB 1998 Coverage (%) | 76.5 | 75.8 -1% | 72.3 -5% | 96.5 26% | 74.6 -2% | 96.5 26% | 96.3 26% |
| Response Times | -193% | -274% | -14% | -220% | -3% | 93% | |
| Response Time Grey 50% / Grey 80% * (ms) | 9.06 ? | 32.2 ? -255% | 35 ? -286% | 1.15 ? 87% | 31.8 ? -251% | 0.68 ? 92% | 0.49 ? 95% |
| Response Time Black / White * (ms) | 6.7 ? | 15.4 ? -130% | 24.2 ? -261% | 14.4 ? -115% | 19.3 ? -188% | 13.2 ? -97% | 0.65 ? 90% |
| PWM Frequency (Hz) | 90.02 ? | 240 ? | 240 ? | ||||
| Screen | 21% | 1% | 5% | 3% | -10% | 135% | |
| Brightness middle (cd/m²) | 403 | 402 0% | 299.4 -26% | 369 -8% | 344.7 -14% | 353 -12% | 400 -1% |
| Brightness (cd/m²) | 394 | 371 -6% | 290 -26% | 364 -8% | 334 -15% | 354 -10% | 399 1% |
| Brightness Distribution (%) | 90 | 86 -4% | 92 2% | 85 -6% | 92 2% | 98 9% | 93 3% |
| Black Level * (cd/m²) | 0.34 | 0.27 21% | 0.21 38% | 0.31 9% | 0.03 91% | ||
| Contrast (:1) | 1185 | 1489 26% | 1426 20% | 1112 -6% | 13333 1025% | ||
| Colorchecker dE 2000 * | 3.13 | 1.8 42% | 4.25 -36% | 2.85 9% | 3.01 4% | 4.23 -35% | 2.3 27% |
| Colorchecker dE 2000 max. * | 6.14 | 3.6 41% | 6.71 -9% | 4.22 31% | 6.3 -3% | 7.13 -16% | 4.15 32% |
| Colorchecker dE 2000 calibrated * | 1.65 | 1.5 9% | 0.52 68% | 2.18 -32% | 0.83 50% | 2.42 -47% | 1.66 -1% |
| Greyscale dE 2000 * | 4.5 | 1.8 60% | 5.5 -22% | 2.2 51% | 4.6 -2% | 2.5 44% | 2.7 40% |
| Gamma | 2.18 101% | 2.27 97% | 2.35 94% | 2.15 102% | 2.28 96% | 2.4 92% | 2.266 97% |
| CCT | 6261 104% | 6695 97% | 6368 102% | 6518 100% | 6420 101% | 6642 98% | 7047 92% |
| Media total (Programa/Opciones) | -57% /
-14% | -92% /
-39% | 4% /
6% | -73% /
-30% | 2% /
-1% | 83% /
105% |
* ... más pequeño es mejor
El panel cubre el 99% del espacio de color sRGB al tiempo que ofrece una reproducción decente de Adobe RGB y Display P3. Esto hace que el Pavilion Plus 16 sea adecuado para el consumo multimedia general y también para flujos de trabajo de edición básicos, especialmente para contenidos web.
Utilizando el espectrofotómetro X-Rite i1Basic Pro 3 y el software Calman Ultimate de Portrait Displays, pudimos mejorar los valores medios de escala de grises y ColorChecker Delta E 2000 de 4,5 a 0,6 y de 3,13 a 1,65, respectivamente.
Puede descargar nuestro archivo calibrado en el enlace anterior.
Tiempos de respuesta del display
| ↔ Tiempo de respuesta de Negro a Blanco | ||
|---|---|---|
| 6.7 ms ... subida ↗ y bajada ↘ combinada | ↗ 3.6 ms subida | 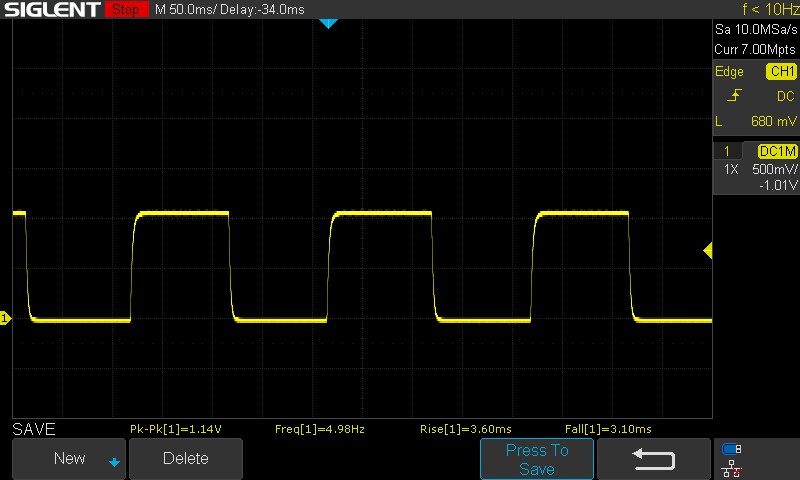 |
| ↘ 3.1 ms bajada | ||
| La pantalla mostró tiempos de respuesta muy rápidos en nuestros tests y debería ser adecuada para juegos frenéticos. En comparación, todos los dispositivos de prueba van de ##min### (mínimo) a 240 (máximo) ms. » 21 % de todos los dispositivos son mejores. Esto quiere decir que el tiempo de respuesta medido es mejor que la media (19.9 ms) de todos los dispositivos testados. | ||
| ↔ Tiempo de respuesta 50% Gris a 80% Gris | ||
| 9.06 ms ... subida ↗ y bajada ↘ combinada | ↗ 4.27 ms subida | 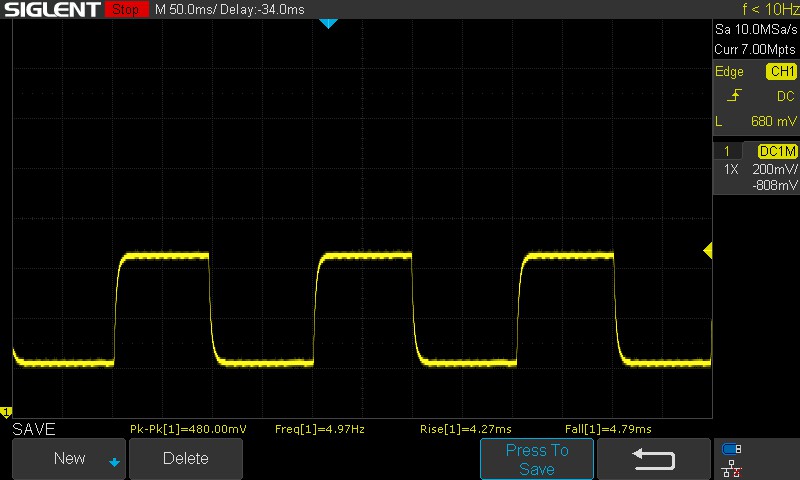 |
| ↘ 4.79 ms bajada | ||
| La pantalla mostró tiempos de respuesta rápidos en nuestros tests y debería ser adecuada para juegos. En comparación, todos los dispositivos de prueba van de ##min### (mínimo) a 636 (máximo) ms. » 22 % de todos los dispositivos son mejores. Esto quiere decir que el tiempo de respuesta medido es mejor que la media (31.1 ms) de todos los dispositivos testados. | ||
Parpadeo de Pantalla / PWM (Pulse-Width Modulation)
| Parpadeo de Pantalla / PWM no detectado | ≤ 100 % de brillo | 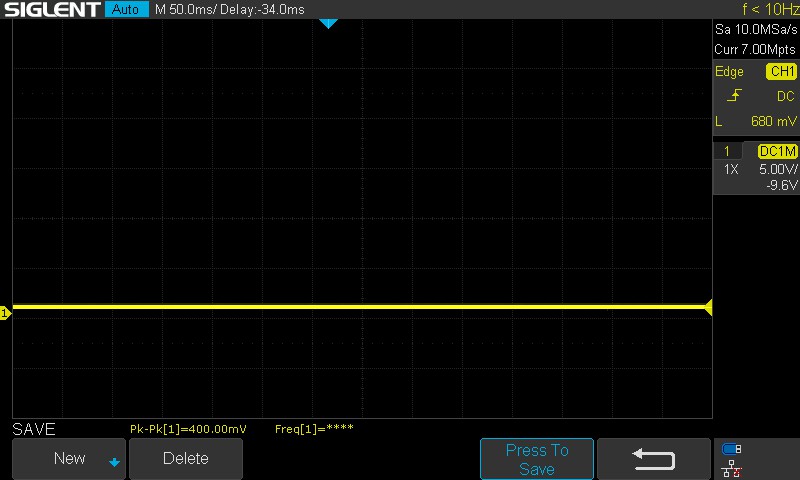 | |
Comparación: 52 % de todos los dispositivos testados no usaron PWM para atenuar el display. Si se usó, medimos una media de 7798 (mínimo: 5 - máxmo: 343500) Hz. | |||
Los tiempos de respuesta son decentes teniendo en cuenta que el Pavilion Plus 16 no está dirigido al público de los juegos. No observamos PWM en ninguno de los niveles de brillo probados, lo que es positivo.
Para más información, consulte nuestro artículo "Por qué el PWM es un dolor de cabeza". Nuestra tabla de clasificación de PWM PWM Ranking - Notebooks, Smartphones, and Tablets with PWM ofrece una visión general del PWM medido en los dispositivos analizados.
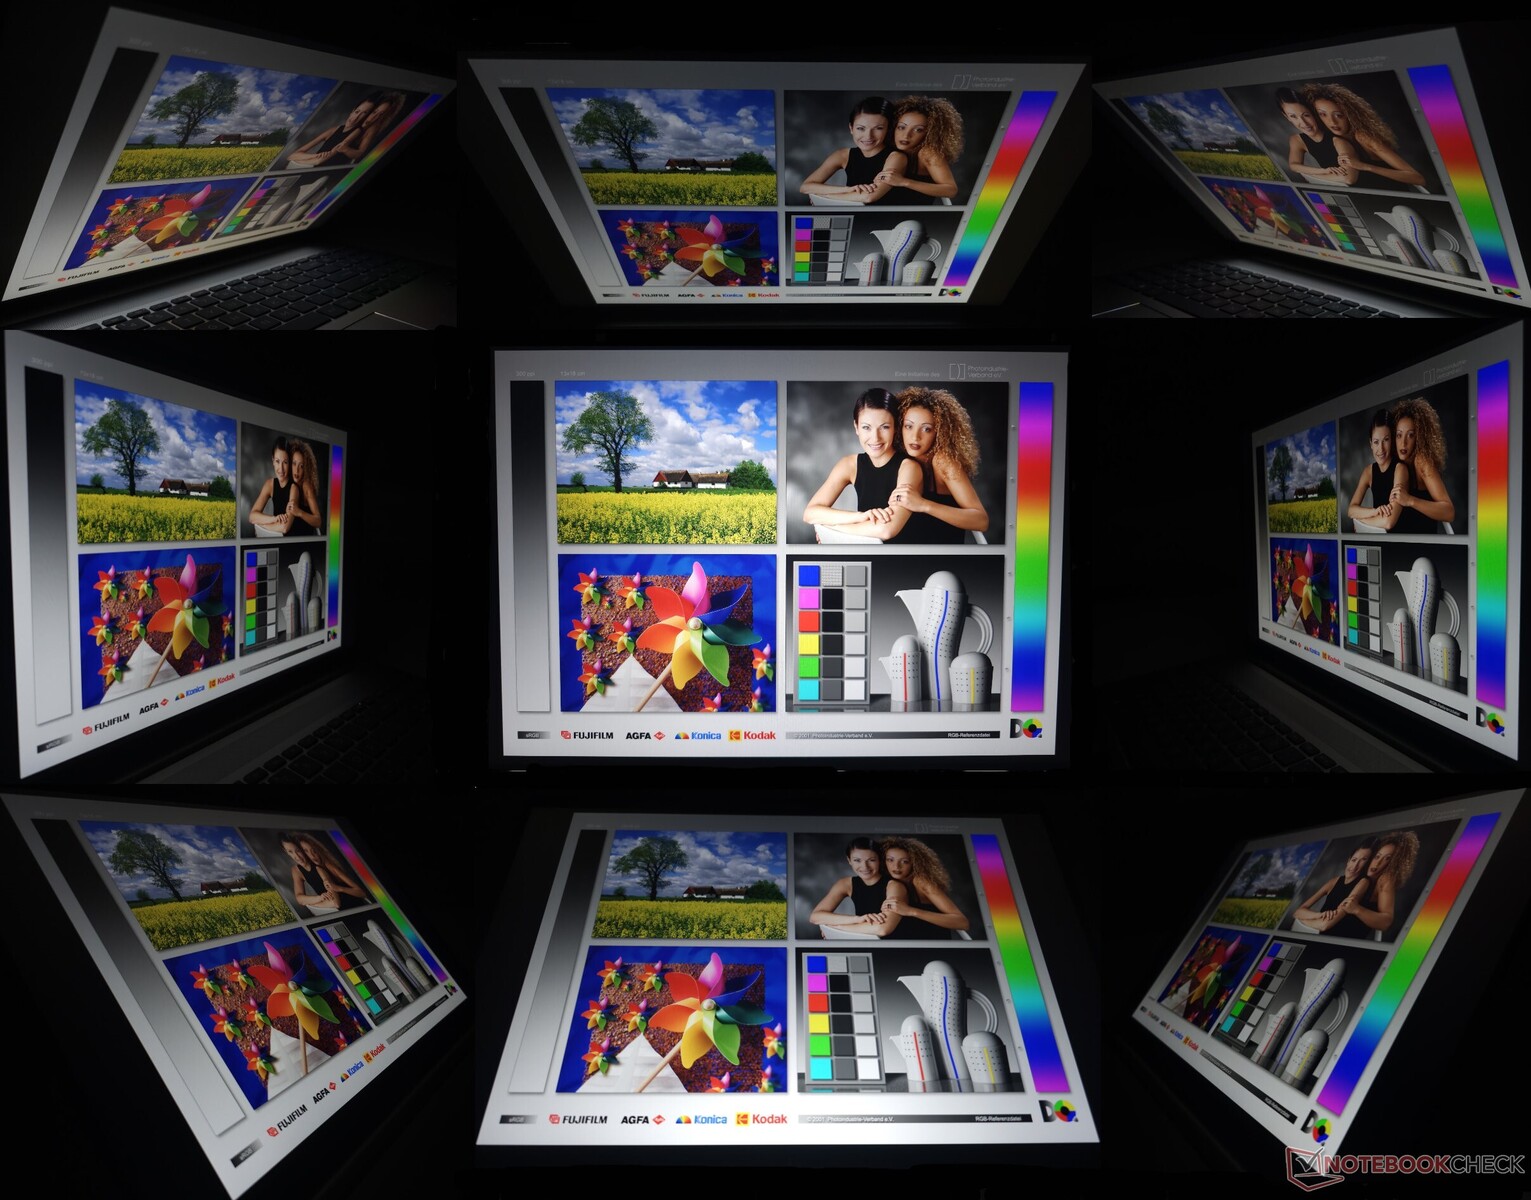
La visualización en exteriores suele ser correcta al brillo máximo siempre que no incida luz solar directa sobre la pantalla. Los ángulos de visión son estables, pero observamos pérdida de brillo e información de color en los extremos.
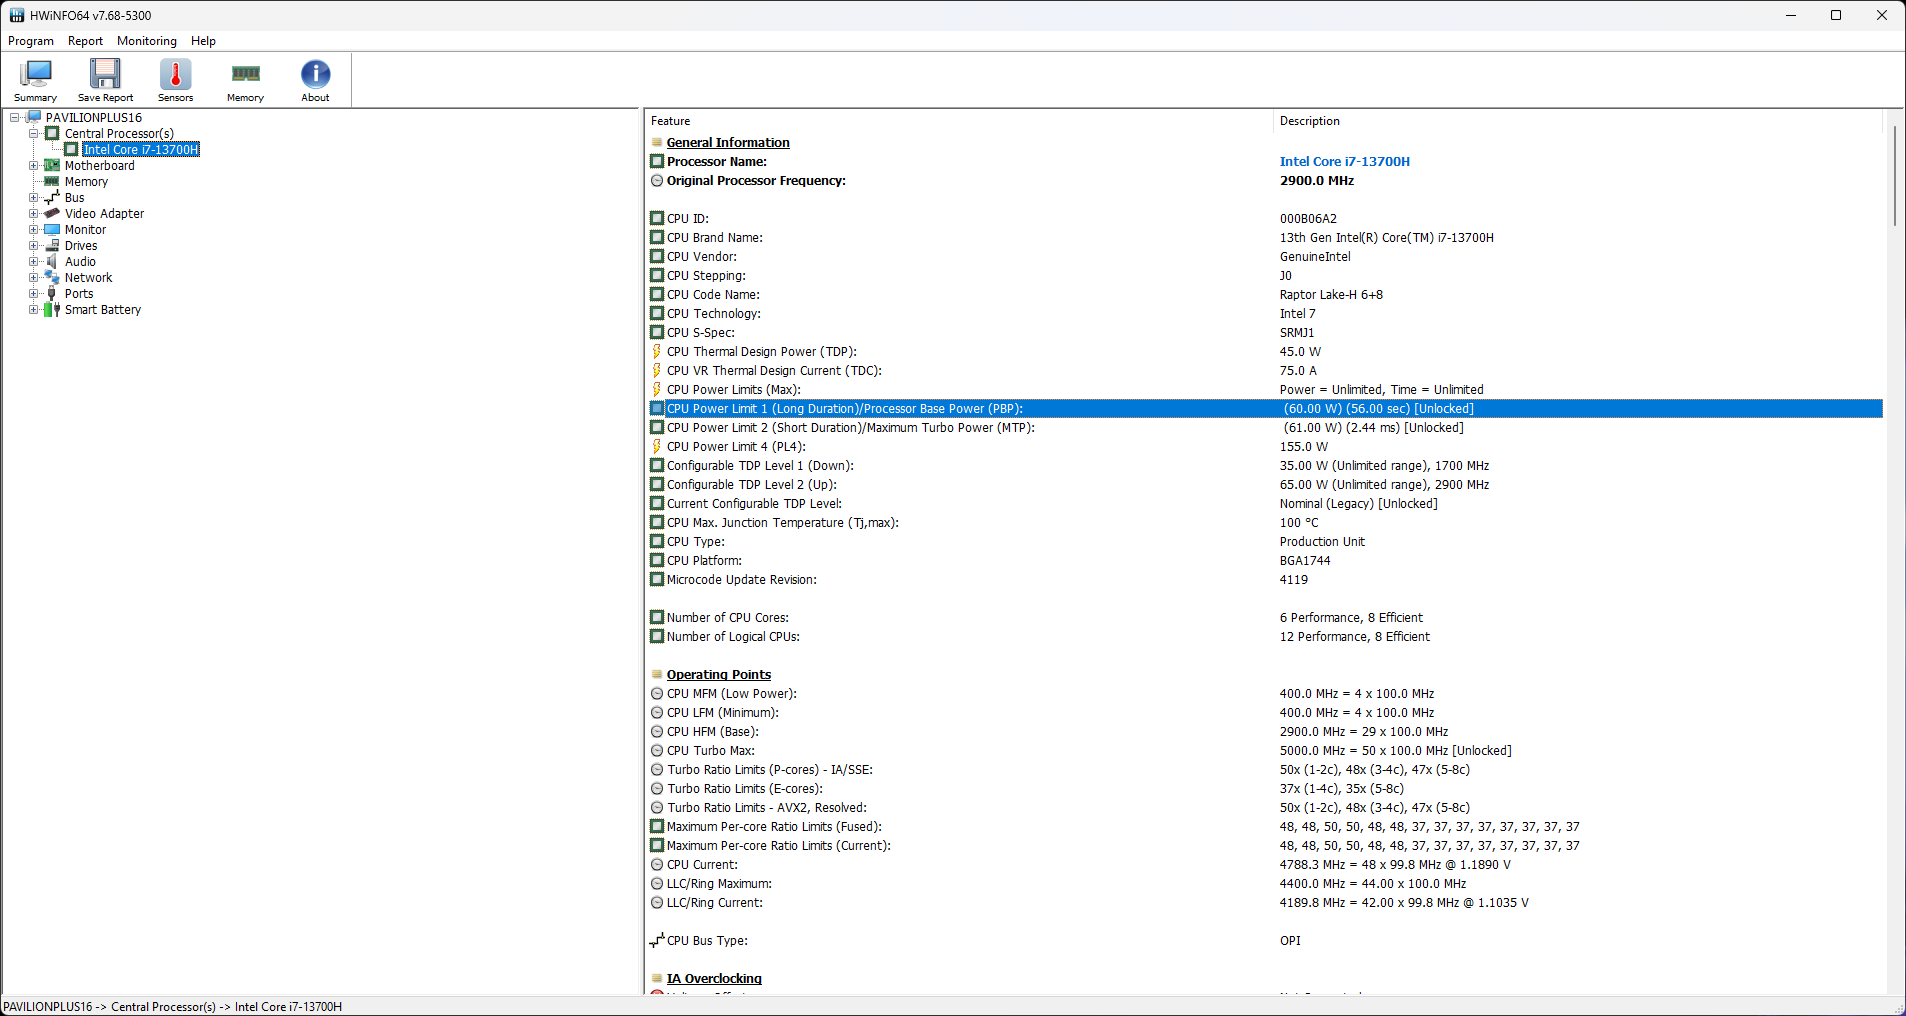
Rendimiento: Core i7-13700H limitado por el bajo PL2
Dependiendo de la región, HP ofrece el Pavilion Plus 16 en Core i5-13500H y Core i7-13700H junto con gráficos opcionales RTX 3050 de 6 GB.
Condiciones de prueba
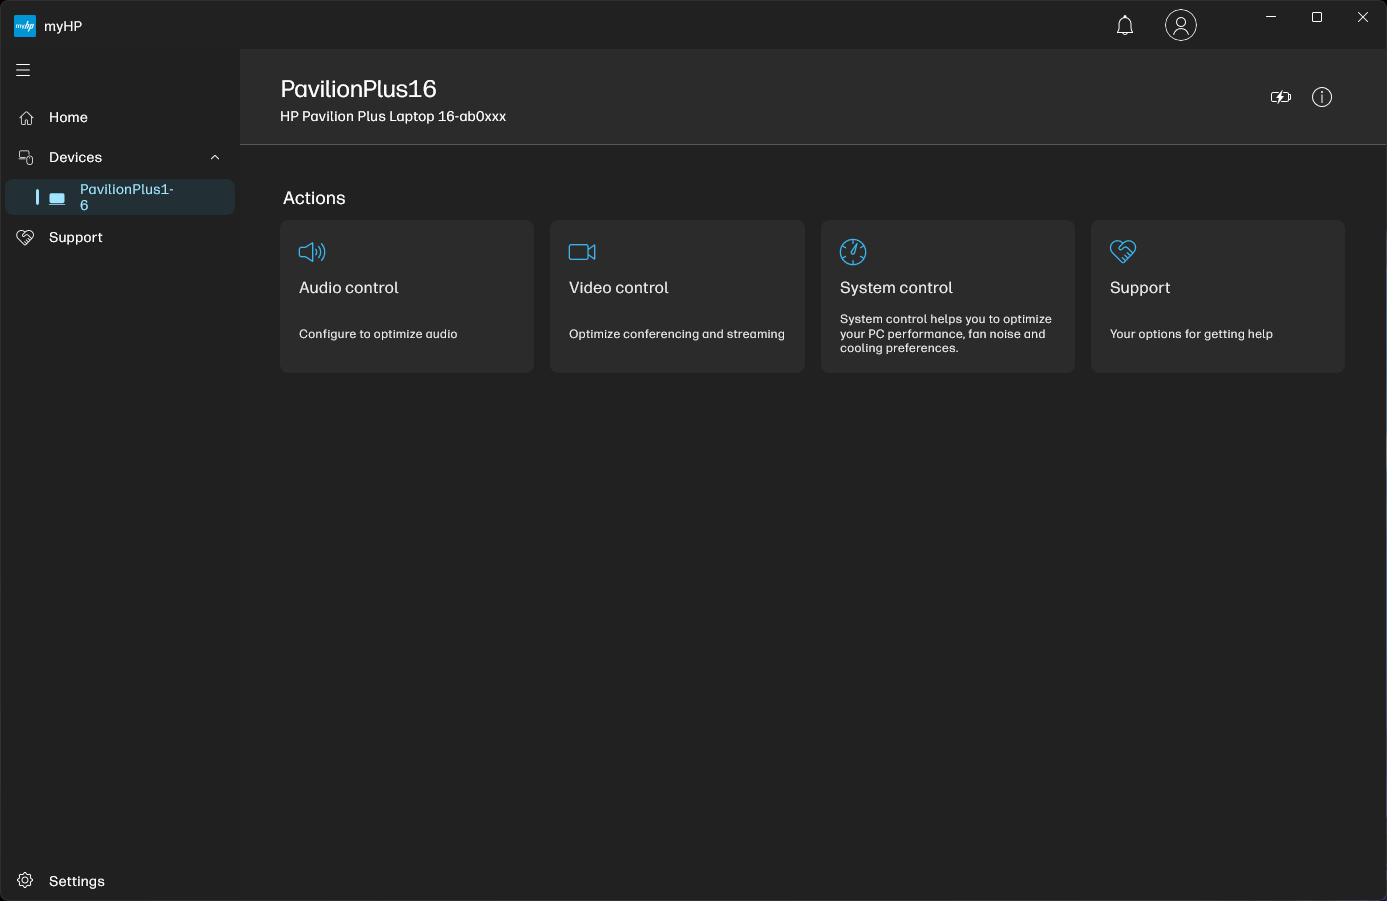
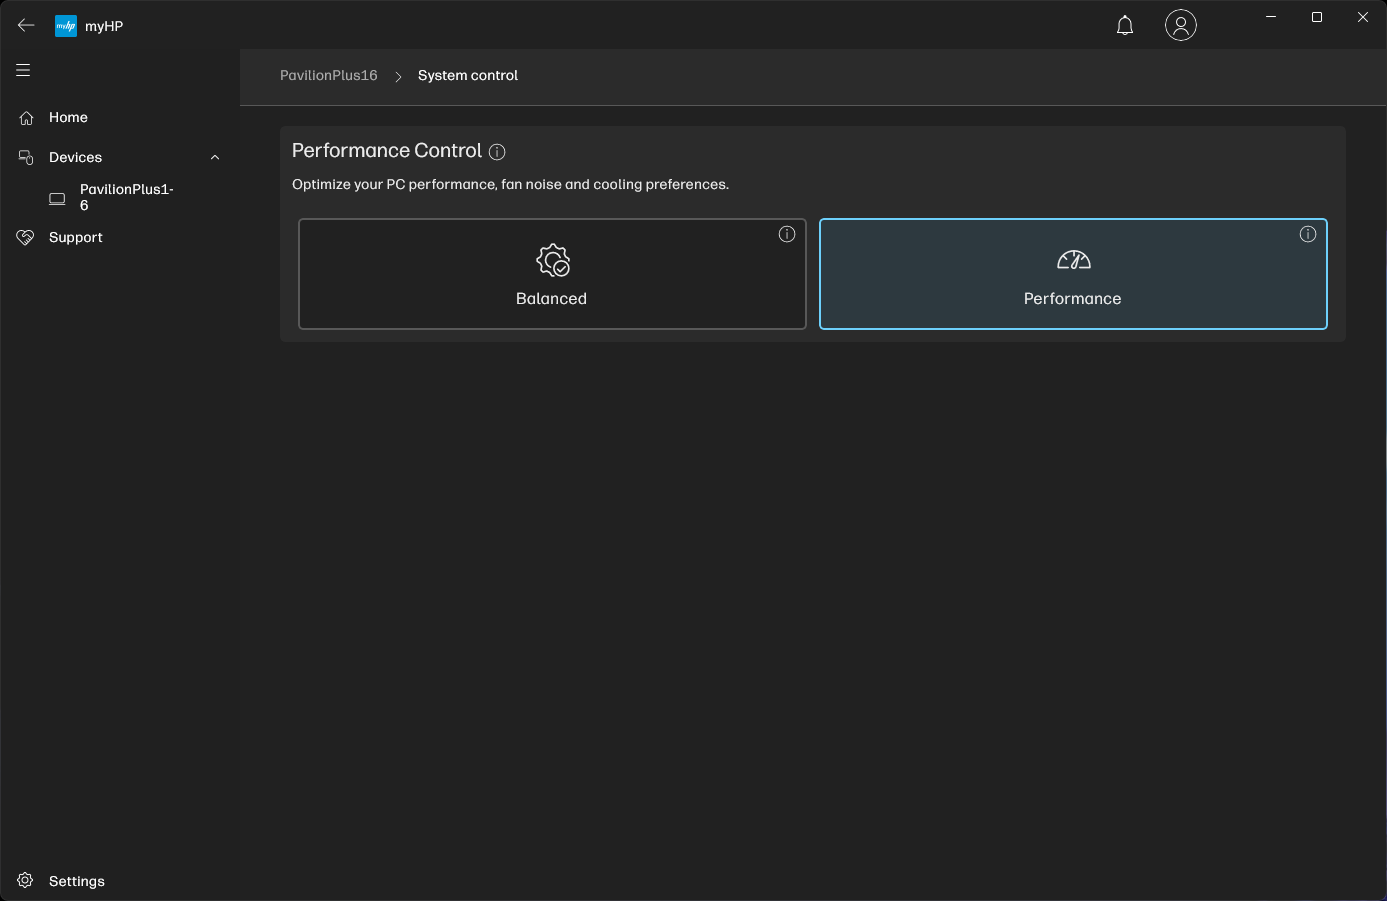
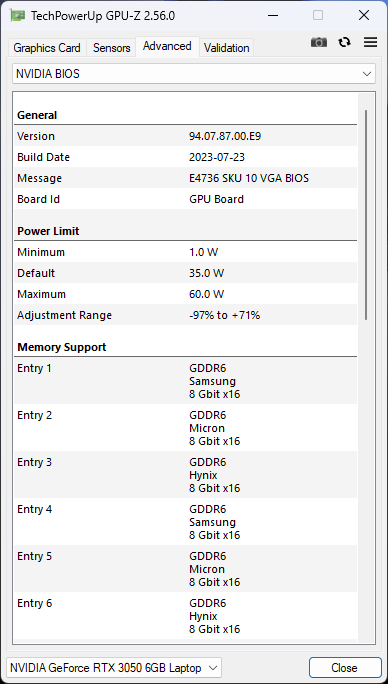
La aplicación myHP permite a los usuarios seleccionar entre dos modos de funcionamiento: Equilibrado y Rendimiento. El modo Equilibrado utiliza un PL1 de 50 W, que sube a 60 W en el modo Rendimiento. El PL2 en estos dos modos tiene un tope de 61 W.
La GPU RTX 3050 de 6 GB funciona por defecto en modo MSHybrid / Optimus sin posibilidad de conmutación MUX.
Utilizamos el modo Rendimiento para todas las pruebas comparativas. El PL1/PL2 desciende a 35 W / 35 W en batería.
Procesador
El Core i7-13700H del Pavilion Plus 16 se ve lastrado por un valor PL2 bajo. Esto se hace particularmente evidente en las pruebas comparativas multinúcleo, donde se queda significativamente por detrás de modelos como el Dell Inspiron 16 Plus 7630 que luce un Core i7-13700H de 89 W PL2.
Dicho esto, la refrigeración del Pavilion Plus 16 parece ser muy eficaz para garantizar un rendimiento bien sostenido durante nuestra prueba de bucle multinúcleo Cinebench R15.
El Pavilion Plus 16 encabeza la mayoría de las listas de CPU de un solo núcleo, pero el Schenker Vision 14 M23 le pisa los talones en estas pruebas.
Cinebench R15 Multi Loop
Cinebench R23: Multi Core | Single Core
Cinebench R20: CPU (Multi Core) | CPU (Single Core)
Cinebench R15: CPU Multi 64Bit | CPU Single 64Bit
Blender: v2.79 BMW27 CPU
7-Zip 18.03: 7z b 4 | 7z b 4 -mmt1
Geekbench 6.7: Multi-Core | Single-Core
Geekbench 5.5: Multi-Core | Single-Core
HWBOT x265 Benchmark v2.2: 4k Preset
LibreOffice : 20 Documents To PDF
R Benchmark 2.5: Overall mean
| CPU Performance rating | |
| Media de la clase Multimedia | |
| Dell Inspiron 16 Plus 7630 | |
| Medio Intel Core i7-13700H | |
| HP Pavilion Plus 16-ab0456tx | |
| Asus VivoBook Pro 16 K6602VU | |
| Samsung Galaxy Book3 Ultra 16 -2! | |
| Schenker Vision 14 M23 RTX 3050 | |
| Asus VivoBook 14X K3405 -2! | |
| Lenovo Slim Pro 7 14ARP8 -2! | |
| Cinebench R23 / Multi Core | |
| Media de la clase Multimedia (4861 - 33362, n=81, últimos 2 años) | |
| Dell Inspiron 16 Plus 7630 | |
| Samsung Galaxy Book3 Ultra 16 | |
| Medio Intel Core i7-13700H (5890 - 20034, n=29) | |
| Asus VivoBook Pro 16 K6602VU | |
| Asus VivoBook 14X K3405 | |
| Schenker Vision 14 M23 RTX 3050 | |
| Lenovo Slim Pro 7 14ARP8 | |
| HP Pavilion Plus 16-ab0456tx | |
| Cinebench R23 / Single Core | |
| Media de la clase Multimedia (1128 - 2459, n=73, últimos 2 años) | |
| HP Pavilion Plus 16-ab0456tx | |
| Schenker Vision 14 M23 RTX 3050 | |
| Dell Inspiron 16 Plus 7630 | |
| Medio Intel Core i7-13700H (1323 - 1914, n=29) | |
| Asus VivoBook Pro 16 K6602VU | |
| Asus VivoBook 14X K3405 | |
| Samsung Galaxy Book3 Ultra 16 | |
| Lenovo Slim Pro 7 14ARP8 | |
| Cinebench R20 / CPU (Multi Core) | |
| Media de la clase Multimedia (1887 - 12912, n=64, últimos 2 años) | |
| Dell Inspiron 16 Plus 7630 | |
| Samsung Galaxy Book3 Ultra 16 | |
| Medio Intel Core i7-13700H (2322 - 7674, n=29) | |
| HP Pavilion Plus 16-ab0456tx | |
| Asus VivoBook Pro 16 K6602VU | |
| Asus VivoBook 14X K3405 | |
| Schenker Vision 14 M23 RTX 3050 | |
| Lenovo Slim Pro 7 14ARP8 | |
| Cinebench R20 / CPU (Single Core) | |
| HP Pavilion Plus 16-ab0456tx | |
| Schenker Vision 14 M23 RTX 3050 | |
| Dell Inspiron 16 Plus 7630 | |
| Media de la clase Multimedia (425 - 853, n=64, últimos 2 años) | |
| Medio Intel Core i7-13700H (508 - 741, n=29) | |
| Asus VivoBook Pro 16 K6602VU | |
| Asus VivoBook 14X K3405 | |
| Samsung Galaxy Book3 Ultra 16 | |
| Lenovo Slim Pro 7 14ARP8 | |
| Cinebench R15 / CPU Multi 64Bit | |
| Media de la clase Multimedia (856 - 5224, n=68, últimos 2 años) | |
| Samsung Galaxy Book3 Ultra 16 | |
| Asus VivoBook Pro 16 K6602VU | |
| Dell Inspiron 16 Plus 7630 | |
| Medio Intel Core i7-13700H (905 - 2982, n=29) | |
| Asus VivoBook 14X K3405 | |
| HP Pavilion Plus 16-ab0456tx | |
| Lenovo Slim Pro 7 14ARP8 | |
| Schenker Vision 14 M23 RTX 3050 | |
| Cinebench R15 / CPU Single 64Bit | |
| Media de la clase Multimedia (184.8 - 326, n=66, últimos 2 años) | |
| HP Pavilion Plus 16-ab0456tx | |
| Schenker Vision 14 M23 RTX 3050 | |
| Dell Inspiron 16 Plus 7630 | |
| Medio Intel Core i7-13700H (213 - 278, n=29) | |
| Asus VivoBook Pro 16 K6602VU | |
| Asus VivoBook 14X K3405 | |
| Samsung Galaxy Book3 Ultra 16 | |
| Lenovo Slim Pro 7 14ARP8 | |
| Blender / v2.79 BMW27 CPU | |
| Schenker Vision 14 M23 RTX 3050 | |
| Media de la clase Multimedia (100 - 557, n=65, últimos 2 años) | |
| Lenovo Slim Pro 7 14ARP8 | |
| Asus VivoBook 14X K3405 | |
| Medio Intel Core i7-13700H (169 - 555, n=29) | |
| Samsung Galaxy Book3 Ultra 16 | |
| Dell Inspiron 16 Plus 7630 | |
| HP Pavilion Plus 16-ab0456tx | |
| Asus VivoBook Pro 16 K6602VU | |
| 7-Zip 18.03 / 7z b 4 | |
| Asus VivoBook Pro 16 K6602VU | |
| HP Pavilion Plus 16-ab0456tx | |
| Samsung Galaxy Book3 Ultra 16 | |
| Medio Intel Core i7-13700H (27322 - 76344, n=29) | |
| Dell Inspiron 16 Plus 7630 | |
| Media de la clase Multimedia (29095 - 130368, n=62, últimos 2 años) | |
| Lenovo Slim Pro 7 14ARP8 | |
| Schenker Vision 14 M23 RTX 3050 | |
| Asus VivoBook 14X K3405 | |
| 7-Zip 18.03 / 7z b 4 -mmt1 | |
| Schenker Vision 14 M23 RTX 3050 | |
| HP Pavilion Plus 16-ab0456tx | |
| Media de la clase Multimedia (3666 - 7545, n=63, últimos 2 años) | |
| Medio Intel Core i7-13700H (4825 - 6238, n=29) | |
| Asus VivoBook Pro 16 K6602VU | |
| Dell Inspiron 16 Plus 7630 | |
| Asus VivoBook 14X K3405 | |
| Samsung Galaxy Book3 Ultra 16 | |
| Lenovo Slim Pro 7 14ARP8 | |
| Geekbench 6.7 / Multi-Core | |
| Media de la clase Multimedia (4983 - 29415, n=76, últimos 2 años) | |
| Dell Inspiron 16 Plus 7630 | |
| HP Pavilion Plus 16-ab0456tx | |
| Schenker Vision 14 M23 RTX 3050 | |
| Medio Intel Core i7-13700H (8415 - 13832, n=13) | |
| Asus VivoBook Pro 16 K6602VU | |
| Geekbench 6.7 / Single-Core | |
| Media de la clase Multimedia (1534 - 4335, n=75, últimos 2 años) | |
| Schenker Vision 14 M23 RTX 3050 | |
| Dell Inspiron 16 Plus 7630 | |
| HP Pavilion Plus 16-ab0456tx | |
| Medio Intel Core i7-13700H (2316 - 2639, n=13) | |
| Asus VivoBook Pro 16 K6602VU | |
| Geekbench 5.5 / Multi-Core | |
| Media de la clase Multimedia (4652 - 20422, n=62, últimos 2 años) | |
| Dell Inspiron 16 Plus 7630 | |
| Medio Intel Core i7-13700H (6165 - 14215, n=29) | |
| Samsung Galaxy Book3 Ultra 16 | |
| HP Pavilion Plus 16-ab0456tx | |
| Schenker Vision 14 M23 RTX 3050 | |
| Asus VivoBook Pro 16 K6602VU | |
| Asus VivoBook 14X K3405 | |
| Lenovo Slim Pro 7 14ARP8 | |
| Geekbench 5.5 / Single-Core | |
| Media de la clase Multimedia (805 - 2974, n=62, últimos 2 años) | |
| Dell Inspiron 16 Plus 7630 | |
| Schenker Vision 14 M23 RTX 3050 | |
| HP Pavilion Plus 16-ab0456tx | |
| Medio Intel Core i7-13700H (1362 - 1919, n=29) | |
| Asus VivoBook Pro 16 K6602VU | |
| Samsung Galaxy Book3 Ultra 16 | |
| Asus VivoBook 14X K3405 | |
| Lenovo Slim Pro 7 14ARP8 | |
| HWBOT x265 Benchmark v2.2 / 4k Preset | |
| Media de la clase Multimedia (5.26 - 36.1, n=63, últimos 2 años) | |
| Samsung Galaxy Book3 Ultra 16 | |
| Asus VivoBook Pro 16 K6602VU | |
| Medio Intel Core i7-13700H (6.72 - 21.2, n=29) | |
| HP Pavilion Plus 16-ab0456tx | |
| Lenovo Slim Pro 7 14ARP8 | |
| Dell Inspiron 16 Plus 7630 | |
| Asus VivoBook 14X K3405 | |
| Schenker Vision 14 M23 RTX 3050 | |
| LibreOffice / 20 Documents To PDF | |
| HP Pavilion Plus 16-ab0456tx | |
| Lenovo Slim Pro 7 14ARP8 | |
| Schenker Vision 14 M23 RTX 3050 | |
| Asus VivoBook Pro 16 K6602VU | |
| Media de la clase Multimedia (23.9 - 146.7, n=64, últimos 2 años) | |
| Samsung Galaxy Book3 Ultra 16 | |
| Medio Intel Core i7-13700H (31.3 - 62.4, n=29) | |
| Asus VivoBook 14X K3405 | |
| Dell Inspiron 16 Plus 7630 | |
| R Benchmark 2.5 / Overall mean | |
| Lenovo Slim Pro 7 14ARP8 | |
| Asus VivoBook 14X K3405 | |
| Samsung Galaxy Book3 Ultra 16 | |
| Asus VivoBook Pro 16 K6602VU | |
| Medio Intel Core i7-13700H (0.4308 - 0.607, n=29) | |
| Media de la clase Multimedia (0.3604 - 0.947, n=63, últimos 2 años) | |
| Schenker Vision 14 M23 RTX 3050 | |
| HP Pavilion Plus 16-ab0456tx | |
| Dell Inspiron 16 Plus 7630 | |
* ... más pequeño es mejor
AIDA64: FP32 Ray-Trace | FPU Julia | CPU SHA3 | CPU Queen | FPU SinJulia | FPU Mandel | CPU AES | CPU ZLib | FP64 Ray-Trace | CPU PhotoWorxx
| Performance rating | |
| Media de la clase Multimedia | |
| Asus VivoBook Pro 16 K6602VU | |
| Lenovo Slim Pro 7 14ARP8 | |
| HP Pavilion Plus 16-ab0456tx | |
| Samsung Galaxy Book3 Ultra 16 | |
| Medio Intel Core i7-13700H | |
| Dell Inspiron 16 Plus 7630 | |
| Asus VivoBook 14X K3405 | |
| Schenker Vision 14 M23 RTX 3050 | |
| AIDA64 / FP32 Ray-Trace | |
| Media de la clase Multimedia (2214 - 50388, n=60, últimos 2 años) | |
| Lenovo Slim Pro 7 14ARP8 | |
| HP Pavilion Plus 16-ab0456tx | |
| Samsung Galaxy Book3 Ultra 16 | |
| Medio Intel Core i7-13700H (4986 - 18908, n=29) | |
| Dell Inspiron 16 Plus 7630 | |
| Asus VivoBook Pro 16 K6602VU | |
| Asus VivoBook 14X K3405 | |
| Schenker Vision 14 M23 RTX 3050 | |
| AIDA64 / FPU Julia | |
| Lenovo Slim Pro 7 14ARP8 | |
| Media de la clase Multimedia (12867 - 201874, n=61, últimos 2 años) | |
| HP Pavilion Plus 16-ab0456tx | |
| Asus VivoBook Pro 16 K6602VU | |
| Medio Intel Core i7-13700H (25360 - 92359, n=29) | |
| Samsung Galaxy Book3 Ultra 16 | |
| Dell Inspiron 16 Plus 7630 | |
| Asus VivoBook 14X K3405 | |
| Schenker Vision 14 M23 RTX 3050 | |
| AIDA64 / CPU SHA3 | |
| Media de la clase Multimedia (653 - 8623, n=61, últimos 2 años) | |
| Asus VivoBook 14X K3405 | |
| HP Pavilion Plus 16-ab0456tx | |
| Asus VivoBook Pro 16 K6602VU | |
| Samsung Galaxy Book3 Ultra 16 | |
| Medio Intel Core i7-13700H (1339 - 4224, n=29) | |
| Lenovo Slim Pro 7 14ARP8 | |
| Dell Inspiron 16 Plus 7630 | |
| Schenker Vision 14 M23 RTX 3050 | |
| AIDA64 / CPU Queen | |
| Dell Inspiron 16 Plus 7630 | |
| Samsung Galaxy Book3 Ultra 16 | |
| HP Pavilion Plus 16-ab0456tx | |
| Medio Intel Core i7-13700H (59324 - 107159, n=29) | |
| Asus VivoBook Pro 16 K6602VU | |
| Lenovo Slim Pro 7 14ARP8 | |
| Schenker Vision 14 M23 RTX 3050 | |
| Asus VivoBook 14X K3405 | |
| Media de la clase Multimedia (13483 - 181505, n=49, últimos 2 años) | |
| AIDA64 / FPU SinJulia | |
| Lenovo Slim Pro 7 14ARP8 | |
| HP Pavilion Plus 16-ab0456tx | |
| Media de la clase Multimedia (1240 - 28794, n=61, últimos 2 años) | |
| Samsung Galaxy Book3 Ultra 16 | |
| Dell Inspiron 16 Plus 7630 | |
| Asus VivoBook Pro 16 K6602VU | |
| Medio Intel Core i7-13700H (4800 - 11050, n=29) | |
| Schenker Vision 14 M23 RTX 3050 | |
| Asus VivoBook 14X K3405 | |
| AIDA64 / FPU Mandel | |
| Lenovo Slim Pro 7 14ARP8 | |
| Media de la clase Multimedia (6395 - 105740, n=60, últimos 2 años) | |
| HP Pavilion Plus 16-ab0456tx | |
| Samsung Galaxy Book3 Ultra 16 | |
| Medio Intel Core i7-13700H (12321 - 45118, n=29) | |
| Asus VivoBook Pro 16 K6602VU | |
| Dell Inspiron 16 Plus 7630 | |
| Asus VivoBook 14X K3405 | |
| Schenker Vision 14 M23 RTX 3050 | |
| AIDA64 / CPU AES | |
| Asus VivoBook Pro 16 K6602VU | |
| Asus VivoBook 14X K3405 | |
| Medio Intel Core i7-13700H (28769 - 151254, n=29) | |
| HP Pavilion Plus 16-ab0456tx | |
| Samsung Galaxy Book3 Ultra 16 | |
| Media de la clase Multimedia (13243 - 126790, n=61, últimos 2 años) | |
| Dell Inspiron 16 Plus 7630 | |
| Schenker Vision 14 M23 RTX 3050 | |
| Lenovo Slim Pro 7 14ARP8 | |
| AIDA64 / CPU ZLib | |
| Samsung Galaxy Book3 Ultra 16 | |
| Media de la clase Multimedia (167.2 - 2022, n=61, últimos 2 años) | |
| HP Pavilion Plus 16-ab0456tx | |
| Asus VivoBook Pro 16 K6602VU | |
| Medio Intel Core i7-13700H (389 - 1215, n=29) | |
| Asus VivoBook 14X K3405 | |
| Dell Inspiron 16 Plus 7630 | |
| Schenker Vision 14 M23 RTX 3050 | |
| Lenovo Slim Pro 7 14ARP8 | |
| AIDA64 / FP64 Ray-Trace | |
| Media de la clase Multimedia (1014 - 26875, n=61, últimos 2 años) | |
| HP Pavilion Plus 16-ab0456tx | |
| Lenovo Slim Pro 7 14ARP8 | |
| Samsung Galaxy Book3 Ultra 16 | |
| Asus VivoBook Pro 16 K6602VU | |
| Medio Intel Core i7-13700H (2540 - 10135, n=29) | |
| Dell Inspiron 16 Plus 7630 | |
| Asus VivoBook 14X K3405 | |
| Schenker Vision 14 M23 RTX 3050 | |
| AIDA64 / CPU PhotoWorxx | |
| Media de la clase Multimedia (12860 - 88154, n=61, últimos 2 años) | |
| Samsung Galaxy Book3 Ultra 16 | |
| Schenker Vision 14 M23 RTX 3050 | |
| HP Pavilion Plus 16-ab0456tx | |
| Medio Intel Core i7-13700H (12872 - 52727, n=29) | |
| Asus VivoBook Pro 16 K6602VU | |
| Dell Inspiron 16 Plus 7630 | |
| Lenovo Slim Pro 7 14ARP8 | |
| Asus VivoBook 14X K3405 | |
Eche un vistazo a nuestro Intel Core i7-13700H para ver más comparaciones de rendimiento.
Rendimiento del sistema
El Pavilion Plus 16 se las arregla de alguna manera para superar al VivoBook Pro 16 con un Core i9-13900H y RTX 4050 en las pruebas generales de CrossMark, pero pierde ante este último en PCMark 10 por un 6%.
Por lo demás, el sistema se siente bastante sensible para las tareas diarias de productividad y navegación web.
CrossMark: Overall | Productivity | Creativity | Responsiveness
AIDA64: Memory Copy | Memory Read | Memory Write | Memory Latency
WebXPRT 3: Overall
WebXPRT 4: Overall
Mozilla Kraken 1.1: Total
| PCMark 10 / Score | |
| Media de la clase Multimedia (4325 - 10386, n=58, últimos 2 años) | |
| Dell Inspiron 16 Plus 7630 | |
| Asus VivoBook Pro 16 K6602VU | |
| Samsung Galaxy Book3 Ultra 16 | |
| Asus VivoBook 14X K3405 | |
| HP Pavilion Plus 16-ab0456tx | |
| Medio Intel Core i7-13700H, NVIDIA GeForce RTX 3050 6GB Laptop GPU (6290 - 6597, n=2) | |
| Lenovo Slim Pro 7 14ARP8 | |
| Schenker Vision 14 M23 RTX 3050 | |
| PCMark 10 / Essentials | |
| Dell Inspiron 16 Plus 7630 | |
| Samsung Galaxy Book3 Ultra 16 | |
| Media de la clase Multimedia (8025 - 11664, n=57, últimos 2 años) | |
| Asus VivoBook Pro 16 K6602VU | |
| Asus VivoBook 14X K3405 | |
| HP Pavilion Plus 16-ab0456tx | |
| Medio Intel Core i7-13700H, NVIDIA GeForce RTX 3050 6GB Laptop GPU (9943 - 10112, n=2) | |
| Lenovo Slim Pro 7 14ARP8 | |
| Schenker Vision 14 M23 RTX 3050 | |
| PCMark 10 / Productivity | |
| Media de la clase Multimedia (7323 - 18233, n=57, últimos 2 años) | |
| Dell Inspiron 16 Plus 7630 | |
| Asus VivoBook 14X K3405 | |
| Schenker Vision 14 M23 RTX 3050 | |
| Medio Intel Core i7-13700H, NVIDIA GeForce RTX 3050 6GB Laptop GPU (8803 - 8950, n=2) | |
| HP Pavilion Plus 16-ab0456tx | |
| Asus VivoBook Pro 16 K6602VU | |
| Samsung Galaxy Book3 Ultra 16 | |
| Lenovo Slim Pro 7 14ARP8 | |
| PCMark 10 / Digital Content Creation | |
| Dell Inspiron 16 Plus 7630 | |
| Asus VivoBook Pro 16 K6602VU | |
| Media de la clase Multimedia (3651 - 16240, n=57, últimos 2 años) | |
| Samsung Galaxy Book3 Ultra 16 | |
| Lenovo Slim Pro 7 14ARP8 | |
| HP Pavilion Plus 16-ab0456tx | |
| Asus VivoBook 14X K3405 | |
| Medio Intel Core i7-13700H, NVIDIA GeForce RTX 3050 6GB Laptop GPU (7590 - 8752, n=2) | |
| Schenker Vision 14 M23 RTX 3050 | |
| CrossMark / Overall | |
| Media de la clase Multimedia (866 - 2728, n=67, últimos 2 años) | |
| Dell Inspiron 16 Plus 7630 | |
| HP Pavilion Plus 16-ab0456tx | |
| Asus VivoBook Pro 16 K6602VU | |
| Asus VivoBook 14X K3405 | |
| Medio Intel Core i7-13700H, NVIDIA GeForce RTX 3050 6GB Laptop GPU (1504 - 1752, n=2) | |
| Samsung Galaxy Book3 Ultra 16 | |
| Schenker Vision 14 M23 RTX 3050 | |
| Lenovo Slim Pro 7 14ARP8 | |
| CrossMark / Productivity | |
| Dell Inspiron 16 Plus 7630 | |
| Media de la clase Multimedia (931 - 2489, n=67, últimos 2 años) | |
| Asus VivoBook Pro 16 K6602VU | |
| HP Pavilion Plus 16-ab0456tx | |
| Asus VivoBook 14X K3405 | |
| Medio Intel Core i7-13700H, NVIDIA GeForce RTX 3050 6GB Laptop GPU (1417 - 1657, n=2) | |
| Samsung Galaxy Book3 Ultra 16 | |
| Schenker Vision 14 M23 RTX 3050 | |
| Lenovo Slim Pro 7 14ARP8 | |
| CrossMark / Creativity | |
| Media de la clase Multimedia (907 - 3465, n=67, últimos 2 años) | |
| Dell Inspiron 16 Plus 7630 | |
| HP Pavilion Plus 16-ab0456tx | |
| Asus VivoBook Pro 16 K6602VU | |
| Medio Intel Core i7-13700H, NVIDIA GeForce RTX 3050 6GB Laptop GPU (1711 - 1970, n=2) | |
| Schenker Vision 14 M23 RTX 3050 | |
| Asus VivoBook 14X K3405 | |
| Samsung Galaxy Book3 Ultra 16 | |
| Lenovo Slim Pro 7 14ARP8 | |
| CrossMark / Responsiveness | |
| Dell Inspiron 16 Plus 7630 | |
| Asus VivoBook Pro 16 K6602VU | |
| Media de la clase Multimedia (605 - 2024, n=67, últimos 2 años) | |
| Samsung Galaxy Book3 Ultra 16 | |
| Asus VivoBook 14X K3405 | |
| HP Pavilion Plus 16-ab0456tx | |
| Medio Intel Core i7-13700H, NVIDIA GeForce RTX 3050 6GB Laptop GPU (1220 - 1458, n=2) | |
| Schenker Vision 14 M23 RTX 3050 | |
| Lenovo Slim Pro 7 14ARP8 | |
| AIDA64 / Memory Copy | |
| Media de la clase Multimedia (21158 - 132135, n=61, últimos 2 años) | |
| Samsung Galaxy Book3 Ultra 16 | |
| Schenker Vision 14 M23 RTX 3050 | |
| Medio Intel Core i7-13700H, NVIDIA GeForce RTX 3050 6GB Laptop GPU (64356 - 65837, n=2) | |
| HP Pavilion Plus 16-ab0456tx | |
| Dell Inspiron 16 Plus 7630 | |
| Asus VivoBook Pro 16 K6602VU | |
| Lenovo Slim Pro 7 14ARP8 | |
| Asus VivoBook 14X K3405 | |
| AIDA64 / Memory Read | |
| Media de la clase Multimedia (19699 - 174586, n=61, últimos 2 años) | |
| Schenker Vision 14 M23 RTX 3050 | |
| Samsung Galaxy Book3 Ultra 16 | |
| Medio Intel Core i7-13700H, NVIDIA GeForce RTX 3050 6GB Laptop GPU (65825 - 70861, n=2) | |
| Dell Inspiron 16 Plus 7630 | |
| Asus VivoBook Pro 16 K6602VU | |
| HP Pavilion Plus 16-ab0456tx | |
| Lenovo Slim Pro 7 14ARP8 | |
| Asus VivoBook 14X K3405 | |
| AIDA64 / Memory Write | |
| Samsung Galaxy Book3 Ultra 16 | |
| Media de la clase Multimedia (17733 - 134998, n=61, últimos 2 años) | |
| HP Pavilion Plus 16-ab0456tx | |
| Medio Intel Core i7-13700H, NVIDIA GeForce RTX 3050 6GB Laptop GPU (68174 - 76930, n=2) | |
| Schenker Vision 14 M23 RTX 3050 | |
| Asus VivoBook Pro 16 K6602VU | |
| Dell Inspiron 16 Plus 7630 | |
| Lenovo Slim Pro 7 14ARP8 | |
| Asus VivoBook 14X K3405 | |
| AIDA64 / Memory Latency | |
| Media de la clase Multimedia (7 - 535, n=60, últimos 2 años) | |
| Lenovo Slim Pro 7 14ARP8 | |
| Samsung Galaxy Book3 Ultra 16 | |
| Dell Inspiron 16 Plus 7630 | |
| Asus VivoBook Pro 16 K6602VU | |
| HP Pavilion Plus 16-ab0456tx | |
| Asus VivoBook 14X K3405 | |
| Medio Intel Core i7-13700H, NVIDIA GeForce RTX 3050 6GB Laptop GPU (85.7 - 89.7, n=2) | |
| Schenker Vision 14 M23 RTX 3050 | |
| WebXPRT 3 / Overall | |
| Media de la clase Multimedia (136.4 - 596, n=70, últimos 2 años) | |
| Dell Inspiron 16 Plus 7630 | |
| Schenker Vision 14 M23 RTX 3050 | |
| Medio Intel Core i7-13700H, NVIDIA GeForce RTX 3050 6GB Laptop GPU (286 - 300, n=2) | |
| HP Pavilion Plus 16-ab0456tx | |
| Asus VivoBook 14X K3405 | |
| Lenovo Slim Pro 7 14ARP8 | |
| Samsung Galaxy Book3 Ultra 16 | |
| WebXPRT 4 / Overall | |
| Schenker Vision 14 M23 RTX 3050 | |
| Medio Intel Core i7-13700H, NVIDIA GeForce RTX 3050 6GB Laptop GPU (273 - 325, n=2) | |
| Media de la clase Multimedia (167.3 - 402, n=71, últimos 2 años) | |
| Dell Inspiron 16 Plus 7630 | |
| HP Pavilion Plus 16-ab0456tx | |
| Asus VivoBook 14X K3405 | |
| Asus VivoBook Pro 16 K6602VU | |
| Samsung Galaxy Book3 Ultra 16 | |
| Lenovo Slim Pro 7 14ARP8 | |
| Mozilla Kraken 1.1 / Total | |
| Lenovo Slim Pro 7 14ARP8 | |
| Samsung Galaxy Book3 Ultra 16 | |
| Asus VivoBook 14X K3405 | |
| Asus VivoBook Pro 16 K6602VU | |
| Dell Inspiron 16 Plus 7630 | |
| Schenker Vision 14 M23 RTX 3050 | |
| Medio Intel Core i7-13700H, NVIDIA GeForce RTX 3050 6GB Laptop GPU (490 - 496, n=2) | |
| HP Pavilion Plus 16-ab0456tx | |
| Media de la clase Multimedia (228 - 835, n=74, últimos 2 años) | |
* ... más pequeño es mejor
| PCMark 8 Home Score Accelerated v2 | 5525 puntos | |
| PCMark 8 Work Score Accelerated v2 | 5653 puntos | |
| PCMark 10 Score | 6597 puntos | |
ayuda | ||
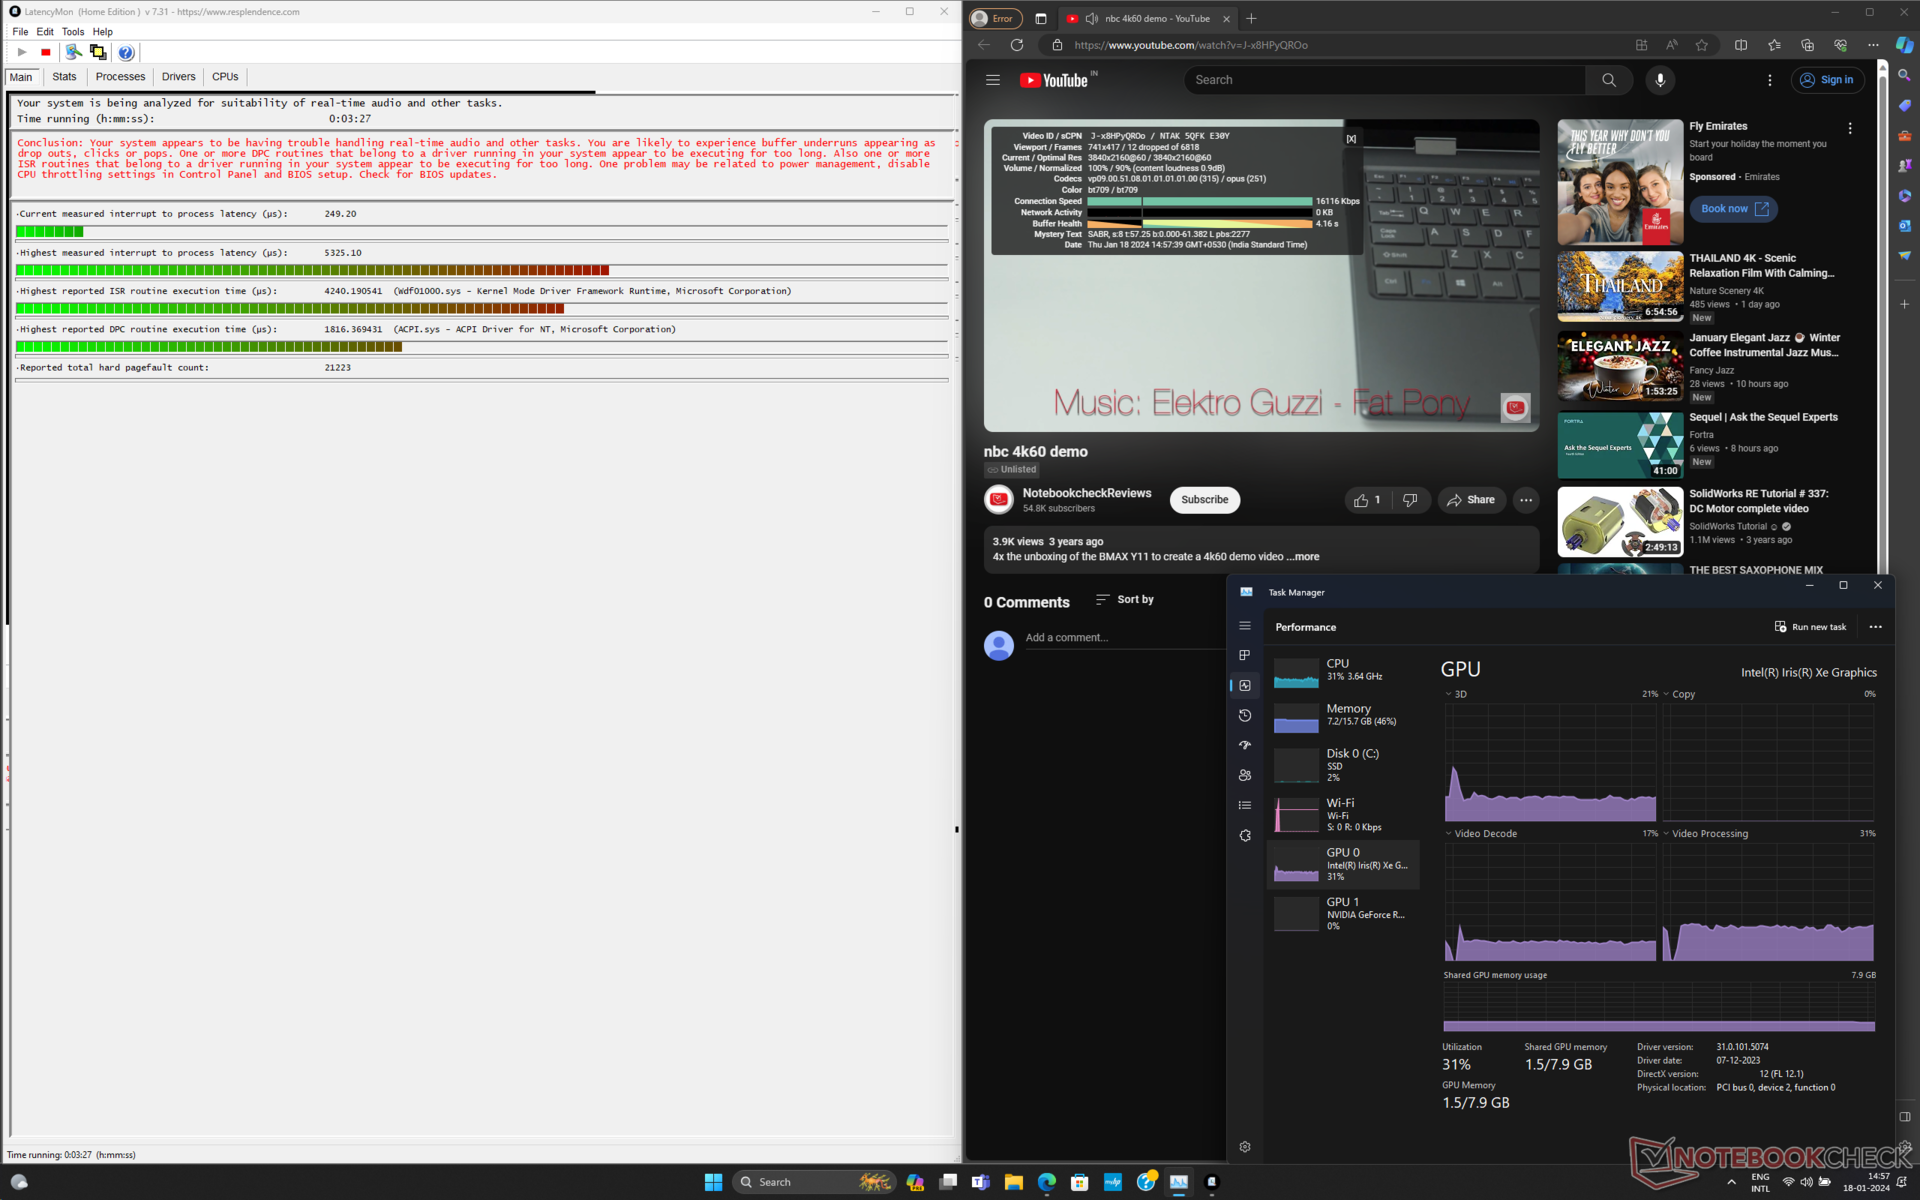
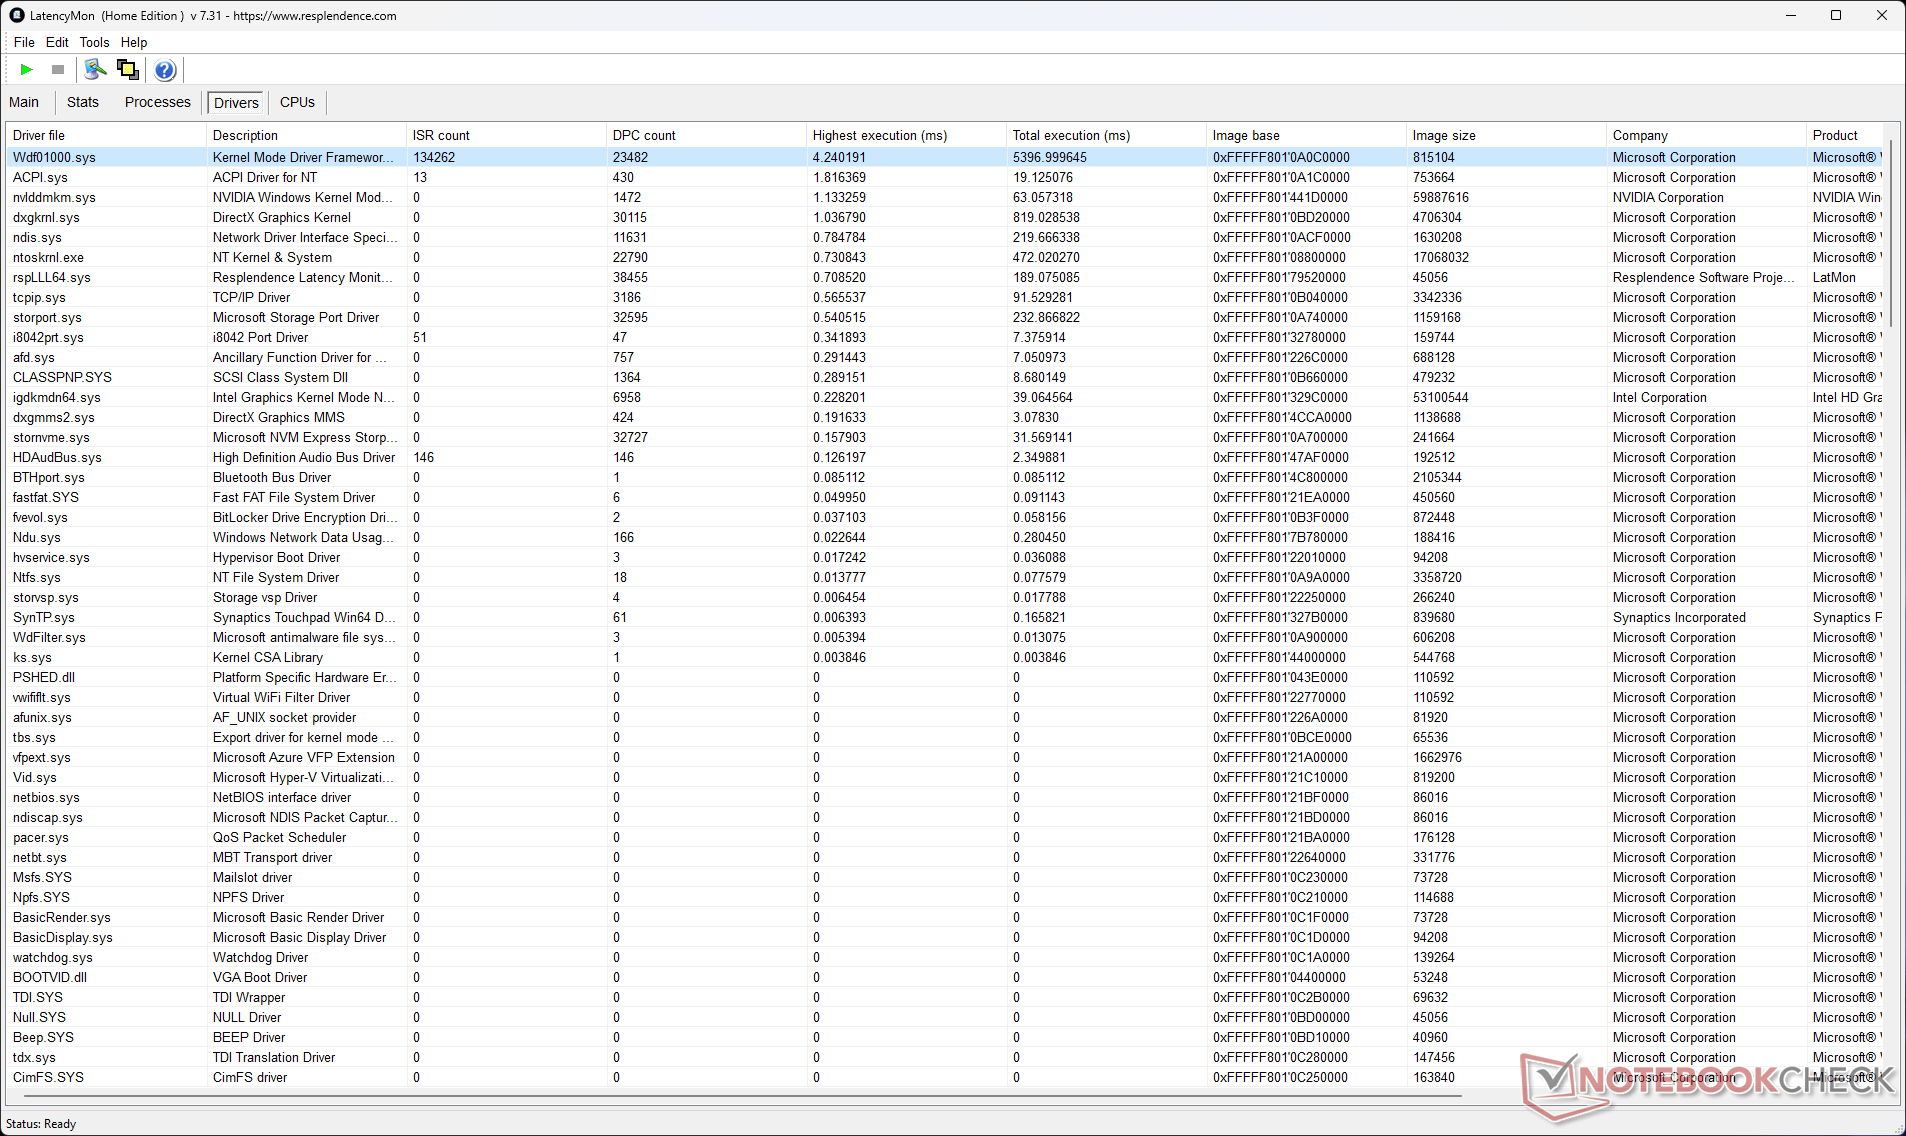
Latencia del CPD
La latencia medida de interrupción a proceso de la Pavilion Plus 16 de 5325,1 μs está en el lado más alto, lo que puede ser una preocupación para quienes se dedican a flujos de trabajo de audio y vídeo en tiempo real.
| DPC Latencies / LatencyMon - interrupt to process latency (max), Web, Youtube, Prime95 | |
| HP Pavilion Plus 16-ab0456tx | |
| Samsung Galaxy Book3 Ultra 16 | |
| Asus VivoBook Pro 16 K6602VU | |
| Schenker Vision 14 M23 RTX 3050 | |
| Lenovo Slim Pro 7 14ARP8 | |
| Asus VivoBook 14X K3405 | |
| Dell Inspiron 16 Plus 7630 | |
* ... más pequeño es mejor
Nuestra Clasificación de la latencia del CPD ofrece más comparaciones de latencia entre los dispositivos analizados.
Dispositivos de almacenamiento
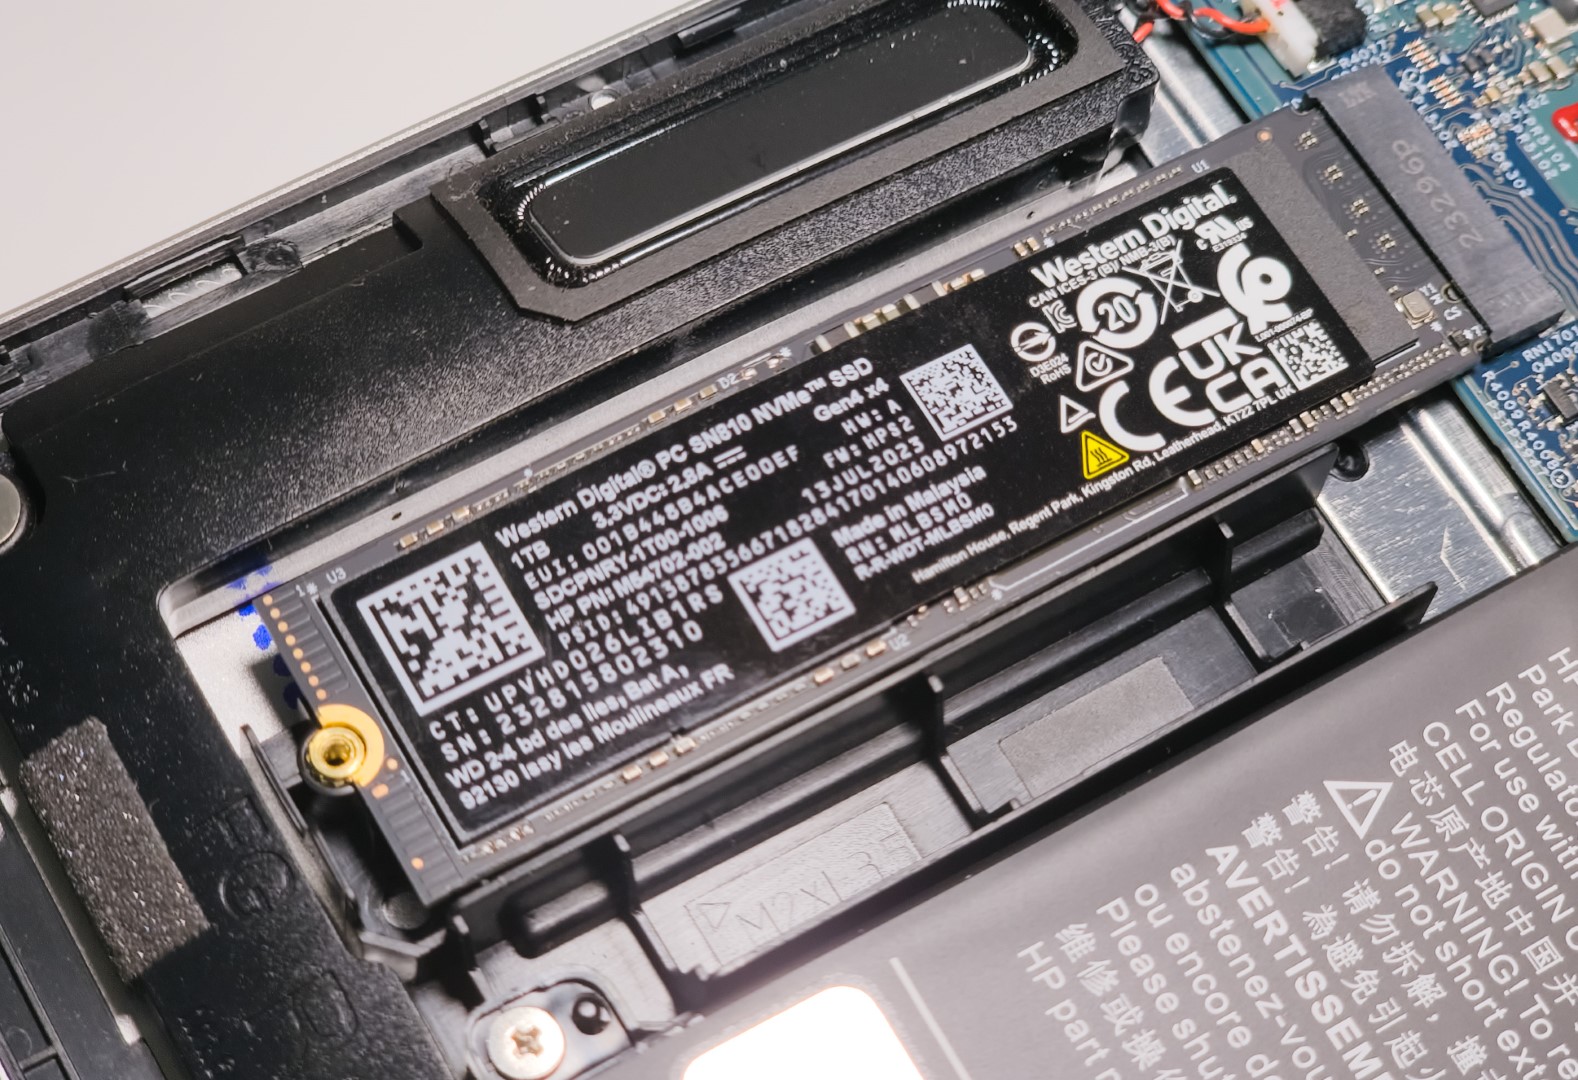
Una unidad Western Digital PC SN810 NVMe de 1 TB viene instalada en nuestra unidad Pavilion Plus 16. El rendimiento acumulado de la unidad es aproximadamente un 10% más lento que el Samsung 990 Pro en el Schenker Vision 14 M23 y aproximadamente un 16% más lento que el Samsung PM9A1 en el Samsung Galaxy Book3 Ultra 16.
El menor rendimiento de lectura/escritura 4K contribuye principalmente a este déficit de rendimiento.
Por desgracia, sólo se puede instalar una unidad SSD en el chasis. Tampoco hay margen para añadir unidades de 2,5 pulgadas.

* ... más pequeño es mejor
Estrangulamiento de disco: Bucle de lectura DiskSpd, profundidad de cola 8
Aunque HP proporciona una cubierta térmica para la SSD, aparentemente no es suficiente para evitar que la unidad se ralentice después del bucle 25 durante nuestra prueba de bucle de lectura DiskSpd a una profundidad de cola de 8.
Encontrará más pruebas comparativas de almacenamiento en nuestra Página de comparación de SSD.
Rendimiento de la GPU
El Pavilion Plus 16 es el único otro portátil que hemos probado que incorpora la nueva GPU RTX 3050 de 6 GB para portátiles, aparte del Lenovo Slim Pro 7 y el Schenker Vision 14 M23.
La RTX 3050 de 6 GB del portátil HP tiene una TGP de 60 W, mientras que los Schenker y Lenovo incorporan implementaciones de 50 W y 63 W, respectivamente.
En consecuencia, el Slim 7 Pro tiene una ligera ventaja en el rendimiento acumulado 3DMark sobre el Pavilion Plus 16 mientras que el Vision 14 M23 queda por detrás del HP en un 5%.
| 3DMark 11 Performance | 17282 puntos | |
| 3DMark Ice Storm Standard Score | 82182 puntos | |
| 3DMark Cloud Gate Standard Score | 43015 puntos | |
| 3DMark Fire Strike Score | 10890 puntos | |
| 3DMark Fire Strike Extreme Score | 5641 puntos | |
ayuda | ||
| Blender / v3.3 Classroom OPTIX/RTX | |
| Asus VivoBook 14X K3405 | |
| Schenker Vision 14 M23 RTX 3050 | |
| Medio NVIDIA GeForce RTX 3050 4GB Laptop GPU (53 - 99, n=12) | |
| Lenovo Slim Pro 7 14ARP8 | |
| HP Pavilion Plus 16-ab0456tx | |
| Media de la clase Multimedia (12 - 105, n=24, últimos 2 años) | |
| Samsung Galaxy Book3 Ultra 16 | |
| Asus VivoBook Pro 16 K6602VU | |
| Dell Inspiron 16 Plus 7630 | |
| Blender / v3.3 Classroom CUDA | |
| Asus VivoBook 14X K3405 | |
| Asus VivoBook 14X K3405 | |
| Medio NVIDIA GeForce RTX 3050 4GB Laptop GPU (97 - 152, n=13) | |
| Schenker Vision 14 M23 RTX 3050 | |
| Lenovo Slim Pro 7 14ARP8 | |
| HP Pavilion Plus 16-ab0456tx | |
| Samsung Galaxy Book3 Ultra 16 | |
| Media de la clase Multimedia (20 - 186, n=24, últimos 2 años) | |
| Asus VivoBook Pro 16 K6602VU | |
| Dell Inspiron 16 Plus 7630 | |
| Blender / v3.3 Classroom CPU | |
| Medio NVIDIA GeForce RTX 3050 4GB Laptop GPU (388 - 937, n=11) | |
| Schenker Vision 14 M23 RTX 3050 | |
| Asus VivoBook 14X K3405 | |
| Lenovo Slim Pro 7 14ARP8 | |
| Dell Inspiron 16 Plus 7630 | |
| Media de la clase Multimedia (134.5 - 1042, n=68, últimos 2 años) | |
| Samsung Galaxy Book3 Ultra 16 | |
| HP Pavilion Plus 16-ab0456tx | |
| Asus VivoBook Pro 16 K6602VU | |
* ... más pequeño es mejor
Rendimiento en juegos
Vemos alrededor de un 10% de beneficio acumulado en juegos a 1080p con la RTX 3050 de 6 GB en comparación con la RTX 3050 DE 4 GB de media.
La RTX 3050 del Pavilion Plus 16 muestra buenas ganancias en rendimiento acumulado en juegos a 1080p con respecto al Slim Pro 7 y al Vision 14 M23, mientras que queda por detrás de la GPU RTX 4050 de 65 W para portátiles del VivoBook Pro 16 en un 25%.
Curiosamente, el Pavilion Plus 16 también es capaz de superar al Galaxy Book3 Ultra 16 con una RTX 4050 en juegos en general, pero esto se debe al pobre rendimiento de este último en Dota 2 Reborn y X-Plane 11.
La RTX 3050 de 6 GB puede jugar a títulos más antiguos sin problemas a 1080p Ultra, pero los juegos AAA modernos tienen problemas con cualquier configuración superior a 1080p Alto.
La tabla de FPS de Witcher 3
No observamos ninguna ralentización perceptible durante una prueba de estrés con The Witcher 3 a 1080p Ultra, lo que indica una refrigeración eficaz.
| bajo | medio | alto | ultra | QHD | |
|---|---|---|---|---|---|
| GTA V (2015) | 177.9 | 172 | 123.3 | 62.7 | 42.7 |
| The Witcher 3 (2015) | 244 | 159.1 | 91.4 | 50.1 | 37 |
| Dota 2 Reborn (2015) | 155.2 | 131 | 124.2 | 116.9 | |
| Final Fantasy XV Benchmark (2018) | 128.2 | 70.9 | 52 | 37.4 | |
| X-Plane 11.11 (2018) | 140.6 | 117 | 97.3 | ||
| Far Cry 5 (2018) | 89 | 82 | 76 | 52 | |
| Strange Brigade (2018) | 256 | 112.8 | 91.9 | 80.5 | 57.1 |
| F1 22 (2022) | 150.2 | 145.3 | 109.5 | 34 | 20.1 |
| F1 23 (2023) | 150.1 | 141.2 | 97.5 | 26 | 14.3 |
| Cyberpunk 2077 (2023) | 67.6 | 52.1 | 43.2 | 36.9 | 21.3 |
| Assassin's Creed Mirage (2023) | 70 | 63 | 55 | 41 | 31 |
| Avatar Frontiers of Pandora (2023) | 39.5 | 36.3 | 31.5 | 23.4 | 15.1 |
Consulte nuestro dedicado GPU Nvidia GeForce RTX 3050 6 GB para portátiles para obtener más información.
Emisiones: Ruido de ventilador tolerable pero altas temperaturas superficiales bajo carga
Ruido del sistema
Medimos un nivel de presión sonora (SPL) de 42,1 dB(A) en el modo Rendimiento bajo carga máxima. Parece que HP ha establecido límites para que el ruido del ventilador se mantenga por debajo de 35 dB(A) en el modo Equilibrado y de 45 dB(A) en el modo Rendimiento.
Ruido
| Ocioso |
| 22.22 / 22.22 / 22.22 dB(A) |
| Carga |
| 42.03 / 42.1 dB(A) |
 | ||
30 dB silencioso 40 dB(A) audible 50 dB(A) ruidosamente alto |
||
min: | ||
| Modo de rendimiento | En ralentí dB(A) | Carga media dB(A) | Carga máxima dB(A) | El Witcher 3 1080p Ultra dB(A) |
|---|---|---|---|---|
| Equilibrado | 22.22 | 33.81 | 34.08 | 34.41 / 48 fps |
| Rendimiento | 22.22 | 42.03 | 42.1 | 42.1 / 50 fps |
| HP Pavilion Plus 16-ab0456tx i7-13700H, GeForce RTX 3050 6GB Laptop GPU | Schenker Vision 14 M23 RTX 3050 i7-13700H, GeForce RTX 3050 6GB Laptop GPU | Dell Inspiron 16 Plus 7630 i7-13700H, GeForce RTX 4060 Laptop GPU | Asus VivoBook 14X K3405 i5-13500H, GeForce RTX 3050 4GB Laptop GPU | Lenovo Slim Pro 7 14ARP8 R7 7735HS, GeForce RTX 3050 6GB Laptop GPU | Asus VivoBook Pro 16 K6602VU i9-13900H, GeForce RTX 4050 Laptop GPU | Samsung Galaxy Book3 Ultra 16 i7-13700H, GeForce RTX 4050 Laptop GPU | |
|---|---|---|---|---|---|---|---|
| Noise | -10% | -7% | -10% | -4% | -14% | -9% | |
| apagado / medio ambiente * (dB) | 22.22 | 23.5 -6% | 23.2 -4% | 21.46 3% | 22.7 -2% | 20.96 6% | 25 -13% |
| Idle Minimum * (dB) | 22.22 | 23.5 -6% | 23.2 -4% | 22.08 1% | 22.8 -3% | 25.28 -14% | 26 -17% |
| Idle Average * (dB) | 22.22 | 23.5 -6% | 23.2 -4% | 22.08 1% | 22.8 -3% | 25.28 -14% | 27 -22% |
| Idle Maximum * (dB) | 22.22 | 26 -17% | 23.2 -4% | 22.08 1% | 22.8 -3% | 25.28 -14% | 28 -26% |
| Load Average * (dB) | 42.03 | 43.6 -4% | 35.1 16% | 52.98 -26% | 43.8 -4% | 51.88 -23% | 40 5% |
| Witcher 3 ultra * (dB) | 42.1 | 48.7 -16% | 52.5 -25% | 52.7 -25% | 43.8 -4% | 49 -16% | 39 7% |
| Load Maximum * (dB) | 42.1 | 49.1 -17% | 52.5 -25% | 52.67 -25% | 47.1 -12% | 51.8 -23% | 41 3% |
* ... más pequeño es mejor
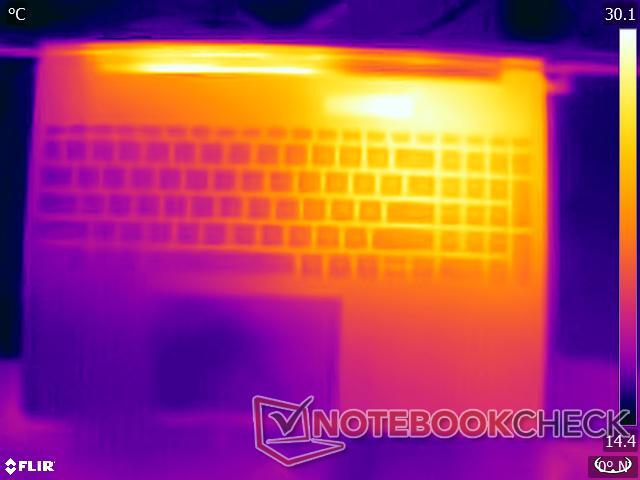
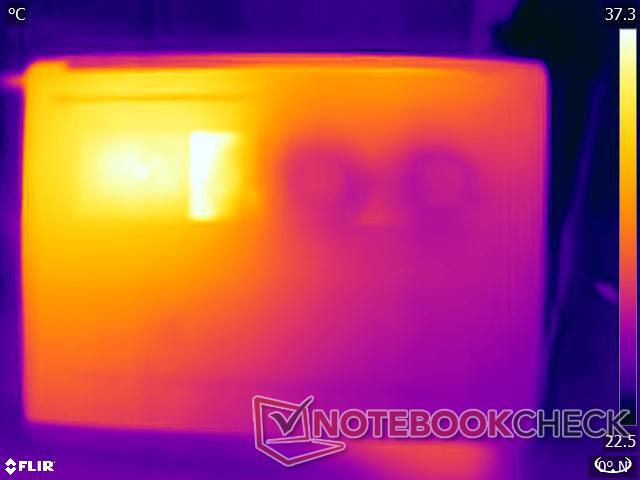
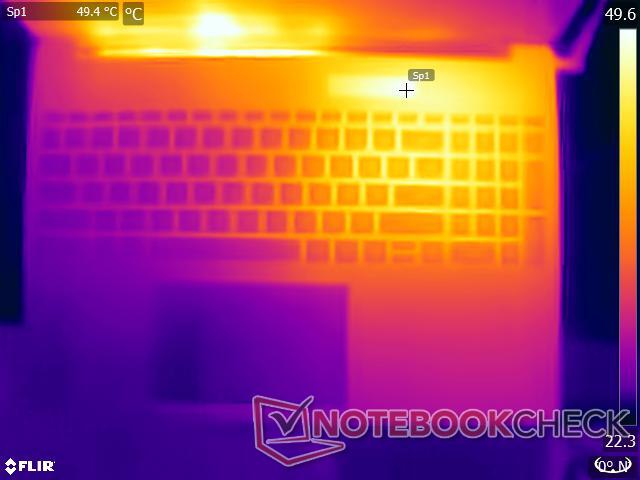
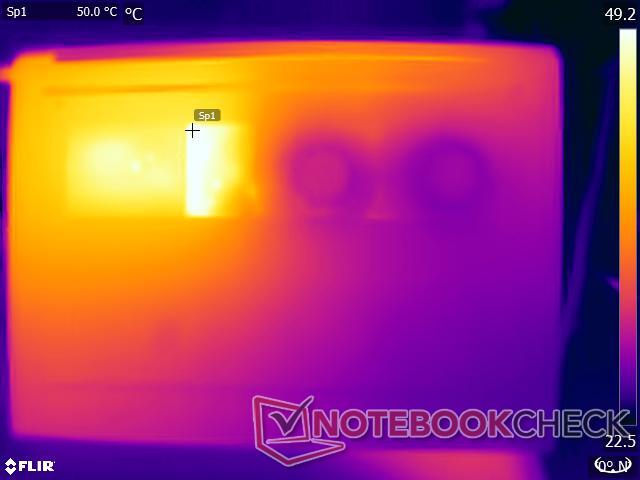
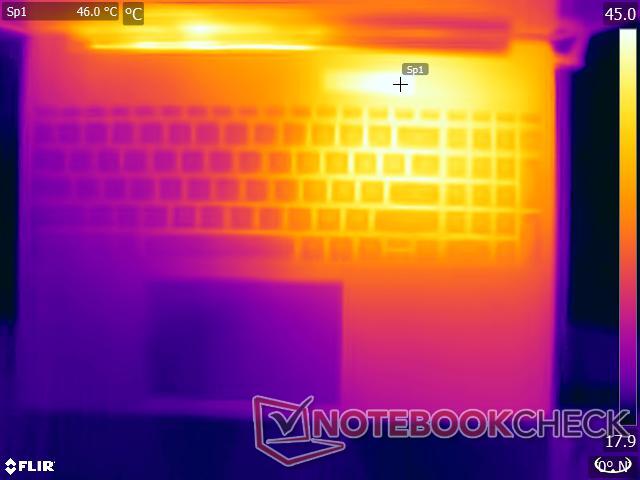
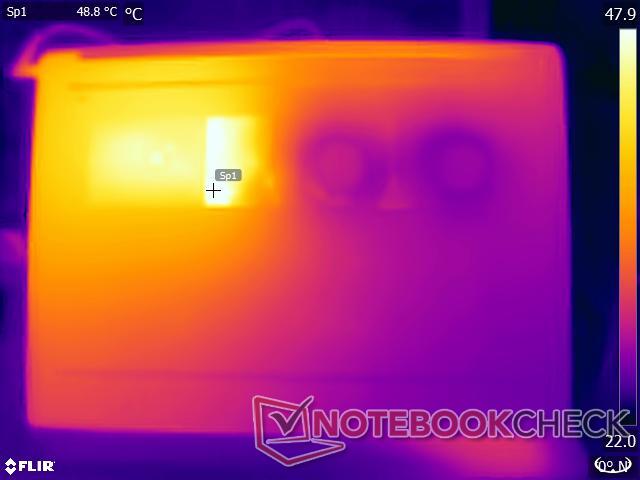
Temperatura
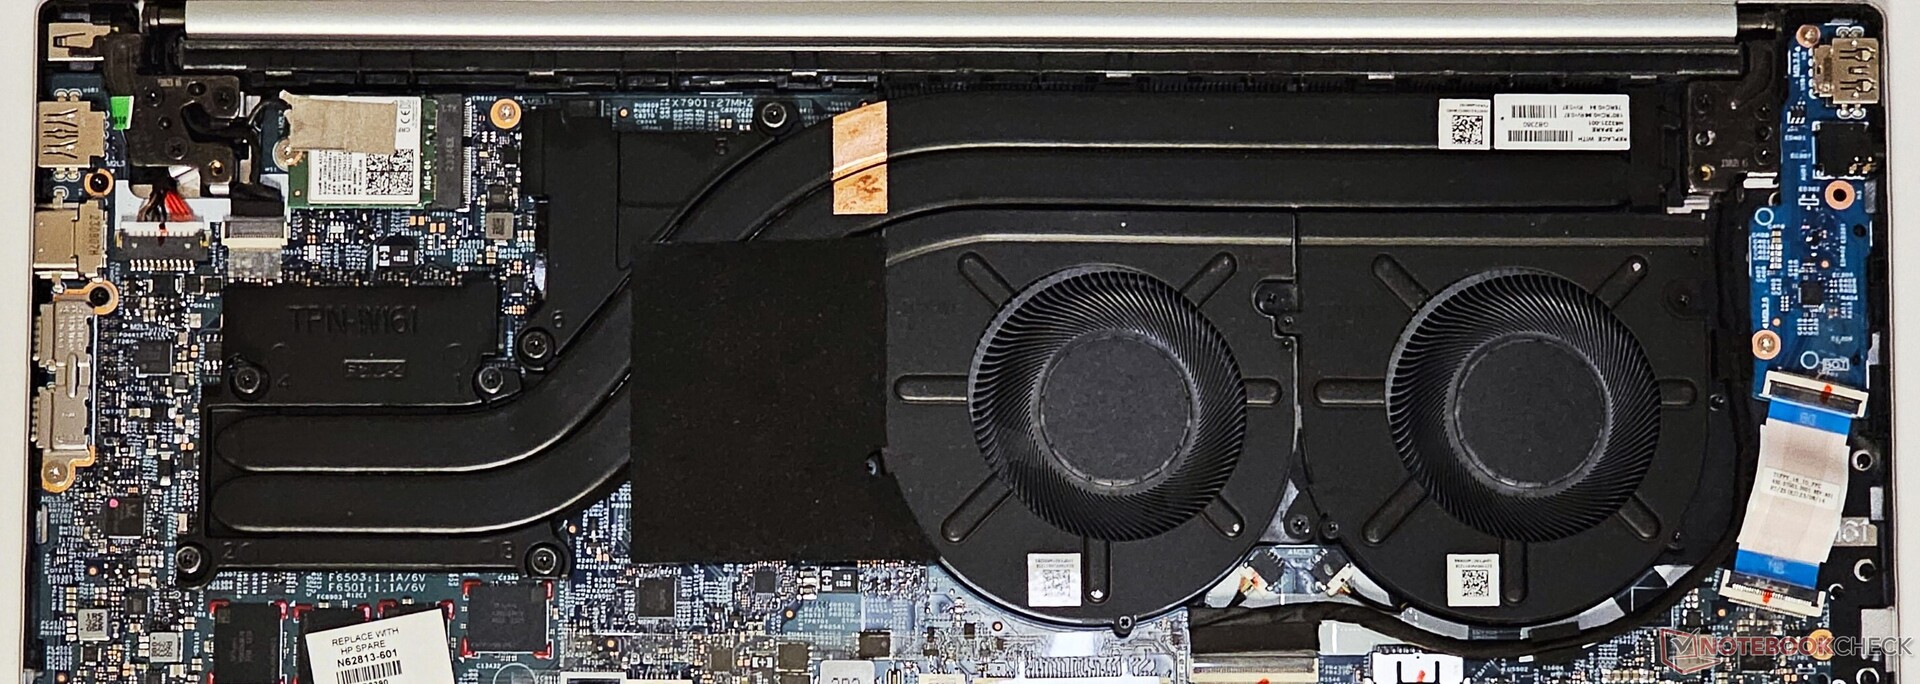
La Pavilion Plus 16 emplea un sistema de doble ventilador y doble tubo de calor para refrigerar la CPU y la GPU. Durante nuestras pruebas de estrés, esta configuración se llevó al límite con temperaturas superficiales que alcanzaron los 49,6°C en la parte superior y los 45,8°C en la inferior.
Aunque el dispositivo puede utilizarse cómodamente sobre el regazo para tareas ligeras, puede resultar incómodo bajo cargas de trabajo pesadas.
(-) La temperatura máxima en la parte superior es de 49.6 °C / 121 F, frente a la media de 36.8 °C / 98 F, que oscila entre 21 y 71 °C para la clase Multimedia.
(-) El fondo se calienta hasta un máximo de 45.8 °C / 114 F, frente a la media de 39.1 °C / 102 F
(±) En reposo, la temperatura media de la parte superior es de 32.3 °C / 90# F, frente a la media del dispositivo de 31.3 °C / 88 F.
(-) Jugando a The Witcher 3, la temperatura media de la parte superior es de 39.7 °C / 103 F, frente a la media del dispositivo de 31.3 °C / 88 F.
(+) Los reposamanos y el panel táctil alcanzan como máximo la temperatura de la piel (35 °C / 95 F) y, por tanto, no están calientes.
(-) La temperatura media de la zona del reposamanos de dispositivos similares fue de 28.7 °C / 83.7 F (-6.3 °C / -11.3 F).
| HP Pavilion Plus 16-ab0456tx Intel Core i7-13700H, NVIDIA GeForce RTX 3050 6GB Laptop GPU | Schenker Vision 14 M23 RTX 3050 Intel Core i7-13700H, NVIDIA GeForce RTX 3050 6GB Laptop GPU | Dell Inspiron 16 Plus 7630 Intel Core i7-13700H, NVIDIA GeForce RTX 4060 Laptop GPU | Asus VivoBook 14X K3405 Intel Core i5-13500H, NVIDIA GeForce RTX 3050 4GB Laptop GPU | Lenovo Slim Pro 7 14ARP8 AMD Ryzen 7 7735HS, NVIDIA GeForce RTX 3050 6GB Laptop GPU | Asus VivoBook Pro 16 K6602VU Intel Core i9-13900H, NVIDIA GeForce RTX 4050 Laptop GPU | Samsung Galaxy Book3 Ultra 16 Intel Core i7-13700H, NVIDIA GeForce RTX 4050 Laptop GPU | |
|---|---|---|---|---|---|---|---|
| Heat | 10% | 6% | -2% | 19% | -1% | 22% | |
| Maximum Upper Side * (°C) | 49.6 | 48.5 2% | 47.8 4% | 49.2 1% | 42.2 15% | 42.6 14% | 41 17% |
| Maximum Bottom * (°C) | 45.8 | 52.8 -15% | 42.2 8% | 54 -18% | 49 -7% | 48.4 -6% | 44 4% |
| Idle Upper Side * (°C) | 39.2 | 27.6 30% | 35.2 10% | 33.6 14% | 24.4 38% | 39.4 -1% | 23 41% |
| Idle Bottom * (°C) | 35.4 | 27 24% | 35 1% | 37.6 -6% | 25.2 29% | 39.8 -12% | 26 27% |
* ... más pequeño es mejor
Prueba de estrés
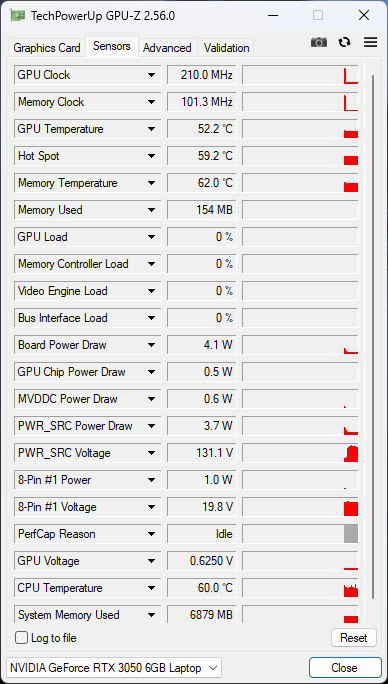
Durante un estrés Prime95 in-place de grandes FFTs, el Core i7-13700H del Pavilion Plus 16 funciona a una media de 2,2 GHz mientras consume una media de 53 W de potencia del paquete.
Al añadir FurMark, el Core i7-13700H y la RTX 3050 compiten por la energía, lo que se traduce en subidas y bajadas de reloj intermitentes tanto para la CPU como para la GPU.
De media, el Core i7-13700H sólo puede funcionar a 1,96 GHz mientras que la RTX 3050 lo hace a 910 MHz con un consumo medio de 41 W y 39 W, respectivamente.
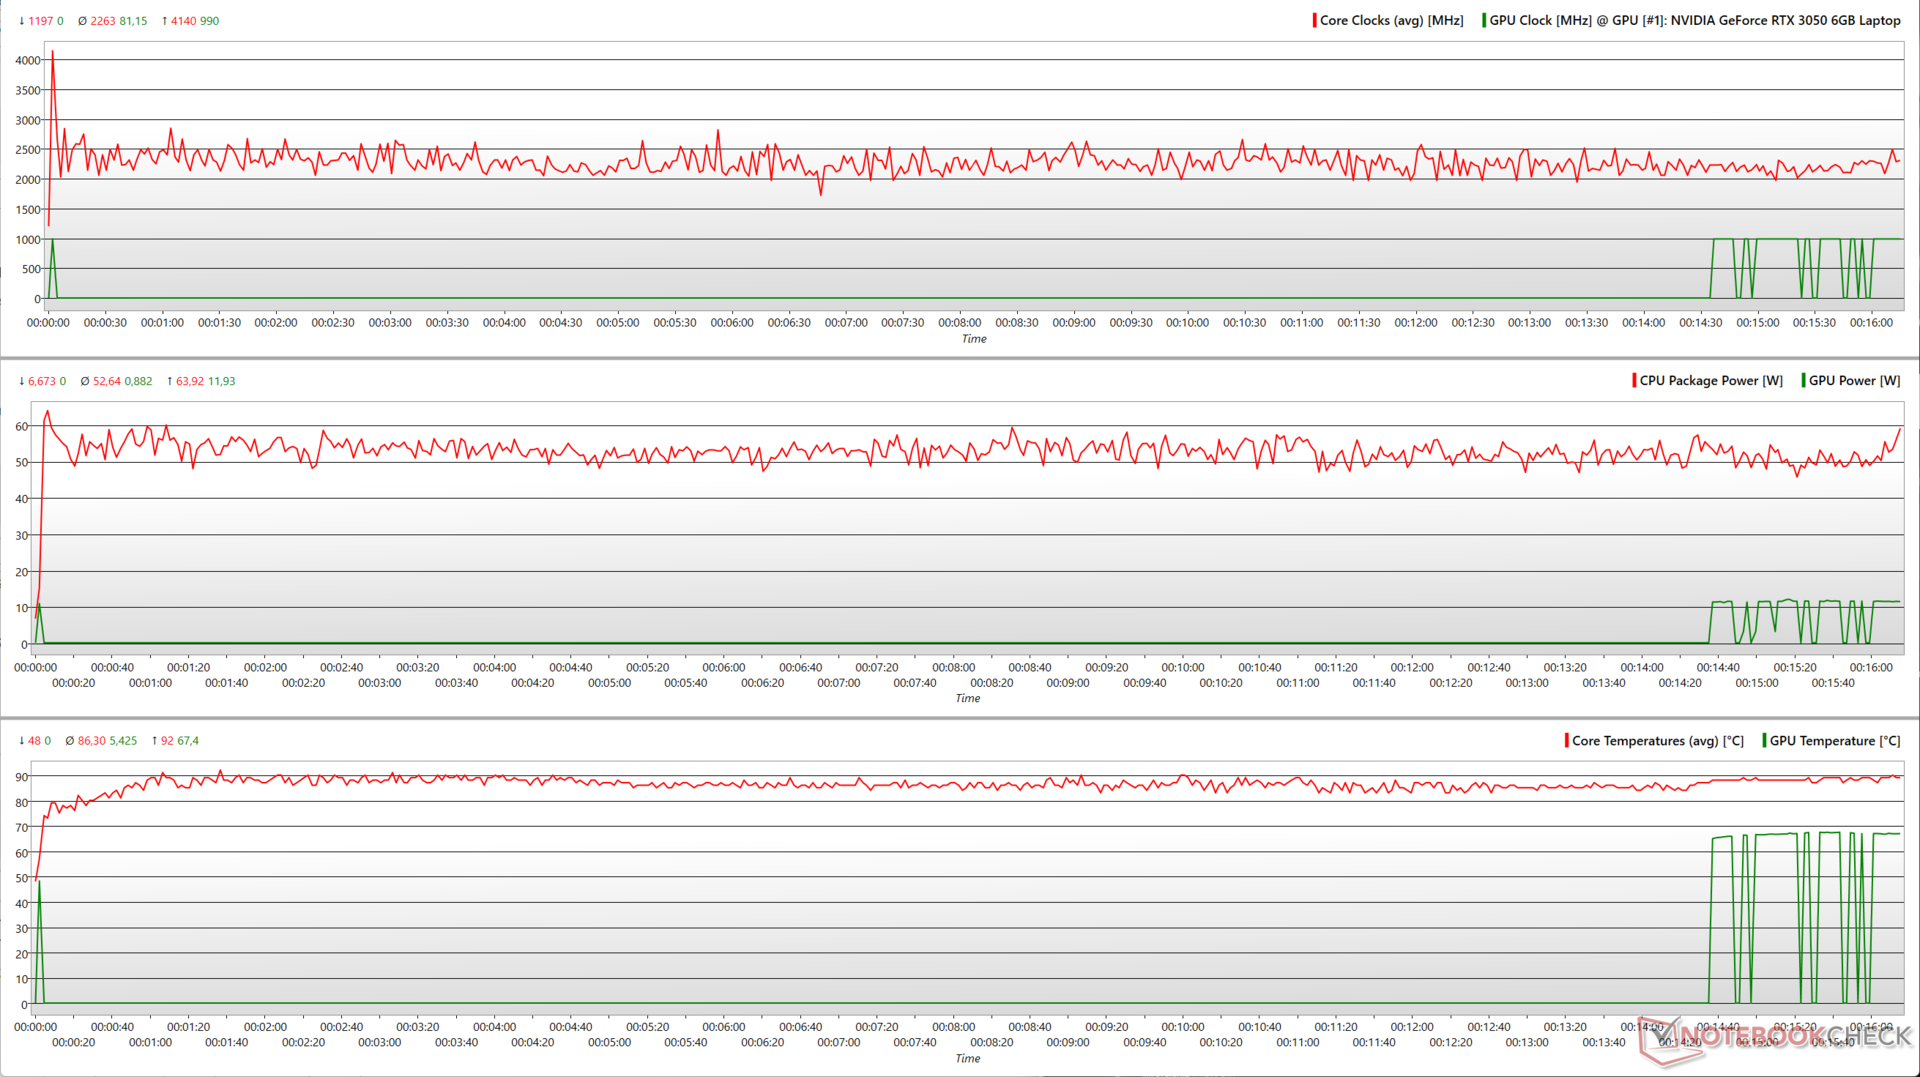
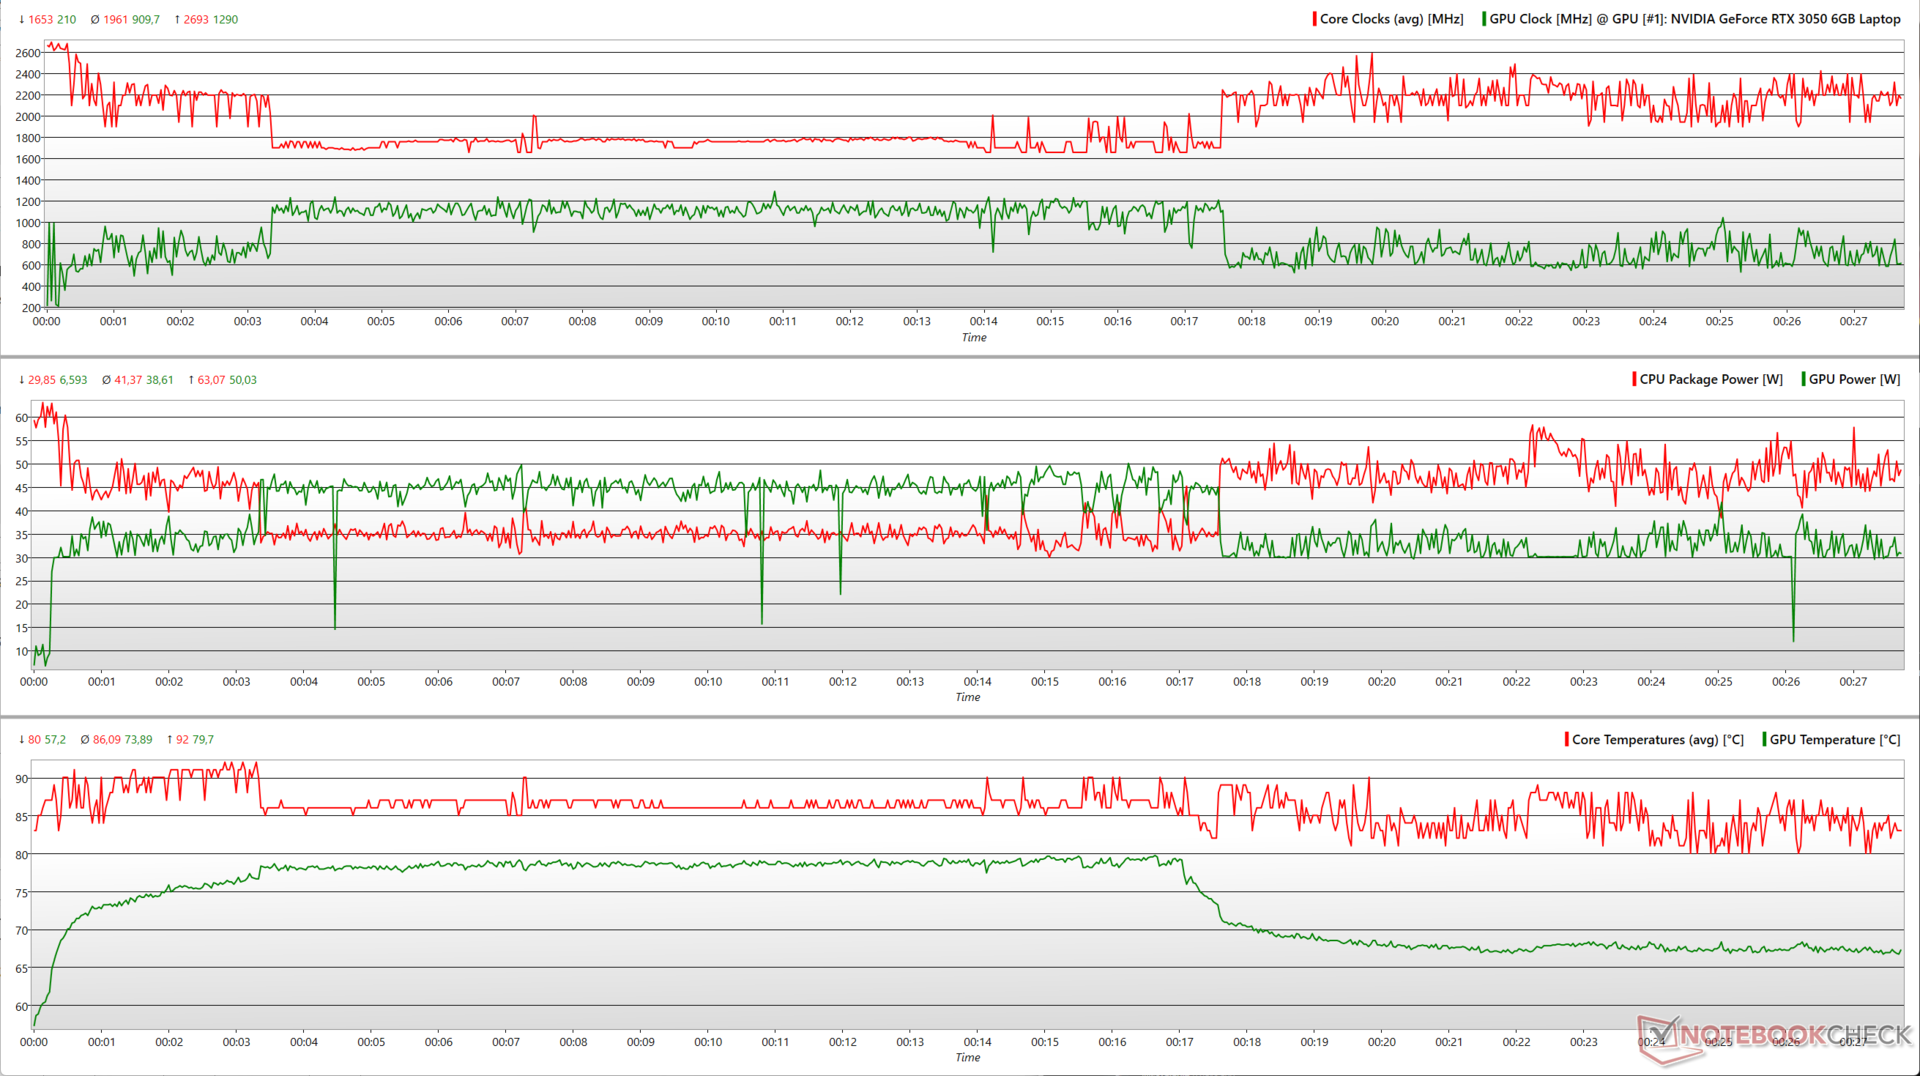
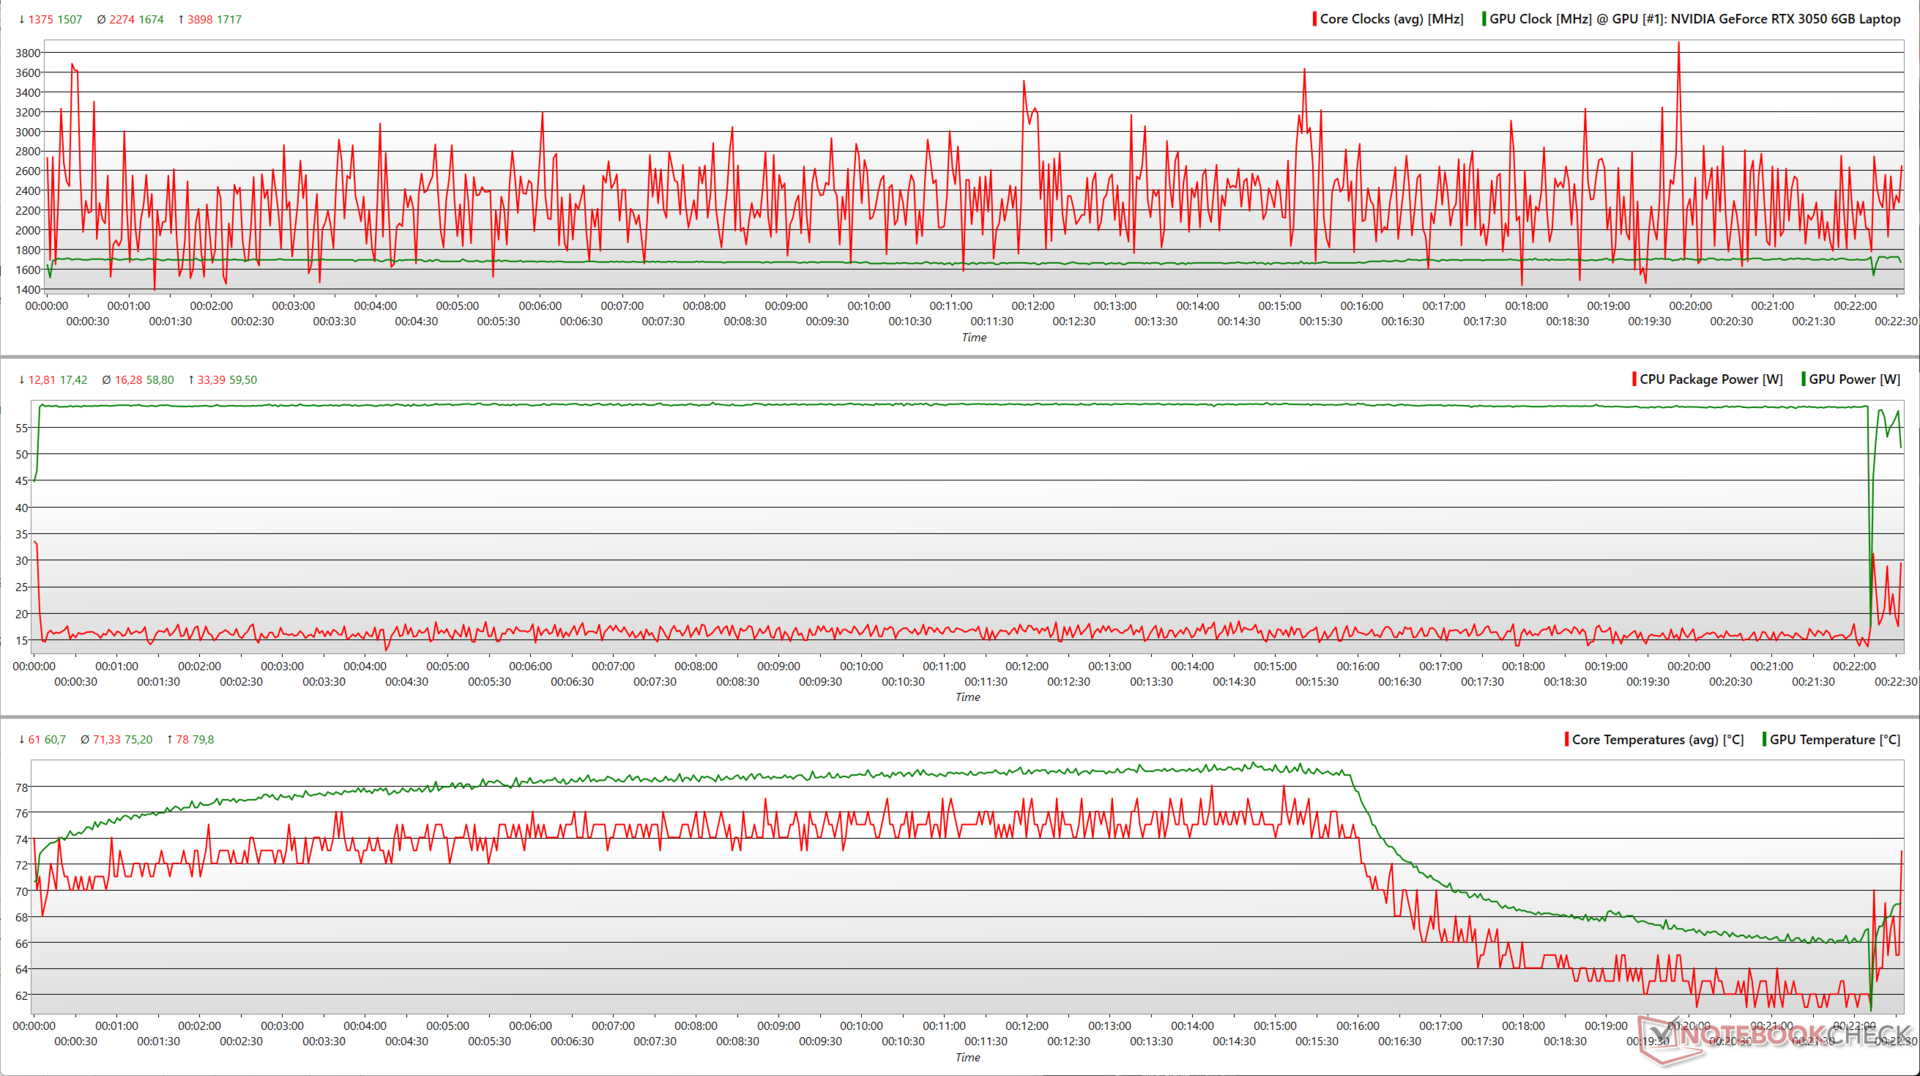
Las cosas se vuelven mucho más predecibles con The Witcher 3 a 1080p Ultra. La RTX 3050 es ahora capaz de casi utilizar su TGP máxima cerca de 60 W de forma consistente.
Curiosamente, las temperaturas del núcleo empiezan a bajar al cabo de un rato, incluso cuando los relojes de la CPU/GPU y la potencia permanecen relativamente invariables.
| Prueba de estrés | Relojdela CPU (GHz) | Reloj de la GPU (MHz) | Temperatura mediadela CPU (°C) | Temperatura media de la GPU (°C) |
| Sistema en reposo | 3,74 | - | 52 | 31,1 |
| Prime95 | 2,1 | - | 86 | 67,4 |
| Prime95+ FurMark | 1,93 | 735 | 86 | 73,5 |
| El Witcher 3 1080p Ultra | 2,2 | 1.717 | 71 | 74,2 |
Altavoces
El Pavilion Plus 16 viene con un par de altavoces estéreo que tienen una salida razonablemente alta de 74,2 dB(A), lo que debería bastar en la mayoría de las habitaciones de tamaño medio. Los graves son perceptibles pero no muy prominentes. Sin embargo, los medios y los agudos están relativamente bien definidos.
No obstante, los usuarios pueden obtener mejor audio a través de altavoces externos o Bluetooth 5.3.
HP Pavilion Plus 16-ab0456tx análisis de audio
(±) | la sonoridad del altavoz es media pero buena (74.2 dB)
Graves 100 - 315 Hz
(±) | lubina reducida - en promedio 14.7% inferior a la mediana
(±) | la linealidad de los graves es media (7.8% delta a frecuencia anterior)
Medios 400 - 2000 Hz
(+) | medios equilibrados - a sólo 3.4% de la mediana
(+) | los medios son lineales (4.2% delta a la frecuencia anterior)
Altos 2 - 16 kHz
(+) | máximos equilibrados - a sólo 4.6% de la mediana
(+) | los máximos son lineales (4.8% delta a la frecuencia anterior)
Total 100 - 16.000 Hz
(±) | la linealidad del sonido global es media (16.7% de diferencia con la mediana)
En comparación con la misma clase
» 44% de todos los dispositivos probados de esta clase eran mejores, 8% similares, 48% peores
» El mejor tuvo un delta de 5%, la media fue 17%, el peor fue ###max##%
En comparación con todos los dispositivos probados
» 29% de todos los dispositivos probados eran mejores, 7% similares, 64% peores
» El mejor tuvo un delta de 4%, la media fue 24%, el peor fue ###max##%
Apple MacBook Pro 16 2021 M1 Pro análisis de audio
(+) | los altavoces pueden reproducir a un volumen relativamente alto (#84.7 dB)
Graves 100 - 315 Hz
(+) | buen bajo - sólo 3.8% lejos de la mediana
(+) | el bajo es lineal (5.2% delta a la frecuencia anterior)
Medios 400 - 2000 Hz
(+) | medios equilibrados - a sólo 1.3% de la mediana
(+) | los medios son lineales (2.1% delta a la frecuencia anterior)
Altos 2 - 16 kHz
(+) | máximos equilibrados - a sólo 1.9% de la mediana
(+) | los máximos son lineales (2.7% delta a la frecuencia anterior)
Total 100 - 16.000 Hz
(+) | el sonido global es lineal (4.6% de diferencia con la mediana)
En comparación con la misma clase
» 0% de todos los dispositivos probados de esta clase eran mejores, 0% similares, 100% peores
» El mejor tuvo un delta de 5%, la media fue 17%, el peor fue ###max##%
En comparación con todos los dispositivos probados
» 0% de todos los dispositivos probados eran mejores, 0% similares, 100% peores
» El mejor tuvo un delta de 4%, la media fue 24%, el peor fue ###max##%
Gestión de la energía: Consumo de energía económico y buena duración de la batería
Consumo de energía
El Pavilion Plus 16 consume relativamente menos energía para el hardware dado en general. Mientras que el Schenker Vision 14 M23 y el Lenovo Slim Pro 7 son más frugales en carga media y El Witcher 3, el Pavilion Plus 16 es más económico en carga máxima.
El adaptador de corriente de 135 W suministrado es más que suficiente para alimentar el portátil bajo estrés.
| Off / Standby | |
| Ocioso | |
| Carga |
|
Clave:
min: | |
| HP Pavilion Plus 16-ab0456tx i7-13700H, GeForce RTX 3050 6GB Laptop GPU, IPS, 2560x1600, 16" | Schenker Vision 14 M23 RTX 3050 i7-13700H, GeForce RTX 3050 6GB Laptop GPU, IPS, 2880x1800, 14" | Dell Inspiron 16 Plus 7630 i7-13700H, GeForce RTX 4060 Laptop GPU, IPS, 2560x1600, 16" | Asus VivoBook 14X K3405 i5-13500H, GeForce RTX 3050 4GB Laptop GPU, , 2880x1800, 14" | Lenovo Slim Pro 7 14ARP8 R7 7735HS, GeForce RTX 3050 6GB Laptop GPU, IPS, 2560x1600, 14.5" | Asus VivoBook Pro 16 K6602VU i9-13900H, GeForce RTX 4050 Laptop GPU, OLED, 3200x2000, 16" | Samsung Galaxy Book3 Ultra 16 i7-13700H, GeForce RTX 4050 Laptop GPU, AMOLED, 2880x1800, 16" | Medio NVIDIA GeForce RTX 3050 6GB Laptop GPU | Media de la clase Multimedia | |
|---|---|---|---|---|---|---|---|---|---|
| Power Consumption | -2% | -100% | 6% | -30% | -141% | 20% | -8% | -13% | |
| Idle Minimum * (Watt) | 3.3 | 5.2 -58% | 15.6 -373% | 4.96 -50% | 7.6 -130% | 21.06 -538% | 3 9% | 4.55 ? -38% | 5.71 ? -73% |
| Idle Average * (Watt) | 7.3 | 7.8 -7% | 17.7 -142% | 7.54 -3% | 12.2 -67% | 24.27 -232% | 5 32% | 8.63 ? -18% | 10.1 ? -38% |
| Idle Maximum * (Watt) | 14.24 | 9 37% | 20.6 -45% | 9.31 35% | 12.8 10% | 25.12 -76% | 11 23% | 11.7 ? 18% | 12.4 ? 13% |
| Load Average * (Watt) | 91.7 | 78.6 14% | 87.4 5% | 83.4 9% | 76.5 17% | 52.4 43% | 72 21% | 86.6 ? 6% | 65 ? 29% |
| Witcher 3 ultra * (Watt) | 96.2 | 86.8 10% | 121.7 -27% | 73.3 24% | 89.5 7% | 110.2 -15% | 69.7 28% | ||
| Load Maximum * (Watt) | 115.8 | 121.2 -5% | 138 -19% | 91.74 21% | 135.7 -17% | 146 -26% | 108 7% | 127.6 ? -10% | 112.2 ? 3% |
* ... más pequeño es mejor
Power Consumption: The Witcher 3 / Stress test
Power Consumption: External monitor
Duración de las pilas
Los potentes componentes internos, aunque de baja potencia, contribuyen a una buena duración de la batería. Con un brillo de 150 nits, la batería de 68 WHr del Pavilion Plus 16 podría alcanzar casi 10,5 horas de navegación web y 12 horas de reproducción de vídeo 1080p, unos tiempos de ejecución impresionantes.
| HP Pavilion Plus 16-ab0456tx i7-13700H, GeForce RTX 3050 6GB Laptop GPU, 68 Wh | Schenker Vision 14 M23 RTX 3050 i7-13700H, GeForce RTX 3050 6GB Laptop GPU, 99 Wh | Dell Inspiron 16 Plus 7630 i7-13700H, GeForce RTX 4060 Laptop GPU, 86 Wh | Asus VivoBook 14X K3405 i5-13500H, GeForce RTX 3050 4GB Laptop GPU, 63 Wh | Lenovo Slim Pro 7 14ARP8 R7 7735HS, GeForce RTX 3050 6GB Laptop GPU, 73 Wh | Asus VivoBook Pro 16 K6602VU i9-13900H, GeForce RTX 4050 Laptop GPU, 96 Wh | Samsung Galaxy Book3 Ultra 16 i7-13700H, GeForce RTX 4050 Laptop GPU, 76 Wh | Media de la clase Multimedia | |
|---|---|---|---|---|---|---|---|---|
| Duración de Batería | 16% | -10% | -18% | 1% | -11% | 2% | 26% | |
| H.264 (h) | 12 | 10.4 -13% | 9.8 -18% | 13.4 12% | 16.4 ? 37% | |||
| WiFi v1.3 (h) | 10.4 | 12.1 16% | 9.4 -10% | 8.1 -22% | 10.5 1% | 10.1 -3% | 9.6 -8% | 12 ? 15% |
| Reader / Idle (h) | 17.6 | 18.2 | 25.2 ? | |||||
| Load (h) | 1.4 | 1.1 | 1.8 | 1.675 ? | ||||
| Witcher 3 ultra (h) | 1.3 |
Pro
Contra
Veredicto: Un gran potencial frenado por compromisos
El HP Pavilion Plus 16 comprueba la mayoría de las casillas que uno esperaría de un portátil multimedia moderno para el trabajo y el entretenimiento. El Pavilion Plus 16 presenta una construcción totalmente metálica que desprende una sensación de primera calidad sin flexiones innecesarias, y una selección de puertos que cubre lo esencial.
El panel de 2560 x 1600 120 Hz no presume de HDR ni de una amplia cobertura Adobe RGB y Display P3 como se ha visto con el Pavilion Plus 142,8K OLED. Sin embargo, cumple con lo básico con tiempos de respuesta decentes y sin parpadeo PWM.
El HP Pavilion Plus 16 es un portátil multimedia y de productividad capaz para todo, pero por su precio lo ideal habría sido incluir una RTX 4050 como mínimo"
Las limitaciones de rendimiento se hacen evidentes una vez que se empieza a comparar con la competencia. El PL2 de 60 W resulta especialmente desventajoso para el Pavilion Plus 16 en multi-núcleo cuando se compara con el Dell Inspiron 16 Plus 7630 e incluso el Samsung Galaxy Book3 Ultra 16que cuentan con un Core i7-13700H de mayor vataje.
HP podría haber permitido fácilmente 80 W PL2 o más en un perfil de potencia adicional para maximizar el potencial del chip. Sin embargo, el subsistema de refrigeración ya parece tenso con la configuración actual bajo carga.
La Nvidia GeForce RTX 3050 de 6 GB se queda corta con respecto a la generación Ada en términos de rendimiento y eficiencia energética. Aunque los juegos a 1080p experimentan un notable aumento con respecto a la RTX 3050 de 4 GB, las pruebas sintéticas no muestran un gran incentivo.
Con un precio de venta de 1.350 dólares en el sitio de HP, el Pavilion Plus 16 es 100 dólares más caro que el Inspiron 16 Plus 7630 que ofrece una RTX 4060 de 60 W y un Core i7-13700H de mejor rendimiento. Dicho esto, el Pavilion Plus 16 tiene un precio más barato que el Inspiron 16 Plus 7630 en el mercado indio.
El Asus VivoBook Pro 16 con una pantalla OLED de 3,2K, Core i9-13900H y hasta una RTX 4060 es una excelente alternativa para los creadores en ciernes siempre que el plástico y el sobreprecio de 300 dólares no le echen para atrás.
Precio y disponibilidad
El HP Pavilion Plus 16-ab0456tx probado se puede conseguir en la página oficial HP India por ₹1.24.999. El portátil también se puede configurar en el sitio de HP en EE.UU. por 1.350 dólares.
Amazon India ofrece el Pavilion Plus 16 sin la dGPU RTX 3050 por ₹1.25.900.
HP Pavilion Plus 16-ab0456tx
- 02/07/2024 v7 (old)
Vaidyanathan Subramaniam
Transparencia
La selección de los dispositivos que se van a reseñar corre a cargo de nuestro equipo editorial. La muestra de prueba fue proporcionada al autor en calidad de préstamo por el fabricante o el minorista a los efectos de esta reseña. El prestamista no tuvo ninguna influencia en esta reseña, ni el fabricante recibió una copia de la misma antes de su publicación. No había ninguna obligación de publicar esta reseña. Como empresa de medios independiente, Notebookcheck no está sujeta a la autoridad de fabricantes, minoristas o editores.
Así es como prueba Notebookcheck
Cada año, Notebookcheck revisa de forma independiente cientos de portátiles y smartphones utilizando procedimientos estandarizados para asegurar que todos los resultados son comparables. Hemos desarrollado continuamente nuestros métodos de prueba durante unos 20 años y hemos establecido los estándares de la industria en el proceso. En nuestros laboratorios de pruebas, técnicos y editores experimentados utilizan equipos de medición de alta calidad. Estas pruebas implican un proceso de validación en varias fases. Nuestro complejo sistema de clasificación se basa en cientos de mediciones y puntos de referencia bien fundamentados, lo que mantiene la objetividad.Price comparison

