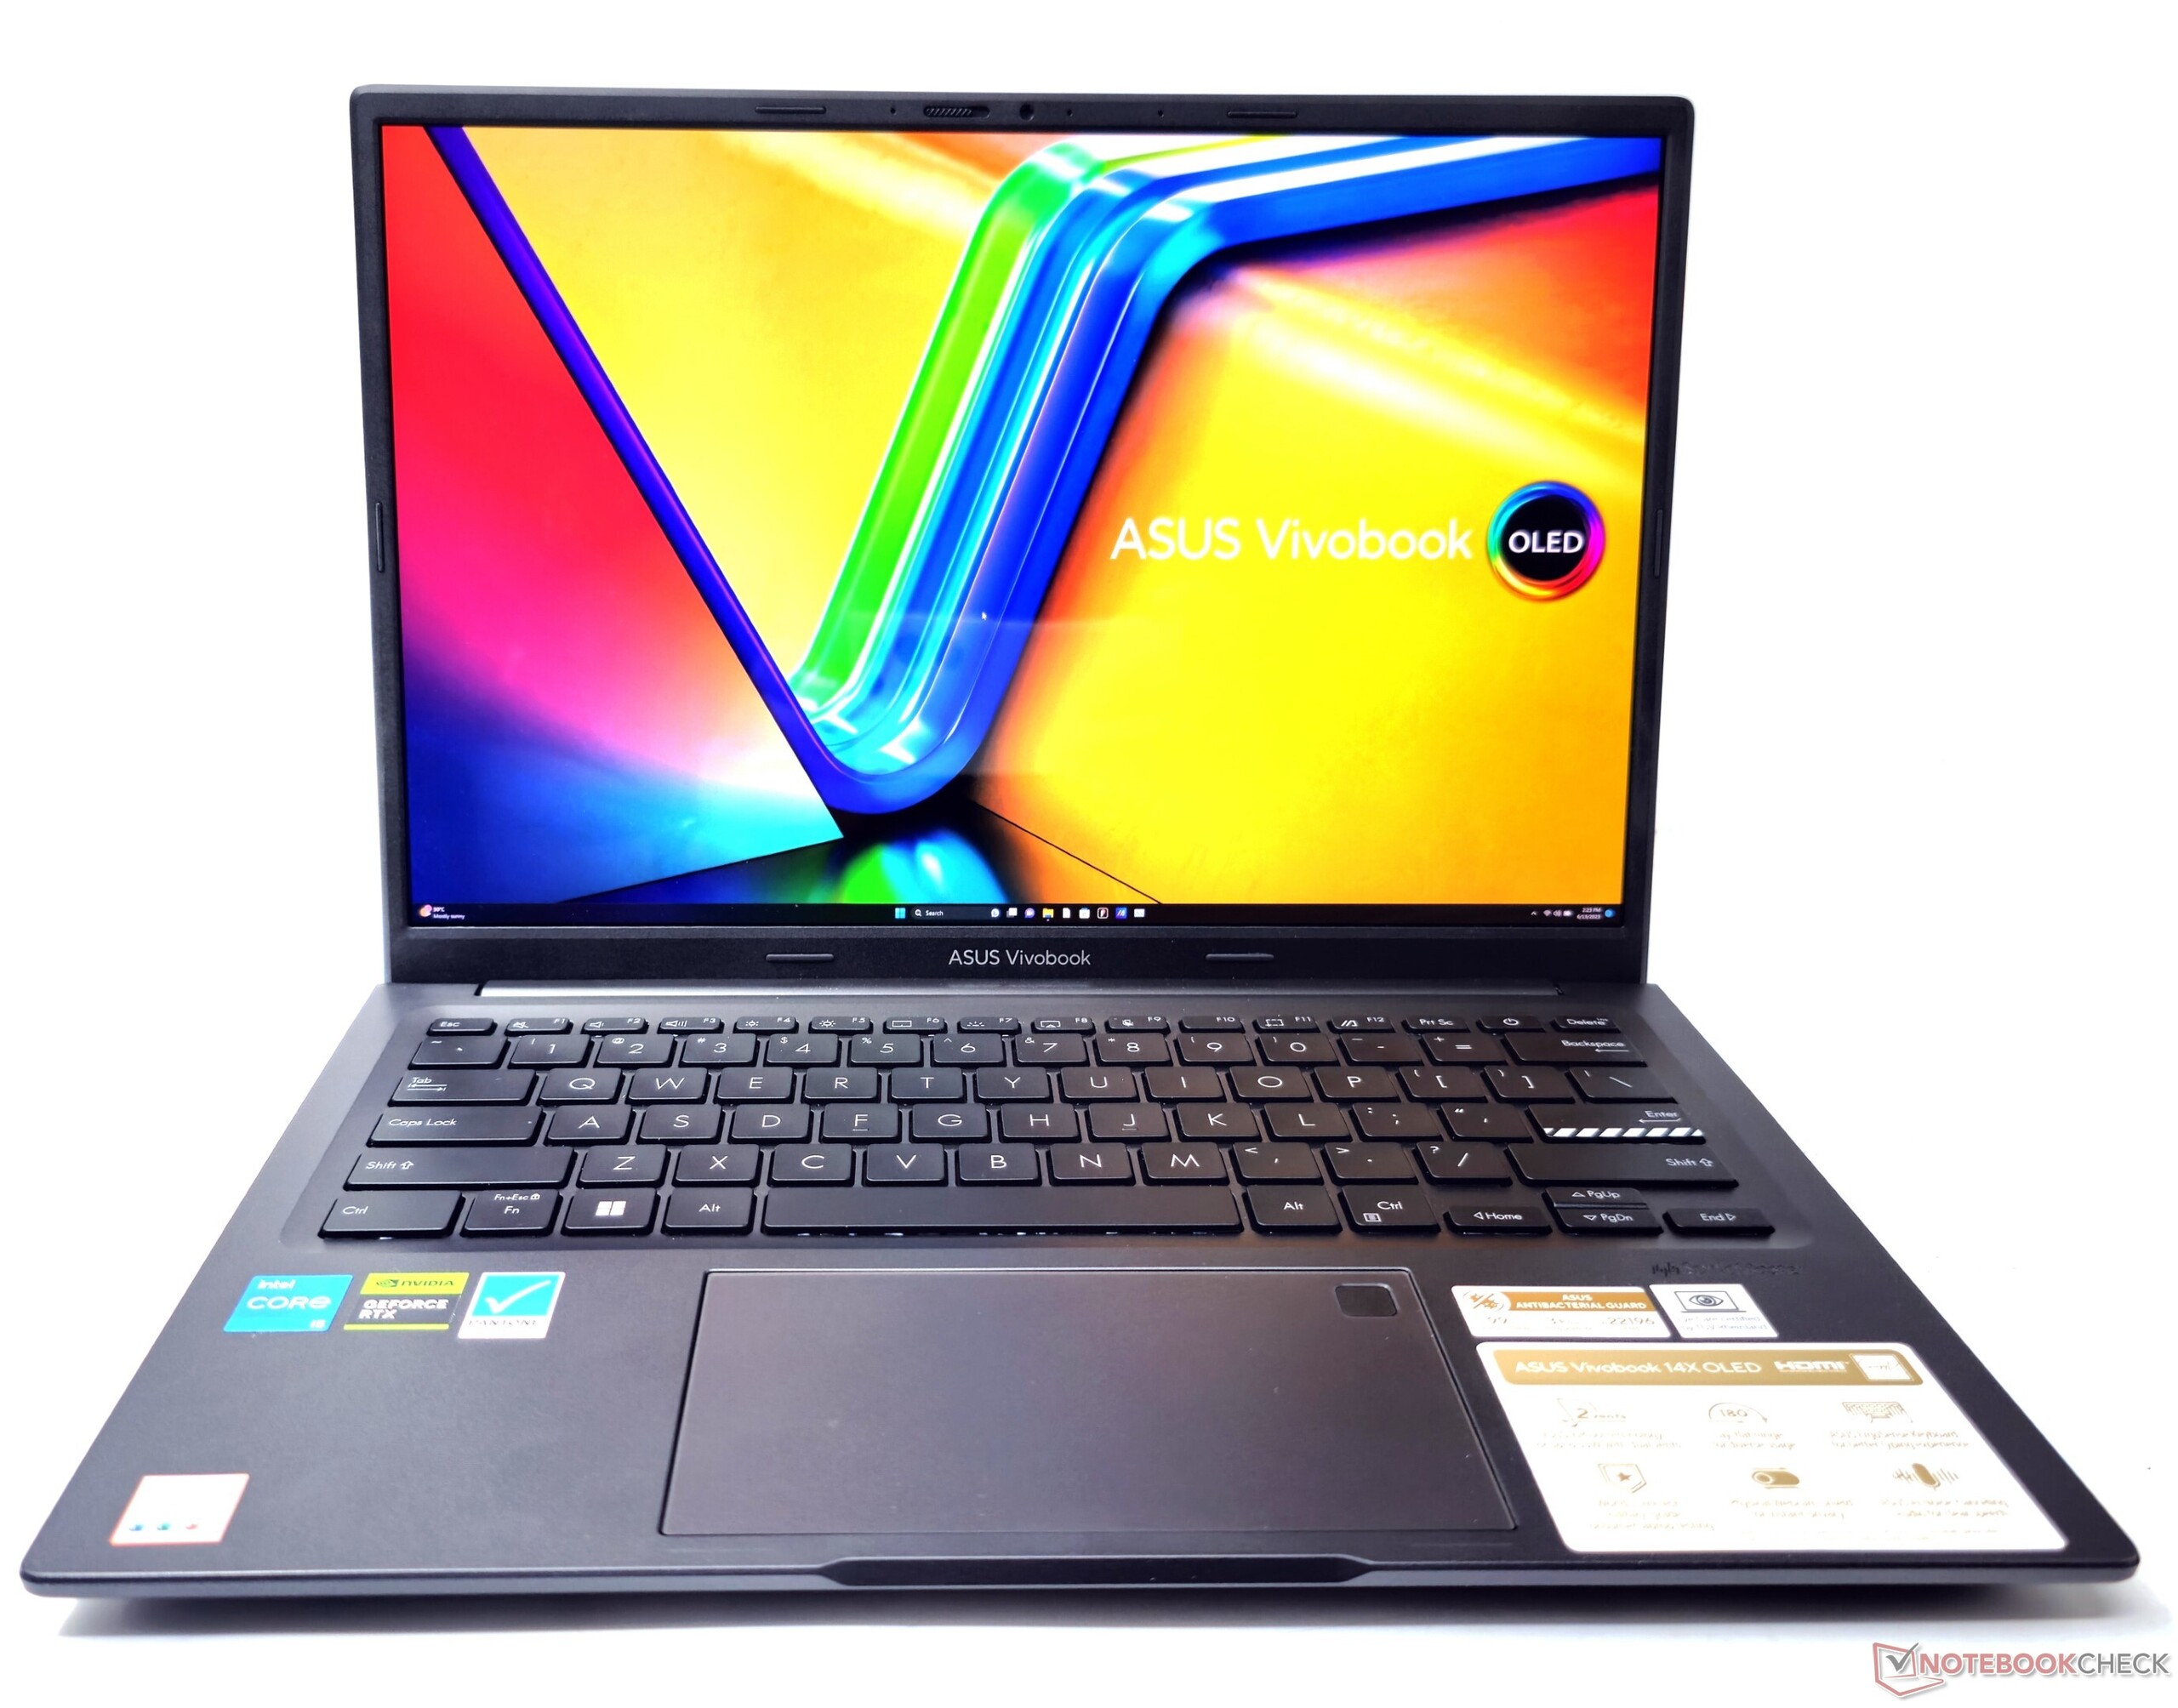
Análisis del portátil Asus VivoBook 14X OLED K3405: Portátil multimedia sin florituras con Core i5-13500H y vibrante pantalla OLED 2.8K

Asus ha lanzado varios VivoBooks mejorados este año. Mientras que el nuevo VivoBook 15X ofrece opciones Intel Raptor Lake-P y AMD Ryzen 7030U Barcelo-R, el VivoBook Pro 16Xsube el listón hasta llegar al Core i9-13980HX. Ahora nos centramos en el VivoBook 14X que viene con una CPU Raptor Lake-H45.
El VivoBook 14X nos ofrece el primer vistazo alIntel Core i5-13500Hjunto con una CPUGPU Nvidia GeForce RTX 3050 para portátiles. OLED se han convertido en más o menos el pilar de VivoBooks, con exclusión de algunos SKU de gama baja. En este caso, el VivoBook 14X cuenta con una pantalla OLED 2.8K de 14 pulgadas con una frecuencia de actualización de 90 Hz.
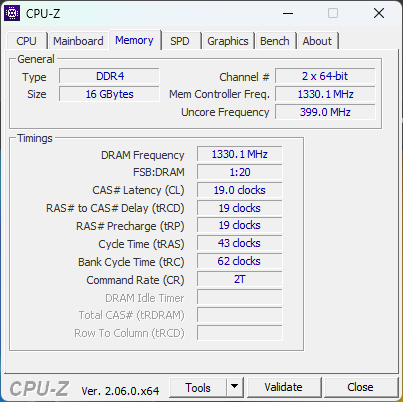
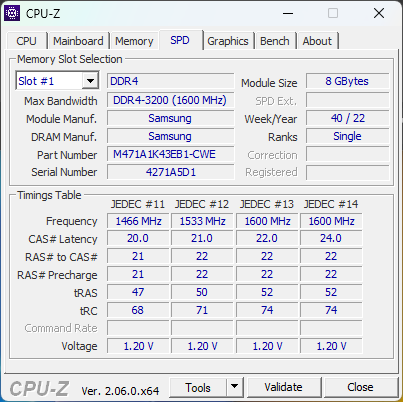
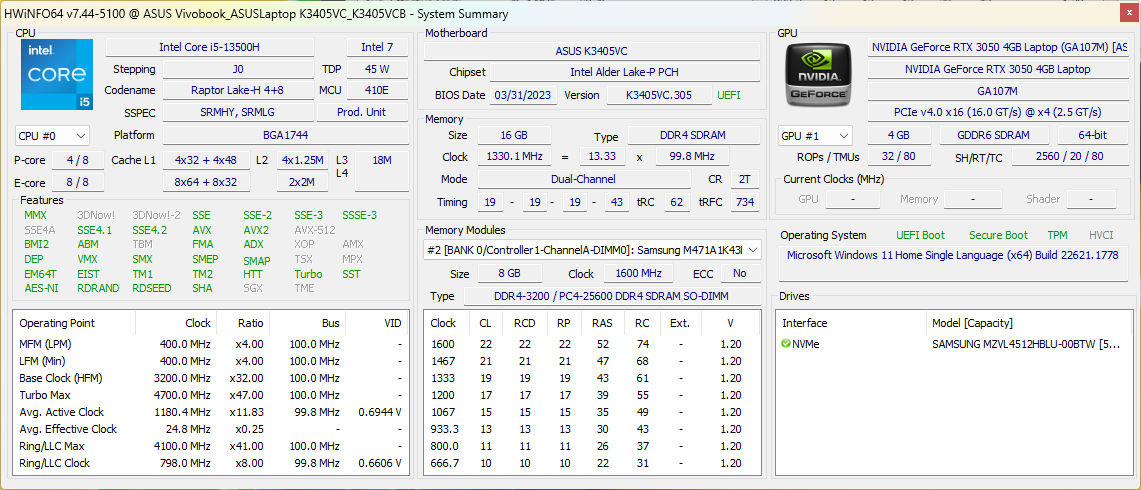
Asus también equipa el portátil con 16 GB de RAM DDR4-3200, Wi-Fi 6E, y un SSD NVMe de 512 GB. Esta configuración te costará ₹96.990 (US$1.172).
Posibles contendientes en la comparación
Valoración | Fecha | Modelo | Peso | Altura | Tamaño | Resolución | Precio |
|---|---|---|---|---|---|---|---|
| 85.6 % v7 (old) | 08/2023 | Asus VivoBook 14X K3405 i5-13500H, GeForce RTX 3050 4GB Laptop GPU | 1.4 kg | 18.9 mm | 14.00" | 2880x1800 | |
| 86.3 % v7 (old) | 07/2023 | Acer Swift X SFX14-71G i7-13700H, GeForce RTX 4050 Laptop GPU | 1.5 kg | 17.9 mm | 14.50" | 2880x1800 | |
| 85.4 % v7 (old) | 07/2023 | MSI Stealth 14 Studio A13V i7-13700H, GeForce RTX 4050 Laptop GPU | 1.7 kg | 19 mm | 14.00" | 2560x1600 | |
| 89.4 % v7 (old) | 05/2023 | Gigabyte Aero 14 OLED BMF i7-13700H, GeForce RTX 4050 Laptop GPU | 1.4 kg | 17 mm | 14.00" | 2880x1800 | |
| 89.2 % v7 (old) | 04/2023 | Lenovo Slim Pro 7 14ARP8 R7 7735HS, GeForce RTX 3050 6GB Laptop GPU | 1.6 kg | 15.6 mm | 14.50" | 2560x1600 | |
| 88.8 % v7 (old) | 10/2022 | Schenker Vision 14 2022 RTX 3050 Ti i7-12700H, GeForce RTX 3050 Ti Laptop GPU | 1.3 kg | 16.6 mm | 14.00" | 2880x1800 |
Chasis: Ligero pero utilitario
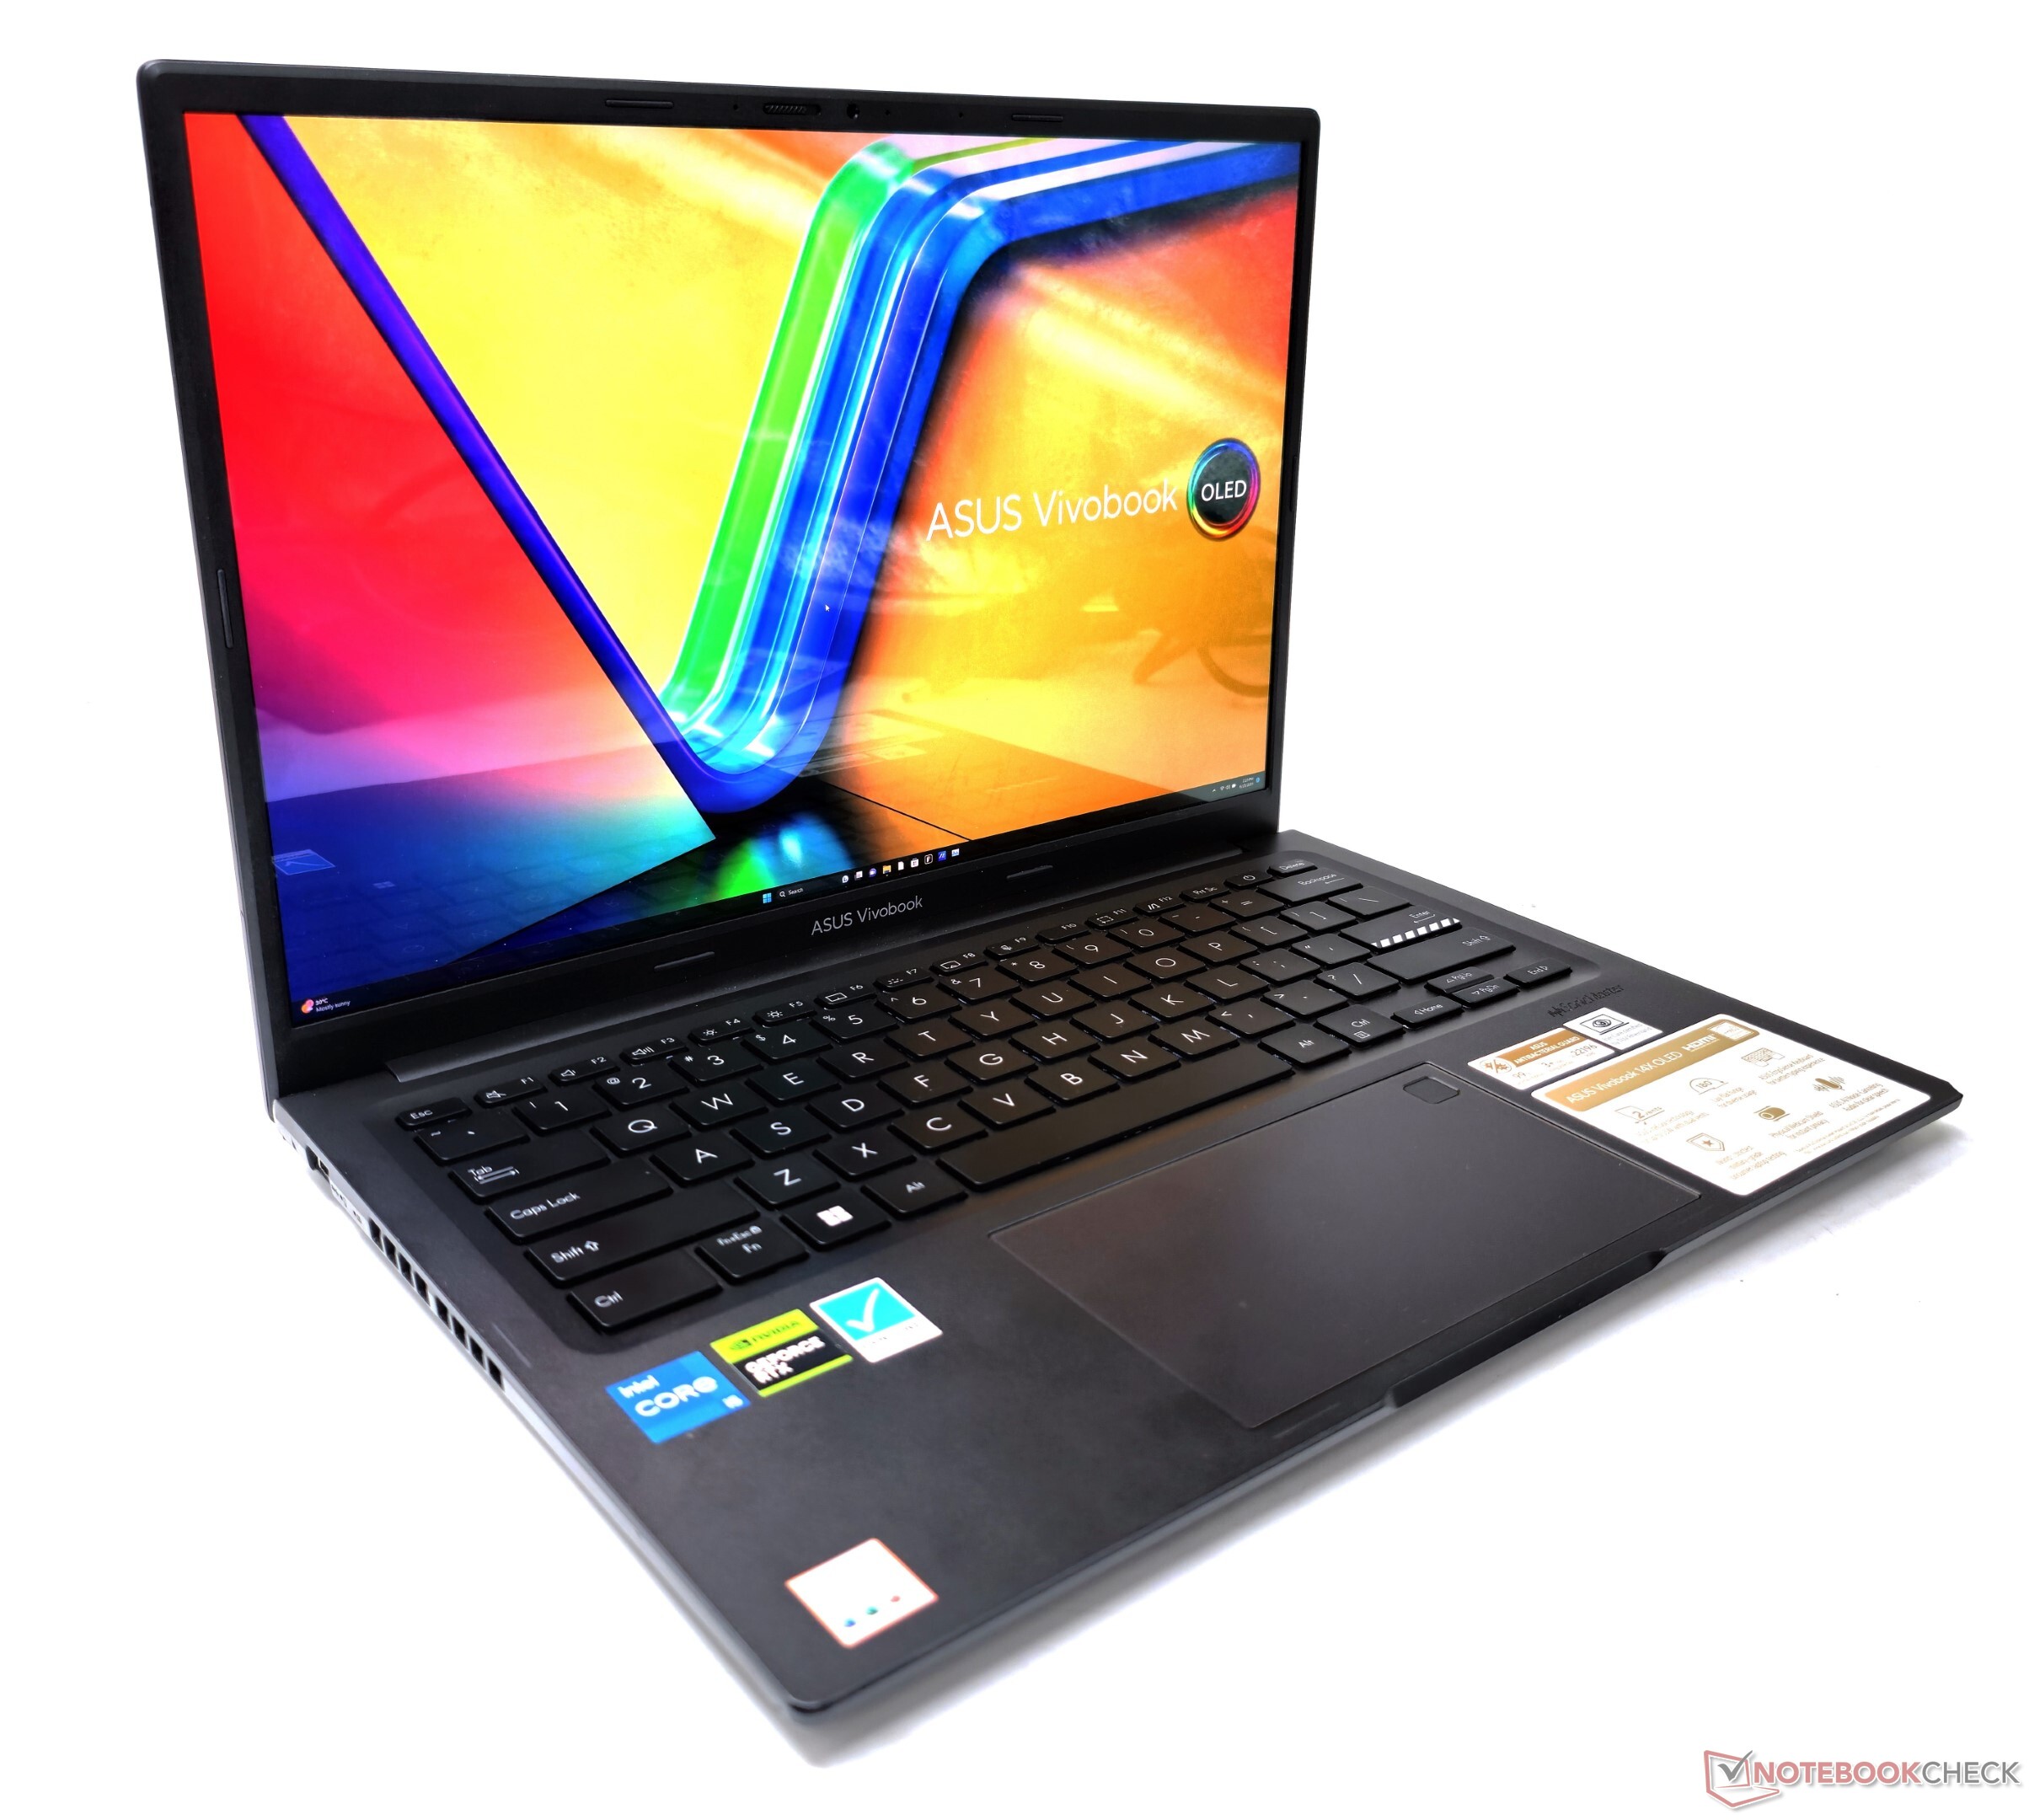
Similar al VivoBook 15X, Asus ofrece el VivoBook 14X en dos opciones de color: Cool Silver e Indie Black (nuestra variante). Como suele ser habitual en los VivoBook, el chasis de 1,4 kg está fabricado principalmente en plástico, mientras que la tapa metálica luce el logo distintivo de VivoBook.
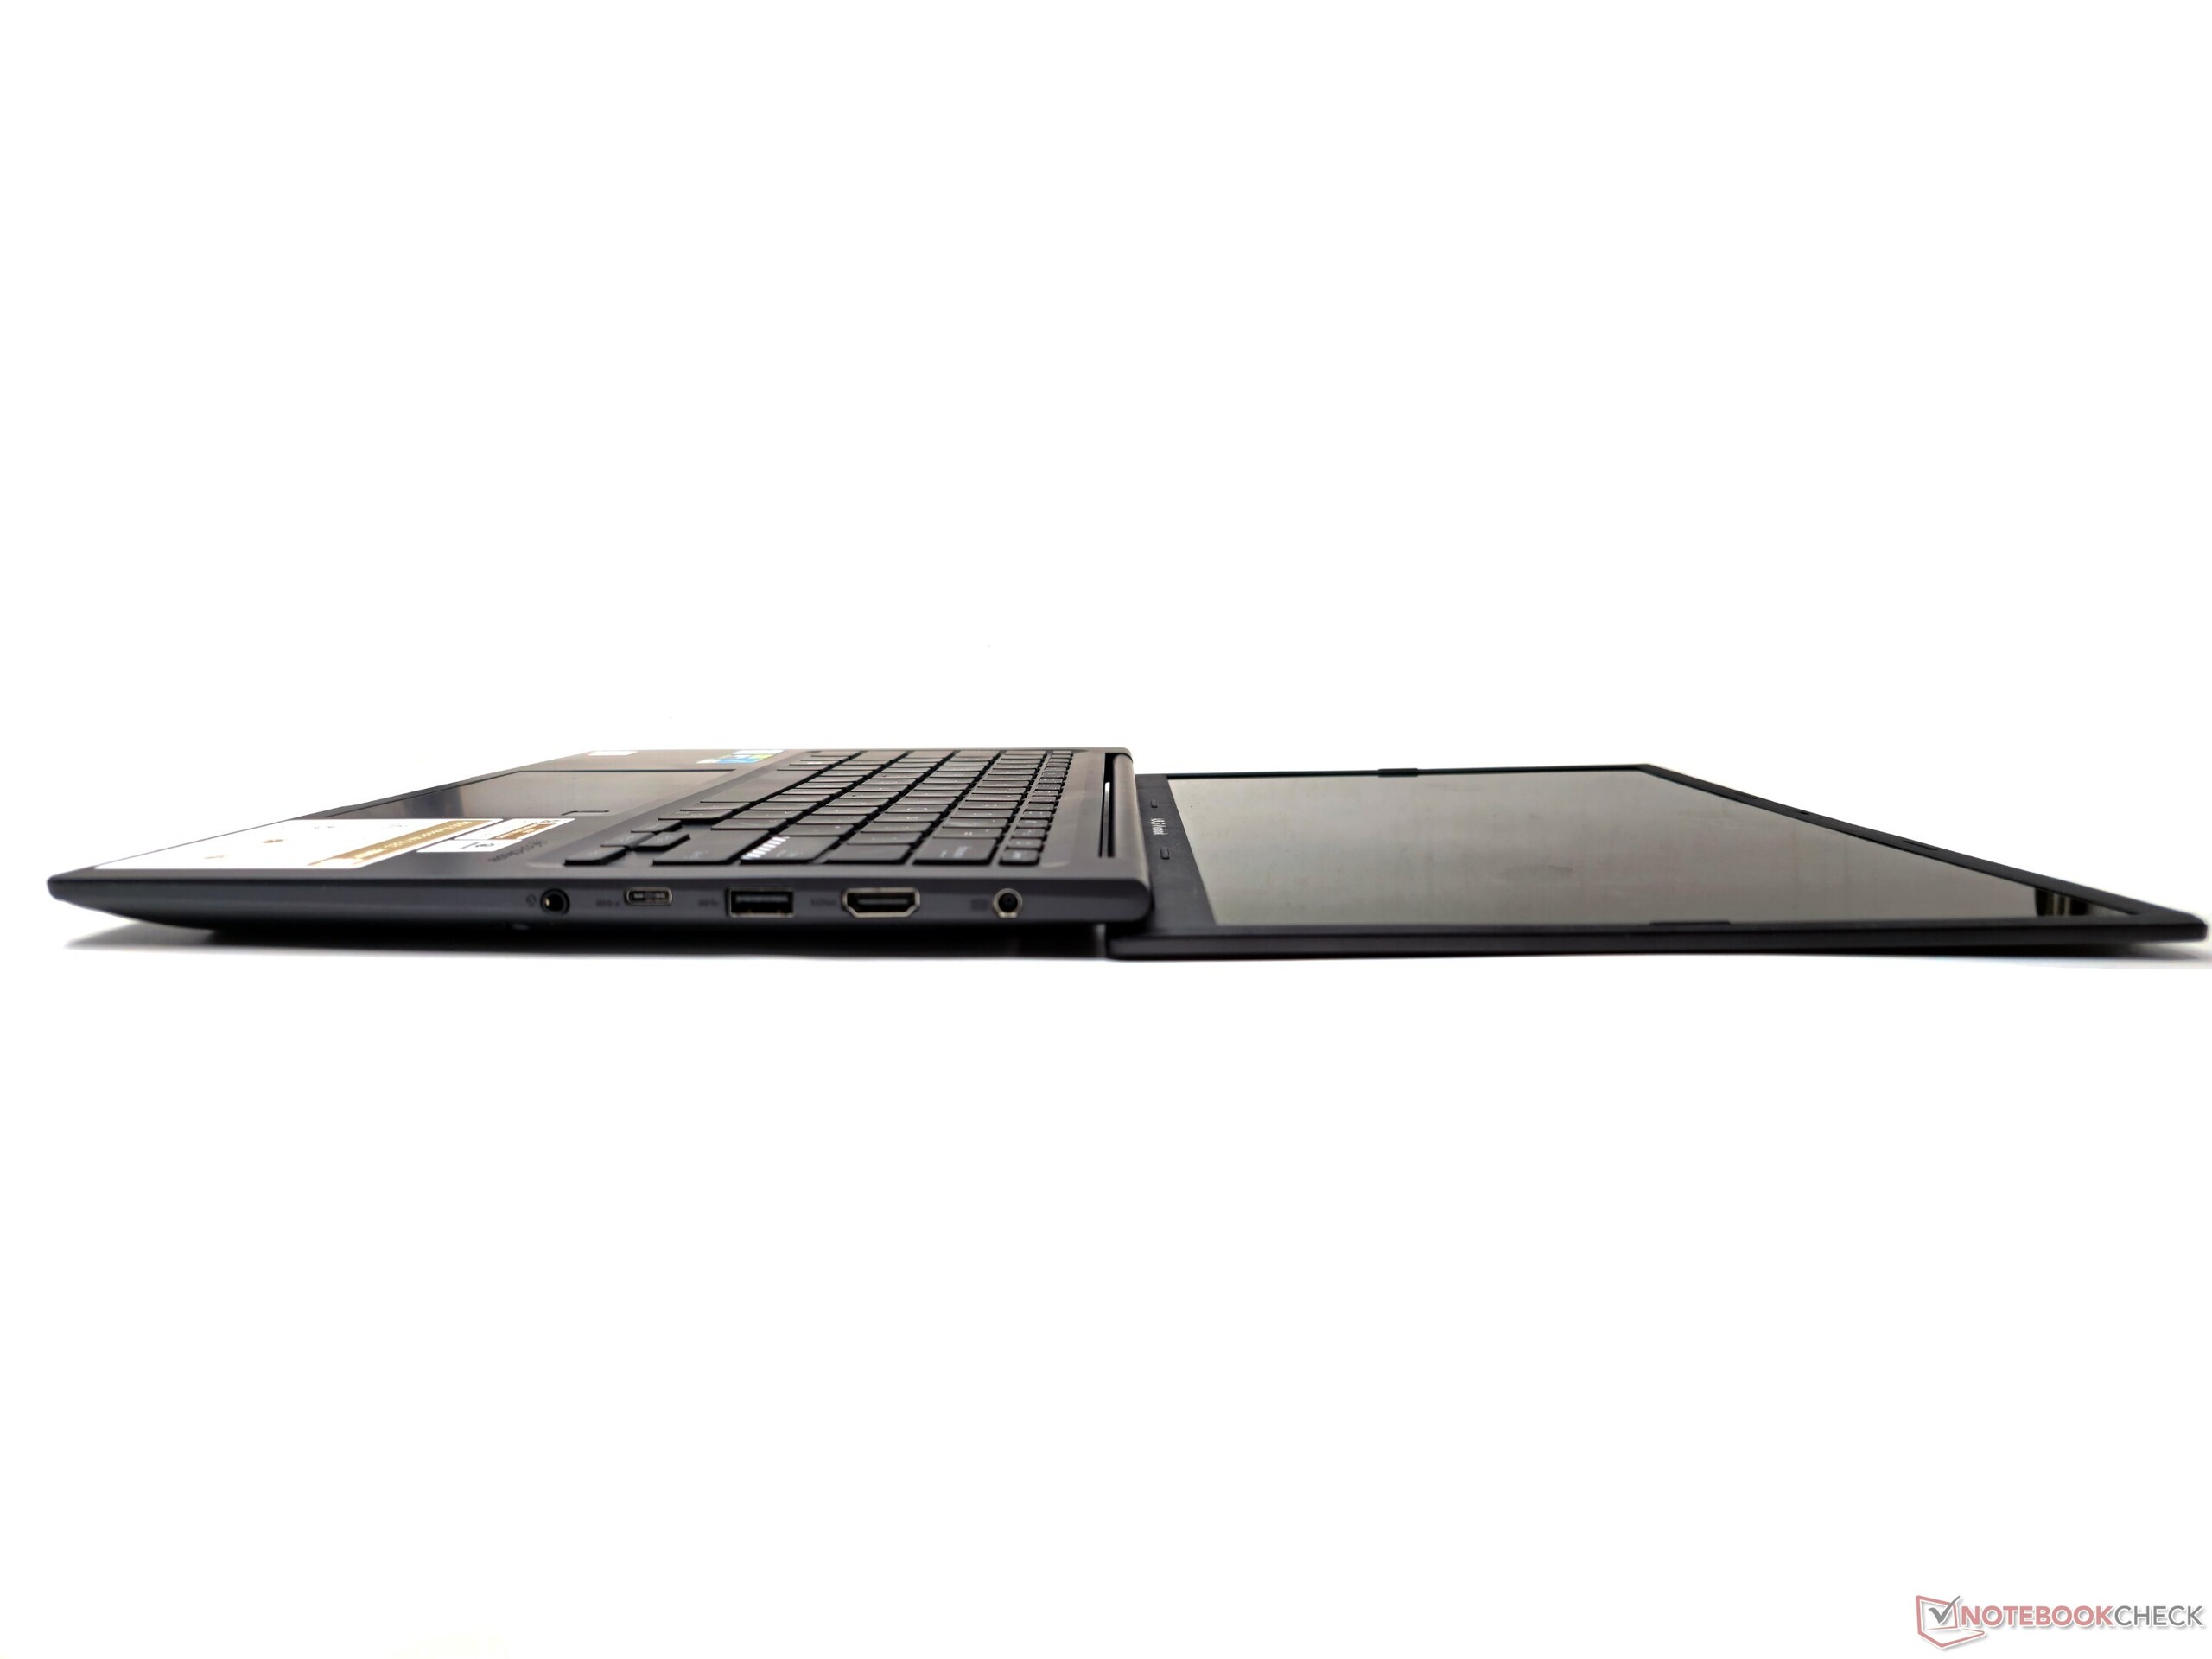
Abrir la tapa de la pantalla es muy fácil, con un solo dedo, y el portátil se mantiene estable sin deslizarse. La pantalla puede colocarse plana en un ángulo de 180°. Hay un poco de flexión en la pantalla y la cubierta del teclado, pero esto no debería ser una preocupación durante el uso normal.
Las bisagras parecen sólidas, sin crujidos ni resistencia excesiva. El protector antimicrobiano de Asus inhibe el crecimiento de bacterias durante al menos tres años. Asus también afirma que el portátil cumple los estándares de durabilidad MIL-STD-810H.
Conectividad: El rendimiento de Wi-Fi 6E no está a la altura
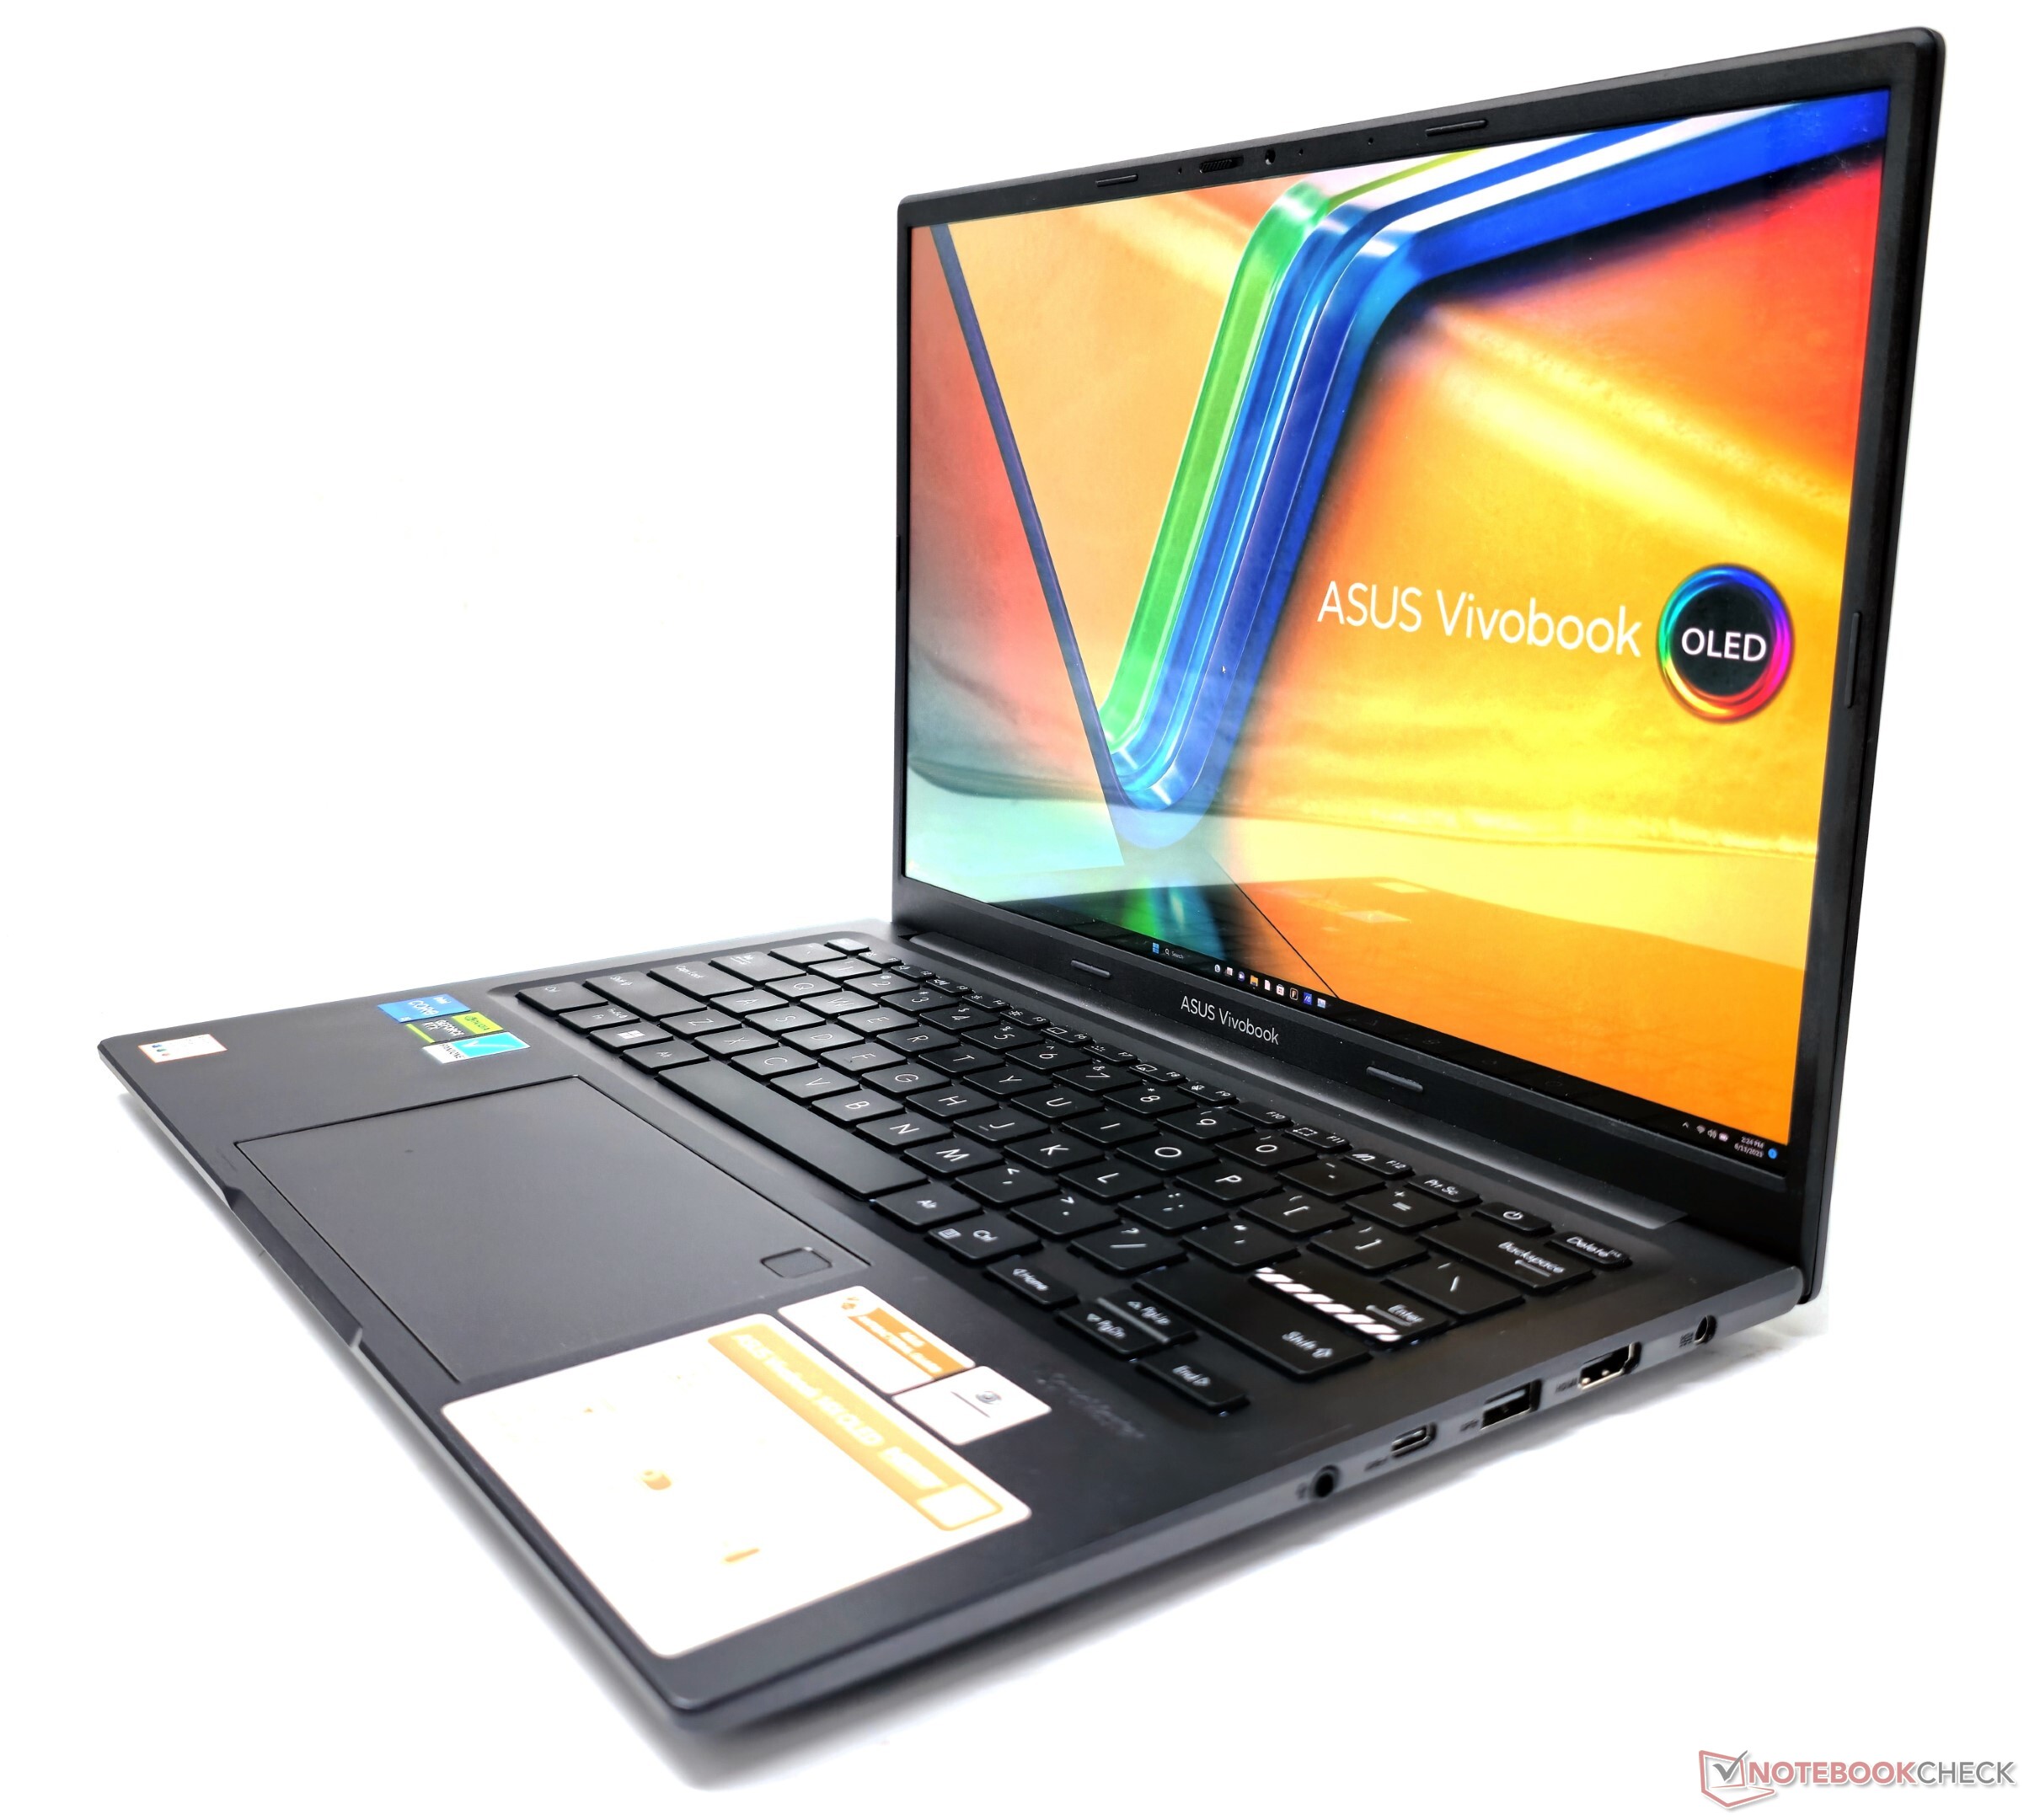
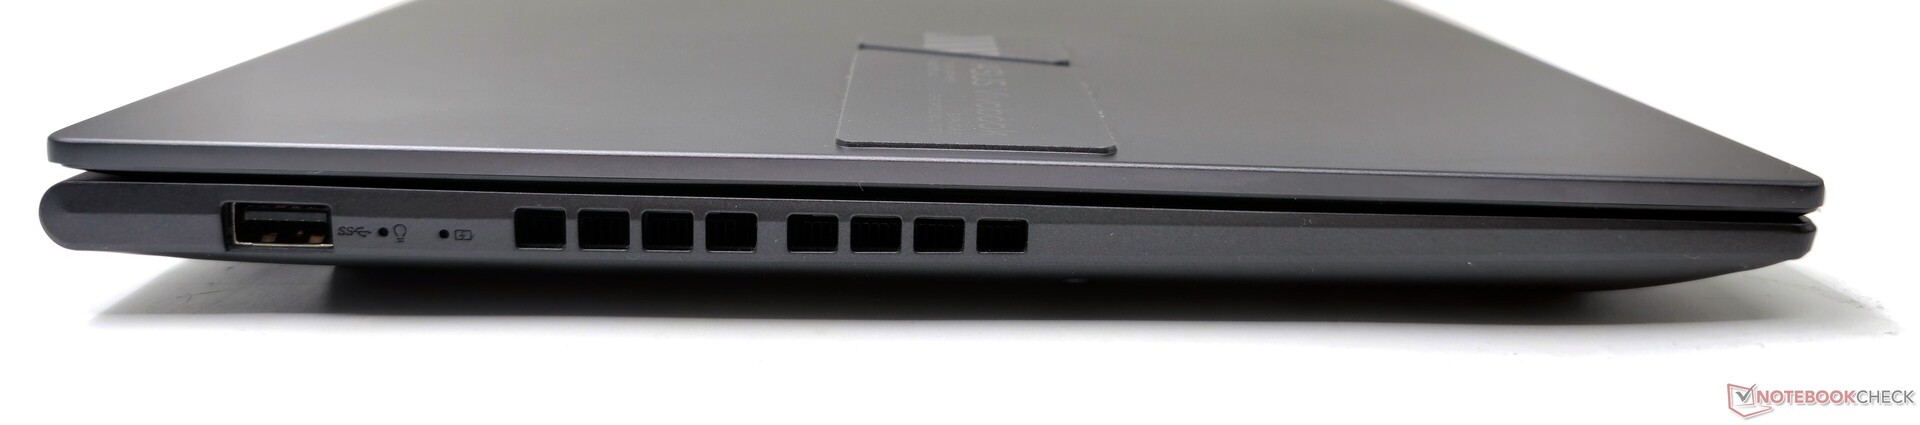
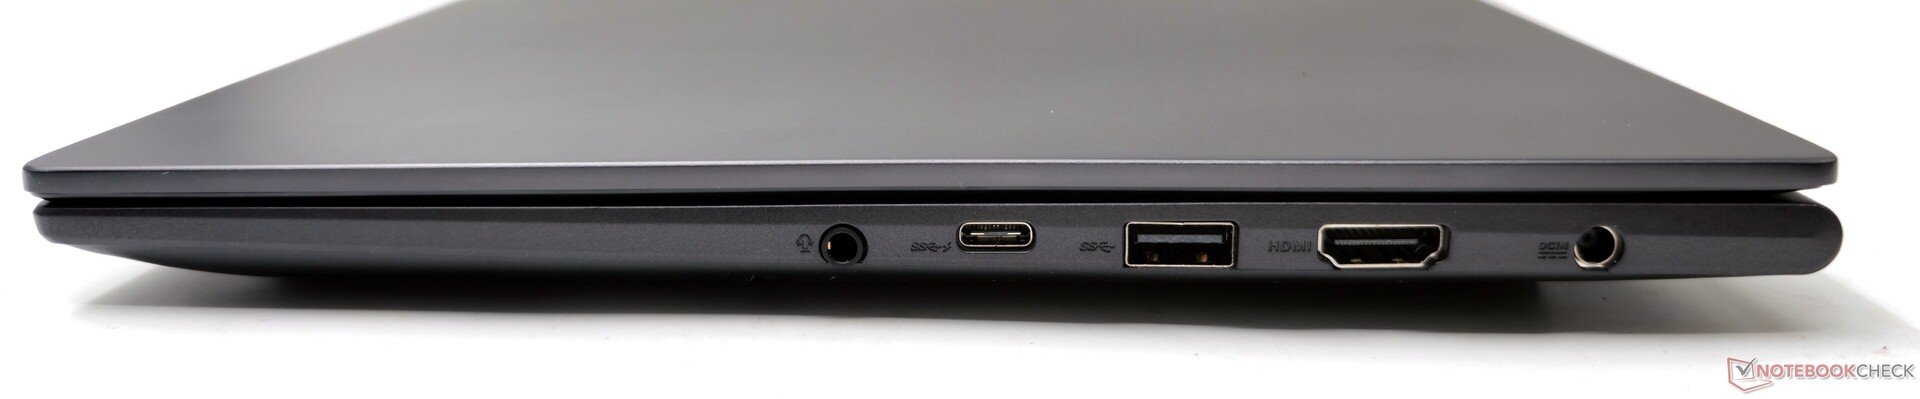
La disposición de los puertos se parece a la que ya hemos visto en el VivoBook 15X. En el lado izquierdo hay un único puerto USB 3.2 Gen1 Tipo-A, mientras que el resto están situados en el lado derecho.
Esta distribución unilateral de puertos puede resultar molesta, especialmente cuando se usa un ratón externo y si se pretende conectar varios periféricos. Sin embargo, el espacio entre los puertos es suficiente y no causará problemas de conectividad.
Comunicación
La tarjeta Intel Wi-Fi 6E AX211 muestra un rendimiento excelente en la banda de 5 GHz sin caídas perceptibles cuando la probamos con nuestro router de referencia Asus ROG Rapture GT-AXE11000.
Sin embargo, no se puede decir lo mismo de la banda de 6 GHz, que muestra un rendimiento inconsistente con caídas regulares de rendimiento durante la prueba.
En comparación, el Gigabyte Aero 14 OLED con tarjeta Intel Wi-Fi 6E AX210 rinde bien en ambas bandas.
| Networking / iperf3 transmit AXE11000 | |
| Asus VivoBook 14X K3405 (iperf 3.1.3) | |
| Acer Swift X SFX14-71G | |
| Gigabyte Aero 14 OLED BMF (iperf 3.1.3) | |
| MSI Stealth 14 Studio A13V | |
| Schenker Vision 14 2022 RTX 3050 Ti (iperf 3.1.3) | |
| Lenovo Slim Pro 7 14ARP8 (iperf 3.1.3) | |
| Media de la clase Multimedia (606 - 1978, n=54, últimos 2 años) | |
| Medio Intel Wi-Fi 6E AX211 (64 - 1921, n=276) | |
| Networking / iperf3 receive AXE11000 | |
| Asus VivoBook 14X K3405 (iperf 3.1.3) | |
| Gigabyte Aero 14 OLED BMF (iperf 3.1.3) | |
| Schenker Vision 14 2022 RTX 3050 Ti (iperf 3.1.3) | |
| MSI Stealth 14 Studio A13V | |
| Acer Swift X SFX14-71G | |
| Lenovo Slim Pro 7 14ARP8 (iperf 3.1.3) | |
| Medio Intel Wi-Fi 6E AX211 (582 - 1890, n=276) | |
| Media de la clase Multimedia (682 - 1818, n=54, últimos 2 años) | |
| Networking / iperf3 transmit AXE11000 6GHz | |
| Gigabyte Aero 14 OLED BMF (iperf 3.1.3) | |
| Media de la clase Multimedia (869 - 2373, n=23, últimos 2 años) | |
| Asus VivoBook 14X K3405 (iperf 3.1.3) | |
| Medio Intel Wi-Fi 6E AX211 (385 - 1851, n=226) | |
| Networking / iperf3 receive AXE11000 6GHz | |
| Gigabyte Aero 14 OLED BMF (iperf 3.1.3) | |
| Media de la clase Multimedia (1212 - 2361, n=23, últimos 2 años) | |
| Asus VivoBook 14X K3405 (iperf 3.1.3) | |
| Medio Intel Wi-Fi 6E AX211 (700 - 1857, n=226) | |
Cámara web
La webcam integrada de 720p del VivoBook 14X muestra poca nitidez y desviaciones de color significativas. El test X-Rite ColorChecker Passport revela el Delta E más alto de 22.45 con el color Azul Púrpura.
Aunque la webcam puede bastar para videollamadas ocasionales, Asus debería haber equipado idealmente el portátil con un módulo 1080p para mejorar la calidad.
Se proporciona un obturador físico de webcam para mayor privacidad.


Seguridad
Un escáner de huellas dactilares integrado en el panel táctil facilita el inicio de sesión biométrico. Además, cuenta con un módulo TPM 2.0.
Accesorios y garantía
No hay accesorios adicionales en la caja, aparte del adaptador de corriente de 90 W y la documentación habitual.
En India, Asus ofrece el VivoBook 14X con un año de garantía estándar. Aquellos que adquieran el portátil antes del 31 de agosto de 2023 también podrán beneficiarse de las ventajas de Back to College que incluyen varias opciones de extensión de garantía y protección local contra daños accidentales que van desde los ₹99 a los ₹2.999.
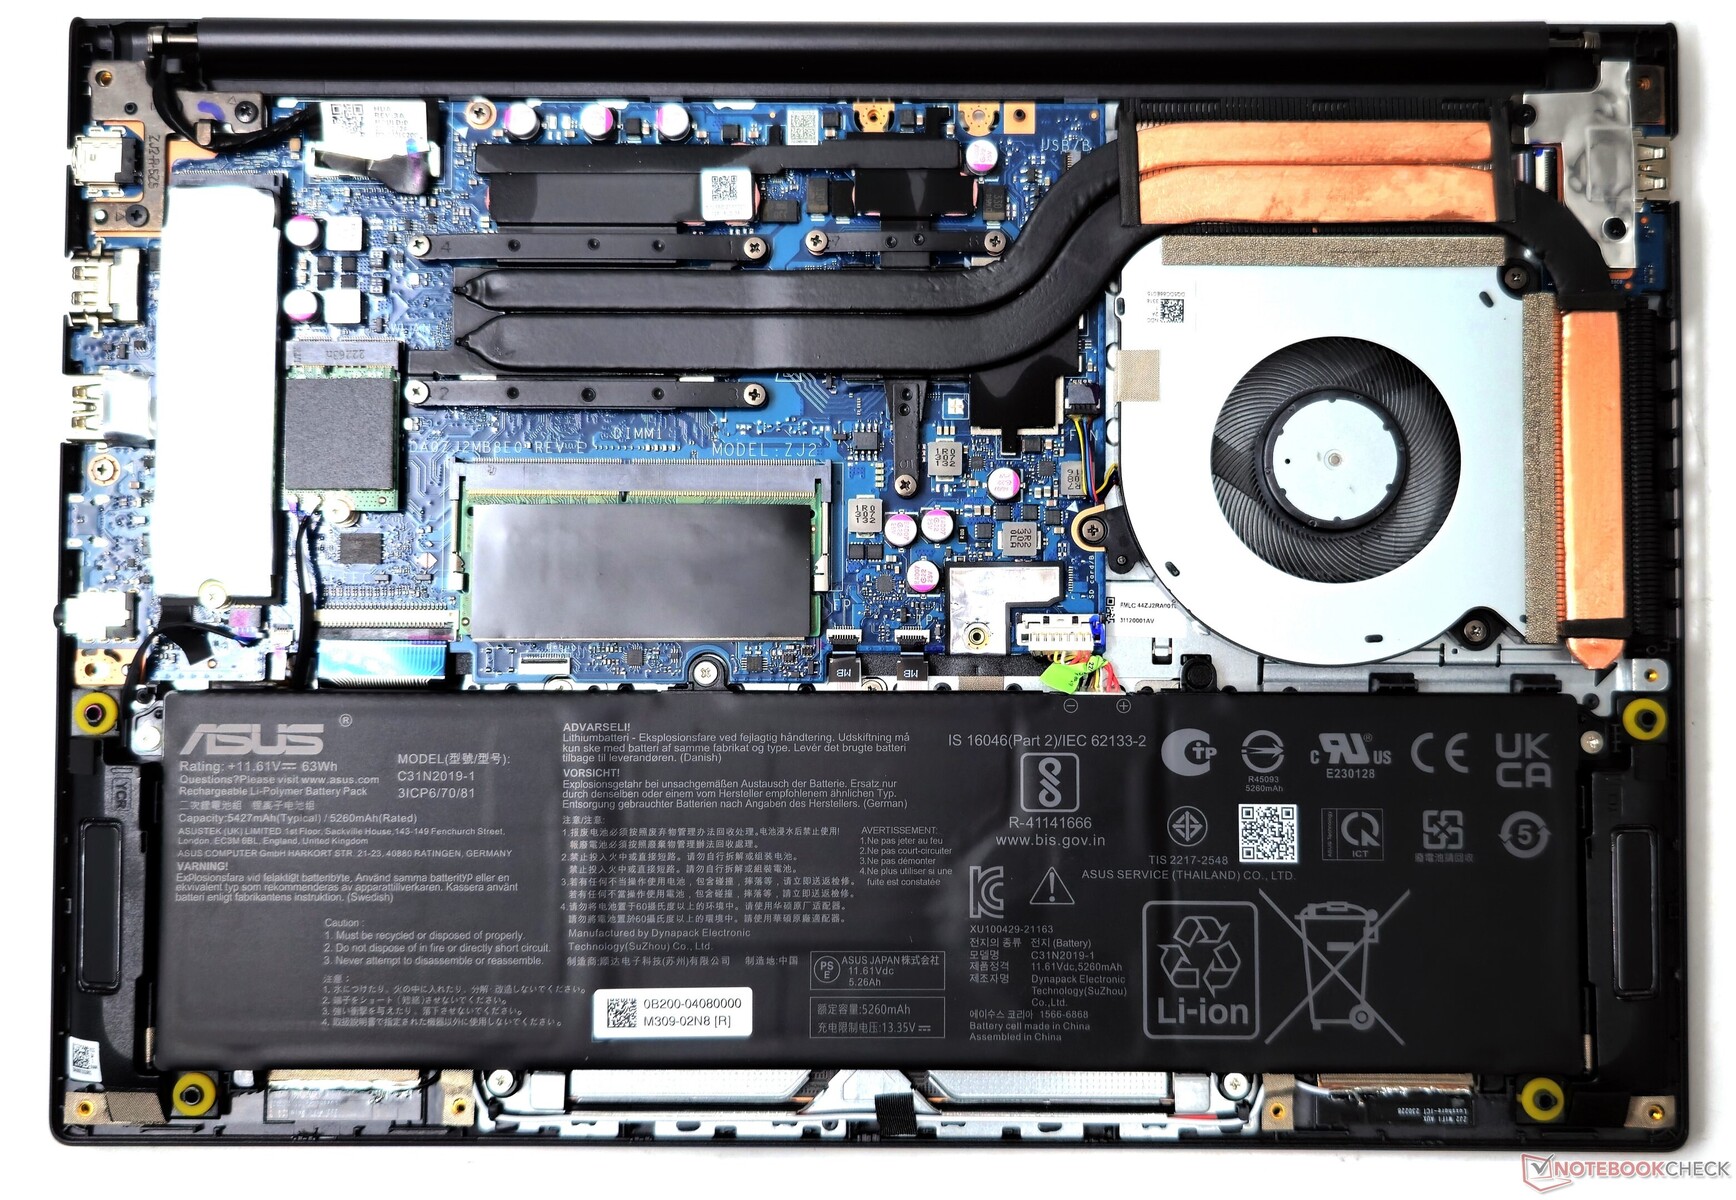
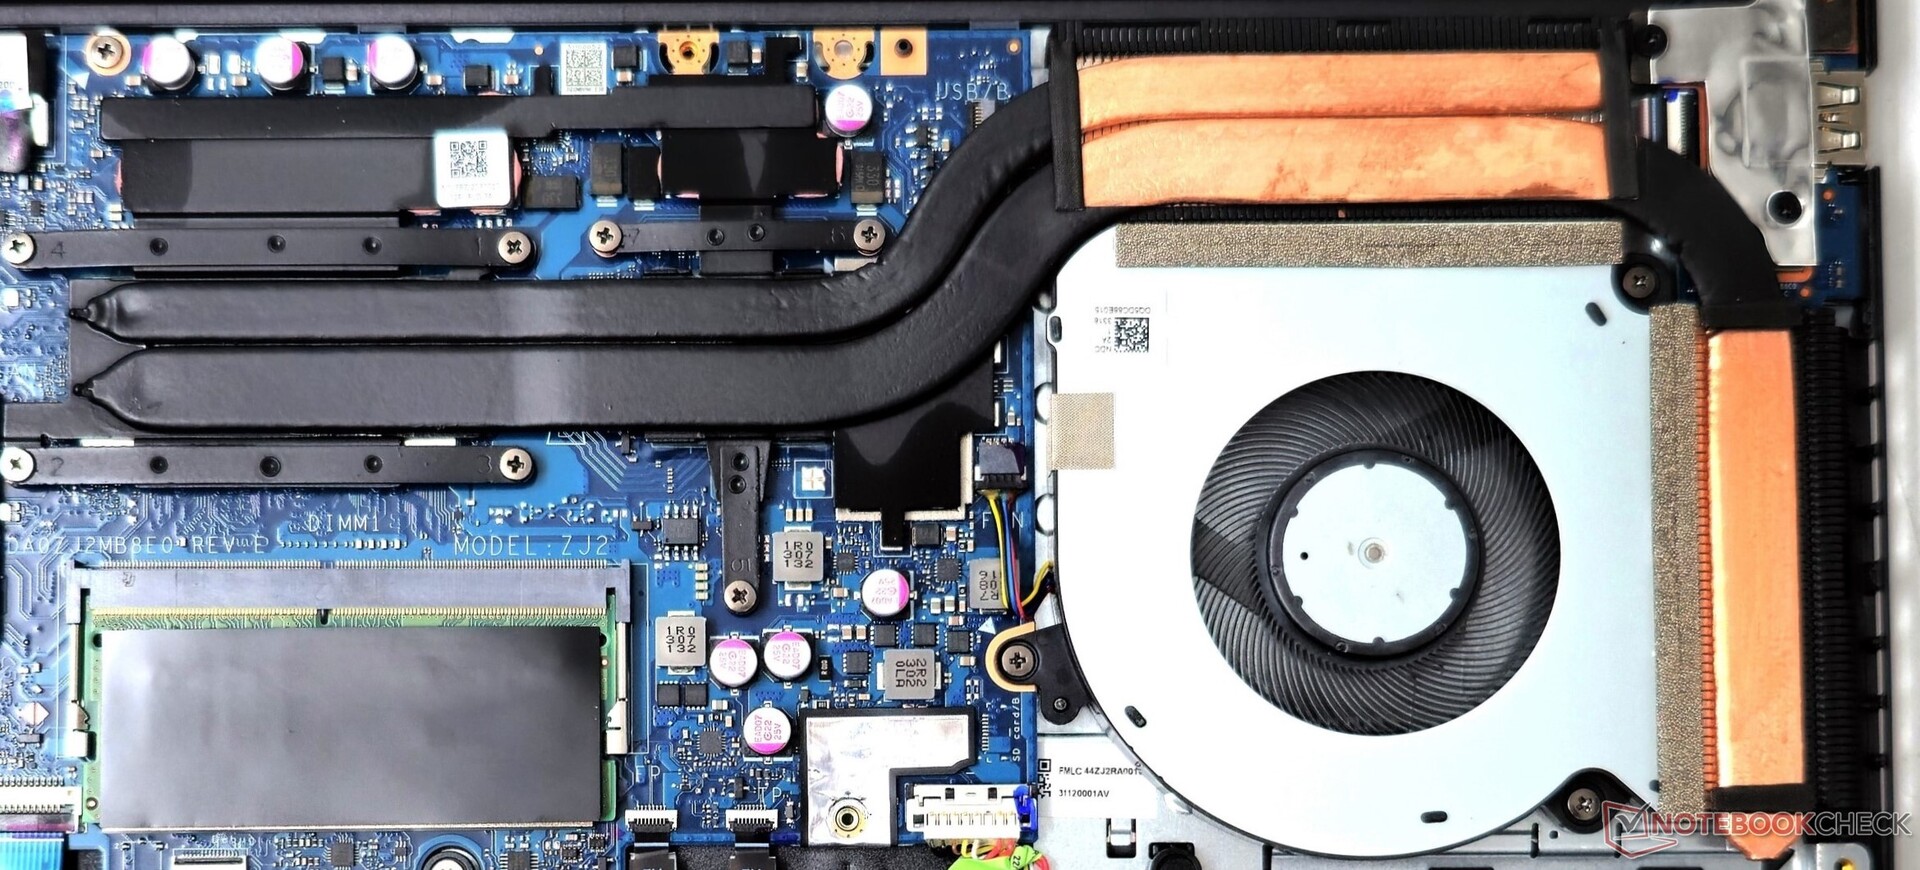
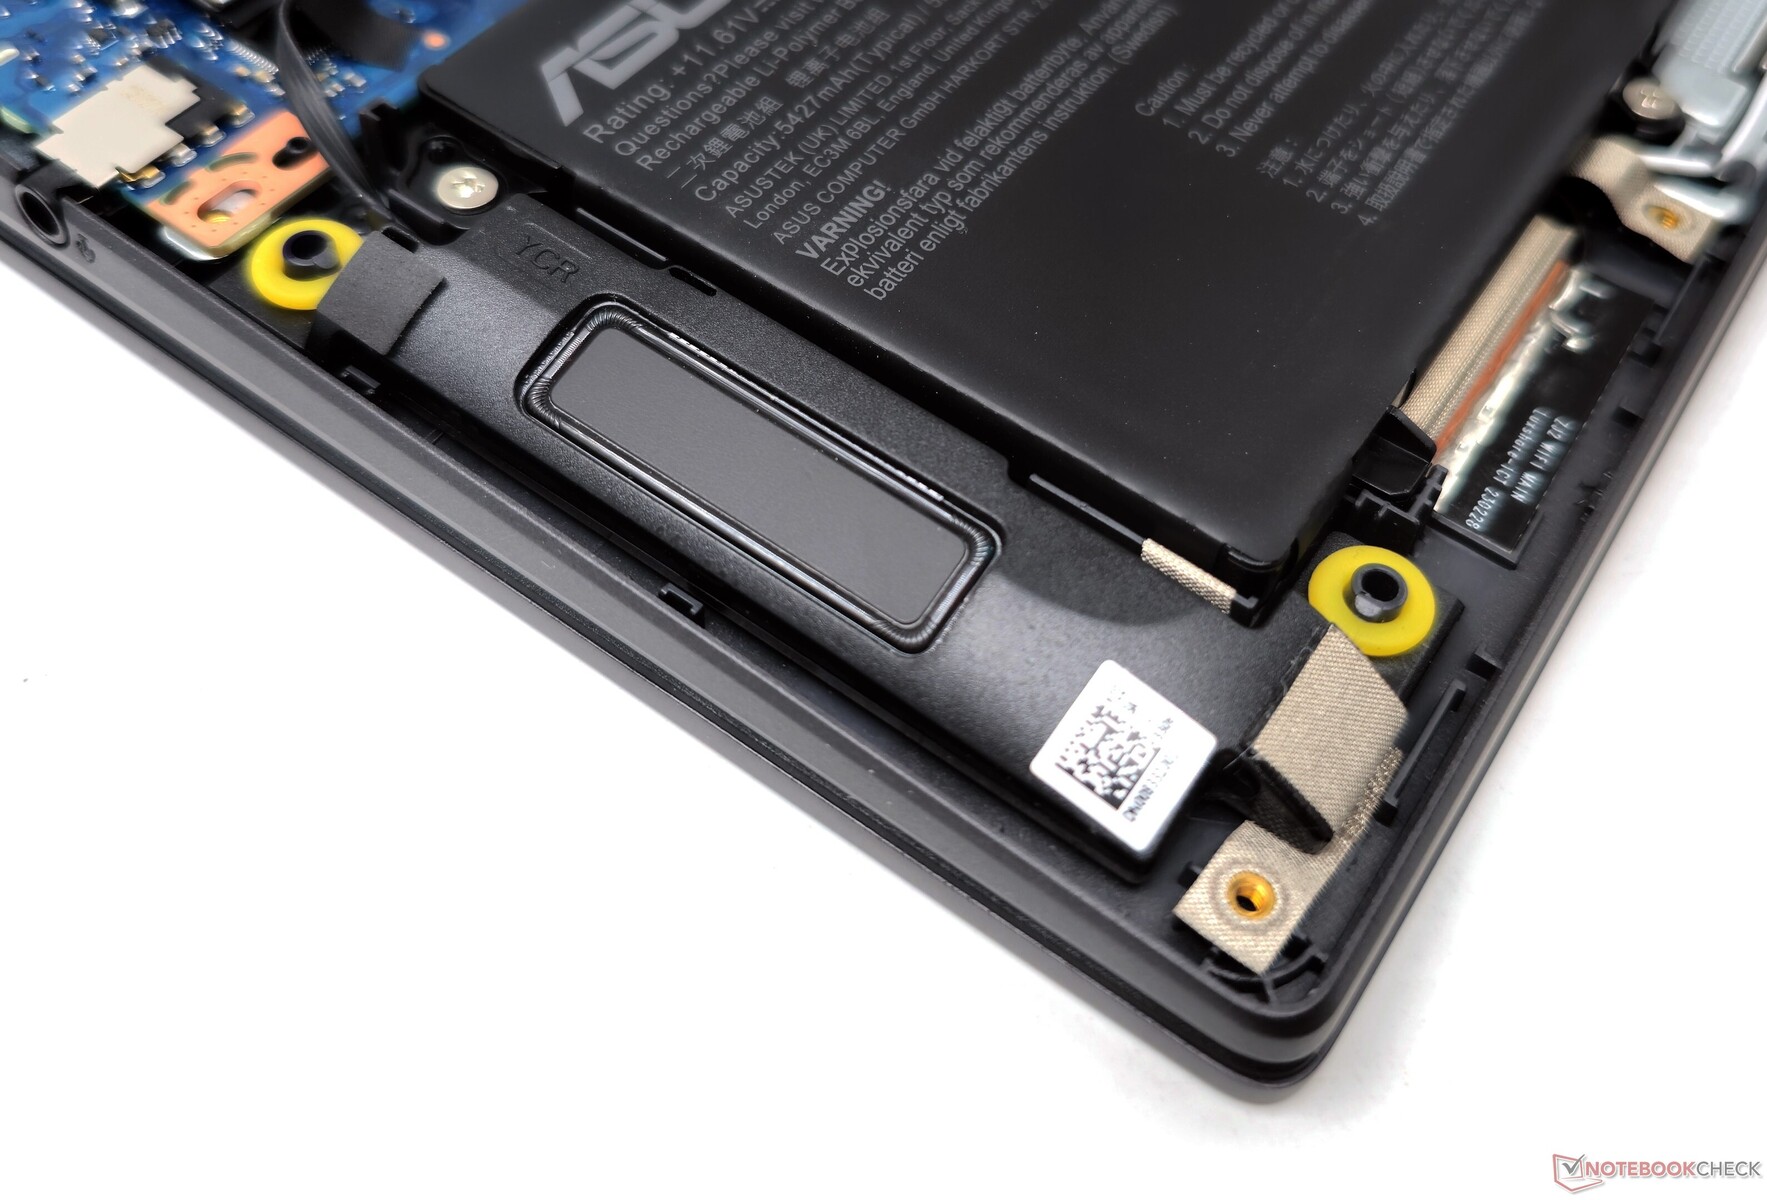
Mantenimiento
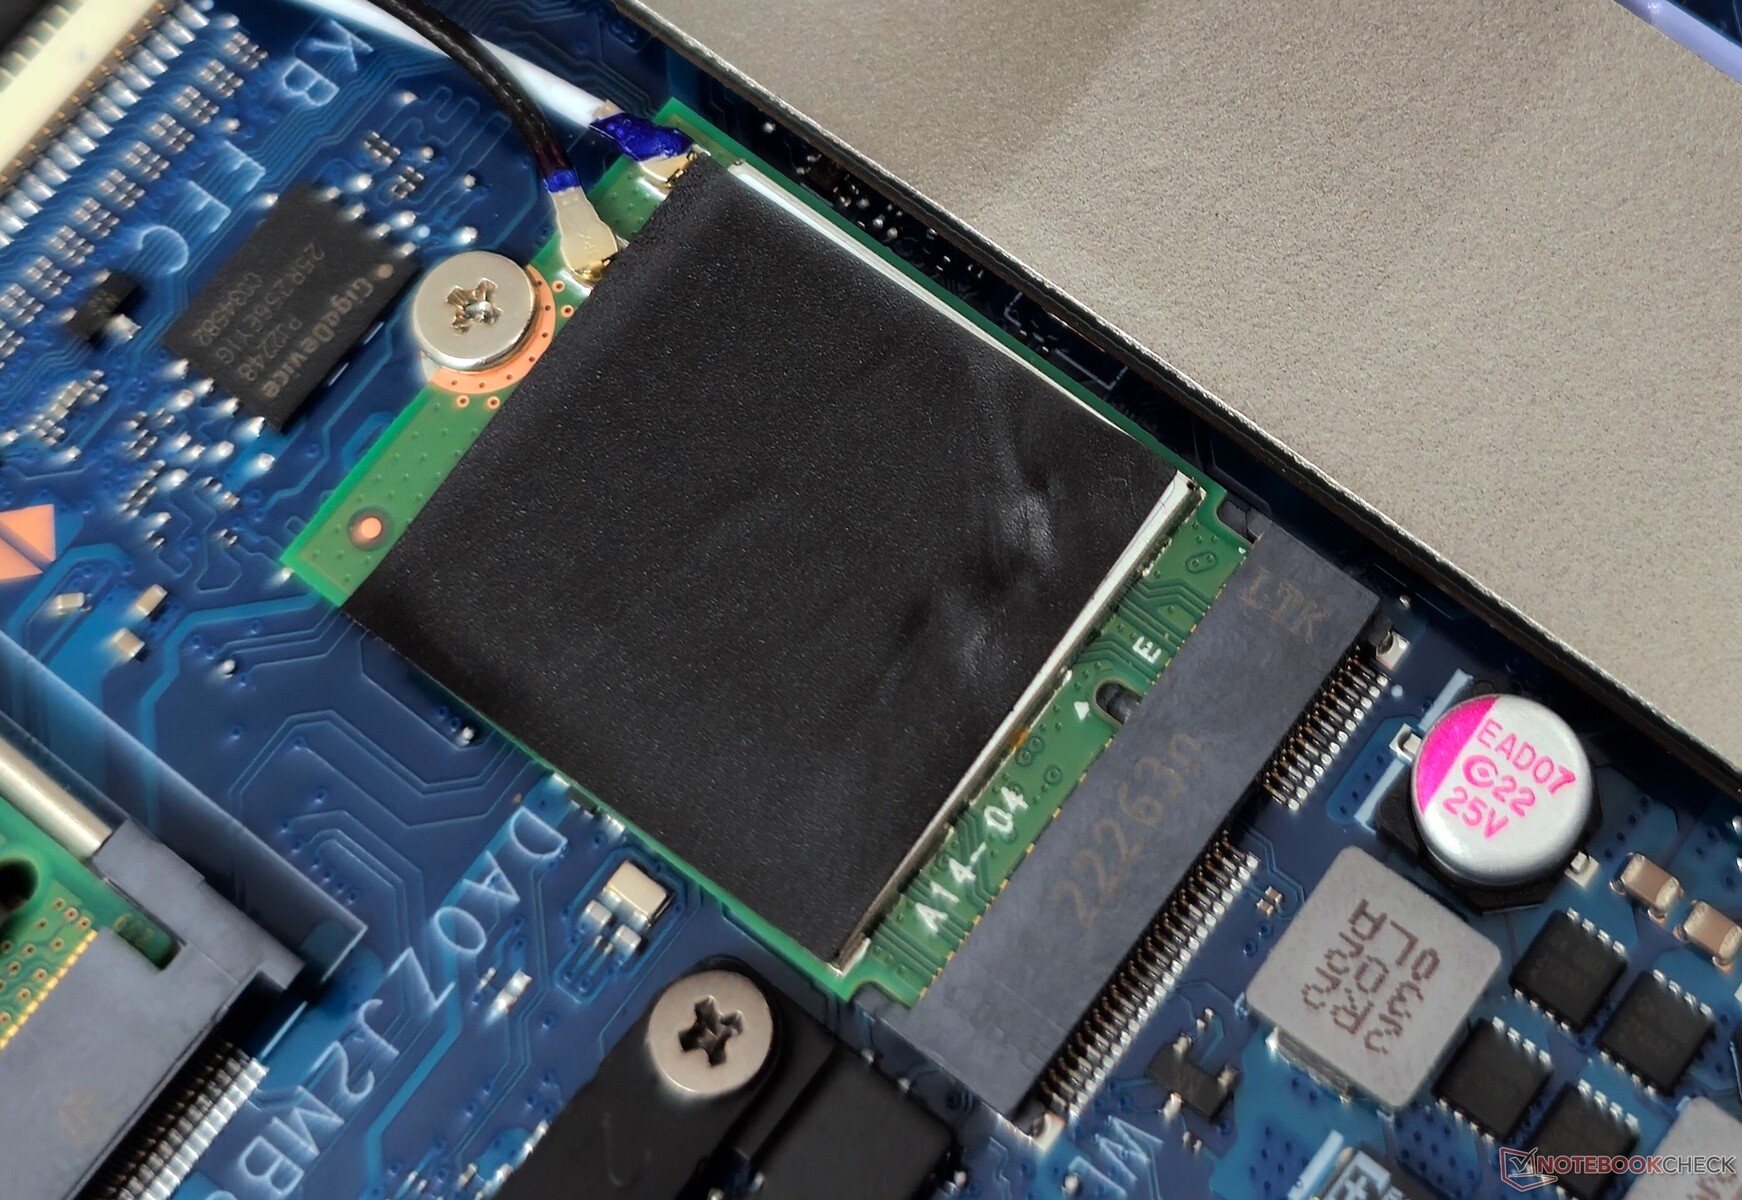
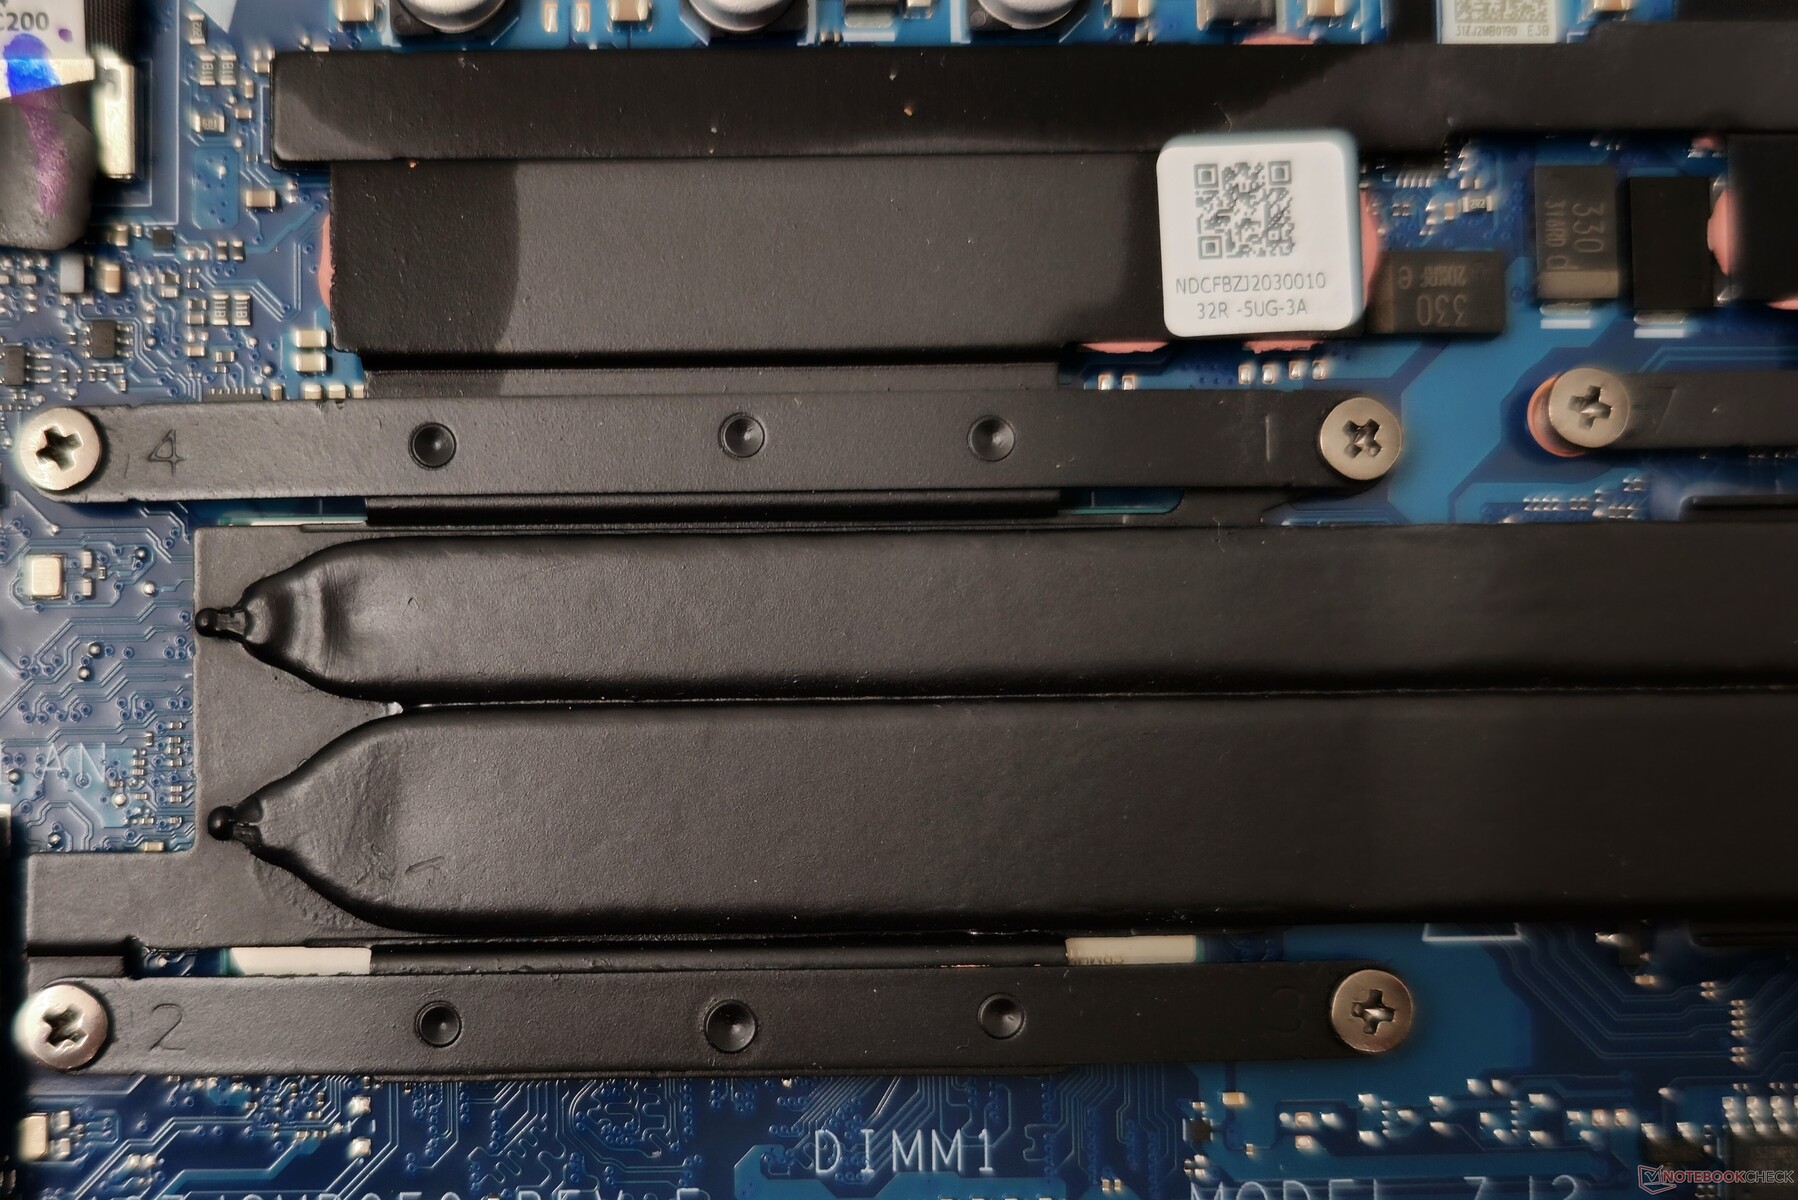
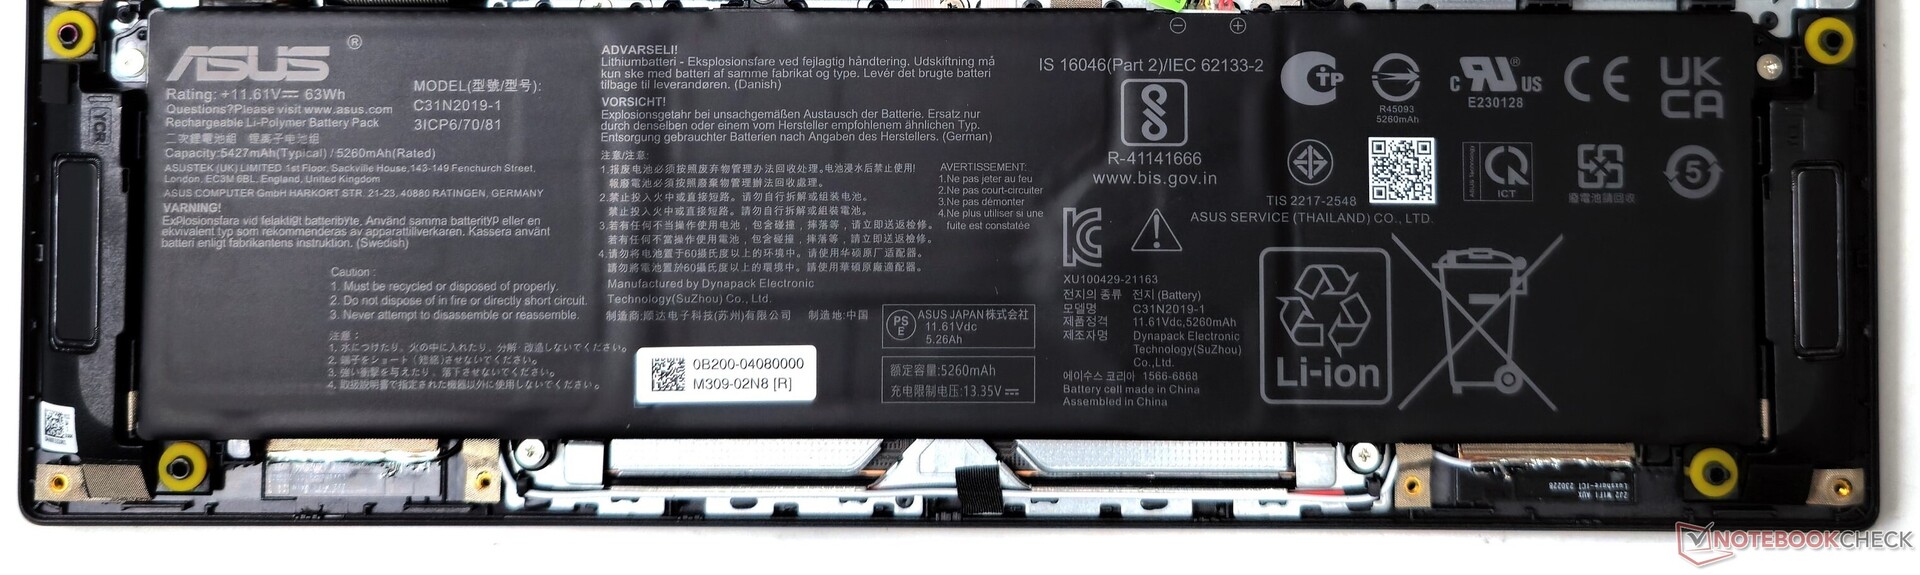
Para acceder a las entrañas hay que quitar siete tornillos PH0 del panel trasero. Una vez dentro, puedes cambiar fácilmente la tarjeta WLAN y el SSD NVMe.
Merece la pena señalar que 8 GB de RAM vienen soldados a la placa base, lo que significa que solo puedes ampliar una ranura SO-DIMM. La batería se puede desenroscar y cambiar si es necesario.
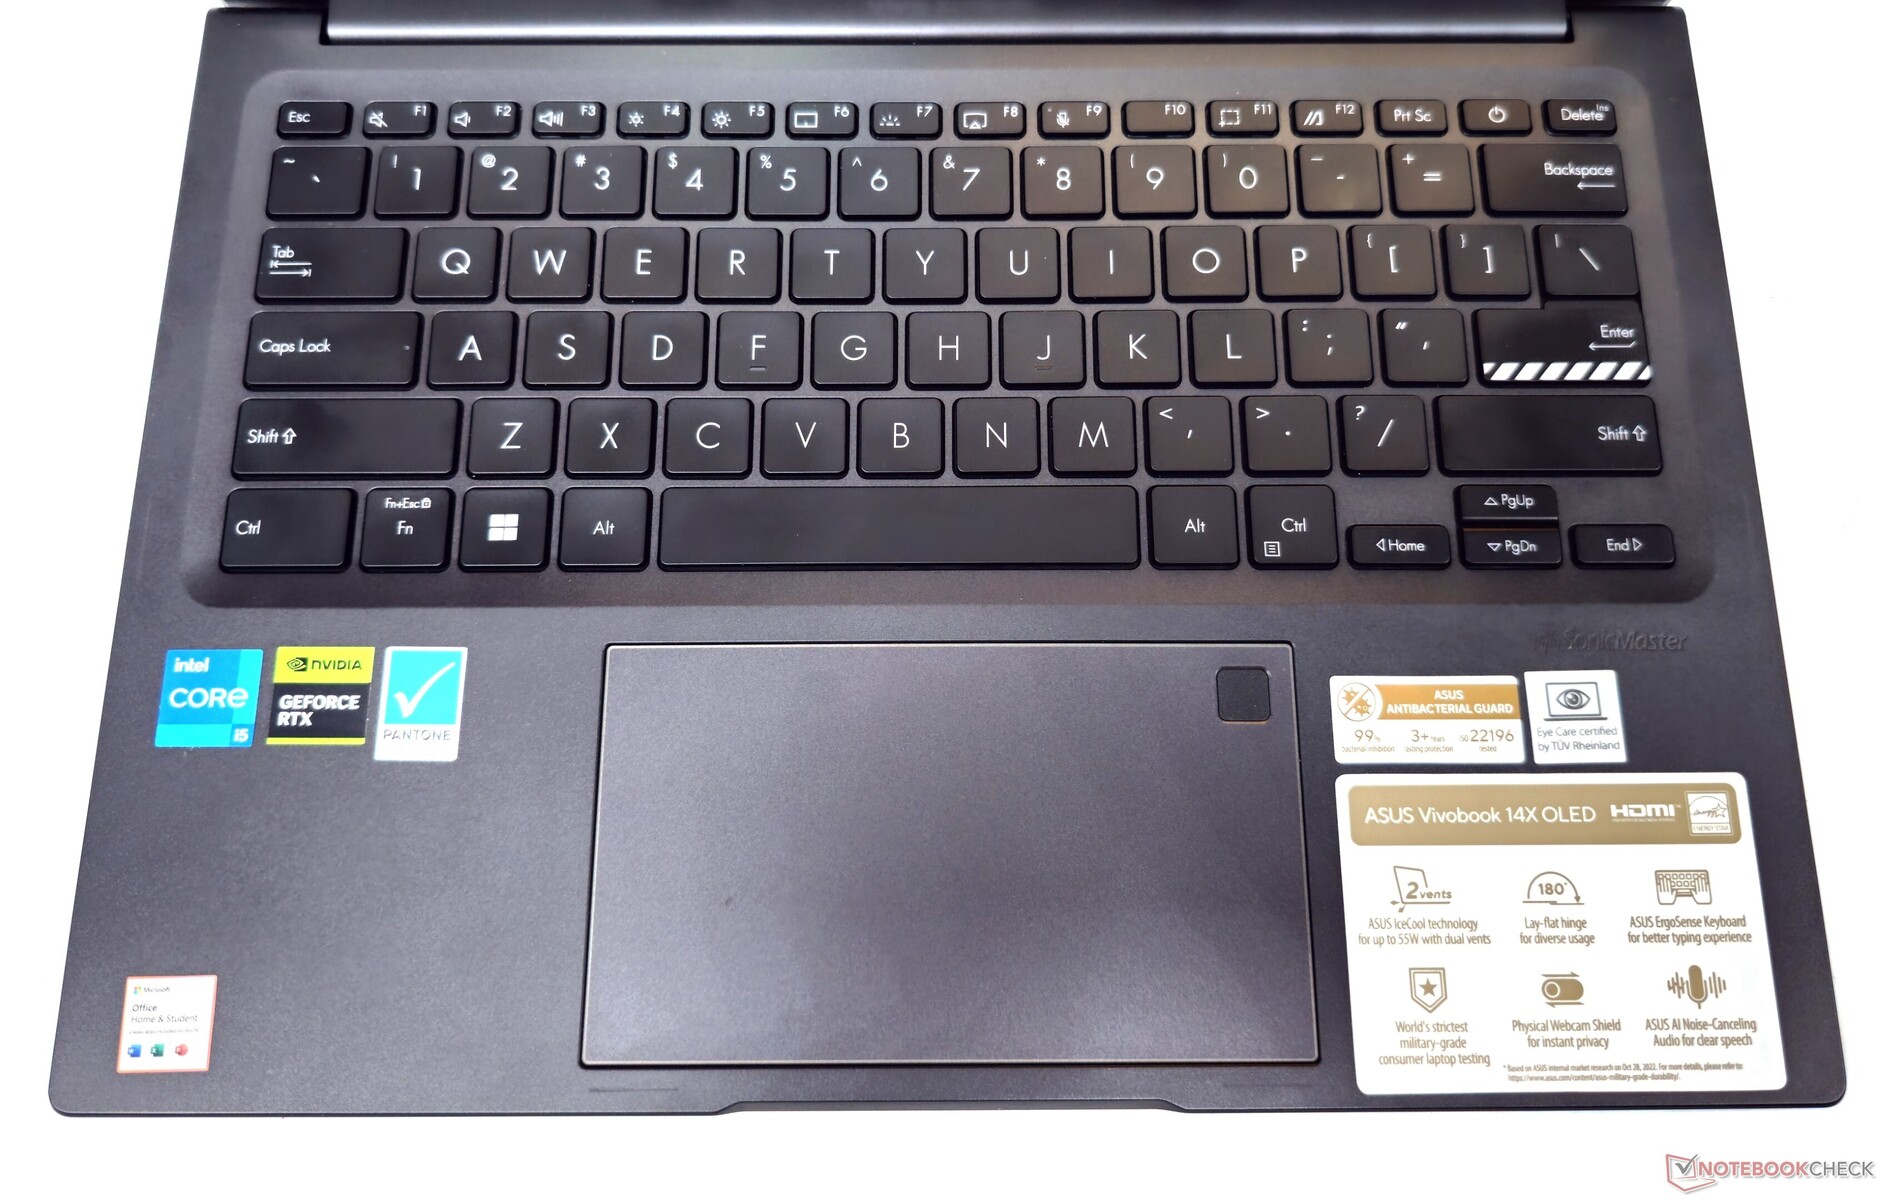
Dispositivos de entrada: Teclado y touchpad decentes
Teclado
El VivoBook 14X está equipado con lo que Asus llama un teclado ErgoSense, que ofrece un recorrido de tecla de 1,4 mm. Escribir en este teclado es una experiencia cómoda, gracias a las teclas cóncavas y bien espaciadas.
La fila superior contiene las teclas F1-F12 y las teclas especiales, cuyas funciones principales se pueden configurar con la aplicación MyAsus. Las teclas de dirección pueden parecer un poco estrechas, pero es típico de un portátil de este formato. La retroiluminación de tres niveles ofrece una legibilidad decente en entornos oscuros.
Panel táctil
El touchpad del VivoBook 14X mide 7,5 cm x 13 cm, lo que proporciona un amplio espacio para la navegación, y ofrece una experiencia de deslizamiento suave.
Toda la superficie sirve como botón izquierdo del ratón, y los clics son sensibles y relativamente silenciosos.
Pantalla: OLED de 2,8K con HDR y PWM de 90 Hz
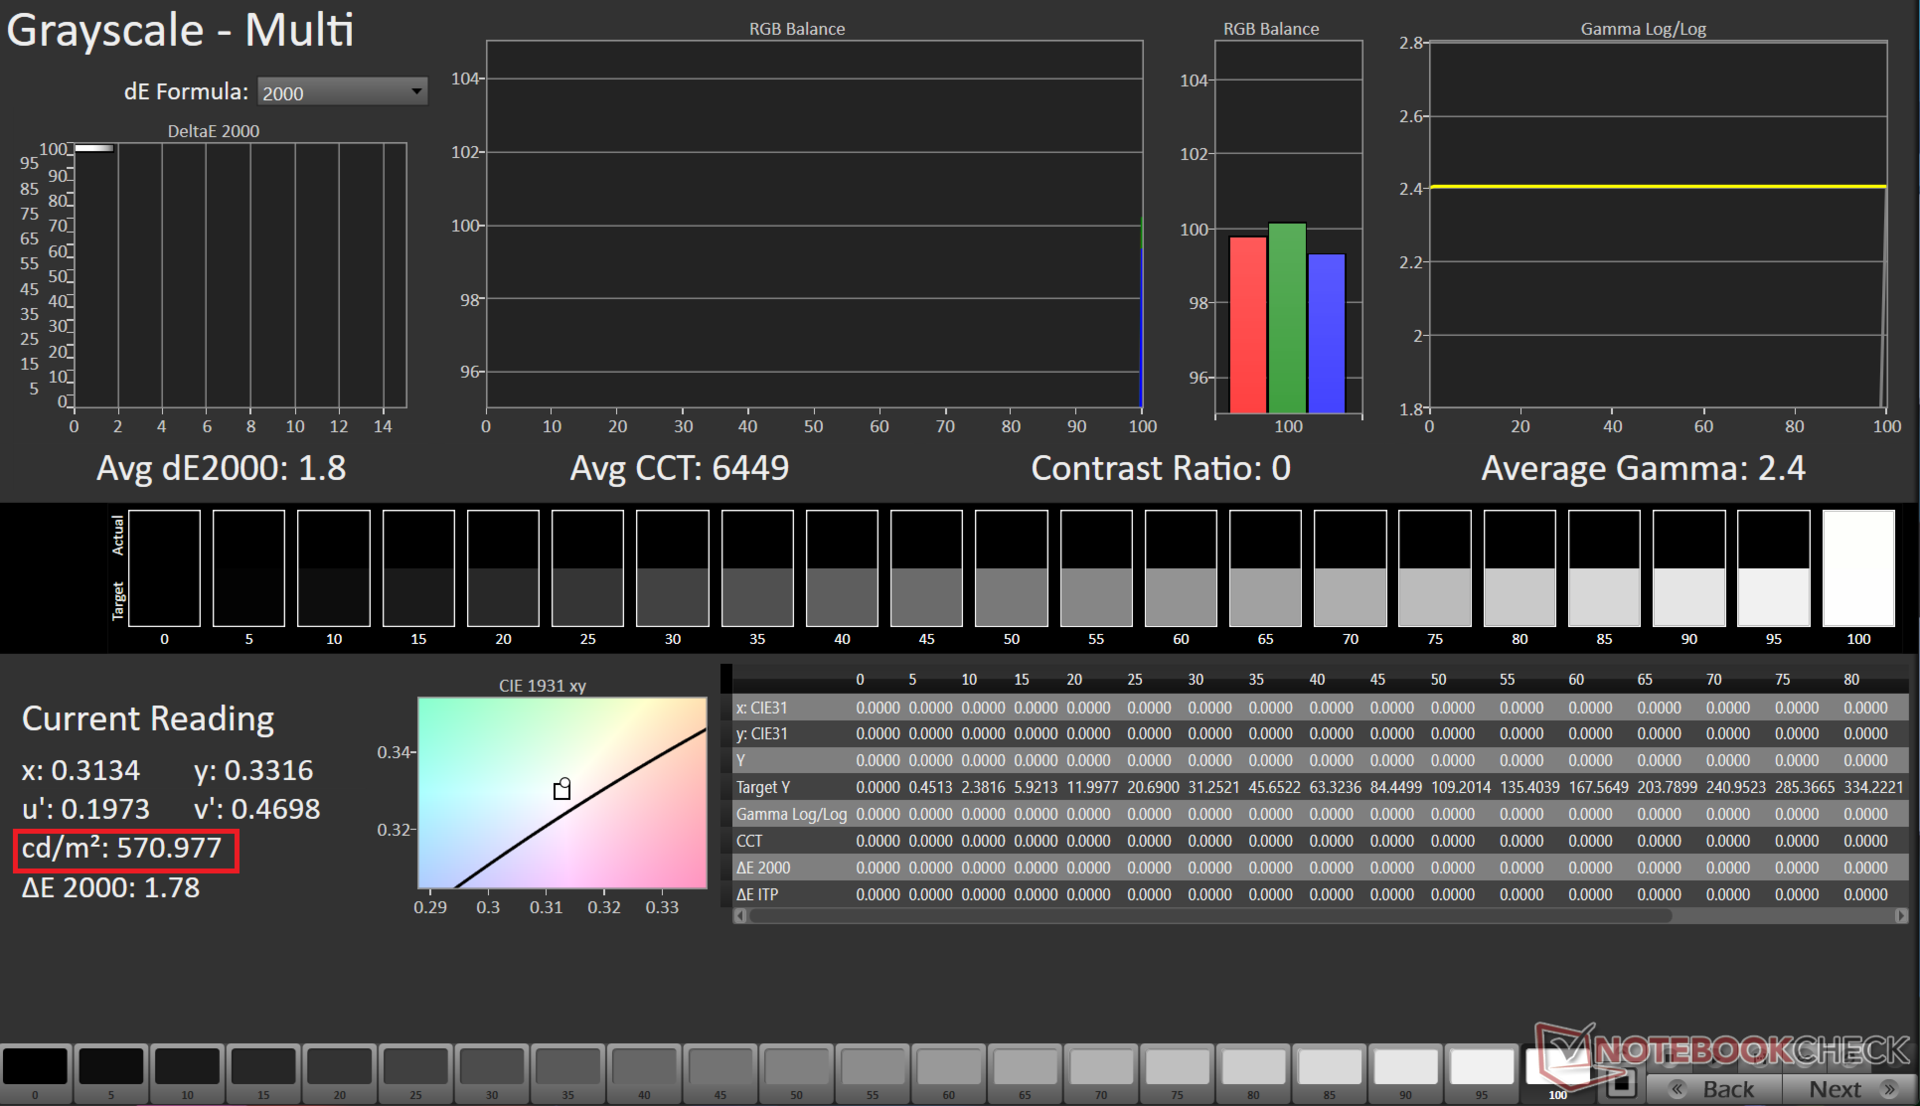
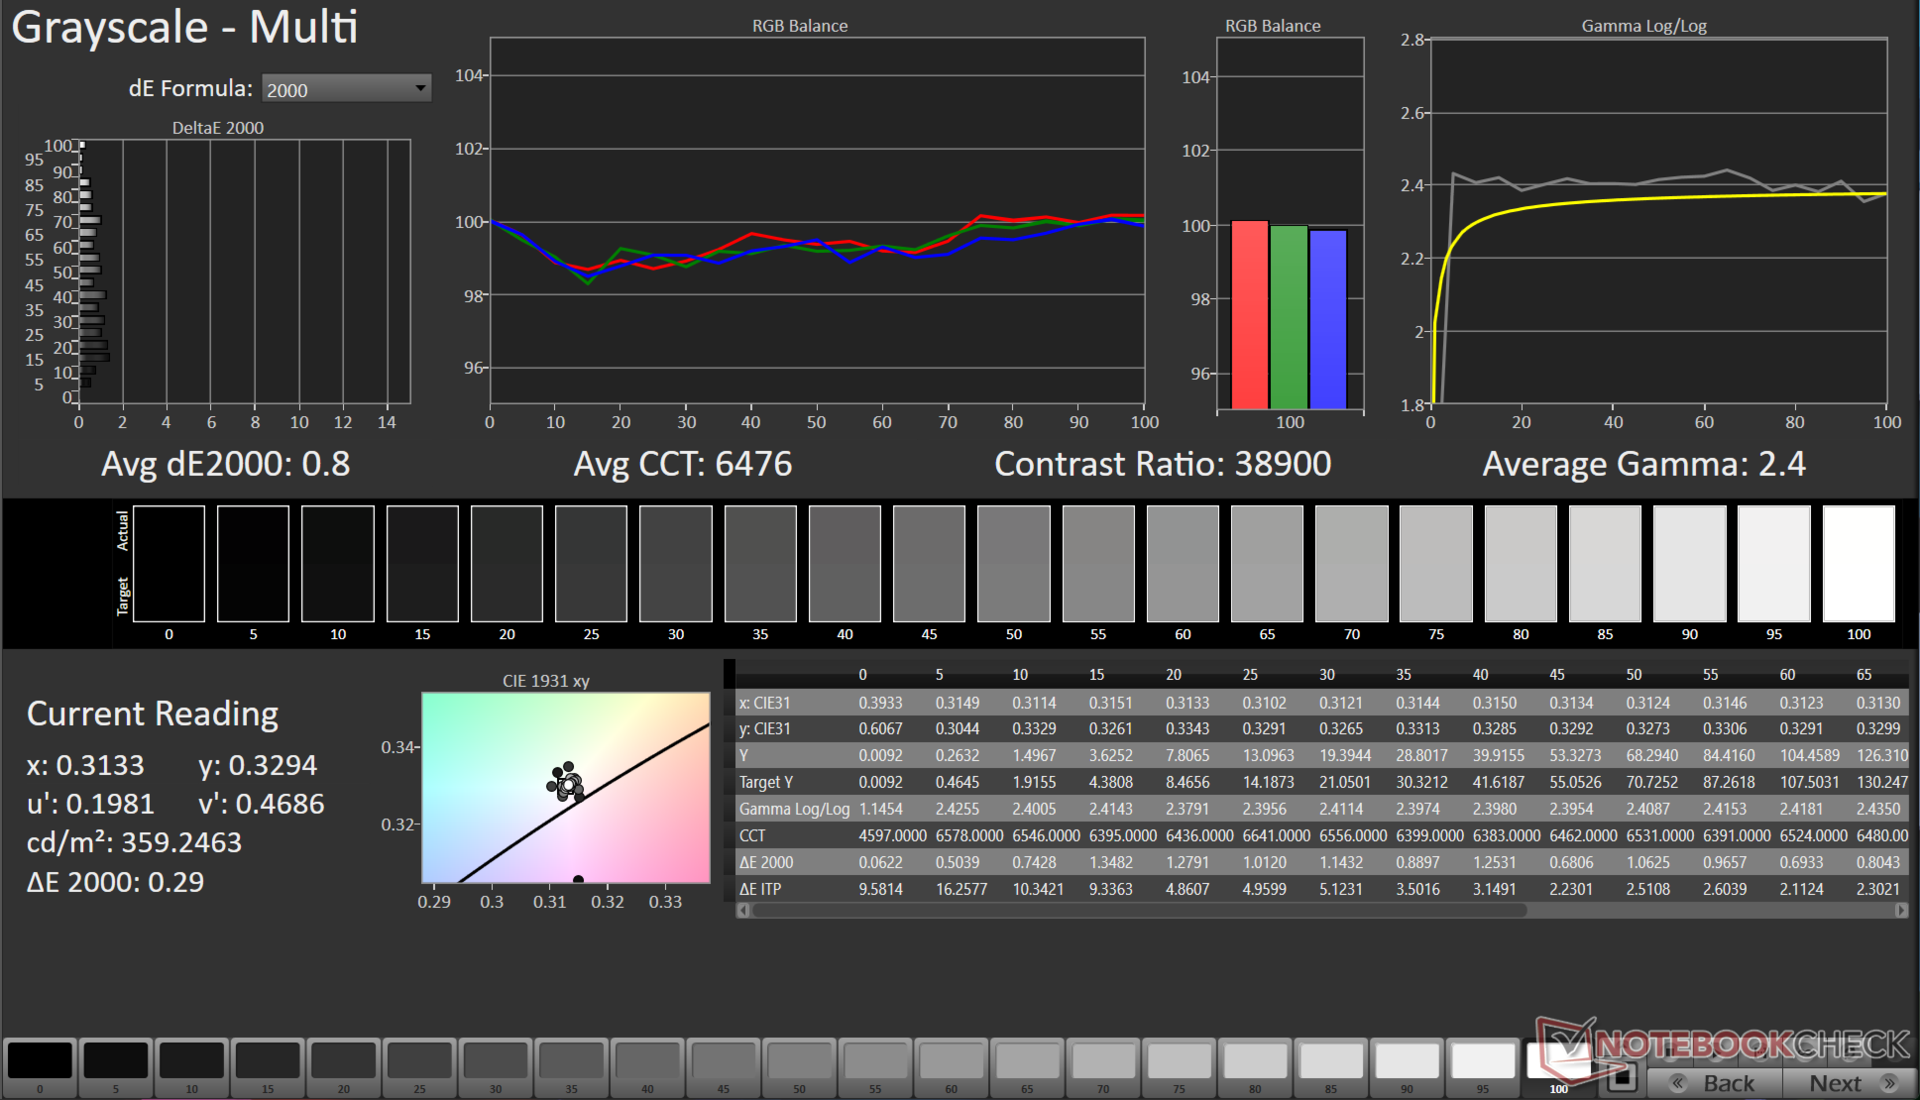
El panel OLED Samsung de 2880 x 1800 16:10 90 Hz del VivoBook 14X ofrece una buena distribución del brillo y un ratio de contraste esencialmente infinito.
Medimos un brillo máximo de 373 nits en modo SDR. La pantalla está certificada para VESA DisplayHDR True Black 600, y pudimos medir hasta 571 nits reproduciendo contenido HDR. No hay sangrado de retroiluminación dado que se trata de una pantalla OLED.
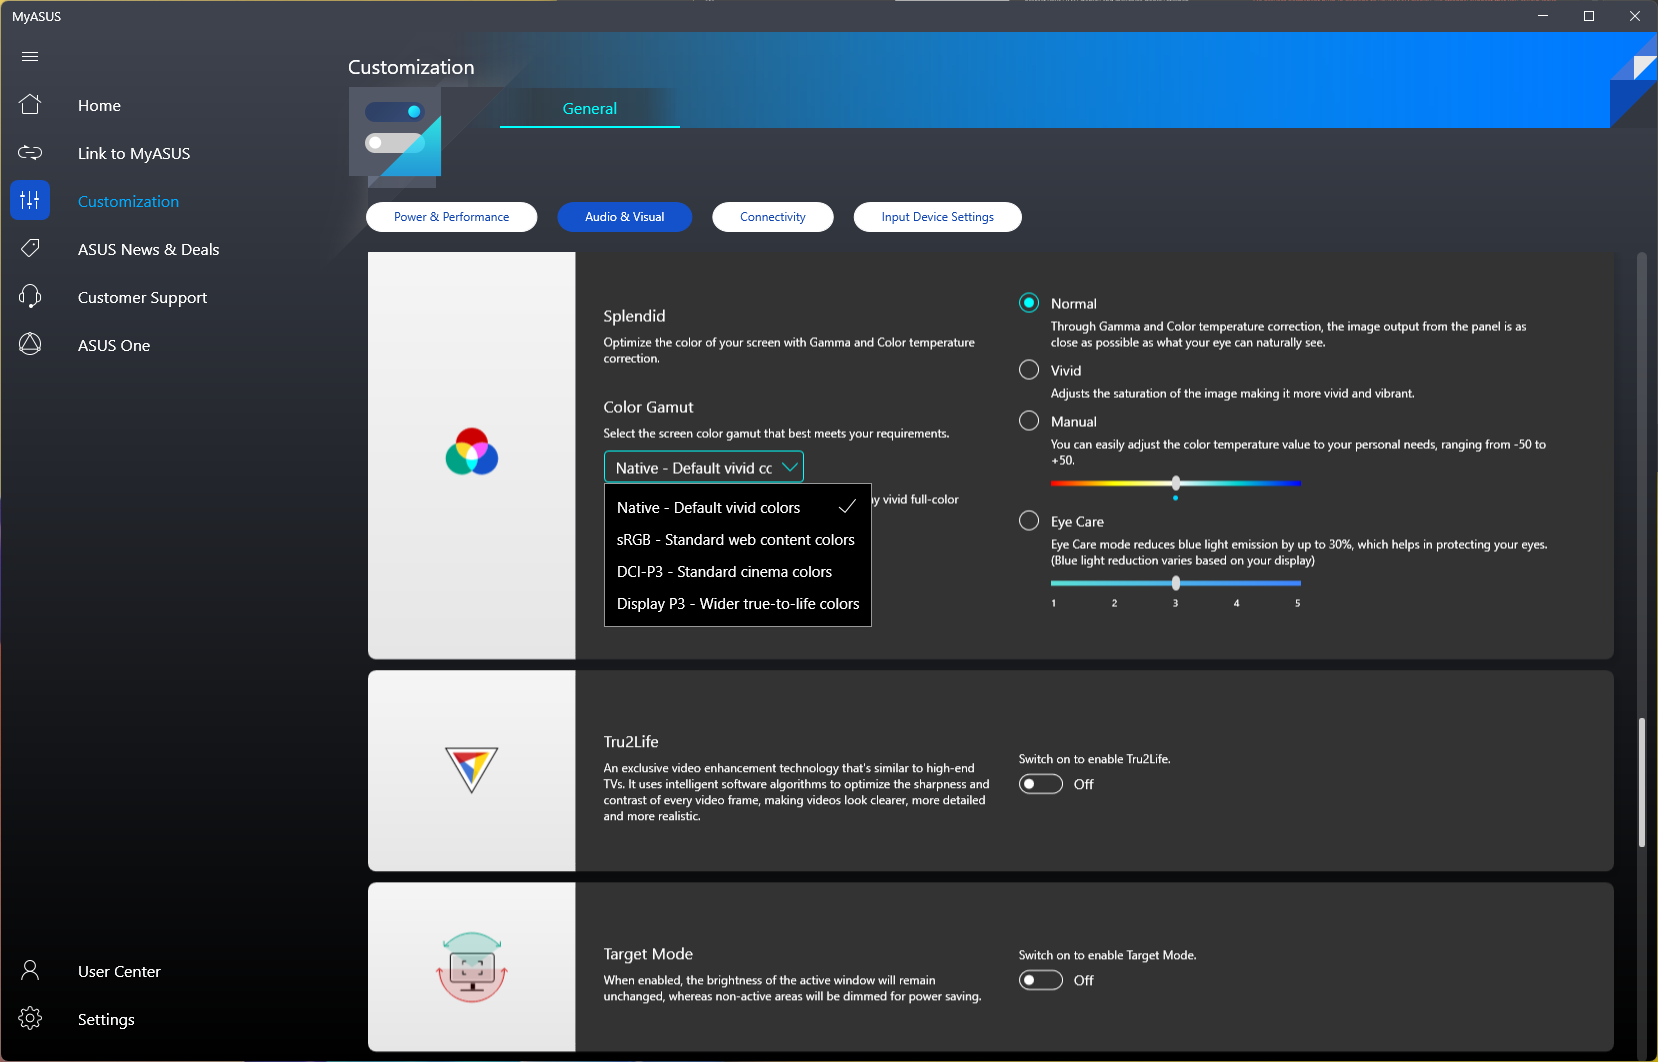
La aplicación MyAsus ofrece varias opciones de pantalla. Realizamos todas las pruebas usando el modo Normal por defecto con una gama de color Nativa.

| |||||||||||||||||||||||||
iluminación: 85 %
Brillo con batería: 367 cd/m²
Contraste: ∞:1 (Negro: 0 cd/m²)
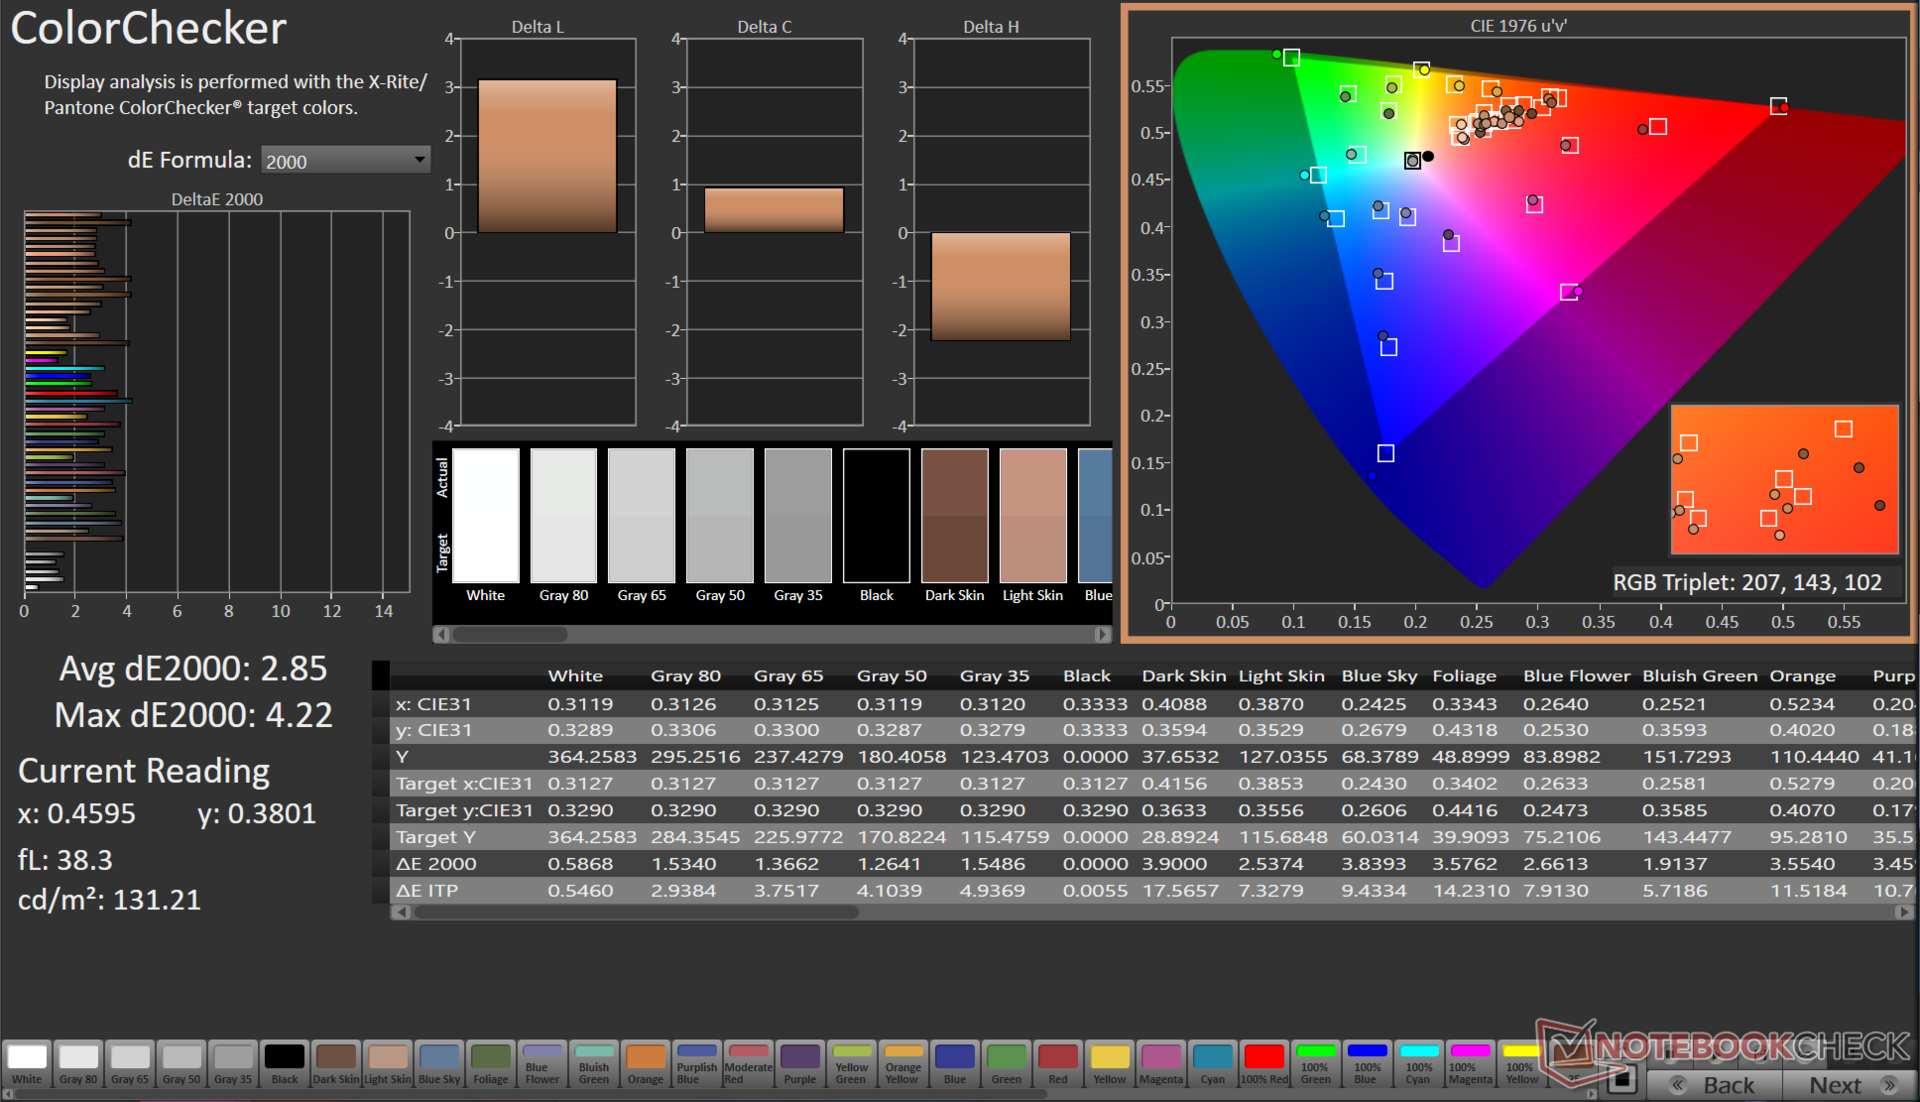
ΔE ColorChecker Calman: 2.85 | ∀{0.5-29.43 Ø4.71}
calibrated: 2.18
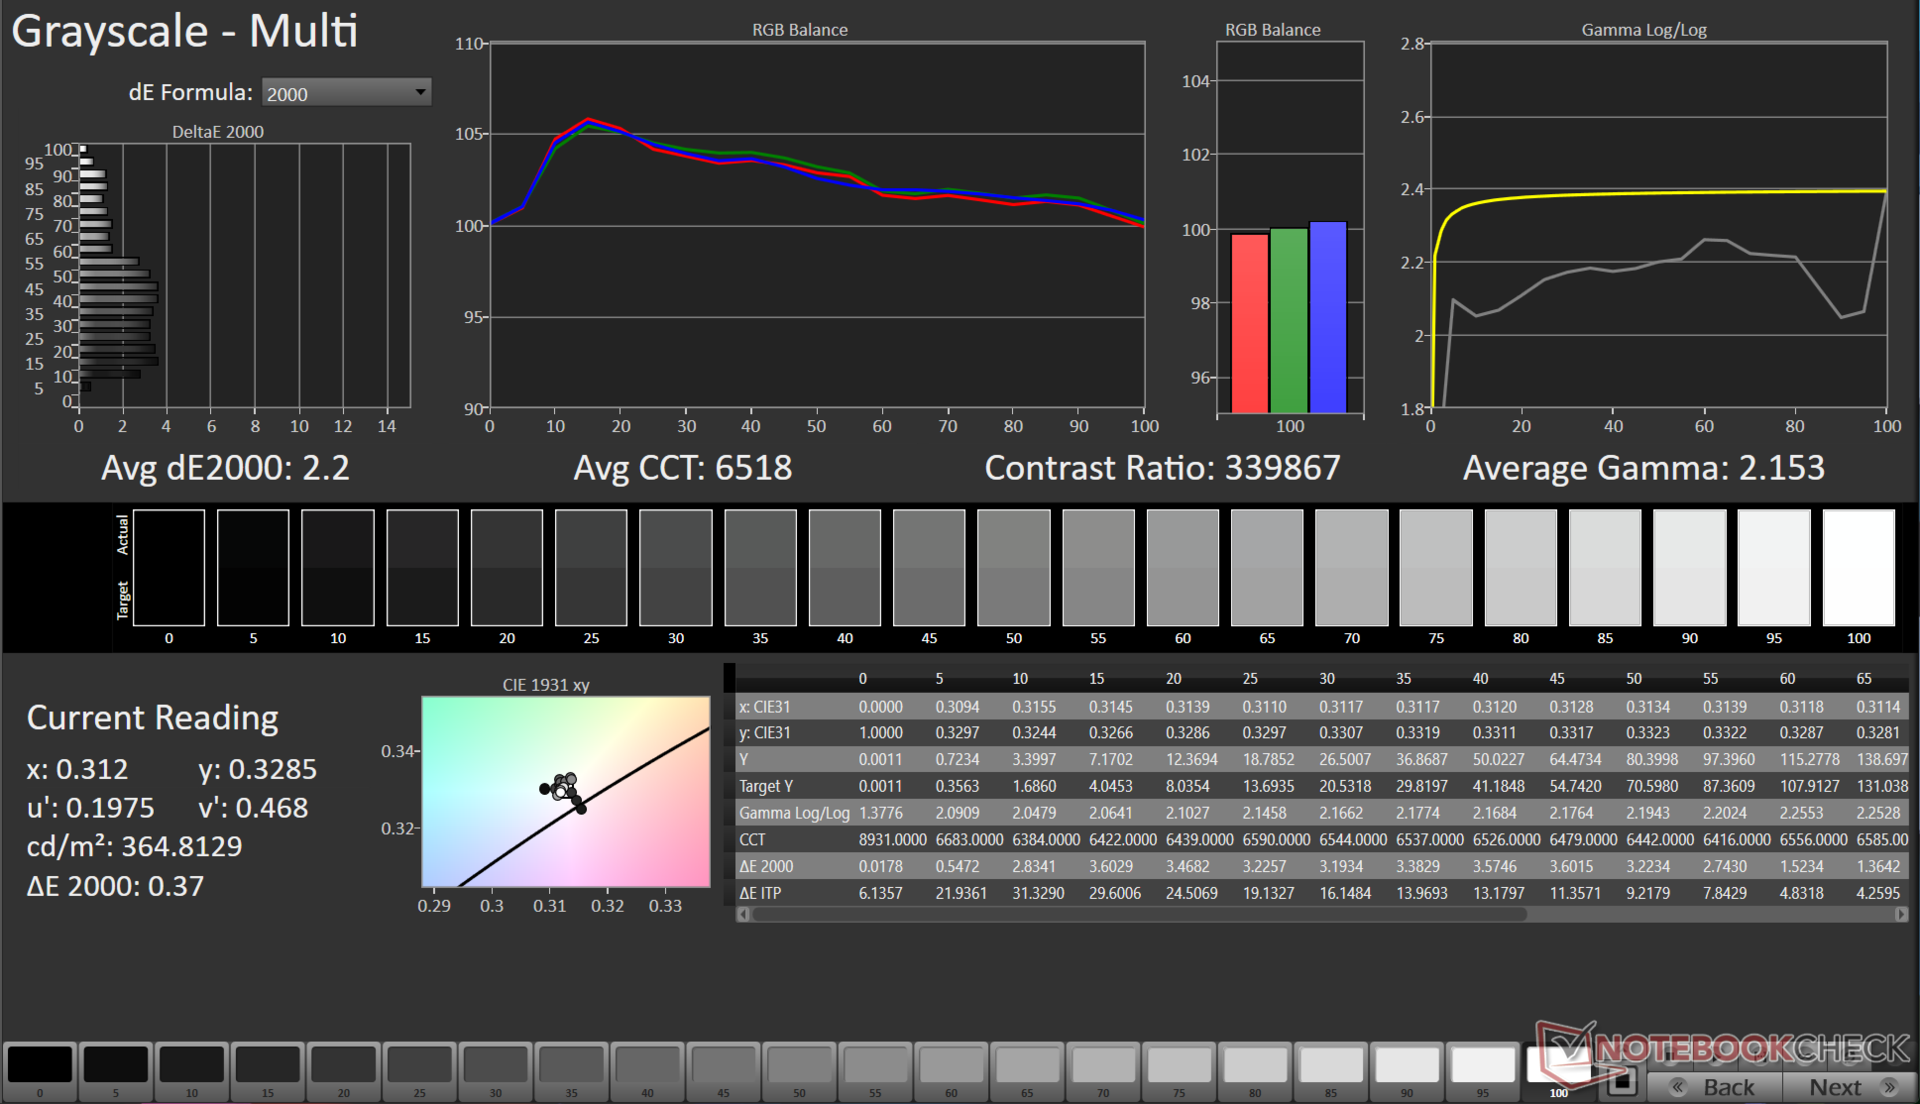
ΔE Greyscale Calman: 2.2 | ∀{0.09-98 Ø4.96}
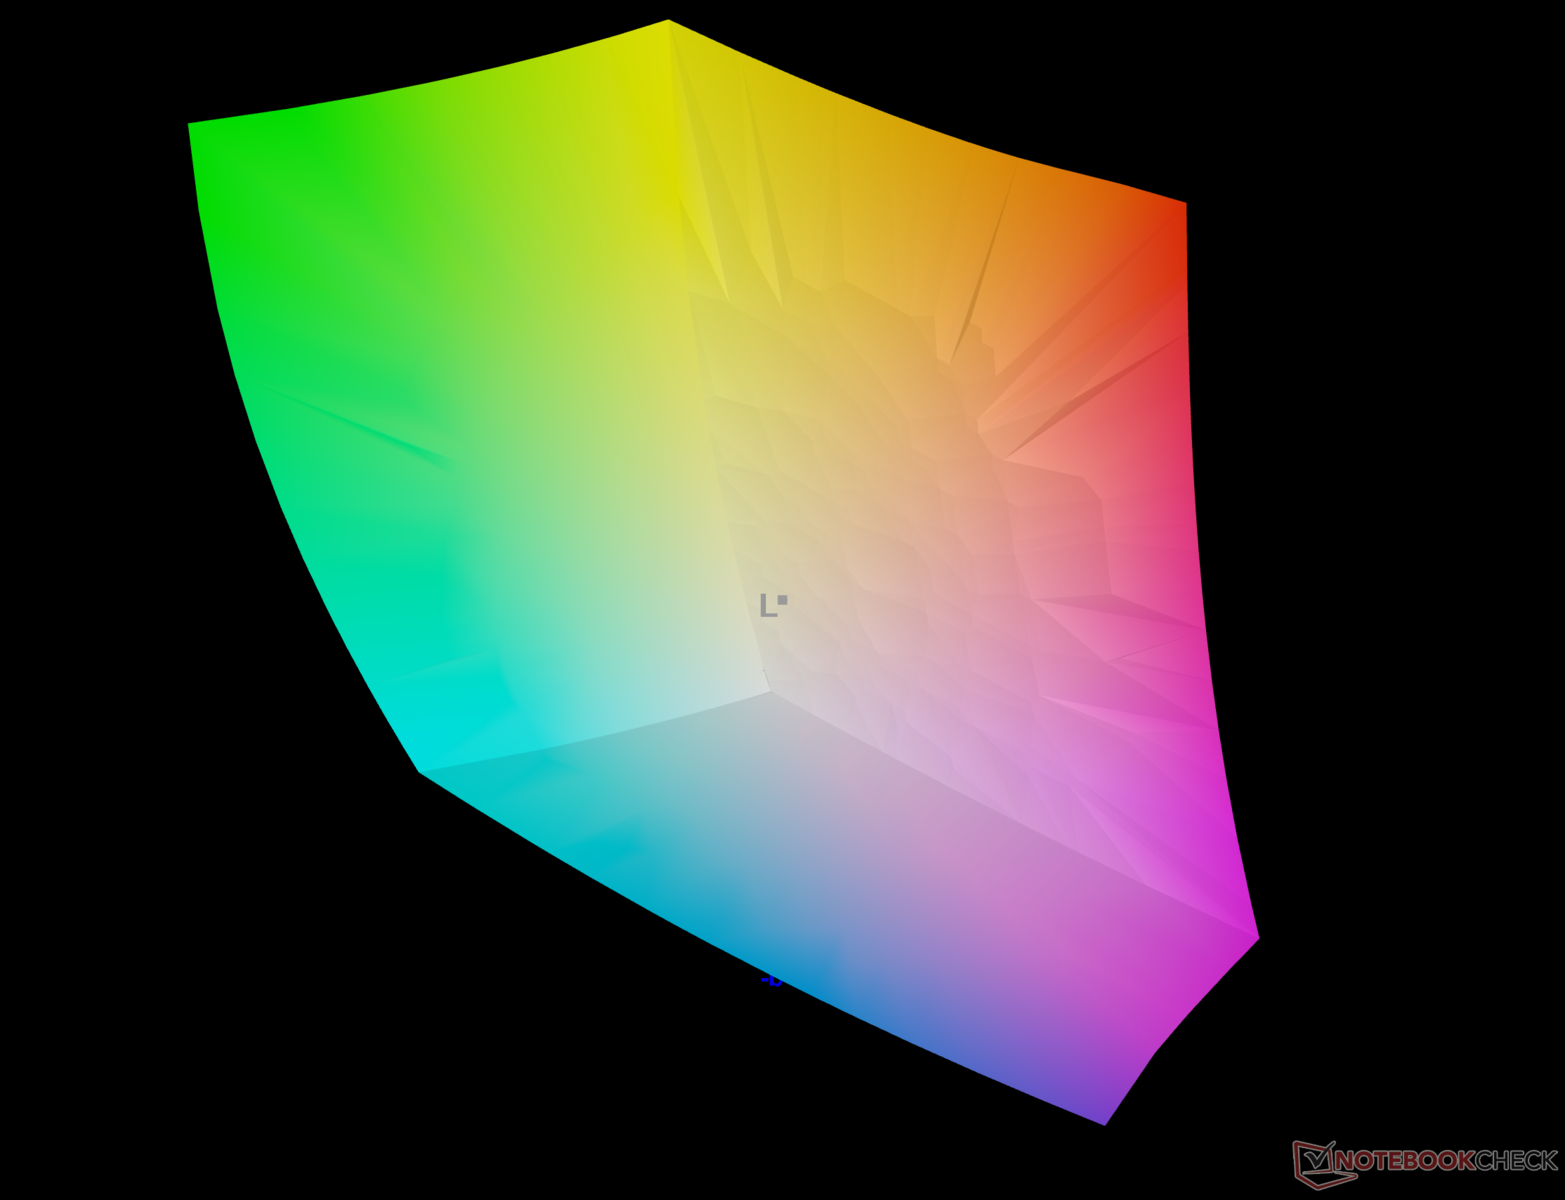
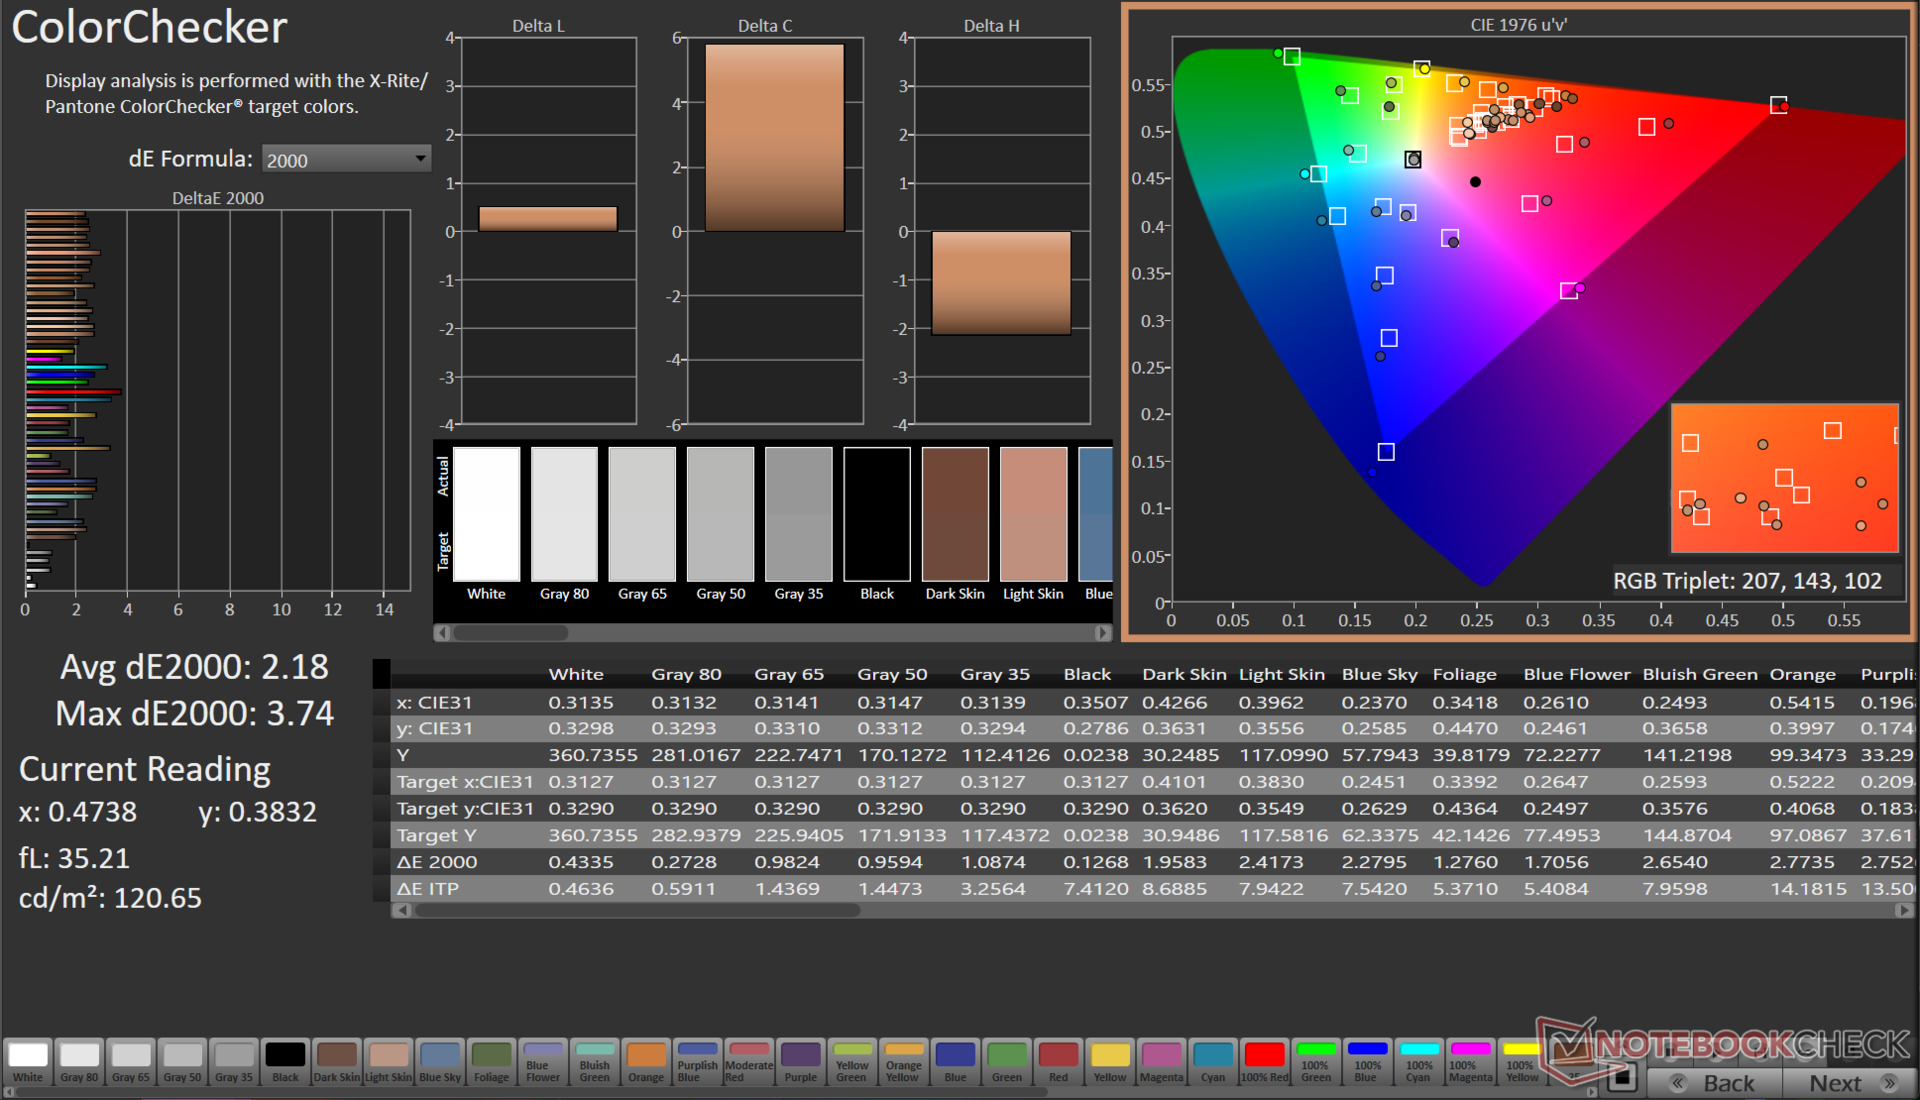
96.5% AdobeRGB 1998 (Argyll 3D)
100% sRGB (Argyll 3D)
99.9% Display P3 (Argyll 3D)
Gamma: 2.15
CCT: 6518 K
| Asus VivoBook 14X K3405 Samsung ATNA40YK07-1, , 2880x1800, 14" | Acer Swift X SFX14-71G ATNA45AF03-0, OLED, 2880x1800, 14.5" | MSI Stealth 14 Studio A13V B140QAN06.T, IPS, 2560x1600, 14" | Gigabyte Aero 14 OLED BMF Samsung SDC4192 (ATNA40YK14-0), OLED, 2880x1800, 14" | Lenovo Slim Pro 7 14ARP8 LEN89C1, IPS, 2560x1600, 14.5" | Schenker Vision 14 2022 RTX 3050 Ti MNE007ZA1-1, IPS, 2880x1800, 14" | |
|---|---|---|---|---|---|---|
| Display | 0% | -5% | -3% | -17% | -17% | |
| Display P3 Coverage (%) | 99.9 | 99.9 0% | 96.2 -4% | 99.8 0% | 72.9 -27% | 74.1 -26% |
| sRGB Coverage (%) | 100 | 99.9 0% | 99.6 0% | 100 0% | 98.2 -2% | 97.4 -3% |
| AdobeRGB 1998 Coverage (%) | 96.5 | 96.2 0% | 85.3 -12% | 88.7 -8% | 74.6 -23% | 75.3 -22% |
| Response Times | 81% | -159% | -13% | -1350% | -1320% | |
| Response Time Grey 50% / Grey 80% * (ms) | 1.15 ? | 0.4 ? 65% | 5.5 ? -378% | 2.4 ? -109% | 31.8 ? -2665% | 31.5 ? -2639% |
| Response Time Black / White * (ms) | 14.4 ? | 0.6 ? 96% | 5.8 ? 60% | 2.4 ? 83% | 19.3 ? -34% | 14.5 ? -1% |
| PWM Frequency (Hz) | 90.02 ? | 240 ? | 300 | |||
| Screen | 15% | 3% | 45% | -16% | -14% | |
| Brightness middle (cd/m²) | 369 | 388 5% | 419 14% | 423 15% | 344.7 -7% | 421 14% |
| Brightness (cd/m²) | 364 | 390 7% | 402 10% | 427 17% | 334 -8% | 416 14% |
| Brightness Distribution (%) | 85 | 98 15% | 89 5% | 98 15% | 92 8% | 89 5% |
| Black Level * (cd/m²) | 0.43 | 0.1 | 0.31 | 0.28 | ||
| Colorchecker dE 2000 * | 2.85 | 2.2 23% | 2.3 19% | 0.55 81% | 3.01 -6% | 3.2 -12% |
| Colorchecker dE 2000 max. * | 4.22 | 3.9 8% | 5.8 -37% | 1.15 73% | 6.3 -49% | 5.5 -30% |
| Colorchecker dE 2000 calibrated * | 2.18 | 1.9 13% | 0.9 59% | 1.15 47% | 0.83 62% | 2 8% |
| Greyscale dE 2000 * | 2.2 | 1.4 36% | 3.3 -50% | 0.69 69% | 4.6 -109% | 4.4 -100% |
| Gamma | 2.15 102% | 2.22 99% | 2.14 103% | 2.42 91% | 2.28 96% | 2.22 99% |
| CCT | 6518 100% | 6380 102% | 6550 99% | 6479 100% | 6420 101% | 6384 102% |
| Contrast (:1) | 974 | 4230 | 1112 | 1504 | ||
| Media total (Programa/Opciones) | 32% /
22% | -54% /
-26% | 10% /
24% | -461% /
-238% | -450% /
-233% |
* ... más pequeño es mejor
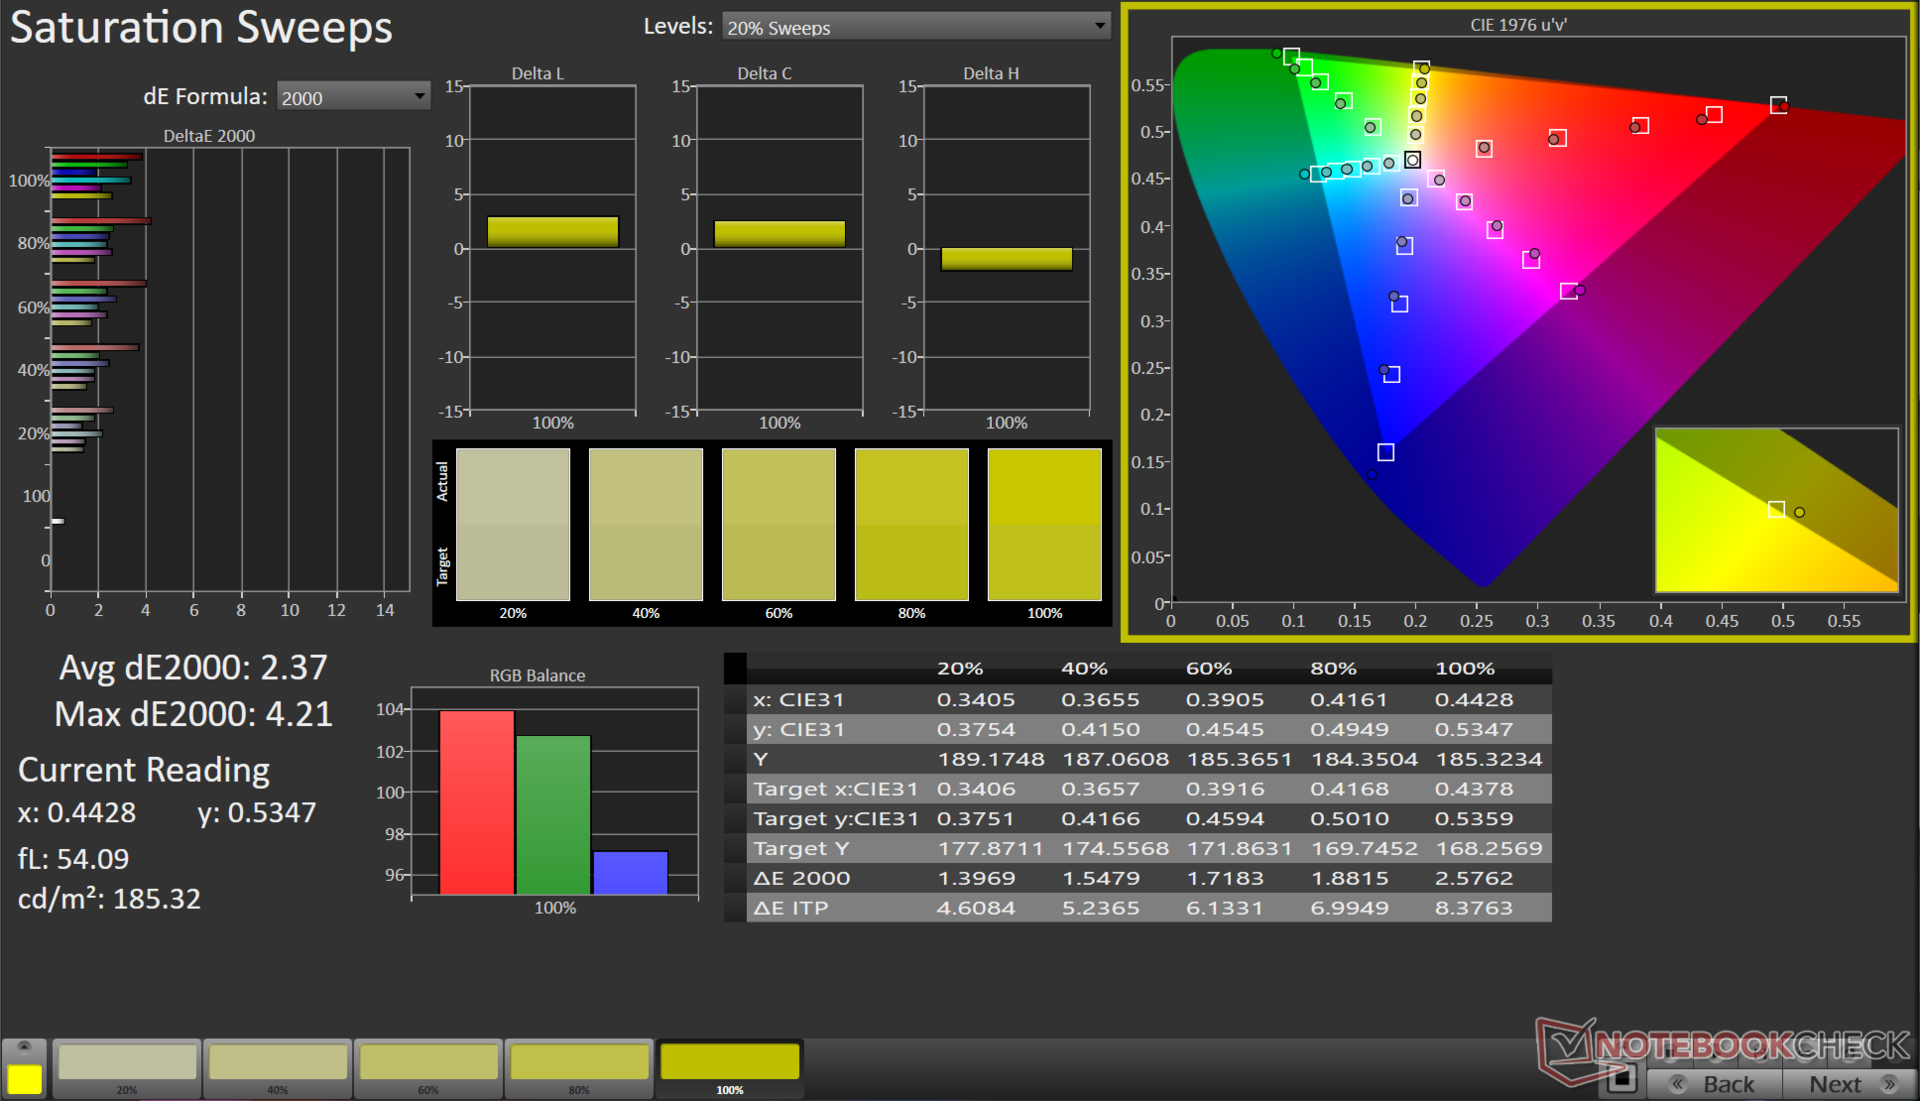
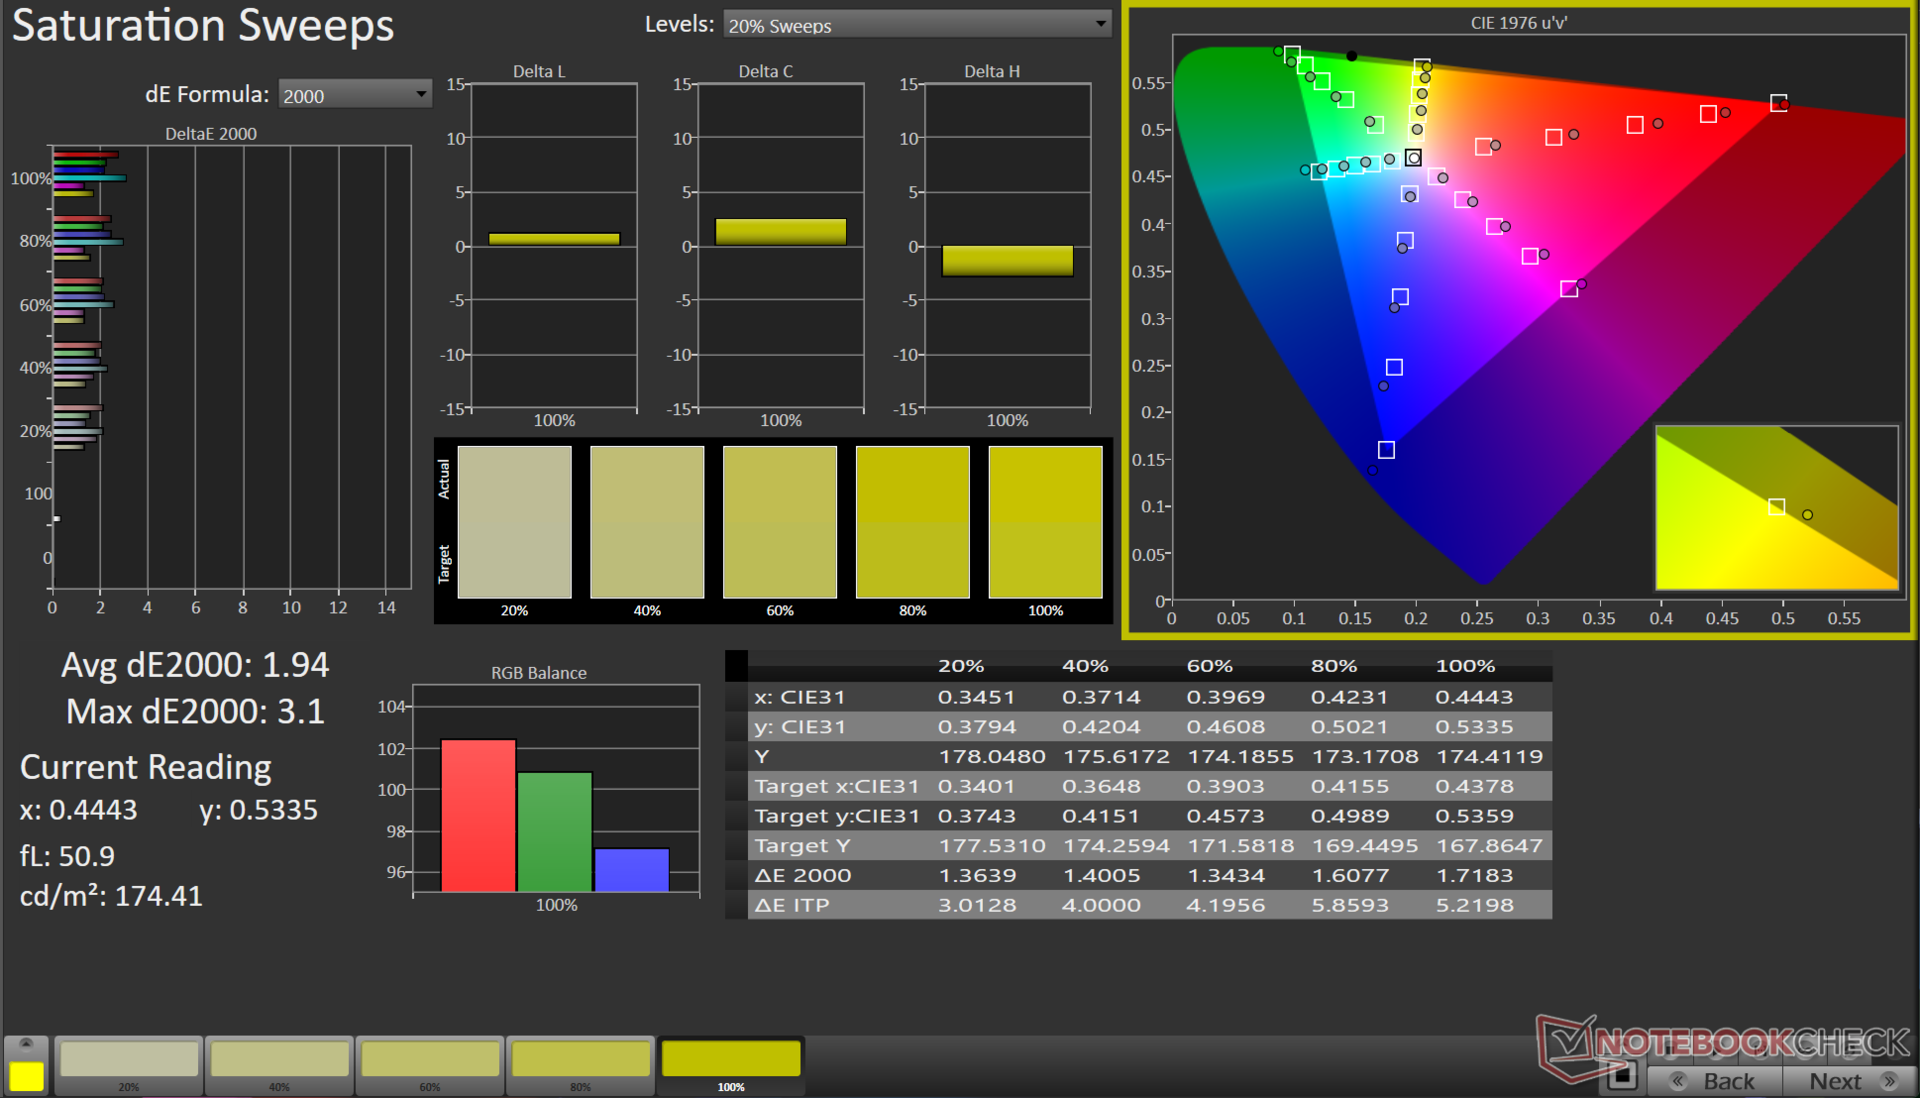
Los creadores de contenidos estarán encantados con la impresionante cobertura del VivoBook 14X de todo el espacio de color sRGB (100%), junto con una cobertura casi completa de las gamas de color Adobe RGB (96,5%) y Display P3 (99,9%).


Realizamos la calibración del color en el espacio de color Display P3. El VivoBook 14X ya muestra valores Delta E bajos en Escala de grises y ColorChecker de forma inmediata. También puedes utilizar el ProArt Creator Hub y un calibrador X-Rite i1Display compatible para realizar tu propia calibración.
Utilizando nuestro espectrofotómetro X-Rite i1Basic Pro 3 y el software Calman Ultimate de Portrait Displays, pudimos conseguir un Delta E significativamente más bajo de 0,8 en escala de grises. Sin embargo, sólo se observaron mejoras marginales en los valores de ColorChecker.
El archivo ICC calibrado puede descargarse desde el enlace anterior.
Tiempos de respuesta del display
| ↔ Tiempo de respuesta de Negro a Blanco | ||
|---|---|---|
| 14.4 ms ... subida ↗ y bajada ↘ combinada | ↗ 12.8 ms subida | 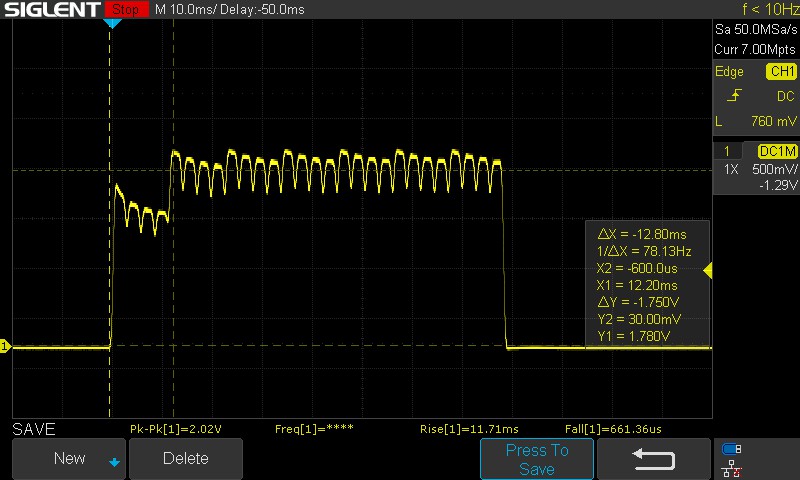 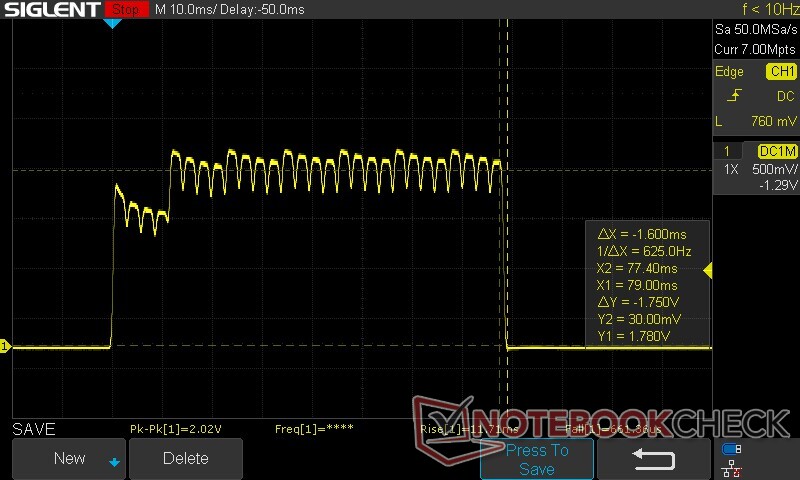 |
| ↘ 1.6 ms bajada | ||
| La pantalla mostró buenos tiempos de respuesta en nuestros tests pero podría ser demasiado lenta para los jugones competitivos. En comparación, todos los dispositivos de prueba van de ##min### (mínimo) a 240 (máximo) ms. » 36 % de todos los dispositivos son mejores. Esto quiere decir que el tiempo de respuesta medido es mejor que la media (19.8 ms) de todos los dispositivos testados. | ||
| ↔ Tiempo de respuesta 50% Gris a 80% Gris | ||
| 1.15 ms ... subida ↗ y bajada ↘ combinada | ↗ 0.57 ms subida | 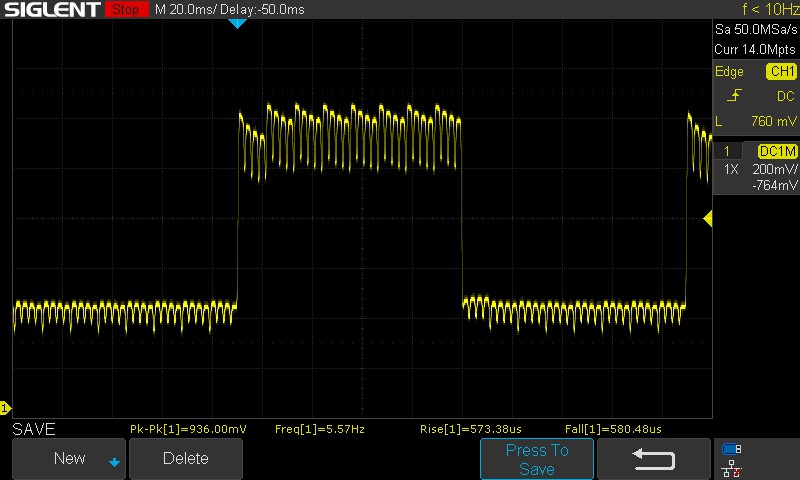 |
| ↘ 0.58 ms bajada | ||
| La pantalla mostró tiempos de respuesta muy rápidos en nuestros tests y debería ser adecuada para juegos frenéticos. En comparación, todos los dispositivos de prueba van de ##min### (mínimo) a 636 (máximo) ms. » 5 % de todos los dispositivos son mejores. Esto quiere decir que el tiempo de respuesta medido es mejor que la media (31 ms) de todos los dispositivos testados. | ||
Fue necesario realizar mediciones manuales para estimar los tiempos de respuesta debido al parpadeo de fondo. Una transición del 100% de negro al 100% de blanco tarda 14,4 ms, un poco más para un panel OLED. Sin embargo, las transiciones del 50% de gris al 80% de gris son mucho más rápidas: 1,15 ms.
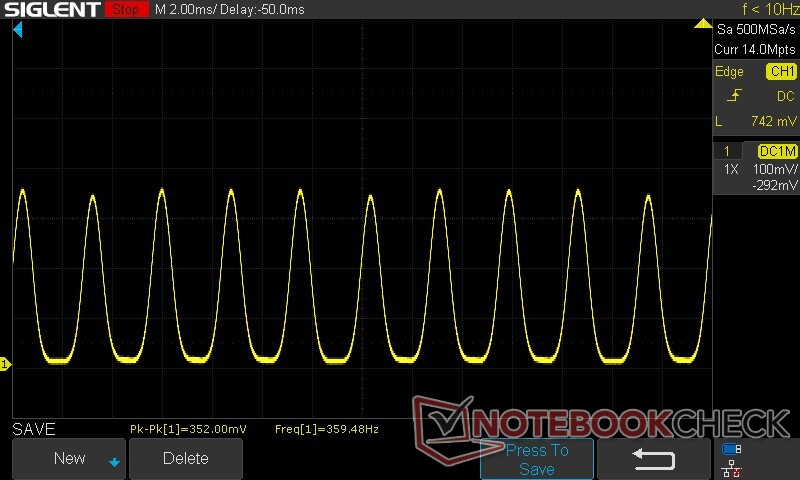
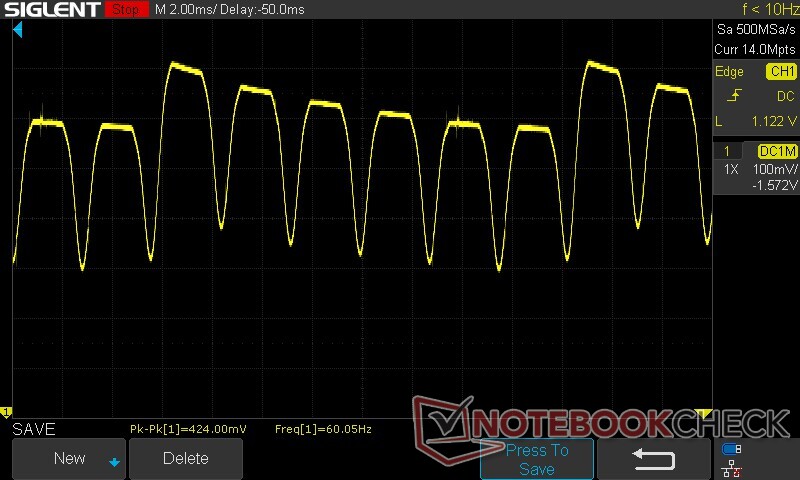
Parpadeo de Pantalla / PWM (Pulse-Width Modulation)
| Parpadeo de Pantalla / PWM detectado | 90.02 Hz | 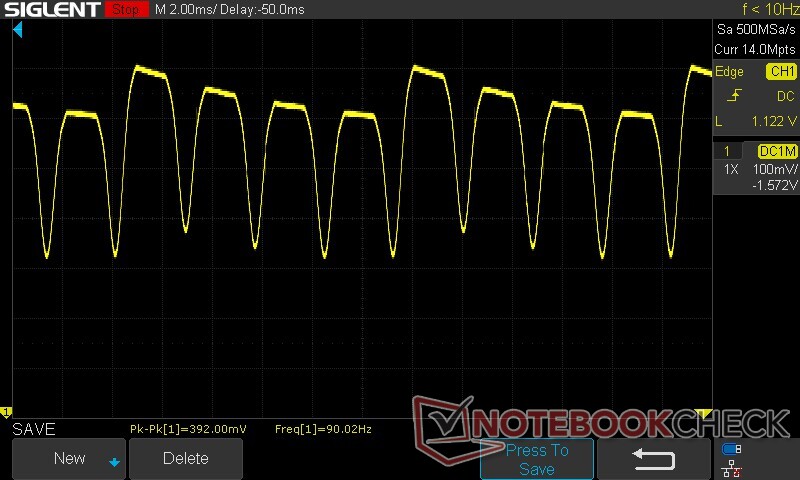 | |
| ≤ 100 cd/m² brillo | |||
La retroiluminación del display parpadea a 90.02 Hz (seguramente usa PWM - Pulse-Width Modulation) a un brillo del 100 cd/m² e inferior. Sobre este nivel de brillo no debería darse parpadeo / PWM. La frecuencia de 90.02 Hz es bajísima, por lo que el parpadeo puede causar fatiga visual y cefaleas cuando se usa mucho tiempo. El parpadeo se da a un brillo relativamente bajo, por lo que el uso prolongado en interiores con este nivel de brillo puede ser fatigoso. Comparación: 52 % de todos los dispositivos testados no usaron PWM para atenuar el display. Si se usó, medimos una media de 7757 (mínimo: 5 - máxmo: 343500) Hz. | |||
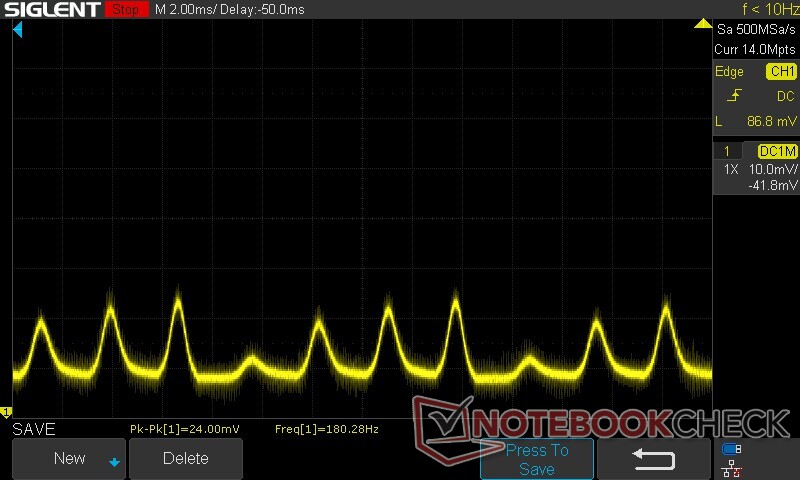
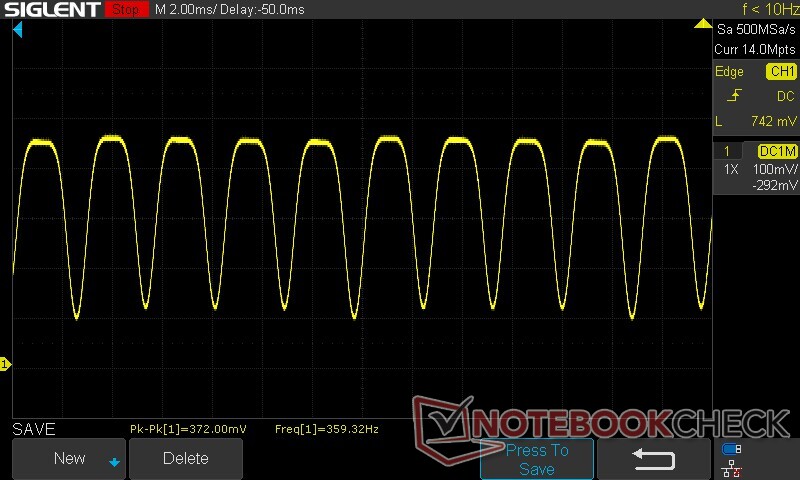
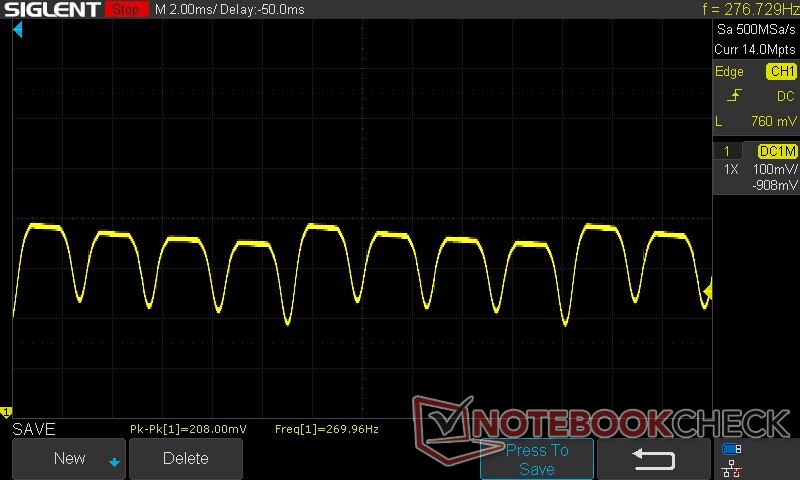
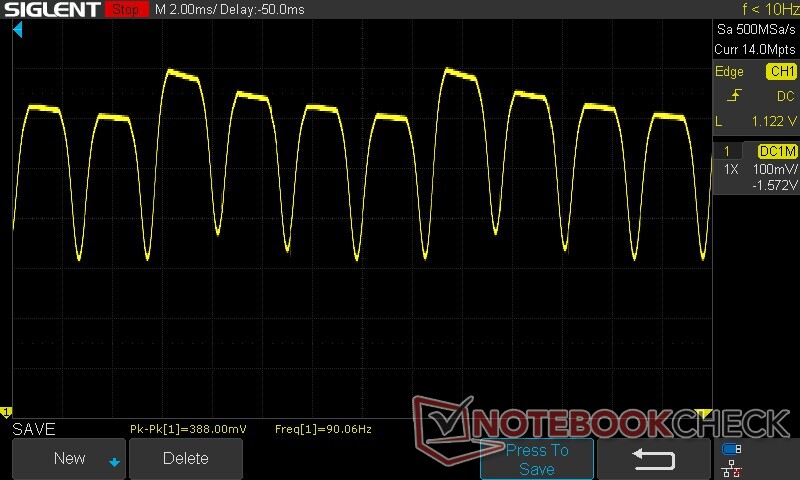
El panel utiliza 90 Hz DC Dimming entre el 75% y el 100% de luminosidad. Por debajo del 75%, el panel cambia a una frecuencia PWM de unos 360 Hz.
La atenuación DC a 90 Hz debería ser relativamente menos agotadora para los ojos que el parpadeo PWM. Esta frecuencia desciende a 60 Hz con la frecuencia de actualización correspondiente.
Recomendamos ajustar los niveles de brillo por encima del 50% para minimizar la fatiga visual.
Para más información, consulte "Por qué el PWM es un dolor de cabeza"y "Análisis: DC Dimming vs PWM - ¿Se pueden atenuar las pantallas AMOLED sin parpadeos?". Una visión general de la medición PWM en todos los dispositivos revisados se puede encontrar en nuestra Tabla de clasificación PWM.
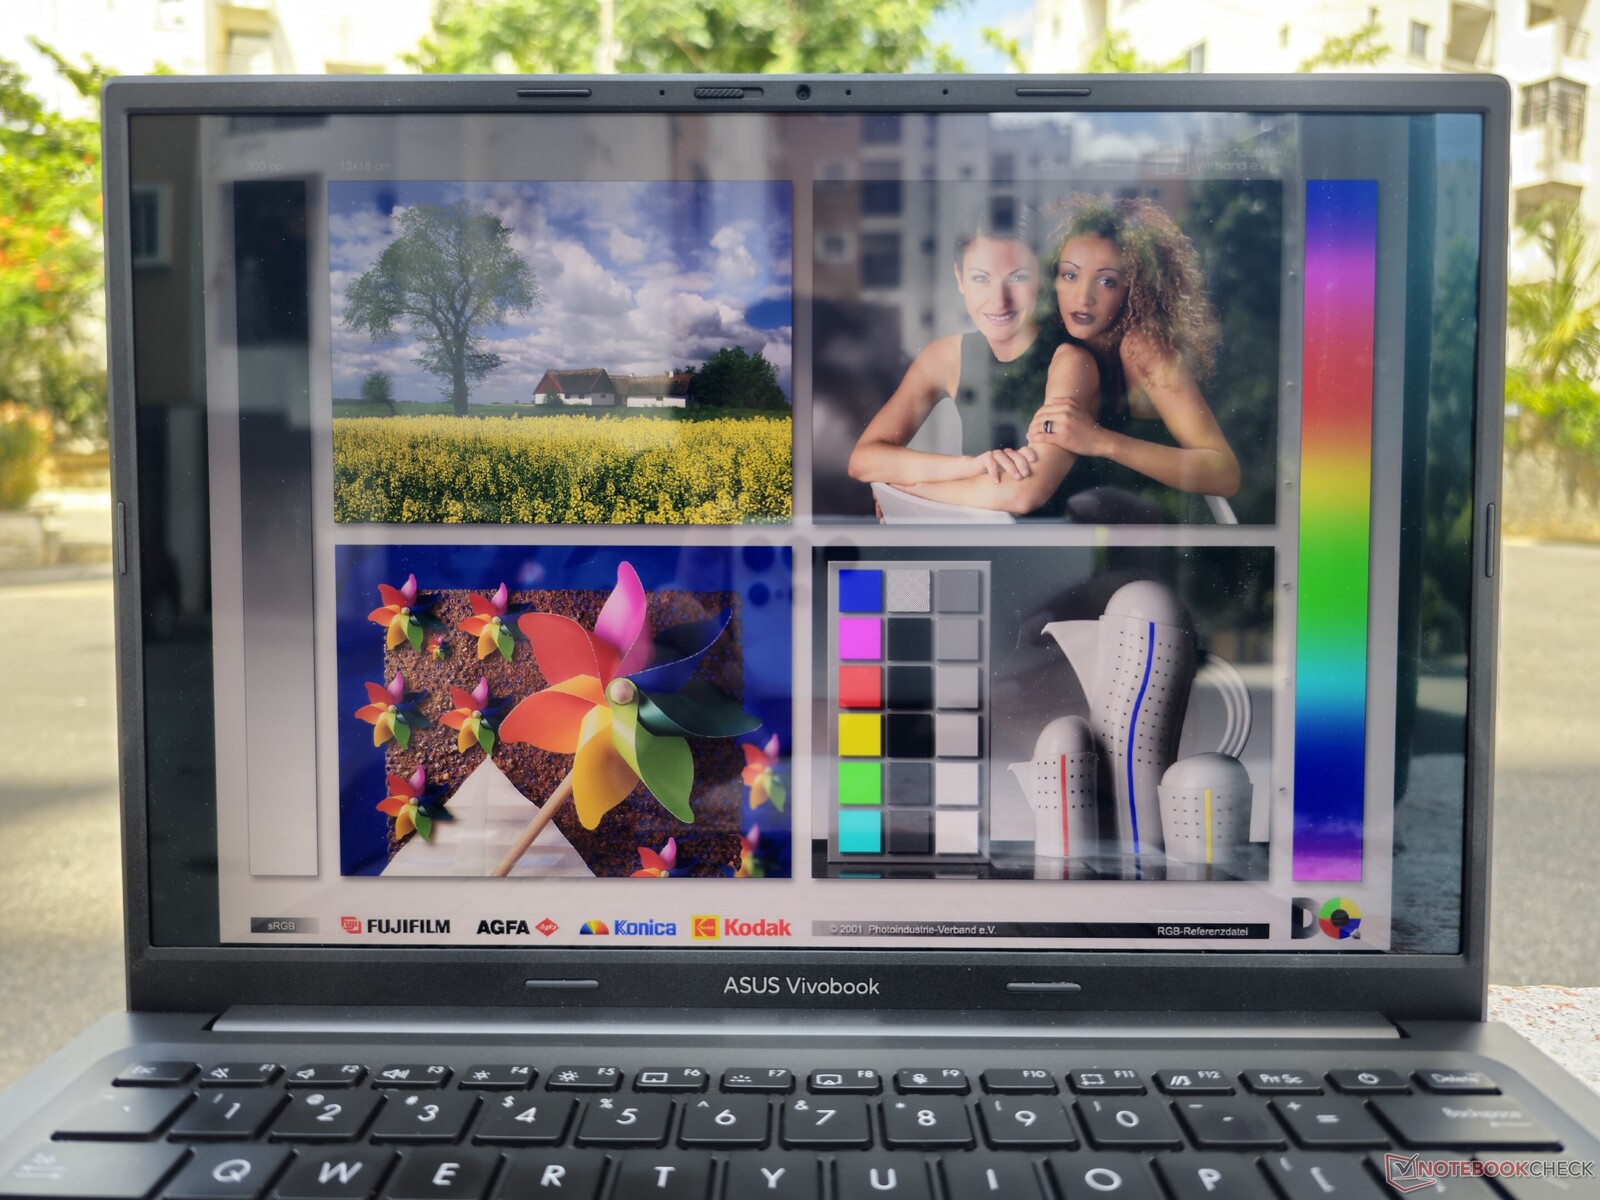
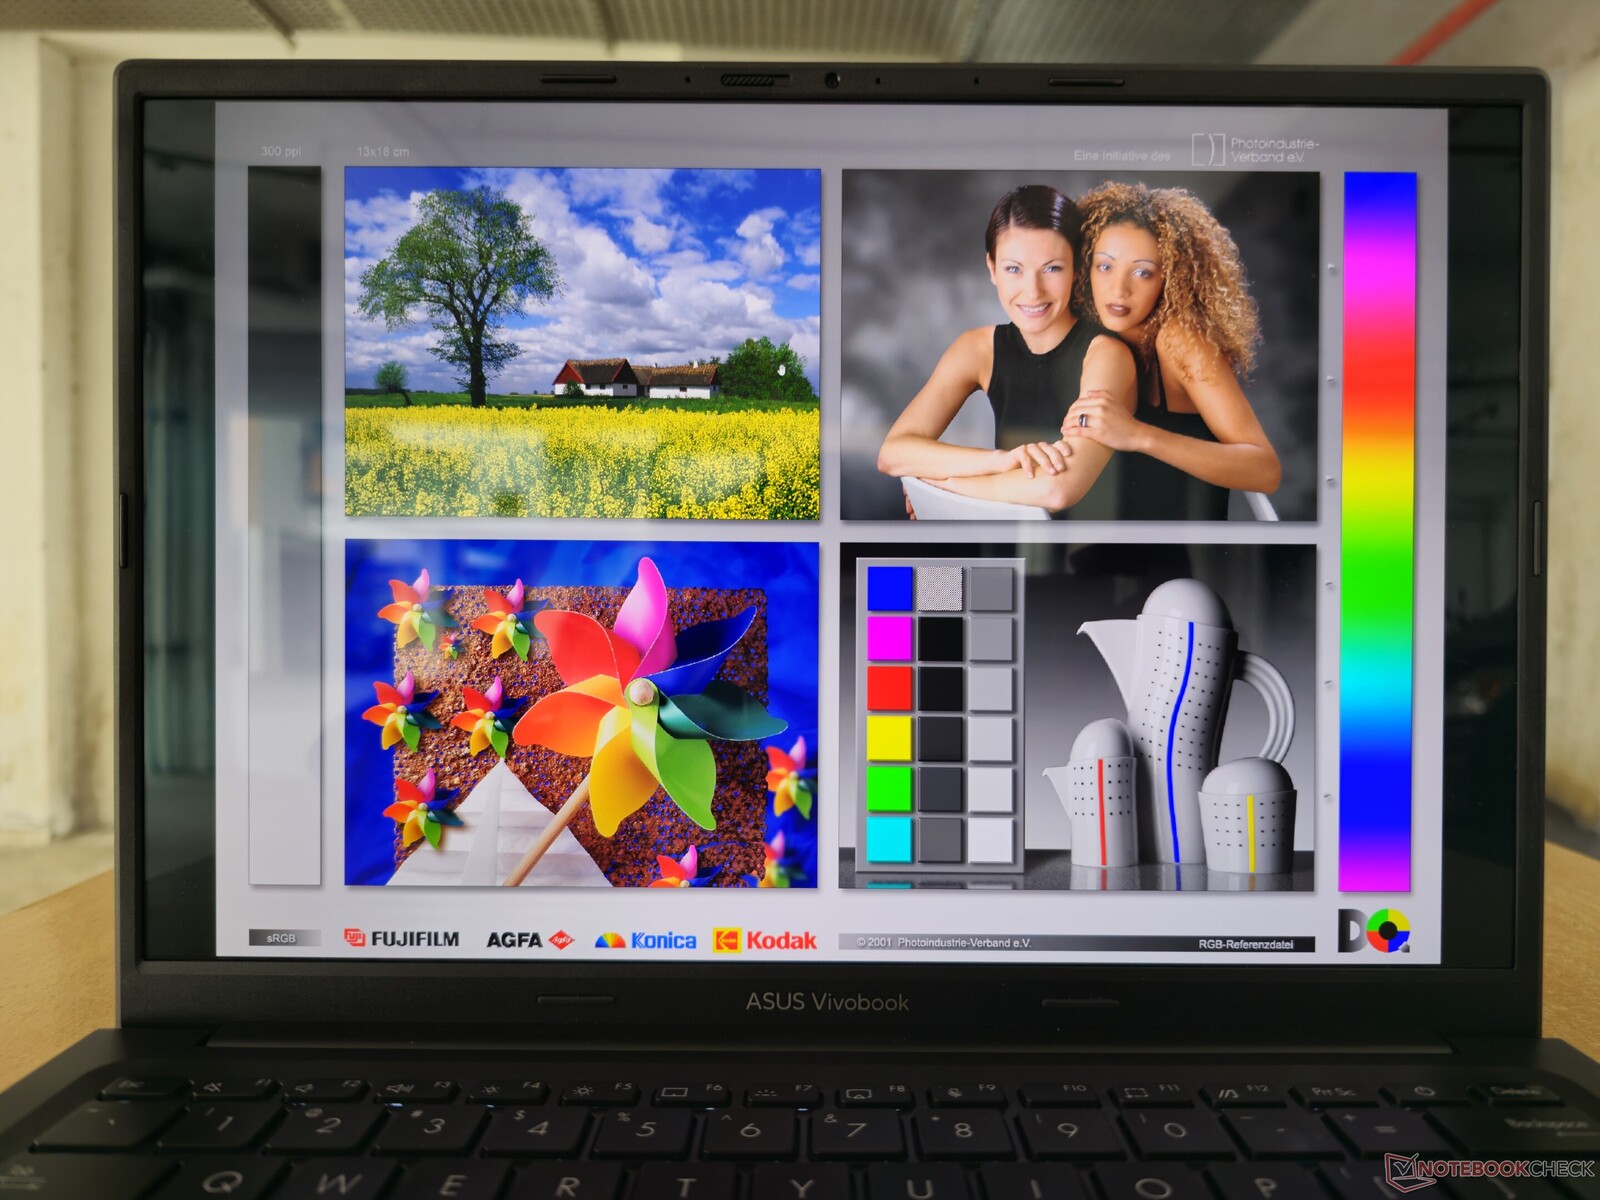
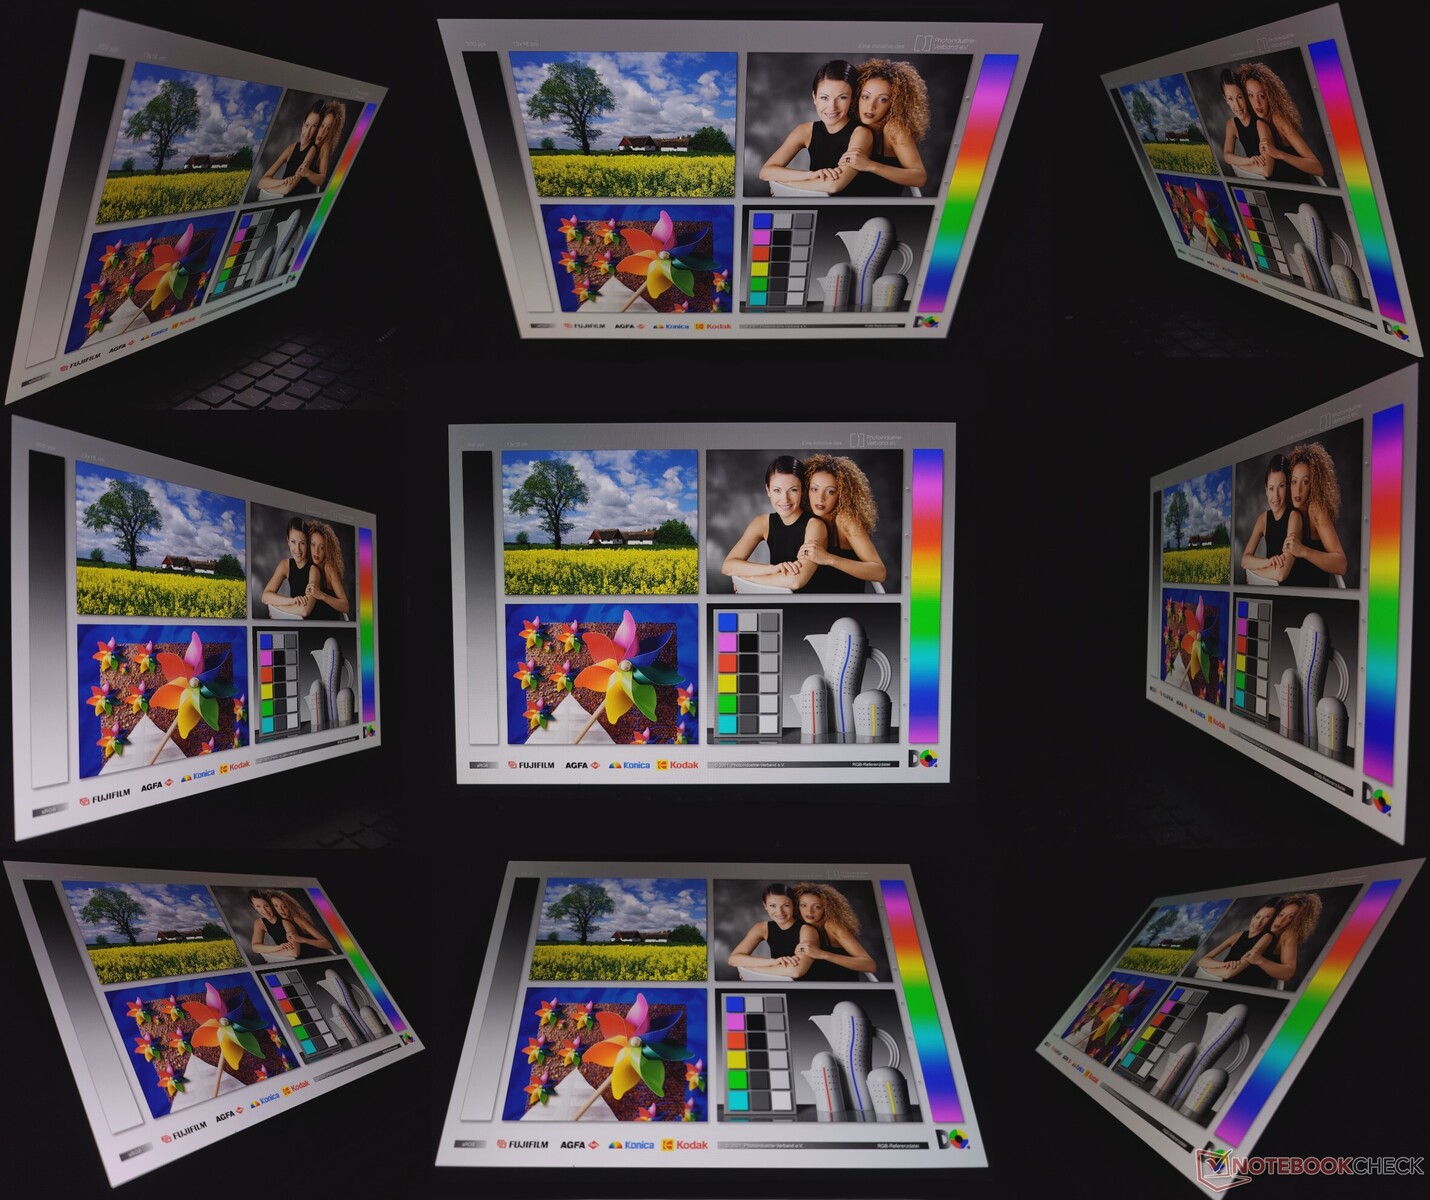
La visualización en exteriores bajo la luz del sol puede ser molesta debido al brillo de la pantalla. Los ángulos de visión son buenos, con una pérdida mínima de brillo en ángulos extremos y sin tinte verde visible.
Rendimiento: Core i5-13500H con un poco de ralentización
Nuestro Asus VivoBook 14X OLED está equipado con el Intel Core i5-13500H Y una GPU Nvidia GeForce RTX 3050 de 4 GB para portátiles. Las SKU RTX 3050 se pueden configurar con un Core i5-13500H o un Core i9-13900H.
En RTX 2050 Mobile pero sólo con un Core i5-13500H.
Condiciones de ensayo
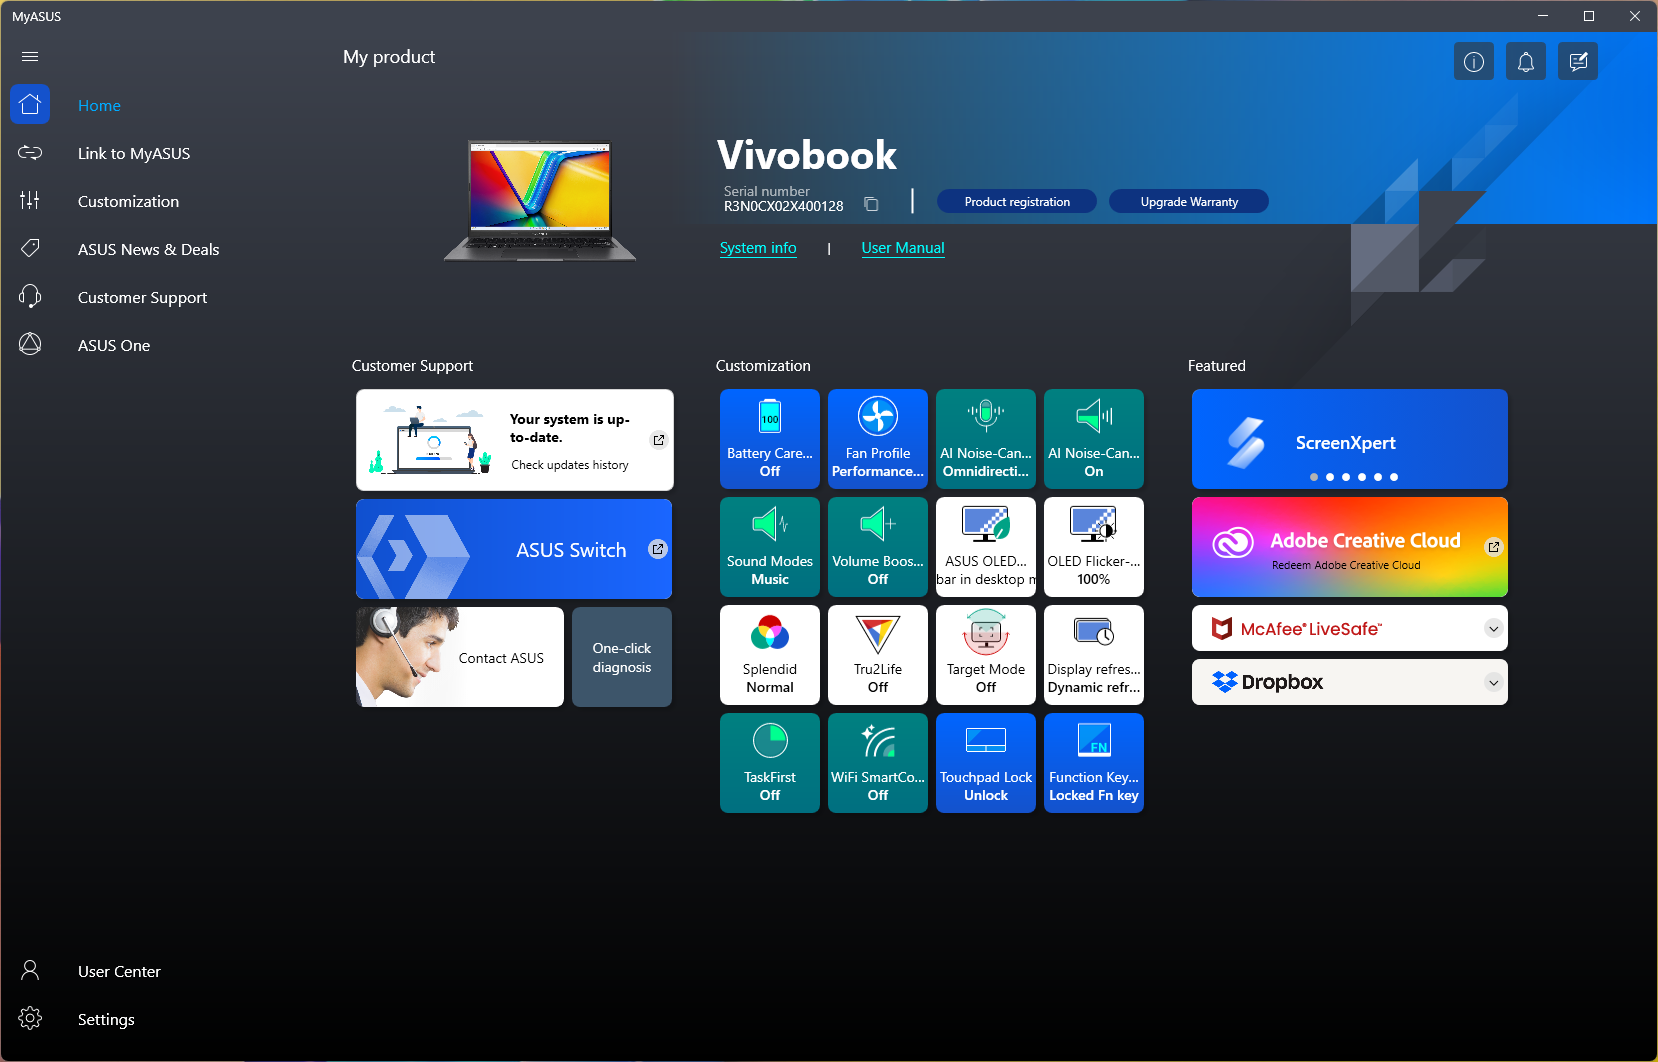
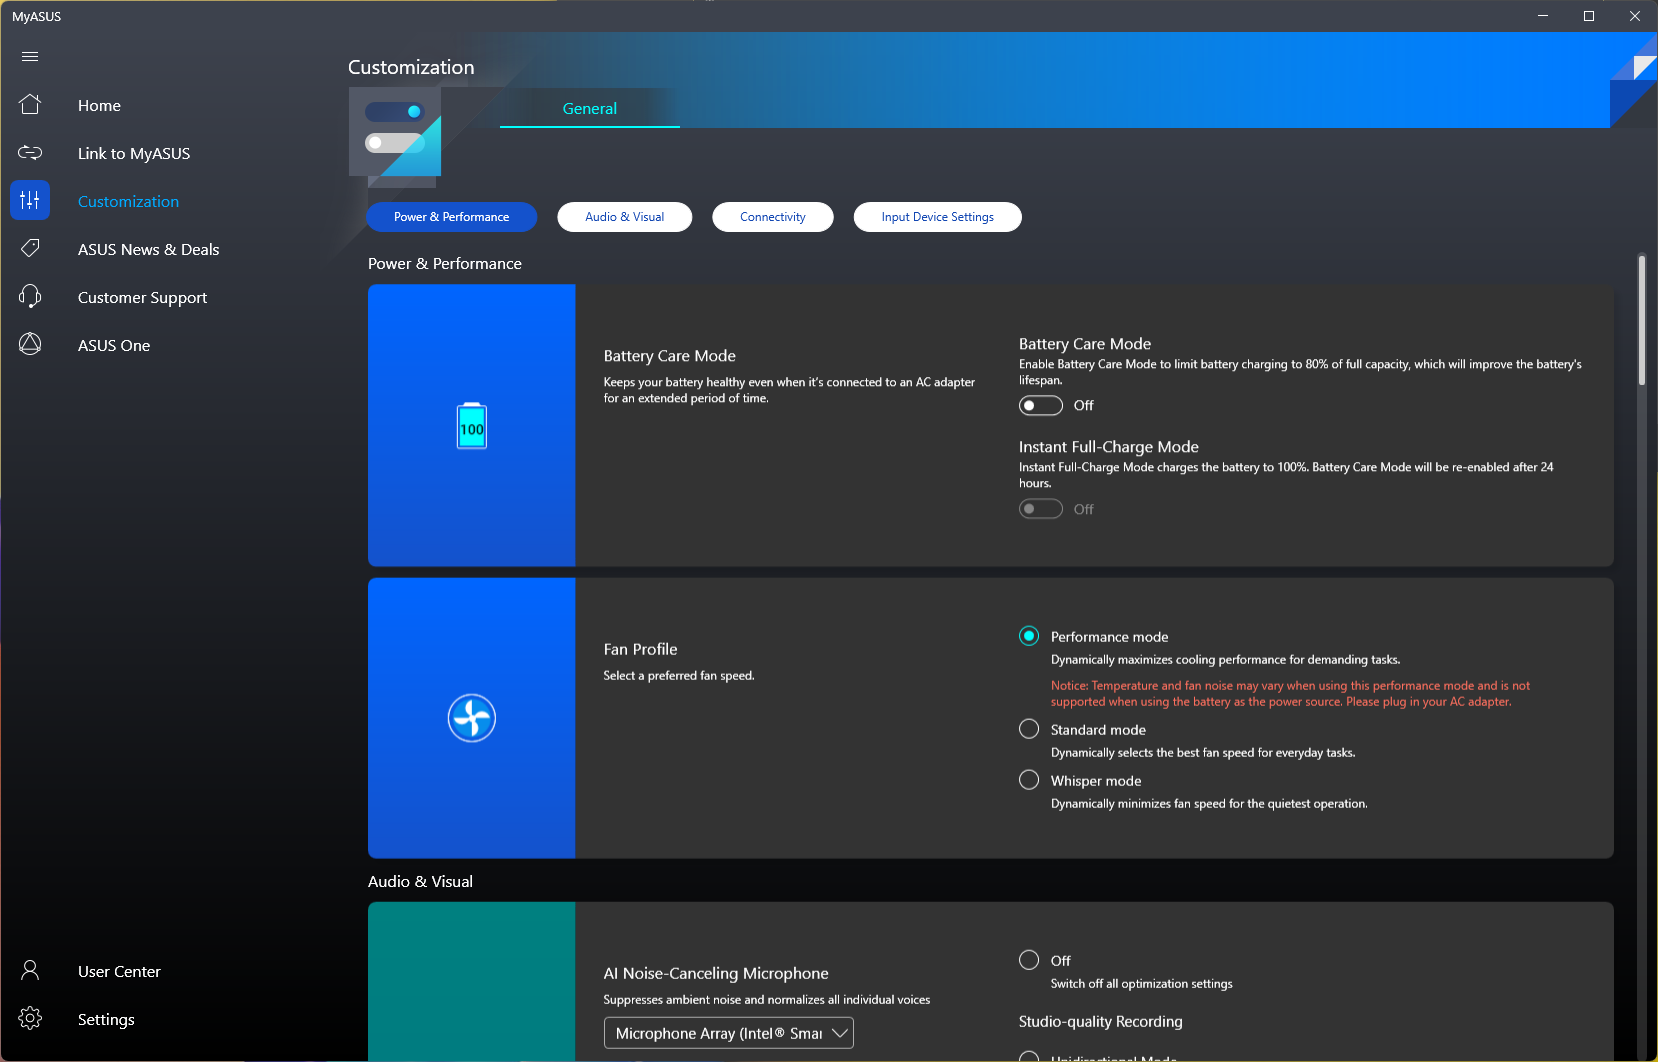
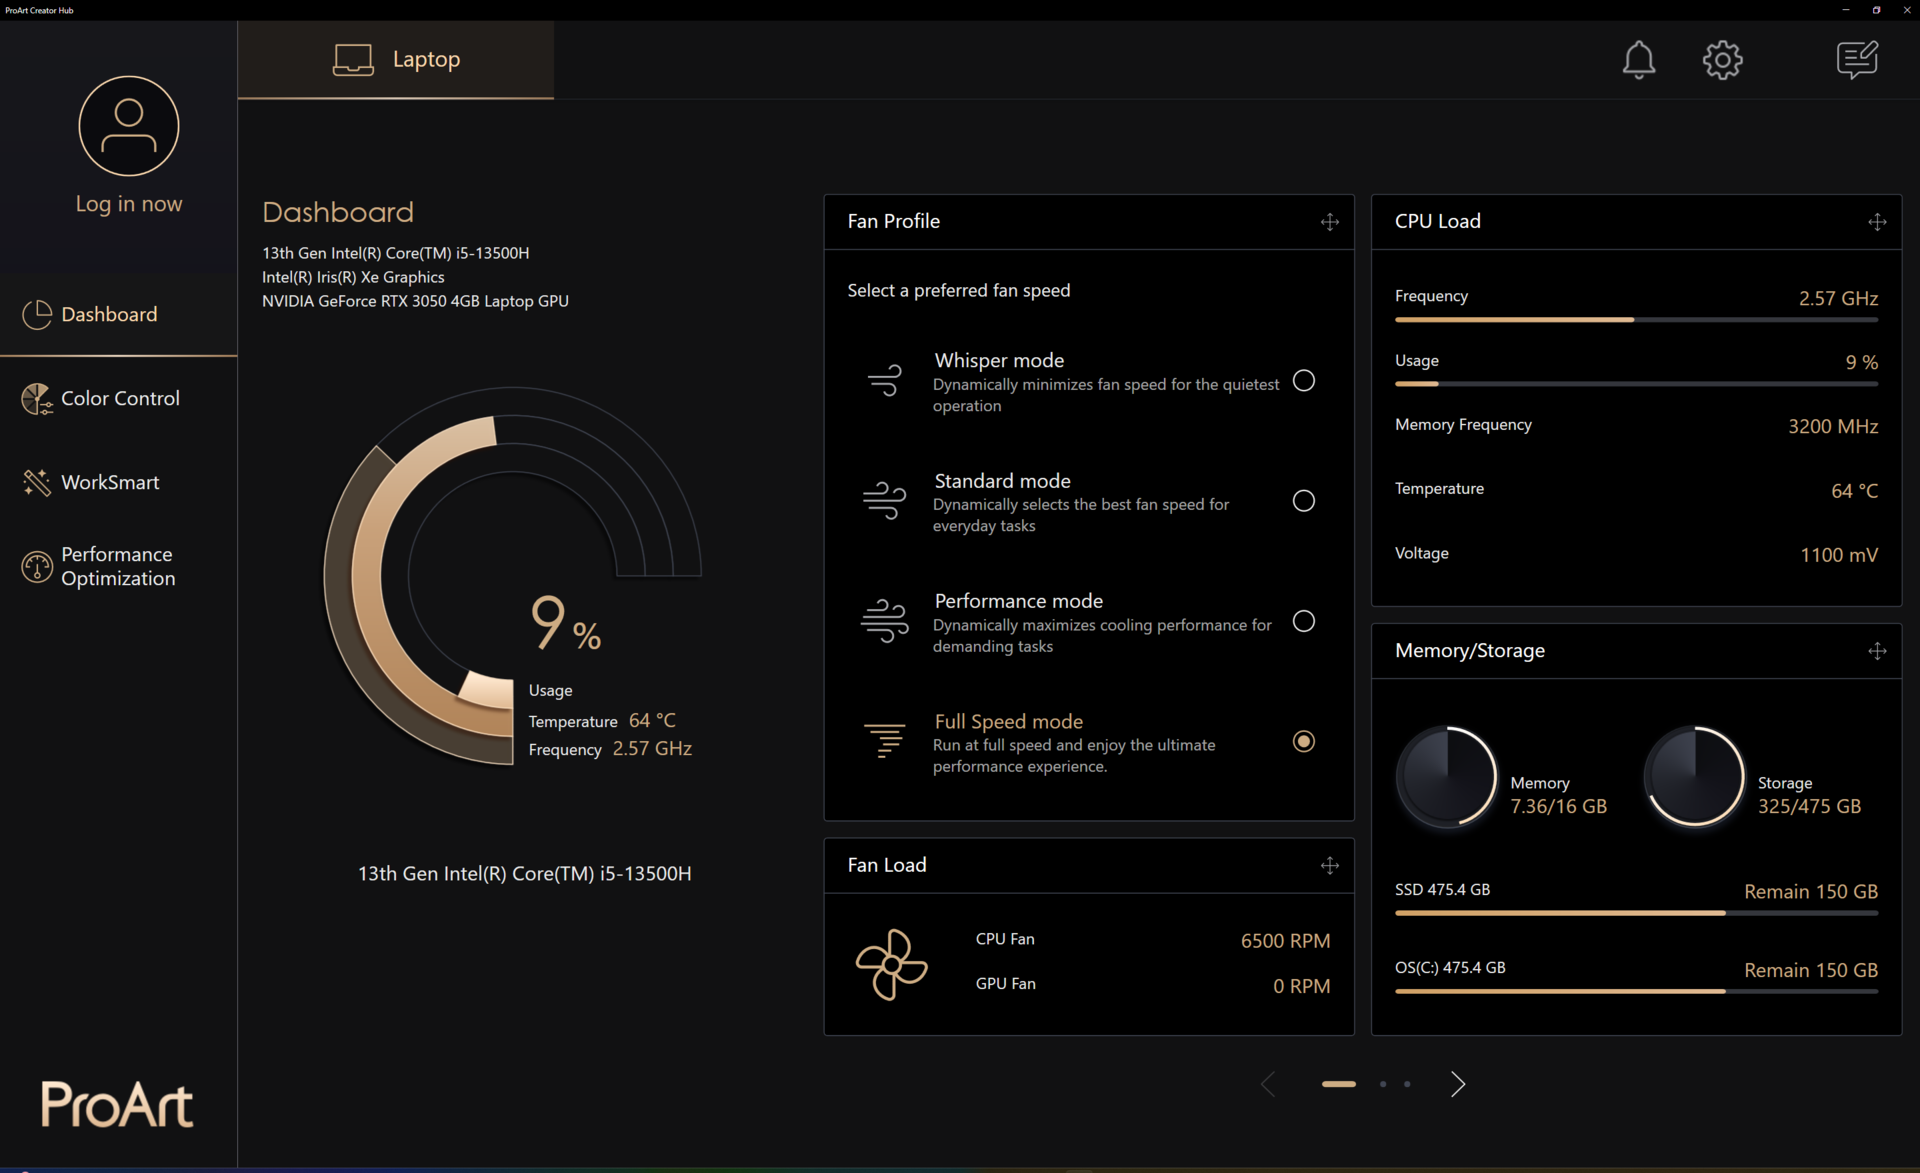
Asus divide redundantemente los ajustes de rendimiento entre la app MyAsus y el ProArt Creator Hub, aunque la app MyAsus debería ser suficiente en la mayoría de los casos. Sin embargo, tendrás que usar ProArt Creator Hub para acceder al modo Full Speed.
Usamos el modo Full Speed para todas las pruebas de rendimiento y el modo Standard para las pruebas de batería.
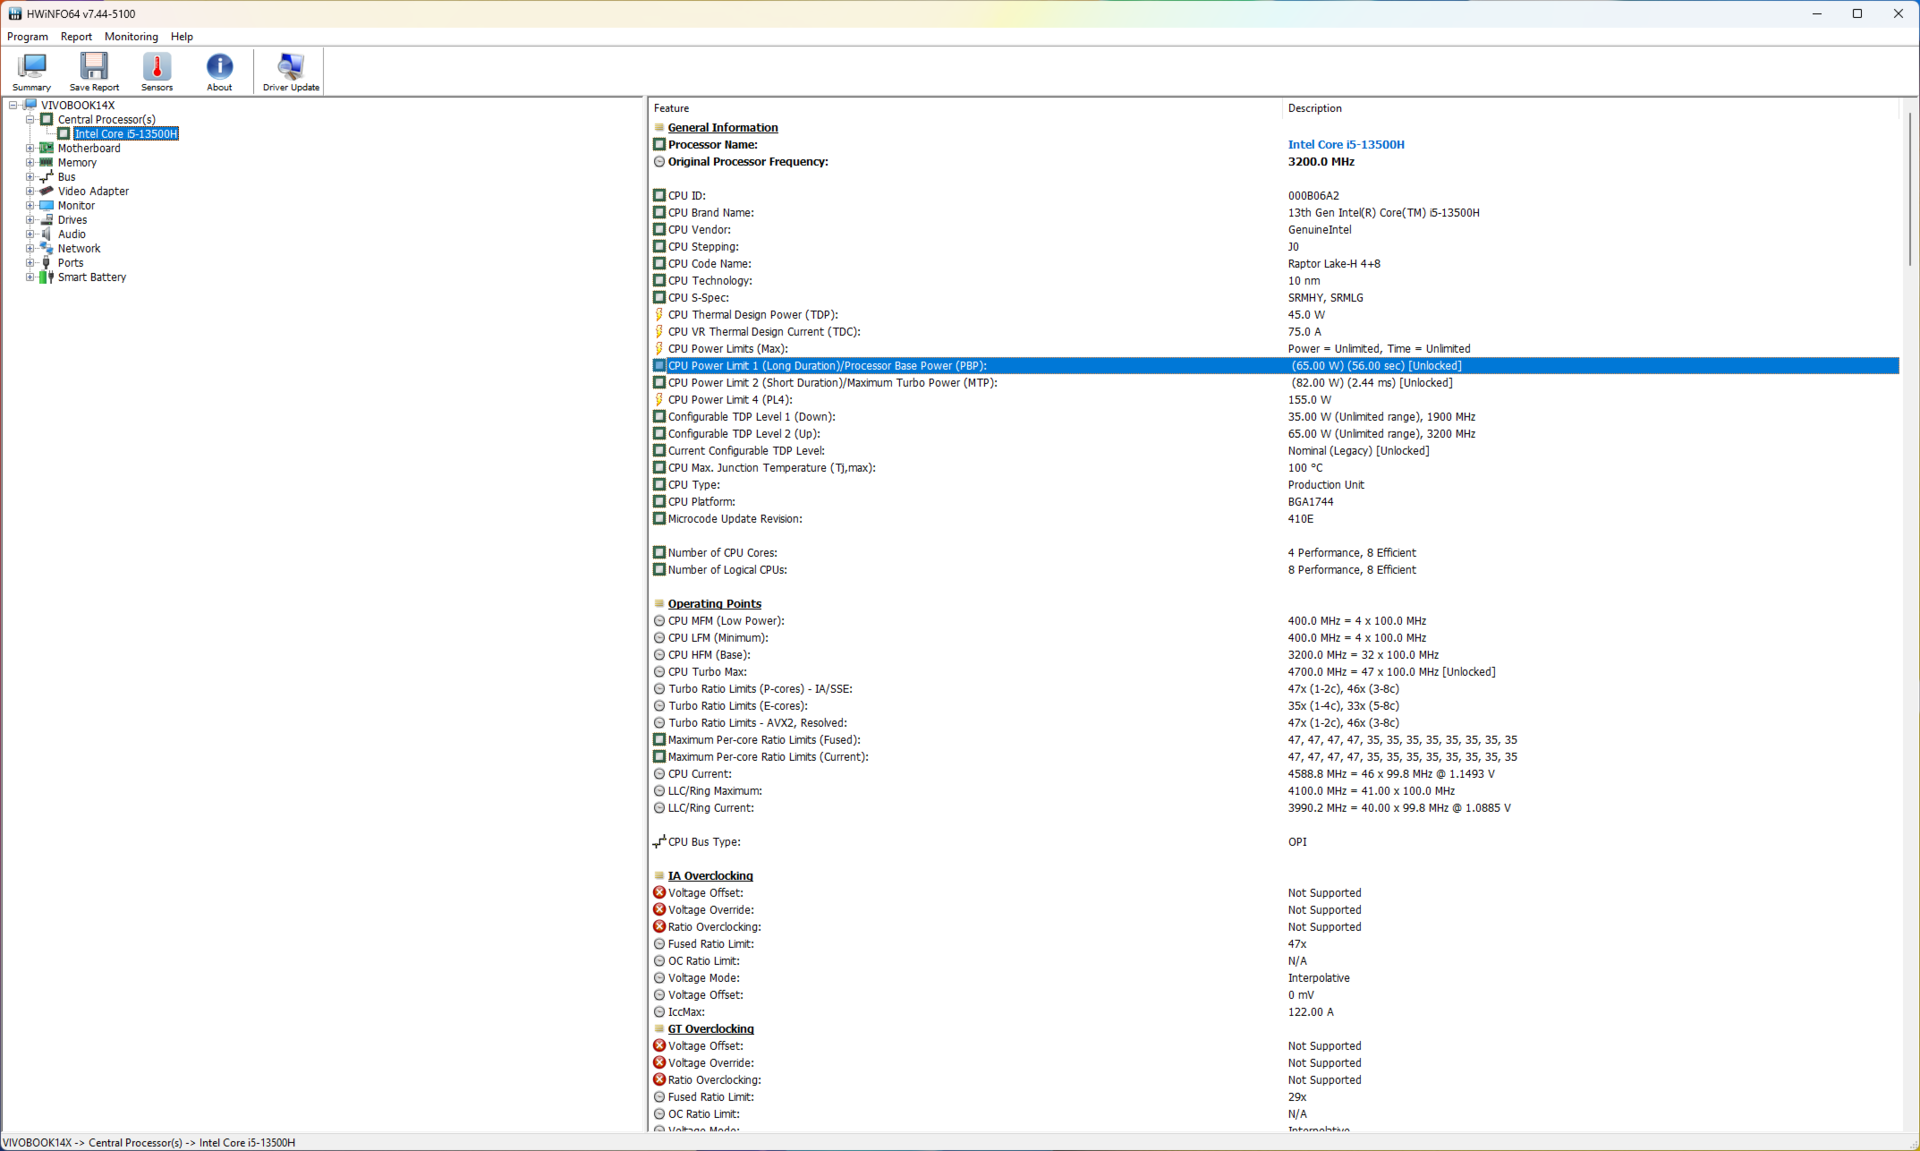
La siguiente tabla ilustra cómo varían los valores PL1 y PL2 del Core i5-13500H en función de la configuración de rendimiento elegida.
| Modo de rendimiento | PL1 (PBP) / Tau | PL2 (MTP) / Tau |
|---|---|---|
| Susurro | 30 W / 56 s | 54 W / 2,44 ms |
| Estándar | 50 W / 56 s | 82 W / 2,44 ms |
| Rendimiento | 55 W / 56 s | 82 W / 2,44 ms |
| Velocidad máxima | 65 W / 56 s | 82 W / 2,44 ms |
Procesador
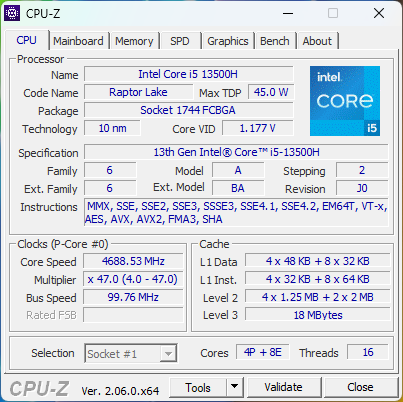
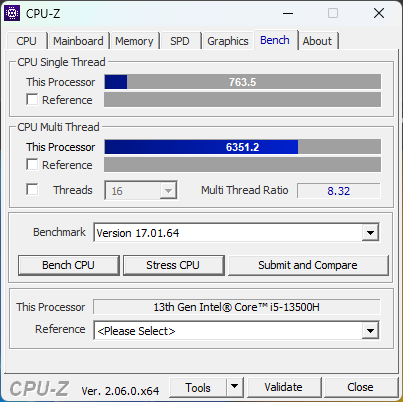
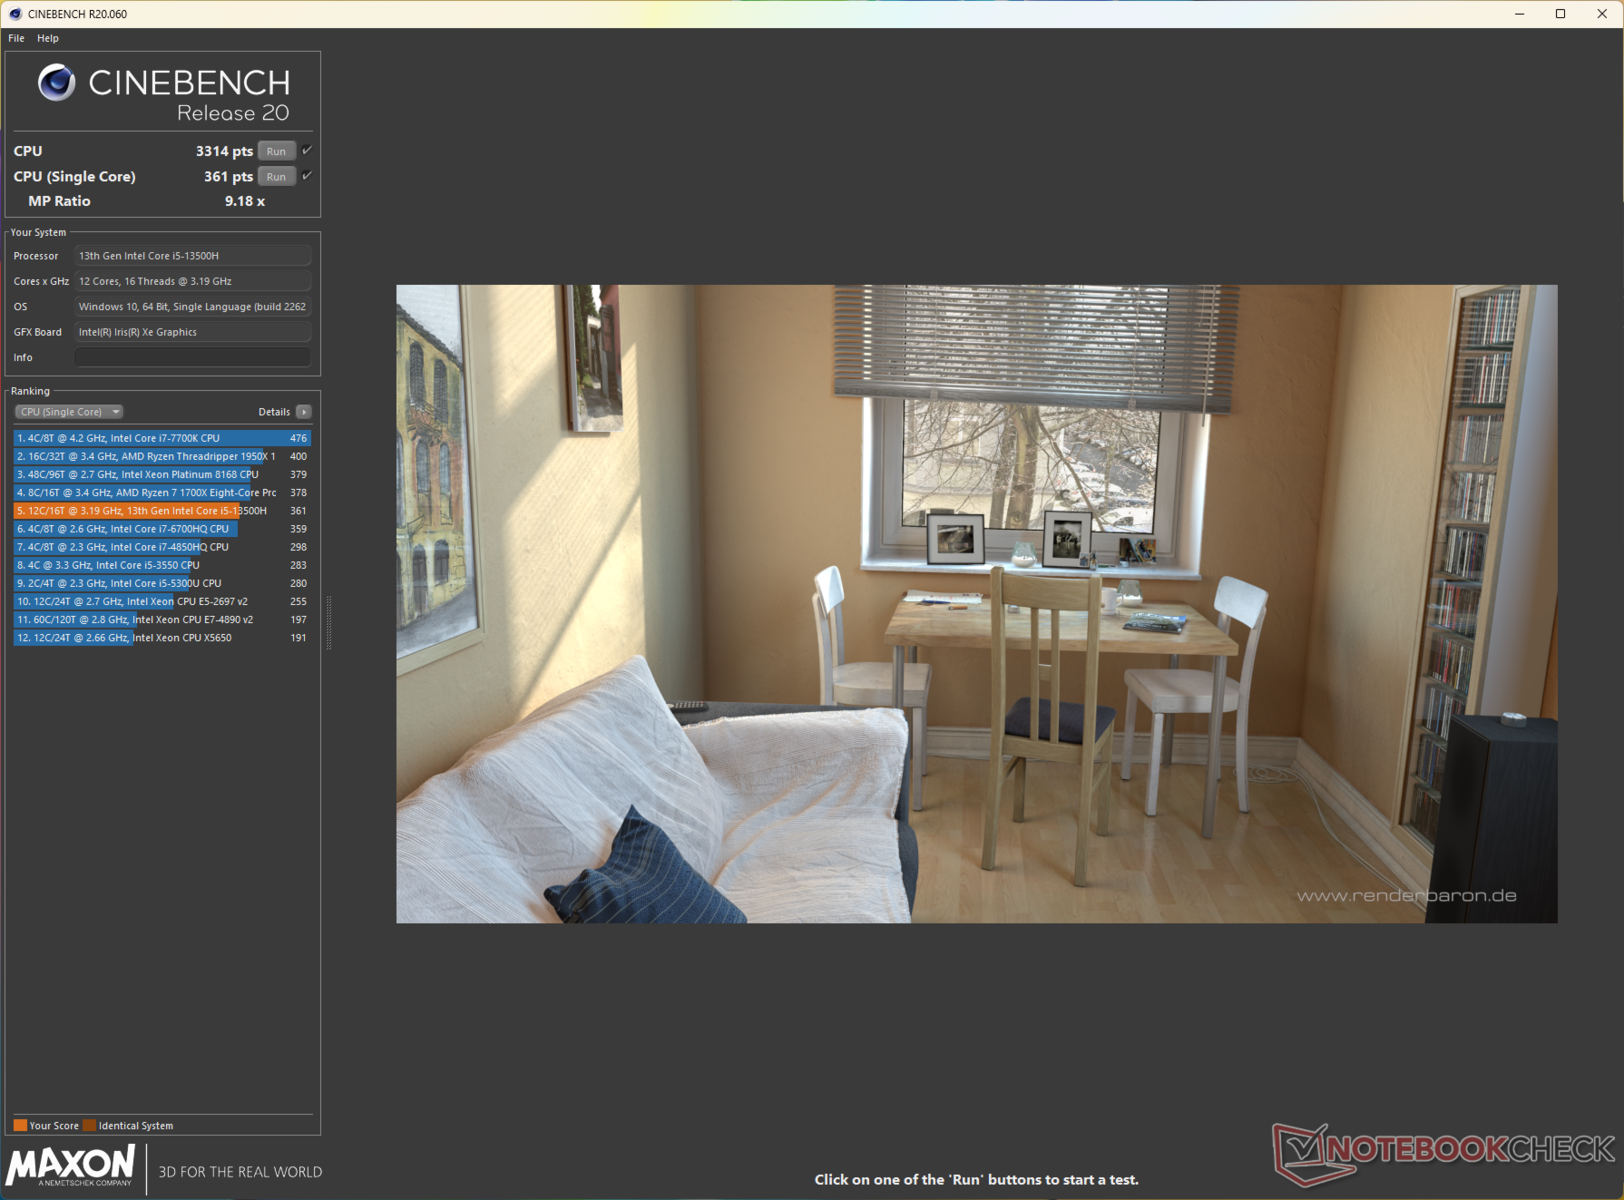
El Core i5-13500H ofrece 12 núcleos (4P + 8E) y 16 subprocesos con potencias de un solo núcleo de hasta 4,7 GHz y un TDP de 45 W. El rendimiento general de la CPU está muy en línea con un Core i7-12700Hpero se queda un 10% por detrás delCore i7-13700H en el MSI Stealth 14 Studio.
Dicho esto, el rendimiento de la CPU cae un 18% al final de la prueba Cinebench R15 multi-core loop. Sin embargo, esta ralentización no es tan drástica comparada con lo que observamos con el Core i7-13700H en elAcer Swift X SFX14.
Cinebench R15 Multi Loop
Cinebench R23: Multi Core | Single Core
Cinebench R20: CPU (Multi Core) | CPU (Single Core)
Cinebench R15: CPU Multi 64Bit | CPU Single 64Bit
Blender: v2.79 BMW27 CPU
7-Zip 18.03: 7z b 4 | 7z b 4 -mmt1
Geekbench 5.5: Multi-Core | Single-Core
HWBOT x265 Benchmark v2.2: 4k Preset
LibreOffice : 20 Documents To PDF
R Benchmark 2.5: Overall mean
| CPU Performance rating | |
| Media de la clase Multimedia | |
| MSI Stealth 14 Studio A13V | |
| Gigabyte Aero 14 OLED BMF | |
| Acer Swift X SFX14-71G | |
| Schenker Vision 14 2022 RTX 3050 Ti | |
| Medio Intel Core i5-13500H | |
| Asus VivoBook 14X K3405 | |
| Lenovo Slim Pro 7 14ARP8 | |
| Cinebench R23 / Multi Core | |
| MSI Stealth 14 Studio A13V | |
| Media de la clase Multimedia (4861 - 33362, n=74, últimos 2 años) | |
| Acer Swift X SFX14-71G | |
| Schenker Vision 14 2022 RTX 3050 Ti | |
| Medio Intel Core i5-13500H (13542 - 16335, n=5) | |
| Asus VivoBook 14X K3405 | |
| Gigabyte Aero 14 OLED BMF | |
| Lenovo Slim Pro 7 14ARP8 | |
| Cinebench R23 / Single Core | |
| Media de la clase Multimedia (1128 - 2459, n=66, últimos 2 años) | |
| Acer Swift X SFX14-71G | |
| Gigabyte Aero 14 OLED BMF | |
| Medio Intel Core i5-13500H (1704 - 1799, n=5) | |
| Asus VivoBook 14X K3405 | |
| Schenker Vision 14 2022 RTX 3050 Ti | |
| MSI Stealth 14 Studio A13V | |
| Lenovo Slim Pro 7 14ARP8 | |
| Cinebench R20 / CPU (Multi Core) | |
| MSI Stealth 14 Studio A13V | |
| Media de la clase Multimedia (1887 - 12912, n=57, últimos 2 años) | |
| Acer Swift X SFX14-71G | |
| Schenker Vision 14 2022 RTX 3050 Ti | |
| Asus VivoBook 14X K3405 | |
| Medio Intel Core i5-13500H (5108 - 6212, n=5) | |
| Gigabyte Aero 14 OLED BMF | |
| Lenovo Slim Pro 7 14ARP8 | |
| Cinebench R20 / CPU (Single Core) | |
| Acer Swift X SFX14-71G | |
| Media de la clase Multimedia (425 - 853, n=57, últimos 2 años) | |
| Gigabyte Aero 14 OLED BMF | |
| Schenker Vision 14 2022 RTX 3050 Ti | |
| Medio Intel Core i5-13500H (655 - 687, n=5) | |
| Asus VivoBook 14X K3405 | |
| MSI Stealth 14 Studio A13V | |
| Lenovo Slim Pro 7 14ARP8 | |
| Cinebench R15 / CPU Multi 64Bit | |
| MSI Stealth 14 Studio A13V | |
| Media de la clase Multimedia (856 - 5224, n=61, últimos 2 años) | |
| Gigabyte Aero 14 OLED BMF | |
| Acer Swift X SFX14-71G | |
| Medio Intel Core i5-13500H (2234 - 2475, n=5) | |
| Asus VivoBook 14X K3405 | |
| Schenker Vision 14 2022 RTX 3050 Ti | |
| Lenovo Slim Pro 7 14ARP8 | |
| Cinebench R15 / CPU Single 64Bit | |
| Media de la clase Multimedia (184.8 - 326, n=59, últimos 2 años) | |
| Acer Swift X SFX14-71G | |
| Gigabyte Aero 14 OLED BMF | |
| Schenker Vision 14 2022 RTX 3050 Ti | |
| Medio Intel Core i5-13500H (243 - 261, n=5) | |
| Asus VivoBook 14X K3405 | |
| MSI Stealth 14 Studio A13V | |
| Lenovo Slim Pro 7 14ARP8 | |
| Blender / v2.79 BMW27 CPU | |
| Acer Swift X SFX14-71G | |
| Schenker Vision 14 2022 RTX 3050 Ti | |
| Media de la clase Multimedia (100 - 557, n=58, últimos 2 años) | |
| Lenovo Slim Pro 7 14ARP8 | |
| Medio Intel Core i5-13500H (205 - 263, n=6) | |
| Asus VivoBook 14X K3405 | |
| Gigabyte Aero 14 OLED BMF | |
| MSI Stealth 14 Studio A13V | |
| 7-Zip 18.03 / 7z b 4 | |
| MSI Stealth 14 Studio A13V | |
| Gigabyte Aero 14 OLED BMF | |
| Media de la clase Multimedia (26062 - 130368, n=55, últimos 2 años) | |
| Acer Swift X SFX14-71G | |
| Lenovo Slim Pro 7 14ARP8 | |
| Medio Intel Core i5-13500H (50846 - 58567, n=6) | |
| Asus VivoBook 14X K3405 | |
| Schenker Vision 14 2022 RTX 3050 Ti | |
| 7-Zip 18.03 / 7z b 4 -mmt1 | |
| Acer Swift X SFX14-71G | |
| Gigabyte Aero 14 OLED BMF | |
| Media de la clase Multimedia (3666 - 7545, n=56, últimos 2 años) | |
| Schenker Vision 14 2022 RTX 3050 Ti | |
| Medio Intel Core i5-13500H (5500 - 5885, n=6) | |
| Asus VivoBook 14X K3405 | |
| MSI Stealth 14 Studio A13V | |
| Lenovo Slim Pro 7 14ARP8 | |
| Geekbench 5.5 / Multi-Core | |
| Media de la clase Multimedia (4652 - 20422, n=56, últimos 2 años) | |
| MSI Stealth 14 Studio A13V | |
| Acer Swift X SFX14-71G | |
| Schenker Vision 14 2022 RTX 3050 Ti | |
| Gigabyte Aero 14 OLED BMF | |
| Medio Intel Core i5-13500H (9312 - 11465, n=5) | |
| Asus VivoBook 14X K3405 | |
| Lenovo Slim Pro 7 14ARP8 | |
| Geekbench 5.5 / Single-Core | |
| Media de la clase Multimedia (805 - 2974, n=56, últimos 2 años) | |
| Gigabyte Aero 14 OLED BMF | |
| Acer Swift X SFX14-71G | |
| Schenker Vision 14 2022 RTX 3050 Ti | |
| Medio Intel Core i5-13500H (1674 - 1762, n=5) | |
| MSI Stealth 14 Studio A13V | |
| Asus VivoBook 14X K3405 | |
| Lenovo Slim Pro 7 14ARP8 | |
| HWBOT x265 Benchmark v2.2 / 4k Preset | |
| Media de la clase Multimedia (5.26 - 36.1, n=56, últimos 2 años) | |
| MSI Stealth 14 Studio A13V | |
| Lenovo Slim Pro 7 14ARP8 | |
| Asus VivoBook 14X K3405 | |
| Medio Intel Core i5-13500H (14.4 - 17.9, n=6) | |
| Gigabyte Aero 14 OLED BMF | |
| Schenker Vision 14 2022 RTX 3050 Ti | |
| Acer Swift X SFX14-71G | |
| LibreOffice / 20 Documents To PDF | |
| Lenovo Slim Pro 7 14ARP8 | |
| MSI Stealth 14 Studio A13V | |
| Medio Intel Core i5-13500H (44 - 65.5, n=5) | |
| Media de la clase Multimedia (23.9 - 146.7, n=57, últimos 2 años) | |
| Asus VivoBook 14X K3405 | |
| Schenker Vision 14 2022 RTX 3050 Ti | |
| Gigabyte Aero 14 OLED BMF | |
| Acer Swift X SFX14-71G | |
| R Benchmark 2.5 / Overall mean | |
| Lenovo Slim Pro 7 14ARP8 | |
| MSI Stealth 14 Studio A13V | |
| Asus VivoBook 14X K3405 | |
| Medio Intel Core i5-13500H (0.471 - 0.51, n=6) | |
| Media de la clase Multimedia (0.3604 - 0.947, n=56, últimos 2 años) | |
| Schenker Vision 14 2022 RTX 3050 Ti | |
| Gigabyte Aero 14 OLED BMF | |
| Acer Swift X SFX14-71G | |
* ... más pequeño es mejor
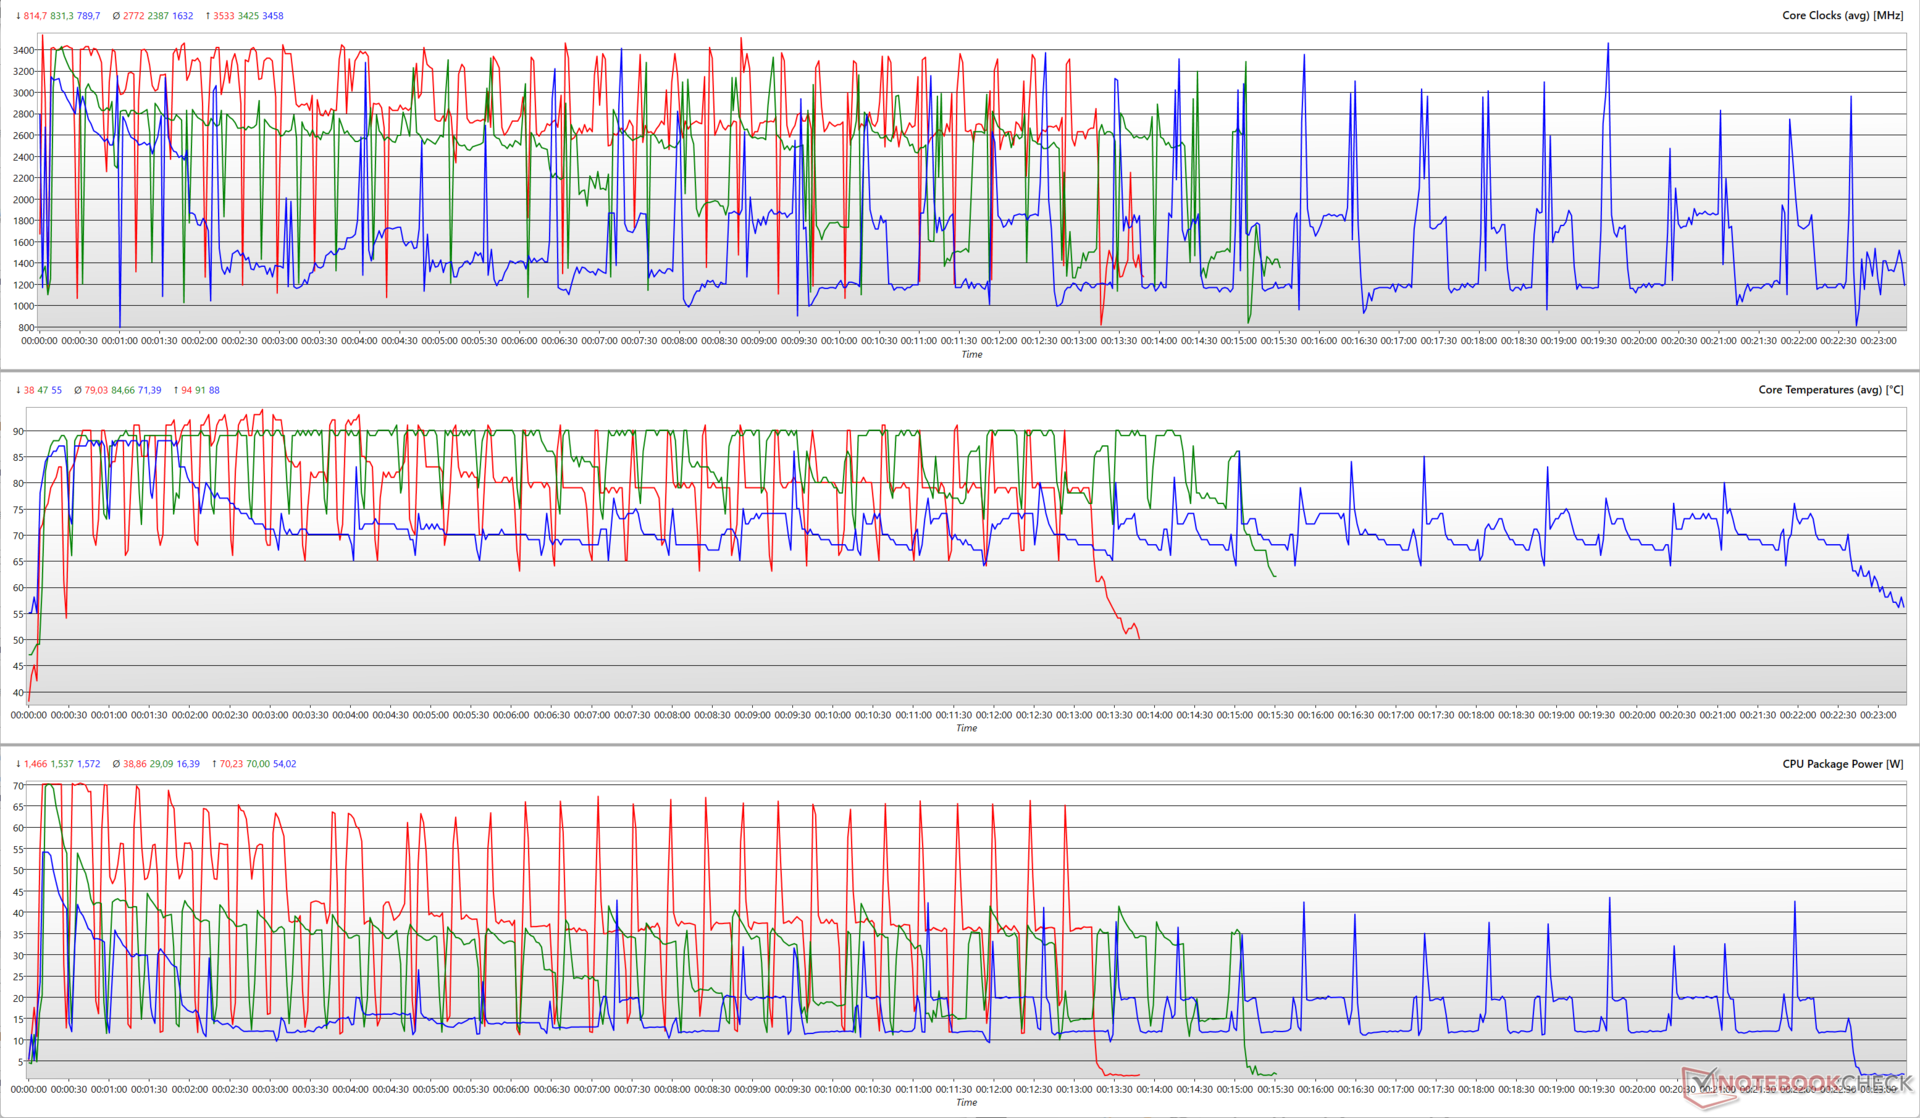
La ejecución del bucle multinúcleo Cinebench R15 en diferentes modos de rendimiento revela que la implementación Core i5-13500H del VivoBook 14X no puede utilizar plenamente su presupuesto TDP asignado. En los perfiles Standard y Full Speed, el pico de potencia del paquete observado es de sólo 70 W frente a los 82 W permitidos.
Además, este nivel de potencia sólo se alcanza durante el bucle inicial, con el reloj máximo en torno a la marca de 3,5 GHz. En el modo Whisper, el procesador puede utilizar hasta 54 W de pico, pero la media es de apenas 16 W durante la prueba.
Cinebench R20 cae en picado en modo batería con caídas del 45% y 41% en rendimiento mononúcleo y multinúcleo, respectivamente.
AIDA64: FP32 Ray-Trace | FPU Julia | CPU SHA3 | CPU Queen | FPU SinJulia | FPU Mandel | CPU AES | CPU ZLib | FP64 Ray-Trace | CPU PhotoWorxx
| Performance rating | |
| MSI Stealth 14 Studio A13V | |
| Media de la clase Multimedia | |
| Lenovo Slim Pro 7 14ARP8 | |
| Gigabyte Aero 14 OLED BMF | |
| Asus VivoBook 14X K3405 | |
| Medio Intel Core i5-13500H | |
| Schenker Vision 14 2022 RTX 3050 Ti | |
| Acer Swift X SFX14-71G | |
| AIDA64 / FP32 Ray-Trace | |
| Media de la clase Multimedia (2214 - 50388, n=53, últimos 2 años) | |
| MSI Stealth 14 Studio A13V | |
| Lenovo Slim Pro 7 14ARP8 | |
| Asus VivoBook 14X K3405 | |
| Medio Intel Core i5-13500H (11081 - 15390, n=6) | |
| Gigabyte Aero 14 OLED BMF | |
| Schenker Vision 14 2022 RTX 3050 Ti | |
| Acer Swift X SFX14-71G | |
| AIDA64 / FPU Julia | |
| Lenovo Slim Pro 7 14ARP8 | |
| MSI Stealth 14 Studio A13V | |
| Media de la clase Multimedia (12867 - 201874, n=54, últimos 2 años) | |
| Asus VivoBook 14X K3405 | |
| Medio Intel Core i5-13500H (56813 - 74251, n=6) | |
| Gigabyte Aero 14 OLED BMF | |
| Schenker Vision 14 2022 RTX 3050 Ti | |
| Acer Swift X SFX14-71G | |
| AIDA64 / CPU SHA3 | |
| Media de la clase Multimedia (626 - 8623, n=54, últimos 2 años) | |
| MSI Stealth 14 Studio A13V | |
| Asus VivoBook 14X K3405 | |
| Lenovo Slim Pro 7 14ARP8 | |
| Medio Intel Core i5-13500H (2621 - 3623, n=6) | |
| Gigabyte Aero 14 OLED BMF | |
| Schenker Vision 14 2022 RTX 3050 Ti | |
| Acer Swift X SFX14-71G | |
| AIDA64 / CPU Queen | |
| Gigabyte Aero 14 OLED BMF | |
| MSI Stealth 14 Studio A13V | |
| Acer Swift X SFX14-71G | |
| Schenker Vision 14 2022 RTX 3050 Ti | |
| Lenovo Slim Pro 7 14ARP8 | |
| Medio Intel Core i5-13500H (77835 - 85727, n=6) | |
| Asus VivoBook 14X K3405 | |
| Media de la clase Multimedia (13483 - 181505, n=41, últimos 2 años) | |
| AIDA64 / FPU SinJulia | |
| Lenovo Slim Pro 7 14ARP8 | |
| MSI Stealth 14 Studio A13V | |
| Media de la clase Multimedia (886 - 28794, n=54, últimos 2 años) | |
| Gigabyte Aero 14 OLED BMF | |
| Schenker Vision 14 2022 RTX 3050 Ti | |
| Medio Intel Core i5-13500H (7249 - 8086, n=6) | |
| Asus VivoBook 14X K3405 | |
| Acer Swift X SFX14-71G | |
| AIDA64 / FPU Mandel | |
| Lenovo Slim Pro 7 14ARP8 | |
| Media de la clase Multimedia (6395 - 105740, n=53, últimos 2 años) | |
| MSI Stealth 14 Studio A13V | |
| Asus VivoBook 14X K3405 | |
| Medio Intel Core i5-13500H (27820 - 38336, n=6) | |
| Gigabyte Aero 14 OLED BMF | |
| Schenker Vision 14 2022 RTX 3050 Ti | |
| Acer Swift X SFX14-71G | |
| AIDA64 / CPU AES | |
| Gigabyte Aero 14 OLED BMF | |
| Asus VivoBook 14X K3405 | |
| Medio Intel Core i5-13500H (62657 - 120493, n=6) | |
| Acer Swift X SFX14-71G | |
| MSI Stealth 14 Studio A13V | |
| Schenker Vision 14 2022 RTX 3050 Ti | |
| Media de la clase Multimedia (8171 - 126790, n=54, últimos 2 años) | |
| Lenovo Slim Pro 7 14ARP8 | |
| AIDA64 / CPU ZLib | |
| MSI Stealth 14 Studio A13V | |
| Media de la clase Multimedia (143.8 - 2022, n=54, últimos 2 años) | |
| Schenker Vision 14 2022 RTX 3050 Ti | |
| Asus VivoBook 14X K3405 | |
| Medio Intel Core i5-13500H (782 - 992, n=6) | |
| Gigabyte Aero 14 OLED BMF | |
| Lenovo Slim Pro 7 14ARP8 | |
| Acer Swift X SFX14-71G | |
| AIDA64 / FP64 Ray-Trace | |
| Media de la clase Multimedia (1014 - 26875, n=54, últimos 2 años) | |
| MSI Stealth 14 Studio A13V | |
| Lenovo Slim Pro 7 14ARP8 | |
| Asus VivoBook 14X K3405 | |
| Medio Intel Core i5-13500H (5955 - 8495, n=6) | |
| Gigabyte Aero 14 OLED BMF | |
| Schenker Vision 14 2022 RTX 3050 Ti | |
| Acer Swift X SFX14-71G | |
| AIDA64 / CPU PhotoWorxx | |
| Gigabyte Aero 14 OLED BMF | |
| Media de la clase Multimedia (8187 - 88154, n=54, últimos 2 años) | |
| Acer Swift X SFX14-71G | |
| MSI Stealth 14 Studio A13V | |
| Medio Intel Core i5-13500H (20212 - 37618, n=6) | |
| Schenker Vision 14 2022 RTX 3050 Ti | |
| Lenovo Slim Pro 7 14ARP8 | |
| Asus VivoBook 14X K3405 | |
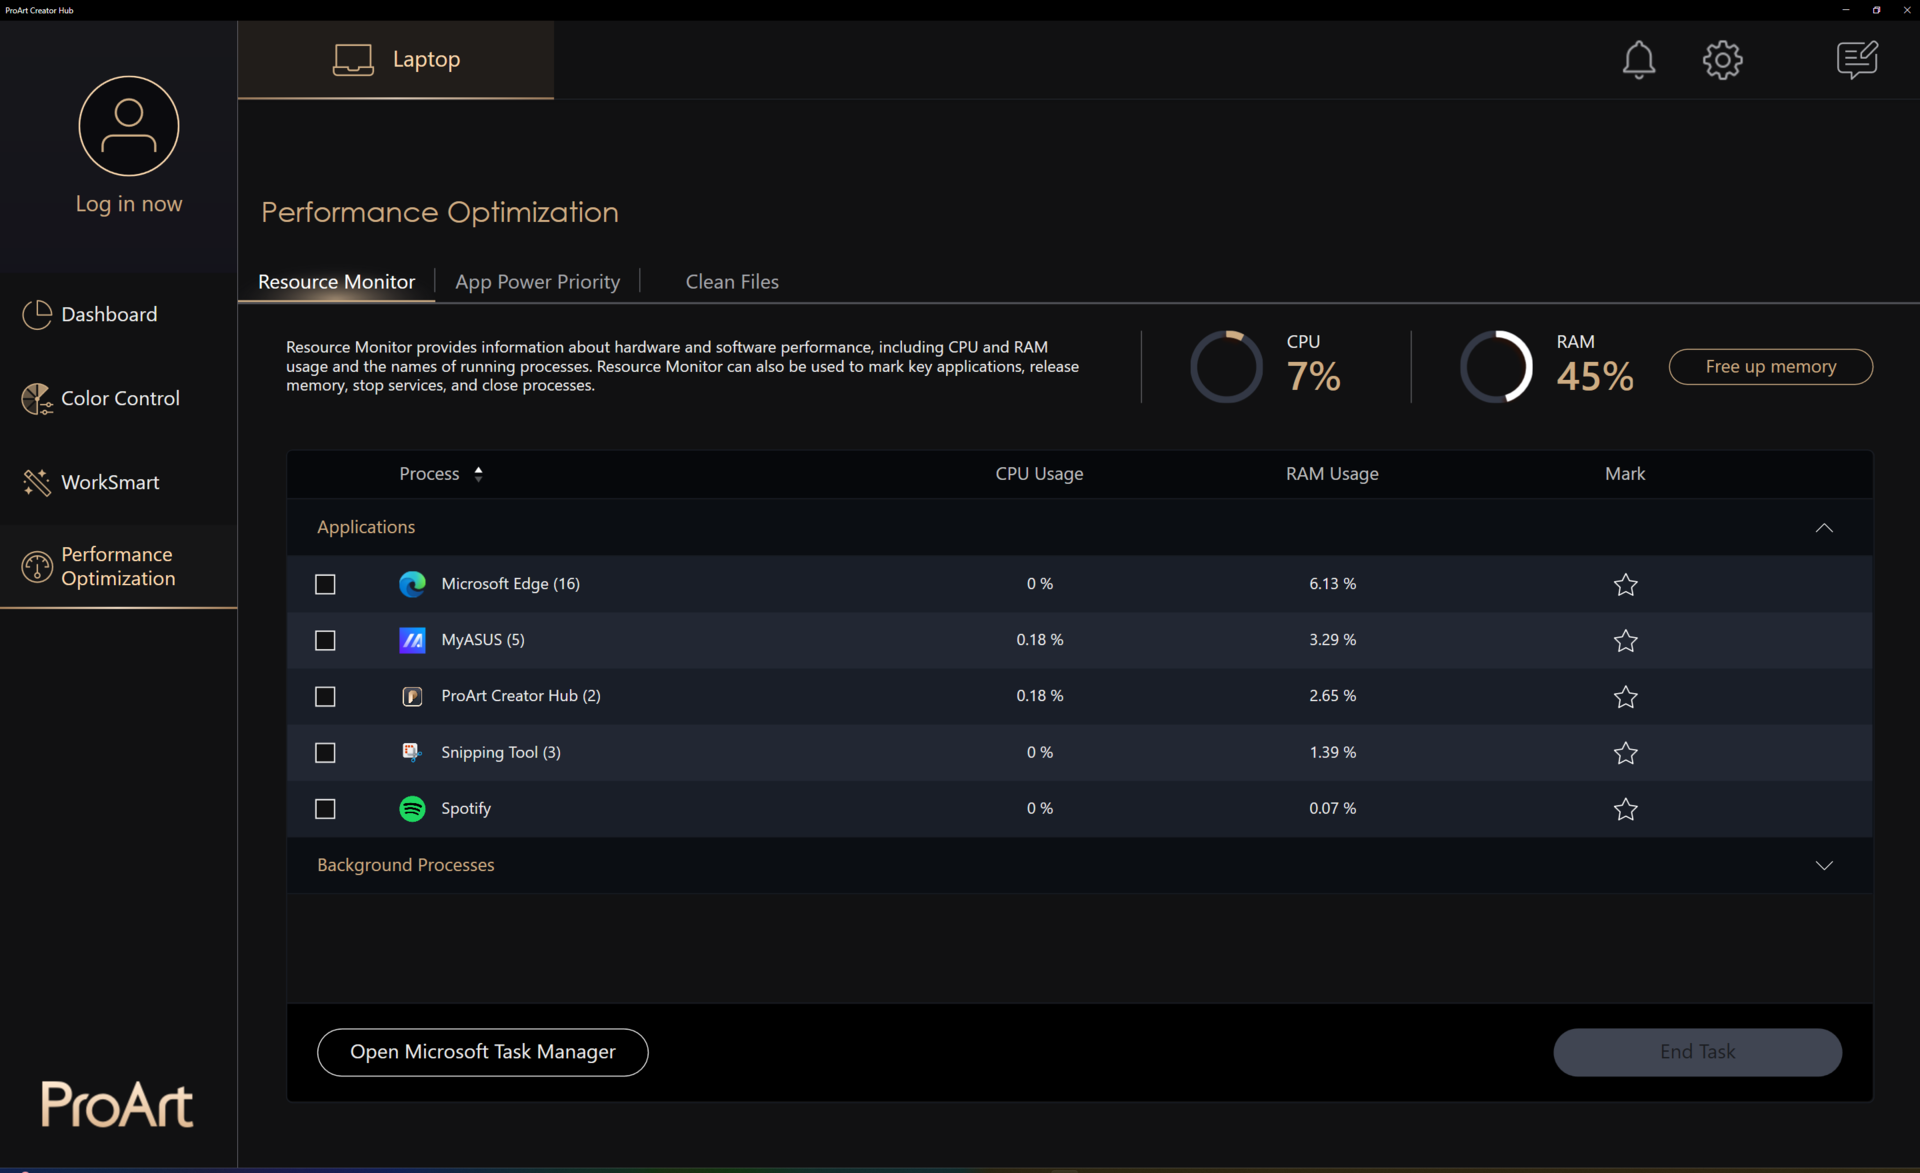
Rendimiento del sistema
El VivoBook 14X queda por detrás del MSI Stealth 14 en las pruebas PCMark 10 y CrossMark, pero no por mucho. El rendimiento general del sistema en el uso diario típico es fluido y sensible.
CrossMark: Overall | Productivity | Creativity | Responsiveness
AIDA64: Memory Copy | Memory Read | Memory Write | Memory Latency
| PCMark 10 / Score | |
| Media de la clase Multimedia (4325 - 10386, n=52, últimos 2 años) | |
| Gigabyte Aero 14 OLED BMF | |
| Acer Swift X SFX14-71G | |
| MSI Stealth 14 Studio A13V | |
| Asus VivoBook 14X K3405 | |
| Medio Intel Core i5-13500H, NVIDIA GeForce RTX 3050 4GB Laptop GPU (n=1) | |
| Schenker Vision 14 2022 RTX 3050 Ti | |
| Lenovo Slim Pro 7 14ARP8 | |
| PCMark 10 / Essentials | |
| Gigabyte Aero 14 OLED BMF | |
| Acer Swift X SFX14-71G | |
| Media de la clase Multimedia (8025 - 11664, n=51, últimos 2 años) | |
| Schenker Vision 14 2022 RTX 3050 Ti | |
| MSI Stealth 14 Studio A13V | |
| Asus VivoBook 14X K3405 | |
| Medio Intel Core i5-13500H, NVIDIA GeForce RTX 3050 4GB Laptop GPU (n=1) | |
| Lenovo Slim Pro 7 14ARP8 | |
| PCMark 10 / Productivity | |
| Media de la clase Multimedia (7323 - 18233, n=51, últimos 2 años) | |
| Acer Swift X SFX14-71G | |
| Gigabyte Aero 14 OLED BMF | |
| Asus VivoBook 14X K3405 | |
| Medio Intel Core i5-13500H, NVIDIA GeForce RTX 3050 4GB Laptop GPU (n=1) | |
| Schenker Vision 14 2022 RTX 3050 Ti | |
| MSI Stealth 14 Studio A13V | |
| Lenovo Slim Pro 7 14ARP8 | |
| PCMark 10 / Digital Content Creation | |
| Media de la clase Multimedia (3651 - 16240, n=51, últimos 2 años) | |
| MSI Stealth 14 Studio A13V | |
| Acer Swift X SFX14-71G | |
| Gigabyte Aero 14 OLED BMF | |
| Lenovo Slim Pro 7 14ARP8 | |
| Schenker Vision 14 2022 RTX 3050 Ti | |
| Asus VivoBook 14X K3405 | |
| Medio Intel Core i5-13500H, NVIDIA GeForce RTX 3050 4GB Laptop GPU (n=1) | |
| CrossMark / Overall | |
| Acer Swift X SFX14-71G | |
| Media de la clase Multimedia (866 - 2728, n=60, últimos 2 años) | |
| Gigabyte Aero 14 OLED BMF | |
| MSI Stealth 14 Studio A13V | |
| Schenker Vision 14 2022 RTX 3050 Ti | |
| Asus VivoBook 14X K3405 | |
| Medio Intel Core i5-13500H, NVIDIA GeForce RTX 3050 4GB Laptop GPU (n=1) | |
| Lenovo Slim Pro 7 14ARP8 | |
| CrossMark / Productivity | |
| Acer Swift X SFX14-71G | |
| Gigabyte Aero 14 OLED BMF | |
| Media de la clase Multimedia (931 - 2489, n=60, últimos 2 años) | |
| MSI Stealth 14 Studio A13V | |
| Schenker Vision 14 2022 RTX 3050 Ti | |
| Asus VivoBook 14X K3405 | |
| Medio Intel Core i5-13500H, NVIDIA GeForce RTX 3050 4GB Laptop GPU (n=1) | |
| Lenovo Slim Pro 7 14ARP8 | |
| CrossMark / Creativity | |
| Media de la clase Multimedia (907 - 3465, n=60, últimos 2 años) | |
| Acer Swift X SFX14-71G | |
| Gigabyte Aero 14 OLED BMF | |
| MSI Stealth 14 Studio A13V | |
| Schenker Vision 14 2022 RTX 3050 Ti | |
| Asus VivoBook 14X K3405 | |
| Medio Intel Core i5-13500H, NVIDIA GeForce RTX 3050 4GB Laptop GPU (n=1) | |
| Lenovo Slim Pro 7 14ARP8 | |
| CrossMark / Responsiveness | |
| Acer Swift X SFX14-71G | |
| Gigabyte Aero 14 OLED BMF | |
| MSI Stealth 14 Studio A13V | |
| Schenker Vision 14 2022 RTX 3050 Ti | |
| Media de la clase Multimedia (605 - 2024, n=60, últimos 2 años) | |
| Asus VivoBook 14X K3405 | |
| Medio Intel Core i5-13500H, NVIDIA GeForce RTX 3050 4GB Laptop GPU (n=1) | |
| Lenovo Slim Pro 7 14ARP8 | |
| AIDA64 / Memory Copy | |
| Media de la clase Multimedia (11299 - 132135, n=54, últimos 2 años) | |
| Gigabyte Aero 14 OLED BMF | |
| Acer Swift X SFX14-71G | |
| MSI Stealth 14 Studio A13V | |
| Lenovo Slim Pro 7 14ARP8 | |
| Schenker Vision 14 2022 RTX 3050 Ti | |
| Asus VivoBook 14X K3405 | |
| Medio Intel Core i5-13500H, NVIDIA GeForce RTX 3050 4GB Laptop GPU (n=1) | |
| AIDA64 / Memory Read | |
| Media de la clase Multimedia (11624 - 174586, n=54, últimos 2 años) | |
| Gigabyte Aero 14 OLED BMF | |
| MSI Stealth 14 Studio A13V | |
| Acer Swift X SFX14-71G | |
| Lenovo Slim Pro 7 14ARP8 | |
| Asus VivoBook 14X K3405 | |
| Medio Intel Core i5-13500H, NVIDIA GeForce RTX 3050 4GB Laptop GPU (n=1) | |
| Schenker Vision 14 2022 RTX 3050 Ti | |
| AIDA64 / Memory Write | |
| Gigabyte Aero 14 OLED BMF | |
| Media de la clase Multimedia (11755 - 134998, n=54, últimos 2 años) | |
| Acer Swift X SFX14-71G | |
| Lenovo Slim Pro 7 14ARP8 | |
| MSI Stealth 14 Studio A13V | |
| Schenker Vision 14 2022 RTX 3050 Ti | |
| Asus VivoBook 14X K3405 | |
| Medio Intel Core i5-13500H, NVIDIA GeForce RTX 3050 4GB Laptop GPU (n=1) | |
| AIDA64 / Memory Latency | |
| Media de la clase Multimedia (7 - 535, n=53, últimos 2 años) | |
| Lenovo Slim Pro 7 14ARP8 | |
| Acer Swift X SFX14-71G | |
| Gigabyte Aero 14 OLED BMF | |
| Schenker Vision 14 2022 RTX 3050 Ti | |
| Asus VivoBook 14X K3405 | |
| Medio Intel Core i5-13500H, NVIDIA GeForce RTX 3050 4GB Laptop GPU (n=1) | |
| MSI Stealth 14 Studio A13V | |
* ... más pequeño es mejor
| PCMark 8 Home Score Accelerated v2 | 5514 puntos | |
| PCMark 8 Work Score Accelerated v2 | 6078 puntos | |
| PCMark 10 Score | 6645 puntos | |
ayuda | ||
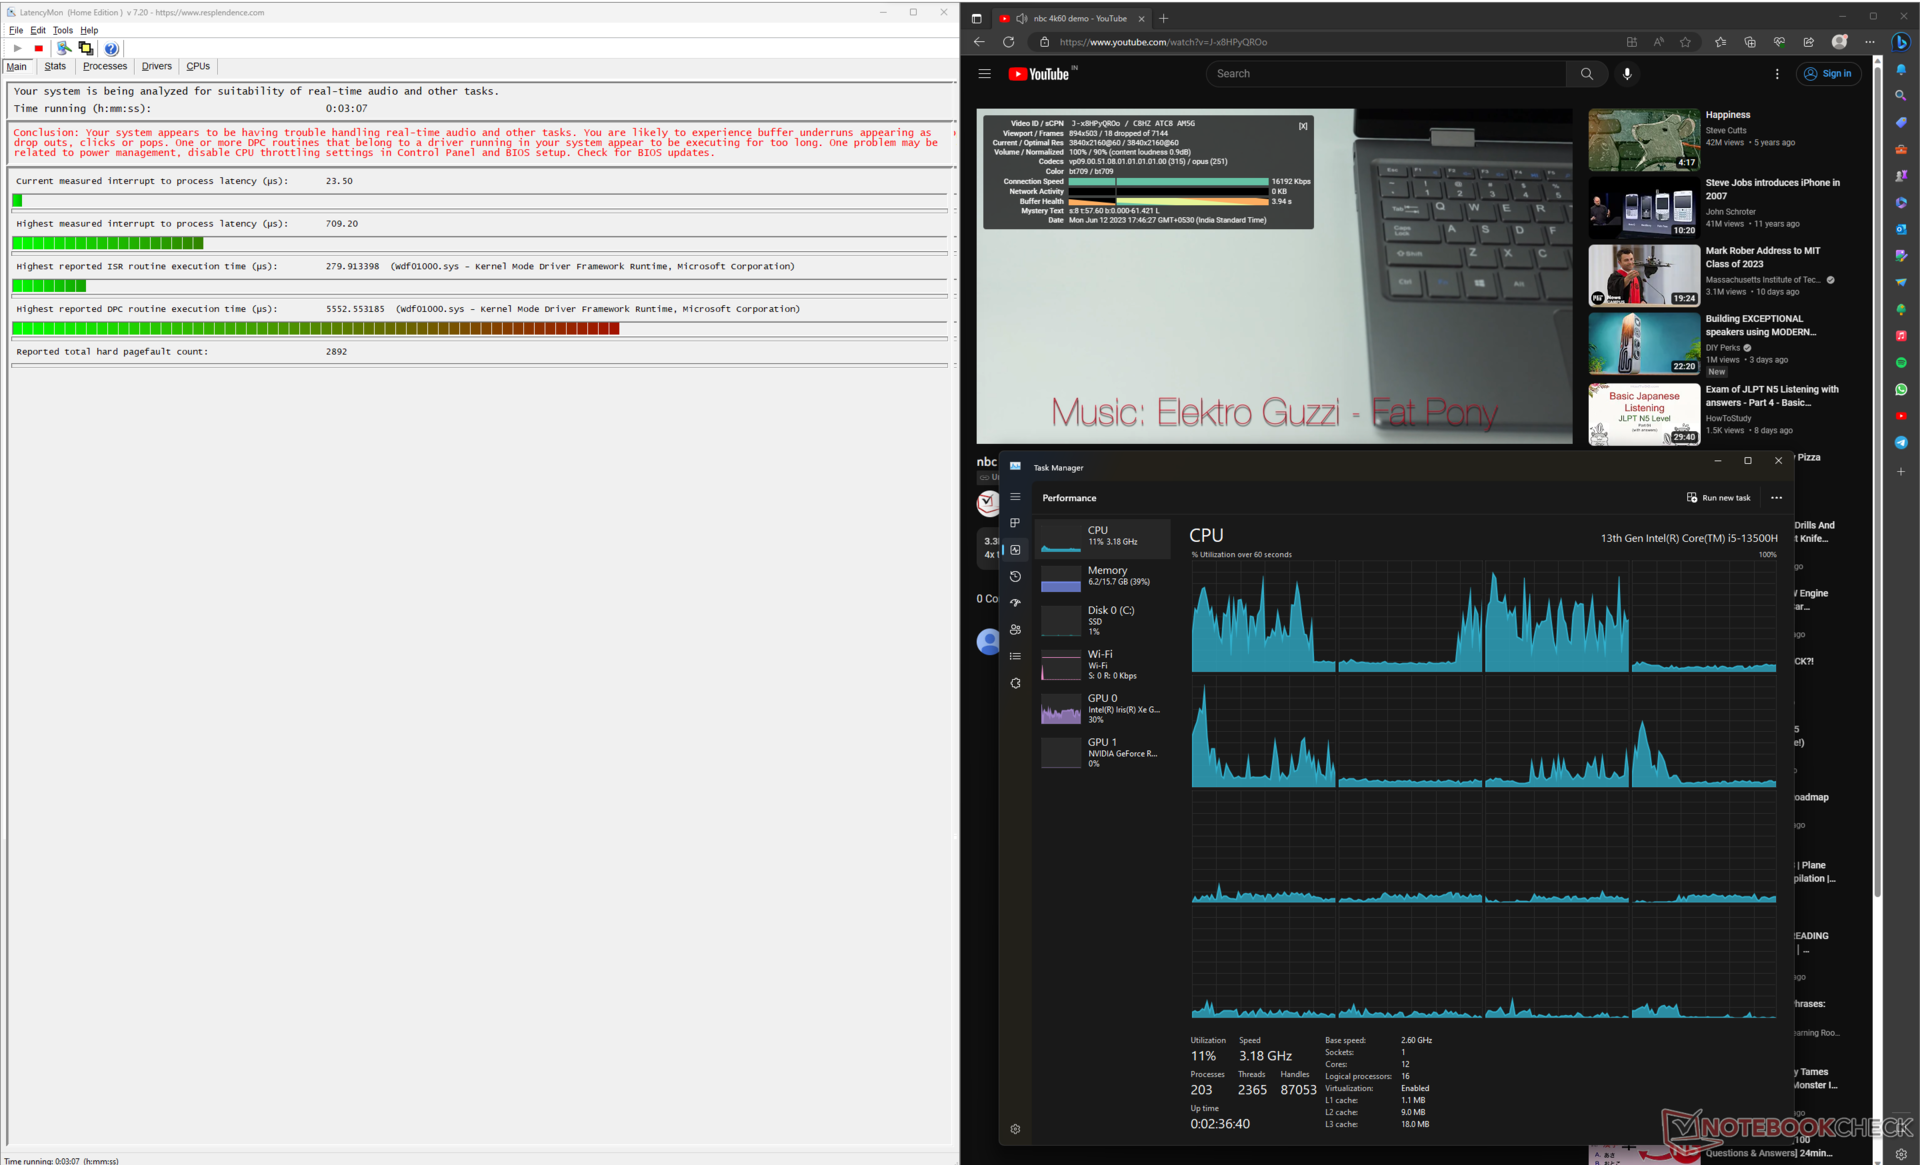
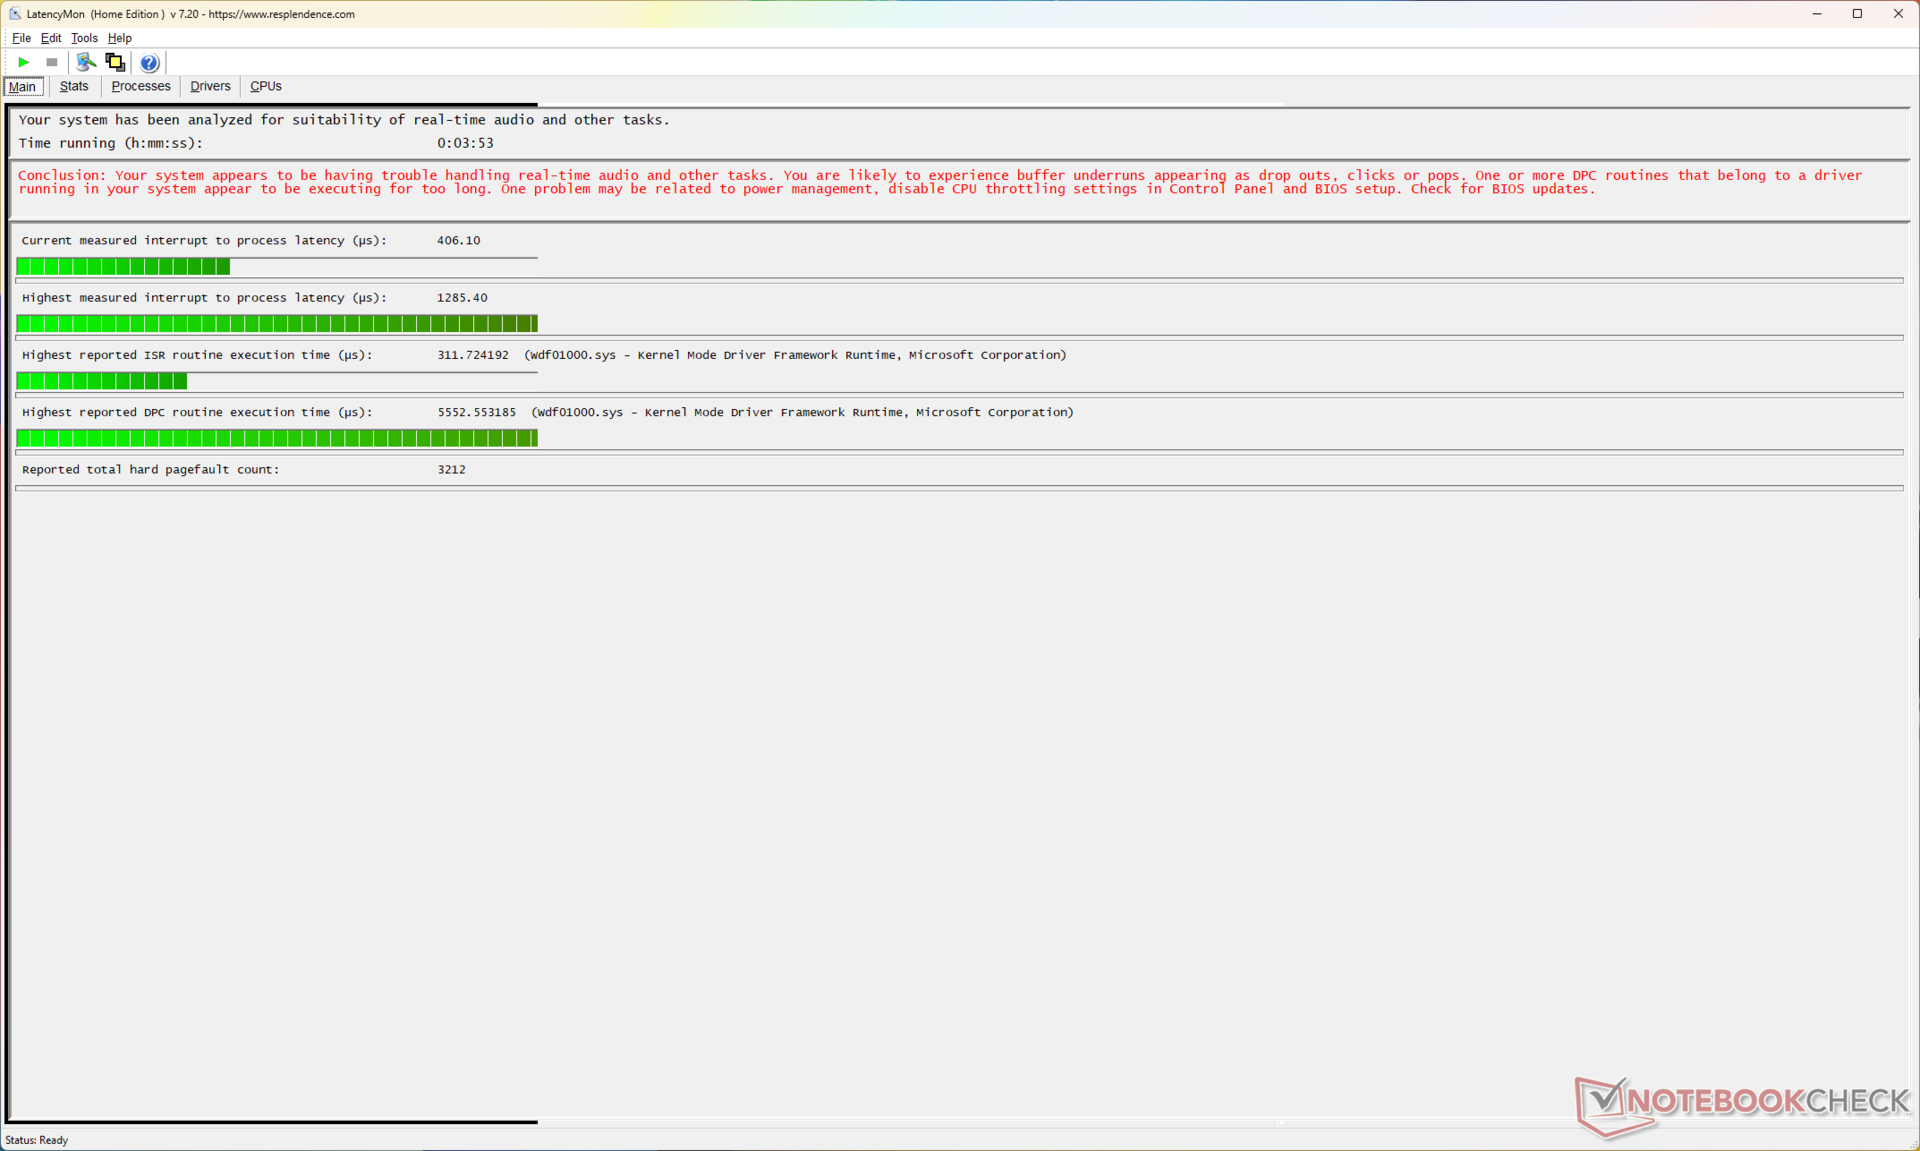
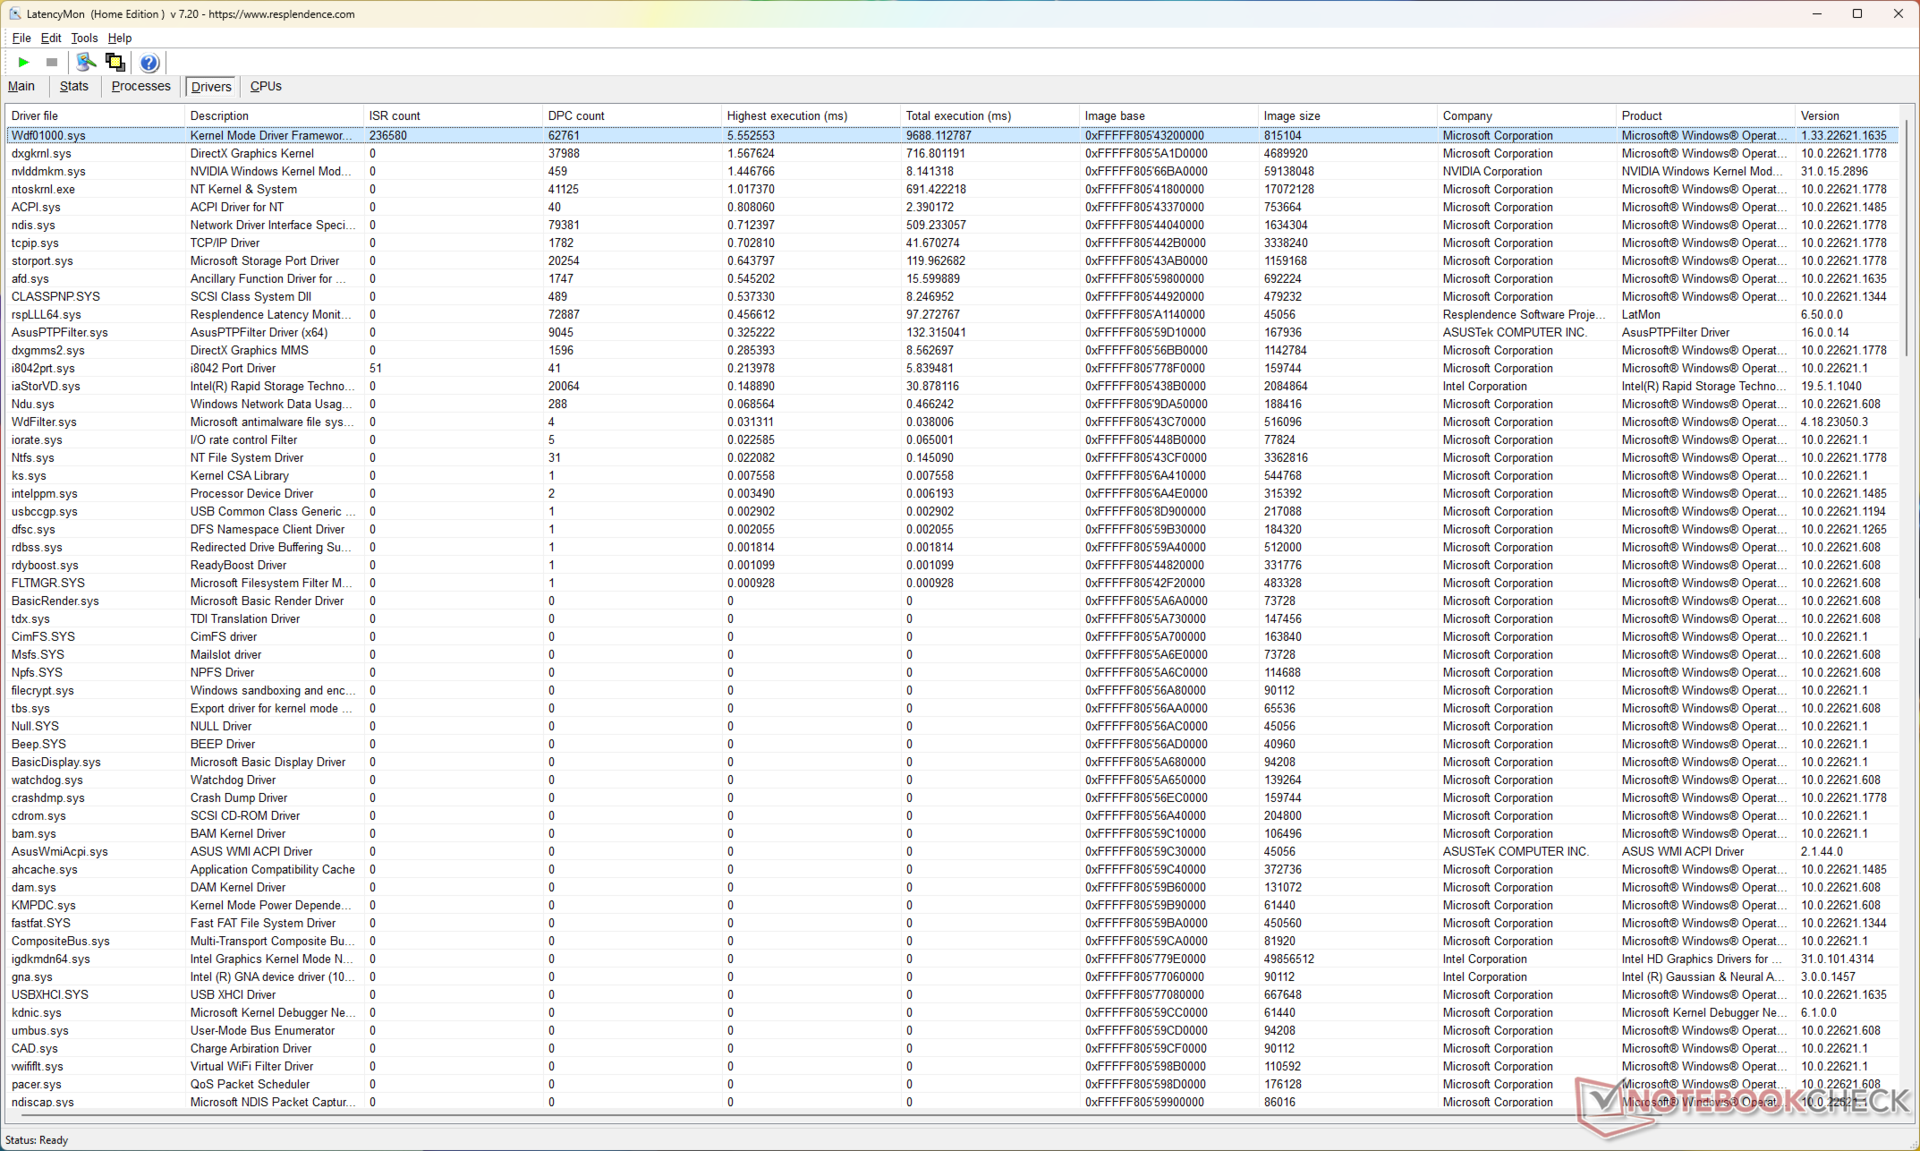
Latencia del CPD
La latencia del CPD parece estar en el lado más alto. La latencia medida entre interrupciones y procesos fue inicialmente de 709,20 µs durante la reproducción de un vídeo 4K de YouTube.
Este valor aumentó a 1285,40 µs tras un estrés de 10 segundos en Prime95, lo que sugiere que los flujos de trabajo en tiempo real pueden verse afectados bajo una carga pesada.
| DPC Latencies / LatencyMon - interrupt to process latency (max), Web, Youtube, Prime95 | |
| Acer Swift X SFX14-71G | |
| Gigabyte Aero 14 OLED BMF | |
| MSI Stealth 14 Studio A13V | |
| Lenovo Slim Pro 7 14ARP8 | |
| Asus VivoBook 14X K3405 | |
| Schenker Vision 14 2022 RTX 3050 Ti | |
* ... más pequeño es mejor
NuestroClasificación de latencia del CPDofrece más comparaciones de latencia entre los dispositivos analizados.
Dispositivos de almacenamiento
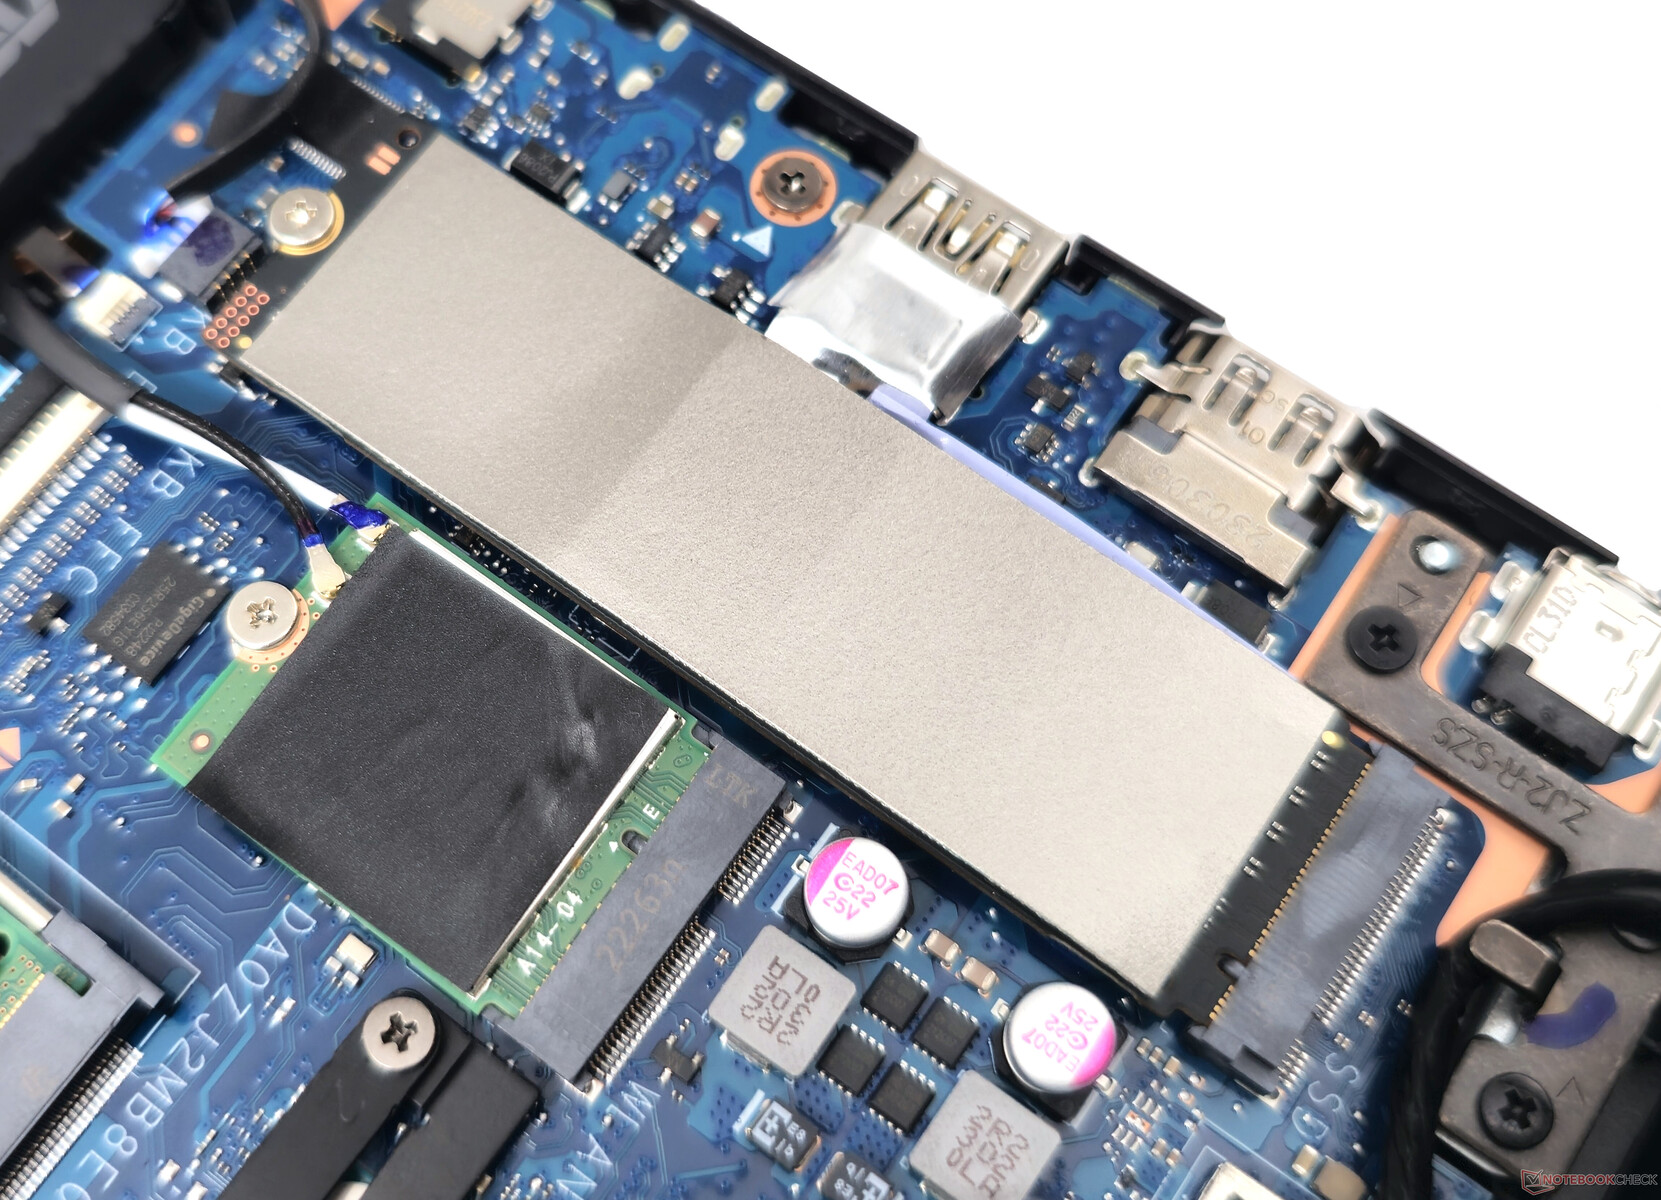
El SSD NVMe Samsung PM9B1 instalado ofrece un rendimiento satisfactorio para la mayoría de aplicaciones. Asus ha puesto una almohadilla térmica bajo la unidad, lo que ayuda a mantener un rendimiento relativamente estable durante el test de bucle de lectura DiskSpd.
Dicho esto, el SSD PM9B1 queda significativamente por detrás de la competencia en casi todos los aspectos excepto en las escrituras 4K. No hay posibilidad de ampliar el almacenamiento.

* ... más pequeño es mejor
Disk Throttling: DiskSpd Read Loop, Queue Depth 8
Encontrará más comparaciones de rendimiento de almacenamiento en nuestras Comparativas de HDD y SSD y SSD.
Rendimiento de la GPU
Asus implementa una GPU Nvidia GeForce RTX 3050 de 4 GB para portátiles en el VivoBook 14X. La RTX 3050 de 4 GB está desfasada para un dispositivo 2023 con un procesador Intel de 13ª generación, y lo vemos reflejado en las pruebas sintéticas y de juego.
El rendimiento acumulado en 3DMark es un 23% inferior al de la RTX 3050 Ti en el Schenker Vision 14y un 26% en comparación con la RTX 3050 de 6 GB del Lenovo Slim Pro 7.
El VivoBook 14X también se queda atrás en un 38% frente a la más reciente 35 W RTX 4050 del Gigabyte Aero 14 OLED.
| 3DMark 11 Performance | 13942 puntos | |
| 3DMark Ice Storm Standard Score | 70334 puntos | |
| 3DMark Cloud Gate Standard Score | 36793 puntos | |
| 3DMark Fire Strike Score | 8504 puntos | |
| 3DMark Fire Strike Extreme Score | 4371 puntos | |
| 3DMark Time Spy Score | 3832 puntos | |
ayuda | ||
| Blender / v3.3 Classroom OPTIX/RTX | |
| Asus VivoBook 14X K3405 | |
| Medio NVIDIA GeForce RTX 3050 4GB Laptop GPU (53 - 99, n=12) | |
| Lenovo Slim Pro 7 14ARP8 | |
| Schenker Vision 14 2022 RTX 3050 Ti | |
| Media de la clase Multimedia (12 - 105, n=22, últimos 2 años) | |
| Gigabyte Aero 14 OLED BMF | |
| Acer Swift X SFX14-71G | |
| MSI Stealth 14 Studio A13V | |
| Blender / v3.3 Classroom CUDA | |
| Asus VivoBook 14X K3405 | |
| Asus VivoBook 14X K3405 | |
| Medio NVIDIA GeForce RTX 3050 4GB Laptop GPU (97 - 152, n=13) | |
| Lenovo Slim Pro 7 14ARP8 | |
| Schenker Vision 14 2022 RTX 3050 Ti | |
| Gigabyte Aero 14 OLED BMF | |
| Media de la clase Multimedia (20 - 186, n=22, últimos 2 años) | |
| Acer Swift X SFX14-71G | |
| Blender / v3.3 Classroom CPU | |
| Medio NVIDIA GeForce RTX 3050 4GB Laptop GPU (388 - 937, n=11) | |
| Acer Swift X SFX14-71G | |
| Schenker Vision 14 2022 RTX 3050 Ti | |
| Gigabyte Aero 14 OLED BMF | |
| Asus VivoBook 14X K3405 | |
| Lenovo Slim Pro 7 14ARP8 | |
| Media de la clase Multimedia (134.5 - 1042, n=62, últimos 2 años) | |
| MSI Stealth 14 Studio A13V | |
* ... más pequeño es mejor
Rendimiento en juegos
El VivoBook 14X no está orientado al público gamer, pero es capaz de jugar decentemente a 1080p Ultra, particularmente con títulos eSports menos exigentes.
Se pueden lograr aumentos perceptibles de la frecuencia de imagen aprovechando los algoritmos de escalado de los juegos compatibles.
| The Witcher 3 - 1920x1080 Ultra Graphics & Postprocessing (HBAO+) | |
| MSI Stealth 14 Studio A13V | |
| Gigabyte Aero 14 OLED BMF | |
| Gigabyte Aero 14 OLED BMF | |
| Acer Swift X SFX14-71G | |
| Media de la clase Multimedia (11 - 121, n=7, últimos 2 años) | |
| Lenovo Slim Pro 7 14ARP8 | |
| Schenker Vision 14 2022 RTX 3050 Ti | |
| Asus VivoBook 14X K3405 | |
| Final Fantasy XV Benchmark - 1920x1080 High Quality | |
| MSI Stealth 14 Studio A13V | |
| Acer Swift X SFX14-71G | |
| Gigabyte Aero 14 OLED BMF | |
| Media de la clase Multimedia (7.61 - 144.4, n=57, últimos 2 años) | |
| Lenovo Slim Pro 7 14ARP8 | |
| Schenker Vision 14 2022 RTX 3050 Ti | |
| Asus VivoBook 14X K3405 | |
| Strange Brigade - 1920x1080 ultra AA:ultra AF:16 | |
| MSI Stealth 14 Studio A13V | |
| Acer Swift X SFX14-71G | |
| Gigabyte Aero 14 OLED BMF | |
| Media de la clase Multimedia (13.3 - 303, n=57, últimos 2 años) | |
| Schenker Vision 14 2022 RTX 3050 Ti | |
| Asus VivoBook 14X K3405 | |
| Dota 2 Reborn - 1920x1080 ultra (3/3) best looking | |
| MSI Stealth 14 Studio A13V | |
| Gigabyte Aero 14 OLED BMF | |
| Acer Swift X SFX14-71G | |
| Asus VivoBook 14X K3405 | |
| Schenker Vision 14 2022 RTX 3050 Ti | |
| Lenovo Slim Pro 7 14ARP8 | |
| Media de la clase Multimedia (29 - 179.9, n=59, últimos 2 años) | |
Witcher 3 Tabla de FPS
No hay grandes problemas con la refrigeración de la GPU, ya que observamos frecuencias de cuadro relativamente estables al ejecutar The Witcher 3 a 1080p Ultra.
Witcher 3 FPS Chart
| bajo | medio | alto | ultra | QHD | 4K | |
|---|---|---|---|---|---|---|
| GTA V (2015) | 175 | 167.8 | 100.4 | 48.4 | 33.7 | 32 |
| The Witcher 3 (2015) | 150.4 | 68.8 | 70.6 | 40 | 24.4 | |
| Dota 2 Reborn (2015) | 163.4 | 141 | 135.3 | 115.3 | 57.1 | |
| Final Fantasy XV Benchmark (2018) | 99.4 | 52.5 | 37.7 | 27.3 | 15 | |
| X-Plane 11.11 (2018) | 111 | 95.2 | 78.9 | 66.1 | ||
| Far Cry 5 (2018) | 127 | 68 | 61 | 57 | 39 | 19 |
| Strange Brigade (2018) | 179.7 | 78.6 | 65.2 | 57.9 | 41.1 | 23.4 |
| F1 2021 (2021) | 232 | 123.6 | 96 | 44.1 | 32.1 | 12.7 |
| Cyberpunk 2077 1.6 (2022) | 51.7 | 38.2 | 28.4 | 25.3 | 15.6 | 5.57 |
| F1 22 (2022) | 119.4 | 108.5 | 75.2 | 21.3 | 13.2 | 5.9 |
Echa un vistazo a nuestro GPU Nvidia GeForce RTX 3050 para portátiles para obtener más información y comparaciones de rendimiento.
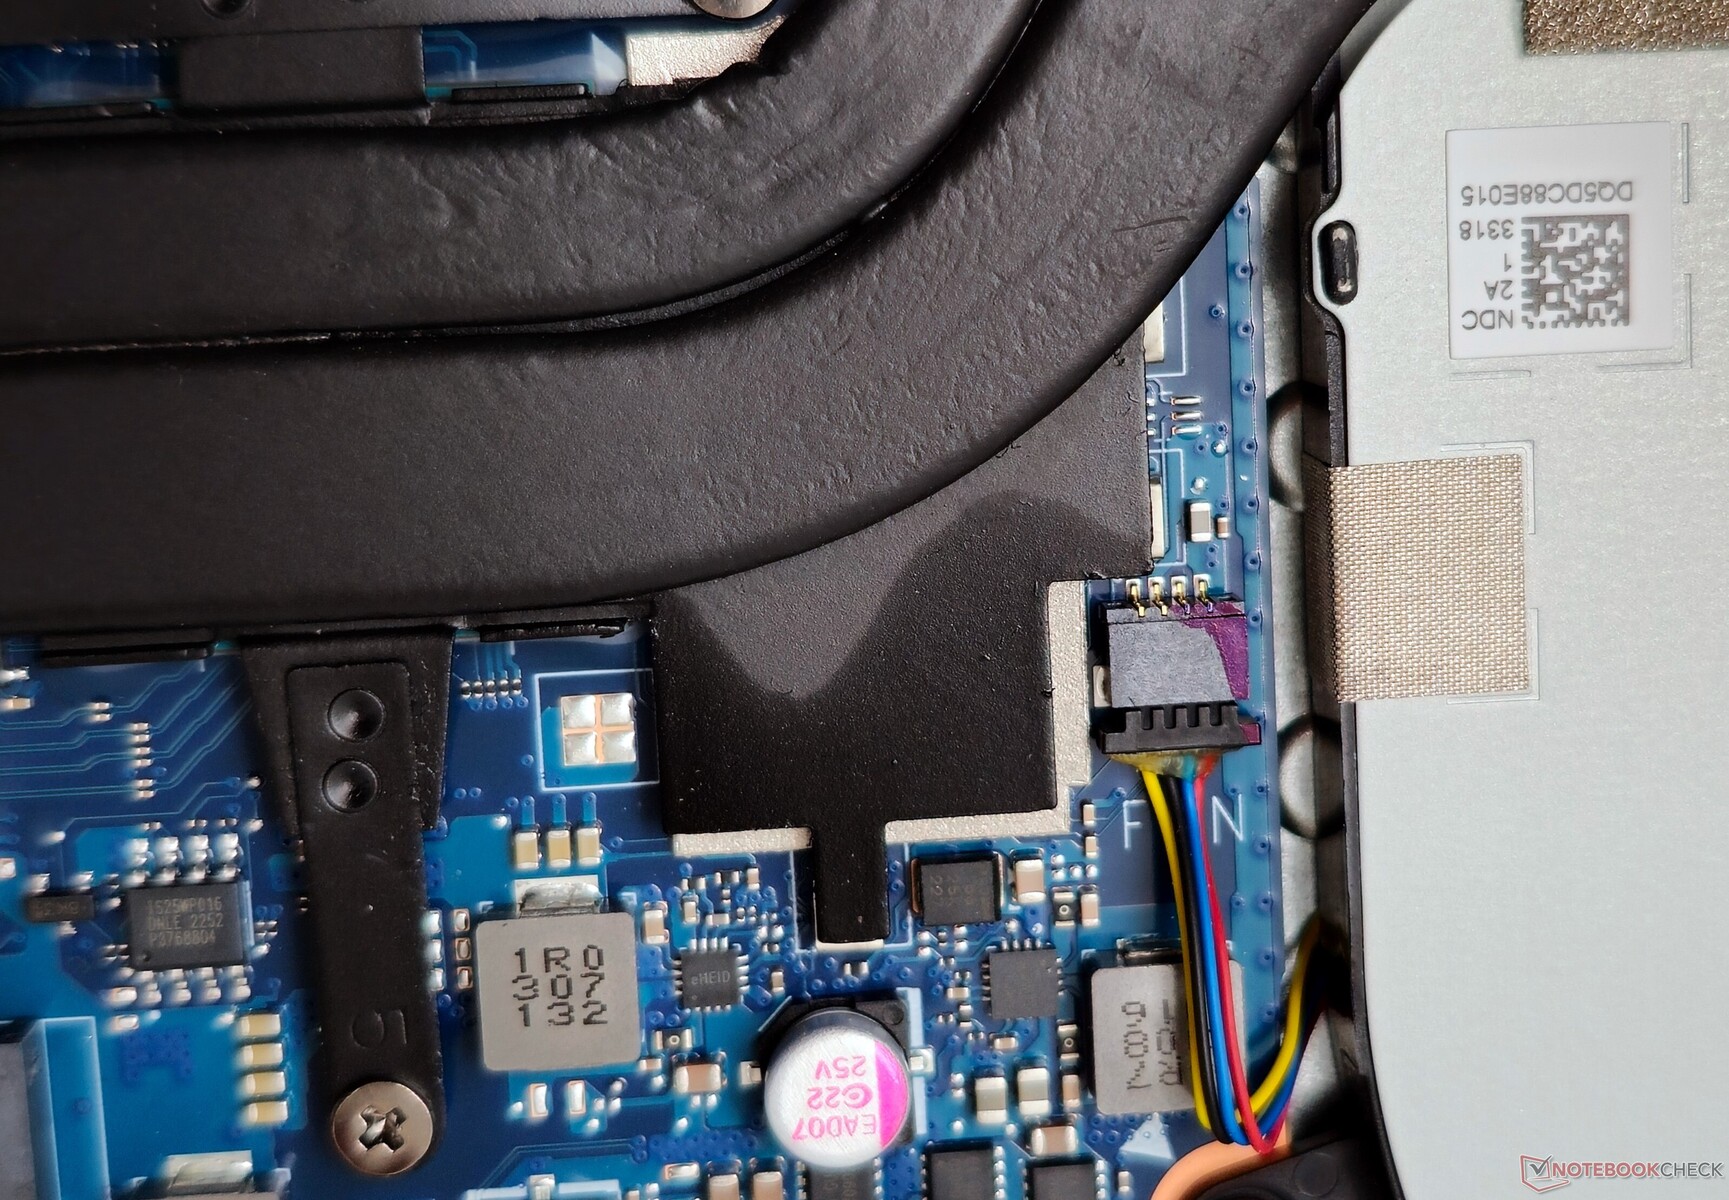
Emisiones: Combinación de ventilador único y tubo de calor doble exprimido al máximo
Ruido del sistema
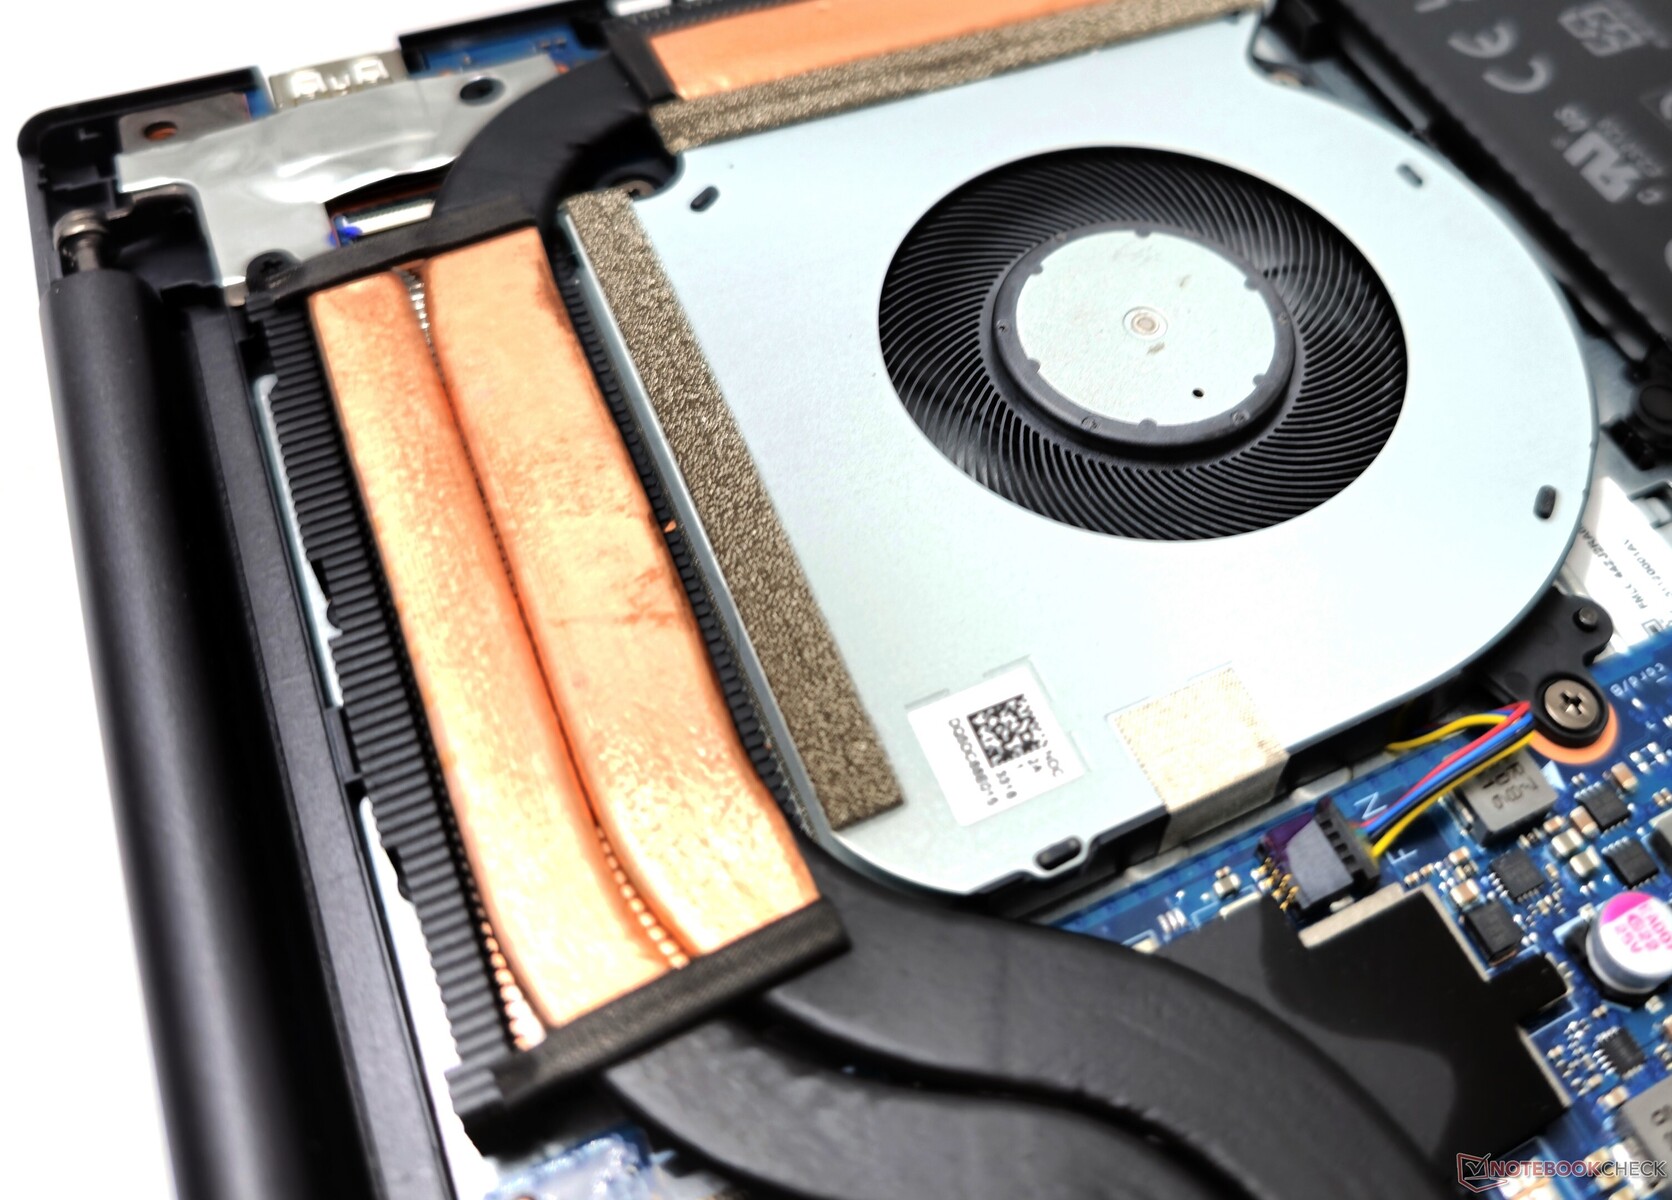
Asus equipa al VivoBook 14X con un único ventilador para refrigerar tanto la CPU como la GPU. Similar a nuestros hallazgos con otros modelos VivoBook, Asus parece haber puesto un límite al ruido máximo del ventilador para cada perfil de rendimiento.
La compañía afirma menos de 40 dB(A) de ruido de ventilador en el perfil Estándar. Registramos niveles de presión sonora de 31 dB(A) en el modo Susurro, 42 dB(A) en Estándar, y casi 53 dB(A) en el modo Rendimiento.
El perfil del modo Full Speed mantiene un SPL constante de casi 53 dB(A) independientemente de la carga.
Ruido
| Ocioso |
| 22.08 / 22.08 / 22.08 dB(A) |
| Carga |
| 52.98 / 52.67 dB(A) |
 | ||
30 dB silencioso 40 dB(A) audible 50 dB(A) ruidosamente alto |
||
min: | ||
| Modo de rendimiento | En ralentí dB(A) | Carga media dB(A) | Carga máxima dB(A) | El Witcher 3 1080p Ultra dB(A) |
|---|---|---|---|---|
| Susurro | 21,73 | 30,61 | 31,13 | 30,67 / 34 fps |
| Estándar | 21,62 | 42,33 | 42,12 | 42,23 / 38 fps |
| Rendimiento | 22,08 | 52,98 | 52,67 | 52,65 / 40 fps |
| Asus VivoBook 14X K3405 i5-13500H, GeForce RTX 3050 4GB Laptop GPU | Acer Swift X SFX14-71G i7-13700H, GeForce RTX 4050 Laptop GPU | MSI Stealth 14 Studio A13V i7-13700H, GeForce RTX 4050 Laptop GPU | Gigabyte Aero 14 OLED BMF i7-13700H, GeForce RTX 4050 Laptop GPU | Lenovo Slim Pro 7 14ARP8 R7 7735HS, GeForce RTX 3050 6GB Laptop GPU | Schenker Vision 14 2022 RTX 3050 Ti i7-12700H, GeForce RTX 3050 Ti Laptop GPU | |
|---|---|---|---|---|---|---|
| Noise | -14% | -10% | -11% | 4% | -4% | |
| apagado / medio ambiente * (dB) | 21.46 | 24.8 -16% | 25.3 -18% | 24 -12% | 22.7 -6% | 24.4 -14% |
| Idle Minimum * (dB) | 22.08 | 28.2 -28% | 25.3 -15% | 24 -9% | 22.8 -3% | 24.4 -11% |
| Idle Average * (dB) | 22.08 | 31.8 -44% | 25 -13% | 24 -9% | 22.8 -3% | 24.4 -11% |
| Idle Maximum * (dB) | 22.08 | 31.8 -44% | 33.7 -53% | 35.71 -62% | 22.8 -3% | 27.8 -26% |
| Load Average * (dB) | 52.98 | 38.2 28% | 42.2 20% | 43.8 17% | 43.3 18% | |
| Witcher 3 ultra * (dB) | 52.7 | 50 5% | 51 3% | 40.22 24% | 43.8 17% | 48.2 9% |
| Load Maximum * (dB) | 52.67 | 52.2 1% | 51 3% | 51.93 1% | 47.1 11% | 48.8 7% |
* ... más pequeño es mejor
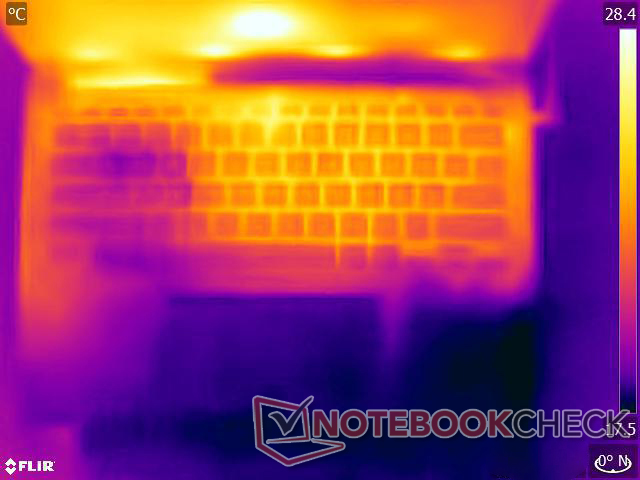
Temperatura
Asus afirma haber mejorado el rendimiento térmico con el nuevo diseño de ventilador, pero la combinación de ventilador único y doble tubo de calor tiene sus límites a la hora de mantener las temperaturas superficiales bajo control bajo estrés.
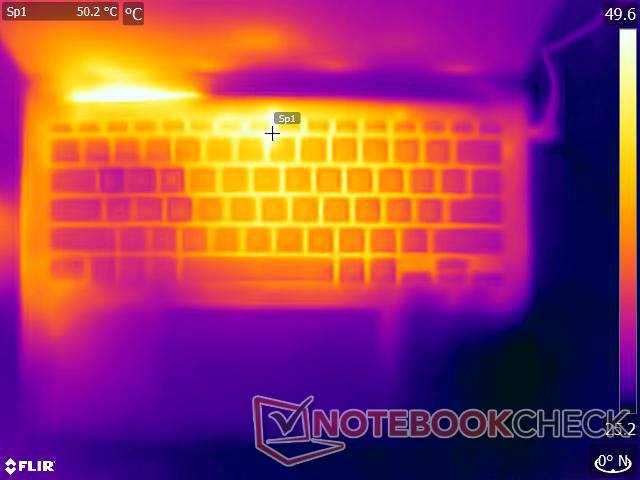
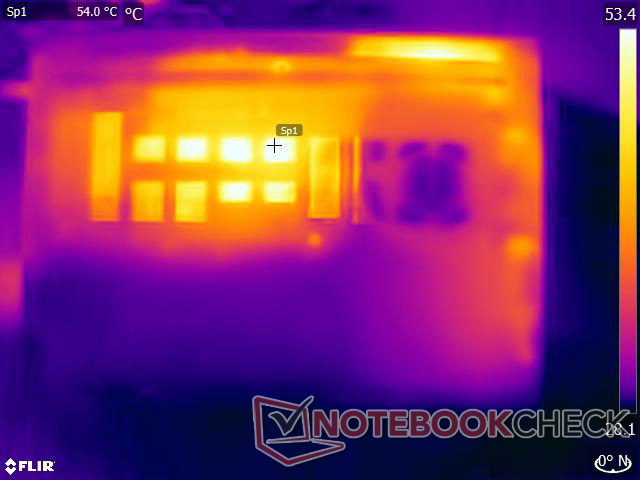
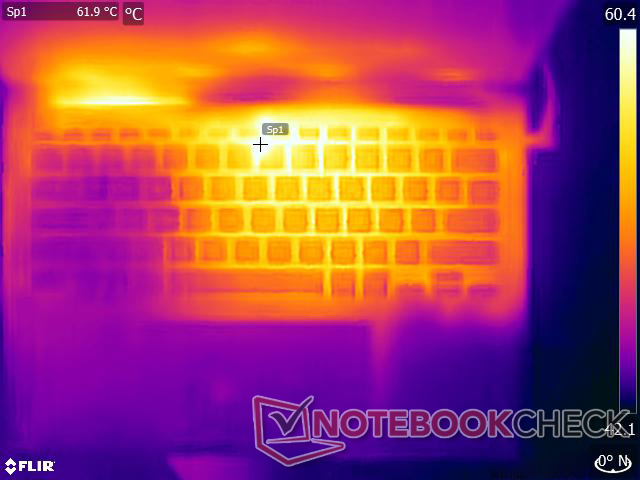
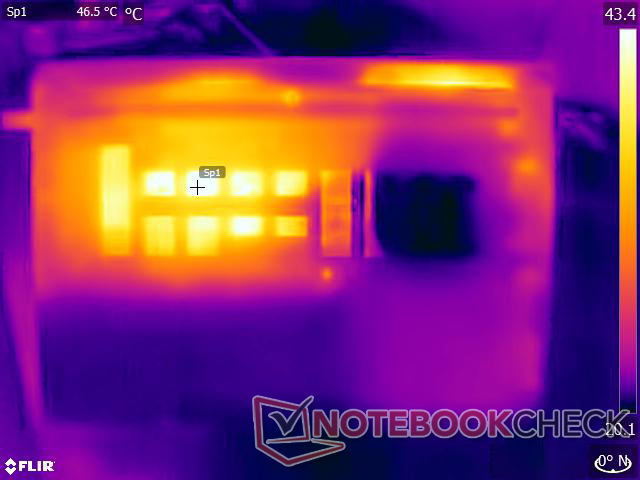
Registramos temperaturas de hasta 49 °C en la parte superior y hasta 54 °C en la inferior bajo carga máxima. Las áreas del touchpad y el reposamuñecas derecho permanecen relativamente frescas, sin embargo.
(-) La temperatura máxima en la parte superior es de 49.2 °C / 121 F, frente a la media de 36.8 °C / 98 F, que oscila entre 21 y 71 °C para la clase Multimedia.
(-) El fondo se calienta hasta un máximo de 54 °C / 129 F, frente a la media de 39.1 °C / 102 F
(+) En reposo, la temperatura media de la parte superior es de 30.6 °C / 87# F, frente a la media del dispositivo de 31.3 °C / 88 F.
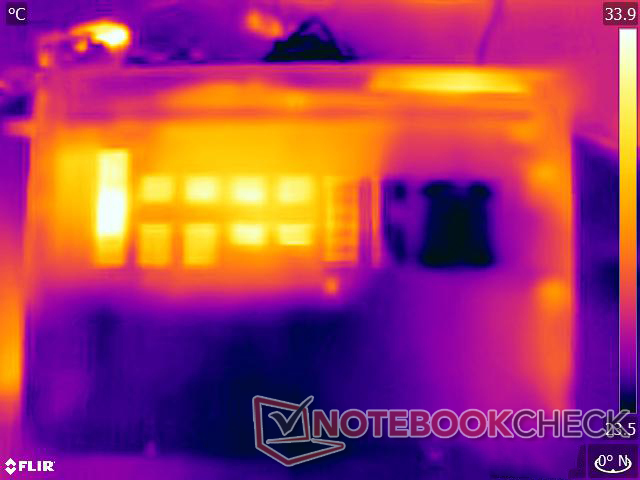
(±) Jugando a The Witcher 3, la temperatura media de la parte superior es de 37.8 °C / 100 F, frente a la media del dispositivo de 31.3 °C / 88 F.
(+) Los reposamanos y el panel táctil alcanzan como máximo la temperatura de la piel (35.4 °C / 95.7 F) y, por tanto, no están calientes.
(-) La temperatura media de la zona del reposamanos de dispositivos similares fue de 28.7 °C / 83.7 F (-6.7 °C / -12 F).
| Asus VivoBook 14X K3405 Intel Core i5-13500H, NVIDIA GeForce RTX 3050 4GB Laptop GPU | Acer Swift X SFX14-71G Intel Core i7-13700H, NVIDIA GeForce RTX 4050 Laptop GPU | MSI Stealth 14 Studio A13V Intel Core i7-13700H, NVIDIA GeForce RTX 4050 Laptop GPU | Gigabyte Aero 14 OLED BMF Intel Core i7-13700H, NVIDIA GeForce RTX 4050 Laptop GPU | Lenovo Slim Pro 7 14ARP8 AMD Ryzen 7 7735HS, NVIDIA GeForce RTX 3050 6GB Laptop GPU | Schenker Vision 14 2022 RTX 3050 Ti Intel Core i7-12700H, NVIDIA GeForce RTX 3050 Ti Laptop GPU | |
|---|---|---|---|---|---|---|
| Heat | 16% | -0% | 18% | 21% | 9% | |
| Maximum Upper Side * (°C) | 49.2 | 46.4 6% | 46.9 5% | 42 15% | 42.2 14% | 48.4 2% |
| Maximum Bottom * (°C) | 54 | 49 9% | 56.1 -4% | 52 4% | 49 9% | 57.1 -6% |
| Idle Upper Side * (°C) | 33.6 | 26.5 21% | 33.8 -1% | 26 23% | 24.4 27% | 28.1 16% |
| Idle Bottom * (°C) | 37.6 | 26.6 29% | 37.9 -1% | 27 28% | 25.2 33% | 29 23% |
* ... más pequeño es mejor
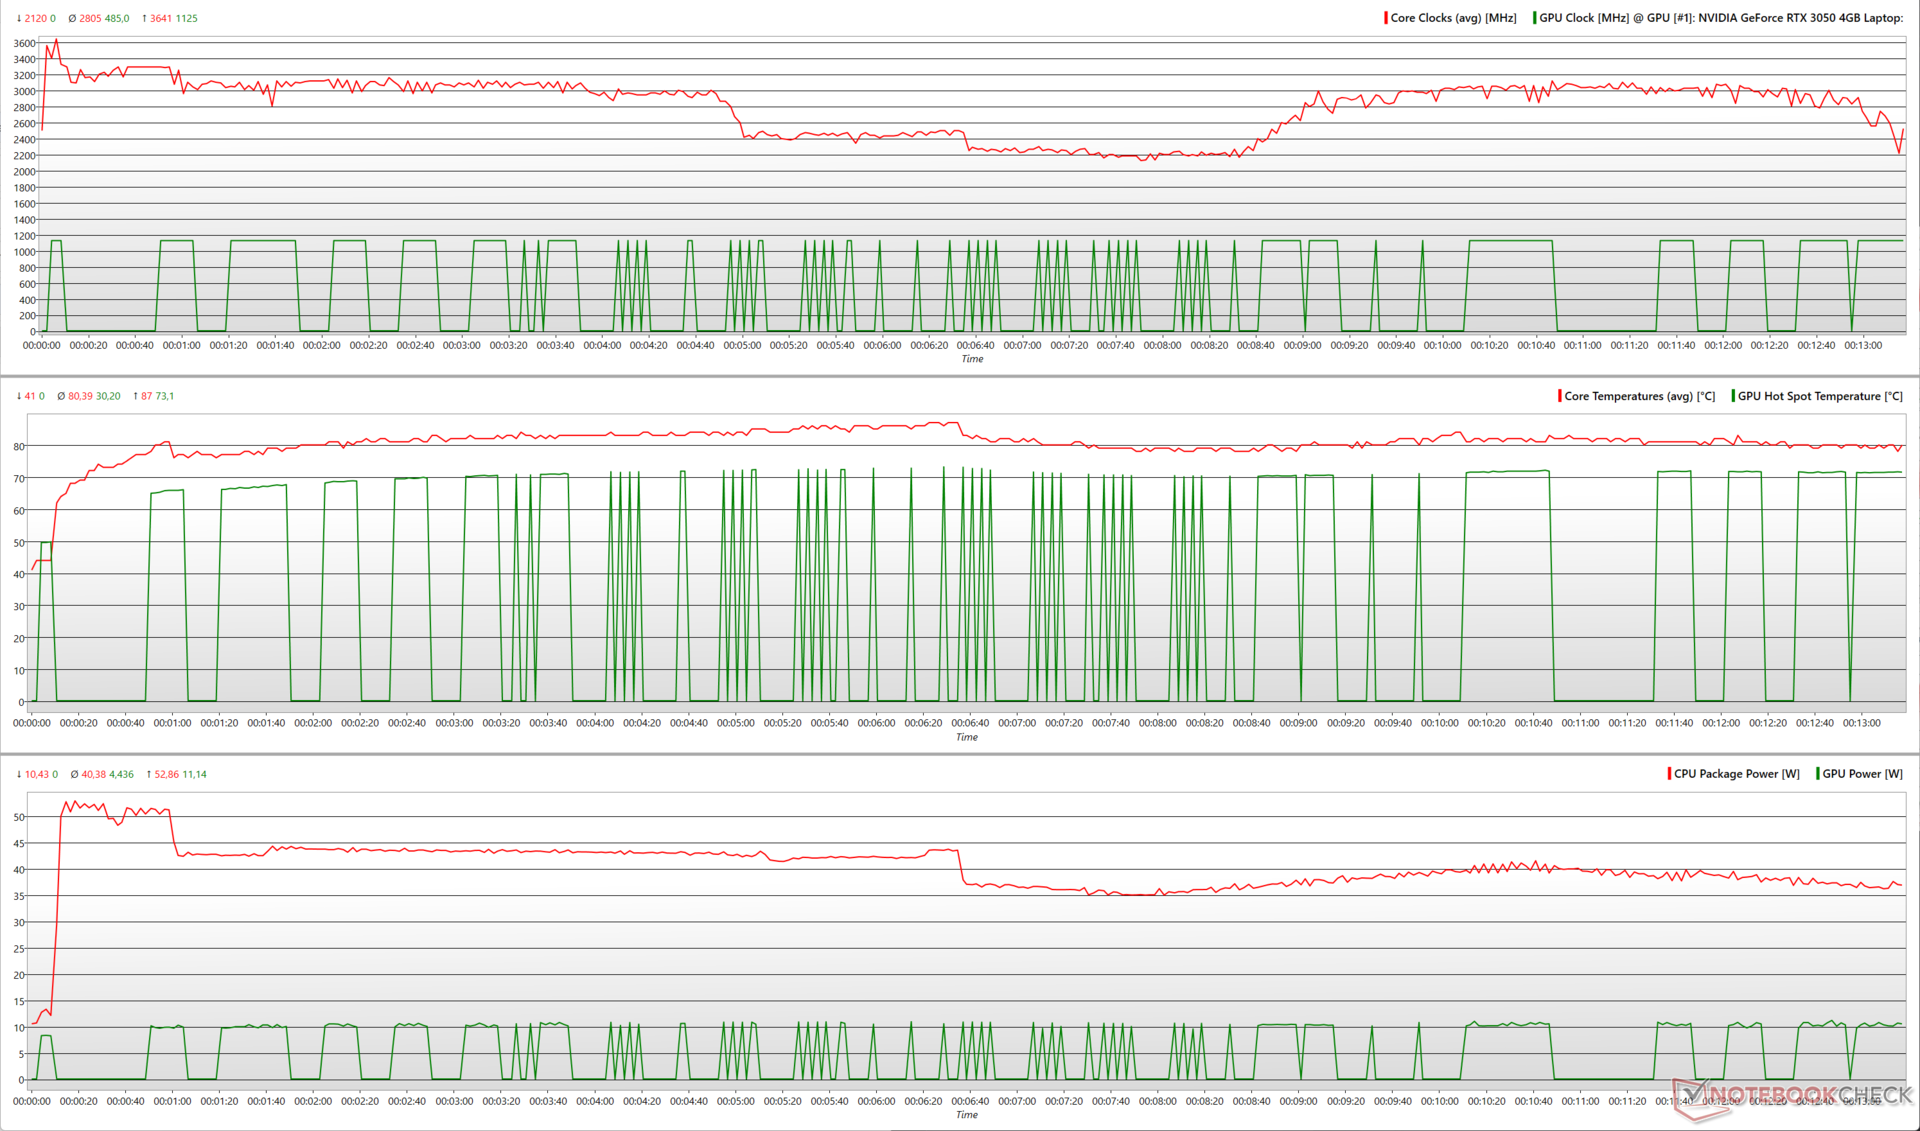
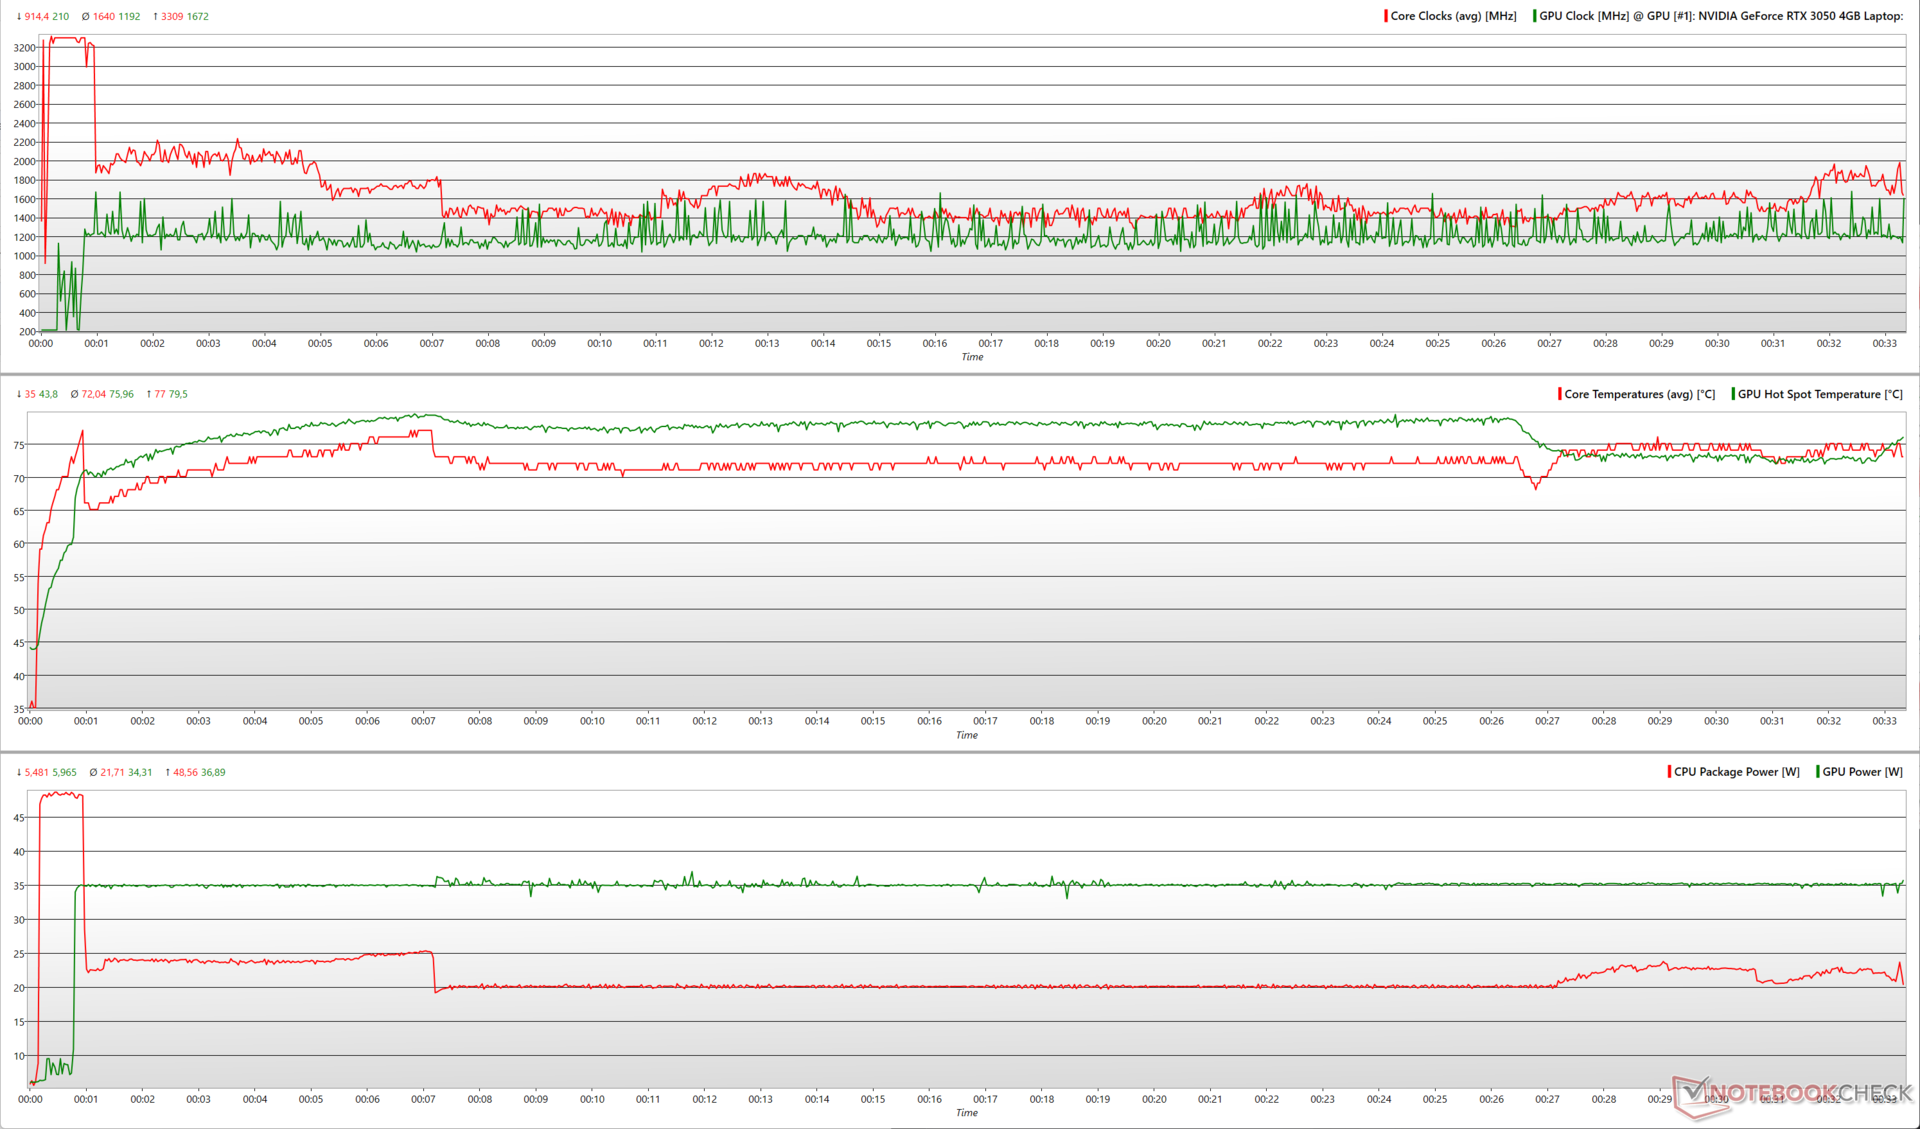
Prueba de resistencia
Al forzar el VivoBook 14X con Prime95 in-place large FFTs, el Core i5-13500H alcanza un pico de 3,6 GHz y consume casi 53 W de energía.
Si añadimos FurMark a la mezcla, el pico de potencia de la CPU cae hasta los 48,6 W y se mantiene en 22 W. La RTX 3050 muestra frecuencias medias de 1.192 MHz con un consumo de energía constante de 34 W.
| Prueba de estrés | Relojdela CPU (GHz) | Reloj de la GPU (MHz) | Temperatura media dela CPU (°C) | Temperatura media de la GPU (°C) |
| Sistema en reposo | 3,8 | 0 | 40 | 25,1 |
| Prime95 | 2,95 | 0 | 80 | 25,3 |
| Prime95 + FurMark | 1,75 | 1.177 | 72 | 68,3 |
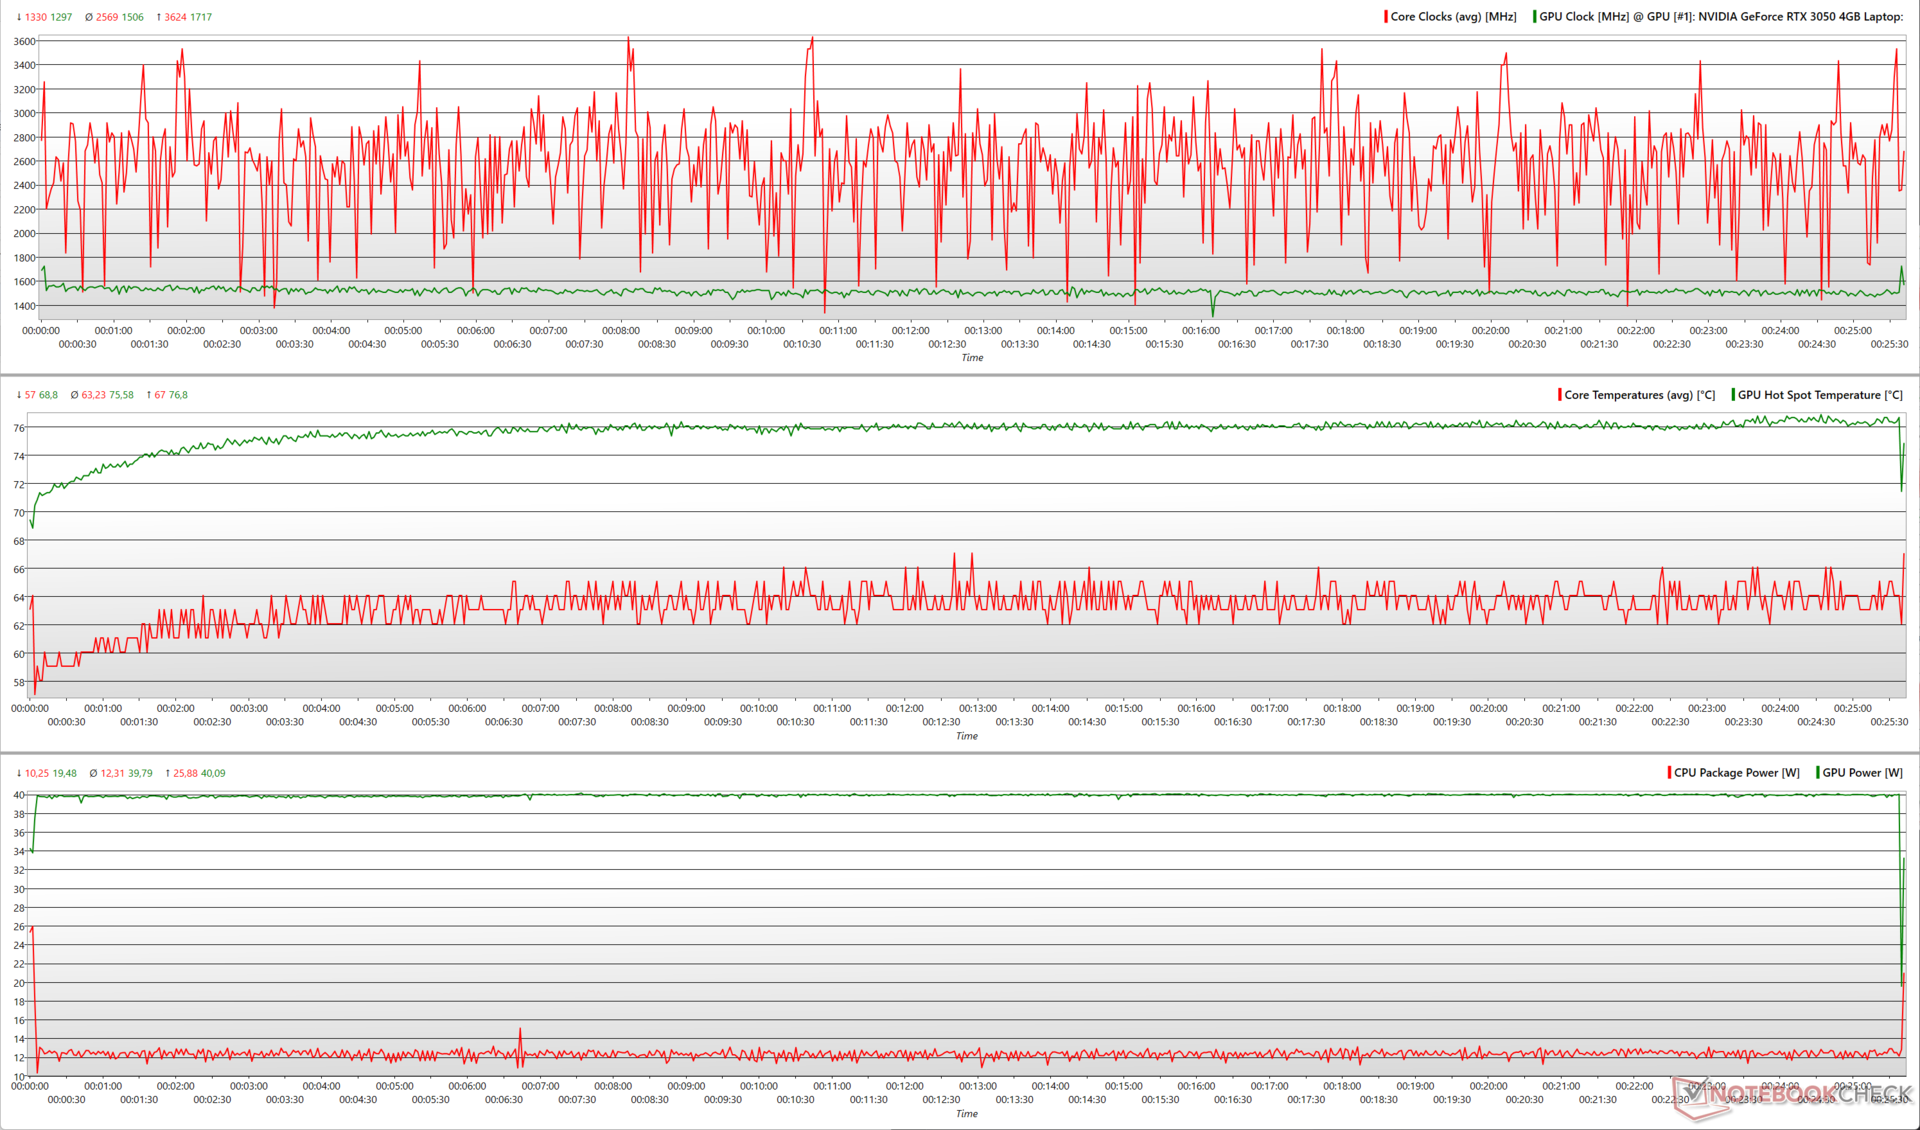
| Witcher 3 1080p Ultra | 2,56 | 1.506 | 63,2 | 75,6 |
Con Witcher 3 a 1080p Ultra, la RTX 3050 puede alcanzar un pico de 1.717 MHz y consumir 40 W. El Core i5-13500H tiene un promedio de 12 W y una frecuencia media de unos 2,6 GHz.
Según Asus, el sistema de refrigeración del VivoBook 14X puede permitir un TDP combinado de 55 W de CPU y GPU. Nuestras pruebas de estrés confirman esta afirmación, ya que observamos un consumo medio de 56 W al ejecutar Prime95 + FurMark y 52 W durante la prueba de estrés The Witcher 3.
Altavoces
Con un pico de sonoridad de 70,7 db(A), los altavoces estéreo del VivoBook 14X no son lo suficientemente altos. Dicho esto, la sintonización Dirac puede permitirse cierta cantidad de graves, manteniendo al mismo tiempo unos medios y agudos equilibrados.
Los usuarios pueden obtener una experiencia de audio mucho mejor conectando dispositivos de audio externos mediante el conector de audio de 3,5 mm o a través de Bluetooth 5.3.
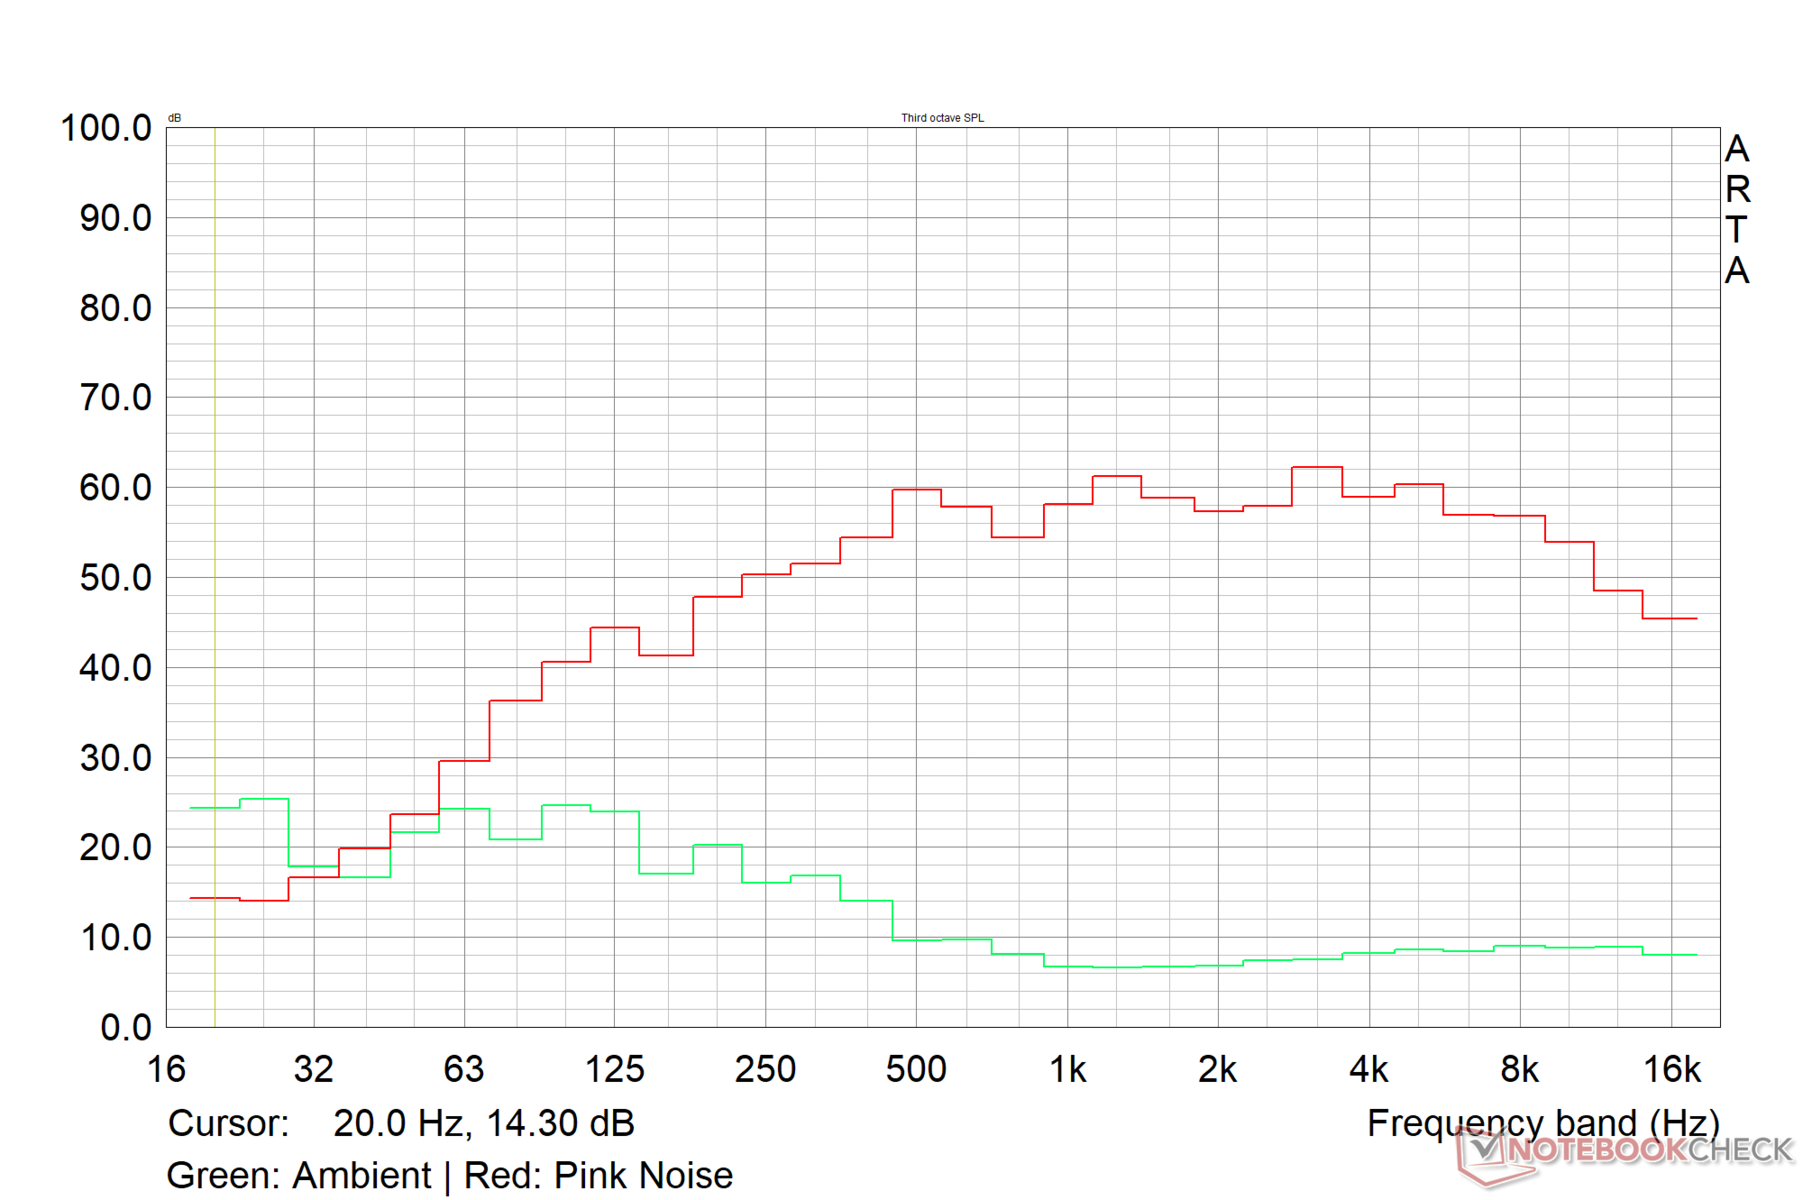
Asus VivoBook 14X K3405 análisis de audio
(-) | altavoces no muy altos (#70.7 dB)
Graves 100 - 315 Hz
(±) | lubina reducida - en promedio 10.8% inferior a la mediana
(±) | la linealidad de los graves es media (7.4% delta a frecuencia anterior)
Medios 400 - 2000 Hz
(+) | medios equilibrados - a sólo 2.1% de la mediana
(+) | los medios son lineales (6.3% delta a la frecuencia anterior)
Altos 2 - 16 kHz
(+) | máximos equilibrados - a sólo 2.2% de la mediana
(+) | los máximos son lineales (4.8% delta a la frecuencia anterior)
Total 100 - 16.000 Hz
(+) | el sonido global es lineal (13.2% de diferencia con la mediana)
En comparación con la misma clase
» 27% de todos los dispositivos probados de esta clase eran mejores, 5% similares, 68% peores
» El mejor tuvo un delta de 5%, la media fue 17%, el peor fue ###max##%
En comparación con todos los dispositivos probados
» 13% de todos los dispositivos probados eran mejores, 3% similares, 84% peores
» El mejor tuvo un delta de 4%, la media fue 23%, el peor fue ###max##%
Apple MacBook Pro 16 2021 M1 Pro análisis de audio
(+) | los altavoces pueden reproducir a un volumen relativamente alto (#84.7 dB)
Graves 100 - 315 Hz
(+) | buen bajo - sólo 3.8% lejos de la mediana
(+) | el bajo es lineal (5.2% delta a la frecuencia anterior)
Medios 400 - 2000 Hz
(+) | medios equilibrados - a sólo 1.3% de la mediana
(+) | los medios son lineales (2.1% delta a la frecuencia anterior)
Altos 2 - 16 kHz
(+) | máximos equilibrados - a sólo 1.9% de la mediana
(+) | los máximos son lineales (2.7% delta a la frecuencia anterior)
Total 100 - 16.000 Hz
(+) | el sonido global es lineal (4.6% de diferencia con la mediana)
En comparación con la misma clase
» 0% de todos los dispositivos probados de esta clase eran mejores, 0% similares, 100% peores
» El mejor tuvo un delta de 5%, la media fue 17%, el peor fue ###max##%
En comparación con todos los dispositivos probados
» 0% de todos los dispositivos probados eran mejores, 0% similares, 100% peores
» El mejor tuvo un delta de 4%, la media fue 23%, el peor fue ###max##%
Gestión de la energía: Consumo frugal en ralentí y en carga
Consumo de energía
La combinación Core i5-13500H y RTX 3050 es bastante económica en términos de consumo de energía en comparación con la competencia. El VivoBook 14X OLED es capaz de usar completamente el adaptador de corriente de 90 W suministrado bajo carga máxima.
Mientras que el Lenovo Slim Pro 7 con unRyzen 7 7735HSy una RTX 3050 de 6 GB demuestra un consumo de energía un 8% inferior en carga media, muestra mayores consumos en inactivo, juegos y carga máxima.
| Off / Standby | |
| Ocioso | |
| Carga |
|
Clave:
min: | |
| Asus VivoBook 14X K3405 i5-13500H, GeForce RTX 3050 4GB Laptop GPU, , 2880x1800, 14" | Acer Swift X SFX14-71G i7-13700H, GeForce RTX 4050 Laptop GPU, OLED, 2880x1800, 14.5" | MSI Stealth 14 Studio A13V i7-13700H, GeForce RTX 4050 Laptop GPU, IPS, 2560x1600, 14" | Gigabyte Aero 14 OLED BMF i7-13700H, GeForce RTX 4050 Laptop GPU, OLED, 2880x1800, 14" | Lenovo Slim Pro 7 14ARP8 R7 7735HS, GeForce RTX 3050 6GB Laptop GPU, IPS, 2560x1600, 14.5" | Schenker Vision 14 2022 RTX 3050 Ti i7-12700H, GeForce RTX 3050 Ti Laptop GPU, IPS, 2880x1800, 14" | Medio NVIDIA GeForce RTX 3050 4GB Laptop GPU | Media de la clase Multimedia | |
|---|---|---|---|---|---|---|---|---|
| Power Consumption | -30% | -100% | -14% | -36% | -26% | -37% | -17% | |
| Idle Minimum * (Watt) | 4.96 | 8.4 -69% | 10.4 -110% | 7.4 -49% | 7.6 -53% | 7.5 -51% | 7.17 ? -45% | 5.66 ? -14% |
| Idle Average * (Watt) | 7.54 | 11.5 -53% | 19.1 -153% | 8.3 -10% | 12.2 -62% | 10.4 -38% | 10.4 ? -38% | 10.2 ? -35% |
| Idle Maximum * (Watt) | 9.31 | 11.9 -28% | 19.4 -108% | 8.7 7% | 12.8 -37% | 11.4 -22% | 14.8 ? -59% | 12.5 ? -34% |
| Load Average * (Watt) | 83.4 | 84.9 -2% | 95.9 -15% | 76 9% | 76.5 8% | 83.3 -0% | 89.7 ? -8% | 65.2 ? 22% |
| Witcher 3 ultra * (Watt) | 73.3 | 83.6 -14% | 141.6 -93% | 70 5% | 89.5 -22% | 92.7 -26% | ||
| Load Maximum * (Watt) | 91.74 | 104.2 -14% | 203 -121% | 132 -44% | 135.7 -48% | 110.3 -20% | 124.8 ? -36% | 113.5 ? -24% |
* ... más pequeño es mejor
Power Consumption: The Witcher 3 / Stress test
Power Consumption: External monitor
Duración de la batería
La batería de 63 WHr del VivoBook 14X no ofrece una longevidad extraordinaria, pero debería aguantar la mayor parte de una jornada de trabajo estándar antes de necesitar una recarga.
La batería dura casi 10,5 horas reproduciendo un vídeo H.264 1080p a 150 nits de brillo, lo que es impresionante. Sin embargo, el aguante del portátil en juegos es considerablemente menor, con poco más de una hora.
El adaptador de corriente incluido es capaz de recargar la batería del portátil del 0% al 60% en unos 50 minutos.
| Asus VivoBook 14X K3405 i5-13500H, GeForce RTX 3050 4GB Laptop GPU, 63 Wh | Acer Swift X SFX14-71G i7-13700H, GeForce RTX 4050 Laptop GPU, 76 Wh | MSI Stealth 14 Studio A13V i7-13700H, GeForce RTX 4050 Laptop GPU, 72 Wh | Gigabyte Aero 14 OLED BMF i7-13700H, GeForce RTX 4050 Laptop GPU, 63 Wh | Lenovo Slim Pro 7 14ARP8 R7 7735HS, GeForce RTX 3050 6GB Laptop GPU, 73 Wh | Schenker Vision 14 2022 RTX 3050 Ti i7-12700H, GeForce RTX 3050 Ti Laptop GPU, 99.8 Wh | Media de la clase Multimedia | |
|---|---|---|---|---|---|---|---|
| Duración de Batería | -17% | -17% | 15% | 30% | 41% | 55% | |
| H.264 (h) | 10.4 | 9.5 -9% | 6.6 -37% | 11.1 7% | 17.1 ? 64% | ||
| WiFi v1.3 (h) | 8.1 | 7.7 -5% | 6.3 -22% | 7.6 -6% | 10.5 30% | 10.1 25% | 12.2 ? 51% |
| Witcher 3 ultra (h) | 1.3 | ||||||
| Load (h) | 1.1 | 0.7 -36% | 1.2 9% | 1.5 36% | 2.1 91% | 1.664 ? 51% | |
| Reader / Idle (h) | 11.3 | 24.9 ? |
Pro
Contra
Veredicto: Portátil multimedia versátil con mucho margen de mejora
El Asus VivoBook 14X K3405 aporta las ventajas de rendimiento y eficiencia del Intel Core i5-13500Hen un chasis elegante y ligero.
El portátil ofrece una conectividad decente, pero el rendimiento Wi-Fi 6E necesita más refinamientos. También se echa en falta Thunderbolt 4.
Asus usa un panel Samsung OLED 2.8K 90 Hz en el VivoBook 14X que muestra excelentes características de color para los editores en ciernes. El panel sufre de PWM a niveles bajos de brillo, pero usa DC Dimming para compensar algo el parpadeo a mayor iluminación.
El Asus VivoBook 14X no grita precisamente potencia y ciertamente puede beneficiarse de mejoras de GPU y refrigeración, pero es un portátil multimedia bien dotado que también permite algún juego ligero aparte"
El Core i5-13500H tiene algunos méritos a su favor en nuestras pruebas, pero las limitaciones del chasis y la refrigeración del VivoBook 14X no permiten que la CPU saque todo su potencial. Una RTX 4050 de 35 W habría sido la guinda del pastel, pero es probable que Asus haya optado por la vetusta RTX 3050 para mantener los costes bajos.
También nos gustaría ver la transición de Asus a un sistema de refrigeración de doble ventilador en próximas iteraciones, ya que la solución de un solo ventilador del VivoBook 14X puede llegar rápidamente a sus límites.
A pesar de estas limitaciones, el Asus VivoBook 14X sigue siendo un atractivo portátil multimedia de gama media-alta cercano a los 1.100 euros (menos de ₹1.000). Una alternativa viable es el Lenovo Slim Pro 7 que ofrece una pantalla táctil IPS de 2,5K y Ryzen 7 7735HS.
El Gigabyte Aero 14 OLED con una RTX 4050 de 35 W y Core i7-13700H ofrece una configuración más actual, siempre que estés dispuesto a desembolsar el sobreprecio.
Precio y disponibilidad
La combinación probada de Core i5-13500 y RTX 3050 del VivoBook 14X OLED se vende al por menor por ₹96.990, y la única forma de adquirirlo es a través de la tienda online Asus India.
Amazon India y Flipkart solo tienen en stock la versión con Core i5-13500H y RTX 2050, que cuesta unos 82.000 yenes. Amazon US y Best Buy US también parecen tener solo las SKU RTX 2050 con paneles OLED FHD+ por unos 850 dólares.
Asus VivoBook 14X K3405
- 08/07/2023 v7 (old)
Vaidyanathan Subramaniam
Transparencia
La selección de los dispositivos que se van a reseñar corre a cargo de nuestro equipo editorial. La muestra de prueba fue proporcionada al autor en calidad de préstamo por el fabricante o el minorista a los efectos de esta reseña. El prestamista no tuvo ninguna influencia en esta reseña, ni el fabricante recibió una copia de la misma antes de su publicación. No había ninguna obligación de publicar esta reseña. Como empresa de medios independiente, Notebookcheck no está sujeta a la autoridad de fabricantes, minoristas o editores.
Así es como prueba Notebookcheck
Cada año, Notebookcheck revisa de forma independiente cientos de portátiles y smartphones utilizando procedimientos estandarizados para asegurar que todos los resultados son comparables. Hemos desarrollado continuamente nuestros métodos de prueba durante unos 20 años y hemos establecido los estándares de la industria en el proceso. En nuestros laboratorios de pruebas, técnicos y editores experimentados utilizan equipos de medición de alta calidad. Estas pruebas implican un proceso de validación en varias fases. Nuestro complejo sistema de clasificación se basa en cientos de mediciones y puntos de referencia bien fundamentados, lo que mantiene la objetividad.Price comparison

