Análisis del MSI Katana GF76 12UGS: ¿Merece la pena uno de los portátiles gaming RTX 3070 Ti más asequibles?
En los portales de comparación, el MSI Katana aparece como uno de los portátiles de juego más asequibles. El primero es el modelo Alder Lake de 17 pulgadas por 1199 Euros para la versión con RTX 3050 Ti. El modelo con una RTX 3060 parte de 1349 Euros, y nuestra configuración de pruebas con la RTX 3070 Ti te costará 1949 Euros. Tras el Acer Nitro 5 y el hermano menor de 15 pulgadas, nuestro modelo de 17 pulgadas es el portátil más asequible con una RTX 3070 Ti.
El año pasado probamos el predecesor con una CPU Tiger Lake y RTX 3060y ahora sigue la actualización a Alder Lake y las GPUs Ti.
Dado que nuestra base de datos carece actualmente de portátiles asequibles de 17 pulgadas con GPU RTX 3070 Ti, comparamos el nuevo Katana además de su predecesor también con el significativamente más caro Razer Blade 17el mejor de todos, elAorus 17 XE4y los modelos de 15 y 16 pulgadas Lenovo Legion 5 Pro 16 G7y MSI Vector GP66 12UGSde 15 pulgadas.
Posibles contendientes en la comparación
Valoración | Fecha | Modelo | Peso | Altura | Tamaño | Resolución | Precio |
|---|---|---|---|---|---|---|---|
| 82.6 % v7 (old) | 05/2022 | MSI Katana GF76 12UGS i7-12700H, GeForce RTX 3070 Ti Laptop GPU | 2.7 kg | 25.2 mm | 17.30" | 1920x1080 | |
| 80.4 % v7 (old) | 06/2021 | MSI Katana GF76 11UE i7-11800H, GeForce RTX 3060 Laptop GPU | 2.7 kg | 25.2 mm | 17.30" | 1920x1080 | |
| 85.2 % v7 (old) | 04/2022 | Aorus 17 XE4 i7-12700H, GeForce RTX 3070 Ti Laptop GPU | 2.6 kg | 27 mm | 17.30" | 1920x1080 | |
| 90.1 % v7 (old) | 05/2022 | Razer Blade 17 (i7-12800H, RTX 3070 Ti) i7-12800H, GeForce RTX 3070 Ti Laptop GPU | 2.8 kg | 19.9 mm | 17.30" | 2560x1440 | |
| 88 % v7 (old) | 03/2022 | Lenovo Legion 5 Pro 16 G7 i7 RTX 3070Ti i7-12700H, GeForce RTX 3070 Ti Laptop GPU | 2.6 kg | 26.6 mm | 16.00" | 2560x1600 | |
| 86.9 % v7 (old) | 03/2022 | MSI Vector GP66 12UGS i9-12900H, GeForce RTX 3070 Ti Laptop GPU | 2.3 kg | 23.4 mm | 15.60" | 1920x1080 |
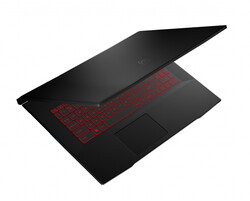
Estuche - Una espada de plástico
Los materiales utilizados en la carcasa del Katana son exclusivamente de plástico. La pantalla y su marco producen unos potentes chirridos incluso si sólo se deforma ligeramente, sobre todo en las esquinas superiores, e inmediatamente empezamos a preocuparnos por el panel. La base, en cambio, da una impresión de robustez. Por lo demás, la fabricación parece buena, y no notamos ninguna brecha evidente.
Las bisagras son capaces de abrir la pantalla hasta 180 grados. Sólo son ligeramente débiles en el último tercio del rango de apertura, pero por lo demás mantienen la pantalla en su sitio bastante bien.
El diseño es bastante sencillo, aparte de la colorida iluminación del teclado y las estilizadas letras de las teclas. Hay una gran muesca en la parte frontal de la base, que permite abrir fácilmente el portátil con una mano.
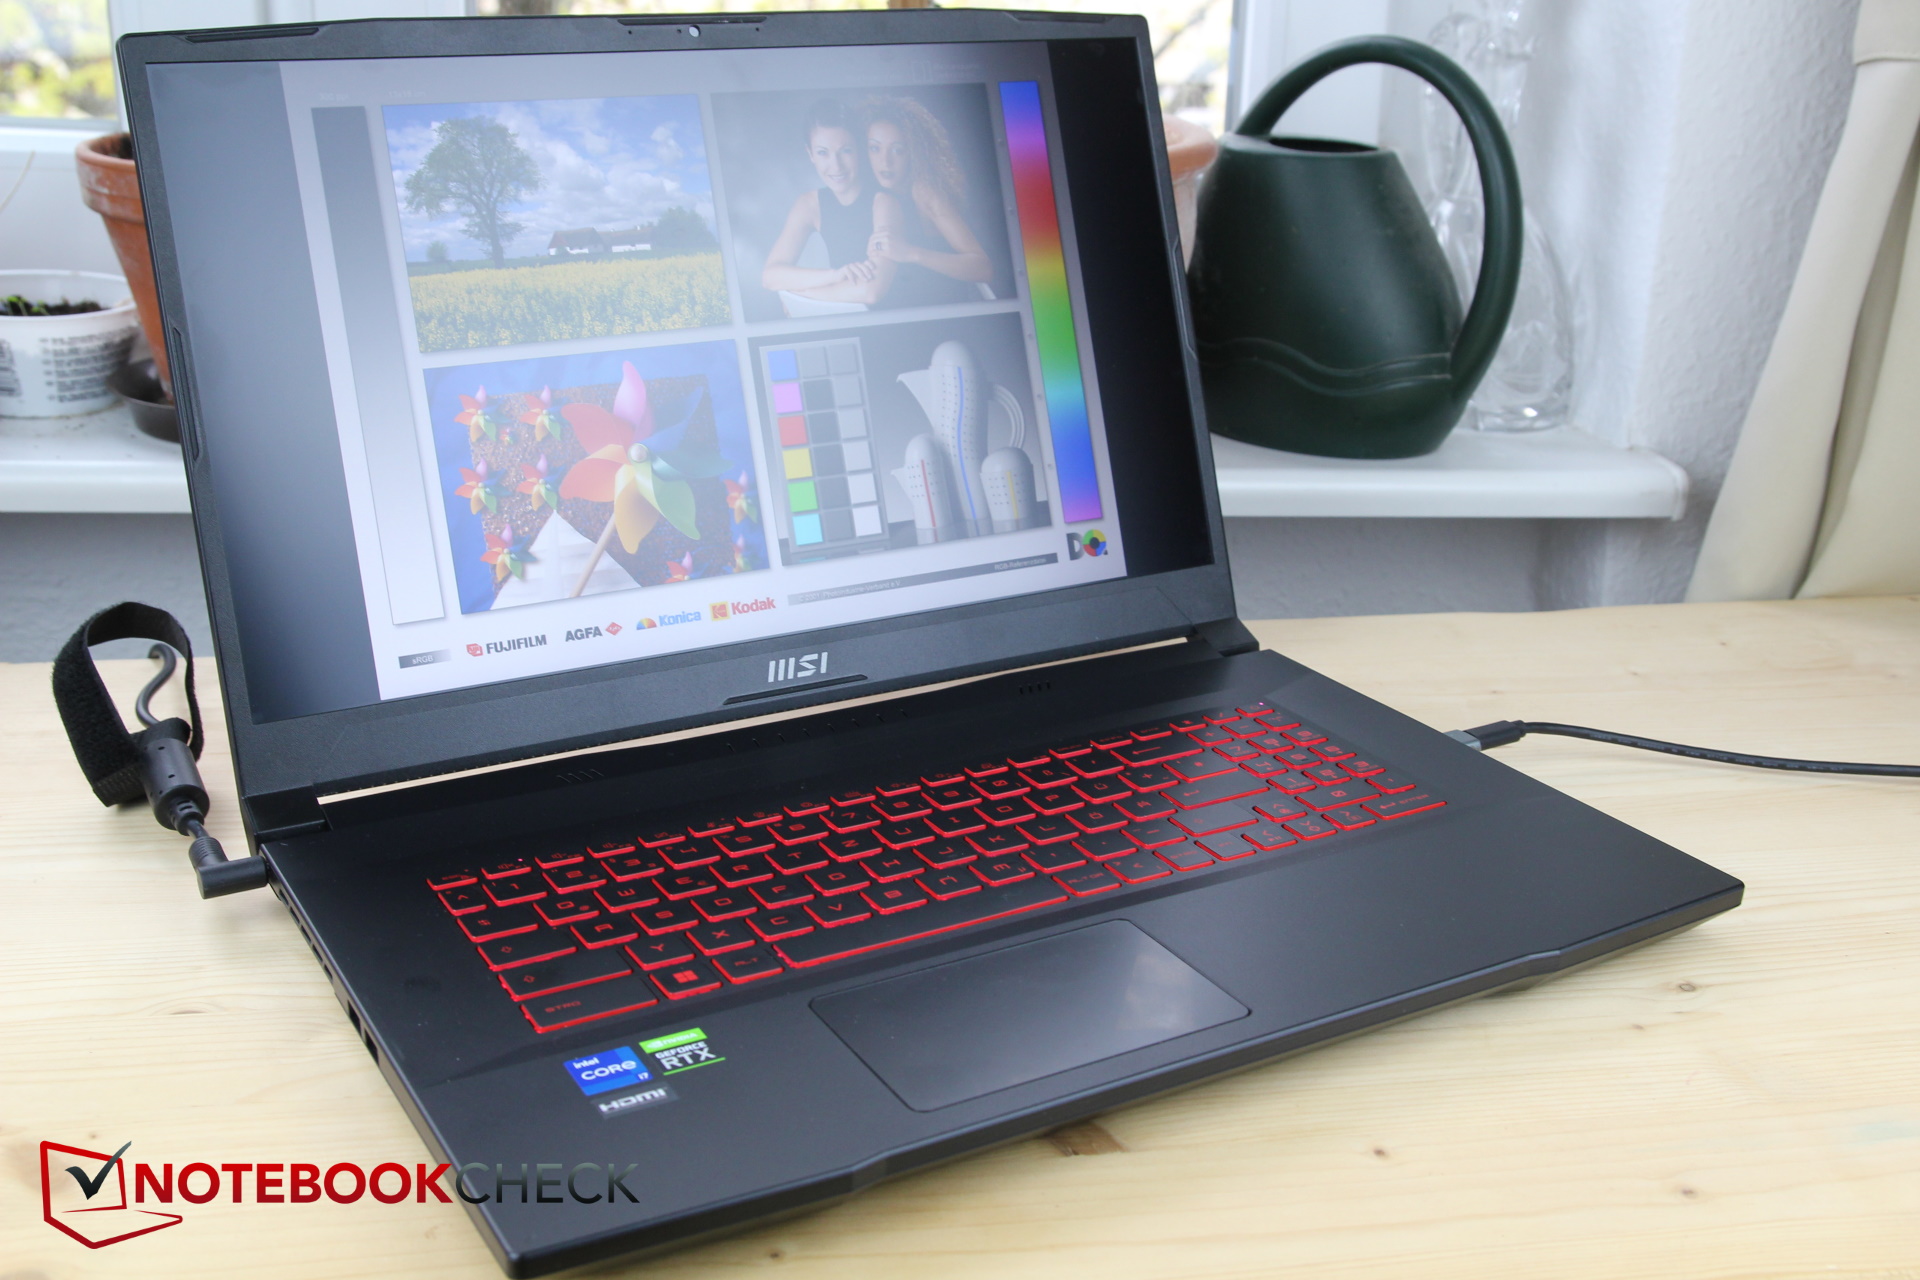
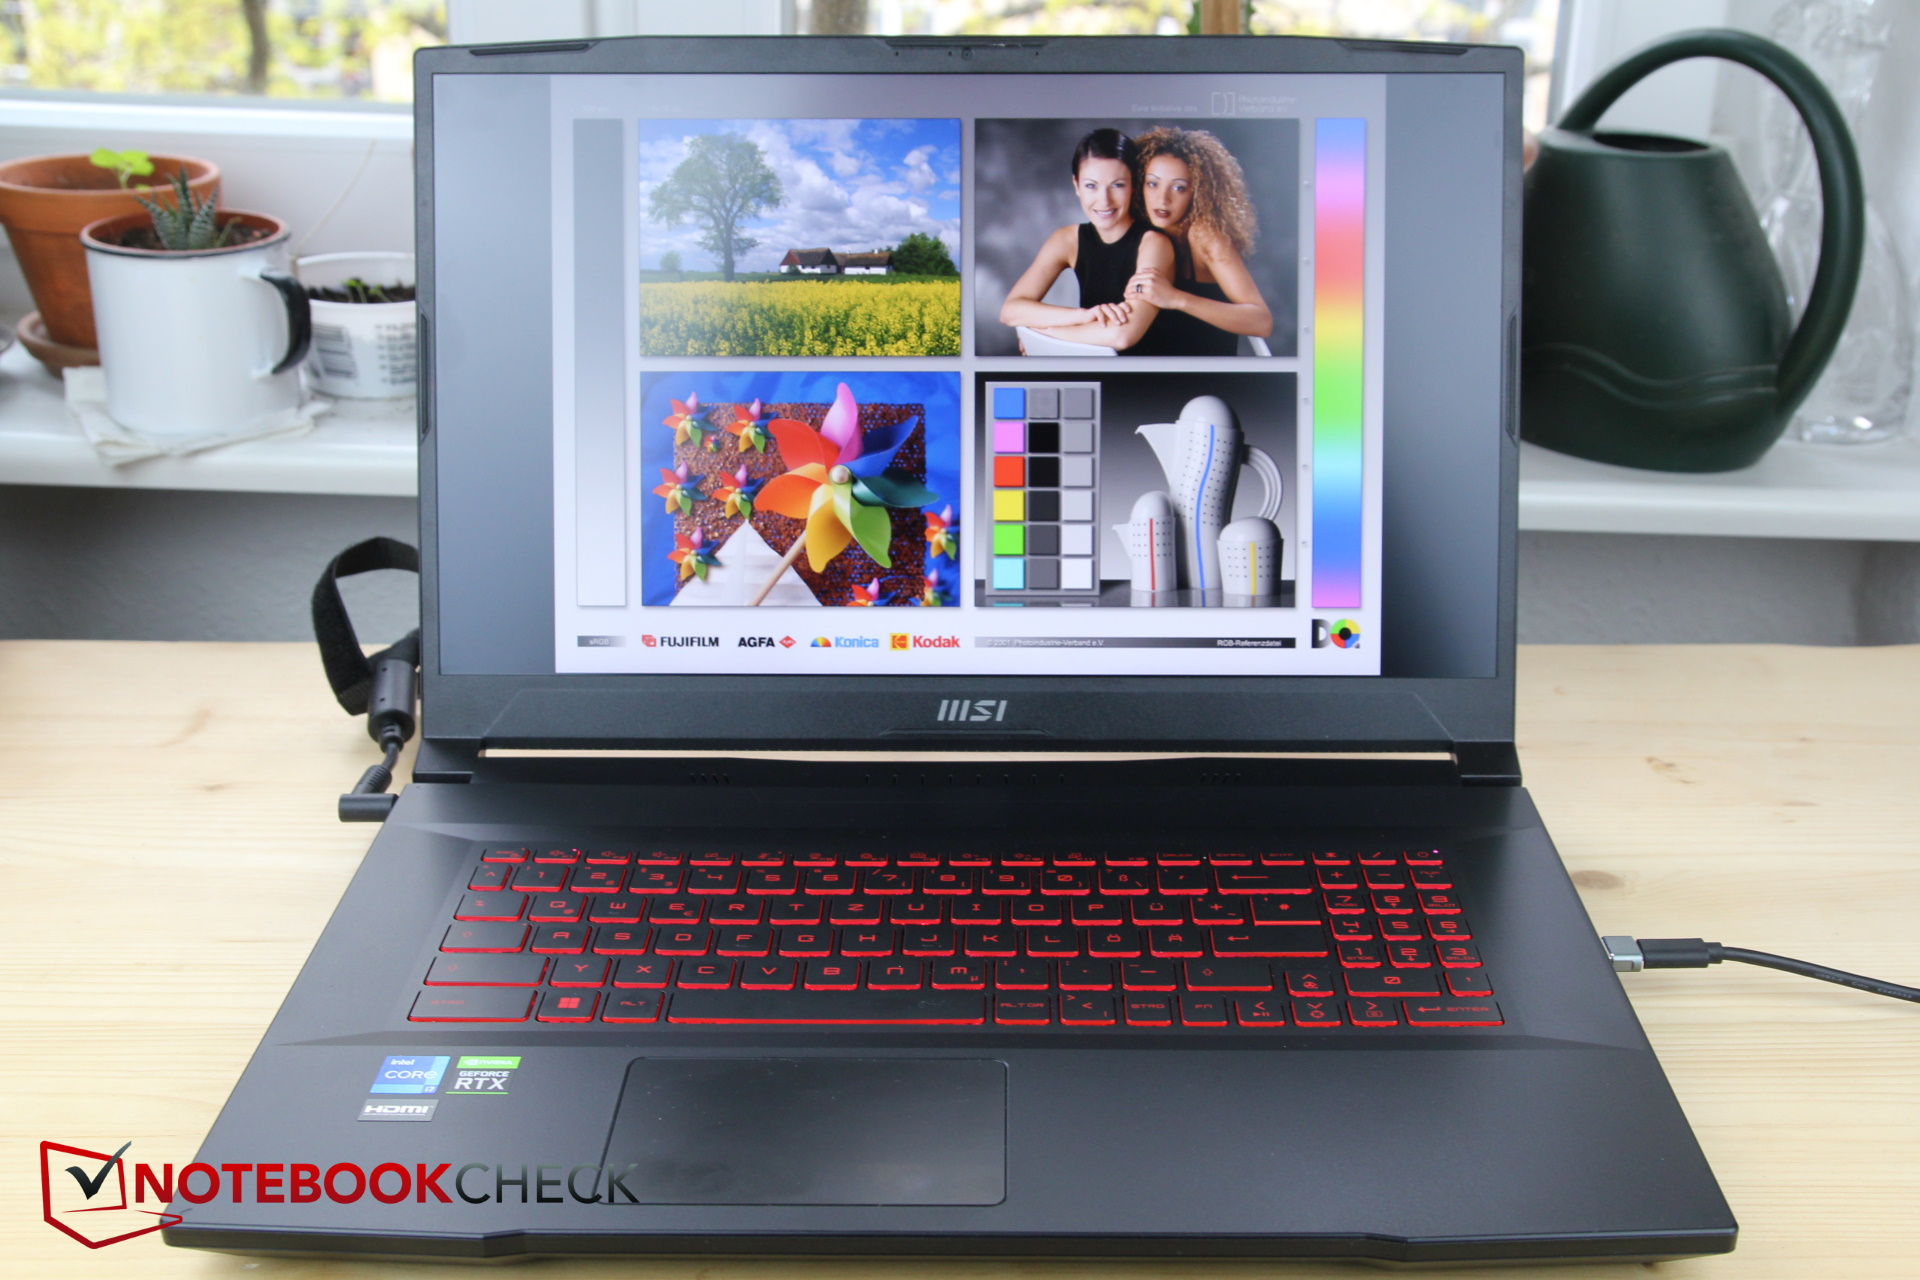
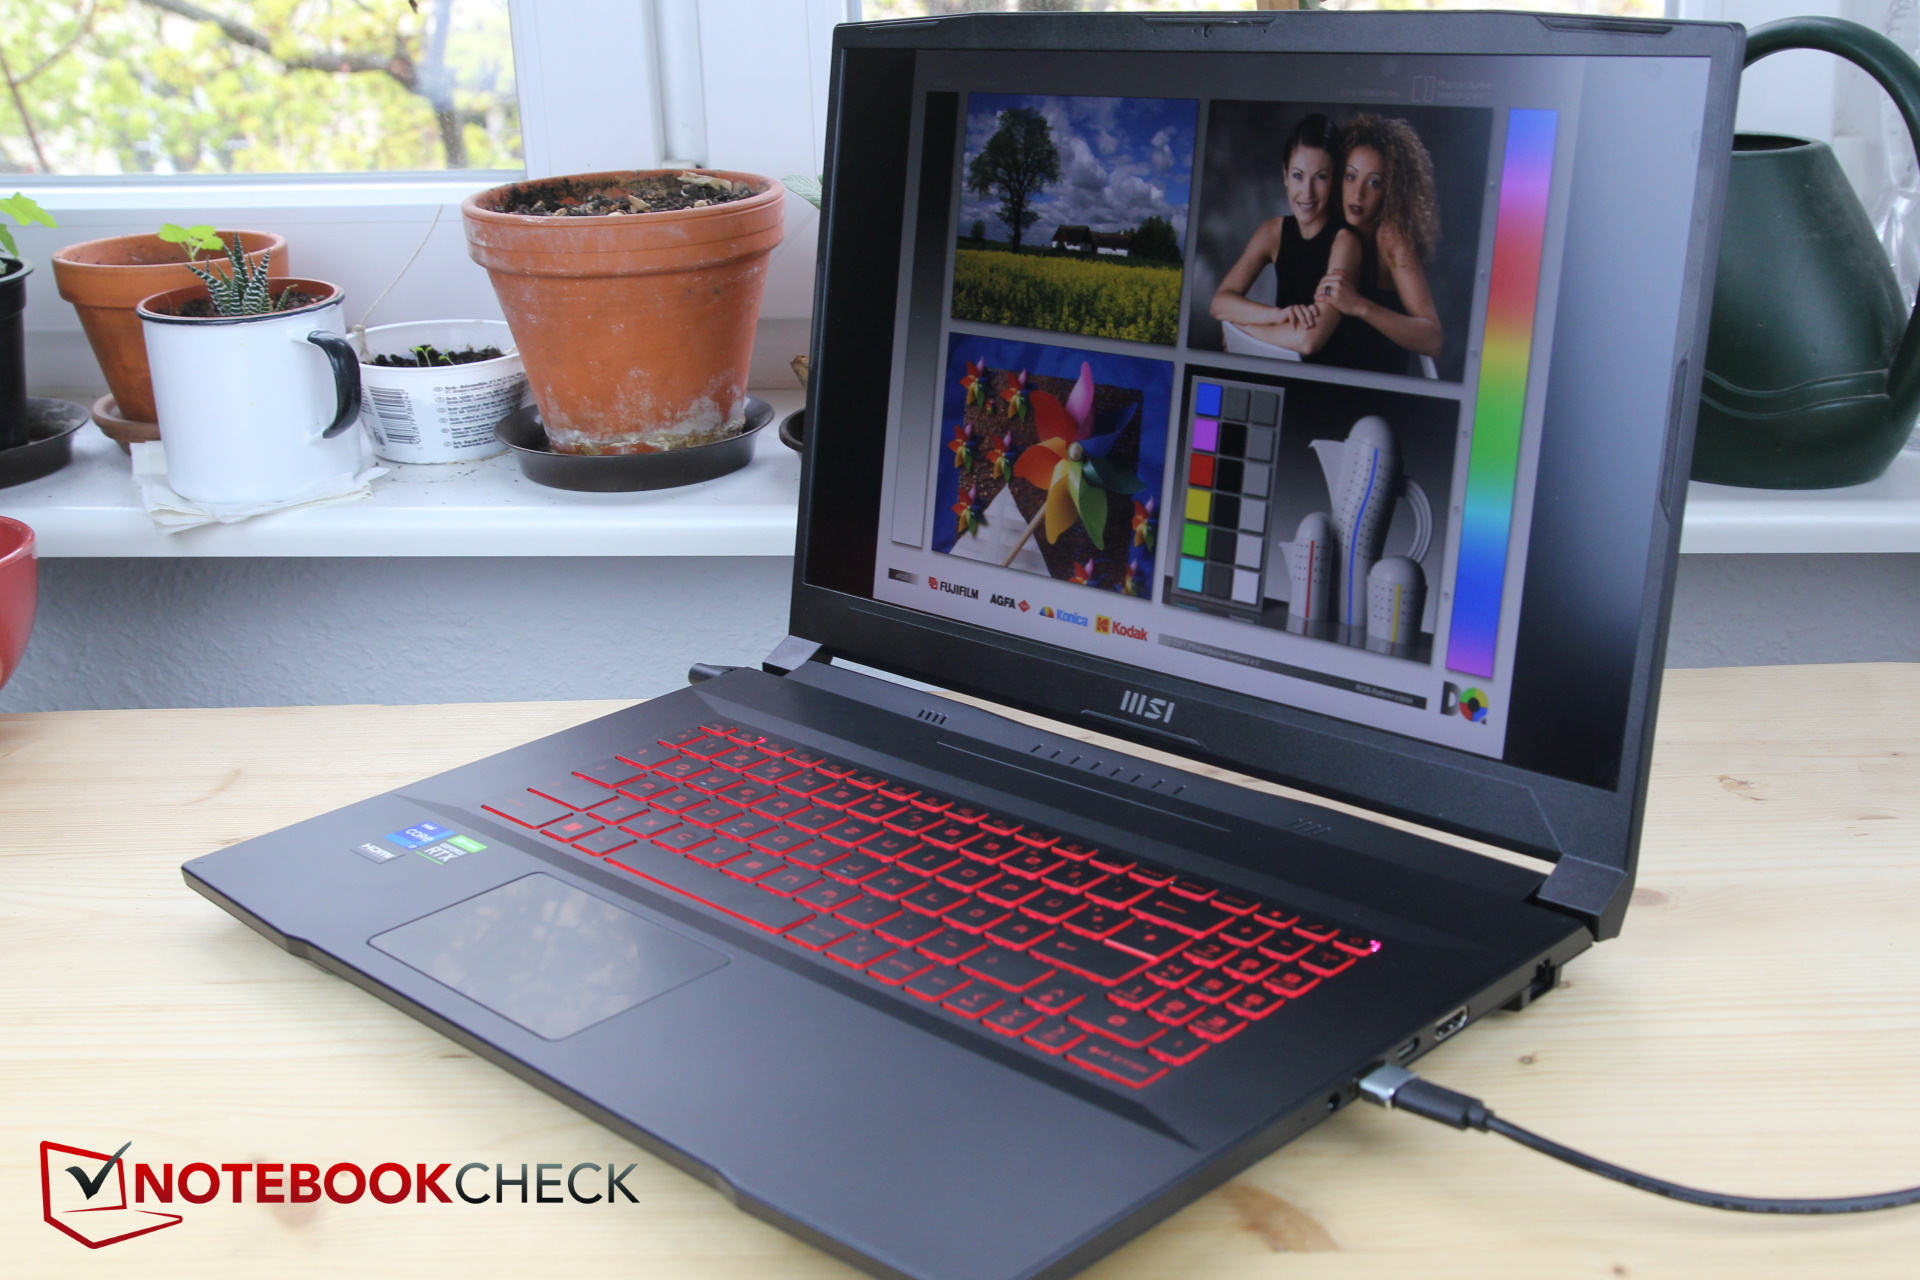
Teniendo en cuenta el hardware incluido, la Katana es bastante compacta, y la carcasa de plástico también la hace parecer más ligera que la Blade 17, aunque la diferencia es sólo de unos 100 g (~3,5 oz). Aunque el Aorus es mínimamente más grueso, tiene casi 20 mm menos de profundidad. ElBlade 17 es más delgado y también más pequeño en general. Aunque el Katana es más bien uno de los portátiles de juego más grandes, no resulta demasiado grueso.
Equipo - Por favor, actualice
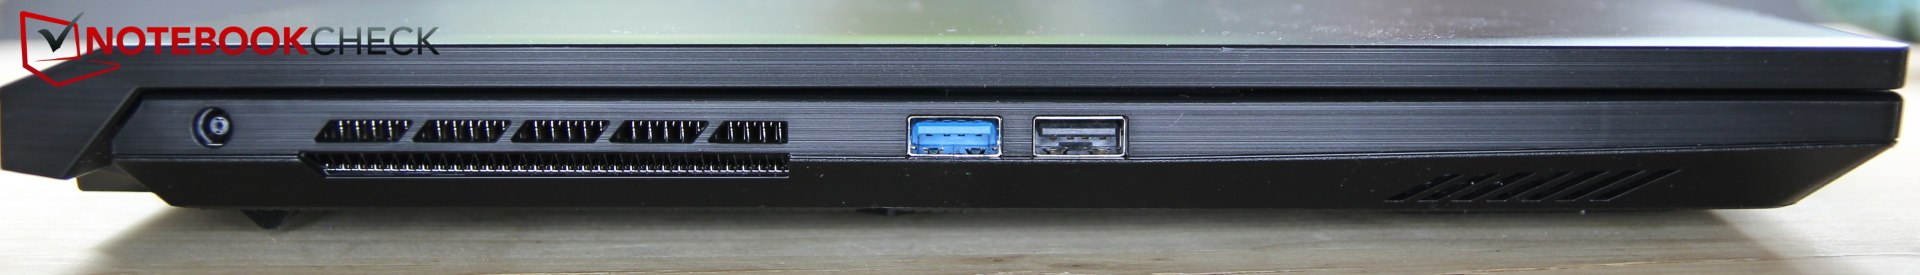
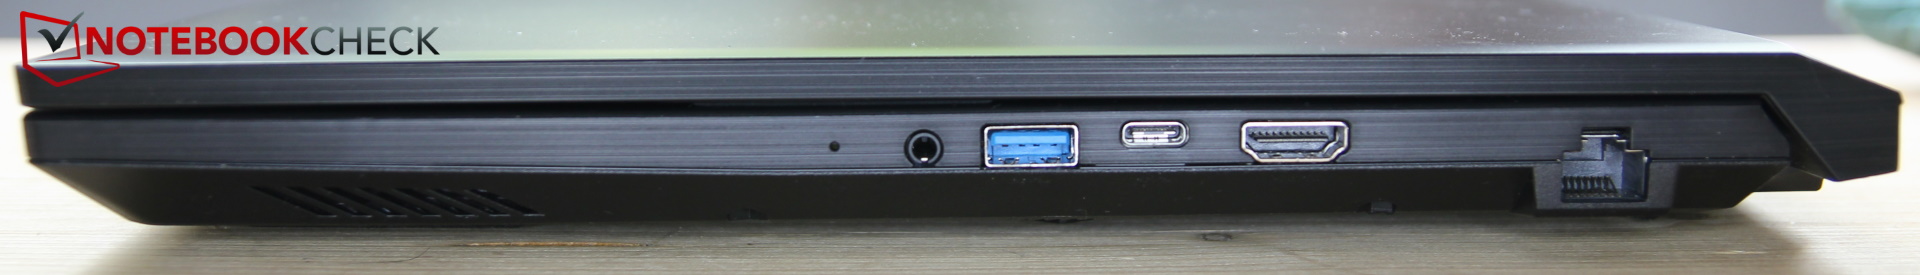
Incluso en 2022, MSI sigue equipando el Katana con un puerto USB-A 2.0, y también sigue renunciando a Thunderbolt y a un lector de tarjetas SD. El puerto USB-C sólo funciona a velocidad USB-3.0 y, por supuesto, no ofrece Power Delivery.
La clavija de alimentación no encaja muy bien en nuestro modelo y también puede salirse lentamente al mover el portátil. El ajuste de algunos dispositivos USB-C no es óptimo en el puerto correspondiente.
La carcasa externa M.2 con conexión USB-C del autor tiene algunos problemas con varios portátiles como el MSI Katana o también el MSI Pulse GL66 pero funciona bien con otros portátiles. Aparentemente, algunos enchufes no pueden insertarse lo suficientemente profundo en los puertos, lo que lleva a que el SSD reciba energía pero no sea reconocido de forma fiable por Windows y se desconecte continuamente. El autor tuvo que utilizar un adaptador de USB-C a A y hacer funcionar el SSD a través de un puerto USB-A.
El hecho de que los puertos para cables potencialmente gruesos y rígidos como HDMI y LAN estén en el lado derecho, donde también podría usarse un ratón, tampoco es óptimo.
Comunicación
Se usa un módulo Intel Wi-Fi 6 AX201 para la comunicación WLAN. En combinación con nuestro router de pruebas Asus ROG GT-AXE11000, el módulo logra unas tasas de transferencia adecuadamente buenas, y la conexión también es bastante estable.
Cámara web
Como cámara web, se utiliza una cámara estándar de 720p. Aunque la calidad de la imagen no ayudaría a convertir al usuario en una estrella de YouTube, las desviaciones de color siguen estando dentro de los límites.


Accesorios y garantía
Teniendo en cuenta el bajo precio, la falta de accesorios incluidos no debería sorprender. Como es habitual en MSI, el periodo de garantía es de dos años.
Mantenimiento
La parte inferior de la caja está asegurada por 13 tornillos. Como el último está colocado debajo de un sello adhesivo, no queremos romperlo por ser nuestra unidad de prueba un préstamo. Desgraciadamente, MSI sigue usando sellos adhesivos y se reserva así la opción de limitar la garantía tras la apertura indebida del dispositivo por parte de usuarios no cualificados.
Sin embargo, no debería haber demasiados cambios en comparación con el predecesor, y puedes encontrar una imagen del Katana abierto en el revisión del predecesor.
Dispositivos de entrada - ¿Por qué todo es tan pequeño a pesar de las 17 pulgadas?
Teclado
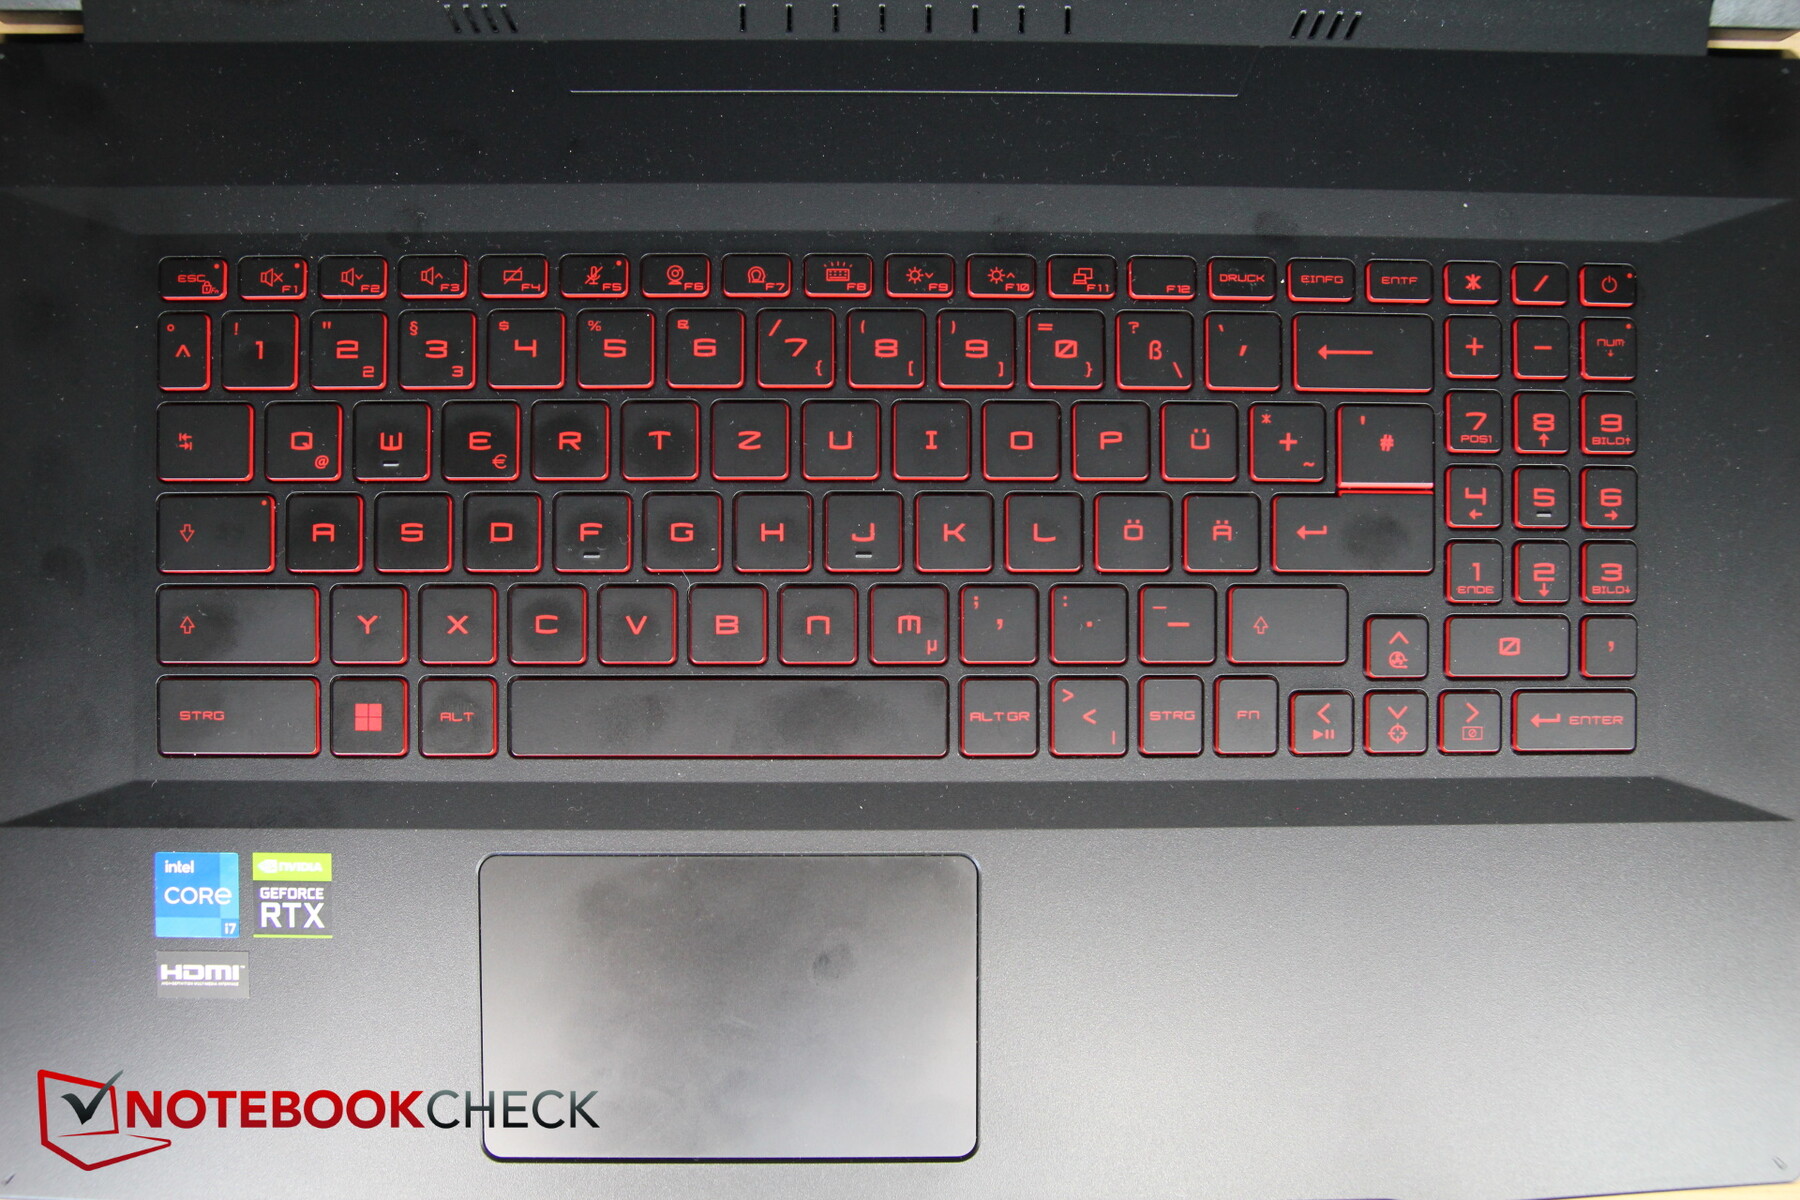
Para un portátil de 17 pulgadas, las teclas resultan bastante pequeñas, y apretado en el lado derecho de la base hay también un teclado numérico con teclas increíblemente pequeñas. A pesar de que todavía hay suficiente espacio en el lado izquierdo y derecho del teclado, MSI no lo utiliza para aumentar el tamaño de las teclas. En la fila superior de las teclas de función, las teclas son sólo la mitad de altas. El botón de encendido está colocado como una tecla normal en la esquina superior derecha del teclado numérico.
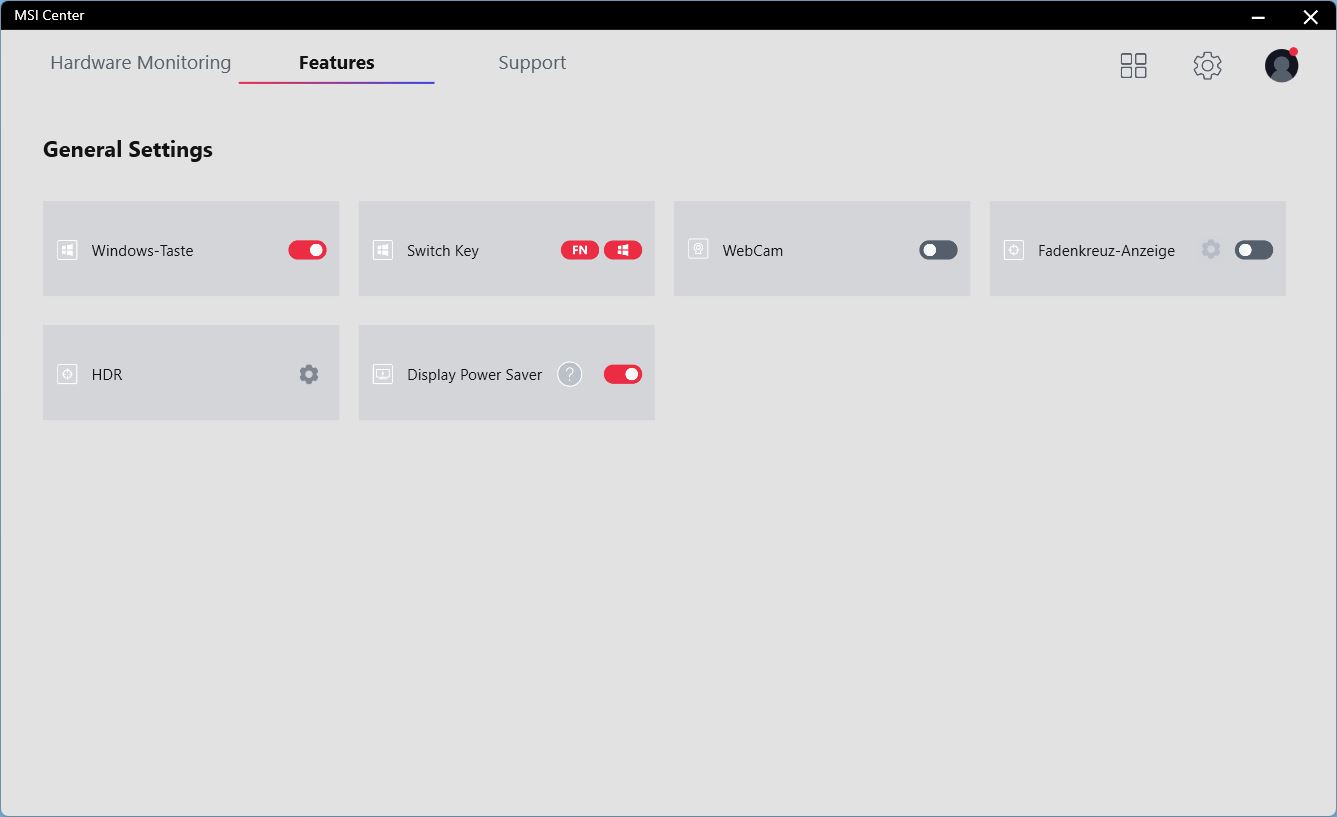
Como es costumbre para MSI, extrañamente la tecla Fn está colocada en el lado derecho, pero puedes cambiar su función con la tecla Windows en la izquierda.
La pulsación de la tecla es relativamente corta, pero la respuesta es notable. Sin embargo, las teclas aún se sienten ligeramente esponjosas, y el usuario tiene la impresión de que las teclas sólo están realmente fijas en el centro y pueden inclinarse fácilmente hacia sus lados. Por otro lado, las tareas de tecleo siguen siendo bastante rápidas y fáciles. El ruido de tecleo es moderado
Las letras de las teclas son fácilmente visibles, pero su fuente es un poco inusual, lo que probablemente se supone que atrae a los jugadores. En entornos oscuros, la iluminación del teclado ayuda. Aunque sólo hay una zona, la luz puede atenuarse en tres pasos. Sólo se ilumina en rojo.
Teclado táctil
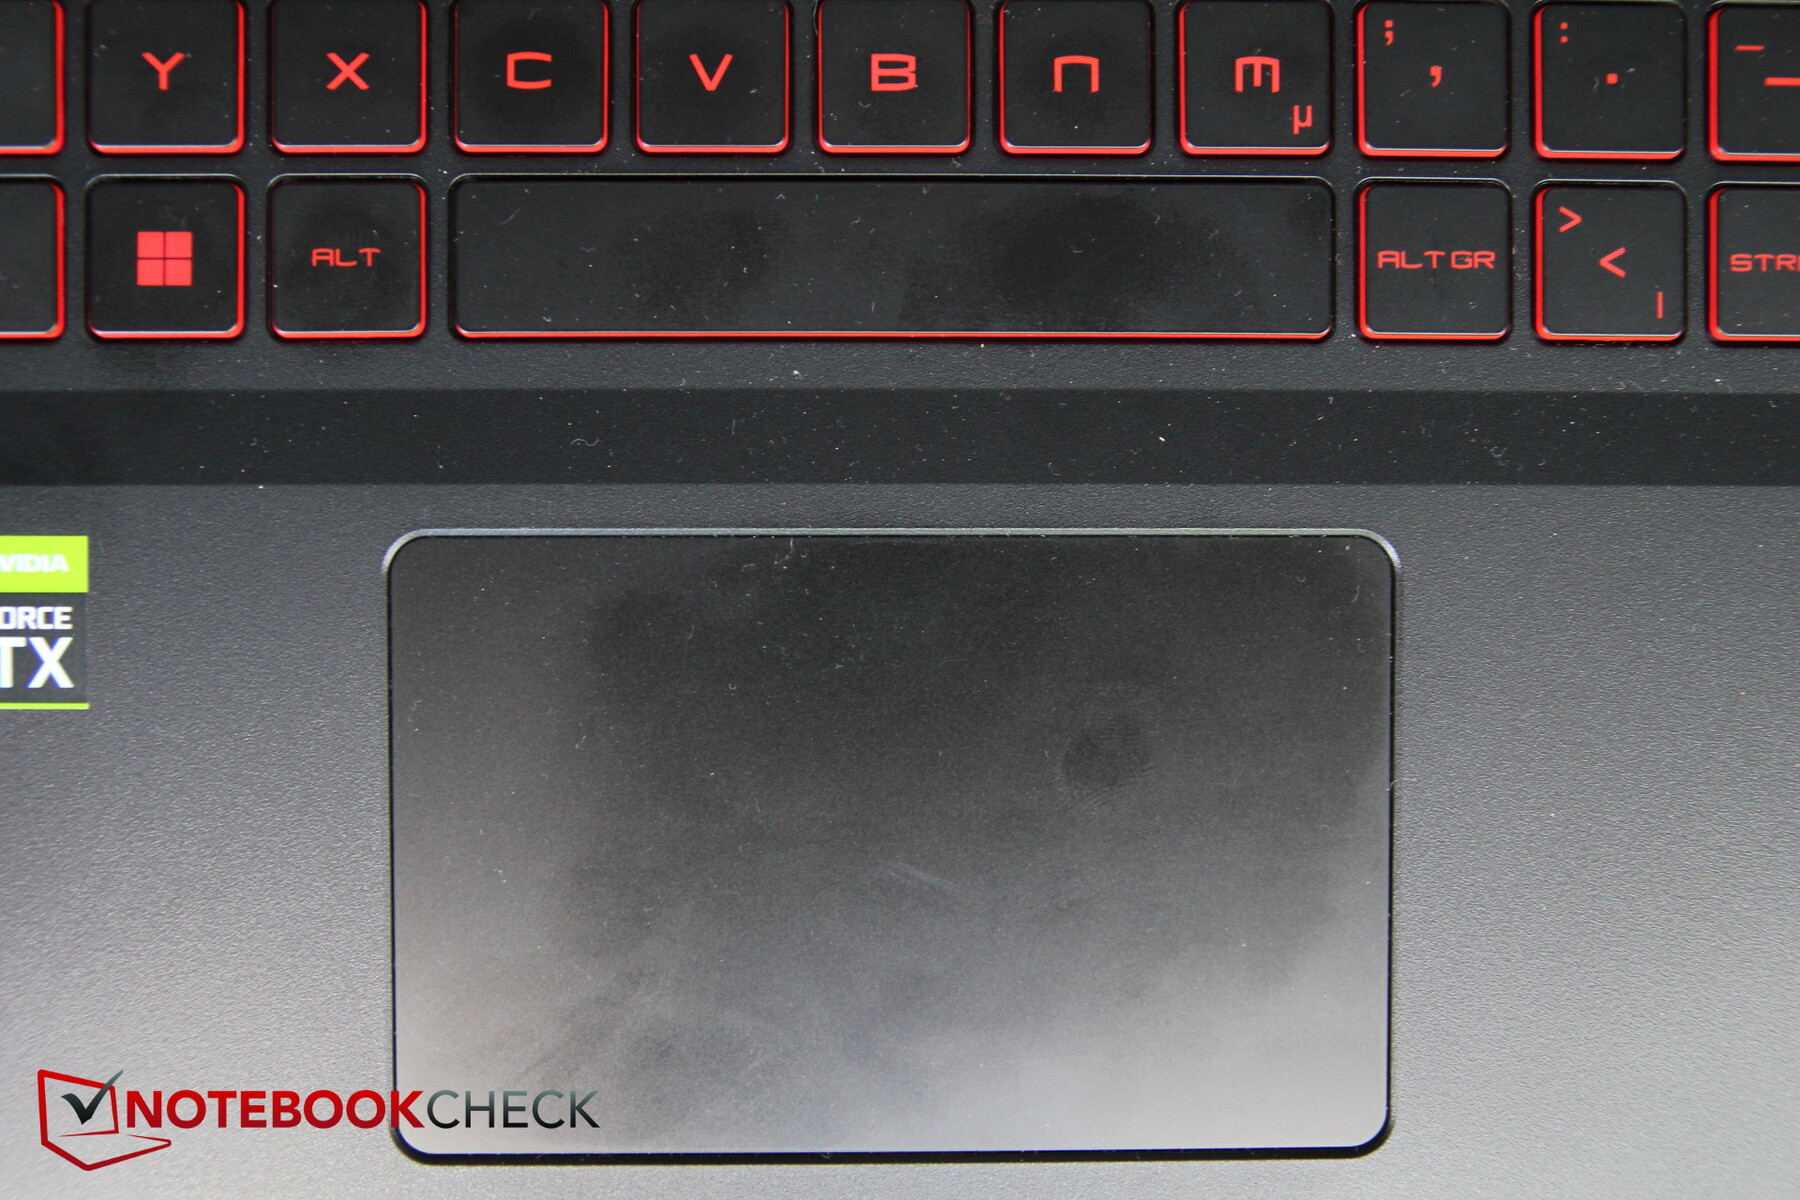
El touchpad es suficiente pero no muy grande para un dispositivo de 17 pulgadas (~10,5 x 6,5 cm, ~4,1 x 2,6 in). La superficie facilita el deslizamiento de los dedos, y sólo se atascan con movimientos muy lentos o si los dedos están mojados.
Las teclas integradas también funcionan con bastante precisión, pero tienen un recorrido extremadamente corto y parecen muy nítidas. Los ruidos del gatillo no son realmente silenciosos.
Pantalla - 144 Hz pero todavía no es un jugador
MSI ha decidido utilizar la misma pantalla Full-HD de AU Optronics que en el predecesor. Aunque este puede manejar 144 Hz, con una media de 264 nits, el brillo no es muy alto. Los tiempos de respuesta son realmente débiles para un jugador, en particular los más de 40 ms de gris a gris. Con un 88%, la distribución del brillo sigue siendo relativamente uniforme.
Al menos, la pantalla tiene un valor de negro bastante bajo, lo que lleva a un buen contraste.
| |||||||||||||||||||||||||
iluminación: 88 %
Brillo con batería: 283 cd/m²
Contraste: 1405:1 (Negro: 0.2 cd/m²)
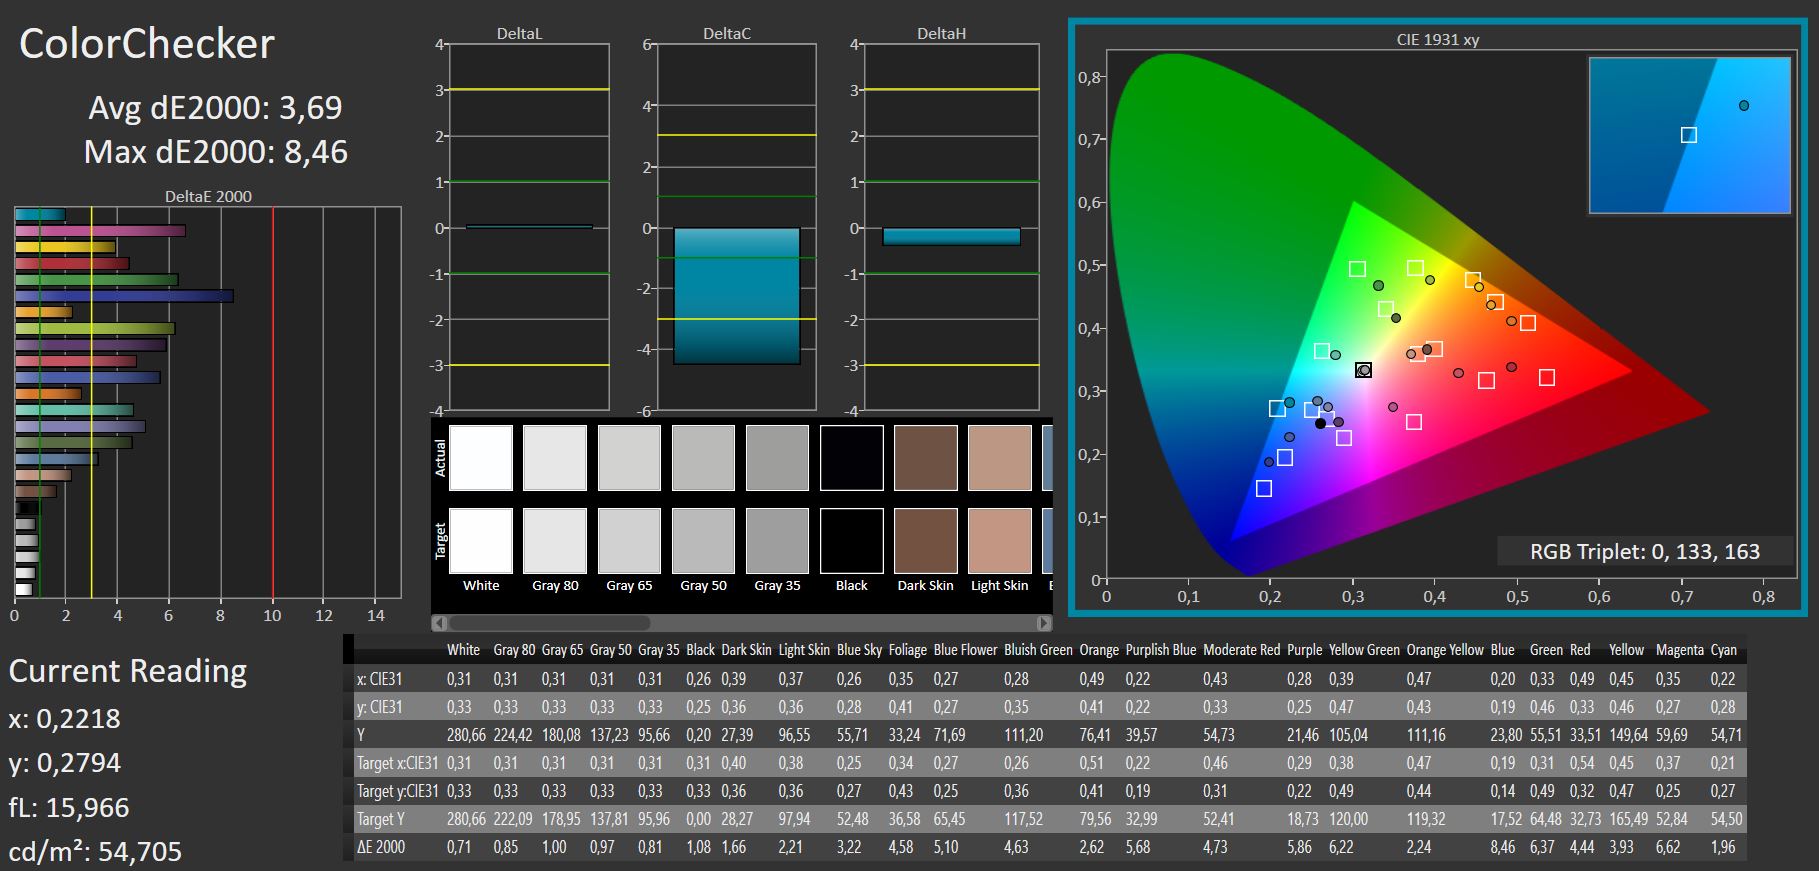
ΔE ColorChecker Calman: 3.69 | ∀{0.5-29.43 Ø4.71}
calibrated: 3.61
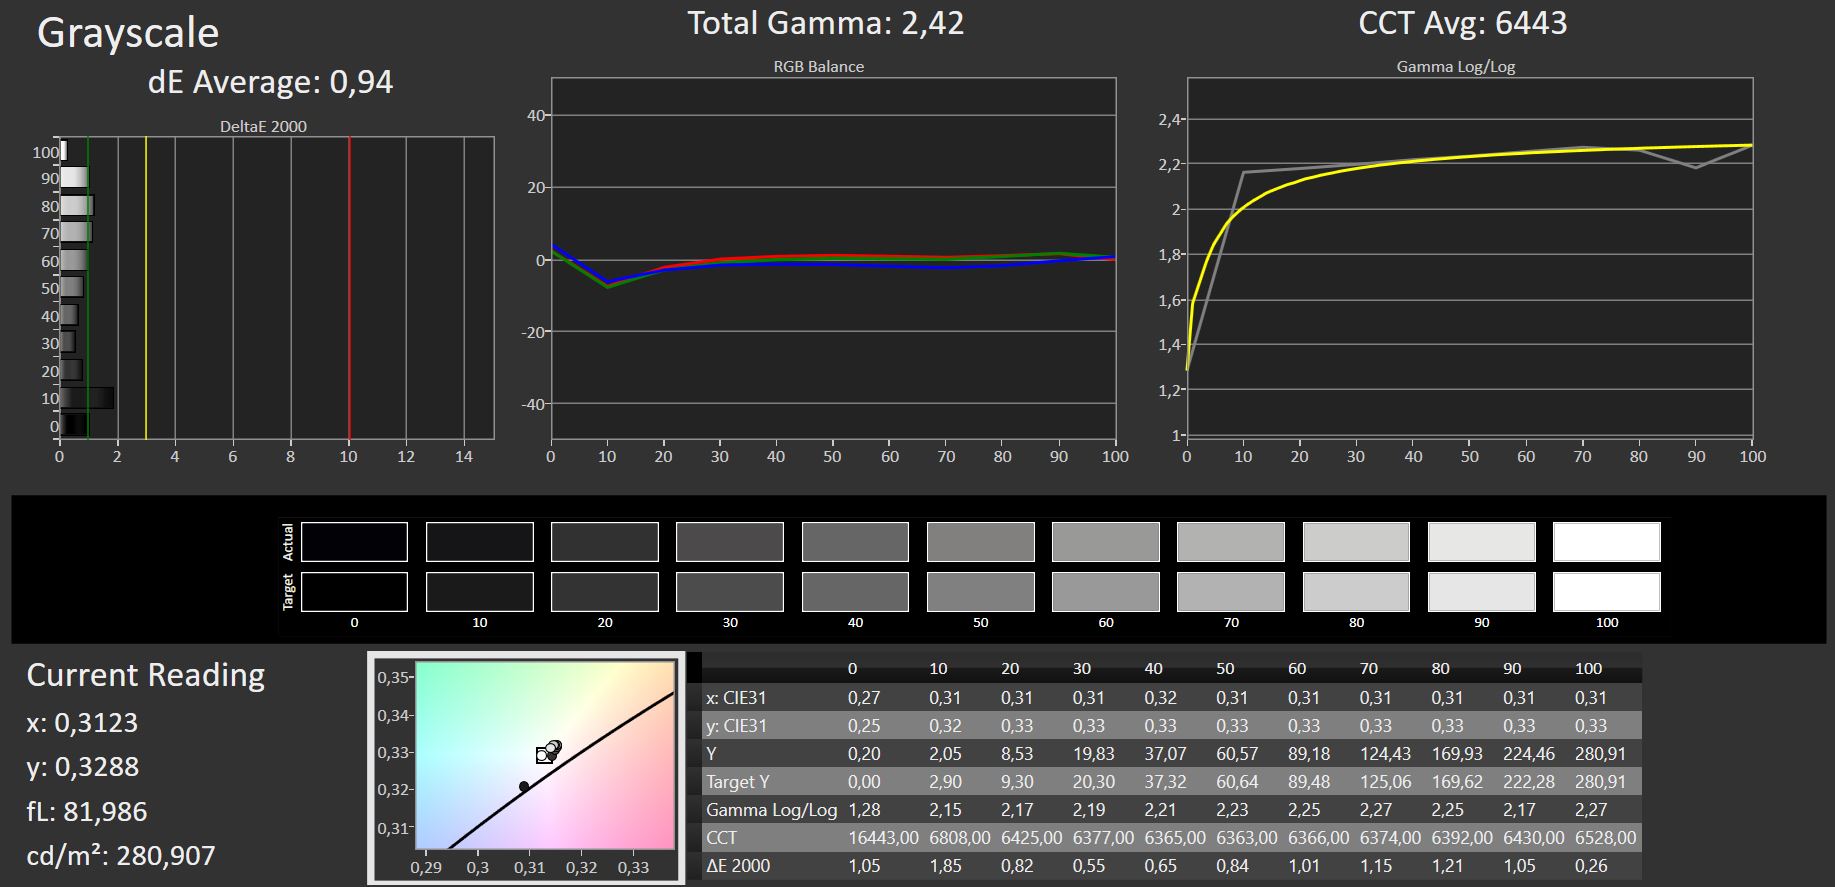
ΔE Greyscale Calman: 0.94 | ∀{0.09-98 Ø4.96}
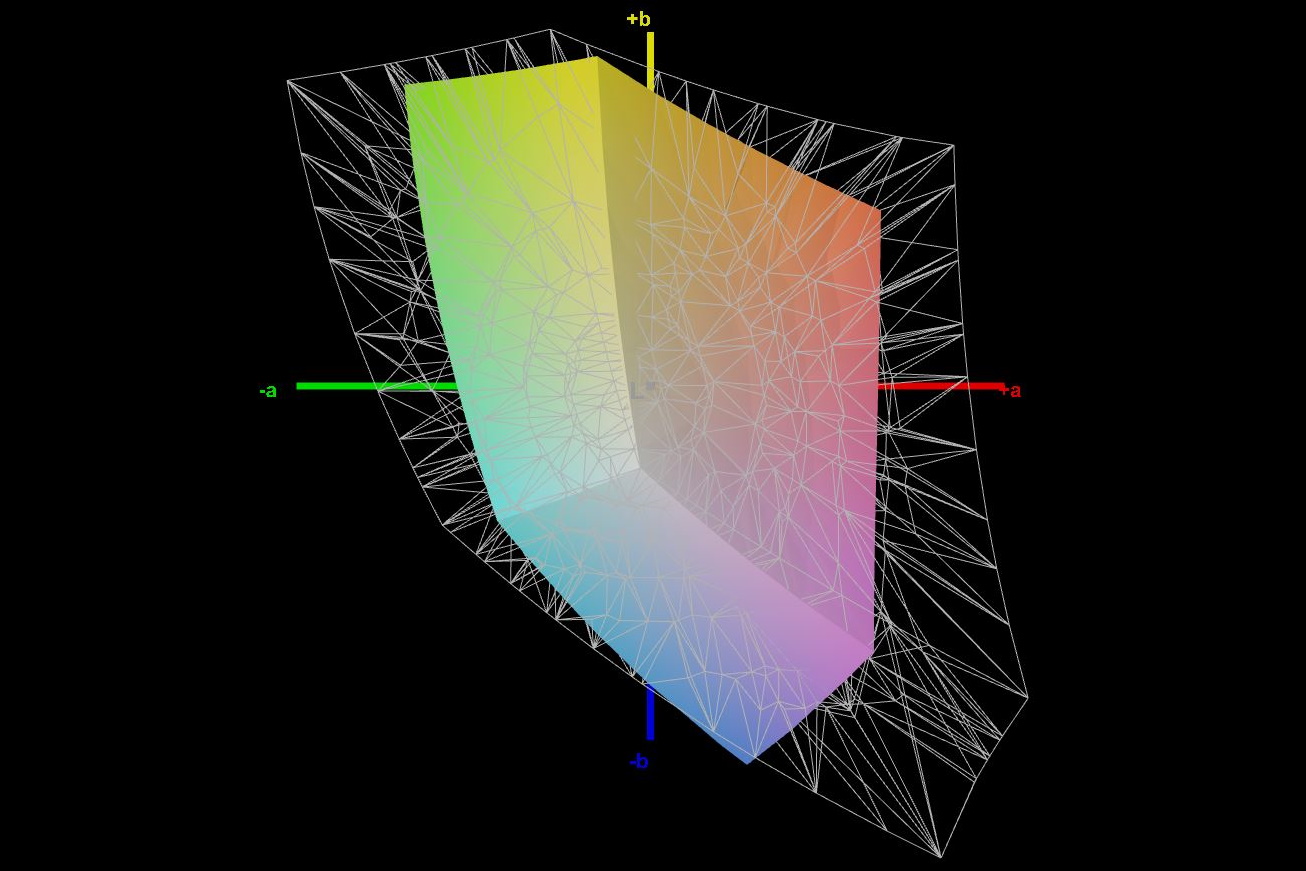
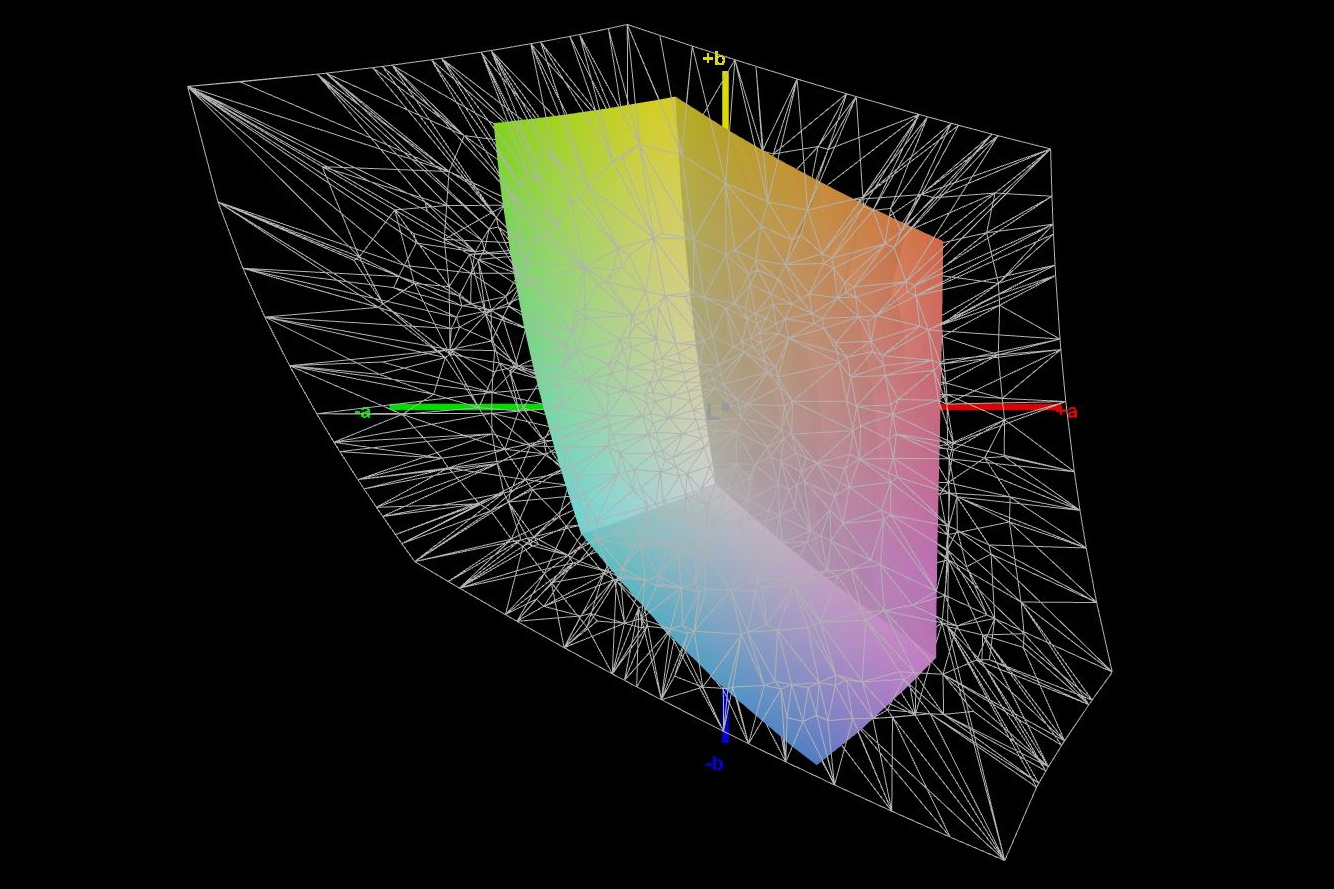
39.8% AdobeRGB 1998 (Argyll 3D)
57.8% sRGB (Argyll 3D)
38.5% Display P3 (Argyll 3D)
Gamma: 2.42
CCT: 6443 K
| MSI Katana GF76 12UGS AU Optronics B173HAN04.9, IPS, 1920x1080, 17.3" | MSI Katana GF76 11UE AU Optronics B173HAN04.9, IPS, 1920x1080, 17.3" | Aorus 17 XE4 Sharp LQ173M1JW12, IPS, 1920x1080, 17.3" | Razer Blade 17 (i7-12800H, RTX 3070 Ti) BOE CQ NE173QHM-NZ1 (BOE09F9), IPS, 2560x1440, 17.3" | Lenovo Legion 5 Pro 16 G7 i7 RTX 3070Ti NE160QDM-NY1, IPS, 2560x1600, 16" | MSI Vector GP66 12UGS BOE NE156FHM-NZ3, IPS, 1920x1080, 15.6" | |
|---|---|---|---|---|---|---|
| Display | 3% | 77% | 114% | 75% | 78% | |
| Display P3 Coverage (%) | 38.5 | 39.8 3% | 69 79% | 97.9 154% | 68.7 78% | 70.1 82% |
| sRGB Coverage (%) | 57.8 | 59.5 3% | 99.4 72% | 99.9 73% | 97.6 69% | 99.5 72% |
| AdobeRGB 1998 Coverage (%) | 39.8 | 41.12 3% | 71.2 79% | 85.5 115% | 70.9 78% | 72.1 81% |
| Response Times | 6% | 61% | 61% | 64% | 75% | |
| Response Time Grey 50% / Grey 80% * (ms) | 40.6 ? | 36.8 ? 9% | 15.2 ? 63% | 15.2 ? 63% | 17.6 ? 57% | 5.8 ? 86% |
| Response Time Black / White * (ms) | 26.4 ? | 26 ? 2% | 11.2 ? 58% | 11.2 ? 58% | 7.6 ? 71% | 9.6 ? 64% |
| PWM Frequency (Hz) | ||||||
| Screen | -33% | -12% | -64% | 3% | -28% | |
| Brightness middle (cd/m²) | 281 | 260 -7% | 274 -2% | 341 21% | 502 79% | 353.1 26% |
| Brightness (cd/m²) | 264 | 251 -5% | 267 1% | 308 17% | 491 86% | 325 23% |
| Brightness Distribution (%) | 88 | 85 -3% | 82 -7% | 82 -7% | 91 3% | 85 -3% |
| Black Level * (cd/m²) | 0.2 | 0.26 -30% | 0.25 -25% | 0.45 -125% | 0.37 -85% | 0.38 -90% |
| Contrast (:1) | 1405 | 1000 -29% | 1096 -22% | 758 -46% | 1357 -3% | 929 -34% |
| Colorchecker dE 2000 * | 3.69 | 3.9 -6% | 2.07 44% | 4.16 -13% | 2.7 27% | 2.24 39% |
| Colorchecker dE 2000 max. * | 8.46 | 20.64 -144% | 4.89 42% | 8.14 4% | 4.5 47% | 5 41% |
| Colorchecker dE 2000 calibrated * | 3.61 | 3.71 -3% | 0.83 77% | 3 17% | 1.4 61% | 1.02 72% |
| Greyscale dE 2000 * | 0.94 | 1.6 -70% | 3 -219% | 5.09 -441% | 2.7 -187% | 4 -326% |
| Gamma | 2.42 91% | 2.068 106% | 2.207 100% | 2.48 89% | 2.44 90% | 2.24 98% |
| CCT | 6443 101% | 6511 100% | 6999 93% | 6884 94% | 6326 103% | 6864 95% |
| Media total (Programa/Opciones) | -8% /
-20% | 42% /
17% | 37% /
-8% | 47% /
27% | 42% /
10% |
* ... más pequeño es mejor
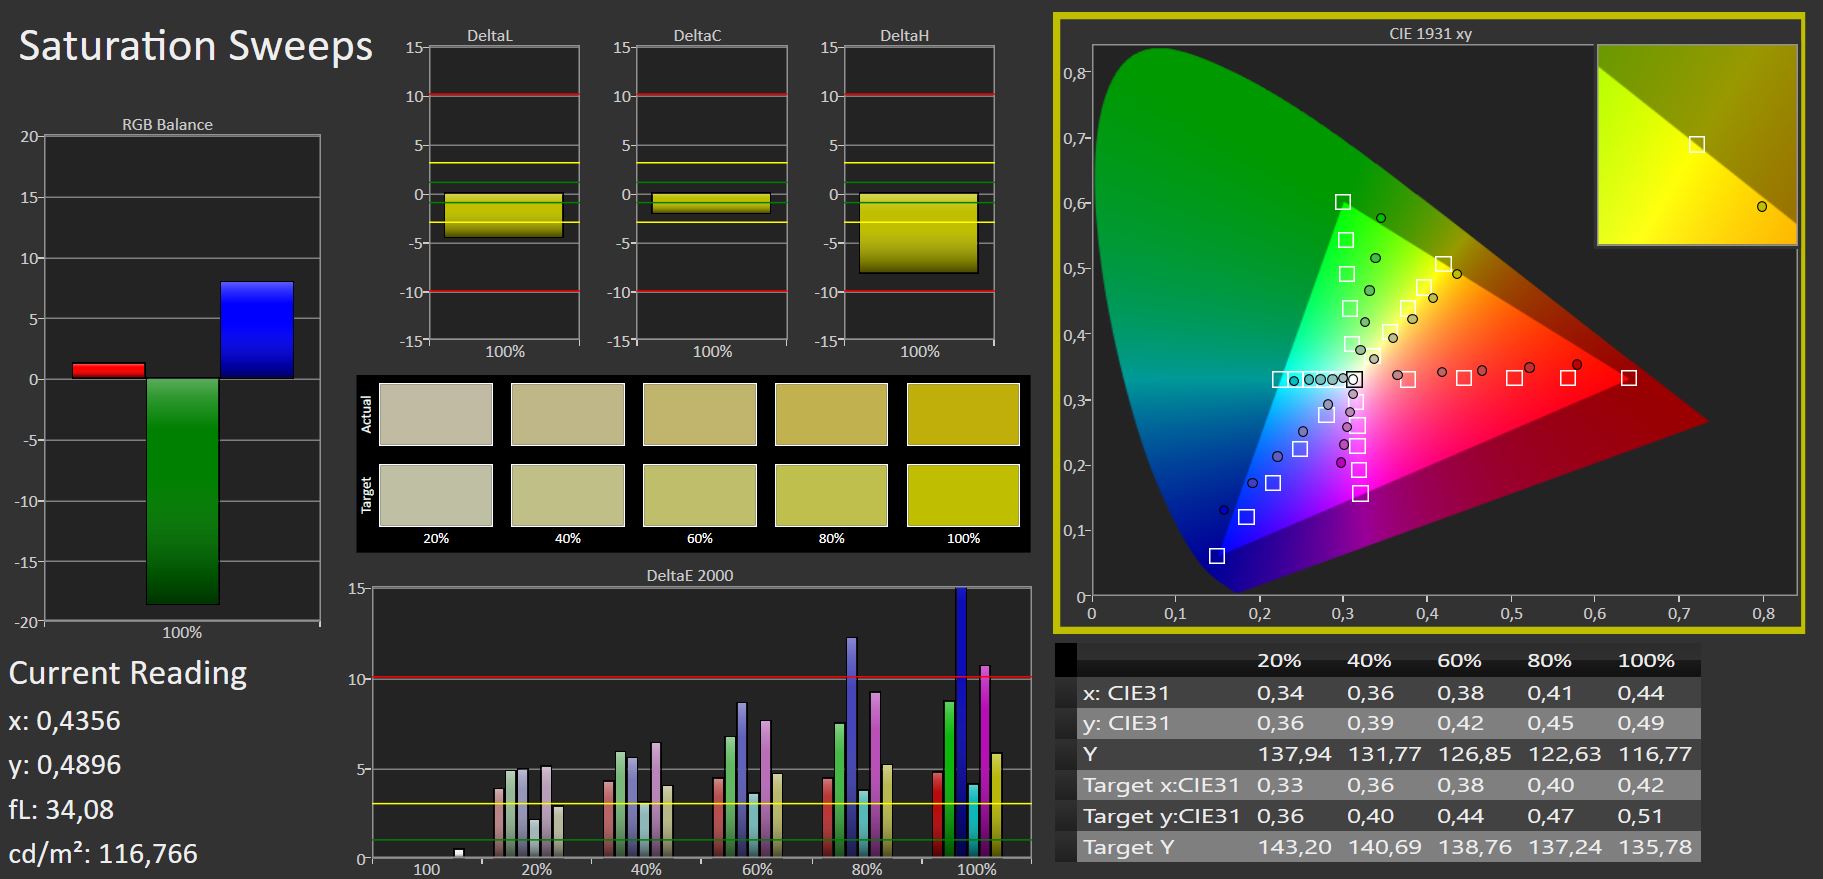
Los editores profesionales de imagen y vídeo deberían utilizar un monitor externo, ya que el espacio de color mostrado es bastante reducido. Sólo se reproduce alrededor del 40% de AdobeRGB, y menos del 60% de sRGB.
En el estado de entrega, las desviaciones de la escala de grises ya son inferiores a 1. Sin embargo, las desviaciones del color son mayores, pero desgraciadamente no mejoran significativamente con una calibración manual utilizando nuestro dispositivo de medición del color X-Rite (Portrait Displays Calman Color Calibration).
Tiempos de respuesta del display
| ↔ Tiempo de respuesta de Negro a Blanco | ||
|---|---|---|
| 26.4 ms ... subida ↗ y bajada ↘ combinada | ↗ 13.8 ms subida | 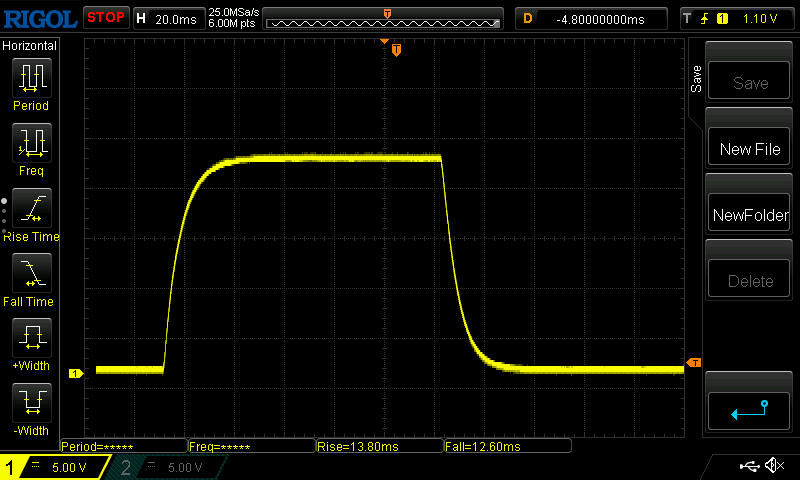 |
| ↘ 12.6 ms bajada | ||
| La pantalla mostró tiempos de respuesta relativamente lentos en nuestros tests pero podría ser demasiado lenta para los jugones. En comparación, todos los dispositivos de prueba van de ##min### (mínimo) a 240 (máximo) ms. » 66 % de todos los dispositivos son mejores. Eso quiere decir que el tiempo de respuesta es peor que la media (19.8 ms) de todos los dispositivos testados. | ||
| ↔ Tiempo de respuesta 50% Gris a 80% Gris | ||
| 40.6 ms ... subida ↗ y bajada ↘ combinada | ↗ 18.8 ms subida | |
| ↘ 21.8 ms bajada | ||
| La pantalla mostró tiempos de respuesta lentos en nuestros tests y podría ser demasiado lenta para los jugones. En comparación, todos los dispositivos de prueba van de ##min### (mínimo) a 636 (máximo) ms. » 64 % de todos los dispositivos son mejores. Eso quiere decir que el tiempo de respuesta es peor que la media (31 ms) de todos los dispositivos testados. | ||
Parpadeo de Pantalla / PWM (Pulse-Width Modulation)
| Parpadeo de Pantalla / PWM no detectado | 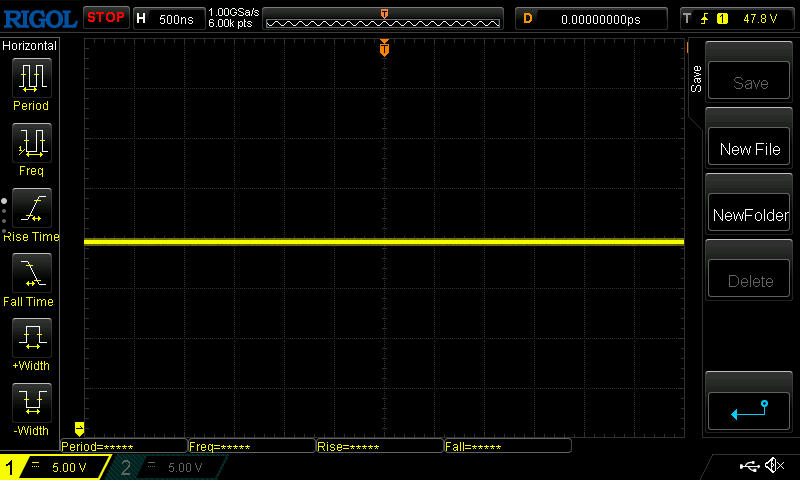 | ||
Comparación: 52 % de todos los dispositivos testados no usaron PWM para atenuar el display. Si se usó, medimos una media de 7754 (mínimo: 5 - máxmo: 343500) Hz. | |||
Si bien la superficie mate evita muchos reflejos, el bajo brillo y la estabilidad del ángulo de visión más bien débil hacen que la usabilidad en exteriores sea limitada.
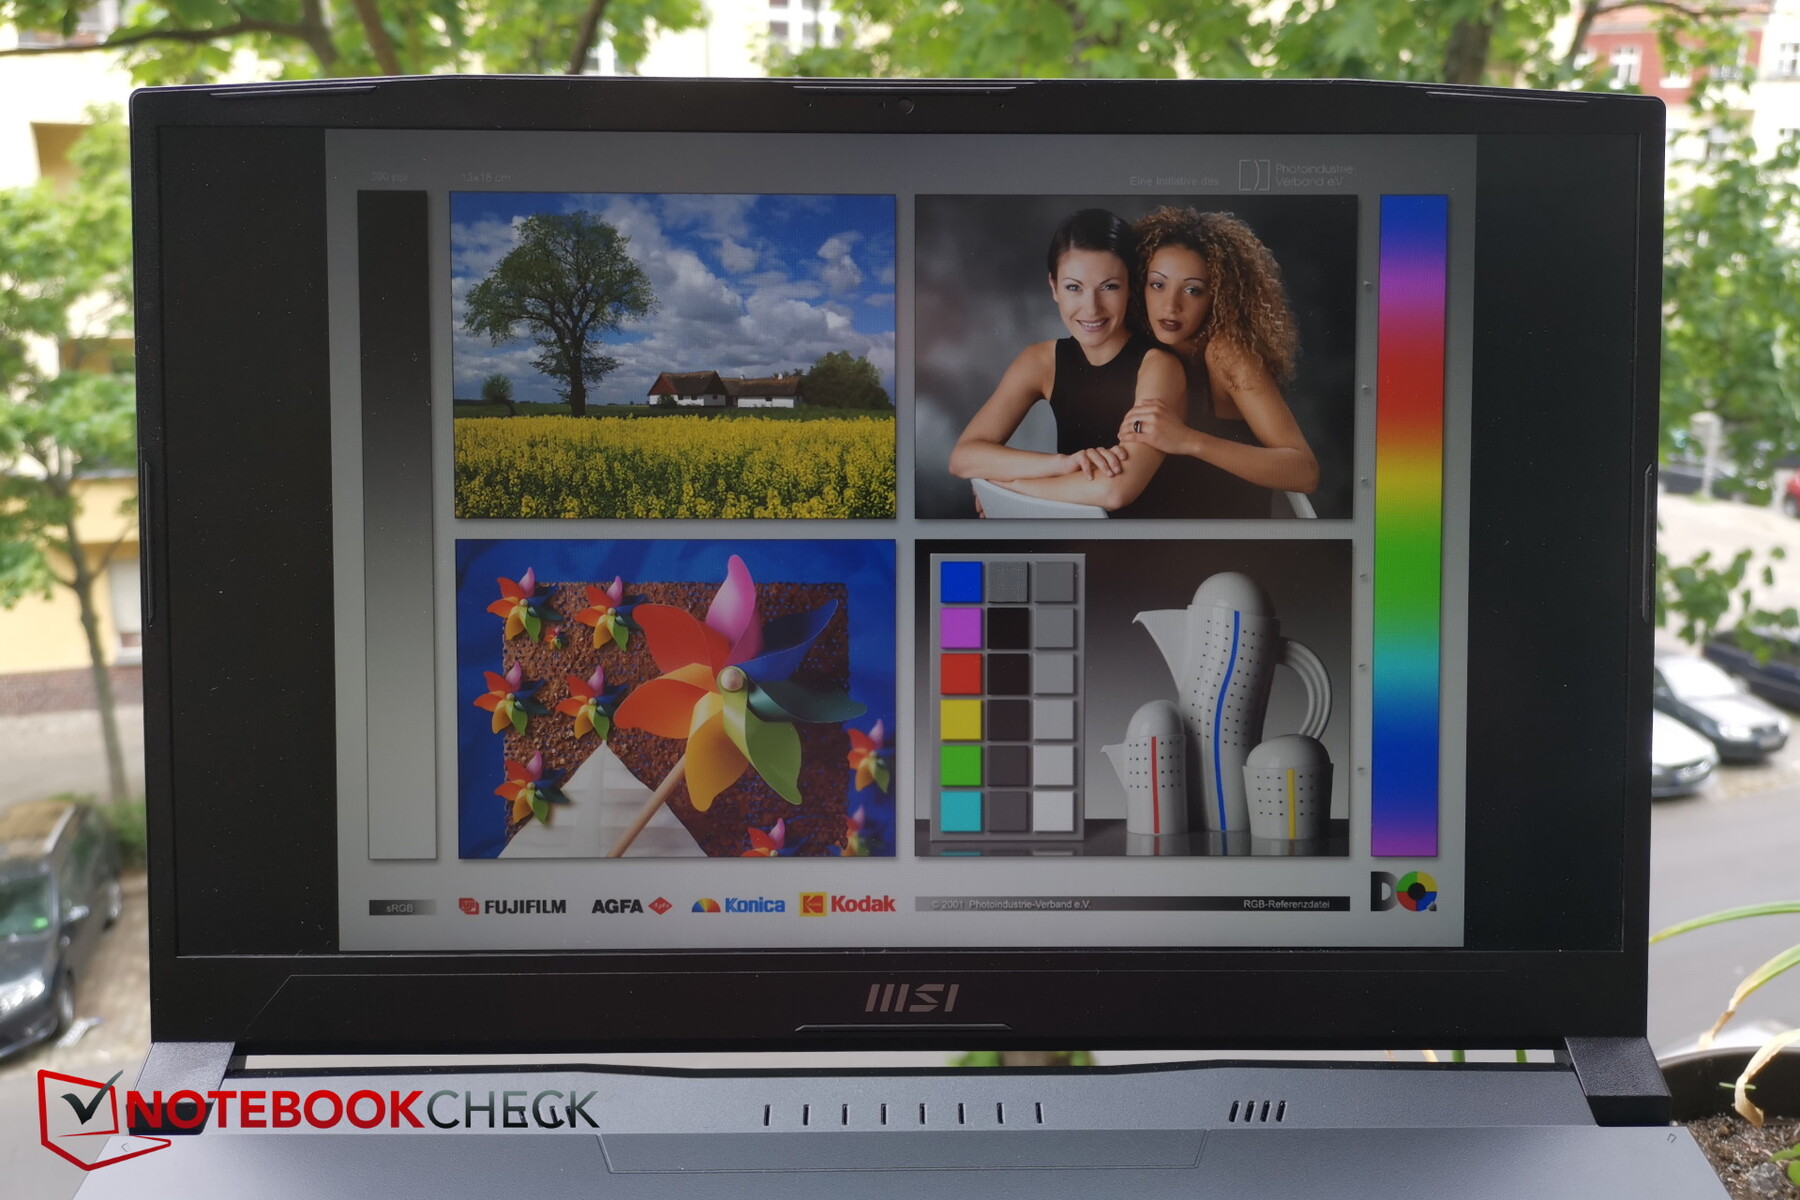
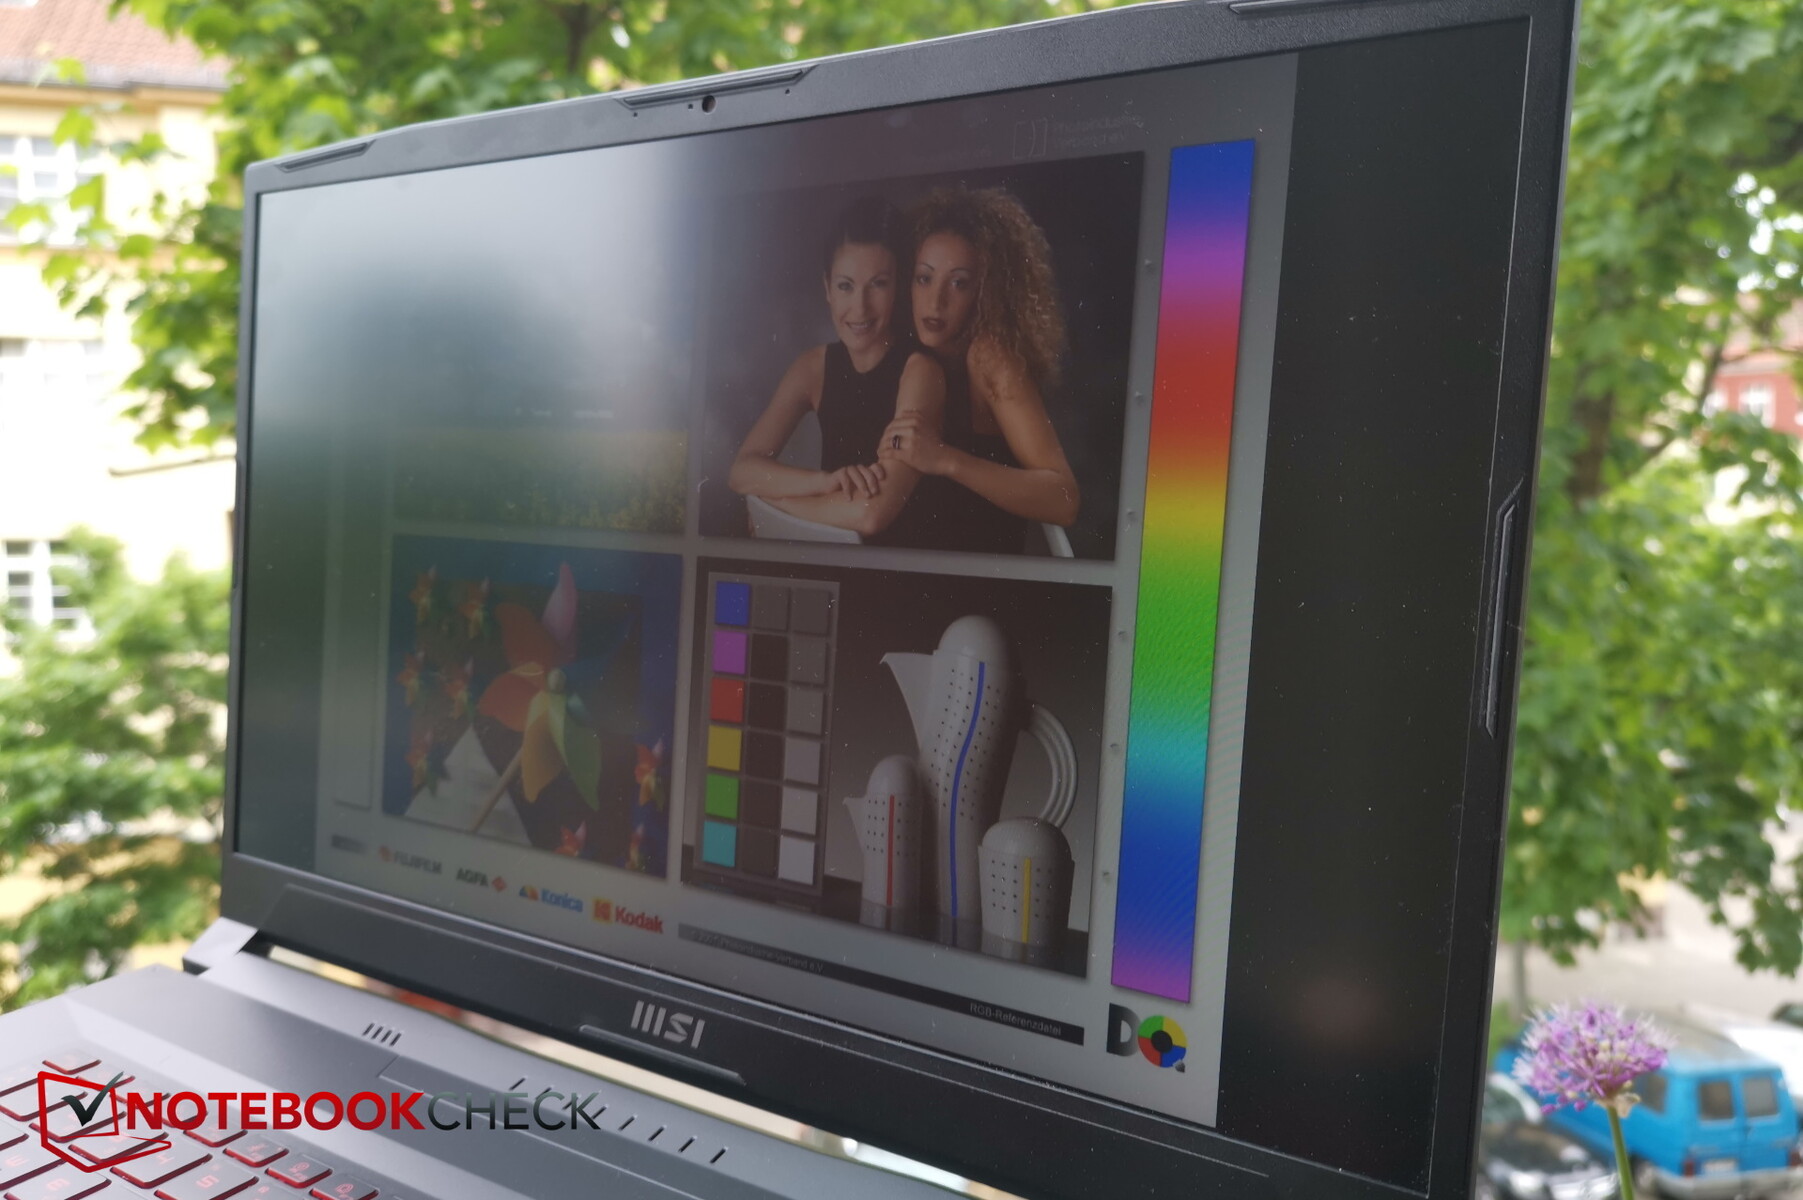
Mientras que normalmente los paneles IPS brillan por su estabilidad en los ángulos de visión, este no es el caso de la pantalla del Katana. A partir de ángulos de visión extremos, el brillo y los colores disminuyen notablemente su intensidad.

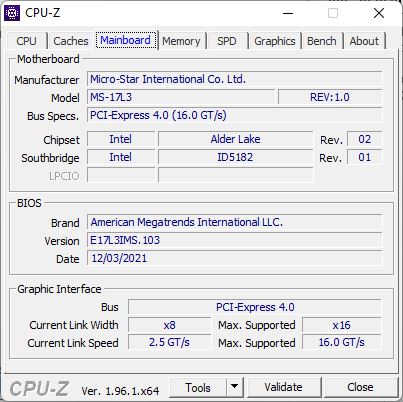
Rendimiento - RTX 3070 Ti con límite de 100 vatios
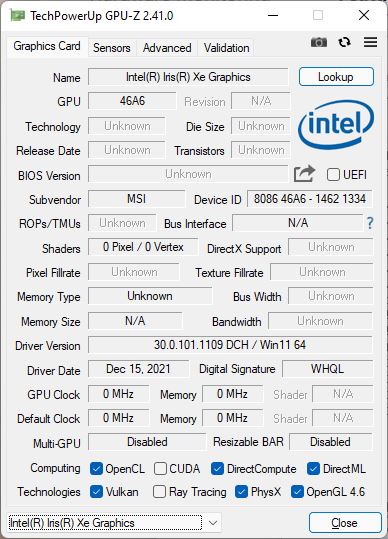
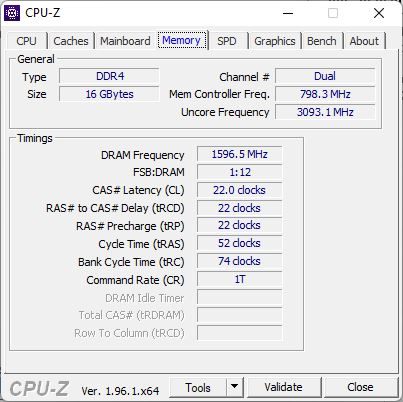
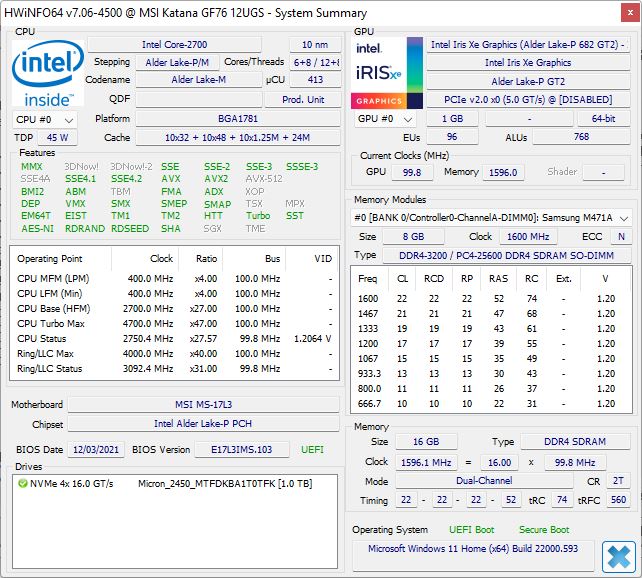
El Katana GF76 12U está disponible en un total de nueve configuraciones. Ocho de ellas utilizan un Core i7-12700Hcomo CPU y sólo un modelo viene con uni5-12500Hlas versiones de la GPU parten de laRTX 3050hasta laRTX 3070 Tiincluyendo todos los modelos RTX disponibles actualmente de Nvidia. La pantalla y la RAM (2x 8 GB DDR4, también 16 GB) son las mismas para todos los modelos. Como tamaño de SSD, están disponibles 1 TB o 512 GB.
Nuestra configuración representa el extremo superior con una RTX 3070 Ti y un SSD de 1 TB. Debería poder jugar a todos los juegos actuales en la resolución FHD nativa con fluidez incluso al máximo nivel de detalle.
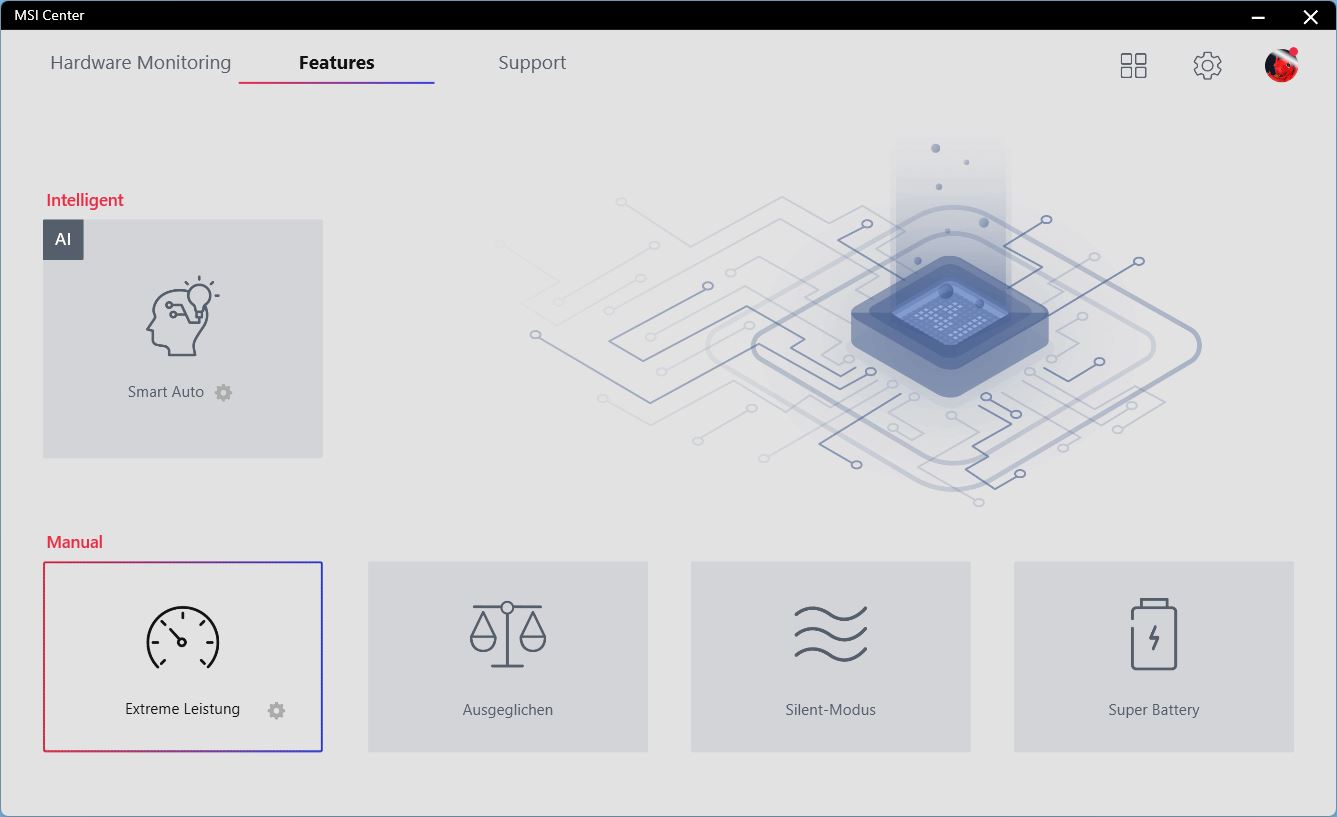
Condiciones de la prueba
Para obtener los mejores resultados del benchmark, utilizamos el modo "Rendimiento extremo" en el Centro MSI. Si bien este software permite ajustar varias configuraciones importantes del sistema, en su primer arranque hay que aceptar una declaración de privacidad de datos que pide el envío de datos anónimos del usuario. Las configuraciones de ajuste incluyen los perfiles de usuario, los modos de control de los ventiladores, y también los ajustes generales como el cambio de la tecla Fn y Windows. También permite buscar actualizaciones de controladores, pero desafortunadamente no se instalan automáticamente después de la descarga
El Centro MSI tarda demasiado en cargarse para nuestro gusto, y también ocurrió repetidamente que el perfil del ventilador volviera a "Equilibrado" sin ninguna razón discernible después de reiniciar el software.
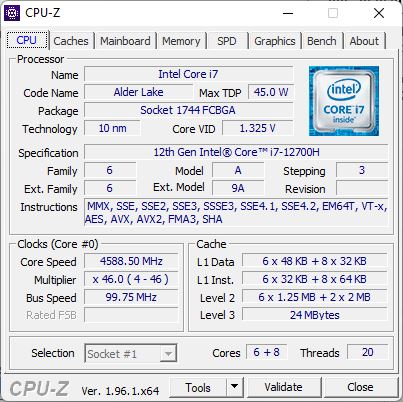
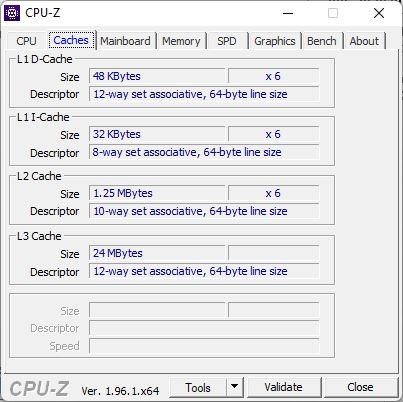
Procesador
MSI utiliza un Intel Core i7-12700Hque además del mínimamente mejor i7-12800H representa una de las CPUs estándar para los portátiles de juego actuales, siempre que se busque Intel y no AMD. Posee un total de 14 núcleos y es capaz de funcionar con 20 hilos simultáneamente. Cada uno de sus seis núcleos P es capaz de funcionar hasta a 4,7 GHz en Turbo Boost, y su velocidad de reloj básica es de 1,7 (núcleos E) y 2,4 GHz (núcleos P).
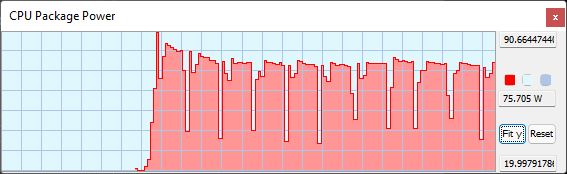
Mientras que la CPU de 45 vatios debería ser capaz de consumir hasta 115 vatios durante un corto período de tiempo, nuestra unidad de prueba sólo alcanza 105 vatios durante un tiempo muy corto en la primera ejecución. En las siguientes ejecuciones, aún alcanza de 70 a 76 vatios, lo que es capaz de mantener relativamente bien dentro de una ejecución.
Con esto, el Katane rinde al mismo nivel que los competidores, que también son buenos. El anterior Katana es superado por cerca de un 30%.
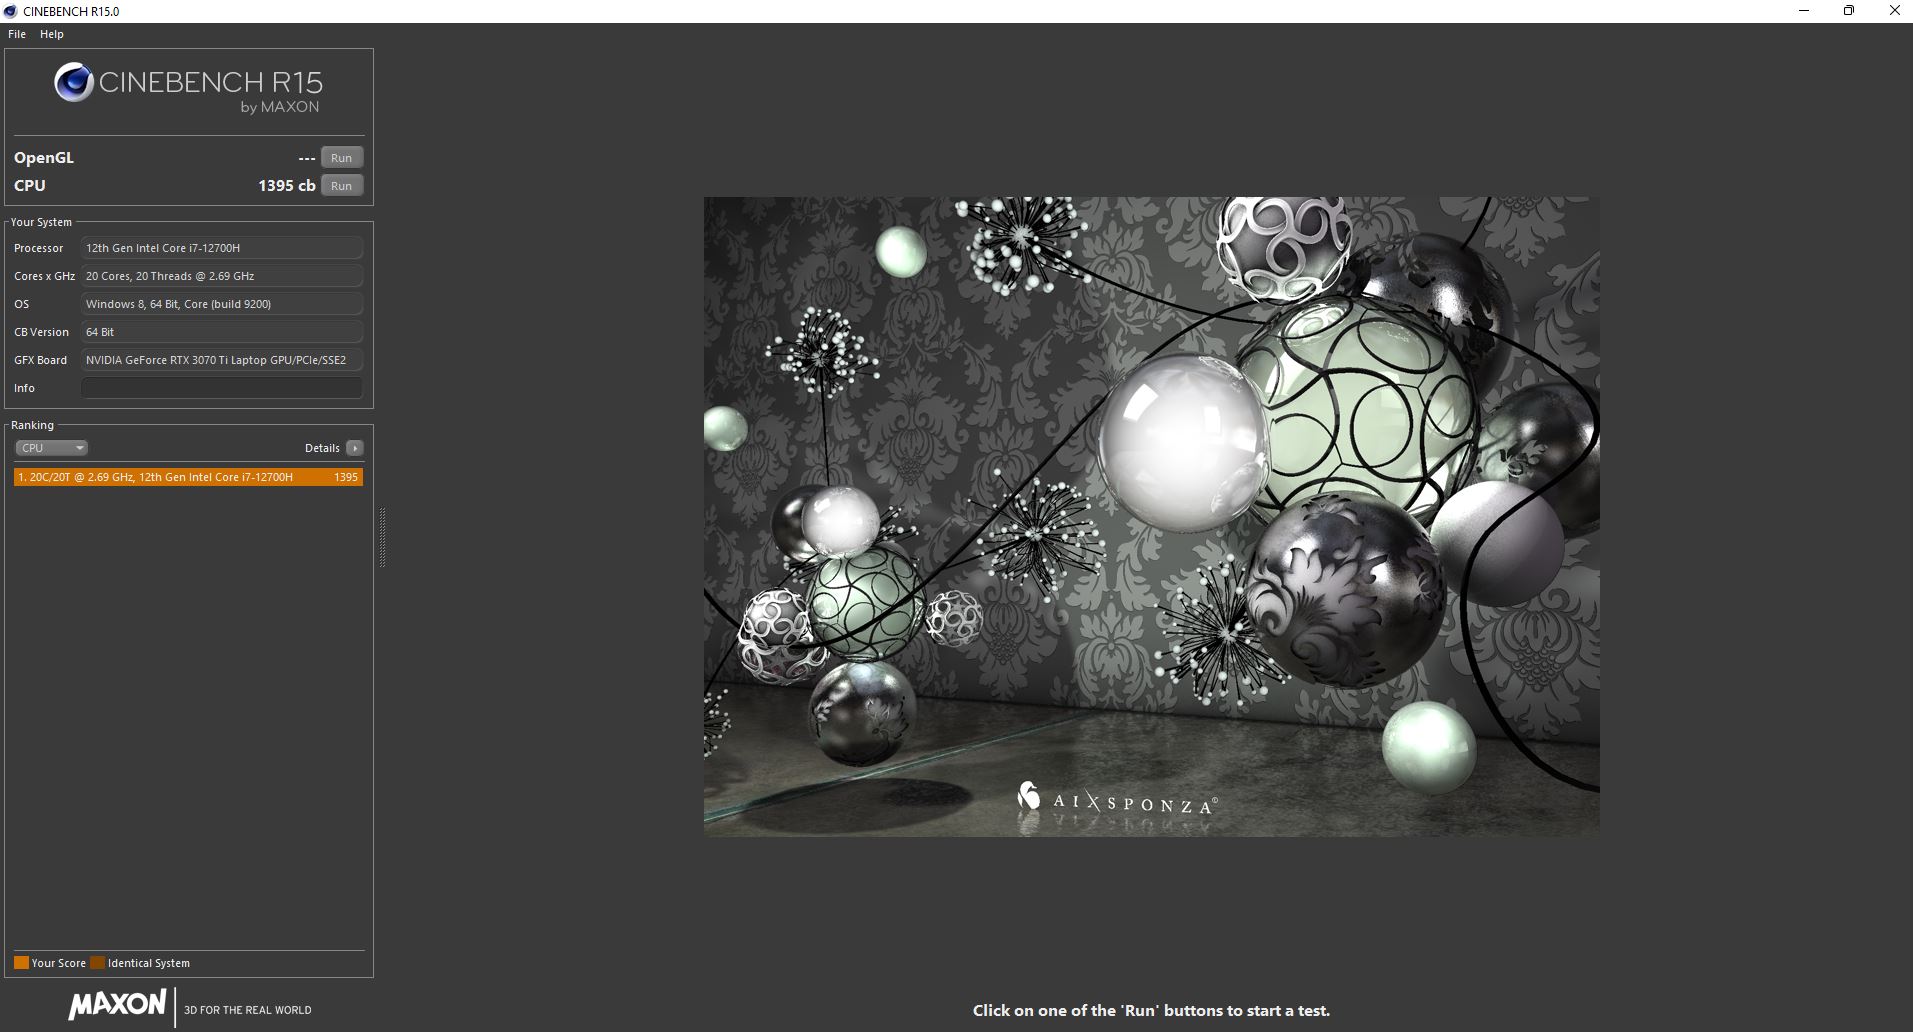
En la prueba Cinebench R15, el rendimiento se reduce en cerca de un 40% en funcionamiento con batería.
Cinebench R15 Multi Constant Load Test
Cinebench R23: Multi Core | Single Core
Cinebench R20: CPU (Multi Core) | CPU (Single Core)
Cinebench R15: CPU Multi 64Bit | CPU Single 64Bit
Blender: v2.79 BMW27 CPU
7-Zip 18.03: 7z b 4 | 7z b 4 -mmt1
Geekbench 5.5: Multi-Core | Single-Core
HWBOT x265 Benchmark v2.2: 4k Preset
LibreOffice : 20 Documents To PDF
R Benchmark 2.5: Overall mean
| CPU Performance rating | |
| Media de la clase Gaming | |
| Lenovo Legion 5 Pro 16 G7 i7 RTX 3070Ti | |
| MSI Vector GP66 12UGS | |
| MSI Katana GF76 12UGS | |
| Aorus 17 XE4 | |
| Razer Blade 17 (i7-12800H, RTX 3070 Ti) | |
| Medio Intel Core i7-12700H | |
| MSI Katana GF76 11UE | |
| Cinebench R23 / Multi Core | |
| Media de la clase Gaming (10488 - 42661, n=107, últimos 2 años) | |
| Lenovo Legion 5 Pro 16 G7 i7 RTX 3070Ti | |
| MSI Katana GF76 12UGS | |
| MSI Vector GP66 12UGS | |
| Aorus 17 XE4 | |
| Medio Intel Core i7-12700H (4032 - 19330, n=64) | |
| Razer Blade 17 (i7-12800H, RTX 3070 Ti) | |
| MSI Katana GF76 11UE | |
| Cinebench R23 / Single Core | |
| Media de la clase Gaming (1166 - 2415, n=107, últimos 2 años) | |
| MSI Vector GP66 12UGS | |
| Razer Blade 17 (i7-12800H, RTX 3070 Ti) | |
| Lenovo Legion 5 Pro 16 G7 i7 RTX 3070Ti | |
| Aorus 17 XE4 | |
| MSI Katana GF76 12UGS | |
| Medio Intel Core i7-12700H (778 - 1826, n=63) | |
| MSI Katana GF76 11UE | |
| Cinebench R20 / CPU (Multi Core) | |
| Media de la clase Gaming (4029 - 16433, n=106, últimos 2 años) | |
| Lenovo Legion 5 Pro 16 G7 i7 RTX 3070Ti | |
| MSI Vector GP66 12UGS | |
| Aorus 17 XE4 | |
| MSI Katana GF76 12UGS | |
| Medio Intel Core i7-12700H (1576 - 7407, n=64) | |
| Razer Blade 17 (i7-12800H, RTX 3070 Ti) | |
| MSI Katana GF76 11UE | |
| Cinebench R20 / CPU (Single Core) | |
| Media de la clase Gaming (442 - 913, n=106, últimos 2 años) | |
| MSI Vector GP66 12UGS | |
| Razer Blade 17 (i7-12800H, RTX 3070 Ti) | |
| MSI Katana GF76 12UGS | |
| Lenovo Legion 5 Pro 16 G7 i7 RTX 3070Ti | |
| Aorus 17 XE4 | |
| Medio Intel Core i7-12700H (300 - 704, n=64) | |
| MSI Katana GF76 11UE | |
| Cinebench R15 / CPU Multi 64Bit | |
| Media de la clase Gaming (1578 - 6330, n=105, últimos 2 años) | |
| Lenovo Legion 5 Pro 16 G7 i7 RTX 3070Ti | |
| Razer Blade 17 (i7-12800H, RTX 3070 Ti) | |
| MSI Katana GF76 12UGS | |
| Aorus 17 XE4 | |
| Medio Intel Core i7-12700H (1379 - 2916, n=70) | |
| MSI Vector GP66 12UGS | |
| MSI Katana GF76 11UE | |
| Cinebench R15 / CPU Single 64Bit | |
| Media de la clase Gaming (188.8 - 350, n=106, últimos 2 años) | |
| MSI Vector GP66 12UGS | |
| Razer Blade 17 (i7-12800H, RTX 3070 Ti) | |
| Lenovo Legion 5 Pro 16 G7 i7 RTX 3070Ti | |
| Aorus 17 XE4 | |
| MSI Katana GF76 12UGS | |
| Medio Intel Core i7-12700H (113 - 263, n=65) | |
| MSI Katana GF76 11UE | |
| Blender / v2.79 BMW27 CPU | |
| MSI Katana GF76 11UE | |
| Aorus 17 XE4 | |
| Medio Intel Core i7-12700H (168 - 732, n=63) | |
| Razer Blade 17 (i7-12800H, RTX 3070 Ti) | |
| MSI Vector GP66 12UGS | |
| MSI Katana GF76 12UGS | |
| Lenovo Legion 5 Pro 16 G7 i7 RTX 3070Ti | |
| Media de la clase Gaming (79 - 330, n=104, últimos 2 años) | |
| 7-Zip 18.03 / 7z b 4 | |
| Media de la clase Gaming (33491 - 148086, n=105, últimos 2 años) | |
| Lenovo Legion 5 Pro 16 G7 i7 RTX 3070Ti | |
| MSI Vector GP66 12UGS | |
| Razer Blade 17 (i7-12800H, RTX 3070 Ti) | |
| MSI Katana GF76 12UGS | |
| Medio Intel Core i7-12700H (22844 - 73067, n=63) | |
| Aorus 17 XE4 | |
| MSI Katana GF76 11UE | |
| 7-Zip 18.03 / 7z b 4 -mmt1 | |
| Media de la clase Gaming (4199 - 7436, n=105, últimos 2 años) | |
| MSI Vector GP66 12UGS | |
| Aorus 17 XE4 | |
| Lenovo Legion 5 Pro 16 G7 i7 RTX 3070Ti | |
| MSI Katana GF76 12UGS | |
| Razer Blade 17 (i7-12800H, RTX 3070 Ti) | |
| Medio Intel Core i7-12700H (2743 - 5972, n=63) | |
| MSI Katana GF76 11UE | |
| Geekbench 5.5 / Multi-Core | |
| Media de la clase Gaming (6460 - 28263, n=105, últimos 2 años) | |
| Lenovo Legion 5 Pro 16 G7 i7 RTX 3070Ti | |
| MSI Vector GP66 12UGS | |
| Aorus 17 XE4 | |
| Razer Blade 17 (i7-12800H, RTX 3070 Ti) | |
| Medio Intel Core i7-12700H (5144 - 13745, n=64) | |
| MSI Katana GF76 12UGS | |
| MSI Katana GF76 11UE | |
| Geekbench 5.5 / Single-Core | |
| Media de la clase Gaming (986 - 2474, n=105, últimos 2 años) | |
| MSI Vector GP66 12UGS | |
| MSI Katana GF76 12UGS | |
| Aorus 17 XE4 | |
| Razer Blade 17 (i7-12800H, RTX 3070 Ti) | |
| Lenovo Legion 5 Pro 16 G7 i7 RTX 3070Ti | |
| Medio Intel Core i7-12700H (803 - 1851, n=64) | |
| MSI Katana GF76 11UE | |
| HWBOT x265 Benchmark v2.2 / 4k Preset | |
| Media de la clase Gaming (11.5 - 44.4, n=105, últimos 2 años) | |
| Lenovo Legion 5 Pro 16 G7 i7 RTX 3070Ti | |
| MSI Vector GP66 12UGS | |
| Medio Intel Core i7-12700H (4.67 - 21.8, n=64) | |
| Aorus 17 XE4 | |
| Razer Blade 17 (i7-12800H, RTX 3070 Ti) | |
| MSI Katana GF76 12UGS | |
| MSI Katana GF76 11UE | |
| LibreOffice / 20 Documents To PDF | |
| Media de la clase Gaming (33.2 - 88.8, n=105, últimos 2 años) | |
| MSI Katana GF76 11UE | |
| Medio Intel Core i7-12700H (34.2 - 95.3, n=63) | |
| Lenovo Legion 5 Pro 16 G7 i7 RTX 3070Ti | |
| Razer Blade 17 (i7-12800H, RTX 3070 Ti) | |
| MSI Katana GF76 12UGS | |
| MSI Vector GP66 12UGS | |
| Aorus 17 XE4 | |
| R Benchmark 2.5 / Overall mean | |
| MSI Katana GF76 11UE | |
| Medio Intel Core i7-12700H (0.4441 - 1.052, n=63) | |
| Razer Blade 17 (i7-12800H, RTX 3070 Ti) | |
| Aorus 17 XE4 | |
| MSI Katana GF76 12UGS | |
| Lenovo Legion 5 Pro 16 G7 i7 RTX 3070Ti | |
| Media de la clase Gaming (0.3439 - 0.759, n=106, últimos 2 años) | |
| MSI Vector GP66 12UGS | |
* ... más pequeño es mejor
AIDA64: FP32 Ray-Trace | FPU Julia | CPU SHA3 | CPU Queen | FPU SinJulia | FPU Mandel | CPU AES | CPU ZLib | FP64 Ray-Trace | CPU PhotoWorxx
| Performance rating | |
| Media de la clase Gaming | |
| Lenovo Legion 5 Pro 16 G7 i7 RTX 3070Ti | |
| Medio Intel Core i7-12700H | |
| MSI Vector GP66 12UGS | |
| MSI Katana GF76 12UGS | |
| Razer Blade 17 (i7-12800H, RTX 3070 Ti) | |
| Aorus 17 XE4 | |
| MSI Katana GF76 11UE -9! | |
| AIDA64 / FP32 Ray-Trace | |
| Media de la clase Gaming (10227 - 85542, n=105, últimos 2 años) | |
| Medio Intel Core i7-12700H (2585 - 17957, n=64) | |
| Lenovo Legion 5 Pro 16 G7 i7 RTX 3070Ti | |
| MSI Katana GF76 12UGS | |
| MSI Vector GP66 12UGS | |
| Razer Blade 17 (i7-12800H, RTX 3070 Ti) | |
| Aorus 17 XE4 | |
| AIDA64 / FPU Julia | |
| Media de la clase Gaming (51376 - 238426, n=105, últimos 2 años) | |
| Medio Intel Core i7-12700H (12439 - 90760, n=64) | |
| Lenovo Legion 5 Pro 16 G7 i7 RTX 3070Ti | |
| MSI Vector GP66 12UGS | |
| MSI Katana GF76 12UGS | |
| Razer Blade 17 (i7-12800H, RTX 3070 Ti) | |
| Aorus 17 XE4 | |
| AIDA64 / CPU SHA3 | |
| Media de la clase Gaming (2180 - 10115, n=105, últimos 2 años) | |
| Lenovo Legion 5 Pro 16 G7 i7 RTX 3070Ti | |
| MSI Katana GF76 12UGS | |
| Medio Intel Core i7-12700H (833 - 4242, n=64) | |
| MSI Vector GP66 12UGS | |
| Razer Blade 17 (i7-12800H, RTX 3070 Ti) | |
| Aorus 17 XE4 | |
| AIDA64 / CPU Queen | |
| Media de la clase Gaming (49785 - 173351, n=90, últimos 2 años) | |
| MSI Vector GP66 12UGS | |
| Aorus 17 XE4 | |
| Lenovo Legion 5 Pro 16 G7 i7 RTX 3070Ti | |
| MSI Katana GF76 12UGS | |
| Medio Intel Core i7-12700H (57923 - 103202, n=63) | |
| Razer Blade 17 (i7-12800H, RTX 3070 Ti) | |
| AIDA64 / FPU SinJulia | |
| Media de la clase Gaming (4424 - 33636, n=105, últimos 2 años) | |
| Lenovo Legion 5 Pro 16 G7 i7 RTX 3070Ti | |
| MSI Vector GP66 12UGS | |
| MSI Katana GF76 12UGS | |
| Razer Blade 17 (i7-12800H, RTX 3070 Ti) | |
| Medio Intel Core i7-12700H (3249 - 9939, n=64) | |
| Aorus 17 XE4 | |
| AIDA64 / FPU Mandel | |
| Media de la clase Gaming (25115 - 128721, n=105, últimos 2 años) | |
| Medio Intel Core i7-12700H (7135 - 44760, n=64) | |
| Lenovo Legion 5 Pro 16 G7 i7 RTX 3070Ti | |
| MSI Katana GF76 12UGS | |
| MSI Vector GP66 12UGS | |
| Razer Blade 17 (i7-12800H, RTX 3070 Ti) | |
| Aorus 17 XE4 | |
| AIDA64 / CPU AES | |
| Media de la clase Gaming (39258 - 247074, n=105, últimos 2 años) | |
| Lenovo Legion 5 Pro 16 G7 i7 RTX 3070Ti | |
| MSI Vector GP66 12UGS | |
| MSI Katana GF76 12UGS | |
| Medio Intel Core i7-12700H (31839 - 144360, n=64) | |
| Aorus 17 XE4 | |
| Razer Blade 17 (i7-12800H, RTX 3070 Ti) | |
| AIDA64 / CPU ZLib | |
| Media de la clase Gaming (574 - 2531, n=105, últimos 2 años) | |
| Lenovo Legion 5 Pro 16 G7 i7 RTX 3070Ti | |
| MSI Vector GP66 12UGS | |
| MSI Katana GF76 12UGS | |
| Razer Blade 17 (i7-12800H, RTX 3070 Ti) | |
| Medio Intel Core i7-12700H (305 - 1171, n=64) | |
| Aorus 17 XE4 | |
| MSI Katana GF76 11UE | |
| AIDA64 / FP64 Ray-Trace | |
| Media de la clase Gaming (5509 - 45446, n=105, últimos 2 años) | |
| Medio Intel Core i7-12700H (1437 - 9692, n=64) | |
| Lenovo Legion 5 Pro 16 G7 i7 RTX 3070Ti | |
| MSI Katana GF76 12UGS | |
| MSI Vector GP66 12UGS | |
| Razer Blade 17 (i7-12800H, RTX 3070 Ti) | |
| Aorus 17 XE4 | |
| AIDA64 / CPU PhotoWorxx | |
| Media de la clase Gaming (12271 - 89891, n=105, últimos 2 años) | |
| Lenovo Legion 5 Pro 16 G7 i7 RTX 3070Ti | |
| Medio Intel Core i7-12700H (12863 - 52207, n=64) | |
| Razer Blade 17 (i7-12800H, RTX 3070 Ti) | |
| MSI Vector GP66 12UGS | |
| MSI Katana GF76 12UGS | |
| Aorus 17 XE4 | |
Rendimiento del sistema
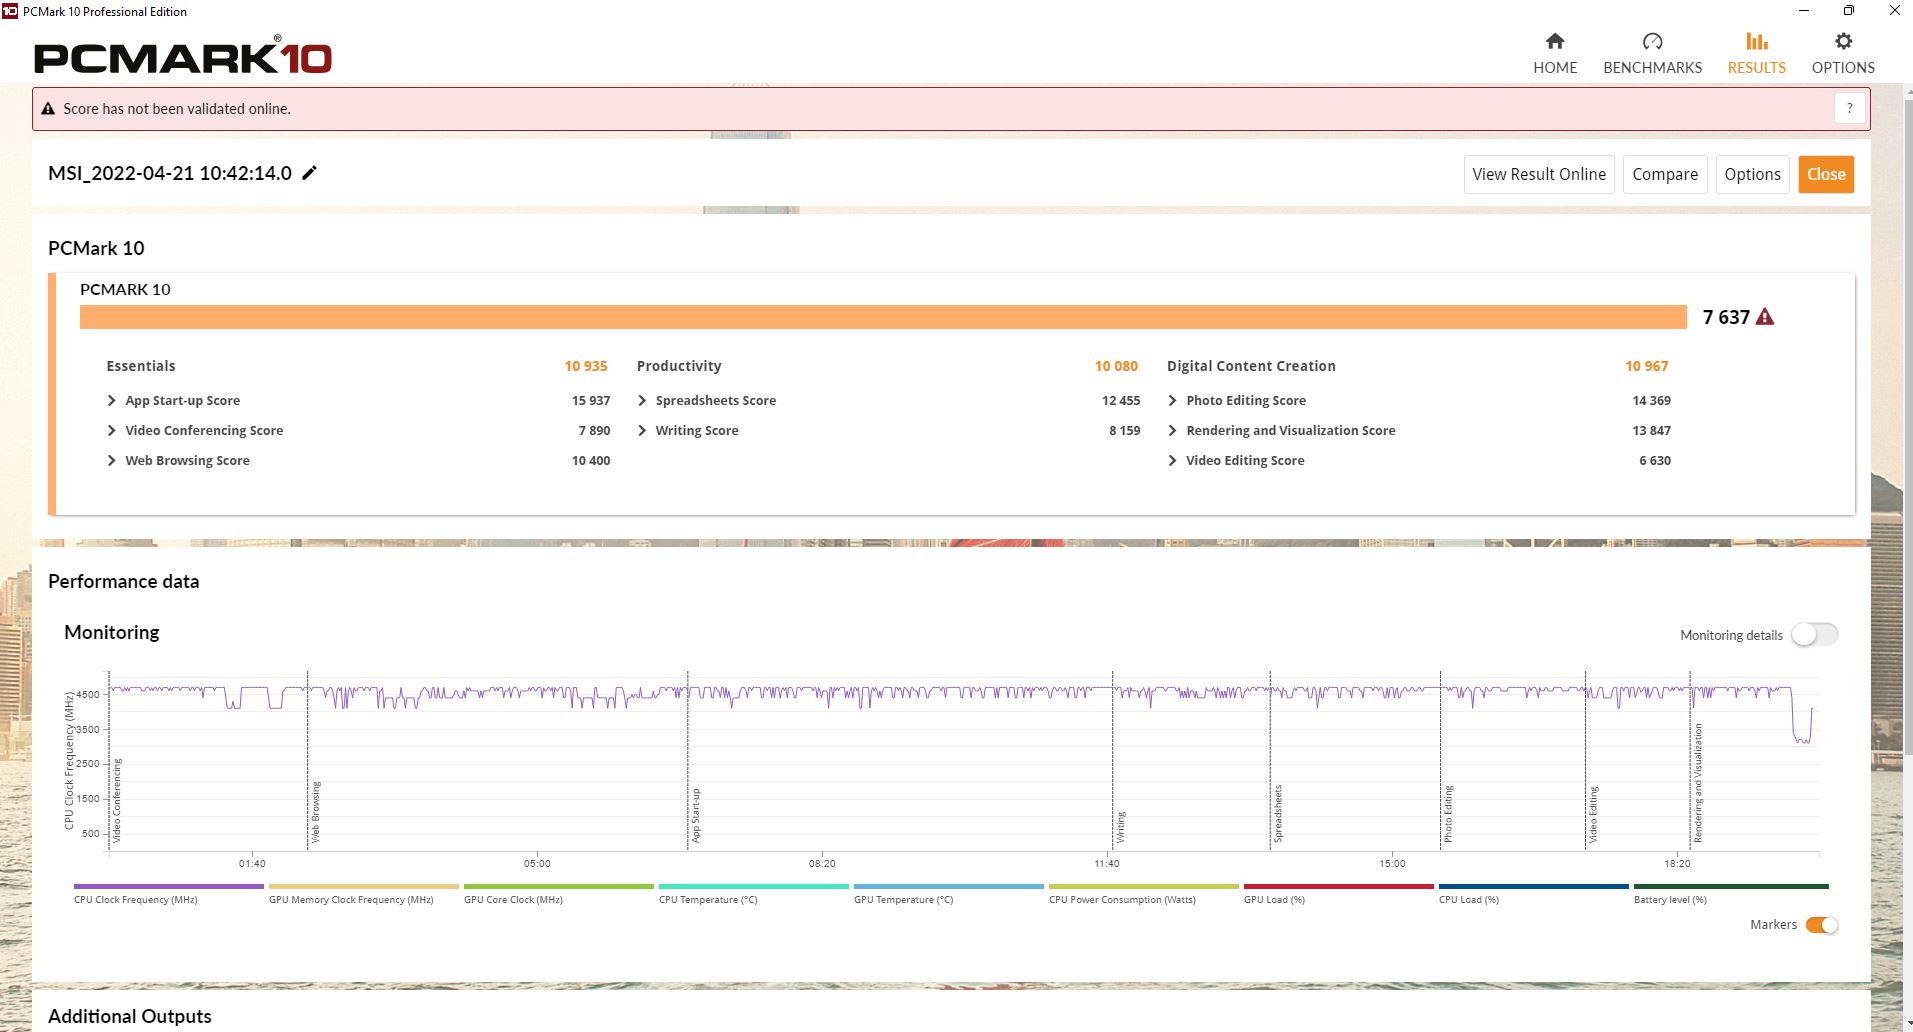
En PCMark 10, el Katana hace un buen trabajo, quedando en segundo lugar la mayor parte del tiempo. Sólo en el segmento de creación de contenidos digitales, el rendimiento baja ligeramente.
CrossMark: Overall | Productivity | Creativity | Responsiveness
| PCMark 10 / Score | |
| Media de la clase Gaming (5828 - 12414, n=93, últimos 2 años) | |
| MSI Vector GP66 12UGS | |
| Aorus 17 XE4 | |
| MSI Katana GF76 12UGS | |
| Lenovo Legion 5 Pro 16 G7 i7 RTX 3070Ti | |
| Medio Intel Core i7-12700H, NVIDIA GeForce RTX 3070 Ti Laptop GPU (6941 - 7947, n=11) | |
| Razer Blade 17 (i7-12800H, RTX 3070 Ti) | |
| MSI Katana GF76 11UE | |
| PCMark 10 / Essentials | |
| MSI Vector GP66 12UGS | |
| MSI Katana GF76 12UGS | |
| Aorus 17 XE4 | |
| Media de la clase Gaming (8810 - 11935, n=97, últimos 2 años) | |
| Medio Intel Core i7-12700H, NVIDIA GeForce RTX 3070 Ti Laptop GPU (9892 - 10935, n=11) | |
| Razer Blade 17 (i7-12800H, RTX 3070 Ti) | |
| Lenovo Legion 5 Pro 16 G7 i7 RTX 3070Ti | |
| MSI Katana GF76 11UE | |
| PCMark 10 / Productivity | |
| Media de la clase Gaming (6845 - 25323, n=95, últimos 2 años) | |
| MSI Vector GP66 12UGS | |
| MSI Katana GF76 12UGS | |
| Lenovo Legion 5 Pro 16 G7 i7 RTX 3070Ti | |
| Aorus 17 XE4 | |
| Medio Intel Core i7-12700H, NVIDIA GeForce RTX 3070 Ti Laptop GPU (9024 - 10638, n=11) | |
| Razer Blade 17 (i7-12800H, RTX 3070 Ti) | |
| MSI Katana GF76 11UE | |
| PCMark 10 / Digital Content Creation | |
| Media de la clase Gaming (7602 - 19954, n=95, últimos 2 años) | |
| MSI Vector GP66 12UGS | |
| Lenovo Legion 5 Pro 16 G7 i7 RTX 3070Ti | |
| Aorus 17 XE4 | |
| Medio Intel Core i7-12700H, NVIDIA GeForce RTX 3070 Ti Laptop GPU (10165 - 12546, n=11) | |
| Razer Blade 17 (i7-12800H, RTX 3070 Ti) | |
| MSI Katana GF76 12UGS | |
| MSI Katana GF76 11UE | |
| CrossMark / Overall | |
| Aorus 17 XE4 | |
| Media de la clase Gaming (1366 - 2409, n=94, últimos 2 años) | |
| Lenovo Legion 5 Pro 16 G7 i7 RTX 3070Ti | |
| MSI Katana GF76 12UGS | |
| Medio Intel Core i7-12700H, NVIDIA GeForce RTX 3070 Ti Laptop GPU (974 - 2000, n=12) | |
| Razer Blade 17 (i7-12800H, RTX 3070 Ti) | |
| CrossMark / Productivity | |
| Aorus 17 XE4 | |
| MSI Katana GF76 12UGS | |
| Lenovo Legion 5 Pro 16 G7 i7 RTX 3070Ti | |
| Media de la clase Gaming (1386 - 2254, n=94, últimos 2 años) | |
| Medio Intel Core i7-12700H, NVIDIA GeForce RTX 3070 Ti Laptop GPU (907 - 1962, n=12) | |
| Razer Blade 17 (i7-12800H, RTX 3070 Ti) | |
| CrossMark / Creativity | |
| Media de la clase Gaming (1343 - 2786, n=94, últimos 2 años) | |
| Lenovo Legion 5 Pro 16 G7 i7 RTX 3070Ti | |
| Aorus 17 XE4 | |
| Razer Blade 17 (i7-12800H, RTX 3070 Ti) | |
| Medio Intel Core i7-12700H, NVIDIA GeForce RTX 3070 Ti Laptop GPU (1027 - 2057, n=12) | |
| MSI Katana GF76 12UGS | |
| CrossMark / Responsiveness | |
| Aorus 17 XE4 | |
| MSI Katana GF76 12UGS | |
| Lenovo Legion 5 Pro 16 G7 i7 RTX 3070Ti | |
| Medio Intel Core i7-12700H, NVIDIA GeForce RTX 3070 Ti Laptop GPU (1029 - 2142, n=12) | |
| Media de la clase Gaming (1226 - 2334, n=94, últimos 2 años) | |
| Razer Blade 17 (i7-12800H, RTX 3070 Ti) | |
| PCMark 10 Score | 7637 puntos | |
ayuda | ||
| AIDA64 / Memory Copy | |
| Media de la clase Gaming (21750 - 129946, n=105, últimos 2 años) | |
| Medio Intel Core i7-12700H (25615 - 80511, n=64) | |
| Lenovo Legion 5 Pro 16 G7 i7 RTX 3070Ti | |
| Razer Blade 17 (i7-12800H, RTX 3070 Ti) | |
| MSI Katana GF76 12UGS | |
| MSI Vector GP66 12UGS | |
| Aorus 17 XE4 | |
| AIDA64 / Memory Read | |
| Media de la clase Gaming (22956 - 118858, n=105, últimos 2 años) | |
| Lenovo Legion 5 Pro 16 G7 i7 RTX 3070Ti | |
| Medio Intel Core i7-12700H (25586 - 79442, n=64) | |
| Razer Blade 17 (i7-12800H, RTX 3070 Ti) | |
| MSI Katana GF76 12UGS | |
| MSI Vector GP66 12UGS | |
| Aorus 17 XE4 | |
| AIDA64 / Memory Write | |
| Media de la clase Gaming (22297 - 135096, n=105, últimos 2 años) | |
| Lenovo Legion 5 Pro 16 G7 i7 RTX 3070Ti | |
| Medio Intel Core i7-12700H (23679 - 88660, n=64) | |
| Razer Blade 17 (i7-12800H, RTX 3070 Ti) | |
| MSI Katana GF76 12UGS | |
| MSI Vector GP66 12UGS | |
| Aorus 17 XE4 | |
| AIDA64 / Memory Latency | |
| Media de la clase Gaming (75.3 - 259, n=105, últimos 2 años) | |
| Lenovo Legion 5 Pro 16 G7 i7 RTX 3070Ti | |
| MSI Katana GF76 12UGS | |
| Aorus 17 XE4 | |
| MSI Vector GP66 12UGS | |
| Medio Intel Core i7-12700H (76.2 - 133.9, n=62) | |
| MSI Katana GF76 11UE | |
| Razer Blade 17 (i7-12800H, RTX 3070 Ti) | |
* ... más pequeño es mejor
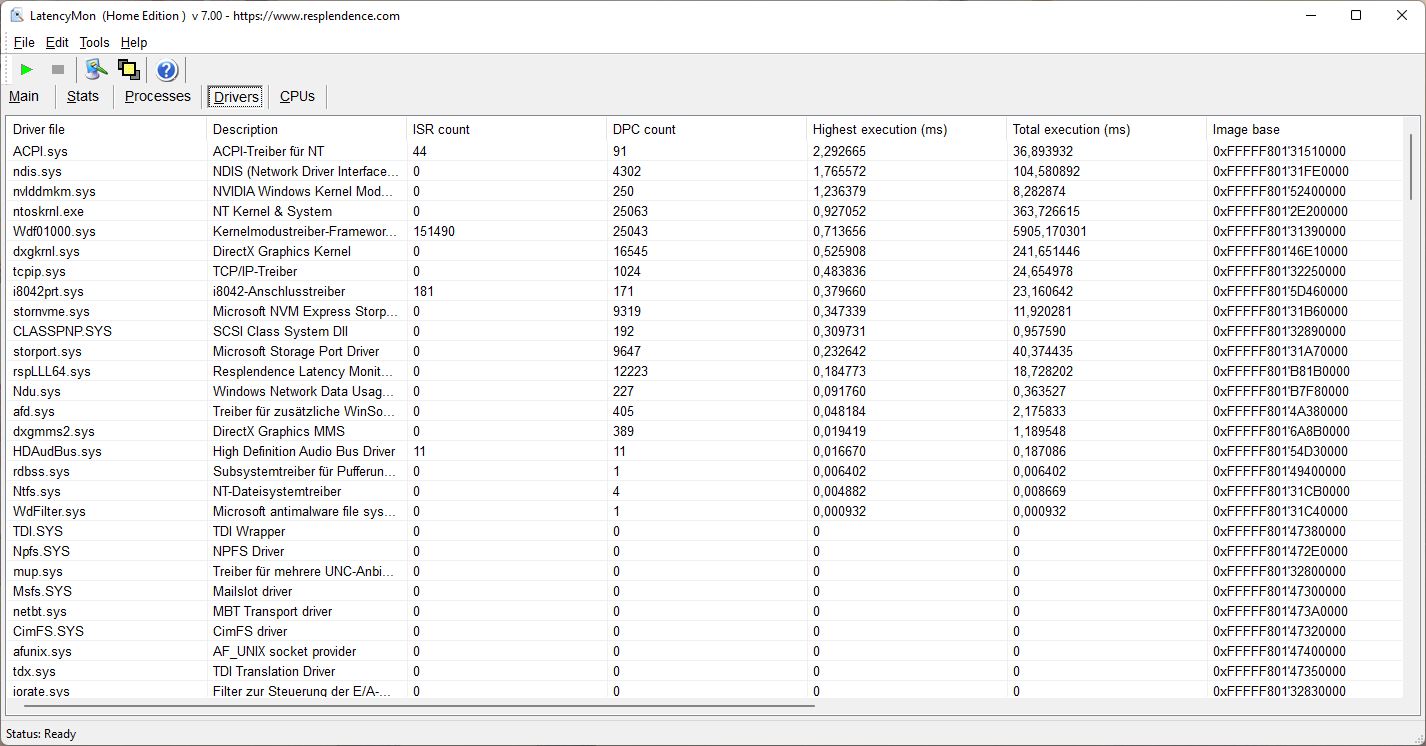
Latencias del CPD
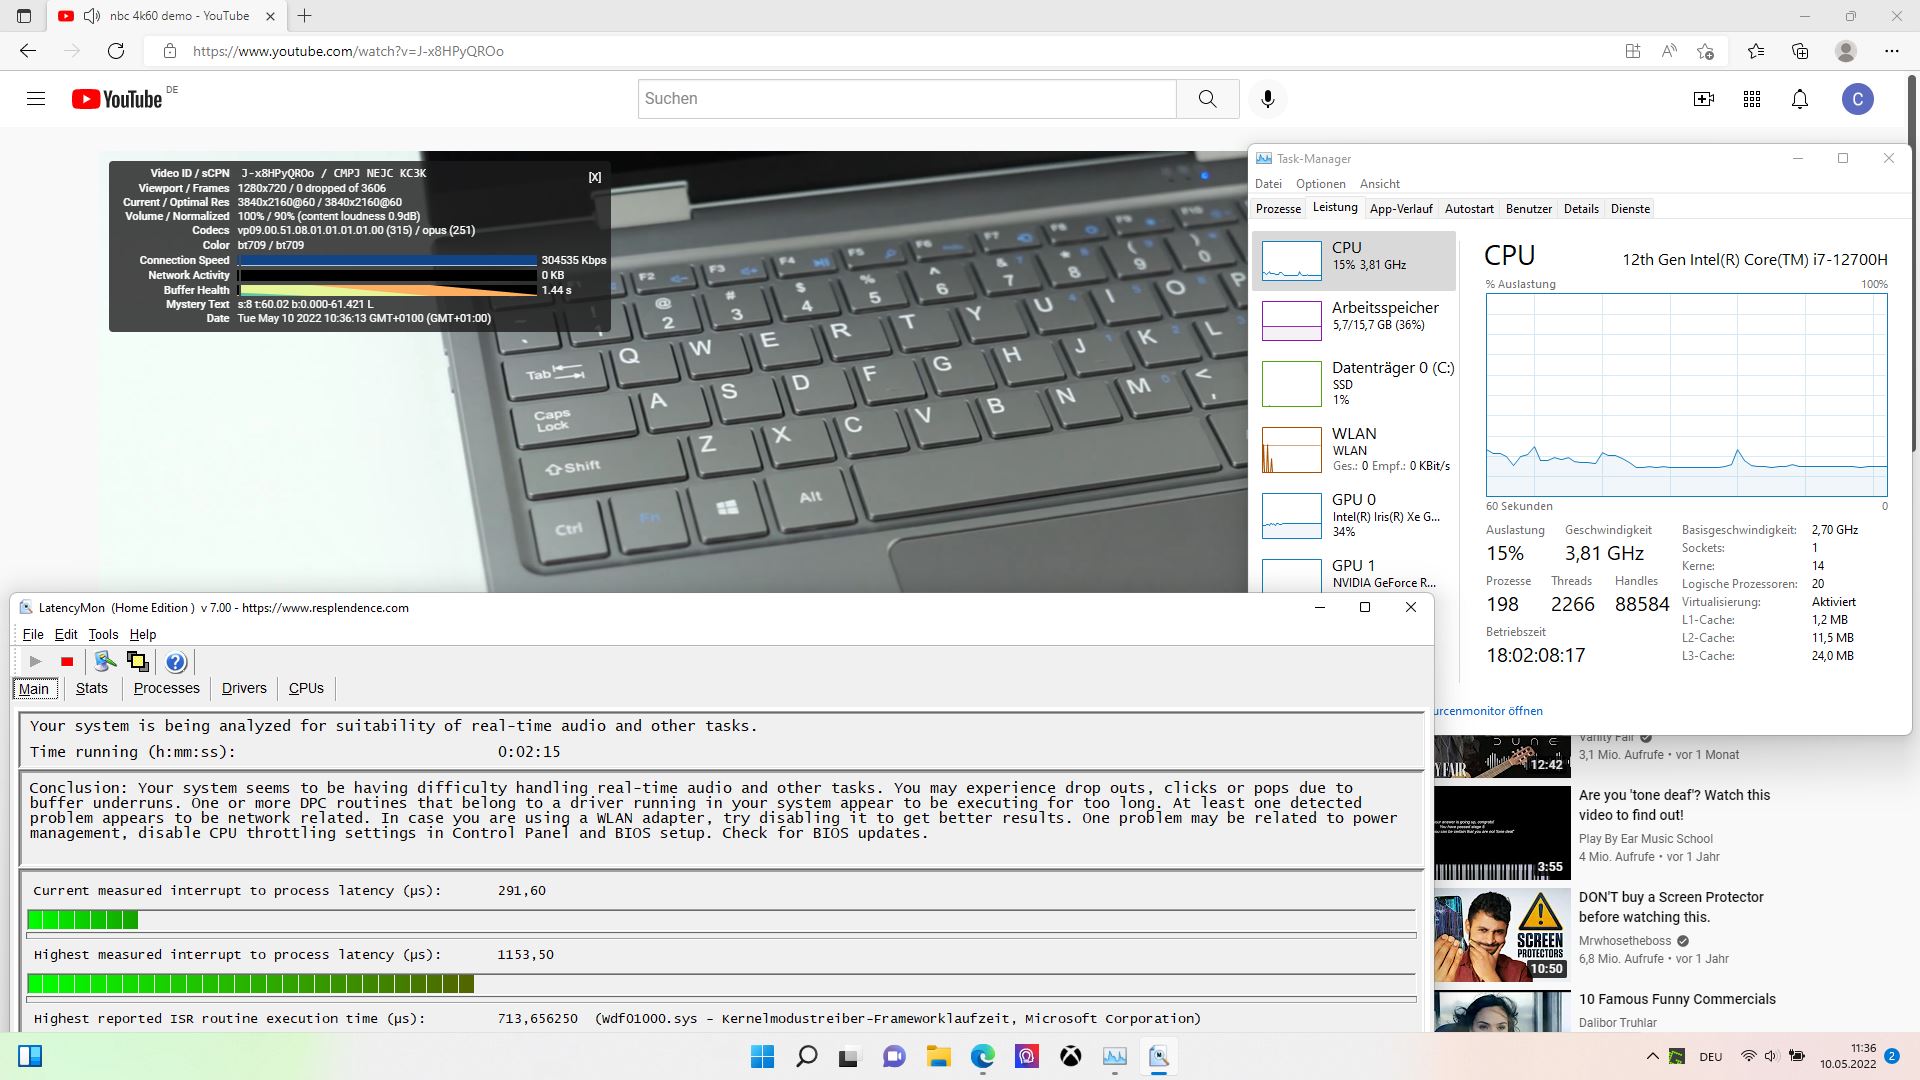
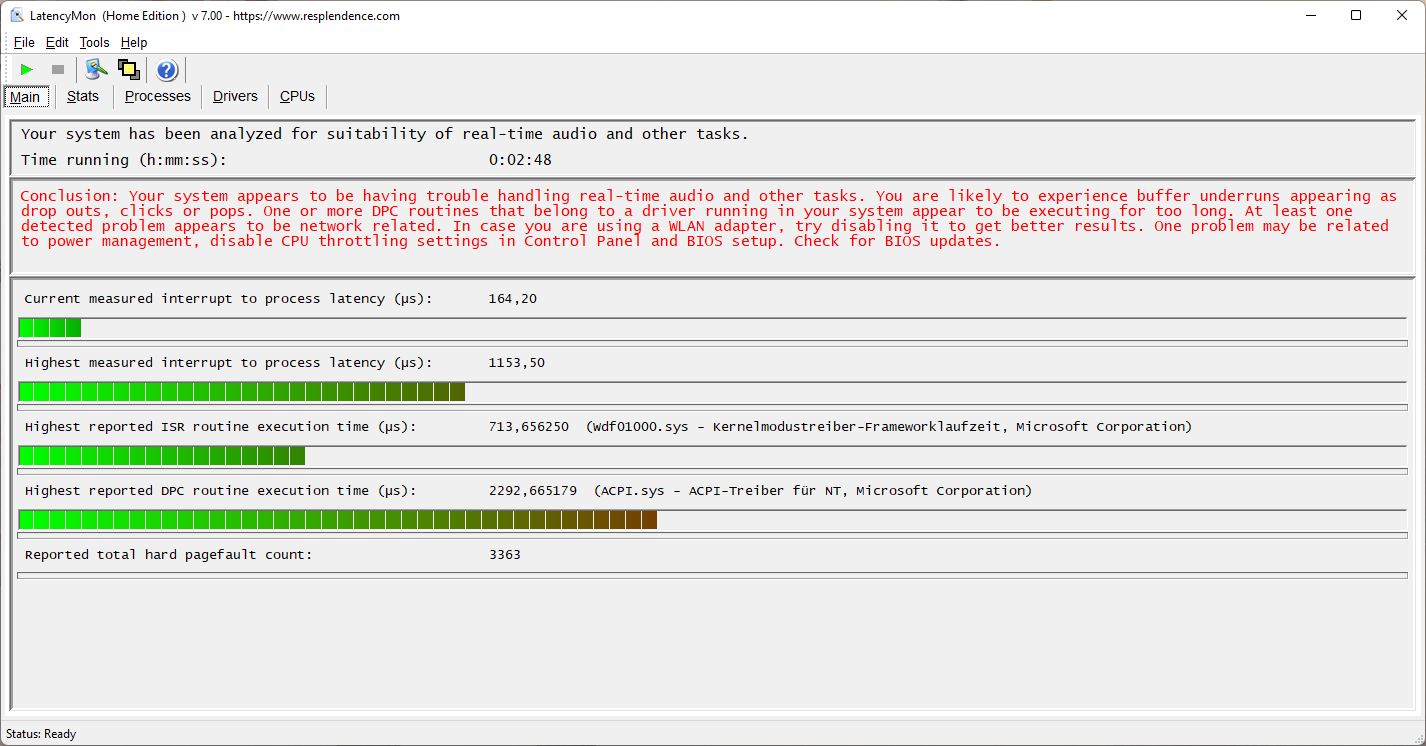
Ni la apertura del navegador, ni varias pestañas abiertas en nuestra página web crean ningún problema para el Katana. Sin embargo, la herramienta LatencyMon sí muestra algunos retrasos al reproducir nuestro vídeo de prueba de YouTube a 4K/60 fps, pero sigue sin haber caídas de frames durante la reproducción.
| DPC Latencies / LatencyMon - interrupt to process latency (max), Web, Youtube, Prime95 | |
| MSI Katana GF76 11UE | |
| MSI Vector GP66 12UGS | |
| Aorus 17 XE4 | |
| MSI Katana GF76 12UGS | |
| Razer Blade 17 (i7-12800H, RTX 3070 Ti) | |
| Lenovo Legion 5 Pro 16 G7 i7 RTX 3070Ti | |
* ... más pequeño es mejor
Solución de almacenamiento
MSI usa un SSD NVMe de Micron con 1 TB. Aunque el almacenamiento ya está conectado por PCIe 4.0, la velocidad sigue estando más en un nivel alto de PCIe 3.0, por lo que los modelos de los competidores más caros suelen ser más rápidos. Por otro lado, el rendimiento constante es muy bueno, terminando en un buen 12º lugar en nuestra lista de mejores dispositivos de almacenamiento.

* ... más pequeño es mejor
Constant Performance Reading: DiskSpd Read Loop, Queue Depth 8
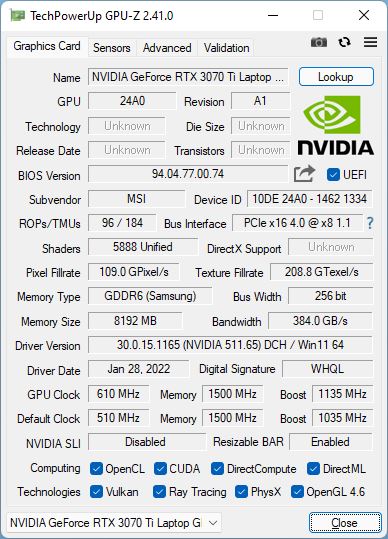
Tarjeta gráfica
La Nvidia Geforce RTX 3070 Ti es una de las GPUs móviles más potentes y debería ser capaz de jugar a todos los juegos actuales sin problemas. Sin embargo, en el Katana su TGP está limitada a sólo 100 vatios, mientras que algunos de los competidores alcanzan aquí los 150 vatios. El rendimiento gráfico debería acabar siendo correspondientemente inferior.
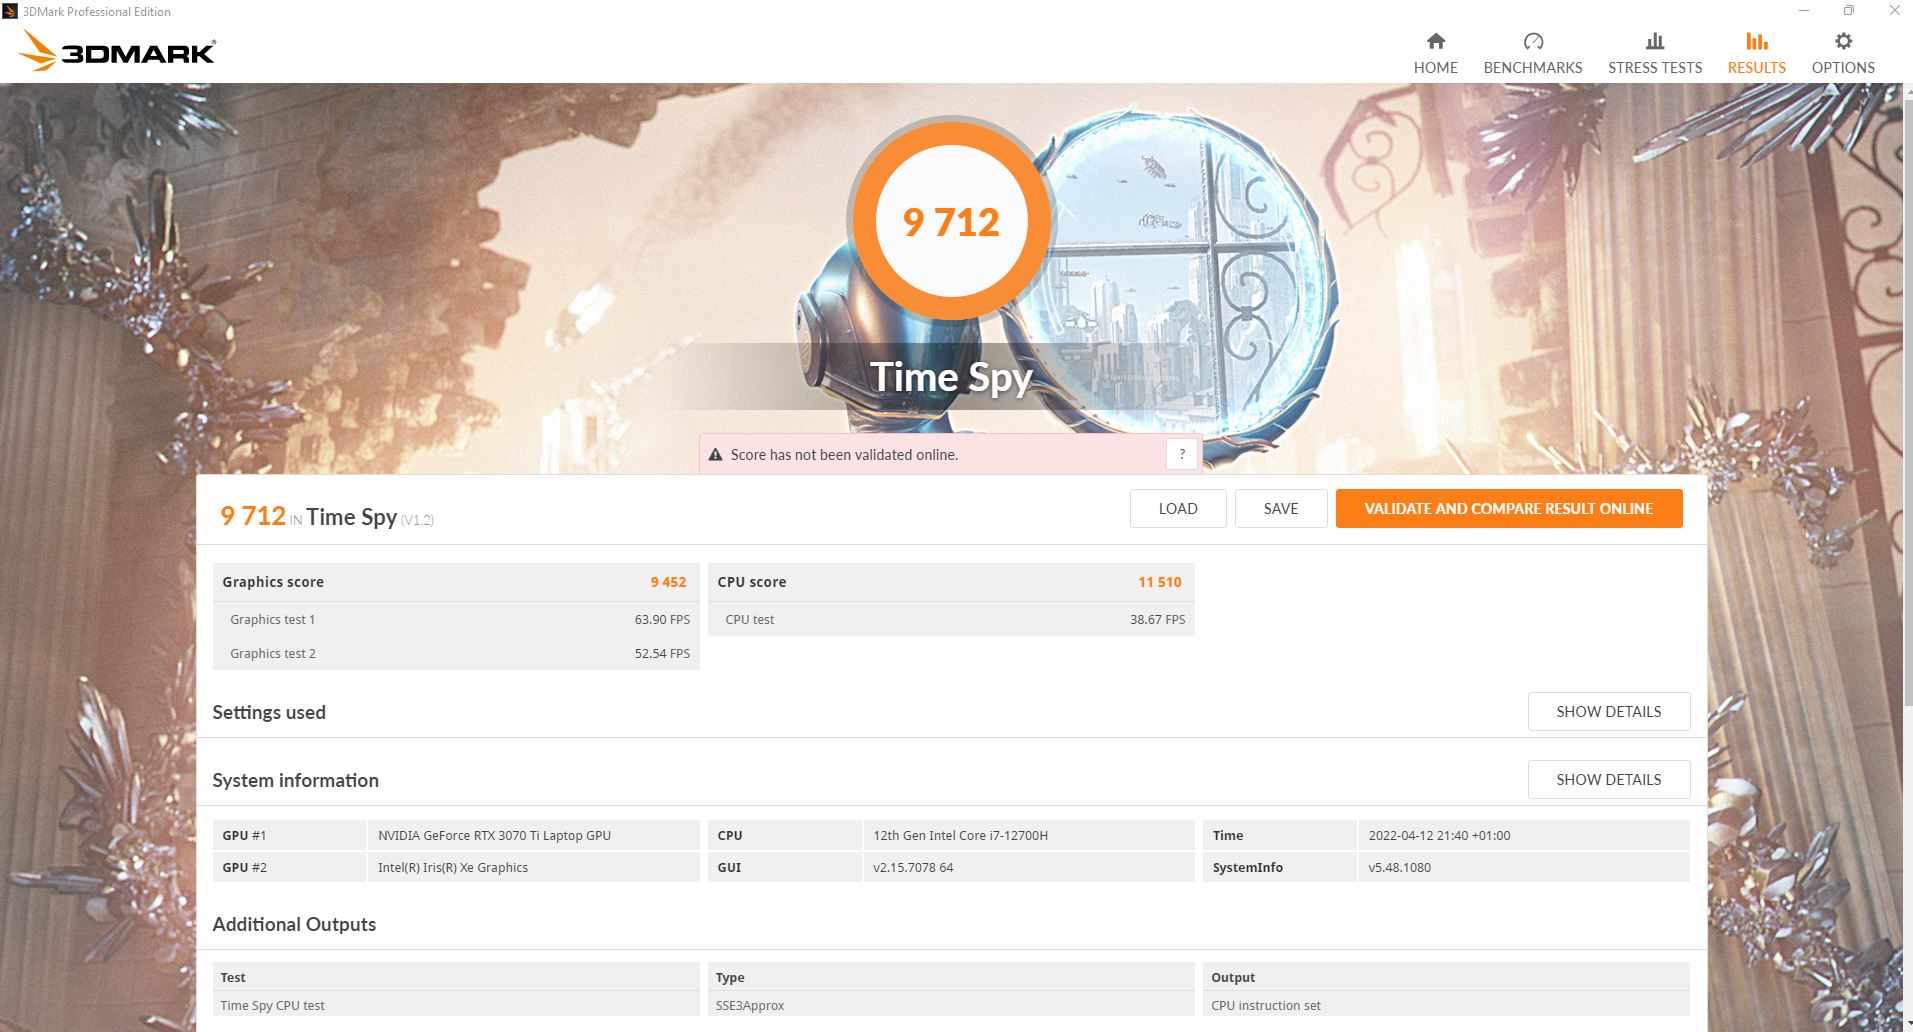
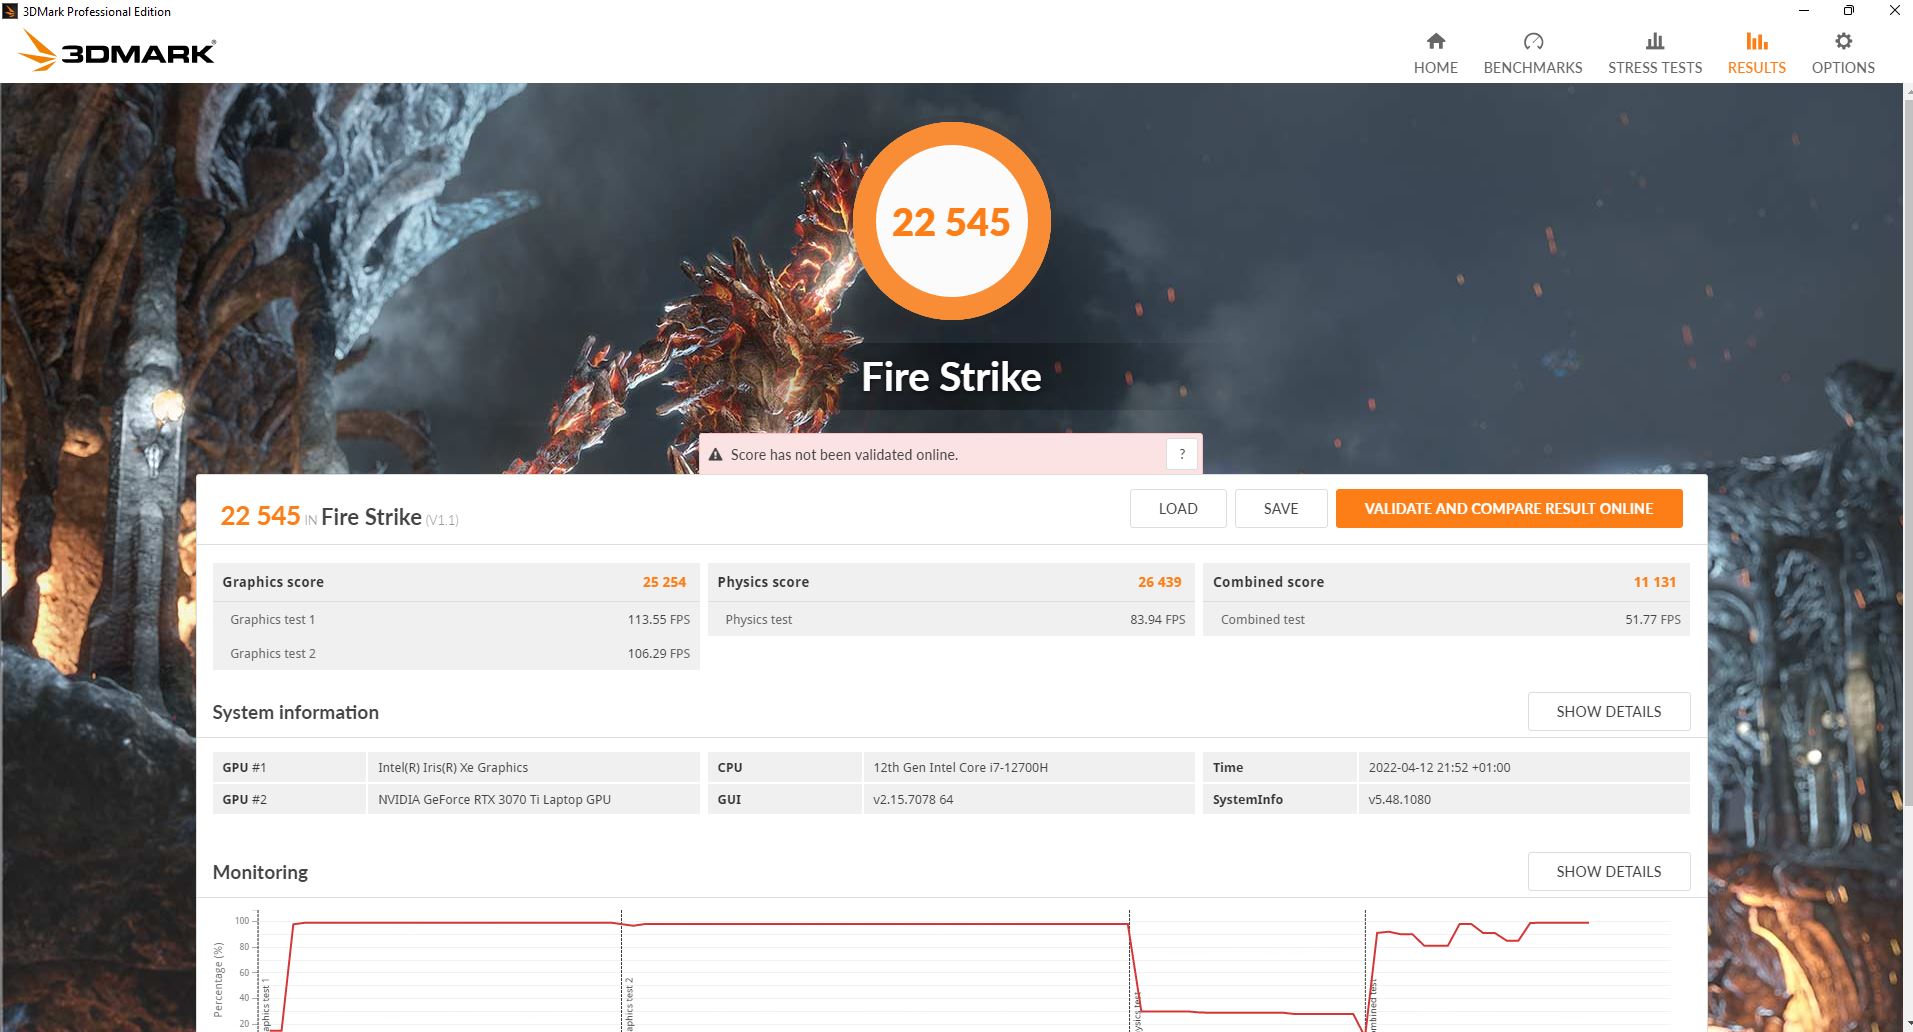
En las pruebas sintéticas de 3DMark, la Katana acaba ligeramente por debajo de la media, terminando entre un 7 y un 10% por detrás de una RTX 3070 Ti media, lo que debería deberse al menor TGP.
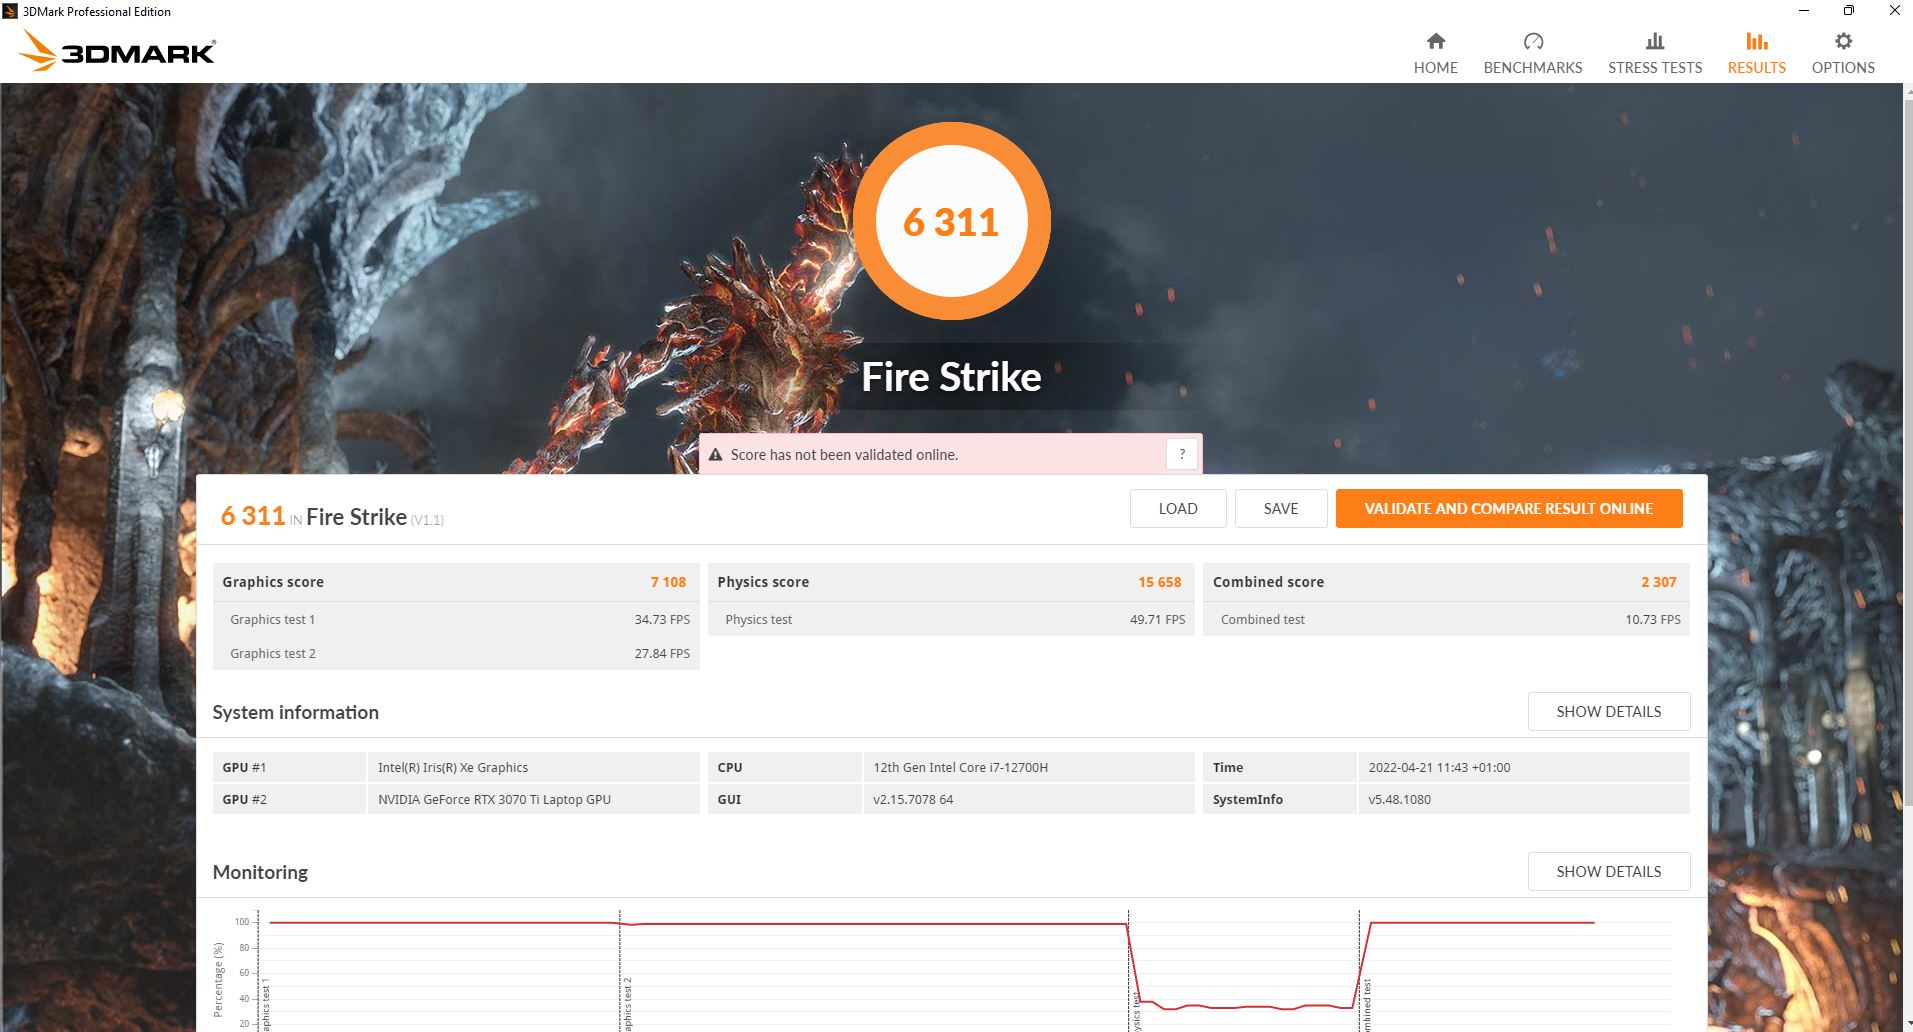
En funcionamiento en batería, el rendimiento 3D se reduce en más de un 70%, como muestra otra ejecución de Fire Strike.
| 3DMark 11 Performance | 14168 puntos | |
| 3DMark Cloud Gate Standard Score | 28010 puntos | |
| 3DMark Fire Strike Score | 22545 puntos | |
| 3DMark Time Spy Score | 9712 puntos | |
ayuda | ||
Rendimiento de los juegos
En la resolución FHD nativa, casi todos los juegos también se reproducen con fluidez con los ajustes de detalle máximos. Sin embargo, en"Cyberpunk 2077 1.5" las cosas pueden volverse apretadas a veces para los efectos de raytracing, y la tasa de frames cae de unos 48.5 fps a sólo 28.5 fps con Raytracing Ultra activado
En general, la RTX 3070 Ti del Katana rinde un 10% menos que la media de todos los portátiles con la misma GPU de nuestra base de datos. Teniendo en cuenta el rendimiento de una RTX 3070 Ti, la mayoría de usuarios debería poder vivir con eso, pero los entusiastas del rendimiento quizá quieran echar un vistazo a los portátiles que no limitan su GPU a 100 vatios. En ese sentido, los competidores directos son en su mayoría más rápidos. El predecesor con RTX 3060 es superado por "sólo" un 15 a 20%. La mayoría de las veces, el MSI Vector queda en primer lugar en términos de rendimiento 3D.
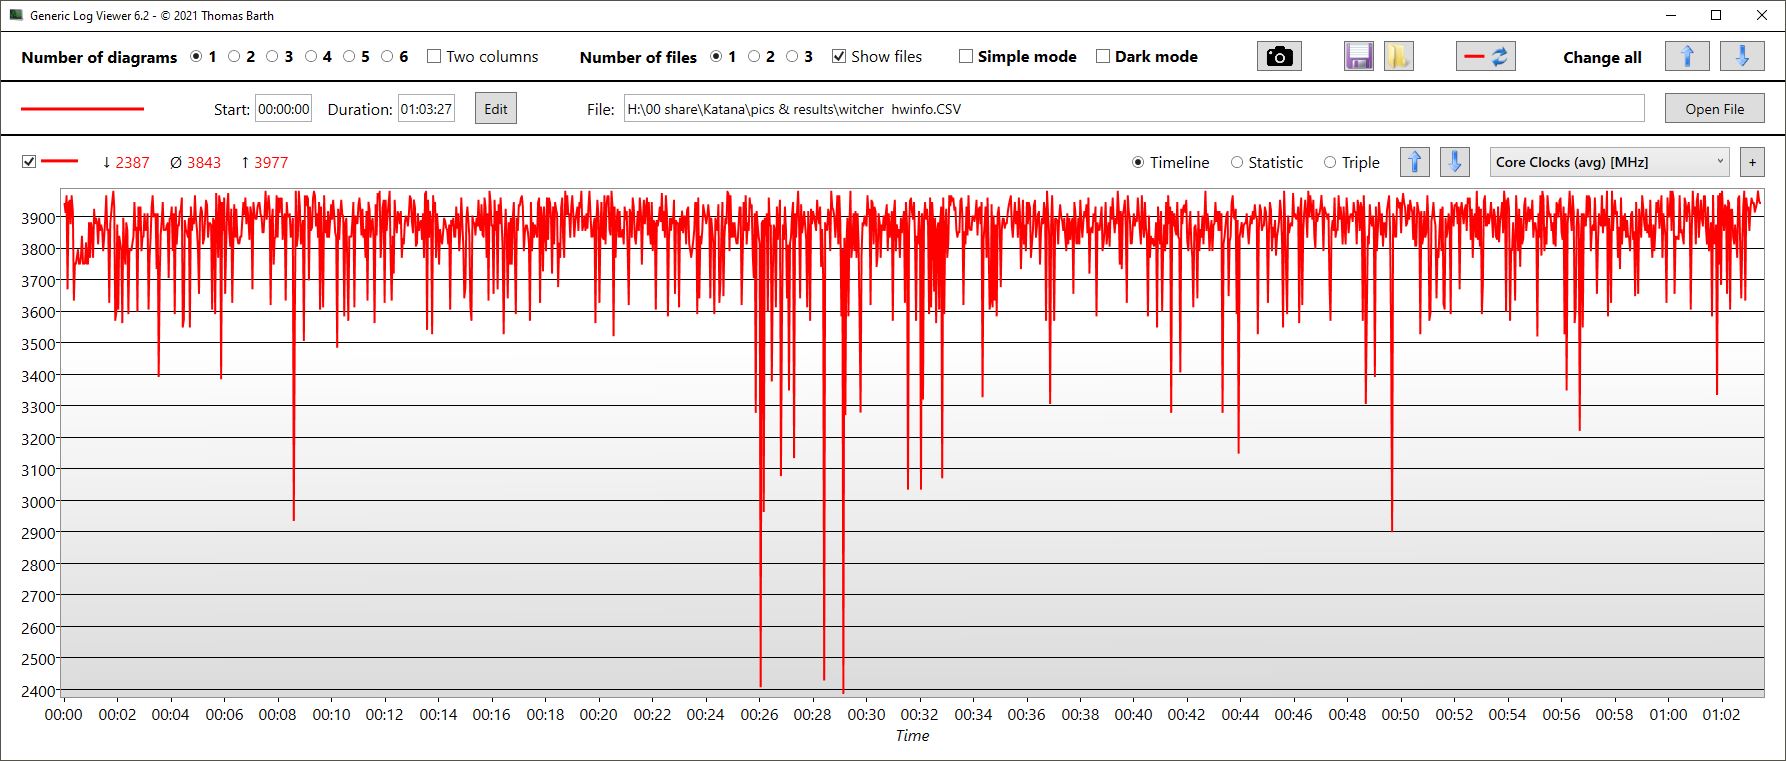
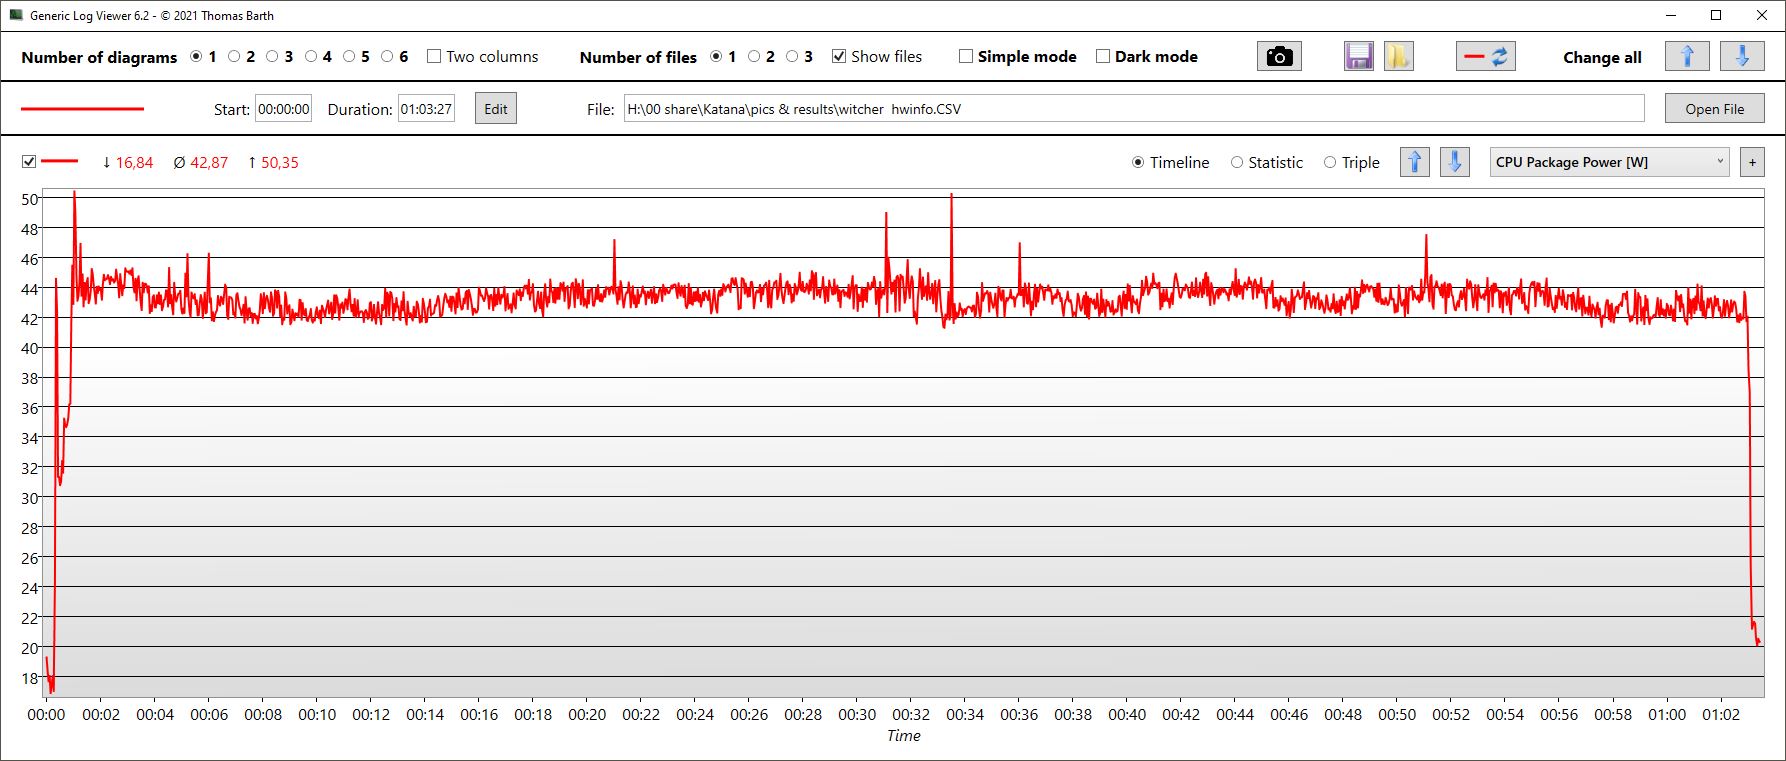
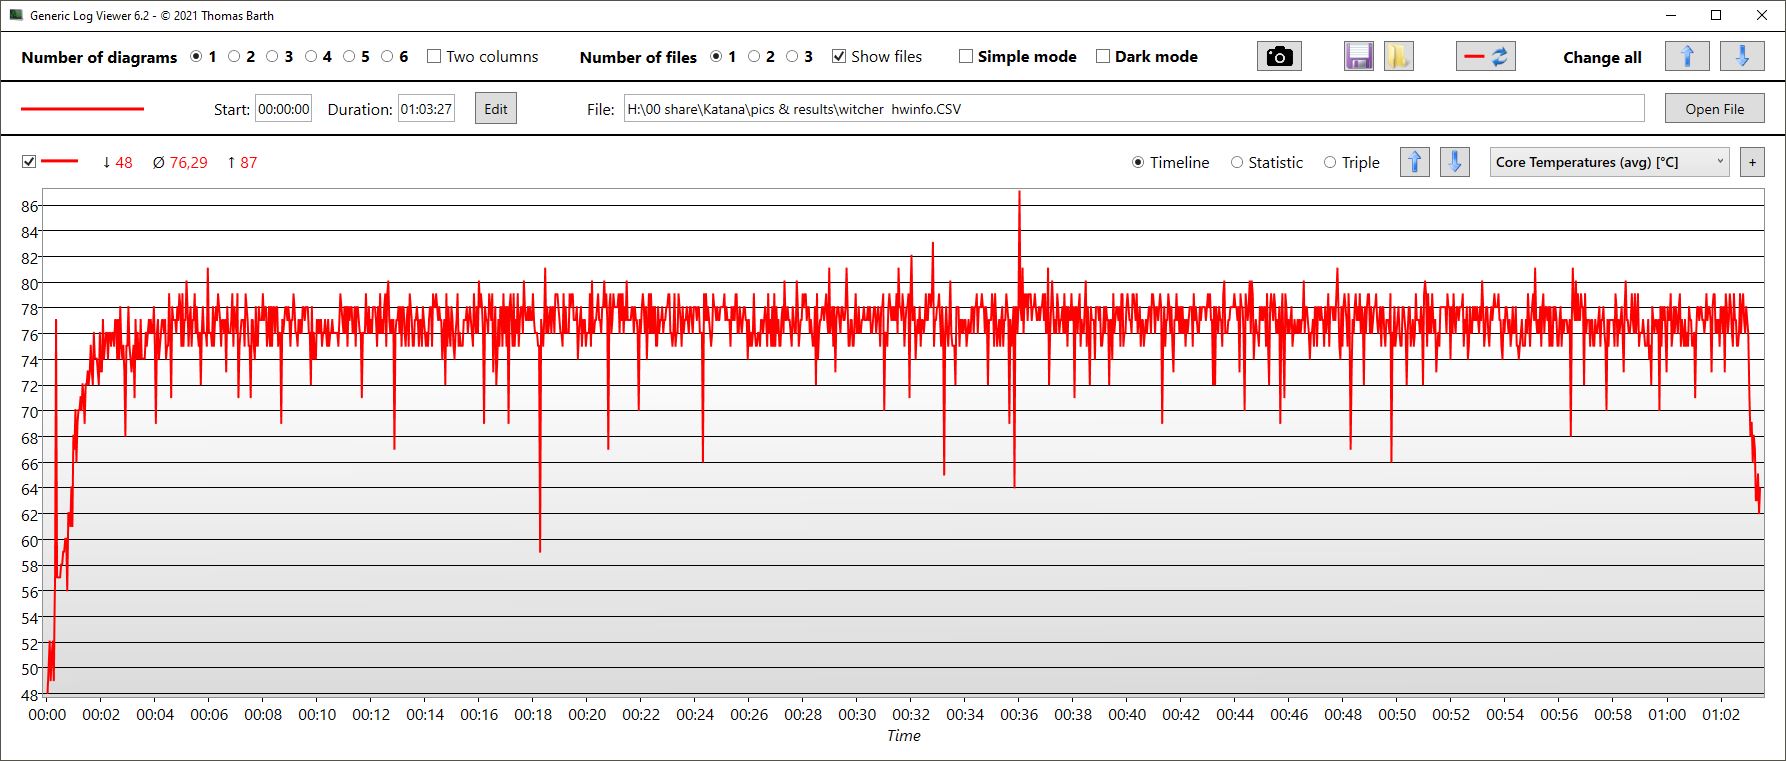
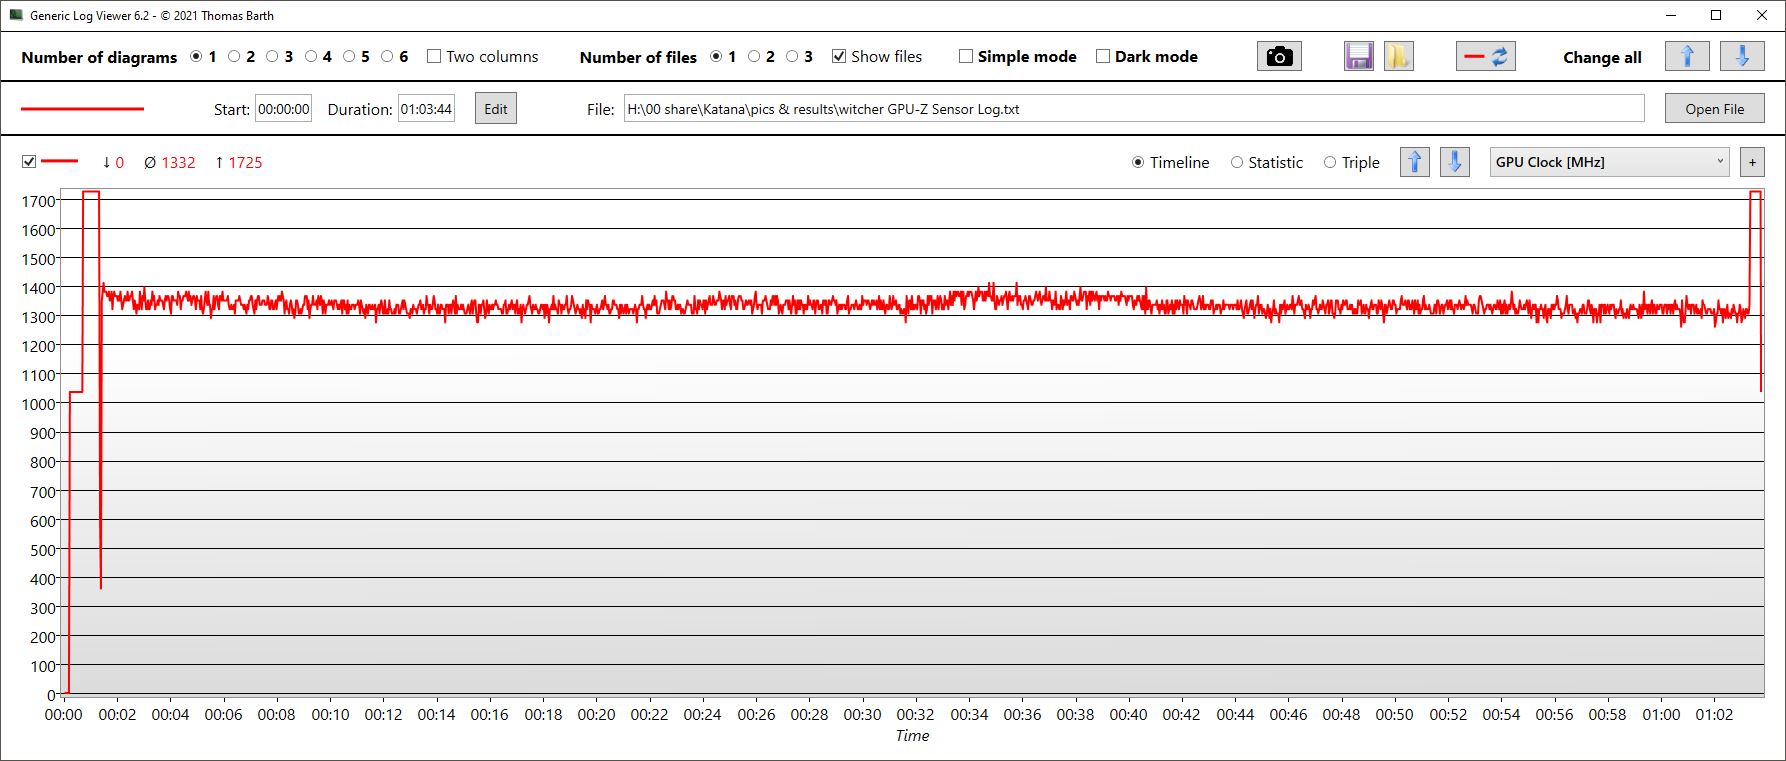
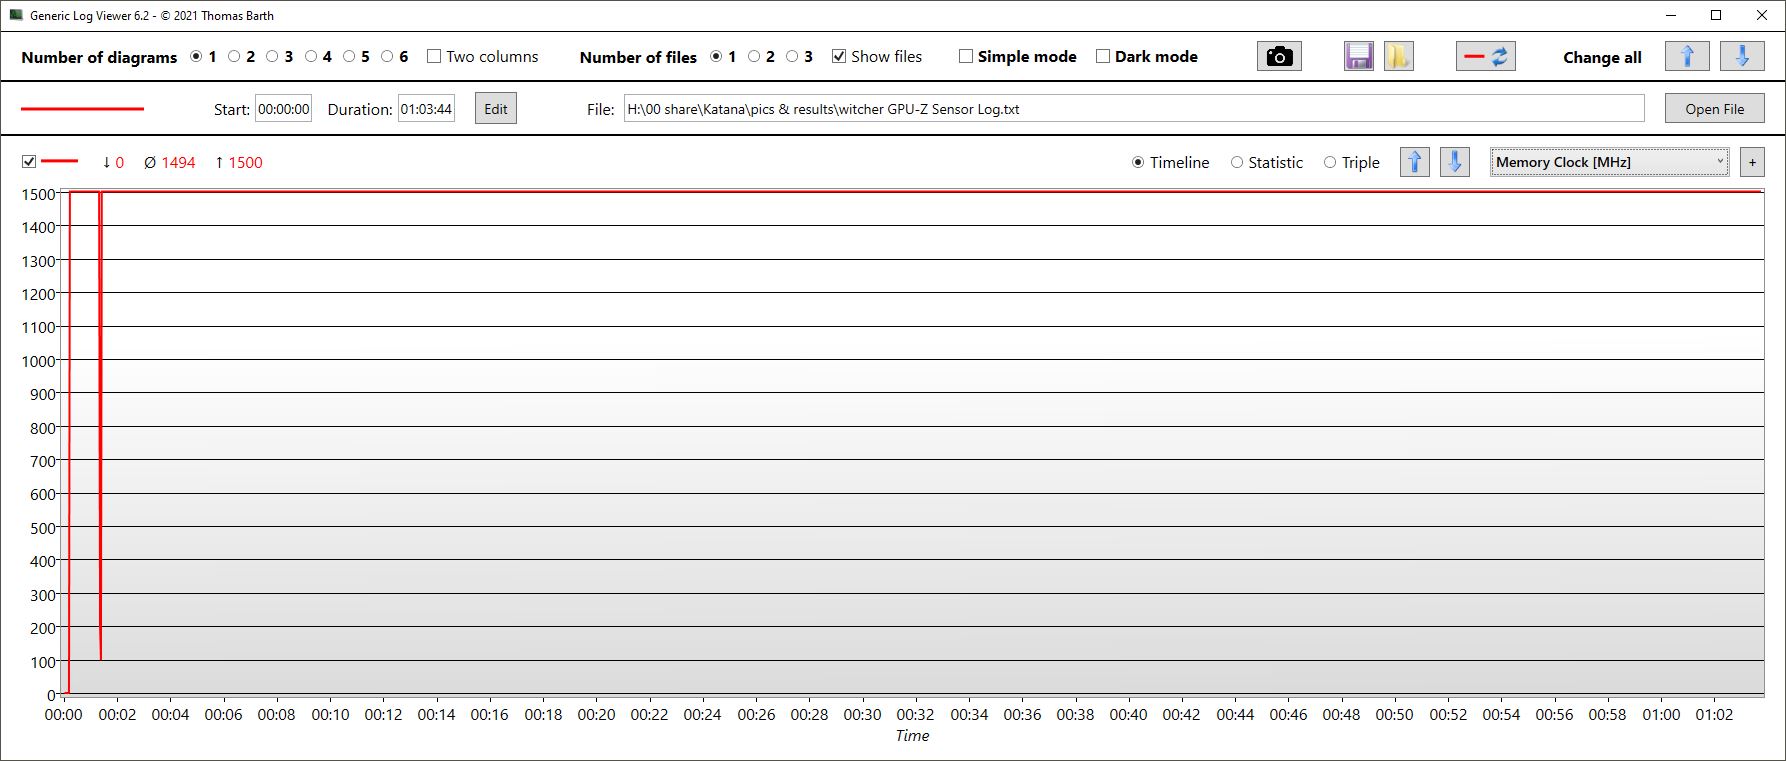
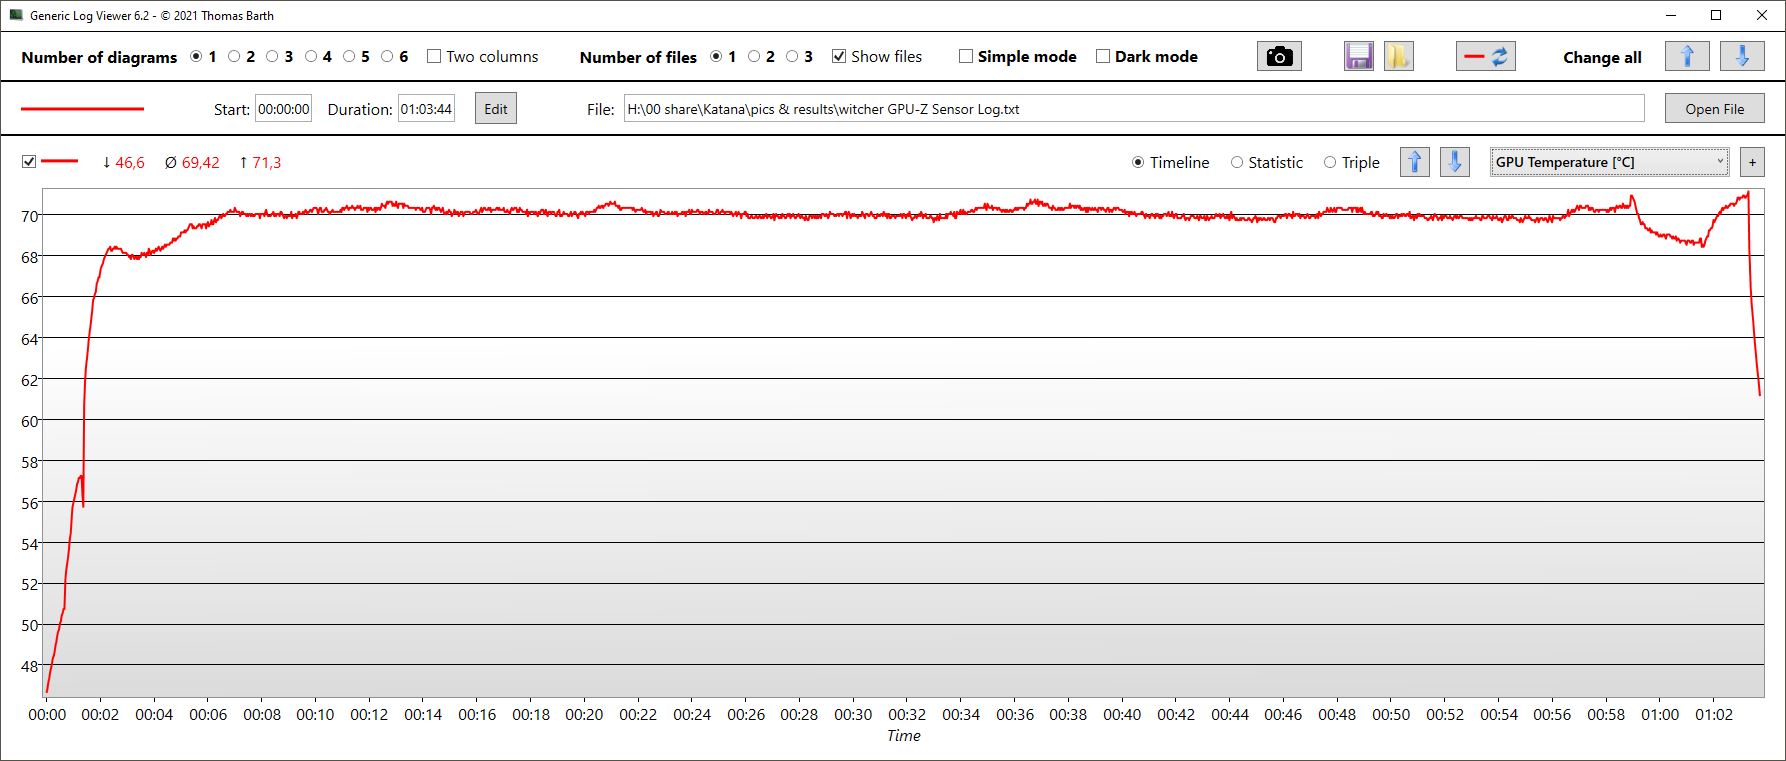
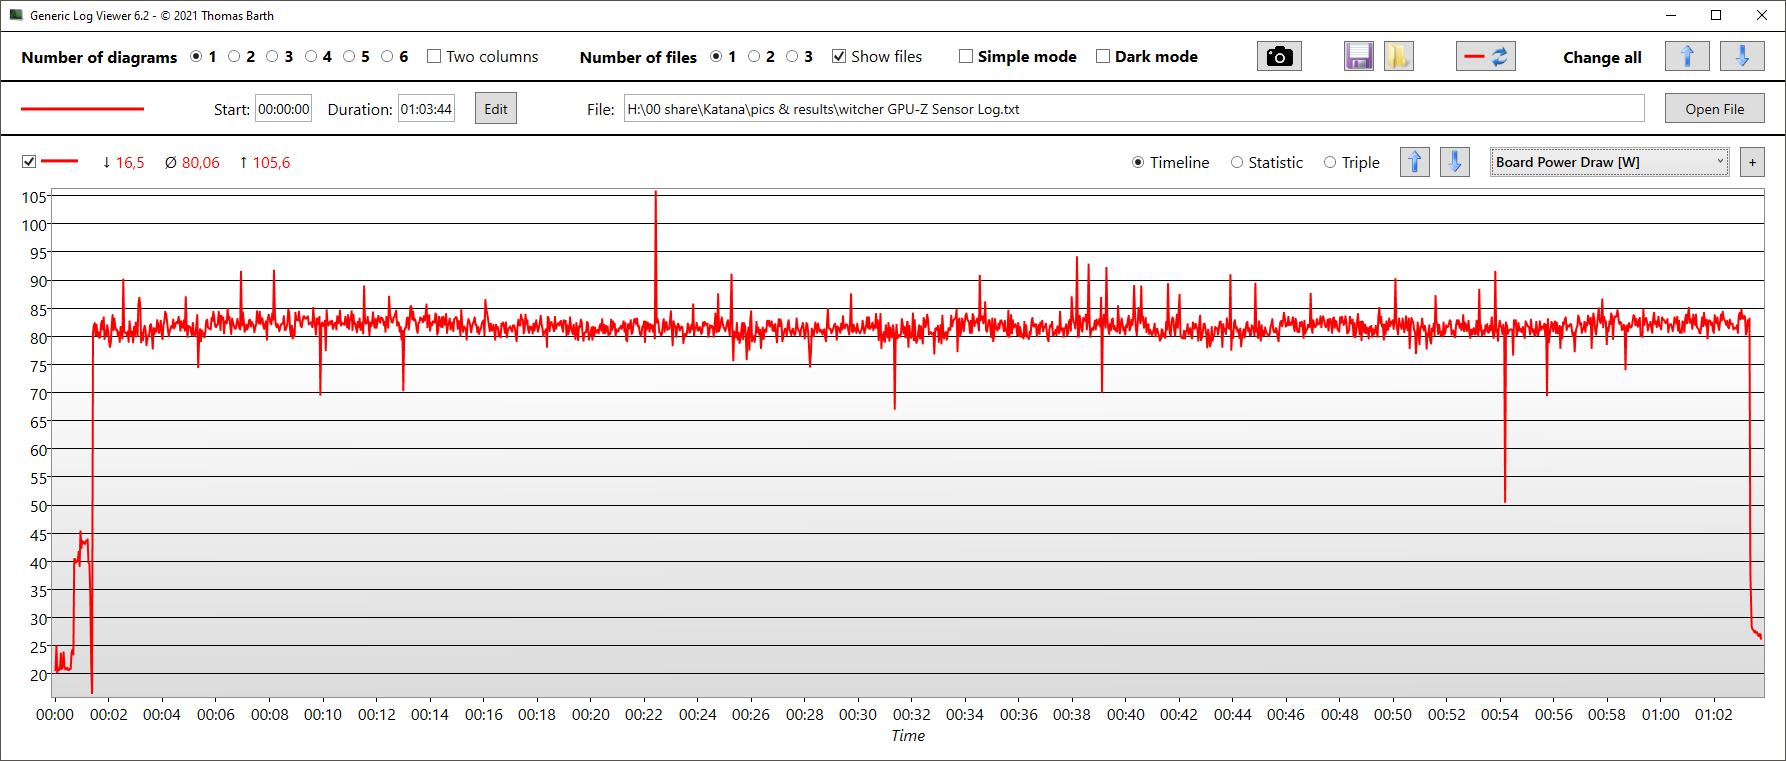
La velocidad de fotogramas mientras se ejecuta"The Witcher 3" durante una hora se mantiene bastante constante. Los núcleos de la CPU alcanzan una velocidad de reloj de 3,8 GHz (76 °C, ~169 °F) de media, y la GPU, de unos 1,3 GHz (~70 °C, ~158 °F).
The Witcher 3 FPS Chart
| bajo | medio | alto | ultra | |
|---|---|---|---|---|
| GTA V (2015) | 184.6 | 174.4 | 156 | 97.7 |
| The Witcher 3 (2015) | 388 | 267 | 165 | 91.5 |
| Dota 2 Reborn (2015) | 172.1 | 153.6 | 142.6 | 135.8 |
| Final Fantasy XV Benchmark (2018) | 141.1 | 119.2 | 89.7 | |
| X-Plane 11.11 (2018) | 135.9 | 115.2 | 95 | |
| Far Cry 5 (2018) | 154 | 123 | 118 | 112 |
| Strange Brigade (2018) | 425 | 224 | 183.1 | 159.5 |
| Cyberpunk 2077 1.6 (2022) | 117.5 | 98.9 | 65 | 48.5 |
Emisiones - Los ventiladores también funcionan durante el funcionamiento en vacío
Emisiones acústicas
El sistema de refrigeración no está ajustado de forma óptima en cuanto al nivel de ruido. Los ventiladores se encienden incluso durante el funcionamiento en reposo sin ninguna carga y en el modo equilibrado o incluso en el modo silencioso. Están activos casi constantemente, también variando sus velocidades. Esto parece innecesario y es molesto. Incluso el más delgadoBlade 17por ejemplo, permanece casi silencioso durante el funcionamiento en vacío incluso en el modo de mayor rendimiento.
El sistema de refrigeración, bastante subóptimo, es probablemente también la razón de que la GPU esté limitada a 100 vatios. En 3DMark06, el Katana es el modelo más ruidoso de nuestra comparativa, y durante el juego y en términos de volumen máximo, sólo es superado por el Vector, también de MSI.
Ruido
| Ocioso |
| 28.41 / 28.41 / 36.71 dB(A) |
| Carga |
| 53.04 / 54.38 dB(A) |
 | ||
30 dB silencioso 40 dB(A) audible 50 dB(A) ruidosamente alto |
||
min: | ||
| MSI Katana GF76 12UGS GeForce RTX 3070 Ti Laptop GPU, i7-12700H, Micron 2450 1TB MTFDKBK1T0TFK | MSI Katana GF76 11UE GeForce RTX 3060 Laptop GPU, i7-11800H, Kingston OM8PCP3512F-AB | Aorus 17 XE4 GeForce RTX 3070 Ti Laptop GPU, i7-12700H, Gigabyte AG470S1TB-SI B10 | Razer Blade 17 (i7-12800H, RTX 3070 Ti) GeForce RTX 3070 Ti Laptop GPU, i7-12800H, Samsung PM9A1 MZVL21T0HCLR | Lenovo Legion 5 Pro 16 G7 i7 RTX 3070Ti GeForce RTX 3070 Ti Laptop GPU, i7-12700H, Samsung PM9A1 MZVL21T0HCLR | MSI Vector GP66 12UGS GeForce RTX 3070 Ti Laptop GPU, i9-12900H | |
|---|---|---|---|---|---|---|
| Noise | -5% | 3% | 17% | 4% | 11% | |
| apagado / medio ambiente * (dB) | 23 | 25 -9% | 24 -4% | 23 -0% | 24.6 -7% | 22.9 -0% |
| Idle Minimum * (dB) | 28.41 | 33 -16% | 30 -6% | 23 19% | 28.4 -0% | 23.4 18% |
| Idle Average * (dB) | 28.41 | 34 -20% | 31 -9% | 23 19% | 28.4 -0% | 23.4 18% |
| Idle Maximum * (dB) | 36.71 | 35 5% | 34 7% | 23 37% | 28.4 23% | 27.4 25% |
| Load Average * (dB) | 53.04 | 53 -0% | 44 17% | 36.92 30% | 49.4 7% | 36 32% |
| Witcher 3 ultra * (dB) | 54.22 | 49 10% | 51 6% | 50 8% | 49.4 9% | 58.2 -7% |
| Load Maximum * (dB) | 54.38 | 57 -5% | 49 10% | 50 8% | 54.7 -1% | 58 -7% |
* ... más pequeño es mejor
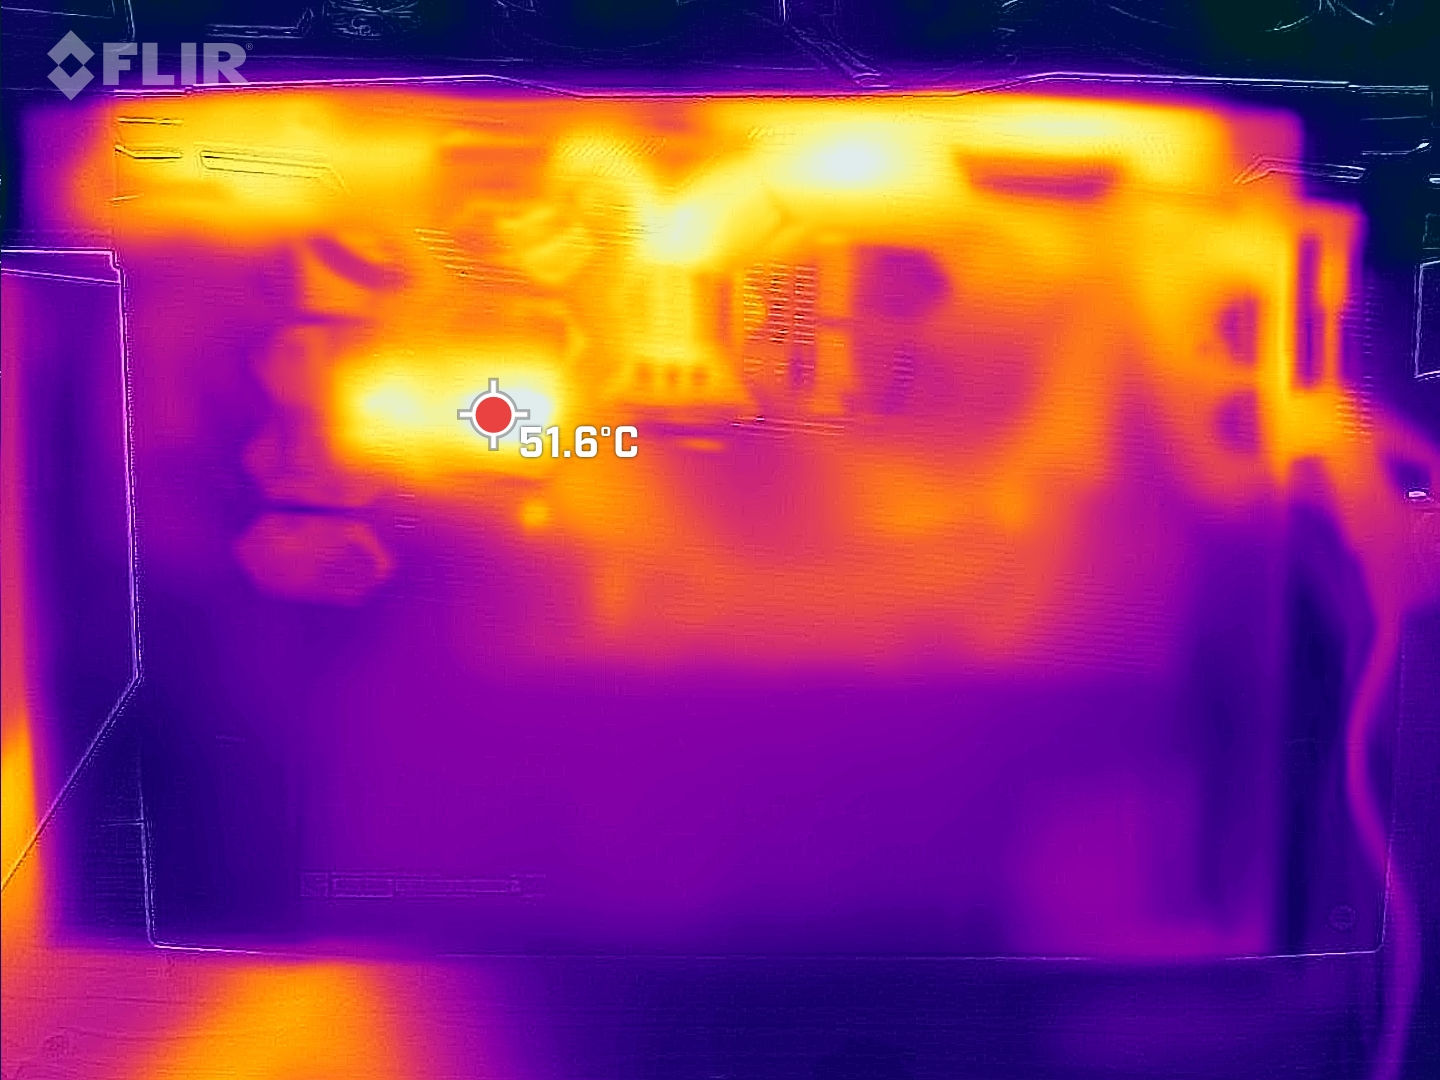
Temperatura
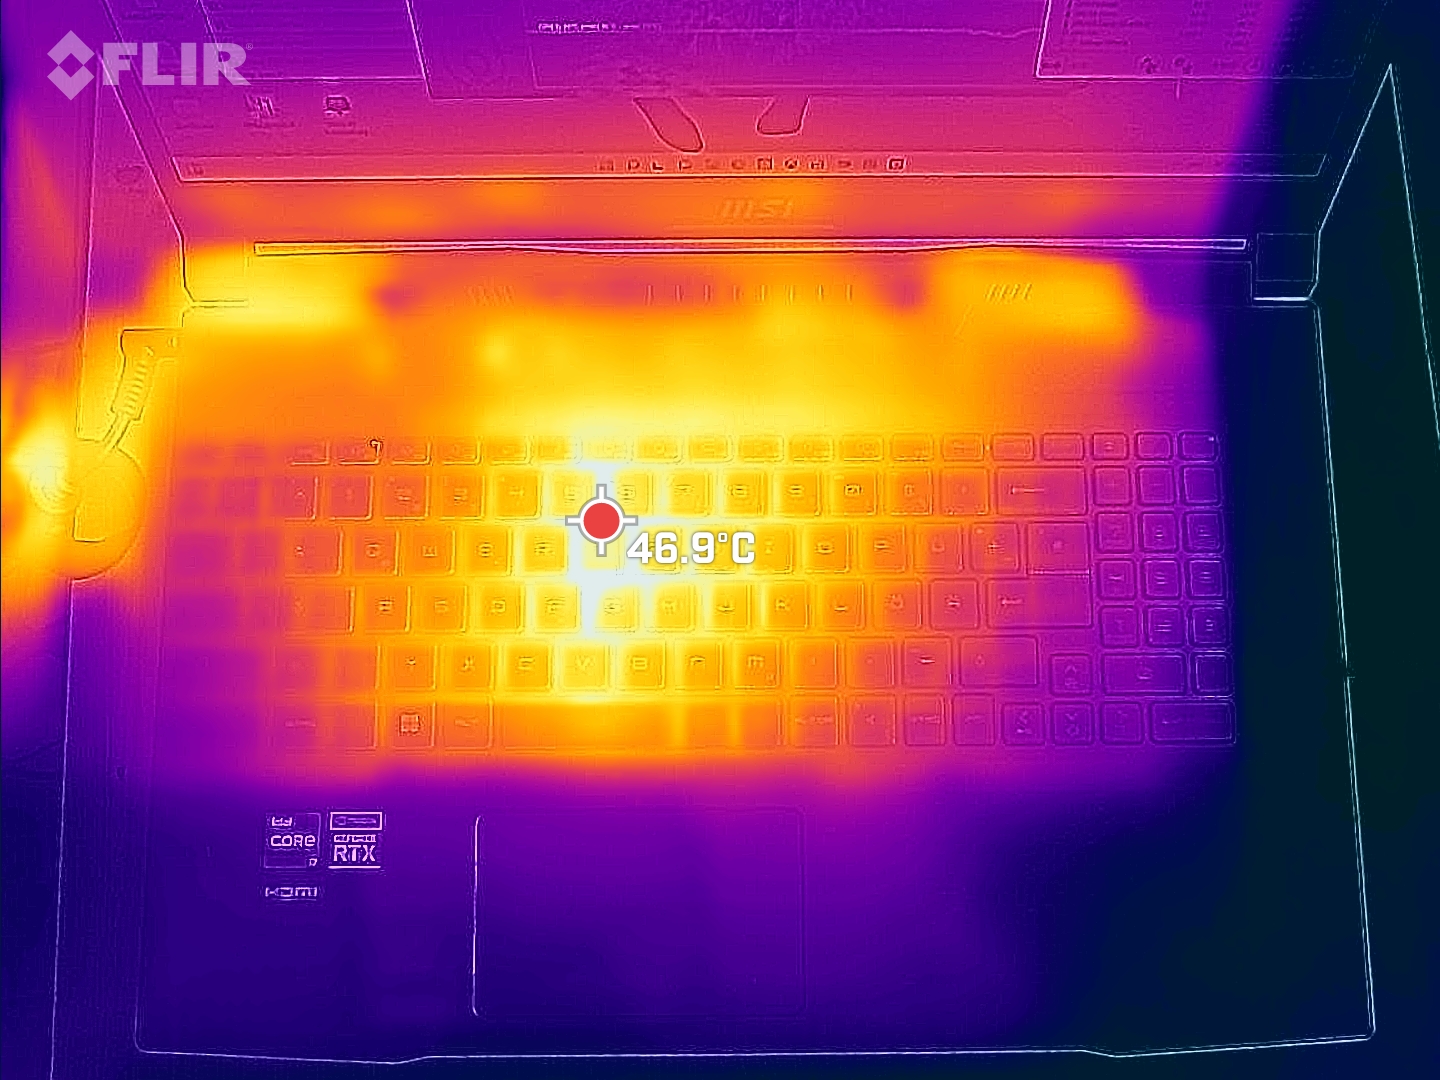
A pesar de que los ventiladores se encienden esporádicamente, hasta los 37 °C el Katana ya está más caliente durante el funcionamiento en vacío que los competidores. Bajo carga, el Blade 17 y el MSI Vector siguen siendo más fríos que el Katana, a pesar de su mayor rendimiento. El Aorus y el Legion se calientan de forma similar.
Los puntos calientes, que se encuentran en el centro y hacia la pantalla, pueden alcanzar hasta 55 °C.
(-) La temperatura máxima en la parte superior es de 51 °C / 124 F, frente a la media de 40.4 °C / 105 F, que oscila entre 21.2 y 68.8 °C para la clase Gaming.
(-) El fondo se calienta hasta un máximo de 55 °C / 131 F, frente a la media de 43.2 °C / 110 F
(+) En reposo, la temperatura media de la parte superior es de 30.7 °C / 87# F, frente a la media del dispositivo de 33.9 °C / 93 F.
(+) El reposamanos y el panel táctil están a una temperatura inferior a la de la piel, con un máximo de 26 °C / 78.8 F y, por tanto, son fríos al tacto.
(+) La temperatura media de la zona del reposamanos de dispositivos similares fue de 28.8 °C / 83.8 F (+2.8 °C / 5 F).
| MSI Katana GF76 12UGS Intel Core i7-12700H, NVIDIA GeForce RTX 3070 Ti Laptop GPU | MSI Katana GF76 11UE Intel Core i7-11800H, NVIDIA GeForce RTX 3060 Laptop GPU | Aorus 17 XE4 Intel Core i7-12700H, NVIDIA GeForce RTX 3070 Ti Laptop GPU | Razer Blade 17 (i7-12800H, RTX 3070 Ti) Intel Core i7-12800H, NVIDIA GeForce RTX 3070 Ti Laptop GPU | Lenovo Legion 5 Pro 16 G7 i7 RTX 3070Ti Intel Core i7-12700H, NVIDIA GeForce RTX 3070 Ti Laptop GPU | MSI Vector GP66 12UGS Intel Core i9-12900H, NVIDIA GeForce RTX 3070 Ti Laptop GPU | |
|---|---|---|---|---|---|---|
| Heat | 11% | 8% | 15% | 10% | 13% | |
| Maximum Upper Side * (°C) | 51 | 51 -0% | 50 2% | 43 16% | 45.3 11% | 40.2 21% |
| Maximum Bottom * (°C) | 55 | 52 5% | 58 -5% | 44 20% | 61.2 -11% | 43.8 20% |
| Idle Upper Side * (°C) | 37 | 32 14% | 30 19% | 32 14% | 28.6 23% | 34.8 6% |
| Idle Bottom * (°C) | 38 | 29 24% | 32 16% | 34 11% | 31.4 17% | 37 3% |
* ... más pequeño es mejor
Prueba de esfuerzo
Los núcleos de la CPU comienzan nuestra prueba de estrés a unos 4 GHz. Sin embargo, sólo lo mantienen muy brevemente, ya que tras unos pocos segundos los núcleos ya sobrepasan el límite térmico a más de 90 °C, haciendo que las velocidades de reloj caigan después, y finalmente se nivelen entre 2 y 2.4 GHz. Las temperaturas rondan los 81 °C de media.
Por otro lado, durante todo el periodo de pruebas, la velocidad de reloj de la GPU varía continuamente entre 800 y 1600 MHz, y la velocidad de almacenamiento, sólo entre 1,4 y 1,5 GHz. Las temperaturas del núcleo oscilan en torno a los 70 °C. La tarjeta gráfica consume unos 71 vatios de media, y sólo alcanza los 100 vatios especificados de forma esporádica en el mejor de los casos.
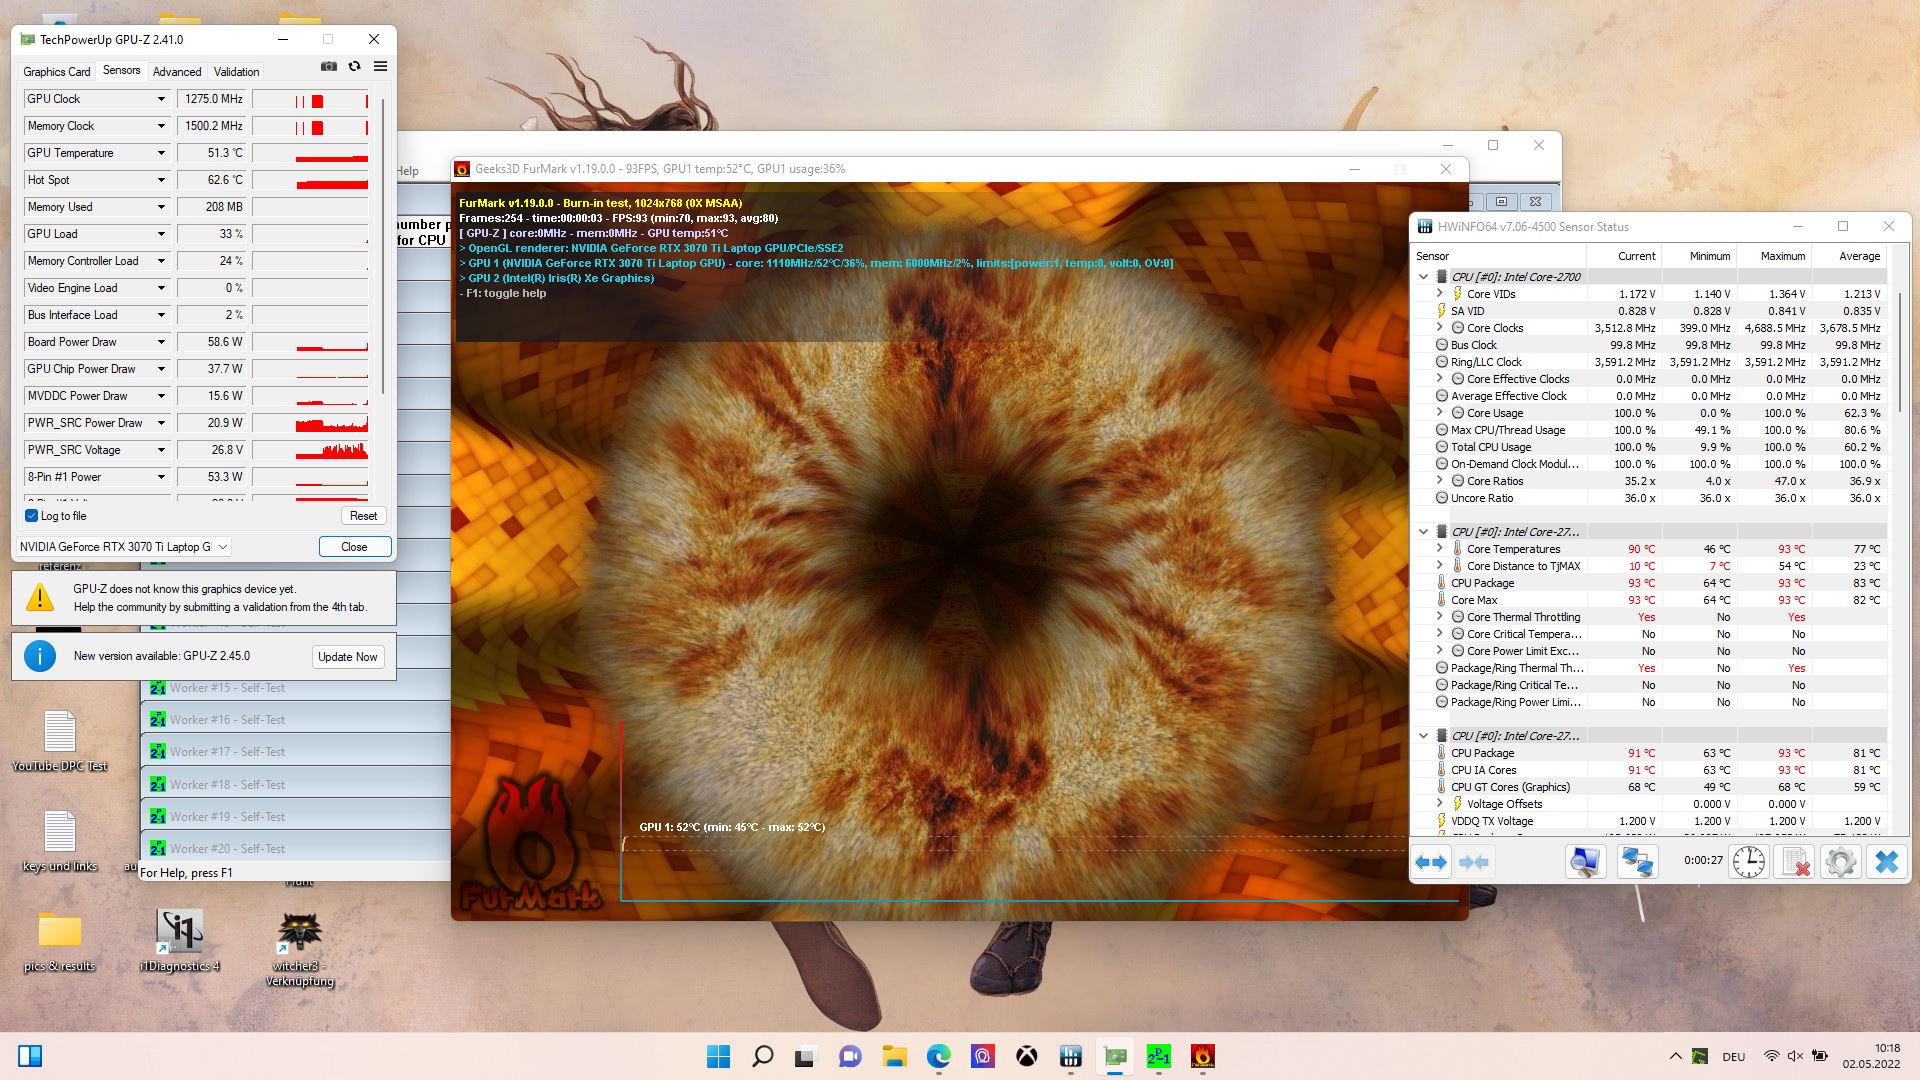
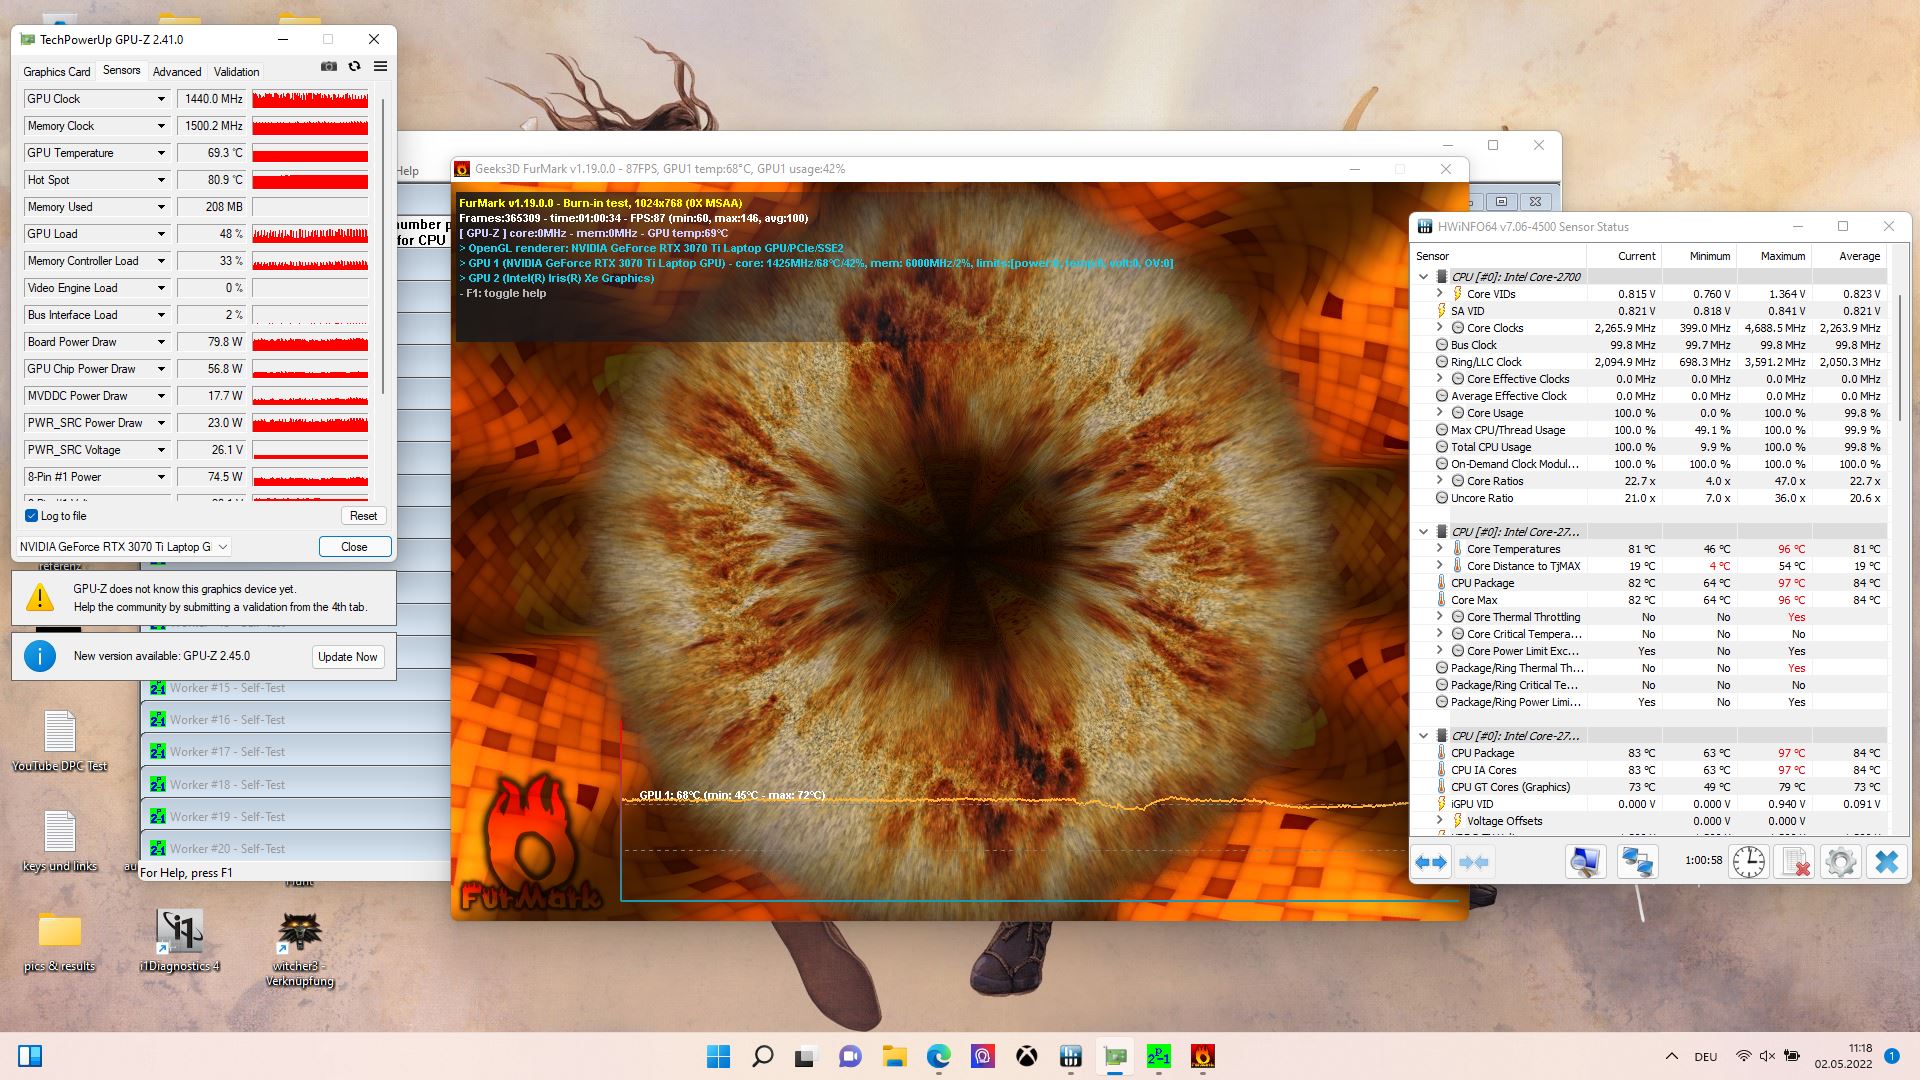
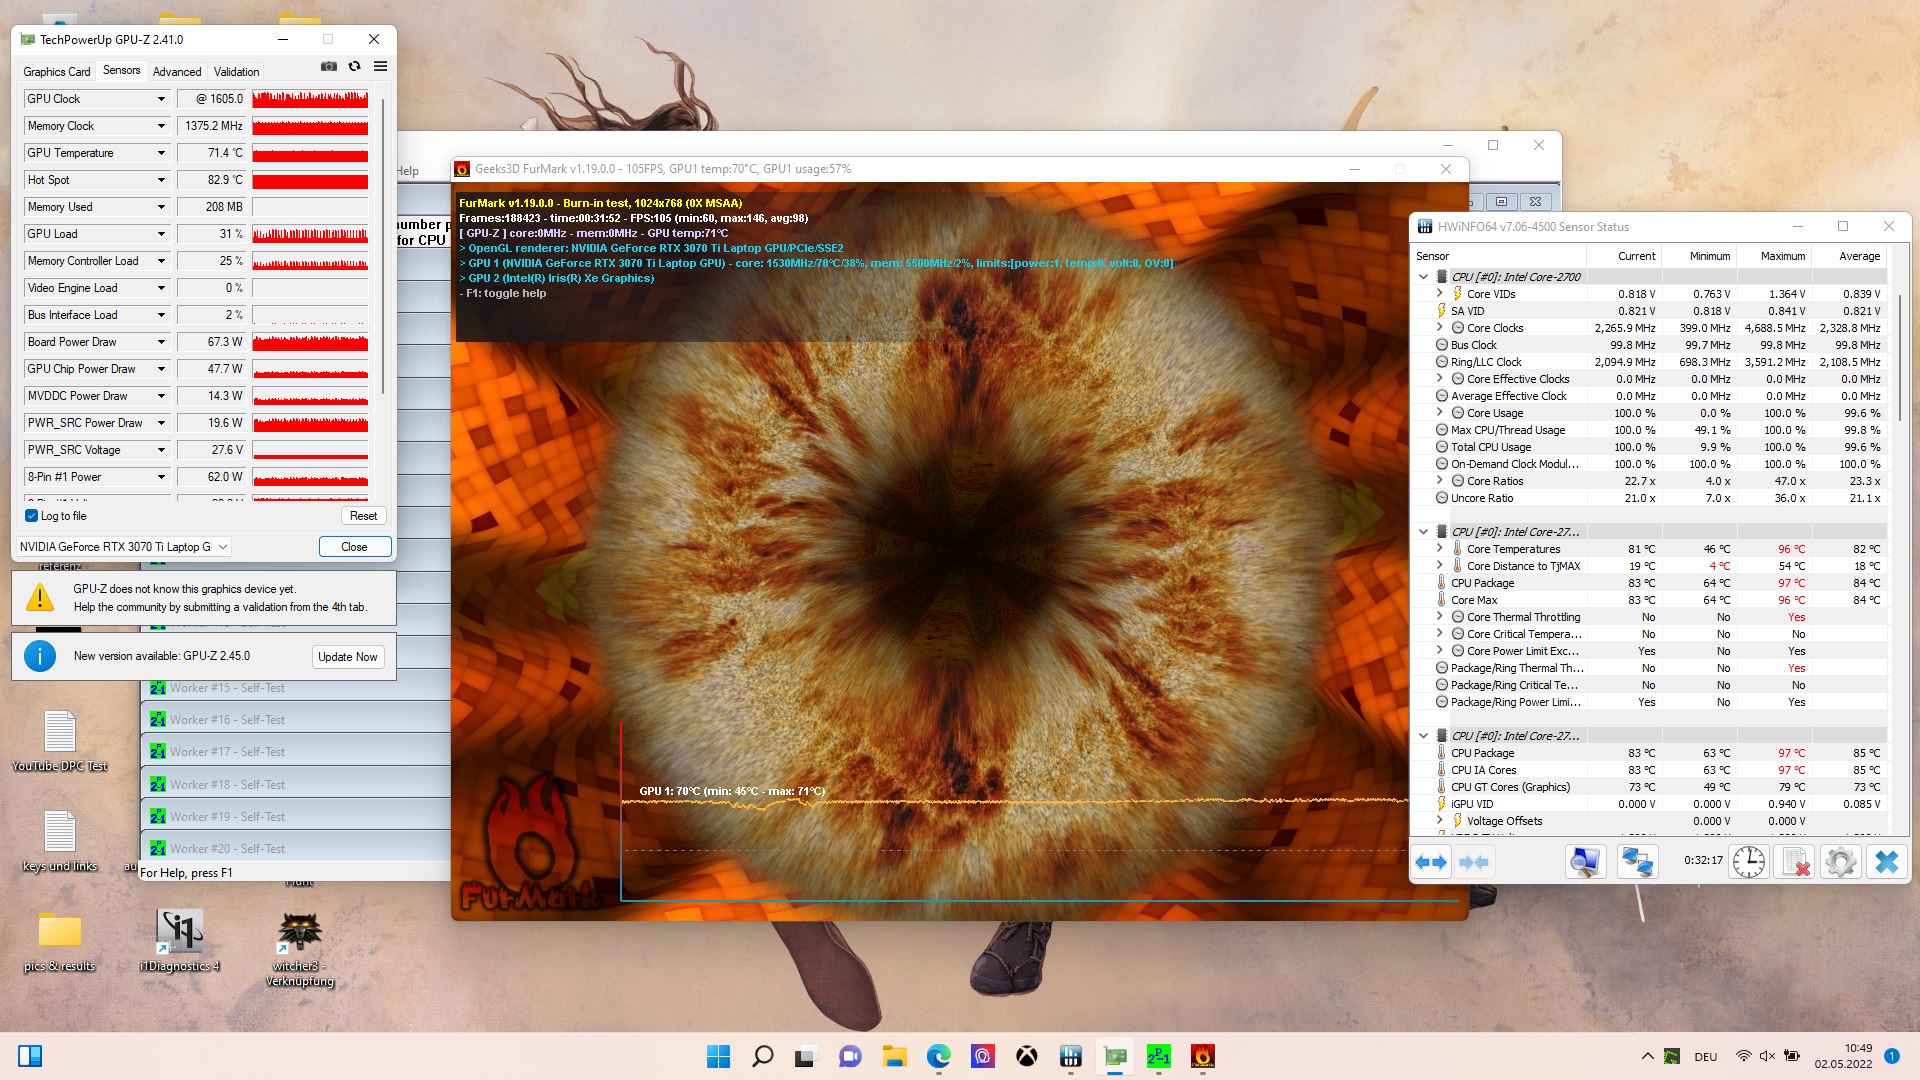
| Reloj dela CPU (GHz) | Reloj de la GPU (MHz) | Temperatura media dela CPU (°C) | Temperatura media de la GPU (°C) | |
| Prime95 + FurMark Stress | 2,3 | 1,254 | 81 | 70 |
| Witcher 3 Estrés | 3,8 | 1.332 | 76 | 70 |
Altavoces
Los altavoces no tienen mucho volumen y carecen claramente de graves. Pero al menos, los medios están bastante equilibrados. Recomendamos conectar dispositivos de audio externos. Para ello, se dispone de un puerto de auriculares combinado de 3,5 mm.
MSI Katana GF76 12UGS análisis de audio
(±) | la sonoridad del altavoz es media pero buena (81.81 dB)
Graves 100 - 315 Hz
(-) | casi sin bajos - de media 18.2% inferior a la mediana
(±) | la linealidad de los graves es media (11% delta a frecuencia anterior)
Medios 400 - 2000 Hz
(+) | medios equilibrados - a sólo 3.8% de la mediana
(+) | los medios son lineales (4.8% delta a la frecuencia anterior)
Altos 2 - 16 kHz
(+) | máximos equilibrados - a sólo 4.1% de la mediana
(±) | la linealidad de los máximos es media (7.1% delta a frecuencia anterior)
Total 100 - 16.000 Hz
(±) | la linealidad del sonido global es media (15.2% de diferencia con la mediana)
En comparación con la misma clase
» 33% de todos los dispositivos probados de esta clase eran mejores, 6% similares, 61% peores
» El mejor tuvo un delta de 6%, la media fue 18%, el peor fue ###max##%
En comparación con todos los dispositivos probados
» 22% de todos los dispositivos probados eran mejores, 4% similares, 74% peores
» El mejor tuvo un delta de 4%, la media fue 23%, el peor fue ###max##%
Aorus 17 XE4 análisis de audio
(+) | los altavoces pueden reproducir a un volumen relativamente alto (#84 dB)
Graves 100 - 315 Hz
(-) | casi sin bajos - de media 25.3% inferior a la mediana
(±) | la linealidad de los graves es media (12.5% delta a frecuencia anterior)
Medios 400 - 2000 Hz
(+) | medios equilibrados - a sólo 3.9% de la mediana
(+) | los medios son lineales (4.8% delta a la frecuencia anterior)
Altos 2 - 16 kHz
(+) | máximos equilibrados - a sólo 4.4% de la mediana
(±) | la linealidad de los máximos es media (7.3% delta a frecuencia anterior)
Total 100 - 16.000 Hz
(±) | la linealidad del sonido global es media (17.5% de diferencia con la mediana)
En comparación con la misma clase
» 49% de todos los dispositivos probados de esta clase eran mejores, 12% similares, 39% peores
» El mejor tuvo un delta de 6%, la media fue 18%, el peor fue ###max##%
En comparación con todos los dispositivos probados
» 34% de todos los dispositivos probados eran mejores, 8% similares, 58% peores
» El mejor tuvo un delta de 4%, la media fue 23%, el peor fue ###max##%
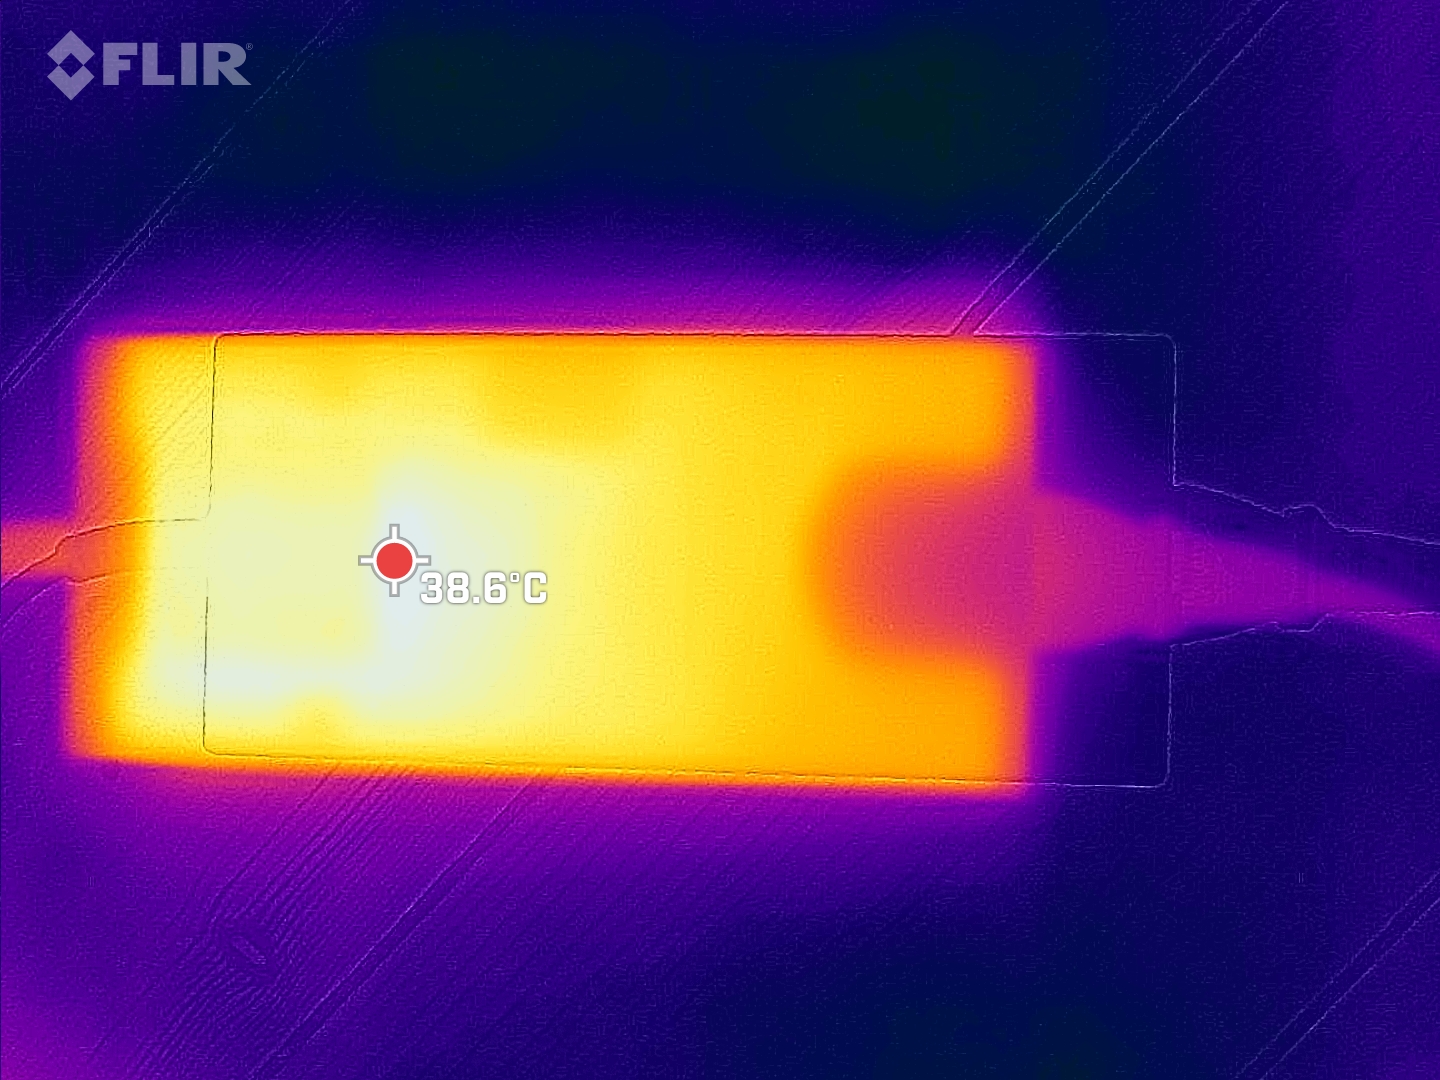
Gestión de la energía - Relativamente eficiente
Consumo de energía
Durante el funcionamiento en reposo, el Katana consume casi tanta o tan poca energía como el Razer Blade 17. Bajo carga, como en los juegos, se convierte en uno de los dispositivos más eficientes de nuestra comparación, debido a su limitado consumo de energía de la GPU. Por ejemplo, en"The Witcher 3," sólo consume un 6% más de energía que su predecesor con la RTX 3060, mientras que ofrece un rendimiento hasta un 26% superior.
Medimos un breve consumo máximo de 219 vatios, que la fuente de alimentación de 240 vatios debería poder manejar sin problemas.
| Ocioso | |
| Carga |
|
Clave:
min: | |
| MSI Katana GF76 12UGS i7-12700H, GeForce RTX 3070 Ti Laptop GPU, Micron 2450 1TB MTFDKBK1T0TFK, IPS, 1920x1080, 17.3" | MSI Katana GF76 11UE i7-11800H, GeForce RTX 3060 Laptop GPU, Kingston OM8PCP3512F-AB, IPS, 1920x1080, 17.3" | Aorus 17 XE4 i7-12700H, GeForce RTX 3070 Ti Laptop GPU, Gigabyte AG470S1TB-SI B10, IPS, 1920x1080, 17.3" | Razer Blade 17 (i7-12800H, RTX 3070 Ti) i7-12800H, GeForce RTX 3070 Ti Laptop GPU, Samsung PM9A1 MZVL21T0HCLR, IPS, 2560x1440, 17.3" | Lenovo Legion 5 Pro 16 G7 i7 RTX 3070Ti i7-12700H, GeForce RTX 3070 Ti Laptop GPU, Samsung PM9A1 MZVL21T0HCLR, IPS, 2560x1600, 16" | MSI Vector GP66 12UGS i9-12900H, GeForce RTX 3070 Ti Laptop GPU, , IPS, 1920x1080, 15.6" | Medio NVIDIA GeForce RTX 3070 Ti Laptop GPU | Media de la clase Gaming | |
|---|---|---|---|---|---|---|---|---|
| Power Consumption | 15% | -26% | -14% | -6% | -38% | -14% | -8% | |
| Idle Minimum * (Watt) | 14.2 | 9 37% | 20 -41% | 14.4 -1% | 8.6 39% | 17.5 -23% | 14.2 ? -0% | 13 ? 8% |
| Idle Average * (Watt) | 18 | 13 28% | 23 -28% | 20 -11% | 17.6 2% | 20.1 -12% | 19.9 ? -11% | 19 ? -6% |
| Idle Maximum * (Watt) | 22 | 20 9% | 28 -27% | 21.5 2% | 18.5 16% | 47.3 -115% | 26.2 ? -19% | 24.6 ? -12% |
| Load Average * (Watt) | 98 | 102 -4% | 120 -22% | 119 -21% | 110 -12% | 107.3 -9% | 125.8 ? -28% | 110.7 ? -13% |
| Witcher 3 ultra * (Watt) | 159 | 149 6% | 196 -23% | 218 -37% | 227 -43% | 225 -42% | ||
| Load Maximum * (Watt) | 219 | 187 15% | 257 -17% | 248 -13% | 294.6 -35% | 277.7 -27% | 248 ? -13% | 259 ? -18% |
* ... más pequeño es mejor
Power Consumption The Witcher 3 / Stress Test
Power Consumption with External Monitor
Duración de la batería
El Katana tiene una batería de 53,5 Wh. Aunque no es diferente de la de su predecesor, también es significativamente menor que la de los competidores, algunos de los cuales ofrecen casi el doble de capacidad (Aorus 17). En consecuencia, la duración de la batería no resulta ser muy impresionante, particularmente bajo carga.
En nuestra prueba de vídeo, el portátil sólo dura menos de 3 horas. Dependiendo del brillo ajustado, puede navegar lejos de la toma de corriente entre 1:47 horas y 3:47 horas.
| MSI Katana GF76 12UGS i7-12700H, GeForce RTX 3070 Ti Laptop GPU, 53.5 Wh | MSI Katana GF76 11UE i7-11800H, GeForce RTX 3060 Laptop GPU, 53 Wh | Aorus 17 XE4 i7-12700H, GeForce RTX 3070 Ti Laptop GPU, 99 Wh | Razer Blade 17 (i7-12800H, RTX 3070 Ti) i7-12800H, GeForce RTX 3070 Ti Laptop GPU, 82 Wh | Lenovo Legion 5 Pro 16 G7 i7 RTX 3070Ti i7-12700H, GeForce RTX 3070 Ti Laptop GPU, 80 Wh | MSI Vector GP66 12UGS i9-12900H, GeForce RTX 3070 Ti Laptop GPU, 65 Wh | Media de la clase Gaming | |
|---|---|---|---|---|---|---|---|
| Duración de Batería | -0% | 41% | 40% | 25% | 9% | 79% | |
| H.264 (h) | 3.3 | 3.9 18% | 6.1 85% | 4.9 48% | 6.3 91% | 8.32 ? 152% | |
| WiFi v1.3 (h) | 3.7 | 3.7 0% | 5.1 38% | 5.9 59% | 5.4 46% | 5.7 54% | 7.11 ? 92% |
| Load (h) | 1.6 | 1.3 -19% | 1.6 0% | 1.8 13% | 0.6 -63% | 1 -37% | 1.502 ? -6% |
| Reader / Idle (h) | 4.8 | 8.6 | 7.9 | 8.27 ? | |||
| Witcher 3 ultra (h) | 0.8 |
Pro
Contra
Veredicto - Un jugador asequible
El MSI Katana GF76 12U es uno de los portátiles para juegos más asequibles con todas las ventajas y desventajas que esto conlleva. La parte positiva es que el Katana es capaz de reproducir casi todos los juegos modernos con fluidez incluso con los ajustes de detalle máximos. Aquellos para los que esto sea suficiente obtendrán un portátil para juegos asequible con el Katana, cuyo funcionamiento también es relativamente eficiente.
Por supuesto, el bajo precio también conlleva algunas desventajas. La pantalla forma más bien el nivel de calidad IPS más bajo, la batería es pequeña, y la duración de la batería, corta. Las conexiones no son muy modernas, el sistema de refrigeración necesita alguna optimización urgente, y la RTX 3070 Ti está limitada a 100 vatios, lo que significa que su rendimiento ni siquiera es capaz de acercarse a su potencial.
El MSI Katana GF76 es uno de los portátiles de juego más asequibles. Aunque los compradores interesados con un presupuesto limitado deberían ser capaces de jugar a todos los juegos actuales sin problemas, las muchas desventajas menores exigen un presupuesto mayor.
Entre los competidores, merece la pena echar un vistazo al Gigabyte Aorus 17, que también ofrece Thunderbolt y un mayor rendimiento siendo sólo ligeramente más caro que el Katana. El Asus TUF Gaming F17 también podría merecer tu consideración con su mayor rendimiento, pero su versión más asequible tiene una pantalla que es incluso peor en algunas partes. Debido a la importante limitación de TGP, también podría merecer la pena echar un vistazo a un modelo con una RTX 3060 y un TGP superior.
Precio y disponibilidad
El 2022 MSI Katana GF76 está disponible, por ejemplo, en Amazon a partir de 1499 dólares.
MSI Katana GF76 12UGS
- 05/13/2022 v7 (old)
Christian Hintze
Price comparison

