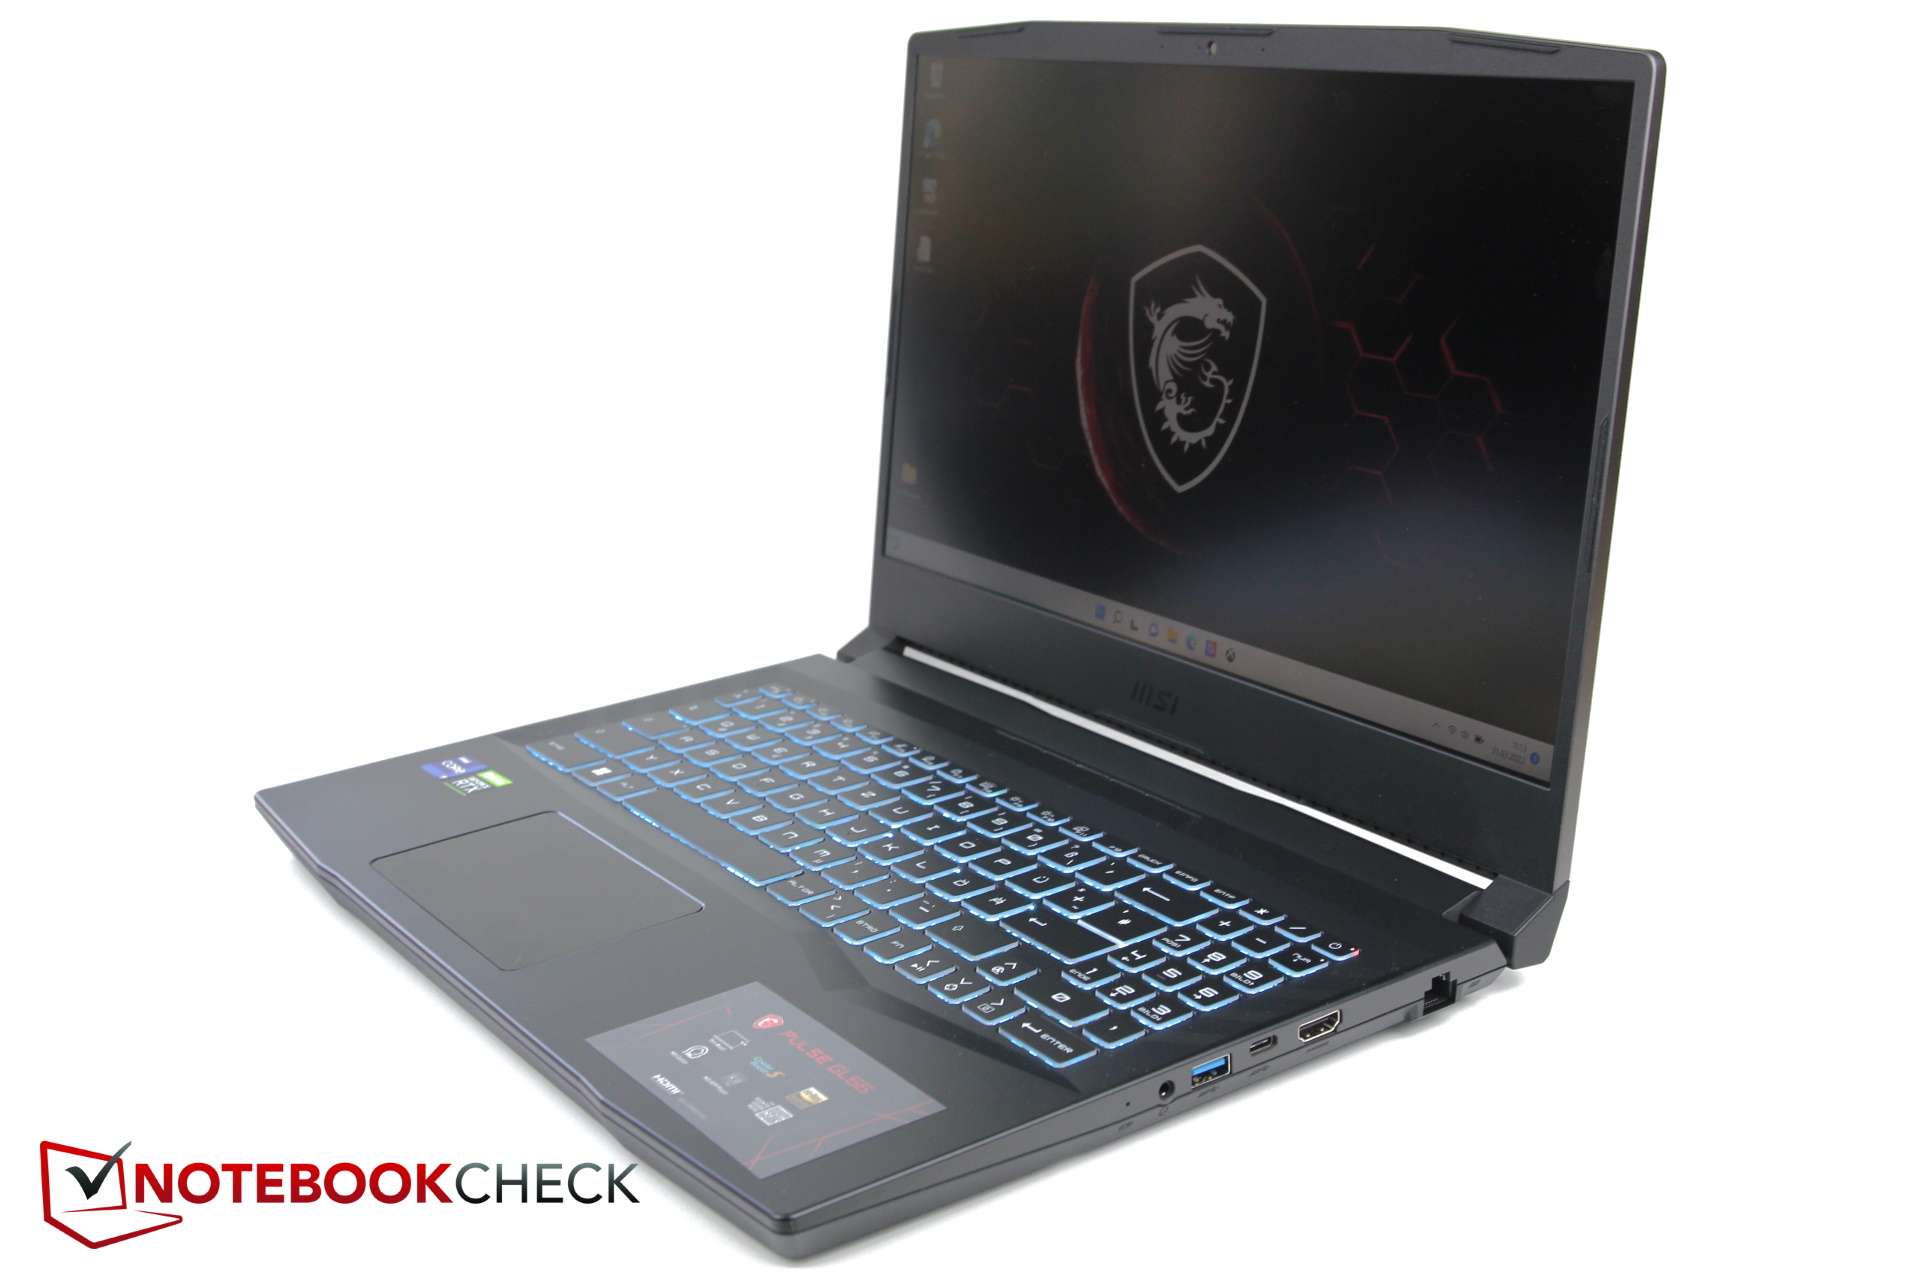
Análisis del MSI Pulse GL66: ¿El i9-12900H mejora el portátil para juegos RTX-3060 o sólo lo encarece?
El año pasado, la serie de juegos Pulse se presentó por primera vez con los dos modelos GL66 y GL76, y este año llega la actualización a Alder Lake. Como no probamos los dispositivos el año pasado, la prueba de esta serie es nueva para nosotros. Analizamos el GL66 de 15 pulgadas en su segunda iteración con unaRTX 3060y Core i9-12900Hque está disponible por unos 1,900 Euros (~$2057).
Ya probamos la combinación de Alder Lake y RTX 3060 en el Alienware x14 (14 pulgadas) y el Asus TUF Gaming F15como dispositivos de comparación adicionales, usamos otros portátiles de juego de 15 pulgadas con la misma GPU como el Schenker XMG Apex 15, elLenovo Legion S7y el Alienware m15 R5.
Posibles contendientes en la comparación
Valoración | Fecha | Modelo | Peso | Altura | Tamaño | Resolución | Precio |
|---|---|---|---|---|---|---|---|
| 80.7 % v7 (old) | 04/2022 | MSI Pulse GL66 12UEK i9-12900H, GeForce RTX 3060 Laptop GPU | 2.3 kg | 25 mm | 15.60" | 1920x1080 | |
| 87.2 % v7 (old) | 03/2022 | Asus TUF Gaming F15 FX507ZM i7-12700H, GeForce RTX 3060 Laptop GPU | 2.1 kg | 24.95 mm | 15.60" | 1920x1080 | |
| 86.7 % v7 (old) | 03/2022 | Alienware x14 i7 RTX 3060 i7-12700H, GeForce RTX 3060 Laptop GPU | 1.8 kg | 14.5 mm | 14.00" | 1920x1080 | |
| 84.4 % v7 (old) | 11/2021 | Schenker XMG Apex 15 NH57E PS R7 5800H, GeForce RTX 3060 Laptop GPU | 2.1 kg | 29 mm | 15.60" | 1920x1080 | |
| 87.9 % v7 (old) | 11/2021 | Lenovo Legion S7 15ACH6 82K80030GE R9 5900HX, GeForce RTX 3060 Laptop GPU | 2 kg | 18.9 mm | 15.60" | 3840x2160 | |
| 84.7 % v7 (old) | 06/2021 | Alienware m15 R5 Ryzen Edition R7 5800H, GeForce RTX 3060 Laptop GPU | 2.5 kg | 22.85 mm | 15.60" | 1920x1080 |
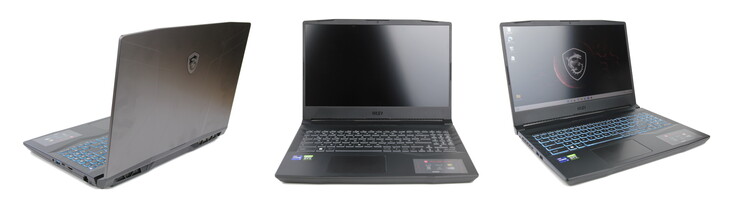
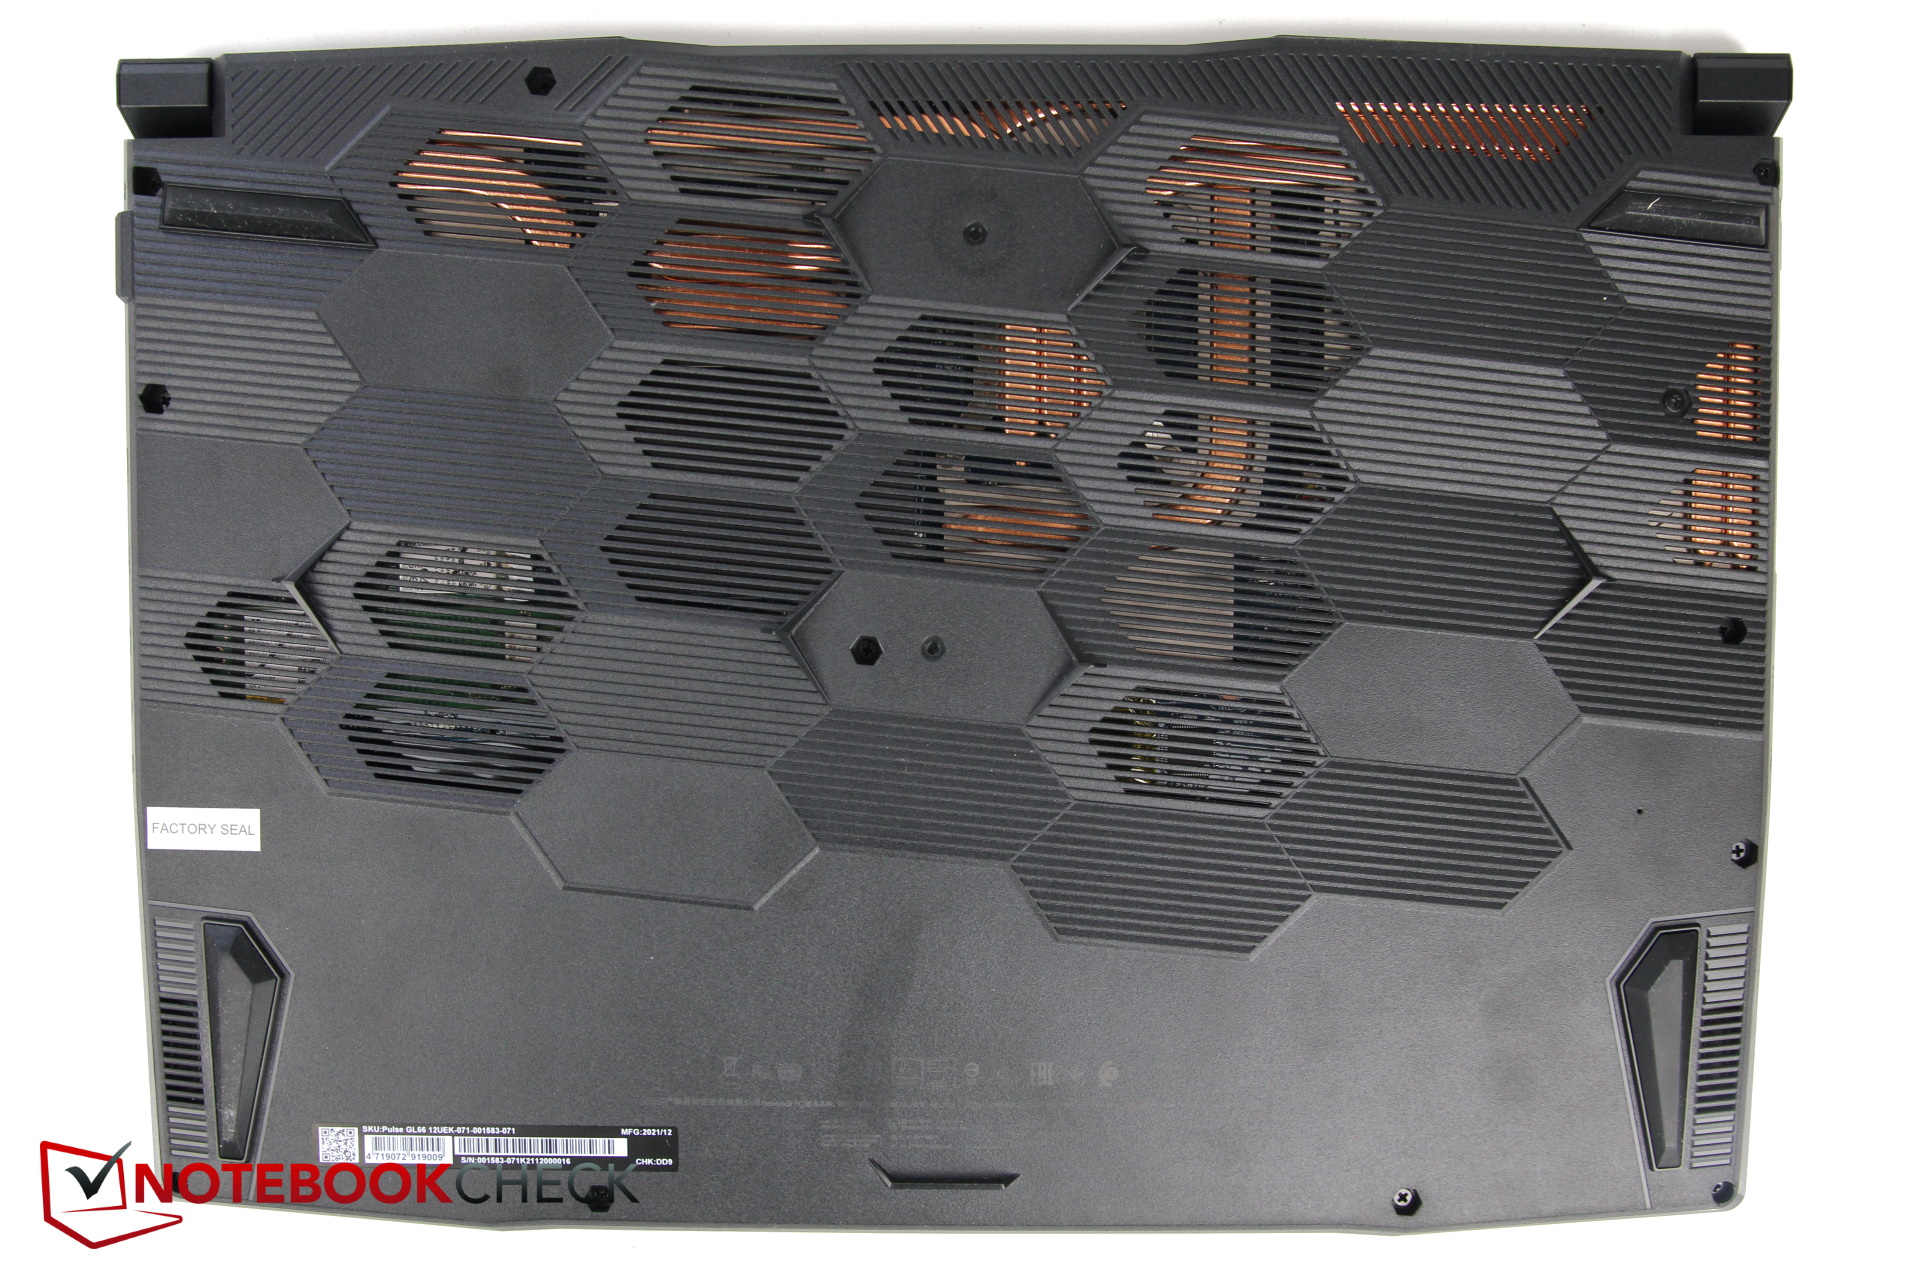
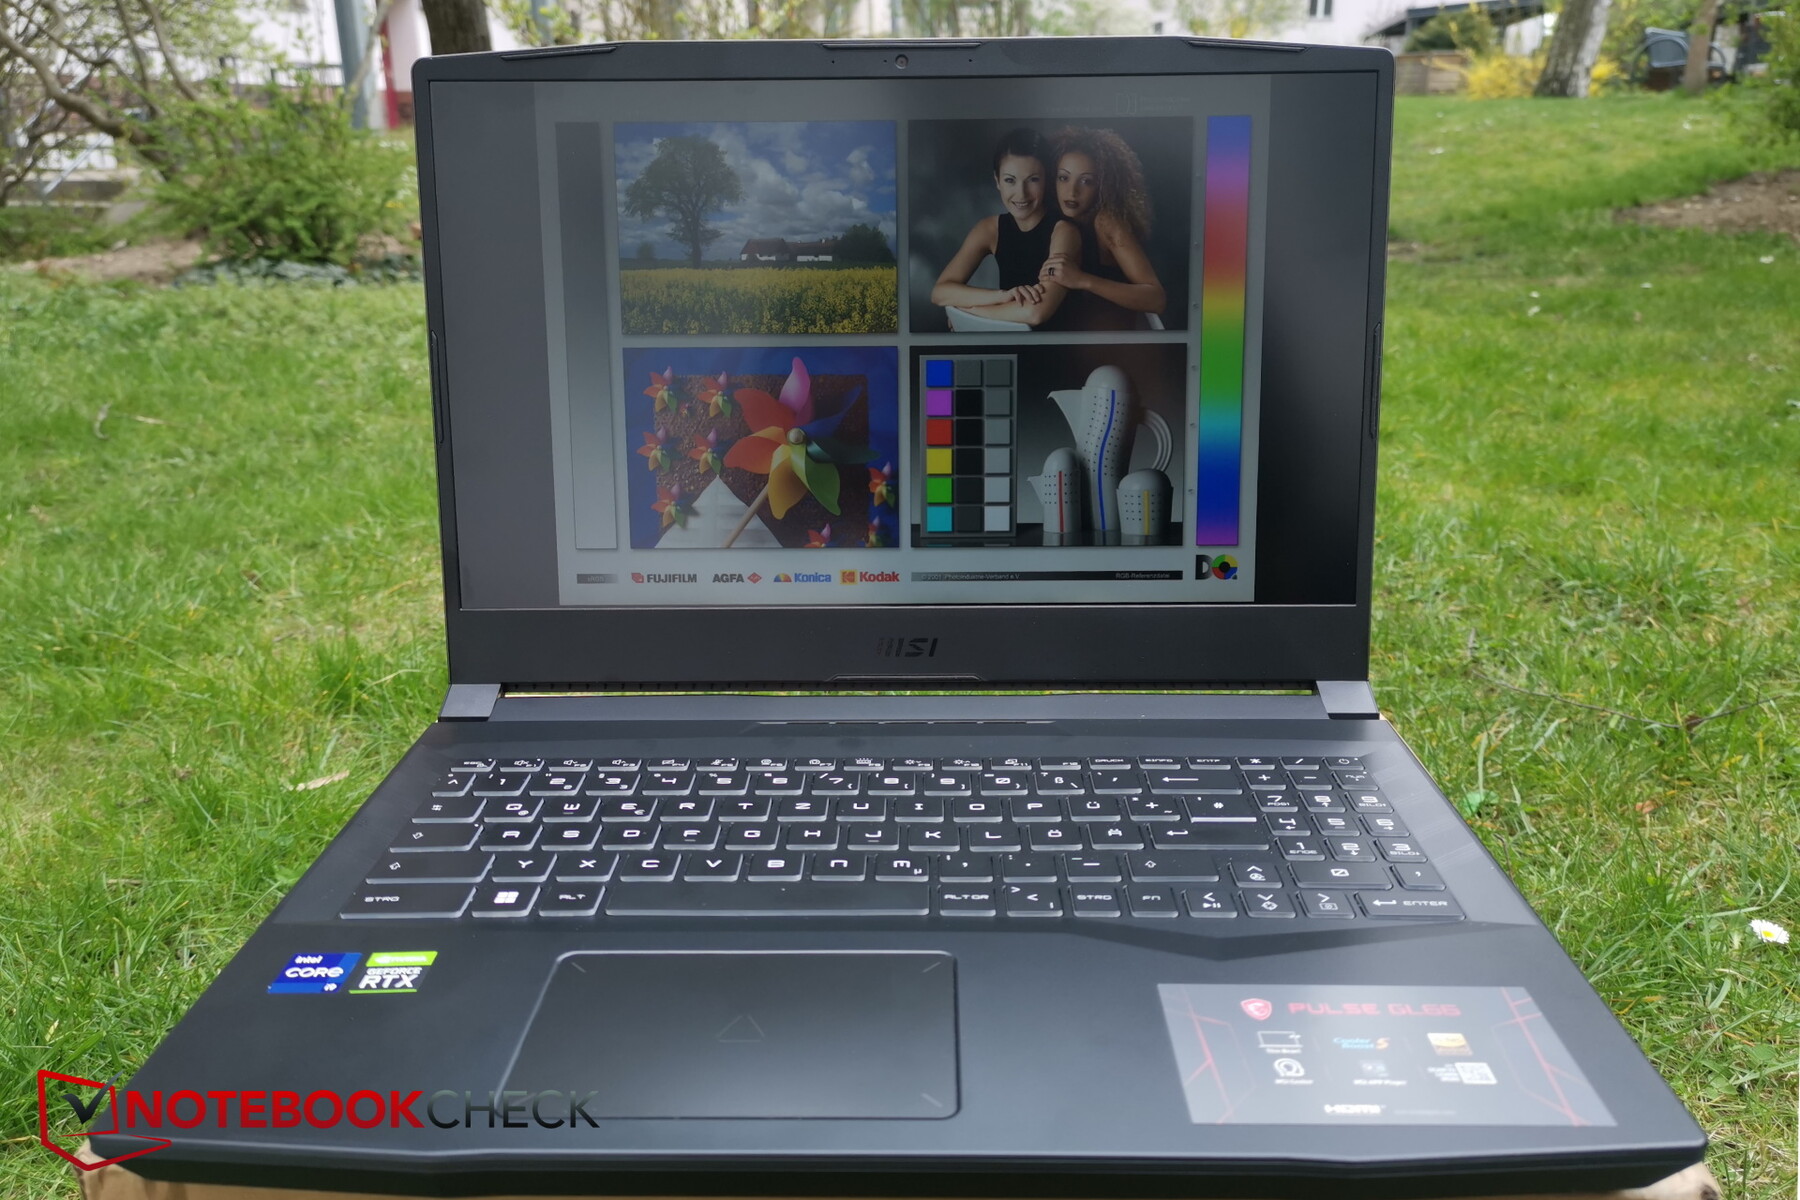
Caso
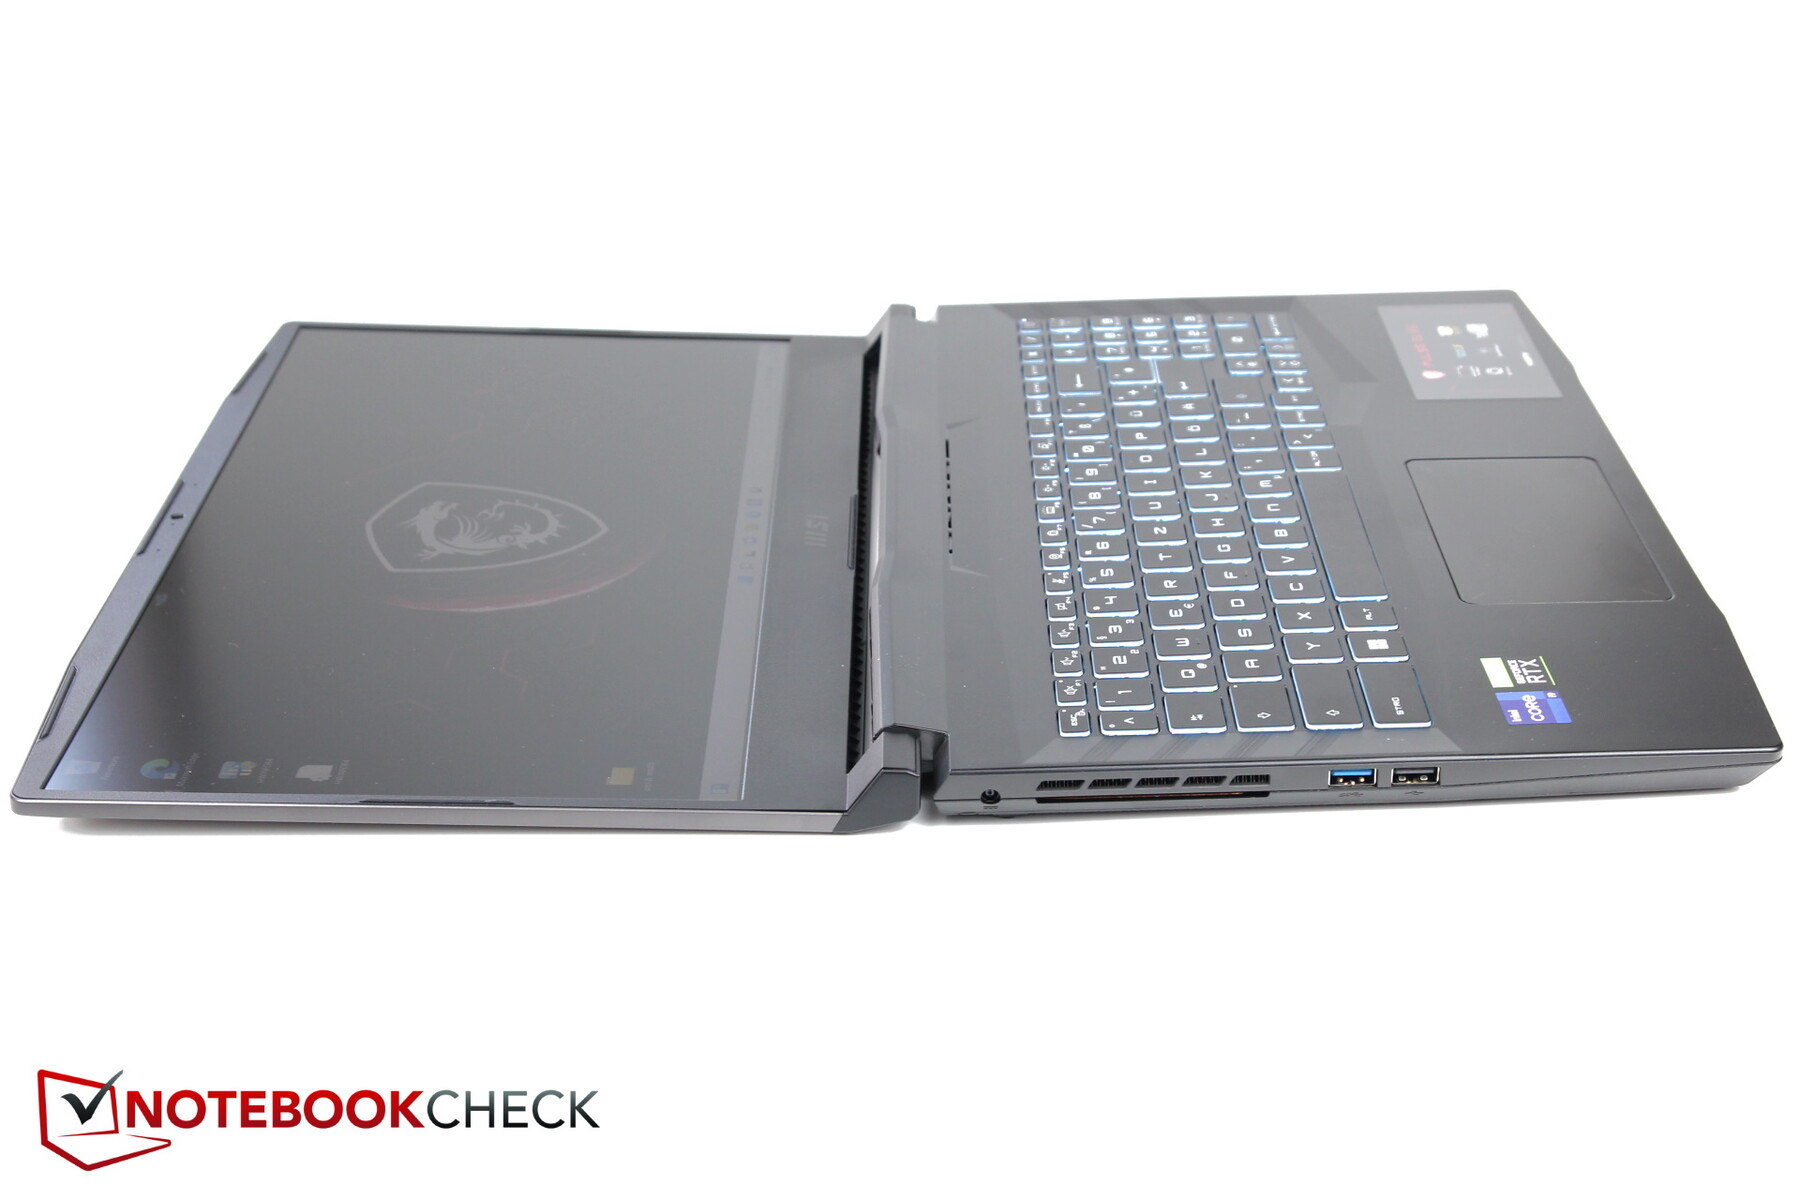
Sólo la tapa de la pantalla del Pulse es de metal y el resto del portátil es de plástico. Esto hace que la tapa sea bastante resistente a la deformación. Su ángulo máximo de apertura es de casi 180 grados. Las dos bisagras de los lados hacen un buen trabajo, pero como debido a su construcción metálica la tapa no es particularmente ligera, puede abrirse accidentalmente por completo cuando se mueve el portátil, particularmente si se abre más de dos tercios del camino.
Una muesca en la base permite abrir el portátil fácilmente con una mano. Aunque la base también es bastante estable, los intentos de deformación también pueden producir algunos ruidos de crujido a veces
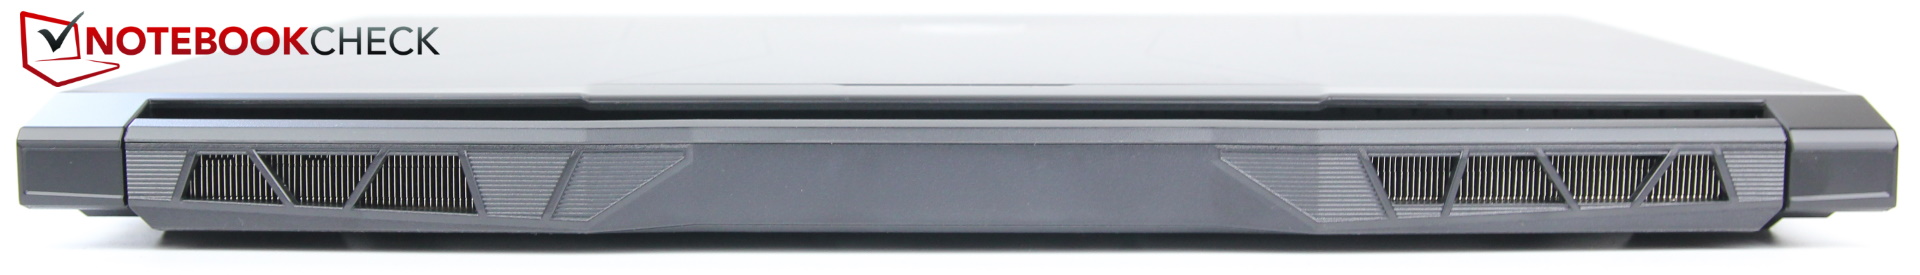
El teclado está ligeramente empotrado, por lo que los reposamanos están mínimamente elevados. El fondo de la carcasa es de plástico fino y está cubierto por muchas estructuras grandes en forma de panal, algunas de las cuales son rejillas de ventilación. El aire de salida sale por la parte trasera y por el lado izquierdo hacia la parte posterior.
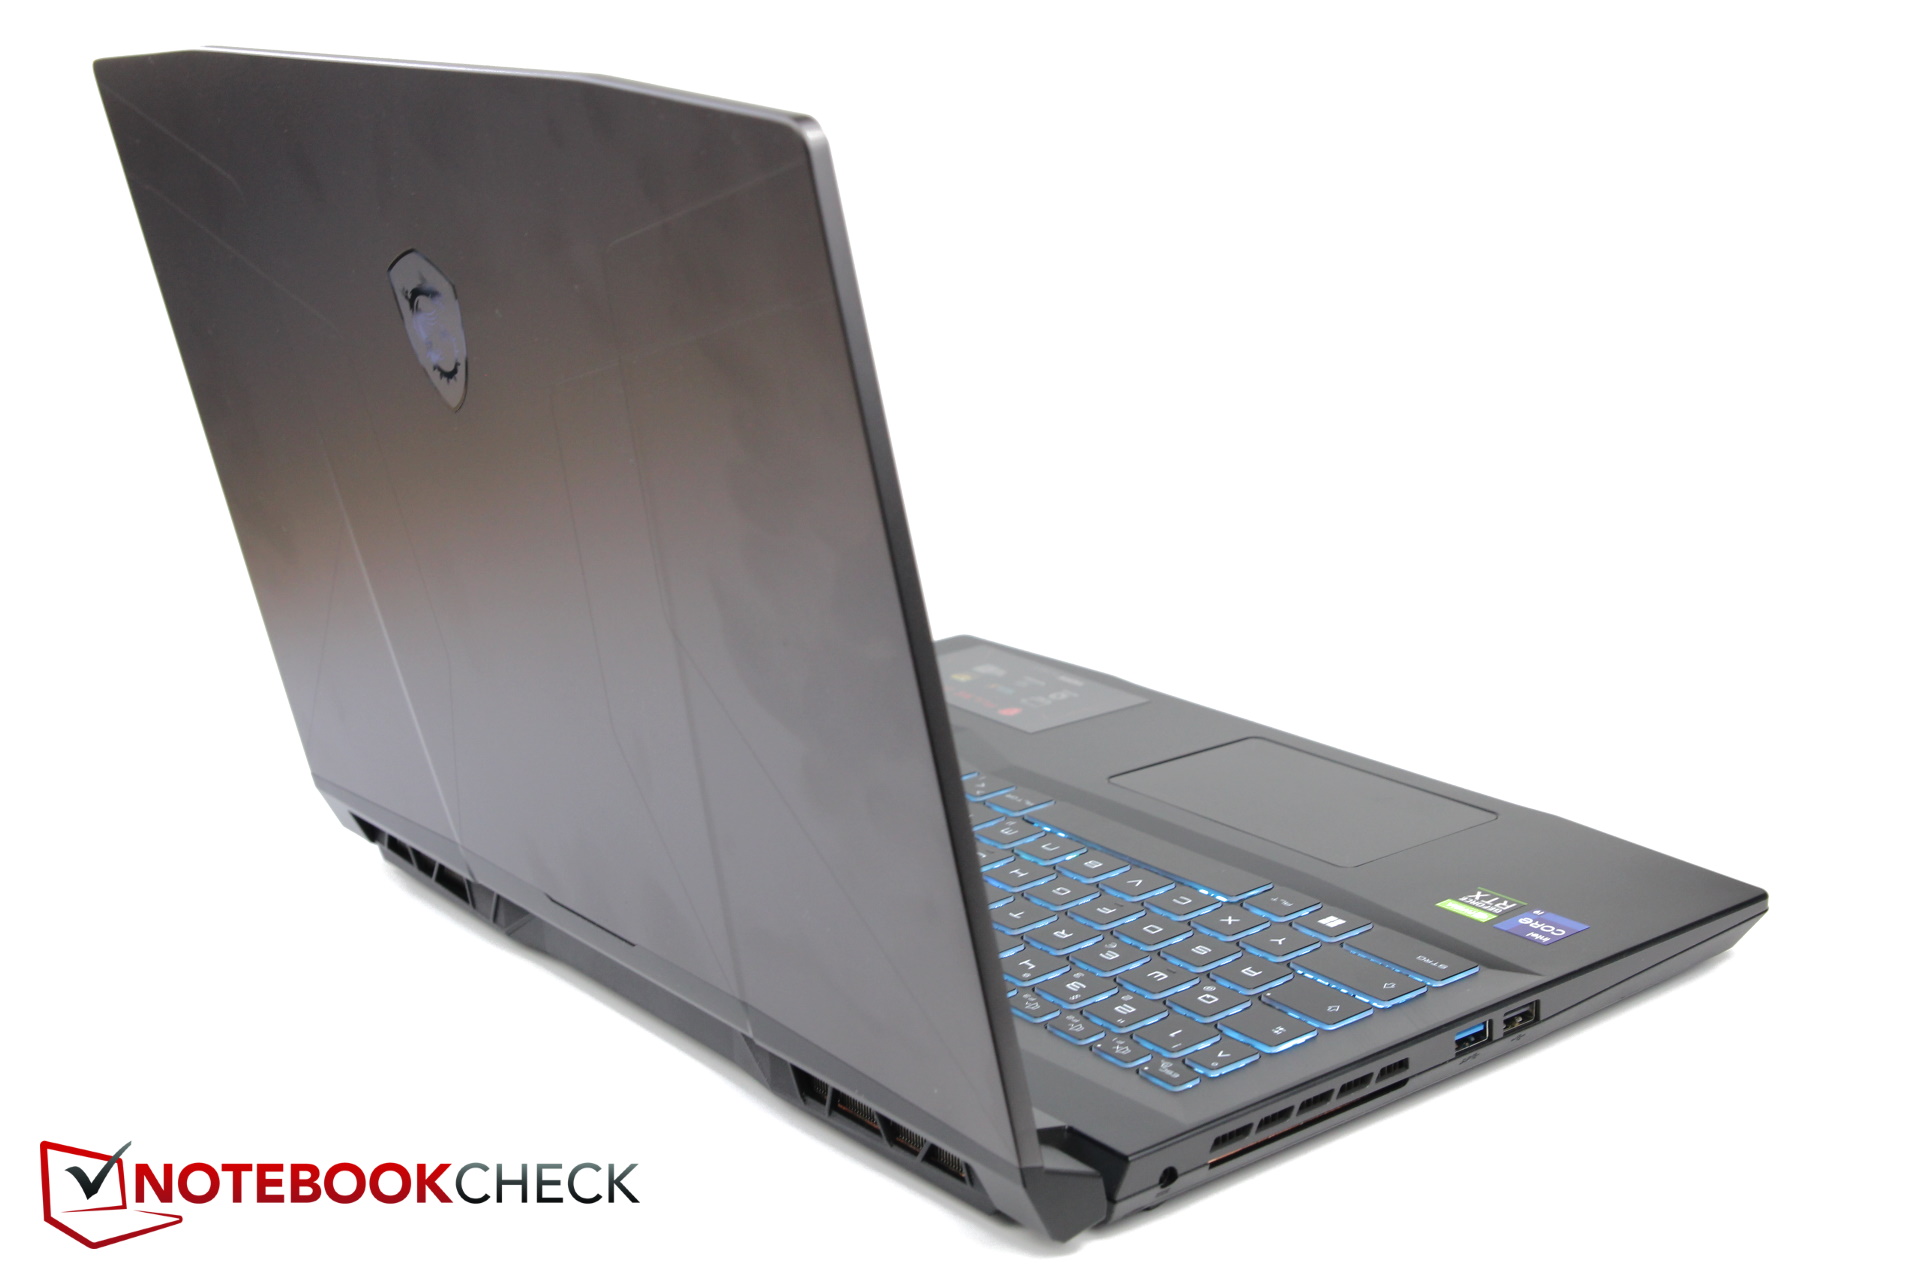
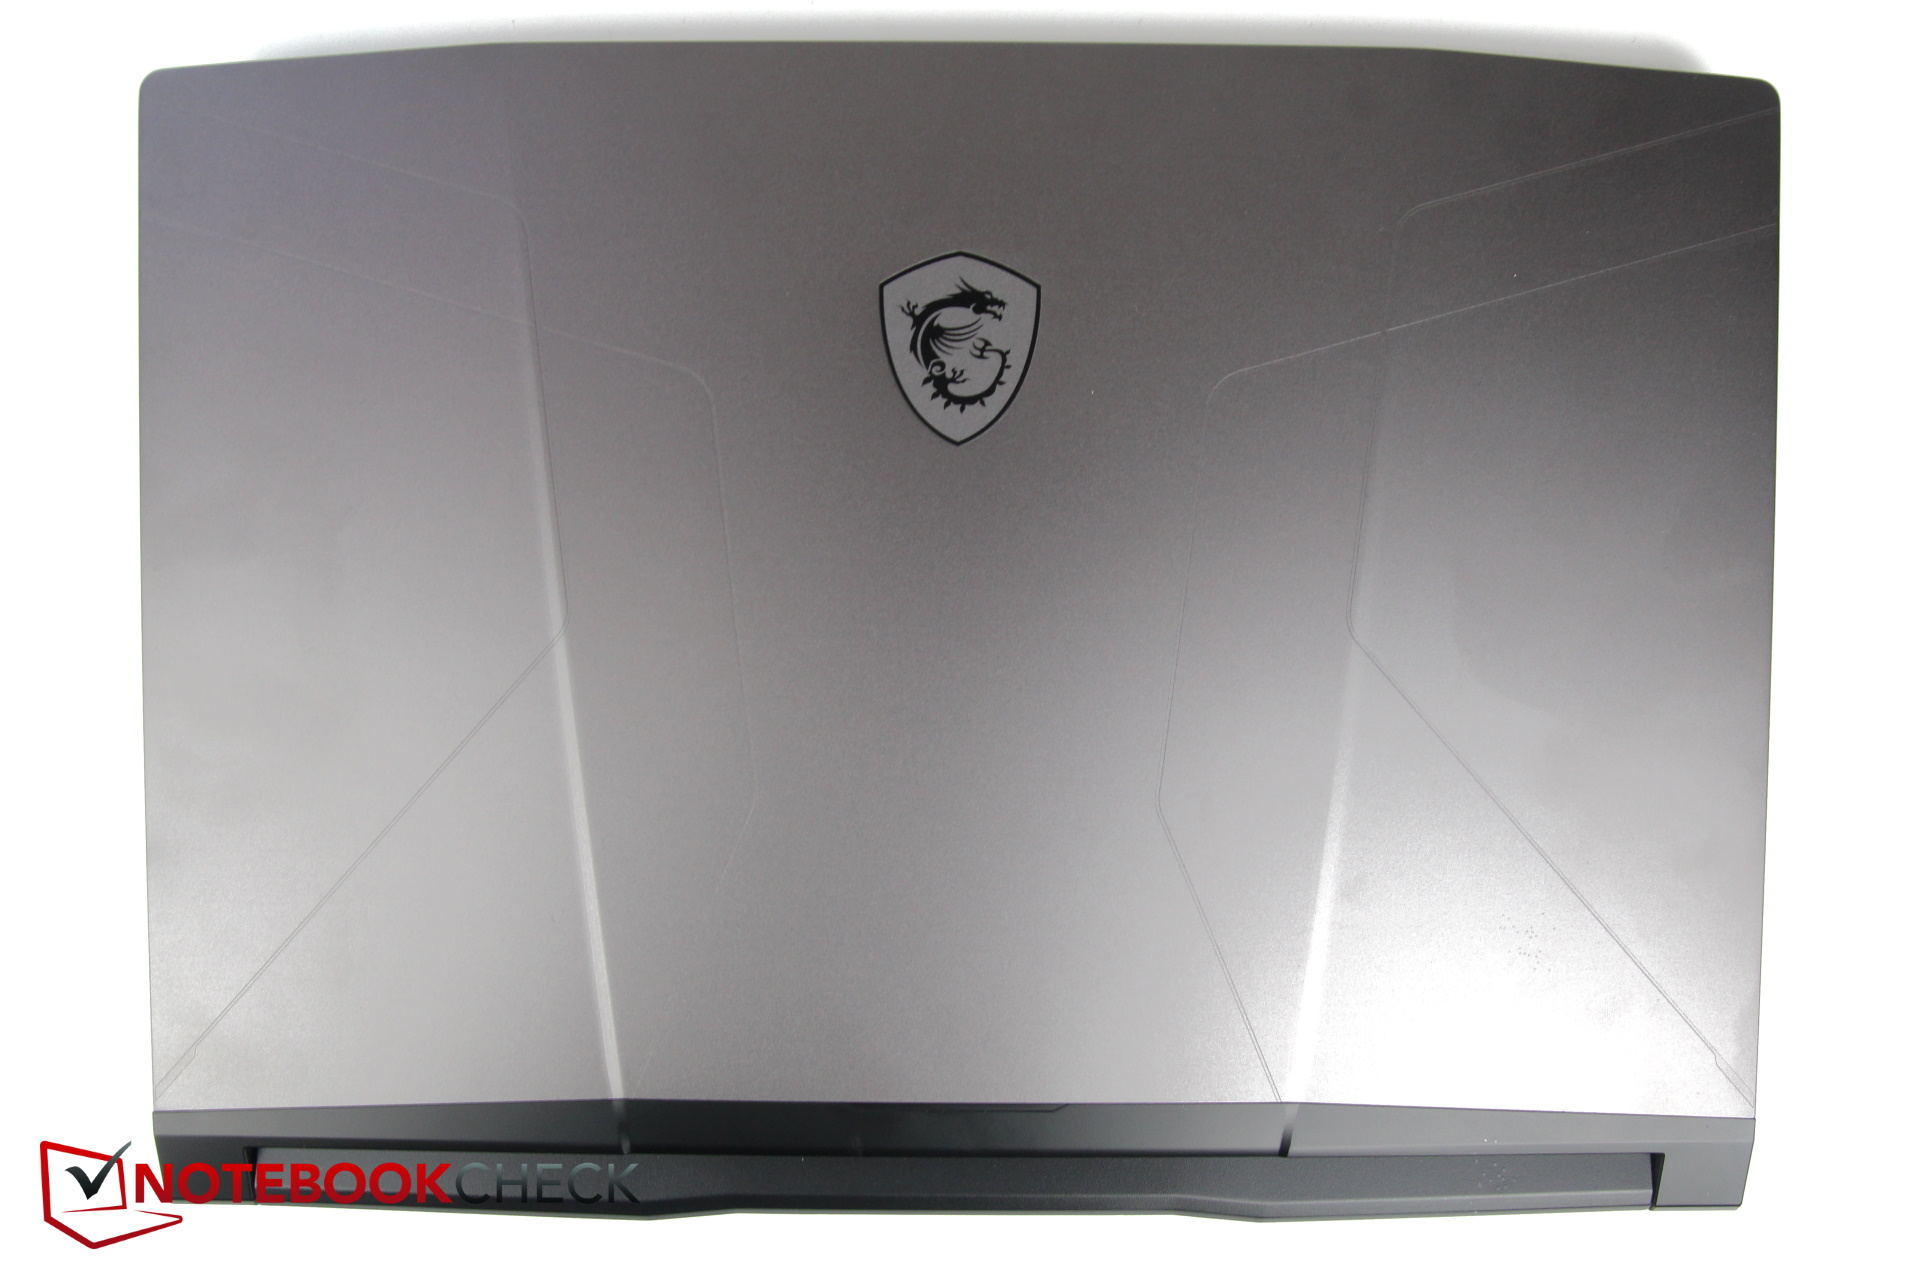
El diseño está orientado a los jugadores sin ser excesivamente ornamentado. La parte superior, de color gris plateado, muestra de forma destacada el logotipo del escudo de Porsche con el dragón, y la base y la parte inferior se mantienen en un negro oscuro. La fabricación parece ser buena, y no notamos ningún hueco irregular.
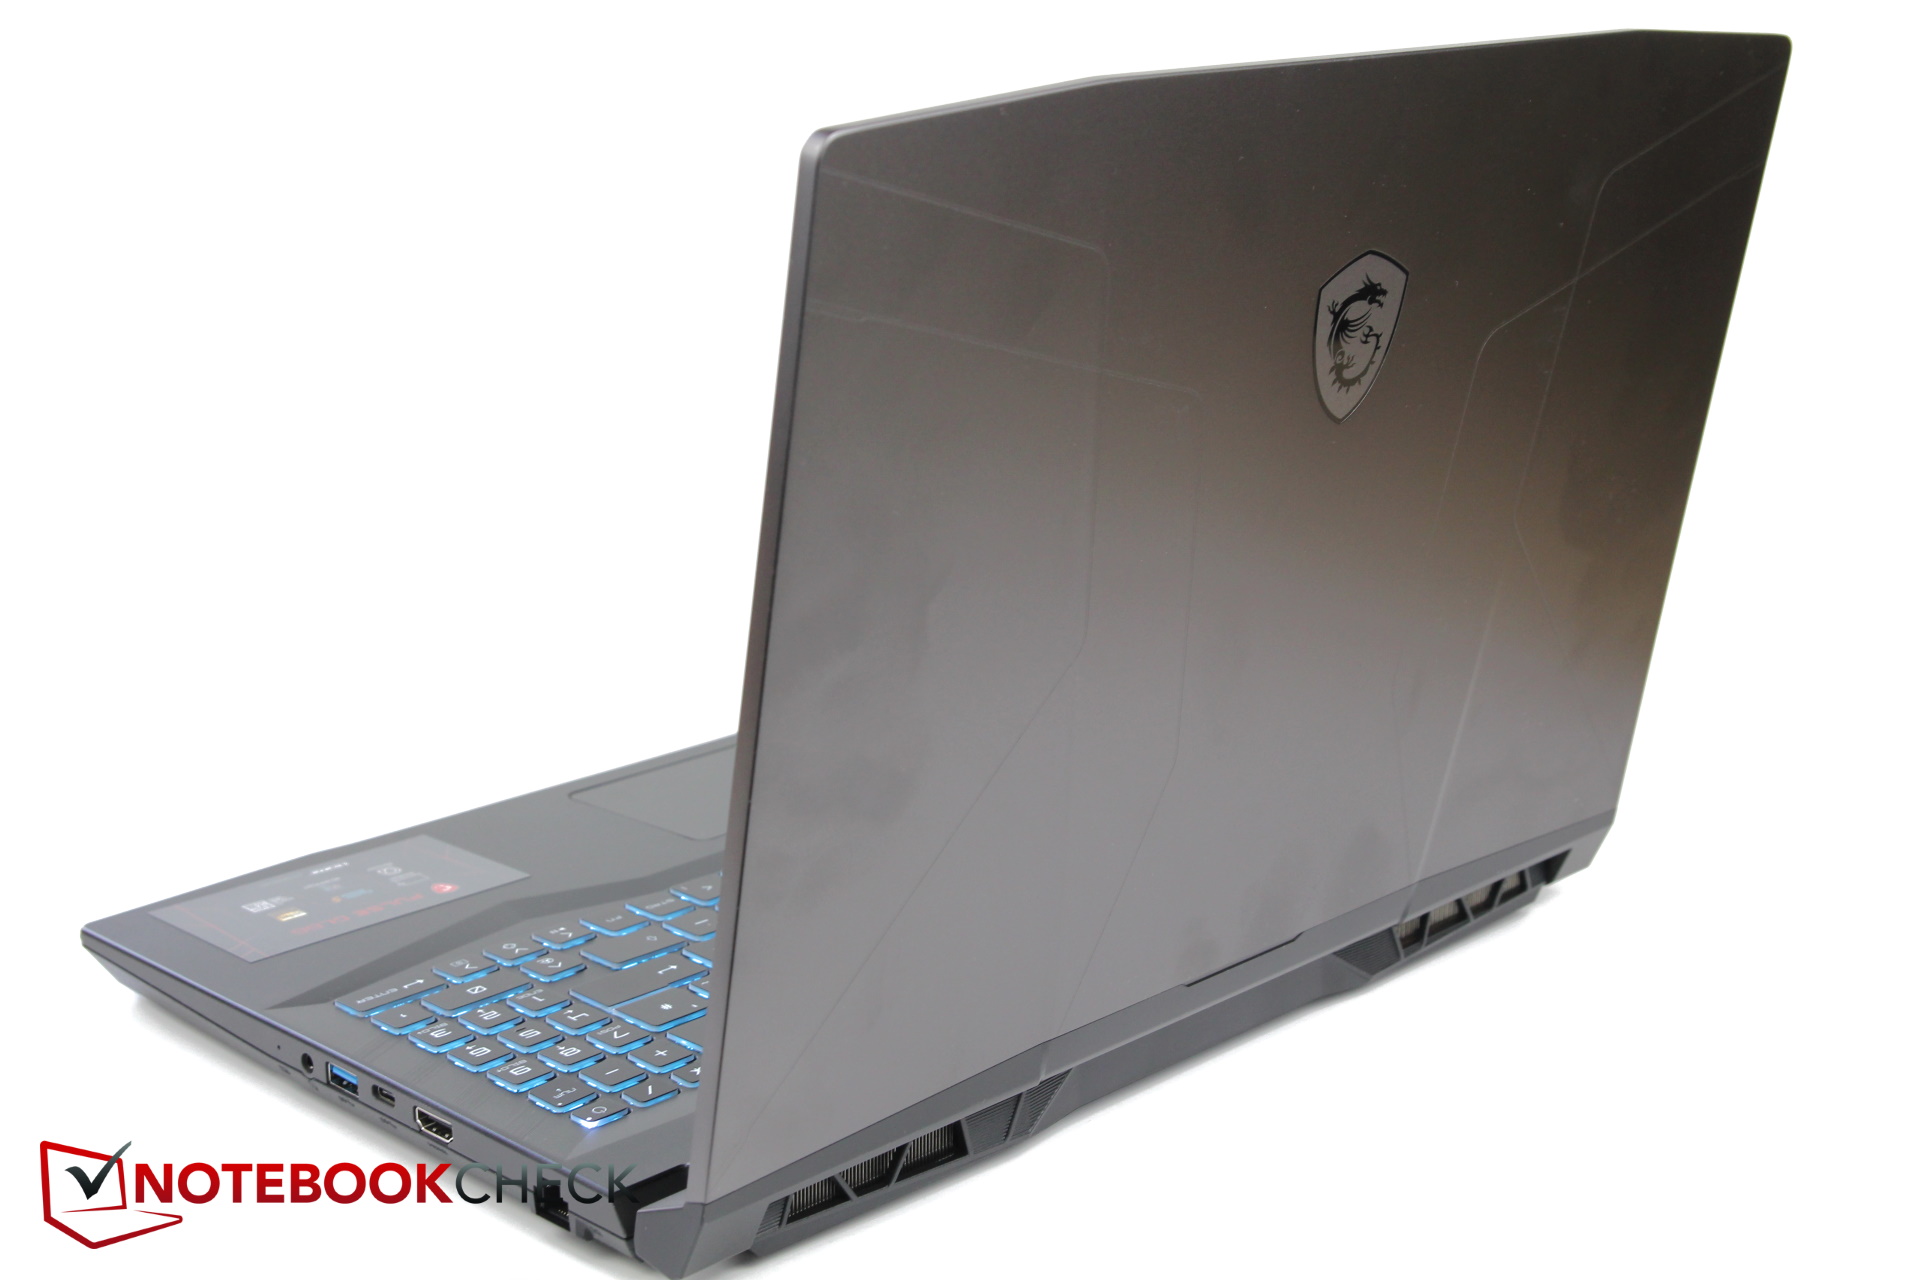
Salvo el Alienware m5, más grande, la mayoría de los portátiles de nuestro campo de pruebas tienen más o menos la misma longitud y anchura. El grosor del MSI lo sitúa en el centro del campo. Sin embargo, el grosor especificado por MSI de 23,4 mm (~0,92 pulgadas) se refiere más bien al lugar más delgado, y el portátil mide más bien 25 mm (~0,98 pulgadas) hacia la parte trasera.
El Legion S7 y el Alienware x14 demuestran que los portátiles para juegos también pueden ser más delgados, pero tanto el XMG Apex como el TUG Gaming F15 son más gruesos. En cuanto al peso, el MSI es uno de los modelos más pesados y sólo el Alienware m5 es aún más pesado.
Equipo
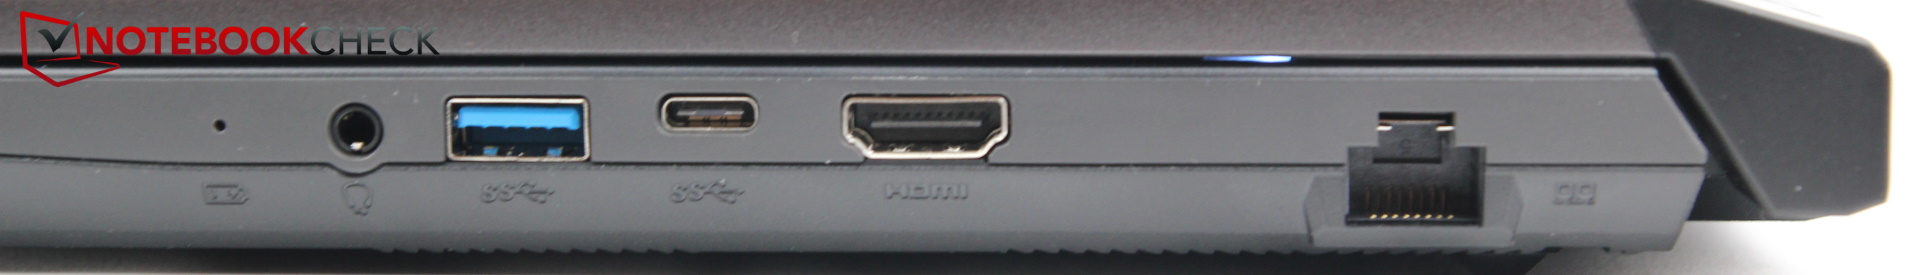
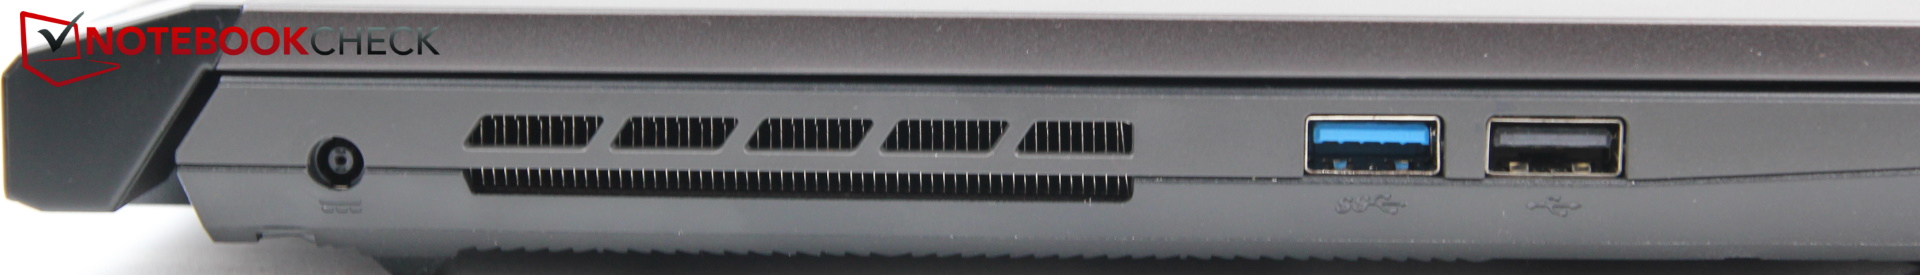
Sólo están presentes las conexiones más necesarias, pero nada más. Hay cuatro puertos USB en total, con uno de ellos en formato USB-C. Por desgracia, también es sólo 3.2 Gen 1, que es casi lo mismo que el USB 3.0 (5Gb/s). Falta Thunderbolt, al igual que un lector de tarjetas SD. Uno de los tres puertos USB-A incluso sólo soporta la velocidad 2.0, que ya no está a la altura de los estándares actuales.
Pero lo que es peor, es que el puerto USB-C no funcionó correctamente. Nuestro SSD externo en una carcasa M.2 se anunciaba constantemente en el puerto USB-C. Mientras que la luz del SSD permanecía encendida constantemente, el SO seguía registrándolo y desregistrándolo continuamente. Un reinicio tampoco ayudó, y tuvimos que cambiar al uso de un adaptador de USB-C a A. Después de eso, el problema no volvió a ocurrir. Encontramos el mismo problema con el MSI Katana, pero el Asus TUF Gaming F17 o el ROG Strix Scar que también estamos probando al mismo tiempo no tuvieron el problema. Quizá nuestra clavija USB-C no pueda insertarse con la suficiente profundidad en los puertos MSI.
La distribución de los puertos también es menos que óptima. La mayoría de los puertos están en el lado derecho, incluyendo el puerto HDMI con sus enchufes potencialmente grandes y sus cables rígidos. Esto es una molestia para los usuarios diestros. Además, los puertos están colocados bastante cerca unos de otros, especialmente los dos puertos USB-A del lado izquierdo, que por lo demás está vacío de conexiones.
También hay que mencionar que el enchufe de alimentación no queda muy ajustado. Durante nuestra prueba, ocurrió varias veces que se deslizó hasta la mitad sin que nos diéramos cuenta.
Comunicación
El Pulse se conecta a la WLAN mediante un módulo Intel AX201. Su potencial no se aprovecha al máximo, y las tasas de transferencia están en el extremo inferior de nuestra comparación.
Cámara web
Se utiliza una cámara web estándar de 720p. Durante años, no ha habido realmente ninguna mejora importante en muchos portátiles en este aspecto, ya sea por la escasez de Corona o no. Pero al menos las desviaciones de color se mantienen dentro de los límites.


Seguridad
El Pulse no tiene mucho que ofrecer a los puristas de la seguridad, y no hay ni sensor de huellas dactilares ni conexión Kensington. Sin embargo, el TPM 2.0 está incluido, por supuesto.
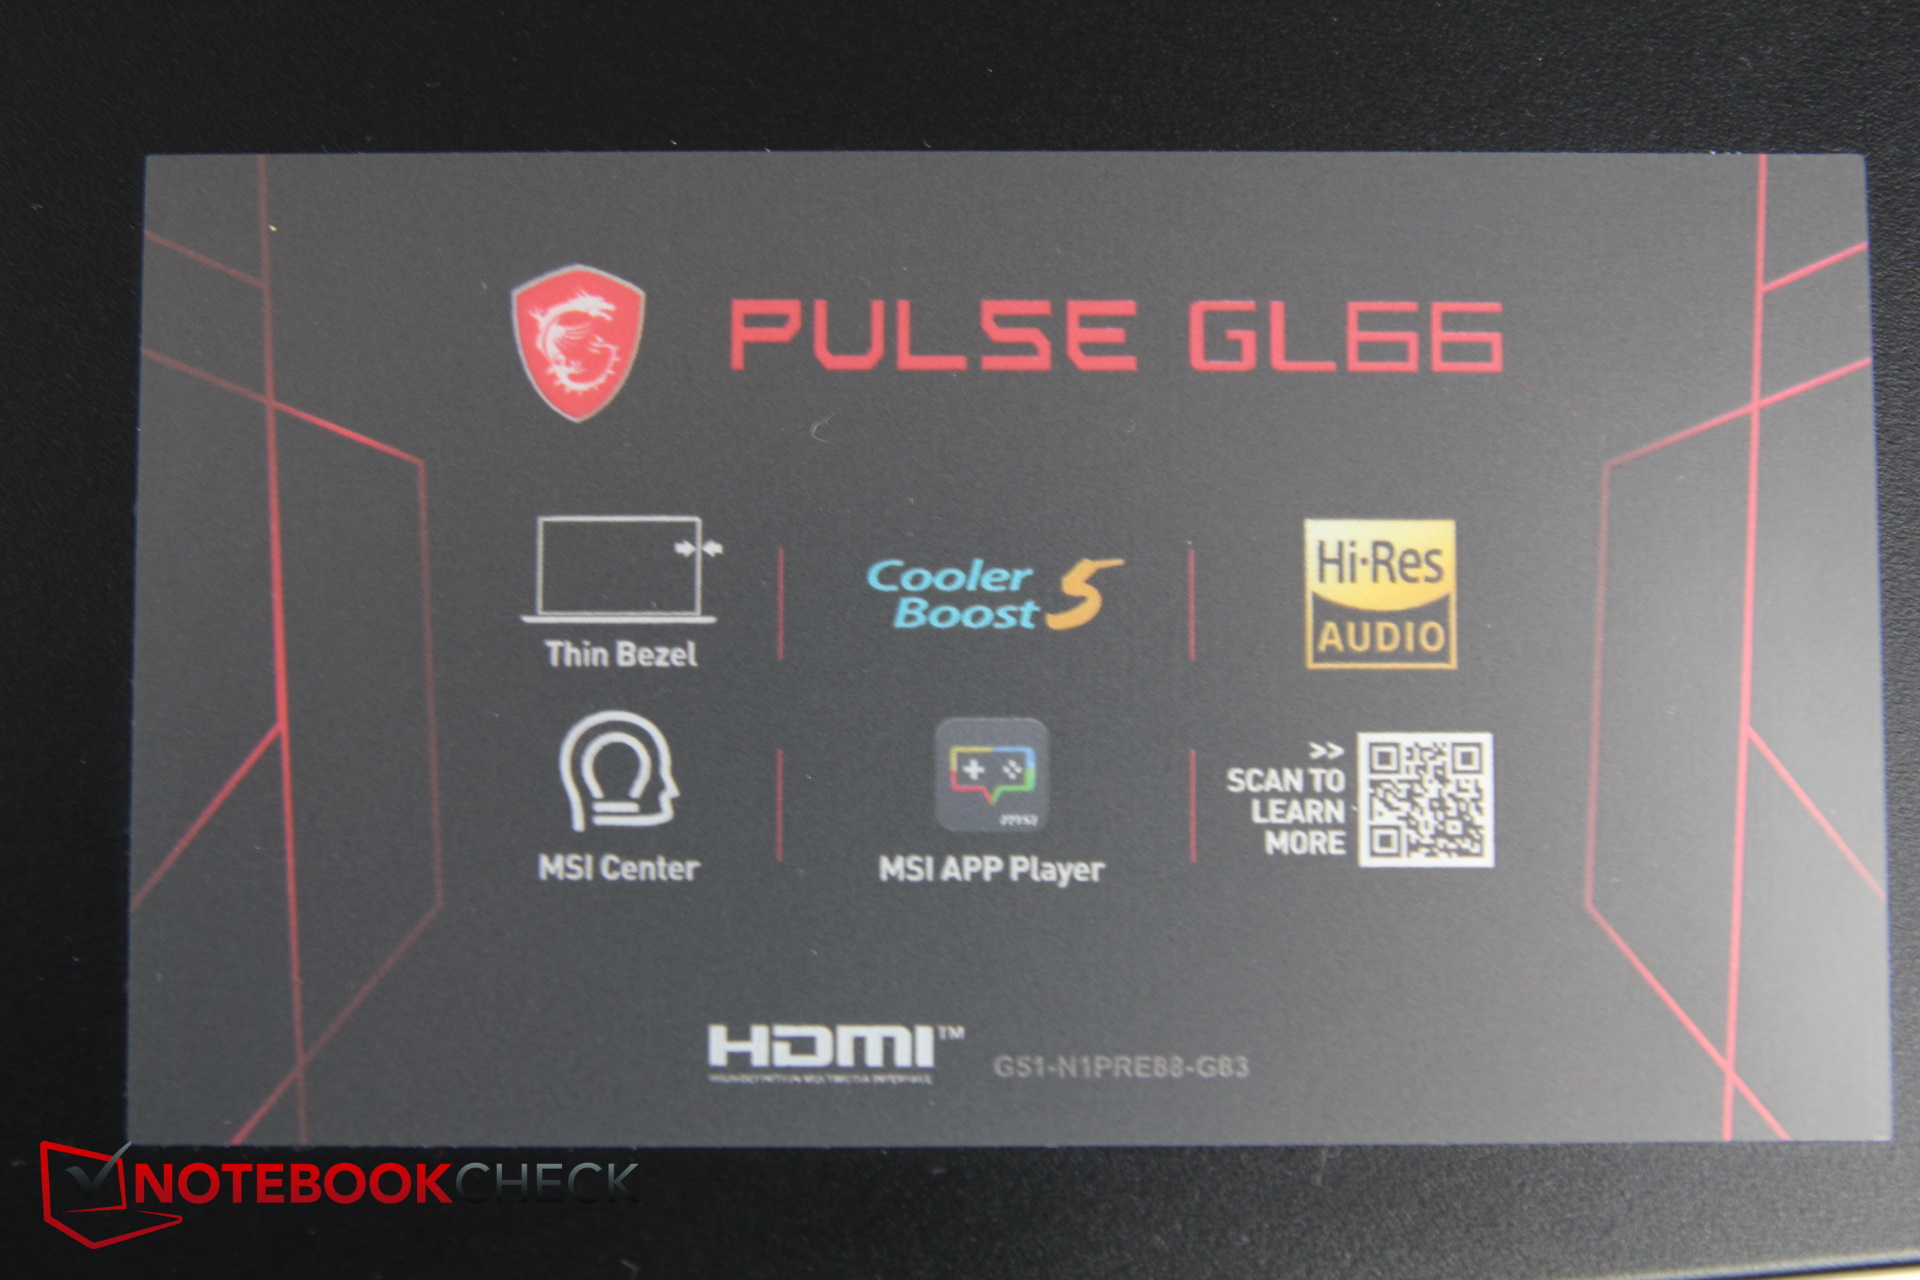
Accesorios y garantía
Aparte de unas cuantas pegatinas "chulas" y la fuente de alimentación de 240 vatios, MSI no incluye nada más digno de mención con el portátil. La garantía cubre 24 meses de servicio de recogida y devolución.
Mantenimiento
MSI esconde uno de los tornillos detrás de una pegatina. Nuestra unidad de prueba es un préstamo proporcionado por la tienda Cyberport, por lo que no quisimos dañar el sello adhesivo para abrir el dispositivo. Sin embargo, según MSI el dispositivo también puede ser abierto por el cliente para tareas de mantenimiento. Mientras esto se haga de forma "profesional", la garantía del dispositivo no debería verse afectada.
Dispositivos de entrada
Teclado
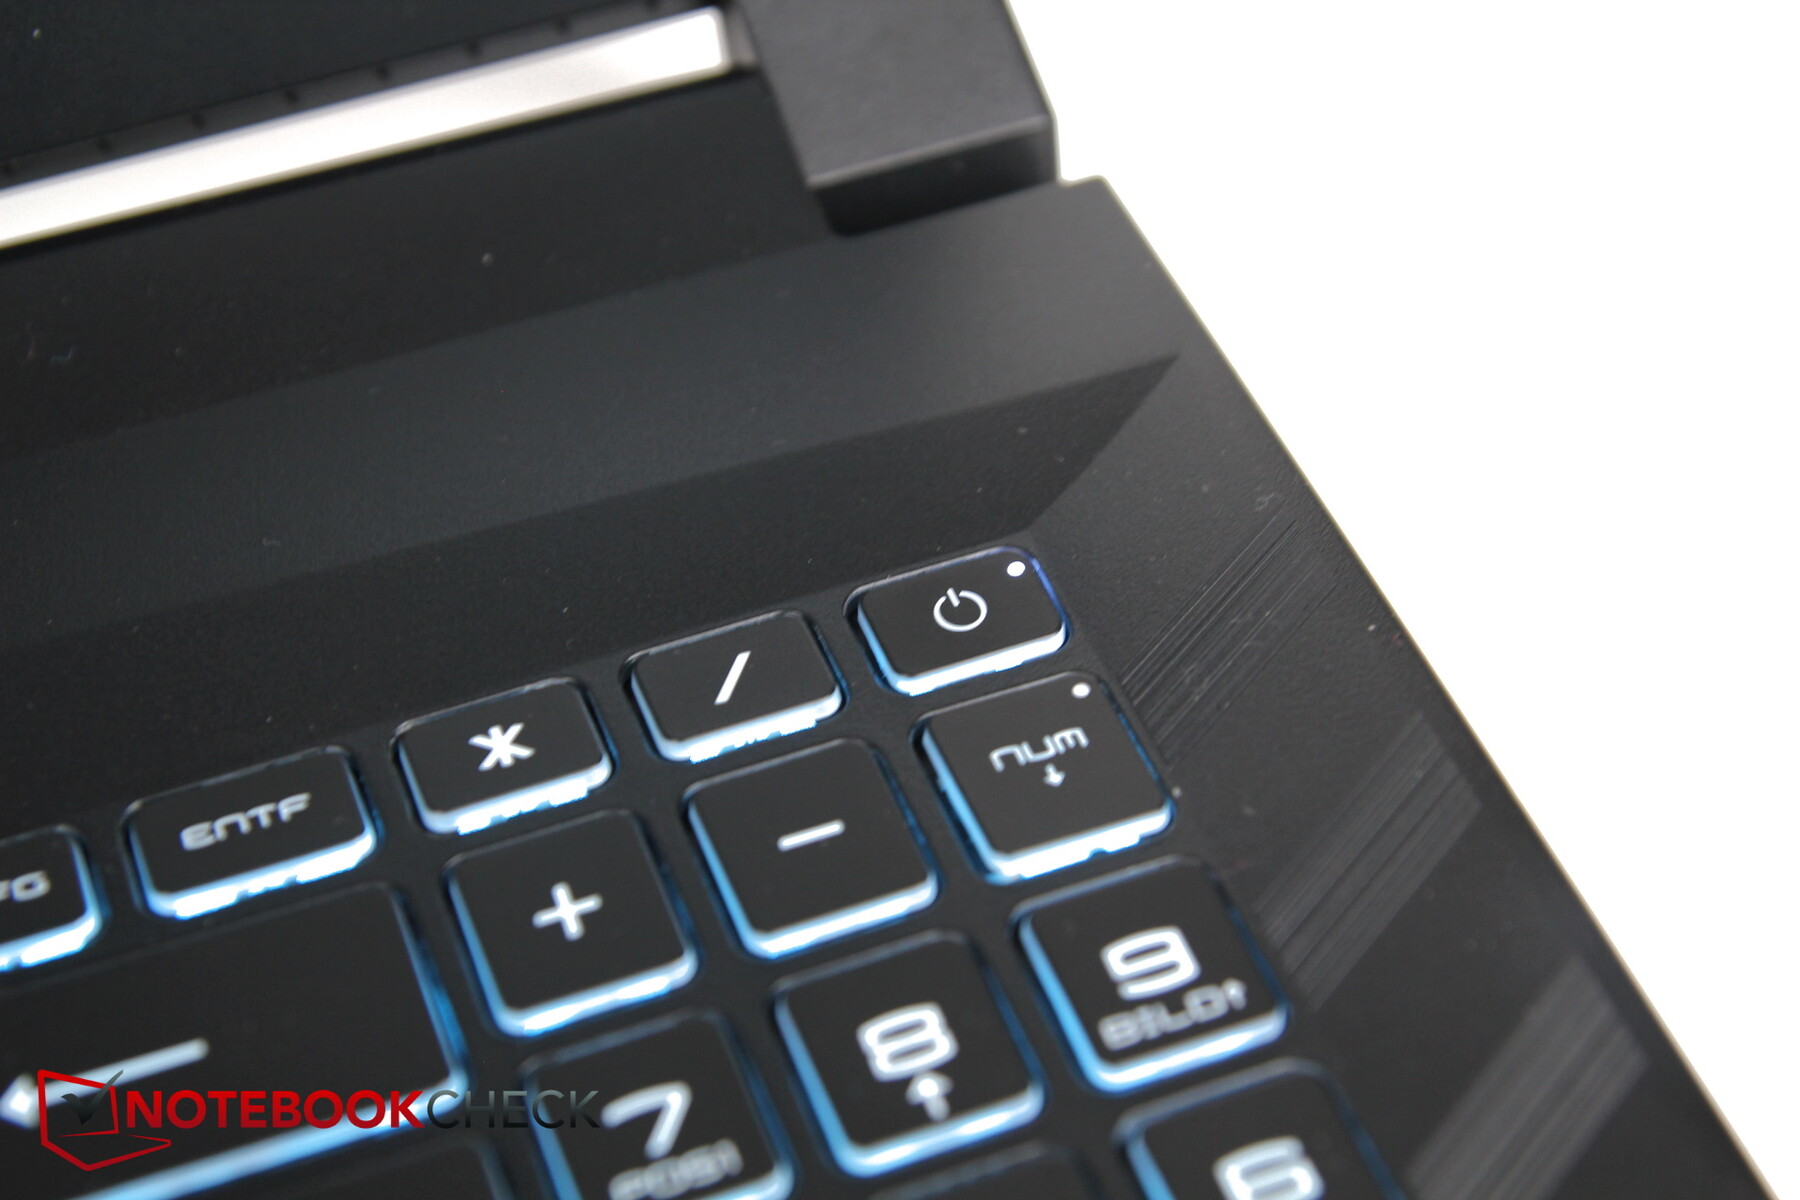
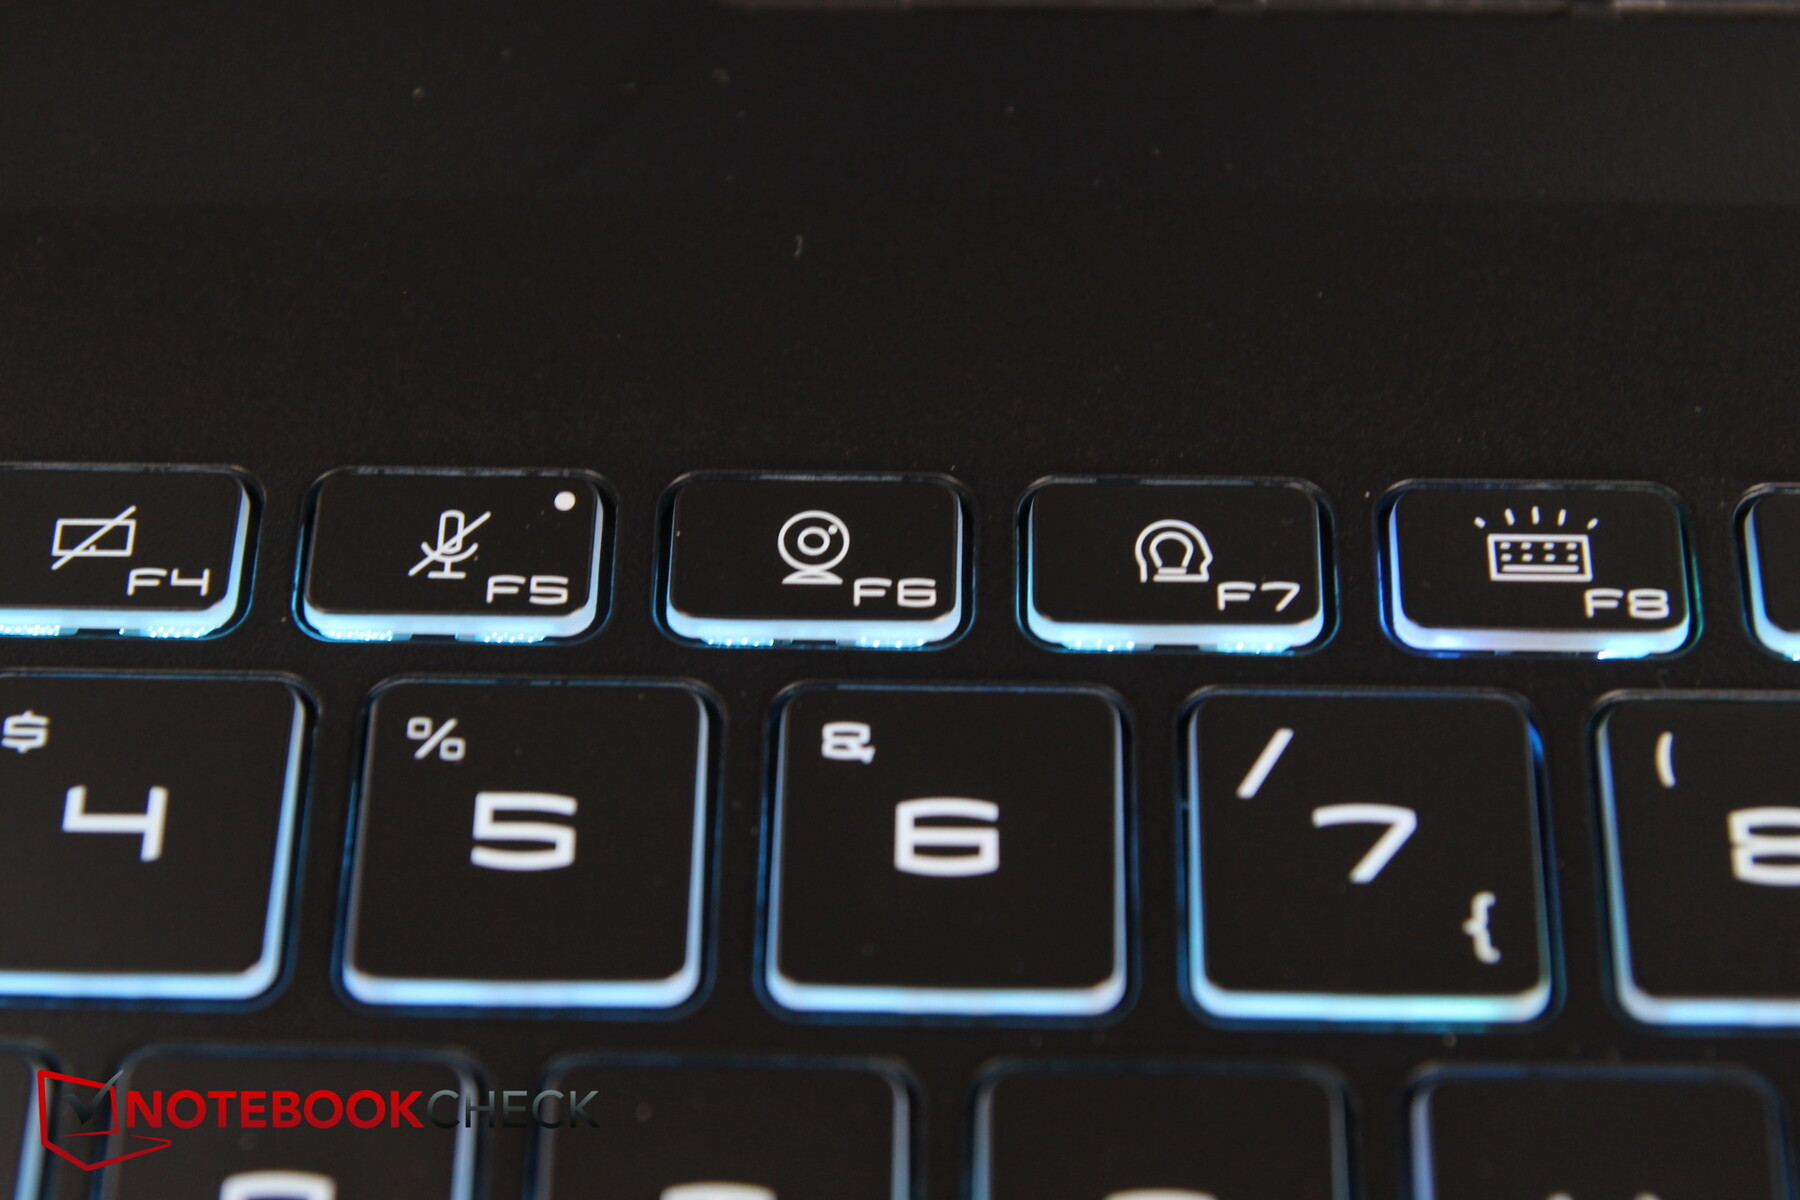
El teclado muestra una gran similitud con otros portátiles MSI como la serie Katana. La disposición parece bien dispuesta, pero con sus teclas muy juntas y algunas de ellas también muy pequeñas, también parece un poco abarrotado. Particularmente las teclas F y aún más el pad numérico que está apretado al lado de ellas resultaron muy pequeñas.
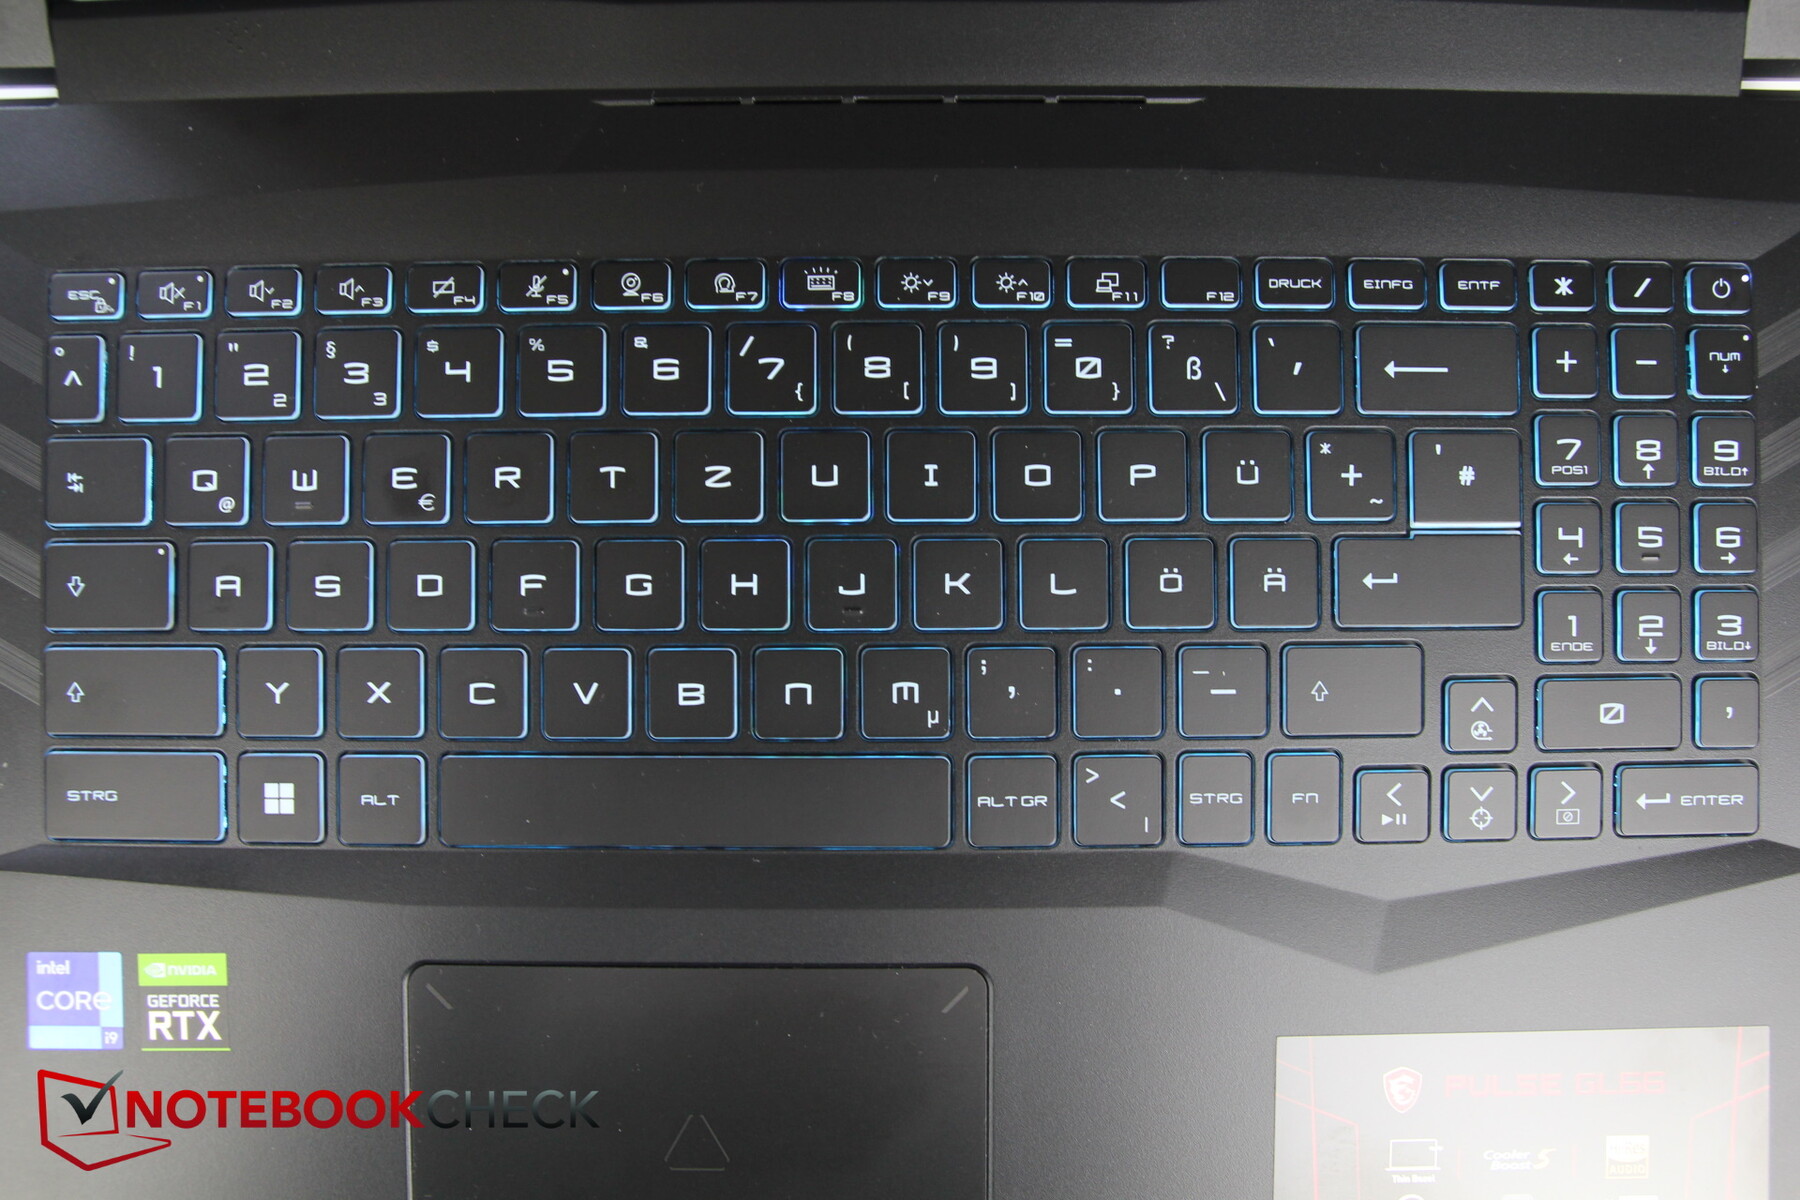
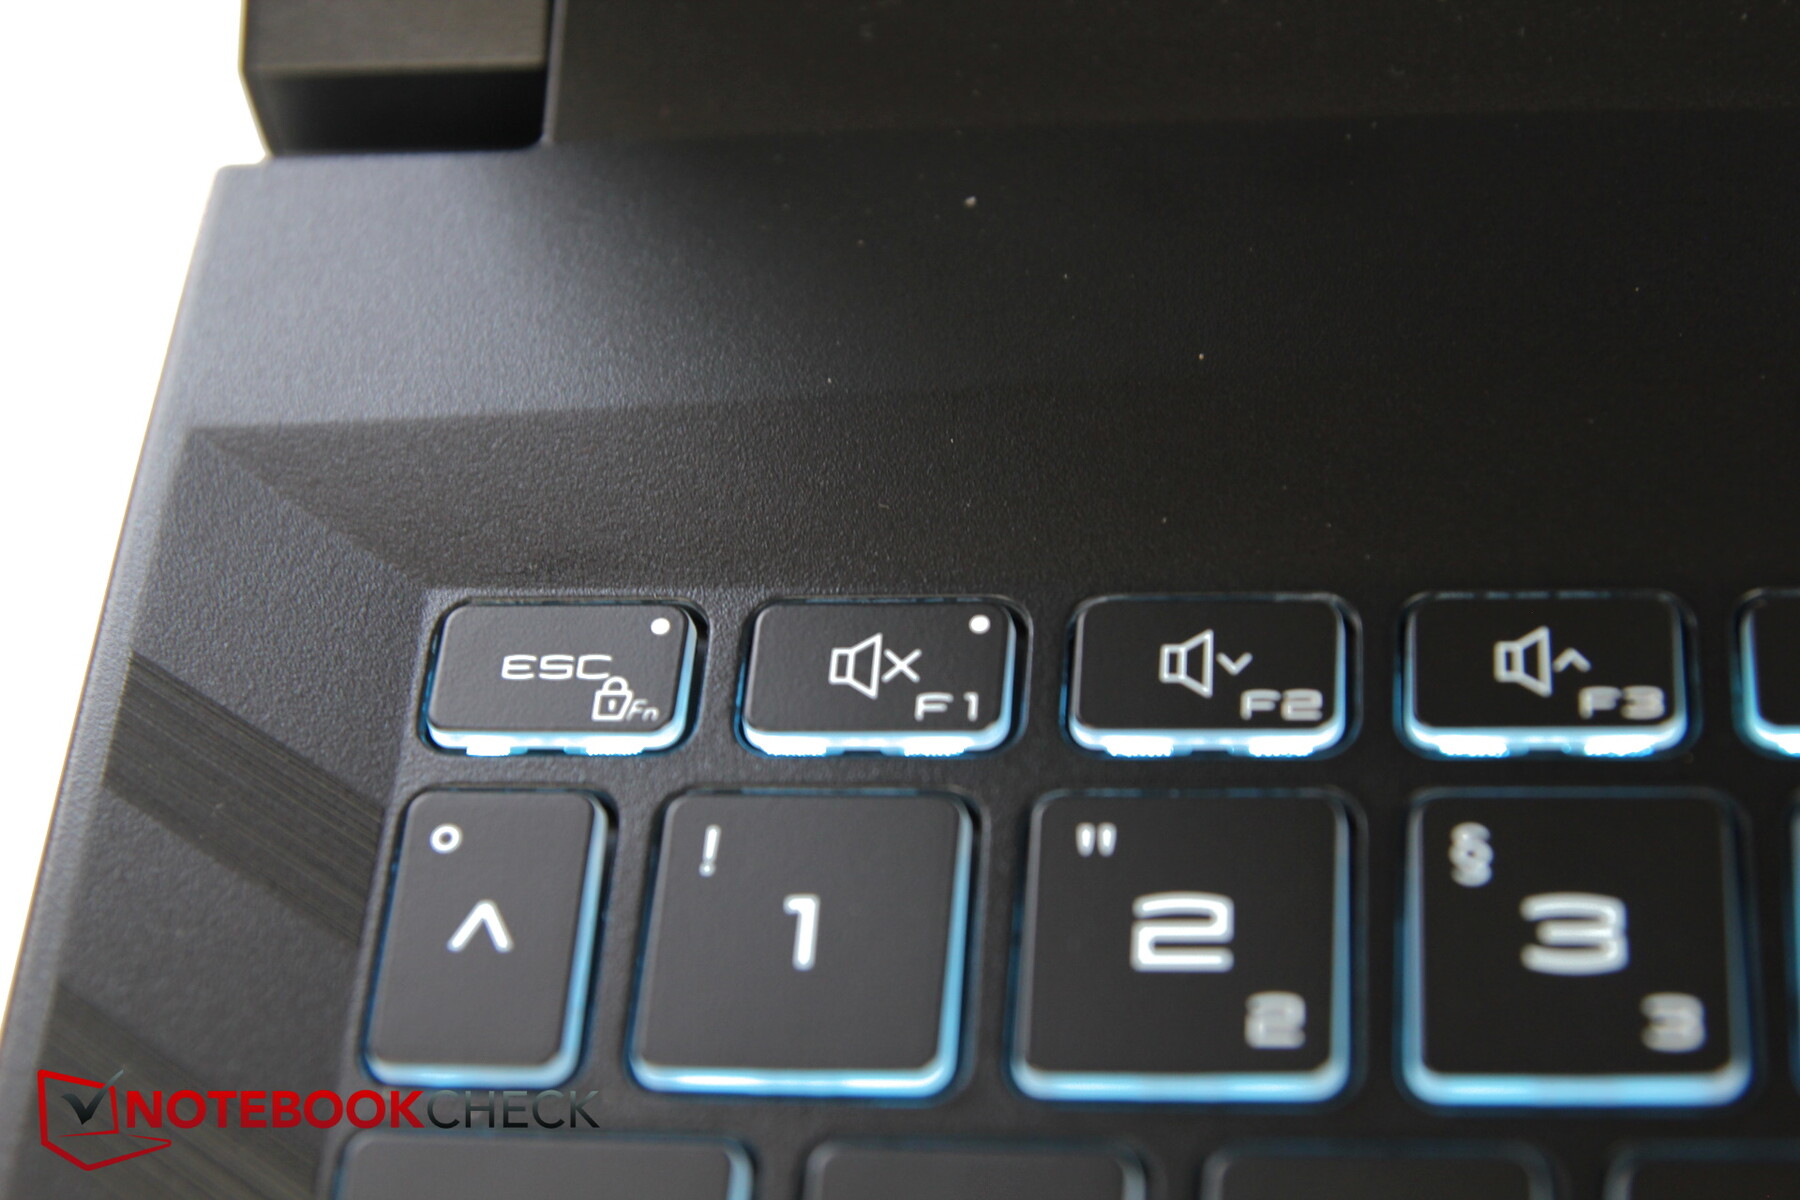
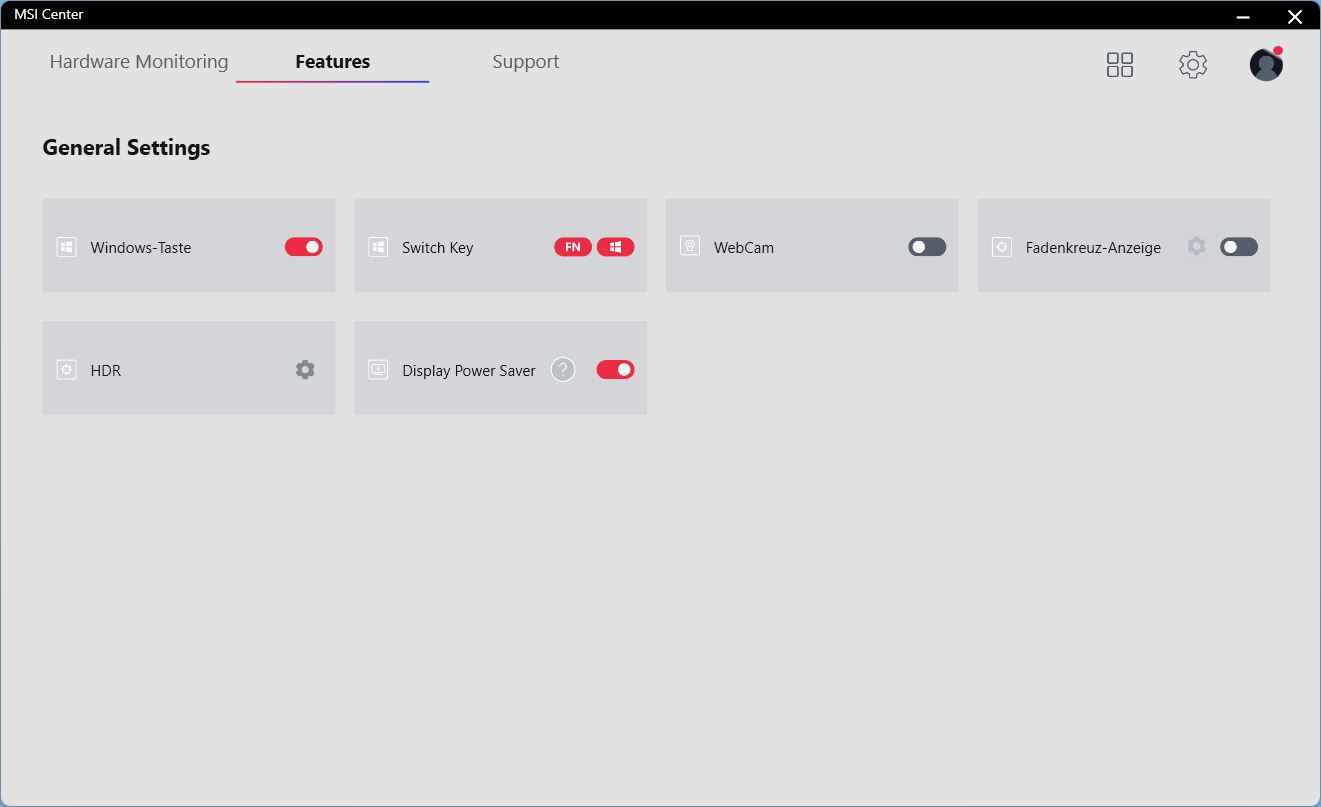
Como es típico en MSI, la tecla Fn está colocada a la derecha en vez de a la izquierda, pero puede cambiar de función con la tecla Windows a la izquierda. Las teclas de flecha también albergan funciones especiales como encender el ventilador, apagar la pantalla o superponer cruces.
El etiquetado de las teclas es fácil de leer y utiliza un estilo de letra futurista que probablemente se supone que atraerá a los jugadores.
Aunque el recorrido es corto, la respuesta es buena y permite escribir con facilidad y rapidez. El teclado no se dobla de forma molesta bajo presión, y el ruido al escribir es moderado.
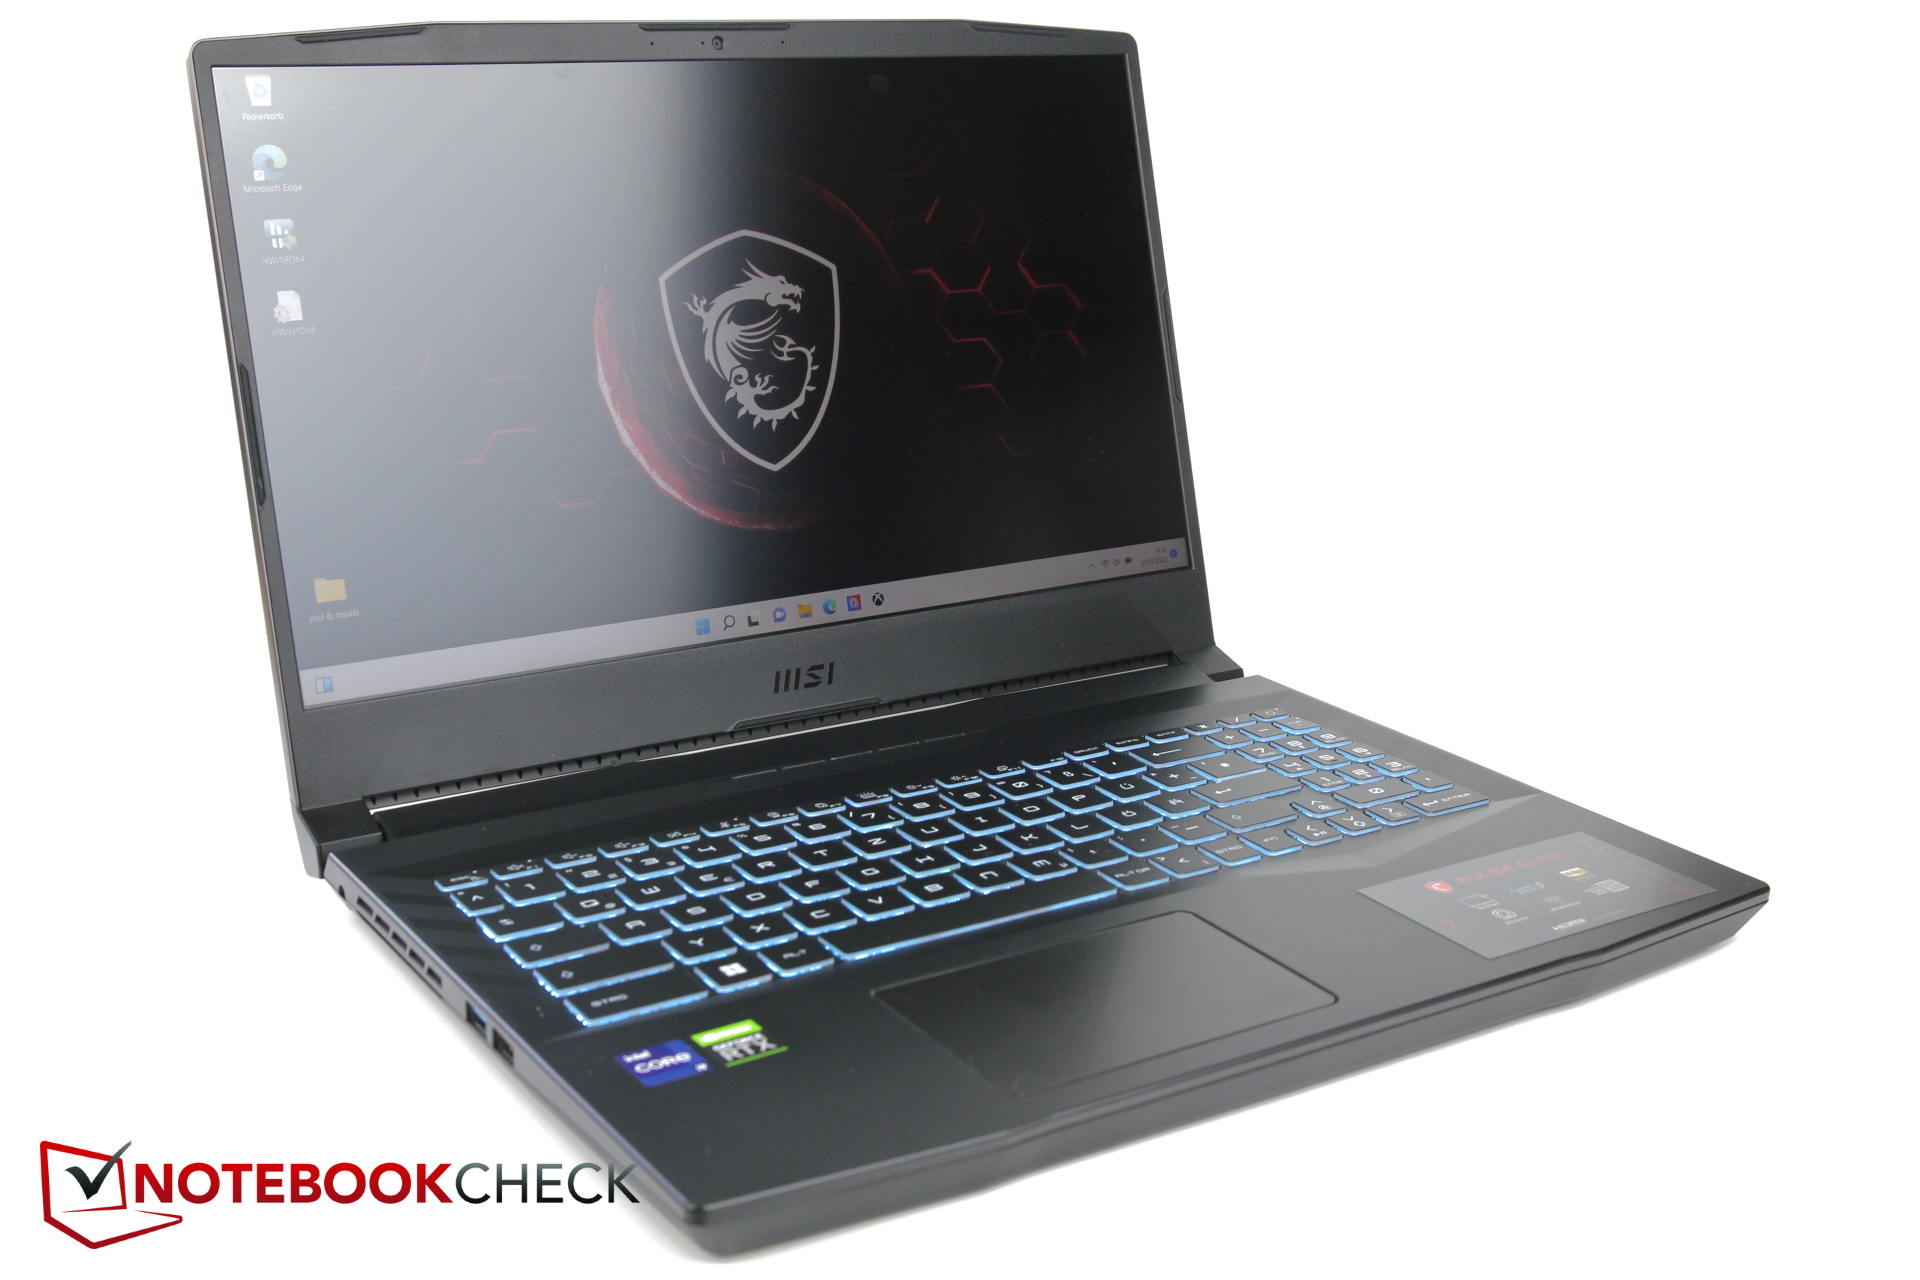
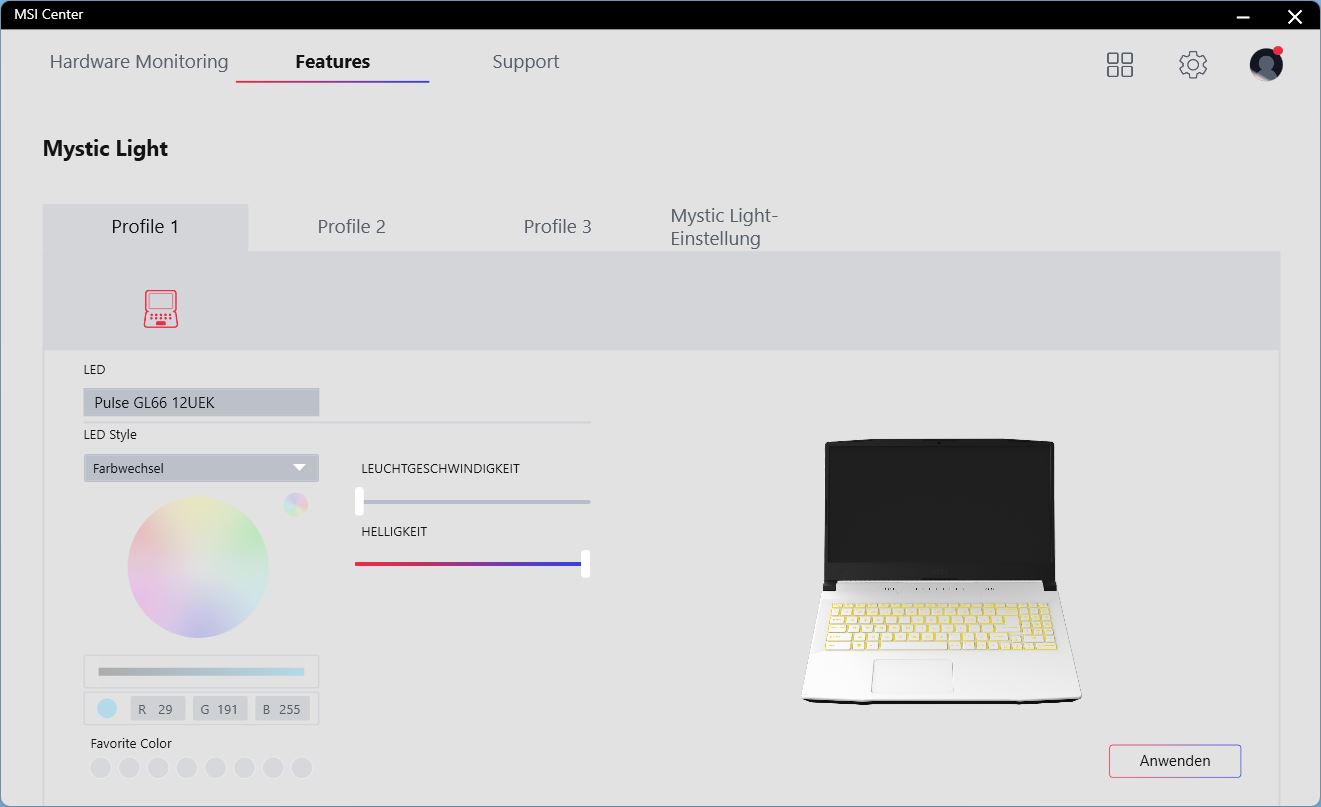
Si bien hay una iluminación del teclado, sólo tiene una zona. Puedes ajustar el color y muchos otros ajustes en el Centro MSI.
Teclado táctil
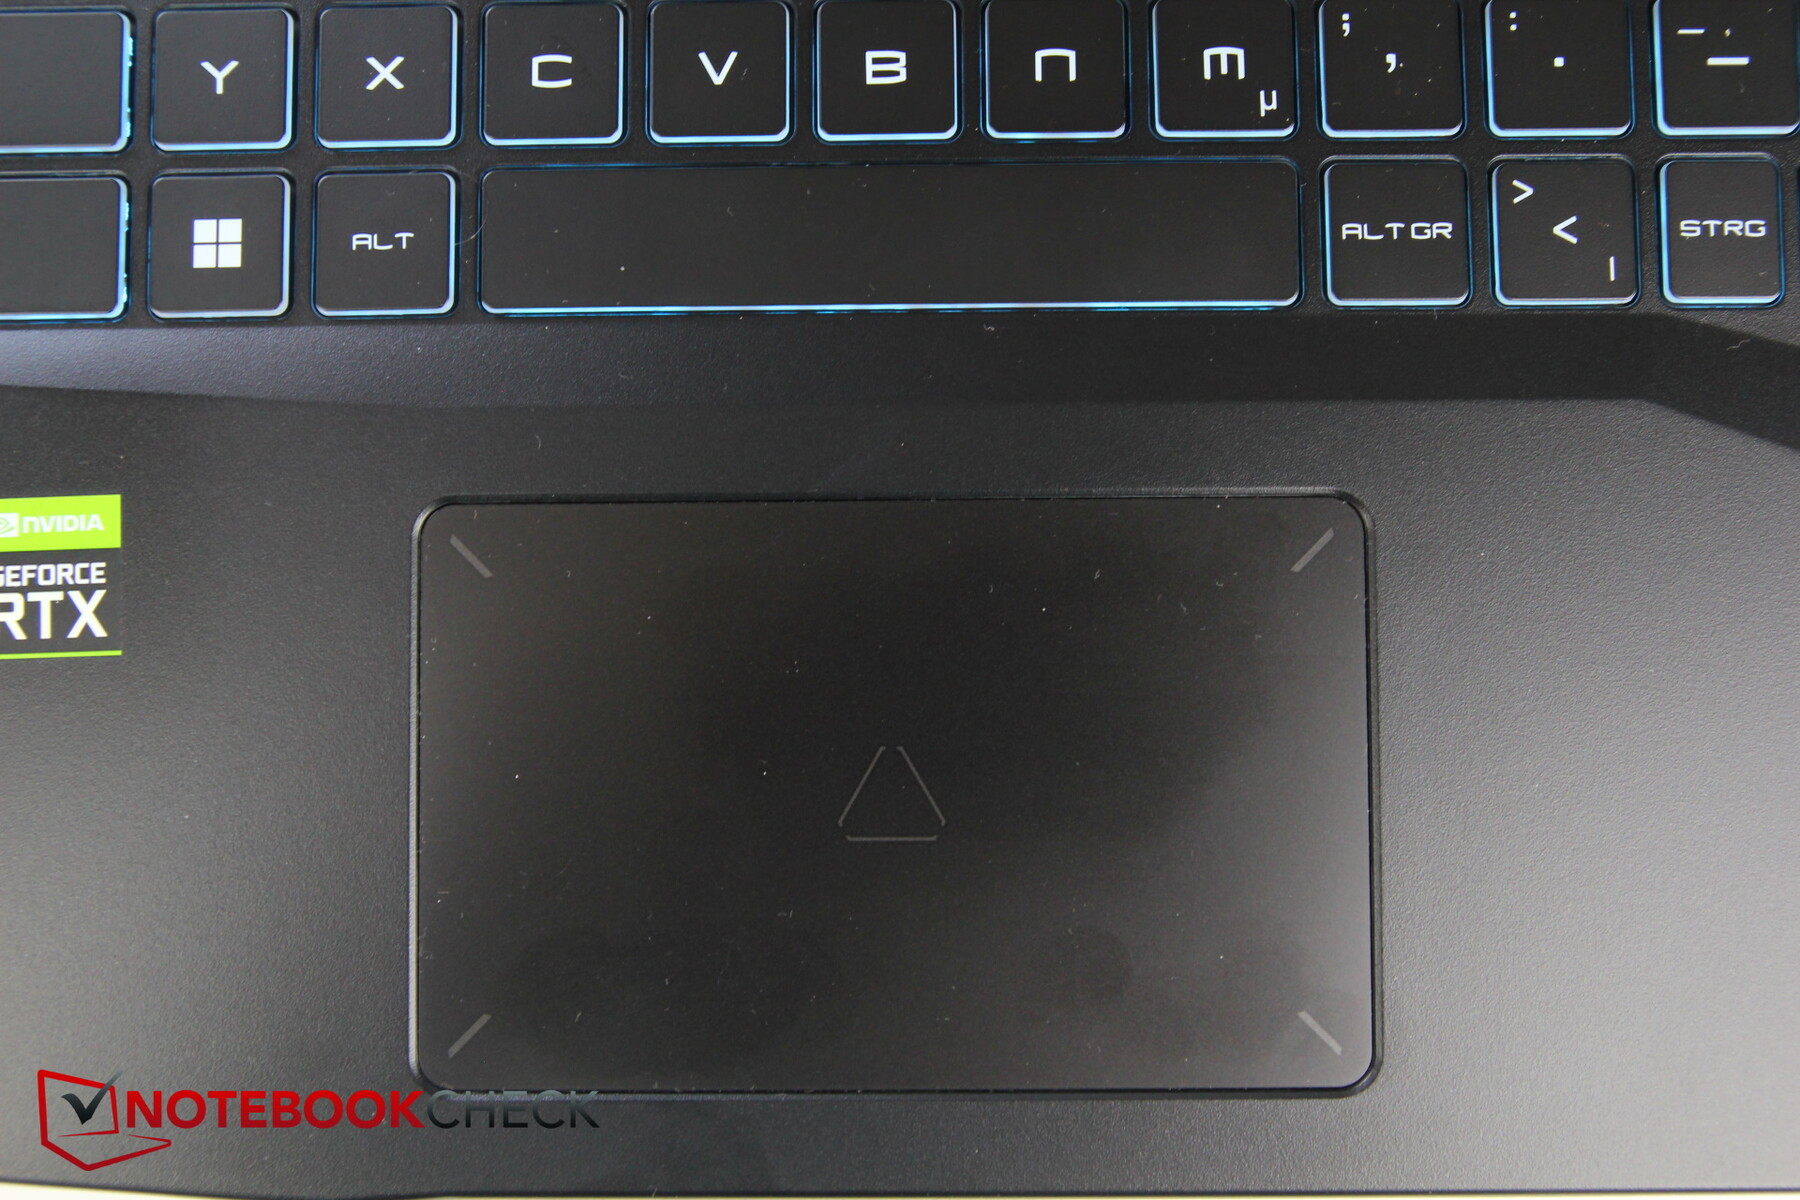
El touchpad no parece muy grande, con unos 10,5 x 6,5 cm (~4,1 x 2,6 in). Aunque la superficie es lisa, los dedos pueden pegarse un poco cuando están ligeramente mojados. Las entradas multitáctiles siguen funcionando muy bien.
Las teclas integradas del ratón tienen un punto de presión claro, muy corto y nítido. Son ligeramente más ruidosas que el teclado, pero no hasta un punto que sea particularmente molesto
Mostrar

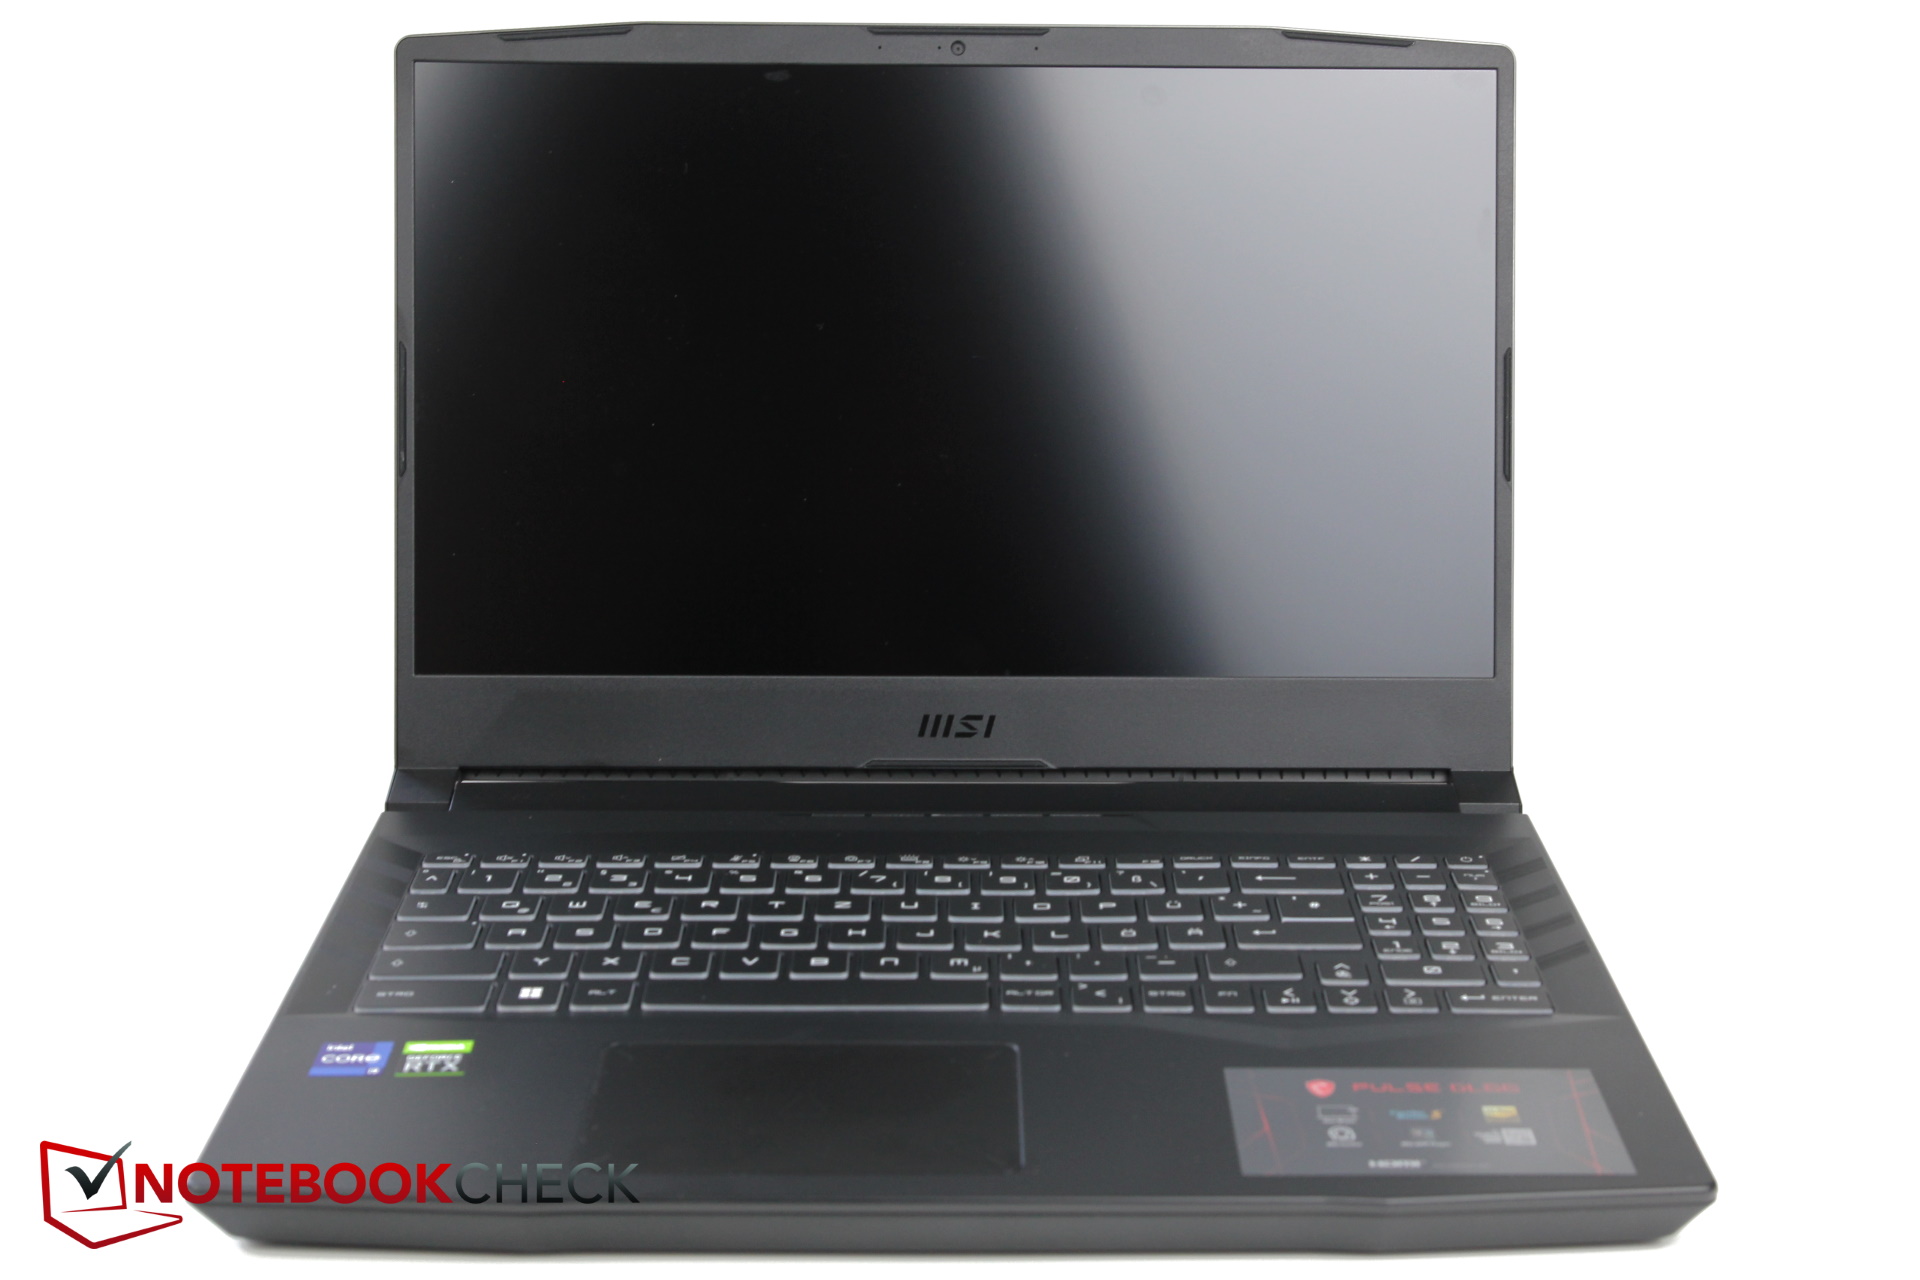
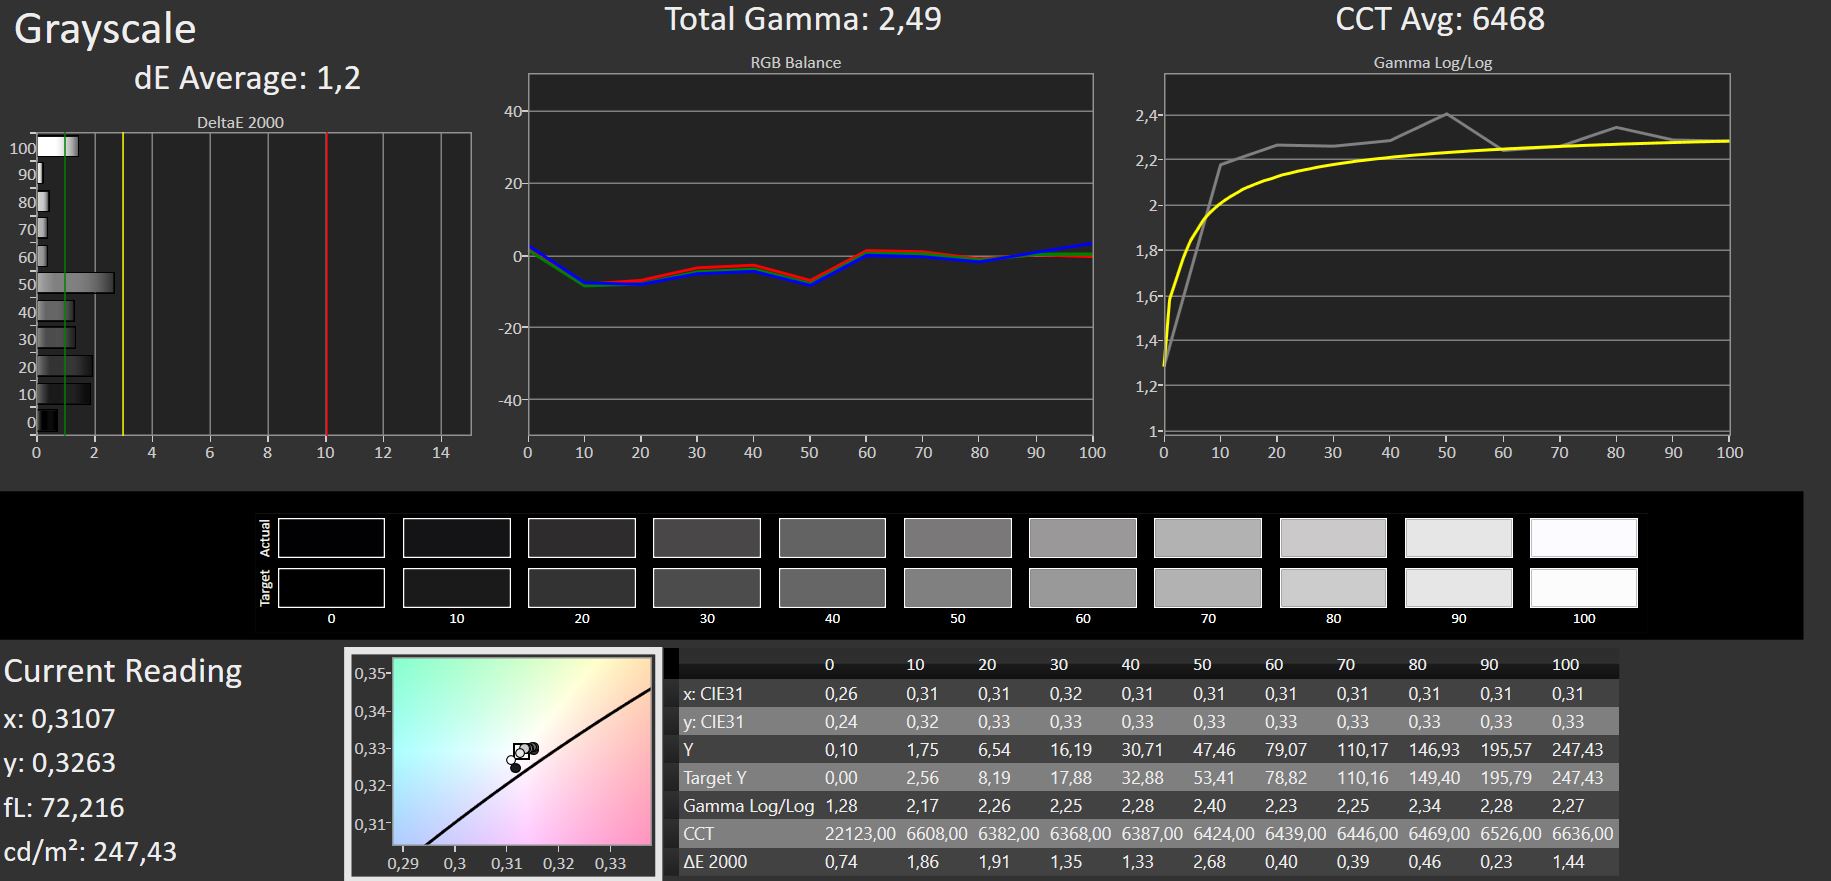
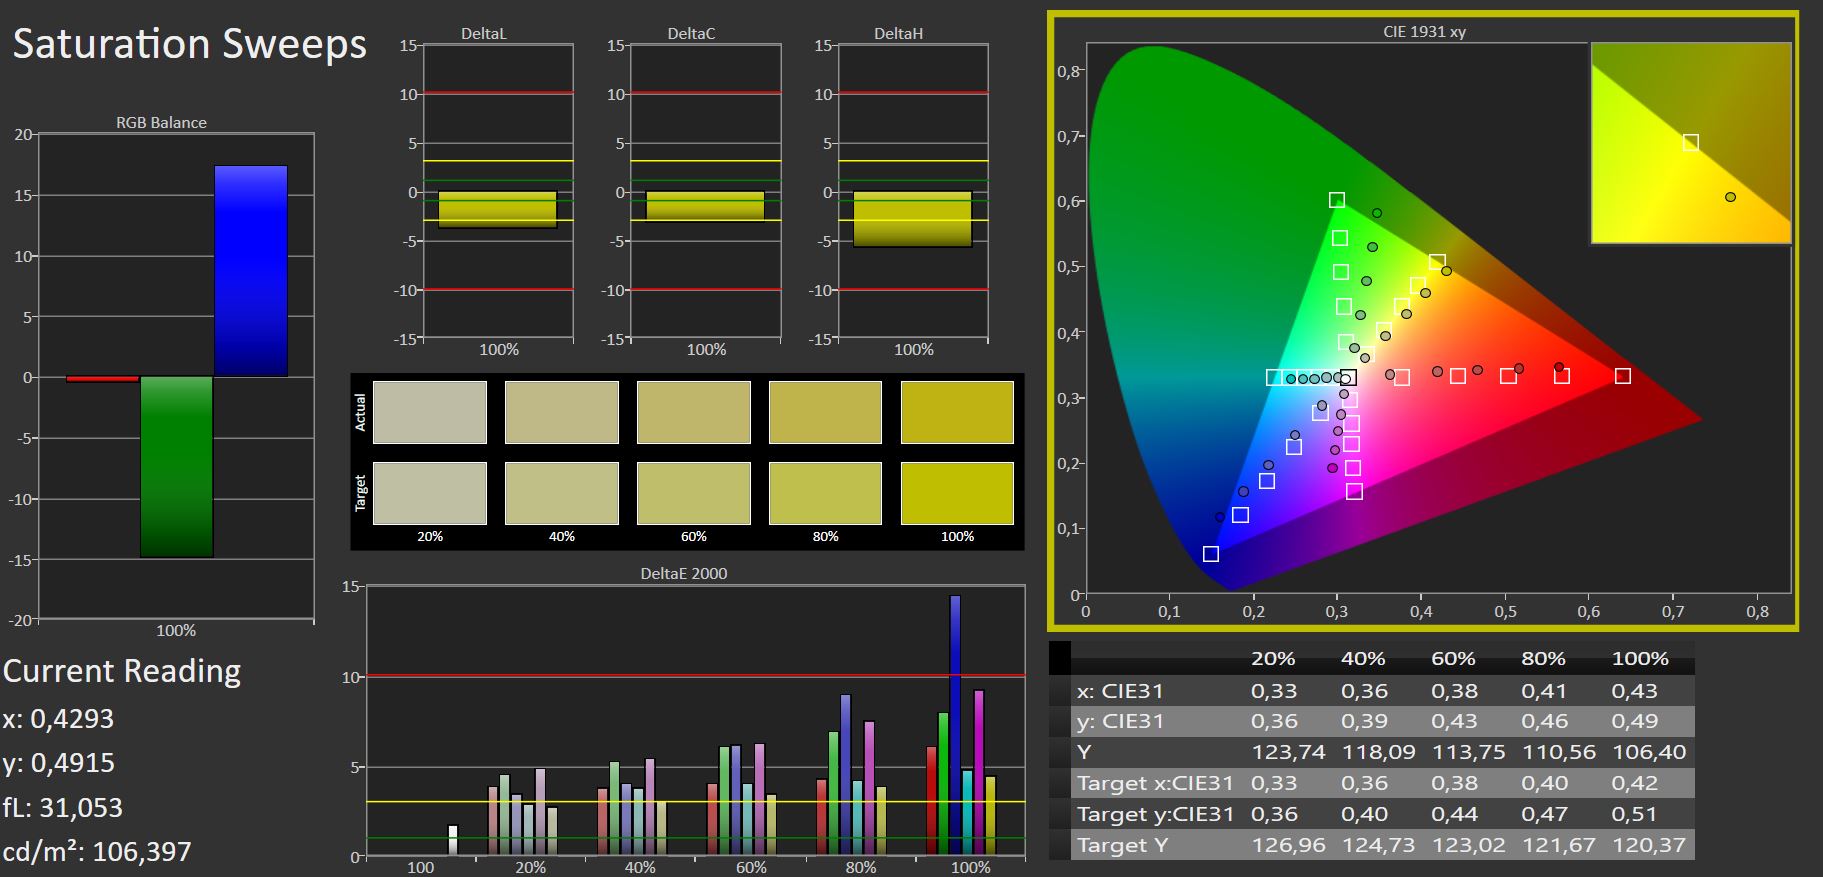
MSI usa un display IPS Full-HD mate con 144 Hz de AU Optronics. MSI ya usó este modelo el año pasado, por ejemplo en el GF65 Thin. Una gran desventaja del panel es particularmente su débil brillo de menos de 250 nits. La distribución del brillo sigue estando dentro de los límites aceptables con un 86%.
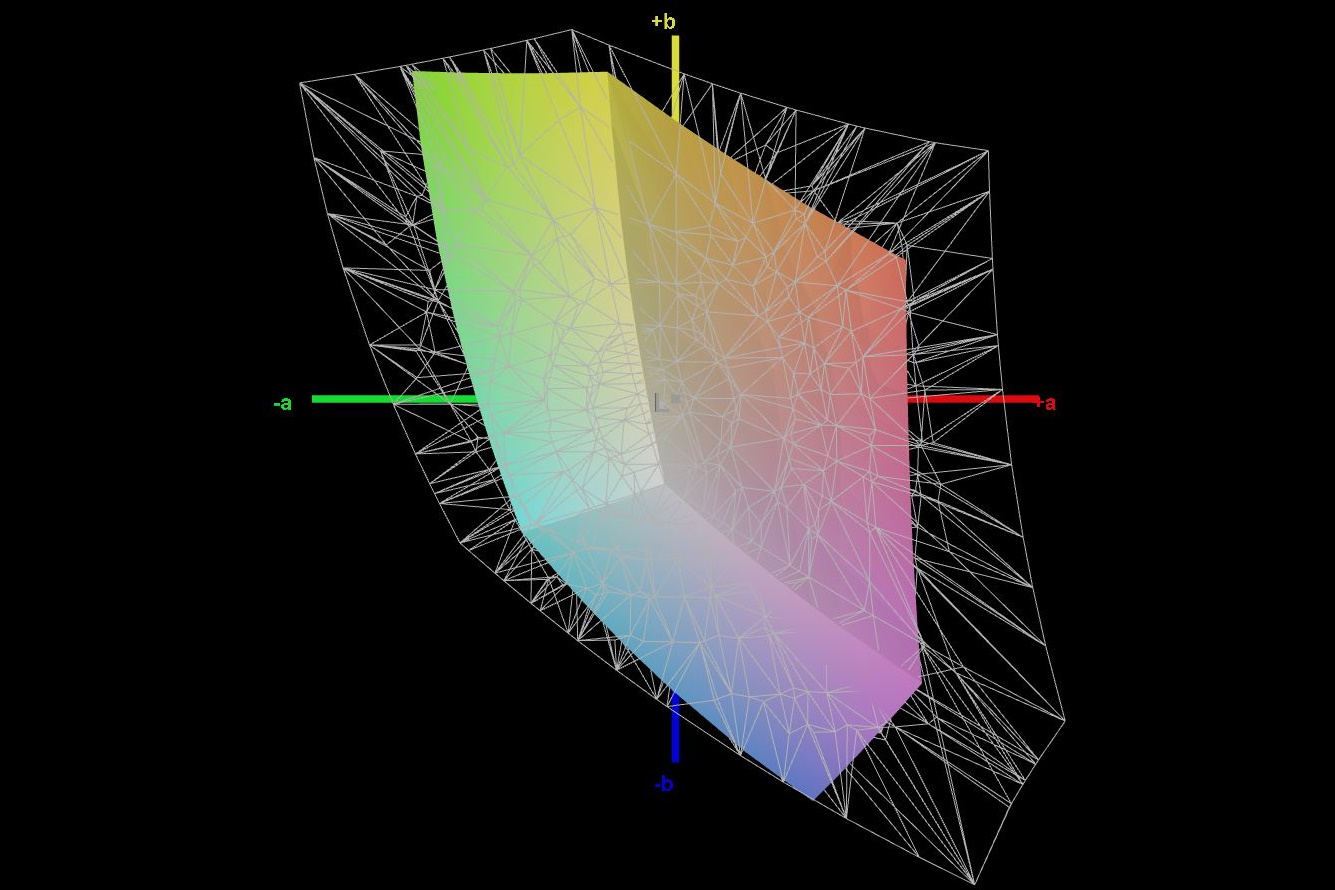
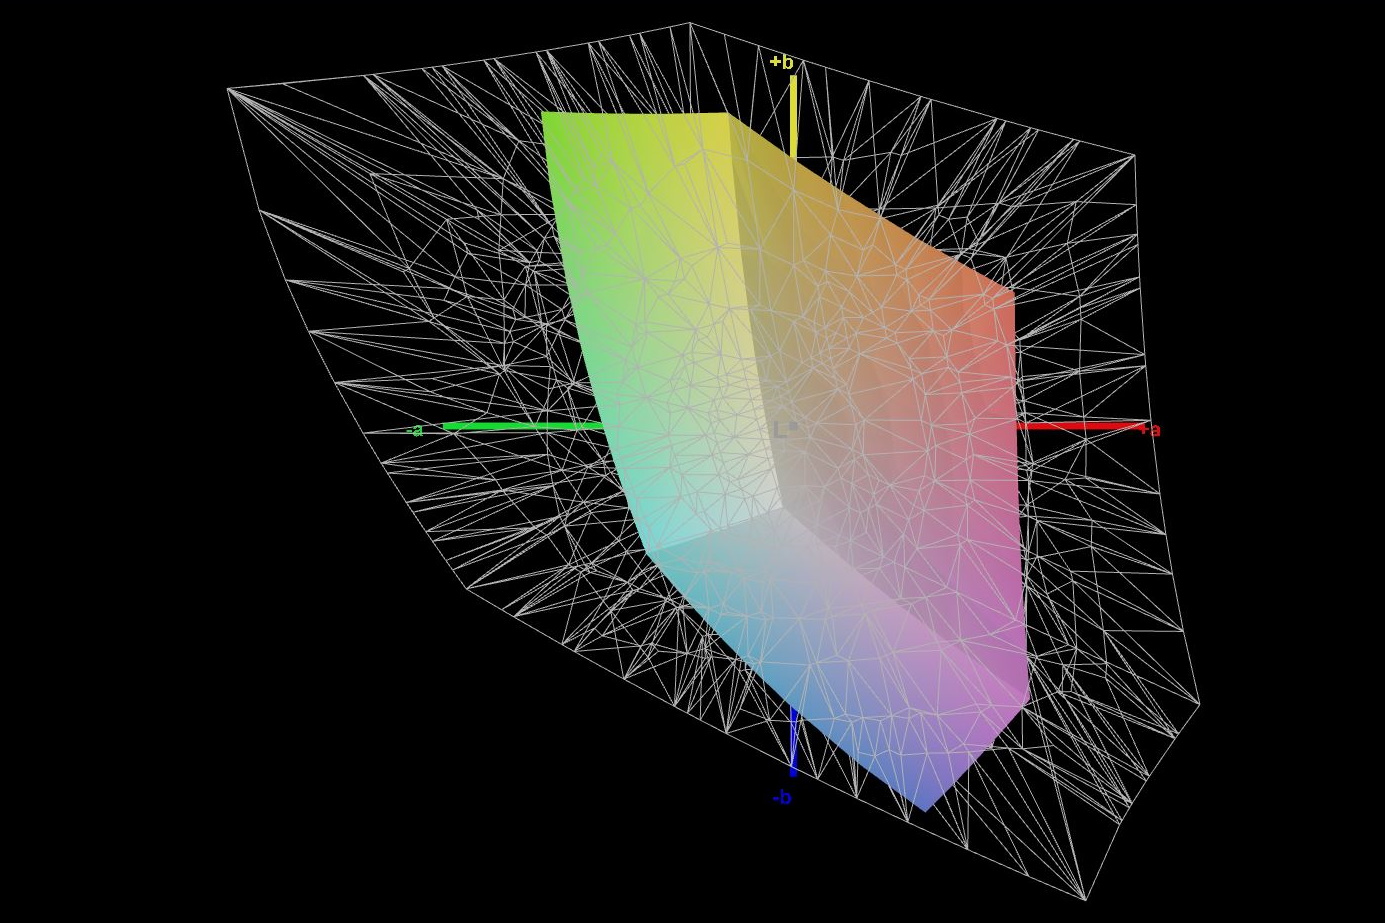
Al menos el valor de negro es bajo y el contraste alto, pero con sólo un 58% de sRGB, la cobertura del espacio de color resulta débil. Los tiempos de respuesta también son bastante débiles para un portátil de juegos
Por desgracia, no parece que haya otras opciones de pantalla. Al menos el Pulse de 17 pulgadas ofrece un panel con 360 Hz, y esperemos que también sea más brillante.
Aunque hay algo de sangrado de pantalla en el borde superior izquierdo, apenas se nota.
| |||||||||||||||||||||||||
iluminación: 86 %
Brillo con batería: 247 cd/m²
Contraste: 1908:1 (Negro: 0.13 cd/m²)
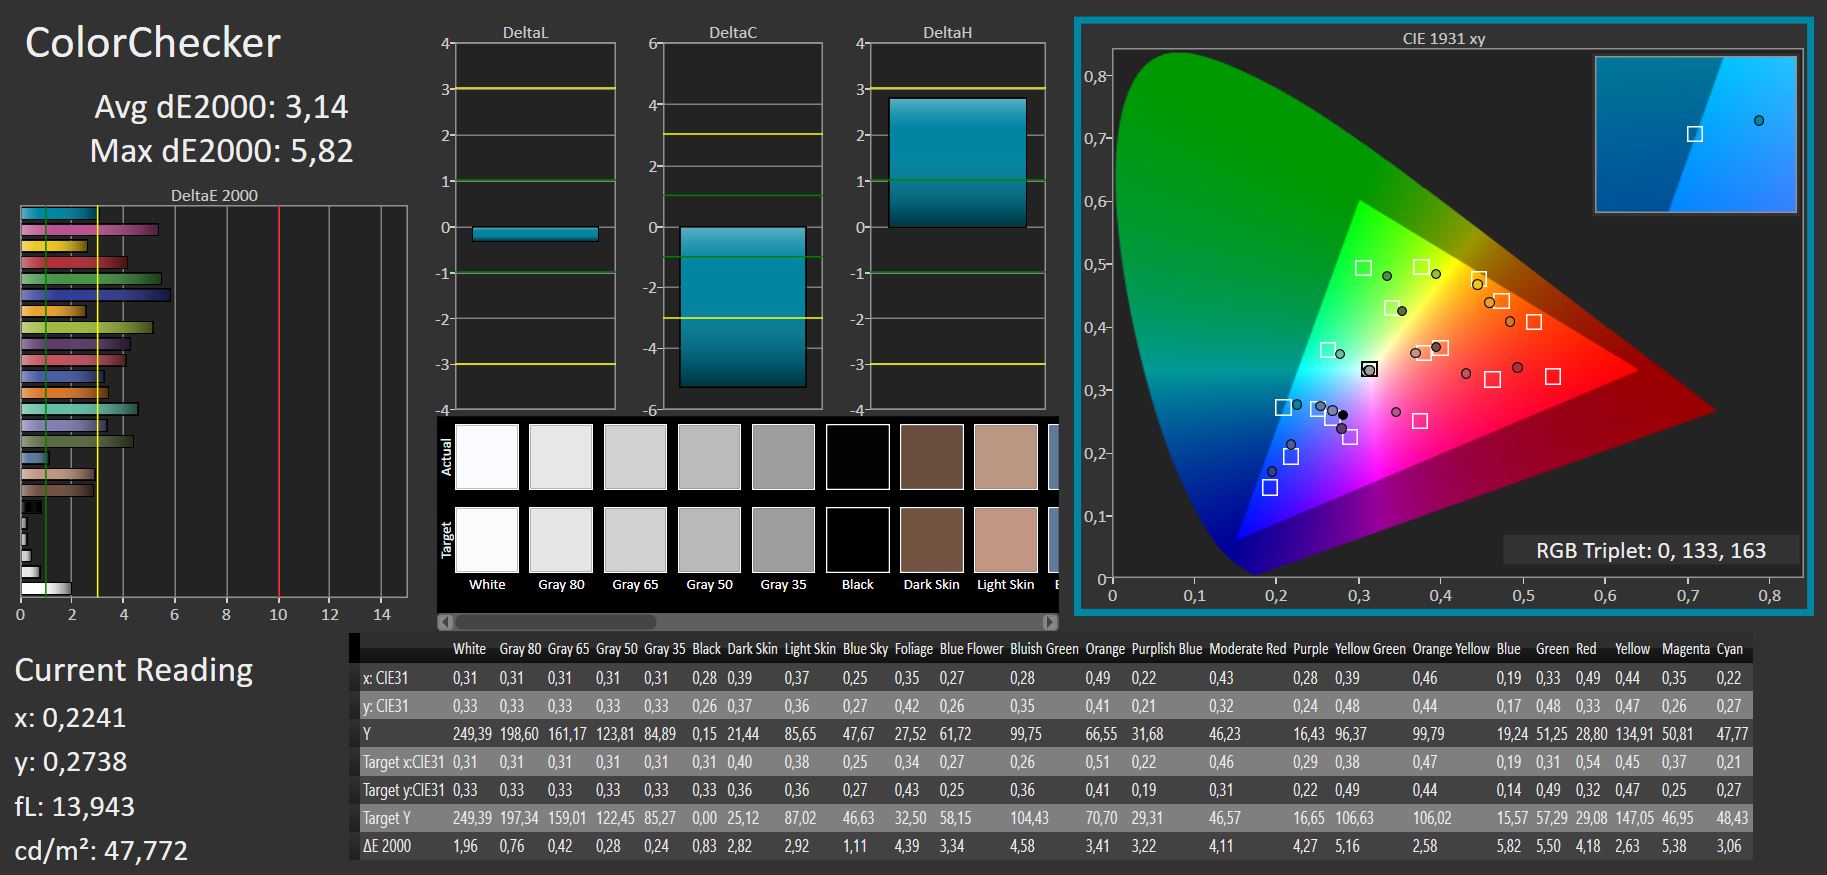
ΔE ColorChecker Calman: 3.14 | ∀{0.5-29.43 Ø4.71}
calibrated: 3.14
ΔE Greyscale Calman: 1.2 | ∀{0.09-98 Ø4.96}
40.3% AdobeRGB 1998 (Argyll 3D)
58.4% sRGB (Argyll 3D)
39% Display P3 (Argyll 3D)
Gamma: 2.49
CCT: 6468 K
| MSI Pulse GL66 12UEK AU Optronics B156HAN08.4 (AUOAF90), IPS, 1920x1080, 15.6" | Asus TUF Gaming F15 FX507ZM TL156VDXP0101, IPS, 1920x1080, 15.6" | Alienware x14 i7 RTX 3060 SHP154D, IPS, 1920x1080, 14" | Schenker XMG Apex 15 NH57E PS LG Philips LGD0625 (LP156WFG-SPB3), IPS, 1920x1080, 15.6" | Lenovo Legion S7 15ACH6 82K80030GE CSOT T3 MNF601EA1-6, IPS, 3840x2160, 15.6" | Alienware m15 R5 Ryzen Edition B156HAN, IPS, 1920x1080, 15.6" | |
|---|---|---|---|---|---|---|
| Display | 69% | 114% | 64% | 110% | ||
| Display P3 Coverage (%) | 39 | 66.4 70% | 99.6 155% | 64.5 65% | 85.2 118% | |
| sRGB Coverage (%) | 58.4 | 97 66% | 100 71% | 95.9 64% | 98.8 69% | |
| AdobeRGB 1998 Coverage (%) | 40.3 | 68.5 70% | 87.6 117% | 65.8 63% | 98.2 144% | |
| Response Times | 70% | 74% | 60% | 31% | 80% | |
| Response Time Grey 50% / Grey 80% * (ms) | 38.8 ? | 5.6 ? 86% | 9.6 ? 75% | 15 61% | 31.6 ? 19% | 4 ? 90% |
| Response Time Black / White * (ms) | 28 ? | 12.8 ? 54% | 7.6 ? 73% | 11.6 59% | 16 ? 43% | 8.4 ? 70% |
| PWM Frequency (Hz) | ||||||
| Screen | -3% | -24% | -40% | 30% | -12% | |
| Brightness middle (cd/m²) | 248 | 353.7 43% | 434 75% | 393 58% | 607 145% | 329 33% |
| Brightness (cd/m²) | 245 | 340 39% | 411 68% | 353 44% | 605 147% | 321 31% |
| Brightness Distribution (%) | 86 | 89 3% | 89 3% | 83 -3% | 93 8% | 92 7% |
| Black Level * (cd/m²) | 0.13 | 0.34 -162% | 0.25 -92% | 0.47 -262% | 0.41 -215% | 0.27 -108% |
| Contrast (:1) | 1908 | 1040 -45% | 1736 -9% | 836 -56% | 1480 -22% | 1219 -36% |
| Colorchecker dE 2000 * | 3.14 | 1.74 45% | 3 4% | 2.84 10% | 0.84 73% | 2.78 11% |
| Colorchecker dE 2000 max. * | 5.82 | 3.63 38% | 7.1 -22% | 7.15 -23% | 3.02 48% | 4.88 16% |
| Colorchecker dE 2000 calibrated * | 3.14 | 0.5 84% | 0.7 78% | 0.67 79% | 0.69 78% | 1.63 48% |
| Greyscale dE 2000 * | 1.2 | 2.1 -75% | 5.1 -325% | 3.73 -211% | 1.1 8% | 2.5 -108% |
| Gamma | 2.49 88% | 2.3 96% | 2.19 100% | 2.53 87% | 2.131 103% | 2.106 104% |
| CCT | 6468 100% | 6257 104% | 6204 105% | 7312 89% | 6648 98% | 6201 105% |
| Color Space (Percent of AdobeRGB 1998) (%) | 76 | |||||
| Color Space (Percent of sRGB) (%) | 99 | |||||
| Media total (Programa/Opciones) | 45% /
23% | 55% /
19% | 28% /
-4% | 57% /
47% | 34% /
5% |
* ... más pequeño es mejor
Al menos el panel ya está bien calibrado en el estado de entrega. La desviación en la escala de grises es de sólo 1,2. Por lo tanto, apenas se pueden obtener mejoras con una calibración manual.
Tiempos de respuesta del display
| ↔ Tiempo de respuesta de Negro a Blanco | ||
|---|---|---|
| 28 ms ... subida ↗ y bajada ↘ combinada | ↗ 14.6 ms subida | 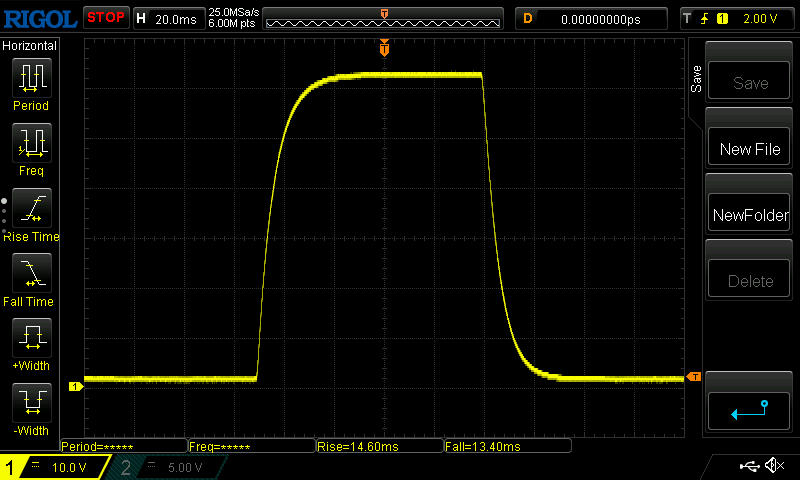 |
| ↘ 13.4 ms bajada | ||
| La pantalla mostró tiempos de respuesta relativamente lentos en nuestros tests pero podría ser demasiado lenta para los jugones. En comparación, todos los dispositivos de prueba van de ##min### (mínimo) a 240 (máximo) ms. » 71 % de todos los dispositivos son mejores. Eso quiere decir que el tiempo de respuesta es peor que la media (19.8 ms) de todos los dispositivos testados. | ||
| ↔ Tiempo de respuesta 50% Gris a 80% Gris | ||
| 38.8 ms ... subida ↗ y bajada ↘ combinada | ↗ 18.2 ms subida | 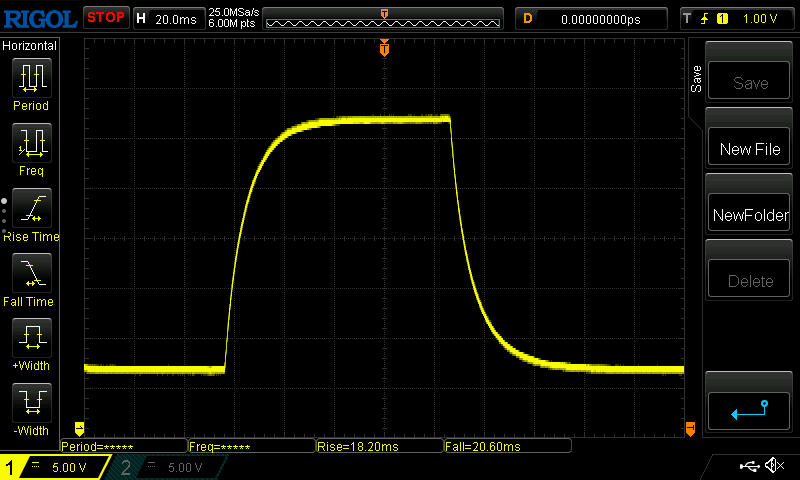 |
| ↘ 20.6 ms bajada | ||
| La pantalla mostró tiempos de respuesta lentos en nuestros tests y podría ser demasiado lenta para los jugones. En comparación, todos los dispositivos de prueba van de ##min### (mínimo) a 636 (máximo) ms. » 58 % de todos los dispositivos son mejores. Eso quiere decir que el tiempo de respuesta es peor que la media (31 ms) de todos los dispositivos testados. | ||
Parpadeo de Pantalla / PWM (Pulse-Width Modulation)
| Parpadeo de Pantalla / PWM no detectado |  | ||
Comparación: 52 % de todos los dispositivos testados no usaron PWM para atenuar el display. Si se usó, medimos una media de 7757 (mínimo: 5 - máxmo: 343500) Hz. | |||
En el exterior, sobre todo la baja luminosidad dificultará las cosas, por lo que es obligatorio buscar entornos menos luminosos.
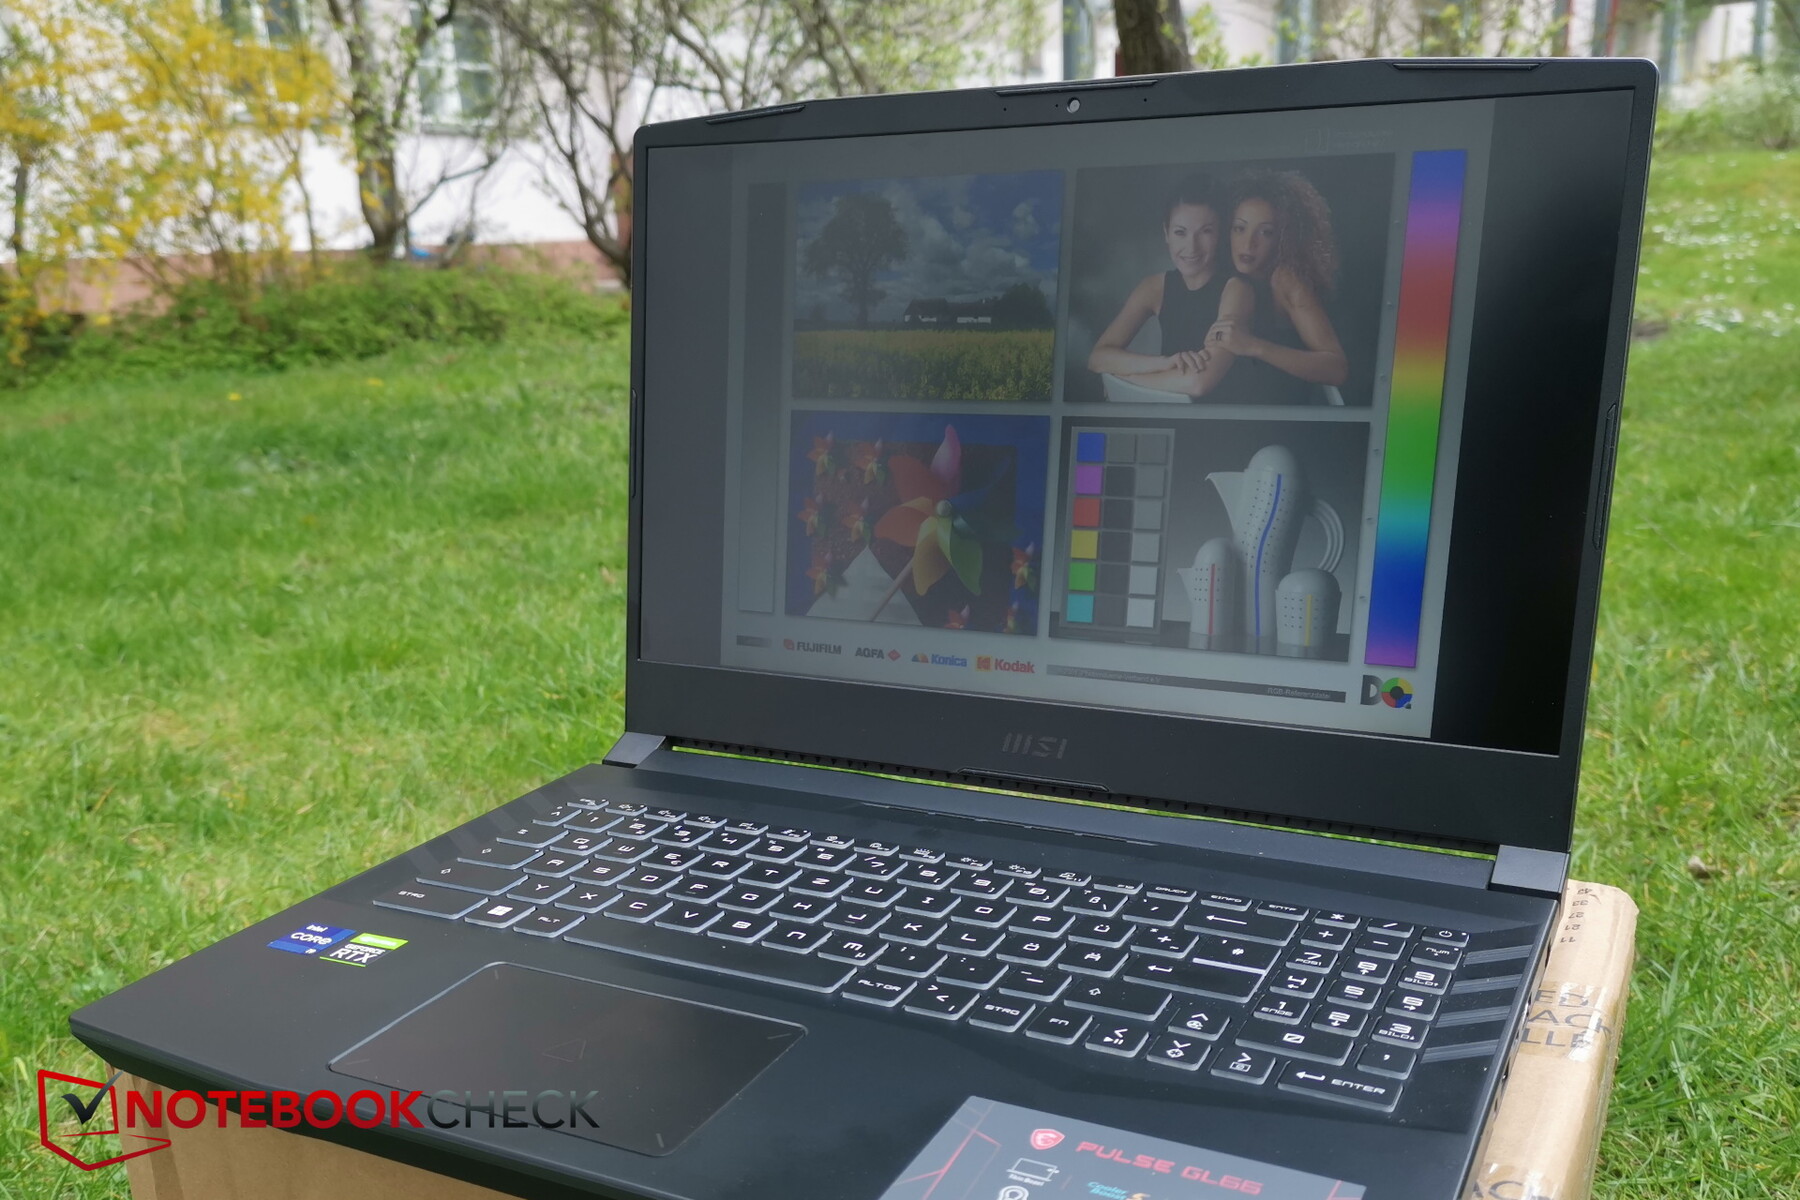
Aunque las pantallas IPS suelen tener ángulos de visión bastante estables, se puede notar una reducción significativa del brillo cuando se mira nuestra unidad de prueba desde ángulos de visión extremos.

Rendimiento
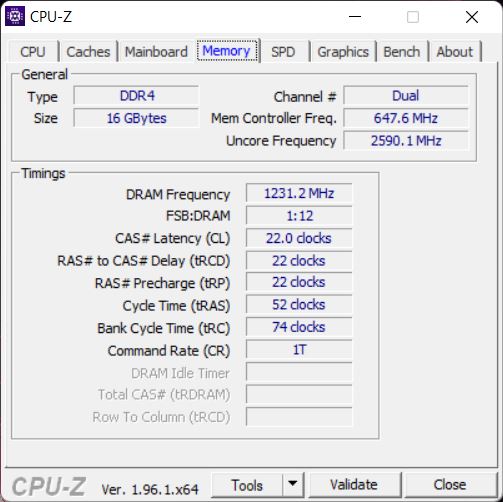
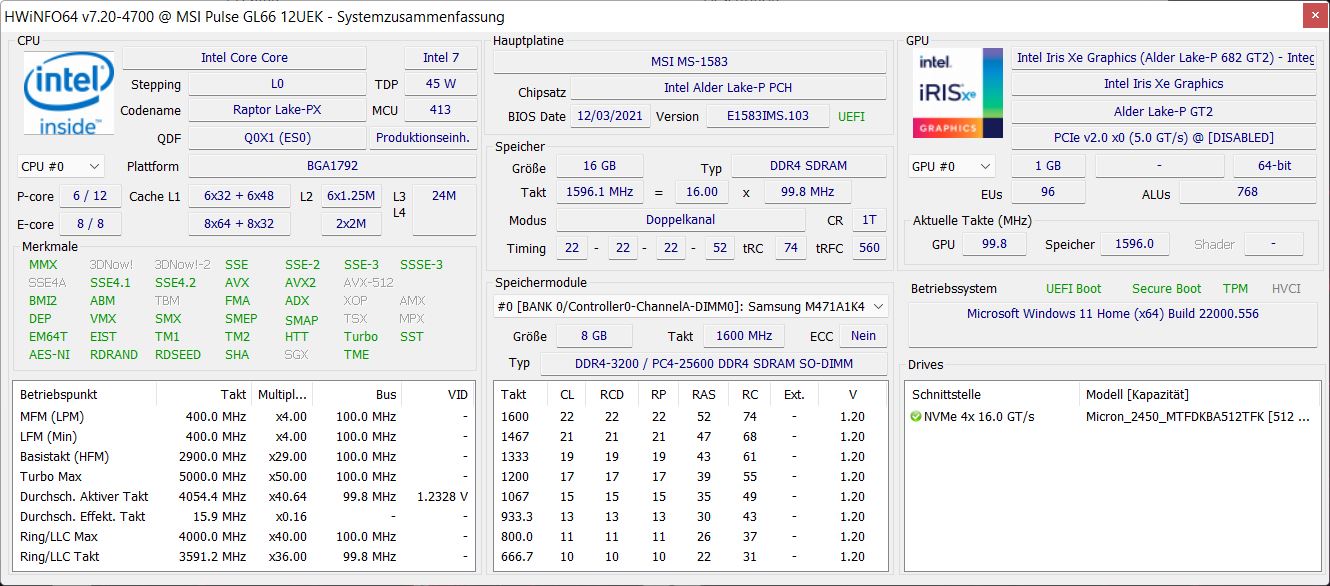
Con su combinación de unIntel Core i9-12900Hy RTX 3060el Pulse está claramente dirigido a los jugadores. Además, hay 16 GB de RAM, y MSI sigue usando DDR4-RAM. Aunque cuesta unos 1900 euros, el dispositivo sigue perteneciendo al segmento de gama media baja
Condiciones de la prueba
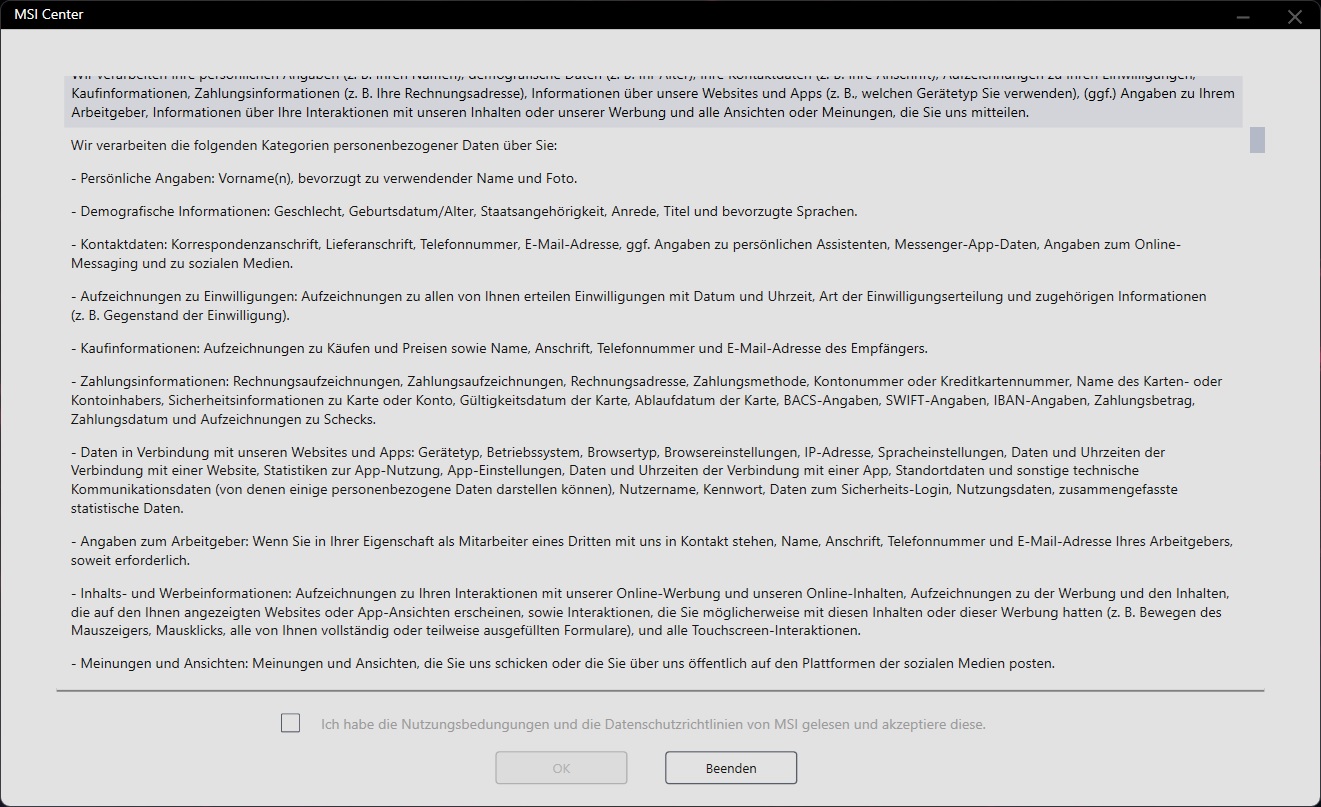
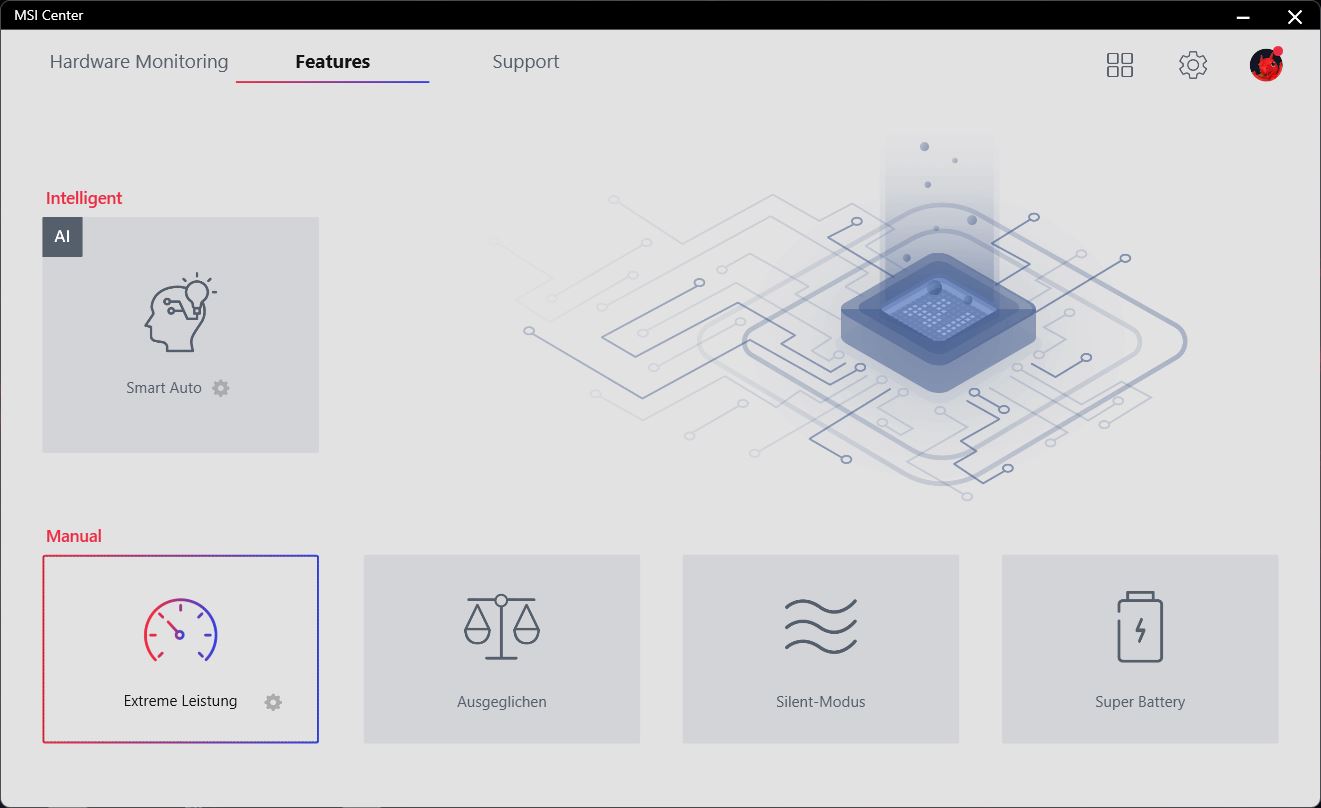
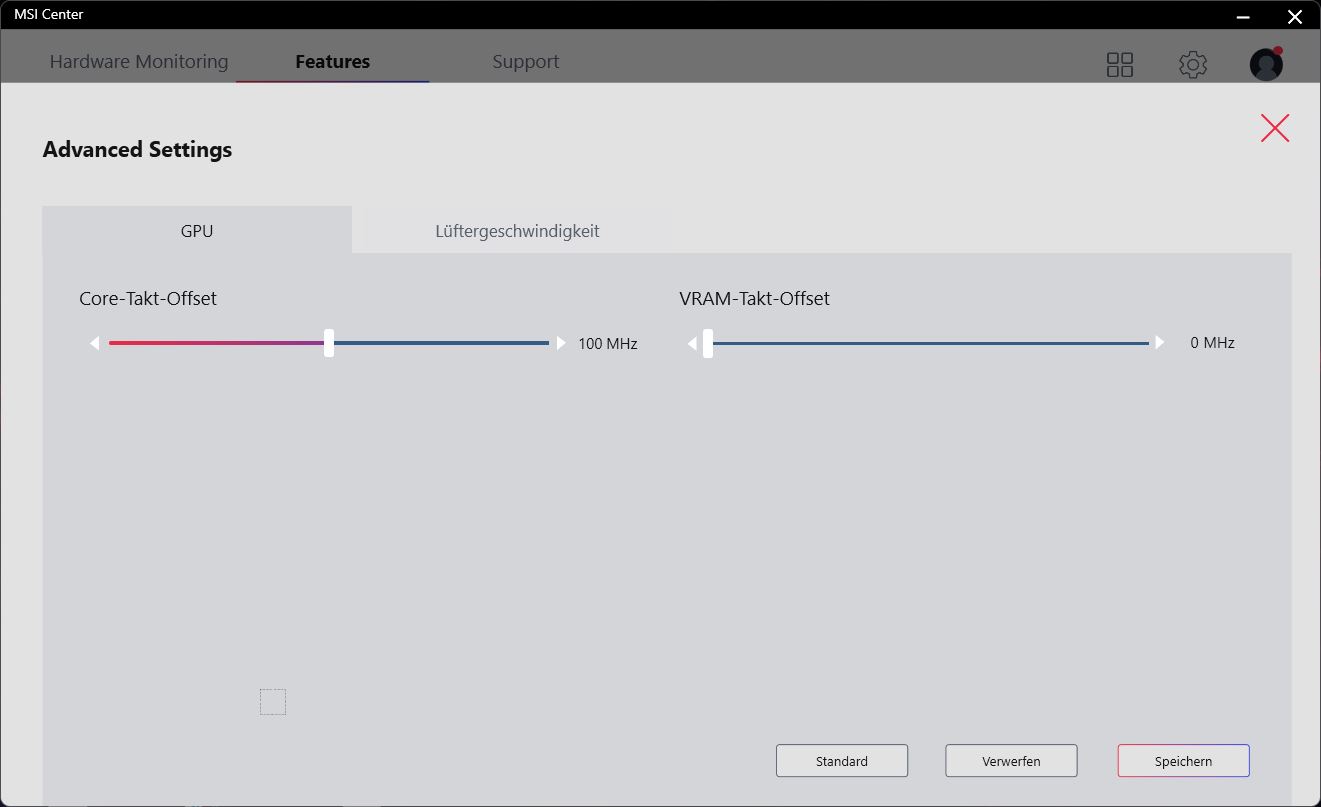
Para obtener los mejores resultados del benchmark, seleccionamos el modo "Rendimiento extremo" en el software de MSI. En la configuración avanzada, utilizamos el estándar.
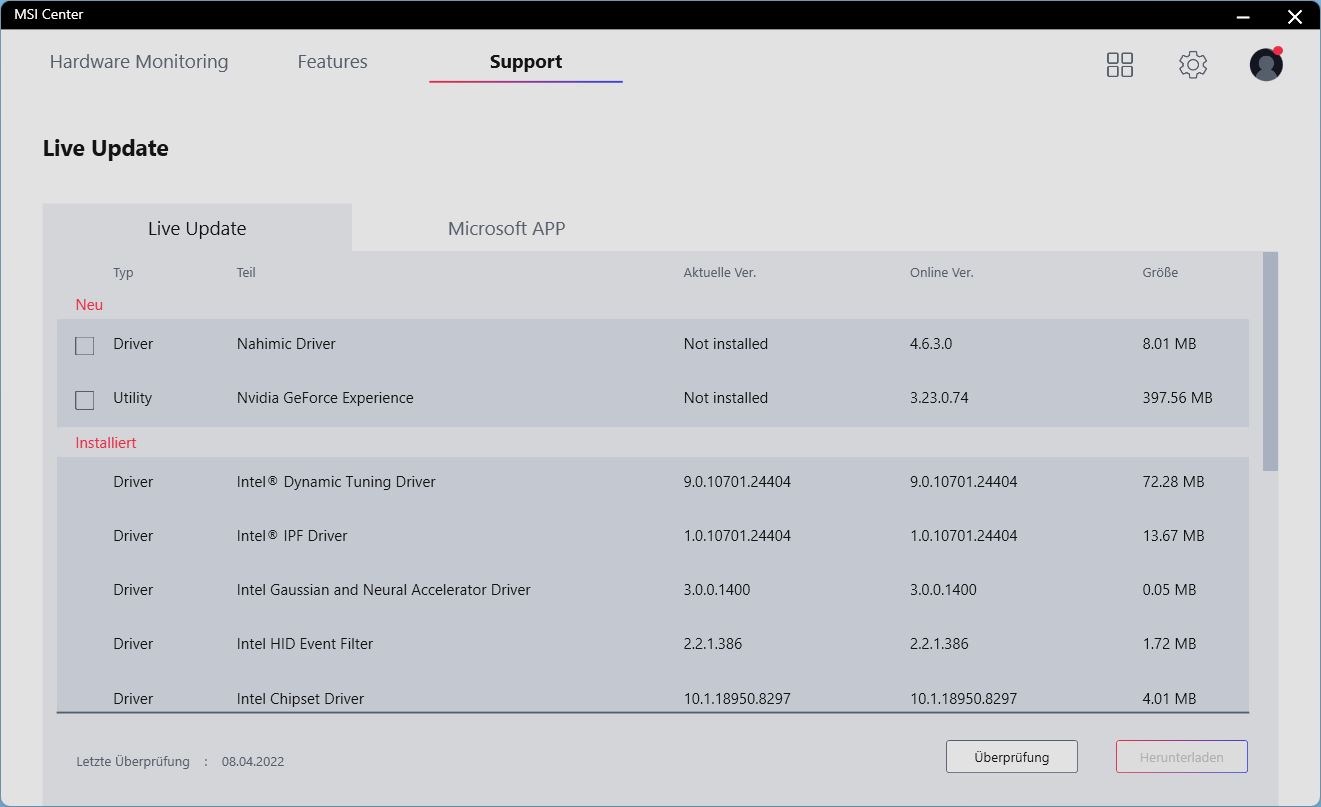
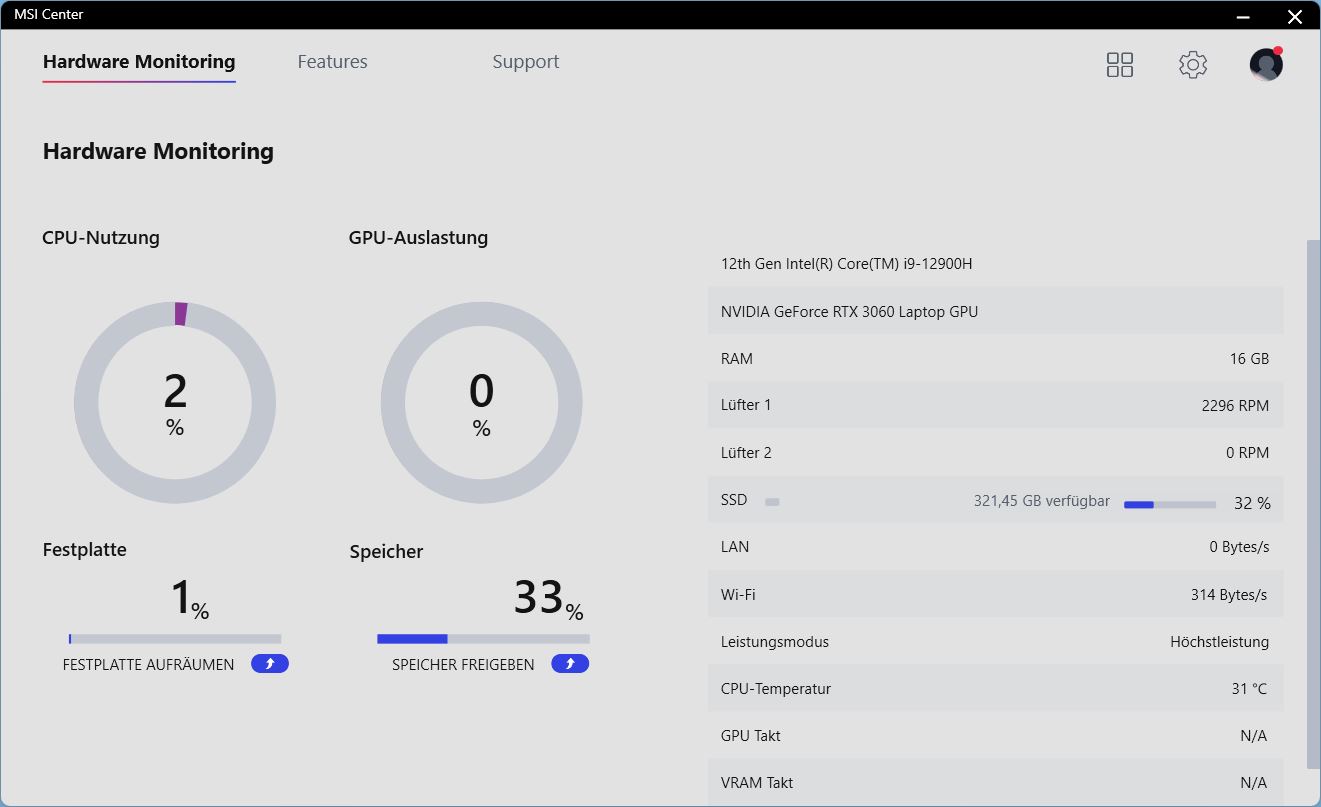
Los usuarios deberían familiarizarse con el Centro MSI, ya que además de configurar los perfiles de los ventiladores, también puedes comprobar las actualizaciones del sistema, configurar la iluminación del teclado, y ajustar la configuración general y muchas más cosas aquí. Por supuesto, el fabricante también recoge algunos datos de los usuarios aquí.
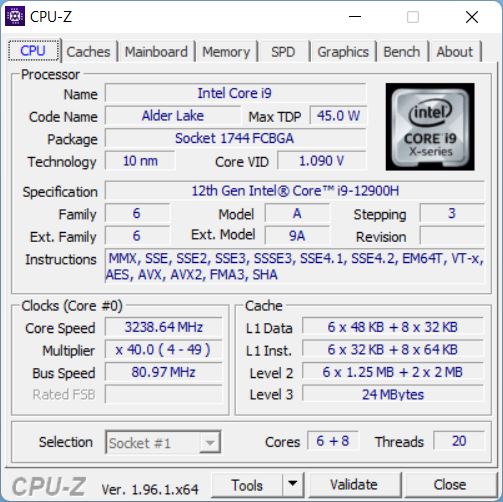
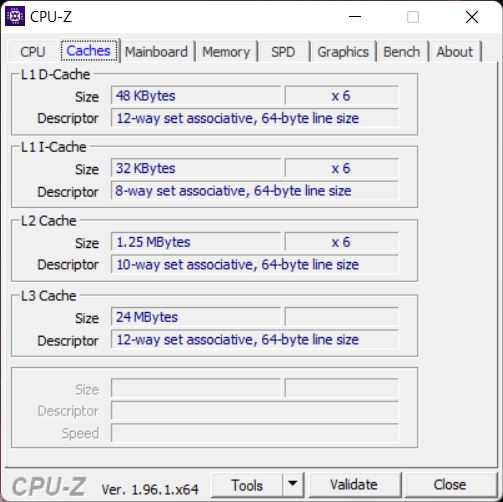
Procesador
ElCore i9-12900Hes uno de los modelos superiores de la actual serie Alder Lake de Intel, por lo que debería cumplir con todas las exigencias de los jugadores. La CPU combina 6 núcleos de rendimiento y 8 de eficiencia y es capaz de funcionar con hasta 20 hilos simultáneamente. La velocidad de reloj Turbo alcanza los 5 GHz
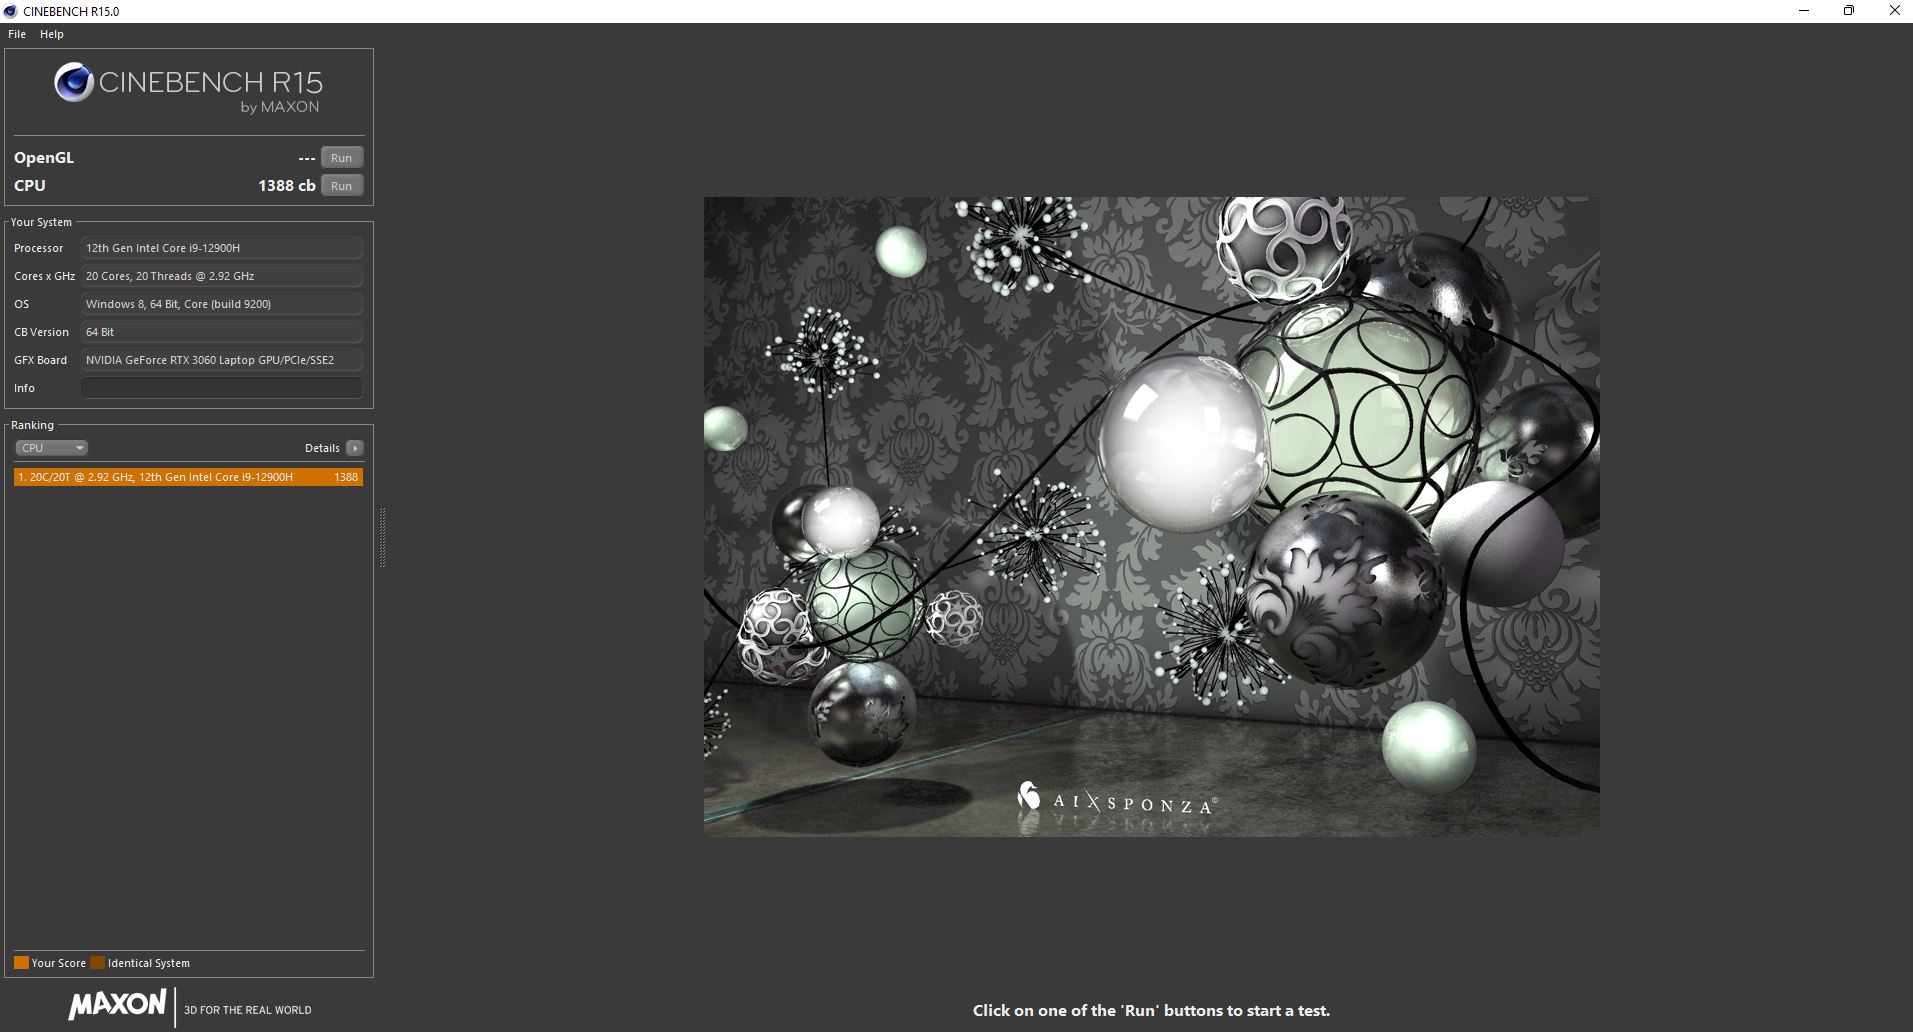
El rendimiento en el bucle de Cinebench es bueno, y la CPU es capaz de vencer a la generación anterior con sus procesadores AMD sin problemas. Sin embargo, el i9 del Pulse no es significativamente más rápido que el i7-12700H en algunos de los portátiles de la competencia. En particular, el Asus TUF F15rinde al menos a la altura de los ojos y en algunas partes incluso es ligeramente más rápido. MSI podría haberse ahorrado a sí misma y a sus clientes la prima adicional del significativamente más caro i9-12900H. Por otro lado, el delgado Alienware x14con el i7-12700H es entre un 6 y un 7 por ciento más lento.
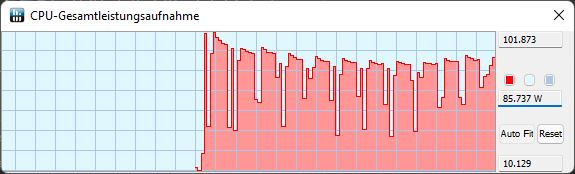
Al principio de la primera ejecución, el TDP se sitúa en torno a los 100 vatios, antes de que empiece a descender y finalmente se estabilice en 85 vatios. Sin embargo, rara vez baja a los 45 vatios nominales.
En funcionamiento de batería, el modo de Rendimiento Extremo ya no está disponible y cambia al modo Equilibrado. En Cinebench, el rendimiento cae un 45% y sólo alcanza 1388 puntos
Cinebench R15 Multi Constant Load Test
Cinebench R23: Multi Core | Single Core
Cinebench R20: CPU (Multi Core) | CPU (Single Core)
Cinebench R15: CPU Multi 64Bit | CPU Single 64Bit
Blender: v2.79 BMW27 CPU
7-Zip 18.03: 7z b 4 | 7z b 4 -mmt1
Geekbench 5.5: Multi-Core | Single-Core
HWBOT x265 Benchmark v2.2: 4k Preset
LibreOffice : 20 Documents To PDF
R Benchmark 2.5: Overall mean
| CPU Performance rating | |
| Media de la clase Gaming | |
| MSI Pulse GL66 12UEK | |
| Asus TUF Gaming F15 FX507ZM | |
| Alienware x14 i7 RTX 3060 | |
| Medio Intel Core i9-12900H | |
| Schenker XMG Apex 15 NH57E PS | |
| Lenovo Legion S7 15ACH6 82K80030GE | |
| Alienware m15 R5 Ryzen Edition | |
| Cinebench R23 / Multi Core | |
| Media de la clase Gaming (10488 - 42661, n=107, últimos 2 años) | |
| Asus TUF Gaming F15 FX507ZM | |
| MSI Pulse GL66 12UEK | |
| Alienware x14 i7 RTX 3060 | |
| Medio Intel Core i9-12900H (7359 - 19648, n=28) | |
| Lenovo Legion S7 15ACH6 82K80030GE | |
| Schenker XMG Apex 15 NH57E PS | |
| Alienware m15 R5 Ryzen Edition | |
| Cinebench R23 / Single Core | |
| Media de la clase Gaming (1166 - 2415, n=107, últimos 2 años) | |
| MSI Pulse GL66 12UEK | |
| Medio Intel Core i9-12900H (1634 - 1930, n=28) | |
| Asus TUF Gaming F15 FX507ZM | |
| Alienware x14 i7 RTX 3060 | |
| Lenovo Legion S7 15ACH6 82K80030GE | |
| Alienware m15 R5 Ryzen Edition | |
| Schenker XMG Apex 15 NH57E PS | |
| Cinebench R20 / CPU (Multi Core) | |
| Media de la clase Gaming (4029 - 16433, n=106, últimos 2 años) | |
| Asus TUF Gaming F15 FX507ZM | |
| MSI Pulse GL66 12UEK | |
| Alienware x14 i7 RTX 3060 | |
| Medio Intel Core i9-12900H (2681 - 7471, n=28) | |
| Lenovo Legion S7 15ACH6 82K80030GE | |
| Schenker XMG Apex 15 NH57E PS | |
| Alienware m15 R5 Ryzen Edition | |
| Cinebench R20 / CPU (Single Core) | |
| Media de la clase Gaming (442 - 913, n=106, últimos 2 años) | |
| MSI Pulse GL66 12UEK | |
| Medio Intel Core i9-12900H (624 - 738, n=28) | |
| Alienware x14 i7 RTX 3060 | |
| Asus TUF Gaming F15 FX507ZM | |
| Lenovo Legion S7 15ACH6 82K80030GE | |
| Alienware m15 R5 Ryzen Edition | |
| Schenker XMG Apex 15 NH57E PS | |
| Cinebench R15 / CPU Multi 64Bit | |
| Media de la clase Gaming (1578 - 6330, n=105, últimos 2 años) | |
| Asus TUF Gaming F15 FX507ZM | |
| MSI Pulse GL66 12UEK | |
| Alienware x14 i7 RTX 3060 | |
| Medio Intel Core i9-12900H (1395 - 3077, n=28) | |
| Lenovo Legion S7 15ACH6 82K80030GE | |
| Schenker XMG Apex 15 NH57E PS | |
| Alienware m15 R5 Ryzen Edition | |
| Cinebench R15 / CPU Single 64Bit | |
| Media de la clase Gaming (188.8 - 350, n=106, últimos 2 años) | |
| MSI Pulse GL66 12UEK | |
| Medio Intel Core i9-12900H (235 - 277, n=29) | |
| Asus TUF Gaming F15 FX507ZM | |
| Alienware x14 i7 RTX 3060 | |
| Lenovo Legion S7 15ACH6 82K80030GE | |
| Alienware m15 R5 Ryzen Edition | |
| Schenker XMG Apex 15 NH57E PS | |
| Blender / v2.79 BMW27 CPU | |
| Alienware m15 R5 Ryzen Edition | |
| Schenker XMG Apex 15 NH57E PS | |
| Medio Intel Core i9-12900H (160 - 451, n=28) | |
| Lenovo Legion S7 15ACH6 82K80030GE | |
| Alienware x14 i7 RTX 3060 | |
| MSI Pulse GL66 12UEK | |
| Asus TUF Gaming F15 FX507ZM | |
| Media de la clase Gaming (79 - 330, n=104, últimos 2 años) | |
| 7-Zip 18.03 / 7z b 4 | |
| Media de la clase Gaming (33491 - 148086, n=105, últimos 2 años) | |
| Asus TUF Gaming F15 FX507ZM | |
| Alienware x14 i7 RTX 3060 | |
| MSI Pulse GL66 12UEK | |
| Medio Intel Core i9-12900H (34684 - 76677, n=28) | |
| Lenovo Legion S7 15ACH6 82K80030GE | |
| Schenker XMG Apex 15 NH57E PS | |
| Alienware m15 R5 Ryzen Edition | |
| 7-Zip 18.03 / 7z b 4 -mmt1 | |
| Media de la clase Gaming (4199 - 7436, n=105, últimos 2 años) | |
| MSI Pulse GL66 12UEK | |
| Medio Intel Core i9-12900H (5302 - 6289, n=28) | |
| Lenovo Legion S7 15ACH6 82K80030GE | |
| Alienware x14 i7 RTX 3060 | |
| Alienware m15 R5 Ryzen Edition | |
| Schenker XMG Apex 15 NH57E PS | |
| Asus TUF Gaming F15 FX507ZM | |
| Geekbench 5.5 / Multi-Core | |
| Media de la clase Gaming (6460 - 28263, n=105, últimos 2 años) | |
| Alienware x14 i7 RTX 3060 | |
| Asus TUF Gaming F15 FX507ZM | |
| Medio Intel Core i9-12900H (8519 - 14376, n=31) | |
| MSI Pulse GL66 12UEK | |
| Lenovo Legion S7 15ACH6 82K80030GE | |
| Schenker XMG Apex 15 NH57E PS | |
| Alienware m15 R5 Ryzen Edition | |
| Geekbench 5.5 / Single-Core | |
| Media de la clase Gaming (986 - 2474, n=105, últimos 2 años) | |
| MSI Pulse GL66 12UEK | |
| Medio Intel Core i9-12900H (1631 - 1897, n=31) | |
| Alienware x14 i7 RTX 3060 | |
| Asus TUF Gaming F15 FX507ZM | |
| Lenovo Legion S7 15ACH6 82K80030GE | |
| Schenker XMG Apex 15 NH57E PS | |
| Alienware m15 R5 Ryzen Edition | |
| HWBOT x265 Benchmark v2.2 / 4k Preset | |
| Media de la clase Gaming (11.5 - 44.4, n=105, últimos 2 años) | |
| Asus TUF Gaming F15 FX507ZM | |
| MSI Pulse GL66 12UEK | |
| Alienware x14 i7 RTX 3060 | |
| Medio Intel Core i9-12900H (8.05 - 22.5, n=28) | |
| Lenovo Legion S7 15ACH6 82K80030GE | |
| Schenker XMG Apex 15 NH57E PS | |
| Alienware m15 R5 Ryzen Edition | |
| LibreOffice / 20 Documents To PDF | |
| Lenovo Legion S7 15ACH6 82K80030GE | |
| Alienware m15 R5 Ryzen Edition | |
| Schenker XMG Apex 15 NH57E PS | |
| Asus TUF Gaming F15 FX507ZM | |
| Media de la clase Gaming (33.2 - 88.8, n=105, últimos 2 años) | |
| Medio Intel Core i9-12900H (36.8 - 59.8, n=28) | |
| MSI Pulse GL66 12UEK | |
| Alienware x14 i7 RTX 3060 | |
| R Benchmark 2.5 / Overall mean | |
| Alienware m15 R5 Ryzen Edition | |
| Schenker XMG Apex 15 NH57E PS | |
| Lenovo Legion S7 15ACH6 82K80030GE | |
| Asus TUF Gaming F15 FX507ZM | |
| Alienware x14 i7 RTX 3060 | |
| Medio Intel Core i9-12900H (0.4218 - 0.506, n=28) | |
| Media de la clase Gaming (0.3439 - 0.759, n=106, últimos 2 años) | |
| MSI Pulse GL66 12UEK | |
* ... más pequeño es mejor
AIDA64: FP32 Ray-Trace | FPU Julia | CPU SHA3 | CPU Queen | FPU SinJulia | FPU Mandel | CPU AES | CPU ZLib | FP64 Ray-Trace | CPU PhotoWorxx
| Performance rating | |
| Media de la clase Gaming | |
| Lenovo Legion S7 15ACH6 82K80030GE | |
| Schenker XMG Apex 15 NH57E PS | |
| Alienware m15 R5 Ryzen Edition | |
| Medio Intel Core i9-12900H | |
| Alienware x14 i7 RTX 3060 | |
| MSI Pulse GL66 12UEK | |
| Asus TUF Gaming F15 FX507ZM | |
| AIDA64 / FP32 Ray-Trace | |
| Media de la clase Gaming (10227 - 85542, n=105, últimos 2 años) | |
| Lenovo Legion S7 15ACH6 82K80030GE | |
| Schenker XMG Apex 15 NH57E PS | |
| Alienware m15 R5 Ryzen Edition | |
| Medio Intel Core i9-12900H (4074 - 18289, n=29) | |
| Asus TUF Gaming F15 FX507ZM | |
| MSI Pulse GL66 12UEK | |
| Alienware x14 i7 RTX 3060 | |
| AIDA64 / FPU Julia | |
| Media de la clase Gaming (51376 - 238426, n=105, últimos 2 años) | |
| Lenovo Legion S7 15ACH6 82K80030GE | |
| Schenker XMG Apex 15 NH57E PS | |
| Alienware m15 R5 Ryzen Edition | |
| Medio Intel Core i9-12900H (22307 - 93236, n=29) | |
| Asus TUF Gaming F15 FX507ZM | |
| MSI Pulse GL66 12UEK | |
| Alienware x14 i7 RTX 3060 | |
| AIDA64 / CPU SHA3 | |
| Media de la clase Gaming (2180 - 10115, n=105, últimos 2 años) | |
| Lenovo Legion S7 15ACH6 82K80030GE | |
| Asus TUF Gaming F15 FX507ZM | |
| Schenker XMG Apex 15 NH57E PS | |
| MSI Pulse GL66 12UEK | |
| Alienware m15 R5 Ryzen Edition | |
| Medio Intel Core i9-12900H (1378 - 4215, n=29) | |
| Alienware x14 i7 RTX 3060 | |
| AIDA64 / CPU Queen | |
| Media de la clase Gaming (49785 - 173351, n=90, últimos 2 años) | |
| MSI Pulse GL66 12UEK | |
| Lenovo Legion S7 15ACH6 82K80030GE | |
| Medio Intel Core i9-12900H (78172 - 111241, n=28) | |
| Alienware x14 i7 RTX 3060 | |
| Asus TUF Gaming F15 FX507ZM | |
| Schenker XMG Apex 15 NH57E PS | |
| Alienware m15 R5 Ryzen Edition | |
| AIDA64 / FPU SinJulia | |
| Media de la clase Gaming (4424 - 33636, n=105, últimos 2 años) | |
| Lenovo Legion S7 15ACH6 82K80030GE | |
| Schenker XMG Apex 15 NH57E PS | |
| Alienware m15 R5 Ryzen Edition | |
| MSI Pulse GL66 12UEK | |
| Asus TUF Gaming F15 FX507ZM | |
| Alienware x14 i7 RTX 3060 | |
| Medio Intel Core i9-12900H (5709 - 10410, n=29) | |
| AIDA64 / FPU Mandel | |
| Media de la clase Gaming (25115 - 128721, n=105, últimos 2 años) | |
| Lenovo Legion S7 15ACH6 82K80030GE | |
| Schenker XMG Apex 15 NH57E PS | |
| Alienware m15 R5 Ryzen Edition | |
| Medio Intel Core i9-12900H (11257 - 45581, n=29) | |
| Asus TUF Gaming F15 FX507ZM | |
| MSI Pulse GL66 12UEK | |
| Alienware x14 i7 RTX 3060 | |
| AIDA64 / CPU AES | |
| Lenovo Legion S7 15ACH6 82K80030GE | |
| Schenker XMG Apex 15 NH57E PS | |
| Alienware m15 R5 Ryzen Edition | |
| Media de la clase Gaming (39258 - 247074, n=105, últimos 2 años) | |
| MSI Pulse GL66 12UEK | |
| Alienware x14 i7 RTX 3060 | |
| Medio Intel Core i9-12900H (31935 - 151546, n=29) | |
| Asus TUF Gaming F15 FX507ZM | |
| AIDA64 / CPU ZLib | |
| Media de la clase Gaming (574 - 2531, n=105, últimos 2 años) | |
| Asus TUF Gaming F15 FX507ZM | |
| MSI Pulse GL66 12UEK | |
| Alienware x14 i7 RTX 3060 | |
| Medio Intel Core i9-12900H (449 - 1193, n=29) | |
| Lenovo Legion S7 15ACH6 82K80030GE | |
| Schenker XMG Apex 15 NH57E PS | |
| Alienware m15 R5 Ryzen Edition | |
| AIDA64 / FP64 Ray-Trace | |
| Media de la clase Gaming (5509 - 45446, n=105, últimos 2 años) | |
| Lenovo Legion S7 15ACH6 82K80030GE | |
| Schenker XMG Apex 15 NH57E PS | |
| Alienware m15 R5 Ryzen Edition | |
| Medio Intel Core i9-12900H (2235 - 10511, n=29) | |
| Asus TUF Gaming F15 FX507ZM | |
| MSI Pulse GL66 12UEK | |
| Alienware x14 i7 RTX 3060 | |
| AIDA64 / CPU PhotoWorxx | |
| Alienware x14 i7 RTX 3060 | |
| Media de la clase Gaming (12271 - 89891, n=105, últimos 2 años) | |
| Medio Intel Core i9-12900H (20960 - 48269, n=30) | |
| Asus TUF Gaming F15 FX507ZM | |
| MSI Pulse GL66 12UEK | |
| Schenker XMG Apex 15 NH57E PS | |
| Lenovo Legion S7 15ACH6 82K80030GE | |
| Alienware m15 R5 Ryzen Edition | |
Rendimiento del sistema
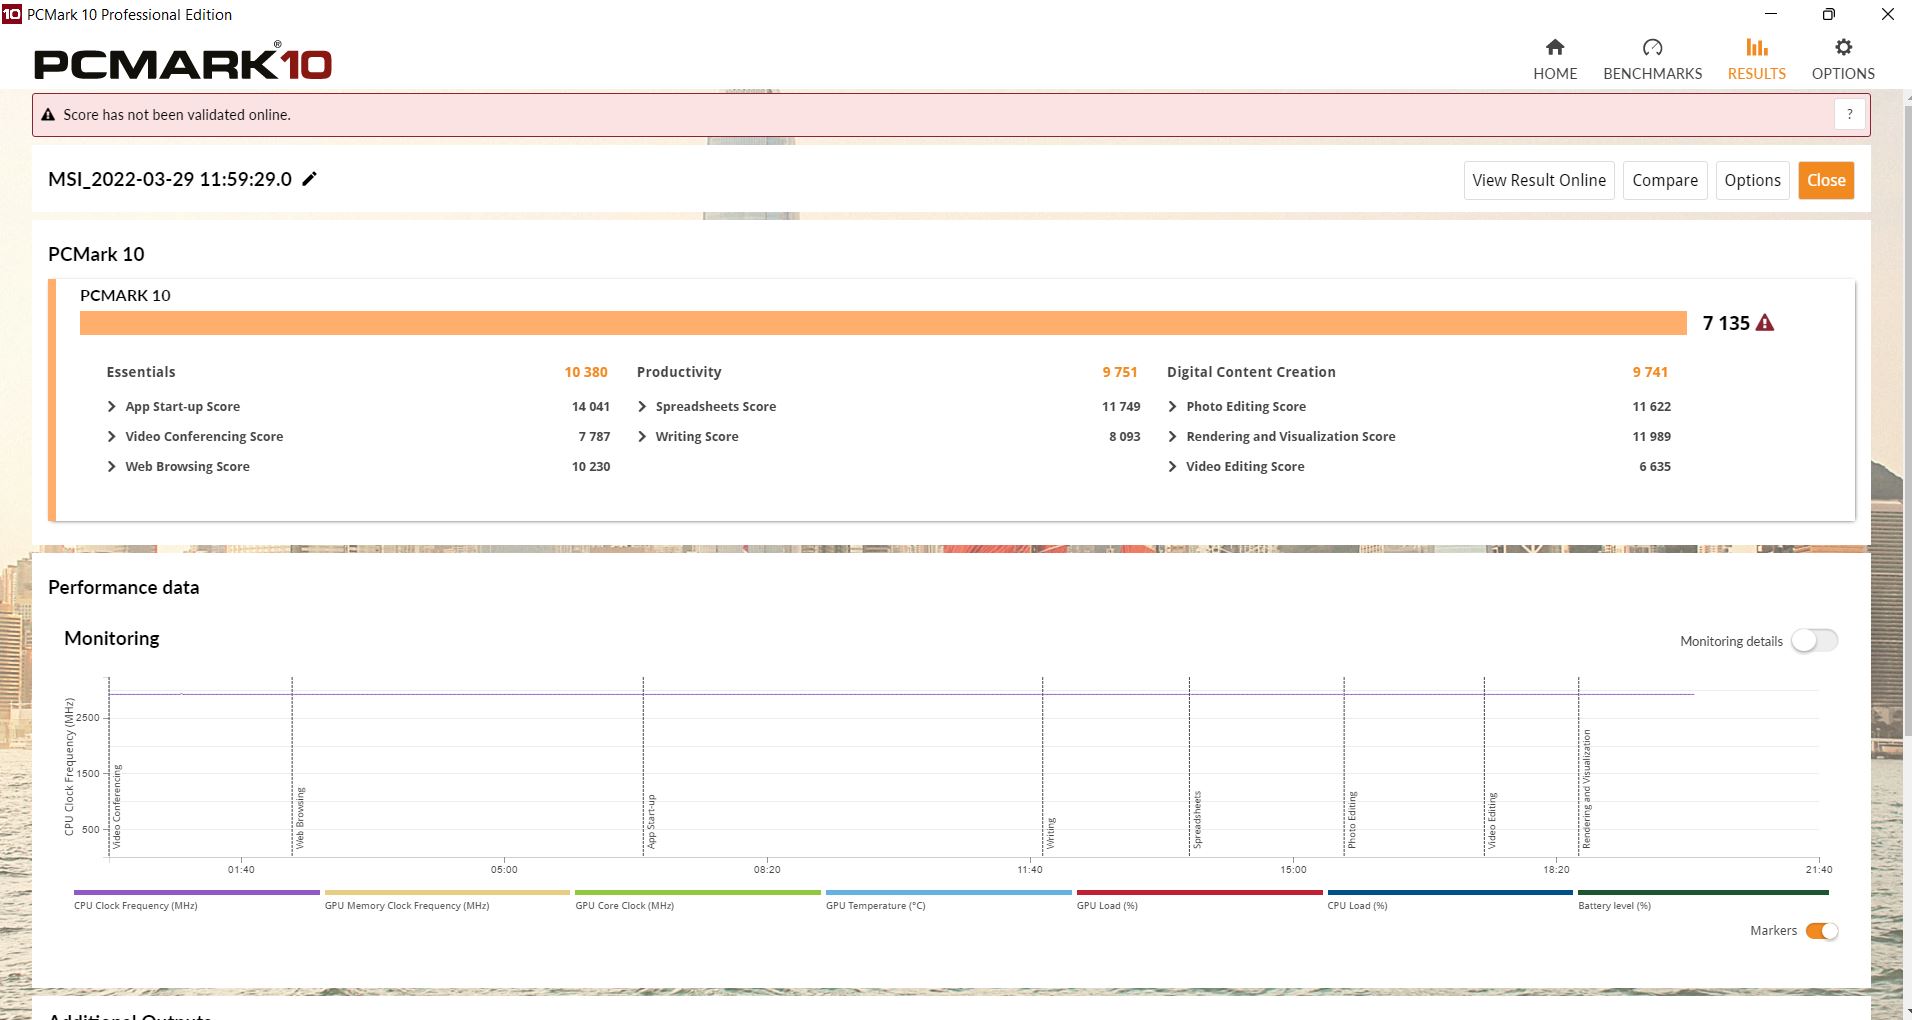
En el benchmark PCMark 10 Productivity, el Pulse queda en primer lugar, pero en las otras áreas, es ligeramente superado por el Asus TUF Gaming 15 y a veces también por el Alienware X14. Por otro lado, en CrossMark nuestra unidad de pruebas también acaba por delante del X14.
CrossMark: Overall | Productivity | Creativity | Responsiveness
| PCMark 10 / Score | |
| Media de la clase Gaming (5828 - 12414, n=93, últimos 2 años) | |
| Medio Intel Core i9-12900H, NVIDIA GeForce RTX 3060 Laptop GPU (7135 - 7861, n=4) | |
| Asus TUF Gaming F15 FX507ZM | |
| Alienware x14 i7 RTX 3060 | |
| MSI Pulse GL66 12UEK | |
| Schenker XMG Apex 15 NH57E PS | |
| Lenovo Legion S7 15ACH6 82K80030GE | |
| Alienware m15 R5 Ryzen Edition | |
| PCMark 10 / Essentials | |
| Medio Intel Core i9-12900H, NVIDIA GeForce RTX 3060 Laptop GPU (10380 - 11198, n=4) | |
| Media de la clase Gaming (8810 - 11935, n=97, últimos 2 años) | |
| Asus TUF Gaming F15 FX507ZM | |
| MSI Pulse GL66 12UEK | |
| Alienware x14 i7 RTX 3060 | |
| Schenker XMG Apex 15 NH57E PS | |
| Lenovo Legion S7 15ACH6 82K80030GE | |
| Alienware m15 R5 Ryzen Edition | |
| PCMark 10 / Productivity | |
| Media de la clase Gaming (6845 - 25323, n=95, últimos 2 años) | |
| Medio Intel Core i9-12900H, NVIDIA GeForce RTX 3060 Laptop GPU (9751 - 10486, n=4) | |
| MSI Pulse GL66 12UEK | |
| Alienware x14 i7 RTX 3060 | |
| Asus TUF Gaming F15 FX507ZM | |
| Alienware m15 R5 Ryzen Edition | |
| Lenovo Legion S7 15ACH6 82K80030GE | |
| Schenker XMG Apex 15 NH57E PS | |
| PCMark 10 / Digital Content Creation | |
| Media de la clase Gaming (7602 - 19954, n=95, últimos 2 años) | |
| Asus TUF Gaming F15 FX507ZM | |
| Medio Intel Core i9-12900H, NVIDIA GeForce RTX 3060 Laptop GPU (9741 - 11226, n=4) | |
| Alienware x14 i7 RTX 3060 | |
| MSI Pulse GL66 12UEK | |
| Schenker XMG Apex 15 NH57E PS | |
| Lenovo Legion S7 15ACH6 82K80030GE | |
| Alienware m15 R5 Ryzen Edition | |
| CrossMark / Overall | |
| MSI Pulse GL66 12UEK | |
| Media de la clase Gaming (1366 - 2409, n=94, últimos 2 años) | |
| Medio Intel Core i9-12900H, NVIDIA GeForce RTX 3060 Laptop GPU (1789 - 2096, n=4) | |
| Alienware x14 i7 RTX 3060 | |
| CrossMark / Productivity | |
| MSI Pulse GL66 12UEK | |
| Medio Intel Core i9-12900H, NVIDIA GeForce RTX 3060 Laptop GPU (1677 - 2062, n=4) | |
| Media de la clase Gaming (1386 - 2254, n=94, últimos 2 años) | |
| Alienware x14 i7 RTX 3060 | |
| CrossMark / Creativity | |
| Media de la clase Gaming (1343 - 2786, n=94, últimos 2 años) | |
| Medio Intel Core i9-12900H, NVIDIA GeForce RTX 3060 Laptop GPU (2032 - 2125, n=4) | |
| MSI Pulse GL66 12UEK | |
| Alienware x14 i7 RTX 3060 | |
| CrossMark / Responsiveness | |
| MSI Pulse GL66 12UEK | |
| Medio Intel Core i9-12900H, NVIDIA GeForce RTX 3060 Laptop GPU (1486 - 2230, n=4) | |
| Alienware x14 i7 RTX 3060 | |
| Media de la clase Gaming (1226 - 2334, n=94, últimos 2 años) | |
| PCMark 10 Score | 7135 puntos | |
ayuda | ||
| AIDA64 / Memory Copy | |
| Alienware x14 i7 RTX 3060 | |
| Media de la clase Gaming (21750 - 129946, n=105, últimos 2 años) | |
| Medio Intel Core i9-12900H (34438 - 74264, n=29) | |
| Asus TUF Gaming F15 FX507ZM | |
| MSI Pulse GL66 12UEK | |
| Schenker XMG Apex 15 NH57E PS | |
| Lenovo Legion S7 15ACH6 82K80030GE | |
| Alienware m15 R5 Ryzen Edition | |
| AIDA64 / Memory Read | |
| Alienware x14 i7 RTX 3060 | |
| Media de la clase Gaming (22956 - 118858, n=105, últimos 2 años) | |
| Medio Intel Core i9-12900H (36365 - 74642, n=29) | |
| Asus TUF Gaming F15 FX507ZM | |
| MSI Pulse GL66 12UEK | |
| Schenker XMG Apex 15 NH57E PS | |
| Lenovo Legion S7 15ACH6 82K80030GE | |
| Alienware m15 R5 Ryzen Edition | |
| AIDA64 / Memory Write | |
| Media de la clase Gaming (22297 - 135096, n=105, últimos 2 años) | |
| Alienware x14 i7 RTX 3060 | |
| Medio Intel Core i9-12900H (32276 - 67858, n=29) | |
| Asus TUF Gaming F15 FX507ZM | |
| MSI Pulse GL66 12UEK | |
| Schenker XMG Apex 15 NH57E PS | |
| Lenovo Legion S7 15ACH6 82K80030GE | |
| Alienware m15 R5 Ryzen Edition | |
| AIDA64 / Memory Latency | |
| Alienware x14 i7 RTX 3060 | |
| Media de la clase Gaming (75.3 - 259, n=105, últimos 2 años) | |
| MSI Pulse GL66 12UEK | |
| Medio Intel Core i9-12900H (74.7 - 118.1, n=28) | |
| Lenovo Legion S7 15ACH6 82K80030GE | |
| Alienware m15 R5 Ryzen Edition | |
| Schenker XMG Apex 15 NH57E PS | |
| Asus TUF Gaming F15 FX507ZM | |
* ... más pequeño es mejor
Latencias del CPD
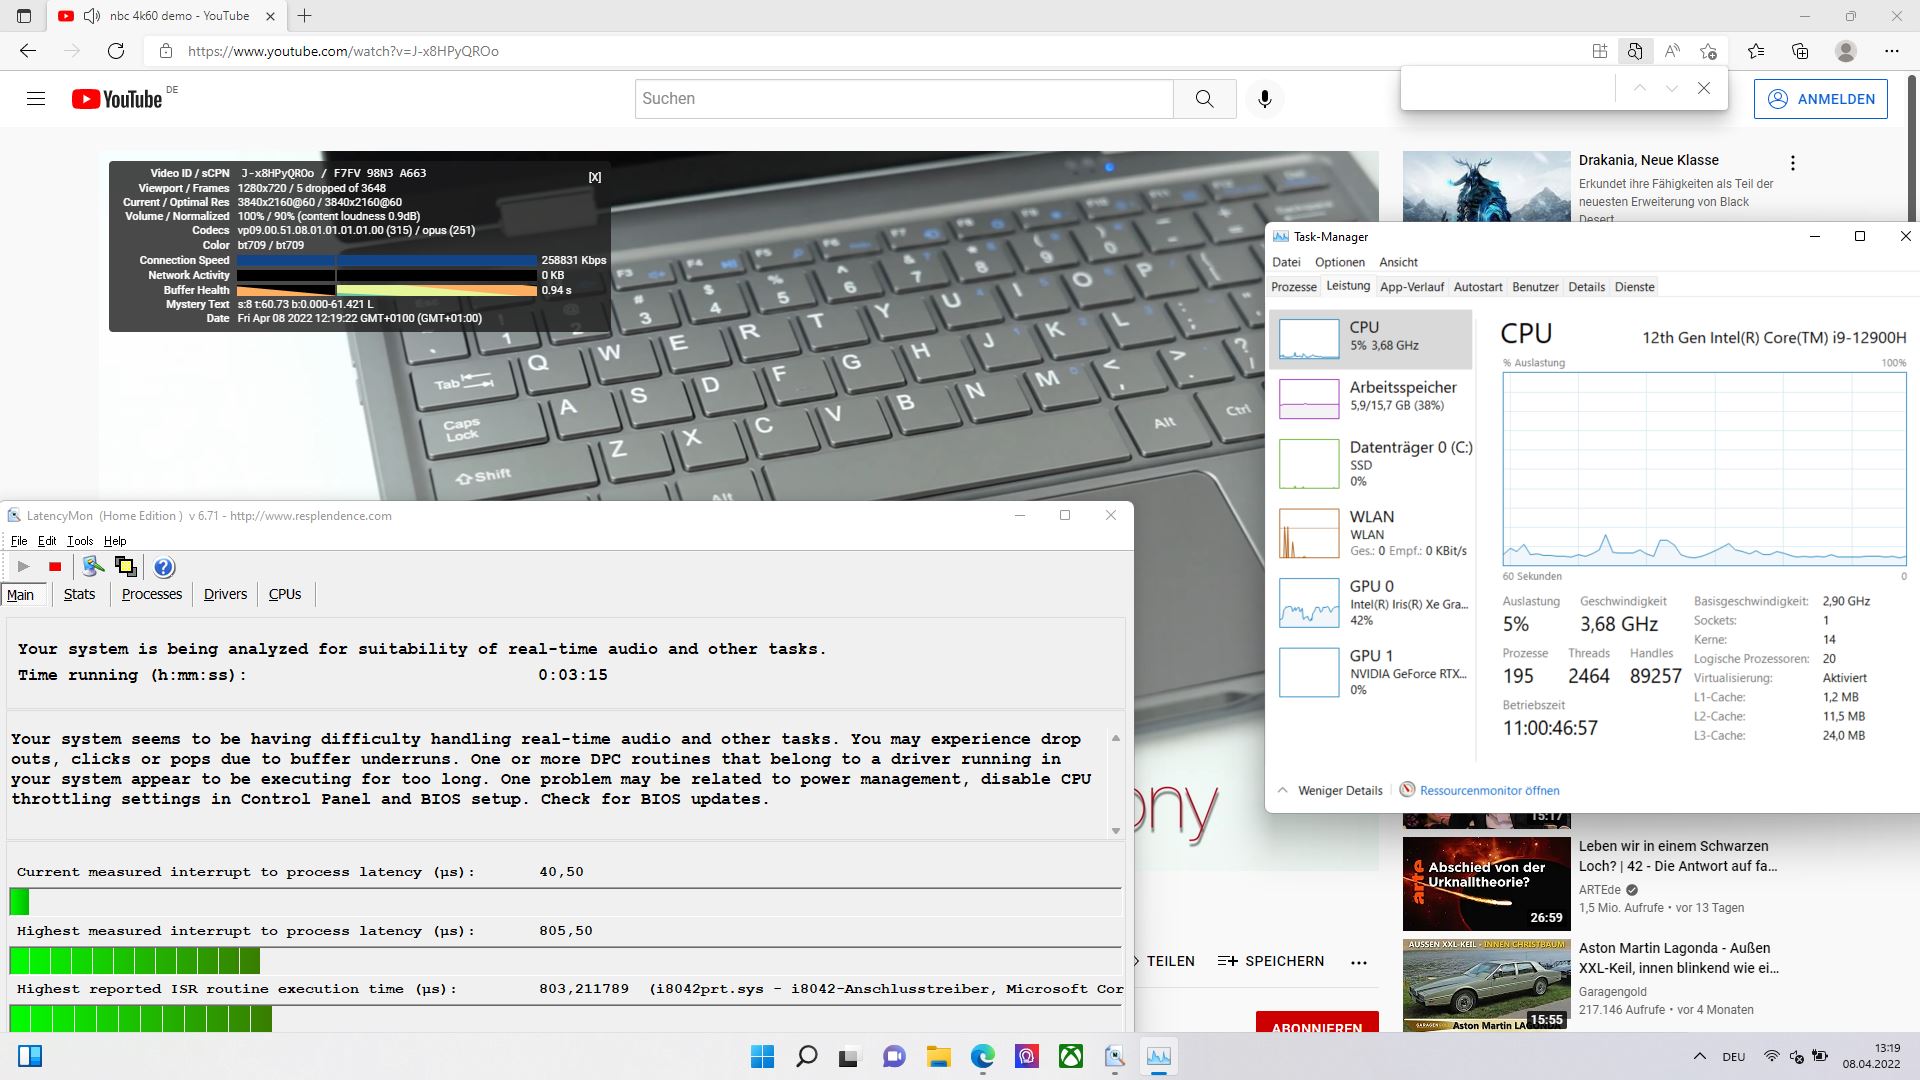
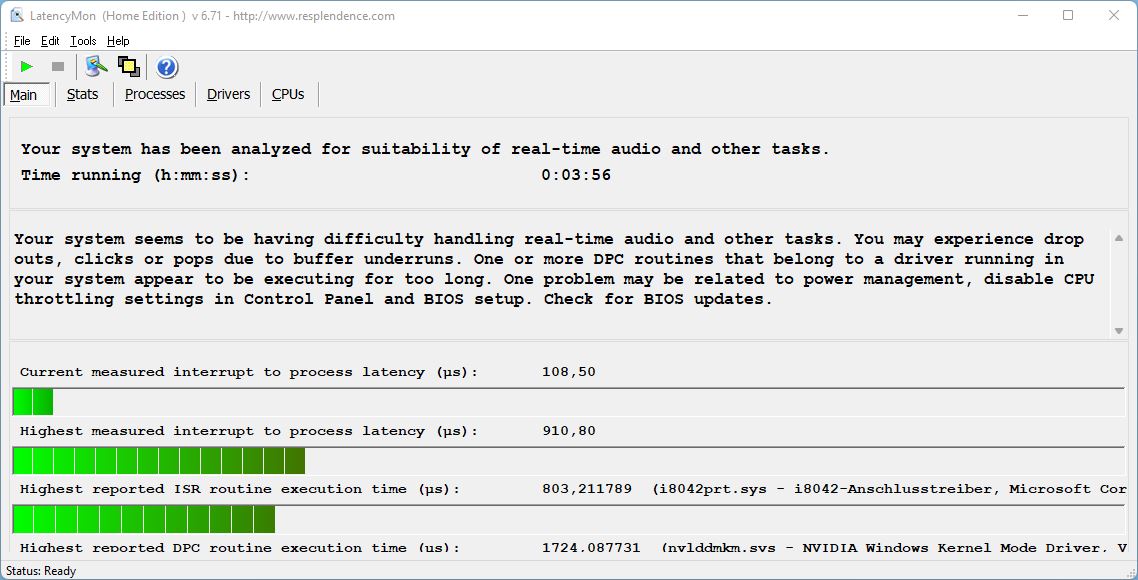
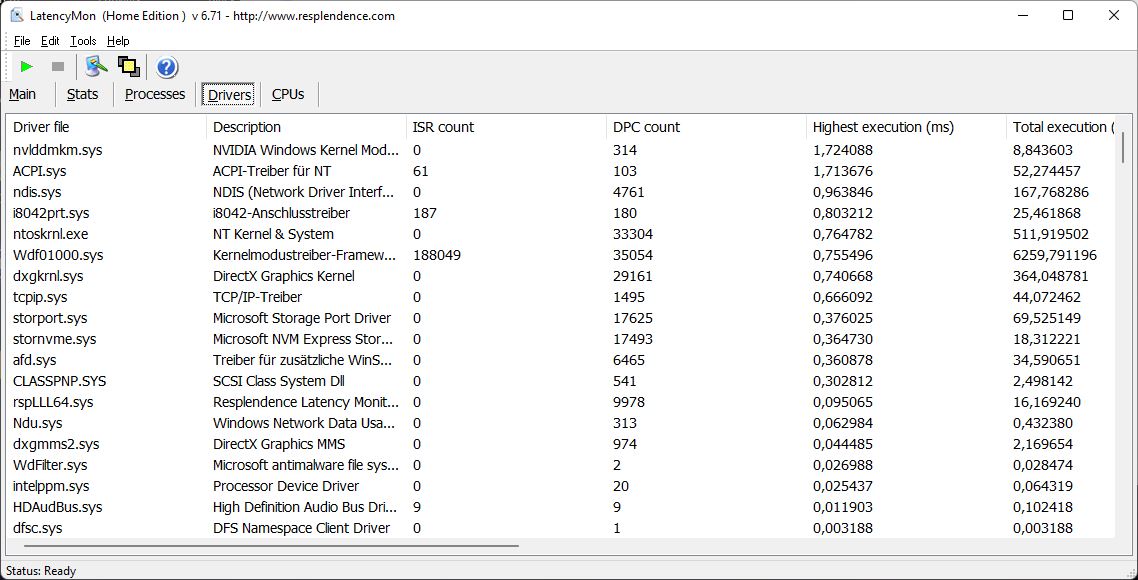
Por desgracia, LatencyMon ya muestra algunos problemas menores al abrir el navegador. Abrir varias pestañas no muestra más impacto. Hay cinco fotogramas caídos al reproducir nuestro vídeo 4K/60-fps de YouTube. Un Prime95 de 10 segundos justo después aumenta aún más el valor de la latencia.
| DPC Latencies / LatencyMon - interrupt to process latency (max), Web, Youtube, Prime95 | |
| Schenker XMG Apex 15 NH57E PS | |
| Alienware x14 i7 RTX 3060 | |
| MSI Pulse GL66 12UEK | |
| Asus TUF Gaming F15 FX507ZM | |
| Lenovo Legion S7 15ACH6 82K80030GE | |
| Alienware m15 R5 Ryzen Edition | |
* ... más pequeño es mejor
Solución de almacenamiento
MSI usa un SSD NVMe de 512 GB de Micron. Su rendimiento constante sigue siendo muy uniforme y alcanza unos 3000 MB/s en lectura y escritura secuencial, lo que está bien.

* ... más pequeño es mejor
Constant Performance Reading: DiskSpd Read Loop, Queue Depth 8
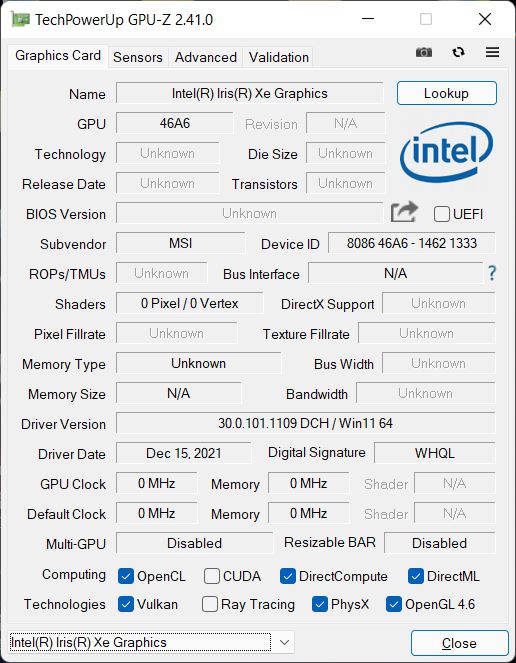
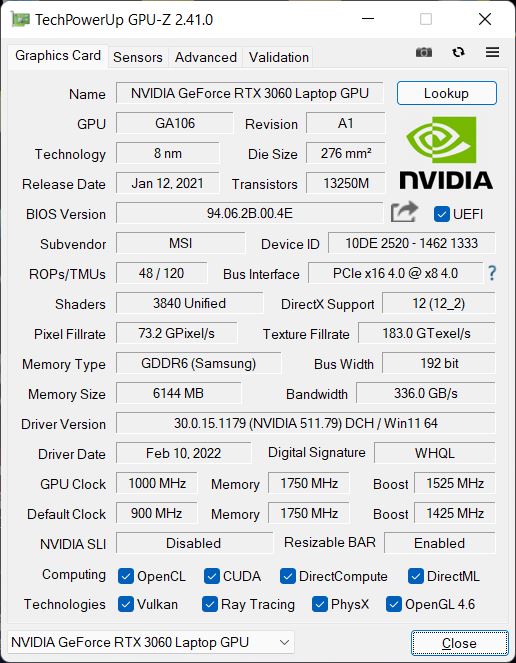
Rendimiento gráfico
La Nvidia Geforce RTX 3060 con 6 GB de VRAM se usa como GPU. Sin embargo, en vez del máximo posible de 140 vatios, sólo puede usar hasta 105 vatios incluyendo Dynamic Boost. Esto podría llevar a algunos competidores más rápidos en términos de rendimiento 3D puro.
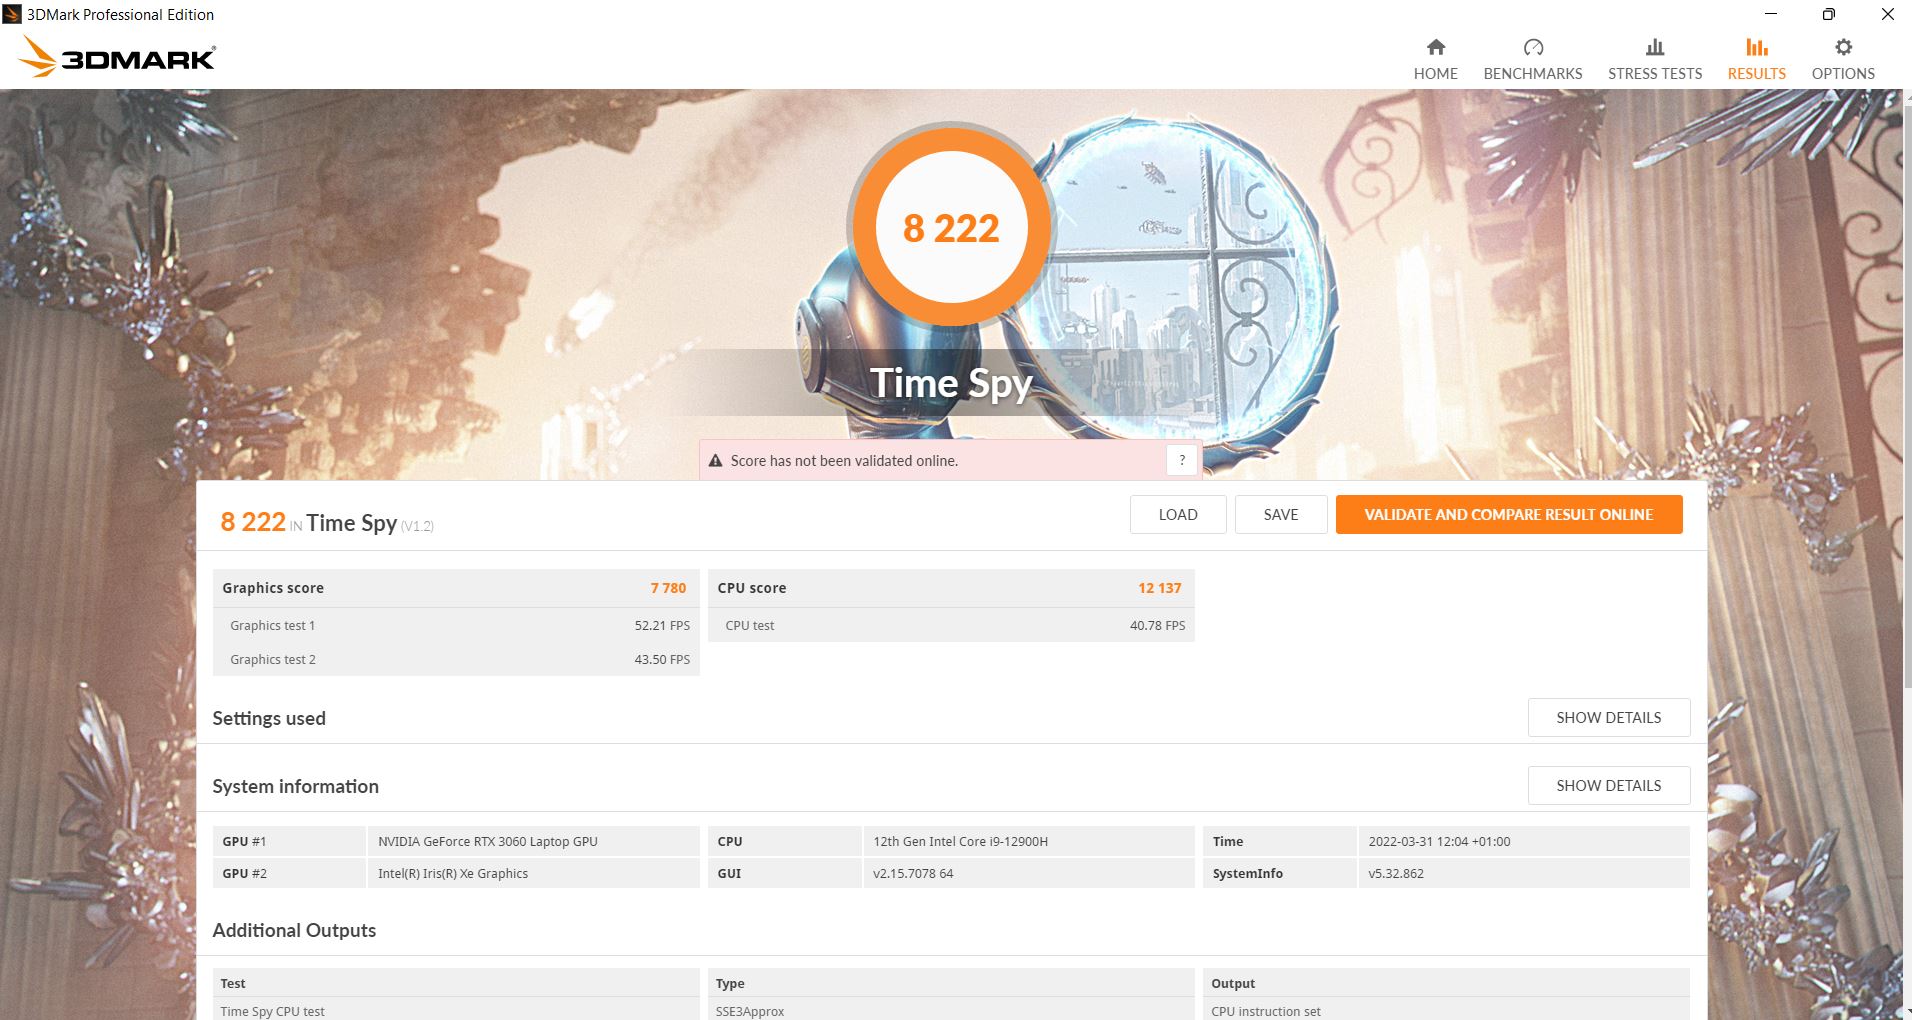
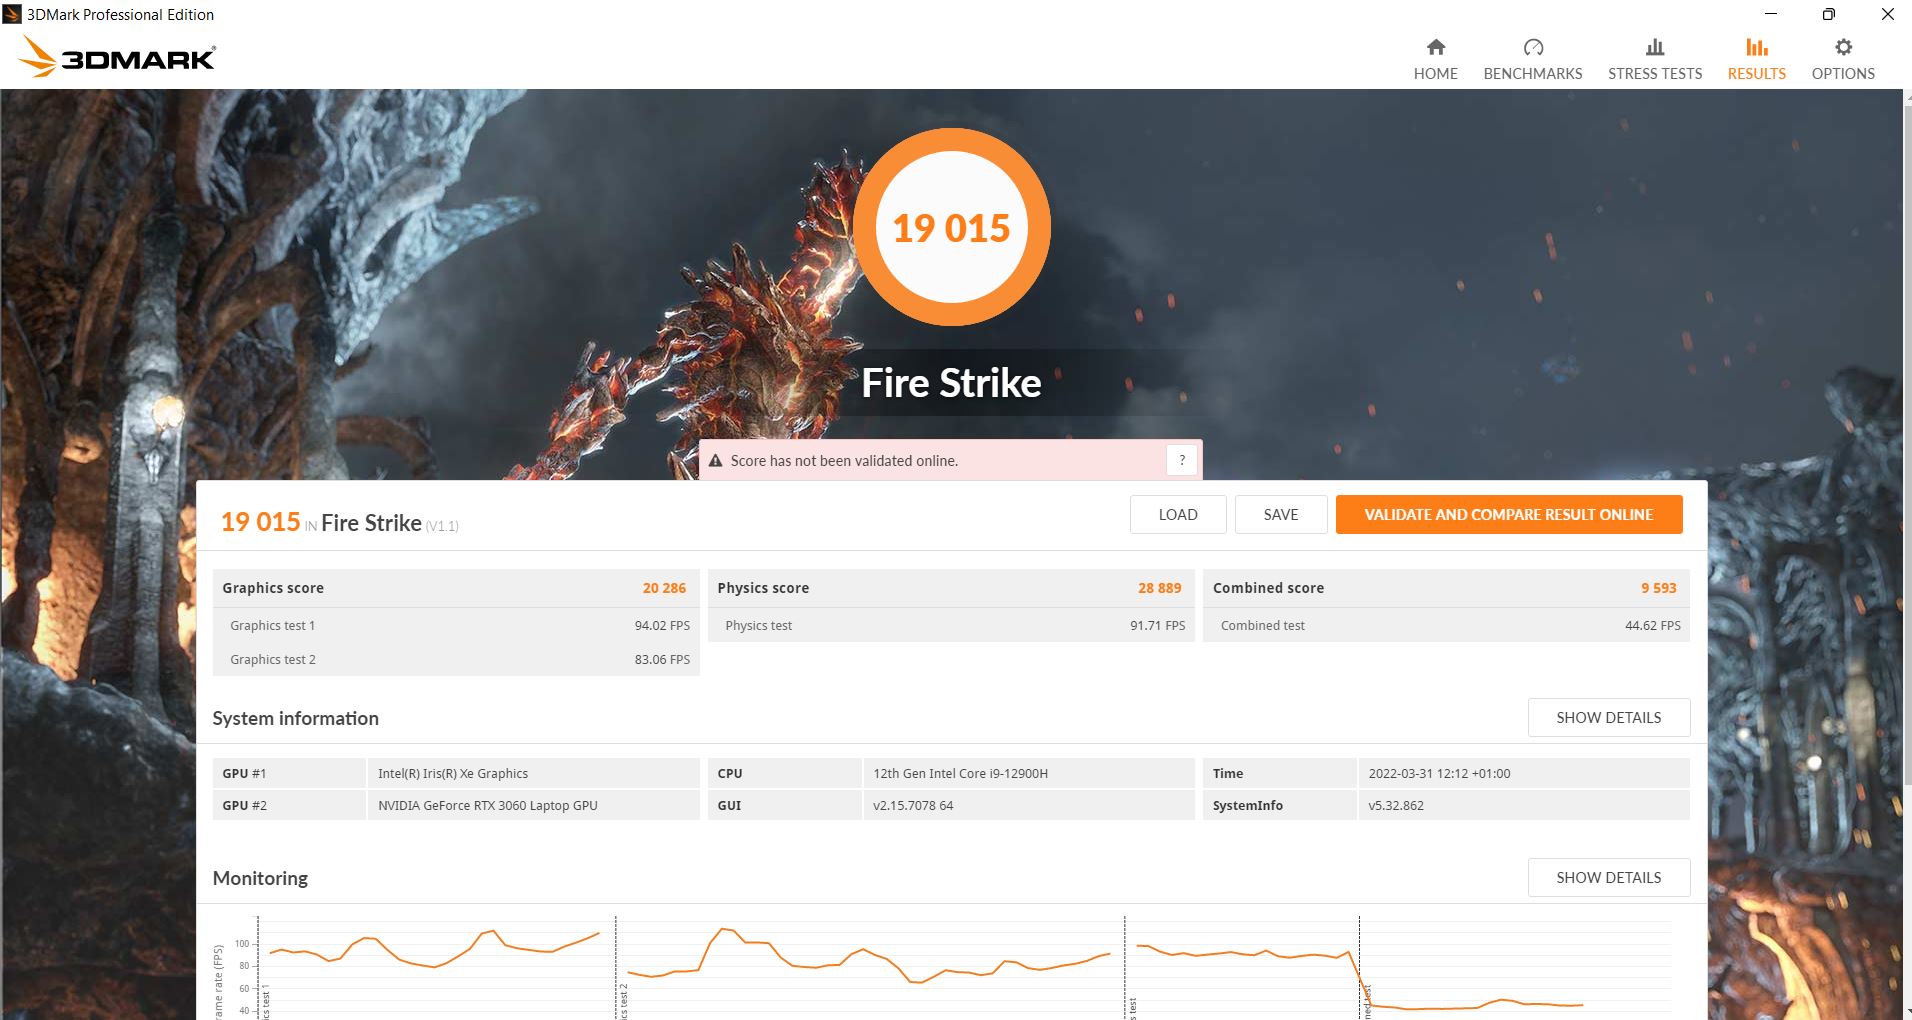
En las pruebas sintéticas de 3DMark, la Pulse es capaz de alcanzar los niveles esperados para una RTX 3060 media en las pruebas Time Spy y Fire Strike. Varios competidores son más rápidos, incluyendo el Asus TUF Gaming F15, pero algunos también son ligeramente más lentos, como el Alienware X4. Sin embargo, la distancia con los de mayor rendimiento es mayor que con los de menor rendimiento.
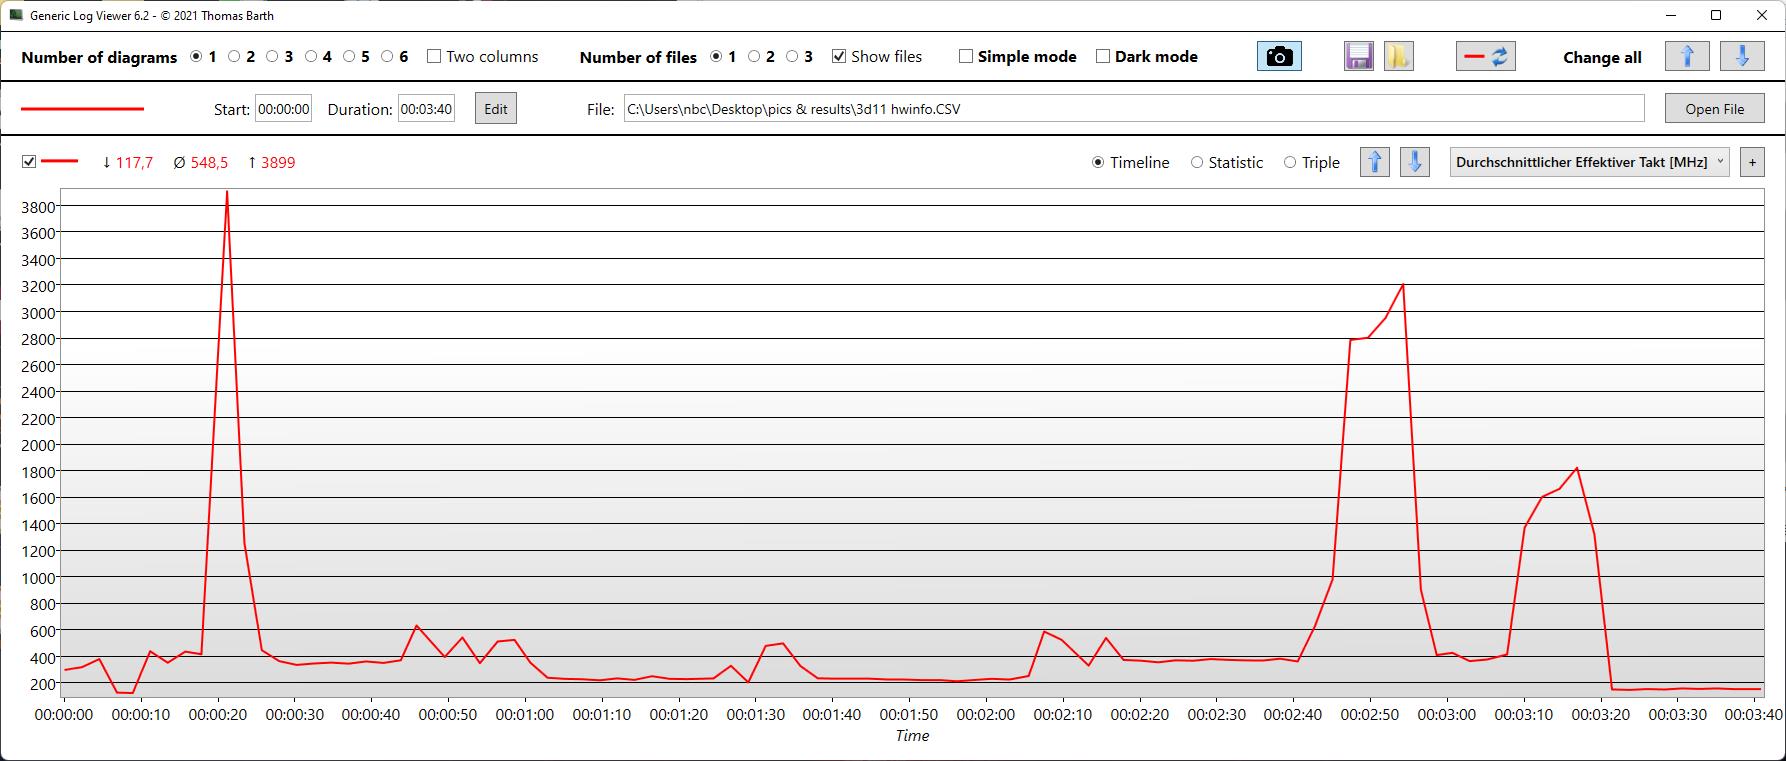
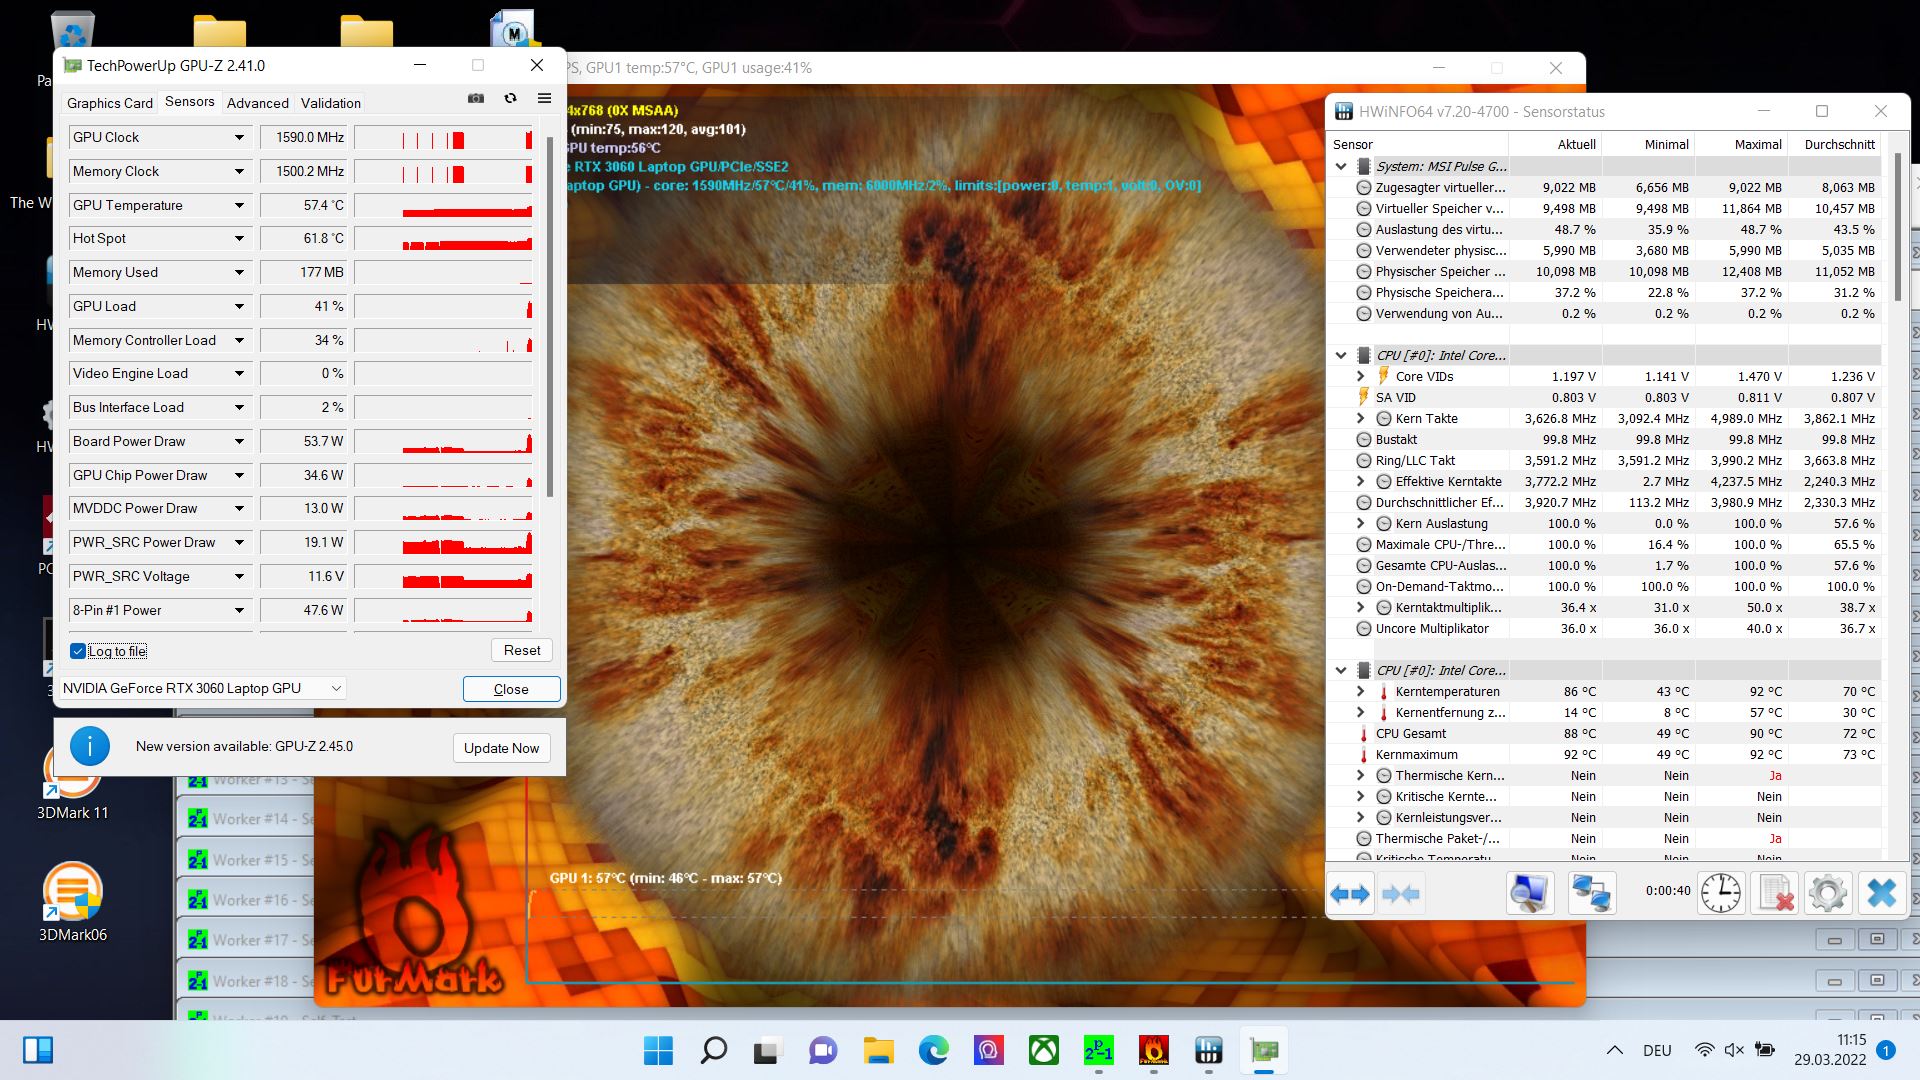
Por otro lado, el rendimiento del portátil en el 3DMark 11 es muy decepcionante. Incluso después de más de 4 ejecuciones, incluyendo algunos reinicios entre ellas, se repitió el extraño resultado de nivel inferior. Un registro de HWinfo muestra que la velocidad de reloj de la CPU es extrañamente baja (ver gráfico a la derecha). Observamos un comportamiento similar en el benchmark Cloud-Gate.
En funcionamiento en batería, la velocidad de fotogramas cae de 75 fps a unos 30 fps bastante constantes en
"The Witcher 3" Además, el sistema de refrigeración sólo se activa muy tarde.
| 3DMark 11 Performance | 14164 puntos | |
| 3DMark Cloud Gate Standard Score | 28859 puntos | |
| 3DMark Fire Strike Score | 19015 puntos | |
| 3DMark Time Spy Score | 8222 puntos | |
ayuda | ||
Rendimiento de los juegos
"El Witcher 3" funciona en resolución nativa y ajustes Ultra a unos 75 fps. Esto corresponde al nivel esperado, pero varios competidores, encabezados por el Asus TUF, siguen siendo más rápidos. En"Cyberpunk 2077 1.5", el sistema sólo alcanza unos 40 fps con la misma configuración. Aunque se puede jugar con fluidez, es insuficiente para los efectos de raytracing
En "Far Cry 5" y en"X-Plane 11.11", el Pulse consigue incluso alcanzar el segundo puesto por detrás del Asus TUF. A pesar del TGP relativamente bajo, se puede jugar con fluidez a casi cualquier juego en resolución nativa y niveles de detalle altos.
| Cyberpunk 2077 1.6 | |
| 1920x1080 Medium Preset | |
| Medio NVIDIA GeForce RTX 3060 Laptop GPU (68 - 118, n=14) | |
| MSI Pulse GL66 12UEK | |
| Alienware x14 i7 RTX 3060 | |
| 1920x1080 High Preset | |
| Medio NVIDIA GeForce RTX 3060 Laptop GPU (42.2 - 87.7, n=14) | |
| Alienware x14 i7 RTX 3060 | |
| MSI Pulse GL66 12UEK | |
| 1920x1080 Ultra Preset | |
| Alienware x14 i7 RTX 3060 | |
| Medio NVIDIA GeForce RTX 3060 Laptop GPU (40 - 78.8, n=16) | |
| MSI Pulse GL66 12UEK | |
| 1920x1080 Ray Tracing Ultra Preset (DLSS off) | |
| Medio NVIDIA GeForce RTX 3060 Laptop GPU (12.6 - 28.9, n=7) | |
| MSI Pulse GL66 12UEK | |
El Pulse no tiene un Optimus avanzado y tampoco hay un interruptor MUX a bordo. Sin embargo, la tasa de fotogramas de"The Witcher 3" sigue siendo bastante constante a lo largo de una hora.
The Witcher 3 FPS Chart
| bajo | medio | alto | ultra | |
|---|---|---|---|---|
| The Witcher 3 (2015) | 368.5 | 247.2 | 139.6 | 78 |
| Dota 2 Reborn (2015) | 179 | 161 | 151 | 144 |
| X-Plane 11.11 (2018) | 142 | 123 | 100 | |
| Far Cry 5 (2018) | 168 | 128 | 120 | 112 |
| Cyberpunk 2077 1.6 (2022) | 88.1 | 87.1 | 42.2 | 40.7 |
Emisiones
Emisiones acústicas
Aunque ejecutamos la mayoría de los benchmarks en el modo de Rendimiento Extremo, MSI recomienda el modo Balanceado. En el modo Extremo, los ventiladores incluso se encienden brevemente durante el funcionamiento en inactivo, pero en el modo Equilibrado incluso permanecen en silencio tras 5 minutos de"The Witcher 3" durante el funcionamiento de la batería.
Aunque los ventiladores también pueden encenderse durante las tareas habituales de trabajo (como la redacción de esta reseña) en el modo Equilibrado, entonces zumban silenciosamente y apenas se notan.
En modo Extremo, sólo el Schenker Core se vuelve más ruidoso bajo carga. El Asus TUF más rápido produce un nivel de ruido similar.
Ruido
| Ocioso |
| 23 / 27 / 27 dB(A) |
| Carga |
| 48.2 / 56.94 dB(A) |
 | ||
30 dB silencioso 40 dB(A) audible 50 dB(A) ruidosamente alto |
||
min: | ||
| MSI Pulse GL66 12UEK GeForce RTX 3060 Laptop GPU, i9-12900H, Micron 2450 512GB MTFDKBA512TFK | Asus TUF Gaming F15 FX507ZM GeForce RTX 3060 Laptop GPU, i7-12700H, SK Hynix HFM001TD3JX013N | Alienware x14 i7 RTX 3060 GeForce RTX 3060 Laptop GPU, i7-12700H, WDC PC SN810 1TB | Schenker XMG Apex 15 NH57E PS GeForce RTX 3060 Laptop GPU, R7 5800H, Samsung SSD 980 500GB (MZ-V8V500BW) | Lenovo Legion S7 15ACH6 82K80030GE GeForce RTX 3060 Laptop GPU, R9 5900HX, Samsung PM981a MZVLB1T0HBLR | Alienware m15 R5 Ryzen Edition GeForce RTX 3060 Laptop GPU, R7 5800H, Toshiba KBG40ZNS512G NVMe | |
|---|---|---|---|---|---|---|
| Noise | 6% | 2% | 6% | -5% | 1% | |
| apagado / medio ambiente * (dB) | 23 | 23.2 -1% | 24.7 -7% | 23 -0% | 25 -9% | 24 -4% |
| Idle Minimum * (dB) | 23 | 23.6 -3% | 24.7 -7% | 23 -0% | 25 -9% | 24 -4% |
| Idle Average * (dB) | 27 | 23.6 13% | 24.7 9% | 23 15% | 30 -11% | 25 7% |
| Idle Maximum * (dB) | 27 | 25.4 6% | 30.9 -14% | 26.4 2% | 36 -33% | 35 -30% |
| Load Average * (dB) | 48.2 | 38 21% | 40 17% | 34.25 29% | 42 13% | 44 9% |
| Witcher 3 ultra * (dB) | 56.9 | 54.1 5% | 51.5 9% | 58.4 -3% | 53 7% | 48 16% |
| Load Maximum * (dB) | 56.94 | 57.2 -0% | 51.5 10% | 58.42 -3% | 54 5% | 50 12% |
* ... más pequeño es mejor
Temperatura
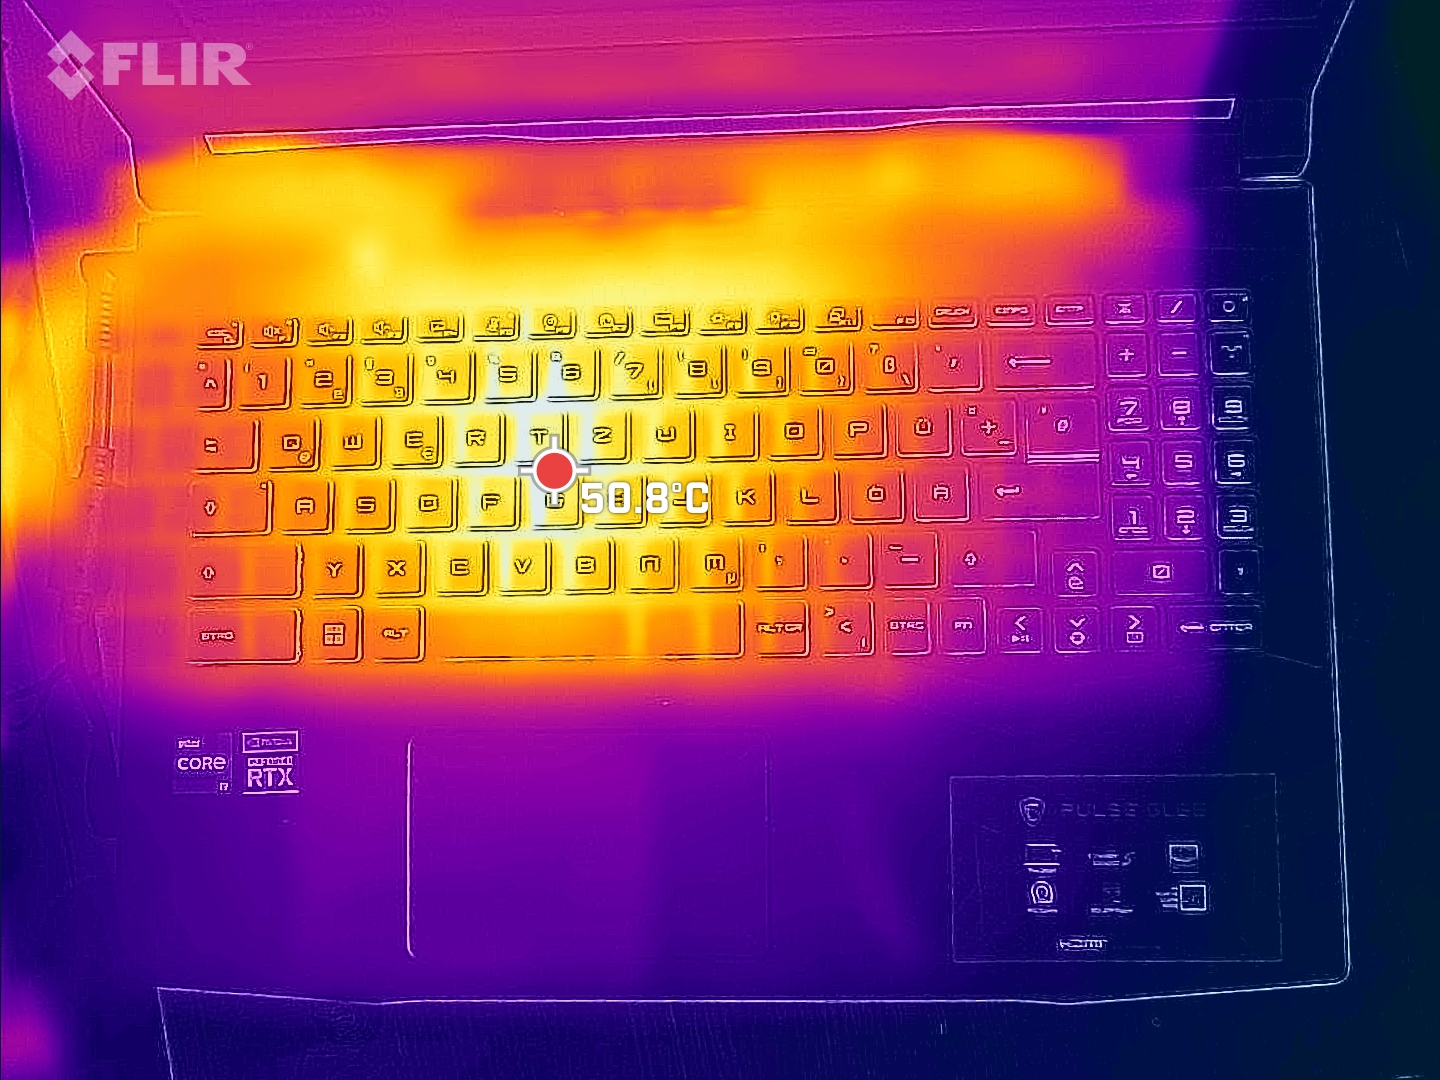
A unos 37 °C durante el funcionamiento en reposo, el portátil se calienta ligeramente más que los competidores. Sólo el Asus TUF se calienta de forma similar. Bajo carga, esto continúa hasta los 50 °C, con varios competidores alcanzando temperaturas similares (Lenovo Legion S7) o incluso más calientes (Alienware m5).
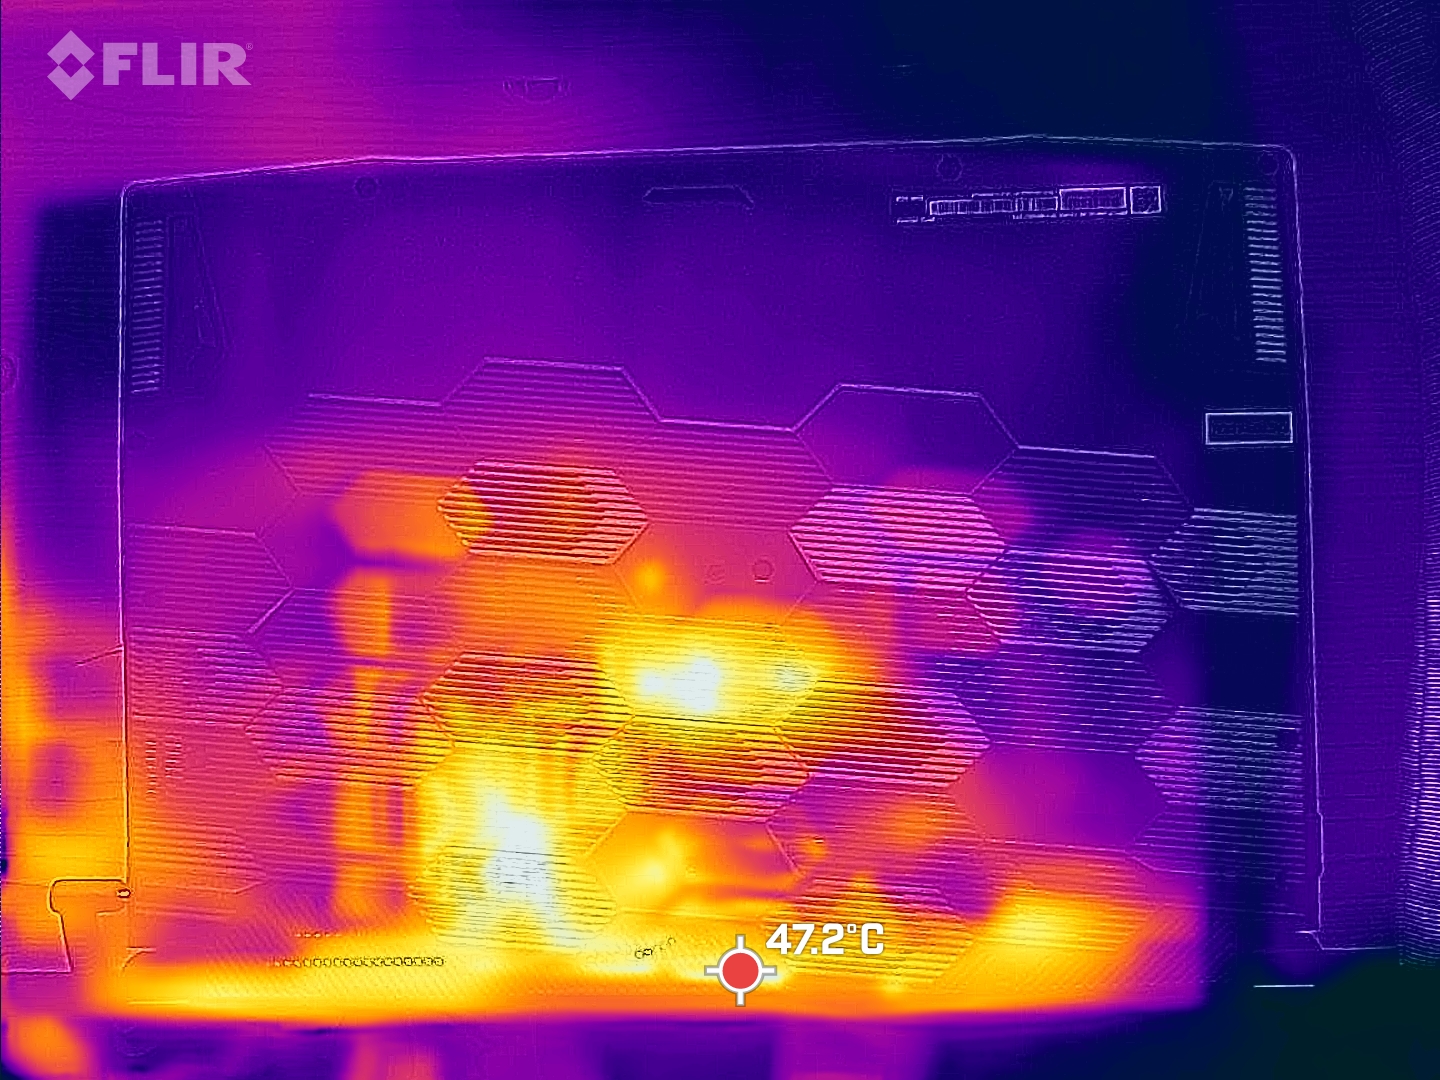
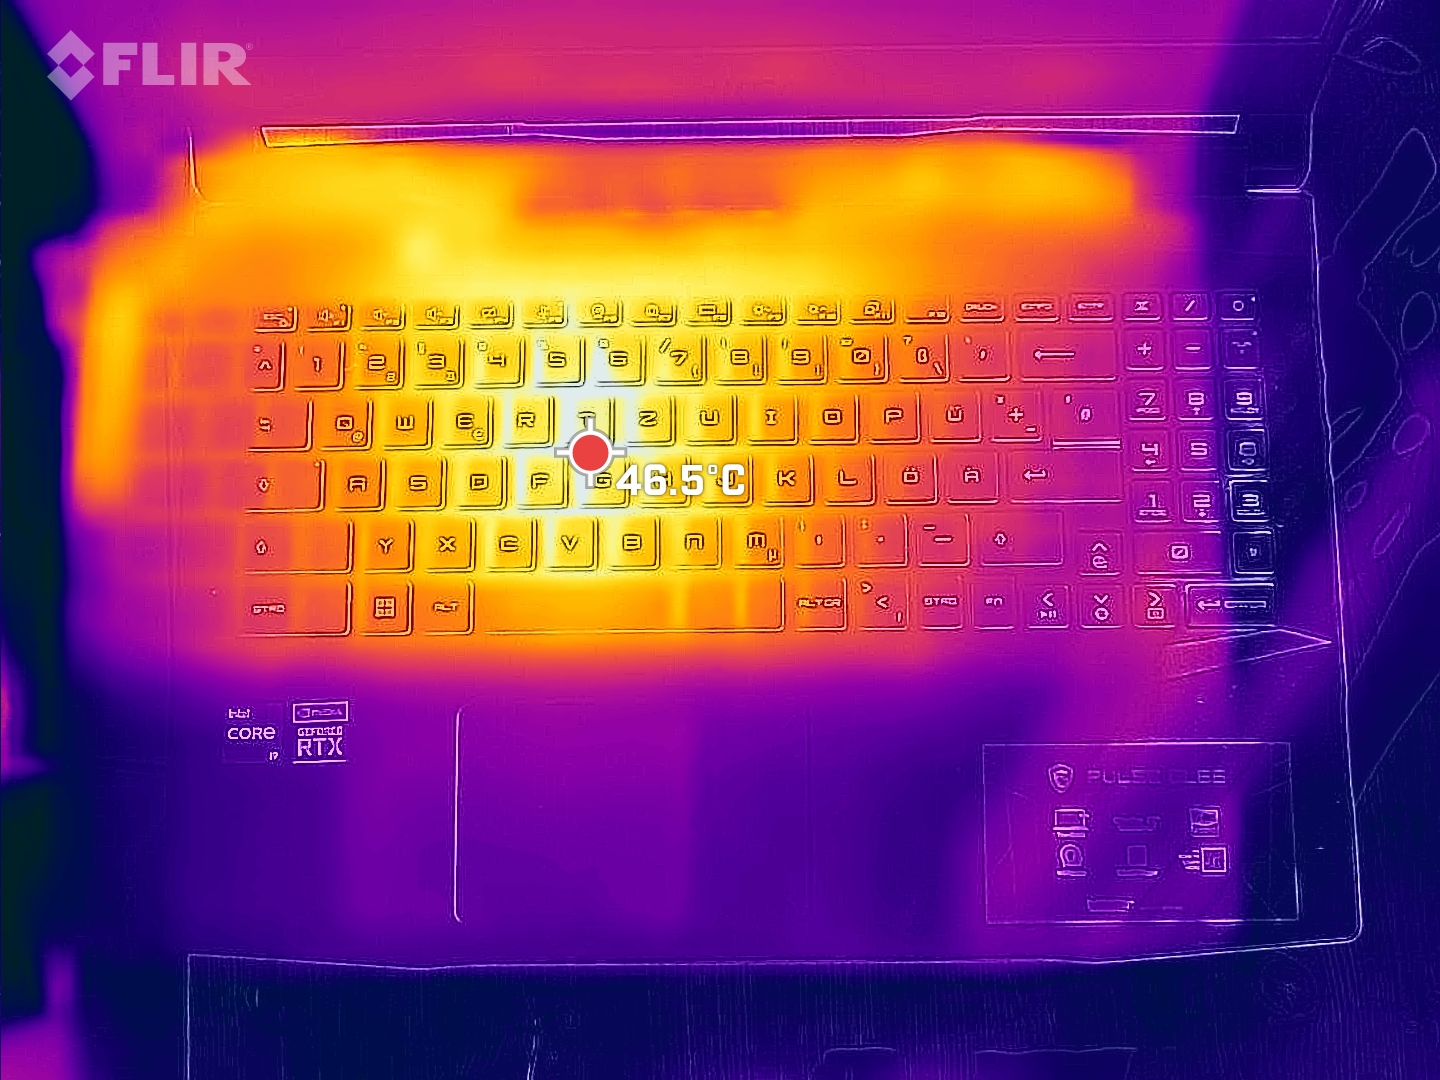
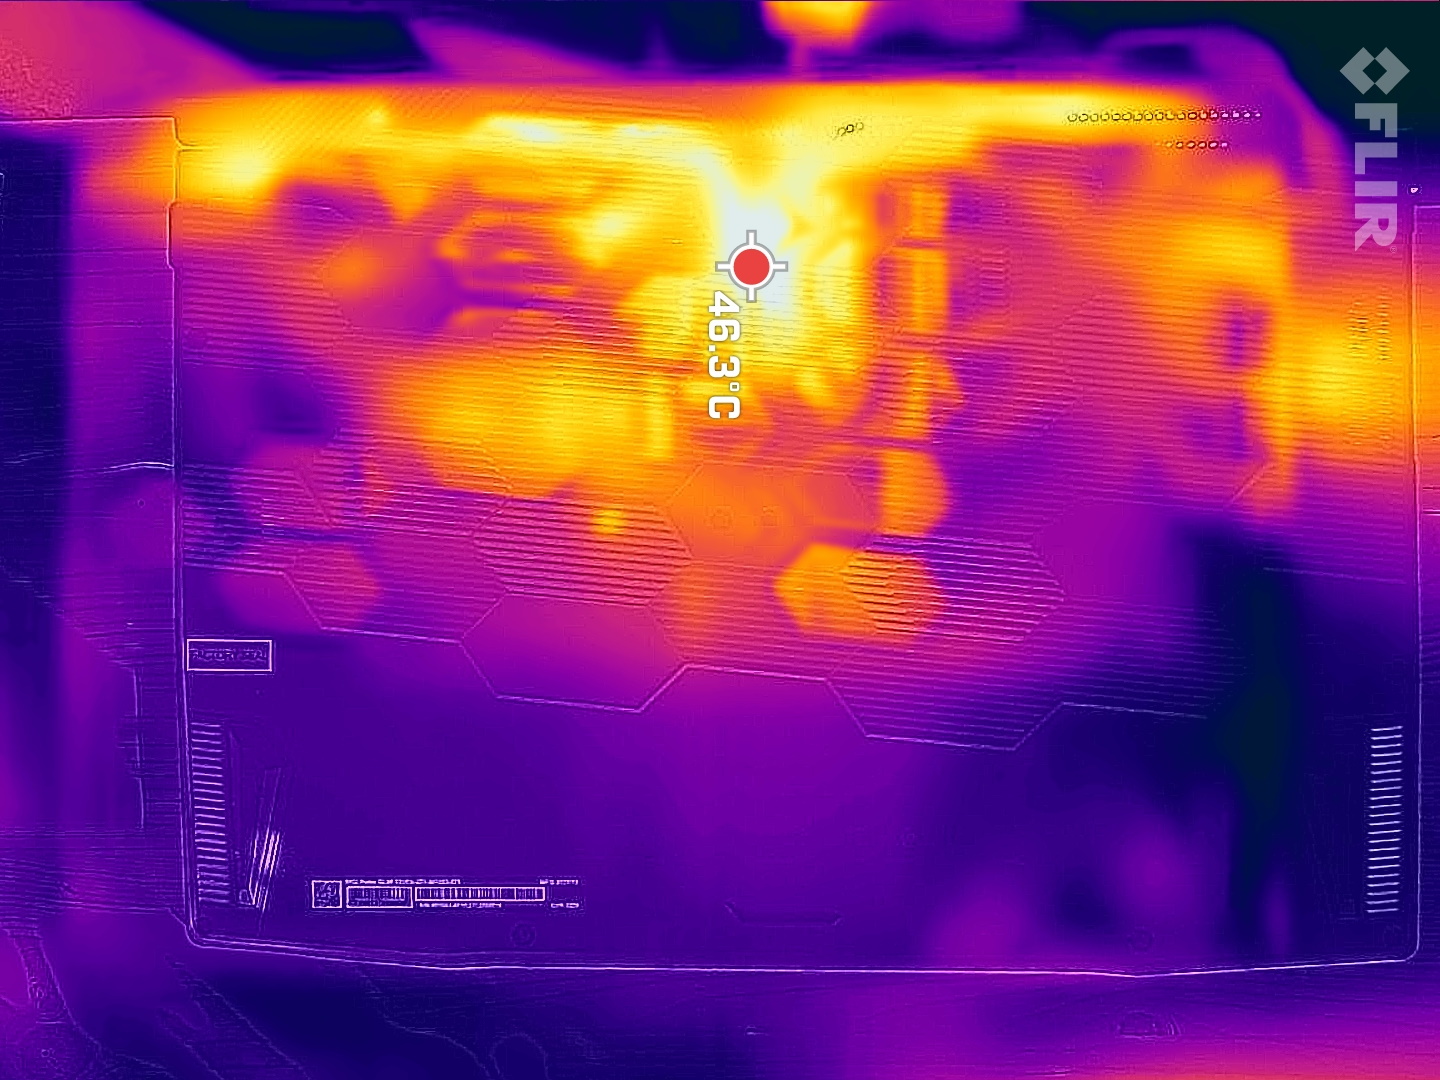
Afortunadamente, el reposamanos siempre permanece fresco. Los puntos calientes están en el centro o más cerca de la pantalla.
(-) La temperatura máxima en la parte superior es de 50 °C / 122 F, frente a la media de 40.4 °C / 105 F, que oscila entre 21.2 y 68.8 °C para la clase Gaming.
(-) El fondo se calienta hasta un máximo de 47 °C / 117 F, frente a la media de 43.2 °C / 110 F
(+) En reposo, la temperatura media de la parte superior es de 30.8 °C / 87# F, frente a la media del dispositivo de 33.9 °C / 93 F.
(-) Jugando a The Witcher 3, la temperatura media de la parte superior es de 39.6 °C / 103 F, frente a la media del dispositivo de 33.9 °C / 93 F.
(+) El reposamanos y el panel táctil están a una temperatura inferior a la de la piel, con un máximo de 26 °C / 78.8 F y, por tanto, son fríos al tacto.
(+) La temperatura media de la zona del reposamanos de dispositivos similares fue de 28.8 °C / 83.8 F (+2.8 °C / 5 F).
| MSI Pulse GL66 12UEK Intel Core i9-12900H, NVIDIA GeForce RTX 3060 Laptop GPU | Asus TUF Gaming F15 FX507ZM Intel Core i7-12700H, NVIDIA GeForce RTX 3060 Laptop GPU | Alienware x14 i7 RTX 3060 Intel Core i7-12700H, NVIDIA GeForce RTX 3060 Laptop GPU | Schenker XMG Apex 15 NH57E PS AMD Ryzen 7 5800H, NVIDIA GeForce RTX 3060 Laptop GPU | Lenovo Legion S7 15ACH6 82K80030GE AMD Ryzen 9 5900HX, NVIDIA GeForce RTX 3060 Laptop GPU | Alienware m15 R5 Ryzen Edition AMD Ryzen 7 5800H, NVIDIA GeForce RTX 3060 Laptop GPU | |
|---|---|---|---|---|---|---|
| Heat | -1% | 14% | 19% | 9% | -10% | |
| Maximum Upper Side * (°C) | 50 | 44.4 11% | 51.3 -3% | 36 28% | 49 2% | 62 -24% |
| Maximum Bottom * (°C) | 47 | 48.8 -4% | 44.4 6% | 38 19% | 50 -6% | 61 -30% |
| Idle Upper Side * (°C) | 36 | 37.8 -5% | 27.2 24% | 31 14% | 29 19% | 36 -0% |
| Idle Bottom * (°C) | 38 | 39.6 -4% | 26.6 30% | 33 13% | 30 21% | 33 13% |
* ... más pequeño es mejor
Prueba de esfuerzo
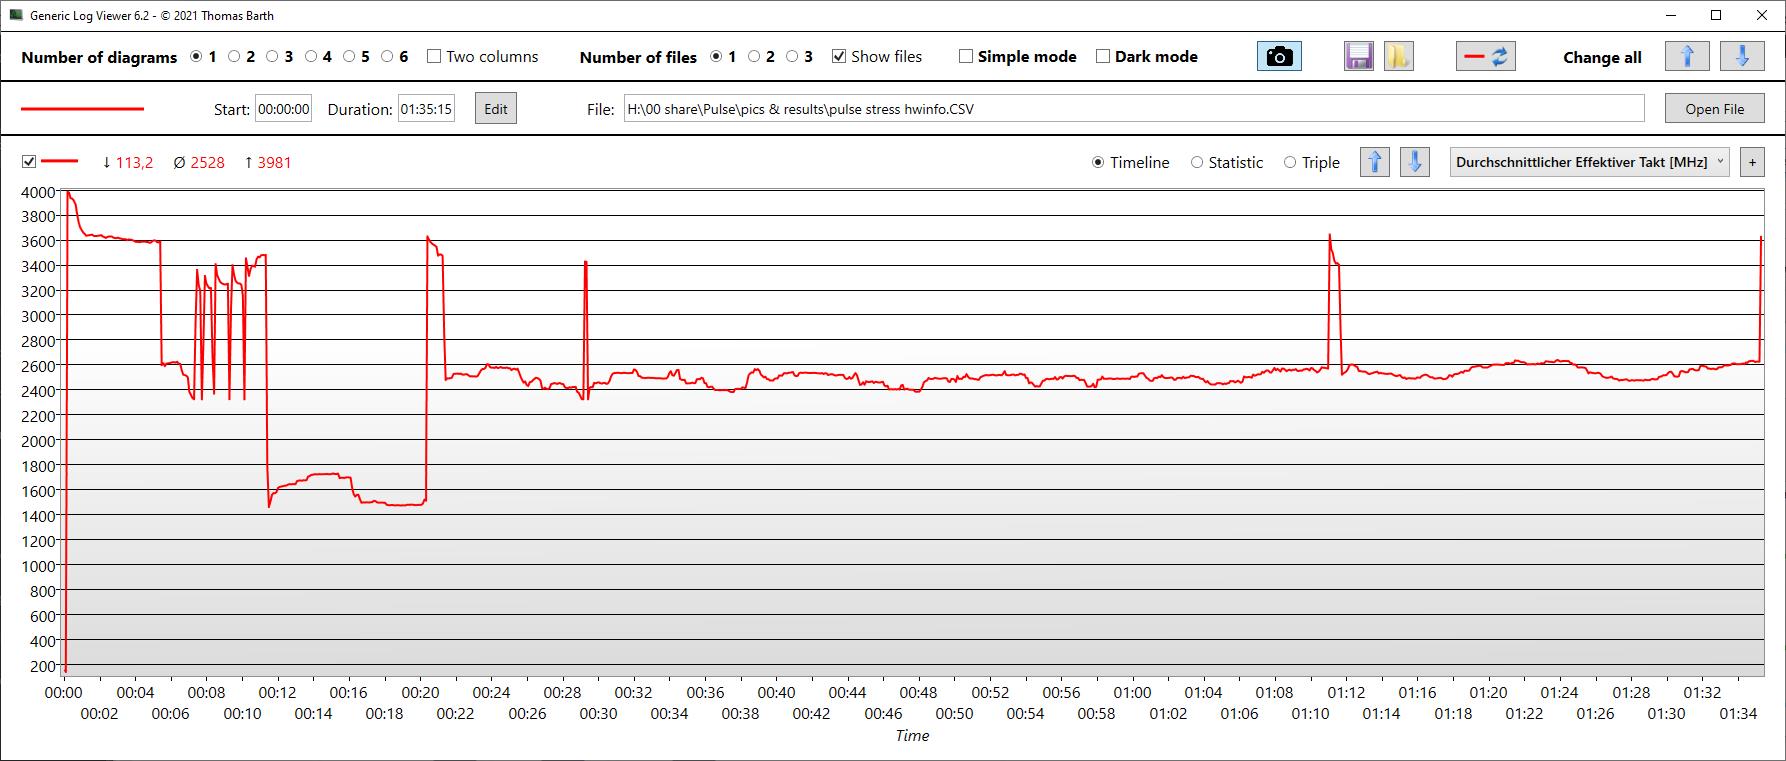
Al principio de nuestra prueba de estrés, los núcleos se aceleran inicialmente a 3,6 GHz, lo que está lejos del máximo de 5 GHz que es posible. Tras el minuto inicial, las velocidades de reloj caen continuamente. Medimos sólo 2,9 GHz después de 10 minutos y alrededor de 2,3 GHz después de una hora. Esto significa que, a pesar del modo de Rendimiento Extremo, la CPU es estrangulada aquí. Tras una hora, las temperaturas del núcleo rondan los 80 °C. Durante el transcurso de la prueba, la temperatura máxima subió a 97 °C, que es la razón por la que la velocidad de reloj fue reducida
Vimos una extraña caída de rendimiento entre el minuto 12 y el 20, quizás hubo algunos otros procesos que interfirieron aquí.
La velocidad de reloj de la GPU es muy variable, oscilando entre 1,6 y 1,2 GHz en una hora, y las temperaturas rondan los 70 °C. Hay algunas caídas de rendimiento mayores en las velocidades de reloj de la GPU y también en la velocidad de almacenamiento. Al menos esta última debería mantenerse bastante constante, pero según el registro de GPU-Z, ambos valores bajaron a 200 MHz durante el transcurso de la prueba.
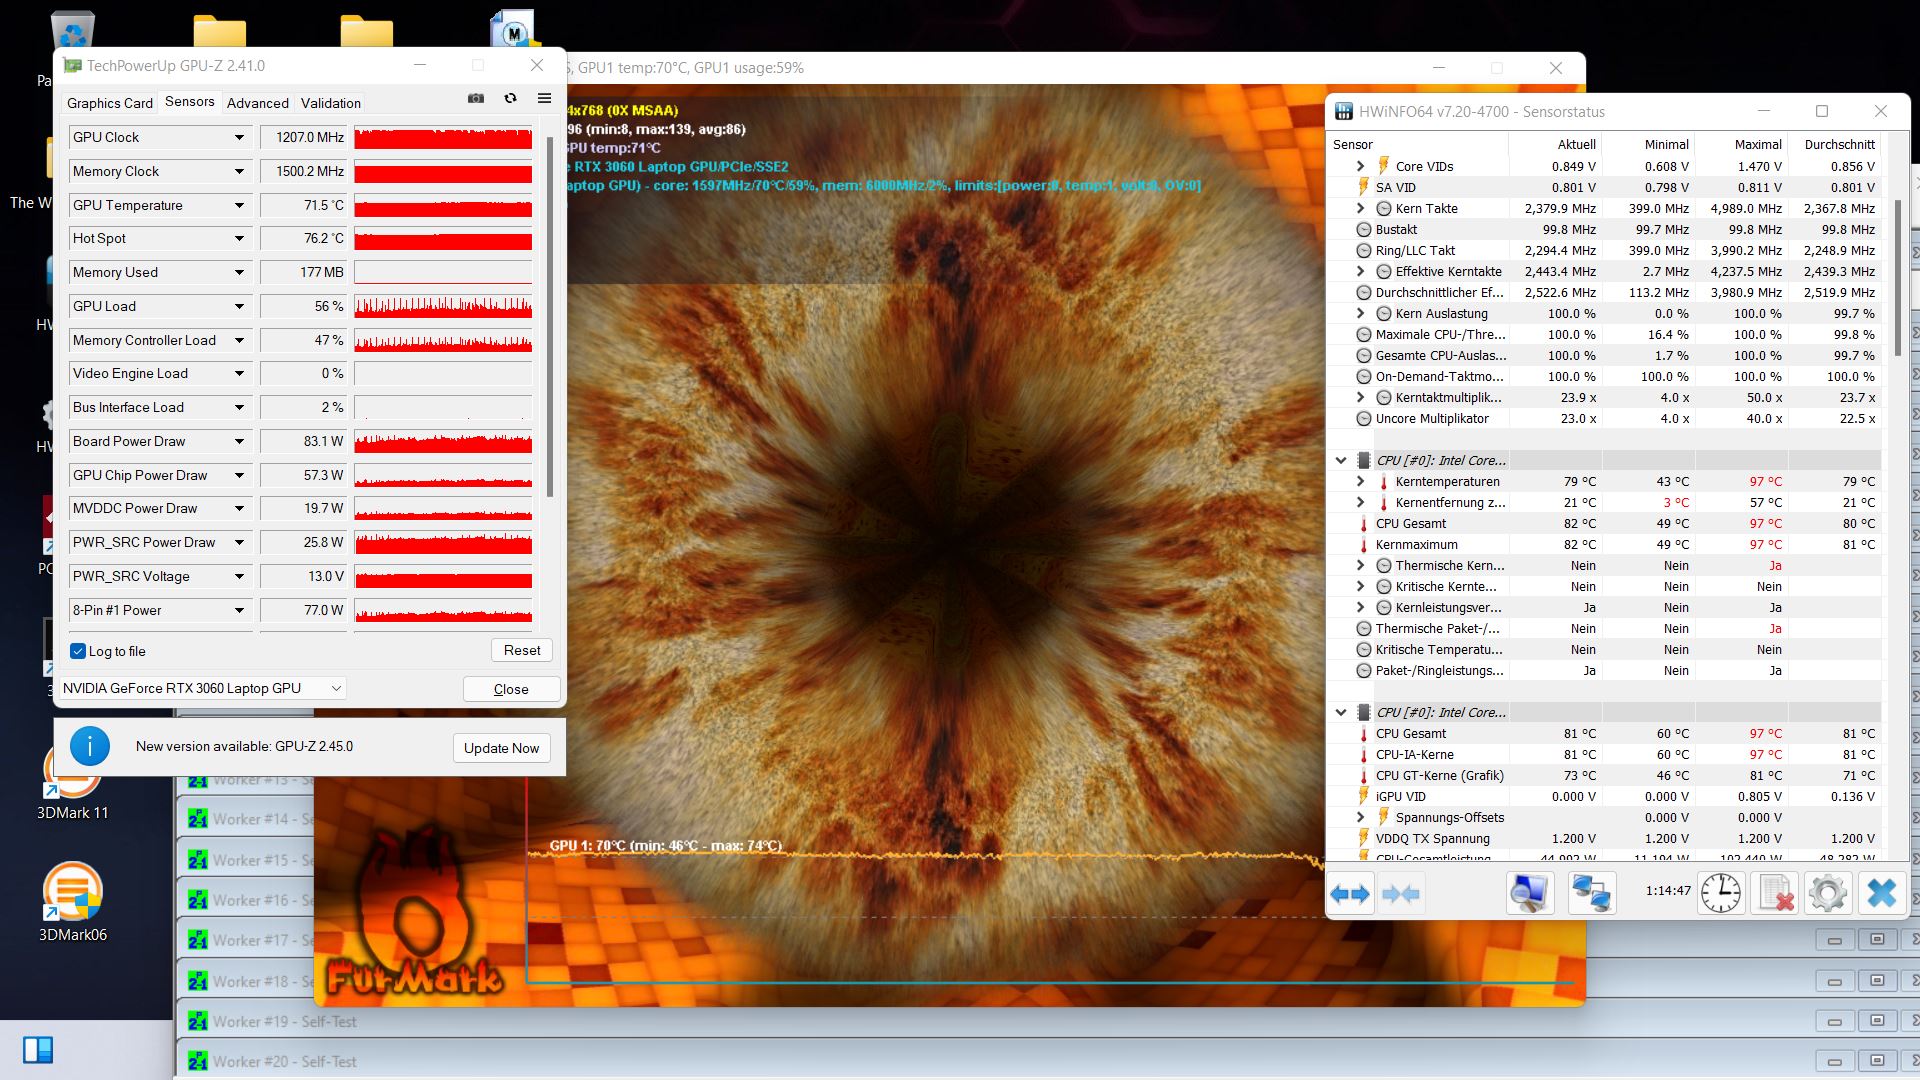
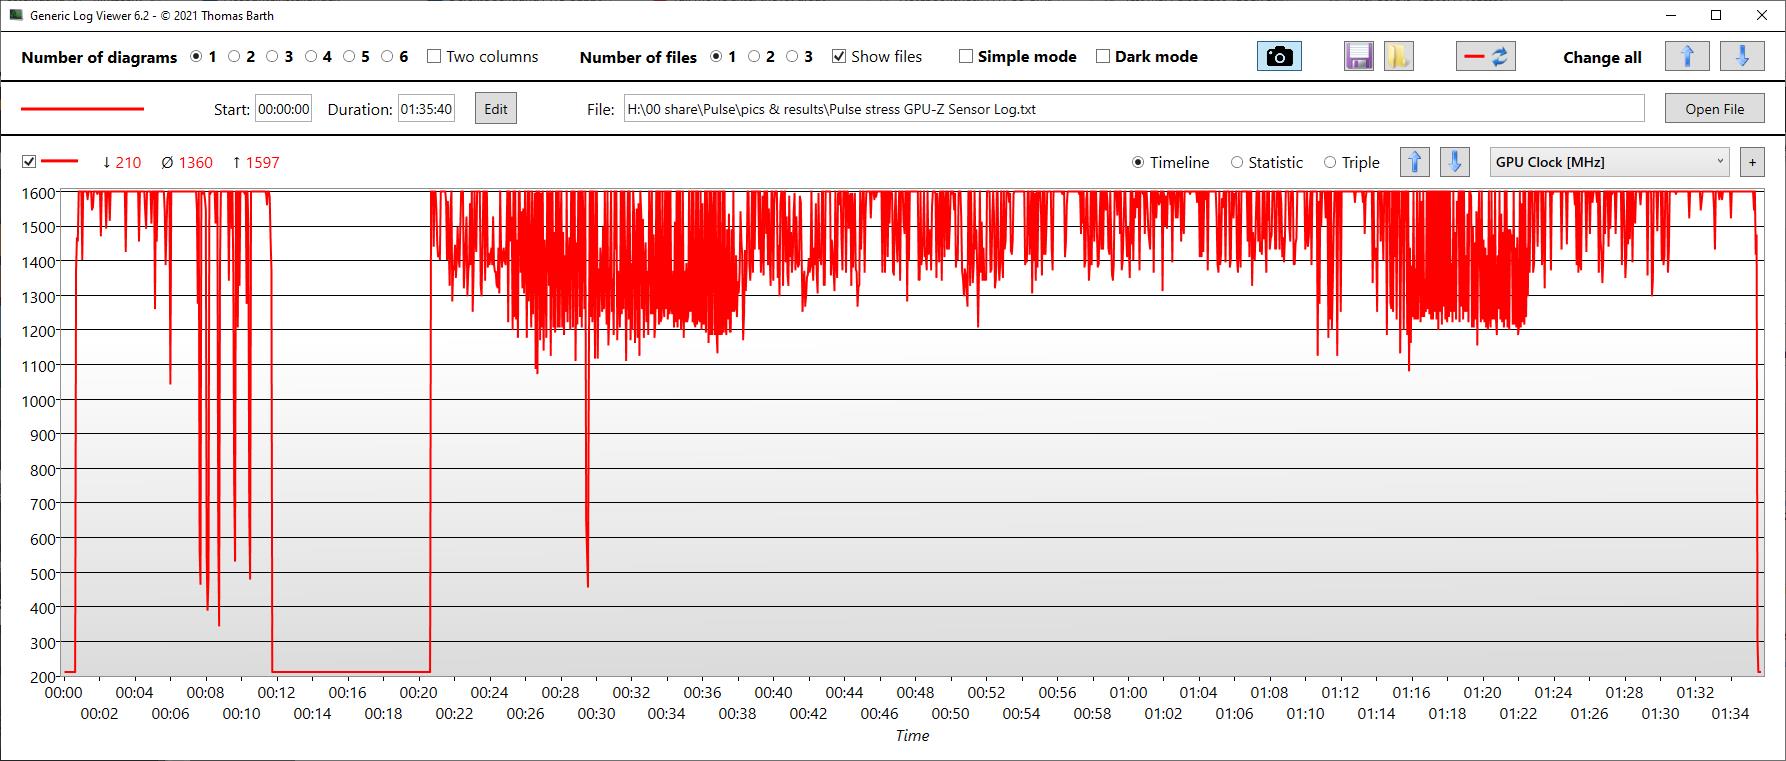
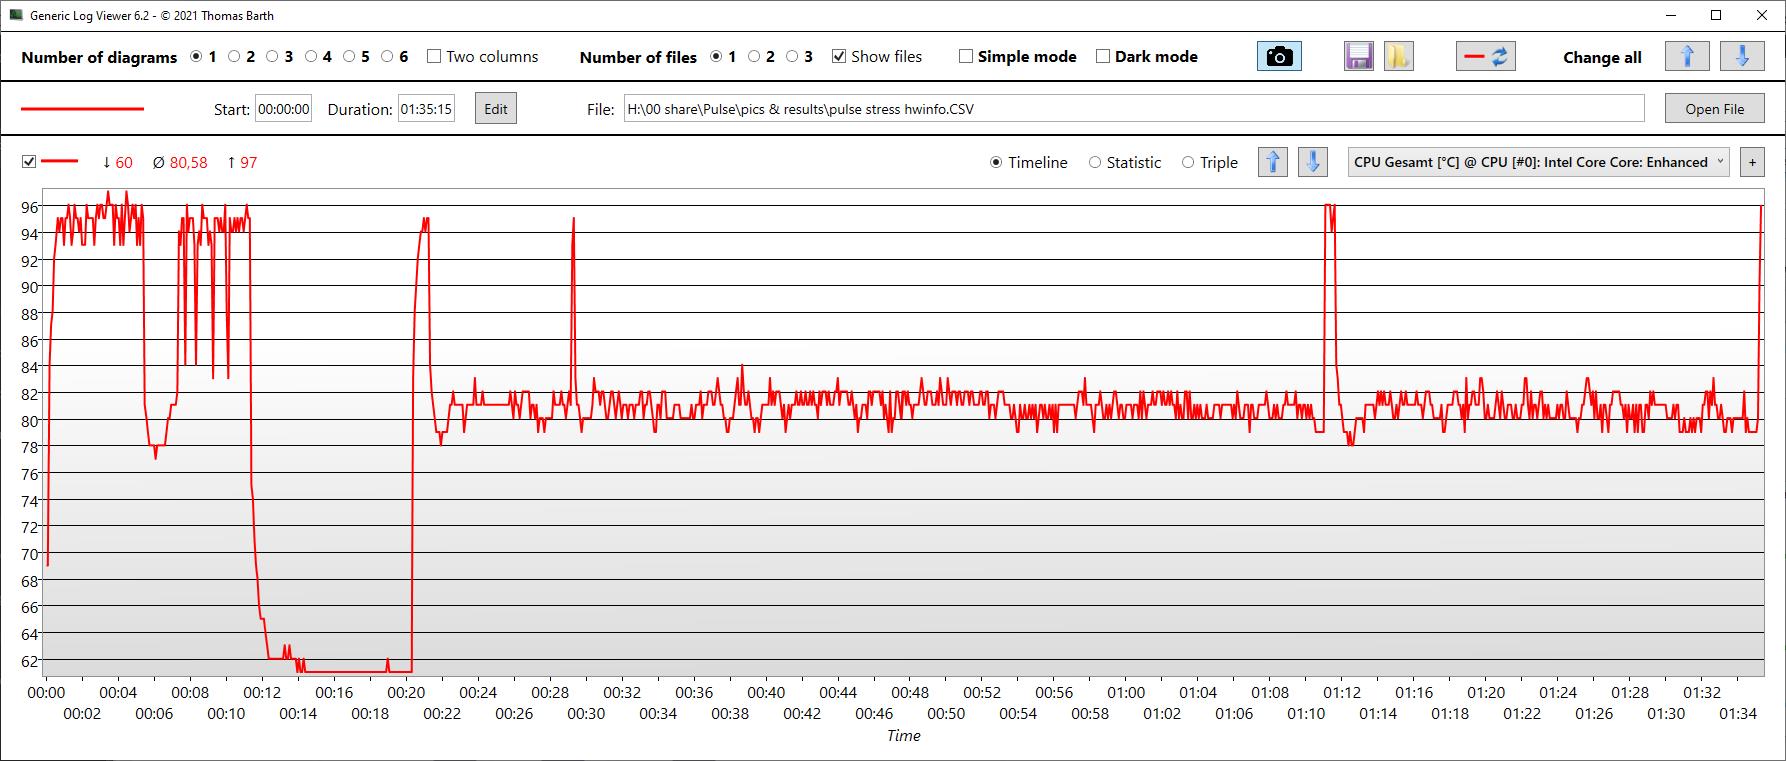
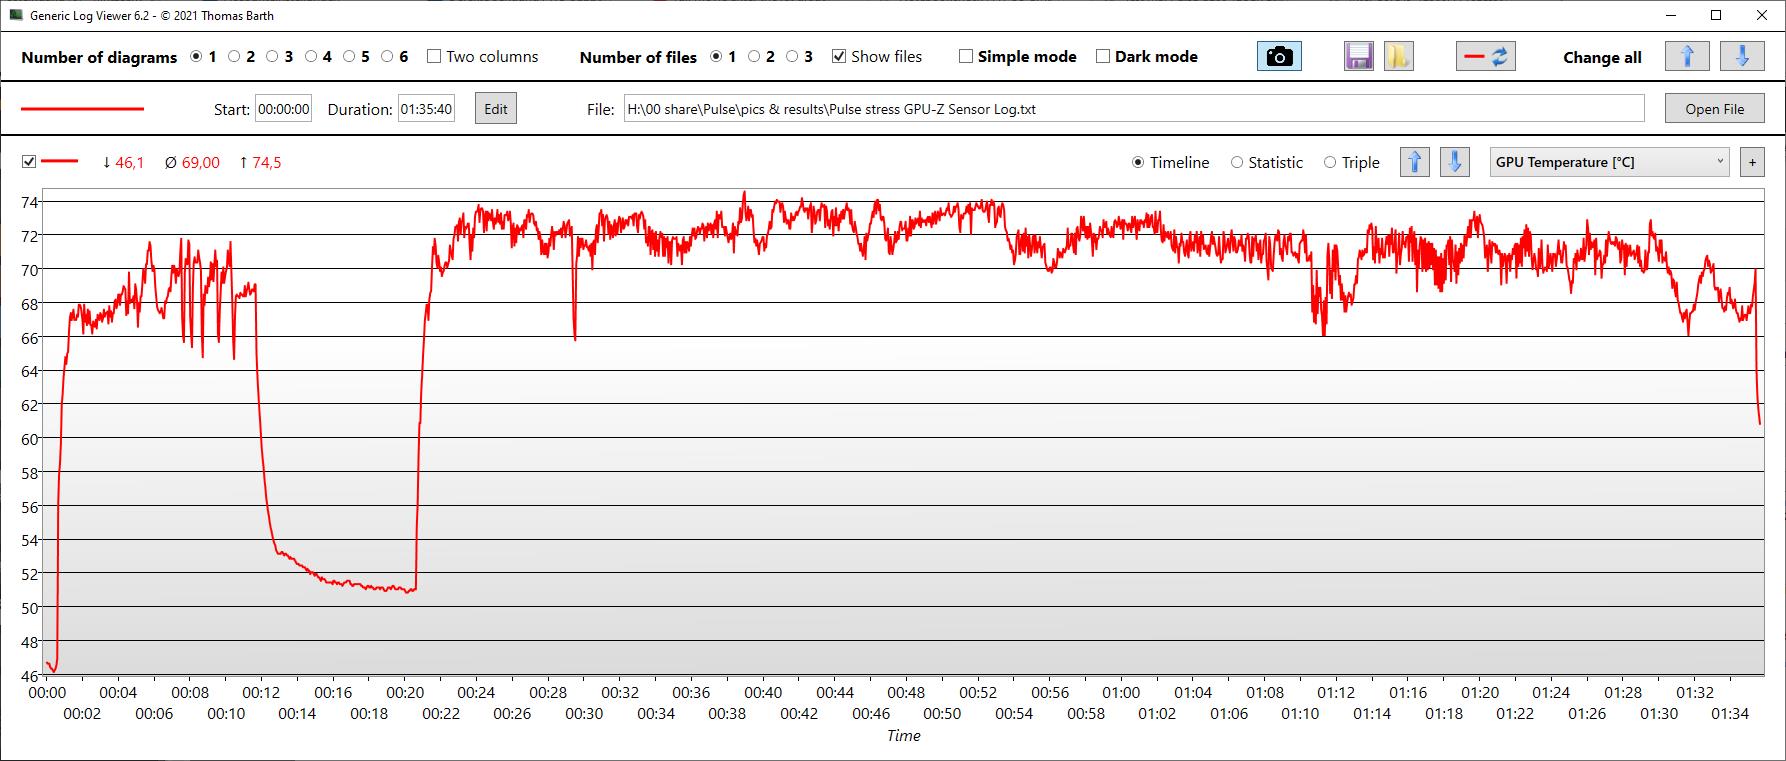
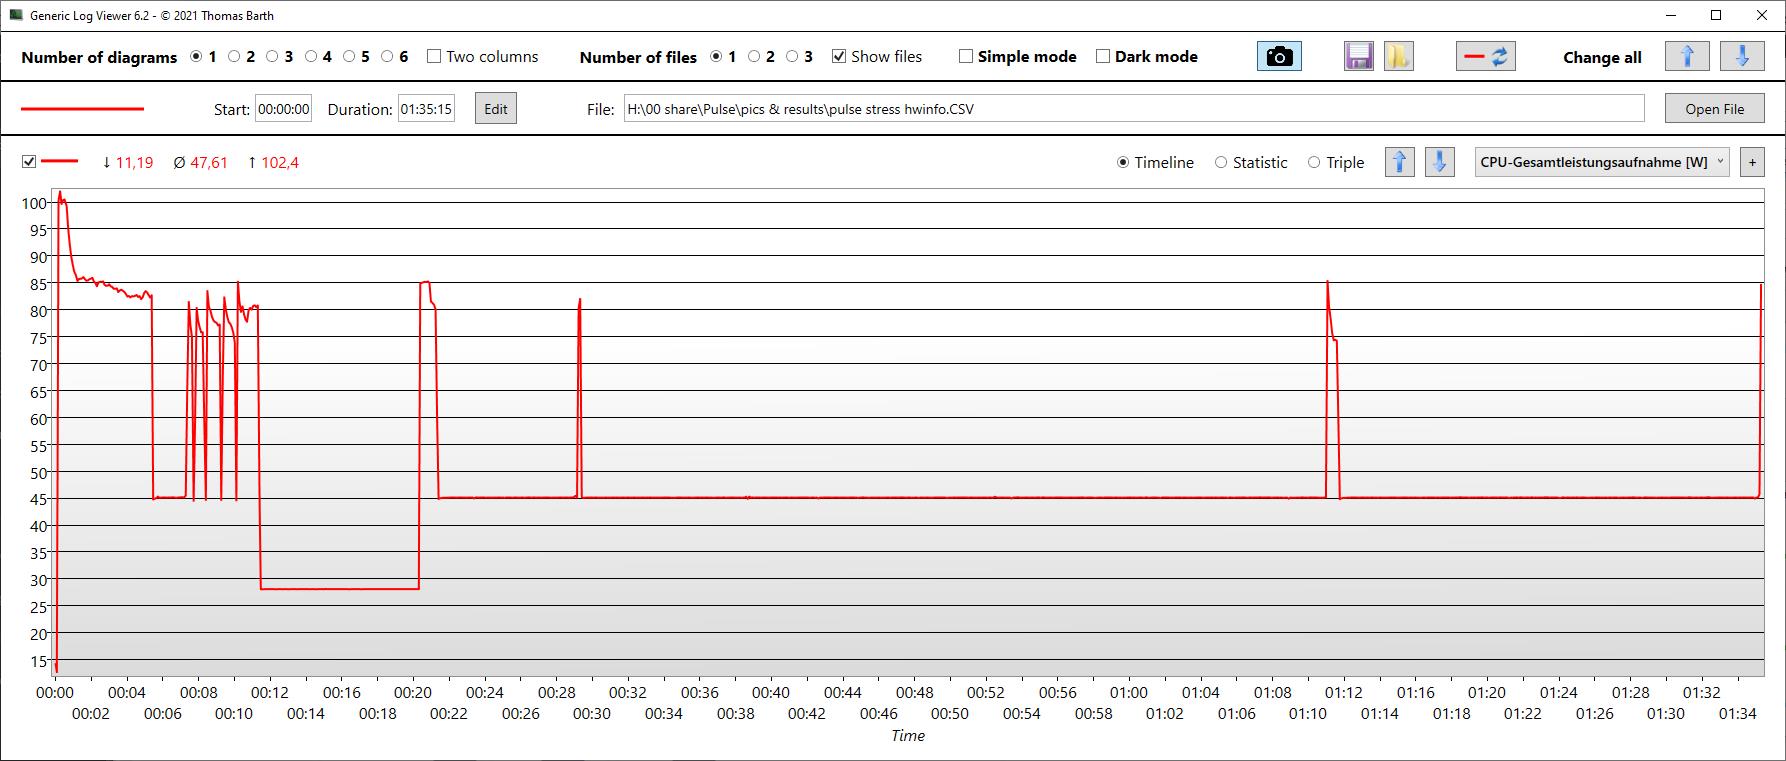
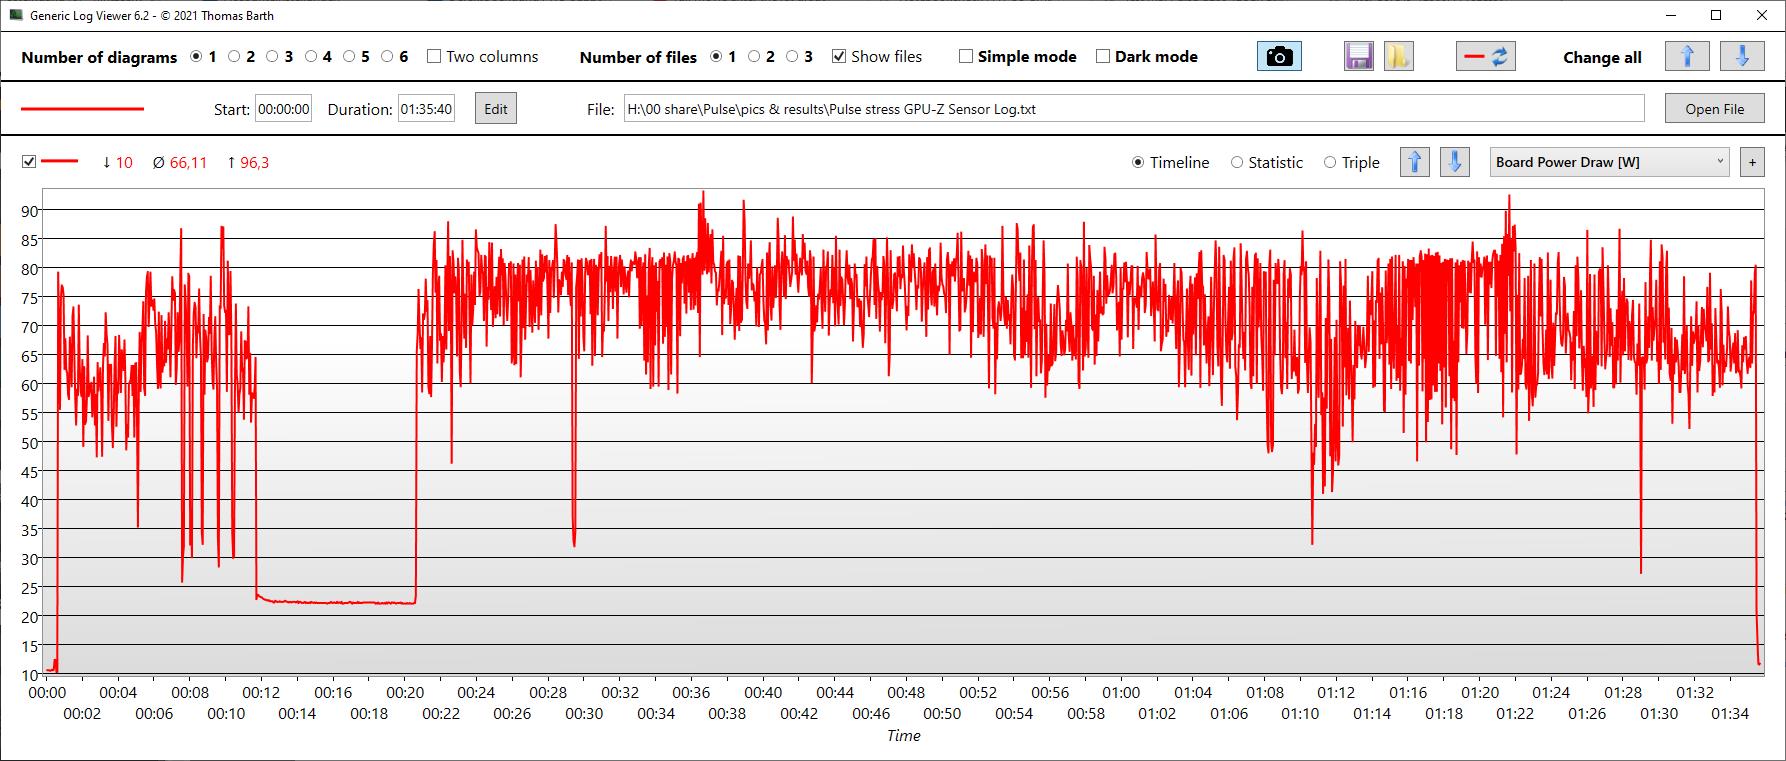
| Reloj dela CPU (GHz) | Reloj de la GPU (MHz) | Temperatura media dela CPU (°C) | Temperatura media de la GPU (°C) | |
| Prime95 + FurMark Stress | 2,5 | 1.360 | 81 | 69 |
Altavoces
Los altavoces podrían tener más volumen y es evidente que les faltan algunos graves. Pero al menos los medios y los agudos están bastante equilibrados. Hay un puerto de audio combinado para conectar dispositivos de audio externos analógicos.
MSI Pulse GL66 12UEK análisis de audio
(±) | la sonoridad del altavoz es media pero buena (79.8 dB)
Graves 100 - 315 Hz
(-) | casi sin bajos - de media 16.2% inferior a la mediana
(±) | la linealidad de los graves es media (10.4% delta a frecuencia anterior)
Medios 400 - 2000 Hz
(±) | medias más altas - de media 7.6% más altas que la mediana
(+) | los medios son lineales (6.8% delta a la frecuencia anterior)
Altos 2 - 16 kHz
(+) | máximos equilibrados - a sólo 4.1% de la mediana
(±) | la linealidad de los máximos es media (8.1% delta a frecuencia anterior)
Total 100 - 16.000 Hz
(±) | la linealidad del sonido global es media (18.8% de diferencia con la mediana)
En comparación con la misma clase
» 62% de todos los dispositivos probados de esta clase eran mejores, 8% similares, 30% peores
» El mejor tuvo un delta de 6%, la media fue 18%, el peor fue ###max##%
En comparación con todos los dispositivos probados
» 43% de todos los dispositivos probados eran mejores, 8% similares, 49% peores
» El mejor tuvo un delta de 4%, la media fue 23%, el peor fue ###max##%
Asus TUF Gaming F15 FX507ZM análisis de audio
(±) | la sonoridad del altavoz es media pero buena (76.7 dB)
Graves 100 - 315 Hz
(±) | lubina reducida - en promedio 13.7% inferior a la mediana
(±) | la linealidad de los graves es media (10.1% delta a frecuencia anterior)
Medios 400 - 2000 Hz
(±) | medias más altas - de media 5.2% más altas que la mediana
(+) | los medios son lineales (4.9% delta a la frecuencia anterior)
Altos 2 - 16 kHz
(+) | máximos equilibrados - a sólo 4.1% de la mediana
(±) | la linealidad de los máximos es media (8.6% delta a frecuencia anterior)
Total 100 - 16.000 Hz
(±) | la linealidad del sonido global es media (15.9% de diferencia con la mediana)
En comparación con la misma clase
» 38% de todos los dispositivos probados de esta clase eran mejores, 7% similares, 56% peores
» El mejor tuvo un delta de 6%, la media fue 18%, el peor fue ###max##%
En comparación con todos los dispositivos probados
» 25% de todos los dispositivos probados eran mejores, 5% similares, 70% peores
» El mejor tuvo un delta de 4%, la media fue 23%, el peor fue ###max##%
Gestión de la energía
Consumo de energía
Durante el funcionamiento en reposo y especialmente también bajo cargas medias (3DMark06), el consumo de energía es muy bajo. Durante el juego, el consumo se sitúa en la mitad del campo, pero al menos es entonces también uno de los dispositivos más rápidos. En nuestro test de estrés, el consumo es el más alto, alcanzando los mismos niveles que el Asus TUF, que es realmente más rápido. Sin embargo, el consumo es bajo o adecuado en general.
| Ocioso | |
| Carga |
|
Clave:
min: | |
| MSI Pulse GL66 12UEK i9-12900H, GeForce RTX 3060 Laptop GPU, Micron 2450 512GB MTFDKBA512TFK, IPS, 1920x1080, 15.6" | Asus TUF Gaming F15 FX507ZM i7-12700H, GeForce RTX 3060 Laptop GPU, SK Hynix HFM001TD3JX013N, IPS, 1920x1080, 15.6" | Alienware x14 i7 RTX 3060 i7-12700H, GeForce RTX 3060 Laptop GPU, WDC PC SN810 1TB, IPS, 1920x1080, 14" | Schenker XMG Apex 15 NH57E PS R7 5800H, GeForce RTX 3060 Laptop GPU, Samsung SSD 980 500GB (MZ-V8V500BW), IPS, 1920x1080, 15.6" | Lenovo Legion S7 15ACH6 82K80030GE R9 5900HX, GeForce RTX 3060 Laptop GPU, Samsung PM981a MZVLB1T0HBLR, IPS, 3840x2160, 15.6" | Alienware m15 R5 Ryzen Edition R7 5800H, GeForce RTX 3060 Laptop GPU, Toshiba KBG40ZNS512G NVMe, IPS, 1920x1080, 15.6" | Medio NVIDIA GeForce RTX 3060 Laptop GPU | Media de la clase Gaming | |
|---|---|---|---|---|---|---|---|---|
| Power Consumption | -33% | -7% | -36% | -43% | -52% | -45% | -69% | |
| Idle Minimum * (Watt) | 7 | 6.3 10% | 7.9 -13% | 10.5 -50% | 13 -86% | 11 -57% | 10.4 ? -49% | 13 ? -86% |
| Idle Average * (Watt) | 13 | 9.8 25% | 11.1 15% | 15 -15% | 16 -23% | 14 -8% | 14.5 ? -12% | 19 ? -46% |
| Idle Maximum * (Watt) | 13.7 | 26.5 -93% | 11.8 14% | 17 -24% | 23 -68% | 25 -82% | 21.4 ? -56% | 24.6 ? -80% |
| Load Average * (Watt) | 48.4 | 103.8 -114% | 107.4 -122% | 109 -125% | 95 -96% | 123 -154% | 109.3 ? -126% | 110.7 ? -129% |
| Witcher 3 ultra * (Watt) | 148 | 189 -28% | 111 25% | 186 -26% | 156 -5% | 176 -19% | ||
| Load Maximum * (Watt) | 244 | 241.9 1% | 140.4 42% | 186 24% | 191 22% | 226 7% | 206 ? 16% | 259 ? -6% |
* ... más pequeño es mejor
Power Consumption The Witcher 3 / Stress Test
Power Consumption With External Monitor
Duración de la batería
MSI usa una batería bastante pequeña con una capacidad de sólo 53-Wh, y la duración de la batería del portátil de juegos es correspondientemente baja. Sólo el Schenker tiene una batería similarmente pequeña, pero todos los demás competidores tienen una capacidad de 80 (Alienware) o incluso 90-Wh (Asus TUF).
Esto significa que apenas es suficiente para 4 horas de ver vídeos o 4,5 horas de navegar con el brillo completo (es decir, más bien mediocre).
| MSI Pulse GL66 12UEK i9-12900H, GeForce RTX 3060 Laptop GPU, 53.5 Wh | Asus TUF Gaming F15 FX507ZM i7-12700H, GeForce RTX 3060 Laptop GPU, 90 Wh | Alienware x14 i7 RTX 3060 i7-12700H, GeForce RTX 3060 Laptop GPU, 80 Wh | Schenker XMG Apex 15 NH57E PS R7 5800H, GeForce RTX 3060 Laptop GPU, 49 Wh | Lenovo Legion S7 15ACH6 82K80030GE R9 5900HX, GeForce RTX 3060 Laptop GPU, 71 Wh | Alienware m15 R5 Ryzen Edition R7 5800H, GeForce RTX 3060 Laptop GPU, 86 Wh | Media de la clase Gaming | |
|---|---|---|---|---|---|---|---|
| Duración de Batería | -42% | 39% | -6% | 26% | 34% | 44% | |
| H.264 (h) | 4 | 9.4 135% | 4.6 15% | 7.5 88% | 8.8 120% | 8.32 ? 108% | |
| Load (h) | 1.9 | 1.1 -42% | 0.8 -58% | 1.4 -26% | 1.2 -37% | 0.9 -53% | 1.502 ? -21% |
| Reader / Idle (h) | 15.8 | 14 | 14.7 | 8.27 ? | |||
| WiFi v1.3 (h) | 4.8 | 8.9 | 6.5 | 7 | 5.1 | 7.11 ? | |
| Witcher 3 ultra (h) | 0.8 | 1.6 |
Pro
Contra
Veredicto - Mucho potencial de mejora
Aunque la RTX 3060 sólo es capaz de utilizar 105 vatios, nos ha gustado el rendimiento en los juegos, sobre todo porque esto también hace que el Pulse sea cómodamente eficiente pero no lento de ninguna manera.
Ni la pantalla oscura con sus penosos tiempos de respuesta, ni el USB 2.0 o la falta de Thunderbolt gustarán a los auténticos gamers. El uso de un sello de fábrica adhesivo, que es al menos cuestionable, tampoco inspirará ningún entusiasmo.
Es obvio que el portátil está realmente diseñado para jugadores preocupados por el precio, aunque el precio actual de unos 1,900 Euros no lo convierte en una ganga. MSI podría haber bajado el precio sin problemas, si el fabricante hubiera usado un procesador i7-12700H o i7-12800H como la mayoría de los competidores, en vez del caro i9-12900H. La diferencia de rendimiento no se nota en el Pulse y no justifica el sobreprecio.
Con el Pulse GL66, la relativamente nueva serie de juegos de MSI aún revela algunos problemas de ajuste. La costosa CPU no rinde a su máximo nivel, y un modelo más asequible habría bajado el precio del sistema a un nivel más apropiado.
Mirando el rendimiento, el Asus TUF Gaming F15 se recomienda como alternativa. Es más rápido, ofrece la mejor pantalla, y es incluso más asequible a unos 1.600 euros (~1.732 dólares). Costando casi lo mismo que el Pulse, el Lenovo Legion S7 también puede brillar con una buena pantalla.
Precio y disponibilidad
En Estados Unidos, varias configuraciones del Pulse GL66 12UEK con un i7-12700H están disponibles en Amazon a partir de 1549 dólares.
MSI Pulse GL66 12UEK
- 04/11/2022 v7 (old)
Christian Hintze
Price comparison

